Embed Size (px)
Citation preview
Photophysics and rotational relaxation dynamics of cationic phenaziniumdyes in anionic reverse micelles: Effect of methyl substitution
Debosreeta Bose, Deboleena Sarkar,a� Agnishwar Girigoswami, Atanu Mahata,Debanjana Ghosh, and Nitin Chattopadhyaya�
Department of Chemistry, Jadavpur University, Kolkata 700 032, India
�Received 25 April 2009; accepted 20 August 2009; published online 21 September 2009�
We present here, a detailed photophysical and rotational relaxation dynamical study of threestructurally analogous cationic dyes, namely, phenosafranin �PSF�, safranin-T �ST�, and safranin-O�SO�, carried out in well characterized, monodispersed biomimicking anionic reverse micellarnanocavities composed of sodium bis�2-ethylhexyl�sulfosuccinate �AOT�/heptane with increasingwater contents. The dyes belong to the phenazinium family and they differ in terms of methylsubstitution on the planar phenazinium skeleton. The objective of the present study is to investigatethe modification in the photophysical and dynamical behavior of the dyes with the change in the sizeof the water pool of the reverse micelle and thereby to explore the role of methyl substitution.Steady state and time resolved emission and anisotropy studies have been exploited for the purpose.The dyes are found to exhibit a marked decrease in the fluorescence anisotropy with increasingwater/surfactant mole ratio �w�, i.e., the water pool size in the reverse micellar core, implying thatoverall motional restriction experienced by the molecules are decreased with increasing hydration.Some of the depth dependent fluorescence parameters such as fluorescence maximum, fluorescenceanisotropy �r� have been monitored for exploring the microenvironment around the probes in thereverse micelles. Fluorescence studies suggest that at low w values, the probes do not penetrate intothe reverse micellar core; rather it binds at the interfacial region. Estimates of the micropolarity atthe binding sites of the probe molecule have been determined as a function of w. Finally, dynamicstudies reveal that both the lifetime and rotational relaxation time decrease with an increase in w forall the three probes, the extent of the decrease being more for PSF than ST and SO. This indicatesa stronger binding of the reverse micelle with ST and SO compared to that with PSF which isrationalized in terms of an increase in the hydrophobicity of the former two dyes because of themethyl substitution on the phenazinium moiety. © 2009 American Institute of Physics.�doi:10.1063/1.3225476�
I. INTRODUCTION
Surfactants are often able to aggregate in organic non-aqueous nonpolar solvents to form reverse micelles �RMs�.Inverted or reverse micelles are clear, macroscopically ho-mogeneous, and thermodynamically stable solutions.1–4 Insuch multicomponent mixtures, polar solvent molecules aretrapped in a confinement created by the self aggregation ofthe surfactant head groups, while the alkyl chain �or tail� ofthe surfactant molecules remain in the bulk nonpolar solvent�oil�.5 RMs are nanopools of polar solvents protected by amonolayer of surfactant molecules at the periphery with po-lar head groups pointing toward the polar solvent trapped atthe center and the hydrocarbon tail directed toward the non-polar organic bulk medium.6,7 RMs provide an attractivemodel for biosystems since they can mimic several importantand essential features of biological membranes. One of thesignificant features of RMs is the presence of highly struc-tured and nonhomogeneous water molecules, which repre-sent an interesting model of water molecules present in bio-
logical systems such as membranes.8–10 The chemicalapproach to biological problems through investigations ofmodels rests upon the ability of the chosen system to mimicsome functions of biological ensembles. RMs with water na-nopools resemble the water pockets found in various bioag-gregates such as proteins, membranes and mitochondria.Thus, these systems are often considered as excellent bio-mimics for the exploration of biomembranes and biologicallyconfined water molecules.2,11,12 It has also been projectedthat enzyme-containing RMs may offer novel tools for bio-technology and for drug delivery through solubilization ofliophilic drugs.13
The physicochemical properties of the entrapped waterhave been found to be strongly dependent on the chemicalnature of the dispersant phase �oil�, surfactant and also on thehydration level of the RM �w= �water� / �surfactant��. Thethree governing factors for solubilization are electrostatic,hydrophobic, and interactions of the RM interface with thespecific moiety or segments of solubilized biological macro-molecules. The most widely studied RM for various pur-poses is that made by the anionic surfactant sodium bis�2-ethylhexyl� sulfosuccinate �AOT� as it can form sphericalRMs over a wide range of w values.14 The AOT-alkane-water
a�Authors to whom correspondence should be addressed. Electronicaddresses: [email protected] and [email protected]: 91-33-2414-6266.
THE JOURNAL OF CHEMICAL PHYSICS 131, 114707 �2009�
0021-9606/2009/131�11�/114707/9/$25.00 © 2009 American Institute of Physics131, 114707-1
Downloaded 02 Oct 2009 to 203.197.118.120. Redistribution subject to AIP license or copyright; see http://jcp.aip.org/jcp/copyright.jsp
system is interesting as the solution is macroscopically ho-mogeneous and optically transparent over a wide range oftemperature, pressure and pH. The AOT RM can compart-mentalize a large amount of water within its core and thenanoscale aggregation process is fairly well characterizedwith respect to size and shape at various water contents.14 Inliquid alkanes, AOT RMs �at low w� are aggregates of thesurfactant and each micelle contains 23 monomers.15 Thestructure of this RM is slightly asymmetric and is of a roundcylindrical nature.14 The water droplets present in AOT RMhave well defined spherical structures and the relationshipbetween water pool diameter and w is given by1,3
dwp�nm� = 0.29w + 1.1. �1�
Various studies have shown that water inside the RM isgenerally of two types: �i� interfacial or bound and �ii� coreor free water.1–4 Existence of a third type of water molecule�trapped water� present between the polar head groups of theindividual surfactant molecules are also given in manyreports.9 Thus the interior of the RMs is truly heterogeneous,and a polar or charged fluorescent probe has finite possibilityof distribution in any of these regions depending on the na-ture of the probe as well as on the difference in the rigidityand polarity of these regions. As the confinement severelyaffects the structure of water molecules �mainly the H-bondnetwork� and considerably modifies several bulk solventproperties, extensive research has been carried out over theyears to understand the effect of surfactant-water interactionon the structure and dynamics of the encapsulated watermolecules.1–20 RMs are known as common organic reactionmedia to perform biocatalysis. They have also been associ-ated with the idea of a “nanocage” or “microreactor.”15 Re-cently, photoinduced intramolecular charge transfer �ICT� re-actions have been studied in AOT/heptane/water RMs tohave a control on the ICT process.21,22 In this paper, we haveattempted to study and characterize the photophysical androtational dynamical behavior of three cationic ICT probes,differing in terms of methyl substitution, in anionic AOT/water/heptane RMs of different pool size. Our focus remainson the effect of the surface charge of the RM and the waterpool size on the various photophysical and dynamical param-eters and also in identifying and comparing the effect ofmethyl substitution and thereby the hydrophobicity on suchbehavior upon confinement within the nanopool.
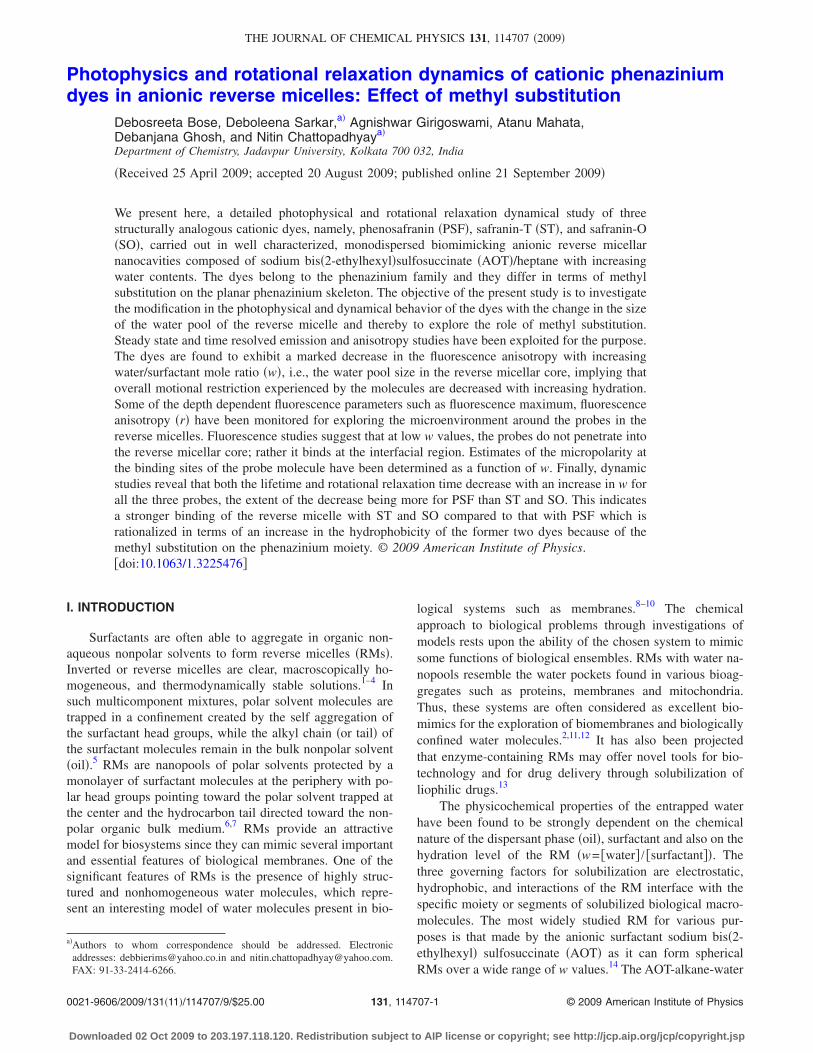
For this purpose we have used three cationic phena-zinium dyes, namely, phenosafranin �PSF, 3,7-diamino-5-phenyl phenazinium chloride�, safranin-T �ST, 3,6-diamino-2,7-dimethyl-5-phenyl phenazinium chloride�, andsafranin-O �SO, 3,7-diamino-2,8-dimethyl-5-phenyl phena-zinium chloride� �Scheme 1�. These dyes have extensivelybeen used in semiconductors, as energy sensitizers, and as
probes for studying various microheterogeneous environ-ments including micelles, RMs, and polymeric matrices.23–26
They have also been established as DNA intercalators27 andare found to form dimeric aggregates at higherconcentrations.28 All the three dyes are red colored with aplanar tricyclic phenazinium moiety bearing a positivecharge. PSF, ST, and SO are water-soluble dyes with thecorresponding broad absorption peaks in the visible region.23
The dyes vary with respect to the methyl substitution on thephenazinium moiety.
The spectroscopic and photophysical data of these mo-lecular systems in homogeneous and microheterogeneousmedia is very useful for a better understanding of the biodis-tribution of these dyes inside the living cells. Since AOTforms negatively charged RM, the interaction of the cationicprobes with the surfactant head group �anionic� is expectedto be interesting. It will therefore be fascinating to find outhow the water droplet size and electrostatic interaction influ-ence the rotation of the solute in the AOT reverse micellarnanopools. An organized molecular assembly is often knownto impose restriction on the dynamics and mobility of theprobe trapped in it. Depolarization of the fluorescence of theprobe has been established to be a most sensitive and pow-erful technique to elucidate the dynamical information aboutthe fluorophore in the complex microheterogeneous environ-ments such as micelles, RMs, lipids, cyclodextrins,etc.1,8,11,12,15 Ionic and/or charged probes usually provide anopportunity to study the dynamics in fairly well definedaqueous micellar nanopools. Dynamical information in-cludes tumbling or rotational motion of the bound fluoro-phore within the microheterogeneous environments on thepicosecond/nanosecond time scale. In general the rotationaldiffusion coefficient is inversely related to the viscosity ofthe solvent by the Stokes–Einstein equation for neutral mol-ecules. In microheterogeneous media the rotational dynamicsof a dye is fundamentally different from that in the homoge-neous media in two aspects. First, the existence of anaqueous/nonaqueous interface leads to an orientationallynonrandom equilibrium distribution of the molecules andsecond, the molecular dynamics is highly restricted. Under-standing of the rotational dynamics of a probe in microhet-erogeneous media is thus highly significant for the interpre-tation of the dynamics of drugs in biological systems. We,therefore, intend to delve into the dynamics of three cationicprobes in the anionic RMs to understand their rotational be-havior in such organized assemblies.
II. EXPERIMENTAL
Phenosafranin �PSF� and safranin-O �SO� were pur-chased from Sigma-Aldrich �USA�. Safranin-T �ST� and so-dium bis�2-ethylhexyl� sulfosuccinate �AOT� were pur-chased from Fluka �USA�. All the dyes and AOT were usedas received without further purification. UV spectroscopicgrade n-heptane was procured from Spectrochem �India� andwas used as received. The concentrations of all the threefluorophores were kept at approximately 7�10−6M through-out the experiment.
Absorption and steady state fluorescence measurements
SCHEME 1. Structures of �a� phenosafranin, �b� safranin-T, and �c�safranin-O.
114707-2 Bose et al. J. Chem. Phys. 131, 114707 �2009�
Downloaded 02 Oct 2009 to 203.197.118.120. Redistribution subject to AIP license or copyright; see http://jcp.aip.org/jcp/copyright.jsp
were performed using a Shimadzu MPS 2000 spectropho-tometer and a Spex fluorolog II spectrofluorimeter, respec-tively. The steady state fluorescence anisotropy was mea-sured with a PerkinElmer LS55 spectrofluorimeter. Steadystate anisotropy r is defined by29
r = �IVV − G · IVH�/�IVV + 2G · IVH� , �2�
where IVV and IVH are the intensities obtained with the exci-tation polarizer oriented vertically and the emission polarizeroriented vertically and horizontally, respectively. The G fac-tor was defined as
G = IHV/IHH. �3�
I terms refer to parameters similar to those mentioned abovefor the horizontal position of the excitation polarizer. Quan-tum yields were determined using quinine sulfate in 0.1NH2SO4 �� f =0.54�.30 Fluorescence lifetimes were determinedfrom time resolved intensity decays by the method of time-correlated single-photon counting using a picosecond diodelaser at 403 nm �IBH, U.K., nanoLED-07� as the light sourceand TBX-04 as the detector and the signals were collected ata magic angle �54.7°�. The decays were analyzed using IBHDAS-6 decay analysis software. Goodness of fits was evalu-ated by �2 criterion and the randomness of the residuals ofthe fitted function to the data.
For anisotropy decay measurements, the samples wereexcited at 403 nm using a picosecond diode laser �IBH� andthe responses were collected using a Hamamatsu microchan-nel plate photomultiplier tube �3809U�. The instrument re-sponse function of the setup was 90 ps. For the anisotropy
decays, we used a motorized polarizer in the emission side.The emission intensities at parallel �I�� and perpendicular�I�� polarizations were collected alternatively until a presetpeak difference was reached. The preset value depended onthe tail matching of the parallel and perpendicular decays.Logically, the technique might fail for extremely slow tum-bling motion of the fluorophore introduced by some veryrigid microenvironment. For the reverse micellar systemssuch as the present one, however, the method works quitewell. Furthermore, to combat with a relatively bigger micel-lar or reverse micellar systems, the preset value of the peakdifference is often enhanced.11,12,15 To improve the signal-to-noise ratio, the data sets were averaged. The analysis of thedata was done using IBH DAS, version 6, decay analysissoftware. The quality of the fits was determined from thereduced �2 and the randomness of the residuals of the fittedfunction to the data. All the experiments were performedwith air-equilibrated solutions at 25 °C temperature.
III. RESULTS AND DISCUSSION
A. Steady state absorption and emission
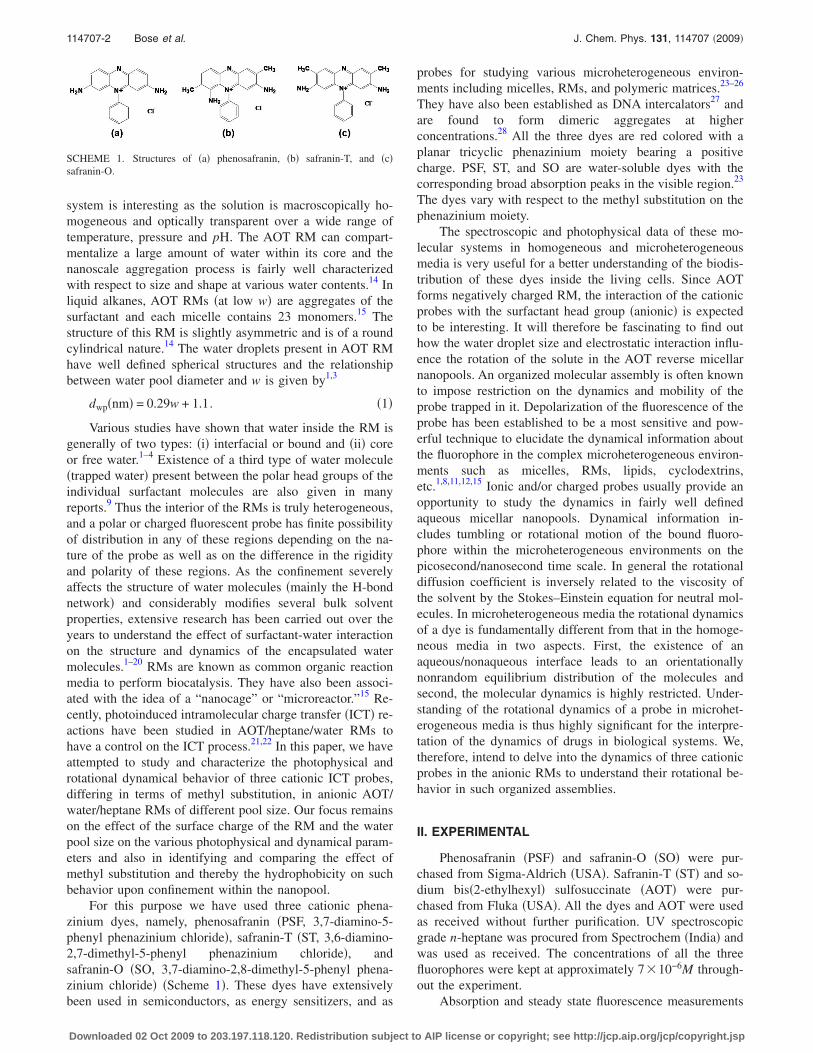
Figure 1 shows the absorption spectra of the PSF in wa-ter and AOT-RM containing water. The absorption spectrafor all the three dyes show a redshift from 520 in water to530 nm in the AOT RMs, indicating a finite interaction be-tween the dyes and the RMs. However it is observed that nonoticeable shift in the absorption maximum is observed uponincreasing the water pool size. It is known that these dyes aremore sensitive to polarizability of the microenvironment thanthe polarity.9,31 The redshift thus, may also indicate the loca-tion of the dyes closer to the RM interface with lower polar-ity than the polar central core of the RM.
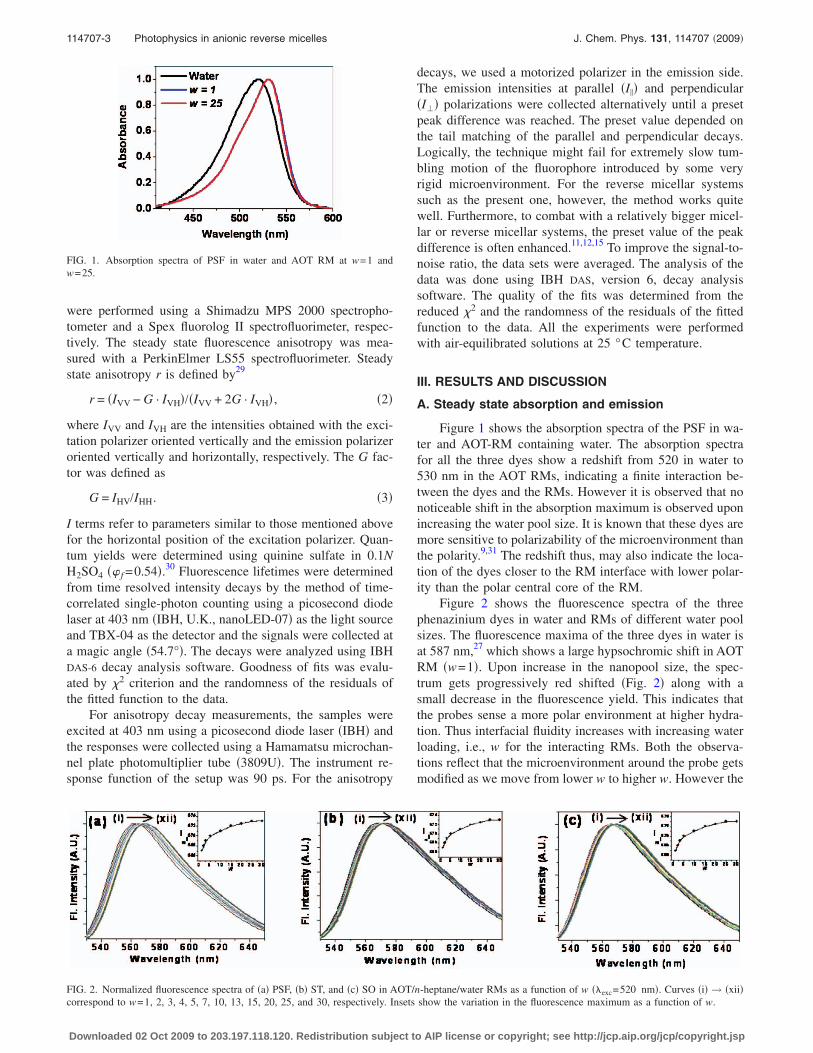
Figure 2 shows the fluorescence spectra of the threephenazinium dyes in water and RMs of different water poolsizes. The fluorescence maxima of the three dyes in water isat 587 nm,27 which shows a large hypsochromic shift in AOTRM �w=1�. Upon increase in the nanopool size, the spec-trum gets progressively red shifted �Fig. 2� along with asmall decrease in the fluorescence yield. This indicates thatthe probes sense a more polar environment at higher hydra-tion. Thus interfacial fluidity increases with increasing waterloading, i.e., w for the interacting RMs. Both the observa-tions reflect that the microenvironment around the probe getsmodified as we move from lower w to higher w. However the
FIG. 1. Absorption spectra of PSF in water and AOT RM at w=1 andw=25.
FIG. 2. Normalized fluorescence spectra of �a� PSF, �b� ST, and �c� SO in AOT/n-heptane/water RMs as a function of w ��exc=520 nm�. Curves �i� → �xii�correspond to w=1, 2, 3, 4, 5, 7, 10, 13, 15, 20, 25, and 30, respectively. Insets show the variation in the fluorescence maximum as a function of w.
114707-3 Photophysics in anionic reverse micelles J. Chem. Phys. 131, 114707 �2009�
Downloaded 02 Oct 2009 to 203.197.118.120. Redistribution subject to AIP license or copyright; see http://jcp.aip.org/jcp/copyright.jsp
large difference in the emission maximum in the reverse mi-cellar environments compared to that in the bulk water indi-cates that the microenvironment around the dyes are signifi-cantly different from the bulk water. As the water content isincreased the water pool swells in size and the polarity of themicroenvironment increases32,33 resulting in the red-shift inthe emission maximum. The observed shift points to an im-portant aspect that the change in polarity experienced in an-isotropic assemblies will depend on the position �location� ofthe probe molecule.34,35 Kelker et al.36 explained this issueusing anthroloxy probes of different chain length and showedthat the sensitivity of the emission maximum of these probesreduces as the position �location� of the fluorophore in-creases from the periphery of the water pool. The sensitivityof the emission maximum to the added water therefore ap-pears to be dependent on the position of the fluorophore inthe RM. Using 7-nitrobenz-2-oxa-1,3-diazol-4-yl �NBD�cholesterol they found that the emission maximum is invari-ant to w number indicating that the probe molecule is locatedin a region of the RM, which is characterized by reducedwater penetration.36 In the present investigation, the emissionmaximum is �20 nm blueshifted from that in the bulk wa-ter. Following the work of Kelker et al.36 and Hazra et al.37
from the dependence of the shift in the emission maximumon w, we rule out the possibility of localization of the probemolecule in bulk heptane. A noteworthy difference in theposition of the emission maxima in the RMs and bulk watersuggests that the probe molecules experience a more con-fined environment than pure aqueous medium. Apart from
the bathochromic shift in the RMs the fluorescence spectrashow a decrease in the fluorescence intensity with an in-crease in w. This can be rationalized in terms of localizationof the probes in more polar �hydrated� site, i.e., toward thecore of the RMs with an increase in the water pool size.27
According to the spectral studies of Wong et al.32 thepolarity of the water pool increases as the micellar radiusincreases. They attributed this increase to an increase in thenumber of bulk type water molecules in the water pool. Thepeak shift is significantly small for w=10 to 20. Waterpresent in the small RM �w�5� hydrates the surfactant headgroups. With a progressive loading of water, bulk-type waterbegins to form, and any further addition of water increasesthe water pool size by increasing the amount of bulk-typewater. Calorimetric studies34,35 suggested that beyond w�10, any further loading of water is identified as bulk-type.The studies of Biswas et al.38 confirmed that the effectivedielectric constant at the water/surfactant interface increasesas w0 increases reaching a plateau at w�12. The micropo-larity experiments of Novaria et al.21,22 reveal an increase inthe polarity inside the RM up to w=10 above which it attainsa plateau.
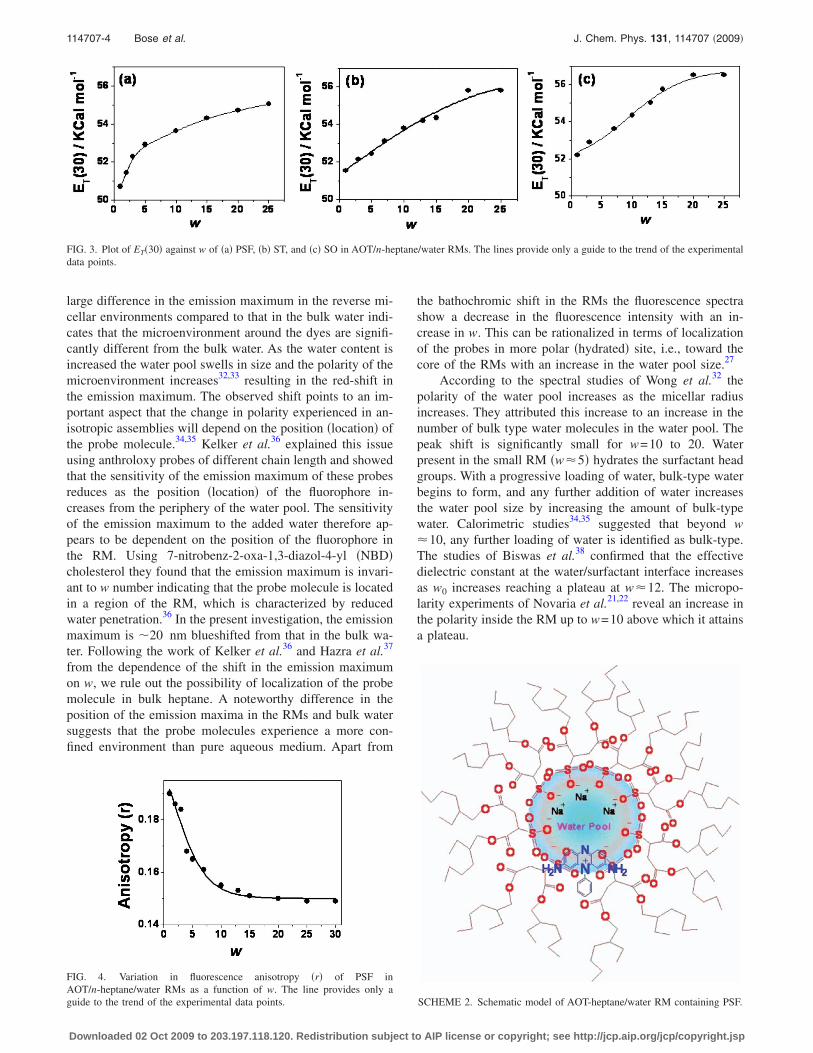
FIG. 3. Plot of ET�30� against w of �a� PSF, �b� ST, and �c� SO in AOT/n-heptane/water RMs. The lines provide only a guide to the trend of the experimentaldata points.
FIG. 4. Variation in fluorescence anisotropy �r� of PSF inAOT/n-heptane/water RMs as a function of w. The line provides only aguide to the trend of the experimental data points. SCHEME 2. Schematic model of AOT-heptane/water RM containing PSF.
114707-4 Bose et al. J. Chem. Phys. 131, 114707 �2009�
Downloaded 02 Oct 2009 to 203.197.118.120. Redistribution subject to AIP license or copyright; see http://jcp.aip.org/jcp/copyright.jsp
Consistent with the literature, the present steady statefluorescence studies on the phenazinium group dyes alsosuggest that the dyes can hardly distinguish the water polar-ity beyond w=10–15. With an increase in w, the extent ofred-shift is found to be more for PSF ��8 nm�, compared tothe other two, ST and SO �5–6 nm�. The probes are all cat-ionic in nature and therefore it is obvious that there will be astrong electrostatic attraction between the probes and thenegatively charged AOT head groups constituting the RM.Because of the methyl substitution, especially in the planarphenazinium moiety, on ST and SO the hydrophobicity in-creases. Hence, binding with the AOT surfactants becomesstronger for ST and SO. Therefore dissolution in the waterpools becomes less for them leading to a decrease in theextent of red-shift with increasing w values.
As polarity of the medium plays a dominant role in con-trolling the photophysical behavior of the dyes confined inthe reverse micellar nanopools, it is rational to have an esti-mate of the micropolarity of the polar solvent pools insidethe microemulsion at various water concentrations. In orderto get a quantitative measure of the polarity of the localenvironment of the dyes in RMs empirical solvent polarityparameter ET�30� based on the transition energy for the sol-vatochromic ICT absorption of the betaine dye 2,6-diphenyl-4�2,4,6-triphenyl-1-pyridono�phenolate as developed by Rei-chardt have been used.39 For this purpose, the fluorescencebehavior of PSF, ST and SO have been studied in water-dioxane mixtures of varying composition. Plots of the CTfluorescence maxima of the dyes in water-dioxane mixtureagainst ET�30� establishes a linear correlation between thetwo.40 From the position of the CT maxima of the three dyesobserved at different w values, we have determined, in termsof ET�30�, the micropolarity around the probe in RMs withvarious w values. The variation in micropolarity around thethree dyes in reverse micellar environments as a function ofw has been depicted in Fig. 3.
Figure 3 reveals that with increasing w, ET�30� increasesand then levels off. This leveling off is observed at w�5.This is because water present in the smaller RMs hydratesthe surfactant head groups. With increase in water pool size,there occurs a progressive loading of water due to which anyfurther addition of water increases the water pool size byincreasing the amount of bulk-type water.34,35,38 Our resultsare consistent with the observations of Novaria et al.21,22
Using the different dyes ET�30� value at the highest wcomes out to be �54–56 Kcal mol−1.40 This indicates that
the environment of the probe molecules is still reasonablyless polar than that of bulk water �63.1 Kcal mol−1�.39 Inother words, the bulk dielectric constant of water decreasesdrastically upon confinement. This has also been predictedby a simulation study.41
B. Steady state fluorescence anisotropy
Measurement of fluorescence anisotropy has demandingrole for its potential in biochemical research. Any factor thataffects size, shape or segmental flexibility of a molecule willaffect the observed anisotropy.29 As a representative for thethree dyes the steady state anisotropy �r� for PSF in AOTRMs with varying water pool size �w� is presented in Fig. 4.
It is evident from Fig. 4 that throughout the range of wstudied, the value of anisotropy is quite high compared tothat in free aqueous solution ��0.04�.27 In RMs a motionalrestriction in rotation is thus implied. Fluorescence aniso-tropy decreases with an increase in w suggesting that theprobe molecule experiences an increase in the rotational free-dom with an increase in the w value. The experiment revealsthat fluorescence anisotropy �r� decreases rapidly till w�15 for PSF and w�14 for ST and SO and then levels offgradually. Similar results have been reported by Senguptaand co-workers.42,43 It has been established that the waterrelaxation rate in RMs becomes faster with an increase inw.44 This increase in the relaxation rate is reflected in thedecrease in anisotropy for probes in RMs with increasingsize of water pool.45,46 At the highest w, the observed aniso-tropy is still higher than the anisotropy in pure water indicat-ing that the dye molecules in the RM experiences reasonablerestriction compared to the situation in bulk water. This in-dicates that the dye molecules come closer to the restrictedwater pool upon increase in w, due to their high solubility inwater. However, the microenvironment inside this bound wa-ter is quite different from that of bulk water, due to which theobserved anisotropy at considerably high values of w is stillmuch above the values observed in bulk water. Scheme 2provides a model of the AOT RM containing PSF.
C. Metal ion induced fluorescence quenching study
Quenching of the fluorescence of phenazinium dyes dueto external heavy metal ion has been studied as a function ofw using ionic quencher Cu2+ with an intention to see how theaccessibility of the quencher molecule to the fluorophore de-pends upon the core size �w� and hence to throw some light
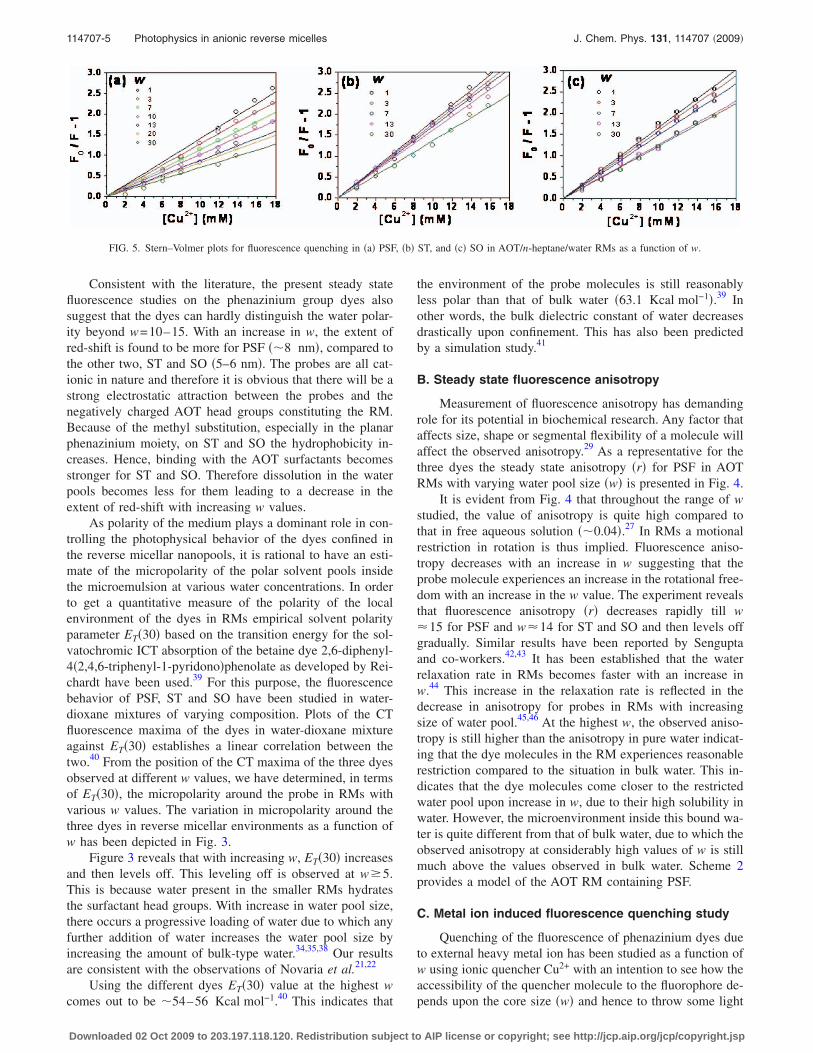
FIG. 5. Stern–Volmer plots for fluorescence quenching in �a� PSF, �b� ST, and �c� SO in AOT/n-heptane/water RMs as a function of w.
114707-5 Photophysics in anionic reverse micelles J. Chem. Phys. 131, 114707 �2009�
Downloaded 02 Oct 2009 to 203.197.118.120. Redistribution subject to AIP license or copyright; see http://jcp.aip.org/jcp/copyright.jsp
on the probable location of the dyes in the reverse micellarenvironments. The results of these experiments for quench-ing of the dyes by Cu2+ at different w are shown through Fig.5 in terms of Stern–Volmer plots. The slope of such a plot�KSV� is related to the degree of exposure �accessibility� ofthe probe to the quencher �Cu2+�. Higher the slope, greater isthe degree of exposure of the fluorophore to the quencher.29
The decrease in the efficiency of the quenching processmay be correlated with increasing rigidity of the medium thatslows down the rate of diffusion of the interacting species.The relatively low value of KSV in microemulsion than thatin aqueous medium was interpreted by Panda et al.47 interms of interfacial barrier �by way of solvation and separa-tion� for interaction of fluorophore and quencher populatedpreferentially in the oil and water, respectively. In a similartune, the KSV values obtained in the RMs are relatively lowerthan normal KSV values involving electrostatic interactionswith heavy metal quenchers. Moreover, an initial electro-static repulsion between the cationic PSF and the positivelycharged metal ion quencher may be responsible for the lowerKSV values. It is imperative from the above account that theinterfacial barrier and regional fluidity have a say on thephotophysical process involving the fluorophore and thequencher. In the present investigation also the interactionpropensity is essentially guided by both the interfacial barrierand fluidity of the core water.
It is found that in all the three cases, the KSV valuesdecrease with increasing w, contrasting our observation witha neutral probe �AODIQ� in AOT RM.46 This invites deci-phering of interaction of the cationic phenazinium dyes in-side the RMs with an increase in w. It can be presumed thatan electrostatic interaction plays a major role in this casebecause of the presence of a positively charged dye at thewater/surfactant interface of negatively charged AOT RMs
�Scheme 2�. The positively charged dyes as well as thequencher Cu2+ ion experience electrostatic attractions towardthe negatively charged AOT surfactant head groups. ThusAOT acts like a negotiator between the positively chargeddye molecule and the positively charged quencher and helpsin bringing the participants in the quenching process intocloser proximity ensuring an effective communication be-tween the interacting partners. This results in higher KSV
values at lower w.48,49 Since anionic micellar surface attractsthe cationic quencher rendering a crowding of the quencherion, KSV value at the lowest w value is maximum. Howeverwith increase in water pool size, the probe start penetratinginto the water pool as is established from our previous stud-ies, thereby the local concentration of the quencher close tothe dye molecules decrease. Hence the KSV value drops withincrease in the water pool size.
A closer inspection of the KSV values show that the ex-tent of decrease in KSV values as a function of w follows theorder PSF�ST�SO. This might be rationalized in the lightof the presence of methyl substituents in ST and SO overPSF, leading to an increased hydrophobicity in these dyes.The greater hydrophobicity leads to a stronger binding withthe micelle. This restricts the fluorophore, in a sense, frompenetrating into the central water pool. Hence appreciablequenching is observed for ST and SO at higher w valueswhere it is suppressed very much in case of PSF. Some im-portant parameters related to the photophysics of the dyesinside the RMs as a function of w are summarized in Table I.
D. Dynamic behavior inside micellar nanopools
1. Time-resolved fluorescence study
Fluorescence lifetime serves as an excellent indicator topinpoint the location of the probe in a multicomponent envi-
TABLE I. Photophysical data for PSF, ST, and SO in the RMs as a function of w.
w
PSF ST SO
ET�30��kcal mol−1� �r�
Ksv
�mM−1�ET�30�
�kcal mol−1� �r�Ksv
�mM−1�ET�30�
�kcal mol−1� �r�Ksv
�mM−1�
1 50.7 0.19 0.14 51.5 0.18 0.17 51.5 0.18 0.193 51.4 0.19 0.13 52.3 0.17 0.16 52.9 0.17 0.187 53.2 0.17 0.11 53.1 0.15 0.15 53.6 0.16 0.1713 54.0 0.16 0.09 54.8 0.14 0.13 55.0 0.15 0.1630 55.0 0.14 0.07 55.8 0.13 0.11 56.5 0.14 0.14
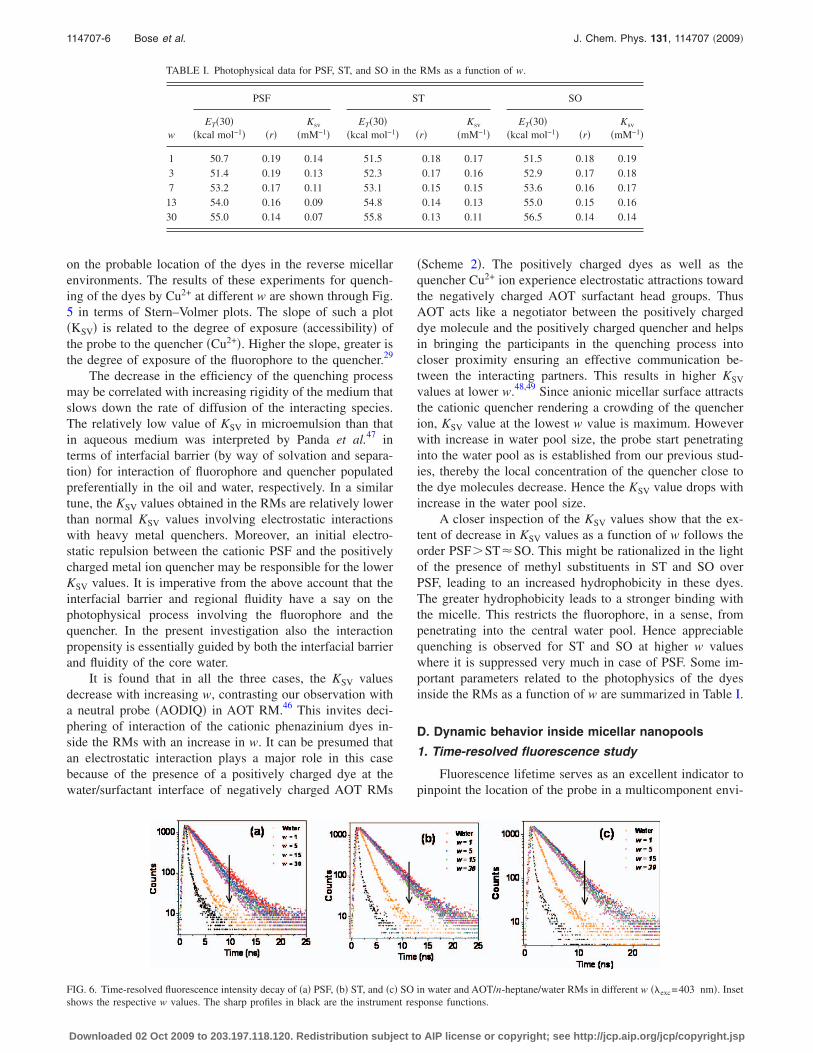
FIG. 6. Time-resolved fluorescence intensity decay of �a� PSF, �b� ST, and �c� SO in water and AOT/n-heptane/water RMs in different w ��exc=403 nm�. Insetshows the respective w values. The sharp profiles in black are the instrument response functions.
114707-6 Bose et al. J. Chem. Phys. 131, 114707 �2009�
Downloaded 02 Oct 2009 to 203.197.118.120. Redistribution subject to AIP license or copyright; see http://jcp.aip.org/jcp/copyright.jsp
ronment. This is useful to understand the diffusional dynam-ics of the probe in the microheterogeneous environment. Dif-ferential degrees of solvent relaxation around the fluorophoreand/or partitioning of the fluorophore in different distinct re-gions of a confined environment give rise to differences inthe lifetime of the fluorophore. The present dyes show mo-noexponential decays in aqueous solutions as well as insidethe reverse micellar cavities. However, the lifetime valueswithin RM are observed to be longer than those in pure aque-ous solution. Cho et al.50 pointed out that if the diffusioncoefficient �D� of the probe in water pool is the same as thatof an aromatic molecule in ordinary water �0.05 Å2 ps−1�,the probe molecule moves about 10 Å/ns in a direction nor-mal to the surface �Z2=2D�t�. Thus, the dye molecules canpass through several water layers within the observed life-time in the range of nanosecond. If the diffusion coefficientinside the water pool is smaller by one order of magnitudecompared to that of pure aqueous medium, every dye mol-ecule would be more or less confined to one layer of watermolecule, which justifies the monoexponential decays for thedyes �Fig. 6�. The fluorescence lifetimes of the three dyes asa function of w are given in Table II.
Thus, the fluorescence lifetime decreases with increasein w, which is consistent with the findings of Mandal et al.,51
Chattopadhyay et al.,52 and Datta et al.53 using different ICT/TICT probes. This is also consistent with our steady stateresults where fluorescence yields were found to decreasewith an increase in w. However, as we note from the table,even at the highest value of w, the lifetime values are rea-sonably greater than those in aqueous solution. This indicatesthat even at w=30, the probe molecule experiences restrictedenvironments in the RMs, consistent with the steady state
studies. This is broadly due to two possible reasons. First, theconfined water inside the water pool is known to have lessfreedom of movement than the bulk water.1–4 Second, theprobes reside in the micelle-water interface which seemslogical considering the electrostatic attraction between thepositive charge of the dyes and the negatively charged sur-factant heads constituting the RMs.
2. Time-resolved fluorescence anisotropy
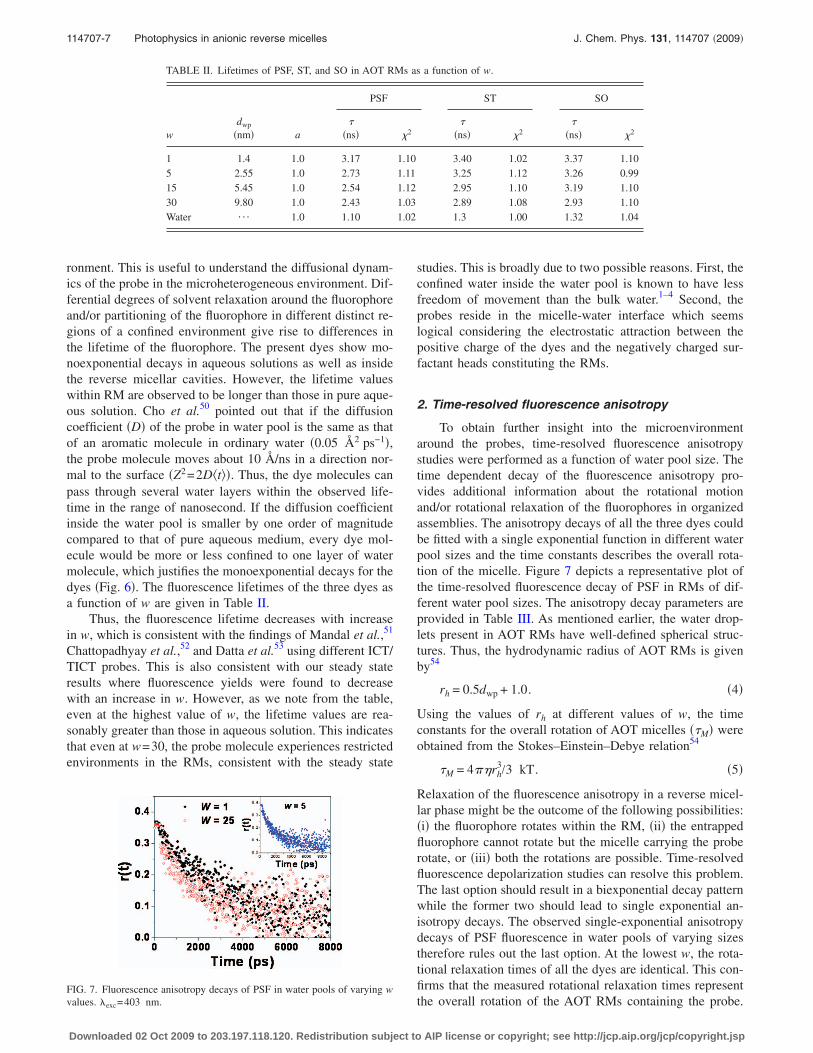
To obtain further insight into the microenvironmentaround the probes, time-resolved fluorescence anisotropystudies were performed as a function of water pool size. Thetime dependent decay of the fluorescence anisotropy pro-vides additional information about the rotational motionand/or rotational relaxation of the fluorophores in organizedassemblies. The anisotropy decays of all the three dyes couldbe fitted with a single exponential function in different waterpool sizes and the time constants describes the overall rota-tion of the micelle. Figure 7 depicts a representative plot ofthe time-resolved fluorescence decay of PSF in RMs of dif-ferent water pool sizes. The anisotropy decay parameters areprovided in Table III. As mentioned earlier, the water drop-lets present in AOT RMs have well-defined spherical struc-tures. Thus, the hydrodynamic radius of AOT RMs is givenby54
rh = 0.5dwp + 1.0. �4�
Using the values of rh at different values of w, the timeconstants for the overall rotation of AOT micelles ��M� wereobtained from the Stokes–Einstein–Debye relation54
�M = 4�rh3/3 kT. �5�
Relaxation of the fluorescence anisotropy in a reverse micel-lar phase might be the outcome of the following possibilities:�i� the fluorophore rotates within the RM, �ii� the entrappedfluorophore cannot rotate but the micelle carrying the proberotate, or �iii� both the rotations are possible. Time-resolvedfluorescence depolarization studies can resolve this problem.The last option should result in a biexponential decay patternwhile the former two should lead to single exponential an-isotropy decays. The observed single-exponential anisotropydecays of PSF fluorescence in water pools of varying sizestherefore rules out the last option. At the lowest w, the rota-tional relaxation times of all the dyes are identical. This con-firms that the measured rotational relaxation times representthe overall rotation of the AOT RMs containing the probe.
TABLE II. Lifetimes of PSF, ST, and SO in AOT RMs as a function of w.
wdwp
�nm� a
PSF ST SO
��ns� �2
��ns� �2
��ns� �2
1 1.4 1.0 3.17 1.10 3.40 1.02 3.37 1.105 2.55 1.0 2.73 1.11 3.25 1.12 3.26 0.9915 5.45 1.0 2.54 1.12 2.95 1.10 3.19 1.1030 9.80 1.0 2.43 1.03 2.89 1.08 2.93 1.10Water ¯ 1.0 1.10 1.02 1.3 1.00 1.32 1.04
FIG. 7. Fluorescence anisotropy decays of PSF in water pools of varying wvalues. �exc=403 nm.
114707-7 Photophysics in anionic reverse micelles J. Chem. Phys. 131, 114707 �2009�
Downloaded 02 Oct 2009 to 203.197.118.120. Redistribution subject to AIP license or copyright; see http://jcp.aip.org/jcp/copyright.jsp
The single exponential nature of the decays also implies ab-sence of internal rotation of the probes within the RMs. Thisis also consistent with the results obtained by Dutt54 andSpry et al.55 All these rotational relaxation times are less thanthe fluorescence lifetime of the probes in the correspondingenvironments reflecting that the relaxation processes com-plete within the lifetime of the photoexcited state of the fluo-rophores. However, at higher w, the rotational relaxationtimes ��M� of the RMs are remarkably higher than the corre-sponding depolarization times ��r� of the fluorescence in themedia. This indicates that the relaxation of the fluorescenceanisotropy at higher w results from the rotation of the dyeinside the RMs and not of the RMs.56 A higher value of therotational relaxation times of the probes in the RMs com-pared to that in pure water solution reveals that the probemolecules experience motionally restricted environments inthe RMs.56 It is pertinent to mention here that while we didobserve only single-exponential decay patterns, it is possiblethat the dynamics may be more complex. However, limita-tions of our analysis procedure and data acquisition do notpermit further consideration. Many of the researchers haveobserved more complex orientational dynamics; so the ques-tion is open regarding the dynamics of probe molecules in-side AOT RM.1,2,8,11,12,15,37,54–60
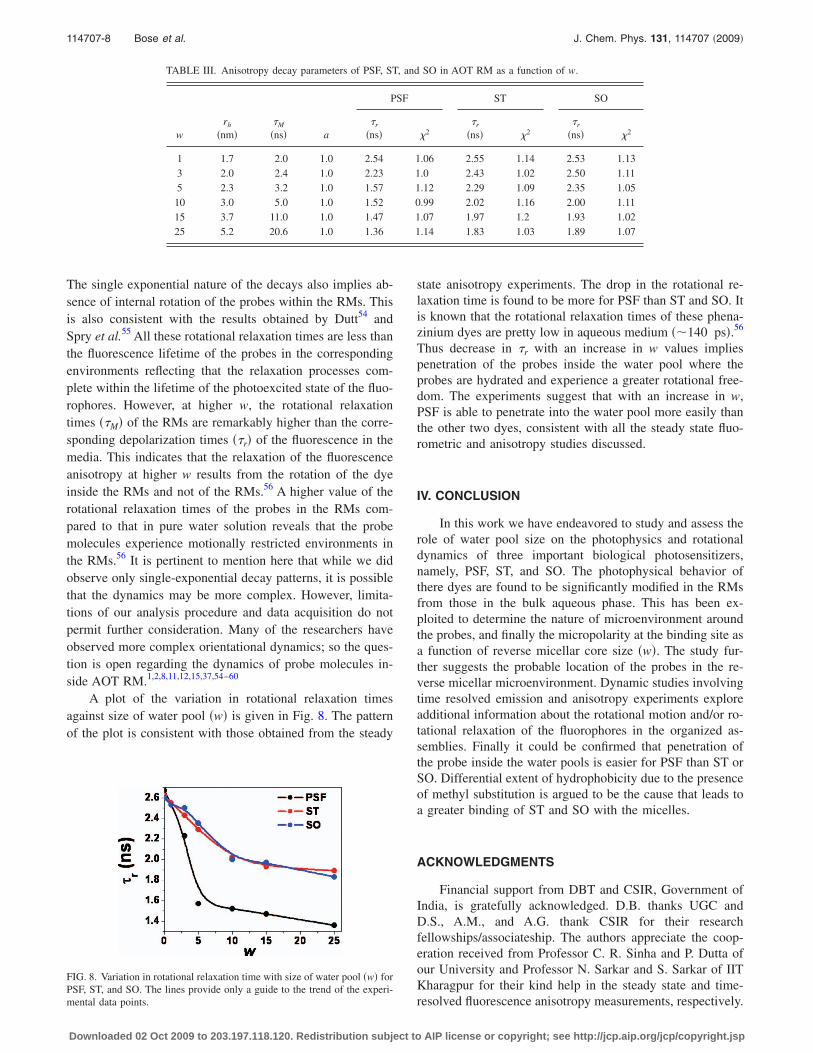
A plot of the variation in rotational relaxation timesagainst size of water pool �w� is given in Fig. 8. The patternof the plot is consistent with those obtained from the steady
state anisotropy experiments. The drop in the rotational re-laxation time is found to be more for PSF than ST and SO. Itis known that the rotational relaxation times of these phena-zinium dyes are pretty low in aqueous medium ��140 ps�.56
Thus decrease in �r with an increase in w values impliespenetration of the probes inside the water pool where theprobes are hydrated and experience a greater rotational free-dom. The experiments suggest that with an increase in w,PSF is able to penetrate into the water pool more easily thanthe other two dyes, consistent with all the steady state fluo-rometric and anisotropy studies discussed.
IV. CONCLUSION
In this work we have endeavored to study and assess therole of water pool size on the photophysics and rotationaldynamics of three important biological photosensitizers,namely, PSF, ST, and SO. The photophysical behavior ofthere dyes are found to be significantly modified in the RMsfrom those in the bulk aqueous phase. This has been ex-ploited to determine the nature of microenvironment aroundthe probes, and finally the micropolarity at the binding site asa function of reverse micellar core size �w�. The study fur-ther suggests the probable location of the probes in the re-verse micellar microenvironment. Dynamic studies involvingtime resolved emission and anisotropy experiments exploreadditional information about the rotational motion and/or ro-tational relaxation of the fluorophores in the organized as-semblies. Finally it could be confirmed that penetration ofthe probe inside the water pools is easier for PSF than ST orSO. Differential extent of hydrophobicity due to the presenceof methyl substitution is argued to be the cause that leads toa greater binding of ST and SO with the micelles.
ACKNOWLEDGMENTS
Financial support from DBT and CSIR, Government ofIndia, is gratefully acknowledged. D.B. thanks UGC andD.S., A.M., and A.G. thank CSIR for their researchfellowships/associateship. The authors appreciate the coop-eration received from Professor C. R. Sinha and P. Dutta ofour University and Professor N. Sarkar and S. Sarkar of IITKharagpur for their kind help in the steady state and time-resolved fluorescence anisotropy measurements, respectively.
TABLE III. Anisotropy decay parameters of PSF, ST, and SO in AOT RM as a function of w.
wrh
�nm��M
�ns� a
PSF ST SO
�r
�ns� �2�r
�ns� �2�r
�ns� �2
1 1.7 2.0 1.0 2.54 1.06 2.55 1.14 2.53 1.133 2.0 2.4 1.0 2.23 1.0 2.43 1.02 2.50 1.115 2.3 3.2 1.0 1.57 1.12 2.29 1.09 2.35 1.05
10 3.0 5.0 1.0 1.52 0.99 2.02 1.16 2.00 1.1115 3.7 11.0 1.0 1.47 1.07 1.97 1.2 1.93 1.0225 5.2 20.6 1.0 1.36 1.14 1.83 1.03 1.89 1.07
FIG. 8. Variation in rotational relaxation time with size of water pool �w� forPSF, ST, and SO. The lines provide only a guide to the trend of the experi-mental data points.
114707-8 Bose et al. J. Chem. Phys. 131, 114707 �2009�
Downloaded 02 Oct 2009 to 203.197.118.120. Redistribution subject to AIP license or copyright; see http://jcp.aip.org/jcp/copyright.jsp

1 N. E. Levinger, Science 298, 1722 �2002�.2 K. Bhattacharyya, Acc. Chem. Res. 36, 95 �2003�.3 B. Baruah, J. M. Roden, M. Sedgwick, N. M. Correa, D. C. Crans, and N.E. Levinger, J. Am. Chem. Soc. 128, 12758 �2006�.
4 D. M. Willard, R. E. Riter, and N. E. Levinger, J. Am. Chem. Soc. 120,4151 �1998�.
5 J. J. Silber, A. Biasutti, E. Abuin, and E. Lissi, Adv. Colloid Interface Sci.82, 189 �1999�.
6 P. L. Luisi, M. Giomini, M. P. Pileni, and B. H. Robinson, Biochim.Biophys. Acta 947, 209 �1988�.
7 J. H. Fendler, Acc. Chem. Res. 9, 153 �1976�.8 R. K. Mitra, S. S. Sinha, and S. K. Pal, Langmuir 24, 49 �2008�.9 T. K. Jain, M. Varshney, and A. Maitra, J. Phys. Chem. B 93, 7409�1989�.
10 D. S. Venables, K. Huang, and C. A. Schmuttenmaer, J. Phys. Chem. B105, 9132 �2001�.
11 K. Bhattacharyya and B. Bagchi, Chem. Rev. 100, 20460 �2000�.12 K. Bhattacharyya and B. Bagchi, J. Phys. Chem. A 104, 10603 �2000�.13 Reverse Micelles, edited by P. L. Luisi and B. E. Straube �Plenum, New
York, 1984�.14 S. Nave, J. Eastoe, R. K. Heenan, D. Steytlar, and I. Grillo, Langmuir 16,
8741 �2000�.15 A. K. Shaw and S. K. Pal, J. Phys. Chem. B 111, 4189 �2007�.16 T. De and A. Maitra, Adv. Colloid Interface Sci. 59, 95 �1995�.17 H.-S. Tan, I. R. Piltic, and M. D. Fayer, J. Chem. Phys. 122, 174501
�2005�.18 I. R. Peltic, H.-S. Tan, and M. D. Fayer, J. Phys. Chem. B 109, 273
�2005�.19 E. M. Corbeil and N. E. Levinger, Langmuir 19, 7264 �2003�.20 N. M. Correa and N. E. Levinger, J. Phys. Chem. B 110, 13050 �2006�.21 M. Novaira, M. A. Biasutti, J. J. Silber, and N. M. Correa, J. Phys. Chem.
B 111, 748 �2007�.22 M. Novaira, F. Moyano, M. A. Biasutti, J. J. Silber, and N. M. Correa,
Langmuir 24, 4637 �2008�.23 M. F. Broglia, M. L. Gomez, S. G. Bertolotti, H. A. Montejano, and C.
M. Previtali, J. Photochem. Photobiol., A: Chem. 173, 115 �2005�.24 S. Jockush, J. Timpe, W. Schnabel, and N. J. Turro, J. Phys. Chem. A
101, 440 �1997�.25 S. Saravanan Jayanthi and P. Ramamurthy, J. Chem. Soc., Faraday Trans.
94, 1675 �1998�.26 K. R. Gopidas and P. V. Kamat, J. Phys. Chem. 94, 4723 �1990�.27 D. Sarkar, P. Das, S. Basak, and N. Chattopadhyay, J. Phys. Chem. B
112, 9243 �2008�.28 D. Sarkar, P. Das, A. Girigoswami, and N. Chattopadhyay, J. Phys.
Chem. A 112, 9684 �2008�.29 J. R. Lakowicz, Principles of Fluorescence Spectroscopy, 3rd ed. �Ple-
num, New York, 2006�.30 G. A. Crosby and J. N. Demas, J. Phys. Chem. 75, 991 �1971�.31 R. K. Dutta and S. N. Bhat, Colloids Surf., A 106, 127 �1996�.32 M. Wong, J. K. Thomas, and T. Notwak, J. Am. Chem. Soc. 99, 4730
�1977�.33 M. Wong, J. K. Thomas, and M. Graetzel, J. Am. Chem. Soc. 98, 2391
�1976�.34 A. Goto, S. Harada, T. Fujita, Y. Miwa, H. Yoshioka, and H. Kishimoto,
Langmuir 9, 86 �1993�.35 A. Goto, H. Yoshioka, H. Kishimoto, and T. Fujita, Langmuir 8, 441
�1992�.36 D. A. Kelker, A. Devaki, and A. Chattopadhyay, J. Phys. Chem. B 108,
12151 �2004�.37 P. Hazra, D. Chakraborty, and N. Sarkar, Langmuir 18, 7872 �2002�.38 R. Biswas, N. Rohman, T. Pradhan, and R. Buchner, J. Phys. Chem. B
112, 9379 �2008�.39 C. Reichardt, Chem. Rev. 94, 2319 �1994�.40 E. M. Kosower, H. Dodiuk, K. Tanizawa, M. Ottolenghi, and N. Orbach,
J. Am. Chem. Soc. 97, 2167 �1975�.41 S. Senapati and A. K. Chandra, J. Phys. Chem. B 105, 5106 �2001�.42 B. Sengupta, J. Guharay, and P. K. Sengupta, Spectrochim. Acta, Part A
56, 1433 �2000�.43 J. Guharay and P. K. Sengupta, Biochem. Biophys. Res. Commun. 219,
388 �1996�.44 N. Sarkar, K. Das, A. Datta, S. Das, and K. Bhattacharya, J. Phys. Chem.
B 100, 10523 �1996�.45 N. Sarkar, J. G. Ray, and P. K. Sengupta, J. Photochem. Photobiol., A:
Chem. 95, 157 �1996�.46 A. Mallick, B. Haldar, S. Maiti, S. C. Bera, and N. Chattopadhyay, J.
Phys. Chem. B 109, 14675 �2005�.47 M. Panda, P. K. Behera, B. K. Misra, and G. B. Behera, J. Photochem.
Photobiol., A: Chem. 90, 69 �1995�.48 A. Mallick, M. C. Mandal, B. Haldar, A. Chakrabarty, P. Das, and N.
Chattopadhyay, J. Am. Chem. Soc. 128, 3126 �2006�; 128, 10629�2006�.
49 P. Das, A. Mallick, D. Sarkar, and N. Chattopadhayay, J. Colloid Inter-face Sci. 320, 9 �2008�.
50 C. H. Cho, M. Chung, J. Lee, T. Nguyen, S. Singh, M. Vedamulthu, S.Yao, S. B. Zhu, and G. W. Robinson, J. Phys. Chem. 99, 7806 �1995�.
51 D. Mandal, S. K. Pal, A. Datta, and K. Bhattacharyya, Anal. Sci. 14, 199�1998�.
52 A. Chattopadhyay, S. Mukherjee, and H. Raghuraman, J. Phys. Chem. B106, 13002 �2002�.
53 A. Datta, D. Mandal, S. K. Pal, and K. Bhattacharya, J. Phys. Chem. B101, 10221 �1997�.
54 G. B. Dutt, J. Phys. Chem. B 112, 7220 �2008�.55 D. B. Spry, A. Goun, K. Glusac, D. E. Moilanen, and M. D. Fayer, J. Am.
Chem. Soc. 129, 8122 �2007�.56 P. Das, A. Chakrabarty, A. Mallick, and N. Chattopadhyay, J. Phys.
Chem. B 111, 11169 �2007�.57 G. B. Dutt, J. Phys. Chem. B 108, 805 �2004�.58 S. S. Narayanan, S. S. Sinha, R. Sarkar, and S. K. Pal, J. Phys. Chem. B
112, 2859 �2008�.59 A. Chakraborty, D. Seth, P. Setua, and N. Sarkar, J. Phys. Chem. B 110,
5359 �2006�.60 R. K. Mitra, S. S. Sinha, P. K. Verma, and S. K. Pal, J. Phys. Chem. B
112, 12946 �2008�.
114707-9 Photophysics in anionic reverse micelles J. Chem. Phys. 131, 114707 �2009�
Downloaded 02 Oct 2009 to 203.197.118.120. Redistribution subject to AIP license or copyright; see http://jcp.aip.org/jcp/copyright.jsp


