Embed Size (px)
Citation preview
Quaternary Research 88 (2014) 109–120
Contents lists available at ScienceDirect
Quaternary Research
j ourna l homepage: www.e lsev ie r .com/ locate /yqres
Phosphorus limitation during a phytoplankton spring bloom in thewestern Dutch Wadden Sea
Juliette Ly a, Catharina J.M. Philippart b, Jacco C. Kromkamp a,⁎a Department of Marine Microbiology, Royal Netherlands Institute for Sea Research, P.O. Box 140, 4400 AC Yerseke, The Netherlandsb Department of Marine Ecology, Royal Netherlands Institute for Sea Research, P.O. Box 59, 1790 AB Den Burg, The Netherlands
⁎ Corresponding author.E-mail address: [email protected] (J.C. Kromka
http://dx.doi.org/10.1016/j.seares.2013.12.0101385-1101 © 2014 The Authors. Published by Els(http://creativecommons.org/licenses/by/3.0/).
a b s t r a c t
a r t i c l e i n f oArticle history:Received 8 April 2013Recieved in revised form 7 December 2013Accepted 19 December 2013Available online 5 January 2014
Keywords:Western Wadden SeaPhytoplankton communityPhosphorus limitationBioassaysAlkaline phosphatase activity
Likemany aquatic ecosystems, thewestern DutchWadden Sea has undergone eutrophication. Due to changes inmanagement policy, nutrient loads, especially phosphorus decreased after the mid-80s. It is still under debate,however, whether nutrients or light is limiting phytoplankton production in thewesternWadden Sea, as studiesusing monitoring data delivered sometimes opposite conclusions and outcomes were related to years, seasonsand approaches used. Clearly, themonitoring data alonewere not sufficient.We therefore examined the limitingfactors for the phytoplankton spring bloom using different experimental approaches. During the spring bloom inApril 2010, we investigated several nutrient regimes on natural phytoplankton assemblages at a long termmon-itoring site, the NIOZ-Jetty sampling (Marsdiep, The Netherlands). Four bioassays, lasting 6 days each, were per-formed in controlled conditions. From changes in phytoplankton biomass, chlorophyll-a (Chla), we couldconclude that the phytoplankton in generalwasmainly P-limitedduring this period,whereas a Si–P-co-limitationwas likely for the diatom populations, when present. These results were confirmed by changes in the photosyn-thetic efficiency (Fv/Fm), in the expression of alkaline phosphatase activity (APA) measured with the fluorescentprobe ELF-97, and in the 13C stable isotope incorporation in particulate organic carbon (POC). During our bioassayexperiments, we observed a highly dynamic phytoplankton community with regard to species composition andgrowth rates. The considerable differences in net population growth rates, occurring under more or less similarenvironmental incubation conditions, suggest that phytoplankton species composition and grazing activity bysmall grazers were important structuring factors for net growth during this period.© 2014 The Authors. Published by Elsevier Inc. on behalf of University of Washington. This is an open access
article under the CC BY license (http://creativecommons.org/licenses/by/3.0/).
Contents
1. Introduction . . . . . . . . . . . . . . . . . . . . . . . . . . . . . . . . . . . . . . . . . . . . . . . . . . . . . . . . . . . . . . 1102. Material and methods . . . . . . . . . . . . . . . . . . . . . . . . . . . . . . . . . . . . . . . . . . . . . . . . . . . . . . . . . 110
2.1. Sampling site and procedure . . . . . . . . . . . . . . . . . . . . . . . . . . . . . . . . . . . . . . . . . . . . . . . . . . . 1102.2. Experimental design . . . . . . . . . . . . . . . . . . . . . . . . . . . . . . . . . . . . . . . . . . . . . . . . . . . . . . . 1112.3. Nutrient concentrations . . . . . . . . . . . . . . . . . . . . . . . . . . . . . . . . . . . . . . . . . . . . . . . . . . . . . 1112.4. Chlorophyll-a . . . . . . . . . . . . . . . . . . . . . . . . . . . . . . . . . . . . . . . . . . . . . . . . . . . . . . . . . . 1122.6. Species counts . . . . . . . . . . . . . . . . . . . . . . . . . . . . . . . . . . . . . . . . . . . . . . . . . . . . . . . . . 1122.7. Photosynthetic carbon incorporation using 13C uptake into particulate organic carbon (POC) . . . . . . . . . . . . . . . . . . . . . . 1122.8. Photosynthesis physiology . . . . . . . . . . . . . . . . . . . . . . . . . . . . . . . . . . . . . . . . . . . . . . . . . . . . 1122.9. Alkaline phosphatase activity (APA) . . . . . . . . . . . . . . . . . . . . . . . . . . . . . . . . . . . . . . . . . . . . . . . . 1122.10. Statistics analysis . . . . . . . . . . . . . . . . . . . . . . . . . . . . . . . . . . . . . . . . . . . . . . . . . . . . . . . . 112
3. Results . . . . . . . . . . . . . . . . . . . . . . . . . . . . . . . . . . . . . . . . . . . . . . . . . . . . . . . . . . . . . . . . 1123.1. Starting conditions at each bioassay . . . . . . . . . . . . . . . . . . . . . . . . . . . . . . . . . . . . . . . . . . . . . . . . 1123.2. Phytoplankton growth rates . . . . . . . . . . . . . . . . . . . . . . . . . . . . . . . . . . . . . . . . . . . . . . . . . . . 1133.3. Carbon incorporation rates . . . . . . . . . . . . . . . . . . . . . . . . . . . . . . . . . . . . . . . . . . . . . . . . . . . . 1143.4. Physiological properties: fluorescence and alkaline phosphatase activity . . . . . . . . . . . . . . . . . . . . . . . . . . . . . . . 115
mp).
evier Inc. on behalf of University of Washington. This is an open access article under the CC BY license
110 J. Ly et al. / Quaternary Research 88 (2014) 109–120
4. Discussion . . . . . . . . . . . . . . . . . . . . . . . . . . . . . . . . . . . . . . . . . . . . . . . . . . . . . . . . . . . . . . . 1164.1. Nutrient versus light limitation . . . . . . . . . . . . . . . . . . . . . . . . . . . . . . . . . . . . . . . . . . . . . . . . . . 1164.2. Bioassays and physiological indices of nutrient limitation . . . . . . . . . . . . . . . . . . . . . . . . . . . . . . . . . . . . . . 1174.3. Interactions between nutrient limitation and phytoplankton succession . . . . . . . . . . . . . . . . . . . . . . . . . . . . . . . . 119
5. Conclusion . . . . . . . . . . . . . . . . . . . . . . . . . . . . . . . . . . . . . . . . . . . . . . . . . . . . . . . . . . . . . . . 119Acknowledgments . . . . . . . . . . . . . . . . . . . . . . . . . . . . . . . . . . . . . . . . . . . . . . . . . . . . . . . . . . . . . . 120References . . . . . . . . . . . . . . . . . . . . . . . . . . . . . . . . . . . . . . . . . . . . . . . . . . . . . . . . . . . . . . . . . 120
Table 1Timing and start of the bioassays.
Bioassay Start End
B1 30th March 2010 5th April 2010B2 10th April 2010 16th April 2010B3 17thApril 2010 23rd April 2010B4 24th April 2010 30th April 2010
1. Introduction
The need for a better understanding of the impacts of eutrophicationon freshwater, coastal andmarine ecosystems has been one of themainreasons to explore relationships between primary producer communi-ties and fluctuations of nutrient concentrations (Cloern, 2001). Apartfrom influencing productivity levels, changes in ambient nutrient con-centrations can also affect phytoplankton species composition, grazeractivity and the trophic transfer to higher trophic levels (Brett andMuller-Navarra, 1997; Finkel et al., 2010; Malzahn et al., 2007). Studieson the response of phytoplankton communities to changes in nutrientloads at various scales, ranging from small-scale laboratory techniques,via field mesocosms to lakes and estuaries (Beardall et al., 2001; Heckyand Kilham, 1988; Schindler, 2009), show that interpretation of theresults obtained at small scales is sometimes difficult to extrapolate tofield conditions.
The widely accepted paradigm on nutrient limitation assumesthat nitrogen (N) is the limiting nutrient for primary production in ma-rine ecosystems, whereas phosphorus (P) is the limiting nutrient forprimary production in lakes (Hecky and Kilham, 1988; Howarth andMarino, 2006). In both marine and freshwater ecosystems, however,chlorophyll-a (Chla) concentrations were found to be correlated withmean concentrations or loads of total nitrogen (TN) and total phospho-rus (TP) (Heip et al., 1995; Smith et al., 2006). The study by Heip et al.(1995) also highlighted the importance of organic matter for primaryproduction, whilst Monbet (1992) demonstrated the influence ofthe tidal regime on the relationship between N-availability and Chlaconcentrations. In addition, a meta-analysis on nutrient enrichmentsin a suite of habitats by Elser et al. (2007) revealed that freshwatersystems can be frequently limited by N, and marine habitats by P.
TheWadden Sea is one of the world's largest coastal marine ecosys-tems which is strongly affected by changes in anthropogenic nutrientloads (Cloern, 2001). In thewestern part of this area, the concentrationsof dissolved inorganic phosphorus (DIP) and dissolved inorganic nitro-gen (DIN) increased during the 1970s and decreased after the mid-1980s as the result of changing riverine loads (Cadée and Hegeman,2002; Loebl et al., 2009; Philippart et al., 2007). Although the resultshere consider the Marsdiep basin of the western Dutch Wadden Sea,many coastal systems have seen a decrease in nutrient loading as aresult of changes in policy measures to combat eutrophication, and forthis reasons the results applied here can probably serve as an examplefor other temperate coastal systemwhich underwent similar reductionsin nutrient loadings. These changes in absolute and relative nutrientloads coincided with major changes in phytoplankton communitystructure during the late 1970s and the late 1980s (Philippart et al.,2000) and were accompanied by changes in community structures ofmacrozoobenthos, fish and estuarine birds (Philippart et al., 2007;Tulp et al., 2008).
Long-term trends in relative nutrient concentrations in the westernWadden Sea strongly suggest that phytoplankton production duringthe spring and summer blooms was P-limited in the 1970s, Si-limited(diatoms) or N-limited (flagellates) in the 1980s, and then P-limitedagain thereafter (Philippart et al., 2007). Light limitation appears toplay aminor role during the blooms.Whilst previous analyses indicatedco-limitation by light (Colijn and Cadée, 2003), more recent results
using the same index (Cloern, 1999, 2001) suggested that nutrientswere the main limiting resource during the growing season for phyto-plankton in theWadden Sea (Loebl et al., 2009). In addition, the turbid-ity of these waters was found to be highly variable during this periodbut did not exhibit the long-term trends (Philippart et al., 2013).
Previous results on the nature and strength of nutrient limitation inthewesternWadden Seawere all based on ambient nutrient concentra-tions, which are only weak indices of nutrient limitation because no in-formation on uptake and mineralization is taken into account (Doddet al., 2003). To unambiguously determine the nature of the actuallimiting nutrient, we performed nutrient enrichment experimentsduring the spring bloom in combination with several physiologicalmeasurements. To test the viability of historical statements on nutrientlimitation in the western Wadden Sea, we performed bioassay experi-ments and physiological measurements and compare the results withconclusions drawn from ambient nutrient concentrations and ratios.
2. Material and methods
2.1. Sampling site and procedure
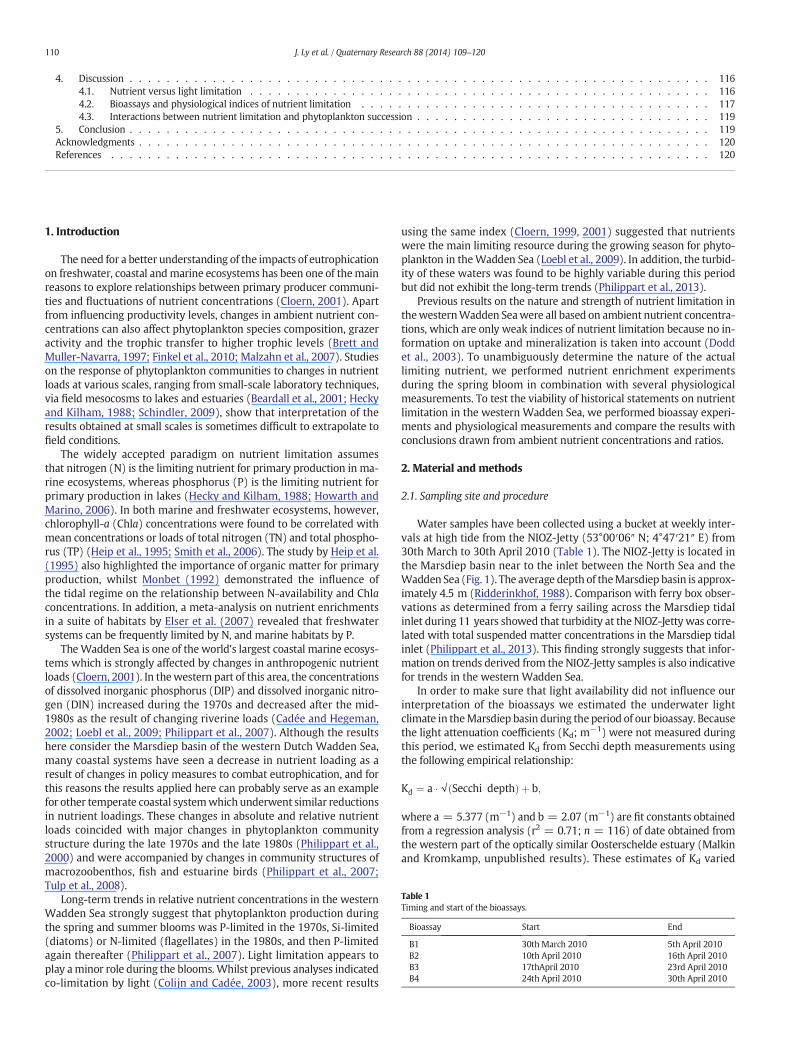
Water samples have been collected using a bucket at weekly inter-vals at high tide from the NIOZ-Jetty (53°00′06″ N; 4°47′21″ E) from30th March to 30th April 2010 (Table 1). The NIOZ-Jetty is located inthe Marsdiep basin near to the inlet between the North Sea and theWadden Sea (Fig. 1). The average depth of theMarsdiep basin is approx-imately 4.5 m (Ridderinkhof, 1988). Comparison with ferry box obser-vations as determined from a ferry sailing across the Marsdiep tidalinlet during 11 years showed that turbidity at the NIOZ-Jetty was corre-lated with total suspended matter concentrations in the Marsdiep tidalinlet (Philippart et al., 2013). This finding strongly suggests that infor-mation on trends derived from the NIOZ-Jetty samples is also indicativefor trends in the western Wadden Sea.
In order to make sure that light availability did not influence ourinterpretation of the bioassays we estimated the underwater lightclimate in theMarsdiep basin during the period of our bioassay. Becausethe light attenuation coefficients (Kd; m−1) were not measured duringthis period, we estimated Kd from Secchi depth measurements usingthe following empirical relationship:
Kd ¼ a � √ Secchi depthð Þ þ b;
where a = 5.377 (m−1) and b = 2.07 (m−1) are fit constants obtainedfrom a regression analysis (r2 = 0.71; n = 116) of date obtained fromthe western part of the optically similar Oosterschelde estuary (Malkinand Kromkamp, unpublished results). These estimates of Kd varied
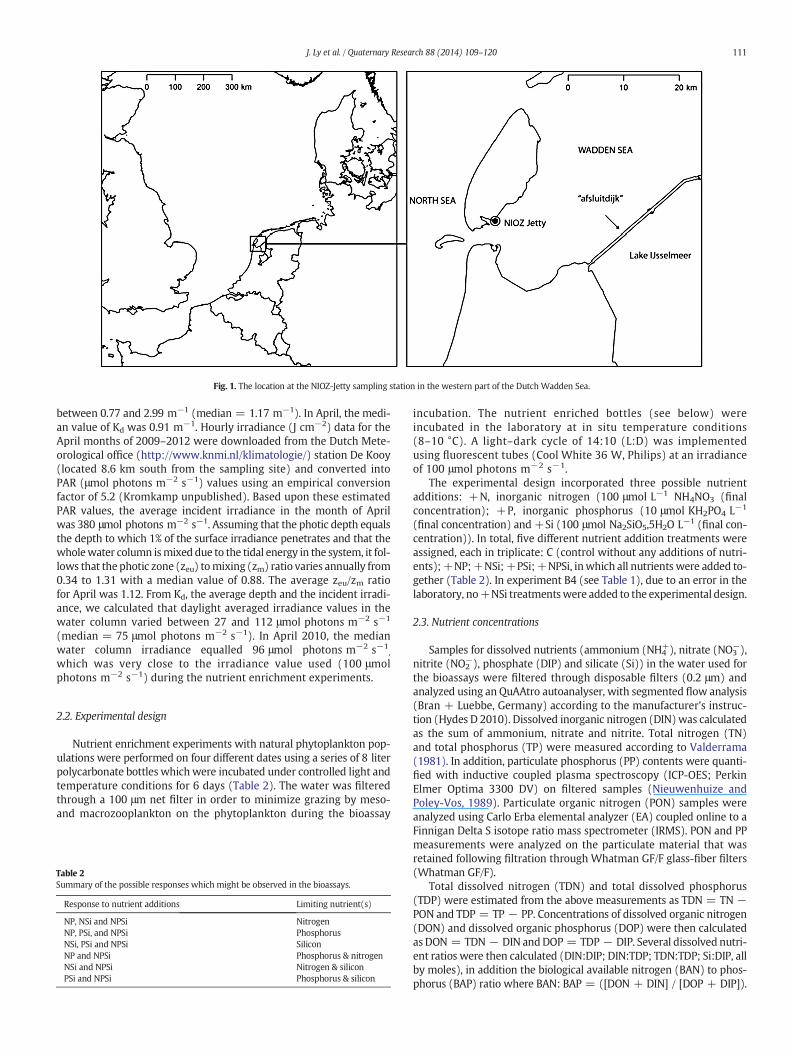
Fig. 1. The location at the NIOZ-Jetty sampling station in the western part of the Dutch Wadden Sea.
111J. Ly et al. / Quaternary Research 88 (2014) 109–120
between 0.77 and 2.99 m−1 (median = 1.17 m−1). In April, the medi-an value of Kd was 0.91 m−1. Hourly irradiance (J cm−2) data for theApril months of 2009–2012 were downloaded from the Dutch Mete-orological office (http://www.knmi.nl/klimatologie/) station De Kooy(located 8.6 km south from the sampling site) and converted intoPAR (μmol photons m−2 s−1) values using an empirical conversionfactor of 5.2 (Kromkamp unpublished). Based upon these estimatedPAR values, the average incident irradiance in the month of Aprilwas 380 μmol photons m−2 s−1. Assuming that the photic depth equalsthe depth to which 1% of the surface irradiance penetrates and that thewholewater column ismixed due to the tidal energy in the system, it fol-lows that the photic zone (zeu) tomixing (zm) ratio varies annually from0.34 to 1.31 with a median value of 0.88. The average zeu/zm ratiofor April was 1.12. From Kd, the average depth and the incident irradi-ance, we calculated that daylight averaged irradiance values in thewater column varied between 27 and 112 μmol photons m−2 s−1
(median = 75 μmol photons m−2 s−1). In April 2010, the medianwater column irradiance equalled 96 μmol photons m−2 s−1
,
which was very close to the irradiance value used (100 μmolphotons m−2 s−1) during the nutrient enrichment experiments.
2.2. Experimental design
Nutrient enrichment experiments with natural phytoplankton pop-ulations were performed on four different dates using a series of 8 literpolycarbonate bottles whichwere incubated under controlled light andtemperature conditions for 6 days (Table 2). The water was filteredthrough a 100 μm net filter in order to minimize grazing by meso-and macrozooplankton on the phytoplankton during the bioassay
Table 2Summary of the possible responses which might be observed in the bioassays.
Response to nutrient additions Limiting nutrient(s)
NP, NSi and NPSi NitrogenNP, PSi, and NPSi PhosphorusNSi, PSi and NPSi SiliconNP and NPSi Phosphorus & nitrogenNSi and NPSi Nitrogen & siliconPSi and NPSi Phosphorus & silicon
incubation. The nutrient enriched bottles (see below) wereincubated in the laboratory at in situ temperature conditions(8–10 °C). A light–dark cycle of 14:10 (L:D) was implementedusing fluorescent tubes (Cool White 36 W, Philips) at an irradianceof 100 μmol photons m−2 s−1.
The experimental design incorporated three possible nutrientadditions: +N, inorganic nitrogen (100 μmol L−1 NH4NO3 (finalconcentration); +P, inorganic phosphorus (10 μmol KH2PO4 L−1
(final concentration) and +Si (100 μmol Na2SiO5,5H2O L−1 (final con-centration)). In total, five different nutrient addition treatments wereassigned, each in triplicate: C (control without any additions of nutri-ents);+NP;+NSi;+PSi;+NPSi, inwhich all nutrients were added to-gether (Table 2). In experiment B4 (see Table 1), due to an error in thelaboratory, no+NSi treatmentswere added to the experimental design.
2.3. Nutrient concentrations
Samples for dissolved nutrients (ammonium (NH4+), nitrate (NO3
−),nitrite (NO2
−), phosphate (DIP) and silicate (Si)) in the water used forthe bioassays were filtered through disposable filters (0.2 μm) andanalyzed using an QuAAtro autoanalyser, with segmented flow analysis(Bran + Luebbe, Germany) according to the manufacturer's instruc-tion (Hydes D 2010). Dissolved inorganic nitrogen (DIN)was calculatedas the sum of ammonium, nitrate and nitrite. Total nitrogen (TN)and total phosphorus (TP) were measured according to Valderrama(1981). In addition, particulate phosphorus (PP) contents were quanti-fied with inductive coupled plasma spectroscopy (ICP-OES; PerkinElmer Optima 3300 DV) on filtered samples (Nieuwenhuize andPoley-Vos, 1989). Particulate organic nitrogen (PON) samples wereanalyzed using Carlo Erba elemental analyzer (EA) coupled online to aFinnigan Delta S isotope ratio mass spectrometer (IRMS). PON and PPmeasurements were analyzed on the particulate material that wasretained following filtration through Whatman GF/F glass-fiber filters(Whatman GF/F).
Total dissolved nitrogen (TDN) and total dissolved phosphorus(TDP) were estimated from the above measurements as TDN = TN −PON and TDP = TP − PP. Concentrations of dissolved organic nitrogen(DON) and dissolved organic phosphorus (DOP) were then calculatedasDON = TDN − DIN andDOP = TDP − DIP. Several dissolved nutri-ent ratios were then calculated (DIN:DIP; DIN:TDP; TDN:TDP; Si:DIP, allby moles), in addition the biological available nitrogen (BAN) to phos-phorus (BAP) ratio where BAN: BAP = ([DON + DIN] / [DOP + DIP]).
112 J. Ly et al. / Quaternary Research 88 (2014) 109–120
2.4. Chlorophyll-a
For each chlorophyll-a (Chla) sample, a volume of 50 to 100 mLwasfiltered through a 47 mmWhatman GF/F filters. The filters were imme-diately placed in a glass containerwith 10 mL of 90% acetone and storedin the freezer (−20 °C) for at least 24 h, afterwhich the Chla concentra-tionsweremeasuredwith a fluorometer (Hitachi Fluorescence Spectro-photometer F-2500) with an excitation wavelength of 431 nm andemission wavelength of 671 nm. The fluorometer was calibrated witha known concentration of Chla. Net specific phytoplankton growthrates (μ, day−1) within the bioassay bottles were calculated from theobserved daily changes in Chla over time from day 1 to day 6 (t, days)as: μ = 1 / t × ln (Chla(t) / Chla(0)).
2.6. Species counts
As part of the long-term field observation program from the NIOZ-Jetty, phytoplankton species composition was determined from surfacewater samples at a sampling frequency from once a month in mid-winter and twice per week during spring blooms. Phytoplanktonsamples were preserved with Lugol's iodine and the preserved cellswere counted with a Zeiss inverted microscope using 5-mL countingchambers (Philippart et al., in prep). Most algae were identified tospecies level; some were clustered into coarser taxonomic and sizegroups (e.g. small flagellates).
2.7. Photosynthetic carbon incorporation using 13C uptake into particulateorganic carbon (POC)
Water samples of 1–2 l from the bioassays were taken at the begin-ning (day 0) and end (day 6) of each nutrient addition treatment for 13Cstable isotope incubation. Thesewater sampleswere enrichedwith 13C-NaHCO3 (99% 13C; Cambridge Isotope Laboratories, Inc.) for 2 h with aconcentration of 4% of the ambient dissolved inorganic carbon (DIC)concentration. Samples for the 13C incubation were filtered throughprecombusted glass-fiber filters (Whatman GF/F) and later analyzedwith a Carlo Erba elemental analyzer (EA) coupled in-line to a FinniganDelta S isotope ratio mass spectrometer (IRMS). Stable isotope data areexpressed in the delta notation (δ13C) relative to carbon isotope ratio(R = 13C/12C) of Vienna Pee Dee Belemnite (RVPDB = 0.0112372):δ13C = [Rsample / RVPDB) − 1 × 1000]. The fraction of 13C (μg C L−1) inPOC is expressed as the 13C fraction (13C / (12C + 13C) = R / (R + 1)derived from the delta notation (Middelburg et al., 2000). The 13C up-take of POC (μmol C L−1) was calculated from the difference of the frac-tion of 13C at the start and at the end of the incubation, multiplied bythe concentration of POC at the start of the incubation. After correctionfor the NaH13CO3 enrichment (4% added of ambient DIC), the rate of13C-incorporation at the incubation conditions (μmol C L−1 h−1) wasobtained by dividing the uptake by the incubation time (2 h). Total dis-solved inorganic carbon (DIC) varied around 2.22 ± 0.06 mmol L−1
(E. Epping, pers. comm).
2.8. Photosynthesis physiology
Chlorophyll fluorescence was measured daily on a water samplefrom the bioassay using a Water-PAM fluorometer equipped with redLEDs (Heinz Walz, Effeltrich, Germany). The duration of the saturatingflash was 800 ms. For each sample, the minimum fluorescence yield(F0) and the maximum fluorescence yield (Fm) were measured using a1 min dark adaptation time before measurement in order to obtainthe maximum PSII quantum efficiency (Fv/Fm = (Fm − F0) / Fm).Although this time might be too short to obtain full relaxationof non-photochemical quenching (NPQ), the little amount of NPQpresent and induced at the moderate growth light intensity relaxedquickly allowing a short relaxation time in order to evaluate changesin the Fv/Fm.
2.9. Alkaline phosphatase activity (APA)
At the beginning and end of each nutrient enrichment experiment,samples for cell-specific detection of APAweremeasured using amolec-ular probe, ELF-97 (Endogenous Phosphatase Detection Kit; E6601, Mo-lecular Probes, Invitrogen, California). The phytoplankton biomass in avolume of 100–150 mL was reduced to approx. 5–10 mL using a mem-brane filter of 0.2 μm, and to 1 mL of the concentrated sample a freshlyprepared ELF-97 working solution was added. The concentrations wereapproximate because we were only interested in the proportion of ELF-97 labeled cells and not in cell concentrations. After 30 min incubationin the dark, 100 μL of the phosphate buffer solution and 20 μL of a mix-ture of paraformaldehyde and glutaraldehyde (0.01:0.1%) were added,and the preserved samples were stored at 4 °C. ELF samples were ana-lyzed within one month. The inoculated ELF samples were visualizedusing an epifluorescence microscope (Carl Zeiss axioplan 2 imaging mi-croscope) connected to a LED illumination system (Colibri, Carl ZeissSAS, Germany). Carl Zeiss Axiovision software was used to acquire andanalyze the images. During the storage, however, the algal cells andother components in the water formed large aggregates which madeit nearly impossible to detect individual cells as a recognizable species,making microscopy observations on single algal cells difficult. As thebright green fluorescence of the ELF stain was clearly visible withinthese aggregates, we decided to make a relative score of the “density”of the ELF stained particles in the aggregates, where an intense brightgreen fluorescence was scored as “high”, a pale green fluorescenceas “low”, and the absence of any fluorescence as “zero”. In total, 100cells or aggregates were scored for each sample. Only ELF fluorescenceof intact algal cells was scored, i.e. only when the red chlorophyllautofluorescence was visible, the ELF fluorescence was included.
2.10. Statistics analysis
Parameters such as Chla, Fv/Fm and C-incorporation via 13C labelingwere analyzed with an analysis of variance (ANOVA), with time ofincubation (6 days) and treatments as fixed factors for each bioassay(5 levels: control (C), +NP, +NSi, +PSi, +NPSi). A one way ANOVAwas performed to test the difference among the nutrient addition treat-ments for each bioassay at different times during the incubation.Assumptions of ANOVA (normality and homogeneity of variances)were tested. Analyses were undertaken using R version 2.12.0(http://www.r-project.org/) with a level of significance of p b 0.05.
3. Results
3.1. Starting conditions at each bioassay
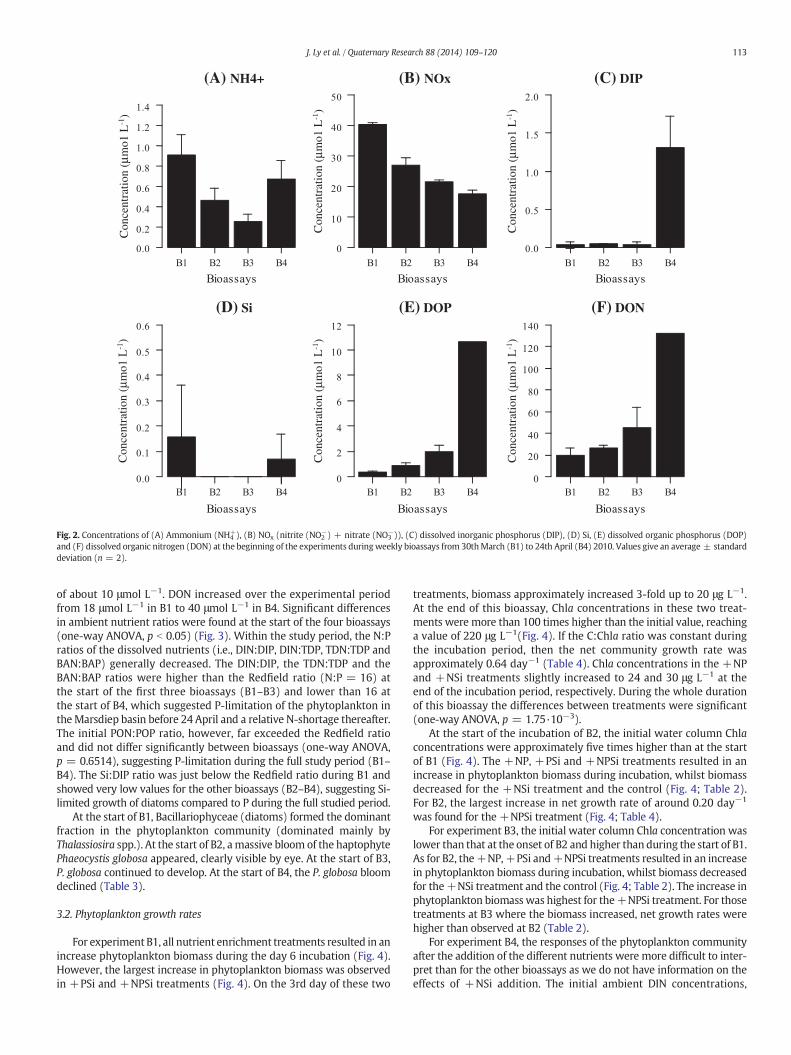
Before nutrients were added in each bioassay, significant differencesin ambient nutrient concentrations were found between all bioassays(B1, B2, B3 and B4) (one-way ANOVA, p b 0.05) and these will bediscussed here. At the start of the first three bioassays (B1, B2 and B3),the ambient DIP concentrations ranged from 0.04 to 0.05 μmol L−1
which was close to the detection limit for this nutrient (Fig. 2). At thestart of B4, the DIP concentration was higher, reaching a concentrationof 1.5 μmol L−1. The concentrations of Si were below the detectionlimit at the start of B2 and B3, and low (0.15 μmol L−1 for B1 and0.07 μmol L−1 for B4) but not significantly different at the start of theother two bioassays. From B1 to B3, NH4
+ concentrations decreasedsignificantly from 0.91 to 0.26 μmol L−1. In B4, NH4
+ concentrationshad increased again to 0.67 μmol L−1. NOx was the main contributorof the DIN pool with NO3 contributing around 97% of total NOx,e.g. NOx concentrations were already 40 times higher than NH4
+ in B1.Concentrations of NOx decreased from 40 μmol L−1 at the start of B1to 17.5 μmol L−1 at the start of B4.
Ambient DOP increased from 0.5 μmol L−1 in B1 to 1 and 2 μmol L−1
in B2 and B3, respectively. In B4, DOP levels showed the highest values
Con
cent
ratio
n (µ
mo1
L-1
)
Con
cent
ratio
n (µ
mo1
L-1
)
Con
cent
ratio
n (µ
mo1
L-1
)
Con
cent
ratio
n (µ
mo1
L-1
)
Con
cent
ratio
n (µ
mo1
L-1
)
Con
cent
ratio
n (µ
mo1
L-1
)
(A) NH4+ (B) NOx (C) DIP
(D) Si (E) DOP (F) DON
Fig. 2. Concentrations of (A) Ammonium (NH4+), (B) NOx (nitrite (NO2
−) + nitrate (NO3−)), (C) dissolved inorganic phosphorus (DIP), (D) Si, (E) dissolved organic phosphorus (DOP)
and (F) dissolved organic nitrogen (DON) at the beginning of the experiments duringweekly bioassays from 30thMarch (B1) to 24th April (B4) 2010. Values give an average ± standarddeviation (n = 2).
113J. Ly et al. / Quaternary Research 88 (2014) 109–120
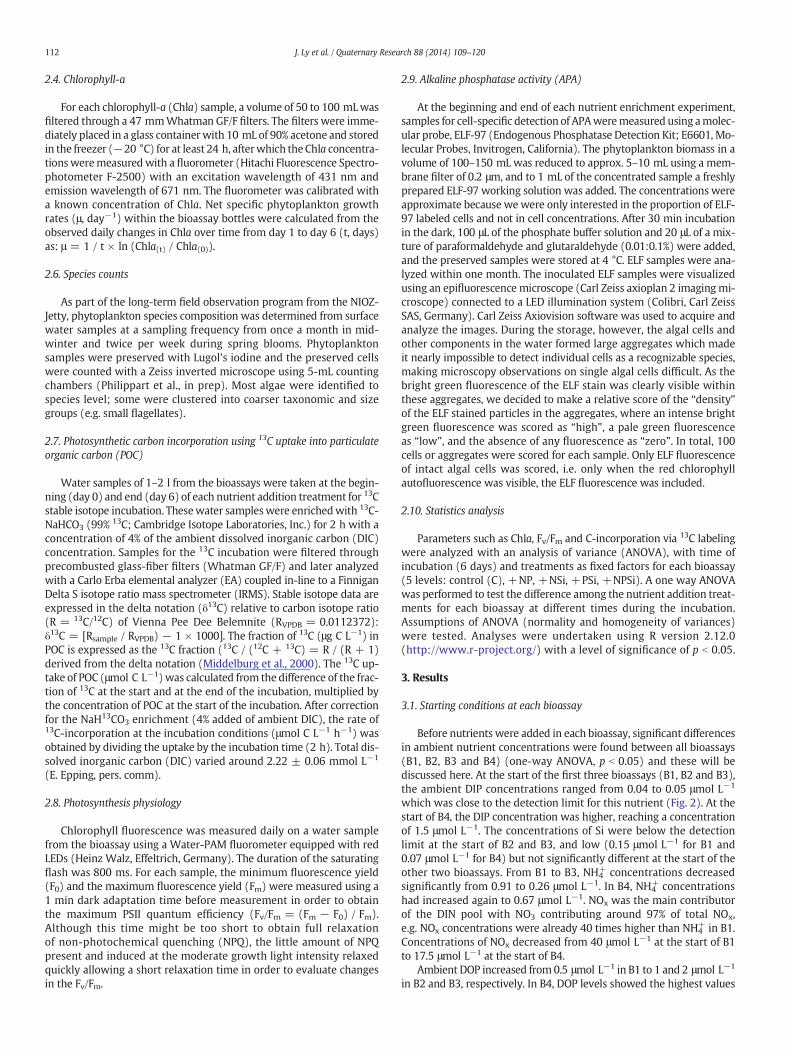
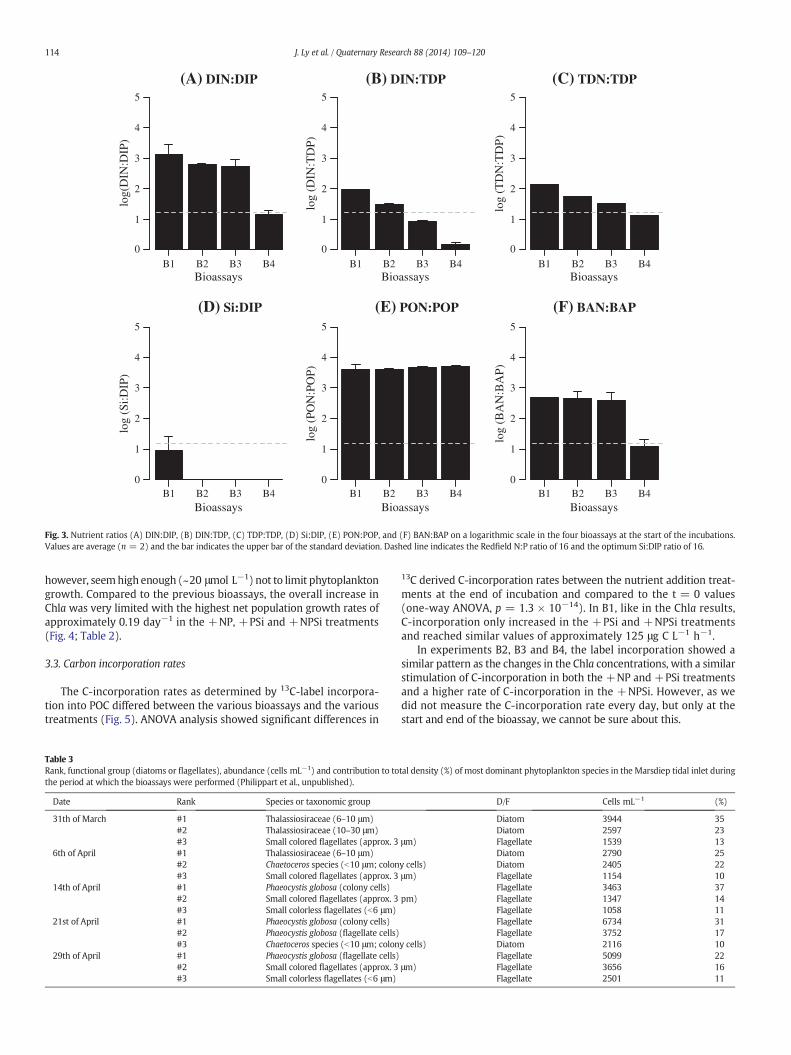
of about 10 μmol L−1. DON increased over the experimental periodfrom 18 μmol L−1 in B1 to 40 μmol L−1 in B4. Significant differencesin ambient nutrient ratios were found at the start of the four bioassays(one-way ANOVA, p b 0.05) (Fig. 3). Within the study period, the N:Pratios of the dissolved nutrients (i.e., DIN:DIP, DIN:TDP, TDN:TDP andBAN:BAP) generally decreased. The DIN:DIP, the TDN:TDP and theBAN:BAP ratios were higher than the Redfield ratio (N:P = 16) atthe start of the first three bioassays (B1–B3) and lower than 16 atthe start of B4, which suggested P-limitation of the phytoplankton intheMarsdiep basin before 24 April and a relative N-shortage thereafter.The initial PON:POP ratio, however, far exceeded the Redfield ratioand did not differ significantly between bioassays (one-way ANOVA,p = 0.6514), suggesting P-limitation during the full study period (B1–B4). The Si:DIP ratio was just below the Redfield ratio during B1 andshowed very low values for the other bioassays (B2–B4), suggesting Si-limited growth of diatoms compared to P during the full studied period.
At the start of B1, Bacillariophyceae (diatoms) formed the dominantfraction in the phytoplankton community (dominated mainly byThalassiosira spp.). At the start of B2, amassive bloom of the haptophytePhaeocystis globosa appeared, clearly visible by eye. At the start of B3,P. globosa continued to develop. At the start of B4, the P. globosa bloomdeclined (Table 3).
3.2. Phytoplankton growth rates
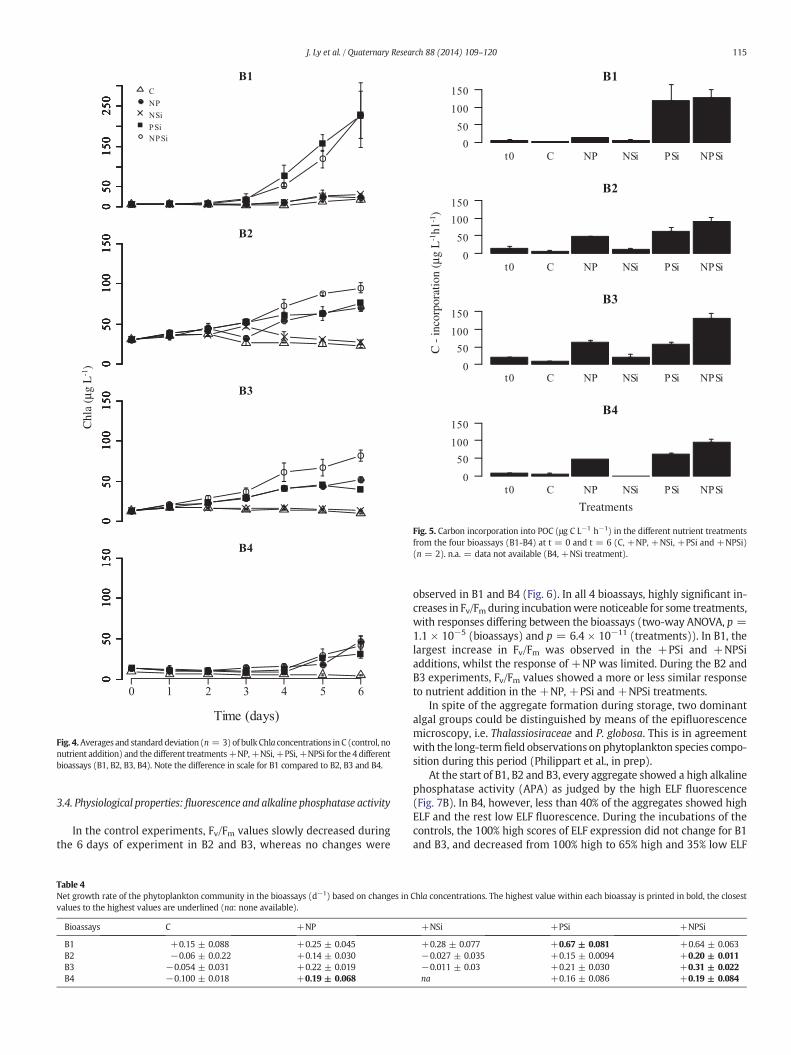
For experiment B1, all nutrient enrichment treatments resulted in anincrease phytoplankton biomass during the day 6 incubation (Fig. 4).However, the largest increase in phytoplankton biomass was observedin +PSi and +NPSi treatments (Fig. 4). On the 3rd day of these two
treatments, biomass approximately increased 3-fold up to 20 μg L−1.At the end of this bioassay, Chla concentrations in these two treat-ments were more than 100 times higher than the initial value, reachinga value of 220 μg L−1(Fig. 4). If the C:Chla ratio was constant duringthe incubation period, then the net community growth rate wasapproximately 0.64 day−1 (Table 4). Chla concentrations in the +NPand +NSi treatments slightly increased to 24 and 30 μg L−1 at theend of the incubation period, respectively. During the whole durationof this bioassay the differences between treatments were significant(one-way ANOVA, p = 1.75·10−3).
At the start of the incubation of B2, the initial water column Chlaconcentrations were approximately five times higher than at the startof B1 (Fig. 4). The +NP, +PSi and +NPSi treatments resulted in anincrease in phytoplankton biomass during incubation, whilst biomassdecreased for the +NSi treatment and the control (Fig. 4; Table 2).For B2, the largest increase in net growth rate of around 0.20 day−1
was found for the +NPSi treatment (Fig. 4; Table 4).For experiment B3, the initial water column Chla concentration was
lower than that at the onset of B2 and higher than during the start of B1.As for B2, the+NP,+PSi and+NPSi treatments resulted in an increasein phytoplankton biomass during incubation, whilst biomass decreasedfor the+NSi treatment and the control (Fig. 4; Table 2). The increase inphytoplankton biomass was highest for the+NPSi treatment. For thosetreatments at B3 where the biomass increased, net growth rates werehigher than observed at B2 (Table 2).
For experiment B4, the responses of the phytoplankton communityafter the addition of the different nutrients were more difficult to inter-pret than for the other bioassays as we do not have information on theeffects of +NSi addition. The initial ambient DIN concentrations,
B1 B2 B3 B4
(A) DIN:DIP
Bioassays
log(
DIN
:DIP
)
0
1
2
3
4
5
B1 B2 B3 B4
(B) DIN:TDP
Bioassays
log
(DIN
:TD
P)
0
1
2
3
4
5
B1 B2 B3 B4
(C) TDN:TDP
Bioassays
log
(TD
N:T
DP)
0
1
2
3
4
5
B1 B2 B3 B4
(D) Si:DIP
Bioassays
log
(Si:D
IP)
0
1
2
3
4
5
B1 B2 B3 B4
(E) PON:POP
Bioassays
log
(PO
N:P
OP)
0
1
2
3
4
5
B1 B2 B3 B4
(F) BAN:BAP
Bioassayslo
g (B
AN
:BA
P)
0
1
2
3
4
5
Fig. 3. Nutrient ratios (A) DIN:DIP, (B) DIN:TDP, (C) TDP:TDP, (D) Si:DIP, (E) PON:POP, and (F) BAN:BAP on a logarithmic scale in the four bioassays at the start of the incubations.Values are average (n = 2) and the bar indicates the upper bar of the standard deviation. Dashed line indicates the Redfield N:P ratio of 16 and the optimum Si:DIP ratio of 16.
114 J. Ly et al. / Quaternary Research 88 (2014) 109–120
however, seemhigh enough (~20 μmol L−1) not to limit phytoplanktongrowth. Compared to the previous bioassays, the overall increase inChla was very limited with the highest net population growth rates ofapproximately 0.19 day−1 in the +NP, +PSi and +NPSi treatments(Fig. 4; Table 2).
3.3. Carbon incorporation rates
The C-incorporation rates as determined by 13C-label incorpora-tion into POC differed between the various bioassays and the varioustreatments (Fig. 5). ANOVA analysis showed significant differences in
Table 3Rank, functional group (diatoms or flagellates), abundance (cells mL−1) and contribution to tothe period at which the bioassays were performed (Philippart et al., unpublished).
Date Rank Species or taxonomic group
31th of March #1 Thalassiosiraceae (6–10 μm)#2 Thalassiosiraceae (10–30 μm)#3 Small colored flagellates (approx. 3
6th of April #1 Thalassiosiraceae (6–10 μm)#2 Chaetoceros species (b10 μm; colon#3 Small colored flagellates (approx. 3
14th of April #1 Phaeocystis globosa (colony cells)#2 Small colored flagellates (approx. 3#3 Small colorless flagellates (b6 μm)
21st of April #1 Phaeocystis globosa (colony cells)#2 Phaeocystis globosa (flagellate cells)#3 Chaetoceros species (b10 μm; colon
29th of April #1 Phaeocystis globosa (flagellate cells)#2 Small colored flagellates (approx. 3#3 Small colorless flagellates (b6 μm)
13C derived C-incorporation rates between the nutrient addition treat-ments at the end of incubation and compared to the t = 0 values(one-way ANOVA, p = 1.3 × 10⁻¹⁴). In B1, like in the Chla results,C-incorporation only increased in the +PSi and +NPSi treatmentsand reached similar values of approximately 125 μg C L−1 h−1.
In experiments B2, B3 and B4, the label incorporation showed asimilar pattern as the changes in the Chla concentrations, with a similarstimulation of C-incorporation in both the +NP and +PSi treatmentsand a higher rate of C-incorporation in the +NPSi. However, as wedid not measure the C-incorporation rate every day, but only at thestart and end of the bioassay, we cannot be sure about this.
tal density (%) of most dominant phytoplankton species in the Marsdiep tidal inlet during
D/F Cells mL−1 (%)
Diatom 3944 35Diatom 2597 23
μm) Flagellate 1539 13Diatom 2790 25
y cells) Diatom 2405 22μm) Flagellate 1154 10
Flagellate 3463 37pm) Flagellate 1347 14
Flagellate 1058 11Flagellate 6734 31Flagellate 3752 17
y cells) Diatom 2116 10Flagellate 5099 22
μm) Flagellate 3656 16Flagellate 2501 11
Chl
a (µ
g L
-1)
Fig. 4.Averages and standard deviation (n = 3)of bulk Chla concentrations in C (control, nonutrient addition) and the different treatments+NP,+NSi,+PSi,+NPSi for the 4 differentbioassays (B1, B2, B3, B4). Note the difference in scale for B1 compared to B2, B3 and B4.
Treatments
C -
inco
rpor
atio
n (µ
g L
-1h1
-1)
Fig. 5. Carbon incorporation into POC (μg C L−1 h−1) in the different nutrient treatmentsfrom the four bioassays (B1-B4) at t = 0 and t = 6 (C, +NP, +NSi, +PSi and +NPSi)(n = 2). n.a. = data not available (B4, +NSi treatment).
115J. Ly et al. / Quaternary Research 88 (2014) 109–120
3.4. Physiological properties: fluorescence and alkaline phosphatase activity
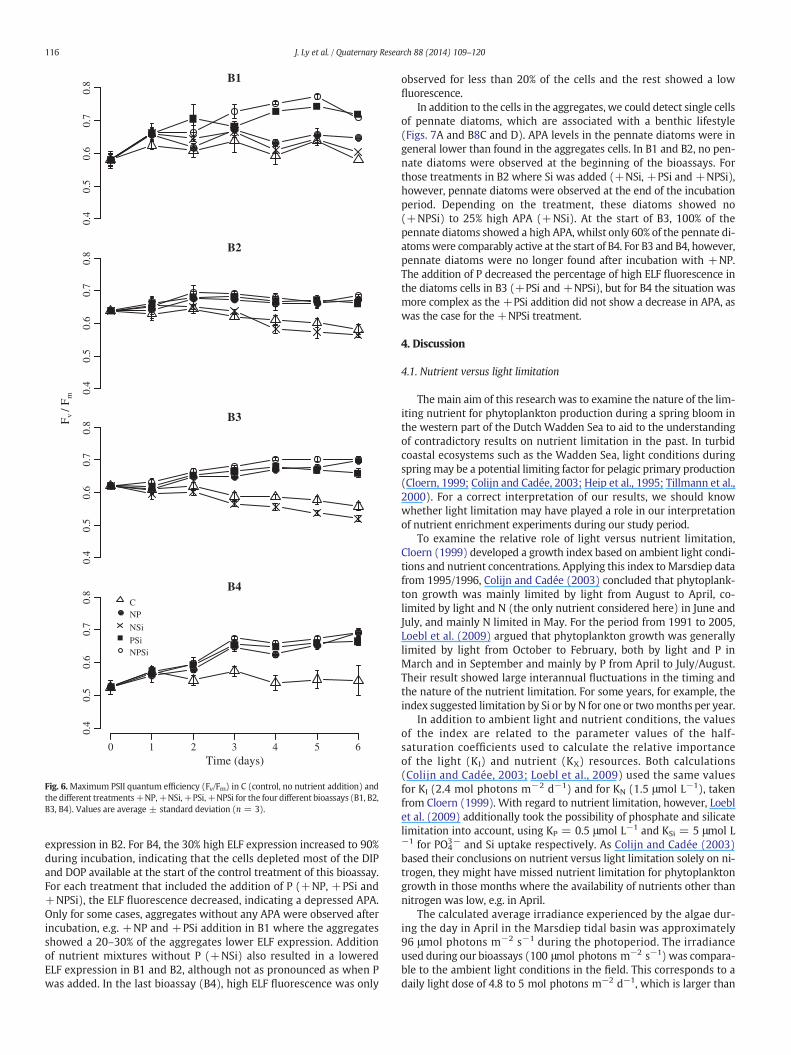
In the control experiments, Fv/Fm values slowly decreased duringthe 6 days of experiment in B2 and B3, whereas no changes were
Table 4Net growth rate of the phytoplankton community in the bioassays (d−1) based on changes invalues to the highest values are underlined (na: none available).
Bioassays C +NP
B1 +0.15 ± 0.088 +0.25 ± 0.045B2 −0.06 ± 0.0.22 +0.14 ± 0.030B3 −0.054 ± 0.031 +0.22 ± 0.019B4 −0.100 ± 0.018 +0.19 ± 0.068
observed in B1 and B4 (Fig. 6). In all 4 bioassays, highly significant in-creases in Fv/Fm during incubationwere noticeable for some treatments,with responses differing between the bioassays (two-way ANOVA, p =1.1 × 10⁻⁵ (bioassays) and p = 6.4 × 10⁻¹¹ (treatments)). In B1, thelargest increase in Fv/Fm was observed in the +PSi and +NPSiadditions, whilst the response of +NP was limited. During the B2 andB3 experiments, Fv/Fm values showed a more or less similar responseto nutrient addition in the +NP, +PSi and +NPSi treatments.
In spite of the aggregate formation during storage, two dominantalgal groups could be distinguished by means of the epifluorescencemicroscopy, i.e. Thalassiosiraceae and P. globosa. This is in agreementwith the long-term field observations on phytoplankton species compo-sition during this period (Philippart et al., in prep).
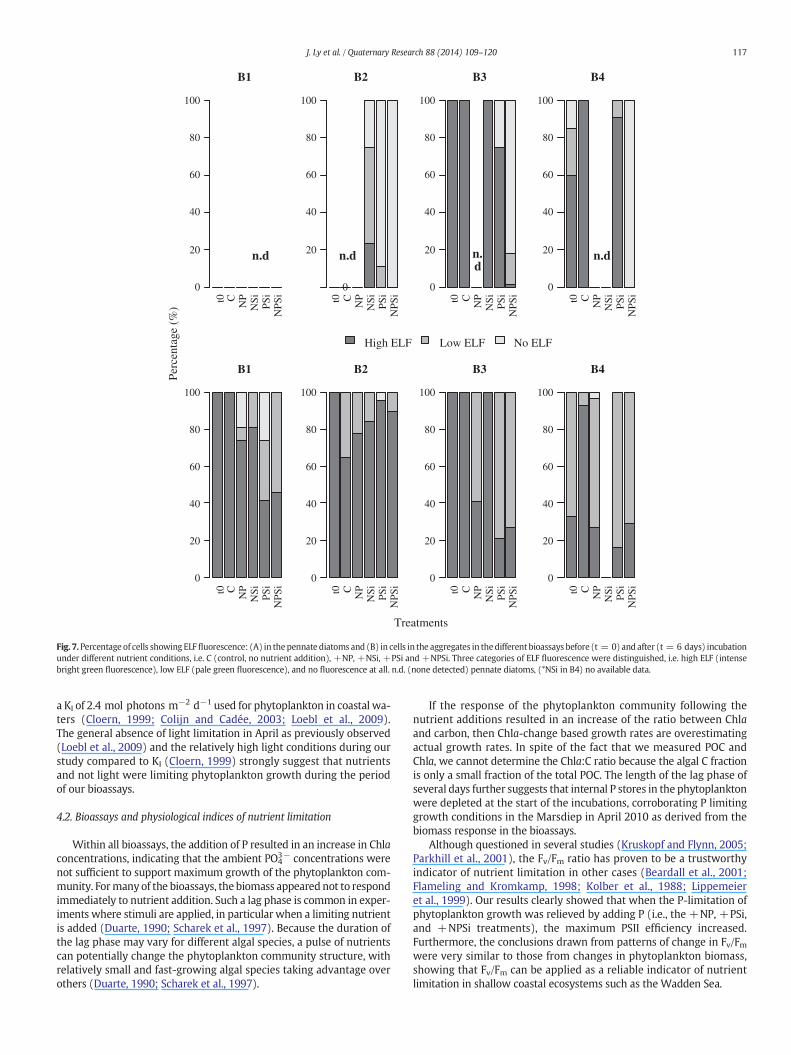
At the start of B1, B2 and B3, every aggregate showed a high alkalinephosphatase activity (APA) as judged by the high ELF fluorescence(Fig. 7B). In B4, however, less than 40% of the aggregates showed highELF and the rest low ELF fluorescence. During the incubations of thecontrols, the 100% high scores of ELF expression did not change for B1and B3, and decreased from 100% high to 65% high and 35% low ELF
Chla concentrations. The highest value within each bioassay is printed in bold, the closest
+NSi +PSi +NPSi
+0.28 ± 0.077 +0.67 ± 0.081 +0.64 ± 0.063−0.027 ± 0.035 +0.15 ± 0.0094 +0.20 ± 0.011−0.011 ± 0.03 +0.21 ± 0.030 +0.31 ± 0.022na +0.16 ± 0.086 +0.19 ± 0.084
0.4
0.5
0.6
0.7
0.8 B1
0.4
0.5
0.6
0.7
0.8 B2
0.4
0.5
0.6
0.7
0.8 B3
0.4
0.5
0.6
0.7
0.8 B4
0 1 2 3 4 5 6Time (days)
CNP
NSi
PSiNPSi
F v /
F m
Fig. 6.Maximum PSII quantum efficiency (Fv/Fm) in C (control, no nutrient addition) andthe different treatments+NP,+NSi,+PSi,+NPSi for the four different bioassays (B1, B2,B3, B4). Values are average ± standard deviation (n = 3).
116 J. Ly et al. / Quaternary Research 88 (2014) 109–120
expression in B2. For B4, the 30% high ELF expression increased to 90%during incubation, indicating that the cells depleted most of the DIPand DOP available at the start of the control treatment of this bioassay.For each treatment that included the addition of P (+NP, +PSi and+NPSi), the ELF fluorescence decreased, indicating a depressed APA.Only for some cases, aggregates without any APA were observed afterincubation, e.g. +NP and +PSi addition in B1 where the aggregatesshowed a 20–30% of the aggregates lower ELF expression. Additionof nutrient mixtures without P (+NSi) also resulted in a loweredELF expression in B1 and B2, although not as pronounced as when Pwas added. In the last bioassay (B4), high ELF fluorescence was only
observed for less than 20% of the cells and the rest showed a lowfluorescence.
In addition to the cells in the aggregates, we could detect single cellsof pennate diatoms, which are associated with a benthic lifestyle(Figs. 7A and B8C and D). APA levels in the pennate diatoms were ingeneral lower than found in the aggregates cells. In B1 and B2, no pen-nate diatoms were observed at the beginning of the bioassays. Forthose treatments in B2 where Si was added (+NSi, +PSi and +NPSi),however, pennate diatoms were observed at the end of the incubationperiod. Depending on the treatment, these diatoms showed no(+NPSi) to 25% high APA (+NSi). At the start of B3, 100% of thepennate diatoms showed a high APA, whilst only 60% of the pennate di-atomswere comparably active at the start of B4. For B3 and B4, however,pennate diatoms were no longer found after incubation with +NP.The addition of P decreased the percentage of high ELF fluorescence inthe diatoms cells in B3 (+PSi and +NPSi), but for B4 the situation wasmore complex as the +PSi addition did not show a decrease in APA, aswas the case for the +NPSi treatment.
4. Discussion
4.1. Nutrient versus light limitation
The main aim of this research was to examine the nature of the lim-iting nutrient for phytoplankton production during a spring bloom inthe western part of the Dutch Wadden Sea to aid to the understandingof contradictory results on nutrient limitation in the past. In turbidcoastal ecosystems such as the Wadden Sea, light conditions duringspringmay be a potential limiting factor for pelagic primary production(Cloern, 1999; Colijn and Cadée, 2003; Heip et al., 1995; Tillmann et al.,2000). For a correct interpretation of our results, we should knowwhether light limitation may have played a role in our interpretationof nutrient enrichment experiments during our study period.
To examine the relative role of light versus nutrient limitation,Cloern (1999) developed a growth index based on ambient light condi-tions and nutrient concentrations. Applying this index toMarsdiep datafrom 1995/1996, Colijn and Cadée (2003) concluded that phytoplank-ton growth was mainly limited by light from August to April, co-limited by light and N (the only nutrient considered here) in June andJuly, and mainly N limited in May. For the period from 1991 to 2005,Loebl et al. (2009) argued that phytoplankton growth was generallylimited by light from October to February, both by light and P inMarch and in September and mainly by P from April to July/August.Their result showed large interannual fluctuations in the timing andthe nature of the nutrient limitation. For some years, for example, theindex suggested limitation by Si or by N for one or twomonths per year.
In addition to ambient light and nutrient conditions, the valuesof the index are related to the parameter values of the half-saturation coefficients used to calculate the relative importanceof the light (KI) and nutrient (KX) resources. Both calculations(Colijn and Cadée, 2003; Loebl et al., 2009) used the same valuesfor KI (2.4 mol photons m−2 d−1) and for KN (1.5 μmol L−1), takenfrom Cloern (1999). With regard to nutrient limitation, however, Loeblet al. (2009) additionally took the possibility of phosphate and silicatelimitation into account, using KP = 0.5 μmol L−1 and KSi = 5 μmol L−1 for PO4
3− and Si uptake respectively. As Colijn and Cadée (2003)based their conclusions on nutrient versus light limitation solely on ni-trogen, they might have missed nutrient limitation for phytoplanktongrowth in those months where the availability of nutrients other thannitrogen was low, e.g. in April.
The calculated average irradiance experienced by the algae dur-ing the day in April in the Marsdiep tidal basin was approximately96 μmol photons m−2 s−1 during the photoperiod. The irradianceused during our bioassays (100 μmol photons m−2 s−1) was compara-ble to the ambient light conditions in the field. This corresponds to adaily light dose of 4.8 to 5 mol photons m−2 d−1, which is larger than
t0 CN
PN
Si PSi
NPS
i
B1
0
20
40
60
80
100
n.d
t0 CN
PN
Si PSi
NPS
i
B2
n.d
t0 CN
PN
Si PSi
NPS
i
B3
n.d
t0 CN
PN
Si PSi
NPS
i
B4
n.d
t0 CN
PN
Si PSi
NPS
i
B1
0
20
40
60
80
100
0
20
40
60
80
100
0
20
40
60
80
100
0
20
40
60
80
100
0
20
40
60
80
100
0
20
40
60
80
100
0
20
40
60
80
100
t0 CN
PN
Si PSi
NPS
i
B2
t0 CN
PN
Si PSi
NPS
i
B3
t0 CN
PN
Si PSi
NPS
i
B4
Perc
enta
ge (
%)
Treatments
High ELF Low ELF No ELF
Fig. 7.Percentage of cells showing ELFfluorescence: (A) in thepennate diatoms and (B) in cells in the aggregates in thedifferent bioassays before (t = 0) and after (t = 6 days) incubationunder different nutrient conditions, i.e. C (control, no nutrient addition), +NP, +NSi, +PSi and +NPSi. Three categories of ELF fluorescence were distinguished, i.e. high ELF (intensebright green fluorescence), low ELF (pale green fluorescence), and no fluorescence at all. n.d. (none detected) pennate diatoms, (*NSi in B4) no available data.
117J. Ly et al. / Quaternary Research 88 (2014) 109–120
a KI of 2.4 mol photons m−2 d−1 used for phytoplankton in coastal wa-ters (Cloern, 1999; Colijn and Cadée, 2003; Loebl et al., 2009).The general absence of light limitation in April as previously observed(Loebl et al., 2009) and the relatively high light conditions during ourstudy compared to KI (Cloern, 1999) strongly suggest that nutrientsand not light were limiting phytoplankton growth during the periodof our bioassays.
4.2. Bioassays and physiological indices of nutrient limitation
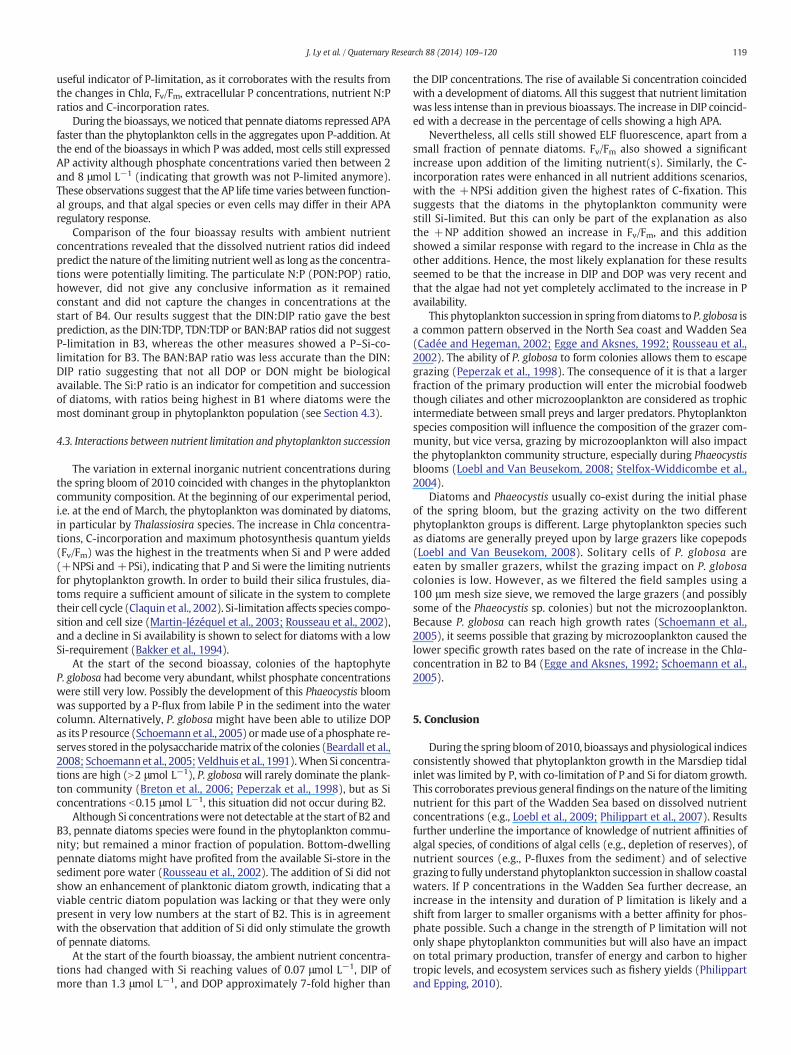
Within all bioassays, the addition of P resulted in an increase in Chlaconcentrations, indicating that the ambient PO4
3− concentrations werenot sufficient to support maximum growth of the phytoplankton com-munity. Formany of the bioassays, the biomass appeared not to respondimmediately to nutrient addition. Such a lag phase is common in exper-iments where stimuli are applied, in particular when a limiting nutrientis added (Duarte, 1990; Scharek et al., 1997). Because the duration ofthe lag phase may vary for different algal species, a pulse of nutrientscan potentially change the phytoplankton community structure, withrelatively small and fast-growing algal species taking advantage overothers (Duarte, 1990; Scharek et al., 1997).
If the response of the phytoplankton community following thenutrient additions resulted in an increase of the ratio between Chlaand carbon, then Chla-change based growth rates are overestimatingactual growth rates. In spite of the fact that we measured POC andChla, we cannot determine the Chla:C ratio because the algal C fractionis only a small fraction of the total POC. The length of the lag phase ofseveral days further suggests that internal P stores in the phytoplanktonwere depleted at the start of the incubations, corroborating P limitinggrowth conditions in the Marsdiep in April 2010 as derived from thebiomass response in the bioassays.
Although questioned in several studies (Kruskopf and Flynn, 2005;Parkhill et al., 2001), the Fv/Fm ratio has proven to be a trustworthyindicator of nutrient limitation in other cases (Beardall et al., 2001;Flameling and Kromkamp, 1998; Kolber et al., 1988; Lippemeieret al., 1999). Our results clearly showed that when the P-limitation ofphytoplankton growth was relieved by adding P (i.e., the +NP, +PSi,and +NPSi treatments), the maximum PSII efficiency increased.Furthermore, the conclusions drawn from patterns of change in Fv/Fmwere very similar to those from changes in phytoplankton biomass,showing that Fv/Fm can be applied as a reliable indicator of nutrientlimitation in shallow coastal ecosystems such as the Wadden Sea.

A B
C D
E F
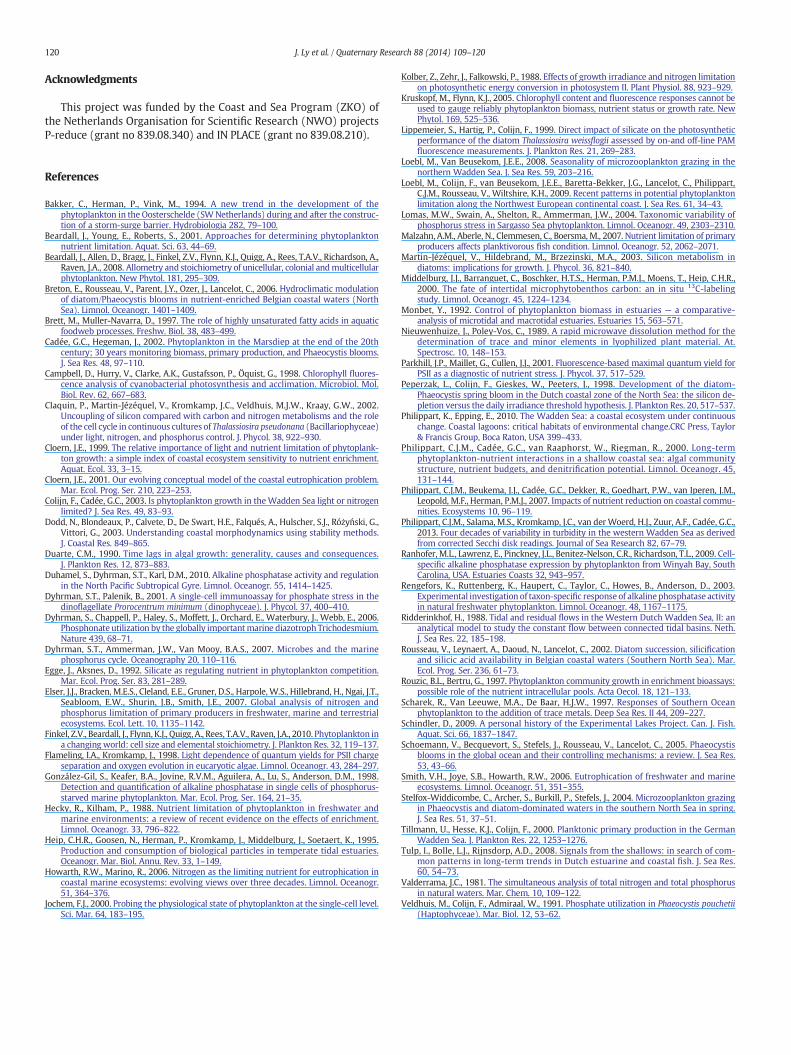
Fig. 8. Selected pictures of ELF stained samples. Images showing: red chlorophyll autofluorescence (left images) and green fluorescence indicating the alkaline phosphatase activity(right images) forMediopyxis helysia (A & B), for pennate diatoms (C & D) and for aggregated cells and a chain-forming Chaetoceros species (E & F). Green spots indicate presence of AP.
118 J. Ly et al. / Quaternary Research 88 (2014) 109–120
Our results for B4, where Si limitation appeared to have loweredFv/Fm, are in agreement with the findings for diatom cultures(Lippemeier et al., 1999) but never observed during field studies before.Theoretically, a lowered Fv/Fm can be caused by an interference ofphycobilin fluorescence from cyanobacteria (Campbell et al., 1998).According to our pigment data (not shown in this study), however, nozeaxanthin, a pigment biomarker for cyanobacteria, was detected.Therefore, we can conclude that the signal is from eukaryotic phyto-plankton. In spite of that fact that Si is not a structural component ofthe photosynthetic apparatus, we think it likely that when cells harvestmore light than they can use for growth and formation of storageproducts, this will cause backpressure on photosystem II, loweringthe PSII quantum efficiency. Only when the cells have reduced theirpigment contents to cover their need, Fv/Fm will recover.
Alkaline phosphatase activity (APA) is used bymany authors as an in-dicator of P-limitation of phytoplankton (Duhamel et al., 2010; Dyhrman
and Palenik, 2001; González-Gil et al., 1998; Rengefors et al., 2003). Inmarine ecosystems, DOP is often present in higher concentrations thanDIP (Dyhrman et al., 2007). APA is generally considered to be able tohydrolyze the phosphate group from DOP only when the phosphategroup is ester-bound (C\O\P bond). So-called phosphonates, whichare ether-bound organic P compounds (C\P bond), were thought notto be used by phytoplanktonuntil the recent observation of phosphonateutilization by the marine cyanobacterium Trichodesmium sp. (Dyhrmanet al., 2006). The characterization of DOP in combination with thecapacity of photoautotrophs to utilize the several forms of DOP requiresfurther study.
Some studies suggest that APA is regulated by external phosphateconcentrations (Jochem, 2000; Lomas et al., 2004) whereas others indi-cate that it is the internal P content which regulates APA (Lomas et al.,2004; Ranhofer et al., 2009; Rouzic and Bertru, 1997). Although wedid not measure internal P storage, our results showed that ELF is a
119J. Ly et al. / Quaternary Research 88 (2014) 109–120
useful indicator of P-limitation, as it corroborates with the results fromthe changes in Chla, Fv/Fm, extracellular P concentrations, nutrient N:Pratios and C-incorporation rates.
During the bioassays, we noticed that pennate diatoms repressed APAfaster than the phytoplankton cells in the aggregates upon P-addition. Atthe end of the bioassays in which P was added, most cells still expressedAP activity although phosphate concentrations varied then between 2and 8 μmol L−1 (indicating that growth was not P-limited anymore).These observations suggest that the AP life time varies between function-al groups, and that algal species or even cells may differ in their APAregulatory response.
Comparison of the four bioassay results with ambient nutrientconcentrations revealed that the dissolved nutrient ratios did indeedpredict the nature of the limiting nutrientwell as long as the concentra-tions were potentially limiting. The particulate N:P (PON:POP) ratio,however, did not give any conclusive information as it remainedconstant and did not capture the changes in concentrations at thestart of B4. Our results suggest that the DIN:DIP ratio gave the bestprediction, as the DIN:TDP, TDN:TDP or BAN:BAP ratios did not suggestP-limitation in B3, whereas the other measures showed a P–Si-co-limitation for B3. The BAN:BAP ratio was less accurate than the DIN:DIP ratio suggesting that not all DOP or DON might be biologicalavailable. The Si:P ratio is an indicator for competition and successionof diatoms, with ratios being highest in B1 where diatoms were themost dominant group in phytoplankton population (see Section 4.3).
4.3. Interactions between nutrient limitation and phytoplankton succession
The variation in external inorganic nutrient concentrations duringthe spring bloom of 2010 coincided with changes in the phytoplanktoncommunity composition. At the beginning of our experimental period,i.e. at the end of March, the phytoplankton was dominated by diatoms,in particular by Thalassiosira species. The increase in Chla concentra-tions, C-incorporation and maximum photosynthesis quantum yields(Fv/Fm) was the highest in the treatments when Si and P were added(+NPSi and +PSi), indicating that P and Si were the limiting nutrientsfor phytoplankton growth. In order to build their silica frustules, dia-toms require a sufficient amount of silicate in the system to completetheir cell cycle (Claquin et al., 2002). Si-limitation affects species compo-sition and cell size (Martin-Jézéquel et al., 2003; Rousseau et al., 2002),and a decline in Si availability is shown to select for diatoms with a lowSi-requirement (Bakker et al., 1994).
At the start of the second bioassay, colonies of the haptophyteP. globosa had become very abundant, whilst phosphate concentrationswere still very low. Possibly the development of this Phaeocystis bloomwas supported by a P-flux from labile P in the sediment into the watercolumn. Alternatively, P. globosa might have been able to utilize DOPas its P resource (Schoemann et al., 2005) ormade use of a phosphate re-serves stored in thepolysaccharidematrix of the colonies (Beardall et al.,2008; Schoemannet al., 2005; Veldhuis et al., 1991).When Si concentra-tions are high (N2 μmol L−1), P. globosawill rarely dominate the plank-ton community (Breton et al., 2006; Peperzak et al., 1998), but as Siconcentrations b0.15 μmol L−1, this situation did not occur during B2.
Although Si concentrationswere not detectable at the start of B2 andB3, pennate diatoms species were found in the phytoplankton commu-nity; but remained a minor fraction of population. Bottom-dwellingpennate diatoms might have profited from the available Si-store in thesediment pore water (Rousseau et al., 2002). The addition of Si did notshow an enhancement of planktonic diatom growth, indicating that aviable centric diatom population was lacking or that they were onlypresent in very low numbers at the start of B2. This is in agreementwith the observation that addition of Si did only stimulate the growthof pennate diatoms.
At the start of the fourth bioassay, the ambient nutrient concentra-tions had changed with Si reaching values of 0.07 μmol L−1, DIP ofmore than 1.3 μmol L−1, and DOP approximately 7-fold higher than
the DIP concentrations. The rise of available Si concentration coincidedwith a development of diatoms. All this suggest that nutrient limitationwas less intense than in previous bioassays. The increase in DIP coincid-ed with a decrease in the percentage of cells showing a high APA.
Nevertheless, all cells still showed ELF fluorescence, apart from asmall fraction of pennate diatoms. Fv/Fm also showed a significantincrease upon addition of the limiting nutrient(s). Similarly, the C-incorporation rates were enhanced in all nutrient additions scenarios,with the +NPSi addition given the highest rates of C-fixation. Thissuggests that the diatoms in the phytoplankton community werestill Si-limited. But this can only be part of the explanation as alsothe +NP addition showed an increase in Fv/Fm, and this additionshowed a similar response with regard to the increase in Chla as theother additions. Hence, the most likely explanation for these resultsseemed to be that the increase in DIP and DOP was very recent andthat the algae had not yet completely acclimated to the increase in Pavailability.
This phytoplankton succession in spring fromdiatoms to P. globosa isa common pattern observed in the North Sea coast and Wadden Sea(Cadée and Hegeman, 2002; Egge and Aksnes, 1992; Rousseau et al.,2002). The ability of P. globosa to form colonies allows them to escapegrazing (Peperzak et al., 1998). The consequence of it is that a largerfraction of the primary production will enter the microbial foodwebthough ciliates and other microzooplankton are considered as trophicintermediate between small preys and larger predators. Phytoplanktonspecies composition will influence the composition of the grazer com-munity, but vice versa, grazing by microzooplankton will also impactthe phytoplankton community structure, especially during Phaeocystisblooms (Loebl and Van Beusekom, 2008; Stelfox-Widdicombe et al.,2004).
Diatoms and Phaeocystis usually co-exist during the initial phaseof the spring bloom, but the grazing activity on the two differentphytoplankton groups is different. Large phytoplankton species suchas diatoms are generally preyed upon by large grazers like copepods(Loebl and Van Beusekom, 2008). Solitary cells of P. globosa areeaten by smaller grazers, whilst the grazing impact on P. globosacolonies is low. However, as we filtered the field samples using a100 μm mesh size sieve, we removed the large grazers (and possiblysome of the Phaeocystis sp. colonies) but not the microzooplankton.Because P. globosa can reach high growth rates (Schoemann et al.,2005), it seems possible that grazing by microzooplankton caused thelower specific growth rates based on the rate of increase in the Chla-concentration in B2 to B4 (Egge and Aksnes, 1992; Schoemann et al.,2005).
5. Conclusion
During the spring bloomof 2010, bioassays and physiological indicesconsistently showed that phytoplankton growth in the Marsdiep tidalinlet was limited by P, with co-limitation of P and Si for diatom growth.This corroborates previous generalfindings on the nature of the limitingnutrient for this part of the Wadden Sea based on dissolved nutrientconcentrations (e.g., Loebl et al., 2009; Philippart et al., 2007). Resultsfurther underline the importance of knowledge of nutrient affinities ofalgal species, of conditions of algal cells (e.g., depletion of reserves), ofnutrient sources (e.g., P-fluxes from the sediment) and of selectivegrazing to fully understand phytoplankton succession in shallow coastalwaters. If P concentrations in the Wadden Sea further decrease, anincrease in the intensity and duration of P limitation is likely and ashift from larger to smaller organisms with a better affinity for phos-phate possible. Such a change in the strength of P limitation will notonly shape phytoplankton communities but will also have an impacton total primary production, transfer of energy and carbon to highertropic levels, and ecosystem services such as fishery yields (Philippartand Epping, 2010).
120 J. Ly et al. / Quaternary Research 88 (2014) 109–120
Acknowledgments
This project was funded by the Coast and Sea Program (ZKO) ofthe Netherlands Organisation for Scientific Research (NWO) projectsP-reduce (grant no 839.08.340) and IN PLACE (grant no 839.08.210).
References
Bakker, C., Herman, P., Vink, M., 1994. A new trend in the development of thephytoplankton in the Oosterschelde (SWNetherlands) during and after the construc-tion of a storm-surge barrier. Hydrobiologia 282, 79–100.
Beardall, J., Young, E., Roberts, S., 2001. Approaches for determining phytoplanktonnutrient limitation. Aquat. Sci. 63, 44–69.
Beardall, J., Allen, D., Bragg, J., Finkel, Z.V., Flynn, K.J., Quigg, A., Rees, T.A.V., Richardson, A.,Raven, J.A., 2008. Allometry and stoichiometry of unicellular, colonial andmulticellularphytoplankton. New Phytol. 181, 295–309.
Breton, E., Rousseau, V., Parent, J.Y., Ozer, J., Lancelot, C., 2006. Hydroclimatic modulationof diatom/Phaeocystis blooms in nutrient-enriched Belgian coastal waters (NorthSea). Limnol. Oceanogr. 1401–1409.
Brett, M., Muller-Navarra, D., 1997. The role of highly unsaturated fatty acids in aquaticfoodweb processes. Freshw. Biol. 38, 483–499.
Cadée, G.C., Hegeman, J., 2002. Phytoplankton in the Marsdiep at the end of the 20thcentury; 30 years monitoring biomass, primary production, and Phaeocystis blooms.J. Sea Res. 48, 97–110.
Campbell, D., Hurry, V., Clarke, A.K., Gustafsson, P., Öquist, G., 1998. Chlorophyll fluores-cence analysis of cyanobacterial photosynthesis and acclimation. Microbiol. Mol.Biol. Rev. 62, 667–683.
Claquin, P., Martin-Jézéquel, V., Kromkamp, J.C., Veldhuis, M.J.W., Kraay, G.W., 2002.Uncoupling of silicon compared with carbon and nitrogen metabolisms and the roleof the cell cycle in continuous cultures of Thalassiosira pseudonana (Bacillariophyceae)under light, nitrogen, and phosphorus control. J. Phycol. 38, 922–930.
Cloern, J.E., 1999. The relative importance of light and nutrient limitation of phytoplank-ton growth: a simple index of coastal ecosystem sensitivity to nutrient enrichment.Aquat. Ecol. 33, 3–15.
Cloern, J.E., 2001. Our evolving conceptual model of the coastal eutrophication problem.Mar. Ecol. Prog. Ser. 210, 223–253.
Colijn, F., Cadée, G.C., 2003. Is phytoplankton growth in theWadden Sea light or nitrogenlimited? J. Sea Res. 49, 83–93.
Dodd, N., Blondeaux, P., Calvete, D., De Swart, H.E., Falqués, A., Hulscher, S.J., Różyński, G.,Vittori, G., 2003. Understanding coastal morphodynamics using stability methods.J. Coastal Res. 849–865.
Duarte, C.M., 1990. Time lags in algal growth: generality, causes and consequences.J. Plankton Res. 12, 873–883.
Duhamel, S., Dyhrman, S.T., Karl, D.M., 2010. Alkaline phosphatase activity and regulationin the North Pacific Subtropical Gyre. Limnol. Oceanogr. 55, 1414–1425.
Dyhrman, S.T., Palenik, B., 2001. A single‐cell immunoassay for phosphate stress in thedinoflagellate Prorocentrum minimum (dinophyceae). J. Phycol. 37, 400–410.
Dyhrman, S., Chappell, P., Haley, S., Moffett, J., Orchard, E., Waterbury, J., Webb, E., 2006.Phosphonate utilization by the globally importantmarine diazotroph Trichodesmium.Nature 439, 68–71.
Dyhrman, S.T., Ammerman, J.W., Van Mooy, B.A.S., 2007. Microbes and the marinephosphorus cycle. Oceanography 20, 110–116.
Egge, J., Aksnes, D., 1992. Silicate as regulating nutrient in phytoplankton competition.Mar. Ecol. Prog. Ser. 83, 281–289.
Elser, J.J., Bracken, M.E.S., Cleland, E.E., Gruner, D.S., Harpole, W.S., Hillebrand, H., Ngai, J.T.,Seabloom, E.W., Shurin, J.B., Smith, J.E., 2007. Global analysis of nitrogen andphosphorus limitation of primary producers in freshwater, marine and terrestrialecosystems. Ecol. Lett. 10, 1135–1142.
Finkel, Z.V., Beardall, J., Flynn, K.J., Quigg, A., Rees, T.A.V., Raven, J.A., 2010. Phytoplankton ina changing world: cell size and elemental stoichiometry. J. Plankton Res. 32, 119–137.
Flameling, I.A., Kromkamp, J., 1998. Light dependence of quantum yields for PSII chargeseparation and oxygen evolution in eucaryotic algae. Limnol. Oceanogr. 43, 284–297.
González-Gil, S., Keafer, B.A., Jovine, R.V.M., Aguilera, A., Lu, S., Anderson, D.M., 1998.Detection and quantification of alkaline phosphatase in single cells of phosphorus-starved marine phytoplankton. Mar. Ecol. Prog. Ser. 164, 21–35.
Hecky, R., Kilham, P., 1988. Nutrient limitation of phytoplankton in freshwater andmarine environments: a review of recent evidence on the effects of enrichment.Limnol. Oceanogr. 33, 796–822.
Heip, C.H.R., Goosen, N., Herman, P., Kromkamp, J., Middelburg, J., Soetaert, K., 1995.Production and consumption of biological particles in temperate tidal estuaries.Oceanogr. Mar. Biol. Annu. Rev. 33, 1–149.
Howarth, R.W., Marino, R., 2006. Nitrogen as the limiting nutrient for eutrophication incoastal marine ecosystems: evolving views over three decades. Limnol. Oceanogr.51, 364–376.
Jochem, F.J., 2000. Probing the physiological state of phytoplankton at the single-cell level.Sci. Mar. 64, 183–195.
Kolber, Z., Zehr, J., Falkowski, P., 1988. Effects of growth irradiance and nitrogen limitationon photosynthetic energy conversion in photosystem II. Plant Physiol. 88, 923–929.
Kruskopf, M., Flynn, K.J., 2005. Chlorophyll content and fluorescence responses cannot beused to gauge reliably phytoplankton biomass, nutrient status or growth rate. NewPhytol. 169, 525–536.
Lippemeier, S., Hartig, P., Colijn, F., 1999. Direct impact of silicate on the photosyntheticperformance of the diatom Thalassiosira weissflogii assessed by on-and off-line PAMfluorescence measurements. J. Plankton Res. 21, 269–283.
Loebl, M., Van Beusekom, J.E.E., 2008. Seasonality of microzooplankton grazing in thenorthern Wadden Sea. J. Sea Res. 59, 203–216.
Loebl, M., Colijn, F., van Beusekom, J.E.E., Baretta-Bekker, J.G., Lancelot, C., Philippart,C.J.M., Rousseau, V., Wiltshire, K.H., 2009. Recent patterns in potential phytoplanktonlimitation along the Northwest European continental coast. J. Sea Res. 61, 34–43.
Lomas, M.W., Swain, A., Shelton, R., Ammerman, J.W., 2004. Taxonomic variability ofphosphorus stress in Sargasso Sea phytoplankton. Limnol. Oceanogr. 49, 2303–2310.
Malzahn, A.M., Aberle, N., Clemmesen, C., Boersma, M., 2007. Nutrient limitation of primaryproducers affects planktivorous fish condition. Limnol. Oceanogr. 52, 2062–2071.
Martin-Jézéquel, V., Hildebrand, M., Brzezinski, M.A., 2003. Silicon metabolism indiatoms: implications for growth. J. Phycol. 36, 821–840.
Middelburg, J.J., Barranguet, C., Boschker, H.T.S., Herman, P.M.J., Moens, T., Heip, C.H.R.,2000. The fate of intertidal microphytobenthos carbon: an in situ 13C-labelingstudy. Limnol. Oceanogr. 45, 1224–1234.
Monbet, Y., 1992. Control of phytoplankton biomass in estuaries — a comparative-analysis of microtidal and macrotidal estuaries. Estuaries 15, 563–571.
Nieuwenhuize, J., Poley-Vos, C., 1989. A rapid microwave dissolution method for thedetermination of trace and minor elements in lyophilized plant material. At.Spectrosc. 10, 148–153.
Parkhill, J.P., Maillet, G., Cullen, J.J., 2001. Fluorescence‐based maximal quantum yield forPSII as a diagnostic of nutrient stress. J. Phycol. 37, 517–529.
Peperzak, L., Colijn, F., Gieskes, W., Peeters, J., 1998. Development of the diatom-Phaeocystis spring bloom in the Dutch coastal zone of the North Sea: the silicon de-pletion versus the daily irradiance threshold hypothesis. J. Plankton Res. 20, 517–537.
Philippart, K., Epping, E., 2010. The Wadden Sea: a coastal ecosystem under continuouschange. Coastal lagoons: critical habitats of environmental change.CRC Press, Taylor& Francis Group, Boca Raton, USA 399–433.
Philippart, C.J.M., Cadée, G.C., van Raaphorst, W., Riegman, R., 2000. Long-termphytoplankton-nutrient interactions in a shallow coastal sea: algal communitystructure, nutrient budgets, and denitrification potential. Limnol. Oceanogr. 45,131–144.
Philippart, C.J.M., Beukema, J.J., Cadée, G.C., Dekker, R., Goedhart, P.W., van Iperen, J.M.,Leopold, M.F., Herman, P.M.J., 2007. Impacts of nutrient reduction on coastal commu-nities. Ecosystems 10, 96–119.
Philippart, C.J.M., Salama, M.S., Kromkamp, J.C., van derWoerd, H.J., Zuur, A.F., Cadée, G.C.,2013. Four decades of variability in turbidity in the western Wadden Sea as derivedfrom corrected Secchi disk readings. Journal of Sea Research 82, 67–79.
Ranhofer, M.L., Lawrenz, E., Pinckney, J.L., Benitez-Nelson, C.R., Richardson, T.L., 2009. Cell-specific alkaline phosphatase expression by phytoplankton from Winyah Bay, SouthCarolina, USA. Estuaries Coasts 32, 943–957.
Rengefors, K., Ruttenberg, K., Haupert, C., Taylor, C., Howes, B., Anderson, D., 2003.Experimental investigation of taxon-specific response of alkaline phosphatase activityin natural freshwater phytoplankton. Limnol. Oceanogr. 48, 1167–1175.
Ridderinkhof, H., 1988. Tidal and residual flows in the Western Dutch Wadden Sea, II: ananalytical model to study the constant flow between connected tidal basins. Neth.J. Sea Res. 22, 185–198.
Rousseau, V., Leynaert, A., Daoud, N., Lancelot, C., 2002. Diatom succession, silicificationand silicic acid availability in Belgian coastal waters (Southern North Sea). Mar.Ecol. Prog. Ser. 236, 61–73.
Rouzic, B.L., Bertru, G., 1997. Phytoplankton community growth in enrichment bioassays:possible role of the nutrient intracellular pools. Acta Oecol. 18, 121–133.
Scharek, R., Van Leeuwe, M.A., De Baar, H.J.W., 1997. Responses of Southern Oceanphytoplankton to the addition of trace metals. Deep Sea Res. II 44, 209–227.
Schindler, D., 2009. A personal history of the Experimental Lakes Project. Can. J. Fish.Aquat. Sci. 66, 1837–1847.
Schoemann, V., Becquevort, S., Stefels, J., Rousseau, V., Lancelot, C., 2005. Phaeocystisblooms in the global ocean and their controlling mechanisms: a review. J. Sea Res.53, 43–66.
Smith, V.H., Joye, S.B., Howarth, R.W., 2006. Eutrophication of freshwater and marineecosystems. Limnol. Oceanogr. 51, 351–355.
Stelfox-Widdicombe, C., Archer, S., Burkill, P., Stefels, J., 2004. Microzooplankton grazingin Phaeocystis and diatom-dominated waters in the southern North Sea in spring.J. Sea Res. 51, 37–51.
Tillmann, U., Hesse, K.J., Colijn, F., 2000. Planktonic primary production in the GermanWadden Sea. J. Plankton Res. 22, 1253–1276.
Tulp, I., Bolle, L.J., Rijnsdorp, A.D., 2008. Signals from the shallows: in search of com-mon patterns in long-term trends in Dutch estuarine and coastal fish. J. Sea Res.60, 54–73.
Valderrama, J.C., 1981. The simultaneous analysis of total nitrogen and total phosphorusin natural waters. Mar. Chem. 10, 109–122.
Veldhuis, M., Colijn, F., Admiraal, W., 1991. Phosphate utilization in Phaeocystis pouchetii(Haptophyceae). Mar. Biol. 12, 53–62.