Embed Size (px)
Citation preview
Boundary Community
MeetingChester Jordan Elementary
September 28, 2016
Socorro Independent School District
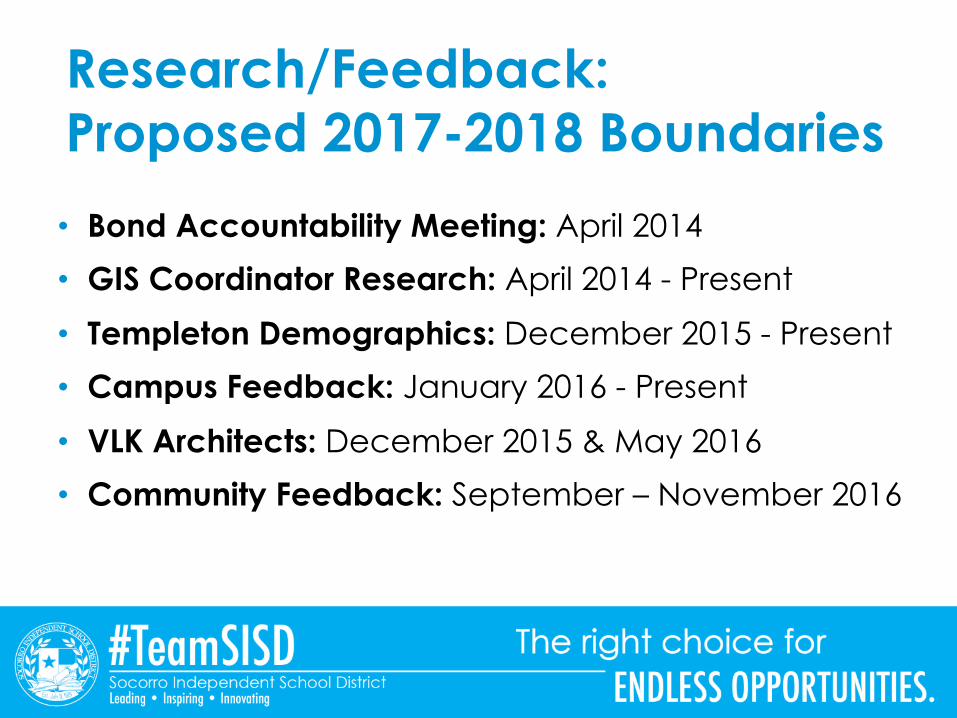
Research/Feedback:Proposed 2017-2018 Boundaries• Bond Accountability Meeting: April 2014• GIS Coordinator Research: April 2014 - Present
• Templeton Demographics: December 2015 - Present• Campus Feedback: January 2016 - Present
• VLK Architects: December 2015 & May 2016• Community Feedback: September – November 2016
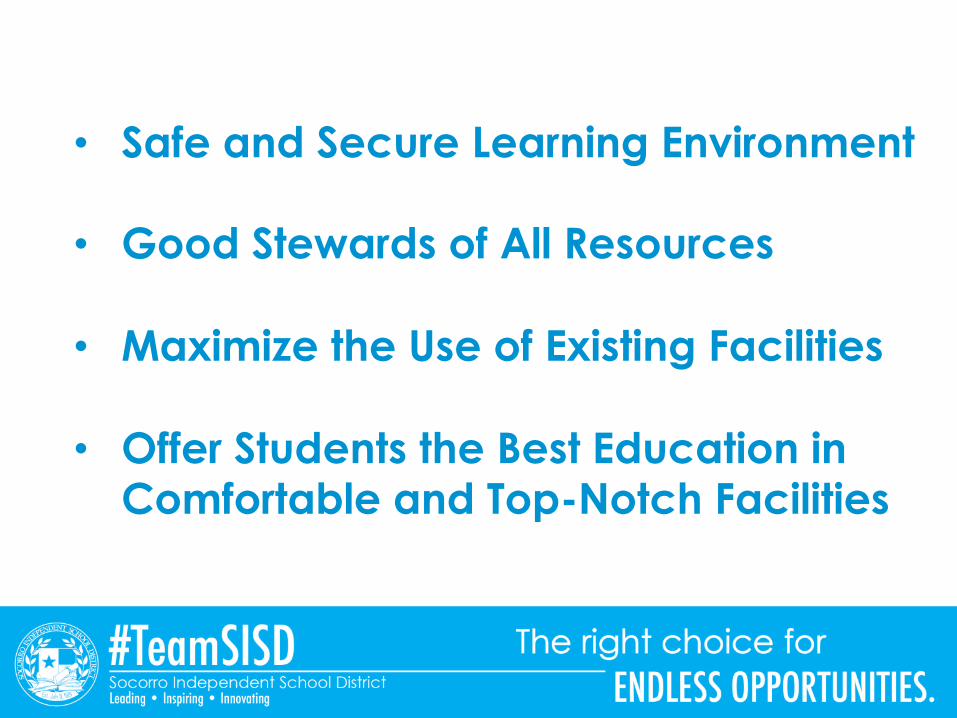
• Safe and Secure Learning Environment
• Good Stewards of All Resources
• Maximize the Use of Existing Facilities
• Offer Students the Best Education in Comfortable and Top-Notch Facilities
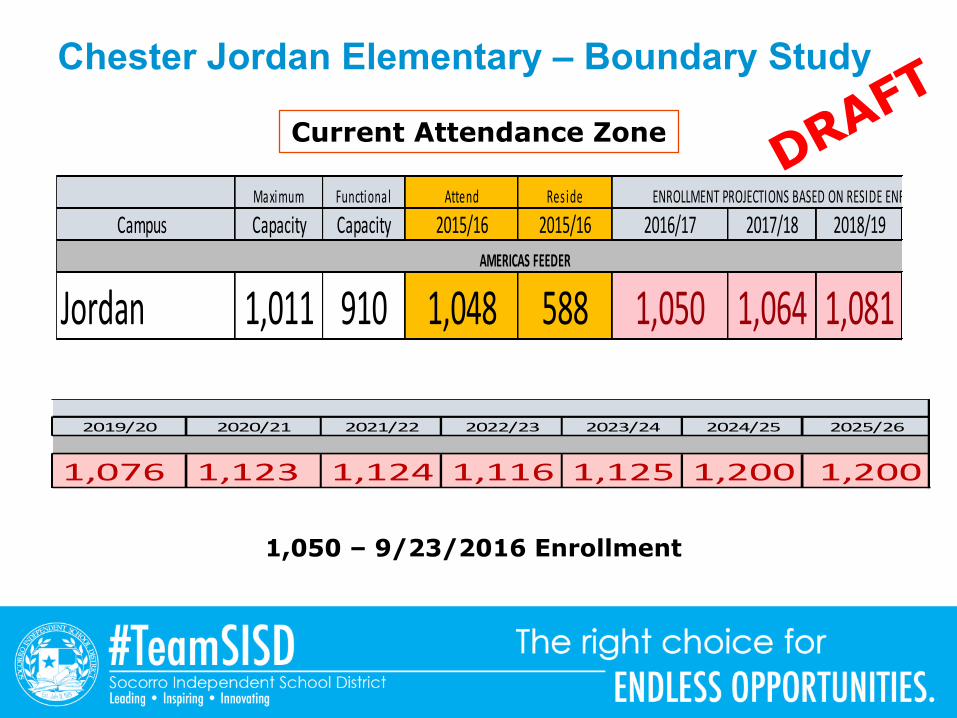
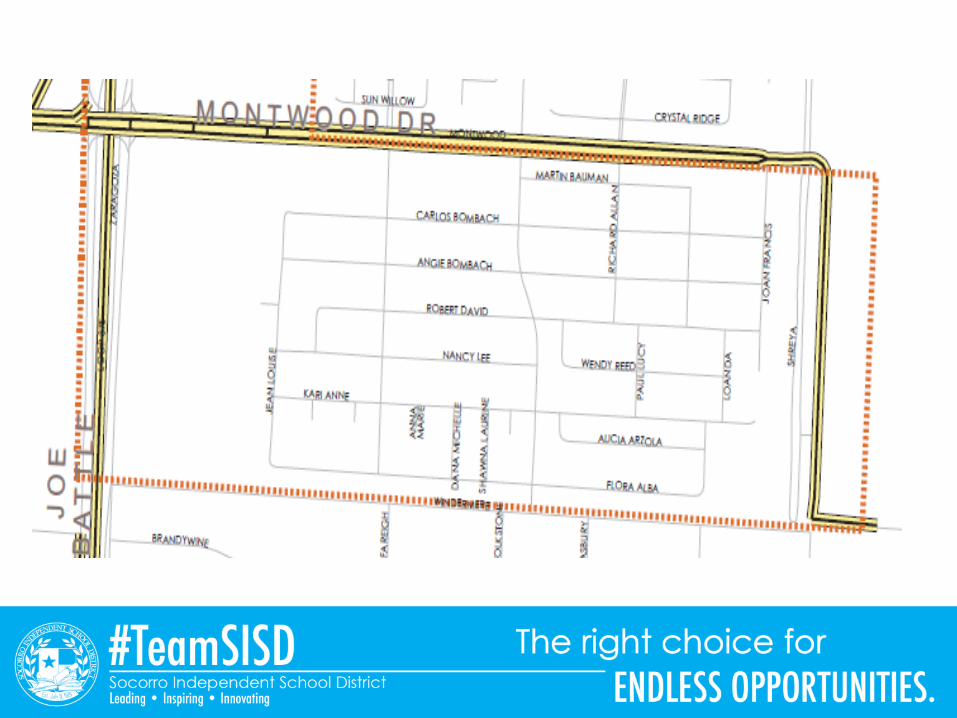
Chester Jordan Elementary – Boundary Study
Current Attendance Zone
Maximum Functional Attend Res ideCampus Capacity Capacity 2015/16 2015/16 2016/17 2017/18 2018/19
Jordan 1,011 910 1,048 588 1,050 1,064 1,081AMERICASFEEDER
ENROLLMENTPROJECTIONSBASEDONRESIDEENROLLMENT
2019/20 2020/21 2021/22 2022/23 2023/24 2024/25 2025/26
1,076 1,123 1,124 1,116 1,125 1,200 1,200
1,050 – 9/23/2016 Enrollment

Spring 2016 STAAR Passing Rates
#1 Overall Student Performance
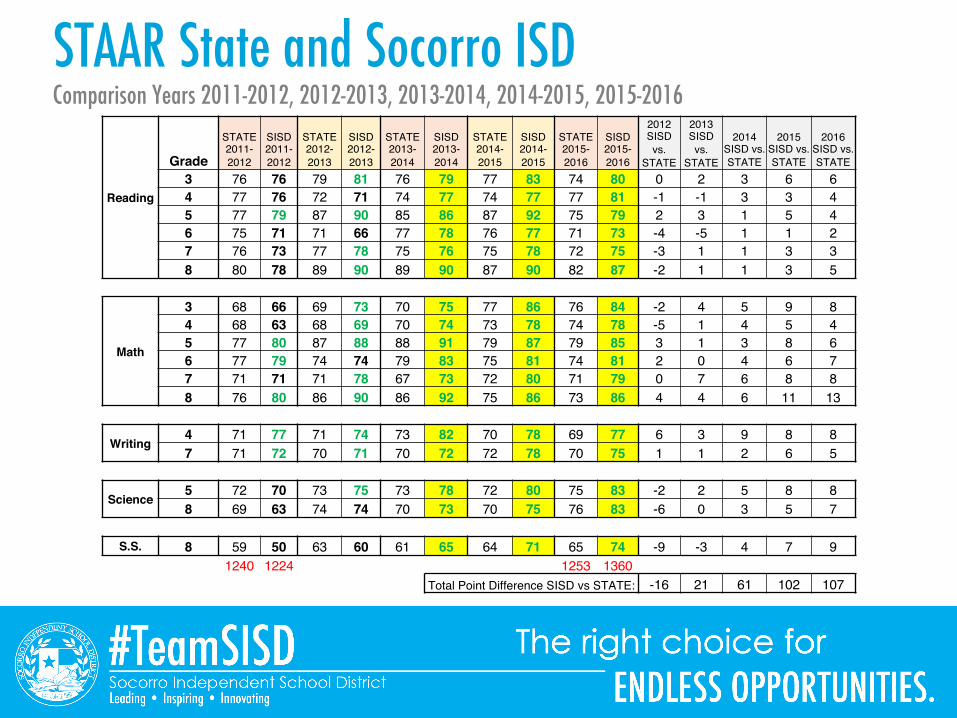
STAAR State and Socorro ISDComparison Years 2011-2012, 2012-2013, 2013-2014, 2014-2015, 2015-2016
Reading
Grade
STATE 2011-2012
SISD 2011-2012
STATE 2012-2013
SISD 2012-2013
STATE 2013-2014
SISD 2013-2014
STATE 2014-2015
SISD 2014-2015
STATE 2015-2016
SISD 2015-2016
2012 SISD vs.
STATE
2013 SISD vs.
STATE
2014 SISD vs. STATE
2015 SISD vs. STATE
2016 SISD vs. STATE
3 76 76 79 81 76 79 77 83 74 80 0 2 3 6 64 77 76 72 71 74 77 74 77 77 81 -1 -1 3 3 45 77 79 87 90 85 86 87 92 75 79 2 3 1 5 46 75 71 71 66 77 78 76 77 71 73 -4 -5 1 1 27 76 73 77 78 75 76 75 78 72 75 -3 1 1 3 38 80 78 89 90 89 90 87 90 82 87 -2 1 1 3 5
Math
3 68 66 69 73 70 75 77 86 76 84 -2 4 5 9 84 68 63 68 69 70 74 73 78 74 78 -5 1 4 5 45 77 80 87 88 88 91 79 87 79 85 3 1 3 8 66 77 79 74 74 79 83 75 81 74 81 2 0 4 6 77 71 71 71 78 67 73 72 80 71 79 0 7 6 8 88 76 80 86 90 86 92 75 86 73 86 4 4 6 11 13
Writing4 71 77 71 74 73 82 70 78 69 77 6 3 9 8 87 71 72 70 71 70 72 72 78 70 75 1 1 2 6 5
Science5 72 70 73 75 73 78 72 80 75 83 -2 2 5 8 88 69 63 74 74 70 73 70 75 76 83 -6 0 3 5 7
S.S. 8 59 50 63 60 61 65 64 71 65 74 -9 -3 4 7 91240 1224 1253 1360
Total Point Difference SISD vs STATE: -16 21 61 102 107
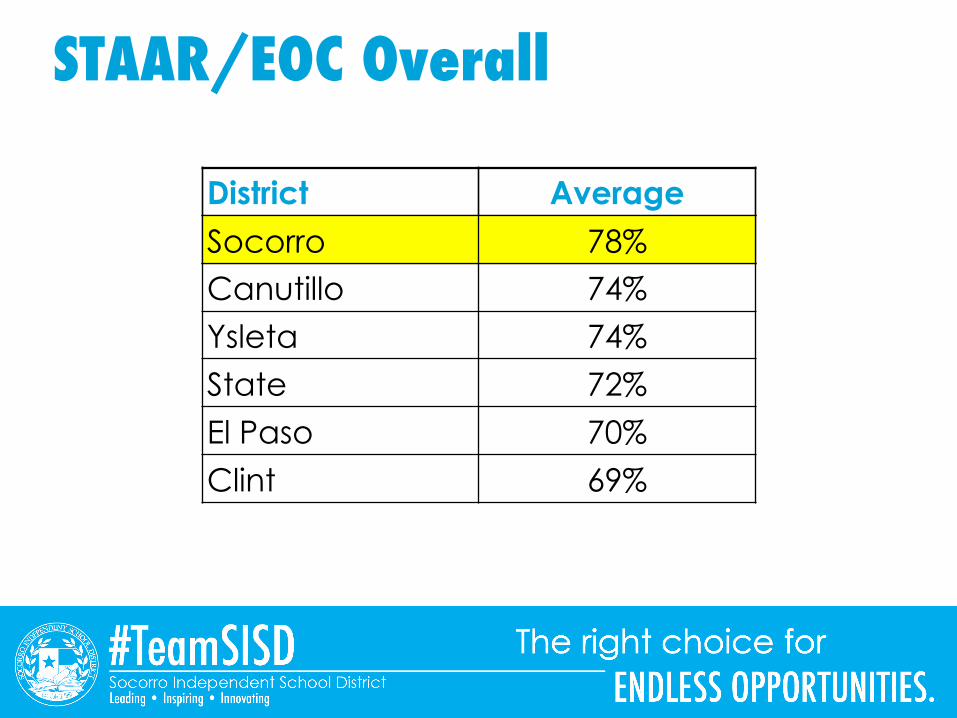
STAAR/EOC Overall
District Average
Canutillo 74%Ysleta 74%State 72%El Paso 70%Clint 69%
Socorro 78%
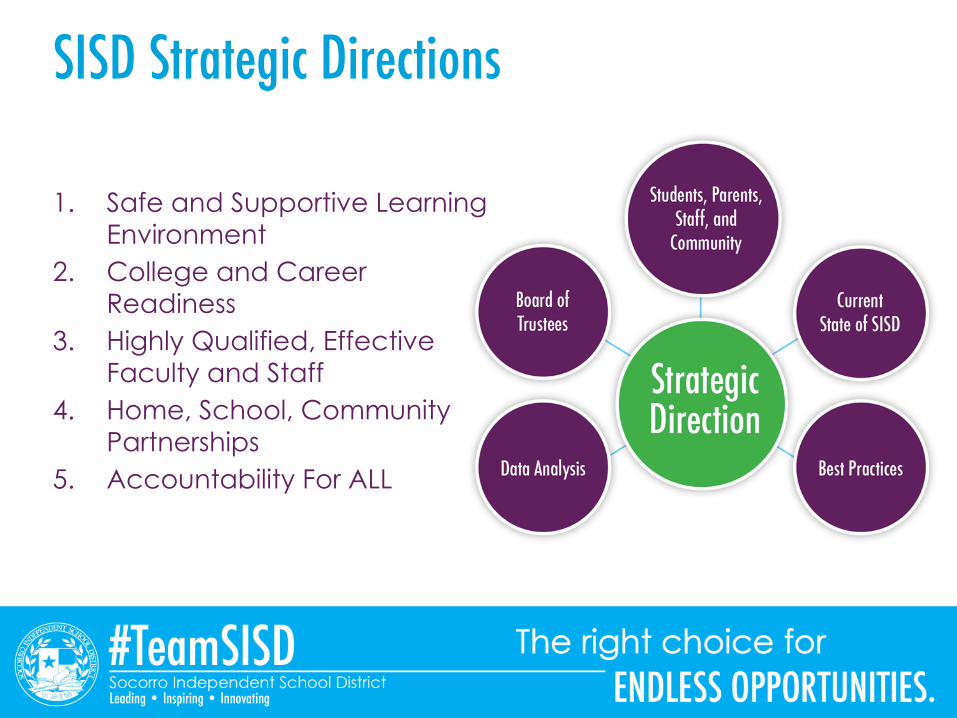
SISD Strategic Directions
1. Safe and Supportive Learning Environment
2. College and Career Readiness
3. Highly Qualified, Effective Faculty and Staff
4. Home, School, Community Partnerships
5. Accountability For ALL
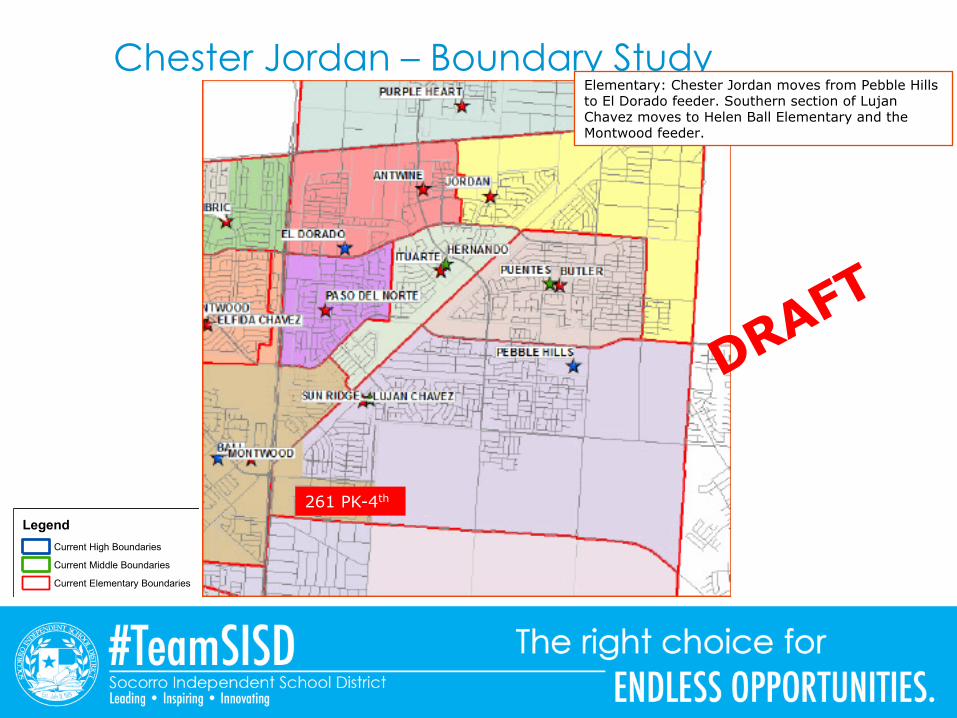
Chester Jordan – Boundary StudyElementary: Chester Jordan moves from Pebble Hills to El Dorado feeder. Southern section of Lujan Chavez moves to Helen Ball Elementary and the Montwood feeder.
LegendCurrent High Boundaries
Current Middle Boundaries
Current Elementary Boundaries
261 PK-4th
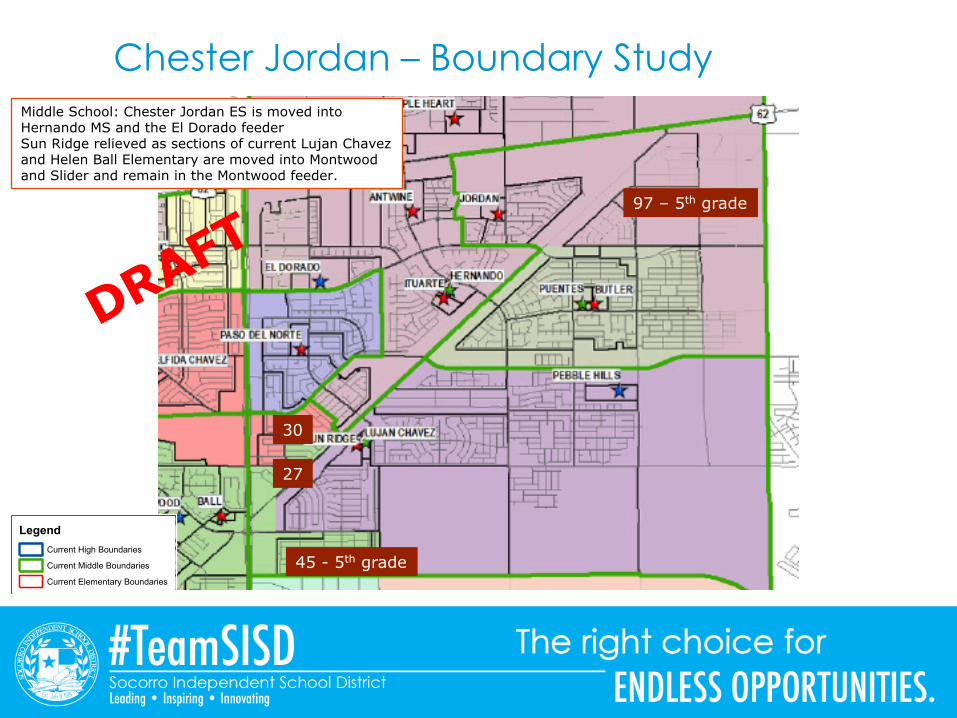
Chester Jordan – Boundary StudyMiddle School: Chester Jordan ES is moved into Hernando MS and the El Dorado feederSun Ridge relieved as sections of current Lujan Chavez and Helen Ball Elementary are moved into Montwood and Slider and remain in the Montwood feeder.
LegendCurrent High Boundaries
Current Middle Boundaries
Current Elementary Boundaries
30
45 - 5th grade
97 – 5th grade
27
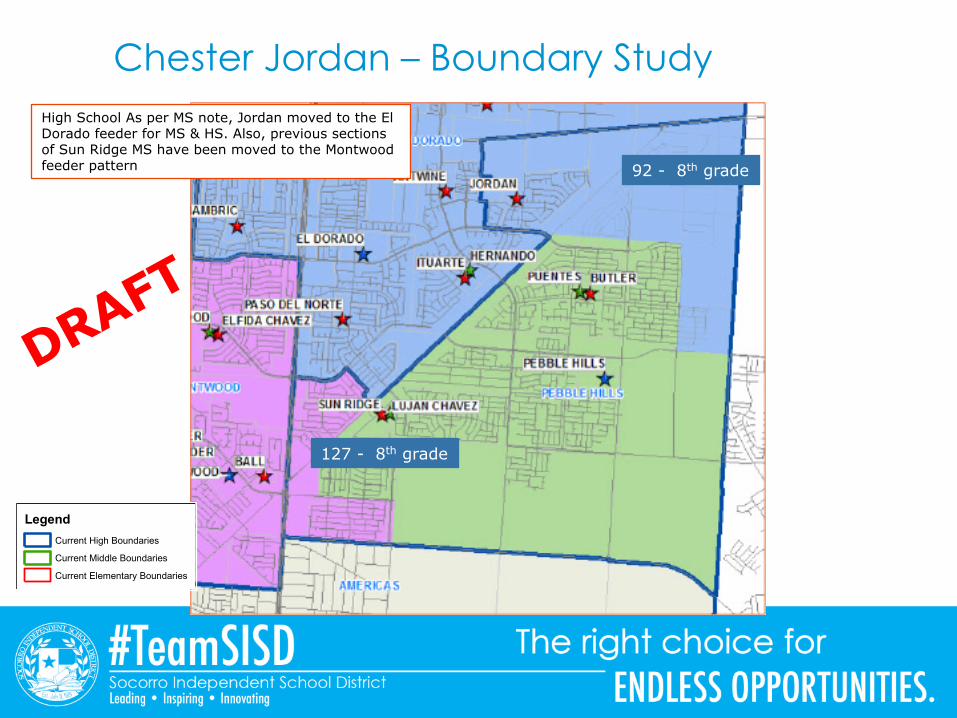
Chester Jordan – Boundary StudyHigh School As per MS note, Jordan moved to the El Dorado feeder for MS & HS. Also, previous sections of Sun Ridge MS have been moved to the Montwood feeder pattern
LegendCurrent High Boundaries
Current Middle Boundaries
Current Elementary Boundaries
127 - 8th grade
92 - 8th grade
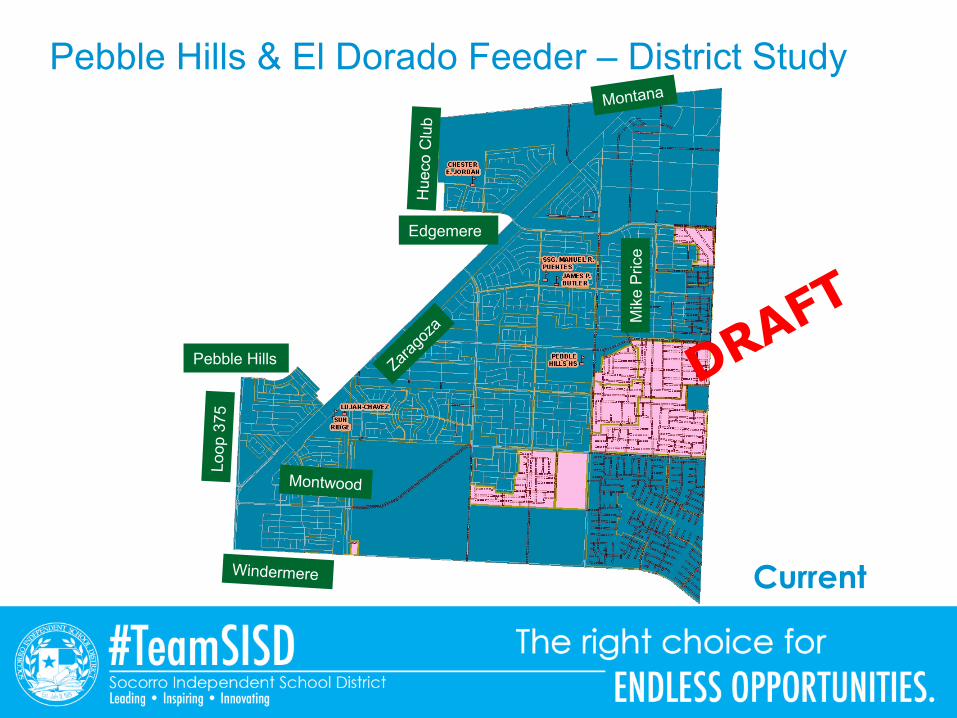
Pebble Hills & El Dorado Feeder – District Study
Pebble Hills
Mik
e Pr
ice
Edgemere
Current
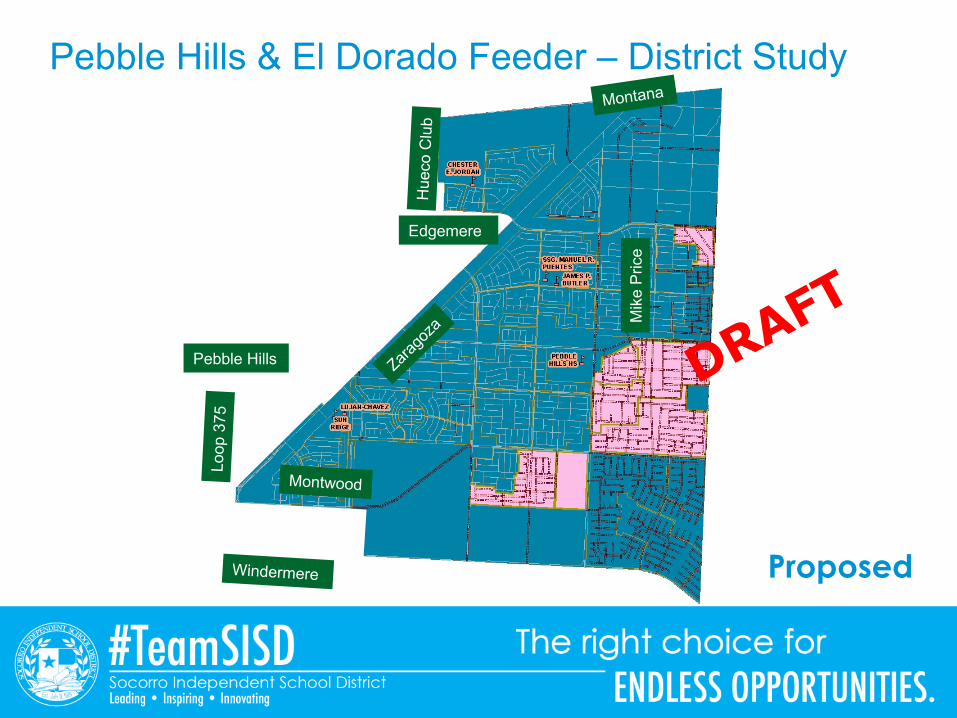
Pebble Hills & El Dorado Feeder – District Study
Pebble Hills
Mik
e Pr
ice
Edgemere
Proposed
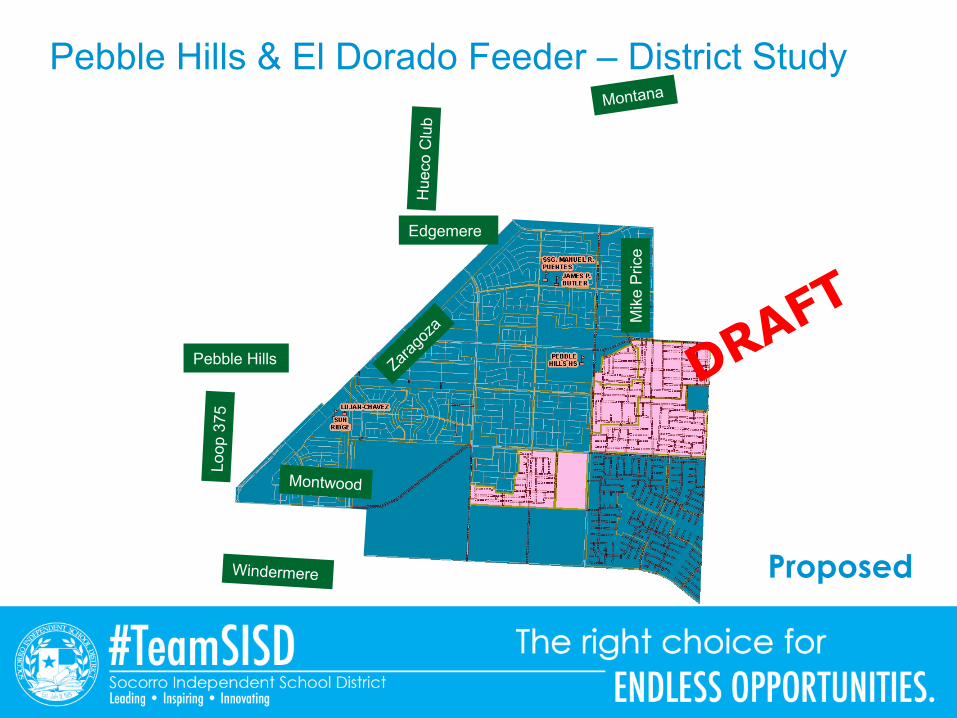
Pebble Hills & El Dorado Feeder – District Study
Pebble Hills
Mik
e Pr
ice
Edgemere
Proposed
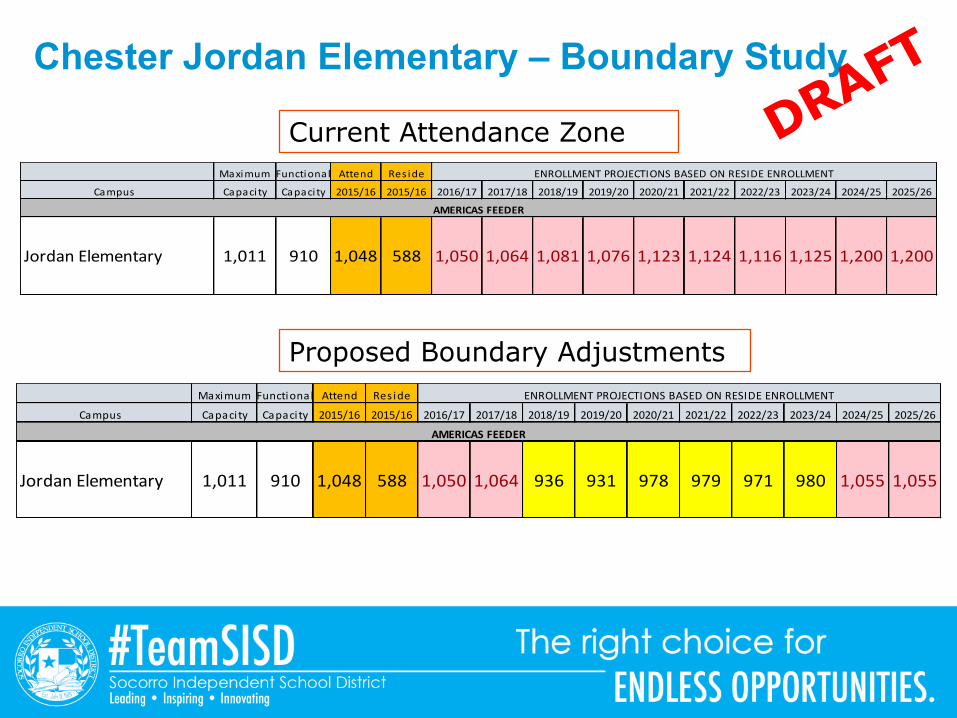
Chester Jordan Elementary – Boundary Study
Current Attendance ZoneMaximum Functional Attend Res ide
Campus Capacity Capacity 2015/16 2015/16 2016/17 2017/18 2018/19 2019/20 2020/21 2021/22 2022/23 2023/24 2024/25 2025/26
JordanElementary 1,011 910 1,048 588 1,050 1,064 1,081 1,076 1,123 1,124 1,116 1,125 1,200 1,200
AMERICASFEEDER
ENROLLMENTPROJECTIONSBASEDONRESIDEENROLLMENT
Proposed Boundary AdjustmentsMaximum Functional Attend Res ide
Campus Capacity Capacity 2015/16 2015/16 2016/17 2017/18 2018/19 2019/20 2020/21 2021/22 2022/23 2023/24 2024/25 2025/26
JordanElementary 1,011 910 1,048 588 1,050 1,064 936 931 978 979 971 980 1,055 1,055
AMERICASFEEDER
ENROLLMENTPROJECTIONSBASEDONRESIDEENROLLMENT
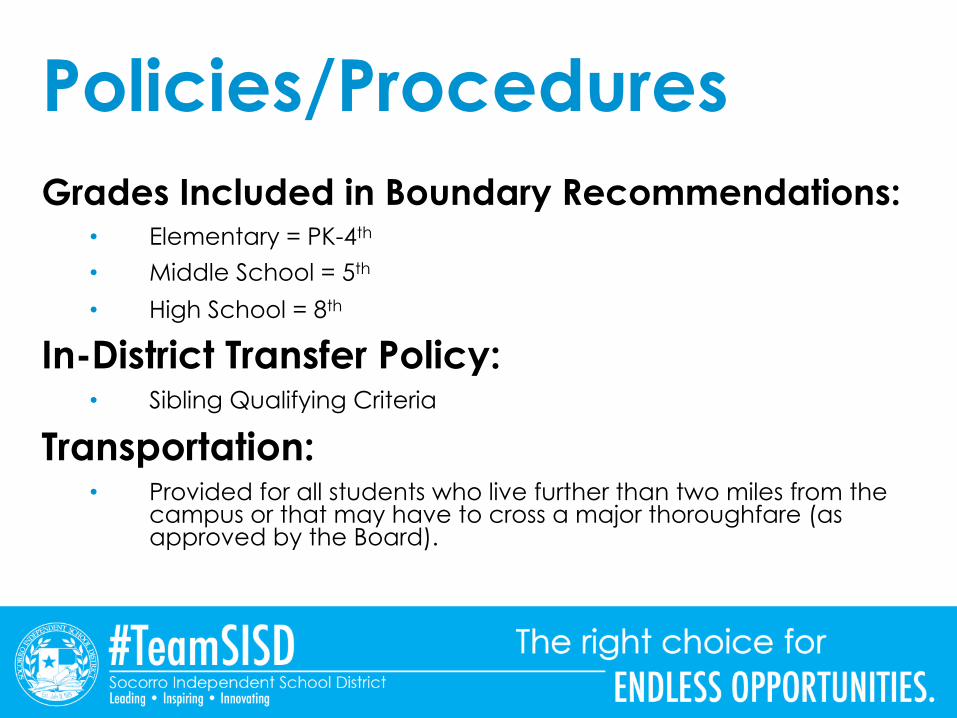
Policies/ProceduresGrades Included in Boundary Recommendations:
• Elementary = PK-4th
• Middle School = 5th
• High School = 8th
In-District Transfer Policy:• Sibling Qualifying Criteria
Transportation:• Provided for all students who live further than two miles from the
campus or that may have to cross a major thoroughfare (as approved by the Board).
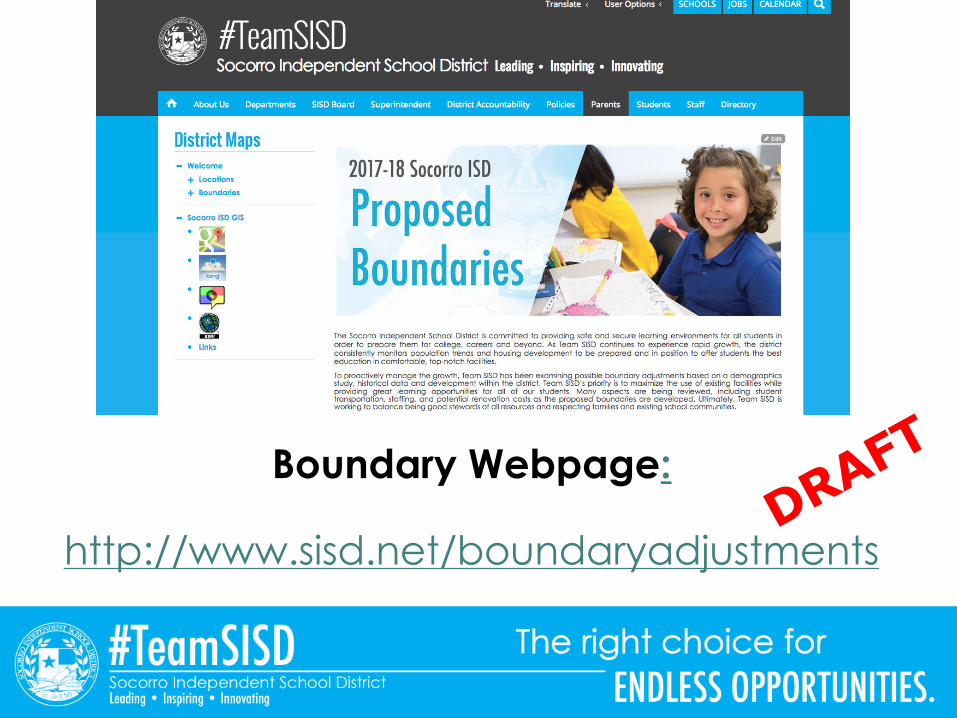
Boundary Webpage:
http://www.sisd.net/boundaryadjustments
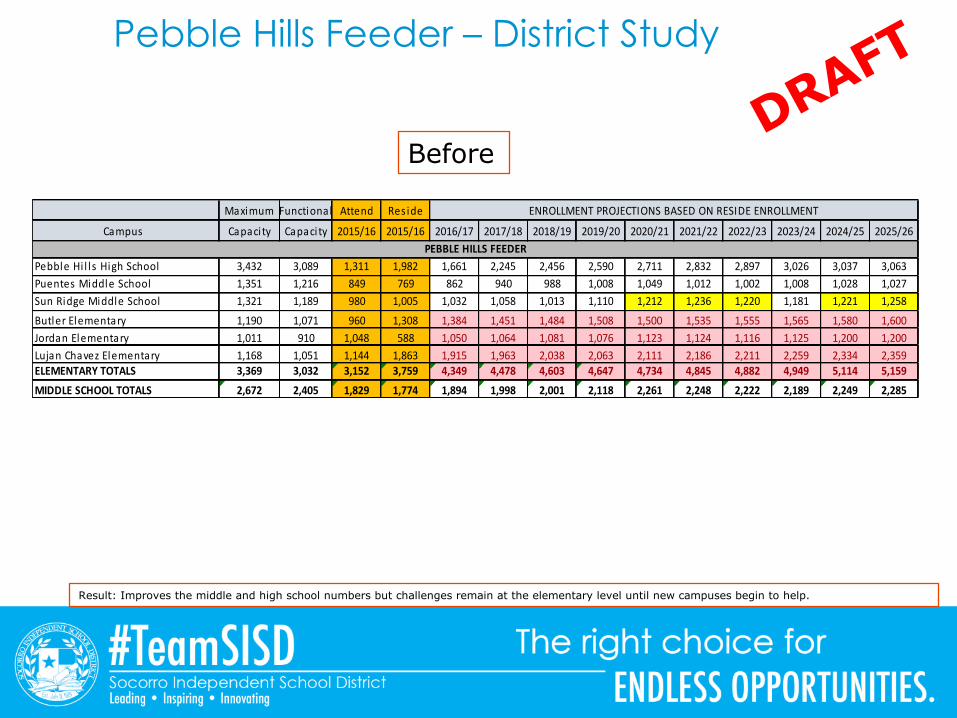
Pebble Hills Feeder – District Study
Before
Result: Improves the middle and high school numbers but challenges remain at the elementary level until new campuses begin to help.
Maximum Functional Attend Res ide
Campus Capacity Capacity 2015/16 2015/16 2016/17 2017/18 2018/19 2019/20 2020/21 2021/22 2022/23 2023/24 2024/25 2025/26
PebbleHi l l s HighSchool 3,432 3,089 1,311 1,982 1,661 2,245 2,456 2,590 2,711 2,832 2,897 3,026 3,037 3,063Puentes MiddleSchool 1,351 1,216 849 769 862 940 988 1,008 1,049 1,012 1,002 1,008 1,028 1,027SunRidgeMiddleSchool 1,321 1,189 980 1,005 1,032 1,058 1,013 1,110 1,212 1,236 1,220 1,181 1,221 1,258ButlerElementary 1,190 1,071 960 1,308 1,384 1,451 1,484 1,508 1,500 1,535 1,555 1,565 1,580 1,600JordanElementary 1,011 910 1,048 588 1,050 1,064 1,081 1,076 1,123 1,124 1,116 1,125 1,200 1,200LujanChavezElementary 1,168 1,051 1,144 1,863 1,915 1,963 2,038 2,063 2,111 2,186 2,211 2,259 2,334 2,359ELEMENTARYTOTALS 3,369 3,032 3,152 3,759 4,349 4,478 4,603 4,647 4,734 4,845 4,882 4,949 5,114 5,159MIDDLESCHOOLTOTALS 2,672 2,405 1,829 1,774 1,894 1,998 2,001 2,118 2,261 2,248 2,222 2,189 2,249 2,285
PEBBLEHILLSFEEDER
ENROLLMENTPROJECTIONSBASEDONRESIDEENROLLMENT
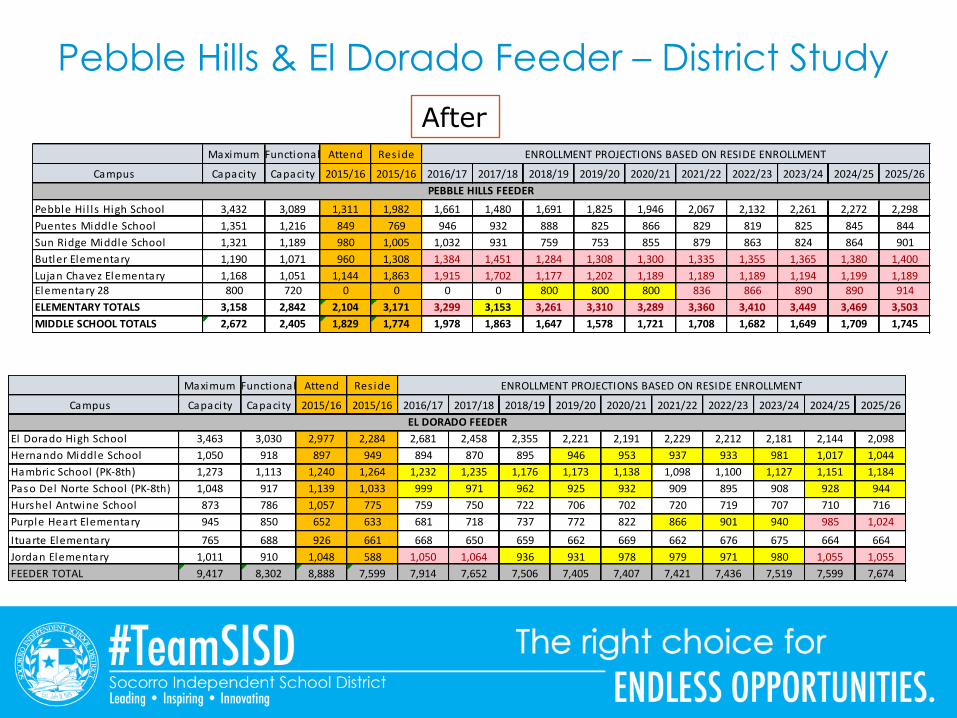
Pebble Hills & El Dorado Feeder – District Study
Maximum Functional Attend Res ide
Campus Capacity Capacity 2015/16 2015/16 2016/17 2017/18 2018/19 2019/20 2020/21 2021/22 2022/23 2023/24 2024/25 2025/26
El DoradoHighSchool 3,463 3,030 2,977 2,284 2,681 2,458 2,355 2,221 2,191 2,229 2,212 2,181 2,144 2,098HernandoMiddleSchool 1,050 918 897 949 894 870 895 946 953 937 933 981 1,017 1,044HambricSchool (PK-8th) 1,273 1,113 1,240 1,264 1,232 1,235 1,176 1,173 1,138 1,098 1,100 1,127 1,151 1,184PasoDel NorteSchool (PK-8th) 1,048 917 1,139 1,033 999 971 962 925 932 909 895 908 928 944Hurshel AntwineSchool 873 786 1,057 775 759 750 722 706 702 720 719 707 710 716PurpleHeartElementary 945 850 652 633 681 718 737 772 822 866 901 940 985 1,024ItuarteElementary 765 688 926 661 668 650 659 662 669 662 676 675 664 664JordanElementary 1,011 910 1,048 588 1,050 1,064 936 931 978 979 971 980 1,055 1,055FEEDERTOTAL 9,417 8,302 8,888 7,599 7,914 7,652 7,506 7,405 7,407 7,421 7,436 7,519 7,599 7,674
ELDORADOFEEDER
ENROLLMENTPROJECTIONSBASEDONRESIDEENROLLMENT
Maximum Functional Attend Res ide
Campus Capacity Capacity 2015/16 2015/16 2016/17 2017/18 2018/19 2019/20 2020/21 2021/22 2022/23 2023/24 2024/25 2025/26
PebbleHi l l s HighSchool 3,432 3,089 1,311 1,982 1,661 1,480 1,691 1,825 1,946 2,067 2,132 2,261 2,272 2,298Puentes MiddleSchool 1,351 1,216 849 769 946 932 888 825 866 829 819 825 845 844SunRidgeMiddleSchool 1,321 1,189 980 1,005 1,032 931 759 753 855 879 863 824 864 901ButlerElementary 1,190 1,071 960 1,308 1,384 1,451 1,284 1,308 1,300 1,335 1,355 1,365 1,380 1,400LujanChavezElementary 1,168 1,051 1,144 1,863 1,915 1,702 1,177 1,202 1,189 1,189 1,189 1,194 1,199 1,189Elementary28 800 720 0 0 0 0 800 800 800 836 866 890 890 914ELEMENTARYTOTALS 3,158 2,842 2,104 3,171 3,299 3,153 3,261 3,310 3,289 3,360 3,410 3,449 3,469 3,503MIDDLESCHOOLTOTALS 2,672 2,405 1,829 1,774 1,978 1,863 1,647 1,578 1,721 1,708 1,682 1,649 1,709 1,745
PEBBLEHILLSFEEDER
ENROLLMENTPROJECTIONSBASEDONRESIDEENROLLMENT
After
Community Input/Feedback

Thank You!
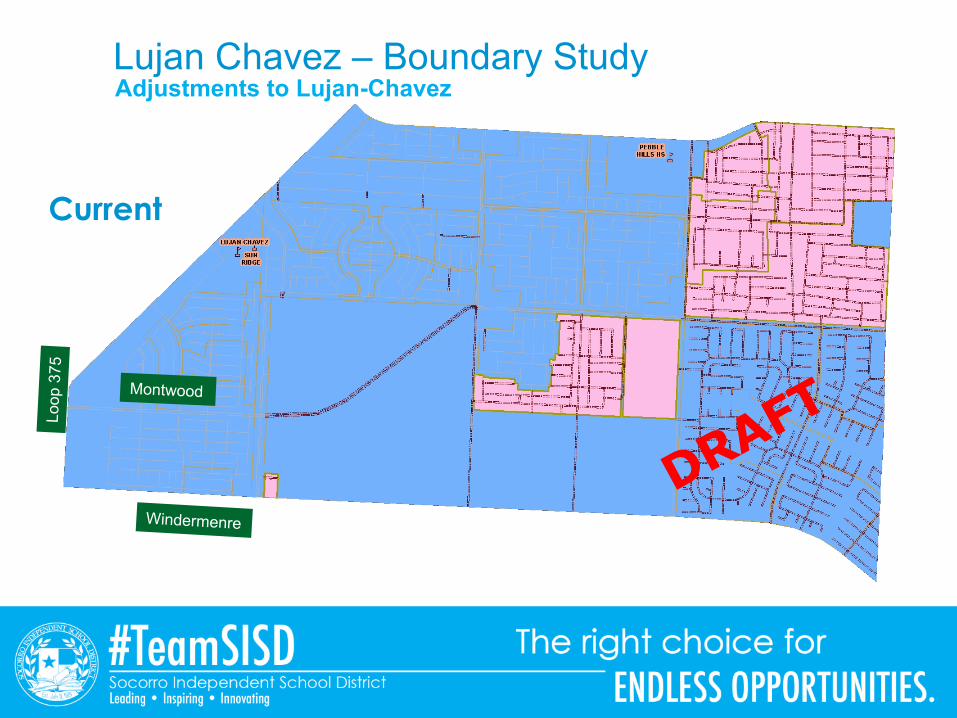
Lujan Chavez – Boundary StudyAdjustments to Lujan-Chavez
Current
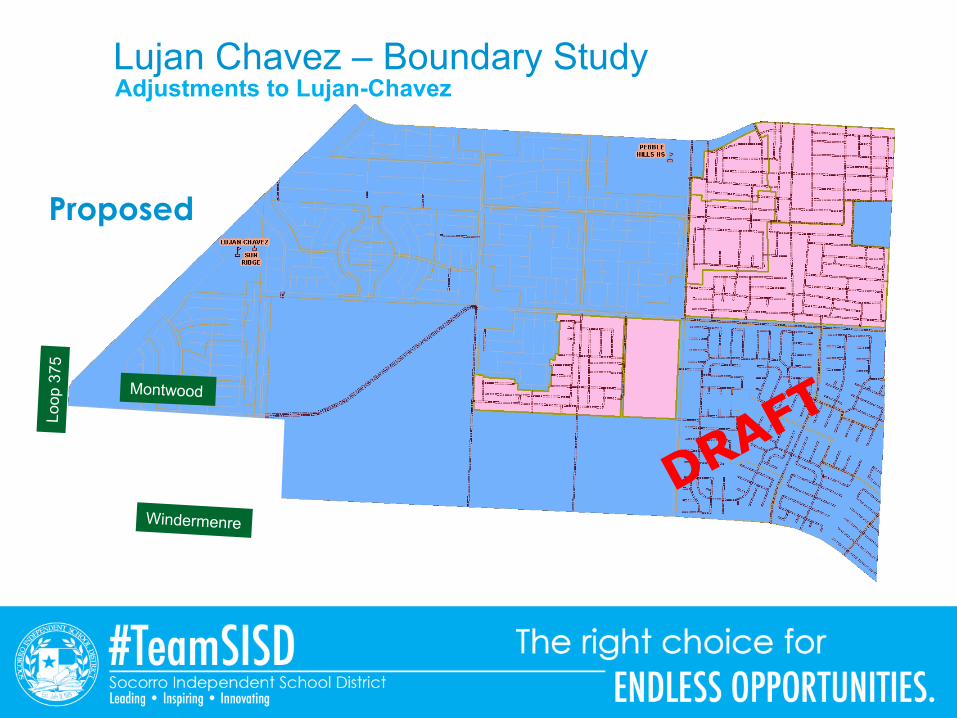
Lujan Chavez – Boundary StudyAdjustments to Lujan-Chavez
Proposed
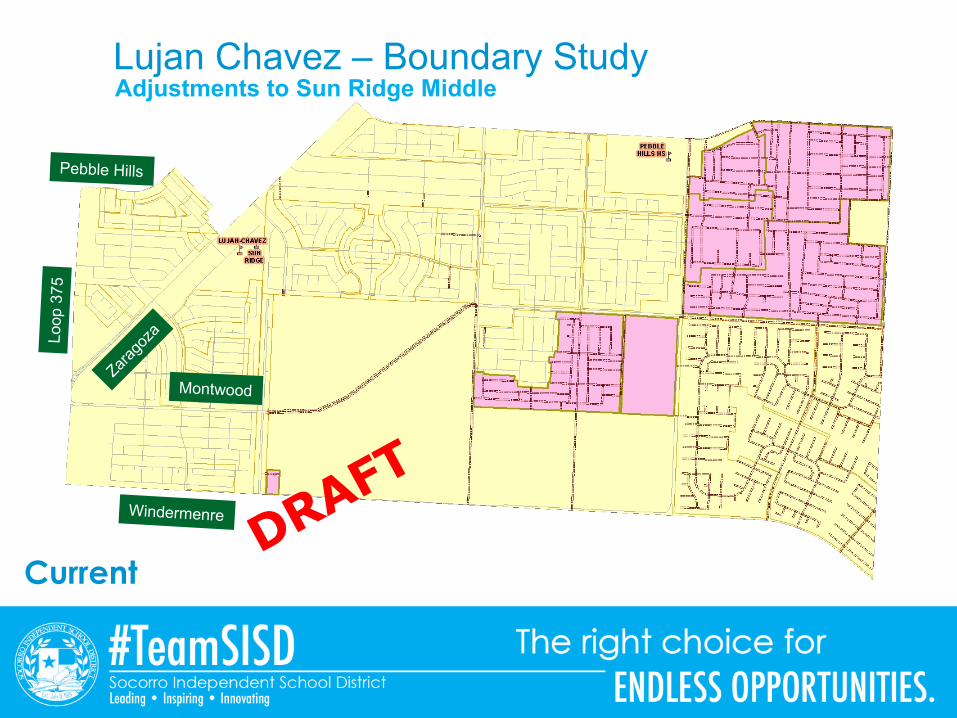
Lujan Chavez – Boundary StudyAdjustments to Sun Ridge Middle
Current
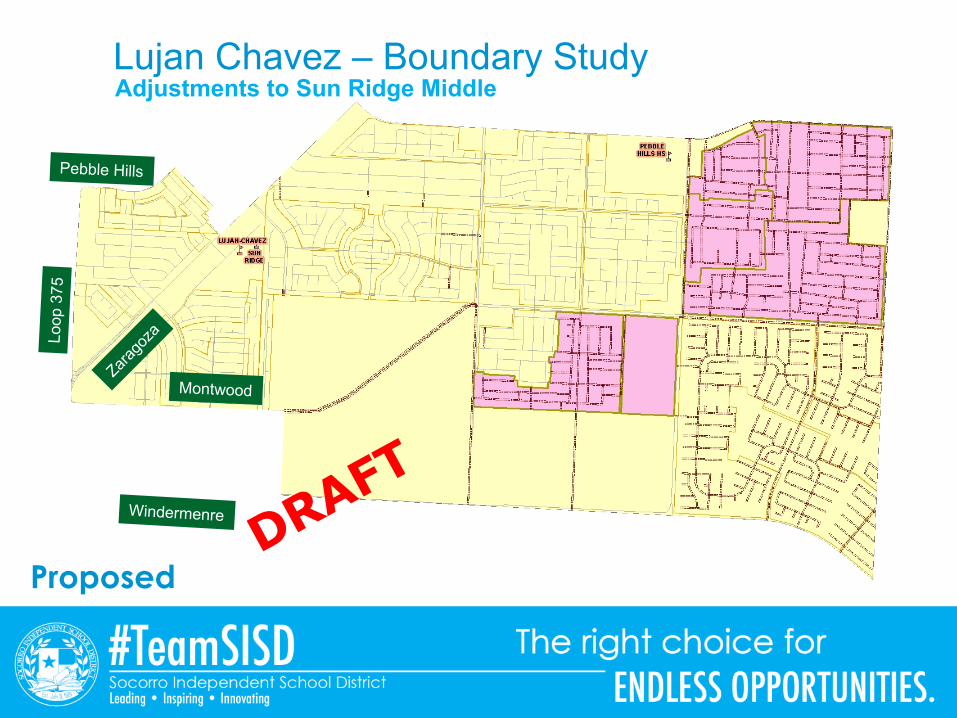
Lujan Chavez – Boundary StudyAdjustments to Sun Ridge Middle
Proposed
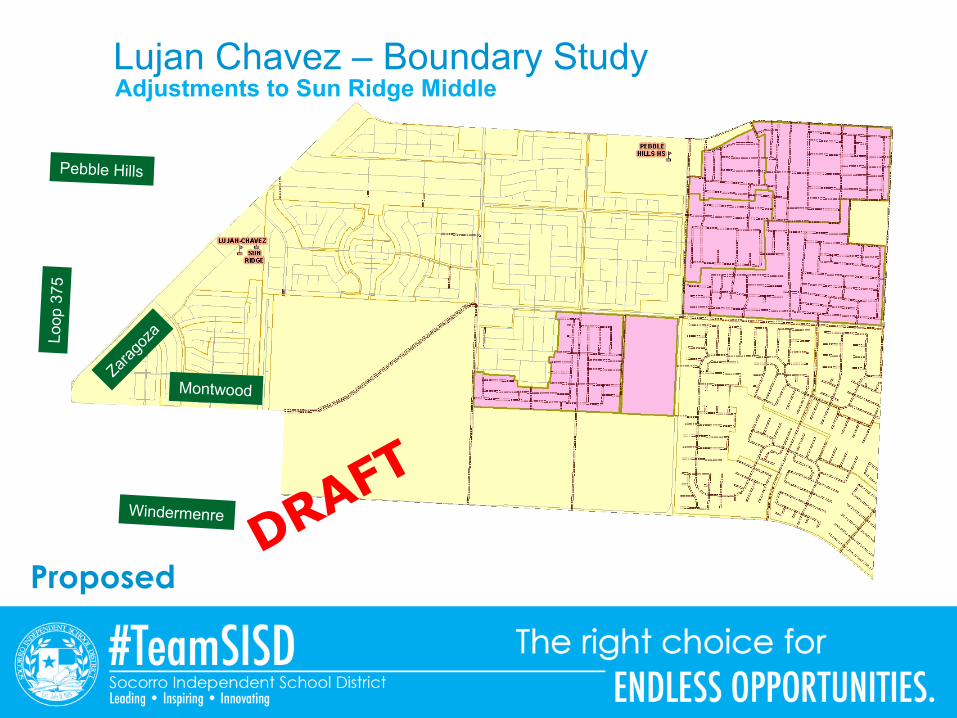
Lujan Chavez – Boundary StudyAdjustments to Sun Ridge Middle
Proposed