Embed Size (px)
Citation preview
1
Phase Coexistence and the Structure of the Morphotropic Phase Boundary
Region in (1-x)Bi(Mg1/2Zr1/2)O3-xPbTiO3 Piezoceramics
Rishikesh Pandey, Ashish Tiwari, Ashutosh Upadhyay and Akhilesh Kumar Singh*
School of Materials Science & Technology, Indian Institute of Technology (Banaras Hindu
University) Varanasi- 221005, India
Abstract
Structure of the morphotropic phase and the phase coexistence region has been investigated
in (1-x)Bi(Mg1/2Zr1/2)O3-xPbTiO3 ceramics. The structure is cubic with space group Pm3m for the
compositions with x<0.57 and tetragonal with space group P4mm for the compositions with x>0.59.
For the compositions with 0.56<x<0.60, both the tetragonal and cubic phases coexist, which suggest
very narrow morphotropic phase boundary region of compositional width Δx~0.03. Rietveld
refinement of the structure using x-ray diffraction data confirms coexistence of the tetragonal and
cubic phases in the MPB region and rules out the coexistence of tetragonal and rhombohedral
structure reported by earlier workers. After poling appearance of significant value of
electromechanical coupling coefficient in the cubic compositions (x=0.55, 0.56) suggests the
presence of electric field induced transition from centrosymmetric cubic phase to
noncentrosymmetric phase. Polarization- Electric field hysteresis loop measurement on the cubic
composition with x=0.56 gives well saturated loop similar to that observed in Pb(Mg1/3Nb2/3)O3
relaxor below the freezing temperature.
Keywords: X-ray diffraction (XRD); Piezoelectricity; SEM; Phase transition; Rietveld refinement.
* Corresponding author
E-mail address: [email protected], [email protected]
2
1. Introduction
From last several decades the Pb-based piezoceramics such as Pb(ZrxTi1-x)O3 (PZT)
and Pb(Mg1/3Nb2/3)O3-xPbTiO3 (PMN-PT) have been the best choice as active materials for
device applications in electromechanical transducers and actuators [1-2]. In recent years,
there is great interest in lead free piezoceramics because of worldwide growing concern over
toxicity of lead [3-6]. This has shifted the attention of researchers towards Bi-based
piezoelectric ceramics and morphotropic phase boundary (MPB) solid solutions [7]. Several
new Bi-based MPB systems have been investigated recently and some of them have added
advantage of TC higher than PZT making them more useful for high temperature piezoelectric
applications [8-12]. In the search of such high temperature stable perovskites, solid solution
of BiScO3 with PbTiO3 i.e. (1-x)BiScO3-xPbTiO3 (BS-PT) has been investigated with high
transition temperature (TC~ 460 0C) higher than PZT (~ 400
0C) and tremendous piezoelectric
response near MPB around x~0.64 [9]. However, because of costly ‘Sc’ this system is not
cost effective. Several other Bi-based solid solutions such as (1-x)Bi(Ni1/2Ti1/2)O3-xPbTiO3
[13], (1-x)Bi(Ni1/2Hf1/2)O3-xPbTiO3 [14], (1-x)Bi(Zn1/2Ti1/2)O3-xPbTiO3 [15], (1-
x)Bi(Mg1/2Ti1/2)O3-xPbTiO3 (BMT-PT) [8], (Bi0.5Na0.5)TiO3-BaTiO3-(Bi0.5K0.5)TiO3 (BNT-
BT-BKT), and (1-x)Bi(Mg1/2Zr1/2)O3-xPbTiO3 (BMZ-PT) [5-7, 16-17] have been explored
and some of them have significantly higher transition temperature (TC) than PZT making
them superior for high temperature piezoelectric applications. In BMZ-PT solid solution,
Suchomel et al. [7] have reported recently that the structure is cubic at x=0.55 and tetragonal
at x=0.60 which indicates that MPB for this system may lie somewhere in between 0.55 to
0.60. Shabbir et al. [16] and Qureshi et al. [17] studied the structure and dielectric properties
of this solid solution and reported MPB around ~0.54 to 0.57 and 0.55 to 0.60, respectively.
However, the piezoelectric characterization of BMZ-PT has not been done by these workers.
Further, the structure of MPB was reported to be the coexistence of rhombohedral and
3
tetragonal structures, but the x-ray diffraction patterns shown by these workers do not support
this fact. It is well-known that the crystal structure of the MPB compositions plays very
important role in high piezoelectric response at MPB and very small variation (~0.05 in PZT
[18]) in composition can change the crystal structure and significantly decrease the
piezoelectric response. In view of this we decided to carryout detailed investigation of the
structure and piezoelectric response of BMZ-PT solid- solution on the compositions prepared
at 1% interval. We find that the width of the MPB region is very narrow (Δx~0.03) in this
solid- solution similar to PZT [18] and (1-x)BiFeO3-xPbTiO3 (BF-PT) [19], but the structure
of the MPB composition at room temperature consists of coexisting tetragonal and cubic
phases, and not monoclinic as observed in high piezo-response ceramics such as PZT [20]
and PMN-PT [21].
2. Experimental procedure
(1-x)Bi(Mg1/2Zr1/2)O3-xPbTiO3 ceramics with x=0.55, 0.56, 0.57, 0.58, 0.59 and 0.60
were prepared by traditional solid state ceramic route. Analytical reagent grade Bi2O3, ZrO2,
MgO, TiO2, and PbO of purity > 99% obtained from HiMedia Laboratories Pvt. Ltd. were
used as raw materials. Stoichiometric amount of these powders with acetone as mixing media
were mixed for 6 h in a planetary ball mill (Retsch, Germany) using agate jar and balls. This
mixture was dried and then calcined inside muffle furnace for 6 h at optimized temperature of
775 0C. The calcined powders were checked for phase purity using an 18 kW, rotating Cu
target, Rigaku (Japan) x-ray diffractometer operating in the Bragg-Brentano geometry with
the curved crystal graphite monochromator fitted in the diffracted beam. The instrumental
resolution is 0.10 degree. The XRD data were collected at a scan rate of 2 degrees/min in the
2-theta range from 200- 120
0 at the scan step of 0.02
0. For pellet formation, 2% polyvinyl
alcohol solution in water was used as binder. Cold compaction of calcined powder was done
at an optimized load of 65 kN using a steel die of 12 mm diameter and an uniaxial hydraulic
4
press. The green pellets were kept at 500 0C for 10 h to burn off the binder material and then
sintered at optimized temperature of 975 0C for 3 h in sealed crucibles with controlled PbO/
Bi2O3 atmosphere using small amount of PbO and Bi2O3 as sacrificial powder. Density of the
sintered pellets was higher than 98% of the theoretical density. For recording XRD patterns,
sintered pellets were crushed into fine powders and then annealed at 500 0C for 10 h to
remove the strains introduced during crushing. The microstructure of the as sintered sample
surface was studied by Scanning electron microscope (SEM) using ZEISS SUPRA40. Thin
gold film was sputter coated on the sintered pellets before examining under SEM. For
electroding, flat surfaces of the sintered pellets were gently polished with 0.25 µm diamond
paste and washed with acetone. Isopropyl alcohol was applied to clean the surfaces and
removing the moisture, if any. Fired on silver paste was subsequently applied on both the
surfaces of the pellet. It was first dried around 120 0C in an oven and then cured by firing at
500 0C for 5 minutes. The electroded pellets were poled in silicon oil bath cooling from 100
0C to room temperature under 30kV/cm DC field. Electromechanical coupling coefficients of
poled pellets were measured by resonance- antiresonance method [1]. For polarization (P-E)
measurements, Radiant Ferroelectric Loop Tracer (USA) was used. The structural analysis by
Rietveld method was done using FullProf Suite [22]. In all structural refinements origin was
fixed at A-site cations (Pb2+
/Bi3+
) except for the rhombohedral structure. To fix the origin for
the rhombohedral structure, the z-coordinate of O2-
ion was fixed at 1/6. Pseudo-Voigt
function was used to model the XRD profiles while anisotropic peak broadening functions
suggested by Stephens [23] was used to fit the anisotropic broadening of reflections.
Background was modelled by 5th
order polynomial.
3. Results and discussion
3.1. Crystal structure: A Rietveld study

5
Powder XRD patterns of BMZ-PT ceramics with x=0.55, 0.56, 0.57, 0.58, 0.59 and
0.60 collected at room temperature for the 2θ range of 20 to 60
degrees is shown in Fig.1. All
the reflections shown in Fig.1 correspond to perovskite structure except negligibly weak
reflections (marked with asterisks) around 2-theta ≈ 27.580, 28.69
0 and 32.82
0 in the XRD
profile. Similar impurity reflections are also seen in the XRD patterns of BMZ-PT samples
reported by earlier workers [16-17]. To eliminate these impurity phases one needs multiple
calcination and sintering steps [7]. Our samples were prepared in single step calcination and
sintering schedule. The phase fraction for this impurity phase is negligibly small as determine
by using Rietveld method. A careful examination of Fig.1 suggests the presence of three
different crystallographic compositional regions, (i) x>0.59 (ii) x<0.57 and (iii) 0.57≤ x
≤0.59, where the nature of the XRD profiles changes (see e.g. the peak around 2θ= 460
encircled in Fig.1). To analyze the structure, we have shown in Fig.2, the selected
pseudocubic (110), (111) and (200) profiles of BMZ-PT ceramics with x=0.55, 0.56, 0.57,
0.58, 0.59 and 0.60. In all the profiles shown in this figure, the contribution from CuKα2
wavelength has been subtracted by using standard software. For the compositions with
x≤0.56, all the pseudocubic reflections shown in Fig.2 appear to be singlet. This characterizes
a cubic structure with space group Pm3m for the compositions with x≤0.56. This is consistent
with the results of Suchomel et al. [7], where cubic structure is reported for x=0.55. For the
composition with x=0.60, (110) and (200) profiles are clearly splitted into doublet while
(111) profile remains singlet. This characterises tetragonal structure for x≥0.60. Earlier
workers have also reported tetragonal structure with space group P4mm for x=0.60 [7, 16].
For the compositions with x=0.57, 0.58 and 0.59, the examination of (200) pseudocubic XRD
profile shown in Fig.2 suggest that the peaks corresponding to both the cubic and tetragonal
phases are present indicating coexistence of these two phases. Thus the compositions with
0.57≤x≤0.59 correspond to the MPB region in which both the tetragonal and cubic phases
6
coexist. As shown in Fig.2, the intensity of the peak corresponding to cubic phase marked by
‘C’ is dominant in x=0.57 and 0.58 while the intensity of the peak corresponding to
tetragonal phase marked by ‘T’ is dominant in x=0.59. There is no lower angle splitting or
asymmetry in (111) profile expected for the rhombohedral/monoclinic structures. This
suggests that the rhombohedral structure is not present in or outside the MPB region in BMZ-
PT ceramics.
To confirm the coexistence of tetragonal and cubic phases and for the sake of
completeness we have analyzed the crystal structure of MPB compositions [0.57≤x≤0.59,
Δx= 0.03] using various plausible structures i.e. rhombohedral (R3m), cubic (Pm3m) and
monoclinic (Pm and Cm) coexisting with the tetragonal (P4mm) structure. Our Rietveld
analysis of the XRD data for these compositions reveals that the best fit is obtained for the
coexistence of cubic and tetragonal (Pm3m+P4mm) phases. The value of χ2= 2.19 is also
lowest for this structural model as against the (R3m+P4mm) model giving χ2= 3.80 for
x=0.59. Thus we may conclude that the structure for the compositions with 0.57≤ x≤0.59
consists of coexisting cubic and tetragonal phases (Pm3m+P4mm) and not the rhombohedral
and tetragonal (R3m+P4mm) phases reported by earlier workers [16-17]. This is further,
confirmed by the absence of splitting in the (111) pseudocubic XRD profiles expected for the
rhombohedral structure (see Fig.2 and inset to Fig.3(c)). In contrast, the MPB systems such as
PZT [20] and PMN-PT [21] show clear splitting in (111) pseudocubic XRD profile for the
compositions with rhombohedral structure. First-principles density functional theory
calculations by Grinberg and Rappe [24] also suggest that TC decreases rapidly for BMZ-PT
solid solution with decreasing PT concentration and approaches to 300K for x≈0.50. The
Rietveld structure refinement of all the compositions has been done to determine precisely
the structural parameters. The Rietveld fits for x=0.56, 0.59 and x=0.60 using cubic, cubic+
tetragonal and tetragonal structures respectively, are shown in Fig.3. The Rietveld analysis
7
also confirms the tetragonal structure for x=0.60. Very good fit between the observed and
calculated profiles were obtained using tetragonal P4mm space group [see Fig.3(a) for
x=0.60]. Consideration of small coexisting cubic phase for x=0.60 further improve the fit
however, the structure is predominantly tetragonal. Fig.3(c) depicts the Rietveld fit of the
XRD data for x=0.56 using cubic space group Pm3m. The fit between the observed and
calculated profiles is quite good confirming the cubic structure of BMZ-PT for x<0.57. As
shown in Fig. 3(b) the Rietveld fit for the composition with x=0.59 using coexistence of
cubic and tetragonal (Pm3m+P4mm) phases is also quite good. A similar coexistence of the
cubic and tetragonal phases in the MPB region has been reported in the (1-x)Pb(Fe2/3W1/3)O3-
xPbTiO3 ceramics [25], but with very wide phase coexistence region (0.20≤x≤0.37). The
compositional width of the MPB is very narrow in the BMZ-PT system similar to PZT [18].
The fact that some MPB systems like PZT [20], BS-PT [9-12], BF-PT [19], BMZ-PT etc.
have very narrow compositional width of the phase coexistence region while the MPB
systems such as PMN-PT [21], BMT-PT [8], (1-x)Pb(Fe2/3W1/3)O3-xPbTiO3 [25] etc. have
wide phase coexistence region is very much intriguing. Suchomel et al. [7] have successfully
investigated the possible relationship between the tolerance factor and the position and
compositional width of the phase coexistence region for MPB ceramics. It has been reported
that the position of MPB shifts to the PbTiO3 rich end as the difference of the tolerance factor
with the other end component increases. However, increase in the difference in tolerance
factor results in narrow compositional width of the MPB. This is indeed the case for the MPB
ceramics such as PZT [20], BS-PT [9-12] as well as for the BMZ-PT system. The BF-PT [19]
may be an exception for which the MPB lies on the lower PT side, while the compositional
width of the MPB is also narrow. The presence of rotational instabilities in the rhombohedral
structure of BiFeO3 may be the possible reason for this anomaly [19]. More detailed
theoretical studies will be needed to understand the location and the compositional width of

8
the MPB in ‘Pb’ and Bi-based MPB systems. Further, in PMN-PT system the structure of the
component PMN is pseudocubic but in the vicinity of the MPB short range monoclinic
followed by long range monoclinic structure is stabilized with PbTiO3 substitution [21].
Theoretical studies will be needed to understand why similar rhombohedral phase is not
stabilized in the vicinity of the MPB in BMZ-PT system.
The refined structural parameters are listed in Table.1 along with the agreement
factors for the compositions with x=0.59 and 0.60. As observed in several Pb-based
piezoelectric ceramics [21], the isotropic thermal parameters for the A-site cations (Pb2+
/Bi3+
)
were very high (>4 Å2). In view of this we considered anisotropic thermal parameters for
these ions in tetragonal structure. As can be seen in table I, the thermal ellipsoid is more
elongated about xy-axes than the z-axis. For cubic phase of the x=0.59 composition, the
refined thermal parameters for oxygen and B-site cations (Mg2+
/Zr4+
/Ti4+
) were also very
high. However, fixing their values to low level manually do not affect significantly the value
of 2 suggesting these parameters are not correctly determined with the XRD data. Powder
neutron diffraction data will be needed to ascertain correctly the thermal parameters for these
ions.
Variation of the tetragonal phase fraction and lattice parameters with composition, as
obtained by Rietveld refinement of the structure are plotted in Fig.4. It is evident from this
figure that very small change in PT concentration (x) affects significantly the fraction of
tetragonal phase. As expected, the tetragonality increases with increasing PT concentration
for tetragonal phase region. The values of the lattice parameters for x= 0.55 and 0.60 are in
good agreement with that reported by Suchomel et al. [7].
3.2. Microstructure Studies
SEM micrographs of (1-x)BMZ-xPT ceramics with composition x=0.56, 0.58 and
0.60 are shown in Fig.5(a), Fig.5(b) and Fig.5(c) respectively. The average grain size for

9
x=0.56, 0.58 and 0.60 is obtained to be ~ 5.34 μm, 6.54 μm and 6.75 μm respectively, which
suggests slightly increasing trend in the grain size with increasing PT concentration. Since
Bi2O3 is well known grain size refiner, smaller grain size is expected in the Bi-rich
compositions. There are few dark grains at the junction of the grain boundaries marked by
the arrow in Fig.5(a) and Fig.5(b). These dark grains are due to an impurity phase as
confirmed by the energy dispersive spectroscopy (EDS) studies. Presence of small impurity
phase is also evident in the XRD studies. The EDS spectra of the perovskite and impurity
phases for x=0.56 are shown in Fig.6 (a) and Fig.6(b) respectively. A comparison of Fig.6 (a)
and (b) suggests that the impurity phase is significantly deficient in Ti and also Pb and Bi.
Quantitative analysis of the impurity phase reveals that it is mostly Mg and O based
compound with small concentration of Pb and Bi.
3.3 Polarization Studies
Polarization- Electric field (P-E) hysteresis loops for the compositions with x=0.56
(cubic), 0.58 (cubic+Tetragonal) and x=0.60 (tetragonal) are shown in Fig.7(a), 7(b) and 7(c)
respectively. As can be seen from Fig.7(a) a well saturated hysteresis loop is observed for
x=0.56. Since the structure of this composition is cubic at room temperature one should not
get the hysteresis loop if it is the centrosymmetric paraelectric phase. This anomalous result
could be explained only if we consider the presence of the relaxor behaviour in this
composition. In fact, temperature dependence of the dielectric permittivity of BMZ-PT with
x=0.55 reported by Suchomel [7] et al. exhibit a strong peak around ~ 250 0C (Tm) with large
frequency dispersion suggesting presence of strong relaxor features. In canonical relaxor
PMN it is known that the average structure remains cubic down to 4K temperature [26]
because of the fact that the development of long range ferroelectric order is prevented by the
presence of the quenched random fields [27] resulting from the presence of off-valent
Mg2+
/Nb5+
ions at the B-site. However, temperature dependence of the dielectric permittivity
10
exhibit strong peak with huge dielectric permittivity and frequency dispersion around 290K.
Recently in case of Pb(Mg1/3Nb2/3)O3 (PMN) [28] also, it has been reported that a well
saturated hysteresis loop similar to normal ferroelectrics is observed when temperature is
lowered below freezing temperature (Tvf=220K) [29-30]. Since Tm=250 0C [7] for BMZ-PT
with x=0.55, the freezing temperature can be well above the room temperature resulting in
the well saturated hysteresis loop in average cubic symmetry similar to PMN. Appearance of
well saturated hysteresis loop for x=0.55 misled to Shabbir et al [16] and Qureshi et al [17] to
draw the conclusion that this compositions is rhombohedral even though no splitting were
seen in the XRD profiles. Surprisingly, the hysteresis loops shown in Fig.7(c) for the
tetragonal phase with x=0.60, is very slim in comparison to that for x=0.55 and saturation is
not reached. Similarly the hysteresis loop for the composition with x=0.58 showing the
coexistence of the cubic and tetragonal phases is also less saturated than that observed for
x=0.55. It seems that the reorientation of the nanodomains in x=0.55 is much easier than the
microscopic domains in x=0.60 preventing the saturation of the hysteresis loop. We tried to
open the loop at higher electric fields but dielectric breakdown occurred. Detailed studies of
these aspects are underway and will be reported elsewhere.
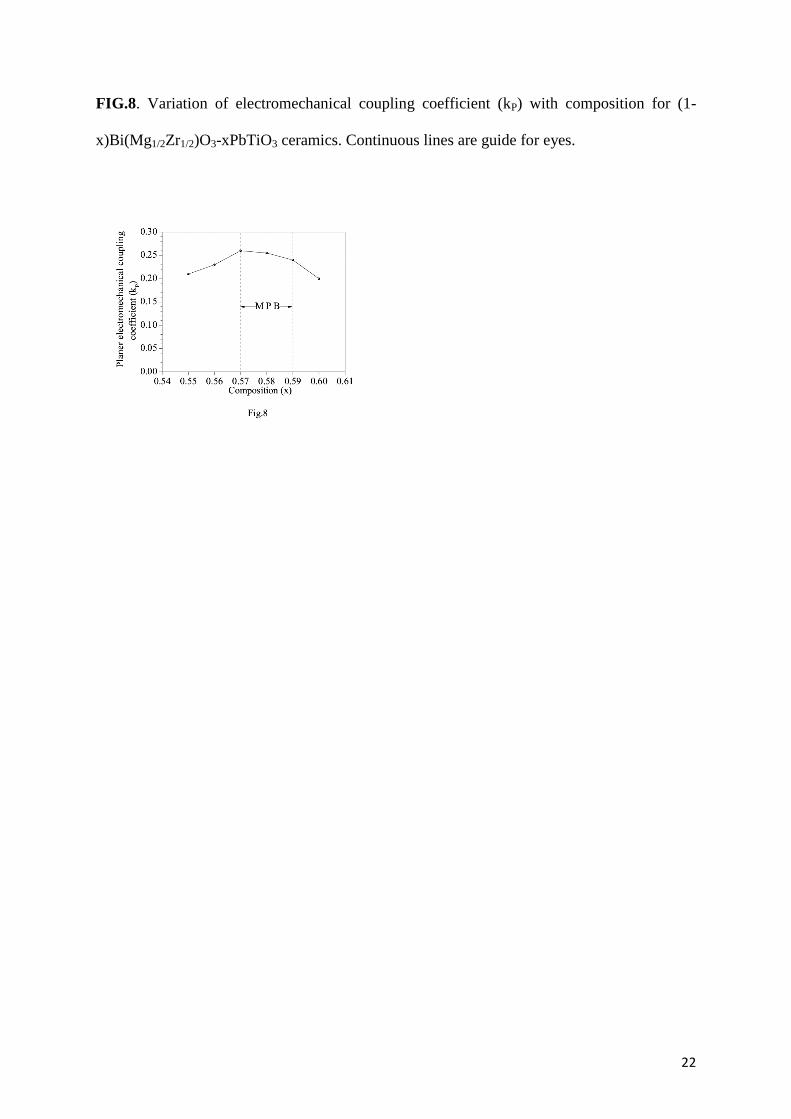
3.4 Composition dependence of the Electromechanical Coupling Coefficient (kP)
Fig.8 shows the variation of planer electromechanical coupling coefficient (kP) with
composition for BMZ-PT ceramics. The value of kP is significantly lower (~0.26) than the
widely used MPB systems such as PZT and PMN-PT. As reported by Fu and Cohen [31], the
high piezoelectric response near MPB is linked with the ease of rotation of the polarization
vector under external stimuli like electric field or stress. The presence of monoclinic phase in
the MPB region provides a low energy path way for the rotation of the polarization vector.
This is the reason why the Bi-based MPB systems like BS-PT, also exhibit high piezoelectric
response for the MPB compositions with monoclinic structure [9-12]. The presence of cubic

11
phase coexisting with the tetragonal phase in the BMZ-PT system may be attributed for lower
kP as against PZT [2, 18], PMN-PT [2, 21] and BS-PT [9-12]. Further, as shown in Fig.5,
appreciable electromechanical coupling coefficient kP (~0.21) is obtained for the cubic
composition with x=0.55 also, which is not expected for the centrosymmetric structure. This
could be explained only if there is an electric field induced phase transition from paraelectric
cubic phase to a ferroelectric phase with non-centrosymmetric structure. Electric field
induced phase transition from pseudocubic phase to a ferroelectric phase have been observed
recently in pseudocubic compositions of several Bi-based solid solutions [32-34]. Possibly a
similar phase transition is taking place in x=0.55 also during poling of the samples.
Temperature dependence of the dielectric permittivity of BMZ-PT with x=0.55 reported by
Suchomel [7] et al. exhibit a strong peak around ~250 0C with large frequency dispersion
which is not expected for the paraelectric cubic structure. This suggests that the cubic
structure of x=0.55 composition is because of the strong relaxor features similar to that
reported in canonical relaxor PMN [35-36]. It has been reported for PMN that a field induced
relaxor to ferroelectric phase transition takes place under the application of electric field [37-
38]. A similar phase transition from pseudocubic relaxor to noncentrosymmetric phase in
0.45BMZ-0.55PT can be attributed to the appearance of piezoelectric response after poling. It
will be interesting to study the depoling temperature and temperature of transition to
relaxor/paraelectric phase, for this ferroelectric phase, resulting from field induced transition.
Appearance of piezoelectric response in pseudocubic compositions of BMZ-PT suggests that
apart from the non-centrosymmetric structures of solid solutions, the pseudocubic
compositions should also be explored for the piezoelectric properties.
4. Conclusions
To conclude, detailed Rietveld analysis of the structure of BMZ-PT for the
compositions with 0.55≤x≤0.60 reveals that the structure is cubic in the Pm3m space group
12
for the compositions with x<0.57, tetragonal in the space group P4mm for the compositions
with x>0.59 while the two phases coexists for the intermediate compositions. Thus the width
of the MPB region is very narrow Δx~0.03. Our results clearly rule out the coexistence of
tetragonal and rhombohedral structure for the MPB compositions reported by earlier workers.
Highest electromechanical coupling coefficient obtained for the composition with x=0.57 is
0.26, which is significantly lower than PZT, because of the fact that there is no monoclinic
phase in the MPB region of BMZ-PT. After poling the cubic compositions (x=0.55, 0.56)
also show piezoelectricity suggesting an electric field induced phase transition to a
ferroelectric phase. The BMZ-PT Composition with x=0.56 having cubic structure shows
well saturated hysteresis loop similar to that observed for well known relaxor PMN below
freezing temperature. Our results would further encourage ab-initio first principles
calculations to understand the nature of the MPB in the Bi-based ceramics and help in
developing lead free piezo-ceramics with higher piezoelectric response.
Acknowledgement
RP acknowledges University Grant Commission (UGC), India for the financial
support as Senior Research Fellowship (SRF).
References
1. Jaffe B, Cook WR and Jaffe H, Piezoelectric Ceramics, Academic press, London
(1971).
2. Park S-E and Shrout TR, J Appl Phys 1997; 82: 1804.
3. Rodel J, Jo W, Seifert KTP, Anton EM, Granzow T and Damjanovic D, J Am Ceram
Soc 2009; 92: 1153.
4. Pandey R, Pillutla RK, Shankar U and Singh AK, J Appl Phys 2013; 113: 184109.
13
5. Saito Y, Takao H, Tani T, Nonoyama T, Takatori K, Homma T, Nagaya T and
Nakamura M, Nature 2004; 432: 84.
6. Shieh J, Wu KC and Chen CS, Acta Mater 2007; 55: 3081. Zhang ST, Yang B and
Cao W, Acta Mater 2012; 60: 469. Dittmer R, Webber KG, Aulbach E, Jo W, Tan X
and Rodel J, Acta Mater 2013; 61: 1350.
7. Suchomel MR and Davies PK, J Appl Phys 2004; 96: 4405.
8. Randall CA, Eitel R, Jones B, Shrout TR, Woodward DI and Reaney IM, J Appl Phys
2004; 95: 3633.
9. Eitel RE, Randall CA, Shrout TR, Rehrig PW, Hakenberger W and Park S-E, Jpn J
Appl Phys 2001; 40: 5999.
10. Eitel RE, Randall CA, Shrout TR and Park S-E, Jpn J Appl Phys 2002; 41: 2099.
11. Chaigneau J, Kiat JM, Malibert C and Bogicevic C, Phys Rev B 2007; 76: 094111.
12. Alguero M, Ramos P, Jimenez R, Amorin H, Vila E and Castro A, Acta Mater 2012;
60: 1174.
13. Choi SM, Stringer CJ, Shrout TR and Randall CA, J Appl Phys 2005; 98: 034108.
14. Pan Z, Chen J, Fan L, Liu L, Fang L and Xing X, J Appl Phys 2012; 112: 114120.
15. Suchomel MR and Davies PK, Appl Phys Lett 2005; 86: 262905.
16. Shabbir G, Qureshi AH, Kojima S and Hall DA, Ferroelectrics 2007; 346: 72.
17. Qureshi AH, Shabbir G and Hall DA, Mater Lett 2007; 61: 4482.
18. Noheda B, Cox DE, Shirane G, Gonzalo JA, Cross LE and Park S-E, Appl Phys Lett
1999; 74: 2059.
19. Bhattacharjee S, Tripathi S and Pandey D, Appl Phys Lett 2007; 91: 042903.
20. Pandey D, Singh AK and Baik S, Acta Cryst A 2008; 64: 192.
21. Singh AK, Pandey D and Zaharko O, Phys Rev B 2006; 74: 024101. Singh AK and
Pandey D, Phys Rev B 2003; 67: 064102.

14
22. Rodriguez-Carvajal J, FULLPROF, A Rietveld Refinement and Pattern Matching
Analysis Program, Laboratory Leon Brillouin (CEA-CNRS), France, 2011.
23. Stephens PW, J Appl Cryst 1999; 32: 281. Tutuncu G, Motahari M, Daymond MR
and Ustundag E, Acta Mater 2012; 60: 1494.
24. Grinberg I and Rappe AM, Phys Rev Lett 2007; 98: 037603.
25. Mitoseriu L, Vilarinho PM and Baptista JL, Appl Phys Lett 2002; 80: 4422.
26. Mathan N, Husson E, Calvarin G, Gavarri JR, Hewat AW and Morell A, J Phys
Condens Matter 1991; 3: 8159.
27. Westphal V, Kleemann W and Glinchuk MD, Phys Rev Lett 1992; 68: 847.
28. Fu D, Taniguchi H, Itoh M, Koshihara S, Yamamoto N and Moris S, Phys Rev Lett
2009; 103: 207601.
29. Colla EV, Koroleva E Y, Okuneva NM and Vakhrushev SB, Phys Rev Lett 1995; 74:
1681.
30. Viehland D, Li JF, Jang SJ, Cross LE and Wuttig M, Phys Rev B 1991; 43: 8316.
31. Fu H and Cohen RE, Nature 2000; 403: 281.
32. Daniels JE, Jo W, Rodel J and Jones JL, Appl Phys Lett 2009; 95: 032904.
33. Rao BN and Ranjan R, Phys Rev B 2012; 86: 134103.
34. Ma C, Guo H, Beckman SP and Tan X, Phys Rev Lett 2012; 109: 107602.
35. Smolenskii GA, Isupov VA, Agranovskaya AI and Popov SN, Sov Phys Solid State
1961; 2: 2651.
36. Bokov AA and Ye ZG, J Mater Sci 2006; 41: 31.
37. Arndt H, Sauerbier F, Schmit G and Shebakov LA, Ferroelectrics 1998; 79: 145.
38. Calvarin G, Husson E and Ye ZG, Ferroelectrics 1995; 165: 349.
15
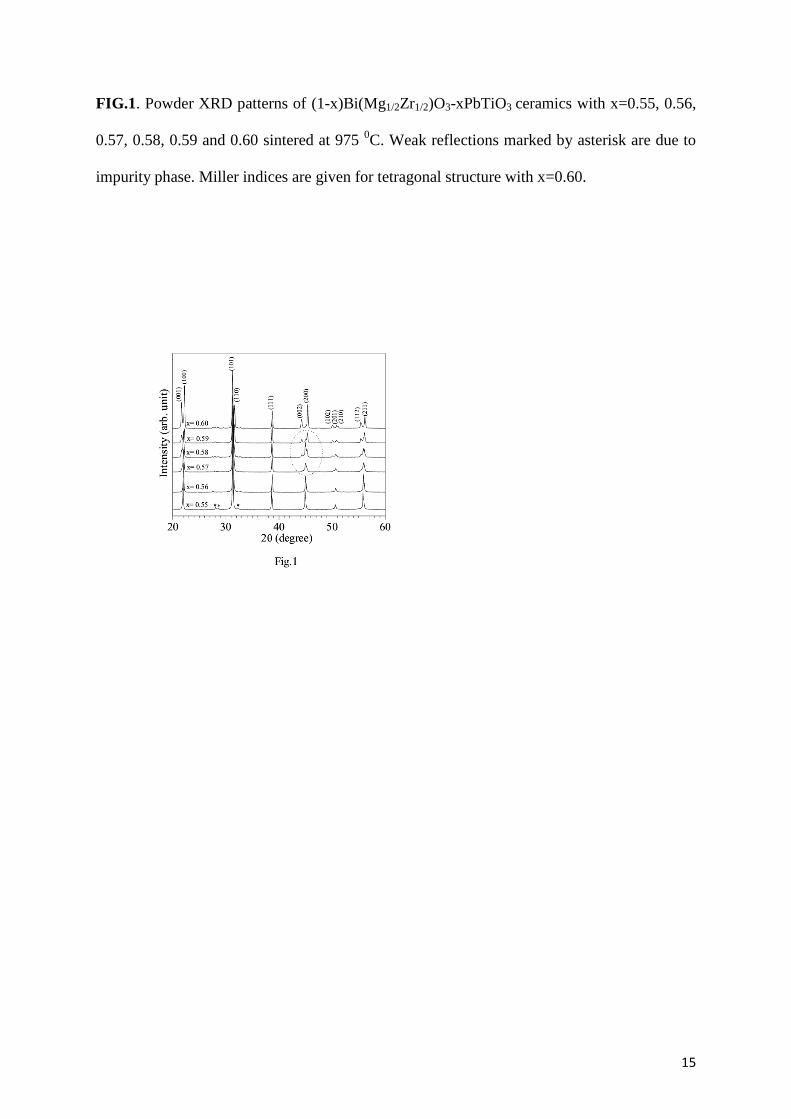
FIG.1. Powder XRD patterns of (1-x)Bi(Mg1/2Zr1/2)O3-xPbTiO3 ceramics with x=0.55, 0.56,
0.57, 0.58, 0.59 and 0.60 sintered at 975 0C. Weak reflections marked by asterisk are due to
impurity phase. Miller indices are given for tetragonal structure with x=0.60.

16
FIG.2. Pseudocubic (110), (111) and (200) powder XRD profiles of (1-x)Bi(Mg1/2Zr1/2)O3-
xPbTiO3 ceramics for the compositions with x=0.55, 0.56, 0.57, 0.58, 0.59 and 0.60. The
peaks marked with ‘C’ and ‘T’ correspond to cubic and tetragonal phases respectively.
17
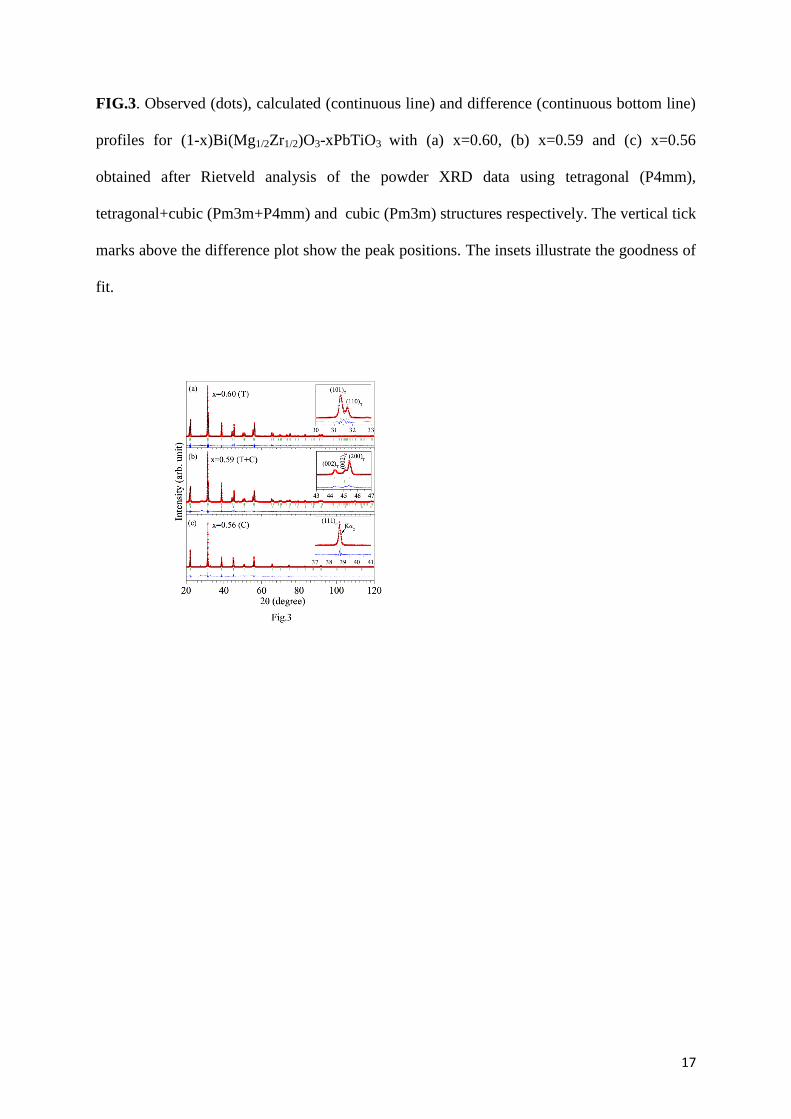
FIG.3. Observed (dots), calculated (continuous line) and difference (continuous bottom line)
profiles for (1-x)Bi(Mg1/2Zr1/2)O3-xPbTiO3 with (a) x=0.60, (b) x=0.59 and (c) x=0.56
obtained after Rietveld analysis of the powder XRD data using tetragonal (P4mm),
tetragonal+cubic (Pm3m+P4mm) and cubic (Pm3m) structures respectively. The vertical tick
marks above the difference plot show the peak positions. The insets illustrate the goodness of
fit.

18
FIG.4. Compositional variation of cubic (aC), tetragonal (aT, cT) lattice parameters and
tetragonal Phase fraction (PT) for (1-x)Bi(Mg1/2Zr1/2)O3-xPbTiO3 ceramics obtained after
Rietveld analysis. Continuous lines are guide for eyes.

19
FIG.5. SEM images of (1-x)Bi(Mg1/2Zr1/2)O3-xPbTiO3 ceramics for (a) x=0.56 (b) x=0.58
and (c) x=0.60. The dark grains marked by arrow correspond to impurity phase.

20
FIG.6. EDS spectrum of the (a) perovskite phase and (b) impurity phase of the (1-
x)Bi(Mg1/2Zr1/2)O3-xPbTiO3 ceramics for the composition with x=0.56.
21
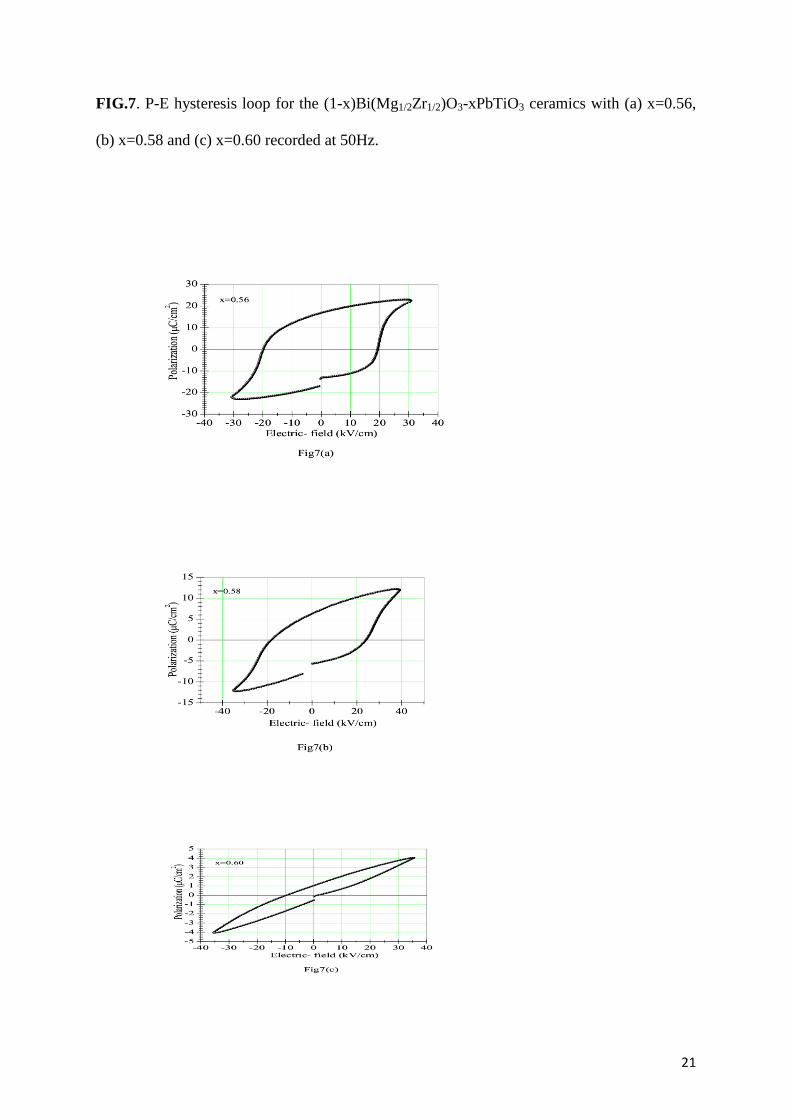
FIG.7. P-E hysteresis loop for the (1-x)Bi(Mg1/2Zr1/2)O3-xPbTiO3 ceramics with (a) x=0.56,
(b) x=0.58 and (c) x=0.60 recorded at 50Hz.
22
FIG.8. Variation of electromechanical coupling coefficient (kP) with composition for (1-
x)Bi(Mg1/2Zr1/2)O3-xPbTiO3 ceramics. Continuous lines are guide for eyes.
![Evidence for MB and MC phases in the morphotropic phase boundary region of (1-x)[Pb(Mg1/3Nb2/3)O3]-xPbTiO3: A Rietveld study](https://img.dokumen.tips/doc/110x75/631516e285333559270cfc93/evidence-for-mb-and-mc-phases-in-the-morphotropic-phase-boundary-region-of-1-xpbmg13nb23o3-xpbtio3.jpg)


