Embed Size (px)
Citation preview
Contents
Cautionary StatementStatements made in this annual report with respect to Sony’s currentplans, estimates, strategies and beliefs and other statements that arenot historical facts are forward-looking statements about the futureperformance of Sony. Forward-looking statements include, but arenot limited to, those statements using words such as “believe”,“expect”, “plans”, “strategy”, “prospects”, “forecast”, “estimate”,“project”, “anticipate”, “aim”, “may” or “might” and words of similarmeaning in connection with a discussion of future operations, finan-cial performance, events or conditions. From time to time, oral orwritten forward-looking statements may also be included in othermaterials released to the public. These statements are based onmanagement’s assumptions and beliefs in light of the information cur-rently available to it. Sony cautions you that a number of importantrisks and uncertainties could cause actual results to differ materiallyfrom those discussed in the forward-looking statements, and there-fore you should not place undue reliance on them. You also shouldnot rely on any obligation of Sony to update or revise any forward-looking statements, whether as a result of new information, futureevents or otherwise. Sony disclaims any such obligation. Risks anduncertainties that might affect Sony include, but are not limited to (i)the global economic environment in which Sony operates, as well asthe economic conditions in Sony’s markets, particularly levels of con-sumer spending; (ii) exchange rates, particularly between the yen andthe U.S. dollar, the euro and other currencies in which Sony makessignificant sales or in which Sony’s assets and liabilities are denomi-nated; (iii) Sony’s ability to continue to design and develop and winacceptance of its products and services, which are offered in highlycompetitive markets characterized by continual new product intro-ductions, rapid development in technology and subjective and chang-ing consumer preferences (particularly in the Electronics, Game,Music, Pictures and Other segments); (iv) Sony’s ability to implementsuccessfully personnel reduction and other business reorganizationactivities in its Electronics, Music, Pictures and Other segments;(v) Sony’s ability to implement successfully its network strategy for itsElectronics, Music, Pictures and Other segments and to develop andimplement successful sales and distribution strategies in its Music,Pictures and Other segments in light of the Internet and other techno-logical developments; (vi) Sony’s continued ability to devote sufficientresources to research and development and, with respect to capitalexpenditures, to correctly prioritize investments (particularly in theElectronics segment); (vii) shifts in customer demand for financial ser-vices such as life insurance and failure to conduct successful AssetLiability Management and (viii) the success of Sony’s joint venturesand alliances. Risks and uncertainties also include the impact of anyfuture events with material unforeseen impacts.
Financial Highlights 1Operating Performance Highlights 2To Our Shareholders 4Review of Operations 8
Electronics 8Game 13Entertainment 16Financial Services 20Other 22
R&D Strategies and Selection of Key Technological Fields 23The Sony Challenge: Seeing is Believing 26Corporate Governance/New Directors and Corporate Executive Officers 32Corporate Social Responsibility 34Financial Section 35Stock Information 130Stock Acquisition Rights and Bond Information 131Investor Information 132
SONY AR-E0629 05.7.6, 2:16 PMPage 36 Adobe PageMaker 6.0J/PPC
Sony Corporation 1
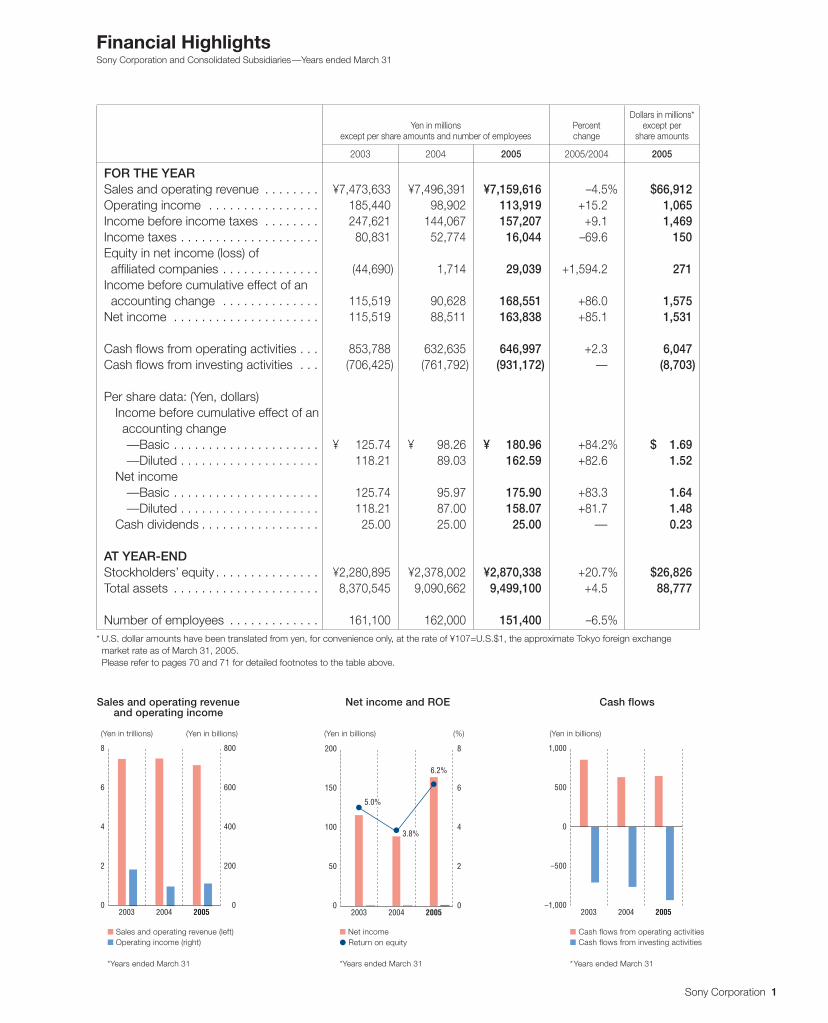
Financial HighlightsSony Corporation and Consolidated Subsidiaries—Years ended March 31
Sales and operating revenueand operating income
■ Sales and operating revenue (left)■ Operating income (right)
*Years ended March 31
(Yen in trillions) (Yen in billions)
8
6
4
2
0
800
600
400
200
02003 2004 2005
8
6
4
2
0
200
150
100
50
02003 2004 2005
5.0%
3.8%
6.2%
Net income and ROE
■ Net income● Return on equity
*Years ended March 31
(Yen in billions) (%)
Cash flows
■ Cash flows from operating activities■ Cash flows from investing activities
*Years ended March 31
1,000
500
0
–500
–1,0002003 2004 2005
(Yen in billions)
Dollars in millions*Yen in millions Percent except per
except per share amounts and number of employees change share amounts
2003 2004 2005 2005/2004 2005
FOR THE YEARSales and operating revenue . . . . . . . . ¥7,473,633 ¥7,496,391 ¥7,159,616 –4.5% $66,912Operating income . . . . . . . . . . . . . . . . 185,440 98,902 113,919 +15.2 1,065Income before income taxes . . . . . . . . 247,621 144,067 157,207 +9.1 1,469Income taxes . . . . . . . . . . . . . . . . . . . . 80,831 52,774 16,044 –69.6 150Equity in net income (loss) of affiliated companies . . . . . . . . . . . . . . (44,690) 1,714 29,039 +1,594.2 271Income before cumulative effect of an accounting change . . . . . . . . . . . . . . 115,519 90,628 168,551 +86.0 1,575Net income . . . . . . . . . . . . . . . . . . . . . 115,519 88,511 163,838 +85.1 1,531
Cash flows from operating activities . . . 853,788 632,635 646,997 +2.3 6,047Cash flows from investing activities . . . (706,425) (761,792) (931,172) — (8,703)
Per share data: (Yen, dollars)Income before cumulative effect of an accounting change
—Basic . . . . . . . . . . . . . . . . . . . . . ¥ 125.74. ¥ 98.26. ¥ 180.96. +84.2% $ 1.69.—Diluted . . . . . . . . . . . . . . . . . . . . 118.21. 89.03. 162.59. +82.6 1.52.
Net income—Basic . . . . . . . . . . . . . . . . . . . . . 125.74. 95.97. 175.90. +83.3 1.64.—Diluted . . . . . . . . . . . . . . . . . . . . 118.21. 87.00. 158.07. +81.7 1.48.
Cash dividends . . . . . . . . . . . . . . . . . 25.00. 25.00. 25.00. — 0.23.
AT YEAR-ENDStockholders’ equity . . . . . . . . . . . . . . . ¥2,280,895 ¥2,378,002 ¥2,870,338 +20.7% $26,826Total assets . . . . . . . . . . . . . . . . . . . . . 8,370,545 9,090,662 9,499,100 +4.5 88,777
Number of employees . . . . . . . . . . . . . 161,100 162,000 151,400 –6.5%* U.S. dollar amounts have been translated from yen, for convenience only, at the rate of ¥107=U.S.$1, the approximate Tokyo foreign exchange
market rate as of March 31, 2005.Please refer to pages 70 and 71 for detailed footnotes to the table above.
SONY AR-E0629 05.7.6, 2:42 PMPage 1 Adobe PageMaker 6.0J/PPC
2 Sony Corporation
Financial Highlights by Business Segment(Years ended March 31)
2005/2004(Percent
(Yen in billions, %) 2003 2004 2005 change)
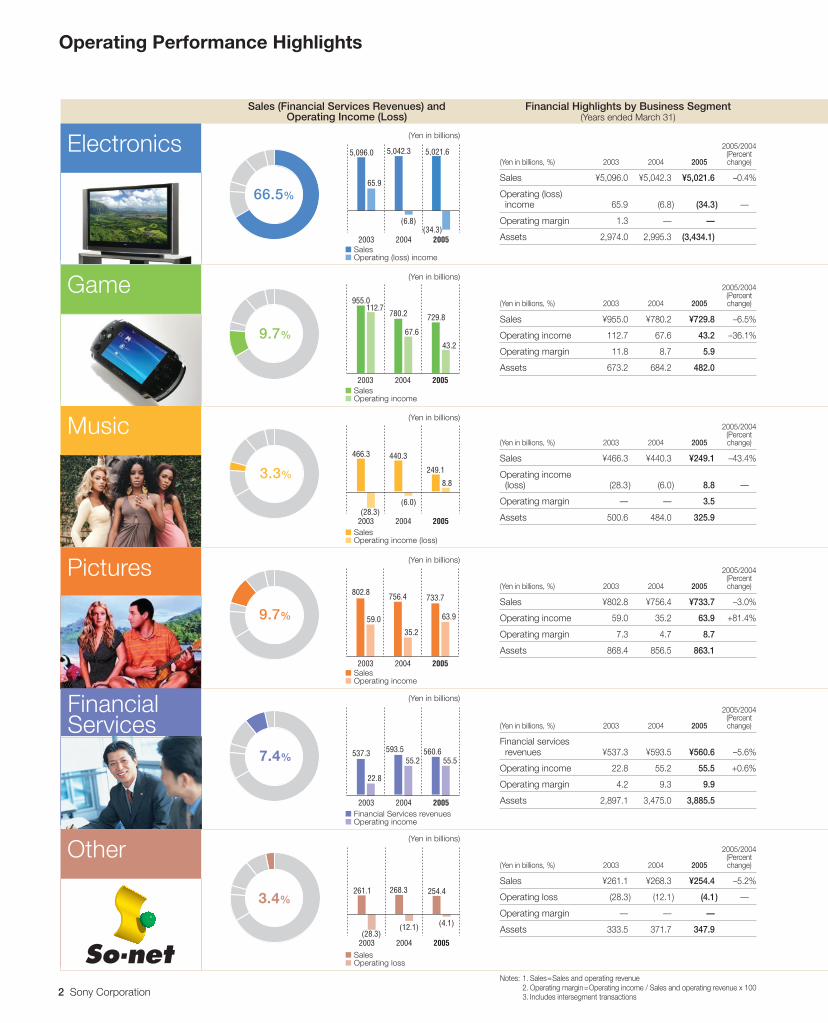
Sales ¥5,096.0 ¥5,042.3 ¥5,021.6 –0.4%
Operating (loss) income 65.9. (6.8.) (34.3.) —%
Operating margin 1.3 — — %
Assets 2,974.0 2,995.3 (3,434.1)
Sales (Financial Services Revenues) andOperating Income (Loss)
■ Sales■ Operating (loss) income
■ Sales■ Operating income
■ Sales■ Operating income (loss)
■ Sales■ Operating income
■ Financial Services revenues■ Operating income
■ Sales■ Operating loss
Game
FinancialServices
Music
2003 2004 2005
5,096.0
65.9
(6.8)(34.3)
5,042.3 5,021.6
2003 2004 2005
955.0
780.2
67.6
729.8
43.2
112.7
2003 2004 2005
268.3
(28.3)
261.1
(12.1)
254.4
(4.1)
2003 2004 2005
802.8
59.0
35.2
756.4
63.9
733.7
2003 2004 2005
466.3 440.3
249.1
(6.0)
8.8
(28.3)
2003 2004 2005
22.8
537.3 593.555.2
560.655.5
Operating Performance Highlights
2005/2004(Percent
(Yen in billions, %) 2003 2004 2005 change)
Sales ¥955.0 ¥780.2 ¥729.8 –6.5%
Operating income 112.7 67.6 43.2 –36.1%
Operating margin 11.8 8.7 5.9
Assets 673.2 684.2 482.0
2005/2004(Percent
(Yen in billions, %) 2003 2004 2005 change)
Sales ¥466.3 ¥440.3 ¥249.1 –43.4%
Operating income (loss) (28.3.) (6.0.) 8.8. —%
Operating margin — — 3.5 %
Assets 500.6 484.0 325.9
2005/2004(Percent
(Yen in billions, %) 2003 2004 2005 change)
Sales ¥802.8 ¥756.4 ¥733.7 –3.0%
Operating income 59.0 35.2 63.9 +81.4%
Operating margin 7.3 4.7 8.7
Assets 868.4 856.5 863.1
2005/2004(Percent
(Yen in billions, %) 2003 2004 2005 change)
Financial services revenues ¥537.3 ¥593.5 ¥560.6 –5.6%
Operating income 22.8 55.2 55.5 0.+0.6%
Operating margin 4.2 9.3 0.9.9
Assets 2,897.1 3,475.0 3,885.5 0.0
2005/2004(Percent
(Yen in billions, %) 2003 2004 2005 change)
Sales ¥261.1 ¥268.3 ¥254.4 –5.2%
Operating loss (28.3.) (12.1.) (4.1.) —%
Operating margin — — — %
Assets 333.5 371.7 347.9
66.5%
9.7%
3.3%
9.7%
7.4%
3.4%
Notes: 1. Sales=Sales and operating revenue2. Operating margin=Operating income / Sales and operating revenue x 1003. Includes intersegment transactions
(Yen in billions)
(Yen in billions)
(Yen in billions)
(Yen in billions)
(Yen in billions)
(Yen in billions)
Electronics
Game
Pictures
Other
FinancialServices
Music
SONY AR-E0629 05.7.6, 2:42 PMPage 2 Adobe PageMaker 6.0J/PPC
Sony Corporation 3
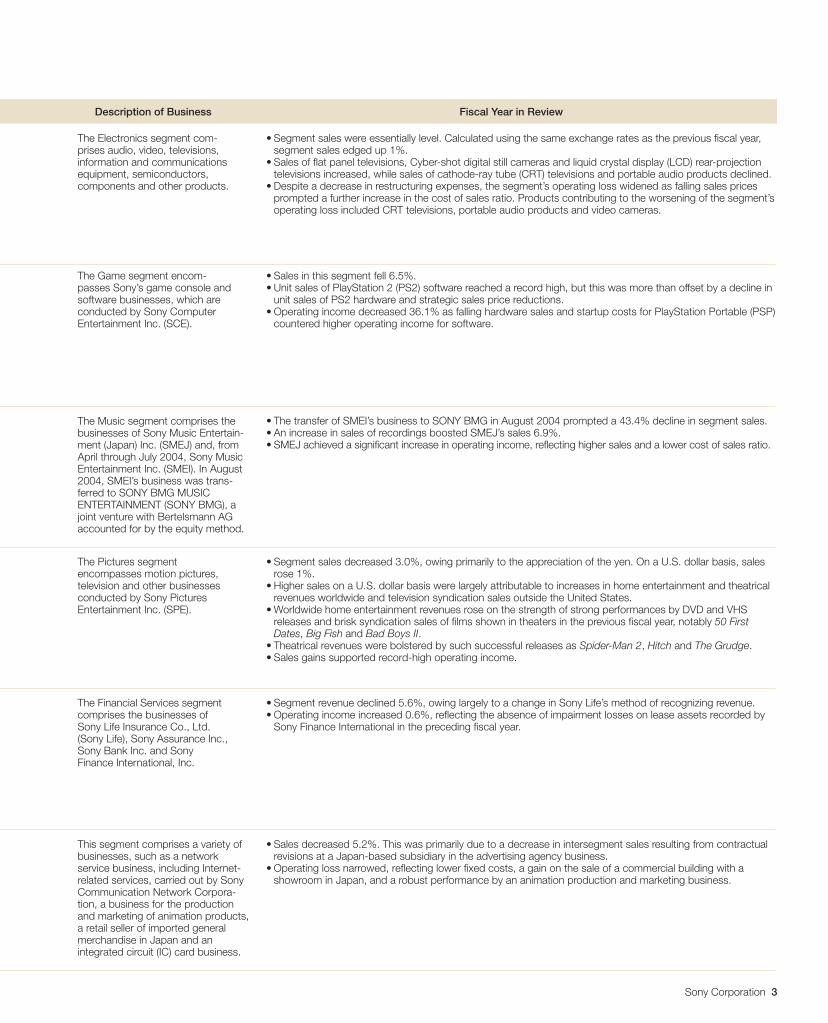
Fiscal Year in ReviewDescription of Business
The Electronics segment com-prises audio, video, televisions,information and communicationsequipment, semiconductors,components and other products.
• Segment sales were essentially level. Calculated using the same exchange rates as the previous fiscal year,segment sales edged up 1%.
• Sales of flat panel televisions, Cyber-shot digital still cameras and liquid crystal display (LCD) rear-projectiontelevisions increased, while sales of cathode-ray tube (CRT) televisions and portable audio products declined.
• Despite a decrease in restructuring expenses, the segment’s operating loss widened as falling sales pricesprompted a further increase in the cost of sales ratio. Products contributing to the worsening of the segment’soperating loss included CRT televisions, portable audio products and video cameras.
• Sales in this segment fell 6.5%.• Unit sales of PlayStation 2 (PS2) software reached a record high, but this was more than offset by a decline in
unit sales of PS2 hardware and strategic sales price reductions.• Operating income decreased 36.1% as falling hardware sales and startup costs for PlayStation Portable (PSP)
countered higher operating income for software.
• The transfer of SMEI’s business to SONY BMG in August 2004 prompted a 43.4% decline in segment sales.• An increase in sales of recordings boosted SMEJ’s sales 6.9%.• SMEJ achieved a significant increase in operating income, reflecting higher sales and a lower cost of sales ratio.
• Segment sales decreased 3.0%, owing primarily to the appreciation of the yen. On a U.S. dollar basis, salesrose 1%.
• Higher sales on a U.S. dollar basis were largely attributable to increases in home entertainment and theatricalrevenues worldwide and television syndication sales outside the United States.
• Worldwide home entertainment revenues rose on the strength of strong performances by DVD and VHSreleases and brisk syndication sales of films shown in theaters in the previous fiscal year, notably 50 FirstDates, Big Fish and Bad Boys II.
• Theatrical revenues were bolstered by such successful releases as Spider-Man 2, Hitch and The Grudge.• Sales gains supported record-high operating income.
• Segment revenue declined 5.6%, owing largely to a change in Sony Life’s method of recognizing revenue.• Operating income increased 0.6%, reflecting the absence of impairment losses on lease assets recorded by
Sony Finance International in the preceding fiscal year.
• Sales decreased 5.2%. This was primarily due to a decrease in intersegment sales resulting from contractualrevisions at a Japan-based subsidiary in the advertising agency business.
• Operating loss narrowed, reflecting lower fixed costs, a gain on the sale of a commercial building with ashowroom in Japan, and a robust performance by an animation production and marketing business.
The Game segment encom-passes Sony’s game console andsoftware businesses, which areconducted by Sony ComputerEntertainment Inc. (SCE).
The Music segment comprises thebusinesses of Sony Music Entertain-ment (Japan) Inc. (SMEJ) and, fromApril through July 2004, Sony MusicEntertainment Inc. (SMEI). In August2004, SMEI’s business was trans-ferred to SONY BMG MUSICENTERTAINMENT (SONY BMG), ajoint venture with Bertelsmann AGaccounted for by the equity method.
The Pictures segmentencompasses motion pictures,television and other businessesconducted by Sony PicturesEntertainment Inc. (SPE).
The Financial Services segmentcomprises the businesses ofSony Life Insurance Co., Ltd.(Sony Life), Sony Assurance Inc.,Sony Bank Inc. and SonyFinance International, Inc.
This segment comprises a variety ofbusinesses, such as a networkservice business, including Internet-related services, carried out by SonyCommunication Network Corpora-tion, a business for the productionand marketing of animation products,a retail seller of imported generalmerchandise in Japan and anintegrated circuit (IC) card business.
SONY AR-E0629 05.7.6, 2:38 PMPage 3 Adobe PageMaker 6.0J/PPC
4 Sony Corporation
To Our Shareholders
4 Sony Corporation
A Message from Nobuyuki IdeiThe Year in ReviewIn the fiscal year ended March 31, 2005, we recorded key strategic achievementsthat positioned the Sony Group for further growth as a global enterprise. Theseinclude strengthening our entertainment business through important alliances,establishing a firm foundation for our mobile phone business and making significantadvances in the development of next-generation microprocessors. With regard to ourcore electronics business, however, we faced an increasingly harsh operating envi-ronment, owing to such factors as intensified price competition. Accordingly, restoringprofitability in our mainstay Electronics segment remains management’s top priority.
Sales and operating revenue in the period under review edged down from theprevious year, owing to the transfer of our non-Japanese recorded music businessto our new joint venture SONY BMG MUSIC ENTERTAINMENT (SONY BMG), whichis accounted for using the equity method, and to the impact of a strong yen. Operat-ing income rose on the strength of strong performances by the Pictures and Musicsegments, while the Financial Services segment continued to see steady gains. Wealso registered a major increase in net income, reflecting contributions from SonyEricsson Mobile Communications AB, and other equity-method affiliates.
In the Electronics segment, we increased sales of flat panel televisions and digitalstill cameras by enhancing product appeal. Nonetheless, segment sales were largelyunchanged, a consequence of flagging markets for cathode-ray tube (CRT) televi-sions, coupled with a shift in demand from MD Walkman, CD Walkman and otherportable audio products toward hard disk and flash memory audio players. Thesegment’s operating loss widened, as higher variable costs accompanying down-ward pressure on prices outweighed the positive impact of restructuring-derivedreductions in fixed costs. In contrast, Sony Ericsson’s worldwide shipments of mobilephones, particularly camera phones, exceeded 43 million units during the period,significantly boosting its sales and operating profit.
In the Game segment, shipments of PlayStation 2 (PS2) software reached a record252 million units during the period. Sales fell, however, as a result of a decline in PS2hardware sales volume and strategic price reductions. PlayStation Portable (PSP) hard-ware and software had a strong start, following PSP’s launch in Japan in December2004 and North America in March 2005. A decline in the segment’s operating incomewas largely attributable to a decrease in overall sales of game hardware and startupcosts for PSP.
SONY AR-E0629 05.7.6, 2:37 PMPage 4 Adobe PageMaker 6.0J/PPC
Sony Corporation 5Sony Corporation 5
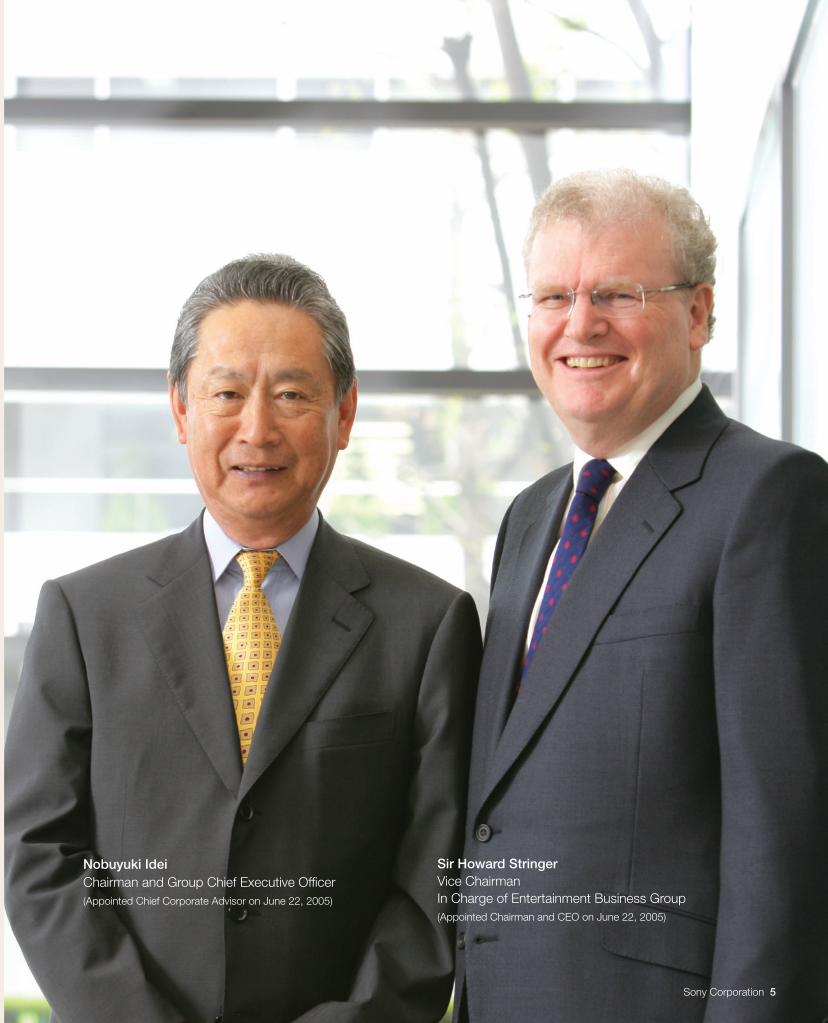
Sir Howard StringerVice ChairmanIn Charge of Entertainment Business Group(Appointed Chairman and CEO on June 22, 2005)
Nobuyuki IdeiChairman and Group Chief Executive Officer(Appointed Chief Corporate Advisor on June 22, 2005)
SONY AR-E0629 05.7.6, 2:37 PMPage 5 Adobe PageMaker 6.0J/PPC
6 Sony Corporation6 Sony Corporation
Operating in a shrinking market, the Music segment generated an increase in oper-ating income, thanks partly to a string of hits by new artists at Sony Music Entertain-ment (Japan) Inc. (SMEJ), which greatly bolstered SMEJ’s recorded music sales. Inthe Pictures segment, expanded box office revenue as well as sales of titles on DVDand VHS—attributable to such hits as Spider-Man 2—drove both sales and operatingincome to new heights.
During the period, we took several steps that reinforced the already formidable posi-tion of our entertainment business in the industry. Of particular note, we formed two keyequity and business alliances. In August 2004, we created SONY BMG, a joint venturethat brings together our non-Japanese recorded music business Sony Music Enter-tainment Inc. and BMG, the music group of Bertelsmann AG, with the aim of raisingprofitability through enhanced efficiency and expanded scale. In April 2005, a consor-tium comprising Sony and four partner companies completed the acquisition ofMetro–Goldwyn–Mayer Inc. (MGM).
In addition to using our global channels to distribute MGM’s existing library of filmand television content, we will be involved in co-financing and producing new titles.
New Management StructureGuided by our “Transformation 60” (TR60) groupwide medium-term corporate strategy—which focuses on structural reforms aimed at enhancing operational profitability andgrowth strategies—efforts to reduce fixed costs through the restructuring of operationsare proceeding according to plan. Although our electronics business has yet to suffi-ciently recover in terms of profitability, we have been implementing strategies thatwill ensure the steady growth of the Sony Group. The fiscal year ending March 31,2006, marks the start of the next stage of Sony’s evolution—a stage of acceleratedgrowth. Accordingly, we judged this to be an opportune time to create a newmanagement structure.
At the Board of Directors meeting to be held following the Ordinary General Meet-ing of Shareholders on June 22, 2005, we expect three candidates for positions onthe Board to be approved: Sir Howard Stringer, nominated as Chairman and ChiefExecutive Officer (CEO), Dr. Ryoji Chubachi, nominated as President and ElectronicsCEO, and Mr. Katsumi Ihara, nominated as Executive Deputy President and Presidentof the Home Electronics Network Company. Under the robust guidance of this newmanagement team, the Sony Group will remain on course for further growth.
April 26, 2005
Nobuyuki IdeiChairman and Group Chief Executive Officer(Appointed Chief Corporate Advisor on June 22, 2005)
SONY AR-E0629 05.7.6, 2:34 PMPage 6 Adobe PageMaker 6.0J/PPC
Sony Corporation 7
A Message from Ryoji ChubachiThe Sony Group continues to operate in a very challenging business environment.Accordingly, I am committed to forming a tightly knit management team with Sir Howardand Mr. Ihara and working with them to enhance the Group’s corporate value.
As CEO of the Electronics Business Group, my principal mission is to enhance thecompetitiveness of our electronics business. I believe the key to this lies in our abilityto develop products from the customer’s viewpoint. Our passion for craftsmanshipremains as strong as ever. In addition to identifying key business areas and enhanc-ing technological competence, we will strengthen our operations in areas crucial tocompetitiveness, including engineering, manufacturing, distribution and sales. Inrecent years, we have undertaken ambitious, growth-oriented technological develop-ment and capital investment, thereby sowing promising seeds for the future. Bringingthese seeds to bloom is our foremost challenge.
On this, the occasion of Sony’s 60th anniversary, I renew my pledge to build astrong, sound company. In the years ahead, we will continue to work to inspire anddelight our stakeholders, including our shareholders, customers, business partners,employees and the community at large, while remaining true to our statement ofpurpose: “to establish an ideal factory that stresses a spirit of freedom and open-mindedness.” This statement is included in Sony’s founding prospectus andcontinues to define our spirit.
April 26, 2005
Ryoji ChubachiExecutive Deputy President and Electronics CEO(Appointed President and Electronics CEO on June 22, 2005)
A Message from Sir Howard StringerSony has built up important traditions and assets during its 60-year history. I amhonored to be given the responsibility of drawing upon these to carve out a newhistory for Sony.
As CEO, my priority will be to recreate the excitement and spirit of innovationthat has evolved into the Sony brand over the past six decades. Although we facemany challenges, we also recognize a wealth of exciting opportunities. Together withDr. Chubachi and Mr. Ihara, I will work to deliver the best in electronics and entertainmentto customers by fostering the further convergence of Sony’s technological hardwareand content development.
The new management team will not hold back from implementing reforms in allbusinesses in its drive to ensure Sony’s position as the world’s leading electronicsand entertainment company. We will accelerate the reforms introduced by the currentmanagement and exert our best efforts to drive Sony’s growth as a global enterprisewith core capabilities in electronics, entertainment and technology.
April 26, 2005
Sir Howard StringerVice ChairmanIn Charge of Entertainment Business Group(Appointed Chairman and CEO on June 22, 2005)
Sony Corporation 7
SONY AR-E0629 05.7.6, 2:34 PMPage 7 Adobe PageMaker 6.0J/PPC
8 Sony Corporation
Electronicshttp://www.sony.net/electronics/
Review of Operations
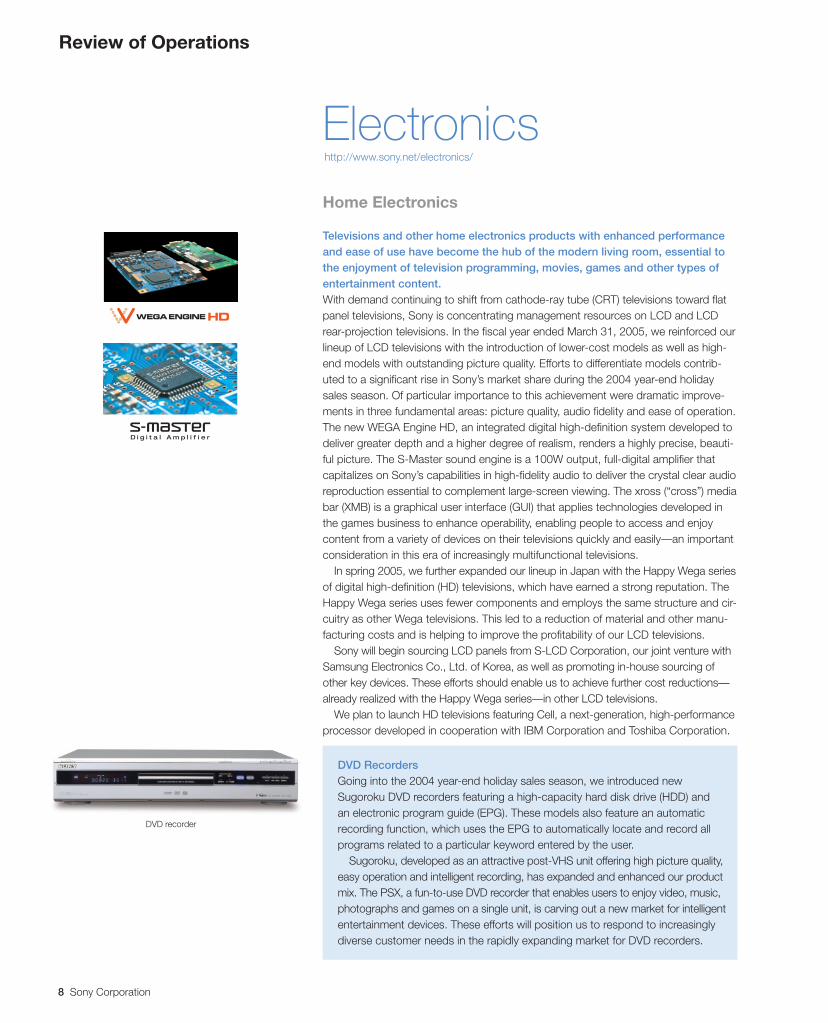
DVD RecordersGoing into the 2004 year-end holiday sales season, we introduced newSugoroku DVD recorders featuring a high-capacity hard disk drive (HDD) andan electronic program guide (EPG). These models also feature an automaticrecording function, which uses the EPG to automatically locate and record allprograms related to a particular keyword entered by the user.
Sugoroku, developed as an attractive post-VHS unit offering high picture quality,easy operation and intelligent recording, has expanded and enhanced our productmix. The PSX, a fun-to-use DVD recorder that enables users to enjoy video, music,photographs and games on a single unit, is carving out a new market for intelligententertainment devices. These efforts will position us to respond to increasinglydiverse customer needs in the rapidly expanding market for DVD recorders.
DVD recorder
Home Electronics
Televisions and other home electronics products with enhanced performanceand ease of use have become the hub of the modern living room, essential tothe enjoyment of television programming, movies, games and other types ofentertainment content.With demand continuing to shift from cathode-ray tube (CRT) televisions toward flatpanel televisions, Sony is concentrating management resources on LCD and LCDrear-projection televisions. In the fiscal year ended March 31, 2005, we reinforced ourlineup of LCD televisions with the introduction of lower-cost models as well as high-end models with outstanding picture quality. Efforts to differentiate models contrib-uted to a significant rise in Sony’s market share during the 2004 year-end holidaysales season. Of particular importance to this achievement were dramatic improve-ments in three fundamental areas: picture quality, audio fidelity and ease of operation.The new WEGA Engine HD, an integrated digital high-definition system developed todeliver greater depth and a higher degree of realism, renders a highly precise, beauti-ful picture. The S-Master sound engine is a 100W output, full-digital amplifier thatcapitalizes on Sony’s capabilities in high-fidelity audio to deliver the crystal clear audioreproduction essential to complement large-screen viewing. The xross (“cross”) mediabar (XMB) is a graphical user interface (GUI) that applies technologies developed inthe games business to enhance operability, enabling people to access and enjoycontent from a variety of devices on their televisions quickly and easily—an importantconsideration in this era of increasingly multifunctional televisions.
In spring 2005, we further expanded our lineup in Japan with the Happy Wega seriesof digital high-definition (HD) televisions, which have earned a strong reputation. TheHappy Wega series uses fewer components and employs the same structure and cir-cuitry as other Wega televisions. This led to a reduction of material and other manu-facturing costs and is helping to improve the profitability of our LCD televisions.
Sony will begin sourcing LCD panels from S-LCD Corporation, our joint venture withSamsung Electronics Co., Ltd. of Korea, as well as promoting in-house sourcing ofother key devices. These efforts should enable us to achieve further cost reductions—already realized with the Happy Wega series—in other LCD televisions.
We plan to launch HD televisions featuring Cell, a next-generation, high-performanceprocessor developed in cooperation with IBM Corporation and Toshiba Corporation.
SONY AR-E0629 05.7.6, 2:31 PMPage 8 Adobe PageMaker 6.0J/PPC
Sony Corporation 9Sony Corporation 9Sony Corporation 9
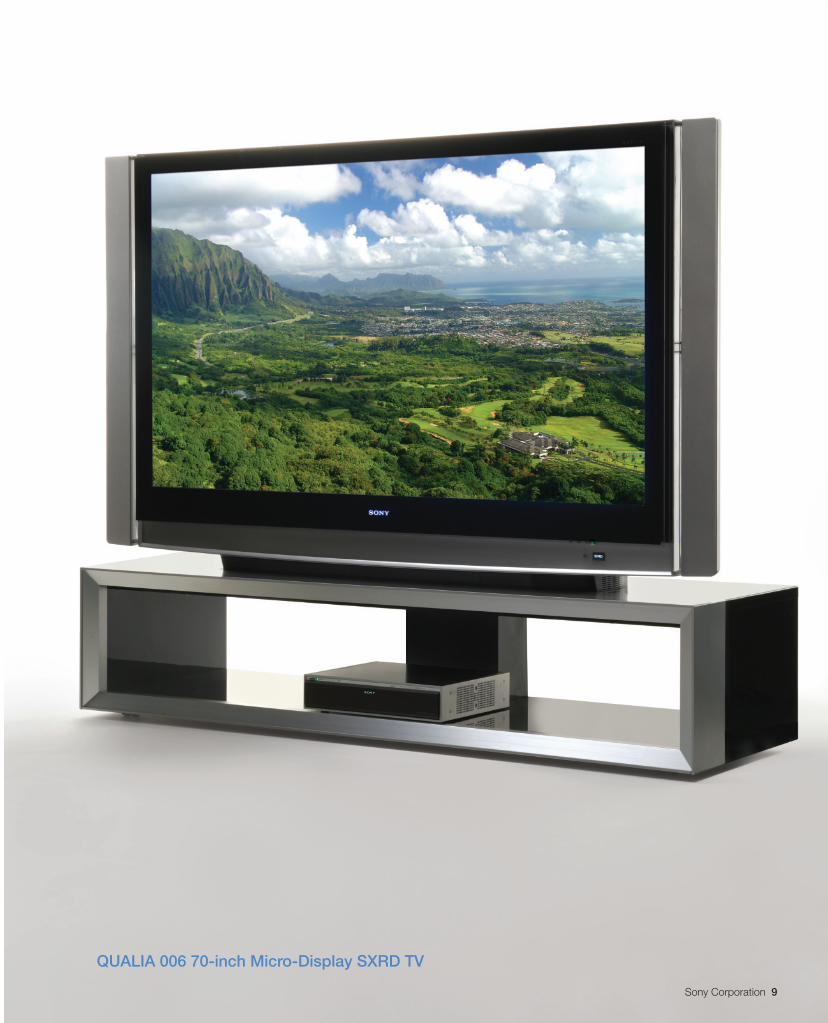
QUALIA 006 70-inch Micro-Display SXRD TV
SONY AR-E0629 05.7.6, 2:31 PMPage 9 Adobe PageMaker 6.0J/PPC
10 Sony Corporation
Cyber-shot DSC-T7
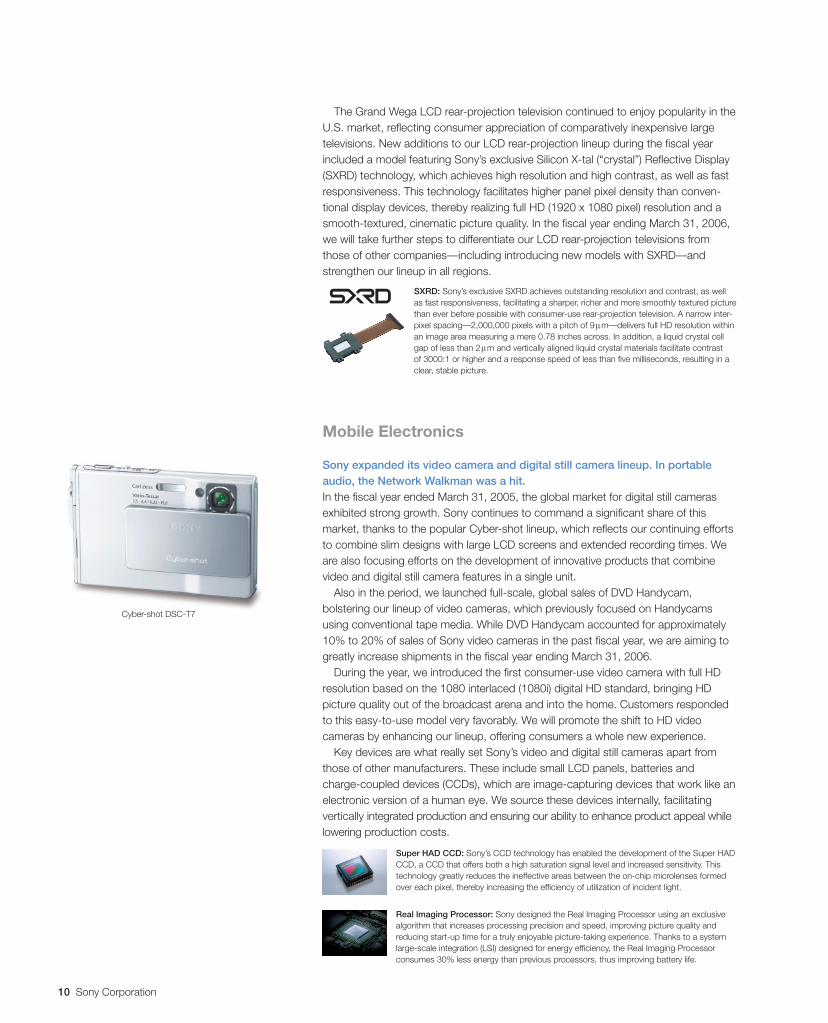
Real lmaging Processor: Sony designed the Real Imaging Processor using an exclusivealgorithm that increases processing precision and speed, improving picture quality andreducing start-up time for a truly enjoyable picture-taking experience. Thanks to a systemlarge-scale integration (LSI) designed for energy efficiency, the Real Imaging Processorconsumes 30% less energy than previous processors, thus improving battery life.
Super HAD CCD: Sony’s CCD technology has enabled the development of the Super HADCCD, a CCD that offers both a high saturation signal level and increased sensitivity. Thistechnology greatly reduces the ineffective areas between the on-chip microlenses formedover each pixel, thereby increasing the efficiency of utilization of incident light.
SXRD: Sony’s exclusive SXRD achieves outstanding resolution and contrast, as wellas fast responsiveness, facilitating a sharper, richer and more smoothly textured picturethan ever before possible with consumer-use rear-projection television. A narrow inter-pixel spacing—2,000,000 pixels with a pitch of 9 m—delivers full HD resolution withinan image area measuring a mere 0.78 inches across. In addition, a liquid crystal cellgap of less than 2 m and vertically aligned liquid crystal materials facilitate contrastof 3000:1 or higher and a response speed of less than five milliseconds, resulting in aclear, stable picture.
Mobile Electronics
Sony expanded its video camera and digital still camera lineup. In portableaudio, the Network Walkman was a hit.In the fiscal year ended March 31, 2005, the global market for digital still camerasexhibited strong growth. Sony continues to command a significant share of thismarket, thanks to the popular Cyber-shot lineup, which reflects our continuing effortsto combine slim designs with large LCD screens and extended recording times. Weare also focusing efforts on the development of innovative products that combinevideo and digital still camera features in a single unit.
Also in the period, we launched full-scale, global sales of DVD Handycam,bolstering our lineup of video cameras, which previously focused on Handycamsusing conventional tape media. While DVD Handycam accounted for approximately10% to 20% of sales of Sony video cameras in the past fiscal year, we are aiming togreatly increase shipments in the fiscal year ending March 31, 2006.
During the year, we introduced the first consumer-use video camera with full HDresolution based on the 1080 interlaced (1080i) digital HD standard, bringing HDpicture quality out of the broadcast arena and into the home. Customers respondedto this easy-to-use model very favorably. We will promote the shift to HD videocameras by enhancing our lineup, offering consumers a whole new experience.
Key devices are what really set Sony’s video and digital still cameras apart fromthose of other manufacturers. These include small LCD panels, batteries andcharge-coupled devices (CCDs), which are image-capturing devices that work like anelectronic version of a human eye. We source these devices internally, facilitatingvertically integrated production and ensuring our ability to enhance product appeal whilelowering production costs.
The Grand Wega LCD rear-projection television continued to enjoy popularity in theU.S. market, reflecting consumer appreciation of comparatively inexpensive largetelevisions. New additions to our LCD rear-projection lineup during the fiscal yearincluded a model featuring Sony’s exclusive Silicon X-tal (“crystal”) Reflective Display(SXRD) technology, which achieves high resolution and high contrast, as well as fastresponsiveness. This technology facilitates higher panel pixel density than conven-tional display devices, thereby realizing full HD (1920 x 1080 pixel) resolution and asmooth-textured, cinematic picture quality. In the fiscal year ending March 31, 2006,we will take further steps to differentiate our LCD rear-projection televisions fromthose of other companies—including introducing new models with SXRD—andstrengthen our lineup in all regions.
SONY AR-E0629 05.7.6, 2:31 PMPage 10 Adobe PageMaker 6.0J/PPC
Sony Corporation 11Sony Corporation 11
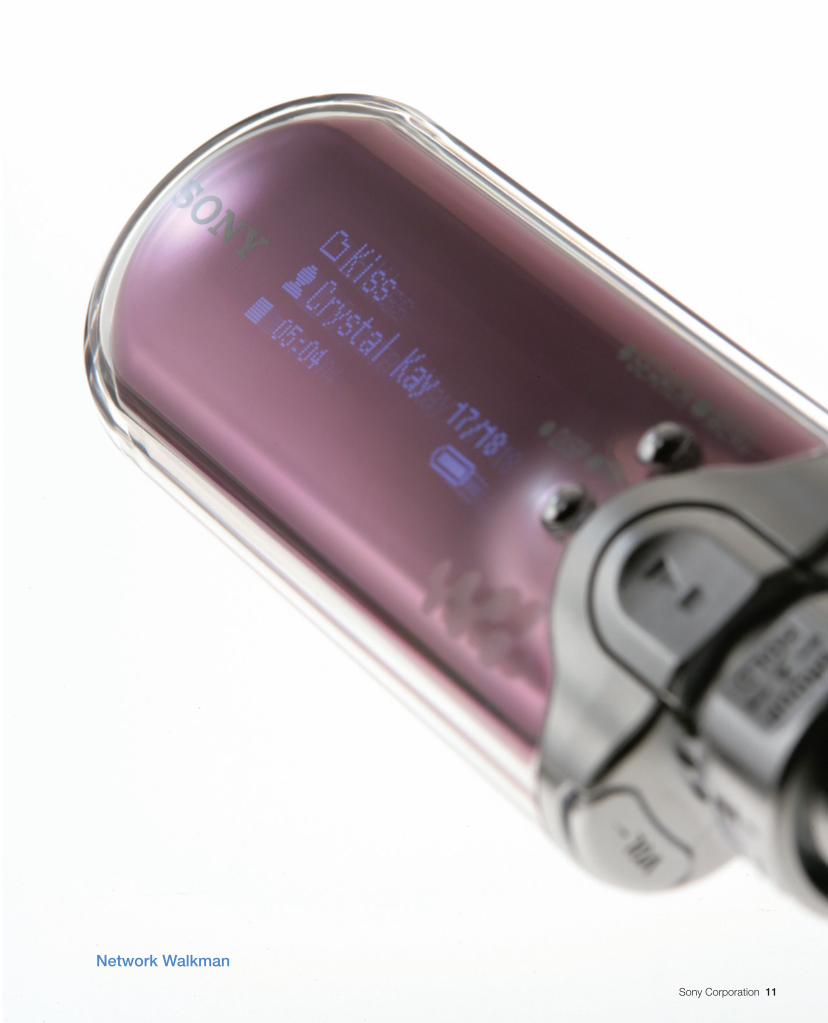
Network Walkman
SONY AR-E0629 05.7.6, 2:31 PMPage 11 Adobe PageMaker 6.0J/PPC
12 Sony Corporation
VAIO T-Series
K750 Z800 W31S premini®-IIW800
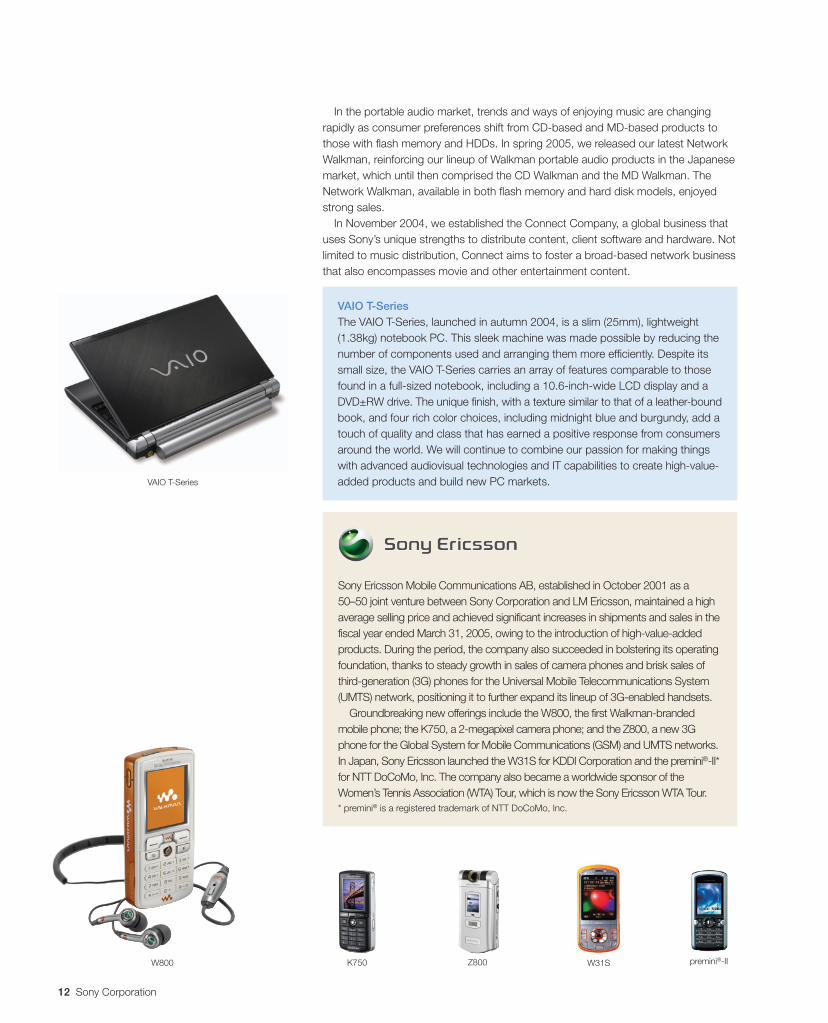
Sony Ericsson Mobile Communications AB, established in October 2001 as a50–50 joint venture between Sony Corporation and LM Ericsson, maintained a highaverage selling price and achieved significant increases in shipments and sales in thefiscal year ended March 31, 2005, owing to the introduction of high-value-addedproducts. During the period, the company also succeeded in bolstering its operatingfoundation, thanks to steady growth in sales of camera phones and brisk sales ofthird-generation (3G) phones for the Universal Mobile Telecommunications System(UMTS) network, positioning it to further expand its lineup of 3G-enabled handsets.
Groundbreaking new offerings include the W800, the first Walkman-brandedmobile phone; the K750, a 2-megapixel camera phone; and the Z800, a new 3Gphone for the Global System for Mobile Communications (GSM) and UMTS networks.In Japan, Sony Ericsson launched the W31S for KDDI Corporation and the premini®-II*for NTT DoCoMo, Inc. The company also became a worldwide sponsor of theWomen’s Tennis Association (WTA) Tour, which is now the Sony Ericsson WTA Tour.
VAIO T-SeriesThe VAIO T-Series, launched in autumn 2004, is a slim (25mm), lightweight(1.38kg) notebook PC. This sleek machine was made possible by reducing thenumber of components used and arranging them more efficiently. Despite itssmall size, the VAIO T-Series carries an array of features comparable to thosefound in a full-sized notebook, including a 10.6-inch-wide LCD display and aDVD±RW drive. The unique finish, with a texture similar to that of a leather-boundbook, and four rich color choices, including midnight blue and burgundy, add atouch of quality and class that has earned a positive response from consumersaround the world. We will continue to combine our passion for making thingswith advanced audiovisual technologies and IT capabilities to create high-value-added products and build new PC markets.
In the portable audio market, trends and ways of enjoying music are changingrapidly as consumer preferences shift from CD-based and MD-based products tothose with flash memory and HDDs. In spring 2005, we released our latest NetworkWalkman, reinforcing our lineup of Walkman portable audio products in the Japanesemarket, which until then comprised the CD Walkman and the MD Walkman. TheNetwork Walkman, available in both flash memory and hard disk models, enjoyedstrong sales.
In November 2004, we established the Connect Company, a global business thatuses Sony’s unique strengths to distribute content, client software and hardware. Notlimited to music distribution, Connect aims to foster a broad-based network businessthat also encompasses movie and other entertainment content.
* premini® is a registered trademark of NTT DoCoMo, Inc.
SONY AR-E0629 05.7.6, 2:30 PMPage 12 Adobe PageMaker 6.0J/PPC
Sony Corporation 13
Gamehttp://www.scei.co.jp/global/
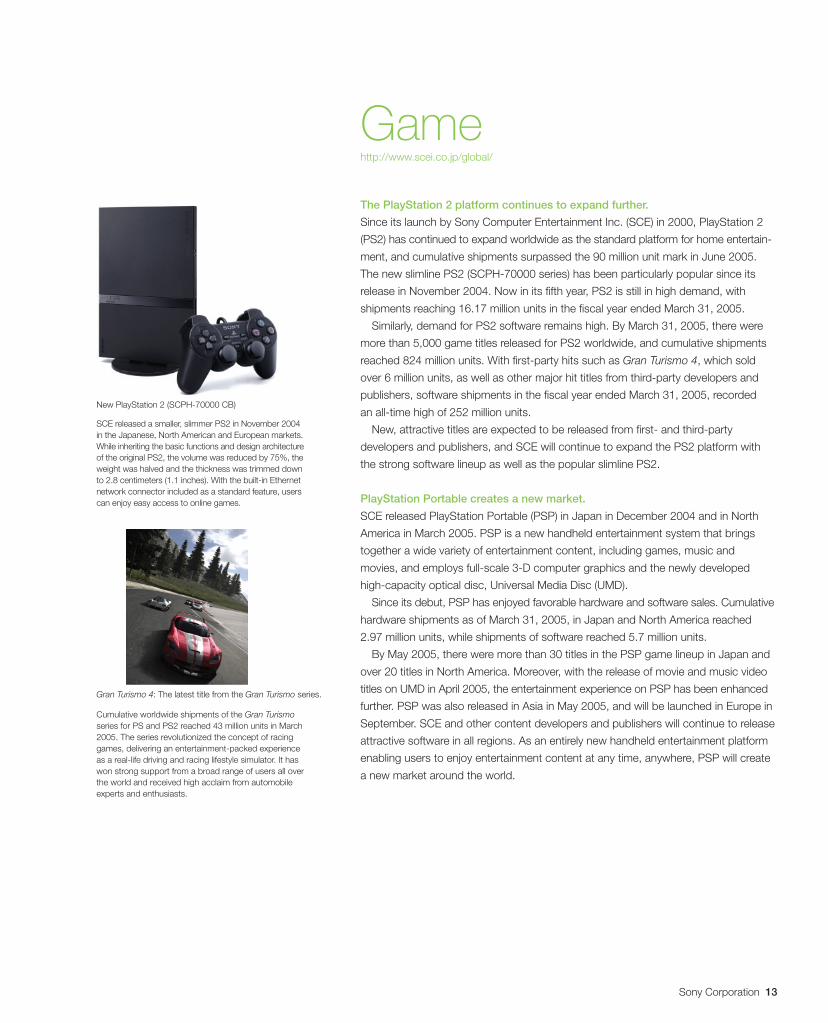
The PlayStation 2 platform continues to expand further.
Since its launch by Sony Computer Entertainment Inc. (SCE) in 2000, PlayStation 2
(PS2) has continued to expand worldwide as the standard platform for home entertain-
ment, and cumulative shipments surpassed the 90 million unit mark in June 2005.
The new slimline PS2 (SCPH-70000 series) has been particularly popular since its
release in November 2004. Now in its fifth year, PS2 is still in high demand, with
shipments reaching 16.17 million units in the fiscal year ended March 31, 2005.
Similarly, demand for PS2 software remains high. By March 31, 2005, there were
more than 5,000 game titles released for PS2 worldwide, and cumulative shipments
reached 824 million units. With first-party hits such as Gran Turismo 4, which sold
over 6 million units, as well as other major hit titles from third-party developers and
publishers, software shipments in the fiscal year ended March 31, 2005, recorded
an all-time high of 252 million units.
New, attractive titles are expected to be released from first- and third-party
developers and publishers, and SCE will continue to expand the PS2 platform with
the strong software lineup as well as the popular slimline PS2.
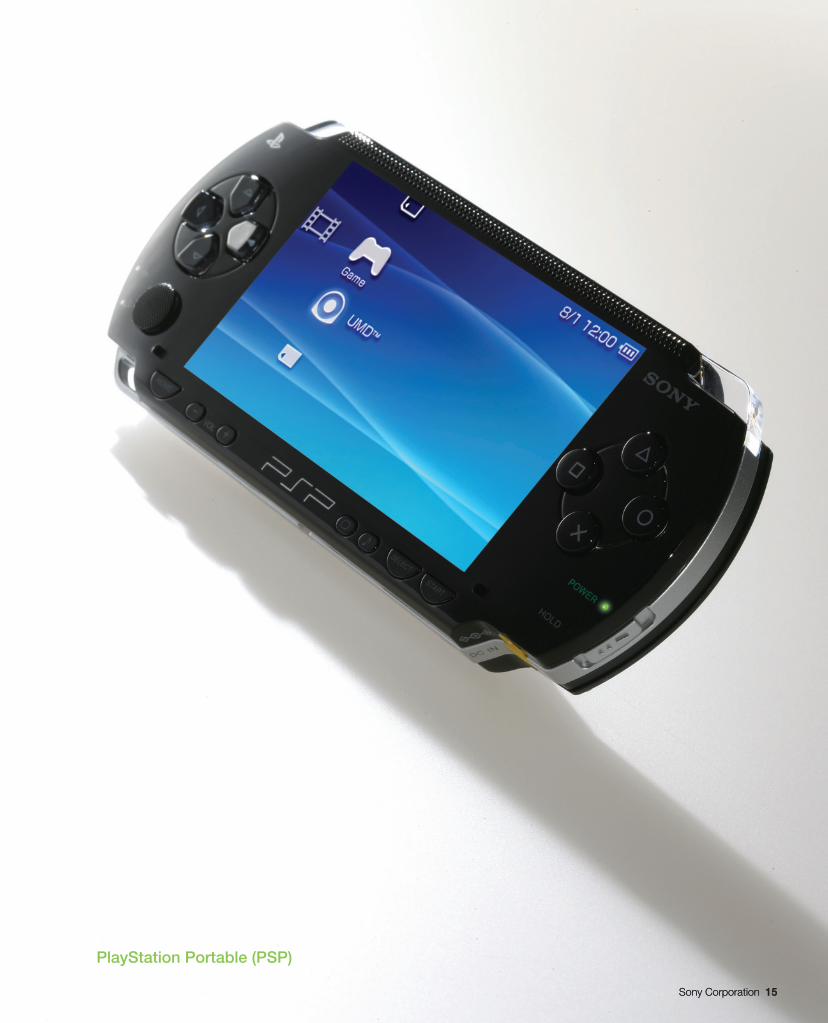
PlayStation Portable creates a new market.
SCE released PlayStation Portable (PSP) in Japan in December 2004 and in North
America in March 2005. PSP is a new handheld entertainment system that brings
together a wide variety of entertainment content, including games, music and
movies, and employs full-scale 3-D computer graphics and the newly developed
high-capacity optical disc, Universal Media Disc (UMD).
Since its debut, PSP has enjoyed favorable hardware and software sales. Cumulative
hardware shipments as of March 31, 2005, in Japan and North America reached
2.97 million units, while shipments of software reached 5.7 million units.
By May 2005, there were more than 30 titles in the PSP game lineup in Japan and
over 20 titles in North America. Moreover, with the release of movie and music video
titles on UMD in April 2005, the entertainment experience on PSP has been enhanced
further. PSP was also released in Asia in May 2005, and will be launched in Europe in
September. SCE and other content developers and publishers will continue to release
attractive software in all regions. As an entirely new handheld entertainment platform
enabling users to enjoy entertainment content at any time, anywhere, PSP will create
a new market around the world.
Cumulative worldwide shipments of the Gran Turismoseries for PS and PS2 reached 43 million units in March2005. The series revolutionized the concept of racinggames, delivering an entertainment-packed experienceas a real-life driving and racing lifestyle simulator. It haswon strong support from a broad range of users all overthe world and received high acclaim from automobileexperts and enthusiasts.
SCE released a smaller, slimmer PS2 in November 2004in the Japanese, North American and European markets.While inheriting the basic functions and design architectureof the original PS2, the volume was reduced by 75%, theweight was halved and the thickness was trimmed downto 2.8 centimeters (1.1 inches). With the built-in Ethernetnetwork connector included as a standard feature, userscan enjoy easy access to online games.
New PlayStation 2 (SCPH-70000 CB)
Gran Turismo 4: The latest title from the Gran Turismo series.
SONY AR-E0629 05.7.6, 2:30 PMPage 13 Adobe PageMaker 6.0J/PPC
14 Sony Corporation
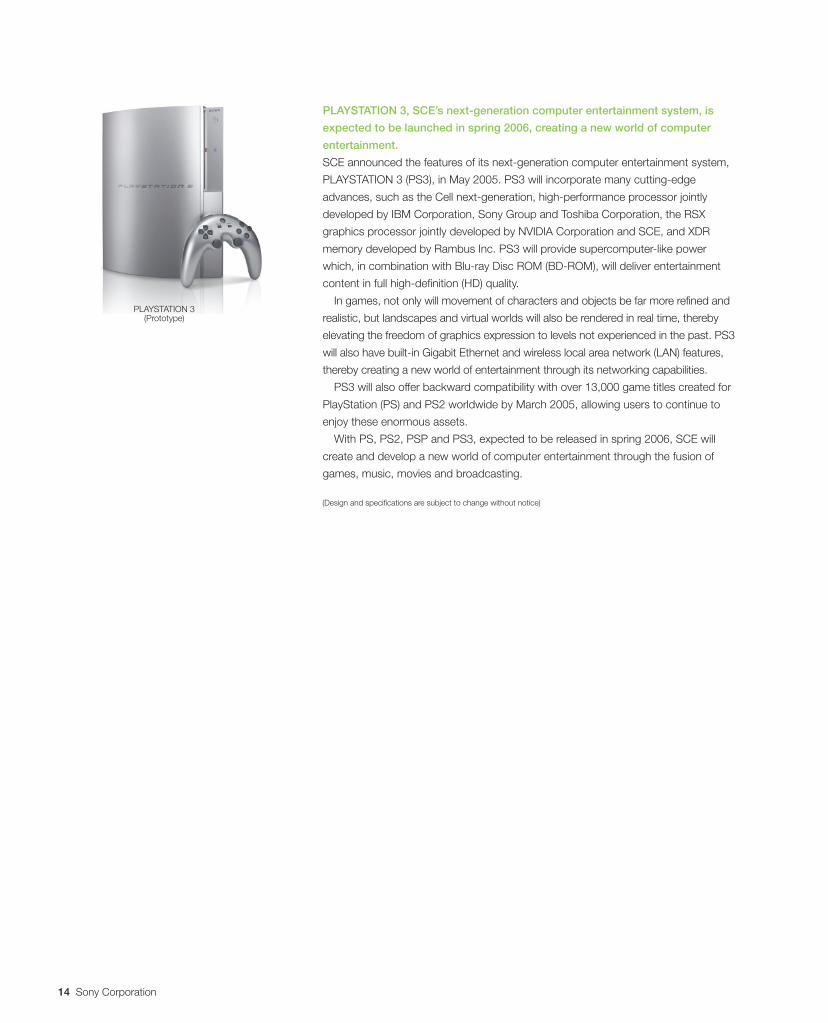
PLAYSTATION 3(Prototype)
PLAYSTATION 3, SCE’s next-generation computer entertainment system, is
expected to be launched in spring 2006, creating a new world of computer
entertainment.
SCE announced the features of its next-generation computer entertainment system,
PLAYSTATION 3 (PS3), in May 2005. PS3 will incorporate many cutting-edge
advances, such as the Cell next-generation, high-performance processor jointly
developed by IBM Corporation, Sony Group and Toshiba Corporation, the RSX
graphics processor jointly developed by NVIDIA Corporation and SCE, and XDR
memory developed by Rambus Inc. PS3 will provide supercomputer-like power
which, in combination with Blu-ray Disc ROM (BD-ROM), will deliver entertainment
content in full high-definition (HD) quality.
In games, not only will movement of characters and objects be far more refined and
realistic, but landscapes and virtual worlds will also be rendered in real time, thereby
elevating the freedom of graphics expression to levels not experienced in the past. PS3
will also have built-in Gigabit Ethernet and wireless local area network (LAN) features,
thereby creating a new world of entertainment through its networking capabilities.
PS3 will also offer backward compatibility with over 13,000 game titles created for
PlayStation (PS) and PS2 worldwide by March 2005, allowing users to continue to
enjoy these enormous assets.
With PS, PS2, PSP and PS3, expected to be released in spring 2006, SCE will
create and develop a new world of computer entertainment through the fusion of
games, music, movies and broadcasting.
(Design and specifications are subject to change without notice)
SONY AR-E0629 05.7.6, 2:29 PMPage 14 Adobe PageMaker 6.0J/PPC
Sony Corporation 15Sony Corporation 15Sony Corporation 15
PlayStation Portable (PSP)
SONY AR-E0629 05.7.6, 2:29 PMPage 15 Adobe PageMaker 6.0J/PPC
16 Sony Corporation
EntertainmentThe fiscal year ended March 31, 2005 was a pivotal year in Sony’s entertain-ment businesses, with the successful integration of the SONY BMG MUSICENTERTAINMENT (SONY BMG) joint venture and a record performance bySony Pictures Entertainment Inc. (SPE). In addition, the acquisition of Metro–Goldwyn–Mayer (MGM) by a consortium led by Sony Corporation ofAmerica (SCA) was completed in early April 2005.In August 2004, Sony Corporation and Bertelsmann AG merged their recorded musicassets to create SONY BMG, a joint venture with an impressive array of currentartists and a vast catalog that includes some of the most important recordings inhistory. SONY BMG is streamlining its operations and investing in talent developmentto position the company for future growth.
In the fiscal year ended March 31, 2005, SPE generated record-breaking operatingincome, due in part to the worldwide success of Spider-Man 2, strong homeentertainment sales and international television syndication. In April 2005, a consor-tium comprised of SCA, Providence Equity Partners Inc., Texas Pacific Group,Comcast Corporation and DLJ Merchant Banking Partners completed its acquisitionof MGM. In conjunction with the acquisition, SPE entered into agreements to co-finance and produce new motion pictures with MGM and to distribute MGM’s existingfilm and television content. The members of the consortium entered into a separateagreement to form a joint venture, to be managed by Comcast, establishing newcable/satellite channels that will feature SPE and MGM content.
By expanding access to content, Sony’s entertainment companies have improvedtheir strategic position. Licensing of the content to existing and emerging distributionchannels such as digital cable, mobile and broadband services, as well as distributionin new media formats, are expected to create a wide array of revenue-generatingopportunities.
Through the consortium’s acquisition of MGM, one of the world’s mostrenowned motion picture studios, Sony has created a strategic partnershipwith a massive library of entertainment content.MGM owns the world’s largest library of modern films, comprising approxi-mately 4,000 titles. MGM’s film library has received 208 Academy Awards®,making it one of the largest award-winning collections in the world, and itincludes several of the most successful film franchises in history, includingJames Bond, Pink Panther and Rocky.
Additionally, the library also includes over 10,400 episodes from televisionseries previously broadcast on prime-time network television, cable or in first-run syndication, where original episodes are initially broadcast on a syndicateof television stations and not on a single network. The programs in the MGMlibrary have won, among others, 108 Emmy Awards and 17 Golden GlobeAwards.
With our strong financial and strategic partners, Sony looks forward tobuilding on MGM’s exceptional legacy and capitalizing on emerging technolo-gies and markets to provide consumers worldwide more opportunities to enjoyMGM’s vast library.
SONY AR-E0629 05.7.6, 2:26 PMPage 16 Adobe PageMaker 6.0J/PPC

Sony Corporation 17Sony Corporation 17Sony Corporation 17
Destiny’s ChildDestiny’s Child’s Destiny Fulfilled was released inNovember 2004 and went on to sell 5.5 million unitsduring the fiscal year, achieving double platinumstatus in the United States, Canada and Japan,and platinum and gold status in countries acrossEurope, Oceania and Asia.
Maroon 5Maroon 5 was honored with the Best New Artistaward at the 2005 GRAMMY® Awards. Their de-but album, Songs about Jane, has spent 104weeks on the Billboard 200 Chart and sold morethan 8 million albums worldwide.
UsherUsher’s Confessions, the world’s bestselling albumin 2004, was honored with three awards at the 2005GRAMMY® Awards.
Ken HiraiKen Hirai’s soulful voice has cemented hisposition as one of Japan’s most popular malevocalists. His single “Close Your Eyes”—used asthe theme song for the film Crying Out Love in theCenter of the World in 2004—was one of a stringof hits from his sixth album, SENTIMENTALovers,which sold 1.8 million units.
ORANGE RANGEOkinawa’s six-man pop-rock unit ORANGE RANGEhas emerged in recent years as one of Japan’s mostpopular bands. The band has released several hitsingles, including “Hana,” used as the theme songfor the film Ima, Ai ni Yukimasu. Their second album,musiQ, sold 2.8 million units, putting ORANGERANGE firmly among the top of the J-Pop scene.
Gretchen WilsonGretchen Wilson’s Here for the Party, which wasreleased in May 2004, was the top-selling debutalbum in any genre for the year. The artist won the2005 GRAMMY® for Best Female Country VocalPerformance.
Spider-Man 2 – Motion Picture © 2004 Columbia PicturesIndustries, Inc. All rights reserved. Spider-Man Character® & © 2004 Marvel Characters, Inc. All rights reserved.
Spider-Man 2Columbia Pictures’ critically lauded blockbusterSpider-Man 2 was the No. 1 live action film of 2004,generating nearly $800 million in worldwide boxoffice receipts. Spider-Man 2 opened at No. 1 inmore than 70 territories around the globe.
HitchWill Smith’s romantic comedy Hitch was a breakoutsuccess around the world for Columbia Pictures in2005, earning more than $359 million in ticket sales.
Kung Fu HustleProduced by Columbia Pictures Film ProductionAsia, Kung Fu Hustle has become one of Asia’smost successful local films of all time, grossing closeto $70 million. It broke a number of records through-out Asia, including all-time biggest opening week-ends in China, Hong Kong, Taiwan and Malaysia.
Jeopardy!Jeopardy! is a classic TV quiz show with a twist:the host provides the answers and the contestantsmust give the questions. Now in its 21st season,Jeopardy! remains the highest-rated quiz show ontelevision, attracting 10 million viewers daily.
50 First DatesAdam Sandler continues to be one of ColumbiaPictures’ most consistent and bankable stars. His2004 romantic comedy 50 First Dates was a hitwith audiences in movie theaters worldwide andwas one of the studio’s most successful homeentertainment titles this past year.
SeinfeldThe first four seasons of Seinfeld, considered bymany to be the best TV sitcom ever, were releasedon DVD by Sony Pictures Home Entertainment.Seinfeld has become one of the fastest selling TVtitles on DVD ever.
Pictures
Music
SONY AR-E0629 05.7.6, 2:25 PMPage 17 Adobe PageMaker 6.0J/PPC
18 Sony Corporation
MUSIC http://www.sony.net/music/
The creation of the SONY BMG joint venture enables the company to continue toinvest aggressively in new talent and develop new musical content throughout itsworldwide operations. During the year, successful artist development efforts deliveredstrong results from such artists as Anastacia, Ciara, Destiny’s Child, John Legend,Jennifer Lopez, Mario, Maroon 5, Britney Spears, Rod Stewart, Usher and GretchenWilson. At the 47th Annual GRAMMY® Awards ceremony, the newly combinedcompany led the industry with a total of 28 GRAMMY® Awards in a wide range ofgenres, including R&B, pop, rock and country, with awards going to such artists asAlicia Keys, Usher, John Mayer, Los Lonely Boys and Gretchen Wilson.
The merger also provided the company with the resources to continue to build onits position as a global leader in the growing online and mobile music markets. SONYBMG aggressively expanded its efforts in the mobile arena by establishing newrelationships for the distribution of master ringtones, which are actual recordings thatreplace the standard mobile phone ringer, and ringback tones, which are recordingsthat take the place of the ringing sound callers traditionally hear when dialing. Thecompany also entered into agreements with wireless carriers in Europe and Asia tofacilitate the growth of 3G mobile services, which provide such features as full-lengthaudio and video offerings. Master ringtones represented one of the largest areas ofgrowth in wireless service, with a number of master ringtones achieving total sales ofmore than a million units during the fiscal year ended March 31, 2005.
Even as the music company forged a wide range of new relationships for the digitaldistribution of its content, it also played an active role in the successful introduction ofa new product designed to rejuvenate the traditional retail market. In the UnitedStates, SONY BMG led the music industry’s rollout of DualDisc, a new, two-sided,single-disc product that combines DVD video content and enhanced audio on oneside, with a full-length audio album on the other. High-profile titles such as Omarion’sdebut release O and Jennifer Lopez’s Rebirth were issued simultaneously on CD andDualDisc, with DualDisc accounting for well over 30% of weekly sales for both titles.
Sony Music Entertainment Japan
http://www.sonymusic.co.jp/
In the fiscal year ended March 31, 2005, a string of hits from leading artists, includingORANGE RANGE’s musiQ, Ken Hirai’s SENTIMENTALovers and Porno Graffitti’sPORNO GRAFFITTI BEST BLUE’S, contributed to sales of Sony Music Entertainment(Japan) Inc. (SMEJ). During the period, SMEJ continuously enjoyed the top share ofthe Japanese music market in terms of sales. At the 19th Japan Gold Disc Awards,ORANGE RANGE was named Artist of the Year, while releases by SMEJ artistsgarnered seven of 20 Japanese Rock and Pop Album of the Year awards.
SMEJ also took steps to accelerate growth in its network service business.Downloads from SMEJ’s various services, including Chaku-Uta®, launched in 2002,and Chaku-Uta Full™ master ringtone download services, are currently in the order of5.0 million per month, and SMEJ continues to enjoy the top share of this key marketin terms of revenues.
Sony will continue to grow its music business in Japan by developing new talentand providing exciting new recordings, while at the same time cultivating new ways ofenjoying music that take advantage of technological advances.
Sony Music Network is leading theevolution of network music servicesin Japan.Capitalizing on its digital network capa-bilities, on April 1, 2005, SMEJ estab-lished Sony Music Network Inc. The newcompany operates SMEJ’s Internetmusic distribution site, Sony MusicOnline Japan, a pioneering site thatoffers fee-based downloads of copy-right-protected music, as well as musicvideo clips and a wide range of othervisual content.
The online music download servicemarket is expanding rapidly, and signspoint to further growth as the numberof Internet and advanced mobile phoneusers rises. This trend is signaling acrucial change in the way people enjoymusic. By upgrading and strengtheningits Internet music distribution services,Chaku-Uta® mobile phone masterringtone download service and otherofferings, Sony Music Network aims tobring entertainment even closer to itscustomers. The company will also focuson developing new businesses in suchareas as e-commerce and network-based music and video promotions, withthe aim of further maximizing its digitalnetwork capabilities.
SONY AR-E0629 05.7.6, 2:23 PMPage 18 Adobe PageMaker 6.0J/PPC
Sony Corporation 19
PICTURES http://www.sony.net/movies/
With a consistent and stable approach to its core businesses, SPE achieved recordprofitability in the fiscal year ended March 31, 2005. The year was filled with criticaland commercial successes and further strengthened SPE’s position as a globalleader in the entertainment industry. In calendar year 2004, the studio was No. 1 intheatrical market share in the United States for the second time in the past threeyears, and generated ticket sales in excess of $1 billion in each of the United Statesand international markets for the third year in a row, which set a company record.
Leading the way was Spider-Man 2, which opened at No. 1 in the United Statesand 70 of the international territories in which it was released. The film has grossednearly $800 million in worldwide box office revenue to date and won the AcademyAward® for Best Achievement in Visual Effects. In addition, the studio experiencedtremendous success with films such as Hitch and The Grudge. SPE continues topursue a local language production and distribution strategy and achieved notewor-thy results this year with the foreign language films The House of Flying Daggers andKung Fu Hustle, which both enjoyed critical acclaim and box office success aroundthe world.
The strength and consistency of the film slate has translated into significant resultsin the home entertainment market, with Spider-Man 2 being this year’s top performer.In addition, the studio capitalized on content from Sony Pictures Television for DVDdistribution, most notably Seinfeld, which has become one of the fastest sellingtelevision titles on DVD in history. Having digitized more film and television titles thanany other studio, SPE is well positioned for continued success with emerging homeentertainment formats, including the Universal Media Disc (UMD) used by Sony’sPlayStation Portable (PSP). As a result, PSP owners have the opportunity to watchsome of SPE’s latest films, including Spider-Man 2, on a portable device.
Sony Pictures Television International (SPTI) continued to pursue its brandedinternational channel strategy with the launches of Animax India in July 2004 andAXN Germany in November 2004. To date, SPTI has formed or invested in approxi-mately 40 international networks, which are available in more than 100 countries.
Local Language Television ProductionThe past decade has seen significant growth in demand for local languagetelevision content. To capitalize on this market trend, SPTI has steadilyexpanded its local language production capabilities in key markets around theworld. With dedicated offices in France, Germany, Hong Kong, Miami (LatinAmerica), the People’s Republic of China, Spain and the United Kingdom, SPTImanages the production of shows based on its popular game show formats,such as The Dating Game and The Newlywed Game, as well as scriptedformats. The Nanny, for example, which ended production in the United Statesin 1999, is now enjoying success with localized versions in Greece, Russia,Turkey and Argentina.
Today, SPTI is the global leader in local language production, with morethan 9,000 episodes produced in over 30 countries. In fact, SPTI is the No. 1independent comedy producer in Germany and produces more originalprogramming in Russia than any other major Hollywood studio. In November2004, SPTI formed the first fully government-approved television productionjoint venture in the People’s Republic of China.
SONY AR-E0629 05.7.6, 2:23 PMPage 19 Adobe PageMaker 6.0J/PPC
20 Sony Corporation
Financial Serviceshttp://www.sony.co.jp/money/
Sony Financial HoldingsIn April 2004, Sony established Sony Financial Holdings Inc. (SFH) to oversee theoperations of Sony Life Insurance Co., Ltd. (Sony Life), Sony Assurance Inc. andSony Bank Inc. With this move, SFH became Japan’s first financial holding companyto integrate insurance and banking institutions under one umbrella.
In the fiscal year ended March 31, 2005, its first year of operation, SFH strengthenedtie-ups among the three companies in the provision and delivery of products and ser-vices, complementing the existing tie-ups in such areas as the provision of automobileinsurance and group credit life insurance. In June 2004, Sony Bank launched sales ofSony Life’s pension insurance policies through its web site MONEYKit. In October2004, Sony Assurance began to offer a fire insurance policy limited to customers takingout Sony Bank loans, while in December 2004 Sony Life’s highly trained life insuranceprofessionals, Lifeplanners, began introducing Sony Bank’s housing loans.
Recognizing the importance of maintaining financial soundness for the protectionof policyholders and depositors, SFH took initiatives in reinforcing risk managementand compliance systems for the entire SFH Group. In June 2004, SFH took steps toenhance Sony Bank’s financial condition, injecting into the bank ¥10.0 billion equitywith the proceeds of a third-party allotment of SFH shares to Sony.
In the fiscal year ending March 31, 2006, SFH will continue to reinforce the SFHGroup’s synergies and bolster risk management and compliance systems, as well asprepare for its initial public offering, which is being targeted to occur within the fiscalyear ending March 31, 2007.
Sony LifeSony Life, by enforcing needs-based sales solutions through its Lifeplanners (salesemployees) and Partners (independent agents), provides optimal protection that bestmatches the needs of each customer, as well as comprehensive after-sales servicesfor policyholders.
In May 2004, Sony Life introduced an optional feature for its existing family incomeinsurance policy, covering death and serious disability, which expands coverage toinclude other specified disabilities and conditions requiring nursing care. Sony Lifealso enhanced its lineup of services with the launch of a special agreement exempt-ing policyholders from future premium payments if they fall victim to any of three majorillnesses—cancer, acute myocardial infarction and/or stroke—or develop certaindisabilities, including conditions that necessitate nursing care.
In the fiscal year ended March 31, 2005, Sony Life’s results continued to improvesteadily. The amount of individual life insurance and annuity policies in force increased6%, to ¥27,823.4 billion, and the solvency margin, which reflects a life insurance com-pany’s ability to pay claims and other benefits in unforeseen events, was 1,317.1%,indicating an extremely high level of stability.
Sony AssuranceSony Assurance has sold non-life insurance products using direct marketing viatelephone and the Internet since its operations began. Sony Assurance offers risk-segmented automobile insurance and medical insurance, and aims to providecarefully tailored policies with reasonable premiums.
In the fiscal year ended March 31, 2005, Sony Assurance offered a new discountoption to automobile insurance policyholders based on annually traveled distance, an
SONY AR-E0629 05.7.6, 2:21 PMPage 20 Adobe PageMaker 6.0J/PPC
Sony Corporation 21
example of risk segmentation. Policyholders can enjoy this option when their traveleddistance does not exceed a specified annual limit, and apply a discount to the follow-ing year’s premiums, the size of which is based on the distance remaining under thelimit. Sony Assurance also launched a new service that eliminates the requirement forpolicyholders to report to the insurance company and to pay extra premiums whenthey exceed the distance limit agreed to in the policy.
In medical insurance, to respond to diversifying customer needs, Sony Assurancebroadened the choice of coverage options for its whole-life insurance products andcommenced sales of SURE Basic and SURE Wide in May 2005.
In the fiscal year ended March 31, 2005, net premiums increased 18%, to ¥36.6billion. The total number of automobile and cancer insurance policies in forcesurpassed 650,000.
Sony BankSony Bank, founded as an Internet bank that provides asset management and otherfinancial services to individual customers, has actively and inventively offered variousnew services.
In June 2004, the New Zealand dollar was added to the foreign currency deposittransaction service line-up. The foreign currency deposit service is one of the bank’smain services. In addition, to support individual customers’ flexible investment activi-ties, in December 2004 Sony Bank introduced limit order services as well as foreigncurrency time deposits with special agreements.
In the fiscal year ended March 31, 2005, Sony Bank newly added 17 investmenttrusts to its investment trust business, bringing the total number of funds it handles to40. Meanwhile, the bank successfully enhanced the features of its housing loan busi-ness in November 2004 by, among other things, developing a special arrangementthat enables borrowers to partially set various fixed rates from time to time on theirfloating-rate loans.
In the fiscal year ended March 31, 2005, deposits from customers in the bankingbusiness rose 44%, to ¥546.7 billion, and the balance of loans doubled to ¥126.3billion. Additionally, the number of accounts at Sony Bank as of March 31, 2005,increased by 98,968, or 37%, to 367,748.
Sony Finance InternationalSony Finance International, Inc., is involved in credit card, e-commerce paymentprocessing and leasing operations. In 2002, the company began issuing its eLIO-branded cards, which were created specifically for Internet shopping and incorpo-rated FeliCa, Sony’s contactless IC card technology. Efforts to increase the numberof member merchants and affiliated partners are supporting steady growth in the totalnumber of eLIO card members and the volume of transactions. As of March 31, 2005,Sony Finance International had issued approximately 750,000 eLIO cards and900,000 conventional credit cards. Developed by Sony Finance International, eLIO isa simple and secure credit service. Card members place their card on an electronicreading device, instead of inputting personal identification numbers (PINs) or creditcard numbers, removing the need to transmit such vital information over the Web.eLIO cards can be used for a variety of transactions, including shopping. They arecompatible with the Edy prepaid e-money service operated by bitWallet, Inc., andalso function as conventional Visa® cards. During the fiscal year, Sony Finance Inter-national launched eLIO Order, an easy-to-use service allowing card members toplace orders and purchase products with their mobile phones*.
* eLIO Order is available for NTT DoCoMo mobile phones that have been embedded with a chip basedon FeliCa technology.
eLIO card
SONY AR-E0629 05.7.6, 2:21 PMPage 21 Adobe PageMaker 6.0J/PPC
22 Sony Corporation
OtherSony Communication Network Corporation (SCN) is primarily expanding the So-netInternet service in Japan. So-net presently provides Internet access and contentservices to approximately 2.45 million subscribers.
The market for broadband Internet services continues to grow quickly. The domes-tic market for constant-connection broadband services—including asymmetric digitalsubscriber lines (ADSLs), fiber-to-the-home (FTTH) and cable television—exceeded18 million subscribers in December 2004, according to Ministry of Internal Affairs andCommunications statistics, and Internet users continue to join.
In the fiscal year ended March 31, 2005, SCN sought to attract new subscribersby strengthening its broadband content services and adding personalized services,such as the customizable portal My So-net and the easy-to-use personal web siteservice, So-net Blog. To allow subscribers to use its network without worry, SCN wasan early adopter of personal privacy policies, obtaining Privacy Mark* certification inNovember 1999.
Two of SCN’s affiliates were listed on the Tokyo Stock Exchange Mothers marketin the period under review. So-net M3, Inc., a consolidated subsidiary of SCN listedin September 2004, provides pharmaceutical marketing support services centeredon m3.com, a portal for physicians in Japan. In May 2005, the subscriber base form3.com reached 100,000, making it the largest in the country. DeNA Co., Ltd., anSCN equity-method affiliate listed in February 2005, offers e-commerce solutions,including Bidders, an auction and shopping site, and Mobaoku, an auction site formobile phone users.
To provide SCN with greater independence and more flexibility to adopt its ownmanagement structures and growth strategies, we are considering the possibility ofpursuing an initial public offering of SCN’s common stock and delisting our subsidiarytracking stock. We believe this would allow SCN to achieve its full potential within theSony Group.
* Privacy Mark: Personal information management accreditation administered by the Japan InformationProcessing Development Corporation (JIPDEC).
A470001(03)
SONY AR-E0629 05.7.6, 2:21 PMPage 22 Adobe PageMaker 6.0J/PPC
Sony Corporation 23
R&D Strategies and Selection of Key Technological Fields
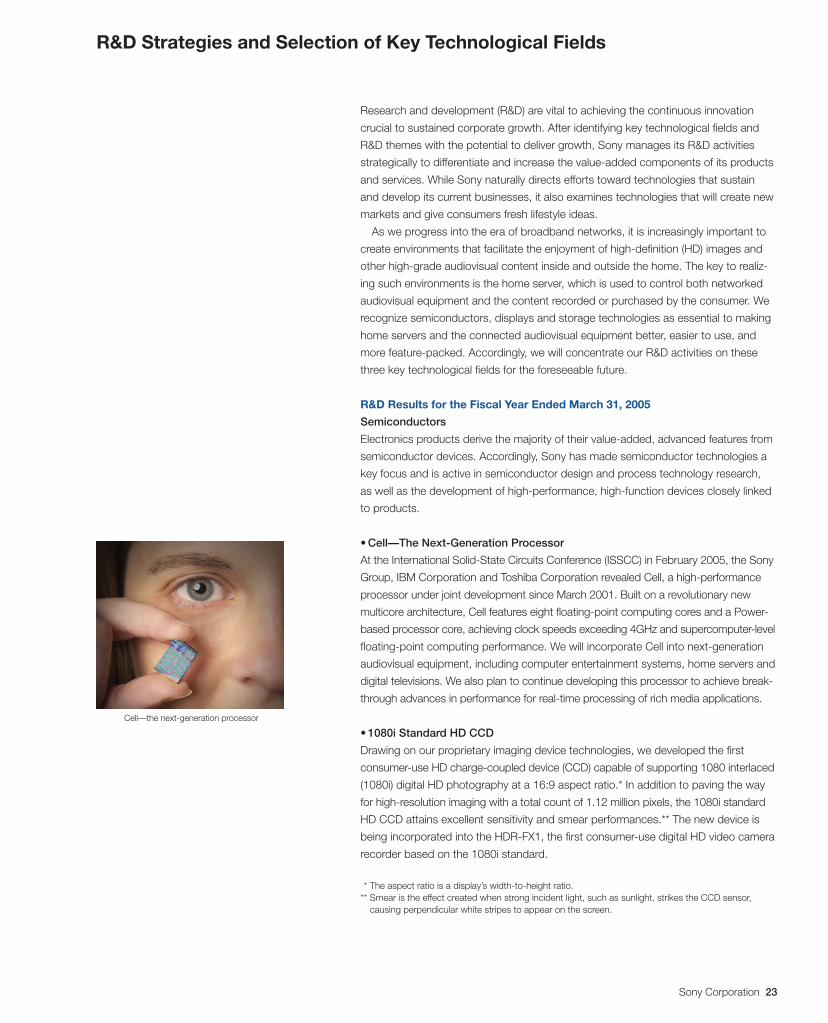
Cell—the next-generation processor
Research and development (R&D) are vital to achieving the continuous innovation
crucial to sustained corporate growth. After identifying key technological fields and
R&D themes with the potential to deliver growth, Sony manages its R&D activities
strategically to differentiate and increase the value-added components of its products
and services. While Sony naturally directs efforts toward technologies that sustain
and develop its current businesses, it also examines technologies that will create new
markets and give consumers fresh lifestyle ideas.
As we progress into the era of broadband networks, it is increasingly important to
create environments that facilitate the enjoyment of high-definition (HD) images and
other high-grade audiovisual content inside and outside the home. The key to realiz-
ing such environments is the home server, which is used to control both networked
audiovisual equipment and the content recorded or purchased by the consumer. We
recognize semiconductors, displays and storage technologies as essential to making
home servers and the connected audiovisual equipment better, easier to use, and
more feature-packed. Accordingly, we will concentrate our R&D activities on these
three key technological fields for the foreseeable future.
R&D Results for the Fiscal Year Ended March 31, 2005
Semiconductors
Electronics products derive the majority of their value-added, advanced features from
semiconductor devices. Accordingly, Sony has made semiconductor technologies a
key focus and is active in semiconductor design and process technology research,
as well as the development of high-performance, high-function devices closely linked
to products.
• Cell—The Next-Generation Processor
At the International Solid-State Circuits Conference (ISSCC) in February 2005, the Sony
Group, IBM Corporation and Toshiba Corporation revealed Cell, a high-performance
processor under joint development since March 2001. Built on a revolutionary new
multicore architecture, Cell features eight floating-point computing cores and a Power-
based processor core, achieving clock speeds exceeding 4GHz and supercomputer-level
floating-point computing performance. We will incorporate Cell into next-generation
audiovisual equipment, including computer entertainment systems, home servers and
digital televisions. We also plan to continue developing this processor to achieve break-
through advances in performance for real-time processing of rich media applications.
• 1080i Standard HD CCD
Drawing on our proprietary imaging device technologies, we developed the first
consumer-use HD charge-coupled device (CCD) capable of supporting 1080 interlaced
(1080i) digital HD photography at a 16:9 aspect ratio.* In addition to paving the way
for high-resolution imaging with a total count of 1.12 million pixels, the 1080i standard
HD CCD attains excellent sensitivity and smear performances.** The new device is
being incorporated into the HDR-FX1, the first consumer-use digital HD video camera
recorder based on the 1080i standard.
** The aspect ratio is a display’s width-to-height ratio.** Smear is the effect created when strong incident light, such as sunlight, strikes the CCD sensor,
causing perpendicular white stripes to appear on the screen.
SONY AR-E0629 05.7.6, 2:20 PMPage 23 Adobe PageMaker 6.0J/PPC
24 Sony Corporation
Displays
With the advent of HD broadcasting and Blu-ray Disc recorders for recording and
playing back HD content, and of high-resolution digital still cameras and video cam-
eras, Sony is developing the architecture that will allow people to enjoy and be enter-
tained by the growing diversity of high-resolution content. To this end, we are using
our proprietary know-how to advance display technologies and devices in the pursuit
of “realism,” our concept of the ideal picture quality.
• Triluminous Wide-Spectrum Backlit LED System
We developed Triluminous, a wide-spectrum backlit light-emitting diode (LED) sys-
tem, and used it in the QUALIA 005 LCD television, making the QUALIA 005 the first
consumer-use LCD television with LED backlighting. By using independent panels for
red, green and blue (RGB) signals, this backlit LED system achieves more realistic,
wide-spectrum color reproduction than previous LCD television backlit systems.
• GxL System
Our new projection format, called the GxL (“G-by-L”) system, utilizes diffraction grat-
ing elements on the surface of a micro-electromechanical systems (MEMS) chip and
primary color lasers to reproduce colors more faithfully than LEDs. The GxL system
debuted in March 2005 at the Laser Dream Theater at the 2005 World Exposition in
Aichi, Japan, projecting at high resolution onto an ultra-wide 2005-inch screen
(approximately 10 meters high and 50 meters wide).
Storage
We are developing a range of backbone devices compliant with the Blu-ray Disc
standard to complement our fast-track commercialization of Blu-ray Disc systems for
HD image recording and playback.
• Three-Wavelength Optical Recording/Playback Heads for Blu-ray Discs,
DVDs and CDs
Combining our extensive experience in semiconductor laser, surface mount and
optical technologies, we developed a three-wavelength optical recording and playback
head that supports Blu-ray Disc, DVD and CD playback with a single optical head.
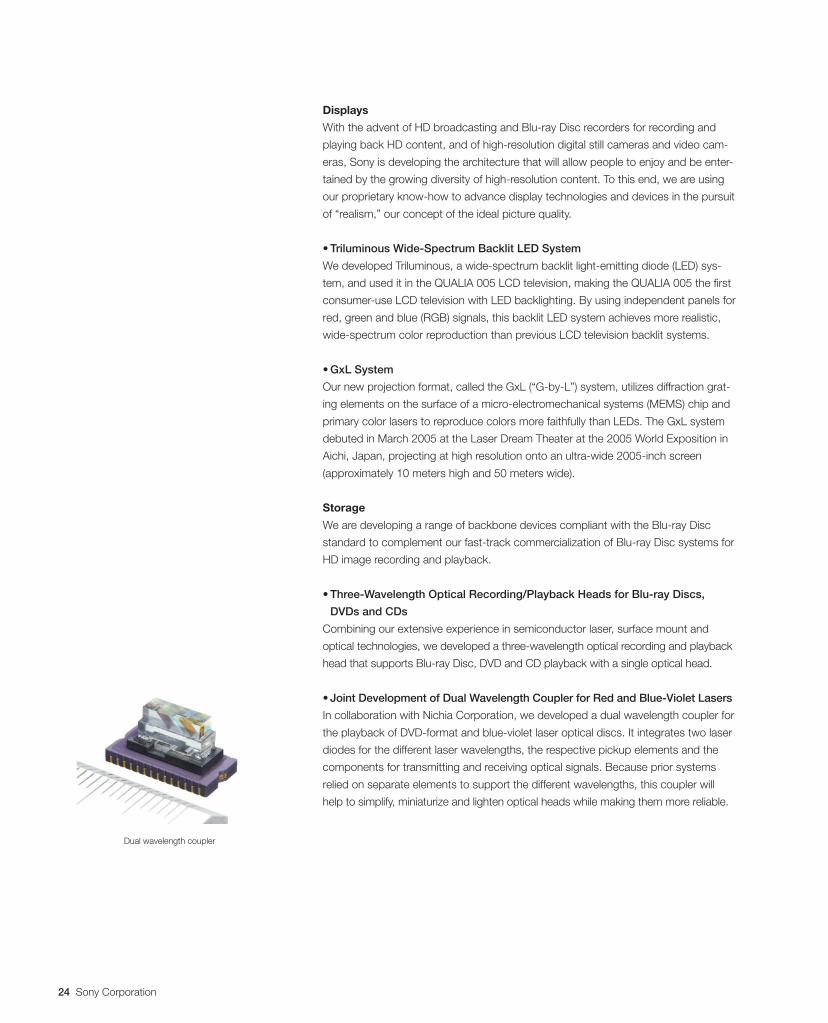
• Joint Development of Dual Wavelength Coupler for Red and Blue-Violet Lasers
In collaboration with Nichia Corporation, we developed a dual wavelength coupler for
the playback of DVD-format and blue-violet laser optical discs. It integrates two laser
diodes for the different laser wavelengths, the respective pickup elements and the
components for transmitting and receiving optical signals. Because prior systems
relied on separate elements to support the different wavelengths, this coupler will
help to simplify, miniaturize and lighten optical heads while making them more reliable.
Dual wavelength coupler
SONY AR-E0629 05.7.6, 2:20 PMPage 24 Adobe PageMaker 6.0J/PPC
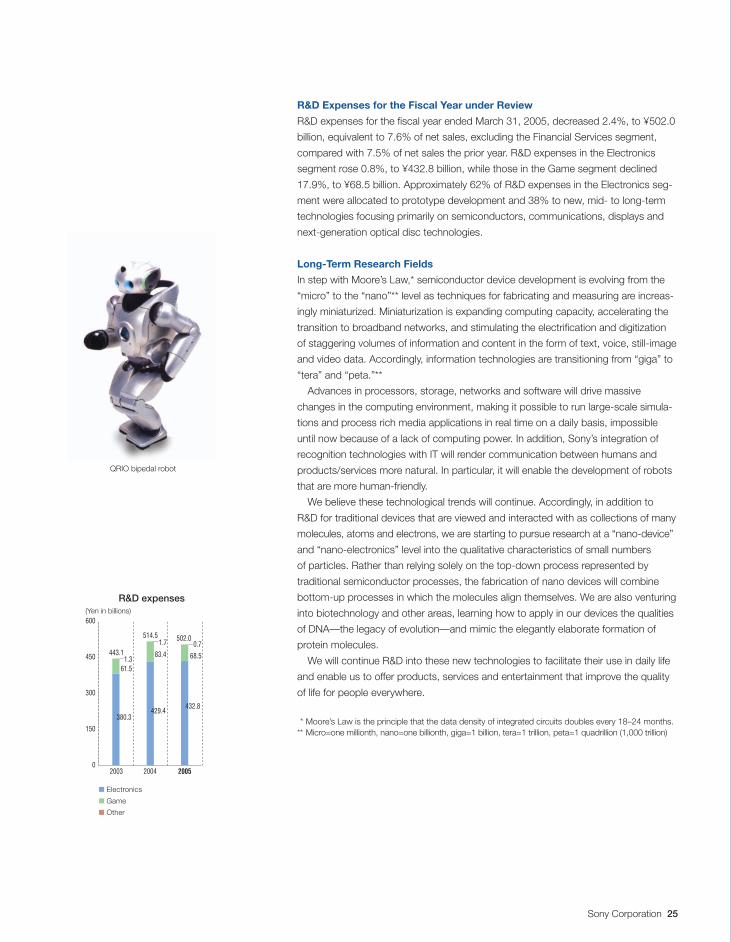
QRIO bipedal robot
R&D Expenses for the Fiscal Year under Review
R&D expenses for the fiscal year ended March 31, 2005, decreased 2.4%, to ¥502.0
billion, equivalent to 7.6% of net sales, excluding the Financial Services segment,
compared with 7.5% of net sales the prior year. R&D expenses in the Electronics
segment rose 0.8%, to ¥432.8 billion, while those in the Game segment declined
17.9%, to ¥68.5 billion. Approximately 62% of R&D expenses in the Electronics seg-
ment were allocated to prototype development and 38% to new, mid- to long-term
technologies focusing primarily on semiconductors, communications, displays and
next-generation optical disc technologies.
Long-Term Research Fields
In step with Moore’s Law,* semiconductor device development is evolving from the
“micro” to the “nano”** level as techniques for fabricating and measuring are increas-
ingly miniaturized. Miniaturization is expanding computing capacity, accelerating the
transition to broadband networks, and stimulating the electrification and digitization
of staggering volumes of information and content in the form of text, voice, still-image
and video data. Accordingly, information technologies are transitioning from “giga” to
“tera” and “peta.”**
Advances in processors, storage, networks and software will drive massive
changes in the computing environment, making it possible to run large-scale simula-
tions and process rich media applications in real time on a daily basis, impossible
until now because of a lack of computing power. In addition, Sony’s integration of
recognition technologies with IT will render communication between humans and
products/services more natural. In particular, it will enable the development of robots
that are more human-friendly.
We believe these technological trends will continue. Accordingly, in addition to
R&D for traditional devices that are viewed and interacted with as collections of many
molecules, atoms and electrons, we are starting to pursue research at a “nano-device”
and “nano-electronics” level into the qualitative characteristics of small numbers
of particles. Rather than relying solely on the top-down process represented by
traditional semiconductor processes, the fabrication of nano devices will combine
bottom-up processes in which the molecules align themselves. We are also venturing
into biotechnology and other areas, learning how to apply in our devices the qualities
of DNA—the legacy of evolution—and mimic the elegantly elaborate formation of
protein molecules.
We will continue R&D into these new technologies to facilitate their use in daily life
and enable us to offer products, services and entertainment that improve the quality
of life for people everywhere.
** Moore’s Law is the principle that the data density of integrated circuits doubles every 18–24 months.** Micro=one millionth, nano=one billionth, giga=1 billion, tera=1 trillion, peta=1 quadrillion (1,000 trillion)
■ Electronics
■ Game
■ Other
26 Sony Corporation
The SonyChallenge:Seeing isBelieving
Sony Corporation 25
At Sony, our commitment to creating new visual
experiences doesn’t stop at consumer electronics.
In this special feature, we take a look at three
applications of Sony technologies that underscore
this statement: the Laser Dream Theater, which uses
innovative technologies to offer images of unsurpassed
beauty; Sony Pictures Imageworks, a visual effects
and character animation leader; and CineAlta, a
revolutionary digital movie production system.
Our challenge is to continue developing technologies
like these, enabling us to offer innovative content
and hardware that mean seeing really is believing.
600
450
300
150
02003
443.1
380.3
61.51.3
429.4
83.4
1.7
432.8
68.5
0.7514.5 502.0
2004
(Yen in billions)
R&D expenses
2005
Sony Corporation 27
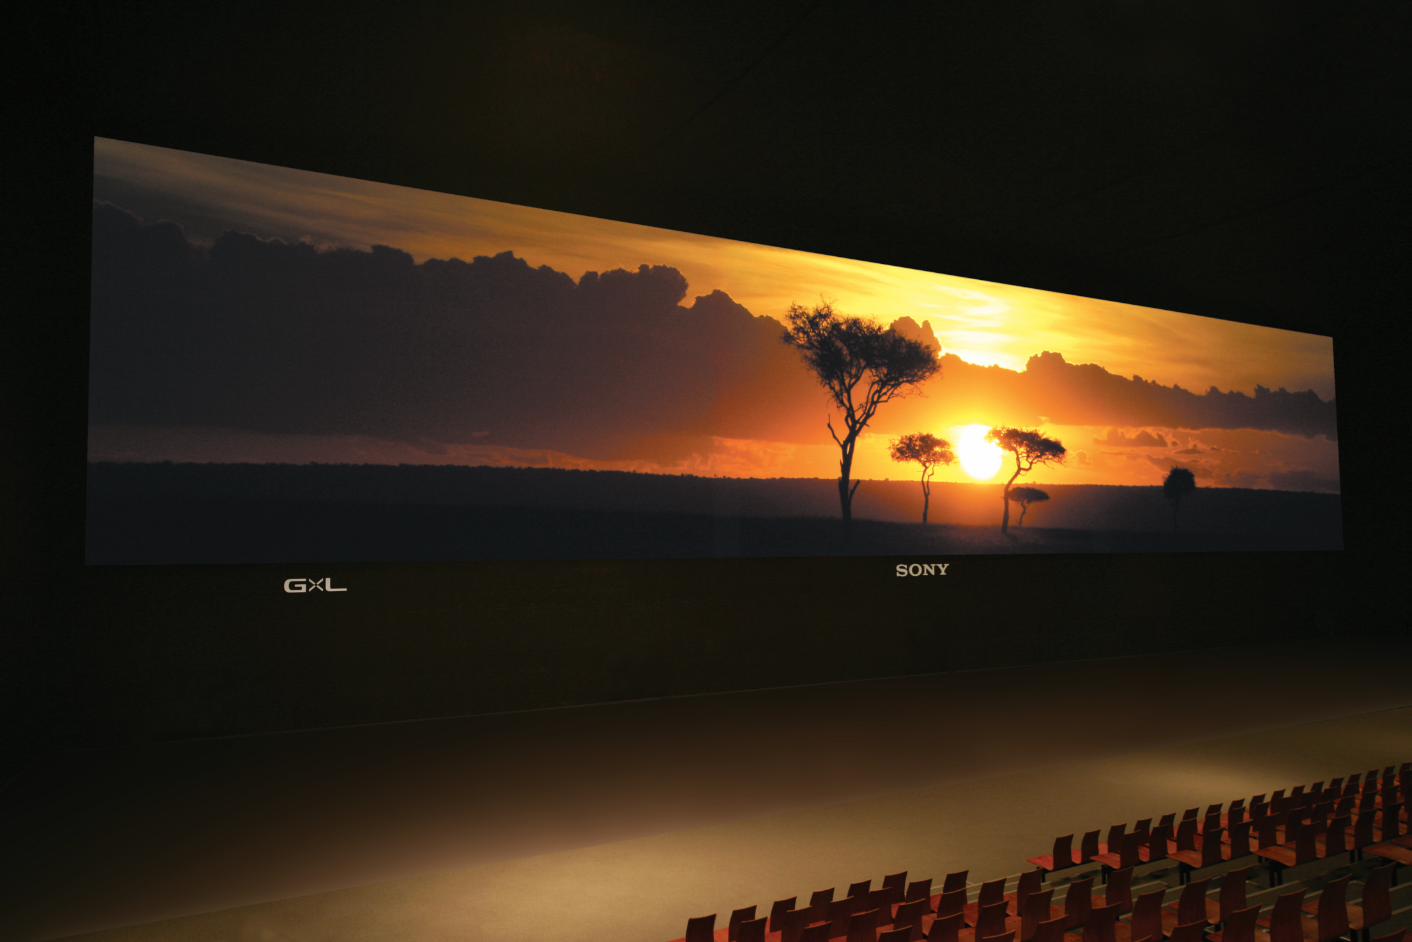
Sony’s GxL display technology offers images like none ever seen before.At the 2005 World Exposition in Aichi, Japan, Sony is presenting the Laser DreamTheater, where high-quality images are projected with lasers onto one of the world’slargest screens. The ultra-wide, 2005-inch screen is big enough to show even a
whale in life-size proportions, or display the skyline at dusk over the savanna withsuch realism that you believe the real thing is right before your eyes.
Behind this amazing performance is the GxL (“G-by-L”) system under developmentat Sony. GxL is a projection system that combines our proprietary high-output lasertechnologies and cutting-edge micro-electromechanical systems (MEMS). By usingred, green and blue (RGB) lasers, it is able to more than double the
vividness of color produced in cathode-ray tube (CRT) televisions.For example, only the GxL system can faithfully reproduce the brilliantdeep blue of the earth as shown at the end of Laser Dream Theater’spresentation—the same hue as found on the wings of the Morphobutterfly (morpho menelaus) dwelling in the Amazon.
The Laser Dream Theater brings together multiple Sony Group technologies, from
those used in content planning around the Expo’s theme, “Nature’s Wisdom,” tothose used in filming, music scores and image projection. A specially developedcamera system was used to film the images, which entered a single lens and weresimultaneously recorded onto three Hi-Vision video system HDCAM-SRs. Sony MusicEntertainment Japan also produced the high-fidelity music flowing from the 86speakers installed in the theater.
Gathering the best in technology, Sony overcame numerous difficulties to realize its
dream of delivering high-quality, beautiful imagery never before seen on so gigantic ascreen. In pursuit of achievements like this, we will continue to follow our dreams andcuriosity to bring wonder and delight to people worldwide.
GxL colorreproduction
spectrumHDTV color
reproductionspecifications
CIE 1931 chromaticity diagram(xy chromaticity diagram)
Spectrumlocus
It was the summer of 2002 when I first heard about Sony’s plans to participatein the World Exposition. About the only thing decided then was that we wouldtry to create a 2005-inch screen to honor the year of the Expo. At the time, the
GxL prototype could only project up to 200 inches, so there was a more thantenfold discrepancy between that and the 2005-inch goal. Nevertheless, a pas-sion burned within us to create a laser display, a so-called “dream display,” withour own hands. We managed to overcome many obstacles in an amazinglyshort period to develop brand-new blue and green lasers.
The human optic nerve is constituted so it can respond to the three additive
primary colors—red, green and blue. The GxL system uses single wavelengthRGB lasers with outstanding color purity, enabling it to reproduce the samecolors as in real objects. The beauty it produces far exceeded even my ownexpectations. When you look at the real world through a 2005-inch screen likesome huge window, you can’t help but feel a sense of wonder and excitement.
GxL System
GxL Color Reproduction
Laser Dream Theater
GxL deviceMagnified image of surface
Size: 25 microns
Size: 34 x 6 x 2mm
Sony Corporation 27
Morpho menelaus© Clive S. Pratt–
The Insect Company
Naoya Eguchi
General Manager, Laser & Optics Development Department,
Photonics Development Division, Core Technology
Development Group, Micro Systems Network Company,
Sony Corporation
SONY AR-E0629 05.7.6, 2:19 PMPage 27 Adobe PageMaker 6.0J/PPC
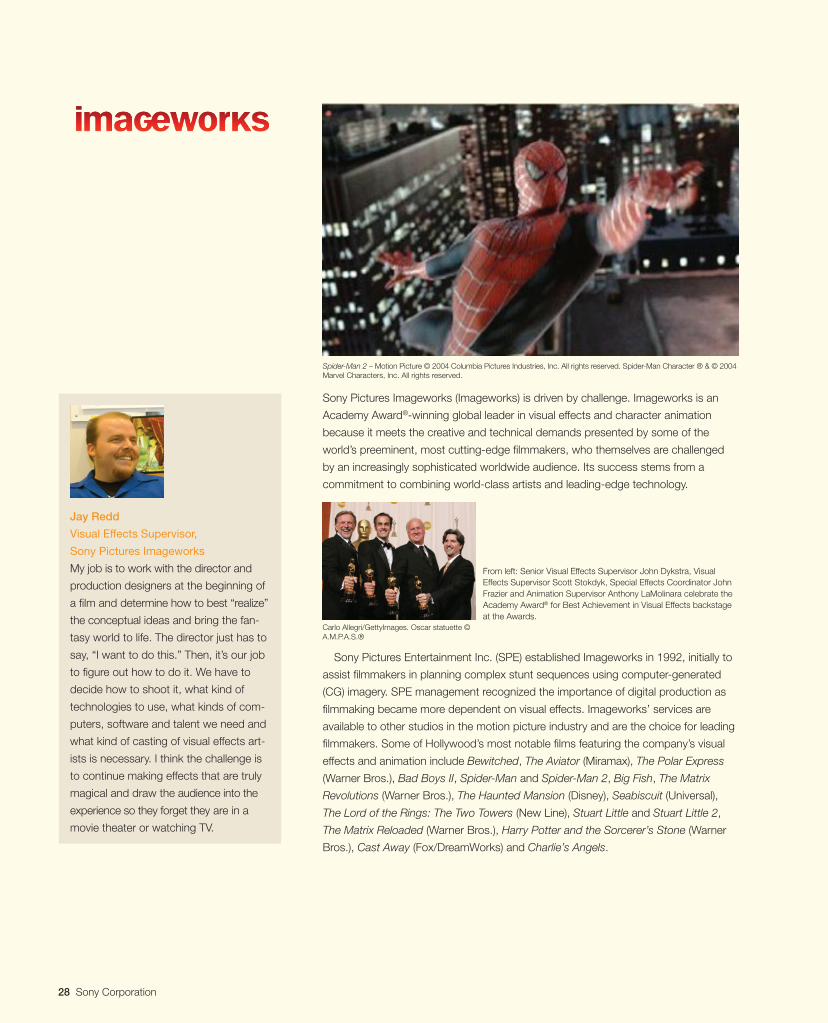
28 Sony Corporation
Sony Pictures Imageworks (Imageworks) is driven by challenge. Imageworks is an
Academy Award®-winning global leader in visual effects and character animation
because it meets the creative and technical demands presented by some of the
world’s preeminent, most cutting-edge filmmakers, who themselves are challenged
by an increasingly sophisticated worldwide audience. Its success stems from a
commitment to combining world-class artists and leading-edge technology.
Sony Pictures Entertainment Inc. (SPE) established Imageworks in 1992, initially to
assist filmmakers in planning complex stunt sequences using computer-generated
(CG) imagery. SPE management recognized the importance of digital production as
filmmaking became more dependent on visual effects. Imageworks’ services are
available to other studios in the motion picture industry and are the choice for leading
filmmakers. Some of Hollywood’s most notable films featuring the company’s visual
effects and animation include Bewitched, The Aviator (Miramax), The Polar Express
(Warner Bros.), Bad Boys II, Spider-Man and Spider-Man 2, Big Fish, The Matrix
Revolutions (Warner Bros.), The Haunted Mansion (Disney), Seabiscuit (Universal),
The Lord of the Rings: The Two Towers (New Line), Stuart Little and Stuart Little 2,
The Matrix Reloaded (Warner Bros.), Harry Potter and the Sorcerer’s Stone (Warner
Bros.), Cast Away (Fox/DreamWorks) and Charlie’s Angels.
Jay Redd
Visual Effects Supervisor,
Sony Pictures Imageworks
My job is to work with the director and
production designers at the beginning of
a film and determine how to best “realize”
the conceptual ideas and bring the fan-
tasy world to life. The director just has to
say, “I want to do this.” Then, it’s our job
to figure out how to do it. We have to
decide how to shoot it, what kind of
technologies to use, what kinds of com-
puters, software and talent we need and
what kind of casting of visual effects art-
ists is necessary. I think the challenge is
to continue making effects that are truly
magical and draw the audience into the
experience so they forget they are in a
movie theater or watching TV.
Spider-Man 2 – Motion Picture © 2004 Columbia Pictures Industries, Inc. All rights reserved. Spider-Man Character ® & © 2004Marvel Characters, Inc. All rights reserved.
From left: Senior Visual Effects Supervisor John Dykstra, VisualEffects Supervisor Scott Stokdyk, Special Effects Coordinator JohnFrazier and Animation Supervisor Anthony LaMolinara celebrate theAcademy Award® for Best Achievement in Visual Effects backstageat the Awards.
28 Sony Corporation
Carlo Allegri/GettyImages. Oscar statuette ©A.M.P.A.S.®
SONY AR-E0629 05.7.6, 2:19 PMPage 28 Adobe PageMaker 6.0J/PPC
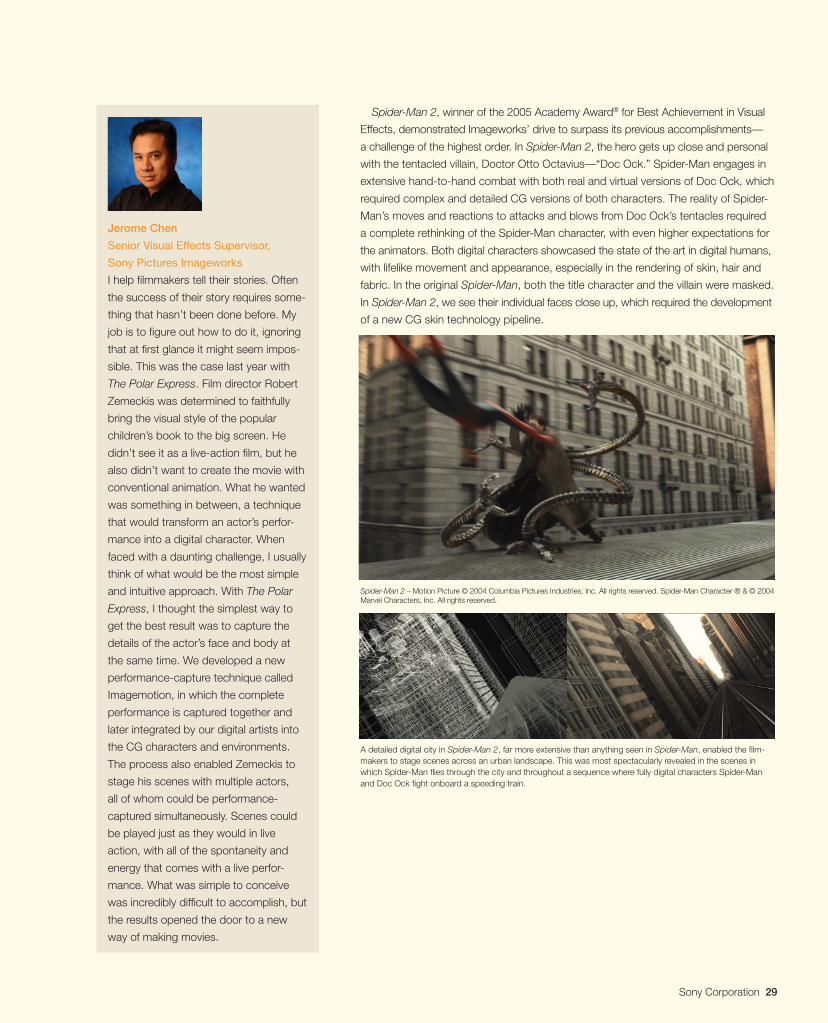
Sony Corporation 29
Spider-Man 2, winner of the 2005 Academy Award® for Best Achievement in Visual
Effects, demonstrated Imageworks’ drive to surpass its previous accomplishments—
a challenge of the highest order. In Spider-Man 2, the hero gets up close and personal
with the tentacled villain, Doctor Otto Octavius—“Doc Ock.” Spider-Man engages in
extensive hand-to-hand combat with both real and virtual versions of Doc Ock, which
required complex and detailed CG versions of both characters. The reality of Spider-
Man’s moves and reactions to attacks and blows from Doc Ock’s tentacles required
a complete rethinking of the Spider-Man character, with even higher expectations for
the animators. Both digital characters showcased the state of the art in digital humans,
with lifelike movement and appearance, especially in the rendering of skin, hair and
fabric. In the original Spider-Man, both the title character and the villain were masked.
In Spider-Man 2, we see their individual faces close up, which required the development
of a new CG skin technology pipeline.
Jerome Chen
Senior Visual Effects Supervisor,
Sony Pictures Imageworks
I help filmmakers tell their stories. Often
the success of their story requires some-
thing that hasn’t been done before. My
job is to figure out how to do it, ignoring
that at first glance it might seem impos-
sible. This was the case last year with
The Polar Express. Film director Robert
Zemeckis was determined to faithfully
bring the visual style of the popular
children’s book to the big screen. He
didn’t see it as a live-action film, but he
also didn’t want to create the movie with
conventional animation. What he wanted
was something in between, a technique
that would transform an actor’s perfor-
mance into a digital character. When
faced with a daunting challenge, I usually
think of what would be the most simple
and intuitive approach. With The Polar
Express, I thought the simplest way to
get the best result was to capture the
details of the actor’s face and body at
the same time. We developed a new
performance-capture technique called
Imagemotion, in which the complete
performance is captured together and
later integrated by our digital artists into
the CG characters and environments.
The process also enabled Zemeckis to
stage his scenes with multiple actors,
all of whom could be performance-
captured simultaneously. Scenes could
be played just as they would in live
action, with all of the spontaneity and
energy that comes with a live perfor-
mance. What was simple to conceive
was incredibly difficult to accomplish, but
the results opened the door to a new
way of making movies.
A detailed digital city in Spider-Man 2, far more extensive than anything seen in Spider-Man, enabled the film-makers to stage scenes across an urban landscape. This was most spectacularly revealed in the scenes inwhich Spider-Man flies through the city and throughout a sequence where fully digital characters Spider-Manand Doc Ock fight onboard a speeding train.
Sony Corporation 29
Spider-Man 2 – Motion Picture © 2004 Columbia Pictures Industries, Inc. All rights reserved. Spider-Man Character ® & © 2004Marvel Characters, Inc. All rights reserved.
SONY AR-E0629 05.7.6, 2:19 PMPage 29 Adobe PageMaker 6.0J/PPC
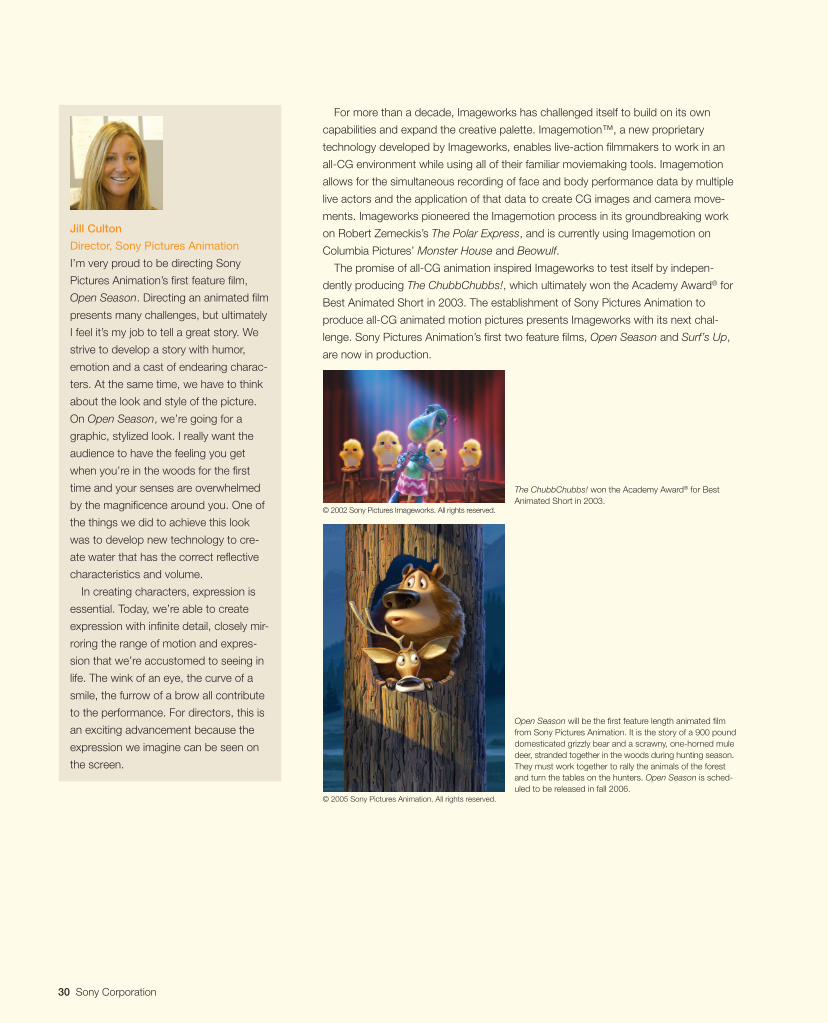
30 Sony Corporation
For more than a decade, Imageworks has challenged itself to build on its own
capabilities and expand the creative palette. Imagemotion™, a new proprietary
technology developed by Imageworks, enables live-action filmmakers to work in an
all-CG environment while using all of their familiar moviemaking tools. Imagemotion
allows for the simultaneous recording of face and body performance data by multiple
live actors and the application of that data to create CG images and camera move-
ments. Imageworks pioneered the Imagemotion process in its groundbreaking work
on Robert Zemeckis’s The Polar Express, and is currently using Imagemotion on
Columbia Pictures’ Monster House and Beowulf.
The promise of all-CG animation inspired Imageworks to test itself by indepen-
dently producing The ChubbChubbs!, which ultimately won the Academy Award® for
Best Animated Short in 2003. The establishment of Sony Pictures Animation to
produce all-CG animated motion pictures presents Imageworks with its next chal-
lenge. Sony Pictures Animation’s first two feature films, Open Season and Surf’s Up,
are now in production.
Jill Culton
Director, Sony Pictures Animation
I’m very proud to be directing Sony
Pictures Animation’s first feature film,
Open Season. Directing an animated film
presents many challenges, but ultimately
I feel it’s my job to tell a great story. We
strive to develop a story with humor,
emotion and a cast of endearing charac-
ters. At the same time, we have to think
about the look and style of the picture.
On Open Season, we’re going for a
graphic, stylized look. I really want the
audience to have the feeling you get
when you’re in the woods for the first
time and your senses are overwhelmed
by the magnificence around you. One of
the things we did to achieve this look
was to develop new technology to cre-
ate water that has the correct reflective
characteristics and volume.
In creating characters, expression is
essential. Today, we’re able to create
expression with infinite detail, closely mir-
roring the range of motion and expres-
sion that we’re accustomed to seeing in
life. The wink of an eye, the curve of a
smile, the furrow of a brow all contribute
to the performance. For directors, this is
an exciting advancement because the
expression we imagine can be seen on
the screen.
The ChubbChubbs! won the Academy Award® for BestAnimated Short in 2003.
Open Season will be the first feature length animated filmfrom Sony Pictures Animation. It is the story of a 900 pounddomesticated grizzly bear and a scrawny, one-horned muledeer, stranded together in the woods during hunting season.They must work together to rally the animals of the forestand turn the tables on the hunters. Open Season is sched-uled to be released in fall 2006.
30 Sony Corporation
© 2002 Sony Pictures Imageworks. All rights reserved.
© 2005 Sony Pictures Animation. All rights reserved.
SONY AR-E0629 05.7.6, 2:18 PMPage 30 Adobe PageMaker 6.0J/PPC
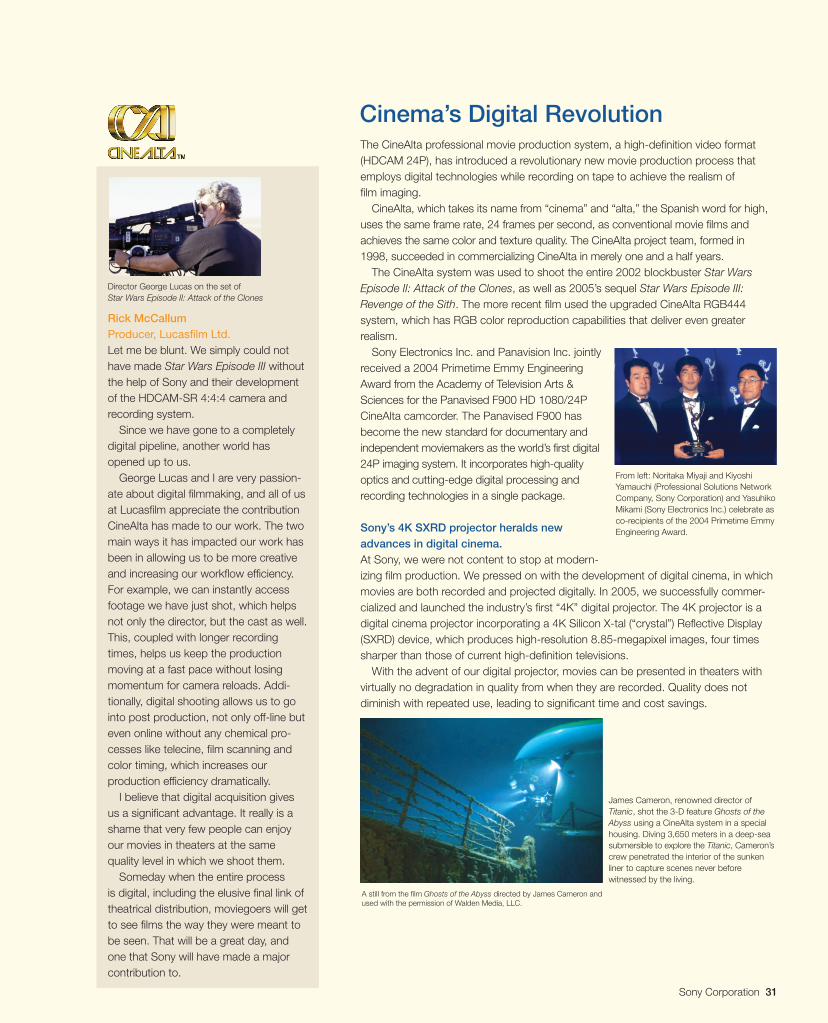
Sony Corporation 31
Cinema’s Digital RevolutionThe CineAlta professional movie production system, a high-definition video format(HDCAM 24P), has introduced a revolutionary new movie production process thatemploys digital technologies while recording on tape to achieve the realism offilm imaging.
CineAlta, which takes its name from “cinema” and “alta,” the Spanish word for high,uses the same frame rate, 24 frames per second, as conventional movie films andachieves the same color and texture quality. The CineAlta project team, formed in1998, succeeded in commercializing CineAlta in merely one and a half years.
The CineAlta system was used to shoot the entire 2002 blockbuster Star WarsEpisode II: Attack of the Clones, as well as 2005’s sequel Star Wars Episode III:Revenge of the Sith. The more recent film used the upgraded CineAlta RGB444system, which has RGB color reproduction capabilities that deliver even greaterrealism.
Sony Electronics Inc. and Panavision Inc. jointlyreceived a 2004 Primetime Emmy EngineeringAward from the Academy of Television Arts &Sciences for the Panavised F900 HD 1080/24PCineAlta camcorder. The Panavised F900 hasbecome the new standard for documentary andindependent moviemakers as the world’s first digital24P imaging system. It incorporates high-qualityoptics and cutting-edge digital processing andrecording technologies in a single package.
Sony’s 4K SXRD projector heralds newadvances in digital cinema.At Sony, we were not content to stop at modern-izing film production. We pressed on with the development of digital cinema, in whichmovies are both recorded and projected digitally. In 2005, we successfully commer-cialized and launched the industry’s first “4K” digital projector. The 4K projector is adigital cinema projector incorporating a 4K Silicon X-tal (“crystal”) Reflective Display(SXRD) device, which produces high-resolution 8.85-megapixel images, four timessharper than those of current high-definition televisions.
With the advent of our digital projector, movies can be presented in theaters withvirtually no degradation in quality from when they are recorded. Quality does notdiminish with repeated use, leading to significant time and cost savings.
Sony Corporation 31
Rick McCallumProducer, Lucasfilm Ltd.Let me be blunt. We simply could nothave made Star Wars Episode III withoutthe help of Sony and their developmentof the HDCAM-SR 4:4:4 camera andrecording system.
Since we have gone to a completelydigital pipeline, another world hasopened up to us.
George Lucas and I are very passion-ate about digital filmmaking, and all of usat Lucasfilm appreciate the contributionCineAlta has made to our work. The twomain ways it has impacted our work hasbeen in allowing us to be more creativeand increasing our workflow efficiency.For example, we can instantly accessfootage we have just shot, which helpsnot only the director, but the cast as well.This, coupled with longer recordingtimes, helps us keep the productionmoving at a fast pace without losingmomentum for camera reloads. Addi-tionally, digital shooting allows us to gointo post production, not only off-line buteven online without any chemical pro-cesses like telecine, film scanning andcolor timing, which increases ourproduction efficiency dramatically.
I believe that digital acquisition givesus a significant advantage. It really is ashame that very few people can enjoyour movies in theaters at the samequality level in which we shoot them.
Someday when the entire processis digital, including the elusive final link oftheatrical distribution, moviegoers will getto see films the way they were meant tobe seen. That will be a great day, andone that Sony will have made a majorcontribution to.
Director George Lucas on the set ofStar Wars Episode II: Attack of the Clones
James Cameron, renowned director ofTitanic, shot the 3-D feature Ghosts of theAbyss using a CineAlta system in a specialhousing. Diving 3,650 meters in a deep-seasubmersible to explore the Titanic, Cameron’screw penetrated the interior of the sunkenliner to capture scenes never beforewitnessed by the living.
A still from the film Ghosts of the Abyss directed by James Cameron andused with the permission of Walden Media, LLC.
From left: Noritaka Miyaji and KiyoshiYamauchi (Professional Solutions NetworkCompany, Sony Corporation) and YasuhikoMikami (Sony Electronics Inc.) celebrate asco-recipients of the 2004 Primetime EmmyEngineering Award.
SONY AR-E0629 05.7.6, 2:17 PMPage 31 Adobe PageMaker 6.0J/PPC
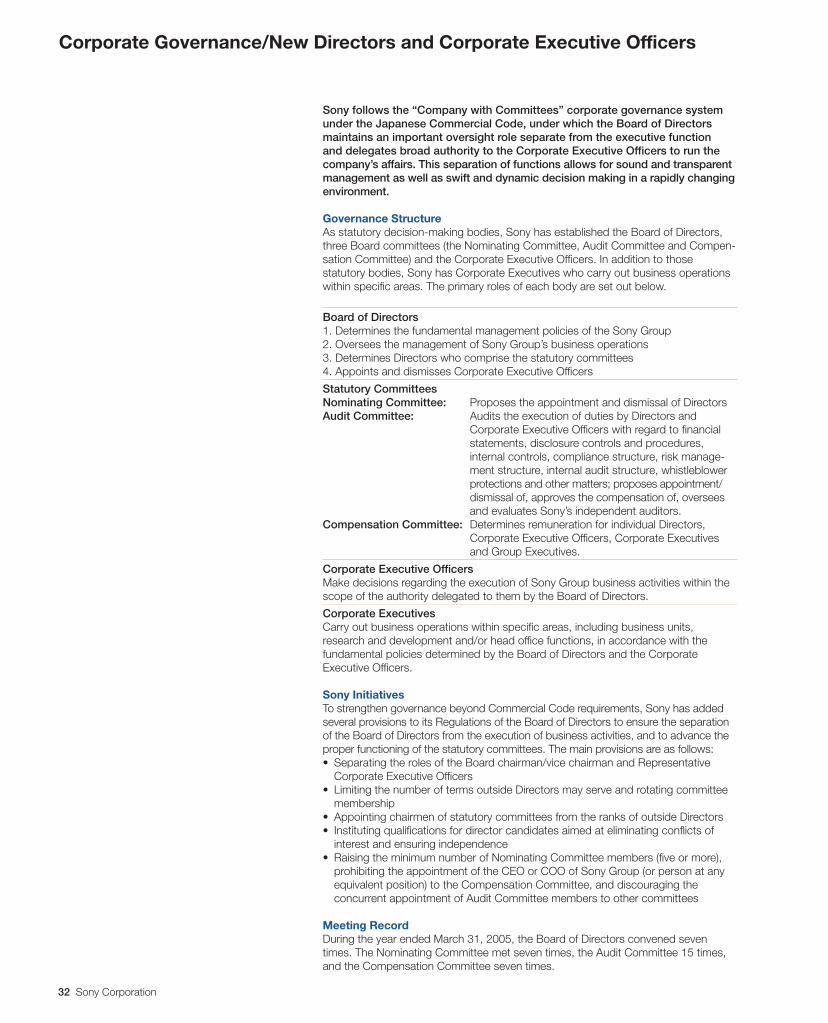
32 Sony Corporation
Sony follows the “Company with Committees” corporate governance systemunder the Japanese Commercial Code, under which the Board of Directorsmaintains an important oversight role separate from the executive functionand delegates broad authority to the Corporate Executive Officers to run thecompany’s affairs. This separation of functions allows for sound and transparentmanagement as well as swift and dynamic decision making in a rapidly changingenvironment.
Governance StructureAs statutory decision-making bodies, Sony has established the Board of Directors,three Board committees (the Nominating Committee, Audit Committee and Compen-sation Committee) and the Corporate Executive Officers. In addition to thosestatutory bodies, Sony has Corporate Executives who carry out business operationswithin specific areas. The primary roles of each body are set out below.
Board of Directors1. Determines the fundamental management policies of the Sony Group2. Oversees the management of Sony Group’s business operations3. Determines Directors who comprise the statutory committees4. Appoints and dismisses Corporate Executive Officers
Statutory CommitteesNominating Committee: Proposes the appointment and dismissal of DirectorsAudit Committee: Audits the execution of duties by Directors and
Corporate Executive Officers with regard to financialstatements, disclosure controls and procedures,internal controls, compliance structure, risk manage-ment structure, internal audit structure, whistleblowerprotections and other matters; proposes appointment/dismissal of, approves the compensation of, overseesand evaluates Sony’s independent auditors.
Compensation Committee: Determines remuneration for individual Directors,Corporate Executive Officers, Corporate Executivesand Group Executives.
Corporate Executive OfficersMake decisions regarding the execution of Sony Group business activities within thescope of the authority delegated to them by the Board of Directors.
Corporate ExecutivesCarry out business operations within specific areas, including business units,research and development and/or head office functions, in accordance with thefundamental policies determined by the Board of Directors and the CorporateExecutive Officers.
Sony InitiativesTo strengthen governance beyond Commercial Code requirements, Sony has addedseveral provisions to its Regulations of the Board of Directors to ensure the separationof the Board of Directors from the execution of business activities, and to advance theproper functioning of the statutory committees. The main provisions are as follows:• Separating the roles of the Board chairman/vice chairman and Representative
Corporate Executive Officers• Limiting the number of terms outside Directors may serve and rotating committee
membership• Appointing chairmen of statutory committees from the ranks of outside Directors• Instituting qualifications for director candidates aimed at eliminating conflicts of
interest and ensuring independence• Raising the minimum number of Nominating Committee members (five or more),
prohibiting the appointment of the CEO or COO of Sony Group (or person at anyequivalent position) to the Compensation Committee, and discouraging theconcurrent appointment of Audit Committee members to other committees
Meeting RecordDuring the year ended March 31, 2005, the Board of Directors convened seventimes. The Nominating Committee met seven times, the Audit Committee 15 times,and the Compensation Committee seven times.
Corporate Governance/New Directors and Corporate Executive Officers
SONY AR-E0629 05.7.6, 2:17 PMPage 32 Adobe PageMaker 6.0J/PPC
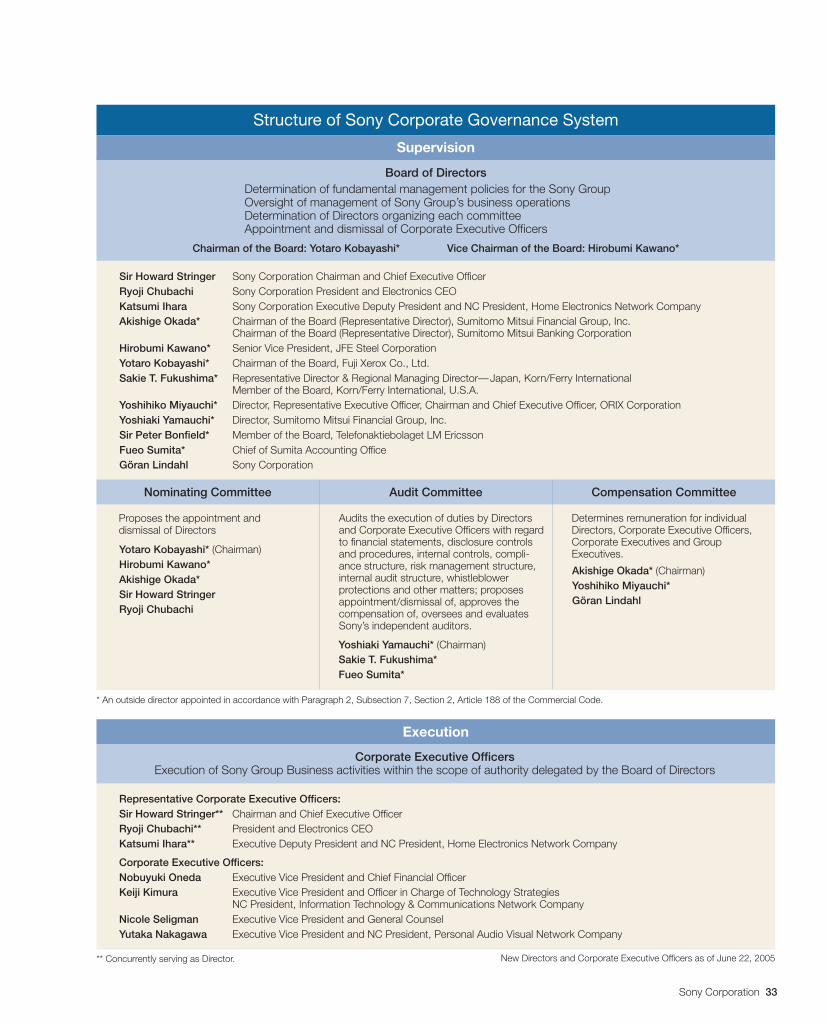
Sony Corporation 33
Corporate Executive OfficersExecution of Sony Group Business activities within the scope of authority delegated by the Board of Directors
Supervision
Nominating Committee Audit Committee Compensation Committee
Execution
Structure of Sony Corporate Governance System
Representative Corporate Executive Officers:Sir Howard Stringer** Chairman and Chief Executive OfficerRyoji Chubachi** President and Electronics CEOKatsumi Ihara** Executive Deputy President and NC President, Home Electronics Network Company
Corporate Executive Officers:Nobuyuki Oneda Executive Vice President and Chief Financial OfficerKeiji Kimura Executive Vice President and Officer in Charge of Technology Strategies
NC President, Information Technology & Communications Network CompanyNicole Seligman Executive Vice President and General CounselYutaka Nakagawa Executive Vice President and NC President, Personal Audio Visual Network Company
New Directors and Corporate Executive Officers as of June 22, 2005
Sir Howard Stringer Sony Corporation Chairman and Chief Executive OfficerRyoji Chubachi Sony Corporation President and Electronics CEOKatsumi Ihara Sony Corporation Executive Deputy President and NC President, Home Electronics Network CompanyAkishige Okada* Chairman of the Board (Representative Director), Sumitomo Mitsui Financial Group, Inc.
Chairman of the Board (Representative Director), Sumitomo Mitsui Banking CorporationHirobumi Kawano* Senior Vice President, JFE Steel CorporationYotaro Kobayashi* Chairman of the Board, Fuji Xerox Co., Ltd.Sakie T. Fukushima* Representative Director & Regional Managing Director—Japan, Korn/Ferry International
Member of the Board, Korn/Ferry International, U.S.A.Yoshihiko Miyauchi* Director, Representative Executive Officer, Chairman and Chief Executive Officer, ORIX CorporationYoshiaki Yamauchi* Director, Sumitomo Mitsui Financial Group, Inc.Sir Peter Bonfield* Member of the Board, Telefonaktiebolaget LM EricssonFueo Sumita* Chief of Sumita Accounting OfficeGöran Lindahl Sony Corporation
Determination of fundamental management policies for the Sony GroupOversight of management of Sony Group’s business operationsDetermination of Directors organizing each committeeAppointment and dismissal of Corporate Executive Officers
Board of Directors
Proposes the appointment anddismissal of Directors
Audits the execution of duties by Directorsand Corporate Executive Officers with regardto financial statements, disclosure controlsand procedures, internal controls, compli-ance structure, risk management structure,internal audit structure, whistleblowerprotections and other matters; proposesappointment/dismissal of, approves thecompensation of, oversees and evaluatesSony’s independent auditors.
Determines remuneration for individualDirectors, Corporate Executive Officers,Corporate Executives and GroupExecutives.
Chairman of the Board: Yotaro Kobayashi* Vice Chairman of the Board: Hirobumi Kawano*
* An outside director appointed in accordance with Paragraph 2, Subsection 7, Section 2, Article 188 of the Commercial Code.
** Concurrently serving as Director.
Yotaro Kobayashi* (Chairman)Hirobumi Kawano*Akishige Okada*Sir Howard StringerRyoji Chubachi
Yoshiaki Yamauchi* (Chairman)Sakie T. Fukushima*Fueo Sumita*
Akishige Okada* (Chairman)Yoshihiko Miyauchi*Göran Lindahl
SONY AR-E0629 05.7.6, 2:16 PMPage 33 Adobe PageMaker 6.0J/PPC
34 Sony Corporation
The Sony CSR Policy and ActivitiesThe core responsibility of the Sony Group to society is to pursue enhancement ofcorporate value through innovation and sound business practices. The Sony Grouprecognizes that its businesses have direct and indirect impact on the societies inwhich it operates. Sound business practice requires that business decisions give dueconsideration to the interests of Sony’s stakeholders, including shareholders,customers, employees, suppliers, business partners, local communities and otherorganizations.
To ensure our ability to continue fulfilling our fundamental social responsibility, weare acting on a number of fronts. These include strengthening our corporate gover-nance, compliance and quality management systems, as well as maintaining soundlabor and employment practices and a healthy working environment, conserving theenvironment (mainly through reducing greenhouse gases emissions, raising resourceproductivity and improving chemical substance management), and contributing toour communities through social contribution programs.
Compliance System ImprovementsWe have established the Sony Group Code of Conduct and have introduced it at allGroup companies with the objective of reinforcing Sony’s commitment to integrity,corporate governance, legal and regulatory compliance and ethical businesspractices. In addition, we have set up the Sony Group Compliance Hotline, aninternal tool designed to provide each employee with a means of reporting anyperceived violation of law, regulation or internal company rule or policy, or to raiseconcerns about any such matters.
Through our global network of Regional Compliance Offices, we are continuallyworking to strengthen our compliance system throughout the Sony Group.
Corporate Social Responsibility
Sony CSR Report 2005Please refer to the Sony CSR Report forfull details of our CSR activities.http://www.sony.net/csr/
Dow Jones Sustainability IndexesJointly developed by Dow Jones Indexes (UnitedStates), STOXX Limited (Switzerland) and theSAM Group (Switzerland)
FTSE4Good Global 100 IndexDeveloped by the FTSE Group, a Financial Times Ltd.(United Kingdom) and London Stock Exchange plc jointventure
Sony Group Compliance Network
Regional Subsidiaries
Subsidiaries in the Americas
*1. Responsible for Japan, South Korea and Taiwan
*2. Responsible for Mainland China and Hong Kong
*3. Responsible for Southeast Asia, the Middle East, Africa and Oceania
Subsidiaries in Europe
Subsidiaries in Japan
*1 *2 *3
Subsidiaries in East Asia
Subsidiaries in Pan-Asia
Regional Compliance
Offices
Americas
ComplianceOfficer
Europe
ComplianceOfficer
Japan
ComplianceOfficer
East Asia
ComplianceOfficer
Pan-Asia
ComplianceOfficer
Corporate Executive Officer in Charge of Compliance
Compliance Office
Socially Responsible InvestingSony’s efforts to be socially responsible are recognized worldwide with its inclusion insuch leading indices as the Dow Jones Sustainability Indexes (as of April 1, 2005).
Sony Corporation 35
Contents
Operating and Financial Review and Prospects . . . . . . . . . . . . . . . . . . . . . . . . . . . . . . . . . . . . . . . . 36
Five-Year Summary of Selected Financial Data . . . . . . . . . . . . . . . . . . . . . . . . . . . . . . . . . . . . . . . . . 69
Quarterly Financial and Stock Information . . . . . . . . . . . . . . . . . . . . . . . . . . . . . . . . . . . . . . . . . . . . . 71
Segment Information . . . . . . . . . . . . . . . . . . . . . . . . . . . . . . . . . . . . . . . . . . . . . . . . . . . . . . . . . . . . 72
Consolidated Balance Sheets . . . . . . . . . . . . . . . . . . . . . . . . . . . . . . . . . . . . . . . . . . . . . . . . . . . . . 74
Consolidated Statements of Income. . . . . . . . . . . . . . . . . . . . . . . . . . . . . . . . . . . . . . . . . . . . . . . . . 76
Consolidated Statements of Cash Flows . . . . . . . . . . . . . . . . . . . . . . . . . . . . . . . . . . . . . . . . . . . . . 78
Consolidated Statements of Changes in Stockholders’ Equity . . . . . . . . . . . . . . . . . . . . . . . . . . . . . 80
Notes to Consolidated Financial Statements . . . . . . . . . . . . . . . . . . . . . . . . . . . . . . . . . . . . . . . . . . 83
Report of Independent Auditors . . . . . . . . . . . . . . . . . . . . . . . . . . . . . . . . . . . . . . . . . . . . . . . . . . . 129
Financial Section
BH6/30 05.7.7, 3:35 AMPage 35 Adobe PageMaker 6.0J/PPC
36 Sony Corporation
OPERATING RESULTSOperating Results for the Fiscal Year Ended March 31, 2005
compared with the Fiscal Year Ended March 31, 2004
OVERVIEW
After translation of Sony’s financial results into yen (the currency in
which Sony’s financial statements are prepared), in accordance
with Generally Accepted Accounting Principles in the U.S. (“U.S.
GAAP”). Sony’s sales and operating revenue (“sales”) for the fiscal
year ended March 31, 2005 decreased 4.5 percent compared
with the previous fiscal year. On a local currency basis (regarding
references to results of operations expressed on a local currency
basis, refer to “Foreign Exchange Fluctuations and Risk Hedging”
below), sales for the fiscal year decreased approximately 3 per-
cent. This decrease is mainly due to the fact that, as of August
1, 2004, the sales of Sony’s overseas recorded music business
are no longer recorded within Sony’s consolidated sales as a result
of the establishment of SONY BMG MUSIC ENTERTAINMENT
(“SONY BMG”), which is accounted for by the equity method,
through the merger of Sony’s overseas recorded music business
with Bertelsmann AG’s recorded music business, and a change
in the method of recognizing insurance premiums received on
certain products at Sony Life Insurance Co., Ltd. (“Sony Life”),
as of the third quarter beginning October 1, 2003, from being
recorded as revenues to being offset against the related
provision for future insurance policy benefits.
Operating income increased 15.2 percent compared with the
previous fiscal year. On a local currency basis, operating income
increased approximately 26 percent compared with the previous
fiscal year. In addition to a decrease in restructuring charges
compared to the previous fiscal year, several segments experi-
enced an improvement in profitability such as the Pictures
segment, where Spider-Man 2 was a significant contributor,
and the Music segment, where several best-selling albums and
singles in Japan contributed to improved profitability. On the
other hand, the Electronics segment, where the cost of sales
ratio deteriorated due to pricing pressures, and the Game
segment, where there was a decrease in hardware sales,
both experienced deteriorated profitability.
RESTRUCTURING
In the fiscal year ended March 31, 2005, Sony recorded restruc-
turing charges of 90.0 billion yen, a decrease from the 168.1 bil-
lion yen recorded in the previous fiscal year. The primary restruc-
turing activities were in the Electronics and Music segments.
Of the total 90.0 billion yen, Sony recorded 53.6 billion yen in
personnel related costs. This expense was incurred because
12,000 people, mainly in Japan, the U.S. and Western Europe,
left the company primarily through early retirement programs.
For more detailed information about restructuring, please refer
to Note 25 of Notes to the Consolidated Financial Statements.
■ ELECTRONICS
Restructuring charges in the Electronics segment for the fiscal
year ended March 31, 2005 were 81.8 billion yen, compared to
143.3 billion yen in the previous fiscal year. Of these restructuring
charges, restructuring charges of 2.1 billion yen and 1.1 billion
yen, for the years ended March 31, 2004 and 2005, respectively,
were recorded in the non-Japan based disc manufacturing and
physical distribution businesses, formerly included within the
Music segment but reclassified to the Electronics segment. See
Note 25 of Notes to the Consolidated Financial Statements for
more information on this reclassification.
In the fiscal year ended March 31, 2004, Sony made a
decision to shut down certain TV display CRT manufacturing
operations in Japan to rationalize production facilities and
downsize its business, due to a contraction in the market as a
result of a shift in demand from CRT televisions to plasma and
liquid crystal display (“LCD”) panel televisions. In the year ended
March 31, 2005, as part of this restructuring program, Sony
recorded a non-cash impairment charge of 7.5 billion yen for the
CRT TV display manufacturing facilities located in Europe. The
impairment charge was calculated as the difference between
the carrying value of the asset group and the present value of
estimated future cash flows. The charge was recorded in loss on
sale, disposal or impairment of assets, net in the consolidated
statements of income.
In addition to the above restructuring efforts, Sony undertook
several headcount reduction programs to further reduce operat-
ing costs in the Electronics segment. As a result of these pro-
grams, Sony recorded restructuring charges of 50.3 billion yen
for the fiscal year ended March 31, 2005, and these charges
were included in selling, general and administrative expenses in
the consolidated statements of income. These staff reductions
were achieved worldwide mostly through the implementation of
early retirement programs. The remaining liability balance as of
March 31, 2005 was 14.0 billion yen and will be paid through
the fiscal year ending March 31, 2006. Sony will continue seek-
ing the appropriate headcount level to optimize the workforce in
the Electronics segment.
■ MUSIC
Restructuring charges in the Music segment, including at Sony
Music Entertainment (Japan) Inc. (“SMEJ”), for the fiscal year
ended March 31, 2005 were 3.8 billion yen, compared to 9.9
billion yen in the previous fiscal year.
Operating and Financial Review and ProspectsSony Corporation and Consolidated Subsidiaries
BH6/30 05.7.7, 3:35 AMPage 36 Adobe PageMaker 6.0J/PPC
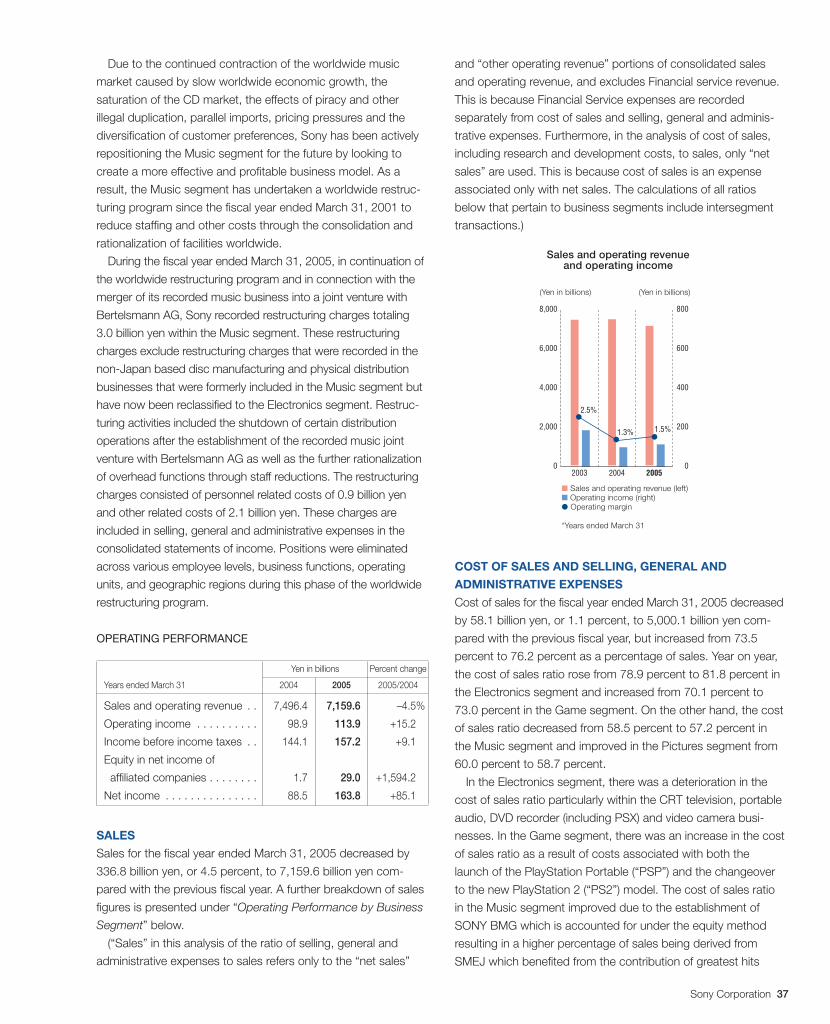
Sony Corporation 37
Due to the continued contraction of the worldwide music
market caused by slow worldwide economic growth, the
saturation of the CD market, the effects of piracy and other
illegal duplication, parallel imports, pricing pressures and the
diversification of customer preferences, Sony has been actively
repositioning the Music segment for the future by looking to
create a more effective and profitable business model. As a
result, the Music segment has undertaken a worldwide restruc-
turing program since the fiscal year ended March 31, 2001 to
reduce staffing and other costs through the consolidation and
rationalization of facilities worldwide.
During the fiscal year ended March 31, 2005, in continuation of
the worldwide restructuring program and in connection with the
merger of its recorded music business into a joint venture with
Bertelsmann AG, Sony recorded restructuring charges totaling
3.0 billion yen within the Music segment. These restructuring
charges exclude restructuring charges that were recorded in the
non-Japan based disc manufacturing and physical distribution
businesses that were formerly included in the Music segment but
have now been reclassified to the Electronics segment. Restruc-
turing activities included the shutdown of certain distribution
operations after the establishment of the recorded music joint
venture with Bertelsmann AG as well as the further rationalization
of overhead functions through staff reductions. The restructuring
charges consisted of personnel related costs of 0.9 billion yen
and other related costs of 2.1 billion yen. These charges are
included in selling, general and administrative expenses in the
consolidated statements of income. Positions were eliminated
across various employee levels, business functions, operating
units, and geographic regions during this phase of the worldwide
restructuring program.
OPERATING PERFORMANCE
Yen in billions Percent change
Years ended March 31 2004 2005 2005/2004
Sales and operating revenue . . 7,496.4 7,159.6 –4.5%
Operating income . . . . . . . . . . 98.9 113.9 +15.2
Income before income taxes . . 144.1 157.2 +9.1
Equity in net income of
affiliated companies . . . . . . . . 1.7 29.0 +1,594.2
Net income . . . . . . . . . . . . . . . 88.5 163.8 +85.1
SALES
Sales for the fiscal year ended March 31, 2005 decreased by
336.8 billion yen, or 4.5 percent, to 7,159.6 billion yen com-
pared with the previous fiscal year. A further breakdown of sales
figures is presented under “Operating Performance by Business
Segment” below.
(“Sales” in this analysis of the ratio of selling, general and
administrative expenses to sales refers only to the “net sales”
and “other operating revenue” portions of consolidated sales
and operating revenue, and excludes Financial service revenue.
This is because Financial Service expenses are recorded
separately from cost of sales and selling, general and adminis-
trative expenses. Furthermore, in the analysis of cost of sales,
including research and development costs, to sales, only “net
sales” are used. This is because cost of sales is an expense
associated only with net sales. The calculations of all ratios
below that pertain to business segments include intersegment
transactions.)
COST OF SALES AND SELLING, GENERAL AND
ADMINISTRATIVE EXPENSES
Cost of sales for the fiscal year ended March 31, 2005 decreased
by 58.1 billion yen, or 1.1 percent, to 5,000.1 billion yen com-
pared with the previous fiscal year, but increased from 73.5
percent to 76.2 percent as a percentage of sales. Year on year,
the cost of sales ratio rose from 78.9 percent to 81.8 percent in
the Electronics segment and increased from 70.1 percent to
73.0 percent in the Game segment. On the other hand, the cost
of sales ratio decreased from 58.5 percent to 57.2 percent in
the Music segment and improved in the Pictures segment from
60.0 percent to 58.7 percent.
In the Electronics segment, there was a deterioration in the
cost of sales ratio particularly within the CRT television, portable
audio, DVD recorder (including PSX) and video camera busi-
nesses. In the Game segment, there was an increase in the cost
of sales ratio as a result of costs associated with both the
launch of the PlayStation Portable (“PSP”) and the changeover
to the new PlayStation 2 (“PS2”) model. The cost of sales ratio
in the Music segment improved due to the establishment of
SONY BMG which is accounted for under the equity method
resulting in a higher percentage of sales being derived from
SMEJ which benefited from the contribution of greatest hits
Sales and operating revenueand operating income
■ Sales and operating revenue (left)■ Operating income (right)● Operating margin
*Years ended March 31
(Yen in billions) (Yen in billions)
8,000
6,000
4,000
2,000
0
800
600
400
200
02003 2004 2005
2.5%
1.3% 1.5%
BH6/30 05.7.7, 3:35 AMPage 37 Adobe PageMaker 6.0J/PPC
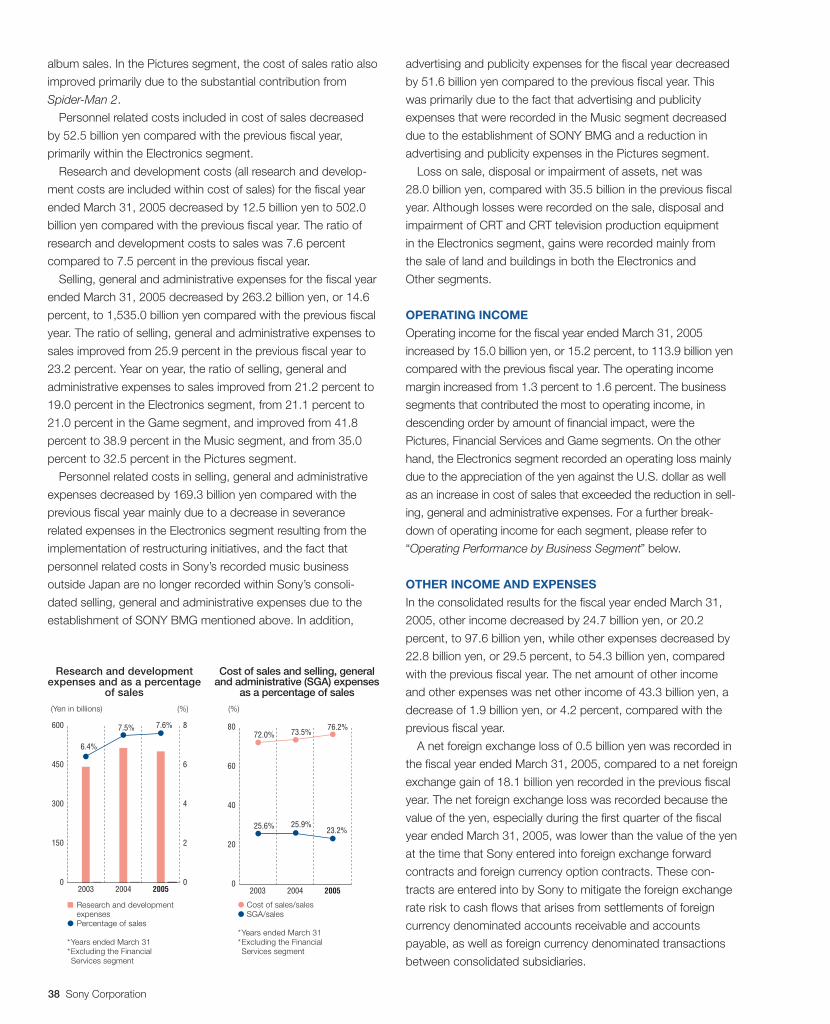
38 Sony Corporation
album sales. In the Pictures segment, the cost of sales ratio also
improved primarily due to the substantial contribution from
Spider-Man 2.
Personnel related costs included in cost of sales decreased
by 52.5 billion yen compared with the previous fiscal year,
primarily within the Electronics segment.
Research and development costs (all research and develop-
ment costs are included within cost of sales) for the fiscal year
ended March 31, 2005 decreased by 12.5 billion yen to 502.0
billion yen compared with the previous fiscal year. The ratio of
research and development costs to sales was 7.6 percent
compared to 7.5 percent in the previous fiscal year.
Selling, general and administrative expenses for the fiscal year
ended March 31, 2005 decreased by 263.2 billion yen, or 14.6
percent, to 1,535.0 billion yen compared with the previous fiscal
year. The ratio of selling, general and administrative expenses to
sales improved from 25.9 percent in the previous fiscal year to
23.2 percent. Year on year, the ratio of selling, general and
administrative expenses to sales improved from 21.2 percent to
19.0 percent in the Electronics segment, from 21.1 percent to
21.0 percent in the Game segment, and improved from 41.8
percent to 38.9 percent in the Music segment, and from 35.0
percent to 32.5 percent in the Pictures segment.
Personnel related costs in selling, general and administrative
expenses decreased by 169.3 billion yen compared with the
previous fiscal year mainly due to a decrease in severance
related expenses in the Electronics segment resulting from the
implementation of restructuring initiatives, and the fact that
personnel related costs in Sony’s recorded music business
outside Japan are no longer recorded within Sony’s consoli-
dated selling, general and administrative expenses due to the
establishment of SONY BMG mentioned above. In addition,
advertising and publicity expenses for the fiscal year decreased
by 51.6 billion yen compared to the previous fiscal year. This
was primarily due to the fact that advertising and publicity
expenses that were recorded in the Music segment decreased
due to the establishment of SONY BMG and a reduction in
advertising and publicity expenses in the Pictures segment.
Loss on sale, disposal or impairment of assets, net was
28.0 billion yen, compared with 35.5 billion in the previous fiscal
year. Although losses were recorded on the sale, disposal and
impairment of CRT and CRT television production equipment
in the Electronics segment, gains were recorded mainly from
the sale of land and buildings in both the Electronics and
Other segments.
OPERATING INCOME
Operating income for the fiscal year ended March 31, 2005
increased by 15.0 billion yen, or 15.2 percent, to 113.9 billion yen
compared with the previous fiscal year. The operating income
margin increased from 1.3 percent to 1.6 percent. The business
segments that contributed the most to operating income, in
descending order by amount of financial impact, were the
Pictures, Financial Services and Game segments. On the other
hand, the Electronics segment recorded an operating loss mainly
due to the appreciation of the yen against the U.S. dollar as well
as an increase in cost of sales that exceeded the reduction in sell-
ing, general and administrative expenses. For a further break-
down of operating income for each segment, please refer to
“Operating Performance by Business Segment” below.
OTHER INCOME AND EXPENSES
In the consolidated results for the fiscal year ended March 31,
2005, other income decreased by 24.7 billion yen, or 20.2
percent, to 97.6 billion yen, while other expenses decreased by
22.8 billion yen, or 29.5 percent, to 54.3 billion yen, compared
with the previous fiscal year. The net amount of other income
and other expenses was net other income of 43.3 billion yen, a
decrease of 1.9 billion yen, or 4.2 percent, compared with the
previous fiscal year.
A net foreign exchange loss of 0.5 billion yen was recorded in
the fiscal year ended March 31, 2005, compared to a net foreign
exchange gain of 18.1 billion yen recorded in the previous fiscal
year. The net foreign exchange loss was recorded because the
value of the yen, especially during the first quarter of the fiscal
year ended March 31, 2005, was lower than the value of the yen
at the time that Sony entered into foreign exchange forward
contracts and foreign currency option contracts. These con-
tracts are entered into by Sony to mitigate the foreign exchange
rate risk to cash flows that arises from settlements of foreign
currency denominated accounts receivable and accounts
payable, as well as foreign currency denominated transactions
between consolidated subsidiaries.
8
6
4
2
0
600
450
300
150
02003 2004 2005
6.4%
7.5% 7.6%
Research and developmentexpenses and as a percentage
of sales
■ Research and developmentexpenses
● Percentage of sales
*Years ended March 31*Excluding the FinancialServices segment
(Yen in billions) (%)
Cost of sales and selling, generaland administrative (SGA) expenses
as a percentage of sales
● Cost of sales/sales● SGA/sales
*Years ended March 31*Excluding the FinancialServices segment
(%)
80
60
40
20
02003 2004 2005
72.0% 73.5%
25.6% 25.9%
76.2%
23.2%
BH6/30 05.7.7, 3:35 AMPage 38 Adobe PageMaker 6.0J/PPC
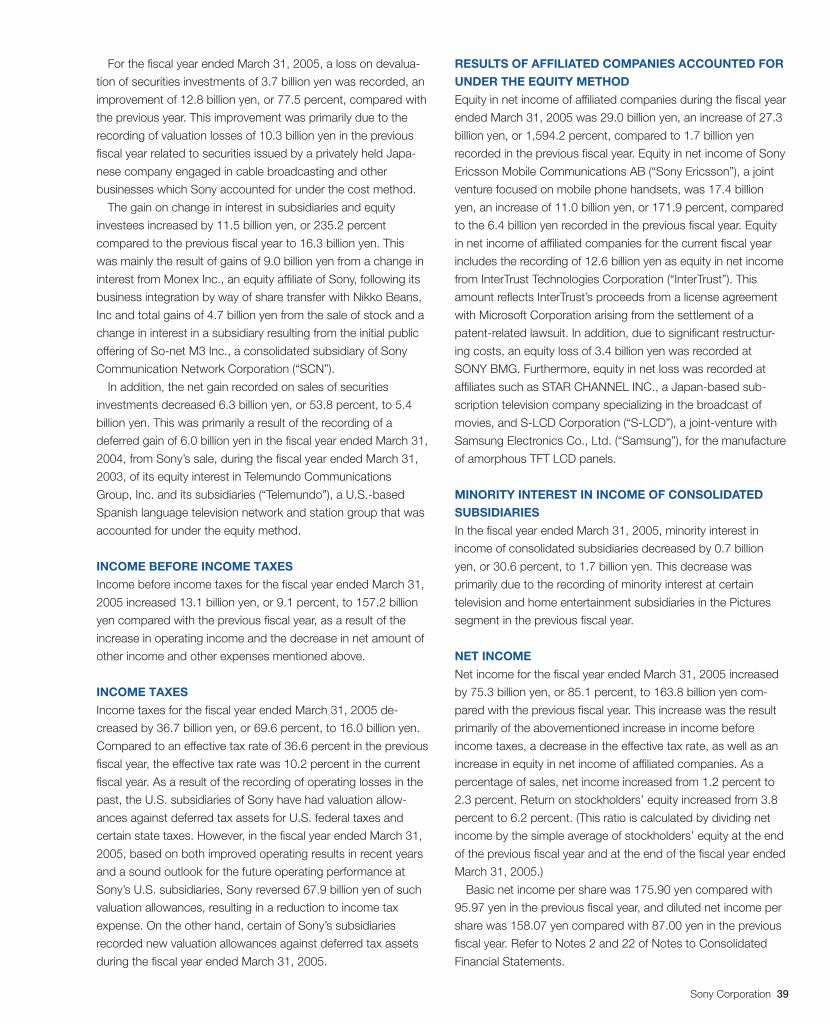
Sony Corporation 39
For the fiscal year ended March 31, 2005, a loss on devalua-
tion of securities investments of 3.7 billion yen was recorded, an
improvement of 12.8 billion yen, or 77.5 percent, compared with
the previous year. This improvement was primarily due to the
recording of valuation losses of 10.3 billion yen in the previous
fiscal year related to securities issued by a privately held Japa-
nese company engaged in cable broadcasting and other
businesses which Sony accounted for under the cost method.
The gain on change in interest in subsidiaries and equity
investees increased by 11.5 billion yen, or 235.2 percent
compared to the previous fiscal year to 16.3 billion yen. This
was mainly the result of gains of 9.0 billion yen from a change in
interest from Monex Inc., an equity affiliate of Sony, following its
business integration by way of share transfer with Nikko Beans,
Inc and total gains of 4.7 billion yen from the sale of stock and a
change in interest in a subsidiary resulting from the initial public
offering of So-net M3 Inc., a consolidated subsidiary of Sony
Communication Network Corporation (“SCN”).
In addition, the net gain recorded on sales of securities
investments decreased 6.3 billion yen, or 53.8 percent, to 5.4
billion yen. This was primarily a result of the recording of a
deferred gain of 6.0 billion yen in the fiscal year ended March 31,
2004, from Sony’s sale, during the fiscal year ended March 31,
2003, of its equity interest in Telemundo Communications
Group, Inc. and its subsidiaries (“Telemundo”), a U.S.-based
Spanish language television network and station group that was
accounted for under the equity method.
INCOME BEFORE INCOME TAXES
Income before income taxes for the fiscal year ended March 31,
2005 increased 13.1 billion yen, or 9.1 percent, to 157.2 billion
yen compared with the previous fiscal year, as a result of the
increase in operating income and the decrease in net amount of
other income and other expenses mentioned above.
INCOME TAXES
Income taxes for the fiscal year ended March 31, 2005 de-
creased by 36.7 billion yen, or 69.6 percent, to 16.0 billion yen.
Compared to an effective tax rate of 36.6 percent in the previous
fiscal year, the effective tax rate was 10.2 percent in the current
fiscal year. As a result of the recording of operating losses in the
past, the U.S. subsidiaries of Sony have had valuation allow-
ances against deferred tax assets for U.S. federal taxes and
certain state taxes. However, in the fiscal year ended March 31,
2005, based on both improved operating results in recent years
and a sound outlook for the future operating performance at
Sony’s U.S. subsidiaries, Sony reversed 67.9 billion yen of such
valuation allowances, resulting in a reduction to income tax
expense. On the other hand, certain of Sony’s subsidiaries
recorded new valuation allowances against deferred tax assets
during the fiscal year ended March 31, 2005.
RESULTS OF AFFILIATED COMPANIES ACCOUNTED FOR
UNDER THE EQUITY METHOD
Equity in net income of affiliated companies during the fiscal year
ended March 31, 2005 was 29.0 billion yen, an increase of 27.3
billion yen, or 1,594.2 percent, compared to 1.7 billion yen
recorded in the previous fiscal year. Equity in net income of Sony
Ericsson Mobile Communications AB (“Sony Ericsson”), a joint
venture focused on mobile phone handsets, was 17.4 billion
yen, an increase of 11.0 billion yen, or 171.9 percent, compared
to the 6.4 billion yen recorded in the previous fiscal year. Equity
in net income of affiliated companies for the current fiscal year
includes the recording of 12.6 billion yen as equity in net income
from InterTrust Technologies Corporation (“InterTrust”). This
amount reflects InterTrust’s proceeds from a license agreement
with Microsoft Corporation arising from the settlement of a
patent-related lawsuit. In addition, due to significant restructur-
ing costs, an equity loss of 3.4 billion yen was recorded at
SONY BMG. Furthermore, equity in net loss was recorded at
affiliates such as STAR CHANNEL INC., a Japan-based sub-
scription television company specializing in the broadcast of
movies, and S-LCD Corporation (“S-LCD”), a joint-venture with
Samsung Electronics Co., Ltd. (“Samsung”), for the manufacture
of amorphous TFT LCD panels.
MINORITY INTEREST IN INCOME OF CONSOLIDATED
SUBSIDIARIES
In the fiscal year ended March 31, 2005, minority interest in
income of consolidated subsidiaries decreased by 0.7 billion
yen, or 30.6 percent, to 1.7 billion yen. This decrease was
primarily due to the recording of minority interest at certain
television and home entertainment subsidiaries in the Pictures
segment in the previous fiscal year.
NET INCOME
Net income for the fiscal year ended March 31, 2005 increased
by 75.3 billion yen, or 85.1 percent, to 163.8 billion yen com-
pared with the previous fiscal year. This increase was the result
primarily of the abovementioned increase in income before
income taxes, a decrease in the effective tax rate, as well as an
increase in equity in net income of affiliated companies. As a
percentage of sales, net income increased from 1.2 percent to
2.3 percent. Return on stockholders’ equity increased from 3.8
percent to 6.2 percent. (This ratio is calculated by dividing net
income by the simple average of stockholders’ equity at the end
of the previous fiscal year and at the end of the fiscal year ended
March 31, 2005.)
Basic net income per share was 175.90 yen compared with
95.97 yen in the previous fiscal year, and diluted net income per
share was 158.07 yen compared with 87.00 yen in the previous
fiscal year. Refer to Notes 2 and 22 of Notes to Consolidated
Financial Statements.
BH6/30 05.7.7, 3:35 AMPage 39 Adobe PageMaker 6.0J/PPC
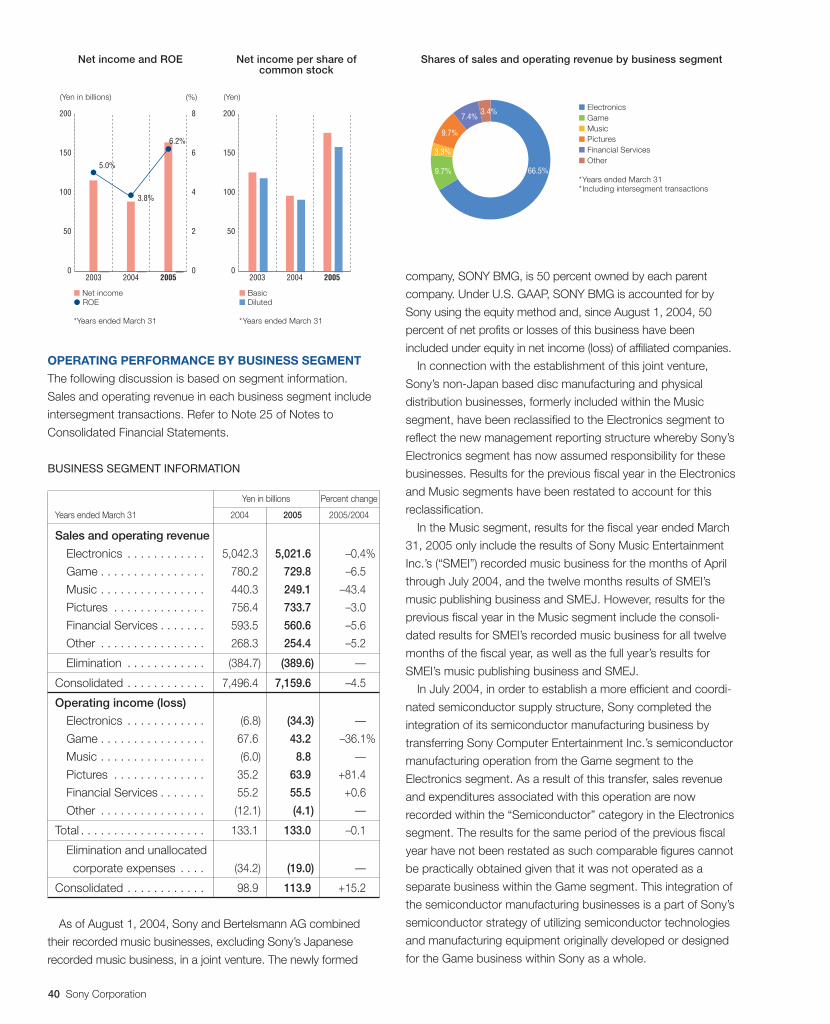
40 Sony Corporation
company, SONY BMG, is 50 percent owned by each parent
company. Under U.S. GAAP, SONY BMG is accounted for by
Sony using the equity method and, since August 1, 2004, 50
percent of net profits or losses of this business have been
included under equity in net income (loss) of affiliated companies.
In connection with the establishment of this joint venture,
Sony’s non-Japan based disc manufacturing and physical
distribution businesses, formerly included within the Music
segment, have been reclassified to the Electronics segment to
reflect the new management reporting structure whereby Sony’s
Electronics segment has now assumed responsibility for these
businesses. Results for the previous fiscal year in the Electronics
and Music segments have been restated to account for this
reclassification.
In the Music segment, results for the fiscal year ended March
31, 2005 only include the results of Sony Music Entertainment
Inc.’s (“SMEI”) recorded music business for the months of April
through July 2004, and the twelve months results of SMEI’s
music publishing business and SMEJ. However, results for the
previous fiscal year in the Music segment include the consoli-
dated results for SMEI’s recorded music business for all twelve
months of the fiscal year, as well as the full year’s results for
SMEI’s music publishing business and SMEJ.
In July 2004, in order to establish a more efficient and coordi-
nated semiconductor supply structure, Sony completed the
integration of its semiconductor manufacturing business by
transferring Sony Computer Entertainment Inc.’s semiconductor
manufacturing operation from the Game segment to the
Electronics segment. As a result of this transfer, sales revenue
and expenditures associated with this operation are now
recorded within the “Semiconductor” category in the Electronics
segment. The results for the same period of the previous fiscal
year have not been restated as such comparable figures cannot
be practically obtained given that it was not operated as a
separate business within the Game segment. This integration of
the semiconductor manufacturing businesses is a part of Sony’s
semiconductor strategy of utilizing semiconductor technologies
and manufacturing equipment originally developed or designed
for the Game business within Sony as a whole.
OPERATING PERFORMANCE BY BUSINESS SEGMENT
The following discussion is based on segment information.
Sales and operating revenue in each business segment include
intersegment transactions. Refer to Note 25 of Notes to
Consolidated Financial Statements.
BUSINESS SEGMENT INFORMATION
Yen in billions Percent change
Years ended March 31 2004 2005 2005/2004
Sales and operating revenue
Electronics . . . . . . . . . . . . 5,042.3 5,021.6 –0.4%
Game . . . . . . . . . . . . . . . . 780.2 729.8 –6.5%
Music . . . . . . . . . . . . . . . . 440.3 249.1 –43.4%
Pictures . . . . . . . . . . . . . . 756.4 733.7 –3.0%
Financial Services . . . . . . . 593.5 560.6 –5.6%
Other . . . . . . . . . . . . . . . . 268.3 254.4 –5.2%
Elimination . . . . . . . . . . . . (384.7) (389.6) —%
Consolidated . . . . . . . . . . . . 7,496.4 7,159.6 –4.5%
Operating income (loss)
Electronics . . . . . . . . . . . . (6.8) (34.3) —%
Game . . . . . . . . . . . . . . . . 67.6 43.2 –36.1%
Music . . . . . . . . . . . . . . . . (6.0) 8.8 —%
Pictures . . . . . . . . . . . . . . 35.2 63.9 +81.4%
Financial Services . . . . . . . 55.2 55.5 +0.6%
Other . . . . . . . . . . . . . . . . (12.1) (4.1) —%
Total . . . . . . . . . . . . . . . . . . . 133.1 133.0 –0.1%
Elimination and unallocated
corporate expenses . . . . (34.2) (19.0) —%
Consolidated . . . . . . . . . . . . 98.9 113.9 +15.2%
As of August 1, 2004, Sony and Bertelsmann AG combined
their recorded music businesses, excluding Sony’s Japanese
recorded music business, in a joint venture. The newly formed
Net income and ROE
■ Net income● ROE
*Years ended March 31
(Yen in billions) (%) (Yen)
Net income per share ofcommon stock
■ Basic■ Diluted
*Years ended March 31
200
150
100
50
02003 2004 2005
8
6
4
2
0
200
150
100
50
02003 2004 2005
5.0%
3.8%
6.2%
■ Electronics■ Game■ Music■ Pictures■ Financial Services■ Other
*Years ended March 31*Including intersegment transactions
Shares of sales and operating revenue by business segment
9.7% 66.5%
3.3%
9.7%
7.4%3.4%
BH6/30 05.7.7, 3:35 AMPage 40 Adobe PageMaker 6.0J/PPC
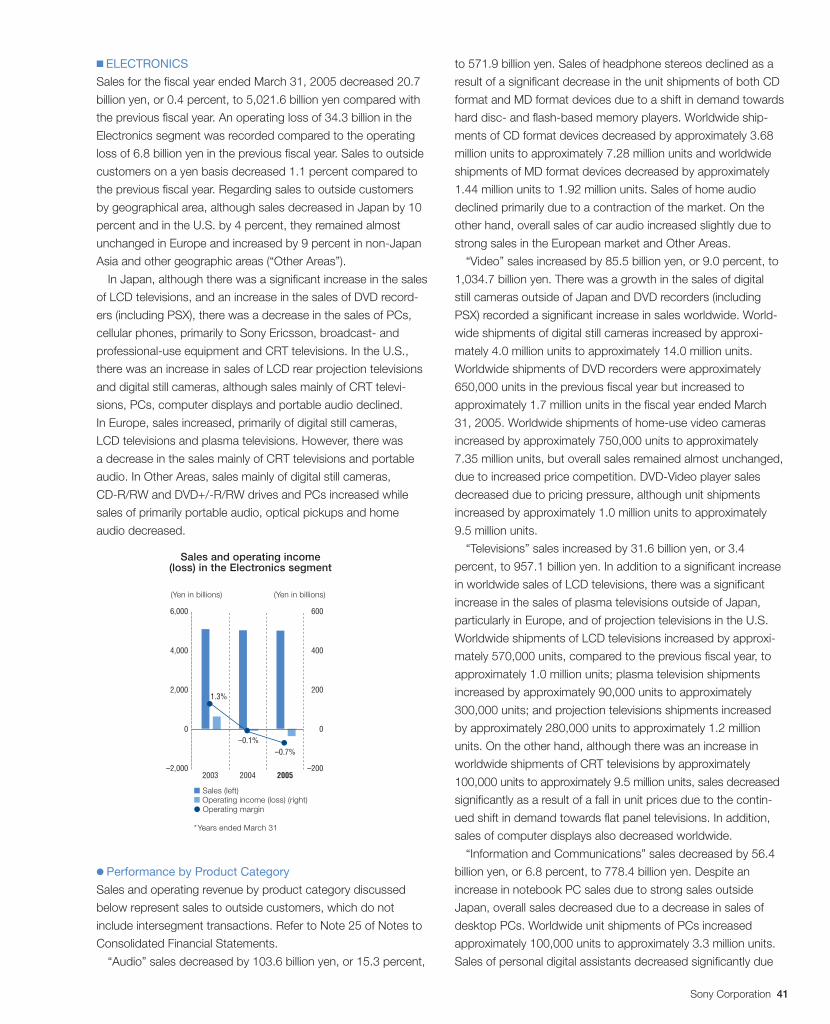
Sony Corporation 41
■ ELECTRONICS
Sales for the fiscal year ended March 31, 2005 decreased 20.7
billion yen, or 0.4 percent, to 5,021.6 billion yen compared with
the previous fiscal year. An operating loss of 34.3 billion in the
Electronics segment was recorded compared to the operating
loss of 6.8 billion yen in the previous fiscal year. Sales to outside
customers on a yen basis decreased 1.1 percent compared to
the previous fiscal year. Regarding sales to outside customers
by geographical area, although sales decreased in Japan by 10
percent and in the U.S. by 4 percent, they remained almost
unchanged in Europe and increased by 9 percent in non-Japan
Asia and other geographic areas (“Other Areas”).
In Japan, although there was a significant increase in the sales
of LCD televisions, and an increase in the sales of DVD record-
ers (including PSX), there was a decrease in the sales of PCs,
cellular phones, primarily to Sony Ericsson, broadcast- and
professional-use equipment and CRT televisions. In the U.S.,
there was an increase in sales of LCD rear projection televisions
and digital still cameras, although sales mainly of CRT televi-
sions, PCs, computer displays and portable audio declined.
In Europe, sales increased, primarily of digital still cameras,
LCD televisions and plasma televisions. However, there was
a decrease in the sales mainly of CRT televisions and portable
audio. In Other Areas, sales mainly of digital still cameras,
CD-R/RW and DVD+/-R/RW drives and PCs increased while
sales of primarily portable audio, optical pickups and home
audio decreased.
● Performance by Product Category
Sales and operating revenue by product category discussed
below represent sales to outside customers, which do not
include intersegment transactions. Refer to Note 25 of Notes to
Consolidated Financial Statements.
“Audio” sales decreased by 103.6 billion yen, or 15.3 percent,
to 571.9 billion yen. Sales of headphone stereos declined as a
result of a significant decrease in the unit shipments of both CD
format and MD format devices due to a shift in demand towards
hard disc- and flash-based memory players. Worldwide ship-
ments of CD format devices decreased by approximately 3.68
million units to approximately 7.28 million units and worldwide
shipments of MD format devices decreased by approximately
1.44 million units to 1.92 million units. Sales of home audio
declined primarily due to a contraction of the market. On the
other hand, overall sales of car audio increased slightly due to
strong sales in the European market and Other Areas.
“Video” sales increased by 85.5 billion yen, or 9.0 percent, to
1,034.7 billion yen. There was a growth in the sales of digital
still cameras outside of Japan and DVD recorders (including
PSX) recorded a significant increase in sales worldwide. World-
wide shipments of digital still cameras increased by approxi-
mately 4.0 million units to approximately 14.0 million units.
Worldwide shipments of DVD recorders were approximately
650,000 units in the previous fiscal year but increased to
approximately 1.7 million units in the fiscal year ended March
31, 2005. Worldwide shipments of home-use video cameras
increased by approximately 750,000 units to approximately
7.35 million units, but overall sales remained almost unchanged,
due to increased price competition. DVD-Video player sales
decreased due to pricing pressure, although unit shipments
increased by approximately 1.0 million units to approximately
9.5 million units.
“Televisions” sales increased by 31.6 billion yen, or 3.4
percent, to 957.1 billion yen. In addition to a significant increase
in worldwide sales of LCD televisions, there was a significant
increase in the sales of plasma televisions outside of Japan,
particularly in Europe, and of projection televisions in the U.S.
Worldwide shipments of LCD televisions increased by approxi-
mately 570,000 units, compared to the previous fiscal year, to
approximately 1.0 million units; plasma television shipments
increased by approximately 90,000 units to approximately
300,000 units; and projection televisions shipments increased
by approximately 280,000 units to approximately 1.2 million
units. On the other hand, although there was an increase in
worldwide shipments of CRT televisions by approximately
100,000 units to approximately 9.5 million units, sales decreased
significantly as a result of a fall in unit prices due to the contin-
ued shift in demand towards flat panel televisions. In addition,
sales of computer displays also decreased worldwide.
“Information and Communications” sales decreased by 56.4
billion yen, or 6.8 percent, to 778.4 billion yen. Despite an
increase in notebook PC sales due to strong sales outside
Japan, overall sales decreased due to a decrease in sales of
desktop PCs. Worldwide unit shipments of PCs increased
approximately 100,000 units to approximately 3.3 million units.
Sales of personal digital assistants decreased significantly due
(Yen in billions) (Yen in billions)
Sales and operating income(loss) in the Electronics segment
■ Sales (left)■ Operating income (loss) (right)● Operating margin
*Years ended March 31
6,000
4,000
2,000
0
–2,000
600
400
200
0
–2002003 2004 2005
1.3%
–0.7%–0.1%
BH6/30 05.7.7, 3:34 AMPage 41 Adobe PageMaker 6.0J/PPC
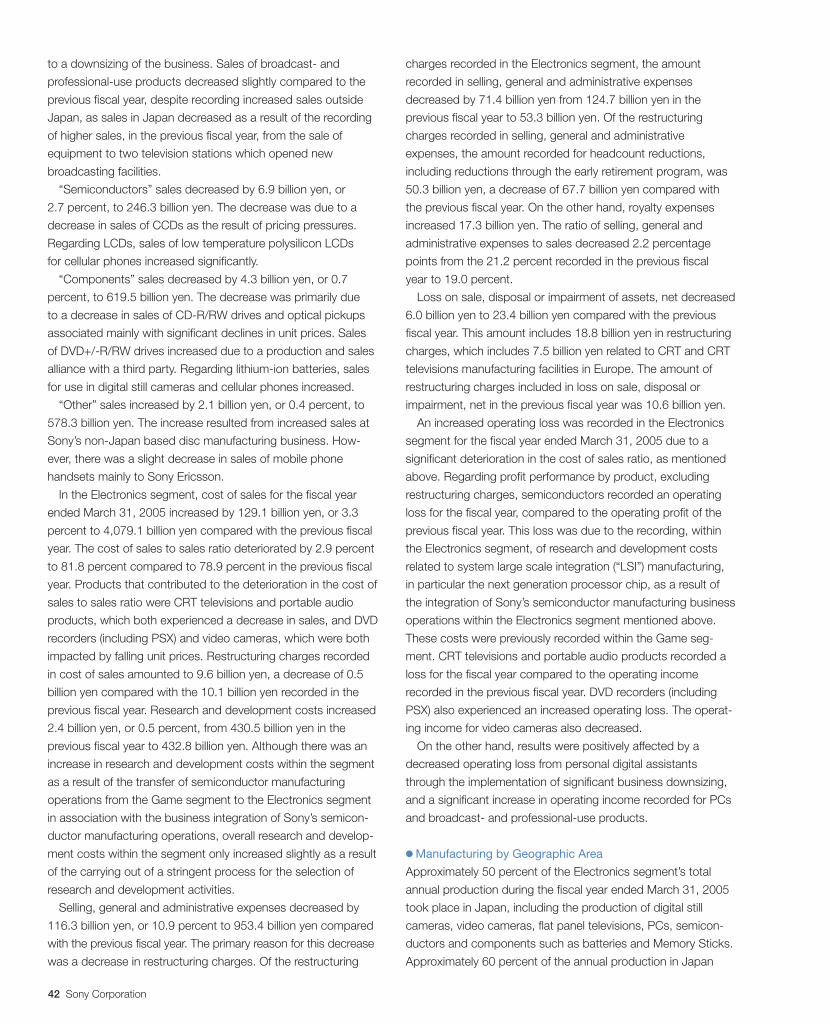
42 Sony Corporation
to a downsizing of the business. Sales of broadcast- and
professional-use products decreased slightly compared to the
previous fiscal year, despite recording increased sales outside
Japan, as sales in Japan decreased as a result of the recording
of higher sales, in the previous fiscal year, from the sale of
equipment to two television stations which opened new
broadcasting facilities.
“Semiconductors” sales decreased by 6.9 billion yen, or
2.7 percent, to 246.3 billion yen. The decrease was due to a
decrease in sales of CCDs as the result of pricing pressures.
Regarding LCDs, sales of low temperature polysilicon LCDs
for cellular phones increased significantly.
“Components” sales decreased by 4.3 billion yen, or 0.7
percent, to 619.5 billion yen. The decrease was primarily due
to a decrease in sales of CD-R/RW drives and optical pickups
associated mainly with significant declines in unit prices. Sales
of DVD+/-R/RW drives increased due to a production and sales
alliance with a third party. Regarding lithium-ion batteries, sales
for use in digital still cameras and cellular phones increased.
“Other” sales increased by 2.1 billion yen, or 0.4 percent, to
578.3 billion yen. The increase resulted from increased sales at
Sony’s non-Japan based disc manufacturing business. How-
ever, there was a slight decrease in sales of mobile phone
handsets mainly to Sony Ericsson.
In the Electronics segment, cost of sales for the fiscal year
ended March 31, 2005 increased by 129.1 billion yen, or 3.3
percent to 4,079.1 billion yen compared with the previous fiscal
year. The cost of sales to sales ratio deteriorated by 2.9 percent
to 81.8 percent compared to 78.9 percent in the previous fiscal
year. Products that contributed to the deterioration in the cost of
sales to sales ratio were CRT televisions and portable audio
products, which both experienced a decrease in sales, and DVD
recorders (including PSX) and video cameras, which were both
impacted by falling unit prices. Restructuring charges recorded
in cost of sales amounted to 9.6 billion yen, a decrease of 0.5
billion yen compared with the 10.1 billion yen recorded in the
previous fiscal year. Research and development costs increased
2.4 billion yen, or 0.5 percent, from 430.5 billion yen in the
previous fiscal year to 432.8 billion yen. Although there was an
increase in research and development costs within the segment
as a result of the transfer of semiconductor manufacturing
operations from the Game segment to the Electronics segment
in association with the business integration of Sony’s semicon-
ductor manufacturing operations, overall research and develop-
ment costs within the segment only increased slightly as a result
of the carrying out of a stringent process for the selection of
research and development activities.
Selling, general and administrative expenses decreased by
116.3 billion yen, or 10.9 percent to 953.4 billion yen compared
with the previous fiscal year. The primary reason for this decrease
was a decrease in restructuring charges. Of the restructuring
charges recorded in the Electronics segment, the amount
recorded in selling, general and administrative expenses
decreased by 71.4 billion yen from 124.7 billion yen in the
previous fiscal year to 53.3 billion yen. Of the restructuring
charges recorded in selling, general and administrative
expenses, the amount recorded for headcount reductions,
including reductions through the early retirement program, was
50.3 billion yen, a decrease of 67.7 billion yen compared with
the previous fiscal year. On the other hand, royalty expenses
increased 17.3 billion yen. The ratio of selling, general and
administrative expenses to sales decreased 2.2 percentage
points from the 21.2 percent recorded in the previous fiscal
year to 19.0 percent.
Loss on sale, disposal or impairment of assets, net decreased
6.0 billion yen to 23.4 billion yen compared with the previous
fiscal year. This amount includes 18.8 billion yen in restructuring
charges, which includes 7.5 billion yen related to CRT and CRT
televisions manufacturing facilities in Europe. The amount of
restructuring charges included in loss on sale, disposal or
impairment, net in the previous fiscal year was 10.6 billion yen.
An increased operating loss was recorded in the Electronics
segment for the fiscal year ended March 31, 2005 due to a
significant deterioration in the cost of sales ratio, as mentioned
above. Regarding profit performance by product, excluding
restructuring charges, semiconductors recorded an operating
loss for the fiscal year, compared to the operating profit of the
previous fiscal year. This loss was due to the recording, within
the Electronics segment, of research and development costs
related to system large scale integration (“LSI”) manufacturing,
in particular the next generation processor chip, as a result of
the integration of Sony’s semiconductor manufacturing business
operations within the Electronics segment mentioned above.
These costs were previously recorded within the Game seg-
ment. CRT televisions and portable audio products recorded a
loss for the fiscal year compared to the operating income
recorded in the previous fiscal year. DVD recorders (including
PSX) also experienced an increased operating loss. The operat-
ing income for video cameras also decreased.
On the other hand, results were positively affected by a
decreased operating loss from personal digital assistants
through the implementation of significant business downsizing,
and a significant increase in operating income recorded for PCs
and broadcast- and professional-use products.
● Manufacturing by Geographic Area
Approximately 50 percent of the Electronics segment’s total
annual production during the fiscal year ended March 31, 2005
took place in Japan, including the production of digital still
cameras, video cameras, flat panel televisions, PCs, semicon-
ductors and components such as batteries and Memory Sticks.
Approximately 60 percent of the annual production in Japan
BH6/30 05.7.7, 3:34 AMPage 42 Adobe PageMaker 6.0J/PPC
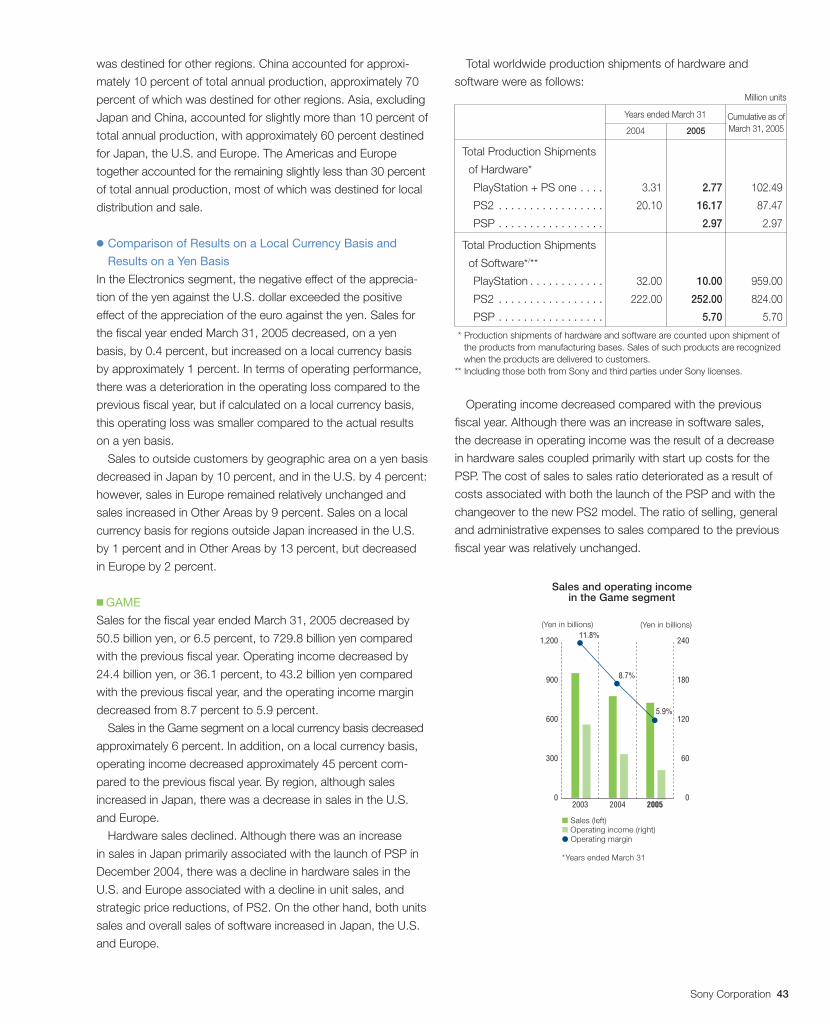
Sony Corporation 43
Total worldwide production shipments of hardware and
software were as follows:Million units
Years ended March 31 Cumulative as of
2004 2005 March 31, 2005
Total Production Shipments
of Hardware*
PlayStation + PS one . . . . 3.31 2.77 102.49
PS2 . . . . . . . . . . . . . . . . . 20.10 16.17 87.47
PSP . . . . . . . . . . . . . . . . . 2.97 2.97
Total Production Shipments
of Software*/**
PlayStation . . . . . . . . . . . . 32.00 10.00 959.00
PS2 . . . . . . . . . . . . . . . . . 222.00 252.00 824.00
PSP . . . . . . . . . . . . . . . . . 5.70 5.70
** Production shipments of hardware and software are counted upon shipment ofthe products from manufacturing bases. Sales of such products are recognizedwhen the products are delivered to customers.
** Including those both from Sony and third parties under Sony licenses.
Operating income decreased compared with the previous
fiscal year. Although there was an increase in software sales,
the decrease in operating income was the result of a decrease
in hardware sales coupled primarily with start up costs for the
PSP. The cost of sales to sales ratio deteriorated as a result of
costs associated with both the launch of the PSP and with the
changeover to the new PS2 model. The ratio of selling, general
and administrative expenses to sales compared to the previous
fiscal year was relatively unchanged.
was destined for other regions. China accounted for approxi-
mately 10 percent of total annual production, approximately 70
percent of which was destined for other regions. Asia, excluding
Japan and China, accounted for slightly more than 10 percent of
total annual production, with approximately 60 percent destined
for Japan, the U.S. and Europe. The Americas and Europe
together accounted for the remaining slightly less than 30 percent
of total annual production, most of which was destined for local
distribution and sale.
● Comparison of Results on a Local Currency Basis and
Results on a Yen Basis
In the Electronics segment, the negative effect of the apprecia-
tion of the yen against the U.S. dollar exceeded the positive
effect of the appreciation of the euro against the yen. Sales for
the fiscal year ended March 31, 2005 decreased, on a yen
basis, by 0.4 percent, but increased on a local currency basis
by approximately 1 percent. In terms of operating performance,
there was a deterioration in the operating loss compared to the
previous fiscal year, but if calculated on a local currency basis,
this operating loss was smaller compared to the actual results
on a yen basis.
Sales to outside customers by geographic area on a yen basis
decreased in Japan by 10 percent, and in the U.S. by 4 percent:
however, sales in Europe remained relatively unchanged and
sales increased in Other Areas by 9 percent. Sales on a local
currency basis for regions outside Japan increased in the U.S.
by 1 percent and in Other Areas by 13 percent, but decreased
in Europe by 2 percent.
■ GAME
Sales for the fiscal year ended March 31, 2005 decreased by
50.5 billion yen, or 6.5 percent, to 729.8 billion yen compared
with the previous fiscal year. Operating income decreased by
24.4 billion yen, or 36.1 percent, to 43.2 billion yen compared
with the previous fiscal year, and the operating income margin
decreased from 8.7 percent to 5.9 percent.
Sales in the Game segment on a local currency basis decreased
approximately 6 percent. In addition, on a local currency basis,
operating income decreased approximately 45 percent com-
pared to the previous fiscal year. By region, although sales
increased in Japan, there was a decrease in sales in the U.S.
and Europe.
Hardware sales declined. Although there was an increase
in sales in Japan primarily associated with the launch of PSP in
December 2004, there was a decline in hardware sales in the
U.S. and Europe associated with a decline in unit sales, and
strategic price reductions, of PS2. On the other hand, both units
sales and overall sales of software increased in Japan, the U.S.
and Europe.
(Yen in billions)
Sales and operating incomein the Game segment
■ Sales (left)■ Operating income (right)● Operating margin
*Years ended March 31
1,200
900
600
300
0
240
180
120
60
02003 2004 2005
11.8%
8.7%
5.9%
(Yen in billions)
BH6/30 05.7.7, 3:34 AMPage 43 Adobe PageMaker 6.0J/PPC
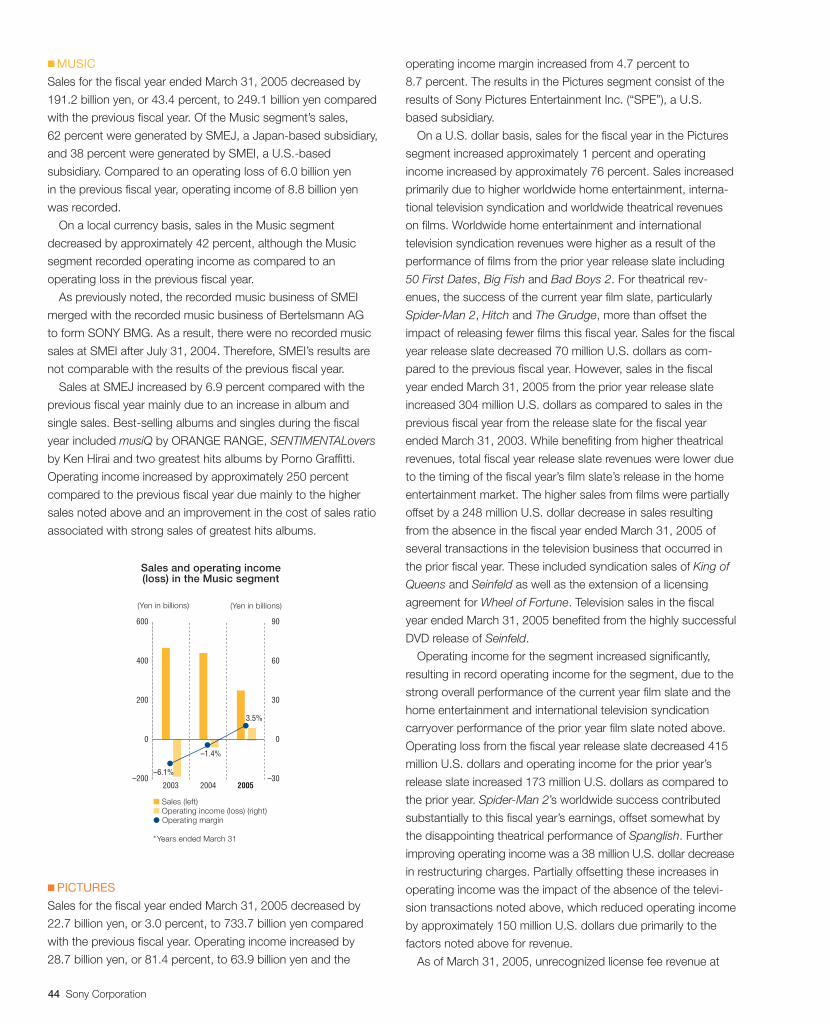
44 Sony Corporation
■ MUSIC
Sales for the fiscal year ended March 31, 2005 decreased by
191.2 billion yen, or 43.4 percent, to 249.1 billion yen compared
with the previous fiscal year. Of the Music segment’s sales,
62 percent were generated by SMEJ, a Japan-based subsidiary,
and 38 percent were generated by SMEI, a U.S.-based
subsidiary. Compared to an operating loss of 6.0 billion yen
in the previous fiscal year, operating income of 8.8 billion yen
was recorded.
On a local currency basis, sales in the Music segment
decreased by approximately 42 percent, although the Music
segment recorded operating income as compared to an
operating loss in the previous fiscal year.
As previously noted, the recorded music business of SMEI
merged with the recorded music business of Bertelsmann AG
to form SONY BMG. As a result, there were no recorded music
sales at SMEI after July 31, 2004. Therefore, SMEI’s results are
not comparable with the results of the previous fiscal year.
Sales at SMEJ increased by 6.9 percent compared with the
previous fiscal year mainly due to an increase in album and
single sales. Best-selling albums and singles during the fiscal
year included musiQ by ORANGE RANGE, SENTIMENTALovers
by Ken Hirai and two greatest hits albums by Porno Graffitti.
Operating income increased by approximately 250 percent
compared to the previous fiscal year due mainly to the higher
sales noted above and an improvement in the cost of sales ratio
associated with strong sales of greatest hits albums.
■ PICTURES
Sales for the fiscal year ended March 31, 2005 decreased by
22.7 billion yen, or 3.0 percent, to 733.7 billion yen compared
with the previous fiscal year. Operating income increased by
28.7 billion yen, or 81.4 percent, to 63.9 billion yen and the
operating income margin increased from 4.7 percent to
8.7 percent. The results in the Pictures segment consist of the
results of Sony Pictures Entertainment Inc. (“SPE”), a U.S.
based subsidiary.
On a U.S. dollar basis, sales for the fiscal year in the Pictures
segment increased approximately 1 percent and operating
income increased by approximately 76 percent. Sales increased
primarily due to higher worldwide home entertainment, interna-
tional television syndication and worldwide theatrical revenues
on films. Worldwide home entertainment and international
television syndication revenues were higher as a result of the
performance of films from the prior year release slate including
50 First Dates, Big Fish and Bad Boys 2. For theatrical rev-
enues, the success of the current year film slate, particularly
Spider-Man 2, Hitch and The Grudge, more than offset the
impact of releasing fewer films this fiscal year. Sales for the fiscal
year release slate decreased 70 million U.S. dollars as com-
pared to the previous fiscal year. However, sales in the fiscal
year ended March 31, 2005 from the prior year release slate
increased 304 million U.S. dollars as compared to sales in the
previous fiscal year from the release slate for the fiscal year
ended March 31, 2003. While benefiting from higher theatrical
revenues, total fiscal year release slate revenues were lower due
to the timing of the fiscal year’s film slate’s release in the home
entertainment market. The higher sales from films were partially
offset by a 248 million U.S. dollar decrease in sales resulting
from the absence in the fiscal year ended March 31, 2005 of
several transactions in the television business that occurred in
the prior fiscal year. These included syndication sales of King of
Queens and Seinfeld as well as the extension of a licensing
agreement for Wheel of Fortune. Television sales in the fiscal
year ended March 31, 2005 benefited from the highly successful
DVD release of Seinfeld.
Operating income for the segment increased significantly,
resulting in record operating income for the segment, due to the
strong overall performance of the current year film slate and the
home entertainment and international television syndication
carryover performance of the prior year film slate noted above.
Operating loss from the fiscal year release slate decreased 415
million U.S. dollars and operating income for the prior year’s
release slate increased 173 million U.S. dollars as compared to
the prior year. Spider-Man 2’s worldwide success contributed
substantially to this fiscal year’s earnings, offset somewhat by
the disappointing theatrical performance of Spanglish. Further
improving operating income was a 38 million U.S. dollar decrease
in restructuring charges. Partially offsetting these increases in
operating income was the impact of the absence of the televi-
sion transactions noted above, which reduced operating income
by approximately 150 million U.S. dollars due primarily to the
factors noted above for revenue.
As of March 31, 2005, unrecognized license fee revenue at
Sales and operating income(loss) in the Music segment
■ Sales (left)■ Operating income (loss) (right)● Operating margin
*Years ended March 31
(Yen in billions) (Yen in billions)
2003 2004 2005
–1.4%
3.5%
–6.1%
600
400
200
0
–200
90
60
30
0
–30
BH6/30 05.7.7, 3:34 AMPage 44 Adobe PageMaker 6.0J/PPC
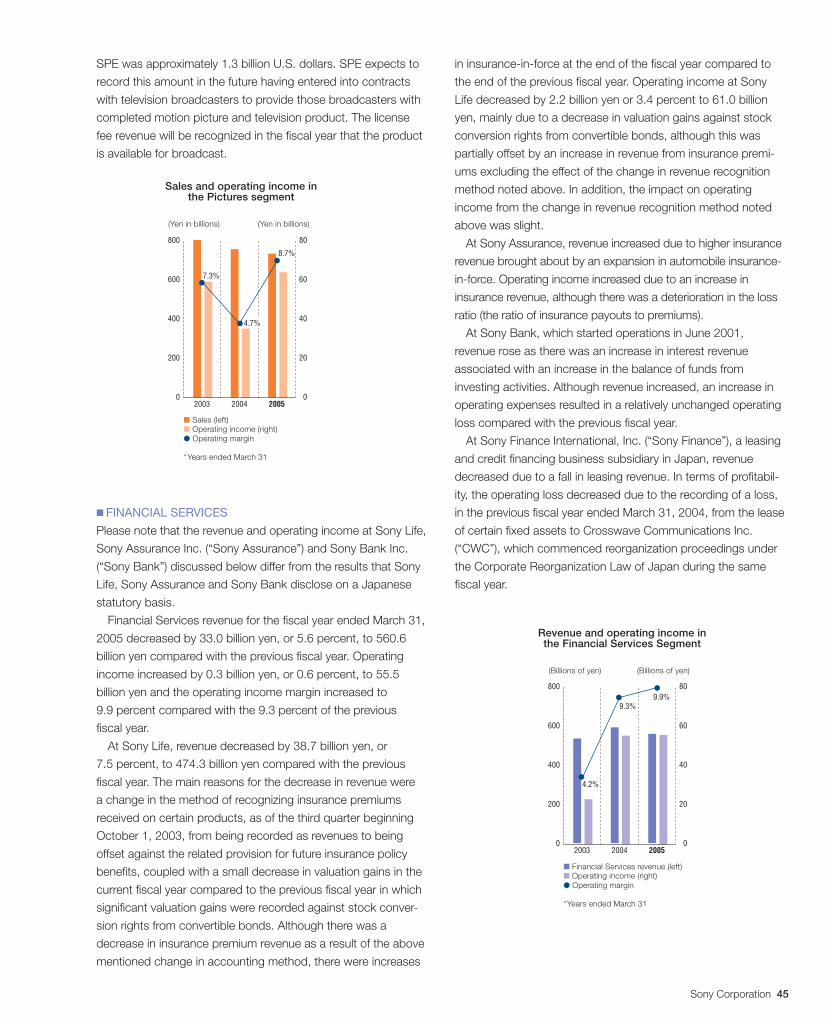
Sony Corporation 45
SPE was approximately 1.3 billion U.S. dollars. SPE expects to
record this amount in the future having entered into contracts
with television broadcasters to provide those broadcasters with
completed motion picture and television product. The license
fee revenue will be recognized in the fiscal year that the product
is available for broadcast.
■ FINANCIAL SERVICES
Please note that the revenue and operating income at Sony Life,
Sony Assurance Inc. (“Sony Assurance”) and Sony Bank Inc.
(“Sony Bank”) discussed below differ from the results that Sony
Life, Sony Assurance and Sony Bank disclose on a Japanese
statutory basis.
Financial Services revenue for the fiscal year ended March 31,
2005 decreased by 33.0 billion yen, or 5.6 percent, to 560.6
billion yen compared with the previous fiscal year. Operating
income increased by 0.3 billion yen, or 0.6 percent, to 55.5
billion yen and the operating income margin increased to
9.9 percent compared with the 9.3 percent of the previous
fiscal year.
At Sony Life, revenue decreased by 38.7 billion yen, or
7.5 percent, to 474.3 billion yen compared with the previous
fiscal year. The main reasons for the decrease in revenue were
a change in the method of recognizing insurance premiums
received on certain products, as of the third quarter beginning
October 1, 2003, from being recorded as revenues to being
offset against the related provision for future insurance policy
benefits, coupled with a small decrease in valuation gains in the
current fiscal year compared to the previous fiscal year in which
significant valuation gains were recorded against stock conver-
sion rights from convertible bonds. Although there was a
decrease in insurance premium revenue as a result of the above
mentioned change in accounting method, there were increases
in insurance-in-force at the end of the fiscal year compared to
the end of the previous fiscal year. Operating income at Sony
Life decreased by 2.2 billion yen or 3.4 percent to 61.0 billion
yen, mainly due to a decrease in valuation gains against stock
conversion rights from convertible bonds, although this was
partially offset by an increase in revenue from insurance premi-
ums excluding the effect of the change in revenue recognition
method noted above. In addition, the impact on operating
income from the change in revenue recognition method noted
above was slight.
At Sony Assurance, revenue increased due to higher insurance
revenue brought about by an expansion in automobile insurance-
in-force. Operating income increased due to an increase in
insurance revenue, although there was a deterioration in the loss
ratio (the ratio of insurance payouts to premiums).
At Sony Bank, which started operations in June 2001,
revenue rose as there was an increase in interest revenue
associated with an increase in the balance of funds from
investing activities. Although revenue increased, an increase in
operating expenses resulted in a relatively unchanged operating
loss compared with the previous fiscal year.
At Sony Finance International, Inc. (“Sony Finance”), a leasing
and credit financing business subsidiary in Japan, revenue
decreased due to a fall in leasing revenue. In terms of profitabil-
ity, the operating loss decreased due to the recording of a loss,
in the previous fiscal year ended March 31, 2004, from the lease
of certain fixed assets to Crosswave Communications Inc.
(“CWC”), which commenced reorganization proceedings under
the Corporate Reorganization Law of Japan during the same
fiscal year.
Sales and operating income inthe Pictures segment
■ Sales (left)■ Operating income (right)● Operating margin
*Years ended March 31
800
600
400
200
0
80
60
40
20
02003 2004 2005
7.3%
8.7%
4.7%
(Yen in billions) (Yen in billions)
(Billions of yen) (Billions of yen)
Revenue and operating income inthe Financial Services Segment
■ Financial Services revenue (left)■ Operating income (right)● Operating margin
*Years ended March 31
800
600
400
200
0
80
60
40
20
02003 2004 2005
4.2%
9.3%9.9%
BH6/30 05.7.7, 3:34 AMPage 45 Adobe PageMaker 6.0J/PPC
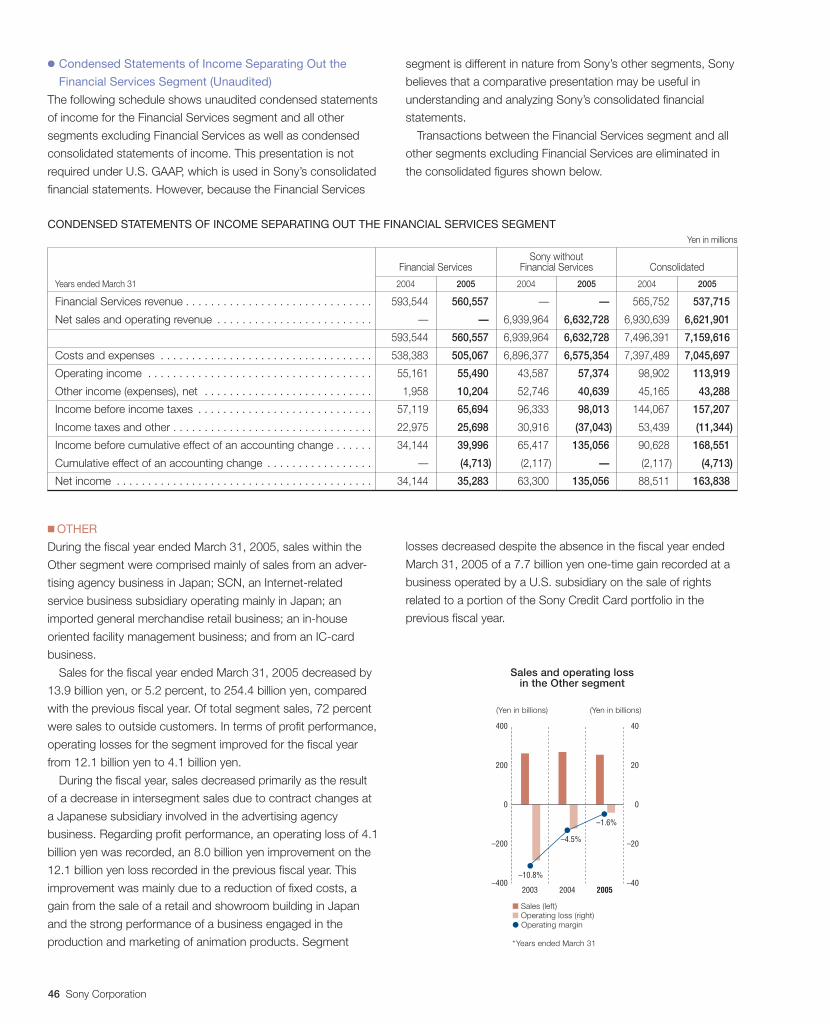
46 Sony Corporation
● Condensed Statements of Income Separating Out the
Financial Services Segment (Unaudited)
The following schedule shows unaudited condensed statements
of income for the Financial Services segment and all other
segments excluding Financial Services as well as condensed
consolidated statements of income. This presentation is not
required under U.S. GAAP, which is used in Sony’s consolidated
financial statements. However, because the Financial Services
segment is different in nature from Sony’s other segments, Sony
believes that a comparative presentation may be useful in
understanding and analyzing Sony’s consolidated financial
statements.
Transactions between the Financial Services segment and all
other segments excluding Financial Services are eliminated in
the consolidated figures shown below.
Sales and operating lossin the Other segment
2003 2004 2005
–4.5%
–1.6%
–10.8%
400
200
0
–200
–400
40
20
0
–20
–40
(Yen in billions) (Yen in billions)
■ Sales (left)■ Operating loss (right)● Operating margin
*Years ended March 31
CONDENSED STATEMENTS OF INCOME SEPARATING OUT THE FINANCIAL SERVICES SEGMENTYen in millions
Sony withoutFinancial Services Financial Services Consolidated
Years ended March 31 2004 2005 2004 2005 2004 2005
Financial Services revenue . . . . . . . . . . . . . . . . . . . . . . . . . . . . . . 593,544 560,557 — — 565,752 537,715
Net sales and operating revenue . . . . . . . . . . . . . . . . . . . . . . . . . — — 6,939,964 6,632,728 6,930,639 6,621,901
. . . . . . . . . . . . . . . . . . . . . . . . . . . . . . . . . . . . . . . . . . . . . . . . . . 593,544 560,557 6,939,964 6,632,728 7,496,391 7,159,616
Costs and expenses . . . . . . . . . . . . . . . . . . . . . . . . . . . . . . . . . . 538,383 505,067 6,896,377 6,575,354 7,397,489 7,045,697
Operating income . . . . . . . . . . . . . . . . . . . . . . . . . . . . . . . . . . . . 55,161 55,490 43,587 57,374 98,902 113,919
Other income (expenses), net . . . . . . . . . . . . . . . . . . . . . . . . . . . 1,958 10,204 52,746 40,639 45,165 43,288
Income before income taxes . . . . . . . . . . . . . . . . . . . . . . . . . . . . 57,119 65,694 96,333 98,013 144,067 157,207
Income taxes and other . . . . . . . . . . . . . . . . . . . . . . . . . . . . . . . . 22,975 25,698 30,916 (37,043) 53,439 (11,344)
Income before cumulative effect of an accounting change . . . . . . 34,144 39,996 65,417 135,056 90,628 168,551
Cumulative effect of an accounting change . . . . . . . . . . . . . . . . . — (4,713) (2,117) — (2,117) (4,713)
Net income . . . . . . . . . . . . . . . . . . . . . . . . . . . . . . . . . . . . . . . . . 34,144 35,283 63,300 135,056 88,511 163,838
■ OTHER
During the fiscal year ended March 31, 2005, sales within the
Other segment were comprised mainly of sales from an adver-
tising agency business in Japan; SCN, an Internet-related
service business subsidiary operating mainly in Japan; an
imported general merchandise retail business; an in-house
oriented facility management business; and from an IC-card
business.
Sales for the fiscal year ended March 31, 2005 decreased by
13.9 billion yen, or 5.2 percent, to 254.4 billion yen, compared
with the previous fiscal year. Of total segment sales, 72 percent
were sales to outside customers. In terms of profit performance,
operating losses for the segment improved for the fiscal year
from 12.1 billion yen to 4.1 billion yen.
During the fiscal year, sales decreased primarily as the result
of a decrease in intersegment sales due to contract changes at
a Japanese subsidiary involved in the advertising agency
business. Regarding profit performance, an operating loss of 4.1
billion yen was recorded, an 8.0 billion yen improvement on the
12.1 billion yen loss recorded in the previous fiscal year. This
improvement was mainly due to a reduction of fixed costs, a
gain from the sale of a retail and showroom building in Japan
and the strong performance of a business engaged in the
production and marketing of animation products. Segment
losses decreased despite the absence in the fiscal year ended
March 31, 2005 of a 7.7 billion yen one-time gain recorded at a
business operated by a U.S. subsidiary on the sale of rights
related to a portion of the Sony Credit Card portfolio in the
previous fiscal year.
BH6/30 05.7.7, 3:34 AMPage 46 Adobe PageMaker 6.0J/PPC
Sony Corporation 47
CHANGES IN THE CLASSIFICATION OF BUSINESS
SEGMENTS FOR THE FISCAL YEAR ENDING MARCH 31, 2006
In association with a significant contraction in the size of the
Music segment as a result of the establishment of SONY BMG
in August, 2004, Sony will discontinue the separate reporting of
the Music segment as of the first quarter of the fiscal year
ending March 31, 2006, and will instead consolidate its results
within the Other segment. After the establishment of SONY
BMG, for the second half of the fiscal year ended March 31,
2005, sales revenue for the Music segment (including
intersegment sales) was 2.3 percent of total consolidated sales
and operating income was 7.9 percent of the total operating
income for all segments recording an operating profit. In
addition, total assets for the Music segment, as of March 31,
2005, were 3.5 percent of the total assets for all segments.
Furthermore, as of the first quarter of the fiscal year ending
March 31, 2006, Sony’s Japan-based disc manufacturing and
distribution business, previously classified within the Music
segment, is scheduled to be reclassified to the Electronics
segment.
FOREIGN EXCHANGE FLUCTUATIONS AND RISK
HEDGING
During the fiscal year ended March 31, 2005, the average value
of the yen was 106.5 yen against the U.S. dollar, and 133.7 yen
against the euro, which was 5.2 percent higher against the U.S.
dollar and 1.9 percent lower against the euro, respectively, com-
pared with the average of the previous fiscal year. Operating
results on a local currency basis described in “Overview” and
“Operating Performance” show results of sales and operating
revenue and operating income obtained by applying the yen’s
monthly average exchange rate in the previous fiscal year to
monthly local currency-denominated sales, cost of sales, and sell-
ing, general and administrative expenses for the fiscal year ended
March 31, 2005, as if the value of the yen had remained constant.
In the Music segment, Sony consolidates the yen-translated
results of SMEI (a U.S.-based operation that aggregates the
results of its worldwide subsidiaries on a U.S. dollar basis) and
the results of SMEJ (a Japan based operation that aggregates
the results of its operations in yen). In addition, in the Music
segment, results for this fiscal year only include the results of
SMEI’s recorded music business for the months of April through
July 2004, and the twelve month results for SMEI’s music
publishing business and SMEJ. However, results for the previ-
ous fiscal year in the Music segment include the consolidated
results for SMEI’s recorded music business for all twelve
months, as well as the full year’s results for SMEI’s publishing
business and SMEJ.
In the Pictures segment, Sony translates into yen the U.S.
dollar consolidated results of SPE (a U.S. based operation that
has worldwide subsidiaries).
Therefore, analysis and discussion of certain portions of the
operating results of SMEI and SPE are specified as being on “a
U.S. dollar basis.” Results on a local currency basis and results
on a U.S. dollar basis are not on the same basis as Sony’s
consolidated financial statements and do not conform with U.S.
GAAP. In addition, Sony does not believe that these measures
are a substitute for U.S. GAAP measures. However, Sony
believes that local currency basis results provide additional
useful information to investors regarding operating performance.
Sony’s consolidated results are subject to foreign currency
rate fluctuations mainly derived from the fact that the countries
where manufacturing takes place may be different from those
where such products are sold. In order to reduce the risk
caused by such fluctuations, Sony employs derivatives, includ-
ing foreign exchange forward contracts and foreign currency
option contracts, in accordance with a consistent risk manage-
ment strategy. Such derivatives are used primarily to mitigate the
effect of foreign currency exchange rate fluctuations on cash
flows generated by anticipated intercompany transactions and
intercompany accounts receivable and payable denominated in
foreign currencies.
Sony Global Treasury Services Plc (“SGTS”) in London
provides integrated treasury services for Sony Corporation and
its subsidiaries. Sony’s policy is that Sony Corporation and all
subsidiaries with foreign exchange exposures should enter into
commitments with SGTS for hedging their exposures. Sony
Corporation and most of its subsidiaries utilize SGTS for this
purpose. The concentration of foreign exchange exposures at
SGTS means that, in effect, SGTS hedges the net foreign
exchange exposure of Sony Corporation and its subsidiaries.
SGTS in turn enters into foreign exchange transactions with
creditworthy third-party financial institutions. Most of the
transactions are entered into against projected exposures before
the actual export and import transactions take place. In general,
SGTS hedges the projected exposures on average three months
before the actual transactions take place. However, in certain
cases, SGTS partially hedges the projected exposures one
month before the actual transactions take place when business
requirements such as shorter production-sales cycle for certain
products arise. Sony enters into foreign exchange transactions
with financial institutions primarily for hedging purposes. Sony
does not use these derivative financial instruments for trading
or speculative purposes except for certain derivatives in the
Financial Services segment utilized for portfolio investments.
To minimize the adverse effects of foreign exchange fluctua-
tions on its financial results, particularly in the Electronics
segment, Sony seeks, when appropriate, to localize material
and parts procurement, design, and manufacturing operations
in areas outside of Japan.
Changes in the fair value of derivatives designated as cash
flow hedges, including foreign exchange forward contracts and
BH6/30 05.7.7, 3:34 AMPage 47 Adobe PageMaker 6.0J/PPC
48 Sony Corporation
foreign currency option contracts, are initially recorded in other
comprehensive income and reclassified into earnings when the
hedged transaction affects earnings. Foreign exchange forward
contracts, foreign currency option contracts and other deriva-
tives that do not qualify as hedges are marked-to-market with
changes in value recognized in Other Income and Expenses.
The notional amounts of foreign exchange forward contracts,
currency option contracts purchased and currency option
contracts written as of March 31, 2005 were 1,545.8 billion
yen, 428.3 billion yen and 146.5 billion yen, respectively.
ASSETS, LIABILITIES AND STOCKHOLDERS’EQUITY
ASSETS
Total assets on March 31, 2005 increased by 408.4 billion yen,
or 4.5 percent, to 9,499.1 billion yen, compared with the
previous fiscal year-end. Total assets on March 31, 2005 in all
segments excluding the Financial Services segment decreased
by 32.9 billion yen, or 0.5 percent, to 6,027.9 billion yen and
total assets on March 31, 2005 in the Financial Services
segment increased by 410.5 billion yen, or 11.8 percent, to
3,885.5 billion yen, compared with the previous fiscal year-end.
Total assets on March 31, 2005 in all segments excluding the
Financial Services segment would have decreased by approxi-
mately 2 percent compared with the previous fiscal year-end if
the value of the yen had remained the same on March 31, 2005
as it was on March 31, 2004.
■ CURRENT ASSETS
Current assets on March 31, 2005 increased by 192.8 billion
yen, or 5.7 percent, to 3,556.2 billion yen compared with the
previous fiscal year-end. Current assets on March 31, 2005 in all
segments excluding the Financial Services segment decreased
by 99.6 billion yen, or 3.7 percent, to 2,592.8 billion yen.
Cash and cash equivalents on March 31, 2005 in all segments
excluding Financial Services segment decreased 73.2 billion
yen, or 12.3 percent, to 519.7 billion yen compared with the
previous fiscal year-end. This is primarily a result of a 57.3 billion
yen repayment of long-term debt relating to a variable interest
entity responsible for the operation and development of a real
estate complex in Berlin, Germany.
Notes and accounts receivable, trade (net allowance for
doubtful accounts and sales returns) on March 31, 2005, in all
segments excluding Financial Services segment increased 9.1
billion yen, or 1.0 percent, compared with the previous fiscal
year-end to 952.7 billion yen.
Inventories on March 31, 2005 decreased by 35.2 billion yen,
or 5.3 percent, to 631.3 billion yen compared with the previous
fiscal year-end. The inventory to cost of sales turnover ratio
(based on the average of inventories at the end of each fiscal
year and previous fiscal year) was 1.56 months compared to
1.53 months at the end of the previous fiscal year. Sony consid-
ers this level of inventory to be appropriate in the aggregate.
Current assets on March 31, 2005 in the Financial Services
segment increased by 290.5 billion yen, or 41.5 percent, to
990.2 billion yen, compared with the previous fiscal year-end.
The increase was primarily attributable to an increase in
marketable securities. (Refer to Note 8 of Notes to Consolidated
Financial Statements.)
■ INVESTMENTS AND ADVANCES
Investments and advances on March 31, 2005 increased by
232.7 billion yen, or 9.3 percent, to 2,745.7 billion yen, com-
pared with the previous fiscal year-end.
Investments and advances on March 31, 2005 in all segments
excluding the Financial Services segment increased by 86.8
billion yen, or 24.2 percent, to 445.4 billion yen. This increase
was mainly the result of investments associated with the
establishment of S-LCD, a joint venture with Samsung for the
manufacture of amorphous TFT LCD panels.
Investments and advances on March 31, 2005 in the Financial
Services segment increased by 104.5 billion yen, or 4.6 percent,
to 2,379.0 billion yen, compared with the previous fiscal year-
end. This increase was primarily due to investments mainly in
Japanese fixed income securities resulting from an increase in
insurance premiums at Sony Life, and an increase in housing
loans due to a campaign carried out at Sony Bank.
Also see “Investments” below.
■ PROPERTY, PLANT AND EQUIPMENT (AFTER DEDUCTION
OF ACCUMULATED DEPRECIATION)
Property, plant and equipment on March 31, 2005 increased by
7.4 billion yen, or 0.5 percent, to 1,372.4 billion yen, compared
with the previous fiscal year-end.
Property, plant and equipment on March 31, 2005 in all
segments excluding the Financial Services segment increased
by 9.6 billion yen, or 0.7 percent, to 1,333.8 billion yen, com-
pared with the previous fiscal year-end.
Capital expenditures (part of the increase in property, plant and
equipment) for the fiscal year ended March 31, 2005 decreased
by 21.4 billion yen, or 5.7 percent, to 356.8 billion yen compared
with the previous fiscal year. Capital expenditures in the Electron-
ics segment increased by 59.1 billion yen, or 23.5 percent, to
311.1 billion yen but decreased in the Game segment by 81.5
billion yen, or 81.2 percent, to 18.8 billion yen. Capital expendi-
tures in the semiconductor businesses mainly in the Electronics
segment amounted to 150.0 billion yen, of which investments in
production equipment for system large-scale integration (“LSI”)
including the Cell next-generation, high-performance processor
amounted to 90.0 billion yen. Capital expenditures in the Music
BH6/30 05.7.7, 3:34 AMPage 48 Adobe PageMaker 6.0J/PPC
Sony Corporation 49
segment decreased by 0.8 billion yen, or 20.7 percent, to 2.9
billion yen, and decreased in the Pictures segment by 0.2 billion
yen, or 3.4 percent to 5.8 billion yen, and decreased in the Other
segment by 4.0 billion yen, or 39.3 percent, to 6.1 billion yen.
Property, plant and equipment on March 31, 2005 in the
Financial Services segment decreased by 2.3 billion yen, or 5.6
percent, to 38.6 billion yen compared with the previous fiscal
year-end. Capital expenditures in the Financial Services segment
decreased by 0.8 billion yen, or 16.7 percent, to 3.8 billion yen.
■ OTHER ASSETS
Other assets on March 31, 2005 decreased by 46.7 billion yen,
or 2.9 percent, to 1,545.9 billion yen, compared with the
previous fiscal year-end.
Other assets on March 31, 2005 in all segments excluding
the Financial Services segment decreased by 62.5 billion yen to
1,189.4 billion yen. This decrease was primarily the result of the
fact that, due to the establishment of SONY BMG, artist’s
contracts belonging to the joint venture are no longer recorded
as intangible assets within Sony’s consolidated balance sheets.
Deferred tax assets on March 31, 2005 increased by 37.2 bil-
lion yen, or 18.3 percent, to 240.4 billion yen compared with the
previous fiscal year-end. As a result of the recording of operating
losses in the past, certain U.S. subsidiaries of Sony have had
valuation allowances against deferred tax assets for U.S. federal
taxes and certain state taxes. However, in the fiscal year ended
March 31, 2005, based on both improved operating results in
recent years and a sound outlook for the future operating perfor-
mance at Sony’s U.S. subsidiaries, Sony reversed 67.9 billion
yen of such valuation allowances. On the other hand, certain of
Sony’s subsidiaries recorded new valuation allowances against
deferred tax assets during the fiscal year ended March 31, 2005.
Other assets in the Financial Services segment on March 31,
2005 increased by 17.8 billion yen, or 3.9 percent, to 477.8
billion yen compared with the previous fiscal year-end. This was
mainly due to an increase in deferred insurance acquisition costs
at Sony Life.
LIABILITIES
Total current and long-term liabilities on March 31, 2005
decreased by 84.9 billion yen, or 1.3 percent, to 6,604.9 billion
yen compared with the previous fiscal year-end. Total current
and long-term liabilities on March 31, 2005 in all segments
excluding the Financial Services segment decreased by 489.5
billion yen, or 12.7 percent, to 3,366.4 billion yen. Total current
and long-term liabilities in the Financial Services segment on
March 31, 2005 increased by 365.5 billion yen, or 11.8 percent,
to 3,465.3 billion yen, compared with the previous fiscal year-
end. Total current and long-term liabilities on March 31, 2005 in
all segments excluding the Financial Services segment would
have decreased by approximately 14 percent compared with the
previous fiscal year-end if the value of the yen had remained the
same on March 31, 2005 as it was on March 31, 2004.
■ CURRENT LIABILITIES
Current liabilities on March 31, 2005 decreased by 172.8 billion
yen, or 5.8 percent, to 2,809.4 billion yen compared with the
previous fiscal year-end. Current liabilities on March 31, 2005 in
all segments excluding the Financial Services segment decreased
by 236.1 billion yen, or 9.9 percent, to 2,137.5 billion yen.
Short-term borrowings and the current portion of long-term
debt on March 31, 2005 in all segments excluding the Financial
Services segment decreased 205.7 billion yen, or 50.2 percent,
to 204.0 billion yen compared with the previous fiscal year-end.
This decrease was mainly a result of the fact that of 300.0 billion
yen of convertible bonds due on March 31, 2005, 5.0 billion yen
were redeemed on the maturity date with 282.8 billion yen of the
287.8 billion yen balance outstanding at the start of the fiscal
year being converted into common stock, which was partially
offset by the reclassification of long-term debt to current liabilities
mainly consisting of 119.0 billion yen of straight bonds and
bonds with warrants redeemable during the fiscal year ending
March 31, 2006. (Refer to Note 12 of Notes to Consolidated
Financial Statements.)
Notes and accounts payable, trade on March 31, 2005 in all
segments excluding the Financial Services segment increased
by 28.0 billion yen, or 3.6 percent, to 801.3 billion yen compared
with the previous fiscal year-end, mainly due to an increase
within the Game segment.
Current liabilities on March 31, 2005 in the Financial Services
segment increased by 59.8 billion yen, or 9.2 percent, to 708.6
billion yen, mainly due to the increase in deposits from customers
in the banking business. Deposits from customers in the banking
business increased by 167.9 billion yen, or 44.3 percent, to 546.7
billion yen, due to the expansion of the banking business.
■ LONG-TERM LIABILITIES
Long-term liabilities on March 31, 2005 increased by 88.0 billion
yen, or 2.4 percent, to 3,795.5 billion yen compared with the
previous fiscal year-end.
Long-term liabilities on March 31, 2005 in all segments
excluding the Financial Services segment decreased by 253.5
billion yen, or 17.1 percent, to 1,228.9 billion yen. Long-term
debt on March 31, 2005 in all segments excluding the Financial
Services segment decreased 147.9 billion yen, or 19.1 percent,
to 627.4 billion yen. This was primarily the result of the reclassifi-
cation of long-term debt to current liabilities, including 119.0
billion yen of bonds redeemable during the fiscal year ending
March 31, 2006 and a decrease in accrued pension and
severance costs of 20.2 billion yen, or 5.6 percent, to 338.0
billion yen, primarily due to the reform of Sony’s employee
retirement pension plan in Japan.
BH6/30 05.7.7, 3:34 AMPage 49 Adobe PageMaker 6.0J/PPC
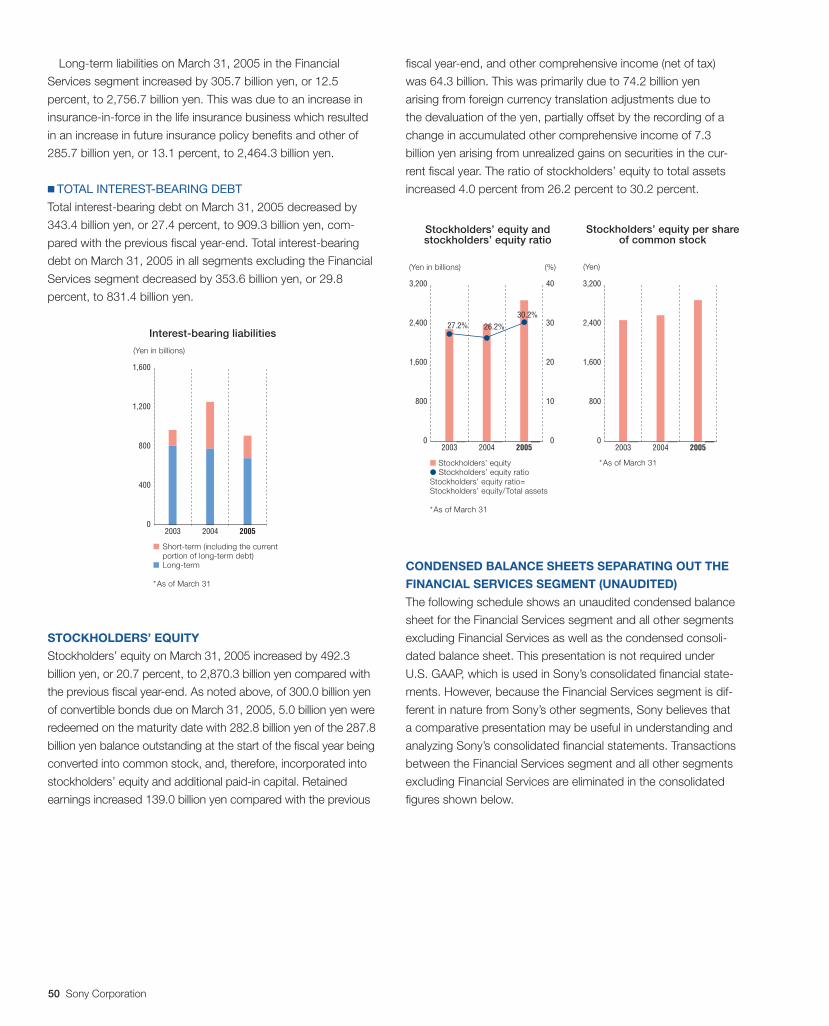
50 Sony Corporation
Long-term liabilities on March 31, 2005 in the Financial
Services segment increased by 305.7 billion yen, or 12.5
percent, to 2,756.7 billion yen. This was due to an increase in
insurance-in-force in the life insurance business which resulted
in an increase in future insurance policy benefits and other of
285.7 billion yen, or 13.1 percent, to 2,464.3 billion yen.
■ TOTAL INTEREST-BEARING DEBT
Total interest-bearing debt on March 31, 2005 decreased by
343.4 billion yen, or 27.4 percent, to 909.3 billion yen, com-
pared with the previous fiscal year-end. Total interest-bearing
debt on March 31, 2005 in all segments excluding the Financial
Services segment decreased by 353.6 billion yen, or 29.8
percent, to 831.4 billion yen.
STOCKHOLDERS’ EQUITY
Stockholders’ equity on March 31, 2005 increased by 492.3
billion yen, or 20.7 percent, to 2,870.3 billion yen compared with
the previous fiscal year-end. As noted above, of 300.0 billion yen
of convertible bonds due on March 31, 2005, 5.0 billion yen were
redeemed on the maturity date with 282.8 billion yen of the 287.8
billion yen balance outstanding at the start of the fiscal year being
converted into common stock, and, therefore, incorporated into
stockholders’ equity and additional paid-in capital. Retained
earnings increased 139.0 billion yen compared with the previous
fiscal year-end, and other comprehensive income (net of tax)
was 64.3 billion. This was primarily due to 74.2 billion yen
arising from foreign currency translation adjustments due to
the devaluation of the yen, partially offset by the recording of a
change in accumulated other comprehensive income of 7.3
billion yen arising from unrealized gains on securities in the cur-
rent fiscal year. The ratio of stockholders’ equity to total assets
increased 4.0 percent from 26.2 percent to 30.2 percent.
CONDENSED BALANCE SHEETS SEPARATING OUT THE
FINANCIAL SERVICES SEGMENT (UNAUDITED)
The following schedule shows an unaudited condensed balance
sheet for the Financial Services segment and all other segments
excluding Financial Services as well as the condensed consoli-
dated balance sheet. This presentation is not required under
U.S. GAAP, which is used in Sony’s consolidated financial state-
ments. However, because the Financial Services segment is dif-
ferent in nature from Sony’s other segments, Sony believes that
a comparative presentation may be useful in understanding and
analyzing Sony’s consolidated financial statements. Transactions
between the Financial Services segment and all other segments
excluding Financial Services are eliminated in the consolidated
figures shown below.
(Yen in billions)
Interest-bearing liabilities
■ Short-term (including the currentportion of long-term debt)
■ Long-term
*As of March 31
1,600
1,200
800
400
02003 2004 2005
(Yen)
Stockholders’ equity per shareof common stock
*As of March 31
3,200
2,400
1,600
800
02003 2004 2005
(Yen in billions)
Stockholders’ equity andstockholders’ equity ratio
■ Stockholders’ equity● Stockholders’ equity ratioStockholders’ equity ratio=Stockholders’ equity/Total assets
*As of March 31
(%)
40
30
20
10
0
3,200
2,400
1,600
800
02003 2004 2005
27.2% 26.2%30.2%
BH6/30 05.7.7, 9:28 AMPage 50 Adobe PageMaker 6.0J/PPC
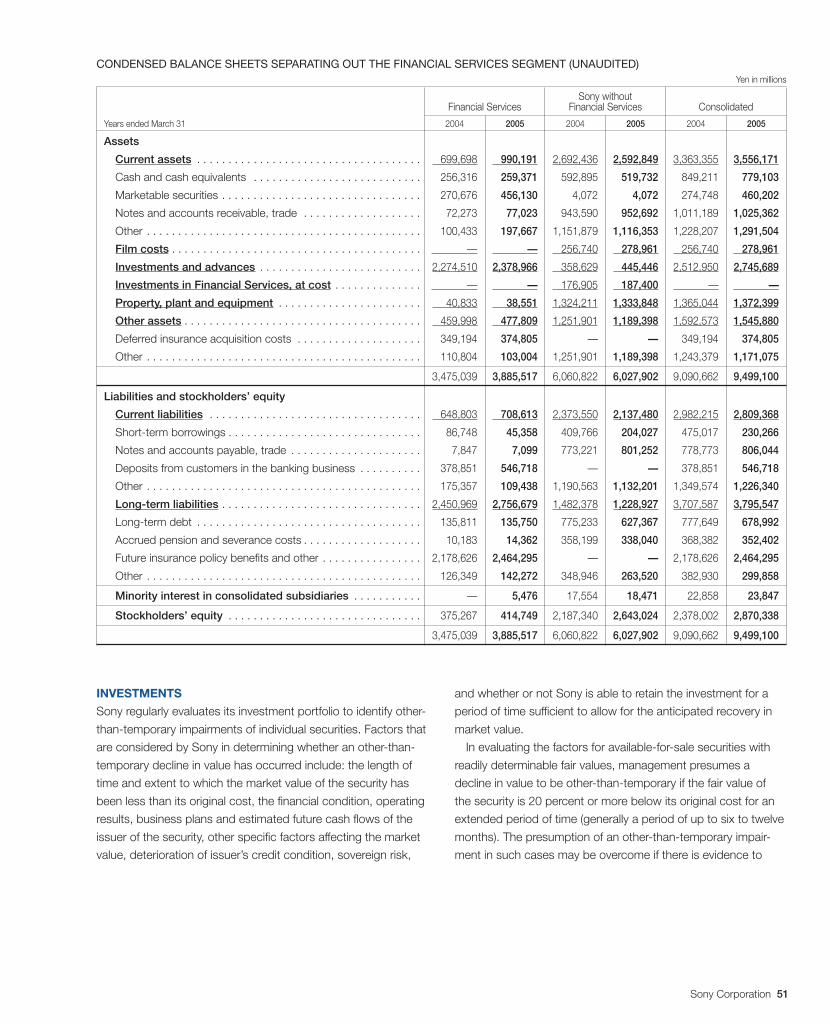
Sony Corporation 51
CONDENSED BALANCE SHEETS SEPARATING OUT THE FINANCIAL SERVICES SEGMENT (UNAUDITED)Yen in millions
Sony withoutFinancial Services Financial Services Consolidated
Years ended March 31 2004 2005 2004 2005 2004 2005
Assets
Current assets . . . . . . . . . . . . . . . . . . . . . . . . . . . . . . . . . . . . 699,698 990,191 2,692,436 2,592,849 3,363,355 3,556,171
Cash and cash equivalents . . . . . . . . . . . . . . . . . . . . . . . . . . . 256,316 259,371 592,895 519,732 849,211 779,103
Marketable securities . . . . . . . . . . . . . . . . . . . . . . . . . . . . . . . . 270,676 456,130 4,072 4,072 274,748 460,202
Notes and accounts receivable, trade . . . . . . . . . . . . . . . . . . . 72,273 77,023 943,590 952,692 1,011,189 1,025,362
Other . . . . . . . . . . . . . . . . . . . . . . . . . . . . . . . . . . . . . . . . . . . . 100,433 197,667 1,151,879 1,116,353 1,228,207 1,291,504
Film costs . . . . . . . . . . . . . . . . . . . . . . . . . . . . . . . . . . . . . . . . — — 256,740 278,961 256,740 278,961
Investments and advances . . . . . . . . . . . . . . . . . . . . . . . . . . 2,274,510 2,378,966 358,629 445,446 2,512,950 2,745,689
Investments in Financial Services, at cost . . . . . . . . . . . . . . — — 176,905 187,400 — —
Property, plant and equipment . . . . . . . . . . . . . . . . . . . . . . . 40,833 38,551 1,324,211 1,333,848 1,365,044 1,372,399
Other assets . . . . . . . . . . . . . . . . . . . . . . . . . . . . . . . . . . . . . . 459,998 477,809 1,251,901 1,189,398 1,592,573 1,545,880
Deferred insurance acquisition costs . . . . . . . . . . . . . . . . . . . . 349,194 374,805 — — 349,194 374,805
Other . . . . . . . . . . . . . . . . . . . . . . . . . . . . . . . . . . . . . . . . . . . . 110,804 103,004 1,251,901 1,189,398 1,243,379 1,171,075
. . . . . . . . . . . . . . . . . . . . . . . . . . . . . . . . . . . . . . . . . . . . . . . . 3,475,039 3,885,517 6,060,822 6,027,902 9,090,662 9,499,100
Liabilities and stockholders’ equity
Current liabilities . . . . . . . . . . . . . . . . . . . . . . . . . . . . . . . . . . 648,803 708,613 2,373,550 2,137,480 2,982,215 2,809,368
Short-term borrowings . . . . . . . . . . . . . . . . . . . . . . . . . . . . . . . 86,748 45,358 409,766 204,027 475,017 230,266
Notes and accounts payable, trade . . . . . . . . . . . . . . . . . . . . . 7,847 7,099 773,221 801,252 778,773 806,044
Deposits from customers in the banking business . . . . . . . . . . 378,851 546,718 — — 378,851 546,718
Other . . . . . . . . . . . . . . . . . . . . . . . . . . . . . . . . . . . . . . . . . . . . 175,357 109,438 1,190,563 1,132,201 1,349,574 1,226,340
Long-term liabilities . . . . . . . . . . . . . . . . . . . . . . . . . . . . . . . . 2,450,969 2,756,679 1,482,378 1,228,927 3,707,587 3,795,547
Long-term debt . . . . . . . . . . . . . . . . . . . . . . . . . . . . . . . . . . . . 135,811 135,750 775,233 627,367 777,649 678,992
Accrued pension and severance costs . . . . . . . . . . . . . . . . . . . 10,183 14,362 358,199 338,040 368,382 352,402
Future insurance policy benefits and other . . . . . . . . . . . . . . . . 2,178,626 2,464,295 — — 2,178,626 2,464,295
Other . . . . . . . . . . . . . . . . . . . . . . . . . . . . . . . . . . . . . . . . . . . . 126,349 142,272 348,946 263,520 382,930 299,858
Minority interest in consolidated subsidiaries . . . . . . . . . . . — 5,476 17,554 18,471 22,858 23,847
Stockholders’ equity . . . . . . . . . . . . . . . . . . . . . . . . . . . . . . . 375,267 414,749 2,187,340 2,643,024 2,378,002 2,870,338
. . . . . . . . . . . . . . . . . . . . . . . . . . . . . . . . . . . . . . . . . . . . . . . . 3,475,039 3,885,517 6,060,822 6,027,902 9,090,662 9,499,100
INVESTMENTS
Sony regularly evaluates its investment portfolio to identify other-
than-temporary impairments of individual securities. Factors that
are considered by Sony in determining whether an other-than-
temporary decline in value has occurred include: the length of
time and extent to which the market value of the security has
been less than its original cost, the financial condition, operating
results, business plans and estimated future cash flows of the
issuer of the security, other specific factors affecting the market
value, deterioration of issuer’s credit condition, sovereign risk,
and whether or not Sony is able to retain the investment for a
period of time sufficient to allow for the anticipated recovery in
market value.
In evaluating the factors for available-for-sale securities with
readily determinable fair values, management presumes a
decline in value to be other-than-temporary if the fair value of
the security is 20 percent or more below its original cost for an
extended period of time (generally a period of up to six to twelve
months). The presumption of an other-than-temporary impair-
ment in such cases may be overcome if there is evidence to
BH6/30 05.7.7, 3:34 AMPage 51 Adobe PageMaker 6.0J/PPC
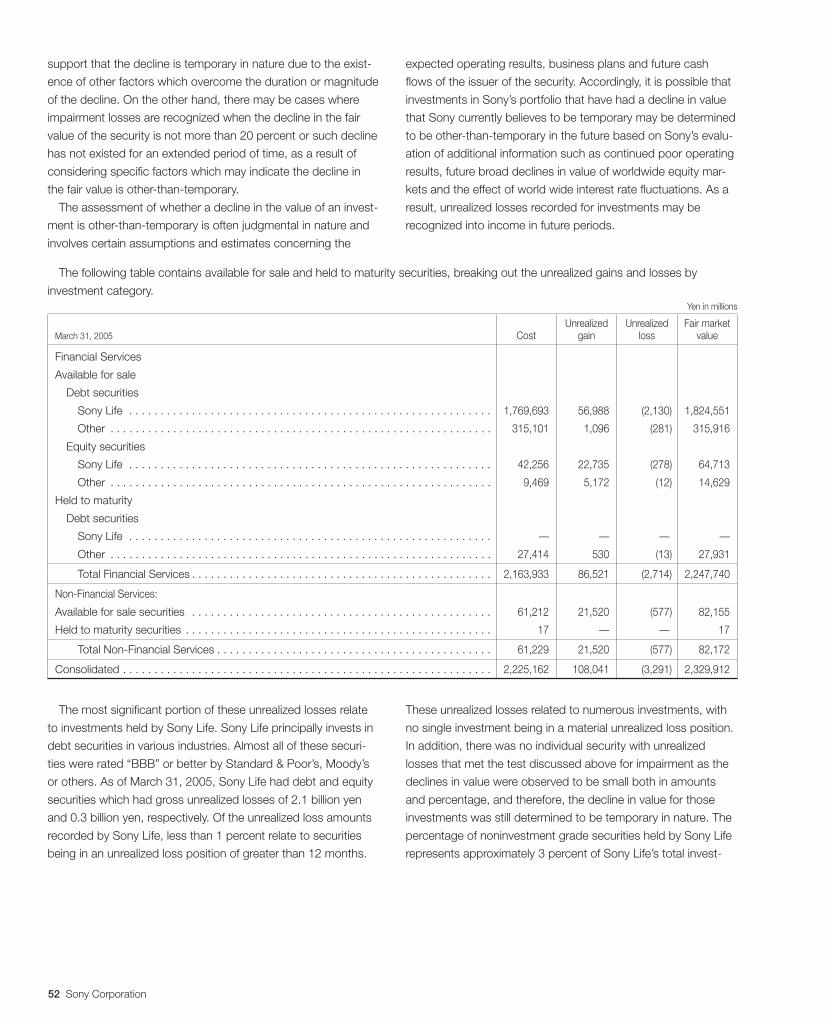
52 Sony Corporation
The following table contains available for sale and held to maturity securities, breaking out the unrealized gains and losses by
investment category.Yen in millions
Unrealized Unrealized Fair marketMarch 31, 2005 Cost gain loss value
Financial Services
Available for sale
Debt securities
Sony Life . . . . . . . . . . . . . . . . . . . . . . . . . . . . . . . . . . . . . . . . . . . . . . . . . . . . . . . . . . 1,769,693 56,988 (2,130) 1,824,551
Other . . . . . . . . . . . . . . . . . . . . . . . . . . . . . . . . . . . . . . . . . . . . . . . . . . . . . . . . . . . . . 315,101 1,096 (281) 315,916
Equity securities
Sony Life . . . . . . . . . . . . . . . . . . . . . . . . . . . . . . . . . . . . . . . . . . . . . . . . . . . . . . . . . . 42,256 22,735 (278) 64,713
Other . . . . . . . . . . . . . . . . . . . . . . . . . . . . . . . . . . . . . . . . . . . . . . . . . . . . . . . . . . . . . 9,469 5,172 (12) 14,629
Held to maturity
Debt securities
Sony Life . . . . . . . . . . . . . . . . . . . . . . . . . . . . . . . . . . . . . . . . . . . . . . . . . . . . . . . . . . — — — —
Other . . . . . . . . . . . . . . . . . . . . . . . . . . . . . . . . . . . . . . . . . . . . . . . . . . . . . . . . . . . . . 27,414 530 (13) 27,931
Total Financial Services . . . . . . . . . . . . . . . . . . . . . . . . . . . . . . . . . . . . . . . . . . . . . . . . 2,163,933 86,521 (2,714) 2,247,740
Non-Financial Services:
Available for sale securities . . . . . . . . . . . . . . . . . . . . . . . . . . . . . . . . . . . . . . . . . . . . . . . . 61,212 21,520 (577) 82,155
Held to maturity securities . . . . . . . . . . . . . . . . . . . . . . . . . . . . . . . . . . . . . . . . . . . . . . . . . 17 — — 17
Total Non-Financial Services . . . . . . . . . . . . . . . . . . . . . . . . . . . . . . . . . . . . . . . . . . . . 61,229 21,520 (577) 82,172
Consolidated . . . . . . . . . . . . . . . . . . . . . . . . . . . . . . . . . . . . . . . . . . . . . . . . . . . . . . . . . . . 2,225,162 108,041 (3,291) 2,329,912
The most significant portion of these unrealized losses relate
to investments held by Sony Life. Sony Life principally invests in
debt securities in various industries. Almost all of these securi-
ties were rated “BBB” or better by Standard & Poor’s, Moody’s
or others. As of March 31, 2005, Sony Life had debt and equity
securities which had gross unrealized losses of 2.1 billion yen
and 0.3 billion yen, respectively. Of the unrealized loss amounts
recorded by Sony Life, less than 1 percent relate to securities
being in an unrealized loss position of greater than 12 months.
These unrealized losses related to numerous investments, with
no single investment being in a material unrealized loss position.
In addition, there was no individual security with unrealized
losses that met the test discussed above for impairment as the
declines in value were observed to be small both in amounts
and percentage, and therefore, the decline in value for those
investments was still determined to be temporary in nature. The
percentage of noninvestment grade securities held by Sony Life
represents approximately 3 percent of Sony Life’s total invest-
support that the decline is temporary in nature due to the exist-
ence of other factors which overcome the duration or magnitude
of the decline. On the other hand, there may be cases where
impairment losses are recognized when the decline in the fair
value of the security is not more than 20 percent or such decline
has not existed for an extended period of time, as a result of
considering specific factors which may indicate the decline in
the fair value is other-than-temporary.
The assessment of whether a decline in the value of an invest-
ment is other-than-temporary is often judgmental in nature and
involves certain assumptions and estimates concerning the
expected operating results, business plans and future cash
flows of the issuer of the security. Accordingly, it is possible that
investments in Sony’s portfolio that have had a decline in value
that Sony currently believes to be temporary may be determined
to be other-than-temporary in the future based on Sony’s evalu-
ation of additional information such as continued poor operating
results, future broad declines in value of worldwide equity mar-
kets and the effect of world wide interest rate fluctuations. As a
result, unrealized losses recorded for investments may be
recognized into income in future periods.
BH6/30 05.7.7, 3:34 AMPage 52 Adobe PageMaker 6.0J/PPC
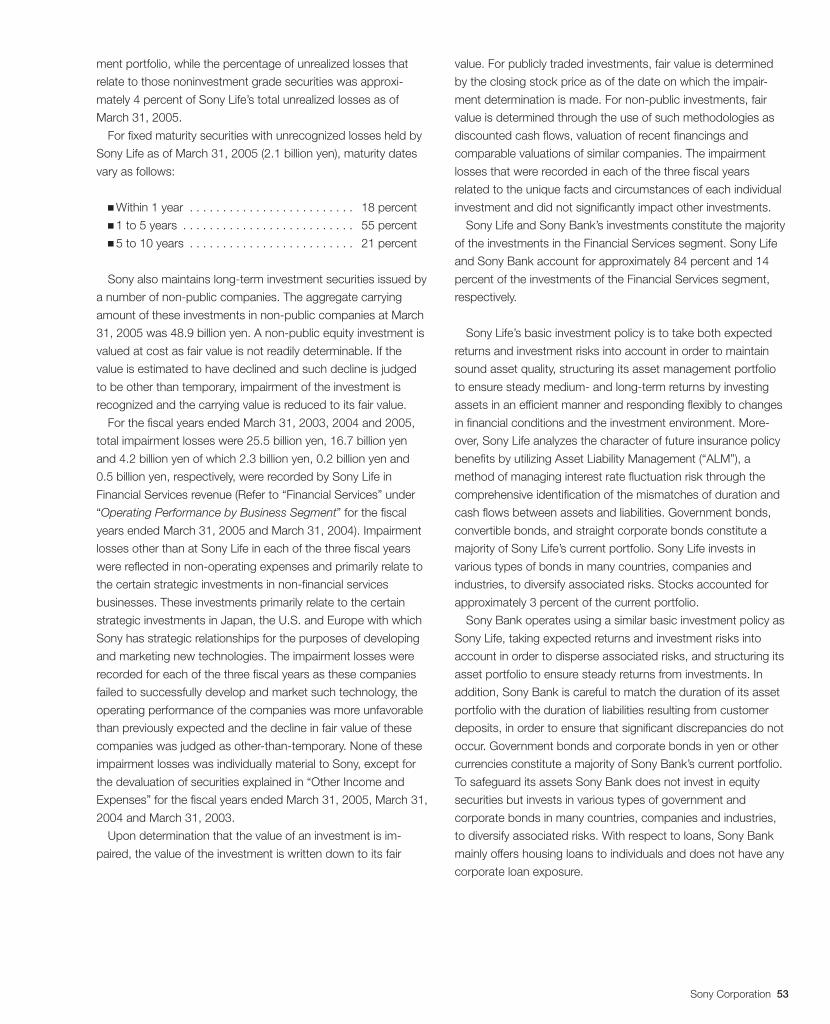
Sony Corporation 53
ment portfolio, while the percentage of unrealized losses that
relate to those noninvestment grade securities was approxi-
mately 4 percent of Sony Life’s total unrealized losses as of
March 31, 2005.
For fixed maturity securities with unrecognized losses held by
Sony Life as of March 31, 2005 (2.1 billion yen), maturity dates
vary as follows:
■ Within 1 year . . . . . . . . . . . . . . . . . . . . . . . . . 18 percent■ 1 to 5 years . . . . . . . . . . . . . . . . . . . . . . . . . . 55 percent■ 5 to 10 years . . . . . . . . . . . . . . . . . . . . . . . . . 21 percent
Sony also maintains long-term investment securities issued by
a number of non-public companies. The aggregate carrying
amount of these investments in non-public companies at March
31, 2005 was 48.9 billion yen. A non-public equity investment is
valued at cost as fair value is not readily determinable. If the
value is estimated to have declined and such decline is judged
to be other than temporary, impairment of the investment is
recognized and the carrying value is reduced to its fair value.
For the fiscal years ended March 31, 2003, 2004 and 2005,
total impairment losses were 25.5 billion yen, 16.7 billion yen
and 4.2 billion yen of which 2.3 billion yen, 0.2 billion yen and
0.5 billion yen, respectively, were recorded by Sony Life in
Financial Services revenue (Refer to “Financial Services” under
“Operating Performance by Business Segment” for the fiscal
years ended March 31, 2005 and March 31, 2004). Impairment
losses other than at Sony Life in each of the three fiscal years
were reflected in non-operating expenses and primarily relate to
the certain strategic investments in non-financial services
businesses. These investments primarily relate to the certain
strategic investments in Japan, the U.S. and Europe with which
Sony has strategic relationships for the purposes of developing
and marketing new technologies. The impairment losses were
recorded for each of the three fiscal years as these companies
failed to successfully develop and market such technology, the
operating performance of the companies was more unfavorable
than previously expected and the decline in fair value of these
companies was judged as other-than-temporary. None of these
impairment losses was individually material to Sony, except for
the devaluation of securities explained in “Other Income and
Expenses” for the fiscal years ended March 31, 2005, March 31,
2004 and March 31, 2003.
Upon determination that the value of an investment is im-
paired, the value of the investment is written down to its fair
value. For publicly traded investments, fair value is determined
by the closing stock price as of the date on which the impair-
ment determination is made. For non-public investments, fair
value is determined through the use of such methodologies as
discounted cash flows, valuation of recent financings and
comparable valuations of similar companies. The impairment
losses that were recorded in each of the three fiscal years
related to the unique facts and circumstances of each individual
investment and did not significantly impact other investments.
Sony Life and Sony Bank’s investments constitute the majority
of the investments in the Financial Services segment. Sony Life
and Sony Bank account for approximately 84 percent and 14
percent of the investments of the Financial Services segment,
respectively.
Sony Life’s basic investment policy is to take both expected
returns and investment risks into account in order to maintain
sound asset quality, structuring its asset management portfolio
to ensure steady medium- and long-term returns by investing
assets in an efficient manner and responding flexibly to changes
in financial conditions and the investment environment. More-
over, Sony Life analyzes the character of future insurance policy
benefits by utilizing Asset Liability Management (“ALM”), a
method of managing interest rate fluctuation risk through the
comprehensive identification of the mismatches of duration and
cash flows between assets and liabilities. Government bonds,
convertible bonds, and straight corporate bonds constitute a
majority of Sony Life’s current portfolio. Sony Life invests in
various types of bonds in many countries, companies and
industries, to diversify associated risks. Stocks accounted for
approximately 3 percent of the current portfolio.
Sony Bank operates using a similar basic investment policy as
Sony Life, taking expected returns and investment risks into
account in order to disperse associated risks, and structuring its
asset portfolio to ensure steady returns from investments. In
addition, Sony Bank is careful to match the duration of its asset
portfolio with the duration of liabilities resulting from customer
deposits, in order to ensure that significant discrepancies do not
occur. Government bonds and corporate bonds in yen or other
currencies constitute a majority of Sony Bank’s current portfolio.
To safeguard its assets Sony Bank does not invest in equity
securities but invests in various types of government and
corporate bonds in many countries, companies and industries,
to diversify associated risks. With respect to loans, Sony Bank
mainly offers housing loans to individuals and does not have any
corporate loan exposure.
BH6/30 05.7.7, 3:34 AMPage 53 Adobe PageMaker 6.0J/PPC
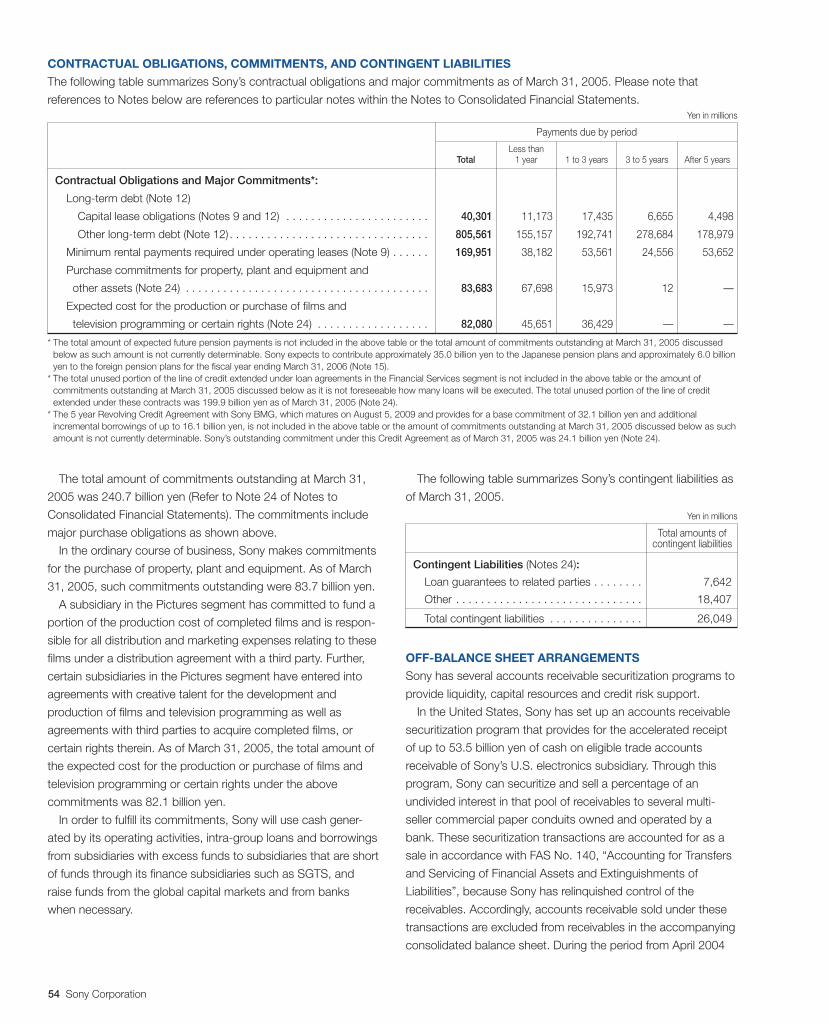
54 Sony Corporation
CONTRACTUAL OBLIGATIONS, COMMITMENTS, AND CONTINGENT LIABILITIES
The following table summarizes Sony’s contractual obligations and major commitments as of March 31, 2005. Please note that
references to Notes below are references to particular notes within the Notes to Consolidated Financial Statements.Yen in millions
Payments due by period
Less thanTotal 1 year 1 to 3 years 3 to 5 years After 5 years
Contractual Obligations and Major Commitments*:
Long-term debt (Note 12)
Capital lease obligations (Notes 9 and 12) . . . . . . . . . . . . . . . . . . . . . . . 40,301 11,173 17,435 6,655 4,498
Other long-term debt (Note 12) . . . . . . . . . . . . . . . . . . . . . . . . . . . . . . . . 805,561 155,157 192,741 278,684 178,979
Minimum rental payments required under operating leases (Note 9) . . . . . . 169,951 38,182 53,561 24,556 53,652
Purchase commitments for property, plant and equipment and
other assets (Note 24) . . . . . . . . . . . . . . . . . . . . . . . . . . . . . . . . . . . . . . . 83,683 67,698 15,973 12 —
Expected cost for the production or purchase of films and
television programming or certain rights (Note 24) . . . . . . . . . . . . . . . . . . 82,080 45,651 36,429 — —
* The total amount of expected future pension payments is not included in the above table or the total amount of commitments outstanding at March 31, 2005 discussedbelow as such amount is not currently determinable. Sony expects to contribute approximately 35.0 billion yen to the Japanese pension plans and approximately 6.0 billionyen to the foreign pension plans for the fiscal year ending March 31, 2006 (Note 15).
* The total unused portion of the line of credit extended under loan agreements in the Financial Services segment is not included in the above table or the amount ofcommitments outstanding at March 31, 2005 discussed below as it is not foreseeable how many loans will be executed. The total unused portion of the line of creditextended under these contracts was 199.9 billion yen as of March 31, 2005 (Note 24).
* The 5 year Revolving Credit Agreement with Sony BMG, which matures on August 5, 2009 and provides for a base commitment of 32.1 billion yen and additionalincremental borrowings of up to 16.1 billion yen, is not included in the above table or the amount of commitments outstanding at March 31, 2005 discussed below as suchamount is not currently determinable. Sony’s outstanding commitment under this Credit Agreement as of March 31, 2005 was 24.1 billion yen (Note 24).
The total amount of commitments outstanding at March 31,
2005 was 240.7 billion yen (Refer to Note 24 of Notes to
Consolidated Financial Statements). The commitments include
major purchase obligations as shown above.
In the ordinary course of business, Sony makes commitments
for the purchase of property, plant and equipment. As of March
31, 2005, such commitments outstanding were 83.7 billion yen.
A subsidiary in the Pictures segment has committed to fund a
portion of the production cost of completed films and is respon-
sible for all distribution and marketing expenses relating to these
films under a distribution agreement with a third party. Further,
certain subsidiaries in the Pictures segment have entered into
agreements with creative talent for the development and
production of films and television programming as well as
agreements with third parties to acquire completed films, or
certain rights therein. As of March 31, 2005, the total amount of
the expected cost for the production or purchase of films and
television programming or certain rights under the above
commitments was 82.1 billion yen.
In order to fulfill its commitments, Sony will use cash gener-
ated by its operating activities, intra-group loans and borrowings
from subsidiaries with excess funds to subsidiaries that are short
of funds through its finance subsidiaries such as SGTS, and
raise funds from the global capital markets and from banks
when necessary.
The following table summarizes Sony’s contingent liabilities as
of March 31, 2005.
Yen in millions
Total amounts ofcontingent liabilities
Contingent Liabilities (Notes 24):
Loan guarantees to related parties . . . . . . . . 7,642
Other . . . . . . . . . . . . . . . . . . . . . . . . . . . . . . 18,407
Total contingent liabilities . . . . . . . . . . . . . . . 26,049
OFF-BALANCE SHEET ARRANGEMENTS
Sony has several accounts receivable securitization programs to
provide liquidity, capital resources and credit risk support.
In the United States, Sony has set up an accounts receivable
securitization program that provides for the accelerated receipt
of up to 53.5 billion yen of cash on eligible trade accounts
receivable of Sony’s U.S. electronics subsidiary. Through this
program, Sony can securitize and sell a percentage of an
undivided interest in that pool of receivables to several multi-
seller commercial paper conduits owned and operated by a
bank. These securitization transactions are accounted for as a
sale in accordance with FAS No. 140, “Accounting for Transfers
and Servicing of Financial Assets and Extinguishments of
Liabilities”, because Sony has relinquished control of the
receivables. Accordingly, accounts receivable sold under these
transactions are excluded from receivables in the accompanying
consolidated balance sheet. During the period from April 2004
BH6/30 05.7.7, 3:34 AMPage 54 Adobe PageMaker 6.0J/PPC
Sony Corporation 55
to January 2005, Sony sold a total of 80.3 billion yen of accounts
receivable under this program. There were no outstanding
amounts due at March 31, 2005 relating to the existing undi-
vided interests in the pool of receivables that had been sold.
Losses from these transactions were insignificant. This program
was terminated in May 2005.
During the fiscal year ended March 31, 2005, Sony entered
into new accounts receivable sales programs that provide for
the accelerated receipt of up to 47.5 billion yen of eligible trade
accounts receivable of Sony Corporation. Through these
programs, Sony can sell receivables to special purpose
entities owned and operated by banks. These transactions
are accounted for as a sale in accordance with FAS No. 140,
because Sony has relinquished control of the receivables.
Accordingly, accounts receivable sold under these transactions
are excluded from receivables in the accompanying consolidated
balance sheet. The initial sale of these receivables was in March
2005, and Sony sold a total of 10.0 billion yen for the fiscal year
ended March 31, 2005. Losses from these transactions were
insignificant. Although Sony continues servicing the sold receiv-
ables, no servicing liabilities are recorded because costs regarding
collection of the sold receivables are insignificant.
Refer to Note 7 of Notes to Consolidated Financial Statements
for more information.
Sony has, from time to time, entered into various financing
arrangements with Variable Interest Entities (“VIEs”). These
arrangements include facilities which provide for the leasing of
certain property, the financing of film production and the
development and operation of a multi-use real estate complex.
Although not a significant part of its financing activities, Sony
employs these arrangements because they provide a diversifica-
tion of funding sources. The assets and liabilities associated with
these arrangements previously qualified for off-balance sheet
treatment. On July 1, 2003, Sony adopted FIN 46 and accord-
ingly, the assets and liabilities associated with these arrange-
ments were consolidated. Refer to Note 23 of Notes to Consoli-
dated Financial Statements for more information. As a result,
Sony recognized a one time charge with no tax effect of 2.1
billion yen for cumulative effect of an accounting change for the
year ended March 31, 2004. Additionally, Sony’s assets and
liabilities increased as non-cash transactions, which resulted in
no cash flows, by 95.3 billion yen and 98.0 billion yen, respec-
tively. Cash and cash equivalents as of March 31, 2005, also
increased by 1.5 billion yen compared with previous fiscal year-
end. As of March 31, 2005, Sony is a primary beneficiary for all
the VIEs in which Sony holds a significant variable interest, and
all these VIEs are consolidated by Sony.
Also, in connection with Sony’s utilization of joint venture and
alliances to achieve certain strategic objectives, Sony has
recently entered into several joint ventures and made certain
strategic investments which include SONY BMG, S-LCD and
Metro–Goldwyn–Mayer Inc. (“MGM”). Sony has reviewed these
investments and determined that both SONY BMG and S-LCD
are not VIEs while MGM is a VIE. However, MGM will not be
consolidated as Sony is not the primary beneficiary of this VIE.
Accordingly, Sony has accounted for these investments under
the equity method.
CASH FLOWS
(The fiscal year ended March 31, 2005 compared with the fiscal
year ended March 31, 2004)
Operating Activities: During the fiscal year ended March 31,
2005, Sony generated 647.0 billion yen of net cash from
operating activities, a increase of 14.4 billion yen, or 2.3 percent
compared with the previous fiscal year. Of this total, all segments
excluding the Financial Services segment generated 485.4 billion
yen of net cash from operating activities, a increase of 84.3 billion
yen, or 21.0 percent, compared with the previous fiscal year, and
the Financial Services segment generated 168.1 billion yen of net
cash from operating activities, a decrease of 73.5 billion yen, or
30.4 percent, compared with the previous fiscal year.
During the fiscal year, in addition to profit contributions from
the Pictures, Financial Services, Game and Music segments and
depreciation expenses, operating cash flow benefited from an
increase in notes and accounts payable, trade, primarily associ-
ated with an increase in sales and procurement related primarily
to the PSP within the Game segment during the fourth quarter
of the fiscal year, a decrease in notes and accounts receivable,
trade, associated with a sales decrease in the Pictures segment
during the fourth quarter and within the Music segment associ-
ated with the decrease in sales after August 2004, and a
decrease in inventory mainly within the Game and Electronics
segments. Partially offsetting these contributions were factors
including an increase in notes and accounts receivable, trade
primarily within the Game segment. In addition, in the Financial
Services segment, an increase in future insurance policy benefits
and other, due to an increase in insurance-in-force, contributed
to operating cash flow in the Financial Services segment.
Compared with the previous fiscal year, net cash provided by
operating activities increased, due to a decrease in inventory
during the fiscal year compared to an increase in inventory in the
previous fiscal year, and there was a smaller increase in notes
and accounts receivable, trade, compared with the previous
fiscal year associated with the decrease in sales. These factors
were partially offset by factors such as a smaller increase in
notes and accounts payable, trade.
BH6/30 05.7.7, 3:34 AMPage 55 Adobe PageMaker 6.0J/PPC
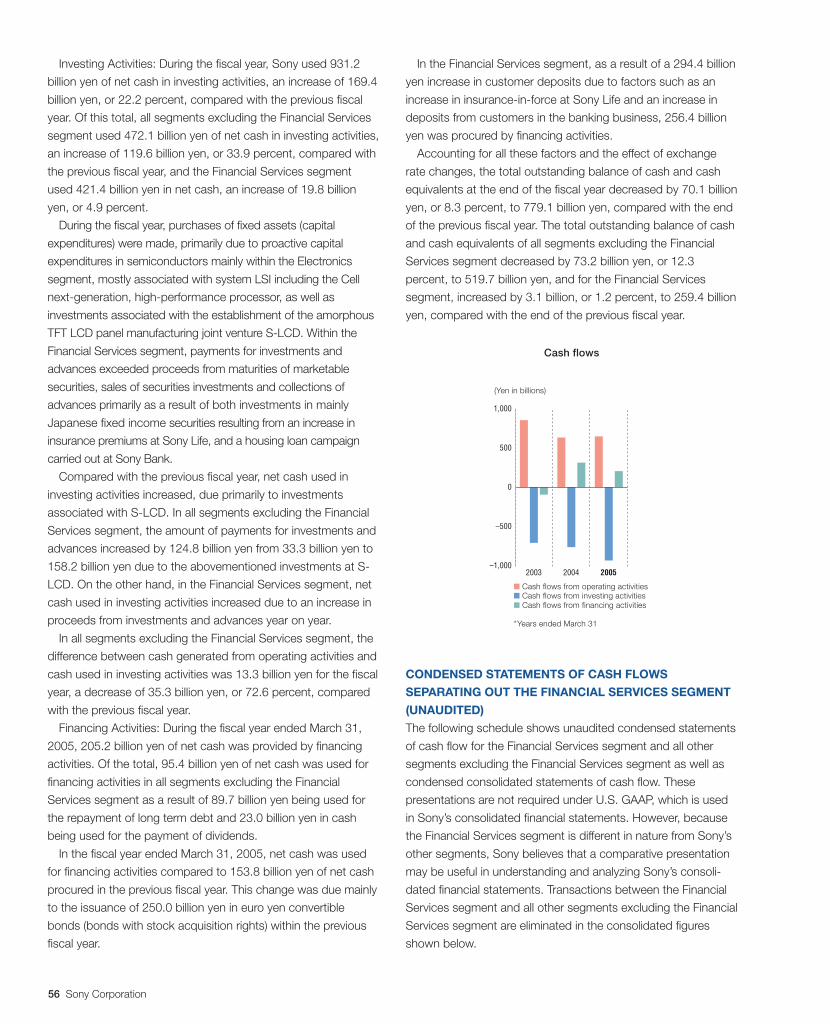
56 Sony Corporation
(Yen in billions)
Cash flows
■ Cash flows from operating activities■ Cash flows from investing activities■ Cash flows from financing activities
*Years ended March 31
1,000
500
0
–500
–1,0002003 2004 2005
Investing Activities: During the fiscal year, Sony used 931.2
billion yen of net cash in investing activities, an increase of 169.4
billion yen, or 22.2 percent, compared with the previous fiscal
year. Of this total, all segments excluding the Financial Services
segment used 472.1 billion yen of net cash in investing activities,
an increase of 119.6 billion yen, or 33.9 percent, compared with
the previous fiscal year, and the Financial Services segment
used 421.4 billion yen in net cash, an increase of 19.8 billion
yen, or 4.9 percent.
During the fiscal year, purchases of fixed assets (capital
expenditures) were made, primarily due to proactive capital
expenditures in semiconductors mainly within the Electronics
segment, mostly associated with system LSI including the Cell
next-generation, high-performance processor, as well as
investments associated with the establishment of the amorphous
TFT LCD panel manufacturing joint venture S-LCD. Within the
Financial Services segment, payments for investments and
advances exceeded proceeds from maturities of marketable
securities, sales of securities investments and collections of
advances primarily as a result of both investments in mainly
Japanese fixed income securities resulting from an increase in
insurance premiums at Sony Life, and a housing loan campaign
carried out at Sony Bank.
Compared with the previous fiscal year, net cash used in
investing activities increased, due primarily to investments
associated with S-LCD. In all segments excluding the Financial
Services segment, the amount of payments for investments and
advances increased by 124.8 billion yen from 33.3 billion yen to
158.2 billion yen due to the abovementioned investments at S-
LCD. On the other hand, in the Financial Services segment, net
cash used in investing activities increased due to an increase in
proceeds from investments and advances year on year.
In all segments excluding the Financial Services segment, the
difference between cash generated from operating activities and
cash used in investing activities was 13.3 billion yen for the fiscal
year, a decrease of 35.3 billion yen, or 72.6 percent, compared
with the previous fiscal year.
Financing Activities: During the fiscal year ended March 31,
2005, 205.2 billion yen of net cash was provided by financing
activities. Of the total, 95.4 billion yen of net cash was used for
financing activities in all segments excluding the Financial
Services segment as a result of 89.7 billion yen being used for
the repayment of long term debt and 23.0 billion yen in cash
being used for the payment of dividends.
In the fiscal year ended March 31, 2005, net cash was used
for financing activities compared to 153.8 billion yen of net cash
procured in the previous fiscal year. This change was due mainly
to the issuance of 250.0 billion yen in euro yen convertible
bonds (bonds with stock acquisition rights) within the previous
fiscal year.
In the Financial Services segment, as a result of a 294.4 billion
yen increase in customer deposits due to factors such as an
increase in insurance-in-force at Sony Life and an increase in
deposits from customers in the banking business, 256.4 billion
yen was procured by financing activities.
Accounting for all these factors and the effect of exchange
rate changes, the total outstanding balance of cash and cash
equivalents at the end of the fiscal year decreased by 70.1 billion
yen, or 8.3 percent, to 779.1 billion yen, compared with the end
of the previous fiscal year. The total outstanding balance of cash
and cash equivalents of all segments excluding the Financial
Services segment decreased by 73.2 billion yen, or 12.3
percent, to 519.7 billion yen, and for the Financial Services
segment, increased by 3.1 billion, or 1.2 percent, to 259.4 billion
yen, compared with the end of the previous fiscal year.
CONDENSED STATEMENTS OF CASH FLOWS
SEPARATING OUT THE FINANCIAL SERVICES SEGMENT
(UNAUDITED)
The following schedule shows unaudited condensed statements
of cash flow for the Financial Services segment and all other
segments excluding the Financial Services segment as well as
condensed consolidated statements of cash flow. These
presentations are not required under U.S. GAAP, which is used
in Sony’s consolidated financial statements. However, because
the Financial Services segment is different in nature from Sony’s
other segments, Sony believes that a comparative presentation
may be useful in understanding and analyzing Sony’s consoli-
dated financial statements. Transactions between the Financial
Services segment and all other segments excluding the Financial
Services segment are eliminated in the consolidated figures
shown below.
BH6/30 05.7.7, 3:34 AMPage 56 Adobe PageMaker 6.0J/PPC
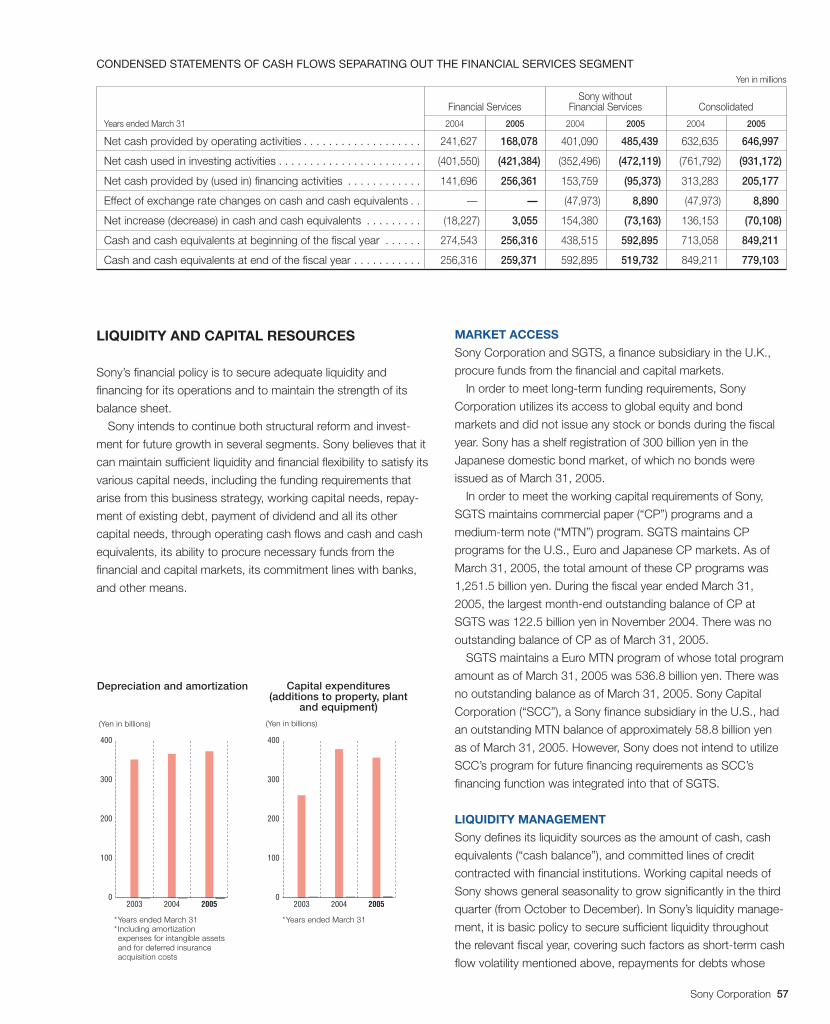
Sony Corporation 57
CONDENSED STATEMENTS OF CASH FLOWS SEPARATING OUT THE FINANCIAL SERVICES SEGMENTYen in millions
Sony withoutFinancial Services Financial Services Consolidated
Years ended March 31 2004 2005 2004 2005 2004 2005
Net cash provided by operating activities . . . . . . . . . . . . . . . . . . . 241,627 168,078 401,090 485,439 632,635 646,997
Net cash used in investing activities . . . . . . . . . . . . . . . . . . . . . . . (401,550) (421,384) (352,496) (472,119) (761,792) (931,172)
Net cash provided by (used in) financing activities . . . . . . . . . . . . 141,696 256,361 153,759 (95,373) 313,283 205,177
Effect of exchange rate changes on cash and cash equivalents . . — — (47,973) 8,890 (47,973) 8,890
Net increase (decrease) in cash and cash equivalents . . . . . . . . . (18,227) 3,055 154,380 (73,163) 136,153 (70,108)
Cash and cash equivalents at beginning of the fiscal year . . . . . . 274,543 256,316 438,515 592,895 713,058 849,211
Cash and cash equivalents at end of the fiscal year . . . . . . . . . . . 256,316 259,371 592,895 519,732 849,211 779,103
LIQUIDITY AND CAPITAL RESOURCES
Sony’s financial policy is to secure adequate liquidity and
financing for its operations and to maintain the strength of its
balance sheet.
Sony intends to continue both structural reform and invest-
ment for future growth in several segments. Sony believes that it
can maintain sufficient liquidity and financial flexibility to satisfy its
various capital needs, including the funding requirements that
arise from this business strategy, working capital needs, repay-
ment of existing debt, payment of dividend and all its other
capital needs, through operating cash flows and cash and cash
equivalents, its ability to procure necessary funds from the
financial and capital markets, its commitment lines with banks,
and other means.
MARKET ACCESS
Sony Corporation and SGTS, a finance subsidiary in the U.K.,
procure funds from the financial and capital markets.
In order to meet long-term funding requirements, Sony
Corporation utilizes its access to global equity and bond
markets and did not issue any stock or bonds during the fiscal
year. Sony has a shelf registration of 300 billion yen in the
Japanese domestic bond market, of which no bonds were
issued as of March 31, 2005.
In order to meet the working capital requirements of Sony,
SGTS maintains commercial paper (“CP”) programs and a
medium-term note (“MTN”) program. SGTS maintains CP
programs for the U.S., Euro and Japanese CP markets. As of
March 31, 2005, the total amount of these CP programs was
1,251.5 billion yen. During the fiscal year ended March 31,
2005, the largest month-end outstanding balance of CP at
SGTS was 122.5 billion yen in November 2004. There was no
outstanding balance of CP as of March 31, 2005.
SGTS maintains a Euro MTN program of whose total program
amount as of March 31, 2005 was 536.8 billion yen. There was
no outstanding balance as of March 31, 2005. Sony Capital
Corporation (“SCC”), a Sony finance subsidiary in the U.S., had
an outstanding MTN balance of approximately 58.8 billion yen
as of March 31, 2005. However, Sony does not intend to utilize
SCC’s program for future financing requirements as SCC’s
financing function was integrated into that of SGTS.
LIQUIDITY MANAGEMENT
Sony defines its liquidity sources as the amount of cash, cash
equivalents (“cash balance”), and committed lines of credit
contracted with financial institutions. Working capital needs of
Sony shows general seasonality to grow significantly in the third
quarter (from October to December). In Sony’s liquidity manage-
ment, it is basic policy to secure sufficient liquidity throughout
the relevant fiscal year, covering such factors as short-term cash
flow volatility mentioned above, repayments for debts whose
(Yen in billions)
Depreciation and amortization
*Years ended March 31* Including amortizationexpenses for intangible assetsand for deferred insuranceacquisition costs
400
300
200
100
02003 2004 2005
Capital expenditures(additions to property, plant
and equipment)
*Years ended March 31
(Yen in billions)
400
300
200
100
02003 2004 2005
BH6/30 05.7.7, 3:34 AMPage 57 Adobe PageMaker 6.0J/PPC
58 Sony Corporation
due date come within the fiscal year, and possible downward
earnings risk due to business environment change.
Sony has a policy to keep more than a certain level of cash
balance to absorb any working capital needs daily and monthly.
The cash balance on March 31, 2005, was 523.8 billion yen. A
short-term shortage in the cash balance is financed by the
issuance of CP. However, Sony controls the outstanding CP
amount through internal limits as part of its short-term debt risk
management strategy. In the fiscal year ended March 31, 2005,
there was no outstanding CP amount.
As part of its additional liquidity sources, Sony has a total of
868.7 billion yen in committed lines of credit, of which the
unused amount was approximately 863.9 billion yen as of March
31, 2005. Major committed lines of credit include 574.3 billion
yen of the Global Commitment Facilities contracted with a
syndicate of global banks, and 250 billion yen of committed lines
of credit contracted with a syndicate of Japanese banks. There
has been no major change since the last fiscal year in terms of
the total amount and composition of the committed lines of
credit. Sony uses these lines for general corporate purposes,
including the support of commercial paper programs and for
emergency purposes. There are no financial covenants in any
of Sony’s material financial agreements that would cause an
acceleration of the obligation in the event of a downgrade in
Sony’s credit ratings. However, a downgrade in Sony’s credit
ratings could increase the cost of borrowings. There are no
restrictions on how Sony’s borrowings can be used except that
some borrowings may not be used to acquire securities listed
on a U.S. exchange or traded over-the-counter in U.S., and use
of such borrowings must comply with the rules and regulations
issued by authorities such as the Board of Governors of the
Federal Reserve Board.
RATINGS
Sony considers it to be one of management’s top priorities to
maintain a stable and appropriate credit rating in order to ensure
financial flexibility for liquidity and capital management, and to
continue to maintain adequate access to sufficient funding
resources in the financial and capital markets.
In order to facilitate access to global capital markets, Sony
obtains credit ratings from two rating agencies, Moody’s
Investors Service (“Moody’s”) and Standard and Poor’s Rating
Services (“S&P”). In addition, Sony maintains a rating from
Rating and Investment Information, Inc. (“R&I”), a rating agency
in Japan, for access to the Japanese capital market.
Sony’s current debt ratings from each agency are noted below:
Moody’s S&P R&I
Long-term debt A1 (Outlook: A (Outlook: AANegative) Negative)
Short-term debt P-1 A-1 a-1+
On November 22, 2004, S&P downgraded Sony’s long-term
debt rating from A+ to A (outlook: negative). This action reflected
the concerns of S&P that it is uncertain if Sony will strengthen and
stabilize its profitability particularly in the electronics business,
under the severe competition and deflationary pressures. Sony’s
short-term debt rating from S&P has been unaffected. Despite the
downgrading of Sony’s long-term debt rating by S&P, Sony
believes its access to the global capital markets and ability to
issue CP for its working capital needs has not been limited.
CASH MANAGEMENT
Sony is centralizing and working to make more efficient its global
cash management activities through SGTS. The excess or
shortage of cash at most of Sony’s subsidiaries is invested or
funded by SGTS after having been netted out, although Sony
recognizes that fund transfers are limited in certain countries and
geographical areas due to restrictions on capital transactions. In
order to pursue more efficient cash management, Sony man-
ages uneven cash distribution among its subsidiaries directly or
indirectly through SGTS so that Sony can reduce unnecessary
cash and cash equivalents as well as borrowings as much as
possible.
The above description covers liquidity and capital resources
for consolidated Sony excluding the Financial Services segment
which secure liquidity on their own.
FINANCIAL SERVICES SEGMENT
In the Financial Services segment, the management of Sony
Financial Holdings Inc., Sony Life, Sony Assurance and Sony
Bank recognize the importance of securing sufficient liquidity to
cover the payment obligations that they take on as a result of
their ordinary course of business, and these companies abide
by the regulations imposed by regulatory authorities and
establish and operate under company guidelines that comply
with these regulations. Their purpose in doing so is to maintain
sufficient cash and cash equivalents and secure sufficient means
to pay their obligations. For instance, Sony Life’s cash inflows
come mainly from policyholders’ insurance premiums and Sony
Life keeps sufficient liquidity in the form of investments primarily
in various securities. Sony Bank, on the other hand, uses its
cash inflows, which come mainly from customers’ deposits
in local or foreign currencies, in order to offer housing loans
to individuals or to make bond investments, and establish
a necessary level of liquidity for the smooth settlement of
transactions.
Sony Life currently obtains ratings from four rating agencies:
A+ by S&P both for long-term local currency issuer ratings and
insurance and finance capability ratings, A+ by AM Best
Corporation for insurance and finance capability ratings, and AA
by R&I and the Japan Credit Rating Agency Ltd for insurance
claim payment capabilities ratings. Sony Bank obtained an A-/A-2
BH6/30 05.7.7, 3:34 AMPage 58 Adobe PageMaker 6.0J/PPC
Sony Corporation 59
rating from S&P for its long-term/short-term local/foreign
currency issuer ratings.
RESEARCH AND DEVELOPMENT
Recognizing that research and development are indispensable
for business growth, Sony has established semiconductors,
displays, and optical technologies and related devices as focus
areas for research and development and is devoting its energies
to the development of a variety of strategic devices and innova-
tive new products as part of research and development activities
within the Network companies and business groups. Moreover,
a Technology Round Table has been set up to facilitate the
selection, consolidation and convergence of themes for research
and development, for the sharing and validation of research and
development roadmaps and to frame research and development
strategy. In addition, while continually endeavoring to improve
product quality, Sony is also striving to develop products that
are even more environmentally-friendly. During the fiscal year
ended March 31, 2005, Sony received a special commendation
and award from the Ministry of Agriculture, Forestry and Fisher-
ies of Japan for excellence in the utilization of biomass as a
result of Sony’s “technological development and proactive
implementation of vegetable-based plastics in home electronic
appliances.” Sony continues to strengthen the basic research
and development structure at two of its corporate laboratories,
the Material Laboratories and the Information Technology
Laboratories. These laboratories closely collaborate with the
research and development activities carried out by the network
companies, with the aim of forging new future markets. In
addition, Sony operates three independent research laborato-
ries; Sony Computer Science Laboratories, Inc. (focusing on
fundamental research and user interface research); Sony-Kihara
Research Center, Inc. (focusing on three-dimensional computer
graphics and image processing technologies); and Sony
Intelligence Dynamics Laboratories, Inc.
Research and development costs for the fiscal year ended
March 31, 2005 decreased 12.5 billion yen, or 2.4 percent, to
502.0 billion yen, compared with the previous fiscal year. The
ratio of research and development costs to sales (excluding the
Financial Services segment) increased from 7.5 percent to 7.6
percent. The bulk of research and development costs were
incurred in the Electronics and Game segments. Expenses in
the Electronics segment increased 2.4 billion yen, or 0.5
percent, to 432.8 billion yen, and expenses in the Game
segment decreased 14.9 billion yen, or 17.9 percent, to 68.5
billion yen. In the Electronics segment, approximately 62 percent
of expenses were for the development of new product proto-
types while the remaining 38 percent were for the development
of mid- to long-term new technologies in such areas as semi-
conductors, communications, displays and next generation
optical discs. There was an increase in research and develop-
ment costs related to semiconductor process technology
associated with the transfer of Sony Computer Entertainment’s
semiconductor manufacturing operations from the Game
segment to the Electronics segment. However, the stringent
selection of research and development activities resulted in a
small increase in research and development costs within the
Electronics segment. Research and development costs in
the Game segment remained high due to the research and
development associated with PSP and PLAYSTATION 3 (“PS3”).
REWARDING SHAREHOLDERS
Sony believes that continuously increasing corporate value and
providing dividends are essential to rewarding shareholders. It is
Sony’s policy to utilize retained earnings, after ensuring the
perpetuation of stable dividends, to carry out various investments
that contribute to an increase in corporate value such as those
that ensure future growth and strengthen competitiveness.
A fiscal year-end cash dividend of 12.5 yen per share of Sony
Corporation Common Stock was approved at the Board of
Directors meeting held on May 16, 2005 and was paid on June
1, 2005. Sony Corporation has already paid an interim dividend
for Common Stock of 12.5 yen per share to each shareholder;
accordingly, the total annual cash dividend per share of
Common Stock is 25.0 yen.
Regarding shares of subsidiary tracking stock issued in Japan
by Sony Corporation, SCN has been working to manage its
operations so as to expand cash flow, fully solidify its financial
base and increase its retained earnings to aggressively expand
its business to strengthen its foundation and respond to the
quickly expanding Internet market. For these reasons, SCN
does not plan to distribute earnings to SCN shareholders for
the time being. As such, Sony Corporation will continue its
policy of not paying dividends to shareholders of the subsidiary
tracking stock.
NUMBER OF EMPLOYEES
The number of employees at the end of March 2005 was
approximately 151,400, a decrease of approximately 10,600
employees from the end of March 2004. Although employees
increased at manufacturing facilities in Asia, particularly in China,
the total number of employees declined due to the reductions
associated with the implementation of restructuring activities in
Japan, the U.S., Europe and South-East Asia, and a decrease in
the number of employees due to the establishment of Sony BMG.
BH6/30 05.7.7, 3:34 AMPage 59 Adobe PageMaker 6.0J/PPC
60 Sony Corporation
TREND INFORMATION
This section, including the Forecast of Consolidated Results,
contains forward-looking statements about the possible future
performance of Sony and should be read in light of the caution-
ary statement on that subject, which appears on the inside front
cover page and which applies to this entire document.
ISSUES FACING SONY AND MANAGEMENT’S RESPONSE
TO THOSE ISSUES
Competition in many of Sony’s business segments continues to
intensify and price erosion, especially in the Electronics seg-
ment, remains persistent. Competition has intensified due to the
penetration of broadband, which has led to an augmentation of
network infrastructure, making it easier for companies in other
sectors to enter the markets in which Sony competes.
In response to these challenges, over the three fiscal years
ending March 31, 2006, Sony is implementing Transformation
60, a series of fundamental reforms aimed at improving opera-
tional profitability and competitiveness in anticipation of future
growth. Through greater focus of management resources on
strategic businesses, accelerated reform of its manufacturing
platform, headcount reductions in administrative (including
corporate) and sales functions and reductions in the cost of
non-production materials, Sony intends to reduce fixed costs.
Sony also aims to lay the seeds for future growth through
strategic investments in research and development, as well as
aggressive capital expenditures in the area of semiconductors.
In addition to this cost-cutting and investment for growth,
each of Sony’s business segments grappled with issues specific
to that segment. Below is a description of the issues manage-
ment believes each segment continues to face and an explana-
tion as to how each segment is approaching those issues.
■ ELECTRONICS
Although the Electronics segment continues to hold a very
strong position in the worldwide consumer audio visual products
market, that position has become increasingly threatened as a
result of the entrance of new manufacturers and distributors.
These new entrants are threatening Sony’s position due to the
industry shift from analog to digital technology. In the analog era,
complicated functionality of electronics products was made
possible through the combination of several complex parts, and
Sony held a competitive advantage in the design and manufac-
ture of those parts as a result of its accumulated expertise. In
the digital era, however, complicated functionality has become
concentrated on semiconductors and other key digital devices.
Since these semiconductors and key devices are able to be
mass produced, they have become readily available to new
market entrants, and the functionality that once commanded a
high premium has become more affordable. This has led to
intense price erosion in the end-user consumer audio visual
products market. To respond to these challenges, Sony is
striving to keep pace with price erosion by reducing its manufac-
turing and other costs. It is seeking to maintain the premium
pricing it enjoys on many of its end-user products by adding
functionality to those products and developing new applications
and ways of use that are then communicated to the consumer.
In addition, it is taking steps to increase its competitive edge by
developing high value-added semiconductors and other digital
key devices in-house. By increasing the ratio of key devices
produced in-house, Sony aims to capture the value that has
become increasingly concentrated in those devices.
In the area of semiconductors, in the fiscal years ended March
31, 2004 and 2005, Sony carried out 175 billion yen and 150
billion yen, respectively, of capital expenditure mainly on system
LSIs and CCDs. Of this, Sony invested 69 billion yen in the fiscal
year ended March 31, 2004 and invested 90 billion yen in the
fiscal year ended March 31, 2005 on semiconductor fabrication
equipment built at the 65 nanometer level of process technol-
ogy. Chips that will be manufactured using this equipment will
be some of the most highly advanced on the market, and will
include the Cell next-generation, high-performance processor,
as well as other system LSI for use in the next generation
computer entertainment system PS3 and a variety of future
consumer electronics products. Sony began developing Cell
together with IBM Corporation and Toshiba Corporation in the
spring of 2001. In July 2004, in order to establish a more efficient
and coordinated semiconductor supply structure, Sony has
integrated its semiconductor manufacturing business by transfer-
ring Sony Computer Entertainment’s semiconductor manufac-
turing operation from the Game segment to the semiconductor
category within the Electronics segment.
In the area of other key devices, Sony invested in 7th genera-
tion amorphous TFT LCD panel production equipment, through
a one billion U.S. dollar investment in S-LCD, a joint venture with
Samsung, based in South Korea. This investment reflects Sony’s
belief that demand for LCD televisions will continue to increase
rapidly. Samsung holds 50 percent plus one share of the equity
of the joint venture while Sony holds 50 percent minus one
share of the equity of the joint venture. The President and CEO
comes from Samsung while the CFO comes from Sony. Produc-
tion of LCD panels began in April 2005. Expected production
capacity is 60,000 sheets per month at the 7th generation
(1,870 mm x 2,200 mm) level of technology.
■ GAME
In the Game segment, PS2 has a high share of the global game
console market, and the PS2 business, particularly the PS2
software business, remains in its harvest stage. However,
production shipment units of PS2 hardware are expected to
decrease in the fiscal year ending March 31, 2006. In order to
BH6/30 05.7.7, 3:34 AMPage 60 Adobe PageMaker 6.0J/PPC
Sony Corporation 61
ensure future growth in the Game segment, Sony is investing,
as described above, in the research and development of
cutting-edge microprocessors and other LSIs that will be
used in the next generation computer entertainment system,
PS3. Furthermore, Sony is working to develop a new market
through its introduction of PSP, a new handheld video game
system on which a variety of content can be enjoyed. PSP
was introduced in Japan and U.S. in December 2004 and
March 2005, respectively and will be introduced in Europe in
September 2005.
■ MUSIC
Within the music industry, album sales over the past several
years have decreased due to piracy and competition from other
entertainment sectors. One way Sony is working to combat
digital piracy and generate profits is through the digital distribu-
tion of content, is through its launch of the Connect music store,
a digital downloading service, which is now classified as part of
the Other segment. As part of an effort to achieve significant
operational efficiencies, Sony merged its recorded music
business, excluding its recorded music business in Japan, with
the recorded music business of Bertelsmann AG in August
2004, forming the joint venture SONY BMG. The newly formed
company is 50 percent owned by each parent company and is
accounted for by Sony under the equity method.
■ PICTURES
In the Pictures segment, Sony faces intense competition, rising
advertising and promotion expenses and a growing trend
toward digital piracy. To meet these challenges, Sony is working
to distribute a diversified portfolio of motion pictures and
capitalize on the expanding DVD home entertainment market,
which is becoming a more significant source of revenues and
profits. One of the ways that Sony is working to distribute a
diversified portfolio of motion pictures and capitalize on the
expanding DVD home entertainment market is through its
participation in the acquisition of MGM. In conjunction with the
transaction, SPE entered into agreements to co-finance and
produce new motion pictures with MGM and to distribute
MGM’s existing film and television content in, among other
markets, the DVD home entertainment market.
■ FINANCIAL SERVICES
In the Financial Services segment, the value of assets accumu-
lated by the businesses in the segment has grown continuously
over the past several fiscal years, resulting in a large portion
(approximately 40 percent) of Sony’s total assets being ac-
counted for by the Financial Services segment. To strengthen
asset management and risk management in parallel with this
growing asset value, enhance disclosure of business details,
and offer customers integrated financial services tailored to their
individual needs, in April 2004 Sony established Sony Financial
Holdings, a holding company comprised of Sony Life, Sony
Assurance and Sony Bank, with the aim of both increasing the
synergies between these businesses and targeting an initial
public offering during the fiscal year ending March 31, 2007.
FORECAST OF CONSOLIDATED RESULTS
Factors which may affect Sony’s financial performance include
the following: market conditions, including general economic
conditions, in major areas where Sony conducts its businesses,
levels of consumer spending, foreign exchange fluctuations,
Sony’s ability to continue to design, develop, manufacture, sell,
and win acceptance of its products and services, Sony’s ability
to continue to implement personnel reductions and other
business reorganization initiatives, Sony’s ability to implement its
network strategy, and implement successful sales and distribu-
tion strategies in the light of the Internet and other technological
developments, Sony’s ability to devote sufficient resources to
research and development, and capital expenditures, and the
success of Sony’s joint ventures and alliances. Risks and
uncertainties also include the impact of any future events with
material unforeseen impacts. Refer also to the “Cautionary
Statement”.
Regarding the forecast of consolidated results for the fiscal
year ending March 31, 2006, sales and operating revenue,
operating income, and income before income taxes are expected
to increase compared with the fiscal year ended March 31,
2005. Net income is expected to decrease. This forecast
assumes that the yen for the fiscal year ending March 31, 2006
will strengthen against the U.S. dollar and the euro compared
with the fiscal year ended March 31, 2005.
During the fiscal year ending March 31, 2006, restructuring
charges, primarily in the Electronics segment, of approximately
72 billion yen are expected to be incurred across Sony as a
whole. 90 billion yen of restructuring charges were recorded in
the fiscal year ended March 31, 2005.
The forecast for operating income and income before income
taxes reflects an estimated gain of approximately 60 billion yen
related to the transfer to the Japanese Government of the
substitutional portion, the benefit obligation related to past
employee service, of Sony’s Employee Pension Fund. Further-
more, 35 billion yen of this estimated gain is reflected in the
forecast for net income after deductions for the effect of
income taxes.
In June 6, 2005, SCN sold 17,935 shares of So-Net M3 Inc.,
at 694,600 yen per share with a total value of 12.5 billion yen.
As a result of this sale, Sony records approximately 11.9 billion
yen gain on the sale of its stock for the year ending March 31,
2006, and Sony’s ownership interest has been reduced from
74.8 percent to 60.8 percent.
BH6/30 05.7.7, 3:34 AMPage 61 Adobe PageMaker 6.0J/PPC
62 Sony Corporation
As of March 31, 2005, Sony had deferred tax assets on tax
loss carry forwards in relation to Japanese local income taxes
totaling 77.5 billion yen. However, there is a possibility that,
depending on future operating performance, Sony may establish
a valuation allowance against part or all of its deferred tax assets
that would be charged to income as an increase in tax expense.
However, the forecast above does not include this possibility.
The forecast for each business segment (excluding the
anticipated gain from the transfer of the substitutional portion of
Sony’s Employee Pension Fund) is as follows:
■ ELECTRONICS
Sales are expected to increase primarily due to an increase in
the sales of products such as flat panel televisions and LCD rear
projection televisions. With regard to operating performance,
although an improvement is expected due to the increase in
sales and a reduction in fixed costs relating to restructuring
implemented during the previous fiscal year, a decline in unit
prices, appreciation of the yen against the U.S. dollar and euro
and increase in both depreciation and amortization and research
and development costs are also anticipated. An improvement in
operating performance is expected, reflecting the above-
mentioned factors, as well as an anticipated reduction in
restructuring charges.
■ GAME
Sales are expected to increase due to the contribution from
both PSP hardware and software. Although PS2 and PSP are
expected to contribute to operating income, increased research
and development costs primarily for PS3 are expected to leave
operating income relatively unchanged.
■ MUSIC
Due to the establishment of SONY BMG, sales are expected to
decrease. A small increase in operating income is anticipated.
■ PICTURES
Although sales are expected to increase due to the impact of
SPE’s agreements with MGM, operating income is expected to
decrease compared to the fiscal year ended March 31, 2005, in
which Spider-Man 2 was a substantial contributor.
■ FINANCIAL SERVICES
Although revenue is expected to continue to grow mainly due to
an increase in revenue from insurance premiums at Sony Life, a
small decrease is expected in operating income due to the
conservative estimation of insurance claim payments.
■ CAPITAL EXPENDITURES
In the fiscal year ending March 31, 2006, capital expenditures
(additions to fixed assets) are expected to be 410 billion yen, an
increase of 15 percent compared with the fiscal year ended
March 31, 2005. Approximately 90 percent of the amount is
expected to be spent in the Electronics segment. Of this
amount, capital expenditures on semiconductors during the
fiscal year are expected to amount to 160 billion yen (actual
amount in the fiscal year ended March 31, 2005 was 150 billion
yen). For an explanation regarding fund procurement, refer to
“Liquidity and Capital Resources” above.
■ DEPRECIATION AND AMORTIZATION
In the fiscal year ending March 31, 2006, expenses for deprecia-
tion and amortization, which includes the amortization of
intangible assets and the amortization of deferred insurance
acquisition costs, are expected to be 390 billion yen, an in-
crease of 5 percent compared with the fiscal year ended March
31, 2005. Both expenses for the amortization of deferred
insurance acquisition costs in the Financial Services segment
and expenses for depreciation and amortization in the
Electronics segment are expected to increase.
■ RESEARCH AND DEVELOPMENT
Sony expects research and development costs (total of expenses
for the development of new product prototypes and expenses for
the development of mid- to long-term new technologies) for the
fiscal year ending March 31, 2006 to be 520 billion yen, a 4
percent increase compared with the fiscal year ended March 31,
2005. Research and development costs for both the Electronics
and Game segments are expected to increase.
CRITICAL ACCOUNTING POLICIES
The preparation of the consolidated financial statements in
conformity with U.S. GAAP requires management to make
estimates and assumptions that affect the reported amounts of
assets and liabilities, disclosure of contingent assets and
liabilities at the date of the financial statements and the reported
amounts of revenues and expenses during the reporting period.
On an ongoing basis, Sony evaluates its estimates which are
based on historical experience and on various other assump-
tions that are believed to be reasonable under the circum-
stances. The results of these evaluations form the basis for
making judgments about the carrying values of assets and
liabilities and the reported amounts of expenses that are not
readily apparent from other sources. Actual results may differ
from these estimates under different assumptions. Sony
considers an accounting policy to be critical if it is important to
its financial condition and results, and requires significant
judgments and estimates on the part of management in its
application. Sony believes that the following represent the critical
accounting policies of the company.
BH6/30 05.7.7, 3:34 AMPage 62 Adobe PageMaker 6.0J/PPC
Sony Corporation 63
■ INVESTMENTS
Sony’s investments are comprised of debt and equity securities
accounted for under both the cost and equity method of
accounting. If it has been determined that an investment has
sustained an other-than-temporary decline in its value, the
investment is written down to its fair value by a charge to
earnings. Sony regularly evaluates its investment portfolio to
identify other-than-temporary impairments of individual securi-
ties. Factors that are considered by Sony in determining whether
an other-than-temporary decline in value has occurred include:
the length of time and extent to which the market value of the
security has been less than its original cost, the financial
condition, operating results, business plans and estimated future
cash flows of the issuer of the security, other specific factors
affecting the market value, deterioration of credit condition of the
issuers, sovereign risk, and ability to retain the investment for a
period of time sufficient to allow for the anticipated recovery in
market value.
In evaluating the factors for available-for-sale securities whose
fair values are readily determinable, management presumes a
decline in value to be other-than-temporary if the fair value of the
security is 20 percent or more below its original cost for an
extended period of time (generally a period of up to six to twelve
months). This criteria is employed as a threshold to identify
securities which may have a decline in value that is other-than-
temporary. The presumption of an other-than-temporary
impairment in such cases may be overcome if there is evidence
to support that the decline is temporary in nature due to the
existence of other factors which overcome the duration or
magnitude of the decline. On the other hand, there may be
cases where impairment losses are recognized when the decline
in the fair value of the security is not more than 20% or such
decline has not existed for an extended period of time, as a
result of considering specific factors which may indicate the
decline in the fair value is other-than-temporary.
The assessment of whether a decline in the value of an
investment is other-than-temporary often requires management
judgment based on evaluation of relevant factors. Those factors
include business plans and future cash flows of the issuer of the
security, the regulatory, economic or technological environment
of the investee, and the general market condition of either the
geographic area or the industry in which the investee operates.
Accordingly, it is possible that investments in Sony’s portfolio
that have had a decline in value that are currently believed to
be temporary may determine to be other-than-temporary in the
future based on Sony’s evaluation of additional information such
as continued poor operating results, future broad declines in
value of worldwide equity markets or circumstances in market
interest rate fluctuations. As a result, unrealized losses
recorded for investments may be recognized into income
in future periods.
■ IMPAIRMENT OF LONG-LIVED ASSETS
Sony reviews the carrying value of its long-lived assets held and
used and long-lived assets to be disposed of whenever events
or changes in circumstances indicate that the carrying value of
the assets may not be recoverable. This review is performed
using estimates of future cash flows by product category (e.g.
TV display CRTs) or entity (e.g. semiconductor manufacturing
division in the U.S.). If the carrying value of the asset is consid-
ered impaired, an impairment charge is recorded for the amount
by which the carrying value of the asset exceeds its fair value.
Fair value is determined using the present value of estimated net
cash flows or comparable market values.
Management believes that the estimates of future cash flows
and fair value are reasonable; however, changes in estimates
resulting in lower future cash flows and fair value due to unfore-
seen changes in business assumptions could negatively affect
the valuations of those long-lived assets. These unforeseen
changes include a possible further decline in demand for TV
display CRTs due to a shift in demand from CRT displays to
LCD and plasma panel displays.
In the fiscal year ended March 31, 2003, Sony recorded
impairment charges for long-lived assets totaling 12.4 billion
yen. This included 8.1 billion yen for the impairment of semicon-
ductor and computer display CRT manufacturing equipment to
be abandoned or to be sold in connection with certain restruc-
turing activities in the Electronics segment. It also included 2.7
billion yen for the impairment of a CD manufacturing facility in
the U.S., the fair value of which was estimated by using meth-
ods such as a survey of the local real estate market.
In the fiscal year ended March 31, 2004, Sony recorded
impairment charges for long-lived assets totaling 16.1 billion
yen. This included 5.3 billion yen for the impairment of long-lived
assets such as semiconductor and TV display CRT manufactur-
ing equipment to be abandoned or sold in connection with
certain restructuring activities in the Electronics segment. It also
included 3.0 billion yen for the impairment of long-lived assets in
the Music segment such as a certain CD manufacturing facility
to be abandoned or sold and a recording studio and equipment
to be held and used in Japan. Fair value of these assets was
determined using estimated future discounted cash flows based
on the best information available.
In the fiscal year ended March 31, 2005, Sony recorded
impairment charges for long-lived assets totaling 19.2 billion
yen. This included 7.5 billion yen for the impairment of long-lived
assets of CRT TV display manufacturing facilities to be held and
used in Europe in connection with certain restructuring activities
in the Electronics segment. Fair value of these assets was
determined using estimated future discounted cash flows based
on the best information available.
BH6/30 05.7.7, 3:33 AMPage 63 Adobe PageMaker 6.0J/PPC
64 Sony Corporation
■ GOODWILL AND OTHER INTANGIBLE ASSETS
Goodwill and other intangible assets that are determined to have
an indefinite life are not amortized, but are tested for impairment
in accordance with FAS No. 142 on an annual basis and
between annual tests if an event occurs or circumstances
change that would more likely than not reduce the fair value of
these assets below their carrying value. Such an event would
include unfavorable variances from established business plans,
significant changes in forecasted results or volatility inherent to
external markets and industries, which are periodically reviewed
by management. Specifically, goodwill impairment is determined
using a two-step process. The first step of the goodwill impair-
ment test is used to identify potential impairment by comparing
the fair value of a reporting unit (generally, Sony’s operating
segments) with its carrying amount, including goodwill. If the fair
value of a reporting unit exceeds its carrying amount, goodwill of
the reporting unit is considered not impaired and the second
step of the impairment test is unnecessary. If the carrying
amount of a reporting unit exceeds its fair value, the second
step of the goodwill impairment test is performed to measure
the amount of impairment loss, if any. The second step of the
goodwill impairment test compares the implied fair value of the
reporting unit’s goodwill with the carrying amount of that
goodwill. If the carrying amount of the reporting unit’s goodwill
exceeds the implied fair value of that goodwill, an impairment
loss is recognized in an amount equal to that excess. The
implied fair value of goodwill is determined in the same manner
as the amount of goodwill recognized in a business combina-
tion. That is, the fair value of the reporting unit is allocated to all
of the assets and liabilities of that unit (including any unrecog-
nized intangible assets) as if the reporting unit had been ac-
quired in a business combination and the fair value of the
reporting unit was the purchase price paid to acquire the
reporting unit. Other intangible assets are tested for impairment
by comparing the fair value of the intangible asset with its
carrying value. If the carrying value of the intangible asset
exceeds its fair value, an impairment loss is recognized in an
amount equal to that excess.
Determining the fair value of a reporting unit under the first
step of the goodwill impairment test and determining the fair
value of individual assets and liabilities of a reporting unit
(including unrecognized intangible assets) under the second
step of the goodwill impairment test is judgmental in nature and
often involves the use of significant estimates and assumptions.
Similarly, estimates and assumptions are used in determining the
fair value of other intangible assets. These estimates and
assumptions could significantly impact whether or not an
impairment charge is recognized as well as the magnitude of
any such charge. In its impairment review, Sony performs
internal valuation analyses or utilizes third-party valuations when
management believes it to be appropriate, and considers other
market information that is publicly available. Estimates of fair
value are primarily determined using discounted cash flow
analysis. This approach uses significant estimates and assump-
tions including projected future cash flows, the timing of such
cash flows, discount rates reflecting the risk inherent in future
cash flows, perpetual growth rates, determination of appropriate
market comparables and the determination of whether a
premium or discount should be applied to comparables. During
the fourth quarter of the fiscal year ended March 31, 2005, Sony
performed the annual impairment analysis and no impairment
loss has been recognized.
Management believes that the estimates of future cash flows
and fair value are reasonable; however, changes in estimates
resulting in lower future cash flows and fair value due to unfore-
seen changes in business assumptions could negatively affect
the valuations, which may result in Sony recognizing impairment
charges for goodwill and other intangible assets in the future.
In order to evaluate the sensitivity of the fair value calculations
on the impairment analysis, Sony applied a hypothetical 10%
decrease to the fair value of each reporting unit. As of March
31, 2005, a 10% hypothetical decrease to the fair value of
each reporting units would not have resulted in a material
impairment loss.
■ PENSION BENEFITS COSTS
Employee pension benefit costs and obligations are dependent
on certain assumptions including discount rates, retirement
rates and mortality rates, which are based upon current statisti-
cal data, as well as expected long-term rates of return on plan
assets and other factors. Specifically, the discount rate and
expected long-term rate of return on assets are two critical
assumptions in the determination of periodic pension costs and
pension liabilities. Assumptions are evaluated at least annually,
or at the time when events occur or circumstances change and
these events or changes could have a significant effect on these
critical assumptions. In accordance with U.S. GAAP, actual
results that differ from the assumptions are accumulated and
amortized over future periods. Therefore, actual results generally
affect recognized expenses and the recorded obligations for
pensions in future periods. While management believes that the
assumptions used are appropriate, differences in actual experi-
ence or changes in assumptions may affect Sony’s pension
obligations and future expenses.
Sony’s principal pension plans are its Japanese pension plans.
Foreign pension plans are not significant individually with total
assets and pension obligations amounting to less than 10% of
those of the aggregate of the Japanese pension plans.
To determine the benefit obligation of the Japanese pension
plans, Sony used a discount rate of 2.3% for its Japanese
pension plans as of March 31, 2005. The discount rate was
determined by using available information about rates of return
BH6/30 05.7.7, 3:33 AMPage 64 Adobe PageMaker 6.0J/PPC
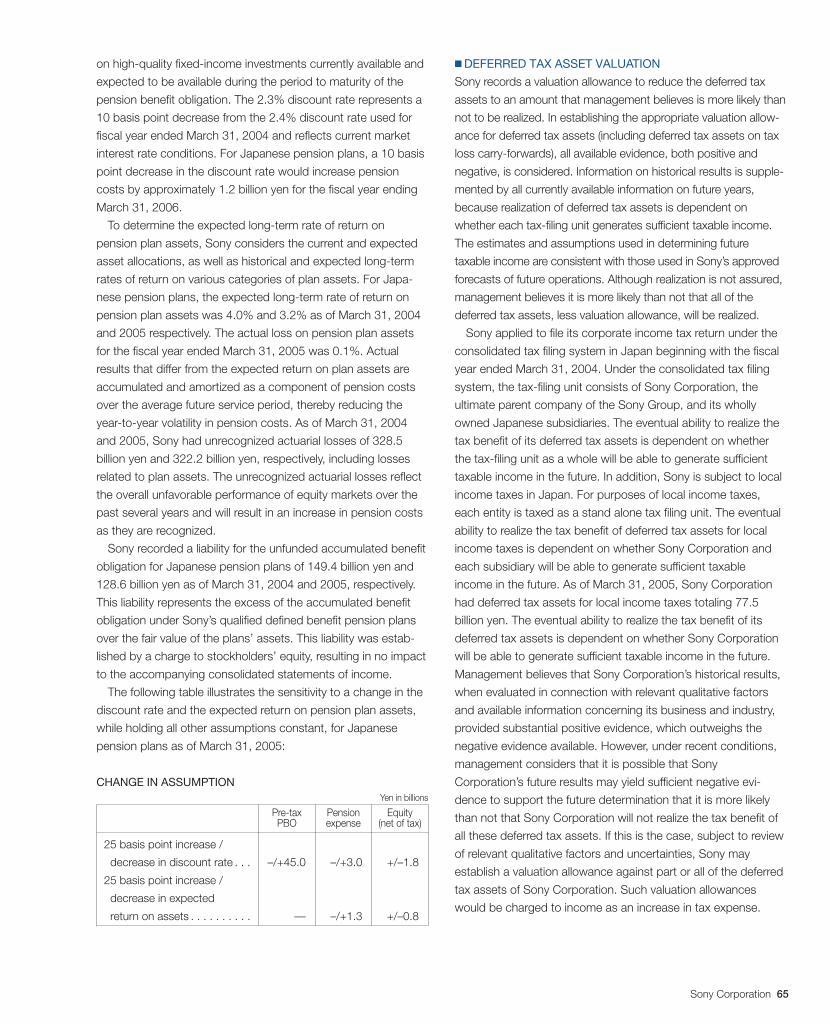
Sony Corporation 65
on high-quality fixed-income investments currently available and
expected to be available during the period to maturity of the
pension benefit obligation. The 2.3% discount rate represents a
10 basis point decrease from the 2.4% discount rate used for
fiscal year ended March 31, 2004 and reflects current market
interest rate conditions. For Japanese pension plans, a 10 basis
point decrease in the discount rate would increase pension
costs by approximately 1.2 billion yen for the fiscal year ending
March 31, 2006.
To determine the expected long-term rate of return on
pension plan assets, Sony considers the current and expected
asset allocations, as well as historical and expected long-term
rates of return on various categories of plan assets. For Japa-
nese pension plans, the expected long-term rate of return on
pension plan assets was 4.0% and 3.2% as of March 31, 2004
and 2005 respectively. The actual loss on pension plan assets
for the fiscal year ended March 31, 2005 was 0.1%. Actual
results that differ from the expected return on plan assets are
accumulated and amortized as a component of pension costs
over the average future service period, thereby reducing the
year-to-year volatility in pension costs. As of March 31, 2004
and 2005, Sony had unrecognized actuarial losses of 328.5
billion yen and 322.2 billion yen, respectively, including losses
related to plan assets. The unrecognized actuarial losses reflect
the overall unfavorable performance of equity markets over the
past several years and will result in an increase in pension costs
as they are recognized.
Sony recorded a liability for the unfunded accumulated benefit
obligation for Japanese pension plans of 149.4 billion yen and
128.6 billion yen as of March 31, 2004 and 2005, respectively.
This liability represents the excess of the accumulated benefit
obligation under Sony’s qualified defined benefit pension plans
over the fair value of the plans’ assets. This liability was estab-
lished by a charge to stockholders’ equity, resulting in no impact
to the accompanying consolidated statements of income.
The following table illustrates the sensitivity to a change in the
discount rate and the expected return on pension plan assets,
while holding all other assumptions constant, for Japanese
pension plans as of March 31, 2005:
CHANGE IN ASSUMPTIONYen in billions
Pre-tax Pension EquityPBO expense (net of tax)
25 basis point increase /
decrease in discount rate . . . –/+45.0 –/+3.0 +/–1.8
25 basis point increase /
decrease in expected
return on assets . . . . . . . . . . — –/+1.3 +/–0.8
■ DEFERRED TAX ASSET VALUATION
Sony records a valuation allowance to reduce the deferred tax
assets to an amount that management believes is more likely than
not to be realized. In establishing the appropriate valuation allow-
ance for deferred tax assets (including deferred tax assets on tax
loss carry-forwards), all available evidence, both positive and
negative, is considered. Information on historical results is supple-
mented by all currently available information on future years,
because realization of deferred tax assets is dependent on
whether each tax-filing unit generates sufficient taxable income.
The estimates and assumptions used in determining future
taxable income are consistent with those used in Sony’s approved
forecasts of future operations. Although realization is not assured,
management believes it is more likely than not that all of the
deferred tax assets, less valuation allowance, will be realized.
Sony applied to file its corporate income tax return under the
consolidated tax filing system in Japan beginning with the fiscal
year ended March 31, 2004. Under the consolidated tax filing
system, the tax-filing unit consists of Sony Corporation, the
ultimate parent company of the Sony Group, and its wholly
owned Japanese subsidiaries. The eventual ability to realize the
tax benefit of its deferred tax assets is dependent on whether
the tax-filing unit as a whole will be able to generate sufficient
taxable income in the future. In addition, Sony is subject to local
income taxes in Japan. For purposes of local income taxes,
each entity is taxed as a stand alone tax filing unit. The eventual
ability to realize the tax benefit of deferred tax assets for local
income taxes is dependent on whether Sony Corporation and
each subsidiary will be able to generate sufficient taxable
income in the future. As of March 31, 2005, Sony Corporation
had deferred tax assets for local income taxes totaling 77.5
billion yen. The eventual ability to realize the tax benefit of its
deferred tax assets is dependent on whether Sony Corporation
will be able to generate sufficient taxable income in the future.
Management believes that Sony Corporation’s historical results,
when evaluated in connection with relevant qualitative factors
and available information concerning its business and industry,
provided substantial positive evidence, which outweighs the
negative evidence available. However, under recent conditions,
management considers that it is possible that Sony
Corporation’s future results may yield sufficient negative evi-
dence to support the future determination that it is more likely
than not that Sony Corporation will not realize the tax benefit of
all these deferred tax assets. If this is the case, subject to review
of relevant qualitative factors and uncertainties, Sony may
establish a valuation allowance against part or all of the deferred
tax assets of Sony Corporation. Such valuation allowances
would be charged to income as an increase in tax expense.
BH6/30 05.7.7, 3:33 AMPage 65 Adobe PageMaker 6.0J/PPC
66 Sony Corporation
■ FILM ACCOUNTING
An aspect of film accounting that requires the exercise of
judgment relates to the process of estimating the total revenues
to be received throughout a film’s life cycle. Such estimate of a
film’s ultimate revenue is important for two reasons. First, while a
film is being produced and the related costs are being capital-
ized, it is necessary for management to estimate the ultimate
revenue, less additional costs to be incurred, including exploita-
tion costs which are expensed as incurred, in order to determine
whether the value of a film has been impaired and thus requires
an immediate write off of unrecoverable film costs. Second, the
amount of film costs recognized as cost of sales for a given film
as it is exhibited in various markets throughout its life cycle is
based upon the proportion that current period actual revenues
bear to the estimated ultimate total revenues.
Management bases its estimates of ultimate revenue for
each film on several factors including the historical performance
of similar genre films, the star power of the lead actors and
actresses, the expected number of theaters at which the film
will be released, anticipated performance in the home entertain-
ment, television and other ancillary markets, and agreements for
future sales. Management updates such estimates based on the
actual results to date of each film. For example, a film that has
resulted in lower than expected theatrical revenues in its initial
weeks of release would generally have its theatrical, home enter-
tainment and television distribution ultimate revenues adjusted
downward; a failure to do so would result in the understatement
of amortized film costs for the period. Since the total film cost to
be amortized for a given film is fixed, the estimate of ultimate
revenues impacts only the timing of film cost amortization.
■ FUTURE INSURANCE POLICY BENEFITS
Liabilities for future insurance policy benefits are established in
amounts adequate to meet the estimated future obligations of
policies in force. These liabilities are computed by the net level
premium method based upon estimates as to future investment
yield, morbidity, mortality, withdrawals and other factors. Future
policy benefits are computed using interest rates ranging from
approximately 1.30% to 5.20%. Mortality, morbidity and with-
drawal assumptions for all policies are based on either the life
insurance subsidiary’s own experience or various actuarial
tables. Generally these assumptions are “locked-in” upon the
issuance of new insurance. While management believes that the
assumptions used are appropriate, differences in actual experi-
ence or changes in assumptions may affect Sony’s future
insurance policy benefits.
RECENTLY ADOPTED ACCOUNTINGSTANDARDS
■ ACCOUNTING AND REPORTING BY INSURANCE
ENTERPRISES FOR CERTAIN NONTRADITIONAL LONG-
DURATION CONTRACTS AND FOR SEPARATE
ACCOUNTS
In July 2003, the Accounting Standards Executive Committee of
the American Institute of Certified Public Accountants (“AcSEC”)
issued the Statement of Position (“SOP”) 03-1, “Accounting and
Reporting by Insurance Enterprises for Certain Nontraditional
Long-Duration Contracts and for Separate Accounts”. SOP 03-
1 requires insurance enterprises to record additional reserves for
long-duration life insurance contracts with minimum guarantee
or annuity receivable options. Additionally, SOP 03-1 provides
guidance for the presentation of separate accounts. This
statement is effective for fiscal years beginning after December
15, 2003. Sony adopted SOP 03-1 on April 1, 2004. As a result
of the adoption of SOP 03-1, Sony’s operating income
decreased by 5.2 billion yen for the fiscal year ended March 31,
2005. Additionally, on April 1, 2004, Sony recorded a 4.7 billion
yen charge (net of income taxes of 2.7 billion yen) as a cumula-
tive effect of an accounting change. In addition, the separate
account assets, which are defined by insurance business law in
Japan and were previously included in “Securities investments
and other” in the consolidated balance sheet, were excluded
from the category of separate accounts under the provision
of SOP 03-1. Accordingly, the assets previously treated as
separate account assets are now treated within general
account assets.
■ THE EFFECT OF CONTINGENTLY CONVERTIBLE
INSTRUMENTS ON DILUTED EARNINGS PER SHARE
In July 2004, the Emerging Issues Task Force (“EITF”) issued
EITF Issue No. 04-8, “The Effect of Contingently Convertible
Instruments on Diluted Earnings per Share.” In accordance with
Statement of Financial Accounting Standards (“FAS’’) No.128,
“Earnings per Share’’, Sony had not previously included in the
computation of diluted earnings per share (“EPS’’) the number
of potential common stock issuable upon the conversion of
contingently convertible debt instruments (“Co-Cos’’) that had
not met the conditions to exercise the stock acquisition rights.
EITF Issue No. 04-8 requires that the maximum number of
common stock that could be issued upon the conversion of
Co-Cos be included in diluted EPS computations from the date
of issuance regardless of whether the conditions to exercise the
BH6/30 05.7.7, 3:33 AMPage 66 Adobe PageMaker 6.0J/PPC
Sony Corporation 67
stock acquisition rights have been met. EITF Issue No. 04-8 is
effective for reporting periods ending after December 15, 2004.
Sony adopted EITF Issue No. 04-8 during the quarter ended
December 31, 2004. As a result of the adoption of EITF Issue
No. 04-8, Sony’s diluted EPS of income before cumulative effect
of an accounting change and net income for the fiscal year
ended March 31, 2004 were restated respectively. Sony’s
diluted EPS of income before cumulative effect of an accounting
change and net income for the fiscal year ended March 31,
2005 were decreased by 7.26 yen and 7.06 yen, respectively,
compared to those before adopting EITF Issue No. 04-8.
■ EMPLOYERS’ DISCLOSURES ABOUT PENSIONS AND
OTHER POSTRETIREMENT BENEFITS
In December 2003, the Financial Accounting Standards Board
(“FASB”) issued FAS No. 132 (revised 2003), “Employers’
Disclosures about Pensions and Other Postretirement Benefits”
(“FAS No. 132(R)”), which revised FAS No. 132, “Employers’
Disclosures about Pensions and Other Postretirement Benefits”,
an amendment of FAS No. 87, “Employers’ Accounting for
Pensions”, FAS No. 88, “Employers’ Accounting for Settlements
and Curtailments of Defined Benefit Pension Plans and for
Termination Benefits”, and FAS No. 106, “Employers’ Account-
ing for Postretirement Benefits Other Than Pensions”. FAS No.
132(R) revised employers’ disclosures about pension plans and
other postretirement benefit plans. It did not change the mea-
surement or recognition of those plans required by FAS No. 87,
88 and 106. While retaining the disclosure requirements of FAS
No. 132, FAS No. 132(R) requires additional disclosures about
assets, obligations and cash flows. The provisions of FAS No.
132(R) were generally effective for financial statements with fiscal
years ending after December 15, 2003, excluding the disclosure
of certain information about foreign plans. The information about
foreign plans is effective for fiscal years ending after June 15,
2004. In accordance with FAS No. 132(R), Note 15 of Notes to
the Consolidated Financial Statements, Pension and severance
plans, has been expanded to include the new disclosures.
■ CONSOLIDATION OF VARIABLE INTEREST ENTITIES
In January 2003, the FASB issued FASB Interpretation (“FIN”)
No. 46, “Consolidation of Variable Interest Entities - an Interpre-
tation of ARB No. 51”. FIN No. 46 addresses consolidation by a
primary beneficiary of a variable interest entity (“VIE”). Sony early
adopted the provisions of FIN No. 46 on July 1, 2003. As a
result of adopting the original FIN No. 46, Sony recognized a
one-time charge with no tax effect of 2.1 billion yen as a
cumulative effect of accounting change in the consolidated
statement of income, and Sony’s assets and liabilities increased
by 95.3 billion yen and 98.0 billion yen, respectively. These
increases were treated as non-cash transactions in the consoli-
dated statement of cash flows. In addition, cash and cash
equivalents increased by 1.5 billion yen. See Note 23 of Notes
to Consolidated Financial Statements for further discussion on
the VIEs that are used by Sony.
In December 2003, the FASB issued revised FIN No. 46
(“FIN No. 46R”), which replaced FIN No. 46. Sony early adopted
the provisions of FIN No. 46R upon its issuance. The adoption
of FIN No. 46R did not have an impact on Sony’s results of
operations and financial position or impact the way Sony had
previously accounted for VIEs.
RECENT PRONOUNCEMENTS
■ ACCOUNTING FOR STOCK-BASED COMPENSATION
In December 2004, the FASB issued FAS No. 123 (revised
2004), “Share-Based Payment” (“FAS No. 123(R)”). This
statement requires the use of the fair value based method
of accounting for employee stock-based compensation and
eliminates the alternative use of the intrinsic value method pre-
scribed by Accounting Principle Board Opinion (“APB”) No. 25,
“Accounting for Stock Issued to Employees.” With limited
exceptions, FAS No. 123(R) requires that the grant-date fair
value of share-based payments to employees be expensed over
the period the service is received. Sony has accounted for its
employee stock-based compensation in accordance with the
provisions prescribed by APB No. 25 and its related interpreta-
tions and has disclosed the net effect on net income and net
ncome per share allocated to the common stock if Sony had
applied the fair value recognition provisions of FAS No. 123 to
stock-based compensation as described in Consolidated
Financial Statements Note 2(2) Significant accounting policies—
Stock-based compensation. This statement shall be effective for
fiscal years beginning after June 15, 2005, with early adoption
encouraged during the fiscal years beginning after the date this
statement is issued. The options for transition methods
prescribed in FAS No. 123(R) include either the modified pro-
spective or the modified retrospective methods. Sony intends
to adopt the modified prospective method of transition, which
requires that compensation expense be recorded for all
unvested stock acquisition rights as the requisite service is
rendered beginning with the first period of adoption. Sony is
BH6/30 05.7.7, 3:33 AMPage 67 Adobe PageMaker 6.0J/PPC
68 Sony Corporation
currently evaluating the impact of adopting this new pronounce-
ment. However, Sony expects that the total expenses to be
recorded in the future periods will be consistent with the pro
forma information in Note 2(2) of Notes to the Consolidated
Financial Statements—Stock-based compensation.
■ INVENTORY COSTS
In November 2004, the FASB issued FAS No. 151, “Inventory
Costs, an amendment of Accounting Research Bulletin (“ARB”)
No. 43, Chapter 4”. This statement requires certain abnormal
expenditures to be recognized as expenses in the current
period. It also requires that the amount of fixed production
overhead allocated to inventory be based on the normal
capacity of the production facilities. This statement shall be
effective for fiscal years beginning after June 15, 2005, with early
adoption encouraged during the fiscal years beginning after the
date this statement is issued. The adoption of FAS No. 151 is
not expected to have a material impact on Sony’s results of
operations and financial position.
■ EXCHANGES OF NONMONETARY ASSETS
In December 2004, the FASB issued FAS No. 153, “Exchanges
of Nonmonetary Assets, an amendment of APB Opinion No.
29.” This statement requires that exchanges of productive
assets be accounted for at fair value unless fair value cannot
be reasonably determined or the transaction lacks commercial
substance. This statement shall be effective for nonmonetary
asset exchanges occurring in the fiscal periods beginning after
June 15, 2005, with early adoption during the fiscal periods
beginning after the date this statement is issued encouraged.
Sony is currently evaluating the impact of adopting this new
pronouncement.
BH6/30 05.7.7, 3:33 AMPage 68 Adobe PageMaker 6.0J/PPC
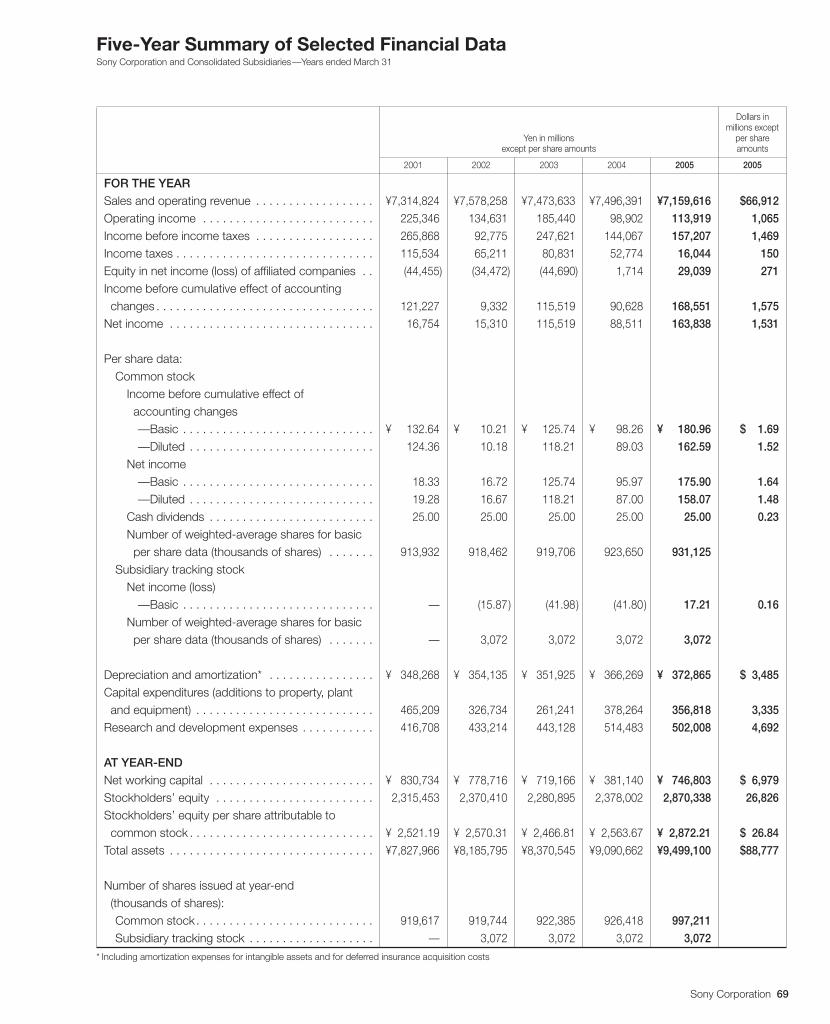
Sony Corporation 69
Five-Year Summary of Selected Financial DataSony Corporation and Consolidated Subsidiaries—Years ended March 31
Dollars inmillions except
Yen in millions per shareexcept per share amounts amounts
2001 2002 2003 2004 2005 2005
FOR THE YEAR
Sales and operating revenue . . . . . . . . . . . . . . . . . . ¥7,314,824 ¥7,578,258 ¥7,473,633 ¥7,496,391 ¥7,159,616 $66,912
Operating income . . . . . . . . . . . . . . . . . . . . . . . . . . 225,346 134,631 185,440 98,902 113,919 1,065
Income before income taxes . . . . . . . . . . . . . . . . . . 265,868 92,775 247,621 144,067 157,207 1,469
Income taxes . . . . . . . . . . . . . . . . . . . . . . . . . . . . . . 115,534 65,211 80,831 52,774 16,044 150
Equity in net income (loss) of affiliated companies . . (44,455) (34,472) (44,690) 1,714 29,039 271
Income before cumulative effect of accounting changes . . . . . . . . . . . . . . . . . . . . . . . . . . . . . . . . . 121,227 9,332 115,519 90,628 168,551 1,575
Net income . . . . . . . . . . . . . . . . . . . . . . . . . . . . . . . 16,754 15,310 115,519 88,511 163,838 1,531
Per share data:Common stock
Income before cumulative effect of accounting changes
—Basic . . . . . . . . . . . . . . . . . . . . . . . . . . . . . ¥ 132.64. ¥ 10.21. ¥ 125.74. ¥ 98.26. ¥ 180.96. $ 1.69.
—Diluted . . . . . . . . . . . . . . . . . . . . . . . . . . . . 124.36. 10.18. 118.21. 89.03. 162.59. 1.52.
Net income—Basic . . . . . . . . . . . . . . . . . . . . . . . . . . . . . 18.33. 16.72. 125.74. 95.97. 175.90. 1.64.
—Diluted . . . . . . . . . . . . . . . . . . . . . . . . . . . . 19.28. 16.67. 118.21. 87.00. 158.07. 1.48.
Cash dividends . . . . . . . . . . . . . . . . . . . . . . . . . 25.00. 25.00. 25.00. 25.00. 25.00. 0.23.
Number of weighted-average shares for basic per share data (thousands of shares) . . . . . . . 913,932 918,462 919,706 923,650 931,125
Subsidiary tracking stockNet income (loss)
—Basic . . . . . . . . . . . . . . . . . . . . . . . . . . . . . — (15.87.) (41.98.) (41.80.) 17.21. 0.16.
Number of weighted-average shares for basic per share data (thousands of shares) . . . . . . . — 3,072 3,072 3,072 3,072
Depreciation and amortization* . . . . . . . . . . . . . . . . ¥ 348,268 ¥ 354,135 ¥ 351,925 ¥ 366,269 ¥ 372,865 $ 3,485
Capital expenditures (additions to property, plant and equipment) . . . . . . . . . . . . . . . . . . . . . . . . . . . 465,209 326,734 261,241 378,264 356,818 3,335
Research and development expenses . . . . . . . . . . . 416,708 433,214 443,128 514,483 502,008 4,692
AT YEAR-END
Net working capital . . . . . . . . . . . . . . . . . . . . . . . . . ¥ 830,734 ¥ 778,716 ¥ 719,166 ¥ 381,140 ¥ 746,803 $ 6,979
Stockholders’ equity . . . . . . . . . . . . . . . . . . . . . . . . 2,315,453 2,370,410 2,280,895 2,378,002 2,870,338 26,826
Stockholders’ equity per share attributable to common stock . . . . . . . . . . . . . . . . . . . . . . . . . . . . ¥ 2,521.19. ¥ 2,570.31. ¥ 2,466.81. ¥ 2,563.67. ¥ 2,872.21. $ 26.84.
Total assets . . . . . . . . . . . . . . . . . . . . . . . . . . . . . . . ¥7,827,966. ¥8,185,795. ¥8,370,545. ¥9,090,662. ¥9,499,100. $88,777
Number of shares issued at year-end (thousands of shares):
Common stock. . . . . . . . . . . . . . . . . . . . . . . . . . . 919,617 919,744 922,385 926,418 997,211
Subsidiary tracking stock . . . . . . . . . . . . . . . . . . . — 3,072 3,072 3,072 3,072
* Including amortization expenses for intangible assets and for deferred insurance acquisition costs
BH6/30 05.7.7, 3:33 AMPage 69 Adobe PageMaker 6.0J/PPC
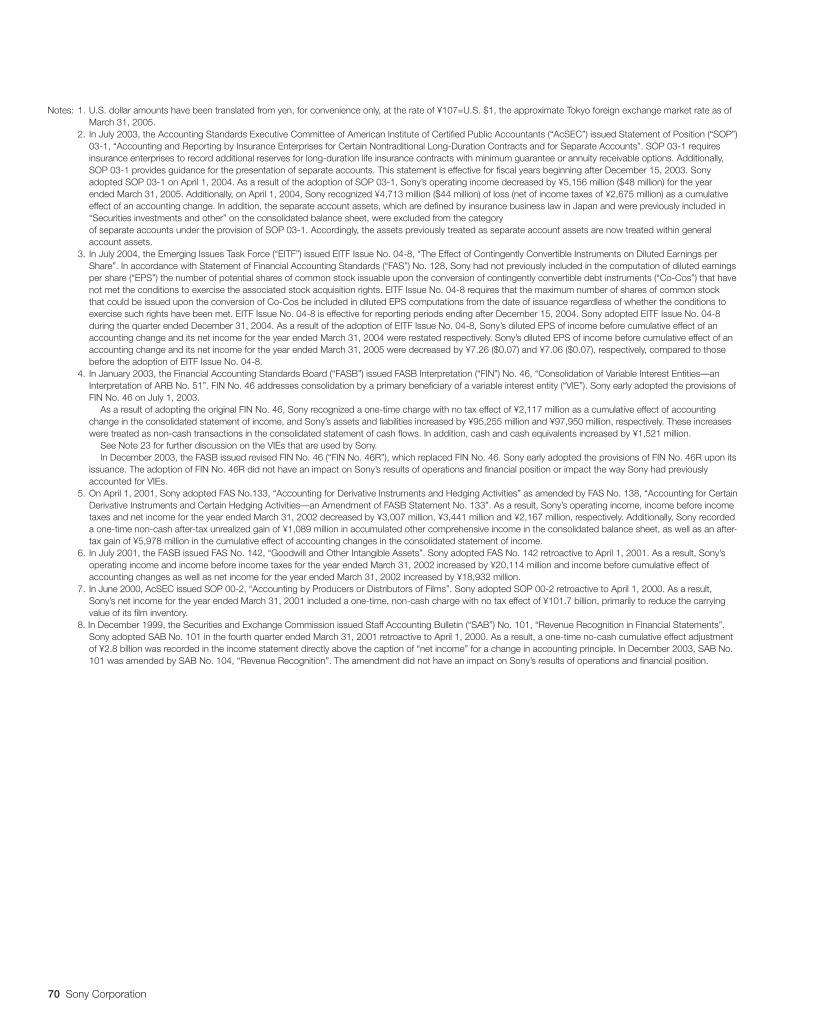
70 Sony Corporation
Notes: 1. U.S. dollar amounts have been translated from yen, for convenience only, at the rate of ¥107=U.S. $1, the approximate Tokyo foreign exchange market rate as ofMarch 31, 2005.
2. In July 2003, the Accounting Standards Executive Committee of American Institute of Certified Public Accountants (“AcSEC”) issued Statement of Position (“SOP”)03-1, “Accounting and Reporting by Insurance Enterprises for Certain Nontraditional Long-Duration Contracts and for Separate Accounts”. SOP 03-1 requiresinsurance enterprises to record additional reserves for long-duration life insurance contracts with minimum guarantee or annuity receivable options. Additionally,SOP 03-1 provides guidance for the presentation of separate accounts. This statement is effective for fiscal years beginning after December 15, 2003. Sonyadopted SOP 03-1 on April 1, 2004. As a result of the adoption of SOP 03-1, Sony’s operating income decreased by ¥5,156 million ($48 million) for the yearended March 31, 2005. Additionally, on April 1, 2004, Sony recognized ¥4,713 million ($44 million) of loss (net of income taxes of ¥2,675 million) as a cumulativeeffect of an accounting change. In addition, the separate account assets, which are defined by insurance business law in Japan and were previously included in“Securities investments and other” on the consolidated balance sheet, were excluded from the categoryof separate accounts under the provision of SOP 03-1. Accordingly, the assets previously treated as separate account assets are now treated within generalaccount assets.
3. In July 2004, the Emerging Issues Task Force (“EITF”) issued EITF Issue No. 04-8, “The Effect of Contingently Convertible Instruments on Diluted Earnings perShare”. In accordance with Statement of Financial Accounting Standards (“FAS”) No. 128, Sony had not previously included in the computation of diluted earningsper share (“EPS”) the number of potential shares of common stock issuable upon the conversion of contingently convertible debt instruments (“Co-Cos”) that havenot met the conditions to exercise the associated stock acquisition rights. EITF Issue No. 04-8 requires that the maximum number of shares of common stockthat could be issued upon the conversion of Co-Cos be included in diluted EPS computations from the date of issuance regardless of whether the conditions toexercise such rights have been met. EITF Issue No. 04-8 is effective for reporting periods ending after December 15, 2004. Sony adopted EITF Issue No. 04-8during the quarter ended December 31, 2004. As a result of the adoption of EITF Issue No. 04-8, Sony’s diluted EPS of income before cumulative effect of anaccounting change and its net income for the year ended March 31, 2004 were restated respectively. Sony’s diluted EPS of income before cumulative effect of anaccounting change and its net income for the year ended March 31, 2005 were decreased by ¥7.26 ($0.07) and ¥7.06 ($0.07), respectively, compared to thosebefore the adoption of EITF Issue No. 04-8.
4. In January 2003, the Financial Accounting Standards Board (“FASB”) issued FASB Interpretation (“FIN”) No. 46, “Consolidation of Variable Interest Entities—anInterpretation of ARB No. 51”. FIN No. 46 addresses consolidation by a primary beneficiary of a variable interest entity (“VIE”). Sony early adopted the provisions ofFIN No. 46 on July 1, 2003.
As a result of adopting the original FIN No. 46, Sony recognized a one-time charge with no tax effect of ¥2,117 million as a cumulative effect of accountingchange in the consolidated statement of income, and Sony’s assets and liabilities increased by ¥95,255 million and ¥97,950 million, respectively. These increaseswere treated as non-cash transactions in the consolidated statement of cash flows. In addition, cash and cash equivalents increased by ¥1,521 million.
See Note 23 for further discussion on the VIEs that are used by Sony.In December 2003, the FASB issued revised FIN No. 46 (“FIN No. 46R”), which replaced FIN No. 46. Sony early adopted the provisions of FIN No. 46R upon its
issuance. The adoption of FIN No. 46R did not have an impact on Sony’s results of operations and financial position or impact the way Sony had previouslyaccounted for VIEs.
5. On April 1, 2001, Sony adopted FAS No.133, “Accounting for Derivative Instruments and Hedging Activities” as amended by FAS No. 138, “Accounting for CertainDerivative Instruments and Certain Hedging Activities—an Amendment of FASB Statement No. 133”. As a result, Sony’s operating income, income before incometaxes and net income for the year ended March 31, 2002 decreased by ¥3,007 million, ¥3,441 million and ¥2,167 million, respectively. Additionally, Sony recordeda one-time non-cash after-tax unrealized gain of ¥1,089 million in accumulated other comprehensive income in the consolidated balance sheet, as well as an after-tax gain of ¥5,978 million in the cumulative effect of accounting changes in the consolidated statement of income.
6. In July 2001, the FASB issued FAS No. 142, “Goodwill and Other Intangible Assets”. Sony adopted FAS No. 142 retroactive to April 1, 2001. As a result, Sony’soperating income and income before income taxes for the year ended March 31, 2002 increased by ¥20,114 million and income before cumulative effect ofaccounting changes as well as net income for the year ended March 31, 2002 increased by ¥18,932 million.
7. In June 2000, AcSEC issued SOP 00-2, “Accounting by Producers or Distributors of Films”. Sony adopted SOP 00-2 retroactive to April 1, 2000. As a result,Sony’s net income for the year ended March 31, 2001 included a one-time, non-cash charge with no tax effect of ¥101.7 billion, primarily to reduce the carryingvalue of its film inventory.
8. In December 1999, the Securities and Exchange Commission issued Staff Accounting Bulletin (“SAB”) No. 101, “Revenue Recognition in Financial Statements”.Sony adopted SAB No. 101 in the fourth quarter ended March 31, 2001 retroactive to April 1, 2000. As a result, a one-time no-cash cumulative effect adjustmentof ¥2.8 billion was recorded in the income statement directly above the caption of “net income” for a change in accounting principle. In December 2003, SAB No.101 was amended by SAB No. 104, “Revenue Recognition”. The amendment did not have an impact on Sony’s results of operations and financial position.
BH6/30 05.7.7, 3:33 AMPage 70 Adobe PageMaker 6.0J/PPC
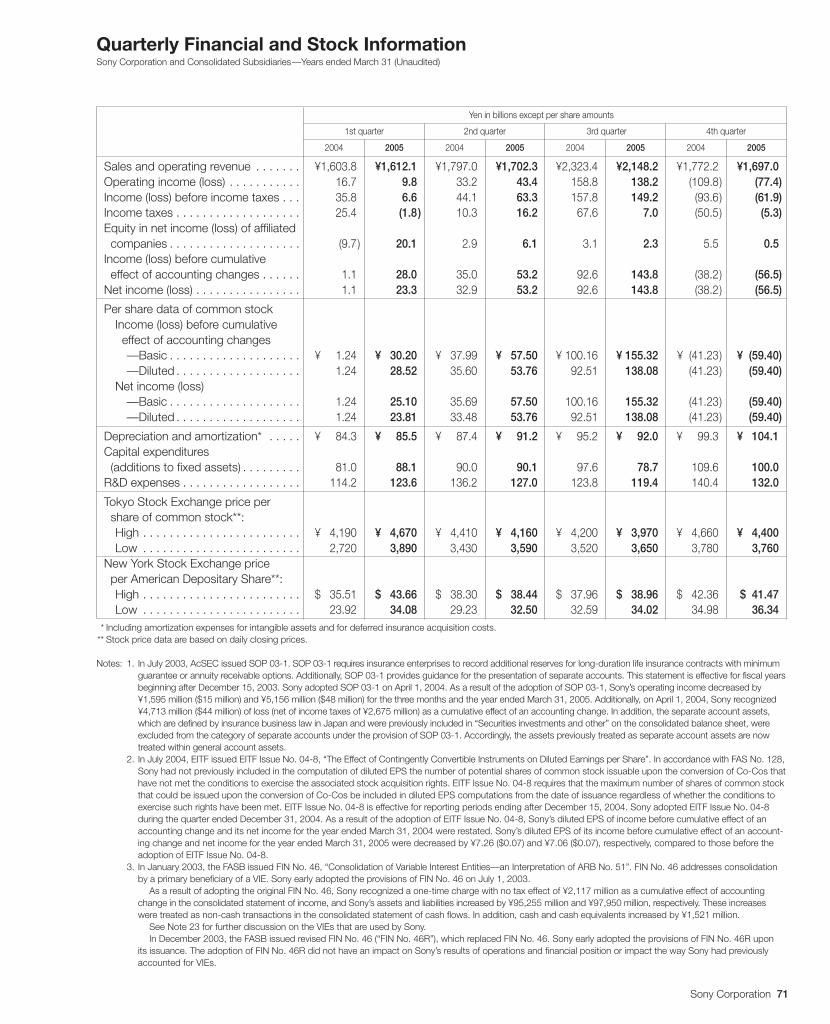
Sony Corporation 71
Quarterly Financial and Stock InformationSony Corporation and Consolidated Subsidiaries—Years ended March 31 (Unaudited)
.
Yen in billions except per share amounts
1st quarter 2nd quarter 3rd quarter 4th quarter
2004 2005 2004 2005 2004 2005 2004 2005
Sales and operating revenue . . . . . . . ¥1,603.8. ¥1,612.1. ¥1,797.0. ¥1,702.3. ¥2,323.4. ¥2,148.2. ¥1,772.2. ¥1,697.0.Operating income (loss) . . . . . . . . . . . 16.7. 9.8. 33.2. 43.4. 158.8. 138.2. (109.8.) (77.4.)Income (loss) before income taxes . . . 35.8. 6.6. 44.1. 63.3. 157.8. 149.2. (93.6.) (61.9.)Income taxes . . . . . . . . . . . . . . . . . . . 25.4. (1.8.) 10.3. 16.2. 67.6. 7.0. (50.5.) (5.3.)Equity in net income (loss) of affiliated companies . . . . . . . . . . . . . . . . . . . . (9.7.) 20.1. 2.9. 6.1. 3.1. 2.3. 5.5. 0.5.Income (loss) before cumulative effect of accounting changes . . . . . . 1.1. 28.0. 35.0. 53.2. 92.6. 143.8. (38.2.) (56.5.)Net income (loss) . . . . . . . . . . . . . . . . 1.1. 23.3. 32.9. 53.2. 92.6. 143.8. (38.2.) (56.5.)
Per share data of common stockIncome (loss) before cumulative effect of accounting changes
—Basic . . . . . . . . . . . . . . . . . . . . ¥ 1.24. ¥ 30.20. ¥ 37.99. ¥ 57.50. ¥ 100.16. ¥ 155.32. ¥ (41.23.) ¥ (59.40.)—Diluted . . . . . . . . . . . . . . . . . . . 1.24. 28.52. 35.60. 53.76. 92.51. 138.08. (41.23.) (59.40.)
Net income (loss)—Basic . . . . . . . . . . . . . . . . . . . . 1.24. 25.10. 35.69. 57.50. 100.16. 155.32. (41.23.) (59.40.)—Diluted . . . . . . . . . . . . . . . . . . . 1.24. 23.81. 33.48. 53.76. 92.51. 138.08. (41.23.) (59.40.)
Depreciation and amortization* . . . . . ¥ 84.3. ¥ 85.5. ¥ 87.4. ¥ 91.2. ¥ 95.2. ¥ 92.0. ¥ 99.3. ¥ 104.1.Capital expenditures (additions to fixed assets) . . . . . . . . . 81.0. 88.1. 90.0. 90.1. 97.6. 78.7. 109.6. 100.0.R&D expenses . . . . . . . . . . . . . . . . . . 114.2. 123.6. 136.2. 127.0. 123.8. 119.4. 140.4. 132.0.
Tokyo Stock Exchange price per share of common stock**:
High . . . . . . . . . . . . . . . . . . . . . . . . ¥ 4,190 ¥ 4,670 ¥ 4,410 ¥ 4,160 ¥ 4,200 ¥ 3,970 ¥ 4,660 ¥ 4,400Low . . . . . . . . . . . . . . . . . . . . . . . . 2,720 3,890 3,430 3,590 3,520 3,650 3,780 3,760
New York Stock Exchange price per American Depositary Share**:
High . . . . . . . . . . . . . . . . . . . . . . . . $ 35.51. $ 43.66. $ 38.30. $ 38.44. $ 37.96. $ 38.96. $ 42.36. $ 41.47.Low . . . . . . . . . . . . . . . . . . . . . . . . 23.92. 34.08. 29.23. 32.50. 32.59. 34.02. 34.98. 36.34.
* Including amortization expenses for intangible assets and for deferred insurance acquisition costs.** Stock price data are based on daily closing prices.
Notes: 1. In July 2003, AcSEC issued SOP 03-1. SOP 03-1 requires insurance enterprises to record additional reserves for long-duration life insurance contracts with minimumguarantee or annuity receivable options. Additionally, SOP 03-1 provides guidance for the presentation of separate accounts. This statement is effective for fiscal yearsbeginning after December 15, 2003. Sony adopted SOP 03-1 on April 1, 2004. As a result of the adoption of SOP 03-1, Sony’s operating income decreased by¥1,595 million ($15 million) and ¥5,156 million ($48 million) for the three months and the year ended March 31, 2005. Additionally, on April 1, 2004, Sony recognized¥4,713 million ($44 million) of loss (net of income taxes of ¥2,675 million) as a cumulative effect of an accounting change. In addition, the separate account assets,which are defined by insurance business law in Japan and were previously included in “Securities investments and other” on the consolidated balance sheet, wereexcluded from the category of separate accounts under the provision of SOP 03-1. Accordingly, the assets previously treated as separate account assets are nowtreated within general account assets.
2. In July 2004, EITF issued EITF Issue No. 04-8, “The Effect of Contingently Convertible Instruments on Diluted Earnings per Share”. In accordance with FAS No. 128,Sony had not previously included in the computation of diluted EPS the number of potential shares of common stock issuable upon the conversion of Co-Cos thathave not met the conditions to exercise the associated stock acquisition rights. EITF Issue No. 04-8 requires that the maximum number of shares of common stockthat could be issued upon the conversion of Co-Cos be included in diluted EPS computations from the date of issuance regardless of whether the conditions toexercise such rights have been met. EITF Issue No. 04-8 is effective for reporting periods ending after December 15, 2004. Sony adopted EITF Issue No. 04-8during the quarter ended December 31, 2004. As a result of the adoption of EITF Issue No. 04-8, Sony’s diluted EPS of income before cumulative effect of anaccounting change and its net income for the year ended March 31, 2004 were restated. Sony’s diluted EPS of its income before cumulative effect of an account-ing change and net income for the year ended March 31, 2005 were decreased by ¥7.26 ($0.07) and ¥7.06 ($0.07), respectively, compared to those before theadoption of EITF Issue No. 04-8.
3. In January 2003, the FASB issued FIN No. 46, “Consolidation of Variable Interest Entities—an Interpretation of ARB No. 51”. FIN No. 46 addresses consolidationby a primary beneficiary of a VIE. Sony early adopted the provisions of FIN No. 46 on July 1, 2003.
As a result of adopting the original FIN No. 46, Sony recognized a one-time charge with no tax effect of ¥2,117 million as a cumulative effect of accountingchange in the consolidated statement of income, and Sony’s assets and liabilities increased by ¥95,255 million and ¥97,950 million, respectively. These increaseswere treated as non-cash transactions in the consolidated statement of cash flows. In addition, cash and cash equivalents increased by ¥1,521 million.
See Note 23 for further discussion on the VIEs that are used by Sony.In December 2003, the FASB issued revised FIN No. 46 (“FIN No. 46R”), which replaced FIN No. 46. Sony early adopted the provisions of FIN No. 46R upon
its issuance. The adoption of FIN No. 46R did not have an impact on Sony’s results of operations and financial position or impact the way Sony had previouslyaccounted for VIEs.
BH6/30 05.7.7, 3:33 AMPage 71 Adobe PageMaker 6.0J/PPC
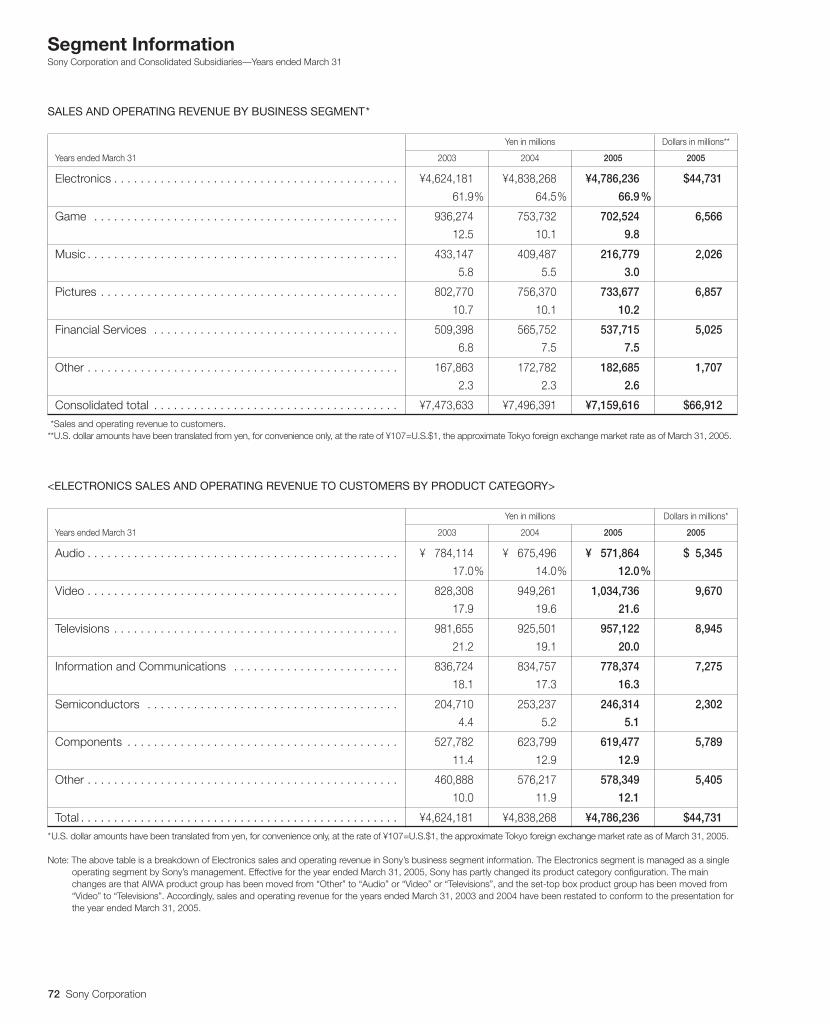
72 Sony Corporation
Segment InformationSony Corporation and Consolidated Subsidiaries—Years ended March 31
SALES AND OPERATING REVENUE BY BUSINESS SEGMENT*
Yen in millions Dollars in millions**
Years ended March 31 2003 2004 2005 2005
Electronics . . . . . . . . . . . . . . . . . . . . . . . . . . . . . . . . . . . . . . . . . . . ¥4,624,181 ¥4,838,268 ¥4,786,236 $44,731
. . . . . . . . . . . . . . . . . . . . . . . . . . . . . . . . . . . . . . . . . . . . . . . . . . . 61.9.% 64.5.% 66.9.%
Game . . . . . . . . . . . . . . . . . . . . . . . . . . . . . . . . . . . . . . . . . . . . . . 936,274 753,732 702,524 6,566
. . . . . . . . . . . . . . . . . . . . . . . . . . . . . . . . . . . . . . . . . . . . . . . . . . . 12.5. 10.1. 9.8.
Music . . . . . . . . . . . . . . . . . . . . . . . . . . . . . . . . . . . . . . . . . . . . . . . 433,147 409,487 216,779 2,026
. . . . . . . . . . . . . . . . . . . . . . . . . . . . . . . . . . . . . . . . . . . . . . . . . . . 5.8. 5.5. 3.0.
Pictures . . . . . . . . . . . . . . . . . . . . . . . . . . . . . . . . . . . . . . . . . . . . . 802,770 756,370 733,677 6,857
. . . . . . . . . . . . . . . . . . . . . . . . . . . . . . . . . . . . . . . . . . . . . . . . . . . 10.7. 10.1. 10.2.
Financial Services . . . . . . . . . . . . . . . . . . . . . . . . . . . . . . . . . . . . . 509,398 565,752 537,715 5,025
. . . . . . . . . . . . . . . . . . . . . . . . . . . . . . . . . . . . . . . . . . . . . . . . . . . 6.8. 7.5. 7.5.
Other . . . . . . . . . . . . . . . . . . . . . . . . . . . . . . . . . . . . . . . . . . . . . . . 167,863 172,782 182,685 1,707
. . . . . . . . . . . . . . . . . . . . . . . . . . . . . . . . . . . . . . . . . . . . . . . . . . . 2.3. 2.3. 2.6.
Consolidated total . . . . . . . . . . . . . . . . . . . . . . . . . . . . . . . . . . . . . ¥7,473,633 ¥7,496,391 ¥7,159,616 $66,912
**Sales and operating revenue to customers.**U.S. dollar amounts have been translated from yen, for convenience only, at the rate of ¥107=U.S.$1, the approximate Tokyo foreign exchange market rate as of March 31, 2005.
<ELECTRONICS SALES AND OPERATING REVENUE TO CUSTOMERS BY PRODUCT CATEGORY>
Yen in millions Dollars in millions*
Years ended March 31 2003 2004 2005 2005
Audio . . . . . . . . . . . . . . . . . . . . . . . . . . . . . . . . . . . . . . . . . . . . . . . ¥ 784,114 ¥ 675,496 ¥ 571,864 $ 5,345
. . . . . . . . . . . . . . . . . . . . . . . . . . . . . . . . . . . . . . . . . . . . . . . . . . . . . . . . . 17.0.% 14.0.% 12.0.%
Video . . . . . . . . . . . . . . . . . . . . . . . . . . . . . . . . . . . . . . . . . . . . . . . 828,308 949,261 1,034,736 9,670
. . . . . . . . . . . . . . . . . . . . . . . . . . . . . . . . . . . . . . . . . . . . . . . . . . . 17.9. 19.6. 21.6.
Televisions . . . . . . . . . . . . . . . . . . . . . . . . . . . . . . . . . . . . . . . . . . . 981,655 925,501 957,122 8,945
. . . . . . . . . . . . . . . . . . . . . . . . . . . . . . . . . . . . . . . . . . . . . . . . . . . 21.2. 19.1. 20.0.
Information and Communications . . . . . . . . . . . . . . . . . . . . . . . . . 836,724 834,757 778,374 7,275
. . . . . . . . . . . . . . . . . . . . . . . . . . . . . . . . . . . . . . . . . . . . . . . . . . . 18.1. 17.3. 16.3.
Semiconductors . . . . . . . . . . . . . . . . . . . . . . . . . . . . . . . . . . . . . . 204,710 253,237 246,314 2,302
. . . . . . . . . . . . . . . . . . . . . . . . . . . . . . . . . . . . . . . . . . . . . . . . . . . 4.4. 5.2. 5.1.
Components . . . . . . . . . . . . . . . . . . . . . . . . . . . . . . . . . . . . . . . . . 527,782 623,799 619,477 5,789
. . . . . . . . . . . . . . . . . . . . . . . . . . . . . . . . . . . . . . . . . . . . . . . . . . . 11.4. 12.9. 12.9.
Other . . . . . . . . . . . . . . . . . . . . . . . . . . . . . . . . . . . . . . . . . . . . . . . 460,888 576,217 578,349 5,405
. . . . . . . . . . . . . . . . . . . . . . . . . . . . . . . . . . . . . . . . . . . . . . . . . . . 10.0. 11.9. 12.1.
Total . . . . . . . . . . . . . . . . . . . . . . . . . . . . . . . . . . . . . . . . . . . . . . . . ¥4,624,181 ¥4,838,268 ¥4,786,236 $44,731
*U.S. dollar amounts have been translated from yen, for convenience only, at the rate of ¥107=U.S.$1, the approximate Tokyo foreign exchange market rate as of March 31, 2005.
Note: The above table is a breakdown of Electronics sales and operating revenue in Sony’s business segment information. The Electronics segment is managed as a singleoperating segment by Sony’s management. Effective for the year ended March 31, 2005, Sony has partly changed its product category configuration. The mainchanges are that AIWA product group has been moved from “Other” to “Audio” or “Video” or “Televisions”, and the set-top box product group has been moved from“Video” to “Televisions”. Accordingly, sales and operating revenue for the years ended March 31, 2003 and 2004 have been restated to conform to the presentation forthe year ended March 31, 2005.
BH6/30 05.7.7, 3:33 AMPage 72 Adobe PageMaker 6.0J/PPC
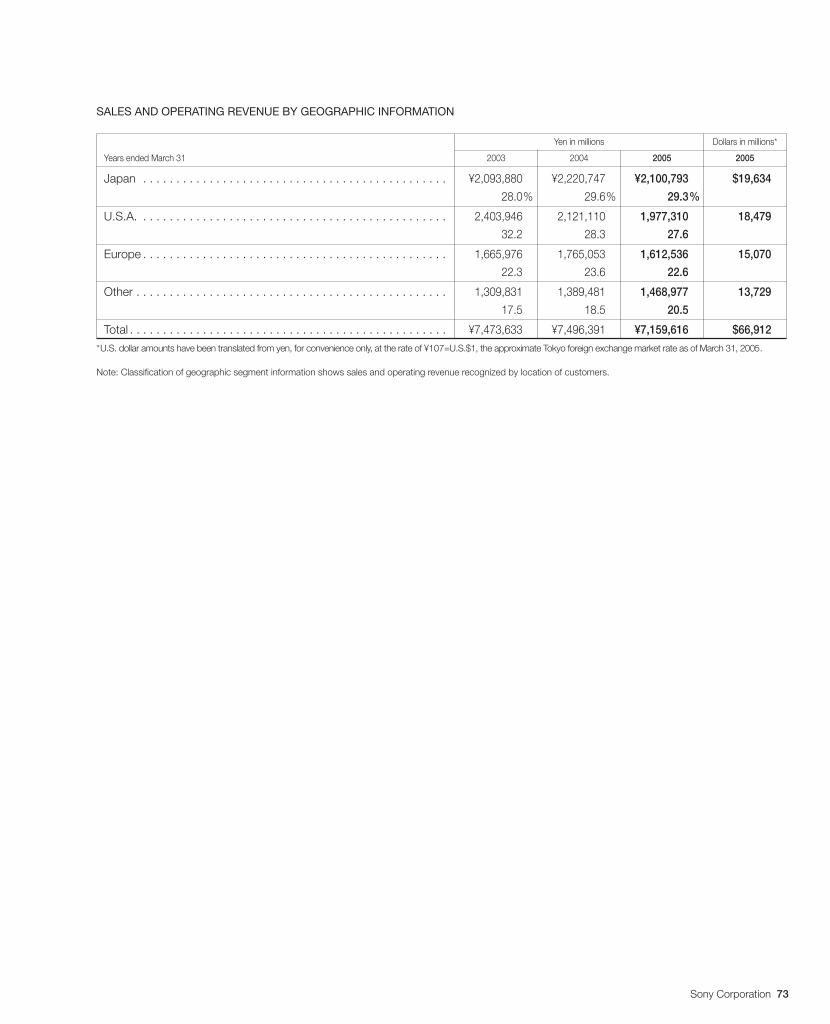
Sony Corporation 73
SALES AND OPERATING REVENUE BY GEOGRAPHIC INFORMATION
Yen in millions Dollars in millions*
Years ended March 31 2003 2004 2005 2005
Japan . . . . . . . . . . . . . . . . . . . . . . . . . . . . . . . . . . . . . . . . . . . . . . ¥2,093,880 ¥2,220,747 ¥2,100,793 $19,634
. . . . . . . . . . . . . . . . . . . . . . . . . . . . . . . . . . . . . . . . . . . . . . . . . . . . . . . . . 28.0.% 29.6.% 29.3.%
U.S.A. . . . . . . . . . . . . . . . . . . . . . . . . . . . . . . . . . . . . . . . . . . . . . . 2,403,946 2,121,110 1,977,310 18,479
. . . . . . . . . . . . . . . . . . . . . . . . . . . . . . . . . . . . . . . . . . . . . . . . . . . . . . . . . 32.2. 28.3. 27.6.
Europe . . . . . . . . . . . . . . . . . . . . . . . . . . . . . . . . . . . . . . . . . . . . . . 1,665,976 1,765,053 1,612,536 15,070
. . . . . . . . . . . . . . . . . . . . . . . . . . . . . . . . . . . . . . . . . . . . . . . . . . . . . . . . . 22.3. 23.6. 22.6.
Other . . . . . . . . . . . . . . . . . . . . . . . . . . . . . . . . . . . . . . . . . . . . . . . 1,309,831 1,389,481 1,468,977 13,729
. . . . . . . . . . . . . . . . . . . . . . . . . . . . . . . . . . . . . . . . . . . . . . . . . . . . . . . . . 17.5. 18.5. 20.5.
Total . . . . . . . . . . . . . . . . . . . . . . . . . . . . . . . . . . . . . . . . . . . . . . . . ¥7,473,633 ¥7,496,391 ¥7,159,616 $66,912
*U.S. dollar amounts have been translated from yen, for convenience only, at the rate of ¥107=U.S.$1, the approximate Tokyo foreign exchange market rate as of March 31, 2005.
Note: Classification of geographic segment information shows sales and operating revenue recognized by location of customers.
BH6/30 05.7.7, 3:33 AMPage 73 Adobe PageMaker 6.0J/PPC
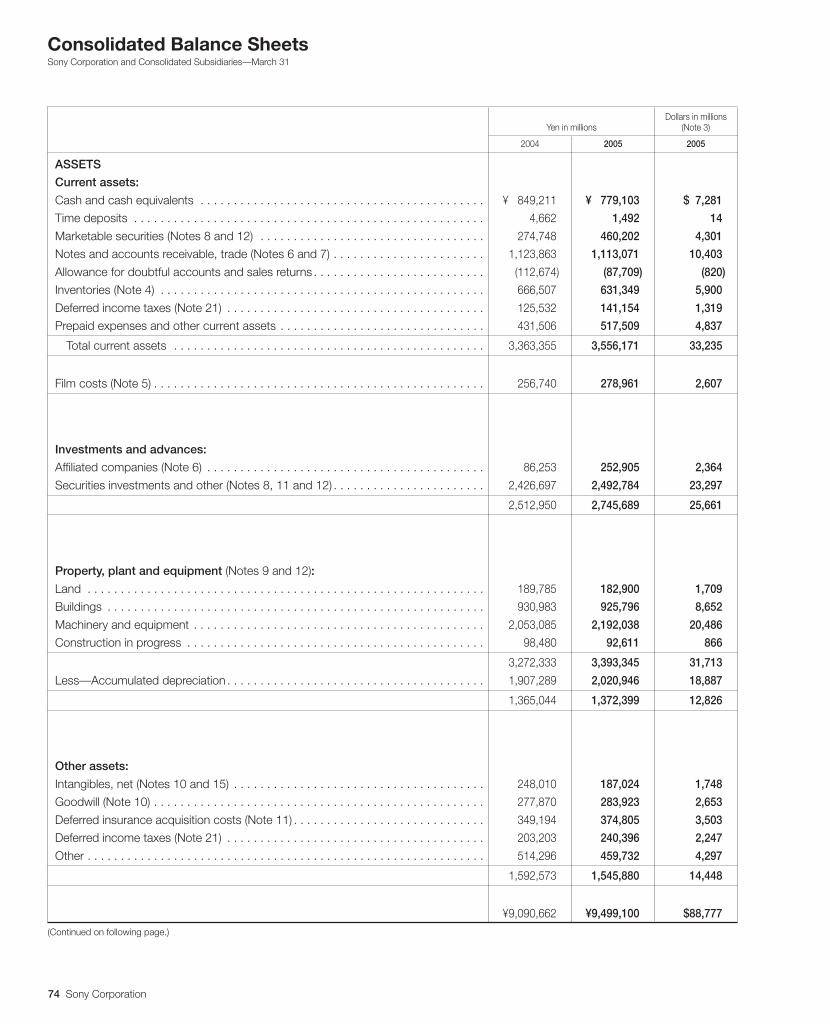
74 Sony Corporation
Consolidated Balance SheetsSony Corporation and Consolidated Subsidiaries—March 31
Dollars in millionsYen in millions (Note 3)
2004 2005 2005
ASSETS
Current assets:
Cash and cash equivalents . . . . . . . . . . . . . . . . . . . . . . . . . . . . . . . . . . . . . . . . . . . ¥0,849,211 ¥0,779,103 $07,281
Time deposits . . . . . . . . . . . . . . . . . . . . . . . . . . . . . . . . . . . . . . . . . . . . . . . . . . . . . 4,662 1,492 14
Marketable securities (Notes 8 and 12) . . . . . . . . . . . . . . . . . . . . . . . . . . . . . . . . . . 274,748 460,202 4,301
Notes and accounts receivable, trade (Notes 6 and 7) . . . . . . . . . . . . . . . . . . . . . . . 1,123,863 1,113,071 10,403
Allowance for doubtful accounts and sales returns . . . . . . . . . . . . . . . . . . . . . . . . . . (112,674) (87,709) (820)
Inventories (Note 4) . . . . . . . . . . . . . . . . . . . . . . . . . . . . . . . . . . . . . . . . . . . . . . . . . 666,507 631,349 5,900
Deferred income taxes (Note 21) . . . . . . . . . . . . . . . . . . . . . . . . . . . . . . . . . . . . . . . 125,532 141,154 1,319
Prepaid expenses and other current assets . . . . . . . . . . . . . . . . . . . . . . . . . . . . . . . 431,506 517,509 4,837
Total current assets . . . . . . . . . . . . . . . . . . . . . . . . . . . . . . . . . . . . . . . . . . . . . . . 3,363,355 3,556,171 33,235
Film costs (Note 5) . . . . . . . . . . . . . . . . . . . . . . . . . . . . . . . . . . . . . . . . . . . . . . . . . . 256,740 278,961 2,607
Investments and advances:
Affiliated companies (Note 6) . . . . . . . . . . . . . . . . . . . . . . . . . . . . . . . . . . . . . . . . . . 86,253 252,905 2,364
Securities investments and other (Notes 8, 11 and 12) . . . . . . . . . . . . . . . . . . . . . . . 2,426,697 2,492,784 23,297
. . . . . . . . . . . . . . . . . . . . . . . . . . . . . . . . . . . . . . . . . . . . . . . . . . . . . . . . . . . . . 2,512,950 2,745,689 25,661
Property, plant and equipment (Notes 9 and 12):
Land . . . . . . . . . . . . . . . . . . . . . . . . . . . . . . . . . . . . . . . . . . . . . . . . . . . . . . . . . . . . 189,785 182,900 1,709
Buildings . . . . . . . . . . . . . . . . . . . . . . . . . . . . . . . . . . . . . . . . . . . . . . . . . . . . . . . . . 930,983 925,796 8,652
Machinery and equipment . . . . . . . . . . . . . . . . . . . . . . . . . . . . . . . . . . . . . . . . . . . . 2,053,085 2,192,038 20,486
Construction in progress . . . . . . . . . . . . . . . . . . . . . . . . . . . . . . . . . . . . . . . . . . . . . 98,480 92,611 866
. . . . . . . . . . . . . . . . . . . . . . . . . . . . . . . . . . . . . . . . . . . . . . . . . . . . . . . . . . . . . 3,272,333 3,393,345 31,713
Less—Accumulated depreciation . . . . . . . . . . . . . . . . . . . . . . . . . . . . . . . . . . . . . . . 1,907,289 2,020,946 18,887
. . . . . . . . . . . . . . . . . . . . . . . . . . . . . . . . . . . . . . . . . . . . . . . . . . . . . . . . . . . . . 1,365,044 1,372,399 12,826
Other assets:
Intangibles, net (Notes 10 and 15) . . . . . . . . . . . . . . . . . . . . . . . . . . . . . . . . . . . . . . 248,010 187,024 1,748
Goodwill (Note 10) . . . . . . . . . . . . . . . . . . . . . . . . . . . . . . . . . . . . . . . . . . . . . . . . . . 277,870 283,923 2,653
Deferred insurance acquisition costs (Note 11) . . . . . . . . . . . . . . . . . . . . . . . . . . . . . 349,194 374,805 3,503
Deferred income taxes (Note 21) . . . . . . . . . . . . . . . . . . . . . . . . . . . . . . . . . . . . . . . 203,203 240,396 2,247
Other . . . . . . . . . . . . . . . . . . . . . . . . . . . . . . . . . . . . . . . . . . . . . . . . . . . . . . . . . . . . 514,296 459,732 4,297
. . . . . . . . . . . . . . . . . . . . . . . . . . . . . . . . . . . . . . . . . . . . . . . . . . . . . . . . . . . . . 1,592,573 1,545,880 14,448
. . . . . . . . . . . . . . . . . . . . . . . . . . . . . . . . . . . . . . . . . . . . . . . . . . . . . . . . . . . . . . . . . . . ¥9,090,662 ¥9,499,100 $88,777
(Continued on following page.)
BH6/30 05.7.7, 3:33 AMPage 74 Adobe PageMaker 6.0J/PPC
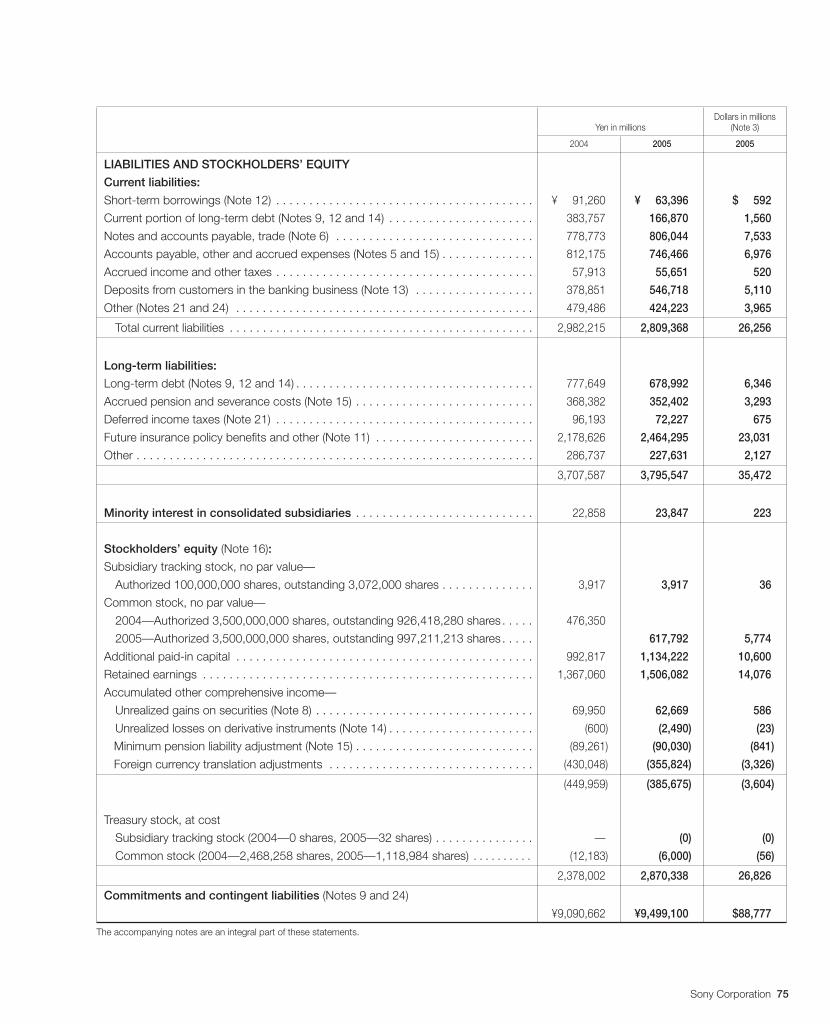
Sony Corporation 75
Dollars in millionsYen in millions (Note 3)
2004 2005 2005
LIABILITIES AND STOCKHOLDERS’ EQUITY
Current liabilities:
Short-term borrowings (Note 12) . . . . . . . . . . . . . . . . . . . . . . . . . . . . . . . . . . . . . . . ¥0,091,260 ¥0,063,396 $00,592
Current portion of long-term debt (Notes 9, 12 and 14) . . . . . . . . . . . . . . . . . . . . . . 383,757 166,870 1,560
Notes and accounts payable, trade (Note 6) . . . . . . . . . . . . . . . . . . . . . . . . . . . . . . 778,773 806,044 7,533
Accounts payable, other and accrued expenses (Notes 5 and 15) . . . . . . . . . . . . . . 812,175 746,466 6,976
Accrued income and other taxes . . . . . . . . . . . . . . . . . . . . . . . . . . . . . . . . . . . . . . . 57,913 55,651 520
Deposits from customers in the banking business (Note 13) . . . . . . . . . . . . . . . . . . 378,851 546,718 5,110
Other (Notes 21 and 24) . . . . . . . . . . . . . . . . . . . . . . . . . . . . . . . . . . . . . . . . . . . . . 479,486 424,223 3,965
Total current liabilities . . . . . . . . . . . . . . . . . . . . . . . . . . . . . . . . . . . . . . . . . . . . . . 2,982,215 2,809,368 26,256
Long-term liabilities:
Long-term debt (Notes 9, 12 and 14) . . . . . . . . . . . . . . . . . . . . . . . . . . . . . . . . . . . . 777,649 678,992 6,346
Accrued pension and severance costs (Note 15) . . . . . . . . . . . . . . . . . . . . . . . . . . . 368,382 352,402 3,293
Deferred income taxes (Note 21) . . . . . . . . . . . . . . . . . . . . . . . . . . . . . . . . . . . . . . . 96,193 72,227 675
Future insurance policy benefits and other (Note 11) . . . . . . . . . . . . . . . . . . . . . . . . 2,178,626 2,464,295 23,031
Other . . . . . . . . . . . . . . . . . . . . . . . . . . . . . . . . . . . . . . . . . . . . . . . . . . . . . . . . . . . . 286,737 227,631 2,127
. . . . . . . . . . . . . . . . . . . . . . . . . . . . . . . . . . . . . . . . . . . . . . . . . . . . . . . . . . . . . 3,707,587 3,795,547 35,472
Minority interest in consolidated subsidiaries . . . . . . . . . . . . . . . . . . . . . . . . . . . 22,858 23,847 223
Stockholders’ equity (Note 16):
Subsidiary tracking stock, no par value—
Authorized 100,000,000 shares, outstanding 3,072,000 shares . . . . . . . . . . . . . . 3,917 3,917 36
Common stock, no par value—
2004—Authorized 3,500,000,000 shares, outstanding 926,418,280 shares . . . . . 476,350
2005—Authorized 3,500,000,000 shares, outstanding 997,211,213 shares . . . . . 617,792 5,774
Additional paid-in capital . . . . . . . . . . . . . . . . . . . . . . . . . . . . . . . . . . . . . . . . . . . . . 992,817 1,134,222 10,600
Retained earnings . . . . . . . . . . . . . . . . . . . . . . . . . . . . . . . . . . . . . . . . . . . . . . . . . . 1,367,060 1,506,082 14,076
Accumulated other comprehensive income—
Unrealized gains on securities (Note 8) . . . . . . . . . . . . . . . . . . . . . . . . . . . . . . . . . 69,950 62,669 586
Unrealized losses on derivative instruments (Note 14) . . . . . . . . . . . . . . . . . . . . . . (600) (2,490) (23)
Minimum pension liability adjustment (Note 15) . . . . . . . . . . . . . . . . . . . . . . . . . . . (89,261) (90,030) (841)
Foreign currency translation adjustments . . . . . . . . . . . . . . . . . . . . . . . . . . . . . . . (430,048) (355,824) (3,326)
. . . . . . . . . . . . . . . . . . . . . . . . . . . . . . . . . . . . . . . . . . . . . . . . . . . . . . . . . . . . . (449,959) (385,675) (3,604)
Treasury stock, at cost
Subsidiary tracking stock (2004—0 shares, 2005—32 shares) . . . . . . . . . . . . . . . — (0) (0)
Common stock (2004—2,468,258 shares, 2005—1,118,984 shares) . . . . . . . . . . (12,183) (6,000) (56)
. . . . . . . . . . . . . . . . . . . . . . . . . . . . . . . . . . . . . . . . . . . . . . . . . . . . . . . . . . . . . 2,378,002 2,870,338 26,826
Commitments and contingent liabilities (Notes 9 and 24)
. . . . . . . . . . . . . . . . . . . . . . . . . . . . . . . . . . . . . . . . . . . . . . . . . . . . . . . . . . . . . ¥9,090,662 ¥9,499,100 $88,777
The accompanying notes are an integral part of these statements.
BH6/30 05.7.7, 3:33 AMPage 75 Adobe PageMaker 6.0J/PPC
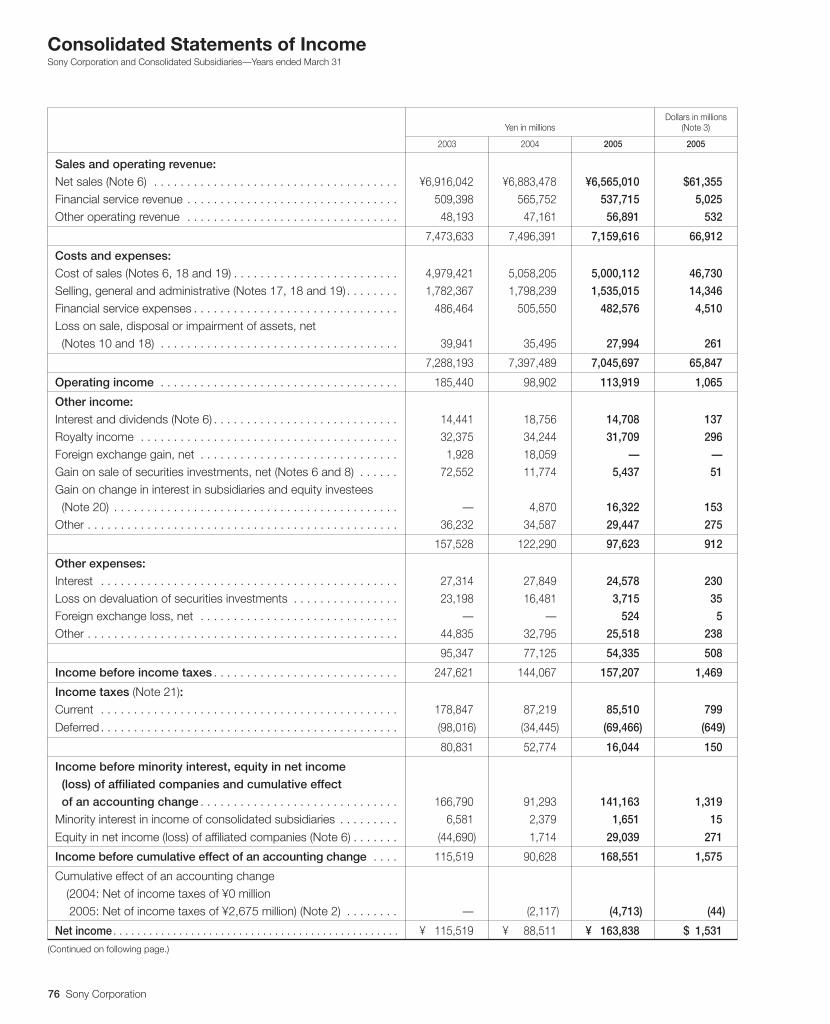
76 Sony Corporation
Consolidated Statements of IncomeSony Corporation and Consolidated Subsidiaries—Years ended March 31
Dollars in millionsYen in millions (Note 3)
2003 2004 2005 2005
Sales and operating revenue:
Net sales (Note 6) . . . . . . . . . . . . . . . . . . . . . . . . . . . . . . . . . . . . . ¥6,916,042 ¥6,883,478 ¥6,565,010 $61,355
Financial service revenue . . . . . . . . . . . . . . . . . . . . . . . . . . . . . . . . 509,398 565,752 537,715 5,025
Other operating revenue . . . . . . . . . . . . . . . . . . . . . . . . . . . . . . . . 48,193 47,161 56,891 532
. . . . . . . . . . . . . . . . . . . . . . . . . . . . . . . . . . . . . . . . . . . . . . . . . . . 7,473,633 7,496,391 7,159,616 66,912
Costs and expenses:
Cost of sales (Notes 6, 18 and 19) . . . . . . . . . . . . . . . . . . . . . . . . . 4,979,421 5,058,205 5,000,112 46,730
Selling, general and administrative (Notes 17, 18 and 19) . . . . . . . . 1,782,367 1,798,239 1,535,015 14,346
Financial service expenses . . . . . . . . . . . . . . . . . . . . . . . . . . . . . . . 486,464 505,550 482,576 4,510
Loss on sale, disposal or impairment of assets, net (Notes 10 and 18) . . . . . . . . . . . . . . . . . . . . . . . . . . . . . . . . . . . . 39,941 35,495 27,994 261
. . . . . . . . . . . . . . . . . . . . . . . . . . . . . . . . . . . . . . . . . . . . . . . . . . . 7,288,193 7,397,489 7,045,697 65,847
Operating income . . . . . . . . . . . . . . . . . . . . . . . . . . . . . . . . . . . . 185,440 98,902 113,919 1,065
Other income:
Interest and dividends (Note 6) . . . . . . . . . . . . . . . . . . . . . . . . . . . . 14,441 18,756 14,708 137
Royalty income . . . . . . . . . . . . . . . . . . . . . . . . . . . . . . . . . . . . . . . 32,375 34,244 31,709 296
Foreign exchange gain, net . . . . . . . . . . . . . . . . . . . . . . . . . . . . . . 1,928 18,059 — —
Gain on sale of securities investments, net (Notes 6 and 8) . . . . . . 72,552 11,774 5,437 51
Gain on change in interest in subsidiaries and equity investees (Note 20) . . . . . . . . . . . . . . . . . . . . . . . . . . . . . . . . . . . . . . . . . . . — 4,870 16,322 153
Other . . . . . . . . . . . . . . . . . . . . . . . . . . . . . . . . . . . . . . . . . . . . . . . 36,232 34,587 29,447 275
. . . . . . . . . . . . . . . . . . . . . . . . . . . . . . . . . . . . . . . . . . . . . . . . . . . 157,528 122,290 97,623 912
Other expenses:
Interest . . . . . . . . . . . . . . . . . . . . . . . . . . . . . . . . . . . . . . . . . . . . . 27,314 27,849 24,578 230
Loss on devaluation of securities investments . . . . . . . . . . . . . . . . 23,198 16,481 3,715 35
Foreign exchange loss, net . . . . . . . . . . . . . . . . . . . . . . . . . . . . . . — — 524 5
Other . . . . . . . . . . . . . . . . . . . . . . . . . . . . . . . . . . . . . . . . . . . . . . . 44,835 32,795 25,518 238
. . . . . . . . . . . . . . . . . . . . . . . . . . . . . . . . . . . . . . . . . . . . . . . . . . . 95,347 77,125 54,335 508
Income before income taxes . . . . . . . . . . . . . . . . . . . . . . . . . . . . 247,621 144,067 157,207 1,469
Income taxes (Note 21):Current . . . . . . . . . . . . . . . . . . . . . . . . . . . . . . . . . . . . . . . . . . . . . 178,847 87,219 85,510 799
Deferred . . . . . . . . . . . . . . . . . . . . . . . . . . . . . . . . . . . . . . . . . . . . . (98,016) (34,445) (69,466) (649)
. . . . . . . . . . . . . . . . . . . . . . . . . . . . . . . . . . . . . . . . . . . . . . . . . . . 80,831 52,774 16,044 150
Income before minority interest, equity in net income
(loss) of affiliated companies and cumulative effect
of an accounting change . . . . . . . . . . . . . . . . . . . . . . . . . . . . . . 166,790 91,293 141,163 1,319
Minority interest in income of consolidated subsidiaries . . . . . . . . . 6,581 2,379 1,651 15
Equity in net income (loss) of affiliated companies (Note 6) . . . . . . . (44,690) 1,714 29,039 271
Income before cumulative effect of an accounting change . . . . 115,519 90,628 168,551 1,575
Cumulative effect of an accounting change(2004: Net of income taxes of ¥0 million(2005: Net of income taxes of ¥2,675 million) (Note 2) . . . . . . . . — (2,117) (4,713) (44)
Net income . . . . . . . . . . . . . . . . . . . . . . . . . . . . . . . . . . . . . . . . . . . . . . . . ¥0,115,519 ¥0,088,511 ¥0,163,838 $01,531
(Continued on following page.)
BH6/30 05.7.7, 3:33 AMPage 76 Adobe PageMaker 6.0J/PPC
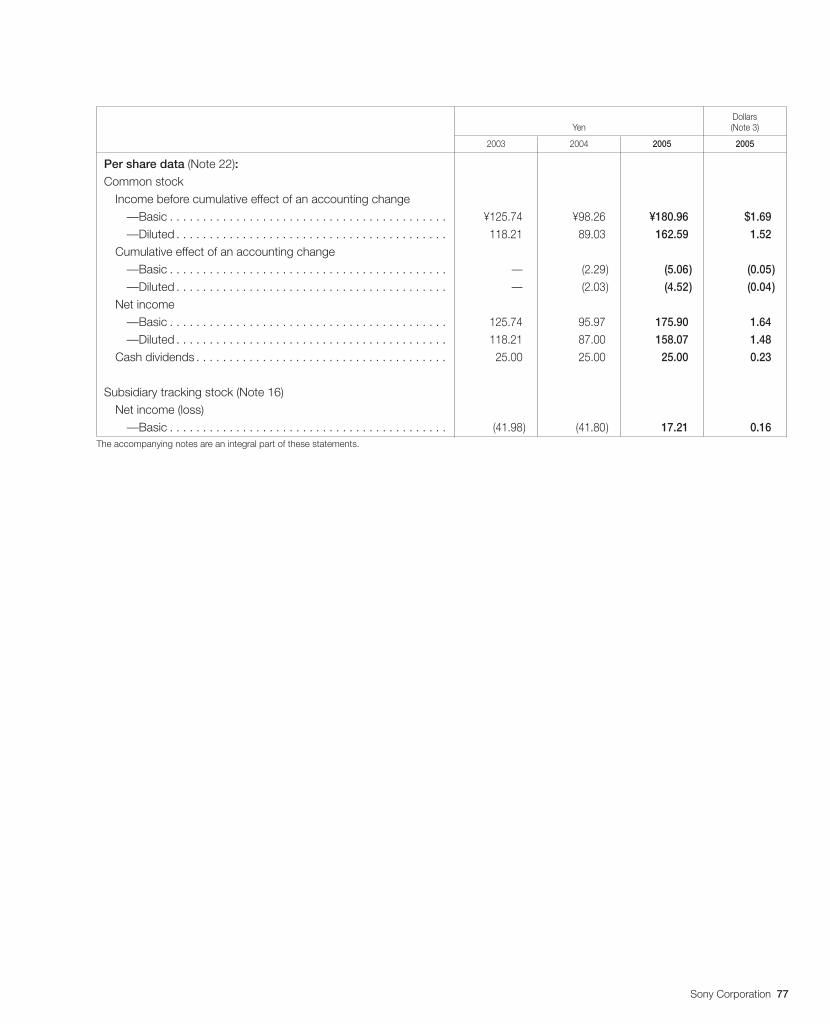
Sony Corporation 77
DollarsYen (Note 3)
2003 2004 2005 2005
Per share data (Note 22):Common stock
Income before cumulative effect of an accounting change—Basic . . . . . . . . . . . . . . . . . . . . . . . . . . . . . . . . . . . . . . . . . . ¥125.74. ¥98.26. ¥180.96. $1.69.
—Diluted . . . . . . . . . . . . . . . . . . . . . . . . . . . . . . . . . . . . . . . . . 118.21. 89.03. 162.59. 1.52.
Cumulative effect of an accounting change—Basic . . . . . . . . . . . . . . . . . . . . . . . . . . . . . . . . . . . . . . . . . . — (2.29.) (5.06.) (0.05.)
—Diluted . . . . . . . . . . . . . . . . . . . . . . . . . . . . . . . . . . . . . . . . . — (2.03.) (4.52.) (0.04.)
Net income—Basic . . . . . . . . . . . . . . . . . . . . . . . . . . . . . . . . . . . . . . . . . . 125.74. 95.97. 175.90. 1.64.
—Diluted . . . . . . . . . . . . . . . . . . . . . . . . . . . . . . . . . . . . . . . . . 118.21. 87.00. 158.07. 1.48.
Cash dividends . . . . . . . . . . . . . . . . . . . . . . . . . . . . . . . . . . . . . . 25.00. 25.00. 25.00. 0.23.
Subsidiary tracking stock (Note 16)Net income (loss)
—Basic . . . . . . . . . . . . . . . . . . . . . . . . . . . . . . . . . . . . . . . . . . (41.98.) (41.80.) 17.21. 0.16.The accompanying notes are an integral part of these statements.
BH6/30 05.7.7, 3:33 AMPage 77 Adobe PageMaker 6.0J/PPC
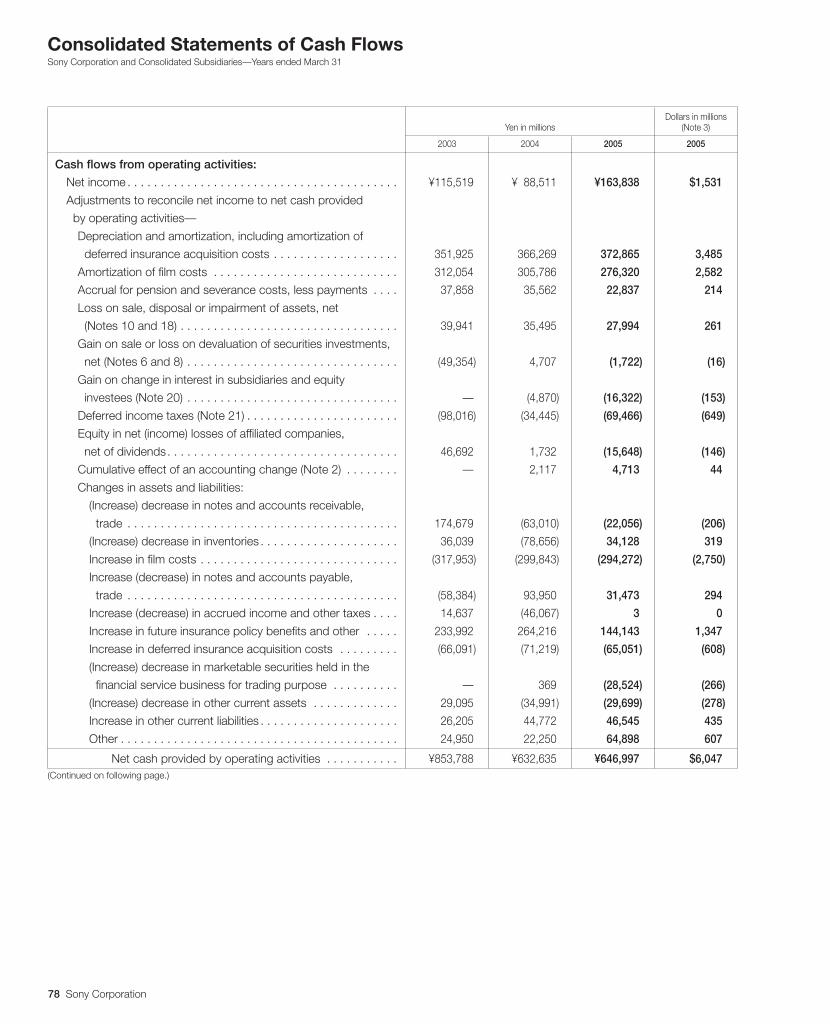
78 Sony Corporation
Consolidated Statements of Cash FlowsSony Corporation and Consolidated Subsidiaries—Years ended March 31
Dollars in millionsYen in millions (Note 3)
2003 2004 2005 2005
Cash flows from operating activities:
Net income . . . . . . . . . . . . . . . . . . . . . . . . . . . . . . . . . . . . . . . . . ¥115,519 ¥088,511 ¥163,838 $1,531
Adjustments to reconcile net income to net cash provided
by operating activities—
Depreciation and amortization, including amortization of
deferred insurance acquisition costs . . . . . . . . . . . . . . . . . . . 351,925 366,269 372,865 3,485
Amortization of film costs . . . . . . . . . . . . . . . . . . . . . . . . . . . . 312,054 305,786 276,320 2,582
Accrual for pension and severance costs, less payments . . . . 37,858 35,562 22,837 214
Loss on sale, disposal or impairment of assets, net
(Notes 10 and 18) . . . . . . . . . . . . . . . . . . . . . . . . . . . . . . . . . 39,941 35,495 27,994 261
Gain on sale or loss on devaluation of securities investments,
net (Notes 6 and 8) . . . . . . . . . . . . . . . . . . . . . . . . . . . . . . . . (49,354) 4,707 (1,722) (16)
Gain on change in interest in subsidiaries and equity
investees (Note 20) . . . . . . . . . . . . . . . . . . . . . . . . . . . . . . . . — (4,870) (16,322) (153)
Deferred income taxes (Note 21) . . . . . . . . . . . . . . . . . . . . . . . (98,016) (34,445) (69,466) (649)
Equity in net (income) losses of affiliated companies,
net of dividends. . . . . . . . . . . . . . . . . . . . . . . . . . . . . . . . . . . 46,692 1,732 (15,648) (146)
Cumulative effect of an accounting change (Note 2) . . . . . . . . — 2,117 4,713 44
Changes in assets and liabilities:
(Increase) decrease in notes and accounts receivable,
trade . . . . . . . . . . . . . . . . . . . . . . . . . . . . . . . . . . . . . . . . . 174,679 (63,010) (22,056) (206)
(Increase) decrease in inventories . . . . . . . . . . . . . . . . . . . . . 36,039 (78,656) 34,128 319
Increase in film costs . . . . . . . . . . . . . . . . . . . . . . . . . . . . . . (317,953) (299,843) (294,272) (2,750)
Increase (decrease) in notes and accounts payable,
trade . . . . . . . . . . . . . . . . . . . . . . . . . . . . . . . . . . . . . . . . . (58,384) 93,950 31,473 294
Increase (decrease) in accrued income and other taxes . . . . 14,637 (46,067) 3 0
Increase in future insurance policy benefits and other . . . . . 233,992 264,216 144,143 1,347
Increase in deferred insurance acquisition costs . . . . . . . . . (66,091) (71,219) (65,051) (608)
(Increase) decrease in marketable securities held in the
financial service business for trading purpose . . . . . . . . . . — 369 (28,524) (266)
(Increase) decrease in other current assets . . . . . . . . . . . . . 29,095 (34,991) (29,699) (278)
Increase in other current liabilities . . . . . . . . . . . . . . . . . . . . . 26,205 44,772 46,545 435
Other . . . . . . . . . . . . . . . . . . . . . . . . . . . . . . . . . . . . . . . . . . 24,950 22,250 64,898 607
Net cash provided by operating activities . . . . . . . . . . . ¥853,788 ¥632,635 ¥646,997 $6,047(Continued on following page.)
BH6/30 05.7.7, 3:33 AMPage 78 Adobe PageMaker 6.0J/PPC
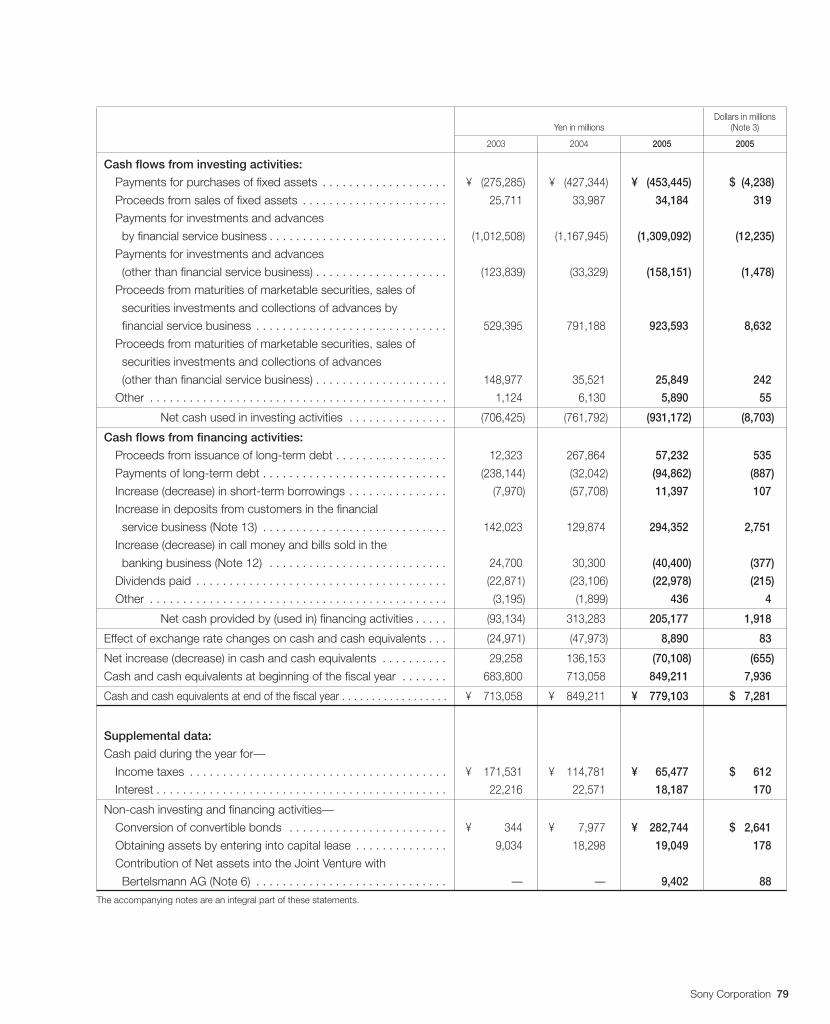
Sony Corporation 79
Dollars in millionsYen in millions (Note 3)
2003 2004 2005 2005
Cash flows from investing activities:
Payments for purchases of fixed assets . . . . . . . . . . . . . . . . . . . ¥ (275,285) ¥ (427,344) ¥ (453,445) $ (4,238)
Proceeds from sales of fixed assets . . . . . . . . . . . . . . . . . . . . . . 25,711 33,987 34,184 319
Payments for investments and advances
by financial service business . . . . . . . . . . . . . . . . . . . . . . . . . . . (1,012,508) (1,167,945) (1,309,092) (12,235)
Payments for investments and advances
(other than financial service business) . . . . . . . . . . . . . . . . . . . . (123,839) (33,329) (158,151) (1,478)
Proceeds from maturities of marketable securities, sales of
securities investments and collections of advances by
financial service business . . . . . . . . . . . . . . . . . . . . . . . . . . . . . 529,395 791,188 923,593 8,632
Proceeds from maturities of marketable securities, sales of
securities investments and collections of advances
(other than financial service business) . . . . . . . . . . . . . . . . . . . . 148,977 35,521 25,849 242
Other . . . . . . . . . . . . . . . . . . . . . . . . . . . . . . . . . . . . . . . . . . . . . 1,124 6,130 5,890 55
Net cash used in investing activities . . . . . . . . . . . . . . . (706,425) (761,792) (931,172) (8,703)
Cash flows from financing activities:
Proceeds from issuance of long-term debt . . . . . . . . . . . . . . . . . 12,323 267,864 57,232 535
Payments of long-term debt . . . . . . . . . . . . . . . . . . . . . . . . . . . . (238,144) (32,042) (94,862) (887)
Increase (decrease) in short-term borrowings . . . . . . . . . . . . . . . (7,970) (57,708) 11,397 107
Increase in deposits from customers in the financial
service business (Note 13) . . . . . . . . . . . . . . . . . . . . . . . . . . . . 142,023 129,874 294,352 2,751
Increase (decrease) in call money and bills sold in the
banking business (Note 12) . . . . . . . . . . . . . . . . . . . . . . . . . . . 24,700 30,300 (40,400) (377)
Dividends paid . . . . . . . . . . . . . . . . . . . . . . . . . . . . . . . . . . . . . . (22,871) (23,106) (22,978) (215)
Other . . . . . . . . . . . . . . . . . . . . . . . . . . . . . . . . . . . . . . . . . . . . . (3,195) (1,899) 436 4
Net cash provided by (used in) financing activities . . . . . (93,134) 313,283 205,177 1,918
Effect of exchange rate changes on cash and cash equivalents . . . (24,971) (47,973) 8,890 83
Net increase (decrease) in cash and cash equivalents . . . . . . . . . . 29,258 136,153 (70,108) (655)
Cash and cash equivalents at beginning of the fiscal year . . . . . . . 683,800 713,058 849,211 7,936
Cash and cash equivalents at end of the fiscal year . . . . . . . . . . . . . . . . . . ¥ 713,058 ¥ 849,211 ¥ 779,103 $ 7,281
Supplemental data:
Cash paid during the year for—
Income taxes . . . . . . . . . . . . . . . . . . . . . . . . . . . . . . . . . . . . . . . ¥ 171,531 ¥ 114,781 ¥ 65,477 $ 612
Interest . . . . . . . . . . . . . . . . . . . . . . . . . . . . . . . . . . . . . . . . . . . . 22,216 22,571 18,187 170
Non-cash investing and financing activities—
Conversion of convertible bonds . . . . . . . . . . . . . . . . . . . . . . . . ¥ 344 ¥ 7,977 ¥ 282,744 $ 2,641
Obtaining assets by entering into capital lease . . . . . . . . . . . . . . 9,034 18,298 19,049 178
Contribution of Net assets into the Joint Venture with
Bertelsmann AG (Note 6) . . . . . . . . . . . . . . . . . . . . . . . . . . . . . — — 9,402 88
The accompanying notes are an integral part of these statements.
BH6/30 05.7.7, 3:33 AMPage 79 Adobe PageMaker 6.0J/PPC
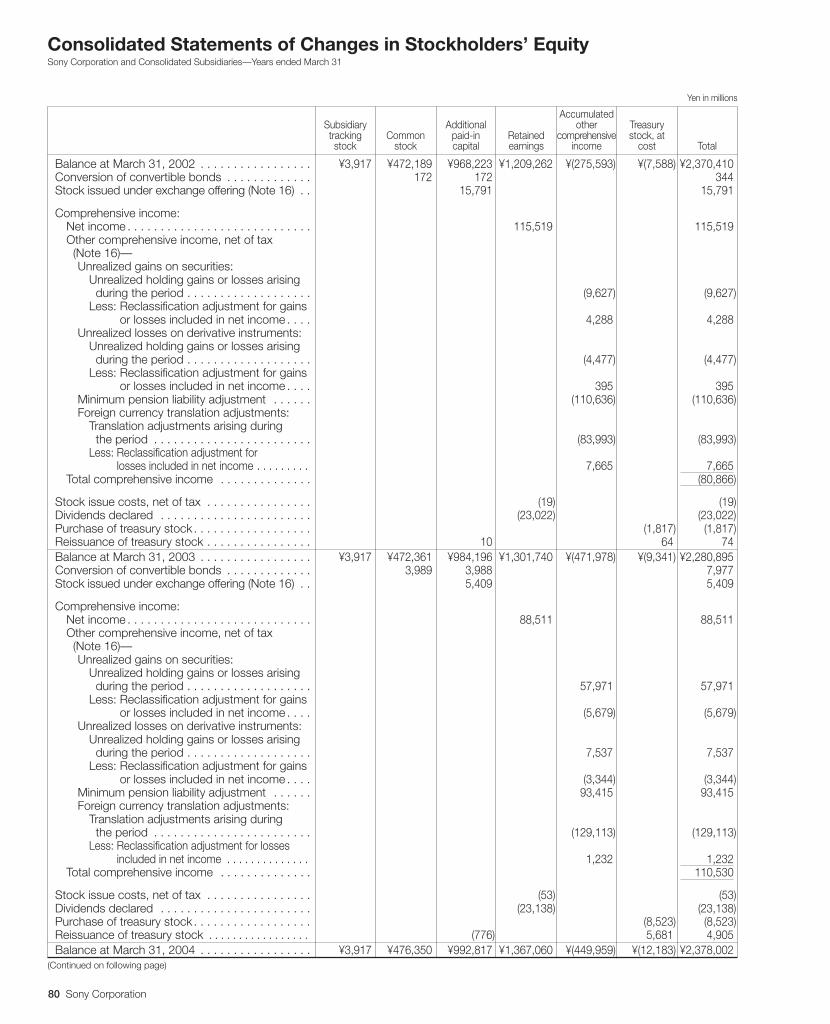
80 Sony Corporation
Consolidated Statements of Changes in Stockholders’ EquitySony Corporation and Consolidated Subsidiaries—Years ended March 31
Yen in millions
AccumulatedSubsidiary Additional other Treasurytracking Common paid-in Retained comprehensive stock, atstock stock capital earnings income cost Total
Balance at March 31, 2002 . . . . . . . . . . . . . . . . . ¥3,917 ¥472,189 ¥968,223 ¥1,209,262 ¥(275,593) ¥(7,588) ¥2,370,410Conversion of convertible bonds . . . . . . . . . . . . . 172 172 344Stock issued under exchange offering (Note 16) . . 15,791 15,791
Comprehensive income:Net income . . . . . . . . . . . . . . . . . . . . . . . . . . . . 115,519 115,519Other comprehensive income, net of tax (Note 16)—
Unrealized gains on securities:Unrealized holding gains or losses arising during the period . . . . . . . . . . . . . . . . . . . (9,627) (9,627)Less: Reclassification adjustment for gainsLess: or losses included in net income . . . . 4,288 4,288
Unrealized losses on derivative instruments:Unrealized holding gains or losses arising during the period . . . . . . . . . . . . . . . . . . . (4,477) (4,477)Less: Reclassification adjustment for gainsLess: or losses included in net income . . . . 395 395
Minimum pension liability adjustment . . . . . . (110,636) (110,636)Foreign currency translation adjustments:
Translation adjustments arising during the period . . . . . . . . . . . . . . . . . . . . . . . . (83,993) (83,993)Less: Reclassification adjustment forLess: losses included in net income . . . . . . . . . 7,665 7,665
Total comprehensive income . . . . . . . . . . . . . . (80,866)
Stock issue costs, net of tax . . . . . . . . . . . . . . . . (19) (19)Dividends declared . . . . . . . . . . . . . . . . . . . . . . . (23,022) (23,022)Purchase of treasury stock . . . . . . . . . . . . . . . . . . (1,817) (1,817)Reissuance of treasury stock . . . . . . . . . . . . . . . . 10 64 74Balance at March 31, 2003 . . . . . . . . . . . . . . . . . ¥3,917 ¥472,361 ¥984,196 ¥1,301,740 ¥(471,978) ¥(9,341) ¥2,280,895Conversion of convertible bonds . . . . . . . . . . . . . 3,989 3,988 7,977Stock issued under exchange offering (Note 16) . . 5,409 5,409
Comprehensive income:Net income . . . . . . . . . . . . . . . . . . . . . . . . . . . . 88,511 88,511Other comprehensive income, net of tax (Note 16)—
Unrealized gains on securities:Unrealized holding gains or losses arising during the period . . . . . . . . . . . . . . . . . . . 57,971 57,971Less: Reclassification adjustment for gainsLess: or losses included in net income . . . . (5,679) (5,679)
Unrealized losses on derivative instruments:Unrealized holding gains or losses arising during the period . . . . . . . . . . . . . . . . . . . 7,537 7,537Less: Reclassification adjustment for gainsLess: or losses included in net income . . . . (3,344) (3,344)
Minimum pension liability adjustment . . . . . . 93,415 93,415Foreign currency translation adjustments:
Translation adjustments arising during the period . . . . . . . . . . . . . . . . . . . . . . . . (129,113) (129,113)Less: Reclassification adjustment for lossesLess: included in net income . . . . . . . . . . . . . . 1,232 1,232
Total comprehensive income . . . . . . . . . . . . . . 110,530
Stock issue costs, net of tax . . . . . . . . . . . . . . . . (53) (53)Dividends declared . . . . . . . . . . . . . . . . . . . . . . . (23,138) (23,138)Purchase of treasury stock . . . . . . . . . . . . . . . . . . (8,523) (8,523)Reissuance of treasury stock . . . . . . . . . . . . . . . . . (776) 5,681 4,905Balance at March 31, 2004 . . . . . . . . . . . . . . . . . ¥3,917 ¥476,350 ¥992,817 ¥1,367,060 ¥(449,959) ¥(12,183) ¥2,378,002
(Continued on following page)
BH6/30 05.7.7, 3:33 AMPage 80 Adobe PageMaker 6.0J/PPC
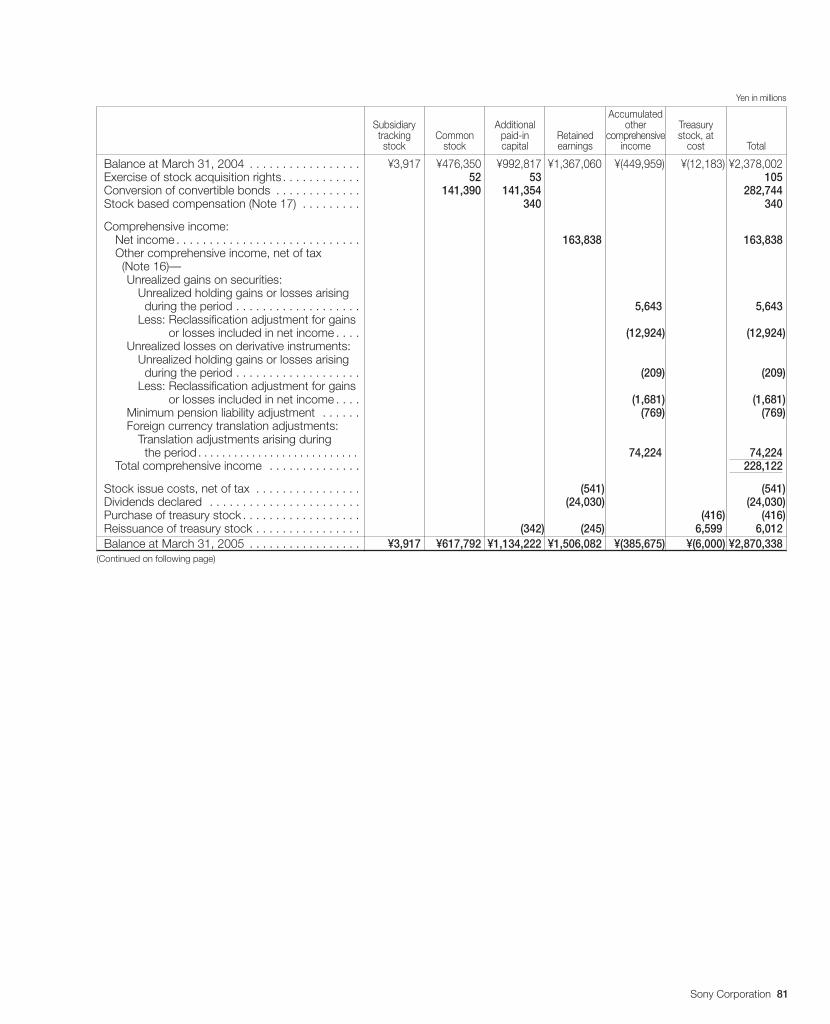
Sony Corporation 81
Yen in millions
AccumulatedSubsidiary Additional other Treasurytracking Common paid-in Retained comprehensive stock, atstock stock capital earnings income cost Total
Balance at March 31, 2004 . . . . . . . . . . . . . . . . . ¥3,917 ¥476,350 ¥992,817 ¥1,367,060 ¥(449,959) ¥(12,183) ¥2,378,002Exercise of stock acquisition rights . . . . . . . . . . . . 52 53 105Conversion of convertible bonds . . . . . . . . . . . . . 141,390 141,354 282,744Stock based compensation (Note 17) . . . . . . . . . 340 340
Comprehensive income:Net income . . . . . . . . . . . . . . . . . . . . . . . . . . . . 163,838 163,838Other comprehensive income, net of tax (Note 16)—
Unrealized gains on securities:Unrealized holding gains or losses arising during the period . . . . . . . . . . . . . . . . . . . 5,643 5,643Less: Reclassification adjustment for gainsLess: or losses included in net income . . . . (12,924) (12,924)
Unrealized losses on derivative instruments:Unrealized holding gains or losses arising during the period . . . . . . . . . . . . . . . . . . . (209) (209)Less: Reclassification adjustment for gainsLess: or losses included in net income . . . . (1,681) (1,681)
Minimum pension liability adjustment . . . . . . (769) (769)Foreign currency translation adjustments:
Translation adjustments arising during the period . . . . . . . . . . . . . . . . . . . . . . . . . . . 74,224 74,224
Total comprehensive income . . . . . . . . . . . . . . 228,122
Stock issue costs, net of tax . . . . . . . . . . . . . . . . (541) (541)Dividends declared . . . . . . . . . . . . . . . . . . . . . . . (24,030) (24,030)Purchase of treasury stock . . . . . . . . . . . . . . . . . . (416) (416)Reissuance of treasury stock . . . . . . . . . . . . . . . . (342) (245) 6,599 6,012Balance at March 31, 2005 . . . . . . . . . . . . . . . . . ¥3,917 ¥617,792 ¥1,134,222 ¥1,506,082 ¥(385,675) ¥(6,000) ¥2,870,338
(Continued on following page)
BH6/30 05.7.7, 3:33 AMPage 81 Adobe PageMaker 6.0J/PPC
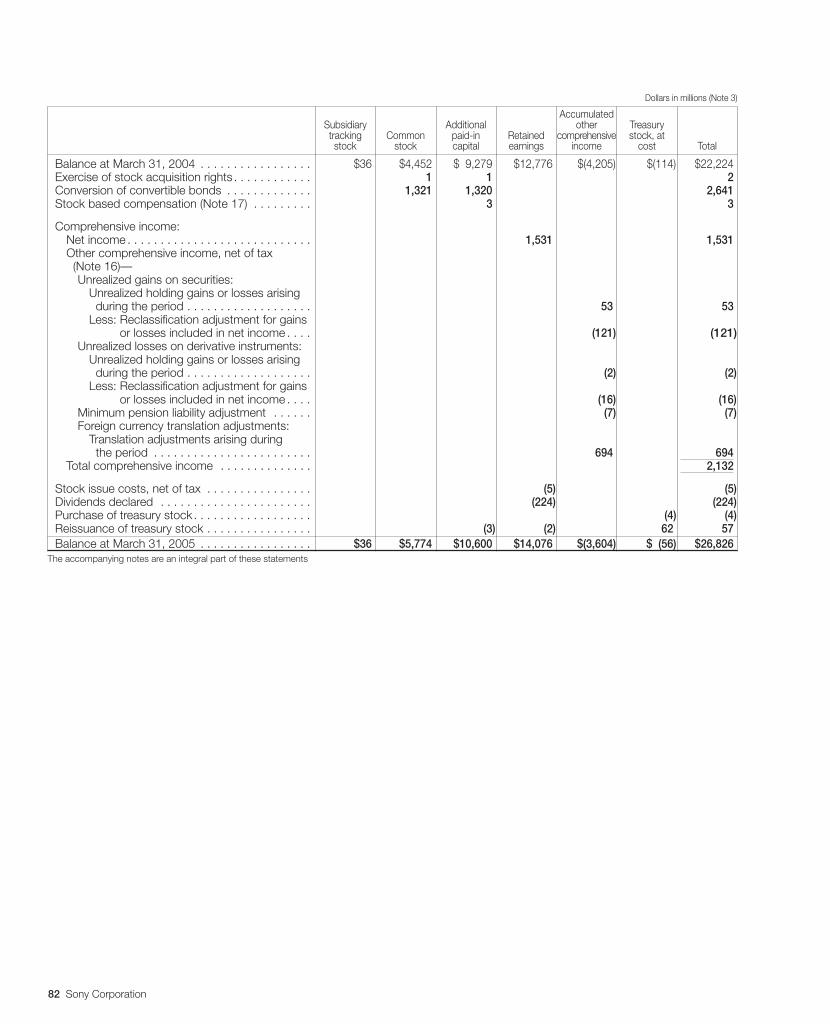
82 Sony Corporation
Dollars in millions (Note 3)
AccumulatedSubsidiary Additional other Treasurytracking Common paid-in Retained comprehensive stock, atstock stock capital earnings income cost Total
Balance at March 31, 2004 . . . . . . . . . . . . . . . . . $36 $4,452 $ 9,279 $12,776 $(4,205) $(114) $22,224Exercise of stock acquisition rights . . . . . . . . . . . . 1 1 2Conversion of convertible bonds . . . . . . . . . . . . . 1,321 1,320 2,641Stock based compensation (Note 17) . . . . . . . . . 3 3
Comprehensive income:Net income . . . . . . . . . . . . . . . . . . . . . . . . . . . . 1,531 1,531Other comprehensive income, net of tax (Note 16)—
Unrealized gains on securities:Unrealized holding gains or losses arising during the period . . . . . . . . . . . . . . . . . . . 53 53Less: Reclassification adjustment for gainsLess: or losses included in net income . . . . (121) (121)
Unrealized losses on derivative instruments:Unrealized holding gains or losses arising during the period . . . . . . . . . . . . . . . . . . . (2) (2)Less: Reclassification adjustment for gainsLess: or losses included in net income . . . . (16) (16)
Minimum pension liability adjustment . . . . . . (7) (7)Foreign currency translation adjustments:
Translation adjustments arising during the period . . . . . . . . . . . . . . . . . . . . . . . . 694 694
Total comprehensive income . . . . . . . . . . . . . . 2,132
Stock issue costs, net of tax . . . . . . . . . . . . . . . . (5) (5)Dividends declared . . . . . . . . . . . . . . . . . . . . . . . (224) (224)Purchase of treasury stock . . . . . . . . . . . . . . . . . . (4) (4)Reissuance of treasury stock . . . . . . . . . . . . . . . . (3) (2) 62 57Balance at March 31, 2005 . . . . . . . . . . . . . . . . . $36 $5,774 $10,600 $14,076 $(3,604) $ (56) $26,826
The accompanying notes are an integral part of these statements
BH6/30 05.7.7, 3:33 AMPage 82 Adobe PageMaker 6.0J/PPC
Sony Corporation 83
Index to Notes to Consolidated Financial Statements
1. Nature of operations . . . . . . . . . . . . . . . . . . . . . . . . . . . . . . . . . . . . . . . . . . . . . . . . . . . . . . . . 84
2. Summary of significant accounting policies . . . . . . . . . . . . . . . . . . . . . . . . . . . . . . . . . . . . . . . 84
3. U.S. dollar amounts . . . . . . . . . . . . . . . . . . . . . . . . . . . . . . . . . . . . . . . . . . . . . . . . . . . . . . . . . 91
4. Inventories . . . . . . . . . . . . . . . . . . . . . . . . . . . . . . . . . . . . . . . . . . . . . . . . . . . . . . . . . . . . . . . . 91
5. Film costs . . . . . . . . . . . . . . . . . . . . . . . . . . . . . . . . . . . . . . . . . . . . . . . . . . . . . . . . . . . . . . . . 91
6. Related party transactions . . . . . . . . . . . . . . . . . . . . . . . . . . . . . . . . . . . . . . . . . . . . . . . . . . . . 92
7. Accounts receivable securitization programs . . . . . . . . . . . . . . . . . . . . . . . . . . . . . . . . . . . . . . 93
8. Marketable securities and securities investments and other . . . . . . . . . . . . . . . . . . . . . . . . . . . 94
9. Leased assets . . . . . . . . . . . . . . . . . . . . . . . . . . . . . . . . . . . . . . . . . . . . . . . . . . . . . . . . . . . . . 95
10. Goodwill and intangible assets . . . . . . . . . . . . . . . . . . . . . . . . . . . . . . . . . . . . . . . . . . . . . . . . . 96
11. Insurance-related accounts . . . . . . . . . . . . . . . . . . . . . . . . . . . . . . . . . . . . . . . . . . . . . . . . . . . 97
12. Short-term borrowings and long-term debt . . . . . . . . . . . . . . . . . . . . . . . . . . . . . . . . . . . . . . . 98
13. Deposits from customers in the banking business . . . . . . . . . . . . . . . . . . . . . . . . . . . . . . . . . 100
14. Financial instruments . . . . . . . . . . . . . . . . . . . . . . . . . . . . . . . . . . . . . . . . . . . . . . . . . . . . . . . 100
15. Pension and severance plans . . . . . . . . . . . . . . . . . . . . . . . . . . . . . . . . . . . . . . . . . . . . . . . . 103
16. Stockholders’ equity . . . . . . . . . . . . . . . . . . . . . . . . . . . . . . . . . . . . . . . . . . . . . . . . . . . . . . . 107
17. Stock-based compensation plans . . . . . . . . . . . . . . . . . . . . . . . . . . . . . . . . . . . . . . . . . . . . . 110
18. Restructuring charges and asset impairments . . . . . . . . . . . . . . . . . . . . . . . . . . . . . . . . . . . . 113
19. Research and development costs, advertising costs and shipping and handling costs . . . . . 116
20. Gain on change in interest in subsidiaries and equity investees . . . . . . . . . . . . . . . . . . . . . . . 116
21. Income taxes . . . . . . . . . . . . . . . . . . . . . . . . . . . . . . . . . . . . . . . . . . . . . . . . . . . . . . . . . . . . . 117
22. Reconciliation of the differences between basic and diluted net income per share (“EPS”) . . . 120
23. Variable interest entities . . . . . . . . . . . . . . . . . . . . . . . . . . . . . . . . . . . . . . . . . . . . . . . . . . . . . 121
24. Commitments and contingent liabilities . . . . . . . . . . . . . . . . . . . . . . . . . . . . . . . . . . . . . . . . . 122
25. Business segment information . . . . . . . . . . . . . . . . . . . . . . . . . . . . . . . . . . . . . . . . . . . . . . . . 123
Notes to Consolidated Financial StatementsSony Corporation and Consolidated Subsidiaries
BH6/30 05.7.7, 3:33 AMPage 83 Adobe PageMaker 6.0J/PPC
84 Sony Corporation
Notes to Consolidated Financial StatementsSony Corporation and Consolidated Subsidiaries
1. Nature of operationsSony Corporation and consolidated subsidiaries (hereinafter
collectively referred to as “Sony”) are engaged in the develop-
ment, design, manufacture, and sale of various kinds of elec-
tronic equipment, instruments, and devices for consumer and
industrial markets. Sony also develops, produces, manufac-
tures, and markets home-use game consoles and software.
Sony’s principal manufacturing facilities are located in Japan, the
United States of America, Europe, and Asia. Its electronic
products are marketed throughout the world and game prod-
ucts are marketed mainly in Japan, the United States of America
and Europe by sales subsidiaries and unaffiliated local distribu-
tors as well as direct sales via the Internet. Sony is engaged in
the development, production, manufacture, marketing, distribu-
tion and broadcasting of image-based software, including film,
video and television product. Sony is also engaged in the devel-
opment, production, manufacture, and distribution of recorded
music, in all commercial formats and music genres. Further,
Sony is engaged in various financial service businesses including
insurance operations through a Japanese life insurance subsid-
iary and non-life insurance subsidiaries, banking operations
through a Japanese internet-based banking subsidiary and
leasing and credit financing operations in Japan. In addition to
the above, Sony is engaged in Internet-related businesses, an
animation production and marketing business, an imported
general merchandise retail business, an IC card business and an
advertising agency business in Japan.
2. Summary of significant accounting policiesSony Corporation and its subsidiaries in Japan maintain their
records and prepare their financial statements in accordance
with accounting principles generally accepted in Japan while its
foreign subsidiaries maintain their records and prepare their
financial statements in conformity with accounting principles
generally accepted in the countries of their domiciles. Certain
adjustments and reclassifications have been incorporated in the
accompanying consolidated financial statements to conform
with accounting principles generally accepted in the United
States of America (“U.S. GAAP”). These adjustments were not
recorded in the statutory books of account.
(1) Newly adopted accounting pronouncements:■ Accounting and reporting by insurance enterprises for
certain nontraditional long-duration contracts and for
separate accounts
In July 2003, the Accounting Standards Executive Committee of
the American Institute of Certified Public Accountants (“AcSEC”)
issued the Statement of Position (“SOP”) 03-1, “Accounting and
Reporting by Insurance Enterprises for Certain Nontraditional
Long-Duration Contracts and for Separate Accounts”. SOP 03-
1 requires insurance enterprises to record additional reserves for
long-duration life insurance contracts with minimum guarantee
or annuity receivable options. Additionally, SOP 03-1 provides
guidance for the presentation of separate accounts. This state-
ment is effective for fiscal years beginning after December 15,
2003. Sony adopted SOP 03-1 on April 1, 2004. As a result of
the adoption of SOP 03-1, Sony’s operating income decreased
by ¥5,156 million ($48 million) for the year ended March 31,
2005. Additionally, on April 1, 2004, Sony recorded a ¥4,713
million ($44 million) charge (net of income taxes of ¥2,675
million) as a cumulative effect of an accounting change. In
addition, the separate account assets, which are defined by
insurance business law in Japan and were previously included in
“Securities investments and other” in the consolidated balance
sheet, were excluded from the category of separate accounts
under the provision of SOP 03-1. Accordingly, the assets previ-
ously treated as separate account assets are now treated within
general account assets (Note 8).
■ The effect of contingently convertible instruments on
diluted earnings per share
In July 2004, the Emerging Issues Task Force (“EITF”) issued
EITF Issue No. 04-8, “The Effect of Contingently Convertible
Instruments on Diluted Earnings per Share”. In accordance with
Statement of Financial Accounting Standards (“FAS’’) No.128,
“Earnings per Share’’, Sony had not previously included in the
computation of diluted earnings per share (“EPS’’) the number of
potential common stock issuable upon the conversion of contin-
gently convertible debt instruments (“Co-Cos’’) that had not met
the conditions to exercise the stock acquisition rights. EITF Issue
No. 04-8 requires that the maximum number of common stock
that could be issued upon the conversion of Co-Cos be in-
cluded in diluted EPS computations from the date of issuance
regardless of whether the conditions to exercise the stock
acquisition rights have been met. EITF Issue No. 04-8 is effec-
tive for reporting periods ending after December 15, 2004. Sony
adopted EITF Issue No. 04-8 during the quarter ended Decem-
ber 31, 2004. As a result of the adoption of EITF Issue No. 04-8,
Sony’s diluted EPS of income before cumulative effect of an
accounting change and net income for the year ended March
31, 2004 were restated respectively. Sony’s diluted EPS of
income before cumulative effect of an accounting change and
net income for the year ended March 31, 2005 were decreased
by ¥7.26 ($0.07) and ¥7.06 ($0.07), respectively, compared to
those before adopting EITF Issue No. 04-8.
BH6/30 05.7.7, 3:33 AMPage 84 Adobe PageMaker 6.0J/PPC
Sony Corporation 85
■ Employers’ disclosures about pensions and other
postretirement benefits
In December 2003, the Financial Accounting Standards Board
(“FASB”) issued FAS No. 132 (revised 2003), “Employers’ Disclo-
sures about Pensions and Other Postretirement Benefits” (“FAS
No. 132(R)”), which revised FAS No. 132, “Employers’ Disclosures
about Pensions and Other Postretirement Benefits”, an amend-
ment of FAS No. 87, “Employers’ Accounting for Pensions”, FAS
No. 88, “Employers’ Accounting for Settlements and Curtailments
of Defined Benefit Pension Plans and for Termination Benefits”,
and FAS No. 106, “Employers’ Accounting for Postretirement
Benefits Other Than Pensions”. FAS No. 132(R) revised employ-
ers’ disclosures about pension plans and other postretirement
benefit plans. It did not change the measurement or recognition of
those plans required by FAS No. 87, 88 and 106. While retaining
the disclosure requirements of FAS No. 132, FAS No. 132(R)
requires additional disclosures about assets, obligations and cash
flows. The provisions of FAS No. 132(R) were generally effective
for financial statements with fiscal years ending after December
15, 2003, excluding the disclosure of certain information about
foreign plans. The information about foreign plans is effective for
fiscal years ending after June 15, 2004. In accordance with FAS
No. 132(R), (Note 15), Pension and severance plans, has been
expanded to include the new disclosures.
■ Consolidation of variable interest entities
In January 2003, the FASB issued FASB Interpretation (“FIN”)
No. 46, “Consolidation of Variable Interest Entities—an Interpre-
tation of ARB No. 51”. FIN No. 46 addresses consolidation by a
primary beneficiary of a variable interest entity (“VIE”). Sony early
adopted the provisions of FIN No. 46 on July 1, 2003. As a
result of adopting the original FIN No. 46, Sony recognized a
one-time charge with no tax effect of ¥2,117 million as a cumu-
lative effect of accounting change in the consolidated statement
of income, and Sony’s assets and liabilities increased by
¥95,255 million and ¥97,950 million, respectively. These in-
creases were treated as non-cash transactions in the consoli-
dated statement of cash flows. In addition, cash and cash
equivalents increased by ¥1,521 million. See Note 23 for further
discussion on the VIEs that are used by Sony.
In December 2003, the FASB issued revised FIN No. 46 (“FIN
No. 46R”), which replaced FIN No. 46. Sony early adopted the
provisions of FIN No. 46R upon its issuance. The adoption of
FIN No. 46R did not have an impact on Sony’s results of opera-
tions and financial position or impact the way Sony had previ-
ously accounted for VIEs.
(2) Significant accounting policies:■ Basis of consolidation and accounting for investments in
affiliated companies
The consolidated financial statements include the accounts of
Sony Corporation and its majority-owned subsidiary companies,
general partnerships in which Sony has a controlling interest,
and variable interest entities for which Sony is the primary
beneficiary. All intercompany transactions and accounts are
eliminated. Investments in business entities in which Sony does
not have control, but has the ability to exercise significant influ-
ence over operating and financial policies generally through 20-
50% ownership, are accounted for under the equity method. In
addition, investments in general partnerships in which Sony
does not have a controlling interest and limited partnerships are
also accounted for under the equity method. Under the equity
method, investments are stated at cost plus/minus Sony’s
equity in undistributed earnings or losses. Consolidated net
income includes Sony’s equity in current earnings or losses of
such companies, after elimination of unrealized intercompany
profits. If the value of an investment has declined and is judged
to be other than temporary, the investment is written down to its
fair value.
On occasion, a consolidated subsidiary or an affiliated com-
pany accounted for by the equity method may issue its shares
to third parties in either a public or private offering or upon
conversion of convertible debt to common stock at amounts per
share in excess of or less than Sony’s average per share carry-
ing value. With respect to such transactions, where the sale of
such shares is not part of a broader corporate reorganization
and the reacquisition of such shares is not contemplated at the
time of issuance, the resulting gains or losses arising from the
change in interest are recorded in income for the year the
change in interest transaction occurs. If the sale of such shares
is part of a broader corporate reorganization, the reacquisition of
such shares is contemplated at the time of issuance or realiza-
tion of such gain is not reasonably assured (i.e., the entity is
newly formed, non-operating, a research and development or
start-up/development stage entity, or where the entity’s ability to
continue in existence is in question), the transaction is ac-
counted for as a capital transaction.
The excess of the cost over the underlying net equity of
investments in consolidated subsidiaries and affiliated compa-
nies accounted for on an equity basis is allocated to identifiable
assets and liabilities based on fair values at the date of acquisi-
tion. The unassigned residual value of the excess of the cost
over the underlying net equity is recognized as goodwill.
■ Use of estimates
The preparation of the consolidated financial statements in
conformity with U.S. GAAP requires management to make
estimates and assumptions that affect the reported amounts of
assets and liabilities and disclosure of contingent assets and
liabilities at the date of the financial statements and the reported
amounts of revenues and expenses during the reporting period.
Actual results could differ from those estimates.
BH6/30 05.7.7, 3:33 AMPage 85 Adobe PageMaker 6.0J/PPC
86 Sony Corporation
■ Translation of foreign currencies
All asset and liability accounts of foreign subsidiaries and affili-
ates are translated into Japanese yen at appropriate year-end
current rates and all income and expense accounts are trans-
lated at rates that approximate those rates prevailing at the time
of the transactions. The resulting translation adjustments are
accumulated as a component of accumulated other compre-
hensive income.
Foreign currency receivables and payables are translated at
appropriate year-end current rates and the resulting translation
gains or losses are taken into income.
■ Cash and cash equivalents
Cash and cash equivalents include all highly liquid investments,
generally with original maturities of three months or less, that are
readily convertible to known amounts of cash and are so near
maturity that they present insignificant risk of changes in value
because of changes in interest rates.
■ Marketable debt and equity securities
Debt and equity securities designated as available-for-sale, whose
fair values are readily determinable, are carried at fair value with
unrealized gains or losses included as a component of accumu-
lated other comprehensive income, net of applicable taxes. Debt
and equity securities classified as trading securities are carried at
fair value with unrealized gains or losses included in income. Debt
securities that are expected to be held-to-maturity are carried at
amortized cost. Individual securities classified as either available-
for-sale or held-to-maturity are reduced to net realizable value by
a charge to income for other than temporary declines in fair value.
Realized gains and losses are determined on the average cost
method and are reflected in income.
■ Equity securities in non-public companies
Equity securities in non-public companies are carried at cost as
fair value is not readily determinable. If the value of a non-public
equity investment is estimated to have declined and such decline
is judged to be other than temporary, Sony recognizes the
impairment of the investment and the carrying value is reduced
to its fair value. Determination of impairment is based on the
consideration of such factors as operating results, business
plans and estimated future cash flows. Fair value is determined
through the use of such methodologies as discounted cash
flows, valuation of recent financings and comparable valuations
of similar companies.
■ Inventories
Inventories in electronics, game and music as well as non-film
inventories for pictures are valued at cost, not in excess of
market, cost being determined on the “average cost” basis
except for the cost of finished products carried by certain
subsidiary companies in electronics which is determined on the
“first-in, first-out” basis.
■ Film costs
Film costs related to theatrical and television product (which
includes direct production costs, production overhead and
acquisition costs) are stated at the lower of unamortized cost or
estimated fair value and classified as non-current assets. Film
costs are amortized, and the estimated liabilities for residuals
and participations are accrued, for an individual product based
on the proportion that current period actual revenues bear to the
estimated remaining total lifetime revenues. These estimates are
reviewed on a periodic basis.
■ Property, plant and equipment and depreciation
Property, plant and equipment are stated at cost. Depreciation
of property, plant and equipment is primarily computed on the
declining-balance method for Sony Corporation and its Japa-
nese subsidiaries, except for certain semiconductor manufactur-
ing facilities whose depreciation is computed on the straight-line
method, and on the straight-line method for its foreign subsidiar-
ies at rates based on estimated useful lives of the assets, princi-
pally, ranging from 15 years up to 50 years for buildings and
from 2 years up to 10 years for machinery and equipment.
Significant renewals and additions are capitalized at cost. Main-
tenance and repairs, and minor renewals and betterments are
charged to income as incurred.
■ Goodwill and other intangible assets
Goodwill and certain other intangible assets that are determined
to have an indefinite life are not amortized and are tested for
impairment on an annual basis and between annual tests if an
event occurs or circumstances change that would more likely
than not reduce the fair value below its carrying amount. Fair
value for those assets is generally determined using a discounted
cash flow analysis.
Intangible assets that are determined not to have an indefinite
life mainly consist of artist contracts, music catalogs, acquired
patent rights and software to be sold, leased or otherwise
marketed. Artist contracts and music catalogs are amortized on
a straight-line basis over a period of up to 40 years. Acquired
patent rights and software to be sold, leased or otherwise mar-
keted are amortized on a straight-line basis over 3 to 10 years.
■ Accounting for computer software to be sold
Sony accounts for software development costs in accordance
with FAS No. 86, “Accounting for the Costs of Computer Soft-
ware to Be Sold, Leased, or Otherwise Marketed”.
In the Electronics segment, costs related to establishing the
technological feasibility of a software product are expensed as
incurred as a part of research and development in cost of sales.
BH6/30 05.7.7, 3:33 AMPage 86 Adobe PageMaker 6.0J/PPC
Sony Corporation 87
Costs that are incurred to produce the finished product after
technological feasibility is established are capitalized and
amortized over the estimated economic life of the product,
which is generally three years. Sony performs periodic reviews
to ensure that unamortized program costs remain recoverable
from future revenue.
In the Game segment, technological feasibility of the underly-
ing software is reached shortly before the products are released
to manufacturing. Costs incurred after technological feasibility is
established are not material, and accordingly, Sony expenses
software development costs for the Game segment as incurred
as a part of research and development in cost of sales.
■ Deferred insurance acquisition costs
Costs that vary with and are primarily related to acquiring new
insurance policies are deferred as long as they are recoverable.
The deferred insurance acquisition costs include such items as
commission, medical examination and inspection report fees.
The deferred insurance acquisition costs for traditional life
insurance contracts are amortized over the premium-paying
period of the related insurance policies using assumptions
consistent with those used in computing policy reserves. The
deferred insurance acquisition costs for non-traditional life
insurance contracts are amortized over the expected life in
proportion to the estimated gross profits.
■ Product warranty
Sony provides for the estimated cost of product warranties at
the time revenue is recognized by either product category group
or individual product. The product warranty is calculated based
upon product sales, estimated probability of failure and esti-
mated cost per claim. The variables used in the calculation of
the provision are reviewed on a periodic basis.
Certain subsidiaries in the Electronics segment offer extended
warranty programs. The consideration received through extended
warranty service is deferred and amortized on a straight-line
basis over the term of the extended warranty.
■ Future insurance policy benefits
Liabilities for future insurance policy benefits are primarily com-
prised of the present value of estimated future payments to
policyholders. These liabilities are computed by the net level
premium method based upon the assumptions such as future
investment yield, morbidity, mortality and withdrawals. These
assumptions are reviewed on a periodic basis. Liabilities for
future insurance policy benefits also include liabilities for guaran-
teed benefits related to certain non-traditional long-duration life
and annuity contracts.
■ Accounting for the impairment of long-lived assets
Sony periodically reviews the carrying value of its long-lived
assets held and used, other than goodwill and intangible assets
with indefinite lives, and assets to be disposed of, whenever
events or changes in circumstances indicated that the carrying
amount may not be recoverable. Long-lived assets to be held
and used are reviewed for impairment by comparing the carrying
value of the assets with their estimated undiscounted future
cash flows. If it is determined that an impairment loss has
occurred, the loss would be recognized during the period. The
impairment loss would be calculated as the difference between
asset carrying value and the present value of estimated net cash
flows or comparable market values, giving consideration to
recent operating performance. Long-lived assets that are to be
disposed of other than by sale are considered held and used
until they are disposed of. Long-lived assets that are to be
disposed of by sale are reported at the lower of their carrying
value or fair value less cost to sell. Reductions in carrying value
are recognized in the period in which the long-lived assets are
classified as held for sale.
■ Derivative financial instruments
All derivatives, including certain derivative financial instruments
embedded in other contracts, are recognized as either assets or
liabilities in the balance sheet at fair value. Changes in the fair
value of derivative financial instruments are either recognized
periodically in income or stockholders’ equity (as a component
of accumulated other comprehensive income), depending on
whether the derivative financial instrument qualifies as a hedge
and the derivative is being used to hedge changes in fair value
or cash flows.
In accordance with FAS No. 133, the derivative financial instru-
ments held by Sony are classified and accounted as below.
Fair value hedges
Changes in the fair value of derivatives designated and effective
as fair value hedges for recognized assets or liabilities or unrecog-
nized firm commitments are recognized in earnings as offsets to
changes in the fair value of the related hedged assets or liabilities.
Cash flow hedges
Changes in the fair value of derivatives designated and effective
as cash flow hedges for forecasted transactions or exposures
associated with recognized assets or liabilities are initially recorded
in other comprehensive income and reclassified into earnings
when the hedged transaction affects earnings. Changes in the
fair value of the ineffective portion are recognized in current
period earnings.
Derivatives not designated as hedges
Changes in the fair value of derivatives that are not designated
as hedges under FAS No. 133 are recognized in current period
earnings.
BH6/30 05.7.7, 3:33 AMPage 87 Adobe PageMaker 6.0J/PPC
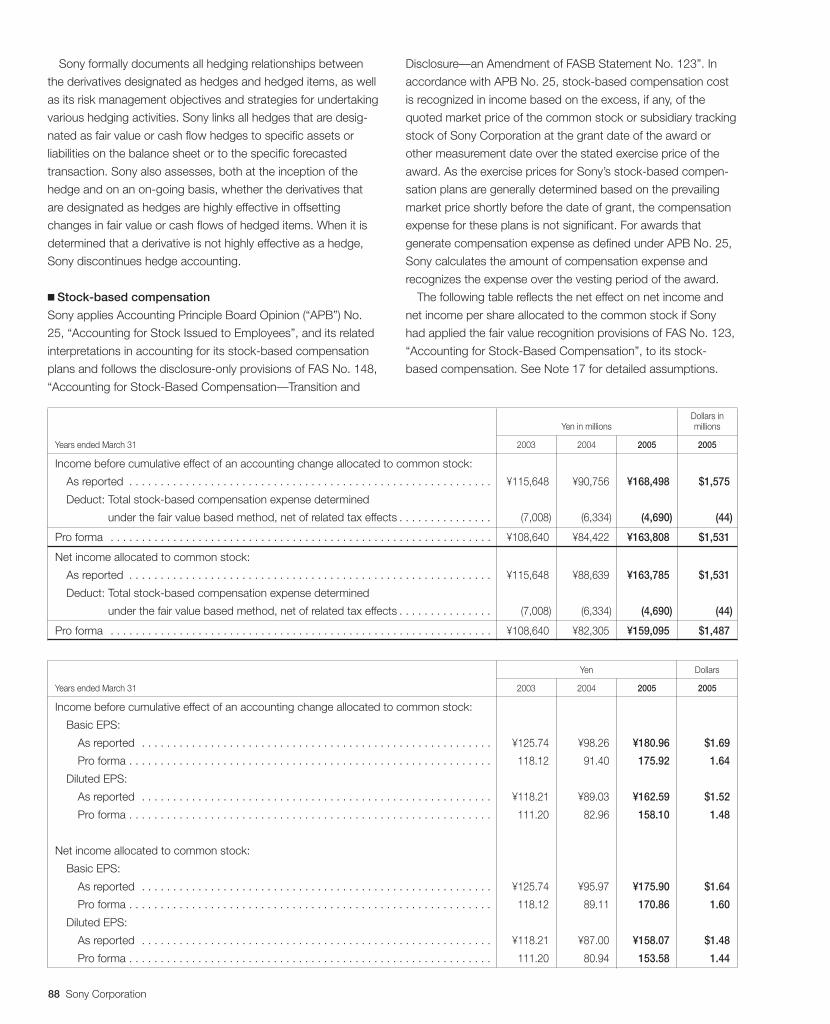
88 Sony Corporation
Dollars inYen in millions millions
Years ended March 31 2003 2004 2005 2005
Income before cumulative effect of an accounting change allocated to common stock:
As reported . . . . . . . . . . . . . . . . . . . . . . . . . . . . . . . . . . . . . . . . . . . . . . . . . . . . . . . . . . ¥115,648 ¥90,756 ¥168,498 $1,575
Deduct: Total stock-based compensation expense determined
Deduct: under the fair value based method, net of related tax effects . . . . . . . . . . . . . . . (7,008) (6,334) (4,690) (44)
Pro forma . . . . . . . . . . . . . . . . . . . . . . . . . . . . . . . . . . . . . . . . . . . . . . . . . . . . . . . . . . . . . ¥108,640 ¥84,422 ¥163,808 $1,531
Net income allocated to common stock:
As reported . . . . . . . . . . . . . . . . . . . . . . . . . . . . . . . . . . . . . . . . . . . . . . . . . . . . . . . . . . ¥115,648 ¥88,639 ¥163,785 $1,531
Deduct: Total stock-based compensation expense determined
Deduct: under the fair value based method, net of related tax effects . . . . . . . . . . . . . . . (7,008) (6,334) (4,690) (44)
Pro forma . . . . . . . . . . . . . . . . . . . . . . . . . . . . . . . . . . . . . . . . . . . . . . . . . . . . . . . . . . . . . ¥108,640 ¥82,305 ¥159,095 $1,487
Yen Dollars
Years ended March 31 2003 2004 2005 2005
Income before cumulative effect of an accounting change allocated to common stock:
Basic EPS:
As reported . . . . . . . . . . . . . . . . . . . . . . . . . . . . . . . . . . . . . . . . . . . . . . . . . . . . . . . . ¥125.74. ¥98.26. ¥180.96. $1.69.
Pro forma . . . . . . . . . . . . . . . . . . . . . . . . . . . . . . . . . . . . . . . . . . . . . . . . . . . . . . . . . . 118.12. 91.40. 175.92. 1.64.
Diluted EPS:
As reported . . . . . . . . . . . . . . . . . . . . . . . . . . . . . . . . . . . . . . . . . . . . . . . . . . . . . . . . ¥118.21. ¥89.03. ¥162.59. $1.52.
Pro forma . . . . . . . . . . . . . . . . . . . . . . . . . . . . . . . . . . . . . . . . . . . . . . . . . . . . . . . . . . 111.20. 82.96. 158.10. 1.48.
Net income allocated to common stock:
Basic EPS:
As reported . . . . . . . . . . . . . . . . . . . . . . . . . . . . . . . . . . . . . . . . . . . . . . . . . . . . . . . . ¥125.74. ¥95.97. ¥175.90. $1.64.
Pro forma . . . . . . . . . . . . . . . . . . . . . . . . . . . . . . . . . . . . . . . . . . . . . . . . . . . . . . . . . . 118.12. 89.11. 170.86. 1.60.
Diluted EPS:
As reported . . . . . . . . . . . . . . . . . . . . . . . . . . . . . . . . . . . . . . . . . . . . . . . . . . . . . . . . ¥118.21. ¥87.00. ¥158.07. $1.48.
Pro forma . . . . . . . . . . . . . . . . . . . . . . . . . . . . . . . . . . . . . . . . . . . . . . . . . . . . . . . . . . 111.20. 80.94. 153.58. 1.44.
Sony formally documents all hedging relationships between
the derivatives designated as hedges and hedged items, as well
as its risk management objectives and strategies for undertaking
various hedging activities. Sony links all hedges that are desig-
nated as fair value or cash flow hedges to specific assets or
liabilities on the balance sheet or to the specific forecasted
transaction. Sony also assesses, both at the inception of the
hedge and on an on-going basis, whether the derivatives that
are designated as hedges are highly effective in offsetting
changes in fair value or cash flows of hedged items. When it is
determined that a derivative is not highly effective as a hedge,
Sony discontinues hedge accounting.
■ Stock-based compensation
Sony applies Accounting Principle Board Opinion (“APB”) No.
25, “Accounting for Stock Issued to Employees”, and its related
interpretations in accounting for its stock-based compensation
plans and follows the disclosure-only provisions of FAS No. 148,
“Accounting for Stock-Based Compensation—Transition and
Disclosure—an Amendment of FASB Statement No. 123”. In
accordance with APB No. 25, stock-based compensation cost
is recognized in income based on the excess, if any, of the
quoted market price of the common stock or subsidiary tracking
stock of Sony Corporation at the grant date of the award or
other measurement date over the stated exercise price of the
award. As the exercise prices for Sony’s stock-based compen-
sation plans are generally determined based on the prevailing
market price shortly before the date of grant, the compensation
expense for these plans is not significant. For awards that
generate compensation expense as defined under APB No. 25,
Sony calculates the amount of compensation expense and
recognizes the expense over the vesting period of the award.
The following table reflects the net effect on net income and
net income per share allocated to the common stock if Sony
had applied the fair value recognition provisions of FAS No. 123,
“Accounting for Stock-Based Compensation”, to its stock-
based compensation. See Note 17 for detailed assumptions.
BH6/30 05.7.7, 3:33 AMPage 88 Adobe PageMaker 6.0J/PPC
Sony Corporation 89
Net income and net income per share allocated to the subsid-
iary tracking stock would not be impacted if Sony had applied
the fair value recognition provisions of FAS No. 123.
As a result of the adoption of EITF Issue No. 04-8, Sony’s
diluted EPS of income before cumulative effect of an accounting
change and net income for the year ended March 31, 2004
were restated in the above table.
■ Free distribution of common stock
On occasion, Sony Corporation may make a free distribution of
common stock which is accounted for either by a transfer from
additional paid-in capital to the common stock account or with
no entry if free shares are distributed from the portion of previously
issued shares in the common stock account.
Under the Japanese Commercial Code, a stock dividend can
be effected by an appropriation of retained earnings to the
common stock account, followed by a free share distribution
with respect to the amount appropriated by resolution of the
Board of Directors’ meeting.
Free distribution of common stock is recorded in the consoli-
dated financial statements only when it becomes effective, except
for the calculation and presentation of per share amounts.
■ Stock issue costs
Stock issue costs are directly charged to retained earnings, net
of tax, in the accompanying consolidated financial statements as
the Japanese Commercial Code prohibits charging such stock
issue costs to capital accounts which is the prevailing practice in
the United States of America.
■ Revenue recognition
Revenues from electronics, game and music sales are recog-
nized upon delivery which is considered to have occurred when
the customer has taken title to the product and the risk and
rewards of ownership have been substantively transferred. If the
sales contract contains a customer acceptance provision, then
sales are recognized after customer acceptance occurs or the
acceptance provisions lapse.
Revenues from the theatrical exhibition of motion pictures are
recognized as the customer exhibits the film. Revenues from the
licensing of feature films and television programming are recorded
when the material is available for telecast by the licensee and
when any restrictions regarding the exhibition or exploitation of the
product lapse. Revenues from the sale of home videocassettes
and DVDs are recognized upon availability of sale to the public.
Traditional life insurance policies that the life insurance subsid-
iary writes, most of which are categorized as long-duration con-
tracts, mainly consist of whole life, term life and accident and
health insurance contracts. Premiums from these policies are
reported as revenue when due from policyholders.
Amounts received as payment for non-traditional contracts
such as interest sensitive whole life contracts, single payment
endowment contracts, single payment juvenile contracts and
other contracts without life contingencies are recognized as
deposits to policyholder account balances and included in future
insurance policy benefits and other. Revenues from these con-
tracts are comprised of fees earned for administrative and
contract-holder services, which are recognized over the period
of the contracts, and included in financial service revenue.
Property and casualty insurance policies that the non-life
insurance subsidiary writes are primarily automotive insurance
contracts which are categorized as short-duration contracts.
Premiums from these policies are reported as revenue over the
period of the contract in proportion to the amount of insurance
protection provided.
■ Accounting for consideration given to a customer or a reseller
In accordance with EITF Issue No. 01-09, “Accounting for Con-
sideration Given by a Vendor to a Customer or Reseller of the
Vendor’s Products”, cash consideration given to a customer or a
reseller including payments for buydowns, slotting fees and coop-
erative advertising programs, is accounted for as a reduction of
revenue unless Sony receives an identifiable benefit (goods or ser-
vices) in exchange for the consideration, can reasonably estimate
the fair value of this benefit and receives documentation from the
reseller to support the amounts spent. Any payments meeting
these criteria are treated as selling, general and administrative
expenses. For the years ended March 31, 2003, 2004 and 2005,
consideration given to a reseller, primarily for free promotional
shipping and cooperative advertising programs included in sell-
ing, general and administrative expense totaled ¥29,135 million,
¥30,338 million and ¥27,946 million ($261 million), respectively.
■ Cost of sales
Costs classified as cost of sales relate to the producing and
manufacturing of products and include such items as material
cost, subcontractor cost, depreciation of fixed assets, personnel
expenses, research and development costs, and amortization of
film cost related to theatrical and television products.
■ Research and development costs
Research and development costs are expensed as incurred.
■ Selling, general and administrative
Costs classified as selling expense relate to the promoting and
selling of products and include such items as advertising,
promotion, shipping, and warranty expenses.
General and administrative expenses include operating items
such as officer’s salaries, personnel expenses, depreciation of
fixed assets, office rental for sales, marketing and administrative
divisions, a provision for doubtful accounts and amortization of
intangible assets.
BH6/30 05.7.7, 3:33 AMPage 89 Adobe PageMaker 6.0J/PPC
90 Sony Corporation
Selling, general and administrative expenses are expensed
as incurred.
■ Financial service expenses
Financial service expenses include a provision for policy reserves
and amortization of deferred insurance acquisition cost, and all
other operating costs such as personnel expenses, depreciation
of fixed assets, and office rental of subsidiaries in the Financial
Services segment.
■ Advertising costs
Advertising costs are expensed when the advertisement or
commercial appears in the selected media, except for advertising
costs for acquiring new insurance policies which are deferred and
amortized as part of insurance acquisition costs.
■ Shipping and handling costs
The majority of shipping and handling, warehousing and internal
transfer costs for finished goods are included in selling, general
and administrative expenses. An exception to this is in the
Pictures segment where such costs are charged to cost of sales
as they are integral part of producing and distributing the film
under SOP 00-2, “Accounting by Producers or Distributors of
Films”. All other costs related to Sony’s distribution network are
included in cost of sales, including inbound freight charges,
purchasing and receiving costs, inspection costs and warehous-
ing costs for raw materials and in-process inventory. In addition,
amounts paid by customers for shipping and handling costs are
included in net sales.
■ Income taxes
The provision for income taxes is computed based on the pretax
income included in the consolidated statements of income. The
asset and liability approach is used to recognize deferred tax
assets and liabilities for the expected future tax consequences
of temporary differences between the carrying amounts and the
tax bases of assets and liabilities. Sony records a valuation
allowances to reduce deferred tax assets to the amount that
management believes is more likely than not to be realized.
In assessing the likelihood of realization, Sony considers all
currently available evidence for future years, both positive and
negative, supplemented by information of historical results for
each tax filling unit.
■ Net income per share
Sony calculates and presents per share data separately for
Sony’s common stock and for the subsidiary tracking stock,
based on FAS No. 128. The holders of the subsidiary tracking
stock have the right to participate in earnings, together with
common stockholders. Accordingly, Sony calculates per share
data by the “two-class” method based on FAS No. 128. Under
this method, basic net income per share (“EPS”) for each class
of stock is calculated based on the earnings allocated to each
class of stock for the applicable period, divided by the weighted-
average number of outstanding shares in each class during the
applicable period.
The earnings allocated to the subsidiary tracking stock are
determined based on the subsidiary tracking stock holders’
economic interest in the targeted subsidiary’s earnings available
for dividends. As defined by Sony Corporation’s articles of
incorporation, the amount distributable to the subsidiary tracking
stock holders is based on the declared dividends of the targeted
subsidiary, which may only be declared from the amounts
available for dividends of the targeted subsidiary. The targeted
subsidiary’s earnings available for dividends are, as stipulated by
the Japanese Commercial Code, not including those of the
targeted subsidiary’s subsidiaries. If the targeted subsidiary has
accumulated losses, a change in accumulated losses is also
allocated to the subsidiary tracking stock. The subsidiary track-
ing stock holders’ economic interest is calculated as the number
of the subsidiary tracking stock outstanding (3,072,000 shares
as of March 31, 2005) divided by the number of the targeted
subsidiary’s common stock outstanding (235,520 shares as of
March 31, 2005), subject to multiplying by the Standard Ratio
(tracking stock : subsidiary’s common stock=1 : 100, as defined
in the articles of incorporation). The earnings allocated to the
common stock are calculated by subtracting the earnings allo-
cated to the subsidiary tracking stock from Sony’s net income
for the period.
The computation of diluted net income per common stock
reflects the maximum possible dilution from conversion, exer-
cise, or contingent issuance of securities including the conver-
sion of Co-Cos regardless of whether the conditions to exercise
the conversion rights have been met.
There are no potentially dilutive securities for net income per
subsidiary tracking stock, as tracking stock shares outstanding
are increased upon potential subsidiary tracking stocks’ being
exercised, which results in a proportionate increase in earnings
allocated to the subsidiary tracking stock. However, they could
have a dilutive effect on net income per common stock, as
earnings allocated to the common stock would be decreased.
(3) Recent pronouncements:■ Accounting for stock-based compensation
In December 2004, the FASB issued FAS No. 123 (revised
2004), “Share-Based Payment” (“FAS No. 123(R)”). This state-
ment requires the use of the fair value based method of account-
ing for employee stock-based compensation and eliminates the
alternative use of the intrinsic value method prescribed by APB
No. 25. With limited exceptions, FAS No. 123(R) requires that
the grant-date fair value of share-based payments to employees
be expensed over the period the service is received. Sony has
BH6/30 05.7.7, 3:33 AMPage 90 Adobe PageMaker 6.0J/PPC
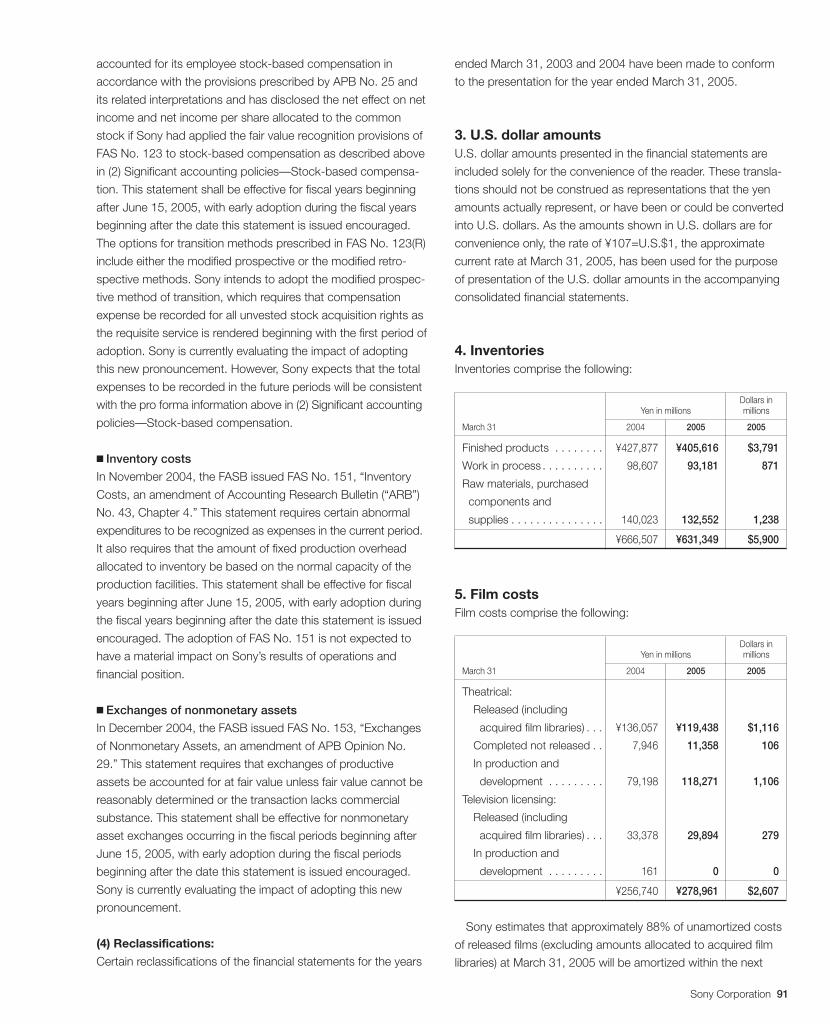
Sony Corporation 91
accounted for its employee stock-based compensation in
accordance with the provisions prescribed by APB No. 25 and
its related interpretations and has disclosed the net effect on net
income and net income per share allocated to the common
stock if Sony had applied the fair value recognition provisions of
FAS No. 123 to stock-based compensation as described above
in (2) Significant accounting policies—Stock-based compensa-
tion. This statement shall be effective for fiscal years beginning
after June 15, 2005, with early adoption during the fiscal years
beginning after the date this statement is issued encouraged.
The options for transition methods prescribed in FAS No. 123(R)
include either the modified prospective or the modified retro-
spective methods. Sony intends to adopt the modified prospec-
tive method of transition, which requires that compensation
expense be recorded for all unvested stock acquisition rights as
the requisite service is rendered beginning with the first period of
adoption. Sony is currently evaluating the impact of adopting
this new pronouncement. However, Sony expects that the total
expenses to be recorded in the future periods will be consistent
with the pro forma information above in (2) Significant accounting
policies—Stock-based compensation.
■ Inventory costs
In November 2004, the FASB issued FAS No. 151, “Inventory
Costs, an amendment of Accounting Research Bulletin (“ARB”)
No. 43, Chapter 4.” This statement requires certain abnormal
expenditures to be recognized as expenses in the current period.
It also requires that the amount of fixed production overhead
allocated to inventory be based on the normal capacity of the
production facilities. This statement shall be effective for fiscal
years beginning after June 15, 2005, with early adoption during
the fiscal years beginning after the date this statement is issued
encouraged. The adoption of FAS No. 151 is not expected to
have a material impact on Sony’s results of operations and
financial position.
■ Exchanges of nonmonetary assets
In December 2004, the FASB issued FAS No. 153, “Exchanges
of Nonmonetary Assets, an amendment of APB Opinion No.
29.” This statement requires that exchanges of productive
assets be accounted for at fair value unless fair value cannot be
reasonably determined or the transaction lacks commercial
substance. This statement shall be effective for nonmonetary
asset exchanges occurring in the fiscal periods beginning after
June 15, 2005, with early adoption during the fiscal periods
beginning after the date this statement is issued encouraged.
Sony is currently evaluating the impact of adopting this new
pronouncement.
(4) Reclassifications:
Certain reclassifications of the financial statements for the years
ended March 31, 2003 and 2004 have been made to conform
to the presentation for the year ended March 31, 2005.
3. U.S. dollar amountsU.S. dollar amounts presented in the financial statements are
included solely for the convenience of the reader. These transla-
tions should not be construed as representations that the yen
amounts actually represent, or have been or could be converted
into U.S. dollars. As the amounts shown in U.S. dollars are for
convenience only, the rate of ¥107=U.S.$1, the approximate
current rate at March 31, 2005, has been used for the purpose
of presentation of the U.S. dollar amounts in the accompanying
consolidated financial statements.
4. InventoriesInventories comprise the following:
Dollars inYen in millions millions
March 31 2004 2005 2005
Finished products . . . . . . . . ¥427,877 ¥405,616 $3,791
Work in process . . . . . . . . . . 98,607 93,181 871
Raw materials, purchased
components and
supplies . . . . . . . . . . . . . . . 140,023 132,552 1,238
. . . . . . . . . . . . . . . . . . . . ¥666,507 ¥631,349 $5,900
5. Film costsFilm costs comprise the following:
Dollars inYen in millions millions
March 31 2004 2005 2005
Theatrical:
Released (including
acquired film libraries) . . . ¥136,057 ¥119,438 $1,116
Completed not released . . 7,946 11,358 106
In production and
development . . . . . . . . . 79,198 118,271 1,106
Television licensing:
Released (including
acquired film libraries) . . . 33,378 29,894 279
In production and
development . . . . . . . . . 161 0 0
. . . . . . . . . . . . . . . . . . . . ¥256,740 ¥278,961 $2,607
Sony estimates that approximately 88% of unamortized costs
of released films (excluding amounts allocated to acquired film
libraries) at March 31, 2005 will be amortized within the next
BH6/30 05.7.7, 3:33 AMPage 91 Adobe PageMaker 6.0J/PPC
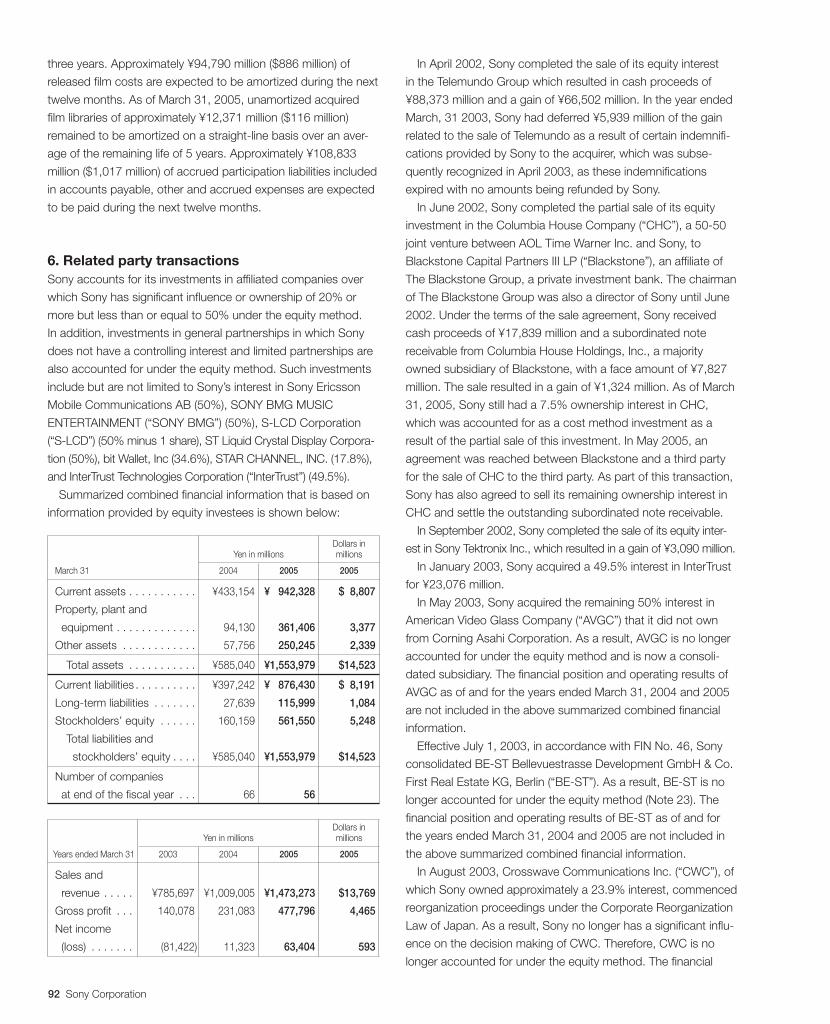
92 Sony Corporation
three years. Approximately ¥94,790 million ($886 million) of
released film costs are expected to be amortized during the next
twelve months. As of March 31, 2005, unamortized acquired
film libraries of approximately ¥12,371 million ($116 million)
remained to be amortized on a straight-line basis over an aver-
age of the remaining life of 5 years. Approximately ¥108,833
million ($1,017 million) of accrued participation liabilities included
in accounts payable, other and accrued expenses are expected
to be paid during the next twelve months.
6. Related party transactionsSony accounts for its investments in affiliated companies over
which Sony has significant influence or ownership of 20% or
more but less than or equal to 50% under the equity method.
In addition, investments in general partnerships in which Sony
does not have a controlling interest and limited partnerships are
also accounted for under the equity method. Such investments
include but are not limited to Sony’s interest in Sony Ericsson
Mobile Communications AB (50%), SONY BMG MUSIC
ENTERTAINMENT (“SONY BMG”) (50%), S-LCD Corporation
(“S-LCD”) (50% minus 1 share), ST Liquid Crystal Display Corpora-
tion (50%), bit Wallet, Inc (34.6%), STAR CHANNEL, INC. (17.8%),
and InterTrust Technologies Corporation (“InterTrust”) (49.5%).
Summarized combined financial information that is based on
information provided by equity investees is shown below:
Dollars inYen in millions millions
March 31 2004 2005 2005
Current assets . . . . . . . . . . . ¥433,154 ¥0,942,328 $08,807
Property, plant and
equipment . . . . . . . . . . . . . 94,130 361,406 3,377
Other assets . . . . . . . . . . . . 57,756 250,245 2,339
Total assets . . . . . . . . . . . ¥585,040 ¥1,553,979 $14,523
Current liabilities . . . . . . . . . . ¥397,242 ¥0,876,430 $08,191
Long-term liabilities . . . . . . . 27,639 115,999 1,084
Stockholders’ equity . . . . . . 160,159 561,550 5,248
Total liabilities and
stockholders’ equity . . . . ¥585,040 ¥1,553,979 $14,523
Number of companies
at end of the fiscal year . . . 66 56
Dollars inYen in millions millions
Years ended March 31 2003 2004 2005 2005
Sales and
revenue . . . . . ¥785,697 ¥1,009,005 ¥1,473,273 $13,769
Gross profit . . . 140,078 231,083 477,796 4,465
Net income
(loss) . . . . . . . (81,422) 11,323 63,404 593
In April 2002, Sony completed the sale of its equity interest
in the Telemundo Group which resulted in cash proceeds of
¥88,373 million and a gain of ¥66,502 million. In the year ended
March, 31 2003, Sony had deferred ¥5,939 million of the gain
related to the sale of Telemundo as a result of certain indemnifi-
cations provided by Sony to the acquirer, which was subse-
quently recognized in April 2003, as these indemnifications
expired with no amounts being refunded by Sony.
In June 2002, Sony completed the partial sale of its equity
investment in the Columbia House Company (“CHC”), a 50-50
joint venture between AOL Time Warner Inc. and Sony, to
Blackstone Capital Partners III LP (“Blackstone”), an affiliate of
The Blackstone Group, a private investment bank. The chairman
of The Blackstone Group was also a director of Sony until June
2002. Under the terms of the sale agreement, Sony received
cash proceeds of ¥17,839 million and a subordinated note
receivable from Columbia House Holdings, Inc., a majority
owned subsidiary of Blackstone, with a face amount of ¥7,827
million. The sale resulted in a gain of ¥1,324 million. As of March
31, 2005, Sony still had a 7.5% ownership interest in CHC,
which was accounted for as a cost method investment as a
result of the partial sale of this investment. In May 2005, an
agreement was reached between Blackstone and a third party
for the sale of CHC to the third party. As part of this transaction,
Sony has also agreed to sell its remaining ownership interest in
CHC and settle the outstanding subordinated note receivable.
In September 2002, Sony completed the sale of its equity inter-
est in Sony Tektronix Inc., which resulted in a gain of ¥3,090 million.
In January 2003, Sony acquired a 49.5% interest in InterTrust
for ¥23,076 million.
In May 2003, Sony acquired the remaining 50% interest in
American Video Glass Company (“AVGC”) that it did not own
from Corning Asahi Corporation. As a result, AVGC is no longer
accounted for under the equity method and is now a consoli-
dated subsidiary. The financial position and operating results of
AVGC as of and for the years ended March 31, 2004 and 2005
are not included in the above summarized combined financial
information.
Effective July 1, 2003, in accordance with FIN No. 46, Sony
consolidated BE-ST Bellevuestrasse Development GmbH & Co.
First Real Estate KG, Berlin (“BE-ST”). As a result, BE-ST is no
longer accounted for under the equity method (Note 23). The
financial position and operating results of BE-ST as of and for
the years ended March 31, 2004 and 2005 are not included in
the above summarized combined financial information.
In August 2003, Crosswave Communications Inc. (“CWC”), of
which Sony owned approximately a 23.9% interest, commenced
reorganization proceedings under the Corporate Reorganization
Law of Japan. As a result, Sony no longer has a significant influ-
ence on the decision making of CWC. Therefore, CWC is no
longer accounted for under the equity method. The financial
BH6/30 05.7.7, 3:33 AMPage 92 Adobe PageMaker 6.0J/PPC
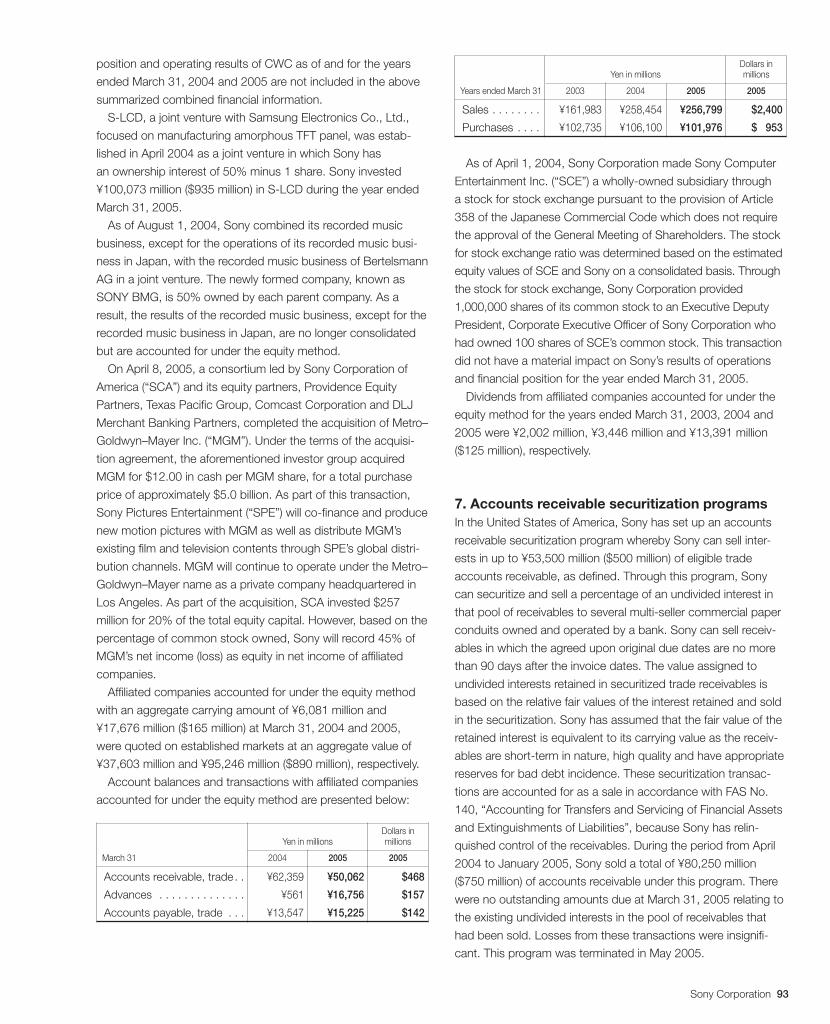
Sony Corporation 93
position and operating results of CWC as of and for the years
ended March 31, 2004 and 2005 are not included in the above
summarized combined financial information.
S-LCD, a joint venture with Samsung Electronics Co., Ltd.,
focused on manufacturing amorphous TFT panel, was estab-
lished in April 2004 as a joint venture in which Sony has
an ownership interest of 50% minus 1 share. Sony invested
¥100,073 million ($935 million) in S-LCD during the year ended
March 31, 2005.
As of August 1, 2004, Sony combined its recorded music
business, except for the operations of its recorded music busi-
ness in Japan, with the recorded music business of Bertelsmann
AG in a joint venture. The newly formed company, known as
SONY BMG, is 50% owned by each parent company. As a
result, the results of the recorded music business, except for the
recorded music business in Japan, are no longer consolidated
but are accounted for under the equity method.
On April 8, 2005, a consortium led by Sony Corporation of
America (“SCA”) and its equity partners, Providence Equity
Partners, Texas Pacific Group, Comcast Corporation and DLJ
Merchant Banking Partners, completed the acquisition of Metro–
Goldwyn–Mayer Inc. (“MGM”). Under the terms of the acquisi-
tion agreement, the aforementioned investor group acquired
MGM for $12.00 in cash per MGM share, for a total purchase
price of approximately $5.0 billion. As part of this transaction,
Sony Pictures Entertainment (“SPE”) will co-finance and produce
new motion pictures with MGM as well as distribute MGM’s
existing film and television contents through SPE’s global distri-
bution channels. MGM will continue to operate under the Metro–
Goldwyn–Mayer name as a private company headquartered in
Los Angeles. As part of the acquisition, SCA invested $257
million for 20% of the total equity capital. However, based on the
percentage of common stock owned, Sony will record 45% of
MGM’s net income (loss) as equity in net income of affiliated
companies.
Affiliated companies accounted for under the equity method
with an aggregate carrying amount of ¥6,081 million and
¥17,676 million ($165 million) at March 31, 2004 and 2005,
were quoted on established markets at an aggregate value of
¥37,603 million and ¥95,246 million ($890 million), respectively.
Account balances and transactions with affiliated companies
accounted for under the equity method are presented below:
Dollars inYen in millions millions
March 31 2004 2005 2005
Accounts receivable, trade . . ¥62,359 ¥50,062 $468
Advances . . . . . . . . . . . . . . ¥561 ¥16,756 $157
Accounts payable, trade . . . ¥13,547 ¥15,225 $142
Dollars inYen in millions millions
Years ended March 31 2003 2004 2005 2005
Sales . . . . . . . . ¥161,983 ¥258,454 ¥256,799 $2,400
Purchases . . . . ¥102,735 ¥106,100 ¥101,976 $ 953
As of April 1, 2004, Sony Corporation made Sony Computer
Entertainment Inc. (“SCE”) a wholly-owned subsidiary through
a stock for stock exchange pursuant to the provision of Article
358 of the Japanese Commercial Code which does not require
the approval of the General Meeting of Shareholders. The stock
for stock exchange ratio was determined based on the estimated
equity values of SCE and Sony on a consolidated basis. Through
the stock for stock exchange, Sony Corporation provided
1,000,000 shares of its common stock to an Executive Deputy
President, Corporate Executive Officer of Sony Corporation who
had owned 100 shares of SCE’s common stock. This transaction
did not have a material impact on Sony’s results of operations
and financial position for the year ended March 31, 2005.
Dividends from affiliated companies accounted for under the
equity method for the years ended March 31, 2003, 2004 and
2005 were ¥2,002 million, ¥3,446 million and ¥13,391 million
($125 million), respectively.
7. Accounts receivable securitization programsIn the United States of America, Sony has set up an accounts
receivable securitization program whereby Sony can sell inter-
ests in up to ¥53,500 million ($500 million) of eligible trade
accounts receivable, as defined. Through this program, Sony
can securitize and sell a percentage of an undivided interest in
that pool of receivables to several multi-seller commercial paper
conduits owned and operated by a bank. Sony can sell receiv-
ables in which the agreed upon original due dates are no more
than 90 days after the invoice dates. The value assigned to
undivided interests retained in securitized trade receivables is
based on the relative fair values of the interest retained and sold
in the securitization. Sony has assumed that the fair value of the
retained interest is equivalent to its carrying value as the receiv-
ables are short-term in nature, high quality and have appropriate
reserves for bad debt incidence. These securitization transac-
tions are accounted for as a sale in accordance with FAS No.
140, “Accounting for Transfers and Servicing of Financial Assets
and Extinguishments of Liabilities”, because Sony has relin-
quished control of the receivables. During the period from April
2004 to January 2005, Sony sold a total of ¥80,250 million
($750 million) of accounts receivable under this program. There
were no outstanding amounts due at March 31, 2005 relating to
the existing undivided interests in the pool of receivables that
had been sold. Losses from these transactions were insignifi-
cant. This program was terminated in May 2005.
BH6/30 05.7.7, 3:33 AMPage 93 Adobe PageMaker 6.0J/PPC
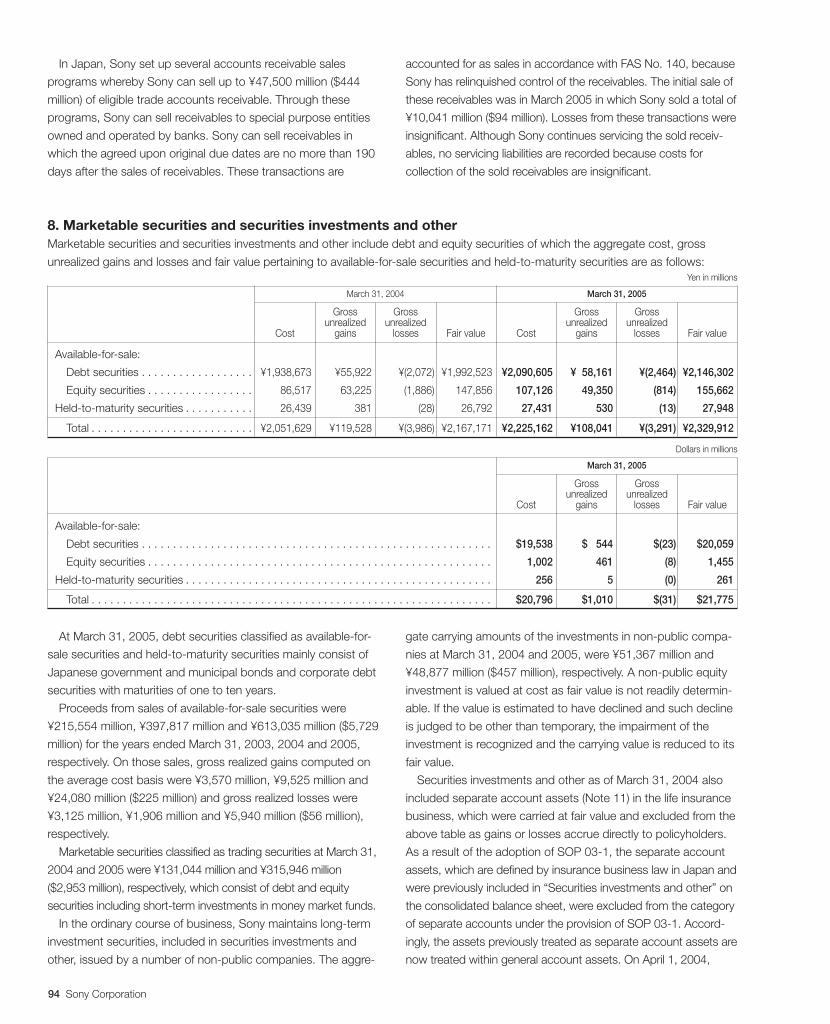
94 Sony Corporation
8. Marketable securities and securities investments and otherMarketable securities and securities investments and other include debt and equity securities of which the aggregate cost, gross
unrealized gains and losses and fair value pertaining to available-for-sale securities and held-to-maturity securities are as follows:Yen in millions
March 31, 2004 March 31, 2005
Gross Gross Gross Grossunrealized unrealized unrealized unrealized
Cost gains losses Fair value Cost gains losses Fair value
Available-for-sale:
Debt securities . . . . . . . . . . . . . . . . . . ¥1,938,673 ¥55,922 ¥(2,072) ¥1,992,523 ¥2,090,605 ¥ 58,161 ¥(2,464) ¥2,146,302
Equity securities . . . . . . . . . . . . . . . . . 86,517 63,225 (1,886) 147,856 107,126 49,350 (814) 155,662
Held-to-maturity securities . . . . . . . . . . . 26,439 381 (28) 26,792 27,431 530 (13) 27,948
Total . . . . . . . . . . . . . . . . . . . . . . . . . . ¥2,051,629 ¥119,528 ¥(3,986) ¥2,167,171 ¥2,225,162 ¥108,041 ¥(3,291) ¥2,329,912
Dollars in millions
March 31, 2005
Gross Grossunrealized unrealized
Cost gains losses Fair value
Available-for-sale:
Debt securities . . . . . . . . . . . . . . . . . . . . . . . . . . . . . . . . . . . . . . . . . . . . . . . . . . . . . . . . $19,538 $ 544 $(23) $20,059
Equity securities . . . . . . . . . . . . . . . . . . . . . . . . . . . . . . . . . . . . . . . . . . . . . . . . . . . . . . . 1,002 461 (8) 1,455
Held-to-maturity securities . . . . . . . . . . . . . . . . . . . . . . . . . . . . . . . . . . . . . . . . . . . . . . . . . 256 5 (0) 261
Total . . . . . . . . . . . . . . . . . . . . . . . . . . . . . . . . . . . . . . . . . . . . . . . . . . . . . . . . . . . . . . . . $20,796 $1,010 $(31) $21,775
In Japan, Sony set up several accounts receivable sales
programs whereby Sony can sell up to ¥47,500 million ($444
million) of eligible trade accounts receivable. Through these
programs, Sony can sell receivables to special purpose entities
owned and operated by banks. Sony can sell receivables in
which the agreed upon original due dates are no more than 190
days after the sales of receivables. These transactions are
accounted for as sales in accordance with FAS No. 140, because
Sony has relinquished control of the receivables. The initial sale of
these receivables was in March 2005 in which Sony sold a total of
¥10,041 million ($94 million). Losses from these transactions were
insignificant. Although Sony continues servicing the sold receiv-
ables, no servicing liabilities are recorded because costs for
collection of the sold receivables are insignificant.
At March 31, 2005, debt securities classified as available-for-
sale securities and held-to-maturity securities mainly consist of
Japanese government and municipal bonds and corporate debt
securities with maturities of one to ten years.
Proceeds from sales of available-for-sale securities were
¥215,554 million, ¥397,817 million and ¥613,035 million ($5,729
million) for the years ended March 31, 2003, 2004 and 2005,
respectively. On those sales, gross realized gains computed on
the average cost basis were ¥3,570 million, ¥9,525 million and
¥24,080 million ($225 million) and gross realized losses were
¥3,125 million, ¥1,906 million and ¥5,940 million ($56 million),
respectively.
Marketable securities classified as trading securities at March 31,
2004 and 2005 were ¥131,044 million and ¥315,946 million
($2,953 million), respectively, which consist of debt and equity
securities including short-term investments in money market funds.
In the ordinary course of business, Sony maintains long-term
investment securities, included in securities investments and
other, issued by a number of non-public companies. The aggre-
gate carrying amounts of the investments in non-public compa-
nies at March 31, 2004 and 2005, were ¥51,367 million and
¥48,877 million ($457 million), respectively. A non-public equity
investment is valued at cost as fair value is not readily determin-
able. If the value is estimated to have declined and such decline
is judged to be other than temporary, the impairment of the
investment is recognized and the carrying value is reduced to its
fair value.
Securities investments and other as of March 31, 2004 also
included separate account assets (Note 11) in the life insurance
business, which were carried at fair value and excluded from the
above table as gains or losses accrue directly to policyholders.
As a result of the adoption of SOP 03-1, the separate account
assets, which are defined by insurance business law in Japan and
were previously included in “Securities investments and other” on
the consolidated balance sheet, were excluded from the category
of separate accounts under the provision of SOP 03-1. Accord-
ingly, the assets previously treated as separate account assets are
now treated within general account assets. On April 1, 2004,
BH6/30 05.7.7, 3:33 AMPage 94 Adobe PageMaker 6.0J/PPC
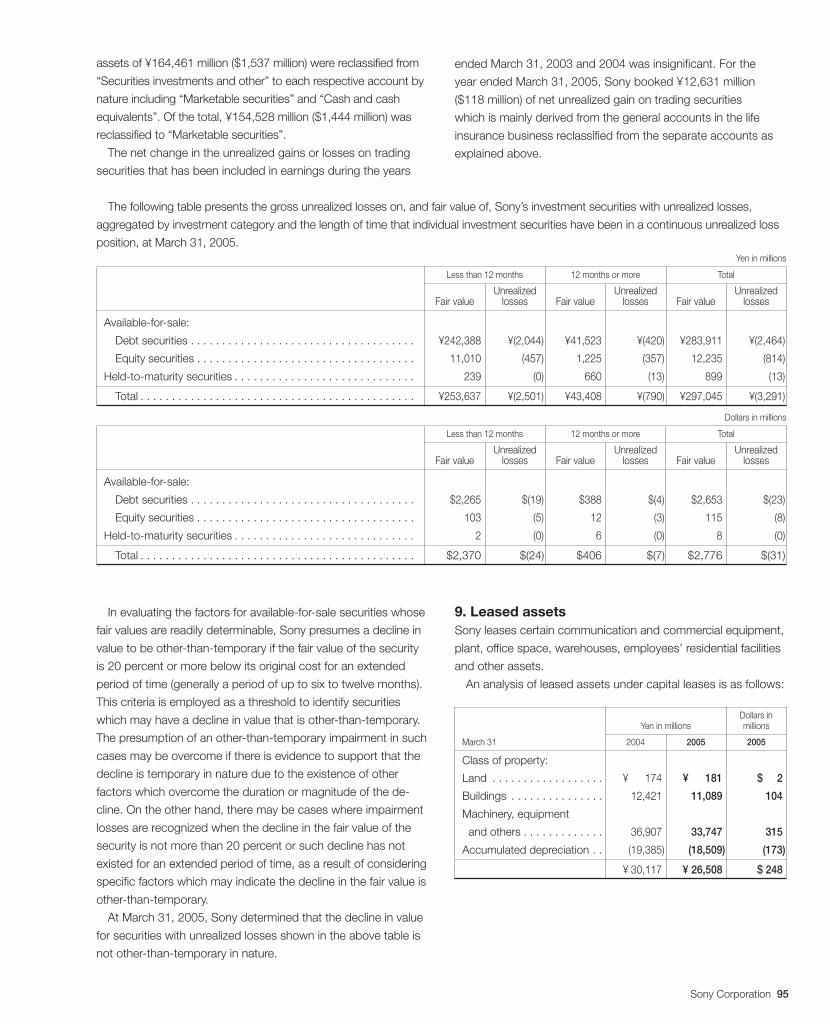
Sony Corporation 95
ended March 31, 2003 and 2004 was insignificant. For the
year ended March 31, 2005, Sony booked ¥12,631 million
($118 million) of net unrealized gain on trading securities
which is mainly derived from the general accounts in the life
insurance business reclassified from the separate accounts as
explained above.
assets of ¥164,461 million ($1,537 million) were reclassified from
“Securities investments and other” to each respective account by
nature including “Marketable securities” and “Cash and cash
equivalents”. Of the total, ¥154,528 million ($1,444 million) was
reclassified to “Marketable securities”.
The net change in the unrealized gains or losses on trading
securities that has been included in earnings during the years
The following table presents the gross unrealized losses on, and fair value of, Sony’s investment securities with unrealized losses,
aggregated by investment category and the length of time that individual investment securities have been in a continuous unrealized loss
position, at March 31, 2005.Yen in millions
Less than 12 months 12 months or more Total
Unrealized Unrealized UnrealizedFair value losses Fair value losses Fair value losses
Available-for-sale:
Debt securities . . . . . . . . . . . . . . . . . . . . . . . . . . . . . . . . . . . . ¥242,388 ¥(2,044) ¥41,523 ¥(420) ¥283,911 ¥(2,464)
Equity securities . . . . . . . . . . . . . . . . . . . . . . . . . . . . . . . . . . . 11,010 (457) 1,225 (357) 12,235 (814)
Held-to-maturity securities . . . . . . . . . . . . . . . . . . . . . . . . . . . . . 239 (0) 660 (13) 899 (13)
Total . . . . . . . . . . . . . . . . . . . . . . . . . . . . . . . . . . . . . . . . . . . . ¥253,637 ¥(2,501) ¥43,408 ¥(790) ¥297,045 ¥(3,291)
Dollars in millions
Less than 12 months 12 months or more Total
Unrealized Unrealized UnrealizedFair value losses Fair value losses Fair value losses
Available-for-sale:
Debt securities . . . . . . . . . . . . . . . . . . . . . . . . . . . . . . . . . . . . $2,265 $(19) $388 $(4) $2,653 $(23)
Equity securities . . . . . . . . . . . . . . . . . . . . . . . . . . . . . . . . . . . 103 (5) 12 (3) 115 (8)
Held-to-maturity securities . . . . . . . . . . . . . . . . . . . . . . . . . . . . . 2 (0) 6 (0) 8 (0)
Total . . . . . . . . . . . . . . . . . . . . . . . . . . . . . . . . . . . . . . . . . . . . $2,370 $(24) $406 $(7) $2,776 $(31)
In evaluating the factors for available-for-sale securities whose
fair values are readily determinable, Sony presumes a decline in
value to be other-than-temporary if the fair value of the security
is 20 percent or more below its original cost for an extended
period of time (generally a period of up to six to twelve months).
This criteria is employed as a threshold to identify securities
which may have a decline in value that is other-than-temporary.
The presumption of an other-than-temporary impairment in such
cases may be overcome if there is evidence to support that the
decline is temporary in nature due to the existence of other
factors which overcome the duration or magnitude of the de-
cline. On the other hand, there may be cases where impairment
losses are recognized when the decline in the fair value of the
security is not more than 20 percent or such decline has not
existed for an extended period of time, as a result of considering
specific factors which may indicate the decline in the fair value is
other-than-temporary.
At March 31, 2005, Sony determined that the decline in value
for securities with unrealized losses shown in the above table is
not other-than-temporary in nature.
9. Leased assetsSony leases certain communication and commercial equipment,
plant, office space, warehouses, employees’ residential facilities
and other assets.
An analysis of leased assets under capital leases is as follows:
Dollars inYen in millions millions
March 31 2004 2005 2005
Class of property:
Land . . . . . . . . . . . . . . . . . . ¥(00,174 ¥(00,181 $(002
Buildings . . . . . . . . . . . . . . . 12,421 11,089 104
Machinery, equipment
and others . . . . . . . . . . . . . 36,907 33,747 315
Accumulated depreciation . . (19,385) (18,509) (173)
. . . . . . . . . . . . . . . . . . . . ¥(30,117 ¥(26,508 $(248
BH6/30 05.7.7, 3:33 AMPage 95 Adobe PageMaker 6.0J/PPC
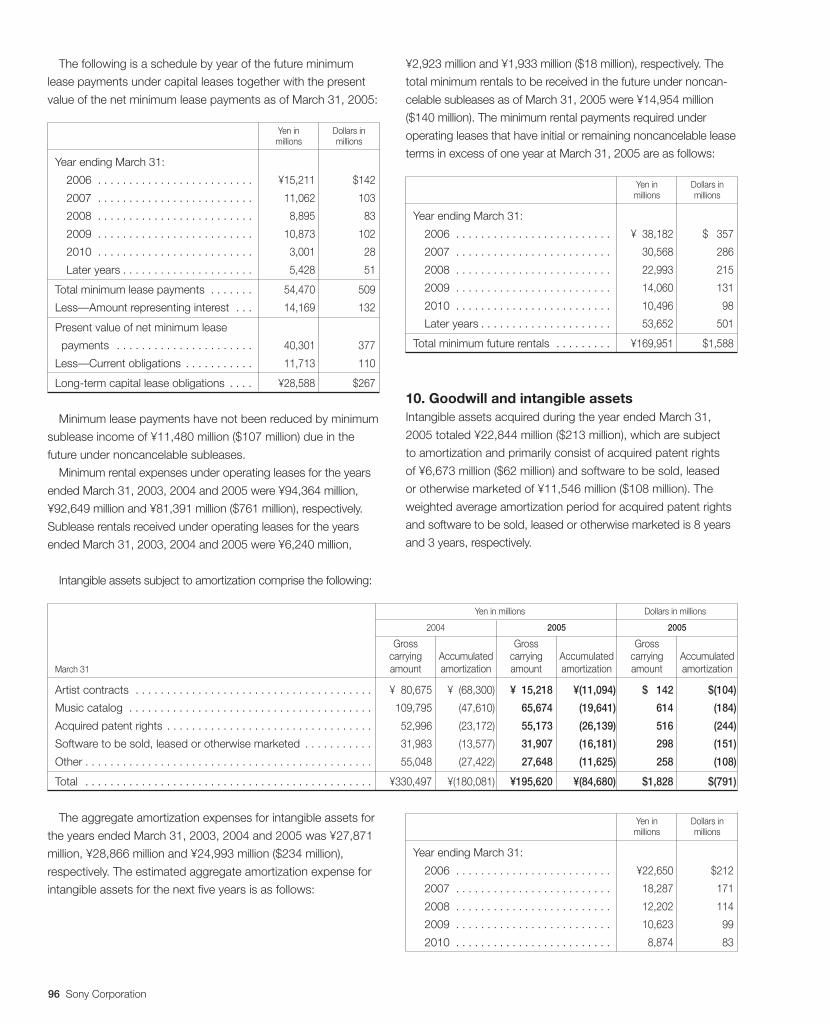
96 Sony Corporation
Yen in Dollars inmillions millions
Year ending March 31:
2006 . . . . . . . . . . . . . . . . . . . . . . . . . ¥22,650 $212
2007 . . . . . . . . . . . . . . . . . . . . . . . . . 18,287 171
2008 . . . . . . . . . . . . . . . . . . . . . . . . . 12,202 114
2009 . . . . . . . . . . . . . . . . . . . . . . . . . 10,623 99
2010 . . . . . . . . . . . . . . . . . . . . . . . . . 8,874 83
The aggregate amortization expenses for intangible assets for
the years ended March 31, 2003, 2004 and 2005 was ¥27,871
million, ¥28,866 million and ¥24,993 million ($234 million),
respectively. The estimated aggregate amortization expense for
intangible assets for the next five years is as follows:
The following is a schedule by year of the future minimum
lease payments under capital leases together with the present
value of the net minimum lease payments as of March 31, 2005:
Yen in Dollars inmillions millions
Year ending March 31:
2006 . . . . . . . . . . . . . . . . . . . . . . . . . ¥15,211 $142
2007 . . . . . . . . . . . . . . . . . . . . . . . . . 11,062 103
2008 . . . . . . . . . . . . . . . . . . . . . . . . . 8,895 83
2009 . . . . . . . . . . . . . . . . . . . . . . . . . 10,873 102
2010 . . . . . . . . . . . . . . . . . . . . . . . . . 3,001 28
Later years . . . . . . . . . . . . . . . . . . . . . 5,428 51
Total minimum lease payments . . . . . . . 54,470 509
Less—Amount representing interest . . . 14,169 132
Present value of net minimum lease
payments . . . . . . . . . . . . . . . . . . . . . . 40,301 377
Less—Current obligations . . . . . . . . . . . 11,713 110
Long-term capital lease obligations . . . . ¥28,588 $267
Minimum lease payments have not been reduced by minimum
sublease income of ¥11,480 million ($107 million) due in the
future under noncancelable subleases.
Minimum rental expenses under operating leases for the years
ended March 31, 2003, 2004 and 2005 were ¥94,364 million,
¥92,649 million and ¥81,391 million ($761 million), respectively.
Sublease rentals received under operating leases for the years
ended March 31, 2003, 2004 and 2005 were ¥6,240 million,
¥2,923 million and ¥1,933 million ($18 million), respectively. The
total minimum rentals to be received in the future under noncan-
celable subleases as of March 31, 2005 were ¥14,954 million
($140 million). The minimum rental payments required under
operating leases that have initial or remaining noncancelable lease
terms in excess of one year at March 31, 2005 are as follows:
Yen in Dollars inmillions millions
Year ending March 31:
2006 . . . . . . . . . . . . . . . . . . . . . . . . . ¥038,182 $0,357
2007 . . . . . . . . . . . . . . . . . . . . . . . . . 30,568 286
2008 . . . . . . . . . . . . . . . . . . . . . . . . . 22,993 215
2009 . . . . . . . . . . . . . . . . . . . . . . . . . 14,060 131
2010 . . . . . . . . . . . . . . . . . . . . . . . . . 10,496 98
Later years . . . . . . . . . . . . . . . . . . . . . 53,652 501
Total minimum future rentals . . . . . . . . . ¥169,951 $1,588
10. Goodwill and intangible assetsIntangible assets acquired during the year ended March 31,
2005 totaled ¥22,844 million ($213 million), which are subject
to amortization and primarily consist of acquired patent rights
of ¥6,673 million ($62 million) and software to be sold, leased
or otherwise marketed of ¥11,546 million ($108 million). The
weighted average amortization period for acquired patent rights
and software to be sold, leased or otherwise marketed is 8 years
and 3 years, respectively.
Intangible assets subject to amortization comprise the following:
Yen in millions Dollars in millions
2004 2005 2005
Gross Gross Grosscarrying Accumulated carrying Accumulated carrying Accumulated
March 31 amount amortization amount amortization amount amortization
Artist contracts . . . . . . . . . . . . . . . . . . . . . . . . . . . . . . . . . . . . . . ¥080,675 ¥0(68,300) ¥015,218 ¥(11,094) $0,142 $(104)
Music catalog . . . . . . . . . . . . . . . . . . . . . . . . . . . . . . . . . . . . . . . 109,795 (47,610) 65,674 (19,641) 614 (184)
Acquired patent rights . . . . . . . . . . . . . . . . . . . . . . . . . . . . . . . . . 52,996 (23,172) 55,173 (26,139) 516 (244)
Software to be sold, leased or otherwise marketed . . . . . . . . . . . 31,983 (13,577) 31,907 (16,181) 298 (151)
Other . . . . . . . . . . . . . . . . . . . . . . . . . . . . . . . . . . . . . . . . . . . . . . 55,048 (27,422) 27,648 (11,625) 258 (108)
Total . . . . . . . . . . . . . . . . . . . . . . . . . . . . . . . . . . . . . . . . . . . . . . ¥330,497 ¥(180,081) ¥195,620 ¥(84,680) $1,828 $(791)
BH6/30 05.7.7, 3:33 AMPage 96 Adobe PageMaker 6.0J/PPC
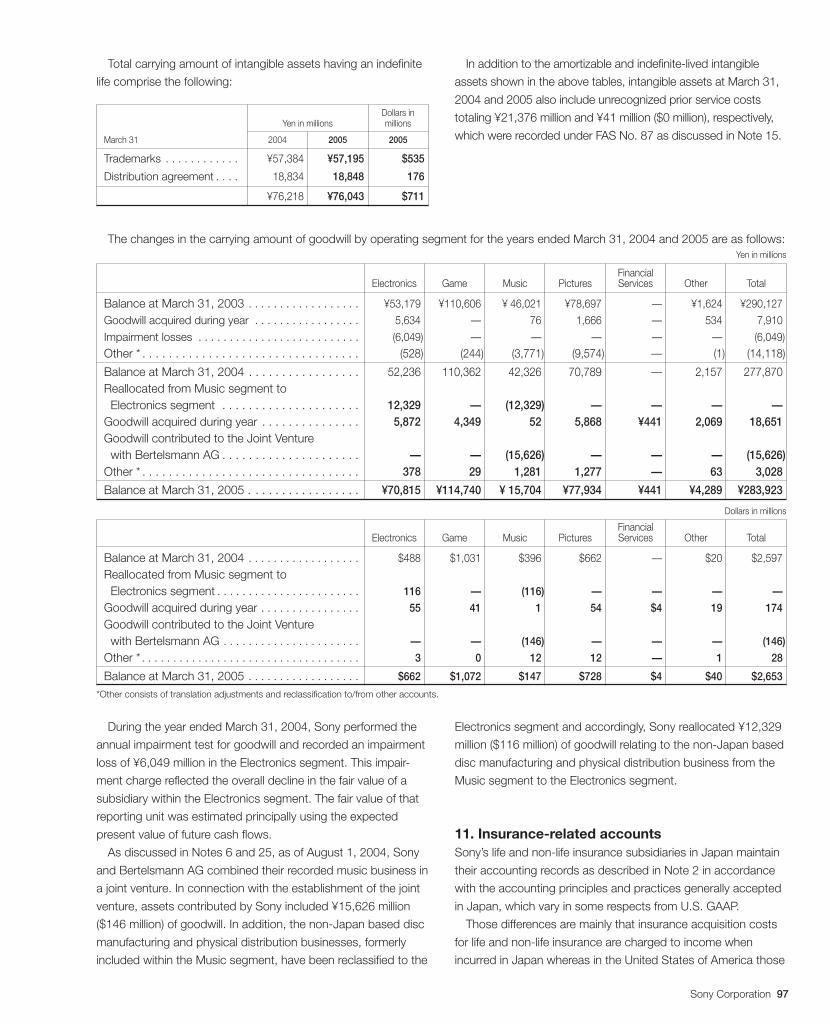
Sony Corporation 97
Total carrying amount of intangible assets having an indefinite
life comprise the following:
Dollars inYen in millions millions
March 31 2004 2005 2005
Trademarks . . . . . . . . . . . . ¥57,384 ¥57,195 $535
Distribution agreement . . . . 18,834 18,848 176
. . . . . . . . . . . . . . . . . . . . . ¥76,218 ¥76,043 $711
The changes in the carrying amount of goodwill by operating segment for the years ended March 31, 2004 and 2005 are as follows:Yen in millions
FinancialElectronics Game Music Pictures Services Other Total
Balance at March 31, 2003 . . . . . . . . . . . . . . . . . . ¥53,179 ¥110,606 ¥(46,021 ¥78,697 — ¥1,624 ¥290,127Goodwill acquired during year . . . . . . . . . . . . . . . . . 5,634 — 76 1,666 — 534 7,910
Impairment losses . . . . . . . . . . . . . . . . . . . . . . . . . . (6,049) — — — — — (6,049)Other * . . . . . . . . . . . . . . . . . . . . . . . . . . . . . . . . . (528) (244) (3,771) (9,574) — (1) (14,118)
Balance at March 31, 2004 . . . . . . . . . . . . . . . . . 52,236 110,362 42,326 70,789 — 2,157 277,870Reallocated from Music segment to Electronics segment . . . . . . . . . . . . . . . . . . . . . 12,329 — (12,329) — — — —Goodwill acquired during year . . . . . . . . . . . . . . . 5,872 4,349 52 5,868 ¥441 2,069 18,651Goodwill contributed to the Joint Venture with Bertelsmann AG . . . . . . . . . . . . . . . . . . . . . — — (15,626) — — — (15,626)Other * . . . . . . . . . . . . . . . . . . . . . . . . . . . . . . . . . 378 29 1,281 1,277 — 63 3,028
Balance at March 31, 2005 . . . . . . . . . . . . . . . . . ¥70,815 ¥114,740 ¥(15,704 ¥77,934 ¥441 ¥4,289 ¥283,923
Dollars in millions
FinancialElectronics Game Music Pictures Services Other Total
Balance at March 31, 2004 . . . . . . . . . . . . . . . . . . $488 $1,031 $396 $662 — $20 $2,597Reallocated from Music segment to Electronics segment . . . . . . . . . . . . . . . . . . . . . . . 116 — (116) — — — —
Goodwill acquired during year . . . . . . . . . . . . . . . . 55 41 1 54 $4 19 174
Goodwill contributed to the Joint Venture with Bertelsmann AG . . . . . . . . . . . . . . . . . . . . . . — — (146) — — — (146)
Other * . . . . . . . . . . . . . . . . . . . . . . . . . . . . . . . . . . . 3 0 12 12 — 1 28
Balance at March 31, 2005 . . . . . . . . . . . . . . . . . . $662 $1,072 $147 $728 $4 $40 $2,653
*Other consists of translation adjustments and reclassification to/from other accounts.
During the year ended March 31, 2004, Sony performed the
annual impairment test for goodwill and recorded an impairment
loss of ¥6,049 million in the Electronics segment. This impair-
ment charge reflected the overall decline in the fair value of a
subsidiary within the Electronics segment. The fair value of that
reporting unit was estimated principally using the expected
present value of future cash flows.
As discussed in Notes 6 and 25, as of August 1, 2004, Sony
and Bertelsmann AG combined their recorded music business in
a joint venture. In connection with the establishment of the joint
venture, assets contributed by Sony included ¥15,626 million
($146 million) of goodwill. In addition, the non-Japan based disc
manufacturing and physical distribution businesses, formerly
included within the Music segment, have been reclassified to the
Electronics segment and accordingly, Sony reallocated ¥12,329
million ($116 million) of goodwill relating to the non-Japan based
disc manufacturing and physical distribution business from the
Music segment to the Electronics segment.
11. Insurance-related accountsSony’s life and non-life insurance subsidiaries in Japan maintain
their accounting records as described in Note 2 in accordance
with the accounting principles and practices generally accepted
in Japan, which vary in some respects from U.S. GAAP.
Those differences are mainly that insurance acquisition costs
for life and non-life insurance are charged to income when
incurred in Japan whereas in the United States of America those
In addition to the amortizable and indefinite-lived intangible
assets shown in the above tables, intangible assets at March 31,
2004 and 2005 also include unrecognized prior service costs
totaling ¥21,376 million and ¥41 million ($0 million), respectively,
which were recorded under FAS No. 87 as discussed in Note 15.
BH6/30 05.7.7, 3:33 AMPage 97 Adobe PageMaker 6.0J/PPC
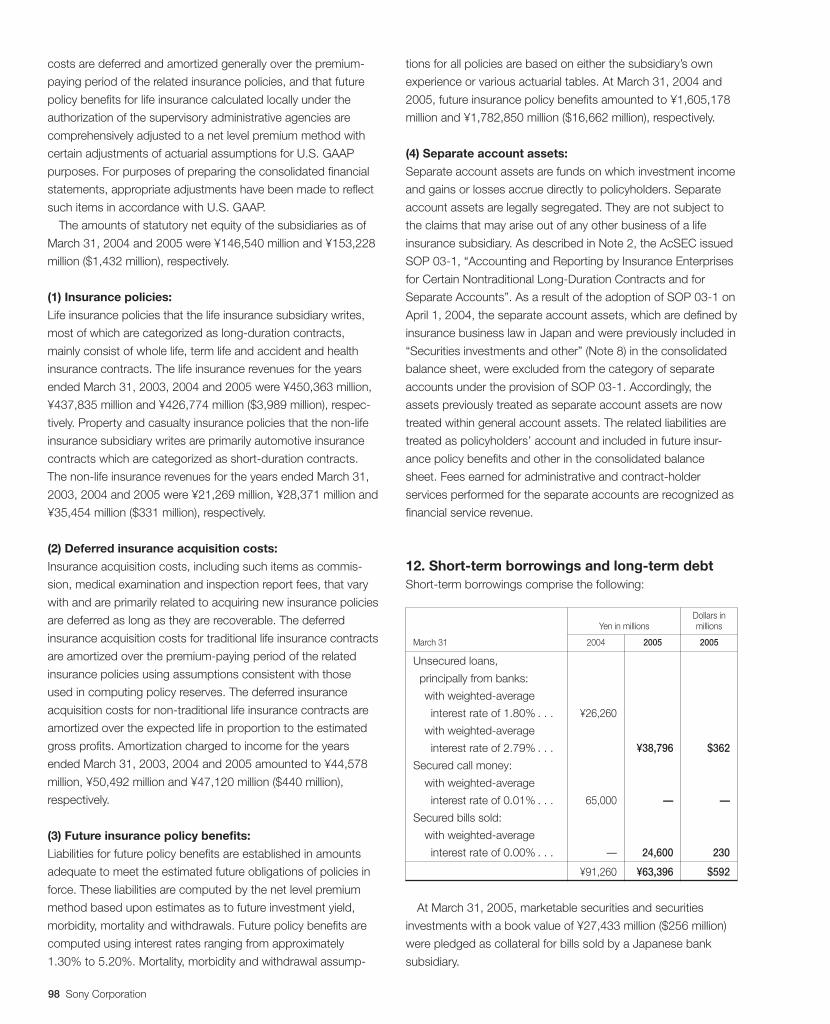
98 Sony Corporation
costs are deferred and amortized generally over the premium-
paying period of the related insurance policies, and that future
policy benefits for life insurance calculated locally under the
authorization of the supervisory administrative agencies are
comprehensively adjusted to a net level premium method with
certain adjustments of actuarial assumptions for U.S. GAAP
purposes. For purposes of preparing the consolidated financial
statements, appropriate adjustments have been made to reflect
such items in accordance with U.S. GAAP.
The amounts of statutory net equity of the subsidiaries as of
March 31, 2004 and 2005 were ¥146,540 million and ¥153,228
million ($1,432 million), respectively.
(1) Insurance policies:
Life insurance policies that the life insurance subsidiary writes,
most of which are categorized as long-duration contracts,
mainly consist of whole life, term life and accident and health
insurance contracts. The life insurance revenues for the years
ended March 31, 2003, 2004 and 2005 were ¥450,363 million,
¥437,835 million and ¥426,774 million ($3,989 million), respec-
tively. Property and casualty insurance policies that the non-life
insurance subsidiary writes are primarily automotive insurance
contracts which are categorized as short-duration contracts.
The non-life insurance revenues for the years ended March 31,
2003, 2004 and 2005 were ¥21,269 million, ¥28,371 million and
¥35,454 million ($331 million), respectively.
(2) Deferred insurance acquisition costs:
Insurance acquisition costs, including such items as commis-
sion, medical examination and inspection report fees, that vary
with and are primarily related to acquiring new insurance policies
are deferred as long as they are recoverable. The deferred
insurance acquisition costs for traditional life insurance contracts
are amortized over the premium-paying period of the related
insurance policies using assumptions consistent with those
used in computing policy reserves. The deferred insurance
acquisition costs for non-traditional life insurance contracts are
amortized over the expected life in proportion to the estimated
gross profits. Amortization charged to income for the years
ended March 31, 2003, 2004 and 2005 amounted to ¥44,578
million, ¥50,492 million and ¥47,120 million ($440 million),
respectively.
(3) Future insurance policy benefits:
Liabilities for future policy benefits are established in amounts
adequate to meet the estimated future obligations of policies in
force. These liabilities are computed by the net level premium
method based upon estimates as to future investment yield,
morbidity, mortality and withdrawals. Future policy benefits are
computed using interest rates ranging from approximately
1.30% to 5.20%. Mortality, morbidity and withdrawal assump-
tions for all policies are based on either the subsidiary’s own
experience or various actuarial tables. At March 31, 2004 and
2005, future insurance policy benefits amounted to ¥1,605,178
million and ¥1,782,850 million ($16,662 million), respectively.
(4) Separate account assets:
Separate account assets are funds on which investment income
and gains or losses accrue directly to policyholders. Separate
account assets are legally segregated. They are not subject to
the claims that may arise out of any other business of a life
insurance subsidiary. As described in Note 2, the AcSEC issued
SOP 03-1, “Accounting and Reporting by Insurance Enterprises
for Certain Nontraditional Long-Duration Contracts and for
Separate Accounts”. As a result of the adoption of SOP 03-1 on
April 1, 2004, the separate account assets, which are defined by
insurance business law in Japan and were previously included in
“Securities investments and other” (Note 8) in the consolidated
balance sheet, were excluded from the category of separate
accounts under the provision of SOP 03-1. Accordingly, the
assets previously treated as separate account assets are now
treated within general account assets. The related liabilities are
treated as policyholders’ account and included in future insur-
ance policy benefits and other in the consolidated balance
sheet. Fees earned for administrative and contract-holder
services performed for the separate accounts are recognized as
financial service revenue.
12. Short-term borrowings and long-term debtShort-term borrowings comprise the following:
Dollars inYen in millions millions
March 31 2004 2005 2005
Unsecured loans,
principally from banks:
with weighted-average
interest rate of 1.80% . . . ¥26,260
with weighted-average
interest rate of 2.79% . . . ¥38,796 $362
Secured call money:
with weighted-average
interest rate of 0.01% . . . 65,000 — —
Secured bills sold:
with weighted-average
interest rate of 0.00% . . . — 24,600 230
. . . . . . . . . . . . . . . . . . . . ¥91,260 ¥63,396 $592
At March 31, 2005, marketable securities and securities
investments with a book value of ¥27,433 million ($256 million)
were pledged as collateral for bills sold by a Japanese bank
subsidiary.
BH6/30 05.7.7, 3:33 AMPage 98 Adobe PageMaker 6.0J/PPC
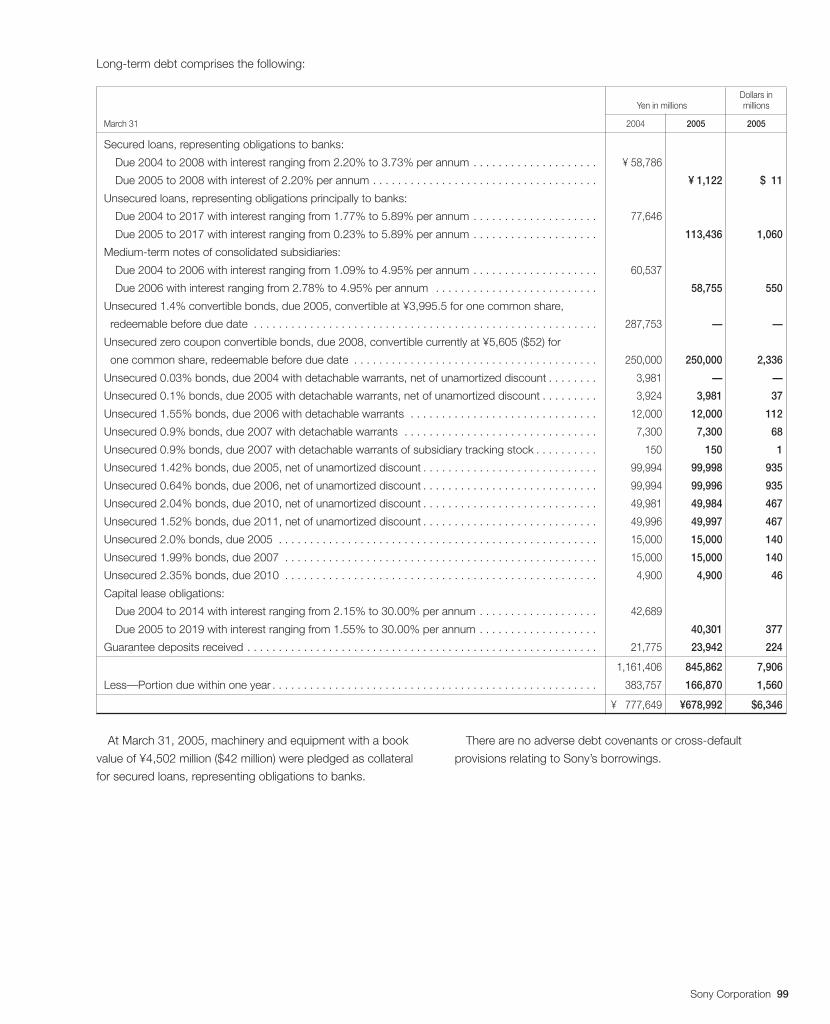
Sony Corporation 99
Long-term debt comprises the following:
Dollars inYen in millions millions
March 31 2004 2005 2005
Secured loans, representing obligations to banks:
Due 2004 to 2008 with interest ranging from 2.20% to 3.73% per annum . . . . . . . . . . . . . . . . . . . . ¥ 58,786
Due 2005 to 2008 with interest of 2.20% per annum . . . . . . . . . . . . . . . . . . . . . . . . . . . . . . . . . . . . ¥ 1,122 $ 11
Unsecured loans, representing obligations principally to banks:
Due 2004 to 2017 with interest ranging from 1.77% to 5.89% per annum . . . . . . . . . . . . . . . . . . . . 77,646
Due 2005 to 2017 with interest ranging from 0.23% to 5.89% per annum . . . . . . . . . . . . . . . . . . . . 113,436 1,060
Medium-term notes of consolidated subsidiaries:
Due 2004 to 2006 with interest ranging from 1.09% to 4.95% per annum . . . . . . . . . . . . . . . . . . . . 60,537
Due 2006 with interest ranging from 2.78% to 4.95% per annum . . . . . . . . . . . . . . . . . . . . . . . . . . 58,755 550
Unsecured 1.4% convertible bonds, due 2005, convertible at ¥3,995.5 for one common share,
redeemable before due date . . . . . . . . . . . . . . . . . . . . . . . . . . . . . . . . . . . . . . . . . . . . . . . . . . . . . . . 287,753 — —
Unsecured zero coupon convertible bonds, due 2008, convertible currently at ¥5,605 ($52) for
one common share, redeemable before due date . . . . . . . . . . . . . . . . . . . . . . . . . . . . . . . . . . . . . . . 250,000 250,000 2,336
Unsecured 0.03% bonds, due 2004 with detachable warrants, net of unamortized discount . . . . . . . . 3,981 — —
Unsecured 0.1% bonds, due 2005 with detachable warrants, net of unamortized discount . . . . . . . . . 3,924 3,981 37
Unsecured 1.55% bonds, due 2006 with detachable warrants . . . . . . . . . . . . . . . . . . . . . . . . . . . . . . 12,000 12,000 112
Unsecured 0.9% bonds, due 2007 with detachable warrants . . . . . . . . . . . . . . . . . . . . . . . . . . . . . . . 7,300 7,300 68
Unsecured 0.9% bonds, due 2007 with detachable warrants of subsidiary tracking stock . . . . . . . . . . 150 150 1
Unsecured 1.42% bonds, due 2005, net of unamortized discount . . . . . . . . . . . . . . . . . . . . . . . . . . . . 99,994 99,998 935
Unsecured 0.64% bonds, due 2006, net of unamortized discount . . . . . . . . . . . . . . . . . . . . . . . . . . . . 99,994 99,996 935
Unsecured 2.04% bonds, due 2010, net of unamortized discount . . . . . . . . . . . . . . . . . . . . . . . . . . . . 49,981 49,984 467
Unsecured 1.52% bonds, due 2011, net of unamortized discount . . . . . . . . . . . . . . . . . . . . . . . . . . . . 49,996 49,997 467
Unsecured 2.0% bonds, due 2005 . . . . . . . . . . . . . . . . . . . . . . . . . . . . . . . . . . . . . . . . . . . . . . . . . . . 15,000 15,000 140
Unsecured 1.99% bonds, due 2007 . . . . . . . . . . . . . . . . . . . . . . . . . . . . . . . . . . . . . . . . . . . . . . . . . . 15,000 15,000 140
Unsecured 2.35% bonds, due 2010 . . . . . . . . . . . . . . . . . . . . . . . . . . . . . . . . . . . . . . . . . . . . . . . . . . 4,900 4,900 46
Capital lease obligations:
Due 2004 to 2014 with interest ranging from 2.15% to 30.00% per annum . . . . . . . . . . . . . . . . . . . 42,689
Due 2005 to 2019 with interest ranging from 1.55% to 30.00% per annum . . . . . . . . . . . . . . . . . . . 40,301 377
Guarantee deposits received . . . . . . . . . . . . . . . . . . . . . . . . . . . . . . . . . . . . . . . . . . . . . . . . . . . . . . . . 21,775 23,942 224
. . . . . . . . . . . . . . . . . . . . . . . . . . . . . . . . . . . . . . . . . . . . . . . . . . . . . . . . . . . . . . . . . . . . . . . . . . . . 1,161,406 845,862 7,906
Less—Portion due within one year . . . . . . . . . . . . . . . . . . . . . . . . . . . . . . . . . . . . . . . . . . . . . . . . . . . . 383,757 166,870 1,560
. . . . . . . . . . . . . . . . . . . . . . . . . . . . . . . . . . . . . . . . . . . . . . . . . . . . . . . . . . . . . . . . . . . . . . . . . . . . ¥0,777,649 ¥678,992 $6,346
At March 31, 2005, machinery and equipment with a book
value of ¥4,502 million ($42 million) were pledged as collateral
for secured loans, representing obligations to banks.
There are no adverse debt covenants or cross-default
provisions relating to Sony’s borrowings.
BH6/30 05.7.7, 3:33 AMPage 99 Adobe PageMaker 6.0J/PPC
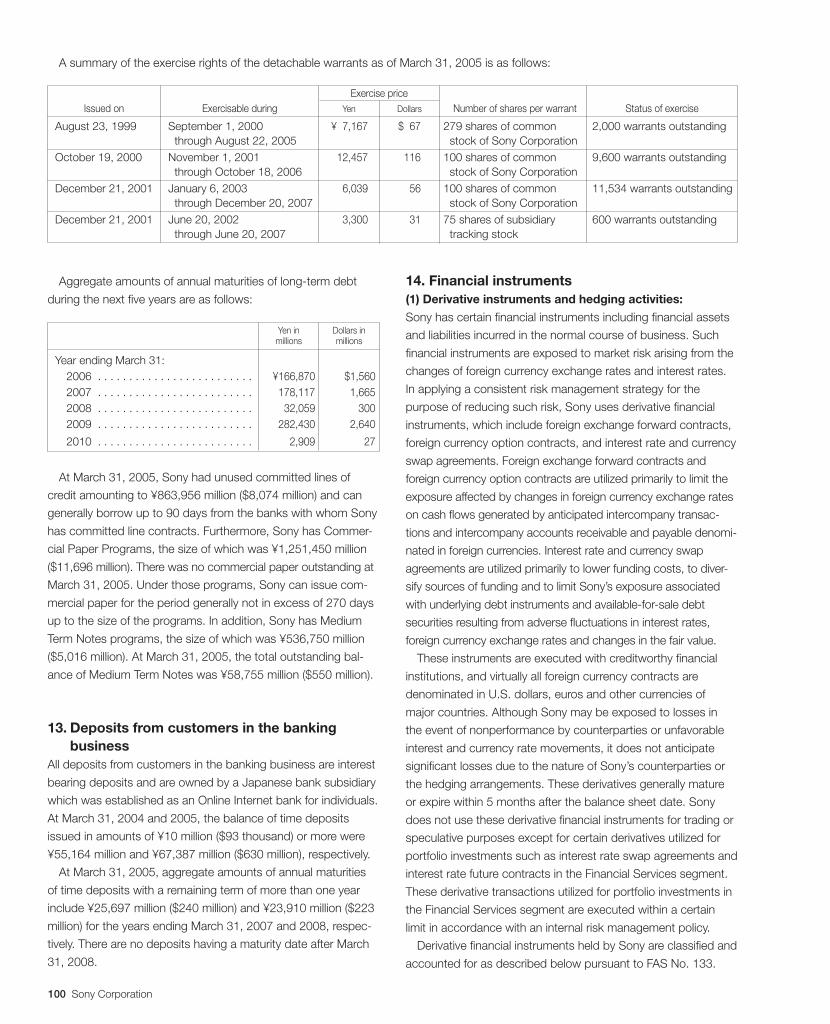
100 Sony Corporation
A summary of the exercise rights of the detachable warrants as of March 31, 2005 is as follows:
Exercise priceIssued on Exercisable during Yen Dollars Number of shares per warrant Status of exercise
August 23, 1999 September 1, 2000 ¥07,167 $067 279 shares of common 2,000 warrants outstanding through August 22, 2005 stock of Sony Corporation
October 19, 2000 November 1, 2001 12,457 116 100 shares of common 9,600 warrants outstanding through October 18, 2006 stock of Sony Corporation
December 21, 2001 January 6, 2003 6,039 56 100 shares of common 11,534 warrants outstanding through December 20, 2007 stock of Sony Corporation
December 21, 2001 June 20, 2002 3,300 31 75 shares of subsidiary 600 warrants outstanding through June 20, 2007 tracking stock
Aggregate amounts of annual maturities of long-term debt
during the next five years are as follows:
Yen in Dollars inmillions millions
Year ending March 31:2006 . . . . . . . . . . . . . . . . . . . . . . . . . ¥166,870 $1,5602007 . . . . . . . . . . . . . . . . . . . . . . . . . 178,117 1,6652008 . . . . . . . . . . . . . . . . . . . . . . . . . 32,059 3002009 . . . . . . . . . . . . . . . . . . . . . . . . . 282,430 2,640
2010 . . . . . . . . . . . . . . . . . . . . . . . . . 2,909 27
At March 31, 2005, Sony had unused committed lines of
credit amounting to ¥863,956 million ($8,074 million) and can
generally borrow up to 90 days from the banks with whom Sony
has committed line contracts. Furthermore, Sony has Commer-
cial Paper Programs, the size of which was ¥1,251,450 million
($11,696 million). There was no commercial paper outstanding at
March 31, 2005. Under those programs, Sony can issue com-
mercial paper for the period generally not in excess of 270 days
up to the size of the programs. In addition, Sony has Medium
Term Notes programs, the size of which was ¥536,750 million
($5,016 million). At March 31, 2005, the total outstanding bal-
ance of Medium Term Notes was ¥58,755 million ($550 million).
13. Deposits from customers in the bankingbusiness
All deposits from customers in the banking business are interest
bearing deposits and are owned by a Japanese bank subsidiary
which was established as an Online Internet bank for individuals.
At March 31, 2004 and 2005, the balance of time deposits
issued in amounts of ¥10 million ($93 thousand) or more were
¥55,164 million and ¥67,387 million ($630 million), respectively.
At March 31, 2005, aggregate amounts of annual maturities
of time deposits with a remaining term of more than one year
include ¥25,697 million ($240 million) and ¥23,910 million ($223
million) for the years ending March 31, 2007 and 2008, respec-
tively. There are no deposits having a maturity date after March
31, 2008.
14. Financial instruments(1) Derivative instruments and hedging activities:
Sony has certain financial instruments including financial assets
and liabilities incurred in the normal course of business. Such
financial instruments are exposed to market risk arising from the
changes of foreign currency exchange rates and interest rates.
In applying a consistent risk management strategy for the
purpose of reducing such risk, Sony uses derivative financial
instruments, which include foreign exchange forward contracts,
foreign currency option contracts, and interest rate and currency
swap agreements. Foreign exchange forward contracts and
foreign currency option contracts are utilized primarily to limit the
exposure affected by changes in foreign currency exchange rates
on cash flows generated by anticipated intercompany transac-
tions and intercompany accounts receivable and payable denomi-
nated in foreign currencies. Interest rate and currency swap
agreements are utilized primarily to lower funding costs, to diver-
sify sources of funding and to limit Sony’s exposure associated
with underlying debt instruments and available-for-sale debt
securities resulting from adverse fluctuations in interest rates,
foreign currency exchange rates and changes in the fair value.
These instruments are executed with creditworthy financial
institutions, and virtually all foreign currency contracts are
denominated in U.S. dollars, euros and other currencies of
major countries. Although Sony may be exposed to losses in
the event of nonperformance by counterparties or unfavorable
interest and currency rate movements, it does not anticipate
significant losses due to the nature of Sony’s counterparties or
the hedging arrangements. These derivatives generally mature
or expire within 5 months after the balance sheet date. Sony
does not use these derivative financial instruments for trading or
speculative purposes except for certain derivatives utilized for
portfolio investments such as interest rate swap agreements and
interest rate future contracts in the Financial Services segment.
These derivative transactions utilized for portfolio investments in
the Financial Services segment are executed within a certain
limit in accordance with an internal risk management policy.
Derivative financial instruments held by Sony are classified and
accounted for as described below pursuant to FAS No. 133.
BH6/30 05.7.7, 3:33 AMPage 100 Adobe PageMaker 6.0J/PPC
Sony Corporation 101
Fair value hedges
The derivatives designated as fair value hedges include interest
rate and currency swap agreements.
Both the derivatives designated as fair value hedges and
hedged items are reflected at fair value in the consolidated
balance sheet. Changes in the fair value of the derivatives
designated as fair value hedges as well as offsetting changes in
the carrying value of the underlying hedged items are recognized
in income.
The amount of ineffectiveness of these fair value hedges, that
was reflected in earnings, was not material for the years ended
March 31, 2003, 2004 and 2005. In addition, there were no
amounts excluded from the assessment of hedge effectiveness
of fair value hedges.
Cash flow hedges
The derivatives designated as cash flow hedges include foreign
exchange forward contracts, foreign currency option contracts
and interest rate and currency swap agreements.
Changes in the fair value of derivatives designated as cash
flow hedges are initially recorded in other comprehensive income
and reclassified into earnings when the hedged transaction
affects earnings. For the years ended March 31, 2003 and
2004, these cash flow hedges were fully effective. For the year
ended March 31, 2005, the amount of ineffectiveness of these
cash flow hedges that was reflected in earnings was not mate-
rial. In addition, there were no amounts excluded from the
assessment of hedge effectiveness of cash flow hedges. At
March 31, 2005, amounts related to derivatives qualifying as
cash flow hedges amounted to a net reduction of equity of
¥2,490 million ($23 million). Within the next twelve months,
¥1,615 million ($15 million) is expected to be reclassified from
equity into earnings as loss. For the year ended March 31,
2005, there were no forecasted transactions that failed to occur
which resulted in the discontinuance of cash flow hedges.
Derivatives not designated as hedges
The derivatives not designated as hedges under FAS No. 133
include foreign exchange forward contracts, foreign currency
option contracts, interest rate and currency swap agreements,
convertible rights included in convertible bonds and other.
Changes in the fair value of derivatives not designated as
hedges are recognized in income.
A description of the purpose and classification of the deriva-
tive financial instruments held by Sony is as follows:
Foreign exchange forward contracts and foreign currency option
contracts
Sony enters into foreign exchange forward contracts and pur-
chased and written foreign currency option contracts primarily to
fix the cash flows from intercompany accounts receivable and
payable and forecasted transactions denominated in functional
currencies (Japanese yen, U.S. dollars and euros) of Sony’s
major operating units. The majority of written foreign currency
option contracts are a part of range forward contract arrange-
ments and expire in the same month with the corresponding
purchased foreign currency option contracts.
Sony also enters into foreign exchange forward contracts,
which effectively fix the cash flows from foreign currency
denominated debt. Accordingly, these derivatives have been
designated as cash flow hedges in accordance with FAS
No. 133.
Foreign exchange forward contracts and foreign currency
option contracts that do not qualify as hedges are marked-
to-market with changes in value recognized in other income
and expenses.
Interest rate and currency swap agreements
Sony enters into interest rate and currency swap agreements,
which are used for reducing the risk arising from the changes in
the fair value of fixed rate debt and available-for-sale debt
securities. For example, Sony enters into interest rate and
currency swap agreements, which effectively swap foreign
currency denominated fixed rate debt for functional currency
denominated variable rate debt. These derivatives are consid-
ered to be a hedge against changes in the fair value of Sony’s
foreign denominated fixed-rate obligations. Accordingly, these
derivatives have been designated as fair value hedges in accor-
dance with FAS No. 133.
Sony also enters into interest rate and currency swap agree-
ments that are used for reducing the risk arising from the
changes in anticipated cash flow of variable rate debt and
foreign currency denominated debt. For example, Sony enters
into interest rate and currency swap agreements, which effec-
tively swap foreign currency denominated variable rate debt for
functional currency denominated fixed rate debt. These deriva-
tives are considered to be a hedge against changes in the
anticipated cash flow of Sony’s foreign denominated variable
rate obligations. Accordingly, these derivatives have been desig-
nated as cash flow hedges in accordance with FAS No. 133.
Certain subsidiaries in the Financial Services segment have
interest rate swap agreements as part of portfolio investments,
which are marked-to-market with changes in value recognized
in financial service revenue.
Any other interest rate and currency swap agreements that do
not qualify as hedges, which are used for reducing the risk
arising from changes of variable rate and foreign currency
dominated intercompany debt, are marked-to-market with
changes in value recognized in other income and expenses.
Interest rate future contracts
Certain subsidiaries in the Financial Services segment have
BH6/30 05.7.7, 3:33 AMPage 101 Adobe PageMaker 6.0J/PPC
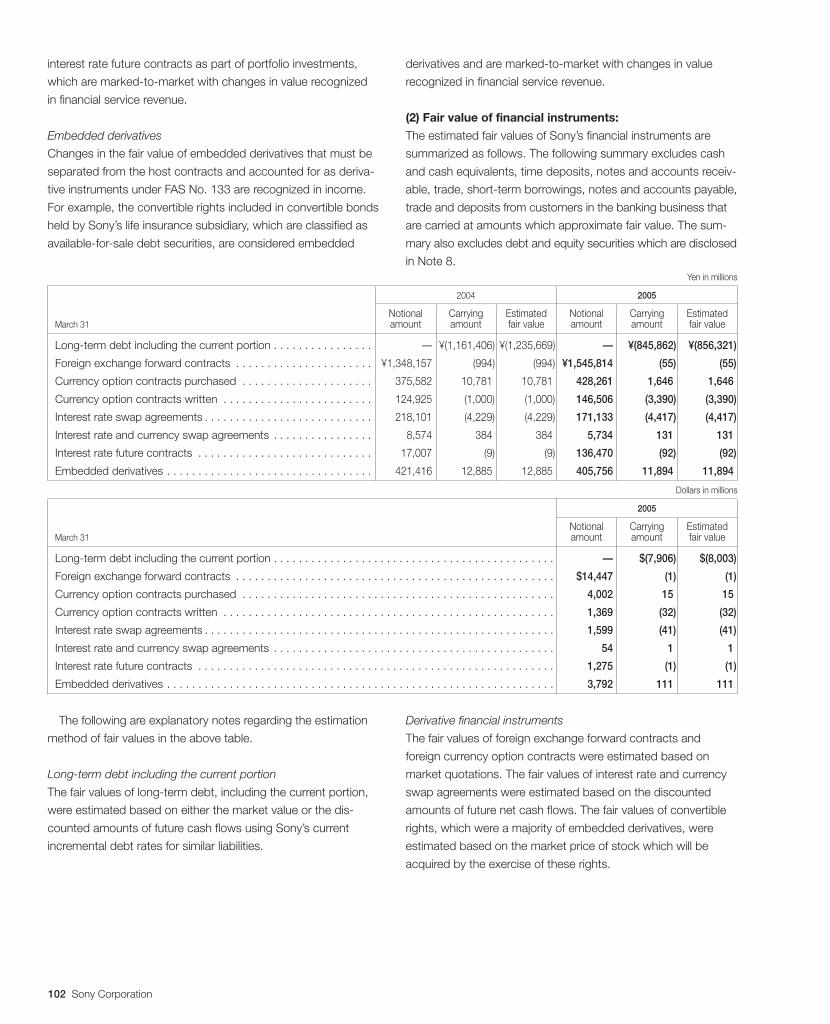
102 Sony Corporation
interest rate future contracts as part of portfolio investments,
which are marked-to-market with changes in value recognized
in financial service revenue.
Embedded derivatives
Changes in the fair value of embedded derivatives that must be
separated from the host contracts and accounted for as deriva-
tive instruments under FAS No. 133 are recognized in income.
For example, the convertible rights included in convertible bonds
held by Sony’s life insurance subsidiary, which are classified as
available-for-sale debt securities, are considered embedded
derivatives and are marked-to-market with changes in value
recognized in financial service revenue.
(2) Fair value of financial instruments:
The estimated fair values of Sony’s financial instruments are
summarized as follows. The following summary excludes cash
and cash equivalents, time deposits, notes and accounts receiv-
able, trade, short-term borrowings, notes and accounts payable,
trade and deposits from customers in the banking business that
are carried at amounts which approximate fair value. The sum-
mary also excludes debt and equity securities which are disclosed
in Note 8.Yen in millions
2004 2005
Notional Carrying Estimated Notional Carrying EstimatedMarch 31 amount amount fair value amount amount fair value
Long-term debt including the current portion . . . . . . . . . . . . . . . . — ¥(1,161,406) ¥(1,235,669) — ¥(845,862) ¥(856,321)
Foreign exchange forward contracts . . . . . . . . . . . . . . . . . . . . . . ¥1,348,157 (994) (994) ¥1,545,814 (55) (55)
Currency option contracts purchased . . . . . . . . . . . . . . . . . . . . . 375,582 10,781 10,781 428,261 1,646 1,646
Currency option contracts written . . . . . . . . . . . . . . . . . . . . . . . . 124,925 (1,000) (1,000) 146,506 (3,390) (3,390)
Interest rate swap agreements . . . . . . . . . . . . . . . . . . . . . . . . . . . 218,101 (4,229) (4,229) 171,133 (4,417) (4,417)
Interest rate and currency swap agreements . . . . . . . . . . . . . . . . 8,574 384 384 5,734 131 131
Interest rate future contracts . . . . . . . . . . . . . . . . . . . . . . . . . . . . 17,007 (9) (9) 136,470 (92) (92)
Embedded derivatives . . . . . . . . . . . . . . . . . . . . . . . . . . . . . . . . . 421,416 12,885 12,885 405,756 11,894 11,894
Dollars in millions
2005
Notional Carrying EstimatedMarch 31 amount amount fair value
Long-term debt including the current portion . . . . . . . . . . . . . . . . . . . . . . . . . . . . . . . . . . . . . . . . . . . . . — $(7,906) $(8,003)
Foreign exchange forward contracts . . . . . . . . . . . . . . . . . . . . . . . . . . . . . . . . . . . . . . . . . . . . . . . . . . . $14,447 (1) (1)
Currency option contracts purchased . . . . . . . . . . . . . . . . . . . . . . . . . . . . . . . . . . . . . . . . . . . . . . . . . . 4,002 15 15
Currency option contracts written . . . . . . . . . . . . . . . . . . . . . . . . . . . . . . . . . . . . . . . . . . . . . . . . . . . . . 1,369 (32) (32)
Interest rate swap agreements . . . . . . . . . . . . . . . . . . . . . . . . . . . . . . . . . . . . . . . . . . . . . . . . . . . . . . . . 1,599 (41) (41)
Interest rate and currency swap agreements . . . . . . . . . . . . . . . . . . . . . . . . . . . . . . . . . . . . . . . . . . . . . 54 1 1
Interest rate future contracts . . . . . . . . . . . . . . . . . . . . . . . . . . . . . . . . . . . . . . . . . . . . . . . . . . . . . . . . . 1,275 (1) (1)
Embedded derivatives . . . . . . . . . . . . . . . . . . . . . . . . . . . . . . . . . . . . . . . . . . . . . . . . . . . . . . . . . . . . . . 3,792 111 111
The following are explanatory notes regarding the estimation
method of fair values in the above table.
Long-term debt including the current portion
The fair values of long-term debt, including the current portion,
were estimated based on either the market value or the dis-
counted amounts of future cash flows using Sony’s current
incremental debt rates for similar liabilities.
Derivative financial instruments
The fair values of foreign exchange forward contracts and
foreign currency option contracts were estimated based on
market quotations. The fair values of interest rate and currency
swap agreements were estimated based on the discounted
amounts of future net cash flows. The fair values of convertible
rights, which were a majority of embedded derivatives, were
estimated based on the market price of stock which will be
acquired by the exercise of these rights.
BH6/30 05.7.7, 3:33 AMPage 102 Adobe PageMaker 6.0J/PPC
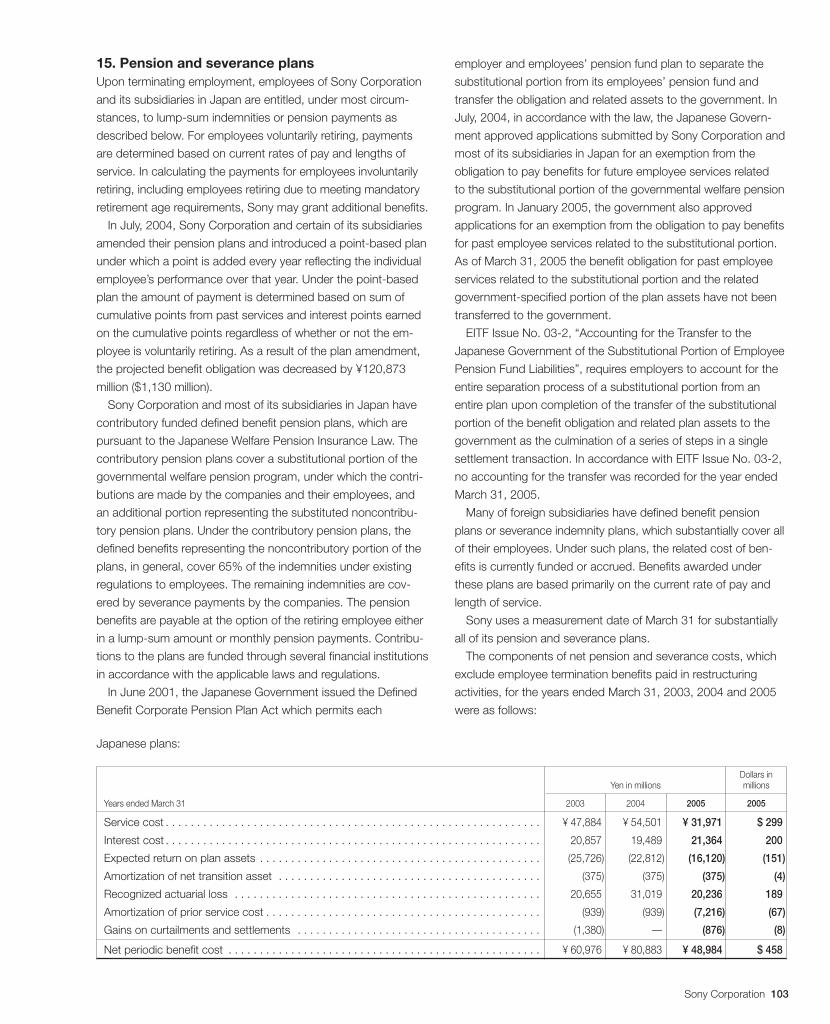
Sony Corporation 103
15. Pension and severance plansUpon terminating employment, employees of Sony Corporation
and its subsidiaries in Japan are entitled, under most circum-
stances, to lump-sum indemnities or pension payments as
described below. For employees voluntarily retiring, payments
are determined based on current rates of pay and lengths of
service. In calculating the payments for employees involuntarily
retiring, including employees retiring due to meeting mandatory
retirement age requirements, Sony may grant additional benefits.
In July, 2004, Sony Corporation and certain of its subsidiaries
amended their pension plans and introduced a point-based plan
under which a point is added every year reflecting the individual
employee’s performance over that year. Under the point-based
plan the amount of payment is determined based on sum of
cumulative points from past services and interest points earned
on the cumulative points regardless of whether or not the em-
ployee is voluntarily retiring. As a result of the plan amendment,
the projected benefit obligation was decreased by ¥120,873
million ($1,130 million).
Sony Corporation and most of its subsidiaries in Japan have
contributory funded defined benefit pension plans, which are
pursuant to the Japanese Welfare Pension Insurance Law. The
contributory pension plans cover a substitutional portion of the
governmental welfare pension program, under which the contri-
butions are made by the companies and their employees, and
an additional portion representing the substituted noncontribu-
tory pension plans. Under the contributory pension plans, the
defined benefits representing the noncontributory portion of the
plans, in general, cover 65% of the indemnities under existing
regulations to employees. The remaining indemnities are cov-
ered by severance payments by the companies. The pension
benefits are payable at the option of the retiring employee either
in a lump-sum amount or monthly pension payments. Contribu-
tions to the plans are funded through several financial institutions
in accordance with the applicable laws and regulations.
In June 2001, the Japanese Government issued the Defined
Benefit Corporate Pension Plan Act which permits each
employer and employees’ pension fund plan to separate the
substitutional portion from its employees’ pension fund and
transfer the obligation and related assets to the government. In
July, 2004, in accordance with the law, the Japanese Govern-
ment approved applications submitted by Sony Corporation and
most of its subsidiaries in Japan for an exemption from the
obligation to pay benefits for future employee services related
to the substitutional portion of the governmental welfare pension
program. In January 2005, the government also approved
applications for an exemption from the obligation to pay benefits
for past employee services related to the substitutional portion.
As of March 31, 2005 the benefit obligation for past employee
services related to the substitutional portion and the related
government-specified portion of the plan assets have not been
transferred to the government.
EITF Issue No. 03-2, “Accounting for the Transfer to the
Japanese Government of the Substitutional Portion of Employee
Pension Fund Liabilities”, requires employers to account for the
entire separation process of a substitutional portion from an
entire plan upon completion of the transfer of the substitutional
portion of the benefit obligation and related plan assets to the
government as the culmination of a series of steps in a single
settlement transaction. In accordance with EITF Issue No. 03-2,
no accounting for the transfer was recorded for the year ended
March 31, 2005.
Many of foreign subsidiaries have defined benefit pension
plans or severance indemnity plans, which substantially cover all
of their employees. Under such plans, the related cost of ben-
efits is currently funded or accrued. Benefits awarded under
these plans are based primarily on the current rate of pay and
length of service.
Sony uses a measurement date of March 31 for substantially
all of its pension and severance plans.
The components of net pension and severance costs, which
exclude employee termination benefits paid in restructuring
activities, for the years ended March 31, 2003, 2004 and 2005
were as follows:
Japanese plans:
Dollars inYen in millions millions
Years ended March 31 2003 2004 2005 2005
Service cost . . . . . . . . . . . . . . . . . . . . . . . . . . . . . . . . . . . . . . . . . . . . . . . . . . . . . . . . . . . . ¥(47,884 ¥(54,501 ¥(31,971 $(299
Interest cost . . . . . . . . . . . . . . . . . . . . . . . . . . . . . . . . . . . . . . . . . . . . . . . . . . . . . . . . . . . . 20,857 19,489 21,364 200
Expected return on plan assets . . . . . . . . . . . . . . . . . . . . . . . . . . . . . . . . . . . . . . . . . . . . . (25,726) (22,812) (16,120) (151)
Amortization of net transition asset . . . . . . . . . . . . . . . . . . . . . . . . . . . . . . . . . . . . . . . . . . (375) (375) (375) (4)
Recognized actuarial loss . . . . . . . . . . . . . . . . . . . . . . . . . . . . . . . . . . . . . . . . . . . . . . . . . 20,655 31,019 20,236 189
Amortization of prior service cost . . . . . . . . . . . . . . . . . . . . . . . . . . . . . . . . . . . . . . . . . . . . (939) (939) (7,216) (67)
Gains on curtailments and settlements . . . . . . . . . . . . . . . . . . . . . . . . . . . . . . . . . . . . . . . (1,380) — (876) (8)
Net periodic benefit cost . . . . . . . . . . . . . . . . . . . . . . . . . . . . . . . . . . . . . . . . . . . . . . . . . . ¥(60,976 ¥(80,883 ¥(48,984 $(458
BH6/30 05.7.7, 3:33 AMPage 103 Adobe PageMaker 6.0J/PPC
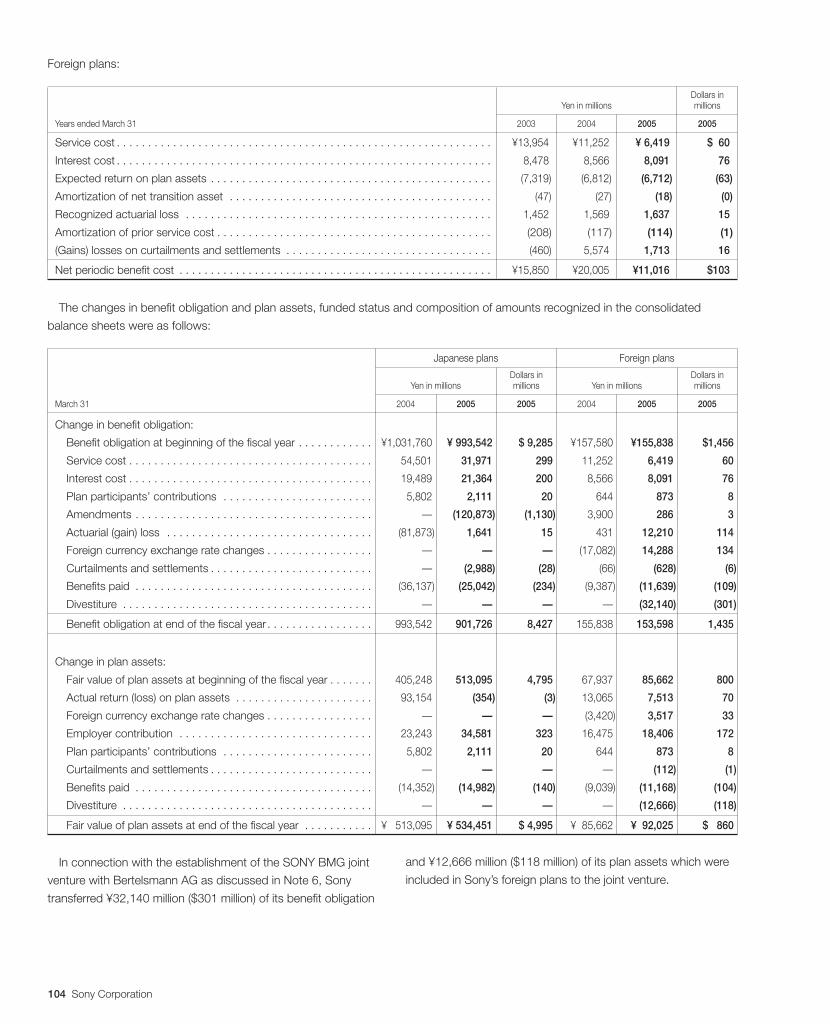
104 Sony Corporation
Foreign plans:
Dollars inYen in millions millions
Years ended March 31 2003 2004 2005 2005
Service cost . . . . . . . . . . . . . . . . . . . . . . . . . . . . . . . . . . . . . . . . . . . . . . . . . . . . . . . . . . . . ¥13,954 ¥11,252 ¥(6,419 $060
Interest cost . . . . . . . . . . . . . . . . . . . . . . . . . . . . . . . . . . . . . . . . . . . . . . . . . . . . . . . . . . . . 8,478 8,566 8,091 76
Expected return on plan assets . . . . . . . . . . . . . . . . . . . . . . . . . . . . . . . . . . . . . . . . . . . . . (7,319) (6,812) (6,712) (63)
Amortization of net transition asset . . . . . . . . . . . . . . . . . . . . . . . . . . . . . . . . . . . . . . . . . . (47) (27) (18) (0)
Recognized actuarial loss . . . . . . . . . . . . . . . . . . . . . . . . . . . . . . . . . . . . . . . . . . . . . . . . . 1,452 1,569 1,637 15
Amortization of prior service cost . . . . . . . . . . . . . . . . . . . . . . . . . . . . . . . . . . . . . . . . . . . . (208) (117) (114) (1)
(Gains) losses on curtailments and settlements . . . . . . . . . . . . . . . . . . . . . . . . . . . . . . . . . (460) 5,574 1,713 16
Net periodic benefit cost . . . . . . . . . . . . . . . . . . . . . . . . . . . . . . . . . . . . . . . . . . . . . . . . . . ¥15,850 ¥20,005 ¥11,016 $103
The changes in benefit obligation and plan assets, funded status and composition of amounts recognized in the consolidated
balance sheets were as follows:
Japanese plans Foreign plans
Dollars in Dollars inYen in millions millions Yen in millions millions
March 31 2004 2005 2005 2004 2005 2005
Change in benefit obligation:
Benefit obligation at beginning of the fiscal year . . . . . . . . . . . . ¥1,031,760 ¥(993,542 $(9,285 ¥157,580 ¥155,838 $1,456
Service cost . . . . . . . . . . . . . . . . . . . . . . . . . . . . . . . . . . . . . . . 54,501 31,971 299 11,252 6,419 60
Interest cost . . . . . . . . . . . . . . . . . . . . . . . . . . . . . . . . . . . . . . . 19,489 21,364 200 8,566 8,091 76
Plan participants’ contributions . . . . . . . . . . . . . . . . . . . . . . . . 5,802 2,111 20 644 873 8
Amendments . . . . . . . . . . . . . . . . . . . . . . . . . . . . . . . . . . . . . . — (120,873) (1,130) 3,900 286 3
Actuarial (gain) loss . . . . . . . . . . . . . . . . . . . . . . . . . . . . . . . . . (81,873) 1,641 15 431 12,210 114
Foreign currency exchange rate changes . . . . . . . . . . . . . . . . . — — — (17,082) 14,288 134
Curtailments and settlements . . . . . . . . . . . . . . . . . . . . . . . . . . — (2,988) (28) (66) (628) (6)
Benefits paid . . . . . . . . . . . . . . . . . . . . . . . . . . . . . . . . . . . . . . (36,137) (25,042) (234) (9,387) (11,639) (109)
Divestiture . . . . . . . . . . . . . . . . . . . . . . . . . . . . . . . . . . . . . . . . — — — — (32,140) (301)
Benefit obligation at end of the fiscal year . . . . . . . . . . . . . . . . . 993,542 901,726 8,427 155,838 153,598 1,435
Change in plan assets:
Fair value of plan assets at beginning of the fiscal year . . . . . . . 405,248 513,095 4,795 67,937 85,662 800
Actual return (loss) on plan assets . . . . . . . . . . . . . . . . . . . . . . 93,154 (354) (3) 13,065 7,513 70
Foreign currency exchange rate changes . . . . . . . . . . . . . . . . . — — — (3,420) 3,517 33
Employer contribution . . . . . . . . . . . . . . . . . . . . . . . . . . . . . . . 23,243 34,581 323 16,475 18,406 172
Plan participants’ contributions . . . . . . . . . . . . . . . . . . . . . . . . 5,802 2,111 20 644 873 8
Curtailments and settlements . . . . . . . . . . . . . . . . . . . . . . . . . . — — — — (112) (1)
Benefits paid . . . . . . . . . . . . . . . . . . . . . . . . . . . . . . . . . . . . . . (14,352) (14,982) (140) (9,039) (11,168) (104)
Divestiture . . . . . . . . . . . . . . . . . . . . . . . . . . . . . . . . . . . . . . . . — — — — (12,666) (118)
Fair value of plan assets at end of the fiscal year . . . . . . . . . . . ¥ 513,095 ¥(534,451 $(4,995 ¥ 85,662 ¥ (92,025 $0,860
In connection with the establishment of the SONY BMG joint
venture with Bertelsmann AG as discussed in Note 6, Sony
transferred ¥32,140 million ($301 million) of its benefit obligation
and ¥12,666 million ($118 million) of its plan assets which were
included in Sony’s foreign plans to the joint venture.
BH6/30 05.7.7, 3:33 AMPage 104 Adobe PageMaker 6.0J/PPC
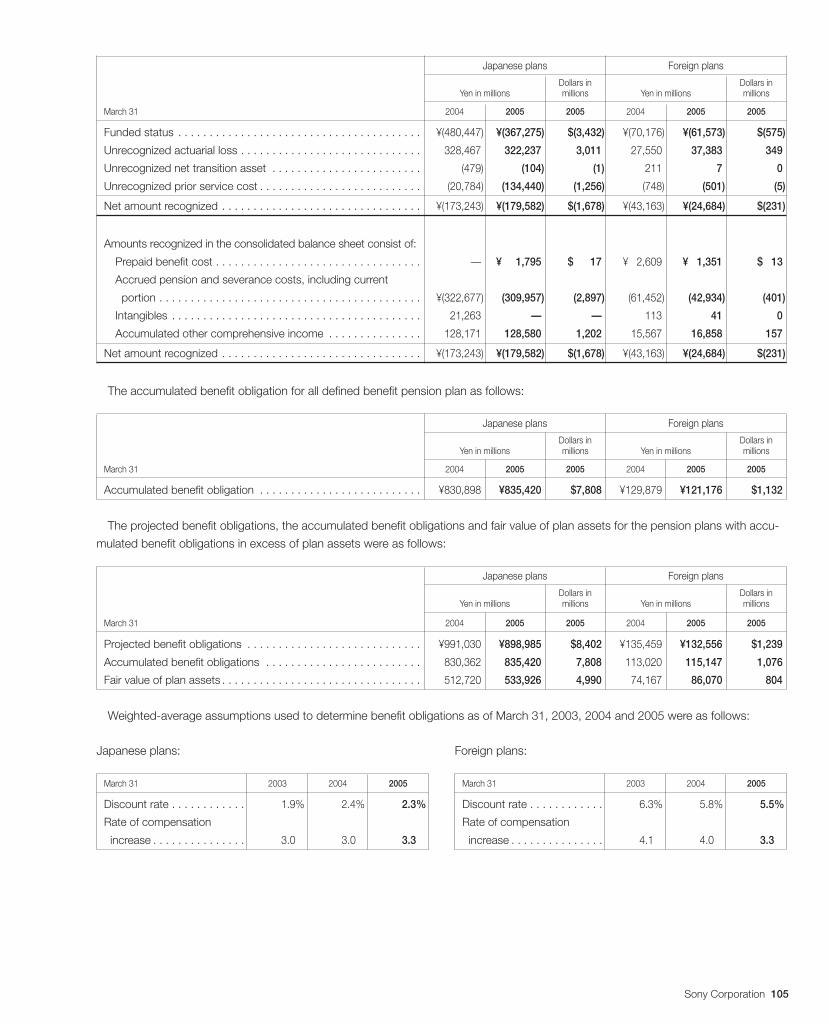
Sony Corporation 105
Foreign plans:
March 31 2003 2004 2005
Discount rate . . . . . . . . . . . . 6.3% 5.8% 5.5%
Rate of compensation
increase . . . . . . . . . . . . . . . 4.1 4.0 3.3
Japanese plans:
March 31 2003 2004 2005
Discount rate . . . . . . . . . . . . 1.9% 2.4% 2.3%
Rate of compensation
increase . . . . . . . . . . . . . . . 3.0 3.0 3.3
Japanese plans Foreign plans
Dollars in Dollars inYen in millions millions Yen in millions millions
March 31 2004 2005 2005 2004 2005 2005
Funded status . . . . . . . . . . . . . . . . . . . . . . . . . . . . . . . . . . . . . . . ¥(480,447) ¥(367,275) $(3,432) ¥(70,176) ¥(61,573) $(575)
Unrecognized actuarial loss . . . . . . . . . . . . . . . . . . . . . . . . . . . . . 328,467 322,237 3,011 27,550 37,383 349
Unrecognized net transition asset . . . . . . . . . . . . . . . . . . . . . . . . (479) (104) (1) 211 7 0
Unrecognized prior service cost . . . . . . . . . . . . . . . . . . . . . . . . . . (20,784) (134,440) (1,256) (748) (501) (5)
Net amount recognized . . . . . . . . . . . . . . . . . . . . . . . . . . . . . . . . ¥(173,243) ¥(179,582) $(1,678) ¥(43,163) ¥(24,684) $(231)
Amounts recognized in the consolidated balance sheet consist of:
Prepaid benefit cost . . . . . . . . . . . . . . . . . . . . . . . . . . . . . . . . . — ¥(001,795 $(0,017 ¥(02,609 ¥(01,351 $(013
Accrued pension and severance costs, including current
portion . . . . . . . . . . . . . . . . . . . . . . . . . . . . . . . . . . . . . . . . . . ¥(322,677) (309,957) (2,897) (61,452) (42,934) (401)
Intangibles . . . . . . . . . . . . . . . . . . . . . . . . . . . . . . . . . . . . . . . . 21,263 — — 113 41 0
Accumulated other comprehensive income . . . . . . . . . . . . . . . 128,171 128,580 1,202 15,567 16,858 157
Net amount recognized . . . . . . . . . . . . . . . . . . . . . . . . . . . . . . . . ¥(173,243) ¥(179,582) $(1,678) ¥(43,163) ¥(24,684) $(231)
The accumulated benefit obligation for all defined benefit pension plan as follows:
Japanese plans Foreign plans
Dollars in Dollars inYen in millions millions Yen in millions millions
March 31 2004 2005 2005 2004 2005 2005
Accumulated benefit obligation . . . . . . . . . . . . . . . . . . . . . . . . . . ¥830,898 ¥835,420 $7,808 ¥129,879 ¥121,176 $1,132
The projected benefit obligations, the accumulated benefit obligations and fair value of plan assets for the pension plans with accu-
mulated benefit obligations in excess of plan assets were as follows:
Japanese plans Foreign plans
Dollars in Dollars inYen in millions millions Yen in millions millions
March 31 2004 2005 2005 2004 2005 2005
Projected benefit obligations . . . . . . . . . . . . . . . . . . . . . . . . . . . . ¥991,030 ¥898,985 $8,402 ¥135,459 ¥132,556 $1,239
Accumulated benefit obligations . . . . . . . . . . . . . . . . . . . . . . . . . 830,362 835,420 7,808 113,020 115,147 1,076
Fair value of plan assets . . . . . . . . . . . . . . . . . . . . . . . . . . . . . . . . 512,720 533,926 4,990 74,167 86,070 804
Weighted-average assumptions used to determine benefit obligations as of March 31, 2003, 2004 and 2005 were as follows:
BH6/30 05.7.7, 3:33 AMPage 105 Adobe PageMaker 6.0J/PPC
106 Sony Corporation
Japanese plans:
March 31 2004 2005
Equity securities . . . . . . . . . . . . . . . . . . . 39.0% 28.0%
Debt securities . . . . . . . . . . . . . . . . . . . . 14.7 34.7
Cash . . . . . . . . . . . . . . . . . . . . . . . . . . . 42.7 33.7
Other . . . . . . . . . . . . . . . . . . . . . . . . . . . 3.6 3.6
Total . . . . . . . . . . . . . . . . . . . . . . . . . . . 100.0% 100.0%
Weighted-average assumptions used to determine net pension and severance costs for the years ended March 31, 2003, 2004 and
2005 were as follows:
As required under FAS No. 87, the assumptions are reviewed
in accordance with changes in circumstances.
To determine the expected long-term rate of return on pen-
sion plan assets, Sony considers the current and expected
asset allocations, as well as historical and expected long-term
rate of returns on various categories of plan assets.
Japanese plans:
Years ended March 31 2003 2004 2005
Discount rate . . . . . . . . . . . . 2.4% 1.9% 2.4%
Expected return on plan
assets . . . . . . . . . . . . . . . . 4.0 4.0 3.2
Rate of compensation
increase . . . . . . . . . . . . . . . 3.0 3.0 3.3
Foreign plans:
Years ended March 31 2003 2004 2005
Discount rate . . . . . . . . . . . . 6.6% 6.3% 5.8%
Expected return on plan
assets . . . . . . . . . . . . . . . . 8.1 8.3 7.8
Rate of compensation
increase . . . . . . . . . . . . . . . 4.5 4.1 4.0
Following FAS132(R), the weighted-average rate of
compensation increase is calculated based on the pay-related
plans only. The point-based plan discussed above is excluded
from the calculation because payments made under the plan
are not based on employee compensation.
Foreign plans:
March 31 2004 2005
Equity securities . . . . . . . . . . . . . . . . . . . 63.2% 68.3%
Debt securities . . . . . . . . . . . . . . . . . . . . 26.6 23.4
Real estate . . . . . . . . . . . . . . . . . . . . . . 3.2 4.0
Other . . . . . . . . . . . . . . . . . . . . . . . . . . . 7.0 4.3
Total . . . . . . . . . . . . . . . . . . . . . . . . . . . 100.0% 100.0%
For the pension plans of Sony Corporation and most of its
subsidiaries, Sony’s asset investment policy is set so as to
compensate the appropriate level for employee’s benefit over
the long term.
For the pension plans of Sony Corporation and most of its
subsidiaries in Japan, the target allocation as of March 31,
2005, is, as a result of our Asset Liability management, 34% of
public equity, 56% of fixed income securities and 10% of other.
When determining an appropriate asset allocation, diversification
among assets is duly considered. The actual asset allocation as
of March 31, 2005 for Sony’s principal pension plans did not
meet the aforementioned target allocation as the Sony Employ-
ees’ Pension Fund tentatively held cash to be paid to the Japa-
nese government in relation to the transfer of the substitutional
portion of the benefit obligation and the related government-
specified portion of the plan assets discussed above. Such
transfer is expected to occur in the year ending March 31, 2006.
Sony makes contributions to its contributory funded defined
benefit pension plans as required by government regulation or
as deemed appropriate by management after considering the
fair value of plan assets, expected return on plan assets and the
present value of benefit obligations. Sony expects to contribute
approximately ¥35 billion ($327 million) to the Japanese plans
and approximately ¥6 billion ($56 million) to the foreign plans for
the year ending March 31, 2006.
The future benefit payments are expected as follows:
Japanese plans Foreign plans
Yen in Dollars in Yen in Dollars inmillions millions millions millions
Year ending March 31:
2006 . . . . . . . . . . . . . ¥018,281 $ 171 ¥ 5,625 $ 53
2007 . . . . . . . . . . . . . 19,734 184 5,977 56
2008 . . . . . . . . . . . . . 22,075 206 6,308 59
2009 . . . . . . . . . . . . . 24,600 230 6,860 64
2010 . . . . . . . . . . . . . 29,475 275 7,912 74
2011–2015 . . . . . . . . 181,527 1,697 51,919 485
Weighted-average pension plan asset allocations based on the fair value of such assets as of March 31, 2004 and 2005 were
as follows:
BH6/30 05.7.7, 3:33 AMPage 106 Adobe PageMaker 6.0J/PPC
Sony Corporation 107
16. Stockholders’ equity(1) Subsidiary tracking stock:
On June 20, 2001, Sony Corporation issued shares of subsid-
iary tracking stock in Japan, the economic value of which is
intended to be linked to the economic value of Sony Communi-
cation Network Corporation (“SCN”), a directly and indirectly
wholly owned subsidiary of Sony Corporation which is engaged
in Internet-related services. The subsidiary tracking stock hold-
ers have no direct rights in the equity or assets of SCN or the
assets of Sony Corporation. Except as summarized below, the
shares of subsidiary tracking stock have the same rights and
characteristics as those of shares of common stock.
The dividend on the shares of this series of subsidiary tracking
stock is payable only when the Board of Directors of SCN has
resolved to pay to its common stock holders a dividend in an
amount per share of the subsidiary tracking stock equal to the
amount of SCN’s dividend per share of its common stock
multiplied by the Standard Ratio (as defined in the articles of
incorporation), subject to statutory restriction on Sony
Corporation’s ability to pay dividends on its shares of capital
stock and the maximum dividend amount (as defined in the
articles of incorporation). If the amount of dividends paid to the
subsidiary tracking stock holders is less than the amount, which
should have been paid pursuant to the formula set forth above
due to the statutory restriction referred to above or for any other
reason, such shortfall will be accumulated and such cumulative
amount will be paid to the subsidiary tracking stock holders for
subsequent fiscal years. Any such dividend on the subsidiary
tracking stock is payable in priority to the payment of dividends
to the common stock holders. However, the subsidiary tracking
stockholders have no right to participate in the dividends to
common stock holders. Furthermore, even if the Board of
Directors of SCN does not take a resolution for the payment of
dividends to SCN’s common stock holders, Sony Corporation
may decide to pay dividends to its common stock holders.
The subsidiary tracking stockholders have the same voting
rights as those of the common stock holders and, thus, are
entitled to participate and vote at any General Meeting of Share-
holders in the same way as the common stock holders. In
addition, as each series of subsidiary tracking stock is a sepa-
rate class of stock different from common stock, if any resolu-
tion of the General Meeting of Shareholders would adversely
affect the rights of the shareholders of a particular class of
subsidiary tracking stock, the shareholders of each class of
subsidiary tracking stock will have the right to approve or disap-
prove such resolution by a special resolution of the meeting of
shareholders of that class of subsidiary tracking stock.
In the event of distribution of residual assets to the sharehold-
ers of Sony Corporation where, as long as such assets include
shares of common stock of SCN, the number of shares of SCN
common stock obtained by multiplying the number of shares of
the subsidiary tracking stock held by each holder by the Stan-
dard Ratio or the net proceeds from the sale of the shares of
SCN common stock so to be distributed will be distributed to
the holders of the subsidiary tracking stock.
The shares of subsidiary tracking stock may be subject to
repurchase and retirement in the same manner and under the
same restriction as the shares of common stock. In addition, at
any time after the passage of three years from the date of the
initial issuance of shares of a series of subsidiary tracking stock,
it may retire the entire amount of all outstanding shares of that
series of subsidiary tracking stock upon paying to the sharehold-
ers thereof an amount equal to the current market price of the
subsidiary tracking stock out of Sony Corporation’s retained
earnings available for dividend payments. Sony Corporation may
also retire the shares of a series of subsidiary tracking stock in
their entirety pursuant to the procedures prescribed by the
Japanese Commercial Code for the reduction of capital upon
payment to the subsidiary tracking stock holders an amount
equal to the market value thereof as set forth above.
At any time after the passage of three years from the date of
the initial issuance of shares of a series of subsidiary tracking
stock, it may convert the entire amount of all outstanding shares
of the subsidiary tracking stock into the shares of Sony
Corporation’s common stock at the rate of the multiple of 1.1 of
the market value (as defined in the articles of incorporation) of
shares of the subsidiary tracking stock divided by the market
value (as similarly defined) of the shares of Sony Corporation’s
common stock.
If any events (as defined in the articles of incorporation) occur,
the entire amount of all outstanding shares of the subsidiary
tracking stock will be either retired or converted into shares of
Sony Corporation’s common stock at the price or rate set forth
above. On April 26, 2005, Sony Corporation decided at the Board
of Directors to go through procedures for the initial public offering
of SCN. If the listing of SCN common stock is approved by the
stock exchange, subject to required procedures, all of the subsid-
iary tracking stock will be compulsorily terminated pursuant to the
articles of incorporation. The method of such termination will be
one of the following: 1) compulsory retirement in cash, 2) compul-
sory conversion to common stock of Sony Corporation, or 3)
compulsory exchange with common stock of SCN.
The number of shares of the subsidiary tracking stock issued
and outstanding at March 31, 2005 was 3,072,000. At March
31, 2005, 136,454 shares of the subsidiary tracking stock would
be issued upon exercise of warrants and stock acquisition rights
outstanding.
BH6/30 05.7.7, 3:33 AMPage 107 Adobe PageMaker 6.0J/PPC
108 Sony Corporation
(2) Common stock:
Changes in the number of shares of common stock issued and
outstanding during the years ended March 31, 2003, 2004 and
2005 have resulted from the following:Number of shares
Balance at March 31, 2002 . . . . . . . . . . . . . . . . . . . 919,744,355
Conversion of convertible bonds . . . . . . . . . . . . . . . 138,330
Stock issued under exchange offering . . . . . . . . . . . 2,502,491
Balance at March 31, 2003 . . . . . . . . . . . . . . . . . . . 922,385,176
Conversion of convertible bonds . . . . . . . . . . . . . . . 2,944,800
Stock issued under exchange offering . . . . . . . . . . . 1,088,304
Balance at March 31, 2004 . . . . . . . . . . . . . . . . . . . 926,418,280
Conversion of convertible bonds . . . . . . . . . . . . . . . 70,765,533
Exercise of stock acquisition rights . . . . . . . . . . . . . 27,400
Balance at March 31, 2005 . . . . . . . . . . . . . . . . . . . 997,211,213
At March 31, 2005, 55,609,085 shares of common stock
would be issued upon conversion or exercise of all convertible
bonds, warrants and stock acquisition rights outstanding.
On October 1, 2002, Sony Corporation implemented a share
exchange as a result of which Aiwa Co., Ltd. became a wholly-
owned subsidiary. As a result of this share exchange, Sony
Corporation issued 2,502,491 new shares, the minority interest
in Aiwa Co., Ltd. was eliminated from the balance sheet, and
additional paid-in capital increased ¥15,791 million.
On May 1, 2003, Sony Corporation implemented a share
exchange as a result of which CIS Corporation became a
wholly-owned subsidiary. As a result of this share exchange,
Sony Corporation issued 1,088,304 new shares, and additional
paid-in capital increased ¥5,409 million.
On November 20, 1991, Sony Corporation made a free share
distribution of 33,908,621 shares in ratios of one share for each
ten shares held for which no accounting entry was required in
Japan. Had the distribution been accounted for in the manner
adopted by companies in the United States of America,
¥201,078 million would have been transferred from retained
earnings to the appropriate capital accounts. This has been the
only free distribution of common stock where no accounting
entry was required in Japan.
Conversions of convertible bonds into common stock are
accounted for in accordance with the provisions of the Japa-
nese Commercial Code by crediting approximately one-half of
the conversion proceeds to the common stock account and the
remainder to the additional paid-in capital account.
Prior to the amendments to the Japanese Commercial Code
enacted on April 1, 2002, purchase and retirement by Sony
Corporation of its own shares could be made at any time by
resolution of the Board of Directors. No common stock and
subsidiary tracking stock had been acquired under the approval
during the year ended March 31, 2002.
Following the amendments to the Japanese Commercial Code
enacted on April 1, 2002, purchase by Sony Corporation of its
own shares was subject to the prior approval of shareholders at
the Ordinary General Meeting of Shareholders, which included the
maximum number of shares and the maximum total amount to be
purchased for each class of stock. Once such approval of share-
holders was obtained, Sony Corporation could purchase its own
shares at any time during the period up to the conclusion of the
next Ordinary General Meeting of Shareholders.
The Ordinary General Meeting of Shareholders held on June
20, 2002 approved that Sony Corporation acquire up to a total
not exceeding 90 million outstanding shares of its common
stock at an amount in total not exceeding ¥650 billion and a
total not exceeding 300 thousand outstanding shares of the
subsidiary tracking stock at an amount in total not exceeding ¥1
billion until the conclusion of the General Meeting of Sharehold-
ers held for the year ended March 31, 2003. As a result, no
common stock and subsidiary tracking stock had been acquired
under this approval.
The Ordinary General Meeting of Shareholders held on June
20, 2003 approved that Sony Corporation acquire up to a total
not exceeding 90 million outstanding shares of its common stock
at an amount in total not exceeding ¥400 billion and a total not
exceeding 300 thousand outstanding shares of the subsidiary
tracking stock at an amount in total not exceeding ¥1 billion. As a
result, Sony Corporation had acquired 2 million outstanding
shares of its common stock at an amount in ¥8,200 million. No
subsidiary tracking stock had been acquired under this approval.
The Ordinary General Meeting of Shareholders held on June
22, 2004 approved to amend the articles of incorporation that
Sony Corporation may purchase its own shares by a resolution
of the Board of Directors, in accordance with the amendments
to the Japanese Commercial Code enacted on September 25,
2003. With the amendment of the articles of incorporation, Sony
Corporation may purchase its own shares at any time by a
resolution of the Board of Directors up to the retained earnings
available for dividends to shareholders. No common stock and
subsidiary tracking stock had been acquired by the resolution of
the Board of Directors during the year ended March 31, 2005.
(3) Retained earnings:
The amount of statutory retained earnings of Sony Corporation
available for dividends to shareholders as of March 31, 2005
was ¥557,856 million ($5,214million). The appropriation of
retained earnings for the year ended March 31, 2005 including
cash dividends for the six-month period ended March 31, 2005
has been incorporated in the accompanying consolidated
financial statements. This appropriation of retained earnings was
approved at the meeting of the Board of Directors of Sony
Corporation held on May 16, 2005 and was then recorded in the
statutory books of account, in accordance with the Japanese
Commercial Code.
BH6/30 05.7.7, 3:33 AMPage 108 Adobe PageMaker 6.0J/PPC
Sony Corporation 109
(4) Other comprehensive income:
Other comprehensive income for the years ended March 31, 2003, 2004 and 2005 were as follows:Yen in millions
Pre-tax Tax Net-of-taxamount expense amount
For the year ended March 31, 2003:
Unrealized gains on securities—
Unrealized holding gains (losses) arising during the period . . . . . . . . . . . . . . . . . . . . . . . . . . . . . . . . ¥0(18,575) ¥ 08,948 ¥00(9,627)
Less: Reclassification adjustment for gains (losses) included in net income . . . . . . . . . . . . . . . . . . . 3,421 867 4,288
Unrealized losses on derivative instruments—
Unrealized holding gains (losses) arising during the period . . . . . . . . . . . . . . . . . . . . . . . . . . . . . . . . (6,268) 1,791 (4,477)
Less: Reclassification adjustment for gains (losses) included in net income . . . . . . . . . . . . . . . . . . . 682 (287) 395
Minimum pension liability adjustment . . . . . . . . . . . . . . . . . . . . . . . . . . . . . . . . . . . . . . . . . . . . . . . . . . (181,725) 71,089 (110,636)
Foreign currency translation adjustments—
Translation adjustments arising during the period . . . . . . . . . . . . . . . . . . . . . . . . . . . . . . . . . . . . . . . (87,103) 3,110 (83,993)
Less: Reclassification adjustment for losses included in net income . . . . . . . . . . . . . . . . . . . . . . . . 7,665 — 7,665
Other comprehensive income . . . . . . . . . . . . . . . . . . . . . . . . . . . . . . . . . . . . . . . . . . . . . . . . . . . . . . . ¥(281,903) ¥ 85,518 ¥(196,385)
For the year ended March 31, 2004:
Unrealized gains on securities—
Unrealized holding gains (losses) arising during the period . . . . . . . . . . . . . . . . . . . . . . . . . . . . . . . . ¥(089,861 ¥(31,890) ¥(057,971
Less: Reclassification adjustment for gains (losses) included in net income . . . . . . . . . . . . . . . . . . . (7,371) 1,692 (5,679)
Unrealized losses on derivative instruments—
Unrealized holding gains (losses) arising during the period . . . . . . . . . . . . . . . . . . . . . . . . . . . . . . . . 11,586 (4,049) 7,537
Less: Reclassification adjustment for gains (losses) included in net income . . . . . . . . . . . . . . . . . . . (5,961) 2,617 (3,344)
Minimum pension liability adjustment . . . . . . . . . . . . . . . . . . . . . . . . . . . . . . . . . . . . . . . . . . . . . . . . . . 162,408 (68,993) 93,415
Foreign currency translation adjustments—
Translation adjustments arising during the period . . . . . . . . . . . . . . . . . . . . . . . . . . . . . . . . . . . . . . . (134,312) 5,199 (129,113)
Less: Reclassification adjustment for losses included in net income . . . . . . . . . . . . . . . . . . . . . . . . . 1,232 — 1,232
Other comprehensive income . . . . . . . . . . . . . . . . . . . . . . . . . . . . . . . . . . . . . . . . . . . . . . . . . . . . . . . ¥(117,443 ¥(95,424) ¥(022,019
For the year ended March 31, 2005:
Unrealized gains on securities—
Unrealized holding gains (losses) arising during the period . . . . . . . . . . . . . . . . . . . . . . . . . . . . . . . . ¥ (07,184 ¥ (1,541) ¥( 05,643
Less: Reclassification adjustment for gains (losses) included in net income . . . . . . . . . . . . . . . . . . . (18,140) 5,216 (12,924)
Unrealized losses on derivative instruments—
Unrealized holding gains (losses) arising during the period . . . . . . . . . . . . . . . . . . . . . . . . . . . . . . . . (2,015) 1,806 (209)
Less: Reclassification adjustment for gains (losses) included in net income . . . . . . . . . . . . . . . . . . . (2,848) 1,167 (1,681)
Minimum pension liability adjustment . . . . . . . . . . . . . . . . . . . . . . . . . . . . . . . . . . . . . . . . . . . . . . . . . . (1,700) 931 (769)
Foreign currency translation adjustments—
Translation adjustments arising during the period . . . . . . . . . . . . . . . . . . . . . . . . . . . . . . . . . . . . . . . 76,585 (2,361) 74,224
Other comprehensive income . . . . . . . . . . . . . . . . . . . . . . . . . . . . . . . . . . . . . . . . . . . . . . . . . . . . . . . ¥ (59,066 ¥ (5,218 ¥ (64,284
Retained earnings include Sony’s equity in undistributed
earnings of affiliated companies accounted for by the equity
method in the amount of ¥2,261 million and ¥2,724 million ($25
million) at March 31, 2004 and 2005, respectively.
BH6/30 05.7.7, 3:33 AMPage 109 Adobe PageMaker 6.0J/PPC
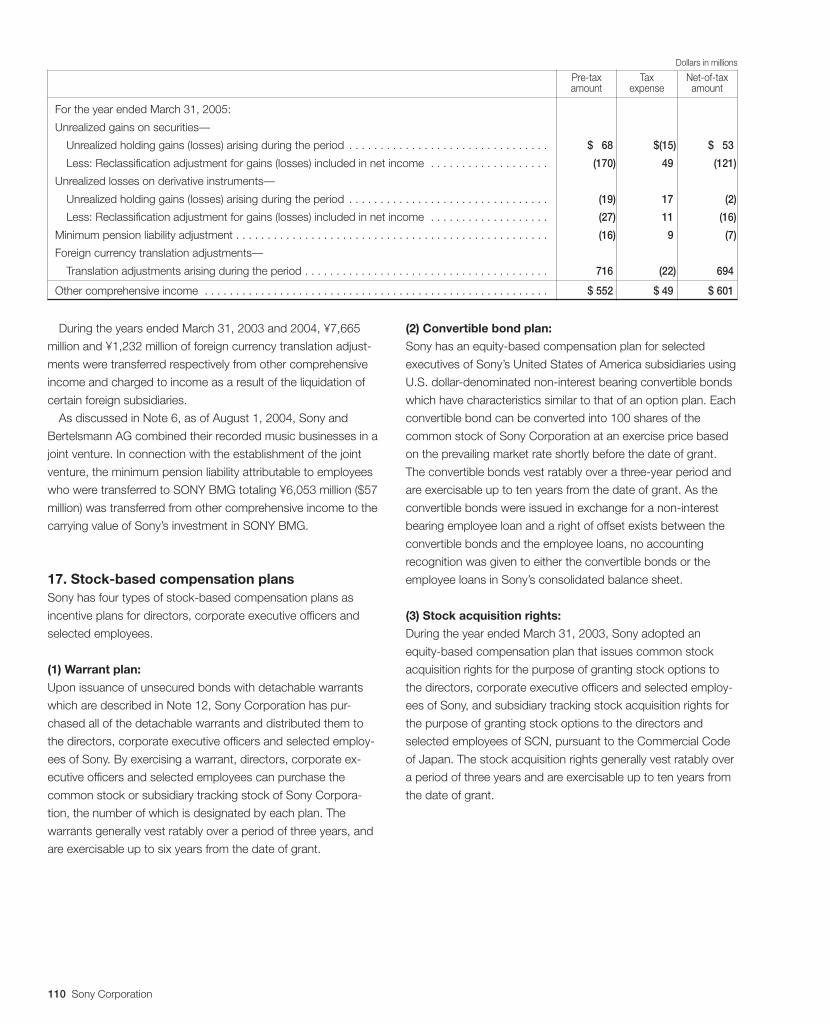
110 Sony Corporation
Dollars in millions
Pre-tax Tax Net-of-taxamount expense amount
For the year ended March 31, 2005:
Unrealized gains on securities—
Unrealized holding gains (losses) arising during the period . . . . . . . . . . . . . . . . . . . . . . . . . . . . . . . . $(068 $(15) $(053
Less: Reclassification adjustment for gains (losses) included in net income . . . . . . . . . . . . . . . . . . . (170) 49 (121)
Unrealized losses on derivative instruments—
Unrealized holding gains (losses) arising during the period . . . . . . . . . . . . . . . . . . . . . . . . . . . . . . . . (19) 17 (2)
Less: Reclassification adjustment for gains (losses) included in net income . . . . . . . . . . . . . . . . . . . (27) 11 (16)
Minimum pension liability adjustment . . . . . . . . . . . . . . . . . . . . . . . . . . . . . . . . . . . . . . . . . . . . . . . . . . (16) 9 (7)
Foreign currency translation adjustments—
Translation adjustments arising during the period . . . . . . . . . . . . . . . . . . . . . . . . . . . . . . . . . . . . . . . 716 (22) 694
Other comprehensive income . . . . . . . . . . . . . . . . . . . . . . . . . . . . . . . . . . . . . . . . . . . . . . . . . . . . . . . $(552 $(49 $(601
During the years ended March 31, 2003 and 2004, ¥7,665
million and ¥1,232 million of foreign currency translation adjust-
ments were transferred respectively from other comprehensive
income and charged to income as a result of the liquidation of
certain foreign subsidiaries.
As discussed in Note 6, as of August 1, 2004, Sony and
Bertelsmann AG combined their recorded music businesses in a
joint venture. In connection with the establishment of the joint
venture, the minimum pension liability attributable to employees
who were transferred to SONY BMG totaling ¥6,053 million ($57
million) was transferred from other comprehensive income to the
carrying value of Sony’s investment in SONY BMG.
17. Stock-based compensation plansSony has four types of stock-based compensation plans as
incentive plans for directors, corporate executive officers and
selected employees.
(1) Warrant plan:
Upon issuance of unsecured bonds with detachable warrants
which are described in Note 12, Sony Corporation has pur-
chased all of the detachable warrants and distributed them to
the directors, corporate executive officers and selected employ-
ees of Sony. By exercising a warrant, directors, corporate ex-
ecutive officers and selected employees can purchase the
common stock or subsidiary tracking stock of Sony Corpora-
tion, the number of which is designated by each plan. The
warrants generally vest ratably over a period of three years, and
are exercisable up to six years from the date of grant.
(2) Convertible bond plan:
Sony has an equity-based compensation plan for selected
executives of Sony’s United States of America subsidiaries using
U.S. dollar-denominated non-interest bearing convertible bonds
which have characteristics similar to that of an option plan. Each
convertible bond can be converted into 100 shares of the
common stock of Sony Corporation at an exercise price based
on the prevailing market rate shortly before the date of grant.
The convertible bonds vest ratably over a three-year period and
are exercisable up to ten years from the date of grant. As the
convertible bonds were issued in exchange for a non-interest
bearing employee loan and a right of offset exists between the
convertible bonds and the employee loans, no accounting
recognition was given to either the convertible bonds or the
employee loans in Sony’s consolidated balance sheet.
(3) Stock acquisition rights:
During the year ended March 31, 2003, Sony adopted an
equity-based compensation plan that issues common stock
acquisition rights for the purpose of granting stock options to
the directors, corporate executive officers and selected employ-
ees of Sony, and subsidiary tracking stock acquisition rights for
the purpose of granting stock options to the directors and
selected employees of SCN, pursuant to the Commercial Code
of Japan. The stock acquisition rights generally vest ratably over
a period of three years and are exercisable up to ten years from
the date of grant.
BH6/30 05.7.7, 3:33 AMPage 110 Adobe PageMaker 6.0J/PPC
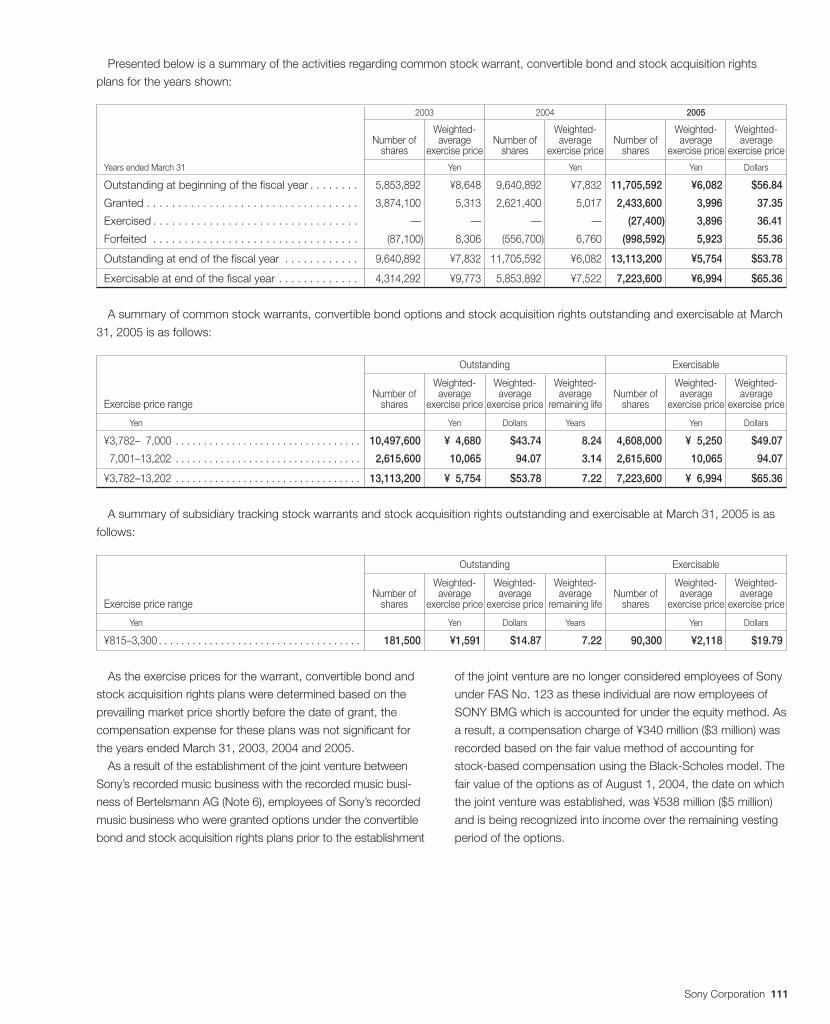
Sony Corporation 111
Presented below is a summary of the activities regarding common stock warrant, convertible bond and stock acquisition rights
plans for the years shown:
2003 2004 2005
Weighted- Weighted- Weighted- Weighted-Number of average Number of average Number of average average
shares exercise price shares exercise price shares exercise price exercise price
Years ended March 31 Yen Yen Yen Dollars
Outstanding at beginning of the fiscal year . . . . . . . . 5,853,892 ¥8,648 9,640,892 ¥7,832 11,705,592 ¥6,082 $56.84
Granted . . . . . . . . . . . . . . . . . . . . . . . . . . . . . . . . . . 3,874,100 5,313 2,621,400 5,017 2,433,600 3,996 37.35
Exercised . . . . . . . . . . . . . . . . . . . . . . . . . . . . . . . . . — — — — (27,400) 3,896 36.41
Forfeited . . . . . . . . . . . . . . . . . . . . . . . . . . . . . . . . . (87,100) 8,306 (556,700) 6,760 (998,592) 5,923 55.36
Outstanding at end of the fiscal year . . . . . . . . . . . . 9,640,892 ¥7,832 11,705,592 ¥6,082 13,113,200 ¥5,754 $53.78
Exercisable at end of the fiscal year . . . . . . . . . . . . . 4,314,292 ¥9,773 5,853,892 ¥7,522 7,223,600 ¥6,994 $65.36
A summary of common stock warrants, convertible bond options and stock acquisition rights outstanding and exercisable at March
31, 2005 is as follows:
Outstanding Exercisable
Weighted- Weighted- Weighted- Weighted- Weighted-Number of average average average Number of average average
Exercise price range shares exercise price exercise price remaining life shares exercise price exercise price
Yen Yen Dollars Years Yen Dollars
¥3,782–07,000 . . . . . . . . . . . . . . . . . . . . . . . . . . . . . . . . . 10,497,600 ¥04,680 $43.74. 8.24. 4,608,000 ¥05,250 $49.07.
¥7,001–13,202 . . . . . . . . . . . . . . . . . . . . . . . . . . . . . . . . . 2,615,600 10,065 94.07. 3.14. 2,615,600 10,065 94.07.
¥3,782–13,202 . . . . . . . . . . . . . . . . . . . . . . . . . . . . . . . . . 13,113,200 ¥05,754 $53.78. 7.22. 7,223,600 ¥06,994 $65.36.
A summary of subsidiary tracking stock warrants and stock acquisition rights outstanding and exercisable at March 31, 2005 is as
follows:
Outstanding Exercisable
Weighted- Weighted- Weighted- Weighted- Weighted-Number of average average average Number of average average
Exercise price range shares exercise price exercise price remaining life shares exercise price exercise price
Yen Yen Dollars Years Yen Dollars
¥815–3,300 . . . . . . . . . . . . . . . . . . . . . . . . . . . . . . . . . . . . 181,500 ¥1,591 $14.87. 7.22. 90,300 ¥2,118 $19.79.
As the exercise prices for the warrant, convertible bond and
stock acquisition rights plans were determined based on the
prevailing market price shortly before the date of grant, the
compensation expense for these plans was not significant for
the years ended March 31, 2003, 2004 and 2005.
As a result of the establishment of the joint venture between
Sony’s recorded music business with the recorded music busi-
ness of Bertelsmann AG (Note 6), employees of Sony’s recorded
music business who were granted options under the convertible
bond and stock acquisition rights plans prior to the establishment
of the joint venture are no longer considered employees of Sony
under FAS No. 123 as these individual are now employees of
SONY BMG which is accounted for under the equity method. As
a result, a compensation charge of ¥340 million ($3 million) was
recorded based on the fair value method of accounting for
stock-based compensation using the Black-Scholes model. The
fair value of the options as of August 1, 2004, the date on which
the joint venture was established, was ¥538 million ($5 million)
and is being recognized into income over the remaining vesting
period of the options.
BH6/30 05.7.7, 3:33 AMPage 111 Adobe PageMaker 6.0J/PPC
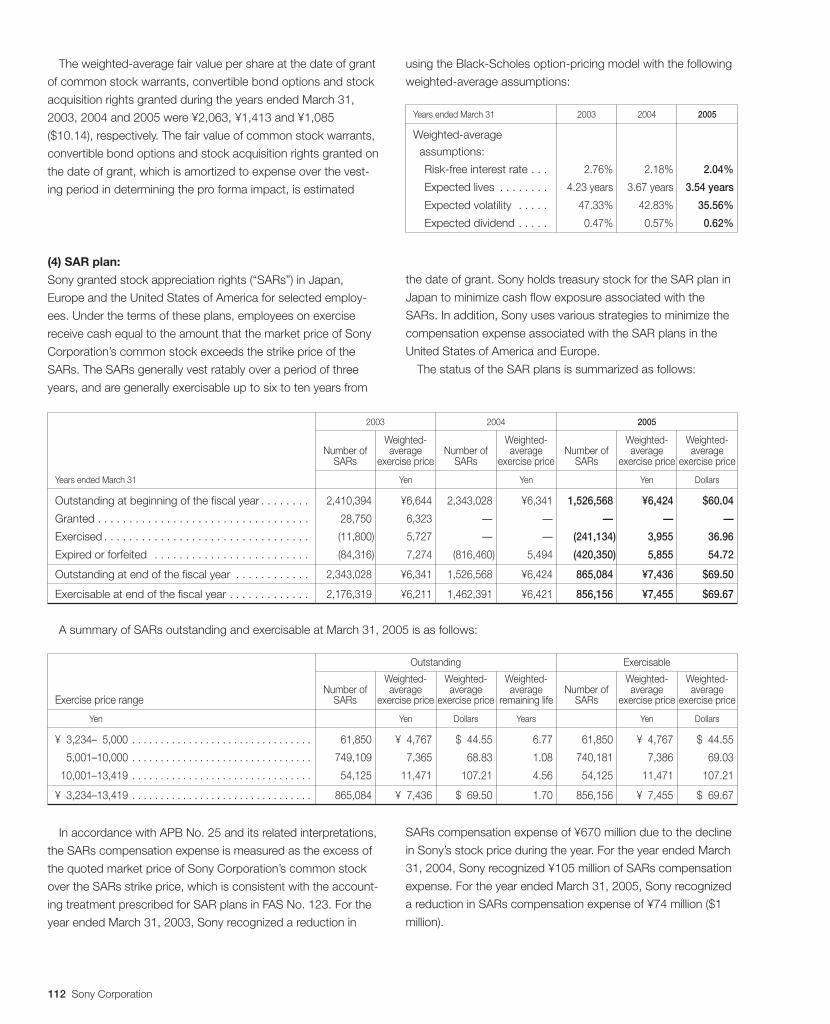
112 Sony Corporation
2003 2004 2005
Weighted- Weighted- Weighted- Weighted-Number of average Number of average Number of average average
SARs exercise price SARs exercise price SARs exercise price exercise price
Years ended March 31 Yen Yen Yen Dollars
Outstanding at beginning of the fiscal year . . . . . . . . 2,410,394 ¥6,644 2,343,028 ¥6,341 1,526,568 ¥6,424 $60.04.
Granted . . . . . . . . . . . . . . . . . . . . . . . . . . . . . . . . . . 28,750 6,323 — — — — —
Exercised . . . . . . . . . . . . . . . . . . . . . . . . . . . . . . . . . (11,800) 5,727 — — (241,134) 3,955 36.96.
Expired or forfeited . . . . . . . . . . . . . . . . . . . . . . . . . (84,316) 7,274 (816,460) 5,494 (420,350) 5,855 54.72.
Outstanding at end of the fiscal year . . . . . . . . . . . . 2,343,028 ¥6,341 1,526,568 ¥6,424 865,084 ¥7,436 $69.50.
Exercisable at end of the fiscal year . . . . . . . . . . . . . 2,176,319 ¥6,211 1,462,391 ¥6,421 856,156 ¥7,455 $69.67.
A summary of SARs outstanding and exercisable at March 31, 2005 is as follows:
Outstanding Exercisable
Weighted- Weighted- Weighted- Weighted- Weighted-Number of average average average Number of average average
Exercise price range SARs exercise price exercise price remaining life SARs exercise price exercise price
Yen Yen Dollars Years Yen Dollars
¥03,234–05,000 . . . . . . . . . . . . . . . . . . . . . . . . . . . . . . . . 61,850 ¥04,767 $044.55. 6.77. 61,850 ¥04,767 $044.55.
¥05,001–10,000 . . . . . . . . . . . . . . . . . . . . . . . . . . . . . . . . 749,109 7,365 68.83. 1.08. 740,181 7,386 69.03.
¥10,001–13,419 . . . . . . . . . . . . . . . . . . . . . . . . . . . . . . . . 54,125 11,471 107.21. 4.56. 54,125 11,471 107.21.
¥03,234–13,419 . . . . . . . . . . . . . . . . . . . . . . . . . . . . . . . . 865,084 ¥07,436 $069.50. 1.70. 856,156 ¥07,455 $069.67.
In accordance with APB No. 25 and its related interpretations,
the SARs compensation expense is measured as the excess of
the quoted market price of Sony Corporation’s common stock
over the SARs strike price, which is consistent with the account-
ing treatment prescribed for SAR plans in FAS No. 123. For the
year ended March 31, 2003, Sony recognized a reduction in
The weighted-average fair value per share at the date of grant
of common stock warrants, convertible bond options and stock
acquisition rights granted during the years ended March 31,
2003, 2004 and 2005 were ¥2,063, ¥1,413 and ¥1,085
($10.14), respectively. The fair value of common stock warrants,
convertible bond options and stock acquisition rights granted on
the date of grant, which is amortized to expense over the vest-
ing period in determining the pro forma impact, is estimated
using the Black-Scholes option-pricing model with the following
weighted-average assumptions:
Years ended March 31 2003 2004 2005
Weighted-average
assumptions:
Risk-free interest rate . . . 2.76% 2.18% 2.04%
Expected lives . . . . . . . . 4.23 years 3.67 years 3.54 years
Expected volatility . . . . . 47.33% 42.83% 35.56%
Expected dividend . . . . . 0.47% 0.57% 0.62%
(4) SAR plan:
Sony granted stock appreciation rights (“SARs”) in Japan,
Europe and the United States of America for selected employ-
ees. Under the terms of these plans, employees on exercise
receive cash equal to the amount that the market price of Sony
Corporation’s common stock exceeds the strike price of the
SARs. The SARs generally vest ratably over a period of three
years, and are generally exercisable up to six to ten years from
the date of grant. Sony holds treasury stock for the SAR plan in
Japan to minimize cash flow exposure associated with the
SARs. In addition, Sony uses various strategies to minimize the
compensation expense associated with the SAR plans in the
United States of America and Europe.
The status of the SAR plans is summarized as follows:
SARs compensation expense of ¥670 million due to the decline
in Sony’s stock price during the year. For the year ended March
31, 2004, Sony recognized ¥105 million of SARs compensation
expense. For the year ended March 31, 2005, Sony recognized
a reduction in SARs compensation expense of ¥74 million ($1
million).
BH6/30 05.7.7, 3:33 AMPage 112 Adobe PageMaker 6.0J/PPC
Sony Corporation 113
18. Restructuring charges and asset impairmentsAs part of its effort to improve the performance of the various
businesses, Sony has undertaken a number of restructuring
initiatives within the Electronics, Music and Pictures segments.
For the years ended March 31, 2003, 2004 and 2005, Sony
recorded total restructuring charges of ¥106,251 million,
¥168,091 million and ¥89,963 million ($841 million), respectively.
Significant restructuring charges and asset impairments include
the following:
Electronics Segment
In an effort to improve the performance of the Electronics seg-
ment, Sony has undergone a number of restructuring efforts to
reduce its operating costs. For the years ended March 31,
2003, 2004 and 2005, Sony recorded total restructuring
charges of ¥72,473 million, ¥143,310 million and ¥81,768
million ($764 million), respectively, within the Electronics seg-
ment. In addition to the above charges, the Electronics segment
also reflects restructuring of ¥7,950 million and ¥2,122 million
for the years ended March 31, 2003 and 2004, respectively, that
relate to the non-Japan based disc manufacturing and physical
distribution businesses that were part of the restructuring
charges of the Music segment which is discussed below. These
restructuring charges were formerly included within the Music
segment but were reclassified to the Electronics segment. See
Notes 6 and 25 for more information on this reclassification.
Significant restructuring activities are the following:
Downsizing of computer display CRT operations
In the year ended March 31, 2003, due to the market shrinkage
and demand shift from CRT displays to LCDs, Sony made a
decision to discontinue certain computer display CRT manufac-
turing operations in Japan and Southeast Asia to rationalize
production facilities and downsize its business. Restructuring
charges totaling ¥6,902 million consisted of personnel related
costs of ¥1,208 million, non-cash equipment impairment and
disposal costs of ¥4,010 million and contract termination and
other costs of ¥1,684 million. Of the total restructuring charges,
¥1,264 million was recorded in cost of sales; ¥1,684 million was
included in selling, general and administrative expenses, and
¥3,954 million was recorded in loss on sale, disposal or impair-
ment of assets, net in the consolidated statements of income.
The restructuring activity was completed in the year ended
March 31, 2003 and no liability existed as of March 31, 2004.
Downsizing of CRT TV display operations
Due to the worldwide market shrinkage and demand shift from
CRT displays to plasma and LCD panel displays, Sony has
begun to implement a worldwide plan to rationalize production
facilities of CRT TV display and downsize its business over the
next several years. The overall restructuring plan is still being
formulated as Sony is carefully monitoring the market situation in
each area. As a result, the expected completion date and total
estimated cost of this program cannot be determined at this time.
As part of its worldwide plan, Sony made a decision in the
year ended March 31, 2004 to discontinue certain CRT TV
display manufacturing operations in Japan. Restructuring
charges totaling ¥8,478 million consisted of personnel related
costs of ¥3,139 million and non-cash equipment impairment,
disposal and other costs of ¥5,339 million. Of the total restruc-
turing charges, ¥158 million was recorded in cost of sales,
¥3,139 million was included in selling, general and administrative
expenses, and ¥5,181 million was included in loss on sale,
disposal or impairment of assets, net in the consolidated state-
ments of income. This phase of the restructuring program was
completed in the year ended March 31, 2004 and no liability
existed as of March 31, 2005.
In the year ended March 31, 2005, as part of this restructuring
program, Sony recorded a non-cash impairment charge of
¥7,479 million ($70 million) for the CRT TV display manufactur-
ing facilities located in Europe. The impairment charge was
calculated as the difference between the carrying value of the
asset group and the present value of estimated future cash
flows. The charge was recorded in loss on sale, disposal or
impairment of assets, net in the consolidated statements of
income. This phase of the restructuring program was completed
in the year ended March 31, 2005 and no liability existed as of
March 31, 2005.
Aiwa Co., Ltd. restructuring
Due to the continued decline in the operating results of Aiwa,
the restructuring program that was initiated in the year ended
March 31, 2002 was accelerated and additional restructuring
charges of ¥23,007 million were recorded in the year ended
March 31, 2003. Additional restructuring included further cuts in
staffing levels and the shutdown of remaining production facili-
ties. These charges consisted of non-cash equipment impair-
ment and disposal costs of ¥3,504 million, personnel related
costs of ¥7,647 million, devaluation of inventory of ¥6,144
million, operating lease termination costs of ¥3,823 million and
other costs of ¥1,889 million. Among these charges ¥13,791
million was recorded in cost of sales, ¥5,712 million was in-
cluded in selling, general and administrative expenses, and
¥3,504 million was included in loss on sale, disposal or impair-
ment of assets, net in the consolidated statements of income.
The restructuring program was completed in the year ended
March 31, 2003 and no liability existed as of March 31, 2003.
Aiwa Co., Ltd. was merged into Sony Corporation as of Decem-
ber 1, 2002.
BH6/30 05.7.7, 3:33 AMPage 113 Adobe PageMaker 6.0J/PPC
114 Sony Corporation
Closing of a semiconductor plant in the U.S.
Due to a significant decline in the business conditions of the
U.S. semiconductor industry, Sony made a decision in the fourth
quarter of the year ended March 31, 2003, to close a semicon-
ductor plant in the U.S. This restructuring activity was substan-
tially completed in the year ended March 31, 2005 and total
restructuring charges of ¥4,936 million ($46 million) have been
incurred through March 31, 2005. The remaining liability balance
as of March 31, 2005 was ¥161 million ($2 million) and will be
paid or settled through the year ended March 31, 2006.
During the year ended March 31, 2003, Sony recorded
restructuring charges totaling ¥5,856 million, which consisted
of the accelerated depreciation of equipment of ¥3,128 million,
personnel related costs of ¥1,329 million and the devaluation of
inventory and other costs of ¥1,399 million. These charges were
all recorded in cost of sales in the consolidated statements
of income.
During the year ended March 31, 2004, Sony recorded net
restructuring charges totaling ¥874 million which consisted of
the accelerated depreciation and write-down of equipment of
¥1,982 million, gain on disposal of assets of ¥1,962 million, and
¥854 million of other costs including lease contract termination
costs. Among these charges ¥1,760 million was recorded in
cost of sales, while asset write-down and disposal costs of
¥1,076 million and the gain on asset disposals of ¥1,962 million
were included in loss on sale, disposal or impairment of assets,
net in the consolidated statements of income.
During the year ended March 31, 2005, Sony sold the facilities
and recorded a gain on disposal of ¥1,794 million ($17 million).
The gain was included in loss (gain) on disposal or impairment of
assets, net in the consolidated statements of income.
Retirement programs
In addition to the restructuring efforts disclosed above, Sony has
undergone several headcount reduction programs to further reduce
operating costs in the Electronics segment. As a result of these
programs, Sony recorded restructuring charges totaling ¥22,236
million, ¥114,870 million and ¥50,276 million ($470 million) for
the years ended March 31, 2003, 2004 and 2005, respectively,
and these charges were included in selling, general and admin-
istrative expenses in the consolidated statements of income.
These staff reductions were achieved worldwide mostly through
the implementation of early retirement programs. The remaining
liability balance as of March 31, 2005 was ¥14,011 million ($131
million) and will be paid through the year ending March 31, 2006.
Sony will continue seeking the appropriate level of headcount to
optimize the workforce in the Electronics segment.
Music Segment
Due to the continued contraction of the worldwide music market
due to slow worldwide economic growth, the saturation of the
CD market, the effects of piracy and other illegal duplication,
parallel imports, pricing pressures and the diversification of
customer preferences, Sony has been actively repositioning the
Music segment for the future by looking to create a more effec-
tive and profitable business model. As a result, the Music seg-
ment has undergone a worldwide restructuring program since
the year ended March 31, 2001 to reduce staffing and other
costs through the consolidation and rationalization of facilities
worldwide excluding Japan. As part of this restructuring pro-
gram, Sony combined its recorded music business with the
recorded music business of Bertelsmann AG to form SONY
BMG, a joint venture that is accounted for under the equity
method. See Note 6 for more information on this transaction.
For the years ended March 31, 2003, 2004 and 2005, Sony
recorded total restructuring charges of ¥22,350 million, ¥10,691
million and ¥3,025 million ($28 million), respectively, related to
the restructuring of the Music segment excluding Japan. Of
these restructuring charges, ¥7,950 million and ¥2,122 million
for the years ended March 31, 2003 and 2004, respectively,
were recorded in the non-Japan based disc manufacturing and
physical distribution businesses, formerly included within the
Music segment but reclassified to the Electronics segment. See
Notes 6 and 25 for more information on this reclassification. This
worldwide restructuring of the Music segment is expected to be
completed during the year ended March 31, 2006, and the total
cost of the program is estimated to be ¥53,106 million ($496
million), of which ¥52,573 million ($491 million) was incurred from
the inception of the program through the year ended March 31,
2005. The restructuring costs within the Music segment do not
include the restructuring costs of SONY BMG since the establish-
ment of the joint venture. At March 31, 2005, the liability balance
was ¥1,856 million ($17 million) with most of the liabilities to be
paid or settled during the year ending March 31, 2006.
In addition to the above, Sony also recorded restructuring
charges of ¥1,519 million, ¥1,291 million and ¥ 803 million ($8
million) for the years ended March 31, 2003, 2004 and 2005,
respectively, in Japan, which were primarily personnel related
costs included in selling, general and administrative expenses
in the consolidated statement of income.
Significant restructuring activities included the following:
In the year ended March 31, 2003, restructuring charges related
to the worldwide restructuring of the Music segment totaled
¥22,350 million. Restructuring activities included the further
consolidation of operations through the shutdown of a cassette
and CD manufacturing and distribution center in Holland and a
CD manufacturing facility in the U.S. as well as further staff
reductions in other areas. The restructuring charges consisted of
personnel related costs of ¥14,932 million, non-cash asset
impairment and disposal costs of ¥3,256 million and other costs
of ¥4,162 million including lease termination costs. Among these
charges ¥19,094 million was recorded in selling, general and
BH6/30 05.7.7, 3:33 AMPage 114 Adobe PageMaker 6.0J/PPC
Sony Corporation 115
administrative expenses, and ¥3,256 million was included in loss
on sale, disposal or impairment of assets, net in the consolidated
statements of income. Employees were eliminated across
various employee levels, business functions, operating units,
and geographic regions during this phase of the worldwide
restructuring program.
During the year ended March 31, 2004, Sony broadened the
scope of its worldwide restructuring of the Music segment,
which resulted in restructuring charges totaling ¥10,691 million.
Restructuring activities included the continuation of the shut-
down of the CD manufacturing facility in the U.S. as well as the
restructuring of music label operations and the further rational-
ization of overhead functions through staff reductions. The
restructuring charges consisted of personnel related costs of
¥5,137 million, lease abandonment costs of ¥1,323 million and
other related costs of ¥4,231 million including non-cash asset
impairment and disposal costs. Most of these charges are
included in selling, general and administrative expenses in the
consolidated statements of income. Employees were eliminated
across various employee levels, business functions, operating
units, and geographic regions during this phase of the world-
wide restructuring program.
During the year ended March 31, 2005, in continuation of the
worldwide restructuring program and in connection with the
establishment of the joint venture with Bertelsmann AG (Note 6),
Sony recorded restructuring charges totaling ¥3,025 million ($28
million) within the Music segment. Restructuring activities included
the shutdown of certain distribution operations that were no
longer required as a result of the recorded music joint venture
with Bertelsmann AG as well as the further rationalization of
overhead functions through staff reductions. The restructuring
charges consisted of personnel related costs of ¥883 million
($8 million) and other related costs of ¥2,142 million ($20 mil-
lion). These charges are included in selling, general and adminis-
trative expenses in the consolidated statements of income.
Employees were eliminated across various employee levels,
business functions, operating units, and geographic regions
during this phase of the worldwide restructuring program.
Pictures Segment
In an effort to improve the performance of the Pictures segment,
Sony has undergone a number of restructuring efforts to reduce
its operating costs. For the years ended March 31, 2003, 2004
and 2005, Sony recorded total restructuring charges of ¥480
million, ¥4,611 million and ¥385 million ($4 million), respectively,
within the Pictures segment. Significant restructuring activities
are the following:
Consolidation of television operations
Due to changes within the television production and distribution
business, the competition between network owned production
companies and other production and distribution companies to
license product to the major televisions networks is becoming
more intense. This competitive environment has resulted in
fewer opportunities to produce shows for the networks and a
shorter lifespan for ordered shows that do not immediately
achieve favorable ratings. This trend has resulted in an increase
in the number of new programs being distributed yet canceled in
their first or second season, which are generally less profitable,
and a decrease in the number of network programs that are
able to achieve syndication, which are generally more profitable.
As a result, in the year ended March 31, 2002, Sony decided to
consolidate its television operations and downsize the network
television production business in the Pictures segment. In the year
ended March 31, 2003, Sony recorded restructuring charges
totaling ¥480 million. These costs were included in cost of sales
in the consolidated statements of income. This restructuring
program was completed in the year ending March 31, 2005,
and the total cost of the program from the inception was ¥8,932
million ($83 million). No liability existed as of March 31, 2005.
Fixed cost reduction program
During the year ended March 31, 2004, the Pictures segment
implemented a fixed cost reduction program to further reduce its
operating costs. This restructuring program primarily related to
the reduction of staffing levels and the disposal of certain long-
lived assets. This restructuring program was substantially com-
pleted during the year ended March 31, 2005 and the total cost
of this restructuring program was ¥4,996 million ($47 million).
The Pictures segment recorded ¥4,611 million of these costs
during the year ended March 31, 2004. These restructuring
charges consisted of personnel related costs of ¥993 million,
non-cash asset impairment and disposal costs of ¥1,746 million,
and other costs of ¥1,872 million including those relating to the
buy-out of term deal commitments. Of the restructuring costs
incurred, ¥1,525 million was included in cost of sales, ¥1,340
million was included in selling, general and administrative
expenses, and ¥1,746 million was included in loss on sale,
disposal or impairment of assets, net in the consolidated
statements of income.
During the year ended March 31, 2005, the Pictures segment
substantially completed the fixed cost reduction program and
recorded ¥385 million ($4 million) of additional restructuring
costs. These restructuring charges consisted primarily of per-
sonnel related costs of ¥292 million ($3 million) which were
included in selling, general and administrative expenses in the
consolidated statements of income. At March 31, 2005, the
remaining liability balance was ¥207 million ($2 million), which
will be paid or settled over the next year.
BH6/30 05.7.7, 3:33 AMPage 115 Adobe PageMaker 6.0J/PPC
116 Sony Corporation
The changes in the accrued restructuring charges for the years ended March 31, 2003, 2004 and 2005 are as follows:Yen in millions
Employee Non-cash Othertermination write-downs associated
benefits and disposals costs Total
Balance at March 31, 2002 . . . . . . . . . . . . . . . . . . . . . . . . . . . . . . . . . . . . . . . . . . . . . . . . ¥ 6,243 — ¥ 13,637 ¥ 19,880
Restructuring costs . . . . . . . . . . . . . . . . . . . . . . . . . . . . . . . . . . . . . . . . . . . . . . . . . . . . 46,953 ¥ 42,768 16,530 106,251
Non-cash charges . . . . . . . . . . . . . . . . . . . . . . . . . . . . . . . . . . . . . . . . . . . . . . . . . . . . . — (42,240) — (42,240)
Cash payments . . . . . . . . . . . . . . . . . . . . . . . . . . . . . . . . . . . . . . . . . . . . . . . . . . . . . . . (38,548) — (23,172) (61,720)
Adjustments . . . . . . . . . . . . . . . . . . . . . . . . . . . . . . . . . . . . . . . . . . . . . . . . . . . . . . . . . . 136 (528) (1,208) (1,600)
Balance at March 31, 2003 . . . . . . . . . . . . . . . . . . . . . . . . . . . . . . . . . . . . . . . . . . . . . . . . 14,784 — 5,787 20,571
Restructuring costs . . . . . . . . . . . . . . . . . . . . . . . . . . . . . . . . . . . . . . . . . . . . . . . . . . . . 133,367 19,170 15,554 168,091
Non-cash charges . . . . . . . . . . . . . . . . . . . . . . . . . . . . . . . . . . . . . . . . . . . . . . . . . . . . . — (19,170) — (19,170)
Cash payments . . . . . . . . . . . . . . . . . . . . . . . . . . . . . . . . . . . . . . . . . . . . . . . . . . . . . . . (124,674) — (13,686) (138,360)
Adjustments . . . . . . . . . . . . . . . . . . . . . . . . . . . . . . . . . . . . . . . . . . . . . . . . . . . . . . . . . . 1,173 0 333 1,506
Balance at March 31, 2004 . . . . . . . . . . . . . . . . . . . . . . . . . . . . . . . . . . . . . . . . . . . . . . . . 24,650 — 7,988 32,638
Restructuring costs . . . . . . . . . . . . . . . . . . . . . . . . . . . . . . . . . . . . . . . . . . . . . . . . . . . . 53,563 25,564 10,836 89,963
Non-cash charges . . . . . . . . . . . . . . . . . . . . . . . . . . . . . . . . . . . . . . . . . . . . . . . . . . . . . — (25,564) — (25,564)
Cash payments . . . . . . . . . . . . . . . . . . . . . . . . . . . . . . . . . . . . . . . . . . . . . . . . . . . . . . . (61,523) — (10,427) (71,950)
Adjustments* . . . . . . . . . . . . . . . . . . . . . . . . . . . . . . . . . . . . . . . . . . . . . . . . . . . . . . . . . (1,705) — (3,096) (4,801)
Balance at March 31, 2005 . . . . . . . . . . . . . . . . . . . . . . . . . . . . . . . . . . . . . . . . . . . . . . . . ¥ 14,985 — ¥ 5,301 ¥ 20,286
Dollars in millions
Employee Non-cash Othertermination write-downs associated
benefits and disposals costs Total
Balance at March 31, 2004 . . . . . . . . . . . . . . . . . . . . . . . . . . . . . . . . . . . . . . . . . . . . . . . . $ 230 — $ 75 $ 305
Restructuring costs . . . . . . . . . . . . . . . . . . . . . . . . . . . . . . . . . . . . . . . . . . . . . . . . . . . . 501 $ 239 101 841
Non-cash charges . . . . . . . . . . . . . . . . . . . . . . . . . . . . . . . . . . . . . . . . . . . . . . . . . . . . . — (239) — (239)
Cash payments . . . . . . . . . . . . . . . . . . . . . . . . . . . . . . . . . . . . . . . . . . . . . . . . . . . . . . . (575) — (97) (672)
Adjustments* . . . . . . . . . . . . . . . . . . . . . . . . . . . . . . . . . . . . . . . . . . . . . . . . . . . . . . . . . (16) — (29) (45)
Balance at March 31, 2005 . . . . . . . . . . . . . . . . . . . . . . . . . . . . . . . . . . . . . . . . . . . . . . . . $ 140 — $ 50 $ 190
*Adjustments primarily consist of the transfer of the accrued restructuring charges to SONY BMG, a joint venture with Bertelsmann AG (Note 6).
19. Research and development costs, advertisingcosts and shipping and handling costs
(1) Research and development costs:
Research and development costs charged to cost of sales for the
years ended March 31, 2003, 2004 and 2005 were ¥443,128
million, ¥514,483 million and ¥502,008 million ($4,692 million),
respectively.
(2) Advertising costs:
Advertising costs included in selling, general and administrative
expenses for the years ended March 31, 2003, 2004 and 2005
were ¥442,741 million, ¥421,433 million and ¥359,661 million
($3,361 million), respectively.
(3) Shipping and handling costs:
Shipping and handling costs for finished goods included in selling,
general and administrative expenses for the years ended March
31, 2003, 2004 and 2005 were ¥98,195 million, ¥106,590 million
and ¥107,983 million ($1,009 million), respectively, which included
the internal transportation costs of finished goods.
20. Gain on change in interest in subsidiaries andequity investees
In January 2004, FeliCa Networks, Inc., whose field of business
is Mobile FeliCa IC chip development and production/sales
licensing and operation of the Mobile FeliCa service platform,
issued 115,000 shares at ¥100,000 per share with a total value
of ¥11,500 million in connection with its private offering. As a
result of this issuance, Sony recorded a gain of ¥3,364 million
and provided deferred taxes on this gain. This issuance reduced
Sony’s ownership interest from 100% to 60%.
In addition to the above transaction, for the year ended March
31, 2004, Sony recognized ¥1,506 million of other gains on
change in interest in subsidiaries and equity investees resulting
in total gains of ¥4,870 million.
BH6/30 05.7.7, 3:32 AMPage 116 Adobe PageMaker 6.0J/PPC
Sony Corporation 117
21. Income taxesIncome before income taxes and income tax expense comprise the following:
Dollars inYen in millions millions
Years ended March 31 2003 2004 2005 2005
Income (loss) before income taxes:
Sony Corporation and subsidiaries in Japan . . . . . . . . . . . . . . . . . . . . . . . . . . . . . . . . . . ¥ (7,998) ¥ (84,571) ¥005,005 $0,047
Foreign subsidiaries . . . . . . . . . . . . . . . . . . . . . . . . . . . . . . . . . . . . . . . . . . . . . . . . . . . . 255,619 228,638 152,202 1,422
. . . . . . . . . . . . . . . . . . . . . . . . . . . . . . . . . . . . . . . . . . . . . . . . . . . . . . . . . . . . . . . . . . . ¥247,621 ¥144,067 ¥157,207 $1,469
Income taxes—Current:
Sony Corporation and subsidiaries in Japan . . . . . . . . . . . . . . . . . . . . . . . . . . . . . . . . . . ¥069,311 ¥ 22,286 ¥ 23,497 $ 220
Foreign subsidiaries . . . . . . . . . . . . . . . . . . . . . . . . . . . . . . . . . . . . . . . . . . . . . . . . . . . . 109,536 64,933 62,013 579
. . . . . . . . . . . . . . . . . . . . . . . . . . . . . . . . . . . . . . . . . . . . . . . . . . . . . . . . . . . . . . . . . . . ¥178,847 ¥ 87,219 ¥ 85,510 $ 799
Income taxes—Deferred:
Sony Corporation and subsidiaries in Japan . . . . . . . . . . . . . . . . . . . . . . . . . . . . . . . . . . ¥ (90,016) ¥ (32,845) ¥ 0(4,976 $ 47
Foreign subsidiaries . . . . . . . . . . . . . . . . . . . . . . . . . . . . . . . . . . . . . . . . . . . . . . . . . . . . (8,000) (1,600) (74,442) (696)
. . . . . . . . . . . . . . . . . . . . . . . . . . . . . . . . . . . . . . . . . . . . . . . . . . . . . . . . . . . . . . . . . . . ¥ (98,016) ¥ (34,445) ¥ (69,466) $ (649)
In August 2, 2004, Monex Inc., which provides on-line security
trading services in Japan, and Nikko Beans, Inc. established
Monex Beans Holdings, Inc. by way of share transfer of the
existing shares of Monex Inc. and Nikko Beans, Inc.. At this
establishment, 1 share of Monex Beans Holdings, Inc. was
allotted to each share of Monex Inc. and 3.4 shares of Monex
Beans Holdings, Inc. were allotted to each share of Nikko
Beans, Inc.. As a result of this share transfer, Monex Beans
Holdings, Inc. issued 2,341,287 shares and Sony recorded a
gain of ¥8,951 million ($84 million) and provided deferred taxes
on this gain. This issuance reduced Sony’s ownership interest
from 29.9% to 20.1%.
In September 2004, So-net M3 Inc., which provides medical
services via the Internet in Japan, issued 2,800 shares at
¥850,000 ($7,944) per share with a total value of ¥2,380 million
($22 million) in connection with its initial public offering. SCN, a
parent company of So-net M3 Inc., sold 3,260 shares of So-net
M3 Inc., at ¥790,500 ($7,388) per share with a total value of
¥2,577 million ($24 million). In October 2004, SCN sold 740
shares of So-net M3 Inc., at ¥790,500 ($7,388) per share with a
total value of ¥585 million ($5 million). As a result of these trans-
actions, Sony recorded a ¥1,823 million ($17 million) gain on
issuance of stock by So-net M3 Inc. and provided deferred
taxes on this gain. In addition, Sony recorded a ¥2,876 million
($27 million) gain on the sale of its stock. These transactions
reduced Sony’s ownership interest from 90.0% to 74.8%.
In June 6, 2005, SCN sold 17,935 shares of So-net M3 Inc.,
at ¥694,600 ($6,492) per share with a total value of ¥12,458
million ($116 million). As a result of this sale, Sony records
¥11,979 million ($112 million) gain on the sale of its stock for the
year ending March 31, 2006, and Sony’s ownership interest has
been reduced from 74.8% to 60.8%.
In January 2005, DeNA Co., Ltd., whose field of business is
operation of on-line auction websites in Japan, issued 14,000
shares at ¥204,600 ($1,912) per share with a total value of
¥2,864 million ($27 million) in connection with its initial public
offering. In March 2005, SCN, which had owned 27.7% interest
in DeNA Co., Ltd., sold 2,000 shares of DeNA Co., Ltd. at
¥204,600 ($1,912) per share with a total value of ¥409 million
($4 million). As a result of these transactions, Sony recorded a
¥686 million ($6 million) gain on issuance of stock by DeNA Co.,
Ltd. and provided deferred taxes on this gain. In addition, Sony
recorded a ¥76 million ($1 million) gain on the sale of its stock.
These transactions reduced Sony’s ownership interest from
27.7% to 24.8%.
In addition to the above transactions, for the year ended
March 31, 2005, Sony recognized ¥1,911 million ($18 million) of
other gains on change in interest in subsidiaries and equity
investees resulting in total gains of ¥16,322 million ($153 million).
These transactions were not part of a broader corporate reorgani-
zation and the reacquisition of such shares was not contemplated
at the time of issuance.
Sony is subjected to a number of different income taxes. Due
to changes in Japanese income tax regulations, a consolidated
tax filing system was introduced on April 1, 2002. Sony applied
to file its return under the consolidated tax filing system begin-
ning with the year ended March 31, 2004. Under the Japanese
consolidated tax filing system, a 2% surtax was imposed only
for the year ended March 31, 2004. As a result, the statutory tax
rate was 43.9% for the year ended March 31, 2004.
BH6/30 05.7.7, 3:32 AMPage 117 Adobe PageMaker 6.0J/PPC
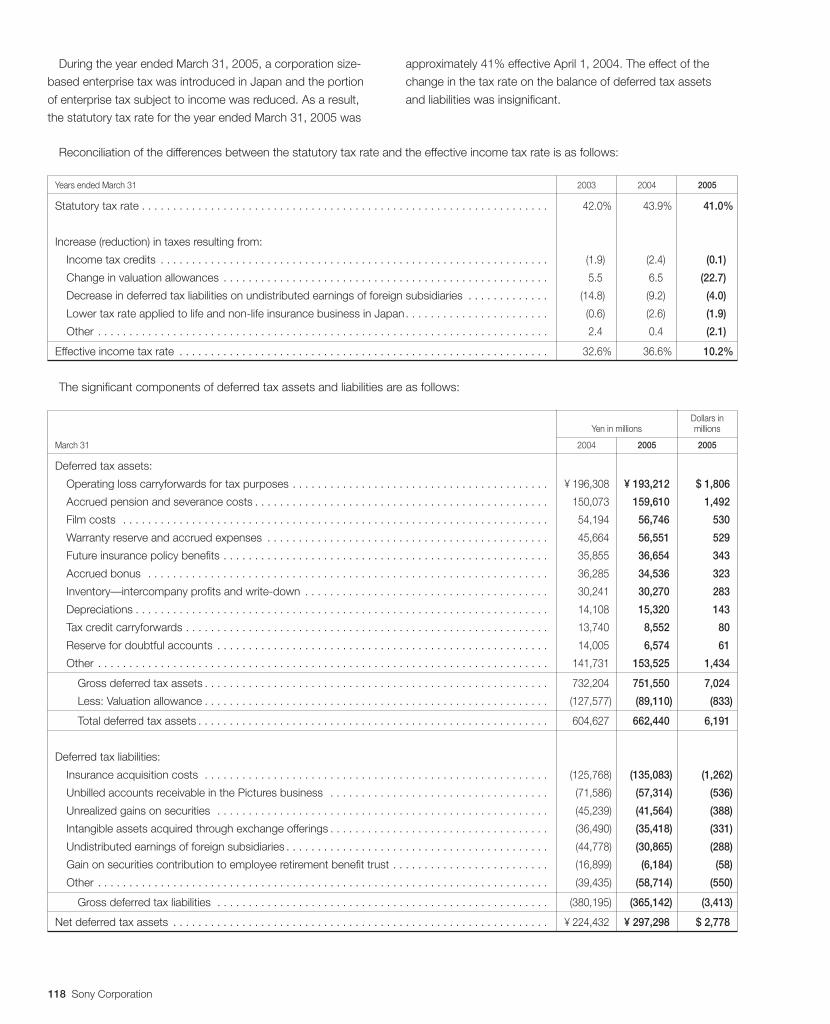
118 Sony Corporation
During the year ended March 31, 2005, a corporation size-
based enterprise tax was introduced in Japan and the portion
of enterprise tax subject to income was reduced. As a result,
the statutory tax rate for the year ended March 31, 2005 was
Reconciliation of the differences between the statutory tax rate and the effective income tax rate is as follows:
Years ended March 31 2003 2004 2005
Statutory tax rate . . . . . . . . . . . . . . . . . . . . . . . . . . . . . . . . . . . . . . . . . . . . . . . . . . . . . . . . . . . . . . . . . 42.0% 43.9% 41.0%
Increase (reduction) in taxes resulting from:
Income tax credits . . . . . . . . . . . . . . . . . . . . . . . . . . . . . . . . . . . . . . . . . . . . . . . . . . . . . . . . . . . . . . (1.9) (2.4) (0.1)
Change in valuation allowances . . . . . . . . . . . . . . . . . . . . . . . . . . . . . . . . . . . . . . . . . . . . . . . . . . . . 5.5 6.5 (22.7)
Decrease in deferred tax liabilities on undistributed earnings of foreign subsidiaries . . . . . . . . . . . . . (14.8) (9.2) (4.0)
Lower tax rate applied to life and non-life insurance business in Japan. . . . . . . . . . . . . . . . . . . . . . . (0.6) (2.6) (1.9)
Other . . . . . . . . . . . . . . . . . . . . . . . . . . . . . . . . . . . . . . . . . . . . . . . . . . . . . . . . . . . . . . . . . . . . . . . . 2.4 0.4 (2.1)
Effective income tax rate . . . . . . . . . . . . . . . . . . . . . . . . . . . . . . . . . . . . . . . . . . . . . . . . . . . . . . . . . . . 32.6% 36.6% 10.2%
The significant components of deferred tax assets and liabilities are as follows:
Dollars inYen in millions millions
March 31 2004 2005 2005
Deferred tax assets:
Operating loss carryforwards for tax purposes . . . . . . . . . . . . . . . . . . . . . . . . . . . . . . . . . . . . . . . . . ¥(196,308 ¥(193,212 $(1,806
Accrued pension and severance costs . . . . . . . . . . . . . . . . . . . . . . . . . . . . . . . . . . . . . . . . . . . . . . . 150,073 159,610 1,492
Film costs . . . . . . . . . . . . . . . . . . . . . . . . . . . . . . . . . . . . . . . . . . . . . . . . . . . . . . . . . . . . . . . . . . . . 54,194 56,746 530
Warranty reserve and accrued expenses . . . . . . . . . . . . . . . . . . . . . . . . . . . . . . . . . . . . . . . . . . . . . 45,664 56,551 529
Future insurance policy benefits . . . . . . . . . . . . . . . . . . . . . . . . . . . . . . . . . . . . . . . . . . . . . . . . . . . . 35,855 36,654 343
Accrued bonus . . . . . . . . . . . . . . . . . . . . . . . . . . . . . . . . . . . . . . . . . . . . . . . . . . . . . . . . . . . . . . . . 36,285 34,536 323
Inventory—intercompany profits and write-down . . . . . . . . . . . . . . . . . . . . . . . . . . . . . . . . . . . . . . . 30,241 30,270 283
Depreciations . . . . . . . . . . . . . . . . . . . . . . . . . . . . . . . . . . . . . . . . . . . . . . . . . . . . . . . . . . . . . . . . . . 14,108 15,320 143
Tax credit carryforwards . . . . . . . . . . . . . . . . . . . . . . . . . . . . . . . . . . . . . . . . . . . . . . . . . . . . . . . . . . 13,740 8,552 80
Reserve for doubtful accounts . . . . . . . . . . . . . . . . . . . . . . . . . . . . . . . . . . . . . . . . . . . . . . . . . . . . . 14,005 6,574 61
Other . . . . . . . . . . . . . . . . . . . . . . . . . . . . . . . . . . . . . . . . . . . . . . . . . . . . . . . . . . . . . . . . . . . . . . . . 141,731 153,525 1,434
Gross deferred tax assets . . . . . . . . . . . . . . . . . . . . . . . . . . . . . . . . . . . . . . . . . . . . . . . . . . . . . . . 732,204 751,550 7,024
Less: Valuation allowance . . . . . . . . . . . . . . . . . . . . . . . . . . . . . . . . . . . . . . . . . . . . . . . . . . . . . . . (127,577) (89,110) (833)
Total deferred tax assets . . . . . . . . . . . . . . . . . . . . . . . . . . . . . . . . . . . . . . . . . . . . . . . . . . . . . . . . 604,627 662,440 6,191
Deferred tax liabilities:
Insurance acquisition costs . . . . . . . . . . . . . . . . . . . . . . . . . . . . . . . . . . . . . . . . . . . . . . . . . . . . . . . (125,768) (135,083) (1,262)
Unbilled accounts receivable in the Pictures business . . . . . . . . . . . . . . . . . . . . . . . . . . . . . . . . . . . (71,586) (57,314) (536)
Unrealized gains on securities . . . . . . . . . . . . . . . . . . . . . . . . . . . . . . . . . . . . . . . . . . . . . . . . . . . . . (45,239) (41,564) (388)
Intangible assets acquired through exchange offerings . . . . . . . . . . . . . . . . . . . . . . . . . . . . . . . . . . . (36,490) (35,418) (331)
Undistributed earnings of foreign subsidiaries . . . . . . . . . . . . . . . . . . . . . . . . . . . . . . . . . . . . . . . . . . (44,778) (30,865) (288)
Gain on securities contribution to employee retirement benefit trust . . . . . . . . . . . . . . . . . . . . . . . . . (16,899) (6,184) (58)
Other . . . . . . . . . . . . . . . . . . . . . . . . . . . . . . . . . . . . . . . . . . . . . . . . . . . . . . . . . . . . . . . . . . . . . . . . (39,435) (58,714) (550)
Gross deferred tax liabilities . . . . . . . . . . . . . . . . . . . . . . . . . . . . . . . . . . . . . . . . . . . . . . . . . . . . . (380,195) (365,142) (3,413)
Net deferred tax assets . . . . . . . . . . . . . . . . . . . . . . . . . . . . . . . . . . . . . . . . . . . . . . . . . . . . . . . . . . . . ¥(224,432 ¥(297,298 $(2,778
approximately 41% effective April 1, 2004. The effect of the
change in the tax rate on the balance of deferred tax assets
and liabilities was insignificant.
BH6/30 05.7.7, 3:32 AMPage 118 Adobe PageMaker 6.0J/PPC
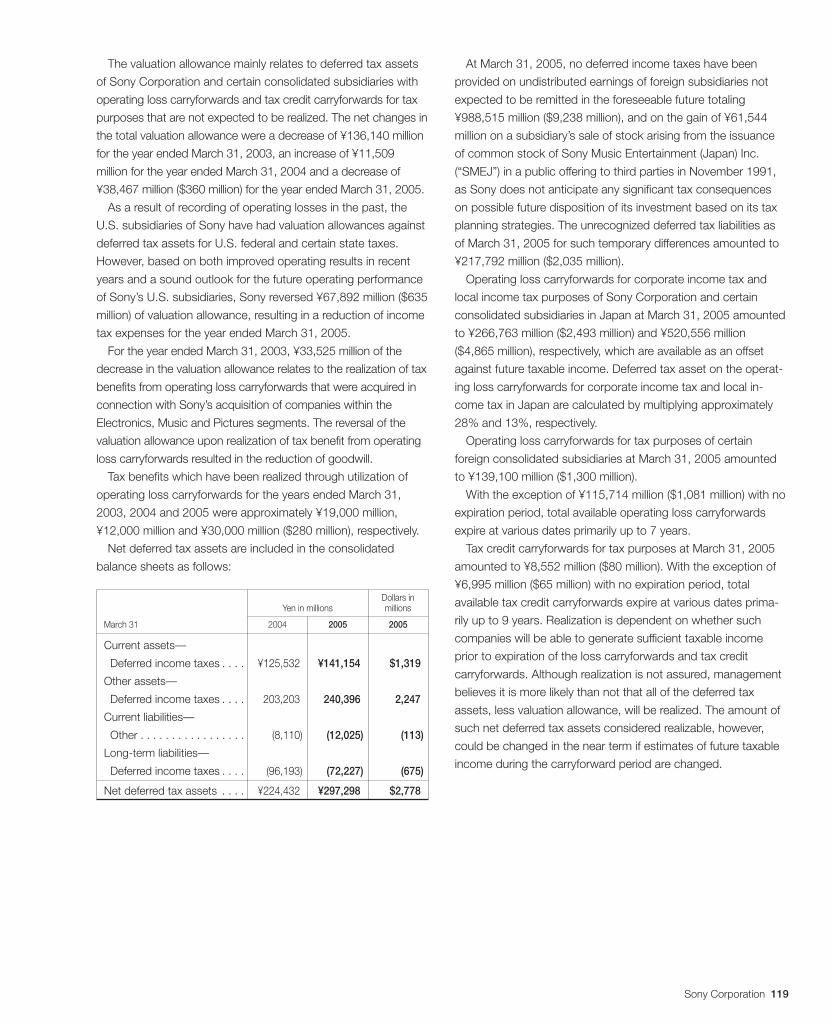
Sony Corporation 119
The valuation allowance mainly relates to deferred tax assets
of Sony Corporation and certain consolidated subsidiaries with
operating loss carryforwards and tax credit carryforwards for tax
purposes that are not expected to be realized. The net changes in
the total valuation allowance were a decrease of ¥136,140 million
for the year ended March 31, 2003, an increase of ¥11,509
million for the year ended March 31, 2004 and a decrease of
¥38,467 million ($360 million) for the year ended March 31, 2005.
As a result of recording of operating losses in the past, the
U.S. subsidiaries of Sony have had valuation allowances against
deferred tax assets for U.S. federal and certain state taxes.
However, based on both improved operating results in recent
years and a sound outlook for the future operating performance
of Sony’s U.S. subsidiaries, Sony reversed ¥67,892 million ($635
million) of valuation allowance, resulting in a reduction of income
tax expenses for the year ended March 31, 2005.
For the year ended March 31, 2003, ¥33,525 million of the
decrease in the valuation allowance relates to the realization of tax
benefits from operating loss carryforwards that were acquired in
connection with Sony’s acquisition of companies within the
Electronics, Music and Pictures segments. The reversal of the
valuation allowance upon realization of tax benefit from operating
loss carryforwards resulted in the reduction of goodwill.
Tax benefits which have been realized through utilization of
operating loss carryforwards for the years ended March 31,
2003, 2004 and 2005 were approximately ¥19,000 million,
¥12,000 million and ¥30,000 million ($280 million), respectively.
Net deferred tax assets are included in the consolidated
balance sheets as follows:
Dollars inYen in millions millions
March 31 2004 2005 2005
Current assets—
Deferred income taxes . . . . ¥125,532 ¥141,154 $1,319
Other assets—
Deferred income taxes . . . . 203,203 240,396 2,247
Current liabilities—
Other . . . . . . . . . . . . . . . . . (8,110) (12,025) (113)
Long-term liabilities—
Deferred income taxes . . . . (96,193) (72,227) (675)
Net deferred tax assets . . . . ¥224,432 ¥297,298 $2,778
At March 31, 2005, no deferred income taxes have been
provided on undistributed earnings of foreign subsidiaries not
expected to be remitted in the foreseeable future totaling
¥988,515 million ($9,238 million), and on the gain of ¥61,544
million on a subsidiary’s sale of stock arising from the issuance
of common stock of Sony Music Entertainment (Japan) Inc.
(“SMEJ”) in a public offering to third parties in November 1991,
as Sony does not anticipate any significant tax consequences
on possible future disposition of its investment based on its tax
planning strategies. The unrecognized deferred tax liabilities as
of March 31, 2005 for such temporary differences amounted to
¥217,792 million ($2,035 million).
Operating loss carryforwards for corporate income tax and
local income tax purposes of Sony Corporation and certain
consolidated subsidiaries in Japan at March 31, 2005 amounted
to ¥266,763 million ($2,493 million) and ¥520,556 million
($4,865 million), respectively, which are available as an offset
against future taxable income. Deferred tax asset on the operat-
ing loss carryforwards for corporate income tax and local in-
come tax in Japan are calculated by multiplying approximately
28% and 13%, respectively.
Operating loss carryforwards for tax purposes of certain
foreign consolidated subsidiaries at March 31, 2005 amounted
to ¥139,100 million ($1,300 million).
With the exception of ¥115,714 million ($1,081 million) with no
expiration period, total available operating loss carryforwards
expire at various dates primarily up to 7 years.
Tax credit carryforwards for tax purposes at March 31, 2005
amounted to ¥8,552 million ($80 million). With the exception of
¥6,995 million ($65 million) with no expiration period, total
available tax credit carryforwards expire at various dates prima-
rily up to 9 years. Realization is dependent on whether such
companies will be able to generate sufficient taxable income
prior to expiration of the loss carryforwards and tax credit
carryforwards. Although realization is not assured, management
believes it is more likely than not that all of the deferred tax
assets, less valuation allowance, will be realized. The amount of
such net deferred tax assets considered realizable, however,
could be changed in the near term if estimates of future taxable
income during the carryforward period are changed.
BH6/30 05.7.7, 3:32 AMPage 119 Adobe PageMaker 6.0J/PPC
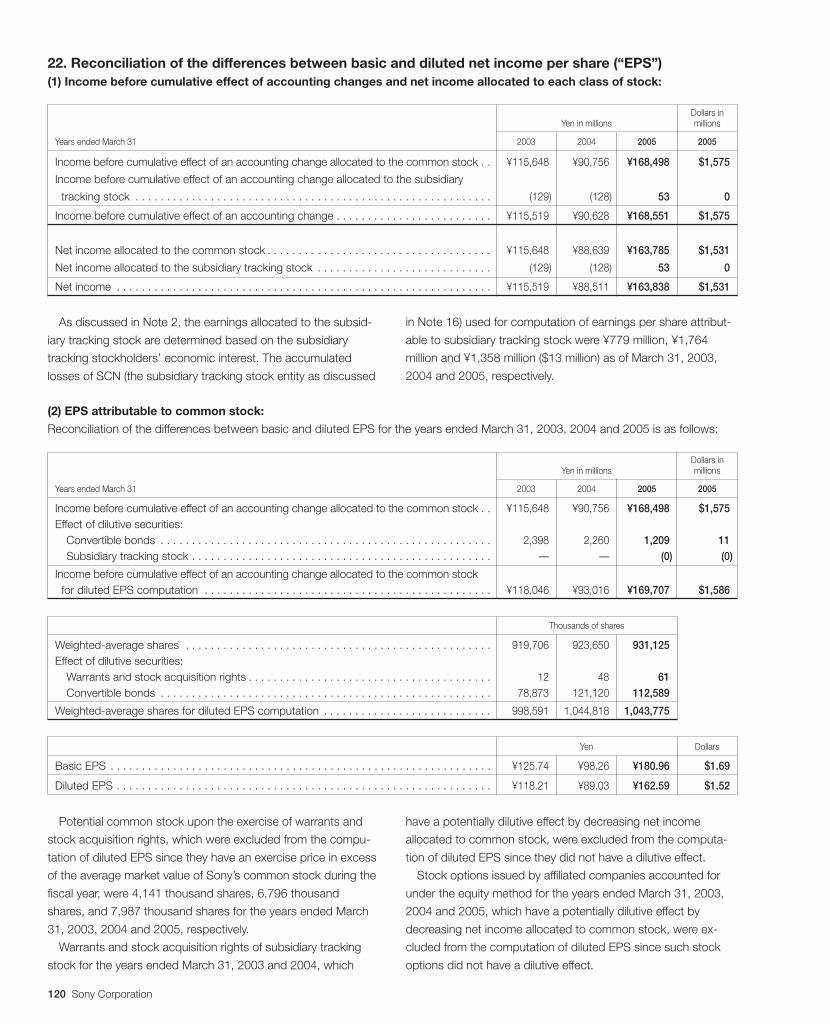
120 Sony Corporation
22. Reconciliation of the differences between basic and diluted net income per share (“EPS”)(1) Income before cumulative effect of accounting changes and net income allocated to each class of stock:
Dollars inYen in millions millions
Years ended March 31 2003 2004 2005 2005
Income before cumulative effect of an accounting change allocated to the common stock . . ¥115,648 ¥90,756 ¥168,498 $1,575
Income before cumulative effect of an accounting change allocated to the subsidiary
tracking stock . . . . . . . . . . . . . . . . . . . . . . . . . . . . . . . . . . . . . . . . . . . . . . . . . . . . . . . . . (129) (128) 53 0
Income before cumulative effect of an accounting change . . . . . . . . . . . . . . . . . . . . . . . . . ¥115,519 ¥90,628 ¥168,551 $1,575
Net income allocated to the common stock . . . . . . . . . . . . . . . . . . . . . . . . . . . . . . . . . . . . ¥115,648 ¥88,639 ¥163,785 $1,531
Net income allocated to the subsidiary tracking stock . . . . . . . . . . . . . . . . . . . . . . . . . . . . (129) (128) 53 0
Net income . . . . . . . . . . . . . . . . . . . . . . . . . . . . . . . . . . . . . . . . . . . . . . . . . . . . . . . . . . . . ¥115,519 ¥88,511 ¥163,838 $1,531
.
(2) EPS attributable to common stock:
Reconciliation of the differences between basic and diluted EPS for the years ended March 31, 2003, 2004 and 2005 is as follows:
Dollars inYen in millions millions
Years ended March 31 2003 2004 2005 2005
Income before cumulative effect of an accounting change allocated to the common stock . . ¥115,648 ¥90,756 ¥168,498 $1,575Effect of dilutive securities:
Convertible bonds . . . . . . . . . . . . . . . . . . . . . . . . . . . . . . . . . . . . . . . . . . . . . . . . . . . . . 2,398 2,260 1,209 11Subsidiary tracking stock . . . . . . . . . . . . . . . . . . . . . . . . . . . . . . . . . . . . . . . . . . . . . . . . — — (0) (0)
Income before cumulative effect of an accounting change allocated to the common stock for diluted EPS computation . . . . . . . . . . . . . . . . . . . . . . . . . . . . . . . . . . . . . . . . . . . . . . ¥118,046 ¥93,016 ¥169,707 $1,586
Thousands of shares
Weighted-average shares . . . . . . . . . . . . . . . . . . . . . . . . . . . . . . . . . . . . . . . . . . . . . . . . . 919,706 923,650 931,125Effect of dilutive securities:
Warrants and stock acquisition rights . . . . . . . . . . . . . . . . . . . . . . . . . . . . . . . . . . . . . . . 12 48 61Convertible bonds . . . . . . . . . . . . . . . . . . . . . . . . . . . . . . . . . . . . . . . . . . . . . . . . . . . . . 78,873 121,120 112,589
Weighted-average shares for diluted EPS computation . . . . . . . . . . . . . . . . . . . . . . . . . . . 998,591 1,044,818 1,043,775
Yen Dollars
Basic EPS . . . . . . . . . . . . . . . . . . . . . . . . . . . . . . . . . . . . . . . . . . . . . . . . . . . . . . . . . . . . . ¥125.74. ¥98.26. ¥180.96. $1.69.
Diluted EPS . . . . . . . . . . . . . . . . . . . . . . . . . . . . . . . . . . . . . . . . . . . . . . . . . . . . . . . . . . . . ¥118.21. ¥89.03. ¥162.59. $1.52.
As discussed in Note 2, the earnings allocated to the subsid-
iary tracking stock are determined based on the subsidiary
tracking stockholders’ economic interest. The accumulated
losses of SCN (the subsidiary tracking stock entity as discussed
in Note 16) used for computation of earnings per share attribut-
able to subsidiary tracking stock were ¥779 million, ¥1,764
million and ¥1,358 million ($13 million) as of March 31, 2003,
2004 and 2005, respectively.
.
Potential common stock upon the exercise of warrants and
stock acquisition rights, which were excluded from the compu-
tation of diluted EPS since they have an exercise price in excess
of the average market value of Sony’s common stock during the
fiscal year, were 4,141 thousand shares, 6,796 thousand
shares, and 7,987 thousand shares for the years ended March
31, 2003, 2004 and 2005, respectively.
Warrants and stock acquisition rights of subsidiary tracking
stock for the years ended March 31, 2003 and 2004, which
have a potentially dilutive effect by decreasing net income
allocated to common stock, were excluded from the computa-
tion of diluted EPS since they did not have a dilutive effect.
Stock options issued by affiliated companies accounted for
under the equity method for the years ended March 31, 2003,
2004 and 2005, which have a potentially dilutive effect by
decreasing net income allocated to common stock, were ex-
cluded from the computation of diluted EPS since such stock
options did not have a dilutive effect.
BH6/30 05.7.7, 3:32 AMPage 120 Adobe PageMaker 6.0J/PPC
Sony Corporation 121
On October 1, 2002, Sony implemented a share exchange as
a result of which Aiwa Co.,Ltd. became a wholly-owned subsid-
iary. As a result of this share exchange, Sony issued 2,502
thousand shares. The shares were included in the computation
of basic and diluted EPS.
On May 1, 2003, Sony implemented a share exchange as a
result of which CIS Corporation became a wholly-owned subsid-
iary. As a result of this share exchange, Sony issued 1,088
thousand shares. The shares were included in the computation
of basic and diluted EPS.
As a result of the adoption of EITF Issue No. 04-8, Sony’s
diluted EPS of income before cumulative effect of an accounting
change for the year ended March 31, 2004 was restated in the
above table (Note 2).
(3) EPS attributable to subsidiary tracking stock:
Weighted-average shares used for computation of EPS attribut-
able to subsidiary tracking stock for the years ended March 31,
2003, 2004 and 2005 were 3,072 thousand shares. As dis-
cussed in Note 2, there were no potentially dilutive securities for
EPS of subsidiary tracking stock outstanding at March 31,
2003, 2004 and 2005.
23. Variable interest entitiesSony has, from time to time, entered into various arrangements
with VIEs. These arrangements consist of facilities which provide
for the leasing of certain property, the financing of film production,
the development and operation of a multi-use real estate complex
and the implementation of a stock option plan for Japanese
employees. As described in Note 2, the FASB issued FIN No. 46,
which requires the consolidation or disclosure of VIEs. The VIEs
that have been consolidated by Sony are described as follows:
Sony leases the headquarters of its U.S. subsidiary from a
VIE, which has been consolidated by Sony since July 1, 2003.
Upon consolidation of the VIE, assets and liabilities increased by
¥25,277 million and ¥27,035 million, respectively, and a cumula-
tive effect of accounting change of ¥1,729 million was charged to
net income with no tax effect. Sony has the option to purchase
the building at any time during the lease term which expires in
December 2008 for ¥27,374 million ($256 million). The debt held
by the VIE is unsecured. At the end of the lease term, Sony has
agreed to either renew the lease, purchase the building or
remarket it to a third party on behalf of the owner. If the sales price
is less than ¥27,374 million ($256 million), Sony is obligated to
make up the lesser of the shortfall or ¥22,973 million ($215 million).
A subsidiary in the Pictures segment entered into a joint
venture agreement with a VIE for the purpose of funding the
acquisition of certain international film rights. The subsidiary is
required to distribute the product internationally, for contractually
defined fees determined as percentages of gross receipts, as
defined, and is responsible for all distribution and marketing
expenses, which are recouped from such distribution fees. The
VIE was capitalized with total financing of ¥43,584 million. Of
this amount, ¥1,181 million was contributed by the subsidiary,
¥10,198 million was provided by unrelated third party investors
and the remaining funding is provided through a ¥32,205 million
bank credit facility. On July 1, 2003, Sony consolidated this entity.
Upon consolidation of the VIE, assets and liabilities increased by
¥10,179 million and ¥10,586 million, respectively, and a cumula-
tive effect of accounting change of ¥388 million was charged to
net income with no tax effect. As of March 31, 2005, the total
outstanding under the bank credit facility was ¥6,441 million
($60 million). Under the agreement, the subsidiary’s ¥1,181
million ($11 million) equity investment is the last equity to be
repaid. Additionally, it must pay to the third party investors up
to ¥2,040 million ($19 million) of any losses out of a portion of
its distribution fees. Any losses incurred by the VIE over and
above ¥3,221 million ($30 million) will be shared by the other
investors. The subsidiary acquired the international distribution
rights, as defined, to twelve pictures meeting certain minimum
requirements within the time period provided in the agreement.
Sony had utilized a VIE to erect and operate a multi-use real
estate complex in Berlin, Germany, which had been accounted
for under the equity method by Sony until June 30, 2003. On
July 1, 2003, Sony consolidated this entity. Upon consolidation
of the VIE, assets and liabilities increased by ¥61,320 million and
¥60,329 million, respectively. However, there was no impact to
Sony’s net income. On November 4, 2004, Sony purchased the
remaining shares of the VIE from other partners. As a result, it is
now a 100% owned subsidiary and no longer a VIE.
Sony has utilized a VIE to implement a stock option plan for
selected Japanese employees. The VIE has been consolidated by
Sony since its establishment. With respect to this entity, there was
no impact to Sony’s results of operations and financial position
upon the adoption of FIN No. 46. Under the terms of the stock
option plan, upon exercise, Japanese employees receive cash
equal to the amount that the market price of Sony Corporation’s
common stock exceeds the strike price of the plan. In order to
minimize cash flow exposure associated with the plan, Sony
holds treasury stock through the VIE. The VIE purchased the
common stock with funding provided by the employee’s cash
contribution and a bank loan. At March 31, 2005, the balance of
the bank loan was ¥3,034 million ($28 million).
As of March 31, 2005, there is no VIE in which Sony holds a
significant variable interest that Sony is not the primary beneficiary.
As described in Note 6, on April 8, 2005, a consortium led by
SCA and its equity partners completed the acquisition of MGM.
Sony has reviewed the investment and determined that MGM is
a VIE. However, MGM will not be consolidated but accounted
for under the equity method as Sony is not the primary beneficiary
of this VIE.
BH6/30 05.7.7, 3:32 AMPage 121 Adobe PageMaker 6.0J/PPC
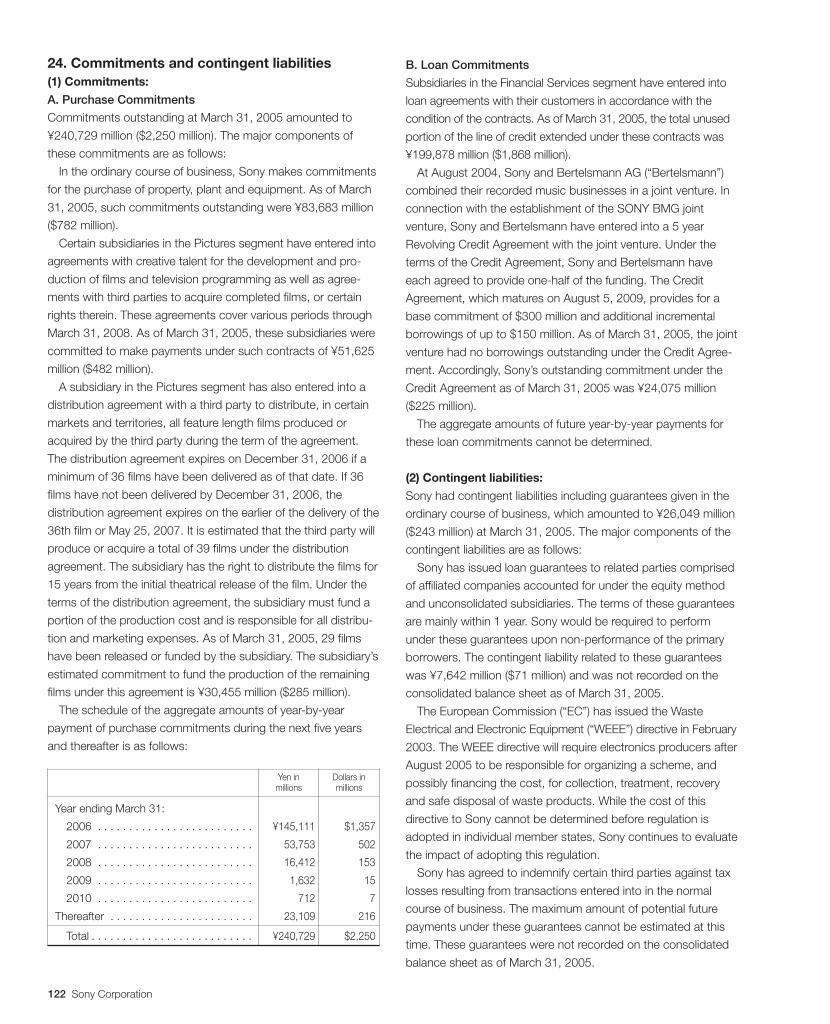
122 Sony Corporation
24. Commitments and contingent liabilities(1) Commitments:
A. Purchase Commitments
Commitments outstanding at March 31, 2005 amounted to
¥240,729 million ($2,250 million). The major components of
these commitments are as follows:
In the ordinary course of business, Sony makes commitments
for the purchase of property, plant and equipment. As of March
31, 2005, such commitments outstanding were ¥83,683 million
($782 million).
Certain subsidiaries in the Pictures segment have entered into
agreements with creative talent for the development and pro-
duction of films and television programming as well as agree-
ments with third parties to acquire completed films, or certain
rights therein. These agreements cover various periods through
March 31, 2008. As of March 31, 2005, these subsidiaries were
committed to make payments under such contracts of ¥51,625
million ($482 million).
A subsidiary in the Pictures segment has also entered into a
distribution agreement with a third party to distribute, in certain
markets and territories, all feature length films produced or
acquired by the third party during the term of the agreement.
The distribution agreement expires on December 31, 2006 if a
minimum of 36 films have been delivered as of that date. If 36
films have not been delivered by December 31, 2006, the
distribution agreement expires on the earlier of the delivery of the
36th film or May 25, 2007. It is estimated that the third party will
produce or acquire a total of 39 films under the distribution
agreement. The subsidiary has the right to distribute the films for
15 years from the initial theatrical release of the film. Under the
terms of the distribution agreement, the subsidiary must fund a
portion of the production cost and is responsible for all distribu-
tion and marketing expenses. As of March 31, 2005, 29 films
have been released or funded by the subsidiary. The subsidiary’s
estimated commitment to fund the production of the remaining
films under this agreement is ¥30,455 million ($285 million).
The schedule of the aggregate amounts of year-by-year
payment of purchase commitments during the next five years
and thereafter is as follows:
Yen in Dollars inmillions millions
Year ending March 31:
2006 . . . . . . . . . . . . . . . . . . . . . . . . . ¥145,111 $1,357
2007 . . . . . . . . . . . . . . . . . . . . . . . . . 53,753 502
2008 . . . . . . . . . . . . . . . . . . . . . . . . . 16,412 153
2009 . . . . . . . . . . . . . . . . . . . . . . . . . 1,632 15
2010 . . . . . . . . . . . . . . . . . . . . . . . . . 712 7
Thereafter . . . . . . . . . . . . . . . . . . . . . . . 23,109 216
Total . . . . . . . . . . . . . . . . . . . . . . . . . . ¥240,729 $2,250
B. Loan Commitments
Subsidiaries in the Financial Services segment have entered into
loan agreements with their customers in accordance with the
condition of the contracts. As of March 31, 2005, the total unused
portion of the line of credit extended under these contracts was
¥199,878 million ($1,868 million).
At August 2004, Sony and Bertelsmann AG (“Bertelsmann”)
combined their recorded music businesses in a joint venture. In
connection with the establishment of the SONY BMG joint
venture, Sony and Bertelsmann have entered into a 5 year
Revolving Credit Agreement with the joint venture. Under the
terms of the Credit Agreement, Sony and Bertelsmann have
each agreed to provide one-half of the funding. The Credit
Agreement, which matures on August 5, 2009, provides for a
base commitment of $300 million and additional incremental
borrowings of up to $150 million. As of March 31, 2005, the joint
venture had no borrowings outstanding under the Credit Agree-
ment. Accordingly, Sony’s outstanding commitment under the
Credit Agreement as of March 31, 2005 was ¥24,075 million
($225 million).
The aggregate amounts of future year-by-year payments for
these loan commitments cannot be determined.
(2) Contingent liabilities:
Sony had contingent liabilities including guarantees given in the
ordinary course of business, which amounted to ¥26,049 million
($243 million) at March 31, 2005. The major components of the
contingent liabilities are as follows:
Sony has issued loan guarantees to related parties comprised
of affiliated companies accounted for under the equity method
and unconsolidated subsidiaries. The terms of these guarantees
are mainly within 1 year. Sony would be required to perform
under these guarantees upon non-performance of the primary
borrowers. The contingent liability related to these guarantees
was ¥7,642 million ($71 million) and was not recorded on the
consolidated balance sheet as of March 31, 2005.
The European Commission (“EC”) has issued the Waste
Electrical and Electronic Equipment (“WEEE”) directive in February
2003. The WEEE directive will require electronics producers after
August 2005 to be responsible for organizing a scheme, and
possibly financing the cost, for collection, treatment, recovery
and safe disposal of waste products. While the cost of this
directive to Sony cannot be determined before regulation is
adopted in individual member states, Sony continues to evaluate
the impact of adopting this regulation.
Sony has agreed to indemnify certain third parties against tax
losses resulting from transactions entered into in the normal
course of business. The maximum amount of potential future
payments under these guarantees cannot be estimated at this
time. These guarantees were not recorded on the consolidated
balance sheet as of March 31, 2005.
BH6/30 05.7.7, 3:32 AMPage 122 Adobe PageMaker 6.0J/PPC
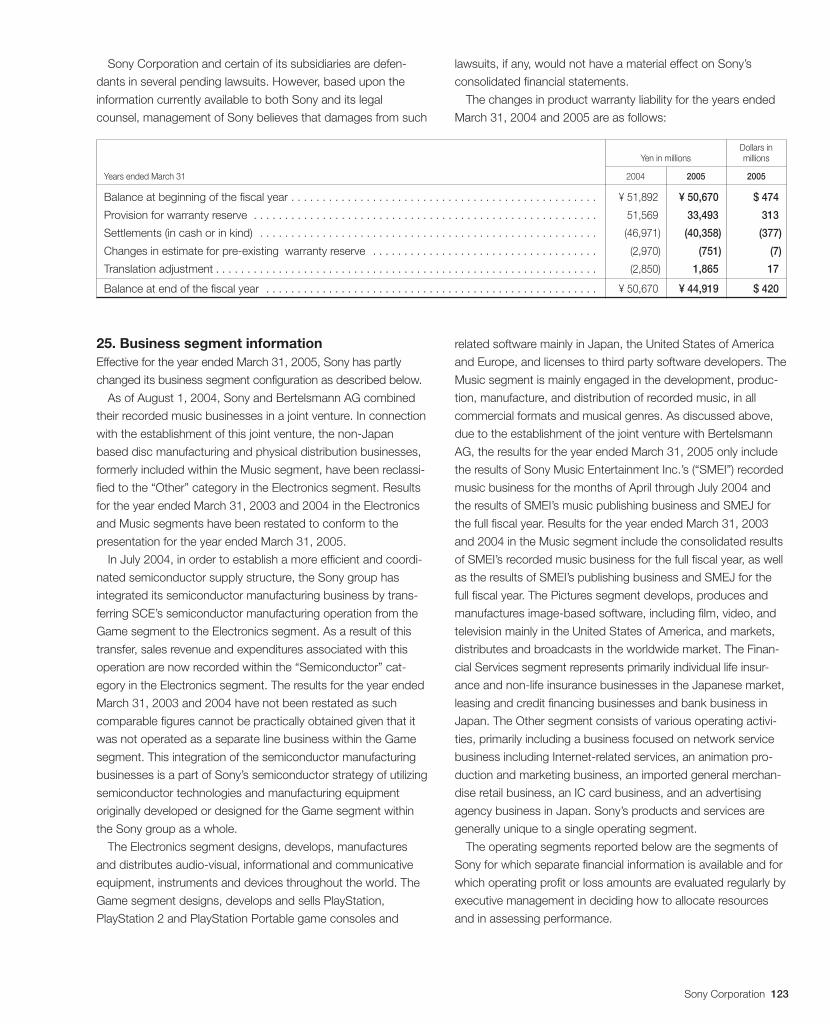
Sony Corporation 123
Sony Corporation and certain of its subsidiaries are defen-
dants in several pending lawsuits. However, based upon the
information currently available to both Sony and its legal
counsel, management of Sony believes that damages from such
lawsuits, if any, would not have a material effect on Sony’s
consolidated financial statements.
The changes in product warranty liability for the years ended
March 31, 2004 and 2005 are as follows:
Dollars inYen in millions millions
Years ended March 31 2004 2005 2005
Balance at beginning of the fiscal year . . . . . . . . . . . . . . . . . . . . . . . . . . . . . . . . . . . . . . . . . . . . . . . . . ¥ 51,892 ¥ 50,670 $ 474
Provision for warranty reserve . . . . . . . . . . . . . . . . . . . . . . . . . . . . . . . . . . . . . . . . . . . . . . . . . . . . . . . 51,569 33,493 313
Settlements (in cash or in kind) . . . . . . . . . . . . . . . . . . . . . . . . . . . . . . . . . . . . . . . . . . . . . . . . . . . . . . (46,971) (40,358) (377)
Changes in estimate for pre-existing warranty reserve . . . . . . . . . . . . . . . . . . . . . . . . . . . . . . . . . . . . (2,970) (751) (7)
Translation adjustment . . . . . . . . . . . . . . . . . . . . . . . . . . . . . . . . . . . . . . . . . . . . . . . . . . . . . . . . . . . . . (2,850) 1,865 17
Balance at end of the fiscal year . . . . . . . . . . . . . . . . . . . . . . . . . . . . . . . . . . . . . . . . . . . . . . . . . . . . . ¥ 50,670 ¥ 44,919 $ 420
25. Business segment informationEffective for the year ended March 31, 2005, Sony has partly
changed its business segment configuration as described below.
As of August 1, 2004, Sony and Bertelsmann AG combined
their recorded music businesses in a joint venture. In connection
with the establishment of this joint venture, the non-Japan
based disc manufacturing and physical distribution businesses,
formerly included within the Music segment, have been reclassi-
fied to the “Other” category in the Electronics segment. Results
for the year ended March 31, 2003 and 2004 in the Electronics
and Music segments have been restated to conform to the
presentation for the year ended March 31, 2005.
In July 2004, in order to establish a more efficient and coordi-
nated semiconductor supply structure, the Sony group has
integrated its semiconductor manufacturing business by trans-
ferring SCE’s semiconductor manufacturing operation from the
Game segment to the Electronics segment. As a result of this
transfer, sales revenue and expenditures associated with this
operation are now recorded within the “Semiconductor” cat-
egory in the Electronics segment. The results for the year ended
March 31, 2003 and 2004 have not been restated as such
comparable figures cannot be practically obtained given that it
was not operated as a separate line business within the Game
segment. This integration of the semiconductor manufacturing
businesses is a part of Sony’s semiconductor strategy of utilizing
semiconductor technologies and manufacturing equipment
originally developed or designed for the Game segment within
the Sony group as a whole.
The Electronics segment designs, develops, manufactures
and distributes audio-visual, informational and communicative
equipment, instruments and devices throughout the world. The
Game segment designs, develops and sells PlayStation,
PlayStation 2 and PlayStation Portable game consoles and
related software mainly in Japan, the United States of America
and Europe, and licenses to third party software developers. The
Music segment is mainly engaged in the development, produc-
tion, manufacture, and distribution of recorded music, in all
commercial formats and musical genres. As discussed above,
due to the establishment of the joint venture with Bertelsmann
AG, the results for the year ended March 31, 2005 only include
the results of Sony Music Entertainment Inc.’s (“SMEI”) recorded
music business for the months of April through July 2004 and
the results of SMEI’s music publishing business and SMEJ for
the full fiscal year. Results for the year ended March 31, 2003
and 2004 in the Music segment include the consolidated results
of SMEI’s recorded music business for the full fiscal year, as well
as the results of SMEI’s publishing business and SMEJ for the
full fiscal year. The Pictures segment develops, produces and
manufactures image-based software, including film, video, and
television mainly in the United States of America, and markets,
distributes and broadcasts in the worldwide market. The Finan-
cial Services segment represents primarily individual life insur-
ance and non-life insurance businesses in the Japanese market,
leasing and credit financing businesses and bank business in
Japan. The Other segment consists of various operating activi-
ties, primarily including a business focused on network service
business including Internet-related services, an animation pro-
duction and marketing business, an imported general merchan-
dise retail business, an IC card business, and an advertising
agency business in Japan. Sony’s products and services are
generally unique to a single operating segment.
The operating segments reported below are the segments of
Sony for which separate financial information is available and for
which operating profit or loss amounts are evaluated regularly by
executive management in deciding how to allocate resources
and in assessing performance.
BH6/30 05.7.7, 3:32 AMPage 123 Adobe PageMaker 6.0J/PPC
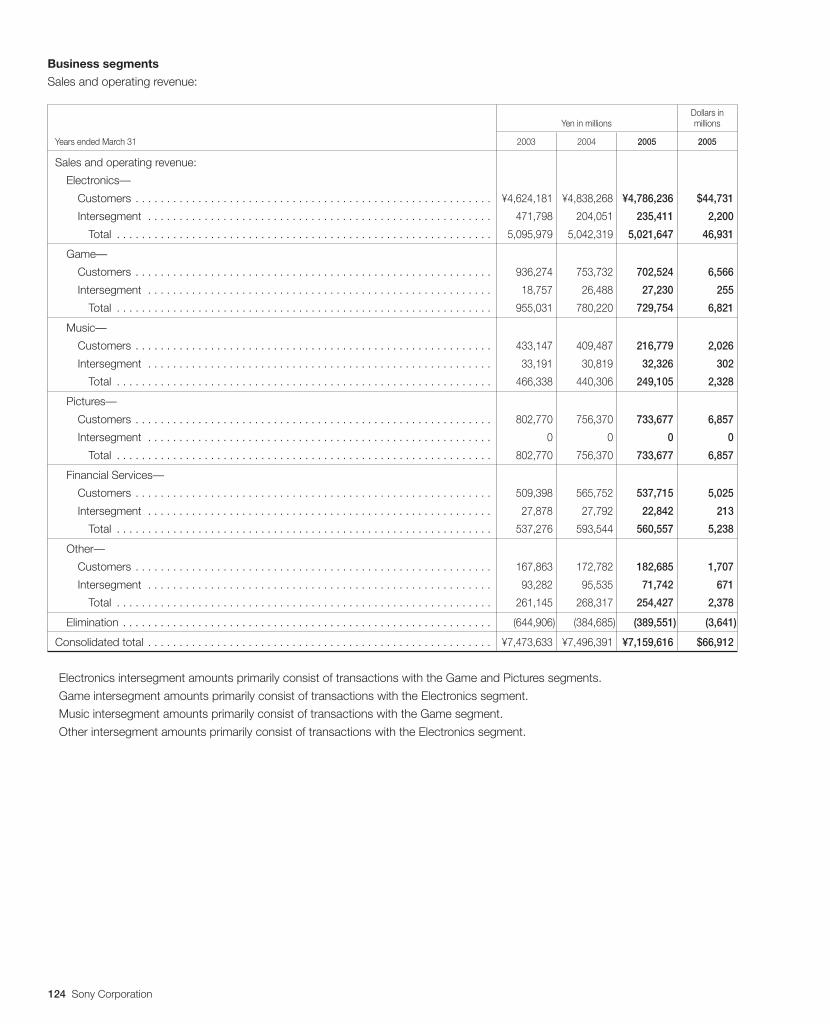
124 Sony Corporation
Business segments
Sales and operating revenue:
Dollars inYen in millions millions
Years ended March 31 2003 2004 2005 2005
Sales and operating revenue:
Electronics—
Customers . . . . . . . . . . . . . . . . . . . . . . . . . . . . . . . . . . . . . . . . . . . . . . . . . . . . . . . . . ¥4,624,181 ¥4,838,268 ¥4,786,236 $44,731
Intersegment . . . . . . . . . . . . . . . . . . . . . . . . . . . . . . . . . . . . . . . . . . . . . . . . . . . . . . . 471,798 204,051 235,411 2,200
Total . . . . . . . . . . . . . . . . . . . . . . . . . . . . . . . . . . . . . . . . . . . . . . . . . . . . . . . . . . . . 5,095,979 5,042,319 5,021,647 46,931
Game—
Customers . . . . . . . . . . . . . . . . . . . . . . . . . . . . . . . . . . . . . . . . . . . . . . . . . . . . . . . . . 936,274 753,732 702,524 6,566
Intersegment . . . . . . . . . . . . . . . . . . . . . . . . . . . . . . . . . . . . . . . . . . . . . . . . . . . . . . . 18,757 26,488 27,230 255
Total . . . . . . . . . . . . . . . . . . . . . . . . . . . . . . . . . . . . . . . . . . . . . . . . . . . . . . . . . . . . 955,031 780,220 729,754 6,821
Music—
Customers . . . . . . . . . . . . . . . . . . . . . . . . . . . . . . . . . . . . . . . . . . . . . . . . . . . . . . . . . 433,147 409,487 216,779 2,026
Intersegment . . . . . . . . . . . . . . . . . . . . . . . . . . . . . . . . . . . . . . . . . . . . . . . . . . . . . . . 33,191 30,819 32,326 302
Total . . . . . . . . . . . . . . . . . . . . . . . . . . . . . . . . . . . . . . . . . . . . . . . . . . . . . . . . . . . . 466,338 440,306 249,105 2,328
Pictures—
Customers . . . . . . . . . . . . . . . . . . . . . . . . . . . . . . . . . . . . . . . . . . . . . . . . . . . . . . . . . 802,770 756,370 733,677 6,857
Intersegment . . . . . . . . . . . . . . . . . . . . . . . . . . . . . . . . . . . . . . . . . . . . . . . . . . . . . . . 0 0 0 0
Total . . . . . . . . . . . . . . . . . . . . . . . . . . . . . . . . . . . . . . . . . . . . . . . . . . . . . . . . . . . . 802,770 756,370 733,677 6,857
Financial Services—
Customers . . . . . . . . . . . . . . . . . . . . . . . . . . . . . . . . . . . . . . . . . . . . . . . . . . . . . . . . . 509,398 565,752 537,715 5,025
Intersegment . . . . . . . . . . . . . . . . . . . . . . . . . . . . . . . . . . . . . . . . . . . . . . . . . . . . . . . 27,878 27,792 22,842 213
Total . . . . . . . . . . . . . . . . . . . . . . . . . . . . . . . . . . . . . . . . . . . . . . . . . . . . . . . . . . . . 537,276 593,544 560,557 5,238
Other—
Customers . . . . . . . . . . . . . . . . . . . . . . . . . . . . . . . . . . . . . . . . . . . . . . . . . . . . . . . . . 167,863 172,782 182,685 1,707
Intersegment . . . . . . . . . . . . . . . . . . . . . . . . . . . . . . . . . . . . . . . . . . . . . . . . . . . . . . . 93,282 95,535 71,742 671
Total . . . . . . . . . . . . . . . . . . . . . . . . . . . . . . . . . . . . . . . . . . . . . . . . . . . . . . . . . . . . 261,145 268,317 254,427 2,378
Elimination . . . . . . . . . . . . . . . . . . . . . . . . . . . . . . . . . . . . . . . . . . . . . . . . . . . . . . . . . . . (644,906) (384,685) (389,551) (3,641)
Consolidated total . . . . . . . . . . . . . . . . . . . . . . . . . . . . . . . . . . . . . . . . . . . . . . . . . . . . . . . ¥7,473,633 ¥7,496,391 ¥7,159,616 $66,912
Electronics intersegment amounts primarily consist of transactions with the Game and Pictures segments.
Game intersegment amounts primarily consist of transactions with the Electronics segment.
Music intersegment amounts primarily consist of transactions with the Game segment.
Other intersegment amounts primarily consist of transactions with the Electronics segment.
BH6/30 05.7.7, 3:32 AMPage 124 Adobe PageMaker 6.0J/PPC
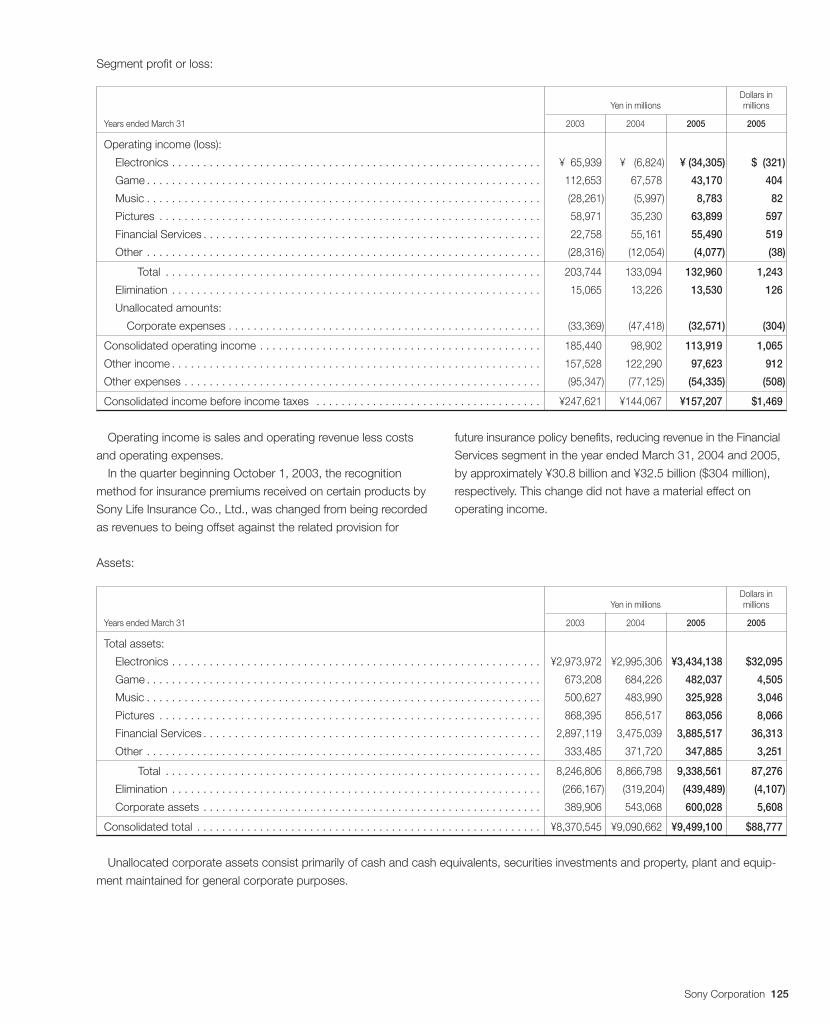
Sony Corporation 125
Segment profit or loss:
Dollars inYen in millions millions
Years ended March 31 2003 2004 2005 2005
Operating income (loss):
Electronics . . . . . . . . . . . . . . . . . . . . . . . . . . . . . . . . . . . . . . . . . . . . . . . . . . . . . . . . . . . ¥065,939 ¥ (6,824) ¥ (34,305) $ (321)
Game . . . . . . . . . . . . . . . . . . . . . . . . . . . . . . . . . . . . . . . . . . . . . . . . . . . . . . . . . . . . . . . 112,653 67,578 43,170 404
Music . . . . . . . . . . . . . . . . . . . . . . . . . . . . . . . . . . . . . . . . . . . . . . . . . . . . . . . . . . . . . . . (28,261) (5,997) 8,783 82
Pictures . . . . . . . . . . . . . . . . . . . . . . . . . . . . . . . . . . . . . . . . . . . . . . . . . . . . . . . . . . . . . 58,971 35,230 63,899 597
Financial Services . . . . . . . . . . . . . . . . . . . . . . . . . . . . . . . . . . . . . . . . . . . . . . . . . . . . . . 22,758 55,161 55,490 519
Other . . . . . . . . . . . . . . . . . . . . . . . . . . . . . . . . . . . . . . . . . . . . . . . . . . . . . . . . . . . . . . . (28,316) (12,054) (4,077) (38)
Total . . . . . . . . . . . . . . . . . . . . . . . . . . . . . . . . . . . . . . . . . . . . . . . . . . . . . . . . . . . . 203,744 133,094 132,960 1,243
Elimination . . . . . . . . . . . . . . . . . . . . . . . . . . . . . . . . . . . . . . . . . . . . . . . . . . . . . . . . . . . 15,065 13,226 13,530 126
Unallocated amounts:
Corporate expenses . . . . . . . . . . . . . . . . . . . . . . . . . . . . . . . . . . . . . . . . . . . . . . . . . . (33,369) (47,418) (32,571) (304)
Consolidated operating income . . . . . . . . . . . . . . . . . . . . . . . . . . . . . . . . . . . . . . . . . . . . . 185,440 98,902 113,919 1,065
Other income . . . . . . . . . . . . . . . . . . . . . . . . . . . . . . . . . . . . . . . . . . . . . . . . . . . . . . . . . . . 157,528 122,290 97,623 912
Other expenses . . . . . . . . . . . . . . . . . . . . . . . . . . . . . . . . . . . . . . . . . . . . . . . . . . . . . . . . . (95,347) (77,125) (54,335) (508)
Consolidated income before income taxes . . . . . . . . . . . . . . . . . . . . . . . . . . . . . . . . . . . . ¥247,621 ¥144,067 ¥157,207 $1,469
Assets:
Dollars inYen in millions millions
Years ended March 31 2003 2004 2005 2005
Total assets:
Electronics . . . . . . . . . . . . . . . . . . . . . . . . . . . . . . . . . . . . . . . . . . . . . . . . . . . . . . . . . . . ¥2,973,972 ¥2,995,306 ¥3,434,138 $32,095
Game . . . . . . . . . . . . . . . . . . . . . . . . . . . . . . . . . . . . . . . . . . . . . . . . . . . . . . . . . . . . . . . 673,208 684,226 482,037 4,505
Music . . . . . . . . . . . . . . . . . . . . . . . . . . . . . . . . . . . . . . . . . . . . . . . . . . . . . . . . . . . . . . . 500,627 483,990 325,928 3,046
Pictures . . . . . . . . . . . . . . . . . . . . . . . . . . . . . . . . . . . . . . . . . . . . . . . . . . . . . . . . . . . . . 868,395 856,517 863,056 8,066
Financial Services . . . . . . . . . . . . . . . . . . . . . . . . . . . . . . . . . . . . . . . . . . . . . . . . . . . . . . 2,897,119 3,475,039 3,885,517 36,313
Other . . . . . . . . . . . . . . . . . . . . . . . . . . . . . . . . . . . . . . . . . . . . . . . . . . . . . . . . . . . . . . . 333,485 371,720 347,885 3,251
Total . . . . . . . . . . . . . . . . . . . . . . . . . . . . . . . . . . . . . . . . . . . . . . . . . . . . . . . . . . . . 8,246,806 8,866,798 9,338,561 87,276
Elimination . . . . . . . . . . . . . . . . . . . . . . . . . . . . . . . . . . . . . . . . . . . . . . . . . . . . . . . . . . . (266,167) (319,204) (439,489) (4,107)
Corporate assets . . . . . . . . . . . . . . . . . . . . . . . . . . . . . . . . . . . . . . . . . . . . . . . . . . . . . . 389,906 543,068 600,028 5,608
Consolidated total . . . . . . . . . . . . . . . . . . . . . . . . . . . . . . . . . . . . . . . . . . . . . . . . . . . . . . . ¥8,370,545 ¥9,090,662 ¥9,499,100 $88,777
Unallocated corporate assets consist primarily of cash and cash equivalents, securities investments and property, plant and equip-
ment maintained for general corporate purposes.
Operating income is sales and operating revenue less costs
and operating expenses.
In the quarter beginning October 1, 2003, the recognition
method for insurance premiums received on certain products by
Sony Life Insurance Co., Ltd., was changed from being recorded
as revenues to being offset against the related provision for
future insurance policy benefits, reducing revenue in the Financial
Services segment in the year ended March 31, 2004 and 2005,
by approximately ¥30.8 billion and ¥32.5 billion ($304 million),
respectively. This change did not have a material effect on
operating income.
BH6/30 05.7.7, 3:32 AMPage 125 Adobe PageMaker 6.0J/PPC
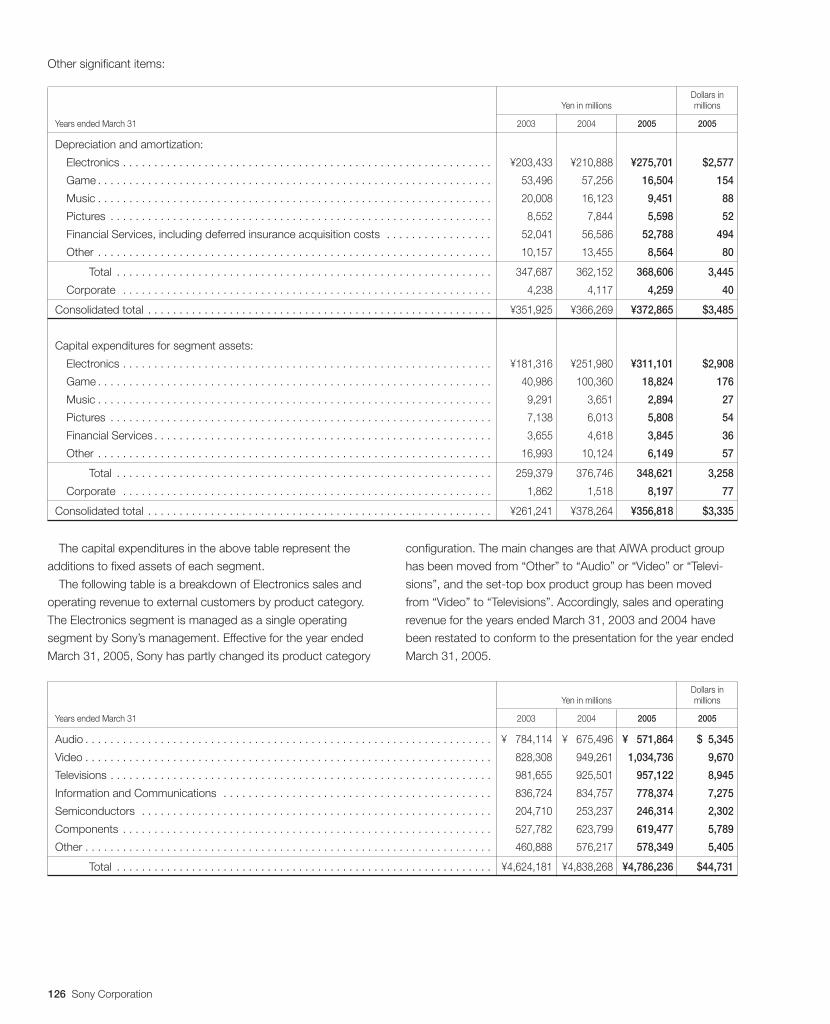
126 Sony Corporation
Dollars inYen in millions millions
Years ended March 31 2003 2004 2005 2005
Audio . . . . . . . . . . . . . . . . . . . . . . . . . . . . . . . . . . . . . . . . . . . . . . . . . . . . . . . . . . . . . . . . . ¥0,784,114 ¥0,675,496 ¥0,571,864 $05,345
Video . . . . . . . . . . . . . . . . . . . . . . . . . . . . . . . . . . . . . . . . . . . . . . . . . . . . . . . . . . . . . . . . . 828,308 949,261 1,034,736 9,670
Televisions . . . . . . . . . . . . . . . . . . . . . . . . . . . . . . . . . . . . . . . . . . . . . . . . . . . . . . . . . . . . . 981,655 925,501 957,122 8,945
Information and Communications . . . . . . . . . . . . . . . . . . . . . . . . . . . . . . . . . . . . . . . . . . . 836,724 834,757 778,374 7,275
Semiconductors . . . . . . . . . . . . . . . . . . . . . . . . . . . . . . . . . . . . . . . . . . . . . . . . . . . . . . . . 204,710 253,237 246,314 2,302
Components . . . . . . . . . . . . . . . . . . . . . . . . . . . . . . . . . . . . . . . . . . . . . . . . . . . . . . . . . . . 527,782 623,799 619,477 5,789
Other . . . . . . . . . . . . . . . . . . . . . . . . . . . . . . . . . . . . . . . . . . . . . . . . . . . . . . . . . . . . . . . . . 460,888 576,217 578,349 5,405
Total . . . . . . . . . . . . . . . . . . . . . . . . . . . . . . . . . . . . . . . . . . . . . . . . . . . . . . . . . . . . ¥4,624,181 ¥4,838,268 ¥4,786,236 $44,731
Other significant items:
Dollars inYen in millions millions
Years ended March 31 2003 2004 2005 2005
Depreciation and amortization:
Electronics . . . . . . . . . . . . . . . . . . . . . . . . . . . . . . . . . . . . . . . . . . . . . . . . . . . . . . . . . . . ¥203,433 ¥210,888 ¥275,701 $2,577
Game . . . . . . . . . . . . . . . . . . . . . . . . . . . . . . . . . . . . . . . . . . . . . . . . . . . . . . . . . . . . . . . 53,496 57,256 16,504 154
Music . . . . . . . . . . . . . . . . . . . . . . . . . . . . . . . . . . . . . . . . . . . . . . . . . . . . . . . . . . . . . . . 20,008 16,123 9,451 88
Pictures . . . . . . . . . . . . . . . . . . . . . . . . . . . . . . . . . . . . . . . . . . . . . . . . . . . . . . . . . . . . . 8,552 7,844 5,598 52
Financial Services, including deferred insurance acquisition costs . . . . . . . . . . . . . . . . . 52,041 56,586 52,788 494
Other . . . . . . . . . . . . . . . . . . . . . . . . . . . . . . . . . . . . . . . . . . . . . . . . . . . . . . . . . . . . . . . 10,157 13,455 8,564 80
Total . . . . . . . . . . . . . . . . . . . . . . . . . . . . . . . . . . . . . . . . . . . . . . . . . . . . . . . . . . . . 347,687 362,152 368,606 3,445
Corporate . . . . . . . . . . . . . . . . . . . . . . . . . . . . . . . . . . . . . . . . . . . . . . . . . . . . . . . . . . . 4,238 4,117 4,259 40
Consolidated total . . . . . . . . . . . . . . . . . . . . . . . . . . . . . . . . . . . . . . . . . . . . . . . . . . . . . . . ¥351,925 ¥366,269 ¥372,865 $3,485
Capital expenditures for segment assets:
Electronics . . . . . . . . . . . . . . . . . . . . . . . . . . . . . . . . . . . . . . . . . . . . . . . . . . . . . . . . . . . ¥181,316 ¥251,980 ¥311,101 $2,908
Game . . . . . . . . . . . . . . . . . . . . . . . . . . . . . . . . . . . . . . . . . . . . . . . . . . . . . . . . . . . . . . . 40,986 100,360 18,824 176
Music . . . . . . . . . . . . . . . . . . . . . . . . . . . . . . . . . . . . . . . . . . . . . . . . . . . . . . . . . . . . . . . 9,291 3,651 2,894 27
Pictures . . . . . . . . . . . . . . . . . . . . . . . . . . . . . . . . . . . . . . . . . . . . . . . . . . . . . . . . . . . . . 7,138 6,013 5,808 54
Financial Services . . . . . . . . . . . . . . . . . . . . . . . . . . . . . . . . . . . . . . . . . . . . . . . . . . . . . . 3,655 4,618 3,845 36
Other . . . . . . . . . . . . . . . . . . . . . . . . . . . . . . . . . . . . . . . . . . . . . . . . . . . . . . . . . . . . . . . 16,993 10,124 6,149 57
Total . . . . . . . . . . . . . . . . . . . . . . . . . . . . . . . . . . . . . . . . . . . . . . . . . . . . . . . . . . . . 259,379 376,746 348,621 3,258
Corporate . . . . . . . . . . . . . . . . . . . . . . . . . . . . . . . . . . . . . . . . . . . . . . . . . . . . . . . . . . . 1,862 1,518 8,197 77
Consolidated total . . . . . . . . . . . . . . . . . . . . . . . . . . . . . . . . . . . . . . . . . . . . . . . . . . . . . . . ¥261,241 ¥378,264 ¥356,818 $3,335
The capital expenditures in the above table represent the
additions to fixed assets of each segment.
The following table is a breakdown of Electronics sales and
operating revenue to external customers by product category.
The Electronics segment is managed as a single operating
segment by Sony’s management. Effective for the year ended
March 31, 2005, Sony has partly changed its product category
configuration. The main changes are that AIWA product group
has been moved from “Other” to “Audio” or “Video” or “Televi-
sions”, and the set-top box product group has been moved
from “Video” to “Televisions”. Accordingly, sales and operating
revenue for the years ended March 31, 2003 and 2004 have
been restated to conform to the presentation for the year ended
March 31, 2005.
BH6/30 05.7.7, 3:32 AMPage 126 Adobe PageMaker 6.0J/PPC
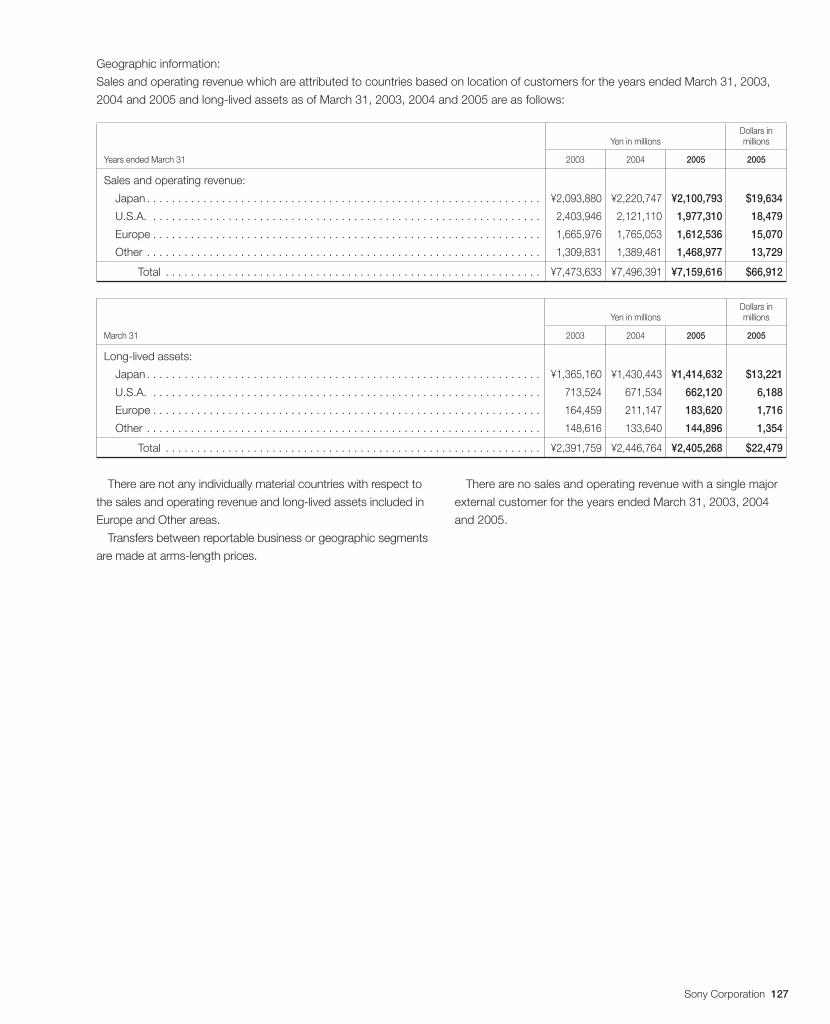
Sony Corporation 127
Geographic information:
Sales and operating revenue which are attributed to countries based on location of customers for the years ended March 31, 2003,
2004 and 2005 and long-lived assets as of March 31, 2003, 2004 and 2005 are as follows:
Dollars inYen in millions millions
Years ended March 31 2003 2004 2005 2005
Sales and operating revenue:
Japan . . . . . . . . . . . . . . . . . . . . . . . . . . . . . . . . . . . . . . . . . . . . . . . . . . . . . . . . . . . . . . . ¥2,093,880 ¥2,220,747 ¥2,100,793 $19,634
U.S.A. . . . . . . . . . . . . . . . . . . . . . . . . . . . . . . . . . . . . . . . . . . . . . . . . . . . . . . . . . . . . . . 2,403,946 2,121,110 1,977,310 18,479
Europe . . . . . . . . . . . . . . . . . . . . . . . . . . . . . . . . . . . . . . . . . . . . . . . . . . . . . . . . . . . . . . 1,665,976 1,765,053 1,612,536 15,070
Other . . . . . . . . . . . . . . . . . . . . . . . . . . . . . . . . . . . . . . . . . . . . . . . . . . . . . . . . . . . . . . . 1,309,831 1,389,481 1,468,977 13,729
Total . . . . . . . . . . . . . . . . . . . . . . . . . . . . . . . . . . . . . . . . . . . . . . . . . . . . . . . . . . . . ¥7,473,633 ¥7,496,391 ¥7,159,616 $66,912
Dollars inYen in millions millions
March 31 2003 2004 2005 2005
Long-lived assets:
Japan . . . . . . . . . . . . . . . . . . . . . . . . . . . . . . . . . . . . . . . . . . . . . . . . . . . . . . . . . . . . . . . ¥1,365,160 ¥1,430,443 ¥1,414,632 $13,221
U.S.A. . . . . . . . . . . . . . . . . . . . . . . . . . . . . . . . . . . . . . . . . . . . . . . . . . . . . . . . . . . . . . . 713,524 671,534 662,120 6,188
Europe . . . . . . . . . . . . . . . . . . . . . . . . . . . . . . . . . . . . . . . . . . . . . . . . . . . . . . . . . . . . . . 164,459 211,147 183,620 1,716
Other . . . . . . . . . . . . . . . . . . . . . . . . . . . . . . . . . . . . . . . . . . . . . . . . . . . . . . . . . . . . . . . 148,616 133,640 144,896 1,354
Total . . . . . . . . . . . . . . . . . . . . . . . . . . . . . . . . . . . . . . . . . . . . . . . . . . . . . . . . . . . . ¥2,391,759 ¥2,446,764 ¥2,405,268 $22,479
There are not any individually material countries with respect to
the sales and operating revenue and long-lived assets included in
Europe and Other areas.
Transfers between reportable business or geographic segments
are made at arms-length prices.
There are no sales and operating revenue with a single major
external customer for the years ended March 31, 2003, 2004
and 2005.
BH6/30 05.7.7, 3:32 AMPage 127 Adobe PageMaker 6.0J/PPC
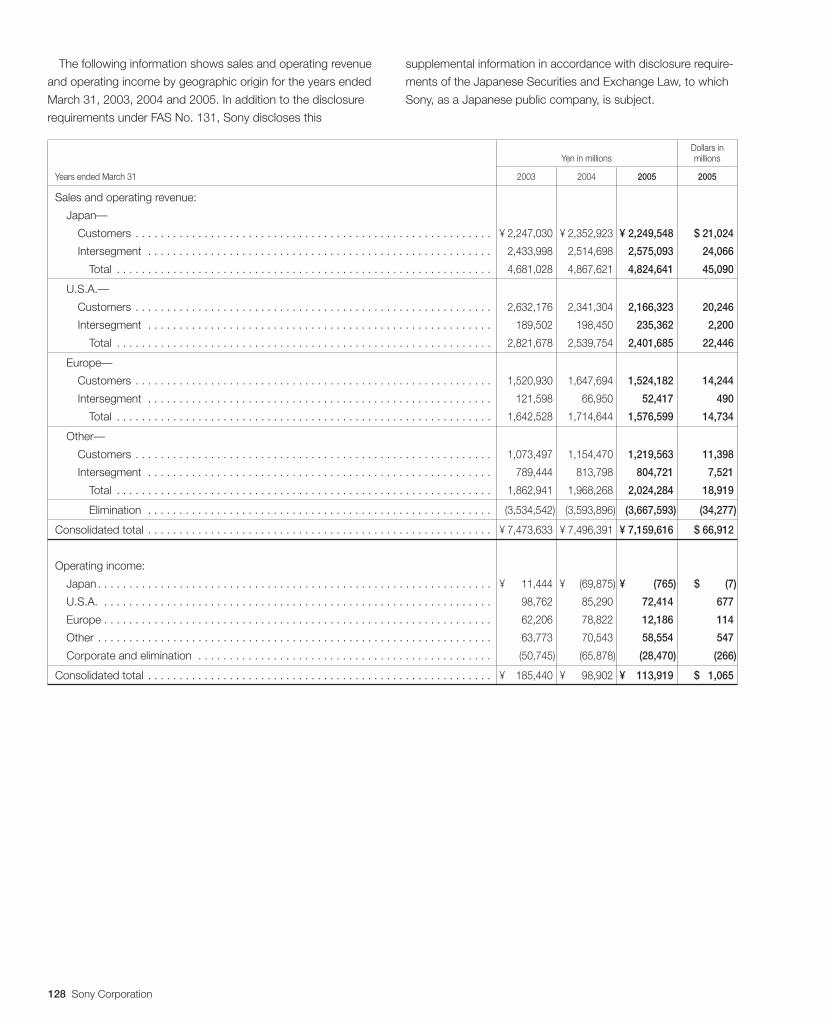
128 Sony Corporation
Dollars inYen in millions millions
Years ended March 31 2003 2004 2005 2005
Sales and operating revenue:
Japan—
Customers . . . . . . . . . . . . . . . . . . . . . . . . . . . . . . . . . . . . . . . . . . . . . . . . . . . . . . . . . ¥(2,247,030 ¥(2,352,923 ¥(2,249,548 $(21,024
Intersegment . . . . . . . . . . . . . . . . . . . . . . . . . . . . . . . . . . . . . . . . . . . . . . . . . . . . . . . 2,433,998 2,514,698 2,575,093 24,066
Total . . . . . . . . . . . . . . . . . . . . . . . . . . . . . . . . . . . . . . . . . . . . . . . . . . . . . . . . . . . . 4,681,028 4,867,621 4,824,641 45,090
U.S.A.—
Customers . . . . . . . . . . . . . . . . . . . . . . . . . . . . . . . . . . . . . . . . . . . . . . . . . . . . . . . . . 2,632,176 2,341,304 2,166,323 20,246
Intersegment . . . . . . . . . . . . . . . . . . . . . . . . . . . . . . . . . . . . . . . . . . . . . . . . . . . . . . . 189,502 198,450 235,362 2,200
Total . . . . . . . . . . . . . . . . . . . . . . . . . . . . . . . . . . . . . . . . . . . . . . . . . . . . . . . . . . . . 2,821,678 2,539,754 2,401,685 22,446
Europe—
Customers . . . . . . . . . . . . . . . . . . . . . . . . . . . . . . . . . . . . . . . . . . . . . . . . . . . . . . . . . 1,520,930 1,647,694 1,524,182 14,244
Intersegment . . . . . . . . . . . . . . . . . . . . . . . . . . . . . . . . . . . . . . . . . . . . . . . . . . . . . . . 121,598 66,950 52,417 490
Total . . . . . . . . . . . . . . . . . . . . . . . . . . . . . . . . . . . . . . . . . . . . . . . . . . . . . . . . . . . . 1,642,528 1,714,644 1,576,599 14,734
Other—
Customers . . . . . . . . . . . . . . . . . . . . . . . . . . . . . . . . . . . . . . . . . . . . . . . . . . . . . . . . . 1,073,497 1,154,470 1,219,563 11,398
Intersegment . . . . . . . . . . . . . . . . . . . . . . . . . . . . . . . . . . . . . . . . . . . . . . . . . . . . . . . 789,444 813,798 804,721 7,521
Total . . . . . . . . . . . . . . . . . . . . . . . . . . . . . . . . . . . . . . . . . . . . . . . . . . . . . . . . . . . . 1,862,941 1,968,268 2,024,284 18,919
Elimination . . . . . . . . . . . . . . . . . . . . . . . . . . . . . . . . . . . . . . . . . . . . . . . . . . . . . . . (3,534,542) (3,593,896) (3,667,593) (34,277)
Consolidated total . . . . . . . . . . . . . . . . . . . . . . . . . . . . . . . . . . . . . . . . . . . . . . . . . . . . . . . ¥(7,473,633 ¥(7,496,391 ¥(7,159,616 $(66,912
Operating income:
Japan . . . . . . . . . . . . . . . . . . . . . . . . . . . . . . . . . . . . . . . . . . . . . . . . . . . . . . . . . . . . . . . ¥(0,011,444 ¥0,0(69,875) ¥0,000,(765) $00,00(7)
U.S.A. . . . . . . . . . . . . . . . . . . . . . . . . . . . . . . . . . . . . . . . . . . . . . . . . . . . . . . . . . . . . . . 98,762 85,290 72,414 677
Europe . . . . . . . . . . . . . . . . . . . . . . . . . . . . . . . . . . . . . . . . . . . . . . . . . . . . . . . . . . . . . . 62,206 78,822 12,186 114
Other . . . . . . . . . . . . . . . . . . . . . . . . . . . . . . . . . . . . . . . . . . . . . . . . . . . . . . . . . . . . . . . 63,773 70,543 58,554 547
Corporate and elimination . . . . . . . . . . . . . . . . . . . . . . . . . . . . . . . . . . . . . . . . . . . . . . . (50,745) (65,878) (28,470) (266)
Consolidated total . . . . . . . . . . . . . . . . . . . . . . . . . . . . . . . . . . . . . . . . . . . . . . . . . . . . . . . ¥(0,185,440 ¥(0,098,902 ¥(0,113,919 $(01,065
The following information shows sales and operating revenue
and operating income by geographic origin for the years ended
March 31, 2003, 2004 and 2005. In addition to the disclosure
requirements under FAS No. 131, Sony discloses this
supplemental information in accordance with disclosure require-
ments of the Japanese Securities and Exchange Law, to which
Sony, as a Japanese public company, is subject.
BH6/30 05.7.7, 3:32 AMPage 128 Adobe PageMaker 6.0J/PPC
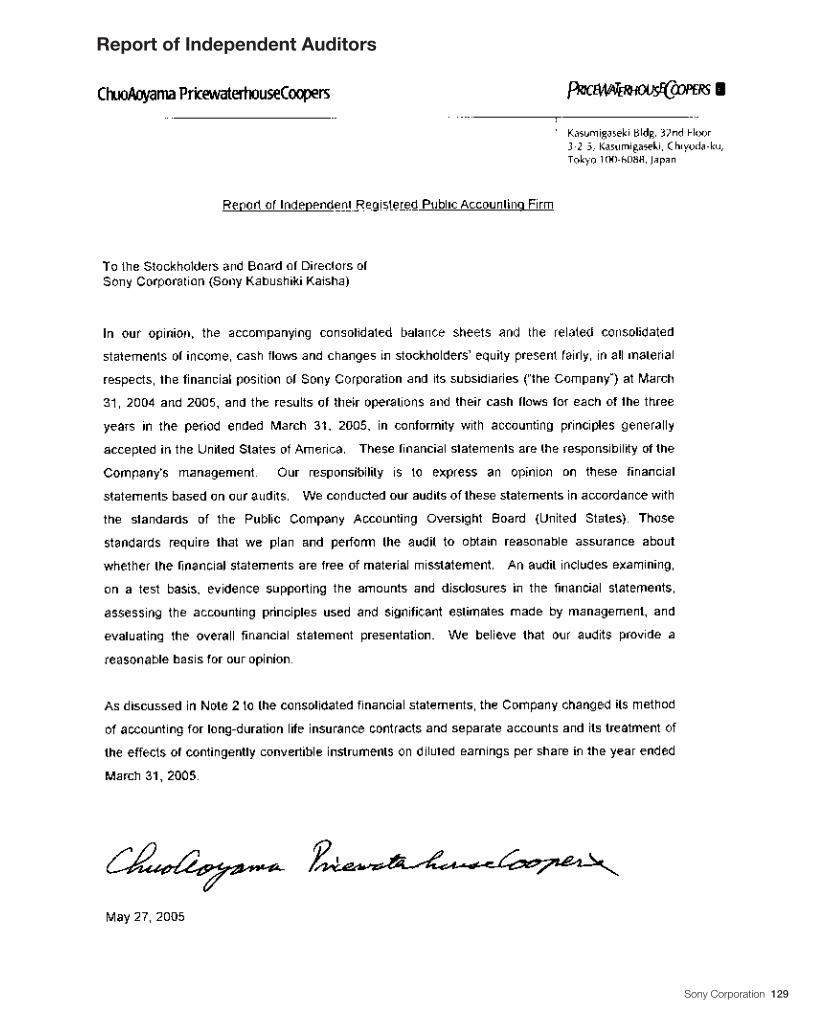
Sony Corporation 129
Report of Independent Auditors
BH6/30 05.7.7, 3:32 AMPage 129 Adobe PageMaker 6.0J/PPC
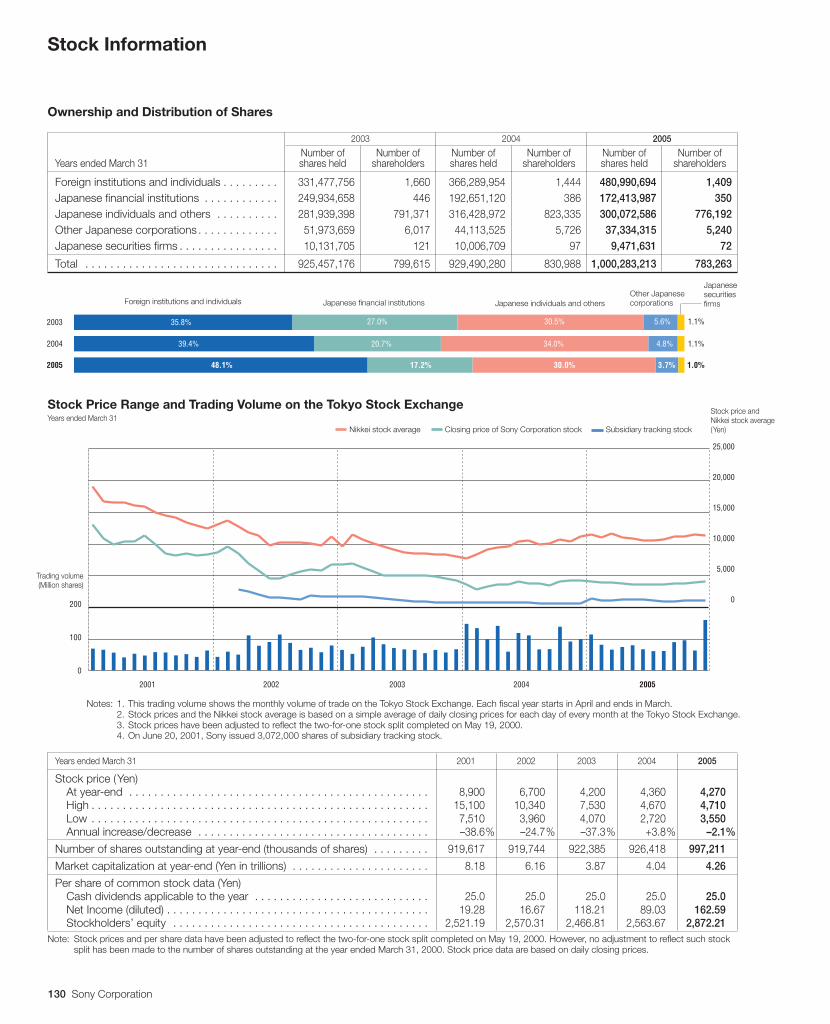
130 Sony Corporation
Stock Information
Ownership and Distribution of Shares
2003 2004 2005
Number of Number of Number of Number of Number of Number ofYears ended March 31 shares held shareholders shares held shareholders shares held shareholders
Foreign institutions and individuals . . . . . . . . . 331,477,756 1,660 366,289,954 1,444 480,990,694 1,409Japanese financial institutions . . . . . . . . . . . . 249,934,658 446 192,651,120 386 172,413,987 350Japanese individuals and others . . . . . . . . . . 281,939,398 791,371 316,428,972 823,335 300,072,586 776,192Other Japanese corporations . . . . . . . . . . . . . 51,973,659 6,017 44,113,525 5,726 37,334,315 5,240Japanese securities firms . . . . . . . . . . . . . . . . 10,131,705 121 10,006,709 97 9,471,631 72
Total . . . . . . . . . . . . . . . . . . . . . . . . . . . . . . . 925,457,176 799,615 929,490,280 830,988 1,000,283,213 783,263
Years ended March 31 2001 2002 2003 2004 2005
Stock price (Yen)At year-end . . . . . . . . . . . . . . . . . . . . . . . . . . . . . . . . . . . . . . . . . . . . . . . . 8,900 6,700 4,200 4,360 4,270High . . . . . . . . . . . . . . . . . . . . . . . . . . . . . . . . . . . . . . . . . . . . . . . . . . . . . . 15,100 10,340 7,530 4,670 4,710Low . . . . . . . . . . . . . . . . . . . . . . . . . . . . . . . . . . . . . . . . . . . . . . . . . . . . . . 7,510 3,960 4,070 2,720 3,550Annual increase/decrease . . . . . . . . . . . . . . . . . . . . . . . . . . . . . . . . . . . . . –38.6.% –24.7.% –37.3.% +3.8.% –2.1.%
Number of shares outstanding at year-end (thousands of shares) . . . . . . . . . 919,617 919,744 922,385 926,418 997,211
Market capitalization at year-end (Yen in trillions) . . . . . . . . . . . . . . . . . . . . . . 8.18. 6.16. 3.87. 4.04. 4.26.
Per share of common stock data (Yen)Cash dividends applicable to the year . . . . . . . . . . . . . . . . . . . . . . . . . . . . 25.0. 25.0. 25.0. 25.0. 25.0.Net Income (diluted) . . . . . . . . . . . . . . . . . . . . . . . . . . . . . . . . . . . . . . . . . . 19.28. 16.67. 118.21. 89.03. 162.59.Stockholders’ equity . . . . . . . . . . . . . . . . . . . . . . . . . . . . . . . . . . . . . . . . . 2,521.19. 2,570.31. 2,466.81. 2,563.67. 2,872.21.
Note: Stock prices and per share data have been adjusted to reflect the two-for-one stock split completed on May 19, 2000. However, no adjustment to reflect such stocksplit has been made to the number of shares outstanding at the year ended March 31, 2000. Stock price data are based on daily closing prices.
Stock Price Range and Trading Volume on the Tokyo Stock ExchangeYears ended March 31
Japanese individuals and othersJapanese financial institutionsForeign institutions and individuals
2003
2004
2005
35.8% 27.0% 30.5% 5.6%
48.1% 17.2% 30.0% 3.7%
1.1%
39.4% 20.7% 34.0% 4.8% 1.1%
1.0%
Other Japanesecorporations
Japanesesecuritiesfirms
Notes: 1. This trading volume shows the monthly volume of trade on the Tokyo Stock Exchange. Each fiscal year starts in April and ends in March.2. Stock prices and the Nikkei stock average is based on a simple average of daily closing prices for each day of every month at the Tokyo Stock Exchange.3. Stock prices have been adjusted to reflect the two-for-one stock split completed on May 19, 2000.4. On June 20, 2001, Sony issued 3,072,000 shares of subsidiary tracking stock.
Trading volume(Million shares)
Stock price andNikkei stock average(Yen)
20022001 2003 2004 2005
25,000
20,000
15,000
10,000
5,000
0200
100
0
Nikkei stock average Closing price of Sony Corporation stock Subsidiary tracking stock
BH6/30 05.7.7, 3:32 AMPage 130 Adobe PageMaker 6.0J/PPC
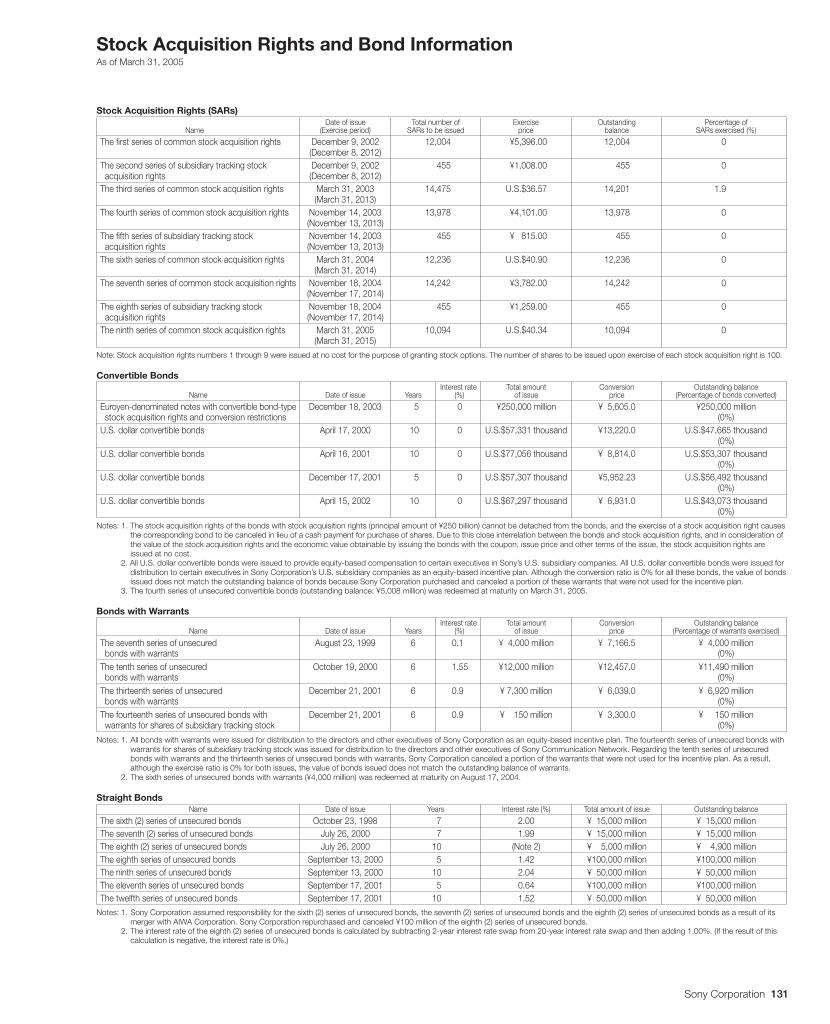
Sony Corporation 131
Stock Acquisition Rights and Bond InformationAs of March 31, 2005
Stock Acquisition Rights (SARs)Date of issue Total number of Exercise Outstanding Percentage of
Name (Exercise period) SARs to be issued price balance SARs exercised (%)
The first series of common stock acquisition rights December 9, 2002 12,004 ¥5,396.00 12,004 0(December 8, 2012)
The second series of subsidiary tracking stock December 9, 2002 455 ¥1,008.00 455 0 acquisition rights (December 8, 2012)The third series of common stock acquisition rights March 31, 2003 14,475 U.S.$36.57 14,201 1.9
(March 31, 2013)The fourth series of common stock acquisition rights November 14, 2003 13,978 ¥4,101.00 13,978 0
(November 13, 2013)The fifth series of subsidiary tracking stock November 14, 2003 455 ¥ 815.00 455 0 acquisition rights (November 13, 2013)The sixth series of common stock acquisition rights March 31, 2004 12,236 U.S.$40.90 12,236 0
(March 31, 2014)The seventh series of common stock acquisition rights November 18, 2004 14,242 ¥3,782.00 14,242 0
(November 17, 2014)The eighth series of subsidiary tracking stock November 18, 2004 455 ¥1,259.00 455 0 acquisition rights (November 17, 2014)The ninth series of common stock acquisition rights March 31, 2005 10,094 U.S.$40.34 10,094 0
(March 31, 2015)
Note: Stock acquisition rights numbers 1 through 9 were issued at no cost for the purpose of granting stock options. The number of shares to be issued upon exercise of each stock acquisition right is 100.
Convertible BondsInterest rate Total amount Conversion Outstanding balance
Name Date of issue Years (%) of issue price (Percentage of bonds converted)
Euroyen-denominated notes with convertible bond-type December 18, 2003 5 0 ¥250,000.million ¥ 5,605.0 ¥250,000.million stock acquisition rights and conversion restrictions (0%)U.S. dollar convertible bonds April 17, 2000 10 0 U.S.$57,331.thousand ¥13,220.0 U.S.$47,665.thousand
(0%)U.S. dollar convertible bonds April 16, 2001 10 0 U.S.$77,056.thousand ¥ 8,814.0 U.S.$53,307.thousand
(0%)U.S. dollar convertible bonds December 17, 2001 5 0 U.S.$57,307.thousand ¥5,952.23 U.S.$56,492.thousand
(0%)U.S. dollar convertible bonds April 15, 2002 10 0 U.S.$67,297.thousand ¥ 6,931.0 U.S.$43,073.thousand
(0%)
Notes: 1. The stock acquisition rights of the bonds with stock acquisition rights (principal amount of ¥250 billion) cannot be detached from the bonds, and the exercise of a stock acquisition right causesthe corresponding bond to be canceled in lieu of a cash payment for purchase of shares. Due to this close interrelation between the bonds and stock acquisition rights, and in consideration ofthe value of the stock acquisition rights and the economic value obtainable by issuing the bonds with the coupon, issue price and other terms of the issue, the stock acquisition rights areissued at no cost.
2. All U.S. dollar convertible bonds were issued to provide equity-based compensation to certain executives in Sony’s U.S. subsidiary companies. All U.S. dollar convertible bonds were issued fordistribution to certain executives in Sony Corporation’s U.S. subsidiary companies as an equity-based incentive plan. Although the conversion ratio is 0% for all these bonds, the value of bondsissued does not match the outstanding balance of bonds because Sony Corporation purchased and canceled a portion of these warrants that were not used for the incentive plan.
3. The fourth series of unsecured convertible bonds (outstanding balance: ¥5,008 million) was redeemed at maturity on March 31, 2005..
Bonds with WarrantsInterest rate Total amount Conversion Outstanding balance
Name Date of issue Years (%) of issue price (Percentage of warrants exercised)
The seventh series of unsecured August 23, 1999 6 0.1 ¥ 4,000 million ¥ 7,166.5 ¥ 4,000 million bonds with warrants (0%)The tenth series of unsecured October 19, 2000 6 1.55 ¥12,000 million ¥12,457.0 ¥11,490 million bonds with warrants (0%)The thirteenth series of unsecured December 21, 2001 6 0.9 ¥ 7,300 million ¥ 6,039.0 ¥ 6,920 million bonds with warrants (0%)The fourteenth series of unsecured bonds with December 21, 2001 6 0.9 ¥ 150 million ¥ 3,300.0 ¥ 150 million warrants for shares of subsidiary tracking stock (0%)
Notes: 1. All bonds with warrants were issued for distribution to the directors and other executives of Sony Corporation as an equity-based incentive plan. The fourteenth series of unsecured bonds withwarrants for shares of subsidiary tracking stock was issued for distribution to the directors and other executives of Sony Communication Network. Regarding the tenth series of unsecuredbonds with warrants and the thirteenth series of unsecured bonds with warrants, Sony Corporation canceled a portion of the warrants that were not used for the incentive plan. As a result,although the exercise ratio is 0% for both issues, the value of bonds issued does not match the outstanding balance of warrants.
2. The sixth series of unsecured bonds with warrants (¥4,000 million) was redeemed at maturity on August 17, 2004.
Straight BondsName Date of issue Years Interest rate (%) Total amount of issue Outstanding balance
The sixth (2) series of unsecured bonds October 23, 1998 7 2.00 ¥ 15,000 million ¥ 15,000 millionThe seventh (2) series of unsecured bonds July 26, 2000 7 1.99 ¥ 15,000 million ¥ 15,000 millionThe eighth (2) series of unsecured bonds July 26, 2000 10 (Note 2) ¥ 5,000 million ¥ 4,900 millionThe eighth series of unsecured bonds September 13, 2000 5 1.42 ¥100,000 million ¥100,000 millionThe ninth series of unsecured bonds September 13, 2000 10 2.04 ¥ 50,000 million ¥ 50,000 millionThe eleventh series of unsecured bonds September 17, 2001 5 0.64 ¥100,000 million ¥100,000 millionThe twelfth series of unsecured bonds September 17, 2001 10 1.52 ¥ 50,000 million ¥ 50,000 million
Notes: 1. Sony Corporation assumed responsibility for the sixth (2) series of unsecured bonds, the seventh (2) series of unsecured bonds and the eighth (2) series of unsecured bonds as a result of itsmerger with AIWA Corporation. Sony Corporation repurchased and canceled ¥100 million of the eighth (2) series of unsecured bonds.
2. The interest rate of the eighth (2) series of unsecured bonds is calculated by subtracting 2-year interest rate swap from 20-year interest rate swap and then adding 1.00%. (If the result of thiscalculation is negative, the interest rate is 0%.)
BH6/30 05.7.7, 3:32 AMPage 131 Adobe PageMaker 6.0J/PPC
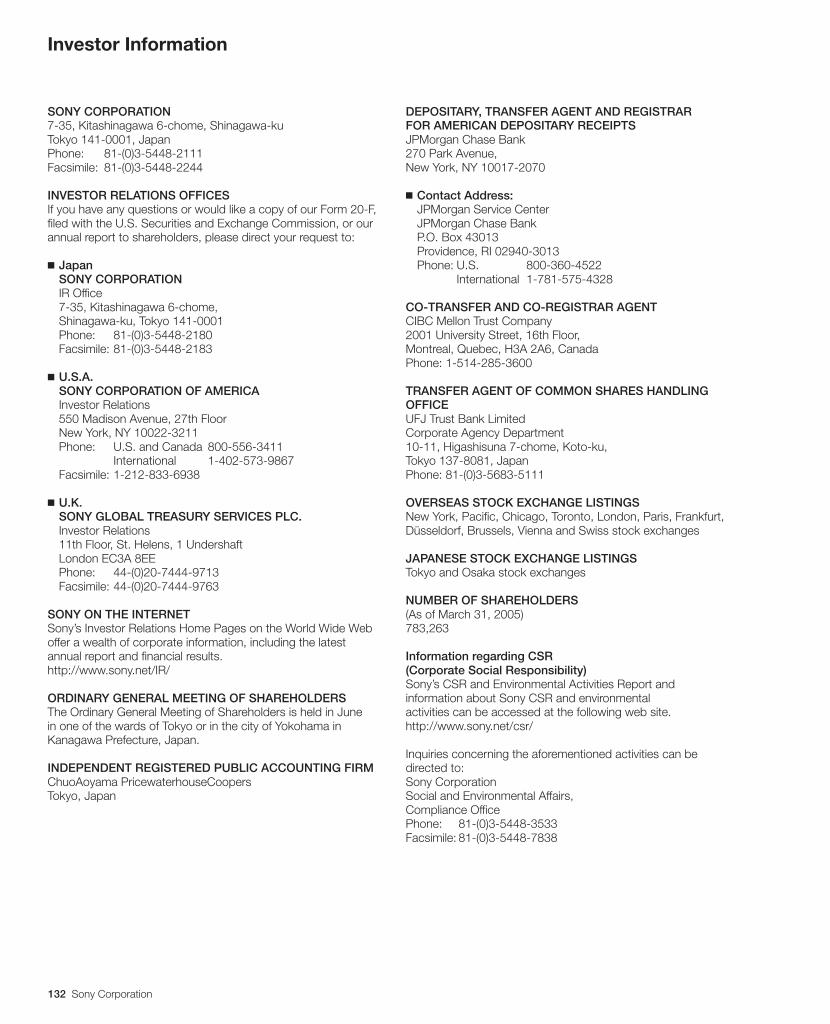
132 Sony Corporation
Investor Information
SONY CORPORATION7-35, Kitashinagawa 6-chome, Shinagawa-kuTokyo 141-0001, JapanPhone: 81-(0)3-5448-2111Facsimile: 81-(0)3-5448-2244
INVESTOR RELATIONS OFFICESIf you have any questions or would like a copy of our Form 20-F,filed with the U.S. Securities and Exchange Commission, or ourannual report to shareholders, please direct your request to:
■ JapanSONY CORPORATIONIR Office7-35, Kitashinagawa 6-chome,Shinagawa-ku, Tokyo 141-0001Phone: 81-(0)3-5448-2180Facsimile: 81-(0)3-5448-2183
■ U.S.A.SONY CORPORATION OF AMERICAInvestor Relations550 Madison Avenue, 27th FloorNew York, NY 10022-3211Phone: U.S. and Canada 800-556-3411
International 1-402-573-9867Facsimile: 1-212-833-6938
■ U.K.SONY GLOBAL TREASURY SERVICES PLC.Investor Relations11th Floor, St. Helens, 1 UndershaftLondon EC3A 8EEPhone: 44-(0)20-7444-9713Facsimile: 44-(0)20-7444-9763
SONY ON THE INTERNETSony’s Investor Relations Home Pages on the World Wide Weboffer a wealth of corporate information, including the latestannual report and financial results.http://www.sony.net/IR/
ORDINARY GENERAL MEETING OF SHAREHOLDERSThe Ordinary General Meeting of Shareholders is held in Junein one of the wards of Tokyo or in the city of Yokohama inKanagawa Prefecture, Japan.
INDEPENDENT REGISTERED PUBLIC ACCOUNTING FIRMChuoAoyama PricewaterhouseCoopersTokyo, Japan
DEPOSITARY, TRANSFER AGENT AND REGISTRARFOR AMERICAN DEPOSITARY RECEIPTSJPMorgan Chase Bank270 Park Avenue,New York, NY 10017-2070
■ Contact Address:JPMorgan Service CenterJPMorgan Chase BankP.O. Box 43013Providence, RI 02940-3013Phone: U.S. 800-360-4522
International 1-781-575-4328
CO-TRANSFER AND CO-REGISTRAR AGENTCIBC Mellon Trust Company2001 University Street, 16th Floor,Montreal, Quebec, H3A 2A6, CanadaPhone: 1-514-285-3600
TRANSFER AGENT OF COMMON SHARES HANDLINGOFFICEUFJ Trust Bank LimitedCorporate Agency Department10-11, Higashisuna 7-chome, Koto-ku,Tokyo 137-8081, JapanPhone: 81-(0)3-5683-5111
OVERSEAS STOCK EXCHANGE LISTINGSNew York, Pacific, Chicago, Toronto, London, Paris, Frankfurt,Düsseldorf, Brussels, Vienna and Swiss stock exchanges
JAPANESE STOCK EXCHANGE LISTINGSTokyo and Osaka stock exchanges
NUMBER OF SHAREHOLDERS(As of March 31, 2005)783,263
Information regarding CSR(Corporate Social Responsibility)Sony’s CSR and Environmental Activities Report andinformation about Sony CSR and environmentalactivities can be accessed at the following web site.http://www.sony.net/csr/
Inquiries concerning the aforementioned activities can bedirected to:Sony CorporationSocial and Environmental Affairs,Compliance OfficePhone: 81-(0)3-5448-3533Facsimile: 81-(0)3-5448-7838
BH6/30 05.7.7, 3:32 AMPage 132 Adobe PageMaker 6.0J/PPC

Printed on 100% recycled paper.Printed using VOC (volatile organic compound)-free vegetable oil-based ink.
Motion pictures and artwork © 2005 Sony Pictures Entertainment Inc.All rights reserved.
SONY AR-E0629 05.7.6, 2:16 PMPage 37 Adobe PageMaker 6.0J/PPC