Embed Size (px)
Citation preview
Patterns of PCBs and PCDD/PCDFs in chicken and pork fatfollowing a Belgian food contamination incident
Adrian Covaci a,*, John Jake Ryan b, Paul Schepens a
a Toxicological Centre, University of Antwerp, Universiteitsplein 1, B-2610 Wilrijk, Belgiumb Health Canada, Bureau of Chemical Safety, Ottawa, Ont., Canada K1A 0L2
Received 11 December 2000; received in revised form 17 July 2001; accepted 24 August 2001
Abstract
A food contamination incident involving polychlorobiphenyls (PCBs) and PCDD/Fs occurred in 1999 in Belgium.
On heavily affected farms, concentrations of PCBs in chicken or pork fat exceeded the Belgium tolerance limit of 200
ng/g lipid weight for the sum of seven marker PCBs. Analysis of contaminated samples showed that the patterns for
PCB and PCDD/F congeners differed among feed, chicken fat and pork fat. Lower chlorinated PCBs and poly-
chlorodibenzofurans (PCDFs) including those with high TEFs (PCBs 105, 118, 126 and 2,3,4,7,8-PeCDF) were shown
to either bioaccumulate more in chicken fat or to be eliminated more readily in pork. This leads to the possibility that
consumption of chicken would result in a higher TEQ human body burden than that from the same consumption of
pork. In addition, PCDF congeners with non-2,3,7,8-substitution (e.g., 1,2,4,7,8-PeCDF) were present in chicken fat
but absent in pork fat. Since the residue pattern in this commercial episode changes less in the avian species, these
results reinforce the value of birds rather than mammals as markers of the source of contamination with persistent
organochlorine pollutants. � 2002 Elsevier Science Ltd. All rights reserved.
Keywords: PCBs; PCDDs; PCDFs; Contamination; Feed; Chicken; Pork; Patterns
1. Introduction
In February 1999, a contamination incident occurred
on several farms in Belgium. The use of 60 tons of
contaminated fat from a Belgian fat rendering company
for production of approximately 500 tons of animal feed
resulted in the introduction of approximately 50 kg of
polychlorobiphenyls (PCBs) and 1 g of mostly furans in
the commercial food chain (Van Larebeke et al., 2001).
This incident caused widespread concern both within
and outside Belgium and forced the Belgian authorities
to take drastic measures, including measurements of
PCBs on thousands, and of dioxin on hundreds of
samples of animal feed, animal fat and various fat
containing food items (Bernard et al., 1999; Van Lare-
beke et al., 2001). Analysis of contaminated foodstuff
showed a pattern of PCBs closely matching a mixture
of Aroclor 1254 and 1260 and a consistent pattern of
dioxin-like compounds, dominated by polychlorodi-
benzofurans (PCDFs). These patterns were virtually
identical to those in the Yusho rice poisoning caused
by heat degraded PCBs (Tanabe et al., 1989). The oc-
currence of the Belgian PCB/dioxin contamination is
similar to other past poultry poisonings with PCBs
(Drotman et al., 1983; Gilbertson et al., 1991). Patho-
logic conditions were first recorded in Belgian chicken
batteries and hatcheries. They included a decrease in egg
production and hatching, and an epidemic of chicken
oedema disease.
For poultry, PCBs have been reported to adversely af-
fect hatchability through embryotoxicity (Bernard et al.,
Chemosphere 47 (2002) 207–217
www.elsevier.com/locate/chemosphere
*Corresponding author. Tel.: +32-3-820-2704; fax: +32-3-
820-2722.
E-mail address: [email protected] (A. Covaci).
0045-6535/02/$ - see front matter � 2002 Elsevier Science Ltd. All rights reserved.
PII: S0045-6535 (01 )00191-6
1999), along with reduced weight gain. Other pathologic
effects reported are generalised oedema and liver ne-
crosis. PCBs have also been shown to induce embryo-
toxicty (Ax and Hansen, 1975) and hepatic drug
metabolizing enzyme activity in birds (Hansen et al.,
1981). Circulating thyroid hormones and growth are
also decreased by PCB exposure (Gould et al., 1999).
Dioxins have been shown to induce mortality in chicken
(Ryan et al., 1985) and young pigs (Ryan, 1983) raised
on PCP-treated wooden floors.
Some data are available on the accumulation or
changes in the relative distribution of PCB congeners
during ingestion studies in chicken (Hansen et al., 1976,
1983), pork (Borchard et al., 1976; Hansen and Wel-
born, 1977; Hansen et al., 1981, 1983) or sheep (Bor-
chard et al., 1976). PCB residues in animals only vaguely
resemble the mixture from which they originate. Chan-
ges in Aroclor 1254 component composition in tissues
were less apparent than in Aroclor 1242. Subtle differ-
ences between congeners are further amplified by species
differences in absorption, distribution, biotransforma-
tion and excretion. Most of the previous work done in
controlled feeding studies used packed GC columns,
thus making the correct identification of congeners more
difficult. There is no information on specific isomer ac-
cumulation when animals are fed a diet containing a
mixture of Aroclor 1254 and 1260, as seen in the Belgian
episode.
The study was undertaken to examine the accumu-
lation patterns of PCBs and dioxins/furans in chicken
and pork resulting from the consumption of commercial
feed accidentally adulterated by a mixture of Aroclor
1254 and 1260. Compositional changes were also ex-
amined to determine the relative importance of single
PCB isomers as residues in human food.
2. Materials and methods
Three samples of chicken fat (one low (#10078),
medium (#6134) and high (#6133) PCB levels) and two
of pork fat (low (#7129) and medium (#7133)) along
with a highly adulterated chicken feed sample obtained
during the Belgian PCB/dioxin crisis were chosen for
detailed analyses. They were collected through Veteri-
nary Commission of Ministry of Agriculture, sent sealed
to the Toxicological Centre (Antwerp, Belgium) and
kept at �20 �C until analysis. All solvents (n-hexane,acetone and dichloromethane) were of pesticide grade
purity (Merck, Belgium). Chromatographic adsorbents
(Merck) were washed with hexane and activated over-
night. PCB standard solutions (10 ng=ll in iso-octane)
were purchased from Dr. Ehrenstorfer Laboratories
(Augsburg, Germany). Both carbon-12 and carbon-13
standards of dioxins and furans were obtained either
from Cambridge Isotope Laboratories (Andover,
USA) or Wellington Laboratories (Guelph, Canada).
All glassware was cleaned as required by this type of ana-
lysis.
2.1. Determination of PCBs
2.1.1. Sample preparation
A homogenised portion of animal fat was melted (50
�C for chicken fat and 80 �C for pork fat, respectively).
To 0.5 g fat, solubilized in 10 ml n-hexane, internalstandards, PCB 46 and PCB 143 were added to give
concentrations of 50 ng/g lipid weight. The mixture was
equilibrated in ultrasonic bath for 10 min, cleaned over
5 g acidified silica (concentrated sulphuric acid: sil-
ica¼ 1:1, w/w) topped with 0.5 g Na2SO4 and eluted
with 20 ml n-hexane. The eluate was concentrated on a
rotary evaporator until almost dry. The residue was
solubilised in 500 ll iso-octane and 25 ll 1,2,3,4-tetra-chloronaphthalene (TCN) as recovery standard. One llwas injected into the gas chromatographic system.
To 0.5 g feed (6% fat content), 5 ml n-hexane were
added together with the internal standards to give con-
centrations of 50 ng/g lipid weighs. After ultrasonication
for 20 min, the supernatant was subjected to the same
clean-up procedures as described above.
2.1.2. Analysis
A Hewlett Packard 6890 gas chromatograph with
l-ECD was equipped with a HT-8 (SGE, Australia)
capillary column (30 m� 0:22 mm� 0:25 lm). Injectorand detector temperatures were 270 and 320 �C, re-spectively. Helium was used as carrier gas at a flow rate
of 1 ml/min. Argon: CH4 was used as make-up gas at a
flow rate of 40 ml/min. One ll was injected in pulsed
splitess mode (pressure pulse of 25 psi for 1.5 min) with
the split outlet opened after 1.5 min) with the split out-
let opened after 1.5 min. The temperature programme
started from 90 �C, kept for 1 min and then increasing
the temperature with 15 �C/min to 180 �C, kept for 1min, further by 3 �C/min to 250 �C and further by 15 �C/min to 290 �C, kept for 6 min.
For confirmatory purposes, a Hewlett Packard 6890
gas chromatograph was connected to a Hewlett Packard
5793 mass spectrometer (MS) and equipped with a DB-
5MS (J&W Scientific, Folsom, USA) capillary column
(30 m� 0:25 mm� 0:25 lm). Injector and transfer line
temperatures were 265 and 280 �C, respectively. Heliumwas used as carrier gas at a flow rate of 1 ml/min. One llwas manually injected in pulsed splitless mode (pressure
pulse of 20 psi for 1 min) with the split outlet opened
after 1.25 min. The temperature programme started at
90 �C, kept for 1 min and gradually increasing the
temperature by 15 �C/min up to 275 �C, which was
maintained for 10 min.
Values on MS were almost the same as on ECD
taking in account the coelutions (Frame, 1997). Peak
208 A. Covaci et al. / Chemosphere 47 (2002) 207–217
identification was based on relative retention time (to
TCN) and for MS on characteristic ions. Recoveries
of internal standards were 72� 8% for PCB 46 and
78� 10% for PCB 143, respectively. Multi-level cali-
bration curves ðR2 > 0:99Þ were created for the quanti-
fication using the above analytical conditions.
Quality control was assured by the analysis of certi-
fied fish oil (CRM 349) (RSD < 10% on results) and by
successful participation of the Toxicological Centre
in two national interlaboratory tests organised by the
Belgian Ministries of Health and Agriculture (Beernaert
and De Poorter, 1999).
2.2. Determination of PCDD/Fs and non-ortho-PCBs
A mixture of 17 13C-2,3,7,8-substituted PCDD/Fs
and three non-ortho-PCBs was added to 1–5 g of chicken
or pork fat or 0.1 g of chicken feed. The samples were
homogenised and extracted with acetone–hexane (a
small aliquot was used for the lipid determination
gravimetrically), defatted with concentrated sulphuric
acid, adsorbed on acid/base silica and Florisil, and
separated on activated carbon. Identification was by gas
chromatography–high resolution mass spectrometry and
quantification by the isotope dilution internal standard
method (Ryan et al., 1992). Detection limits varied de-
pending on congener and sample size and were as low
as 0.2 pg/g for tetra- to hexa-PCDD/Fs. Each batch of
12 samples for analysis contained a laboratory reagent
blank to check for contamination within and a com-
mercial butter sample with low natural background
levels of PCDDs/PCDFs. The relative standard devia-
tions (RSD) for repeat analyses were the following:
for TEQ < 10%; for 2,3,4,7,8-PeCDF <15%; and for
2,3,7,8-TCDD <20%. The Health Canada laboratory
has participated in several recent interlaboratory ana-
lytical studies for dioxin-like compounds including those
organised by the World Health Organisation (WHO).
3. Results and discussion
During the Belgian food contamination episode, the
Toxicological Centre performed for 231 PCB analyses of
foods for national consumption (June and July 1999)
and 1850 analyses for exportation (August–November
1999). The samples tested for national consumption
consisted of 55 chicken fat (5 exceeding the Belgian
tolerance level of 200 ng/g lipid weight) and 176 pork fat
(58 samples exceeding the tolerance level). The Gov-
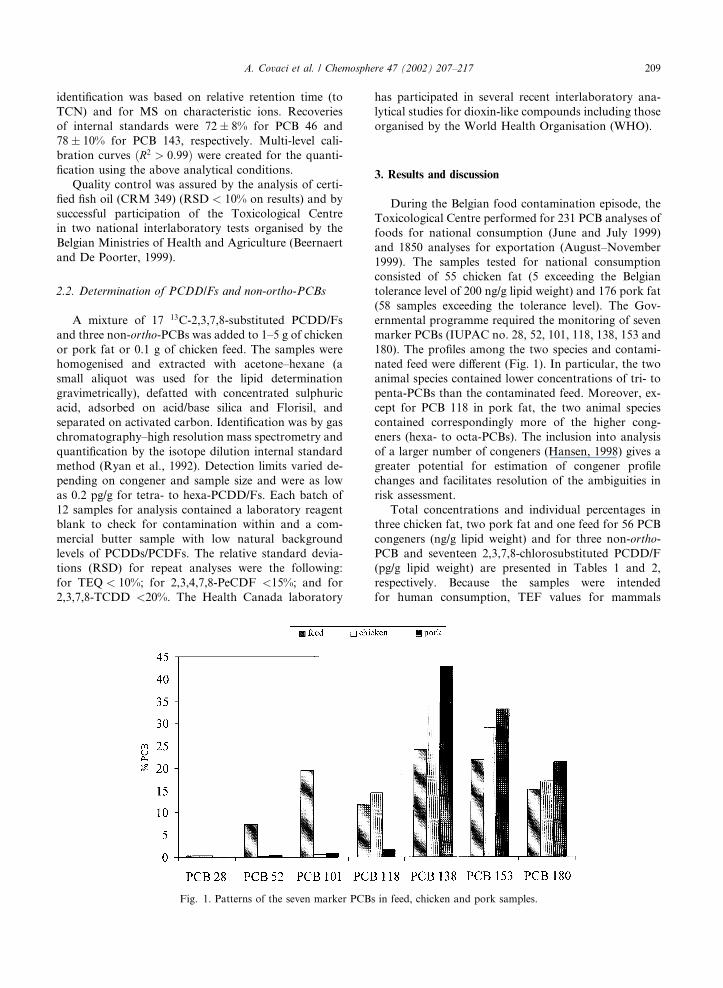
ernmental programme required the monitoring of seven
marker PCBs (IUPAC no. 28, 52, 101, 118, 138, 153 and
180). The profiles among the two species and contami-
nated feed were different (Fig. 1). In particular, the two
animal species contained lower concentrations of tri- to
penta-PCBs than the contaminated feed. Moreover, ex-
cept for PCB 118 in pork fat, the two animal species
contained correspondingly more of the higher cong-
eners (hexa- to octa-PCBs). The inclusion into analysis
of a larger number of congeners (Hansen, 1998) gives a
greater potential for estimation of congener profile
changes and facilitates resolution of the ambiguities in
risk assessment.
Total concentrations and individual percentages in
three chicken fat, two pork fat and one feed for 56 PCB
congeners (ng/g lipid weight) and for three non-ortho-
PCB and seventeen 2,3,7,8-chlorosubstituted PCDD/F
(pg/g lipid weight) are presented in Tables 1 and 2,
respectively. Because the samples were intended
for human consumption, TEF values for mammals
Fig. 1. Patterns of the seven marker PCBs in feed, chicken and pork samples.
A. Covaci et al. / Chemosphere 47 (2002) 207–217 209
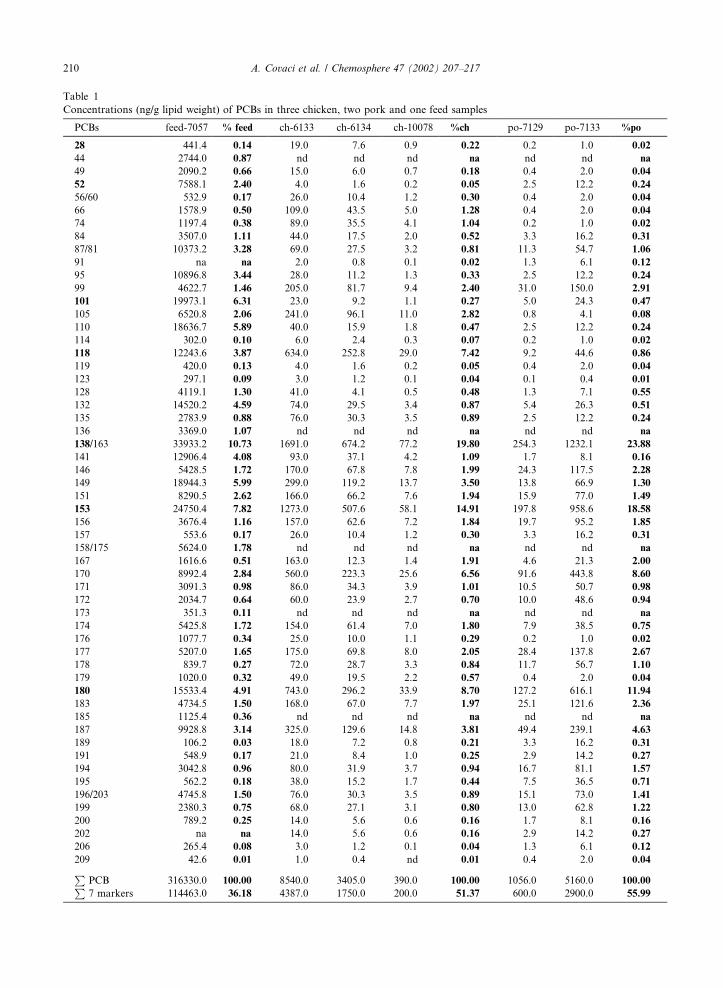
Table 1
Concentrations (ng/g lipid weight) of PCBs in three chicken, two pork and one feed samples
PCBs feed-7057 % feed ch-6133 ch-6134 ch-10078 %ch po-7129 po-7133 %po
28 441.4 0.14 19.0 7.6 0.9 0.22 0.2 1.0 0.02
44 2744.0 0.87 nd nd nd na nd nd na
49 2090.2 0.66 15.0 6.0 0.7 0.18 0.4 2.0 0.04
52 7588.1 2.40 4.0 1.6 0.2 0.05 2.5 12.2 0.24
56/60 532.9 0.17 26.0 10.4 1.2 0.30 0.4 2.0 0.04
66 1578.9 0.50 109.0 43.5 5.0 1.28 0.4 2.0 0.04
74 1197.4 0.38 89.0 35.5 4.1 1.04 0.2 1.0 0.02
84 3507.0 1.11 44.0 17.5 2.0 0.52 3.3 16.2 0.31
87/81 10373.2 3.28 69.0 27.5 3.2 0.81 11.3 54.7 1.06
91 na na 2.0 0.8 0.1 0.02 1.3 6.1 0.12
95 10896.8 3.44 28.0 11.2 1.3 0.33 2.5 12.2 0.24
99 4622.7 1.46 205.0 81.7 9.4 2.40 31.0 150.0 2.91
101 19973.1 6.31 23.0 9.2 1.1 0.27 5.0 24.3 0.47
105 6520.8 2.06 241.0 96.1 11.0 2.82 0.8 4.1 0.08
110 18636.7 5.89 40.0 15.9 1.8 0.47 2.5 12.2 0.24
114 302.0 0.10 6.0 2.4 0.3 0.07 0.2 1.0 0.02
118 12243.6 3.87 634.0 252.8 29.0 7.42 9.2 44.6 0.86
119 420.0 0.13 4.0 1.6 0.2 0.05 0.4 2.0 0.04
123 297.1 0.09 3.0 1.2 0.1 0.04 0.1 0.4 0.01
128 4119.1 1.30 41.0 4.1 0.5 0.48 1.3 7.1 0.55
132 14520.2 4.59 74.0 29.5 3.4 0.87 5.4 26.3 0.51
135 2783.9 0.88 76.0 30.3 3.5 0.89 2.5 12.2 0.24
136 3369.0 1.07 nd nd nd na nd nd na
138/163 33933.2 10.73 1691.0 674.2 77.2 19.80 254.3 1232.1 23.88
141 12906.4 4.08 93.0 37.1 4.2 1.09 1.7 8.1 0.16
146 5428.5 1.72 170.0 67.8 7.8 1.99 24.3 117.5 2.28
149 18944.3 5.99 299.0 119.2 13.7 3.50 13.8 66.9 1.30
151 8290.5 2.62 166.0 66.2 7.6 1.94 15.9 77.0 1.49
153 24750.4 7.82 1273.0 507.6 58.1 14.91 197.8 958.6 18.58
156 3676.4 1.16 157.0 62.6 7.2 1.84 19.7 95.2 1.85
157 553.6 0.17 26.0 10.4 1.2 0.30 3.3 16.2 0.31
158/175 5624.0 1.78 nd nd nd na nd nd na
167 1616.6 0.51 163.0 12.3 1.4 1.91 4.6 21.3 2.00
170 8992.4 2.84 560.0 223.3 25.6 6.56 91.6 443.8 8.60
171 3091.3 0.98 86.0 34.3 3.9 1.01 10.5 50.7 0.98
172 2034.7 0.64 60.0 23.9 2.7 0.70 10.0 48.6 0.94
173 351.3 0.11 nd nd nd na nd nd na
174 5425.8 1.72 154.0 61.4 7.0 1.80 7.9 38.5 0.75
176 1077.7 0.34 25.0 10.0 1.1 0.29 0.2 1.0 0.02
177 5207.0 1.65 175.0 69.8 8.0 2.05 28.4 137.8 2.67
178 839.7 0.27 72.0 28.7 3.3 0.84 11.7 56.7 1.10
179 1020.0 0.32 49.0 19.5 2.2 0.57 0.4 2.0 0.04
180 15533.4 4.91 743.0 296.2 33.9 8.70 127.2 616.1 11.94
183 4734.5 1.50 168.0 67.0 7.7 1.97 25.1 121.6 2.36
185 1125.4 0.36 nd nd nd na nd nd na
187 9928.8 3.14 325.0 129.6 14.8 3.81 49.4 239.1 4.63
189 106.2 0.03 18.0 7.2 0.8 0.21 3.3 16.2 0.31
191 548.9 0.17 21.0 8.4 1.0 0.25 2.9 14.2 0.27
194 3042.8 0.96 80.0 31.9 3.7 0.94 16.7 81.1 1.57
195 562.2 0.18 38.0 15.2 1.7 0.44 7.5 36.5 0.71
196/203 4745.8 1.50 76.0 30.3 3.5 0.89 15.1 73.0 1.41
199 2380.3 0.75 68.0 27.1 3.1 0.80 13.0 62.8 1.22
200 789.2 0.25 14.0 5.6 0.6 0.16 1.7 8.1 0.16
202 na na 14.0 5.6 0.6 0.16 2.9 14.2 0.27
206 265.4 0.08 3.0 1.2 0.1 0.04 1.3 6.1 0.12
209 42.6 0.01 1.0 0.4 nd 0.01 0.4 2.0 0.04
PPCB 316330.0 100.00 8540.0 3405.0 390.0 100.00 1056.0 5160.0 100.00
P7 markers 114463.0 36.18 4387.0 1750.0 200.0 51.37 600.0 2900.0 55.99
210 A. Covaci et al. / Chemosphere 47 (2002) 207–217
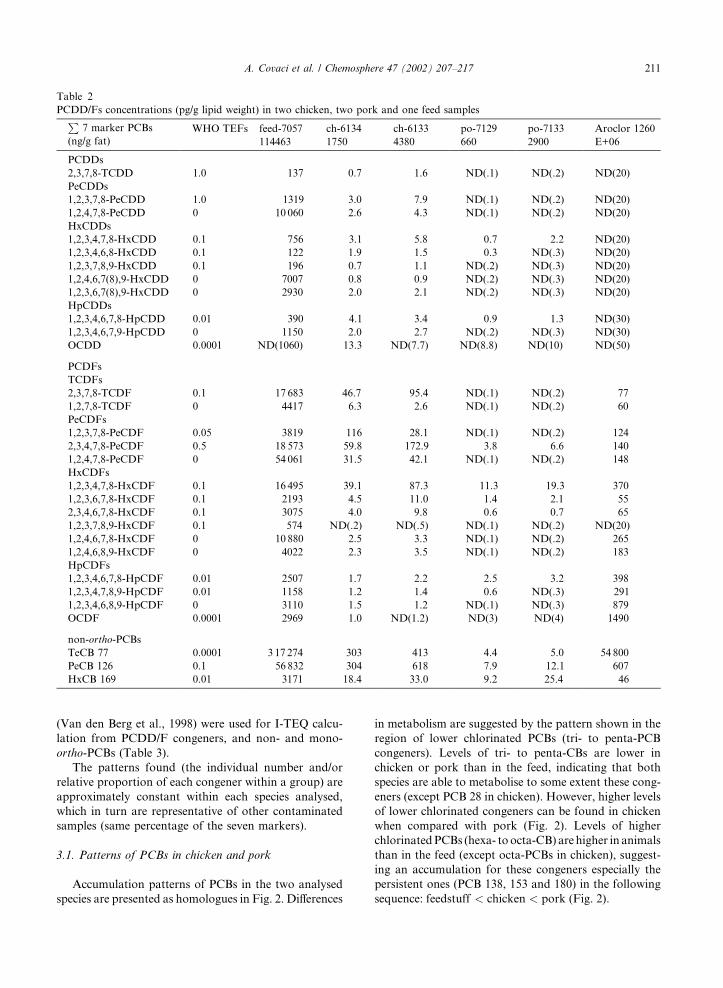
(Van den Berg et al., 1998) were used for I-TEQ calcu-
lation from PCDD/F congeners, and non- and mono-
ortho-PCBs (Table 3).
The patterns found (the individual number and/or
relative proportion of each congener within a group) are
approximately constant within each species analysed,
which in turn are representative of other contaminated
samples (same percentage of the seven markers).
3.1. Patterns of PCBs in chicken and pork
Accumulation patterns of PCBs in the two analysed
species are presented as homologues in Fig. 2. Differences
in metabolism are suggested by the pattern shown in the
region of lower chlorinated PCBs (tri- to penta-PCB
congeners). Levels of tri- to penta-CBs are lower in
chicken or pork than in the feed, indicating that both
species are able to metabolise to some extent these cong-
eners (except PCB 28 in chicken). However, higher levels
of lower chlorinated congeners can be found in chicken
when compared with pork (Fig. 2). Levels of higher
chlorinatedPCBs (hexa- toocta-CB) are higher in animals
than in the feed (except octa-PCBs in chicken), suggest-
ing an accumulation for these congeners especially the
persistent ones (PCB 138, 153 and 180) in the following
sequence: feedstuff < chicken < pork (Fig. 2).
Table 2
PCDD/Fs concentrations (pg/g lipid weight) in two chicken, two pork and one feed samplesP
7 marker PCBs
(ng/g fat)WHO TEFs feed-7057 ch-6134 ch-6133 po-7129 po-7133 Aroclor 1260
114463 1750 4380 660 2900 E+06
PCDDs
2,3,7,8-TCDD 1.0 137 0.7 1.6 ND(.1) ND(.2) ND(20)
PeCDDs
1,2,3,7,8-PeCDD 1.0 1319 3.0 7.9 ND(.1) ND(.2) ND(20)
1,2,4,7,8-PeCDD 0 10 060 2.6 4.3 ND(.1) ND(.2) ND(20)
HxCDDs
1,2,3,4,7,8-HxCDD 0.1 756 3.1 5.8 0.7 2.2 ND(20)
1,2,3,4,6,8-HxCDD 0.1 122 1.9 1.5 0.3 ND(.3) ND(20)
1,2,3,7,8,9-HxCDD 0.1 196 0.7 1.1 ND(.2) ND(.3) ND(20)
1,2,4,6,7(8),9-HxCDD 0 7007 0.8 0.9 ND(.2) ND(.3) ND(20)
1,2,3,6,7(8),9-HxCDD 0 2930 2.0 2.1 ND(.2) ND(.3) ND(20)
HpCDDs
1,2,3,4,6,7,8-HpCDD 0.01 390 4.1 3.4 0.9 1.3 ND(30)
1,2,3,4,6,7,9-HpCDD 0 1150 2.0 2.7 ND(.2) ND(.3) ND(30)
OCDD 0.0001 ND(1060) 13.3 ND(7.7) ND(8.8) ND(10) ND(50)
PCDFs
TCDFs
2,3,7,8-TCDF 0.1 17 683 46.7 95.4 ND(.1) ND(.2) 77
1,2,7,8-TCDF 0 4417 6.3 2.6 ND(.1) ND(.2) 60
PeCDFs
1,2,3,7,8-PeCDF 0.05 3819 116 28.1 ND(.1) ND(.2) 124
2,3,4,7,8-PeCDF 0.5 18 573 59.8 172.9 3.8 6.6 140
1,2,4,7,8-PeCDF 0 54 061 31.5 42.1 ND(.1) ND(.2) 148
HxCDFs
1,2,3,4,7,8-HxCDF 0.1 16 495 39.1 87.3 11.3 19.3 370
1,2,3,6,7,8-HxCDF 0.1 2193 4.5 11.0 1.4 2.1 55
2,3,4,6,7,8-HxCDF 0.1 3075 4.0 9.8 0.6 0.7 65
1,2,3,7,8,9-HxCDF 0.1 574 ND(.2) ND(.5) ND(.1) ND(.2) ND(20)
1,2,4,6,7,8-HxCDF 0 10 880 2.5 3.3 ND(.1) ND(.2) 265
1,2,4,6,8,9-HxCDF 0 4022 2.3 3.5 ND(.1) ND(.2) 183
HpCDFs
1,2,3,4,6,7,8-HpCDF 0.01 2507 1.7 2.2 2.5 3.2 398
1,2,3,4,7,8,9-HpCDF 0.01 1158 1.2 1.4 0.6 ND(.3) 291
1,2,3,4,6,8,9-HpCDF 0 3110 1.5 1.2 ND(.1) ND(.3) 879
OCDF 0.0001 2969 1.0 ND(1.2) ND(3) ND(4) 1490
non-ortho-PCBs
TeCB 77 0.0001 3 17 274 303 413 4.4 5.0 54 800
PeCB 126 0.1 56 832 304 618 7.9 12.1 607
HxCB 169 0.01 3171 18.4 33.0 9.2 25.4 46
A. Covaci et al. / Chemosphere 47 (2002) 207–217 211
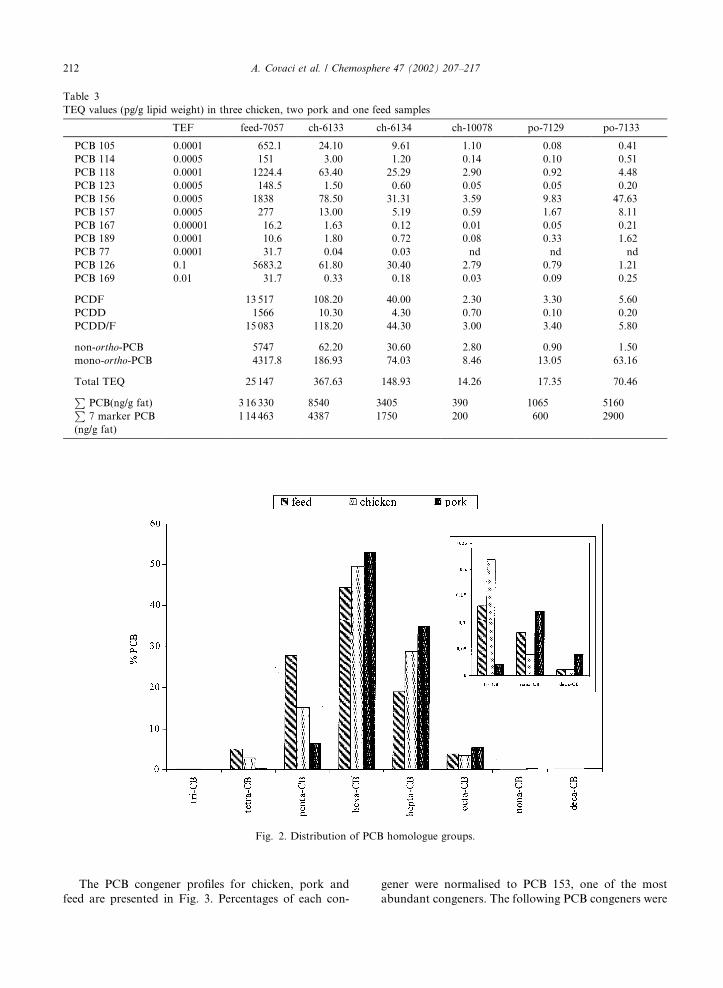
The PCB congener profiles for chicken, pork and
feed are presented in Fig. 3. Percentages of each con-
gener were normalised to PCB 153, one of the most
abundant congeners. The following PCB congeners were
Table 3
TEQ values (pg/g lipid weight) in three chicken, two pork and one feed samples
TEF feed-7057 ch-6133 ch-6134 ch-10078 po-7129 po-7133
PCB 105 0.0001 652.1 24.10 9.61 1.10 0.08 0.41
PCB 114 0.0005 151 3.00 1.20 0.14 0.10 0.51
PCB 118 0.0001 1224.4 63.40 25.29 2.90 0.92 4.48
PCB 123 0.0005 148.5 1.50 0.60 0.05 0.05 0.20
PCB 156 0.0005 1838 78.50 31.31 3.59 9.83 47.63
PCB 157 0.0005 277 13.00 5.19 0.59 1.67 8.11
PCB 167 0.00001 16.2 1.63 0.12 0.01 0.05 0.21
PCB 189 0.0001 10.6 1.80 0.72 0.08 0.33 1.62
PCB 77 0.0001 31.7 0.04 0.03 nd nd nd
PCB 126 0.1 5683.2 61.80 30.40 2.79 0.79 1.21
PCB 169 0.01 31.7 0.33 0.18 0.03 0.09 0.25
PCDF 13 517 108.20 40.00 2.30 3.30 5.60
PCDD 1566 10.30 4.30 0.70 0.10 0.20
PCDD/F 15 083 118.20 44.30 3.00 3.40 5.80
non-ortho-PCB 5747 62.20 30.60 2.80 0.90 1.50
mono-ortho-PCB 4317.8 186.93 74.03 8.46 13.05 63.16
Total TEQ 25 147 367.63 148.93 14.26 17.35 70.46
PPCB(ng/g fat) 3 16 330 8540 3405 390 1065 5160
P7 marker PCB
(ng/g fat)
1 14 463 4387 1750 200 600 2900
Fig. 2. Distribution of PCB homologue groups.
212 A. Covaci et al. / Chemosphere 47 (2002) 207–217
found to have a higher accumulation in chicken than in
pork: 28, 49, 56/60, 74, 105, 114, 118, 126, 135, 141, 149,
174, 176 and 179. Unless there is a difference in uptake,
it seems that there is an ability of mammals to metab-
olise those PCB congeners with two vicinal hydrogen
atoms in meta/para or meta/ortho positions. A similar
selective metabolism of PCBs has been reported in
humans in the Yusho and Yu-cheng rice oil poisonings.
PCB 118, present in high concentrations in the rice oil,
was rapidly metabolised in humans (Masuda et al.,
1995).
It is interesting to mention the relatively high per-
centage of some congeners (PCB 101 and 110) in the
contaminated feed and Aroclor mixtures, while their
concentration in the two investigated species is very low,
probably due to the lack of uptake of rapid metabolism.
Congeners 132, 141, 149 and 151 are easily metabolised
in both species and as expected, some congeners (PCB
99, 138, 153, 156, 170, 177, 180 and 187) accumulate in
both species. Data in the literature are similar with the
findings presented in this paper. In an earlier study
(Hansen et al., 1983), chickens were fed a diet containing
Aroclor 1254 (technical diet) or a diet containing fat of
swine fed with Aroclor 1254 (residue diet). The per-
centages of congeners 49, 70, 95, 101, 118, 141 and 149
were higher in the technical diet than in the residue
diet, indicating that pork selectively degrade and/or
eliminate these PCBs. Likewise their relative concen-
tration is higher in chicken body fat and chicken liver
fat. Chickens accumulate mainly PCBs 138, 153 and 118
in their body fat and liver fat when fed diets formulated
from swine residues. However PCBs 118 and 95 accu-
mulate to a higher extent when technical product
(Aroclor 1254) is given.
The differential growth rates of tissues important in
accumulation of PCBs (such as fat) and those involved
in elimination (such as blood and liver) have a signifi-
cant effect on actual tissue concentrations. Abdominal
fat is the best tissue for residue detection because of the
15–22 times higher residue concentrations than in other
tissues. Liver was reported (Hansen et al., 1976) to be
distinct from other tissues in that it did not concentrate
tri-chlorinated congeners, but tetra- and penta-chlori-
nated ones. Further investigations will be needed to es-
tablish if fat is a reliable and good indicator matrix or
whether concentrations have to be measured in different
tissues.
3.2. Patterns of PCDD/PCDFs in chicken and pork
The presence of PCDFs in the feedstuff in a higher
proportion than the polychlorodibenzodioxins (PCDDs)
excludes the possibility of contamination from the use of
technical pentachlorophenol (PCP) (Ryan et al., 1985)
as wood preservative (exclusive presence of higher
chlorinated PCDD/Fs) or from incineration processes
(Domingo et al., 1999), where the PCDD/F ratio is ap-
proximately equal with the unity. This is consistent with
the presence in Aroclor mixtures of PCDF congeners in
much higher proportion than PCDDs, particularly when
the PCB has been aged or heat degraded, as observed
in the Yusho episode (Tanabe et al., 1989). The Belgian
incident has been caused by a similar situation.
Contaminated chicken tissues contain more PCDD/F
congeners than pork tissues, including some non-2,3,7,8
substituted ones. Similar results were presented previ-
ously (Ryan et al., 1985). This might be related to dif-
ferent metabolic capabilities of mammals and birds.
Feed contains the same congeners, but in higher con-
centrations. Nevertheless, in both animal species, the
2,3,7,8-substituted congeners are accumulating to a
higher degree than the non-2,3,7,8-substituted ones (Fig.
4). Selective absorption of 2,3,7,8-substituted PCDDs
has been noted previously in chickens (Firestone et al.,
1971) and dairy cows (Firestone et al., 1979). Higher
chlorinated dioxins were implicated in the mortality of
yound pigs kept on a PCP treated wooden floor (Ryan,
1983). For HxCDDs, the predominant isomers were
1,2,3,6,7,9- and 1,2,3,6,7,8-HxCDD in wood, while in
pork liver, only 1,2,3,6,7,8-HxCDD was found. 1,2,6,
7,8-HxCDD is most abundant among the toxic 2,3,7,8-
substituted HxCDDs in the animals and the environ-
ment under normal exposure. For hepta congeners, the
same pattern of accumulation of 1,2,3,4,6,7,8-HpCDD
(more toxic) versus 1,2,3,4,6,7,9-HpCDD was found.
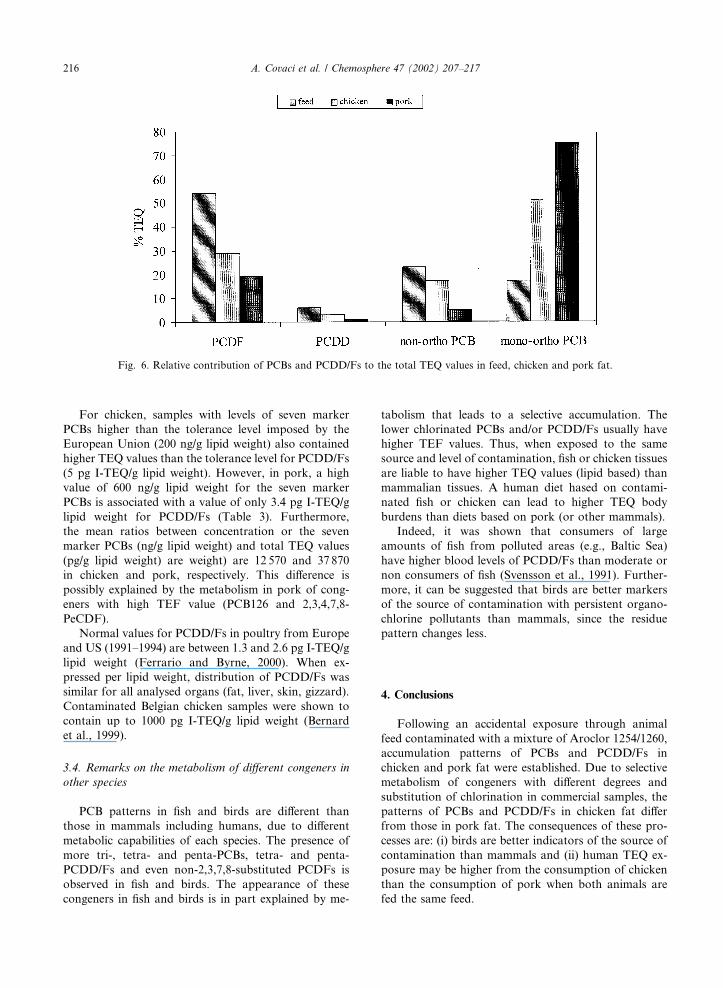
Fig. 5 shows different accumulation patterns between
PCDD/F homologues with a different degree of chlori-
nation. As for PCBs, tetra and penta-PCDD/Fs are se-
lectively accumulating in chicken rather than in pork
whereas the opposite is true for the hexa- and higher
homologues.
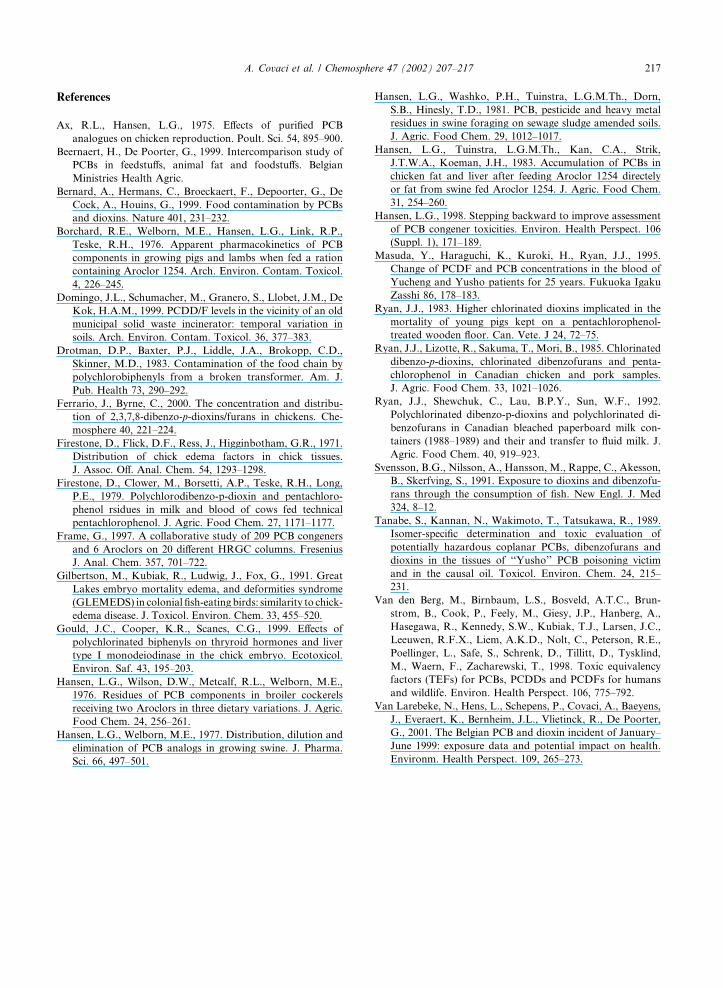
3.3. TEQ values of PCDD/Fs and PCBs
The higher accumulation rate of some PCB congen-
ers in birds (e.g., PCB 105, 118, 126) is partially re-
sponsible for the higher contribution of PCBs to the
total TEQ relative to that for the feed. These congeners
are non- or mono-ortho-chlorine substituted and have
been assigned TEF values (Van den Berg et al., 1998).
Due to PCB 156 and 157, the contribution of mono-
ortho-PCBs to the total TEQ values is even higher in
port (75%) than in chicken (51%) (Fig. 6). However, the
difference in the overall concentration values between
pork and chicken may also be a factor in these variations
in relative contributions to the total TEQ. Because of the
ability of pigs to metabolise tetra- and penta-PCBs and
PCDD/Fs, the relative contributions to the total TEQ
values are different. Uptake rates, exposure times and
species-specific metabolism are factors accounting for
the observed differences.
A. Covaci et al. / Chemosphere 47 (2002) 207–217 213
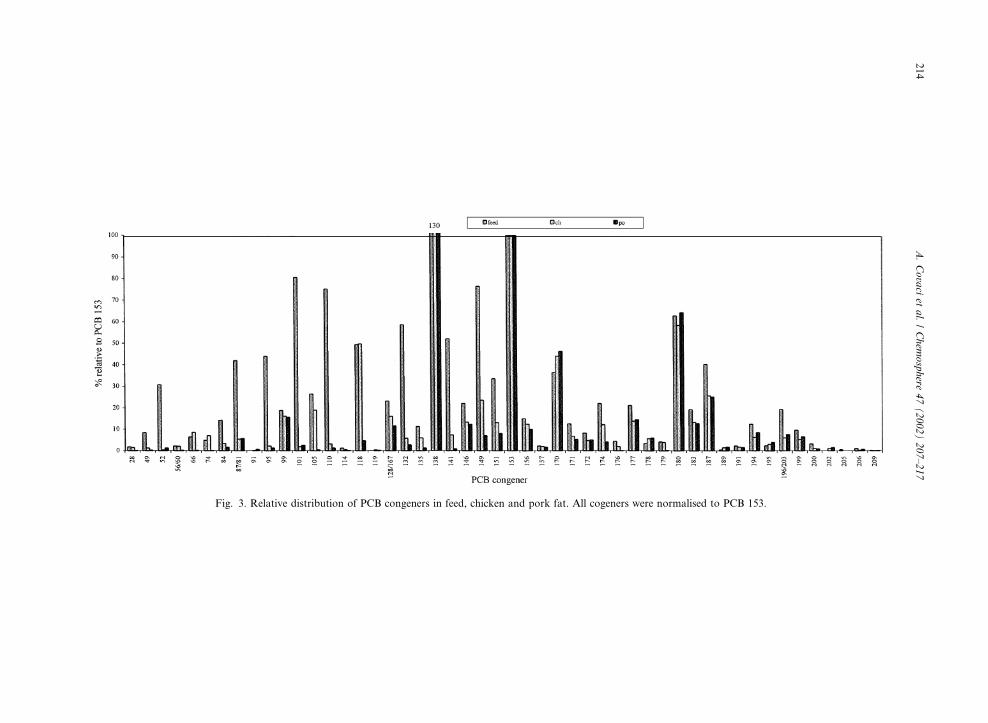
Fig. 3. Relative distribution of PCB congeners in feed, chicken and pork fat. All cogeners were normalised to PCB 153.
214
A.Covaci
etal./Chem
osphere
47(2002)207–217
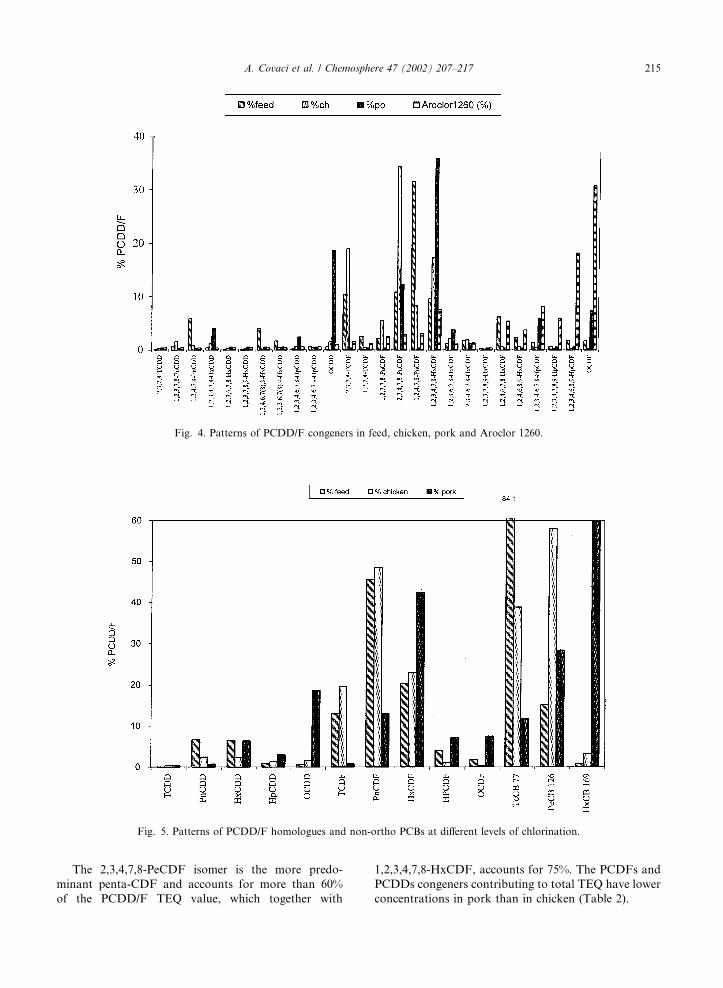
The 2,3,4,7,8-PeCDF isomer is the more predo-
minant penta-CDF and accounts for more than 60%
of the PCDD/F TEQ value, which together with
1,2,3,4,7,8-HxCDF, accounts for 75%. The PCDFs and
PCDDs congeners contributing to total TEQ have lower
concentrations in pork than in chicken (Table 2).
Fig. 4. Patterns of PCDD/F congeners in feed, chicken, pork and Aroclor 1260.
Fig. 5. Patterns of PCDD/F homologues and non-ortho PCBs at different levels of chlorination.
A. Covaci et al. / Chemosphere 47 (2002) 207–217 215
For chicken, samples with levels of seven marker
PCBs higher than the tolerance level imposed by the
European Union (200 ng/g lipid weight) also contained
higher TEQ values than the tolerance level for PCDD/Fs
(5 pg I-TEQ/g lipid weight). However, in pork, a high
value of 600 ng/g lipid weight for the seven marker
PCBs is associated with a value of only 3.4 pg I-TEQ/g
lipid weight for PCDD/Fs (Table 3). Furthermore,
the mean ratios between concentration or the seven
marker PCBs (ng/g lipid weight) and total TEQ values
(pg/g lipid weight) are weight) are 12 570 and 37 870
in chicken and pork, respectively. This difference is
possibly explained by the metabolism in pork of cong-
eners with high TEF value (PCB126 and 2,3,4,7,8-
PeCDF).
Normal values for PCDD/Fs in poultry from Europe
and US (1991–1994) are between 1.3 and 2.6 pg I-TEQ/g
lipid weight (Ferrario and Byrne, 2000). When ex-
pressed per lipid weight, distribution of PCDD/Fs was
similar for all analysed organs (fat, liver, skin, gizzard).
Contaminated Belgian chicken samples were shown to
contain up to 1000 pg I-TEQ/g lipid weight (Bernard
et al., 1999).
3.4. Remarks on the metabolism of different congeners in
other species
PCB patterns in fish and birds are different than
those in mammals including humans, due to different
metabolic capabilities of each species. The presence of
more tri-, tetra- and penta-PCBs, tetra- and penta-
PCDD/Fs and even non-2,3,7,8-substituted PCDFs is
observed in fish and birds. The appearance of these
congeners in fish and birds is in part explained by me-
tabolism that leads to a selective accumulation. The
lower chlorinated PCBs and/or PCDD/Fs usually have
higher TEF values. Thus, when exposed to the same
source and level of contamination, fish or chicken tissues
are liable to have higher TEQ values (lipid based) than
mammalian tissues. A human diet hased on contami-
nated fish or chicken can lead to higher TEQ body
burdens than diets based on pork (or other mammals).
Indeed, it was shown that consumers of large
amounts of fish from polluted areas (e.g., Baltic Sea)
have higher blood levels of PCDD/Fs than moderate or
non consumers of fish (Svensson et al., 1991). Further-
more, it can be suggested that birds are better markers
of the source of contamination with persistent organo-
chlorine pollutants than mammals, since the residue
pattern changes less.
4. Conclusions
Following an accidental exposure through animal
feed contaminated with a mixture of Aroclor 1254/1260,
accumulation patterns of PCBs and PCDD/Fs in
chicken and pork fat were established. Due to selective
metabolism of congeners with different degrees and
substitution of chlorination in commercial samples, the
patterns of PCBs and PCDD/Fs in chicken fat differ
from those in pork fat. The consequences of these pro-
cesses are: (i) birds are better indicators of the source of
contamination than mammals and (ii) human TEQ ex-
posure may be higher from the consumption of chicken
than the consumption of pork when both animals are
fed the same feed.
Fig. 6. Relative contribution of PCBs and PCDD/Fs to the total TEQ values in feed, chicken and pork fat.
216 A. Covaci et al. / Chemosphere 47 (2002) 207–217
References
Ax, R.L., Hansen, L.G., 1975. Effects of purified PCB
analogues on chicken reproduction. Poult. Sci. 54, 895–900.
Beernaert, H., De Poorter, G., 1999. Intercomparison study of
PCBs in feedstuffs, animal fat and foodstuffs. Belgian
Ministries Health Agric.
Bernard, A., Hermans, C., Broeckaert, F., Depoorter, G., De
Cock, A., Houins, G., 1999. Food contamination by PCBs
and dioxins. Nature 401, 231–232.
Borchard, R.E., Welborn, M.E., Hansen, L.G., Link, R.P.,
Teske, R.H., 1976. Apparent pharmacokinetics of PCB
components in growing pigs and lambs when fed a ration
containing Aroclor 1254. Arch. Environ. Contam. Toxicol.
4, 226–245.
Domingo, J.L., Schumacher, M., Granero, S., Llobet, J.M., De
Kok, H.A.M., 1999. PCDD/F levels in the vicinity of an old
municipal solid waste incinerator: temporal variation in
soils. Arch. Environ. Contam. Toxicol. 36, 377–383.
Drotman, D.P., Baxter, P.J., Liddle, J.A., Brokopp, C.D.,
Skinner, M.D., 1983. Contamination of the food chain by
polychlorobiphenyls from a broken transformer. Am. J.
Pub. Health 73, 290–292.
Ferrario, J., Byrne, C., 2000. The concentration and distribu-
tion of 2,3,7,8-dibenzo-p-dioxins/furans in chickens. Che-
mosphere 40, 221–224.
Firestone, D., Flick, D.F., Ress, J., Higginbotham, G.R., 1971.
Distribution of chick edema factors in chick tissues.
J. Assoc. Off. Anal. Chem. 54, 1293–1298.
Firestone, D., Clower, M., Borsetti, A.P., Teske, R.H., Long,
P.E., 1979. Polychlorodibenzo-p-dioxin and pentachloro-
phenol rsidues in milk and blood of cows fed technical
pentachlorophenol. J. Agric. Food Chem. 27, 1171–1177.
Frame, G., 1997. A collaborative study of 209 PCB congeners
and 6 Aroclors on 20 different HRGC columns. Fresenius
J. Anal. Chem. 357, 701–722.
Gilbertson, M., Kubiak, R., Ludwig, J., Fox, G., 1991. Great
Lakes embryo mortality edema, and deformities syndrome
(GLEMEDS) in colonial fish-eating birds: similarity to chick-
edema disease. J. Toxicol. Environ. Chem. 33, 455–520.
Gould, J.C., Cooper, K.R., Scanes, C.G., 1999. Effects of
polychlorinated biphenyls on thryroid hormones and liver
type I monodeiodinase in the chick embryo. Ecotoxicol.
Environ. Saf. 43, 195–203.
Hansen, L.G., Wilson, D.W., Metcalf, R.L., Welborn, M.E.,
1976. Residues of PCB components in broiler cockerels
receiving two Aroclors in three dietary variations. J. Agric.
Food Chem. 24, 256–261.
Hansen, L.G., Welborn, M.E., 1977. Distribution, dilution and
elimination of PCB analogs in growing swine. J. Pharma.
Sci. 66, 497–501.
Hansen, L.G., Washko, P.H., Tuinstra, L.G.M.Th., Dorn,
S.B., Hinesly, T.D., 1981. PCB, pesticide and heavy metal
residues in swine foraging on sewage sludge amended soils.
J. Agric. Food Chem. 29, 1012–1017.
Hansen, L.G., Tuinstra, L.G.M.Th., Kan, C.A., Strik,
J.T.W.A., Koeman, J.H., 1983. Accumulation of PCBs in
chicken fat and liver after feeding Aroclor 1254 directely
or fat from swine fed Aroclor 1254. J. Agric. Food Chem.
31, 254–260.
Hansen, L.G., 1998. Stepping backward to improve assessment
of PCB congener toxicities. Environ. Health Perspect. 106
(Suppl. 1), 171–189.
Masuda, Y., Haraguchi, K., Kuroki, H., Ryan, J.J., 1995.
Change of PCDF and PCB concentrations in the blood of
Yucheng and Yusho patients for 25 years. Fukuoka Igaku
Zasshi 86, 178–183.
Ryan, J.J., 1983. Higher chlorinated dioxins implicated in the
mortality of young pigs kept on a pentachlorophenol-
treated wooden floor. Can. Vete. J 24, 72–75.
Ryan, J.J., Lizotte, R., Sakuma, T., Mori, B., 1985. Chlorinated
dibenzo-p-dioxins, chlorinated dibenzofurans and penta-
chlorophenol in Canadian chicken and pork samples.
J. Agric. Food Chem. 33, 1021–1026.
Ryan, J.J., Shewchuk, C., Lau, B.P.Y., Sun, W.F., 1992.
Polychlorinated dibenzo-p-dioxins and polychlorinated di-
benzofurans in Canadian bleached paperboard milk con-
tainers (1988–1989) and their and transfer to fluid milk. J.
Agric. Food Chem. 40, 919–923.
Svensson, B.G., Nilsson, A., Hansson, M., Rappe, C., Akesson,
B., Skerfving, S., 1991. Exposure to dioxins and dibenzofu-
rans through the consumption of fish. New Engl. J. Med
324, 8–12.
Tanabe, S., Kannan, N., Wakimoto, T., Tatsukawa, R., 1989.
Isomer-specific determination and toxic evaluation of
potentially hazardous coplanar PCBs, dibenzofurans and
dioxins in the tissues of ‘‘Yusho’’ PCB poisoning victim
and in the causal oil. Toxicol. Environ. Chem. 24, 215–
231.
Van den Berg, M., Birnbaum, L.S., Bosveld, A.T.C., Brun-
strom, B., Cook, P., Feely, M., Giesy, J.P., Hanberg, A.,
Hasegawa, R., Kennedy, S.W., Kubiak, T.J., Larsen, J.C.,
Leeuwen, R.F.X., Liem, A.K.D., Nolt, C., Peterson, R.E.,
Poellinger, L., Safe, S., Schrenk, D., Tillitt, D., Tysklind,
M., Waern, F., Zacharewski, T., 1998. Toxic equivalency
factors (TEFs) for PCBs, PCDDs and PCDFs for humans
and wildlife. Environ. Health Perspect. 106, 775–792.
Van Larebeke, N., Hens, L., Schepens, P., Covaci, A., Baeyens,
J., Everaert, K., Bernheim, J.L., Vlietinck, R., De Poorter,
G., 2001. The Belgian PCB and dioxin incident of January–
June 1999: exposure data and potential impact on health.
Environm. Health Perspect. 109, 265–273.
A. Covaci et al. / Chemosphere 47 (2002) 207–217 217


