Embed Size (px)
Citation preview

Marketing Natural Pork: An Empirical Analysisof Consumers in the Mountain Region
Jennifer GrannisUSDA-APHIS, Center for Emerging Issues, Fort Collins, CO 80521.E-mail: [email protected]
Dawn D. ThilmanyDepartment of Agricultural and Resource Economics, Colorado StateUniversity, Fort Collins, CO 80525. E-mail: [email protected]
ABSTRACT
The demand for organic meats, including beef and chicken, has grown dramatically in recent years+Yet, there are few branded pork products+ This research examines the potential market for naturalpork in the Intermountain West, with emphasis on targeting the market segment most likely topurchase this product at a significant premium+ High-income, frequent pork consumers, and thosethat have purchased natural beef are most likely to purchase natural pork products+With respect toproduction-related attributes, those concerned about feed additives, and to a lesser degree, the ef-fects of pork production on the environment, are likely target markets+ @Econ-Lit subject codes:M310, Q130# © 2002 Wiley Periodicals, Inc+
Retail sales of organic foods have grown tremendously in recent years, from $178 mil-lion in 1980 to $7+6 billion in 1999, and consumers seem especially interested in naturallyproduced fruits, vegetables, dairy, and meat products ~Duram, 1998; The Progressive Gro-cer, Annual Report 2000!+ For example, there are several premium beef products mar-keted in supermarkets, including natural brands+ Yet, there are few branded or naturalpork products+ The absence of natural pork products may signal that consumers are lessinterested in the practices used to produce hogs+ Alternatively, a potential market existsfor hog producers willing to meet the demand of those consumers interested in othernatural products, who may also purchase natural pork+
The objective of this study is to define market segments for a natural, regionally pro-duced line of pork products and assist Colorado producers in developing a viable mar-keting plan+While organic meat products are only now being seen on market shelves dueto the stringent requirements of the Food Safety Inspection Service ~FSIS! and the onlyrecently finalized organic standards, “natural” meat products have been available for sometime+ The definition of “natural meat” was not standardized at the time of the survey andhow consumers should differentiate between “natural” and “organic” produce was notspecifically defined+However,we assume that “natural” generally implies a less stringent
Agribusiness, Vol. 18 (4) 475–489 (2002) © 2002 Wiley Periodicals, Inc.Published online in Wiley InterScience (www.interscience.wiley.com). DOI: 10.1002/agr.10029
475

production practice than “organic” to consumers+1 For the purposes of this study, “natu-rally produced meats” were defined on the survey as meat produced “from animals raisedusing environmentally sound practices with no antibiotics or hormones, and never con-fined to small or crowded pens+” The largest difference between the National-Organic-Program-defined “organic” meat and our “natural” meat is that our product was not requiredto be fed 100% organic feed, as national guidelines require ~National Organic Program,Final Rule!+
Gaining a space on grocery store shelves is often the most difficult step in selling aproduct+ Producers must enter into market relationships with distributors and grocery storeswith a well-defined description of their consumers and a distinct plan for marketing andpackaging their product+ This study uses the results from a contingent valuation study todetermine what production practices are most important to consumers, thereby enablingproducers to develop an effective production and marketing plan for their pork+
A description of the potential market for food that is certified organic or natural and asummary of the contingent valuation framework are presented in the following section+The methods section then describes the survey instrument, data, and model used in thisstudy to determine consumer demand for natural pork+ The empirical results of the studyare presented as marginal effects and used to define viable target markets for naturalpork+ The general findings are then discussed in the context of previous research on or-ganic, natural, and meat marketing+ Finally, the article concludes with a discussion ofmarketing implications and plans for future research+
1. BACKGROUND RESEARCH
1.1. Consumer Trends and Research
In order to effectively market natural pork, it is important to understand trends in generalpork consumption+Analysis of the 1992 Consumer Expenditure Survey from the Bureauof Labor Statistics found that household size is positively related to pork chop and hamexpenditures ~Nayga, 1995!+ Expenditures on ham and pork chops show a quadratic cor-relation with age and income, increasing up to some level and then declining as age andincome get significantly higher+Moon and Ward ~1999! estimated a two-stage model wheredemand for pork was the dependent variable+ Results show that household size, educa-tion, and age have significant impacts on demand for pork+ Education’s effect is negative,while age and household size are positive+ Income level was found to be insignificant inpredicting demand for pork+ This study will allow us to test whether similar patterns existamong the market segment likely to buy natural pork+
Colorado producers are interested in determining whether there is a distinct segment ofconsumers who are willing to pay a premium for locally produced food+A Canadian studyfocused on determining the premium a consumer would pay according to the productionorigin of the beef ~Unterschultz, Quagrainie, & Veeman, 1998!+ That study concludedthat product origin is considered a quality attribute, and consumers were willing to pay asignificant premium for local meat+ Thus, producers may be able to capture a significantpremium if Colorado consumers similarly value local food products+
1The survey was specifically focused on “natural” products at the request of the producer group that fundedthe study+
476 GRANNIS AND THILMANY
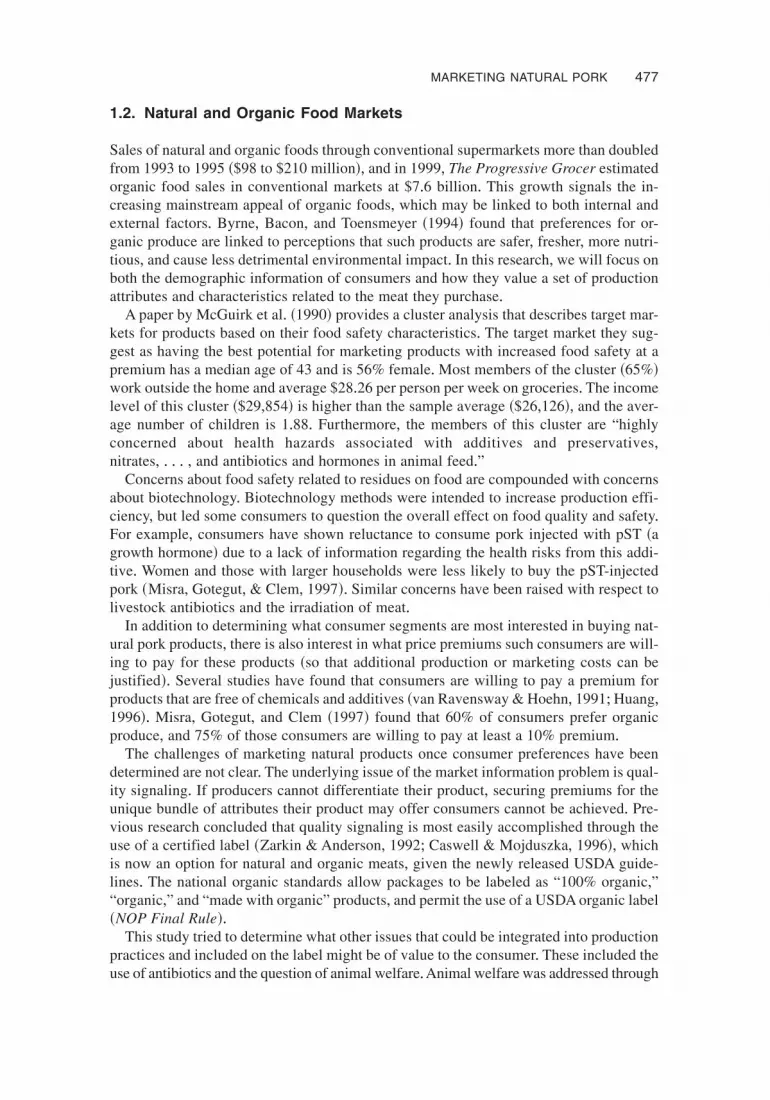
1.2. Natural and Organic Food Markets
Sales of natural and organic foods through conventional supermarkets more than doubledfrom 1993 to 1995 ~$98 to $210 million!, and in 1999, The Progressive Grocer estimatedorganic food sales in conventional markets at $7+6 billion+ This growth signals the in-creasing mainstream appeal of organic foods, which may be linked to both internal andexternal factors+ Byrne, Bacon, and Toensmeyer ~1994! found that preferences for or-ganic produce are linked to perceptions that such products are safer, fresher, more nutri-tious, and cause less detrimental environmental impact+ In this research, we will focus onboth the demographic information of consumers and how they value a set of productionattributes and characteristics related to the meat they purchase+
A paper by McGuirk et al+ ~1990! provides a cluster analysis that describes target mar-kets for products based on their food safety characteristics+ The target market they sug-gest as having the best potential for marketing products with increased food safety at apremium has a median age of 43 and is 56% female+Most members of the cluster ~65%!work outside the home and average $28+26 per person per week on groceries+ The incomelevel of this cluster ~$29,854! is higher than the sample average ~$26,126!, and the aver-age number of children is 1+88+ Furthermore, the members of this cluster are “highlyconcerned about health hazards associated with additives and preservatives,nitrates, + + + , and antibiotics and hormones in animal feed+”
Concerns about food safety related to residues on food are compounded with concernsabout biotechnology+ Biotechnology methods were intended to increase production effi-ciency, but led some consumers to question the overall effect on food quality and safety+For example, consumers have shown reluctance to consume pork injected with pST ~agrowth hormone! due to a lack of information regarding the health risks from this addi-tive+ Women and those with larger households were less likely to buy the pST-injectedpork ~Misra, Gotegut, & Clem, 1997!+ Similar concerns have been raised with respect tolivestock antibiotics and the irradiation of meat+
In addition to determining what consumer segments are most interested in buying nat-ural pork products, there is also interest in what price premiums such consumers are will-ing to pay for these products ~so that additional production or marketing costs can bejustified!+ Several studies have found that consumers are willing to pay a premium forproducts that are free of chemicals and additives ~van Ravensway & Hoehn, 1991;Huang,1996!+ Misra, Gotegut, and Clem ~1997! found that 60% of consumers prefer organicproduce, and 75% of those consumers are willing to pay at least a 10% premium+
The challenges of marketing natural products once consumer preferences have beendetermined are not clear+ The underlying issue of the market information problem is qual-ity signaling+ If producers cannot differentiate their product, securing premiums for theunique bundle of attributes their product may offer consumers cannot be achieved+ Pre-vious research concluded that quality signaling is most easily accomplished through theuse of a certified label ~Zarkin & Anderson, 1992; Caswell & Mojduszka, 1996!, whichis now an option for natural and organic meats, given the newly released USDA guide-lines+ The national organic standards allow packages to be labeled as “100% organic,”“organic,” and “made with organic” products, and permit the use of a USDA organic label~NOP Final Rule!+
This study tried to determine what other issues that could be integrated into productionpractices and included on the label might be of value to the consumer+ These included theuse of antibiotics and the question of animal welfare+Animal welfare was addressed through
MARKETING NATURAL PORK 477

the rating-of-importance of enough room for the animals, which is important in the neworganic standards ~Section 205+239 of NOP specifically addresses the issue!+ Antibioticuse was also addressed in the attribute ratings, and both variables were included in theeconometric analysis+
1.3. Contingent Valuation Methods: Issues to Consider
A contingent valuation mail survey was conducted for this study+ The shortcomings of theCV methodology have been under scrutiny by several researchers in the food-safety field~Buzby, Ready,& Skees, 1995; Fox, Shogren, Clem,& Kliebenstein, 1998!+ In short, it isnot clear that consumers’ revealed preferences match their stated preferences since actualpurchases are never made+ Sample selection bias, nonresponse bias ~Eklof & Karlsson,1997!, and unfamiliarity with the hypothetical product, price, or marketplace are all po-tential shortcomings of the CV method+ Although our methods were not altogether un-affected by such issues, our data source controlled for the former biases+
The data used for this study ~and described in more detail below! came from a randomgeographic sample provided by a national market research agency+ Moreover, we wereable to test for nonresponse bias since there were data available on nonrespondents fromthe survey firm’s database+A simple test showed that income levels ~expected and foundto be a significant factor in willingness to pay and targeting market segments! did notdiffer between respondents and nonrespondents+ Other variables that were tested in-cluded lifestage, household size, and race+ Though lifestage did not differ across subsam-ples, household size was significantly larger for nonrespondents+Race was also significantlydifferent, indicating that more surveys were received from respondents considering them-selves White+ However, the lack of response by ethnic respondents was expected, and thelarger household size nonresponse may be negligible since it was not a significant vari-able in our model+
2. THE DATA AND MODEL
A survey of rural, suburban, and urban consumers in Colorado, Utah, and New Mexicoexplored consumers’willingness to pay for natural, locally produced pork products+Twenty-two hundred primary grocery shoppers were surveyed by mail from the National FamilyOpinion ~NFO! database, and fourteen hundred useable responses were collected ~slight-ly greater than 60% of the sample!+ National Family Opinion ~www+nfo+com! was used toconduct the survey based on its strong reputation in the market research industry and itsreadily available database of consumers willing to respond to surveys, thereby assuringhigh response rates+ The standard NFO database was used, but for this study, a specificgeographic area was targeted+ Beyond targeting the geographic region, no other samplestratification was implemented+
The main impetus for the selection of the survey area was based on defining the re-gional market that the producers ~who funded this study! could likely serve+Although theregional nature may be a limiting factor, there are two reasons why this area may be ofinterest+ First, two of the major natural meat brands were founded in Colorado ~Colemanand Maverick!, so consumers in this area have had exposure to a natural beef product+Also, one of the major natural food chains ~Wild Oats! has a corporate headquarters inthis region, thereby indicating a regional interest in natural products+ Finally, the fundingfor this study came from a group of producers located in the area+
478 GRANNIS AND THILMANY

The survey instrument was pretested with focus groups conducted by NFO and thesurvey was edited according to those results to assure accurate responses+ The variablesincluded in the survey and methods of analysis were based on previous research of or-ganic, natural, and meat market+ Past shopping information was collected, including av-erage weekly expenditures on all grocery products, consumption of pork, consumption ofbeef, past consumption of natural beef, and primary store used for meat purchases+ Table 1defines the variables included in the analysis and presents basic statistics+
Thompson and Kidwell ~1998! found that those who shop in specialty markets aresignificantly different from supermarket shoppers+ To collect the information on multiplestore choices, the survey was structured to allow responses on where most, some, andnone of meat purchases were made+ There was great interest among our producers aboutwhether those who shop in supermarkets would be likely customers, or if they wouldneed to target natural food stores and meat shops+ The NAT1, NAT2, and SHOP2 vari-ables were included to answer this question+ NAT1 represents those who do most of theirshopping in natural food markets, while NAT2 represents those who do some of theirshopping in these stores+ SHOP2 represents those who do some of their shopping in spe-cialty meat shops+ Because of the way the question was structured, there may be overlapwhere, for example, respondents did some meat shopping at a natural food store and mostat a supermarket+ These overlapping variables were included for two reasons+ First, theyrepresent sizeable segments of consumers who do not do all their shopping in supermar-kets+ Second, if only NAT1 had been included, its very small share of consumers wouldhave been too little to provide a useful comparison against supermarket shoppers+
Detailed sociodemographic information was provided by NFO, and the rationale be-hind several of the variables is based on their experience in conducting market researchfor companies introducing new product lines to the marketplace+ The lifestage variableis part of the sociodemographic data provided by the NFO and combines the respon-dent’s age, number of children, and employment status+ This variable is constructed bythe NFO to incorporate these demographic factors into one measure, and thereby rep-resent some of the most common marketing segments as they are grouped for advertis-ing and marketing purposes+ For instance, a household that has a young, married coupleand no children is represented as a unique variable+ Given the data integrated into thelifestage variable, independent variables related to age and family status were not included+
Consumers were asked to rate their relative concern about antibiotics, growth hor-mones, and various other attributes+ These responses help to determine what character-istics established during production, and highlighted in marketing materials and productlabels, would make the products most attractive to customers+ The production attributesthat consumers rated were: no small or crowded pens, no antibiotics, no growth hor-mones, managed grazing to protect streams, managed grazing to protect endangered spe-cies, animals raised within 250 miles, meat aged at least 14 days, and grass-fed animals+2
These attributes were rated independently, on a Likert-like scale of 1 to 5, with 5 beingthe most important+ The respondents were not asked the importance of these attributes in
2Since the survey was conducted for beef and pork producers, and the issues of “concentrated” or “corpo-rate” farms were not of concern to them, these issues are not specifically addressed+ However, the “grazingmanaged to protect endangered species” and “grazing managed to protect streams” attributes are related toconcentrated farming, as the disruption of animal life and water contamination can be results of concentratedfarming+
MARKETING NATURAL PORK 479

their decision to purchase meat; instead, they were asked to rate these attributes on “howimportant these attributes are to you+”
Finally, survey respondents were asked about their willingness to pay for natural porkproducts+ Each respondent chose from a scale of 1 to 10, incrementally increasing pre-
TABLE 1+ Variable Names and Descriptions
Variable Names Variable Description Mean
INC5CAT Five income categories from ,$15,000 to .$75,0001�,$15,000; 2�$15,000 to 30,000; 3�$30,000 to $50,000;4 � $50,000 to $75,000; 5n$75,000
2+973
HHSZ5CAT Five categories where 1 is equal to a household size of 1 and5 is equal to a household size greater than 5
2+385
EXPWKY Seven categories from ,$50 to $4991�,$50; 2�$50 to $99; 3�$100 to $149; 4�$150 to $199;5�$200 to $299; 6�$300 to $499; 7�$300 to $499; 8�$500�
2+085
FREQPORK At home pork consumption in categories from , once a week~1! to 4 or more times a week ~5!
4+281
BUYCHOP Probability of purchasing pork chops saved from first stage 0+637BUYHAM Probability of purchasing ham saved from first stage 0+668
Attributes Ranked from 1 ~not important! to 5 ~very important! Mean RankPENS No small or crowded pens 3+106ANTIBIOT No antibiotics 3+475HORMONES No growth hormones 3+814STREAMS Grazing managed to protect streams 3+441ENDANG Grazing managed to protect endangered species 3+276LOCAL Animal born and raised within 250 miles 2+408AGED Meat aged at least 14 days 3+006GRASSFED Grass-fed animals 3+010
Lifestage Combined age and household composition information Sample ~%!YSINGLE Equals 1 if young single, ,35 5+23MSINGLE Equals 1 if middle-aged single, 35– 65 12+35OSINGLE Equals 1 if older single, .65 8+94YCOUPLE Equals 1 if young couple, ,45, no kids 6+76WRKOCPL Equals 1 if working old couple, .45, no kids 13+37RETOCPL Equals 1 if retired old couple, no kids 11+70YPARENT Equals 1 if young parent, ,45, kid ,6 14+54MPARENT Equals 1 if middle parent, ,45, kid .6 11+34OPARENT Equals 1 if older parent, .45, any kid 13+15ROOMMATE Equals 0 if roommates 2+63
Past Natural Beef ConsumptionDNBFYES Equals 1 if purchased natural beef 17+02DNBFNO Equals 0 if have not purchased natural beef 63+34
Meat Shopping ChoicesSMKT1 Equals 1 if most meat purchased at a supermarket 87+88SMKT2 Equals 1 if some meat purchased at a supermarket 7+96NAT1 Equals 1 if most meat purchased at a natural food store 1+17NAT2 Equals 1 if some meat purchased at a natural food store 0+06SHOP1 Equals 1 if most meat purchased at a meat shop 1+82SHOP2 Equals 1 if some meat purchased at a meat shop 14+31
480 GRANNIS AND THILMANY
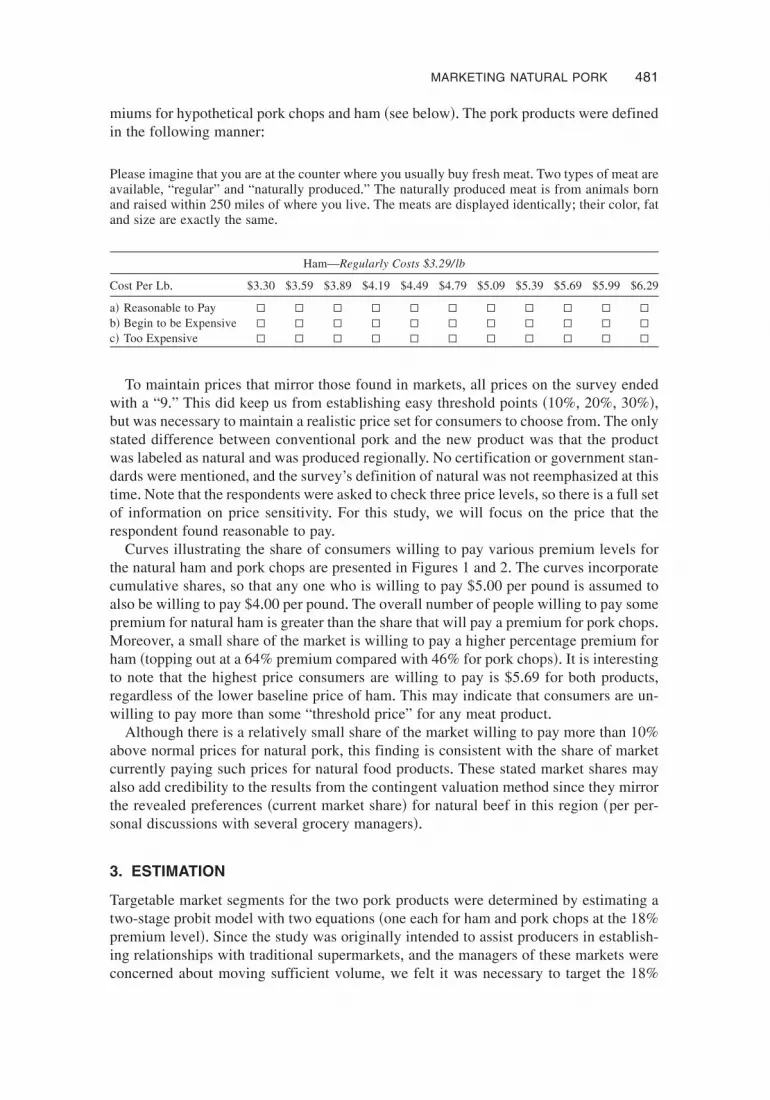
miums for hypothetical pork chops and ham ~see below!+ The pork products were definedin the following manner:
Please imagine that you are at the counter where you usually buy fresh meat+ Two types of meat areavailable, “regular” and “naturally produced+” The naturally produced meat is from animals bornand raised within 250 miles of where you live+ The meats are displayed identically; their color, fatand size are exactly the same+
Ham—Regularly Costs $3.29/lb
Cost Per Lb+ $3+30 $3+59 $3+89 $4+19 $4+49 $4+79 $5+09 $5+39 $5+69 $5+99 $6+29
a! Reasonable to Pay ▫ ▫ ▫ ▫ ▫ ▫ ▫ ▫ ▫ ▫ ▫b! Begin to be Expensive ▫ ▫ ▫ ▫ ▫ ▫ ▫ ▫ ▫ ▫ ▫c! Too Expensive ▫ ▫ ▫ ▫ ▫ ▫ ▫ ▫ ▫ ▫ ▫
To maintain prices that mirror those found in markets, all prices on the survey endedwith a “9+” This did keep us from establishing easy threshold points ~10%, 20%, 30%!,but was necessary to maintain a realistic price set for consumers to choose from+ The onlystated difference between conventional pork and the new product was that the productwas labeled as natural and was produced regionally+ No certification or government stan-dards were mentioned, and the survey’s definition of natural was not reemphasized at thistime+Note that the respondents were asked to check three price levels, so there is a full setof information on price sensitivity+ For this study, we will focus on the price that therespondent found reasonable to pay+
Curves illustrating the share of consumers willing to pay various premium levels forthe natural ham and pork chops are presented in Figures 1 and 2+ The curves incorporatecumulative shares, so that any one who is willing to pay $5+00 per pound is assumed toalso be willing to pay $4+00 per pound+ The overall number of people willing to pay somepremium for natural ham is greater than the share that will pay a premium for pork chops+Moreover, a small share of the market is willing to pay a higher percentage premium forham ~topping out at a 64% premium compared with 46% for pork chops!+ It is interestingto note that the highest price consumers are willing to pay is $5+69 for both products,regardless of the lower baseline price of ham+ This may indicate that consumers are un-willing to pay more than some “threshold price” for any meat product+
Although there is a relatively small share of the market willing to pay more than 10%above normal prices for natural pork, this finding is consistent with the share of marketcurrently paying such prices for natural food products+ These stated market shares mayalso add credibility to the results from the contingent valuation method since they mirrorthe revealed preferences ~current market share! for natural beef in this region ~per per-sonal discussions with several grocery managers!+
3. ESTIMATION
Targetable market segments for the two pork products were determined by estimating atwo-stage probit model with two equations ~one each for ham and pork chops at the 18%premium level!+ Since the study was originally intended to assist producers in establish-ing relationships with traditional supermarkets, and the managers of these markets wereconcerned about moving sufficient volume, we felt it was necessary to target the 18%
MARKETING NATURAL PORK 481

premium level, ~6% to 14% of the consumers responding to this survey!+ Given that someconsumers may choose not to purchase locally produced natural pork at any price, a two-step probit estimation is appropriate+ The survey was worded so that the consumer couldchoose whether or not to purchase the product, and then designate the premium they werewilling to pay if they chose to make the purchase+
The probit that is run in each stage is:
P@BUYi � 1#�F~b 'xi!
where BUY equals the probability that the consumer is: 1! willing to purchase the naturalpork at any price in the first stage, and, 2! willing to pay at least an 18% premium in thesecond stage+
Figure 1 Cumulative willingness to pay for natural ham curves+
Figure 2 Cumulative willingness to pay for natural pork chops+
482 GRANNIS AND THILMANY

F � the cumulative distribution function of the standard normal distribution
xi � 1st stage: ~NAT1, NAT2, SHOP2, FREQPORK, HHSZ5CAT, YSINGLE,MSINGLE, OSINGLE, YPARENT, MPARENT, OPARENT, RETOCPL,WRKOCPL!
2nd stage: ~EXPWKY, NAT1, NAT 2, SHOP2, FREQPORK, DNBFYES,HHSZ5CAT, YPARENT, OPARENT, RETOCPL,WRKOCPL, YSINGLE,OSINGLE, MSINGLE, HORMONES, PENS, ENDANG, ANTIBIOT,STREAMS, LOCAL, DNBFYES, INC5CAT, BUYHAM0CHOP !
b ' � the vector of coefficients associated with the variables
The variables included for ham and pork chops at each stage were identical+We argue that, for the first stage, the model will delineate what types of consumers are
interested in local, natural pork, without being affected by their price sensitivity+ Thus,demographics and shopping behavior were the only variables included in this stage ~seeTable 1 for variable definitions!+ The probabilities from the first stage estimation weresaved, and included as the BUYHAM or BUYCHOP variable in the second set of esti-mations+ These variables were included since they contained important information aboutthe respondent’s decision to purchase the product, without including price information+This is akin to the process of including the inverse Mills ratio in the second stage of theHeckman model for sample selection+
The targetable market segments for the two pork products were determined by esti-mating a probit model based on the consumer’s willingness to buy the specified productat an 18% price premium+ The second model includes the demographic and shoppingbehavior used in estimating likely consumers, but also incorporates several variables thatmay indicate price sensitivity, as well as how important various natural food productcharacteristics may be to the consumer ~see Table 1!+ These variables were based on theliterature presented above, NFO market research protocol, and the production attributelist described above+
The probit models were estimated in LIMDEP 7+0+ Estimation using a logit model wasalso performed, but there were no differences in the significance of variables, althoughthe values of coefficients did change slightly+ The nature of the data would lead one tochoose an ordered probit for estimation, but the extremely small share of responses abovethe 18% premium level and categorical nature of most of the explanatory variables led toestimation problems with the ordered model+ Thus, the two-stage model ~separating thepurchase and price choices! was used for this study+
4. FINDINGS
4.1. First Stage: Who Will Buy Natural Pork?
Table 2 presents the results for the first probit estimation of likely customers of naturalpork ~those who will purchase at some price!+ For both pork chops and ham, those whoalready do some shopping in natural food or meat shops are more likely to purchase,while those who purchase pork more frequently are less likely to buy these meat products
MARKETING NATURAL PORK 483

~as would be expected!+ These results are consistent across the two meats, but there areseveral lifestage variables that only affect the likelihood of consumers purchasing thepork chops ~with neutral effects on ham!+
Older single and retired old-couple households are less likely to buy pork chops, whilesome of the demographics denoting families with children seem more likely to buy thenatural ham ~although these results are insignificant!+ This indicates that the target marketfor these products may be different, even though some factors affect the interest in porkchops and ham similarly+ As discussed previously, the probabilities from this estimationwere included as BUYCHOP and BUYHAM in the next stage of estimation+
4.2. Second Stage: Who Will Pay a Premium for Natural Pork?
The estimation results and marginal effects for the second-stage equation are presented inTables 3 and 4+ The marginal effects are comparable to more familiar elasticities of or-dinary least-squares estimates+ They represent the change in probability of purchase dueto a one-unit ~category! change in each variable, or the difference between 0 and 1 fordummy variables+Marginal effects were calculated at the means of all other variables byLIMDEP, which was used to estimate the probit models+ The t-statistics can be inter-preted traditionally, as they are assumed to be asymptotic in large samples+
For both products, weekly expenditures and income have a positive effect on thelikelihood of a consumer purchasing at a premium ~expenditures are more important forpork and income is more significant for ham!+ These findings support past studies thatfound a notable income effect for natural and organic foods+ Also, the con-sumer’s past purchase of natural beef signals a higher propensity to buy this product ata premium+
TABLE 2+ First-Stage Results: Probability of Purchasing Pork Chops or Ham
Pork Chops Ham
Dependent Variable Coefficient T-Ratio Coefficient T-Ratio
Constant 1+337* 5+7132 0+849 3+6699NAT1 �0+172 �0+5305 �0+065 �0+1981NAT2 0+286** 1+8286 0+210 1+3476SHOP2 0+161 1+5436 0+096 0+9239FREQPORK �0+185* �5+3493 �0+105 �3+0288HHSZ5CAT �0+026 �0+4262 �0+014 �0+2256YSINGLE �0+252 �1+2351 0+046 0+2280MSINGLE �0+251 �1+4778 �0+070 �0+4200OSINGLE �0+488* �2+7434 �0+096 �0+5413YPARENT 0+099 0+5386 0+199 1+0891MPARENT �0+073 �0+3994 0+207 1+1279OPARENT �0+057 �0+3313 0+029 0+1726RETOCPL �0+452* �2+9043 �0+146 �0+9517WRKOCPL �0+081 �0+5303 0+167 1+1029
*Indicates significance at the 5% level+ **Indicates significance at the 10% level+
484 GRANNIS AND THILMANY
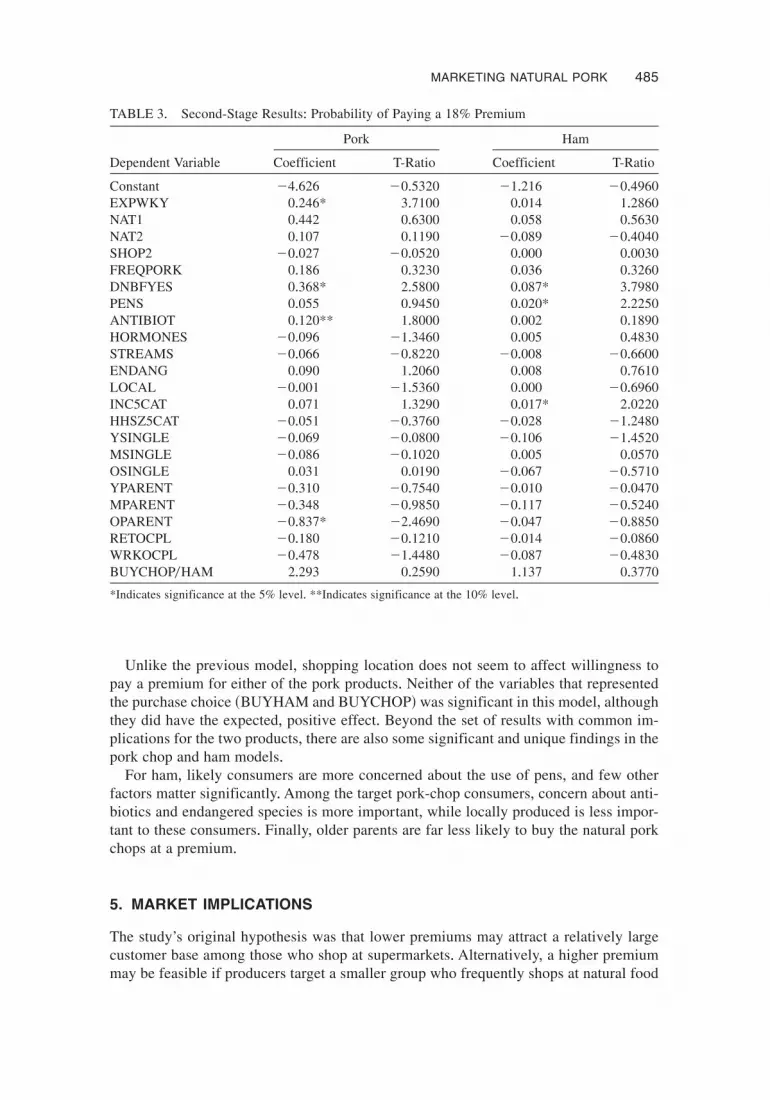
Unlike the previous model, shopping location does not seem to affect willingness topay a premium for either of the pork products+ Neither of the variables that representedthe purchase choice ~BUYHAM and BUYCHOP! was significant in this model, althoughthey did have the expected, positive effect+ Beyond the set of results with common im-plications for the two products, there are also some significant and unique findings in thepork chop and ham models+
For ham, likely consumers are more concerned about the use of pens, and few otherfactors matter significantly+ Among the target pork-chop consumers, concern about anti-biotics and endangered species is more important, while locally produced is less impor-tant to these consumers+ Finally, older parents are far less likely to buy the natural porkchops at a premium+
5. MARKET IMPLICATIONS
The study’s original hypothesis was that lower premiums may attract a relatively largecustomer base among those who shop at supermarkets+ Alternatively, a higher premiummay be feasible if producers target a smaller group who frequently shops at natural food
TABLE 3+ Second-Stage Results: Probability of Paying a 18% Premium
Pork Ham
Dependent Variable Coefficient T-Ratio Coefficient T-Ratio
Constant �4+626 �0+5320 �1+216 �0+4960EXPWKY 0+246* 3+7100 0+014 1+2860NAT1 0+442 0+6300 0+058 0+5630NAT2 0+107 0+1190 �0+089 �0+4040SHOP2 �0+027 �0+0520 0+000 0+0030FREQPORK 0+186 0+3230 0+036 0+3260DNBFYES 0+368* 2+5800 0+087* 3+7980PENS 0+055 0+9450 0+020* 2+2250ANTIBIOT 0+120** 1+8000 0+002 0+1890HORMONES �0+096 �1+3460 0+005 0+4830STREAMS �0+066 �0+8220 �0+008 �0+6600ENDANG 0+090 1+2060 0+008 0+7610LOCAL �0+001 �1+5360 0+000 �0+6960INC5CAT 0+071 1+3290 0+017* 2+0220HHSZ5CAT �0+051 �0+3760 �0+028 �1+2480YSINGLE �0+069 �0+0800 �0+106 �1+4520MSINGLE �0+086 �0+1020 0+005 0+0570OSINGLE 0+031 0+0190 �0+067 �0+5710YPARENT �0+310 �0+7540 �0+010 �0+0470MPARENT �0+348 �0+9850 �0+117 �0+5240OPARENT �0+837* �2+4690 �0+047 �0+8850RETOCPL �0+180 �0+1210 �0+014 �0+0860WRKOCPL �0+478 �1+4480 �0+087 �0+4830BUYCHOP0HAM 2+293 0+2590 1+137 0+3770
*Indicates significance at the 5% level+ **Indicates significance at the 10% level+
MARKETING NATURAL PORK 485

markets, such as the Alfalfa’s3 ~Whole Foods Subsidiary! chain in the targeted region+Although the type of store where consumers shop makes a difference in the decisionwhether to purchase the pork, market choice is not significantly different among thosewho will pay the producer’s desired price+ Also, it appears that income level and foodexpenditures are relatively more important descriptors in this model+
These results suggest that natural pork may be considered a complement to naturalbeef, not a substitute, as is generally the case+ This conclusion is drawn from the signif-icant and positive relationship between the probability of purchasing the new, naturalpork product and past purchases of natural beef+ This indicates that producers may beable to reach most of their targetable market by placing their product in supermarketslocated in high-income areas+A cross-tabulation on the data indicates that the consumerswho have purchased natural beef in the past still shop primarily in traditional supermar-kets+ This is plausible in the Intermountain region since changing marketing conditionshave led larger, commercial stores to offer branded natural beef+ Positioning new natural
3Alfalfa’s, a Colorado natural products store, was purchased shortly after the survey was completed by WildOats, a national chain of natural products stores+
TABLE 4+ Marginal Effects for Second-Stage Results
Pork Ham
Dependent VariableMarginal Effect
~%! T-RatioMarginal Effect
~%! T-Ratio
Constant �43+31 �0+5320 �121+61 �0+4960EXPWKY 2+30* 3+7100 1+38 1+2860NAT1 4+14 0+6300 5+83 0+5630NAT2 1+00 0+1190 �8+91 �0+4040SHOP2 �0+25 �0+0520 0+03 0+0030FREQPORK 1+74 0+3230 3+62 0+3260DNBFYES 3+44* 2+5800 8+69* 3+7980PENS 0+52 0+9450 2+04* 2+2250ANTIBIOT 1+12** 1+8000 0+19 0+1890HORMONES �0+90 �1+3460 0+54 0+4830STREAMS �0+62 �0+8220 �0+79 �0+6600ENDANG 0+84 1+2060 0+82 0+7610LOCAL �0+01 �1+5360 �0+01 �0+6960INC5CAT 0+66 1+3290 1+67* 2+0220HHSZ5CAT �0+48 �0+3760 �2+76 �1+2480YSINGLE �0+65 �0+0800 �10+62 �1+4520MSINGLE �0+81 �0+1020 0+50 0+0570OSINGLE 0+29 0+0190 �6+73 �0+5710YPARENT �2+90 �0+7540 �1+01 �0+0470MPARENT �3+26 �0+9850 �11+72 �0+5240OPARENT �7+84* �2+4690 �4+70 �0+8850RETOCPL �1+69 �0+1210 �1+45 �0+0860WRKOCPL �4+47 �1+4480 �8+73 �0+4830BUYCHOP0HAM 21+47 0+2590 113+74 0+3770
*Indicates significance at the 5% level+ **Indicates significance at the 10% level+Note: Marginal effects were calculated at the means of each variable+
486 GRANNIS AND THILMANY
pork products alongside natural beef will help producers reach a key consumer group+This is strong evidence for pork producers to present to retailers who currently carrynatural beef products in order to secure space alongside natural beef in the glass casewhere most premium meat cuts are displayed+
Target consumers seem concerned that their meat is environmentally and animal friendly,so the producers must ensure that these production practices are emphasized in marketingmaterials and packaging+To attract consumers to their natural product, the producers shouldidentify their production practices on the labels for both ham and pork chops+ The abso-lute ratings of these attributes led us to conclude that environmental and welfare issuescould be important variables in our model, but that was not the case+ Only pens had apositive and significant relationship in the ham equation+ It was also surprising that hor-mone and antibiotic-free practices were not more important ~antibiotics and hormoneswere insignificant attributes for ham consumers while hormones had an insignificant,negative relationship in the pork-chop target market!, given the perceived potential for aconsumer backlash about meat from animals treated by antibiotics+ One possible expla-nation is the fact that natural beef consumers ~a significant factor in this model! may bea proxy for those concerned about chemicals and additives, since most current naturalbeef products make claims about their product+
Natural or organic product sections are becoming more common in mainstream super-markets, and developing a natural meat section is a logical next step+Alternatively, evenhigher premiums could be charged if producers segment their marketing plan and de-velop retail relationships with natural food stores ~even though this would represent a farsmaller absolute market!+ In either case, carrying pork ~along with currently availablebeef and chicken products! will provide the retailers with a meat case that satisfies a widerange of customers+ The store will benefit by carrying a new product, which this analysisindicates a significant portion of consumers are willing to purchase, and the producerswill have secured a viable market for their product+
In short, concentrating on store location, consumer income level, and product place-ment may be the most effective allocation of marketing resources+ This runs counter tothe current strategy of other Western livestock producers that targets numerous small nat-ural food or meat stores+
6. CONCLUSIONS
The producers who commissioned this study have some clear results from a large re-gional market study that they can use to position their product in appropriate marketswith information on the share of customers who are likely to pay various price levels+ Thetarget consumers are very concerned about some of the production practices utilized bythe producers+ If production practices are altered to attract these consumers, a highly vis-ible and descriptive label should be included in marketing materials+ To further charac-terize the target market to potential food distributors or retailers, it can be said that theseconsumers are wealthy, do not consume pork on a regular basis ~from first-stage estima-tion!, and occasionally shop at natural food stores and meat shops+
Placing these products in stores located in a high-income area and developing a mar-keting campaign emphasizing hormone and antibiotic-free production appear to be thebest options available to these producers+ Production practices should be featured in ad-vertisements and product labels at the point of sale+ Now that federal organic label reg-ulations are available, there may be opportunities to complement regulated standards with
MARKETING NATURAL PORK 487
unique assurances the producers are willing to provide+ Other in-store promotions couldbe developed that concentrate on the production practices and local aspect of the productif the supermarket managers believe it complements their own marketing strategies+
One of the original assumptions in framing this study was that “local” or “regional”products are valued more highly than natural products shipped in from distant productionsites+ However, “regional production” ~local! was the least valued of all the rankedattributes+Yet, the “willingness to pay” question combined both the “natural” and “local”attributes, so including “local” on a label with other attributes may be effective+ Furtherresearch into the value of a local labeling is still necessary before it can be promoted asa distinct and effective value-added marketing tool+
Future research using this particular data set can provide insights into the nature of themarketplace+ This study assumes the market segments are distinct and discontinuous+ Itmay be appropriate to revise this assumption and estimate these markets using an orderedbivariate process such as an ordered probit or logit+4 This may also provide informationon the general nature of consumption and identify thresholds of willingness to pay cat-egories for consumers in specific market segments+
ACKNOWLEDGMENTS
The authors wish to thank Ed Sparling, Susan Hine, Andy Seidl, Neal Hooker, and twoanonymous reviewers for helpful comments on this study+ All remaining errors are theresponsibility of the author+ Funding for this research was provided by the Rocky Moun-tain Farmer’s Union and Rocky Mountain Pork Producers, with matching support fromthe Colorado Agricultural Experiment Station+
REFERENCES
Baker, G+,& Crosbie, P+ ~1994!+ Consumer preferences for food safety attributes:A market segmentapproach+ Agribusiness, 10, 319–324+
Buzby, J+C+, Ready, R+C+,& Skees, J+R+ ~1995!+ Contingent valuation in food policy analysis:A casestudy of a pesticide residue risk reduction+ Journal of Agricultural and Applied Economics, 27,277–287+
Byrne, P+J+, Bacon, J+, & Toensmeyer, R+ ~1994!+ Pesticide residue concerns and shopping locationlikelihood+ Agribusiness, 10, 491–501+
Caswell, J+,& Mojduszka, E+ ~1996!+ Using informational labeling to influence the market for qual-ity in food products+ American Journal of Agricultural Economics, 78, 1248–1253+
Duram, L+A+ ~1998!+ Organic agriculture in the United States: Current status and future regulation+CHOICES, 13, 34–38+
Eklof, J+, & Karlsson, S+ ~1997!+ Testing and correcting for sample selection bias in discrete choicecontingent valuation studies, Stockholm School of Economics, The Economic Research Insti-tute+Working Paper No+ 171+
Fox, J+A+, Shogren, J+F+, Hayes, D+J+, & Kliebenstein, J+B+ ~1998!+ CVM-X: Calibrating contingentvalues with experimental auction markets+ American Journal of Agricultural Economics, 80,466– 473+
Huang, C+ ~1996!+ Consumer preferences and attitudes towards organically grown produce+ Euro-pean Review of Agricultural Economics, 23, 331–342+
4As suggested previously, the discontinuous nature of the descriptive variables and small higher premiumlevels make the ordered probit model unsatisfactory for estimation as it is specified now+ Further research intothis type of model is beyond the scope of this article+
488 GRANNIS AND THILMANY

McGuirk,A+, Preston,W+P+, & McCormick,A+ ~1990!+ Toward the development of marketing strat-egies for food safety attributes+ Agribusiness, 6, 297–308+
Misra, S+, Gotegut, D+, & Clem, K+ ~1997!+ Consumer attitude toward recombiant porcine somato-tropin+ Agribusiness, 13, 11–20+
Moon, W+, & Ward, R+ ~1999!+ Effects of health concerns and consumer characteristics on U+S+meat consumption+ American Agricultural Economics Association National Meetings, Nash-ville, TN+
Nayga, Jr+, R+ ~1995!+ Microdata expenditure analysis of disaggregate meat products+ Review ofAgricultural Economics, 17, 275–285+
Thompson, G+D+, & Kidwell, J+ ~1998!+ Explaining the choice of organic produce: Cosmetic de-fects, prices, and consumer preferences+American Journal of Agricultural Economics, 1998, 80,277–287+
Unterschultz, J+, Quagrainie, K+, & Veeman, M+ ~1998!+ Effects of product origin and selected de-mographics on consumer choice of red meats+ Canadian Journal of Agricultural Economics, 46,201–219+
van Ravensway, E+, & Hoehn, J+ ~1991!+ Consumer willingness to pay for reducing pesticide resi-dues in food: Results of a nationwide survey+Michigan Agricultural Experiment Station Project#3800+
Zarkin, G+, & Anderson, D+ ~1992!+ Consumer and producer responses to nutrition label changes+American Journal of Agricultural Economics, 74, 1202–1207+
Jennifer Grannis is an industry analyst at the Center for Emerging Issues of the USDA-APHIS inFort Collins, Colorado. She earned a B.S. in applied economics from Ithaca College in 1995, anda M.A. and Ph.D. in agricultural and resource economics from Colorado State University in 1999and 2001, respectively. Dr. Grannis researches the marketing and trade implications of emergingissues in livestock health and the industry as a whole.
Dawn D. Thilmany is an associate professor in the Department of Agricultural and Resource Eco-nomics at Colorado State University. She earned a B.S. in public service and administration inagriculture at Iowa State University (1990), then an M.S. in agricultural economics (1991) and aPh.D. in agricultural and resource economics (1994) from the University of California, Davis. Dr.Thilmany’s research centers on the marketing implications of emerging issues in agricultural pro-duction and food systems. She also studies immigration, farm labor issues, and rural development.
MARKETING NATURAL PORK 489


