Embed Size (px)
Citation preview
Continental Shelf Research 22 (2002) 1493–1510
Particulate and dissolved 210Pb activities in the shelf and sloperegions of the Gulf of Mexico waters
M. Baskarana,*, Peter H. Santschib
aDepartment of Geology, Wayne State University, Detroit, MI 49202, USAbDepartment of Marine Sciences, Texas A & M University, Galveston, TX 77551, USA
Received 8 September 1999; received in revised form 10 July 2001; accepted 30 January 2002
Abstract
Concentration profiles of dissolved and particulate 210Pb were measured on horizontal transects of the continental
shelf and slope regions of the Gulf of Mexico. Vertical profiles in the slope station in the presence and absence of warm-
core ring enable us to evaluate the differences in the scavenging intensity of 210Pb. A comparison of the rate of
production of 210Pb in the overlying water column to that of its mean annual flux calculated from the sediment
inventory allows us to get a better insight in to the lateral transport and deposition of 210Pb to the slope sediments over
a o100 year time scale.
Our results indicate that there is no general increase of dissolved or particulate 210Pb concentration with depth. The
scavenging residence time of 210Pb for the entire 1500-m water column varied between 0.06 and 4.7 years. There was a
strong correlation between the inventory of total (dissolved+particulate) 210Pb and depth of the water column. The
ratio of measured sediment inventory (F ) of 210Pb to its production (P) in the overlying water column varied between
0.69 and 1.63, suggesting that, at time, lateral inputs from boundary scavenging in a few sites are dominant, while in
other places, vertical scavenging is the primary mechanism of transport for 210Pb. r 2002 Elsevier Science Ltd. All
rights reserved.
Keywords: Boundary scavenging; Warm-core ring; Dissolved and particulate 210Pb; Residence time of 210Pb; Scavenging index;
Distribution coefficients
1. Introduction
One of the particle-reactive radionuclides in the238U decay series is 210Pb (half-life=22.3 yr),which has been successfully used to investigateoceanic processes related to scavenging andsedimentation. The primary sources of 210Pb tothe shelf and slope regions of the oceanic water
column are the atmospheric fallout of 210Pb to thesurface water and production from the decay of itsgrandparent, 226Ra. In comparison, inputs ofdissolved 210Pb from rivers are small, mainly dueto rapid scavenging of dissolved 210Pb from theriver waters and efficient trapping of river-bornesediments in the estuaries (Benninger, 1978). Theresidence time of 210Pb in coastal and estuarineregions is o1 year, in contrast to the deep oceanwhere it is 30–100 years (Rama and Goldberg,1961; Craig et al., 1973; Somayajulu and Craig,1976; Baskaran and Santschi, 1993 and the
*Corresponding author. Tel.: +1-313-577-3262; fax: +1-
313-577-0517.
E-mail address: [email protected] (M. Baskaran).
0278-4343/02/$ - see front matter r 2002 Elsevier Science Ltd. All rights reserved.
PII: S 0 2 7 8 - 4 3 4 3 ( 0 2 ) 0 0 0 1 7 - 1
references therein). This relatively longer residencetime in the deep ocean can be utilized in theinvestigation of the differences in the scavengingintensity of Pb in different oceanic regimes. Forexample, 210Pb has been utilized as a tracer for theinvestigation of transport processes on the con-tinental shelf and slope regions (Bacon et al., 1988;Anderson et al., 1994; Biscaye and Anderson,1994). Indeed, the first direct evidence of rapidscavenging of trace metals in the deep sea wasinferred from the disequilibrium between 210Pband 226Ra (Craig et al., 1973). The deficiency of210Pb between its supply (in dpmm�2) andmeasured inventory (dpmm�2) in the watercolumn is a measure of either the scavengingintensity or lateral transport in a given site. Acomparison of the production rate (P) of 210Pb toits flux (F ), either derived from sediment inventoryor sediment traps, will enable us to investigatesediment focusing and/or boundary scavenging of210Pb. The F/P ratio value of one is suggestive thatthe primary removal mechanism is by verticalscavenging while F/P>1 indicates additionalsources of 210Pb. Similarly, F/P ratios of o1indicate lateral transport to other depocenterswhile values >1 will indicate lateral input fromother areas. The combined effects of verticalscavenging (diapycnal) processes and lateral trans-port (isopycnal) can also be delineated from themeasurements of 210Pb in the water column, andthe 210Pb inventory in the underlying sediments.
There is a considerable body of literaturedescribing water column profiles of 210Pb fromdifferent ocean basins: Atlantic (North EquatorialAtlantic, Spencer et al. (1980); Northwest Atlantic,Cochran et al. (1987); Northeast Atlantic, Thom-son et al. (1993); shelf and slope south of NewEngland and in the Middle Atlantic Bight, Baconet al. (1988, 1994); Pacific, Nozaki et al. (1976);Chung and Craig (1983); North Pacific, Nozakiet al. (1980); Eastern South Pacific, Thomson andTurekian (1976); Indian Ocean (Central and East-ern Indian Ocean, Cochran et al. (1983); WesternIndian Ocean, Chung (1987)); East China andPhilippine Sea, Nozaki et al. (1990); Yellow Sea,Hong et al. (1999); and North Sea, Spencer et al.(1980). But data on 210Pb where the water columnas well as the sediments had been measured
simultaneously are relatively few (e.g., Baconet al., 1994). However, such combined measure-ments are needed to address the relative impor-tance of vertical scavenging vs lateral transport.
We have measured the concentrations of 210Pbin the sediments and water column in the Gulf ofMexico. The water sampling was carried out inthose areas of the Gulf where either a warm-corering was present or absent. These warm-core ringsderived from the Gulf Stream have unique featuressuch as low nutrients (Biggs, 1992; Biggs andMuller-Karger, 1994) and suspended particleconcentrations (Baskaran et al., 1996), and rela-tively longer residence times of suspended particlesand particle-reactive nuclides such as Th (Baskar-an et al., 1996). Previous in situ and satelliteobservations have revealed that there are intensegradients in physical, chemical, and biologicalproperties in the warm-core rings that are uniquelydifferent from those outside. There are only fewstudies that had been carried out on vertical vslateral removal of radionuclides within a warm-core ring (e.g., Baskaran et al., 1996).
In this paper, we report dissolved and particu-late concentrations of 210Pb in the water column,and sediment inventories of 210Pb from selectedsites in the shelf and slope regions of the Gulf ofMexico. The present study provides insight intothe scavenging of Pb in a warm-core ring (moreoligotrophic Caribbean water) and typical springupwelling conditions. The specific questions thatwill be addressed include:
(i) How does the particulate 210Pb concentrationvary with depth? Is there any difference in thefraction of particulate 210Pb in the presenceand absence of a warm-core ring?
(ii) How does the particle-water partition coeffi-cient, Kd; vary with water depth in thepresence and absence of a warm-core ring?
(iii) How does the inventory of 210Pb (dissolvedand particulate) vary with depth?
(iv) How does the residence time of Pb in thewhole water column vary with total waterdepth?
(v) How does vertical and lateral transport of210Pb vary in the slope regions of the Gulf ofMexico waters?
M. Baskaran, P.H. Santschi / Continental Shelf Research 22 (2002) 1493–15101494
2. Materials and methods
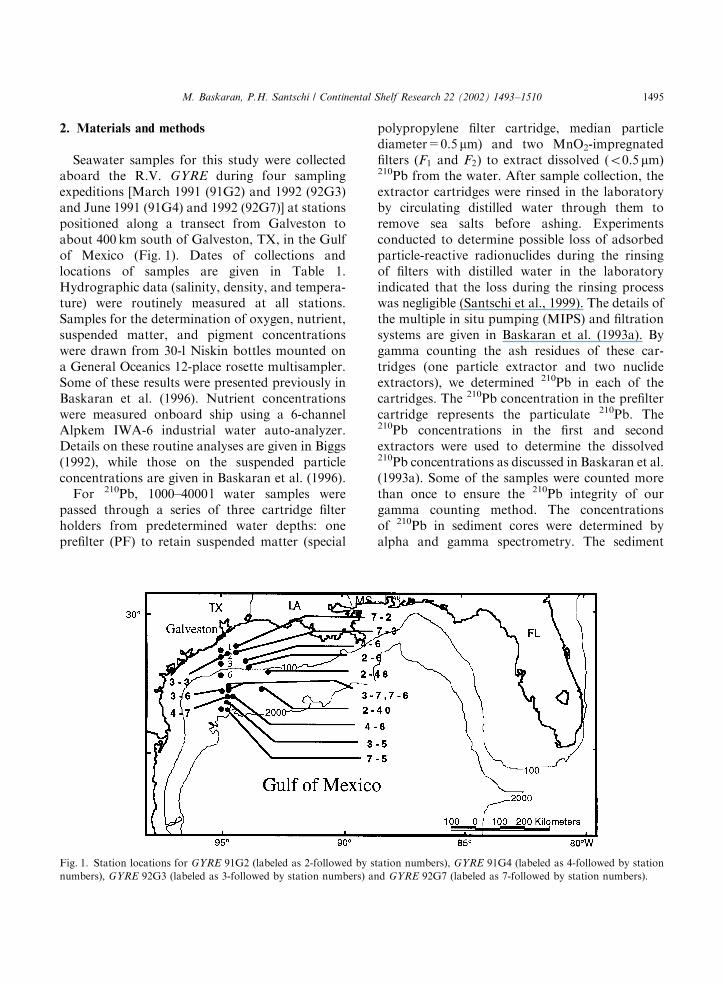
Seawater samples for this study were collectedaboard the R.V. GYRE during four samplingexpeditions [March 1991 (91G2) and 1992 (92G3)and June 1991 (91G4) and 1992 (92G7)] at stationspositioned along a transect from Galveston toabout 400 km south of Galveston, TX, in the Gulfof Mexico (Fig. 1). Dates of collections andlocations of samples are given in Table 1.Hydrographic data (salinity, density, and tempera-ture) were routinely measured at all stations.Samples for the determination of oxygen, nutrient,suspended matter, and pigment concentrationswere drawn from 30-l Niskin bottles mounted ona General Oceanics 12-place rosette multisampler.Some of these results were presented previously inBaskaran et al. (1996). Nutrient concentrationswere measured onboard ship using a 6-channelAlpkem IWA-6 industrial water auto-analyzer.Details on these routine analyses are given in Biggs(1992), while those on the suspended particleconcentrations are given in Baskaran et al. (1996).
For 210Pb, 1000–4000 l water samples werepassed through a series of three cartridge filterholders from predetermined water depths: oneprefilter (PF) to retain suspended matter (special
polypropylene filter cartridge, median particlediameter=0.5 mm) and two MnO2-impregnatedfilters (F1 and F2) to extract dissolved (o0.5 mm)210Pb from the water. After sample collection, theextractor cartridges were rinsed in the laboratoryby circulating distilled water through them toremove sea salts before ashing. Experimentsconducted to determine possible loss of adsorbedparticle-reactive radionuclides during the rinsingof filters with distilled water in the laboratoryindicated that the loss during the rinsing processwas negligible (Santschi et al., 1999). The details ofthe multiple in situ pumping (MIPS) and filtrationsystems are given in Baskaran et al. (1993a). Bygamma counting the ash residues of these car-tridges (one particle extractor and two nuclideextractors), we determined 210Pb in each of thecartridges. The 210Pb concentration in the prefiltercartridge represents the particulate 210Pb. The210Pb concentrations in the first and secondextractors were used to determine the dissolved210Pb concentrations as discussed in Baskaran et al.(1993a). Some of the samples were counted morethan once to ensure the 210Pb integrity of ourgamma counting method. The concentrationsof 210Pb in sediment cores were determined byalpha and gamma spectrometry. The sediment
Fig. 1. Station locations for GYRE 91G2 (labeled as 2-followed by station numbers), GYRE 91G4 (labeled as 4-followed by station
numbers), GYRE 92G3 (labeled as 3-followed by station numbers) and GYRE 92G7 (labeled as 7-followed by station numbers).
M. Baskaran, P.H. Santschi / Continental Shelf Research 22 (2002) 1493–1510 1495
inventories of 210Pb were determined from inte-grating 210Pb profiles as given in Baskaran andNaidu (1995). A complete discussion of thecalibration procedures, standards used, blanks,and reproducibility of 210Pb concentration for thegamma counting method was previously given inBaskaran et al. (1993a).
2.1. Quality of 210Pb data
Precise determination as well as the quality of210Pb data is critical for the calculation of thescavenging residence times and removal rateconstants. All our data were obtained from directcounting of the ashes of prefilter (particulate) andMnO2-coated cartridges (dissolved). Thus, thedata quality critically depends on the extractionefficiency of the MnO2-coated cartridges used. Wehave shown already that the average extractionefficiency obtained using MnO2-coated extractorcartridges is higher for 210Pb than 234Th (Baskaranet al., 1993a). For many of the second MnO2-coated cartridges, the 210Pb concentration wasbelow detection limit. In those samples, a constantefficiency of 90% was assumed. In all the filters forwhich we had data for both F1 and F2; the actualdata were used to calculate the extraction effi-ciency as well as concentration of dissolved 210Pb.
The average extraction efficiency for 210Pb was95%. We estimate the error on the dissolved 210Pbconcentration due to the assumption of a constantefficiency of 95% is probably o10%. Betterextraction efficiency for 210Pb than for 234Th wasalso reported by Colley and Thomson (1994) whohad adopted a very similar procedure like ours.
Replication of samples is another way ofinsuring data quality. As shown in Table 3, the40m samples from Station 5 (92G3) replicatedwithin the 2-sigma counting errors of the measure-ments.
2.2. Modeling
The residence time of total 210Pb in the watercolumn can be calculated based on a box-modelapproach. The major inputs to the box are: (i)atmospheric fallout (IoA) and (ii) the productionfrom its grandparent, 226Ra (lPbARa). The majoroutputs from the box are: (i) decay of 210Pb(lPbAT
Pb) and (ii) its removal by scavenging(c0
cATPb). In this simple approach, additional
sources/sinks (such as the advection, diffusion,etc.) have been assumed to be negligible. Support-ing evidence for this assumption comes from themeasured sediment inventory of 210Pb in severalsediment cores. The measured inventory in major
Table 1
Sample locations, surface salinity, temperature, and maximum depth
Station number Date of collection Latitude Longitude Water depth
(m)
Salinity (%) Sigma–theta (sy)
91G2-6 2 March 1991 27156.160 93152.050 93 36.242 25.59
91G2-40 7 March 1991 27100.50 94159.30 1001 36.122 25.25
91G2-48 9 March 1991 27142.50 94158.170 138 36.198 25.54
91G4-6 15 June 1991 27126.910 94159.330 993 32.186 19.95
91G4-7 17 June 1991 27145.830 95100.50 377 33.479 21.00
91G4-8 18 June 1991 27149.80 95100.00 201 33.536 21.05
92G3-3 18 March 1992 28112.70 95100.20 44 34.672 24.85
92G3-5 17 March 1992 26141.20 94159.40 1505 35.406 24.87
92G3-6 19 March 1992 27137.10 95100.10 400 36.128 25.49
92G3-7 20 March 1992 27150.00 94159.80 199 35.726 25.29
92G7-2 21 June 1992 28124.80 94159.80 38 31.735 19.62
92G7-3 21 June 1992 28112.50 94159.90 43 32.221 19.98
92G7-5 22 June 1992 26139.90 94159.80 1004 35.966 22.75
92G7-6 25 June 1992 27143.80 95100.10 395 35.510 22.08
M. Baskaran, P.H. Santschi / Continental Shelf Research 22 (2002) 1493–15101496
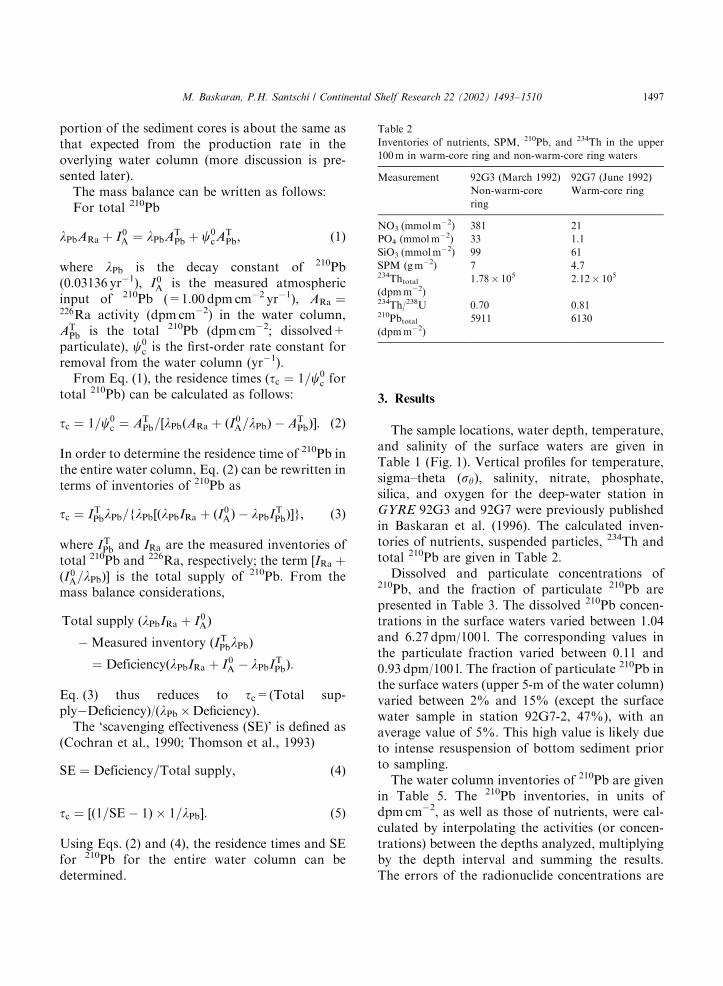
portion of the sediment cores is about the same asthat expected from the production rate in theoverlying water column (more discussion is pre-sented later).
The mass balance can be written as follows:For total 210Pb
lPbARa þ I0A ¼ lPbATPb þ c0
cATPb; ð1Þ
where lPb is the decay constant of 210Pb(0.03136 yr�1), I0A is the measured atmosphericinput of 210Pb (=1.00 dpm cm�2 yr�1), ARa ¼226Ra activity (dpm cm�2) in the water column,AT
Pb is the total 210Pb (dpm cm�2; dissolved+particulate), c0
c is the first-order rate constant forremoval from the water column (yr�1).
From Eq. (1), the residence times (tc ¼ 1=c0c for
total 210Pb) can be calculated as follows:
tc ¼ 1=c0c ¼ AT
Pb=½lPbðARa þ ðI0A=lPbÞ � ATPbÞ�: ð2Þ
In order to determine the residence time of 210Pb inthe entire water column, Eq. (2) can be rewritten interms of inventories of 210Pb as
tc ¼ ITPblPb=flPb½ðlPbIRa þ ðI0AÞ � lPbITPbÞ�g; ð3Þ
where ITPb and IRa are the measured inventories oftotal 210Pb and 226Ra, respectively; the term ½IRa þðI0A=lPbÞ� is the total supply of 210Pb. From themass balance considerations,
Total supply ðlPbIRa þ I0AÞ
�Measured inventory ðITPblPbÞ
¼ DeficiencyðlPbIRa þ I0A � lPbITPbÞ:
Eq. (3) thus reduces to tc=(Total sup-ply�Deficiency)/(lPb �Deficiency).
The ‘scavenging effectiveness (SE)’ is defined as(Cochran et al., 1990; Thomson et al., 1993)
SE ¼ Deficiency=Total supply; ð4Þ
tc ¼ ½ð1=SE� 1Þ � 1=lPb�: ð5Þ
Using Eqs. (2) and (4), the residence times and SEfor 210Pb for the entire water column can bedetermined.
3. Results
The sample locations, water depth, temperature,and salinity of the surface waters are given inTable 1 (Fig. 1). Vertical profiles for temperature,sigma–theta (sy), salinity, nitrate, phosphate,silica, and oxygen for the deep-water station inGYRE 92G3 and 92G7 were previously publishedin Baskaran et al. (1996). The calculated inven-tories of nutrients, suspended particles, 234Th andtotal 210Pb are given in Table 2.
Dissolved and particulate concentrations of210Pb, and the fraction of particulate 210Pb arepresented in Table 3. The dissolved 210Pb concen-trations in the surface waters varied between 1.04and 6.27 dpm/100 l. The corresponding values inthe particulate fraction varied between 0.11 and0.93 dpm/100 l. The fraction of particulate 210Pb inthe surface waters (upper 5-m of the water column)varied between 2% and 15% (except the surfacewater sample in station 92G7-2, 47%), with anaverage value of 5%. This high value is likely dueto intense resuspension of bottom sediment priorto sampling.
The water column inventories of 210Pb are givenin Table 5. The 210Pb inventories, in units ofdpm cm�2, as well as those of nutrients, were cal-culated by interpolating the activities (or concen-trations) between the depths analyzed, multiplyingby the depth interval and summing the results.The errors of the radionuclide concentrations are
Table 2
Inventories of nutrients, SPM, 210Pb, and 234Th in the upper
100m in warm-core ring and non-warm-core ring waters
Measurement 92G3 (March 1992) 92G7 (June 1992)
Non-warm-core
ring
Warm-core ring
NO3 (mmolm�2) 381 21
PO4 (mmolm�2) 33 1.1
SiO3 (mmolm�2) 99 61
SPM (gm�2) 7 4.7234Thtotal(dpmm�2)
1.78� 105 2.12� 105
234Th/238U 0.70 0.81210Pbtotal(dpmm�2)
5911 6130
M. Baskaran, P.H. Santschi / Continental Shelf Research 22 (2002) 1493–1510 1497
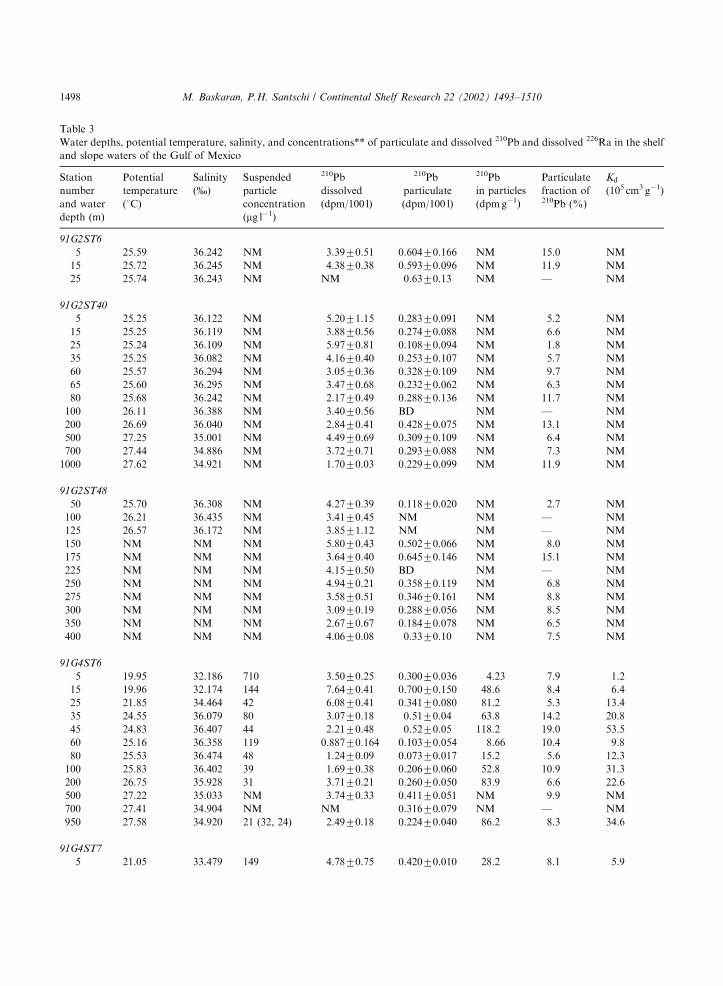
Table 3
Water depths, potential temperature, salinity, and concentrations** of particulate and dissolved 210Pb and dissolved 226Ra in the shelf
and slope waters of the Gulf of Mexico
Station
number
and water
depth (m)
Potential
temperature
(1C)
Salinity
(%)
Suspended
particle
concentration
(mg l�1)
210Pb
dissolved
(dpm/100 l)
210Pb
particulate
(dpm/100 l)
210Pb
in particles
(dpmg�1)
Particulate
fraction of210Pb (%)
Kd
(105 cm3 g�1)
91G2ST6
5 25.59 36.242 NM 3.3970.51 0.60470.166 NM 15.0 NM
15 25.72 36.245 NM 4.3870.38 0.59370.096 NM 11.9 NM
25 25.74 36.243 NM NM 0.6370.13 NM — NM
91G2ST40
5 25.25 36.122 NM 5.2071.15 0.28370.091 NM 5.2 NM
15 25.25 36.119 NM 3.8870.56 0.27470.088 NM 6.6 NM
25 25.24 36.109 NM 5.9770.81 0.10870.094 NM 1.8 NM
35 25.25 36.082 NM 4.1670.40 0.25370.107 NM 5.7 NM
60 25.57 36.294 NM 3.0570.36 0.32870.109 NM 9.7 NM
65 25.60 36.295 NM 3.4770.68 0.23270.062 NM 6.3 NM
80 25.68 36.242 NM 2.1770.49 0.28870.136 NM 11.7 NM
100 26.11 36.388 NM 3.4070.56 BD NM — NM
200 26.69 36.040 NM 2.8470.41 0.42870.075 NM 13.1 NM
500 27.25 35.001 NM 4.4970.69 0.30970.109 NM 6.4 NM
700 27.44 34.886 NM 3.7270.71 0.29370.088 NM 7.3 NM
1000 27.62 34.921 NM 1.7070.03 0.22970.099 NM 11.9 NM
91G2ST48
50 25.70 36.308 NM 4.2770.39 0.11870.020 NM 2.7 NM
100 26.21 36.435 NM 3.4170.45 NM NM — NM
125 26.57 36.172 NM 3.8571.12 NM NM — NM
150 NM NM NM 5.8070.43 0.50270.066 NM 8.0 NM
175 NM NM NM 3.6470.40 0.64570.146 NM 15.1 NM
225 NM NM NM 4.1570.50 BD NM — NM
250 NM NM NM 4.9470.21 0.35870.119 NM 6.8 NM
275 NM NM NM 3.5870.51 0.34670.161 NM 8.8 NM
300 NM NM NM 3.0970.19 0.28870.056 NM 8.5 NM
350 NM NM NM 2.6770.67 0.18470.078 NM 6.5 NM
400 NM NM NM 4.0670.08 0.3370.10 NM 7.5 NM
91G4ST6
5 19.95 32.186 710 3.5070.25 0.30070.036 4.23 7.9 1.2
15 19.96 32.174 144 7.6470.41 0.70070.150 48.6 8.4 6.4
25 21.85 34.464 42 6.0870.41 0.34170.080 81.2 5.3 13.4
35 24.55 36.079 80 3.0770.18 0.5170.04 63.8 14.2 20.8
45 24.83 36.407 44 2.2170.48 0.5270.05 118.2 19.0 53.5
60 25.16 36.358 119 0.88770.164 0.10370.054 8.66 10.4 9.8
80 25.53 36.474 48 1.2470.09 0.07370.017 15.2 5.6 12.3
100 25.83 36.402 39 1.6970.38 0.20670.060 52.8 10.9 31.3
200 26.75 35.928 31 3.7170.21 0.26070.050 83.9 6.6 22.6
500 27.22 35.033 NM 3.7470.33 0.41170.051 NM 9.9 NM
700 27.41 34.904 NM NM 0.31670.079 NM — NM
950 27.58 34.920 21 (32, 24) 2.4970.18 0.22470.040 86.2 8.3 34.6
91G4ST7
5 21.05 33.479 149 4.7870.75 0.42070.010 28.2 8.1 5.9
M. Baskaran, P.H. Santschi / Continental Shelf Research 22 (2002) 1493–15101498
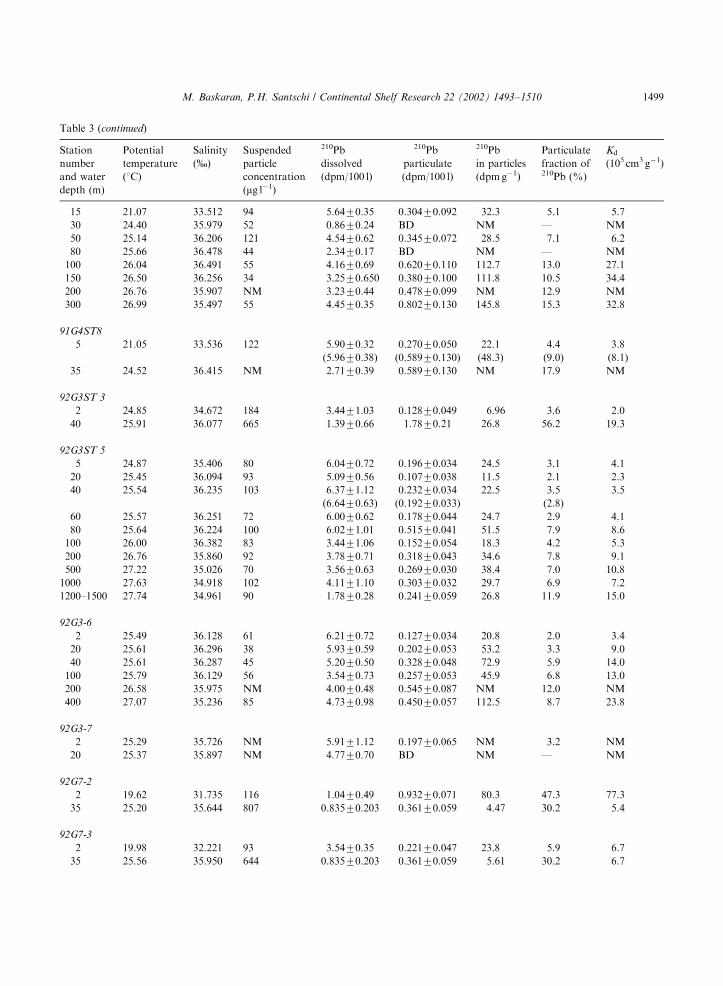
Table 3 (continued)
Station
number
and water
depth (m)
Potential
temperature
(1C)
Salinity
(%)
Suspended
particle
concentration
(mg l�1)
210Pb
dissolved
(dpm/100 l)
210Pb
particulate
(dpm/100 l)
210Pb
in particles
(dpmg�1)
Particulate
fraction of210Pb (%)
Kd
(105 cm3 g�1)
15 21.07 33.512 94 5.6470.35 0.30470.092 32.3 5.1 5.7
30 24.40 35.979 52 0.8670.24 BD NM — NM
50 25.14 36.206 121 4.5470.62 0.34570.072 28.5 7.1 6.2
80 25.66 36.478 44 2.3470.17 BD NM — NM
100 26.04 36.491 55 4.1670.69 0.62070.110 112.7 13.0 27.1
150 26.50 36.256 34 3.2570.650 0.38070.100 111.8 10.5 34.4
200 26.76 35.907 NM 3.2370.44 0.47870.099 NM 12.9 NM
300 26.99 35.497 55 4.4570.35 0.80270.130 145.8 15.3 32.8
91G4ST8
5 21.05 33.536 122 5.9070.32 0.27070.050 22.1 4.4 3.8
(5.9670.38) (0.58970.130) (48.3) (9.0) (8.1)
35 24.52 36.415 NM 2.7170.39 0.58970.130 NM 17.9 NM
92G3ST 3
2 24.85 34.672 184 3.4471.03 0.12870.049 6.96 3.6 2.0
40 25.91 36.077 665 1.3970.66 1.7870.21 26.8 56.2 19.3
92G3ST 5
5 24.87 35.406 80 6.0470.72 0.19670.034 24.5 3.1 4.1
20 25.45 36.094 93 5.0970.56 0.10770.038 11.5 2.1 2.3
40 25.54 36.235 103 6.3771.12 0.23270.034 22.5 3.5 3.5
(6.6470.63) (0.19270.033) (2.8)
60 25.57 36.251 72 6.0070.62 0.17870.044 24.7 2.9 4.1
80 25.64 36.224 100 6.0271.01 0.51570.041 51.5 7.9 8.6
100 26.00 36.382 83 3.4471.06 0.15270.054 18.3 4.2 5.3
200 26.76 35.860 92 3.7870.71 0.31870.043 34.6 7.8 9.1
500 27.22 35.026 70 3.5670.63 0.26970.030 38.4 7.0 10.8
1000 27.63 34.918 102 4.1171.10 0.30370.032 29.7 6.9 7.2
1200–1500 27.74 34.961 90 1.7870.28 0.24170.059 26.8 11.9 15.0
92G3-6
2 25.49 36.128 61 6.2170.72 0.12770.034 20.8 2.0 3.4
20 25.61 36.296 38 5.9370.59 0.20270.053 53.2 3.3 9.0
40 25.61 36.287 45 5.2070.50 0.32870.048 72.9 5.9 14.0
100 25.79 36.129 56 3.5470.73 0.25770.053 45.9 6.8 13.0
200 26.58 35.975 NM 4.0070.48 0.54570.087 NM 12.0 NM
400 27.07 35.236 85 4.7370.98 0.45070.057 112.5 8.7 23.8
92G3-7
2 25.29 35.726 NM 5.9171.12 0.19770.065 NM 3.2 NM
20 25.37 35.897 NM 4.7770.70 BD NM — NM
92G7-2
2 19.62 31.735 116 1.0470.49 0.93270.071 80.3 47.3 77.3
35 25.20 35.644 807 0.83570.203 0.36170.059 4.47 30.2 5.4
92G7-3
2 19.98 32.221 93 3.5470.35 0.22170.047 23.8 5.9 6.7
35 25.56 35.950 644 0.83570.203 0.36170.059 5.61 30.2 6.7
M. Baskaran, P.H. Santschi / Continental Shelf Research 22 (2002) 1493–1510 1499
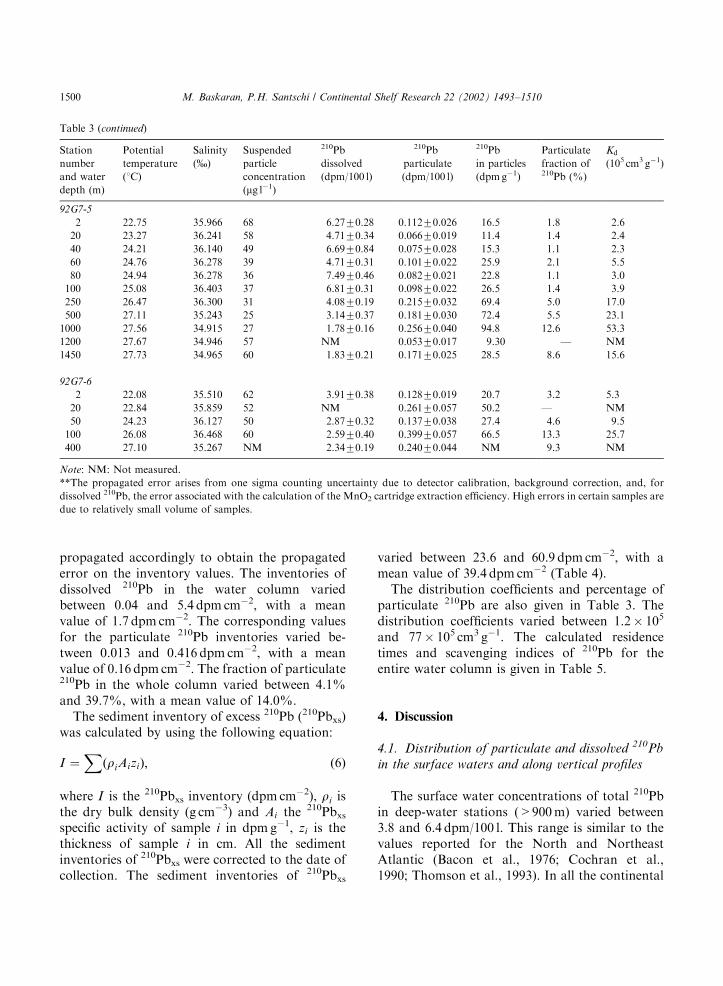
propagated accordingly to obtain the propagatederror on the inventory values. The inventories ofdissolved 210Pb in the water column variedbetween 0.04 and 5.4 dpm cm�2, with a meanvalue of 1.7 dpm cm�2. The corresponding valuesfor the particulate 210Pb inventories varied be-tween 0.013 and 0.416 dpm cm�2, with a meanvalue of 0.16 dpm cm�2. The fraction of particulate210Pb in the whole column varied between 4.1%and 39.7%, with a mean value of 14.0%.
The sediment inventory of excess 210Pb (210Pbxs)was calculated by using the following equation:
I ¼X
ðriAiziÞ; ð6Þ
where I is the 210Pbxs inventory (dpm cm�2), ri isthe dry bulk density (g cm�3) and Ai the 210Pbxsspecific activity of sample i in dpmg�1, zi is thethickness of sample i in cm. All the sedimentinventories of 210Pbxs were corrected to the date ofcollection. The sediment inventories of 210Pbxs
varied between 23.6 and 60.9 dpm cm�2, with amean value of 39.4 dpm cm�2 (Table 4).
The distribution coefficients and percentage ofparticulate 210Pb are also given in Table 3. Thedistribution coefficients varied between 1.2� 105
and 77� 105 cm3 g�1. The calculated residencetimes and scavenging indices of 210Pb for theentire water column is given in Table 5.
4. Discussion
4.1. Distribution of particulate and dissolved 210Pb
in the surface waters and along vertical profiles
The surface water concentrations of total 210Pbin deep-water stations (>900m) varied between3.8 and 6.4 dpm/100 l. This range is similar to thevalues reported for the North and NortheastAtlantic (Bacon et al., 1976; Cochran et al.,1990; Thomson et al., 1993). In all the continental
Table 3 (continued)
Station
number
and water
depth (m)
Potential
temperature
(1C)
Salinity
(%)
Suspended
particle
concentration
(mg l�1)
210Pb
dissolved
(dpm/100 l)
210Pb
particulate
(dpm/100 l)
210Pb
in particles
(dpmg�1)
Particulate
fraction of210Pb (%)
Kd
(105 cm3 g�1)
92G7-5
2 22.75 35.966 68 6.2770.28 0.11270.026 16.5 1.8 2.6
20 23.27 36.241 58 4.7170.34 0.06670.019 11.4 1.4 2.4
40 24.21 36.140 49 6.6970.84 0.07570.028 15.3 1.1 2.3
60 24.76 36.278 39 4.7170.31 0.10170.022 25.9 2.1 5.5
80 24.94 36.278 36 7.4970.46 0.08270.021 22.8 1.1 3.0
100 25.08 36.403 37 6.8170.31 0.09870.022 26.5 1.4 3.9
250 26.47 36.300 31 4.0870.19 0.21570.032 69.4 5.0 17.0
500 27.11 35.243 25 3.1470.37 0.18170.030 72.4 5.5 23.1
1000 27.56 34.915 27 1.7870.16 0.25670.040 94.8 12.6 53.3
1200 27.67 34.946 57 NM 0.05370.017 9.30 — NM
1450 27.73 34.965 60 1.8370.21 0.17170.025 28.5 8.6 15.6
92G7-6
2 22.08 35.510 62 3.9170.38 0.12870.019 20.7 3.2 5.3
20 22.84 35.859 52 NM 0.26170.057 50.2 — NM
50 24.23 36.127 50 2.8770.32 0.13770.038 27.4 4.6 9.5
100 26.08 36.468 60 2.5970.40 0.39970.057 66.5 13.3 25.7
400 27.10 35.267 NM 2.3470.19 0.24070.044 NM 9.3 NM
Note: NM: Not measured.
**The propagated error arises from one sigma counting uncertainty due to detector calibration, background correction, and, for
dissolved 210Pb, the error associated with the calculation of the MnO2 cartridge extraction efficiency. High errors in certain samples are
due to relatively small volume of samples.
M. Baskaran, P.H. Santschi / Continental Shelf Research 22 (2002) 1493–15101500
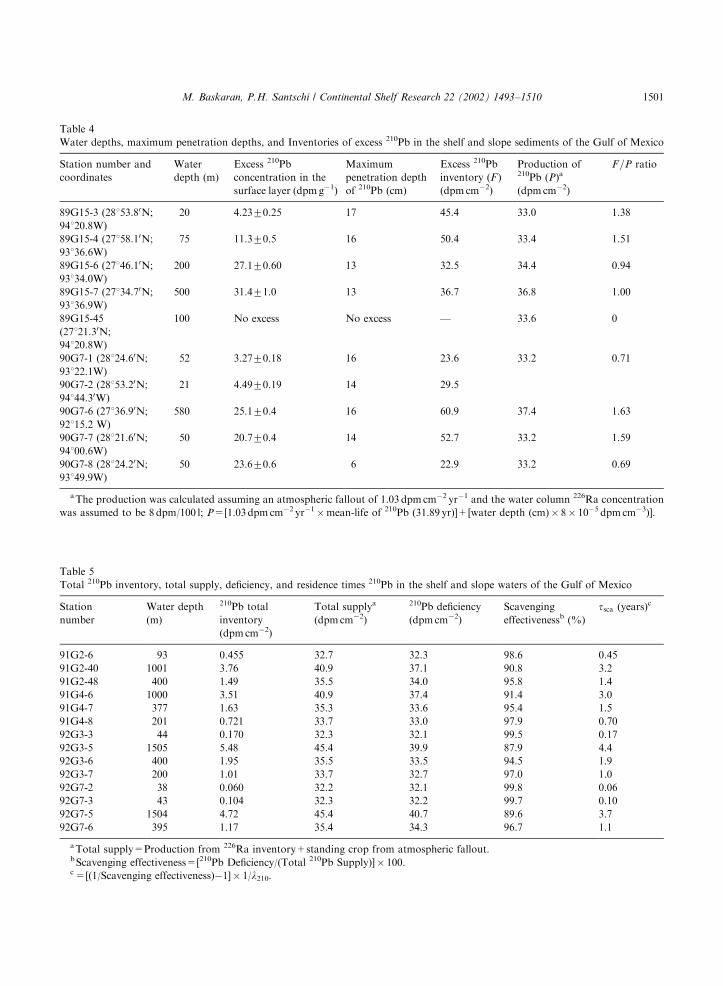
Table 4
Water depths, maximum penetration depths, and Inventories of excess 210Pb in the shelf and slope sediments of the Gulf of Mexico
Station number and
coordinates
Water
depth (m)
Excess 210Pb
concentration in the
surface layer (dpmg�1)
Maximum
penetration depth
of 210Pb (cm)
Excess 210Pb
inventory (F )
(dpmcm�2)
Production of210Pb (P)a
(dpmcm�2)
F=P ratio
89G15-3 (28153.80N;
94120.8W)
20 4.2370.25 17 45.4 33.0 1.38
89G15-4 (27158.10N;
93136.6W)
75 11.370.5 16 50.4 33.4 1.51
89G15-6 (27146.10N;
93134.0W)
200 27.170.60 13 32.5 34.4 0.94
89G15-7 (27134.70N;
93136.9W)
500 31.471.0 13 36.7 36.8 1.00
89G15-45
(27121.30N;
94120.8W)
100 No excess No excess — 33.6 0
90G7-1 (28124.60N;
93122.1W)
52 3.2770.18 16 23.6 33.2 0.71
90G7-2 (28153.20N;
94144.30W)
21 4.4970.19 14 29.5
90G7-6 (27136.90N;
92115.2 W)
580 25.170.4 16 60.9 37.4 1.63
90G7-7 (28121.60N;
94100.6W)
50 20.770.4 14 52.7 33.2 1.59
90G7-8 (28124.20N;
93149.9W)
50 23.670.6 6 22.9 33.2 0.69
aThe production was calculated assuming an atmospheric fallout of 1.03 dpmcm�2 yr�1 and the water column 226Ra concentration
was assumed to be 8 dpm/100 l; P=[1.03dpmcm�2 yr�1�mean-life of 210Pb (31.89 yr)]+[water depth (cm)� 8� 10�5 dpmcm�3)].
Table 5
Total 210Pb inventory, total supply, deficiency, and residence times 210Pb in the shelf and slope waters of the Gulf of Mexico
Station
number
Water depth
(m)
210Pb total
inventory
(dpmcm�2)
Total supplya
(dpmcm�2)
210Pb deficiency
(dpmcm�2)
Scavenging
effectivenessb (%)
tsca (years)c
91G2-6 93 0.455 32.7 32.3 98.6 0.45
91G2-40 1001 3.76 40.9 37.1 90.8 3.2
91G2-48 400 1.49 35.5 34.0 95.8 1.4
91G4-6 1000 3.51 40.9 37.4 91.4 3.0
91G4-7 377 1.63 35.3 33.6 95.4 1.5
91G4-8 201 0.721 33.7 33.0 97.9 0.70
92G3-3 44 0.170 32.3 32.1 99.5 0.17
92G3-5 1505 5.48 45.4 39.9 87.9 4.4
92G3-6 400 1.95 35.5 33.5 94.5 1.9
92G3-7 200 1.01 33.7 32.7 97.0 1.0
92G7-2 38 0.060 32.2 32.1 99.8 0.06
92G7-3 43 0.104 32.3 32.2 99.7 0.10
92G7-5 1504 4.72 45.4 40.7 89.6 3.7
92G7-6 395 1.17 35.4 34.3 96.7 1.1
aTotal supply=Production from 226Ra inventory+standing crop from atmospheric fallout.bScavenging effectiveness=[210Pb Deficiency/(Total 210Pb Supply)]� 100.c=[(1/Scavenging effectiveness)�1]� 1/l210.
M. Baskaran, P.H. Santschi / Continental Shelf Research 22 (2002) 1493–1510 1501
shelf and upper slope stations (o400m waterdepth), except 91G2-6, the highest concentrationsof 210Pb (dissolved as well as the total) were insurface waters. In deep-water stations of the lowerslope, this picture began to change. In lower slopestations (>900m), the highest concentration wasobserved in subsurface waters. This subsurfacemaximum is likely related to ocean marginexchange processes that operate in the removalof particle-reactive nuclides such as those of Pb. Ageneral increase of dissolved 210Pb concentrationwith depth was observed in the Middle AtlanticBight shelf/slope waters (Bacon et al., 1994). Inmost of the deep-water stations where 210Pbproduction from 226Ra exceeds the atmosphericsupply (assuming 8 dpm/100 l as an averagevalue for the entire water column, although226Ra concentrations vary with depth in thewater column, and atmospheric fallout of1 dpm cm�2 yr�1, the production rate of 210Pb ina 4000m water column is equal to that fromatmospheric fallout), subsurface maxima of 210Pbhave been reported. Examples include the WesternIndian Ocean: Chung (1987); Chung and Finkel(1988); Pacific: Chung and Craig (1983); andNorth Pacific: Nozaki et al. (1980). Due to theatmospheric supply of 210Pb, it is anticipated thatthe surface water will contain the highest concen-trations of 210Pb. However, in coastal andcontinental margin waters where efficient scaven-ging of Pb can take place due to relatively highprimary productivity and particle fluxes, subsur-face maxima of 210Pb concentrations could be dueto lateral advection of water masses in the shelf–slope break. Subsurface maxima of 210Pb concen-tration (similar to 234Th/238U ratios >1 beloweuphotic zone) also could occur due to reminer-alization of particles below the euphotic zone.Such subsurface 210Pb maxima can also be seen insome of the published profiles (Bacon et al., 1994)in continental shelf and slope waters of the MiddleAtlantic Bight.
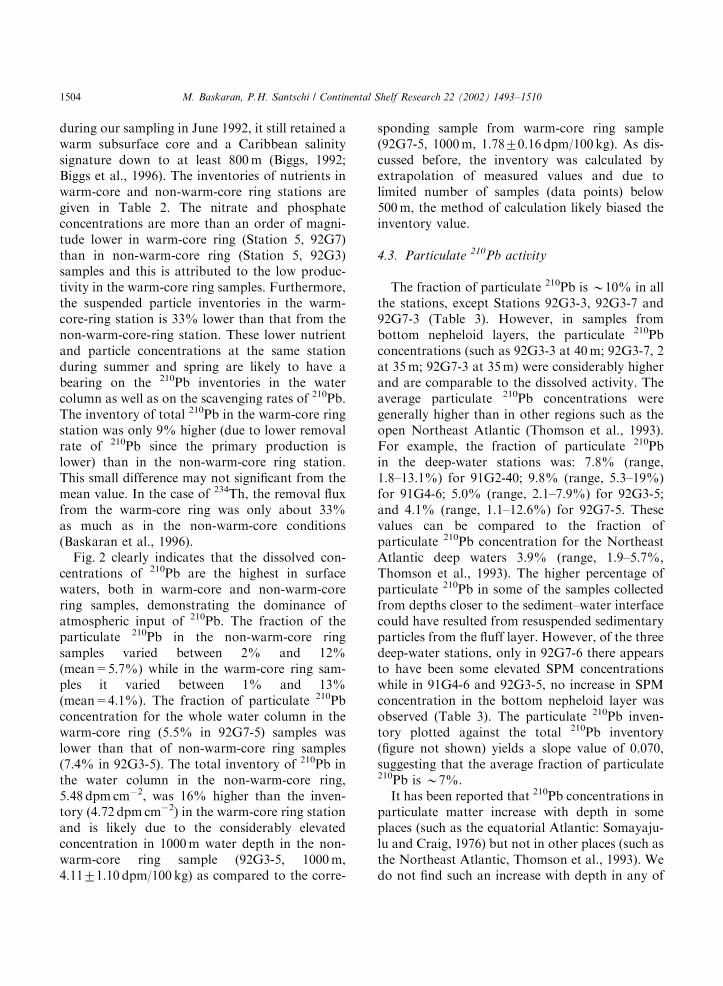
The vertical profiles of dissolved and particulate210Pb concentrations are shown in Fig. 2. In thedeep-water stations (>900m), there is a consider-able decrease in the dissolved as well as total 210Pbconcentrations at the bottom of the euphotic zone.This is likely due to active scavenging in the
overlying waters by biological processes. In twostations, there is some increase in the 210Pbconcentrations below the euphotic zone (around250–500m) and then the concentrations decreaseagain with depth (Fig. 2, 91G2-40, 91G4-6).Bacon et al. (1988) observed broad maxima at1000–1500m depths with a gradual decrease inconcentration toward the bottom in the continen-tal shelf and slope south of New England,suggesting somewhat intensified scavenging to-wards the sediment–water interface. Similar ob-servations have been reported for other regions(Nozaki et al., 1980; Cochran et al., 1983, 1990).Comparisons of dissolved and total profiles inStation 5 during two successive seasons (Spring1992, 92G3-5 and Summer 1992, 92G7-5) indicatethat the profiles are different. In samples from anon-warm-core station (92G3-5), the 210Pb profilesbelow 250m remained relatively constant while inthe warm-core ring station (92G7-5), there was acontinuous decrease in the dissolved as well astotal 210Pb concentration with depth. It has beenshown that scavenging rates of another particle-reactive nuclide, 234Th, were considerably lower ina warm-core ring than that in non-warm-core ringsamples (Table 3, Baskaran et al., 1996). Further-more, the concentrations and inventories ofparticles were significantly lower as well in thewarm-core ring than in the non-warm-core ringsamples (Table 3, Baskaran et al., 1996). Thevariations in the particulate 210Pb activity and thedifferences in the 210Pb inventories in the warm-core and non-warm-ring stations are discussedbelow.
4.2. Comparison of the distribution of 210Pb in
warm-core ring and non-warm-core ring samples
In the Gulf of Mexico, warm-core rings with lowconcentrations of nutrients, particles, and tem-perature and salinity signatures similar to those ofCaribbean waters, are frequently observed (e.g.,Biggs, 1992). The typical life span of warm-corerings is E1 year (Vukovich and Crissman, 1986).In the summer cruise (92G7), we had a station(Station 5) located inside the northern periphery ofthe elongate warm core Eddy Triton (Biggs, 1992).The Eddy Triton formed in August 1991 and
M. Baskaran, P.H. Santschi / Continental Shelf Research 22 (2002) 1493–15101502
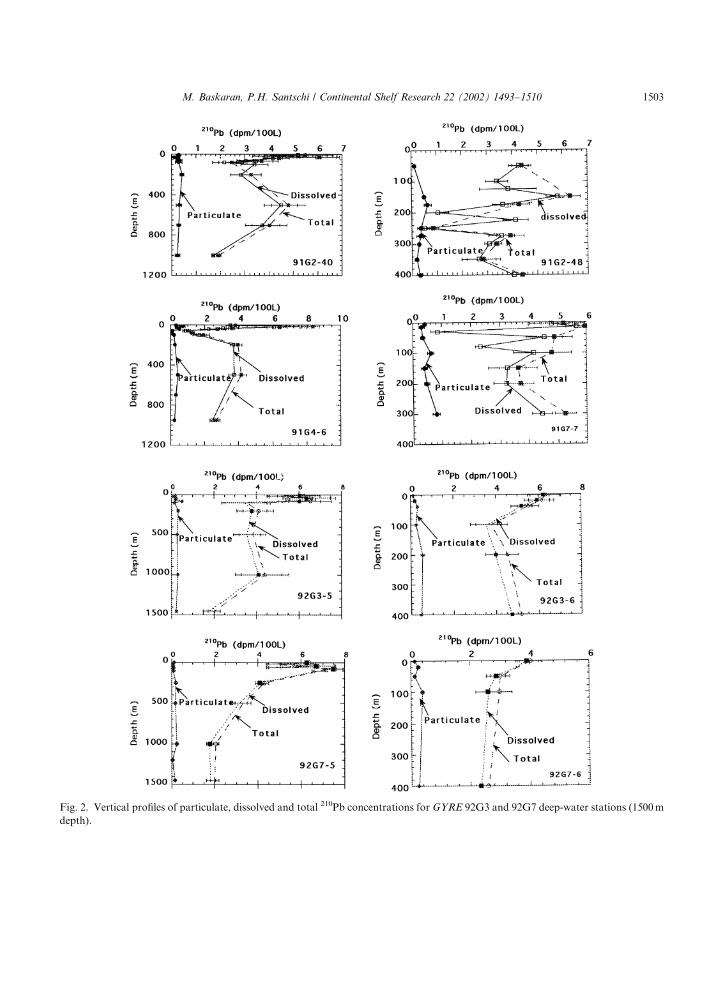
Fig. 2. Vertical profiles of particulate, dissolved and total 210Pb concentrations for GYRE 92G3 and 92G7 deep-water stations (1500m
depth).
M. Baskaran, P.H. Santschi / Continental Shelf Research 22 (2002) 1493–1510 1503
during our sampling in June 1992, it still retained awarm subsurface core and a Caribbean salinitysignature down to at least 800m (Biggs, 1992;Biggs et al., 1996). The inventories of nutrients inwarm-core and non-warm-core ring stations aregiven in Table 2. The nitrate and phosphateconcentrations are more than an order of magni-tude lower in warm-core ring (Station 5, 92G7)than in non-warm-core ring (Station 5, 92G3)samples and this is attributed to the low produc-tivity in the warm-core ring samples. Furthermore,the suspended particle inventories in the warm-core-ring station is 33% lower than that from thenon-warm-core-ring station. These lower nutrientand particle concentrations at the same stationduring summer and spring are likely to have abearing on the 210Pb inventories in the watercolumn as well as on the scavenging rates of 210Pb.The inventory of total 210Pb in the warm-core ringstation was only 9% higher (due to lower removalrate of 210Pb since the primary production islower) than in the non-warm-core ring station.This small difference may not significant from themean value. In the case of 234Th, the removal fluxfrom the warm-core ring was only about 33%as much as in the non-warm-core conditions(Baskaran et al., 1996).
Fig. 2 clearly indicates that the dissolved con-centrations of 210Pb are the highest in surfacewaters, both in warm-core and non-warm-corering samples, demonstrating the dominance ofatmospheric input of 210Pb. The fraction of theparticulate 210Pb in the non-warm-core ringsamples varied between 2% and 12%(mean=5.7%) while in the warm-core ring sam-ples it varied between 1% and 13%(mean=4.1%). The fraction of particulate 210Pbconcentration for the whole water column in thewarm-core ring (5.5% in 92G7-5) samples waslower than that of non-warm-core ring samples(7.4% in 92G3-5). The total inventory of 210Pb inthe water column in the non-warm-core ring,5.48 dpm cm�2, was 16% higher than the inven-tory (4.72 dpm cm�2) in the warm-core ring stationand is likely due to the considerably elevatedconcentration in 1000m water depth in the non-warm-core ring sample (92G3-5, 1000m,4.1171.10 dpm/100 kg) as compared to the corre-
sponding sample from warm-core ring sample(92G7-5, 1000m, 1.7870.16 dpm/100 kg). As dis-cussed before, the inventory was calculated byextrapolation of measured values and due tolimited number of samples (data points) below500m, the method of calculation likely biased theinventory value.
4.3. Particulate 210Pb activity
The fraction of particulate 210Pb is B10% in allthe stations, except Stations 92G3-3, 92G3-7 and92G7-3 (Table 3). However, in samples frombottom nepheloid layers, the particulate 210Pbconcentrations (such as 92G3-3 at 40m; 92G3-7, 2at 35m; 92G7-3 at 35m) were considerably higherand are comparable to the dissolved activity. Theaverage particulate 210Pb concentrations weregenerally higher than in other regions such as theopen Northeast Atlantic (Thomson et al., 1993).For example, the fraction of particulate 210Pbin the deep-water stations was: 7.8% (range,1.8–13.1%) for 91G2-40; 9.8% (range, 5.3–19%)for 91G4-6; 5.0% (range, 2.1–7.9%) for 92G3-5;and 4.1% (range, 1.1–12.6%) for 92G7-5. Thesevalues can be compared to the fraction ofparticulate 210Pb concentration for the NortheastAtlantic deep waters 3.9% (range, 1.9–5.7%,Thomson et al., 1993). The higher percentage ofparticulate 210Pb in some of the samples collectedfrom depths closer to the sediment–water interfacecould have resulted from resuspended sedimentaryparticles from the fluff layer. However, of the threedeep-water stations, only in 92G7-6 there appearsto have been some elevated SPM concentrationswhile in 91G4-6 and 92G3-5, no increase in SPMconcentration in the bottom nepheloid layer wasobserved (Table 3). The particulate 210Pb inven-tory plotted against the total 210Pb inventory(figure not shown) yields a slope value of 0.070,suggesting that the average fraction of particulate210Pb is B7%.
It has been reported that 210Pb concentrations inparticulate matter increase with depth in someplaces (such as the equatorial Atlantic: Somayaju-lu and Craig, 1976) but not in other places (such asthe Northeast Atlantic, Thomson et al., 1993). Wedo not find such an increase with depth in any of
M. Baskaran, P.H. Santschi / Continental Shelf Research 22 (2002) 1493–15101504
our deep-water stations. In areas where theparticulate 210Pb concentration is not affected bylateral processes, the increase in particulate 210Pbconcentration with depth is attributed to in situadsorption processes (Spencer et al., 1980). Eventhough there is no continuous increase of 210Pbconcentration with depth (as was observed for230Th (Guo et al., 1995), the maximum concentra-tion has been observed between 1000 and 4000mdepths (station depths >4600m) in the westernIndian (Chung, 1987; Chung and Finkel, 1988)and Pacific Ocean (Chung and Craig, 1983). Thespecific activity on particles is given in Table 2.The specific activity (dpmg�1) of 210Pb in thesuspended particulate matter varied between 4.2and 146 dpmg�1. This range of values can becompared to the reported values for the SouthAtlantic, 200–500 dpmg�1 (Somayajulu andCraig, 1976) and the MAB, 70 dpmg�1 (Santschiet al., 1999). When these suspended particlessettle and reach the sediment–water interface, wewould expect to find such high-concentrationvalues on sedimentary particles, provided theupper few tens of microns layer could becollected. However, excess 210Pb concentrationsin the upper 1-cm section of sediment corescollected from the study area were lower, andvaried between 4.2 and 31.4 dpmg�1 (Table 4).Since the upper 1-cm could correspond toyears to decades of accumulation and benthicmixing could act to dilute the concentrationsof the recently deposited particles, excess 210Pbconcentration in the upper 1-cm sediment layertend to be lower than the specific activity ofparticulate 210Pb.
From the vertical profiles of specific activity ofparticulate 210Pb (dpmg�1 of suspended particles)for the two deep-water stations (figure not shown),one notices that particulate 210Pb concentrationswere relatively constant from 100 to 1450m(within two sigma error) in stations from the92G3 cruise. However, during 92G7, particulate210Pb activities decreased drastically with depthbelow 1000m. A similar distribution was observedfor 234Th at this site (Baskaran et al., 1996). Thiswas likely due to bottom nepheloid layer scaven-ging and lateral transport effects, as will bediscussed later.
4.4. Inventories of 210Pb in the water column
The water column inventories of dissolved andparticulate 210Pb were calculated by interpolatingthe concentrations between the depths analyzed,multiplying them by the depth interval andsumming the results. The fraction of particulate210Pb for the entire water column varied between4.1% and 39.7% with a mean value of 10.6% on12 stations (excluding two shallow water stationswhere the sampling was likely carried out in thebottom nepheloid layer and resuspended materialaccounted for 29.7 and 39.7% of the total 210Pb).
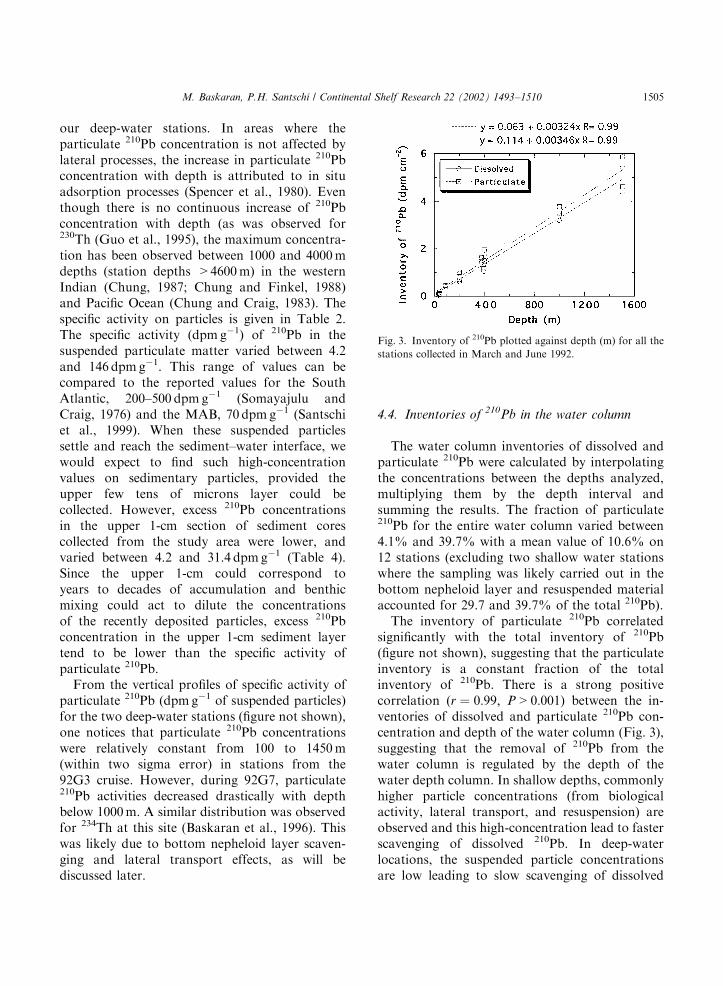
The inventory of particulate 210Pb correlatedsignificantly with the total inventory of 210Pb(figure not shown), suggesting that the particulateinventory is a constant fraction of the totalinventory of 210Pb. There is a strong positivecorrelation (r ¼ 0:99; P > 0:001) between the in-ventories of dissolved and particulate 210Pb con-centration and depth of the water column (Fig. 3),suggesting that the removal of 210Pb from thewater column is regulated by the depth of thewater depth column. In shallow depths, commonlyhigher particle concentrations (from biologicalactivity, lateral transport, and resuspension) areobserved and this high-concentration lead to fasterscavenging of dissolved 210Pb. In deep-waterlocations, the suspended particle concentrationsare low leading to slow scavenging of dissolved
Fig. 3. Inventory of 210Pb plotted against depth (m) for all the
stations collected in March and June 1992.
M. Baskaran, P.H. Santschi / Continental Shelf Research 22 (2002) 1493–1510 1505
210Pb. For water depths of o1000m, the primarysource of 210Pb is atmospheric while in deeperwaters (>3000m), 210Pb production from 226Racould be the dominant source.
4.5. Inventory of 210Pb in sediments
The deficiency of 210Pb in the overlying watercolumn is expected, at steady state, to be found inthe underlying sediments, if vertical scavenging isfast and the dominant mechanism. Even thoughthe sediment cores were collected at different timesand only in nearby places, one can test if theinventory of 210Pb in the sediments reflects thatexpected from the 210Pb in the overlying watercolumn. The sediment inventory of excess 210Pbvaried from 23 to 61 dpm cm�2 (Table 4). In onestation (89G15-45), there was no excess 210Pb(within the error limits of the method), and it istherefore likely that there was no net deposition ofrecent sediments (i.e., ‘relict sediments’) at thatsite. Relict sediments are common on mostcontinental shelves. It has been estimated that,on average, 70% of the continental shelf areas ofthe world ocean is covered with relict sediments(Emery, 1968). Even though there could beconsiderable variation in the inventory of 210Pbfrom site to site, the data reported in Table 5provide some idea on vertical vs lateral scavengingof 210Pb.
The difference (‘deficiency’) of 210Pb betweenthe measured water column inventory and totalinput in the water column, ranging between 32.1and 40.8 dpm cm�2 (Table 5), is in reasonableagreement with the measured sediment inventoriesof 210Pb in this area, 23–61 dpm cm�2 (Table 4).The ratio of measured inventory (F ) to theproduction (P={[1.03 dpm cm�2 yr�1�mean-lifeof 210Pb (31.89 yr)]+[water depth (cm)� 8�10�5 dpm cm�3]}) in the water column over themean-life of 210Pb varied between 0.69 and 1.63(Table 4). The calculation of Pu assumes that theatmospheric input is constant over a long period oftime (over 32 years). Thus, in selected sites in theshelf/slope regions of the Gulf of Mexico, up to63% of the 210Pb was derived from other places. Inthe first phase of studies in the Middle AtlanticBight (SEEP-I), based on the measurements of
dissolved 210Pb concentrations in the water col-umn (Bacon et al., 1988), inventories of 210Pb insediments (Buesseler et al., 1985/86; Andersonet al., 1988), and fluxes of 210Pb collected bysediment traps, it was observed that the measuredfluxes of 210Pb to slope sediments were approxi-mately in balance with its local rate of supply fromatmospheric deposition and decay of 226Ra in thewater column and very little was derived from theopen ocean (Biscaye et al., 1988). It is pertinent topoint out here that even though this F/P ratioexceeded 10 in some cases for 230Th in that area,this ratio never exceeded 1.5 for 210Pb. Asubsequent study on the southern Middle AtlanticBight (SEEP-II) showed that the flux of 210Pb toupper slope sediment greatly exceeded its localsupply by a factor 3–5, and this was attributed tolateral transport of 210Pb (Biscaye and Anderson,1994). Buesseler et al. (1985/86) also reported 2–3times larger excess 210Pb inventories in sedimentsthan can be sustained by the local rate of 210Pbsupply in the continental slope sediments of theNorthwest Atlantic Ocean. It is possible thateffects of lateral transport on the 210Pb inventoriesare likely to be local. We do not see any clear trendin this shelf/slope region of systematic import of210Pb from offshore waters such that the sedimentsof this areas have surpluses of 210Pb above thoseexpected from supply from the atmosphere and Radecay.
The sediment inventory of excess 210Pb can behighly variable even in a narrow region, as wasshown in the case of subcores from a box core inthe upper slope sediments of Middle Atlantic Bight(Biscaye and Anderson, 1994), due to hydrody-namic conditions prevailing at the sediment–waterinterface. Such variations in sediment inventory of210Pb will also result in variable F/P ratios.
There is only few other margin areas wherelateral transport of 210Pb had been identified basedon 210Pbxs measurements in bottom sediments andsediment trap material. Moore et al. (1981)reported that fluxes of 210Pb measured by sedimenttraps in the Santa Barbara Basin off southernCalifornia, are many times greater than theproduction rate of 210Pb plus atmospheric falloutin the basin water, which was attributed to theadvection of water through the basin that brought
M. Baskaran, P.H. Santschi / Continental Shelf Research 22 (2002) 1493–15101506
significant amounts of 210Pb enriched particleswhich subsequently got trapped in the basin.Carpenter et al. (1981) reported that the measured210Pb fluxes in the continental shelf of Washingtonare much higher than what can be explained basedon in situ production plus overhead atmosphericfallout of 210Pb. Baskaran and Naidu (1995)reported about an order of magnitude higher210Pb fluxes in sediment traps as compared to thelong-term sediment-derived fluxes in sedimentsfrom continental shelf regions of the East ChukchiSea, Alaskan Arctic. This observation was attrib-uted to the occasional resuspension of fineparticles in the continental shelf areas and theiradvective transport to sites other than where theywere initially deposited (Baskaran and Naidu,1995).
4.6. Residence time and scavenging effectiveness of210Pb
The measured inventory, calculated total sup-ply, deficiency, SE, and residence time of 210Pb forthe entire water column is given in Table 5. Thetotal supply of 210Pb was calculated from thefollowing equation:
Total supply ¼ Production from 226 Ra inventory
þ standing crop from atmospheric fallout
ðannual fallout�mean-life of 210 PbÞ:
There is no atmospheric fallout data for thesesampling stations. Since the 222Rn exhalation rate(210Pb is one of the progenies of 222Rn) is about2–3 orders of magnitude lower from the oceansurface than the continents, the ocean-derivedaerosols are highly depleted in 210Pb compared tothe continent-derived aerosols. However, the con-tinent-derived aerosols are scavenged from theatmospheric boundary layer relatively close to thecontinental margin, while in the open ocean, theaerosols are supplied from the mid-upper tropo-sphere to the marine boundary layer (Bacon et al.,1976; Turekian et al., 1977). Since all of oursampling stations are within the continentalmargins (shelf and slope regions), it is assumedthat most of the aerosols are continent-derived andwe have used the average atmospheric fallout
value (1.03 dpm cm�2 yr�1) measured over 3 years(1989–1991) at the nearest coastal station, Galves-ton, TX, by Baskaran et al. (1993b). The 226Raconcentrations in the water samples were takenfrom unpublished data (Baskaran and Santschi,unpublished data). Using these values, the totalsupply of 210Pb was calculated.
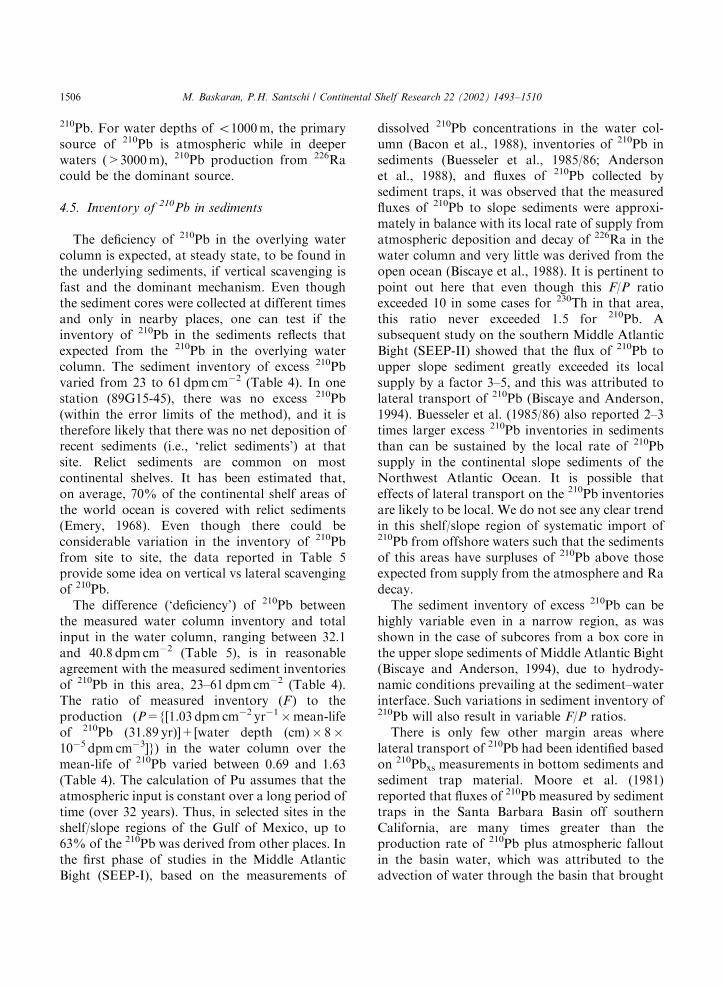
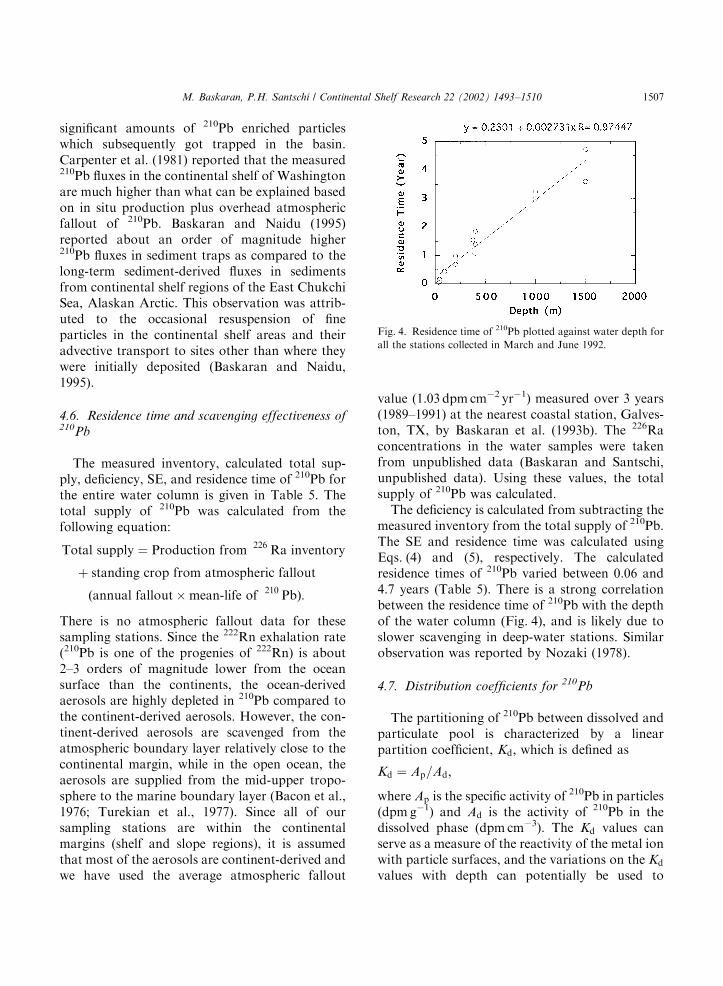
The deficiency is calculated from subtracting themeasured inventory from the total supply of 210Pb.The SE and residence time was calculated usingEqs. (4) and (5), respectively. The calculatedresidence times of 210Pb varied between 0.06 and4.7 years (Table 5). There is a strong correlationbetween the residence time of 210Pb with the depthof the water column (Fig. 4), and is likely due toslower scavenging in deep-water stations. Similarobservation was reported by Nozaki (1978).
4.7. Distribution coefficients for 210Pb
The partitioning of 210Pb between dissolved andparticulate pool is characterized by a linearpartition coefficient, Kd; which is defined as
Kd ¼ Ap=Ad;
where Ap is the specific activity of210Pb in particles
(dpm g�1) and Ad is the activity of 210Pb in thedissolved phase (dpm cm�3). The Kd values canserve as a measure of the reactivity of the metal ionwith particle surfaces, and the variations on the Kd
values with depth can potentially be used to
Fig. 4. Residence time of 210Pb plotted against water depth for
all the stations collected in March and June 1992.
M. Baskaran, P.H. Santschi / Continental Shelf Research 22 (2002) 1493–1510 1507
investigate the interaction of Pb with the particlesof different composition (Wei and Murray, 1994).The Kd approach is, however, only valid forequilibrium conditions. Sherrell and Boyle (1992)observed very similar Kd values over a fivefolddifference in dissolved stable Pb concentrations inthe mid-waters of the Sargasso Sea and thenortheast Pacific waters for particles that hadsubstantially different composition. Thus, we canassume that the distribution of 210Pb betweenparticle and dissolved phases is in equilibrium anduse distribution coefficients to make inferencesabout processes controlling the partitioning.
The calculated values of Kd varied between1.2� 105 and 77� 105 cm3 g�1 (Table 3). Thevertical profiles of distribution coefficients (figurenot shown) indicate that the Kd values aresignificantly higher below the aging warm-corering samples, and this is likely due to lower particleconcentration. Similar observations were alsoreported for 234Th (Baskaran et al., 1996). Theincrease of Kd with depth could also be due todifferences in the composition of particles (morenon-biological particles in deeper waters) as non-biological particles could have stronger affinitiesfor 210Pb than biogenic particles.
5. Conclusions
This is the first study, which quantitativelyevaluates the differences in 210Pb scavengingintensity in the presence and absence of a warm-core ring. It was possible to contrast the twosituations in the Gulf of Mexico shelf and slopewaters. A deep-water station on the slope wassampled in the spring (92G3) and summer 1992(92G7). The summer station was at the peripheryof an aging warm-core ring containing moreoligotrophic, Caribbean waters, while in thespring, only Gulf water was present. The signifi-cant findings of this study are:
(1) There was no general increase of dissolved orparticulate 210Pb concentration with depthunlike 230Th profiles in the open ocean.
(2) The distribution coefficients appeared toincrease with depth in the presence and
absence of a warm-core ring. This can beattributed to the more efficient uptake byrefractory and terrigenous particles in thebottom waters.
(3) There was a strong correlation between watercolumn inventories of 210Pb and depth, andthis is likely due to longer residence time of210Pb in deep-water location.
(4) There was an excellent linear correlationbetween the depth of the water column andthe residence time of total 210Pb for the wholecolumn, as expected, suggesting more activescavenging in shallower waters. The scaven-ging residence time of 210Pb for the wholewater column varied between 0.06 and 4.7years for regions with different water depths.
(5) It appears that in continental margins, thereare areas where both vertical scavenging andlateral transport of 210Pb are dominant. Theratios of measured sediment inventory of210Pb to that of the production rate in theoverlying water column, F/P, is likely con-trolled by the hydrodynamic conditions pre-vailing near the sediment–water interface.
Acknowledgements
We thank the crew and officers of the R.V.GYRE, Doug Biggs and R.V. Pittman for assis-tance with the in situ pumping system, MattQuigley, Laodong Guo, Sarah Oktay, Liang-SawWen, and M. Ravichandran for their assistance insample collection, and Shaunna Asbill, PattyGomez, and Roberta Corvalho for sample proces-sing. This research is based, in part, upon worksupported by the US National Science Foundation(Grant # CE-9012103) and Department of Energy(Grant # DE-FG-05-92ERG 1421).
References
Anderson, R.F., Bopp, Buesseler, K.O., Biscaye, P.E., 1988.
Mixing of particles and organic constituents in sediments
from the continental shelf and slope off Cape Cod: SEEP-I
results. Continental Shelf Research 8, 925–946.
M. Baskaran, P.H. Santschi / Continental Shelf Research 22 (2002) 1493–15101508
Anderson, R.F., Fleischer, M.Q., Biscaye, P.E., Kumar, N.,
Dittrich, B., Kubik, P., Suter, M., 1994. Anomalous
boundary scavenging in the Middle Atlantic Bight: evidence
from 230Th, 231Pa, 10Be and 210Pb. Deep-Sea Research II 41
(2–3), 537–561.
Bacon, M.P., Spencer, D.W., Brewer, P.G., 1976. Pb-210/Ra-
226 and Po-210/Pb-210 disequilibria in seawater and
suspended particulate matter. Earth and Planetary Science
Letters 32, 277–296.
Bacon, M.P., Belastock, R.A., Tecotzky, M., Turekian, K.K.,
Spencer, D.W., 1988. Lead-210 and polonium in ocean
water profiles of the continental shelf and slope south of
New England. Continental Shelf Research 8, 841–853.
Bacon, M.P., Belastock, R.A., Bothner, M.H., 1994. 210Pb
balance and implications for particle transport on the
continental shelf, US Middle Atlantic Bight. Deep-Sea
Research II 41 (2–3), 511–535.
Baskaran, M., Naidu, A.S., 1995. 210Pb-derived chronology and
the fluxes of 210Pb and 137Cs isotopes into continental shelf
sediments, East Chukchi Sea, Alaskan Arctic. Geochimica
et Cosmochimica Acta 59, 4435–4448.
Baskaran, M., Santschi, P.H., 1993. The role of particles and
colloids in the transport of radionuclides in coastal
environments of Texas. Marine Chemistry 43, 95–114.
Baskaran, M., Murphy, D.J., Santschi, P.H., Orr, J.C., Schink,
D.R., 1993a. A method for rapid in situ extraction and
laboratory determination of Th, Pb, and Ra isotopes from
large volumes of seawater. Deep-Sea Research II 40 (4),
849–865.
Baskaran, M., Coleman, C.H., Santschi, P.H., 1993b. Atmo-
spheric depositional fluxes of 7Be and 210Pb at Galveston
and College Station, Texas. Journal of Geophysical
Research 98, 20,555–20,571.
Baskaran, M., Santschi, P.H., Guo, L., Bianchi, T.S., Lambert,
C., 1996. 234Th:238U disequilibria in the Gulf of Mexico: the
importance of organic matter and particle concentration.
Continental Shelf Research 16, 353–380.
Benninger, L.K., 1978. 210Pb balance in Long Island Sound.
Geochimica et Cosmochimica Acta 42, 1165–1174.
Biggs, D.C., 1992. Nutrients, plankton, and productivity in a
warm-core ring in the western Gulf of Mexico. Journal of
Geophysical Research 97, 2143–2154.
Biggs, D.C., Muller-Karger, F.E., 1994. Ship and satellite
observations of chlorophyll stocks in interacting cyclone-
anticyclone eddy pairs in the western Gulf of Mexico.
Journal of Geophysical Research 99, 7371–7384.
Biggs, D.C., Fargion, G.S., Hamilton, P., Leben, R.R., 1996.
Cleavage of a Gulf of Mexico Loop Current eddy by a
deep water cyclone. Journal of Geophysical Research 101,
20,629–20,641.
Biscaye, P.E., Anderson, R.F., 1994. Fluxes of particulate
matter on the slope of the southern Middle Atlantic Bight:
SEEP II. Deep-Sea Research II 41 (2–3), 459–509.
Biscaye, P.E., Anderson, R.F., Deck, B.L., 1988. Fluxes of
particles and constituents to the eastern United States
continental slope and rise: SEEP-I. Continental Shelf
Research 8, 855–904.
Buesseler, K.O., Livingston, H.D., Sholkovitz, E.R., 1985/86.
Pu-239, 240 and excess Pb-210 inventories along the shelf
and slope of the northeast USA. Earth and Planetary
Science Letters 76, 10–22.
Carpenter, R., Bennett, J.T., Peterson, M.L., 1981. Pb-210
activities in and fluxes to sediments of the Washington
continental slope and shelf. Geochimica et Cosmochimica
Acta 45, 1155–1172.
Chung, Y., 1987. 210Pb in the western Indian Ocean: distribu-
tion, disequilibrium, and partitioning between dissolved and
particulate phases. Earth and Planetary Science Letters 85,
28–40.
Chung, Y., Craig, H., 1983. Pb-210 in the Pacific: the GEOSECS
measurements of particulate and dissolved concentrations.
Earth and Planetary Science Letters 65, 406–432.
Chung, Y., Finkel, R., 1988. 210Po in the western Indian Ocean:
distributions, disequilibria and partitioning between the
dissolved and particulate phases. Earth and Planetary
Science Letters 88, 232–240.
Cochran, J.K., Bacon, M.P., Krishnaswami, S., Turekian,
K.K., 1983. Po-210 and Pb-210 distributions in the central
and Eastern Indian Ocean. Earth and Planetary Science
Letters 65, 433–452.
Cochran, J.K., Livingston, H.D., Hirschberg, D.J., Suprenant,
L.D., 1987. Natural and anthropogenic radionuclide dis-
tributions in the Northwest Atlantic Ocean. Earth and
Planetary Science Letters 84, 35–152.
Cochran, J.K., McKibbin-Vaughan, T., Dornblaser, M.M.,
Hirschberg, D., Livingston, H.D., Buessler, K.O., 1990.210Pb scavenging in the North Atlantic and North Pacific
Oceans. Earth and Planetary Science Letters 97, 332–352.
Colley, S., Thomson, J., 1994. Particulate/solution analysis of226Ra, 230Th, and 210Pb in sea water sampled by in-situ large
volume filtration and sorption by manganese oxyhydroxide.
Science and Total Environment 155, 273–283.
Craig, H., Krishnaswami, S., Somayajulu, B.L.K., 1973. Pb-
210, Ra-226: radioactive disequilibrium in the deep sea.
Earth and Planetary Science Letters 17, 295–305.
Emery, K.O., 1968. Relict sediments in continental shelves of
world. Am. Assoc. Petrol. Geol. Bull. 52, 445–464.
Guo, L., Santschi, P.H., Baskaran, M., Zindler, A., 1995.
Dissolved and particulate 230Th and 232Th in seawater
from the Gulf of Mexico and off Cape Hatteras as
measured by SIMS. Earth and Planetary Science Letters
133, 117–128.
Hong, G.-H., Park, S.-K., Baskaran, M., Kim, S.-H., Chung,
C.-S., Lee, S.-H., 1999. Lead-210 and polonium-210 in the
winter well-mixed turbid waters in the mouth of the Yellow
Sea. Continental Shelf Res. 19, 1049–1064.
Moore, W.S., Bruland, K.W., Michel, J., 1981. Fluxes of
uranium and thorium series isotopes in the Santa Barbara
Basin. Earth and Planetary Science Letters 53, 391–399.
Nozaki, Y., 1978. Residence times and the removal mechanisms
of trace elements in the ocean. Chikyu Kagaku (Geochem-
istry) 12, 27–36.
Nozaki, Y., Thomson, J., Turekian, K.K., 1976. The
distribution of Pb-210 and Po-210 in surface waters of
M. Baskaran, P.H. Santschi / Continental Shelf Research 22 (2002) 1493–1510 1509
the Pacific Ocean. Earth and Planetary Science Letters 32,
304–312.
Nozaki, Y., Turekian, K.K., Von Damm, K., 1980. Pb-210 in
GEOSECS water profiles from the North Pacific. Earth and
Planetary Science Letters 49, 393–400.
Nozaki, Y., Ikuta, N., Yashima, M., 1990. Unusually large210Po deficiencies relative to 210Pb in the Kuroshio Current
of the East China and Philippine Seas. Journal of
Geophysical Research 95, 5321–5329.
Rama, M.K., Goldberg, E.D., 1961. Lead-210 in natural
waters. Science 134, 98–99.
Santschi, P.H., Guo, L., Walsh, I.D., Quigley, M.S., Baskaran,
M., 1999. Boundary exchange and scavenging of radio-
nuclides in continental margin waters of the Middle Atlantic
Bight: implications for organic carbon fluxes. Continental
Shelf Research 19, 609–636.
Sherrell, R.M., Boyle, E.A., 1992. Isotopic equilibration
between dissolved and suspended particulate lead in the
Atlantic Ocean: evidence from 210Pb and stable Pb isotopes.
Journal of Geophysical Research 97, 11,257–11,268.
Somayajulu, B.L.K., Craig, H., 1976. Particulate and soluble210Pb activities in the deep sea. Earth and Planetary Science
Letters 32, 268–276.
Spencer, D.W., Bacon, M.P., Brewer, P.G., 1980. Models of the
distribution of Pb-210 in a section across the North
Equatorial Atlantic Ocean. Journal of Marine Research
39, 119–138.
Thomson, J., Turekian, K.K., 1976. Po-210 and Pb-210
distributions in ocean water profiles from the Eastern
South Pacific. Earth and Planetary Science Letters 32,
297–303.
Thomson, J., Colley, S., Anderson, R., Cook, G.T., Mackenzie,
A.B., 1993. 210Pb in the sediments water column of the
Northeast Atlantic from 47 to 591N along 201W. Earth and
Planetary Science Letters 115, 75–87.
Turekian, K.K., Nozaki, Y., Benninger, L.K., 1977. Geo-
chemistry of atmospheric radon and radon products.
Annual Review of Earth and Planetary Science 5,
227–255.
Vukovich, F.M., Crissman, B.W., 1986. Aspects of warm rings
in the Gulf of Mexico. Journal of Geophysical Research 91,
2645–2660.
Wei, C.-L., Murray, J.W., 1994. The behavior of scavenged
isotopes in marine anoxic environments: 210Pb and 210Po in
the water column of the Black Sea. Geochimica et
Cosmochimica Acta 58, 1795–1811.
M. Baskaran, P.H. Santschi / Continental Shelf Research 22 (2002) 1493–15101510


