Embed Size (px)
Citation preview

WH Ireland Limited, 24 Martin Lane, London, EC4R 0DR, tel. 020 7220 1666
WHIreland is authorised and regulated by The Financial Conduct Authority and is a member of The London Stock Exchange. Important disclosures and certifications regarding companies that are the subject of this report can be found within the disclosures page at the end of this document.
CORPORATE SPONSORED MARKETING COMMUNICATION
12 October 2021
Pantheon Resources
Elephants in close quarters
Based on the success of the Talitha #A well result, we are upgrading our fair value estimate for Pantheon Resources to 172p (from under review; and from a pre-drill fair value estimate of 89p). We believe that the Talitha #A result confirmed the presence of multiple oil-bearing conventional oil reservoirs that have success-case potentials of elephantine scale. Our valuation reflects only the potential of Pantheon Resources’ prime assets for which resource estimates have been provided; namely, Theta West, the Shelf Margin Deltaic’s B horizon (SMD-B) and Alkaid.
Theta West: Theta West’s success-case recoverable resource estimate, as determined by Pantheon Resources, is 1.41bn barrels of oil, which we estimate equates to an after-tax NPV10 valuation of $5,879m ($4.17/barrel; 566.5 p/sh). We have included a risked 20% of that value, equating to 113.3p/sh in our fair value estimate.
SMD-B: SMD-B’s success-case recoverable resource estimate, as determined by Pantheon Resources, is 404m barrels of oil, which we estimate equates to an after-tax NPV10 valuation of $2,316m ($5.73/barrel; 223.2 p/sh). We have included a risked 20% of that value, equating to 44.6p/sh in our fair value estimate.
Alkaid: Alkaid’s success-case recoverable resource estimate, as determined by Lee Keeling and Associates, is 76.5m barrels of oil, which we estimate equates to an after-tax NPV10 valuation of $501.6m ($6.56/barrel; 48.3 p/sh). We have included a risked 25% of that value or 12.1p/sh in our fair value estimate.
Talitha #A: Critically, the Talitha #A well bore was cleanly drilled, with no crumbling or caving of the well’s walls, relative to previously drilled wells in the area. This provided a step-change improvement in well log data that allowed for 3D seismic data to be tied confidently to the well data. Talitha #A materially increased confidence in the geometry of the oil reservoirs penetrated by the well.
Independent validation: Well cuttings were independently assessed by a globally recognised leader in that field, Baker Hughes AHS Volatile Analysis Service, which determined that the five targeted zones of the Talitha #A had a combined oil-bearing column of 3,700’ (1.13 km) – an exceptional result by any standard.
Concentrated resource: The Talitha #A well confirmed the presence of a multitude of large-scale oil resources, all within extremely close proximity – elephants in close quarters. We believe this is very appealing from the perspective of potential farm-in partners, as infrastructure and well-pads can be shared. The proximity of this “herd of elephants” to the Dalton Highway and the adjacent Trans Alaska Pipeline System is also critically advantageous, in our opinion.
Next steps: The success of the Talitha #A well has provided significant confidence in the geometric scale of the elephantine-scale resources that it penetrated. This sets the scene to test the productive capabilities of all the reservoirs through well testing – extremely high-impact, forward-looking catalysts given the stakes involved, as confirmed by the Talitha #A well.
In conclusion: Pantheon is, we believe, on a particularly steep trajectory of value creation through operational progress. We believe that the macro-backdrop of i) an acutely forming global energy crisis and ii) robust oil prices further strengthens the outlook for Pantheon Resources. The team at Pantheon Resources and its strategic partners are recognised industry leaders that, we believe, will successfully secure project funding via a farmout when it is optimal to do so.
Ticker PANR
Index FTSE AIM
Sector Oil & Gas
Market Cap £580.5m
Performance Sector
1 month: 51.6%
3 months: 64.9%
12 months: 115.6%
High/Low 87.0p/22.7p
Source: © 2020, S&P Global Market Intelligence
Analyst Brendan Long, CFA +44 (0)0207 220 1694
CORPORATE
Share price 83.5p
0
20
40
60
80
100
Oct-
20
No
v-2
0
De
c-2
0
Ja
n-2
1
Feb
-21
Mar-
21
Apr-
21
May-2
1
Ju
n-2
1
Ju
l-21
Aug
-21
Sep
-21
Oct-
21
Marketing Communication
This document has not been prepared in accordance with
legal requirements designed to promote the independence
of investment research. Please refer to important disclosures
towards the end of this document.
Under the Markets in Financial Instruments Directive II
(“MiFID II”), this research is paid for by the subject issuer as
declared in the disclosure and disclaimer pages of this
document.

WH Ireland 2
Pantheon Resources
COPPER & GOLD
Valuation – WHI fair value estimate
Valuation: The basis of our fair value estimate is provided in Table 1.
Table 1 – Pantheon Resources – WHI fair value estimate (after-tax NPV10 value estimates)
Source: WH Ireland research
Gross
Working Resource % of NPV 10 per Value
Interest Scale USD GBP Share in FV Share $/b
(%) (mnb; oil) (%) (p/share) ($/b)
Core assets
Alkaid 100% 76.5 501.6 358.3 48.3 25.0% 12.1 6.56
Theta West 100% 1,410.0 5,878.7 4,199.1 566.5 20.0% 113.3 4.17
Shelf Margin Deltaic-B 100% 404.0 2,316.2 1,654.5 223.2 20.0% 44.6 5.73
Total of core assets 1,890.5 8,696.6 6,211.8 838.1 n.a. 170.0 n.a.
Balance sheet and other adjustments
Cash (30 March 2021) n.a. 17.8 12.7 1.7 n.a. 1.7 n.a.
Expected Talitha #A costs n.a. (12.5) (8.9) (1.2) n.a. (1.2) n.a.
Cash from assumed exercise of options n.a. 19.4 13.9 1.9 n.a. 1.9 n.a.
Debt n.a. - - - n.a. - n.a.
Total of balance sheet adjustments n.a. 24.7 17.7 2.4 n.a. 2.4 n.a.
Fair value estimate n.a. 8,721.3 6,229.5 840.4 n.a. 172.4 n.a.
Additional assets under evaluation
Talitha Kuparuk 100% tbc tbc tbc tbc - - tbc
Talitha Brookian Slope Fan 100% tbc tbc tbc tbc - - tbc
Talitha SMD-A & SMD-C 100% tbc tbc tbc tbc - - tbc
Additional assets under evaluation tbc tbc tbc tbc - - tbc
Key assumptions:
Long-term oil price: $80/b Brent; $70 realised well-head Alaskan price; inflated at 1% from 2023
USD/GBP: 1.40
Fair Value Estimate
Unrisked Present Value
Net to Company (NPV10)
Key Assumptions
($mn) (£mn) (p/share)
PerTotal

WH Ireland 3
Pantheon Resources
COPPER & GOLD
Theta West, a magnificent beast
Not your average elephant
What’s new and what is the background?
Play opener result: Talitha #A penetrated 600 feet of oil-bearing reservoir facies of Campanian age in an area where prior well log data had not provided a definitive result. In this respect, the Talitha #A represents a very significant step forward that has materially de-risked the success of Theta West.
Theta West: The Talitha #A result provided high-quality data that Pantheon Resources tied to its 3D seismic data. As a result, the company has a very high degree of confidence in the areal extent of Theta West. The combined total area of the Upper and Lower Theta West structures amounts to 113,600 acres or 460km2 – a massive resource. Pantheon Resources’ best estimate success-case recoverable resource potential for Theta West amounts to 1.41bn barrels of oil.
Figure 1 – Theta West fan complex
Source: WH Ireland research
Geological architecture: High-quality well data provided evidence that the Theta West structure consists of sediments that were deposited over multiple cycles of sea level change (eustastic sea level change, subsidence, uplift). As a result, Theta West consists of a giant mass of thinly laminated shales and sandstone sequences. Pantheon estimates that up to 60% of the geobody consists of sandstone. The log of Theta West is shown in Figure 2. In addition to the standard wireline well log shown in Figure 2, Pantheon Resources ran a very-high-definition Formation Microimager tool supplied by Schlumberger, which indicated that, even at the scale of several centimetres, the reservoir is laminated with shale/sand sequences.
Theta West has stepped out of the shadows, coaxed by high-quality 3D seismic data that has been controlled with the high-quality log data gained from the Talitha #A well. Theta West, we can see you! And we know you are a huge bull elephant!
Source: Unsplash (Geran de Klerk)

WH Ireland 4
Pantheon Resources
COPPER & GOLD
Figure 2 – Theta West logs show a stacked multi-depositional cycle fan complex
Source: WH Ireland research
Depositional model has a nearby analogue: Although the nearby Tarn field is 18x smaller by area (and geologically older) than Theta West, the two fields share the same depositional architecture, as seen schematically in Figure 3. For reference, the recovery factor of the Tarn field is expected to exceed 40% (source: Pantheon Resources), which suggests that the average assumed recovery factor for Theta West of 12% is conservative. Having a nearby commercial analogue, the Tarn field, provides confidence regarding the commercial potential of Theta West.
Theta West

WH Ireland 5
Pantheon Resources
COPPER & GOLD
Figure 3 – Theta West depositional schematic
Source: WH Ireland research
We can see for miles: The well’s result combined with high-quality 3D seismic data (as processed by Pantheon’s strategic partner, eSeis) has provided confidence in the geometry of Theta West. It is not just an elephant of an oil field, it is a fully grown, massive bull elephant. Theta West is colossal both in terms of area (460km2) and column height. Critically, Theta West i) thickens materially and ii) rises materially to the west relative to where it was penetrated by the Talitha #A well. The thickest part of the Theta West structure is ca.1,300 feet thick (vs. ca.600 feet at the Talitha #A location). The top of the thickest part of the structure is ca.2,000 feet higher than the top of the Theta West structure at the Talitha #A well. This is important because shallower reservoirs on the North Slope of Alaska (and generally elsewhere in the world) have been subjected to less compaction and have higher porosity (more void rock volume in which oil, gas and water reside). Effectively, we believe that Theta West will be i) more concentrated in oil due to higher porosity, ii) more productive due to higher permeability and iii) thicker updip of the Talitha #A well location. A cross section of Theta West is shown in Figure 4.
Basin floor fan: Theta West is a “basin floor fan”. This is significant because basin floor fans, by their geological nature, tend to be massive in scale. Many of the largest discoveries made in recent decades in the deep water areas around Africa have been basin floor fans. Of course, it is hugely advantageous economically to be onshore vs. in deep water. Importantly, basin floor fans, like all the discoveries made by Pantheon Resources are stratigraphic traps. Globally, these traps have been increasingly the focus of exploration efforts due to advances in seismic technology. Pantheon Resources benefits from having acquired proprietary 3D seismic and, from the seismic interpretation tools and experience of its strategic partner, eSeis, a globally recognised leader in seismic petrophysics. We believe that basin floor fans tend to attract industry interest, which will favour a successful farmout when Pantheon Resources deems it optimal to do so.

WH Ireland 6
Pantheon Resources
COPPER & GOLD
Figure 4 – Theta West cross section
Source: WH Ireland research
Recoverable resource potential: Pantheon Resources estimates that the best estimate success-case recoverable resource estimate (2C) for Theta West amounts to 1.41bn barrels of oil. That estimate is premised on an oil-in-place estimate of 11.0bn and 1.1bn barrels for the Lower and Upper fans, respectively. The recoverable oil estimate is attributable to a 1.20bn barrel estimate for the Lower structure and a 210m barrels for the Upper structure, implying recovery factors of 11% and 20%, respectively. We believe that a success case outcome is contingent, principally, on a successful flow test. We further believe that, based on our appreciation of the Theta West reservoir, it should be responsive to hydraulic fracture stimulations, if needed.
Indicative success-case Theta West development programme: Our indicative success-case developmental profile for Theta West is provided in Figure 5, Figure 6 and Figure 7.

WH Ireland 7
Pantheon Resources
COPPER & GOLD
Figure 5 – Theta West indicative success-case drilling and production profile
Source: WH Ireland research
Figure 6 – Theta West indicative success-case cashflow profile
Source: WH Ireland research
-
10
20
30
40
50
60
70
80
-
50,000
100,000
150,000
200,000
250,000
300,000
350,000
Theta West - Indicative Development Profile
New wells drilled in period (right axis) Production (left axis)
Net
Pro
du
ctio
n (
bo
e/d
)
Wel
ls D
rille
d in
Per
iod
(G
ross
)
(5,000)
-
5,000
10,000
15,000
20,000
2024 2025 2026 2027 2028 2029 2030 2031 2032 2033 2034 2035 2036 2037
Theta West - Indicative Cash Flow Summary
Net capex Net cashflow from operations (rev-opex) Cumulative cash position
$ m
illio
n

WH Ireland 8
Pantheon Resources
COPPER & GOLD
Figure 7 – Theta West indicative success-case decline curve
Source: WH Ireland research
Theta West valuation
A summary of the key assumptions for our success-case valuation estimate is provided in Table 2.
Table 2 – Theta West: assumptions for WHI fair value estimate
Source: WH Ireland research
A summary of our success-case valuation estimates for Theta West is provided in Table 3.
-
200
400
600
800
1,000
1,200
1,400
1,600
0 1 2 3 4 5 6 7 8 9 10
Theta West - Assumed Decline Curve
Rat
e o
f P
rod
uct
ion
(b
/d)
Years
Unit Source WHI Estimate
Long-term Brent crude oil price $/b WHI 80.0
Long-term realised crude oil price $/b WHI 70.0
STOOIP mmb; oil PANR 12,100
Recovery factor % PANR 12%
Recoverable resources mmb; oil PANR 1,410
# Wells # WHI 557
Sweet spot EUR/well mmb/well WHI 2.5
# of sweet spot wells # WHI 557
Year of first production year WHI 2027
Drilling costs / well $M/well WHI 15.0
Non-drilling capex $M WHI 5,378
Total capex / barrel of oil $/b WHI 9.74
Total capex (gross) $M WHI 13,733
Max negative project cashflow (net) $M WHI 2,360
Total opex / barrel $/b WHI 8.50

WH Ireland 9
Pantheon Resources
COPPER & GOLD
Table 3 – Theta West: WHI success-case valuation estimate
Source: WH Ireland research
Unit Source WHI Estimate
Net present value before tax $M WHI 12,488.6
Net present value after tax $M WHI 5,878.7
NPV per barrel before tax $/b WHI 8.86
NPV per barrel after tax $/b WHI 4.17
Internal rate of return after tax % WHI 38%
NPV per share (based on after-tax value) p/sh WHI 566.5
% of NPV included in WHI fair value estimate % WHI 20%
NPV included in WHI fair value estimate p/sh WHI 113.3

WH Ireland 10
Pantheon Resources
COPPER & GOLD
Shelf Margin Deltaic − B
A fair-sized elephant
What’s new?
SMD-B: In our opinion, the B sequence within the Shelf Margin Deltaic formation has emerged as an obvious large-scale resource that warrants prioritised testing. Pantheon Resources estimates that the success-case contingent resource estimate in respect of the Shelf Margin Deltaic – B horizon amounts to 404m barrels of recoverable oil (premised on an oil in place estimate of 2.6 billion). That compares to a pre-drill estimate 265m barrels of recoverable oil under a success case.
SMD-A and SMD-C: The Talitha #A result will likely reduce the expected recoverable resource estimate in relation to the SMD-A horizon, while confirming that of the SMD-C horizon. Pantheon Resources has not disclosed resource estimates for SMD-A and SMD-C; however, we believe the main prize that emerges from the Talitha #A result from the Shelf Margin Deltaic structure is the SMD-B.
Not what we expected: The high-quality well logs from Talitha #A tied to 3D seismic data indicate that the SMD-B extends now into the Alkaid Unit. The continuous learning process and improved technology, utilising data information from Talitha #A and wells drilled in the past, has illuminated the SMD-B payzone across a much larger area than previously believed, resulting in a resource upgrade. Importantly, it is now confirmed that the SMD-B can be partially appraised/developed from the Dalton Highway – a big win. This can be seen from Figure 8. Effectively, the Talitha #A well result had the effect of bringing a multitude of appraisal well results (previously overlooked wells) into the picture that corroborated a newly understood geometry of the structure. All in all, we see a resource that is all teed up for production testing with the benefit of five wells corroborating a strong 3D seismic signal.
Figure 8 – Shelf Margin Deltaic-B
Source: WH Ireland research
Clean log: The log of the SMD-B shows a remarkably clean block of oil-saturated sandstone, as seen in Figure 9.
With a success-case recoverable resource estimate of over 400m barrels, SMD-B is a fair-sized elephant. Additional resource potential is expected from the SMD-A and SMD-C horizons.
Source: Unsplash (Wolfgang Hasselman)

WH Ireland 11
Pantheon Resources
COPPER & GOLD
Figure 9 – SMD-B log: clean oil-bearing sands
Source: WH Ireland research
Pre-drill vs. post-drill areal extent: The Talitha #A result provided increased confidence in the geometry of the SMD-B resource. Importantly, much of the resource can be appraised and developed from the Dalton highway and tied into the nearby Trans Alaska Pipeline System with relative ease and modest costs (see Figure 10). Near-term development options include the use of Modular Arctic Processing Systems to provide valuable production data and expedite cashflow.
Figure 10 – Pre- and post-drill area of SMD-B relative to Dalton Highway
Source: WH Ireland research
Indicative success-case development profile for SMD-B: An indicative development profile for SMD-B is provided in Figure 11, Figure 12 and Figure 13.

WH Ireland 12
Pantheon Resources
COPPER & GOLD
Figure 11 – SMD-B indicative success-case drilling and production profile
Source: WH Ireland research
Figure 12 – SMD-B indicative success-case cash flow profile
Source: WH Ireland research
-
10
20
30
40
50
60
70
80
-
10,000
20,000
30,000
40,000
50,000
60,000
70,000
80,000
90,000
100,000
SMD-B- Indicative Development Profile
New wells drilled in period (right axis) Production (left axis)
Net
Pro
du
ctio
n (
bo
e/d
)
We
lls D
rille
d in
Per
iod
(G
ross
)
(1,500)
(1,000)
(500)
-
500
1,000
1,500
2,000
2,500
3,000
3,500
4,000
2022 2023 2024 2025 2026 2027 2028 2029 2030 2031
SMD-B - Indicative Cash Flow Summary
Net capex Net cashflow from operations (rev-opex) Cumulative cash position
$ m
illio
n

WH Ireland 13
Pantheon Resources
COPPER & GOLD
Figure 13 – SMD-B indicative success-case decline curve
Source: WH Ireland research
SMD-B valuation
A summary of the key assumptions for our valuation estimate is provided in Table 4.
Table 4 – SMD-B: assumptions for WHI fair value estimate
Source: WH Ireland research
A summary of our success-case valuation estimates for SMD-B is provided in Table 5.
-
500
1,000
1,500
2,000
2,500
0 1 2 3 4 5 6 7 8 9 10
SMD-B - Assumed Decline Curve
Rat
e o
f P
rod
uct
ion
(b
/d)
Years
Unit Source WHI Estimate
Long-term Brent crude oil price $/b WHI 80.0
Long-term realised crude oil price $/b WHI 70.0
STOOIP mmb; oil PANR 2,600
Recovery factor % PANR 16%
Prospective resources (recoverable) mmb; oil PANR 404
# Wells # LKA 400
Sweet spot EUR/well mmb/well LKA 1.4
# of sweet spot wells # LKA 194
Year of first production year WHI 2024
Drilling costs / well $M/well LKA 12.0
Non-drilling capex $M WHI 1,086
Total capex / barrel of oil $/b WHI 14.71
Total capex (gross) $M WHI 5,886
Max negative project cashflow (net) $M WHI 489
Total opex / barrel $/b WHI 7.50

WH Ireland 14
Pantheon Resources
COPPER & GOLD
Table 5 – SMD-B: WHI success-case valuation estimate
Source: WH Ireland research
Unit Source WHI Estimate
Net present value before tax $M WHI 4,368.4
Net present value after tax $M WHI 2,316.2
NPV per barrel before tax $/b WHI 10.81
NPV per barrel after tax $/b WHI 5.73
Internal rate of return after tax % WHI 62%
NPV per share (based on after-tax value) p/sh WHI 223.2
% of NPV included in WHI fair value estimate % WHI 20%
NPV included in WHI fair value estimate p/sh WHI 44.6

WH Ireland 15
Pantheon Resources
COPPER & GOLD
Alkaid, core strategic asset
Leading the troop – 76.5 mmb (2C)
What’s new?
Increased strategic significance: The Talitha #A well unlocked multiple “big elephant” oil fields of incredible success-case potential. In our opinion, this increases the strategic relevance of Alkaid, which has potential to generate near-term cash flow to fund future “big elephant” developments. Alkaid can be developed quickly and with relatively modest capital expenditure, largely because it can be developed from the Dalton Highway.
Reminder and key point #1: The field can be drilled and produced from four well pads, of which at least three would be immediately adjacent to the Dalton Highway and the Trans Alaska Pipeline System (see Figure 14). We believe that being immediately proximal to this infrastructure will materially i) reduce costs ii) reduce permitting challenges and iii) allow year-round drilling. We believe Alkaid can be developed on an expedited basis; for example, test production can be trucked 20 miles to the north to the nearest pumping station on the Trans Alaska Pipeline System, allowing for first production in 2021. Similarly, modular processing equipment can be procured on an incremental basis for units of 5,000 barrels of oil per day, allowing for expeditious and low-cost commercialisation of oil. For this reason, we expect the bulk of Alkaid’s developmental capital to be self-funded.
Reminder and key point #2: In 2015, that company drilled the Alkaid 1 well, which made a successful discovery and confirmed the pre-drill geological hypothesis. The Alkaid 1 well penetrated 450 feet of gross pay of which 240 feet is considered to be net productive reservoir (see Figure 15). Drilling operations were abandoned prematurely due to a surface event, the flooding of the Dalton Highway due to the damming of the Sag River with ice, which is a highly uncommon occurrence. The well was still drilling through oil-bearing reservoir when it was abandoned for safety reasons. The recoverable oil estimate of Lee Keeling and Associates is premised on the assumption that oil exists only down to where the drill bit had penetrated; therefore, appraising Greater Alkaid stands to result in an immediate resource upgrade. Pantheon production tested a six-foot interval of the Alkaid 1 well in March 2019.
Reminder and key point #3: Alkaid was tested with a modest fracture stimulation and produced at a rate of 100 b/d of oil (35°API), proving the movability of oil in the reservoir. We believe that the instantaneous flow rate was high relative to the modest interval and frack.
Alkaid, we believe, is a strategic leader of the whole troop: It can be developed quickly from the Dalton Highway with minimal capex and, based on our success-case estimates, would generate significant near-term cash flow, providing funding to develop bigger elephants
Source: Unsplash (David Clode)

WH Ireland 16
Pantheon Resources
COPPER & GOLD
Figure 14 – Alkaid development schematic
Source: WH Ireland research
Figure 15 – Alkaid log
Source: WH Ireland research

WH Ireland 17
Pantheon Resources
COPPER & GOLD
Indicative success-case development programme: Our indicative success-case development profile for the Alkaid field is premised on the 2C resource assessment and developmental parameters, as developed by Lee Keeling and Associates.
Figure 16 – Alkaid success-case drilling and production profile
Source: WH Ireland research
Figure 17 – Alkaid indicative success-case cash flow profile
Source: WH Ireland research
-
5
10
15
20
25
-
5,000
10,000
15,000
20,000
25,000
2020 2021 2022 2023 2024 2025 2026 2027 2028 2029
Alkaid - Indicative Development Profile
New wells drilled in period (right axis) Production (left axis)
Net
Pro
du
ctio
n (
bo
e/d
)
Wel
ls D
rille
d in
Per
iod
(G
ross
)
(400)
(200)
-
200
400
600
800
2020 2021 2022 2023 2024 2025 2026 2027 2028 2029
Alkaid - Indicative Cash Flow Summary
Net capex Net cashflow from operations (rev-opex) Cumulative cash position
$ m
illio
n

WH Ireland 18
Pantheon Resources
COPPER & GOLD
Figure 18 – Alkaid indicative success-case decline curve
Source: WH Ireland research
Alkaid valuation
A summary of the key assumptions for our valuation estimate is provided in Table 6.
Table 6 – Alkaid: assumptions for WHI fair value estimate
Source: WH Ireland research
A summary of our success-case valuation estimates for Alkaid is provided in Table 7.
-
500
1,000
1,500
2,000
2,500
0 1 2 3 4 5 6 7 8 9 10
Alkaid - Assumed Decline Curve
Rat
e o
f P
rod
uct
ion
(b
/d)
Years
Unit Source WHI Estimate
Long-term Brent crude oil price $/b WHI 80.0
Long-term realised crude oil price $/b WHI 70.0
STOOIP mmb; oil LKA 900
Recovery factor % LKA 9%
Recoverable resources mmb; oil LKA 77
# Wells # LKA 44
Sweet spot EUR/well mmb/well LKA 2.3
# of sweet spot wells # LKA 20
Year of first production year WHI 2023
Drilling costs / well $M/well PANR 12.0
Non-drilling capex $M WHI 433
Total capex / barrel of oil $/b WHI 12.56
Total capex (gross) $M WHI 961
Max negative project cashflow (net) $M WHI 181
Total opex / barrel $/b WHI 10.48

WH Ireland 19
Pantheon Resources
COPPER & GOLD
Table 7 – Alkaid: WHI success-case valuation estimate
Source: WH Ireland estimates
Unit Source WHI Estimate
Net present value before tax $M WHI 993.2
Net present value after tax $M WHI 501.6
NPV per barrel before tax $/b WHI 12.98
NPV per barrel after tax $/b WHI 6.56
Internal rate of return after tax % WHI 47%
NPV per share (based on after-tax value) p/sh WHI 48.3
% of NPV included in WHI fair value estimate % WHI 25%
NPV included in WHI fair value estimate p/sh WHI 12.1

WH Ireland 20
Pantheon Resources
COPPER & GOLD
Upside – Elephants are herd animals
For now, we have not included any value for several of the oil-bearing zones that were penetrated by the Talitha #A well, namely: i) the SMD-A and the SMD-C structures; ii) the Slope Fan structures; or iii) the Kuparuk formation, in our valuation. Pantheon Resources is progressing its technical understanding of these oil-bearing zones and they too may be ascribed success-case recoverable oil estimates in due course. In total, the Talitha #A well penetrated five pay intervals, namely: i) the SMD; ii) Slope Fans; iii) Upper Theta West; iv) Lower Theta West; and v) Kuparuk – all of which were entirely (from top to bottom) oil saturated. Importantly, we expect the entirety of the oil-bearing zones, as confirmed by the Talitha #A well, to be production tested in due course.
ESG considerations
We believe it is noteworthy that Pantheon Resources is advancing an initiative that would see the entirety of the emissions from its projects reinjected for permanent underground capture (see Figure 19).
Figure 19 – Schematic of Pantheon Resources’ Green Energy Alaska initiative
Source: Pantheon Resources
We remind investors that the surface footprint of oil & gas operations in Alaska is minimal, as illustrated in Figure 20.

WH Ireland 21
Pantheon Resources
COPPER & GOLD
Figure 20 – Alkaid indicative success-case decline curve
Source: ConocoPhillips
WH Ireland 22
Pantheon Resources
COPPER & GOLD
DISCLAIMER
Marketing Communication
This research report is disseminated by WH Ireland Limited (“WHI”) which is authorised and regulated by the Financial Conduct Authority (“FCA”) and is a member of the
London Stock Exchange. This research report is intended for the sole use of the person for whom it is addressed and is not intended for private individuals or those classified
as Retails Clients as defined by the Markets in Financial Instruments Directive 2004/39/EC (“MiFID”).
Non-independent research
This research report is marketing communications and is produced in accordance with the FCA’s Conduct of Business Sourcebook. It has not been prepared in accordance
with legal requirements designed to promote the independence of investment research and it is not subject to any prohibition on dealing ahead of the dissemination of
investment research. However, WHI is required by the FCA to have policies in place to identify and manage the conflicts of interest which may arise in the production and
dissemination of this research report , such management of conflicts include a firm wide ban of PA dealings in any issuer under research coverage.
Planned frequency of updates to recommendation
WHI does not have a schedule for issuing research recommendations, they are issued whenever the research analyst and members of the research team alone deem it
relevant, but usually in the event of significant development.
Disclaimer
This research report has been approved under part IV article 19 of The Financial Services and Markets Act 2000 (Financial Promotion) Order 2005 (the “FPO”) by WHI for
communication in the United Kingdom only to investment professionals as that term is defined in article 19(5) of the FPO. Its contents are not directed at, may not be suitable
for and should not be relied on by anyone who is not an investment professional including retail clients. This research report is for distribution only as may be permitted by
law. It is not directed to, or intended for distribution to or use by, any person or entity in any jurisdiction where doing so would be contrary to law or regulation or would
subject WHI to any registration or licensing requirement within such jurisdiction. This research report is not an offer or a solicitation of an offer to buy or sell any financial
instruments or to participate in any particular trading strategy. It does not constitute a personal recommendation and recipients must satisfy themselves that any dealing is
appropriate in the light of their own understanding, appraisal of risk and reward, objectives, experience, and financial and operational resources.
The information herein is believed to be reliable and has been obtained from public sources believed to be reliable. WHI makes no representation or warranty, either express
or implied, as to the accuracy or completeness of such information. Any opinions expressed in this research report may change without notice and may differ or be contrary
to opinions expressed by other business areas of WHI. Any statements contained in this report attributed to a third party represent WHI’s interpretation of the data,
information and/or opinions provided by that third party either publicly or through a subscription service, and such use and interpretation have not been reviewed by the
third party. Investments involve risks, and investors should exercise prudence and their own judgement in making their investment decisions. The financial instruments
described in this research report may not be eligible for sale in all jurisdictions or to certain categories of investors. Options, derivative products and futures are not suitable
for all investors, and trading in these instruments is considered risky. Foreign currency rates of exchange may adversely affect the value, price or income of any security or
related instrument referred to in this research report. For investment advice, trade execution or other enquiries, clients should contact their local sales representative.
The value of any investment or income may go down as well as up, and investors may not get back the full amount invested. Past performance is not necessarily a guide to
future performance. WHI accepts no fiduciary duties to the reader of this research report and in communicating it WHI is not acting in a fiduciary capacity. Neither WHI nor
any of its directors, employees or agents accepts any liability for any loss (including investment loss) or damage arising out of the use of all or any of the Information.
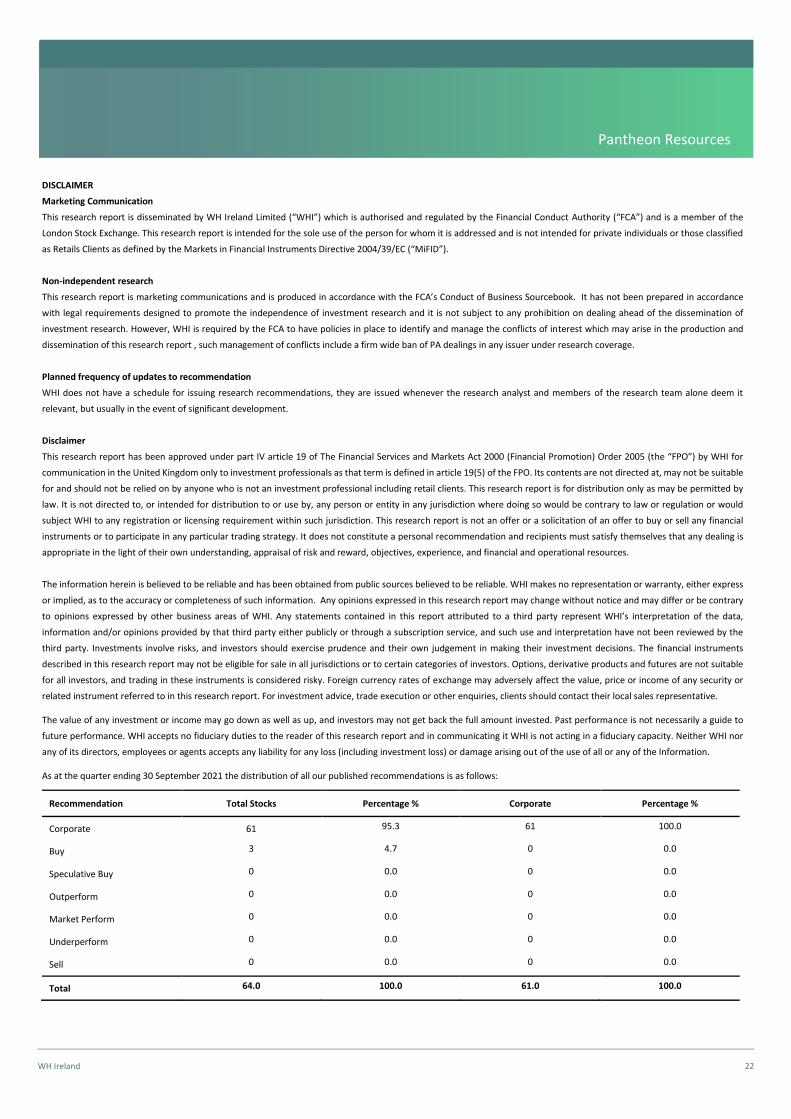
As at the quarter ending 30 September 2021 the distribution of all our published recommendations is as follows:
Recommendation Total Stocks Percentage % Corporate Percentage %
Corporate 61 95.3 61 100.0
Buy 3 4.7 0 0.0
Speculative Buy 0 0.0 0 0.0
Outperform 0 0.0 0 0.0
Market Perform 0 0.0 0 0.0
Underperform 0 0.0 0 0.0
Sell 0 0.0 0 0.0
Total 64.0 100.0 61.0 100.0

WH Ireland 23
Pantheon Resources
COPPER & GOLD
Valuation and Risks
For details relating to valuation and risks for subject issuers, please refer to the comments contained herein or in previously published research reports or sector notes.
Time and date of recommendation and financial instruments in the recommendation
The time and date when the production of this research recommendation is published is the date and time found in the header of the email carrying the research report.
Any prices stated in this document are for information purposes only, there is no representation that any transaction can or could have been effected at those prices. Different
assumptions by any other source may yield substantially different results. Where a price of a financial instrument is quoted it will generally, in the absence of the contrary, be
the closing mid-point price at the close of business the day before publication date.
A draft of this research report has been shown to the company following which factual amendments have been made.
No part of the content of this research report may be copied, forwarded or duplicated in any form or by any means without the prior consent of WHI and WHI accepts no liability
whatsoever for the actions of third parties in this respect.
By accepting this document, you agree to be bound by the disclaimers stated above. Please refer to http://research.whirelandplc.com/research/conflicts_of_interest.asp for
conflicts of Interest regarding Non-Independent Research.
Company/Issuer Disclosures
Company Name Table of interest number 12-month recommendation history Date
Pantheon Resources (PANR) 4 Corporate 11.11.20
http://research.whirelandplc.com/research/regulatory.asp
Companies Mentioned
Company Name Recommendation Price Price Date/Time
Pantheon Resources (PANR) Corporate 83.5p 11.10.21.@ 17:00
Headline Date
Elephants in Close Quarters 12.10.21
World class assets, the right team, poised to create value 11.11.20
Recommendation From To Analyst
Corporate 11.11.20 present CA
Current Analyst (CA), Previous Analyst (PA)
The WH Ireland Research & Corporate Events Portal is available at https://www.whirelandplc.com/research-portal

WH Ireland 24
Pantheon Resources
COPPER & GOLD
Contacts
Head of Capital Markets
Fraser Marshall 020 7220 0484 [email protected]
Research
John Cummins 020 7220 1755 [email protected]
Matthew Davis 0113 394 6620 [email protected]
Brendan Long Oil & Gas 020 7220 1694 [email protected]
Paul Smith Mining 0113 394 6609 [email protected]
Nick Spoliar 020 7220 1761 [email protected]
Jason Streets 020 7220 1693 [email protected]
Emma Ulker Healthcare 020 7398 1141 [email protected]
Susanna Virtanen 020 7220 1674 [email protected]
Charlie Cullen 020 7220 1678 [email protected]
Sales & Trading
Harry Ansell 020 7220 1670 [email protected]
Dan Bristowe 020 7220 1648 [email protected]
Melvyn Brown 020 7220 1688 [email protected]
Corporate Broking & Investor Relations
Adam Pollock 020 7220 0482 [email protected]
Jasper Berry 020 7220 1690 [email protected]
Hayley Mullens 020 7220 1695 [email protected]
Aimee McCusker 020 7398 1136 [email protected]
Alex Carroll 0207 220 1663 [email protected]


