Embed Size (px)
Citation preview
‘INSTITUTO DE ECONOMIA INDUSTRIAL
TEXTO PARA DISCUSSAO NO 93
BRAZIL'S SECOND NATIONAL DEVEL- | _
OPMENT PLAN AND T'TS GROWTH-CUM-
aie DEBT STRATEGY
Jorge Chami Batista
Maio/1986
UNIVERSIDADE FEDERAL DO RIO DE JANEIRO
INSTITUTO DE ECONOMIA INDUSTRIAL
gu
Brazil's Second National Development Plan
and its Growth-Cum-Debt Strategy”)
FRdJ- a) Fan
oO
2 BIBLIOTECA oy oy. Ry a Myer 3 vin ave
(") A preliminary version of this paper was presented in a seminar at the
Faculty of Economics of the University of Cambridge in November 1984 and
at the Department of Political Economy of the University College(London) in
_ November.1985.
EEA Urey BPE iO 1 eucus
7 N2 Regis.ro:
——asaestE res
FICHA CATALOGRAFICA
Batista, Jorge Chami
' Brazil's Second National Development Plan and its Growth-Cum-Debt Strategy. --Rio de Janeiro: UFRJ/Instituto de Economia Industrial, 1986,
94 p.-- (Texto para Discussao; n.93)
I am grateful to Dr. John R. Wells whose
criticisms were a major source of inspiration
for this piece of work. I am also thankful to
Marcelo Abreu and Winston Fritsch for their
useful comments on an earlier version of
this paper, and to José Cechin and Roberto
Viana Batista for their constant
encouragement. Financial support from CNPq
is gratefully acknowledged. None of these
individuals or institutions bear any
responsability for the views and errors
which this paper contains.
page
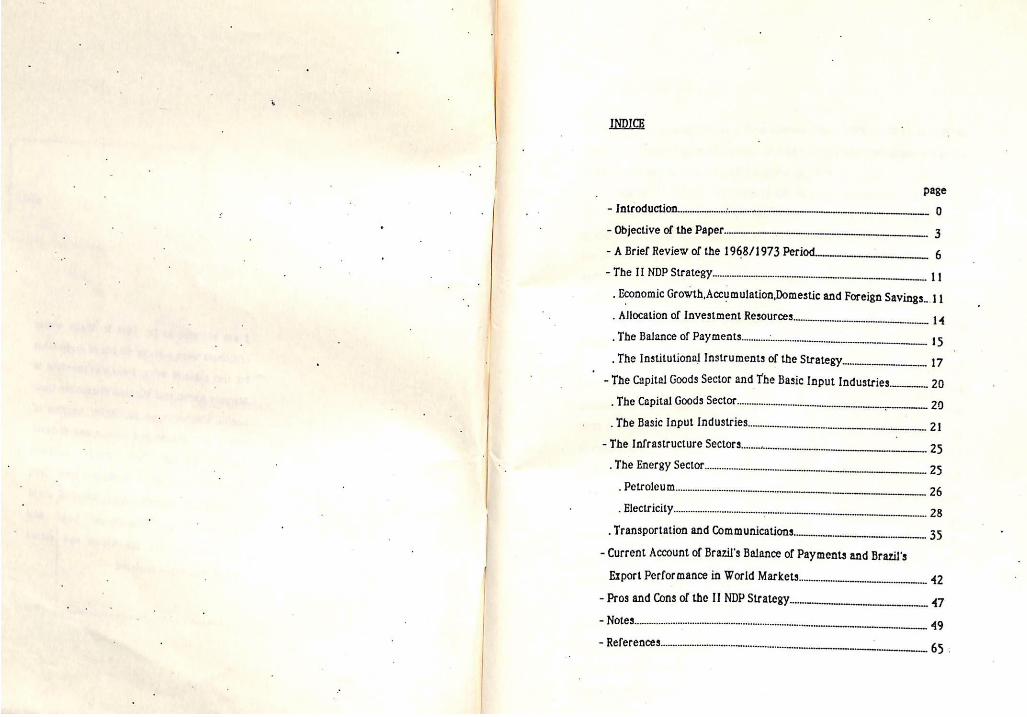
- Introduction : 0
- Objective of the Paper. 3
- A Brief Review of the 1968/1973 Period... 6
- The II NDP Strategy. 1!
. Economic Growth, Accumulation, Domestic and Foreign Savings... 11
. Allocation of Investment Resources......_... stetetersercoeorsserssssscecimnnsttmnenens 1
. The Balance of Payments. : 15
. The Institutional Instruments of the Strategy. 17
The Capital Goods Sector and The Basic Input Industries... 20
. The Capital Goods Sector 20
. The Basic Input Industries 21
- The Infrastructure Sectors 25
. The Energy Sector 25
. Petroleum 2%
. Electricity 28
. Transportation and Communications... ccenmmemenennne 35
- Current Account of Brazil's Balance of Payments and Brazil's
Export Performance in World Markets. ee 42
- Pros and Cons of the II NDP Strategy. _.. 47
- Notes 49
- References, . 65.
INTRODUCTION
Brazil's Second Notional Development Plon (1975 - 1979), I! NDP for
short, vas published in September of 1974 as the basic programme for the
government which came into office in March 1974.
One of the central elements of the strategy proposed in the plan was
the decision to maintain a rapid expansion of the gross domestic product
projected to grow at 10 percent per year between 1974 ond 1979, despite
the quadrupling of the oil prices in 1973/74 and the fact that the industrial
sector in Brazil was working ot full capacity, with some branches showing
signs of overheating. In order to sustain such a high rate of economic growth
while maintaining external equilibrium, the I! NDP emphasised the need to
change the structure of the economy. ’
The preservation of rapid economic growth under deteriorating
international conditions meant that the underlying external adjustment
proposed in the I] NDP was based on 6 medium or long-run strategy. In the
first few years, current account deficits were expected to teke place, and
as result, the net foreign debt would rise. The counterpart of these deficits
vould be on inflow of foreign capital (both in the form of loans and direct
investment) which would be used to finance the investment necessary to
implement the desired change fn the structure of the economy. This change
would be designed to raise exports and reduce imports‘”) so ns to generate in
the medium or long-term sufficient foreign exchange to service the debt and
perhaps, eventually, to eliminate it. —
In point of fact, helped by favourable changes in the terms of trade,
the current account deficits showed a downward trend between 1974 end
1977. Borrowing in excess of what wes required to finance the current
account deficits in the 1976/78 period led to a rise in Brazil's international
reserves, which reached the impressive figure of US$12 billion (10°) by the
lack of confidence in Brazil's growth- the net foreign debt (excluding intern billion at the end of 1973 to us$32 bi
Cum-debt Strategy. On the other hand, ational reserves) increased from US$6 Nion at the snd of 1978, However, the second round of Sherp rise in interest rates end the
In view of these facts, the Srowth-cum-debt Strategy, as q way the Sconomu after the first of| sh Indeed, the Il NDP strategy has time
recession, From
t Plan was born,
-3 -
-(2) djustment era™’. beginning of the adjustm yore
On the occasion of the twentieth anniversary of the we ery in
coup, Roberto Campos added:
“we have made timid and inadequate adjustment to the
first oi! crisis, with too ambitious Frias
sectors (nuclear energy, steel, etc) ond without the s a
of domestic savings while the morbid presence of the
< refusal to adjust which was made possible by ii
easy access to the eurodollor market is at the al of the
collapse of our dreem of becoming a large power). ape es
This view, though on extreme one, has been quite influen i. i
ssed in Brazilion newspapers in a variety of forms”, It w Fi a, re in o series of two articles for The Times on how Brazil also put fo C
ent the foreign loans that left it deep in debt: sp
“Trying to do too much, too quickly, in the years before the second oil price rise, led Brazil into its present financial - 8
difficulties),
E F THE PAP
The principal sim of this paper is to discuss the nai ut in the 1] NDP and adopted in Brazil between 1974 and ;
strategy set 0 king the external adjustment of the economy. The period of ceca a is extended until 1982 in unter to examine same of the effects of the investment decisions made between 1974 and 1979.
It is argued that, despite the mistakes made by the authorities in
» © positive &ccounts in addition to Sustainj
negative aspects of the I NDP strategy.
NC must be stressed that this paper “88 not have the purpose of
«5 =
all other possible alternatives.
“growth in Brazil could be led-boom which took advantage of an pacity in industry in the mid-60's3). less, investment in fixed
of GNP in 1968 to 24.1 in 1970 and 26.0% in.1973(4) However, one essential feat ure of rapid economic expansion in Brazil in this period was the exceptio nally favourable international condition ——which allowed ¢ very Sharp rise in Brazil's capacity to import’), World imports (in US ‘dolla and 1973 compared to 7.1% j (goods-fob-in US$) responded t “ise per annum between 1967 since 195315).
rs) increased 17.5% Per year between 1967 n the 1953/1973 Period. Brazil's exports
0 this upsurge in world trade with o 246% and 1973, after having been almost stagnant
The fact that the volume (quantity index) of Brazil's exports more than doubled between 1967 and 1973 cou
Capital picked up very rapidly from 21.4%
-7 -
exports. As © consequence, the shere of menufactures In total ee 2
US$) went up from 20.7% in 1967 to 31.3% in 1973. Exports ea agriculture
products olso diversified with coffee loosing its relative Teas es
other export crops such os soybeans experlenced a very sharp rise’.
This most vigorous and continuous rise in export anne not
witnessed in Brazil since the 1920's), helped to sustain en extraordinary
increese in imports. The volume of imports (quantity index) rose 18.5%
between 1967 and 1973 while imports of goods in US dollars increased at
the staggering rate of 27.5% per annum betwen these two years. The import
coefficient (imports of goods and services over GNP) went up from 5.62 in
1967 to 9.6% in 1973 os total imports of goods and services soared from
US$2153 millions in 1967 to US$ 685? millions in 1973.
As a result of imports being greater than exports, there were
continuous and, since 1969, rising current eccount deficits from 1967 to
1973. This was meade possible by the extraordinary ae of the
international copite! market"! which not only supplied Brozil via the
necessary financing for the current account deficits, but allowed Brazil to
increase its international reserves from 10% of total imports in 1968 to
1428 of total imports in 19731), Consequently, the gross foreign debt rose
from US$3780 millions at the end of 1966 to US$12571.5 millions at the
" end of 1973, but the net fereign debt (gross foreign debt less international reserves) increased much more modestly from U5$3523 millions to
2) US$6156.5 millions between these two years(!2),
It is perhaps importent to stress at this point the euphorie which was
generated in some quarters of the society by the so-called ‘economic
iracle’. Government propagenda seemed to have reflected as well as m ‘
reinforced the belief of some groups (particularly among military men, government circles, entrepreneurs ond middle class groups) that Brazil wes rapidly becoming a world power. Economic success was likely to have been
Procesg(!5),
Furthermore, Since the j Of capacity by 1972/73, to m
merginol propensity 4 ation. That, in tum, would tend to raise the Yy to import Capital goods above its average propensity. In
h-rate of 22.7% of the domestic capital goods 973, the volume of imports of cepitol goods
he same period’'®). The refore, although Brazil's current account deficits in this Period
fact, despite $n annual growt Sector hetween 1970 end 4 Increased 24.78 per year int
may, b : : Y. by ond large, be explained by the very high rates of economic growth 0 Upled with @ somewhat libero! approach to im ports''?) it sep ’ m Structural nature of Brazil's unbalanced 8 that the growth model wa becoming « major factor in the rise of imp 8 Increasingly
orts as well ag in Making imports less elasti ¢ with respect to @ rise in their price By struct : Fuctural nature of
=942
intermediate goods sector, but also to the relatively small size of the
capital goods sector ond of a number of essential intermediate goods
industries.
If the rising trend in Brazil's current account deficits in 1969/73
was already an indication that « sizeable current account deficit was to be
expected in 1974, even if the terms of trade was to remain constant at the
rather favourable level of 1970, assuming no change in policy end in the
growth pattern of the economy, the first oil shock drastically eggravated
that prospect.
’ As a result of a rising use of oil per unit of output and of on almost
. . stagnant domestic production of oil, imports of crude oil over domestic
consumption (ignoring stock changes) increased from 61% in 1968 to B08 in
1973. New discoveries of oi! in Brazil were roughly equal to the amount
extracted so that the level of known oil reserves remained nearly constant
from 1968 to 1971, showing o declining tendency thereafter. In point of
fact, because oi] production from the known oi! reserves onshore wes
falling and bound to continue to fall due to exhaustion, and bearing in mind
the inevitable log between oil discovery and production, the short run
- prospects of the domestic oil supply in Brazil were not good at oll, even
after the offshore oil reserves became known in 1974.
What the analysis in this section suggests is that by 1974 Brazil's
imports had become quite price inelastic in the short run and, given that
the first oil shock led to both @ drastic contraction in the economic
exponsion of the advanced economies and a fail in the volume of world trade,
it would have been extremely difficult for Brazil to have significantly
increased the rate of growth of the volume of exports, even if domestic
absorption in Brazil was also to fall sharply. As demend in the advanced
economies was declining competition for external morkels must have been
substantially intensified.
-11-
{2) The IL NDP Strategy
(2.1) Economic Growth, Accumulation, Domestic and Foreign Savings
Central to the II NDP strategy wos the decision to maintain a rapid
expansion of the gross domestic product, projected to grow at 10 percent
per year between 1974 ond 1979. Nevertheless, the Il NDP recognised the
difficulties, under the circunstonces, in sustaining such a high rate of
economic growth:
‘The government is aware of the difficulty of
maintaining rates of growth of the order of 10 percent from
1975 onwards, mainly in view of the fact that the industrial
sector has reached full utilization of capacity and due to the
problems related to the energy crisis, the shortage of raw
materials and their effects on the balonce of payments.
Consequently, it will be necessary to keep o flexible
attitude, assessing year by yeer the results achieved in
order to make the proper adjustments. Nevertheless, the
option of sustaining o high rote of growth was teken es a .
basic policy, since for a country which is still building up
its entrepreneurship and industrial structure, a set back
could mean a violent shock for its managerial organization
ond for the viability of its national development™”),
In order to sustain such o high rate of economic growth, while
maintaining external equilibrium, the 1 NDP emphasised the need to change
the structure of the economy.
“It is undeniable that from now on to grow at 10 percent
with the same supply and demand structure of the previous
phase would be difficult and not very rational. The reasons
-12-—
wes th at which Permitted the resumption of e conomic Growth dospitethetalirieuitieisiated tothe impo rtation of
bstitution
and skilleg
Capital goods. Furthermore, the present import su strategy requires inputs, Particularly technology labour, » Whose internal Supply 13 inelastic in th medium term),
nn
It should be stre ssed that the Criticisms of Abreu and Malan f on focussed
-13-
on the inconsistency between the very high growth rote terget and what
they rightly saw es the necessary sdjustment in the supply end demend
structures of the economy,
In order to echieve o 10 percent annual growth rate in the 1974/79
period, the I! NDP estimated that the gross fixed capital formation would
also grow ot 10 percent per year, thus remaining constant ot roughly 25
percent of total GDP. , j
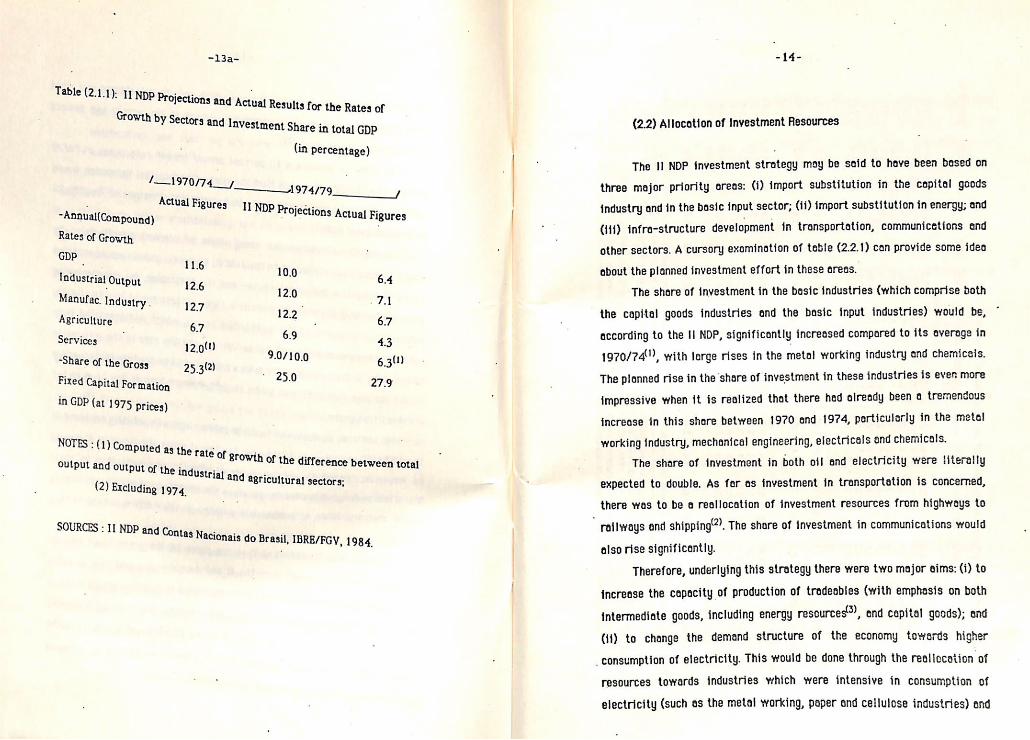
Teble (2.1.1) shows the breek down of planned growth rates by
sectors. Note that, according to the I] NDP, economic growth would continue
to be led by the industriel sector and, in particular, by manufacturing
industry and thot the rates of growth in these sectors would be only stightiy
below those achieved in the 1970/1974 period, which had benefited from
both the favourable international conditions and the rise in the utilization
of capacity. Growth in agriculture was projected to be slightly faster, while
in the service sector it was to be slightly slower than it had been in the
previous five years.
It can also be observed thet the rates of growth actually achieved in
the 1974/79 period were well below the target rates. Nonetheless, it should
be emphasised that the actuol rates of growth remained close to their
historical average rates for Brazil since World War II end were considerably
higher than the rates of economic exponsion in the world economy in this
period®),
It must also be stressed that the share of the gross fixed capital
formation in GDP wes well over the 11 NDP terget - see last row in table
(2.1.1). This is a clear evidence of the tremendous investment effort made in
this period. Moreover, the rete of domestic savings rose from 22.6 percent
in 1965/66 to 23.4 percent in 1967/73 and to 25.3 percent in the 1974/79
period), This is in sharp contrast with the views expressed by Campos
(quoted earlier in this paper) and by Furtedo'!©),
-13a-
Table (2.1.1): 1] jecti i NDP Projections and Actual Results for the Rates of OWL h by Sectors and Investment Share in total GDP
(in percentage)
/__1970/7 : 2 “ Actual Figures Ul san
~Annual(Compound) NDP Projections Actual Figures Rates of Growth
GDP hax: 11.6 10.0
Industrial Output 126 : 6.4
Manufac. Industry . 12.7 12.0 ) 7
Agriculture 67 me 6.7
6.9 Services 12.90) say 43
“Share of the Gross 25,312) 0710.0 6.31)
Fixed Capital For mation ant 27.9
in GDP (at 1975 Prices)
NOTES : (1) Com puted : as the rate of 8rowth of the difference between total output and ou i put of the industrial and agricultural sect ectors; (2) Excluding 1974,
SOURCES : II NDP and Contas Nacionais do Brasil, IBRE/FGV, 1984
-14-
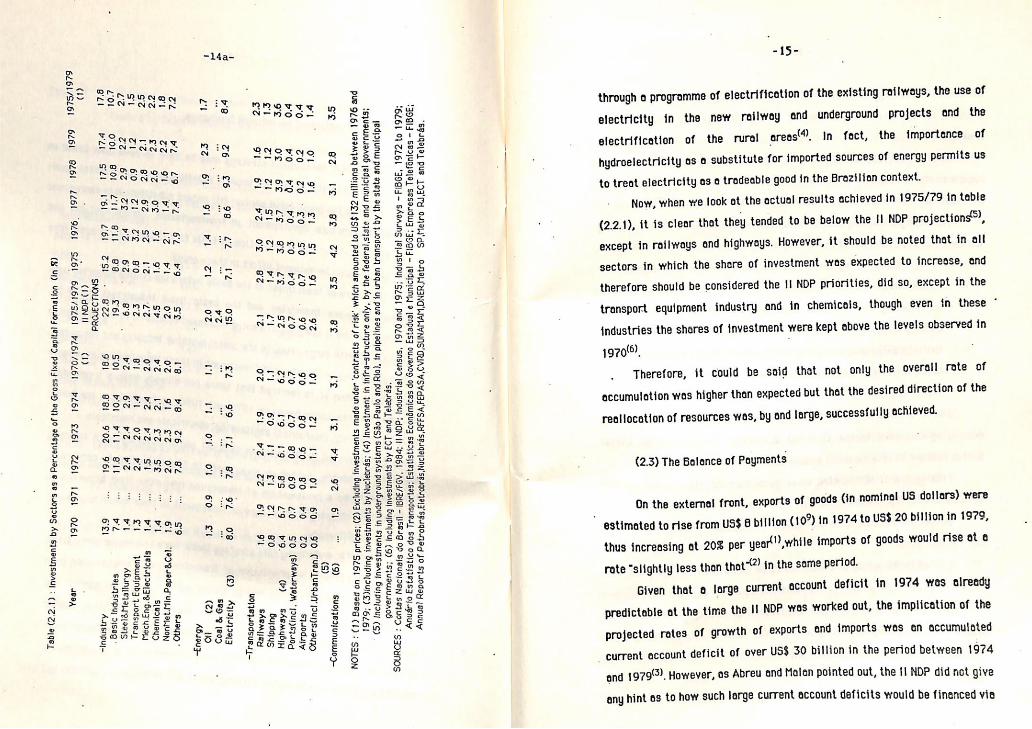
(2.2) Allocation of Investment Resources
The 1] NDP investment strategy may be said to have been based on
three major priority areas: (i) import substitution in the cepital goods
industry ond in the basic input sector; (ii) import substitution in energy; and
(iii) infra-structure development in transportation, communicetions end
other sectors. A cursory exomination of teble (2.2.1) can provide some idea
about the planned investment effort in these areas.
The share of investment in the basic industries (which comprise both
the capital goods industries and the basic input industries) would be,
according to the I NDP, significantly increased compared to its average in
1970/74), with large rises in the metol working industry and chemicsis.
The plonned rise in the ‘share of investment in these industries is eyen more
impressive when it is realized that there had already been a tremendous
increase in this shore between 1970 end 1974, perticularly in the metal
working industry, mechanical engineering, electricals and chemicals.
The share of investment in both oil and electricity were literally
expected to double. As fer as investment in transportation is concerned,
there was to be a reallocation of investment resources from highways to
" railways and shipping”. The shore of investment in communications would
also rise significantly.
Therefore, underlying this strategy there were two major aims: (i) to
increase the capacity of production of tradeabies (with emphasis on both
intermediate goods, including energy resources”, end capital goods); and
(ii) to change the demand structure of the economy towards higher
_consumption of electricity. This would be done through the realiccation of
resources towards industries which were intensive in consumption of
electricity (such as the metal working, paper and cellulose industries) and
Table
(2.2.1)
: Investments
by Sectors
as
a Percentage
of th
e Gr
oss
Fixe
d Ca
pita
l Fo
rmat
ion
Cin
8)
1975/1979
)
1979
1976
1977
19
76,
1975
19
75/1
979
1972
1973
1974
19
70/1
974
1971
1970
{NOP
C1)
PROJ
ECTI
ONS
(n
Year
17,5
10.8
1.6
1.7
Cee
29
ee
28
2.6
6.7
29
3.0
14
19,1
7.4
19.7
11.8
2.4
3.2
25
1.6
2.1
15.2
8a
29
0.8
1.6
1.4
2.1
22.8
19.3
68
2.3
2.7
45
2.0
NonMet.Min.Paper&Cel,
Transport Equipment
Mech.Eng.&Electricals
. Others
Steel&.Metallurgy
Chemicals
. Basic
Industries
Industry
79
64
35
~l4a-
moiv eg OD
m3 nw ia
mM in 7 mn
oe 0 cae)
Moin ns
Qs ire ~
ers NAW
[= iM cls
7 0 _— Zo
oa -= it
2.9 =i
n F Po: So int
mM Lo = ig
= a o
n
as2 ~WOS
», 25 f- 38 sSo0u
(4)
Railways
Shipping
Highways
Ports(incl.
Waterways)
0 Airports
Others(incl.UrbanTran)
0
-Transportatio
n
3.9
3i
06 628
35
42
3A
3.8
3
orl
4.4
&)
19
2.6
(6)
—Communications
to US$132
mill
ions
between
1976
and
by
the
federal,state
and
muni
cipa
l go
vern
ment
s;
¢S)
Including
investments
in underground
syst
ems
(Sao
Pa
ulo
and
Rio)
, in
pipelines
end
in urban
transport
by
the
stat
e an
d municipal
1979
; (3)including
inve
stme
nts
by Nuclebrds;
(4)
Inve
stme
nt
in in
fra-
stru
ctur
e anly,
governments
NOTE
S : (1
) Based
on
1975
pr
ices
; (2
) Ex
clud
ing
investments
made un
der
‘contracts
of ri
sk’
whic
h am
ount
ed
+ (6)
Incl
udin
g in
vest
ment
s by ECT
and
Telebras.
SOUR
CES
: Contas Nacianais
do Br
asil
- IB
RE/F
GV,
1984;
II NDP;
Industrial Census,
1970
and
1975;
Industrial Su
rvey
s ~F
IBGE
, 19
72
to 1979;
Anud
rio
Esta
tist
ico
des
Tran
spor
tes;
Estatisticas Ec
onim
icas
do
Ga
vern
o Estadual
e Mu
nici
pal
- FIBGE; Em
pres
as
Tele
féni
cas
- FIBGE;
Annual Reports
of Pe
trob
ras Eletrobrés,Nuclebrés,RFFSA,FEPASA,CVRD,SUNAMAM,DNER,
Metr
o SP
.Met
ro
RJ,ECT
and
Telebras.
, estimated to rise from US
-15-
through a programme of electrification of the existing railways, the use of
electricity in the new railway and underground projects and the
electrification of the rural areas“. In fact, the importence of
hydroelectricity os 4 substitute for imported sources of energy permits us
to treat electricity os a tradeable good in the Brazilian context.
Now, when we look at the actual results achieved in 1975/79 in table
(2.2.1), it is clear that they tended to be below the 1! NDP projections),
except in railways and highvrays. However, it should be noted that in all
sectors in which the shore of investment was expected to increase, ond
therefore should be considered the 1! NDP priorities, did so, except in the
transport equipment industry and in chemicals, though even in these *
industries the shares of investment were kept above the levels observed in
1970),
Therefore, it could be said that not only the overall rate of
pected but that the desired direction of the
fully achieved. accumulation was higher than ex
reallocation of resources vas, by and large, success
(2.3) The Balance of Payments
On the external front, exports of goods (in nominel US dollars) were
$ 6 billion (10°) in 1974 to US$ 20 billion in 1979,
thus increasing at 20% per yeor'!?,while imports of goods would rise at o
rate “slightly less than that~”) in the seme period.
current account deficit in 1974 wes slready
orked out, the implication of the
Given that a large
predictable at the time the II NDP was W
ected rates of growth of exports and imports wes an accumuloted
cit of over US$ 30 billion in the period between 1974 proj
_ current account defi
and 1979), However, as Abreu and Malen pointed out, the {1 NDP did not give
any hint as to how such lerge current account deficits would be finenced vie
frest to maintain the system in crisis or t 0 3 Permanently. the advance
va d economies or to f rust: underdeveloped countries
Pe » Whic
the international community Countries) would also have to
h moke up the majority of Since they (the oij exporting bear the consequences-(6).
necessity of access b developing Countries to the fi sates tlhe
nancial Centres of Euro States in order to finance those pe and the United countries commercial deficits’”), Finally, the I! Nop stat &d Some guidelines for the current account deficits ang foreign indebtedne s3(6).
{i) the former would be limited to « maximum of 20% of the gross Capital formation (9).
-17-
(2.4) The Institutional Instruments of the Strategy
The I! NDP stressed its commitment to what it called “a modern
model of market economy” in which “the strategy of development {s actively
conducted by the government%"). In fact, the II NDP pledged to be aiming at “an equilibrium” between the participation of the state and of the private
sector in the economy ond between national and foreign enterprises within
the private sector!2),
However, despite the political lobbies against the state intervention
in the economy, the I] NOP made clear the areas in which responsibility
- would fall with the government.
“In addition to being responsible for the strategy and
public functions such as security, justice, etc., the
government considers the following its own arees of ection:
(i)Infra-structure sectors such as energy, trensportation
and communications. The production of equipment and
materials for ‘these sectors is, nonetheless, the
responsibility of the private sector; (ii)The areas of social
development (often in conjunction with the private sector)
such os education, health and social services (housing is a
special case since contracting is the private sector’s.
responsibility),
Bearing in mind the importance of the projected shore of the
investments in infra-structure in the total gross fixed cepital formation
and the very relevant part which the government was expected to play as a
direct producer, especially in mining and in the steel industry, and in the
financing of enterprises in the capital goods sector and in the basic input
industries, it seems clear that, the authorities rhetoric notwithstanding, .
no reduction in the state intervention was envisaged by the 11 NDP.
of contro! of the market and from the absorption of Competitors~6) The 11 NDP Strategy also aimed ot diversifying the origin of foreign
the use of economic instruments - incentives and disi and fiscal - with no use of restrictive legislation ond the rules would be maintoined), Stebility of the
A * regords the results ectualty achieved the existing evidence) Suggest 9°Sts thot indeed the share of government Investment (including those of se 0
-19-
state-owned enterprises) in the total gross fixed capital formation tended
to increase in the 1974/79 period. As to the participation of the national
private entrepreneurship in the economy, to the best of my knowledge, no
clear-cut evidence has yet been produced.
The institutional instruments of the Il NDP strategy came under
attock in Lessa’s ex-post analysis of the 1974/1976 period’), Lessa’s main
critical point seems to have been the supposed “failure of the authoriterian
regime to alter the pattern of industrialization in Brazil“! which was one
of the main goals of the !! NDP.He argued that the state-owned enterprises,
chosen to be the central agents of the I! NDP, could not “for structural
reasons, in the downturn of en economic cycle, carry out the strategy!)
Deleys in some investment projects, the government incapacity to
sustain the projected high levels of aggregate demand and the political
friction between the state and some Brazilian entrepreneurs (particularly
from the capitol goods sector) were pointed out by Lessa as evidence of the
‘collapse’ of the II NDP strategy!!2),
Lessao’s central criticism is rather misleading. It is undeniable that
the military regime was suthoritarion. It is beyond any doubt that a major
change in the structure of the economy (or in the pattern of
industrialization) would inevitably generate political friction among the
"different interests from different sectors of the economy, especially at o
time when economic growth was slowing down. However, there seems te be
no reasoning behind the idea that the state-owned enterprises, becouse of
their own nature, could not carry out the strategy. In fact, given the
circunstances, they were quite successful in sustaining what, by all
standards, should be considered very high rates of economic growth
_ (probably even too high rates), as well as in making fundamental changes in
the structure of the economy, as will be demonstrated in this paper.
’ -20a- -20-
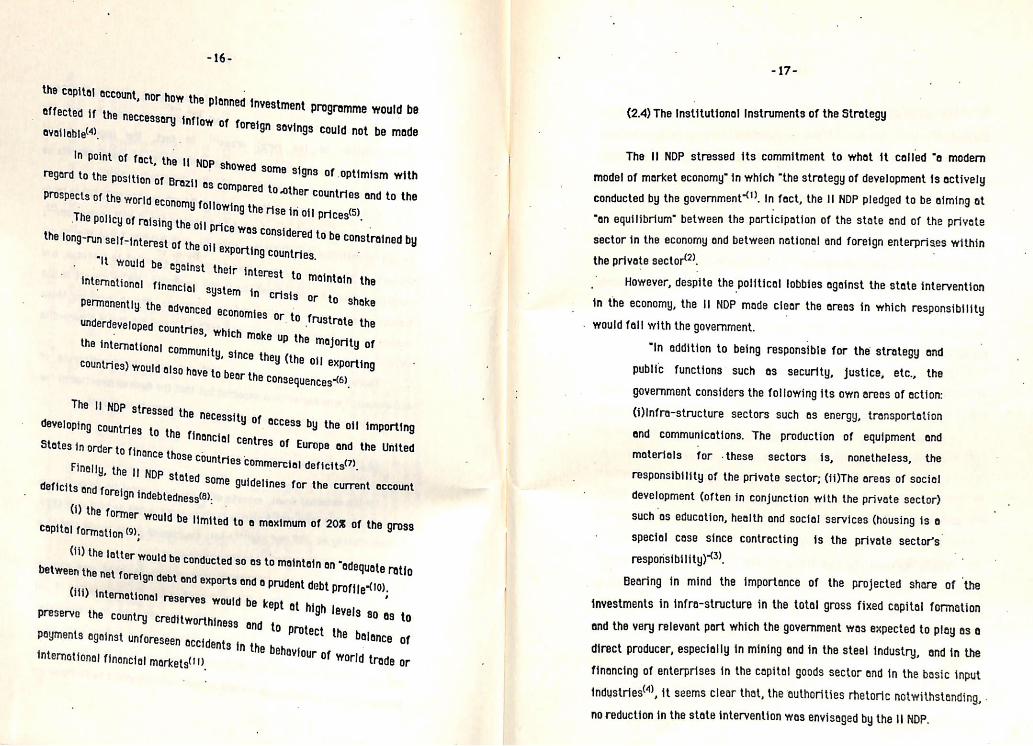
Table (3.1.1): II NDP Projections for the Capital Goods Industry (3) The Capital Soods Sector an Basi 8 |
Planned Output = Annual As the projected allocation of investment resources has shown, the
Growth-Rate (in: percentage)
: ;
in
I NDP strategy made clear its two main priority areas: the energy sector 1974 = 1979 ie
; 11.2
and the basic sector, Comprising the capitat goods Sector and the basic input b: ut( 102 tonnes) 2000 3400
9 Total Outputf
-_ phat ee A
MechEng.&ElecEquip.(i0tonnes) 898 1603 me The adjustment in the economic structure of Brazil
Tractors (1000 unities) ' 4 84 13.8 which is necessary in view of the oi| Crisis and the new
Shipbuilding (1000 DWT) 410 1140 22.7
. Stage of its industria} development implies in great ‘ Railway Equipment (10? tonnes) 122 214 11.9
emphasis to the Basic Industries, especially the copite! "SOURCE: 11 NDP.
goods sector and heavy eletronics as wel! as the Basic Input Industries, in order to Substitute imports and . If possible, open up new exports*2). Table (3.1.2) Capital Goods - Domestic Production of Transport Equipments In the next section the energy sector will be exomined. The next two subsections deal with the impact of the i Year Ships Locomo- Train Aiplanes Tractors Lorries Buses
investment projects on the . oo structures of production ond demend of the Capital goods sector and the Ss 68iwniy Gini (unity) (unity) cunt) CGany stony)
“0 | 1970 120.6 11 1808 52 16707 . 38388 4058
o 197} 188.3 60 1935 61 25448 38868 4393
(3.1) The Capital Goods Sector
1972 3136 36 £9962. GT iri BAAD: 499557, S230 1973 260.5 56 3406. 111 44211 69202 6362 1974 320.4 77 3576 = 105 52741 79413 8262 1975 466.2 107 5025 279 65666 78688 10126
its terget. The 1976 700.5 106 4479515 71713-83891 12059 & tremendous 1977, 511.6 110 2538 550 59419 101338 13828
j 1978 601.0 42 3053 221 55874 = 86269 14340 bie 1979 14015 47 2513-279 64511 93051 12832
SOURCES: Conjuntura Econdmica, FIBGE, Anuario Estatistico dos Transportes and Estudos Especiais N2 1 IBRE-FGY, 1979.
Table (3.1.1) gtves the targets which were set for this sector by the WONDP. Teble (3.1.2) brings out the actual results for the domestic Production of capital goods in the transport equipment industry. It can be observed that the production of ships in 1979 surpassed production of all other transport equipment underwent expansion until about 1976/77, Suggesting that thei Production were likely to have reached levels ye Output, however, has tended to decline since then ag O result of a fall in demend. ,
-21-— io -21a-
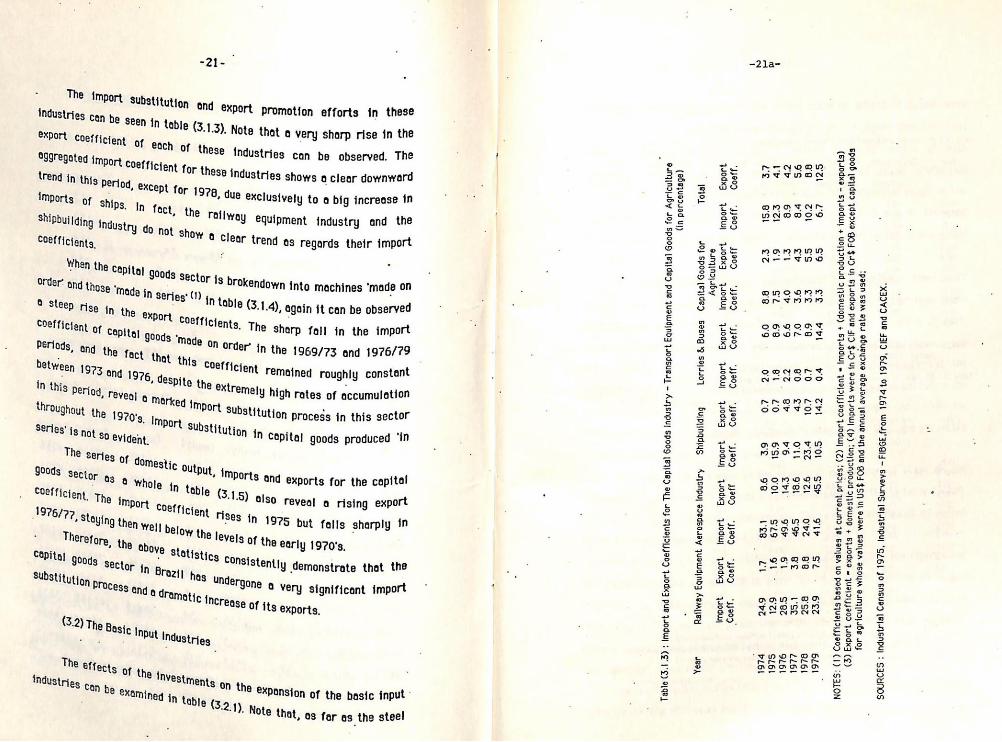
The im Rela Port substitution ond export promotion efforts in these 88 Can be Seen in teble (3.1.3). Note thot a very sharp rise in the Sxport coeff
Coeff.
3
ept for 1978, due exclusively to a big increase in
(in
percentage)
Total
Import
Export
in, te 5 BawooS Shipbuilding industry g ae railway equipment industry and the s O not s a coefficients how « clear trend as regards their import
£8 manne z
az 3 oo When the cq a ’ Pital goog Teng
Order” nd those oN goods ste '8 brokendown into machines ‘made on ZEE engenn N Serigg* (1) : € 3 om © sleep rise in th in table (3.1.4), again it can be observed Se © export Coefficient ag
Lal goods "made on oO 8, Ond the fact between 1973 ang nha this Coefficient remained roughly constant
nie ee » Fspite the extremely high rates of accumulation } marked {m throughout the 1970's, Import s an a A a prottaph
u Series’ is not 50 evident.
8. The sharp fall in the import Tder in the 1969/73 end 1976/79
Coefficient of capi
Export
Coeff
Lorries
& Buses
Capi
tal
Goods
for
Import
Coeff.
2 1 2 9 0 0
Export
Coeff
litution in Copital goods produced ‘in
Shipbuilding
Import
Coeff.
Export
Coeff
Import
Coeff well b
Therefore, the above SIs of the early 1970's, ; Stati Copital goods sector jn sin Stics Consistently demonstrate that the
Plow the ley
Export
Coeff.
Ratlway
Equipment Aerospace
Industry
Import
Coeff
Table
(3.1.3)
: Import
and
Export
Coef
fici
ents
fo
r The
Capital
Goods
Industry
- Tr
ansp
ort
Equipment
and
Capital
Goods
for
Agriculture
Year
omes
tic
production;
(4)
Impo
rts
were
in
Cr$
CIF
and
expo
rts
in Cr
$ FO
B ex
cept
capital
goods
exch
ange
ra
te wa
s used;
urrent prices;
(2)
Import co
effi
cien
t =
Imports
+ (domestic
prod
ucti
on
+ im
port
s - ex
port
s)
for
agriculture
whose
values were
in US$
FOB
and
the
annual average
(3)
Export
coef
fici
ent
= ex
port
s +
4
SOUR
CES
: Industrial Ce
nsug
of
1975
, Industrial Surveys
-FIB
GE.f
rom
1974
to
1979,
CIEF
and
CACEX.
NOTES:
(1)
Coefficients based
on valuas atc
1969
1970
197]
1972
1973
1974
1975
1976 1977 ° 1978. 1979 1980
-21b-
"and ‘in Series’ (in ee Total ‘in series’ Capital Goods Export
1 y ital Goods ‘in series’
‘ cont
Capital oi ‘on a a sie Export
Wise aie Coefficien!
oe Coefficient Coefficient Coofficient Cg
se 43
55.7 3A 2
‘ 31.4 ~
53.1 43
24.7 43
-
48.1 46
ibs oo
"
50.8 3.3
: woe
6.4
0.41 23 e re od 39.8
3.0 27.0’ 7.0
cer Le
40.2 32 279 88 a :
43 5.1
22.8 7.8
242 si
323 46 - 21.4 _ 24
25} es
a79 Bg
20.5 14.3 ,
1 ite
29} 107 ° 24.8
18.7 A
21:
37.) 15.9
249 23.1
dial, 1983
SOURCES: cas bei 1 8 Exports, ae de Ma ‘SnuFaturados Yo Brasil, FGV/Banco Mun
( ‘HAS ang 11.20) an, and Cac) CEX. Tabla (3.3 5): Rates Of Grow wth of
Year
F Output, Exp orts a ne lmport ond Export Coefficients
of the Capital Googe Indus Ustry (in centages) - se on quantity indoxes - ~ base year = 1970)
Real Rates of Growth Import
Export
Domestic Exports Coefficient Coefficient
Cutput E 1979
- Sb
24, 3.0
197) 127
91 279
29
1972 20.9
42.0 29.4
3.4
1973 35.6
200 25.0
3.0
1974 ‘1S7
1045 28.8
33
1975 51
24,7 32.1
63
1976 149
04 23.4 ° 3.5
1977 “45
40.8 19.7
8.1
1978 5.9
28.0 21.0
9.7
1979 57
316 19.9
12.1
1989 66
28% 19.9
14.6
198) ~18,7
11.4 22.0
20.1
1982 ~10.9
27.2 19.2
16.4
1993 -20.2
76 73
19.0 NOTES: (1) Domestic Outbut in 1979 gc cor 1981) oF Malan ang Bonelli (1976);
(2) Exports and imports jn 1970 ca) sty fi value 85 In US$ Fog 08 by using the average
Skchange Tate (say Pricg por
chase Price for ®xports)
SOURCES Conjuntura Ec Shelli ang Rat (19
e Central B id Fi
-22-
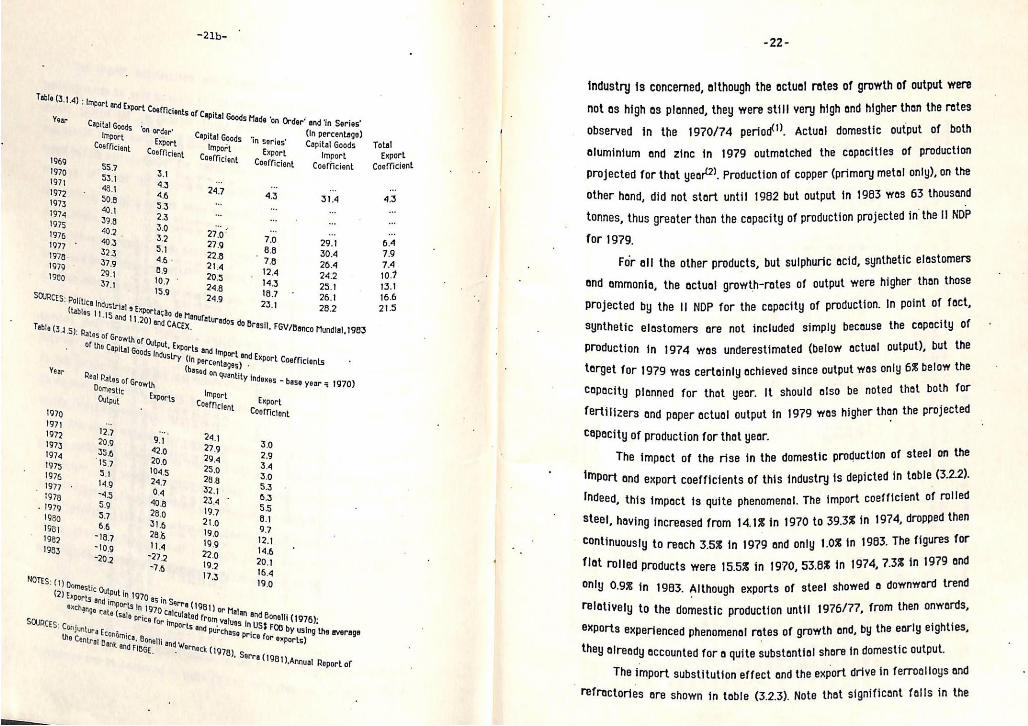
th of output were d, although the actual rates of ; ine thon the retes
industry 1s concerned, wareabill very Mair er tic output of both
not os high as plonned, ms period). Actual aware: of production
observed in the a outmatched the _ metal only), on the
aluminium and zinc a Production of copper ae wos 63 thousand
projected for that year?). until 1982 but output bi rojected in the I! NDP
other hand, did not ba the capacity of production p onnes, thus greater
etic elastomers
1979. ducts, but sulphuric acid, a ae Pada For all the other pro (becrntes of output er In point of fact,
ond ammonia, the a in Ae copacity of ie the copecity of
Projected by the 11 NDP = included simply =e output), but the
synthetic elastomers oe wir eslnat et ne only 6% below the
Production in 1974 was inly achieved since outpu e noted that both for
terget for 1979 was ae eor. It should also b her than the projected
cepacity planned for a al ine 108 BD | the
ilizers ond paper ac
steel on
cl iiieaaiatel oa a domestic sea F teble (3.2.2). The impact of the i of this industry ts ene ig:
import and Rapa’ coneyicten henomenal. The ae 1974, dropped then
Indeed, this impact is quite i 1% in 1970 to 39.3% ae The figures for
Steel, having increased sn 1979 and only 1.0% in if 7.3% in 1979 and
“ontinuously to reach 3.5% Lai in 1970, 53.8% in a Patna tbo flat rolled products were i exports of steel Be from then onwerds,
only 0.9% in 1963. Althoug roduction until 1976/7 : the aorly eighties;
relatively to the domestic -” rotes of growth and, domestic output.
“xPorts experienced phenome uite substantial on ae in ferroalloys and
they already accounted for a q ffect and the export 6 ificant falls in the
The import Siler . (3.2.3). Note thot sign! refractories ore shown in to
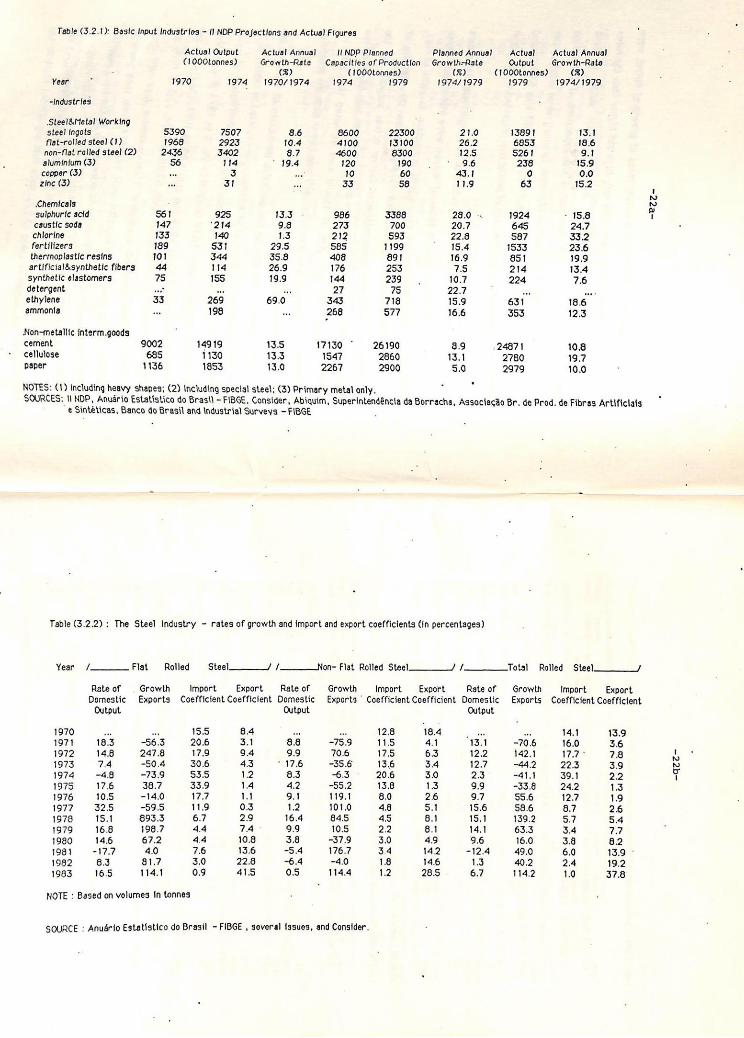
Table (3.2.1); Basic Input Industries — 1] NDP Projections and Actual Figures
HT NOP Planned
Year
-Industries
Steel&Metal Working steel ingots flat-rolled steel (1) non-flat ralled steel (2) aluminium (3) copper (3) zine (3)
Chemicals sulphuric acid caustic soda
chlorine fertilizers thermoplastic resins artificial&synthetic fibers synthetic elastamers detergent ethylene
ammonia
‘Non-metallic interm.goods cement cellulose paper
Actual Output
(1000tonnes)
1970 1974
5390 7907 1968 2923
2436 3402 56 14 a 3
31
561 925 14? “214 133 140
189 $31 101 344 44 114
75 15S
33 269 Ve 198
9002 14919 685 1130 1136 1853
Actual Annual
Capacities of Productian (1000tonnes)
Growth-Rate
(%) 1970/1974 1974
8.6 8600 10.4 4100 3.7 4600
* 19.4 120 hs 10
33
15.5 986 9.8 273 1.3 212
29.5 S585 35.8 408 26.9 176 19.9 144
ea 27 69.0 343
268
13.5 17130 13.3 1547 13.0 2267
1979
22300 13100 6300
199 60 58
3388 700 593
1199 891 253 239 7S
718 577
26190 2860 2900
NOTES: (1) Including heavy shapes; (2) Including special steel; (3) Primary metal only, SOURCES: II NDP, Anuario Estatistico do Brasil - FIBGE, Consider, Abiquim, Superintendéncla da Borracha, Associacdo Br. de Prod. de Fibras Artificials
e Sintéticas, Banco do Brasil and Industrial Surveys — FIBGE
Planned Annual Actual
Growth-Rate Output (%) (1000tonnes)
1974/1979 1979
21.0 13891 26.2 6853 12.5 5261 9.6 238 1 Q
11,9 63
23.0 .. 1924 20.7 645 22.4 S87 15.4 1533 16.9 as! 7S 214
10.7 224 22.7 te 15.9 631 16.6 353
4.9 24871 13.1 2780 5.0 2979
Table (3.2.2) : The Steel Industry - rates of growth and import and export coefficients (in percentages)
Year fii
Rate of Domestic
Output
1970 _ 1971 18.3 1972 14.8 1973 7.4 1974 -4.8 1975 17.6 1976 10.5 1977 32.5 1978 15.1 1979 16.8 1980 14.6 1981 -17.7 1982 83 1983 16.5
Flat Rolled
Growth Import Export Rate of
Exports Coefficient Coefficient Domestic Output
Az 15.5 8.4 aa -56.3 20.6 31 38 247.8 17.9 9.4 9.9
-50.4 30.6 43 ° 17.6 -73.9 93.5 1.2 8.3 38.7 33.9 14 4.2
-14.0 17.7 1 9.1 59.5 11.9 03 1.2 893.3 6.7 29 16.4 198.7 4.4 74 9.9
67.2 44 10.8 3.8
4.0 7.6 13.6 -5.4 81.7 3.90 22.8 -6.4 114.1 09 415 05
NOTE : Based on volumes In tonnes
Growth
-75.9 70.6 -35.6 6.5 -55.2 119.1 101.0 84.5 10.5 -37.9 176.7 ~4.0 114.4
Import
12.8 115 17.5 13.6 20.6 13.8 8.0 48 45 22 3! 3. 1, 1. N
OAA
SOURCE : Anuérlo Estatfstico do Brasil -FIBGE , several issues, and Consider.
Steel__._._£™/ /___Non- Flat Rolled Steel f_
Exports Coefficient Coefficient Domestic
Total
Actual Annual
Growth-Rate
(8) 1974/1979
13.1 18.6 9.1
15.9 0.0
15.2
-P7z-
' 15.8 24.7 33.2 23.6 19.9 13.4 7.6
186 12.3
10.8 19.7 10.0
Rolled Steel... _/
Import Export Export Rate of = Growth Exports Coefficient Coefficient
Output
18.4 atta a 14.1 13.9 41 13.1 -70.6 16.0 3.6 63 12.2 142.1 17.7" 78 3.4 12,7 44,2 22.3 3.9 3.0 2.3 ~41.4 39.1 2.2 13 9.9 -33.8 24.2 13 2.6 97 55.6 12,7 19 5.1 15.6 58.6 87 26 8.1 15.1 139,2 57 5.4 8.1 14.1 63.3 3.4 Ve 493 9.6 16.0 3.4 8.2 14.2 "12.4 49.0 6.0 13.9 ° 14.6 13 40.2 2.4 19.2 28.5 6.7 114.2 1.90 37.8
-qcc-
-22c-
Table (323) : Ferroalloys and Refractories (in Percentages) / — Ferroalloys__ Yoar Rate of Import Export Growth of Coefr, ; Coarr. Domestic Output
: 1970
= 62 177 1971 37.1 18.9 20.0
1972 10.7 88 312
1973 22.7 5.1 26.0
1974 278 75 20.1
1975 73 29 237
1976 19.9 09 283
1977 195 6.1 31.0
1978 10.2 12 365
1979 18.4 03 34.1
1980 127 0.6 30.4
198] 25 2.0 45.6
1992 0.0 0.4 40.7
. 1983 36 02 60.4
NOTE : Baseg on wolumes in tonnas CE : CONS) DER _ hic Table (3.2.4) - Non-Ferrous Metals (in Percentages)
é a Aluminium Rate of Import Export Growth of Coerr. Coerr, Domestic Output 1974 a 50.4 1.6
* 1975 14.8 40.1 1s 1976 15.9 36.0 V4 1977 20.9 36.9 15 1978 73 263 2.0 1979 33.7 23,0 3.4 1980 69 18.8 4.0 1981 5.9 12.0 8.2
* 1982 16.1 4.4 6.4 1963 28.5 23 40.0 — Silicon
Year Rate of Import Growth of Coorf, Domestic Output 1974 ” 94.2
1975 727 - 812
1976 653.5 91
1977 74 06
1978 17.9 05
1979 ~23 0.2
1SB0 1017 03
1981 425 00
1982 sos 18
1983 NOTES - Including prj SOURCE : CONSIDER
15.0 090 70.3, Tae and Secondary mapa} but €xCluding Scrap Imports for Se
‘—___ ey Rale of
Growth of Domestic Output
“377 17.9 17.0 <2:] 18.0 18.6 ~26.6 | 37.4 66.6
Export Coeff,
46.1 35.6 50.1
25.8 31g 26.7 $2.0 72 66.0
Export
Cooff.
25 28 1.4 39 118 13.0 71 27.2 75 15.9
/___ Refractories — Rate of — Import coer
Growth of Coeff. Domestic Output: 5
- 25:3 a 11.8 Ae 59 47 ae
“8.1 6.1 an 62 48 a4 15.8 63 129
pe a 17.6 -23.6 149 223 -23.6 10.1 17.1 “71 5.1
/ (————= iN Export Rate of Import Coat.
Growth of — Coaff. Domestic
tput ei 642—— oe 10.6 56.3 01 33.7 50.7 02 5.7 51.3 01 22.6 49.7 02 15.4 43.3 03 21.8 40,1 106 15.4 21.7 23 -0.4 wt 19 05 3.
4. Tin oan Rate of Import Caaf
Growth of Coaff. Domestic Output as 422
27 12 a “15 06 339 19.7 ae 5 21.1 ! 9 89 03 a ss
“13.2 0.7 B34 -11.4 04 475 19.4 03 685 37.0 0.2
condary production
-23-
ile the export ort coefficients con be observed mee ae ae reveal o quite = ee i ere 'conwarnea’ Tanta a. As for as the main anise import substitution effects la.
provides 0 clear picture. aad industries. In aol! these three se 3 is
the aluminium, zine and ‘ upon imports in 1974, Since the early vai Brazil was highly oa zinc, and since 1977, in the case of sil the case of aluminium ‘an self-sufficient in these metals and a Brazil has Vand ntial shares of its domestic fet = managed to place subs i in the case of aluminium ond silicon). - oe ne at t remained roughly constant at oround pes a i ae ae of primary copper by Caraiba Metais Ades a dhantte scr An down to 40%. Exports of tin fell in 1 aol breueine "hie Rie ac production, but showed a pronounced anne: a ed de tin remeined negligible Saroughout ‘the 1
thereafter. Impo
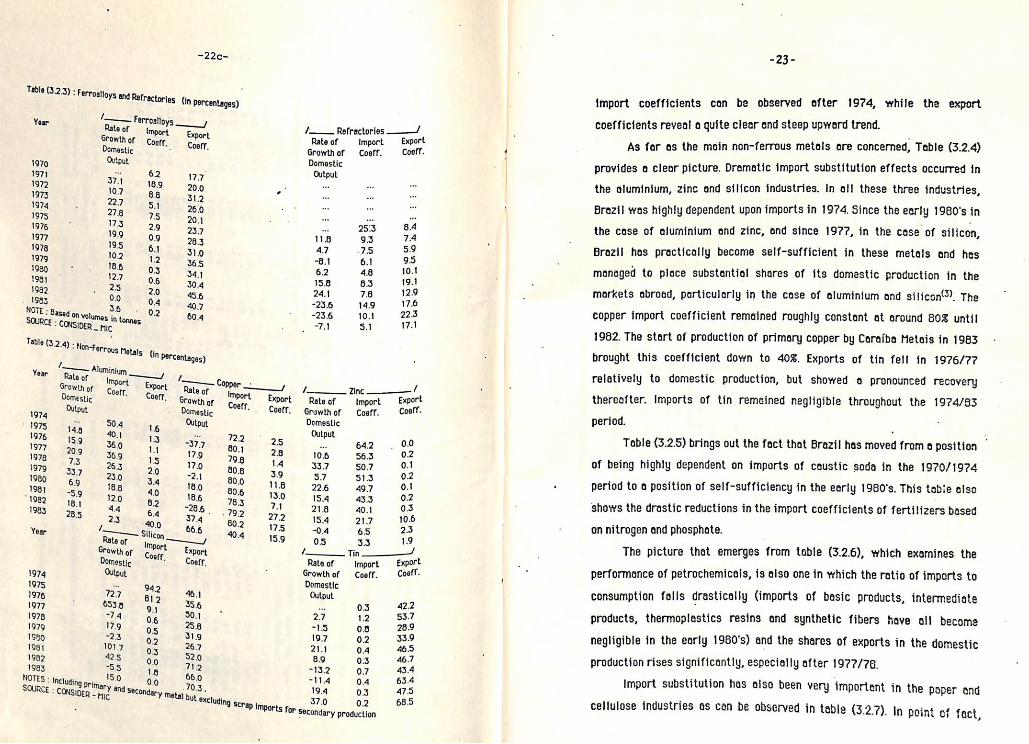
. mr ble (3.2.5) brings out the fect that Brazil hes 7 ra ai ° i
f caustic soda in ale pea enn
es i the early 1980's. = a 7 eetaanin in the import coefficients of fertilizers shows the dras
eS erges from table (3.2.6), which examines és a Li iy is also one in which the retio of ii . performance of petroc ih (imports of basic products, intermedia consumption folis i. resins ond synthetic fibers have oll bests products, ea 1980's) and the shares of exports in the domestic acon een especially after 1927/78. . , ae ee has also been very importent in the poper an
Import su
i eint Gi fact,
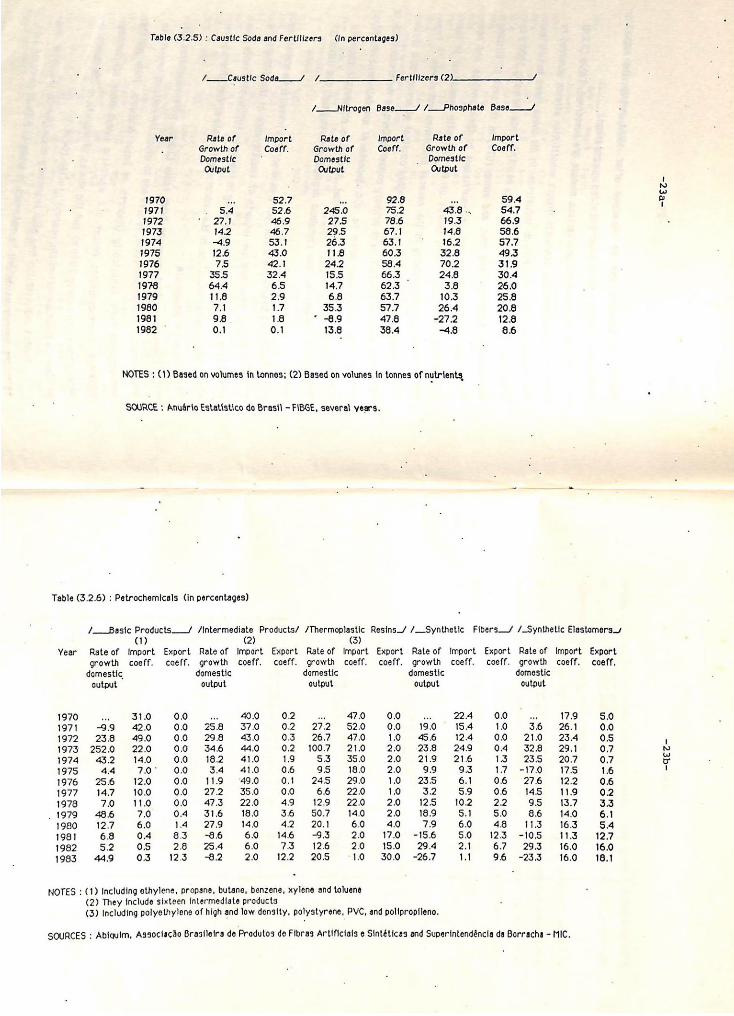
Table (3.2.5) ; Caustic Soda and Fertilizers (In percentages)
Caustic Soda fs er flizers (2)
4.
/——_Nitrogen Base___-/ /__Phosphate Base___/
Year Rate of Import Rate of Import Rate of Import
Growth of Coeff. Growth of Coeff. Growth of Coeff. Domestic ; Domestic _ Domestic Output Output Output
1970 tis 52.7 Rei 92.8 me 59.4 1971 . Sd 52.6 245.0 75.2 8 .. 54,7 1972 ‘ 27.1 46.9 275 78.6 19.3 66.9 1973 14.2 46.7 29.5 67.1 14.8 58.6 1974 ~4.9 53.1 26.3 63.1 : 16.2 57.7 1975 12.6 8.0 11.8 60.3 32.8 49.3 1976 7.0 42.1 24.2 58.4 70.2 31.9 1977 35.5 32.4 15.5 66.3 — 24.8 30.4 1978 64.4 65 14,7 62.3 3.8 26.0 1979 11.8 29 68 63.7 10.3 25.8 1980 TA 17 35.3 o7.7 26.4 20.8 1981 98 18 " -89 478 27.2 12.8 1982 © 0.1 01 13.8 33.4 4.8 36
NOTES : (1) Based on volumes in tonnes; (2) Based on volunes in tonnes of nutrients
SOURCE : Anudrio Estatistico do Brasil - FIBGE, several years.
Table (3,2.6) : Petrochemicals (in percentages)
/__Basic Products__/ /Intermediate Products’ /Thermoplastic Resins_/ /__Synthetic Fibers_/ /_Synthetic Elastomers
MW) (2) (3) Year Rateof Import Export Rate of Import Export Rate of Import Export Rate of Import Export Rate of Import Export
coeff. coeff. growth coeff. coeff. growth coeff. coeff. growth coeff. coeff. growth coeff. coeff. growth domestic domestic domestic domestic domestic output output output output output
1970 se 31.0 0.0 i 1.9 0.2 ae 47.0 0.0 we 22.4 0.0 evs 17.9 5.0 1971 39 42.0 0.0 258 37.0 02 272 52.0 0.0 19.0 15.4 1.0 36 8626.1 0.0
298 43.0 03 26.7 47.0 10 46 124 00 210 23.4 Os 1972 238 49.0 9.0 1973 252.0 22.0 00 346 440 02 1007 21.0 20 238 249 04 328 29.1 07 1974 432 140 OO 182 410 19 #53 350 20 219 216 13 235 207 07 1975 44 70° 00 34 410 O68 95 180 20 99 93 17 -170 175 16 1976 256 120 O00 19 490 Of 245 290 10 235 6.1 O06 276 122 06 1977 147 100 O00 272 350 O00 66 220 10 32 59 068 145 N19 O2 1978 70 10 OO 473 220 49 129 220 20 #125 02 22 95 137 33
(1979 486 70 O04 316 180 36 S07 140 20 189 51 50 86 140 61 1980 127 60 14 279 #140 #42 «201 #60 40 79 #60 48 NS 63 54 1981 68 O4 63 986 60 146 -93 20 170 -156 50 123 -105 113 127 1992 52 OS 28 24 60 73 126 20 1850 24 21 67 293 160 160 1983 449 «#203 «#4123 82 20 122 205 10 300 -267 11 96 -233 160 18.1
NOTES : (1) Including ethylene, propsne, butane, benzene, xylena and toluene
(2) They include sixteen Intermediate products
(3) Including polyethylene of high and low density, polystyrene, PVC, and pollpropilena.
SOURCES : Abiquim, Assoclacdo Brasileira de Produtos de Fibras Artificiais ¢ Sintéticaa and Superintendéncla da Borracha - MIC.
~PEz-
-GEz-
-24- -23c-
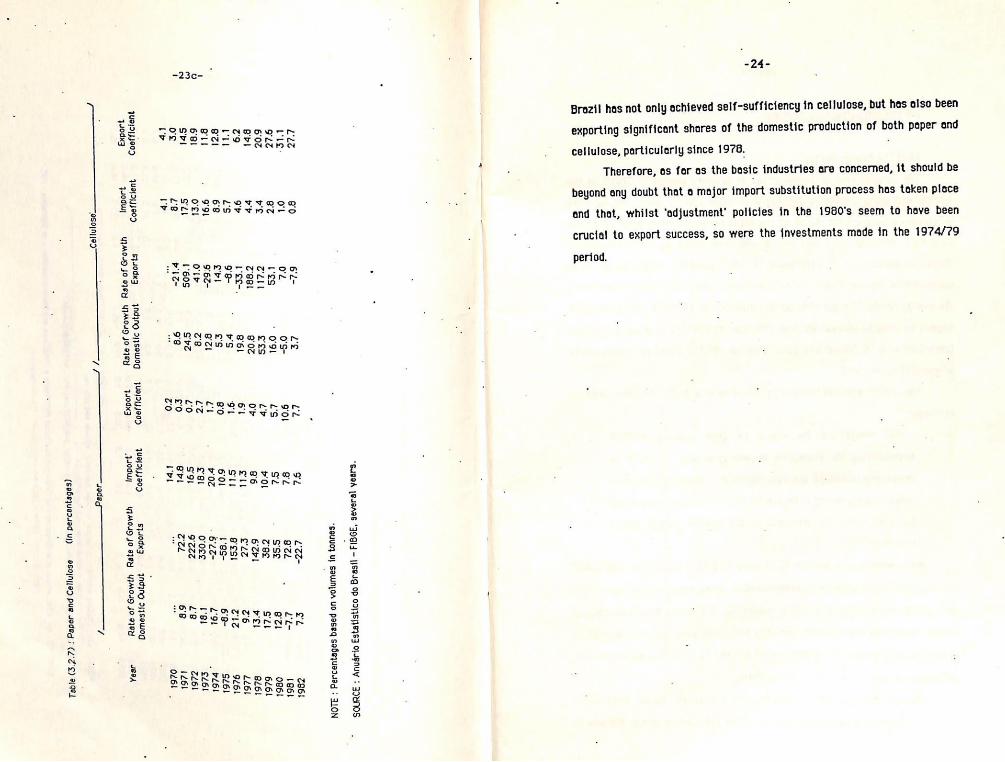
Therefore, as for as the basic industries are concerned, it should be
crucial to export success, so were the investments made in the 1974/79
Brezil has not only achieved self-sufficiency in cellulose, but has also been
exporting significant shares of the domestic production of both paper and
beyond any doubt that a major import substitution process has token ploce
and that, whilst ‘adjustment’ policies in the 1980’s seem to have been
cellulose, particularly since 1976.
3 o
Tt ao a
“GuBOA [USASS
“JOGI4 — [SRG
OP OI!PSITEISg
O|pNUY | 3IYUNOS
"BEUUO}
Ul BAWNLOA
Uo peseg sebejueded
: JLON
LLe 80
6é- “e
ve 92
Lt- eZ
Z86!
Lie: ol
OL os-
9°01 ee
i
be 1861
lz ez
les -
O91 “us
sé .
ise ez
og6!
6'0Z re
eet ees
Le POL
zee Sal
6261
er PP
zeal g'0z
o'r a6
6Zrl rel
e261
z9 oF
L'ee-, 861
6 eth
e2z Z'6
£61
Lhd us
oe "Bs
v1 sll
g'esl zz
926!
eZ! 68
ePl es
80 601
ies- 6's
Sé6l
etl .
991 9°6Z-
ez él
FOZ . &2e-
2°91 _e6l
6 el orl
Ole ze
Lz eal
core 1'el
e261
Srl sél
(60S Spe
z'0 S91
9'22z Le
Z261
oe Ze
P'LZ- 99
£0 Pl
Zz 68
1261
lb IP
us ms
zo ipl
= es
O61
quajrjjjoop = qa121JJ909
squodey —
INdyng 2IysewWog
—UAIAYJe0d === JUAF2IJJ909
sjiodx3 —-ndyng
DI;sewog
qyuodxX7 quodul]
YAOUD
JO 8]eY
yyMoud
jo a7ey
qyodxg
aoduy
YIMOUD
JO a]Ry
YJAOUD
JO a]8y
Jee,
js
“aso1n|199 ee
sadacy f
(sebejuadsad uy)
ESO[N[[eD pue
sede
; (2°2°<)
F981
. ‘ . |
-25a- -25-
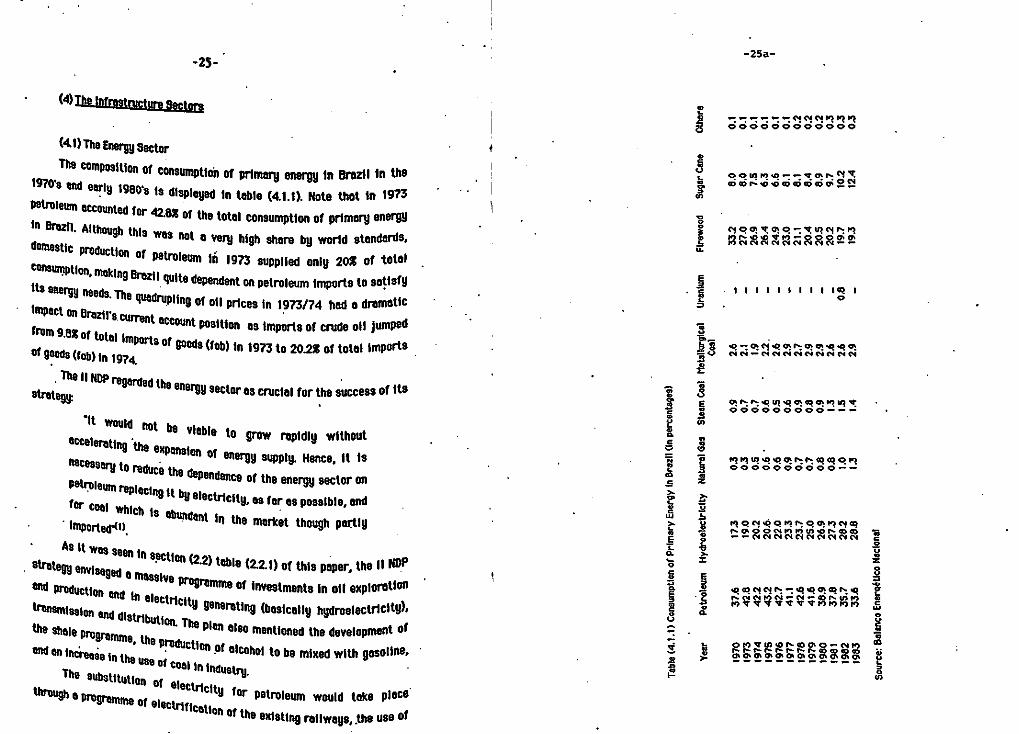
(4) The infrestructure Sectors A 355555899923 (4.1) The Energy Sector The composition of Consumption of primery energy in Brezil in the . |
B sersessess ee 1970's end erly 1980's is displeyed tn table (4.1.1). Note thot in 1973
:
petroleum accounted for 42.6% of the total Consumption of primary energy
AeRaRRaRReee
'n Brazil, Although this wes not ¢ very high share by world stenderds,
o_—
domestic Production of petroteu:
|
m in 1973 supplied only 20% of total consumption, making Brezij Quite E its dependent on petroleum imports to satisfy Z preteen egy ene a neess. The quadrupling of oil prices in 1973/74 had o dramatic . mpac . =<
tn , on Brazil's current Sccount position as imports of crude oil jumped Ss . “SE Of total imports of goods (fob) in 1973 to 20.28 of tote! imports go AaSNaRasaRaS of Seods (fab) in 1974, 2 The WW NDP = 3 at regarded the Snergy sector es crucial for the success of its oS 2 annonenaanns rategy: .
3 3 SSoSs009CO--- . s &@ it 3
seen Would hot be vieble to grow rapidiy without e 8 Cleratin, = = neces 9 the Sxpension of energy supply. Hence, it 18 Ss § SeSSSssssse2 a:
3 TY to reduce the dependence of the energy sector on e 2 Petroleum replacing 4 S 2 for coal Ag it by electricity, os fer as possible, and g 2 ol which ig ’
ANBOMROANAYH -importeg(t) Abundent in the market though partly E g 8 SSRRReSnse .
t $ As it was seen { . = o£ n se - SUrtegy envisaged @ me . ‘Yon (2.2) table (2.2.1) of this peper, the I NOP ' § g S8!ve programme of j oration | a 3 WOANKR-BOKAAnw tnd prog nvestments in off explo BE -£ edavdedeoren treme me in electricity Generating (basically hydroelectricity), é 2 NN SETS TRb8s
ond distribution, Th, = ® Blen algo mention velopment of = the shale programme, the 2d the develor | S § MRERLESSssgR end an incren: Production of atcohos to be mixed with gasoline, 2 BAARARAARRARK Tease in the use Of coal jn indust;
& The substi v tution of Slectricity f mme of Slectrification of the existing raitwoys, the use of
or petroleum would take ploce
Source:
Balance
Eneraético Nectonal
-26-
electricity in the new railway end underground projects ond the electrification of the rural oreos”). The tremendous expansion projected for the intensive electricity consuming industries such es the metal working,
chemical, paper and cellulose industries would also tend to raise the share of electricity in total energy consumption).
Us oa use of hydroelectricity for industrial purposes wos
ojor contribution to the impert substitution process and, especial
ind P ; ly, to the export drive of the intensive electricity consuming ustries in view of the comparative advant low cost and large age stemming from the
Potential of hydro-power in Brazit‘4), Table (4,1. 1) reveals that the share of petroleum in total consumption mary energy remained rou
) Significantly since then. The from 19.0% in 1973 to 25.0% other ind
of pri
ghly unchanged until 1976 but has fallen very shore of hydroelectricity has risen steadily in 1979 and to 26.8% in 1983, The shares of
ergy such as natural gas, steam cool and sugar ® also show n 8 pronounced upward trend. The share of firevood, on T hand, has fallen
igenous sources of en cane hey
the othe uite drastically though consumption in absolute nee 1979(5).
In the next Subsections the emphas
terms has risen Steadily si
energy Sector is examined in more detail, i$ again is plac e don Comparing the actual results achieved with the Projections made in the 1) NDP
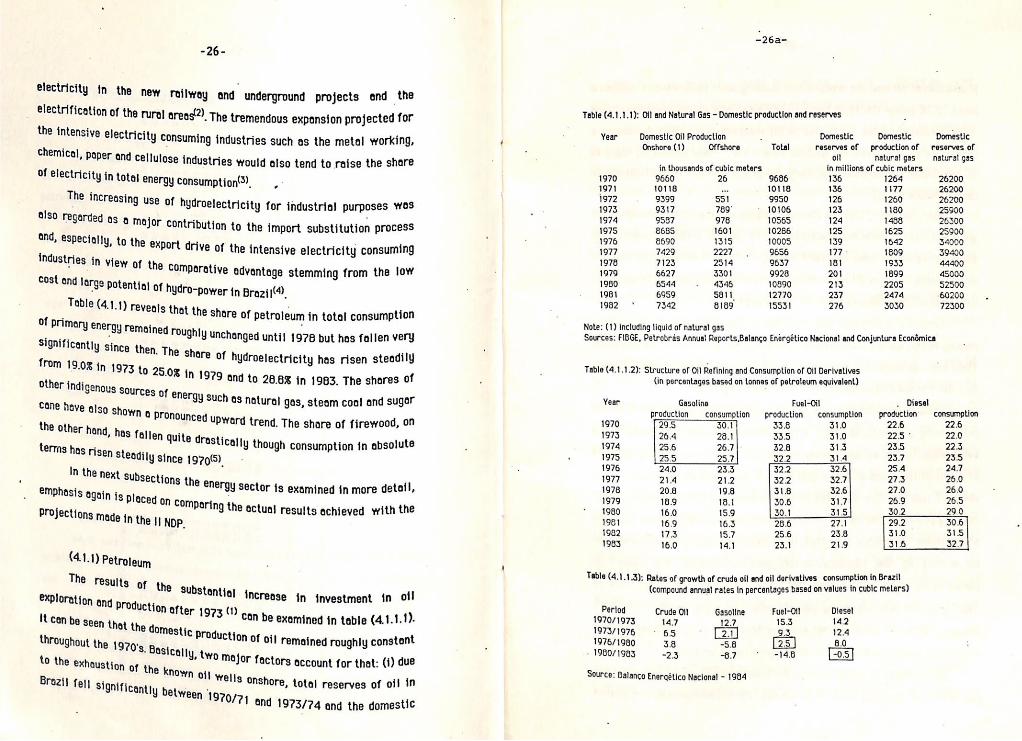
(4.1.1) Petroleum
-26a-
Table (4.1.1.1): Oil and Natural Gas ~ Domestic production and reserves
Year
1970 1971 1972 1973 1974 1975 1976 1977 1978 1979 1960 1981 1982
Domestic Oil Production
Onshore (1)
in thousands of cubic meters
9660 fone
9399 9317
9587 8685 6690 7429 7123 6627 6544 6959 7342
Offshore Total
26 9686 ai 10118 551 9950 789° * 10106
976 10565 1601 10266 W315 10005 2227 9656 2514 9637 3301 9928 4346 10890
5811. 12770 8189 15531
Note: (1) including liquid of natural gas Sources: FIBGE, Petrabras Annua! Raports,Balango Enargetico Nacional and Conjuntura Econémica
Domestic
reserves of
oll
Domestic
production of
natural! gas
in millions of cubic maters
136 136 126 123 124 125 139 177: 181 201 213 237 276
Table (4.1.1.2): Structure of Oil Refining and Consumption of Oil Derivatives {in percentages based on tonnes of petroleum equivalant)
Year
1970 1973 1974 1975 1976 1977 1978 1979 1980 1961
1982 1983
Gasoline Fuel-Oil . Diesel
Production consumption production consumption production consumption
295 30.1 33.8 31.0 22.6 22.6 26.4 28.1 335 31.0 225° 22.0 29.6 26.7 32.8 313 235 22.5 20.5 25.7 32.2 314 23.7 235 24.0 23.3 32.2 32.6 25.4 24.7
21.4 212 32.2 32.7 273 26.0 20.8 19.6 318 32.6 27.0 26.0
18.9 18.1 30.6 31.7 26.9 265 16.0 15.9 30.1 315 30.2 290 16.9 16.3 28.6 27.1 29.2 30.6
73 15.7 29.6 23.8 31.0 315
16.0 14.1 23.1 21.9 31.6 32.7
1264 1177 1260 1180 1488 1625 1642 1809 1S33 1899 2205 2474 3030
Domestic reserves of
natural gas
26200 26200 26200 25900 26300 25900 34000 39400 44400
45000 592500 “60200 72300
Table (4.1.1.3): Rates of growth of crude oil and oil derivatives consumption in Brazil
(compound annual rates In percentages based on values in cubic meters)
Perlod 1970/1973 1973/1976 1976/1980
- 1980/1983
Source: Balanco Eneraético Nacional ~ 1984
Crude Oil
14.7 . 65
38 -2.3
Gasoline
1237
-5.8 6.7
Fuel-Oil
15.3 93
-14.8
Diesel
14.2 12.4 6.0
<2Fe
Production of of! onshore dropped continuously until 1980 when {t reached 0 level 32.3% below the 1970 level; (11) although new discoveries were being made offshore, as the sharp rise in ofl reserves after 1975 demonstrate (compared to 1973 reserves doubled before 1952 an inevitable lag between discove deep offshore wells)(2).
- see column 5), there is
Ty and productjon of oil (particularly in
Note, however, thot the domestic sy pply of oil doubled between 1979 and 1983 and the daily average production by the end of 1984 was more then fr then the 1979 average’). it must be stressed thot the
d2 in of! exploration in 1974/79 were absolutely essential on results achieved in 1979/64.
three times high
investments me
for the Producti
Dome ;
Stic production ang reserves of natural gas rose much more rapidly in this Period. Compared to the 1973 level, pro
ge in the structure of supply occurred in the - As tab! total Production of oi] Of a fall in the sha Te of motor 9osoline,and
ron in the share of fuel off. The
so mine
objective of this change wes to accomodate the ofl structure of Consumption of of! derivatives in Brazil
Oil refining proti|el4) e (4.1.1.2) Shows, the shore of diesel in the derivatives and natural gas increased at the expense
refining profile to the
Indeed, Brazil wa Pvt by fuel ot, an from 1981 to 1983 by diesel. ’ $ *learly @ net exporter of diese! up to 1979, of fuel-oil a :
fter 1980, ond of 98soline after 1976 Onsumption of Crude oi] rose 6.2%
| and fel] “2.3% @nnual)
until 1975, ang again
ut per year between 1973 and 1979 ro
M1979 10 1983. As Consequence, the import
duction wos up 87% by:
-28-
coefficient of crude oil increased from 80.1% in 1973 to 85.9% in 1979,
falling thereofter to 71.63 in 1983 and to 50.0% in 1984 5),
The observation of the fact that the domestic prices of the main oil
derivatives in Brazil (gesoline,fuel and diesel) did not rise in line with the
import price of crude oil, meesured in domestic currency (by using the
actual exchange rate), after the first oi! shock, has led to the argument that
price induced substitution possibilities were underestimated ©), and hed
Brazil adopted o more aggressive price policy, consumption of crude oi! per
unit of output could have been significantly reduced. Although it is very likely thot such on underestimation ectus!ly occurred”), it is difficult to
, _ 988ess how important the price induced substitution could have been if a
severe drop in economic growth end/or’o dramatic. increase in inflation
were to be avoided.
It should also be stressed that consumption of crude oil per unit of GDP, after having increased 6.9% from 1970 to 1973, was kept below the
1973 level throughout the 1974/1979 period®, and then, in 1980/1983, it dropped to a level about 153 lower than that of 1973. Furthermore, table
(4.1.1.3) shows that the ratios of growth of the main oil derivatives were - Severely reduced (via prices or otherwise) in the years in which they became determinants of the totel consumption of crude oil. Therefore, olthough it is likely that there was scope for further reductions in the Consumption of crude oil per unit of output, it should be recognized that Some short-run adjustments were made, and that further adjustments’ via Price would have increasingly sharpened the trade-off between price induced substitution ond inflation for given rates of growth.
(4.1.2) Electricity
_ As mentioned eorlier in this paper, the II NDP gave great priority to the production of electricity, especially hydroelectricity, as e substitute
-29-
for imported sources of energy. According to the I] NDP, installed capacity of generoting electricity wes expected to increase to 28 millions of KW by 1979 while consumption would-reach 107 biltions (10°) of KWh by the same
year”) Both projections were Slightly below actual figures: capecity went up to 30 millions of KW ond consumption reeched 109 billions of KWh in
19797). It fs interesting to note that consumption of electricity wos greater than expected despite the fact that economic growth was much low i
er than planned, which implies that the expected substitution effect was octually underestimated over this period.
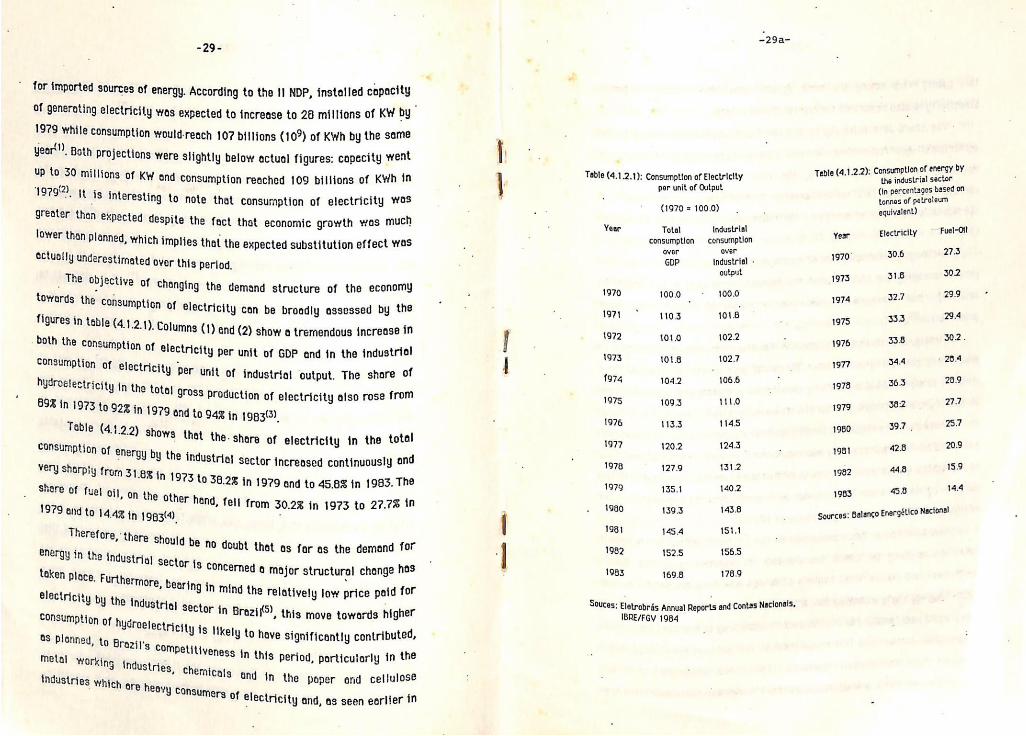
eee” i Changing the demand structure of the economy
figures in teble (4 : : se Of electricity con be broadly assessed by the
both the corsterptts 1) Columns (1) end (2) show a tremendous increase in
vonbiion of electricity per unit of GOP and in the industriel Consumption of electricity per unit of industria! output. The share of hydroelestricj ha ity in the total 9ross production of electricity also rose from
"1973 to 922 in 1979 and to gaz in 19835), Table (4, 1.2.2) shows that the-shera of electricity in the total
consumption of ene Nergy by the industrial s nd very sharp! ector increased continuously 8 Y from 31.8% in renee: 1973 to 38.2% in 1979 end to 45.8% in 1983. The Yel Oil, on the othe : rhend, fell from 30.2% in 1973 to 27.7% in 1979 and to 14.4% tn t9g3t4) ee eee
Therefore, “th
y in the j ; “Te Should be no doubt that as far as the demand for : 2 in ustria] secto ;
token pI T 18 concerned a major structural change has ce. Furthe
ay ‘more, bearing in mind the relotively low price paid for VY by the industrial Sector in B }
consumoti
Q3 plonne
energ
rezil®, this move towards higher y to have significantly contributed,
metal working industries oe In this period, particularly in the industries Which ore heay
it es ee Y¥ Consumers of electricity ond, as seen eerlier in
on of hydroelectricity is like! U, to Brazit's com
Table (4.1.2.1): Consumptton of Electricity
par unit of Output
Year
1970
1974
1972
1973
(974
1975
1976
1977
1978
1979
1980
1981
1982
1983
(1970 = 100.0)
Total
consumption
over GDP
100.0 .
110.3
101.0
101.8
104.2
109.3
113.3
120.2
127.9
135.1
139.3
145.4
152.5
169.8
Industrial consumption
over Industrial - output
100.0
101.8
102.2
102.7
106.6
1110
1145
124.3
131.2
140.2
143.8
151.1
156.5
178.9
-29a-
Souces: Eletrobras Annual Reports and Contas Nactonals, IBRE/FGV 1984
Teble (4.1.2.2): Consumption of energy by
the industrial sector
(in percentages based on
tonnes of petroleum
Year
1970"
1975
1974
1975
1976
1977
1978
1979
1980
1981
1962
1983
equivalent)
Electricity
30.6
31.6
32.7
3335
338
344
36.3
38:2
39.7 ,
42.8
448
5.8
Fual-Otl
273
302
29.9
29.4
30.2.
» 20.4
28.9
277
25.7
15.9
14.4
Sources: Balanco Energéetico Nacional
-30- -
Brazil. this poper, were among the most dynamic tradeable sectors in Electricity is also important for the texti le industry.
in the The share of electricity in the totel consumption of energy ng
ificantly.
agricultural ond residential Sectors also increased very sign tion m However, in these two Sectors, the rise in electricity consump
firewood. A Corresponded to a fall in the relative consumption of discussion on the use of ene on
rgy by the transport sector is left to secti (4.2).
ption of electricity has played such an mr a
itio Clure of the demand for energy in the Braz ; loser
investments made in this sector require a ¢
Although the consum part in changing the stru €conomy, the
examination ?).
Firstly, it is important to electricity Senerating in the 19 made in t
n realize that the sharp rise in investment i = ns 74/79 period was largely due to decisto F :
e his period but Concerning investment Projects that were design Y the projecteg rise g, in the demand for electricity in the 1980 Since these
the Projects require a lengthy period of construction. Indeed, at end of 1979 the total capacit
to satisf
ns YJ Under construction was equal to 26 millio Of KW, which is equivalent to
he almost 90% of the Capacity in operation at t time®). By the end of 1984, these new pro Millions of KW to the existing Capacity in 1
jects would have added 17
979(9). vestment decisions made in the 1974/79 period were largely based on 9 8
and for electricity in the South, “West regions of Brazit was forecast until the year
tudy in which the dem South-East and Centre
CCepted the Projections made in the I! NDP and msde two Projections for th
-31-
t 11.4% ond 8.7% per annum, respectively, between a
Se lation between the demand for blectrtelty
eae fat ae on historical data, and hence, did E
<a eee the substitution of electricity for petroleum tha initially take in
occur. ) ded to the ia tes of this substitution effect!!! were od oe hen estimate
he consump
WW ade under hypothesis II, the forecasts for t eons fonsom '
ride 1985 end 1990 were ebout 9% greater than vonne icity in
the expans res - is |. Bearing this in mind, the programme for satteecd r hypothesis |.
e study w: sa ity of generating electricity recommended by th ee 23 the capac
ing the growth o i hypothesis concerning '
& most optimistic gid take into a the final estimates of the demand for electricity
Therefore, ; um. Satta Mer peaae a ane aicionat electrelty far pauls hydro potentials _ It is worth noting thet, given the most economical hy sett ct
ost o hich were considered in that study, even when the m sake w ‘
leer po : ded that nuc med, the study conclu -_
hypothesis was assumed, 1wasstakon
- become necessary only in ised". Litre be economically
W
f lousible projection then, no nuclear energy coul he fect that the more p
the 0 tified at least before 1990. Nevertheless, in view of truction, the
justifie : dy under cons ; s already
i er plant (Angra 1) wa icel ne ai d re on the grounds of “maintaining ae sid
recommende
r station sho = this sector“’”, at least one nuclear powe nn activities in thi :
existence be under construction, which. would mean the always be un
0. nuclear stations in operation by 199 bitious projection of the demand for i the most am
‘i Therefore, not even
ration programm itu could have lent support to the nuclear coope arial c i
nu in ’ ate Brazil and the Federal Republic of Germany hiram
d between of nae he construction of eight nuclear power plants trusted d the co
ing cons peenigts two of which (Angra Il and Angra 11!) would start being by 1990, two
-32-
ecause in 1976. In fact, construction of Angra III only began in 1980, but b
r plents ° of delays in Angra | due to technical difficulties, three nuclear power p
+9(15) were simultaneously being constructed in Brazil in the early 1980's''9’.
PAM iniiS7S%ew Projections were made concerning the future demond for electricity. It was estimated that consumption of electricity would grow at ebout 12.6% until 1985, though economic growth was then expected to maintoin 0 rate between 6 ond 7 percent per year’) Consumption of
; 7.4% in
electricity would Slow down to 8.3 between 1985 and 1990 and to the 1990/95 periog,
Economic growth in Brazil ave d raged 0.8% per annum between 1979 an 1983, falling 3
ion of “1.63 in 1981/89 ond -3.2% in 1983/82. Consumption '
9 an
electricity, nonetheless, grew on average 6.7% annually between 197
cess
-1983. As 9 Consequence, the Sector has experienced some ex Capacity?)
down quite
Projected to
to 41194 ace
: wed
ond the pace in which new Capacity wos being added hos slo
wos Considerably. In fact, toto! capacity in 1984, which
ced be 45717 MW according to the Schedule of 1979, was redu ording to the schedule of 1983(18),
Because of Brazil's balance of n payments problems and rising inflatio rate, th
to borrow heavily from international Onks while the average tariff rate has tended to decline in real
© combination of rising interest rates (both internationally ond “omestically), excess fapacity of generating electricity) and falling
8 electricity Sector has had Commercial b
terms!!9). tp,
Prices for elect ce
ricity have meant that the electricity sector has had to fa quite Serious qj ficulties to finance its investment programme. However,
6 if the nuclear Programme is left aside, then, although th Investment programme tn hudroelectricity was undoubtedly very ambitious, had it not been
» Consumption of electri City would not have been very far from the Projections made2!)_ To the extent that the recession could not possibly
-33-
for t be the basis have been predicted in the mid-70's, then it we e ond which were mi Condemning the investment decisions taken at ee in Brazil in the designed to increase the copacity of generating elec early and mid-1980's.
the production of hydroelectricity in Rise) in ae both in
In point of fact, the ontributions
Brazil hown before, has brought in vital economic c orts ond import
Fazil, ass ,
ting exp directly substituting for imported oi! and in promo fate of the sector j ial di i tor. The financia : Blanes
Substitution in the industrial sec economic pro ore, by and large, a reflection of the country not to overprotect the re, by an ge,
ate nerhene somewhat magnified by the tendency of the = raeatienets
f the adjus : j beer the bulk 0 of interest
Mvate sector in Brazil and to the rate
B to the future, the question lies on the level of As to the future, 1 ith high capita ity. With h
f growth of the demand for electricity and on the rate o gro ional costs
ri low operationa
i ts, lengthy periods of construction, very requiremen s, len
on fe expecta! 1 over
er the ctor. The long interest rates and load fa }
ore very sensitive to both i ns the sn st rates remal
ill become. -electricity will be
= ee a are on attempt to estimate ow j the figures be To illustrate this point
- es ins itivity to chang J the cost of electricity in Brazil and its sens! y main parts:
pital costs.
ome Key
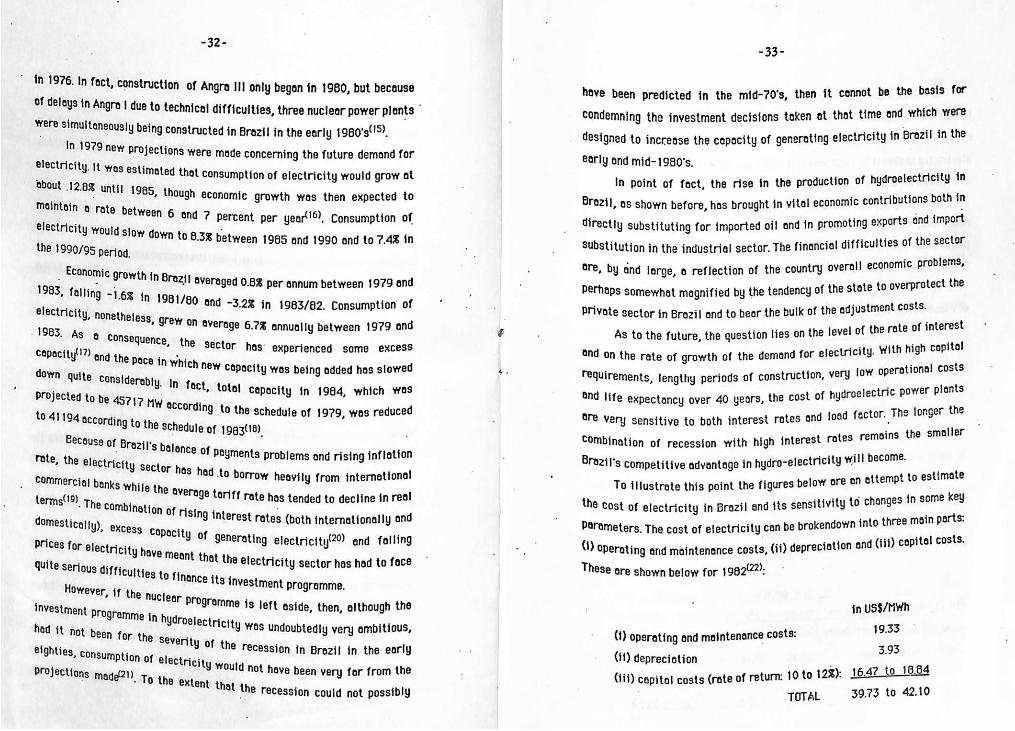
into three . endown into Parameters. The cost of electricity can be brok jation and (iii) co (1) operating and maintenance costs, (ii) deprec (22). These are shown below for 1982*°:
in US$/MWh
19.33
3.93 (ii) depreciation Oto 12%): 16.47 to 18.84 (iii) capital costs (rate of return: 1 TOTAL 39,73 to 42.10
ts: (1) operating and maintenance cos
-34-
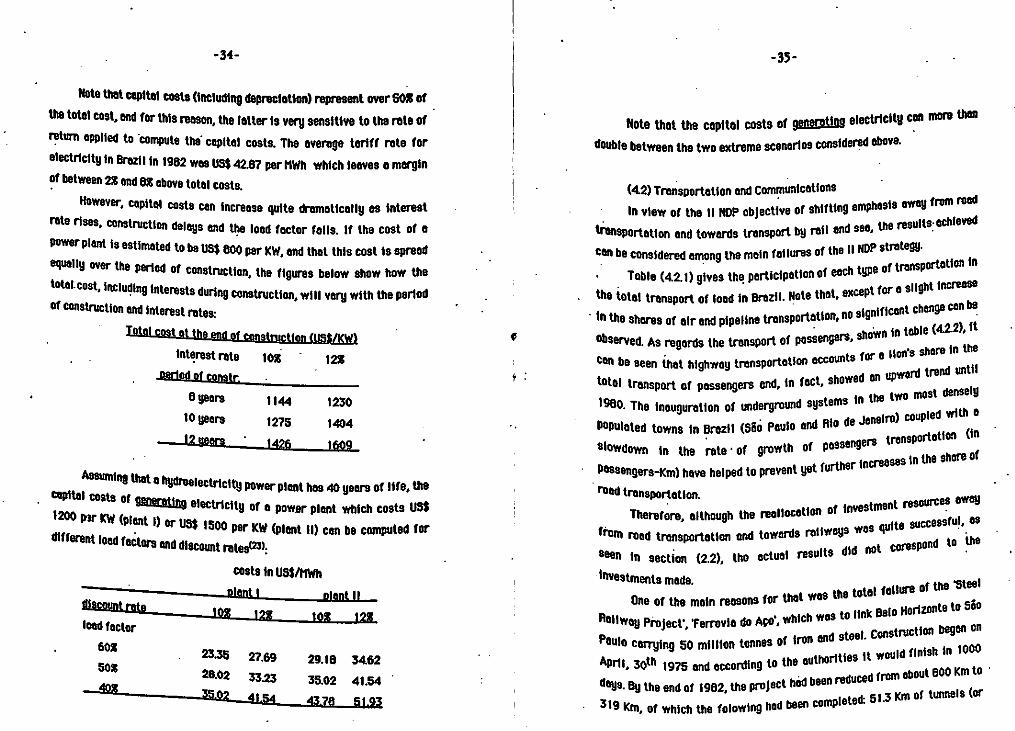
Note that cepitel costs (including depreciation) represent over SO® of the tote! cost, and for this reason, the latter is very sensitive to the rate of return epplied to ‘compute the capital costs. The average toriff rate for electricity in Brezit in 1982 wes US$ 42.87 per MWh which leaves 6 margin of between 2% end 8% above total costs,
However, capital costs Can increose quite dramatically os interest rate rises, construction delays and the Iced fector falls. If the cost of a power plant is estimated to be US$ 800 per KW, and thet this cost is spread equally over the period of Construction, the figures below show how the total. cost, including interests during construction, will very with the period of construction end interest rates:
Total cost at the end of construction (US$/KW) interestrate 10% ~ = 12%
Bericd of Constr. :
6 years 1144 1230 10 years 1275 1404
——I2yeors_"__ 14261609
Assuming that 9 hydroelectricity power plant hes 40 years of life, the Capital costs of Generating electricity of a power plant which costs US$ 1200 par kw (plent §) or US$ 1500 per Kw (plant 11) can be computed for different toad fectors and discount rates(23).
costs in US$/MWh
—Dlant | plant I
load fector
60% 2335 27.69 29.16 3462 508 28.02 33.23 35.02 41.54 ©
0 significs "in the shares of air and pipeline transportation, no $19
‘Toad transportation.
‘Investments made,
-35-
then ating electricity cen more Note that the capita! costs of sare ebove. re . double between the two extreme ecenerios conside
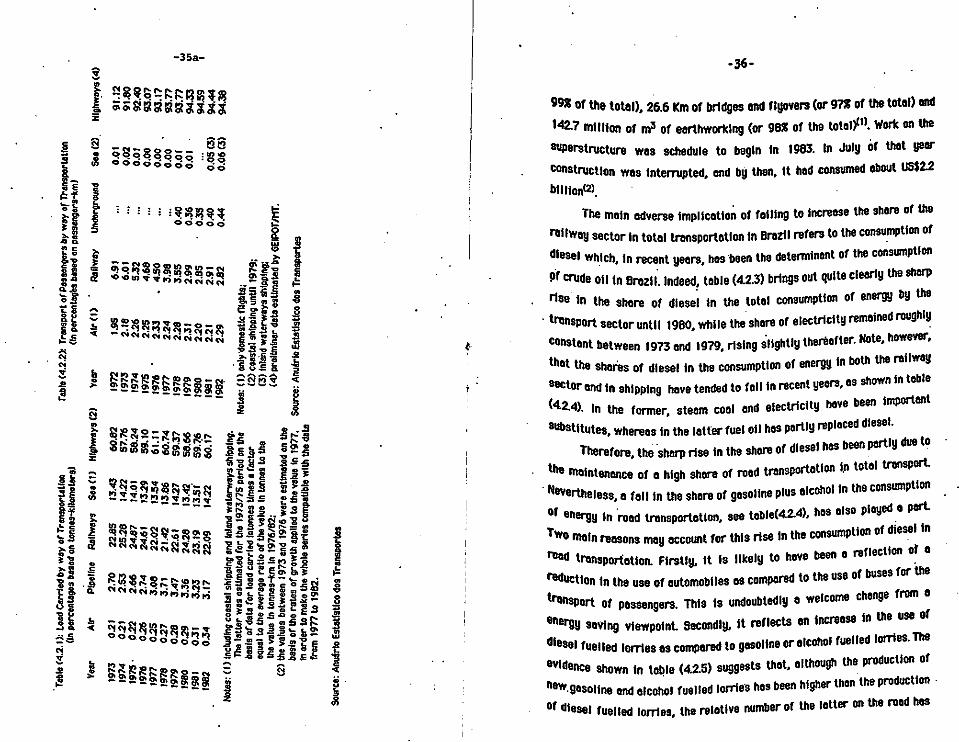
(42) Transportation ond Communications hasis evey from road In view of the I! NDP objective of shifting emp the results: echieved 2, transportation and towards transport by rail a nDe strategy. Cen be considered among the moin failures of the tupe of transportation in
| Table (42.1) gives the participation of each typ
passenge lp sho
jathentho lg
nts for Cen be seen that highway transportation eccou vi on oped trend until
on MFansort of passengers and, nu a the two most densely
ae meuguretion of undergrovne ne "entre coupled with ©
Populated towns in Brazil (S80 Paulo end Alo de resvansporttion (i
Slowdown in the rote ‘of growth of passenge sea inthe shore of incres
Possengers-Km) have helped to prevent yet further
away ent resources Therefore, although the reallecotion of investm
eys wos from rood trensportetion and towards ratiwey
quite successful, 88
d to the not corespon
1
Seen in section (2.2), the actual results did
tee! ag the totel foilure of the ‘S
Horizonte to Sé0
Construction began on Paulo carrying 50 million tonnes of iron end vl ren i 100
April, 30M 1975 and according to the euthorit - _ Soe rea to
days. By the end of 1982, the project hed been mr eat tmel
319 km, of which the folowing hed been completen:
One of the main reasons for that ¥ a to tine Bel0
Railway Project’, ‘Ferrovia do Ago’, which ¥
Unde
rgro
und
Sea(2)
Highways
(4)
Railway
(tn percentages
based
on passangers-km}
Alr
(1)
Yeer
Table
(4.2.2):
Tran
spor
t of Pa
ssen
gers
by wa
y of Tr
ansp
orta
tion
Raitways
Sea(t)
Highways
(2)
(tn percentages
based
on tennes-kilometers)
Alr
Plpetine
“Tab
le (4.2.1):
Load Carried
by wa
y of
Trensportation
Year
—~eee ew ow =e
re ee
~= -=— _—=— Se
(4)-preliminar data estimated
by GEIPOT/MT,
(2)
coas
tal
shipping unt]
1979;
(3)
inla
nd waterways
shipping:
Source:
Anuédrio Estatistico
dos
Transportes
Notes:
(1) o
nly'domestic
flight
s;
"Nevertheless, a fall in the share of gasoline plus alcohol |
in order
to make
the
whole
serles compatible with
the
data
The
latter was
estimated
for
the
1973/75
pericd
on the
from
1977
to 1982.
basis
of d
ata
for
load carried
intonnes times
a factor
equal
to the
average
ratio
of the
value
in tonnes
to the
basis
of th
e rates
of growth
applied
to the
value
in 1977,
the
value
in tonnes-km
In 1976/62;
(2)
the
values between
1973
and
1976
were estimated
on the
Notes:
(1)
incl
udin
g coastal
ship
ping
and
inland wa
terw
ays
shipping.
Source:
Anuério
Estatistico
dos
Transportes
-36-
S98 of the total), 26.6 Km of bridges end flyovers (or 97% of the total) end
142.7 million of m? of earthworking (or 98% of the total", work on the
superstructure was schedule to begin in 1963. In July of thot year
construction wes interrupted, end by then, it had consumed ebout US$2.2
biltion{2),
The main adverse implication of foiling to increase the share
railway sector in total transportation in Brazil refers to the consumption of
diesel which, in recent years, hes ‘been the determinent of the consumption
Of crude oil in Brazil. Indeed, table (4.2.3) brings out quite clearly the sharp
rise in the share of diesel in the toto! consumption of energy by the
of the
hi * trensport sector unti! 1980, while the share of electricity remained roug y
Constant between 1973 and 1979, rising slightly thereafter. Note, however,
that the shares of diesel in the consumption of energy in both the railway
Sector and in shipping hove tended to fall in recent years, 08 shown in teble
(42.4) tn the former, steam coal end electricity heve been importent
Substitutes, whereas in the latter fuel of! has partly replaced diesel.
Therefore, the sharp rise in the shore of diesel hes been partly due to trensport.
tha maintenance of a high shore of roed transportation in total P
n the consumption
da pert Of energy in road trensporteticn, see tebdle(4.2.4), hes also a , i
ese TWo main reasons may account for this rise in the consumption of di
tion of @ rad transportotion. Firstly, it is likely to have been a reflec
ses for the ‘eduction in the use of automobiles os compared to the use of bu
from 4 transport of passengers. This is undoubtedly a welcome chenge
e use of energy saving viewpoint. Secondly, it reflects an increase in n
es. The diesel tuetied torries es compered to gasoline or alcohol fuelled mn of on ®vidence shown in teble (4.2.5) suggests that, although the ee tion ic .
NeW. gasoline end alcoho! fuelled lorries has been higher than the produ
d has Of diese! fuelled torries, the relative number of the fetter on the roe
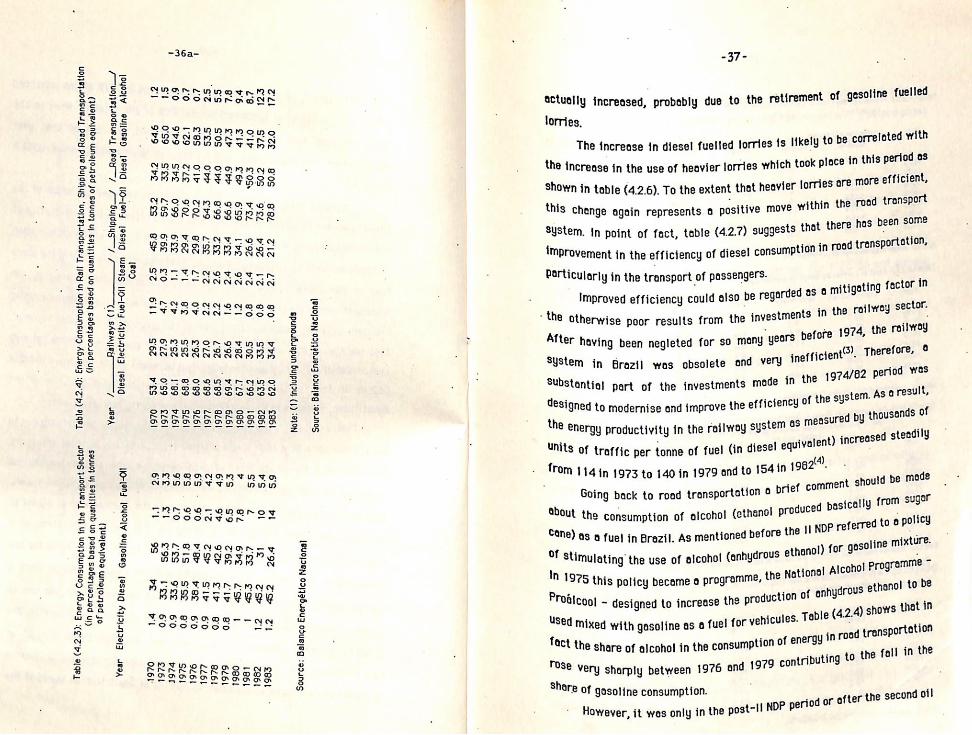
petr
oleu
m equivalent)
Coal
(in
perc
enta
ges
based
on quantities
in tonnes
of
Dies
el
Electricity
Fuel-Oj]
Steam
Diesel
Fuel
-Oil
Di
esel
Gagoline
Alcohol
Table
(4.2.4):
Energy Co
nsum
ptio
n in
Rail
Transportation,
Ship
ping
an
d Road Transportation
Year
/_____Railways (1)______/
/_Shipping__/
/_Road
Transportation_/
Note:
(1)
incl
udin
g undergrounds
Source:
Balanco
Ener
géti
ca Naclonal
quantities
in tonnes
ption
in the
Transport
Sector
IN percentages
based
on
of petroleum
equivalent)
Year
Electricity
Diesel
Gasoline
Alcohol
Fuel-Oll
Table
(4.2.3):
Energy Consum
Source:
Balanco
Energético Nacional
-37-
Gctually increased, probably due to the retirement of gesoline fuelled
lorries.
The increose in diesel fuelled lorries ts likel
the increase in the use of heavier lorries which took
Shown in toble (4.2.6). To the extent that heavier lorries are more efficient,
. n the road transport
y to be correloted with
place in this period 6s
this Chenge again represents a positive move withi
System. In point of fact, teble (4.2.7) suggests that t
improvement in the efficiency of diesel consumption in
here has been some
road transportation,
Particularly in the transport of passengers.
Improved efficiency could also be regarded 5 ° miti
‘the otherwise poor results from the investments in the
1974, the reilwoy
(©), Therefore, © period was
As oresult,
gating factor in
railway sector.
After having been negleted for so meny years before
System in Brazil was obsolete and very snefficien
Substantial part of the investments made in the 1974/82
designed to modernise and improve the efficiency of the system.
the Energy productivity in the railway system 48 measured by th
SHS of traffic per tonne of fuel (in diesel equivalent) increase
n 1982,
rief comment should b
roduced pasically from suger
he 11 NDP referred to 4 policy
hanol) for gasoline mixture.
jonal Alcohol Programme ~
o be
gusands of
d steadily
- from 114 in 1973 to 140 in 1979 and to 1541 e mode
Going back to road transportation © b
About the consumption of alcohol (ethanol P
Cone) as a fuel in Brazil. As mentioned before t
“ Stimulating the use of alcohol (anhydrous etl
In 1975 this policy became @ programme, the Nat ; anol t
Proaicool - designed to increase the production of anhydrous eth ows that in
Used mixed with gasoline as 0 fuel for vehicules. Table (42.4) sh
Tact the share of alcohol in the consumption of energy |
Pose very sharply between 1976 and 1979 contributin
n road trensportation
g to the fall in the
8 ‘ hare of gasoline consumption. rter the second ofl
e
However, it was only in the post-ll NDP period or ©
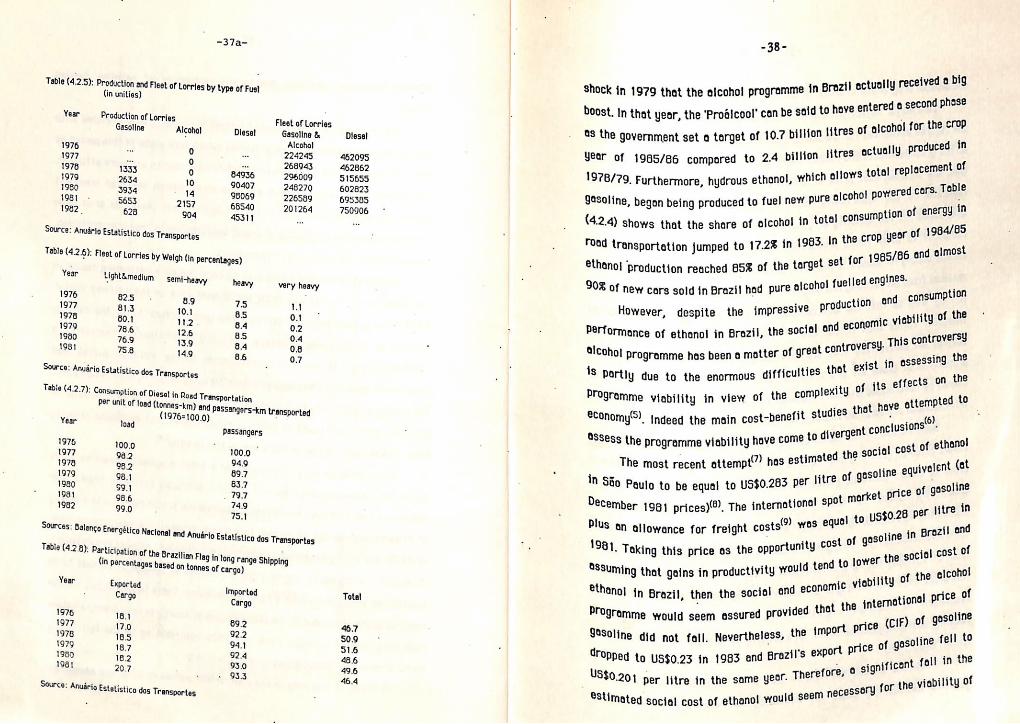
Table (425): Production and Fleet of (in unities)
Year Production of Lorries
-37a-
Lorries by type of Fusl
Fleet of Lorries Gasoline Alcohol Diesel Gasoline & i Alcohol 1976 cs 0 224245 1977 = 0 a 268943 1976 1333 0 84936 294009 1979 2634 10 90407 248270 1980 3934 ~ 14 98069 226589 1981 - 5653 2157 68540 201264 1962 628 904 45311 ie
Source: Anudrio Estatistico dos Transportes
Table (4.2.6): Fleet of Lorrias by Weigh (in percentages)
Year Light&medium semi-heavy heavy very heavy 1976 85 . 8g 75 11 1977 813 10.1 65 0.1 1976 60.1 11.2 8.4 0.2 1979 76.6 12.6 a5 0.4 1980 76.9 13.9 8.4 0.8 1981 75.8 14.9 8.6 0.7
Source: Anuario Estatistico dos Transportes
Tabie (4.2.7): Consumption of Diesal in Road Transportation Per unit of load (tonnes-km) and Passangers-km transported (1976=100,0) Year load
Passangers 1976 100.0
100.0 1977 98.2 949 1978 98.2 89.7 1979 98.1 63.7 1980 $9.1 79.7 1981 98.6 749 1982 99.0 75.1
Sources: Balenco Energético Nacional and Anudrio Estatistico dos Transportes Table (4.2 8): Participation of the Brazilian Flag in long range Shipping (in Percentages based on tonnes of cargo)
Year Exported Cargo
1976 18.1
1977 17.0 1978 185
1979 18,7
1980 1B.2
1981 207
Source: Anudrig Estatistico dos Transportes
Imported Cargo
69.2 92.2 94.1 92.4 93.0
» 933
Diesel
462095 462862 515655 602823 695385 750906
Total
46.7 50.9 51.6 48.6 49.6 46.4
e a si US$0.201 per litre in the same yeor.
= 38 ad
in shock in 1979 that the alcohol programme
on litres 48 the government set a target of 10.7 billl ctually produced in litres © Year of 1985/86 compored to 2.4 billion
ment of s total replace 1978/79. Furthermore, hydrous ethanol, which allow wered cors. Toble tion of energy in
year of 1984/85
5/a6 ond almost
| po §esoline, begon being produced to fuel new pure ie
(4.2.4) shows that the share of elcohol in a the crop road transportation jumped to 17.2% in 1983. vf ie
ethanol ‘production reached 85% of the target $ i ol fuelled eng 908 of new cars sold in Brazil had pure alcoh
; duction 4n ssive pro se viebility of the
is controversy
assessing the
ects on the
nes. tion d consump
However, despite the impre “avceanenen
Performance of ethanol in Brazil, the socio ediereiel
Slcoho! programme has been o matter of gree in thot exist 'S partly due to the enormous difficulties
eff omplexity of its ec mpted to Programme viability in view of th ave ottemp :
j h dies that -benefit stu ®Conomy) indeed the main cost-b vince
ed the social cost 0
clusions.
{ ethanol
ent (at
‘ et *Ssess the programme viability have com a m The most recent attempt”) ines re of gasoline equivel
§M S80 Paulo to be equal to US$0.285 per Hit {90 t price © ot marke December 1984 prices)®). The international SP litre in 0.26 per ual to US$ , Plus en allowance for freight costs wos eq gesoline in Brazil en f ity cost 0 cost of 1981, Taking this price os the opportun!'y saguavente social AX
88Suming that gains in productivity would ten jebility of the elc? cy ethanol in Brazil, then the social end econom!
soline
f nternational
price 0
ce (CIF) of gasoline
e of gasoline fell to
i that the Programme would seem assured ees oe
e 8280line did not fell. Nevertheless, t ric "5 export Pp | in the Cropped to Us$o.23 in 1983 and Brezil gnificant fol ity of the viabili
m ssory for ®stimated social cost of ethanol would see nee Oted socia
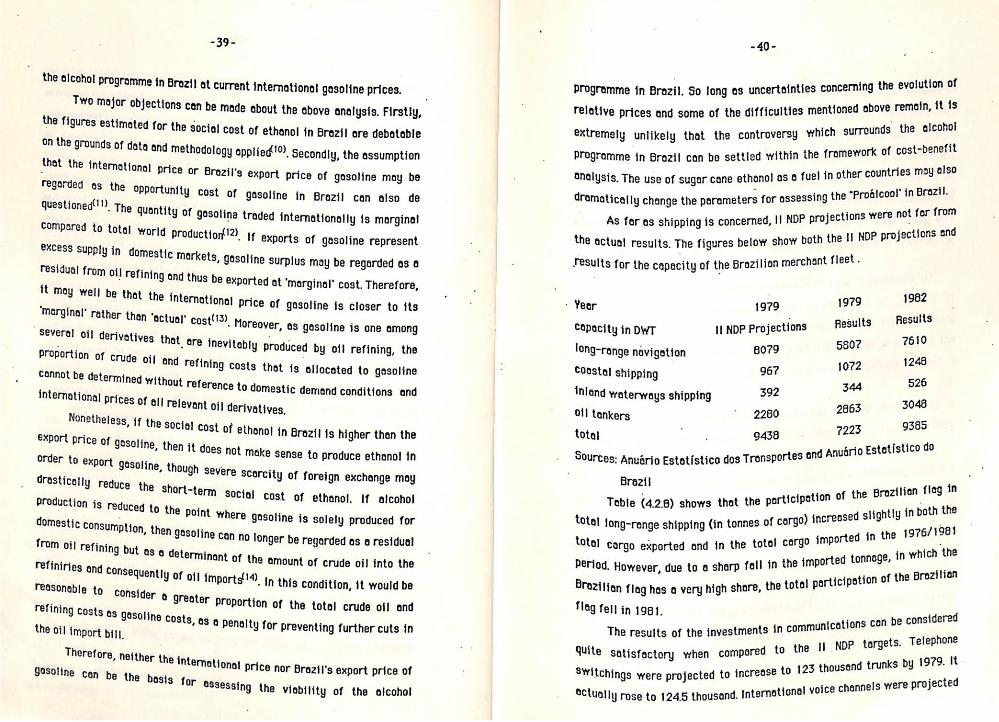
-39-
the alcohol Programme in Brazil at Current international gasoline prices. Two major objections can be made about the above analysis. Firstly, |
the figures estimated for the social cost of ethanol in Brazil are debatable on the grounds of date and methodology applied!), Secondly that
the assumption the the international Price or Brozil's export price of g asoline may be regard garded as the Opportunity cost of gasoline in Brazil can also de uesti (11) questioned’'"”. The quontity of gosoline traded internationally is marginal Compered to tote! world production!!2) if exports of gas excess supply in domestic markets, gasoline surplus may b reel : sidual from Oi] refining and thus be exported at ‘marginal’ it moy well be that the international ‘marginal’
oline represent
@ regarded as a
cost. Therefore,
rather than ‘actual’ cost(t3) M A clad Several oi! derivatives that are j im : a paeNNa Se ONSET
proportion of O79 inevitably produced by oil refining, the Of crude oil ond refining costs that is allocated to gasoline Cannot be dete rmined without reference to domestic demand conditions and
the oi] import bil),
Therefore, n » Neither the international Price nor Brazil's export price of 9asoline can b e the basis for &88essing the viability of the alcohol
- Sources: Anuério Estatistico dos Tronsportes end Anuart
-40-
programme in Brozil. So long es uncertainties concerning the evolution of
reletive prices and some of the difficulties mentioned above remain, it Is
extremely unlikely that the controversy which surrounds the alcohol -be! t
Programme in Brazil con be settled within the framework of cost benefi
Iso analysis. The use of sugar cane ethonol as ¢ fuel in other countries moy 0
; “Proalcool’ in Brazil. dramatically change the parameters for assessing the r from t fo As for as shipping is concerned, 1! NDP projections were det
j and the actual results. The figures below show both the I! NDP projections
results for the capacity of the Brazilian merchant fleet.
- Yeor 1979 1979 1982
7 é esulls Capacity in DWT IWNDP Projections “Results A im
? long-range navigation 8079 5907 ee
Coastal shipping 067 1072 ee
inland waterways shipping 392 344 Aa
Ol] tankers "2280 2665
total a 9438 7223 9385
o Estatistico do
Brazil
Table (4.2.8) shows that the porticipation of
total long-range shipping (in tonnes of cergo) increas 1976/1981
total cargo exported and in the total cargo imported in the sits
Period. However, due to a sharp fall in the imported tonnage, in whi ‘a
Brazilian f lag has a very high share, the total participation of the Brazil
Tlog fell in 1981. t
T vestments in communica
tetera NDP targets. Telephone
the Brazilian fleg in
ed slightly in both the
jons can be considered
Quite satisfactory when compored to the i by 1979. It
Switchings were projected to increase to 123 thousand trunks by i
Sctually rose to 124.5 thousand. International yoice channels were proj
-4]-
to reach 1404 in 1979 ; ia gas aa, (444 via satellite end 960 vie submari
voice channels reached 1336, of wh omen , of which 676 were vie
satellite and 46 0 vie submerine cable. The domestic tel ex network was Planned to ris e@ to 22 thousand installed terminals. In act i ctuality, it rose to 38.3 thousa nd installed terminals. The number of-telephones was estimoted to increase to 8.1 milli Q ee ere n in 1979. In this year, it reached 6.4 mill
as 8.4 million. The intro-stete toll ci ion, but
circuits were Projected to in crease t 0115 thousand in 1979. It rose t 13 } 0 138 thousand!5)
-42-
(S)current Account_of Brozil's Balance of Payments ond Brazil's
ort Perf n orkets
d export drive
on deals with In previous sections, the import substitution process on
in anu mber of individual industries were examined. This secti
tructures ond on the ef fects of these changes on Brazil's export ond import $
performance of Brazil's trade balance on goods and commercial services. The
Brazit's exports as compored to that of other countries and groups of
C ountries is also discussed here. following points:
The main aim of this section is to emphasise the
ted on imports of
(a) Brazil's imports have largely concentra
intermedi j
ediate ond capite! goods, with very little foreign exchange being
Spent o 4 nm consumer durables. A rapid import substitution process in the
interm edtate and capital goods industries is also clear from the chenges in
B ‘ rezil's import structure;
(b) The structure of Brazil's exports hes chenged drameticelly es
®xport .
$ of manufactures, especially capital goods, ropidiy increased their
she re in the value of exports from Brozil;
(c) The transfer of real resources t0 Brozil, 6s meosured by the trade
eclined steadily since 1974
rs since 1980. Indeed, the
f the world in the three
a " goods and commercial services, hos d
Flee. ni into large and negative tronsfe
real resources from Brazil to the rest 0
Years from 1980 to 1982 was equivalent to more then 60 percent of the real
transt er of resources to Brazil in the six yeors period from 1974 to 1979. In
Other words, in the lost three years of the series Brozil has transferred reo!
resourc es abroad at en average per yeor 93 percent greater then the ennual
vero ge inflow of real resources in the 1974/79
rwent after
ment initiated in 1974;
period. This is o measure of
the str enuous adjustment which prozil unde 1960, but only mede
possi ble by the significant structural adjust
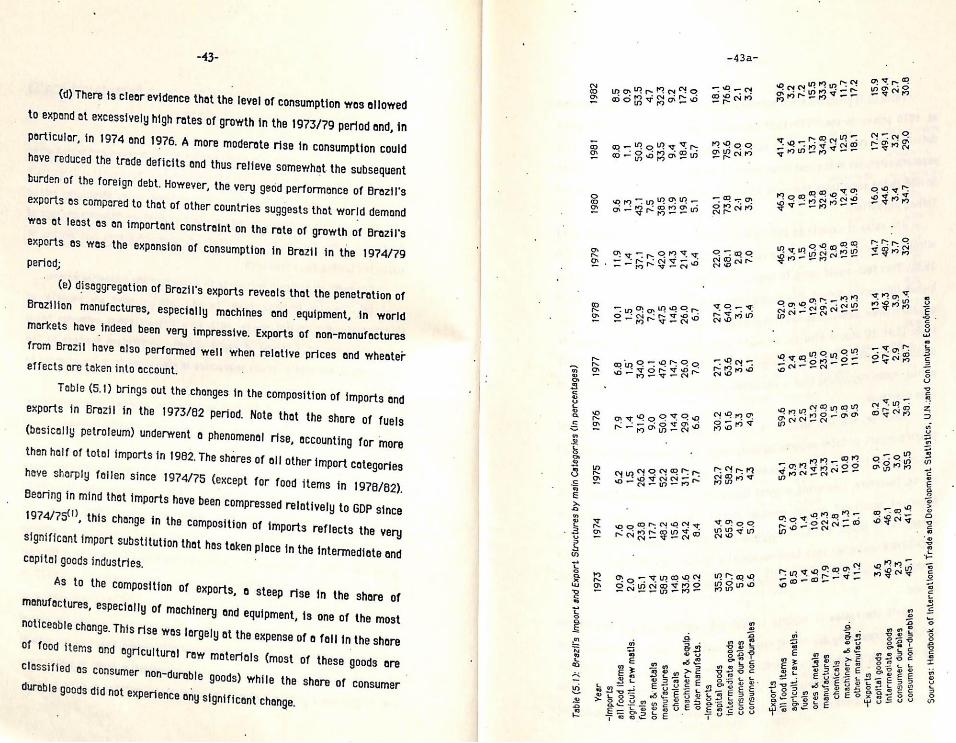
-43-
(d) There is clear evidence that the level of consumption was allowed to expend at excessively high rates of growth in the 1973/79 period and, in Porticular, in 1974 ond 1976. A more moderate rise in consumption could have reduced the trade deficits ond thus relieve somewhat the subsequent burden of the foreign debt. However, the very geod performnunes of Brazil's exporis os compared to that of other countries suggests thot world demond was ot least as an importent constraint on the rate of growth of Brazil's exports as was the expansion of consumption in Brazil in the 1974/79 period;
(e) disaggregation of Brazil's exports reveals that the penetration of Brazilion manufectures, especially machines ond equipment, in world markets have indeed been very impressive. Exports of non-manufactures from Broezil have also Performed well when relative prices and wheater effects are taken into account.
Table (5.1) brings out the changes in the composition of imports and exports in Brezil in the 1973/82 period, Note that the shore of fuels (basically petroleum) underwent a phenomenal rise, accounting for more than half of total imports in 1962. The sheres of ol! other import categories we sharply fallen since 1974/75 (except for food items in 1978/82) Bearing in mind that imports hove been compressed relatively to GDP sin , 1974/75"), this change in the composition of im c significant import Substitution that has taken capital goods industries.
ports reflects the very place in the intermediate and
As to the Composition of exports, o steep rise in the share of manufactures, especially of machinery and equipment, is one of the most noticeable change. This rise was lergely at the expense of a fall in the share of food items and agricultural raw materials (most of these goods are Classifi a ed as consumer non~durable goods) while the shore of consumer © goods did not €xperience ony significant change.
Tabl
e (5.1):
Braz
il’s
Import
and
Expo
rt St
ruct
ures
by main Categories
(in
percentages)
1982
1981
1980
19
74
1975
1976
1977
1978
1979
19
73
Year
-Imp
orts
a5
0.9
53.5
47
32.3
9.2
17.2
6.0
8.8
1.1
$0.5
6.0
33.5
9.4
18.4
S.7
9.6 13
43.1
75
38.5
13.9
19.5
5.1
11.9
1.4
37.1
77
42.0
14.3
21.4
6.4
othe
r manufacts.
all food
items
agricult,
raw
matl
s.
fuels
ores
&
metals
manufactures
“machinery
& eq
uip.
-|mp
orts
chem
ical
s
19.3
78.6
20.1
73.8
2.4
28
7.0
22.0
68.1
27.4
64.0
3.1
27.1
63.6
3.2
6.1
30.2
61.6
3.3
32.7
58.2
37
4.9
25.4
65.9
5.9
58
6.6
35.5
59.7
inte
rmed
iate
go
ods
consumer
durables
capi
tal
good
s
2.9
3.0
3.9
5.4
49
43
consumer
non-durables
-Exports
39.6
3.2
36
41.4
5.1
46.3
4.9
3.4 1S
61.6
52.0
46.5
24
29
59.6
23
54.1
39
25
57.9
6.4
61.7
85
1.4
86
17.9
agricult.
raw
matis.
all food items
fuel
s 7.2
18
1.6
18
25
14
WMpro ee weree
KOyW- rae NO mMewse
15.0
13.8
32.6
32
.8
28
3.6
13.8
12.4
15.8
16.9
12.9
29.7
2.1
12.3
15.3
none? oa Shao
Neng nmoRKagn “aM
14.3
23.3
21
10.8
10.3
W3
10.6
22.3
28
8.1
18
43
V1.2
machinery
& eq
uip.
other
manu
fact
s.
ores
& metals
chemicals
-Exports
-
manufactures
15.9
49.4
2.7
V7.2
49
.1
32
29.0
10.1
13.4
14.7
16.0
47.4
46
3 48
.7
44.6
25
29
3.9
37
3.4
8.2
47.4
33.1
90
$0.1
3.
0
68
46.1
28
intermediate
goods
cons
umer
durables
capi
tal
goods
30.8
35.4
32.0
347
38.7
35.5
416
consumer non-durables
Sources: Handbook
of International
Trade
and
Development
Statistics,
U.N.;and Co
njun
tura
Econbmica
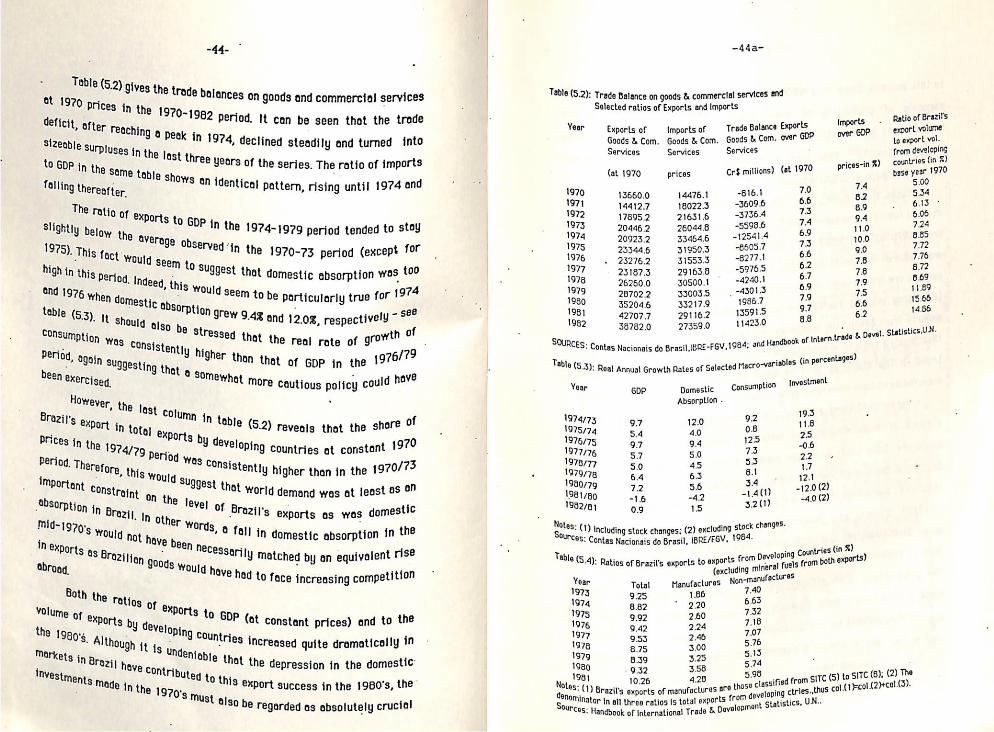
-44-
Table (5.2) gives the trade bal services Snces on goods and commercial s ot 1970 prices in the 1970-1982 e trade Period. It con be seen thot th
ed into ily and turn
deficit, ofter Feaching a peak in 1974, declined ae ratio of imports
sizeable SUrPluses in the last three Years of the series, ; to GDP in the same tab
4 and ‘ ntil 197 le shows an identical patter, rising u
falling thereafter.
The ratio Of exports to GDP in the 1974- Slightly below the ay 1975). This fact wout high in this Period. In ond 1976 When dome: table (5
stay 1979 period tended to -
970-73 period (except ion was too tion was
d seem to Suggest that domestic absorp deed, this Would seem to p
rage observeq “in the 1
974 for | © porticularly true
- ee 3
ly ctive
Stic absorption graw 9.4% and 12.08, respe 3). It shoul 4d also be Stressed that
Consumpt onsistentty higher than t 99@sting that ® somewhat mo
ion wag c
Qoin sy been exercised,
9 76/7 hat of GDP in the 19 Period, 9
ye : Id ha re cautious policy cou the last Column in in tote €xports by Prices jn the 1974/79 Period was c Period. Therefore, this Would Sugges important Constraint On the leve] Sbsorption in Brezil, In other Words Mid-1979'. Would not have been nee
of
However,
toble (5.2) reveals that the ei
Brazil's export developing
countries at oe 970/73 onsistentiy higher than in the tas an t thot wortg demand wes at nena °f Brezil's exports as was do in the 8 fall in domestic Ee
rise essarily matched by an equiva fa have had to face increasing comp
in ExDorts as Brazilian 900ds wourg obroag,
) and to the
Both the Fatios of exports to GDP (at constant ete
Yolume of Exports by q Hy in matica
e¥eloping Countries increased quite: dre
the 19605. Although iti Markets in Brazil have ¢ investments Made jn the
th of rove . the real rote of 9
-44a-
d ervices am mmercial 5 Table (5.2); Trade Balance on goods & co ts 4 Impor' Selected ratios of Exports an
ils Ratio of Brazi Imports: exporL ea Balance Exports SN
ot
Te ees cons oneneDe ra Tas)
Exports of iperts ‘Com. Goods
ail :
in %) en 1970
Year Pan & Com. Goods * Services ‘ prices-in
inte fal Services Service Cr$ millions) (at 197 74 5.34
ices
7.0 82
6.15
(at 1970 pric
-816.1 6.6
89 “6.06
14476.1 -3609.6
73 94
7.24
1970 13660.0
po am ee 7A
11.0 8.85
1971 144127
216316 -5598.6
6.9 10.0
7.22
1972 17895.2
ee emai a 73
9.0 7.76
1973 20446 2 ee ass
66 78
B72
1974 20923.2 se
eT 62 78
ony
1975 233446
31553.3 5976.5
67 79
18
1976. 232762 er
nl 69
75 i566
1977 251875 S000 MS 79 65 14.
1978 26260.0
33003.5 "1986.7
97 62
1979 28702.2
33217.9 135915
88 ,
1980 352046 eee se 1981 eo, | 1982 38782,
evel. istics,U4*- a & D Stati
UN
trad k of Intern + and Handboo! -FGV,1984; a ionais do Brasil, IBRE-FG' SOURCES: Contas Naci
tages) in percen iablas (in pi cro-varia Rates of Selected Ma | Growth
Table (5.3): Real Annua
ion Investment sumption Domestic Con Year
GDP Absorption .
He 92 i 12.0 08
25
1974/73 9.7 40 125 -06
1975/74 5.4 9.4 73 22
1976/75 97 5.0
53 17
1977/76 5.7 45 Bt ya 0}
1978/77 5.0 63
3A ) “08 0)
1979/78 6.4 5.6 -14 if -4)
1980/79 72 -42 32(1 1981/80 e :
15 1982/81 *
hanges- tock ¢ luding 5 2 (2) exc 1984.
Pe. ing stock changes: RE/FGV, sue eat do Brasil. 16 wae (in &) stig Countries (in
javelo ports D om both é to axports ara
ie y
Table (5.4). Ratios of Brazil's exports (onc an ananutectur® — 1 Manufactures
on Tota 1.86
66 198 9.25 "2.20
7.32 1975 9.92
2.24 7.07
1976 9.42
2.46 5.76
1977 9.55 3.00
5.15 (Te (8); (2) Uy
1978 6.75
3.25 5.74
siTc (5) to S ol (2}+cal.(3).
1979 5.39 3.58
5 Massified (rom thus col.(1)¢
1989 9.32
A ne those Cl ing ctries-. 5 ar velop!
1981 a of manufacture
de Notes: (1) Brazil's expor
rom Geng is total exports f Jepment Sta ratios
Minator in all threa tistics. U.N.. & Dove 2 Trada Surces: Handbook of International
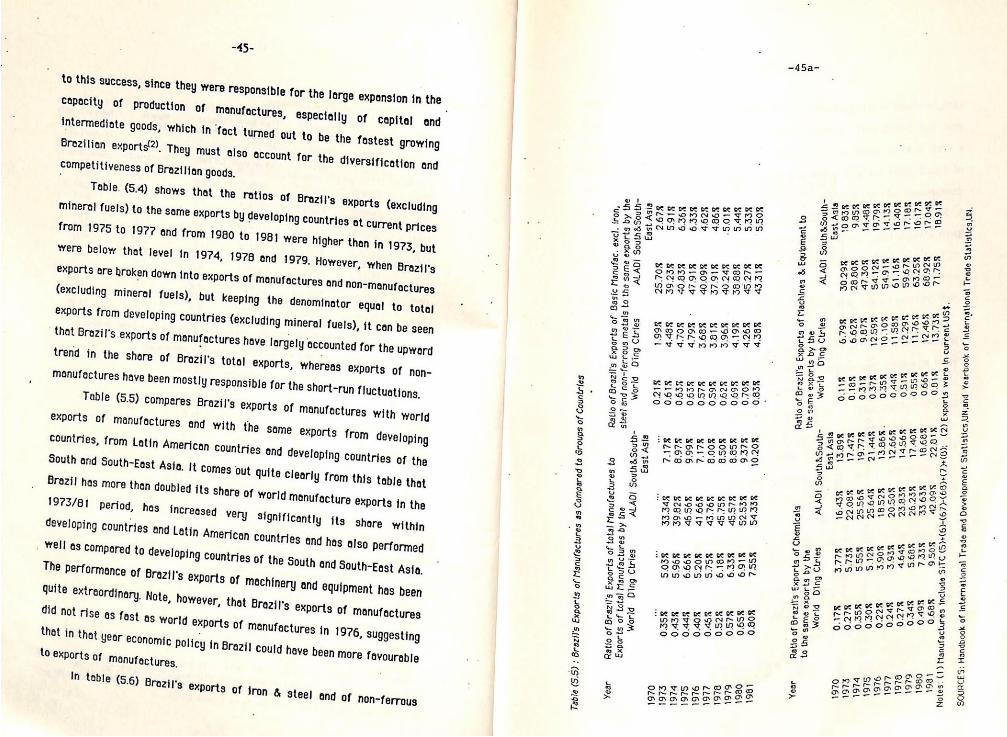
-45-
to this SUCCeSs, since they were responsible for the large expansion in the Capecity of production of manufactures intermediate gcods, which in fact turned out to be the fastest growing
fez 2 Brezilion exports{2). They must also account for the diversification and Competitiveness of Brazilian goods,
In tab} iE
e (5.6) Brazil's exports of iron & steel and of non-ferrous
especially of capital ond
Table
(5.5)
: Brazil's Exports
of Manufactures
as Compared
to Groups
of Countries
Ratio
of Brazil's
Exports
of
Basic
Manufac.
excl.
iron
steel
end
non-ferrous
metals
to
the
same
e.
Ratio
of Brazil's
Exports
of total
Manufactures
to
Exports
of total
Manufactures
by
the
Year
xports
by
the
ALAD/
South&South-
World
Diing
Ctries
ALADI
South&South-
Warld
Diing
Ctries
ip RE SE OF be or be ce oe or OF ~OMNNoO-
SoamMmuonocinn BANNnwowotrTHHNMnN ad
BF SEES BC Oe OC Be be Be oe oMnnM-a-vT = SNDHRONANONM NHNOROnDODNNM NMP SPOTS
Ge Gf CE Gt oe Be ce Bt Oe OS RQOKD— GRO Qynmonaa- aM -TYTMMMmMTTT
GS Bf Ct oF oe oF ot Ot Ot OF ~ MMM ANH OM AoQOwooNnnooro eoo00c0coocoo0*
a < 2 OC GE Ot Of Ot OF Oe OT Of YEE ARDOURSD x sag-oHaena a ~Oanronoaned
ire ,
7 OE be oe oF pe OF OC OC OF TAODDOHOR Bae Ue PS Ps Ue NAoO-MMNN Hhovr rr Tow
BE BE Ge BE GE CE DE OC OE MwouooMNaMmM- Ww SHOARAMAWY NnnNnonNNnNooor
i be Ge ce ce be Gt OC BOTS eR Dee mytETNnog eocooooco0o00o
oOnMTMNWROaTes ere eeeo DADBAARDAD
-45a-
quipment
to
Ratlo
of Brazil's
Exports
of Machines
& E
the
same
exports
by
the
Ratio
of Brazil's
Exports
of Chemicals
to
the
same exports
by
the
Year
ALADI
South&Soutn-
World
Ding
Ctries
ALADI
South&South-
World
D'lng
Ctries
East Asia
East As
ia
O818
(2)
Exports
were
{n current
US$,
86%
66%
S68
408
6GR
22.818
iTC
(5)+(6)-(67)-(68)+(7 +
(8);
13.898
17.47%
19.7
78
21.44%
13
12
14
7 18
16.43%
22.08%
25.56%
25.645
18.528
20,508
23.83%
26.25%
33.63R
42.9098
3.778
S.73R%
S55
5.12%
3.90R
3.938
4.648
5.68%
T33R
9508
Notes:
(1)
Manufactures
include
S
SOURCES:
Handbook
of International
Trade
and
Development
Statistics,
UN.and
Yearbook
of International
Trade
Statistics.UN,
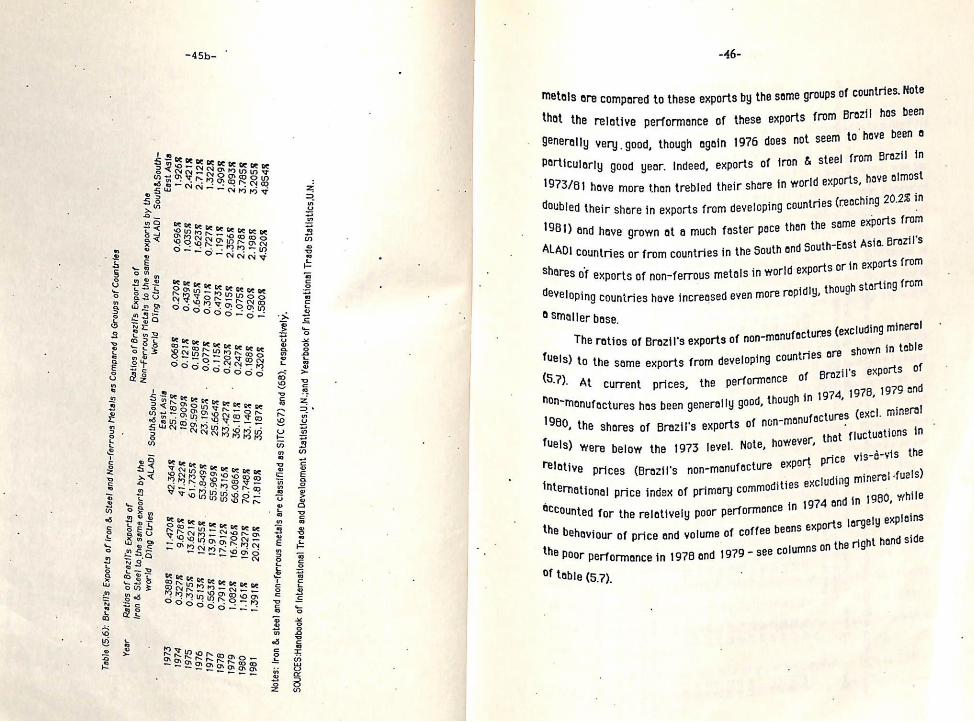
ferrous
Metals
as Compared
to Groups
of Countries
Table
(5.6):
Brazil's
Exports of
Iron
& Steel
and
Non-
Yy the
ALADI
South&South-
Non-Ferrous
Metals
to the
same exporls
b World
Ding
Ctries
Ratios
of Brazil's
Exports
of
ALADI
South&South-
y the
world
Ding
Ctries
Ratios
of Brazil's Exports
of
Iron
& Steel
to t
he same exports
b
Year
-45b-
5
TO OC 0c be be LSuNKane ee ZOTRASSoSH B= nA AeA ETNA = adn ¢
S oF ST OF SC Se ce oe ge ft @smunss ne BE=KAo o seh Tasge “ScosHge
RaBRYHKSS -—= =o Lk ton Gong cf _NNK BH °8S06ceg
Lot © oe be uw te SO SSH Foe oe BRAH2ECaRS
Basia.
SF Ot te oe SABSRSS Es MMR SS-ByFe Vr—n eg Veka YVoRBBSs= ts : Do SEE LE be be ce be GRAB IS SEG ~aeMaarNs “RAR GAS 2ivas
BE BE be ge $B cy 10 10 fe ok BS OR 8 See HBRgoa Floss ol.
MOTI Ber PRoaoH
REARARTRR oo ee ee
Notes:
Iron &
steel
and
non-ferrous
metals
are
classified
as SITC
(67) and
(68),
respectively.
SOURCES
‘Handbook
of International
Trade
and
Development.
Statistics U.N.jand
Yearbook of International
Trade
Statistics,UN..
-46-
groups of countries. Note
Brazil has been
ave been 4
1 in
metals ore compared to these exports by the same
thot the relative performance of these exports from
generally very, good, though again 1976 does not seem toh ae
Porticularly good year. Indeed, exports of iron & steel from
more th A
| "
nay i rts from developing coun
‘ast mei same exports from
1981) and have grown at a much faster pace then ue ALADI countries or from countries in the South end South- in exp Shares of exports of non-ferrous metals in world exports or : starting developing countries have increased even more repidly, a
East Asia. Brazil's
arts from
from
o smaller base.
The ratios of Brazil's exports of non-menufecty fuels) to the same exports from developing countries © F
(5.2). At current prices, the performence of a Fs
nhon-manufactures has been generally good, though in 19? : a
1980, the shares of Brezil’s exports of na en fuels) were below the 1973 level. Note, nena” re yig-a-vis the relative prices (Brazil's non-monufacture is ms Suid minerel fuels) international price index of primary cee ney and in 1980, while Sccounted for the relatively poor performance in i ely explains
and side
res (excluding mineral
re shown in table
s exports of
6, 1979 and
mineral
ns in
larg beans exports the b 1 olume of coffee peor os hiseg anil e columns on the right h
the poor performance in 1978 and 1979 - se
of table (5,7), ,
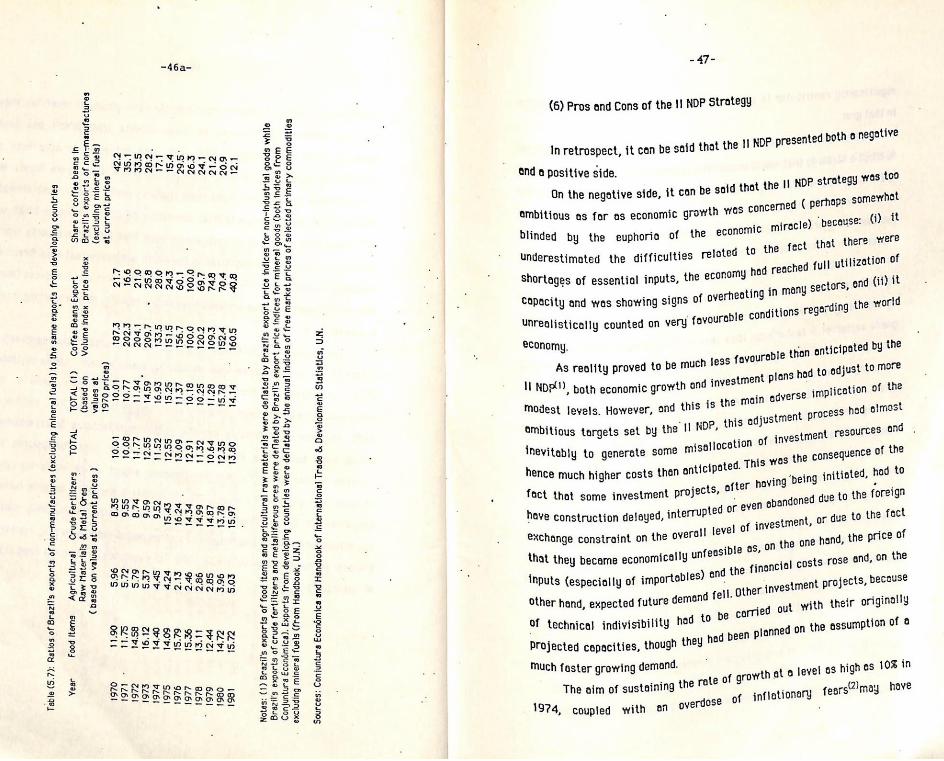
J countries
Braz
il's
exports
of non-manufactures
Shar
e of coffee be
ans
in Co
ffee
Be
ans
Expo
rt
Volume
index
price
index
TOTAL
(1)
(based
on
TOTAL
Crude
Fertilizers
Raw
Mate
rial
s &
Metal
Ores
(based
on values
at current
prices
)
Food
Items
Agri
cult
ural
Table
(5.7):
Rati
os
of Br
azil
's
expo
rts
of non-manufactures
(excluding
mine
ral
fuels)
to
the
same exports
from
deve
lopi
n
Year
-47-
-—
el of investmen
e as, on the one han
nancial costs rose
ee ee
exchange constraint on the overall TeV d, the price of ib!
that they became economically unfeasib i and, on the
ables) and the fi
nd fell. Other inv
be carried out
en planned on the as
use inputs (especially of import
other hand, expected future dema
of technical indivisibility hed t°
projected capacities, though they had be
Much faster growing demand.
The aim of sustaining th
1974, coupled with an overd
estment projects, bece
with their originally
sumption of 8
eS eR ee ee eS
to level as high 6s 10% in f growth 9
e rate of 9 g tears may heave
ose of inflationa
-46a-
(6) Pros ond Cons of the I! NDP Strategy n
a 2 £
= 5 both 0 negative
2 : cf In retrospect, it can be said that the II NDP presented 3 SeBkrreecaa- Bese _ SNe aR aNgS Be > ond a positive side. 11 NOP strategy wes 00
28 BSs the eg Sse a t con be said that
c =e n the negative side, it co net és ek g concerned (perhaps somevt 25 ms ambitious as for as economic growth was iracle) becouse: (i) it 38 223 . nomic mirec §3 & 33 blinded by the euphoria of the eco the fect that. there were
g55 ‘ ‘eri 5 related to ae 3 aeeectentel he eT my hed reached full utilization of
POreseseneee 8 shor inputs, the econo Hit N2NRRaSSSxeg & tages of essential inp | scatingtonnet sectors, ond ( )
5 aly ail WaR-sbow logs" “a ditions regarding the world
= iti yourable cond! eR orMMreansn é unrealistically counted on very fe PRRRPOBSRSHS F economy. nie than enticipated by the
5 s favoure 2 2 As reality proved to be much 1° t plans hed to adjust to more
SESRE 3 ; investmen ‘ 2 =e 5 a 8 SUH LkRR= = , INDE), both economic growth and in main adverse implication of the 2 Heute eres-u¥ o | ig the e
se RL tomie DORSET. HineRE mE - this odjustment process hod. almost = ambitious targets set by the II NOP, of investment resources on set yawna-ay = . location ,
esiarase =< gs 5 inevitably to generate some misal 4. This was the consequence of the
E hence much higher costs than anticipated. roving being initiated, had to ter —_
5 fact that some investment projects, Ph doned due to the foreign
ROS Shexsacen g : ted or even oban fact DH GA NG Se we mG = have construction delayed, interruP t, or due to the
= 2 2 E 2 2
& =) a 5
= a) = o ao
2 = Co
njuntura Ec
onom
ica)
. Ex
port
s fr
om developing
coun
trie
s were
defl
ated
by
th
e an
nual
in
dice
s of free ma
rket
pr
ices
o
Braz
il's
ex
port
s of
crude
fert
iliz
ers
and
metalliferous
ores
we
re
deflated
by Br
azil
's export
price
indi
ces
for
mine
ral
excl
udin
g mineral
fuels
(from
Handbook,
U.N.)
Sources: Conjuntura Ec
oném
ica
and
Hand
book
of In
tern
atio
nal
Trad
e &
Deve
lopm
ent
Stat
isti
cs,
U.N.
- 48-
significantly contributed to some speculative and unnecessary importation
in that yeor.
On the positive side, it can be said that the 11 NDP correctly refused to adopt o strategy thot would drastically reduce economic growth or plunge the country into a recession, as most advanced economies did following the first oi! shock. Equally important was the determination to sustain and even increase the share of investment in total income rather than spend foreign resources in wasteful consumption. :
The determination to advance the industrializetion process in Brazil by implementing an import substitution programme in energy resources and by expanding the capacity of production of the capital and intermediate goods sector at a foster rate then that of the consumer goods sector (in
; order to correct what was rightly seen as an unbalanced economic growth), including the expansion and installation of new industrial branches in areas such as eletronics, mechanical engineering, metallurgy, shipbuilding, roilwoy equipment, aircraft manufacturing, petrochemicals ond pharmaceuticals must also be counted 4S positive factors brou ght about by -the I NDP.
Moreover, it would be reasonable to assume that the learning by doing Process implicit in the tremendous investment effort made in this period must have had a very positive effect on the quality of Brazil's labour force and managing Capacity. Indeed, the recent success of Brazil's exports of engineering services in areas such as civil engineering, hydroelectricity and oil exploration would seem to be one of the Strongest evidence of this fact.
-49-
NOTES:
Introduction
ority g (1) “It is necessary a change in the relative priority
: er to re economic sectors and within industry in ord
iven to diff erent
duce imports and
raise exports”, II NDP, p.19;
(2) Compos (1983);
(3) Jornal do Brasil, 01.04.1984; .
(4) The state penetration in productive investm causes 0
particularly attacked as one of the chief
ent arees hes been
{ Brazil's economic
problems;
(5) The Times, 26.06.1984;
Section (1) (1) The objective of this brief review fs simp
analysis of the post-1973 period. a
Period may be found in Bache (1977) and ra
(2) Cormpound annual rates unless otherw!
Necionois (Conjuntura Economice, December
Bonelli and Werneck (1978). See Suzigen ¢t
ly to set the stoge for the
he
detailed discussion of t
an and Bonelli (1977);
ontes se indicated. See Co!
1ae0 and June 1984) and
al. (1974) for the policies
pursued in this period; 1977);
(3) See Bache (1977) and Malan end Bonelli ¢ cae yee
(4) See Contas Nacionais (Conjunture Economics,
eed, 1984); q
page 145 to 157). I n
the 1968/73 period whe
world
t (see (5) Maten (1981) has emphasised this poin
clear the peculieriety of today is relatively nt of the chenges in the in lig
seen ino historical perspective end
* 48; economic conditions”, Ibid, P-! ~ no
(6) See IFS-IMF. It is interesting to ,
il's hat although the share of Braz!
-50-
ex ports in world imports (at 1970 Prices) underwent 9 marked increase int his period, from 0.86% in 1967 to 1.062 in 1973, it still remained. He below its level in the 1950's and early 1960's when it varied from ae Sec” ee between 1953 and 1961. This point
Pay, een sufficiently stressed in the literature; re thourough analysis of the Brazilian export performance in
this periad see Doellinger et al. (1973) and (1974); (8) See Malan (1981), p.154-
,
_ growth-rat &s Of 16.5% in 1970, 32.68 in 1971 and 19.1% in 1972 we not only unprecedent but by for the Ia 5
ee IFS-INE), Tgest annual increases since 1951
in this period (20 48 on average per annum between
32.5% per annum between 1971] and | ea
{12) See Wells (1973) and Pereira (197 foreign debt in this Period;
973, based on SDRA’s). See IFS-IMF; 4) for an account of this rise in the
(13) That does not mean to say that domestic this period. policies had no importance in
17.13% and 22.68, respectively; (15) See tables in Sections (3) and (4):
-51-
es; (16) Bonelli ond Werneck (1978) end Conjuntura Econémico, several issu
(1?) Doeltinger et al. (1977).
Section (2)
Section (2.1):
(1) II NDP, p.21 (original in Portuguese);
{2) Ibid, p.25;
(3) Abreu and Malen (October 1974). Th
plan itself rather tho
did not have the
orld economy
e dete is important beceuse it
n the actual
meons that they were criticising the s the plan mokers,
Amplementation of it, thus they, ® knowing how the yf
advantege that we now have of
actually developed;
(4) Ibid, p.2, 4 ond 9;
(5) Ibid, p.12;
‘6) Ibid, p.8;
ath
annum
”
2% on average pe
(8) GDP of all countries at constant price rose a8 :
974/79 period, while alo
ar in the same period ~ Se€ IFS/IMF;
o. If the simple avere
n current prices are teken
93.0% in 1967/73 and 23.2%
t 25.5% in
pp of the industrial
(compound rate) in the 1
countries rose 2.7% per Ye
(9) Weighted average at cons
¢ savings based °
ges of
tont price of 197
the rates of domesti
re: 22.6% in 1965/66,
t the domestic sovings
he term
Conjuntura Eco
estic savings
instead, the figures ©
in 1974/79. Note tho t
1974/75, despite the deterioration of
i 77 - s€
5.0% in 1974/
i.
gs thet the relationship petween
in Brozil
estic sovings ©
dramatic fall in the te
rate peoked 6
5 of trade in this period,
nomice, June
and was equal to 2
1984, This suggest
ond foreign savings
complementarity. The foil in dom e
in this period yas one of
fter 197? should be
rms of trade,
“seen as the combined result of th
-52-
the sharp rise in the Edie capaity interest rate on-the foreign debt and th
re e increase
(10) Acco rding to Furtado’ ado’s ex-post analysis of the period od, the I! NDP stretegic obj ectives - to fill the gaps of the indust ustrial sector b y
co i
*
ne e of ~- were sely IT H Ye r - HOoweve he ’ Pointed out th at in order to achieve those objectiv es, it would ha ve been necessa Ssary to take m easures to reduce the shere of c onsumption in
( t im c to pe] t f Cc t
rise in the j
Brazilian model of d t rote. This would have meant modif
durable goods evelopment based on the expansion of itying the
sector.
nof the co
that have been revi He then, based on national accounts nsumer
modified, that ised, argued that the Brazilian statistics
: no stru 2
mode
of the economy in thi Ctural change con be observed in th Denil
is period and € supply sid
stable whi nd that the rat ;
a
le the dome e of investm
stic savi ent remain
Period. He then ings rate actual
ed
came to the c ; ally decreased
did not have onclusion that
in the
the purpos : the indebtean
but was mainly th € of roising the future copabili ess strategy
y the counterpart of
1 ity of the econom
On anti-inflation 4
Furtado (1982 “A ) p.43 to 56 and (1982 Ory policy. See
-B) p.34 to 38.
Section (2.2):
(1) Note that despite .
MCenEAEH bi rads that the date on the actual j
ond, hence, are an oo industry ere besed on a sem oe
sortie this eee of the totel mats e of firms
difference. Furthermore n could not possibly account fo LL
» the shore of investment i ie a e basic
*-53-
from ; roughly 562 in 1970/74 to 852 in 1975/79. It, in fact, reached
0% on average in 1975/79;
2 ) The share of investment in ports end oi
so : me. Other infra-structure investments i
(undertaken by Petrobrés) and
y Metro-SP and Metro-Aio);
tions the aim of
uction of
shale
rports would remain roughly the
n transportation include (in
0 ;
ur celculations) investment in pipelines
in the underground systems (undertaken b
(3) Parti rlicularly of oil and electricity. The |] NDP also men
ry, of raising the prod e
.
xpanding the use of coe! in indust
nd the development of the
a Icohol to be mixed with gasoline ©
Programme;
(4) 0 aetl NDP, p.2?, and from p.74 to p.?6;
E ; . ven allowing for the foct that our estima
industry are underestimated;
tes for investment in
w that the shares of investment in
fall efter 1974 while the snares of
the aerospace
(6) F : ; urther diseggregation would sho
the automobile industry tended to
ty shipbuilding end in
emicals, the share of i
the shares of
(including alco
in . 2 vestments in railway equipmen nvestments in
in dustry tended to rise. Within ch ‘intermediate
oil i : refining declined whereas
micals
ents in cellulose
74 ond 1979.
hol) rose quite
Petrochemicals end non-petroche also showed &
si te:
ignificantly. The share of investm
een 19 See Industrial
Pronounced upward trend betw
5 urveys of FIBGE from 1974 to 1979.
Section (2.3):
(1) In fact, exports’ of goods reached US$ 15.2 piltion in 1979, which
74/79 period,
corresponds to a compound annual rote of 13.9% in the 19
(2) 1 NDP, p.67;
(3 ) In fact, the accumulated cu
US$ 40 billion;
rrent account deficit in 1974/79 reached
-54-
(4) Abreu Q
(5) IL NDP, Sa (October 1974), p.t1.
(6) ibid, p.18;
(7) Ibid, p.19. (8) Ibid, p.121;
(9) In fect , this ratio 1978, risin reached 22.3% in 1974, fell belo
(10) The rati 9 9gein above 20% in 1979 and ¥ 203 from 1975 to
® ratio of the net foreign debt nd 1980;
2.643 to
.
S4in 1979; Ao exports rose from 0.99 in 1973 to
a 1) Intern . ational re
33% of imports i es fell sharply from 1048 of im
n 19? port
i 5, Pose to 848 in 1978, failing th einige to
* ereofter.
Section (2.4):
(1.11 NOP, p.26; (2) Ibid, p.42: ;
(3) Ibid, p.4o:
(4) The I1N DP estima lated that 36.0% of the total investment i n mining and
8 p.1 +
);
’ (6) Ibid, p.45
(8) Rei ) Reichstul and Coutinho (1961). (9) Lessa ( 1978):
expansion inB rezil. See fro
mp.129 to 173
? t
-55-
ro om for monouvre would have to norrow down-The chonge in the
olitical alliance pattern of industrielization woul require @ new P
ts uthoriterian among the economic groups which the state, despite
, character, could not impose. Ibid, p.142;
1 : 2) Ibid, from p.129 to p.159 but, porticulorly, p.143.
Section (3):
(1) The main basic input industries considered 1
fertiliz
n the plon were: steel ,
ers , pesticides , paper
non-ferrous metals, petrochemicals ,
icol industry, cement,
and cellulose, products for the phermaceut
sulphur and other non-metallic minerals;
(2) 11 NDP, p.6;
Section (5.1): (1) Machines and equipments ‘made on order’ are those which ore specially
turbines
designed to fit the specifications of th
es
e buyer. Examples ere
for steel mills, ships, special
ments ‘made in Sé
y from eny
for hydroelectric power plants, furnac ries’ have
tanks or containers, etc.. Machines and equip
standard specifications ond are monufectured jndependent!
particular buyer. Examples ere boilers, tractors, compressors, pumps,
computers, etc.;
Section (3.2):
(1)The relatively slow growth | Brazil in the eorly
1970's, which led to a drastic |
Product - see table (4.4.2) - wa
(storting with the Booz Allen Intern?
underestimated the growth of the demend for stee
Projections for the copacity of production of st
n steel production in
ncrease in the import coefficient of this
g due to studies done in the late 1950's
tional Study in 1966/67) which
| in Brazil. The || NDP
eel in 1979, on the
-56-
Other hand, were clearl| to 63, for the Plans f 1964/65 and 1973.
(2) Capaci Pacity of Production of alu
us, Se
iminium nw 7 261 thousand tonnes by the
in . tonnes by the end of 1983. See
80 Brasileira de Aluminio) 1983;
f-suftj i Ciency in aluminium ore (bauxite)
endo aa 1979 ang reached 424 ri - Be 0 Estatisticg ABAL (A
rec
: Zi] has also achieve
5 sel
Section (4):
Section (4.1). a NDP, p 2a.
(2) Ibid, p25,
{3) Ibig, ig
5 Ba an
984,
Section (4.1.1).
(3) In June of 2
1984 Production re NDP, p.24; ached 5
4i i
{ thousand berrels a doy and by was equ a! to 5
0 thousand, against an average of
@ Relaté latério da Gazeta Mercantil,
expans fon of the steel industry between .
-57-
(4) The refining of of! produces a number of oil derivatives such es gas,
LGP , gasoline, kerosene, naphathe, diesel, fuel-oil, and others. The
vant : quantity of each derivative per unit of crude oil refined depends
basi osically on the type of oil (lighter 0
ts with respect to the shares of each r heavier) ond on technology. There
is some flexibility as well as limi
derivati ative thet can be extracted from a unit of crude oil. Consequently,
rivative that can be extracted from a j .
f the maximum shares of each de ative,
he relative demand for each deriv unit of crude oi! do not match t
n what
h relative demand is greater the
rude oil will be the main determinants
that should be refined (assuming that
then those derivatives for whic
.Can be extracted from a unit of c
of the total amount of crude oil
y in the country); t : .
here is spare oil refining capacit
istico do Bresil) for the co (5)
Series from FIBGE (Anuario Estat nsumption
iries. See Balango Energetico Nacional 0 : f crude oi! in the Brazilian refin
2.1985 for
1982 84 for date of 1983 ond Aelatério do Gazeta Mercontil 26.0
data of 1984;
7 See Modiano (1982) ; ? ) A decline in the consumption 0
utput can take
more efficient
f ‘substitution
{ crude ofl per unit of
Place through the use of substitutes end/or through @
u se of. crude and oil derivatives. Both types °
ie Possibilities’ seem likely to have been underestimated;
Crude oil in cubic meters and GDP at 1970 prices,
Section (4.1.2): (1)
I NDP, page 96, Capacity includ
8 ; lotion being built in Brezil (Angre
rst nuciear power
ed 626 MW from the fi
1) and then schedule to start
Operation in 1977; n in the capacity of
(2 ) The difference in capacity is
4s Annual Repo ‘
mainly due to a revisio
_ Self-producers (see Eletrobr
rt of 1982);
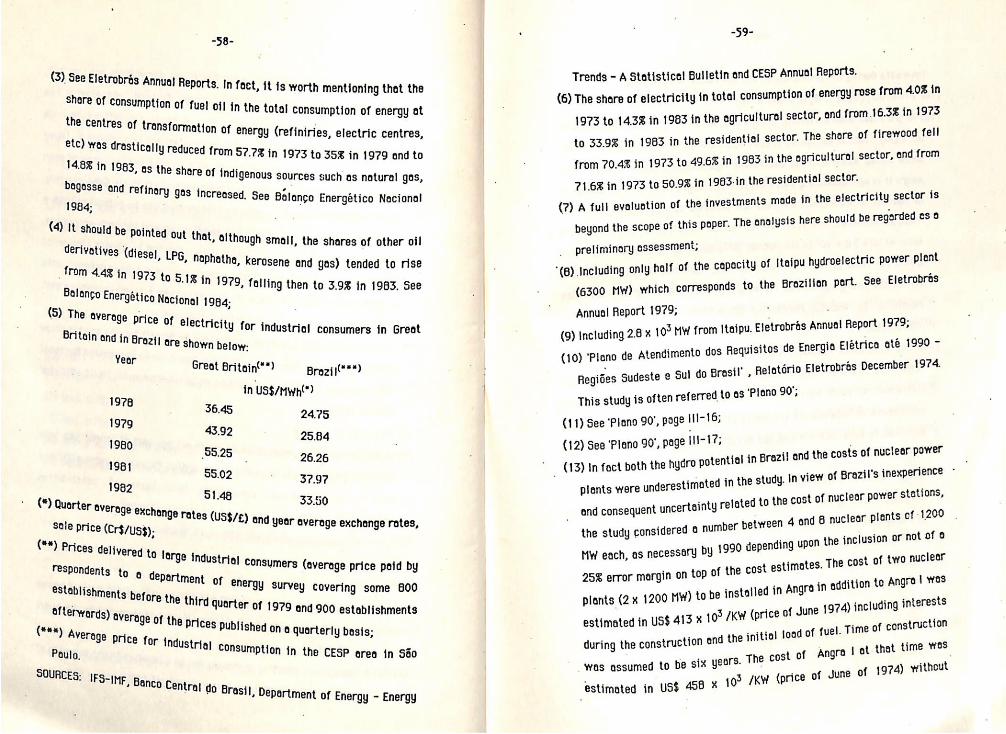
-58-
(3) See Eletrobra eet, $ Annual Reports. In foet, it is worth mentioning that the
s Moree ile of fuel of! in the total consumption of energy at $0 transformation of energy (refiniries, aiscure cantres
etc) was drasti Cally reduced fro ; m 57.73 in 1 ‘
14.8 in 973 to 35% in 197
1983, as the share of indigenous sources om
bagasse ond refinary gas i ,
1984; gas incrensed. See Balan
such as natural gas,
¢o Energético Nacional
(4) It shoul d be poi
derivatives fa ae although small, the shares of other oil es ,
from 4.4% in pi haphatha, kerosene and gas) tended to rise : i 05.1% in 1979
; » fal Balanco Energético Nacional 1984. Sn nee event (5) The ave rage pri site Price of electricity for industrial
n ond in Brazil are shown below. ee
Yeor Great Britoin’**) Brazil"**)
eS in US$/Mwht")
is5 36.45 24.25 4 :
ints 43.92 25.84
ie 59.25 see 1 3
(*) Quorter average exch 51.48 ai
xchange rate ; Sole price (Cr$/uss). 8 (US$/E) and year average exchange rates
(**) Price Ss delivereg t FeEpONGILS “ta : large industrial consumers (average pric id b
" @ pa
establish partment of energy y
ments before the thir Survey covering some 600 : d qua
; ofterwards) average of the pri Se mimetics (*#x) Average price M Prices published on a quarterly basis
r ? Pau industria} Consumption in the CESP 0 { rea in Séo
SOURCES: ; IFS-IMF, B » Banc 0 Central do Brasil, Department of E nergy - Energy
(8) Including only half of the capecit:
~ (13) In fact both the hydro potential
-59-
Trends - A Stetistice! Bulletin and CESP Annual Reports.
(6) The shore of electricity in total consumption of energy rose from 4.02 in
1973 to 14.38 in 1983 in the agricultural sector, and from.16.3% in 1973
to 33.9% in 1983 in the residential sector. The shore of firewood fell
from 70.4% in 1973 to 49.6% in 1983 in the agricultural sector, and from
71.6% in 1973 to 50.9% in 1983-in the residential sector.
(7) A full evaluation of the investments made in the electricity sector is
beyond the scope of this poper. The analysis here should be regarded eso
preliminary assessment;
y of Itaipu hydroelectric power plant
(6300 Mw) which corresponds to the Brazilian part. See Eletrobraés
Annual Report 1979;
(9) Including 2.8 x 10° MW from Itaipu. Eletrobras Annual Report 1979;
(10) ‘Plano de Atendimento dos Requisitos de Energia Elétrica até 1990 -
Regides Sudeste ¢ Sul do Brasil’ , Relotério Eletrobrés December 1974.
This study is often referred to as ‘Plano 90°;
(11) See ‘Plano 90", page II-16;
(12) See ‘Plano 90", page HII-1?;
in Brezi! end the costs of nuclear power
plants were underestimated in the study. In view of Brazil's inexperience
and consequent uncertainty related to the cost of nucleer power stations,
the study considered 4 number between 4 end 6 nuclear plants cf: 1200
MW each, as necessary by 1990 depending upon the inclusion or not of 0
25% error margin on top of the cost estimates. The cost of two nuclear
plants (2x 1200 Mi) to be installed in
Us$ 413 x 10° /KW (price of Ju
truction ond the initial load 0
f Angra
of June of 1974) without
Angra in addition to Angra | was
ne 1974) including interests
estimated in f fuel. Time of construction
during the cons | at that time was
be six yeors. The cost 6
¢ 456 % 10> /KW {price was assumed to
estimated in US
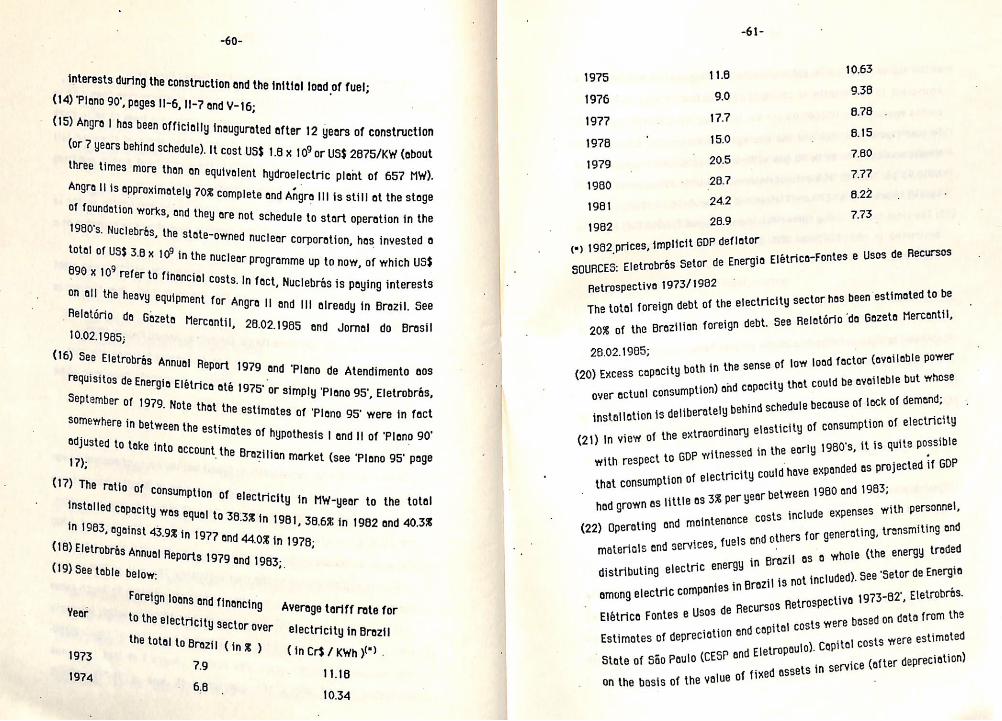
-60-
interests durin ig the construction : and the initi
(14) ‘Plano 90°, pages 11-6, I!-7 and V-16- si al
(15) Angra | has be
(or ? years setae ey Inougurated after 12 years of construction
three times more i 2). It cost US$ 1.8 x 10° or US$ 2875/KW (obout
Angra Il is serach hm caren hydroelectric plant of 657 MW).
of foundation works, and the complete and Angra Il! is still at the stage
1980's. Nuclebras, the stat ore not schedule to start operation in the
total of US$ 3.8 x 10⁹ in fs See ee eaebrp eration; hoy investeilie 890 x 109 nuclear programme up to now, of which US$
refer to financi ial costs. | on all -In fact, Nuclebras i sae
the heavy equipment for Angra It end ebras is paying interests an
Relatério q : 0 Gazeta Me ;
re
10.02.1985; antl,
) Ill already in Brazil. See
68.02.1985 and Jornal do Brasil
(16) See £ letrobras A n
requisitos de Energi nusl Report 1979 and ‘Plano de Atendiment oElé ‘
September of 1979 a aha Pte StS 'or simply ‘Plano 95', El . . iy
;
, Ele ote that the estimates of Sinees robras,
were in fact Somewhere in b etwee adjusted to teke int n the estimates of hypothesis | and I! of ‘Plano 90" ii 0 account the Brazilian market ( P i : see ‘Plano 95° page
(1?) The ratio of con sumption of electricity in MW year t “year to the total y q ;
a
3, against 43 , 43.9% in 197 ‘ ?a
(18) Eletrobrés Annual Reports 4 ne Om TS TE;
(19) See table below:
in 198
979 and 1983;
Farsi oreign loans and financing
Year ta ectrn Average tariff rote for teats Y Sector over electricity i
0 ia ol to Brazil (ing ) (in Li it, wh yO),
11.16 6.8
10.34
1975 11.8 10.63
1976 90 938
19°? 17.7 8.78
1978 | 15.0 8.15
1979 ' 905 7.60
1980 28.7 7.77
1981 242 8.22
1962 28.9 7.73
(") 1982 prices, implicit GDP deflator
SOURCES: Eletrobrés Setor de Energia Elétric
Retrospectiva 1973/1982
The total foreign debt of the electricity sector
torio da Gazeta Mercentil,
o-Fontes e Usos de Recurses
has been estimated to be
20% of the Brazilian foreign debt. See Rele
28.02.1965;
(20) Excess capacity both in the sense of low load factor (availoble power
over actual consumption) and cepacity thot could be aveileble but whose
installation is deliberately behind schedule because of lock of demand;
ticity of consumption of electricity
(21) In view of the extraordinary elas
e early 4980's, it is quite possible
with respect to GDP witnessed in th
that consumption of electricity could have expanded as projected if GDP
ween 1960 and 1983;
had grown &s little as 3% per year bet
include expenses with personnel,
(22) Operating and mointenence costs
services, fuels and athers for generating, transmiting and
1 as a whole (the energy troded
t included). See 'Setor de Energia
pectiva 1973-82’, Eletrobras.
based on date from the
materials end
distributing electric energy in Brazi
among electric companies in Brazil is no
Elétrice Fontes
Estimates of depre
State of Séo Paulo ¢
on the basis of the va
e Usos de Recursos Retros
g were ciation end copital cost
pital costs were estimated
CESP and Eletropoulo). Ca
jue of fixed assets in service (after depreciation)
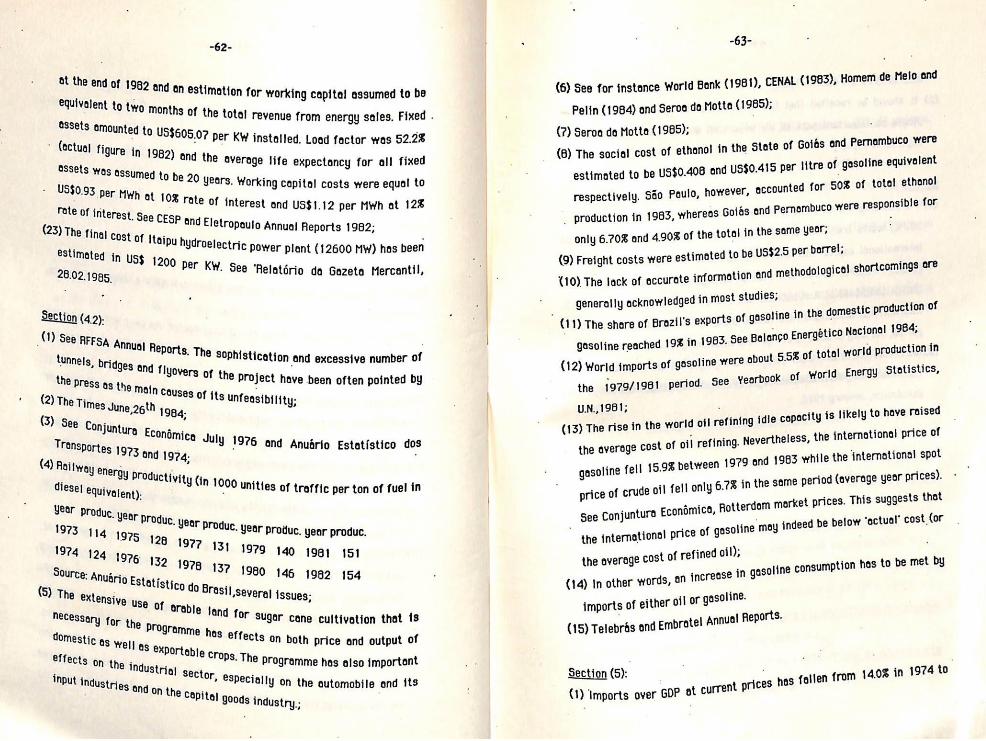
-62-
at the end of 1 962 ond an estimation for working capital assumed to be
assets amount ed to U 5$605.07 per KW installed. Load factor was 52.2%
* (actual fi igure in 198 pee: 2) ond the average life
9S assumed to be 20 expectancy for all fixed
US $0.93 ber MWh at tog rate Fa : ) u of interest, See CESP and E he final cost of Itoipu hydr 0
estimated { n US$ 1200 26.02.1985, Per KW. See ‘Relatério da Gazeta Mercantil
ears. i j y ; . Working capitol costs were equal to
0 interest and US$1.12 per MWh at 12% letropaulo Annual Reports 1962;
electri tric power plant (12600 MW) has been
Section (4.2):
(1) See RFFSA Annual Re tunnels, bridges ang the press 48 the main
Ports. Th : Sophistication and excessive number of
Tlyovers of t ae he Project have been often pointed by
of its unfeasibility; (2) The Ti he Times June, agth 1984 (3 ) See Conjuntura
Econ Trans Omica Jul
(4) Rai Portes 1973 ond 1974, Y 1976 and Anudrio Estatistico do iyway energy prod ,
.
ic
diesel egy; tivity (in
“quivalent): 1000 unities of traffic per ton of fuel in
114 1975 128 1974 124 1976 1977 134 1 . inp ite: 979 140 1981 151
ce: Anuario Estat Pet eth tas 2 (5) The extens; atistico do Brasil.se at sive use ; Several issues: ‘ es;
necessary for the pro 3 vlesland tor suger cane culti 6 ultivation that #8
Cmestic as well ag exp ae Nes effects on both price and f e and o f
effects on the indust oble crops. The Programme has al ae s also important
input ing melisetl ustrie r, especi : S$ 4nd on the Capital goog ally on the automobile ond its
$ industry,;
(11) The share of Brazil's export
-63-
(6) See for instence World Bank (1961), CENAL (1983), Homem de Melo and
Pelin (1984) and Seroa da Motta (1985);
(7) Seron da Motte (1985);
(8) The social cost of ethanol in the State o
estimated to be US$0.408 and US$0.415 per litre of gasoline equivalent
unted for 50% of total ethanol
{ Golds and Pernambuco were
respectively. Sé0 Paulo, however, acco
_ production in 1983, whereos Goidés ond Pernombuco were responsible for
only 6.70% and 4.90% of the total in the same year;
(9) Freight costs were estimated to be US$2.5 per barrel;
(10) The lack of accurate inf ormation and methodological shortcomings are
generally acknowledged in most studies;
s of gasoline in the domestic production of
983. See Balango Energético Nacional 1964;
gasoline reached 19% in 1 |d production in
(12) World imports of gasoline were about 5.5% of total wor
the 1979/1981 period. See Yearbook of world Energy Statistics,
U.N.,1981;
(13) The rise in the world oil re
verage cost of oil refining. Neverthel
1983 while the international spot
fining idle copacity is likely to have raised
the a ess, the international price of
ne fell 15.9% between 1979 and gosoli
rude oil fell only 6.7% in the sé price of ¢
See Conjuntura Economica, Rotterdam ma
me period (average yeor prices).
rket prices. This suggests that
deed be below ‘actual’ cost (or
the international price of gasoline Moy in
the average co
(14) In other word
imports of either 0
(15) Telebras ond Embra
gt of refined oil);
g, an increase in gasoline consumption has to be met by
j1 or gasoline.
tel Annual Reports.
Section (5): rom 14.0% in 1974 to
(1) Imports over GDP at cu
rrent prices hes follen f
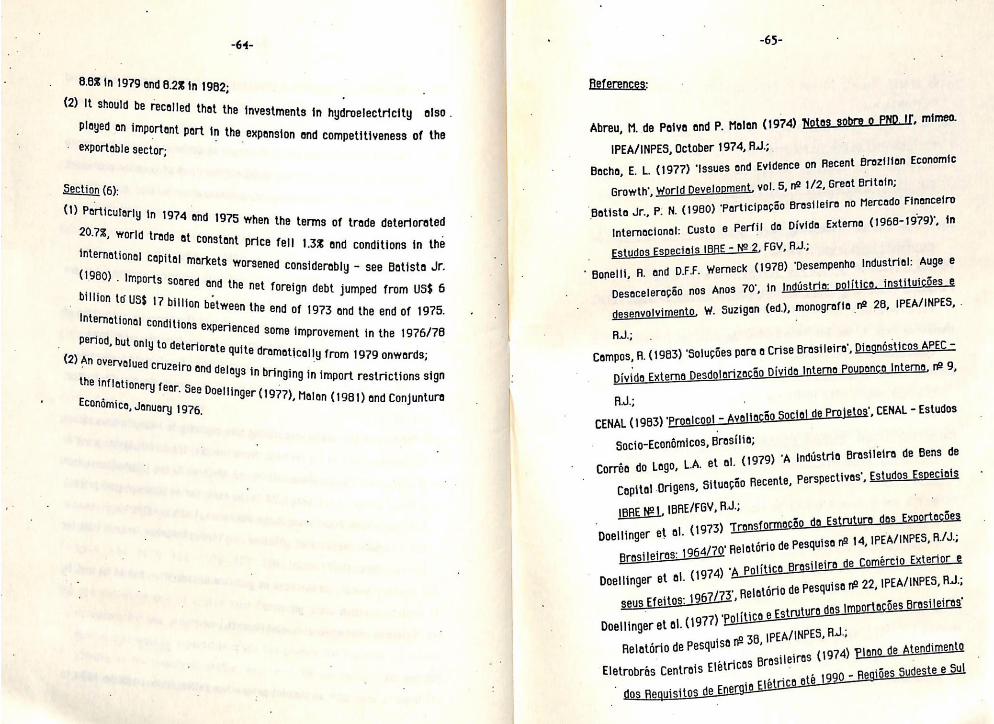
-64-
6.83 in 1979 ond 8.2% in 1982:
(2) It should be r ; | ® recalled that the investments in hydroelectricity also
played on import rtant port in the e
~ exportable sector; zn rabbnston’ ond competitiveness of the
Section (6):
(1) Perticut arly in Y In 1974 ond 1975 when the terms of trade deteriorated 20.7%, world , trade
at constant price fell 1.3% and conditions in the int i ernational capital markets worsened (1980) . considerably - see Batista Jr.
Imports
_ Dillion to uss 17 bina : nd the net foreign debt jumped from US$ 6
International conditions Had the end of 1973 ond the end of 1975.
Period, but only to det °xperienced some improvement in the 1976/78 eriorate quite dramatically from 1979 onwards;
An overvalued > cruzej
the inflatj ere uate bringing in import j
Tonery fear. See Doeltin port restrictions sign Dae er
Econémica, Jenuary 1976, ger (1977), Malan (1981) and Conjuntura
‘Batista Jr., P. N.
‘ Bonelli, A. and D-F-F. wWerneck (1978
=65-
References:
Abreu, M. de Poive end P. Molen (1974) Notes sobre 0 PND.If, mimeo.
IPEA/INPES, October 1974, RJ;
Bacha, E. L. (1977) ‘Issues and Evidence on Recent Brazilian Economic
Growth’, World Development, vol. 5, n2 1/2, Great Britain;
(1960) ‘Participagéo Brasileira no Mercodo Finonceiro
Internocional: Custo @ Perfil do Divida Externa (1966-1979)', in
Estudos Especiais IBRE - N° 2, FGY, A;
) ‘Desempenho Industrial: Auge &
Desoceleragéo nos Anos 70°, in Indistria: politica instituicSes_@
desenvolvimento, W. Suzigan (ed.), monografio re 26, IPEA/INPES, -
Adj; ‘
Campos, A. (1983) ‘Solucdes para a Crise Brasileira’, Diagndsticos APEC -
Divide Externa Desdolarizacio Divide Interna Poupanca Interna, ne 9,
RJ.
CENAL (1983) ‘Proalcool - Avelia éo Soci
Socio-Econémicos, Brasilia;
Corréa do Lago, LA. et al. (1979) ‘A Indastrio Brasileira de Bens de
Capital Origens, Situacéo Recente, Perspectivas’, Estudos Especiats
de Projetos’, CENAL - Estudos
IBRE N21 IBRE/FGY, R.; !
er et al. (1973) TronsformacSo do Estruture dos Exporteries
Brosileiras: 1964/70" Relatério de Pesquisa r= 14, IPEA/INPES, R/J.;
Doellinger et al. (1974) ‘A Politica Brasileira de Comércio Exterior €
geus Efeitos: 1967/73. pelotério de Pesquisa me 22, IPEA/INPES, RuJ.;
Doellinger at al. (1977) politica e Estrutura dag Importacdes Brasileires’
Relatério de Pesquisa 1 36, IPEA/INPES, Rs
5 Elatricas Brasileires (1974) Plano de Atendimento
Eletrobras Centrai 2 :
" dos Requisitos de Ene ja Eletricé ate 199) - Reqises Sudeste &
Doelling
-66-
2 Brasil’, Report : » Decembe Engenharia, Rus: r 1974, Diretoria de Plenejamento @
Eletrobré 5 Centrais. Elatricas Brosileiras (1979) Plano de Atendimento eguisito 5 S de Energio Elétrica até 199 ", september 1979, Au.;
Eletrobras c entrais Elétrica c $ Brasileiras (1983) ‘Setor de Energi étrica ~ Font —tntes € Usos de Recursos Re ‘trospective 1973/1982, DEPF, Au.;
FGV/Banco Mundial (1983) Poli | Honufeturados do Brosiy: FEV 3 dustrial xportacéo
F urteda, C. (1982-4) °g Bresil Pés- Furtado, ©. (1982-5) Tilegre”', Paz e Terra, Ral.
Paz e Terra, Au- ‘ANov é ; © Dependéncia divide externa e monetarismo’,
Homem de Ms lo, F. ond £ oo
gots a A. Pelin (1984) + s Conomia Brasilej ' HUCITED, S.P an =
Lesso, R. (1978) ‘A cote ral 4 até ia de Des ;
Fracesso’, unpublish envolvimento 1974/1976 - Sonho ed thesj . esis for Professor titular” at FEA/UFRJ,
‘ : 1346/1979" temacioneis do Brasil no Periodo
mimeo,, F
Malan, PS. ang FA/UFRA, Ral. A. Bonelti (1976) ‘a3 Lim
Balonco de p ites do Possivel: Notas sobre egamentos e Indistri
esquisn ep dustria na
0 Id end New Developmen i 's', World Development, : Britain; Development, vol. 5, n@ 1/2, Great
ques Exte
NDivide MOS € Precos internos: Dificuldades da
a xternn, Recessio e A uate Fetruturol
7° 40109 (org.) et al, Paz sirurcaueud?
Olitica de Ajuste" i
Tosil Dient i
Seron da Hotta, A. (1985
-67-
Pereira, JE.de C. (1974) Finonciamento Externo e Crescimento Econémico
no Brasil:1966/73', Relatério de Pesquisa r2 27, IPEA/INPES, AJ;
Reichstul,H.P. and L.G. Coutinho (1981) ‘Investimento Estatal 1974-1980:
Ciclo e Crise’, in Desenvolvimento Copitalista no Brasil Enssios sobre
a Crise, vol. 2, Editora Brasiliense, 1983, SP.;
Second Nationel Development Plen - I] NDP (1974) ‘Segundo Pleno de
Desenvolvimento Nacienal’, PND IL, September 1974, Brasilia, D-F.;
) Proolcool: A Socio! Cost-Benefit Study,
Seminar presented at The University College, London, England;
. Serra, J. (1981) ‘Ciclos e Mudanc¢as Estruturais na Economia Brasileira do
Pés-Guerra’, in in Desenvolvimento Capitelista no Brasil Ensaios
sobre a Crise, vol. 1, Editora Brasiliense, 1982, SP.;
Suzigan, W. et al. (1974) ‘Crescimento Industrial no Brosii incentives &
desempenho recente’, Relatério de Pesquisa n? 26, IPEA/INPES, Au;
Wells, J. A. (1973) ‘Euro-do!lars, Foreign Debt and the Brazilian Boom’, -
Working Poper n@ 13, Centre of Latin American Studies, University of
Combridge, Engiand;
rid Bank (1981) ‘Brazil, Alcohol and Biomess Energy’, Steff Appraisal Wo
Report, April 1961, The world Bank, Washington D.C.;


