Embed Size (px)
Citation preview

Economic Adviser’s Wing�Finance Division Government of Pakistan�Islamabad
www.finance.gov.pk


CONTENTS Foreword
Preface
Pakistan Economic Survey Team
Overview of the Economy ................................................................................................................... i-xvi
Chapter 1: Growth and Investment ..................................................................................................... 1
Chapter 2: Agriculture ............................................................................................................................ 17
Chapter 3: Manufacturing and Mining ............................................................................................. 41
Chapter 4: Fiscal Development ........................................................................................................... 61
Chapter 5: Money and Credit ............................................................................................................... 83
Chapter 6: Capital Markets & Corporate Sector ......................................................................... 111
Chapter 7: Inflation ................................................................................................................................ 127
Chapter 8: Trade and Payments ....................................................................................................... 139
Chapter 9: Public Debt .......................................................................................................................... 167
Chapter 10: Education ............................................................................................................................. 183
Chapter 11: Health and Nutrition ....................................................................................................... 203
Chapter 12: Population, Labour Force and Employment ........................................................ 225
Chapter 13: Transport and Communications ................................................................................ 241
Chapter 14: Energy ................................................................................................................................... 259
Chapter 15: Social Protection ............................................................................................................... 275
Chapter 16: Climate Change .................................................................................................................. 293
Annexure Annex-I: Contingent Liabilities ..................................................................................................... 309
Annex-II: Tax Expenditure ............................................................................................................... 311
Annex-III: Information Technology ................................................................................................ 313
Statistical Appendix
Economic and Social Indicators ........................................................................................................... 1-8
Statistical Series ................................................................................................................................. 11-137
Weights and Measures ........................................................................................................................... 138
Abbreviations .............................................................................................................................................. 139
Feed Back Form ........................................................................................................................................ 145

FOREWORD Global coordinated efforts gradually brought the pandemic under control and the world is recovering from the devastating effects of COVID-19. However, the Russia-Ukraine conflict has created new risks to economic growth and posed significant uncertainty about the economic outlook. The economic impact of the conflict is manifesting in terms of higher commodity prices, disrupted trade and supply chains, lower business confidence, and increased investors’ uncertainty. The fallout of conflict will contribute to a significant slowdown in global growth in 2022 and 2023. The global economic growth is projected to slow from an estimated 6.1 percent in 2021-22 to 3.6 percent in 2022-23. The negative economic consequences of the war in Ukraine are spreading across the world and Pakistan is also among the vulnerable countries. The risk for Pakistan’s economy has been elevated by high international commodity and oil prices, significant pressure on external side, and squeezed fiscal space.
According to provisional estimates, Pakistan’s economy in FY2022 has witnessed an estimated GDP growth of 5.97 percent. This unsustainable growth has triggered macroeconomic imbalances. Unfortunately, the weak economic management of the previous government has resulted in the deterioration of the exchange rate, high inflation and widened the twin deficits, thus bringing Pakistan to the verge of a financial crisis.
The present coalition government has inherited a fragile economy with a current account deficit of $13.8 billion in the first 9-months of the year, a fiscal deficit of 3.8 percent of GDP expected to increase to 7.0 percent by June, total public debt at Rs 44,366 billion (end March 2022), inflation at 11.3 percent and depleting forex reserves. The present government is taking politically tough decisions to steer the economy through various crises. Prime Minister Shehbaz Sharif is taking CPEC forward with new vigor, promoting the multifaceted development of the flagship project of China's ambitious Belt and Road Initiative (BRI).
Besides growth, the government is also taking care of its solemn obligation towards the poor segments through a social safety program and targeted subsidies. The government is taking measures to extend relief to the less well-off citizens through Benazir Income Support Programme (BISP).
The Pakistan Economic Survey has reviewed the progress of the outgoing fiscal year based on the latest available data up to March-April 2021-22. As is customary, the Survey is launched just before the presentation of the Federal Budget 2022-23. Hence, the Economic Survey covered the latest available data for the outgoing fiscal year.
I wish to congratulate and thank the Economic Adviser and his team for preparing this important document. It will serve as an invaluable information tool for all stakeholders, including parliamentarians, policymakers, academia and international development partners.
Dr. Miftah Ismail Minister for Finance and Revenue Islamabad, the 09th June, 2022

PREFACE Pakistan Economic Survey is a yearly flagship publication of the Ministry of Finance which highlights the trend of macro-economic indicators, development policies, strategies, as well as sectoral achievements of the economy. Pakistan Economic Survey 2021-22 is being launched at a difficult time when the economy is going through a recovery phase despite mounting uncertainty and ever increasing global prices risks. The survey has reviewed the drivers of this year’s growth including the updated information on other economic variables and the socio-economic progress of first nine to ten months of the outgoing fiscal year. The document consists of analytical text and Statistical Appendix. The first part furnishes a comprehensive analysis of the performance by various sectors of the economy, while the second part provides the time series data of its different sectors.
The statistical data related to all the sectors has been provided by a number of organizations, provincial departments and ministries of the Government of Pakistan. I would like to appreciate them for providing valuable information. The completion of survey could not have been possible without their timely support.
I am highly indebted to EA Wing officers and officials, HRM Wing and Debt Office for their continued support and hard work that led to the completion of Economic Survey well on time. I would also offer my gratitude to worthy Minister for Finance & Revenue, Mr. Miftah Ismail, Minister of State for Finance & Revenue, Dr. Aisha Ghaus Pasha and Finance Secretary, Mr. Hamed Yaqoob Sheikh, for their support and guidance during compilation process.
Pakistan Economic Survey 2021-22 has greatly benefitted from the comments and insights of Dr. Aamer Irshad (FAO), Dr. Khalid Mehmood (PIDE), Dr. Saima Bashir (PIDE), Mr. Javed Sikandar (Planning Commission), Dr. Meraj ul Haq (IIU), Dr. Atif Ali Jaffery (Gujrat University), Dr. Imran Khan Jadoon (Comsats University), Mr. Saqib Jalil Malik (ISE), Dr. Syed Akhtar Hussain Shah and Dr. Muhammad Arshad Khan. I sincerely acknowledge their inputs/views/comments which improved the quality of Economic Survey. A continuous engagement, discussions and advice from the senior officers of the Finance Division, especially Mr. Awais Manzur Sumra, Mr. Tanvir Butt, Mr. Ali Tahir, Mr. Muhammad Anwar Sheikh, and Mr. Aamir Mehmood have been very much productive for the overall improvement of this national document.
Hopefully, the Survey will fulfill the expectations of policymakers, economists, academicians, business practioners, government agencies, students, researchers, the media personnel and those who are interested in developing deeper understanding of Pakistan’s economy. Constructive comments and suggestions for the improvement of this document are always welcomed.
Dr. Imtiaz Ahmad Economic Adviser Islamabad, the 09th June, 2022

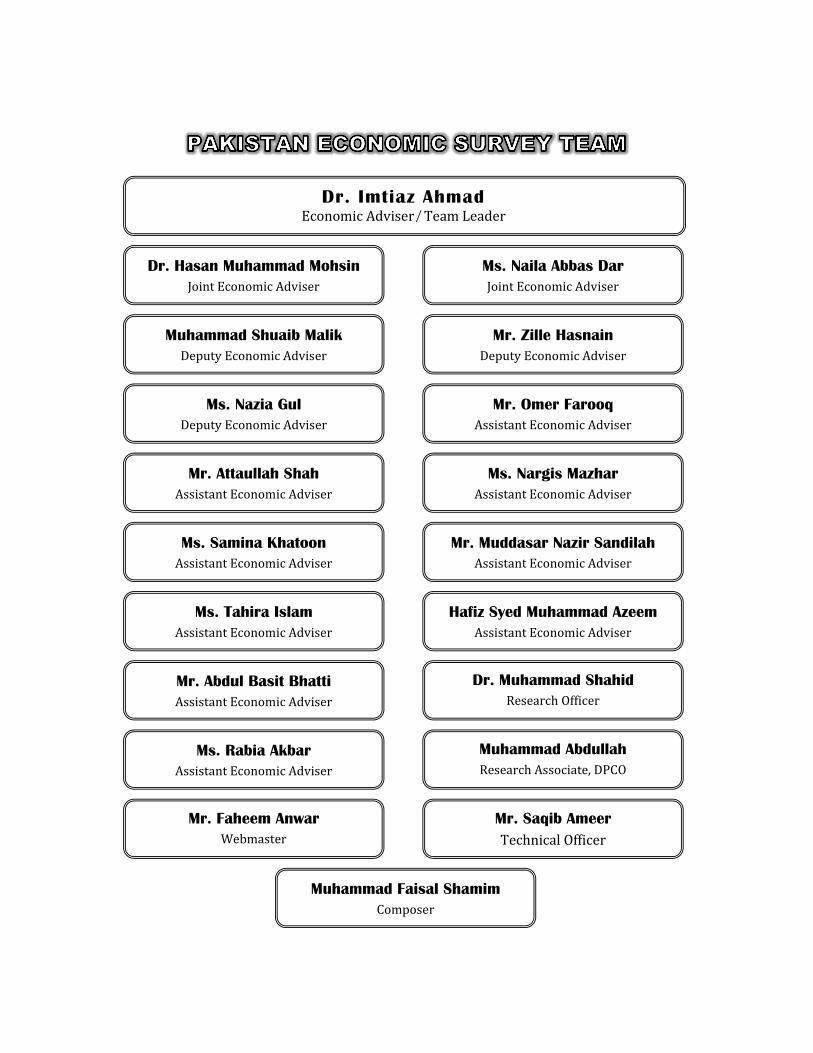
Dr. Imtiaz Ahmad Economic Adviser Team Leader
Dr. Hasan Muhammad Mohsin Joint Economic Adviser
Ms. Naila Abbas Dar Joint Economic Adviser
Muhammad Shuaib Malik Deputy Economic Adviser
Mr. Zille Hasnain Deputy Economic Adviser
Ms. Nazia Gul Deputy Economic Adviser
Mr. Omer Farooq Assistant Economic Adviser
Mr. Attaullah Shah Assistant Economic Adviser
Ms. Nargis Mazhar Assistant Economic Adviser
Ms. Samina Khatoon Assistant Economic Adviser
Mr. Muddasar Nazir Sandilah Assistant Economic Adviser
Ms. Tahira Islam Assistant Economic Adviser
Hafiz Syed Muhammad Azeem Assistant Economic Adviser
Mr. Abdul Basit Bhatti Assistant Economic Adviser
Dr. Muhammad Shahid Research Officer
Ms. Rabia Akbar Assistant Economic Adviser
Muhammad Abdullah Research Associate, DPCO
Mr. Faheem Anwar Webmaster
Mr. Saqib Ameer Technical Officer
Muhammad Faisal Shamim Composer

Global Economic Review
Unprecedented global crisis caused by the outbreak COVID-19 pandemic in early 2020 had led to equally unprecedented worldwide measures to protect lives and likelihoods. Governments and Central banks engaged in accommodative fiscal and monetary policy measures to protect the population from an economic meltdown. The imposed mobility and other necessary restrictive measures took a huge toll on social and economic prosperity. Nevertheless, a recession in 2020 could not be avoided due to the suspension of economic activities and resultant negative growth.
In 2021 vaccination programs, although unevenly spread among world regions, allowed to gradually relax economic restrictions. In the meantime, economic policies continued to support the strong economic revival across the globe that resulted in economic growth exceeding potential output growth in 2021. Supply-demand imbalances became apparent exacerbated by supply chain disruption and bottlenecks in the transport sector. International commodity prices responded abruptly to the economic rebound accelerated inflation in most parts of the world.
In early 2022, the Russian-Ukraine conflict elevated global commodity prices, fueled inflation and domestic inflation rates further. Threats from high inflation, rising interest rates, lingering supply constraints, and mounting uncertainties affected the global economic forecasts. The impact of war has revised the global growth forecast downward by 0.8 and 0.2 percentage points to 3.6 percent in both 2022 and 2023. The projection for economic growth of European Economies has been revised downwards by 1.1 percentage points to 2.8 percent. Similarly, the outlook for advanced and emerging economies also revised downwards by 0.6 and 1.0 percentage points, respectively. In the medium-term, the outlook is revised downwards for all groups, except commodity exporters who are benefitting from the surge in energy and food prices.
Central Banks around the world responded well to the overheated economies and reversed the expansionary monetary policy. Fed and other central banks raised the policy rate to slow the economy enough to tame inflation. On the fiscal side, policy space was already eroded in many countries by the pandemic. The surge in commodity prices and the increase in global interest rates will further reduce fiscal space, especially for oil and food-importing economies. The withdrawal of extraordinary fiscal support was projected to continue because of the overheated economies, shrinking fiscal space, and
Overview of the Economy
Pakistan Economic Survey 2021-22
ii
growing budget deficits. Clear communication and forward guidance on the outlook for monetary policy and greater support from the treasury will be essential to minimize the risk of disruptive adjustments and to ensure that medium and long-term inflation expectations remain well-anchored.
The weakening growth prospects, provision of relief to the vulnerable population, and supportive measures by governments will widen fiscal deficits. Several economies will need to consolidate their fiscal balances. This should not impede governments from providing well-targeted support for vulnerable populations, especially in the presence of high energy and food prices.
Summing up, the recurring economic crisis allowed governments across the globe to develop a strategic response to the crisis. The changing economic landscape brought a paradigm shift in economic policymaking. The focus has been shifted to knowledge-based and service economies where investment in human capital is of equal importance as an investment in machinery, equipment, and buildings.
Pakistan Economic Review
Though economy recovered from the pandemic (a 0.94 percent drop in FY2020) and maintained V-Shaped recovery by posting real GDP growth of 5.97 percent in the fiscal year 2022. This high growth, however, is unsustainable and has resulted in financial and macroeconomic imbalances.
Historically, Pakistan’s economy had shown periodic ‘boom-bust’ growth cycles. The reasons for such volatile growth cycles include the wide-ranging economic challenges like shrinking fiscal space, exchange rate pressure, mounting current account deficit, inflation, energy sector bottlenecks, and the absence of a supportive environment for the private sector.
Political instability in the country also led to a huge increase in economic uncertainty. Uncertainty at individual, firm, and government levels is negatively affecting the economy. Political stability can reduce uncertainty by making clear policy statements to build the trust of domestic as well as foreign investors and the business community.
The coordinated monetary-fiscal policy approach after the COVID-19 outbreak has succeeded in reviving the real economic activity. Specifically, the fiscal-monetary stimulus packages have a cascading effect on growth through a revival in private investment. In addition, the accommodative monetary policy stance in FY2021, focused on the revival of the construction industry and mandatory housing finance targets by the SBP, together with the rebound in external demand has set the stage for stronger growth momentum in FY2022.
Further, growth momentum was observed on account of broad-based expansion in large-scale manufacturing (LSM) and improved crop production. However, the economy also started to show signs of excess demand and overheating through an increase in the import volume of capital and consumer goods, energy, and non-energy imports.
Overview of the Economy
iii
On the external front, the exports grew remarkable on account of policy supports provided-including regionally competitive energy tariff rates, Export Facilitation Scheme 2021, enhancement in coverage and loan limits under LTFF, Changes in FX regulations to facilitate exports, the launch of an e-Tijarat portal and tariff rationalized in various sectors in line with objectives of National Tariff Policy 2019-2024. In addition to this, STPF 2020-25 has been prepared to enhance the export competitiveness of Pakistan through a framework of interventions having an impact across the value chains. Furthermore, textile policy 2020-25 has also been approved to fully utilize the potential of home-grown cotton augmented by man-made fibers and filaments to boost value-added exports. Moreover, at the international level, World Trade Organization (WTO) has undertaken the Trade Policy Review (TPR) for Pakistan to achieve transparency and a better understanding of trade policies and practices.
However, a surge in global commodity prices is exerting pressure on imports by significantly pushing up import payments. Resultantly, the sizeable trade deficit of US$ 32.9 billion during July-April FY2022 was partially financed by significant workers’ remittances. Thus, in the period under discussion, the current account posted a deficit of US$ 13.8 billion compared to a deficit of US$ 0.5 billion during the same period last year. The widening of the current account deficit together with a build-up in inflationary pressures in the backdrop of the geopolitical situation (especially the Russia-Ukraine conflict) has created significant challenges for sustainable economic growth. In addition, the recent emergence of domestic conditions (including political instability) is eroding business confidence. Thus, all in all, inflationary and external sector pressures have created macroeconomic imbalances in the economy.
To counter inflationary pressure and for sustainable economic recovery, SBP moved to monetary policy normalization in September 2021. Policy Rate increased by cumulative 675 bps between September-April, FY2022.
The CPI inflation for the period July-May FY2022 was recorded at 11.3 percent as against 8.8 percent during the same period last year. The pressures on headline inflation can fairly be attributed to adjustments in prices of electricity and gas, a significant increase in the non-perishable food prices, exchange rate depreciation along with a rapid increase in global fuel and commodity prices.
Shocks to the economy caused significant damage to Pakistan’s public finances. In response, the Government formulated and implemented various policy initiatives which improved fiscal outcomes, especially on the revenue side. FBR has initiated various policy and administrative measures to facilitate the taxpayers to mobilize domestic resources and generate sufficient revenue without hurting growth momentum. FBR tax collection witnessed a substantial growth of 28.5 percent during July-April FY2022. However, higher grants and huge subsidies kept the expenditure side under intense pressure. The fiscal deficit increased to 3.8 percent of GDP in July-March FY2022 against 3.0 percent of GDP during the same period last year. Similarly, the primary balance posted a deficit of Rs 447.2 billion.
In the medium term, comprehensive measures are needed to strengthen and reliability of overall economic performance to reinvigorate the economy, spur growth, maintain
Pakistan Economic Survey 2021-22
iv
price stability, provide jobs to the youth and rebuild the key infrastructure of the country. This will also require fiscal adjustments, and reforms in almost every sector of the economy to lay the foundation for higher, inclusive, and sustainable economic growth.
Executive Summary
1. Growth and Investment
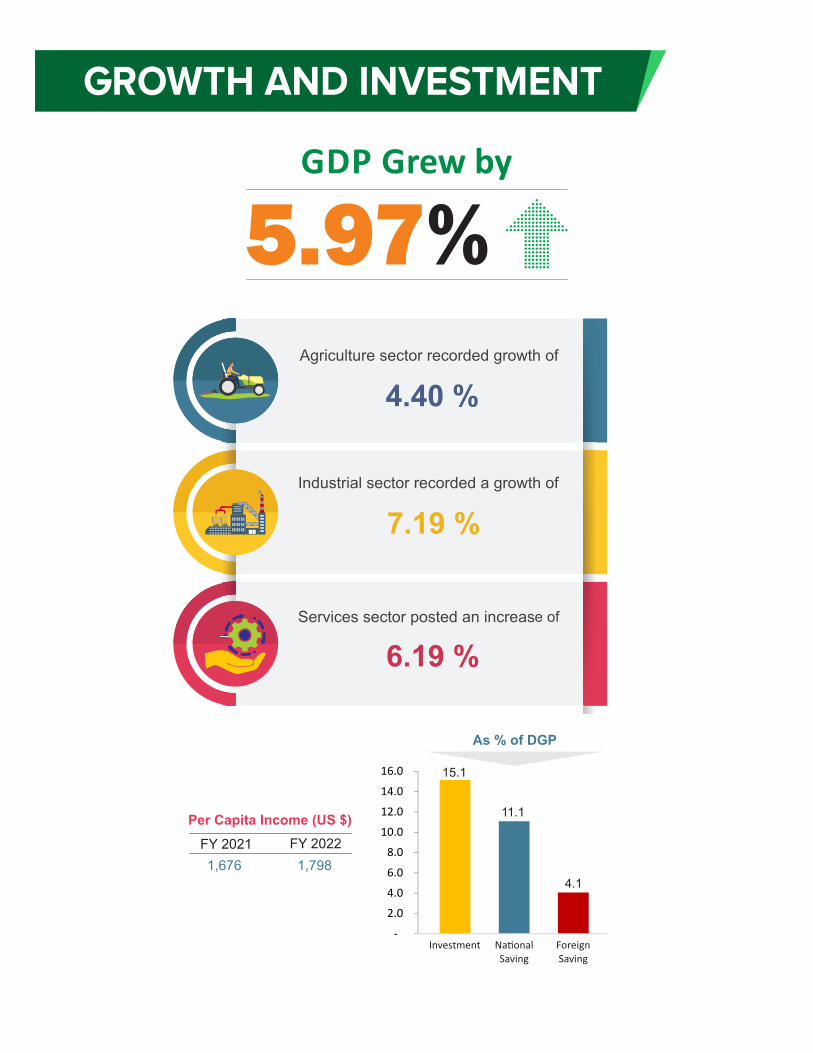
In FY2022, the real GDP growth remained at 5.97 percent. However, underlying macroeconomic imbalances and associated domestic and international risks have dampened celebrations. The economy of Pakistan rebounded from the pandemic (0.94 percent contraction in FY2020) and continued to post a V-Shaped economic recovery which is higher than the 5.74 percent recorded last year (FY2021).
This high growth, however, is also accompanied by external and internal imbalances, as has been the case historically with Pakistan’s economy. However, external circumstances also played a critical role this time. These circumstances have placed almost all economies of the world in shambles. A highly transmissible Omicron variety, changes in Afghanistan's government after the withdrawal of US troops sparked and the Russian-Ukraine conflict started in Feb 2022, all of these have upended the global economic picture. Financial and commodity markets have felt shockwaves. Thus, energy and food prices have surged rapidly and threaten to remain further elevated. The exceedingly uncertain outcome of the crisis is another challenge for developing economies, particularly for Pakistan.
Pakistan’s economy has shown a strong recovery after being depressed due to the pandemic which resulted in lockdown. For FY2022, real GDP (GVA at basic prices 2015-16) posted a growth of 5.97 percent on account of 4.40 percent growth in Agriculture, 7.19 percent growth in the Industrial sector, and 6.19 percent growth in the Services sector. This growth is slightly above the growth of 5.74 percent recorded for FY2021.
For FY2022, GDP at current market prices stands at Rs 66,950 billion showed a growth of 20.0 percent over last year (Rs 55,796 billion). In the dollar term, it remained at US$ 383 billion. Gross National Income (GNI) is also used for measuring and tracking a nation's wealth which is calculated by adding Net Primary Income (NPI) to GDP (MP). Regarding per capita income in terms of dollar, there was a rebound seen in FY2021 which continued in FY2022. In FY2022, per capita income was recorded at US$1,798 which reflects an improvement in prosperity due to the fact that economic growth per person improved.
The Gross Fixed Capital Formation (GFCF) for FY2022 was recorded at Rs 8,992 billion against Rs 7,217 billion in FY2021, thus, posting a growth of 24.6 percent. The GFCF is comprised of Private, Public, and General governments. The GFCF in the private sector during FY2021 is estimated at Rs 6,704 billion against Rs 5,557 billion in FY2021, showing an increase of 20.6 percent. On the basis of data reported by PBS, GFCF in Public sector remained at Rs 481 billion during FY2022 compared to Rs 419 billion last year, registering an increase of 14.9 percent. The overall provisional GFCF in General Government services for FY2022 has been recorded at Rs 1808 billion compared to
Overview of the Economy
v
Rs 1241 billion during FY2021, posting a growth of 45.6 percent. This time, PBS has also provided industry-wise disaggregation of GFCF of General Government. The data suggests that there was a 48, 34, and 25 percent increase in Public Administration & Social Security, Education, and Human Health & Social Work, respectively.
2. Agriculture
During FY2022, the agriculture sector recorded a remarkable growth of 4.40 percent and surpassed the target of 3.5 percent and last year’s growth of 3.48 percent. This growth is mainly driven by high yields, attractive output prices and supportive government policies, better availability of certified seeds, pesticides, and agriculture credit.
The crops sector outperformed and posted a growth of 6.58 percent during FY2022 against 5.96 percent last year. At the sub-sector level, important crops, other crops, and cotton ginning depicted a significant growth of 7.24 percent, 5.44 percent, and 9.19 percent, respectively, against last year’s growth of 5.83 percent, 8.27 percent, and -13.08 percent. The growth in production of important crops namely cotton, rice, sugarcane, and maize are estimated at 17.9 percent, 10.7 percent, 9.4 percent, and 19.0 percent, respectively. The cotton crop increased from 7.1 million bales reported last year to 8.3 million bales during 2021-22; rice production increased from 8.4 million tonnes to 9.3 million tonnes; sugarcane production increased from 81.0 million tonnes to 88.7 million tonnes; maize production increased from 8.9 million tonnes to 10.6 million tonnes respectively, while wheat production decreased from 27.5 million tonnes to 26.4 million tonnes. Other crops having a share of 13.86 percent in agriculture value addition and 3.14 percent in GDP, grew by 5.44 percent on the back of an increase in the production of pulses (29.82 percent), oilseeds (24.75 percent), vegetables (11.52 percent), fruits (1.53 percent) and fodders (0.36 percent).
Livestock having a share of 61.89 percent in agriculture and 14.04 percent in GDP, recorded a growth of 3.26 percent in 2021-22 compared to 2.38 percent during the same period last year. The fishing sector having a share of 1.39 percent in agriculture value addition and 0.32 percent in GDP grew at 0.35 percent compared to a growth of 0.73 percent in the same period last year. The forestry sector having a share of 2.14 percent in agriculture value addition and 0.49 percent in GDP posted a positive growth of 6.13 percent against the negative growth of 0.45 percent last year.
Water availability during Kharif 2021 was recorded at 65.1 million-acre feet (MAF) compared to 65.1 MAF of Kharif 2020. Rabi season 2021-22 stood at 27.4 MAF, showing a decrease of 12 percent over Rabi 2020-21.
The domestic production of fertilizers during FY2022 (July-March) increased by 1.9 percent over the same period of last year. This increase in domestic production of fertilizer is mainly due to the running of two LNG-based plants, FatimaFert and Agritech Limited, from September 2021 to March 2022. Although the import of fertilizer decreased by 6.2 percent, however, the total availability of fertilizer slightly increased by 0.5 percent. There was a decrease in the total offtake of fertilizer nutrients by 3.6 percent.
Pakistan Economic Survey 2021-22
vi
During July-March FY2022, total tractor production reached 41,871 compared to 36,900 produced last year, a 13.5 percent higher than the same period last year.
During FY2022 (July-March), banks disbursed Rs 958.3 billion which is 56.4 percent of the overall annual target and 0.5 percent higher than the disbursement of Rs 953.7 billion made during the same period last year. Further, the outstanding portfolio of agricultural loans has increased by Rs 30.9 billion i.e., from Rs 601.8 billion to Rs 632.7 billion at end of March 2022 as compared to the same period last year. In terms of outreach, the number of outstanding borrowers reached 3.2 million in March 2022.
During FY2022 (July-March), total fish production was recorded at 696.0 thousand MT (marine: 468 thousand MT and inland: 228 thousand MT) witnessing an increase of 0.8 percent over the same period of last year’s fish production of 690.6 thousand MT (marine: 465.2 thousand MT and inland: 225.4 thousand MT).
3. Manufacturing and Mining
The performance of Large-Scale Manufacturing (LSM) stood tremendous with 10.4 percent growth during July-March FY2022 as compared to growth of 4.2 percent same period last year. The prudent measures and continuous support along with rising global demand, easy access to credit, and partially subsidized energy supplies bode well in boosting the business sentiments and achieving higher growth of LSM.
On a year-on-year (y-o-y) basis, LSM grew by 26.6 percent in March FY2022 against 22.5 percent growth in the same month last year. However, on a month-on-month (m-o-m) basis LSM marked the growth of 8.2 percent in March 2022 against 3.7 percent in February 2022.
Out of 22 subsectors, 17 posted growth during July-March FY2022. The performance was broad-based on the back of strong growth of high weighted sectors such as Textile, Food, Wearing Apparel, Chemicals, Automobile, Tobacco, Iron & Steel Products along with Furniture, Wood Products, and Footballs.
The Mining and Quarrying sector remained negative at 4.47 percent during July-March FY2022 as against the growth of 1.21 percent last year. This sector is lagging behind despite huge potential, due to interconnected and cross-cutting issues like poor regulatory framework, insufficient infrastructure at mines sites, outdated technology installed, semi-skilled labor, low financial support, and lack of marketing. Production of major minerals such as Coal, Natural Gas, Chromite, Crude Oil, and Barytes witnessed a growth of 8.34, 3.45, 25.7, 4.48, and 162.5 percent, respectively. However, some witnessed negative growth during the period under review such as Magnesite 52.3 percent, Gypsum 36.9 percent, Lime stone 33.3 percent, Ocher 25.5, Rock Salt 24.2 percent, and Marble 22.9 percent.
4. Fiscal Development
Currently, the fiscal policy at the global level is functioning in a highly volatile environment and Pakistan is no exception. The conflict between Russia and Ukraine has potentially serious economic consequences for Pakistan’s economy as it has exacerbated
Overview of the Economy
vii
difficult policy choices for the country. Thus, controlling inflation, strengthening the economic recovery, supporting the vulnerable, and rebuilding fiscal buffers, all became significantly important.
The conflict and resultantly its impact on higher international commodities prices especially energy and food brought a plethora of challenges to Pakistan’s economy. To offset the impact of increasing oil prices, tax relief to the masses was provided in the shape of a reduction in the petroleum development levy (PDL) and the elimination of the sales tax on all POL products. These measures, combined with energy subsidies, have posed significant risks to fiscal sustainability in an already constrained fiscal environment.
Despite a significant rise in tax collection, higher current and development expenditures widened the fiscal deficit to 3.8 percent of GDP during July-March FY2022 against 3.0 percent in the previous period. Similarly, the primary balance posted a deficit of Rs 447.2 billion against a surplus of Rs 451.8 billion. On the expenditure side, total spending witnessed a sharp increase of 27.0 percent in July-March FY2022 against the contained growth of 4.2 percent in the same period of last year. Higher development and non-markup current spending contributed to an increase in total expenditures during the year.
Total revenues increased by 17.7 percent in July-March FY2022 against 6.5 percent in the same period of last year. A significant increase in tax collection was a key factor in boosting revenue growth, which more than offset the decline in non-tax revenues during the review period. During the first nine months of the current fiscal year, total tax collection (federal & provincial) grew by 28.1 percent, while non-tax revenues fell by 14.3 percent.
FBR outperformed the revenue target during the first ten months of FY2022. During July-April, FY2022, FBR has been able to collect Rs 4,855.8 billion (provisional) net tax revenues reflecting a growth of 28.5 percent. However, tax relief measures have impacted revenue collection by approximately Rs 73 billion during the month of April 2022.
5. Money and Credit
SBP had started to tighten its monetary policy stance from September 2021 after keeping the policy rate unchanged at 7 percent in all the MPC meetings held in FY2021. The monetary policy in Pakistan shifted direction in Q1-FY2022 in accordance with the changing economic outlook owing to a recovery in domestic demand, higher commodity prices, and persistent inflationary pressures. Consequently, the policy rate had increased by a cumulative 275 bps to 9.75 percent during consecutive three monetary policy decisions, within a span of three months.
Accordingly, the MPC in an unscheduled meeting on April 7, 2022, raised the policy rate by 250 basis points. The MPC was of the view that this action would help to safeguard external sector and price stability. During the monetary policy decision held on 23rd May 2022, the MPC decided to raise the policy rate by 150 basis points to 13.75 percent. The
Pakistan Economic Survey 2021-22
viii
decision was based on the outcome of provisional growth estimates for FY2022 more than the target, showing excess aggregate demand, elevated external sector pressure, and a higher inflation outlook due to domestic and international factors.
During the period 01st July-29th April FY2022, broad money (M2) has increased by Rs 1,457.2 billion (growth of 6.0 percent) as compared with Rs 1,632.7 billion (growth of 7.8 percent) during the comparable period of last year. Contained growth in M2 mainly due to negative Net Foreign Assets (NFA) of the banking system, which has been contracted by Rs 1,327.7 billion as compared to an expansion of Rs 980.6 billion last year. This was contained due to pressure on the external front on account of high international commodity prices and expansion in domestic activities, transfers pressure on import bill, and current account deficit. Conversely, the Net Domestic Assets (NDA) of the banking sector observed an expansion of Rs 2,784.8 billion against Rs 652.1 billion last year. The expansion in NDA on account of significant expansion in private sector credit increased lending to Public Sector Enterprises (PSEs) and lending to government commodity procurement agencies.
Private sector credit witnessed an unprecedented expansion of Rs 1,312.9 billion during the period 1st July-29th April, FY2022 compared to Rs 454.4 billion during the same period last year, posting significant growth of 189 percent in flow terms. On a positive note, credit demand increased both for fixed investment and working capital loans. Businesses took advantage of SBP concessionary financing schemes, particularly TERF. As a result, fixed investment loans witnessed a significant expansion of Rs 333.1 billion during July-March, FY2022 as compared to Rs 137.0 billion during the same period last year. Similarly, working capital loans observed an expansion of Rs 608.7 billion during July-March, FY2022 as compared to an expansion of Rs 110.8 billion during the same period last year. This expansion is a signal for both continuation and expansion of economic activities, as evident from the significant economic growth of 5.97 percent in FY2022.
6. Capital Markets & Corporate Sector
The world stock indices started on a positive note during the current fiscal year. However, due to the geopolitical tensions especially the Russia-Ukraine war plummeted the global indices in the month of February and March 2022.
Pakistan stock market’s performance has posted a boom-and-bust situation during the first nine months of the current fiscal year. During July-March FY2022, the benchmark KSE-100 index declined from 47,356 points to 44,929 points. During the period under review, the index closed at its highest level of 48,112 points on August 23, 2021. As of March 31, 2022, the total number of listed companies on the Pakistan Stock Exchange (PSX) stood at 532, with a total market capitalization of Rs 7,583 billion.
The major development of this year in the equity market is the issuance of Initial Public Offerings (IPOs). During July-March FY2022, five companies issued shares through a public offering on the main board of PSX (Citi Pharma limited, Pakistan Aluminium Beverages Cans Limited, Airlink Communications Limited, Octopus Digital Limited, and Adamjee Life Assurance Company Limited), while two companies were listed on the
Overview of the Economy
ix
newly introduced Growth Enterprise Market (GEM) Board (Pak Agro Packaging Limited and Universal Network Systems Limited).
During July-March FY2022, corporations raised Rs 121.5 billion by issuing 32 debt securities, while 102 previous corporate debt securities worth Rs 749.82 billion remain outstanding. Moreover, during July-March FY2022, 2.31 million lots of various commodities futures contracts including gold, crude oil, and US equity indices worth Rs 2.65 trillion were traded on Pakistan Mercantile Exchange Limited.
7. Inflation
The CPI inflation for the period July-May FY2022 recorded at 11.3 percent as against 8.8 percent during the same period last year. The other inflationary indicators like Sensitive Price Indicator (SPI) recorded at 16.7 percent as against 13.5 percent last year. Wholesale Price Index (WPI) recorded at 23.6 percent in July-May FY2022 compared to 8.4 percent same period last year.
The pressures on headline inflation can fairly be attributed to adjustment in prices of electricity and gas, a significant increase in the non-perishable food prices, exchange rate depreciation along with rapid increase in global fuel and commodity prices.
However, there is also significant uncertainty around the outlook for international commodity prices as well which had been exacerbated by the Russia-Ukraine conflict. The government made best efforts to ensure smooth supply of essential domestic goods through vigilant monitoring of prices both at provincial and Federal level.
8. Trade and Payment
As COVID-19 disrupted economic activity worldwide. However, many policy measures were initiated to support export-oriented industries and facilitate these firms to increase export earnings.
During July-April FY2022, goods exports grew by 27.6 percent to US$ 26.8 billion, whereas services exports grew by 18.2 percent to US$ 5.8 billion. Around two-thirds of the increase came from the textile sector, especially from the high value-added segment. Pakistan’s textile exporters capitalized on the policy support available-including the Export Facilitation Scheme 2021, SBP’s concessionary refinances schemes for working capital and fixed investment, and the regionally competitive energy tariffs and managed to ship higher volumes to key destinations (such as the US, UK, and EU). Higher cotton prices also helped increase the export unit prices of both low and high-value-added textile products. Apart from textiles, rice exports also rebounded during July-April FY2022, mainly on the back of the non-basmati variety.
Despite the encouraging export performance, the country’s imports have also risen significantly. The broad-based surge in global commodity prices, COVID-19 vaccine imports, and demand-side pressures, all contributed to the rising imports. Resultantly, the trade deficit grew by 49.6 percent to US$ 32.9 billion which is historically high. Remittances, which always supported in easing out the pressure of trade deficit of both goods and services, recorded at US$ 26.1 billion during July-April FY2022 and posted a
Pakistan Economic Survey 2021-22
x
growth of 7.6 percent. This ever-highest level of workers’ remittances still not sufficient to offset the trade deficit. Thus, the current account deficit was recorded at US$ 13.8 billion during the period under discussion. Further, the low performance of the Financial Account during the period not only resulted in the depletion of foreign reserves but also brought the exchange rate under pressure. The interbank PKR-USD exchange rate depreciated 15.1 percent during July-April FY2022. The SBP’s FX reserves also came under pressure from Q2 onwards, dropping from US$5.9 billion during the review period to US$ 10.5 billion by end-April 2022.
9. Public Debt
Total public debt was recorded at Rs 44,366 billion at end-March 2022. Domestic debt was recorded at Rs 28,076 billion, while external public debt was recorded at Rs 16,290 billion or US$ 88.8 billion at end-March 2022.
The public debt portfolio witnessed various positive developments during the first nine months of the ongoing fiscal year (July-March FY2022), some of them are highlighted as follows:
� Within domestic debt, the Government relied entirely on long-term domestic debt securities for the financing of its fiscal deficit and repayment of debt maturities. In fact, the Government retired/repaid a portion of Treasury Bills amounting to Rs 1.5 trillion which led to a reduction of short-term maturities in-line with the Government’s commitment to reduce its Gross Financing Needs.
� The Government repaid Rs 569 billion against SBP debt. Cumulative debt retirement against SBP debt stood at Rs 2.3 trillion from July 2019 to March 2022.
� The Government successfully issued Shariah Compliant Sukuk instruments amounting to around Rs 1.1 trillion, in line with the target specified in the Medium Term Debt Management Strategy of Pakistan (2019/20 - 2022/23), to increase the share of Shariah-compliant securities within domestic debt stock;
� Debt from multilateral and bilateral sources cumulatively constituted around 79 percent of the external public debt portfolio at end-March 2022. A set of reforms initiated by the Government to improve the economy has brought strong support from multilateral development partners. This is expected to strengthen confidence and catalyze additional support from development partners in the coming years which will also help in reducing the pressure on domestic sources.
� Within external debt, inflows from multilateral and bilateral development partners remained major sources of funding. In addition, Pakistan successfully raised US$ 1 billion in July 2021 through multi-tranche tap issuance of 5, 10 and 30-year Eurobonds. These bonds were issued at a premium.
� In January 2022, the Government of Pakistan successfully raised US$ 1 billion through the issuance of International Sukuk under the ‘Trust Certificate Issuance Program’. This was the first time that the Government has issued International Sukuk with 7 Year maturity and at a market-clearing price i.e., zero issuance premium. The
Overview of the Economy
xi
transaction was a success as healthy participation was witnessed from Middle Eastern and European investors and the books were oversubscribed 2.7 times.
� Government repaid US$ 1 billion against maturing International Sukuks in October 2021.
� Government utilized IMF allocated SDR equivalent to Rs 475 billion to support its budgetary operations.
Total interest servicing was recorded at Rs 2,118 billion during the first nine months of the current fiscal year against its annual budgeted estimate of Rs 3,060 billion. Out of this total, domestic interest payments were Rs 1,897 billion and constituted around 90 percent of total interest servicing during the first nine months of the current fiscal, which is mainly attributable to a higher volume of domestic debt in the total public debt portfolio.
Pakistan’s strategy to reduce its debt burden to a sustainable level includes a commitment to run primary surpluses, maintain low and stable inflation, promote measures that support higher long-term economic growth and follow an exchange rate regime-based on economic fundamentals. With a narrower fiscal deficit, public debt is projected to enter a firm downward path, while the Government’s efforts to improve maturity structure will enhance public debt sustainability.
10. Education
Pakistan is committed to transform its education system into a high-quality global market demand-driven system in accordance with Goal 4 of Sustainable Development Goals (SDGs) which pertains to the quality of education. The progress achieved by Pakistan so far on Goal 4 of the SDGs is as under:
� Primary, Lower, and Upper Secondary Education Completion Rate stood at 67 percent, 47 percent, and 23 percent, respectively, depicting higher Primary attendance than Lower and Upper Secondary levels.
� Parity Indices at Literacy, Youth Literacy, Primary, and Secondary are 0.71, 0.82, 0.88, and 0.89, respectively.
� Participation rate in organized learning (one year before the official primary entry age), by sex is 19 percent showing a low level of consideration of Pre-Primary Education.
� Percentage of population in a given age group achieving at least an affixed level of proficiency in functional; (a) literacy and (b) numeracy skills is 60 percent.
Various initiatives have been taken at federal and provincial levels to raise the standards of education in terms of quality education as part of our commitment to accomplish Goal 4 of SDGs. These initiatives include: i) enhancing access to education by establishing new schools, ii) upgrading the existing schools, iii) improving the learning environment by providing basic educational facilities, iv) digitization of educational institutions, v) enhancing the resilience of educational institutions to cater for unforeseen situations, vi) promoting distance learning, capacity building of teacher, and vii) improving hiring
Pakistan Economic Survey 2021-22
xii
of teachers, particularly hiring of science teachers to address the issues of science education, etc.
A Single National Curriculum (SNC) has been introduced to minimize disparity in the country’s education system where three main education systems are in place, i.e., Public schools, Private schools, and Deeni madaris. SNC is aimed at providing equal learning opportunities to all segments of society and will provide equal opportunity for learning and help the students and parents in case of inter provincial mobility.
The overall education situation based on the key indicators, such as enrolments, number of institutions, and teachers has shown a significant improvement. The total number of enrolments during 2019-20 was recorded at 55.7 million as compared to 53.1 million during 2018-19, which shows an increase of 4.9 percent. It is estimated to increase to 58.5 million during 2020-21. The number of institutions recorded at 277.5 thousand during 2019-20 as compared to 271.8 thousand during 2018-19. However, the number of institutions is estimated to increase to 283.7 thousand in 2020-21. Similarly, there were 1.83 million teachers in 2019-20 as compared to 1.79 million last year. The number of teachers is estimated to increase to 1.89 million during 2020-21.
During 2021-22, PSLM Survey was not conducted due to the upcoming Population & Housing Census 2022. However, according to Labour Force Survey 2020-21, literacy rate trends show 62.8 percent in 2020-21 (as compared to 62.4 percent in 2018-19), more in males (from 73.0 percent to 73.4 percent) than females (from 51.5 percent to 51.9 percent). Area-wise analysis suggests literacy increases in both rural (53.7 percent to 54.0 percent) and urban (76.1 percent to 77.3 percent). The male-female disparity seems to be narrowing down with time span. The literacy rate has gone up in all provinces, Punjab (66.1 percent to 66.3 percent), Sindh (61.6 percent to 61.8 percent), Khyber Pakhtunkhwa (52.4 percent to 55.1 percent), and Balochistan (53.9 percent to 54.5 percent).
Cumulative education expenditures by Federal and Provincial Governments in FY2021 remained at 1.77 percent of GDP (revised estimates). Expenditures on education-related expenditures during FY2021 witnessed an increase of 9.7 percent, reaching Rs 988 billion from Rs 901 billion.
11. Health and Nutrition
Considering, good health is essential for human progress and wellbeing, the Government remained committed to improve the health status of the population through the provision of Universal Health Coverage (UHC) to all segment of the society. To this end, the Sehat Sahulat Card was launched for reducing health inequality in the country and ameliorate the well-being of all, is a step towards achieving UHC. In 2022, the Government also expanded health infrastructure by increasing the number of hospitals, Rural Health Units (RHUs), Basic Health Units (BHUs), doctors, dentists, and dispensaries to meet the growing health services demand. However, COVID-19 had disrupted the major strides in the health sector as the resources were shifted to contain the spread of the fourth and fifth waves of the pandemic. It was a threat to the health
Overview of the Economy
xiii
system, lives, and livelihood which was successfully contained by the Government through timely procurement and a massive vaccination drive.
12. Population, Labour Force, and Employment
Pakistan is the 5th most populous country in the world. According to the National Institute of Population Studies (NIPS), the estimated population of Pakistan is 224.78 million in 2021 of which 82.83 million reside in urban areas whereas 141.96 million live in rural areas and the population density is 282 per Km.
Pakistan has a large labour force that stands among the top 10 largest labour forces in the world. According to the latest Labour Force Survey FY2021, the labour force increased from 65.5 million in FY2018 to 71.76 million in FY2021 and the number of employed persons increased from 61.71 million to 67.25 million during the same period. The unemployment rate decreased from 6.9 percent in FY2019 to 6.3 percent in FY2021. Overall employment to population ratio is 42.1 percent and this ratio is higher in male (64.1 percent) as compared to female (19.4 percent) in FY2021.
According to LFS FY2021, the share of employment in the agriculture sector decreased from 39.2 percent in FY2019 to 37.4 percent in FY2021. The share of employment in the construction sector has increased from 8.0 percent in FY2019 to 9.5 percent in FY2021. This increase shows that job opportunities are being created in the country. The wholesale and retail trade sector has shown 14.4 percent employment in FY2021.
Pakistan has some of the greatest demographic opportunities for development in the world as the growing youth population enters adulthood. The demographic dividend can only be achieved with adequate investments in the education and skills of youth, harvesting the fruits of long-term human capital development. The Government has started different programmes for improving employment opportunities for youth such as "Youth Entrepreneurship Scheme" and "Hunermand Programme-Skills for All”.
13. Transport and communications
Presently, Pakistan has 48 national highways, motorways, and strategic roads with a total length of 14,480 Km. In the first quarter of 2022, PIA has added two airbuses A320 fleets.Pakistan Railways comprised a total of 466 Locomotives for a 7,791 Km route length. During FY2022, PEMRA issued 265 Licenses for FM Radio and 4,152 Cable TV Licenses. In addition to this, there are 9,522 post offices across Pakistan.
CPEC is a flagship and most actively implemented project of the Belt & Road Initiative (BRI) where Pakistan and China have successfully launched 56 projects on the ground. Out of these projects, 26 projects worth approximately US$17 billion have been completed so far and 30 projects worth US$8.5 billion are under construction. The Government is taking benefit of Pakistan’s strategic location and has focused on developing an efficient and well-integrated transport and communication system by connecting remote regions of the country into one road one Asia chain. With the help of CPEC, roads and railways infrastructure will integrate Pakistan with the regional countries which will help in generating economic and business activities by integrating its markets with Central Asia, the Middle East, and other parts of the world.

Pakistan Economic Survey 2021-22
xiv
14. Energy
The latest available data indicates that the import bill of oil increased to US$ 17.03 billion during July-April FY2022 compared to US$8.69 billion during the same period last year, showing increase of 95 percent. Crude oil imports rose by 75.34 percent in value and 1.4 percent in quantity. Similarly, liquefied natural gas witnessed an increase of 82.90 percent in value while liquefied petroleum gas imports also jumped by 39.86 percent during July-April FY2022. During July-February FY2022, 75.64 percent of gas is domestically produced while 24.36 percent of gas is being imported. Coal is also used for electricity generation in Pakistan. Currently, the overall electricity generation from coal has reached 5280 MW. Thar coal is contributing 1,320 MW, while imported coal’s contribution to electricity generation is 3,960 MW which is around 75 percent of the total electricity generation from coal in the country.
The Government is also committed to the global agenda of SDGs goal 7 and investing in renewable and alternate sources of energy to cater to Pakistan’s growing energy demand. Pakistan is rich in hydropower and has the enormous potential to generate electricity from water. Currently, the Hydro installed capacity is 10,251 MW which is around 25 percent of the total installed capacity. Pakistan has also wind corridors. The contribution of Wind to the total installed capacity is 4.8 percent and currently stood at 1,985 MW. The potential for solar power in Pakistan is also high. The installed capacity of solar is 600 MW which is around 1.4 percent of the total installed capacity. Pakistan is also producing energy from nuclear technology whose contribution is increasing gradually. Last year, the gross capacity of the nuclear power plants was 2,530 MW which supplied about 7,076 million units of electricity to the national grid during July-March FY2021. The gross capacity of nuclear power plants has increased by 39 percent and it stood at 3,530 MW.
15. Social Protection
The COVID-19 pandemic has significantly increased poverty and inequality globally, causing a substantial reversal in progress toward global SDGs. According to the latest estimates provided by the United Nations Department of Economic and Social Affairs in the report “The World Economic Situation and Prospects 2022”, progress in reducing extreme poverty has been set back by several years in most countries. An unprecedented 85 million more people entered extreme poverty in 2020 globally.
BISP is currently disbursing payments to around 5.7 million regular beneficiaries under its Ehsaas Kafaalat Programme. During FY2022, the number of regular beneficiaries has been enhanced to 8.0 million. BISP in coordination with Finance Division and World Bank has developed an institutional mechanism as well as a proposal to increase the cash assistance under Kafaalat @ Rs 166.33/- per month or Rs 500/- per quarter w.e.f 1st January 2022 has been approved by the Federal Cabinet.
The second phase of the Ehsaas Emergency Cash Programme (ECAP-II) has been launched in June 2021. As of 30-03-2022, an amount of Rs 30.18 billion has been disbursed to 2.50 million additional beneficiaries (other than UCT beneficiaries)
Overview of the Economy
xv
@ Rs 12,000/- per beneficiaries to ever-married women of the eligible families having valid CNIC.
Under Ehsaas Taleemi Wazaif Programme, 6.52 million children have been enrolled and 25 billion have been paid so far. During FY2022, 3.22 million children have been enrolled and Rs 5.0 billion have been disbursed.
Ehsaas undergraduate scholarship programme, 1,38,133 scholarships were awarded to deserving students, and Rs 13.2 billion were disbursed during FY2020 and FY2021. For FY2022, Rs 9.5 billion was allocated, 122,000 applications have been received and its screening process will soon begin.
50 Ehsaas Nashonuma Centres across 14 districts are being established countrywide at the district and tehsil level to provide health services and conditional cash transfers under two years old; Rs 1500/- for a boy child and mother, and Rs 2000/- for a girl child mainly to prevent children from stunting growth issue. So far, 99,190 beneficiaries have been enrolled and Rs 310.81 million has been disbursed till March FY2022.
Pakistan Poverty Alleviation Fund (PPAF) also helps in micro-credit, water, health, education, and livelihood. Since its inception in April 2000 till March 2022, PPAF has disbursed approximately Rs 237.56 billion to its Partner Organizations (POs) in 147 districts across the country. A total of 8.4 million microcredit loans have been disbursed with 60 percent loans to women and 80 percent financing extended to rural areas.
During July-March FY2022, PPAF disbursed Rs 2,112.70 million to its POs for various programmes funded by Donors and PPAF’s own resources.
Pakistan Baitul Mal (PBM) is providing financial assistance to the destitute, widows, orphans, and other needy persons at the district level. During FY2022, Rs 6.505 billion has been allocated to PBM for its core projects/schemes.
Workers Welfare Fund (WWF) during July-March, FY2022, disbursed Rs 1.43 billion on 15,004 scholarship cases, while Rs 244.07 million was utilized as marriage grants @ Rs 200,000 per worker, benefitting 1819 workers' families. The WWF has also disbursed Rs 420.4 million as a death grant @Rs 600,000 per worker covering 804 cases of mishaps all over the country.
EOBI provides monetary benefits to old age workers through various programmes such as Old Age Pension, Invalidity Pension, Survivors Pension, and Old Age Grant. EOBI has registered 9,429,281 employees. During FY2022, EOBI registered 307,296 new employees. During July-March FY2021, an amount of Rs 33.54 billion has been disbursed by EOBI.
16. Climate Change
In Pakistan, environmental degradation and climate change are adversely affecting the economy, livelihood of the poor, and sustainable development. On the one hand, a growing population, unplanned urban expansion, and decidedly dependence on natural resources puts immense pressure on the environment that triggering climate change.
Pakistan Economic Survey 2021-22
xvi
The existing meager forest resources are crucial to environmental stability in Pakistan, which appeals for serious interventions supported by a commitment to adequate financial flows to improve and enhance the overall forestry, wildlife, and biodiversity sector. However, the TBTTP is helping to restore the ailing ecosystems and it will improve natural capital as well. The programme is being implemented by the Provincial Forest and Wildlife Departments through MoCC on a 50 percent cost-sharing basis except for AJ&K and GB which are 100 percent funded by the Federal Government through PSDP. The programme has achieved 579.093 million plants during July-March FY2022 and cumulatively has attained 1,586.18 million plants till March 2022.

Despite achieving a real GDP growth of 5.97 percent in FY2022, the underlying
macroeconomic imbalances and associated domestic and international risks have
dampened celebrations. The economy of Pakistan rebounded from the pandemic (0.94
percent contraction in FY2020) and continued to post a V-Shaped economic recovery
which is higher than 5.74 percent recorded in last year (FY2021). This high growth,
however, is also accompanied by external and internal imbalances, as has been the case
historically with Pakistan economy. Historically, it has been observed that higher growth
also accompanied with macroeconomic imbalances. However, external circumstances
also played a critical role this time. These circumstances have placed almost all
economies of the world in shambles. A highly transmissible Omicron variety began
making things much worse in 2021, when the global economy had yet to recover from
COVID-19's effects. Changes in Afghanistan's government after the withdrawal of US
troops sparked a global discussion of misery and humanitarian crises, which further
worsened due to the Russian-Ukraine conflict started in February 2022. The crisis has
also upended the global economic picture and considerably increased the uncertainty
for a global economy that was still struggling to recover from COVID-19 aftermath.
Financial and commodity markets have felt shockwaves. Thus, energy and food prices
have surged rapidly and threatens to remain further elevated. The exceedingly uncertain
outcome of the crisis is another challenge for developing economies, particularly for
Pakistan.
In Pakistan, during the outgoing fiscal year, inflationary pressures started rising initially
due to broadly accommodative fiscal and monetary policies to cushion the impact of
COVID-19 in 2020 and 2021. Further, global supply chain disruptions fueled inflation on
account of a significant increase in the cost of freight. On the way, when the government
was planning to start unwinding pandemic emergency measures and gradually shifting
toward fiscal consolidation, the Russian-Ukraine conflict impacted the entire global
economy with the prediction of slower growth and faster inflation. Impacts are
transmitting through three main channels. First, increasing commodity prices, such as
food and energy, driving up inflation further, diminishing the value of income. Thus,
weighing on demand. Second, trading economies are grappling with disrupted trade,
supply chains, and remittances. While, third, high uncertainty in international market is
Chapter 1
Growth and Investment
Pakistan Economic Survey 2021-22
2
reducing business confidence and putting downward pressure on asset values. Further,
tightening financial conditions may increase capital outflows from emerging markets. In
Pakistan, CPI inflation (General) increased by 13.4 percent on a year-over-year basis in
April 2022, compared to 12.7 percent in March 2022, while, it remained at 11.0 percent
for July-April FY2022. Likewise, the WPI posted a growth of 23 percent during the period
under discussion, which in turn intensified domestic inflationary pressure. Since the
international commodity prices, especially oil and food are expressed in US dollars,
therefore, the depreciation of the Rupee exchange rate vis-a-vis US dollar, also
influenced the domestic prices of finished and intermediate products. It is a well-known
fact that high prices erode benefits of high growth and adversely impacting the well-
being of the society. Therefore, price stability is emphasized in government policies
along with sustainable inclusive growth.
Contrary to significant rise in WPI, LSM which is used as proxy for domestic industrial
production, posted a growth of 10.4 percent during July-March FY2022. The growth of
LSM appears to be extensive, as 17 of 22 LSM sectors experienced positive growth. This
significant growth in industrial sector boosted the exports growth by 28 percent during
July-April FY2022. However, trade deficit in goods and services widened by 51 percent
on account of 39 percent increase in imports of goods as well as 34 percent increase in
imports of services according to SBP data. During this period, remittances reached
US$26.1 billion posting a growth of 7.6 percent. Despite historically high remittances,
trade deficit in goods and services could not be offset. Thus, current account deficit
started ballooning up. Further, low performance of Financial Account, not only resulted
in depletion of foreign reserves but also brought exchange rate under pressure.
On fiscal side, expenditures became unpredictable globally due to uncertain economic
environment and same is the case in Pakistan as well. The significant increase in
international prices of commodities especially energy and food are intensifying pressure
public finances as well. Realizing the impact of inflation on masses in Pakistan, the
Government attempted to protect the vulnerable segments of the society from the recent
surge in international energy and food prices. The subsidy provided, thus increased
government expenditures, adding fiscal costs. Though, within IMF program,
Government is unable to borrow from SBP, commercial borrowing is significantly
increased which crowd out the private investment. Historically, consumption always has
highest share in GDP. Thus, on demand side, the share of Consumption in real and
nominal GDP reached 99 and 96 percent respectively during FY2022, Thus, the
imbalance between domestic production and aggregate demand caused inflation, which
in turn adversely impacted price stability and sustainable growth.
To remove macroeconomic imbalances and to achieve long term sustainable and
inclusive growth, there is need to focus on both the supply side and demand side
management. The supply side strategy emphasizes on the extension of production
capacity by stimulating and upgradation of domestic GFCF and attracting FDI. This
Growth and Investment
3
requires conducive environment in which investors feel comfortable to take long term
investment decisions. Such developments are expected to increase the growth rate of
the country’s potential output and employment. On the other hand, increase in
productive capacity will enhance production of exportable, imports substitution, which
in turn improve trade. Since Positive output gap is creating overheating situation in the
economy which not only exerts pressure on domestic prices but also worsen balance of
trade due to increase in imports.
Global Perspective
Soon after the recovery from COVID-19, the economic gains were threatened by the
Russian-Ukraine conflict in start of 2022. due to the outbreak and evolvement of the
COVID-19 pandemic. Initially, the global recovery momentum weakened due to the
Delta variant followed by highly transmissible Omicron. The Russian-Ukraine conflict
brought more economic damage predicting a significant slowdown in global growth in
2022 due to worldwide spillover effects through commodity markets, trade, and
financial channels.
Keeping in view, the prevailing supply shocks for an unknown time length, every
institution working on the global outlook has downgraded global growth. Especially IMF
has downward revised global growth from early estimates made in January 2022 and
October 2021. Global growth is projected to decline from an estimated 6.1 percent in
2021 to 3.6 percent in 2022 and 2023 as well. This decline is 0.8 and 0.2 percentage
points lower for 2022 and 2023 than in the January 2022, while in Oct 2021, IMF was
projecting 4.9 percent global growth. The most worrisome is inflationary pressure.
According to IMF, the conflict will broaden price pressures. Thus, inflation is expected
to remain elevated a longer period than the previous forecasts. The conflict is likely to
have a protracted impact on commodity prices, affecting oil and gas prices more severely
in 2022 and food prices in 2023 (because of the lagged impact from the harvest in 2022).
However, the intensity of impact varies across countries, depending on trade and
financial linkages, exposure to commodity price increases, and the strength of the
existing inflationary pressure.
However, sanctions imposed on Russia by the world community will hamper financial
and trade linkages between Russia and other countries due to the fact that some
countries in Eastern Europe and Central Asia have large trade and migration links with
Russia. Thus, with a delay in conflict settlement, the repercussions will be far-reaching.
Moreover, increased global polarization will also impede the cooperation essential for
long-term prosperity. It is also mentionable that recent lockdowns in key manufacturing
and trade hubs in China will likely compound supply disruptions elsewhere.
On the financial sector, an increase in core sovereign interest rates before the conflict
had already placed pressure on borrowers in some emerging and developing economies.
Markets have so far differentiated across countries depending on their debt exposures
Pakistan Economic Survey 2021-22
4
and trade linkages to advanced economies. Countries with higher debt levels and larger
gross financing needs have usually been vulnerable to more extreme stress in such
episodes. In these countries, increases in domestic long-term yields largely reflect
increases in risk premia, over and above the effects of increases in domestic policy rates.
To the extent that higher core rates may reflect more robust nominal demand in
advanced economy trading partners, countries with stronger trade ties to advanced
economies are less exposed. Summarizing, the global economy faces 'its biggest test'
since WWII due to Russian-Ukraine conflict as concluded in World Economic Forum
meeting held in Davos, recently. It was recorded in the meeting that rising interest rates
are adding to pressure on countries, companies and households with big piles of debt.
Further, market turbulence and ongoing supply chain constraints are also posing risks.
Moreover, the other important risk is the climate change.
Impact of Global Economic Uncertainty on Pakistan’s Economy
Economic activity in Pakistan is influenced by economic growth in its main trading
partners. The cyclical position pf Pakistan’s major trading partners, measured by the
weighted average Composite Leading Indicators (CLI), showed a strong V-shaped
recovery up till the end of 2021. In 2022, the cyclical position of Pakistan’s trading
partners gradually moved back to the normal position.
The cyclical position of Pakistan’s manufacturing sector, which exerts positive multiplier
effects on the rest of the economy, is known to be correlated with the foreign CLI. In
Pakistan, potential output kept on growing in 2022 due to which Pakistan’s growth
performance remained up to the mark in FY2022.
However, higher overall commodity prices especially international inflation had
negative consequences for Pakistan’s economy. Inflation accelerated and the balance of
trade in goods and services deteriorated significantly. As a result, Pakistan’s
international reserves depleted and currency depreciated significantly, feeding further
into domestic inflation. The high rate of inflation eroded the real disposable income of
the population, especially of its lower income segments. Fiscal measures were taken to
protect against these income losses, which aggravated the fiscal deficit putting further
pressure on inflation.
Furthermore, foreign interest rates started rising, because of inflationary expectations
and Central banks’ intentions to raise interest rates, especially in the US and the UK. And
same was followed by other countries, especially Emerging Market and Developing
Countries.
Thus, high inflation, external imbalances, excessive fiscal deficits, and higher interest
rates may compromise Pakistan’s future short-term growth prospects.
Growth and Investment
5
Box - I: Effects of Internal and External Imbalances on Prices and Economic Growth
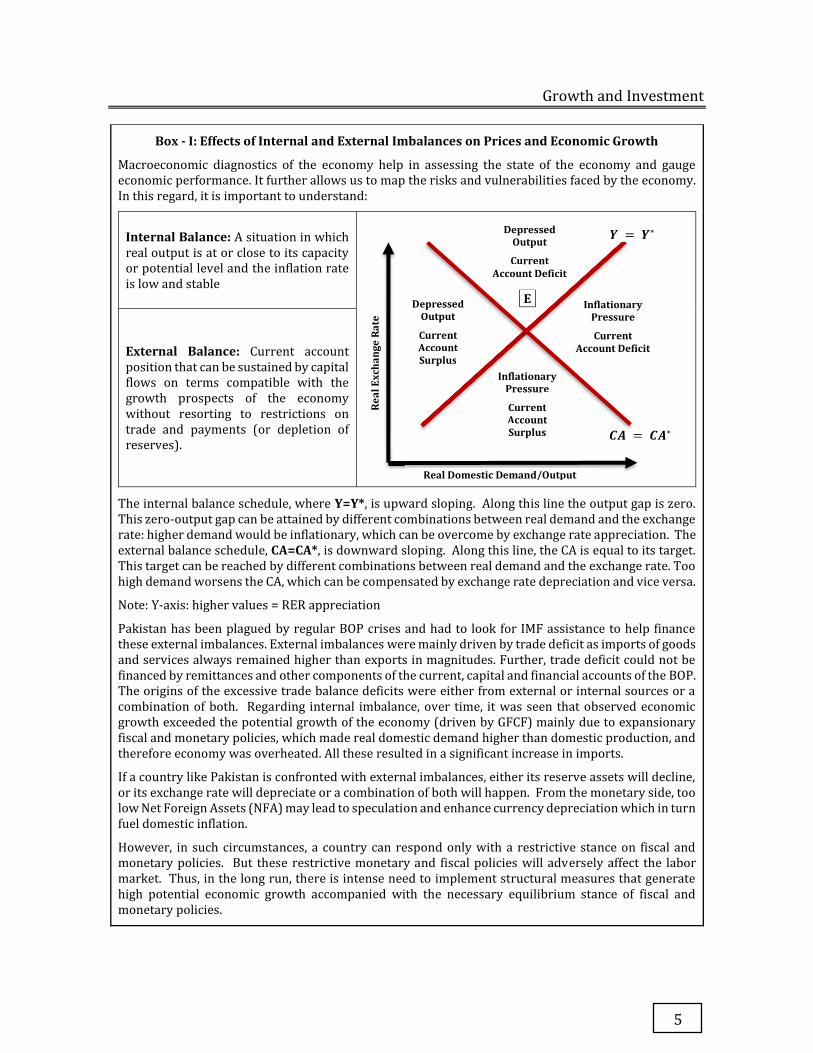
Macroeconomic diagnostics of the economy help in assessing the state of the economy and gauge economic performance. It further allows us to map the risks and vulnerabilities faced by the economy. In this regard, it is important to understand:
Internal Balance: A situation in which real output is at or close to its capacity or potential level and the inflation rate is low and stable
External Balance: Current account position that can be sustained by capital flows on terms compatible with the growth prospects of the economy without resorting to restrictions on trade and payments (or depletion of reserves).
The internal balance schedule, where Y=Y*, is upward sloping. Along this line the output gap is zero. This zero-output gap can be attained by different combinations between real demand and the exchange rate: higher demand would be inflationary, which can be overcome by exchange rate appreciation. The external balance schedule, CA=CA*, is downward sloping. Along this line, the CA is equal to its target. This target can be reached by different combinations between real demand and the exchange rate. Too high demand worsens the CA, which can be compensated by exchange rate depreciation and vice versa.
Note: Y-axis: higher values = RER appreciation
Pakistan has been plagued by regular BOP crises and had to look for IMF assistance to help finance these external imbalances. External imbalances were mainly driven by trade deficit as imports of goods and services always remained higher than exports in magnitudes. Further, trade deficit could not be financed by remittances and other components of the current, capital and financial accounts of the BOP. The origins of the excessive trade balance deficits were either from external or internal sources or a combination of both. Regarding internal imbalance, over time, it was seen that observed economic growth exceeded the potential growth of the economy (driven by GFCF) mainly due to expansionary fiscal and monetary policies, which made real domestic demand higher than domestic production, and therefore economy was overheated. All these resulted in a significant increase in imports.
If a country like Pakistan is confronted with external imbalances, either its reserve assets will decline, or its exchange rate will depreciate or a combination of both will happen. From the monetary side, too low Net Foreign Assets (NFA) may lead to speculation and enhance currency depreciation which in turn fuel domestic inflation.
However, in such circumstances, a country can respond only with a restrictive stance on fiscal and monetary policies. But these restrictive monetary and fiscal policies will adversely affect the labor market. Thus, in the long run, there is intense need to implement structural measures that generate high potential economic growth accompanied with the necessary equilibrium stance of fiscal and monetary policies.
Real
Exc
hang
e Ra
te
Depressed Output
Current Account Deficit
Real Domestic Demand/Output
O
Depressed Output
Current Account Surplus
�� = ��∗
Inflationary Pressure
Current Account Surplus
Output
Current Account Deficit
epressedOutput
Current Account Surplus
��
Inflationary Pressure
Current Account Surplus
Real
Exc
hang
e Ra
te
Inflationary Pressure
Current Account Deficit
E
� = �∗
Pakistan Economic Survey 2021-22
6
Pakistan Economic Performance FY2022
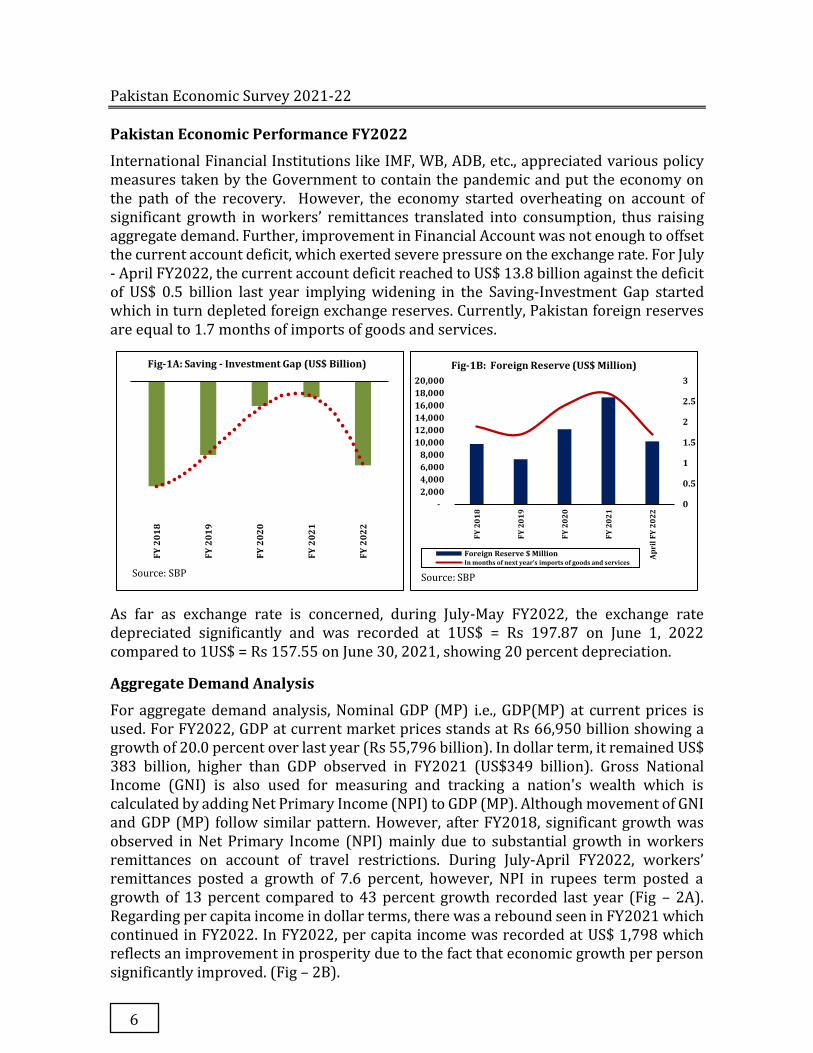
International Financial Institutions like IMF, WB, ADB, etc., appreciated various policy measures taken by the Government to contain the pandemic and put the economy on the path of the recovery. However, the economy started overheating on account of significant growth in workers’ remittances translated into consumption, thus raising aggregate demand. Further, improvement in Financial Account was not enough to offset the current account deficit, which exerted severe pressure on the exchange rate. For July - April FY2022, the current account deficit reached to US$ 13.8 billion against the deficit of US$ 0.5 billion last year implying widening in the Saving-Investment Gap started which in turn depleted foreign exchange reserves. Currently, Pakistan foreign reserves are equal to 1.7 months of imports of goods and services.
As far as exchange rate is concerned, during July-May FY2022, the exchange rate depreciated significantly and was recorded at 1US$ = Rs 197.87 on June 1, 2022 compared to 1US$ = Rs 157.55 on June 30, 2021, showing 20 percent depreciation.
Aggregate Demand Analysis
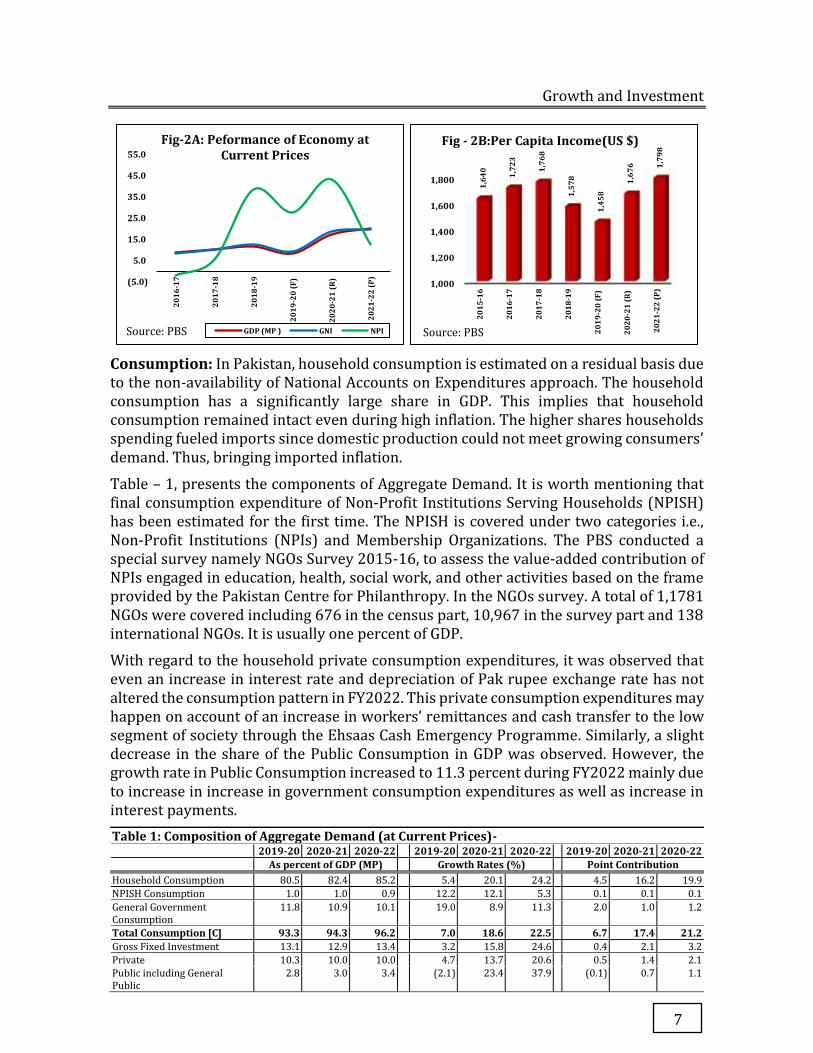
For aggregate demand analysis, Nominal GDP (MP) i.e., GDP(MP) at current prices is used. For FY2022, GDP at current market prices stands at Rs 66,950 billion showing a growth of 20.0 percent over last year (Rs 55,796 billion). In dollar term, it remained US$ 383 billion, higher than GDP observed in FY2021 (US$349 billion). Gross National Income (GNI) is also used for measuring and tracking a nation's wealth which is calculated by adding Net Primary Income (NPI) to GDP (MP). Although movement of GNI and GDP (MP) follow similar pattern. However, after FY2018, significant growth was observed in Net Primary Income (NPI) mainly due to substantial growth in workers remittances on account of travel restrictions. During July-April FY2022, workers’ remittances posted a growth of 7.6 percent, however, NPI in rupees term posted a growth of 13 percent compared to 43 percent growth recorded last year (Fig – 2A). Regarding per capita income in dollar terms, there was a rebound seen in FY2021 which continued in FY2022. In FY2022, per capita income was recorded at US$ 1,798 which reflects an improvement in prosperity due to the fact that economic growth per person significantly improved. (Fig – 2B).
FY 2
018
FY 2
019
FY 2
020
FY 2
021
FY 2
022
Fig-1A: Saving - Investment Gap (US$ Billion)
0
0.5
1
1.5
2
2.5
3
- 2,000 4,000 6,000 8,000
10,000 12,000 14,000 16,000 18,000 20,000
FY 2
018
FY 2
019
FY 2
020
FY 2
021
Apri
l FY
2022
Fig-1B: Foreign Reserve (US$ Million)
Foreign Reserve $ MillionIn months of next year's imports of goods and services
Source: SBPSource: SBP
Growth and Investment
7
Consumption: In Pakistan, household consumption is estimated on a residual basis due to the non-availability of National Accounts on Expenditures approach. The household consumption has a significantly large share in GDP. This implies that household consumption remained intact even during high inflation. The higher shares households spending fueled imports since domestic production could not meet growing consumers’ demand. Thus, bringing imported inflation.
Table – 1, presents the components of Aggregate Demand. It is worth mentioning that final consumption expenditure of Non-Profit Institutions Serving Households (NPISH) has been estimated for the first time. The NPISH is covered under two categories i.e., Non-Profit Institutions (NPIs) and Membership Organizations. The PBS conducted a special survey namely NGOs Survey 2015-16, to assess the value-added contribution of NPIs engaged in education, health, social work, and other activities based on the frame provided by the Pakistan Centre for Philanthropy. In the NGOs survey. A total of 1,1781 NGOs were covered including 676 in the census part, 10,967 in the survey part and 138 international NGOs. It is usually one percent of GDP.
With regard to the household private consumption expenditures, it was observed that even an increase in interest rate and depreciation of Pak rupee exchange rate has not altered the consumption pattern in FY2022. This private consumption expenditures may happen on account of an increase in workers’ remittances and cash transfer to the low segment of society through the Ehsaas Cash Emergency Programme. Similarly, a slight decrease in the share of the Public Consumption in GDP was observed. However, the growth rate in Public Consumption increased to 11.3 percent during FY2022 mainly due to increase in increase in government consumption expenditures as well as increase in interest payments.
Table 1: Composition of Aggregate Demand (at Current Prices)- 2019-20 2020-21 2020-22
2019-20 2020-21 2020-22
2019-20 2020-21 2020-22
As percent of GDP (MP)
Growth Rates (%)
Point Contribution Household Consumption 80.5 82.4 85.2
5.4 20.1 24.2
4.5 16.2 19.9
NPISH Consumption 1.0 1.0 0.9
12.2 12.1 5.3
0.1 0.1 0.1
General Government Consumption
11.8 10.9 10.1
19.0 8.9 11.3
2.0 1.0 1.2
Total Consumption [C] 93.3 94.3 96.2
7.0 18.6 22.5
6.7 17.4 21.2 Gross Fixed Investment 13.1 12.9 13.4
3.2 15.8 24.6
0.4 2.1 3.2
Private 10.3 10.0 10.0
4.7 13.7 20.6
0.5 1.4 2.1
Public including General Public
2.8 3.0 3.4
(2.1) 23.4 37.9
(0.1) 0.7 1.1
(5.0)
5.0
15.0
25.0
35.0
45.0
55.0
2016
-17
2017
-18
2018
-19
2019
-20
(F)
2020
-21
(R)
2021
-22
(P)
Fig-2A: Peformance of Economy at Current Prices
GDP (MP ) GNI NPISource: PBS
1,000
1,200
1,400
1,600
1,800
2015
-16
2016
-17
2017
-18
2018
-19
2019
-20
(F)
2020
-21
(R)
2021
-22
(P)
1,64
0
1,72
3
1,76
8
1,57
8
1,45
8
1,67
6 1,79
8
Fig - 2B:Per Capita Income(US $)
Source: PBS
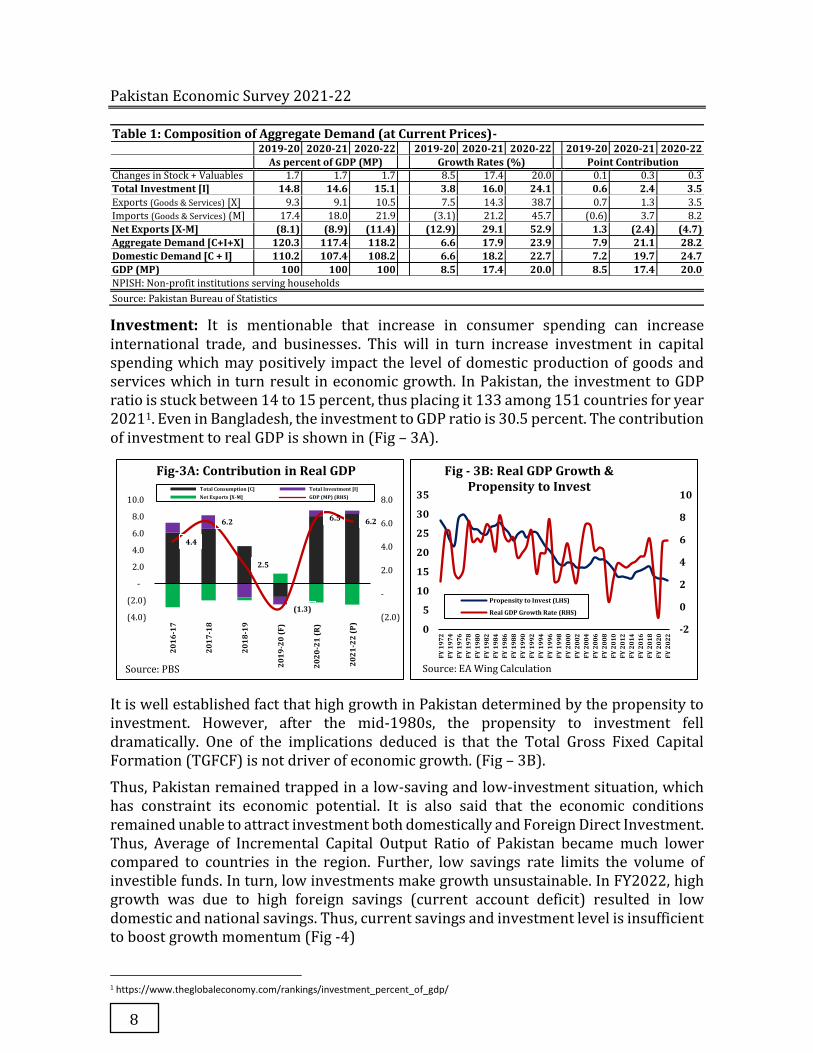
Pakistan Economic Survey 2021-22
8
Table 1: Composition of Aggregate Demand (at Current Prices)- 2019-20 2020-21 2020-22
2019-20 2020-21 2020-22
2019-20 2020-21 2020-22
As percent of GDP (MP)
Growth Rates (%)
Point Contribution Changes in Stock + Valuables 1.7 1.7 1.7
8.5 17.4 20.0
0.1 0.3 0.3
Total Investment [I] 14.8 14.6 15.1
3.8 16.0 24.1
0.6 2.4 3.5 Exports (Goods & Services) [X] 9.3 9.1 10.5
7.5 14.3 38.7
0.7 1.3 3.5
Imports (Goods & Services) (M] 17.4 18.0 21.9
(3.1) 21.2 45.7
(0.6) 3.7 8.2
Net Exports [X-M] (8.1) (8.9) (11.4)
(12.9) 29.1 52.9
1.3 (2.4) (4.7) Aggregate Demand [C+I+X] 120.3 117.4 118.2
6.6 17.9 23.9
7.9 21.1 28.2
Domestic Demand [C + I] 110.2 107.4 108.2
6.6 18.2 22.7
7.2 19.7 24.7 GDP (MP) 100 100 100
8.5 17.4 20.0
8.5 17.4 20.0
NPISH: Non-profit institutions serving households
Source: Pakistan Bureau of Statistics
Investment: It is mentionable that increase in consumer spending can increase international trade, and businesses. This will in turn increase investment in capital spending which may positively impact the level of domestic production of goods and services which in turn result in economic growth. In Pakistan, the investment to GDP ratio is stuck between 14 to 15 percent, thus placing it 133 among 151 countries for year 20211. Even in Bangladesh, the investment to GDP ratio is 30.5 percent. The contribution of investment to real GDP is shown in (Fig – 3A).
It is well established fact that high growth in Pakistan determined by the propensity to investment. However, after the mid-1980s, the propensity to investment fell dramatically. One of the implications deduced is that the Total Gross Fixed Capital Formation (TGFCF) is not driver of economic growth. (Fig – 3B).
Thus, Pakistan remained trapped in a low-saving and low-investment situation, which has constraint its economic potential. It is also said that the economic conditions remained unable to attract investment both domestically and Foreign Direct Investment. Thus, Average of Incremental Capital Output Ratio of Pakistan became much lower compared to countries in the region. Further, low savings rate limits the volume of investible funds. In turn, low investments make growth unsustainable. In FY2022, high growth was due to high foreign savings (current account deficit) resulted in low domestic and national savings. Thus, current savings and investment level is insufficient to boost growth momentum (Fig -4)
1 https://www.theglobaleconomy.com/rankings/investment_percent_of_gdp/
4.4
6.2
2.5
(1.3)
6.5 6.2
(2.0)
-
2.0
4.0
6.0
8.0
(4.0)
(2.0)
-
2.0
4.0
6.0
8.0
10.0
2016
-17
2017
-18
2018
-19
2019
-20
(F)
2020
-21
(R)
2021
-22
(P)
Fig-3A: Contribution in Real GDP Total Consumption [C] Total Investment [I] Net Exports [X-M] GDP (MP) (RHS)
-2
0
2
4
6
8
10
0
5
10
15
20
25
30
35
FY 1
972
FY 1
974
FY 1
976
FY 1
978
FY 1
980
FY 1
982
FY 1
984
FY 1
986
FY 1
988
FY 1
990
FY 1
992
FY 1
994
FY 1
996
FY 1
998
FY 2
000
FY 2
002
FY 2
004
FY 2
006
FY 2
008
FY 2
010
FY 2
012
FY 2
014
FY 2
016
FY 2
018
FY 2
020
FY 2
022
Fig - 3B: Real GDP Growth & Propensity to Invest
Propensity to Invest (LHS)
Real GDP Growth Rate (RHS)
Source: EA Wing CalculationSource: PBS
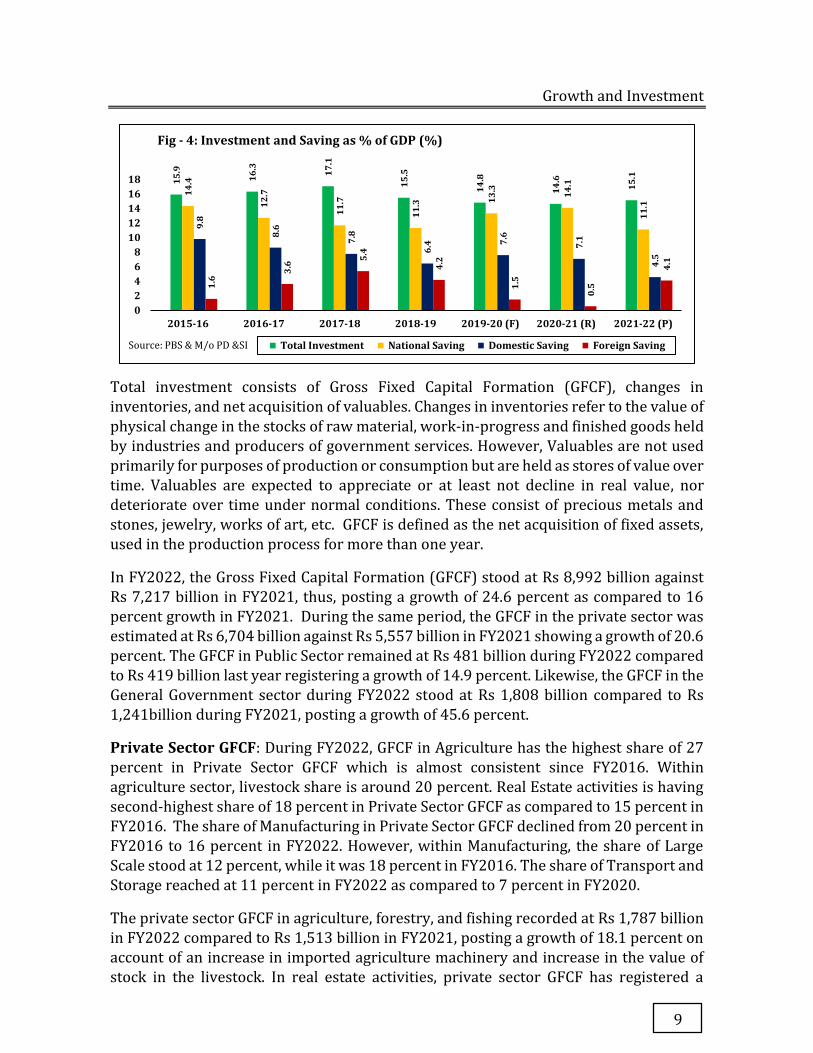
Growth and Investment
9
Total investment consists of Gross Fixed Capital Formation (GFCF), changes in
inventories, and net acquisition of valuables. Changes in inventories refer to the value of
physical change in the stocks of raw material, work-in-progress and finished goods held
by industries and producers of government services. However, Valuables are not used
primarily for purposes of production or consumption but are held as stores of value over
time. Valuables are expected to appreciate or at least not decline in real value, nor
deteriorate over time under normal conditions. These consist of precious metals and
stones, jewelry, works of art, etc. GFCF is defined as the net acquisition of fixed assets,
used in the production process for more than one year.
In FY2022, the Gross Fixed Capital Formation (GFCF) stood at Rs 8,992 billion against
Rs 7,217 billion in FY2021, thus, posting a growth of 24.6 percent as compared to 16
percent growth in FY2021. During the same period, the GFCF in the private sector was
estimated at Rs 6,704 billion against Rs 5,557 billion in FY2021 showing a growth of 20.6
percent. The GFCF in Public Sector remained at Rs 481 billion during FY2022 compared
to Rs 419 billion last year registering a growth of 14.9 percent. Likewise, the GFCF in the
General Government sector during FY2022 stood at Rs 1,808 billion compared to Rs
1,241billion during FY2021, posting a growth of 45.6 percent.
Private Sector GFCF: During FY2022, GFCF in Agriculture has the highest share of 27
percent in Private Sector GFCF which is almost consistent since FY2016. Within
agriculture sector, livestock share is around 20 percent. Real Estate activities is having
second-highest share of 18 percent in Private Sector GFCF as compared to 15 percent in
FY2016. The share of Manufacturing in Private Sector GFCF declined from 20 percent in
FY2016 to 16 percent in FY2022. However, within Manufacturing, the share of Large
Scale stood at 12 percent, while it was 18 percent in FY2016. The share of Transport and
Storage reached at 11 percent in FY2022 as compared to 7 percent in FY2020.
The private sector GFCF in agriculture, forestry, and fishing recorded at Rs 1,787 billion
in FY2022 compared to Rs 1,513 billion in FY2021, posting a growth of 18.1 percent on
account of an increase in imported agriculture machinery and increase in the value of
stock in the livestock. In real estate activities, private sector GFCF has registered a
15.9
16.3
17.1
15.5
14.8
14.6
15.1
14.4
12.7
11.7
11.3
13.3
14.1
11.1
9.8
8.6
7.8
6.4 7.
6
7.1
4.5
1.6
3.6 5.
4
4.2
1.5
0.5
4.1
02468
1012141618
2015-16 2016-17 2017-18 2018-19 2019-20 (F) 2020-21 (R) 2021-22 (P)
Fig - 4: Investment and Saving as % of GDP (%)
Total Investment National Saving Domestic Saving Foreign SavingSource: PBS & M/o PD &SI
Pakistan Economic Survey 2021-22
10
growth of 35 percent on account of higher growth of deflator. The private sector GFCF
in large scale manufacturing for FY2022 reached Rs 785 billion against Rs 761 billion
during FY2021, showing a growth of 3.1 percent. The conservative reporting of
provisional capital formation by private companies is the main reason behind this
relatively slow growth. Regarding private sector GFCF in Transportation & Storage
industry, it posted a growth of 38 percent as its value increased to Rs 751 billion in
FY2022 from Rs 545 billion in FY2021 on account of higher imports as well as domestic
sales of transportation equipment.
Public Sector Enterprises GFCF: During FY2022, the major industries showed an
increase in GFCF compared to FY2021. For instance, construction (Rs 14.0 billion against
Rs 9.8 billion due to Capital Development Authority and Lahore Development
Authority), Transportation & Storage (Rs 117.0 billion against Rs 60.8 billion due to Port
Qasim Authority, Pakistan National Shipping Corporation, and National Logistic Cell),
Information & Communication (Rs 79.0 billion against Rs 34.2 billion due to PTCL and
Ufone on machinery & equipment), and Finance & Insurance (Rs 18.8 billion against Rs
11.4 billion due to Nationalized Banks and EOBI). However, a decline was observed in
Mining & Quarrying (Rs 13.8 billion against Rs 25.3 billion due to OGDC on machinery &
equipment), Manufacturing (Rs 13.9 billion against Rs 14.4 billion due to Pak Arab
Refinery), and Electricity Gas & Water Supply (Rs 224.2 billion against Rs 262.6 billion
due to Water & Power Development Authority and companies relating to machinery &
equipment).
General Government GFCF: For FY2022, GFCF related expenditure for the Federal
Government has been recorded at Rs 566 billion compared to Rs 477 billion last year,
posting a growth of 18.5 percent. Similarly, GFCF related expenditures by Provincial
Governments were increased by 63 percent as these were recorded at Rs 1,064 billion
in FY2022 compared to Rs 654 billion last year. These were mainly related to buildings
and structures in Punjab (from Rs 254.2 to 423.7 billion), Sindh (from Rs 179.3 to 322.4
billion), KP (from Rs 154.2 to 201.3 billion) and Balochistan (from Rs 66.1 to 116.4
billion). Moreover, expenditure on GFCF incurred by District Governments also
increased to Rs 178.2 billion in FY2022 from Rs 110.4 billion in FY2021, posting growth
of 61.4 percent. Industry-wise disaggregation of GFCF of General Government suggests
that there was 48.0, 34.2 and 25.1 percent increase in Public Administration & Social
Security, Education and Human Health & Social Work, respectively during FY2022.
Net Exports: The contribution of Net Exports in aggregate demand, remained negative,
mainly due to the massive decline in imports on account of the pandemic. As per
National Accounts data, Exports of Goods and Services posted a growth of 39 percent,
while Imports of Goods and Services posted a growth of 46 percent in FY2022. Since
1972, a dramatic decline has been seen in the share of Net Exports in GDP (Fig-5A).
Usually, trade openness is frequently used to measure the importance of international
transactions relative to domestic transactions. It is defined as the ratio of exports plus
imports over GDP. Pakistan’s openness to trade improved little after 2005, but reflecting
two markedly divergent trends: import share rose and export share declined (Fig-5B).

Growth and Investment
11
A significant increase in imports caused to decrease the share of Net exports dramatically. However, due to a strong increase in consumption, both government and private households, Pakistan’s economy was confronted with several BOP crises. Moreover, the Term of Trade (TOT) declined substantially, hence the value of net export fallen down dramatically, putting a severe limit on demand-driven growth, since the mid-2000’s (Fig-6).
Sectoral Growth Analysis – Production Side
Pakistan’s economy has shown a strong recovery after being depressed due to the pandemic which resulted in lockdown. For FY2022, Real GDP (GVA at basic prices 2015-16) posted a growth of 5.97 percent on account of 4.40 percent growth in Agriculture, while 7.19 and 6.19 percent growth in Industry and Services respectively. This growth is slightly above the growth of 5.74 percent recorded for FY2021.
Box - II: Rebasing of National Accounts from basic prices of 2005-06 to 2015-16
Recently, the Pakistan Bureau of Statistics has revised National Accounts at basic prices of 2015-16.
Thus, rebasing of National Accounts Series means replacing the old base year used for compiling the constant price estimates with a new or more recent base year for computing constant price estimates
Real GDP is considered more important which is estimated with reference to some base year considered as constant prices. While constant price data have the advantage of being additive, the
-12
-10
-8
-6
-4
-2
0
219
7419
7719
8019
8319
8619
8919
9219
9519
9820
0120
0420
0720
1020
1320
1620
1920
22
Fig - 5A: Share of Net Exports in GDP
Source: EA Wing Calculation based on PBS Data
05
10152025303540
1974
1977
1980
1983
1986
1989
1992
1995
1998
2001
2004
2007
2010
2013
2016
2019
2022
Fig - 5B: Trade Performance
Openness Export Share Import Share
Source: EA Wing Calculation based on PBS Data
-9,000
-8,000
-7,000
-6,000
-5,000
-4,000
-3,000
-2,000
-1,000
0
1,000
0
50
100
150
200
250
300
1974
1976
1978
1980
1982
1984
1986
1988
1990
1992
1994
1996
1998
2000
2002
2004
2006
2008
2010
2012
2014
2016
2018
2020
2022
Fig-6: TOT & Net Exports in Rs Billion
Terms of Trade Net Exports Value (Rs Billion)
Source: EA Wing Calculation based on PBS Data

Pakistan Economic Survey 2021-22
12
pattern of relative prices in the base period becomes increasingly irrelevant with the passage of time. As a result, the base period must be updated to reflect current conditions. Actually, the System of National Accounts (SNA) is a set of internationally agreed standards for measuring economic activity. SNA 2008 is presently in place. It is also mentionable that most of the countries, namely Bangladesh, Hong Kong China, India Nepal, Philippines, Sri Lanka, and Thailand undertake their rebasing exercise at a gap of 10 years.
Advantages of Rebasing � It helps in getting the most reliable and accurate estimations of GDP (GDP). Further, estimates of
new GFCF involve broadening of the scope and coverage of macroeconomic data. Thus, the estimates become in accordance with the System of National Accounts (SNA) standards.
� The rebasing of Pakistan's macroeconomic data is required by government, policymakers and decision makers, researchers, and other national and international users for appropriate policies implications
In Pakistan, prior to recent rebasing, the National Accounts of Pakistan had been estimated on current prices until the base was set as 1959-60, which was adopted in 1962-63. The first change of base took place in 1987 when the year 1980-81 was adopted as the base year. The next change of base was adopted in 2003 setting the base as 1999-2000. Then in 2013, the base year was changed to 2005-06.
1980-81 1999-00 2005-06 2015-16
Rs Million Base Year 1959-60
Base Year 1980-81
Base Year 1980-81
Base Year 1999-00
Base Year 1999-00
Base Year 2005-06
Base Year 2005-06
Base Year 2015-16
Agriculture 71,699 71,399 779,692 923,609 1,457,222 1,775,346 6,749,966 7,306,957
Industry 61,495 56,013 676,369 830,865 1,923,698 1,616,157 5,308,368 5,939,635
Services 114,402 115,419 1,465,927 1,807,546 3,777,607 4,324,274 15,343,961 17,261,613
GDP at basic prices 247,596 247,831 2,921,988 3,562,020 7,158,527 7,715,777 27,402,295 30,508,205
GDP at market prices
277,961 278,196 3,147,167 3,826,112 7,623,205 8,216,160 29,075,633 32,725,049
Change in Key Macroeconomic Variables Ratios
Indicators
Fiscal Year 2021
% Change Base Year 2006 Base Year 2016 Real Sector
GDP Size (current) (Rs mn) 47,709,325 55,795,515 16.9
GDP Size (current) (US$ mn) 298,650 348,678 16.8
Per Capita Income (US$) 1,542 1,676 8.7
Population 211.9 222.6 5.0
Indicators Fiscal Year 2021
% Change Base Year 2006 Base Year 2016
Fiscal Sector
Total Revenue (Rs mn) 6,903,370 6,903,370
Total Revenue (% of GDP) 14.5 12.4 ↓
Tax Revenue (Rs mn) 5,272,699 5,272,699
Tax Revenue (% of GDP) 11.1 9.4 ↓
Total Expenditures (Rs mn) 10,306,691 10,306,691
Total Expenditures (% of GDP) 21.6 18.5 ↓
Current Expenditures (Rs mn) 9,084,010 9,084,010
Current Expenditures (% of GDP) 19.0 16.3 ↓
Fiscal Deficit (Rs mn) 3,403,321 3,403,321
Fiscal Deficit (% of GDP) 7.1 6.1 ↓
Public Debt (Rs bn) 39,861 39,861
(% of GDP) 83.5 71.8 ↓
Primary Deficit (Rs mn) 653,592 653,592
Primary Deficit (% of GDP) 1.4 1.2 ↓
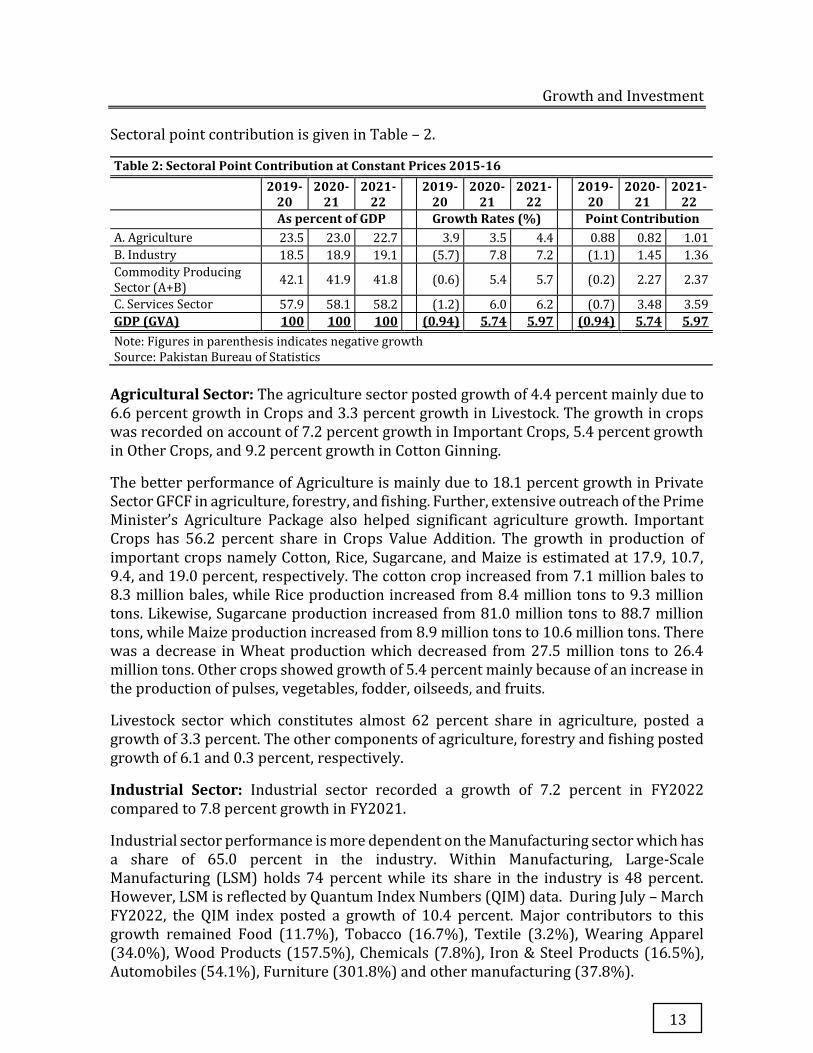
Growth and Investment
13
Sectoral point contribution is given in Table – 2.
Table 2: Sectoral Point Contribution at Constant Prices 2015-16 2019-
20 2020-
21 2021-
22
2019-
20 2020-
21 2021-
22
2019-
20 2020-
21 2021-
22 As percent of GDP
Growth Rates (%)
Point Contribution
A. Agriculture 23.5 23.0 22.7 3.9 3.5 4.4 0.88 0.82 1.01
B. Industry 18.5 18.9 19.1 (5.7) 7.8 7.2 (1.1) 1.45 1.36
Commodity Producing Sector (A+B)
42.1 41.9 41.8 (0.6) 5.4 5.7 (0.2) 2.27 2.37
C. Services Sector 57.9 58.1 58.2 (1.2) 6.0 6.2 (0.7) 3.48 3.59
GDP (GVA) 100 100 100
(0.94) 5.74 5.97
(0.94) 5.74 5.97 Note: Figures in parenthesis indicates negative growth Source: Pakistan Bureau of Statistics
Agricultural Sector: The agriculture sector posted growth of 4.4 percent mainly due to 6.6 percent growth in Crops and 3.3 percent growth in Livestock. The growth in crops was recorded on account of 7.2 percent growth in Important Crops, 5.4 percent growth in Other Crops, and 9.2 percent growth in Cotton Ginning.
The better performance of Agriculture is mainly due to 18.1 percent growth in Private Sector GFCF in agriculture, forestry, and fishing. Further, extensive outreach of the Prime Minister’s Agriculture Package also helped significant agriculture growth. Important Crops has 56.2 percent share in Crops Value Addition. The growth in production of important crops namely Cotton, Rice, Sugarcane, and Maize is estimated at 17.9, 10.7, 9.4, and 19.0 percent, respectively. The cotton crop increased from 7.1 million bales to 8.3 million bales, while Rice production increased from 8.4 million tons to 9.3 million tons. Likewise, Sugarcane production increased from 81.0 million tons to 88.7 million tons, while Maize production increased from 8.9 million tons to 10.6 million tons. There was a decrease in Wheat production which decreased from 27.5 million tons to 26.4 million tons. Other crops showed growth of 5.4 percent mainly because of an increase in the production of pulses, vegetables, fodder, oilseeds, and fruits.
Livestock sector which constitutes almost 62 percent share in agriculture, posted a growth of 3.3 percent. The other components of agriculture, forestry and fishing posted growth of 6.1 and 0.3 percent, respectively.
Industrial Sector: Industrial sector recorded a growth of 7.2 percent in FY2022 compared to 7.8 percent growth in FY2021.
Industrial sector performance is more dependent on the Manufacturing sector which has a share of 65.0 percent in the industry. Within Manufacturing, Large-Scale Manufacturing (LSM) holds 74 percent while its share in the industry is 48 percent. However, LSM is reflected by Quantum Index Numbers (QIM) data. During July – March FY2022, the QIM index posted a growth of 10.4 percent. Major contributors to this growth remained Food (11.7%), Tobacco (16.7%), Textile (3.2%), Wearing Apparel (34.0%), Wood Products (157.5%), Chemicals (7.8%), Iron & Steel Products (16.5%), Automobiles (54.1%), Furniture (301.8%) and other manufacturing (37.8%).
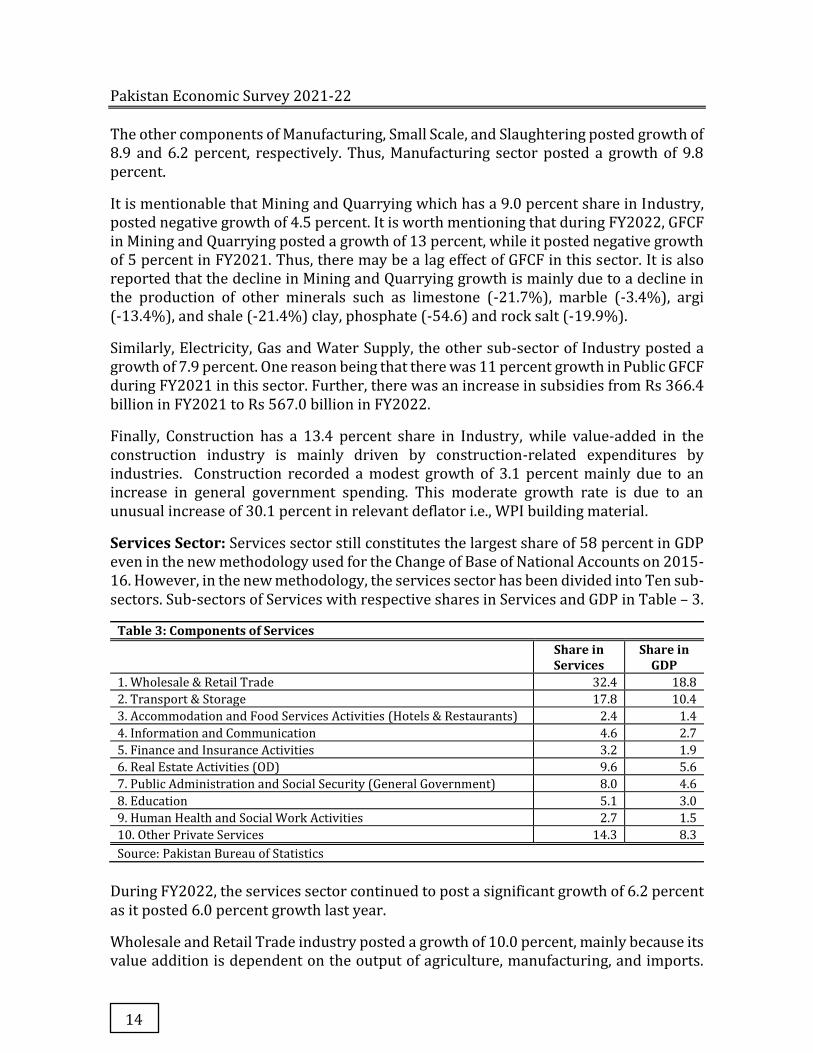
Pakistan Economic Survey 2021-22
14
The other components of Manufacturing, Small Scale, and Slaughtering posted growth of 8.9 and 6.2 percent, respectively. Thus, Manufacturing sector posted a growth of 9.8 percent.
It is mentionable that Mining and Quarrying which has a 9.0 percent share in Industry, posted negative growth of 4.5 percent. It is worth mentioning that during FY2022, GFCF in Mining and Quarrying posted a growth of 13 percent, while it posted negative growth of 5 percent in FY2021. Thus, there may be a lag effect of GFCF in this sector. It is also reported that the decline in Mining and Quarrying growth is mainly due to a decline in the production of other minerals such as limestone (-21.7%), marble (-3.4%), argi (-13.4%), and shale (-21.4%) clay, phosphate (-54.6) and rock salt (-19.9%).
Similarly, Electricity, Gas and Water Supply, the other sub-sector of Industry posted a growth of 7.9 percent. One reason being that there was 11 percent growth in Public GFCF during FY2021 in this sector. Further, there was an increase in subsidies from Rs 366.4 billion in FY2021 to Rs 567.0 billion in FY2022.
Finally, Construction has a 13.4 percent share in Industry, while value-added in the construction industry is mainly driven by construction-related expenditures by industries. Construction recorded a modest growth of 3.1 percent mainly due to an increase in general government spending. This moderate growth rate is due to an unusual increase of 30.1 percent in relevant deflator i.e., WPI building material.
Services Sector: Services sector still constitutes the largest share of 58 percent in GDP even in the new methodology used for the Change of Base of National Accounts on 2015-16. However, in the new methodology, the services sector has been divided into Ten sub-sectors. Sub-sectors of Services with respective shares in Services and GDP in Table – 3.
Table 3: Components of Services Share in
Services Share in
GDP 1. Wholesale & Retail Trade 32.4 18.8
2. Transport & Storage 17.8 10.4
3. Accommodation and Food Services Activities (Hotels & Restaurants) 2.4 1.4
4. Information and Communication 4.6 2.7
5. Finance and Insurance Activities 3.2 1.9
6. Real Estate Activities (OD) 9.6 5.6
7. Public Administration and Social Security (General Government) 8.0 4.6
8. Education 5.1 3.0
9. Human Health and Social Work Activities 2.7 1.5
10. Other Private Services 14.3 8.3
Source: Pakistan Bureau of Statistics
During FY2022, the services sector continued to post a significant growth of 6.2 percent as it posted 6.0 percent growth last year.
Wholesale and Retail Trade industry posted a growth of 10.0 percent, mainly because its value addition is dependent on the output of agriculture, manufacturing, and imports.
Growth and Investment
15
The growth in trade value-added relating to agriculture, manufacturing, and imports stood at 4.0, 9.8, and 19.9 percent, respectively.
Transportation & Storage industry posted a growth of 5.4 percent due to an increase in railways (41.85%), air transport (26.56%), road transport (4.99%), and storage (10.01%).
Accommodation and food services activities showed growth of 4.1 percent. The growth of Information and communication remained at 11.9 percent due to improvements in telecommunication, computer programming, consultancy, and related activities.
Finance and insurance industry shows an overall growth of 4.9 percent mainly due to an increase in Financial Intermediation Services Indirectly Measured (FISIM) on deposits and loans.
Real Estate Activities posted a growth of 3.7 percent, while public administration and social security (General Government) activities posted a negative growth of 1.2 percent mainly due to high deflator.
Education has witnessed a growth of 8.7 percent due to increase in public sector expenditure. Human health and social work activities posted a growth of 2.2 percent due to the general government GFCF. Finally, other private services posted a growth of 3.8 percent.
Way Forward
Pakistan’s economy faces several severe challenges. Inflation is running too high, the prospects for future growth in potential output are challenging. Fiscal deficit is at a level where its financing is becoming challenging. Further, high trade deficit is leading to external imbalances putting extra pressure on foreign reserves and on the exchange rate. Economic growth seems to be slow down next year. Moreover, high uncertainties are restricting market confidence.
In the short run, Pakistan is confronted with the challenge to finance its external finance requirements stemming from current account deficits and foreign debt servicing. Successful conclusion of the seventh review of Pakistan’s reform program which is supported by an IMF Extended Fund Facility arrangement is on the right direction.
Government is very much committed to ensure the stability and confidence in the economy. Stable fiscal policy with a higher, growth promoting path for PSDP, based on physical and human capital development will be obligatory. Likewise, subsidies targeted to stimulate development of innovative industries and services will be essential. On the revenue side, growth-oriented revenue policies will be helpful.
There is intense need of creating an environment conducive for investments. Further, the investment must be capable of considerably augmenting the share of GFCF in GDP as well as increasing the efficiency to create additional welfare. Investors and consumers need to be convinced of a long term sustainable and inclusive growth project that inspires confidence in Pakistan’s economic future and that induces them to take
Pakistan Economic Survey 2021-22
16
initiatives in their own and in the country’s interest. Thus, well-functioning competitive markets is required.
There is also need to continue policies which brought improvement in related sectors. For example, Prime Minister’s Agriculture Package and related agricultural policies remained more effective for better agriculture performance. Likewise, policies related to energy mix and efficient energy supplies. Furthermore, there is also need of stable legislative and political culture.
As a result of these, it is expected that potential output growth will be upgraded, resulting in higher employment and real income growth. It will also create additional capacity for exports and import substitution and a stable exchange rate environment. Thus, demand management fiscal and monetary policies should on average be neutral and play their role of cyclical stabilizers when temporary shocks create deviations from the long-term growth path.
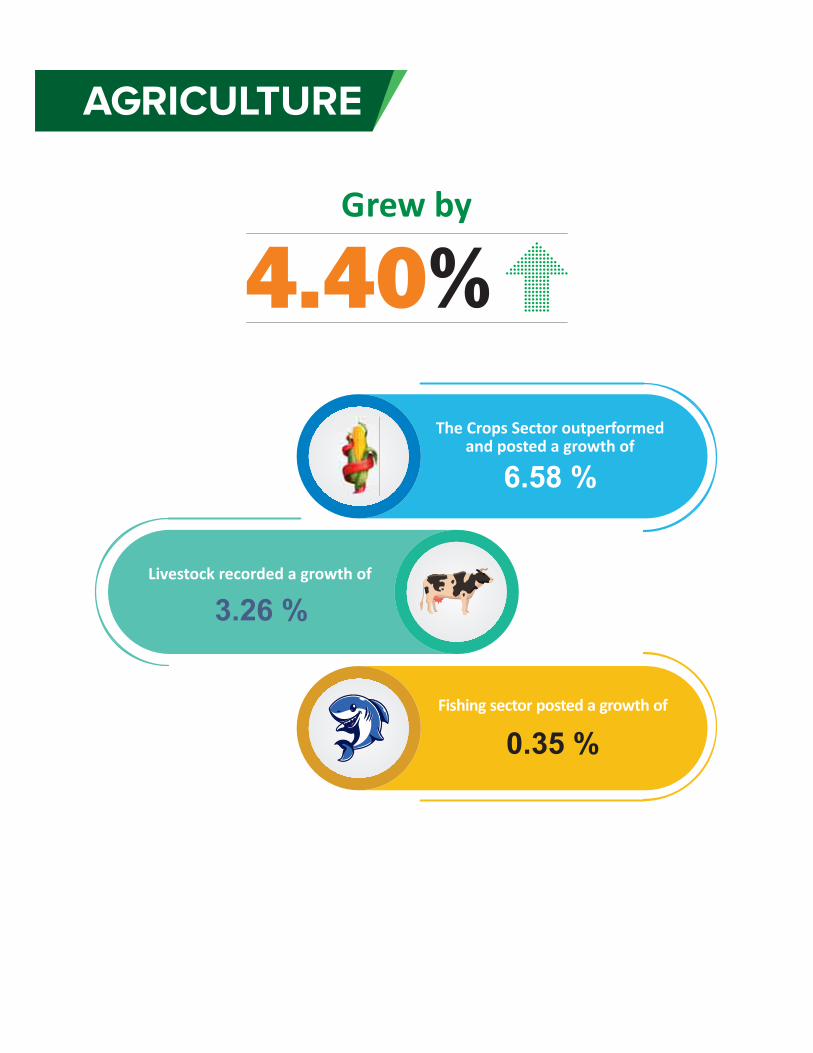


Sustainable growth of the agriculture sector stands vital for food security and rural development in Pakistan. It is a major contributor to the employment and foreign exchange earnings. In addition to that it provides industrial raw material, hence growth in this sector has multiple linkages with the overall economy. It contributes 22.7 percent to the GDP and provides employment to around 37.4 percent of the labour force, manager of rural landscape and environmental shield in protecting and upgrading the climate-resilient production and ecosystem. The improvement in agriculture production systems will increase farm income, reduce consumer prices and enhance diverse food supplies besides generating an exportable surplus. During the post COVID-19 period, the steep rise in the price of various commodities has further enhanced the importance of this sector, especially for the countries who are net importers of food items.
Realizing the importance of agriculture sector, the Government encourage financial inclusion activities in the agriculture sector to adopt new approaches in order to boost the productivity and exports, thus enhancing a rural development-driven economic growth.
Agriculture Performance during 2021-22
During 2021-22, agriculture sector recorded a remarkable growth of 4.40 percent and surpassed the target of 3.5 percent and last year’s growth of 3.48 percent. This growth is mainly driven by high yields, attractive output prices and supportive government policies, better availability of certified seeds, pesticides and agriculture credit. The crops sector outperformed and posted a growth of 6.58 percent during 2021-22 against 5.96 percent last year. At sub sectors level, important crops, other crops and cotton ginning depicted a significant growth of 7.24 percent, 5.44 percent and 9.19 percent, respectively, against last year’s growth of 5.83 percent, 8.27 percent and -13.08 percent. The growth in production of important crops namely cotton, rice, sugarcane and maize are estimated at 17.9 percent, 10.7 percent, 9.4 percent and 19.0 percent respectively. The cotton crop increased from 7.1 million bales reported last year to 8.3 million bales during 2021-22; rice production increased from 8.4 million tonnes to 9.3 million tonnes; sugarcane production increased from 81.0 million tonnes to 88.7 million tonnes; maize production increased from 8.9 million tonnes to 10.6 million tonnes respectively, while wheat production decreased from 27.5 million tonnes to 26.4 million tonnes. Other crops having share of 13.86 percent in agriculture value addition and 3.14 percent in GDP, grew by 5.44 percent on the back of increase in the production of pulses (29.82
Chapter 2
Agriculture
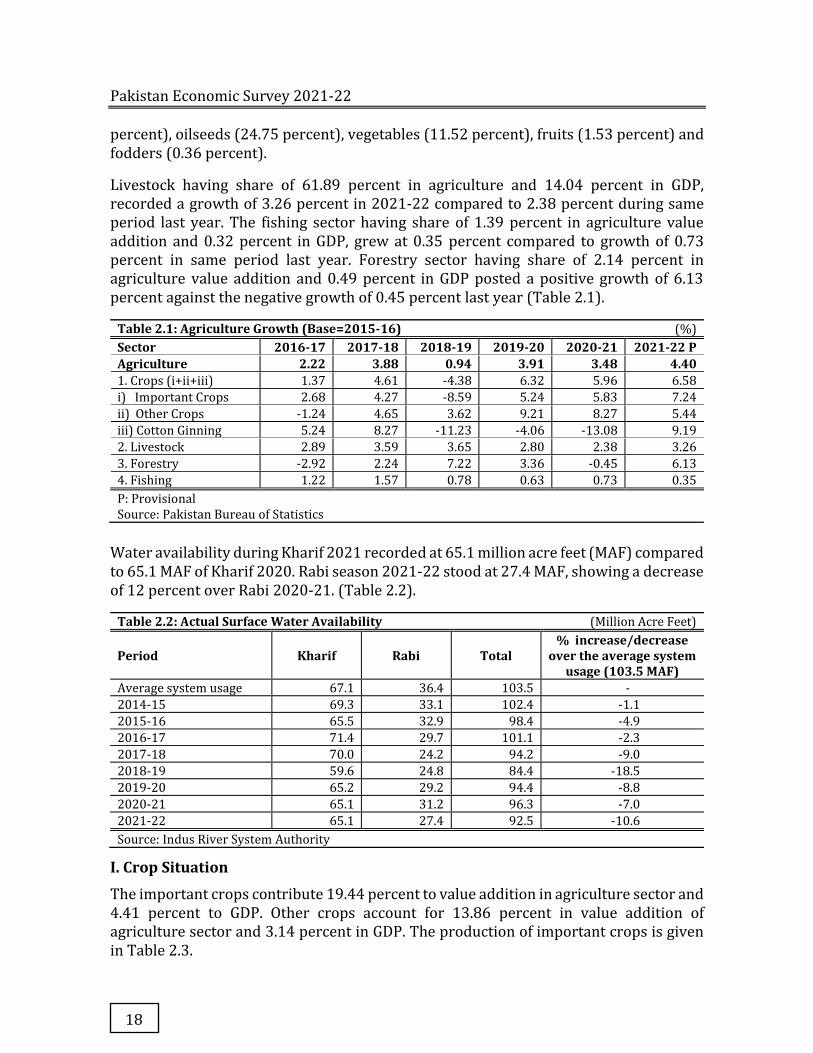
Pakistan Economic Survey 2021-22
18
percent), oilseeds (24.75 percent), vegetables (11.52 percent), fruits (1.53 percent) and fodders (0.36 percent).
Livestock having share of 61.89 percent in agriculture and 14.04 percent in GDP, recorded a growth of 3.26 percent in 2021-22 compared to 2.38 percent during same period last year. The fishing sector having share of 1.39 percent in agriculture value addition and 0.32 percent in GDP, grew at 0.35 percent compared to growth of 0.73 percent in same period last year. Forestry sector having share of 2.14 percent in agriculture value addition and 0.49 percent in GDP posted a positive growth of 6.13 percent against the negative growth of 0.45 percent last year (Table 2.1).
Table 2.1: Agriculture Growth (Base=2015-16) (%) Sector 2016-17 2017-18 2018-19 2019-20 2020-21 2021-22 P Agriculture 2.22 3.88 0.94 3.91 3.48 4.40 1. Crops (i+ii+iii) 1.37 4.61 -4.38 6.32 5.96 6.58
i) Important Crops 2.68 4.27 -8.59 5.24 5.83 7.24
ii) Other Crops -1.24 4.65 3.62 9.21 8.27 5.44
iii) Cotton Ginning 5.24 8.27 -11.23 -4.06 -13.08 9.19
2. Livestock 2.89 3.59 3.65 2.80 2.38 3.26
3. Forestry -2.92 2.24 7.22 3.36 -0.45 6.13
4. Fishing 1.22 1.57 0.78 0.63 0.73 0.35
P: Provisional Source: Pakistan Bureau of Statistics
Water availability during Kharif 2021 recorded at 65.1 million acre feet (MAF) compared to 65.1 MAF of Kharif 2020. Rabi season 2021-22 stood at 27.4 MAF, showing a decrease of 12 percent over Rabi 2020-21. (Table 2.2).
Table 2.2: Actual Surface Water Availability (Million Acre Feet)
Period Kharif Rabi Total % increase/decrease
over the average system usage (103.5 MAF)
Average system usage 67.1 36.4 103.5 -
2014-15 69.3 33.1 102.4 -1.1
2015-16 65.5 32.9 98.4 -4.9
2016-17 71.4 29.7 101.1 -2.3
2017-18 70.0 24.2 94.2 -9.0
2018-19 59.6 24.8 84.4 -18.5
2019-20 65.2 29.2 94.4 -8.8
2020-21 65.1 31.2 96.3 -7.0
2021-22 65.1 27.4 92.5 -10.6
Source: Indus River System Authority
I. Crop Situation
The important crops contribute 19.44 percent to value addition in agriculture sector and 4.41 percent to GDP. Other crops account for 13.86 percent in value addition of agriculture sector and 3.14 percent in GDP. The production of important crops is given in Table 2.3.
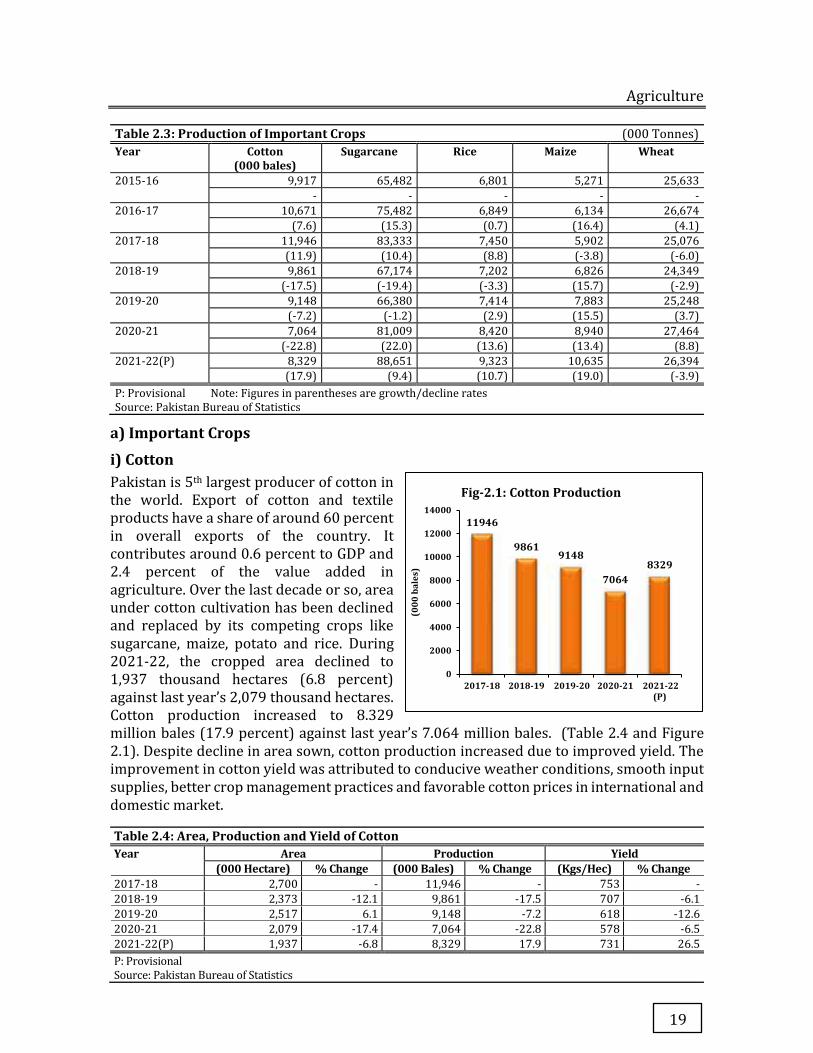
Agriculture
19
Table 2.3: Production of Important Crops (000 Tonnes) Year Cotton
(000 bales) Sugarcane Rice Maize Wheat
2015-16 9,917 65,482 6,801 5,271 25,633
- - - - -
2016-17 10,671 75,482 6,849 6,134 26,674
(7.6) (15.3) (0.7) (16.4) (4.1)
2017-18 11,946 83,333 7,450 5,902 25,076
(11.9) (10.4) (8.8) (-3.8) (-6.0)
2018-19 9,861 67,174 7,202 6,826 24,349
(-17.5) (-19.4) (-3.3) (15.7) (-2.9)
2019-20 9,148 66,380 7,414 7,883 25,248
(-7.2) (-1.2) (2.9) (15.5) (3.7)
2020-21 7,064 81,009 8,420 8,940 27,464
(-22.8) (22.0) (13.6) (13.4) (8.8)
2021-22(P) 8,329 88,651 9,323 10,635 26,394
(17.9) (9.4) (10.7) (19.0) (-3.9)
P: Provisional Note: Figures in parentheses are growth/decline rates Source: Pakistan Bureau of Statistics
a) Important Crops
i) Cotton Pakistan is 5th largest producer of cotton in the world. Export of cotton and textile products have a share of around 60 percent in overall exports of the country. It contributes around 0.6 percent to GDP and 2.4 percent of the value added in agriculture. Over the last decade or so, area under cotton cultivation has been declined and replaced by its competing crops like sugarcane, maize, potato and rice. During 2021-22, the cropped area declined to 1,937 thousand hectares (6.8 percent) against last year’s 2,079 thousand hectares. Cotton production increased to 8.329 million bales (17.9 percent) against last year’s 7.064 million bales. (Table 2.4 and Figure 2.1). Despite decline in area sown, cotton production increased due to improved yield. The improvement in cotton yield was attributed to conducive weather conditions, smooth input supplies, better crop management practices and favorable cotton prices in international and domestic market.
Table 2.4: Area, Production and Yield of Cotton Year Area Production Yield
(000 Hectare) % Change (000 Bales) % Change (Kgs/Hec) % Change 2017-18 2,700 - 11,946 - 753 -
2018-19 2,373 -12.1 9,861 -17.5 707 -6.1
2019-20 2,517 6.1 9,148 -7.2 618 -12.6
2020-21 2,079 -17.4 7,064 -22.8 578 -6.5
2021-22(P) 1,937 -6.8 8,329 17.9 731 26.5
P: Provisional Source: Pakistan Bureau of Statistics
11946
98619148
70648329
0
2000
4000
6000
8000
10000
12000
14000
2017-18 2018-19 2019-20 2020-21 2021-22(P)
(000
bal
es)
Fig-2.1: Cotton Production
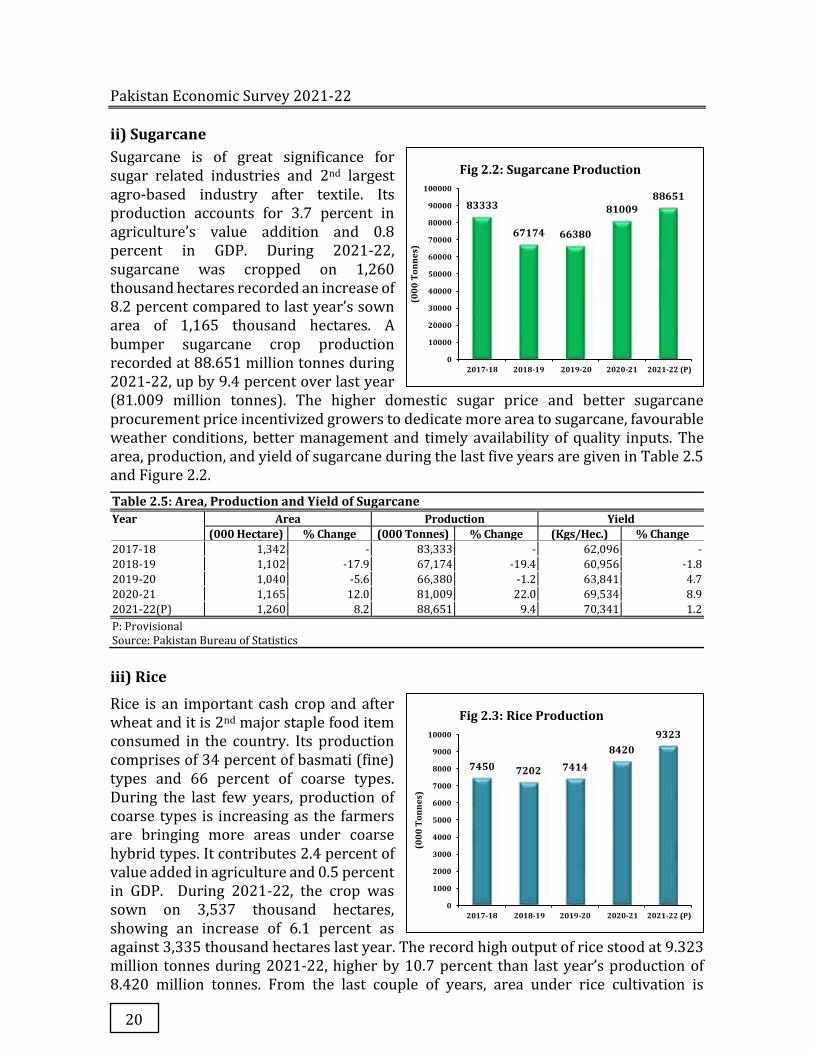
Pakistan Economic Survey 2021-22
20
ii) Sugarcane Sugarcane is of great significance for sugar related industries and 2nd largest agro-based industry after textile. Its production accounts for 3.7 percent in agriculture’s value addition and 0.8 percent in GDP. During 2021-22, sugarcane was cropped on 1,260 thousand hectares recorded an increase of 8.2 percent compared to last year’s sown area of 1,165 thousand hectares. A bumper sugarcane crop production recorded at 88.651 million tonnes during 2021-22, up by 9.4 percent over last year (81.009 million tonnes). The higher domestic sugar price and better sugarcane procurement price incentivized growers to dedicate more area to sugarcane, favourable weather conditions, better management and timely availability of quality inputs. The area, production, and yield of sugarcane during the last five years are given in Table 2.5 and Figure 2.2.
Table 2.5: Area, Production and Yield of Sugarcane Year Area Production Yield
(000 Hectare) % Change (000 Tonnes) % Change (Kgs/Hec.) % Change 2017-18 1,342 - 83,333 - 62,096 -
2018-19 1,102 -17.9 67,174 -19.4 60,956 -1.8
2019-20 1,040 -5.6 66,380 -1.2 63,841 4.7
2020-21 1,165 12.0 81,009 22.0 69,534 8.9
2021-22(P) 1,260 8.2 88,651 9.4 70,341 1.2
P: Provisional Source: Pakistan Bureau of Statistics
iii) Rice
Rice is an important cash crop and after wheat and it is 2nd major staple food item consumed in the country. Its production comprises of 34 percent of basmati (fine) types and 66 percent of coarse types. During the last few years, production of coarse types is increasing as the farmers are bringing more areas under coarse hybrid types. It contributes 2.4 percent of value added in agriculture and 0.5 percent in GDP. During 2021-22, the crop was sown on 3,537 thousand hectares, showing an increase of 6.1 percent as against 3,335 thousand hectares last year. The record high output of rice stood at 9.323 million tonnes during 2021-22, higher by 10.7 percent than last year’s production of 8.420 million tonnes. From the last couple of years, area under rice cultivation is
83333
67174 66380
8100988651
0
10000
20000
30000
40000
50000
60000
70000
80000
90000
100000
2017-18 2018-19 2019-20 2020-21 2021-22 (P)
(000
Ton
nes)
Fig 2.2: Sugarcane Production
7450 7202 74148420
9323
0
1000
2000
3000
4000
5000
6000
7000
8000
9000
10000
2017-18 2018-19 2019-20 2020-21 2021-22 (P)
(000
Ton
nes)
Fig 2.3: Rice Production

Agriculture
21
witnessing rising trend. As domestic rice production exceeds domestic annual requirement, the country often has exportable surplus. The area, production, and yield of rice during the last five years are shown in Table 2.6 and Figure 2.3.
Table 2.6: Area, Production and Yield of Rice Year Area Production Yield
(000 Hectare) % Change (000 Tonnes) % Change (Kgs/Hec.) % Change 2017-18 2,901 - 7,450 - 2,568 -
2018-19 2,810 -3.1 7,202 -3.3 2,563 -0.2
2019-20 3,034 8.0 7,414 2.9 2,444 -4.6
2020-21 3,335 9.9 8,420 13.6 2,525 3.3
2020-22(P) 3,537 6.1 9,323 10.7 2,635 4.4
P: Provisional Source: Pakistan Bureau of Statistics
iv) Wheat Wheat is the staple crop and it ensures food security of the country. Wheat is cultivated over 22 million acres and accounts for 7.8 percent of the value added in agriculture and 1.8 percent of GDP. Self-sufficiency in wheat has been an objective of every Government and thus always challenges for the agriculture experts and policy makers. Wheat is a strategic crop and any shortfall in its production can create an awkward situation leading to political uncertainty, significant drainage of foreign reserves, rise in prices of wheat flour and pocket shortages in vulnerable areas. During 2021-22, area sown decreased to 8,976 thousand hectares (2.1 percent) against last year’s of 9,168 thousand hectares. The production of wheat declined to 26.394 million tonnes (3.9 percent) compared to 27.464 million tonnes
production of last year. Wheat production declined due to decline in area sown, shortfall in irrigation water and drought conditions at sowing, less fertilizers offtake and heat wave in March/April, though the government has increased Minimum Support Price to Rs 2200/40 kg this year is aligned to the cost of production. The wheat production position over the last five years is given in Table 2.7 and Figure 2.4.
Table 2.7: Area, Production and Yield of Wheat Year Area Production Yield
(000 Hectares) % Change (000 Tonnes) % Change (Kgs /Hec.) % Change 2017-18 8,797 - 25,076 - 2,851 -
2018-19 8,678 -1.4 24,349 -2.9 2,806 -1.6
2019-20 8,805 1.5 25,248 3.7 2,868 2.2
2020-21 9,168 4.1 27,464 8.8 2,996 4.5
2021-22(P) 8,976 -2.1 26,394 -3.9 2,940 -1.9
P: Provisional Source: Pakistan Bureau of Statistics
25076
24349
25248
27464
26394
22500
23000
23500
24000
24500
25000
25500
26000
26500
27000
27500
28000
2017-18 2018-19 2019-20 2020-21 2021-22 (P)
(000
Ton
nes)
Fig 2.4: Wheat Production
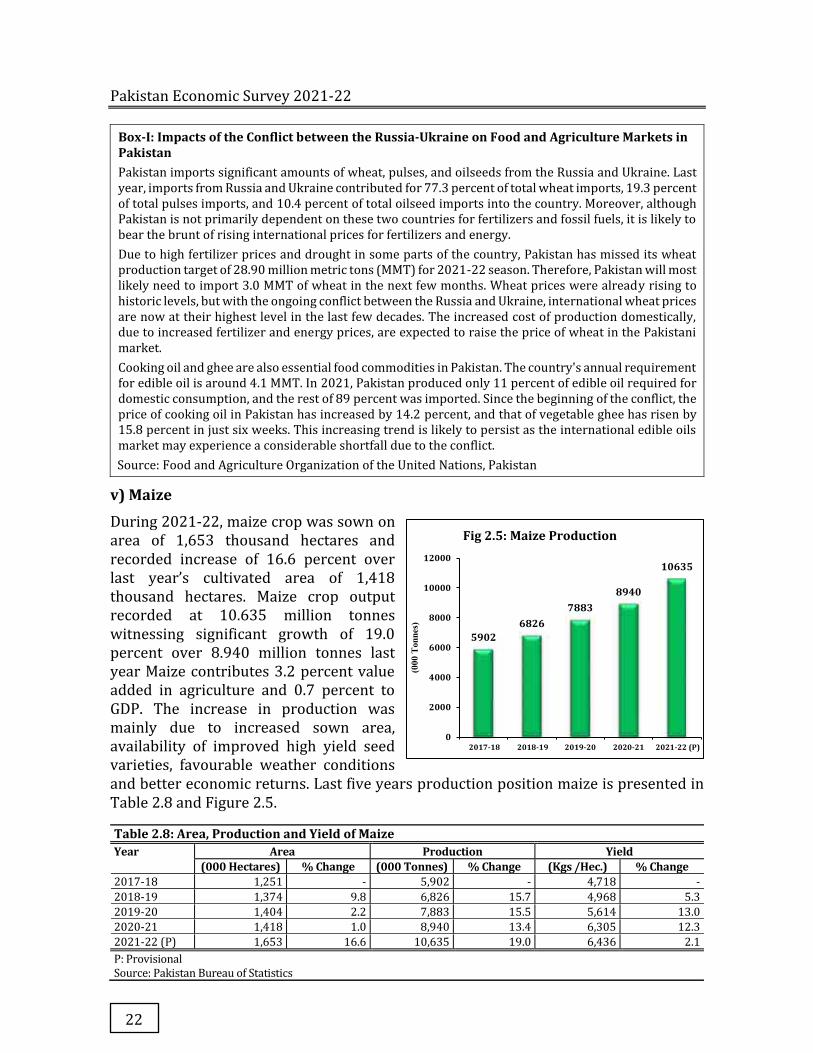
Pakistan Economic Survey 2021-22
22
Box-I: Impacts of the Conflict between the Russia-Ukraine on Food and Agriculture Markets in Pakistan Pakistan imports significant amounts of wheat, pulses, and oilseeds from the Russia and Ukraine. Last year, imports from Russia and Ukraine contributed for 77.3 percent of total wheat imports, 19.3 percent of total pulses imports, and 10.4 percent of total oilseed imports into the country. Moreover, although Pakistan is not primarily dependent on these two countries for fertilizers and fossil fuels, it is likely to bear the brunt of rising international prices for fertilizers and energy.
Due to high fertilizer prices and drought in some parts of the country, Pakistan has missed its wheat production target of 28.90 million metric tons (MMT) for 2021-22 season. Therefore, Pakistan will most likely need to import 3.0 MMT of wheat in the next few months. Wheat prices were already rising to historic levels, but with the ongoing conflict between the Russia and Ukraine, international wheat prices are now at their highest level in the last few decades. The increased cost of production domestically, due to increased fertilizer and energy prices, are expected to raise the price of wheat in the Pakistani market.
Cooking oil and ghee are also essential food commodities in Pakistan. The country's annual requirement for edible oil is around 4.1 MMT. In 2021, Pakistan produced only 11 percent of edible oil required for domestic consumption, and the rest of 89 percent was imported. Since the beginning of the conflict, the price of cooking oil in Pakistan has increased by 14.2 percent, and that of vegetable ghee has risen by 15.8 percent in just six weeks. This increasing trend is likely to persist as the international edible oils market may experience a considerable shortfall due to the conflict.
Source: Food and Agriculture Organization of the United Nations, Pakistan
v) Maize
During 2021-22, maize crop was sown on area of 1,653 thousand hectares and recorded increase of 16.6 percent over last year’s cultivated area of 1,418 thousand hectares. Maize crop output recorded at 10.635 million tonnes witnessing significant growth of 19.0 percent over 8.940 million tonnes last year Maize contributes 3.2 percent value added in agriculture and 0.7 percent to GDP. The increase in production was mainly due to increased sown area, availability of improved high yield seed varieties, favourable weather conditions and better economic returns. Last five years production position maize is presented in Table 2.8 and Figure 2.5.
Table 2.8: Area, Production and Yield of Maize Year Area Production Yield
(000 Hectares) % Change (000 Tonnes) % Change (Kgs /Hec.) % Change 2017-18 1,251 - 5,902 - 4,718 -
2018-19 1,374 9.8 6,826 15.7 4,968 5.3
2019-20 1,404 2.2 7,883 15.5 5,614 13.0
2020-21 1,418 1.0 8,940 13.4 6,305 12.3
2021-22 (P) 1,653 16.6 10,635 19.0 6,436 2.1
P: Provisional Source: Pakistan Bureau of Statistics
59026826
78838940
10635
0
2000
4000
6000
8000
10000
12000
2017-18 2018-19 2019-20 2020-21 2021-22 (P)
(000
Ton
nes)
Fig 2.5: Maize Production
Agriculture
23
b) Other Crops
During 2021-22, gram production grew by 36.3 percent and reached to 319 thousand tonnes on account of availability of certified seeds and favourable weather conditions compared to last year. The production of rapeseed & mustard increased by 26.7 percent while production of Jowar and Bajra witnessed a decrease of 33.3 percent and 15.0 percent, respectively, due to decline in area under cultivation. The production of Barley and Tobacco remained at the last year’s production level. The area and production of other crops is given in Table 2.9.
Table 2.9: Area and Production of Other Kharif and Rabi Crops Crops 2020-21 2021-22(P) % Change in
production over Last year
Area (000 Hectares)
Production (000 Tonnes)
Area (000 Hectares)
Production (000 Tonnes)
Bajra 350 266 227 226 -15.0
Jowar 126 96 77 64 -33.3
Gram 883 234 867 319 36.3
Barley 42 42 39 42 -
Rapeseed & Mustard 224 296 277 375 26.7
Tobacco 55 168 55 168 -
P: Provisional Source: Pakistan Bureau of Statistics
During 2021-22, the production of chillies, potato and moong increased by 36.6 percent, 35.1 percent and 29.0 percent, respectively, as compared to same period of last year. However, the production of mash and onion declined by 11.6 percent and 8.5 percent, respectively, while production of masoor remained same over last year. The area and production of other crops is given in Table 2.10.
Table 2.10: Area and Production of Other Crops Crops 2020-21 2021-22(P) % Change in
production over Last year
Area (000 Hectares)
Production (000 Tonnes)
Area (000 Hectares)
Production (000 Tonnes)
Masoor 6.9 4.1 5.8 4.1 -
Moong 231.1 204.5 301.8 263.8 29.0
Mash 11.0 6.9 8.0 6.1 -11.6
Potato 234.3 5,873.0 313.8 7,937.1 35.1
Onion 153.8 2,305.7 141.0 2,108.8 -8.5
Chillies 46.8 105.4 58.1 144.0 36.6
P: Provisional Source: Pakistan Bureau of Statistics
i) Oilseeds
During FY2022 (July-March), 2.754 million tonnes of edible oil/oil from oilseed for crushing total value Rs 662.657 billion (US$ 3.681 billion) was imported. Local production of edible oil during this period is provisionally estimated at 0.460 million tonnes. Total availability of edible oil during this period is estimated at 3.214 million tonnes. The area and production of oilseed crops is given in Table 2.11.
Pakistan Economic Survey 2021-22
24
Table 2.11: Area and Production of Major Oilseed Crops (000 Tonnes) Crops 2020-21 2021-22 (July-March) (P)
Area (000 Acres)
Production Area (000 Acres)
Production Seed Oil Seed Oil
Cottonseed 5,137 1,782 214 4,740 2,126 255
Rapeseed & Mustard 608 338 108 692 377 121
Sunflower 151 87 33 253 141 54
Canola 77 49 19 124 79 30
Total 5,073 2,256 374 5,809 2,723 460 P: Provisional Source: Pakistan Oilseed Development Board (PODB), Pakistan Bureau of Statistics For promotion of oilseed crops, Ministry of National Food Security & Research (M/o NFS&R) is executing a mega project “National Oilseed Enhancement Programme” with a total cost of Rs 10.964 billion under the National Agriculture Emergency Programme. Subsidy of Rs 5,000 per acre for seed/inputs for canola, sunflower and sesame and 50 percent on purchase of oilseed machineries is being provided to oilseed growers.
II. Farm Inputs
i) Fertilizer
Pakistan meets around 86 percent of its fertilizer requirement through domestic production while remaining 14 percent through imports.
The domestic production of fertilizers during FY2022 (July-March) increased by 1.9 percent over the same period of last year. This increase in domestic production of fertilizer is mainly due to running of two LNG based plants FatimaFert and Agritech Limited from September 2021 to March 2022. Although the import of fertilizer decreased by 6.2 percent, however the total availability of fertilizer slightly increased by 0.5 percent. There was decrease in total offtake of fertilizer nutrients by 3.6 percent. Nitrogen offtake witnessed slightly upward movement by 0.02 percent while Phosphate offtake decreased by 14.3 percent. However, Potash offtake increased by 10.7 percent during FY2022 (July-March). Major reasons for negative growth in Phosphate use is its high prices in international market and accordingly in domestic market. Price of urea increased by 10.4 percent, while that of DAP increased by 88.7 percent. Federal Government announced subsidy of Rs 1,000 per bag of DAP to compensate farming community.
Total availability of urea during Kharif 2021 was 3,404 thousand tonnes, comprising of 298 thousand tonnes of opening inventory and 3,106 thousand tonnes of domestic production (Table 2.12). Urea offtake was about 3,258 thousand tonnes, leaving inventory of 116 thousand tonnes for Rabi 2021-22. Availability of DAP was 1,232 thousand tonnes, comprising of 55 thousand tonnes of opening inventory, 733 thousand tonnes of imported supplies and 444 thousand tonnes of local production. DAP offtake was 889 thousand tonnes leaving an inventory of 353 thousand tonnes for the upcoming Rabi 2021-22.
Rabi 2021-22 started with an opening balance of 116 thousand tonnes of urea (Table 2.12). Domestic production during Rabi 2021-22 was estimated at 3,272 thousand
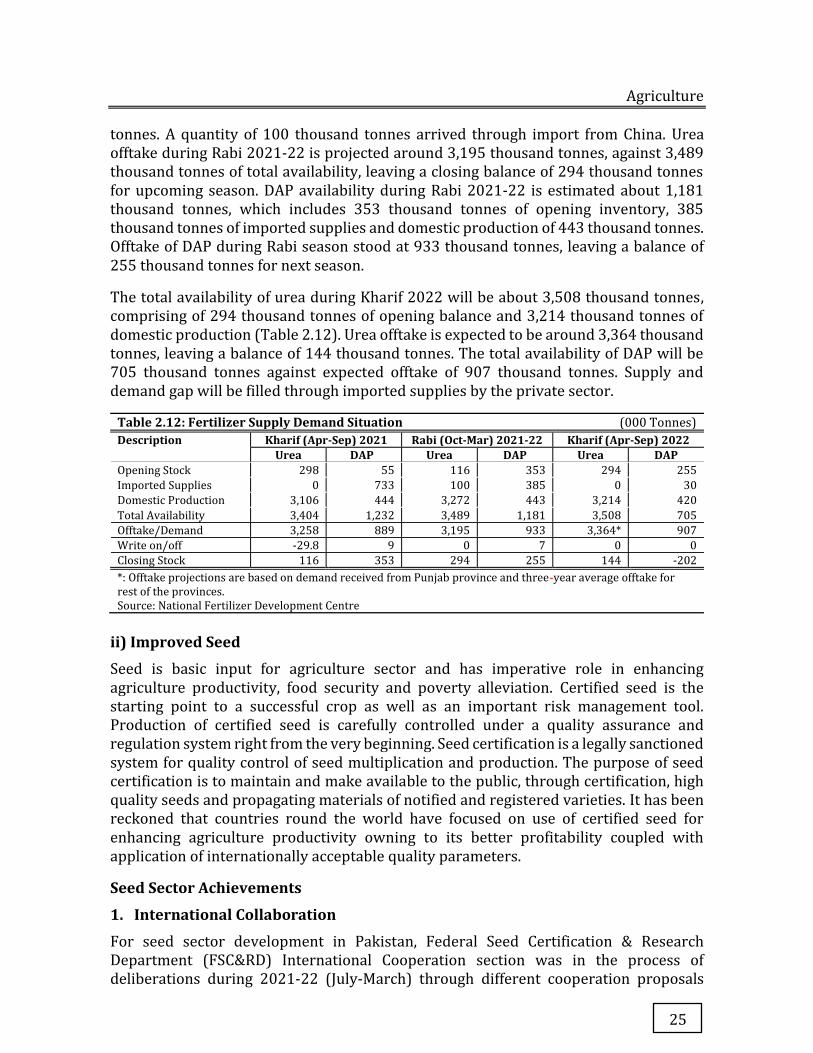
Agriculture
25
tonnes. A quantity of 100 thousand tonnes arrived through import from China. Urea offtake during Rabi 2021-22 is projected around 3,195 thousand tonnes, against 3,489 thousand tonnes of total availability, leaving a closing balance of 294 thousand tonnes for upcoming season. DAP availability during Rabi 2021-22 is estimated about 1,181 thousand tonnes, which includes 353 thousand tonnes of opening inventory, 385 thousand tonnes of imported supplies and domestic production of 443 thousand tonnes. Offtake of DAP during Rabi season stood at 933 thousand tonnes, leaving a balance of 255 thousand tonnes for next season.
The total availability of urea during Kharif 2022 will be about 3,508 thousand tonnes, comprising of 294 thousand tonnes of opening balance and 3,214 thousand tonnes of domestic production (Table 2.12). Urea offtake is expected to be around 3,364 thousand tonnes, leaving a balance of 144 thousand tonnes. The total availability of DAP will be 705 thousand tonnes against expected offtake of 907 thousand tonnes. Supply and demand gap will be filled through imported supplies by the private sector.
Table 2.12: Fertilizer Supply Demand Situation (000 Tonnes) Description Kharif (Apr-Sep) 2021 Rabi (Oct-Mar) 2021-22 Kharif (Apr-Sep) 2022
Urea DAP Urea DAP Urea DAP Opening Stock 298 55 116 353 294 255
Imported Supplies 0 733 100 385 0 30
Domestic Production 3,106 444 3,272 443 3,214 420
Total Availability 3,404 1,232 3,489 1,181 3,508 705
Offtake/Demand 3,258 889 3,195 933 3,364* 907
Write on/off -29.8 9 0 7 0 0
Closing Stock 116 353 294 255 144 -202
*: Offtake projections are based on demand received from Punjab province and three-year average offtake for rest of the provinces. Source: National Fertilizer Development Centre
ii) Improved Seed
Seed is basic input for agriculture sector and has imperative role in enhancing agriculture productivity, food security and poverty alleviation. Certified seed is the starting point to a successful crop as well as an important risk management tool. Production of certified seed is carefully controlled under a quality assurance and regulation system right from the very beginning. Seed certification is a legally sanctioned system for quality control of seed multiplication and production. The purpose of seed certification is to maintain and make available to the public, through certification, high quality seeds and propagating materials of notified and registered varieties. It has been reckoned that countries round the world have focused on use of certified seed for enhancing agriculture productivity owning to its better profitability coupled with application of internationally acceptable quality parameters.
Seed Sector Achievements
1. International Collaboration
For seed sector development in Pakistan, Federal Seed Certification & Research Department (FSC&RD) International Cooperation section was in the process of deliberations during 2021-22 (July-March) through different cooperation proposals
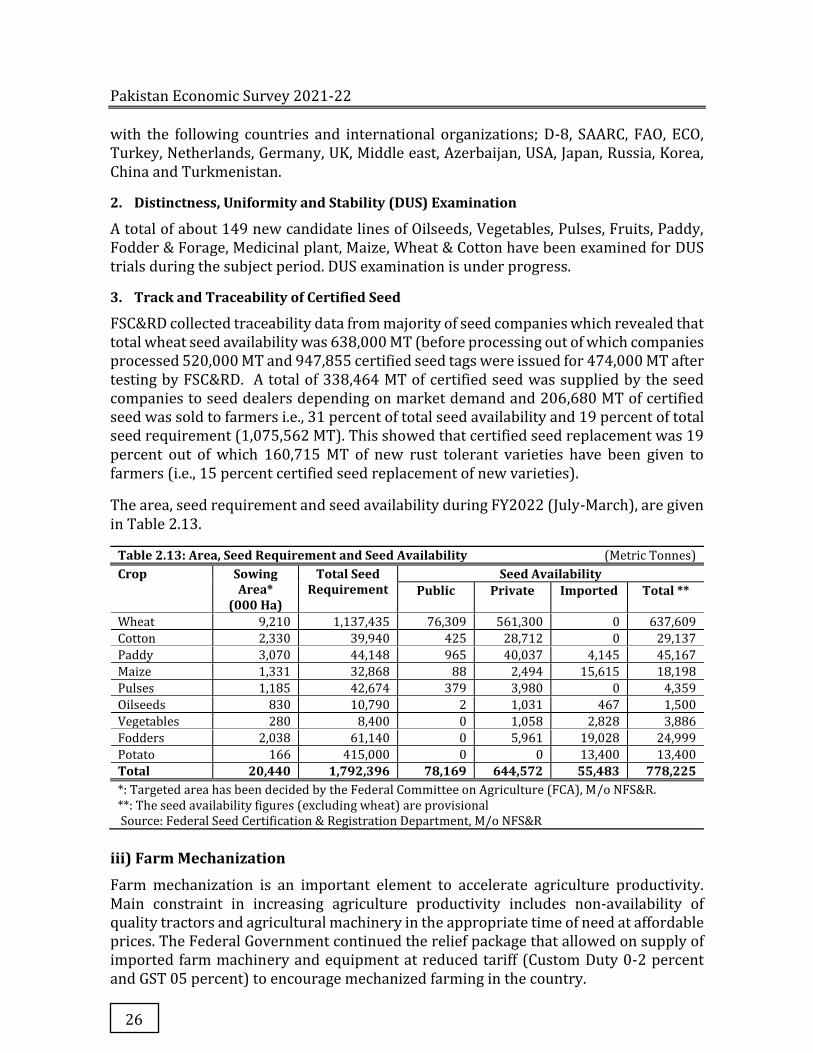
Pakistan Economic Survey 2021-22
26
with the following countries and international organizations; D-8, SAARC, FAO, ECO, Turkey, Netherlands, Germany, UK, Middle east, Azerbaijan, USA, Japan, Russia, Korea, China and Turkmenistan.
2. Distinctness, Uniformity and Stability (DUS) Examination
A total of about 149 new candidate lines of Oilseeds, Vegetables, Pulses, Fruits, Paddy, Fodder & Forage, Medicinal plant, Maize, Wheat & Cotton have been examined for DUS trials during the subject period. DUS examination is under progress.
3. Track and Traceability of Certified Seed
FSC&RD collected traceability data from majority of seed companies which revealed that total wheat seed availability was 638,000 MT (before processing out of which companies processed 520,000 MT and 947,855 certified seed tags were issued for 474,000 MT after testing by FSC&RD. A total of 338,464 MT of certified seed was supplied by the seed companies to seed dealers depending on market demand and 206,680 MT of certified seed was sold to farmers i.e., 31 percent of total seed availability and 19 percent of total seed requirement (1,075,562 MT). This showed that certified seed replacement was 19 percent out of which 160,715 MT of new rust tolerant varieties have been given to farmers (i.e., 15 percent certified seed replacement of new varieties).
The area, seed requirement and seed availability during FY2022 (July-March), are given in Table 2.13.
Table 2.13: Area, Seed Requirement and Seed Availability (Metric Tonnes) Crop Sowing
Area* (000 Ha)
Total Seed Requirement
Seed Availability Public Private Imported Total **
Wheat 9,210 1,137,435 76,309 561,300 0 637,609
Cotton 2,330 39,940 425 28,712 0 29,137
Paddy 3,070 44,148 965 40,037 4,145 45,167
Maize 1,331 32,868 88 2,494 15,615 18,198
Pulses 1,185 42,674 379 3,980 0 4,359
Oilseeds 830 10,790 2 1,031 467 1,500
Vegetables 280 8,400 0 1,058 2,828 3,886
Fodders 2,038 61,140 0 5,961 19,028 24,999
Potato 166 415,000 0 0 13,400 13,400
Total 20,440 1,792,396 78,169 644,572 55,483 778,225 *: Targeted area has been decided by the Federal Committee on Agriculture (FCA), M/o NFS&R. **: The seed availability figures (excluding wheat) are provisional Source: Federal Seed Certification & Registration Department, M/o NFS&R
iii) Farm Mechanization
Farm mechanization is an important element to accelerate agriculture productivity. Main constraint in increasing agriculture productivity includes non-availability of quality tractors and agricultural machinery in the appropriate time of need at affordable prices. The Federal Government continued the relief package that allowed on supply of imported farm machinery and equipment at reduced tariff (Custom Duty 0-2 percent and GST 05 percent) to encourage mechanized farming in the country.
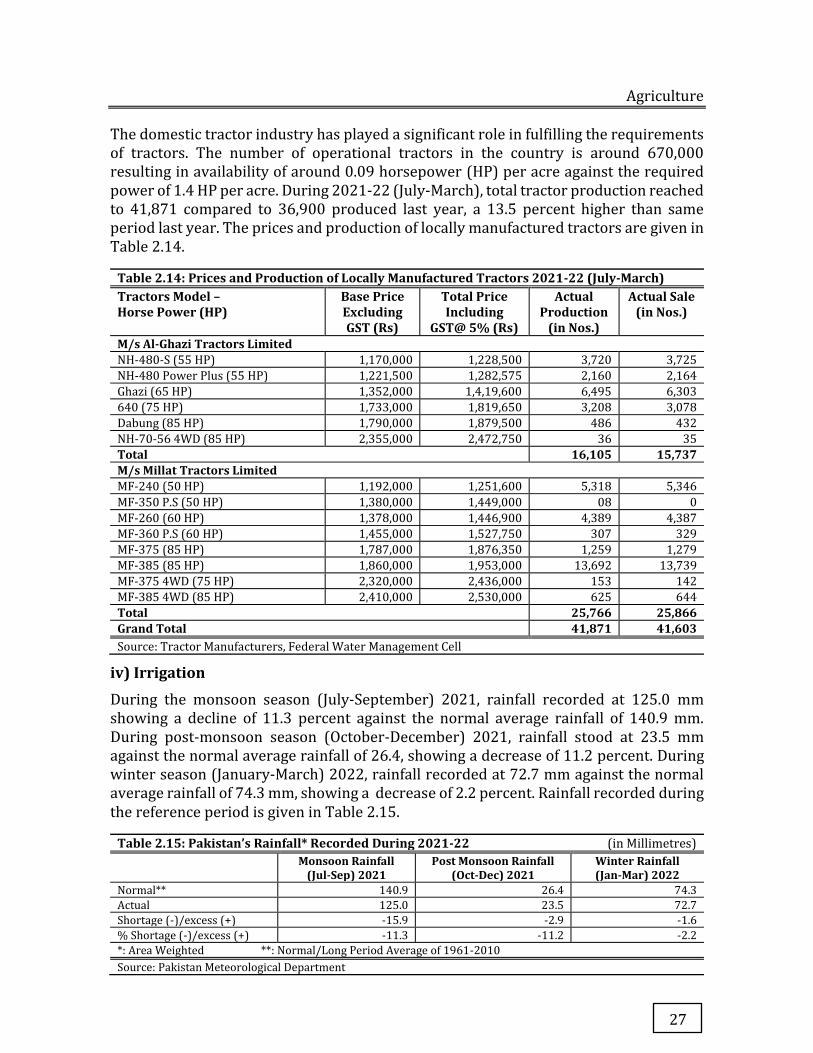
Agriculture
27
The domestic tractor industry has played a significant role in fulfilling the requirements of tractors. The number of operational tractors in the country is around 670,000 resulting in availability of around 0.09 horsepower (HP) per acre against the required power of 1.4 HP per acre. During 2021-22 (July-March), total tractor production reached to 41,871 compared to 36,900 produced last year, a 13.5 percent higher than same period last year. The prices and production of locally manufactured tractors are given in Table 2.14.
Table 2.14: Prices and Production of Locally Manufactured Tractors 2021-22 (July-March) Tractors Model – Horse Power (HP)
Base Price Excluding GST (Rs)
Total Price Including
GST@ 5% (Rs)
Actual Production
(in Nos.)
Actual Sale (in Nos.)
M/s Al-Ghazi Tractors Limited NH-480-S (55 HP) 1,170,000 1,228,500 3,720 3,725
NH-480 Power Plus (55 HP) 1,221,500 1,282,575 2,160 2,164
Ghazi (65 HP) 1,352,000 1,4,19,600 6,495 6,303
640 (75 HP) 1,733,000 1,819,650 3,208 3,078
Dabung (85 HP) 1,790,000 1,879,500 486 432
NH-70-56 4WD (85 HP) 2,355,000 2,472,750 36 35
Total 16,105 15,737 M/s Millat Tractors Limited MF-240 (50 HP) 1,192,000 1,251,600 5,318 5,346
MF-350 P.S (50 HP) 1,380,000 1,449,000 08 0
MF-260 (60 HP) 1,378,000 1,446,900 4,389 4,387
MF-360 P.S (60 HP) 1,455,000 1,527,750 307 329
MF-375 (85 HP) 1,787,000 1,876,350 1,259 1,279
MF-385 (85 HP) 1,860,000 1,953,000 13,692 13,739
MF-375 4WD (75 HP) 2,320,000 2,436,000 153 142
MF-385 4WD (85 HP) 2,410,000 2,530,000 625 644
Total 25,766 25,866 Grand Total 41,871 41,603 Source: Tractor Manufacturers, Federal Water Management Cell
iv) Irrigation
During the monsoon season (July-September) 2021, rainfall recorded at 125.0 mm showing a decline of 11.3 percent against the normal average rainfall of 140.9 mm. During post-monsoon season (October-December) 2021, rainfall stood at 23.5 mm against the normal average rainfall of 26.4, showing a decrease of 11.2 percent. During winter season (January-March) 2022, rainfall recorded at 72.7 mm against the normal average rainfall of 74.3 mm, showing a decrease of 2.2 percent. Rainfall recorded during the reference period is given in Table 2.15.
Table 2.15: Pakistan’s Rainfall* Recorded During 2021-22 (in Millimetres) Monsoon Rainfall
(Jul-Sep) 2021 Post Monsoon Rainfall
(Oct-Dec) 2021 Winter Rainfall (Jan-Mar) 2022
Normal** 140.9 26.4 74.3
Actual 125.0 23.5 72.7
Shortage (-)/excess (+) -15.9 -2.9 -1.6
% Shortage (-)/excess (+) -11.3 -11.2 -2.2
*: Area Weighted **: Normal/Long Period Average of 1961-2010
Source: Pakistan Meteorological Department
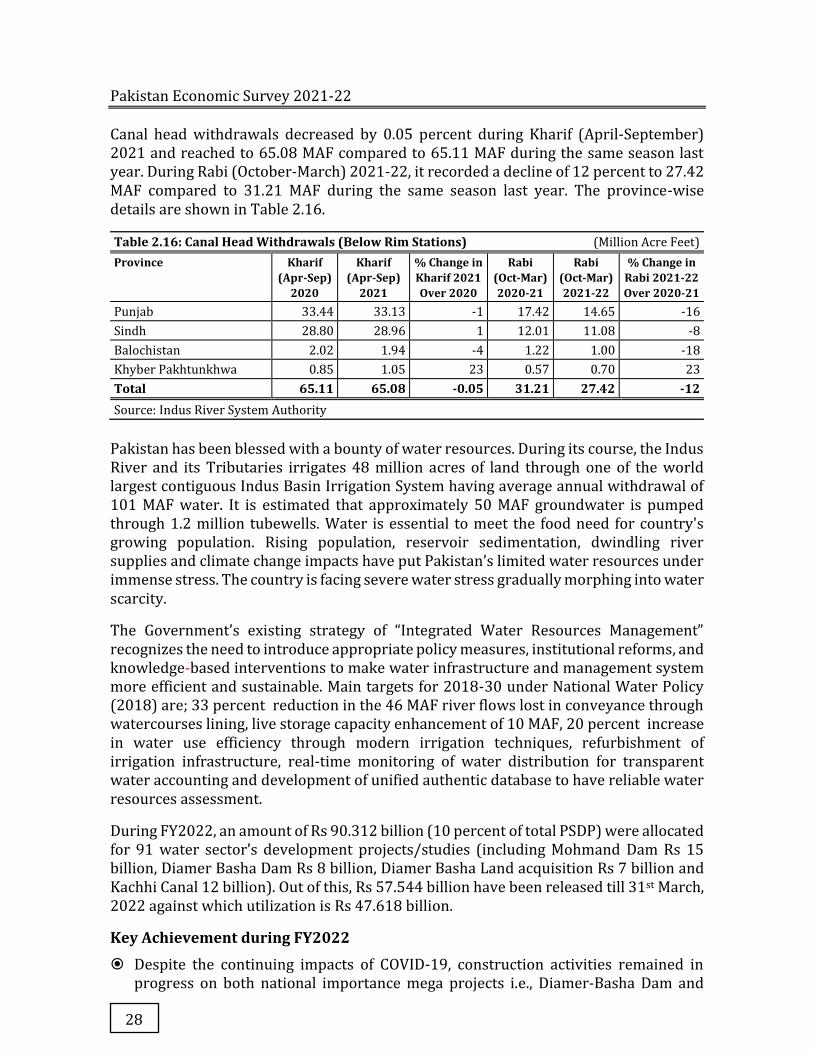
Pakistan Economic Survey 2021-22
28
Canal head withdrawals decreased by 0.05 percent during Kharif (April-September) 2021 and reached to 65.08 MAF compared to 65.11 MAF during the same season last year. During Rabi (October-March) 2021-22, it recorded a decline of 12 percent to 27.42 MAF compared to 31.21 MAF during the same season last year. The province-wise details are shown in Table 2.16.
Table 2.16: Canal Head Withdrawals (Below Rim Stations) (Million Acre Feet) Province Kharif
(Apr-Sep) 2020
Kharif (Apr-Sep)
2021
% Change in Kharif 2021 Over 2020
Rabi (Oct-Mar) 2020-21
Rabi (Oct-Mar) 2021-22
% Change in Rabi 2021-22 Over 2020-21
Punjab 33.44 33.13 -1 17.42 14.65 -16
Sindh 28.80 28.96 1 12.01 11.08 -8
Balochistan 2.02 1.94 -4 1.22 1.00 -18
Khyber Pakhtunkhwa 0.85 1.05 23 0.57 0.70 23
Total 65.11 65.08 -0.05 31.21 27.42 -12 Source: Indus River System Authority
Pakistan has been blessed with a bounty of water resources. During its course, the Indus River and its Tributaries irrigates 48 million acres of land through one of the world largest contiguous Indus Basin Irrigation System having average annual withdrawal of 101 MAF water. It is estimated that approximately 50 MAF groundwater is pumped through 1.2 million tubewells. Water is essential to meet the food need for country's growing population. Rising population, reservoir sedimentation, dwindling river supplies and climate change impacts have put Pakistan’s limited water resources under immense stress. The country is facing severe water stress gradually morphing into water scarcity.
The Government’s existing strategy of “Integrated Water Resources Management” recognizes the need to introduce appropriate policy measures, institutional reforms, and knowledge-based interventions to make water infrastructure and management system more efficient and sustainable. Main targets for 2018-30 under National Water Policy (2018) are; 33 percent reduction in the 46 MAF river flows lost in conveyance through watercourses lining, live storage capacity enhancement of 10 MAF, 20 percent increase in water use efficiency through modern irrigation techniques, refurbishment of irrigation infrastructure, real-time monitoring of water distribution for transparent water accounting and development of unified authentic database to have reliable water resources assessment.
During FY2022, an amount of Rs 90.312 billion (10 percent of total PSDP) were allocated for 91 water sector’s development projects/studies (including Mohmand Dam Rs 15 billion, Diamer Basha Dam Rs 8 billion, Diamer Basha Land acquisition Rs 7 billion and Kachhi Canal 12 billion). Out of this, Rs 57.544 billion have been released till 31st March, 2022 against which utilization is Rs 47.618 billion.
Key Achievement during FY2022
� Despite the continuing impacts of COVID-19, construction activities remained in progress on both national importance mega projects i.e., Diamer-Basha Dam and

Agriculture
29
Mohmand Dam projects. On completion, these dams will greatly mitigate water and power shortages in the country.
� Kachhi Canal (Phase-I) with 72,000 CCA in Balochistan remained operational. 55,000 of this command area has been developed.
� Work on Kachhi Canal Phase-I (Remaining works) having additional 30,000 acres CCA remained in full swing.
� Rainee Canal Phase-I has been completed and handed over to Irrigation Department, Government of Sindh.
� Initiation of about 30 new schemes of small dams/recharge/check having cost about Rs 28.60 billion with an allocation of Rs 2.74 billion in Balochistan.
� Works on Kurram Tangi Dam Phase-I (Kaitu Weir Diversion and allied works) remained in progress in North Waziristan. The project is planned to be completed in next financial year.
� Detailed engineering design of Chashma Right Bank Canal (Lift-cum-Gravity) Project completed, and PC-I submitted by MoWR is under approval process.
� Upon approval of PC-II, Expression of Interests were published for hiring of Consultants for Detailed engineering design of Kurram Tangi Dam Phase-II.
� Under Karachi Transformation Plan (Storm Water Drain Projects), Restoration & Revamping of Mehmoodabad Nullah was completed, while Restoration & Revamping of Gujjar Nullah & Orangi Nullah remained in progress.
� PC-I for Greater Karachi Bulk Water Supply Scheme K-IV approved by ECNEC on 31.01.2022.
� Under Southern Balochistan Package, approval of 17 water sector projects including Sunni Gar, Panjgur, Gish Kaur, Awaran & Shehznek dams and one umbrella PC-II covering 10 feasibility studies has been accorded.
� Under Sindh Package Feasibility study, detailed engineering design, Tender documents & PC-I of Jacobabad, Shikarpur & Kashmore drainage projects, Feasibility for construction of Drainage network in Taulka Ubauro, Daharki, Khangar, Mirpur Mathelo of District Ghotki and construction of small Storage Dams, Delay Action Dams, Recharge Weirs and I.S.S.O barriers have been initiated.
� Revised PC-I of Naulong Multipurpose Dam Project (Jhal Magsi, Balochistan) amounting to Rs 39.9 billion recommended to ECNEC by CDWP.
� Consultants for detailed engineering design of Hingol Dam Project having 65,000 acres CCA in Lasbela, Balochistan under finalization.
� Contractor re-mobilized at Nai Gaj Dam site and re-commenced the suspended works.
� Due to gradual decrease in the surface water inflow at Rim stations, water availability at canal head for Kharif season 2021-22 remained 67.14 MAF compared to 68.04 MAF in Kharif season 2020-21.
� In Balochistan, Sindh, Punjab and Khyber Pakhtunkhwa construction of medium/small/delay action dams and recharge dams remained in progress in FY2022. Province-wise detail is as under:
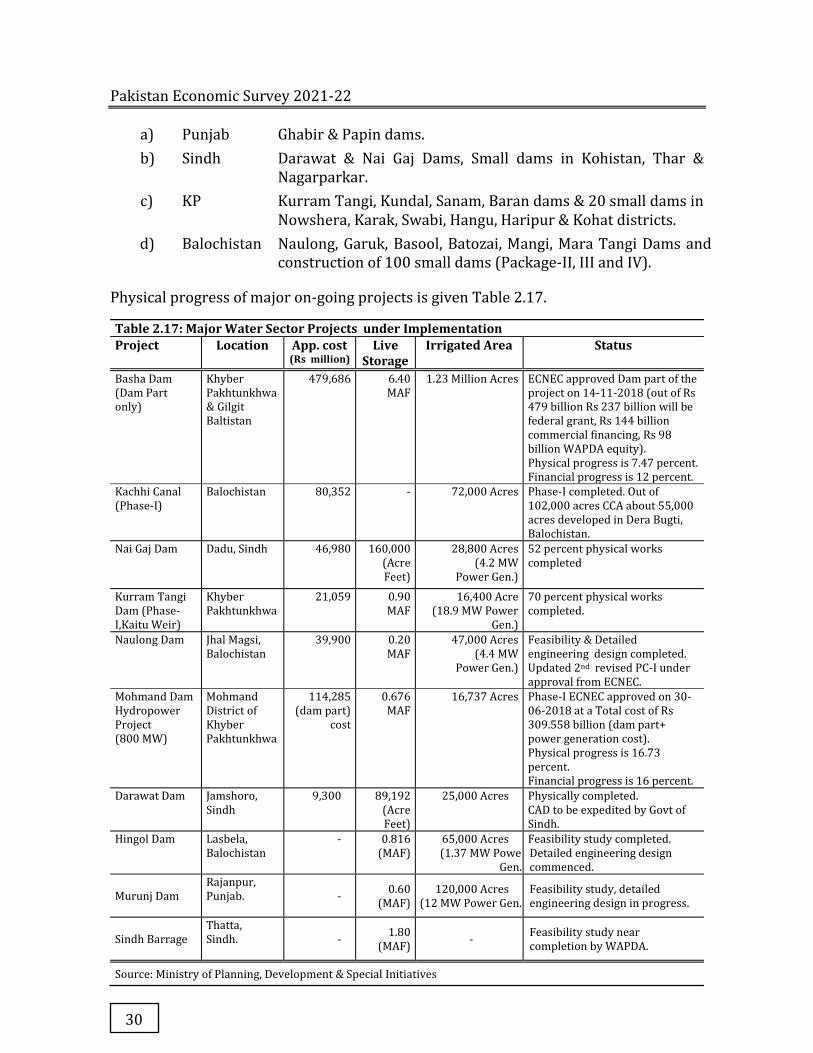
Pakistan Economic Survey 2021-22
30
a) Punjab Ghabir & Papin dams.
b) Sindh Darawat & Nai Gaj Dams, Small dams in Kohistan, Thar & Nagarparkar.
c) KP Kurram Tangi, Kundal, Sanam, Baran dams & 20 small dams in Nowshera, Karak, Swabi, Hangu, Haripur & Kohat districts.
d) Balochistan Naulong, Garuk, Basool, Batozai, Mangi, Mara Tangi Dams and construction of 100 small dams (Package-II, III and IV).
Physical progress of major on-going projects is given Table 2.17.
Table 2.17: Major Water Sector Projects under Implementation Project Location App. cost
(Rs million) Live
Storage Irrigated Area Status
Basha Dam (Dam Part only)
Khyber Pakhtunkhwa & Gilgit Baltistan
479,686 6.40 MAF
1.23 Million Acres
ECNEC approved Dam part of the project on 14-11-2018 (out of Rs 479 billion Rs 237 billion will be federal grant, Rs 144 billion commercial financing, Rs 98 billion WAPDA equity). Physical progress is 7.47 percent. Financial progress is 12 percent.
Kachhi Canal (Phase-I)
Balochistan 80,352 - 72,000 Acres Phase-I completed. Out of 102,000 acres CCA about 55,000 acres developed in Dera Bugti, Balochistan.
Nai Gaj Dam Dadu, Sindh 46,980 160,000 (Acre Feet)
28,800 Acres (4.2 MW
Power Gen.)
52 percent physical works completed
Kurram Tangi Dam (Phase-I,Kaitu Weir)
Khyber Pakhtunkhwa
21,059 0.90 MAF
16,400 Acre (18.9 MW Power
Gen.)
70 percent physical works completed.
Naulong Dam Jhal Magsi, Balochistan
39,900 0.20 MAF
47,000 Acres (4.4 MW
Power Gen.)
Feasibility & Detailed engineering design completed. Updated 2nd revised PC-I under approval from ECNEC.
Mohmand Dam Hydropower Project (800 MW)
Mohmand District of Khyber Pakhtunkhwa
114,285 (dam part)
cost
0.676 MAF
16,737 Acres
Phase-I ECNEC approved on 30-06-2018 at a Total cost of Rs 309.558 billion (dam part+ power generation cost). Physical progress is 16.73 percent. Financial progress is 16 percent.
Darawat Dam Jamshoro, Sindh
9,300 89,192 (Acre Feet)
25,000 Acres Physically completed. CAD to be expedited by Govt of Sindh.
Hingol Dam Lasbela, Balochistan
- 0.816 (MAF)
65,000 Acres (1.37 MW Power
Gen.)
Feasibility study completed. Detailed engineering design commenced.
Murunj Dam Rajanpur, Punjab.
- 0.60
(MAF) 120,000 Acres
(12 MW Power Gen.)Feasibility study, detailed engineering design in progress.
Sindh Barrage Thatta, Sindh.
- 1.80
(MAF) -
Feasibility study near completion by WAPDA.
Source: Ministry of Planning, Development & Special Initiatives
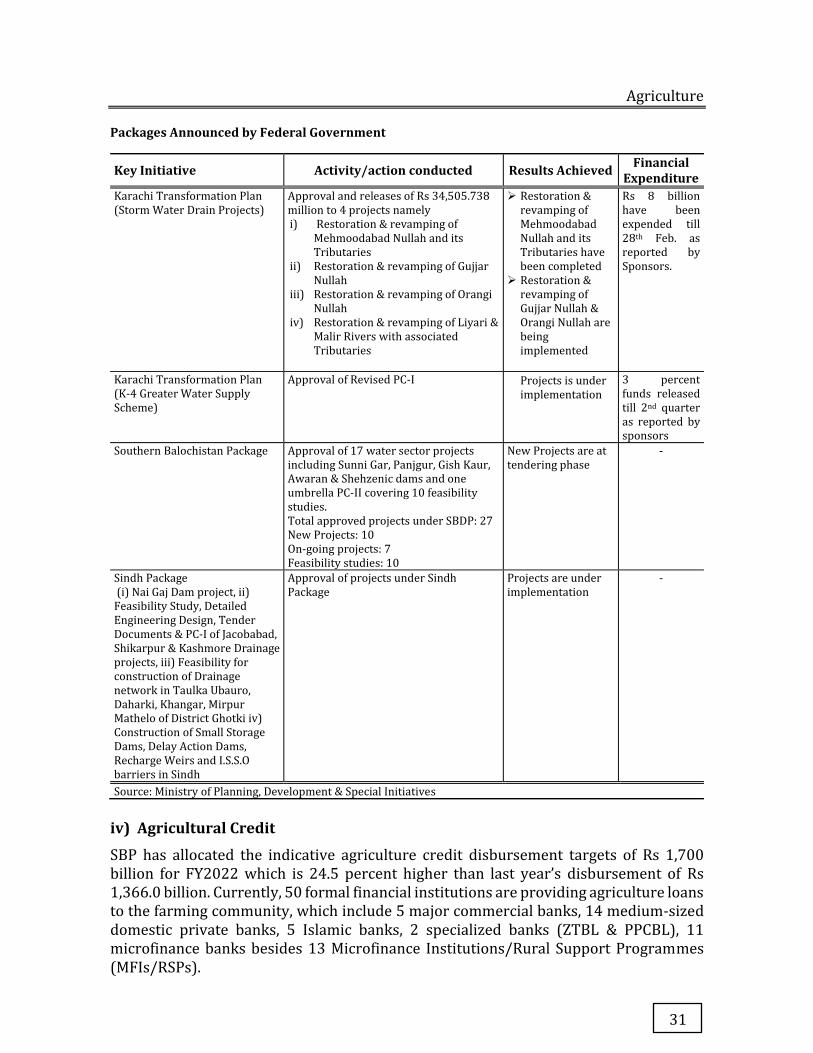
Agriculture
31
Packages Announced by Federal Government
Key Initiative Activity/action conducted Results Achieved Financial Expenditure
Karachi Transformation Plan (Storm Water Drain Projects)
Approval and releases of Rs 34,505.738 million to 4 projects namely i) Restoration & revamping of
Mehmoodabad Nullah and its Tributaries
ii) Restoration & revamping of Gujjar Nullah
iii) Restoration & revamping of Orangi Nullah
iv) Restoration & revamping of Liyari & Malir Rivers with associated Tributaries
� Restoration & revamping of Mehmoodabad Nullah and its Tributaries have been completed
� Restoration & revamping of Gujjar Nullah & Orangi Nullah are being implemented
Rs 8 billion have been expended till 28th Feb. as reported by Sponsors.
Karachi Transformation Plan (K-4 Greater Water Supply Scheme)
Approval of Revised PC-I Projects is under implementation
3 percent funds released till 2nd quarter as reported by sponsors
Southern Balochistan Package Approval of 17 water sector projects including Sunni Gar, Panjgur, Gish Kaur, Awaran & Shehzenic dams and one umbrella PC-II covering 10 feasibility studies. Total approved projects under SBDP: 27 New Projects: 10 On-going projects: 7 Feasibility studies: 10
New Projects are at tendering phase
-
Sindh Package (i) Nai Gaj Dam project, ii) Feasibility Study, Detailed Engineering Design, Tender Documents & PC-I of Jacobabad, Shikarpur & Kashmore Drainage projects, iii) Feasibility for construction of Drainage network in Taulka Ubauro, Daharki, Khangar, Mirpur Mathelo of District Ghotki iv) Construction of Small Storage Dams, Delay Action Dams, Recharge Weirs and I.S.S.O barriers in Sindh
Approval of projects under Sindh Package
Projects are under implementation
-
Source: Ministry of Planning, Development & Special Initiatives
iv) Agricultural Credit
SBP has allocated the indicative agriculture credit disbursement targets of Rs 1,700 billion for FY2022 which is 24.5 percent higher than last year’s disbursement of Rs 1,366.0 billion. Currently, 50 formal financial institutions are providing agriculture loans to the farming community, which include 5 major commercial banks, 14 medium-sized domestic private banks, 5 Islamic banks, 2 specialized banks (ZTBL & PPCBL), 11 microfinance banks besides 13 Microfinance Institutions/Rural Support Programmes (MFIs/RSPs).
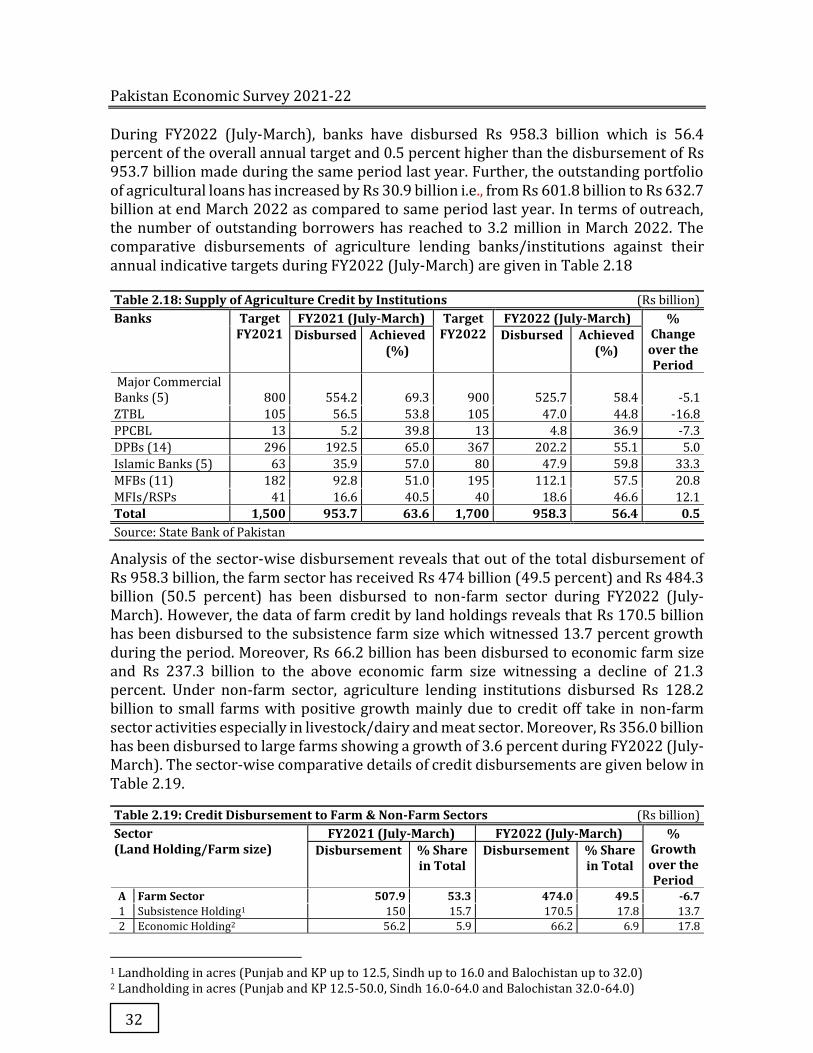
Pakistan Economic Survey 2021-22
32
During FY2022 (July-March), banks have disbursed Rs 958.3 billion which is 56.4 percent of the overall annual target and 0.5 percent higher than the disbursement of Rs 953.7 billion made during the same period last year. Further, the outstanding portfolio of agricultural loans has increased by Rs 30.9 billion i.e., from Rs 601.8 billion to Rs 632.7 billion at end March 2022 as compared to same period last year. In terms of outreach, the number of outstanding borrowers has reached to 3.2 million in March 2022. The comparative disbursements of agriculture lending banks/institutions against their annual indicative targets during FY2022 (July-March) are given in Table 2.18
Table 2.18: Supply of Agriculture Credit by Institutions (Rs billion) Banks Target
FY2021 FY2021 (July-March) Target
FY2022 FY2022 (July-March) %
Change over the Period
Disbursed Achieved (%)
Disbursed Achieved (%)
Major Commercial Banks (5) 800 554.2 69.3 900 525.7 58.4 -5.1
ZTBL 105 56.5 53.8 105 47.0 44.8 -16.8
PPCBL 13 5.2 39.8 13 4.8 36.9 -7.3
DPBs (14) 296 192.5 65.0 367 202.2 55.1 5.0
Islamic Banks (5) 63 35.9 57.0 80 47.9 59.8 33.3
MFBs (11) 182 92.8 51.0 195 112.1 57.5 20.8
MFIs/RSPs 41 16.6 40.5 40 18.6 46.6 12.1
Total 1,500 953.7 63.6 1,700 958.3 56.4 0.5 Source: State Bank of Pakistan
Analysis of the sector-wise disbursement reveals that out of the total disbursement of Rs 958.3 billion, the farm sector has received Rs 474 billion (49.5 percent) and Rs 484.3 billion (50.5 percent) has been disbursed to non-farm sector during FY2022 (July-March). However, the data of farm credit by land holdings reveals that Rs 170.5 billion has been disbursed to the subsistence farm size which witnessed 13.7 percent growth during the period. Moreover, Rs 66.2 billion has been disbursed to economic farm size and Rs 237.3 billion to the above economic farm size witnessing a decline of 21.3 percent. Under non-farm sector, agriculture lending institutions disbursed Rs 128.2 billion to small farms with positive growth mainly due to credit off take in non-farm sector activities especially in livestock/dairy and meat sector. Moreover, Rs 356.0 billion has been disbursed to large farms showing a growth of 3.6 percent during FY2022 (July-March). The sector-wise comparative details of credit disbursements are given below in Table 2.19.
Table 2.19: Credit Disbursement to Farm & Non-Farm Sectors (Rs billion) Sector (Land Holding/Farm size)
FY2021 (July-March) FY2022 (July-March) % Growth over the Period
Disbursement % Share in Total
Disbursement % Share in Total
A Farm Sector 507.9 53.3 474.0 49.5 -6.7 1 Subsistence Holding1 150 15.7 170.5 17.8 13.7
2 Economic Holding2 56.2 5.9 66.2 6.9 17.8
1 Landholding in acres (Punjab and KP up to 12.5, Sindh up to 16.0 and Balochistan up to 32.0) 2 Landholding in acres (Punjab and KP 12.5-50.0, Sindh 16.0-64.0 and Balochistan 32.0-64.0)
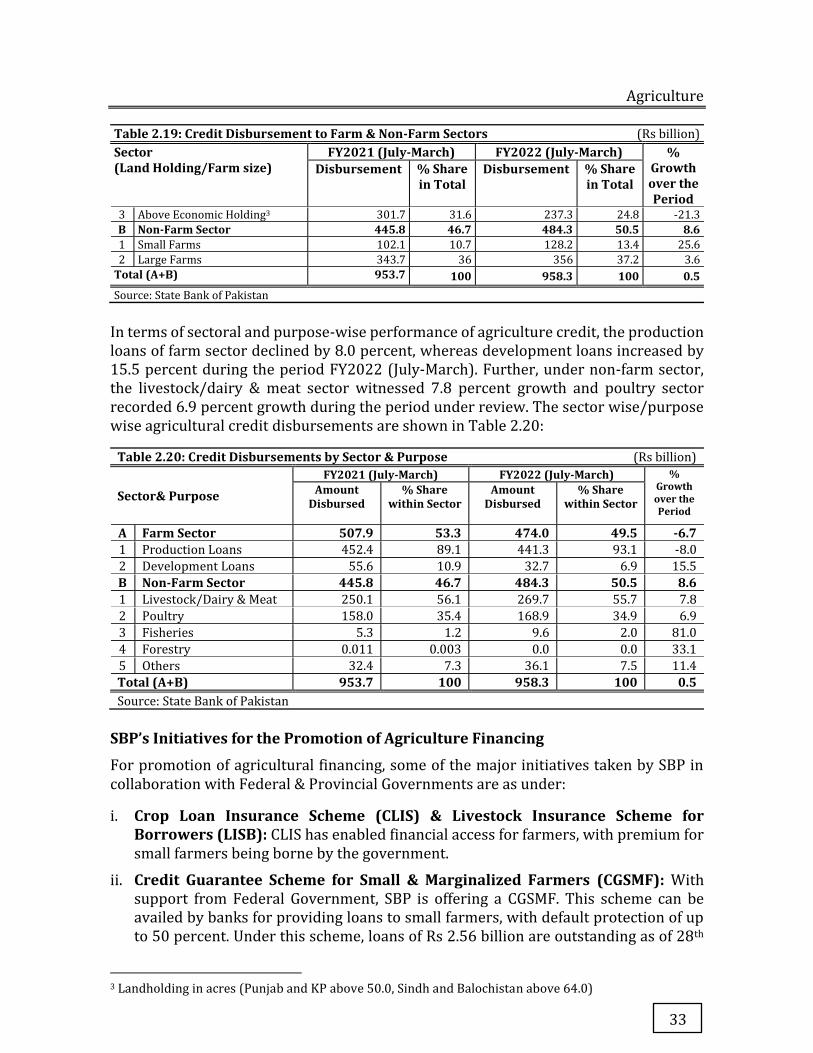
Agriculture
33
Table 2.19: Credit Disbursement to Farm & Non-Farm Sectors (Rs billion) Sector (Land Holding/Farm size)
FY2021 (July-March) FY2022 (July-March) % Growth over the Period
Disbursement % Share in Total
Disbursement % Share in Total
3 Above Economic Holding3 301.7 31.6 237.3 24.8 -21.3
B Non-Farm Sector 445.8 46.7 484.3 50.5 8.6 1 Small Farms 102.1 10.7 128.2 13.4 25.6
2 Large Farms 343.7 36 356 37.2 3.6
Total (A+B) 953.7 100 958.3 100 0.5 Source: State Bank of Pakistan
In terms of sectoral and purpose-wise performance of agriculture credit, the production loans of farm sector declined by 8.0 percent, whereas development loans increased by 15.5 percent during the period FY2022 (July-March). Further, under non-farm sector, the livestock/dairy & meat sector witnessed 7.8 percent growth and poultry sector recorded 6.9 percent growth during the period under review. The sector wise/purpose wise agricultural credit disbursements are shown in Table 2.20:
Table 2.20: Credit Disbursements by Sector & Purpose (Rs billion)
Sector& Purpose FY2021 (July-March) FY2022 (July-March) %
Growth over the Period
Amount Disbursed
% Share within Sector
Amount Disbursed
% Share within Sector
A Farm Sector 507.9 53.3 474.0 49.5 -6.7 1 Production Loans 452.4 89.1 441.3 93.1 -8.0
2 Development Loans 55.6 10.9 32.7 6.9 15.5
B Non-Farm Sector 445.8 46.7 484.3 50.5 8.6 1 Livestock/Dairy & Meat 250.1 56.1 269.7 55.7 7.8
2 Poultry 158.0 35.4 168.9 34.9 6.9
3 Fisheries 5.3 1.2 9.6 2.0 81.0
4 Forestry 0.011 0.003 0.0 0.0 33.1
5 Others 32.4 7.3 36.1 7.5 11.4
Total (A+B) 953.7 100 958.3 100 0.5 Source: State Bank of Pakistan
SBP’s Initiatives for the Promotion of Agriculture Financing
For promotion of agricultural financing, some of the major initiatives taken by SBP in collaboration with Federal & Provincial Governments are as under:
i. Crop Loan Insurance Scheme (CLIS) & Livestock Insurance Scheme for Borrowers (LISB): CLIS has enabled financial access for farmers, with premium for small farmers being borne by the government.
ii. Credit Guarantee Scheme for Small & Marginalized Farmers (CGSMF): With support from Federal Government, SBP is offering a CGSMF. This scheme can be availed by banks for providing loans to small farmers, with default protection of up to 50 percent. Under this scheme, loans of Rs 2.56 billion are outstanding as of 28th
3 Landholding in acres (Punjab and KP above 50.0, Sindh and Balochistan above 64.0)
Pakistan Economic Survey 2021-22
34
February, 2022. Since its inception, more than 131,000 farmers have benefitted through this scheme against Rs 1.1 billion funds released by the Federal Government.
iii. Adoption of Electronic Land Record Management Information System (LRMIS) by banks for Agriculture Financing: SBP is working in collaboration with Provincial Governments and financial institutions for implementing and mainstreaming electronic land verification records and charge creation for availing bank loans.
iv. Promoting Electronic Warehouse Receipt Financing (EWRF): EWRF is a form of credit, extended by banks to farmers, traders and processors against commodities/agricultural produce stored in accredited warehouses. In order to allow banks to start EWRF in line with Collateral Management Company (CMC) Regulations 2019, SBP has issued the necessary amendments in Prudential Regulations while allowing EWR as acceptable collateral for bank financing. Further, to sensitize banking industry and kick start of EWRF in Pakistan, SBP has formally launched EWRF in February, 2022 wherein 25 banks signed the System Usage Agreements (SUA) with CMC.
v. Introduction of Scoring Model for Agriculture Credit Performance of Banks: SBP has introduced the scoring model to promote fairness and transparency in gauging the individual performances of agriculture lending banks. The scoring model utilizes a multi-dimensional criteria based on various indicators, which are used to calculate an aggregate statistic reflective of each bank’s agriculture credit performance.
vi. Introduction of Champion Bank Concept: To address the bottlenecks in agriculture credit outreach in underserved areas by introducing the concept of provincial/regional champion banks in underserved areas. The six regional champion banks will spearhead the efforts in their respective assigned province/region (Southern Punjab, Sindh, Khyber Pakhtunkhwa, Balochistan, AJK and GB) to enhance flow of credit and bring more borrowers into the fold of formal credit network.
III. Forestry
According to the latest findings of National Forest Reference Emissions Level (FREL), the country is maintaining 4.786 million hectare (5.45 percent) area under forest cover. Within the forest cover area, dry temperate forests hold the largest share (36 percent), followed by sub-tropical broadleaved shrub (19 percent), moist temperate (15 percent), Chir Pine (13 percent), Riverine (4 percent), irrigated plantation (4 percent), thorn (3 percent), mangrove (3 percent) and subalpine forests (2 percent). The inadequate forest cover area due to growing population and dependence on the natural resources coupled with deforestation have rendered the country one of the most vulnerable to climate change effects. As a result, natural resources are under tremendous pressure owing to change of land use and habitat destruction and consumption of fuel wood and timber extraction. Such pressures have rendered most of the forests of poor and medium density in need of drastic restocking on war footing.
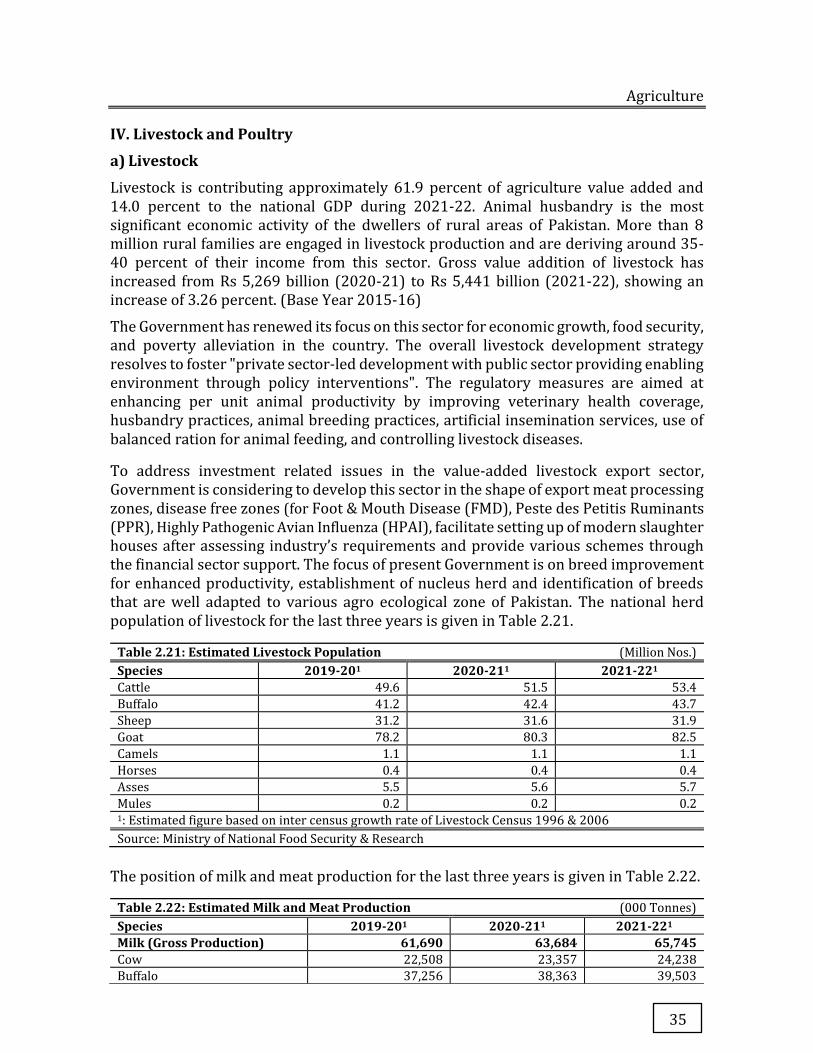
Agriculture
35
IV. Livestock and Poultry
a) Livestock
Livestock is contributing approximately 61.9 percent of agriculture value added and 14.0 percent to the national GDP during 2021-22. Animal husbandry is the most significant economic activity of the dwellers of rural areas of Pakistan. More than 8 million rural families are engaged in livestock production and are deriving around 35-40 percent of their income from this sector. Gross value addition of livestock has increased from Rs 5,269 billion (2020-21) to Rs 5,441 billion (2021-22), showing an increase of 3.26 percent. (Base Year 2015-16)
The Government has renewed its focus on this sector for economic growth, food security, and poverty alleviation in the country. The overall livestock development strategy resolves to foster "private sector-led development with public sector providing enabling environment through policy interventions". The regulatory measures are aimed at enhancing per unit animal productivity by improving veterinary health coverage, husbandry practices, animal breeding practices, artificial insemination services, use of balanced ration for animal feeding, and controlling livestock diseases.
To address investment related issues in the value-added livestock export sector, Government is considering to develop this sector in the shape of export meat processing zones, disease free zones (for Foot & Mouth Disease (FMD), Peste des Petitis Ruminants (PPR), Highly Pathogenic Avian Influenza (HPAI), facilitate setting up of modern slaughter houses after assessing industry’s requirements and provide various schemes through the financial sector support. The focus of present Government is on breed improvement for enhanced productivity, establishment of nucleus herd and identification of breeds that are well adapted to various agro ecological zone of Pakistan. The national herd population of livestock for the last three years is given in Table 2.21.
Table 2.21: Estimated Livestock Population (Million Nos.) Species 2019-201 2020-211 2021-221
Cattle 49.6 51.5 53.4
Buffalo 41.2 42.4 43.7
Sheep 31.2 31.6 31.9
Goat 78.2 80.3 82.5
Camels 1.1 1.1 1.1
Horses 0.4 0.4 0.4
Asses 5.5 5.6 5.7
Mules 0.2 0.2 0.2 1: Estimated figure based on inter census growth rate of Livestock Census 1996 & 2006
Source: Ministry of National Food Security & Research The position of milk and meat production for the last three years is given in Table 2.22.
Table 2.22: Estimated Milk and Meat Production (000 Tonnes) Species 2019-201 2020-211 2021-221 Milk (Gross Production) 61,690 63,684 65,745 Cow 22,508 23,357 24,238
Buffalo 37,256 38,363 39,503
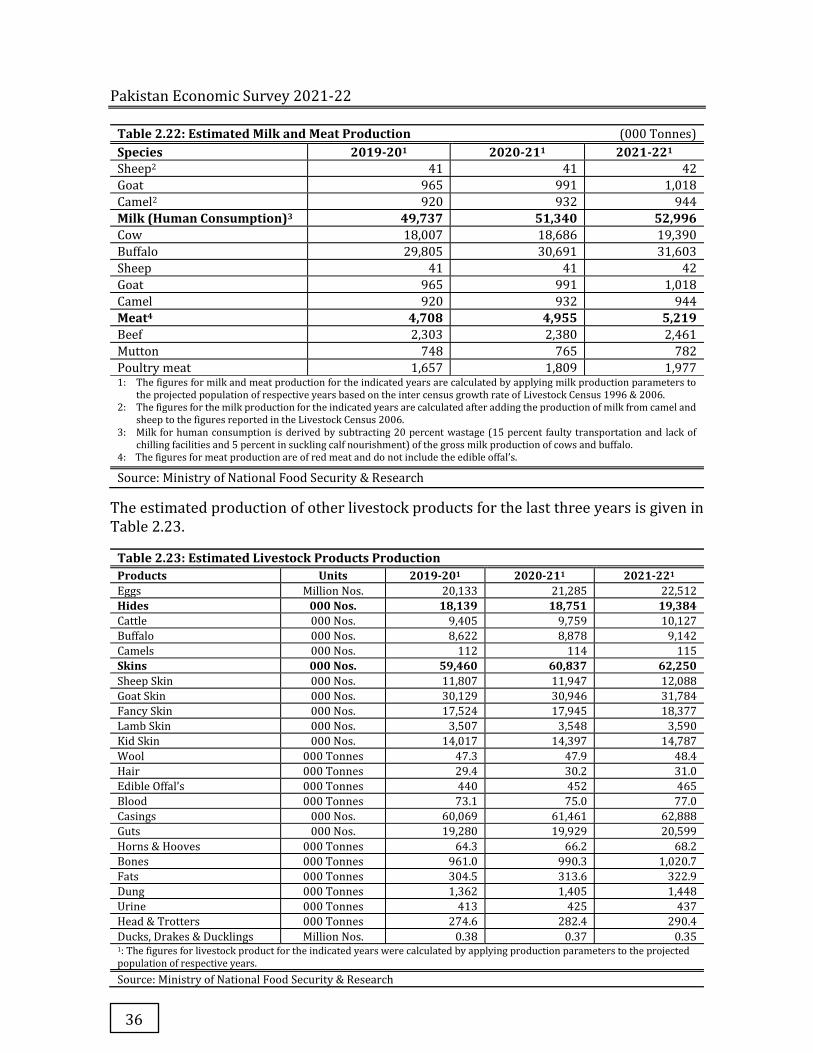
Pakistan Economic Survey 2021-22
36
Table 2.22: Estimated Milk and Meat Production (000 Tonnes) Species 2019-201 2020-211 2021-221 Sheep2 41 41 42
Goat 965 991 1,018
Camel2 920 932 944
Milk (Human Consumption)3 49,737 51,340 52,996 Cow 18,007 18,686 19,390
Buffalo 29,805 30,691 31,603
Sheep 41 41 42
Goat 965 991 1,018
Camel 920 932 944
Meat4 4,708 4,955 5,219 Beef 2,303 2,380 2,461
Mutton 748 765 782
Poultry meat 1,657 1,809 1,977 1: The figures for milk and meat production for the indicated years are calculated by applying milk production parameters to
the projected population of respective years based on the inter census growth rate of Livestock Census 1996 & 2006. 2: The figures for the milk production for the indicated years are calculated after adding the production of milk from camel and
sheep to the figures reported in the Livestock Census 2006. 3: Milk for human consumption is derived by subtracting 20 percent wastage (15 percent faulty transportation and lack of
chilling facilities and 5 percent in suckling calf nourishment) of the gross milk production of cows and buffalo. 4: The figures for meat production are of red meat and do not include the edible offal’s.
Source: Ministry of National Food Security & Research
The estimated production of other livestock products for the last three years is given in Table 2.23.
Table 2.23: Estimated Livestock Products Production Products Units 2019-201 2020-211 2021-221 Eggs Million Nos. 20,133 21,285 22,512
Hides 000 Nos. 18,139 18,751 19,384 Cattle 000 Nos. 9,405 9,759 10,127
Buffalo 000 Nos. 8,622 8,878 9,142
Camels 000 Nos. 112 114 115
Skins 000 Nos. 59,460 60,837 62,250 Sheep Skin 000 Nos. 11,807 11,947 12,088
Goat Skin 000 Nos. 30,129 30,946 31,784
Fancy Skin 000 Nos. 17,524 17,945 18,377
Lamb Skin 000 Nos. 3,507 3,548 3,590
Kid Skin 000 Nos. 14,017 14,397 14,787
Wool 000 Tonnes 47.3 47.9 48.4
Hair 000 Tonnes 29.4 30.2 31.0
Edible Offal’s 000 Tonnes 440 452 465
Blood 000 Tonnes 73.1 75.0 77.0
Casings 000 Nos. 60,069 61,461 62,888
Guts 000 Nos. 19,280 19,929 20,599
Horns & Hooves 000 Tonnes 64.3 66.2 68.2
Bones 000 Tonnes 961.0 990.3 1,020.7
Fats 000 Tonnes 304.5 313.6 322.9
Dung 000 Tonnes 1,362 1,405 1,448
Urine 000 Tonnes 413 425 437
Head & Trotters 000 Tonnes 274.6 282.4 290.4
Ducks, Drakes & Ducklings Million Nos. 0.38 0.37 0.35 1: The figures for livestock product for the indicated years were calculated by applying production parameters to the projected population of respective years.
Source: Ministry of National Food Security & Research
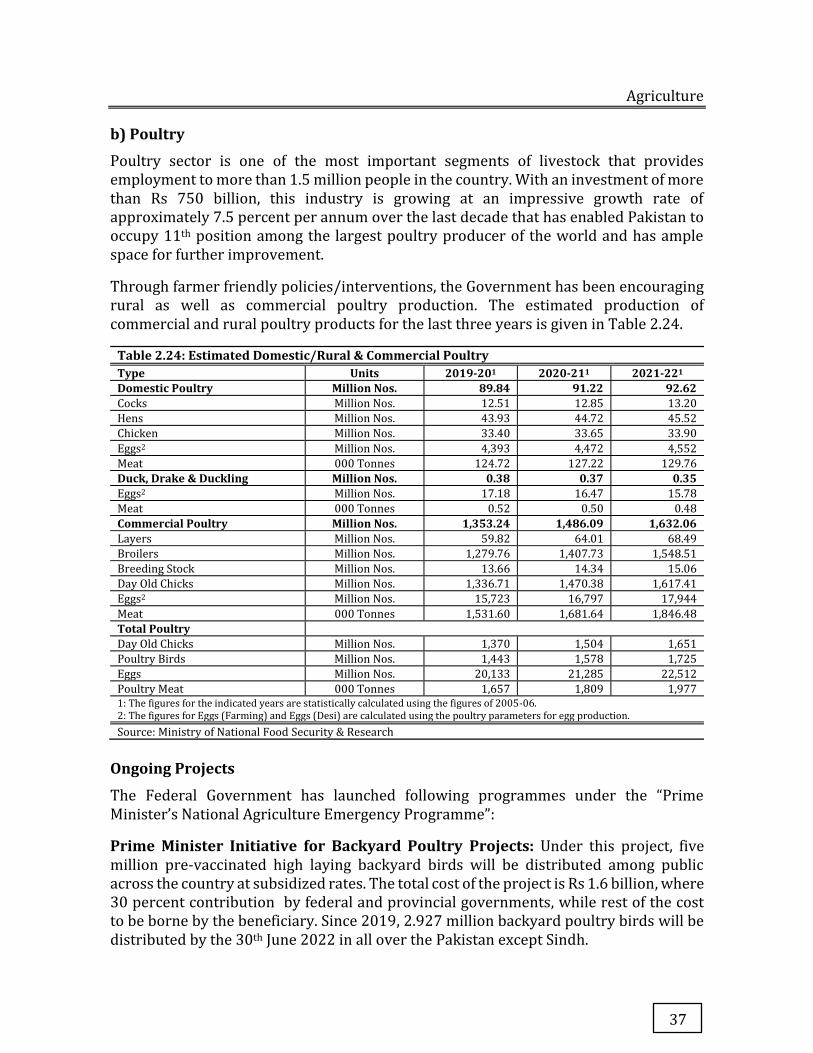
Agriculture
37
b) Poultry
Poultry sector is one of the most important segments of livestock that provides employment to more than 1.5 million people in the country. With an investment of more than Rs 750 billion, this industry is growing at an impressive growth rate of approximately 7.5 percent per annum over the last decade that has enabled Pakistan to occupy 11th position among the largest poultry producer of the world and has ample space for further improvement.
Through farmer friendly policies/interventions, the Government has been encouraging rural as well as commercial poultry production. The estimated production of commercial and rural poultry products for the last three years is given in Table 2.24.
Table 2.24: Estimated Domestic/Rural & Commercial Poultry Type Units 2019-201 2020-211 2021-221 Domestic Poultry Million Nos. 89.84 91.22 92.62 Cocks Million Nos. 12.51 12.85 13.20
Hens Million Nos. 43.93 44.72 45.52
Chicken Million Nos. 33.40 33.65 33.90
Eggs2 Million Nos. 4,393 4,472 4,552
Meat 000 Tonnes 124.72 127.22 129.76
Duck, Drake & Duckling Million Nos. 0.38 0.37 0.35 Eggs2 Million Nos. 17.18 16.47 15.78
Meat 000 Tonnes 0.52 0.50 0.48
Commercial Poultry Million Nos. 1,353.24 1,486.09 1,632.06 Layers Million Nos. 59.82 64.01 68.49
Broilers Million Nos. 1,279.76 1,407.73 1,548.51
Breeding Stock Million Nos. 13.66 14.34 15.06
Day Old Chicks Million Nos. 1,336.71 1,470.38 1,617.41
Eggs2 Million Nos. 15,723 16,797 17,944
Meat 000 Tonnes 1,531.60 1,681.64 1,846.48
Total Poultry Day Old Chicks Million Nos. 1,370 1,504 1,651
Poultry Birds Million Nos. 1,443 1,578 1,725
Eggs Million Nos. 20,133 21,285 22,512
Poultry Meat 000 Tonnes 1,657 1,809 1,977 1: The figures for the indicated years are statistically calculated using the figures of 2005-06. 2: The figures for Eggs (Farming) and Eggs (Desi) are calculated using the poultry parameters for egg production.
Source: Ministry of National Food Security & Research Ongoing Projects
The Federal Government has launched following programmes under the “Prime Minister’s National Agriculture Emergency Programme”:
Prime Minister Initiative for Backyard Poultry Projects: Under this project, five million pre-vaccinated high laying backyard birds will be distributed among public across the country at subsidized rates. The total cost of the project is Rs 1.6 billion, where 30 percent contribution by federal and provincial governments, while rest of the cost to be borne by the beneficiary. Since 2019, 2.927 million backyard poultry birds will be distributed by the 30th June 2022 in all over the Pakistan except Sindh.
Pakistan Economic Survey 2021-22
38
Prime Minister Initiative for Safe the Calf Project: Under this project, 380,000 male calves are projected to be saved from early slaughter in 4 years period through financial incentive of Rs 6,500 per calf to farmers besides reducing mortality with improved nutrition and husbandry practices. This intervention is providing stock for feedlot fattening for enhanced productivity and quality beef which ultimately result in high profit margins for the farmers and reduced rural poverty. The total cost of the project is Rs 3.4 billion. The Federal Government is contributing 20 percent of total cost, while the remaining will be shared by provincial governments. Since 2019, 167175 calves would be saved by the 30th June 2022 in all over the Pakistan except Sindh and Balochistan.
Prime Minister Initiative for Calf Feedlot Fattening in Pakistan: Under this programme, Rs 4,000 for each calf has been allocated as financial incentive to persuade farmers to produce healthy and nutritious beef in the country. In Balochistan, Rs 1500 cash incentive is given for each fattened sheep/goat. The intervention is promoting feedlot fattening business in the country. The total cost of the project is Rs 2.4 billion. Since 2019, 191757 calves fattened in all over Pakistan except Sindh and Balochistan and 240,000 kid/lamb will be fattened in Balochistan by the 30th June 2022.
The following projects are also being launched by Federal Government:
i. Antimicrobial Resistance (AMR). The Fleming Fund Country Grant with the support of U.K. Department of Health and Social Care Programme to help low-and middle-income countries fight AMR has initiated a programme in collaboration of Government of Pakistan with the following objectives:
� Improved policy environment for managing AMR-Data review and analysis
� Enhance quality and quantity of sites reporting on AMR
� Strengthening reference laboratories to strengthen AMR surveillance networks
� Improve AMC and antimicrobial usage (AMU) data at country level
� Support One Health Approach among human, livestock and environment sectors
In the animal health sector, the Fleming Fund Country Grant is providing support for strengthening AMR surveillance in food animals, diagnostic harmonization, capacity development of animal health laboratories, field surveys for AMU and Knowledge Attitudes Practices (KAP) surveys. To cope up with the scope in animal health sector, Fleming Fund through AHC office, M/o NFS&R has identified
� Two National Reference Points
o National Veterinary Laboratories (NVL), Islamabad
o National Reference Laboratory for Poultry Diseases (NRLPD), NARC Islamabad
� 9 Sentinel Labs from all provinces of Pakistan
Agriculture
39
To better coordinate AMR and AMU activities in the animal health sector alongside Human Health, (M/o NFS&R) has notified the establishment of the AMR Coordination Unit (AMR-CU) at the Animal Husbandry Commissioner (AHC) office.
i. Support Development and Piloting Pakistan Animal Identification and Traceability System (PAITS). This project is under execution with the technical and financial support of FAO-Pakistan. Pakistan currently does not have a reliable animal identification and traceability system to manage livestock identification and movements in the country. Lack of such a system poses significant challenges for Pakistan, specifically in export of livestock and their products, in the wake of limited resources and capacity of the animal health services to deliver effective animal health programmes. The project will be used as pilot demonstrations in cattle and buffaloes in limited geographic region in smallholder livestock farming and selected feedlot fattening dairy farms.
ii. National PPR Eradication Programme: Under this project, efforts will be made to move Pakistan into stage 3 of the progressive step-wise approach of Office International des Epizooties (OIE) for PPR eradication in next five years. The total cost of the project is Rs 1.8 billion.
Enhancement of FMD Control Programme in Pakistan: This project is under execution in collaboration of Government of Pakistan, JICA and FAO-Pakistan with the following objectives:
� Reporting of FMD outbreaks by stakeholders (veterinarians, veterinary assistants, and dairy farmers)
� Awareness of dairy farmers
� Rapid response of FMD outbreaks
Other Policy Measures
M/o NFS&R with its re-defined role under the 18th Constitutional Amendment undertook the following measures: i) Import of calf milk replacer and cattle fed premix by the corporate dairy/meat sub sectors at concessional tariff, ii) Import of high yielding dairy cattle breeds of Holstein Friesian and Jersey for enhanced milk production, iii) Semen and embryos of high yielding animals for the genetic improvement of indigenous low producing animals, and iv) Import of high quality feed stuff/micro ingredients for improving the nutritional quality of animals & poultry feed.
V. Fisheries
Fisheries sector plays significant role in the economy and food security of the country and it reduces pressure on demand for mutton, beef, and poultry. It is also considered to be an important source of livelihood for the coastal inhabitants. Apart from marine fisheries, inland fisheries (based in rivers, lakes, dams, etc.) are also a very important activity throughout the country. Fisheries share in GDP although very little, but it adds substantially to the national income through export earnings.
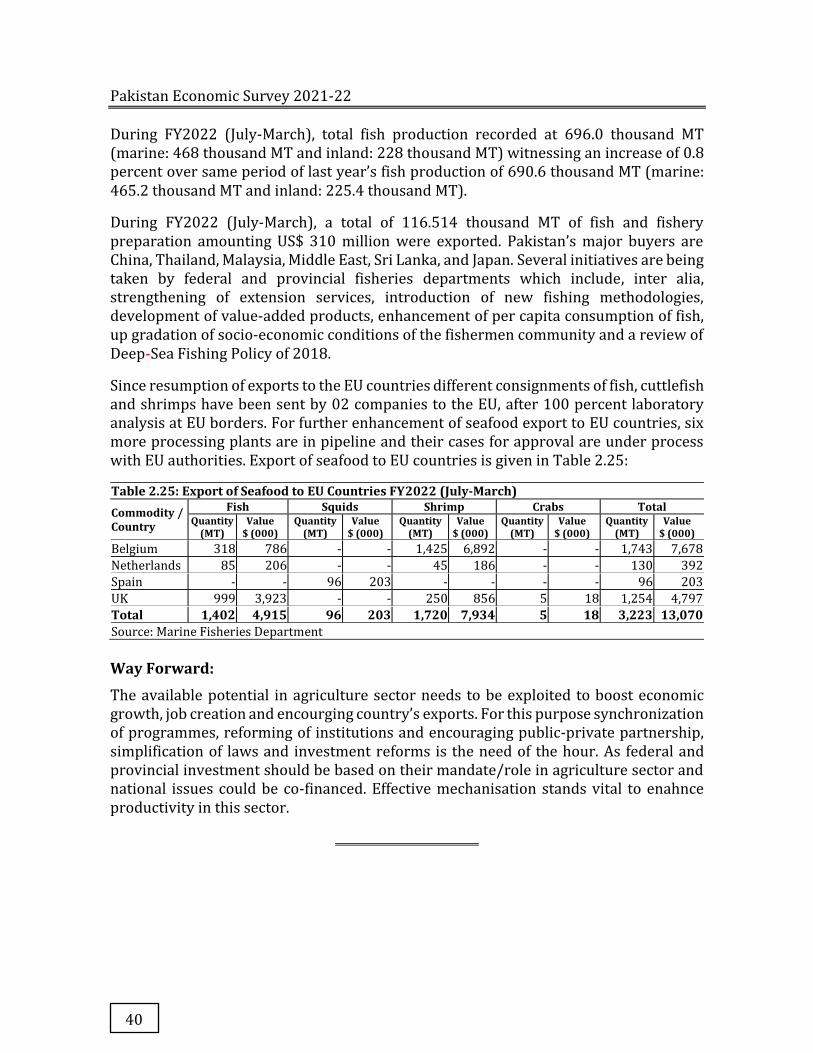
Pakistan Economic Survey 2021-22
40
During FY2022 (July-March), total fish production recorded at 696.0 thousand MT (marine: 468 thousand MT and inland: 228 thousand MT) witnessing an increase of 0.8 percent over same period of last year’s fish production of 690.6 thousand MT (marine: 465.2 thousand MT and inland: 225.4 thousand MT).
During FY2022 (July-March), a total of 116.514 thousand MT of fish and fishery preparation amounting US$ 310 million were exported. Pakistan’s major buyers are China, Thailand, Malaysia, Middle East, Sri Lanka, and Japan. Several initiatives are being taken by federal and provincial fisheries departments which include, inter alia, strengthening of extension services, introduction of new fishing methodologies, development of value-added products, enhancement of per capita consumption of fish, up gradation of socio-economic conditions of the fishermen community and a review of Deep-Sea Fishing Policy of 2018.
Since resumption of exports to the EU countries different consignments of fish, cuttlefish and shrimps have been sent by 02 companies to the EU, after 100 percent laboratory analysis at EU borders. For further enhancement of seafood export to EU countries, six more processing plants are in pipeline and their cases for approval are under process with EU authorities. Export of seafood to EU countries is given in Table 2.25:
Table 2.25: Export of Seafood to EU Countries FY2022 (July-March) Commodity / Country
Fish Squids Shrimp Crabs Total Quantity
(MT) Value
$ (000) Quantity
(MT) Value
$ (000) Quantity
(MT) Value
$ (000) Quantity
(MT) Value
$ (000) Quantity
(MT) Value
$ (000) Belgium 318 786 - - 1,425 6,892 - - 1,743 7,678
Netherlands 85 206 - - 45 186 - - 130 392
Spain - - 96 203 - - - - 96 203
UK 999 3,923 - - 250 856 5 18 1,254 4,797
Total 1,402 4,915 96 203 1,720 7,934 5 18 3,223 13,070 Source: Marine Fisheries Department
Way Forward:
The available potential in agriculture sector needs to be exploited to boost economic growth, job creation and encourging country’s exports. For this purpose synchronization of programmes, reforming of institutions and encouraging public-private partnership, simplification of laws and investment reforms is the need of the hour. As federal and provincial investment should be based on their mandate/role in agriculture sector and national issues could be co-financed. Effective mechanisation stands vital to enahnce productivity in this sector.
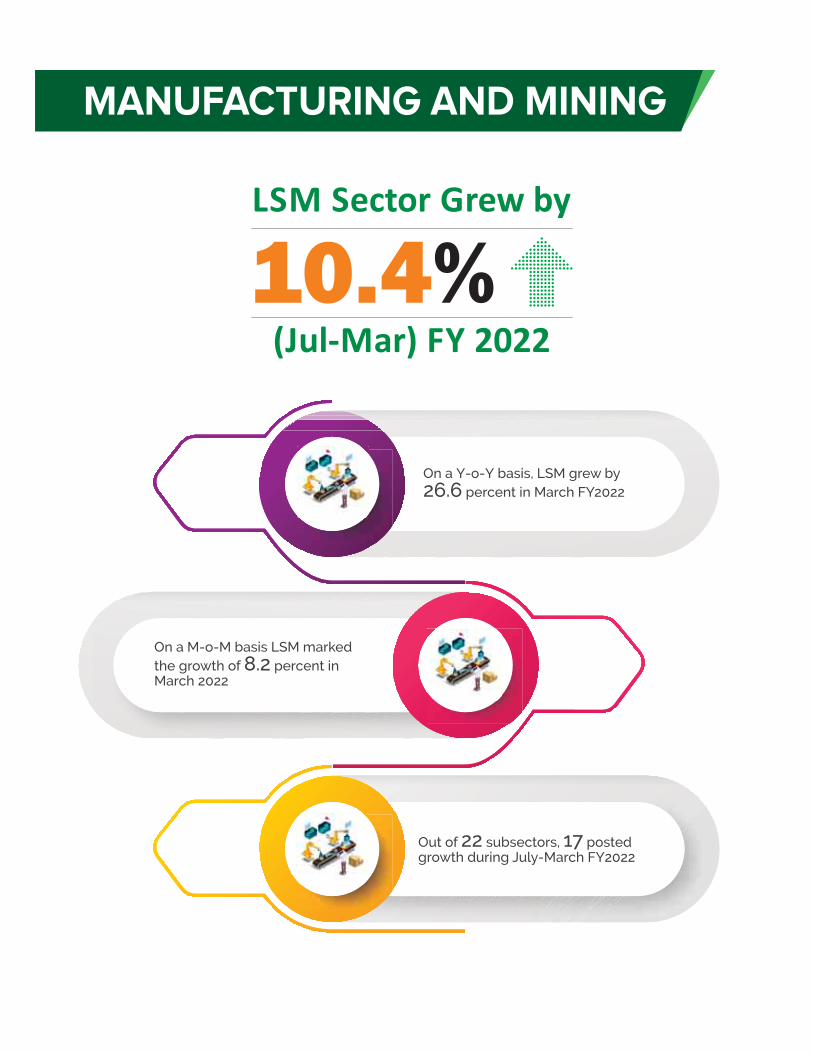

In Pakistan, manufacturing with a share of 12.4 percent in GDP has a dominant presence within the industrial sector. Pakistan’s national accounts capture manufacturing sector in three different components: Large Scale Manufacturing (LSM), Small Scale Manufacturing (SSM) and Slaughtering. Establishments having ten or more employees are covered under LSM. Quantum Index of Manufacturing (QIM) is a measure of LSM performance with 78.4 weight in overall LSM, derived from the Census of Manufacturing Industries (CMI) 2015-16 (Box-I). Similarly, Small Scale Manufacturing (SSM) information is also based on the survey1 conducted in year 2015. It covers industrial and household units engaged in manufacturing activity having less than ten employees. While, slaughtering sector performance is estimated through a methodology which measures the value addition in output of the sector.
During FY2022, LSM with 9.2 percent of GDP dominates the overall manufacturing sector, accounting for 74.3 percent of the sectoral share followed by Small Scale Manufacturing, which accounts for 2.0 percent of total GDP and 15.9 percent sectoral share. The third component, slaughtering, accounts for 1.2 percent of GDP with 9.7 percent sectoral share.
3.1 Performance of Large-Scale Manufacturing
Unprecedented challenges posed by the COVID-19 pandemic exposed the vulnerabilities of global economies. Supply chains were disrupted due to business closures. The industry of Pakistan also experienced interlude in business activity leading to slowdown in its performance in FY2020. Nevertheless, LSM proved to be resilient and gained the growth momentum from the very start of FY2021 owing to gradual opening of economic activities and contingency measures from fiscal and monetary side in the form of industrial support package, construction package, auto policy, ultra-low policy rate, housing finance, and export financing facility coupled with vaccination drive.
Although Pakistan has survived from the COVID-19 crisis, but it faced the daunting tasks in FY2022 such as controlling stimulus induced fiscal deficit, curtailing widening current account deficit, managing pressure on exchange rate along with achieving a sustainable post-pandemic recovery. Moreover, pent-up demand fueled by stimulus and pandemic disruptions accelerated inflation around the world. Additionally, Ukraine War continues
1 A survey titles “Small and Household Manufacturing Industries (SHMI) 2015” was conducted by Pakistan Bureau of Statistics (PBS) for rebasing.
Chapter 3
Manufacturing and Mining
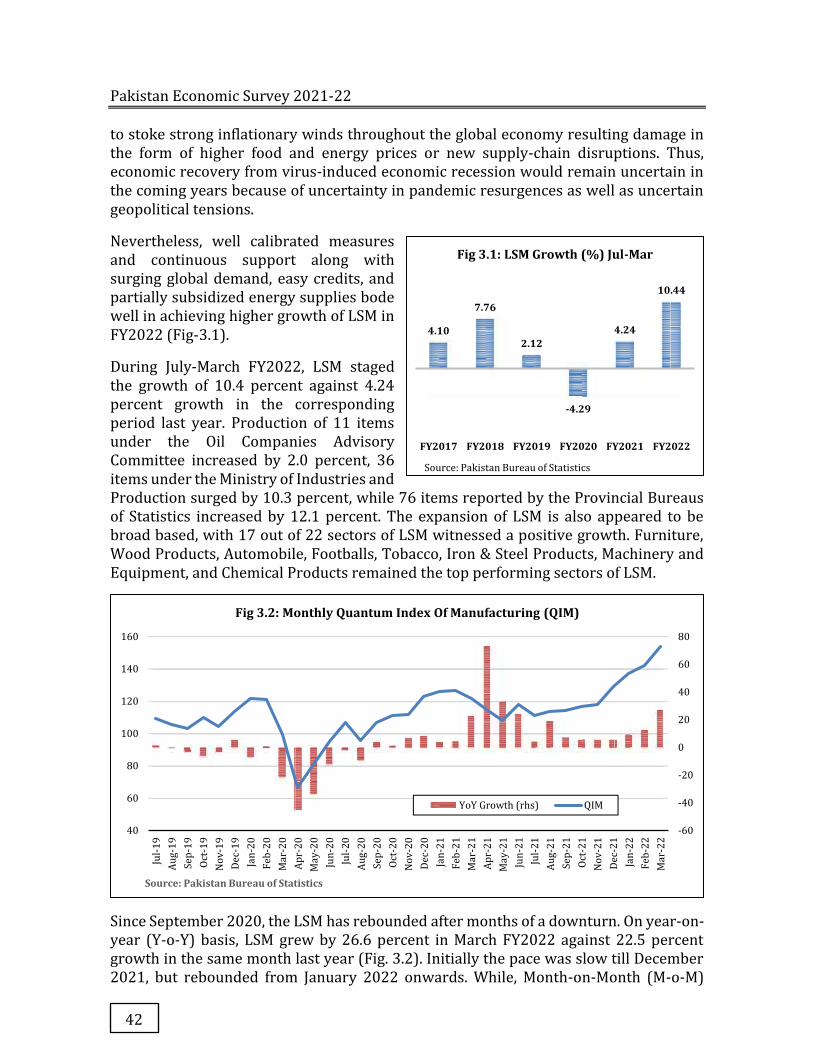
Pakistan Economic Survey 2021-22
42
to stoke strong inflationary winds throughout the global economy resulting damage in the form of higher food and energy prices or new supply-chain disruptions. Thus, economic recovery from virus-induced economic recession would remain uncertain in the coming years because of uncertainty in pandemic resurgences as well as uncertain geopolitical tensions.
Nevertheless, well calibrated measures and continuous support along with surging global demand, easy credits, and partially subsidized energy supplies bode well in achieving higher growth of LSM in FY2022 (Fig-3.1).
During July-March FY2022, LSM staged the growth of 10.4 percent against 4.24 percent growth in the corresponding period last year. Production of 11 items under the Oil Companies Advisory Committee increased by 2.0 percent, 36 items under the Ministry of Industries and Production surged by 10.3 percent, while 76 items reported by the Provincial Bureaus of Statistics increased by 12.1 percent. The expansion of LSM is also appeared to be broad based, with 17 out of 22 sectors of LSM witnessed a positive growth. Furniture, Wood Products, Automobile, Footballs, Tobacco, Iron & Steel Products, Machinery and Equipment, and Chemical Products remained the top performing sectors of LSM.
Since September 2020, the LSM has rebounded after months of a downturn. On year-on-year (Y-o-Y) basis, LSM grew by 26.6 percent in March FY2022 against 22.5 percent growth in the same month last year (Fig. 3.2). Initially the pace was slow till December 2021, but rebounded from January 2022 onwards. While, Month-on-Month (M-o-M)
-60
-40
-20
0
20
40
60
80
40
60
80
100
120
140
160
Jul-
19
Au
g-1
9
Se
p-1
9
Oct
-19
No
v-1
9
De
c-1
9
Jan
-20
Feb
-20
Ma
r-2
0
Ap
r-2
0
Ma
y-2
0
Jun
-20
Jul-
20
Au
g-2
0
Se
p-2
0
Oct
-20
No
v-2
0
De
c-2
0
Jan
-21
Feb
-21
Ma
r-2
1
Ap
r-2
1
Ma
y-2
1
Jun
-21
Jul-
21
Au
g-2
1
Se
p-2
1
Oct
-21
No
v-2
1
De
c-2
1
Jan
-22
Feb
-22
Ma
r-2
2
Source: Pakistan Bureau of Statistics
Fig 3.2: Monthly Quantum Index Of Manufacturing (QIM)
YoY Growth (rhs) QIM
4.10
7.76
2.12
-4.29
4.24
10.44
FY2017 FY2018 FY2019 FY2020 FY2021 FY2022
Source: Pakistan Bureau of Statistics
Fig 3.1: LSM Growth (%) Jul-Mar
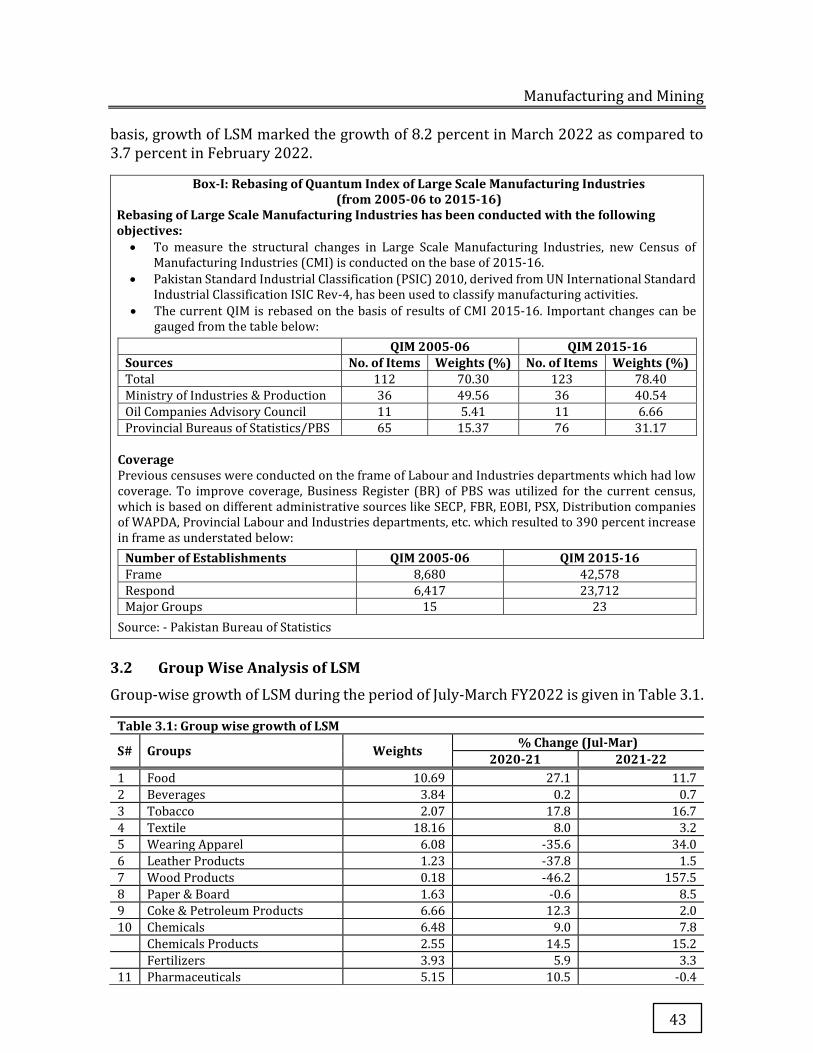
Manufacturing and Mining
43
basis, growth of LSM marked the growth of 8.2 percent in March 2022 as compared to 3.7 percent in February 2022.
Box-I: Rebasing of Quantum Index of Large Scale Manufacturing Industries (from 2005-06 to 2015-16)
Rebasing of Large Scale Manufacturing Industries has been conducted with the following objectives: � To measure the structural changes in Large Scale Manufacturing Industries, new Census of
Manufacturing Industries (CMI) is conducted on the base of 2015-16.
� Pakistan Standard Industrial Classification (PSIC) 2010, derived from UN International Standard Industrial Classification ISIC Rev-4, has been used to classify manufacturing activities.
� The current QIM is rebased on the basis of results of CMI 2015-16. Important changes can be gauged from the table below:
QIM 2005-06 QIM 2015-16 Sources No. of Items Weights (%) No. of Items Weights (%) Total 112 70.30 123 78.40
Ministry of Industries & Production 36 49.56 36 40.54
Oil Companies Advisory Council 11 5.41 11 6.66
Provincial Bureaus of Statistics/PBS 65 15.37 76 31.17
Coverage Previous censuses were conducted on the frame of Labour and Industries departments which had low coverage. To improve coverage, Business Register (BR) of PBS was utilized for the current census, which is based on different administrative sources like SECP, FBR, EOBI, PSX, Distribution companies of WAPDA, Provincial Labour and Industries departments, etc. which resulted to 390 percent increase in frame as understated below:
Number of Establishments QIM 2005-06 QIM 2015-16 Frame 8,680 42,578
Respond 6,417 23,712
Major Groups 15 23
Source: - Pakistan Bureau of Statistics
3.2 Group Wise Analysis of LSM
Group-wise growth of LSM during the period of July-March FY2022 is given in Table 3.1.
Table 3.1: Group wise growth of LSM
S# Groups Weights % Change (Jul-Mar) 2020-21 2021-22
1 Food 10.69 27.1 11.7
2 Beverages 3.84 0.2 0.7
3 Tobacco 2.07 17.8 16.7
4 Textile 18.16 8.0 3.2
5 Wearing Apparel 6.08 -35.6 34.0
6 Leather Products 1.23 -37.8 1.5
7 Wood Products 0.18 -46.2 157.5
8 Paper & Board 1.63 -0.6 8.5
9 Coke & Petroleum Products 6.66 12.3 2.0
10 Chemicals 6.48 9.0 7.8
Chemicals Products 2.55 14.5 15.2
Fertilizers 3.93 5.9 3.3
11 Pharmaceuticals 5.15 10.5 -0.4
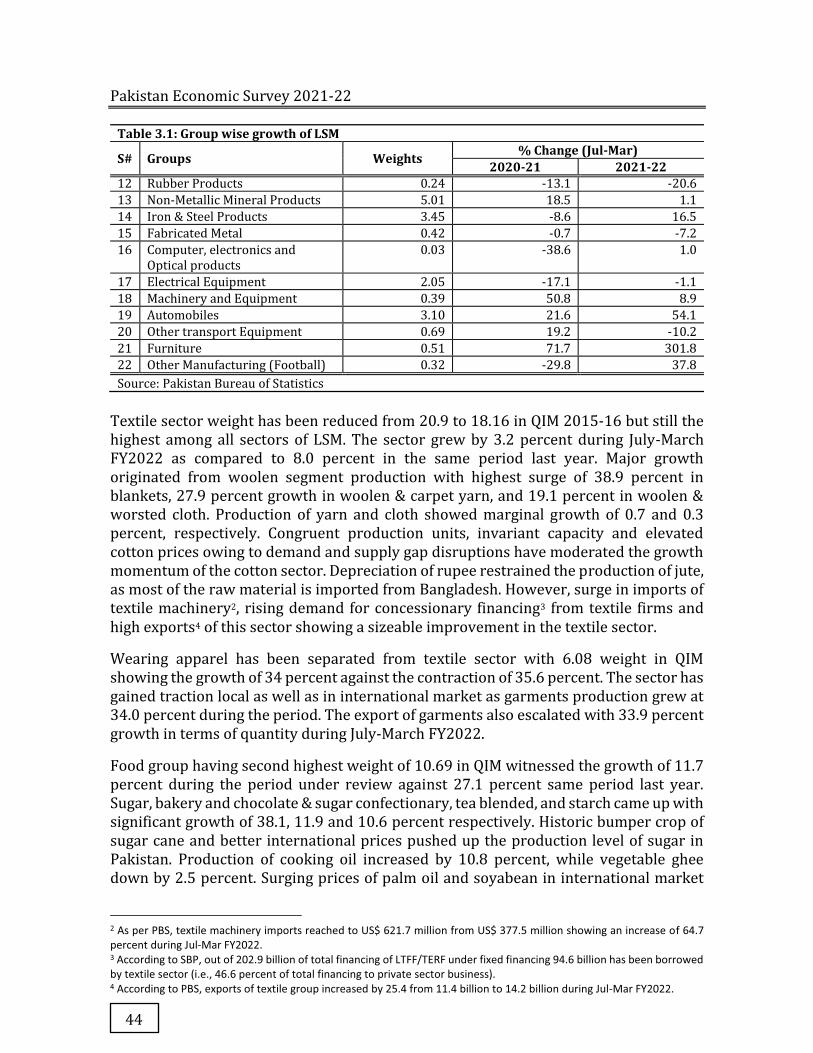
Pakistan Economic Survey 2021-22
44
Table 3.1: Group wise growth of LSM
S# Groups Weights % Change (Jul-Mar) 2020-21 2021-22
12 Rubber Products 0.24 -13.1 -20.6
13 Non-Metallic Mineral Products 5.01 18.5 1.1
14 Iron & Steel Products 3.45 -8.6 16.5
15 Fabricated Metal 0.42 -0.7 -7.2
16 Computer, electronics and Optical products
0.03 -38.6 1.0
17 Electrical Equipment 2.05 -17.1 -1.1
18 Machinery and Equipment 0.39 50.8 8.9
19 Automobiles 3.10 21.6 54.1
20 Other transport Equipment 0.69 19.2 -10.2
21 Furniture 0.51 71.7 301.8
22 Other Manufacturing (Football) 0.32 -29.8 37.8
Source: Pakistan Bureau of Statistics
Textile sector weight has been reduced from 20.9 to 18.16 in QIM 2015-16 but still the highest among all sectors of LSM. The sector grew by 3.2 percent during July-March FY2022 as compared to 8.0 percent in the same period last year. Major growth originated from woolen segment production with highest surge of 38.9 percent in blankets, 27.9 percent growth in woolen & carpet yarn, and 19.1 percent in woolen & worsted cloth. Production of yarn and cloth showed marginal growth of 0.7 and 0.3 percent, respectively. Congruent production units, invariant capacity and elevated cotton prices owing to demand and supply gap disruptions have moderated the growth momentum of the cotton sector. Depreciation of rupee restrained the production of jute, as most of the raw material is imported from Bangladesh. However, surge in imports of textile machinery2, rising demand for concessionary financing3 from textile firms and high exports4 of this sector showing a sizeable improvement in the textile sector.
Wearing apparel has been separated from textile sector with 6.08 weight in QIM showing the growth of 34 percent against the contraction of 35.6 percent. The sector has gained traction local as well as in international market as garments production grew at 34.0 percent during the period. The export of garments also escalated with 33.9 percent growth in terms of quantity during July-March FY2022.
Food group having second highest weight of 10.69 in QIM witnessed the growth of 11.7 percent during the period under review against 27.1 percent same period last year. Sugar, bakery and chocolate & sugar confectionary, tea blended, and starch came up with significant growth of 38.1, 11.9 and 10.6 percent respectively. Historic bumper crop of sugar cane and better international prices pushed up the production level of sugar in Pakistan. Production of cooking oil increased by 10.8 percent, while vegetable ghee down by 2.5 percent. Surging prices of palm oil and soyabean in international market
2 As per PBS, textile machinery imports reached to US$ 621.7 million from US$ 377.5 million showing an increase of 64.7 percent during Jul-Mar FY2022. 3 According to SBP, out of 202.9 billion of total financing of LTFF/TERF under fixed financing 94.6 billion has been borrowed by textile sector (i.e., 46.6 percent of total financing to private sector business). 4 According to PBS, exports of textile group increased by 25.4 from 11.4 billion to 14.2 billion during Jul-Mar FY2022.
Manufacturing and Mining
45
accompanied with the depreciating Pakistani currency against the dollar were the major factors responsible for lower level of production. Production of wheat & rice milling stood negative at 2.6 percent during the period under review.
Coke and Petroleum products marginally grew by 2.0 percent in July-March FY2022 against 12.3 percent same period last year. High global energy prices depressed the overall growth momentum. However, pickup in economic activities especially automobile and resultant increase in transportation activities and oil sales (which showed an increase of 14.9 percent during July-March FY2022 and clocked at 16.3 million tonnes) partially offset the impact of high fuel prices. Besides, production of jute batching oil, jet fuel oil, kerosene oil, diesel and Solvant Naptha remained encouraging as demand spurred from transportation.
Automobile sector marked a vigorous growth of 54.1 percent during July-March FY2022 against 21.6 percent growth last year. New Auto Policy, to promote new technologies including Electric Vehicles (EVs) and Hybrid, and accommodative monetary policy to promote auto financing paved the way to grew automobiles production. Besides, tax incentives to promote locally manufactured cars also pent-up the demand as well as the production of the given sector such as locally manufactured hybrid sales tax reduced from 12.5 percent to 8 percent and FED reduced by 2.5 percent upto 1300cc for locally manufactured cars. Moreover, during July-March FY2022 car production and sale increased by 56.7 and 53.8 percent, respectively. Trucks & Buses production and sale increased by 66.0 and 54.0 percent and tractor production and sale increased by 13.5 and 12.1 percent, respectively. Though the relief measures in form of waiving of taxes pushed up the sector, in the meanwhile reduced the revenues of national exchequer and built the pressure on imports besides creating uncertainty in market sentiments.
Iron & Steel production jumped by 16.5 percent during the period under review against the contraction of 8.6 percent in the same period last year. Billets/Ingots, mainly used in construction industry, grew by 32.8 and H/C.R.Sheets/Strips/Coils/plates increased by 7.9 percent. Both reflect the growth momentum in automobile and construction-allied sectors. Non-metallic Mineral Products inched up 1.1 percent as compared to 18.5 percent increase last year.
Chemicals is subdivided into two components i.e., chemical products and fertilizers with the total weight of 6.48 in QIM. The chemical products showed the growth of 15.2 percent against 14.5 percent same period last year. Sulphuric acid, hydrochloric acid, soda ash, and toilet soaps remained the major contributors to overall growth of chemicals. On the other hand, Fertilizers production showed a meager growth of 3.3 percent as compared to 5.9 percent growth during last year.
Pharmaceuticals growth witnessed a dip of 0.4 percent during July-March FY2022, against the growth 10.5 percent last year, triggered by hefty decline observed in capsules, injections, tablets and galenicals. Electrical equipment declined by 1.1 percent against the hefty shrink of 17.1 percent.
Paper and Board production increased by 8.5 percent during July-March FY2022 as compared to dip of 0.6 percent last year. Rubber Products nosedived by 20.6 percent

Pakistan Economic Survey 2021-22
46
during July-March FY2022 as compared to 13.1 percent growth in the same period last year. Wood Products jumped by 157.5 percent as compared to contraction of 46.2 percent last year. Production of Plywood remained the sole contributor to overall pick up in the output of wood. Furniture production drastically increased by 301.8 against 71.7 percent in the same period last year.
Other manufacturing, particularly footballs production substantially increased by 37.8 percent as compared to 29.8 decline in the corresponding period last year. The sector picked up the growth by pent-up demand in international market and marked a growth of 40.3 percent in exports.
Selected items of Large-Scale Manufacturing are given in Table 3.2.
Table-3.2: Production of selected industrial items of Large-Scale Manufacturing S# Items Unit Weights July-March % Change % Point
Contribution 2020-21 2021-22 1 Deepfreezers (Nos.) 0.167 68,947 84,205 22.13 0.04
2 Jeeps and Cars (Nos.) 2.715 114,617 177,757 55.09 1.41
3 Refrigerators (Nos.) 0.246 928,170 1,024,335 10.36 0.02
4 Upper leather (000 sq.m.) 0.398 13,324 10,966 -17.70 -0.06
5 Cement (000 tonnes) 4.650 37,619 36,543 -2.86 -0.21
6 Liquids/syrups (000 Litres) 1.617 86,212 144,638 67.77 1.30
7 Phos. fertilizers (N tonnes) 0.501 545,612 601,184 10.19 0.06
8 Tablets (000 Nos.) 2.725 20,380,940 14,695,108 -27.90 -0.85
9 Cooking oil (tonnes) 1.476 334,107 370,181 10.80 0.21
10 Nit. fertilizers (N tonnes) 3.429 2,450,066 2,505,757 2.27 0.09
11 Cotton cloth (000 sq.m.) 7.294 786,042 788,285 0.29 0.02
12 Vegetable ghee (tonnes) 1.375 1,087,827 1,060,111 -2.55 -0.05
13 Cotton yarn (tonnes) 8.882 2,577,675 2,594,690 0.66 0.07
14 Sugar (tonnes) 3.427 5,618,976 7,759,825 38.10 2.13
15 Tea blended (tonnes) 0.485 100,566 112,544 11.91 0.06
16 Petroleum Products* (000 Litres) 6.658 - - 2.10 0.01
17 Cigarettes (million No) 2.072 39,473 46,070 16.71 0.38
*Due to different weights within Petroleum products, total output cannot be calculated.
Source: Pakistan Bureau of Statistics (PBS)
3.3 Textile Industry
Textile is the most important manufacturing sector of Pakistan and has the longest production chain, with inherent potential for value addition at each stage of processing, from cotton to ginning, spinning, fabric, dyeing and finishing, made-ups and garments. This sector contributes nearly one-fourth of industrial value-added and provides employment to about 40 percent of industrial labor force. Barring seasonal and cyclical fluctuations, textiles products have maintained an average share of about 61.24 percent in national exports. The export performance of textile sector during the period under review is given in Table 3.3.
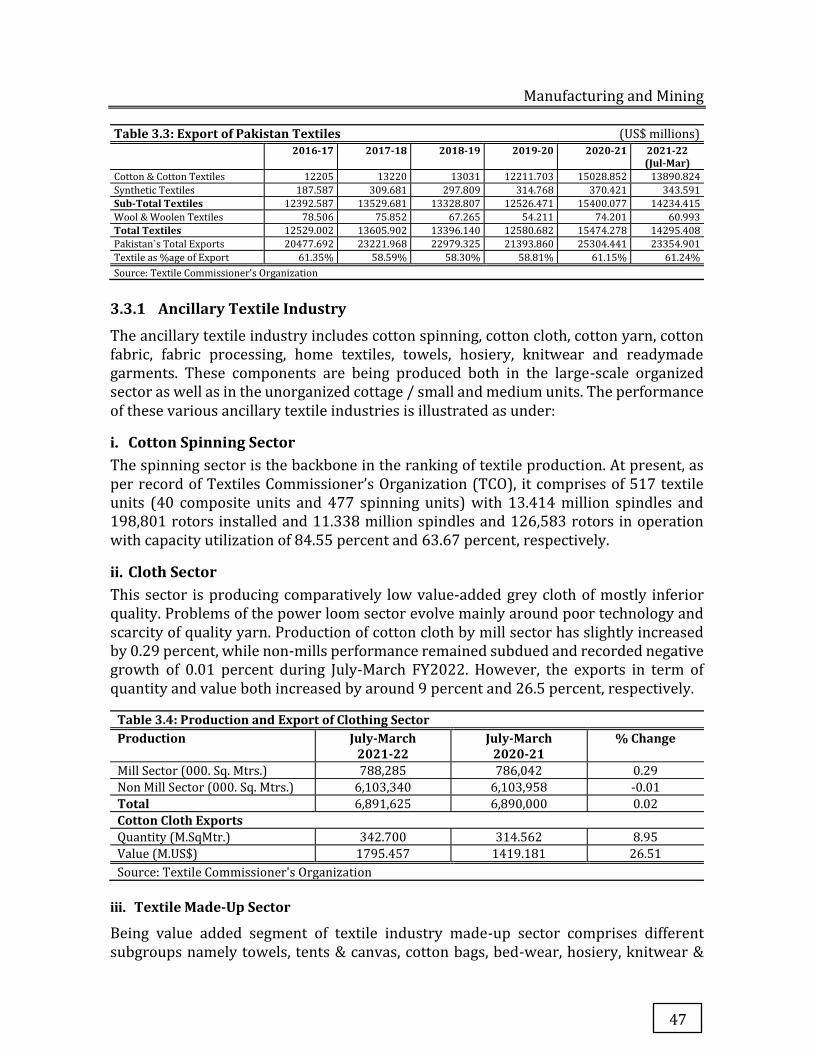
Manufacturing and Mining
47
Table 3.3: Export of Pakistan Textiles (US$ millions)
2016-17 2017-18 2018-19 2019-20
2020-21 2021-22 (Jul-Mar)
Cotton & Cotton Textiles 12205 13220 13031 12211.703 15028.852 13890.824
Synthetic Textiles 187.587 309.681 297.809 314.768 370.421 343.591
Sub-Total Textiles 12392.587 13529.681 13328.807 12526.471 15400.077 14234.415 Wool & Woolen Textiles 78.506 75.852 67.265 54.211 74.201 60.993
Total Textiles 12529.002 13605.902 13396.140 12580.682 15474.278 14295.408 Pakistan`s Total Exports 20477.692 23221.968 22979.325 21393.860 25304.441 23354.901
Textile as %age of Export 61.35% 58.59% 58.30% 58.81% 61.15% 61.24%
Source: Textile Commissioner's Organization
3.3.1 Ancillary Textile Industry
The ancillary textile industry includes cotton spinning, cotton cloth, cotton yarn, cotton fabric, fabric processing, home textiles, towels, hosiery, knitwear and readymade garments. These components are being produced both in the large-scale organized sector as well as in the unorganized cottage / small and medium units. The performance of these various ancillary textile industries is illustrated as under:
i. Cotton Spinning Sector The spinning sector is the backbone in the ranking of textile production. At present, as per record of Textiles Commissioner’s Organization (TCO), it comprises of 517 textile units (40 composite units and 477 spinning units) with 13.414 million spindles and 198,801 rotors installed and 11.338 million spindles and 126,583 rotors in operation with capacity utilization of 84.55 percent and 63.67 percent, respectively.
ii. Cloth Sector This sector is producing comparatively low value-added grey cloth of mostly inferior quality. Problems of the power loom sector evolve mainly around poor technology and scarcity of quality yarn. Production of cotton cloth by mill sector has slightly increased by 0.29 percent, while non-mills performance remained subdued and recorded negative growth of 0.01 percent during July-March FY2022. However, the exports in term of quantity and value both increased by around 9 percent and 26.5 percent, respectively.
Table 3.4: Production and Export of Clothing Sector Production July-March
2021-22 July-March
2020-21 % Change
Mill Sector (000. Sq. Mtrs.) 788,285 786,042 0.29
Non Mill Sector (000. Sq. Mtrs.) 6,103,340 6,103,958 -0.01
Total 6,891,625 6,890,000 0.02
Cotton Cloth Exports Quantity (M.SqMtr.) 342.700 314.562 8.95
Value (M.US$) 1795.457 1419.181 26.51
Source: Textile Commissioner's Organization
iii. Textile Made-Up Sector
Being value added segment of textile industry made-up sector comprises different subgroups namely towels, tents & canvas, cotton bags, bed-wear, hosiery, knitwear &
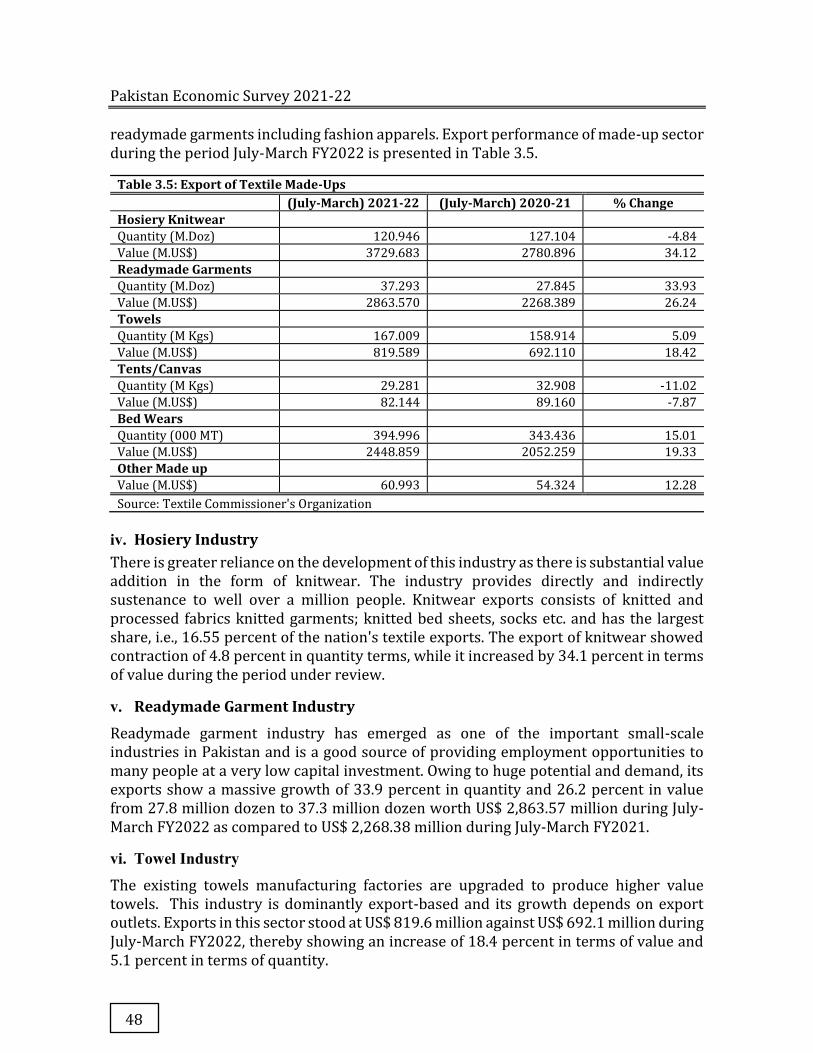
Pakistan Economic Survey 2021-22
48
readymade garments including fashion apparels. Export performance of made-up sector during the period July-March FY2022 is presented in Table 3.5.
Table 3.5: Export of Textile Made-Ups (July-March) 2021-22 (July-March) 2020-21 % Change
Hosiery Knitwear
Quantity (M.Doz) 120.946 127.104 -4.84
Value (M.US$) 3729.683 2780.896 34.12
Readymade Garments
Quantity (M.Doz) 37.293 27.845 33.93
Value (M.US$) 2863.570 2268.389 26.24
Towels
Quantity (M Kgs) 167.009 158.914 5.09
Value (M.US$) 819.589 692.110 18.42
Tents/Canvas
Quantity (M Kgs) 29.281 32.908 -11.02
Value (M.US$) 82.144 89.160 -7.87
Bed Wears
Quantity (000 MT) 394.996 343.436 15.01
Value (M.US$) 2448.859 2052.259 19.33
Other Made up
Value (M.US$) 60.993 54.324 12.28
Source: Textile Commissioner's Organization
iv. Hosiery Industry There is greater reliance on the development of this industry as there is substantial value addition in the form of knitwear. The industry provides directly and indirectly sustenance to well over a million people. Knitwear exports consists of knitted and processed fabrics knitted garments; knitted bed sheets, socks etc. and has the largest share, i.e., 16.55 percent of the nation's textile exports. The export of knitwear showed contraction of 4.8 percent in quantity terms, while it increased by 34.1 percent in terms of value during the period under review.
v. Readymade Garment Industry
Readymade garment industry has emerged as one of the important small-scale industries in Pakistan and is a good source of providing employment opportunities to many people at a very low capital investment. Owing to huge potential and demand, its exports show a massive growth of 33.9 percent in quantity and 26.2 percent in value from 27.8 million dozen to 37.3 million dozen worth US$ 2,863.57 million during July-March FY2022 as compared to US$ 2,268.38 million during July-March FY2021.
vi. Towel Industry
The existing towels manufacturing factories are upgraded to produce higher value towels. This industry is dominantly export-based and its growth depends on export outlets. Exports in this sector stood at US$ 819.6 million against US$ 692.1 million during July-March FY2022, thereby showing an increase of 18.4 percent in terms of value and 5.1 percent in terms of quantity.
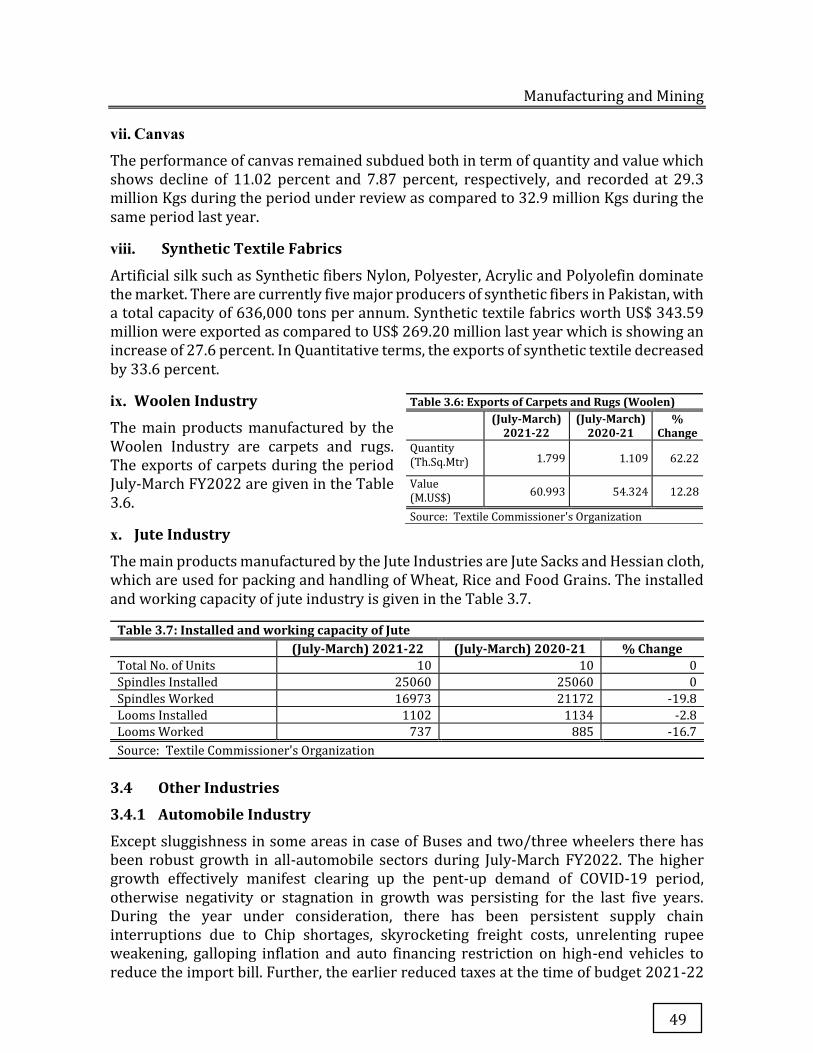
Manufacturing and Mining
49
vii. Canvas
The performance of canvas remained subdued both in term of quantity and value which shows decline of 11.02 percent and 7.87 percent, respectively, and recorded at 29.3 million Kgs during the period under review as compared to 32.9 million Kgs during the same period last year.
viii. Synthetic Textile Fabrics
Artificial silk such as Synthetic fibers Nylon, Polyester, Acrylic and Polyolefin dominate the market. There are currently five major producers of synthetic fibers in Pakistan, with a total capacity of 636,000 tons per annum. Synthetic textile fabrics worth US$ 343.59 million were exported as compared to US$ 269.20 million last year which is showing an increase of 27.6 percent. In Quantitative terms, the exports of synthetic textile decreased by 33.6 percent.
ix. Woolen Industry
The main products manufactured by the Woolen Industry are carpets and rugs. The exports of carpets during the period July-March FY2022 are given in the Table 3.6.
x. Jute Industry
The main products manufactured by the Jute Industries are Jute Sacks and Hessian cloth, which are used for packing and handling of Wheat, Rice and Food Grains. The installed and working capacity of jute industry is given in the Table 3.7.
Table 3.7: Installed and working capacity of Jute (July-March) 2021-22 (July-March) 2020-21 % Change Total No. of Units 10 10 0
Spindles Installed 25060 25060 0
Spindles Worked 16973 21172 -19.8
Looms Installed 1102 1134 -2.8
Looms Worked 737 885 -16.7
Source: Textile Commissioner's Organization
3.4 Other Industries
3.4.1 Automobile Industry
Except sluggishness in some areas in case of Buses and two/three wheelers there has been robust growth in all-automobile sectors during July-March FY2022. The higher growth effectively manifest clearing up the pent-up demand of COVID-19 period, otherwise negativity or stagnation in growth was persisting for the last five years. During the year under consideration, there has been persistent supply chain interruptions due to Chip shortages, skyrocketing freight costs, unrelenting rupee weakening, galloping inflation and auto financing restriction on high-end vehicles to reduce the import bill. Further, the earlier reduced taxes at the time of budget 2021-22
Table 3.6: Exports of Carpets and Rugs (Woolen) (July-March)
2021-22 (July-March)
2020-21 %
Change Quantity (Th.Sq.Mtr) 1.799 1.109 62.22
Value (M.US$)
60.993 54.324 12.28
Source: Textile Commissioner's Organization

Pakistan Economic Survey 2021-22
50
were reversed in the subsequent mini-budget thus frustrating the possible impetus to growth.
New Auto Industry Development and Export Policy 2021-26 has been announced Besides Make in Pakistan notion, in the new policy, interalia, Meri Gari Scheme, New Product Policy and setting up of export targets have been introduced. All these measures are encouraging, and it is expected that these initiatives would soon see the light of day. However, in the forthcoming outlook the demand would weaken, as disposable incomes would decline with higher inflation, and higher exchange rates and increasing interest rates, amongst other factors.
The august performance has been observed in automobile sector during the period of July-March FY2022 (Table 3.8). It was the latent demand for motor vehicles that showed about 50 percent plus growth. Also, in the heavy commercial vehicles, there is substantial growth in trucks as the medium size trucks, around 5 ton, unexpectedly became popular due to affordability and expansion of e-commerce. Additionally, number of small trucks signed up at a reduced rate of 5 percent in response to Kamyab Jawan Scheme. More market expansion is expected owing to inbuilt confidence by the current investors as well as the new entrants in bringing locally produced hybrid vehicles. Therefore, all projections cast a positive outlook for the industry.
In case of passenger cars, the production and sales are up by 57 percent and 54 percent with 166,768 and 172,612 units, respectively. In this regard, higher growth has been observed in up to 800cc and up to 1000cc segments registering 77 percent and 65 percent growth, respectively. Growth in exceeding 1000cc segment was 35 percent. For similar reasons, the production and the sales of light commercial vehicles (LCV) and SUVs registered increase by 44 percent and 46 percent, respectively. In the SUV and SUV crossover segment two new products appear from Beijing Automotive Industry, BAIC BJ40L and BAIC X25 with modest numbers which are expected to grow in time.
Farm tractor sector has shown growth with production and the sales up by 13.5 percent and 12 percent respectively. This pleasant upward surge was due to overall growth in agriculture sector ensuing better crop prices and consequent more buying power of the farmers. However, these numbers are not even close to the highest numbers this industry had achieved in the past.
The two/three wheelers sector showed modest fall in production and the sales by 3.5 percent and 4.1 percent respectively. This fall is due intra-industry production losses by some units, while other units have shown their natural growth. Two/three wheelers offers most economical public transport alternate for the lower income group, however, at same time, it is extremely price sensitive. Massive exchange rate losses kicked off inflationary conditions resulting inevitable price increase. Still, this sector offers most preferred means of transport and best alternative in the absence of Public Transport in the cities and thus holds a dependable and continued potential for growth in the coming years.
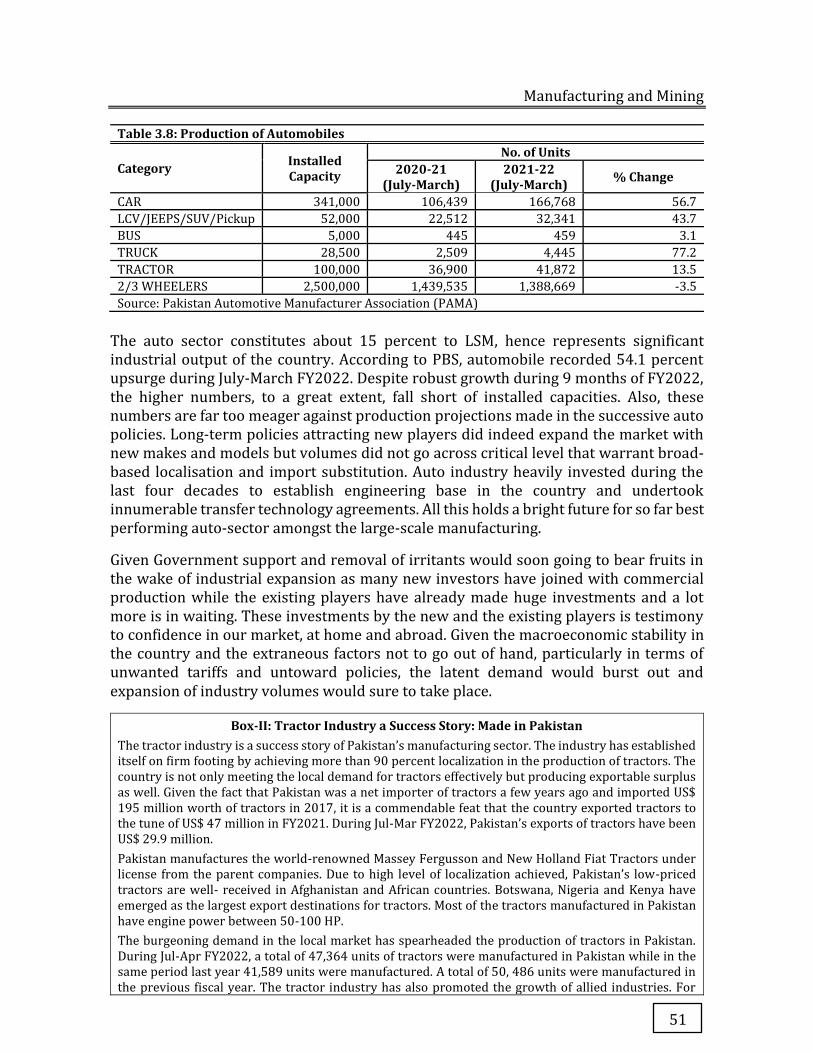
Manufacturing and Mining
51
Table 3.8: Production of Automobiles
Category Installed Capacity
No. of Units 2020-21
(July-March) 2021-22
(July-March) % Change
CAR 341,000 106,439 166,768 56.7
LCV/JEEPS/SUV/Pickup 52,000 22,512 32,341 43.7
BUS 5,000 445 459 3.1
TRUCK 28,500 2,509 4,445 77.2
TRACTOR 100,000 36,900 41,872 13.5
2/3 WHEELERS 2,500,000 1,439,535 1,388,669 -3.5
Source: Pakistan Automotive Manufacturer Association (PAMA)
The auto sector constitutes about 15 percent to LSM, hence represents significant industrial output of the country. According to PBS, automobile recorded 54.1 percent upsurge during July-March FY2022. Despite robust growth during 9 months of FY2022, the higher numbers, to a great extent, fall short of installed capacities. Also, these numbers are far too meager against production projections made in the successive auto policies. Long-term policies attracting new players did indeed expand the market with new makes and models but volumes did not go across critical level that warrant broad-based localisation and import substitution. Auto industry heavily invested during the last four decades to establish engineering base in the country and undertook innumerable transfer technology agreements. All this holds a bright future for so far best performing auto-sector amongst the large-scale manufacturing.
Given Government support and removal of irritants would soon going to bear fruits in the wake of industrial expansion as many new investors have joined with commercial production while the existing players have already made huge investments and a lot more is in waiting. These investments by the new and the existing players is testimony to confidence in our market, at home and abroad. Given the macroeconomic stability in the country and the extraneous factors not to go out of hand, particularly in terms of unwanted tariffs and untoward policies, the latent demand would burst out and expansion of industry volumes would sure to take place.
Box-II: Tractor Industry a Success Story: Made in Pakistan The tractor industry is a success story of Pakistan’s manufacturing sector. The industry has established itself on firm footing by achieving more than 90 percent localization in the production of tractors. The country is not only meeting the local demand for tractors effectively but producing exportable surplus as well. Given the fact that Pakistan was a net importer of tractors a few years ago and imported US$ 195 million worth of tractors in 2017, it is a commendable feat that the country exported tractors to the tune of US$ 47 million in FY2021. During Jul-Mar FY2022, Pakistan’s exports of tractors have been US$ 29.9 million.
Pakistan manufactures the world-renowned Massey Fergusson and New Holland Fiat Tractors under license from the parent companies. Due to high level of localization achieved, Pakistan’s low-priced tractors are well- received in Afghanistan and African countries. Botswana, Nigeria and Kenya have emerged as the largest export destinations for tractors. Most of the tractors manufactured in Pakistan have engine power between 50-100 HP.
The burgeoning demand in the local market has spearheaded the production of tractors in Pakistan. During Jul-Apr FY2022, a total of 47,364 units of tractors were manufactured in Pakistan while in the same period last year 41,589 units were manufactured. A total of 50, 486 units were manufactured in the previous fiscal year. The tractor industry has also promoted the growth of allied industries. For

Pakistan Economic Survey 2021-22
52
example, the iron and steel sector are the major supplier of raw material to the tractor industry and its growth hinges on tractor production in Pakistan. Furthermore, tractor parts and raw material are also being exported worldwide as the allied industries are gradually finding their own feet.
The Agriculture Machinery sector, more specifically the tractor industry, is also promoting the development of SMEs in the engineering sector. Aside from a few big names, most of the manufacturers are small businesses that are successfully meeting the local demand. Some of these players have also established themselves in exports. They manufacture tools and implements that are attached with tractors such as front loaders etc. These implements are considered complementary parts of tractors and are essential for tillage and harvesting.
In the Engineering and Healthcare Show, organized by the MOC and TDAP in February 2022, Pakistan’s tractors and agriculture machinery were in the limelight. The interest of foreign delegates could be gauged from the fact that two deals worth more than US$ 200,000 were finalized on the spot. It is expected that Pakistan’s tractor exports will grow in the near future.
Source: Trade Development Authority of Pakistan
3.4.2 Fertilizer Industry
Fertilizer is an important and costly input responsible for 30 to 50 percent increase in the crop productivity. The overall objective is sustainability and growth in agricultural sector that should match the growing population for food security and the promotion of economic growth. There are nine urea manufacturing plants, one DAP, three NP, four SSP, two CAN, one SOP and two plants of blended NPKs having a total production capacity of 9,172 thousand tonnes per annum. Total fertilizer production during July-March FY2022 was 6,833 thousand tonnes which was 2.9 percent more as compared to the corresponding time of the last year. This increase in fertilizer production is attributed to supply of gas to Fauji Fertilizer Bin Qasim Limited (FFBL) Plant during winter season. Urea is main fertilizer having 70 percent share in total production. Installed production capacity of 6,307 thousand tonnes per annum is enough to meet local demand subject to the availability of uninterrupted gas and RLNG supply.
Nutrient offtake during July-March FY2022 remained 3,826 thousand tonnes which was 3.6 percent less than the corresponding period of the previous year. Nitrogen and phosphate offtake were 2,861 and 903 thousand tonnes, respectively, whereas Potash offtake was 63 thousand tonnes. Offtake of Nitrogen during current fiscal year increased slightly by 0.02 percent, while offtake of Phosphate decreased by 14.3 percent as compared to corresponding time frame of the last year.
Urea and DAP offtake remained 5,076 thousand tonnes and 1,534 thousand tonnes, respectively. Urea offtake increased by 6.5 percent while DAP offtake decreased by 18.6 percent as compared to the same period of the previous year.
3.4.3 Cement Industry
Cement industry of Pakistan remained under pressure since the beginning of FY2022. This was largely attributed to a revival in construction activities in the second half of 2020 as COVID-19 lockdowns were eased. Since then, the demand for cement was said to be ‘sluggish’ due to inflation and high commodity prices. It also pinned its marked fall in exports on political and economic instability in Afghanistan.
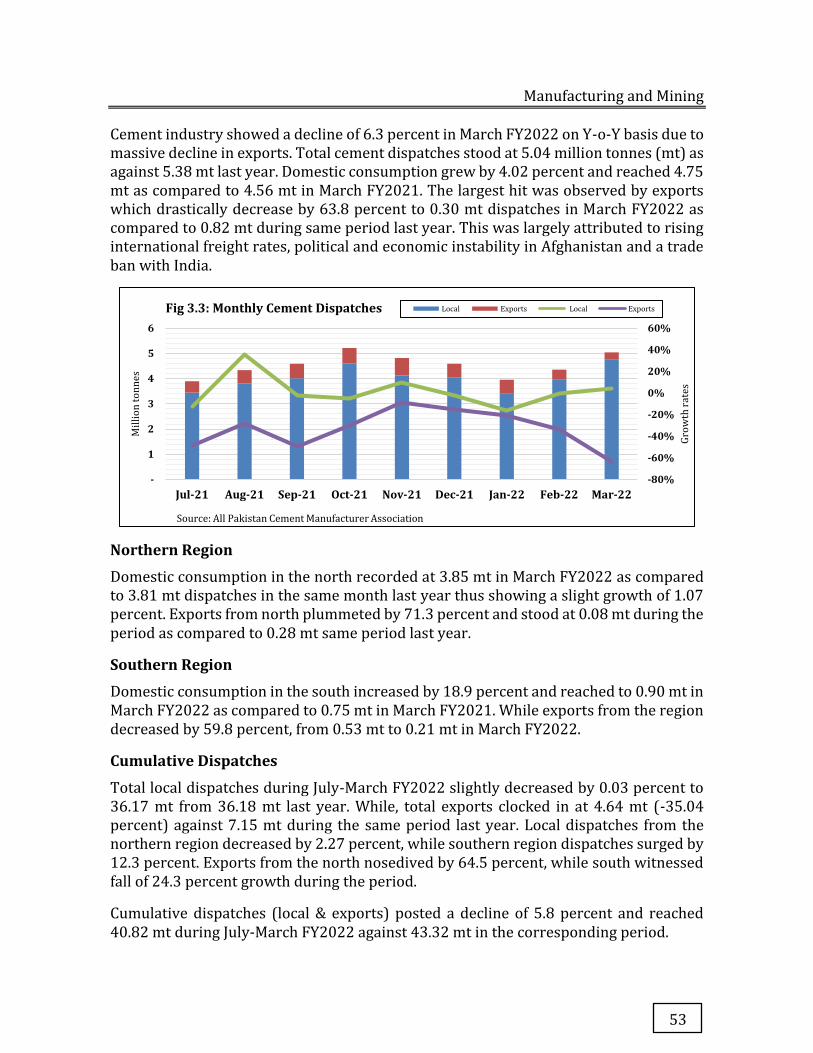
Manufacturing and Mining
53
Cement industry showed a decline of 6.3 percent in March FY2022 on Y-o-Y basis due to massive decline in exports. Total cement dispatches stood at 5.04 million tonnes (mt) as against 5.38 mt last year. Domestic consumption grew by 4.02 percent and reached 4.75 mt as compared to 4.56 mt in March FY2021. The largest hit was observed by exports which drastically decrease by 63.8 percent to 0.30 mt dispatches in March FY2022 as compared to 0.82 mt during same period last year. This was largely attributed to rising international freight rates, political and economic instability in Afghanistan and a trade ban with India.
Northern Region
Domestic consumption in the north recorded at 3.85 mt in March FY2022 as compared to 3.81 mt dispatches in the same month last year thus showing a slight growth of 1.07 percent. Exports from north plummeted by 71.3 percent and stood at 0.08 mt during the period as compared to 0.28 mt same period last year.
Southern Region
Domestic consumption in the south increased by 18.9 percent and reached to 0.90 mt in March FY2022 as compared to 0.75 mt in March FY2021. While exports from the region decreased by 59.8 percent, from 0.53 mt to 0.21 mt in March FY2022.
Cumulative Dispatches
Total local dispatches during July-March FY2022 slightly decreased by 0.03 percent to 36.17 mt from 36.18 mt last year. While, total exports clocked in at 4.64 mt (-35.04 percent) against 7.15 mt during the same period last year. Local dispatches from the northern region decreased by 2.27 percent, while southern region dispatches surged by 12.3 percent. Exports from the north nosedived by 64.5 percent, while south witnessed fall of 24.3 percent growth during the period.
Cumulative dispatches (local & exports) posted a decline of 5.8 percent and reached 40.82 mt during July-March FY2022 against 43.32 mt in the corresponding period.
-80%
-60%
-40%
-20%
0%
20%
40%
60%
-
1
2
3
4
5
6
Jul-21 Aug-21 Sep-21 Oct-21 Nov-21 Dec-21 Jan-22 Feb-22 Mar-22
Gro
wth
ra
tes
Mil
lio
n t
on
ne
s
Source: All Pakistan Cement Manufacturer Association
Fig 3.3: Monthly Cement Dispatches Local Exports Local Exports
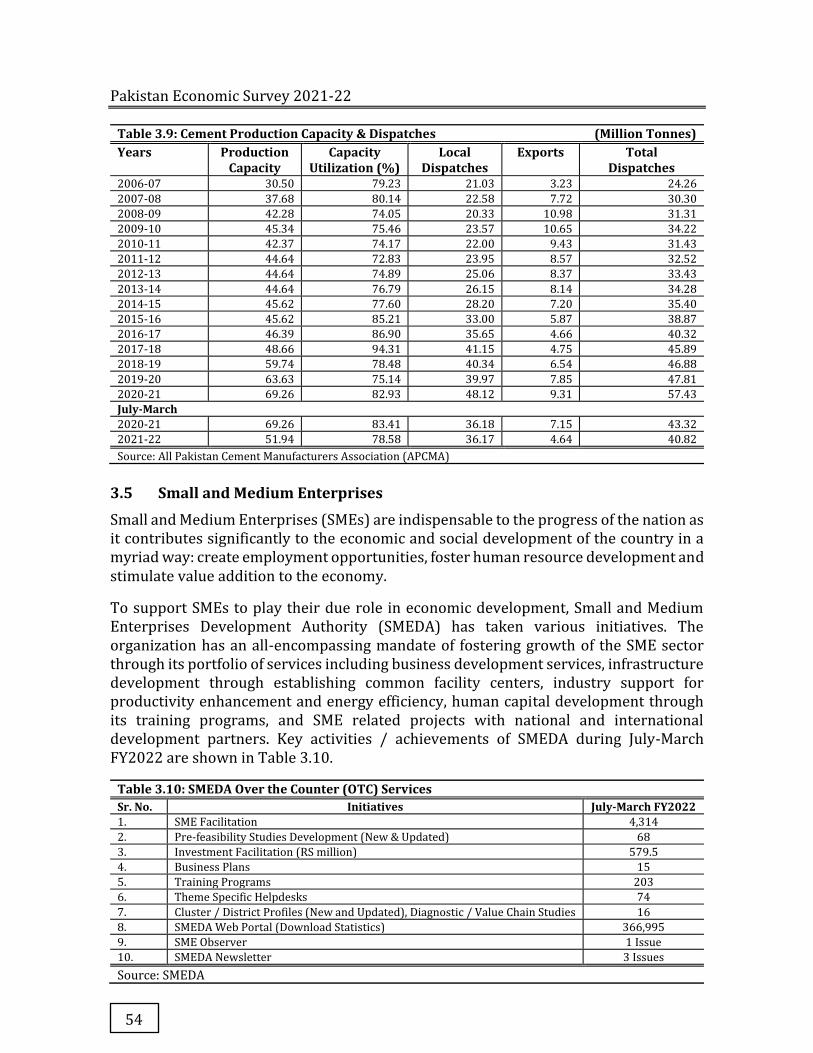
Pakistan Economic Survey 2021-22
54
Table 3.9: Cement Production Capacity & Dispatches (Million Tonnes) Years Production
Capacity Capacity
Utilization (%) Local
Dispatches Exports Total
Dispatches 2006-07 30.50 79.23 21.03 3.23 24.26
2007-08 37.68 80.14 22.58 7.72 30.30
2008-09 42.28 74.05 20.33 10.98 31.31
2009-10 45.34 75.46 23.57 10.65 34.22
2010-11 42.37 74.17 22.00 9.43 31.43
2011-12 44.64 72.83 23.95 8.57 32.52
2012-13 44.64 74.89 25.06 8.37 33.43
2013-14 44.64 76.79 26.15 8.14 34.28
2014-15 45.62 77.60 28.20 7.20 35.40
2015-16 45.62 85.21 33.00 5.87 38.87
2016-17 46.39 86.90 35.65 4.66 40.32
2017-18 48.66 94.31 41.15 4.75 45.89
2018-19 59.74 78.48 40.34 6.54 46.88
2019-20 63.63 75.14 39.97 7.85 47.81
2020-21 69.26 82.93 48.12 9.31 57.43
July-March 2020-21 69.26 83.41 36.18 7.15 43.32
2021-22 51.94 78.58 36.17 4.64 40.82
Source: All Pakistan Cement Manufacturers Association (APCMA)
3.5 Small and Medium Enterprises
Small and Medium Enterprises (SMEs) are indispensable to the progress of the nation as it contributes significantly to the economic and social development of the country in a myriad way: create employment opportunities, foster human resource development and stimulate value addition to the economy.
To support SMEs to play their due role in economic development, Small and Medium Enterprises Development Authority (SMEDA) has taken various initiatives. The organization has an all-encompassing mandate of fostering growth of the SME sector through its portfolio of services including business development services, infrastructure development through establishing common facility centers, industry support for productivity enhancement and energy efficiency, human capital development through its training programs, and SME related projects with national and international development partners. Key activities / achievements of SMEDA during July-March FY2022 are shown in Table 3.10.
Table 3.10: SMEDA Over the Counter (OTC) Services Sr. No. Initiatives July-March FY2022 1. SME Facilitation 4,314
2. Pre-feasibility Studies Development (New & Updated) 68
3. Investment Facilitation (RS million) 579.5
4. Business Plans 15
5. Training Programs 203
6. Theme Specific Helpdesks 74
7. Cluster / District Profiles (New and Updated), Diagnostic / Value Chain Studies 16
8. SMEDA Web Portal (Download Statistics) 366,995
9. SME Observer 1 Issue
10. SMEDA Newsletter 3 Issues
Source: SMEDA
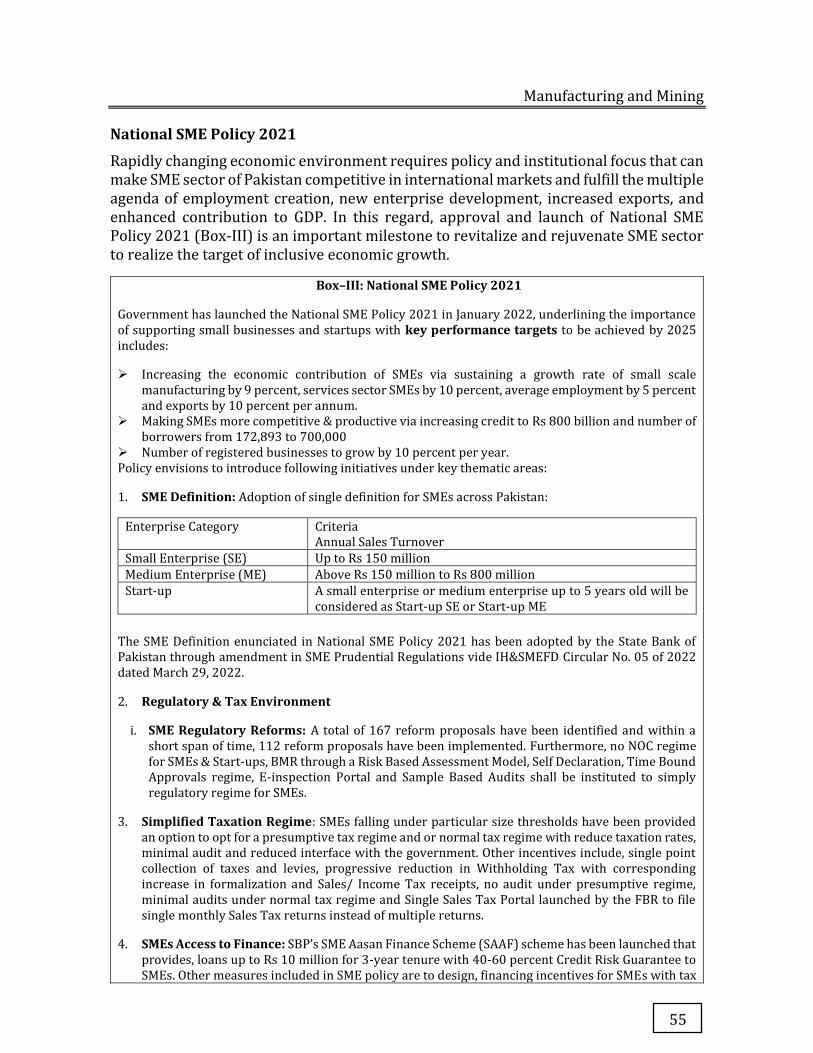
Manufacturing and Mining
55
National SME Policy 2021
Rapidly changing economic environment requires policy and institutional focus that can make SME sector of Pakistan competitive in international markets and fulfill the multiple agenda of employment creation, new enterprise development, increased exports, and enhanced contribution to GDP. In this regard, approval and launch of National SME Policy 2021 (Box-III) is an important milestone to revitalize and rejuvenate SME sector to realize the target of inclusive economic growth.
Box–III: National SME Policy 2021
Government has launched the National SME Policy 2021 in January 2022, underlining the importance of supporting small businesses and startups with key performance targets to be achieved by 2025 includes:
� Increasing the economic contribution of SMEs via sustaining a growth rate of small scale manufacturing by 9 percent, services sector SMEs by 10 percent, average employment by 5 percent and exports by 10 percent per annum.
� Making SMEs more competitive & productive via increasing credit to Rs 800 billion and number of borrowers from 172,893 to 700,000
� Number of registered businesses to grow by 10 percent per year. Policy envisions to introduce following initiatives under key thematic areas:
1. SME Definition: Adoption of single definition for SMEs across Pakistan:
Enterprise Category Criteria Annual Sales Turnover
Small Enterprise (SE) Up to Rs 150 million
Medium Enterprise (ME) Above Rs 150 million to Rs 800 million
Start-up A small enterprise or medium enterprise up to 5 years old will be considered as Start-up SE or Start-up ME
The SME Definition enunciated in National SME Policy 2021 has been adopted by the State Bank of Pakistan through amendment in SME Prudential Regulations vide IH&SMEFD Circular No. 05 of 2022 dated March 29, 2022.
2. Regulatory & Tax Environment
i. SME Regulatory Reforms: A total of 167 reform proposals have been identified and within a short span of time, 112 reform proposals have been implemented. Furthermore, no NOC regime for SMEs & Start-ups, BMR through a Risk Based Assessment Model, Self Declaration, Time Bound Approvals regime, E-inspection Portal and Sample Based Audits shall be instituted to simply regulatory regime for SMEs.
3. Simplified Taxation Regime: SMEs falling under particular size thresholds have been provided an option to opt for a presumptive tax regime and or normal tax regime with reduce taxation rates, minimal audit and reduced interface with the government. Other incentives include, single point collection of taxes and levies, progressive reduction in Withholding Tax with corresponding increase in formalization and Sales/ Income Tax receipts, no audit under presumptive regime, minimal audits under normal tax regime and Single Sales Tax Portal launched by the FBR to file single monthly Sales Tax returns instead of multiple returns.
4. SMEs Access to Finance: SBP’s SME Aasan Finance Scheme (SAAF) scheme has been launched that provides, loans up to Rs 10 million for 3-year tenure with 40-60 percent Credit Risk Guarantee to SMEs. Other measures included in SME policy are to design, financing incentives for SMEs with tax
Pakistan Economic Survey 2021-22
56
history, undertake specialized lending for micro and small enterprises, operationalization of Venture Capital and Credit Guarantee Company and such initiatives for promoting financial inclusion in the country.
5. Skills, Human Resource & Technology: A special focus has been placed on human resource development such as establishing National Skills Fund, undertaking skills mapping, support technology acquisition and research & development for technology upgradation, and developing model of labour market data management.
6. Infrastructure: Allocation of land in existing industrial estates on a land lease-based model is one of the pillars of the National SME Policy. For the purpose, 4,200 acres of land has been identified for SMEs with access to 19,500 plots to set-up business. Similarly, it is envisaged that identified plug and play infrastructure facilities will be made available to SMEs.
7. Entrepreneurship, Innovation & Incubation: To spur entrepreneurial activities, Policy focuses on creation and strengthening of legal frameworks for venture capital, equity financing, crowd-funding and other such avenues, scale-up incubation and acceleration programs and initiate entrepreneurship boot camps.
8. Business Development Services: Linking SMEs with Business Development Service Providers (BDSPs) on cost share basis and undertaking focused development initiatives for high growth SME sub-sectors will catalyze sectoral and cluster-based support for SMEs.
9. Women Entrepreneurship Development: A simplified taxation regime with 25 percent tax reduction in tax liability for income from business of women entrepreneurs has already been announced. Enhancing women’s access to finance shall be ensured through implementation of State Bank of Pakistan’s Banking on Equality Policy.
10. Market Access:
i. Participation of SMEs shall be supported in trade fairs, exhibitions & trade delegations. Furthermore, capacity of SMEs will be enhanced to make them export ready and for adopting digitization to capitalize upon the opportunities of a growing E-commerce market. In this regard, E - Tijarat Platform has been launched on February 21st, 2022 to facilitate SMEs.
ii. Public Procurement: Reservation in public procurement from SMEs, review of requirement of performance guarantees, bid bonds, securities and turnover restrictions, as well as Supplier/Contactors being bound to purchase a fixed percentage of business orders from SMEs are initiatives envisaged to be undertaken as part of implementation of the National SME Policy.
11. Institutional Framework
i. National Coordination Committee (NCC) on SMEs Development: NCC has been constituted to lead the agenda of SME development and ensure effective implementation of the National SME Policy 2021. The NCC is supported by Provincial Working Groups set up in each of the provinces.
ii. Institutional Strengthening of SMEDA a. Institutional Reform of SMEDA: SMEDA will be further strengthened to transform its
organizational potential. b. SME Registration Portal (SMERP)- Single Point Access to all Incentives: An SME
Registration Portal has been developed, which is integrated with NADRA, FBR, SECP and over time, other data gathering agencies. SMEs may register at the SME Registration Portal and apply for SME Size Certificate.
c. SME Development Fund: An SME Development Fund to the tune of PKR 30 billion shall be established.
d. Census of Economic Establishments / SME Census: Pakistan Bureau of Statistics (PBS) shall conduct Census of Economic Establishments.
Manufacturing and Mining
57
e. Advocacy: SMEDA shall continue to take a central role in SME advocacy and coordination of SME related efforts across the country.
f. Presence of SMEDA in Key Regulatory Arenas as a voice of SMEs
Source: SMEDA
National Business Development Program for SMEs (NBDP):
NBDP has been developed, for providing SME start-up support & business improvement through practical, on-ground services to SMEs. The project provides support in establishing new enterprises and building the capacity of existing enterprises through provision of Business Development Services, such as; marketing, technology, incubation, research & development and organizational development services. The program envisages to facilitate 314,901 SMEs, over a period of five years. The total cost of project is Rs 1,954.978 million out of which an allocation of Rs 400 million has been made for FY2022.
In addition, Early-Stage Start-up (ESS) grant has been launched in October 2021 under which ESS grants up to Rs 500,000 will be provided to support SMEs & Start-ups. During July-March FY2022, 1600 applications were received and are under evaluation process. Furthermore, SMEDA’s largest capacity building initiative comprising of 3,800 training programs during 5 years across Pakistan including Federal Capital, AJK & GB has also been launched under NBDP. Over 180 Theme & Sector-Specific training programs have been conducted with over 7,400 SME’s participants. In addition, Demand-Based Training and On-Premises Training Programs for SMEs are also executed at their business locations. Certification Program for the capacity building of Individual Business Development Service Provider (IBDSPs) by offering subsidy to cover up to the 80 percent of the program cost per IBDSP has also been initiated during the period.
1000 Industrial Stitching Units, All Over Pakistan
SMEDA is executing PSDP project sponsored by the Ministry of Commerce and Textile (Textile Division) to boost value addition in the field of textile garments by establishing industrial stitching units across the country. Financial assistance through Matching Grants is provided for establishing “Industrial Stitching Units (ISUs)”. Under this project, 60 percent of grant in the form of machinery is funded by the project and 40 percent cost is borne by the owner/entrepreneur of the stitching unit. The total cost of project is Rs 350.54 million out of which Rs 100 million has been allocated for FY2022. The target for the current Fiscal Year is to establish 50 ISUs. Grants application cycle has already been launched. Out of the total target of establishing 50 ISUs, 20 ISUs have been successfully established till 31st March, 2022 and the remaining ISUs are under process for completion.
UNDP-Small Business Interventions to Support Development of Clusters through CFCs
To develop clusters by establishing Common Facility Centers (CFCs), SMEDA and UNDP are jointly implementing Small Business Interventions Project. During the period, 4 and 3 CFCs were established at Khyber Pakhtunkhwa and Sindh respectively.
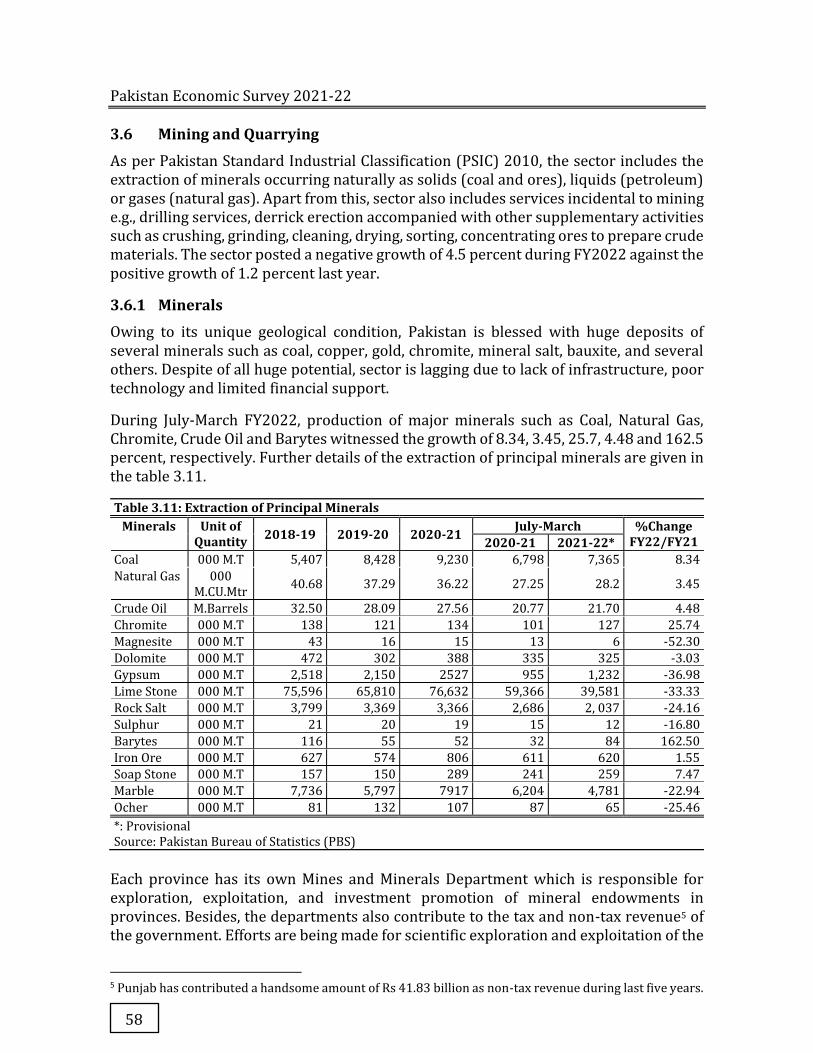
Pakistan Economic Survey 2021-22
58
3.6 Mining and Quarrying
As per Pakistan Standard Industrial Classification (PSIC) 2010, the sector includes the extraction of minerals occurring naturally as solids (coal and ores), liquids (petroleum) or gases (natural gas). Apart from this, sector also includes services incidental to mining e.g., drilling services, derrick erection accompanied with other supplementary activities such as crushing, grinding, cleaning, drying, sorting, concentrating ores to prepare crude materials. The sector posted a negative growth of 4.5 percent during FY2022 against the positive growth of 1.2 percent last year.
3.6.1 Minerals
Owing to its unique geological condition, Pakistan is blessed with huge deposits of several minerals such as coal, copper, gold, chromite, mineral salt, bauxite, and several others. Despite of all huge potential, sector is lagging due to lack of infrastructure, poor technology and limited financial support.
During July-March FY2022, production of major minerals such as Coal, Natural Gas, Chromite, Crude Oil and Barytes witnessed the growth of 8.34, 3.45, 25.7, 4.48 and 162.5 percent, respectively. Further details of the extraction of principal minerals are given in the table 3.11.
Table 3.11: Extraction of Principal Minerals Minerals Unit of
Quantity 2018-19 2019-20 2020-21 July-March %Change FY22/FY21 2020-21 2021-22*
Coal 000 M.T 5,407 8,428 9,230 6,798 7,365 8.34
Natural Gas 000 M.CU.Mtr
40.68 37.29 36.22 27.25 28.2 3.45
Crude Oil M.Barrels 32.50 28.09 27.56 20.77 21.70 4.48
Chromite 000 M.T 138 121 134 101 127 25.74
Magnesite 000 M.T 43 16 15 13 6 -52.30
Dolomite 000 M.T 472 302 388 335 325 -3.03
Gypsum 000 M.T 2,518 2,150 2527 955 1,232 -36.98
Lime Stone 000 M.T 75,596 65,810 76,632 59,366 39,581 -33.33
Rock Salt 000 M.T 3,799 3,369 3,366 2,686 2, 037 -24.16
Sulphur 000 M.T 21 20 19 15 12 -16.80
Barytes 000 M.T 116 55 52 32 84 162.50
Iron Ore 000 M.T 627 574 806 611 620 1.55
Soap Stone 000 M.T 157 150 289 241 259 7.47
Marble 000 M.T 7,736 5,797 7917 6,204 4,781 -22.94
Ocher 000 M.T 81 132 107 87 65 -25.46
*: Provisional Source: Pakistan Bureau of Statistics (PBS)
Each province has its own Mines and Minerals Department which is responsible for exploration, exploitation, and investment promotion of mineral endowments in provinces. Besides, the departments also contribute to the tax and non-tax revenue5 of the government. Efforts are being made for scientific exploration and exploitation of the
5 Punjab has contributed a handsome amount of Rs 41.83 billion as non-tax revenue during last five years.
Manufacturing and Mining
59
mineral resources in all provinces. Government has given prompt attention towards the development of minerals. Following initiatives have been taken during the period of July-March FY2022.
Major Initiatives of Punjab:
� Issuance of NOC(s) to 25 cement companies for grant of exploration licenses of limestone for installation of cement plants.
� 13 exploration licenses of rock salt have been granted for installation of Salt-based Industrial Plants.
� Establishment of Citizen Contact Center in collaboration with Punjab IT Board.
� Amendment in Punjab Mining Concession Rules 2002 in process.
� Drafting of Punjab Mines & Minerals Regulation Act 2022
� Initiatives/Project under Women in Mining.
Major Initiatives of Khyber Pakhtunkhwa
� Mining Cadastral System has been launched for online application process to enhance transparency in award of mineral titles, promote ease of doing business and facilitate investors in searching free mineral bearing areas.
� Under actions against idle leases, a total of 825 idle Mineral Titles has been identified against which legal proceedings have been started.
� Granite Zone Scheme in Dir Lower to be established and is in process of selecting/identifying a suitable site for granite zone.
� To undertake mapping across province, Geological mapping have been awarded to GSP.
Major Initiatives of Sindh
� Environmental Mapping of Mining areas of Sindh for the conservation of Minerals & Natural Resources has been initiated to develop a base map using high resolution latest satellite imageries.
� Feasibility study of Granite Deposits in District Tharparkar Sindh has been completed to explore and evaluate the resources to facilitate investors.
� The department intends to discover new minerals in Sind. For the purpose, a profile study for Identified Minerals for Reserves Estimation in Province of Sindh to be conducted in entire province.
Major Initiatives of Balochistan
� A project has been initiated in the name of “Automation of Royalty Regime in Mining Sector” to automate all the systems of the Department including License Management System, Rahdari/Challan Management System, Royalty Management System, Litigation and Inspection Module, etc. The online dash board will benefit investors and provide one window operation to thousands of investors and mine owners.
Pakistan Economic Survey 2021-22
60
� Several Mineral Titles and Concessions were held without any development, exploration or mining activity. Therefore, the Department initiated action against such concessions/titles and cancelled more than 100 expired/idle concessions/titles which have now become free for serious investors.
� The Government of Balochistan has enacted two companies in the name of Balochistan Mineral Exploration Company (BMEC) and Balochistan Mineral Resources Limited (BMRL). Both companies have been granted exploration licenses. During the current fiscal year BMRL has been granted Reconnaissance License (RL) for Solar Salt for which international investor has approached the company for Joint Venture which will pave the way for mining of solar salt on large scale for the first time in the province.
� The Department has initiated project “Capacity Building of the Officers of Mines & Minerals Development Department” under which 24 officers were given financial and management training at IBA Karachi in October 2021.
3.7 Conclusion
Accommodative fiscal and monetary measures continued in FY2022 provided incentives to the businesses to perform better. Thus, LSM picked up the momentum and staged the overall growth of 10.4 percent during July-March FY2022. The performance was broad based on the back of strong growth of high weighted sectors such as textile, food, wearing apparel, chemicals, automobile, tobacco, and iron & steel products. It is also pertinent to mention here that operationalization of special economic zones under CPEC in Nowshera, Pishin and Faisalabad further paved the way for fast tracked industrial development which is pivotal to achieve inclusive and sustainable economic growth.
Supply-side disruptions which were originated from pandemic still in place due to emergence of new variants. Ukraine-Russia conflict has further escalated this disruption. Thus, internationally commodity prices are increasing significantly along with intense uncertainty in the market confidence. All these may result in severe challenges in LSM performance as industrial production is mainly dependent on import of capital goods. Thus, the future prospects of industrial sector are uncertain as risks still prevails owing to geopolitical environment, surge in energy prices, and new variants.
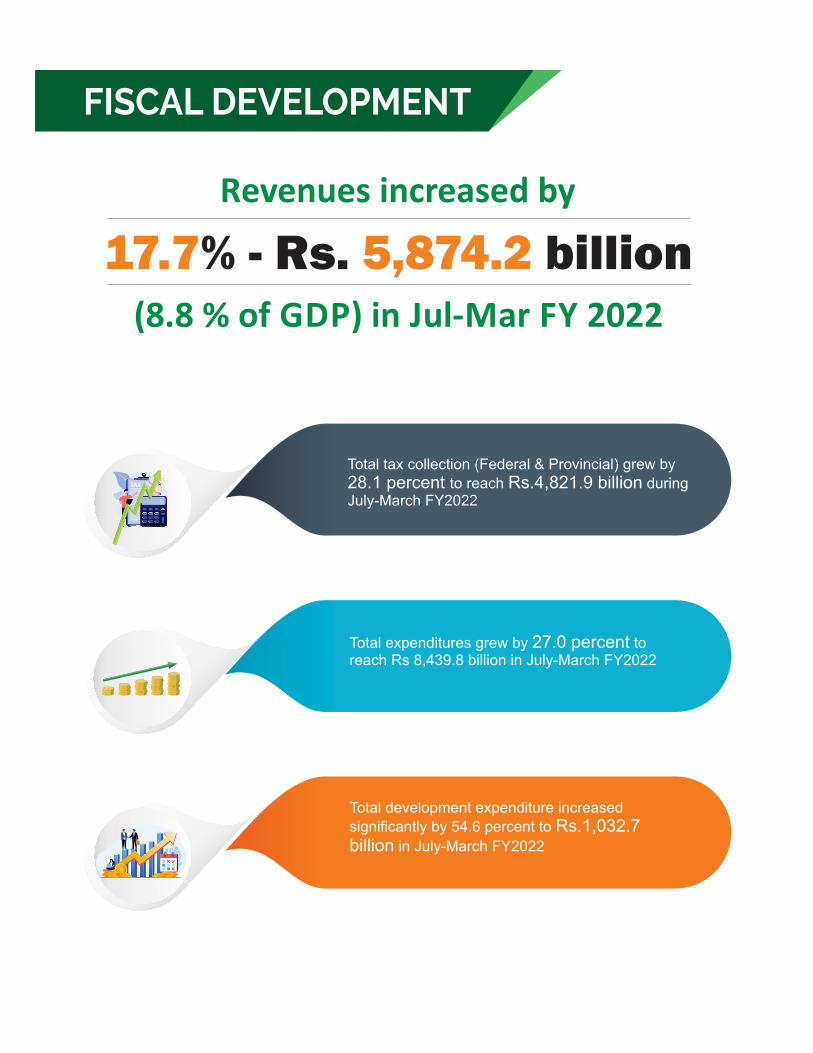

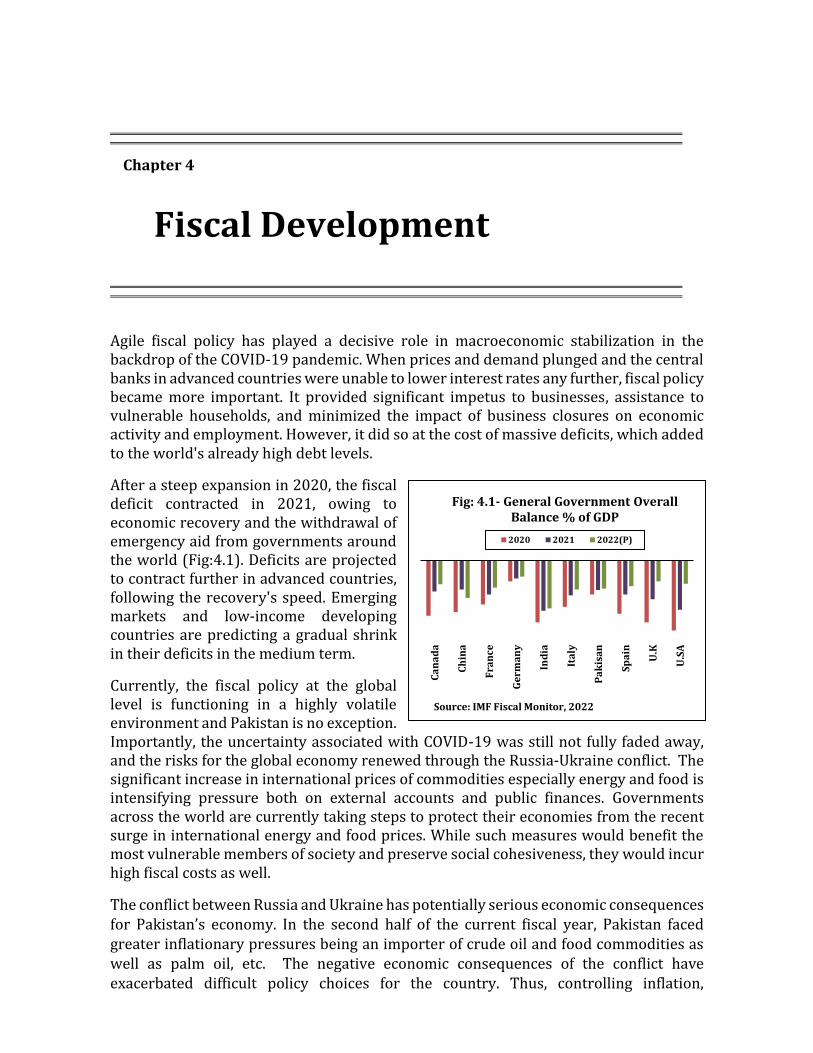
Agile fiscal policy has played a decisive role in macroeconomic stabilization in the backdrop of the COVID-19 pandemic. When prices and demand plunged and the central banks in advanced countries were unable to lower interest rates any further, fiscal policy became more important. It provided significant impetus to businesses, assistance to vulnerable households, and minimized the impact of business closures on economic activity and employment. However, it did so at the cost of massive deficits, which added to the world's already high debt levels.
After a steep expansion in 2020, the fiscal deficit contracted in 2021, owing to economic recovery and the withdrawal of emergency aid from governments around the world (Fig:4.1). Deficits are projected to contract further in advanced countries, following the recovery's speed. Emerging markets and low-income developing countries are predicting a gradual shrink in their deficits in the medium term.
Currently, the fiscal policy at the global level is functioning in a highly volatile environment and Pakistan is no exception. Importantly, the uncertainty associated with COVID-19 was still not fully faded away, and the risks for the global economy renewed through the Russia-Ukraine conflict. The significant increase in international prices of commodities especially energy and food is intensifying pressure both on external accounts and public finances. Governments across the world are currently taking steps to protect their economies from the recent surge in international energy and food prices. While such measures would benefit the most vulnerable members of society and preserve social cohesiveness, they would incur high fiscal costs as well.
The conflict between Russia and Ukraine has potentially serious economic consequences
for Pakistan’s economy. In the second half of the current fiscal year, Pakistan faced
greater inflationary pressures being an importer of crude oil and food commodities as
well as palm oil, etc. The negative economic consequences of the conflict have
exacerbated difficult policy choices for the country. Thus, controlling inflation,
Chapter 4
Fiscal Development
Cana
da
Chin
a
Fran
ce
Germ
any
Indi
a
Ital
y
Paki
san
Spai
n
U.K
U.S
A
Source: IMF Fiscal Monitor, 2022
Fig: 4.1- General Government Overall Balance % of GDP
2020 2021 2022(P)
Pakistan Economic Survey 2021-22
62
strengthening the economic recovery, supporting the vulnerable, and rebuilding fiscal
buffers, all became significantly important. In striking a balance between these policy
choices, the fiscal accounts have come under significant pressure during the current
fiscal year.
A quick review of fiscal indicators shows that FY2021 witnessed a strong performance
in fiscal indicators with a sizeable decline in fiscal deficit to 6.1 percent of GDP against
7.1 percent of GDP in FY2020. Nevertheless, additional spending under COVID-19 funds
for vaccine procurement, IPPs circular debt payment, social sector spending, and higher
development expenditures have kept the strain on this performance for the current
fiscal year. Nonetheless, the sector fared well during the first half of the current fiscal
year. The deficit contained to 2.0 percent of GDP which was similar to the deficit
recorded in the last year. However, during the second half of the current fiscal year, the
global economic challenges due to the Russia-Ukraine conflict and resultantly its impact
on international commodities prices, especially energy and food brought a plethora of
challenges to Pakistan’s economy. Particularly, the fiscal accounts came under further
pressure to provide relief to the masses. To offset the impact of increasing oil prices, tax
relief to the masses was provided in the shape of a reduction in the Petroleum
Development Levy (PDL) and the elimination of the sales tax on all POL goods. These
measures, combined with energy subsidies, have posed significant risks to fiscal
sustainability in an already constrained fiscal environment.
Although tax collection grew significantly during the period under review, however,
higher current and development expenditures widened the fiscal deficit by 55.3 percent
in July-March FY2022. In terms of GDP, the deficit has increased to 3.8 percent during
the period, up from 3.0 percent in the previous period. Similarly, the primary balance
posted a deficit of Rs 447.2 billion (0.7 percent of GDP) during July-March FY2022 as
compared to a surplus of Rs 451.8 billion (0.8 percent of GDP) last year. On the revenue
side, FBR was able to boost the collection by 28.5 percent to reach Rs 4,855.8 billion
during July-April FY2022 against Rs 3,777.7 billion collections in the same period of last
year. Total expenditure, on the other hand, increased by 27.0 percent and reached Rs
8,439.8 billion during July-March FY2022, against Rs 6,644.6 billion in the comparable
period of last year.
Despite significant challenges on the fiscal side, the government is striving hard to
restore fiscal sustainability by reducing the fiscal deficit in the medium to long term.
However, this can only be done through effective revenue mobilization and a prudent
expenditure strategy. In this regard, key priorities are to increase the tax to GDP ratio
through various tax policy and administration reforms and to curtail unnecessary
expenditures by adopting austerity measures. Furthermore, the focus is on the
rationalization of untargeted subsidies and reducing the losses of public sector
enterprises through better governance. These measures would provide significant
support to control the slippages in expenditures and increase the revenues, hence
lowering the fiscal deficit.
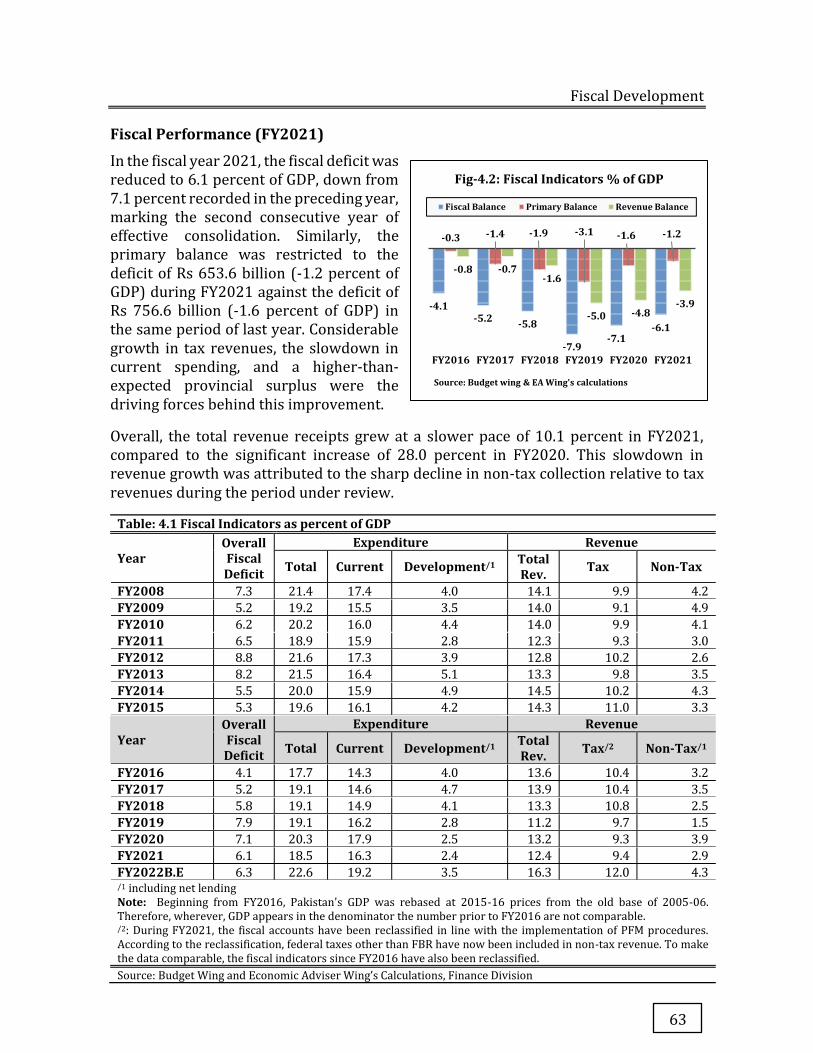
Fiscal Development
63
Fiscal Performance (FY2021)
In the fiscal year 2021, the fiscal deficit was reduced to 6.1 percent of GDP, down from 7.1 percent recorded in the preceding year, marking the second consecutive year of effective consolidation. Similarly, the primary balance was restricted to the deficit of Rs 653.6 billion (-1.2 percent of GDP) during FY2021 against the deficit of Rs 756.6 billion (-1.6 percent of GDP) in the same period of last year. Considerable growth in tax revenues, the slowdown in current spending, and a higher-than-expected provincial surplus were the driving forces behind this improvement.
Overall, the total revenue receipts grew at a slower pace of 10.1 percent in FY2021, compared to the significant increase of 28.0 percent in FY2020. This slowdown in revenue growth was attributed to the sharp decline in non-tax collection relative to tax revenues during the period under review.
Table: 4.1 Fiscal Indicators as percent of GDP
Year Overall Fiscal Deficit
Expenditure Revenue
Total Current Development/1 Total Rev. Tax Non-Tax
FY2008 7.3 21.4 17.4 4.0 14.1 9.9 4.2
FY2009 5.2 19.2 15.5 3.5 14.0 9.1 4.9
FY2010 6.2 20.2 16.0 4.4 14.0 9.9 4.1
FY2011 6.5 18.9 15.9 2.8 12.3 9.3 3.0
FY2012 8.8 21.6 17.3 3.9 12.8 10.2 2.6
FY2013 8.2 21.5 16.4 5.1 13.3 9.8 3.5
FY2014 5.5 20.0 15.9 4.9 14.5 10.2 4.3
FY2015 5.3 19.6 16.1 4.2 14.3 11.0 3.3
Year Overall Fiscal Deficit
Expenditure Revenue
Total Current Development/1 Total Rev. Tax/2 Non-Tax/1
FY2016 4.1 17.7 14.3 4.0 13.6 10.4 3.2
FY2017 5.2 19.1 14.6 4.7 13.9 10.4 3.5
FY2018 5.8 19.1 14.9 4.1 13.3 10.8 2.5
FY2019 7.9 19.1 16.2 2.8 11.2 9.7 1.5
FY2020 7.1 20.3 17.9 2.5 13.2 9.3 3.9
FY2021 6.1 18.5 16.3 2.4 12.4 9.4 2.9
FY2022B.E 6.3 22.6 19.2 3.5 16.3 12.0 4.3 /1 including net lending Note: Beginning from FY2016, Pakistan's GDP was rebased at 2015-16 prices from the old base of 2005-06. Therefore, wherever, GDP appears in the denominator the number prior to FY2016 are not comparable. /2: During FY2021, the fiscal accounts have been reclassified in line with the implementation of PFM procedures. According to the reclassification, federal taxes other than FBR have now been included in non-tax revenue. To make the data comparable, the fiscal indicators since FY2016 have also been reclassified.
Source: Budget Wing and Economic Adviser Wing’s Calculations, Finance Division
-4.1-5.2 -5.8
-7.9-7.1
-6.1
-0.3 -1.4 -1.9 -3.1 -1.6 -1.2
-0.8 -0.7-1.6
-5.0 -4.8-3.9
FY2016 FY2017 FY2018 FY2019 FY2020 FY2021
Source: Budget wing & EA Wing's calculations
Fig-4.2: Fiscal Indicators % of GDP
Fiscal Balance Primary Balance Revenue Balance
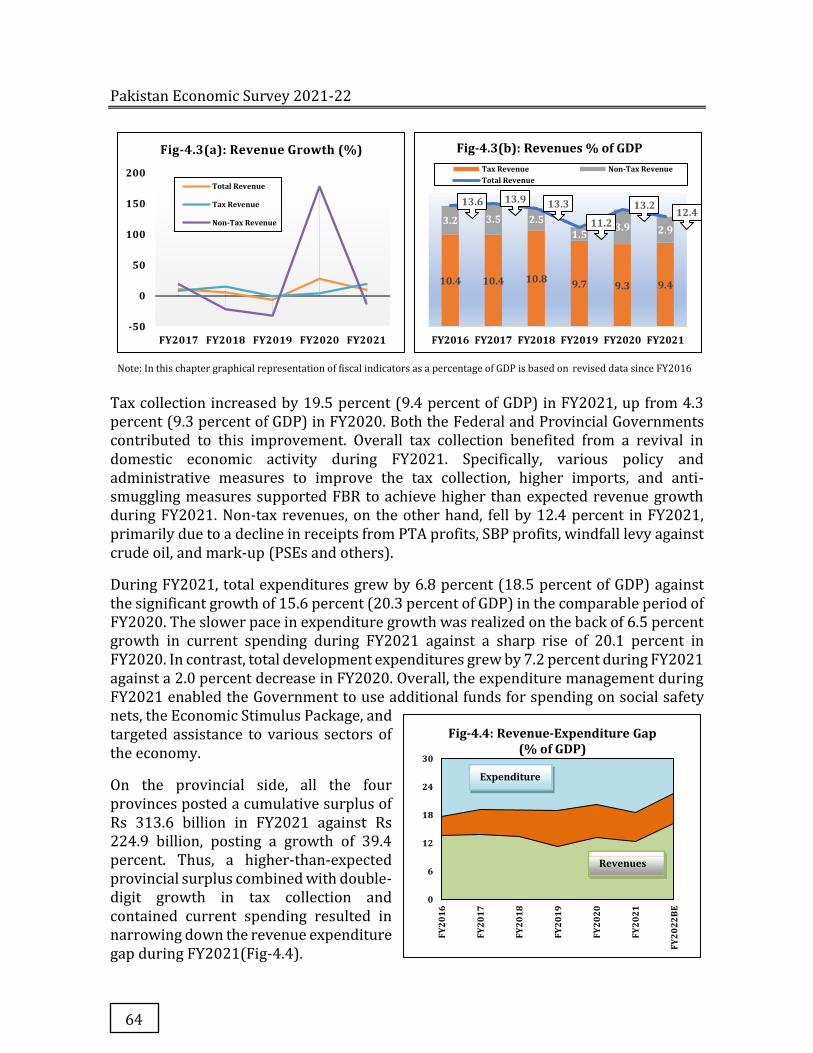
Pakistan Economic Survey 2021-22
64
Note: In this chapter graphical representation of fiscal indicators as a percentage of GDP is based on revised data since FY2016 Tax collection increased by 19.5 percent (9.4 percent of GDP) in FY2021, up from 4.3 percent (9.3 percent of GDP) in FY2020. Both the Federal and Provincial Governments contributed to this improvement. Overall tax collection benefited from a revival in domestic economic activity during FY2021. Specifically, various policy and administrative measures to improve the tax collection, higher imports, and anti-smuggling measures supported FBR to achieve higher than expected revenue growth during FY2021. Non-tax revenues, on the other hand, fell by 12.4 percent in FY2021, primarily due to a decline in receipts from PTA profits, SBP profits, windfall levy against crude oil, and mark-up (PSEs and others).
During FY2021, total expenditures grew by 6.8 percent (18.5 percent of GDP) against the significant growth of 15.6 percent (20.3 percent of GDP) in the comparable period of FY2020. The slower pace in expenditure growth was realized on the back of 6.5 percent growth in current spending during FY2021 against a sharp rise of 20.1 percent in FY2020. In contrast, total development expenditures grew by 7.2 percent during FY2021 against a 2.0 percent decrease in FY2020. Overall, the expenditure management during FY2021 enabled the Government to use additional funds for spending on social safety nets, the Economic Stimulus Package, and targeted assistance to various sectors of the economy.
On the provincial side, all the four provinces posted a cumulative surplus of Rs 313.6 billion in FY2021 against Rs 224.9 billion, posting a growth of 39.4 percent. Thus, a higher-than-expected provincial surplus combined with double-digit growth in tax collection and contained current spending resulted in narrowing down the revenue expenditure gap during FY2021(Fig-4.4).
-50
0
50
100
150
200
FY2017 FY2018 FY2019 FY2020 FY2021
Fig-4.3(a): Revenue Growth (%)
Total Revenue
Tax Revenue
Non-Tax Revenue
10.4 10.4 10.8 9.7 9.3 9.4
3.2 3.5 2.51.5
3.9 2.9
13.6 13.9 13.3
11.213.2
12.4
FY2016 FY2017 FY2018 FY2019 FY2020 FY2021
Fig-4.3(b): Revenues % of GDPTax Revenue Non-Tax RevenueTotal Revenue
0
6
12
18
24
30
FY20
16
FY20
17
FY20
18
FY20
19
FY20
20
FY20
21
FY20
22BE
Fig-4.4: Revenue-Expenditure Gap (% of GDP)
Expenditure
Revenues
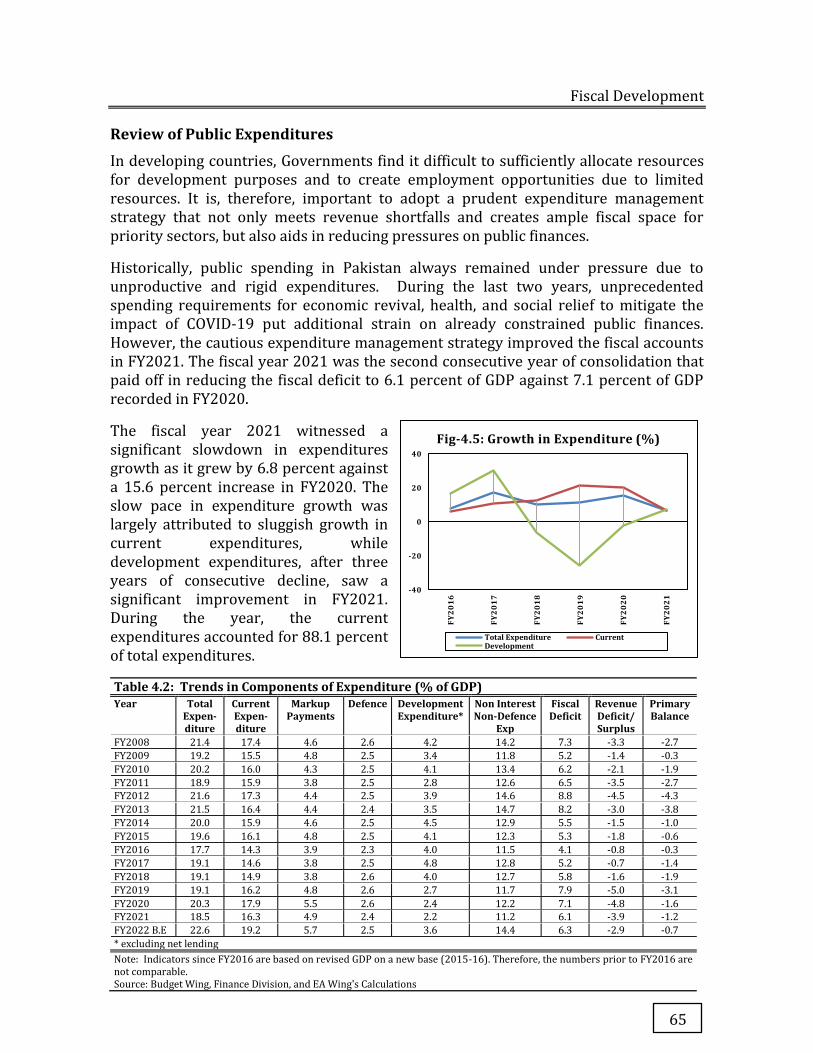
Fiscal Development
65
Review of Public Expenditures
In developing countries, Governments find it difficult to sufficiently allocate resources for development purposes and to create employment opportunities due to limited resources. It is, therefore, important to adopt a prudent expenditure management strategy that not only meets revenue shortfalls and creates ample fiscal space for priority sectors, but also aids in reducing pressures on public finances.
Historically, public spending in Pakistan always remained under pressure due to unproductive and rigid expenditures. During the last two years, unprecedented spending requirements for economic revival, health, and social relief to mitigate the impact of COVID-19 put additional strain on already constrained public finances. However, the cautious expenditure management strategy improved the fiscal accounts in FY2021. The fiscal year 2021 was the second consecutive year of consolidation that paid off in reducing the fiscal deficit to 6.1 percent of GDP against 7.1 percent of GDP recorded in FY2020.
The fiscal year 2021 witnessed a significant slowdown in expenditures growth as it grew by 6.8 percent against a 15.6 percent increase in FY2020. The slow pace in expenditure growth was largely attributed to sluggish growth in current expenditures, while development expenditures, after three years of consecutive decline, saw a significant improvement in FY2021. During the year, the current expenditures accounted for 88.1 percent of total expenditures.
Table 4.2: Trends in Components of Expenditure (% of GDP) Year Total
Expen-diture
Current Expen-diture
Markup Payments
Defence Development Expenditure*
Non Interest Non-Defence
Exp
Fiscal Deficit
Revenue Deficit/ Surplus
Primary Balance
FY2008 21.4 17.4 4.6 2.6 4.2 14.2 7.3 -3.3 -2.7
FY2009 19.2 15.5 4.8 2.5 3.4 11.8 5.2 -1.4 -0.3
FY2010 20.2 16.0 4.3 2.5 4.1 13.4 6.2 -2.1 -1.9
FY2011 18.9 15.9 3.8 2.5 2.8 12.6 6.5 -3.5 -2.7
FY2012 21.6 17.3 4.4 2.5 3.9 14.6 8.8 -4.5 -4.3
FY2013 21.5 16.4 4.4 2.4 3.5 14.7 8.2 -3.0 -3.8
FY2014 20.0 15.9 4.6 2.5 4.5 12.9 5.5 -1.5 -1.0
FY2015 19.6 16.1 4.8 2.5 4.1 12.3 5.3 -1.8 -0.6
FY2016 17.7 14.3 3.9 2.3 4.0 11.5 4.1 -0.8 -0.3
FY2017 19.1 14.6 3.8 2.5 4.8 12.8 5.2 -0.7 -1.4
FY2018 19.1 14.9 3.8 2.6 4.0 12.7 5.8 -1.6 -1.9
FY2019 19.1 16.2 4.8 2.6 2.7 11.7 7.9 -5.0 -3.1
FY2020 20.3 17.9 5.5 2.6 2.4 12.2 7.1 -4.8 -1.6
FY2021 18.5 16.3 4.9 2.4 2.2 11.2 6.1 -3.9 -1.2
FY2022 B.E 22.6 19.2 5.7 2.5 3.6 14.4 6.3 -2.9 -0.7
* excluding net lending
Note: Indicators since FY2016 are based on revised GDP on a new base (2015-16). Therefore, the numbers prior to FY2016 are not comparable. Source: Budget Wing, Finance Division, and EA Wing's Calculations
-40
-20
0
20
40FY
2016
FY20
17
FY20
18
FY20
19
FY20
20
FY20
21
Fig-4.5: Growth in Expenditure (%)
Total Expenditure CurrentDevelopment
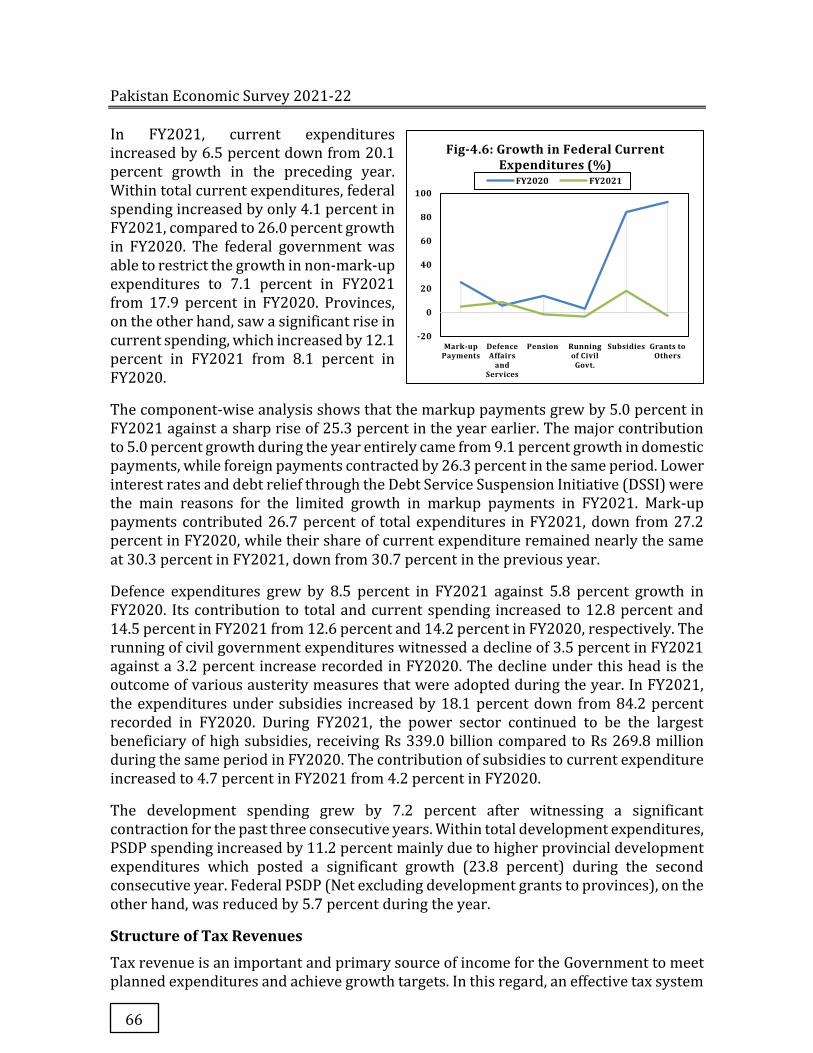
Pakistan Economic Survey 2021-22
66
In FY2021, current expenditures increased by 6.5 percent down from 20.1 percent growth in the preceding year. Within total current expenditures, federal spending increased by only 4.1 percent in FY2021, compared to 26.0 percent growth in FY2020. The federal government was able to restrict the growth in non-mark-up expenditures to 7.1 percent in FY2021 from 17.9 percent in FY2020. Provinces, on the other hand, saw a significant rise in current spending, which increased by 12.1 percent in FY2021 from 8.1 percent in FY2020.
The component-wise analysis shows that the markup payments grew by 5.0 percent in FY2021 against a sharp rise of 25.3 percent in the year earlier. The major contribution to 5.0 percent growth during the year entirely came from 9.1 percent growth in domestic payments, while foreign payments contracted by 26.3 percent in the same period. Lower interest rates and debt relief through the Debt Service Suspension Initiative (DSSI) were the main reasons for the limited growth in markup payments in FY2021. Mark-up payments contributed 26.7 percent of total expenditures in FY2021, down from 27.2 percent in FY2020, while their share of current expenditure remained nearly the same at 30.3 percent in FY2021, down from 30.7 percent in the previous year.
Defence expenditures grew by 8.5 percent in FY2021 against 5.8 percent growth in FY2020. Its contribution to total and current spending increased to 12.8 percent and 14.5 percent in FY2021 from 12.6 percent and 14.2 percent in FY2020, respectively. The running of civil government expenditures witnessed a decline of 3.5 percent in FY2021 against a 3.2 percent increase recorded in FY2020. The decline under this head is the outcome of various austerity measures that were adopted during the year. In FY2021, the expenditures under subsidies increased by 18.1 percent down from 84.2 percent recorded in FY2020. During FY2021, the power sector continued to be the largest beneficiary of high subsidies, receiving Rs 339.0 billion compared to Rs 269.8 million during the same period in FY2020. The contribution of subsidies to current expenditure increased to 4.7 percent in FY2021 from 4.2 percent in FY2020.
The development spending grew by 7.2 percent after witnessing a significant contraction for the past three consecutive years. Within total development expenditures, PSDP spending increased by 11.2 percent mainly due to higher provincial development expenditures which posted a significant growth (23.8 percent) during the second consecutive year. Federal PSDP (Net excluding development grants to provinces), on the other hand, was reduced by 5.7 percent during the year.
Structure of Tax Revenues
Tax revenue is an important and primary source of income for the Government to meet planned expenditures and achieve growth targets. In this regard, an effective tax system
-20
0
20
40
60
80
100
Mark-up Payments
Defence Affairs
and Services
Pension Running of Civil
Govt.
Subsidies Grants to Others
Fig-4.6: Growth in Federal Current Expenditures (%)
FY2020 FY2021
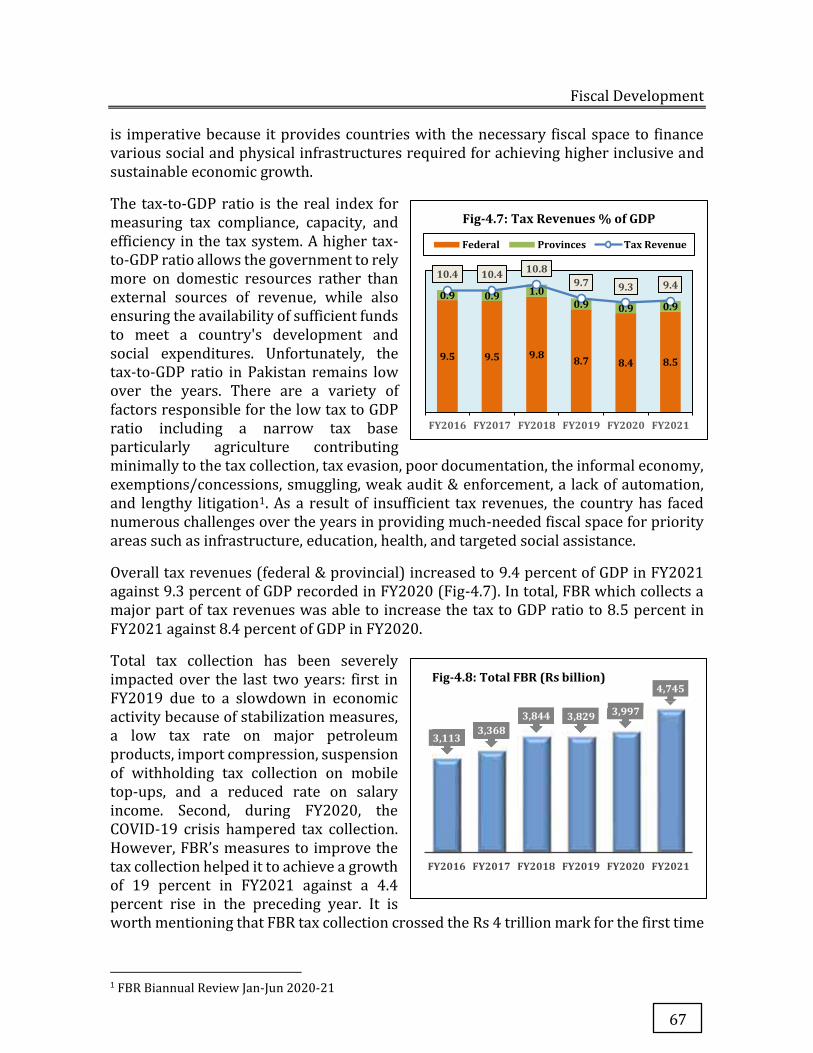
Fiscal Development
67
is imperative because it provides countries with the necessary fiscal space to finance various social and physical infrastructures required for achieving higher inclusive and sustainable economic growth.
The tax-to-GDP ratio is the real index for measuring tax compliance, capacity, and efficiency in the tax system. A higher tax-to-GDP ratio allows the government to rely more on domestic resources rather than external sources of revenue, while also ensuring the availability of sufficient funds to meet a country's development and social expenditures. Unfortunately, the tax-to-GDP ratio in Pakistan remains low over the years. There are a variety of factors responsible for the low tax to GDP ratio including a narrow tax base particularly agriculture contributing minimally to the tax collection, tax evasion, poor documentation, the informal economy, exemptions/concessions, smuggling, weak audit & enforcement, a lack of automation, and lengthy litigation1. As a result of insufficient tax revenues, the country has faced numerous challenges over the years in providing much-needed fiscal space for priority areas such as infrastructure, education, health, and targeted social assistance.
Overall tax revenues (federal & provincial) increased to 9.4 percent of GDP in FY2021 against 9.3 percent of GDP recorded in FY2020 (Fig-4.7). In total, FBR which collects a major part of tax revenues was able to increase the tax to GDP ratio to 8.5 percent in FY2021 against 8.4 percent of GDP in FY2020.
Total tax collection has been severely impacted over the last two years: first in FY2019 due to a slowdown in economic activity because of stabilization measures, a low tax rate on major petroleum products, import compression, suspension of withholding tax collection on mobile top-ups, and a reduced rate on salary income. Second, during FY2020, the COVID-19 crisis hampered tax collection. However, FBR’s measures to improve the tax collection helped it to achieve a growth of 19 percent in FY2021 against a 4.4 percent rise in the preceding year. It is worth mentioning that FBR tax collection crossed the Rs 4 trillion mark for the first time
1 FBR Biannual Review Jan-Jun 2020-21
9.5 9.5 9.8 8.7 8.4 8.5
0.9 0.9 1.00.9 0.9 0.9
10.4 10.4 10.89.7 9.3 9.4
FY2016 FY2017 FY2018 FY2019 FY2020 FY2021
Fig-4.7: Tax Revenues % of GDP
Federal Provinces Tax Revenue
3,1133,368
3,844 3,829 3,997
4,745
FY2016 FY2017 FY2018 FY2019 FY2020 FY2021
Fig-4.8: Total FBR (Rs billion)
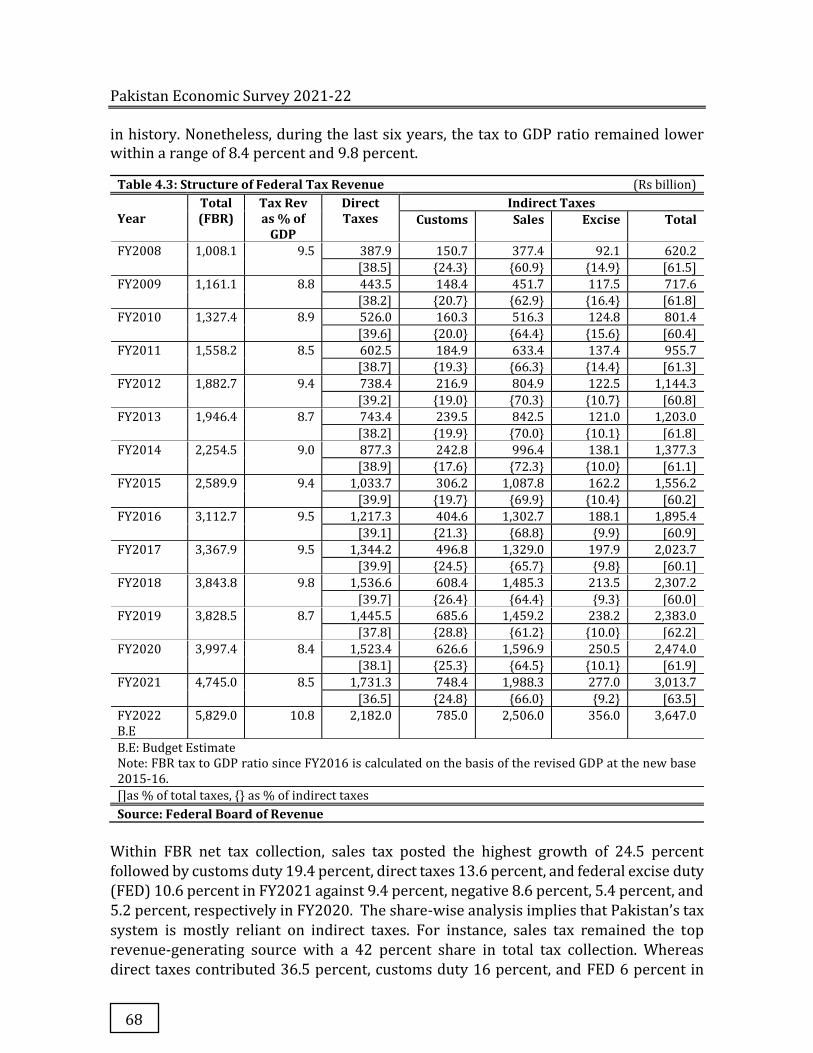
Pakistan Economic Survey 2021-22
68
in history. Nonetheless, during the last six years, the tax to GDP ratio remained lower within a range of 8.4 percent and 9.8 percent.
Table 4.3: Structure of Federal Tax Revenue (Rs billion)
Year Total (FBR)
Tax Rev as % of
GDP
Direct Taxes
Indirect Taxes Customs Sales Excise Total
FY2008 1,008.1 9.5 387.9 150.7 377.4 92.1 620.2
[38.5] {24.3} {60.9} {14.9} [61.5]
FY2009 1,161.1 8.8 443.5 148.4 451.7 117.5 717.6
[38.2] {20.7} {62.9} {16.4} [61.8]
FY2010 1,327.4 8.9 526.0 160.3 516.3 124.8 801.4
[39.6] {20.0} {64.4} {15.6} [60.4]
FY2011 1,558.2 8.5 602.5 184.9 633.4 137.4 955.7
[38.7] {19.3} {66.3} {14.4} [61.3]
FY2012 1,882.7 9.4 738.4 216.9 804.9 122.5 1,144.3
[39.2] {19.0} {70.3} {10.7} [60.8]
FY2013 1,946.4 8.7 743.4 239.5 842.5 121.0 1,203.0
[38.2] {19.9} {70.0} {10.1} [61.8]
FY2014 2,254.5 9.0 877.3 242.8 996.4 138.1 1,377.3
[38.9] {17.6} {72.3} {10.0} [61.1]
FY2015 2,589.9 9.4 1,033.7 306.2 1,087.8 162.2 1,556.2
[39.9] {19.7} {69.9} {10.4} [60.2]
FY2016 3,112.7 9.5 1,217.3 404.6 1,302.7 188.1 1,895.4
[39.1] {21.3} {68.8} {9.9} [60.9]
FY2017 3,367.9 9.5 1,344.2 496.8 1,329.0 197.9 2,023.7
[39.9] {24.5} {65.7} {9.8} [60.1]
FY2018 3,843.8 9.8 1,536.6 608.4 1,485.3 213.5 2,307.2
[39.7] {26.4} {64.4} {9.3} [60.0]
FY2019 3,828.5 8.7 1,445.5 685.6 1,459.2 238.2 2,383.0
[37.8] {28.8} {61.2} {10.0} [62.2]
FY2020 3,997.4 8.4 1,523.4 626.6 1,596.9 250.5 2,474.0
[38.1] {25.3} {64.5} {10.1} [61.9]
FY2021 4,745.0 8.5 1,731.3 748.4 1,988.3 277.0 3,013.7
[36.5] {24.8} {66.0} {9.2} [63.5]
FY2022 B.E
5,829.0 10.8 2,182.0 785.0 2,506.0 356.0 3,647.0
B.E: Budget Estimate Note: FBR tax to GDP ratio since FY2016 is calculated on the basis of the revised GDP at the new base 2015-16.
[]as % of total taxes, {} as % of indirect taxes
Source: Federal Board of Revenue Within FBR net tax collection, sales tax posted the highest growth of 24.5 percent
followed by customs duty 19.4 percent, direct taxes 13.6 percent, and federal excise duty
(FED) 10.6 percent in FY2021 against 9.4 percent, negative 8.6 percent, 5.4 percent, and
5.2 percent, respectively in FY2020. The share-wise analysis implies that Pakistan’s tax
system is mostly reliant on indirect taxes. For instance, sales tax remained the top
revenue-generating source with a 42 percent share in total tax collection. Whereas
direct taxes contributed 36.5 percent, customs duty 16 percent, and FED 6 percent in
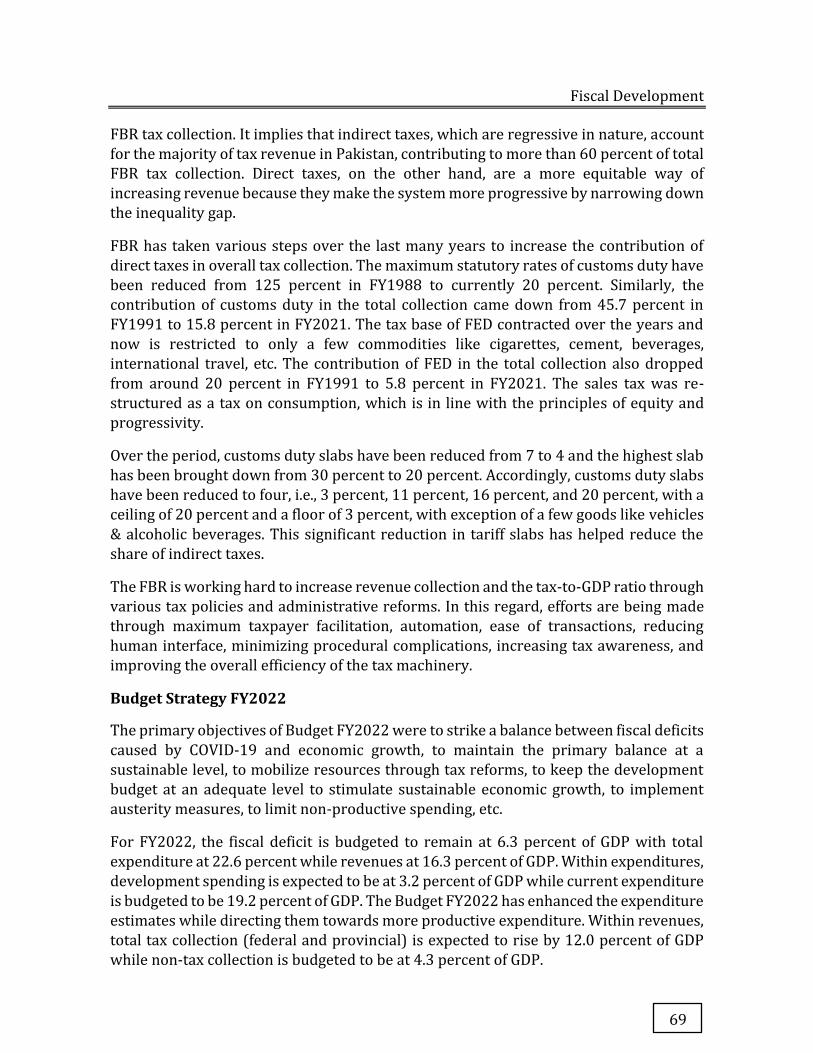
Fiscal Development
69
FBR tax collection. It implies that indirect taxes, which are regressive in nature, account
for the majority of tax revenue in Pakistan, contributing to more than 60 percent of total
FBR tax collection. Direct taxes, on the other hand, are a more equitable way of
increasing revenue because they make the system more progressive by narrowing down
the inequality gap.
FBR has taken various steps over the last many years to increase the contribution of
direct taxes in overall tax collection. The maximum statutory rates of customs duty have
been reduced from 125 percent in FY1988 to currently 20 percent. Similarly, the
contribution of customs duty in the total collection came down from 45.7 percent in
FY1991 to 15.8 percent in FY2021. The tax base of FED contracted over the years and
now is restricted to only a few commodities like cigarettes, cement, beverages,
international travel, etc. The contribution of FED in the total collection also dropped
from around 20 percent in FY1991 to 5.8 percent in FY2021. The sales tax was re-
structured as a tax on consumption, which is in line with the principles of equity and
progressivity.
Over the period, customs duty slabs have been reduced from 7 to 4 and the highest slab
has been brought down from 30 percent to 20 percent. Accordingly, customs duty slabs
have been reduced to four, i.e., 3 percent, 11 percent, 16 percent, and 20 percent, with a
ceiling of 20 percent and a floor of 3 percent, with exception of a few goods like vehicles
& alcoholic beverages. This significant reduction in tariff slabs has helped reduce the
share of indirect taxes.
The FBR is working hard to increase revenue collection and the tax-to-GDP ratio through
various tax policies and administrative reforms. In this regard, efforts are being made
through maximum taxpayer facilitation, automation, ease of transactions, reducing
human interface, minimizing procedural complications, increasing tax awareness, and
improving the overall efficiency of the tax machinery.
Budget Strategy FY2022
The primary objectives of Budget FY2022 were to strike a balance between fiscal deficits
caused by COVID-19 and economic growth, to maintain the primary balance at a
sustainable level, to mobilize resources through tax reforms, to keep the development
budget at an adequate level to stimulate sustainable economic growth, to implement
austerity measures, to limit non-productive spending, etc.
For FY2022, the fiscal deficit is budgeted to remain at 6.3 percent of GDP with total
expenditure at 22.6 percent while revenues at 16.3 percent of GDP. Within expenditures,
development spending is expected to be at 3.2 percent of GDP while current expenditure
is budgeted to be 19.2 percent of GDP. The Budget FY2022 has enhanced the expenditure
estimates while directing them towards more productive expenditure. Within revenues,
total tax collection (federal and provincial) is expected to rise by 12.0 percent of GDP
while non-tax collection is budgeted to be at 4.3 percent of GDP.
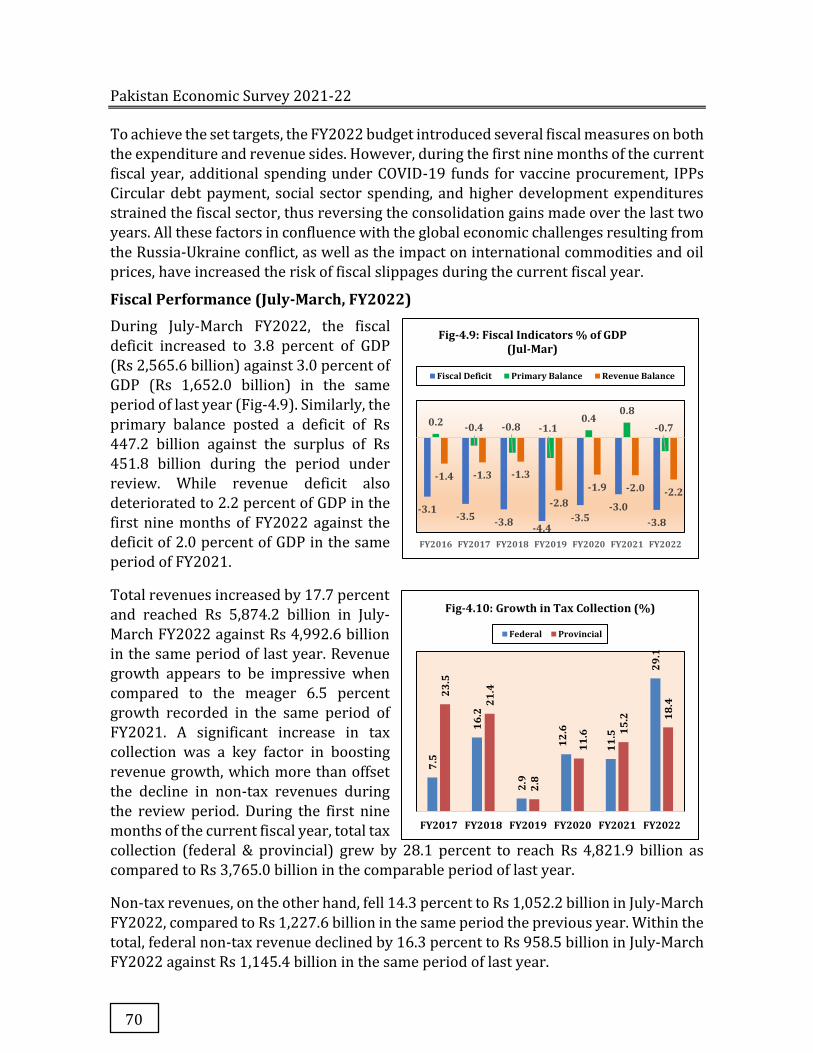
Pakistan Economic Survey 2021-22
70
To achieve the set targets, the FY2022 budget introduced several fiscal measures on both
the expenditure and revenue sides. However, during the first nine months of the current
fiscal year, additional spending under COVID-19 funds for vaccine procurement, IPPs
Circular debt payment, social sector spending, and higher development expenditures
strained the fiscal sector, thus reversing the consolidation gains made over the last two
years. All these factors in confluence with the global economic challenges resulting from
the Russia-Ukraine conflict, as well as the impact on international commodities and oil
prices, have increased the risk of fiscal slippages during the current fiscal year.
Fiscal Performance (July-March, FY2022)
During July-March FY2022, the fiscal
deficit increased to 3.8 percent of GDP
(Rs 2,565.6 billion) against 3.0 percent of
GDP (Rs 1,652.0 billion) in the same
period of last year (Fig-4.9). Similarly, the
primary balance posted a deficit of Rs
447.2 billion against the surplus of Rs
451.8 billion during the period under
review. While revenue deficit also
deteriorated to 2.2 percent of GDP in the
first nine months of FY2022 against the
deficit of 2.0 percent of GDP in the same
period of FY2021.
Total revenues increased by 17.7 percent
and reached Rs 5,874.2 billion in July-
March FY2022 against Rs 4,992.6 billion
in the same period of last year. Revenue
growth appears to be impressive when
compared to the meager 6.5 percent
growth recorded in the same period of
FY2021. A significant increase in tax
collection was a key factor in boosting
revenue growth, which more than offset
the decline in non-tax revenues during
the review period. During the first nine
months of the current fiscal year, total tax
collection (federal & provincial) grew by 28.1 percent to reach Rs 4,821.9 billion as
compared to Rs 3,765.0 billion in the comparable period of last year.
Non-tax revenues, on the other hand, fell 14.3 percent to Rs 1,052.2 billion in July-March
FY2022, compared to Rs 1,227.6 billion in the same period the previous year. Within the
total, federal non-tax revenue declined by 16.3 percent to Rs 958.5 billion in July-March
FY2022 against Rs 1,145.4 billion in the same period of last year.
7.5
16.2
2.9
12.6
11.5
29.1
23.5
21.4
2.8
11.6 15
.2 18.4
FY2017 FY2018 FY2019 FY2020 FY2021 FY2022
Fig-4.10: Growth in Tax Collection (%)
Federal Provincial
-3.1-3.5 -3.8 -4.4
-3.5-3.0
-3.8
0.2 -0.4 -0.8 -1.10.4
0.8-0.7
-1.4 -1.3 -1.3
-2.8-1.9 -2.0 -2.2
FY2016 FY2017 FY2018 FY2019 FY2020 FY2021 FY2022
Fig-4.9: Fiscal Indicators % of GDP (Jul-Mar)
Fiscal Deficit Primary Balance Revenue Balance
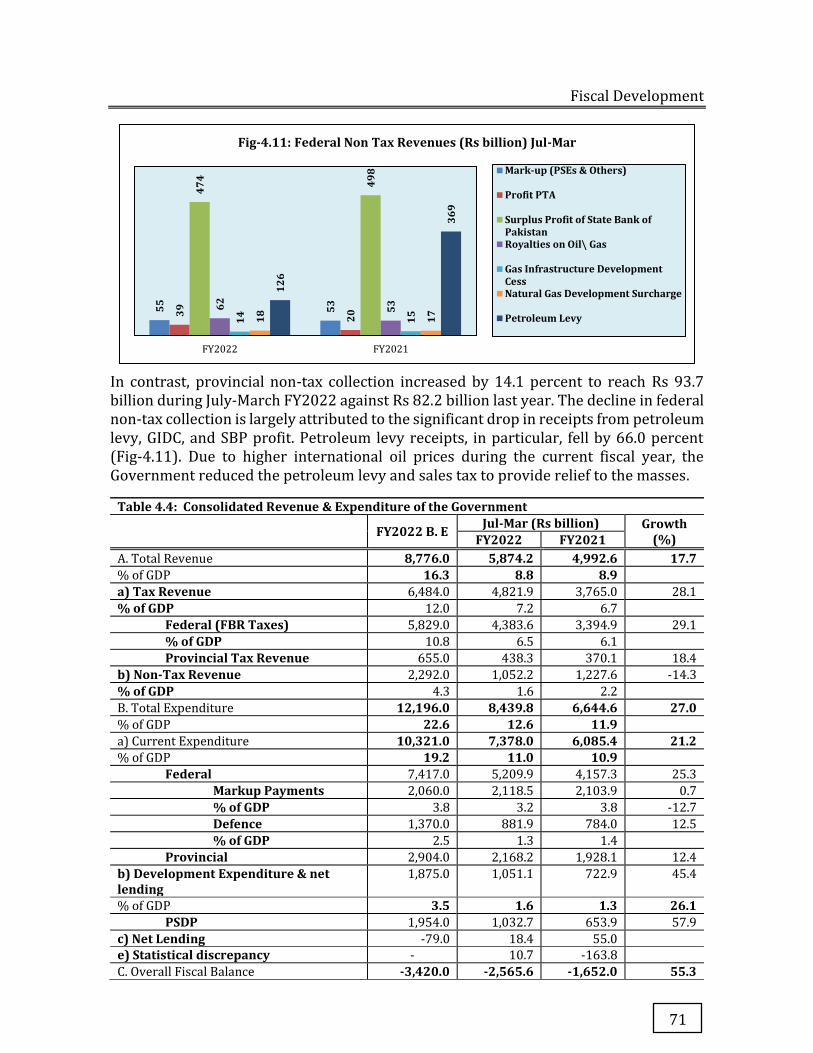
Fiscal Development
71
In contrast, provincial non-tax collection increased by 14.1 percent to reach Rs 93.7 billion during July-March FY2022 against Rs 82.2 billion last year. The decline in federal non-tax collection is largely attributed to the significant drop in receipts from petroleum levy, GIDC, and SBP profit. Petroleum levy receipts, in particular, fell by 66.0 percent (Fig-4.11). Due to higher international oil prices during the current fiscal year, the Government reduced the petroleum levy and sales tax to provide relief to the masses.
Table 4.4: Consolidated Revenue & Expenditure of the Government
FY2022 B. E Jul-Mar (Rs billion) Growth (%) FY2022 FY2021
A. Total Revenue 8,776.0 5,874.2 4,992.6 17.7 % of GDP 16.3 8.8 8.9 a) Tax Revenue 6,484.0 4,821.9 3,765.0 28.1
% of GDP 12.0 7.2 6.7
Federal (FBR Taxes) 5,829.0 4,383.6 3,394.9 29.1
% of GDP 10.8 6.5 6.1
Provincial Tax Revenue 655.0 438.3 370.1 18.4
b) Non-Tax Revenue 2,292.0 1,052.2 1,227.6 -14.3
% of GDP 4.3 1.6 2.2
B. Total Expenditure 12,196.0 8,439.8 6,644.6 27.0 % of GDP 22.6 12.6 11.9 a) Current Expenditure 10,321.0 7,378.0 6,085.4 21.2 % of GDP 19.2 11.0 10.9
Federal 7,417.0 5,209.9 4,157.3 25.3
Markup Payments 2,060.0 2,118.5 2,103.9 0.7
% of GDP 3.8 3.2 3.8 -12.7
Defence 1,370.0 881.9 784.0 12.5
% of GDP 2.5 1.3 1.4
Provincial 2,904.0 2,168.2 1,928.1 12.4
b) Development Expenditure & net lending
1,875.0 1,051.1 722.9 45.4
% of GDP 3.5 1.6 1.3 26.1 PSDP 1,954.0 1,032.7 653.9 57.9
c) Net Lending -79.0 18.4 55.0
e) Statistical discrepancy - 10.7 -163.8
C. Overall Fiscal Balance -3,420.0 -2,565.6 -1,652.0 55.3
55 5339 20
474 49
8
62 53
14 1518 17
126
369
FY2022 FY2021
Fig-4.11: Federal Non Tax Revenues (Rs billion) Jul-Mar
Mark-up (PSEs & Others)
Profit PTA
Surplus Profit of State Bank ofPakistanRoyalties on Oil\ Gas
Gas Infrastructure DevelopmentCessNatural Gas Development Surcharge
Petroleum Levy
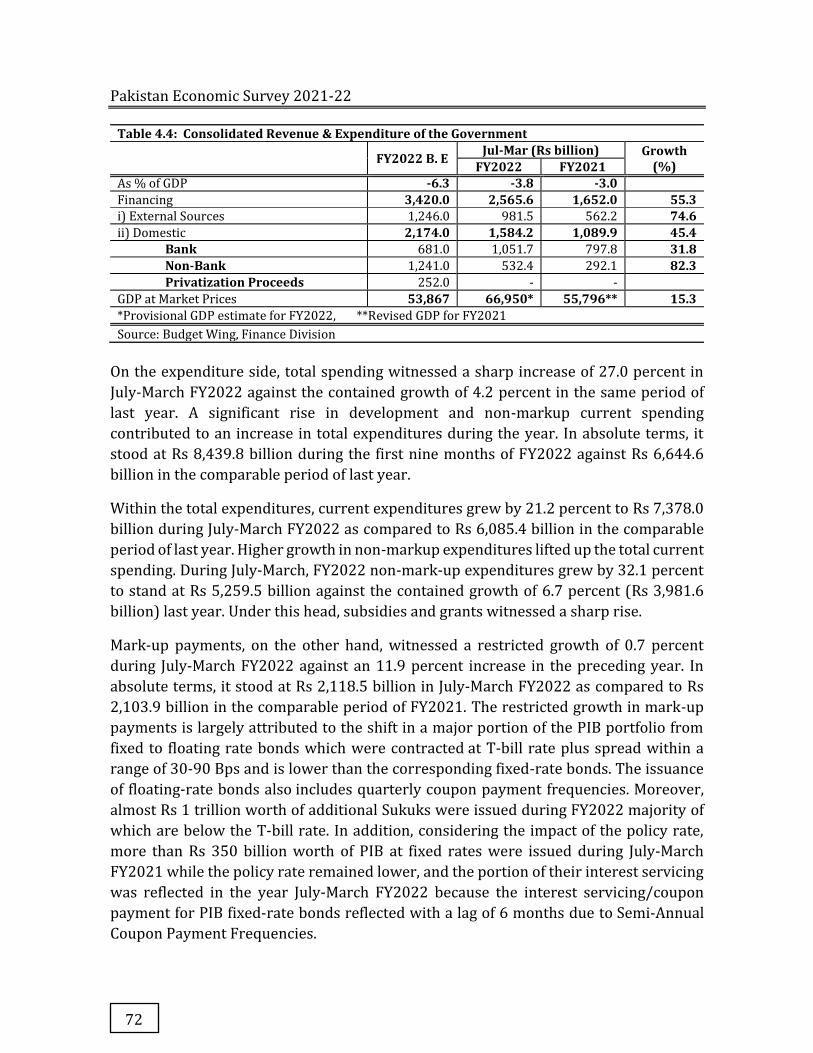
Pakistan Economic Survey 2021-22
72
Table 4.4: Consolidated Revenue & Expenditure of the Government
FY2022 B. E Jul-Mar (Rs billion) Growth (%) FY2022 FY2021
As % of GDP -6.3 -3.8 -3.0 Financing 3,420.0 2,565.6 1,652.0 55.3 i) External Sources 1,246.0 981.5 562.2 74.6 ii) Domestic 2,174.0 1,584.2 1,089.9 45.4
Bank 681.0 1,051.7 797.8 31.8 Non-Bank 1,241.0 532.4 292.1 82.3 Privatization Proceeds 252.0 - -
GDP at Market Prices 53,867 66,950* 55,796** 15.3 *Provisional GDP estimate for FY2022, **Revised GDP for FY2021
Source: Budget Wing, Finance Division
On the expenditure side, total spending witnessed a sharp increase of 27.0 percent in
July-March FY2022 against the contained growth of 4.2 percent in the same period of
last year. A significant rise in development and non-markup current spending
contributed to an increase in total expenditures during the year. In absolute terms, it
stood at Rs 8,439.8 billion during the first nine months of FY2022 against Rs 6,644.6
billion in the comparable period of last year.
Within the total expenditures, current expenditures grew by 21.2 percent to Rs 7,378.0
billion during July-March FY2022 as compared to Rs 6,085.4 billion in the comparable
period of last year. Higher growth in non-markup expenditures lifted up the total current
spending. During July-March, FY2022 non-mark-up expenditures grew by 32.1 percent
to stand at Rs 5,259.5 billion against the contained growth of 6.7 percent (Rs 3,981.6
billion) last year. Under this head, subsidies and grants witnessed a sharp rise.
Mark-up payments, on the other hand, witnessed a restricted growth of 0.7 percent
during July-March FY2022 against an 11.9 percent increase in the preceding year. In
absolute terms, it stood at Rs 2,118.5 billion in July-March FY2022 as compared to Rs
2,103.9 billion in the comparable period of FY2021. The restricted growth in mark-up
payments is largely attributed to the shift in a major portion of the PIB portfolio from
fixed to floating rate bonds which were contracted at T-bill rate plus spread within a
range of 30-90 Bps and is lower than the corresponding fixed-rate bonds. The issuance
of floating-rate bonds also includes quarterly coupon payment frequencies. Moreover,
almost Rs 1 trillion worth of additional Sukuks were issued during FY2022 majority of
which are below the T-bill rate. In addition, considering the impact of the policy rate,
more than Rs 350 billion worth of PIB at fixed rates were issued during July-March
FY2021 while the policy rate remained lower, and the portion of their interest servicing
was reflected in the year July-March FY2022 because the interest servicing/coupon
payment for PIB fixed-rate bonds reflected with a lag of 6 months due to Semi-Annual
Coupon Payment Frequencies.
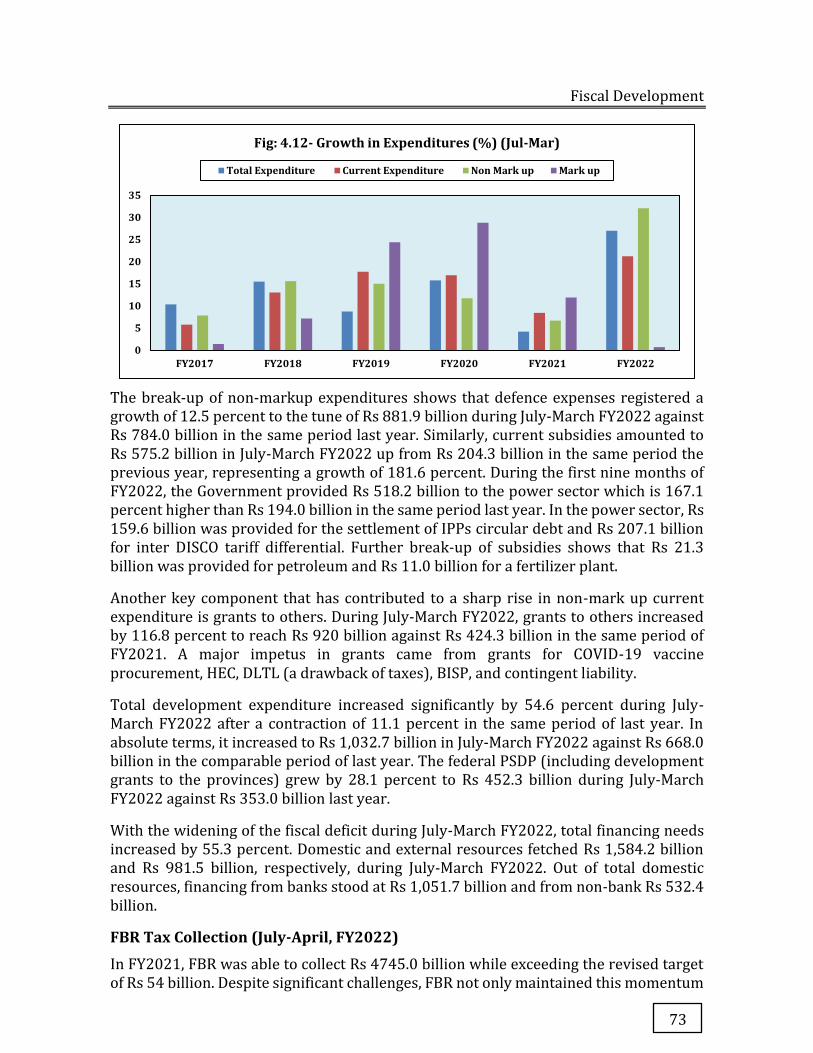
Fiscal Development
73
The break-up of non-markup expenditures shows that defence expenses registered a growth of 12.5 percent to the tune of Rs 881.9 billion during July-March FY2022 against Rs 784.0 billion in the same period last year. Similarly, current subsidies amounted to Rs 575.2 billion in July-March FY2022 up from Rs 204.3 billion in the same period the previous year, representing a growth of 181.6 percent. During the first nine months of FY2022, the Government provided Rs 518.2 billion to the power sector which is 167.1 percent higher than Rs 194.0 billion in the same period last year. In the power sector, Rs 159.6 billion was provided for the settlement of IPPs circular debt and Rs 207.1 billion for inter DISCO tariff differential. Further break-up of subsidies shows that Rs 21.3 billion was provided for petroleum and Rs 11.0 billion for a fertilizer plant.
Another key component that has contributed to a sharp rise in non-mark up current expenditure is grants to others. During July-March FY2022, grants to others increased by 116.8 percent to reach Rs 920 billion against Rs 424.3 billion in the same period of FY2021. A major impetus in grants came from grants for COVID-19 vaccine procurement, HEC, DLTL (a drawback of taxes), BISP, and contingent liability.
Total development expenditure increased significantly by 54.6 percent during July-March FY2022 after a contraction of 11.1 percent in the same period of last year. In absolute terms, it increased to Rs 1,032.7 billion in July-March FY2022 against Rs 668.0 billion in the comparable period of last year. The federal PSDP (including development grants to the provinces) grew by 28.1 percent to Rs 452.3 billion during July-March FY2022 against Rs 353.0 billion last year.
With the widening of the fiscal deficit during July-March FY2022, total financing needs increased by 55.3 percent. Domestic and external resources fetched Rs 1,584.2 billion and Rs 981.5 billion, respectively, during July-March FY2022. Out of total domestic resources, financing from banks stood at Rs 1,051.7 billion and from non-bank Rs 532.4 billion.
FBR Tax Collection (July-April, FY2022)
In FY2021, FBR was able to collect Rs 4745.0 billion while exceeding the revised target of Rs 54 billion. Despite significant challenges, FBR not only maintained this momentum
0
5
10
15
20
25
30
35
FY2017 FY2018 FY2019 FY2020 FY2021 FY2022
Fig: 4.12- Growth in Expenditures (%) (Jul-Mar)
Total Expenditure Current Expenditure Non Mark up Mark up
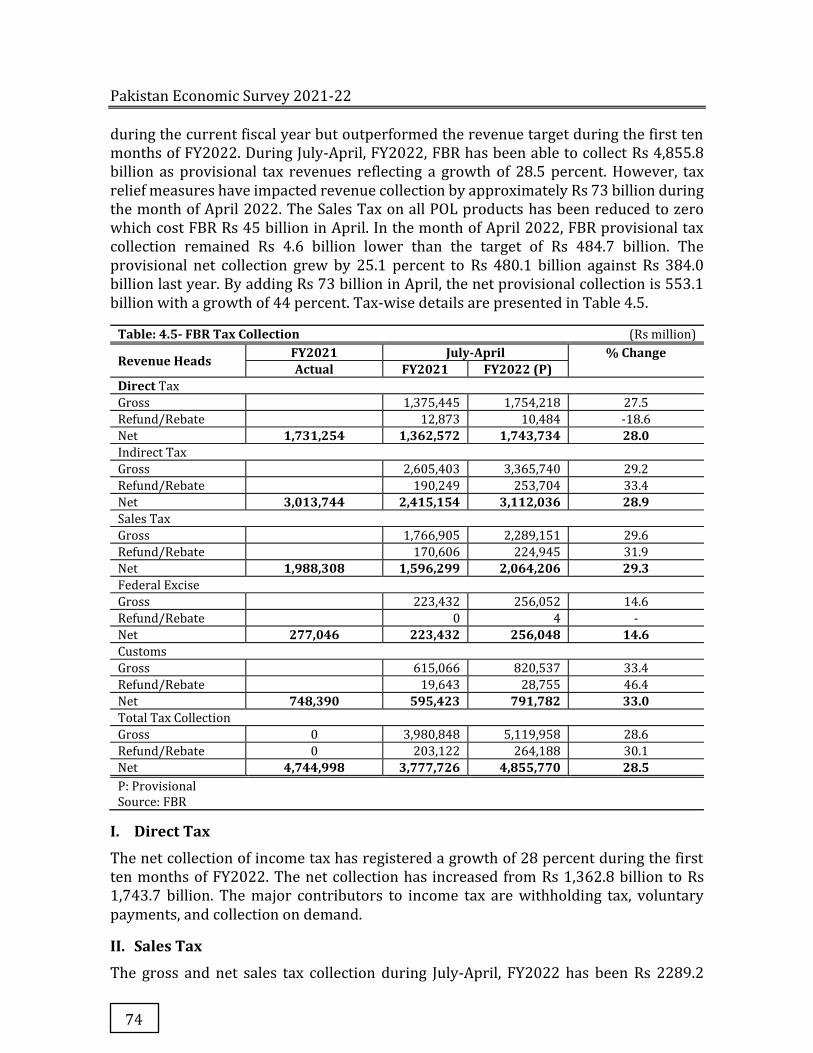
Pakistan Economic Survey 2021-22
74
during the current fiscal year but outperformed the revenue target during the first ten months of FY2022. During July-April, FY2022, FBR has been able to collect Rs 4,855.8 billion as provisional tax revenues reflecting a growth of 28.5 percent. However, tax relief measures have impacted revenue collection by approximately Rs 73 billion during the month of April 2022. The Sales Tax on all POL products has been reduced to zero which cost FBR Rs 45 billion in April. In the month of April 2022, FBR provisional tax collection remained Rs 4.6 billion lower than the target of Rs 484.7 billion. The provisional net collection grew by 25.1 percent to Rs 480.1 billion against Rs 384.0 billion last year. By adding Rs 73 billion in April, the net provisional collection is 553.1 billion with a growth of 44 percent. Tax-wise details are presented in Table 4.5.
Table: 4.5- FBR Tax Collection (Rs million)
Revenue Heads FY2021 July-April % Change Actual FY2021 FY2022 (P)
Direct Tax
Gross 1,375,445 1,754,218 27.5
Refund/Rebate 12,873 10,484 -18.6
Net 1,731,254 1,362,572 1,743,734 28.0 Indirect Tax
Gross 2,605,403 3,365,740 29.2
Refund/Rebate 190,249 253,704 33.4
Net 3,013,744 2,415,154 3,112,036 28.9 Sales Tax
Gross 1,766,905 2,289,151 29.6
Refund/Rebate 170,606 224,945 31.9
Net 1,988,308 1,596,299 2,064,206 29.3 Federal Excise
Gross 223,432 256,052 14.6
Refund/Rebate 0 4 -
Net 277,046 223,432 256,048 14.6 Customs
Gross 615,066 820,537 33.4
Refund/Rebate 19,643 28,755 46.4
Net 748,390 595,423 791,782 33.0 Total Tax Collection
Gross 0 3,980,848 5,119,958 28.6
Refund/Rebate 0 203,122 264,188 30.1
Net 4,744,998 3,777,726 4,855,770 28.5 P: Provisional Source: FBR
I. Direct Tax
The net collection of income tax has registered a growth of 28 percent during the first ten months of FY2022. The net collection has increased from Rs 1,362.8 billion to Rs 1,743.7 billion. The major contributors to income tax are withholding tax, voluntary payments, and collection on demand.
II. Sales Tax
The gross and net sales tax collection during July-April, FY2022 has been Rs 2289.2
Fiscal Development
75
billion and Rs 2064.2 billion, respectively, showing healthy growths of 29.6 percent and 29.3 percent respectively. Around 71.2 percent of total sales tax was contributed by sales tax on imports during July-April, 2021-22, while the rest was contributed by the domestic sector.
III. Federal Excise Duty
The collection of federal excise duties (FED) from July-April, FY2022 has recorded a growth of 14.6 percent. The net collection has stood at Rs 256.0 billion during July-April, FY2022 as against Rs 223.4 billion during the same period last year. The major revenue spinners of FED are cigarettes, cement, services, and beverages.
IV. Customs Duty
Customs duty has registered a growth of 33.4 percent and 33.0 percent in gross and net revenues, respectively. The net collection has increased from Rs 595.4 billion during July-April, FY2021 to Rs 791.8 billion during July-April, FY2022. The major revenue spinners of customs duty have been vehicles, mineral fuels, iron and steel, electrical machinery, plastic, edible fruits, etc.
To maintain the growth momentum and to further improve the revenue collection, FBR has initiated various measures to facilitate the taxpayers in order to create a congenial environment and to fetch sufficient tax revenues. (Box-I)
Box-I: Major Reforms Initiatives
A. Inland Revenue
i. The Track and Trace System: Track and Trace Solution has been rolled out for Tobacco & Sugar sectors and it’s rolling out for Cement, Beverages, and Fertilizer sectors are in progress. The system is aimed at enhancing tax revenue, reducing counterfeiting, and preventing the smuggling of illicit goods through the implementation of a robust, nationwide, electronic monitoring system through the affixation of tax stamps on various products at the production stage. This enables FBR to trace the entire supply chain of manufacturing goods.
ii. Point of Sales (POS): Point of Sales (POS) Invoicing system is a pathway toward digitization. Responding to the growing need for digitization of economic transactions in Pakistan, FBR has launched POS Invoicing, which is a computerized system for recording sales data, managing inventory, and maintaining customer data. It is a real-time sales documentation system that links the electronic systems at the outlets of all tier-1 retailers with the FBR via the internet. The system is aimed to ensure that all sales are reported in real-time to FBR and are duly accounted for in the monthly sales tax returns of such retailers.
iii. Automated Issuance of Refunds: To facilitate taxpayers, a centralized automated refund system has been introduced with no requirement for manual application and verification. The system-based verification system issues refund directly into the bank accounts of taxpayers without any requirement for face-to-face interactions with tax authorities. Enabling legal framework has also been provided through the insertion of relevant provisions in tax laws.
iv. Single Sales Tax Portal/Return: Building further on its vision to facilitate taxpayers and ensure ease of doing business through automation, digitization, and minimization of human interaction with taxpayers, FBR has launched Singles Sales Tax Portal. This facility will enable taxpayers to file single monthly Sales Tax returns instead of multiple returns on different portals; thereby, significantly reducing the time and cost of compliance. The system will automatically apportion

Pakistan Economic Survey 2021-22
76
input tax adjustment as well as tax payments across the sales tax authorities, therefore eliminating the need for reconciliation and payment transfers.
v. E-hearing: To provide faceless tax administration, reduce compliance costs, and save precious time for the taxpayers the mechanism of E-hearing has been devised. Enabling legal provisions for admissibility of evidence collected during E-hearing has been introduced through 227E of the Income Tax Ordinance.
vi. Electronic Filing of an Appeal: The mechanism of online filing of appeals has been made available to the taxpayer. However, enabling legal provisions were lacking which have been introduced through section 127 of the Income Tax Ordinance.
vii. Tax Asaan: A mobile application to facilitate taxpayers, available free of cost for Android as well as iOS-based smartphones. It offers the following facilities for taxpayers:
a. Registration of Income Tax b. Registration of Sales Tax c. Returns filing for Salaried Individuals d. Recovery of Password e. Creation of Tax payments PSIDs f. POS Invoice Verification
viii. IREN and Joint Anti-smuggling Field Intelligence Exercise: Establishment of Inland Revenue Enforcement Network (IREN) to check smuggling and counterfeit products. Inland Revenue Service and Pakistan Customs Service have joined hands for an anti-smuggling field intelligence exercise.
ix. Risk-based Audit: FBR has developed a centralized Risk-based Audit Management System (RAMS) for the selection of audit cases centrally on the basis of pre-determined risk parameters. Selection of scientific matrix allowing allocation and distribution of weightage to different parameters in Risk Grid will segregate the potential and high-risk cases for audit through parametric computer balloting. Subsequently, in September 2020, through Audit Policy, 2019, a total number of 12,533 cases were selected for audit for Tax Year 2018 through the Risk-based Audit Management System (RAMS).
x. Transformation of Traditional Audit Processes through E-Audits: FBR is also moving toward Instituting Data analytics for E-Audit through a transformation in the traditional audit processes. In this system, the correspondence between taxpayers and the tax department would totally be electronic till the conclusion of audit proceedings. The process will be technology-driven with the least human interference and system-based controls for ensuring transparency of the process.
xi. Automation of Audit Monitoring System: A software solution is under process to provide continuous monitoring of the audit cases with sufficient documentation and assistance to the auditors.
B. Customs
i. Pakistan Single Window (PSW): To achieve trade facilitation in an automated environment, reduce clearance times for legitimate trade, and improve compliance through increased access to regulatory information and functions, the system of Pakistan Single Window (PSW) has been launched. This ensures greater collaboration and coordination between Customs and other border regulatory agencies at the national and international level for coordination of border management and increases transparency in regulatory processes and decision-making.
ii. Automated Process for Scanning of Cargo: FBR’s Pakistan Customs Wing has introduced a new automated process in the WeBOC system for scanning containerized import consignments of industrial raw materials for their speedy clearance at ports. The introduction of the Non-Intrusive Inspection System by Customs was a long-awaited initiative aimed at replacing the physical inspection of cargo and reducing the dwell time at ports by using the latest scanning technology in line with international practices.
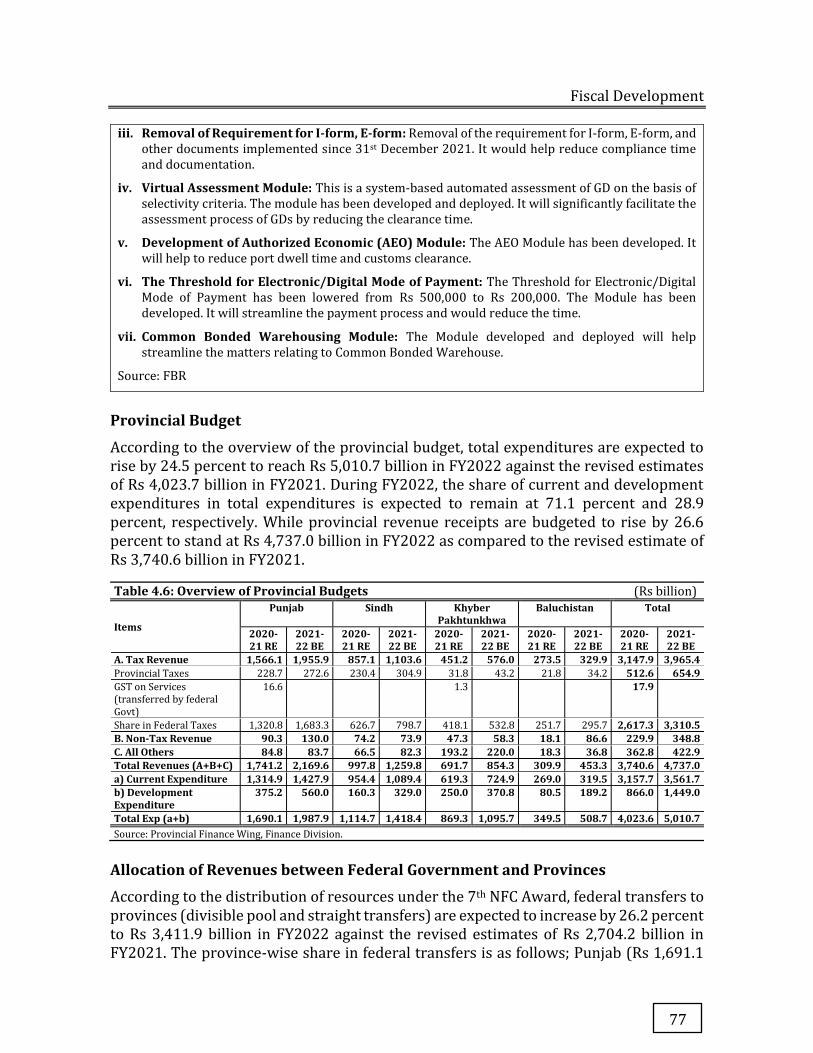
Fiscal Development
77
iii. Removal of Requirement for I-form, E-form: Removal of the requirement for I-form, E-form, and other documents implemented since 31st December 2021. It would help reduce compliance time and documentation.
iv. Virtual Assessment Module: This is a system-based automated assessment of GD on the basis of selectivity criteria. The module has been developed and deployed. It will significantly facilitate the assessment process of GDs by reducing the clearance time.
v. Development of Authorized Economic (AEO) Module: The AEO Module has been developed. It will help to reduce port dwell time and customs clearance.
vi. The Threshold for Electronic/Digital Mode of Payment: The Threshold for Electronic/Digital Mode of Payment has been lowered from Rs 500,000 to Rs 200,000. The Module has been developed. It will streamline the payment process and would reduce the time.
vii. Common Bonded Warehousing Module: The Module developed and deployed will help streamline the matters relating to Common Bonded Warehouse.
Source: FBR
Provincial Budget
According to the overview of the provincial budget, total expenditures are expected to rise by 24.5 percent to reach Rs 5,010.7 billion in FY2022 against the revised estimates of Rs 4,023.7 billion in FY2021. During FY2022, the share of current and development expenditures in total expenditures is expected to remain at 71.1 percent and 28.9 percent, respectively. While provincial revenue receipts are budgeted to rise by 26.6 percent to stand at Rs 4,737.0 billion in FY2022 as compared to the revised estimate of Rs 3,740.6 billion in FY2021.
Table 4.6: Overview of Provincial Budgets (Rs billion)
Items
Punjab Sindh Khyber Pakhtunkhwa
Baluchistan Total
2020-21 RE
2021-22 BE
2020-21 RE
2021-22 BE
2020-21 RE
2021-22 BE
2020-21 RE
2021-22 BE
2020-21 RE
2021-22 BE
A. Tax Revenue 1,566.1 1,955.9 857.1 1,103.6 451.2 576.0 273.5 329.9 3,147.9 3,965.4 Provincial Taxes 228.7 272.6 230.4 304.9 31.8 43.2 21.8 34.2 512.6 654.9 GST on Services (transferred by federal Govt)
16.6 1.3 17.9
Share in Federal Taxes 1,320.8 1,683.3 626.7 798.7 418.1 532.8 251.7 295.7 2,617.3 3,310.5 B. Non-Tax Revenue 90.3 130.0 74.2 73.9 47.3 58.3 18.1 86.6 229.9 348.8 C. All Others 84.8 83.7 66.5 82.3 193.2 220.0 18.3 36.8 362.8 422.9 Total Revenues (A+B+C) 1,741.2 2,169.6 997.8 1,259.8 691.7 854.3 309.9 453.3 3,740.6 4,737.0 a) Current Expenditure 1,314.9 1,427.9 954.4 1,089.4 619.3 724.9 269.0 319.5 3,157.7 3,561.7 b) Development Expenditure
375.2 560.0 160.3 329.0 250.0 370.8 80.5 189.2 866.0 1,449.0
Total Exp (a+b) 1,690.1 1,987.9 1,114.7 1,418.4 869.3 1,095.7 349.5 508.7 4,023.6 5,010.7 Source: Provincial Finance Wing, Finance Division.
Allocation of Revenues between Federal Government and Provinces
According to the distribution of resources under the 7th NFC Award, federal transfers to provinces (divisible pool and straight transfers) are expected to increase by 26.2 percent to Rs 3,411.9 billion in FY2022 against the revised estimates of Rs 2,704.2 billion in FY2021. The province-wise share in federal transfers is as follows; Punjab (Rs 1,691.1
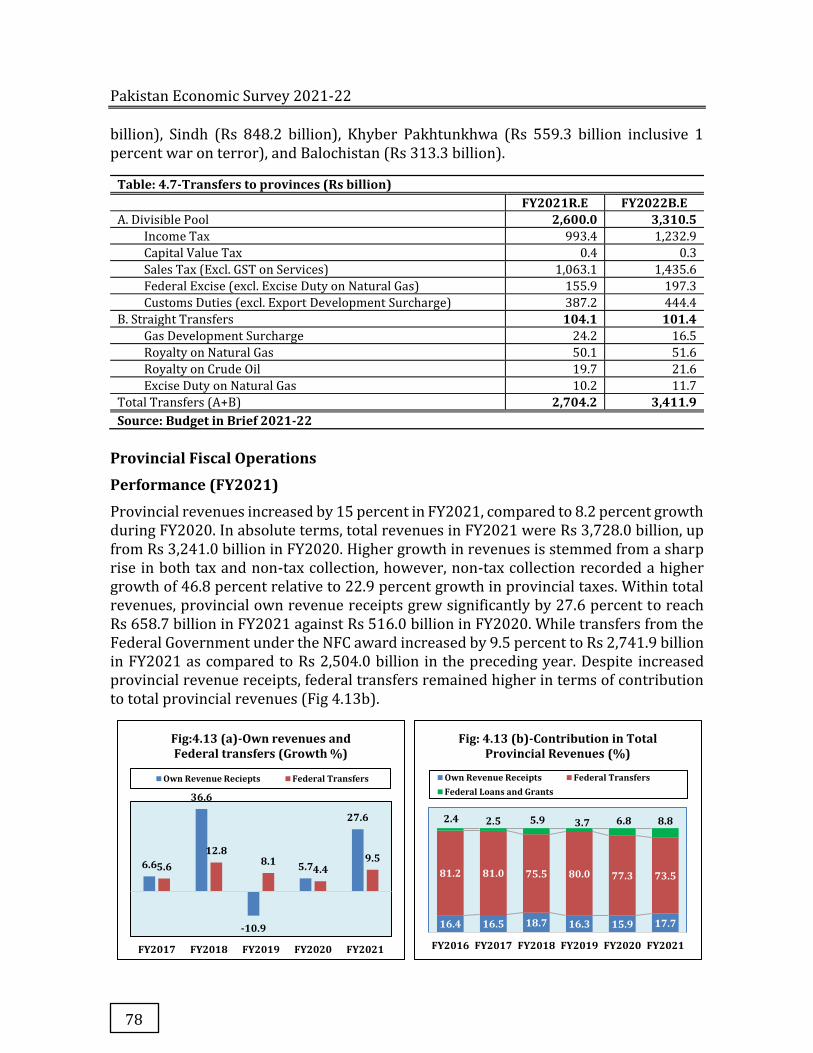
Pakistan Economic Survey 2021-22
78
billion), Sindh (Rs 848.2 billion), Khyber Pakhtunkhwa (Rs 559.3 billion inclusive 1 percent war on terror), and Balochistan (Rs 313.3 billion).
Table: 4.7-Transfers to provinces (Rs billion) FY2021R.E FY2022B.E
A. Divisible Pool 2,600.0 3,310.5 Income Tax 993.4 1,232.9
Capital Value Tax 0.4 0.3
Sales Tax (Excl. GST on Services) 1,063.1 1,435.6
Federal Excise (excl. Excise Duty on Natural Gas) 155.9 197.3
Customs Duties (excl. Export Development Surcharge) 387.2 444.4
B. Straight Transfers 104.1 101.4 Gas Development Surcharge 24.2 16.5
Royalty on Natural Gas 50.1 51.6
Royalty on Crude Oil 19.7 21.6
Excise Duty on Natural Gas 10.2 11.7
Total Transfers (A+B) 2,704.2 3,411.9 Source: Budget in Brief 2021-22
Provincial Fiscal Operations
Performance (FY2021)
Provincial revenues increased by 15 percent in FY2021, compared to 8.2 percent growth during FY2020. In absolute terms, total revenues in FY2021 were Rs 3,728.0 billion, up from Rs 3,241.0 billion in FY2020. Higher growth in revenues is stemmed from a sharp rise in both tax and non-tax collection, however, non-tax collection recorded a higher growth of 46.8 percent relative to 22.9 percent growth in provincial taxes. Within total revenues, provincial own revenue receipts grew significantly by 27.6 percent to reach Rs 658.7 billion in FY2021 against Rs 516.0 billion in FY2020. While transfers from the Federal Government under the NFC award increased by 9.5 percent to Rs 2,741.9 billion in FY2021 as compared to Rs 2,504.0 billion in the preceding year. Despite increased provincial revenue receipts, federal transfers remained higher in terms of contribution to total provincial revenues (Fig 4.13b).
6.6
36.6
-10.9
5.7
27.6
5.612.8
8.14.4
9.5
FY2017 FY2018 FY2019 FY2020 FY2021
Fig:4.13 (a)-Own revenues and Federal transfers (Growth %)
Own Revenue Reciepts Federal Transfers
16.4 16.5 18.7 16.3 15.9 17.7
81.2 81.0 75.5 80.0 77.3 73.5
2.4 2.5 5.9 3.7 6.8 8.8
FY2016 FY2017 FY2018 FY2019 FY2020 FY2021
Fig: 4.13 (b)-Contribution in Total Provincial Revenues (%)
Own Revenue Receipts Federal TransfersFederal Loans and Grants
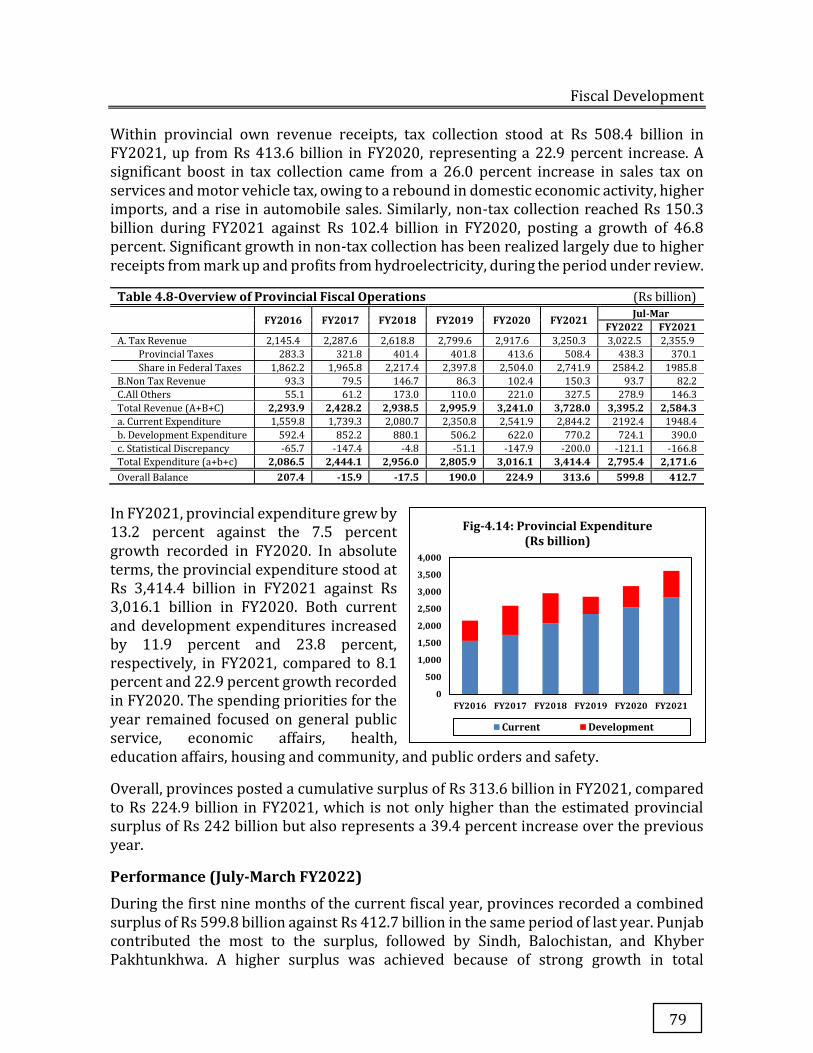
Fiscal Development
79
Within provincial own revenue receipts, tax collection stood at Rs 508.4 billion in FY2021, up from Rs 413.6 billion in FY2020, representing a 22.9 percent increase. A significant boost in tax collection came from a 26.0 percent increase in sales tax on services and motor vehicle tax, owing to a rebound in domestic economic activity, higher imports, and a rise in automobile sales. Similarly, non-tax collection reached Rs 150.3 billion during FY2021 against Rs 102.4 billion in FY2020, posting a growth of 46.8 percent. Significant growth in non-tax collection has been realized largely due to higher receipts from mark up and profits from hydroelectricity, during the period under review.
Table 4.8-Overview of Provincial Fiscal Operations (Rs billion) FY2016 FY2017 FY2018 FY2019 FY2020 FY2021 Jul-Mar
FY2022 FY2021 A. Tax Revenue 2,145.4 2,287.6 2,618.8 2,799.6 2,917.6 3,250.3 3,022.5 2,355.9
Provincial Taxes 283.3 321.8 401.4 401.8 413.6 508.4 438.3 370.1
Share in Federal Taxes 1,862.2 1,965.8 2,217.4 2,397.8 2,504.0 2,741.9 2584.2 1985.8
B.Non Tax Revenue 93.3 79.5 146.7 86.3 102.4 150.3 93.7 82.2
C.All Others 55.1 61.2 173.0 110.0 221.0 327.5 278.9 146.3
Total Revenue (A+B+C) 2,293.9 2,428.2 2,938.5 2,995.9 3,241.0 3,728.0 3,395.2 2,584.3 a. Current Expenditure 1,559.8 1,739.3 2,080.7 2,350.8 2,541.9 2,844.2 2192.4 1948.4
b. Development Expenditure 592.4 852.2 880.1 506.2 622.0 770.2 724.1 390.0
c. Statistical Discrepancy -65.7 -147.4 -4.8 -51.1 -147.9 -200.0 -121.1 -166.8
Total Expenditure (a+b+c) 2,086.5 2,444.1 2,956.0 2,805.9 3,016.1 3,414.4 2,795.4 2,171.6 Overall Balance 207.4 -15.9 -17.5 190.0 224.9 313.6 599.8 412.7
In FY2021, provincial expenditure grew by 13.2 percent against the 7.5 percent growth recorded in FY2020. In absolute terms, the provincial expenditure stood at Rs 3,414.4 billion in FY2021 against Rs 3,016.1 billion in FY2020. Both current and development expenditures increased by 11.9 percent and 23.8 percent, respectively, in FY2021, compared to 8.1 percent and 22.9 percent growth recorded in FY2020. The spending priorities for the year remained focused on general public service, economic affairs, health, education affairs, housing and community, and public orders and safety.
Overall, provinces posted a cumulative surplus of Rs 313.6 billion in FY2021, compared to Rs 224.9 billion in FY2021, which is not only higher than the estimated provincial surplus of Rs 242 billion but also represents a 39.4 percent increase over the previous year.
Performance (July-March FY2022)
During the first nine months of the current fiscal year, provinces recorded a combined surplus of Rs 599.8 billion against Rs 412.7 billion in the same period of last year. Punjab contributed the most to the surplus, followed by Sindh, Balochistan, and Khyber Pakhtunkhwa. A higher surplus was achieved because of strong growth in total
0
500
1,000
1,500
2,000
2,500
3,000
3,500
4,000
FY2016 FY2017 FY2018 FY2019 FY2020 FY2021
Fig-4.14: Provincial Expenditure(Rs billion)
Current Development
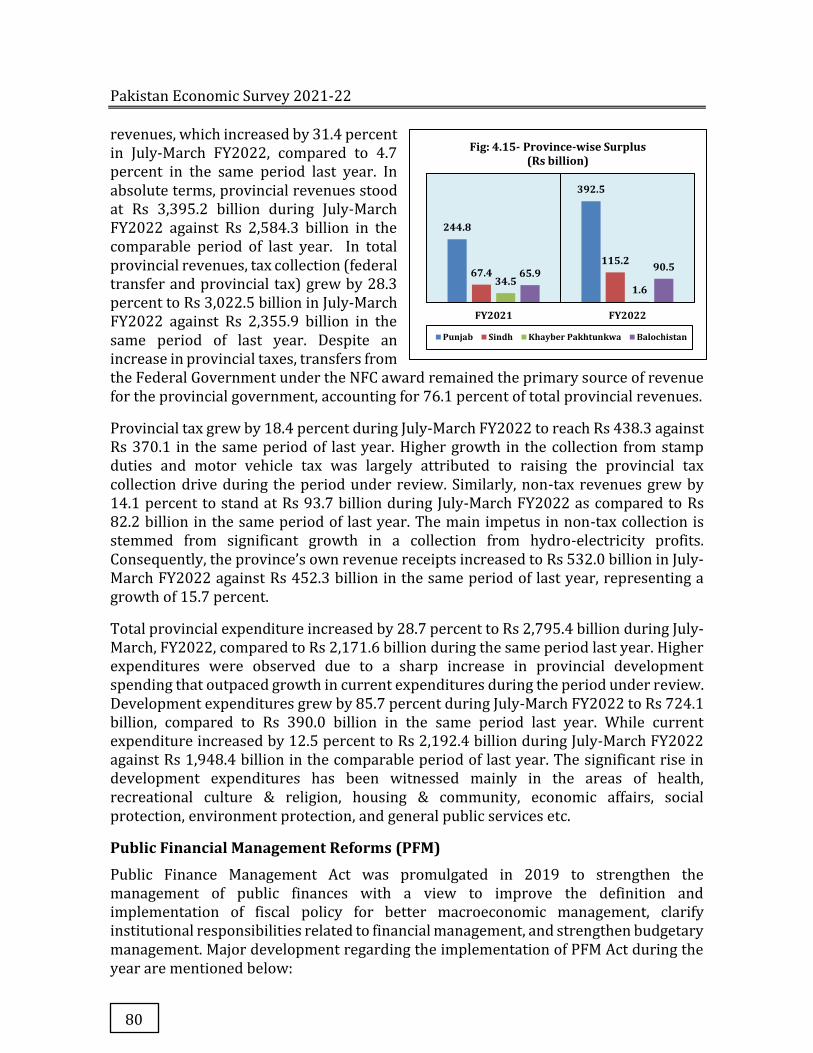
Pakistan Economic Survey 2021-22
80
revenues, which increased by 31.4 percent in July-March FY2022, compared to 4.7 percent in the same period last year. In absolute terms, provincial revenues stood at Rs 3,395.2 billion during July-March FY2022 against Rs 2,584.3 billion in the comparable period of last year. In total provincial revenues, tax collection (federal transfer and provincial tax) grew by 28.3 percent to Rs 3,022.5 billion in July-March FY2022 against Rs 2,355.9 billion in the same period of last year. Despite an increase in provincial taxes, transfers from the Federal Government under the NFC award remained the primary source of revenue for the provincial government, accounting for 76.1 percent of total provincial revenues.
Provincial tax grew by 18.4 percent during July-March FY2022 to reach Rs 438.3 against Rs 370.1 in the same period of last year. Higher growth in the collection from stamp duties and motor vehicle tax was largely attributed to raising the provincial tax collection drive during the period under review. Similarly, non-tax revenues grew by 14.1 percent to stand at Rs 93.7 billion during July-March FY2022 as compared to Rs 82.2 billion in the same period of last year. The main impetus in non-tax collection is stemmed from significant growth in a collection from hydro-electricity profits. Consequently, the province’s own revenue receipts increased to Rs 532.0 billion in July-March FY2022 against Rs 452.3 billion in the same period of last year, representing a growth of 15.7 percent.
Total provincial expenditure increased by 28.7 percent to Rs 2,795.4 billion during July-March, FY2022, compared to Rs 2,171.6 billion during the same period last year. Higher expenditures were observed due to a sharp increase in provincial development spending that outpaced growth in current expenditures during the period under review. Development expenditures grew by 85.7 percent during July-March FY2022 to Rs 724.1 billion, compared to Rs 390.0 billion in the same period last year. While current expenditure increased by 12.5 percent to Rs 2,192.4 billion during July-March FY2022 against Rs 1,948.4 billion in the comparable period of last year. The significant rise in development expenditures has been witnessed mainly in the areas of health, recreational culture & religion, housing & community, economic affairs, social protection, environment protection, and general public services etc.
Public Financial Management Reforms (PFM)
Public Finance Management Act was promulgated in 2019 to strengthen the management of public finances with a view to improve the definition and implementation of fiscal policy for better macroeconomic management, clarify institutional responsibilities related to financial management, and strengthen budgetary management. Major development regarding the implementation of PFM Act during the year are mentioned below:
244.8
392.5
67.4115.2
34.51.6
65.9 90.5
FY2021 FY2022
Fig: 4.15- Province-wise Surplus(Rs billion)
Punjab Sindh Khayber Pakhtunkwa Balochistan
Fiscal Development
81
i. Financial Management and Powers of Principal Accounting Officers Regulations, 2021 was issued wherein the financial advisor’s organization of the Finance Division has been disbanded. Now on completion of the transitory period, the Joint Secretaries or Deputy Secretaries Expenditures, Finance Division shall be reassigned official duties to be performed for various Ministries or Divisions forthwith.
ii. The office of Chief Finance and Account Officer headed by a senior level officer has been established who is responsible for assisting and supporting the Principal Accounting Officer in managing the financial affairs of the Division concerned or more Divisions if so allocated and all the organizations or departments or offices under the administrative control of that Division.
iii. Principal Accounting Officer has been empowered to utilize his one-liner Budget grant without endorsement by the Finance Division.
iv. Amendments have been made in Federal Treasury Rules to facilitate the pensioners.
v. Amendment in GFR 130(3) has been made to empower the head of an office to authorize any gazetted officer serving under him, or such other officials as are authorized by the Finance Division on this behalf, to incur expenditure.
vi. Amendment has been made in GFR 130, sub-rule 3 to authorize Police House Station Officers (SHOs) of Islamabad Capital Territory (ICT) as Drawing and Disbursing Officers (DDOs) for their respective jurisdictions in ICT.
vii. Receipt and Payment Rules, Grant in Aid Rules, and General Financial Rules have been drafted in consultation with stakeholders and are at final stage.
viii. Established TSA phase-I system in Ministries, Divisions, Attached Departments, and Sub-Ordinate Offices (MDAS).
ix. 163 Ministries, Divisions, Attached Departments, and Sub-Ordinate Offices (MDAS) have been notified under Treasury Single Account.
x. Closed over 4500 Commercial Bank Accounts of Government entities.
xi. Conducted awareness workshop on TSA phase-II system for Public Entities including Autonomous bodies, Regulatory Authorities, Funds, Civil Armed Forces, and Defence.
xii. Cash Forecasting Unit (CFU) has been established under the Budget Wing of the Finance Division to forecast Cash Flows and anticipate the cash needs of the Federal Government for improved liquidity management.
xiii. Special Assignment Account Procedure for Public Account of the Federation 2020 has been devised and circulated for the opening and operation of Public Account.
xiv. Financial Management and Powers of Principal Accounting Officers Regulations, 2021 has been reviewed in consultation with stakeholders for the incorporation of amendments in the said regulations.
xv. Amendment in Sr. No 24 & Sr. No.42 of the schedule of Financial Powers delegated to PAOs, Heads of Departments, and Sub-Ordinate Offices, have been made to enhance the powers of the PAOs, Heads of Departments, and Sub-Ordinate Offices.
xvi. Amendment in Sr. No. 4,41,43 & 81 of the schedule of Financial Powers delegated to PAOs, Heads of Departments, and Sub-Ordinate Offices have been made.
Pakistan Economic Survey 2021-22
82
Conclusion
Despite a significant rise in tax collection during July-March FY2022, higher current and development expenditures widened the fiscal deficit to 3.8 percent of GDP against 3.0 percent in the previous period. Similarly, the primary balance posted a deficit of Rs 447.2 billion against a surplus of Rs 451.8 billion. Due to additional spending under COVID-19 funds for vaccine procurement, IPPs Circular debt payment, social sector spending, and higher development expenditures, the fiscal sector remained under tremendous pressure. All these factors, along with the global economic challenges posed by the Russia-Ukraine conflict, as well as the impact on international commodities and oil prices, have increased the risk of fiscal slippages during the current fiscal year. To offset the inflationary pressure, the government initially tried to provide relief to the masses by maintaining domestic oil prices. However, as international commodity and energy prices continued to rise, providing relief acted as a double-edged sword, potentially increasing the fiscal deficit, and reducing fiscal space. To avoid severe fiscal imbalances and to ensure that fiscal consolidation would remain on track, the government has reduced the subsidy by raising the price of petroleum products. At the same time, the government is providing targeted subsidies to protect vulnerable segments of society from rising oil and commodity prices.
The Government is determined to restore fiscal sustainability through effective revenue mobilization and prudent spending. In this regard, key priorities include increasing the tax-to-GDP ratio through various tax policy and administration reforms, as well as reducing unnecessary spending through austerity measures. Furthermore, the emphasis is on rationalizing untargeted subsidies and reducing the losses of public sector enterprises through improved governance. These measures would provide significant assistance in controlling expenditure slippages and increasing revenues, thereby lowering the fiscal deficit in the medium to long term.
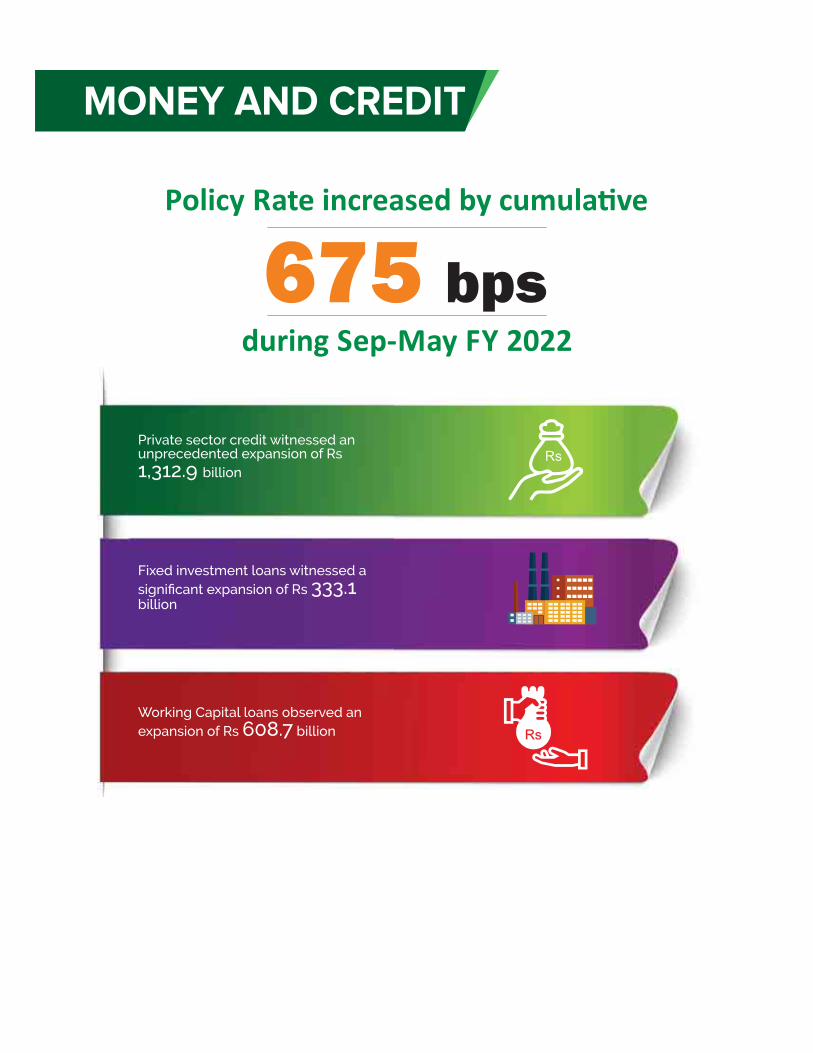

The outbreak of COVID pandemic in 2019 has led to a global macroeconomic shock of unprecedented magnitude. The central banks responded aggressively to avoid deep recession in the economies. Short-term interest rates, which were already low in most advanced economies, quickly fell to around zero in all advanced economies, outpacing their responses to Global Financial Crisis (GFC) in terms of both speed and scope.1 Emerging markets also experienced sharp declines in short-term interest rates, approaching zero in several countries.
The central banks supported national government’s expansionary fiscal policy measures in the form of tax cuts and higher government spending to boost aggregate demand and employment. The GFC and the COVID-19 pandemic have shifted the focus of monetary policy, which involves significant budgetary expansion even if it requires using the money-creation capacity of the central bank.
The global recovery was expected in 2021 after contraction in 2020, but the momentum slowed and fueled by the highly transmissible Delta and Omicron variant, along with emerging price pressures, due to unusual pandemic-related developments, soaring global commodity prices and pandemic-induced supply-demand imbalances during second half of 2021. Further, the Russia-Ukraine conflict raises immediate financial stability risks and questions about the longer-term impact on markets early in the 2022.
In a nutshell, the sharp rise in commodity prices combined with long-term supply disruptions, has exacerbated pre-existing inflationary pressures and shifted inflation risks to the upside. In many countries, inflation has become a central concern. In some advanced economies, including the United States and some European countries, it has reached its highest level in more than 40 years.
War-related supply shortages are expected to amplify these pressures, notably through increases in the price of energy, metals, and food. As a result, inflation is projected to remain elevated for longer than previously expected, in both advanced and emerging market and developing economies.2
In response, central banks around the world began to tighten monetary policy to keep inflationary expectations well anchored. Since July 2021, 53 central banks have
1https://voxeu.org/article/monetary-policy-and-central-banking-COVID-era-new-ebook 2 Global Financial Stability Report, April 2022, IMF
Chapter 5
Money & Credit

Pakistan Economic Survey 2021-22
84
increased their policy rates. The changes in policy rate in some selected countries is shown in Fig-5.1.
In emerging and developing economies, increases in food and fuel prices can significantly increase the risk of poverty. A wider range of emerging market economies can come under pressure if the pace of global monetary tightening accelerates further, especially in the United States, or if financial markets start to reprice more aggressively, which would further weigh on the global outlook.
Global economic challenges like monetary tightening, high international commodity prices, and the Russia-Ukraine conflict have posed a potential risk for Pakistan’s economy which is already struggling to maintain the Post COVID recovery. The impact of global challenges on the domestic economy has been transmitted through higher inflation, deterioration in external accounts, depletion of foreign reserves, which eventually exerts significant pressure on the exchange rate. Accordingly, SBP has moved to monetary policy tightening at the end of the first quarter of FY2022, which was kept unchanged since June 2020.
Monetary Policy Stance in Pakistan
Pakistan’s economy has witnessed a V-shaped recovery in FY2021 after witnessing a contraction of 0.9 percent in FY2020. After the COVID outbreak, the policy rate was reduced by 625 bps within short span of less than three months, during Mar-Jun, 2020. This was the largest policy rate cut in emerging market economies. During FY2021, State Bank of Pakistan maintained an accommodative monetary policy stance, by keeping the policy rate unchanged at 7.0 percent throughout FY2021. Besides, SBP provided liquidity and regulatory support to businesses and households during the challenging times. The economic policy was implemented with a prudent mix which supported the economic recovery without putting any pressure on macroeconomic imbalances.
With heightened uncertainty due to COVID-19, the Monetary Policy Committee for the first time considered it appropriate to provide some forward guidance on monetary policy in its January 2021 meeting3, to facilitate policy predictability and decision- 3 The central bank communication is an important aspect of the monetary policy that aims to reduce economic and financial uncertainty. During unusual economic conditions, some central banks also communicate the future monetary policy stance which is referred to as
1150
985
900
900
800
550
525
500
450
450
450
440
425
400
350
350
350
350
350
325
275
250
250
225
200
200
175
150
125
125
125
100
100
75 75 75 75 75 65 50 50 50 50 50 50 25 25 25 25 25 25 25 25 0 0
-25
-25
-40
-50
-300
-400
-200
0
200
400
600
800
1000
1200
Ru
ssia
Arg
enti
na
Bra
zil
Pa
kis
tan
An
go
la
Ka
zak
hst
an
Pe
ru
Jam
aic
a
Ky
rgy
zsta
n
Bel
aru
s
Arm
en
ia
Mo
ng
oli
a
Do
min
ican
Re
p.
Ice
lan
d
Ro
ma
nia
Co
sta
Ric
a
Egy
pt
New
Zea
lan
d
So
uth
Afr
ica
UK
Rw
and
a
Alb
an
ia
Ser
bia
Jord
an
Sau
di A
rab
ia
US
A
Isra
el
Zam
bia
No
rth
Mac
edo
nia
Ug
an
da
Fig-5.1:Change in Policy Rate Since July 2021 (in basis points)
Source: tradingeconomics.com; cbrates.com; upto April 15, 2022
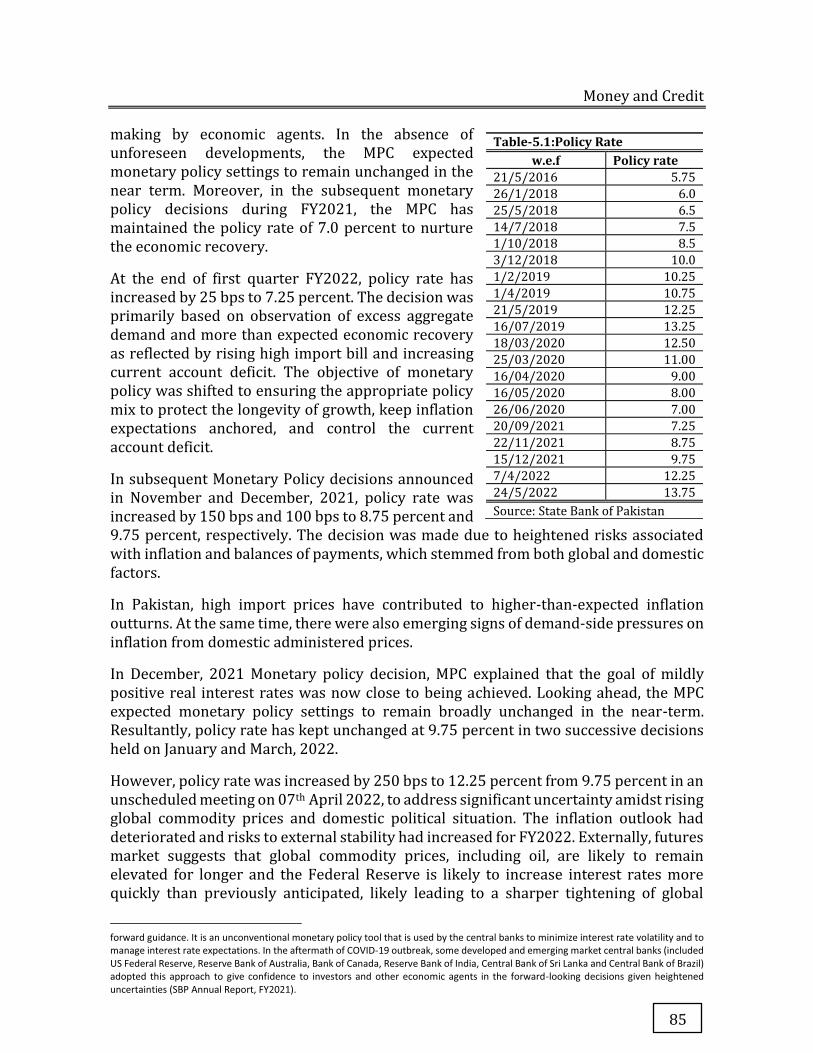
Money and Credit
85
making by economic agents. In the absence of unforeseen developments, the MPC expected monetary policy settings to remain unchanged in the near term. Moreover, in the subsequent monetary policy decisions during FY2021, the MPC has maintained the policy rate of 7.0 percent to nurture the economic recovery.
At the end of first quarter FY2022, policy rate has increased by 25 bps to 7.25 percent. The decision was primarily based on observation of excess aggregate demand and more than expected economic recovery as reflected by rising high import bill and increasing current account deficit. The objective of monetary policy was shifted to ensuring the appropriate policy mix to protect the longevity of growth, keep inflation expectations anchored, and control the current account deficit.
In subsequent Monetary Policy decisions announced in November and December, 2021, policy rate was increased by 150 bps and 100 bps to 8.75 percent and 9.75 percent, respectively. The decision was made due to heightened risks associated with inflation and balances of payments, which stemmed from both global and domestic factors.
In Pakistan, high import prices have contributed to higher-than-expected inflation outturns. At the same time, there were also emerging signs of demand-side pressures on inflation from domestic administered prices.
In December, 2021 Monetary policy decision, MPC explained that the goal of mildly positive real interest rates was now close to being achieved. Looking ahead, the MPC expected monetary policy settings to remain broadly unchanged in the near-term. Resultantly, policy rate has kept unchanged at 9.75 percent in two successive decisions held on January and March, 2022.
However, policy rate was increased by 250 bps to 12.25 percent from 9.75 percent in an unscheduled meeting on 07th April 2022, to address significant uncertainty amidst rising global commodity prices and domestic political situation. The inflation outlook had deteriorated and risks to external stability had increased for FY2022. Externally, futures market suggests that global commodity prices, including oil, are likely to remain elevated for longer and the Federal Reserve is likely to increase interest rates more quickly than previously anticipated, likely leading to a sharper tightening of global
forward guidance. It is an unconventional monetary policy tool that is used by the central banks to minimize interest rate volatility and to manage interest rate expectations. In the aftermath of COVID-19 outbreak, some developed and emerging market central banks (included US Federal Reserve, Reserve Bank of Australia, Bank of Canada, Reserve Bank of India, Central Bank of Sri Lanka and Central Bank of Brazil) adopted this approach to give confidence to investors and other economic agents in the forward-looking decisions given heightened uncertainties (SBP Annual Report, FY2021).
Table-5.1:Policy Rate w.e.f Policy rate
21/5/2016 5.75
26/1/2018 6.0
25/5/2018 6.5
14/7/2018 7.5
1/10/2018 8.5
3/12/2018 10.0
1/2/2019 10.25
1/4/2019 10.75
21/5/2019 12.25
16/07/2019 13.25
18/03/2020 12.50
25/03/2020 11.00
16/04/2020 9.00
16/05/2020 8.00
26/06/2020 7.00
20/09/2021 7.25
22/11/2021 8.75
15/12/2021 9.75
7/4/2022 12.25
24/5/2022 13.75
Source: State Bank of Pakistan

Pakistan Economic Survey 2021-22
86
financial conditions. Domestically, some macroeconomic indicators have deteriorated, as have SBP reserves as a result of debt repayment and political uncertainty. Fig-5.2 presents the trend in policy rate, CPI inflation and current account balance.
In monetary policy decision held on 23rd May, 2022 the MPC decided to raise the policy rate by 150 basis points to 13.75 percent. The decision was based on outcome of provisional growth estimates for FY2022 more than target, shows excess aggregate demand, elevated external sector pressure and the higher inflation outlook due to domestic and international factors.
In addition to policy rate increase, the interest rates on EFS and LTFF loans are also being raised. The MPC has informed that in future, these rates will be linked to the policy rate and will adjust automatically, while continuing to remain below the policy rate in order to incentivize exports.
Box-I: Salient Changes in SBP Act4
� The role of the SBP as defined in the State Bank of Pakistan Act 1956 has undergone several changes over the years.5 These legislative changes were carried out to bring the central bank functions in line with the international best practices so as to enable it to deal with the evolving challenges and issues effectively. In the similar manner, recent amendments in the SBP Act 2022 mainly clarifies the objectives of the SBP, along with enhancing operational and financial autonomy, accountability, and transparency.
� Overall, the amendments balance the provision of necessary operational and financial autonomy to the State Bank while enhancing transparency in decision making and strengthening accountability. More specifically, the amendments have six key purposes:
1. to clearly define the objectives of the SBP to improve its accountability;
2. to outline the SBP’s functions in line with these objectives;
3. to provide the SBP necessary financial resources to help achieve its objectives;
4. to strengthen the functional and administrative autonomy of the SBP;
5. to increase transparency in the operations of the SBP and strengthen its governance;
4 https://www.sbp.org.pk/about/pdf/LF/Brief-1.pdf 5 Major revisions in the SBP Act were introduced in 1994, 1997, 2012 and 2015
-2500
-2000
-1500
-1000
-500
0
500
1000
0.0
4.0
8.0
12.0
16.0
Jul-18 Nov-18 Mar-19 Jul-19 Nov-19 Mar-20 Jul-20 Nov-20 Mar-21 Jul-21 Nov-21 Mar-22
Fig-5.2: Monetary Policy Performance
Current Account Balance (Million US$, rhs)Y0Y CPI InflationPolicy rate
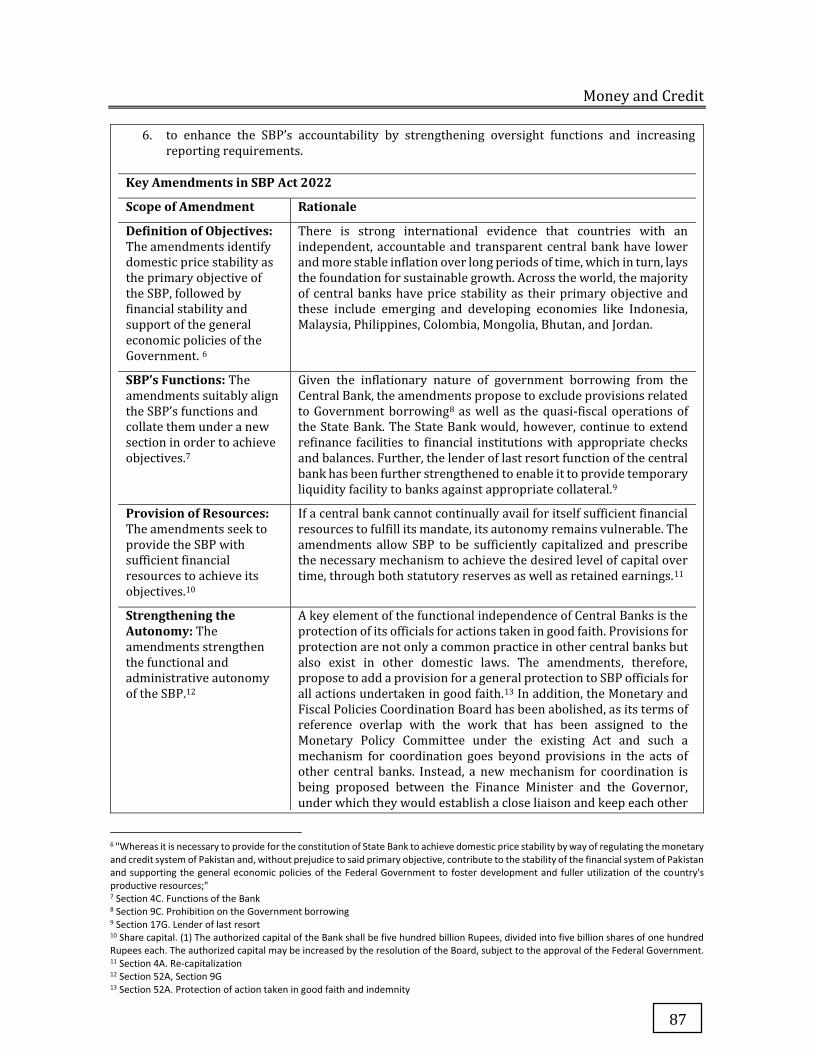
Money and Credit
87
6. to enhance the SBP’s accountability by strengthening oversight functions and increasing reporting requirements.
Key Amendments in SBP Act 2022
Scope of Amendment Rationale
Definition of Objectives: The amendments identify domestic price stability as the primary objective of the SBP, followed by financial stability and support of the general economic policies of the Government. 6
There is strong international evidence that countries with an independent, accountable and transparent central bank have lower and more stable inflation over long periods of time, which in turn, lays the foundation for sustainable growth. Across the world, the majority of central banks have price stability as their primary objective and these include emerging and developing economies like Indonesia, Malaysia, Philippines, Colombia, Mongolia, Bhutan, and Jordan.
SBP’s Functions: The amendments suitably align the SBP’s functions and collate them under a new section in order to achieve objectives.7
Given the inflationary nature of government borrowing from the Central Bank, the amendments propose to exclude provisions related to Government borrowing8 as well as the quasi-fiscal operations of the State Bank. The State Bank would, however, continue to extend refinance facilities to financial institutions with appropriate checks and balances. Further, the lender of last resort function of the central bank has been further strengthened to enable it to provide temporary liquidity facility to banks against appropriate collateral.9
Provision of Resources: The amendments seek to provide the SBP with sufficient financial resources to achieve its objectives.10
If a central bank cannot continually avail for itself sufficient financial resources to fulfill its mandate, its autonomy remains vulnerable. The amendments allow SBP to be sufficiently capitalized and prescribe the necessary mechanism to achieve the desired level of capital over time, through both statutory reserves as well as retained earnings.11
Strengthening the Autonomy: The amendments strengthen the functional and administrative autonomy of the SBP.12
A key element of the functional independence of Central Banks is the protection of its officials for actions taken in good faith. Provisions for protection are not only a common practice in other central banks but also exist in other domestic laws. The amendments, therefore, propose to add a provision for a general protection to SBP officials for all actions undertaken in good faith.13 In addition, the Monetary and Fiscal Policies Coordination Board has been abolished, as its terms of reference overlap with the work that has been assigned to the Monetary Policy Committee under the existing Act and such a mechanism for coordination goes beyond provisions in the acts of other central banks. Instead, a new mechanism for coordination is being proposed between the Finance Minister and the Governor, under which they would establish a close liaison and keep each other
6 "Whereas it is necessary to provide for the constitution of State Bank to achieve domestic price stability by way of regulating the monetary and credit system of Pakistan and, without prejudice to said primary objective, contribute to the stability of the financial system of Pakistan and supporting the general economic policies of the Federal Government to foster development and fuller utilization of the country's productive resources;" 7 Section 4C. Functions of the Bank 8 Section 9C. Prohibition on the Government borrowing 9 Section 17G. Lender of last resort 10 Share capital. (1) The authorized capital of the Bank shall be five hundred billion Rupees, divided into five billion shares of one hundred Rupees each. The authorized capital may be increased by the resolution of the Board, subject to the approval of the Federal Government. 11 Section 4A. Re-capitalization 12 Section 52A, Section 9G 13 Section 52A. Protection of action taken in good faith and indemnity

Pakistan Economic Survey 2021-22
88
informed of matters that jointly concern the Ministry of Finance and the State Bank.14
Increasing Transparency: The amendments increase transparency in the operations of the SBP and strengthen its governance.15
The amendments prescribe qualification and experience requirements,16 tenure,17 conflict of interest18 and disqualification criteria19 for all appointments20, including the directors of the Board of State Bank, members of the Monetary Policy Committee, the Governor and the Deputy Governors. In addition, to introduce a collegial decision-making process, the amendments propose to establish an Executive Committee at State Bank consisting of the Governor, Deputy Governors, and Executive Directors.21 This committee will be responsible for formulating policies related to the Bank’s core functions as well as those related to administration and management matters, excluding those matters falling in the purview of the Monetary Policy Committee or the Board of Directors. All policy decisions will be taken by the Executive Committee.
Enhancing Accountability: The amendments enhance the SBP’s accountability by strengthening oversight functions and increasing reporting requirements22.
The amendments strengthen provisions related to accountability of the State Bank to the Parliament, constitution of an Audit Committee,23 designation of a Chief Internal Auditor24 and appointment of External Auditors.25 In addition, it is proposed that the oversight role of the Board of Directors of State Bank be strengthened and its scope broadened, including by giving them explicit oversight over the affairs and functions of the Bank; the power to supervise the management, Bank’s administration, operations; and right of access to all activities of the Bank.26
Source: https://www.sbp.org.pk/about/pdf/LF/Brief-1.pdf
Recent Monetary and Credit Developments
Broad Money (M2) has increased by Rs 1,457.2 billion during the period 01st July-29th
April, FY2022 as compared to Rs 1,632.7 billion during same period of last year, showing the growth of 6.0 percent. Contained growth in M2 has been observed mainly due to decrease in Net Foreign Assets (NFA) of banking system. NFA’s point contribution has decreased to 5.5 percent as compared to positive contribution of 4.7 percent last year. Whereas Net Domestic Assets (NDA) point contribution stood at 11.5 percent as compared to 3.1 percent during same period last year. As a result, M2 growth reached at 6.0 percent during the period under review as compared 7.8 percent during same period last year (Table-5.2).
14 9G. Governor and Minister of Finance to establish liaison 15 9F. Executive Committee. (1) An Executive Committee shall be established with the power to formulate policies related to the Bank’s core functions as well as those related to administration and management matters, excluding those matters falling in the purview of the Monetary Policy Committee, or the Board of Directors. 16 Section 9(5) Board of Directors 17 Section 14. Terms of Office 18 Section16A. Conflict of interest 19 Section 13. Disqualifications of the Governor, Deputy Governors, Directors and members 20 Section 11A. Appointments 21 Section 9F. Executive Committee 22 Section 39. Accountability (1) The Governor shall submit annual report before the Majlis-e-Shoora (Parliament) regarding the achievement of the Bank's objectives, conduct of monetary policy, state of the economy and the financial system. 23 Section 45. Audit committee. 24 Section 45A. Chief internal auditor 25 43. External Audit 26 Section 9. Board of Directors and 9(A). Powers of the Board
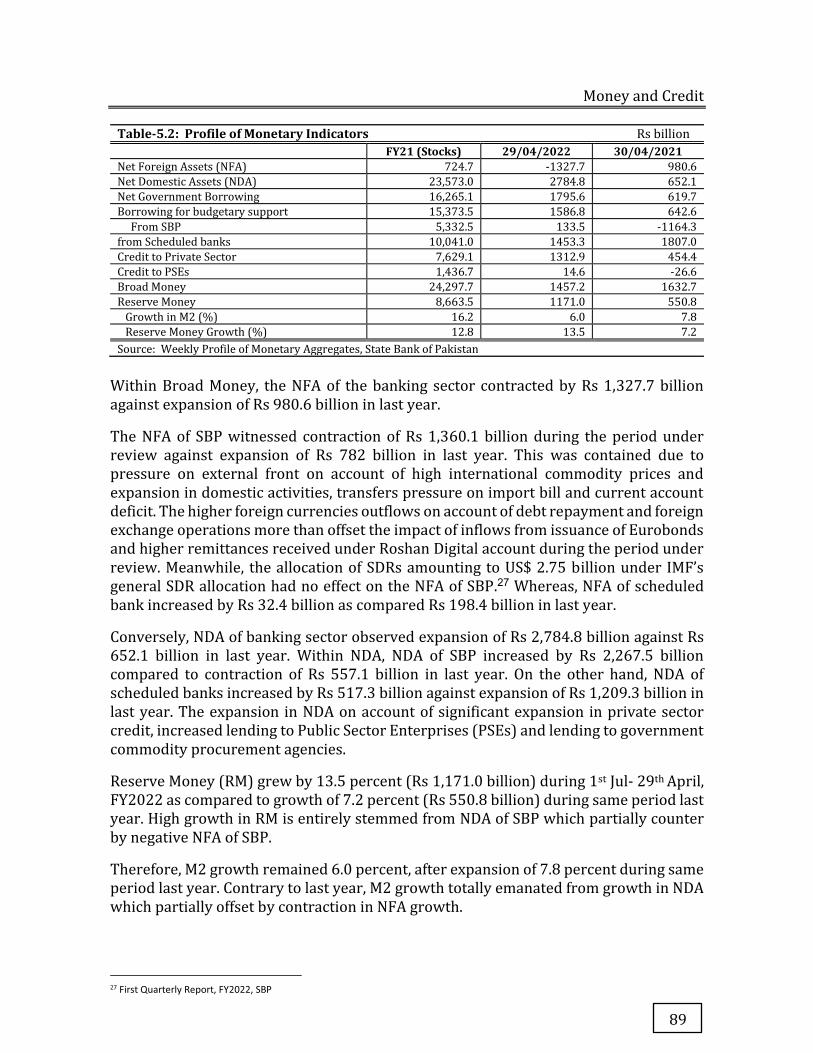
Money and Credit
89
Table-5.2: Profile of Monetary Indicators Rs billion FY21 (Stocks) 29/04/2022 30/04/2021
Net Foreign Assets (NFA) 724.7 -1327.7 980.6
Net Domestic Assets (NDA) 23,573.0 2784.8 652.1
Net Government Borrowing 16,265.1 1795.6 619.7
Borrowing for budgetary support 15,373.5 1586.8 642.6
From SBP 5,332.5 133.5 -1164.3
from Scheduled banks 10,041.0 1453.3 1807.0
Credit to Private Sector 7,629.1 1312.9 454.4
Credit to PSEs 1,436.7 14.6 -26.6
Broad Money 24,297.7 1457.2 1632.7
Reserve Money 8,663.5 1171.0 550.8
Growth in M2 (%) 16.2 6.0 7.8
Reserve Money Growth (%) 12.8 13.5 7.2
Source: Weekly Profile of Monetary Aggregates, State Bank of Pakistan
Within Broad Money, the NFA of the banking sector contracted by Rs 1,327.7 billion against expansion of Rs 980.6 billion in last year.
The NFA of SBP witnessed contraction of Rs 1,360.1 billion during the period under review against expansion of Rs 782 billion in last year. This was contained due to pressure on external front on account of high international commodity prices and expansion in domestic activities, transfers pressure on import bill and current account deficit. The higher foreign currencies outflows on account of debt repayment and foreign exchange operations more than offset the impact of inflows from issuance of Eurobonds and higher remittances received under Roshan Digital account during the period under review. Meanwhile, the allocation of SDRs amounting to US$ 2.75 billion under IMF’s general SDR allocation had no effect on the NFA of SBP.27 Whereas, NFA of scheduled bank increased by Rs 32.4 billion as compared Rs 198.4 billion in last year.
Conversely, NDA of banking sector observed expansion of Rs 2,784.8 billion against Rs 652.1 billion in last year. Within NDA, NDA of SBP increased by Rs 2,267.5 billion compared to contraction of Rs 557.1 billion in last year. On the other hand, NDA of scheduled banks increased by Rs 517.3 billion against expansion of Rs 1,209.3 billion in last year. The expansion in NDA on account of significant expansion in private sector credit, increased lending to Public Sector Enterprises (PSEs) and lending to government commodity procurement agencies.
Reserve Money (RM) grew by 13.5 percent (Rs 1,171.0 billion) during 1st Jul- 29th April, FY2022 as compared to growth of 7.2 percent (Rs 550.8 billion) during same period last year. High growth in RM is entirely stemmed from NDA of SBP which partially counter by negative NFA of SBP.
Therefore, M2 growth remained 6.0 percent, after expansion of 7.8 percent during same period last year. Contrary to last year, M2 growth totally emanated from growth in NDA which partially offset by contraction in NFA growth.
27 First Quarterly Report, FY2022, SBP
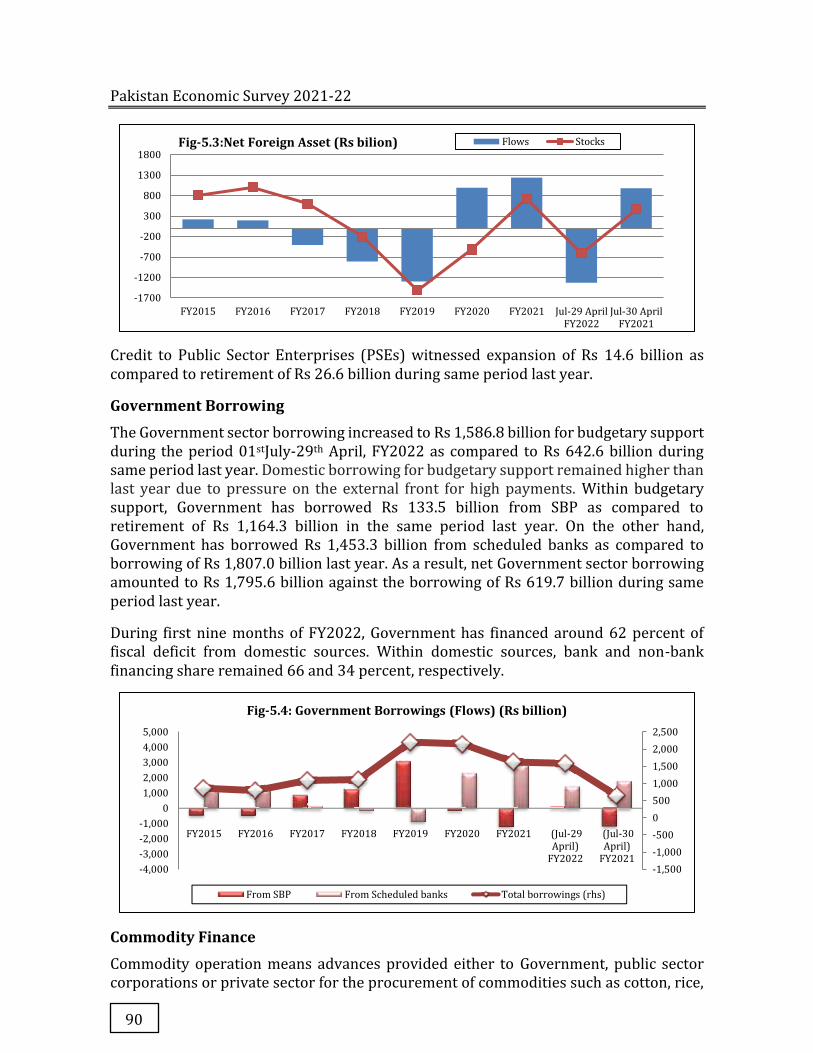
Pakistan Economic Survey 2021-22
90
Credit to Public Sector Enterprises (PSEs) witnessed expansion of Rs 14.6 billion as compared to retirement of Rs 26.6 billion during same period last year.
Government Borrowing
The Government sector borrowing increased to Rs 1,586.8 billion for budgetary support during the period 01stJuly-29th April, FY2022 as compared to Rs 642.6 billion during same period last year. Domestic borrowing for budgetary support remained higher than last year due to pressure on the external front for high payments. Within budgetary support, Government has borrowed Rs 133.5 billion from SBP as compared to retirement of Rs 1,164.3 billion in the same period last year. On the other hand, Government has borrowed Rs 1,453.3 billion from scheduled banks as compared to borrowing of Rs 1,807.0 billion last year. As a result, net Government sector borrowing amounted to Rs 1,795.6 billion against the borrowing of Rs 619.7 billion during same period last year.
During first nine months of FY2022, Government has financed around 62 percent of fiscal deficit from domestic sources. Within domestic sources, bank and non-bank financing share remained 66 and 34 percent, respectively.
Commodity Finance
Commodity operation means advances provided either to Government, public sector corporations or private sector for the procurement of commodities such as cotton, rice,
-1700
-1200
-700
-200
300
800
1300
1800
FY2015 FY2016 FY2017 FY2018 FY2019 FY2020 FY2021 Jul-29 AprilFY2022
Jul-30 AprilFY2021
Fig-5.3:Net Foreign Asset (Rs bilion) Flows Stocks
-1,500
-1,000
-500
0
500
1,000
1,500
2,000
2,500
-4,000
-3,000
-2,000
-1,000
0
1,000
2,000
3,000
4,000
5,000
FY2015 FY2016 FY2017 FY2018 FY2019 FY2020 FY2021 (Jul-29April)
FY2022
(Jul-30April)
FY2021
Fig-5.4: Government Borrowings (Flows) (Rs billion)
From SBP From Scheduled banks Total borrowings (rhs)
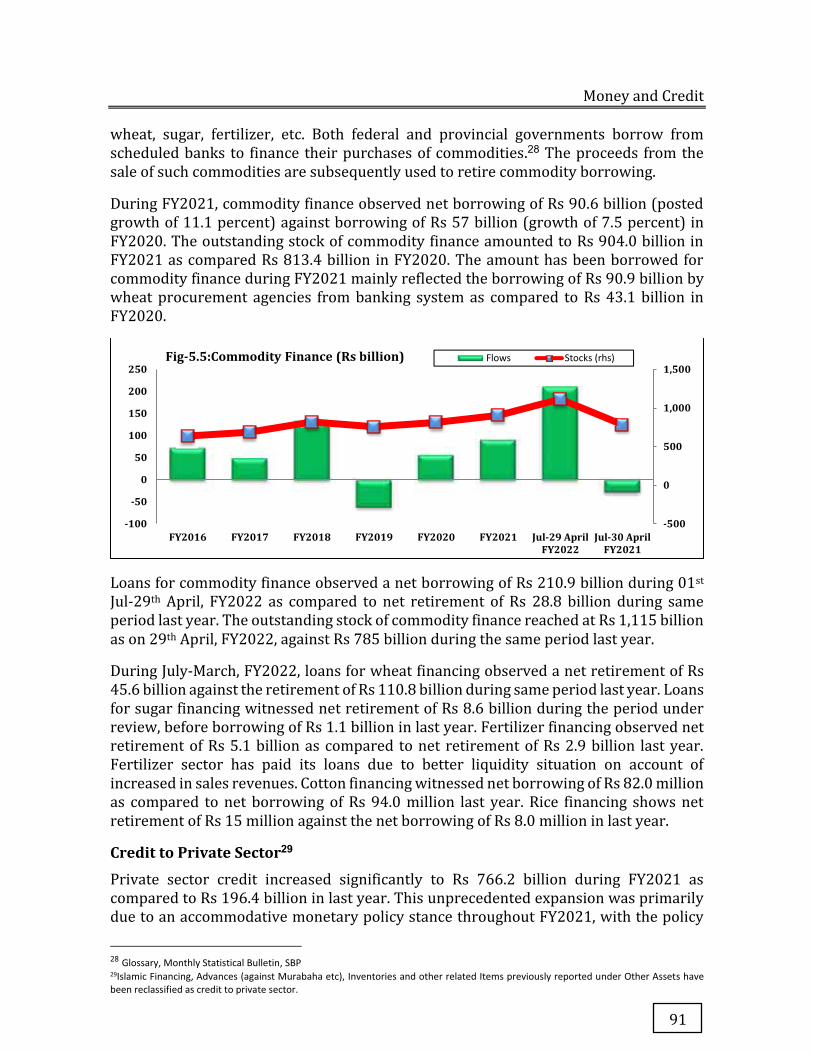
Money and Credit
91
wheat, sugar, fertilizer, etc. Both federal and provincial governments borrow from scheduled banks to finance their purchases of commodities.28 The proceeds from the sale of such commodities are subsequently used to retire commodity borrowing.
During FY2021, commodity finance observed net borrowing of Rs 90.6 billion (posted growth of 11.1 percent) against borrowing of Rs 57 billion (growth of 7.5 percent) in FY2020. The outstanding stock of commodity finance amounted to Rs 904.0 billion in FY2021 as compared Rs 813.4 billion in FY2020. The amount has been borrowed for commodity finance during FY2021 mainly reflected the borrowing of Rs 90.9 billion by wheat procurement agencies from banking system as compared to Rs 43.1 billion in FY2020.
Loans for commodity finance observed a net borrowing of Rs 210.9 billion during 01st Jul-29th April, FY2022 as compared to net retirement of Rs 28.8 billion during same period last year. The outstanding stock of commodity finance reached at Rs 1,115 billion as on 29th April, FY2022, against Rs 785 billion during the same period last year.
During July-March, FY2022, loans for wheat financing observed a net retirement of Rs 45.6 billion against the retirement of Rs 110.8 billion during same period last year. Loans for sugar financing witnessed net retirement of Rs 8.6 billion during the period under review, before borrowing of Rs 1.1 billion in last year. Fertilizer financing observed net retirement of Rs 5.1 billion as compared to net retirement of Rs 2.9 billion last year. Fertilizer sector has paid its loans due to better liquidity situation on account of increased in sales revenues. Cotton financing witnessed net borrowing of Rs 82.0 million as compared to net borrowing of Rs 94.0 million last year. Rice financing shows net retirement of Rs 15 million against the net borrowing of Rs 8.0 million in last year.
Credit to Private Sector29
Private sector credit increased significantly to Rs 766.2 billion during FY2021 as compared to Rs 196.4 billion in last year. This unprecedented expansion was primarily due to an accommodative monetary policy stance throughout FY2021, with the policy
28 Glossary, Monthly Statistical Bulletin, SBP 29Islamic Financing, Advances (against Murabaha etc), Inventories and other related Items previously reported under Other Assets have been reclassified as credit to private sector.
-500
0
500
1,000
1,500
-100
-50
0
50
100
150
200
250
FY2016 FY2017 FY2018 FY2019 FY2020 FY2021 Jul-29 AprilFY2022
Jul-30 AprilFY2021
Fig-5.5:Commodity Finance (Rs billion) Flows Stocks (rhs)
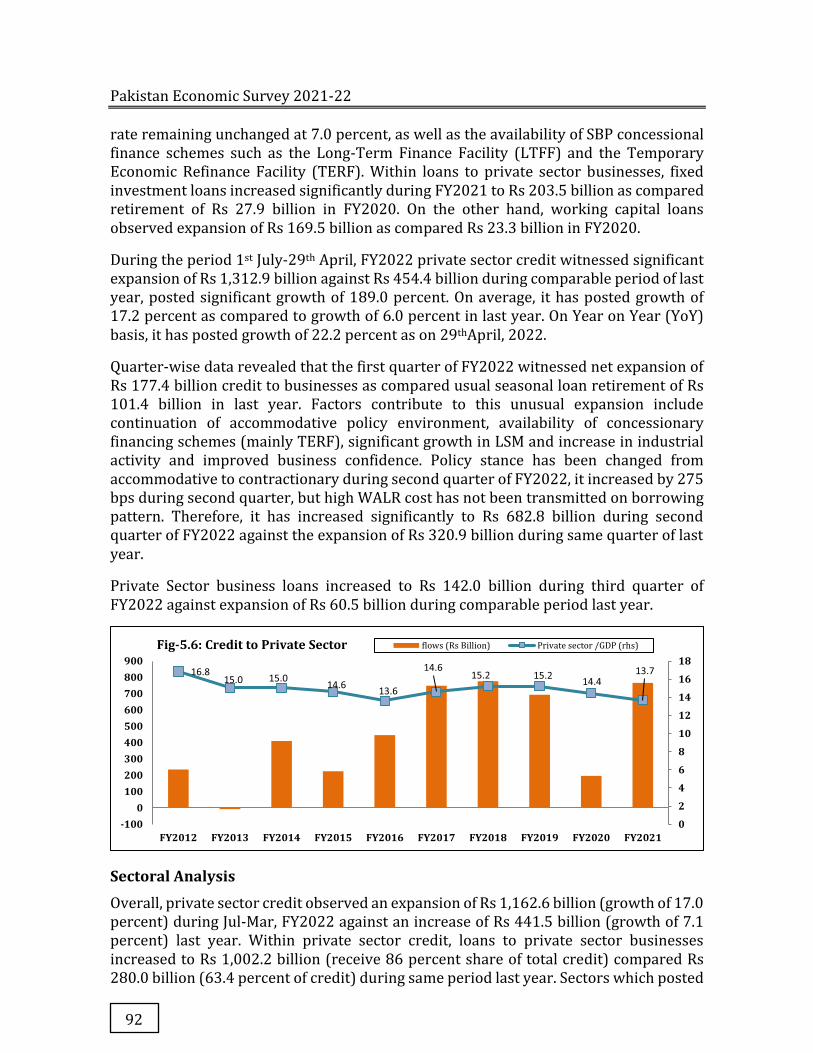
Pakistan Economic Survey 2021-22
92
rate remaining unchanged at 7.0 percent, as well as the availability of SBP concessional finance schemes such as the Long-Term Finance Facility (LTFF) and the Temporary Economic Refinance Facility (TERF). Within loans to private sector businesses, fixed investment loans increased significantly during FY2021 to Rs 203.5 billion as compared retirement of Rs 27.9 billion in FY2020. On the other hand, working capital loans observed expansion of Rs 169.5 billion as compared Rs 23.3 billion in FY2020.
During the period 1st July-29th April, FY2022 private sector credit witnessed significant expansion of Rs 1,312.9 billion against Rs 454.4 billion during comparable period of last year, posted significant growth of 189.0 percent. On average, it has posted growth of 17.2 percent as compared to growth of 6.0 percent in last year. On Year on Year (YoY) basis, it has posted growth of 22.2 percent as on 29thApril, 2022.
Quarter-wise data revealed that the first quarter of FY2022 witnessed net expansion of Rs 177.4 billion credit to businesses as compared usual seasonal loan retirement of Rs 101.4 billion in last year. Factors contribute to this unusual expansion include continuation of accommodative policy environment, availability of concessionary financing schemes (mainly TERF), significant growth in LSM and increase in industrial activity and improved business confidence. Policy stance has been changed from accommodative to contractionary during second quarter of FY2022, it increased by 275 bps during second quarter, but high WALR cost has not been transmitted on borrowing pattern. Therefore, it has increased significantly to Rs 682.8 billion during second quarter of FY2022 against the expansion of Rs 320.9 billion during same quarter of last year.
Private Sector business loans increased to Rs 142.0 billion during third quarter of FY2022 against expansion of Rs 60.5 billion during comparable period last year.
Sectoral Analysis
Overall, private sector credit observed an expansion of Rs 1,162.6 billion (growth of 17.0 percent) during Jul-Mar, FY2022 against an increase of Rs 441.5 billion (growth of 7.1 percent) last year. Within private sector credit, loans to private sector businesses increased to Rs 1,002.2 billion (receive 86 percent share of total credit) compared Rs 280.0 billion (63.4 percent of credit) during same period last year. Sectors which posted
16.815.0 15.0 14.6 13.6
14.615.2 15.2 14.4
13.7
0
2
4
6
8
10
12
14
16
18
-1000
100200300400500600700800900
FY2012 FY2013 FY2014 FY2015 FY2016 FY2017 FY2018 FY2019 FY2020 FY2021
Fig-5.6: Credit to Private Sector flows (Rs Billion) Private sector /GDP (rhs)
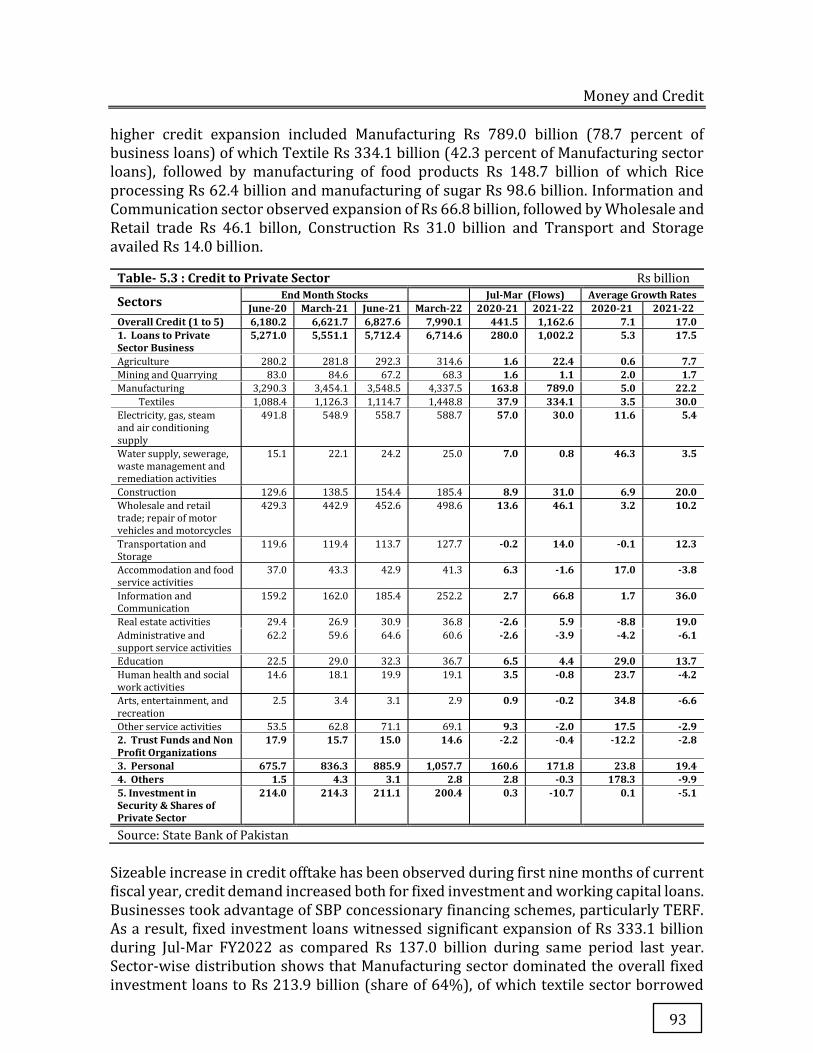
Money and Credit
93
higher credit expansion included Manufacturing Rs 789.0 billion (78.7 percent of business loans) of which Textile Rs 334.1 billion (42.3 percent of Manufacturing sector loans), followed by manufacturing of food products Rs 148.7 billion of which Rice processing Rs 62.4 billion and manufacturing of sugar Rs 98.6 billion. Information and Communication sector observed expansion of Rs 66.8 billion, followed by Wholesale and Retail trade Rs 46.1 billon, Construction Rs 31.0 billion and Transport and Storage availed Rs 14.0 billion.
Table- 5.3 : Credit to Private Sector Rs billion
Sectors End Month Stocks Jul-Mar (Flows) Average Growth Rates June-20 March-21 June-21 March-22 2020-21 2021-22 2020-21 2021-22
Overall Credit (1 to 5) 6,180.2 6,621.7 6,827.6 7,990.1 441.5 1,162.6 7.1 17.0 1. Loans to Private Sector Business
5,271.0 5,551.1 5,712.4 6,714.6 280.0 1,002.2 5.3 17.5
Agriculture 280.2 281.8 292.3 314.6 1.6 22.4 0.6 7.7 Mining and Quarrying 83.0 84.6 67.2 68.3 1.6 1.1 2.0 1.7 Manufacturing 3,290.3 3,454.1 3,548.5 4,337.5 163.8 789.0 5.0 22.2
Textiles 1,088.4 1,126.3 1,114.7 1,448.8 37.9 334.1 3.5 30.0 Electricity, gas, steam and air conditioning supply
491.8 548.9 558.7 588.7 57.0 30.0 11.6 5.4
Water supply, sewerage, waste management and remediation activities
15.1 22.1 24.2 25.0 7.0 0.8 46.3 3.5
Construction 129.6 138.5 154.4 185.4 8.9 31.0 6.9 20.0 Wholesale and retail trade; repair of motor vehicles and motorcycles
429.3 442.9 452.6 498.6 13.6 46.1 3.2 10.2
Transportation and Storage
119.6 119.4 113.7 127.7 -0.2 14.0 -0.1 12.3
Accommodation and food service activities
37.0 43.3 42.9 41.3 6.3 -1.6 17.0 -3.8
Information and Communication
159.2 162.0 185.4 252.2 2.7 66.8 1.7 36.0
Real estate activities 29.4 26.9 30.9 36.8 -2.6 5.9 -8.8 19.0 Administrative and support service activities
62.2 59.6 64.6 60.6 -2.6 -3.9 -4.2 -6.1
Education 22.5 29.0 32.3 36.7 6.5 4.4 29.0 13.7 Human health and social work activities
14.6 18.1 19.9 19.1 3.5 -0.8 23.7 -4.2
Arts, entertainment, and recreation
2.5 3.4 3.1 2.9 0.9 -0.2 34.8 -6.6
Other service activities 53.5 62.8 71.1 69.1 9.3 -2.0 17.5 -2.9 2. Trust Funds and Non Profit Organizations
17.9 15.7 15.0 14.6 -2.2 -0.4 -12.2 -2.8
3. Personal 675.7 836.3 885.9 1,057.7 160.6 171.8 23.8 19.4 4. Others 1.5 4.3 3.1 2.8 2.8 -0.3 178.3 -9.9 5. Investment in Security & Shares of Private Sector
214.0 214.3 211.1 200.4 0.3 -10.7 0.1 -5.1
Source: State Bank of Pakistan
Sizeable increase in credit offtake has been observed during first nine months of current fiscal year, credit demand increased both for fixed investment and working capital loans. Businesses took advantage of SBP concessionary financing schemes, particularly TERF. As a result, fixed investment loans witnessed significant expansion of Rs 333.1 billion during Jul-Mar FY2022 as compared Rs 137.0 billion during same period last year. Sector-wise distribution shows that Manufacturing sector dominated the overall fixed investment loans to Rs 213.9 billion (share of 64%), of which textile sector borrowed

Pakistan Economic Survey 2021-22
94
major share to Rs 94.6 billion during Jul-Mar FY2022 as compared Rs 45.9 billion during same period last year. The sector availed long term loans facility and benefitted from SBP concessionary schemes as evident from data of textile machinery which posted significant growth of 65 percent during Jul-Mar, FY2022.
Within non-manufacturing sectors, information and communication has borrowed long term loans amounted to Rs 72.5 billion as compared to retirement of Rs 1.5 billion during same period last year. The sector has availed long term loans for expansion and up-gradation. Similarly, Electricity and Gas sector has availed fixed investment loans to Rs 26.4 billion, albeit lower than last year of Rs 41.3 billion.
Table-5.4: Loans Classified by Borrowers (By Type of Finance) P (Rs billion) Data based on ISIC 4 Classifications of Private Sector Businesses
Total Credit Working Capital Fixed Investment
LTFF EFS
Jul-Mar FY2021
Jul-Mar FY2022
Jul-Mar FY2021
Jul-Mar FY2022
Jul-Mar FY2021
Jul-Mar FY2022
Jul-Mar FY2021
Jul-Mar FY2022
Jul-Mar FY2021
Jul-Mar FY2022
Loans to Private Sector Business
280.0 1002.2 110.8 608.7 137.0 333.1 120.0 202.9 68.7 101.1
Agriculture, forestry and fishing
1.6 22.4 6.5 12.9 -4.9 8.5 0.2 0.6 0.3 0.1
Mining and quarrying 1.6 1.1 -3.6 -4.3 5.2 5.4 0.0 0.0 -0.2 -0.1
Manufacturing 163.8 789.0 60.9 566.3 99.9 213.9 102.8 194.9 64.1 99.4
Manufacture of food products
125.4 148.7 97.8 134.1 27.0 13.9 7.8 15.1 7.3 15.3
Manufacture of grain mill products
42.8 29.4 41.6 24.3 1.1 4.9 1.0 1.1 10.2 10.7
Wheat Processing -1.9 -20.7 -2.4 -21.1 0.4 0.4 0.4 0.2 0.0 -0.1
Rice Processing 36.7 62.4 35.4 57.1 1.3 5.1 0.5 0.8 8.3 10.4
Manufacture of sugar 73.0 98.6 63.1 100.6 9.7 -2.1 1.2 3.4 -2.3 3.3
Manufacture of beverages 2.4 17.3 0.8 13.8 1.5 3.5 0.5 0.2 -0.4 0.2
Manufacture of textiles 37.9 334.1 -9.8 235.3 45.9 94.6 60.8 94.6 44.8 64.8
Manufacture of coke and refined petroleum products
2.4 25.5 1.3 21.1 1.1 4.5 0.4 1.4 0.3 0.0
Manufacture of refined petroleum products
2.2 25.9 1.1 21.3 1.1 4.6 0.4 1.4 0.3 0.0
Manufacture of chemicals and chemical products
-28.9 24.5 -8.6 3.9 -20.2 20.5 4.1 16.5 0.2 5.0
Electricity, gas, steam and air conditioning supply
57.0 30.0 16.0 3.7 41.3 26.4 1.1 -1.7 -0.1 -0.3
Electric power generation, transmission and distribution
56.4 29.3 14.6 3.6 42.1 25.8 0.9 -2.3 -0.1 0.0
Water supply; sewerage, waste management and remediation activities
7.0 0.8 5.7 1.4 1.3 -0.6 0.0 0.0 0.0 0.0
Construction 8.9 31.0 4.7 -1.2 -12.3 -5.7 3.5 -5.3 0.1 0.0
Wholesale and retail trade; repair of motor vehicles and motorcycles
13.6 46.1 7.0 38.2 6.2 6.0 4.2 0.1 0.6 0.7
Transportation and storage -0.2 14.0 0.4 10.2 -0.6 3.1 0.9 1.8 0.0 0.0
Accommodation and food service activities
6.3 -1.6 0.8 -2.4 4.1 0.8 0.8 1.4 0.0 0.1
Information and communication
2.7 66.8 4.1 -5.7 -1.5 72.5 5.0 9.2 1.0 2.8
Telecommunications -0.3 66.1 2.4 -3.8 -2.7 69.9 4.7 6.7 0.0 2.5
Real estate activities -2.6 5.9 -0.9 0.8 -5.6 -0.2 0.0 0.1 0.0 0.0
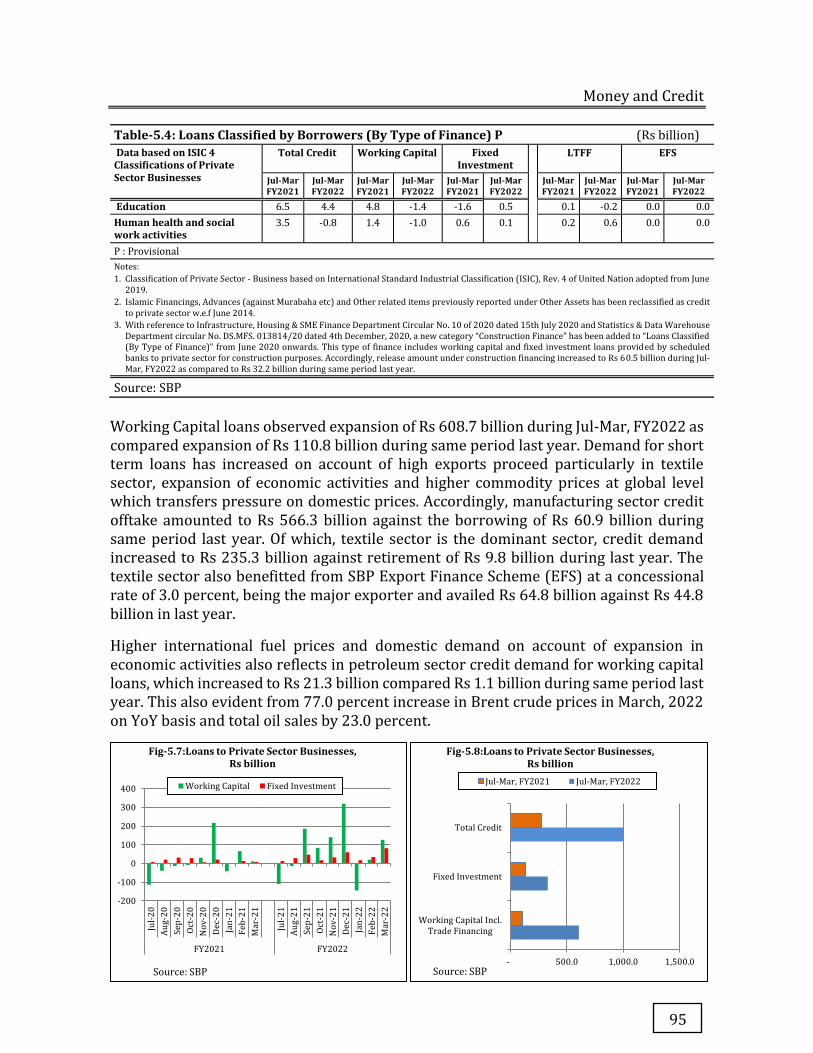
Money and Credit
95
Table-5.4: Loans Classified by Borrowers (By Type of Finance) P (Rs billion) Data based on ISIC 4 Classifications of Private Sector Businesses
Total Credit Working Capital Fixed Investment
LTFF EFS
Jul-Mar FY2021
Jul-Mar FY2022
Jul-Mar FY2021
Jul-Mar FY2022
Jul-Mar FY2021
Jul-Mar FY2022
Jul-Mar FY2021
Jul-Mar FY2022
Jul-Mar FY2021
Jul-Mar FY2022
Education 6.5 4.4 4.8 -1.4 -1.6 0.5 0.1 -0.2 0.0 0.0
Human health and social work activities
3.5 -0.8 1.4 -1.0 0.6 0.1 0.2 0.6 0.0 0.0
P : Provisional
Notes:
1. Classification of Private Sector - Business based on International Standard Industrial Classification (ISIC), Rev. 4 of United Nation adopted from June
2019.
2. Islamic Financings, Advances (against Murabaha etc) and Other related items previously reported under Other Assets has been reclassified as credit
to private sector w.e.f June 2014.
3. With reference to Infrastructure, Housing & SME Finance Department Circular No. 10 of 2020 dated 15th July 2020 and Statistics & Data Warehouse Department circular No. DS.MFS. 013814/20 dated 4th December, 2020, a new category “Construction Finance” has been added to “Loans Classified (By Type of Finance)” from June 2020 onwards. This type of finance includes working capital and fixed investment loans provided by scheduled banks to private sector for construction purposes. Accordingly, release amount under construction financing increased to Rs 60.5 billion during Jul-Mar, FY2022 as compared to Rs 32.2 billion during same period last year.
Source: SBP
Working Capital loans observed expansion of Rs 608.7 billion during Jul-Mar, FY2022 as compared expansion of Rs 110.8 billion during same period last year. Demand for short term loans has increased on account of high exports proceed particularly in textile sector, expansion of economic activities and higher commodity prices at global level which transfers pressure on domestic prices. Accordingly, manufacturing sector credit offtake amounted to Rs 566.3 billion against the borrowing of Rs 60.9 billion during same period last year. Of which, textile sector is the dominant sector, credit demand increased to Rs 235.3 billion against retirement of Rs 9.8 billion during last year. The textile sector also benefitted from SBP Export Finance Scheme (EFS) at a concessional rate of 3.0 percent, being the major exporter and availed Rs 64.8 billion against Rs 44.8 billion in last year.
Higher international fuel prices and domestic demand on account of expansion in economic activities also reflects in petroleum sector credit demand for working capital loans, which increased to Rs 21.3 billion compared Rs 1.1 billion during same period last year. This also evident from 77.0 percent increase in Brent crude prices in March, 2022 on YoY basis and total oil sales by 23.0 percent.
-200
-100
0
100
200
300
400
Jul-
20
Au
g-2
0
Se
p-2
0
Oct
-20
No
v-2
0
De
c-2
0
Jan
-21
Fe
b-2
1
Ma
r-2
1
Jul-
21
Au
g-2
1
Se
p-2
1
Oct
-21
No
v-2
1
De
c-2
1
Jan
-22
Fe
b-2
2
Ma
r-2
2
FY2021 FY2022
Fig-5.7:Loans to Private Sector Businesses, Rs billion
Working Capital Fixed Investment
Source: SBP - 500.0 1,000.0 1,500.0
Working Capital Incl.Trade Financing
Fixed Investment
Total Credit
Fig-5.8:Loans to Private Sector Businesses, Rs billion
Jul-Mar, FY2021 Jul-Mar, FY2022
Source: SBP
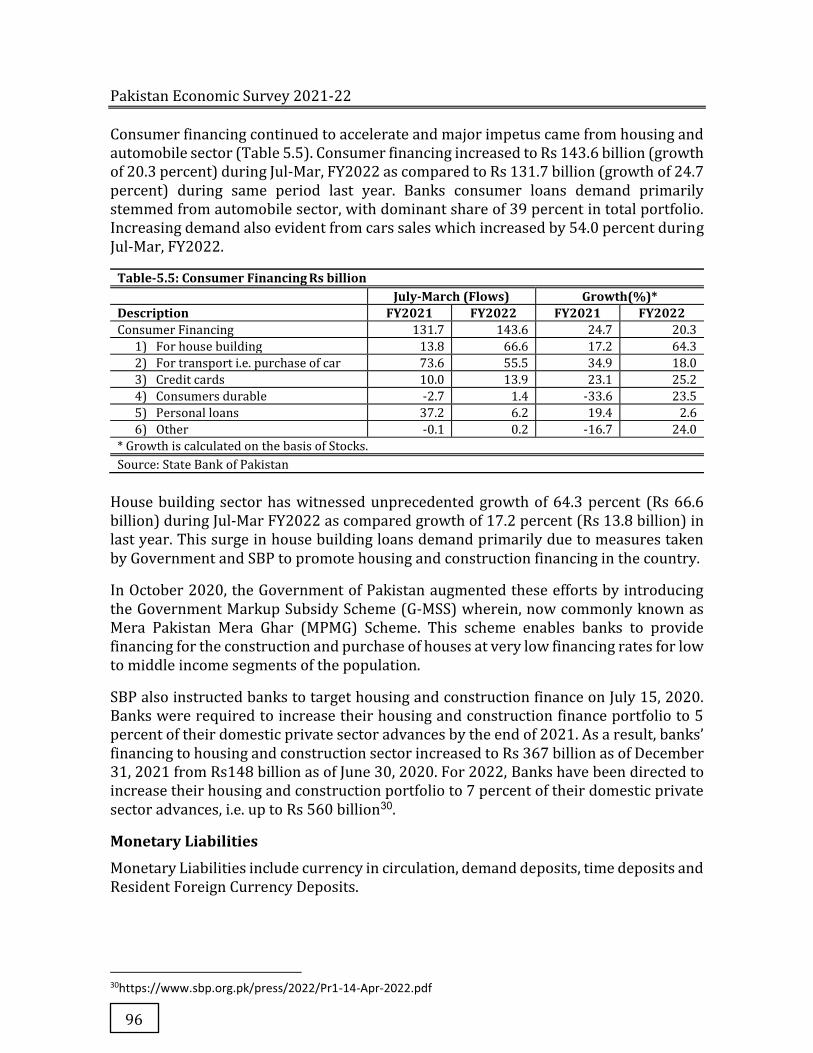
Pakistan Economic Survey 2021-22
96
Consumer financing continued to accelerate and major impetus came from housing and automobile sector (Table 5.5). Consumer financing increased to Rs 143.6 billion (growth of 20.3 percent) during Jul-Mar, FY2022 as compared to Rs 131.7 billion (growth of 24.7 percent) during same period last year. Banks consumer loans demand primarily stemmed from automobile sector, with dominant share of 39 percent in total portfolio. Increasing demand also evident from cars sales which increased by 54.0 percent during Jul-Mar, FY2022.
Table-5.5: Consumer Financing Rs billion July-March (Flows) Growth(%)* Description FY2021 FY2022 FY2021 FY2022 Consumer Financing 131.7 143.6 24.7 20.3
1) For house building 13.8 66.6 17.2 64.3
2) For transport i.e. purchase of car 73.6 55.5 34.9 18.0
3) Credit cards 10.0 13.9 23.1 25.2
4) Consumers durable -2.7 1.4 -33.6 23.5
5) Personal loans 37.2 6.2 19.4 2.6
6) Other -0.1 0.2 -16.7 24.0
* Growth is calculated on the basis of Stocks.
Source: State Bank of Pakistan
House building sector has witnessed unprecedented growth of 64.3 percent (Rs 66.6 billion) during Jul-Mar FY2022 as compared growth of 17.2 percent (Rs 13.8 billion) in last year. This surge in house building loans demand primarily due to measures taken by Government and SBP to promote housing and construction financing in the country.
In October 2020, the Government of Pakistan augmented these efforts by introducing the Government Markup Subsidy Scheme (G-MSS) wherein, now commonly known as Mera Pakistan Mera Ghar (MPMG) Scheme. This scheme enables banks to provide financing for the construction and purchase of houses at very low financing rates for low to middle income segments of the population.
SBP also instructed banks to target housing and construction finance on July 15, 2020. Banks were required to increase their housing and construction finance portfolio to 5 percent of their domestic private sector advances by the end of 2021. As a result, banks’ financing to housing and construction sector increased to Rs 367 billion as of December 31, 2021 from Rs148 billion as of June 30, 2020. For 2022, Banks have been directed to increase their housing and construction portfolio to 7 percent of their domestic private sector advances, i.e. up to Rs 560 billion30.
Monetary Liabilities
Monetary Liabilities include currency in circulation, demand deposits, time deposits and Resident Foreign Currency Deposits.
30https://www.sbp.org.pk/press/2022/Pr1-14-Apr-2022.pdf
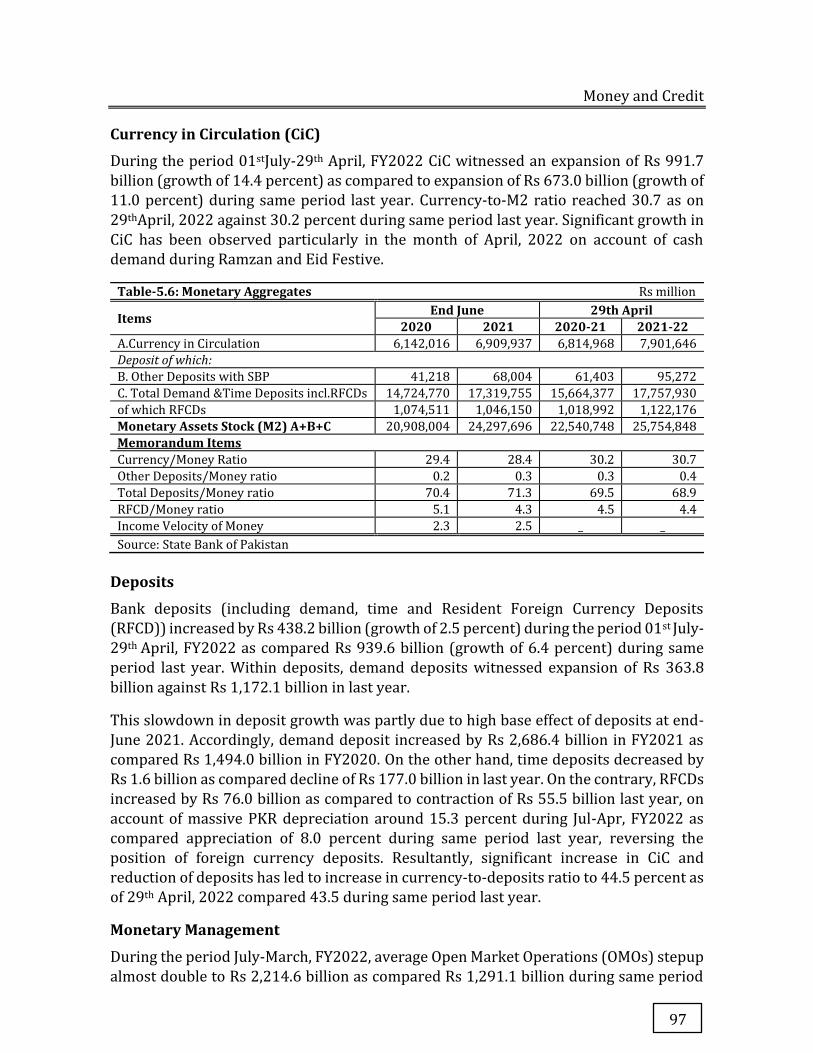
Money and Credit
97
Currency in Circulation (CiC)
During the period 01stJuly-29th April, FY2022 CiC witnessed an expansion of Rs 991.7
billion (growth of 14.4 percent) as compared to expansion of Rs 673.0 billion (growth of
11.0 percent) during same period last year. Currency-to-M2 ratio reached 30.7 as on
29thApril, 2022 against 30.2 percent during same period last year. Significant growth in
CiC has been observed particularly in the month of April, 2022 on account of cash
demand during Ramzan and Eid Festive.
Table-5.6: Monetary Aggregates Rs million
Items End June 29th April 2020 2021 2020-21 2021-22
A.Currency in Circulation 6,142,016 6,909,937 6,814,968 7,901,646
Deposit of which: B. Other Deposits with SBP 41,218 68,004 61,403 95,272
C. Total Demand &Time Deposits incl.RFCDs 14,724,770 17,319,755 15,664,377 17,757,930
of which RFCDs 1,074,511 1,046,150 1,018,992 1,122,176
Monetary Assets Stock (M2) A+B+C 20,908,004 24,297,696 22,540,748 25,754,848
Memorandum Items Currency/Money Ratio 29.4 28.4 30.2 30.7
Other Deposits/Money ratio 0.2 0.3 0.3 0.4
Total Deposits/Money ratio 70.4 71.3 69.5 68.9
RFCD/Money ratio 5.1 4.3 4.5 4.4
Income Velocity of Money 2.3 2.5 _ _
Source: State Bank of Pakistan
Deposits
Bank deposits (including demand, time and Resident Foreign Currency Deposits
(RFCD)) increased by Rs 438.2 billion (growth of 2.5 percent) during the period 01st July-
29th April, FY2022 as compared Rs 939.6 billion (growth of 6.4 percent) during same
period last year. Within deposits, demand deposits witnessed expansion of Rs 363.8
billion against Rs 1,172.1 billion in last year.
This slowdown in deposit growth was partly due to high base effect of deposits at end-
June 2021. Accordingly, demand deposit increased by Rs 2,686.4 billion in FY2021 as
compared Rs 1,494.0 billion in FY2020. On the other hand, time deposits decreased by
Rs 1.6 billion as compared decline of Rs 177.0 billion in last year. On the contrary, RFCDs
increased by Rs 76.0 billion as compared to contraction of Rs 55.5 billion last year, on
account of massive PKR depreciation around 15.3 percent during Jul-Apr, FY2022 as
compared appreciation of 8.0 percent during same period last year, reversing the
position of foreign currency deposits. Resultantly, significant increase in CiC and
reduction of deposits has led to increase in currency-to-deposits ratio to 44.5 percent as
of 29th April, 2022 compared 43.5 during same period last year.
Monetary Management
During the period July-March, FY2022, average Open Market Operations (OMOs) stepup
almost double to Rs 2,214.6 billion as compared Rs 1,291.1 billion during same period
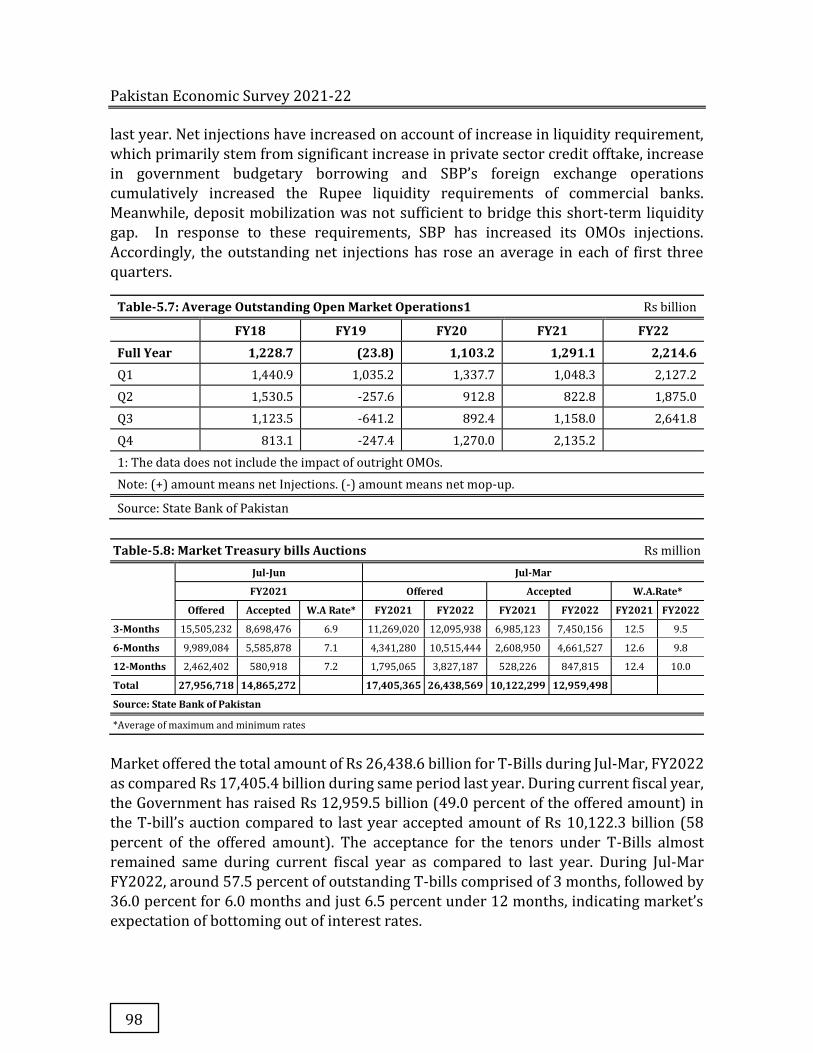
Pakistan Economic Survey 2021-22
98
last year. Net injections have increased on account of increase in liquidity requirement,
which primarily stem from significant increase in private sector credit offtake, increase
in government budgetary borrowing and SBP’s foreign exchange operations
cumulatively increased the Rupee liquidity requirements of commercial banks.
Meanwhile, deposit mobilization was not sufficient to bridge this short-term liquidity
gap. In response to these requirements, SBP has increased its OMOs injections.
Accordingly, the outstanding net injections has rose an average in each of first three
quarters.
Table-5.7: Average Outstanding Open Market Operations1 Rs billion
FY18 FY19 FY20 FY21 FY22 Full Year 1,228.7 (23.8) 1,103.2 1,291.1 2,214.6 Q1 1,440.9 1,035.2 1,337.7 1,048.3 2,127.2
Q2 1,530.5 -257.6 912.8 822.8 1,875.0
Q3 1,123.5 -641.2 892.4 1,158.0 2,641.8
Q4 813.1 -247.4 1,270.0 2,135.2
1: The data does not include the impact of outright OMOs.
Note: (+) amount means net Injections. (-) amount means net mop-up.
Source: State Bank of Pakistan
Table-5.8: Market Treasury bills Auctions Rs million Jul-Jun Jul-Mar
FY2021 Offered Accepted W.A.Rate*
Offered Accepted W.A Rate* FY2021 FY2022 FY2021 FY2022 FY2021 FY2022
3-Months 15,505,232 8,698,476 6.9 11,269,020 12,095,938 6,985,123 7,450,156 12.5 9.5
6-Months 9,989,084 5,585,878 7.1 4,341,280 10,515,444 2,608,950 4,661,527 12.6 9.8
12-Months 2,462,402 580,918 7.2 1,795,065 3,827,187 528,226 847,815 12.4 10.0
Total 27,956,718 14,865,272
17,405,365 26,438,569 10,122,299 12,959,498
Source: State Bank of Pakistan
*Average of maximum and minimum rates
Market offered the total amount of Rs 26,438.6 billion for T-Bills during Jul-Mar, FY2022
as compared Rs 17,405.4 billion during same period last year. During current fiscal year,
the Government has raised Rs 12,959.5 billion (49.0 percent of the offered amount) in
the T-bill’s auction compared to last year accepted amount of Rs 10,122.3 billion (58
percent of the offered amount). The acceptance for the tenors under T-Bills almost
remained same during current fiscal year as compared to last year. During Jul-Mar
FY2022, around 57.5 percent of outstanding T-bills comprised of 3 months, followed by
36.0 percent for 6.0 months and just 6.5 percent under 12 months, indicating market’s
expectation of bottoming out of interest rates.

Money and Credit
99
Table-5.9: Pakistan Investment Bonds Auctions Rs million PIBs July-June Jul-Mar W.A Rate
Offered Accepted W.A Rate
Offered Accepted
FY2021 FY2021 FY2022 FY2021 FY2022 FY2021 FY2022 3 Years 1,181,021 479,261 8.3 337,420 1,436,991 176,740 488,929 8.3 10.2
5 Years 866,330 301,239 9.0 450,548 1,316,745 136,716 408,456 9.0 10.4
10 Years 445,052 149,729 9.5 243,752 1,077,606 83,405 225,451 9.5 10.8
15 Years Maturity
96,589 64,000 9.9 54,549 73,978 37,000 59,000 9.9 10.4
20 Years Maturity
72,061 62,061 10.5 50,061 10,529 40,061 10.5
02 Years (Floater) Maturity (PFL) Quarterly
213423 175664 99.5853
120,025 1,067,462 86,282 738,404 99.6 Cut off price
99.4 Cut off price
03 Years (Floater) Maturity (PFL) Quarterly
365,931 228,976 99.1 287,756 1,948,458 193,776 1,449,403 99.1 cut off price
98.6 cut off price
05 Years (Floater) Maturity (PFL) Quarterly
107,600 90,500 98.0 107,600 90,500 98.0 cut off price
10 Years (Floater) Maturity (PFL) Quarterly
130,050 98,542 95.3 130,050 98,542 95.3 cut off price
03 Years (Floater) Maturity (PFL) Semi-Annual**
1,193,302 624,763 99.6 1,193,302 624,763 99.6 cut off price
05 Years (Floater) Maturity (PFL) Semi-Annual**
776,785 306,271 99.3 577,020 318,000 236,261 129,562 100.3 cut off
price
98.24 cut off
price
10 Years (Floater) Maturity (PFL) Semi-Annual**
384,124 136,707 100.5 384,124 63,150 107,802 64,553 100.1 cut of price
100.0 cut of price
Total 5,832,268 2,661,913 3,936,207 7,312,919 1,911,848 3,563,758
Note: Accepted amount include non-competitive bids as well as short sale accommodation. * The banchmark for coupon rate is defined in clause 'B' of DMMD Circular No. 9 dated May 07, 2018. ** Margins quoted ober benchmark rate in fresh auctions of floating rate PIB (PFL)
Source: State Bank of Pakistan
69.0
25.8
5.2
57.5
36.0
6.5
0
20
40
60
80
3-Months 6-Months 12-Months
Perc
ent
Fig-5.9:Contribution of T-bills FY2021 FY2022

Pakistan Economic Survey 2021-22
100
During Jul-Mar, FY2022, Government remained inclined towards floating rate long-term debt instrument PIBs. Market offers Rs 3,915.8 billion under fixed rate PIBS which is 53.5 percent of offered amount, while for floaters, the market offered Rs 3,397.1 billion, 46 percent of the offered amount. Keeping in view higher yields demanded by the market compared to the prevailing cut- offs, the Government accepted only Rs 1,181 billion from fixed coupon PIBs (33 percent of the accepted amount). In this backdrop, floaters helped the Government to raise medium-to-long term debt. Given these favorable traits of floaters, the Government was able to raise Rs 2,382 billion via issuances of floating rate PIBs (67 percent of accepted amount). Moreover, 3Y quarterly coupon PIBs remained the market’s most favored instrument floaters which contribute around 61 percent of floaters accepted amount.
Monetary policy has changed its direction from accommodating to tightening, the impact has been transferred on Weighted Average Lending Rate (WALR), which was 7.7 percent on gross disbursement in March, 2021 increased to 10.59 percent in March, 2022. Similarly, Weighted Average Deposit Rate (WADR) offered on fresh deposits also increased to 5.1 percent in March, 2022 from 3.2 percent in March, 2021. Accordingly, banking spread, which is the difference between the lending and deposit rates and the cost of channeling funds through intermediaries, increased from 4.5 percent in March, 2021 to 5.5 percent in March, 2022.
9.27.2
4.41.9 2.1
4.5
10.1
4.7 5.2
32.7
12.4
5.6
13.711.5
6.31.7
20.7
40.7
3.6 1.8
0
5
10
15
20
25
30
35
40
45
3 Years 5 Years 10 Years 15 YearsMaturity
20 YearsMaturity
02 Years(Floater)Maturity
(PFL)Quarterly
03 Years(Floater)Maturity
(PFL)Quarterly
05 Years(Floater)Maturity
(PFL)Quarterly
10 Years(Floater)Maturity
(PFL)Quarterly
03 Years(Floater)Maturity
(PFL) Semi-Annual
05 Years(Floater)Maturity
(PFL) Semi-Annual
10 Years(Floater)Maturity
(PFL) Semi-Annual
Perc
ent
Fig-5.10:Contribution of PIBs FY2021 FY2022
1.0
3.0
5.0
7.0
9.0
11.0
13.0
15.0
Ma
r-2
1
Ap
r-2
1
Ma
y-2
1
Jun
-21
Jul-
21
Au
g-2
1
Se
p-2
1
Oct
-21
No
v-2
1
De
c-2
1
Jan
-22
Feb
-22
Ma
r-2
2
Fig-5.11:Lending & Deposit Rates
WALR
WADR
Spread
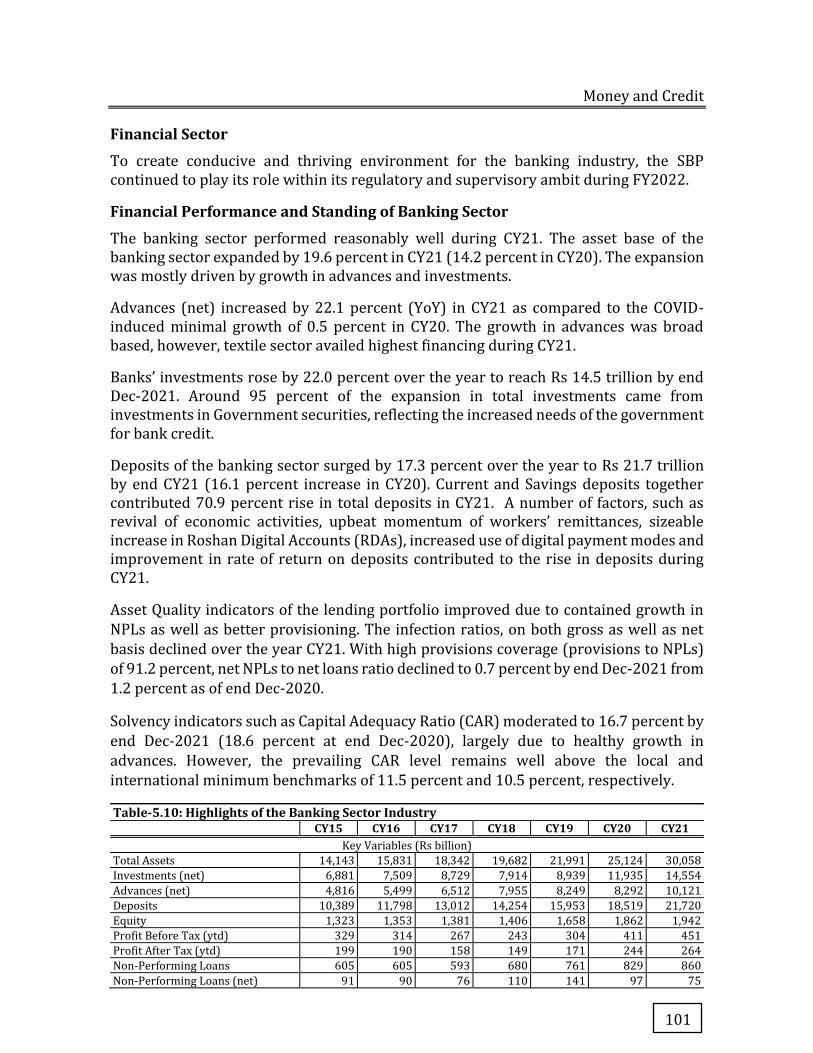
Money and Credit
101
Financial Sector
To create conducive and thriving environment for the banking industry, the SBP continued to play its role within its regulatory and supervisory ambit during FY2022.
Financial Performance and Standing of Banking Sector
The banking sector performed reasonably well during CY21. The asset base of the banking sector expanded by 19.6 percent in CY21 (14.2 percent in CY20). The expansion was mostly driven by growth in advances and investments.
Advances (net) increased by 22.1 percent (YoY) in CY21 as compared to the COVID- induced minimal growth of 0.5 percent in CY20. The growth in advances was broad based, however, textile sector availed highest financing during CY21.
Banks’ investments rose by 22.0 percent over the year to reach Rs 14.5 trillion by end Dec-2021. Around 95 percent of the expansion in total investments came from investments in Government securities, reflecting the increased needs of the government for bank credit.
Deposits of the banking sector surged by 17.3 percent over the year to Rs 21.7 trillion by end CY21 (16.1 percent increase in CY20). Current and Savings deposits together contributed 70.9 percent rise in total deposits in CY21. A number of factors, such as revival of economic activities, upbeat momentum of workers’ remittances, sizeable increase in Roshan Digital Accounts (RDAs), increased use of digital payment modes and improvement in rate of return on deposits contributed to the rise in deposits during CY21.
Asset Quality indicators of the lending portfolio improved due to contained growth in
NPLs as well as better provisioning. The infection ratios, on both gross as well as net
basis declined over the year CY21. With high provisions coverage (provisions to NPLs)
of 91.2 percent, net NPLs to net loans ratio declined to 0.7 percent by end Dec-2021 from
1.2 percent as of end Dec-2020.
Solvency indicators such as Capital Adequacy Ratio (CAR) moderated to 16.7 percent by
end Dec-2021 (18.6 percent at end Dec-2020), largely due to healthy growth in
advances. However, the prevailing CAR level remains well above the local and
international minimum benchmarks of 11.5 percent and 10.5 percent, respectively.
Table-5.10: Highlights of the Banking Sector Industry CY15 CY16 CY17 CY18 CY19 CY20 CY21
Key Variables (Rs billion)
Total Assets 14,143 15,831 18,342 19,682 21,991 25,124 30,058
Investments (net) 6,881 7,509 8,729 7,914 8,939 11,935 14,554
Advances (net) 4,816 5,499 6,512 7,955 8,249 8,292 10,121
Deposits 10,389 11,798 13,012 14,254 15,953 18,519 21,720
Equity 1,323 1,353 1,381 1,406 1,658 1,862 1,942
Profit Before Tax (ytd) 329 314 267 243 304 411 451
Profit After Tax (ytd) 199 190 158 149 171 244 264
Non-Performing Loans 605 605 593 680 761 829 860
Non-Performing Loans (net) 91 90 76 110 141 97 75
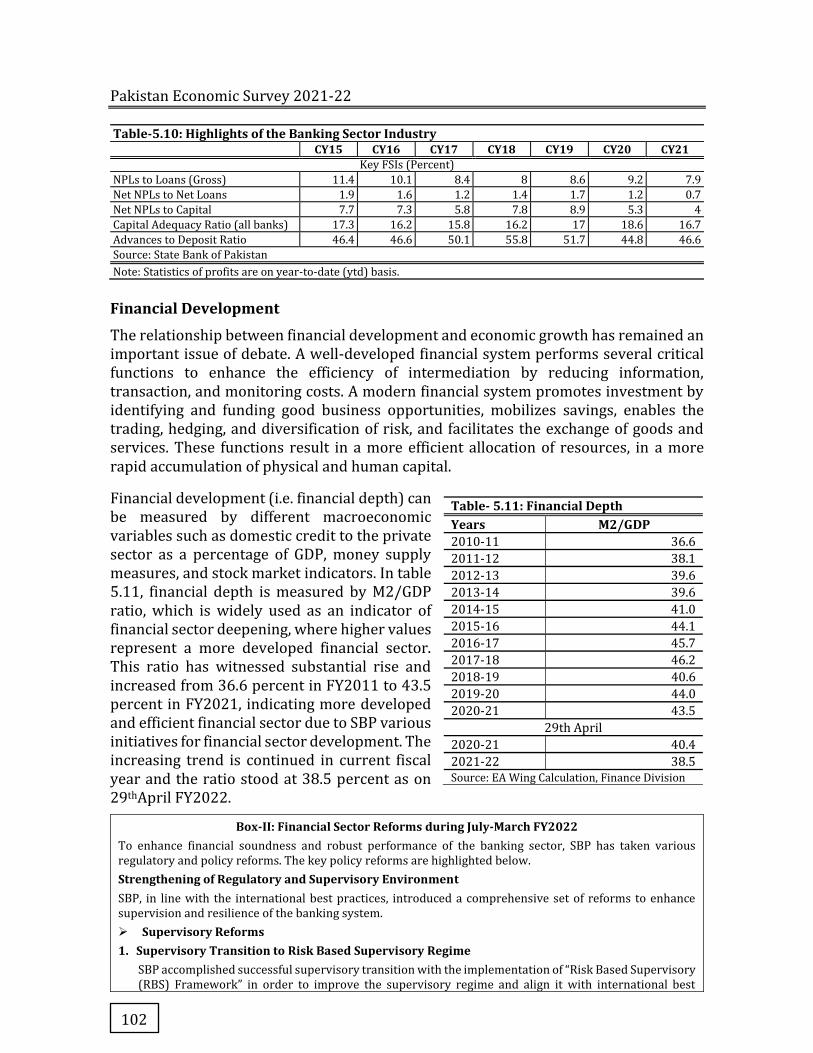
Pakistan Economic Survey 2021-22
102
Table-5.10: Highlights of the Banking Sector Industry CY15 CY16 CY17 CY18 CY19 CY20 CY21
Key FSIs (Percent)
NPLs to Loans (Gross) 11.4 10.1 8.4 8 8.6 9.2 7.9
Net NPLs to Net Loans 1.9 1.6 1.2 1.4 1.7 1.2 0.7
Net NPLs to Capital 7.7 7.3 5.8 7.8 8.9 5.3 4
Capital Adequacy Ratio (all banks) 17.3 16.2 15.8 16.2 17 18.6 16.7
Advances to Deposit Ratio 46.4 46.6 50.1 55.8 51.7 44.8 46.6
Source: State Bank of Pakistan
Note: Statistics of profits are on year-to-date (ytd) basis.
Financial Development
The relationship between financial development and economic growth has remained an important issue of debate. A well-developed financial system performs several critical functions to enhance the efficiency of intermediation by reducing information, transaction, and monitoring costs. A modern financial system promotes investment by identifying and funding good business opportunities, mobilizes savings, enables the trading, hedging, and diversification of risk, and facilitates the exchange of goods and services. These functions result in a more efficient allocation of resources, in a more rapid accumulation of physical and human capital.
Financial development (i.e. financial depth) can be measured by different macroeconomic variables such as domestic credit to the private sector as a percentage of GDP, money supply measures, and stock market indicators. In table 5.11, financial depth is measured by M2/GDP ratio, which is widely used as an indicator of financial sector deepening, where higher values represent a more developed financial sector. This ratio has witnessed substantial rise and increased from 36.6 percent in FY2011 to 43.5 percent in FY2021, indicating more developed and efficient financial sector due to SBP various initiatives for financial sector development. The increasing trend is continued in current fiscal year and the ratio stood at 38.5 percent as on 29thApril FY2022.
Box-II: Financial Sector Reforms during July-March FY2022 To enhance financial soundness and robust performance of the banking sector, SBP has taken various regulatory and policy reforms. The key policy reforms are highlighted below.
Strengthening of Regulatory and Supervisory Environment
SBP, in line with the international best practices, introduced a comprehensive set of reforms to enhance supervision and resilience of the banking system.
� Supervisory Reforms 1. Supervisory Transition to Risk Based Supervisory Regime
SBP accomplished successful supervisory transition with the implementation of “Risk Based Supervisory (RBS) Framework” in order to improve the supervisory regime and align it with international best
Table- 5.11: Financial Depth Years M2/GDP 2010-11 36.6
2011-12 38.1
2012-13 39.6
2013-14 39.6
2014-15 41.0
2015-16 44.1
2016-17 45.7
2017-18 46.2
2018-19 40.6
2019-20 44.0
2020-21 43.5
29th April
2020-21 40.4
2021-22 38.5 Source: EA Wing Calculation, Finance Division

Money and Credit
103
practices. Being a forward-looking framework, it will help better understand the risk profiles of regulated entities with respect to both external & internal risks and controls.
2. National Money Laundering/Terror Financing (ML/TF) Risk Assessment of Pakistan
The National ML/TF Risk Assessment of Pakistan – 2022 (NRA-22) is currently underway and SBP is member of a national level core committee for review and guidance on NRA-22. With respect to NRA-22, SBP conducted a comprehensive assessment of inherent ML/TF vulnerabilities of SBP regulated entities, i.e. Banks, Microfinance Banks, Exchange Companies and Development Finance Institutions.
3. Guidance and Technical Support to Central Directorate of National Savings (CDNS) and Pakistan Post SBP has been providing guidance and support to CDNS and Pakistan Post to bridge gaps identified by Asia Pacific Group (APG) in Pakistan’s Mutual Evaluation Report (MER). Senior officers of SBP are member of Supervisory Boards constituted for both the institutions.
� Regulatory Reforms 1. SBP has developed a licensing and regulatory framework for setting up digital banks in Pakistan. The
primary aim of the framework, inter alia, include enhancement of financial inclusion, provision of affordable/cost effective digital financial services especially to unserved and underserved segments of the society and fostering a new set of customer experience.
2. Revision of Corporate Governance Regime SBP has comprehensively updated the Corporate Governance Regulatory Framework (CGRF) for banks/DFIs (vide BPRD Circular No. 05 of 2021). The revised framework aims to align with the international standards and principles. The framework covers Fit and Proper Test (FPT) criteria and other corporate governance regulatory requirements for the sponsor shareholders Issuance of Licensing and Regulatory Framework for Digital Banks /beneficial owners, members of the Board of Directors (BoDs), Presidents/CEOs and key executives of banks/DFIs.
3. Customers’ Digital On Boarding Framework SBP has developed a “Customers’ Digital on Boarding Framework” for banks/ MFBs which inter alia elaborates basic parameters for opening of bank accounts for Resident Pakistanis through digital channels.
4. Implementation of Regulatory Approval System (RAS) In order to further strengthen the organizational efficiency, effectiveness and turnaround time of regulatory approval process, SBP has implemented Regulatory Approval System to digitize the end-to-end process of various request letters/ proposals received from banks/DFIs/MFBs, their approval process and dissemination of regulatory decisions there against.
5. Revised Prudential Regulations for Consumer Financing to Moderate Import Growth SBP has revised Prudential Regulations (PRs) for Consumer Financing (vide BPRD Circular Letter No. 29
of 2021), to moderate the demand for imported items, particularly the automobiles and address associated prudential risks to the banks. The changes in the PRs effectively prohibit financing for imported vehicles, and tighten regulatory requirements for financing of domestically manufactured/ assembled vehicles of more than 1000 cc engine capacity and rationalize other Consumer Finance Facilities like personal loans and credit cards.
6. Women Branchless Banking Agents under Banking on Equality Policy The introduction of Women Branchless Banking (BB) agents will facilitate women’s adoption of digital
financial services, especially in rural areas.
7. SBP Imposed 100 percent Cash Margin Requirement on Import of Additional 114 Items
SBP imposed 100 percent Cash Margin Requirements (CMR) on import of 114 items vide BPRD Circular Letter No. 30 of 2021, taking the total number of items subject to CMR to 525. In view of the building current account deficit in the context of fast economic growth, SBP has decided to adjust its policy by imposing CMR on additional import items. This will complement SBP’s other policy measures to ease the pressure on import bill and help contain the current account deficit at sustainable levels.
� Foreign Exchange (FX) Regime 1. International Trade
SBP has taken following measures to facilitate E-Commerce, foreign trade, exporters of SME sectors and export proceeds realization. These measures will not only improve the foreign exchange flows into the country but also enhance the ease of doing business in Pakistan.
Pakistan Economic Survey 2021-22
104
a. To promote e-Commerce exports from Pakistan and facilitate Pakistani exporters/entrepreneurs to sell their products through international digital market places including Amazon, e-Bay, Ali Baba, another framework of Business–to-Business-to-Consumer (B2B2C) e-Commerce has been introduced.
b. SBP in collaboration with Pakistan Single Window (PSW) project has developed Electronic Data interchange with Banks. PSW system allows parties involved in trade and transport to lodge standardized information and documents with a single-entry point to fulfil all import, export, and transit-related regulatory requirements. It will help reduce the time and cost of doing business by making trade related business processes more efficient, transparent and consistent.
c. With an objective to improve the timely inflow of foreign exchange from exports proceeds in the market, SBP amended foreign exchange regulations now require exporters to bring export proceeds within a maximum period of 120 days from date of shipment instead of earlier 180 days.
Financial Inclusion
SBP is pursuing financial inclusion as one of its strategic objectives to promote inclusive economic growth in the country by improving the access and usage of quality financial services among individuals and firms. In this connection, SBP is implementing National Financial Inclusion Strategy (NFIS) and pursuing headline targets to be achieved by end 2023.
Under NFIS, a total of 96 actions/sub-actions are being implemented by more than 30 partners envisaged in this multi-focal strategy to be completed by 2023. As of FY21-22 (upto March 2022), 52 actions/sub-actions have been completed while other tasks are in progress. In terms of progress under headline target of active accounts, as of December 2020, overall number of unique active accounts stood at 53.2 million of which 14.5 million were held by women.
Key Initiatives taken under NFIS are listed below:
o Gender Mainstreaming Policy: SBP launched a landmark gender mainstreaming Policy i.e. “Banking on Equality: Reducing the Gender Gap in Financial Inclusion” on September 17, 2021. The Policy aims to introduce a gender lens within the financial sector through five identified pillars and specific measures, to bring a shift towards women friendly business practices. Under the policy, actions are targeted towards improving institutional readiness, product diversification and development capability, customer acquisition and facilitation approaches towards women segments, robust collection of gender disaggregated data, and prioritizing gender focus in SBP’s policies. The Policy is in implementation phase and most banks have already submitted board approved plans for ensuring compliance of BOE Policy, while actions plans are being implemented to achieve the below headline targets:
i. 20 million women owned active accounts by 2023.
ii. 20% of banks’ workforce to be women by 2024.
iii. 10% of Branchless Banking agents to be women by 2024.
iv. 75% of bank access points to have trained women champions in place.
o Asaan Mobile Account (AMA) Scheme: In Dec. 2021, SBP launched the Asaan Mobile Account (AMA) Scheme to cater to the needs of those men and women who don’t have access to a smart phone or internet facility. Under this scheme, anyone with a basic feature phone can open and use an account simply by dialing *2262# and following the steps on their screen. As of March 18, 2022 around 2.7 million AMA accounts have been opened.
o Asaan Digital Accounts: SBP has launched Asaan Digital Accounts as a revolutionary account category that can break barriers, for digital financial inclusion of men and women. The end-to-end digitized solution allows people to open a bank account digitally with a CNIC and no other documentation requirements, from anywhere using their phone or computer through the web portals/apps of banks/MFBs. This account is specifically useful for the female segments who find it challenging to visit bank branches. The account has a maximum balance limit of Rs 1 million, making it a smart choice for freelancers, and home-based workers.
Source: State Bank of Pakistan
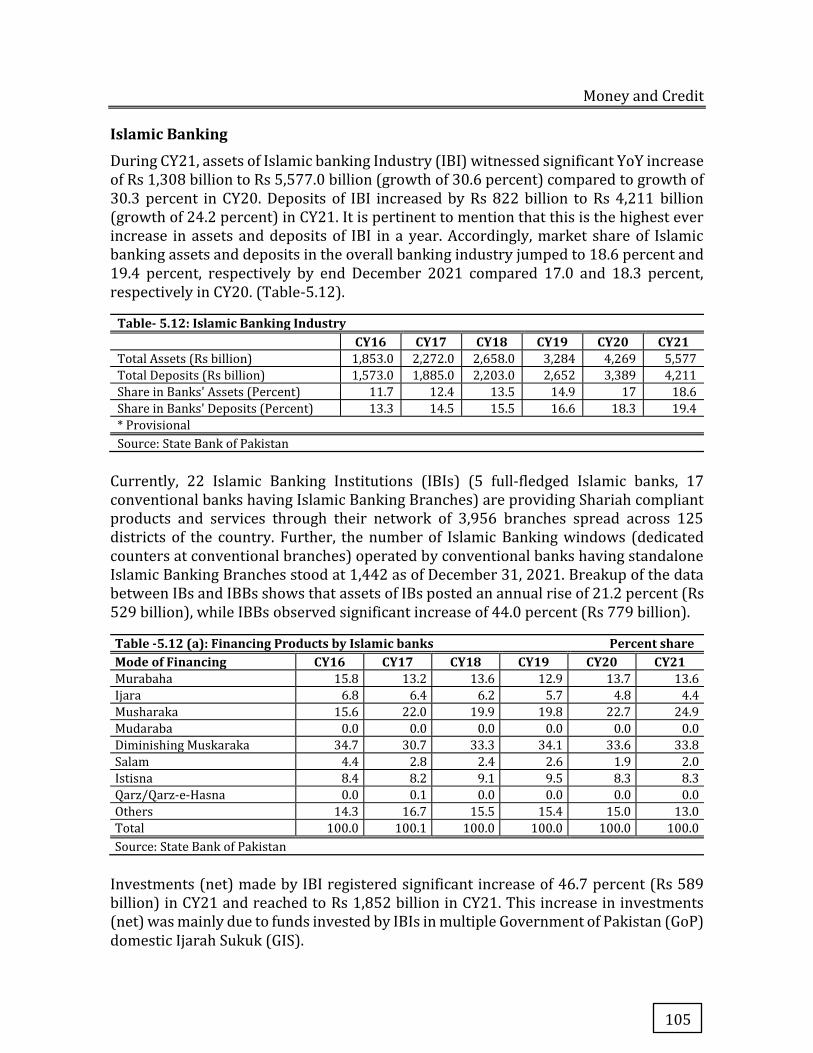
Money and Credit
105
Islamic Banking
During CY21, assets of Islamic banking Industry (IBI) witnessed significant YoY increase of Rs 1,308 billion to Rs 5,577.0 billion (growth of 30.6 percent) compared to growth of 30.3 percent in CY20. Deposits of IBI increased by Rs 822 billion to Rs 4,211 billion (growth of 24.2 percent) in CY21. It is pertinent to mention that this is the highest ever increase in assets and deposits of IBI in a year. Accordingly, market share of Islamic banking assets and deposits in the overall banking industry jumped to 18.6 percent and 19.4 percent, respectively by end December 2021 compared 17.0 and 18.3 percent, respectively in CY20. (Table-5.12).
Table- 5.12: Islamic Banking Industry CY16 CY17 CY18 CY19 CY20 CY21 Total Assets (Rs billion) 1,853.0 2,272.0 2,658.0 3,284 4,269 5,577
Total Deposits (Rs billion) 1,573.0 1,885.0 2,203.0 2,652 3,389 4,211
Share in Banks' Assets (Percent) 11.7 12.4 13.5 14.9 17 18.6
Share in Banks' Deposits (Percent) 13.3 14.5 15.5 16.6 18.3 19.4
* Provisional
Source: State Bank of Pakistan
Currently, 22 Islamic Banking Institutions (IBIs) (5 full-fledged Islamic banks, 17 conventional banks having Islamic Banking Branches) are providing Shariah compliant products and services through their network of 3,956 branches spread across 125 districts of the country. Further, the number of Islamic Banking windows (dedicated counters at conventional branches) operated by conventional banks having standalone Islamic Banking Branches stood at 1,442 as of December 31, 2021. Breakup of the data between IBs and IBBs shows that assets of IBs posted an annual rise of 21.2 percent (Rs 529 billion), while IBBs observed significant increase of 44.0 percent (Rs 779 billion).
Table -5.12 (a): Financing Products by Islamic banks Percent share Mode of Financing CY16 CY17 CY18 CY19 CY20 CY21 Murabaha 15.8 13.2 13.6 12.9 13.7 13.6
Ijara 6.8 6.4 6.2 5.7 4.8 4.4
Musharaka 15.6 22.0 19.9 19.8 22.7 24.9
Mudaraba 0.0 0.0 0.0 0.0 0.0 0.0
Diminishing Muskaraka 34.7 30.7 33.3 34.1 33.6 33.8
Salam 4.4 2.8 2.4 2.6 1.9 2.0
Istisna 8.4 8.2 9.1 9.5 8.3 8.3
Qarz/Qarz-e-Hasna 0.0 0.1 0.0 0.0 0.0 0.0
Others 14.3 16.7 15.5 15.4 15.0 13.0
Total 100.0 100.1 100.0 100.0 100.0 100.0
Source: State Bank of Pakistan
Investments (net) made by IBI registered significant increase of 46.7 percent (Rs 589 billion) in CY21 and reached to Rs 1,852 billion in CY21. This increase in investments (net) was mainly due to funds invested by IBIs in multiple Government of Pakistan (GoP) domestic Ijarah Sukuk (GIS).
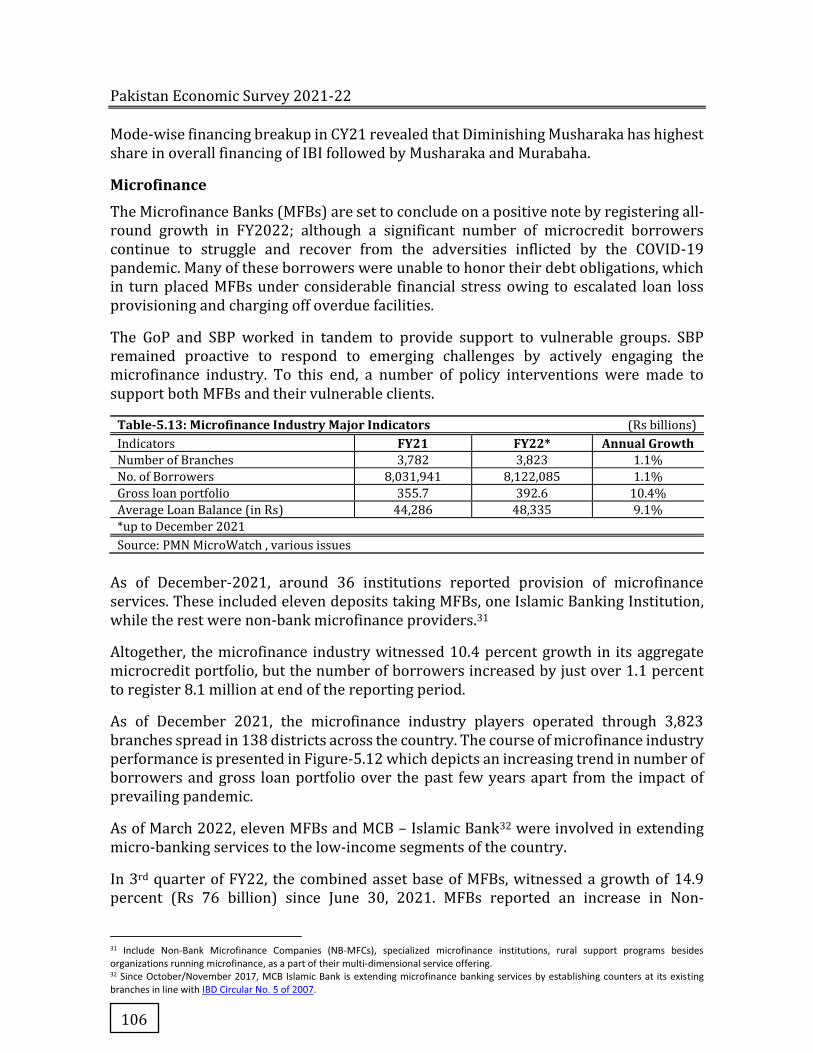
Pakistan Economic Survey 2021-22
106
Mode-wise financing breakup in CY21 revealed that Diminishing Musharaka has highest share in overall financing of IBI followed by Musharaka and Murabaha.
Microfinance
The Microfinance Banks (MFBs) are set to conclude on a positive note by registering all-round growth in FY2022; although a significant number of microcredit borrowers continue to struggle and recover from the adversities inflicted by the COVID-19 pandemic. Many of these borrowers were unable to honor their debt obligations, which in turn placed MFBs under considerable financial stress owing to escalated loan loss provisioning and charging off overdue facilities.
The GoP and SBP worked in tandem to provide support to vulnerable groups. SBP remained proactive to respond to emerging challenges by actively engaging the microfinance industry. To this end, a number of policy interventions were made to support both MFBs and their vulnerable clients.
Table-5.13: Microfinance Industry Major Indicators (Rs billions) Indicators FY21 FY22* Annual Growth Number of Branches 3,782 3,823 1.1%
No. of Borrowers 8,031,941 8,122,085 1.1%
Gross loan portfolio 355.7 392.6 10.4%
Average Loan Balance (in Rs) 44,286 48,335 9.1%
*up to December 2021
Source: PMN MicroWatch , various issues
As of December-2021, around 36 institutions reported provision of microfinance services. These included eleven deposits taking MFBs, one Islamic Banking Institution, while the rest were non-bank microfinance providers.31
Altogether, the microfinance industry witnessed 10.4 percent growth in its aggregate microcredit portfolio, but the number of borrowers increased by just over 1.1 percent to register 8.1 million at end of the reporting period.
As of December 2021, the microfinance industry players operated through 3,823 branches spread in 138 districts across the country. The course of microfinance industry performance is presented in Figure-5.12 which depicts an increasing trend in number of borrowers and gross loan portfolio over the past few years apart from the impact of prevailing pandemic.
As of March 2022, eleven MFBs and MCB – Islamic Bank32 were involved in extending micro-banking services to the low-income segments of the country.
In 3rd quarter of FY22, the combined asset base of MFBs, witnessed a growth of 14.9 percent (Rs 76 billion) since June 30, 2021. MFBs reported an increase in Non-
31 Include Non-Bank Microfinance Companies (NB-MFCs), specialized microfinance institutions, rural support programs besides organizations running microfinance, as a part of their multi-dimensional service offering. 32 Since October/November 2017, MCB Islamic Bank is extending microfinance banking services by establishing counters at its existing branches in line with IBD Circular No. 5 of 2007.
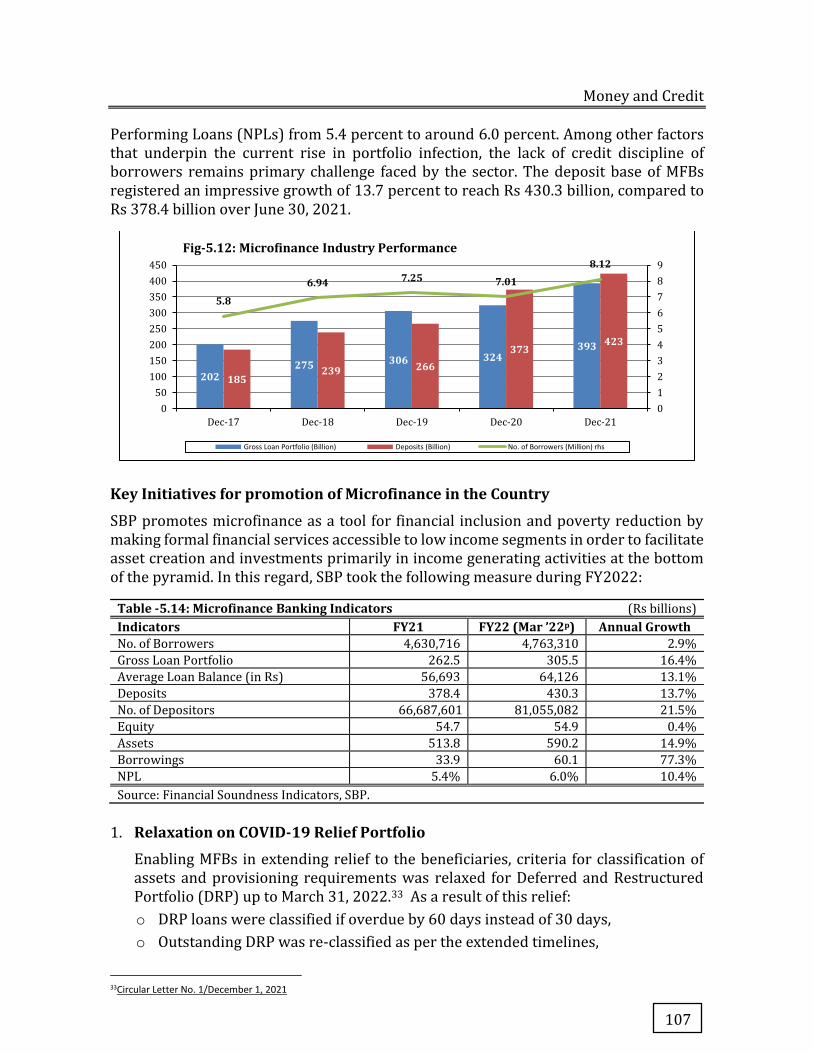
Money and Credit
107
Performing Loans (NPLs) from 5.4 percent to around 6.0 percent. Among other factors that underpin the current rise in portfolio infection, the lack of credit discipline of borrowers remains primary challenge faced by the sector. The deposit base of MFBs registered an impressive growth of 13.7 percent to reach Rs 430.3 billion, compared to Rs 378.4 billion over June 30, 2021.
Key Initiatives for promotion of Microfinance in the Country
SBP promotes microfinance as a tool for financial inclusion and poverty reduction by making formal financial services accessible to low income segments in order to facilitate asset creation and investments primarily in income generating activities at the bottom of the pyramid. In this regard, SBP took the following measure during FY2022:
Table -5.14: Microfinance Banking Indicators (Rs billions) Indicators FY21 FY22 (Mar ’22p) Annual Growth No. of Borrowers 4,630,716 4,763,310 2.9%
Gross Loan Portfolio 262.5 305.5 16.4%
Average Loan Balance (in Rs) 56,693 64,126 13.1%
Deposits 378.4 430.3 13.7%
No. of Depositors 66,687,601 81,055,082 21.5%
Equity 54.7 54.9 0.4%
Assets 513.8 590.2 14.9%
Borrowings 33.9 60.1 77.3%
NPL 5.4% 6.0% 10.4%
Source: Financial Soundness Indicators, SBP.
1. Relaxation on COVID-19 Relief Portfolio
Enabling MFBs in extending relief to the beneficiaries, criteria for classification of assets and provisioning requirements was relaxed for Deferred and Restructured Portfolio (DRP) up to March 31, 2022.33 As a result of this relief:
o DRP loans were classified if overdue by 60 days instead of 30 days,
o Outstanding DRP was re-classified as per the extended timelines,
33Circular Letter No. 1/December 1, 2021
202275 306 324
393
185239 266
373423
5.8
6.94 7.25 7.018.12
0
1
2
3
4
5
6
7
8
9
0
50
100
150
200
250
300
350
400
450
Dec-17 Dec-18 Dec-19 Dec-20 Dec-21
Fig-5.12: Microfinance Industry Performance
Gross Loan Portfolio (Billion) Deposits (Billion) No. of Borrowers (Million) rhs
Pakistan Economic Survey 2021-22
108
o Interest/profit/mark-up/service charges already suspended were reversed for the extended period.
2. Simplified Documentation and Requirements to Report & Obtain Credit Information
To streamline requirement for obtaining Credit Information Report (CIR) and simplifying documentary requirements, following changes have been made;
o Obligations to obtain written declaration about existing facilities has been withdrawn.
o MFBs’ obligation towards reporting to SBP’s eCIB has also been simplified.
o Mandatory requirement to obtain credit report from SBP’s eCIB for credit facilities exceeding Rs 30,000 has been withdrawn.34
These regulatory updates correspond to the developments that have taken place after promulgation of Credit Bureau Act (CBA) 2015 and establishment of Licensed Credit Bureaus that are offering comprehensive CIRs to financial institutions on individuals/borrowers to make informed decisions about borrowers’ credit worthiness and debt carrying capacity.
3. Promotion of Micro Housing and Enterprise Financing
To encourage financing for low cost housing finance and microenterprise lending, following instructions were issued:
o Guidance for MFBs to underwrite housing loans.
o Detailed guidance in respect of property assessment, mortgage creation, risk management, etc. to ensure prudent housing and microenterprise financing.
o Separate requirements for classification/provisioning and charging-off non-performing loans for each loan category.
o Extension in classification cycle from 180 DPDs to 2 years.
o Extension in time to charge-off overdue facilities from 210 DPDs to 5 years.35
These revisions are expected to play a crucial role in enabling MFBs to reach out to the low-income segments of the economy that generally remain financially underserved.
Branchless Banking (BB) Performance
During the period under review, all key indicators of Branchless Banking (BB) exhibited
an encouraging growth following the COVID-19 pandemic and ensuing lockdowns. SBP’s
measures regarding limiting the spread of COVID-19 virus by promoting the use of
Digital Payment Services have further pushed the growth trajectory. The number of
agents, mobile wallets and deposits witnessed a boost in numbers. Notable growth was
witnessed in the number and value of transactions during the period.
34Circular Letter No. 2/December 11, 2021 35Circular No. 2/March 16, 2022
Money and Credit
109
Table -5.15: Branchless Banking Indicators BB Indicators CY20 CY21 Growth
Number of Agents 481,837 587,547 22%
Number of Accounts 62,755,479 78,809,751 26%
Deposits (Rs In millions) 51,671 65,580 27%
No. of transactions ('000') 1,819,184 2,501,293 37%
Value of transactions (Rs in millions) 6,785,764 8,971,352 32%
Source: Agricultural Credit & Microfinance Department, SBP.
Conclusion
SBP had initiated to tighten monetary policy stance from September 2021 after keeping the policy rate unchanged at 7 percent in all the MPC meetings held in FY2021. The monetary policy in Pakistan shifted direction in Q1-FY2022 in accordance with the changing economic outlook owing to recovery in domestic demand, higher commodity prices and persistent inflationary pressures. Consequently, policy rate had increased by cumulative 275 bps to 9.75 percent during consecutive three monetary policy decision, within a span of three months.
The outlook for inflation improved following the reduction in fuel prices and electricity tariffs announced by the Government’s relief package, while data also suggest a moderation in growth. As a result, MPC kept the policy rate unchanged in January and March 2022 meetings.
However, the Russia-Ukraine conflict has created significant uncertainty about the outlook for international commodity prices and global financial conditions. Consequently, the outlook for inflation worsened. Accordingly, the MPC in an unscheduled meeting on April 7, 2022, raised policy rate by 250 basis points to 12.25 percent. The MPC was of the view that this action would help to safeguard external and price stability.
In monetary policy decision held on 23rd May, 2022 the MPC decided to raise the policy rate by 150 basis points to 13.75 percent. The decision was based on outcome of elevated external sector pressure and the higher inflation outlook due to domestic and international factors.
Notwithstanding of monetary policy decisions, private sector credit witnessed unprecedented expansion. On positive note, credit demand increased both for fixed investment and working capital loans. Businesses took advantage of SBP concessionary financing schemes, particularly TERF. As a result, fixed investment and working capital loans witnessed significant expansion. The expansion is a signal for both continuation and expansion of economic activities, which is evident from significant growth of 5.97 percent economic growth for FY2022, surpass the target of 4.8 percent.


Capital market is an organized market where both individuals and business entities can trade various financial instruments such as bonds, stocks, government securities etc. Capital market is a key source of funds for an entity whose securities are permitted by a corporate regulatory authority to be traded, since it can readily sell its debt obligations and equity to investors. Capital market offers a variety of financial instruments that enable economic agents to pool, price and exchange risk. Through assets with attractive yields, liquidity and risk characteristics, it encourages savings in the financial form.
A well-developed capital market creates a sustainable low-cost distribution mechanism for multiple financial products and services which enhance efficient financial intermediation. It increases mobilization of savings and, therefore, improves efficiency, volume of investments and economic development. Capital market can create greater financial inclusion by introducing new products and services tailored to suit investors’ preferences for risk and return as well as borrowers’ project needs and risk appetite.
Considering its role in the economy, the capital market has an important place, through its specific mechanisms, succeeding to give its contribution to the economic development of the country. In consequence, the government must notice the importance of the capital market in the national economy and to make efforts for ensuring the necessary framework for the normal functioning of its specific mechanisms.
The chapter will cover the performance of the equity market, debt market, commodity futures market, non-banking financial companies, corporate sector, Islamic finance and insurance sector for FY2022. The chapter will also be covering the capital markets reforms and development activities introduced by the Securities and Exchange Commission of Pakistan (SECP), the apex regulator of the capital markets in Pakistan.
I – Equity Market
An equity market, also known as a stock market, is a market in which shares of listed companies are issued and traded. The shares that are traded in an equity market are either over the counter or at stock exchanges. Equity market mobilizes financial resources and connecting savers and investors. It also plays a key role in linking real and monetary sectors of the economy.
Chapter 6
Capital Markets and Corporate Sector
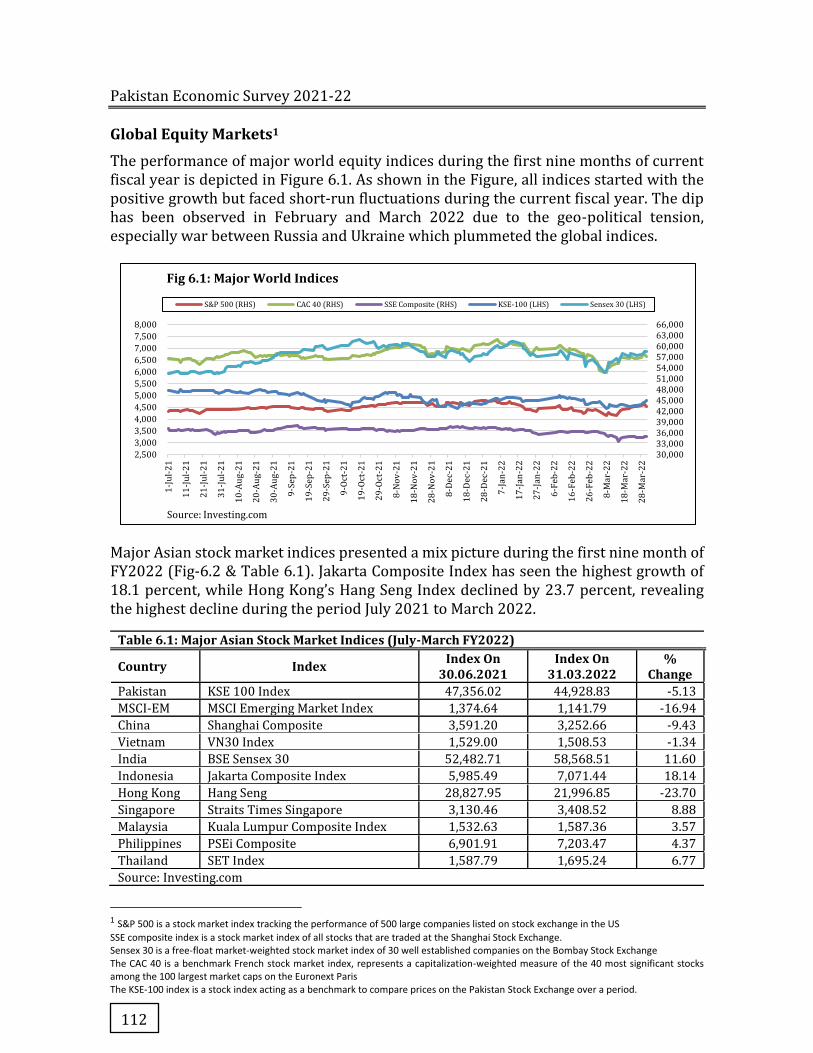
Pakistan Economic Survey 2021-22
112
Global Equity Markets1
The performance of major world equity indices during the first nine months of current fiscal year is depicted in Figure 6.1. As shown in the Figure, all indices started with the positive growth but faced short-run fluctuations during the current fiscal year. The dip has been observed in February and March 2022 due to the geo-political tension, especially war between Russia and Ukraine which plummeted the global indices.
Major Asian stock market indices presented a mix picture during the first nine month of FY2022 (Fig-6.2 & Table 6.1). Jakarta Composite Index has seen the highest growth of 18.1 percent, while Hong Kong’s Hang Seng Index declined by 23.7 percent, revealing the highest decline during the period July 2021 to March 2022.
Table 6.1: Major Asian Stock Market Indices (July-March FY2022)
Country Index Index On 30.06.2021
Index On 31.03.2022
% Change
Pakistan KSE 100 Index 47,356.02 44,928.83 -5.13
MSCI-EM MSCI Emerging Market Index 1,374.64 1,141.79 -16.94
China Shanghai Composite 3,591.20 3,252.66 -9.43
Vietnam VN30 Index 1,529.00 1,508.53 -1.34
India BSE Sensex 30 52,482.71 58,568.51 11.60
Indonesia Jakarta Composite Index 5,985.49 7,071.44 18.14
Hong Kong Hang Seng 28,827.95 21,996.85 -23.70
Singapore Straits Times Singapore 3,130.46 3,408.52 8.88
Malaysia Kuala Lumpur Composite Index 1,532.63 1,587.36 3.57
Philippines PSEi Composite 6,901.91 7,203.47 4.37
Thailand SET Index 1,587.79 1,695.24 6.77
Source: Investing.com
1 S&P 500 is a stock market index tracking the performance of 500 large companies listed on stock exchange in the US SSE composite index is a stock market index of all stocks that are traded at the Shanghai Stock Exchange. Sensex 30 is a free-float market-weighted stock market index of 30 well established companies on the Bombay Stock Exchange The CAC 40 is a benchmark French stock market index, represents a capitalization-weighted measure of the 40 most significant stocks among the 100 largest market caps on the Euronext Paris The KSE-100 index is a stock index acting as a benchmark to compare prices on the Pakistan Stock Exchange over a period.
30,00033,00036,00039,00042,00045,00048,00051,00054,00057,00060,00063,00066,000
2,500
3,000
3,500
4,000
4,500
5,000
5,500
6,000
6,500
7,000
7,500
8,000
1-J
ul-
21
11
-Ju
l-2
1
21
-Ju
l-2
1
31
-Ju
l-2
1
10
-Au
g-2
1
20
-Au
g-2
1
30
-Au
g-2
1
9-S
ep
-21
19
-Se
p-2
1
29
-Se
p-2
1
9-O
ct-2
1
19
-Oct
-21
29
-Oct
-21
8-N
ov
-21
18
-No
v-2
1
28
-No
v-2
1
8-D
ec-
21
18
-De
c-2
1
28
-De
c-2
1
7-J
an
-22
17
-Ja
n-2
2
27
-Ja
n-2
2
6-F
eb-2
2
16
-Fe
b-2
2
26
-Fe
b-2
2
8-M
ar-
22
18
-Ma
r-2
2
28
-Ma
r-2
2
Source: Investing.com
Fig 6.1: Major World Indices
S&P 500 (RHS) CAC 40 (RHS) SSE Composite (RHS) KSE-100 (LHS) Sensex 30 (LHS)
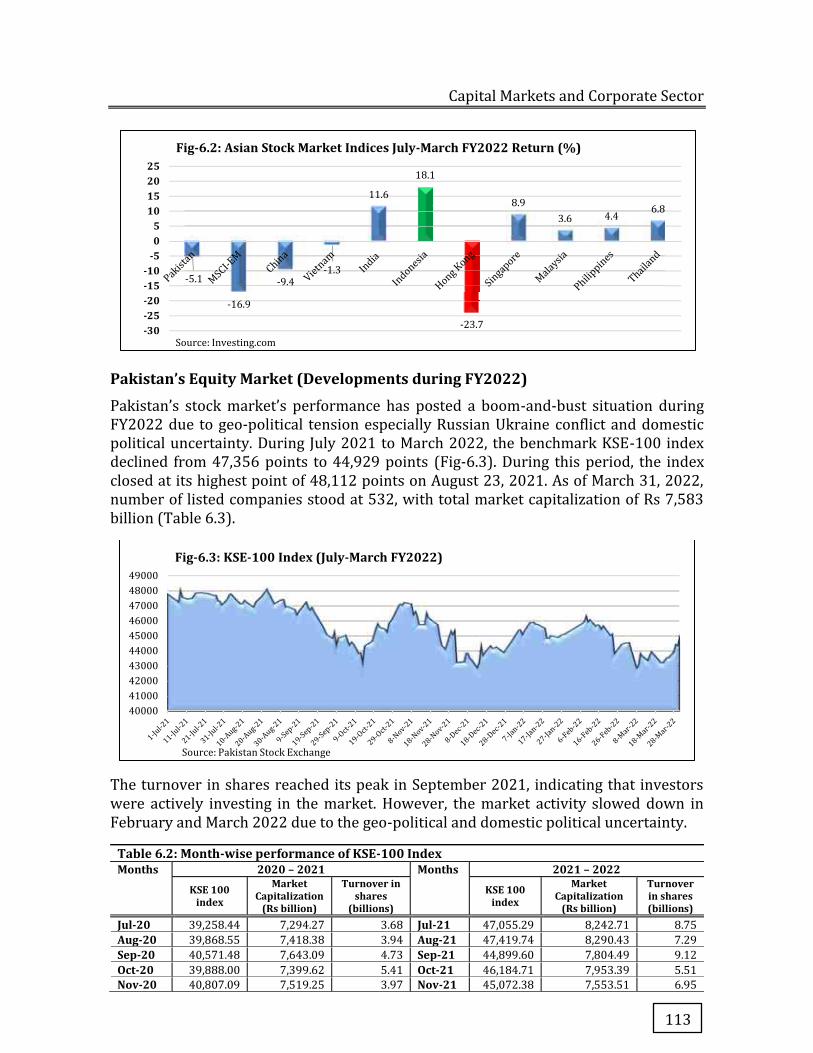
Capital Markets and Corporate Sector
113
Pakistan’s Equity Market (Developments during FY2022)
Pakistan’s stock market’s performance has posted a boom-and-bust situation during FY2022 due to geo-political tension especially Russian Ukraine conflict and domestic political uncertainty. During July 2021 to March 2022, the benchmark KSE-100 index declined from 47,356 points to 44,929 points (Fig-6.3). During this period, the index closed at its highest point of 48,112 points on August 23, 2021. As of March 31, 2022, number of listed companies stood at 532, with total market capitalization of Rs 7,583 billion (Table 6.3).
The turnover in shares reached its peak in September 2021, indicating that investors were actively investing in the market. However, the market activity slowed down in February and March 2022 due to the geo-political and domestic political uncertainty.
Table 6.2: Month-wise performance of KSE-100 Index Months 2020 – 2021 Months 2021 – 2022
KSE 100 index
Market Capitalization
(Rs billion)
Turnover in shares
(billions)
KSE 100 index
Market Capitalization
(Rs billion)
Turnover in shares (billions)
Jul-20 39,258.44 7,294.27 3.68 Jul-21 47,055.29 8,242.71 8.75
Aug-20 39,868.55 7,418.38 3.94 Aug-21 47,419.74 8,290.43 7.29
Sep-20 40,571.48 7,643.09 4.73 Sep-21 44,899.60 7,804.49 9.12
Oct-20 39,888.00 7,399.62 5.41 Oct-21 46,184.71 7,953.39 5.51
Nov-20 40,807.09 7,519.25 3.97 Nov-21 45,072.38 7,553.51 6.95
-5.1
-16.9
-9.4-1.3
11.6
18.1
-23.7
8.9
3.6 4.46.8
-30-25-20-15-10
-505
10152025
Source: Investing.com
Fig-6.2: Asian Stock Market Indices July-March FY2022 Return (%)
40000
41000
42000
43000
44000
45000
46000
47000
48000
49000
Source: Pakistan Stock Exchange
Fig-6.3: KSE-100 Index (July-March FY2022)

Pakistan Economic Survey 2021-22
114
Table 6.2: Month-wise performance of KSE-100 Index Months 2020 – 2021 Months 2021 – 2022
KSE 100 index
Market Capitalization
(Rs billion)
Turnover in shares
(billions)
KSE 100 index
Market Capitalization
(Rs billion)
Turnover in shares (billions)
Dec-20 43,755.38 8,035.36 5.78 Dec-21 44,596.07 7,684.64 5.43
Jan-21 46,385.54 8,398.45 8.40 Jan-22 45,374.68 7,755.93 5.56
Feb-21 45,865.02 8,207.14 4.79 Feb-22 44,461.01 7,612.65 4.54
Mar-21 44,587.85 7,892.19 4.43 Mar-22 44,928.83 7,582.98 4.54
Apr-21 44,262.35 7,718.74 7.79
May-21 47,896.34 8,267.65 11.61
Jun-21 47,356.02 8,297.31 20.09
Source: Pakistan Stock Exchange
The major development of this year in the equity market is the issuance of Initial Public Offerings (IPOs). During July-March FY2022, five companies issued shares through IPOs on the main board of Pakistan Stock Exchange (PSX), while two companies were listed on the newly introduced Growth Enterprise Market (GEM) Board. Their detail is given in Box-I.
Box-I: Initial Public Offerings in FY2022
Main Board
In FY2022, the first IPO was the Citi Pharma limited, manufacturer of pharmaceuticals, medical chemicals and botanical products. The company was listed on 09th July, 2021 and raised funds of Rs 2,326.1 million.
The second IPO was the Pakistan Aluminium Beverages Cans Limited. The principal activity of the Company is manufacturing and sale of aluminium cans. The company was listed on 16th July, 2021 and raised funds of Rs 4,600.5 million.
The third IPO was Airlink Communications Limited. The company imports, exports IT related products and services. The company listed on 22nd September, 2021, raised fund of Rs 6,435 million.
The fourth IPO was Octopus Digital Limited, listed on 05th October, 2021 and raised funds of Rs 1,110 million.
The fifth IPO during FY2022 was the Adamjee Life Assurance Company Limited, listed on 4th March 2022 and successfully raised Rs 700 million.
GEM Board
The first IPO on GEM board was Pak Agro Packaging Limited engaging in the manufacturing of agricultural textile products. The company listed on 26th November, 2021 and raised Rs 198 million.
The second IPO on GEM board was Universal Network Systems Limited with the principal activity of domestic and international courier and allied services. The company listed on 06th December, 2021 and raised Rs 445.7 million.
Source: SECP
The total number of companies listed in PSX till March 2022 stood at 532. Total listed capital with PSX increased from Rs 1,442.64 billion in FY2021 to Rs 1,502.13 billion during the first nine months of current fiscal year. Five new companies were listed with the PSX during July-March 2022 as compared to five companies in the fiscal year 2020-21. The profile of PSX from 2018 to March 2022 is reported in table 6.3.
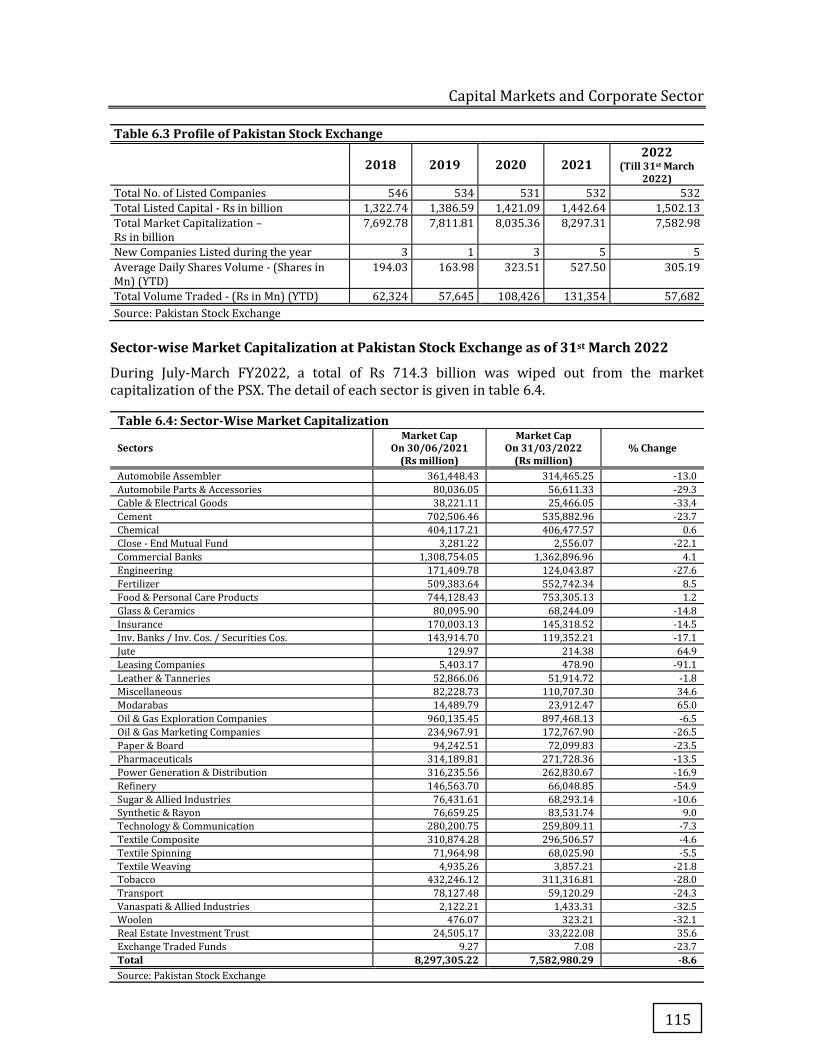
Capital Markets and Corporate Sector
115
Table 6.3 Profile of Pakistan Stock Exchange
2018 2019 2020 2021 2022
(Till 31st March 2022)
Total No. of Listed Companies 546 534 531 532 532
Total Listed Capital - Rs in billion 1,322.74 1,386.59 1,421.09 1,442.64 1,502.13
Total Market Capitalization – Rs in billion
7,692.78 7,811.81 8,035.36 8,297.31 7,582.98
New Companies Listed during the year 3 1 3 5 5
Average Daily Shares Volume - (Shares in Mn) (YTD)
194.03 163.98 323.51 527.50 305.19
Total Volume Traded - (Rs in Mn) (YTD) 62,324 57,645 108,426 131,354 57,682
Source: Pakistan Stock Exchange
Sector-wise Market Capitalization at Pakistan Stock Exchange as of 31st March 2022
During July-March FY2022, a total of Rs 714.3 billion was wiped out from the market capitalization of the PSX. The detail of each sector is given in table 6.4.
Table 6.4: Sector-Wise Market Capitalization
Sectors Market Cap
On 30/06/2021 (Rs million)
Market Cap On 31/03/2022
(Rs million) % Change
Automobile Assembler 361,448.43 314,465.25 -13.0
Automobile Parts & Accessories 80,036.05 56,611.33 -29.3
Cable & Electrical Goods 38,221.11 25,466.05 -33.4
Cement 702,506.46 535,882.96 -23.7
Chemical 404,117.21 406,477.57 0.6
Close - End Mutual Fund 3,281.22 2,556.07 -22.1
Commercial Banks 1,308,754.05 1,362,896.96 4.1
Engineering 171,409.78 124,043.87 -27.6
Fertilizer 509,383.64 552,742.34 8.5
Food & Personal Care Products 744,128.43 753,305.13 1.2
Glass & Ceramics 80,095.90 68,244.09 -14.8
Insurance 170,003.13 145,318.52 -14.5
Inv. Banks / Inv. Cos. / Securities Cos. 143,914.70 119,352.21 -17.1
Jute 129.97 214.38 64.9
Leasing Companies 5,403.17 478.90 -91.1
Leather & Tanneries 52,866.06 51,914.72 -1.8
Miscellaneous 82,228.73 110,707.30 34.6
Modarabas 14,489.79 23,912.47 65.0
Oil & Gas Exploration Companies 960,135.45 897,468.13 -6.5
Oil & Gas Marketing Companies 234,967.91 172,767.90 -26.5
Paper & Board 94,242.51 72,099.83 -23.5
Pharmaceuticals 314,189.81 271,728.36 -13.5
Power Generation & Distribution 316,235.56 262,830.67 -16.9
Refinery 146,563.70 66,048.85 -54.9
Sugar & Allied Industries 76,431.61 68,293.14 -10.6
Synthetic & Rayon 76,659.25 83,531.74 9.0
Technology & Communication 280,200.75 259,809.11 -7.3
Textile Composite 310,874.28 296,506.57 -4.6
Textile Spinning 71,964.98 68,025.90 -5.5
Textile Weaving 4,935.26 3,857.21 -21.8
Tobacco 432,246.12 311,316.81 -28.0
Transport 78,127.48 59,120.29 -24.3
Vanaspati & Allied Industries 2,122.21 1,433.31 -32.5
Woolen 476.07 323.21 -32.1
Real Estate Investment Trust 24,505.17 33,222.08 35.6
Exchange Traded Funds 9.27 7.08 -23.7
Total 8,297,305.22 7,582,980.29 -8.6 Source: Pakistan Stock Exchange
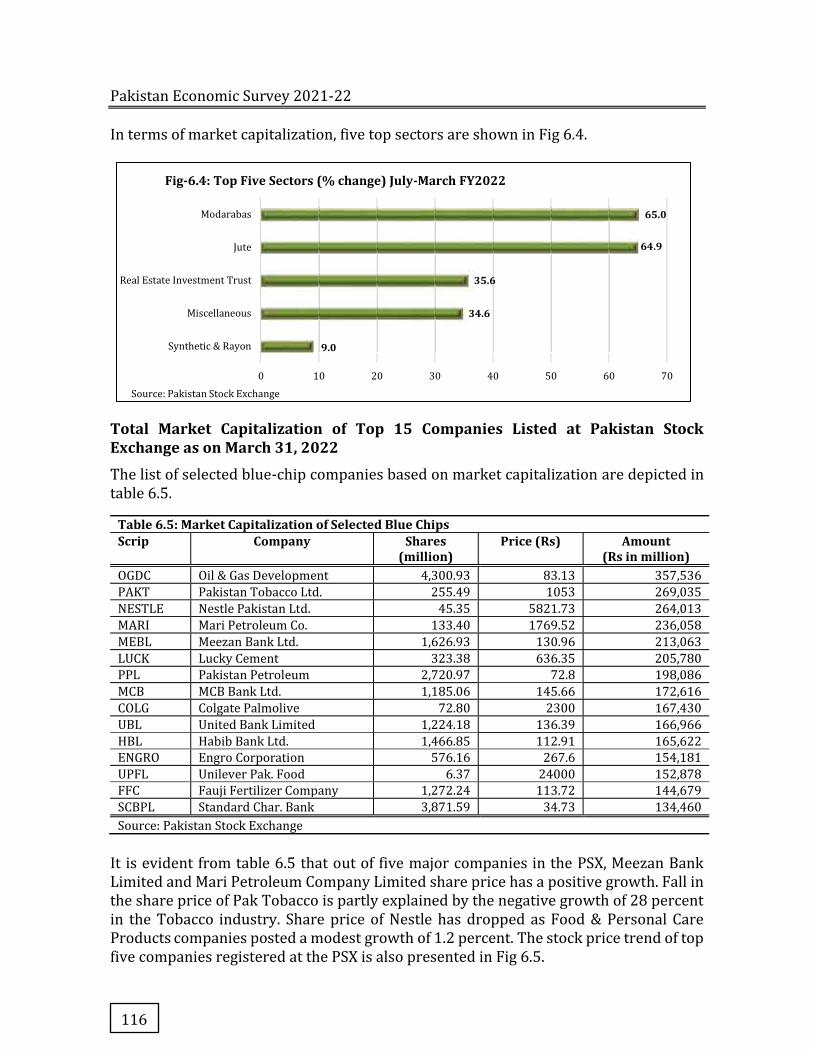
Pakistan Economic Survey 2021-22
116
In terms of market capitalization, five top sectors are shown in Fig 6.4.
Total Market Capitalization of Top 15 Companies Listed at Pakistan Stock Exchange as on March 31, 2022
The list of selected blue-chip companies based on market capitalization are depicted in table 6.5.
Table 6.5: Market Capitalization of Selected Blue Chips Scrip Company Shares
(million) Price (Rs) Amount
(Rs in million) OGDC Oil & Gas Development 4,300.93 83.13 357,536
PAKT Pakistan Tobacco Ltd. 255.49 1053 269,035
NESTLE Nestle Pakistan Ltd. 45.35 5821.73 264,013
MARI Mari Petroleum Co. 133.40 1769.52 236,058
MEBL Meezan Bank Ltd. 1,626.93 130.96 213,063
LUCK Lucky Cement 323.38 636.35 205,780
PPL Pakistan Petroleum 2,720.97 72.8 198,086
MCB MCB Bank Ltd. 1,185.06 145.66 172,616
COLG Colgate Palmolive 72.80 2300 167,430
UBL United Bank Limited 1,224.18 136.39 166,966
HBL Habib Bank Ltd. 1,466.85 112.91 165,622
ENGRO Engro Corporation 576.16 267.6 154,181
UPFL Unilever Pak. Food 6.37 24000 152,878
FFC Fauji Fertilizer Company 1,272.24 113.72 144,679
SCBPL Standard Char. Bank 3,871.59 34.73 134,460
Source: Pakistan Stock Exchange
It is evident from table 6.5 that out of five major companies in the PSX, Meezan Bank Limited and Mari Petroleum Company Limited share price has a positive growth. Fall in the share price of Pak Tobacco is partly explained by the negative growth of 28 percent in the Tobacco industry. Share price of Nestle has dropped as Food & Personal Care Products companies posted a modest growth of 1.2 percent. The stock price trend of top five companies registered at the PSX is also presented in Fig 6.5.
9.0
34.6
35.6
64.9
65.0
0 10 20 30 40 50 60 70
Synthetic & Rayon
Miscellaneous
Real Estate Investment Trust
Jute
Modarabas
Source: Pakistan Stock Exchange
Fig-6.4: Top Five Sectors (% change) July-March FY2022
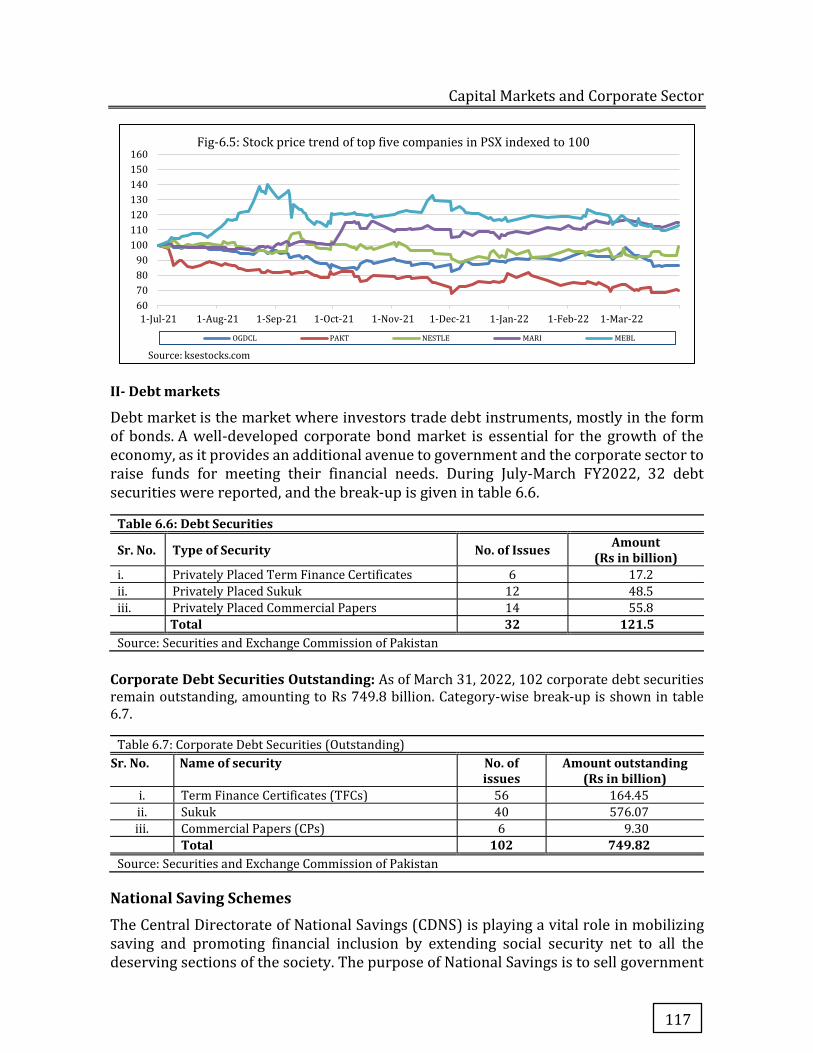
Capital Markets and Corporate Sector
117
II- Debt markets
Debt market is the market where investors trade debt instruments, mostly in the form of bonds. A well-developed corporate bond market is essential for the growth of the economy, as it provides an additional avenue to government and the corporate sector to raise funds for meeting their financial needs. During July-March FY2022, 32 debt securities were reported, and the break-up is given in table 6.6.
Table 6.6: Debt Securities
Sr. No. Type of Security No. of Issues Amount
(Rs in billion)
i. Privately Placed Term Finance Certificates 6 17.2
ii. Privately Placed Sukuk 12 48.5
iii. Privately Placed Commercial Papers 14 55.8
Total 32 121.5 Source: Securities and Exchange Commission of Pakistan
Corporate Debt Securities Outstanding: As of March 31, 2022, 102 corporate debt securities remain outstanding, amounting to Rs 749.8 billion. Category-wise break-up is shown in table 6.7.
Table 6.7: Corporate Debt Securities (Outstanding)
Sr. No. Name of security No. of issues
Amount outstanding (Rs in billion)
i. Term Finance Certificates (TFCs) 56 164.45
ii. Sukuk 40 576.07
iii. Commercial Papers (CPs) 6 9.30
Total 102 749.82 Source: Securities and Exchange Commission of Pakistan
National Saving Schemes
The Central Directorate of National Savings (CDNS) is playing a vital role in mobilizing saving and promoting financial inclusion by extending social security net to all the deserving sections of the society. The purpose of National Savings is to sell government
60
70
80
90
100
110
120
130
140
150
160
1-Jul-21 1-Aug-21 1-Sep-21 1-Oct-21 1-Nov-21 1-Dec-21 1-Jan-22 1-Feb-22 1-Mar-22
Source: ksestocks.com
Fig-6.5: Stock price trend of top five companies in PSX indexed to 100
OGDCL PAKT NESTLE MARI MEBL
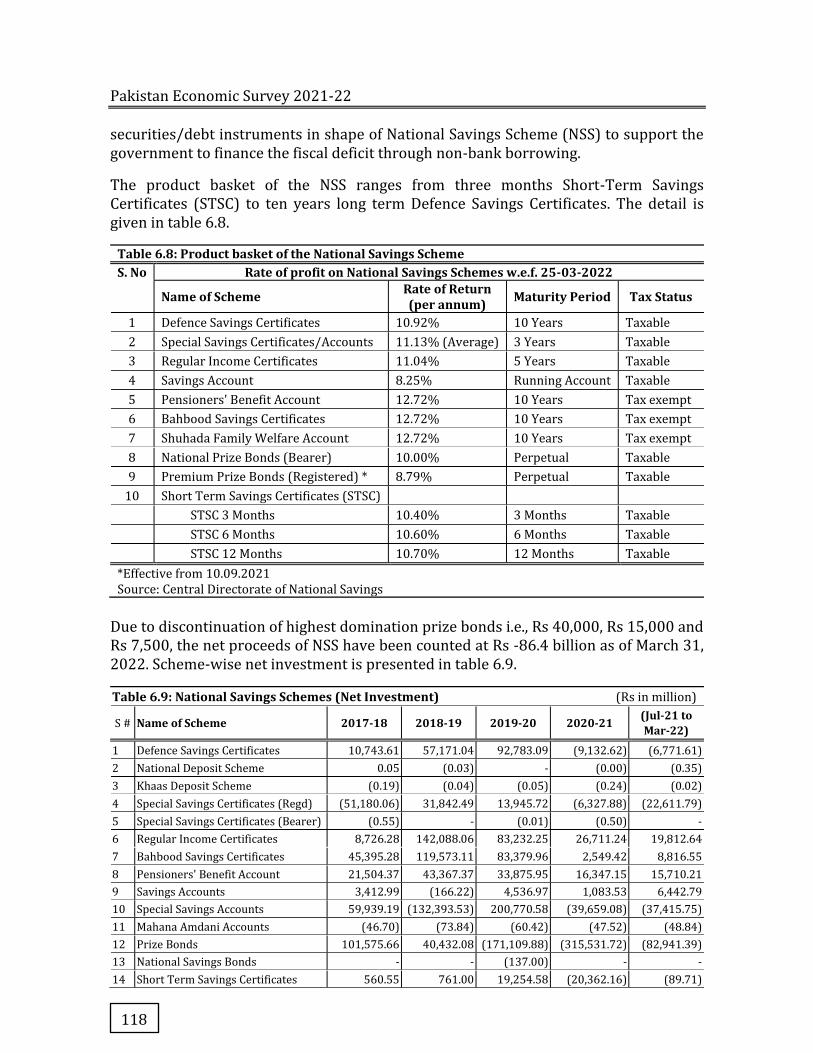
Pakistan Economic Survey 2021-22
118
securities/debt instruments in shape of National Savings Scheme (NSS) to support the government to finance the fiscal deficit through non-bank borrowing.
The product basket of the NSS ranges from three months Short-Term Savings Certificates (STSC) to ten years long term Defence Savings Certificates. The detail is given in table 6.8.
Table 6.8: Product basket of the National Savings Scheme
S. No Rate of profit on National Savings Schemes w.e.f. 25-03-2022
Name of Scheme Rate of Return (per annum) Maturity Period Tax Status
1 Defence Savings Certificates 10.92% 10 Years Taxable
2 Special Savings Certificates/Accounts 11.13% (Average) 3 Years Taxable
3 Regular Income Certificates 11.04% 5 Years Taxable
4 Savings Account 8.25% Running Account Taxable
5 Pensioners' Benefit Account 12.72% 10 Years Tax exempt
6 Bahbood Savings Certificates 12.72% 10 Years Tax exempt
7 Shuhada Family Welfare Account 12.72% 10 Years Tax exempt
8 National Prize Bonds (Bearer) 10.00% Perpetual Taxable
9 Premium Prize Bonds (Registered) * 8.79% Perpetual Taxable
10 Short Term Savings Certificates (STSC)
STSC 3 Months 10.40% 3 Months Taxable STSC 6 Months 10.60% 6 Months Taxable STSC 12 Months 10.70% 12 Months Taxable
*Effective from 10.09.2021 Source: Central Directorate of National Savings
Due to discontinuation of highest domination prize bonds i.e., Rs 40,000, Rs 15,000 and Rs 7,500, the net proceeds of NSS have been counted at Rs -86.4 billion as of March 31, 2022. Scheme-wise net investment is presented in table 6.9.
Table 6.9: National Savings Schemes (Net Investment) (Rs in million)
S # Name of Scheme 2017-18 2018-19 2019-20 2020-21 (Jul-21 to Mar-22)
1 Defence Savings Certificates 10,743.61 57,171.04 92,783.09 (9,132.62) (6,771.61)
2 National Deposit Scheme 0.05 (0.03) - (0.00) (0.35)
3 Khaas Deposit Scheme (0.19) (0.04) (0.05) (0.24) (0.02)
4 Special Savings Certificates (Regd) (51,180.06) 31,842.49 13,945.72 (6,327.88) (22,611.79)
5 Special Savings Certificates (Bearer) (0.55) - (0.01) (0.50) -
6 Regular Income Certificates 8,726.28 142,088.06 83,232.25 26,711.24 19,812.64
7 Bahbood Savings Certificates 45,395.28 119,573.11 83,379.96 2,549.42 8,816.55
8 Pensioners' Benefit Account 21,504.37 43,367.37 33,875.95 16,347.15 15,710.21
9 Savings Accounts 3,412.99 (166.22) 4,536.97 1,083.53 6,442.79
10 Special Savings Accounts 59,939.19 (132,393.53) 200,770.58 (39,659.08) (37,415.75)
11 Mahana Amdani Accounts (46.70) (73.84) (60.42) (47.52) (48.84)
12 Prize Bonds 101,575.66 40,432.08 (171,109.88) (315,531.72) (82,941.39)
13 National Savings Bonds - - (137.00) - -
14 Short Term Savings Certificates 560.55 761.00 19,254.58 (20,362.16) (89.71)
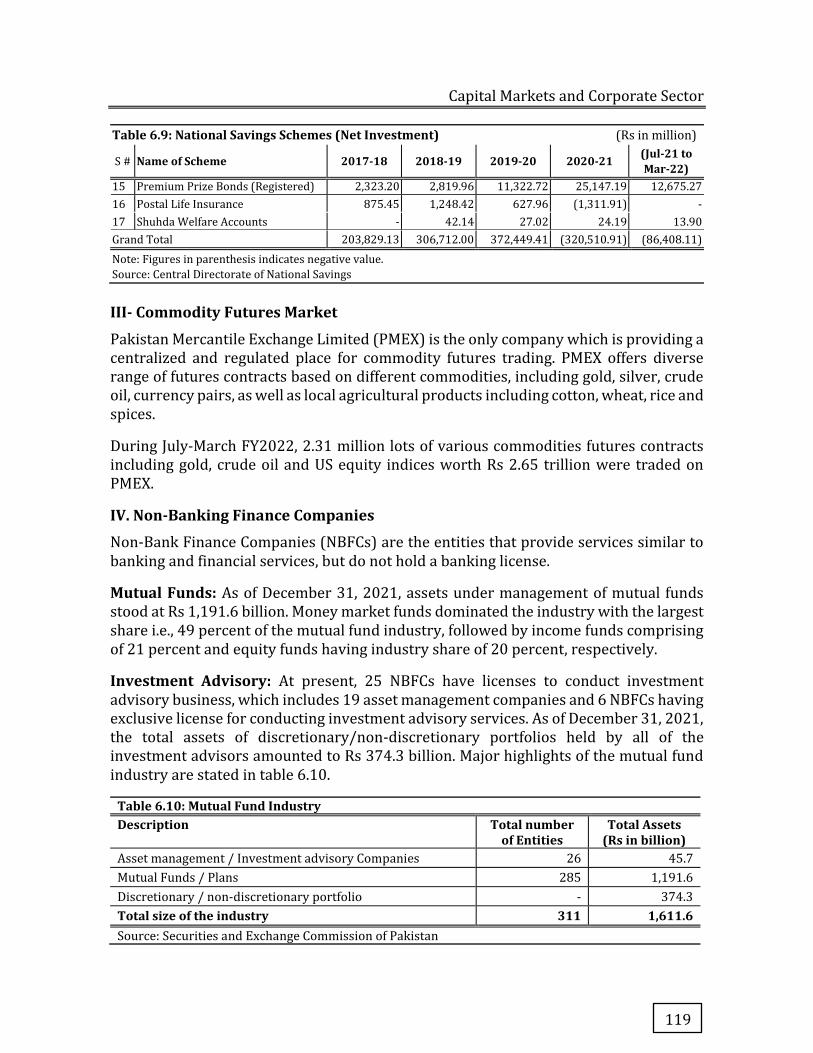
Capital Markets and Corporate Sector
119
Table 6.9: National Savings Schemes (Net Investment) (Rs in million)
S # Name of Scheme 2017-18 2018-19 2019-20 2020-21 (Jul-21 to Mar-22)
15 Premium Prize Bonds (Registered) 2,323.20 2,819.96 11,322.72 25,147.19 12,675.27
16 Postal Life Insurance 875.45 1,248.42 627.96 (1,311.91) -
17 Shuhda Welfare Accounts - 42.14 27.02 24.19 13.90
Grand Total 203,829.13 306,712.00 372,449.41 (320,510.91) (86,408.11)
Note: Figures in parenthesis indicates negative value.
Source: Central Directorate of National Savings
III- Commodity Futures Market
Pakistan Mercantile Exchange Limited (PMEX) is the only company which is providing a centralized and regulated place for commodity futures trading. PMEX offers diverse range of futures contracts based on different commodities, including gold, silver, crude oil, currency pairs, as well as local agricultural products including cotton, wheat, rice and spices.
During July-March FY2022, 2.31 million lots of various commodities futures contracts including gold, crude oil and US equity indices worth Rs 2.65 trillion were traded on PMEX.
IV. Non-Banking Finance Companies
Non-Bank Finance Companies (NBFCs) are the entities that provide services similar to banking and financial services, but do not hold a banking license.
Mutual Funds: As of December 31, 2021, assets under management of mutual funds stood at Rs 1,191.6 billion. Money market funds dominated the industry with the largest share i.e., 49 percent of the mutual fund industry, followed by income funds comprising of 21 percent and equity funds having industry share of 20 percent, respectively.
Investment Advisory: At present, 25 NBFCs have licenses to conduct investment advisory business, which includes 19 asset management companies and 6 NBFCs having exclusive license for conducting investment advisory services. As of December 31, 2021, the total assets of discretionary/non-discretionary portfolios held by all of the investment advisors amounted to Rs 374.3 billion. Major highlights of the mutual fund industry are stated in table 6.10.
Table 6.10: Mutual Fund Industry Description Total number
of Entities Total Assets
(Rs in billion) Asset management / Investment advisory Companies 26 45.7
Mutual Funds / Plans 285 1,191.6
Discretionary / non-discretionary portfolio - 374.3
Total size of the industry 311 1,611.6 Source: Securities and Exchange Commission of Pakistan
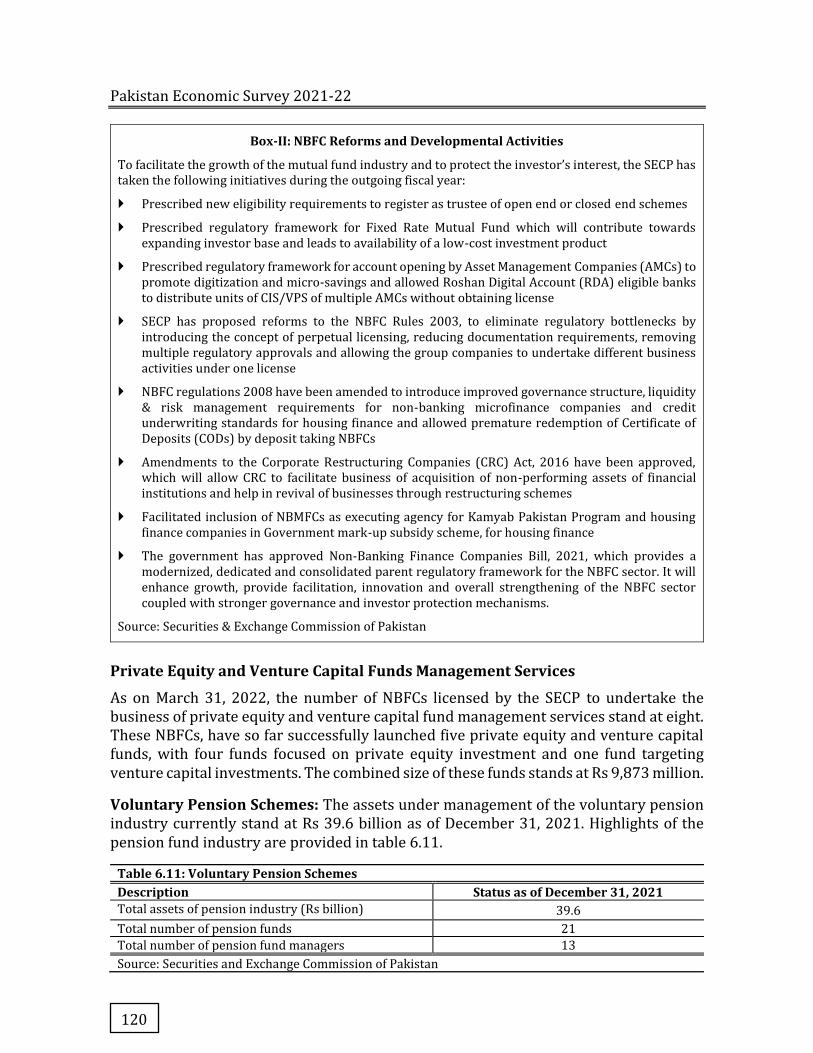
Pakistan Economic Survey 2021-22
120
Box-II: NBFC Reforms and Developmental Activities
To facilitate the growth of the mutual fund industry and to protect the investor’s interest, the SECP has taken the following initiatives during the outgoing fiscal year:
� Prescribed new eligibility requirements to register as trustee of open end or closed end schemes
� Prescribed regulatory framework for Fixed Rate Mutual Fund which will contribute towards expanding investor base and leads to availability of a low-cost investment product
� Prescribed regulatory framework for account opening by Asset Management Companies (AMCs) to promote digitization and micro-savings and allowed Roshan Digital Account (RDA) eligible banks to distribute units of CIS/VPS of multiple AMCs without obtaining license
� SECP has proposed reforms to the NBFC Rules 2003, to eliminate regulatory bottlenecks by introducing the concept of perpetual licensing, reducing documentation requirements, removing multiple regulatory approvals and allowing the group companies to undertake different business activities under one license
� NBFC regulations 2008 have been amended to introduce improved governance structure, liquidity & risk management requirements for non-banking microfinance companies and credit underwriting standards for housing finance and allowed premature redemption of Certificate of Deposits (CODs) by deposit taking NBFCs
� Amendments to the Corporate Restructuring Companies (CRC) Act, 2016 have been approved, which will allow CRC to facilitate business of acquisition of non-performing assets of financial institutions and help in revival of businesses through restructuring schemes
� Facilitated inclusion of NBMFCs as executing agency for Kamyab Pakistan Program and housing finance companies in Government mark-up subsidy scheme, for housing finance
� The government has approved Non-Banking Finance Companies Bill, 2021, which provides a modernized, dedicated and consolidated parent regulatory framework for the NBFC sector. It will enhance growth, provide facilitation, innovation and overall strengthening of the NBFC sector coupled with stronger governance and investor protection mechanisms.
Source: Securities & Exchange Commission of Pakistan
Private Equity and Venture Capital Funds Management Services
As on March 31, 2022, the number of NBFCs licensed by the SECP to undertake the business of private equity and venture capital fund management services stand at eight. These NBFCs, have so far successfully launched five private equity and venture capital funds, with four funds focused on private equity investment and one fund targeting venture capital investments. The combined size of these funds stands at Rs 9,873 million.
Voluntary Pension Schemes: The assets under management of the voluntary pension industry currently stand at Rs 39.6 billion as of December 31, 2021. Highlights of the pension fund industry are provided in table 6.11.
Table 6.11: Voluntary Pension Schemes Description Status as of December 31, 2021 Total assets of pension industry (Rs billion) 39.6
Total number of pension funds 21
Total number of pension fund managers 13
Source: Securities and Exchange Commission of Pakistan

Capital Markets and Corporate Sector
121
Lending NBFCs
Lending NBFCs include leasing companies, investment finance companies, housing finance companies, discount houses and non-bank microfinance companies. Highlights of each category as of December 31, 2021 is stated in table 6.12.
Table 6.12: List of Lending NBFCs
S.No Lending NBFC No. of companies Asset Base (Rs billion)
1 Leasing Companies 4 5.36
2 Investment Banks 16 78.22
3 Non-Bank Microfinance Companies 30 146.11
4 Housing Finance Companies 3 0.216
Source: Securities and Exchange Commission of Pakistan
Real Estate Investment Trusts (REITs)
REITs are investment schemes that own, actively manage income-producing real estate. Through such schemes, investors may own, operate, or finance income-generating property across various real estate categories. The REIT invests in physical real estate and distributes profits from rental income and/or capital gains to its unit holders.
Currently, three REIT schemes have offered units to the investors and acquired property(ies) i.e., Dolmen City REIT, Silk Islamic Developmental REIT and Silk World Islamic REIT. As of December 31, 2021, the aggregate fund size of these REIT Schemes was Rs 67.15 billion. Stakeholders continue to express interest in REIT as a viable option for investing in real estate projects, as evidenced from the number of companies licensed to undertake REIT management services increasing to eleven and receipt of twelve fresh applications for formation of REIT management company/grant of REIT management services licenses.
V- Corporate Sector
Company incorporation trend: Facilitation extended during the pandemic coupled with availability of uninterrupted online services has helped in registration of companies. During July-March FY2022, a total of 19,929 new companies were registered, out of which around 99 percent companies were incorporated through online process.
Digital Portal for Banks: In pursuit of its agenda to promote ease of doing business and digitalization, SECP in coordination with SBP, had launched an exclusive digital portal in March, 2021, enabling banks to open corporate accounts without seeking physically certified copies of statutory documents. Presently, 47 financial institutions have joined the portal, during the period of July-March FY2022.
Biannual Online Reporting System for Employees Contribution Fund: SECP has successfully lunched "Online Reporting System for Filing Biannual Returns" through e-Services platform, the module is related to Employees Contributory Funds (Investment in Listed Securities) Regulations, 2018 (the "Regulations") which were previously filed
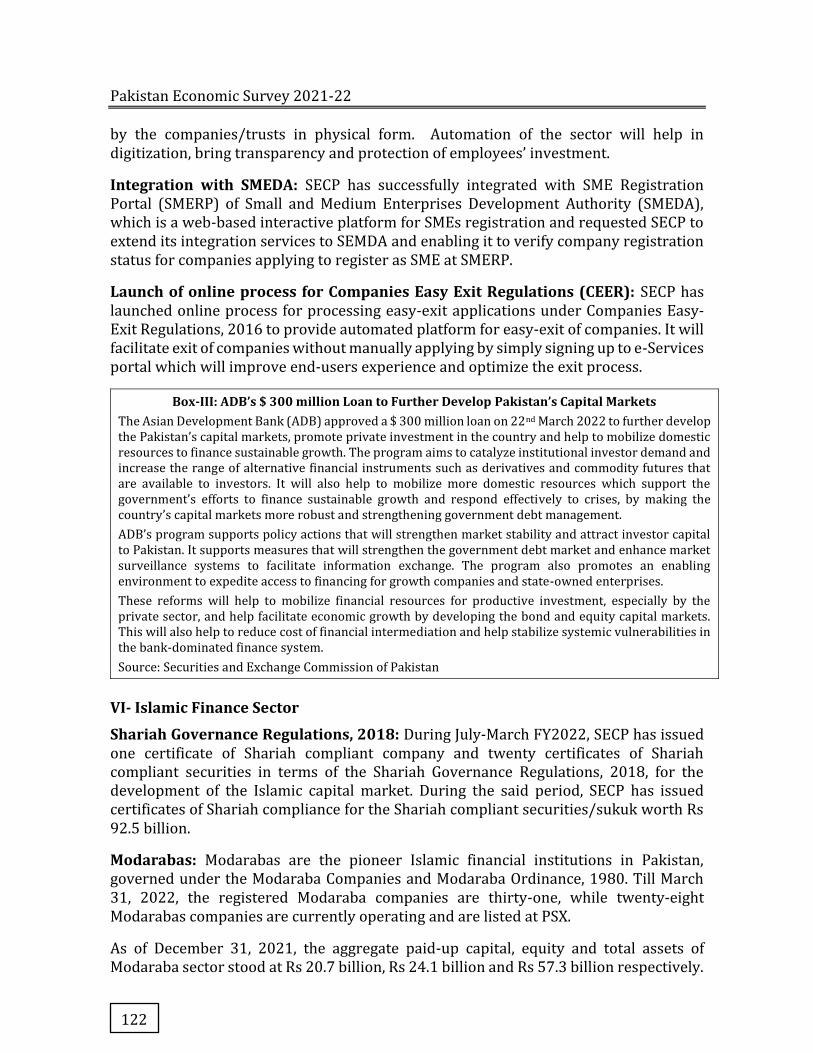
Pakistan Economic Survey 2021-22
122
by the companies/trusts in physical form. Automation of the sector will help in digitization, bring transparency and protection of employees’ investment.
Integration with SMEDA: SECP has successfully integrated with SME Registration Portal (SMERP) of Small and Medium Enterprises Development Authority (SMEDA), which is a web-based interactive platform for SMEs registration and requested SECP to extend its integration services to SEMDA and enabling it to verify company registration status for companies applying to register as SME at SMERP.
Launch of online process for Companies Easy Exit Regulations (CEER): SECP has launched online process for processing easy-exit applications under Companies Easy-Exit Regulations, 2016 to provide automated platform for easy-exit of companies. It will facilitate exit of companies without manually applying by simply signing up to e-Services portal which will improve end-users experience and optimize the exit process.
Box-III: ADB’s $ 300 million Loan to Further Develop Pakistan’s Capital Markets The Asian Development Bank (ADB) approved a $ 300 million loan on 22nd March 2022 to further develop the Pakistan’s capital markets, promote private investment in the country and help to mobilize domestic resources to finance sustainable growth. The program aims to catalyze institutional investor demand and increase the range of alternative financial instruments such as derivatives and commodity futures that are available to investors. It will also help to mobilize more domestic resources which support the government’s efforts to finance sustainable growth and respond effectively to crises, by making the country’s capital markets more robust and strengthening government debt management.
ADB’s program supports policy actions that will strengthen market stability and attract investor capital to Pakistan. It supports measures that will strengthen the government debt market and enhance market surveillance systems to facilitate information exchange. The program also promotes an enabling environment to expedite access to financing for growth companies and state-owned enterprises.
These reforms will help to mobilize financial resources for productive investment, especially by the private sector, and help facilitate economic growth by developing the bond and equity capital markets. This will also help to reduce cost of financial intermediation and help stabilize systemic vulnerabilities in the bank-dominated finance system.
Source: Securities and Exchange Commission of Pakistan
VI- Islamic Finance Sector
Shariah Governance Regulations, 2018: During July-March FY2022, SECP has issued one certificate of Shariah compliant company and twenty certificates of Shariah compliant securities in terms of the Shariah Governance Regulations, 2018, for the development of the Islamic capital market. During the said period, SECP has issued certificates of Shariah compliance for the Shariah compliant securities/sukuk worth Rs 92.5 billion.
Modarabas: Modarabas are the pioneer Islamic financial institutions in Pakistan, governed under the Modaraba Companies and Modaraba Ordinance, 1980. Till March 31, 2022, the registered Modaraba companies are thirty-one, while twenty-eight Modarabas companies are currently operating and are listed at PSX.
As of December 31, 2021, the aggregate paid-up capital, equity and total assets of Modaraba sector stood at Rs 20.7 billion, Rs 24.1 billion and Rs 57.3 billion respectively.
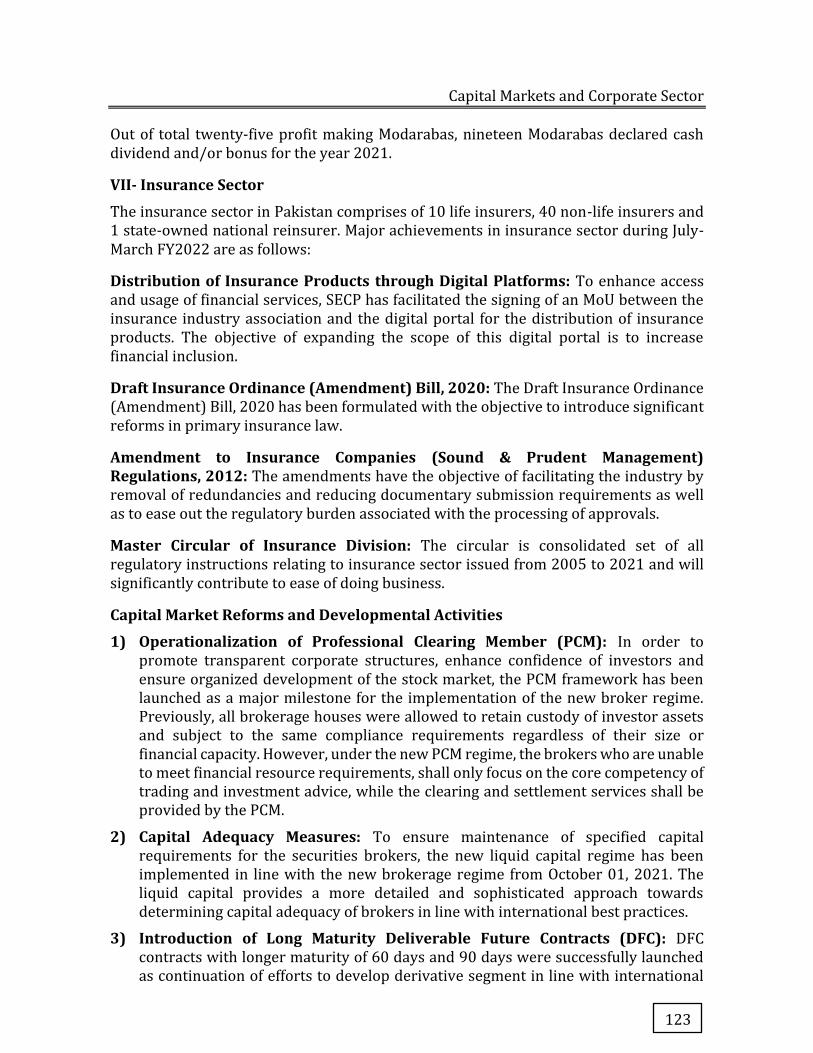
Capital Markets and Corporate Sector
123
Out of total twenty-five profit making Modarabas, nineteen Modarabas declared cash dividend and/or bonus for the year 2021.
VII- Insurance Sector
The insurance sector in Pakistan comprises of 10 life insurers, 40 non-life insurers and 1 state-owned national reinsurer. Major achievements in insurance sector during July-March FY2022 are as follows:
Distribution of Insurance Products through Digital Platforms: To enhance access and usage of financial services, SECP has facilitated the signing of an MoU between the insurance industry association and the digital portal for the distribution of insurance products. The objective of expanding the scope of this digital portal is to increase financial inclusion.
Draft Insurance Ordinance (Amendment) Bill, 2020: The Draft Insurance Ordinance (Amendment) Bill, 2020 has been formulated with the objective to introduce significant reforms in primary insurance law.
Amendment to Insurance Companies (Sound & Prudent Management) Regulations, 2012: The amendments have the objective of facilitating the industry by removal of redundancies and reducing documentary submission requirements as well as to ease out the regulatory burden associated with the processing of approvals.
Master Circular of Insurance Division: The circular is consolidated set of all regulatory instructions relating to insurance sector issued from 2005 to 2021 and will significantly contribute to ease of doing business.
Capital Market Reforms and Developmental Activities
1) Operationalization of Professional Clearing Member (PCM): In order to promote transparent corporate structures, enhance confidence of investors and ensure organized development of the stock market, the PCM framework has been launched as a major milestone for the implementation of the new broker regime. Previously, all brokerage houses were allowed to retain custody of investor assets and subject to the same compliance requirements regardless of their size or financial capacity. However, under the new PCM regime, the brokers who are unable to meet financial resource requirements, shall only focus on the core competency of trading and investment advice, while the clearing and settlement services shall be provided by the PCM.
2) Capital Adequacy Measures: To ensure maintenance of specified capital requirements for the securities brokers, the new liquid capital regime has been implemented in line with the new brokerage regime from October 01, 2021. The liquid capital provides a more detailed and sophisticated approach towards determining capital adequacy of brokers in line with international best practices.
3) Introduction of Long Maturity Deliverable Future Contracts (DFC): DFC contracts with longer maturity of 60 days and 90 days were successfully launched as continuation of efforts to develop derivative segment in line with international
Pakistan Economic Survey 2021-22
124
best practices. The new contracts provided investors with more flexibility with respect to their trading strategies and eliminated the rollover week.
4) Shared KYC Information System: Benefitting from the successful implementation of online opening system in capital markets, a new mechanism has been introduced for facilitating resident Pakistanis in opening trading accounts with securities broker by allowing sharing of KYC information already submitted to the banks with the brokers.
5) Reforms in Dividend Payment: In order to facilitate shareholders of listed companies and to make dividend distribution process more efficient; amendments in Companies (Distribution of Dividend) Regulations, 2017 were approved by the Commission to reduce turnaround time for payment of cash dividend from 15 working days to 10 working days from the date of its declaration.
6) Risk Management Regime for Custodian Clearing Members: Risk management regime for Custodian Clearing Members (CCMs) has been implemented. The new mechanism allows collection of acceptable collateral from CCMs against margin requirements in respect of trades of foreign investors. This will improve efficiency of risk management system while improving the capacity of local brokers.
7) Revision in Fee, Charges and Deposits Schedule of CDC and NCCPL: In order to provide benefit to unit holders of mutual fund industry; the SECP has approved to rationalized NCCPL’s tariff structures of security deposit requirement for Collective Investment Schemes (CIS) and Capital Gain Tax (CGT) fee in a progressive manner. Further, the security deposit shall not be applicable on Asset Management Companies admitted for only using single UIN facility for all CISs under its management.
8) CDC’s Tariff Structure has also been rationalized on account of multiple fee heads, i.e., waiver for online transactions, reduction in annual fee for multiple accounts, significant reduction in fee for fresh issue of shares and redeemable securities especially for short term redeemable securities. Such reduction would be beneficial for corporate sector to issue bonds with substantially reduced induction fee and investors shall be able to have lesser cost to maintain CDC investor and sub-account.
9) Promotion of ETFs: In order to encourage launch of more ETFs at PSX, the SECP has approved reduction in minimum brokerage rates for trading in fixed income ETFs. Further, to promote and develop ETF market, incentives provided previously by PSX, CDC and NCCPL in respect of ETFs, have been further extended for one year.
10) Account Facilitation and Customer Help Centre: In a bid to enhance investor base of capital market, regulatory framework for opening and operations of account facilitation/ customer help centres by securities brokers has been implemented. These centres shall enhance physical presence of securities brokers and facilitate in account opening for new investors in the capital market through utilization of branch networks of Commercial Banks, Asset Management Companies and Insurance Companies, in addition to allowing specially trained sales staff of brokers to carry out permissible marketing activities in public places.

Capital Markets and Corporate Sector
125
Development of Primary Capital Market: Following measures have been taken for development of primary capital market:
i. Deployment of online system “PRIDE” for submission of prospectus and listing applications. This system would make the submission of listing application and supporting documents digital and will be beneficial for PSX and SECP. Further, it would also reduce the turnover time for the processing of listing applications and make it robust and efficient.
ii. Introduction of Special Purpose Acquisition Companies (SPACs): SECP has introduced concept of SPAC, allowing capital market professionals to issue securities and raise capital by forming a special purpose company for entering into merger or acquisition transaction.
iii. Publication of Guidelines for SPAC: Subsequent to amendments in Public Offering Regulations, 2017 regarding SPACs, SECP published guidelines for SPAC to help issuers as well as investors to understand the process of registering and investing in SPACs.
iv. Amendments in the Companies (Asset Backed Securitization) Rules, 1999: Securitization is one of the important segments of debt market, which enable corporates to raise funds through capital market by monetizing their illiquid assets. To enable issuers to issue mortgage-backed securities and covered bonds, certain amendments in the Companies (Asset Backed Securitization) Rules, 1999 have been proposed.
Conclusion
The performance of stock markets remained volatile during the first three quarters of the current fiscal year. The KSE-100 index showed an encouraging trend from the start of July 2021, which is also evident from the listing of significant number of IPOs. However, the index witnessed a declining trend from 24th February 2022 till end March 2022 due to the geo-political tensions, i.e., war between Russia and Ukraine and domestic political uncertainty.
The reforms and development activities introduced by the SECP will not only help the capital markets to regain its momentum but also neutralize the associated risks. However, the performance of Pakistan’s capital market will depend on the domestic as well as international economic conditions in the future.

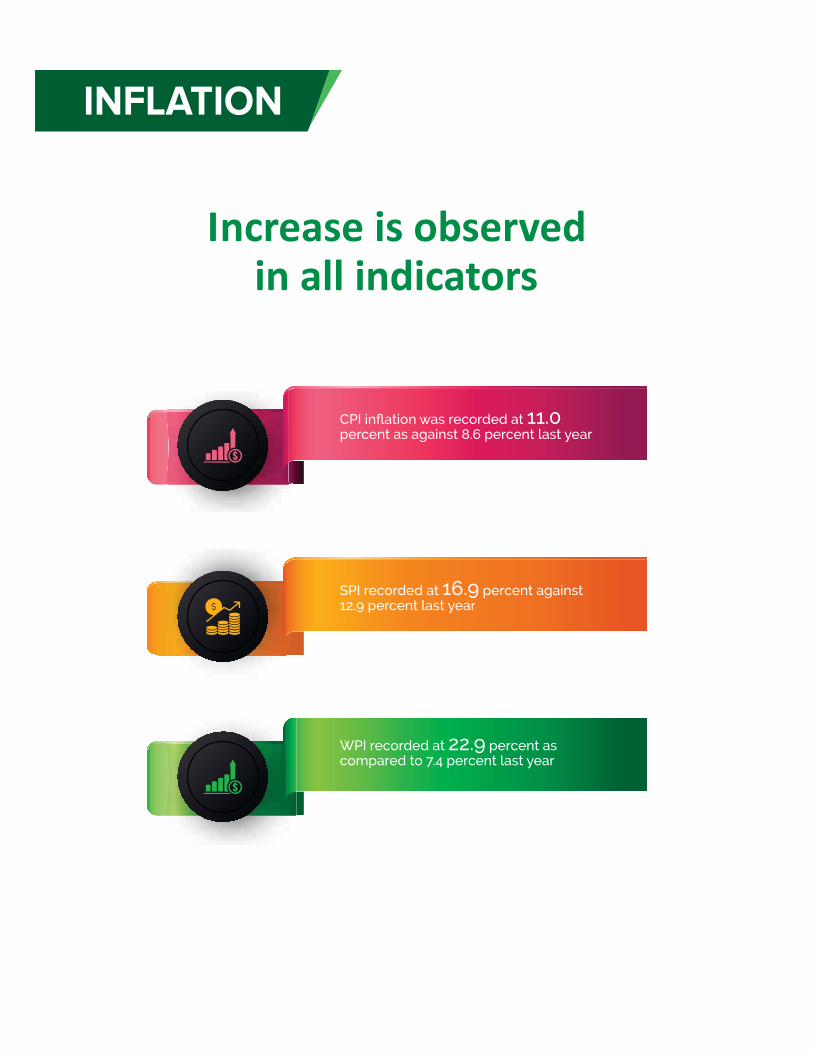

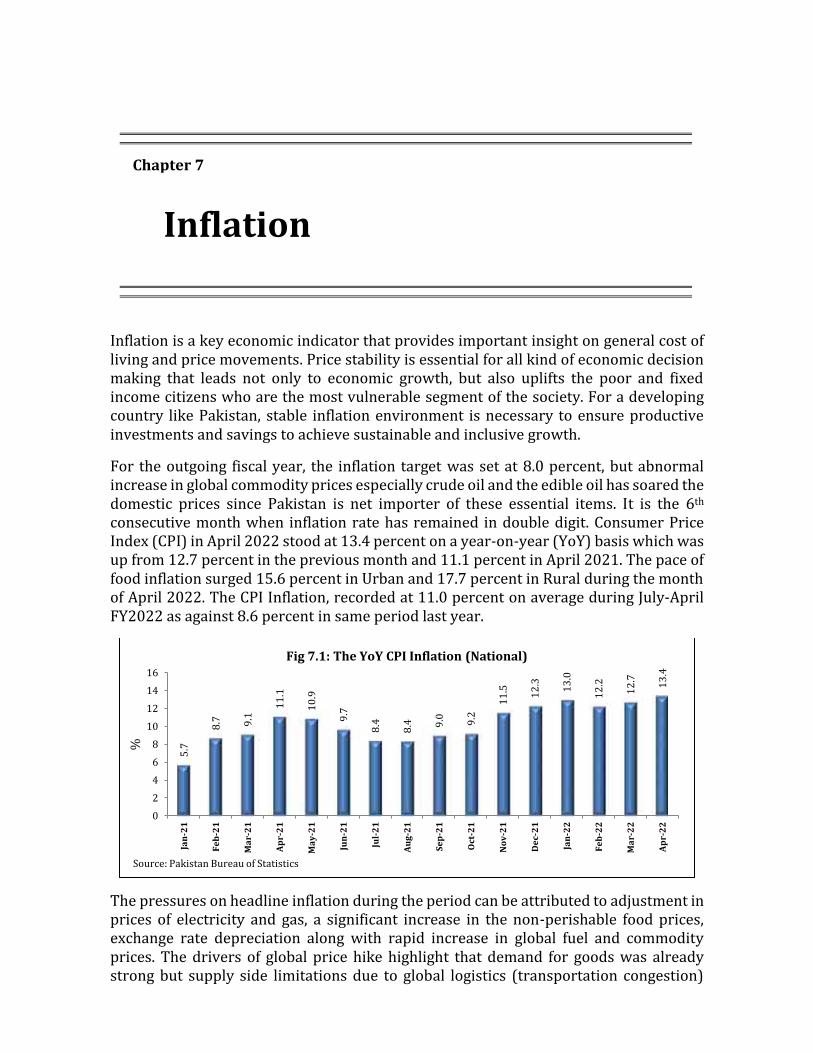
Inflation is a key economic indicator that provides important insight on general cost of living and price movements. Price stability is essential for all kind of economic decision making that leads not only to economic growth, but also uplifts the poor and fixed income citizens who are the most vulnerable segment of the society. For a developing country like Pakistan, stable inflation environment is necessary to ensure productive investments and savings to achieve sustainable and inclusive growth.
For the outgoing fiscal year, the inflation target was set at 8.0 percent, but abnormal increase in global commodity prices especially crude oil and the edible oil has soared the domestic prices since Pakistan is net importer of these essential items. It is the 6th consecutive month when inflation rate has remained in double digit. Consumer Price Index (CPI) in April 2022 stood at 13.4 percent on a year-on-year (YoY) basis which was up from 12.7 percent in the previous month and 11.1 percent in April 2021. The pace of food inflation surged 15.6 percent in Urban and 17.7 percent in Rural during the month of April 2022. The CPI Inflation, recorded at 11.0 percent on average during July-April FY2022 as against 8.6 percent in same period last year.
The pressures on headline inflation during the period can be attributed to adjustment in prices of electricity and gas, a significant increase in the non-perishable food prices, exchange rate depreciation along with rapid increase in global fuel and commodity prices. The drivers of global price hike highlight that demand for goods was already strong but supply side limitations due to global logistics (transportation congestion)
5.7
8.7 9.1
11
.1
10
.9
9.7
8.4
8.4 9
.0 9.2
11
.5
12
.3
13
.0
12
.2
12
.7
13
.4
0
2
4
6
8
10
12
14
16
Jan-
21
Feb-
21
Mar
-21
Apr-
21
May
-21
Jun-
21
Jul-2
1
Aug-
21
Sep-
21
Oct
-21
Nov
-21
Dec
-21
Jan-
22
Feb-
22
Mar
-22
Apr-
22
%
Source: Pakistan Bureau of Statistics
Fig 7.1: The YoY CPI Inflation (National)
Chapter 7
Inflation
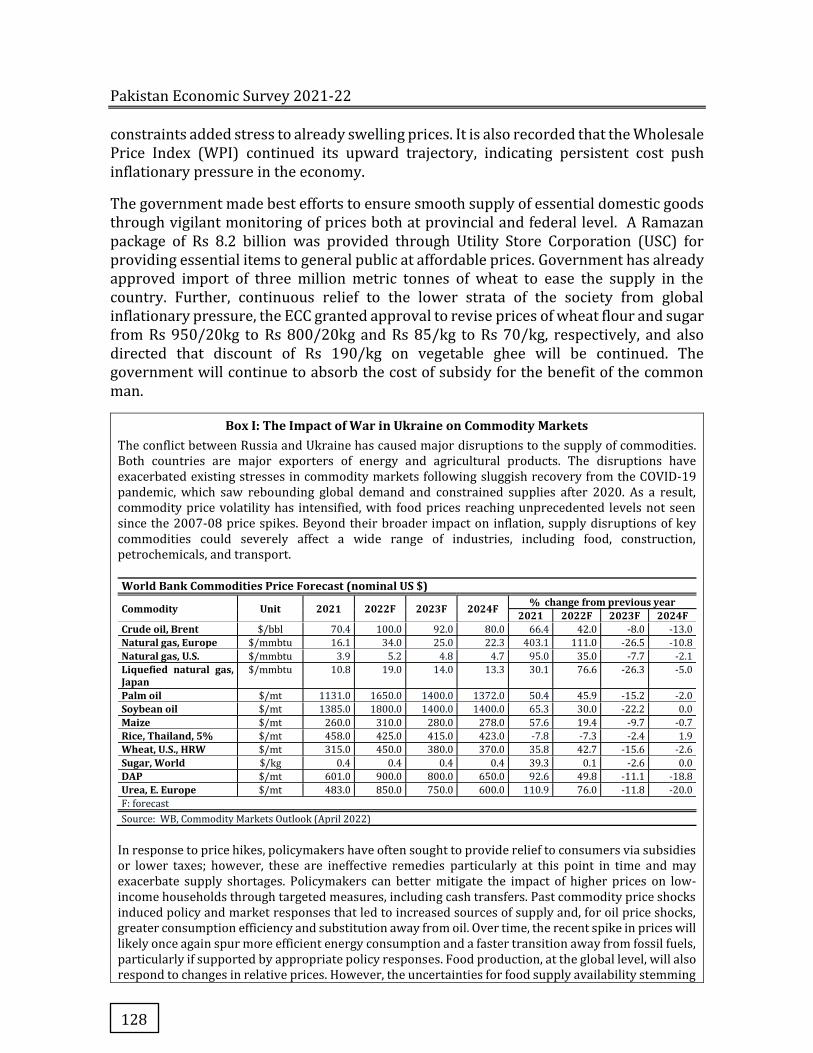
Pakistan Economic Survey 2021-22Pakistan Economic Survey 2021-22
128
constraints added stress to already swelling prices. It is also recorded that the Wholesale Price Index (WPI) continued its upward trajectory, indicating persistent cost push inflationary pressure in the economy.
The government made best efforts to ensure smooth supply of essential domestic goods through vigilant monitoring of prices both at provincial and federal level. A Ramazan package of Rs 8.2 billion was provided through Utility Store Corporation (USC) for providing essential items to general public at affordable prices. Government has already approved import of three million metric tonnes of wheat to ease the supply in the country. Further, continuous relief to the lower strata of the society from global inflationary pressure, the ECC granted approval to revise prices of wheat flour and sugar from Rs 950/20kg to Rs 800/20kg and Rs 85/kg to Rs 70/kg, respectively, and also directed that discount of Rs 190/kg on vegetable ghee will be continued. The government will continue to absorb the cost of subsidy for the benefit of the common man.
Box I: The Impact of War in Ukraine on Commodity Markets The conflict between Russia and Ukraine has caused major disruptions to the supply of commodities. Both countries are major exporters of energy and agricultural products. The disruptions have exacerbated existing stresses in commodity markets following sluggish recovery from the COVID-19 pandemic, which saw rebounding global demand and constrained supplies after 2020. As a result, commodity price volatility has intensified, with food prices reaching unprecedented levels not seen since the 2007-08 price spikes. Beyond their broader impact on inflation, supply disruptions of key commodities could severely affect a wide range of industries, including food, construction, petrochemicals, and transport. World Bank Commodities Price Forecast (nominal US $)
Commodity Unit 2021 2022F 2023F 2024F % change from previous year 2021 2022F 2023F 2024F
Crude oil, Brent $/bbl 70.4 100.0 92.0 80.0 66.4 42.0 -8.0 -13.0
Natural gas, Europe $/mmbtu 16.1 34.0 25.0 22.3 403.1 111.0 -26.5 -10.8
Natural gas, U.S. $/mmbtu 3.9 5.2 4.8 4.7 95.0 35.0 -7.7 -2.1
Liquefied natural gas, Japan
$/mmbtu 10.8 19.0 14.0 13.3 30.1 76.6 -26.3 -5.0
Palm oil $/mt 1131.0 1650.0 1400.0 1372.0 50.4 45.9 -15.2 -2.0
Soybean oil $/mt 1385.0 1800.0 1400.0 1400.0 65.3 30.0 -22.2 0.0
Maize $/mt 260.0 310.0 280.0 278.0 57.6 19.4 -9.7 -0.7
Rice, Thailand, 5% $/mt 458.0 425.0 415.0 423.0 -7.8 -7.3 -2.4 1.9
Wheat, U.S., HRW $/mt 315.0 450.0 380.0 370.0 35.8 42.7 -15.6 -2.6
Sugar, World $/kg 0.4 0.4 0.4 0.4 39.3 0.1 -2.6 0.0
DAP $/mt 601.0 900.0 800.0 650.0 92.6 49.8 -11.1 -18.8
Urea, E. Europe $/mt 483.0 850.0 750.0 600.0 110.9 76.0 -11.8 -20.0
F: forecast
Source: WB, Commodity Markets Outlook (April 2022)
In response to price hikes, policymakers have often sought to provide relief to consumers via subsidies or lower taxes; however, these are ineffective remedies particularly at this point in time and may exacerbate supply shortages. Policymakers can better mitigate the impact of higher prices on low-income households through targeted measures, including cash transfers. Past commodity price shocks induced policy and market responses that led to increased sources of supply and, for oil price shocks, greater consumption efficiency and substitution away from oil. Over time, the recent spike in prices will likely once again spur more efficient energy consumption and a faster transition away from fossil fuels, particularly if supported by appropriate policy responses. Food production, at the global level, will also respond to changes in relative prices. However, the uncertainties for food supply availability stemming
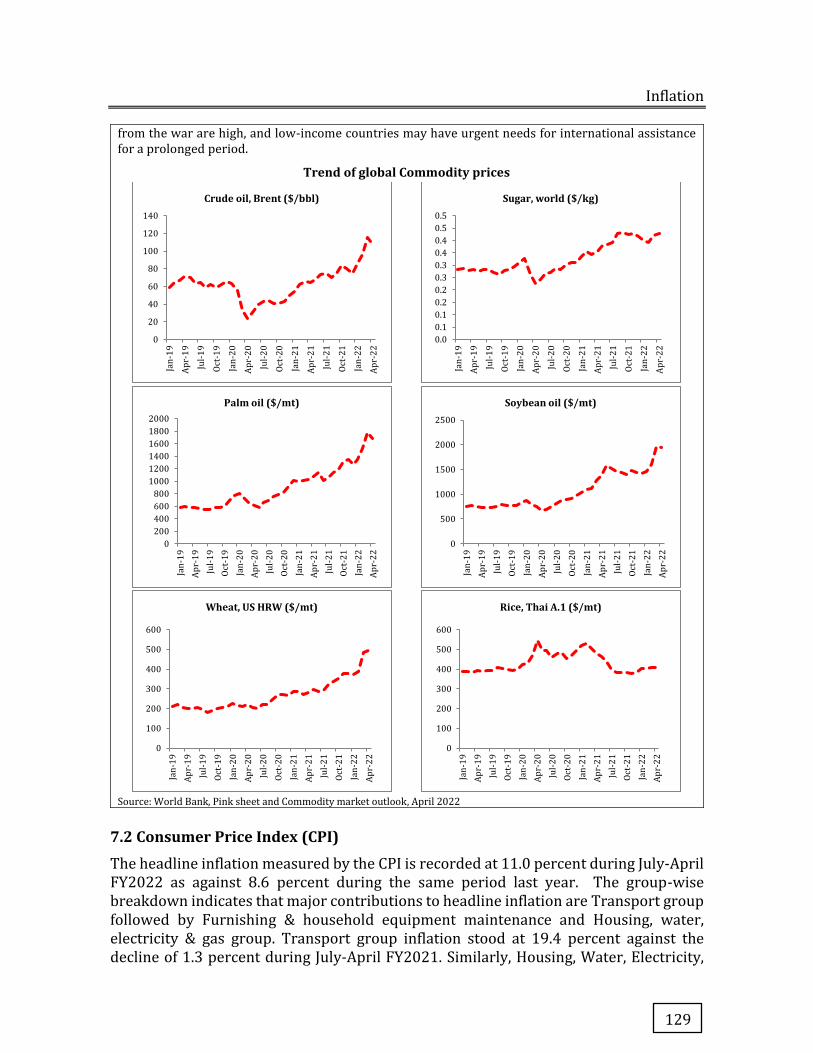
Inflation
129
from the war are high, and low-income countries may have urgent needs for international assistance for a prolonged period.
Trend of global Commodity prices
Source: World Bank, Pink sheet and Commodity market outlook, April 2022
7.2 Consumer Price Index (CPI)
The headline inflation measured by the CPI is recorded at 11.0 percent during July-April FY2022 as against 8.6 percent during the same period last year. The group-wise breakdown indicates that major contributions to headline inflation are Transport group followed by Furnishing & household equipment maintenance and Housing, water, electricity & gas group. Transport group inflation stood at 19.4 percent against the decline of 1.3 percent during July-April FY2021. Similarly, Housing, Water, Electricity,
0
20
40
60
80
100
120
140
Jan
-19
Ap
r-1
9
Jul-
19
Oct
-19
Jan
-20
Ap
r-2
0
Jul-
20
Oct
-20
Jan
-21
Ap
r-2
1
Jul-
21
Oct
-21
Jan
-22
Ap
r-2
2
Crude oil, Brent ($/bbl)
0.0
0.1
0.1
0.2
0.2
0.3
0.3
0.4
0.4
0.5
0.5
Jan
-19
Ap
r-1
9
Jul-
19
Oct
-19
Jan
-20
Ap
r-2
0
Jul-
20
Oct
-20
Jan
-21
Ap
r-2
1
Jul-
21
Oct
-21
Jan
-22
Ap
r-2
2
Sugar, world ($/kg)
0
200
400
600
800
1000
1200
1400
1600
1800
2000
Jan
-19
Ap
r-1
9
Jul-
19
Oct
-19
Jan
-20
Ap
r-2
0
Jul-
20
Oct
-20
Jan
-21
Ap
r-2
1
Jul-
21
Oct
-21
Jan
-22
Ap
r-2
2
Palm oil ($/mt)
0
500
1000
1500
2000
2500
Jan
-19
Ap
r-1
9
Jul-
19
Oct
-19
Jan
-20
Ap
r-2
0
Jul-
20
Oct
-20
Jan
-21
Ap
r-2
1
Jul-
21
Oct
-21
Jan
-22
Ap
r-2
2
Soybean oil ($/mt)
0
100
200
300
400
500
600
Jan
-19
Ap
r-1
9
Jul-
19
Oct
-19
Jan
-20
Ap
r-2
0
Jul-
20
Oct
-20
Jan
-21
Ap
r-2
1
Jul-
21
Oct
-21
Jan
-22
Ap
r-2
2
Wheat, US HRW ($/mt)
0
100
200
300
400
500
600
Jan
-19
Ap
r-1
9
Jul-
19
Oct
-19
Jan
-20
Ap
r-2
0
Jul-
20
Oct
-20
Jan
-21
Ap
r-2
1
Jul-
21
Oct
-21
Jan
-22
Ap
r-2
2
Rice, Thai A.1 ($/mt)
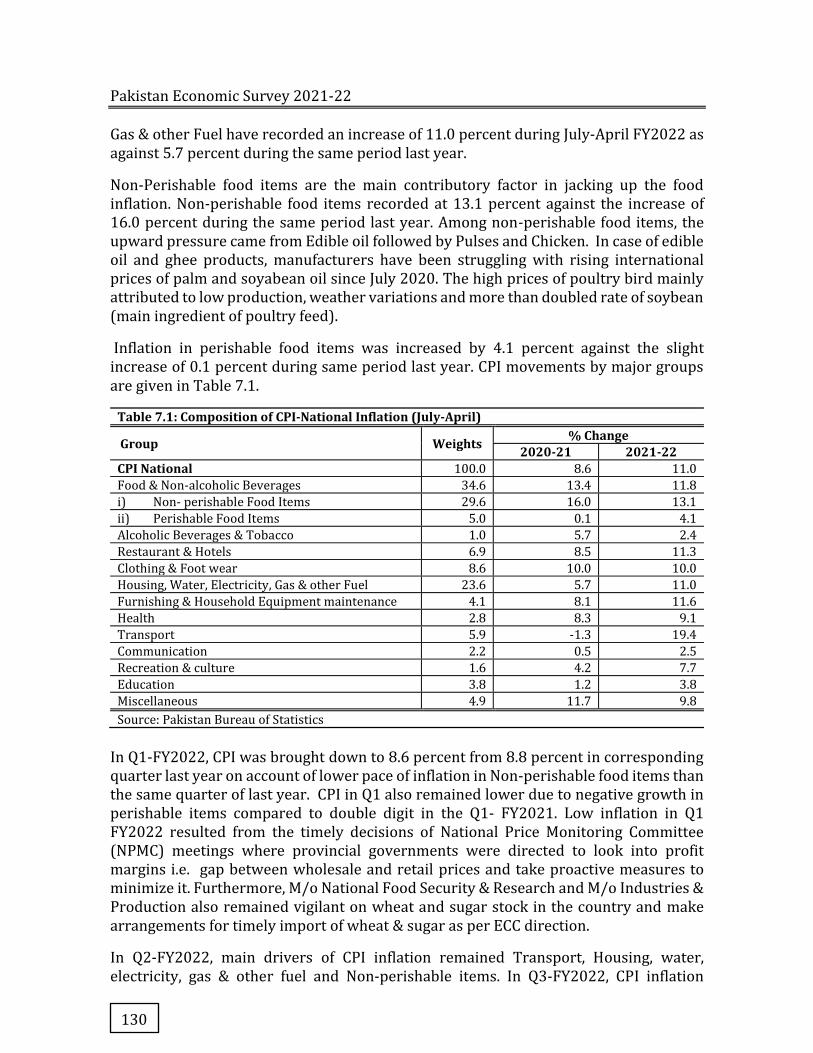
Pakistan Economic Survey 2021-22Pakistan Economic Survey 2021-22
130
Gas & other Fuel have recorded an increase of 11.0 percent during July-April FY2022 as against 5.7 percent during the same period last year.
Non-Perishable food items are the main contributory factor in jacking up the food inflation. Non-perishable food items recorded at 13.1 percent against the increase of 16.0 percent during the same period last year. Among non-perishable food items, the upward pressure came from Edible oil followed by Pulses and Chicken. In case of edible oil and ghee products, manufacturers have been struggling with rising international prices of palm and soyabean oil since July 2020. The high prices of poultry bird mainly attributed to low production, weather variations and more than doubled rate of soybean (main ingredient of poultry feed).
Inflation in perishable food items was increased by 4.1 percent against the slight increase of 0.1 percent during same period last year. CPI movements by major groups are given in Table 7.1.
Table 7.1: Composition of CPI-National Inflation (July-April)
Group Weights % Change 2020-21 2021-22
CPI National 100.0 8.6 11.0
Food & Non-alcoholic Beverages 34.6 13.4 11.8
i) Non- perishable Food Items 29.6 16.0 13.1
ii) Perishable Food Items 5.0 0.1 4.1
Alcoholic Beverages & Tobacco 1.0 5.7 2.4
Restaurant & Hotels 6.9 8.5 11.3
Clothing & Foot wear 8.6 10.0 10.0
Housing, Water, Electricity, Gas & other Fuel 23.6 5.7 11.0
Furnishing & Household Equipment maintenance 4.1 8.1 11.6
Health 2.8 8.3 9.1
Transport 5.9 -1.3 19.4
Communication 2.2 0.5 2.5
Recreation & culture 1.6 4.2 7.7
Education 3.8 1.2 3.8
Miscellaneous 4.9 11.7 9.8
Source: Pakistan Bureau of Statistics
In Q1-FY2022, CPI was brought down to 8.6 percent from 8.8 percent in corresponding quarter last year on account of lower pace of inflation in Non-perishable food items than the same quarter of last year. CPI in Q1 also remained lower due to negative growth in perishable items compared to double digit in the Q1- FY2021. Low inflation in Q1 FY2022 resulted from the timely decisions of National Price Monitoring Committee (NPMC) meetings where provincial governments were directed to look into profit margins i.e. gap between wholesale and retail prices and take proactive measures to minimize it. Furthermore, M/o National Food Security & Research and M/o Industries & Production also remained vigilant on wheat and sugar stock in the country and make arrangements for timely import of wheat & sugar as per ECC direction.
In Q2-FY2022, main drivers of CPI inflation remained Transport, Housing, water, electricity, gas & other fuel and Non-perishable items. In Q3-FY2022, CPI inflation
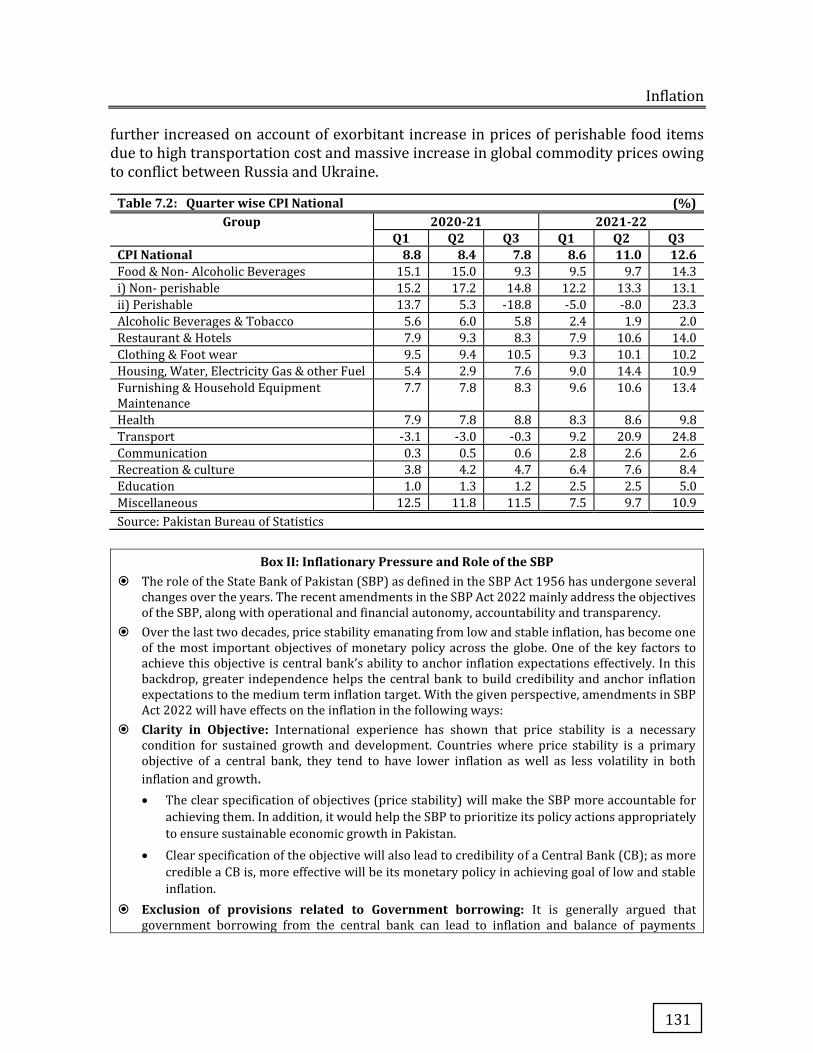
Inflation
131
further increased on account of exorbitant increase in prices of perishable food items due to high transportation cost and massive increase in global commodity prices owing to conflict between Russia and Ukraine.
Table 7.2: Quarter wise CPI National (%) Group 2020-21 2021-22
Q1 Q2 Q3 Q1 Q2 Q3 CPI National 8.8 8.4 7.8 8.6 11.0 12.6 Food & Non- Alcoholic Beverages 15.1 15.0 9.3 9.5 9.7 14.3
i) Non- perishable 15.2 17.2 14.8 12.2 13.3 13.1
ii) Perishable 13.7 5.3 -18.8 -5.0 -8.0 23.3
Alcoholic Beverages & Tobacco 5.6 6.0 5.8 2.4 1.9 2.0
Restaurant & Hotels 7.9 9.3 8.3 7.9 10.6 14.0
Clothing & Foot wear 9.5 9.4 10.5 9.3 10.1 10.2
Housing, Water, Electricity Gas & other Fuel 5.4 2.9 7.6 9.0 14.4 10.9
Furnishing & Household Equipment Maintenance
7.7 7.8 8.3 9.6 10.6 13.4
Health 7.9 7.8 8.8 8.3 8.6 9.8
Transport -3.1 -3.0 -0.3 9.2 20.9 24.8
Communication 0.3 0.5 0.6 2.8 2.6 2.6
Recreation & culture 3.8 4.2 4.7 6.4 7.6 8.4
Education 1.0 1.3 1.2 2.5 2.5 5.0
Miscellaneous 12.5 11.8 11.5 7.5 9.7 10.9
Source: Pakistan Bureau of Statistics
Box II: Inflationary Pressure and Role of the SBP � The role of the State Bank of Pakistan (SBP) as defined in the SBP Act 1956 has undergone several
changes over the years. The recent amendments in the SBP Act 2022 mainly address the objectives of the SBP, along with operational and financial autonomy, accountability and transparency.
� Over the last two decades, price stability emanating from low and stable inflation, has become one of the most important objectives of monetary policy across the globe. One of the key factors to achieve this objective is central bank’s ability to anchor inflation expectations effectively. In this backdrop, greater independence helps the central bank to build credibility and anchor inflation expectations to the medium term inflation target. With the given perspective, amendments in SBP Act 2022 will have effects on the inflation in the following ways:
� Clarity in Objective: International experience has shown that price stability is a necessary condition for sustained growth and development. Countries where price stability is a primary objective of a central bank, they tend to have lower inflation as well as less volatility in both
inflation and growth.
� The clear specification of objectives (price stability) will make the SBP more accountable for
achieving them. In addition, it would help the SBP to prioritize its policy actions appropriately
to ensure sustainable economic growth in Pakistan.
� Clear specification of the objective will also lead to credibility of a Central Bank (CB); as more
credible a CB is, more effective will be its monetary policy in achieving goal of low and stable
inflation.
� Exclusion of provisions related to Government borrowing: It is generally argued that government borrowing from the central bank can lead to inflation and balance of payments
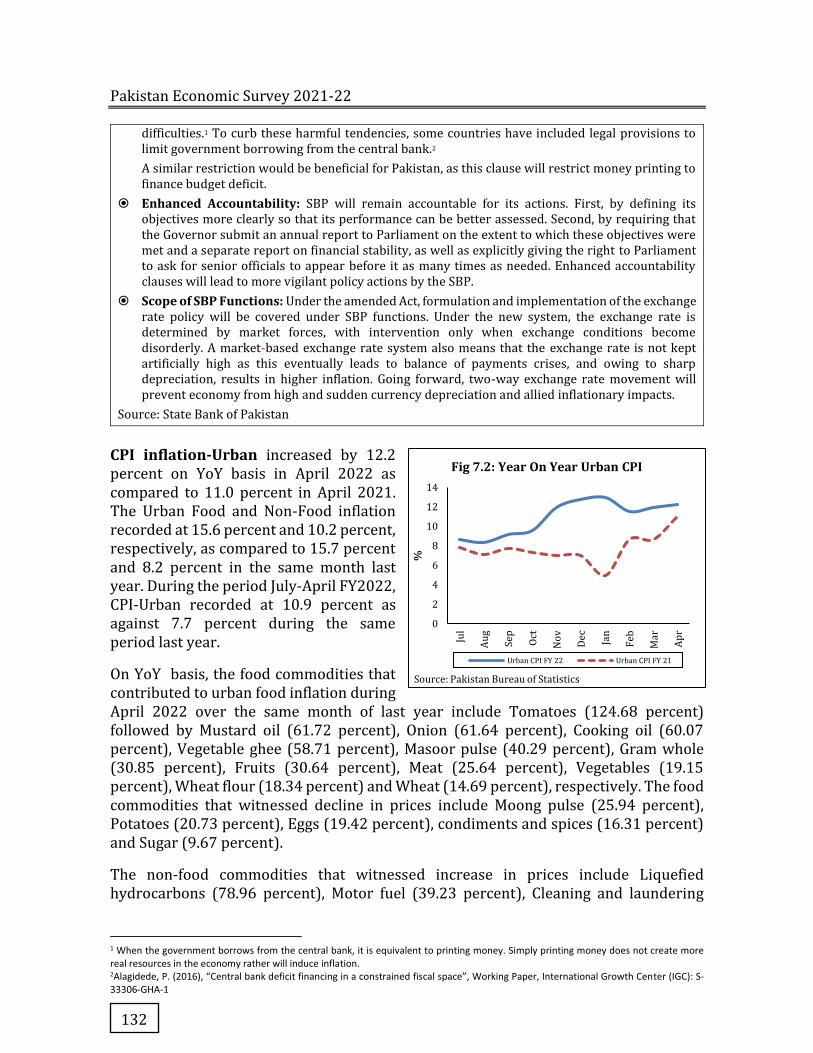
Pakistan Economic Survey 2021-22Pakistan Economic Survey 2021-22
132
difficulties.1 To curb these harmful tendencies, some countries have included legal provisions to limit government borrowing from the central bank.2
A similar restriction would be beneficial for Pakistan, as this clause will restrict money printing to finance budget deficit.
� Enhanced Accountability: SBP will remain accountable for its actions. First, by defining its objectives more clearly so that its performance can be better assessed. Second, by requiring that the Governor submit an annual report to Parliament on the extent to which these objectives were met and a separate report on financial stability, as well as explicitly giving the right to Parliament to ask for senior officials to appear before it as many times as needed. Enhanced accountability clauses will lead to more vigilant policy actions by the SBP.
� Scope of SBP Functions: Under the amended Act, formulation and implementation of the exchange rate policy will be covered under SBP functions. Under the new system, the exchange rate is determined by market forces, with intervention only when exchange conditions become disorderly. A market-based exchange rate system also means that the exchange rate is not kept artificially high as this eventually leads to balance of payments crises, and owing to sharp depreciation, results in higher inflation. Going forward, two-way exchange rate movement will prevent economy from high and sudden currency depreciation and allied inflationary impacts.
Source: State Bank of Pakistan
CPI inflation-Urban increased by 12.2 percent on YoY basis in April 2022 as compared to 11.0 percent in April 2021. The Urban Food and Non-Food inflation recorded at 15.6 percent and 10.2 percent, respectively, as compared to 15.7 percent and 8.2 percent in the same month last year. During the period July-April FY2022, CPI-Urban recorded at 10.9 percent as against 7.7 percent during the same period last year.
On YoY basis, the food commodities that contributed to urban food inflation during April 2022 over the same month of last year include Tomatoes (124.68 percent) followed by Mustard oil (61.72 percent), Onion (61.64 percent), Cooking oil (60.07 percent), Vegetable ghee (58.71 percent), Masoor pulse (40.29 percent), Gram whole (30.85 percent), Fruits (30.64 percent), Meat (25.64 percent), Vegetables (19.15 percent), Wheat flour (18.34 percent) and Wheat (14.69 percent), respectively. The food commodities that witnessed decline in prices include Moong pulse (25.94 percent), Potatoes (20.73 percent), Eggs (19.42 percent), condiments and spices (16.31 percent) and Sugar (9.67 percent).
The non-food commodities that witnessed increase in prices include Liquefied hydrocarbons (78.96 percent), Motor fuel (39.23 percent), Cleaning and laundering
1 When the government borrows from the central bank, it is equivalent to printing money. Simply printing money does not create more real resources in the economy rather will induce inflation. 2Alagidede, P. (2016), “Central bank deficit financing in a constrained fiscal space”, Working Paper, International Growth Center (IGC): S-33306-GHA-1
0
2
4
6
8
10
12
14
Jul
Au
g
Se
p
Oct
No
v
De
c
Jan
Feb
Ma
r
Ap
r
%
Source: Pakistan Bureau of Statistics
Fig 7.2: Year On Year Urban CPI
Urban CPI FY 22 Urban CPI FY 21
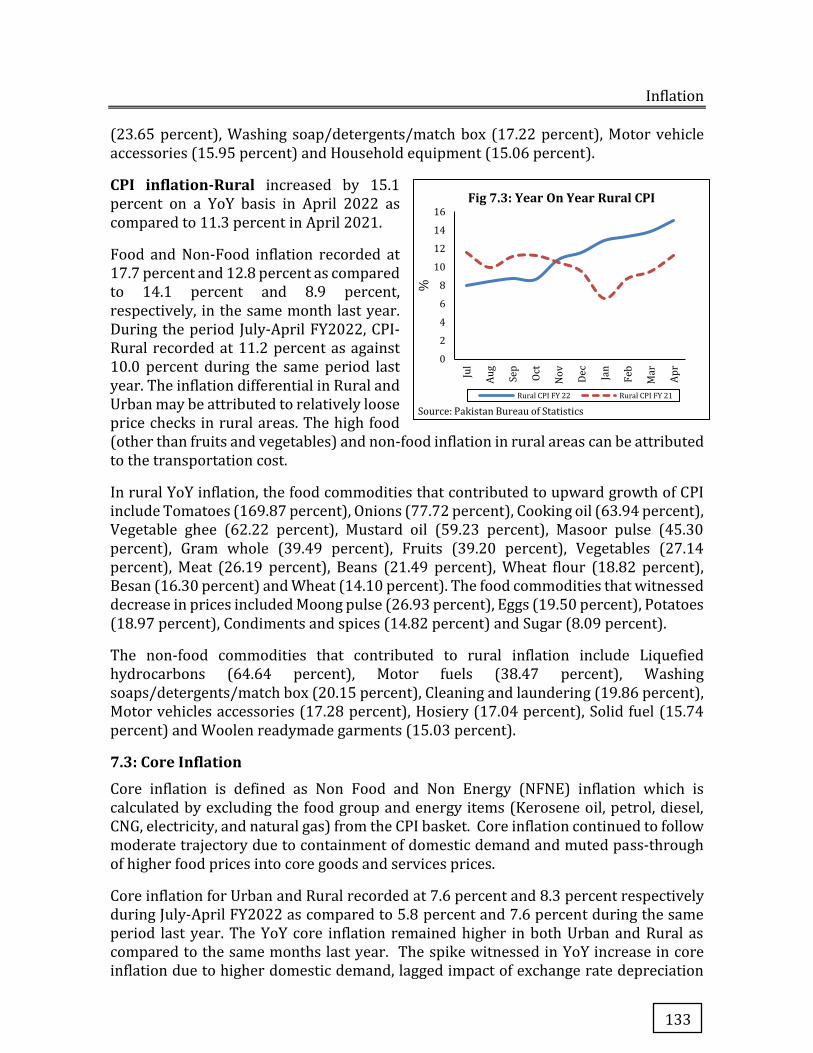
Inflation
133
(23.65 percent), Washing soap/detergents/match box (17.22 percent), Motor vehicle accessories (15.95 percent) and Household equipment (15.06 percent).
CPI inflation-Rural increased by 15.1 percent on a YoY basis in April 2022 as compared to 11.3 percent in April 2021.
Food and Non-Food inflation recorded at 17.7 percent and 12.8 percent as compared to 14.1 percent and 8.9 percent, respectively, in the same month last year. During the period July-April FY2022, CPI-Rural recorded at 11.2 percent as against 10.0 percent during the same period last year. The inflation differential in Rural and Urban may be attributed to relatively loose price checks in rural areas. The high food (other than fruits and vegetables) and non-food inflation in rural areas can be attributed to the transportation cost.
In rural YoY inflation, the food commodities that contributed to upward growth of CPI include Tomatoes (169.87 percent), Onions (77.72 percent), Cooking oil (63.94 percent), Vegetable ghee (62.22 percent), Mustard oil (59.23 percent), Masoor pulse (45.30 percent), Gram whole (39.49 percent), Fruits (39.20 percent), Vegetables (27.14 percent), Meat (26.19 percent), Beans (21.49 percent), Wheat flour (18.82 percent), Besan (16.30 percent) and Wheat (14.10 percent). The food commodities that witnessed decrease in prices included Moong pulse (26.93 percent), Eggs (19.50 percent), Potatoes (18.97 percent), Condiments and spices (14.82 percent) and Sugar (8.09 percent).
The non-food commodities that contributed to rural inflation include Liquefied hydrocarbons (64.64 percent), Motor fuels (38.47 percent), Washing soaps/detergents/match box (20.15 percent), Cleaning and laundering (19.86 percent), Motor vehicles accessories (17.28 percent), Hosiery (17.04 percent), Solid fuel (15.74 percent) and Woolen readymade garments (15.03 percent).
7.3: Core Inflation
Core inflation is defined as Non Food and Non Energy (NFNE) inflation which is calculated by excluding the food group and energy items (Kerosene oil, petrol, diesel, CNG, electricity, and natural gas) from the CPI basket. Core inflation continued to follow moderate trajectory due to containment of domestic demand and muted pass-through of higher food prices into core goods and services prices.
Core inflation for Urban and Rural recorded at 7.6 percent and 8.3 percent respectively during July-April FY2022 as compared to 5.8 percent and 7.6 percent during the same period last year. The YoY core inflation remained higher in both Urban and Rural as compared to the same months last year. The spike witnessed in YoY increase in core inflation due to higher domestic demand, lagged impact of exchange rate depreciation
0
2
4
6
8
10
12
14
16
Jul
Au
g
Se
p
Oct
No
v
De
c
Jan
Feb
Ma
r
Ap
r
%Source: Pakistan Bureau of Statistics
Fig 7.3: Year On Year Rural CPI
Rural CPI FY 22 Rural CPI FY 21
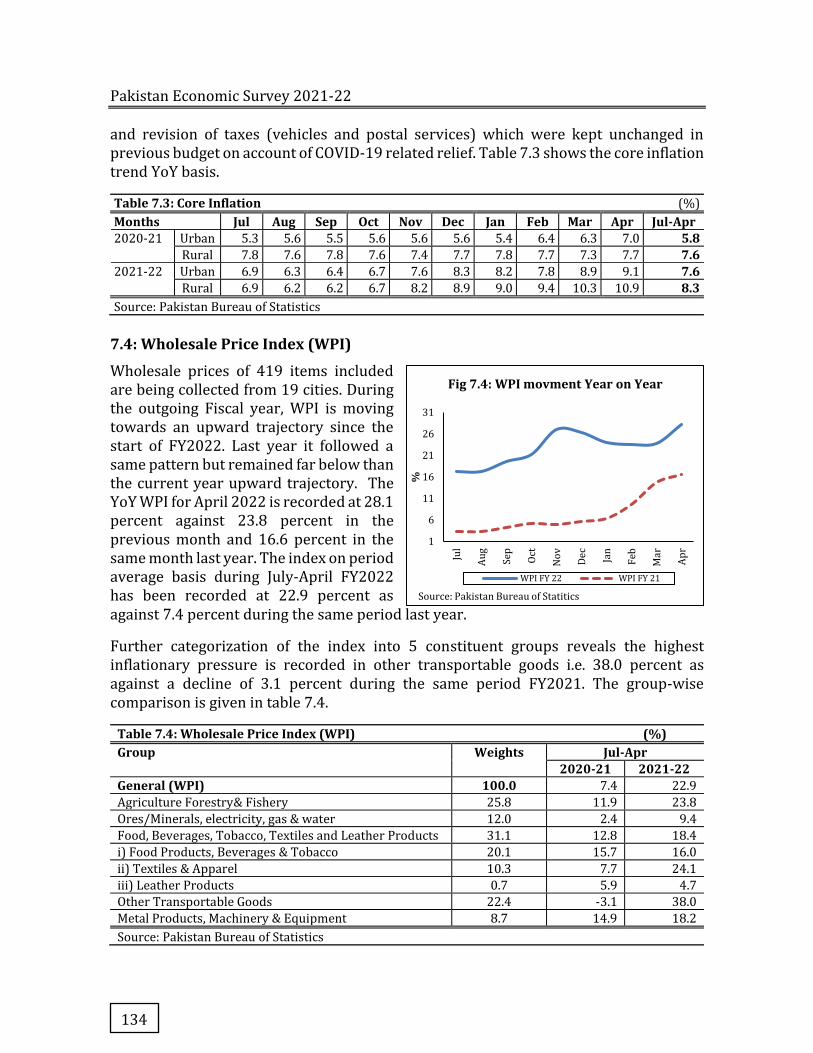
Pakistan Economic Survey 2021-22Pakistan Economic Survey 2021-22
134
and revision of taxes (vehicles and postal services) which were kept unchanged in previous budget on account of COVID-19 related relief. Table 7.3 shows the core inflation trend YoY basis.
Table 7.3: Core Inflation (%) Months Jul Aug Sep Oct Nov Dec Jan Feb Mar Apr Jul-Apr 2020-21 Urban 5.3 5.6 5.5 5.6 5.6 5.6 5.4 6.4 6.3 7.0 5.8
Rural 7.8 7.6 7.8 7.6 7.4 7.7 7.8 7.7 7.3 7.7 7.6 2021-22 Urban 6.9 6.3 6.4 6.7 7.6 8.3 8.2 7.8 8.9 9.1 7.6
Rural 6.9 6.2 6.2 6.7 8.2 8.9 9.0 9.4 10.3 10.9 8.3 Source: Pakistan Bureau of Statistics
7.4: Wholesale Price Index (WPI)
Wholesale prices of 419 items included are being collected from 19 cities. During the outgoing Fiscal year, WPI is moving towards an upward trajectory since the start of FY2022. Last year it followed a same pattern but remained far below than the current year upward trajectory. The YoY WPI for April 2022 is recorded at 28.1 percent against 23.8 percent in the previous month and 16.6 percent in the same month last year. The index on period average basis during July-April FY2022 has been recorded at 22.9 percent as against 7.4 percent during the same period last year.
Further categorization of the index into 5 constituent groups reveals the highest inflationary pressure is recorded in other transportable goods i.e. 38.0 percent as against a decline of 3.1 percent during the same period FY2021. The group-wise comparison is given in table 7.4.
Table 7.4: Wholesale Price Index (WPI) (%) Group Weights Jul-Apr
2020-21 2021-22 General (WPI) 100.0 7.4 22.9
Agriculture Forestry& Fishery 25.8 11.9 23.8
Ores/Minerals, electricity, gas & water 12.0 2.4 9.4
Food, Beverages, Tobacco, Textiles and Leather Products 31.1 12.8 18.4
i) Food Products, Beverages & Tobacco 20.1 15.7 16.0
ii) Textiles & Apparel 10.3 7.7 24.1
iii) Leather Products 0.7 5.9 4.7
Other Transportable Goods 22.4 -3.1 38.0
Metal Products, Machinery & Equipment 8.7 14.9 18.2
Source: Pakistan Bureau of Statistics
1
6
11
16
21
26
31
Jul
Au
g
Se
p
Oct
No
v
De
c
Jan
Feb
Ma
r
Ap
r
%
Source: Pakistan Bureau of Statitics
Fig 7.4: WPI movment Year on Year
WPI FY 22 WPI FY 21
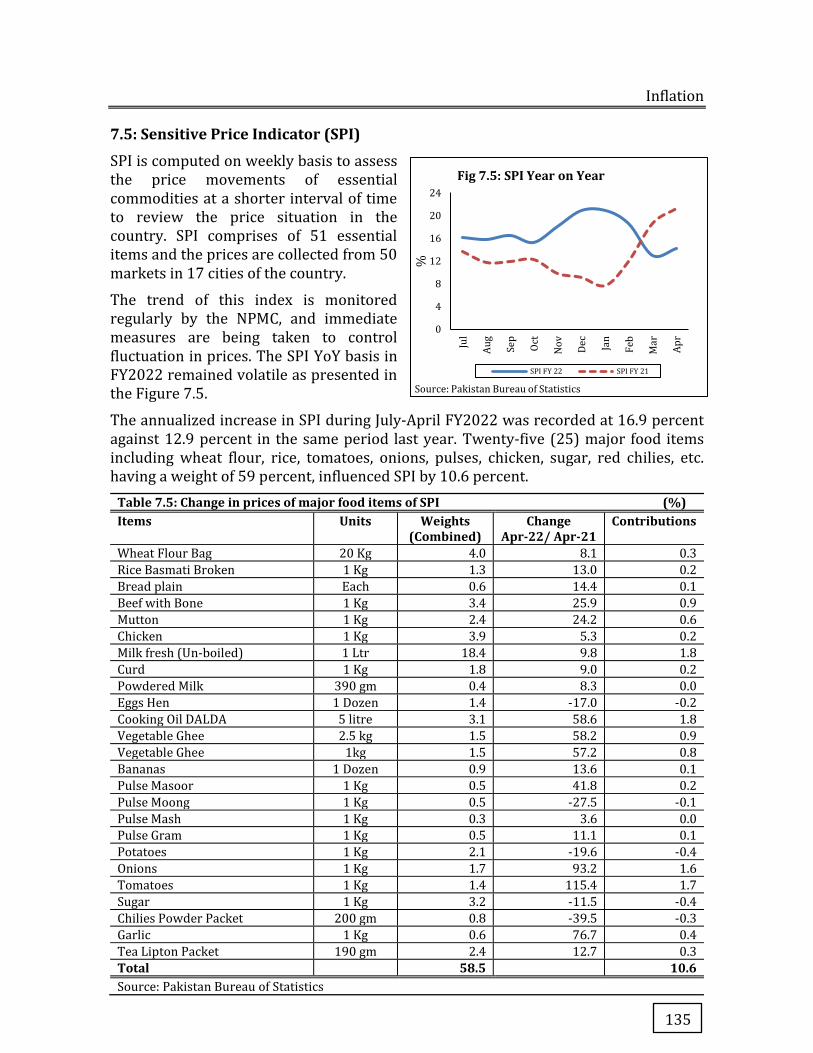
Inflation
135
7.5: Sensitive Price Indicator (SPI)
SPI is computed on weekly basis to assess the price movements of essential commodities at a shorter interval of time to review the price situation in the country. SPI comprises of 51 essential items and the prices are collected from 50 markets in 17 cities of the country.
The trend of this index is monitored regularly by the NPMC, and immediate measures are being taken to control fluctuation in prices. The SPI YoY basis in FY2022 remained volatile as presented in the Figure 7.5.
The annualized increase in SPI during July-April FY2022 was recorded at 16.9 percent against 12.9 percent in the same period last year. Twenty-five (25) major food items including wheat flour, rice, tomatoes, onions, pulses, chicken, sugar, red chilies, etc. having a weight of 59 percent, influenced SPI by 10.6 percent.
Table 7.5: Change in prices of major food items of SPI (%) Items Units Weights
(Combined) Change
Apr-22/ Apr-21 Contributions
Wheat Flour Bag 20 Kg 4.0 8.1 0.3
Rice Basmati Broken 1 Kg 1.3 13.0 0.2
Bread plain Each 0.6 14.4 0.1
Beef with Bone 1 Kg 3.4 25.9 0.9
Mutton 1 Kg 2.4 24.2 0.6
Chicken 1 Kg 3.9 5.3 0.2
Milk fresh (Un-boiled) 1 Ltr 18.4 9.8 1.8
Curd 1 Kg 1.8 9.0 0.2
Powdered Milk 390 gm 0.4 8.3 0.0
Eggs Hen 1 Dozen 1.4 -17.0 -0.2
Cooking Oil DALDA 5 litre 3.1 58.6 1.8
Vegetable Ghee 2.5 kg 1.5 58.2 0.9
Vegetable Ghee 1kg 1.5 57.2 0.8
Bananas 1 Dozen 0.9 13.6 0.1
Pulse Masoor 1 Kg 0.5 41.8 0.2
Pulse Moong 1 Kg 0.5 -27.5 -0.1
Pulse Mash 1 Kg 0.3 3.6 0.0
Pulse Gram 1 Kg 0.5 11.1 0.1
Potatoes 1 Kg 2.1 -19.6 -0.4
Onions 1 Kg 1.7 93.2 1.6
Tomatoes 1 Kg 1.4 115.4 1.7
Sugar 1 Kg 3.2 -11.5 -0.4
Chilies Powder Packet 200 gm 0.8 -39.5 -0.3
Garlic 1 Kg 0.6 76.7 0.4
Tea Lipton Packet 190 gm 2.4 12.7 0.3
Total
58.5 10.6 Source: Pakistan Bureau of Statistics
0
4
8
12
16
20
24
Jul
Au
g
Se
p
Oct
No
v
De
c
Jan
Feb
Ma
r
Ap
r
%
Source: Pakistan Bureau of Statistics
Fig 7.5: SPI Year on Year
SPI FY 22 SPI FY 21
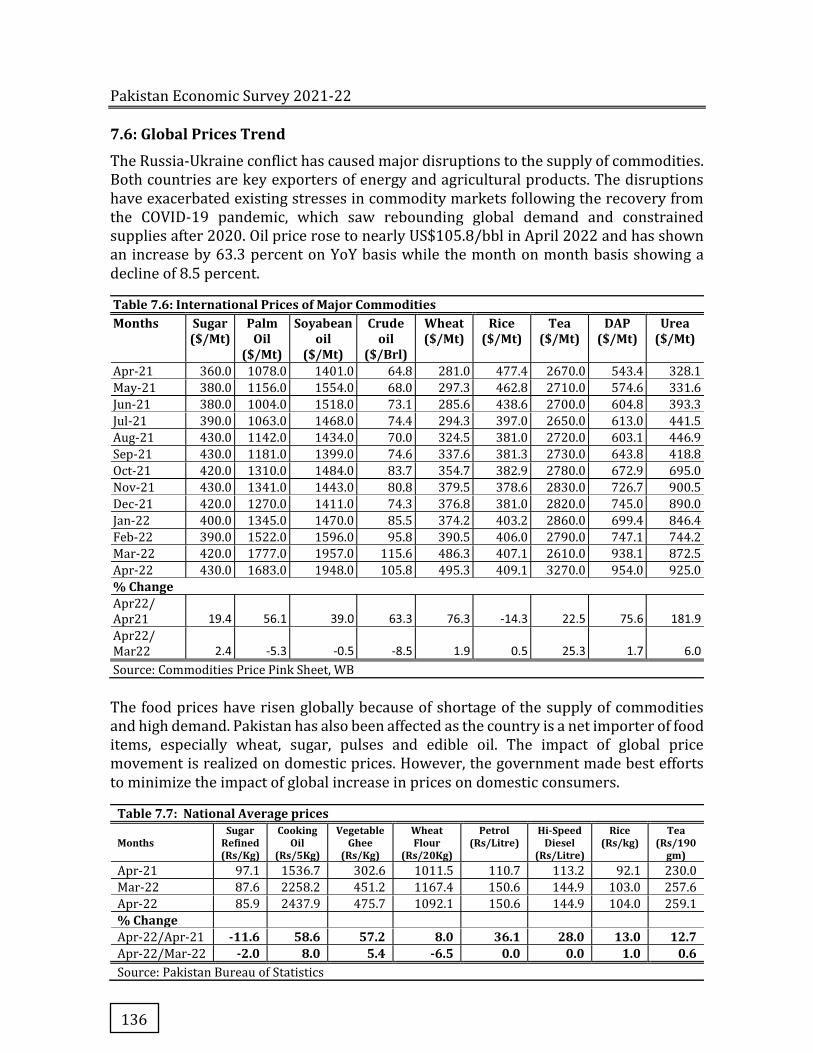
Pakistan Economic Survey 2021-22Pakistan Economic Survey 2021-22
136
7.6: Global Prices Trend
The Russia-Ukraine conflict has caused major disruptions to the supply of commodities. Both countries are key exporters of energy and agricultural products. The disruptions have exacerbated existing stresses in commodity markets following the recovery from the COVID-19 pandemic, which saw rebounding global demand and constrained supplies after 2020. Oil price rose to nearly US$105.8/bbl in April 2022 and has shown an increase by 63.3 percent on YoY basis while the month on month basis showing a decline of 8.5 percent.
Table 7.6: International Prices of Major Commodities Months Sugar
($/Mt) Palm
Oil ($/Mt)
Soyabean oil
($/Mt)
Crude oil
($/Brl)
Wheat ($/Mt)
Rice ($/Mt)
Tea ($/Mt)
DAP ($/Mt)
Urea ($/Mt)
Apr-21 360.0 1078.0 1401.0 64.8 281.0 477.4 2670.0 543.4 328.1
May-21 380.0 1156.0 1554.0 68.0 297.3 462.8 2710.0 574.6 331.6
Jun-21 380.0 1004.0 1518.0 73.1 285.6 438.6 2700.0 604.8 393.3
Jul-21 390.0 1063.0 1468.0 74.4 294.3 397.0 2650.0 613.0 441.5
Aug-21 430.0 1142.0 1434.0 70.0 324.5 381.0 2720.0 603.1 446.9
Sep-21 430.0 1181.0 1399.0 74.6 337.6 381.3 2730.0 643.8 418.8
Oct-21 420.0 1310.0 1484.0 83.7 354.7 382.9 2780.0 672.9 695.0
Nov-21 430.0 1341.0 1443.0 80.8 379.5 378.6 2830.0 726.7 900.5
Dec-21 420.0 1270.0 1411.0 74.3 376.8 381.0 2820.0 745.0 890.0
Jan-22 400.0 1345.0 1470.0 85.5 374.2 403.2 2860.0 699.4 846.4
Feb-22 390.0 1522.0 1596.0 95.8 390.5 406.0 2790.0 747.1 744.2
Mar-22 420.0 1777.0 1957.0 115.6 486.3 407.1 2610.0 938.1 872.5
Apr-22 430.0 1683.0 1948.0 105.8 495.3 409.1 3270.0 954.0 925.0
% Change Apr22/ Apr21 19.4 56.1 39.0 63.3 76.3 -14.3 22.5 75.6 181.9 Apr22/ Mar22 2.4 -5.3 -0.5 -8.5 1.9 0.5 25.3 1.7 6.0 Source: Commodities Price Pink Sheet, WB The food prices have risen globally because of shortage of the supply of commodities and high demand. Pakistan has also been affected as the country is a net importer of food items, especially wheat, sugar, pulses and edible oil. The impact of global price movement is realized on domestic prices. However, the government made best efforts to minimize the impact of global increase in prices on domestic consumers.
Table 7.7: National Average prices
Months Sugar
Refined (Rs/Kg)
Cooking Oil
(Rs/5Kg)
Vegetable Ghee
(Rs/Kg)
Wheat Flour
(Rs/20Kg)
Petrol (Rs/Litre)
Hi-Speed Diesel
(Rs/Litre)
Rice (Rs/kg)
Tea (Rs/190
gm) Apr-21 97.1 1536.7 302.6 1011.5 110.7 113.2 92.1 230.0
Mar-22 87.6 2258.2 451.2 1167.4 150.6 144.9 103.0 257.6
Apr-22 85.9 2437.9 475.7 1092.1 150.6 144.9 104.0 259.1
% Change Apr-22/Apr-21 -11.6 58.6 57.2 8.0 36.1 28.0 13.0 12.7 Apr-22/Mar-22 -2.0 8.0 5.4 -6.5 0.0 0.0 1.0 0.6 Source: Pakistan Bureau of Statistics
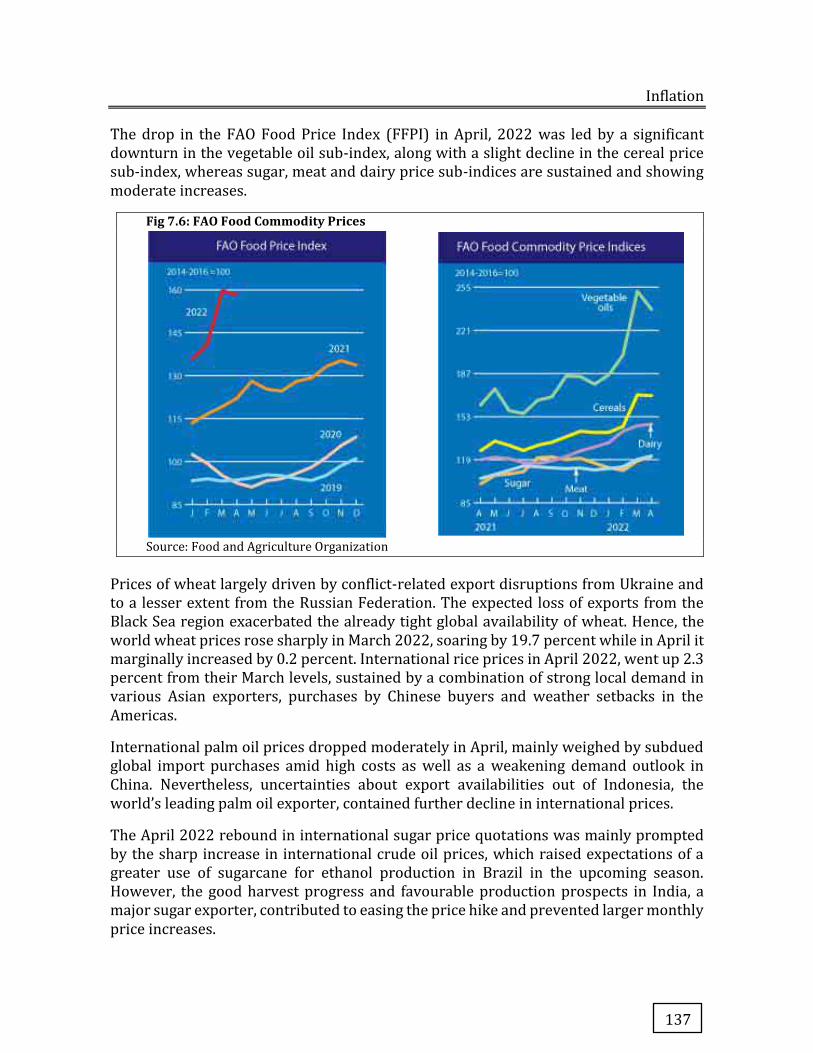
Inflation
137
The drop in the FAO Food Price Index (FFPI) in April, 2022 was led by a significant downturn in the vegetable oil sub-index, along with a slight decline in the cereal price sub-index, whereas sugar, meat and dairy price sub-indices are sustained and showing moderate increases.
Fig 7.6: FAO Food Commodity Prices
Source: Food and Agriculture Organization
Prices of wheat largely driven by conflict-related export disruptions from Ukraine and to a lesser extent from the Russian Federation. The expected loss of exports from the Black Sea region exacerbated the already tight global availability of wheat. Hence, the world wheat prices rose sharply in March 2022, soaring by 19.7 percent while in April it marginally increased by 0.2 percent. International rice prices in April 2022, went up 2.3 percent from their March levels, sustained by a combination of strong local demand in various Asian exporters, purchases by Chinese buyers and weather setbacks in the Americas.
International palm oil prices dropped moderately in April, mainly weighed by subdued global import purchases amid high costs as well as a weakening demand outlook in China. Nevertheless, uncertainties about export availabilities out of Indonesia, the world’s leading palm oil exporter, contained further decline in international prices.
The April 2022 rebound in international sugar price quotations was mainly prompted by the sharp increase in international crude oil prices, which raised expectations of a greater use of sugarcane for ethanol production in Brazil in the upcoming season. However, the good harvest progress and favourable production prospects in India, a major sugar exporter, contributed to easing the price hike and prevented larger monthly price increases.
Pakistan Economic Survey 2021-22Pakistan Economic Survey 2021-22
138
7.8: Way Forward
The rising input costs on the back of high utility prices and the lagged impact of exchange rate depreciation likely to maintain upward pressure on inflation in the following month of outgoing fiscal year. There is significant uncertainty around the outlook for international commodity prices as well which had been exacerbated by the Russia-Ukraine conflict. The impact will be more visible in non-food prices, while the food prices are likely to remain stable due to effective monitoring of prices and smooth supply of essential items by the federal and provincial governments. As a result of these developments, average inflation forecasts have been revised upwards and will remain 11.5-12.0 percent in FY2022.
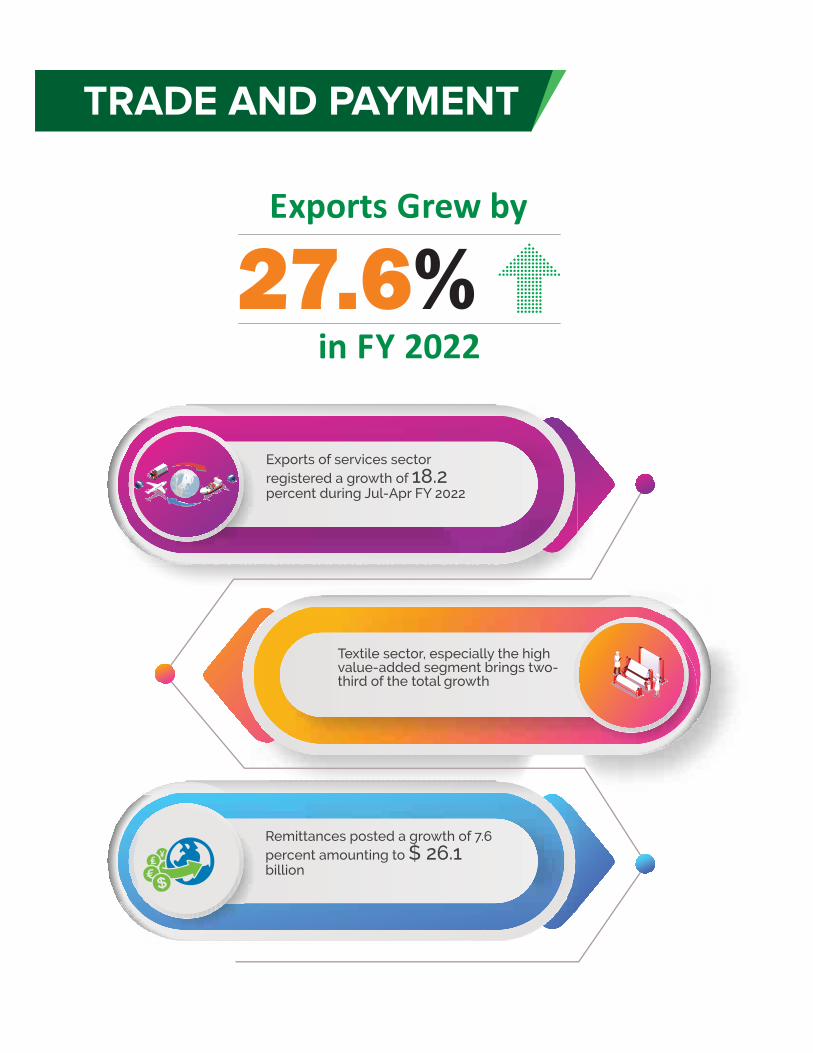

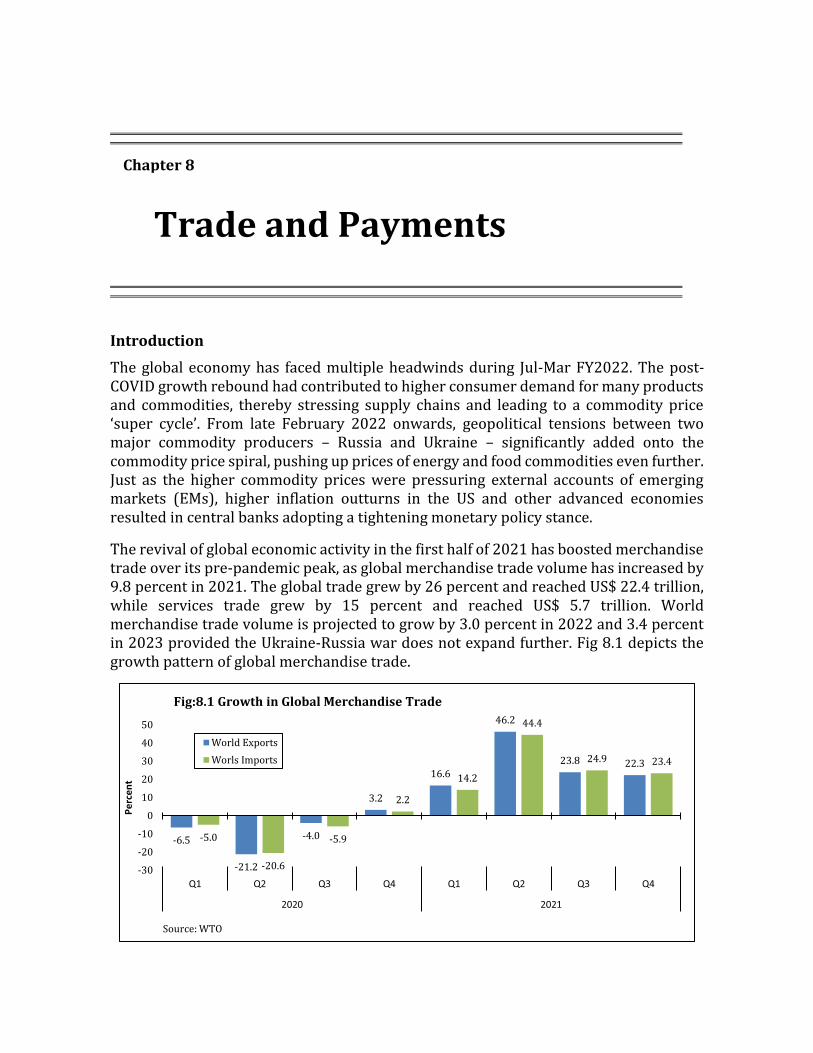
Introduction
The global economy has faced multiple headwinds during Jul-Mar FY2022. The post-COVID growth rebound had contributed to higher consumer demand for many products and commodities, thereby stressing supply chains and leading to a commodity price ‘super cycle’. From late February 2022 onwards, geopolitical tensions between two major commodity producers – Russia and Ukraine – significantly added onto the commodity price spiral, pushing up prices of energy and food commodities even further. Just as the higher commodity prices were pressuring external accounts of emerging markets (EMs), higher inflation outturns in the US and other advanced economies resulted in central banks adopting a tightening monetary policy stance.
The revival of global economic activity in the first half of 2021 has boosted merchandise trade over its pre-pandemic peak, as global merchandise trade volume has increased by 9.8 percent in 2021. The global trade grew by 26 percent and reached US$ 22.4 trillion, while services trade grew by 15 percent and reached US$ 5.7 trillion. World merchandise trade volume is projected to grow by 3.0 percent in 2022 and 3.4 percent in 2023 provided the Ukraine-Russia war does not expand further. Fig 8.1 depicts the growth pattern of global merchandise trade.
-6.5
-21.2
-4.0
3.2
16.6
46.2
23.8 22.3
-5.0
-20.6
-5.9
2.2
14.2
44.4
24.9 23.4
-30
-20
-10
0
10
20
30
40
50
Q1 Q2 Q3 Q4 Q1 Q2 Q3 Q4
2020 2021
Perc
ent
Source: WTO
Fig:8.1 Growth in Global Merchandise Trade
World Exports
Worls Imports
Chapter 8
Trade and Payments
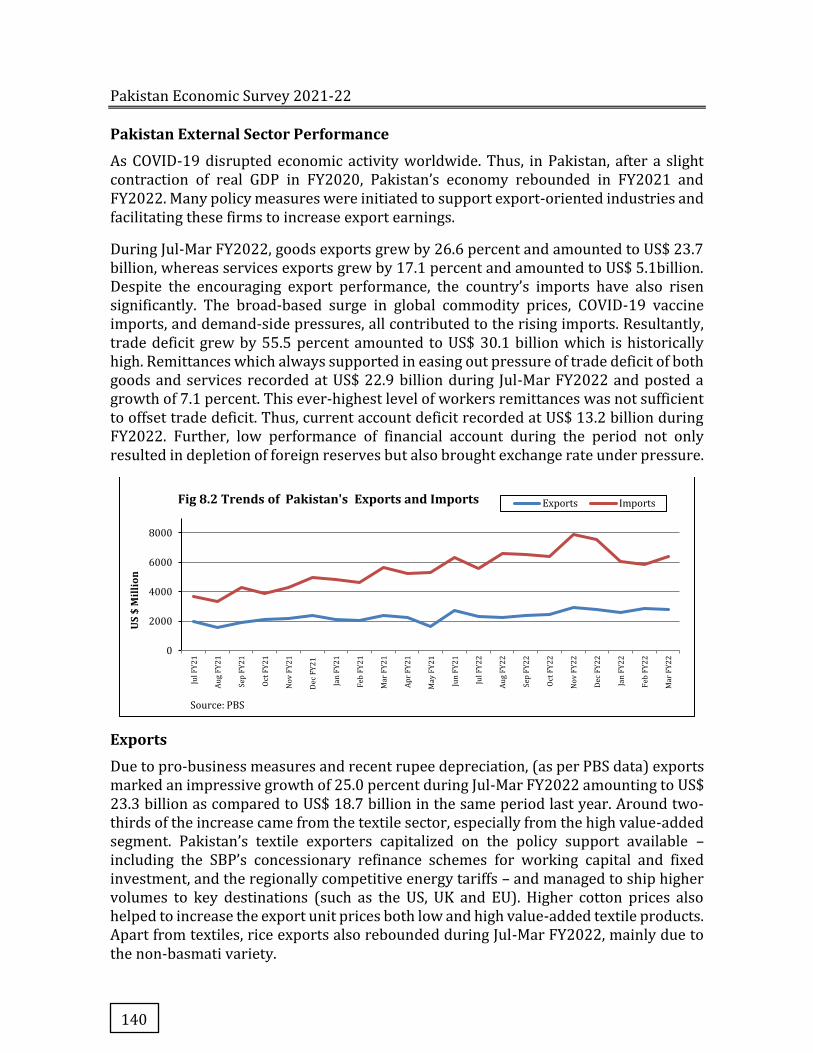
Pakistan Economic Survey 2021-22
140
Pakistan External Sector Performance
As COVID-19 disrupted economic activity worldwide. Thus, in Pakistan, after a slight contraction of real GDP in FY2020, Pakistan’s economy rebounded in FY2021 and FY2022. Many policy measures were initiated to support export-oriented industries and facilitating these firms to increase export earnings.
During Jul-Mar FY2022, goods exports grew by 26.6 percent and amounted to US$ 23.7 billion, whereas services exports grew by 17.1 percent and amounted to US$ 5.1billion. Despite the encouraging export performance, the country’s imports have also risen significantly. The broad-based surge in global commodity prices, COVID-19 vaccine imports, and demand-side pressures, all contributed to the rising imports. Resultantly, trade deficit grew by 55.5 percent amounted to US$ 30.1 billion which is historically high. Remittances which always supported in easing out pressure of trade deficit of both goods and services recorded at US$ 22.9 billion during Jul-Mar FY2022 and posted a growth of 7.1 percent. This ever-highest level of workers remittances was not sufficient to offset trade deficit. Thus, current account deficit recorded at US$ 13.2 billion during FY2022. Further, low performance of financial account during the period not only resulted in depletion of foreign reserves but also brought exchange rate under pressure.
Exports
Due to pro-business measures and recent rupee depreciation, (as per PBS data) exports marked an impressive growth of 25.0 percent during Jul-Mar FY2022 amounting to US$ 23.3 billion as compared to US$ 18.7 billion in the same period last year. Around two-thirds of the increase came from the textile sector, especially from the high value-added segment. Pakistan’s textile exporters capitalized on the policy support available – including the SBP’s concessionary refinance schemes for working capital and fixed investment, and the regionally competitive energy tariffs – and managed to ship higher volumes to key destinations (such as the US, UK and EU). Higher cotton prices also helped to increase the export unit prices both low and high value-added textile products. Apart from textiles, rice exports also rebounded during Jul-Mar FY2022, mainly due to the non-basmati variety.
0
2000
4000
6000
8000
Jul
FY
21
Au
g F
Y2
1
Sep
FY
21
Oct
FY
21
No
v F
Y2
1
Dec
FY
21
Jan
FY
21
Feb
FY
21
Mar
FY
21
Ap
r F
Y2
1
May
FY
21
Jun
FY
21
Jul
FY
22
Au
g F
Y2
2
Sep
FY
22
Oct
FY
22
No
v F
Y2
2
Dec
FY
22
Jan
FY
22
Feb
FY
22
Mar
FY
22
US
$ M
illio
n
Source: PBS
Fig 8.2 Trends of Pakistan's Exports and Imports Exports Imports
Trade and Payments
141
Measures to Boost Export
The economy had stabilized after the lifting of lockdowns at the start of FY2021, various policy measures were taken to support industrial activity and resume the growth momentum. The policy incentives taken to increase exports included:
� Supply of energy to export oriented sectors including textile at regionally competitive rates i.e. electricity at US cents 9/kWh all- inclusive and RLNG at US$ 6.5/MMBtu all- inclusive during FY 2022. However existing tariff of US$ 6. 5 /MMBtu for Captive Power (self-power generation) revised to US$ 9/MMBtu w.e.f.15.11.2021 to 31.03.2022.
� Release of Rs 16 billion under Duty Drawback of Taxes and Levies (textiles & non-textile) till third quarter of FY2022.
� Continuation of duty-free import of textile machinery to encourage investment in the textile sector and enhance capacities
� Enhancement in coverage and loan limits under LTFF: The SBP opened up LTFF for all sectors (as per Export Policy Order of MOC, as amended from time to time) in January 2020. To encourage new projects, the SBP doubled the maximum loan size for a single project to Rs 5 billion from Rs 2.5 billion. Subsequently, the SBP reduced the mark-up rate on LTFF for non-textile firms to 5 percent, aligning the rates charged to textile firms.
� Introduction of incentives for exporters to bring FX proceeds in timely manner: In February 2022, the SBP allowed Rupee-based discounting of export bills for exporters availing Exports Finance Scheme (EFS), at very attractive rates. The FX proceeds being discounted have to be converted and sold in the interbank at the time of discounting. The measure is expected to encourage timely arrival of FX proceeds into the interbank market, and also facilitating exporters to retain access to concessionary working capital.
� Changes in FX regulations to facilitate exports: The SBP introduced a range of changes to FX regulations, to simplify export procedures and encourage diversification in the country’s exports of goods and services. To facilitate exporters, particularly SMEs, to sell to customers worldwide via digital/online platforms (including Amazon, eBay, etc), the SBP introduced a new framework for exports under business-to-business-to-consumer (B2B2C) mechanism. The SBP also updated regulations to facilitate exports of information and communications technology (ICT), including from freelancers, and to help start-ups attract foreign investment.
� To facilitate micro small and medium businesses, an e-Taijarat portal is developed and launched on 21st February 2022. The portal will provide the freelancers educational opportunities and marketplace opportunities to help them grow and flourish as business owners.
In line with the objectives of the National Tariff Policy (2019-2024), tariffs on different items are rationalized during Jul-Mar FY2022. Details are given below:
Pakistan Economic Survey 2021-22
142
i) Addressed the tariff anomalies identified during the budget exercise for the Financial Year 2021-22, and subsequently rationalized Customs Duty (CD), Additional Customs Duty (ACD) and Regulatory Duty (RD) on different tariff lines.
ii) Addressed tariff anomaly under SRO 655 (1)/2006 by the removal/reduction of ACD for vendors and on the import of Heavy Commercial Vehicles in CKD condition.
iii) The tariff rationalization in the Auto sector are as follows: a) Imposition of 10 percent RD on import of EVs in Complete Built Unit (CBU)
Condition of more than 50 KWH battery pack excluding commercial buses and trucks.
b) RD on import of all type of Hybrid vehicles in CBU condition, exceeding 1500cc but not exceeding 1800cc, would be increased from 15 percent to 50 percent.
c) RD on import of vehicles having spark/compression ignition engine (conventional engines) in CBU condition exceeding 850cc but not exceeding 1800cc, would be increased from 15 percent to 50 percent.
d) The matter regarding increase in FED rate, from current 5 percent to 10 percent, on locally assembled/manufactured cars/SUVs, etc. as well as on import in CBU condition, of above 1500cc.
iv) Examined the tariff structure on the import of key products from Afghanistan to facilitate and support economic stability in Afghanistan. Tariff Policy Board (TPB) has approved reduction/removal in CD, ACD and RD on 11 items.
Box-I: Export Facilitation Scheme, 2021 Federal Board of Revenue has notified rules for new Export Facilitation Scheme (EFS) 2021 which is effective since 14th August, 2021 This Scheme runs parallel with existing schemes like Manufacturing Bond, DTRE and Export Oriented Schemes till August, 2023. Rules of EFS 2021 can be accessed at official website of FBR.
Users of this Scheme include Exporters (Manufacturers cum Exporters, Commercial Exporters, Indirect Exporters), Common Export Houses, Vendors and International Toll Manufacturers. Users of this Scheme are subject to authorization of inputs by the Collector of Customs and Director General Input-Output Organization (IOCO). Inputs include all goods (imported or procured local) for manufacture of goods to be exported. These include raw materials, spare parts, components, equipment, plant and machinery. No duty and taxes are levied on inputs imported by the authorized users and local supplies of inputs to the authorized users are zero rated. Through this new Scheme, Common Export House can import inputs duty and tax free for subsequent sale to the authorized users especially SMEs. This Scheme also allows International Toll Manufacturing within Pakistan. Under the said scheme, minimum but necessary documentation and securities based on category and profile of the applicant, user or exporter are required. This scheme encourages new entrants and SMEs. This Scheme is completely automated under WeBOC and PSW where users of the Scheme and regulators (IOCO, Regulator Collector, PCA etc.) are integrated through WeBOC and PSW and communicate through these systems. The focus of the Scheme is on post clearance compliance checks and audits.
Since its inception, the response to EFS is encouraging and so far, 29 new units have opted for EFS besides switching over to EFS from existing schemes which include 11 from Manufacturing Bond Scheme, 9 from DTRE Scheme and 4 from Export Oriented Units. It is expected that EFS 2021 shall reduce cost of doing business and cost of tax compliance, improve ease of doing business, reduce liquidity problems of exporters by eliminating Sales Tax refunds and Duty Drawback for the users of Scheme and shall attract more users and shall ultimately promote exports.
Source: Federal Board of Revenue
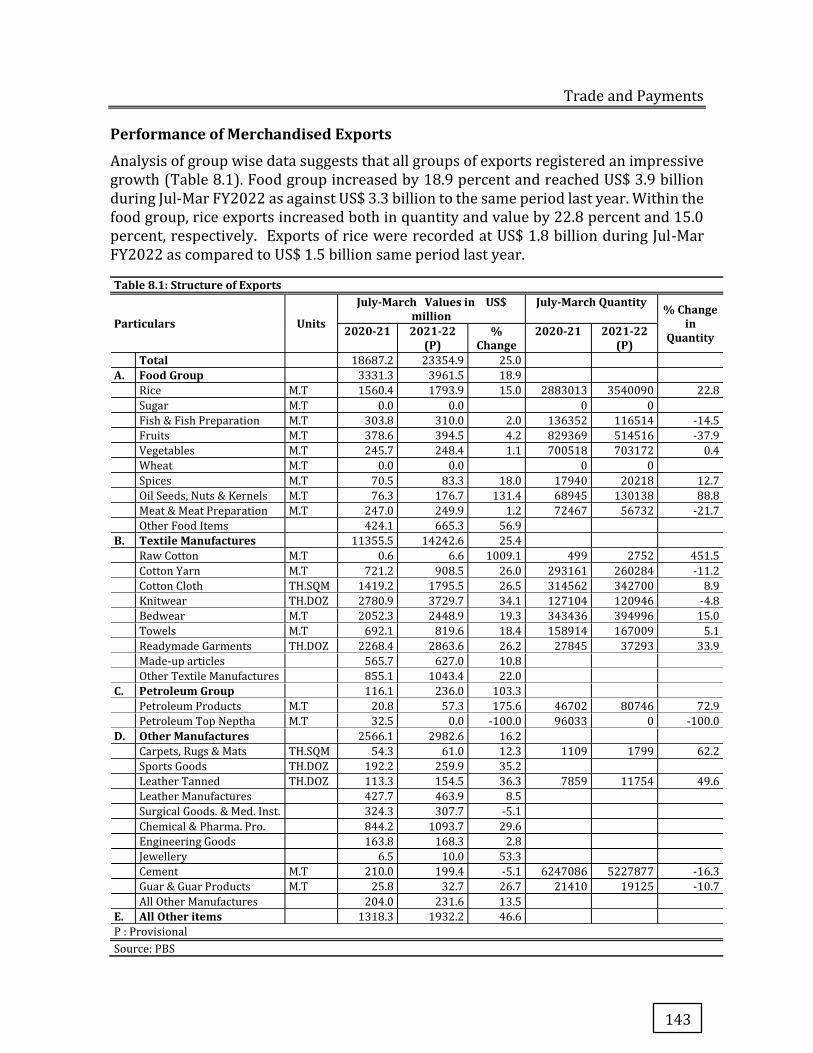
Trade and Payments
143
Performance of Merchandised Exports
Analysis of group wise data suggests that all groups of exports registered an impressive growth (Table 8.1). Food group increased by 18.9 percent and reached US$ 3.9 billion during Jul-Mar FY2022 as against US$ 3.3 billion to the same period last year. Within the food group, rice exports increased both in quantity and value by 22.8 percent and 15.0 percent, respectively. Exports of rice were recorded at US$ 1.8 billion during Jul-Mar FY2022 as compared to US$ 1.5 billion same period last year.
Table 8.1: Structure of Exports
Particulars Units
July-March Values in US$ million
July-March Quantity % Change in
Quantity 2020-21 2021-22 (P)
% Change
2020-21 2021-22 (P)
Total 18687.2 23354.9 25.0
A. Food Group 3331.3 3961.5 18.9
Rice M.T 1560.4 1793.9 15.0 2883013 3540090 22.8
Sugar M.T 0.0 0.0 0 0
Fish & Fish Preparation M.T 303.8 310.0 2.0 136352 116514 -14.5
Fruits M.T 378.6 394.5 4.2 829369 514516 -37.9
Vegetables M.T 245.7 248.4 1.1 700518 703172 0.4
Wheat M.T 0.0 0.0 0 0
Spices M.T 70.5 83.3 18.0 17940 20218 12.7
Oil Seeds, Nuts & Kernels M.T 76.3 176.7 131.4 68945 130138 88.8
Meat & Meat Preparation M.T 247.0 249.9 1.2 72467 56732 -21.7
Other Food Items 424.1 665.3 56.9
B. Textile Manufactures 11355.5 14242.6 25.4
Raw Cotton M.T 0.6 6.6 1009.1 499 2752 451.5
Cotton Yarn M.T 721.2 908.5 26.0 293161 260284 -11.2
Cotton Cloth TH.SQM 1419.2 1795.5 26.5 314562 342700 8.9
Knitwear TH.DOZ 2780.9 3729.7 34.1 127104 120946 -4.8
Bedwear M.T 2052.3 2448.9 19.3 343436 394996 15.0
Towels M.T 692.1 819.6 18.4 158914 167009 5.1
Readymade Garments TH.DOZ 2268.4 2863.6 26.2 27845 37293 33.9
Made-up articles 565.7 627.0 10.8
Other Textile Manufactures 855.1 1043.4 22.0
C. Petroleum Group 116.1 236.0 103.3
Petroleum Products M.T 20.8 57.3 175.6 46702 80746 72.9
Petroleum Top Neptha M.T 32.5 0.0 -100.0 96033 0 -100.0
D. Other Manufactures
2566.1 2982.6 16.2
Carpets, Rugs & Mats TH.SQM 54.3 61.0 12.3 1109 1799 62.2
Sports Goods TH.DOZ 192.2 259.9 35.2
Leather Tanned TH.DOZ 113.3 154.5 36.3 7859 11754 49.6
Leather Manufactures 427.7 463.9 8.5
Surgical Goods. & Med. Inst. 324.3 307.7 -5.1
Chemical & Pharma. Pro. 844.2 1093.7 29.6
Engineering Goods 163.8 168.3 2.8
Jewellery 6.5 10.0 53.3
Cement M.T 210.0 199.4 -5.1 6247086 5227877 -16.3
Guar & Guar Products M.T 25.8 32.7 26.7 21410 19125 -10.7
All Other Manufactures 204.0 231.6 13.5
E. All Other items 1318.3 1932.2 46.6
P : Provisional
Source: PBS
Pakistan Economic Survey 2021-22
144
The Basmati rice exports increased both in quantity and value by 26.1 percent and 21.6 percent respectively, during Jul-Mar FY2022. One major contributor to this increase is exports to Kazakhstan, which grew by over 200 percent during Jul-Feb FY2022. Besides, there was higher demand from Madagascar, Somalia and Malaysia. Price of Pakistan’s basmati rice remained lower than last year, making it more competitive in the international market.
The other varieties under rice group during Jul-Mar FY2021 witnessed a growth of 12.6 percent in value and 22.2 percent in quantity. Higher shipments could be traced to China, where demand was strong, as underscored by growth in consumption and import of rice amidst Asian origin quotes being lower than domestic prices.
Exports of oil seeds, nuts & Kernels witnessed a growth of 88.7 percent in quantity and 131.4 percent in value during Jul-MarFY2022. The export of spices also increased both in quantity and value by 12.7 percent and 18.0 percent, respectively during Jul-Mar FY2022.
Meat and meat preparation increased in value by 1.2 percent; however, its quantity declined by 21.7 percent during Jul-Mar FY2022. Pakistan has the opportunity to harness the Halal meet market in Muslim African and East Asian countries. The major challenges being faced by exporters include: credit risk, under-invoicing, over-supply of chilled meat, new entrants, lack of fair play in domestic market, Foot and Mouth Disease (FMD) and lack of technical expertise. Further, establishment of FMD free zones, livestock feedlot farms, and efficient traceability mechanism are necessary required actions to enhance meat exports.
Textiles and apparel sector occupies a pivotal position in Pakistan’s economy having most intensive backward and forward linkages compared to any other sector. It contributes approximately 60 percent in total exports and 40 percent in industrial employment. Pakistan is the fifth largest cotton producing country with tremendous potential in further improvement in its world share.
During current fiscal year, Textile policy 2020-25 has been approved by the Cabinet. Textiles and Apparel Policy, 2020-25 aims to fully utilize potential of home-grown cotton augmented by Manmade Fibers/Filaments to boost value-added exports and become one of the major players in global textiles and apparel supply chain. The policy aims to provide conducive business environment, consistent, predictable and foreseeable measures and level playing field for the domestic and export-oriented textiles and apparel value-chain industries.
Textile group witnessed a growth of 25.4 percent during Jul-Mar FY2022 and reached US$ 14.2 billion compared to US$ 11.3 billion during the corresponding period last year. Pakistan received higher foreign orders for finished goods, which consequently increased demand of textile intermediaries’, i.e. cotton fabric and yarn and led to enhancing capacity development as well as the value chain. Increased international prices of cotton helped in increased export unit values of Pakistan’s major textile products. Some competitor countries like Bangladesh have witnessed the same surge in exports unit values. According to the US Department of Agriculture (USDA) world cotton
Trade and Payments
145
market updates, strong global demand and lower supplies due to logistical challenges, led to prices rising consistently until the middle of February 2022.1Besides China, Cotton is witnessing strong demand from Pakistan, Bangladesh and Vietnam as well.
Global logistical crisis and rising freight cost elevated the landed cost of imported cotton in Pakistan, which is eventually being factored into exports unit prices of finished goods like apparel and textile. Containers freight rates increased dramatically between January 2019 and March 2022. The year 2021 saw an especially steep increase in global freight rates, reaching a record price of over US$10,800 in September 2021. Whereas, on YOY the global freight rate index increased by 68.3 percent to US$ 8200 in March 2022 as against US$ 4872 in March 2021.2
In case of home textiles, bedwear exports increased both in quantity and value by 15.0 percent and 19.3 percent, respectively, whereas towels exports increased in both quantity and value by 5.1 percent and 18.4 percent in Jul-Mar FY2022. Knitwear exports grew by 34.1 percent in value despite a decline of 4.8 percent in quantity during Jul-Mar FY2022. The exports of readymade garments increased both in quantities by 33.9 percent and in value by 26.2 percent during Jul-Mar FY2022. This increase is mainly due to increase in the demand for formal wear bouncing back as the COVID-related mobility restrictions generally eased around the globe in 2021, and many workers returned to their workplaces.
The exports of intermediate commodities like cotton yarn witnessed an increase in value by 26.0 percent, while the quantity witnessed a decline of 11.2 percent. Cotton cloth export increased both in quantity and value by 8.9 percent and 26.5percent, respectively during Jul-Mar FY2022.
The Petroleum group’s exports posted an increase of 103.3 percent during Jul-Mar FY2022. Furthermore, petroleum crude exports also soared 184.9 percent to US$ 178.7 million during Jul-Mar FY2022.
Export of leather tanned grew remarkably both in quantity and value by 49.6 percent and 36.3 percent, respectively. The leather industry witnessed a steady recovery on account of prudent government policies and significant relaxations in lockdown at various export destinations.
In the case of sports goods, Gloves exports increased both in quantity and value 132.5 percent and 16.4 percent, respectively during Jul-Mar FY2022. Gloves exports were recorded at US$ 56.7 million. Other major sports goods is football witnessed an increase both in quantity and value by 37.8 percent and 40.3 percent, respectively.
Pakistan has been the official makers of match-ball since the 1982 FIFA World Cup. The nowcasts for the football exports is very remarkable as FIFA World Cup is set to commence in Doha, Qatar in November, 2022.The ball named ‘Al-Rihla’ has been manufactured in Pakistan by Adidas.
1 Fibre2Fashion.com 2https://www.statista.com/statistics/1250636/global-container-freight-index/
Pakistan Economic Survey 2021-22
146
Export of carpets, rugs, and mats registered a growth both in quantity and value by 62.2 percent and 12.3 percent, respectively during Jul-Mar FY2022.The export of cement witnessed a decline both in quantity and value by 16.3 percent and 5.1 percent, respectively during Jul-Mar FY0222. Increased production cost, rising international freight rates, soaring coal prices are the main reasons of reduction in cements exports. Moreover, Iranian cement replaced Pakistani cement in Bangladeshi market, as the former is economical due to low cost of energy.
Exports of Chemicals and pharmaceuticals product grew by 29.6 percent and clocked in at US$ 1093.7 million during Jul-Mar FY2022. Chemicals, other than the ones used in pharmaceutical and plastic products, had the highest share.
To tap the huge potential for pharmaceutical products in the global market, the MOC closely coordinated efforts with Ministry of National Health Services, Regulations & Coordination (MNHSR&C) and Drug Regulations Authority of Pakistan (DRAP) to implement the following:
a. One-Window Facility for grant of GMP3 and cGMP4: DRAP has decentralized the process of issuance of cGMP certificates, which are now issued by DRAP’s field offices on priority basis. Moreover, the validity period of the GMP certificate for export purpose has also been extended by DRAP for 3 years.
b. Active Pharmaceutical Ingredient: API is substances used in a finished pharmaceutical product. Pakistan imports over 90 percent of the APIs/pharmaceutical raw material from abroad especially from India and China. In order to decrease reliance on imported raw material and develop indigenous capabilities, the MNHSR&C has finalized draft of the API Policy, which is in the process of approval by the Cabinet.
Surgical industry is an important sector of the economy having an annual export of US$ 426 million in FY2021, providing employment to hundreds of thousands of skilled and semi-skilled workforces in the country. During Jul-Mar FY2022, Surgical goods & Medical Instruments exports were recorded at US$ 307.7 million. The European Union Medical Device Regulation (MDR)/Regulation (EU) 2017/745 (EU MDR) entered into force on 26th May 2021, impacting manufactures which were previously exempt from medical device regulation. The new regulations will be fully implemented from May 2024.
Box-II: International Engineering and Healthcare Show, 2022 The Trade Development Authority of Pakistan (TDAP) organized Pakistan’s first ever Engineering and Healthcare Show, 2022 (EHCS) at Expo Centre Lahore from 25th to 27th February, 2022. In the 1st edition of EHCS, 325 foreign delegates from 27 African countries and 05 Central Asian Republics visited the stalls of 170 exhibitors to get first-hand experience of the whole range of engineering and healthcare products being offered by Pakistan.
3 A Good Manufacturing Practices (GMP) certification scheme 4 Current Good Manufacturing Practice (cGMP)
Trade and Payments
147
The purpose of the event was to provide opportunity to Pakistani SMEs to showcase their products in African and Central Asian markets, to explore opportunities for investments, JVs & brand franchising, and to promote soft image of Pakistan as manufacturing hub of Engineering & its allied products.
Prominent sectors exhibited in the show included Agricultural machinery, Mobile devices, Pharmaceutical, Surgical instruments, Sports goods, Musical instruments, Auto-parts, Electrical machinery, Cutlery, Cookware, Marble, Minerals, Steel & Iron, Construction materials, Gems & Jewelry, Furniture, Mattresses, Rubber & its other products, Packaging, Plastic and its implements, Stationery, Paperboard, Handicrafts, Safety Equipment& Chemicals.
The reported outcome of business deals which have been materialized so far amounts to approximately USD 47 million, based on which it is expected that the actual business generated may exceed USD 150 million.
During the event, TDAP organized around 2100 sector-specific B2B meetings of foreign buyers with local exhibitors in which extensive discussion was held related to business generation and future collaboration. In order to create awareness regarding ease of doing business, investment and financial matters, three seminars were organized by Pakistan Single Window (PSW), BOI and SBP, respectively.
The President of Pakistan formally launched the Pakistan Trade Portal on the sideline event of the show. Pakistan Trade Portal is an initiative of TDAP to cater the need of Pakistan Businesses relating to having a free of cost, cross boarder B2B matchmaking portal. Keeping in view the success of the 1stEdition of EHCS, it has been decided to make Engineering and Healthcare Show a permanent feature of Annual Business Plan of TDAP.
Source: TDAP
Concentration of Exports
The trend of Pakistan’s export of major items remains more or less the same having concentrated on three items namely cotton manufactures, leather and rice (Table 8.2). These three categories account for 69.9 percent of total exports during Jul-Mar FY2022.
Within these few items, cotton manufactures remain the major contributor with 59.2 percent in total exports. Almost all the export earnings have originated from textile manufactures. This pattern shows that Pakistan’s export is still concentrated in a few items. The annual percentage shares of the major export commodities are shown in Table: 8.2.
Table 8.2: Pakistan's Major Exports Percentage Share
Commodity 2015-16 2016-17 2017-18 2018-19 2019-20 2020-21 July-March 2020-21 2021-22 P
Cotton Manufactures 55.0 56.5 61.7 56.4 56.6 59.0 58.8 59.2
Leather** 4.9 4.1 4.2 3.7 3.6 3.3 3.3 3.0
Rice 8.8 8.8 7.7 9.0 10.2 8.1 8.4 7.7
Sub-Total of three Items 68.7 69.4 73.6 69.1 70.4 70.4 70.5 69.9 Other items 31.3 30.6 26.4 30.9 29.6 29.6 29.5 30.1
Total 100.0 100.0 100.0 100.0 100.0 100.0 100.0 100.0 P: Provisional, ** Leather & Leather Manufactured. Source: PBS
Direction of Exports
In so far as the top export destinations are concerned, USA remains the largest export market for Pakistan during Jul-Mar, FY2022. Exports to USA have moderately increased from 20 percent in Jul-Mar FY2021 to 21 percent in Jul- Mar FY2022. Similarly, Chinese
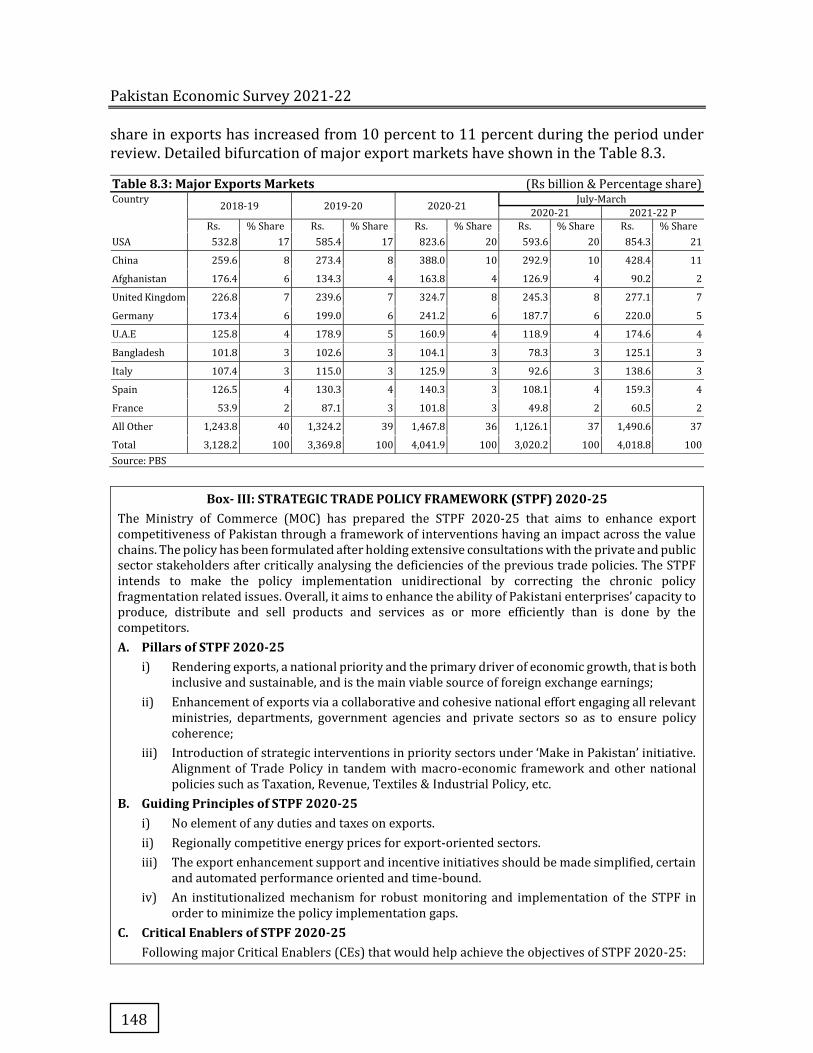
Pakistan Economic Survey 2021-22
148
share in exports has increased from 10 percent to 11 percent during the period under review. Detailed bifurcation of major export markets have shown in the Table 8.3.
Table 8.3: Major Exports Markets (Rs billion & Percentage share) Country
2018-19 2019-20 2020-21 July-March
2020-21 2021-22 P
Rs. % Share Rs. % Share Rs. % Share Rs. % Share Rs. % Share
USA 532.8 17 585.4 17 823.6 20 593.6 20 854.3 21
China 259.6 8 273.4 8 388.0 10 292.9 10 428.4 11
Afghanistan 176.4 6 134.3 4 163.8 4 126.9 4 90.2 2
United Kingdom 226.8 7 239.6 7 324.7 8 245.3 8 277.1 7
Germany 173.4 6 199.0 6 241.2 6 187.7 6 220.0 5
U.A.E 125.8 4 178.9 5 160.9 4 118.9 4 174.6 4
Bangladesh 101.8 3 102.6 3 104.1 3 78.3 3 125.1 3
Italy 107.4 3 115.0 3 125.9 3 92.6 3 138.6 3
Spain 126.5 4 130.3 4 140.3 3 108.1 4 159.3 4
France 53.9 2 87.1 3 101.8 3 49.8 2 60.5 2
All Other 1,243.8 40 1,324.2 39 1,467.8 36 1,126.1 37 1,490.6 37
Total 3,128.2 100 3,369.8 100 4,041.9 100 3,020.2 100 4,018.8 100
Source: PBS
Box- III: STRATEGIC TRADE POLICY FRAMEWORK (STPF) 2020-25 The Ministry of Commerce (MOC) has prepared the STPF 2020-25 that aims to enhance export competitiveness of Pakistan through a framework of interventions having an impact across the value chains. The policy has been formulated after holding extensive consultations with the private and public sector stakeholders after critically analysing the deficiencies of the previous trade policies. The STPF intends to make the policy implementation unidirectional by correcting the chronic policy fragmentation related issues. Overall, it aims to enhance the ability of Pakistani enterprises’ capacity to produce, distribute and sell products and services as or more efficiently than is done by the competitors.
A. Pillars of STPF 2020-25 i) Rendering exports, a national priority and the primary driver of economic growth, that is both
inclusive and sustainable, and is the main viable source of foreign exchange earnings;
ii) Enhancement of exports via a collaborative and cohesive national effort engaging all relevant ministries, departments, government agencies and private sectors so as to ensure policy coherence;
iii) Introduction of strategic interventions in priority sectors under ‘Make in Pakistan’ initiative. Alignment of Trade Policy in tandem with macro-economic framework and other national policies such as Taxation, Revenue, Textiles & Industrial Policy, etc.
B. Guiding Principles of STPF 2020-25 i) No element of any duties and taxes on exports.
ii) Regionally competitive energy prices for export-oriented sectors.
iii) The export enhancement support and incentive initiatives should be made simplified, certain and automated performance oriented and time-bound.
iv) An institutionalized mechanism for robust monitoring and implementation of the STPF in order to minimize the policy implementation gaps.
C. Critical Enablers of STPF 2020-25 Following major Critical Enablers (CEs) that would help achieve the objectives of STPF 2020-25:
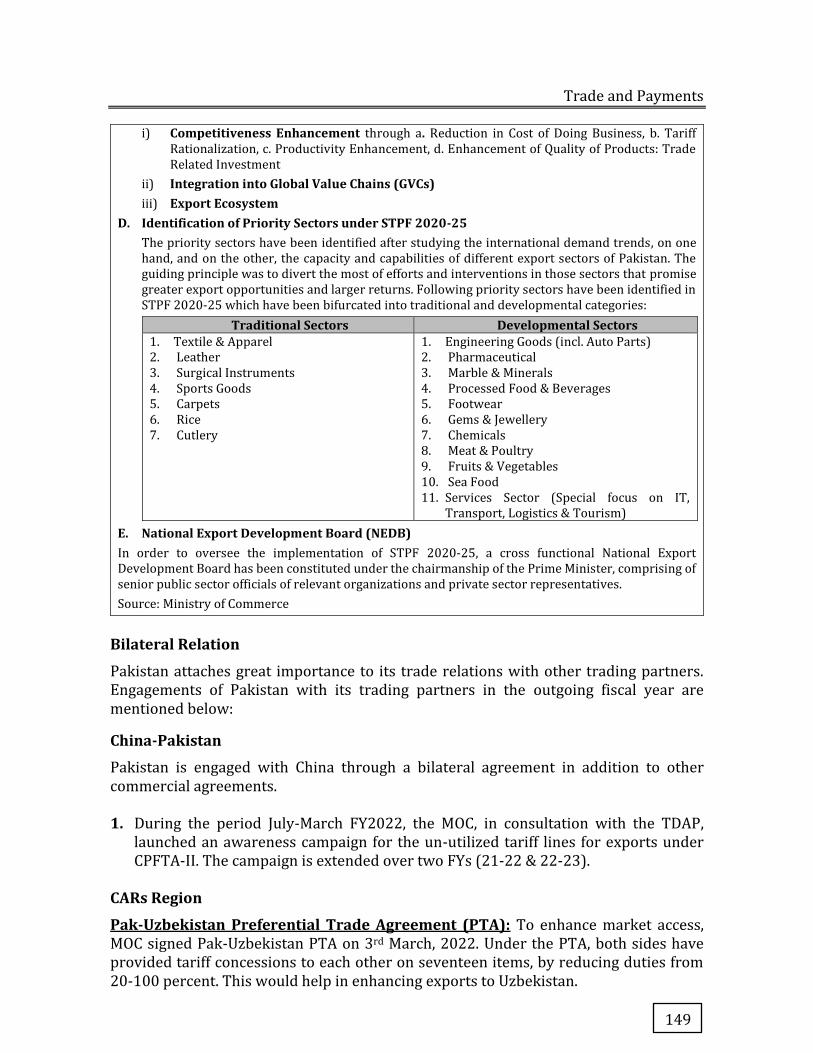
Trade and Payments
149
i) Competitiveness Enhancement through a. Reduction in Cost of Doing Business, b. Tariff Rationalization, c. Productivity Enhancement, d. Enhancement of Quality of Products: Trade Related Investment
ii) Integration into Global Value Chains (GVCs) iii) Export Ecosystem
D. Identification of Priority Sectors under STPF 2020-25 The priority sectors have been identified after studying the international demand trends, on one hand, and on the other, the capacity and capabilities of different export sectors of Pakistan. The guiding principle was to divert the most of efforts and interventions in those sectors that promise greater export opportunities and larger returns. Following priority sectors have been identified in STPF 2020-25 which have been bifurcated into traditional and developmental categories:
Traditional Sectors Developmental Sectors
1. Textile & Apparel 2. Leather 3. Surgical Instruments 4. Sports Goods 5. Carpets 6. Rice 7. Cutlery
1. Engineering Goods (incl. Auto Parts) 2. Pharmaceutical 3. Marble & Minerals 4. Processed Food & Beverages 5. Footwear 6. Gems & Jewellery 7. Chemicals 8. Meat & Poultry 9. Fruits & Vegetables 10. Sea Food 11. Services Sector (Special focus on IT,
Transport, Logistics & Tourism)
E. National Export Development Board (NEDB) In order to oversee the implementation of STPF 2020-25, a cross functional National Export Development Board has been constituted under the chairmanship of the Prime Minister, comprising of senior public sector officials of relevant organizations and private sector representatives.
Source: Ministry of Commerce
Bilateral Relation
Pakistan attaches great importance to its trade relations with other trading partners. Engagements of Pakistan with its trading partners in the outgoing fiscal year are mentioned below:
China-Pakistan
Pakistan is engaged with China through a bilateral agreement in addition to other commercial agreements.
1. During the period July-March FY2022, the MOC, in consultation with the TDAP, launched an awareness campaign for the un-utilized tariff lines for exports under CPFTA-II. The campaign is extended over two FYs (21-22 & 22-23).
CARs Region
Pak-Uzbekistan Preferential Trade Agreement (PTA): To enhance market access, MOC signed Pak-Uzbekistan PTA on 3rd March, 2022. Under the PTA, both sides have provided tariff concessions to each other on seventeen items, by reducing duties from 20-100 percent. This would help in enhancing exports to Uzbekistan.
Pakistan Economic Survey 2021-22
150
a) Pakistan-Uzbekistan Business Forum 2021: 1st Pakistan-Uzbekistan Business Forum was held on 15-17th July, 2021 at Tashkent. More than 2000 business meetings took place during the forum where overall 14 MOUs worth approximately US$ 50 million were signed.
b) Pakistan-Tajikistan Business Forum 2021: Pak-Tajikistan Business Forum was held on 16th September, 2021 at Dushanbe. B2B meetings for 67 Pakistani companies from diverse sectors of pharmaceutical, textile, logistics, fruits & vegetables, mining etc. were organized with Tajik companies. More than 150 Tajik companies participated in the B2B meetings where Eight Agreements/ MOUs signed and several are under negotiation stage.
c) Pakistan-Uzbekistan Business Forum 2022: 2nd Pakistan-Uzbekistan Business Forum was organized on 2nd March 2022 at Islamabad in which 46 Uzbek companies and 150 Pakistani companies participated and B2B meetings were held and at least six MOUs were signed.
The exports in the non-traditional market of Central Asian Republics, increased by 101 percent during Jul-Mar FY2022
DEVELOPMENT OF ECONOMIC CORRIDOR
MOC has taken following actions to develop Economic Corridor and enhance regional connectivity with landlocked CARs:
� Signing of Transit Trade Agreement with Uzbekistan: MOC has signed Agreement between Uzbekistan and Pakistan on Transit Trade (AUPTT) on 15th July, 2021
� Transit Trade Agreement proposed with Tajikistan: Pakistan and Tajikistan decided to start negotiations on Transit Trade Agreement during the meeting of Joint Working Group on 12th August 2021.
� Transit Trade Agreement proposed with Kazakhstan: Pakistan and Kazakhstan decided to start negotiations on Transit Trade Agreement during the meeting of Joint Working Group on 15th November 2021.
Middle East Region
The exports of traditional markets of Middle East, have increased by 24 percent during July-March FY2022. The major events in these markets are as follows:
1. EXPO 2020: Pakistan participated in EXPO 2020 from 1st October 2021 to 31stMarch 2022. It has been reported that over one million visitors visited Pakistan Pavilion during first 82 days of the EXPO 2020. Federal & Provincial departments have organized multiple events during the mega EXPO. Pakistan Pavilion was rated among top-15 National Pavilions in EXPO 2020 by CNN. At the end of the EXPO, Pakistan Pavilion was presented Silver Award by International jury, which is a huge achievement.
2. Pakistan-GCC FTA Negotiations: Pak-GCC FTA is a comprehensive agreement covering goods, services, cooperation in investment and various other fields. Pakistan & GCC have resumed FTA negotiations after thirteen years.
Trade and Payments
151
3. Establish of JWG on Trade with Syria: Pakistan and Syria signed a MOU to establish a Joint Pakistan-Syrian Working Group on Trade & Economic Affairs on 31st of Oct, 2021 in Damascus, Syria. . In this regard, first technical level meeting of JWG was held on 23rd Dec, 2021 to discuss various aspects of trade cooperation.
Africa Region
To enhance exports to the non-traditional market of Africa, MOC launched its Look Africa Policy in 2017/18 to increase commercial presence of Pakistan in Africa, establishment of institutional linkages and strengthening of B2B relations. The exports increased by 12 percent during July-March FY2022.The following initiative has been taken to diversify exports to Africa:
a) 2nd Pakistan Africa Trade Development Conference and Single Country Exhibition: 2nd Pakistan Africa Trade Development Conference and Single Country Exhibition were successfully organized in Lagos, Nigeria from 23-25 November 2021. Efficient coordination with Pahic Abuja, TDAP, TIA Lagos and Nigerian High Commission in Islamabad ensured participation of more than 240 business persons from Pakistan representing 103 companies and around 75 delegates from other ECOWAS countries. Business deals worth around US$ 32 million were finalized during the event.
United States
The USA is the largest exports market for Pakistan’s products with 20 percent share in Pakistan’s total export in 2020-21. Pakistan’s main exports to USA are in articles of apparel & home textiles (78percent), intermediate textile (6percent), leather apparels (3percent), sugar confectionary, rice, spices etc. (3percent), surgical goods (2percent), plastics and rubber (2percent), and furniture & sports goods (2percent).
Russia
The balance of trade is in favour of Russia with Pakistan trade deficit balance of US$ 191.7 million in July-Feb FY2022. The 3rd Joint Working Group meeting on Trade & Investment of the 7th Pakistani-Russian Intergovernmental Commission on Trade, Economic, Scientific and Technical Cooperation was held in Yekaterinburg, Russia on November 24-26, 2021.
United Kingdom
The balance of trade is in favour of Pakistan with a trade balance of US$ 911.13 million in July-Feb FY 2021-22. Post Brexit, UK has given a firm commitment to Pakistan that it will continue to grant similar market access to the Pakistani products which it currently enjoys under EU GSP plus regime. The Government of UK is going to commence its own GSP scheme called Developing Countries Trading Scheme effective from 2022. The new scheme will replace the UK’s current Generalized Scheme of Preferences. Consultation process for the new scheme concluded on 12 September 2021. From Pakistan, the representatives of public sector, private sector and academia participated in the consultation process.
Pakistan Economic Survey 2021-22
152
Box- IV: 5th Trade Policy Review of Pakistan
The Trade Policy Review (TPR) is a mandatory exercise undertaken by Trade Policy Review Board (TPRB) of the World Trade Organization (WTO). The review is undertaken every seven years for Pakistan and engages in surveillance of national trade and economic policies from view point of multilateralism. Pakistan being one of founding members of WTO has undergone four such reviews in the past and the 5th Trade Policy review stretched over May 2021 to April 2022. Main objectives of TPR are to achieve transparency, better understanding of the reviewed Member’s trade policies and practices and contributing to improved adherence by all Members to rules, disciplines and commitments made under the Multilateral Trade Agreements. The review culminates into two reports: ‘Government Report’ and ‘Secretariat Report’ which are circulated amongst all WTO Members and hence have an international audience.
Ministry of Commerce served as focal Ministry for the entire process and liaised with all public sector stakeholders to respond to all queries of the TPRB and to compile such reports as are effective to represent the progressive nature of Pakistan’s economic and investment potentials. Scope of ‘Secretariat Report’ is extensive as it relays detailed analytical information regarding economic environment, trade regime, investment regime, trade policies and practices. ‘Government Report’ comprises of a precise and forward-looking statement from the government focusing on future economic policy aims of the country. After extensive data gathering, analyses and inter-ministerial consultations both the reports were shared with WTO Secretariat and were circulated to all the WTO members.
The Reports were discussed at concluding meetings of TPRB where all WTO Members noted Pakistan’s resilience and effective policies in tackling economic shocks of COVID -19 and subsequent economic recovery. Pakistan was commended largely for quick implementation of the Trade Facilitation Agreement (TFA). The Members unanimously appreciated Pakistan’s active engagement at the WTO upholding the values and fundamental principles of the WTO and support for developing countries & invited Pakistan to join other international agreements on various trade pertinent matters for further integration into multilateralism.
Source: Ministry of Commerce
Imports
The total imports during Jul-Mar FY2022 clocked at US$ 58.9 billion as compared to US$
39.5 billion in the same period last year, showing a growth of 49.1 percent (Table 8.4).
The increase in imports is recorded in all the major groups. Multiple factors have
contributed to the steep rise in imports during Jul-Mar FY2022. Rising global commodity
prices contributed significantly to the increasing import volume.
Disaggregated data on imports indicates that the energy group is the largest source of
the increase in imports, contributing over one-third to the YoY increase in imports
during the period. Similarly, price-led pressures were also noted across non-energy
commodities imported by Pakistan, such as edible oil (palm and soybean), sugar, tea,
fertilizer, and steel. At the same time, the domestic demand for imported raw materials
(such as cotton and steel) and capital goods was also elevated in the wake of the policy-
induced economic rebound.
Trade and Payments
153
Measures to Curtail Unnecessary Imports
The broad-based up surge in global commodity prices, COVID-19 vaccine imports, and demand-side pressures, all contributed to the rising imports. While the PKR exchange rate acted as a shock absorber and depreciated, in response to external payments pressure. Following regulatory measures were taken to curtail the import burden:
� Imposition of 100 percent cash margin requirements: In September 2021, the SBP decided to impose 100 percent cash margin requirement (CMR) on the import of 114 non-essential items. The SBP imposed CMRs on a further 177 items in April 2022. As of April 15, 2022, CMRs are applicable on a total of 702 items, covering 22 percent of overall imports in the country.
� Tightening in prudential regulations for auto and consumer financing: To moderate domestic demand and the import burden from the transport segment, the SBP made the following changes to prudential regulations for auto financing.
o Maximum tenure of auto finance reduced from seven to five years;
o Maximum tenure of personal loans reduced from five to four years;
o Maximum debt-burden ratio, allowed to a borrower, decreased from 50 to 40 percent;
o All auto financing limits availed by one person from all banks/DFIs, in aggregate, not to exceed Rs 3 million at any point in time; and
o Minimum down payment for auto financing increased from 15 percent to 30percent;
� Increase in cash reserve requirement for banks: The SBP increased the average cash reserve requirement (CRR), to be maintained by banks during a two-week period, from 5 percent to 6 percent, and the minimum CRR to be maintained each day from 3 percent to 4 percent. The measure is expected to moderate domestic demand, and also encourage banks to actively pursue deposit mobilization efforts.
� Imported motor cars, SUVs and other motor vehicles
o of cylinder capacity exceeding 1800cc to 3001cc has been increased FED from 25 percent to 30 percent ad val.
o of cylinder capacity exceeding 3001cc FED has been increased from 30 percent to 40 percent ad val.
� Imported double cabin (4x4) pick-up vehicles, FED has been increased from 25 percent to 30 percent ad val.
� Rate of sales tax on imported EV in CBU condition has been enhanced from 5 percent to 12.5 percent.
� The sale tax @ 17 percent ad valorem has been introduced for imported mobile devices valuing more than US$ 200.
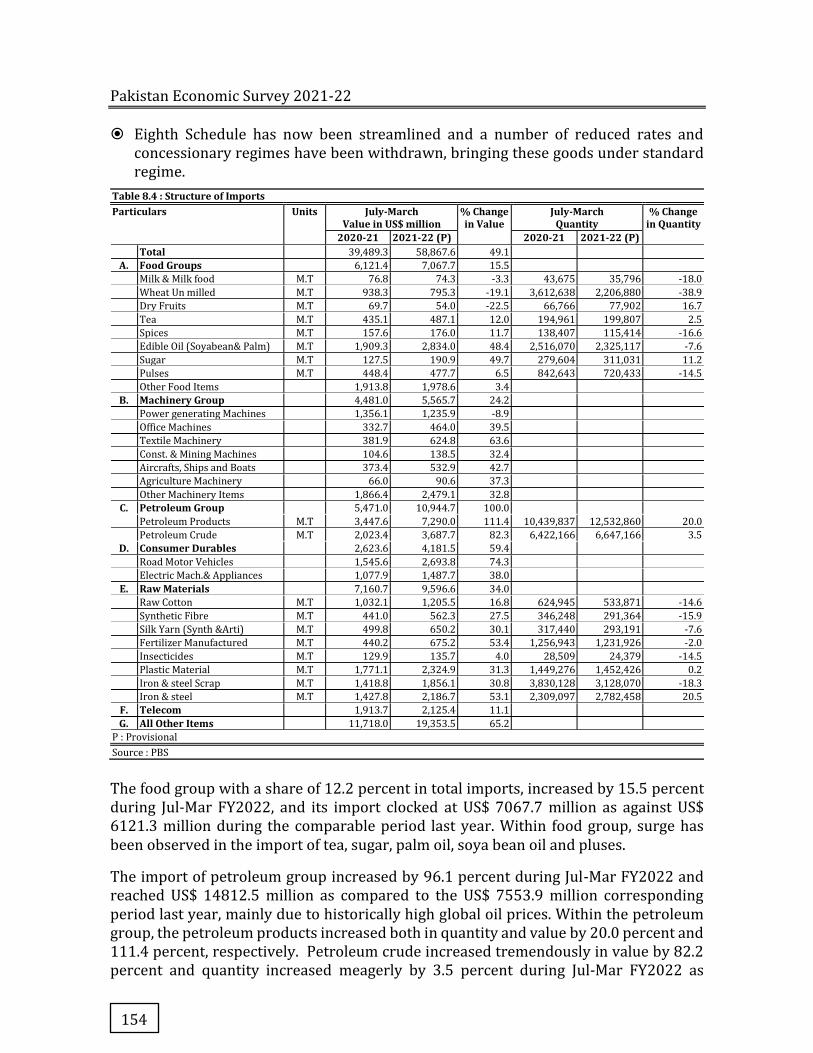
Pakistan Economic Survey 2021-22
154
� Eighth Schedule has now been streamlined and a number of reduced rates and concessionary regimes have been withdrawn, bringing these goods under standard regime.
Table 8.4 : Structure of Imports Particulars Units July-March
Value in US$ million % Change in Value
July-March Quantity
% Change in Quantity
2020-21 2021-22 (P) 2020-21 2021-22 (P) Total
39,489.3 58,867.6 49.1
A. Food Groups
6,121.4 7,067.7 15.5
Milk & Milk food M.T 76.8 74.3 -3.3 43,675 35,796 -18.0
Wheat Un milled M.T 938.3 795.3 -19.1 3,612,638 2,206,880 -38.9 Dry Fruits M.T 69.7 54.0 -22.5 66,766 77,902 16.7 Tea M.T 435.1 487.1 12.0 194,961 199,807 2.5 Spices M.T 157.6 176.0 11.7 138,407 115,414 -16.6 Edible Oil (Soyabean& Palm) M.T 1,909.3 2,834.0 48.4 2,516,070 2,325,117 -7.6 Sugar M.T 127.5 190.9 49.7 279,604 311,031 11.2 Pulses M.T 448.4 477.7 6.5 842,643 720,433 -14.5 Other Food Items
1,913.8 1,978.6 3.4
B. Machinery Group
4,481.0 5,565.7 24.2 Power generating Machines
1,356.1 1,235.9 -8.9
Office Machines
332.7 464.0 39.5 Textile Machinery
381.9 624.8 63.6
Const. & Mining Machines
104.6 138.5 32.4
Aircrafts, Ships and Boats
373.4 532.9 42.7
Agriculture Machinery
66.0 90.6 37.3 Other Machinery Items
1,866.4 2,479.1 32.8
C. Petroleum Group
5,471.0 10,944.7 100.0 Petroleum Products M.T 3,447.6 7,290.0 111.4 10,439,837 12,532,860 20.0 Petroleum Crude M.T 2,023.4 3,687.7 82.3 6,422,166 6,647,166 3.5
D. Consumer Durables
2,623.6 4,181.5 59.4 Road Motor Vehicles
1,545.6 2,693.8 74.3
Electric Mach.& Appliances
1,077.9 1,487.7 38.0
E. Raw Materials
7,160.7 9,596.6 34.0 Raw Cotton M.T 1,032.1 1,205.5 16.8 624,945 533,871 -14.6 Synthetic Fibre M.T 441.0 562.3 27.5 346,248 291,364 -15.9 Silk Yarn (Synth &Arti) M.T 499.8 650.2 30.1 317,440 293,191 -7.6 Fertilizer Manufactured M.T 440.2 675.2 53.4 1,256,943 1,231,926 -2.0 Insecticides M.T 129.9 135.7 4.0 28,509 24,379 -14.5 Plastic Material M.T 1,771.1 2,324.9 31.3 1,449,276 1,452,426 0.2 Iron & steel Scrap M.T 1,418.8 1,856.1 30.8 3,830,128 3,128,070 -18.3 Iron & steel M.T 1,427.8 2,186.7 53.1 2,309,097 2,782,458 20.5
F. Telecom
1,913.7 2,125.4 11.1
G. All Other Items
11,718.0 19,353.5 65.2
P : Provisional
Source : PBS
The food group with a share of 12.2 percent in total imports, increased by 15.5 percent during Jul-Mar FY2022, and its import clocked at US$ 7067.7 million as against US$ 6121.3 million during the comparable period last year. Within food group, surge has been observed in the import of tea, sugar, palm oil, soya bean oil and pluses.
The import of petroleum group increased by 96.1 percent during Jul-Mar FY2022 and reached US$ 14812.5 million as compared to the US$ 7553.9 million corresponding period last year, mainly due to historically high global oil prices. Within the petroleum group, the petroleum products increased both in quantity and value by 20.0 percent and 111.4 percent, respectively. Petroleum crude increased tremendously in value by 82.2 percent and quantity increased meagerly by 3.5 percent during Jul-Mar FY2022 as
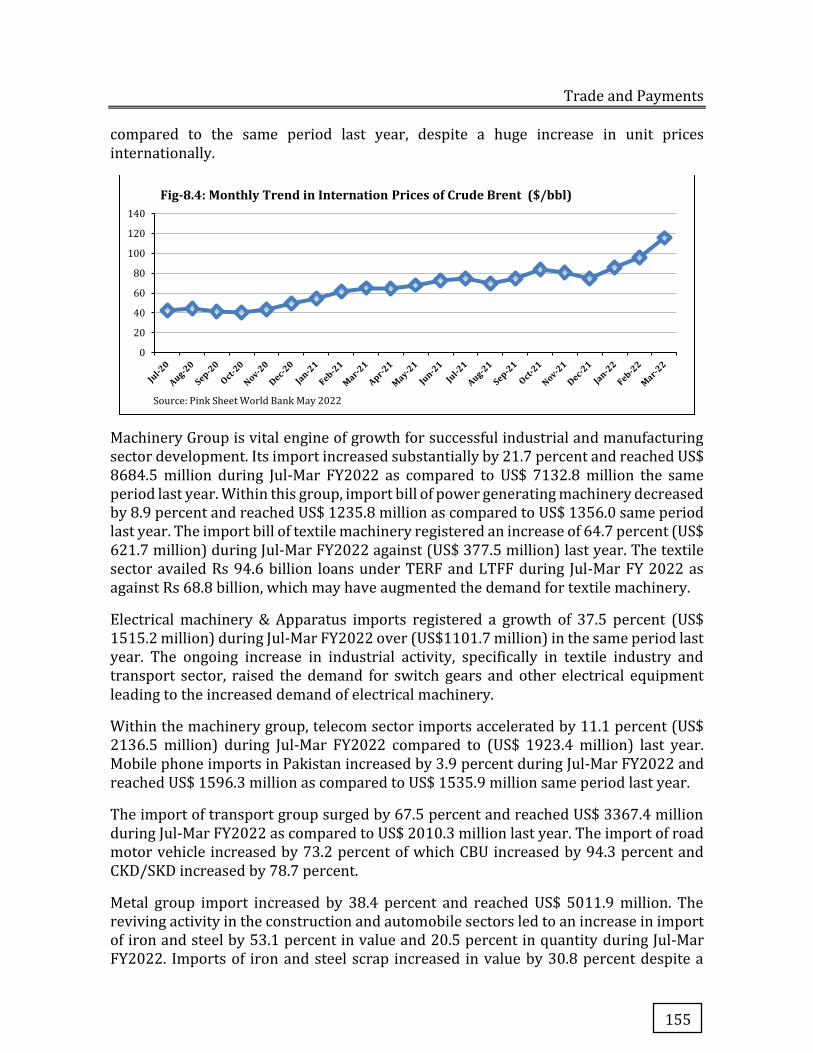
Trade and Payments
155
compared to the same period last year, despite a huge increase in unit prices internationally.
Machinery Group is vital engine of growth for successful industrial and manufacturing sector development. Its import increased substantially by 21.7 percent and reached US$ 8684.5 million during Jul-Mar FY2022 as compared to US$ 7132.8 million the same period last year. Within this group, import bill of power generating machinery decreased by 8.9 percent and reached US$ 1235.8 million as compared to US$ 1356.0 same period last year. The import bill of textile machinery registered an increase of 64.7 percent (US$ 621.7 million) during Jul-Mar FY2022 against (US$ 377.5 million) last year. The textile sector availed Rs 94.6 billion loans under TERF and LTFF during Jul-Mar FY 2022 as against Rs 68.8 billion, which may have augmented the demand for textile machinery.
Electrical machinery & Apparatus imports registered a growth of 37.5 percent (US$ 1515.2 million) during Jul-Mar FY2022 over (US$1101.7 million) in the same period last year. The ongoing increase in industrial activity, specifically in textile industry and transport sector, raised the demand for switch gears and other electrical equipment leading to the increased demand of electrical machinery.
Within the machinery group, telecom sector imports accelerated by 11.1 percent (US$ 2136.5 million) during Jul-Mar FY2022 compared to (US$ 1923.4 million) last year. Mobile phone imports in Pakistan increased by 3.9 percent during Jul-Mar FY2022 and reached US$ 1596.3 million as compared to US$ 1535.9 million same period last year.
The import of transport group surged by 67.5 percent and reached US$ 3367.4 million during Jul-Mar FY2022 as compared to US$ 2010.3 million last year. The import of road motor vehicle increased by 73.2 percent of which CBU increased by 94.3 percent and CKD/SKD increased by 78.7 percent.
Metal group import increased by 38.4 percent and reached US$ 5011.9 million. The reviving activity in the construction and automobile sectors led to an increase in import of iron and steel by 53.1 percent in value and 20.5 percent in quantity during Jul-Mar FY2022. Imports of iron and steel scrap increased in value by 30.8 percent despite a
0
20
40
60
80
100
120
140
Source: Pink Sheet World Bank May 2022
Fig-8.4: Monthly Trend in Internation Prices of Crude Brent ($/bbl)
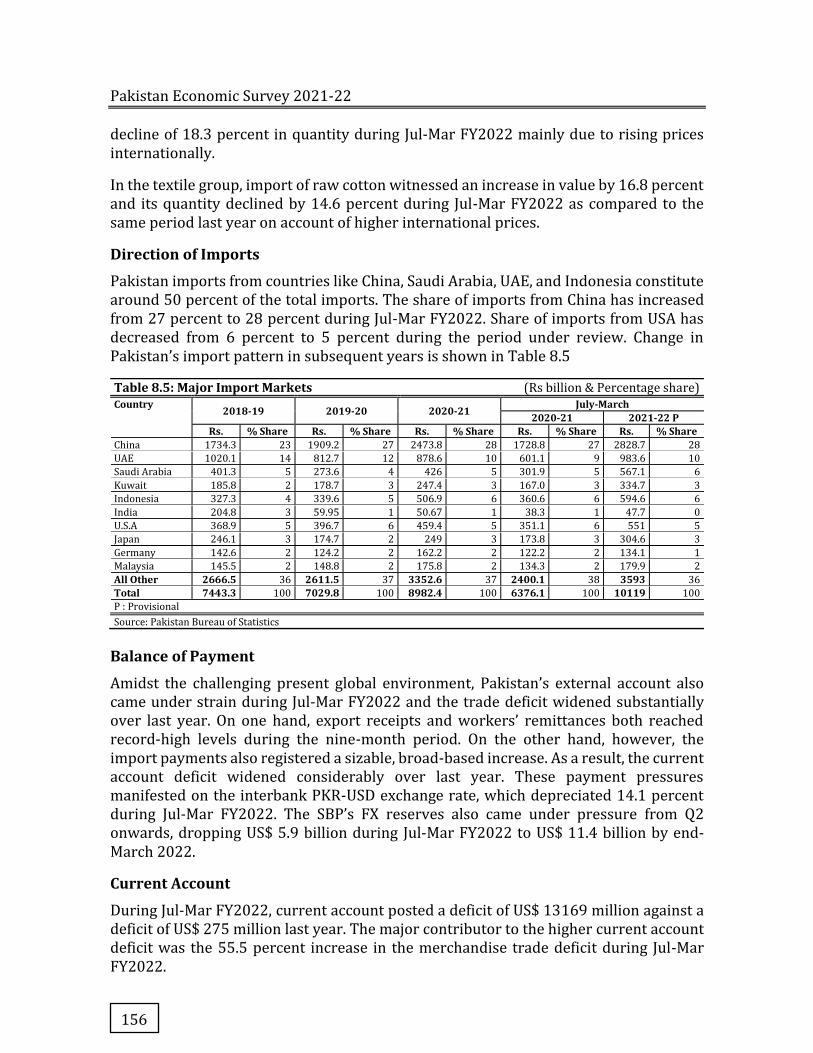
Pakistan Economic Survey 2021-22
156
decline of 18.3 percent in quantity during Jul-Mar FY2022 mainly due to rising prices internationally.
In the textile group, import of raw cotton witnessed an increase in value by 16.8 percent and its quantity declined by 14.6 percent during Jul-Mar FY2022 as compared to the same period last year on account of higher international prices.
Direction of Imports
Pakistan imports from countries like China, Saudi Arabia, UAE, and Indonesia constitute around 50 percent of the total imports. The share of imports from China has increased from 27 percent to 28 percent during Jul-Mar FY2022. Share of imports from USA has decreased from 6 percent to 5 percent during the period under review. Change in Pakistan’s import pattern in subsequent years is shown in Table 8.5
Table 8.5: Major Import Markets (Rs billion & Percentage share) Country 2018-19 2019-20 2020-21 July-March
2020-21 2021-22 P Rs. % Share Rs. % Share Rs. % Share Rs. % Share Rs. % Share
China 1734.3 23 1909.2 27 2473.8 28 1728.8 27 2828.7 28
UAE 1020.1 14 812.7 12 878.6 10 601.1 9 983.6 10
Saudi Arabia 401.3 5 273.6 4 426 5 301.9 5 567.1 6
Kuwait 185.8 2 178.7 3 247.4 3 167.0 3 334.7 3
Indonesia 327.3 4 339.6 5 506.9 6 360.6 6 594.6 6
India 204.8 3 59.95 1 50.67 1 38.3 1 47.7 0
U.S.A 368.9 5 396.7 6 459.4 5 351.1 6 551 5
Japan 246.1 3 174.7 2 249 3 173.8 3 304.6 3
Germany 142.6 2 124.2 2 162.2 2 122.2 2 134.1 1
Malaysia 145.5 2 148.8 2 175.8 2 134.3 2 179.9 2
All Other 2666.5 36 2611.5 37 3352.6 37 2400.1 38 3593 36
Total 7443.3 100 7029.8 100 8982.4 100 6376.1 100 10119 100
P : Provisional
Source: Pakistan Bureau of Statistics
Balance of Payment
Amidst the challenging present global environment, Pakistan’s external account also came under strain during Jul-Mar FY2022 and the trade deficit widened substantially over last year. On one hand, export receipts and workers’ remittances both reached record-high levels during the nine-month period. On the other hand, however, the import payments also registered a sizable, broad-based increase. As a result, the current account deficit widened considerably over last year. These payment pressures manifested on the interbank PKR-USD exchange rate, which depreciated 14.1 percent during Jul-Mar FY2022. The SBP’s FX reserves also came under pressure from Q2 onwards, dropping US$ 5.9 billion during Jul-Mar FY2022 to US$ 11.4 billion by end-March 2022.
Current Account
During Jul-Mar FY2022, current account posted a deficit of US$ 13169 million against a deficit of US$ 275 million last year. The major contributor to the higher current account deficit was the 55.5 percent increase in the merchandise trade deficit during Jul-Mar FY2022.
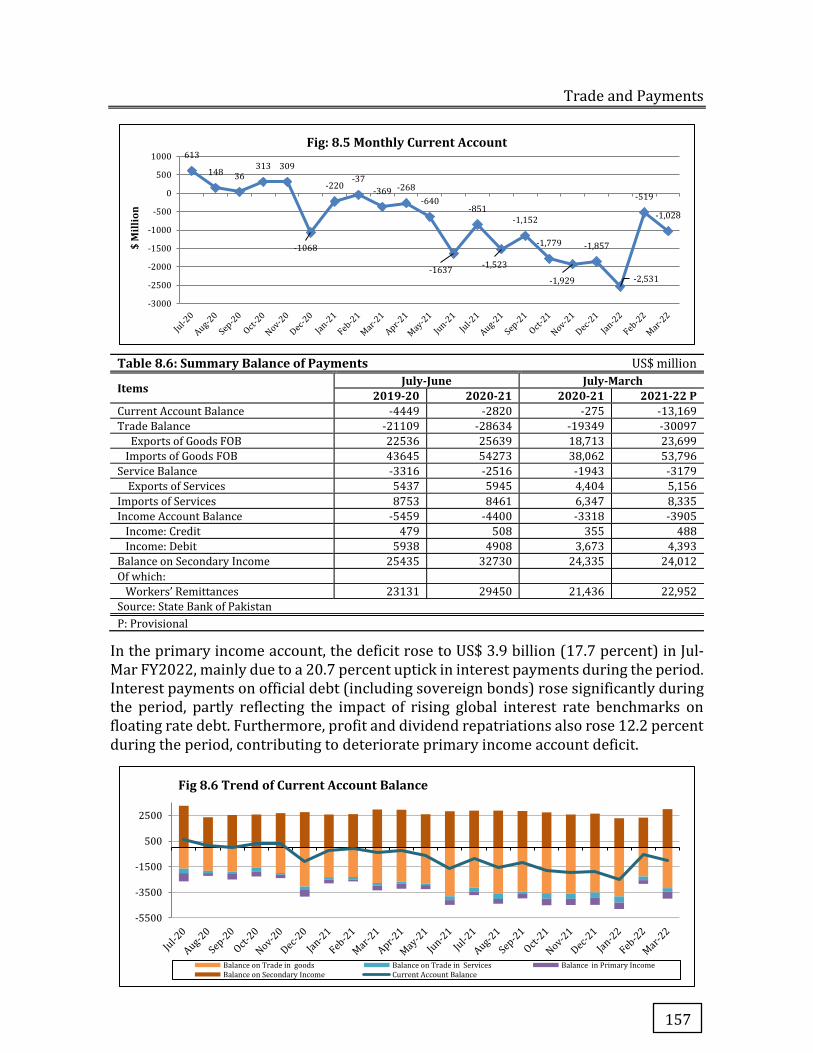
Trade and Payments
157
Table 8.6: Summary Balance of Payments US$ million
Items July-June July-March 2019-20 2020-21 2020-21 2021-22 P
Current Account Balance -4449 -2820 -275 -13,169
Trade Balance -21109 -28634 -19349 -30097
Exports of Goods FOB 22536 25639 18,713 23,699
Imports of Goods FOB 43645 54273 38,062 53,796
Service Balance -3316 -2516 -1943 -3179
Exports of Services 5437 5945 4,404 5,156
Imports of Services 8753 8461 6,347 8,335
Income Account Balance -5459 -4400 -3318 -3905
Income: Credit 479 508 355 488
Income: Debit 5938 4908 3,673 4,393
Balance on Secondary Income 25435 32730 24,335 24,012
Of which:
Workers’ Remittances 23131 29450 21,436 22,952
Source: State Bank of Pakistan
P: Provisional
In the primary income account, the deficit rose to US$ 3.9 billion (17.7 percent) in Jul-Mar FY2022, mainly due to a 20.7 percent uptick in interest payments during the period. Interest payments on official debt (including sovereign bonds) rose significantly during the period, partly reflecting the impact of rising global interest rate benchmarks on floating rate debt. Furthermore, profit and dividend repatriations also rose 12.2 percent during the period, contributing to deteriorate primary income account deficit.
613
148 36313 309
-1068
-220-37
-369 -268
-640
-1637
-851
-1,523
-1,152
-1,779
-1,929
-1,857
-2,531
-519
-1,028
-3000
-2500
-2000
-1500
-1000
-500
0
500
1000
$ M
illio
nFig: 8.5 Monthly Current Account
-5500
-3500
-1500
500
2500
Fig 8.6 Trend of Current Account Balance
Balance on Trade in goods Balance on Trade in Services Balance in Primary IncomeBalance on Secondary Income Current Account Balance
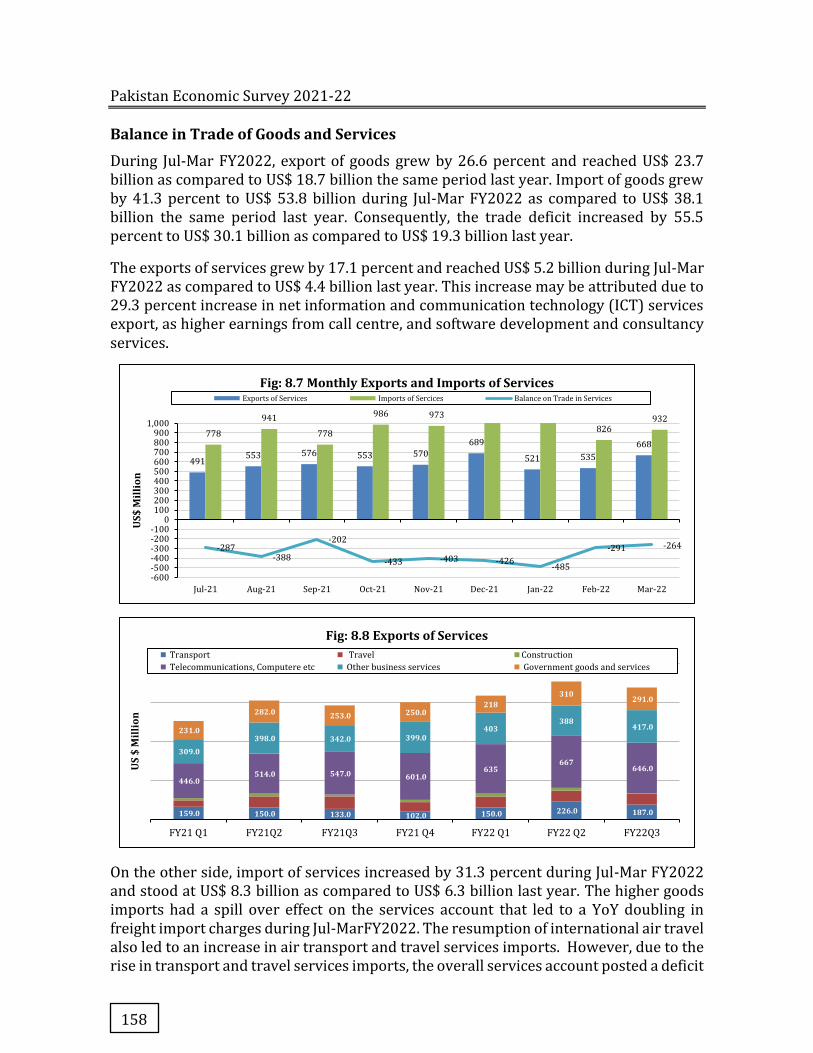
Pakistan Economic Survey 2021-22
158
Balance in Trade of Goods and Services
During Jul-Mar FY2022, export of goods grew by 26.6 percent and reached US$ 23.7 billion as compared to US$ 18.7 billion the same period last year. Import of goods grew by 41.3 percent to US$ 53.8 billion during Jul-Mar FY2022 as compared to US$ 38.1 billion the same period last year. Consequently, the trade deficit increased by 55.5 percent to US$ 30.1 billion as compared to US$ 19.3 billion last year.
The exports of services grew by 17.1 percent and reached US$ 5.2 billion during Jul-Mar FY2022 as compared to US$ 4.4 billion last year. This increase may be attributed due to 29.3 percent increase in net information and communication technology (ICT) services export, as higher earnings from call centre, and software development and consultancy services.
On the other side, import of services increased by 31.3 percent during Jul-Mar FY2022 and stood at US$ 8.3 billion as compared to US$ 6.3 billion last year. The higher goods imports had a spill over effect on the services account that led to a YoY doubling in freight import charges during Jul-MarFY2022. The resumption of international air travel also led to an increase in air transport and travel services imports. However, due to the rise in transport and travel services imports, the overall services account posted a deficit
491553 576 553 570
689
521 535
668778
941
778
986 973
826932
-287-388
-202
-433 -403 -426-485
-291 -264
-600-500-400-300-200-100
0100200300400500600700800900
1,000
Jul-21 Aug-21 Sep-21 Oct-21 Nov-21 Dec-21 Jan-22 Feb-22 Mar-22
US$
Mill
ion
Fig: 8.7 Monthly Exports and Imports of ServicesExports of Services Imports of Sercices Balance on Trade in Services
159.0 150.0 133.0 102.0 150.0 226.0 187.0
446.0 514.0 547.0 601.0
635667
646.0
309.0 398.0 342.0 399.0
403388
417.0 231.0
282.0 253.0 250.0 218
310291.0
FY21 Q1 FY21Q2 FY21Q3 FY21 Q4 FY22 Q1 FY22 Q2 FY22Q3
US
$ M
illio
n
Fig: 8.8 Exports of Services Transport Travel Construction
Telecommunications, Computere etc Other business services Government goods and services
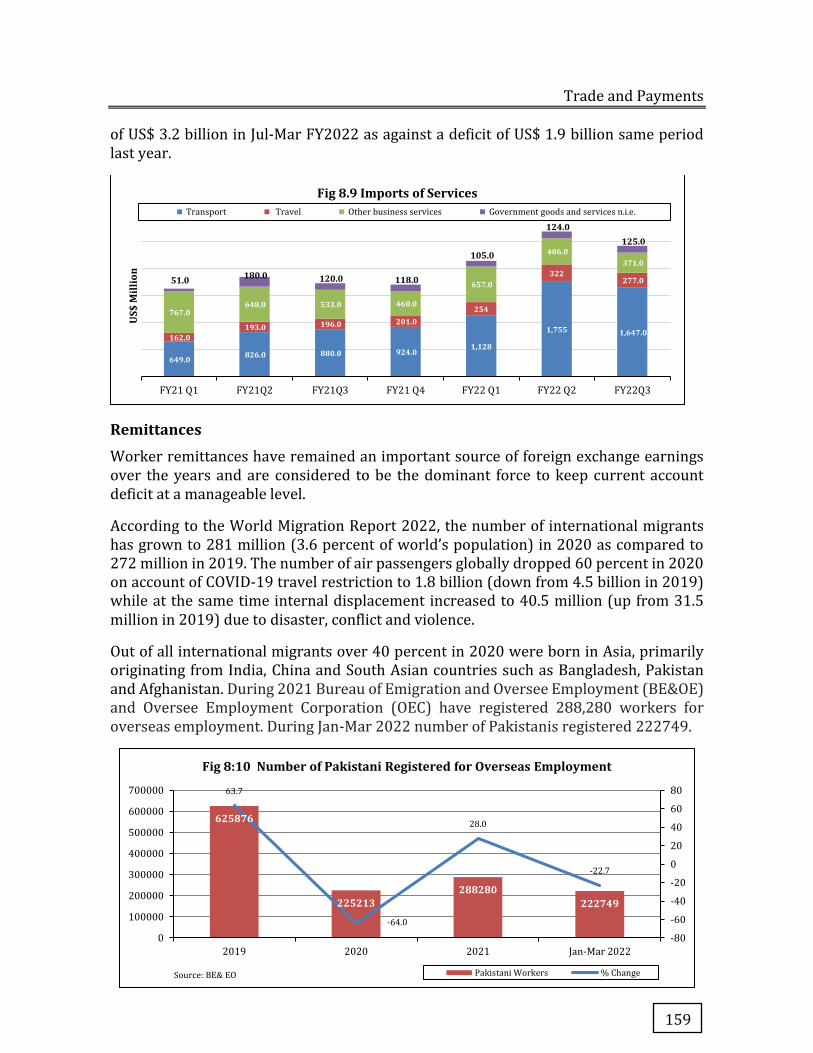
Trade and Payments
159
of US$ 3.2 billion in Jul-Mar FY2022 as against a deficit of US$ 1.9 billion same period last year.
Remittances
Worker remittances have remained an important source of foreign exchange earnings over the years and are considered to be the dominant force to keep current account deficit at a manageable level.
According to the World Migration Report 2022, the number of international migrants has grown to 281 million (3.6 percent of world’s population) in 2020 as compared to 272 million in 2019. The number of air passengers globally dropped 60 percent in 2020 on account of COVID-19 travel restriction to 1.8 billion (down from 4.5 billion in 2019) while at the same time internal displacement increased to 40.5 million (up from 31.5 million in 2019) due to disaster, conflict and violence.
Out of all international migrants over 40 percent in 2020 were born in Asia, primarily originating from India, China and South Asian countries such as Bangladesh, Pakistan and Afghanistan. During 2021 Bureau of Emigration and Oversee Employment (BE&OE) and Oversee Employment Corporation (OEC) have registered 288,280 workers for overseas employment. During Jan-Mar 2022 number of Pakistanis registered 222749.
649.0 826.0 880.0 924.0 1,128
1,755 1,647.0 162.0 193.0 196.0 201.0
254
322277.0
767.0 648.0 533.0 460.0
657.0
486.0 371.0
51.0 180.0 120.0 118.0
105.0
124.0 125.0
FY21 Q1 FY21Q2 FY21Q3 FY21 Q4 FY22 Q1 FY22 Q2 FY22Q3
US$
Mill
ion
Fig 8.9 Imports of Services Transport Travel Other business services Government goods and services n.i.e.
625876
225213288280
222749
63.7
-64.0
28.0
-22.7
-80
-60
-40
-20
0
20
40
60
80
0
100000
200000
300000
400000
500000
600000
700000
2019 2020 2021 Jan-Mar 2022
Source: BE& EO
Fig 8:10 Number of Pakistani Registered for Overseas Employment
Pakistani Workers % Change
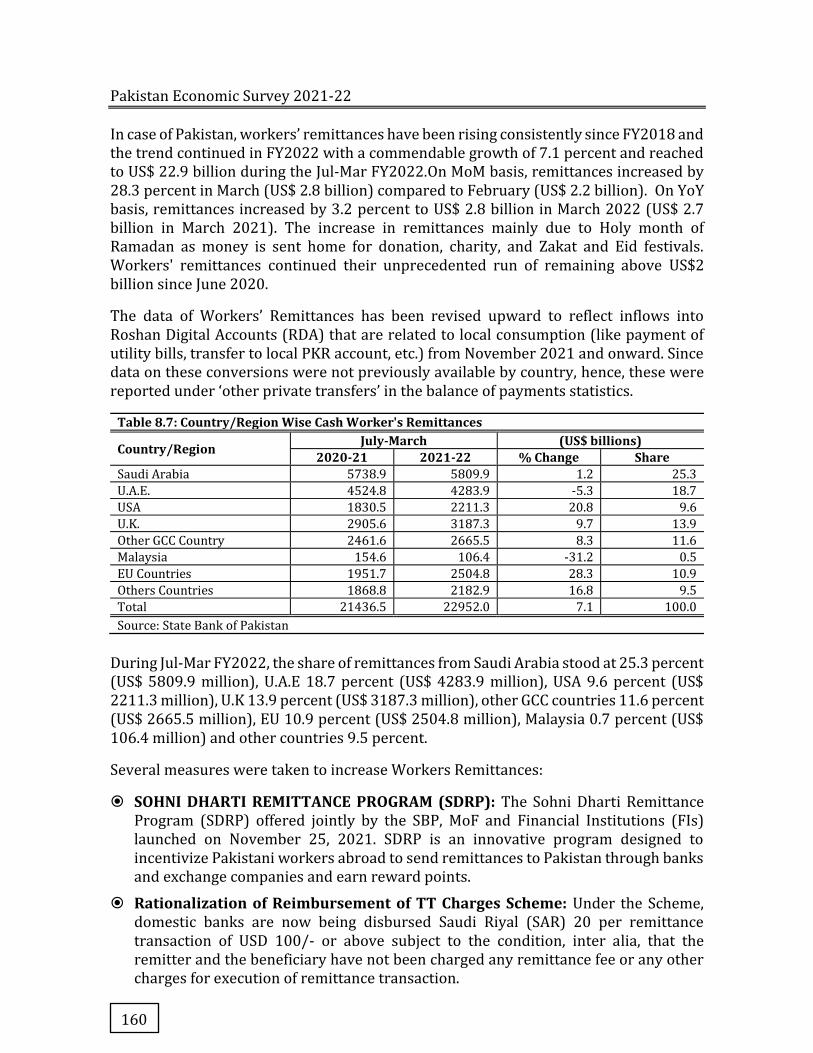
Pakistan Economic Survey 2021-22
160
In case of Pakistan, workers’ remittances have been rising consistently since FY2018 and the trend continued in FY2022 with a commendable growth of 7.1 percent and reached to US$ 22.9 billion during the Jul-Mar FY2022.On MoM basis, remittances increased by 28.3 percent in March (US$ 2.8 billion) compared to February (US$ 2.2 billion). On YoY basis, remittances increased by 3.2 percent to US$ 2.8 billion in March 2022 (US$ 2.7 billion in March 2021). The increase in remittances mainly due to Holy month of Ramadan as money is sent home for donation, charity, and Zakat and Eid festivals. Workers' remittances continued their unprecedented run of remaining above US$2 billion since June 2020.
The data of Workers’ Remittances has been revised upward to reflect inflows into Roshan Digital Accounts (RDA) that are related to local consumption (like payment of utility bills, transfer to local PKR account, etc.) from November 2021 and onward. Since data on these conversions were not previously available by country, hence, these were reported under ‘other private transfers’ in the balance of payments statistics.
Table 8.7: Country/Region Wise Cash Worker's Remittances
Country/Region July-March (US$ billions) 2020-21 2021-22 % Change Share
Saudi Arabia 5738.9 5809.9 1.2 25.3
U.A.E. 4524.8 4283.9 -5.3 18.7
USA 1830.5 2211.3 20.8 9.6
U.K. 2905.6 3187.3 9.7 13.9
Other GCC Country 2461.6 2665.5 8.3 11.6
Malaysia 154.6 106.4 -31.2 0.5
EU Countries 1951.7 2504.8 28.3 10.9
Others Countries 1868.8 2182.9 16.8 9.5
Total 21436.5 22952.0 7.1 100.0
Source: State Bank of Pakistan
During Jul-Mar FY2022, the share of remittances from Saudi Arabia stood at 25.3 percent (US$ 5809.9 million), U.A.E 18.7 percent (US$ 4283.9 million), USA 9.6 percent (US$ 2211.3 million), U.K 13.9 percent (US$ 3187.3 million), other GCC countries 11.6 percent (US$ 2665.5 million), EU 10.9 percent (US$ 2504.8 million), Malaysia 0.7 percent (US$ 106.4 million) and other countries 9.5 percent.
Several measures were taken to increase Workers Remittances:
� SOHNI DHARTI REMITTANCE PROGRAM (SDRP): The Sohni Dharti Remittance Program (SDRP) offered jointly by the SBP, MoF and Financial Institutions (FIs) launched on November 25, 2021. SDRP is an innovative program designed to incentivize Pakistani workers abroad to send remittances to Pakistan through banks and exchange companies and earn reward points.
� Rationalization of Reimbursement of TT Charges Scheme: Under the Scheme, domestic banks are now being disbursed Saudi Riyal (SAR) 20 per remittance transaction of USD 100/- or above subject to the condition, inter alia, that the remitter and the beneficiary have not been charged any remittance fee or any other charges for execution of remittance transaction.
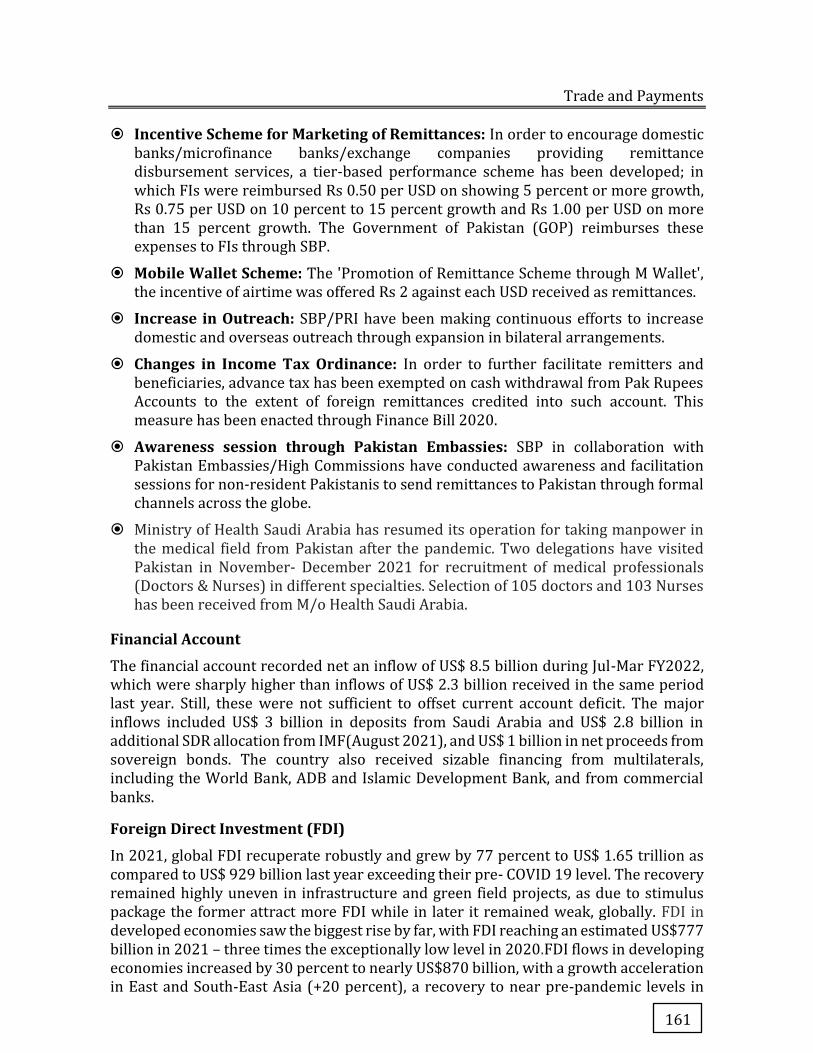
Trade and Payments
161
� Incentive Scheme for Marketing of Remittances: In order to encourage domestic banks/microfinance banks/exchange companies providing remittance disbursement services, a tier-based performance scheme has been developed; in which FIs were reimbursed Rs 0.50 per USD on showing 5 percent or more growth, Rs 0.75 per USD on 10 percent to 15 percent growth and Rs 1.00 per USD on more than 15 percent growth. The Government of Pakistan (GOP) reimburses these expenses to FIs through SBP.
� Mobile Wallet Scheme: The 'Promotion of Remittance Scheme through M Wallet', the incentive of airtime was offered Rs 2 against each USD received as remittances.
� Increase in Outreach: SBP/PRI have been making continuous efforts to increase domestic and overseas outreach through expansion in bilateral arrangements.
� Changes in Income Tax Ordinance: In order to further facilitate remitters and beneficiaries, advance tax has been exempted on cash withdrawal from Pak Rupees Accounts to the extent of foreign remittances credited into such account. This measure has been enacted through Finance Bill 2020.
� Awareness session through Pakistan Embassies: SBP in collaboration with Pakistan Embassies/High Commissions have conducted awareness and facilitation sessions for non-resident Pakistanis to send remittances to Pakistan through formal channels across the globe.
� Ministry of Health Saudi Arabia has resumed its operation for taking manpower in the medical field from Pakistan after the pandemic. Two delegations have visited Pakistan in November- December 2021 for recruitment of medical professionals (Doctors & Nurses) in different specialties. Selection of 105 doctors and 103 Nurses has been received from M/o Health Saudi Arabia.
Financial Account
The financial account recorded net an inflow of US$ 8.5 billion during Jul-Mar FY2022, which were sharply higher than inflows of US$ 2.3 billion received in the same period last year. Still, these were not sufficient to offset current account deficit. The major inflows included US$ 3 billion in deposits from Saudi Arabia and US$ 2.8 billion in additional SDR allocation from IMF(August 2021), and US$ 1 billion in net proceeds from sovereign bonds. The country also received sizable financing from multilaterals, including the World Bank, ADB and Islamic Development Bank, and from commercial banks.
Foreign Direct Investment (FDI)
In 2021, global FDI recuperate robustly and grew by 77 percent to US$ 1.65 trillion as compared to US$ 929 billion last year exceeding their pre- COVID 19 level. The recovery remained highly uneven in infrastructure and green field projects, as due to stimulus package the former attract more FDI while in later it remained weak, globally. FDI in developed economies saw the biggest rise by far, with FDI reaching an estimated US$777 billion in 2021 – three times the exceptionally low level in 2020.FDI flows in developing economies increased by 30 percent to nearly US$870 billion, with a growth acceleration in East and South-East Asia (+20 percent), a recovery to near pre-pandemic levels in
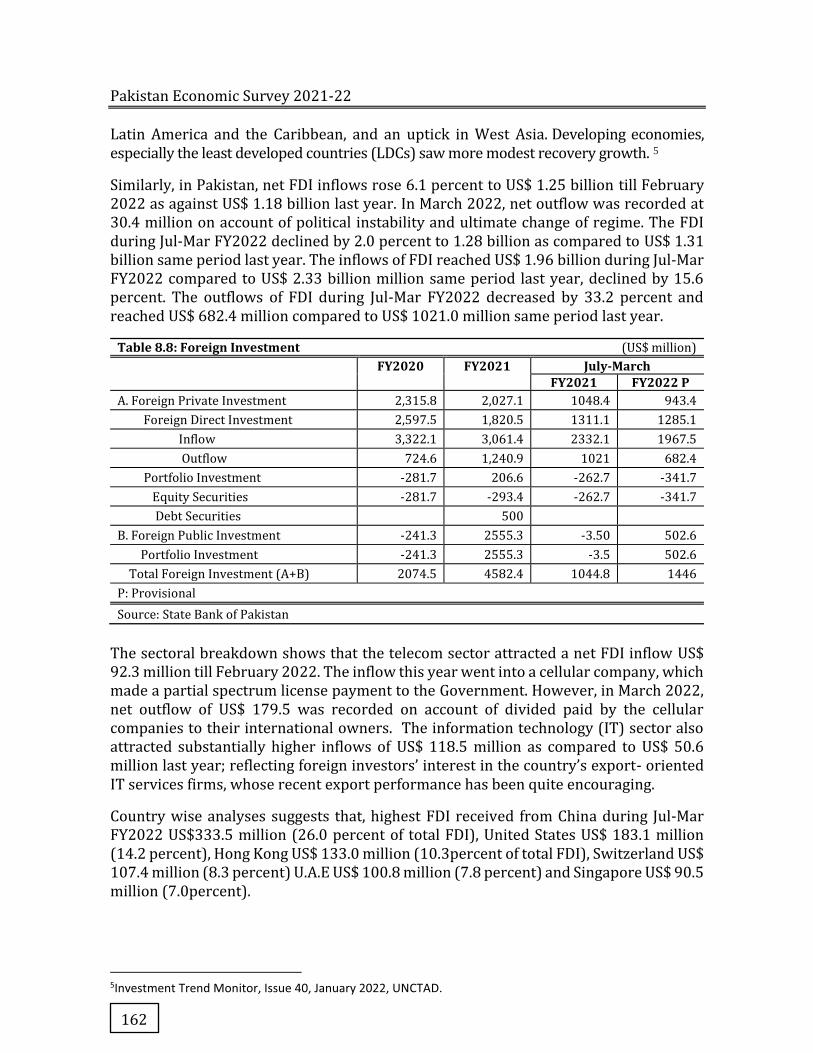
Pakistan Economic Survey 2021-22
162
Latin America and the Caribbean, and an uptick in West Asia. Developing economies, especially the least developed countries (LDCs) saw more modest recovery growth. 5
Similarly, in Pakistan, net FDI inflows rose 6.1 percent to US$ 1.25 billion till February 2022 as against US$ 1.18 billion last year. In March 2022, net outflow was recorded at 30.4 million on account of political instability and ultimate change of regime. The FDI during Jul-Mar FY2022 declined by 2.0 percent to 1.28 billion as compared to US$ 1.31 billion same period last year. The inflows of FDI reached US$ 1.96 billion during Jul-Mar FY2022 compared to US$ 2.33 billion million same period last year, declined by 15.6 percent. The outflows of FDI during Jul-Mar FY2022 decreased by 33.2 percent and reached US$ 682.4 million compared to US$ 1021.0 million same period last year.
Table 8.8: Foreign Investment (US$ million) FY2020 FY2021 July-March
FY2021 FY2022 P A. Foreign Private Investment 2,315.8 2,027.1 1048.4 943.4
Foreign Direct Investment 2,597.5 1,820.5 1311.1 1285.1
Inflow 3,322.1 3,061.4 2332.1 1967.5
Outflow 724.6 1,240.9 1021 682.4
Portfolio Investment -281.7 206.6 -262.7 -341.7
Equity Securities -281.7 -293.4 -262.7 -341.7
Debt Securities
500
B. Foreign Public Investment -241.3 2555.3 -3.50 502.6
Portfolio Investment -241.3 2555.3 -3.5 502.6
Total Foreign Investment (A+B) 2074.5 4582.4 1044.8 1446
P: Provisional
Source: State Bank of Pakistan
The sectoral breakdown shows that the telecom sector attracted a net FDI inflow US$ 92.3 million till February 2022. The inflow this year went into a cellular company, which made a partial spectrum license payment to the Government. However, in March 2022, net outflow of US$ 179.5 was recorded on account of divided paid by the cellular companies to their international owners. The information technology (IT) sector also attracted substantially higher inflows of US$ 118.5 million as compared to US$ 50.6 million last year; reflecting foreign investors’ interest in the country’s export- oriented IT services firms, whose recent export performance has been quite encouraging.
Country wise analyses suggests that, highest FDI received from China during Jul-Mar FY2022 US$333.5 million (26.0 percent of total FDI), United States US$ 183.1 million (14.2 percent), Hong Kong US$ 133.0 million (10.3percent of total FDI), Switzerland US$ 107.4 million (8.3 percent) U.A.E US$ 100.8 million (7.8 percent) and Singapore US$ 90.5 million (7.0percent).
5Investment Trend Monitor, Issue 40, January 2022, UNCTAD.
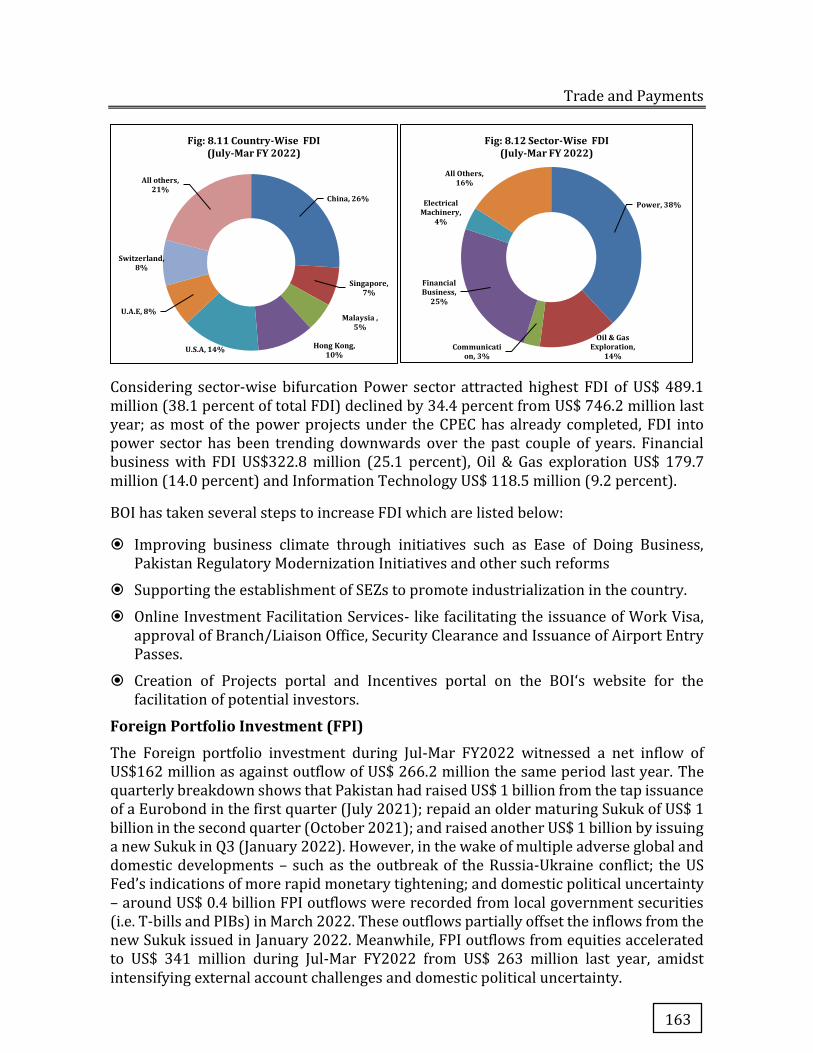
Trade and Payments
163
Considering sector-wise bifurcation Power sector attracted highest FDI of US$ 489.1 million (38.1 percent of total FDI) declined by 34.4 percent from US$ 746.2 million last year; as most of the power projects under the CPEC has already completed, FDI into power sector has been trending downwards over the past couple of years. Financial business with FDI US$322.8 million (25.1 percent), Oil & Gas exploration US$ 179.7 million (14.0 percent) and Information Technology US$ 118.5 million (9.2 percent).
BOI has taken several steps to increase FDI which are listed below:
� Improving business climate through initiatives such as Ease of Doing Business, Pakistan Regulatory Modernization Initiatives and other such reforms
� Supporting the establishment of SEZs to promote industrialization in the country.
� Online Investment Facilitation Services- like facilitating the issuance of Work Visa, approval of Branch/Liaison Office, Security Clearance and Issuance of Airport Entry Passes.
� Creation of Projects portal and Incentives portal on the BOI‘s website for the facilitation of potential investors.
Foreign Portfolio Investment (FPI)
The Foreign portfolio investment during Jul-Mar FY2022 witnessed a net inflow of US$162 million as against outflow of US$ 266.2 million the same period last year. The quarterly breakdown shows that Pakistan had raised US$ 1 billion from the tap issuance of a Eurobond in the first quarter (July 2021); repaid an older maturing Sukuk of US$ 1 billion in the second quarter (October 2021); and raised another US$ 1 billion by issuing a new Sukuk in Q3 (January 2022). However, in the wake of multiple adverse global and domestic developments – such as the outbreak of the Russia-Ukraine conflict; the US Fed’s indications of more rapid monetary tightening; and domestic political uncertainty – around US$ 0.4 billion FPI outflows were recorded from local government securities (i.e. T-bills and PIBs) in March 2022. These outflows partially offset the inflows from the new Sukuk issued in January 2022. Meanwhile, FPI outflows from equities accelerated to US$ 341 million during Jul-Mar FY2022 from US$ 263 million last year, amidst intensifying external account challenges and domestic political uncertainty.
China, 26%
Singapore, 7%
Malaysia , 5%
Hong Kong, 10%
U.S.A, 14%
U.A.E, 8%
Switzerland, 8%
All others, 21%
Fig: 8.11 Country-Wise FDI (July-Mar FY 2022)
Power, 38%
Oil & Gas Exploration,
14%Communicati
on, 3%
Financial Business,
25%
Electrical Machinery,
4%
All Others, 16%
Fig: 8.12 Sector-Wise FDI(July-Mar FY 2022)
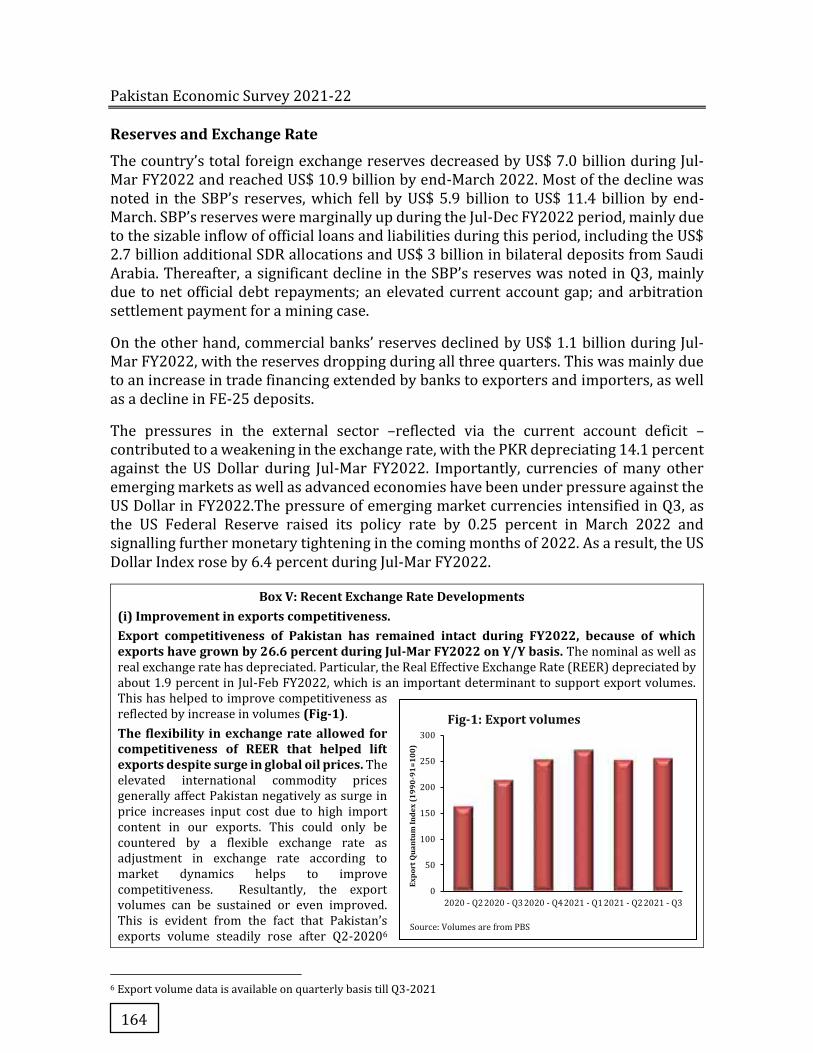
Pakistan Economic Survey 2021-22
164
Reserves and Exchange Rate
The country’s total foreign exchange reserves decreased by US$ 7.0 billion during Jul-Mar FY2022 and reached US$ 10.9 billion by end-March 2022. Most of the decline was noted in the SBP’s reserves, which fell by US$ 5.9 billion to US$ 11.4 billion by end-March. SBP’s reserves were marginally up during the Jul-Dec FY2022 period, mainly due to the sizable inflow of official loans and liabilities during this period, including the US$ 2.7 billion additional SDR allocations and US$ 3 billion in bilateral deposits from Saudi Arabia. Thereafter, a significant decline in the SBP’s reserves was noted in Q3, mainly due to net official debt repayments; an elevated current account gap; and arbitration settlement payment for a mining case.
On the other hand, commercial banks’ reserves declined by US$ 1.1 billion during Jul-Mar FY2022, with the reserves dropping during all three quarters. This was mainly due to an increase in trade financing extended by banks to exporters and importers, as well as a decline in FE-25 deposits.
The pressures in the external sector –reflected via the current account deficit – contributed to a weakening in the exchange rate, with the PKR depreciating 14.1 percent against the US Dollar during Jul-Mar FY2022. Importantly, currencies of many other emerging markets as well as advanced economies have been under pressure against the US Dollar in FY2022.The pressure of emerging market currencies intensified in Q3, as the US Federal Reserve raised its policy rate by 0.25 percent in March 2022 and signalling further monetary tightening in the coming months of 2022. As a result, the US Dollar Index rose by 6.4 percent during Jul-Mar FY2022.
Box V: Recent Exchange Rate Developments (i) Improvement in exports competitiveness. Export competitiveness of Pakistan has remained intact during FY2022, because of which exports have grown by 26.6 percent during Jul-Mar FY2022 on Y/Y basis. The nominal as well as real exchange rate has depreciated. Particular, the Real Effective Exchange Rate (REER) depreciated by about 1.9 percent in Jul-Feb FY2022, which is an important determinant to support export volumes. This has helped to improve competitiveness as reflected by increase in volumes (Fig-1).
The flexibility in exchange rate allowed for competitiveness of REER that helped lift exports despite surge in global oil prices. The elevated international commodity prices generally affect Pakistan negatively as surge in price increases input cost due to high import content in our exports. This could only be countered by a flexible exchange rate as adjustment in exchange rate according to market dynamics helps to improve competitiveness. Resultantly, the export volumes can be sustained or even improved. This is evident from the fact that Pakistan’s exports volume steadily rose after Q2-20206
6 Export volume data is available on quarterly basis till Q3-2021
0
50
100
150
200
250
300
2020 - Q22020 - Q32020 - Q42021 - Q12021 - Q22021 - Q3
Expo
rt Q
uant
um In
dex
(199
0-91
=100
)
Source: Volumes are from PBS
Fig-1: Export volumes
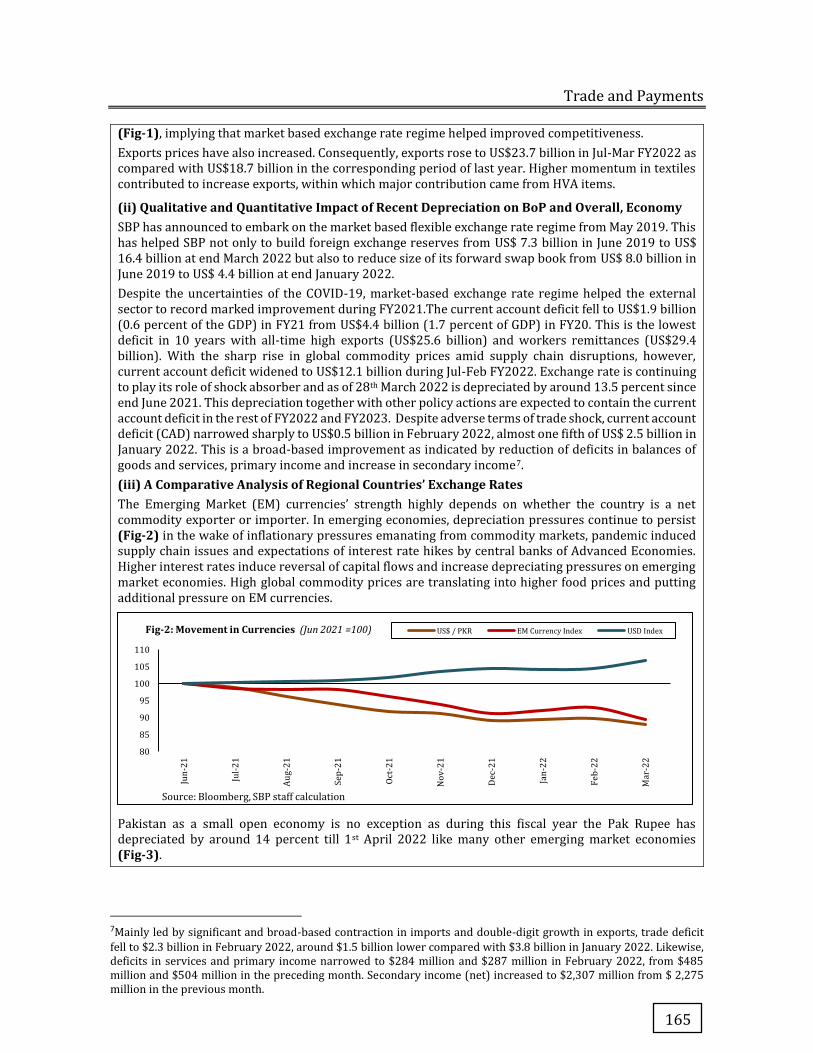
Trade and Payments
165
(Fig-1), implying that market based exchange rate regime helped improved competitiveness.
Exports prices have also increased. Consequently, exports rose to US$23.7 billion in Jul-Mar FY2022 as compared with US$18.7 billion in the corresponding period of last year. Higher momentum in textiles contributed to increase exports, within which major contribution came from HVA items.
(ii) Qualitative and Quantitative Impact of Recent Depreciation on BoP and Overall, Economy SBP has announced to embark on the market based flexible exchange rate regime from May 2019. This has helped SBP not only to build foreign exchange reserves from US$ 7.3 billion in June 2019 to US$ 16.4 billion at end March 2022 but also to reduce size of its forward swap book from US$ 8.0 billion in June 2019 to US$ 4.4 billion at end January 2022.
Despite the uncertainties of the COVID-19, market-based exchange rate regime helped the external sector to record marked improvement during FY2021.The current account deficit fell to US$1.9 billion (0.6 percent of the GDP) in FY21 from US$4.4 billion (1.7 percent of GDP) in FY20. This is the lowest deficit in 10 years with all-time high exports (US$25.6 billion) and workers remittances (US$29.4 billion). With the sharp rise in global commodity prices amid supply chain disruptions, however, current account deficit widened to US$12.1 billion during Jul-Feb FY2022. Exchange rate is continuing to play its role of shock absorber and as of 28th March 2022 is depreciated by around 13.5 percent since end June 2021. This depreciation together with other policy actions are expected to contain the current account deficit in the rest of FY2022 and FY2023. Despite adverse terms of trade shock, current account deficit (CAD) narrowed sharply to US$0.5 billion in February 2022, almost one fifth of US$ 2.5 billion in January 2022. This is a broad-based improvement as indicated by reduction of deficits in balances of goods and services, primary income and increase in secondary income7.
(iii) A Comparative Analysis of Regional Countries’ Exchange Rates The Emerging Market (EM) currencies’ strength highly depends on whether the country is a net commodity exporter or importer. In emerging economies, depreciation pressures continue to persist (Fig-2) in the wake of inflationary pressures emanating from commodity markets, pandemic induced supply chain issues and expectations of interest rate hikes by central banks of Advanced Economies. Higher interest rates induce reversal of capital flows and increase depreciating pressures on emerging market economies. High global commodity prices are translating into higher food prices and putting additional pressure on EM currencies.
Pakistan as a small open economy is no exception as during this fiscal year the Pak Rupee has depreciated by around 14 percent till 1st April 2022 like many other emerging market economies (Fig-3).
7Mainly led by significant and broad-based contraction in imports and double-digit growth in exports, trade deficit
fell to $2.3 billion in February 2022, around $1.5 billion lower compared with $3.8 billion in January 2022. Likewise, deficits in services and primary income narrowed to $284 million and $287 million in February 2022, from $485 million and $504 million in the preceding month. Secondary income (net) increased to $2,307 million from $ 2,275 million in the previous month.
80
85
90
95
100
105
110
Jun
-21
Jul-
21
Au
g-2
1
Se
p-2
1
Oct
-21
No
v-2
1
De
c-2
1
Jan
-22
Fe
b-2
2
Ma
r-2
2
Source: Bloomberg, SBP staff calculation
Fig-2: Movement in Currencies (Jun 2021 =100) US$ / PKR EM Currency Index USD Index
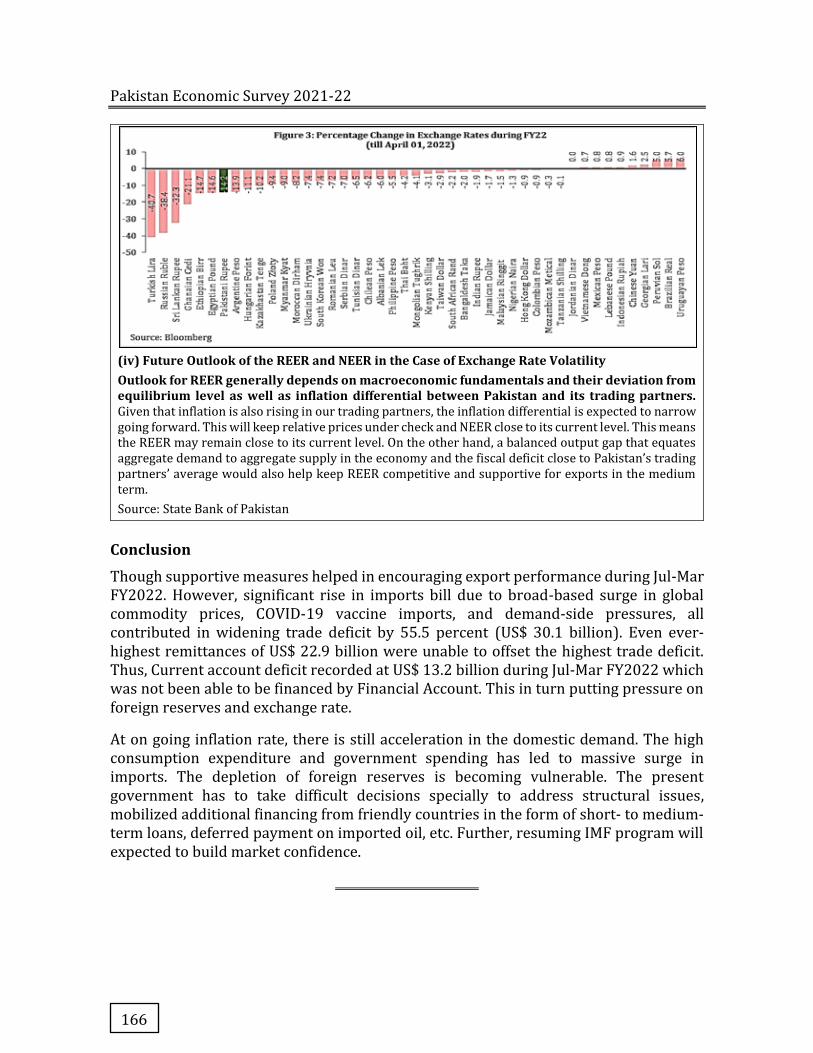
Pakistan Economic Survey 2021-22
166
(iv) Future Outlook of the REER and NEER in the Case of Exchange Rate Volatility Outlook for REER generally depends on macroeconomic fundamentals and their deviation from equilibrium level as well as inflation differential between Pakistan and its trading partners. Given that inflation is also rising in our trading partners, the inflation differential is expected to narrow going forward. This will keep relative prices under check and NEER close to its current level. This means the REER may remain close to its current level. On the other hand, a balanced output gap that equates aggregate demand to aggregate supply in the economy and the fiscal deficit close to Pakistan’s trading partners’ average would also help keep REER competitive and supportive for exports in the medium term.
Source: State Bank of Pakistan
Conclusion
Though supportive measures helped in encouraging export performance during Jul-Mar FY2022. However, significant rise in imports bill due to broad-based surge in global commodity prices, COVID-19 vaccine imports, and demand-side pressures, all contributed in widening trade deficit by 55.5 percent (US$ 30.1 billion). Even ever-highest remittances of US$ 22.9 billion were unable to offset the highest trade deficit. Thus, Current account deficit recorded at US$ 13.2 billion during Jul-Mar FY2022 which was not been able to be financed by Financial Account. This in turn putting pressure on foreign reserves and exchange rate.
At on going inflation rate, there is still acceleration in the domestic demand. The high consumption expenditure and government spending has led to massive surge in imports. The depletion of foreign reserves is becoming vulnerable. The present government has to take difficult decisions specially to address structural issues, mobilized additional financing from friendly countries in the form of short- to medium-term loans, deferred payment on imported oil, etc. Further, resuming IMF program will expected to build market confidence.
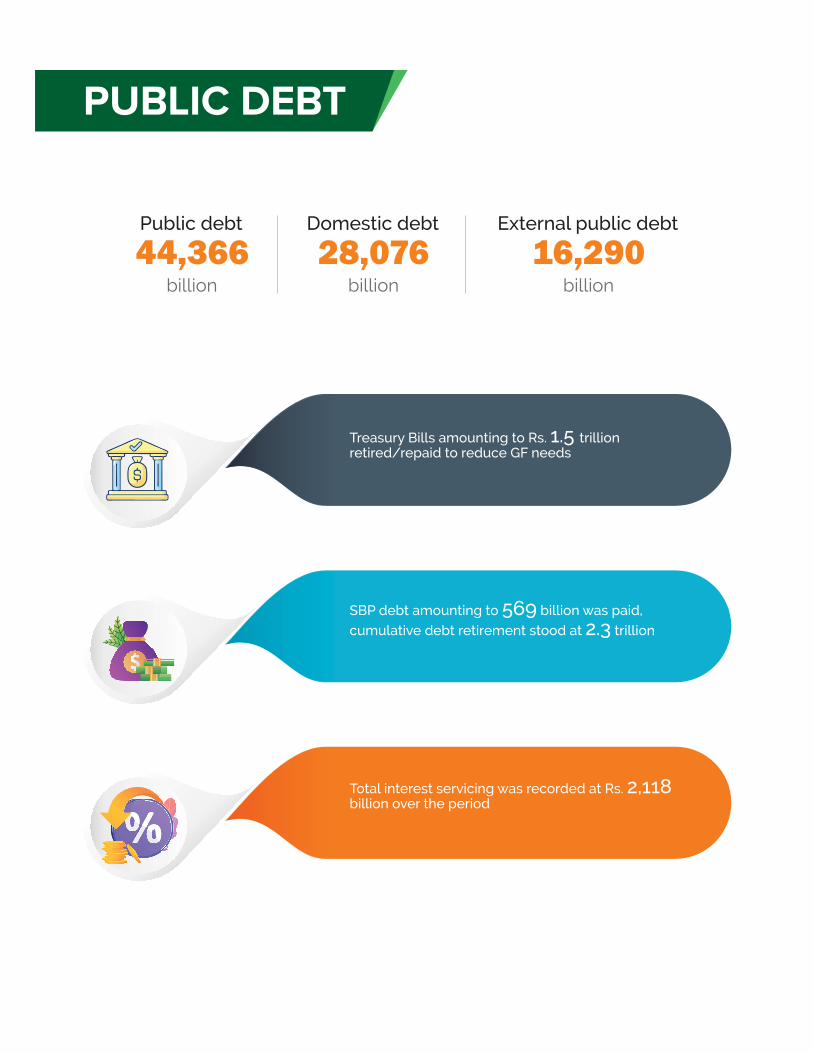

9.1 Introduction
The primary objective of public debt management is to establish and execute a multi-pronged debt strategy to efficiently bridge the gap between the Government’s revenues and expenditures at the lowest possible cost while ensuring a sustainable level of risk. In addition, the development of efficient and liquid domestic debt capital market is also a key objective of public debt management.
The conduct of public debt management varies from country to country due to different institutional setup, macro-dynamics, behaviour of economic fundamentals, legal
frameworks, and governance structures. Nevertheless, the objective is to ensure that both the level and rate of growth in public debt is fundamentally sustainable while safeguarding that the debt portfolios are efficiently structured in terms of currency composition, maturity profile, interest rates, and prudent levels of contingent liabilities.
Public debt portfolio witnessed various developments during first nine months of ongoing fiscal year (Jul-Mar 2021-22), some of them are highlighted as follows:
� Within domestic debt, the Government relied entirely on long-term domestic debt securities for the financing of its fiscal deficit and repayment of debt maturities. Infact, Government retired Treasury Bills amounting to Rs 1.5 trillion which led to a reduction of short-term maturities in-line with the Government’s commitment to reduce its Gross Financing Needs (GFN);
� The Government re paid Rs 569 billion against its debt owed to SBP. The cumulative debt retirement against SBP debt stood at Rs 2.3 trillion from July 2019 to March 2022;
� The Government successfully issued Shariah Compliant Sukuk instruments amounting to around Rs 1.1 trillion, in line with the target specified in Medium Term Debt Management Strategy of Pakistan (2019/20 - 2022/23), to increase the share of Shariah compliant securities within domestic debt stock;
� Debt from multilateral and bilateral sources cumulatively constituted around 79 percent of the external public debt portfolio at end-March 2022. A set of reforms initiated by the Government to improve the economy has brought strong support from multilateral development partners. This is expected to strengthen confidence and catalyse additional support from development partners in the coming years which will also help in reducing the pressure on domestic sources;
Chapter 9
Public Debt
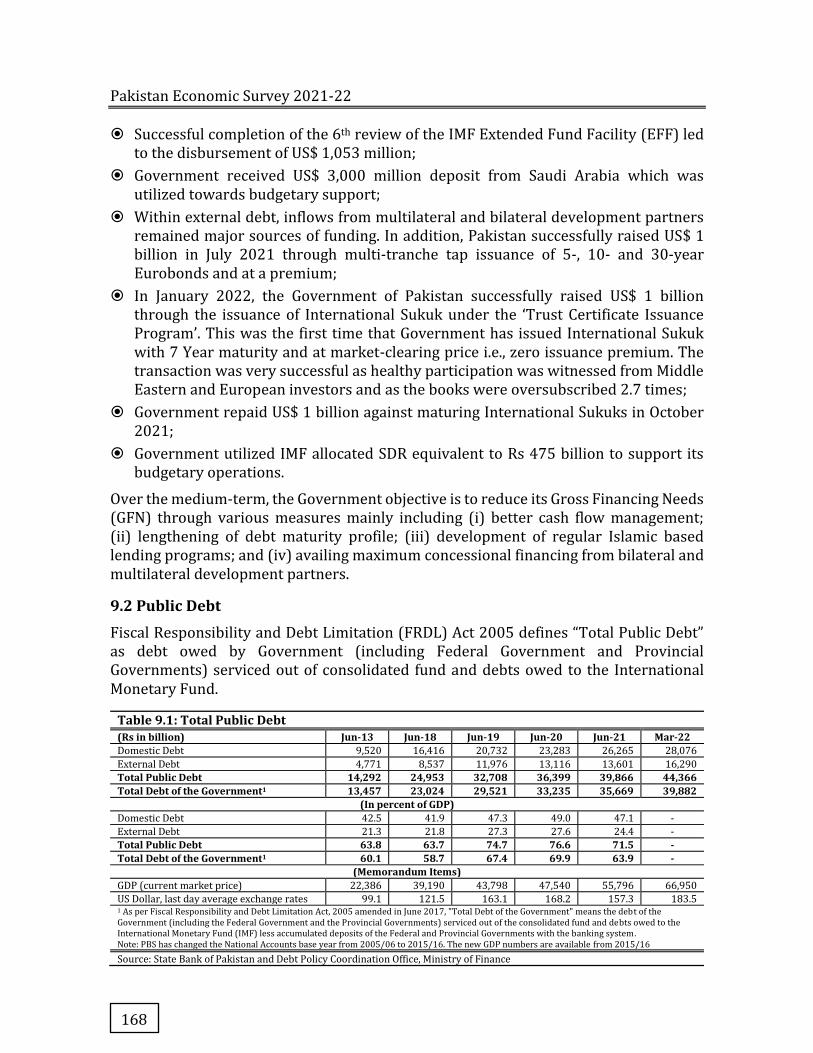
Pakistan Economic Survey 2021-22
168
� Successful completion of the 6th review of the IMF Extended Fund Facility (EFF) led to the disbursement of US$ 1,053 million;
� Government received US$ 3,000 million deposit from Saudi Arabia which was utilized towards budgetary support;
� Within external debt, inflows from multilateral and bilateral development partners remained major sources of funding. In addition, Pakistan successfully raised US$ 1 billion in July 2021 through multi-tranche tap issuance of 5-, 10- and 30-year Eurobonds and at a premium;
� In January 2022, the Government of Pakistan successfully raised US$ 1 billion through the issuance of International Sukuk under the ‘Trust Certificate Issuance Program’. This was the first time that Government has issued International Sukuk with 7 Year maturity and at market-clearing price i.e., zero issuance premium. The transaction was very successful as healthy participation was witnessed from Middle Eastern and European investors and as the books were oversubscribed 2.7 times;
� Government repaid US$ 1 billion against maturing International Sukuks in October 2021;
� Government utilized IMF allocated SDR equivalent to Rs 475 billion to support its budgetary operations.
Over the medium-term, the Government objective is to reduce its Gross Financing Needs (GFN) through various measures mainly including (i) better cash flow management; (ii) lengthening of debt maturity profile; (iii) development of regular Islamic based lending programs; and (iv) availing maximum concessional financing from bilateral and multilateral development partners.
9.2 Public Debt
Fiscal Responsibility and Debt Limitation (FRDL) Act 2005 defines “Total Public Debt” as debt owed by Government (including Federal Government and Provincial Governments) serviced out of consolidated fund and debts owed to the International Monetary Fund.
Table 9.1: Total Public Debt (Rs in billion) Jun-13 Jun-18 Jun-19 Jun-20 Jun-21 Mar-22 Domestic Debt 9,520 16,416 20,732 23,283 26,265 28,076
External Debt 4,771 8,537 11,976 13,116 13,601 16,290
Total Public Debt 14,292 24,953 32,708 36,399 39,866 44,366 Total Debt of the Government1 13,457 23,024 29,521 33,235 35,669 39,882
(In percent of GDP) Domestic Debt 42.5 41.9 47.3 49.0 47.1 -
External Debt 21.3 21.8 27.3 27.6 24.4 -
Total Public Debt 63.8 63.7 74.7 76.6 71.5 - Total Debt of the Government1 60.1 58.7 67.4 69.9 63.9 -
(Memorandum Items) GDP (current market price) 22,386 39,190 43,798 47,540 55,796 66,950
US Dollar, last day average exchange rates 99.1 121.5 163.1 168.2 157.3 183.5 1 As per Fiscal Responsibility and Debt Limitation Act, 2005 amended in June 2017, "Total Debt of the Government" means the debt of the Government (including the Federal Government and the Provincial Governments) serviced out of the consolidated fund and debts owed to the International Monetary Fund (IMF) less accumulated deposits of the Federal and Provincial Governments with the banking system. Note: PBS has changed the National Accounts base year from 2005/06 to 2015/16. The new GDP numbers are available from 2015/16
Source: State Bank of Pakistan and Debt Policy Coordination Office, Ministry of Finance
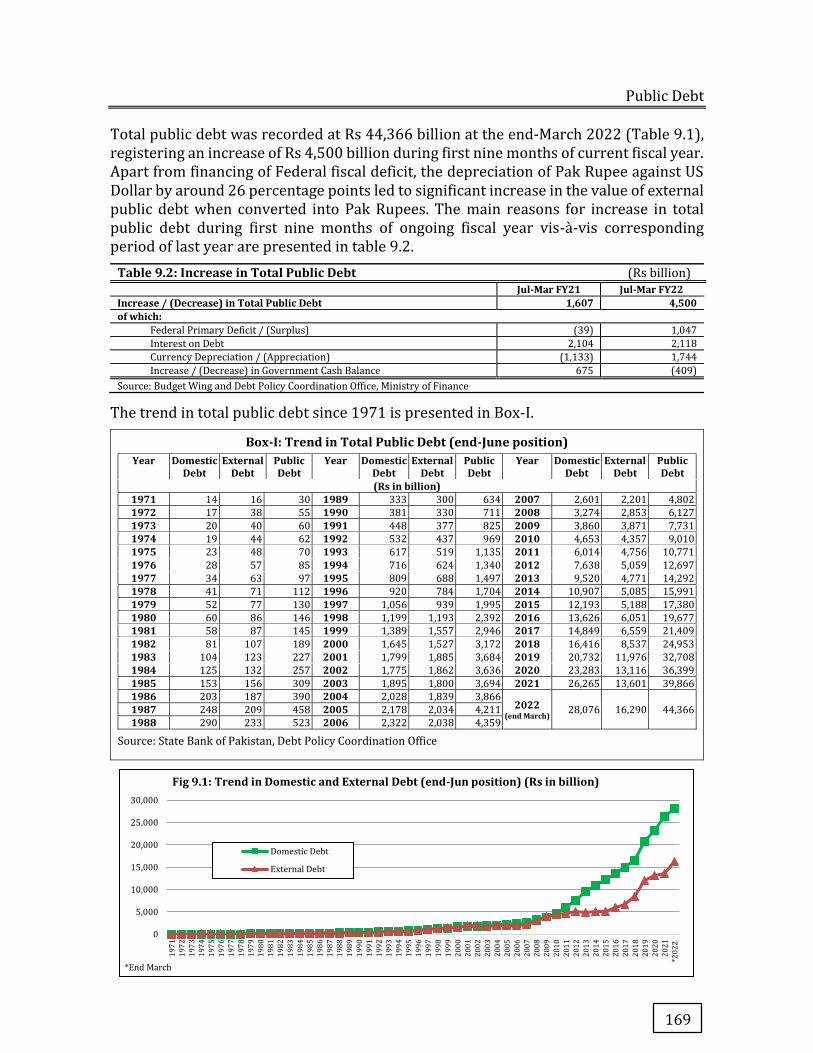
Public Debt
169
Total public debt was recorded at Rs 44,366 billion at the end-March 2022 (Table 9.1), registering an increase of Rs 4,500 billion during first nine months of current fiscal year. Apart from financing of Federal fiscal deficit, the depreciation of Pak Rupee against US Dollar by around 26 percentage points led to significant increase in the value of external public debt when converted into Pak Rupees. The main reasons for increase in total public debt during first nine months of ongoing fiscal year vis-à-vis corresponding period of last year are presented in table 9.2.
Table 9.2: Increase in Total Public Debt (Rs billion) Jul-Mar FY21 Jul-Mar FY22
Increase / (Decrease) in Total Public Debt 1,607 4,500 of which: Federal Primary Deficit / (Surplus) (39) 1,047
Interest on Debt 2,104 2,118
Currency Depreciation / (Appreciation) (1,133) 1,744
Increase / (Decrease) in Government Cash Balance 675 (409)
Source: Budget Wing and Debt Policy Coordination Office, Ministry of Finance
The trend in total public debt since 1971 is presented in Box-I.
Box-I: Trend in Total Public Debt (end-June position) Year Domestic
Debt External
Debt Public Debt
Year Domestic Debt
External Debt
Public Debt
Year Domestic Debt
External Debt
Public Debt
(Rs in billion) 1971 14 16 30 1989 333 300 634 2007 2,601 2,201 4,802
1972 17 38 55 1990 381 330 711 2008 3,274 2,853 6,127
1973 20 40 60 1991 448 377 825 2009 3,860 3,871 7,731
1974 19 44 62 1992 532 437 969 2010 4,653 4,357 9,010
1975 23 48 70 1993 617 519 1,135 2011 6,014 4,756 10,771
1976 28 57 85 1994 716 624 1,340 2012 7,638 5,059 12,697
1977 34 63 97 1995 809 688 1,497 2013 9,520 4,771 14,292
1978 41 71 112 1996 920 784 1,704 2014 10,907 5,085 15,991
1979 52 77 130 1997 1,056 939 1,995 2015 12,193 5,188 17,380
1980 60 86 146 1998 1,199 1,193 2,392 2016 13,626 6,051 19,677
1981 58 87 145 1999 1,389 1,557 2,946 2017 14,849 6,559 21,409
1982 81 107 189 2000 1,645 1,527 3,172 2018 16,416 8,537 24,953
1983 104 123 227 2001 1,799 1,885 3,684 2019 20,732 11,976 32,708
1984 125 132 257 2002 1,775 1,862 3,636 2020 23,283 13,116 36,399
1985 153 156 309 2003 1,895 1,800 3,694 2021 26,265 13,601 39,866
1986 203 187 390 2004 2,028 1,839 3,866 2022
(end March) 28,076 16,290 44,366 1987 248 209 458 2005 2,178 2,034 4,211
1988 290 233 523 2006 2,322 2,038 4,359
Source: State Bank of Pakistan, Debt Policy Coordination Office
0
5,000
10,000
15,000
20,000
25,000
30,000
19
71
19
72
19
73
19
74
19
75
19
76
19
77
19
78
19
79
19
80
19
81
19
82
19
83
19
84
19
85
19
86
19
87
19
88
19
89
19
90
19
91
19
92
19
93
19
94
19
95
19
96
19
97
19
98
19
99
20
00
20
01
20
02
20
03
20
04
20
05
20
06
20
07
20
08
20
09
20
10
20
11
20
12
20
13
20
14
20
15
20
16
20
17
20
18
20
19
20
20
20
21
*2
02
2
*End March
Fig 9.1: Trend in Domestic and External Debt (end-Jun position) (Rs in billion)
Domestic Debt
External Debt
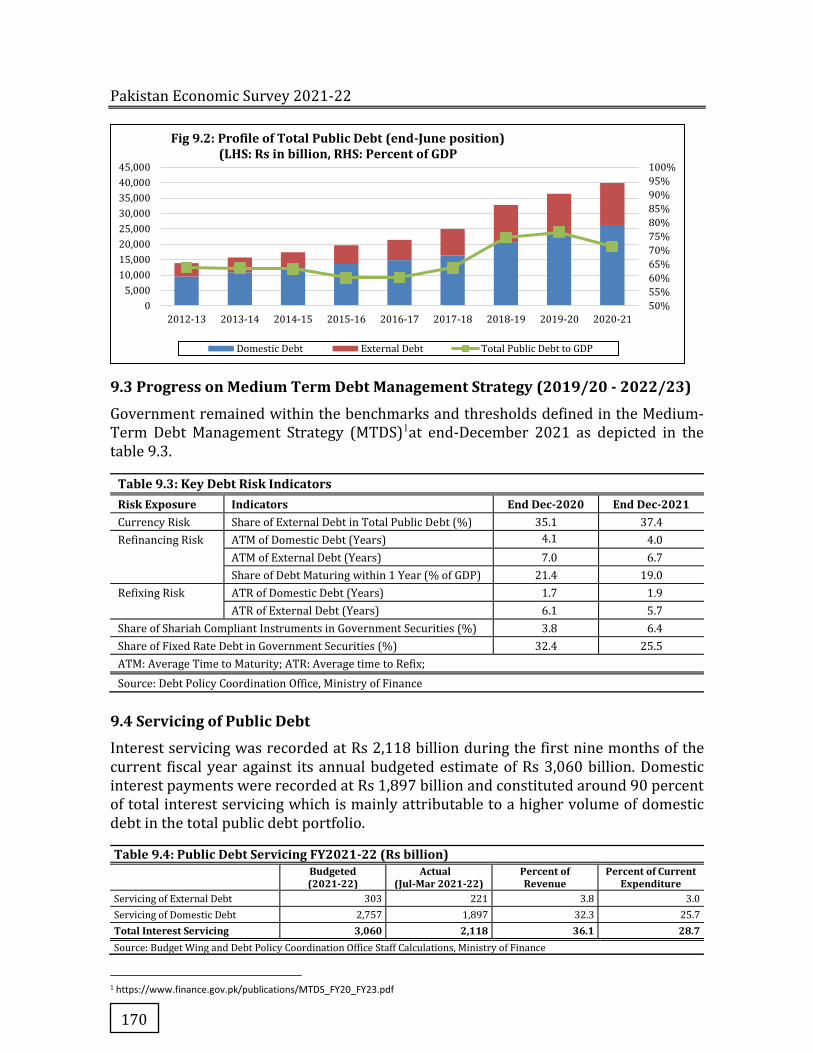
Pakistan Economic Survey 2021-22
170
9.3 Progress on Medium Term Debt Management Strategy (2019/20 - 2022/23)
Government remained within the benchmarks and thresholds defined in the Medium-Term Debt Management Strategy (MTDS)1at end-December 2021 as depicted in the table 9.3.
Table 9.3: Key Debt Risk Indicators Risk Exposure Indicators End Dec-2020 End Dec-2021 Currency Risk Share of External Debt in Total Public Debt (%) 35.1 37.4
Refinancing Risk ATM of Domestic Debt (Years) 4.1 4.0
ATM of External Debt (Years) 7.0 6.7
Share of Debt Maturing within 1 Year (% of GDP) 21.4 19.0
Refixing Risk ATR of Domestic Debt (Years) 1.7 1.9
ATR of External Debt (Years) 6.1 5.7
Share of Shariah Compliant Instruments in Government Securities (%) 3.8 6.4
Share of Fixed Rate Debt in Government Securities (%) 32.4 25.5
ATM: Average Time to Maturity; ATR: Average time to Refix;
Source: Debt Policy Coordination Office, Ministry of Finance
9.4 Servicing of Public Debt
Interest servicing was recorded at Rs 2,118 billion during the first nine months of the current fiscal year against its annual budgeted estimate of Rs 3,060 billion. Domestic interest payments were recorded at Rs 1,897 billion and constituted around 90 percent of total interest servicing which is mainly attributable to a higher volume of domestic debt in the total public debt portfolio.
Table 9.4: Public Debt Servicing FY2021-22 (Rs billion) Budgeted (2021-22)
Actual (Jul-Mar 2021-22)
Percent of Revenue
Percent of Current Expenditure
Servicing of External Debt 303 221 3.8 3.0
Servicing of Domestic Debt 2,757 1,897 32.3 25.7
Total Interest Servicing 3,060 2,118 36.1 28.7 Source: Budget Wing and Debt Policy Coordination Office Staff Calculations, Ministry of Finance
1 https://www.finance.gov.pk/publications/MTDS_FY20_FY23.pdf
50%
55%
60%
65%
70%
75%
80%
85%
90%
95%
100%
0
5,000
10,000
15,000
20,000
25,000
30,000
35,000
40,000
45,000
2012-13 2013-14 2014-15 2015-16 2016-17 2017-18 2018-19 2019-20 2020-21
Fig 9.2: Profile of Total Public Debt (end-June position)(LHS: Rs in billion, RHS: Percent of GDP
Domestic Debt External Debt Total Public Debt to GDP
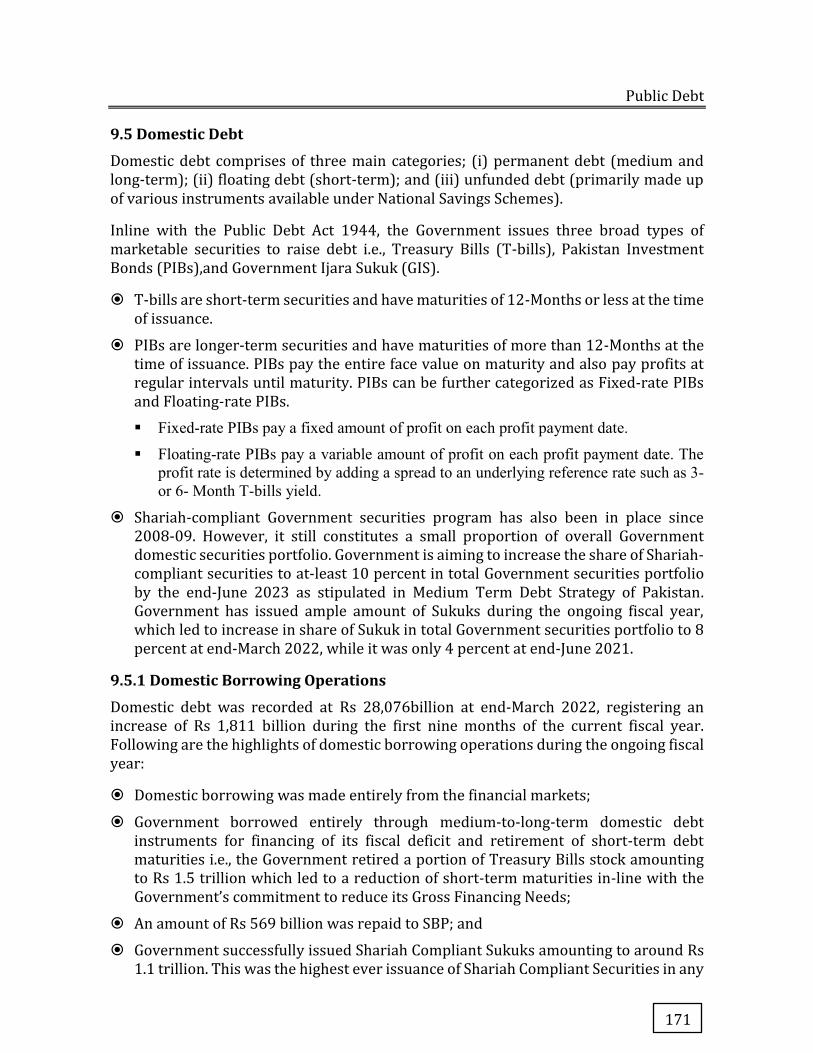
Public Debt
171
9.5 Domestic Debt
Domestic debt comprises of three main categories; (i) permanent debt (medium and long-term); (ii) floating debt (short-term); and (iii) unfunded debt (primarily made up of various instruments available under National Savings Schemes).
Inline with the Public Debt Act 1944, the Government issues three broad types of marketable securities to raise debt i.e., Treasury Bills (T-bills), Pakistan Investment Bonds (PIBs),and Government Ijara Sukuk (GIS).
� T-bills are short-term securities and have maturities of 12-Months or less at the time of issuance.
� PIBs are longer-term securities and have maturities of more than 12-Months at the time of issuance. PIBs pay the entire face value on maturity and also pay profits at regular intervals until maturity. PIBs can be further categorized as Fixed-rate PIBs and Floating-rate PIBs.
� Fixed-rate PIBs pay a fixed amount of profit on each profit payment date.
� Floating-rate PIBs pay a variable amount of profit on each profit payment date. The profit rate is determined by adding a spread to an underlying reference rate such as 3- or 6- Month T-bills yield.
� Shariah-compliant Government securities program has also been in place since 2008-09. However, it still constitutes a small proportion of overall Government domestic securities portfolio. Government is aiming to increase the share of Shariah-compliant securities to at-least 10 percent in total Government securities portfolio by the end-June 2023 as stipulated in Medium Term Debt Strategy of Pakistan. Government has issued ample amount of Sukuks during the ongoing fiscal year, which led to increase in share of Sukuk in total Government securities portfolio to 8 percent at end-March 2022, while it was only 4 percent at end-June 2021.
9.5.1 Domestic Borrowing Operations
Domestic debt was recorded at Rs 28,076billion at end-March 2022, registering an increase of Rs 1,811 billion during the first nine months of the current fiscal year. Following are the highlights of domestic borrowing operations during the ongoing fiscal year:
� Domestic borrowing was made entirely from the financial markets;
� Government borrowed entirely through medium-to-long-term domestic debt instruments for financing of its fiscal deficit and retirement of short-term debt maturities i.e., the Government retired a portion of Treasury Bills stock amounting to Rs 1.5 trillion which led to a reduction of short-term maturities in-line with the Government’s commitment to reduce its Gross Financing Needs;
� An amount of Rs 569 billion was repaid to SBP; and
� Government successfully issued Shariah Compliant Sukuks amounting to around Rs 1.1 trillion. This was the highest ever issuance of Shariah Compliant Securities in any
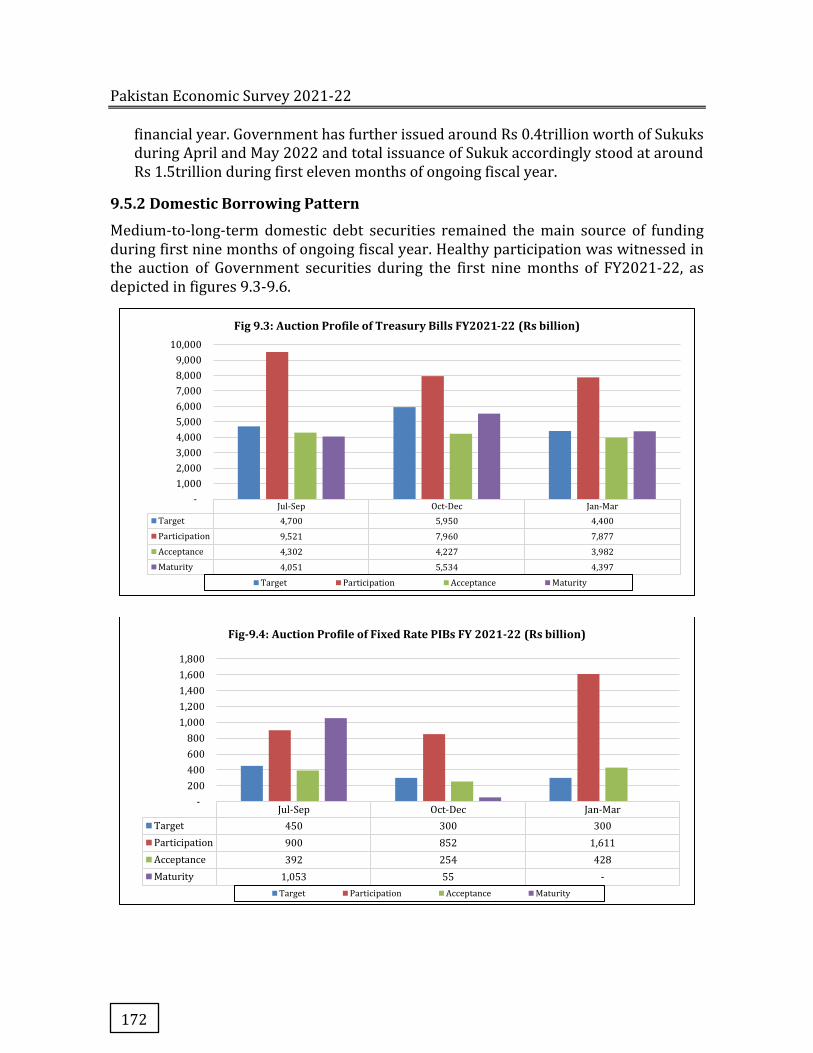
Pakistan Economic Survey 2021-22
172
financial year. Government has further issued around Rs 0.4trillion worth of Sukuks during April and May 2022 and total issuance of Sukuk accordingly stood at around Rs 1.5trillion during first eleven months of ongoing fiscal year.
9.5.2 Domestic Borrowing Pattern
Medium-to-long-term domestic debt securities remained the main source of funding during first nine months of ongoing fiscal year. Healthy participation was witnessed in the auction of Government securities during the first nine months of FY2021-22, as depicted in figures 9.3-9.6.
Jul-Sep Oct-Dec Jan-Mar
Target 4,700 5,950 4,400
Participation 9,521 7,960 7,877
Acceptance 4,302 4,227 3,982
Maturity 4,051 5,534 4,397
-
1,000
2,000
3,000
4,000
5,000
6,000
7,000
8,000
9,000
10,000
Fig 9.3: Auction Profile of Treasury Bills FY2021-22 (Rs billion)
Target Participation Acceptance Maturity
Jul-Sep Oct-Dec Jan-Mar
Target 450 300 300
Participation 900 852 1,611
Acceptance 392 254 428
Maturity 1,053 55 -
-
200
400
600
800
1,000
1,200
1,400
1,600
1,800
Fig-9.4: Auction Profile of Fixed Rate PIBs FY 2021-22 (Rs billion)
Target Participation Acceptance Maturity
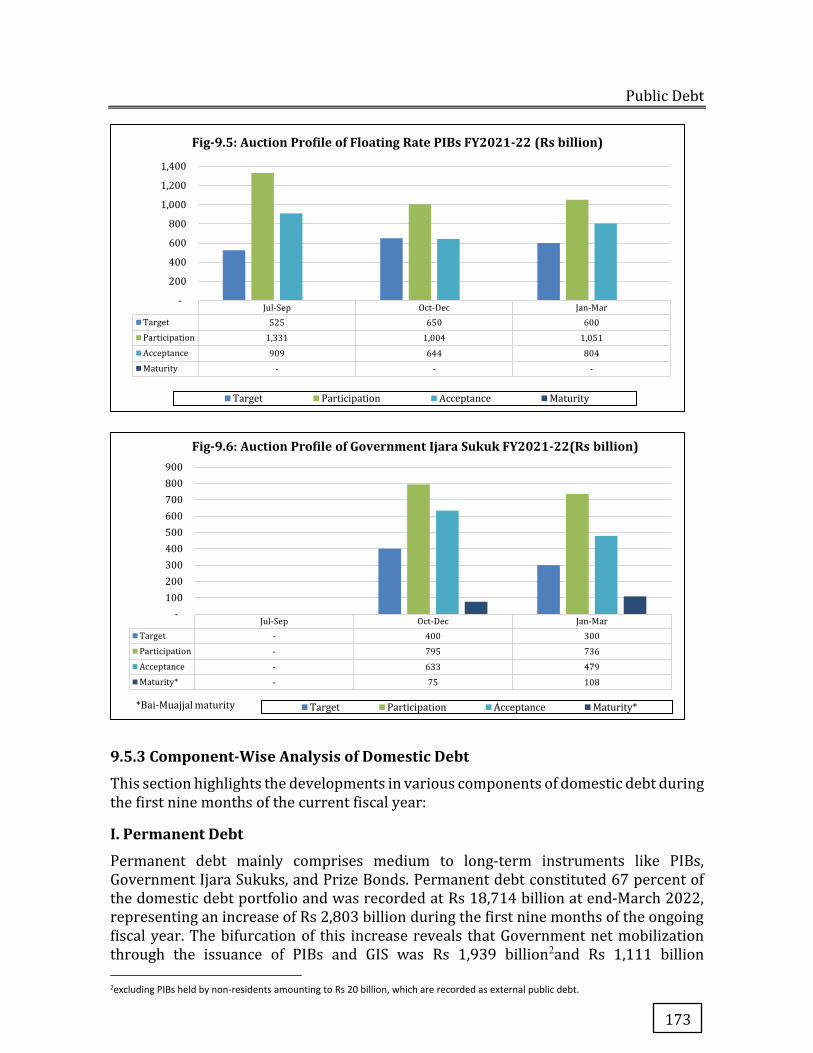
Public Debt
173
9.5.3 Component-Wise Analysis of Domestic Debt
This section highlights the developments in various components of domestic debt during the first nine months of the current fiscal year:
I. Permanent Debt
Permanent debt mainly comprises medium to long-term instruments like PIBs, Government Ijara Sukuks, and Prize Bonds. Permanent debt constituted 67 percent of the domestic debt portfolio and was recorded at Rs 18,714 billion at end-March 2022, representing an increase of Rs 2,803 billion during the first nine months of the ongoing fiscal year. The bifurcation of this increase reveals that Government net mobilization through the issuance of PIBs and GIS was Rs 1,939 billion2and Rs 1,111 billion
2excluding PIBs held by non-residents amounting to Rs 20 billion, which are recorded as external public debt.
Jul-Sep Oct-Dec Jan-Mar
Target 525 650 600
Participation 1,331 1,004 1,051
Acceptance 909 644 804
Maturity - - -
-
200
400
600
800
1,000
1,200
1,400
Fig-9.5: Auction Profile of Floating Rate PIBs FY2021-22 (Rs billion)
Target Participation Acceptance Maturity
Jul-Sep Oct-Dec Jan-Mar
Target - 400 300
Participation - 795 736
Acceptance - 633 479
Maturity* - 75 108
-
100
200
300
400
500
600
700
800
900
*Bai-Muajjal maturity
Fig-9.6: Auction Profile of Government Ijara Sukuk FY2021-22(Rs billion)
Target Participation Acceptance Maturity*
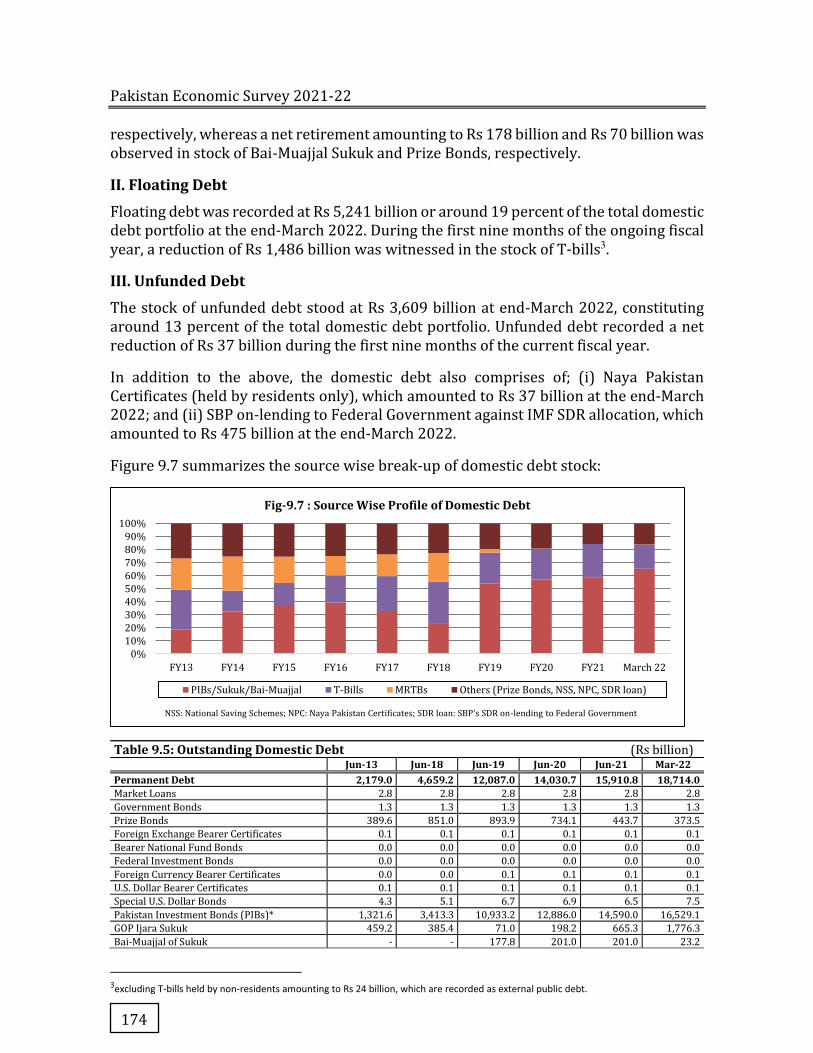
Pakistan Economic Survey 2021-22
174
respectively, whereas a net retirement amounting to Rs 178 billion and Rs 70 billion was observed in stock of Bai-Muajjal Sukuk and Prize Bonds, respectively.
II. Floating Debt
Floating debt was recorded at Rs 5,241 billion or around 19 percent of the total domestic debt portfolio at the end-March 2022. During the first nine months of the ongoing fiscal year, a reduction of Rs 1,486 billion was witnessed in the stock of T-bills3.
III. Unfunded Debt
The stock of unfunded debt stood at Rs 3,609 billion at end-March 2022, constituting around 13 percent of the total domestic debt portfolio. Unfunded debt recorded a net reduction of Rs 37 billion during the first nine months of the current fiscal year.
In addition to the above, the domestic debt also comprises of; (i) Naya Pakistan Certificates (held by residents only), which amounted to Rs 37 billion at the end-March 2022; and (ii) SBP on-lending to Federal Government against IMF SDR allocation, which amounted to Rs 475 billion at the end-March 2022.
Figure 9.7 summarizes the source wise break-up of domestic debt stock:
Table 9.5: Outstanding Domestic Debt (Rs billion) Jun-13 Jun-18 Jun-19 Jun-20 Jun-21 Mar-22
Permanent Debt 2,179.0 4,659.2 12,087.0 14,030.7 15,910.8 18,714.0 Market Loans 2.8 2.8 2.8 2.8 2.8 2.8
Government Bonds 1.3 1.3 1.3 1.3 1.3 1.3
Prize Bonds 389.6 851.0 893.9 734.1 443.7 373.5
Foreign Exchange Bearer Certificates 0.1 0.1 0.1 0.1 0.1 0.1
Bearer National Fund Bonds 0.0 0.0 0.0 0.0 0.0 0.0
Federal Investment Bonds 0.0 0.0 0.0 0.0 0.0 0.0
Foreign Currency Bearer Certificates 0.0 0.0 0.1 0.1 0.1 0.1
U.S. Dollar Bearer Certificates 0.1 0.1 0.1 0.1 0.1 0.1
Special U.S. Dollar Bonds 4.3 5.1 6.7 6.9 6.5 7.5
Pakistan Investment Bonds (PIBs)* 1,321.6 3,413.3 10,933.2 12,886.0 14,590.0 16,529.1
GOP Ijara Sukuk 459.2 385.4 71.0 198.2 665.3 1,776.3
Bai-Muajjal of Sukuk - - 177.8 201.0 201.0 23.2
3excluding T-bills held by non-residents amounting to Rs 24 billion, which are recorded as external public debt.
0%
10%
20%
30%
40%
50%
60%
70%
80%
90%
100%
FY13 FY14 FY15 FY16 FY17 FY18 FY19 FY20 FY21 March 22
Fig-9.7 : Source Wise Profile of Domestic Debt
PIBs/Sukuk/Bai-Muajjal T-Bills MRTBs Others (Prize Bonds, NSS, NPC, SDR loan)
NSS: National Saving Schemes; NPC: Naya Pakistan Certificates; SDR loan: SBP's SDR on-lending to Federal Government
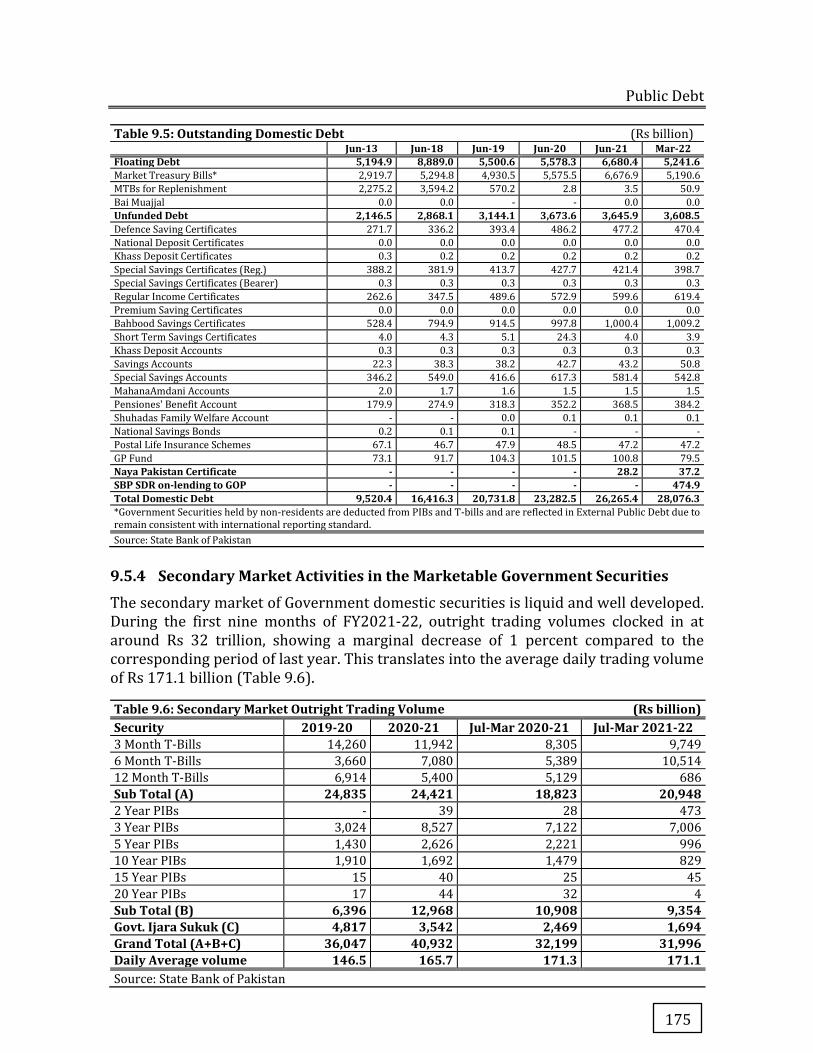
Public Debt
175
Table 9.5: Outstanding Domestic Debt (Rs billion) Jun-13 Jun-18 Jun-19 Jun-20 Jun-21 Mar-22
Floating Debt 5,194.9 8,889.0 5,500.6 5,578.3 6,680.4 5,241.6 Market Treasury Bills* 2,919.7 5,294.8 4,930.5 5,575.5 6,676.9 5,190.6
MTBs for Replenishment 2,275.2 3,594.2 570.2 2.8 3.5 50.9
Bai Muajjal 0.0 0.0 - - 0.0 0.0
Unfunded Debt 2,146.5 2,868.1 3,144.1 3,673.6 3,645.9 3,608.5 Defence Saving Certificates 271.7 336.2 393.4 486.2 477.2 470.4
National Deposit Certificates 0.0 0.0 0.0 0.0 0.0 0.0
Khass Deposit Certificates 0.3 0.2 0.2 0.2 0.2 0.2
Special Savings Certificates (Reg.) 388.2 381.9 413.7 427.7 421.4 398.7
Special Savings Certificates (Bearer) 0.3 0.3 0.3 0.3 0.3 0.3
Regular Income Certificates 262.6 347.5 489.6 572.9 599.6 619.4
Premium Saving Certificates 0.0 0.0 0.0 0.0 0.0 0.0
Bahbood Savings Certificates 528.4 794.9 914.5 997.8 1,000.4 1,009.2
Short Term Savings Certificates 4.0 4.3 5.1 24.3 4.0 3.9
Khass Deposit Accounts 0.3 0.3 0.3 0.3 0.3 0.3
Savings Accounts 22.3 38.3 38.2 42.7 43.2 50.8
Special Savings Accounts 346.2 549.0 416.6 617.3 581.4 542.8
MahanaAmdani Accounts 2.0 1.7 1.6 1.5 1.5 1.5
Pensiones' Benefit Account 179.9 274.9 318.3 352.2 368.5 384.2
Shuhadas Family Welfare Account - - 0.0 0.1 0.1 0.1
National Savings Bonds 0.2 0.1 0.1 - - -
Postal Life Insurance Schemes 67.1 46.7 47.9 48.5 47.2 47.2
GP Fund 73.1 91.7 104.3 101.5 100.8 79.5
Naya Pakistan Certificate - - - - 28.2 37.2 SBP SDR on-lending to GOP - - - - - 474.9 Total Domestic Debt 9,520.4 16,416.3 20,731.8 23,282.5 26,265.4 28,076.3 *Government Securities held by non-residents are deducted from PIBs and T-bills and are reflected in External Public Debt due to remain consistent with international reporting standard.
Source: State Bank of Pakistan
9.5.4 Secondary Market Activities in the Marketable Government Securities
The secondary market of Government domestic securities is liquid and well developed. During the first nine months of FY2021-22, outright trading volumes clocked in at around Rs 32 trillion, showing a marginal decrease of 1 percent compared to the corresponding period of last year. This translates into the average daily trading volume of Rs 171.1 billion (Table 9.6).
Table 9.6: Secondary Market Outright Trading Volume (Rs billion) Security 2019-20 2020-21 Jul-Mar 2020-21 Jul-Mar 2021-22 3 Month T-Bills 14,260 11,942 8,305 9,749
6 Month T-Bills 3,660 7,080 5,389 10,514
12 Month T-Bills 6,914 5,400 5,129 686
Sub Total (A) 24,835 24,421 18,823 20,948 2 Year PIBs - 39 28 473
3 Year PIBs 3,024 8,527 7,122 7,006
5 Year PIBs 1,430 2,626 2,221 996
10 Year PIBs 1,910 1,692 1,479 829
15 Year PIBs 15 40 25 45
20 Year PIBs 17 44 32 4
Sub Total (B) 6,396 12,968 10,908 9,354 Govt. Ijara Sukuk (C) 4,817 3,542 2,469 1,694 Grand Total (A+B+C) 36,047 40,932 32,199 31,996 Daily Average volume 146.5 165.7 171.3 171.1 Source: State Bank of Pakistan
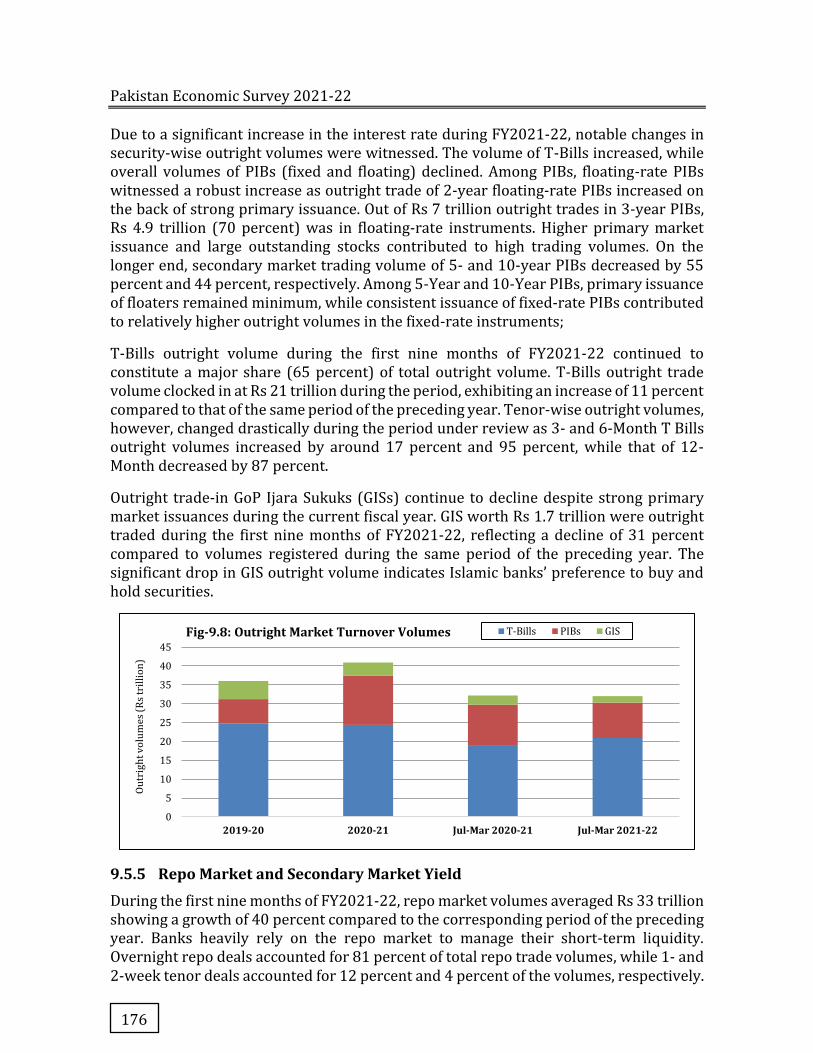
Pakistan Economic Survey 2021-22
176
Due to a significant increase in the interest rate during FY2021-22, notable changes in security-wise outright volumes were witnessed. The volume of T-Bills increased, while overall volumes of PIBs (fixed and floating) declined. Among PIBs, floating-rate PIBs witnessed a robust increase as outright trade of 2-year floating-rate PIBs increased on the back of strong primary issuance. Out of Rs 7 trillion outright trades in 3-year PIBs, Rs 4.9 trillion (70 percent) was in floating-rate instruments. Higher primary market issuance and large outstanding stocks contributed to high trading volumes. On the longer end, secondary market trading volume of 5- and 10-year PIBs decreased by 55 percent and 44 percent, respectively. Among 5-Year and 10-Year PIBs, primary issuance of floaters remained minimum, while consistent issuance of fixed-rate PIBs contributed to relatively higher outright volumes in the fixed-rate instruments;
T-Bills outright volume during the first nine months of FY2021-22 continued to constitute a major share (65 percent) of total outright volume. T-Bills outright trade volume clocked in at Rs 21 trillion during the period, exhibiting an increase of 11 percent compared to that of the same period of the preceding year. Tenor-wise outright volumes, however, changed drastically during the period under review as 3- and 6-Month T Bills outright volumes increased by around 17 percent and 95 percent, while that of 12-Month decreased by 87 percent.
Outright trade-in GoP Ijara Sukuks (GISs) continue to decline despite strong primary market issuances during the current fiscal year. GIS worth Rs 1.7 trillion were outright traded during the first nine months of FY2021-22, reflecting a decline of 31 percent compared to volumes registered during the same period of the preceding year. The significant drop in GIS outright volume indicates Islamic banks’ preference to buy and hold securities.
9.5.5 Repo Market and Secondary Market Yield
During the first nine months of FY2021-22, repo market volumes averaged Rs 33 trillion showing a growth of 40 percent compared to the corresponding period of the preceding year. Banks heavily rely on the repo market to manage their short-term liquidity. Overnight repo deals accounted for 81 percent of total repo trade volumes, while 1- and 2-week tenor deals accounted for 12 percent and 4 percent of the volumes, respectively.
0
5
10
15
20
25
30
35
40
45
2019-20 2020-21 Jul-Mar 2020-21 Jul-Mar 2021-22
Ou
trig
ht
vo
lum
es
(Rs
tril
lio
n)
Fig-9.8: Outright Market Turnover Volumes T-Bills PIBs GIS
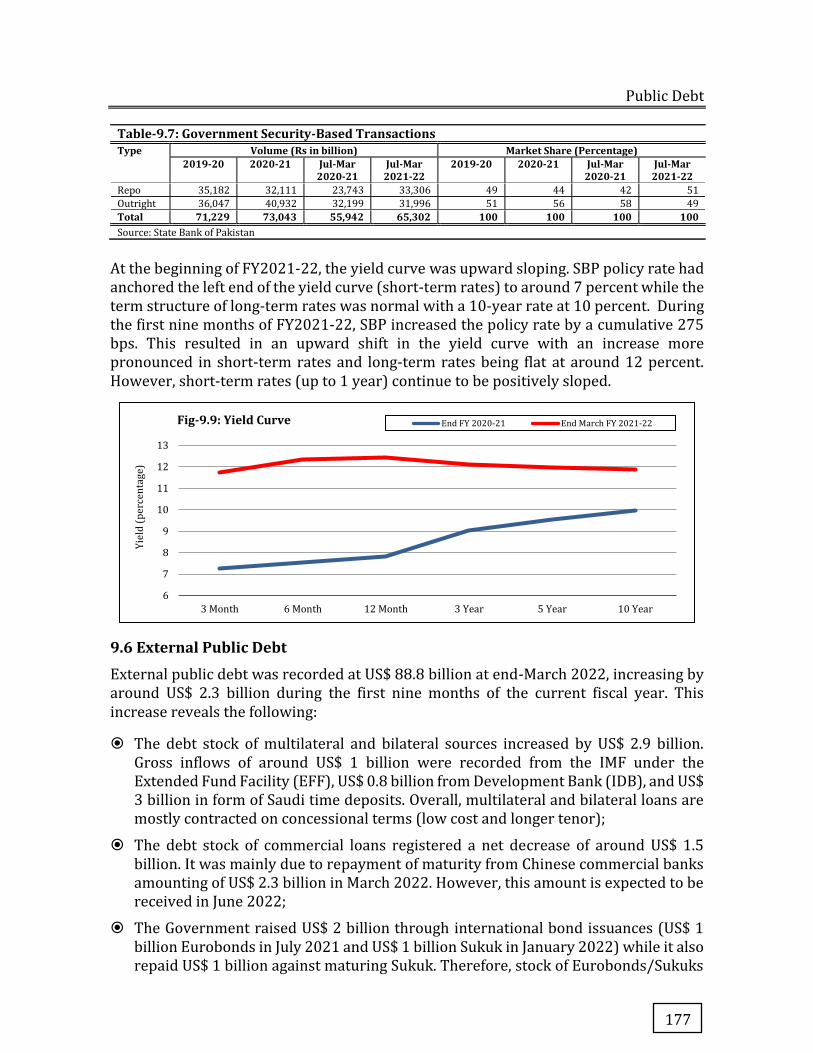
Public Debt
177
Table-9.7: Government Security-Based Transactions Type Volume (Rs in billion) Market Share (Percentage)
2019-20 2020-21 Jul-Mar 2020-21
Jul-Mar 2021-22
2019-20 2020-21 Jul-Mar 2020-21
Jul-Mar 2021-22
Repo 35,182 32,111 23,743 33,306 49 44 42 51
Outright 36,047 40,932 32,199 31,996 51 56 58 49
Total 71,229 73,043 55,942 65,302 100 100 100 100 Source: State Bank of Pakistan
At the beginning of FY2021-22, the yield curve was upward sloping. SBP policy rate had anchored the left end of the yield curve (short-term rates) to around 7 percent while the term structure of long-term rates was normal with a 10-year rate at 10 percent. During the first nine months of FY2021-22, SBP increased the policy rate by a cumulative 275 bps. This resulted in an upward shift in the yield curve with an increase more pronounced in short-term rates and long-term rates being flat at around 12 percent. However, short-term rates (up to 1 year) continue to be positively sloped.
9.6 External Public Debt
External public debt was recorded at US$ 88.8 billion at end-March 2022, increasing by around US$ 2.3 billion during the first nine months of the current fiscal year. This increase reveals the following:
� The debt stock of multilateral and bilateral sources increased by US$ 2.9 billion. Gross inflows of around US$ 1 billion were recorded from the IMF under the Extended Fund Facility (EFF), US$ 0.8 billion from Development Bank (IDB), and US$ 3 billion in form of Saudi time deposits. Overall, multilateral and bilateral loans are mostly contracted on concessional terms (low cost and longer tenor);
� The debt stock of commercial loans registered a net decrease of around US$ 1.5 billion. It was mainly due to repayment of maturity from Chinese commercial banks amounting of US$ 2.3 billion in March 2022. However, this amount is expected to be received in June 2022;
� The Government raised US$ 2 billion through international bond issuances (US$ 1 billion Eurobonds in July 2021 and US$ 1 billion Sukuk in January 2022) while it also repaid US$ 1 billion against maturing Sukuk. Therefore, stock of Eurobonds/Sukuks
6
7
8
9
10
11
12
13
3 Month 6 Month 12 Month 3 Year 5 Year 10 Year
Yie
ld (
pe
rce
nta
ge)
Fig-9.9: Yield Curve End FY 2020-21 End March FY 2021-22
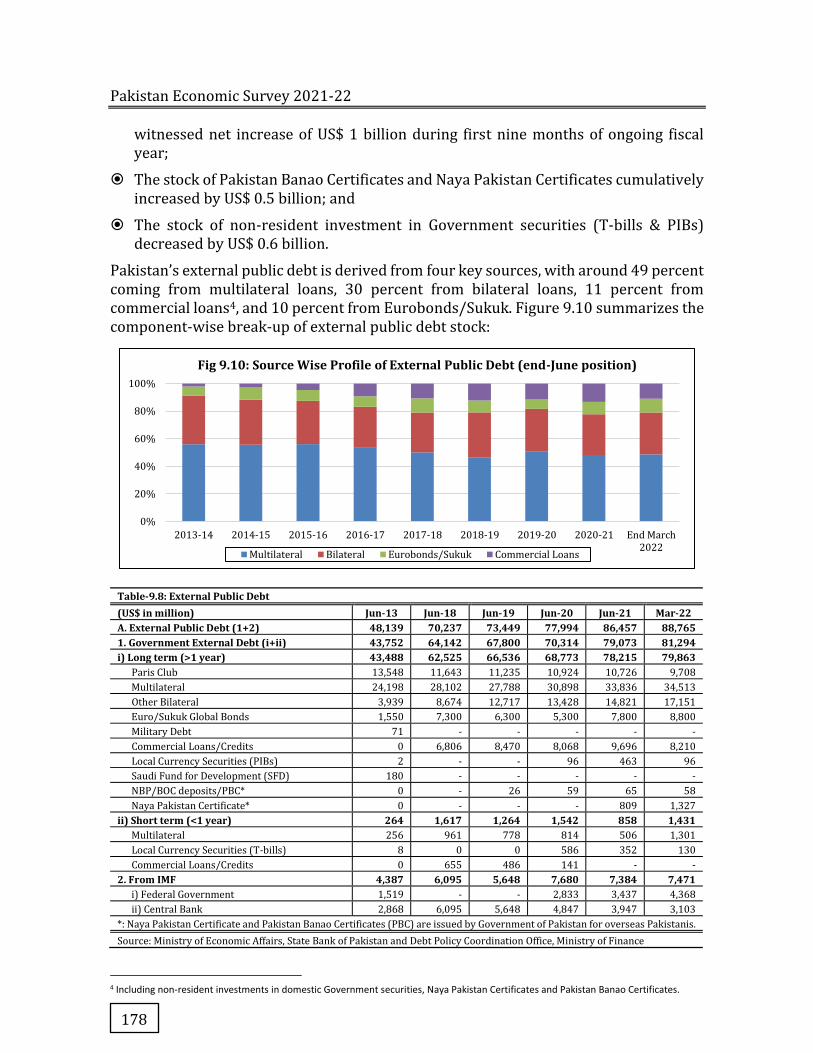
Pakistan Economic Survey 2021-22
178
witnessed net increase of US$ 1 billion during first nine months of ongoing fiscal year;
� The stock of Pakistan Banao Certificates and Naya Pakistan Certificates cumulatively increased by US$ 0.5 billion; and
� The stock of non-resident investment in Government securities (T-bills & PIBs) decreased by US$ 0.6 billion.
Pakistan’s external public debt is derived from four key sources, with around 49 percent coming from multilateral loans, 30 percent from bilateral loans, 11 percent from commercial loans4, and 10 percent from Eurobonds/Sukuk. Figure 9.10 summarizes the component-wise break-up of external public debt stock:
Table-9.8: External Public Debt (US$ in million) Jun-13 Jun-18 Jun-19 Jun-20 Jun-21 Mar-22 A. External Public Debt (1+2) 48,139 70,237 73,449 77,994 86,457 88,765 1. Government External Debt (i+ii) 43,752 64,142 67,800 70,314 79,073 81,294 i) Long term (>1 year) 43,488 62,525 66,536 68,773 78,215 79,863 Paris Club 13,548 11,643 11,235 10,924 10,726 9,708
Multilateral 24,198 28,102 27,788 30,898 33,836 34,513
Other Bilateral 3,939 8,674 12,717 13,428 14,821 17,151
Euro/Sukuk Global Bonds 1,550 7,300 6,300 5,300 7,800 8,800
Military Debt 71 - - - - -
Commercial Loans/Credits 0 6,806 8,470 8,068 9,696 8,210
Local Currency Securities (PIBs) 2 - - 96 463 96
Saudi Fund for Development (SFD) 180 - - - - -
NBP/BOC deposits/PBC* 0 - 26 59 65 58
Naya Pakistan Certificate* 0 - - - 809 1,327
ii) Short term (<1 year) 264 1,617 1,264 1,542 858 1,431 Multilateral 256 961 778 814 506 1,301
Local Currency Securities (T-bills) 8 0 0 586 352 130
Commercial Loans/Credits 0 655 486 141 - -
2. From IMF 4,387 6,095 5,648 7,680 7,384 7,471 i) Federal Government 1,519 - - 2,833 3,437 4,368
ii) Central Bank 2,868 6,095 5,648 4,847 3,947 3,103
*: Naya Pakistan Certificate and Pakistan Banao Certificates (PBC) are issued by Government of Pakistan for overseas Pakistanis.
Source: Ministry of Economic Affairs, State Bank of Pakistan and Debt Policy Coordination Office, Ministry of Finance
4 Including non-resident investments in domestic Government securities, Naya Pakistan Certificates and Pakistan Banao Certificates.
0%
20%
40%
60%
80%
100%
2013-14 2014-15 2015-16 2016-17 2017-18 2018-19 2019-20 2020-21 End March2022
Fig 9.10: Source Wise Profile of External Public Debt (end-June position)
Multilateral Bilateral Eurobonds/Sukuk Commercial Loans

Public Debt
179
9.6.1 External Public Debt Inflows and Outflows
(a) Inflows
Gross external loan disbursements were recorded at US$ 12,779 million5 during the first nine months of FY2021-22, the details of which are as follows:
� Disbursements from multilateral sources amounted to US$ 4,929 million and accounted for 39 percent of the total disbursements. The main contributors were Asian Development Bank (ADB), Islamic Development Bank (IDB), World Bank, and IMF. The disbursements from the IMF were part of the ongoing EFF program while inflows from ADB and World Bank were targeted towards energy, finance, and infrastructure development and to address the pandemic repercussions;
� Bilateral sources contributed US$ 3,228 million or 25 percent in total disbursements. Out of this, the Saudi deposits amounted to US$ 3,000 million;
� Disbursements through international bonds amounted to US$ 2,000 million; and
� Commercial loans contributed US$ 2,623 million in total disbursements. These inflows were mostly taken for refinancing the existing commercial maturities.
(b) Outflows
External public debt repayments were recorded at US$ 8,139 million during the first nine months of FY2021-22 as compared with US$ 5,148 million during the same period last year. This increase in repayments is primarily due to; (i) resumption of debt repayment to bilateral creditors in the third quarter of FY2021-22, which were deferred under Debt Service Suspension Initiative (DSSI); (ii) US$ 1,000 million International Sukuk maturity in October 2021; and (iii) higher repayment of commercial loans maturities as stated above.
Interest payments were recorded at US$ 1,297 million during the first nine months of FY2021-22 as compared to US$ 1,080 million during the same period of the preceding year. The main factors which increased the external interest servicing during the ongoing fiscal year were (i) resumption of interest payments to bilateral creditors in the third quarter of FY2021-22, which were deferred under DSSI; (ii) increase in global interest rates; and (iii) higher interest servicing against commercial loan portfolio and Eurobonds. The source wise details of external public debt inflows and outflows over the last few years are depicted in table 9.11.
Table 9.9: Source Wise External Public Debt Inflows and Outflows (Fiscal Year-wise) (US$ in million) 2015 2016 2017 2018 2019 2020 2021 Jul-Mar 22
DISBURSEMENTS Multilateral 5,435 5,766 3166 2,813 2,021 8,329 4,810 4,929
Bilateral 867 1,040 1,941 1,971 4,377 1,398 1,275 3,228
Bonds 1,000 500 1,000 2,500 - - 2,500 2,000
Commercial / Other 150 1,387 4,426 3,716 4,098 3,347 4,721 2,623
Total Inflows (A) 7,452 8,693 10,533 11,000 10,496 13,074 13,306 12,779 REPAYMENTS
Multilateral 2,407 1,274 1,255 1,403 1,750 2,199 3,391 2,482
Bilateral 407 440 1,200 793 970 783 100 497
5 Excluding disbursement from Pakistan Banao Certificates, NPCs and non-resident investment in Government securities.
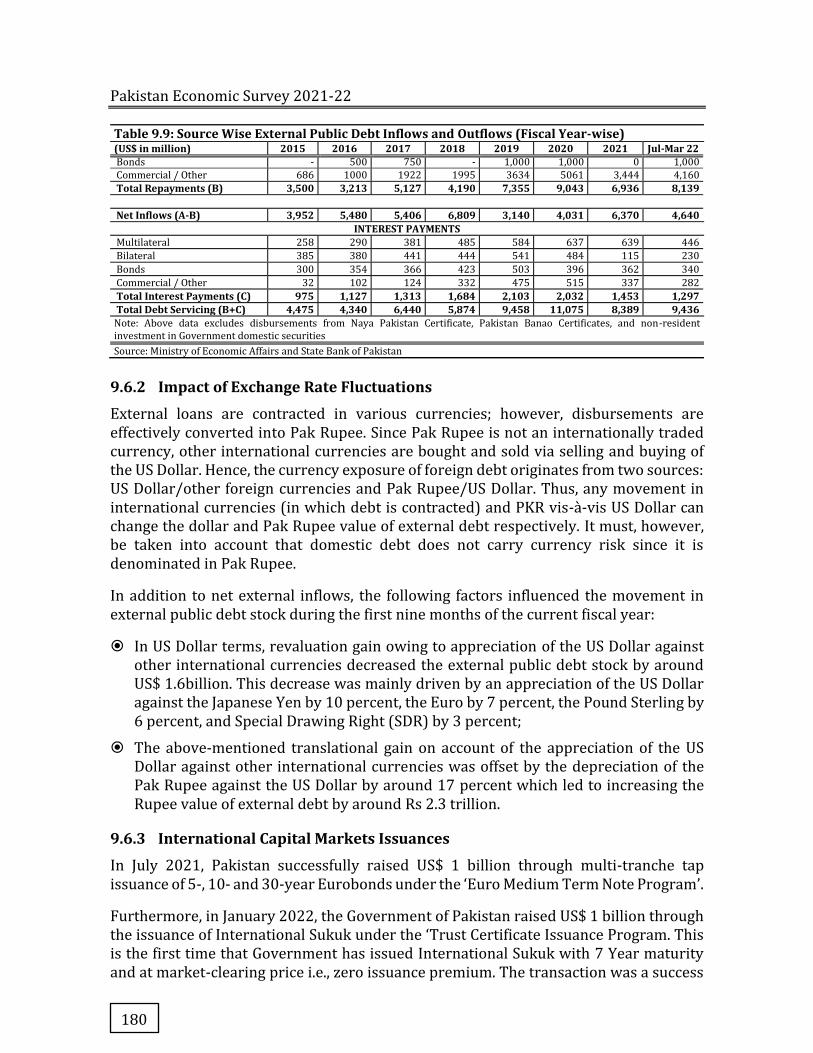
Pakistan Economic Survey 2021-22
180
Table 9.9: Source Wise External Public Debt Inflows and Outflows (Fiscal Year-wise) (US$ in million) 2015 2016 2017 2018 2019 2020 2021 Jul-Mar 22 Bonds - 500 750 - 1,000 1,000 0 1,000
Commercial / Other 686 1000 1922 1995 3634 5061 3,444 4,160
Total Repayments (B) 3,500 3,213 5,127 4,190 7,355 9,043 6,936 8,139 Net Inflows (A-B) 3,952 5,480 5,406 6,809 3,140 4,031 6,370 4,640
INTEREST PAYMENTS Multilateral 258 290 381 485 584 637 639 446
Bilateral 385 380 441 444 541 484 115 230
Bonds 300 354 366 423 503 396 362 340
Commercial / Other 32 102 124 332 475 515 337 282
Total Interest Payments (C) 975 1,127 1,313 1,684 2,103 2,032 1,453 1,297 Total Debt Servicing (B+C) 4,475 4,340 6,440 5,874 9,458 11,075 8,389 9,436 Note: Above data excludes disbursements from Naya Pakistan Certificate, Pakistan Banao Certificates, and non-resident investment in Government domestic securities
Source: Ministry of Economic Affairs and State Bank of Pakistan
9.6.2 Impact of Exchange Rate Fluctuations
External loans are contracted in various currencies; however, disbursements are effectively converted into Pak Rupee. Since Pak Rupee is not an internationally traded currency, other international currencies are bought and sold via selling and buying of the US Dollar. Hence, the currency exposure of foreign debt originates from two sources: US Dollar/other foreign currencies and Pak Rupee/US Dollar. Thus, any movement in international currencies (in which debt is contracted) and PKR vis-à-vis US Dollar can change the dollar and Pak Rupee value of external debt respectively. It must, however, be taken into account that domestic debt does not carry currency risk since it is denominated in Pak Rupee.
In addition to net external inflows, the following factors influenced the movement in external public debt stock during the first nine months of the current fiscal year:
� In US Dollar terms, revaluation gain owing to appreciation of the US Dollar against other international currencies decreased the external public debt stock by around US$ 1.6billion. This decrease was mainly driven by an appreciation of the US Dollar against the Japanese Yen by 10 percent, the Euro by 7 percent, the Pound Sterling by 6 percent, and Special Drawing Right (SDR) by 3 percent;
� The above-mentioned translational gain on account of the appreciation of the US Dollar against other international currencies was offset by the depreciation of the Pak Rupee against the US Dollar by around 17 percent which led to increasing the Rupee value of external debt by around Rs 2.3 trillion.
9.6.3 International Capital Markets Issuances
In July 2021, Pakistan successfully raised US$ 1 billion through multi-tranche tap issuance of 5-, 10- and 30-year Eurobonds under the ‘Euro Medium Term Note Program’.
Furthermore, in January 2022, the Government of Pakistan raised US$ 1 billion through the issuance of International Sukuk under the ‘Trust Certificate Issuance Program. This is the first time that Government has issued International Sukuk with 7 Year maturity and at market-clearing price i.e., zero issuance premium. The transaction was a success
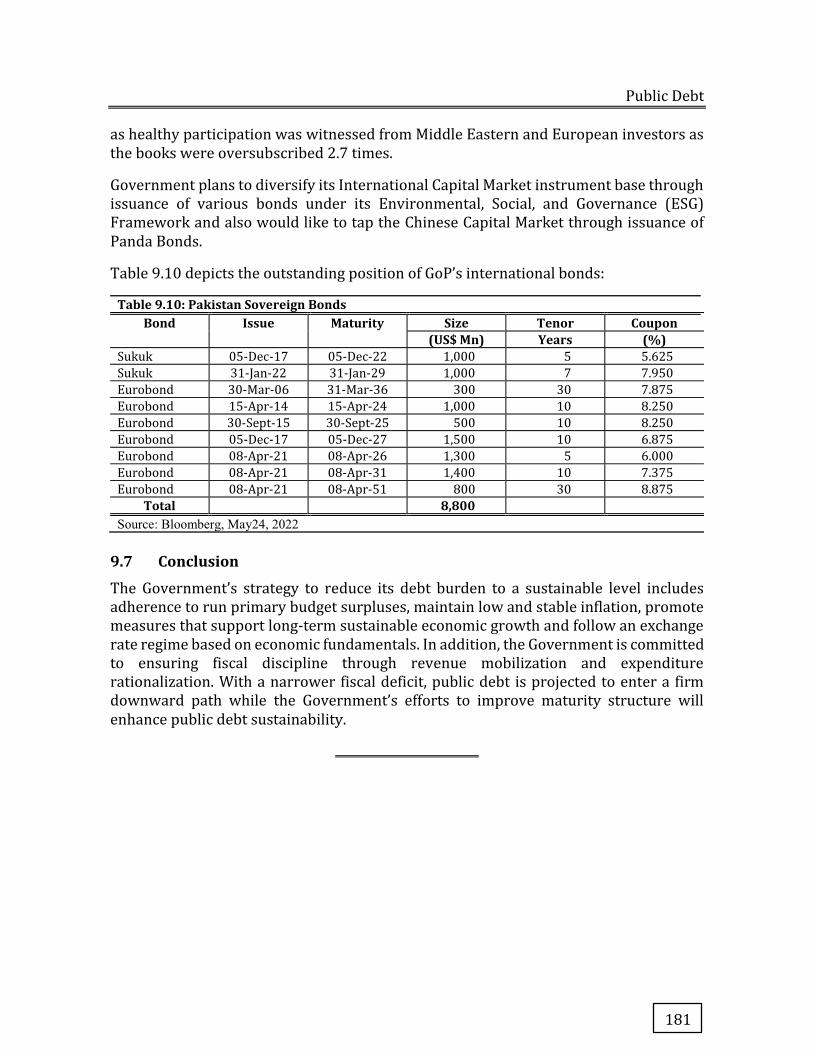
Public Debt
181
as healthy participation was witnessed from Middle Eastern and European investors as the books were oversubscribed 2.7 times.
Government plans to diversify its International Capital Market instrument base through issuance of various bonds under its Environmental, Social, and Governance (ESG) Framework and also would like to tap the Chinese Capital Market through issuance of Panda Bonds.
Table 9.10 depicts the outstanding position of GoP’s international bonds:
Table 9.10: Pakistan Sovereign Bonds Bond Issue Maturity Size Tenor Coupon
(US$ Mn) Years (%) Sukuk 05-Dec-17 05-Dec-22 1,000 5 5.625
Sukuk 31-Jan-22 31-Jan-29 1,000 7 7.950
Eurobond 30-Mar-06 31-Mar-36 300 30 7.875
Eurobond 15-Apr-14 15-Apr-24 1,000 10 8.250
Eurobond 30-Sept-15 30-Sept-25 500 10 8.250
Eurobond 05-Dec-17 05-Dec-27 1,500 10 6.875
Eurobond 08-Apr-21 08-Apr-26 1,300 5 6.000
Eurobond 08-Apr-21 08-Apr-31 1,400 10 7.375
Eurobond 08-Apr-21 08-Apr-51 800 30 8.875
Total 8,800 Source: Bloomberg, May24, 2022
9.7 Conclusion
The Government’s strategy to reduce its debt burden to a sustainable level includes adherence to run primary budget surpluses, maintain low and stable inflation, promote measures that support long-term sustainable economic growth and follow an exchange rate regime based on economic fundamentals. In addition, the Government is committed to ensuring fiscal discipline through revenue mobilization and expenditure rationalization. With a narrower fiscal deficit, public debt is projected to enter a firm downward path while the Government’s efforts to improve maturity structure will enhance public debt sustainability.

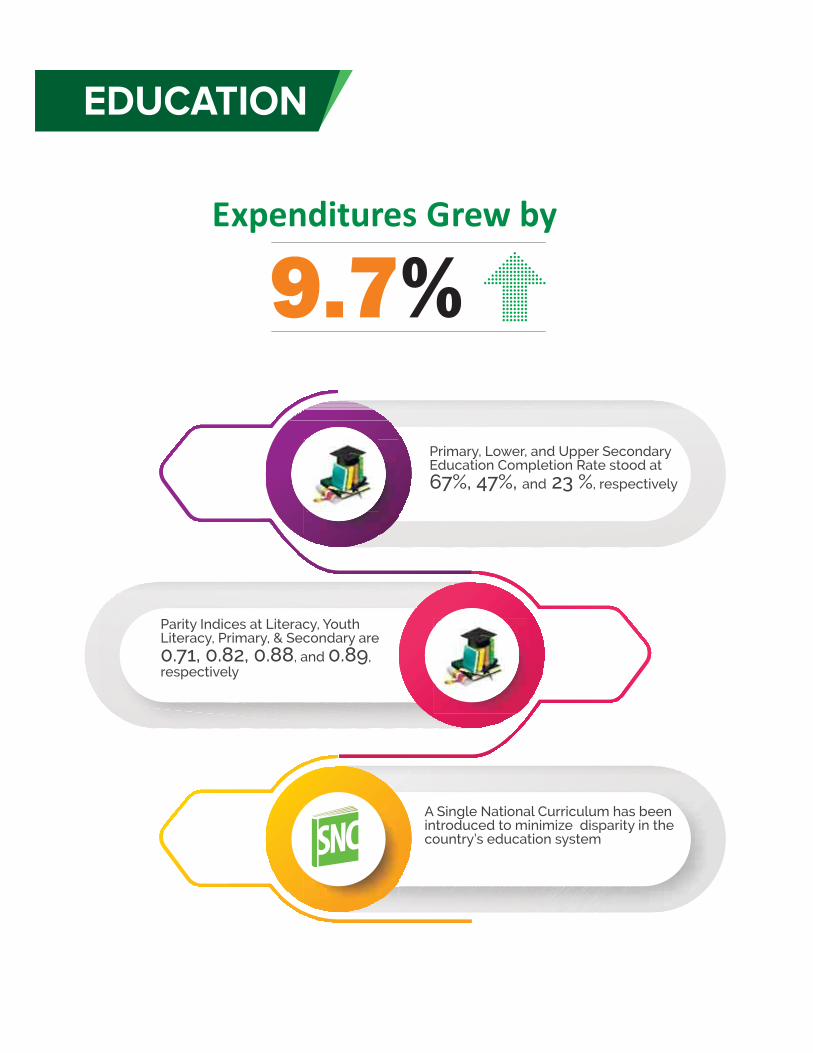

Education is one of the key factors for changing the existing state of a nation into a distinguished position in the community of nations. The educational advancements which have taken place so far and the skills which have been acquired in due course of time are not only benefiting Pakistan but also the surrounding regions. For a country like Pakistan, it becomes even more indispensable for its socio-economic development through effective transition of its huge proportion of population i.e youth. Transformation of 63 percent youth into a real wealth requires optimum capitalization through establishing a high-quality and market demand driven basic, secondary and higher Education.
Pakistan is committed to transform its education system into a high-quality global market demand driven system in accordance with the Goal 4 of Sustainable Development Goals (SDGs) which pertains to quality of education. The progress achieved by Pakistan so far on Goal 4 of SDGs is as under:
� Primary, Lower and Upper Secondary Education Completion Rate stood at 67 percent, 47 percent and 23 percent, respectively, depicting higher Primary attendance than Lower and Upper Secondary levels.
� Parity Indices at Literacy, Youth Literacy, Primary and Secondary are 0.71, 0.82, 0.88 and 0.89, respectively.
� Participation rate in organized learning (one year before the official primary entry age), by sex is 19 percent showing a low level of consideration of Pre-Primary Education.
� Percentage of population in a given age group achieving at least affixed level of proficiency in functional; (a) literacy and (b) numeracy skills is 60 percent.
Various initiatives have been taken at federal and provincial levels to raise the standards of education in terms of quality education as part of our commitment to accomplish Goal 4 of SDGs. These initiatives include: i) enhancing access to education by establishing new schools, ii) upgrading the existing schools, iii) improving learning environment by providing basic educational facilities, iv) digitization of educational institutions, v) enhancing resilience of educational institutions to cater for unforeseen situations, vi) promoting distance learning, capacity building of teacher, and vii) improving hiring of teachers, particularly hiring of science teachers to address the issues of science education, etc.
Chapter 10
Education
Pakistan Economic Survey 2021-22
184
Box-I: Single National Curriculum
� Single National Curriculum (SNC) has been introduced to minimize disparity in country’s education system where three main education systems are in place, i.e. Public schools, Private schools and Deeni madaris. These systems are poles apart and often result is different mind-sets thus fractured psyche of the nation. SNC is aimed at providing equal learning opportunities to all segments of society and will provide equal opportunity of learning, help the students and parents in case of inter provincial mobility.
� Development of SNC is driven by key considerations like teachings of Quran and Sunnah, Constitutional Framework, National Policies, Aspirations and National Standards, Alignment with the SDG-4 goals and targets, vision of Quaid and Iqbal, focus on values, Life Skills Based and Inclusive Education, respect & appreciation for different cultures & religions in local and global context, focus on project, inquiry and activity-based learning, development of 21st century skills including analytical, critical and creative thinking.
� Single National Curriculum is being implemented in three phases:
o Phase I: SNC and textbooks Pre I-V (Academic Year 2021-22)
o Phase II: SNC and textbooks VI-VIII (Academic Year 2022-23)
o Phase III: SNC and textbooks IX-XII (Academic Year 2023-24)
� In first phase, quality textbooks, teachers training, modules and assessment frameworks for Grade Pre I-V have been developed on the basis of SNC which have already been shared with all federating units.
� SNC has been implemented in all streams of education for the students from Grades Pre I-V from academic year 2021-22.
� Implementation has already been started in Islamabad, Punjab, Khyber Pakhtunkhwa and Gilgit-Baltistan from Academic year 2021. In Balochistan and Azad Jammu & Kashmir, implementation will start form the academic year 2022.
� Sindh was an active part of the development of the SNC. However, for implementation, discussions are going on with Sindh government.
Key Features � English has always been taught as a subject in public schools. Now English will be taught as a
language with focus on skills. Islamiat used to be started from Grade 3 onwards. At Grade 1 & 2 Islamiat was a part of General Knowledge. Now Islamiat be taught as a separate subject from Grade 1. In Islamiat curriculum, a complete framework of Seerat un Nabi (PBUH) is ensured focusing on practical aspects of the blessed life of Rasulullah (PBUH).
� For students from minorities, a separate curriculum with the title Religious Education has been developed for seven religions, i.e Christianity, Hinduism, Sikhism, Baha’i, Kalasha, Zoroastrianism and Buddhism. Social Studies is developed to encourage patriotism and global citizenship. Human rights and peace education are important areas focused in the curriculum and textbooks. Mathematics and Science are updated as per modern trends in teaching and learning.
� Teacher Training modules and Assessment framework, based on SNC, are developed for Grades Pre I-V to ensure proper implementation of SNC.
Challenges Since the SNC is a major reform in the country, there are a few challenges in order to implement it in true letter and spirit. These challenges include:
o Capacity building of the existing teachers
o Induction of new teachers as per the requirements
o Uplifting of the educational facilities in the far-flung areas of Pakistan
Source: Ministry of Federal Education and Professional Training
Education
185
Educational Institutions and Enrolment Data1
i) Pre-Primary Education Pre-Primary education is the basic component of Early Childhood Education (ECE). Prep classes are for children between 3 to 5 years of age. At national level, a rise of 6.1 percent in pre-primary enrolment (13.5 million) in 2019-20 over 2018-19 (12.7 million) has been observed and it is further estimated to increase by 6.4 percent to 14.4 million in 2020-21 (Table 10.1).
ii) Primary Education (Classes I-V) In 2019-20, there were a total of 183.9 thousand functional primary schools with 507.6 thousand corresponding teachers recorded in the country. An increase of 4.2 percent in primary enrolment is witnessed as the total enrolled students increased to 24.6 million in 2019-20 against 23.6 million in 2018-19. However, it is projected to further increase to 25.7 million in 2020-21 (4.4 percent).
iii) Middle Education (Classes VI-VIII) During 2019-20, total number of middle institutes stood at 48.3 thousand with 466.4 thousand employed teachers in the country. An increase of 3.9 percent in middle enrolment is observed. The total enrolled students reached to 7.9 million in 2019-20 against 7.6 million in 2018-19 and it is projected to increase by 4.0 percent (from 7.9 million to 8.3 million) in 2020-21.
iv) Secondary/High School Education (Classes IX-X) During the 2019-20, a total of 32.0 thousand secondary schools were functional, with a total number of 582.3 thousand teachers recorded in the country. An increase of 6.2 percent in secondary school enrolment is observed at the national level as the total enrolment increased to 4.2 million in 2019-20 against 4.0 million in 2018-19. However, it is estimated to further increase by 6.5 percent (i.e., from 4.2 million to 4.5 million) during 2020-21.
v) Higher Secondary/Inter Colleges (Classes XI-XII) During 2019-20, 6.0 thousand higher secondary schools/inter colleges with 136.7 thousand teachers were functional at national level. The overall enrolment of students in higher secondary education witnessed an increase of 8.8 percent in 2019-20. The enrolment registered during 2019-20 was 2.33 million as compared to 2.14 million in 2018-19. For 2020-21, it is projected to reach at 2.55 million.
vi) Technical & Vocational Education During 2019-20, 3.8 thousand technical and vocational institutes with 18.6 thousand teachers were functional at the national level. The enrolment increased to 0.46 million in 2019-20 from 0.43 million compared to 2018-19. However, it is estimated to increase by 7.7 percent (i.e., from 0.46 million to 0.50 million) in 2020-21.
1According to Academy of Educational Planning & Management (AEPAM), the estimated data for enrolment, number of institutions and teachers for the year 2021-22 is not available. However, the said data will be available in July 2022 which will be incorporated in the Statistical Supplement of Pakistan Economic Survey, 2021-22. Therefore, the estimated data for the year 2019-20 and 2020-21 is considered for analysis.
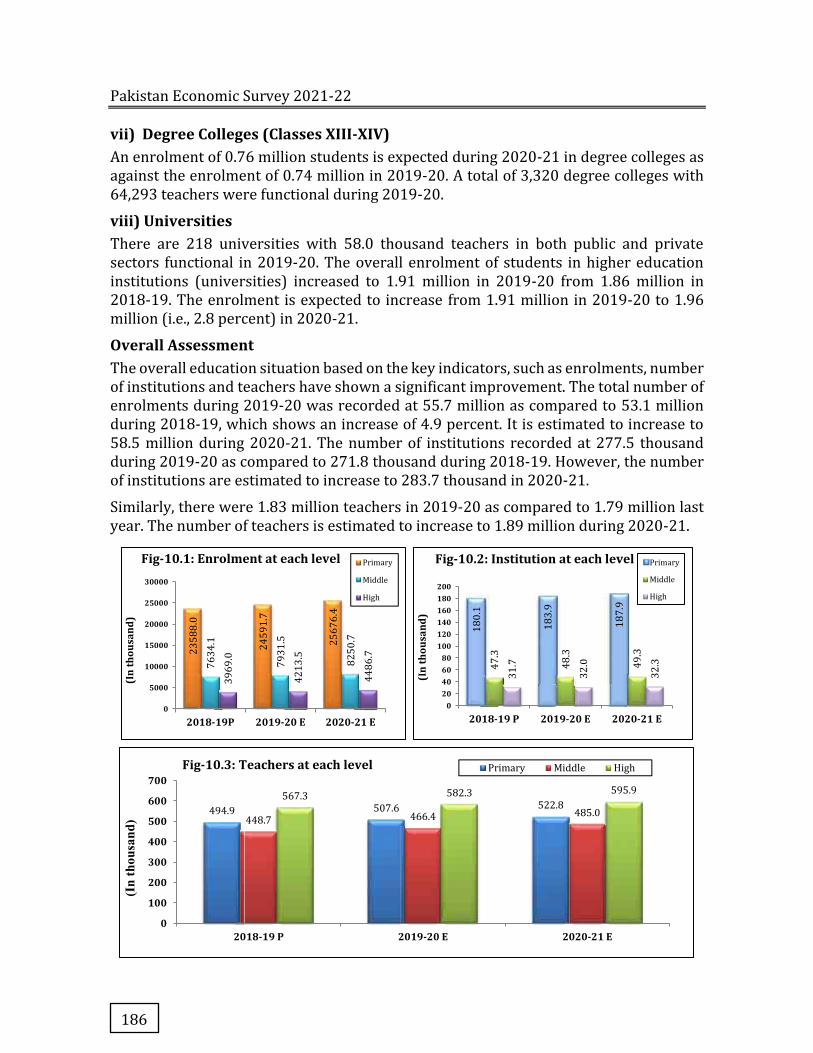
Pakistan Economic Survey 2021-22
186
vii) Degree Colleges (Classes XIII-XIV) An enrolment of 0.76 million students is expected during 2020-21 in degree colleges as against the enrolment of 0.74 million in 2019-20. A total of 3,320 degree colleges with 64,293 teachers were functional during 2019-20.
viii) Universities There are 218 universities with 58.0 thousand teachers in both public and private sectors functional in 2019-20. The overall enrolment of students in higher education institutions (universities) increased to 1.91 million in 2019-20 from 1.86 million in 2018-19. The enrolment is expected to increase from 1.91 million in 2019-20 to 1.96 million (i.e., 2.8 percent) in 2020-21.
Overall Assessment The overall education situation based on the key indicators, such as enrolments, number of institutions and teachers have shown a significant improvement. The total number of enrolments during 2019-20 was recorded at 55.7 million as compared to 53.1 million during 2018-19, which shows an increase of 4.9 percent. It is estimated to increase to 58.5 million during 2020-21. The number of institutions recorded at 277.5 thousand during 2019-20 as compared to 271.8 thousand during 2018-19. However, the number of institutions are estimated to increase to 283.7 thousand in 2020-21.
Similarly, there were 1.83 million teachers in 2019-20 as compared to 1.79 million last year. The number of teachers is estimated to increase to 1.89 million during 2020-21.
23
58
8.0
24
59
1.7
25
67
6.4
76
34
.1
79
31
.5
82
50
.7
39
69
.0
42
13
.5
44
86
.7
0
5000
10000
15000
20000
25000
30000
2018-19P 2019-20 E 2020-21 E
(In
thou
sand
)
Fig-10.1: Enrolment at each level Primary
Middle
High
18
0.1
18
3.9
18
7.9
47
.3
48
.3
49
.3
31
.7
32
.0
32
.3
020406080
100120140160180200
2018-19 P 2019-20 E 2020-21 E
(In
thou
sand
)
Fig-10.2: Institution at each level Primary
Middle
High
494.9 507.6 522.8
448.7 466.4 485.0
567.3 582.3 595.9
0
100
200
300
400
500
600
700
2018-19 P 2019-20 E 2020-21 E
(In
thou
sand
)
Fig-10.3: Teachers at each level Primary Middle High
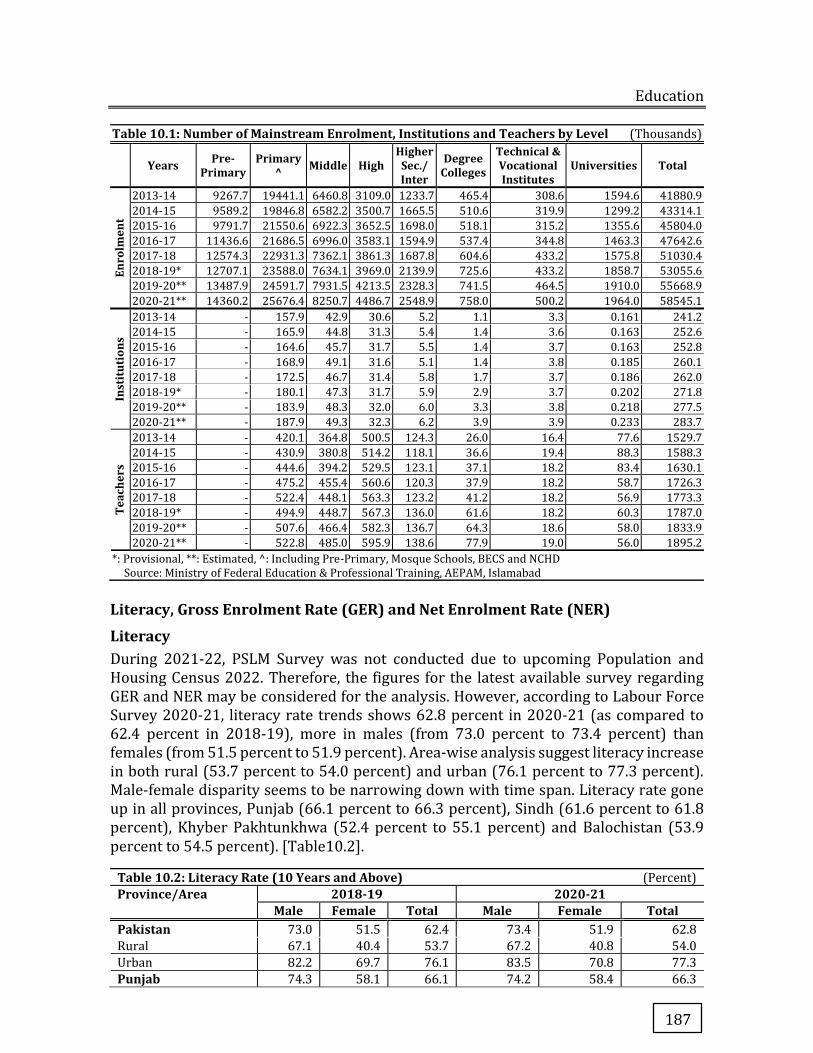
Education
187
Teac
hers
2013-14 - 420.1 364.8 500.5 124.3 26.0 16.4 77.6 1529.7
2014-15 - 430.9 380.8 514.2 118.1 36.6 19.4 88.3 1588.3
2015-16 - 444.6 394.2 529.5 123.1 37.1 18.2 83.4 1630.1
2016-17 - 475.2 455.4 560.6 120.3 37.9 18.2 58.7 1726.3
2017-18 - 522.4 448.1 563.3 123.2 41.2 18.2 56.9 1773.3
2018-19* - 494.9 448.7 567.3 136.0 61.6 18.2 60.3 1787.0
2019-20** - 507.6 466.4 582.3 136.7 64.3 18.6 58.0 1833.9
2020-21** - 522.8 485.0 595.9 138.6 77.9 19.0 56.0 1895.2
*: Provisional, **: Estimated, ^: Including Pre-Primary, Mosque Schools, BECS and NCHD Source: Ministry of Federal Education & Professional Training, AEPAM, Islamabad
Literacy, Gross Enrolment Rate (GER) and Net Enrolment Rate (NER)
Literacy During 2021-22, PSLM Survey was not conducted due to upcoming Population and Housing Census 2022. Therefore, the figures for the latest available survey regarding GER and NER may be considered for the analysis. However, according to Labour Force Survey 2020-21, literacy rate trends shows 62.8 percent in 2020-21 (as compared to 62.4 percent in 2018-19), more in males (from 73.0 percent to 73.4 percent) than females (from 51.5 percent to 51.9 percent). Area-wise analysis suggest literacy increase in both rural (53.7 percent to 54.0 percent) and urban (76.1 percent to 77.3 percent). Male-female disparity seems to be narrowing down with time span. Literacy rate gone up in all provinces, Punjab (66.1 percent to 66.3 percent), Sindh (61.6 percent to 61.8 percent), Khyber Pakhtunkhwa (52.4 percent to 55.1 percent) and Balochistan (53.9 percent to 54.5 percent). [Table10.2].
Table 10.2: Literacy Rate (10 Years and Above) (Percent) Province/Area 2018-19 2020-21
Male Female Total Male Female Total Pakistan 73.0 51.5 62.4 73.4 51.9 62.8
Rural 67.1 40.4 53.7 67.2 40.8 54.0
Urban 82.2 69.7 76.1 83.5 70.8 77.3
Punjab 74.3 58.1 66.1 74.2 58.4 66.3
Table 10.1: Number of Mainstream Enrolment, Institutions and Teachers by Level (Thousands)
Years Pre-Primary
Primary^ Middle High
Higher Sec./ Inter
Degree Colleges
Technical & Vocational Institutes
Universities Total
Enro
lmen
t
2013-14 9267.7 19441.1 6460.8 3109.0 1233.7 465.4 308.6 1594.6 41880.9
2014-15 9589.2 19846.8 6582.2 3500.7 1665.5 510.6 319.9 1299.2 43314.1
2015-16 9791.7 21550.6 6922.3 3652.5 1698.0 518.1 315.2 1355.6 45804.0
2016-17 11436.6 21686.5 6996.0 3583.1 1594.9 537.4 344.8 1463.3 47642.6
2017-18 12574.3 22931.3 7362.1 3861.3 1687.8 604.6 433.2 1575.8 51030.4
2018-19* 12707.1 23588.0 7634.1 3969.0 2139.9 725.6 433.2 1858.7 53055.6
2019-20** 13487.9 24591.7 7931.5 4213.5 2328.3 741.5 464.5 1910.0 55668.9
2020-21** 14360.2 25676.4 8250.7 4486.7 2548.9 758.0 500.2 1964.0 58545.1
Inst
itut
ions
2013-14 - 157.9 42.9 30.6 5.2 1.1 3.3 0.161 241.2
2014-15 - 165.9 44.8 31.3 5.4 1.4 3.6 0.163 252.6
2015-16 - 164.6 45.7 31.7 5.5 1.4 3.7 0.163 252.8
2016-17 - 168.9 49.1 31.6 5.1 1.4 3.8 0.185 260.1
2017-18 - 172.5 46.7 31.4 5.8 1.7 3.7 0.186 262.0
2018-19* - 180.1 47.3 31.7 5.9 2.9 3.7 0.202 271.8
2019-20** - 183.9 48.3 32.0 6.0 3.3 3.8 0.218 277.5
2020-21** - 187.9 49.3 32.3 6.2 3.9 3.9 0.233 283.7
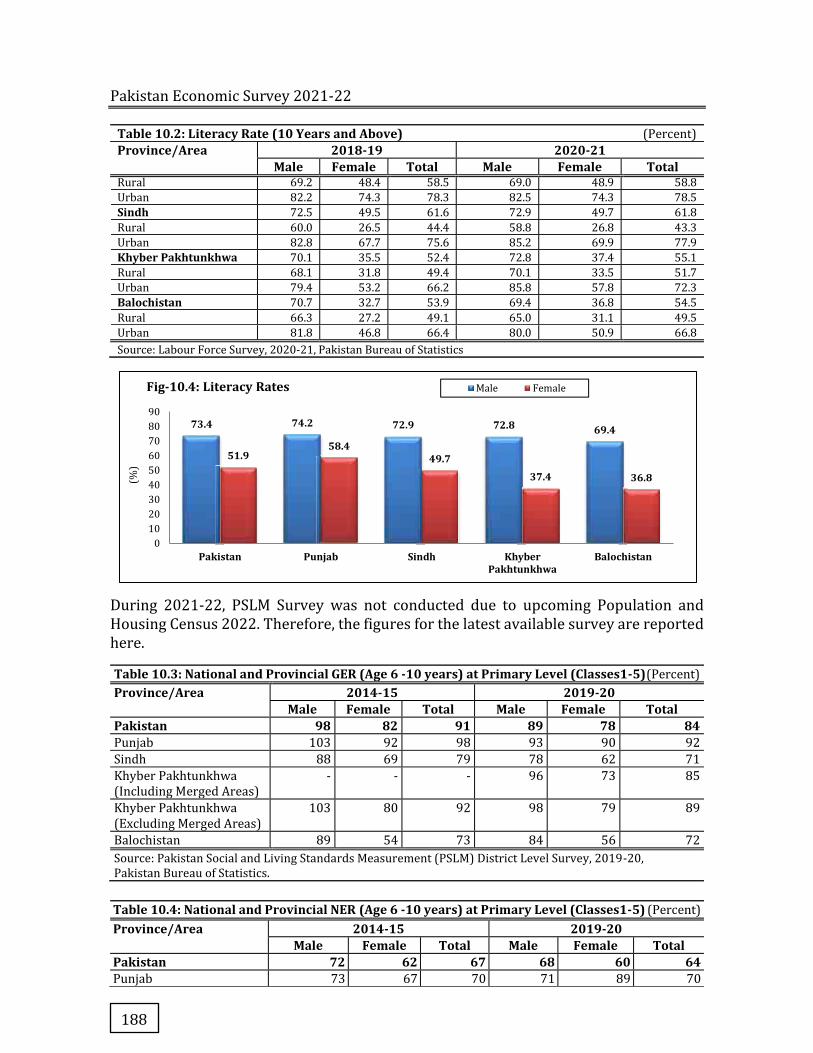
Pakistan Economic Survey 2021-22
188
Table 10.2: Literacy Rate (10 Years and Above) (Percent) Province/Area 2018-19 2020-21
Male Female Total Male Female Total Rural 69.2 48.4 58.5 69.0 48.9 58.8
Urban 82.2 74.3 78.3 82.5 74.3 78.5
Sindh 72.5 49.5 61.6 72.9 49.7 61.8
Rural 60.0 26.5 44.4 58.8 26.8 43.3
Urban 82.8 67.7 75.6 85.2 69.9 77.9
Khyber Pakhtunkhwa 70.1 35.5 52.4 72.8 37.4 55.1
Rural 68.1 31.8 49.4 70.1 33.5 51.7
Urban 79.4 53.2 66.2 85.8 57.8 72.3
Balochistan 70.7 32.7 53.9 69.4 36.8 54.5
Rural 66.3 27.2 49.1 65.0 31.1 49.5
Urban 81.8 46.8 66.4 80.0 50.9 66.8
Source: Labour Force Survey, 2020-21, Pakistan Bureau of Statistics
During 2021-22, PSLM Survey was not conducted due to upcoming Population and Housing Census 2022. Therefore, the figures for the latest available survey are reported here.
Table 10.3: National and Provincial GER (Age 6 -10 years) at Primary Level (Classes1-5) (Percent) Province/Area 2014-15 2019-20
Male Female Total Male Female Total Pakistan 98 82 91 89 78 84 Punjab 103 92 98 93 90 92
Sindh 88 69 79 78 62 71
Khyber Pakhtunkhwa (Including Merged Areas)
- - - 96 73 85
Khyber Pakhtunkhwa (Excluding Merged Areas)
103 80 92 98 79 89
Balochistan 89 54 73 84 56 72
Source: Pakistan Social and Living Standards Measurement (PSLM) District Level Survey, 2019-20, Pakistan Bureau of Statistics.
Table 10.4: National and Provincial NER (Age 6 -10 years) at Primary Level (Classes1-5) (Percent) Province/Area 2014-15 2019-20
Male Female Total Male Female Total Pakistan 72 62 67 68 60 64 Punjab 73 67 70 71 89 70
73.4 74.2 72.9 72.8 69.4
51.958.4
49.7
37.4 36.8
0
10
20
30
40
50
60
70
80
90
Pakistan Punjab Sindh KhyberPakhtunkhwa
Balochistan
(%)
Fig-10.4: Literacy Rates Male Female
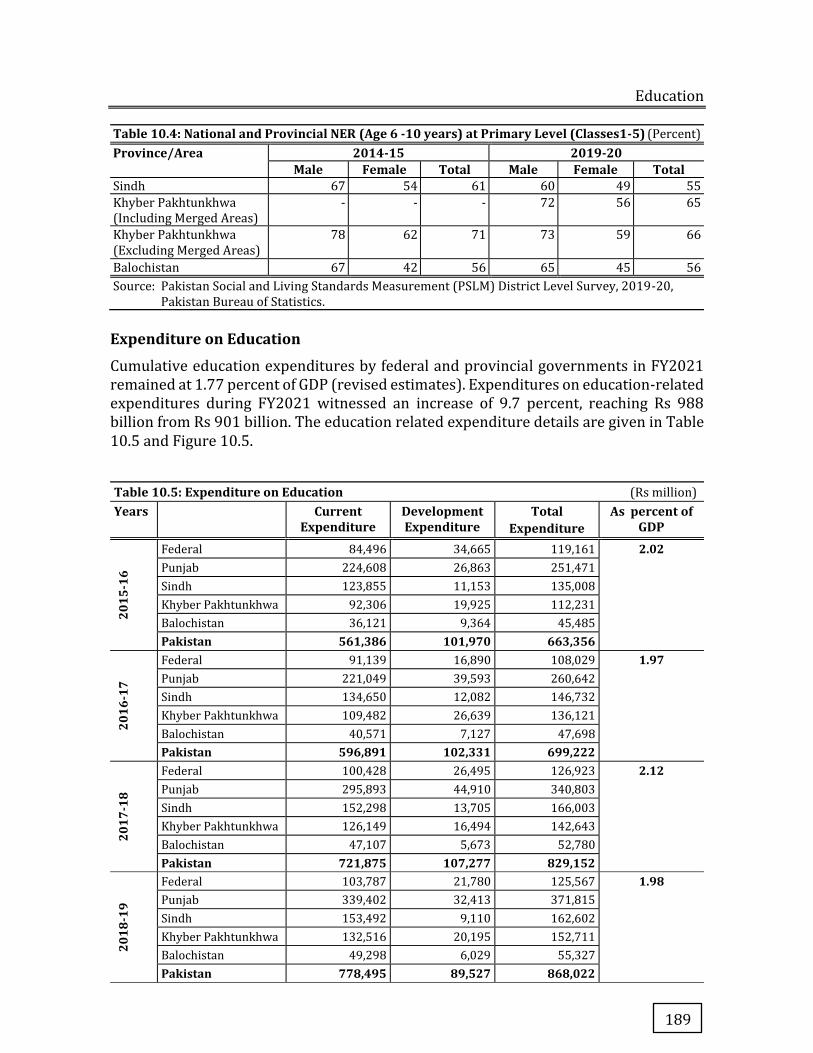
Education
189
Table 10.4: National and Provincial NER (Age 6 -10 years) at Primary Level (Classes1-5) (Percent) Province/Area 2014-15 2019-20
Male Female Total Male Female Total Sindh 67 54 61 60 49 55
Khyber Pakhtunkhwa (Including Merged Areas)
- - - 72 56 65
Khyber Pakhtunkhwa (Excluding Merged Areas)
78 62 71 73 59 66
Balochistan 67 42 56 65 45 56
Source: Pakistan Social and Living Standards Measurement (PSLM) District Level Survey, 2019-20, Pakistan Bureau of Statistics. Expenditure on Education
Cumulative education expenditures by federal and provincial governments in FY2021 remained at 1.77 percent of GDP (revised estimates). Expenditures on education-related expenditures during FY2021 witnessed an increase of 9.7 percent, reaching Rs 988 billion from Rs 901 billion. The education related expenditure details are given in Table 10.5 and Figure 10.5.
Table 10.5: Expenditure on Education (Rs million) Years Current
Expenditure Development Expenditure
Total Expenditure
As percent of GDP
2015
-16
Federal 84,496 34,665 119,161 2.02 Punjab 224,608 26,863 251,471
Sindh 123,855 11,153 135,008
Khyber Pakhtunkhwa 92,306 19,925 112,231
Balochistan 36,121 9,364 45,485
Pakistan 561,386 101,970 663,356
2016
-17
Federal 91,139 16,890 108,029 1.97 Punjab 221,049 39,593 260,642
Sindh 134,650 12,082 146,732
Khyber Pakhtunkhwa 109,482 26,639 136,121
Balochistan 40,571 7,127 47,698
Pakistan 596,891 102,331 699,222
2017
-18
Federal 100,428 26,495 126,923 2.12 Punjab 295,893 44,910 340,803
Sindh 152,298 13,705 166,003
Khyber Pakhtunkhwa 126,149 16,494 142,643
Balochistan 47,107 5,673 52,780
Pakistan 721,875 107,277 829,152
2018
-19
Federal 103,787 21,780 125,567 1.98 Punjab 339,402 32,413 371,815
Sindh 153,492 9,110 162,602
Khyber Pakhtunkhwa 132,516 20,195 152,711
Balochistan 49,298 6,029 55,327
Pakistan 778,495 89,527 868,022
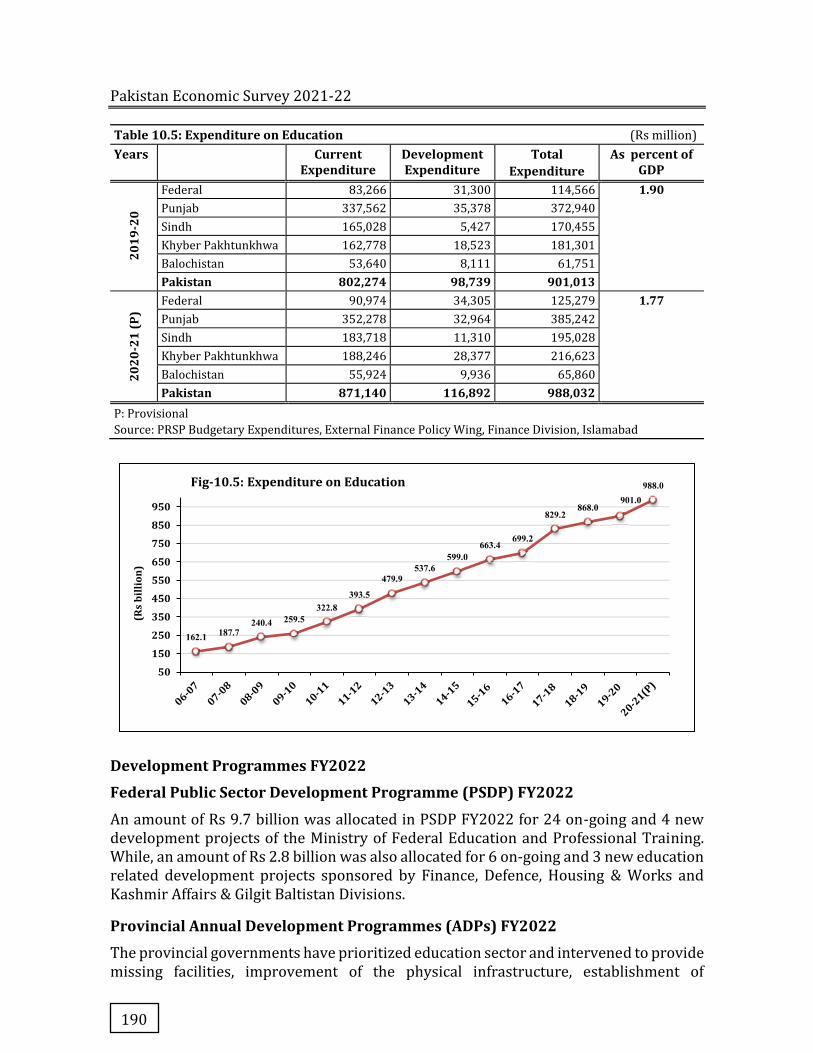
Pakistan Economic Survey 2021-22
190
Table 10.5: Expenditure on Education (Rs million) Years Current
Expenditure Development Expenditure
Total Expenditure
As percent of GDP
2019
-20
Federal 83,266 31,300 114,566 1.90
Punjab 337,562 35,378 372,940
Sindh 165,028 5,427 170,455
Khyber Pakhtunkhwa 162,778 18,523 181,301
Balochistan 53,640 8,111 61,751
Pakistan 802,274 98,739 901,013
2020
-21
(P)
Federal 90,974 34,305 125,279 1.77 Punjab 352,278 32,964 385,242
Sindh 183,718 11,310 195,028
Khyber Pakhtunkhwa 188,246 28,377 216,623
Balochistan 55,924 9,936 65,860
Pakistan 871,140 116,892 988,032 P: Provisional
Source: PRSP Budgetary Expenditures, External Finance Policy Wing, Finance Division, Islamabad
Development Programmes FY2022
Federal Public Sector Development Programme (PSDP) FY2022
An amount of Rs 9.7 billion was allocated in PSDP FY2022 for 24 on-going and 4 new development projects of the Ministry of Federal Education and Professional Training. While, an amount of Rs 2.8 billion was also allocated for 6 on-going and 3 new education related development projects sponsored by Finance, Defence, Housing & Works and Kashmir Affairs & Gilgit Baltistan Divisions.
Provincial Annual Development Programmes (ADPs) FY2022
The provincial governments have prioritized education sector and intervened to provide missing facilities, improvement of the physical infrastructure, establishment of
162.1 187.7240.4 259.5
322.8393.5
479.9537.6
599.0663.4
699.2
829.2868.0
901.0988.0
50
150
250
350
450
550
650
750
850
950
(Rs
billi
on)
Fig-10.5: Expenditure on Education

Education
191
IT/Science labs, up-gradation of girls and boys primary schools to middle, high and secondary levels, construction of new boys and girls schools and colleges, provision of scholarship through endowment funds and other scholarship schemes.
Punjab
During FY2022, an amount of Rs 54.3 billion was allocated by Government of Punjab for 110 on-going and 405 new development projects of education sector. Out of which Rs 35.5 billion was allocated for school education, Rs 15.1 billion for higher education, Rs 0.8 billion for special education and Rs 2.9 billion for literacy and non-formal education.
Sindh
During FY2022, the Sindh government dedicated Rs 30.3 billion for 225 on-going and 283 new development projects of education sector. Out of which an amount of Rs 18.3 billion was allocated for school education, Rs 4.0 billion for college education, Rs 0.8 billion for Empowerment of Persons with Disabilities, Rs 1.2 billion for Sindh TEVTA and Rs 6.0 billion for Universities & Boards.
Khyber Pakhtunkhwa
The government of Khyber Pakhtunkhwa has allocated Rs 24.6 billion in FY2022 for 172 on-going and 39 new development projects. Out of which, an amount of Rs 4.3 billion was allocated for primary education, Rs 12.1 billion for secondary education, Rs 1.2 billion for elementary & secondary education and Rs 7.0 billion for higher education. This amount is 94 percent higher than the last year allocation.
Balochistan
The Balochistan government allocated Rs 31.4 billion for FY2022 for 510 on-going and 380 new development projects. Out of the total allocation, an amount of Rs 2.3 billion was allocated for primary education, Rs 1.9 billion for middle education, Rs 8.6 billion for secondary education, Rs 8.5 billion for college education, Rs 9.5 billion for university education, Rs 0.2 billion for general education and 0.4 billion for technical education.
Technical and Vocational Education
National Vocational & Technical Training Commission (NAVTTC)
NAVTTC executed nation-wide targeted skill development programme which is focused on preparing skilled human resource for local & international labour market and primarily for national mega projects, like CPEC and other energy-related projects.
NAVTTC's prime focus is to engage youth in the economic development of the country by imparting the most demanded marketable skills. Socio-economic progress of youth through skill development & infrastructure upgradation in Human Resource Development, especially youth through skill development in Technical and Vocational Education and Training (TVET) sector is included in Vision 2025 and the globally approved 17 SDGs. Federal TVET/Skill Building Strategy has strong provisions for recommended activities/National Skill for All Strategy, based on recommendations of Task Force on Education.

Pakistan Economic Survey 2021-22
192
Skill development is the quickest and most effective method of youth empowerment and channelizing their energies for socio-economic development of the country. NAVTTC under the umbrella of Ministry of Federal Education and Professional Training, promoting linkages among various stakeholders; improving TVET image; uplift TVET sector; and improves employability. NAVTTC accords a high priority to address the issues being faced by neglected geographical areas, marginalized segments of the society; and uplift TVET sector in the country. A comprehensive skill development programme, i.e., Prime Minister's Special Package to implement "Skills for All" Strategy as a catalyst for TVET Sector Development, is being implemented by NAVTTC. NAVTTC with the vision of "Skills for Employability, Skills for All" is imparting the youth of country with employable technical and vocational hands-on skills to prepare them for decent employment and self-employment in the shortest possible time.
The TVET landscape of Pakistan has taken its shape as a result of consequent policies, measures and interventions taken by the government, which are highlighted as under:
National Skills for All Strategy
Implementation of Prime Minister's "Skills for All Strategy"-Hunarmand Pakistan Programme under Kamyab Jawan Initiative
Government of Pakistan constituted a Task Force under the Ministry of Federal Education and Professional Training to devise a comprehensive strategy for skill development in the country. NAVTTC spearheaded the proceedings of this initiative and developed the National Skill Strategy, which is aligned with the National agenda and National TVET Policy. The strategy has been developed under a framework that aims to revamp and uplift the entire TVET sector by identifying key issues and taking qualitative and quantitative measures to address them, for skill development in the country. Based on the notified terms of reference, the Task Force identified (08) key areas that required immediate Government interventions for proceeding towards a vibrant, responsive and productive TVET system. These eight areas are mentioned below:
� Improving Governance to remove fragmentation/duplications leading to systemic wastages
� Exploring Multi-Source Funding to pursue a broad-based reform agenda
� Capacity Enhancement to create more and more training opportunities
� Quality Assurance to bring quality of skills at par with national-international requirements
� Access and Equity for providing equal opportunities to such marginalized segments of society as females, orphans, special people, youth from less developed areas, etc.
� Industry Ownership to enhance both relevance of training and youth employability
� Skill Development for international market for increasing foreign remittances
� TVET Communication Plan to increase image of skill sector
Education
193
On-going TVET interventions in TVET Sector through "Skill for All" Programme (PSDP) in the light of National Skills Strategy 2018
Subsequent to National Education Policy 2017 and National Skills for All Strategy 2018, the government is executing the "Skill for All Programme" in 14 areas of interventions, which is aimed at total transformation of Pakistan TVET landscape on the international standards under the PSDP project Prime Minister's "Skills for All Strategy"-Hunarmand Pakistan Programme under Kamyab Jawan Initiative, a comprehensive skill development programme is prepared and being implemented by NAVTTC to implement the above recommendations of the Task Force. Fourteen (14) components/areas of interventions covered under this programme include: � Development & Standardization of 200 TVET Qualifications
� International Accreditation of 50 Pakistani TVET Institutes and Initiation of Joint Degree Programmes in TVET
� Extension of NAVTTC's Job Portal into National Employment Exchange (NEX) Portal and refurbishing & connecting all existing job placement facilities across the country to NEX
� Establishing 75 Smart Tech Labs for virtual skill development programmes including distant learning programmes in the TVET sector
� Establishing 10 countries of destination-specific facilitation centers in 10 major manpower exporting cities across Pakistan
� Establishing 70 labs/workshop in madrassa(s) to introduce skill development and TVET activities across Pakistan
� The skill development programme for 50,000 youth belonging to less developed areas of the country, especially Balochistan, GB, AJK and newly merged districts of Khyber Pakhtunkhwa (Ex-FATA), Southern Punjab & Rural Sindh
� Skill development training of 50,000 youth in High-End technologies in reputed Universities of Pakistan and TVET Institutes
� Apprenticeship training of 20,000 youth in the industry under Apprenticeship Act-2018 (formal & informal apprenticeship)
� Recognition of Prior Learning (RPL) of 50,000 youth to certify informally acquired skills inside the country and abroad and training of 4,000 Assessors
� Establishing the National Accreditation Council, placed at ICT
� Accreditation of 2,000 TVET Institutes across the country
� Transfer of Technology through collaboration with technologically advanced countries for bringing the TVET system in Pakistan at par with international standards and Master Training of 500 TVET Teachers in Technology
� Establishment of 50 Business Incubation Centers to promote self-employment and entrepreneurship in skilled youth
Pakistan Economic Survey 2021-22
194
NAVTTC has made major contribution to national human resource development and has generated a large number of employment for the skilled youth, overseas and nationally, benefitting the individuals as well as the national economy. Some key achievements of NAVTTC are;
� 379,350 youth trained as certified skilled professionals
� 170,000 trained in year 2021, in 720 institutes, with 71 percent employed
� 40,361 trained in High-Tech skills including Artificial Intelligence, Robotics, Cyber Security & IT and other 104 trades
� Developed National Skills Information System (NSIS) and established NEXT Skilled Youth & Job Portal with Databank of 311,734 certified skilled youth available in real time;
� 18,627 personnel certified and mainstreamed through RPL (Recognition of Prior Learning)
� Developed National Vocational Qualifications Framework (NVQF)
� Competency Based Training & Assessment (CBT&A)/outcome based Curriculum has been developed in 102 demand driven trades in accordance with international and national job market. Designing of TVET Curriculum to Cater Attitude and Personality Grooming of Skilled Work Force to cater technical skills, professional/work ethics, confidence building, practical tasking, Introduction of CBT&A in TVET sector, i.e. (80 percent practical and 20 percent theory) in all TVET institutes
� Matric-Tech Programme has been launched in 15 schools of ICT, GB & AJK in 08 discipline to mainstream TVET in formal education
� 50 Smart Labs and 500 Class Rooms set up with the Chinese CPEC support;
� 577 national institutes accredited; International Accreditation, etc
� 10 TVET institute Internationally Accredited by International accreditation agencies
� Saudi Takamol Skills Verification Programme (SVP) system has been established for Pakistani Skilled workforce to seek employment in KSA
Higher Education Commission (HEC)
HEC is not only plays a central role for the promotion of quality education and development of the higher educational institutions in Pakistan but also promote universities to become world-class centers of education, and produce quality research in the field of science and technology.
HEC has prepared and launched its Vision 2025, presenting a broader landscape of Higher Education Sector and future strategic frameworks.
HEC Vision Plan 2025 focuses on improving quality education, faculty development, and maximizing the research and development opportunities in higher education sector. Major areas of higher education have restructured to enhance the reach and effectiveness by prioritizing equitable access, improved learning and increased
Education
195
assurance of the attainment regardless of background. Only the gains in education results in increased and sustained socio-economic development
To enhance the equitable access to quality higher education, the total number of universities in the country both in Public Sector & Private Sector has been increased to 233 (Public Sector: 141 & Private Sector: 92). Similarly, the number of sub-campuses of these universities has also been expanded to 115 (Public Sector: 82 & Private Sector: 33). Ultimately, the total enrolment has also been increased to around 2.0 million.
Quality of Higher Education
HEC through its Ordinance, has established Quality Assurance Agency (QAA) in 2005. The agency is a policymaking and monitoring body for enhancement and assurance of quality in Higher Education Institutions. It is involved in the systematic implementation of quality enhancement procedures/criteria to attain improved levels of international compatibility and competitiveness at the institutional and programme level.
Internal Quality Assurance [IQA]
The objective of IQA processes is to enhance and institutionalize the quality culture in institutions of higher learning. For this purpose, the IQA processes relate to the activities with respect to establishing new QEC and strengthening the implementation of QA parameters. To reinforce its objective, IQA holds periodic progress review meetings, capacity building workshops and performs monitoring visits. The quality of the IQA mechanism in an HEI is measured quantitatively, on annual basis, by means of a scorecard. The major outcome of the IQA mechanism is to prepare an HEI for external evaluations.
Currently, 227 QEC are functional in the HEIs across the country. The establishment of QEC is a requirement for every new university established in public as well as private sector HEIs. During FY2022, new QECs have been established in 21 HEIs across Pakistan. Also progress review meetings and capacity building workshops of 227 QECs are conducted in all regions, across the country, i.e. Lahore, Peshawar, Karachi, Islamabad, Bahawalpur, Hyderabad, Quetta and Swat.
External Quality Assurance (EQA)
Institution Level [Institution Performance Evaluation (IPE)
This is an umbrella activity that evaluates the performance of an HEI through a peer review process from all aspects, i.e. quality of teaching & learning, research, the effectiveness of leadership and governance. The main objective is to evaluate the overall performance of an HEI. For this purpose, the QAA plans are administers the activities of IPE against eleven defined standards. The standards are namely, Mission Statement and Goals, Planning and Evaluation, Organization and Governance, Integrity, Faculty, Students, Institutional Resources, Academic Programmes and Curricula, Public Disclosure and Transparency, Assessment & Quality Assurance, and Student Support Service.
Pakistan Economic Survey 2021-22
196
So far, 140 HEIs are reviewed across the country, which includes 22 HEIs in the FY2022. Also, capacity building and consultative sessions were held with the 227 HEIs across Pakistan.
Undergraduate-Level Programme
HEC has established five Accreditation Councils in the areas of Agriculture, Business, Computing, Teacher and Technology Education in addition to already existing nine professional Councils, i.e., Pakistan Council for Architects and Town Planners (PCATP), Pakistan Bar Council (PBC), Pakistan Engineering Council (PEC), Pakistan Medical and Dental Council (PM&DC), Pakistan Nursing Council (PNC), Pakistan Veterinary Medical Council (PVMC), National Council for Tibb (NCT), Pharmacy Council of Pakistan (PCP) and National Council for Homeopathy (NCH).
These Councils worked with universities for accreditation of undergraduate programme in the relevant fields and continuously engaged in improving the quality of programmes offered by them. HEC closely work with these Councils in improving their accreditation standards and processes, capacity building of programme evaluators through training workshops, etc.
So far 1800 professional programmes, across Pakistan, are accredited by the councils established by QAA-HEC.
Postgraduate-Level (Ph.D. & MS/MPhil) Programme
The review of MS/M.Phil./Ph.D. or equivalent Programme is one of the key initiatives of QAA. Under this programme, the Postgraduate programmes (i.e. levels 07 and 08) are reviewed through expert committees to assure the compliance of HEC's minimum criteria/guidelines.
For this purpose, QAA reviews the MS/MPhil and Ph.D. Programmes of HEIs through expert committees to make them internationally compatible. So far, programmes of 121 universities have been reviewed covering more than 2500 MS/MPhil and Ph.D. programmes. Capacity building of reviewers is a regular feature of the programme. So far around 130 reviewers have benefited from QAA Programme Review training workshops.
International Liaison:
HEC Pakistan is experiencing a paradigm shift in terms of QAA aiming at excellence in teaching, learning and research. In order to incorporate international best practices in the context of quality assurance, a liaison has been developed with QAA-UK, international Networks on QA. Membership of the Asia Pacific Quality Network (APQN), CHEA, International Network of Quality Assurance in Higher Education (INQAAHE) and Quality Assurance Agencies of the Islamic World has been earned.
HEC’s officials have been participating in the annual conferences organized by International QA Networks from time to time. The learning outcomes of participation in these networks and exchange of ideas have been incorporated in the QA system of HE sector of Pakistan.
Education
197
Human Resource Development
The HEC is investing a handsome amount on different Scholarship Schemes as well as teaching faculty to meet their aspirations of obtaining highest qualifications through development and recurring projects/programmes of scholarships.
Overseas Scholarships: A total number of 623 scholars proceeded abroad for their PhD, MS and Under-Graduate studies and 146 has completed their studies during FY2022 (Jul-Apr).
In addition, 292 scholars have been awarded whereas 230 scholars completed 6-month PhD research fellowship abroad under International Research Support Initiative Programme (IRSIP) during the said period. HEC of Pakistan is offering six-month research fellowship abroad to full time PhD students enrolled in Pakistan to enhance their research capabilities.
Indigenous Scholarships: A total number of 977 indigenous scholarships were awarded for Under-Graduate, Post-Graduate and PhD studies under various schemes and 327 scholars completed their studies during FY2022 (Jul-Apr).
Foreign Students in Pakistan: Government of Pakistan has offered scholarships to students of Afghanistan, Sri Lanka and least developed countries of OIC. During FY2022 (Jul-Apr) a total 469 scholarships awarded to nationals of these countries, whereas 10 scholars completed their studies.
Need-Based Scholarships: A total number of 2,878 needs-based scholarships were awarded during FY2022 (Jul-Apr) under different need-based programmes, whereas 2,899 scholars completed their studies. It includes:
i. HEC Need-based scholarships
ii. USAID-funded Merit & Need-based Scholarship Programme
Research & Development
HEC aims motivating and facilitating the HEIs to make research a top priority for a sustainable economic growth and future knowledge economy. By putting all efforts in tailoring programmes and formulating policies, it reassures relevant research to address the significant societal issues as well as internationally compatible research for sustainable and progressive research ecosystem in the county.
HEC focused on research activities those have direct impact on community wellbeing and economy of the country. These are:
a. The performance evaluation of HEC recognized 75 ORICs was carried out by the RFI Section, through which 06 ORICs were categorized in the “X” category.
b. HEC R&D Division recognized 04 ORICs who fulfilled the minimum criteria in accordance with the HEC ORIC Policy. These include Karachi Institute of Economics and Technology, Karachi, Muhammad Nawaz Shareef University of Agriculture, Multan, University of Balochistan, Quetta and University of Central Punjab, Lahore – taking the total number of recognized ORICs to 76. (information till March 2022)
Pakistan Economic Survey 2021-22
198
c. HEC in collaboration with the British Council conducted 03 training workshops for ORIC Management in Karachi, Islamabad, and Faisalabad in which Director ORICs of different HEIs of Pakistan participated
d. HEC initiated the call for proposals from interested HEIs for Establishment of Business Incubation Centers (BICs). In response to the call, 23 HEIs submitted their proposals out of which 08 HEIs have been shortlisted for physical evaluation and final award (information till March 2022)
e. HEC in collaboration with SMEDA initiated the Establishment of National Idea Labs at HEC established BICs. 05 BICs (NUST, NED, NTU, IMSciences, BUITEMS) have been shortlisted for the pilot phase and NIL Agreement Signing Ceremony will be held in March 2022. The NIL will provide facilitation service to final year students to convert their ideas into sustainable businesses (information till March 2022)
f. Innovator Seed Fund Pre-Launch Webinars were organized for the facilitation and wider outreach of information of different stakeholders. 09 Webinars were held in total targeting different thematic areas.
g. A one-day rigorous training of BIC Managers was organized in December 2021 on Innovator Seed Fund. BIC Managers of 29 BICs across Pakistan participated in the training.
h. HEC announced call for Concept Notes against HEDP funded Innovator Seed Fund Programme. The deadline for submission of concept notes was 31st January 2022. HEC has finally received 186 applications, endorsed by the partnering BICs for further evaluation process (information till March 2022)
i. Under Innovation Seed Fund Programme of HEDP, Mapping and Needs Assessment Exercise for ORICs and BICs was carried out. The final report has been approved and disseminated with ORICs and BICs virtually.
j. HEC held a series of consultative virtual meetings with Chambers of Commerce and Industries to improve the university-industry linkages. 10 consultative online meetings were held and 04 round table sessions were held for active coordination between industry and academia.
k. HEC relaunched its Access to Scientific Instrumentations Programmes for the facilitation and support of Research Students to have analytical facilities from scientific instruments/laboratories not available in their HEIs. Against first call for applications, HEC R&D Division has received 129 applications so far for grant of Rs 200,000/- per applications as sample analysis funding. The applications are in process of final award and around 150 more applications are anticipated to be awarded by close of FY2022.
l. Key achievements of National Centers’ are given as under:
a. National Centre on Cyber-Security won Erasmus+ Collaborative Project (worth of € 1 million)
b. Beta versions of products started deploying at key strategic partners for validation includes FIA, Military, PTA, MoST, MoIT and others

Education
199
c. NCCS completed Cyber Security audit of federal ministries and departments
d. Delivered Smart City Project brief for PSDP to MoST through HEC P&D
e. Nations’ 1st Bachelor and Master levels curriculum of Cyber Security and Artificial Intelligence
f. National Center for Robotics and Automation (NCRA) was approached by Prime Minister of Pakistan through MoST to develop Pakistan’s 1st National Drone Policy and Civil Drone Regulatory Authority
g. On PM’s instruction, NCRA developed PC-I for “Development of Indigenous UAV Technology in Pakistan”
h. 1st time, in Pakistan these National Centers started holding international IEEE and other conferences on themes of these centers
i. All National Centers further funded 38 (each worth of Rs 15 million) specialized R&D projects to develop products with industry partners other than their PC-I domain to cover wider areas under these centers
j. National Center for Big Data and Cloud Computing established Pakistan’s first Big Data Open Portal and integrated with national needs of the different departments
k. National Center for GIS and Space Application hold the annual conference and was attended by President of Pakistan as a chief guest
l. National Center for GIS and Space application awarded further 12 projects on competitive basis from its research fund
m. Two new national centers, established through PSDP, were operationalized
n. Centers, NCs and USPCASs were bi-annually evaluated through progress reports
o. Standard Operating Procedures (SOP) for the different statutory functions of the centers enshrined and procedures for reporting and evaluation, were worked out
p. Proposal for “Establish a Center of Excellence on Digital Learning to enhance productivity in Higher Education” was submitted to Asian Productivity Organization, Japan in collaboration with National Productivity Organization, Pakistan, Virtual University and National Academy of Higher Education, HEC
q. Concepts for establishment of Endowment Fund Framework of the National Center for Livestock Breeding Genetics and Genomics were worked out.
r. Area Study Centers (6) have been successfully connected with the Strategic Policy Planning Cell, National Security Division for Policy inputs on quarterly basis for the consideration in National/ Regional Foreign Policy of the country.
National Academy of Higher Education (NAHE)
NAHE is the academic arm of HEC, envisioned to establish itself as an apex learning institution that will institute and lead broader national discourse around the purpose, perspectives and policy in Higher Education and held develop high quality human capital to achieve excellence in the academic milieu.

Pakistan Economic Survey 2021-22
200
NAHE works as centre of excellence for capacity building, skills development, and promotion of academic research, governance, and leadership competencies. NAHE was established with the mandate to offer generic as well as needs-based capacity building programmes for HEC employees and HEIs.
� The NAHE conducted three cohorts of its flagship National Faculty Development Programme (200+ contact hours), providing intensive training to 498 Interim Placement for Fresh PhDs (IPFP) fellows.
� NAHE also conducted a series of consultative and capacity building workshops, awareness sessions, and top-up trainings engaging a total of 3,370 participants from faculty and HEC employees during FY2022 (July-April) in 10 training areas.
So far, NAHE trained total 3,868 participants in above mentioned training programme during FY2022 (July-March).
Planning & Development of Higher Education
HEC plans continue reforms that are in line with GoP Vision 2025 mainly to implement a process of developing human capital and to take higher education opportunities at the district level throughout the country.
During FY2022, the government initially allocated Rs 42.450 billion to HEC for implementation of 168 development projects (128 ongoing & 40 new approved projects) of Public Sector Universities/HEIs. However, later on, the PSDP FY2022 was rationalized/curtailed by government to Rs 32.338 billion. During FY2022 (July-April), Rs 24.242 billion around 62 percent of the funds allocation) has been released to HEC/Public Sector Universities/HEIs for meeting expenditure against ongoing projects for various activities.
Annual Status of Education Report (ASER)
Annual Status of Education Report (ASER-Rural) 2021, is the largest citizen-led household-based learning survey across all provinces/areas: Sindh, Balochistan, Punjab, Khyber Pakhtunkhwa (KP), Gilgit Baltistan (GB), Islamabad Capital Territory (ICT) and Azad Jammu Kashmir (AJK). According to the ASER 2021, 10,000 trained volunteer/enumerators surveyed 87,415 households in 4,420 villages across 152 rural districts of Pakistan. Detailed information of 247,978 children aged 3-16 has been collected (57 percent male and 43 percent female), and of these, 212,105 children aged 5-16 years were assessed for language and arithmetic competencies. Moreover, 585 transgenders were also a part of the surveyed sample. Major findings of ASER 2021 and its comparison with 2019 is given in Box-II
Box-II: Summary of Key Findings of ASER 2021(National Rural) Enrolment In 2021, 81 percent of 6-16 year old children in rural Pakistan were enrolled in schools whereas 19 percent children were out-of-school. Amongst the enrolled, 81 percent of children were in government schools and 19 percent were in non-state institutions (18 percent private schools, 1 percent Madrassah, 0 percent others).
Education
201
� In ASER 2021, amongst the 19 percent out-of- school children (age 6-16 years), 10 percent were males and 9 percent were females. This gap has narrowed compared to the last ASER cycle (7 percent males and 9 percent females). However, this time more boys are out of school as compared to girls.
� AJK, GB and Punjab all recorded fall in enrolment ranging between 2 percent to 5 percent. ASER rural results over the years illustrate a decline in the number of children going to non-state schools; 19 percent children of age 6-16 are enrolled in private sector in 2021, while in 2019 the percentage was 30 percent.
� Pre-school enrolment (3-5 years) in 2021 stands at 38 percent as compared to 39 percent in 2019.
Quality of Learning
� Learning levels in two competencies, i.e. Language (Urdu/Sindhi/Pashto) and Arithmetic have declined since 2019. However, English learning levels have improved marginally.
� In ASER 2021, 55 percent of Class 5 students were reported as being able to read a story in Urdu/Sindhi/Pashto. Similarly, 51 percent of Class 5 students were able to do 2-digit division. For English this year, 56 percent of class 5 students could read Class 2 level English sentences as compared to 55 percent of Class 5 students who could do so in 2019.
� The top scorers for Language: Urdu are AJK (72 percent), Punjab (68 percent), Islamabad-ICT, (74 percent), GB (52 percent), and Khyber Pakhtunkhwa (50 percent); English: AJK (86 percent), Punjab (73 percent), GB (65 percent) and Islamabad-ICT (62 percent), and for Arithmetic: Punjab (69 percent), AJK (72 percent), GB (61 percent), and Khyber Pakhtunkhwa (50 percent).
� ASER Rural Survey 2021 highlights as per past trends, children enrolled in private schools are performing better in literacy compared to government counterparts, whilst for numeracy they performed at par.
� Mothers’ Education (National Rural): In 2021, the percentage of mothers’ having completed primary education has declines (32 percent) as compared to 2019 (35 percent).
School Facilities & Other Indicators
� ASER 2021 surveyed 4,096 Government and 1,602 Private schools in 152 rural districts of Pakistan. Private sector still reports better school facilities but with progressive improvement in government schools.
� Overall teacher attendance in government schools was 90 percent compared to 92 percent in private schools. Overall student attendance in government schools was 80 percent compared to 87 percent in private schools.
� 32 percent teachers of government schools have done bachelors compared to 37 percent teachers of private schools. Whereas, 52 percent teachers of government schools have done Masters as compared to 38 percent teachers of private schools.
� 70 percent of the surveyed government primary schools have toilets in 2021 compared to 59 percent in 2019. Similarly, 71 percent surveyed private primary schools have toilet facility in 2021 compared to 89 percent in 2019.
� 57 percent of the surveyed government primary schools have drinking water facility in 2021 compared to 61 percent in 2019; 77 percent of the surveyed private primary schools have drinking water facility in 2021 as compared to 93 percent in 2019.
� Multi-grade Teaching: The trends in multi-grade teaching across schools are as follows. ASER 2021 National-Rural reveals that 40 percent of government and 23 percent of private schools have multi-grade teaching at Class II level; whilst at the Class VIII level, multi-grade teaching is stood at 6 percent in government schools and 19 percent in private sector schools.
ASER Findings on Technological Access and Learning Support Received During COVID-19
ASER 2021 also included a wide range of questions from the households on technological access, recipient of social safety nets, earning and psychological well-being affected during COVID-19, learning support received by children during COVID-19, etc. Few important findings are shared below:

Pakistan Economic Survey 2021-22
202
� 77 percent of households across all rural districts of Pakistan have mobile phones and 62 percent have smart phones. Amongst mobile users, 89 percent use WhatsApp services, whilst 64 percent use SMS facility.
� 23 percent have internet connection and 18 percent have computer/laptops. 65 percent households have TV and 18 percent have radio.
� Only 16 percent of the households stated that they have received support from social safety nets (Categories: Ehsaas, BISP, PSPA, Akhuwat, etc.)
� 30 percent of the households stated that their psychological well-being was substantially affected during COVID-19.
� 16 percent of the households stated that their earning during COVID-19 got affected by more than 50 percent.
� From a high of 68 percent support from family members, 57 percent availed PTV TeleSchool sessions, 37 percent had access to smart phones, followed by 29 percent with access to computer, 27 percent to paid tuition, 14 percent digital learning resources and 6 percent accessed radio programmes for learning support.
Source: ASER 2021
Conclusion
Pakistan’s literacy, enrolment and other educational indicators have been improving over last couple of years. Government is very much focusing on improving both the quality and coverage of education through effective policy interventions and enhancing allocation of resources, but the required reforms and improvement in education sector cannot be achieved without active participation of private sector.
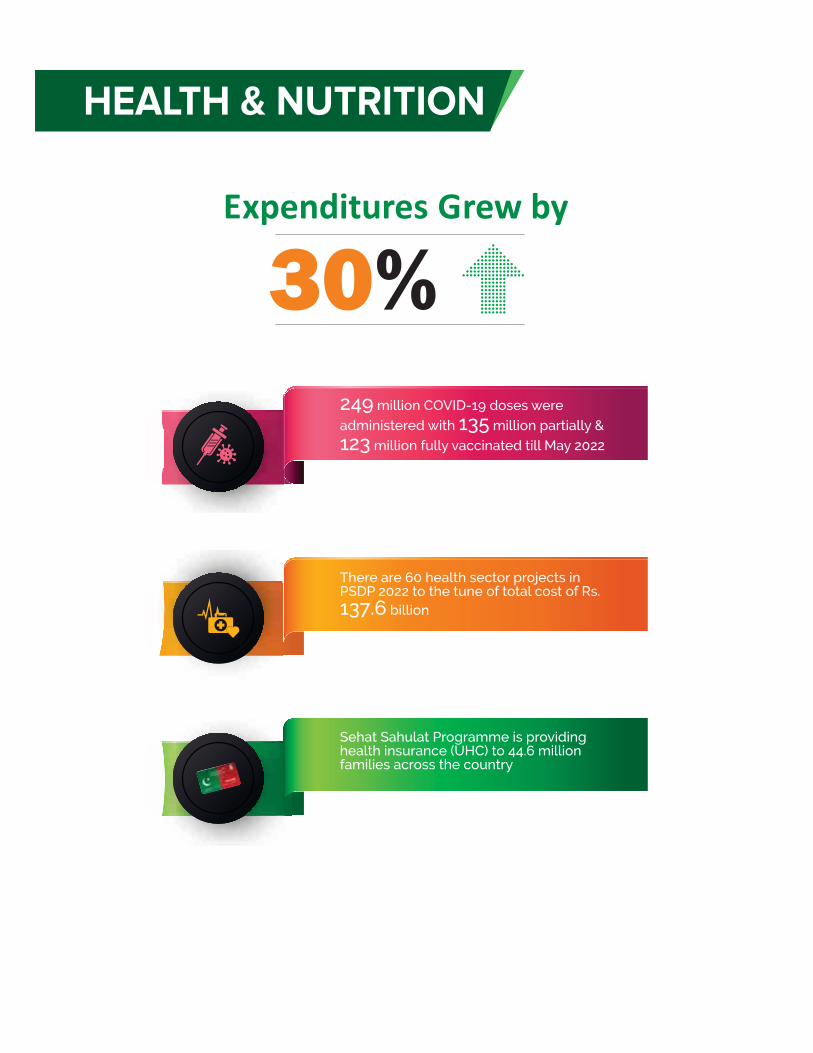

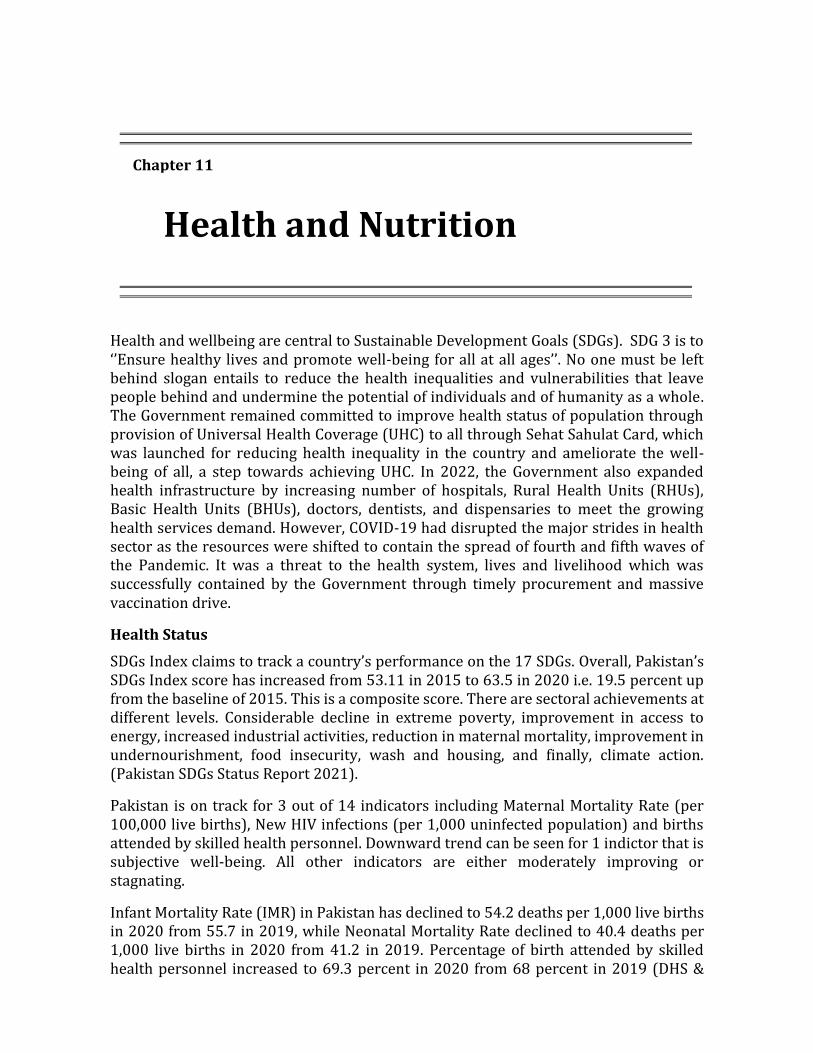
Health and wellbeing are central to Sustainable Development Goals (SDGs). SDG 3 is to ‘’Ensure healthy lives and promote well-being for all at all ages’’. No one must be left behind slogan entails to reduce the health inequalities and vulnerabilities that leave people behind and undermine the potential of individuals and of humanity as a whole. The Government remained committed to improve health status of population through provision of Universal Health Coverage (UHC) to all through Sehat Sahulat Card, which was launched for reducing health inequality in the country and ameliorate the well-being of all, a step towards achieving UHC. In 2022, the Government also expanded health infrastructure by increasing number of hospitals, Rural Health Units (RHUs), Basic Health Units (BHUs), doctors, dentists, and dispensaries to meet the growing health services demand. However, COVID-19 had disrupted the major strides in health sector as the resources were shifted to contain the spread of fourth and fifth waves of the Pandemic. It was a threat to the health system, lives and livelihood which was successfully contained by the Government through timely procurement and massive vaccination drive.
Health Status
SDGs Index claims to track a country’s performance on the 17 SDGs. Overall, Pakistan’s SDGs Index score has increased from 53.11 in 2015 to 63.5 in 2020 i.e. 19.5 percent up from the baseline of 2015. This is a composite score. There are sectoral achievements at different levels. Considerable decline in extreme poverty, improvement in access to energy, increased industrial activities, reduction in maternal mortality, improvement in undernourishment, food insecurity, wash and housing, and finally, climate action. (Pakistan SDGs Status Report 2021).
Pakistan is on track for 3 out of 14 indicators including Maternal Mortality Rate (per 100,000 live births), New HIV infections (per 1,000 uninfected population) and births attended by skilled health personnel. Downward trend can be seen for 1 indictor that is subjective well-being. All other indicators are either moderately improving or stagnating.
Infant Mortality Rate (IMR) in Pakistan has declined to 54.2 deaths per 1,000 live births in 2020 from 55.7 in 2019, while Neonatal Mortality Rate declined to 40.4 deaths per 1,000 live births in 2020 from 41.2 in 2019. Percentage of birth attended by skilled health personnel increased to 69.3 percent in 2020 from 68 percent in 2019 (DHS &
Chapter 11
Health and Nutrition
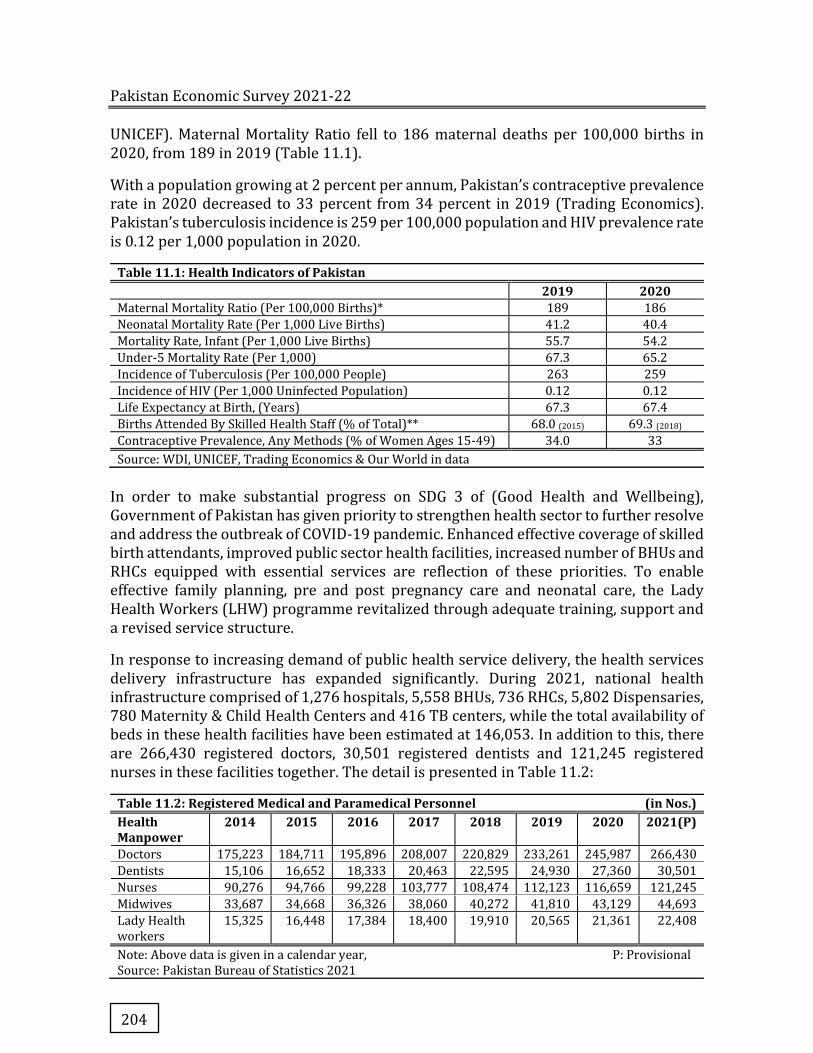
Pakistan Economic Survey 2021-22
204
UNICEF). Maternal Mortality Ratio fell to 186 maternal deaths per 100,000 births in 2020, from 189 in 2019 (Table 11.1).
With a population growing at 2 percent per annum, Pakistan’s contraceptive prevalence rate in 2020 decreased to 33 percent from 34 percent in 2019 (Trading Economics). Pakistan’s tuberculosis incidence is 259 per 100,000 population and HIV prevalence rate is 0.12 per 1,000 population in 2020.
Table 11.1: Health Indicators of Pakistan 2019 2020 Maternal Mortality Ratio (Per 100,000 Births)* 189 186
Neonatal Mortality Rate (Per 1,000 Live Births) 41.2 40.4
Mortality Rate, Infant (Per 1,000 Live Births) 55.7 54.2
Under-5 Mortality Rate (Per 1,000) 67.3 65.2
Incidence of Tuberculosis (Per 100,000 People) 263 259
Incidence of HIV (Per 1,000 Uninfected Population) 0.12 0.12
Life Expectancy at Birth, (Years) 67.3 67.4
Births Attended By Skilled Health Staff (% of Total)** 68.0 (2015) 69.3 (2018)
Contraceptive Prevalence, Any Methods (% of Women Ages 15-49) 34.0 33
Source: WDI, UNICEF, Trading Economics & Our World in data
In order to make substantial progress on SDG 3 of (Good Health and Wellbeing), Government of Pakistan has given priority to strengthen health sector to further resolve and address the outbreak of COVID-19 pandemic. Enhanced effective coverage of skilled birth attendants, improved public sector health facilities, increased number of BHUs and RHCs equipped with essential services are reflection of these priorities. To enable effective family planning, pre and post pregnancy care and neonatal care, the Lady Health Workers (LHW) programme revitalized through adequate training, support and a revised service structure.
In response to increasing demand of public health service delivery, the health services delivery infrastructure has expanded significantly. During 2021, national health infrastructure comprised of 1,276 hospitals, 5,558 BHUs, 736 RHCs, 5,802 Dispensaries, 780 Maternity & Child Health Centers and 416 TB centers, while the total availability of beds in these health facilities have been estimated at 146,053. In addition to this, there are 266,430 registered doctors, 30,501 registered dentists and 121,245 registered nurses in these facilities together. The detail is presented in Table 11.2:
Table 11.2: Registered Medical and Paramedical Personnel (in Nos.) Health Manpower
2014 2015 2016 2017 2018 2019 2020 2021(P)
Doctors 175,223 184,711 195,896 208,007 220,829 233,261 245,987 266,430
Dentists 15,106 16,652 18,333 20,463 22,595 24,930 27,360 30,501
Nurses 90,276 94,766 99,228 103,777 108,474 112,123 116,659 121,245
Midwives 33,687 34,668 36,326 38,060 40,272 41,810 43,129 44,693
Lady Health workers
15,325 16,448 17,384 18,400 19,910 20,565 21,361 22,408
Note: Above data is given in a calendar year, P: Provisional Source: Pakistan Bureau of Statistics 2021
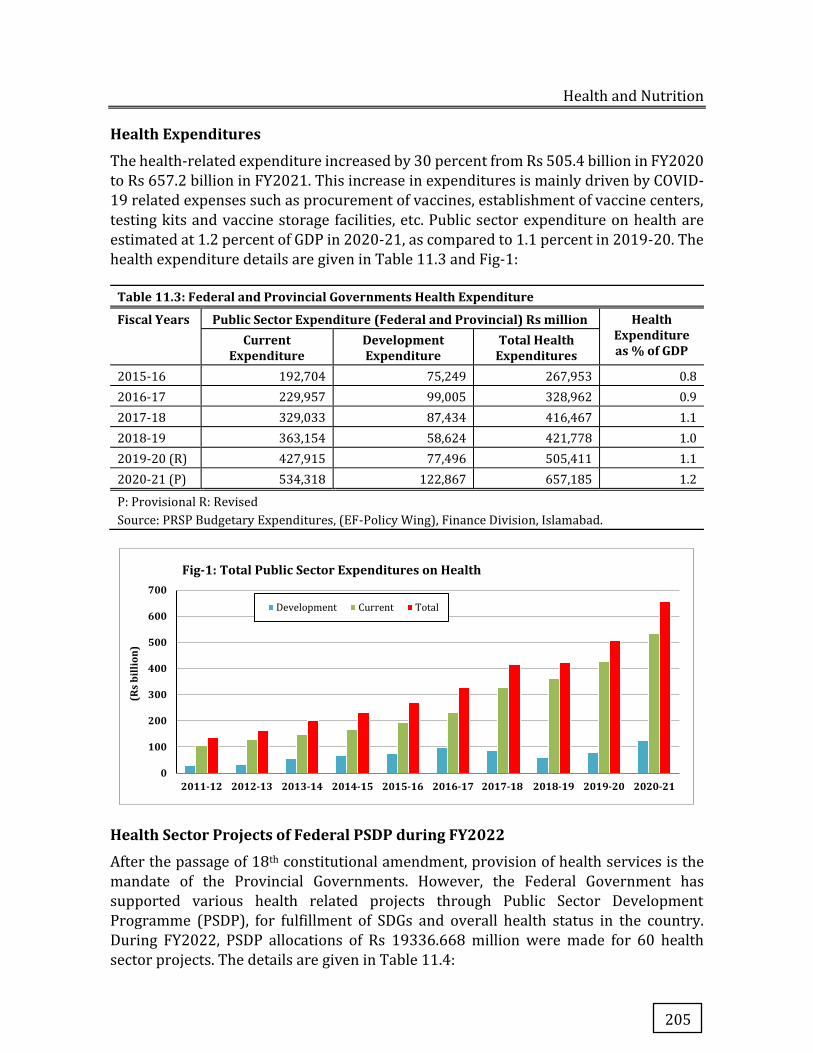
Health and Nutrition
205
Health Expenditures
The health-related expenditure increased by 30 percent from Rs 505.4 billion in FY2020
to Rs 657.2 billion in FY2021. This increase in expenditures is mainly driven by COVID-
19 related expenses such as procurement of vaccines, establishment of vaccine centers,
testing kits and vaccine storage facilities, etc. Public sector expenditure on health are
estimated at 1.2 percent of GDP in 2020-21, as compared to 1.1 percent in 2019-20. The
health expenditure details are given in Table 11.3 and Fig-1:
Table 11.3: Federal and Provincial Governments Health Expenditure
Fiscal Years Public Sector Expenditure (Federal and Provincial) Rs million Health Expenditure as % of GDP
Current Expenditure
Development Expenditure
Total Health Expenditures
2015-16 192,704 75,249 267,953 0.8
2016-17 229,957 99,005 328,962 0.9
2017-18 329,033 87,434 416,467 1.1
2018-19 363,154 58,624 421,778 1.0
2019-20 (R) 427,915 77,496 505,411 1.1
2020-21 (P) 534,318 122,867 657,185 1.2
P: Provisional R: Revised
Source: PRSP Budgetary Expenditures, (EF-Policy Wing), Finance Division, Islamabad.
Health Sector Projects of Federal PSDP during FY2022
After the passage of 18th constitutional amendment, provision of health services is the
mandate of the Provincial Governments. However, the Federal Government has
supported various health related projects through Public Sector Development
Programme (PSDP), for fulfillment of SDGs and overall health status in the country.
During FY2022, PSDP allocations of Rs 19336.668 million were made for 60 health
sector projects. The details are given in Table 11.4:
0
100
200
300
400
500
600
700
2011-12 2012-13 2013-14 2014-15 2015-16 2016-17 2017-18 2018-19 2019-20 2020-21
(Rs
billi
on)
Fig-1: Total Public Sector Expenditures on Health
Development Current Total
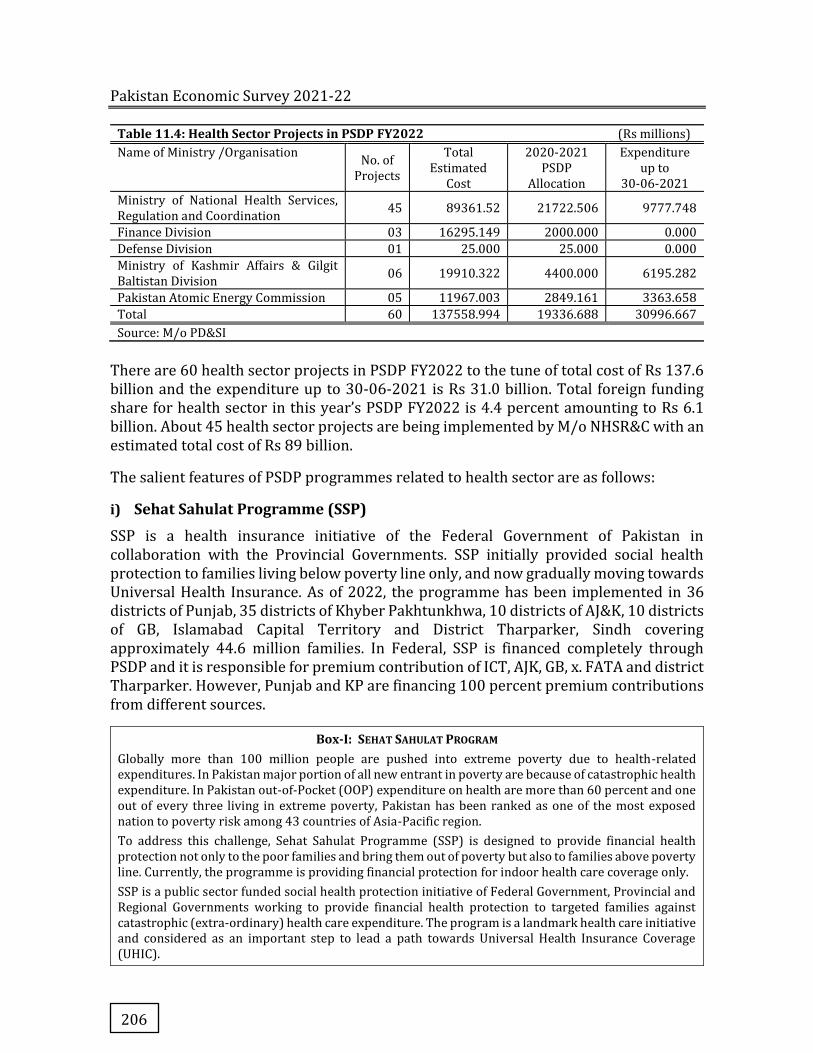
Pakistan Economic Survey 2021-22
206
Table 11.4: Health Sector Projects in PSDP FY2022 (Rs millions) Name of Ministry /Organisation
No. of Projects
Total Estimated
Cost
2020-2021 PSDP
Allocation
Expenditure up to
30-06-2021
Ministry of National Health Services, Regulation and Coordination 45 89361.52 21722.506 9777.748
Finance Division 03 16295.149 2000.000 0.000 Defense Division 01 25.000 25.000 0.000 Ministry of Kashmir Affairs & Gilgit Baltistan Division 06 19910.322 4400.000 6195.282
Pakistan Atomic Energy Commission 05 11967.003 2849.161 3363.658 Total 60 137558.994 19336.688 30996.667 Source: M/o PD&SI
There are 60 health sector projects in PSDP FY2022 to the tune of total cost of Rs 137.6 billion and the expenditure up to 30-06-2021 is Rs 31.0 billion. Total foreign funding share for health sector in this year’s PSDP FY2022 is 4.4 percent amounting to Rs 6.1 billion. About 45 health sector projects are being implemented by M/o NHSR&C with an estimated total cost of Rs 89 billion.
The salient features of PSDP programmes related to health sector are as follows:
i) Sehat Sahulat Programme (SSP)
SSP is a health insurance initiative of the Federal Government of Pakistan in collaboration with the Provincial Governments. SSP initially provided social health protection to families living below poverty line only, and now gradually moving towards Universal Health Insurance. As of 2022, the programme has been implemented in 36 districts of Punjab, 35 districts of Khyber Pakhtunkhwa, 10 districts of AJ&K, 10 districts of GB, Islamabad Capital Territory and District Tharparker, Sindh covering approximately 44.6 million families. In Federal, SSP is financed completely through PSDP and it is responsible for premium contribution of ICT, AJK, GB, x. FATA and district Tharparker. However, Punjab and KP are financing 100 percent premium contributions from different sources.
Box-I: SEHAT SAHULAT PROGRAM Globally more than 100 million people are pushed into extreme poverty due to health-related expenditures. In Pakistan major portion of all new entrant in poverty are because of catastrophic health expenditure. In Pakistan out-of-Pocket (OOP) expenditure on health are more than 60 percent and one out of every three living in extreme poverty, Pakistan has been ranked as one of the most exposed nation to poverty risk among 43 countries of Asia-Pacific region.
To address this challenge, Sehat Sahulat Programme (SSP) is designed to provide financial health protection not only to the poor families and bring them out of poverty but also to families above poverty line. Currently, the programme is providing financial protection for indoor health care coverage only.
SSP is a public sector funded social health protection initiative of Federal Government, Provincial and Regional Governments working to provide financial health protection to targeted families against catastrophic (extra-ordinary) health care expenditure. The program is a landmark health care initiative and considered as an important step to lead a path towards Universal Health Insurance Coverage (UHIC).
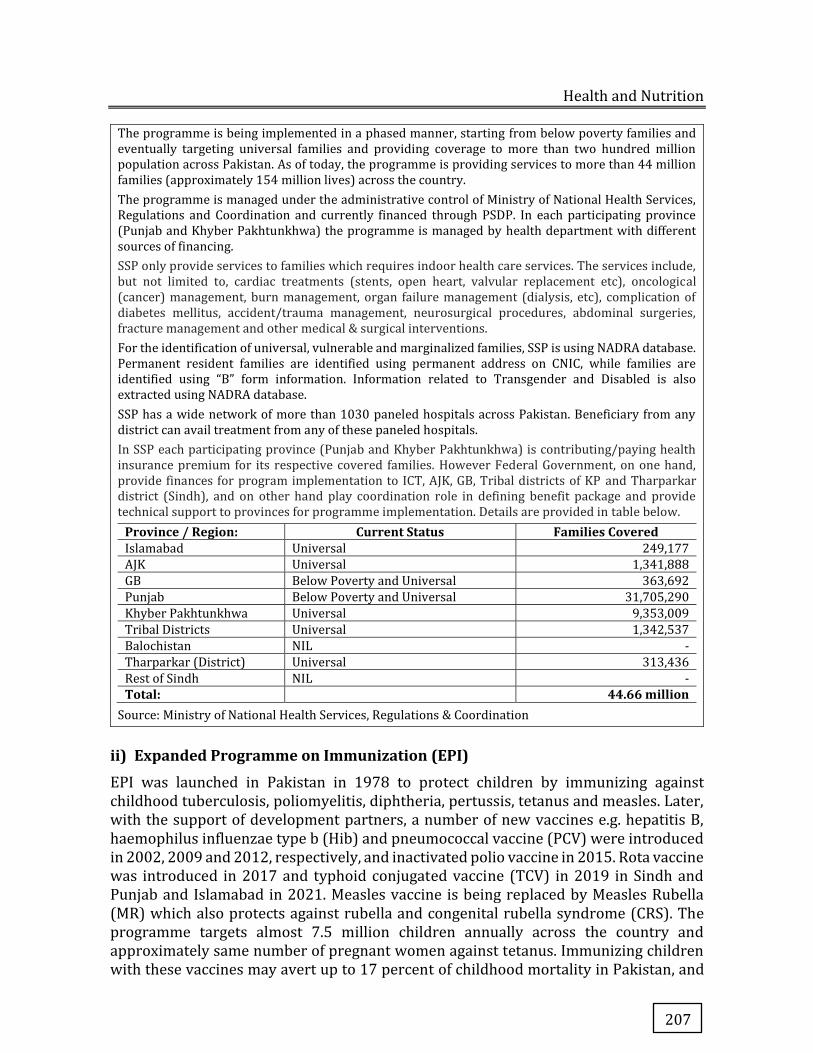
Health and Nutrition
207
The programme is being implemented in a phased manner, starting from below poverty families and eventually targeting universal families and providing coverage to more than two hundred million population across Pakistan. As of today, the programme is providing services to more than 44 million families (approximately 154 million lives) across the country.
The programme is managed under the administrative control of Ministry of National Health Services, Regulations and Coordination and currently financed through PSDP. In each participating province (Punjab and Khyber Pakhtunkhwa) the programme is managed by health department with different sources of financing.
SSP only provide services to families which requires indoor health care services. The services include, but not limited to, cardiac treatments (stents, open heart, valvular replacement etc), oncological (cancer) management, burn management, organ failure management (dialysis, etc), complication of diabetes mellitus, accident/trauma management, neurosurgical procedures, abdominal surgeries, fracture management and other medical & surgical interventions.
For the identification of universal, vulnerable and marginalized families, SSP is using NADRA database. Permanent resident families are identified using permanent address on CNIC, while families are identified using “B” form information. Information related to Transgender and Disabled is also extracted using NADRA database.
SSP has a wide network of more than 1030 paneled hospitals across Pakistan. Beneficiary from any district can avail treatment from any of these paneled hospitals.
In SSP each participating province (Punjab and Khyber Pakhtunkhwa) is contributing/paying health insurance premium for its respective covered families. However Federal Government, on one hand, provide finances for program implementation to ICT, AJK, GB, Tribal districts of KP and Tharparkar district (Sindh), and on other hand play coordination role in defining benefit package and provide technical support to provinces for programme implementation. Details are provided in table below.
Province / Region: Current Status Families Covered Islamabad Universal 249,177
AJK Universal 1,341,888
GB Below Poverty and Universal 363,692
Punjab Below Poverty and Universal 31,705,290
Khyber Pakhtunkhwa Universal 9,353,009
Tribal Districts Universal 1,342,537
Balochistan NIL -
Tharparkar (District) Universal 313,436
Rest of Sindh NIL -
Total: 44.66 million Source: Ministry of National Health Services, Regulations & Coordination
ii) Expanded Programme on Immunization (EPI)
EPI was launched in Pakistan in 1978 to protect children by immunizing against childhood tuberculosis, poliomyelitis, diphtheria, pertussis, tetanus and measles. Later, with the support of development partners, a number of new vaccines e.g. hepatitis B, haemophilus influenzae type b (Hib) and pneumococcal vaccine (PCV) were introduced in 2002, 2009 and 2012, respectively, and inactivated polio vaccine in 2015. Rota vaccine was introduced in 2017 and typhoid conjugated vaccine (TCV) in 2019 in Sindh and Punjab and Islamabad in 2021. Measles vaccine is being replaced by Measles Rubella (MR) which also protects against rubella and congenital rubella syndrome (CRS). The programme targets almost 7.5 million children annually across the country and approximately same number of pregnant women against tetanus. Immunizing children with these vaccines may avert up to 17 percent of childhood mortality in Pakistan, and
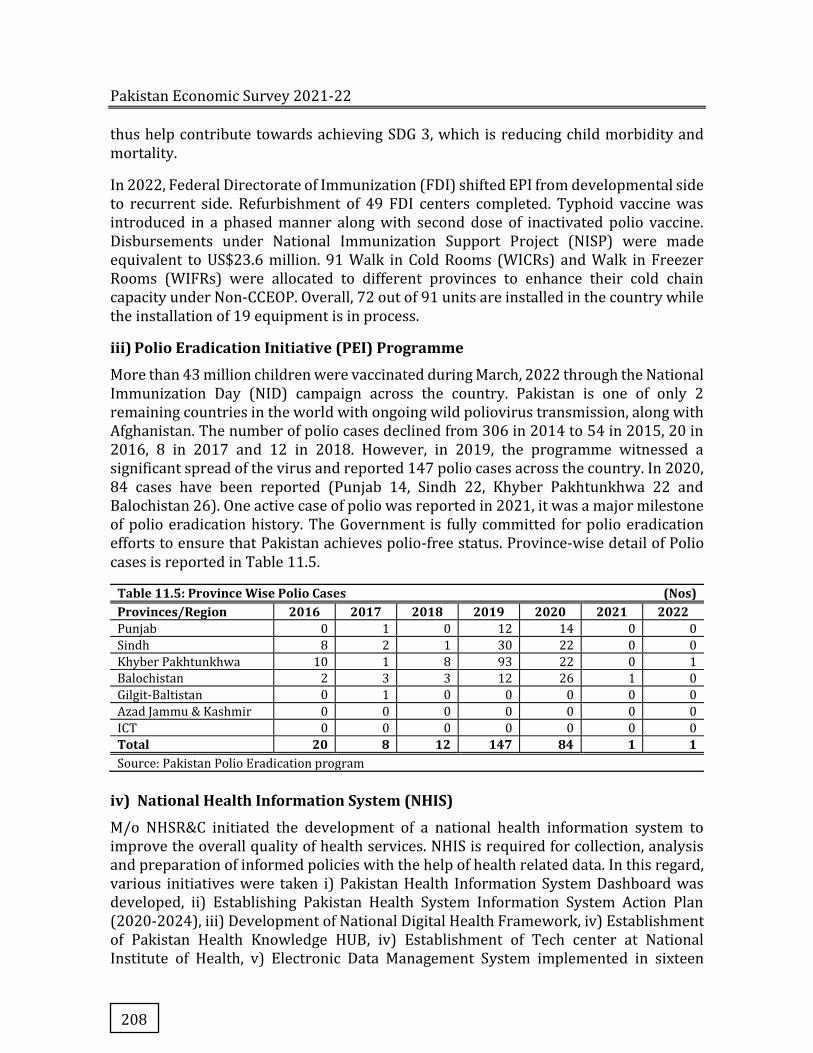
Pakistan Economic Survey 2021-22
208
thus help contribute towards achieving SDG 3, which is reducing child morbidity and mortality.
In 2022, Federal Directorate of Immunization (FDI) shifted EPI from developmental side to recurrent side. Refurbishment of 49 FDI centers completed. Typhoid vaccine was introduced in a phased manner along with second dose of inactivated polio vaccine. Disbursements under National Immunization Support Project (NISP) were made equivalent to US$23.6 million. 91 Walk in Cold Rooms (WICRs) and Walk in Freezer Rooms (WIFRs) were allocated to different provinces to enhance their cold chain capacity under Non-CCEOP. Overall, 72 out of 91 units are installed in the country while the installation of 19 equipment is in process.
iii) Polio Eradication Initiative (PEI) Programme
More than 43 million children were vaccinated during March, 2022 through the National Immunization Day (NID) campaign across the country. Pakistan is one of only 2 remaining countries in the world with ongoing wild poliovirus transmission, along with Afghanistan. The number of polio cases declined from 306 in 2014 to 54 in 2015, 20 in 2016, 8 in 2017 and 12 in 2018. However, in 2019, the programme witnessed a significant spread of the virus and reported 147 polio cases across the country. In 2020, 84 cases have been reported (Punjab 14, Sindh 22, Khyber Pakhtunkhwa 22 and Balochistan 26). One active case of polio was reported in 2021, it was a major milestone of polio eradication history. The Government is fully committed for polio eradication efforts to ensure that Pakistan achieves polio-free status. Province-wise detail of Polio cases is reported in Table 11.5.
Table 11.5: Province Wise Polio Cases (Nos) Provinces/Region 2016 2017 2018 2019 2020 2021 2022 Punjab 0 1 0 12 14 0 0
Sindh 8 2 1 30 22 0 0
Khyber Pakhtunkhwa 10 1 8 93 22 0 1
Balochistan 2 3 3 12 26 1 0
Gilgit-Baltistan 0 1 0 0 0 0 0
Azad Jammu & Kashmir 0 0 0 0 0 0 0
ICT 0 0 0 0 0 0 0
Total 20 8 12 147 84 1 1 Source: Pakistan Polio Eradication program
iv) National Health Information System (NHIS)
M/o NHSR&C initiated the development of a national health information system to improve the overall quality of health services. NHIS is required for collection, analysis and preparation of informed policies with the help of health related data. In this regard, various initiatives were taken i) Pakistan Health Information System Dashboard was developed, ii) Establishing Pakistan Health System Information System Action Plan (2020-2024), iii) Development of National Digital Health Framework, iv) Establishment of Pakistan Health Knowledge HUB, iv) Establishment of Tech center at National Institute of Health, v) Electronic Data Management System implemented in sixteen
Health and Nutrition
209
health facilities of Islamabad and vi) Facility based Maternal Deaths information collected via MPDSR application in KP and Balochistan.
v) Malaria Control Programme (MCP)
Malaria has been a major public health problem in Pakistan and a leading cause of morbidity and mortality in Pakistan since decades. In Pakistan, 1.5 million estimated and 300,000 confirmed cases are reported annually. Current National strategy for Malaria Control and Elimination (2021-2035) is based on the key Result-Based Monitoring (RBM) element which includes, early diagnosis and prompt treatment, improved detection, and response to epidemics, developing viable partnerships with national and international partners, multiple prevention, focused operational research and national commitment. National and provincial Malaria and Other Vector-Borne Diseases (VBD) control programs are playing an active and effective role for the control malaria and other VBDs. Major achievements of Directorate of Malaria control during 2020 are, 1.5 million free of cost Long Lasting Insecticide Nets (LLINs) distributed in 9 targeted districts; distribution of 80 free of cost microscopes, 3.6 million malaria rapid diagnostics test utilized, 97,805 ACTS for confirmed Plasmodium Falciparum variant of malaria cases and 2,634,500 Chloroquin tables for confirmed Plasmodium Vivak malaria cases. In addition, 7,242,2500 Primaquin 7.5 mg tablets for radical cure of malaria, 6492 Artesunate injections for the treatment of sever malaria cases and 2,565 Deltamethrin sachet were provided for indoor residual sprays (IRS) in response to malaria outbreaks.
National and Provincial Strategic plans (2021-2035) for Malaria Elimination and National Plan of Action (PoA) for Management (VBDs) 2020-2024 were also developed. More than three hundred malaria microscopy centers have been strengthened and made functional in 38 districts of the country with project support. Culture and DST network has been expanded to six DST laboratories and 17 culture laboratories.
vi) Tuberculosis (TB) Control Programme
TB is one of the major health problems in Pakistan. The estimated burden is 570,000 TB cases and 25,000 Drug Resistant TB cases every year. Around 42000 people die due to TB every year. The National TB control programme functions under the M/o NHSR&C which is responsible for overall coordination, policy direction, and technical guidance for TB control while implementation is the responsibility of provincial TB program. TB care services structure in Pakistan includes 1743 diagnostics centres, 33 specialized centres for DRTB management, 361 GeneXpert sites are functional for DRTB, 44 TB HIV centre for management of co-infections and over 8000 GPs are engaged in TB control programme. Private sector has also been engaged to boost case finding. Till date, the TB treatment coverage is 339256 with success rate of 94 percent and 2881 cases of DTRB have been treated.
In order to improve awareness of general public related to TB and its preventive measures, M/o NHSR&C developed 40 TB-HIV collaboration sites. Further, policy guidance for TB culture and DST services’’ 2021 was also developed along with National and Provincial strategic plan for tuberculosis control (2020-23).
Pakistan Economic Survey 2021-22
210
vii) Human Immunodeficiency Virus (HIV)/Acquired Immunodeficiency Syndrome (AIDS) Control Programme
National AIDS Control Program (NACP) is part of the Common Management Unit for AIDS, TB and Malaria which works under M/o NHSR&C. All four provinces have dedicated HIV control programme. Using different modelling techniques, it is estimated that in Pakistan 240,000 people are living with HIV/AIDS. HIV response comprises of prevention and treatment. There are 49 HIV treatment centers across Pakistan, 4 in KP, 2 in Balochistan, 2 in Islamabad, 16 in Sindh, and 25 in Punjab. Till December 2021, 29,626 HIV patients are taking Antiretroviral Viral (ARV) medicines and 7,056 people who inject drugs are on ARV therapy.
NACP established 17 community-based organizations. Over the course of programme implementation, 49,584 people living with HIV have been registered at the 51 ART treatment centers. HIV treatment centers provide free of cost HIV testing, diagnostics and treatment to people living with HIV. Almost, 29, 626 patients are in 51 ART treatment centers till December 2021.
viii) Civil Registration and Vital Statistics (CRVS)
Vital Events Registration Information is also critical for monitoring many Sustainable Development Goals, Targets and Indicators. The CRVS project by M/o PD&SI aims to create a revamped model of registration of all vital events (births, deaths, marriage, etc), in model ICT. This would be ensured by instituting improved vital events registration processes and flows using appropriate digital technologies, main streaming health sector information, demand generation and linking of social services with vital events registration. This would be achieved through enabling environment and formulation of legislation/SOPs to bridge the existing gaps to achieve Universal Vital Events Registration in ICT. Until now 35 CRVS counters in health facilities are established in ICT, 33 CRVS counter in UC offices are established, 170 ICT staff (Health and UCs) are oriented on CRVS Reforms/ Revamped Mechanisms, IEC material is developed and awareness campaign are planned during FY2022.
Challenge of COVID-19 Outbreak
In Pakistan, the first two cases of COVID-19 were notified on 26th February 2020. One case was notified in Karachi, while the other case was reported in ICT. To date, Pakistan has experienced five waves of the pandemic. The Government successfully contained COVID-19 through various initiatives taken under Pakistan Preparedness and Response Plan (PPRP) 2021-22, which is a continuation of the first PPRP, launched on 23 April 2020 in response to the detection of COVID-19 in Pakistan on 26 February 2020. The PPRP 2020, was worth US$595 million. The PPRP 2021-22 highlights the achievements in the implementation of PPRP 2020, the challenges and lessons learned, and the proposed priority intervention to be implemented from June 2021 to July 2022. This plan has been developed by the M/o NHSR&C in consultation with all provinces (Punjab, Sindh, KP, Balochistan and GB) and Federating Areas (AJK and ICT). The Plan outlines the international assistance required to support the Government of Pakistan to respond to COVID-19 from July 2021 to June 2022.
Health and Nutrition
211
The Achievements of PPRP are as follows:
� The overall coordination has been under the National Coordination Committee (NCC) and chaired by the Prime Minister, the NCC was operationalized by the national command and operation center. There was creation of the cabinet committee on vaccines following introduction of vaccines and National Disaster Management Authority (NDMA) as the leading operational agency.
� During the period, a national risk communication and community engagement strategy was developed and rapid behavioral assessment and studies were undertaken by Government and partners. This have been useful in provision of information, education, and communication on COVID-19 response, including uptake of new technologies like vaccines. The “Sehat Tahafuz” helpline was established to provide technical advice and helpline number 1166 also provided information for registration for vaccine and healthcare facility.
� COVID-19 guidelines and SOPs were updated and disseminated. Influenza-Like illness (ILI) and Severe Acute Respiratory Infections (SARI) sentinel surveillance was activated and enhanced. Effective implementation of non-pharmaceutical interventions such as smart lock downs, wearing of masks based on positivity rate was done. Existing Polio Eradication Surveillance systems was used, and an Integrated Disease Information Management System (IDIMS) was developed by National Emergency Operation Centre (NEOC).
� Pakistan COVID-19 laboratory testing capacity was enhanced from under 100 test per day as of February 2020 to over 79,749 tests/day as of 30th June 2021. Public private partnership for COVID-19 testing was established and, MoU were signed with private laboratories/hospital facilities for requisitioning additional testing capacity at subsidized prices across the country.
� Treatment guidelines were developed or adapted and disseminated, health facilities were equipped, and health workers capacity were enhanced, including in use of PPE and management of COVID-19 cases. The health systems capacities were continuously monitored including daily ICU bed and ventilator occupancy by COVID-19 cases.
� The Government through the NDMA supported the quantification of supplies and with the support of partners COVID-19 supplies were procured, distributed to points of use, and tracked using the Logistics Management Information System. The Federal Government relaxed the public procurement regulatory authority rules and the Ministry of Justice put in place the indemnity and liability agreements for COVID-19 vaccines though COVAX and bilateral agreements. These effort by Government is part of effort to ensure enabling environment for vaccine availability.
� COVID-19 disrupted the delivery of other Essential Health Services (EHS), necessitating efforts to maintain and enhance its provision; assessments from SARS1, Health Resources and Services Availability Mapping System (HeRAMS3) in Balochistan, and health facility readiness assessment for COVID-19 report enhanced planning for continuity of EHS and guidelines were produced. Various aspects were enhancing such as in access to RMNCH including GBV using telemedicine, use of
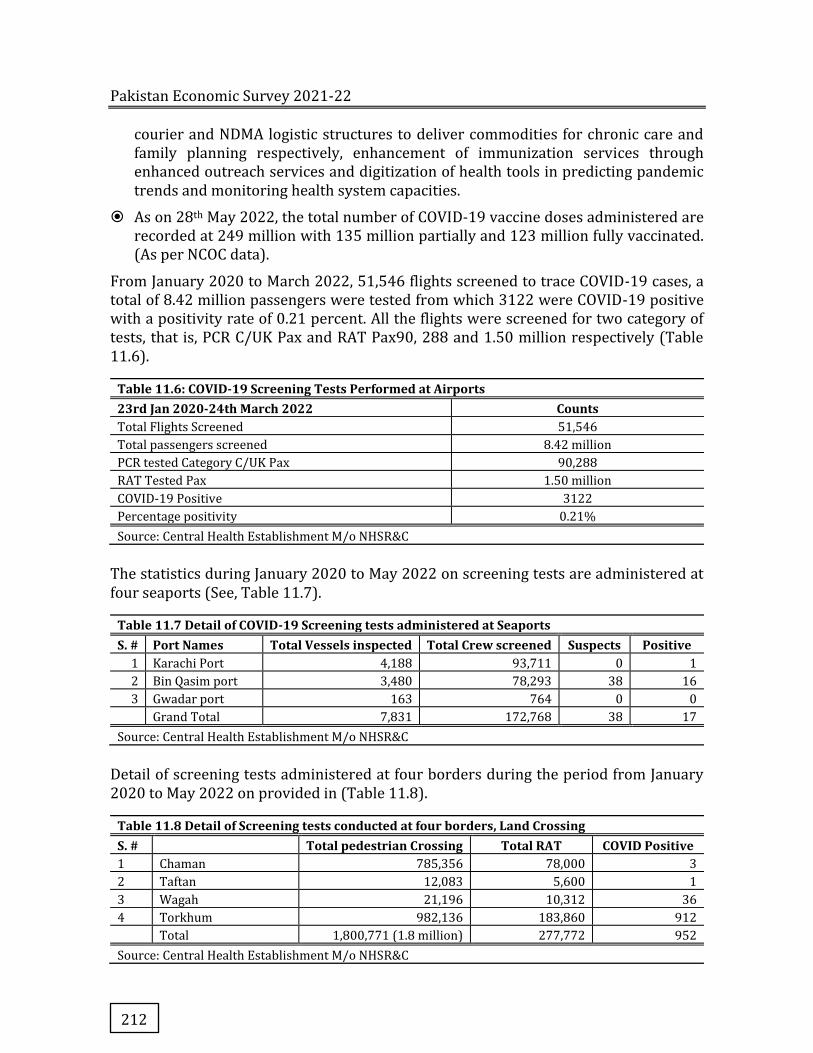
Pakistan Economic Survey 2021-22
212
courier and NDMA logistic structures to deliver commodities for chronic care and family planning respectively, enhancement of immunization services through enhanced outreach services and digitization of health tools in predicting pandemic trends and monitoring health system capacities.
� As on 28th May 2022, the total number of COVID-19 vaccine doses administered are recorded at 249 million with 135 million partially and 123 million fully vaccinated. (As per NCOC data).
From January 2020 to March 2022, 51,546 flights screened to trace COVID-19 cases, a total of 8.42 million passengers were tested from which 3122 were COVID-19 positive with a positivity rate of 0.21 percent. All the flights were screened for two category of tests, that is, PCR C/UK Pax and RAT Pax90, 288 and 1.50 million respectively (Table 11.6).
Table 11.6: COVID-19 Screening Tests Performed at Airports 23rd Jan 2020-24th March 2022 Counts Total Flights Screened 51,546
Total passengers screened 8.42 million
PCR tested Category C/UK Pax 90,288
RAT Tested Pax 1.50 million
COVID-19 Positive 3122
Percentage positivity 0.21%
Source: Central Health Establishment M/o NHSR&C
The statistics during January 2020 to May 2022 on screening tests are administered at four seaports (See, Table 11.7).
Table 11.7 Detail of COVID-19 Screening tests administered at Seaports S. # Port Names Total Vessels inspected Total Crew screened Suspects Positive
1 Karachi Port 4,188 93,711 0 1
2 Bin Qasim port 3,480 78,293 38 16
3 Gwadar port 163 764 0 0
Grand Total 7,831 172,768 38 17
Source: Central Health Establishment M/o NHSR&C
Detail of screening tests administered at four borders during the period from January 2020 to May 2022 on provided in (Table 11.8).
Table 11.8 Detail of Screening tests conducted at four borders, Land Crossing S. #
Total pedestrian Crossing Total RAT COVID Positive
1 Chaman 785,356 78,000 3
2 Taftan 12,083 5,600 1
3 Wagah 21,196 10,312 36
4 Torkhum 982,136 183,860 912
Total 1,800,771 (1.8 million) 277,772 952
Source: Central Health Establishment M/o NHSR&C
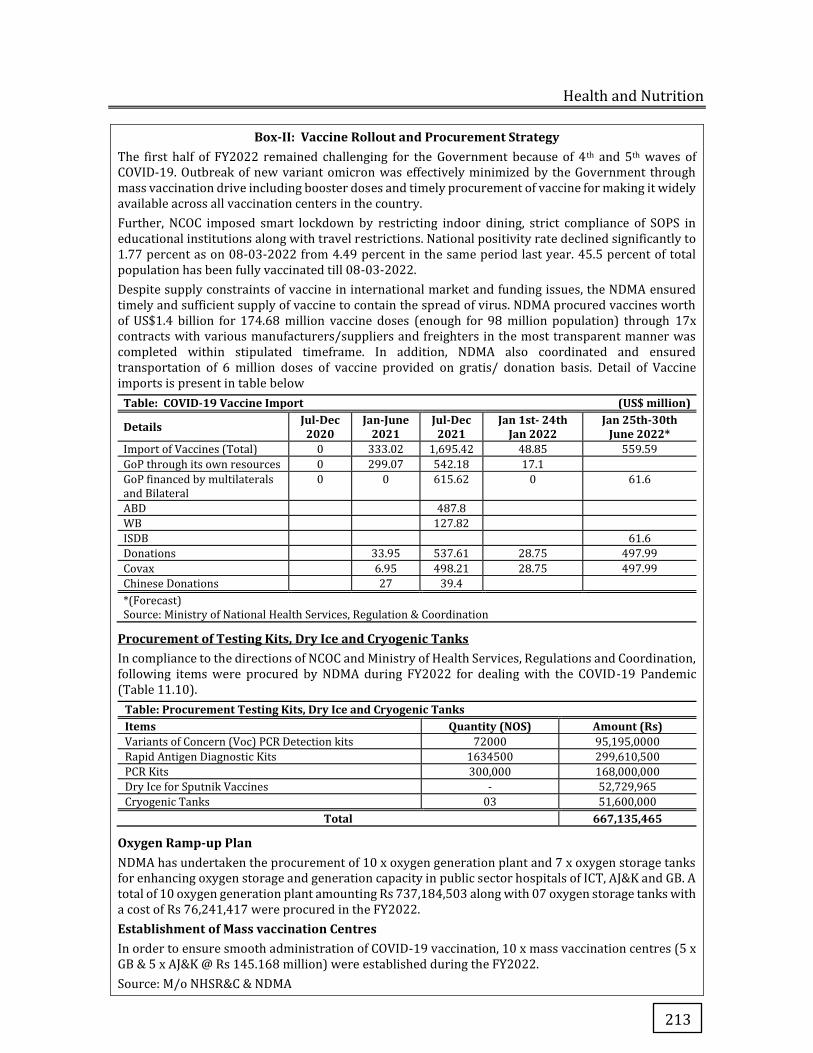
Health and Nutrition
213
Box-II: Vaccine Rollout and Procurement Strategy The first half of FY2022 remained challenging for the Government because of 4th and 5th waves of COVID-19. Outbreak of new variant omicron was effectively minimized by the Government through mass vaccination drive including booster doses and timely procurement of vaccine for making it widely available across all vaccination centers in the country.
Further, NCOC imposed smart lockdown by restricting indoor dining, strict compliance of SOPS in educational institutions along with travel restrictions. National positivity rate declined significantly to 1.77 percent as on 08-03-2022 from 4.49 percent in the same period last year. 45.5 percent of total population has been fully vaccinated till 08-03-2022.
Despite supply constraints of vaccine in international market and funding issues, the NDMA ensured timely and sufficient supply of vaccine to contain the spread of virus. NDMA procured vaccines worth of US$1.4 billion for 174.68 million vaccine doses (enough for 98 million population) through 17x contracts with various manufacturers/suppliers and freighters in the most transparent manner was completed within stipulated timeframe. In addition, NDMA also coordinated and ensured transportation of 6 million doses of vaccine provided on gratis/ donation basis. Detail of Vaccine imports is present in table below
Table: COVID-19 Vaccine Import (US$ million)
Details Jul-Dec 2020
Jan-June 2021
Jul-Dec 2021
Jan 1st- 24th Jan 2022
Jan 25th-30th June 2022*
Import of Vaccines (Total) 0 333.02 1,695.42 48.85 559.59
GoP through its own resources 0 299.07 542.18 17.1
GoP financed by multilaterals and Bilateral
0 0 615.62 0 61.6
ABD 487.8
WB 127.82
ISDB 61.6
Donations 33.95 537.61 28.75 497.99
Covax 6.95 498.21 28.75 497.99
Chinese Donations 27 39.4
*(Forecast) Source: Ministry of National Health Services, Regulation & Coordination
Procurement of Testing Kits, Dry Ice and Cryogenic Tanks In compliance to the directions of NCOC and Ministry of Health Services, Regulations and Coordination, following items were procured by NDMA during FY2022 for dealing with the COVID-19 Pandemic (Table 11.10).
Table: Procurement Testing Kits, Dry Ice and Cryogenic Tanks Items Quantity (NOS) Amount (Rs) Variants of Concern (Voc) PCR Detection kits 72000 95,195,0000
Rapid Antigen Diagnostic Kits 1634500 299,610,500
PCR Kits 300,000 168,000,000
Dry Ice for Sputnik Vaccines - 52,729,965
Cryogenic Tanks 03 51,600,000
Total 667,135,465
Oxygen Ramp-up Plan NDMA has undertaken the procurement of 10 x oxygen generation plant and 7 x oxygen storage tanks for enhancing oxygen storage and generation capacity in public sector hospitals of ICT, AJ&K and GB. A total of 10 oxygen generation plant amounting Rs 737,184,503 along with 07 oxygen storage tanks with a cost of Rs 76,241,417 were procured in the FY2022.
Establishment of Mass vaccination Centres In order to ensure smooth administration of COVID-19 vaccination, 10 x mass vaccination centres (5 x GB & 5 x AJ&K @ Rs 145.168 million) were established during the FY2022.
Source: M/o NHSR&C & NDMA
Pakistan Economic Survey 2021-22
214
Provincial Government Achievements/Initiatives in Health Sector
i) Government of Punjab
During FY2022, Government of Punjab allocated Rs 107.004 and Rs 23.098 billion for
Specialized Healthcare & Medical Education Department and Primary & Secondary
Healthcare Department, respectively. This will help in the smooth and timely
implementation of 185 development projects, which includes establishment of Tertiary
Care Hospital (Nishtar-II) in Multan, establishment of Dera Ghazi Khan Institute of
Cardiology, establishment of Mother & Child Block in Sir Ganga Ram Hospital Lahore and
establishment of Sheikh Zayed-II Hospital. Additionally, under Primary and Secondary
Health Care Department, major initiatives includes establishment of 200 bedded Mother
& Child Hospital in three districts, Attock, Rajanpur and Bahawalnagar along with
provision of 300 Ultra Sonography Machines to 300 BHUs of South and Punjab.
Government of Punjab launched (UHC) Program through the provision of Sehat Insaf
Card aiming to provide health insurance to 30 million families of the province under this
initiative and 100 percent population is covered till March, 2022.
ii) Government of Sindh
Government of Sindh has allocated Rs 199.72 billion for investment on construction,
strengthening, upgrading and rehabilitation of health facilities. This includes provision
of healthcare services, and increased accessibility in line with UHC, rehabilitation and
expansion of various level of health facilities (DHQs, THQ, RHCs, etc.). For enhancing
Human Resource for Health in Sindh, 6 Medical Colleges are being constructed. Latest
equipment (MRI, LINAC, etc.) is being provided to existing hospitals. Surveillance system
in Sindh is being strengthen with the USAID support. These initiatives would ultimately
improve access to quality health care services and better health care coverage to the
people of Sindh.
iii) Government of Khyber Pakhtunkhwa
Khyber Pakhtunkhwa (KP) increased its health allocation in the provincial budget 2021-
22 to Rs 142 billion from Rs 124 billion. KP has led social health insurance development
in the country. This year the province also announced providing universal health
insurance (SehatPlus Card). They have also added organ transplantation and outpatient
health services in the insurance coverage. KP has already started working on an
ambitious reform agenda. Some of the key interventions currently being implemented
by the health department includes services delivery improvement in PHC and SHC levels,
implementing PPP framework, Human Resource Management, Sehat Card Plus, and
improvements in Medical Teaching Institutions (MTIs). Services delivery improvement
intervention for PHC includes strengthening conversion of 200 BHUs in 24/7 SBA
facilities with total cost of Rs 1,652 million.
Moreover, rehabilitation of all RHC across KP and conversion of 50 RHCs into 24/7
facilities at total cost of Rs 934 million. For secondary health care facilities, 6 DHQs have
been selected to bring operational improvement such as equipment and medicine,

Health and Nutrition
215
increasing staff presence, etc. In addition, Health Management Cadre have been
constituted in KP with financial celling of up to Rs 2 million to cater for top medicines,
repair and maintenance and filling HR shortages for 3 months.
iv) Government of Balochistan
Government of Balochistan has increased its budget from Rs 31.4 billion in 2020-21 to
Rs 44.6 billion in the FY2022. Balochistan Cabinet in April 2022 approved the launching
of health card for more than 1.8 million families across the province. Under the health
card, every family would be given a universal Rs 1 million coverage to get quality and
timely health treatment at public and private sector hospitals. There are total of 191
development schemes for the health sector in Balochistan PSDP FY2022 with total cost
of Rs 48 billion. Out of these projects, 86 are new schemes and 105 are ongoing.
Health department of the province declared eleven DHQ hospitals as Teaching DHQs
along with the creation of new posts for Assistant Professors and Senior Registrars for
these hospitals in the regular budget. Moreover, the production of doctors in the
province has been enhanced, with 470 MBBS qualified doctors expected to start
graduating from the public sector medical colleges of Balochistan by 2026. This has been
made possible by increasing the MBBS seats of Bolan Medical College from 192 to 320
(with the permission of PMC), and the recognition of Jhalawan, Loralai and Mekran
Medical Colleges by PMC (each has an annual strength of 50 MBBS seats).
Cancer Treatment Program by Atomic Energy Cancer Hospitals
With the advent of modern technology in medicine, mortality associated with
communicable diseases has been significantly decreased. Today, non-communicable
diseases are responsible for majority of global deaths and cancer is ranked second
leading cause of death worldwide. Pakistan Atomic Energy Commission has given high
priority to application of nuclear technology in health sector, i.e. utilizing radiation
sources in diagnosis and treatment of cancer.
There are 19 Atomic Energy Cancer Hospital (AECHs) dedicated to serving poor cancer
patients not only in major cities but also in remote areas like D.I Khan, Bannu, Swat,
Nawabshah, etc. They are diligently working with aim to provide latest and
comprehensive diagnostic and treatment facilities to cancer patients irrespective of
stage of disease. Construction of one more AECHs is underway at Muzaffarabad, Azad
Jammu & Kashmir. AECHs are operated by skilled team of more than 2,500 professionals,
including doctors, scientists, engineers, paramedical, technical and other supportive
staff.
Routine Services
AECHs are equipped with advanced, sophisticated and modern diagnostic /therapeutic
facilities. Major services provided at these hospitals are diagnostic and therapeutic
Nuclear Medicine, Theranostics, Radiotherapy, Chemotherapy; Indoor wards facilities,
Cancer screening/Filter clinics, Hormonal assays, Biochemistry, Hematology,
Pakistan Economic Survey 2021-22
216
Histopathology and diagnostic Radiology. Seminars, conferences and symposium for
creating public awareness regarding cancer prevention and importance of early
diagnosis are integral part of services at all AECHs.
Achievements
In addition to management of patients, following targets have been achieved in current
fiscal year:
� Research work continued on various IAEA TC/RCA Projects and others in
collaboration with different international/national organizations.
� Provision of teaching and training facilities to about 400 post graduate medical
students/fellows in fields of nuclear medicine, radiation & medical oncology,
radiology and medical physics.
� Events for cancer awareness and campaigns for cancer prevention/control are a
regular feature at all AECH. Over 40 such events were organized throughout Pakistan
which included seminars, workshops and walks for general public education. Mobile
breast care clinics are also functional for screening at Jamshoro, Bahawalpur and
Gujranwala.
Current Projects
� PAEC, in order to provide better treatment facilities to the patients, continued
working on the following projects:
� Establishment of cancer hospital in AJK for which land has been acquired and PC-1
has been approved
� Up-gradations of AECHs,. GINUM (Gujranwala), NORI (Islamabad), BINO
(Bahawalpur), INMOL (Lahore), and KIRAN (Karachi) are underway.
� Various projects are being carried out in collaboration with IAEA with aim to transfer
technology in developing Theranostics in the treatment of cancer through radio
labelled receptor specific bimolecular conjugates in Pakistan.
� Pakistan Atomic Energy Cancer Registry (PAECR) report for 2020-21 is also being
published.
Nutrition Security
Healthy diets provide a foundation to support physical, cognitive, social and productive
individuals leading to a more economically productive and socially active nation.
Inadequate and unhealthy dietary practices are associated with impaired physical
growth, sub-optimal cognitive development, low educational attainment, low labor
productivity, reduced earning potential, compromised health and increased risk of
diseases. The impact of poor diets and nutrition risk lock individuals and countries into
long-term disadvantages. Globally, 149.2 million children under 5 years are stunting
affected in 2020 and Pakistan accounts for 6.9 percent share of the global burden.
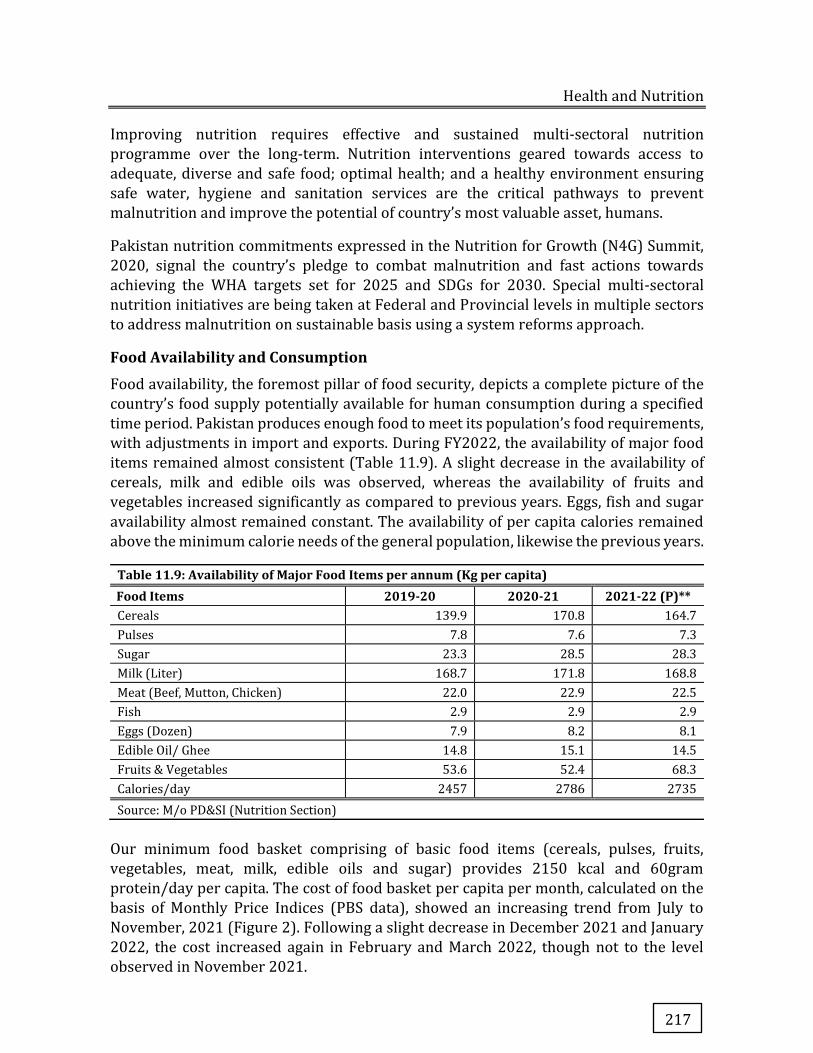
Health and Nutrition
217
Improving nutrition requires effective and sustained multi-sectoral nutrition
programme over the long-term. Nutrition interventions geared towards access to
adequate, diverse and safe food; optimal health; and a healthy environment ensuring
safe water, hygiene and sanitation services are the critical pathways to prevent
malnutrition and improve the potential of country’s most valuable asset, humans.
Pakistan nutrition commitments expressed in the Nutrition for Growth (N4G) Summit,
2020, signal the country’s pledge to combat malnutrition and fast actions towards
achieving the WHA targets set for 2025 and SDGs for 2030. Special multi-sectoral
nutrition initiatives are being taken at Federal and Provincial levels in multiple sectors
to address malnutrition on sustainable basis using a system reforms approach.
Food Availability and Consumption
Food availability, the foremost pillar of food security, depicts a complete picture of the
country’s food supply potentially available for human consumption during a specified
time period. Pakistan produces enough food to meet its population’s food requirements,
with adjustments in import and exports. During FY2022, the availability of major food
items remained almost consistent (Table 11.9). A slight decrease in the availability of
cereals, milk and edible oils was observed, whereas the availability of fruits and
vegetables increased significantly as compared to previous years. Eggs, fish and sugar
availability almost remained constant. The availability of per capita calories remained
above the minimum calorie needs of the general population, likewise the previous years.
Table 11.9: Availability of Major Food Items per annum (Kg per capita)
Food Items 2019-20 2020-21 2021-22 (P)** Cereals 139.9 170.8 164.7
Pulses 7.8 7.6 7.3
Sugar 23.3 28.5 28.3
Milk (Liter) 168.7 171.8 168.8
Meat (Beef, Mutton, Chicken) 22.0 22.9 22.5
Fish 2.9 2.9 2.9
Eggs (Dozen) 7.9 8.2 8.1
Edible Oil/ Ghee 14.8 15.1 14.5
Fruits & Vegetables 53.6 52.4 68.3
Calories/day 2457 2786 2735
Source: M/o PD&SI (Nutrition Section)
Our minimum food basket comprising of basic food items (cereals, pulses, fruits,
vegetables, meat, milk, edible oils and sugar) provides 2150 kcal and 60gram
protein/day per capita. The cost of food basket per capita per month, calculated on the
basis of Monthly Price Indices (PBS data), showed an increasing trend from July to
November, 2021 (Figure 2). Following a slight decrease in December 2021 and January
2022, the cost increased again in February and March 2022, though not to the level
observed in November 2021.
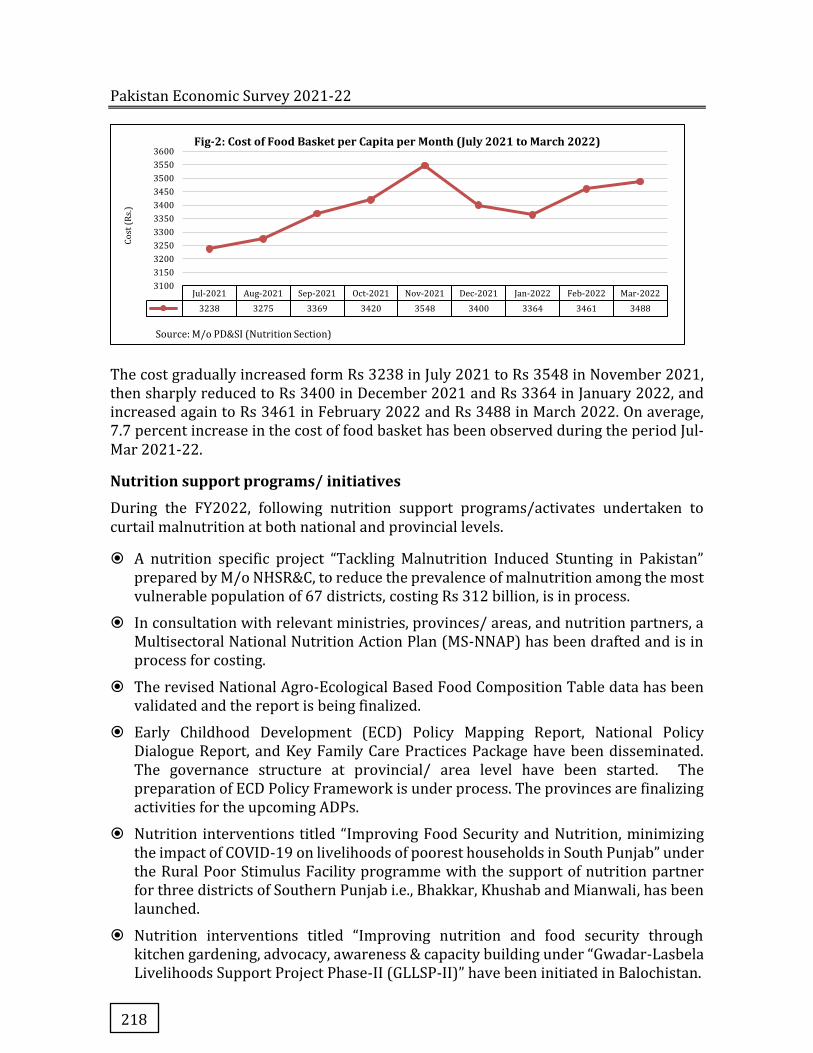
Pakistan Economic Survey 2021-22
218
The cost gradually increased form Rs 3238 in July 2021 to Rs 3548 in November 2021, then sharply reduced to Rs 3400 in December 2021 and Rs 3364 in January 2022, and increased again to Rs 3461 in February 2022 and Rs 3488 in March 2022. On average, 7.7 percent increase in the cost of food basket has been observed during the period Jul- Mar 2021-22.
Nutrition support programs/ initiatives
During the FY2022, following nutrition support programs/activates undertaken to curtail malnutrition at both national and provincial levels.
� A nutrition specific project “Tackling Malnutrition Induced Stunting in Pakistan” prepared by M/o NHSR&C, to reduce the prevalence of malnutrition among the most vulnerable population of 67 districts, costing Rs 312 billion, is in process.
� In consultation with relevant ministries, provinces/ areas, and nutrition partners, a Multisectoral National Nutrition Action Plan (MS-NNAP) has been drafted and is in process for costing.
� The revised National Agro-Ecological Based Food Composition Table data has been validated and the report is being finalized.
� Early Childhood Development (ECD) Policy Mapping Report, National Policy Dialogue Report, and Key Family Care Practices Package have been disseminated. The governance structure at provincial/ area level have been started. The preparation of ECD Policy Framework is under process. The provinces are finalizing activities for the upcoming ADPs.
� Nutrition interventions titled “Improving Food Security and Nutrition, minimizing the impact of COVID-19 on livelihoods of poorest households in South Punjab” under the Rural Poor Stimulus Facility programme with the support of nutrition partner for three districts of Southern Punjab i.e., Bhakkar, Khushab and Mianwali, has been launched.
� Nutrition interventions titled “Improving nutrition and food security through kitchen gardening, advocacy, awareness & capacity building under “Gwadar-Lasbela Livelihoods Support Project Phase-II (GLLSP-II)” have been initiated in Balochistan.
Jul-2021 Aug-2021 Sep-2021 Oct-2021 Nov-2021 Dec-2021 Jan-2022 Feb-2022 Mar-2022
3238 3275 3369 3420 3548 3400 3364 3461 3488
3100
3150
3200
3250
3300
3350
3400
3450
3500
3550
3600
Co
st (
Rs.
)
Source: M/o PD&SI (Nutrition Section)
Fig-2: Cost of Food Basket per Capita per Month (July 2021 to March 2022)
Health and Nutrition
219
� The nutrition interventions (direct and indirect) implemented/ being implemented by federal and provincial departments have been consolidated and unified national nutrition commitments presented at N4G Summit 2021 hosted by the Government of Japan for showcasing to the donors for investments.
� The conditional cash transfer under Ehsaas Nashonuma Programme is operational in 14 districts which is being expanded to additional 50 districts of the country to increase the uptake of health and nutrition services of Pregnant and Lactating Women (PLWs) and children (0-23 months).
� Urdu translation of Pakistan Dietary Guidelines for Better Nutrition (PDGN) has been reviewed and being finalized for dissemination.
� Nutrition Awareness and Advocacy Training sessions have been conducted at PPMI to raise nutrition awareness and advocacy among mid-career officers of various federal and provincial departments.
� Scaling up Nutrition (SUN) Joint Assessment Report 2021 complied/submitted to monitor the progress of SUN Networks.
� The session of high-level National Nutrition Forum (NNF) at Planning Commission has been conducted to review the country’s nutrition status & progress, identify gaps and provide the way forward. The major decisions of NNF are as under:
� Tracking information on the expenditure or financial resources for nutrition interventions in order to assess the progress and effectiveness of the interventions.
� Costing of the Multi-sectoral National Nutrition Action Plan (MS-NNAP)
� Establishment of Multi-Sectoral National Nutrition Information System (MNNIS)
� Preparation of National Food Safety Policy and endorsement.
� Initiation of Multi-sectoral National Nutrition Thought Management Coordination Programme
� Research study on “Impact of Climate Change on the Nutrients of Cereals, Pulses, Meat, Fruits and Vegetables” to determine the changes in food composition resulting from climate change.
Provincial Initiatives
� Punjab � Chief Minister's Stunting Reduction Programme for 11 Districts of Southern
Punjab
� Multi Sectoral Nutrition Strategy for WASH including Water Supply, Sanitation, Hygiene and Waste water
� Integrated Reproductive Maternal Newborn & Child Health (IRMNCH) & Nutrition Programme (Phase-III)
� Establishment of Multi Sectoral Nutrition Center in P&D Board as a governing body for coordination and implementation
Pakistan Economic Survey 2021-22
220
� Khyber Pakhtunkhwa
� Khyber Pakhtunkhwa Stunting Prevention and Rehabilitation Integrated Nutrition Gain (KP SPRING) project being implemented in four districts i.e. D.I.Khan, Tank, Bannu and Nowshera
� Integration of Health Services Delivery with Special Focus on MNCH, LHW and Nutrition Programme
� Health Nutrition Program in merged areas � Poverty alleviation through development of Rural Poultry in Khyber
Pakhtunkhwa
� Sindh
� Accelerated Action Plan (AAP) for “Stunting Reduction and Malnutrition” consisting of nutrition sensitive and specific interventions implemented in 13 districts
� EU-PINS – Programme for improved nutrition covering sensitive and specific interventions in 10 districts
� Implementation of People's Poverty Reduction Programme (PPRP) in Ghotki and Sukkur, and expanded to Khairpur, Badin, Mirpurkhas, Umerkot, Sanghar and Thatta.
� Balochistan
� Nutrition Program in 132 primary schools - 4 primary schools from each district (concept paper approved)
� Gilgit Baltistan (GB)
� Scaling Up Nutrition Program (SUN) GB with the collaboration of P&DD
� Provision of specialized nutritious food to under 5 children and PLW
� Targeting Blue Revolution towards Food Nutrition & Livelihood Security through conservation of local Species
� Food Fortification Programme of Food Department
� Provision of ECD facilities in existing Government P/S of GB
� Social Health Protection Phase-II � Provision of Specialized Nutrition Food for Ultra poor Pregnant and Lactating
Women in all 10 districts
� Azad Jammu & Kashmir (AJ&K)
� Early Childhood Development Programme (ECD) in 300 Middle and 275 High and Higher Secondary Schools
� Agro-Ecological Based Fruit, Vegetable & Agriculture Development as enterprise in AJ&K
Narcotics Control
Pakistan’s counter narcotics efforts revolve around the three main pillars highlighted in the National Anti-Narcotics Policy, 2019. These three pillars include i) Drug Supply Reduction, ii) Drug Demand Reduction and iii) International Cooperation. Counter narcotics efforts not only encompass the law enforcement side for drug supply reduction but also value equally importance of reducing the domestic demand for drugs.
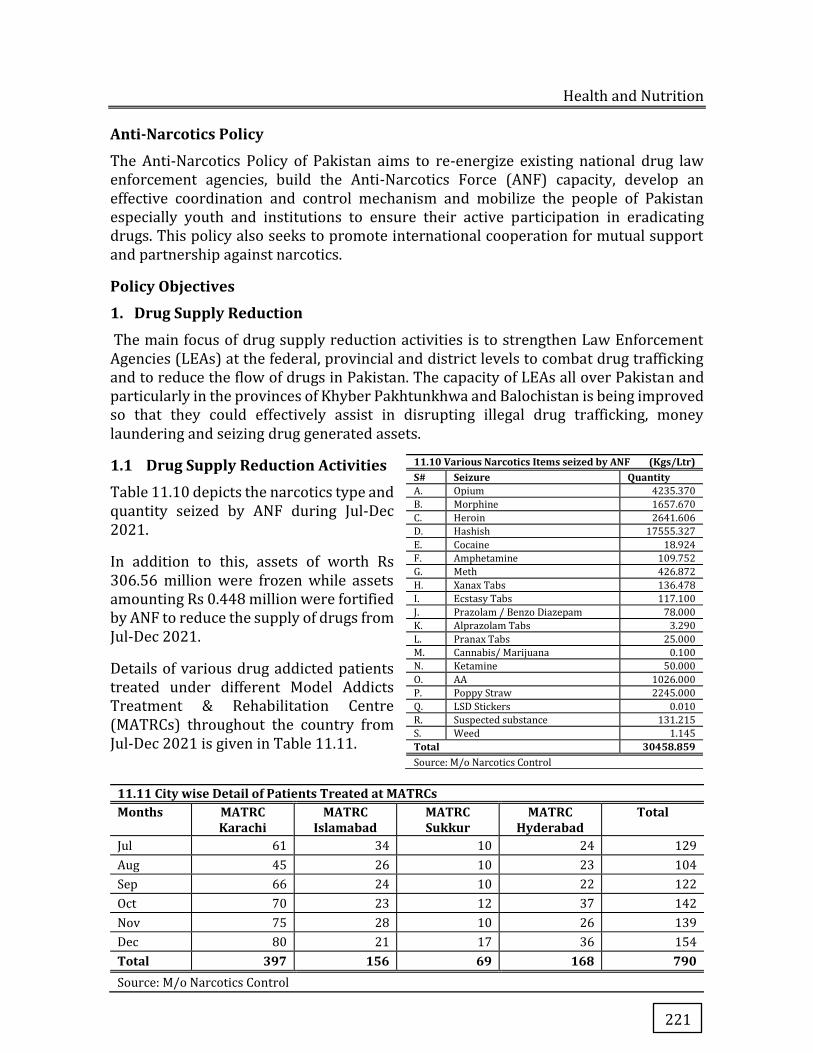
Health and Nutrition
221
Anti-Narcotics Policy
The Anti-Narcotics Policy of Pakistan aims to re-energize existing national drug law enforcement agencies, build the Anti-Narcotics Force (ANF) capacity, develop an effective coordination and control mechanism and mobilize the people of Pakistan especially youth and institutions to ensure their active participation in eradicating drugs. This policy also seeks to promote international cooperation for mutual support and partnership against narcotics.
Policy Objectives
1. Drug Supply Reduction
The main focus of drug supply reduction activities is to strengthen Law Enforcement Agencies (LEAs) at the federal, provincial and district levels to combat drug trafficking and to reduce the flow of drugs in Pakistan. The capacity of LEAs all over Pakistan and particularly in the provinces of Khyber Pakhtunkhwa and Balochistan is being improved so that they could effectively assist in disrupting illegal drug trafficking, money laundering and seizing drug generated assets.
1.1 Drug Supply Reduction Activities
Table 11.10 depicts the narcotics type and quantity seized by ANF during Jul-Dec 2021.
In addition to this, assets of worth Rs 306.56 million were frozen while assets amounting Rs 0.448 million were fortified by ANF to reduce the supply of drugs from Jul-Dec 2021.
Details of various drug addicted patients treated under different Model Addicts Treatment & Rehabilitation Centre (MATRCs) throughout the country from Jul-Dec 2021 is given in Table 11.11.
11.11 City wise Detail of Patients Treated at MATRCs Months MATRC
Karachi MATRC
Islamabad MATRC Sukkur
MATRC Hyderabad
Total
Jul 61 34 10 24 129
Aug 45 26 10 23 104
Sep 66 24 10 22 122
Oct 70 23 12 37 142
Nov 75 28 10 26 139
Dec 80 21 17 36 154
Total 397 156 69 168 790 Source: M/o Narcotics Control
11.10 Various Narcotics Items seized by ANF (Kgs/Ltr) S# Seizure Quantity A. Opium 4235.370
B. Morphine 1657.670
C. Heroin 2641.606
D. Hashish 17555.327
E. Cocaine 18.924
F. Amphetamine 109.752
G. Meth 426.872
H. Xanax Tabs 136.478
I. Ecstasy Tabs 117.100
J. Prazolam / Benzo Diazepam 78.000
K. Alprazolam Tabs 3.290
L. Pranax Tabs 25.000
M. Cannabis/ Marijuana 0.100
N. Ketamine 50.000
O. AA 1026.000
P. Poppy Straw 2245.000
Q. LSD Stickers 0.010
R. Suspected substance 131.215
S. Weed 1.145
Total 30458.859 Source: M/o Narcotics Control
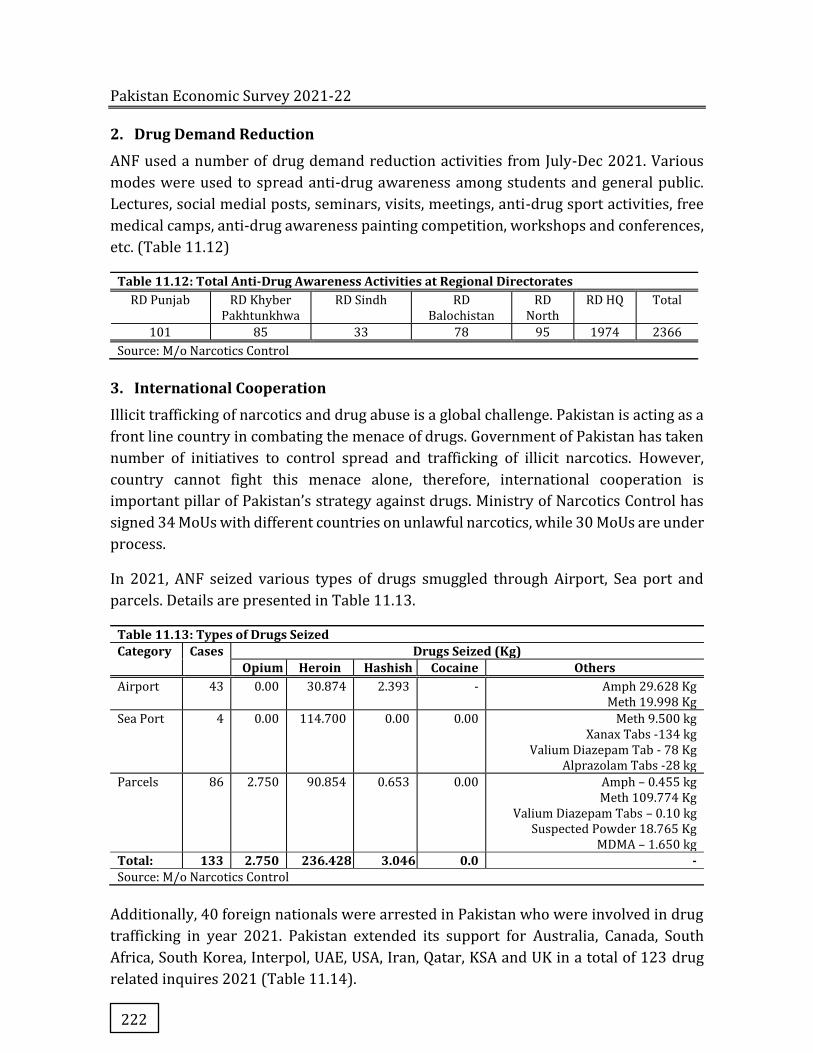
Pakistan Economic Survey 2021-22
222
2. Drug Demand Reduction
ANF used a number of drug demand reduction activities from July-Dec 2021. Various
modes were used to spread anti-drug awareness among students and general public.
Lectures, social medial posts, seminars, visits, meetings, anti-drug sport activities, free
medical camps, anti-drug awareness painting competition, workshops and conferences,
etc. (Table 11.12)
Table 11.12: Total Anti-Drug Awareness Activities at Regional Directorates RD Punjab RD Khyber
Pakhtunkhwa RD Sindh RD
Balochistan RD
North RD HQ Total
101 85 33 78 95 1974 2366
Source: M/o Narcotics Control
3. International Cooperation
Illicit trafficking of narcotics and drug abuse is a global challenge. Pakistan is acting as a
front line country in combating the menace of drugs. Government of Pakistan has taken
number of initiatives to control spread and trafficking of illicit narcotics. However,
country cannot fight this menace alone, therefore, international cooperation is
important pillar of Pakistan’s strategy against drugs. Ministry of Narcotics Control has
signed 34 MoUs with different countries on unlawful narcotics, while 30 MoUs are under
process.
In 2021, ANF seized various types of drugs smuggled through Airport, Sea port and
parcels. Details are presented in Table 11.13.
Table 11.13: Types of Drugs Seized Category Cases Drugs Seized (Kg)
Opium Heroin Hashish Cocaine Others Airport 43 0.00 30.874 2.393 - Amph 29.628 Kg
Meth 19.998 Kg
Sea Port 4 0.00 114.700 0.00 0.00 Meth 9.500 kg Xanax Tabs -134 kg
Valium Diazepam Tab - 78 Kg Alprazolam Tabs -28 kg
Parcels 86 2.750 90.854 0.653 0.00 Amph – 0.455 kg Meth 109.774 Kg
Valium Diazepam Tabs – 0.10 kg Suspected Powder 18.765 Kg
MDMA – 1.650 kg
Total: 133 2.750 236.428 3.046 0.0 - Source: M/o Narcotics Control
Additionally, 40 foreign nationals were arrested in Pakistan who were involved in drug
trafficking in year 2021. Pakistan extended its support for Australia, Canada, South
Africa, South Korea, Interpol, UAE, USA, Iran, Qatar, KSA and UK in a total of 123 drug
related inquires 2021 (Table 11.14).
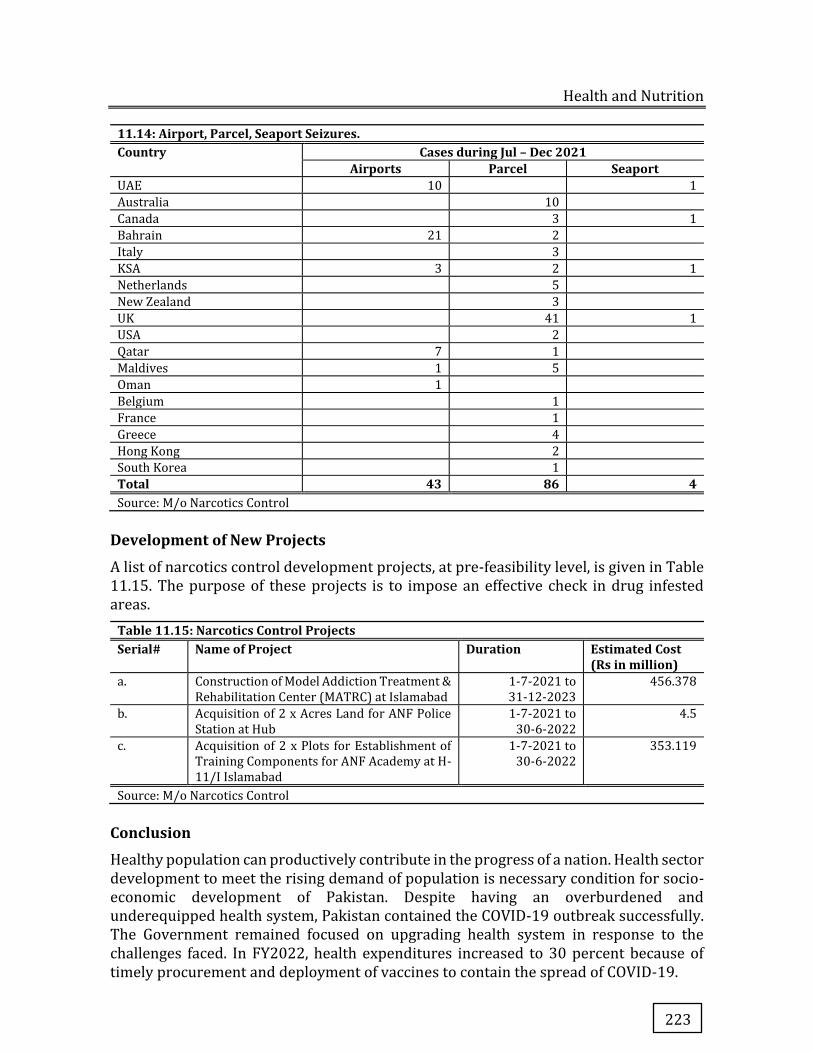
Health and Nutrition
223
11.14: Airport, Parcel, Seaport Seizures. Country Cases during Jul – Dec 2021
Airports Parcel Seaport UAE 10 1
Australia 10
Canada 3 1
Bahrain 21 2
Italy 3
KSA 3 2 1
Netherlands 5
New Zealand 3
UK 41 1
USA 2
Qatar 7 1
Maldives 1 5
Oman 1
Belgium 1
France 1
Greece 4
Hong Kong 2
South Korea 1
Total 43 86 4 Source: M/o Narcotics Control
Development of New Projects
A list of narcotics control development projects, at pre-feasibility level, is given in Table 11.15. The purpose of these projects is to impose an effective check in drug infested areas.
Table 11.15: Narcotics Control Projects Serial# Name of Project Duration Estimated Cost
(Rs in million) a. Construction of Model Addiction Treatment &
Rehabilitation Center (MATRC) at Islamabad 1-7-2021 to 31-12-2023
456.378
b. Acquisition of 2 x Acres Land for ANF Police Station at Hub
1-7-2021 to 30-6-2022
4.5
c. Acquisition of 2 x Plots for Establishment of Training Components for ANF Academy at H-11/I Islamabad
1-7-2021 to 30-6-2022
353.119
Source: M/o Narcotics Control
Conclusion
Healthy population can productively contribute in the progress of a nation. Health sector development to meet the rising demand of population is necessary condition for socio-economic development of Pakistan. Despite having an overburdened and underequipped health system, Pakistan contained the COVID-19 outbreak successfully. The Government remained focused on upgrading health system in response to the challenges faced. In FY2022, health expenditures increased to 30 percent because of timely procurement and deployment of vaccines to contain the spread of COVID-19.
Pakistan Economic Survey 2021-22
224
In order to provide quality health care services to masses especially the poor, Government extended Universal health coverage through Sehat Sahulat Card for reducing health inequality in the country. The Government is committed to pragmatically implement SDG 3 by developing inclusive health system, reducing malnutrition and expanding basic health care in the country. However, low financial allocation for health, weak governance, excessive focus on tertiary rather than primary health care are the problems that need to be addressed for achieving long term sustainable economic development.


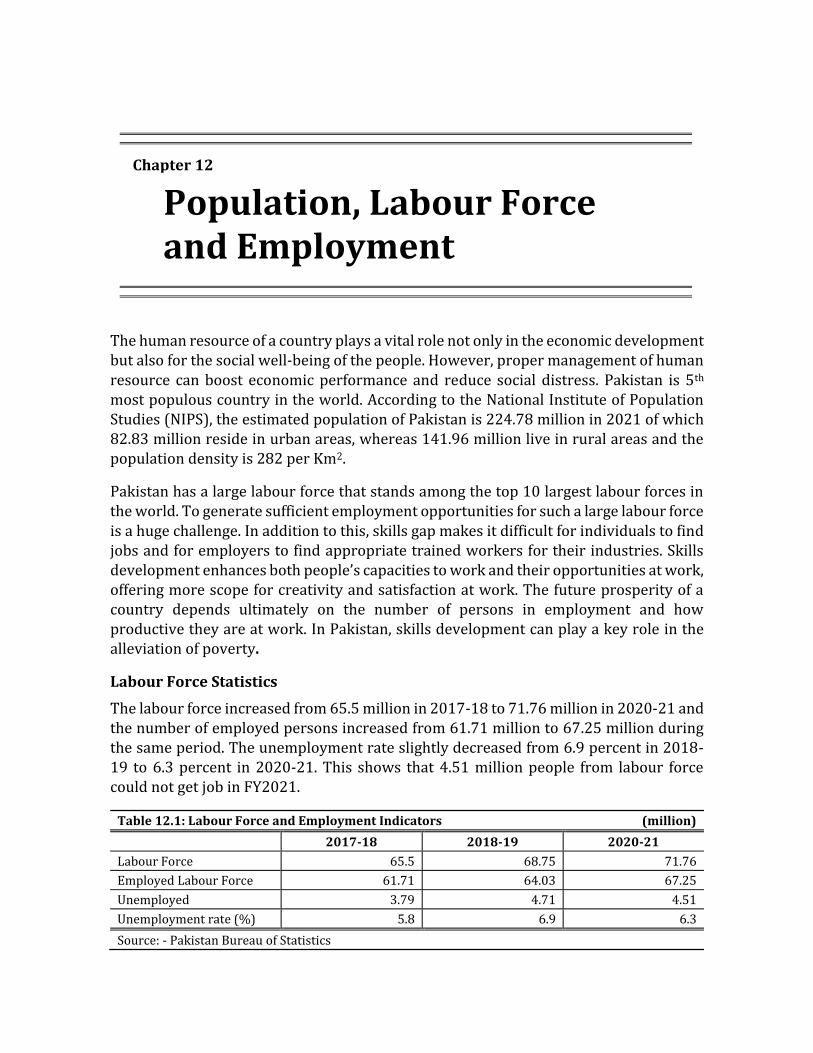
The human resource of a country plays a vital role not only in the economic development
but also for the social well-being of the people. However, proper management of human
resource can boost economic performance and reduce social distress. Pakistan is 5th
most populous country in the world. According to the National Institute of Population
Studies (NIPS), the estimated population of Pakistan is 224.78 million in 2021 of which
82.83 million reside in urban areas, whereas 141.96 million live in rural areas and the
population density is 282 per Km2.
Pakistan has a large labour force that stands among the top 10 largest labour forces in
the world. To generate sufficient employment opportunities for such a large labour force
is a huge challenge. In addition to this, skills gap makes it difficult for individuals to find
jobs and for employers to find appropriate trained workers for their industries. Skills
development enhances both people’s capacities to work and their opportunities at work,
offering more scope for creativity and satisfaction at work. The future prosperity of a
country depends ultimately on the number of persons in employment and how
productive they are at work. In Pakistan, skills development can play a key role in the
alleviation of poverty.
Labour Force Statistics
The labour force increased from 65.5 million in 2017-18 to 71.76 million in 2020-21 and
the number of employed persons increased from 61.71 million to 67.25 million during
the same period. The unemployment rate slightly decreased from 6.9 percent in 2018-
19 to 6.3 percent in 2020-21. This shows that 4.51 million people from labour force
could not get job in FY2021.
Table 12.1: Labour Force and Employment Indicators (million)
2017-18 2018-19 2020-21 Labour Force 65.5 68.75 71.76
Employed Labour Force 61.71 64.03 67.25
Unemployed 3.79 4.71 4.51
Unemployment rate (%) 5.8 6.9 6.3
Source: - Pakistan Bureau of Statistics
Chapter 12
Population, Labour Force and Employment
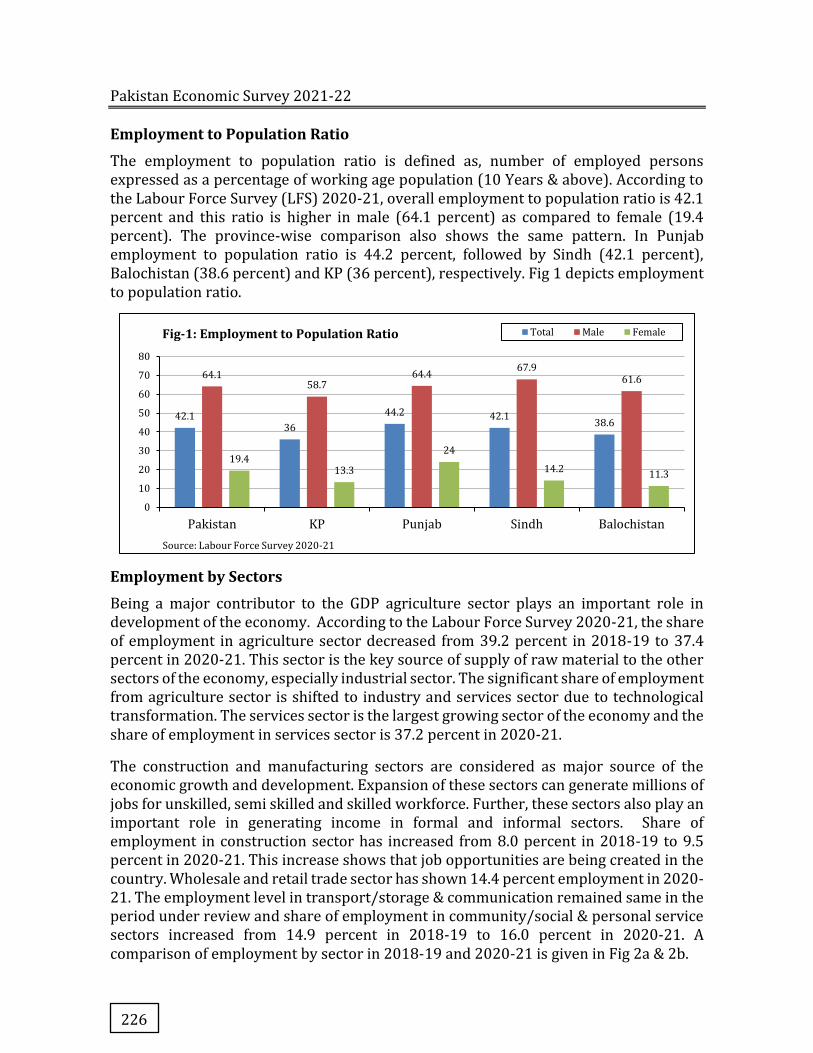
Pakistan Economic Survey 2021-22
226
Employment to Population Ratio
The employment to population ratio is defined as, number of employed persons expressed as a percentage of working age population (10 Years & above). According to the Labour Force Survey (LFS) 2020-21, overall employment to population ratio is 42.1 percent and this ratio is higher in male (64.1 percent) as compared to female (19.4 percent). The province-wise comparison also shows the same pattern. In Punjab employment to population ratio is 44.2 percent, followed by Sindh (42.1 percent), Balochistan (38.6 percent) and KP (36 percent), respectively. Fig 1 depicts employment to population ratio.
Employment by Sectors
Being a major contributor to the GDP agriculture sector plays an important role in development of the economy. According to the Labour Force Survey 2020-21, the share of employment in agriculture sector decreased from 39.2 percent in 2018-19 to 37.4 percent in 2020-21. This sector is the key source of supply of raw material to the other sectors of the economy, especially industrial sector. The significant share of employment from agriculture sector is shifted to industry and services sector due to technological transformation. The services sector is the largest growing sector of the economy and the share of employment in services sector is 37.2 percent in 2020-21.
The construction and manufacturing sectors are considered as major source of the economic growth and development. Expansion of these sectors can generate millions of jobs for unskilled, semi skilled and skilled workforce. Further, these sectors also play an important role in generating income in formal and informal sectors. Share of employment in construction sector has increased from 8.0 percent in 2018-19 to 9.5 percent in 2020-21. This increase shows that job opportunities are being created in the country. Wholesale and retail trade sector has shown 14.4 percent employment in 2020-21. The employment level in transport/storage & communication remained same in the period under review and share of employment in community/social & personal service sectors increased from 14.9 percent in 2018-19 to 16.0 percent in 2020-21. A comparison of employment by sector in 2018-19 and 2020-21 is given in Fig 2a & 2b.
42.136
44.2 42.138.6
64.158.7
64.467.9
61.6
19.413.3
24
14.211.3
0
10
20
30
40
50
60
70
80
Pakistan KP Punjab Sindh Balochistan
Source: Labour Force Survey 2020-21
Fig-1: Employment to Population Ratio Total Male Female

Population, Labour Force and Employment
227
Youth Employment
According to the Labour Force Survey 2020-21, the overall unemployment rate is 6.3 percent with prevalence of higher unemployment rate 12.2 percent among 20-24 years compared with 11.8 percent in 2018-19. Youth unemployment rate is quite high as compared to the average unemployment rate. Improvement in infrastructure and skill development programmes can play an important role to create employment opportunities in the country. Age -wise break up of unemployment rate reflected in Fig-3.
Initiatives for Employment Generation
Construction Sector: Labour Force Survey 2020-21 indicated that employment in construction sector reached to 6.4 million as compared to 5.13 million in 2018-19, showing an increase of 1.28 million of employed people. Construction sector on account of both backward & forward linkages boost approximately 40 allied industries simultaneously. Therefore, expansion of construction activities not only results in substantial increase in GDP growth but also create thousands of jobs in industrial sector.
Agriculture/ forestry/hunting & fishing, 39.2
Manufacturing, 15
Construction, 8
Wholesale & retail trade, 14.5
Transport/ storage &
communication, 6.2
Community/social & personal
services, 14.9
*Others, 2.2
Fig-2a:Employed Distribution in Major Industry 2018-19
Agriculture/ forestry/ hunting & fishing, 37.4
Manufacturing,14.9Construction, 9.5
Wholesale & retail trade, 14.4
Transport/ storage &
communication, 6.2
Community/social & personal services, 16
*Others, 1.5
Fig-2b: Employed Distribution in Major Industry 2020-21
13.3
11.8
8.6
4.3
2.5 2.8 3.1
5.1
7.8
3.9
9.5
12.2
8.9
5.5
3.22.5
3.54.5
3.6
1.2
0
2
4
6
8
10
12
14
15 – 19 20 – 24 25 – 29 30 – 34 35 – 39 40 – 44 45 – 49 50 – 54 55 – 59 60 yearsand above
Source: Ministry of Planning, Development & Special Initiatives
Fig-3: Age-wise Unemployment Rate 2018-19 2020-21
Pakistan Economic Survey 2021-22
228
Skill Development
In pursuance of Goal 8 of Sustainable Development Goals (SDGs), i.e. Decent Work and Economic Growth, the government has developed a broader roadmap for youth development under National Skill Strategy (NSS) which emphasizes on improving governance, exploring multi-source funding, capacity enhancement through employable skills, quality assurance, access and equity, industry ownership and skill development for international market for increasing foreign remittances. The emphasis is also made on re-skilling the existing workers through Recognition of Prior Learning (RPL) and provision of subsidized loan to unemployed youth. Further, the introduction of Competency Based Training and Assessment (CBT&A) is an important element of the National Skills Strategy (NSS), which is the basis of the ongoing Technical and Vocational Education and Training (TVET) sector reform in Pakistan. It also provides the basis for the implementation of the National Vocational Qualifications Framework (NVQF).
The roadmap also urges on public- private partnership; increasing the private sector role in the governance of TVET and encouraging linkages with the informal sector through RPL. Further, youth empowerment and productivity has been given priority in National Youth Development Framework (NYDF). In order to implement the said interventions, following special initiatives under PSDP have been taken in 2021-22:
Table-12.2: Initiatives under PSDP 2021-22 Sr. No Projects Amount (Rs in millions)
1 Introducing Matric-Tech Pathways for Integrating Technical and Vocational Education &Training (TVET) and Formal Education
215.0
2 Establishment of Polytechnic Institute for Boys at Skardu 197.819
Source: PSDP 2021-22
Through aforementioned interventions, 27 TVET Labs for 15 selected schools in ICT, AJK and GB have been established so far. Further, two newly constructed technical &vocational institutes, located at Gwadar and Skardu, will be operationalized soon. In addition, 25% quota is specified for women under these schemes.
Kamyab Jawan Programme
Kamyab Jawan Programme is the medium of change to empower youth and harness their potential for human development and transformation of the future of Pakistan. The government launched Kamyab Jawan Programme to uplift the youth of the country by offering opportunities to utilize their entrepreneurial potential. Under this programme, young people will launch 10,000 start-ups by 2023 to create jobs and economic activities. Around 68,873 jobs1 have created under this programme .This programme has following sub –components:
a) Hunarmand Pakistan-Skill for All Programme
Skills for All (Hunarmand Pakistan) programme was initiated to strengthen the quality of technical and vocational education and training. The purpose of the programme is to
1https://kamyabjawan.gov.pk/
Population, Labour Force and Employment
229
equip youth with market-driven conventional and high-tech skills required for career progression.
This programme will also expand the pool of skilled workforce in all sectors of the economy, and bridging demand and supply gap of skilled workforce. Women will also be able to meet their domestic expenses subsequently. This project is being implemented all over the country. The physical progress of the programme is as follows:
� Almost 74,737 youth have been imparted employable skills (35,268 youth in High-TECH technologies (Cyber Security, Artificial Intelligence, Cloud Computing, Internet of Things, Digital Marketing, etc.) and 39,469 youth have been trained in conventional technologies (Electrician, Welder, Plumber, Beautician, Domestic Tailoring, etc.). Additionally, 25% quota is specified for women.
� About 23,000 youth formally skill tested and certified under RPL.
� NAVTTC has established 10 Country Specific Destination Facilitation Centers.
� Developed National Employment Exchange tool and workforce database and fully functional at: jobs.gov.pk, database: (413,197 skilled work force and 411,735 jobs posted)
� Established National Accreditation Council for TVET Stream (NAC-TVS).
� Developed 200 TVET qualifications developed and accredited 535 TVET institutes nationally
In addition, National Youth Council (NYC) is actively engaged to ensure young people representation and participation and nurture youth leadership by recognizing young people’s achievements through publicly valuing them as part of our society. Besides, development of Pakistan first ever Youth Development Index (YDI) for focused interventions to improve the ranking of Pakistan on Global Youth Development Index is under process of completion.
b) Youth Entrepreneurship Scheme (YES)
Youth Entrepreneurship Scheme, for young entrepreneurs and existing businesses between the age group of 21-45 years (18 Years for IT sector), is designed to provide subsidized financing through 21 Commercial, Islamic and SME banks under the guidance and supervision of the SBP. The loans are being disbursed to SME beneficiaries across Pakistan, covering; Punjab, Sindh, Khyber Pakhtunkhwa, Balochistan, Gilgit Baltistan and Azad Jammu & Kashmir. Under this programme subsidized loans amounting Rs 44,972 million have been disbursed to 27,387 beneficiaries including 3,115 women.
c) National Youth Council (NYC)
NYC is an official national platform for young enthusiasts to play their essential role for the development of youth. Young people between the age of 15 to 29 years with exceptional performance and achievements on their part can become the member of NYC which is reconstituted every year with new talented & capable volunteers.
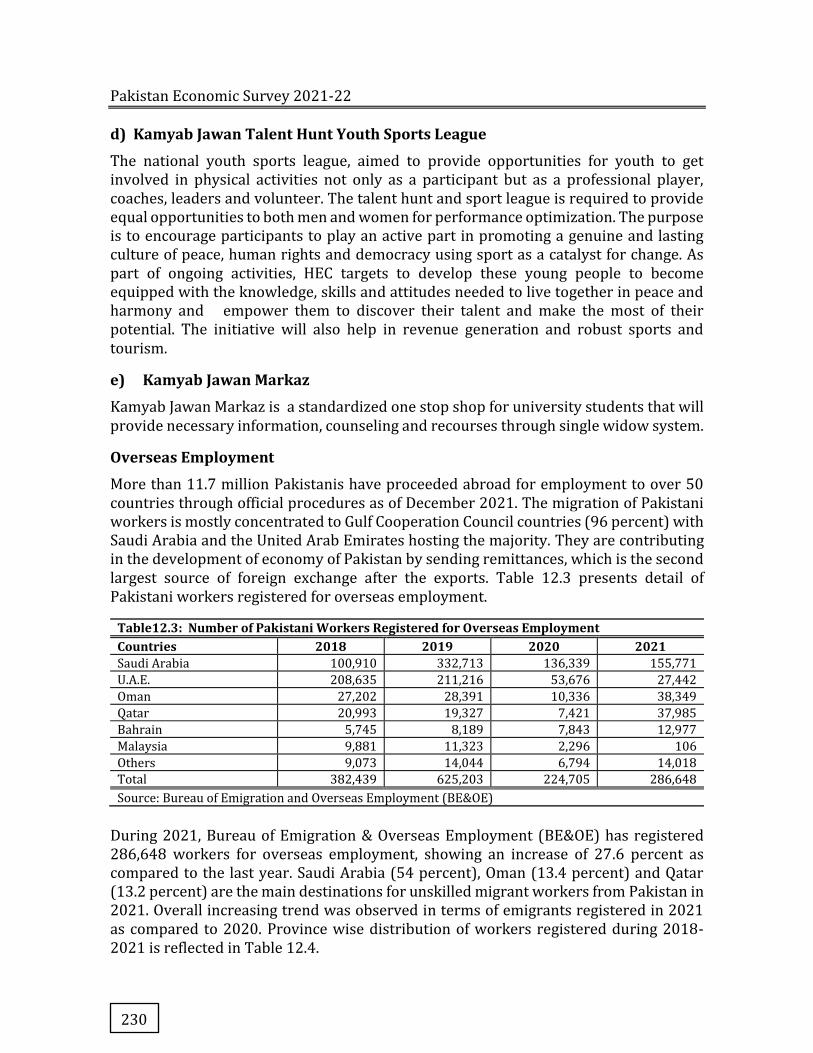
Pakistan Economic Survey 2021-22
230
d) Kamyab Jawan Talent Hunt Youth Sports League
The national youth sports league, aimed to provide opportunities for youth to get involved in physical activities not only as a participant but as a professional player, coaches, leaders and volunteer. The talent hunt and sport league is required to provide equal opportunities to both men and women for performance optimization. The purpose is to encourage participants to play an active part in promoting a genuine and lasting culture of peace, human rights and democracy using sport as a catalyst for change. As part of ongoing activities, HEC targets to develop these young people to become equipped with the knowledge, skills and attitudes needed to live together in peace and harmony and empower them to discover their talent and make the most of their potential. The initiative will also help in revenue generation and robust sports and tourism.
e) Kamyab Jawan Markaz
Kamyab Jawan Markaz is a standardized one stop shop for university students that will provide necessary information, counseling and recourses through single widow system.
Overseas Employment
More than 11.7 million Pakistanis have proceeded abroad for employment to over 50 countries through official procedures as of December 2021. The migration of Pakistani workers is mostly concentrated to Gulf Cooperation Council countries (96 percent) with Saudi Arabia and the United Arab Emirates hosting the majority. They are contributing in the development of economy of Pakistan by sending remittances, which is the second largest source of foreign exchange after the exports. Table 12.3 presents detail of Pakistani workers registered for overseas employment.
Table12.3: Number of Pakistani Workers Registered for Overseas Employment Countries 2018 2019 2020 2021 Saudi Arabia 100,910 332,713 136,339 155,771
U.A.E. 208,635 211,216 53,676 27,442
Oman 27,202 28,391 10,336 38,349
Qatar 20,993 19,327 7,421 37,985
Bahrain 5,745 8,189 7,843 12,977
Malaysia 9,881 11,323 2,296 106
Others 9,073 14,044 6,794 14,018
Total 382,439 625,203 224,705 286,648
Source: Bureau of Emigration and Overseas Employment (BE&OE)
During 2021, Bureau of Emigration & Overseas Employment (BE&OE) has registered 286,648 workers for overseas employment, showing an increase of 27.6 percent as compared to the last year. Saudi Arabia (54 percent), Oman (13.4 percent) and Qatar (13.2 percent) are the main destinations for unskilled migrant workers from Pakistan in 2021. Overall increasing trend was observed in terms of emigrants registered in 2021 as compared to 2020. Province wise distribution of workers registered during 2018-2021 is reflected in Table 12.4.
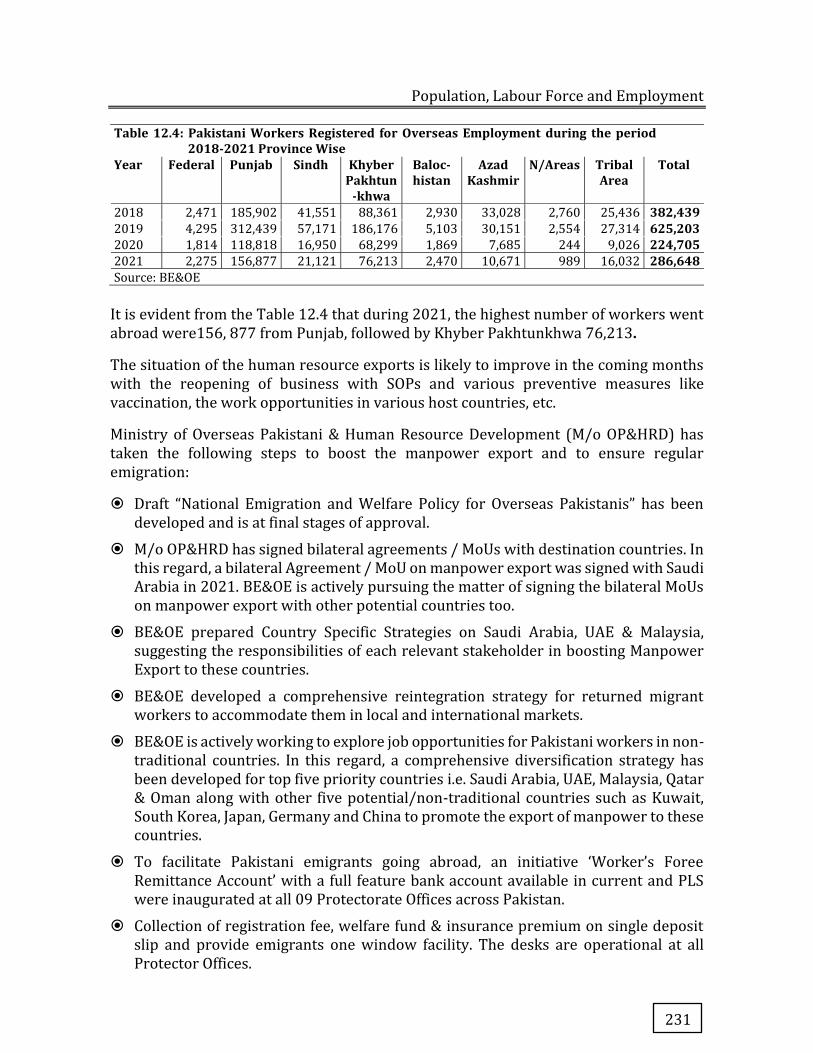
Population, Labour Force and Employment
231
Table 12.4: Pakistani Workers Registered for Overseas Employment during the period 2018-2021 Province Wise
Year Federal Punjab Sindh Khyber Pakhtun
-khwa
Baloc-histan
Azad Kashmir
N/Areas Tribal Area
Total
2018 2,471 185,902 41,551 88,361 2,930 33,028 2,760 25,436 382,439 2019 4,295 312,439 57,171 186,176 5,103 30,151 2,554 27,314 625,203 2020 1,814 118,818 16,950 68,299 1,869 7,685 244 9,026 224,705 2021 2,275 156,877 21,121 76,213 2,470 10,671 989 16,032 286,648 Source: BE&OE
It is evident from the Table 12.4 that during 2021, the highest number of workers went abroad were156, 877 from Punjab, followed by Khyber Pakhtunkhwa 76,213.
The situation of the human resource exports is likely to improve in the coming months with the reopening of business with SOPs and various preventive measures like vaccination, the work opportunities in various host countries, etc.
Ministry of Overseas Pakistani & Human Resource Development (M/o OP&HRD) has taken the following steps to boost the manpower export and to ensure regular emigration:
� Draft “National Emigration and Welfare Policy for Overseas Pakistanis” has been developed and is at final stages of approval.
� M/o OP&HRD has signed bilateral agreements / MoUs with destination countries. In this regard, a bilateral Agreement / MoU on manpower export was signed with Saudi Arabia in 2021. BE&OE is actively pursuing the matter of signing the bilateral MoUs on manpower export with other potential countries too.
� BE&OE prepared Country Specific Strategies on Saudi Arabia, UAE & Malaysia, suggesting the responsibilities of each relevant stakeholder in boosting Manpower Export to these countries.
� BE&OE developed a comprehensive reintegration strategy for returned migrant workers to accommodate them in local and international markets.
� BE&OE is actively working to explore job opportunities for Pakistani workers in non-traditional countries. In this regard, a comprehensive diversification strategy has been developed for top five priority countries i.e. Saudi Arabia, UAE, Malaysia, Qatar & Oman along with other five potential/non-traditional countries such as Kuwait, South Korea, Japan, Germany and China to promote the export of manpower to these countries.
� To facilitate Pakistani emigrants going abroad, an initiative ‘Worker’s Foree Remittance Account’ with a full feature bank account available in current and PLS were inaugurated at all 09 Protectorate Offices across Pakistan.
� Collection of registration fee, welfare fund & insurance premium on single deposit slip and provide emigrants one window facility. The desks are operational at all Protector Offices.
Pakistan Economic Survey 2021-22
232
� BE&OE created linkages between Overseas Employment Corporation (OEC) and NAVTTC for matching of available jobs at BE&OE official website and data of the trained job seekers maintained by NAVTTC (MOU signed between OEC & NAVTTC).
� Awareness Campaigns to guide intending emigrants through print, electronic and social media.
� Campaign against illegal Overseas Job Advertisements in close coordination with newspapers, FIA, PTA and other relevant departments.
� BE&OE started registration of foreign employers on its website so that the intending emigrants may be hired either directly or through OEPs by registered employers depending upon their requirements.
� The Cooperation Agreement between OEC and the Ministry of Health, Kuwait for supply of medical professionals, initially signed in 2020 for the one year has been renewed till 3rd July, 2023. Total of 1,943 medical professionals have so far proceeded to Kuwait for employment since October, 2020. Further recruitment is under process. Following Kuwaiti employers are also procuring manpower through OEC:
� Al-Essa Medical & Scientific Equipment Co.
� Gulf Glass Manufacturing Co.
� Al-Ahleia Switchgear Co.
� Al-Homaiza Food Stuff Co.
� Ministry of Interior-Kuwait
� Ministry of Health Saudi Arabia has resumed its operation for taking manpower in the medical field from Pakistan after the pandemic. Two delegations have visited Pakistan in November- December 2021 for recruitment of medical professionals (Doctors, Nurses) in different specialties. Selection of 105 doctors and 103 Nurses has been received from M/o Health Saudi Arabia.
� The workers were demanded by M/s. Fiki-Bal, a construction company in Nigeria.
� In order to empower the Pakistani skilled workers to obtain jobs in Japan, OEC is going to start Japanese language classes for the potential candidates from Feb 2022. Two Japanese language instructors have been hired for the purpose.
� OEC convenes Korean language training for those persons who are interested to go to Korea for employment purpose and 799 persons have obtained Korean language training.
� Total of 1632 persons have proceeded abroad for employment purpose through OEC during 2021.
Regional Comparison of Manpower Export
The COVID-19 pandemic hampered the manpower export not only from Pakistan but other regional countries as well. The fig4 below indicates that a total of 286,648 emigrants were registered for overseas employment from Pakistan in 2021 as compared to 224,705 registered in 2020 which shows an increase of 61,943 emigrants. Similarly,
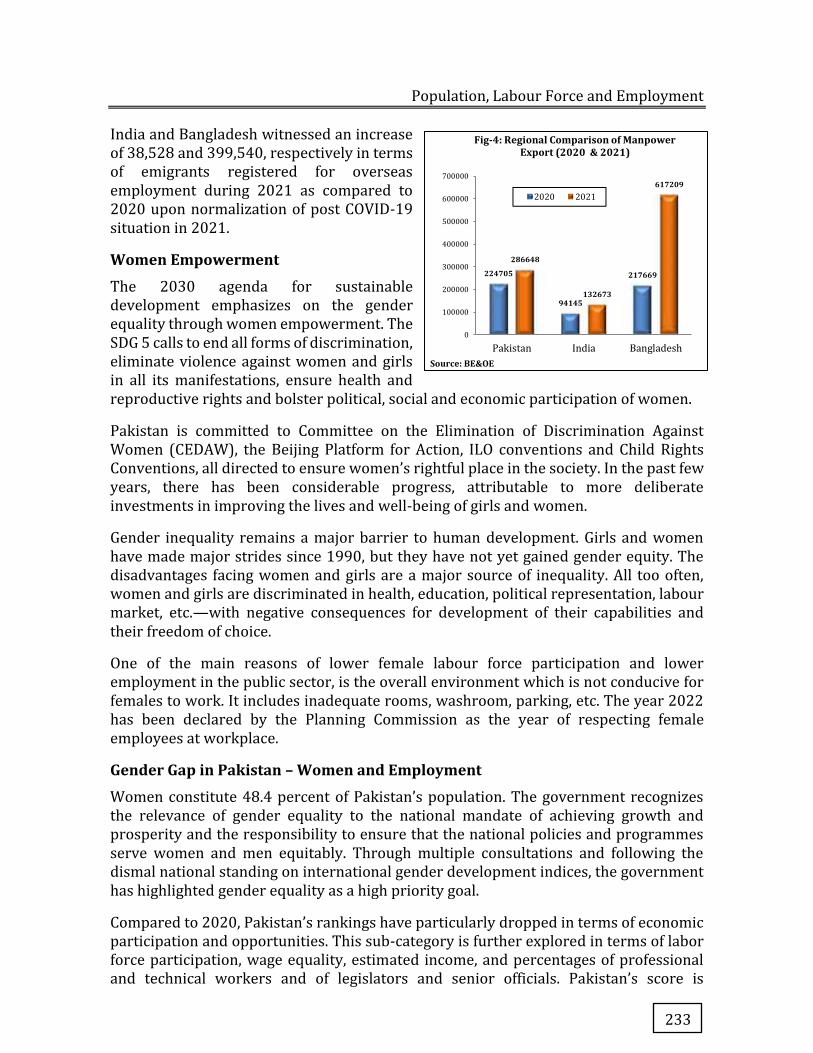
Population, Labour Force and Employment
233
India and Bangladesh witnessed an increase of 38,528 and 399,540, respectively in terms of emigrants registered for overseas employment during 2021 as compared to 2020 upon normalization of post COVID-19 situation in 2021.
Women Empowerment
The 2030 agenda for sustainable development emphasizes on the gender equality through women empowerment. The SDG 5 calls to end all forms of discrimination, eliminate violence against women and girls in all its manifestations, ensure health and reproductive rights and bolster political, social and economic participation of women.
Pakistan is committed to Committee on the Elimination of Discrimination Against Women (CEDAW), the Beijing Platform for Action, ILO conventions and Child Rights Conventions, all directed to ensure women’s rightful place in the society. In the past few years, there has been considerable progress, attributable to more deliberate investments in improving the lives and well-being of girls and women.
Gender inequality remains a major barrier to human development. Girls and women have made major strides since 1990, but they have not yet gained gender equity. The disadvantages facing women and girls are a major source of inequality. All too often, women and girls are discriminated in health, education, political representation, labour market, etc.—with negative consequences for development of their capabilities and their freedom of choice.
One of the main reasons of lower female labour force participation and lower employment in the public sector, is the overall environment which is not conducive for females to work. It includes inadequate rooms, washroom, parking, etc. The year 2022 has been declared by the Planning Commission as the year of respecting female employees at workplace.
Gender Gap in Pakistan – Women and Employment
Women constitute 48.4 percent of Pakistan’s population. The government recognizes the relevance of gender equality to the national mandate of achieving growth and prosperity and the responsibility to ensure that the national policies and programmes serve women and men equitably. Through multiple consultations and following the dismal national standing on international gender development indices, the government has highlighted gender equality as a high priority goal.
Compared to 2020, Pakistan’s rankings have particularly dropped in terms of economic participation and opportunities. This sub-category is further explored in terms of labor force participation, wage equality, estimated income, and percentages of professional and technical workers and of legislators and senior officials. Pakistan’s score is
224705
94145
217669
286648
132673
617209
0
100000
200000
300000
400000
500000
600000
700000
Pakistan India Bangladesh
Source: BE&OE
Fig-4: Regional Comparison of Manpower Export (2020 & 2021)
2020 2021
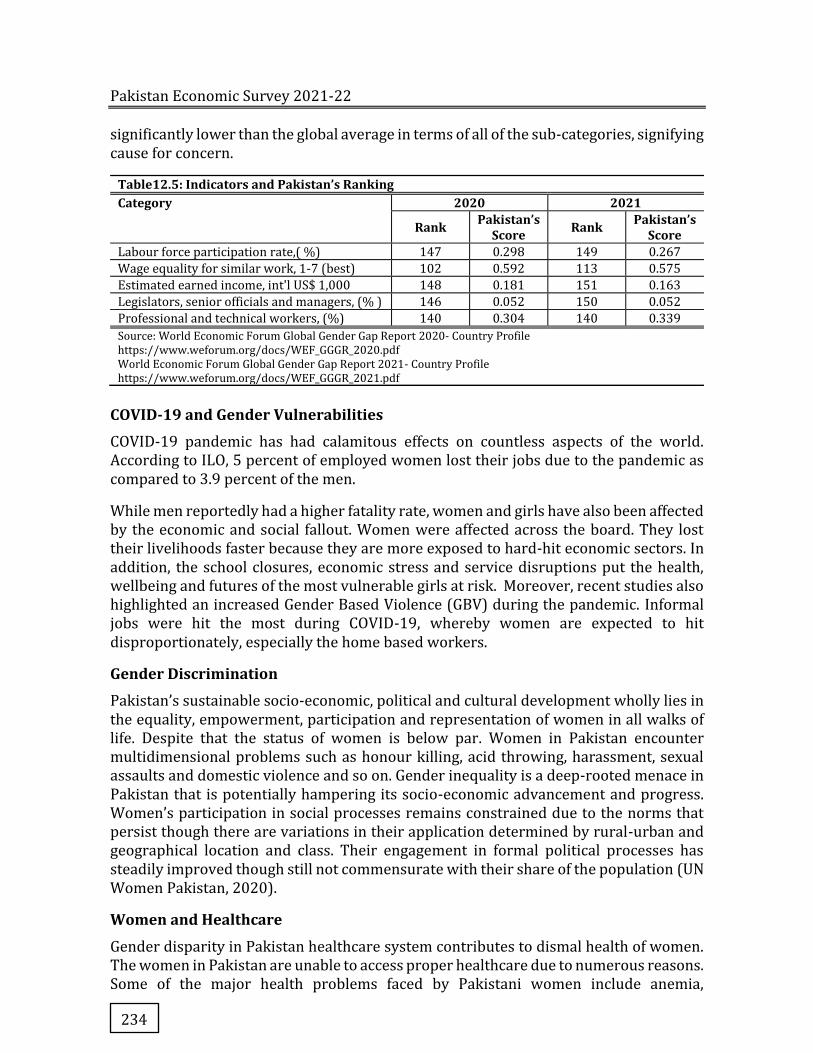
Pakistan Economic Survey 2021-22
234
significantly lower than the global average in terms of all of the sub-categories, signifying cause for concern.
Table12.5: Indicators and Pakistan’s Ranking Category 2020 2021
Rank Pakistan’s Score Rank Pakistan’s
Score Labour force participation rate,( %) 147 0.298 149 0.267
Wage equality for similar work, 1-7 (best) 102 0.592 113 0.575
Estimated earned income, int'l US$ 1,000 148 0.181 151 0.163
Legislators, senior officials and managers, (% ) 146 0.052 150 0.052
Professional and technical workers, (%) 140 0.304 140 0.339
Source: World Economic Forum Global Gender Gap Report 2020- Country Profile https://www.weforum.org/docs/WEF_GGGR_2020.pdf World Economic Forum Global Gender Gap Report 2021- Country Profile https://www.weforum.org/docs/WEF_GGGR_2021.pdf
COVID-19 and Gender Vulnerabilities
COVID-19 pandemic has had calamitous effects on countless aspects of the world. According to ILO, 5 percent of employed women lost their jobs due to the pandemic as compared to 3.9 percent of the men.
While men reportedly had a higher fatality rate, women and girls have also been affected by the economic and social fallout. Women were affected across the board. They lost their livelihoods faster because they are more exposed to hard-hit economic sectors. In addition, the school closures, economic stress and service disruptions put the health, wellbeing and futures of the most vulnerable girls at risk. Moreover, recent studies also highlighted an increased Gender Based Violence (GBV) during the pandemic. Informal jobs were hit the most during COVID-19, whereby women are expected to hit disproportionately, especially the home based workers.
Gender Discrimination
Pakistan’s sustainable socio-economic, political and cultural development wholly lies in the equality, empowerment, participation and representation of women in all walks of life. Despite that the status of women is below par. Women in Pakistan encounter multidimensional problems such as honour killing, acid throwing, harassment, sexual assaults and domestic violence and so on. Gender inequality is a deep-rooted menace in Pakistan that is potentially hampering its socio-economic advancement and progress. Women’s participation in social processes remains constrained due to the norms that persist though there are variations in their application determined by rural-urban and geographical location and class. Their engagement in formal political processes has steadily improved though still not commensurate with their share of the population (UN Women Pakistan, 2020).
Women and Healthcare
Gender disparity in Pakistan healthcare system contributes to dismal health of women. The women in Pakistan are unable to access proper healthcare due to numerous reasons. Some of the major health problems faced by Pakistani women include anemia,
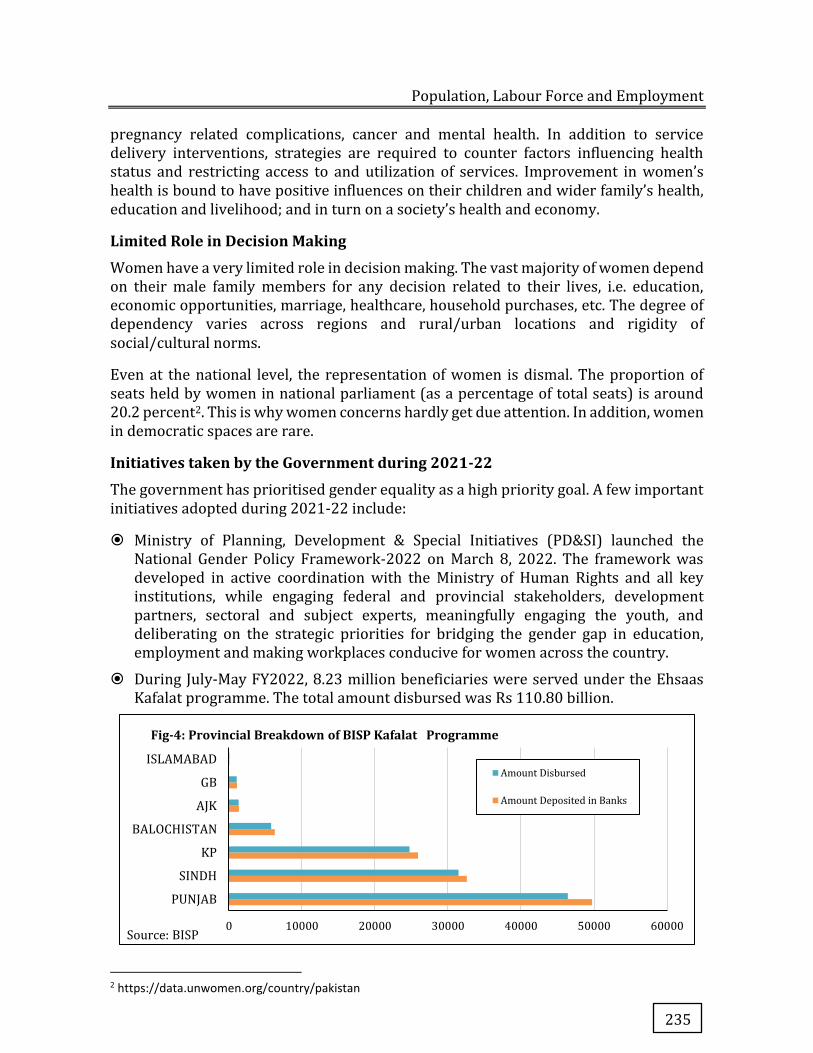
Population, Labour Force and Employment
235
pregnancy related complications, cancer and mental health. In addition to service delivery interventions, strategies are required to counter factors influencing health status and restricting access to and utilization of services. Improvement in women’s health is bound to have positive influences on their children and wider family’s health, education and livelihood; and in turn on a society’s health and economy.
Limited Role in Decision Making
Women have a very limited role in decision making. The vast majority of women depend on their male family members for any decision related to their lives, i.e. education, economic opportunities, marriage, healthcare, household purchases, etc. The degree of dependency varies across regions and rural/urban locations and rigidity of social/cultural norms.
Even at the national level, the representation of women is dismal. The proportion of seats held by women in national parliament (as a percentage of total seats) is around 20.2 percent2. This is why women concerns hardly get due attention. In addition, women in democratic spaces are rare.
Initiatives taken by the Government during 2021-22
The government has prioritised gender equality as a high priority goal. A few important initiatives adopted during 2021-22 include:
� Ministry of Planning, Development & Special Initiatives (PD&SI) launched the National Gender Policy Framework-2022 on March 8, 2022. The framework was developed in active coordination with the Ministry of Human Rights and all key institutions, while engaging federal and provincial stakeholders, development partners, sectoral and subject experts, meaningfully engaging the youth, and deliberating on the strategic priorities for bridging the gender gap in education, employment and making workplaces conducive for women across the country.
� During July-May FY2022, 8.23 million beneficiaries were served under the Ehsaas Kafalat programme. The total amount disbursed was Rs 110.80 billion.
2 https://data.unwomen.org/country/pakistan
0 10000 20000 30000 40000 50000 60000
PUNJAB
SINDH
KP
BALOCHISTAN
AJK
GB
ISLAMABAD
Source: BISP
Fig-4: Provincial Breakdown of BISP Kafalat Programme
Amount Disbursed
Amount Deposited in Banks
Pakistan Economic Survey 2021-22
236
� In the budget allocation for 2021-22, Rs260 billion were allocated for the Ehsaas Programme to provide relief to 14 different categories of low-income groups including students. Some 50 percent of the beneficiaries of all initiatives under the Ehsaas Programme are stated to be women.
� Under KamyabJawan Programme Rs 25 billion funding allocated for women. The government has so far disbursed around Rs 1 billion among the female entrepreneurs, qualified under the Youth Entrepreneurship Scheme (YES) of KamyabJawan Programme (KJP).
� In February 2022, the six-month stipend for deserving women under Ehsaas Kafaalat was increased from Rs 12,000 to Rs 13,000 each.
� By December 2021, 50 centers had been setup in 15 districts for extending Ehsaas Nashonuma support to deserving women and the aim is to extend this programme nationwide.
� Provinces have been requested to develop a gender-based programme in upcoming ADP 2022-2023 aligned to the endorsed National Gender Policy Framework and have their Gender M&E frameworks in place to ensure additional investments and focused efforts in this domain
Legislative measures
Some of the recent legislative measures to promote gender equality are listed below:
� The Protection Against Harassment of Women at the Workplace (Amendment) Act, 2022
� Islamabad Capital Territory Senior Citizens Act, 2021
� The National Commission on the Rights of Child (Amendment) Bill, 2021
� The Islamabad Capital Territory Child Protection (Amendment) Bill, 2021
� The definition of rape under Section 375 has also been expanded and gang rape penalized.
� ICT Rights of Persons with Disability Act, 2020
� Legal Aid and Justice Authority Act, 2020
� The Zainab Alert, Response and Recovery Act, 2020
� Protection of Journalist and Media Professionals Bill, 2021
� Domestic Violence (Prevention and Protection) Bill, 2020
� Torture, Custodial Death and Custodial Rape (Prevention and Punishment) Bill 2020
Besides, the Ministry of Human Rights has drafted a Model Policy on violence against women to address all forms of violence which women faces during their daily life along with an implementation strategy for legislations and policy already enacted to safeguards rights of women.
Population, Labour Force and Employment
237
Box1: Population and Housing Census
� The Population and Housing Census is a vital national exercise linked with provision of data for key policy making matters regarding development programmes, political representation and resource allocation which has far reaching impact.
� A national census is mandated by the Constitution of Pakistan to be held every 10 years. After the independence of Pakistan in 1947, the first census took place in 1951. Since 1951, there have been only 6 nationwide censuses (1951, 1961, 1972, 1981, 1998 and 2017).
� The first census was conducted from 9th February to 28th February, 1951. The Dominion of
Pakistan (both West and East Pakistan) had a population of 75.7 million, in which West
Pakistan had a population of 33.7 million and East Pakistan (today Bangladesh) had a
population of 42 million
� The second population census was conducted from 12th January to 31st January, 1961. The
population was 93 million, with 42.9 million residing in West Pakistan and 50 million residing
in East Pakistan.
� The third census of Pakistan was held in 1972. According to the 1972 census, the population
of Pakistan was 65.3 million.
� The fourth decennial Population Census of Pakistan was conducted in March, 1981. According
to the 1981 census, the population of Pakistan was 84.3 million.
� The 1998 Census of Pakistan was the fifth Pakistan national census and the population of
Pakistan was 132.4 million.
� The sixth census was conducted in two phases in 2017. According to Census-2017, the
country’s total population was 207.7 million, with an annual growth rate of 2.4 per cent.
7th Population and Housing Census – 2022 (Digital Census)
Pakistan Bureau of Statistics (PBS) has started preparatory work to conduct first ever Digital Population and Housing Census. The main recommendations of the Census Advisory Committee are as follows:
− Census must be conducted Digitally with real-time online monitoring & geo-tagging of all structures
− Ensure Universality: Counting of whole population residing in country at the time of the census irrespective of its Status/ Holder of CNIC or not
− De-jure Method of enumeration is recommended (person is enumerated at usual place of residence).
− Single Census questionnaire may be administered which should be strictly in relevance to the objectives of Census.
− Law enforcement agencies may be used for security but not for enumeration / verification.
− Field data collection / monitoring may be carried out by Provincial Governments staff. Comprehensive trainings and involvement of graduate students in the enumeration process is recommended.
− Involvement of stakeholders (especially provinces / political parties) from start to end (planning to finalization of results)
− Establishment of National Census Coordination Center (N3C) with representation of Provincial Governments for effective monitoring, coordination and policy decisions.
− Effective publicity campaign with effective use of social media for clarity regarding the primary objective of census which may begin early and extend right up to the release of the first initial results
− Conduct of Pilot Census for checking the whole process and conduct of Post Enumeration Survey for assessing reliability of data and coverage.
The Census process shall tentatively be completed in 18 months/ 540 days. Results of the 7th Population & Housing Census will be handed over to the Election Commission for delimitation for the
Pakistan Economic Survey 2021-22
238
next General Elections due to be held in 2023. As per recommendations of the Census Advisory Committee, the census questionnaire has been finalized and “Census Monitoring Committee” has also been proposed for monitoring, coordination and policy decisions for smooth conduct of 7th Population & Housing Census.
The Government has been allocated Rs 5 billion in FY-2021-22; the maximum budget will be spent for procurement of hardware for 7th Population and Housing Census-2022.
Source: Pakistan Bureau of Statistics
PSDP Allocation on Population Programmes
The Public Sector Development Programme (PSDP) is an important policy instrument for achieving socio-economic objectives of the government. It also creates spillover impact for the private sector and leverages potential of the economy for creation of greater social good. The allocation on population activities during 2021-22 is as under:
Table 12.6: PSDP Allocation on Population Programmes Sr. # Project PSDP Allocation 1 Population Welfare Programme, GB Rs 107.800 million
2 Implementation of National Action Plan on Population (2021-26) Rs 250.000 million
Source: Ministry of Planning, Development and Special Initiatives
Key Initiatives
a. Three Years Rolling Growth Strategy (3YRGS)
� Planning Commission has constituted a Working Group on “Inter Provincial Augmentation on Population Programmes” to lower growth rate for “Three-Year Rolling Growth Strategy (3YRGS) – Agenda for Economic Diversification, Transformation on Jobs-led Growth”. One of the key pillars of this 3YRGS is “Inter-provincial Augmentation on Population Control Programmes”.
b. Pakistan Demographic Resource Center (PDRC)
In alignment with the government’s vision, efforts are being made to strengthen data generation and population statistics to identify priority population factions before rolling out contextualized reform programmes. In this regard, the PDRC is also envisioned in collaboration with all stakeholders and international consultants. The project is an initiative to collect, analyse and making use of population data in policy making. The center is proposed to be working with concerned stakeholders including provincial population and health departments, National Institute of Population Studies, Pakistan Bureau of Statistics, development partners etc. So far, two meetings have been organized with Data and Research organizations and representatives of Population Welfare Departments. The initiative has been backed and supported by UNFPA and Ministry of Planning Development & Special Initiatives.
c. Revision and Updating of Curriculum for RTIs
The Regional Training Institutes (RTIs), all over Pakistan, are responsible for capacity building training of the health personnel for providing Family Planning (FP) /Reproductive Health (RH) services to the communities. The Training Curriculum
Population, Labour Force and Employment
239
used by the RTIs has been revised and updated with technical assistance from World Health Organization (WHO).
d. Revision and Updating of Standardized In-Service Training Package on Family Planning for Facility-based Providers
Health care providers play a crucial role in delivering high-quality family planning services with respect and dignity to people in need. Family planning services require availability of a range of FP modern methods, logistics system in place to ensure a sustainable supply of FP commodities, method-specific counseling for informed choice, and trained providers for appropriate counseling of clients and necessary technical skills to deliver FP service. With this understanding, the Government has updated Training Package on Family Planning to strengthen its services. The package is specifically designed for health care providers. It is a comprehensive package that addresses all components of FP services and comprises of Facilitator Guide and Participant Module.
Conclusion
Pakistan has some of the greatest demographic opportunities for development in the world as growing youth population enters adulthood. The demographic dividend can only be achieved with adequate investments in the education and skills of youth, harvesting the fruits of long-term human capital development. The Government is also providing young people with skill-training and access to finance for setting up businesses to further promote youth entrepreneurship. Skill development institutes are making all efforts to improve youth employability. Moreover, focused efforts are required for providing equal opportunities of health, education and skills for women to achieve the goal of inclusive and balanced growth.

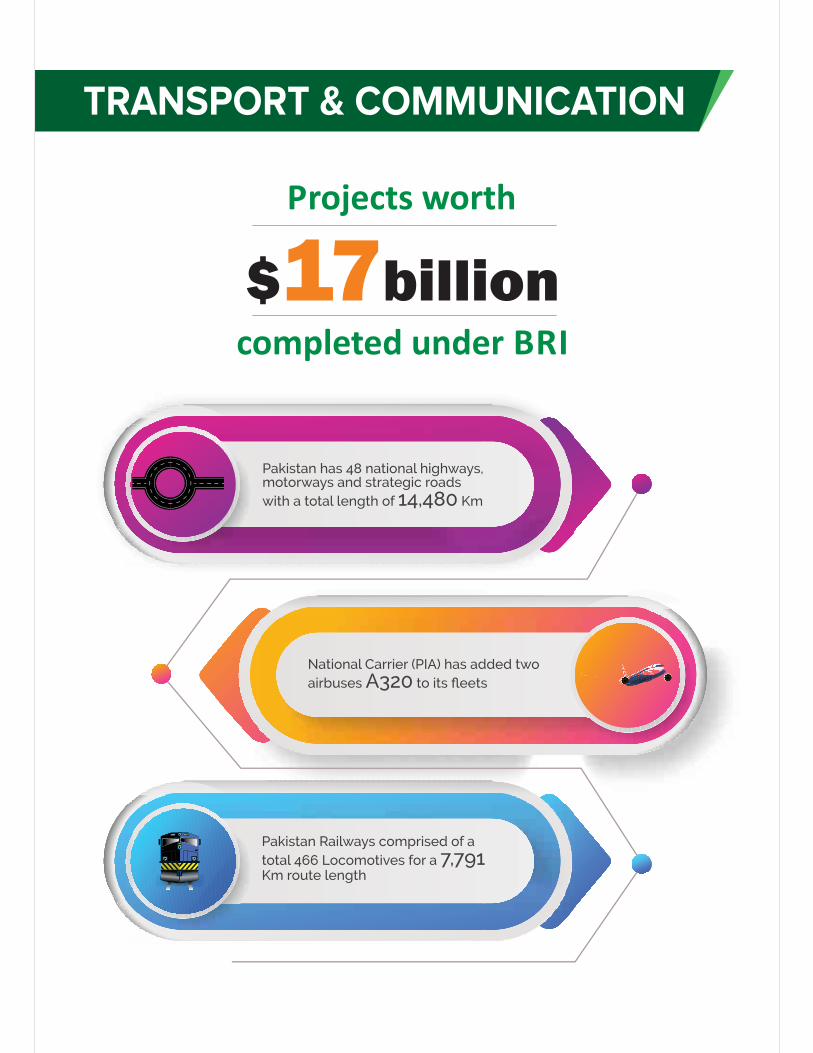

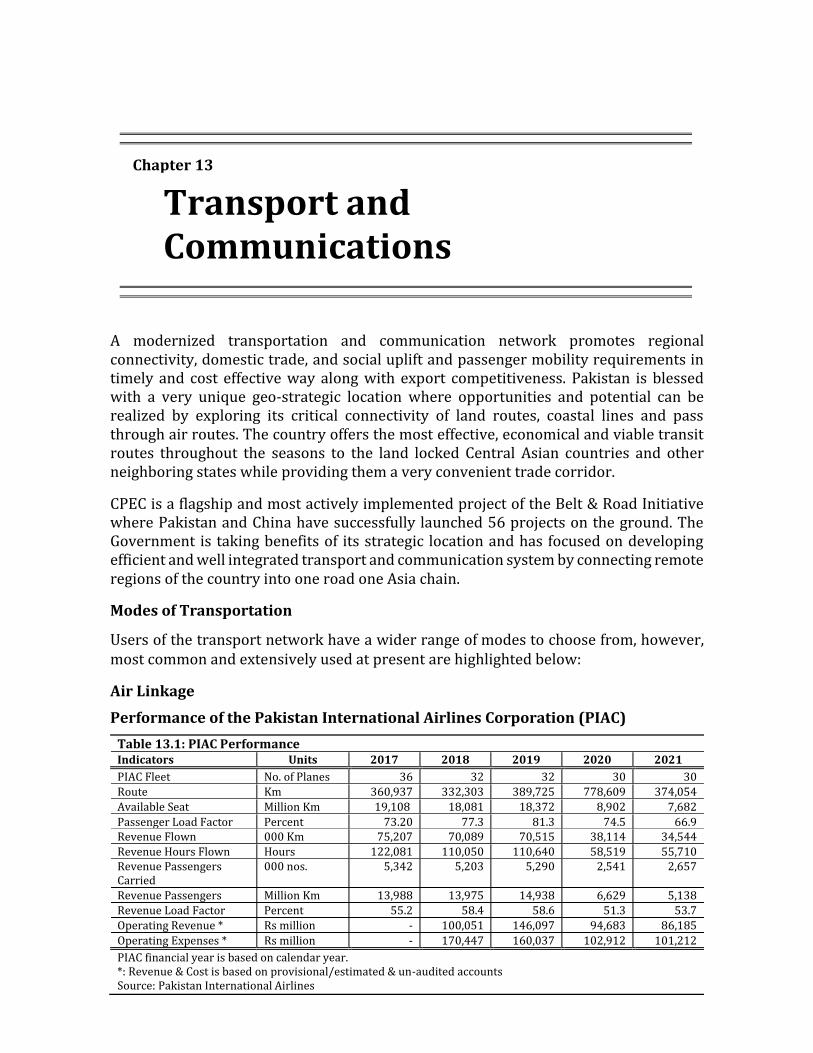
A modernized transportation and communication network promotes regional connectivity, domestic trade, and social uplift and passenger mobility requirements in timely and cost effective way along with export competitiveness. Pakistan is blessed with a very unique geo-strategic location where opportunities and potential can be realized by exploring its critical connectivity of land routes, coastal lines and pass through air routes. The country offers the most effective, economical and viable transit routes throughout the seasons to the land locked Central Asian countries and other neighboring states while providing them a very convenient trade corridor.
CPEC is a flagship and most actively implemented project of the Belt & Road Initiative where Pakistan and China have successfully launched 56 projects on the ground. The Government is taking benefits of its strategic location and has focused on developing efficient and well integrated transport and communication system by connecting remote regions of the country into one road one Asia chain.
Modes of Transportation
Users of the transport network have a wider range of modes to choose from, however,
most common and extensively used at present are highlighted below:
Air Linkage
Performance of the Pakistan International Airlines Corporation (PIAC) Table 13.1: PIAC Performance Indicators Units 2017 2018 2019 2020 2021 PIAC Fleet No. of Planes 36 32 32 30 30
Route Km 360,937 332,303 389,725 778,609 374,054
Available Seat Million Km 19,108 18,081 18,372 8,902 7,682
Passenger Load Factor Percent 73.20 77.3 81.3 74.5 66.9
Revenue Flown 000 Km 75,207 70,089 70,515 38,114 34,544
Revenue Hours Flown Hours 122,081 110,050 110,640 58,519 55,710
Revenue Passengers Carried
000 nos. 5,342 5,203 5,290 2,541 2,657
Revenue Passengers Million Km 13,988 13,975 14,938 6,629 5,138
Revenue Load Factor Percent 55.2 58.4 58.6 51.3 53.7
Operating Revenue * Rs million - 100,051 146,097 94,683 86,185
Operating Expenses * Rs million - 170,447 160,037 102,912 101,212
PIAC financial year is based on calendar year. *: Revenue & Cost is based on provisional/estimated & un-audited accounts Source: Pakistan International Airlines
Chapter 13
Transport and Communications
Pakistan Economic Survey 2021-22
242
PIA has taken following measures for revamping its operation in FY2022:
� PIA has started its fleet replenishment and is adding on new aircrafts in its fleet. PIA has added two A320 in first quarter of 2022 and plans to add four more Airbuses A320s during 2022. The decision of induction of fuel efficient narrow body aircraft overall fits perfectly in PIA’s new direction to capitalize and consolidate itself on the productive domestic and regional routes, paving the way for expansion back on the medium and long haul routes of Europe, UK and North America.
� PIA Engineering & Maintenance (E&M) capability was enhanced to handle state of art modern fleet including Boeing 787 Dreamliner and Airbus A350/A330/A320 NEO fleet.
� PIA commissioned an ATR shed in North Wing of Pakistan, i.e. Islamabad providing maintenance service level up to check ‘A’ level on Airbus A320/Boeing B777 and up to maintenance check ‘C’ level on ATR fleet.
� MRO IT, an ERP solution for maintenance activities are being implemented in PIA Engineering.
� PIA (E&M) regulatory approval-base has considerably increased. In addition to approval from PCAA, PIA hold regulatory approvals from foreign civil aviation authorities like QCAA (Qatar), PACA (Oman), GACA (Saudi Arabia), BCAA (Bahrain) and CAASL (Sri Lanka)
� As a part of route rationalization process, loss making routes were closed and frequencies were increased on profit making routes. Upon acquisition of more aircraft, PIA will certainly avail opportunities to expand its network.
� In order to ensure on-time departures and to avoid delays, special public awareness campaigns were created using mainstream and social media specially consequent to the prevailing COVID-19 related SOPs/PCR testing and delays due to adverse weather conditions / fog, etc.
� PIA sent over 15 million flight information SMS to its valued customers to save them from any hassle especially when flight is delayed due to some reason. The SOP to send SMS for flight details/schedule confirmation and/or for any delay in disruption has resulted in tremendously reducing customer complaints and annoyance.
� A very effective baggage identification system WTR (World Tracer Management) has been introduced through which the misplaced baggage is delivered to the passengers in a very short time.
� Manpower rationalization has been achieved. Cabin crew strength has been brought down from 1500 plus (2019) to 1025(2021).
� Maximum flight assignments are being done from base-to-base in order to reduce domestic travel and hotel accommodation.
� Flight operation (cabin crew) of Multan, Sialkot and Faisalabad is being supported by LHE and ISB bases.
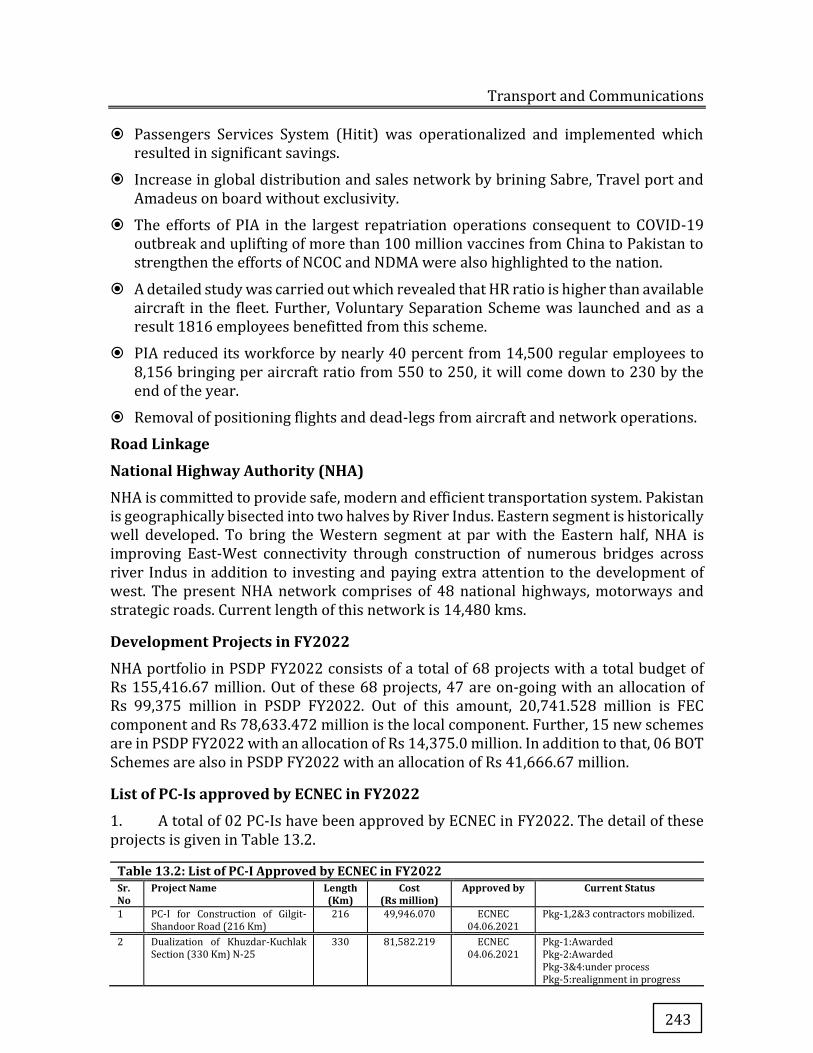
Transport and Communications
243
� Passengers Services System (Hitit) was operationalized and implemented which resulted in significant savings.
� Increase in global distribution and sales network by brining Sabre, Travel port and Amadeus on board without exclusivity.
� The efforts of PIA in the largest repatriation operations consequent to COVID-19 outbreak and uplifting of more than 100 million vaccines from China to Pakistan to strengthen the efforts of NCOC and NDMA were also highlighted to the nation.
� A detailed study was carried out which revealed that HR ratio is higher than available aircraft in the fleet. Further, Voluntary Separation Scheme was launched and as a result 1816 employees benefitted from this scheme.
� PIA reduced its workforce by nearly 40 percent from 14,500 regular employees to 8,156 bringing per aircraft ratio from 550 to 250, it will come down to 230 by the end of the year.
� Removal of positioning flights and dead-legs from aircraft and network operations.
Road Linkage
National Highway Authority (NHA)
NHA is committed to provide safe, modern and efficient transportation system. Pakistan is geographically bisected into two halves by River Indus. Eastern segment is historically well developed. To bring the Western segment at par with the Eastern half, NHA is improving East-West connectivity through construction of numerous bridges across river Indus in addition to investing and paying extra attention to the development of west. The present NHA network comprises of 48 national highways, motorways and strategic roads. Current length of this network is 14,480 kms.
Development Projects in FY2022
NHA portfolio in PSDP FY2022 consists of a total of 68 projects with a total budget of Rs 155,416.67 million. Out of these 68 projects, 47 are on-going with an allocation of Rs 99,375 million in PSDP FY2022. Out of this amount, 20,741.528 million is FEC component and Rs 78,633.472 million is the local component. Further, 15 new schemes are in PSDP FY2022 with an allocation of Rs 14,375.0 million. In addition to that, 06 BOT Schemes are also in PSDP FY2022 with an allocation of Rs 41,666.67 million.
List of PC-Is approved by ECNEC in FY2022
1. A total of 02 PC-Is have been approved by ECNEC in FY2022. The detail of these projects is given in Table 13.2.
Table 13.2: List of PC-I Approved by ECNEC in FY2022 Sr. No
Project Name Length (Km)
Cost (Rs million)
Approved by Current Status
1 PC-I for Construction of Gilgit-Shandoor Road (216 Km)
216 49,946.070 ECNEC 04.06.2021
Pkg-1,2&3 contractors mobilized.
2 Dualization of Khuzdar-Kuchlak Section (330 Km) N-25
330 81,582.219 ECNEC 04.06.2021
Pkg-1:Awarded Pkg-2:Awarded Pkg-3&4:under process Pkg-5:realignment in progress
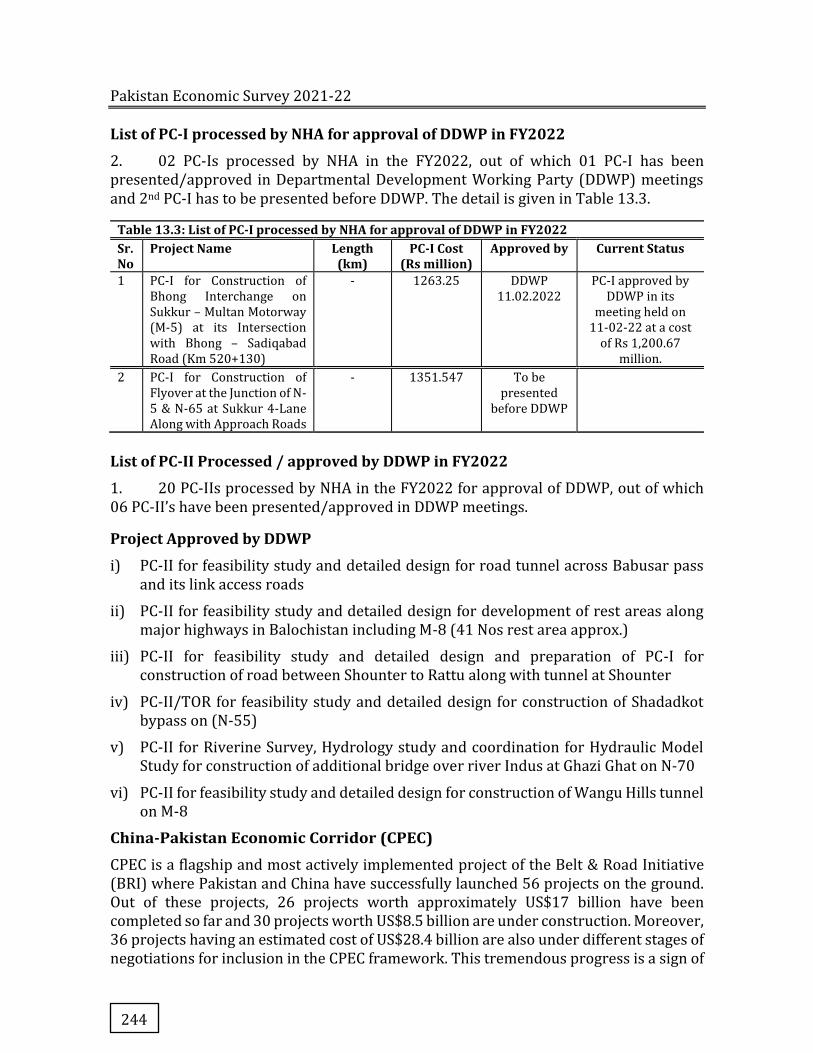
Pakistan Economic Survey 2021-22
244
List of PC-I processed by NHA for approval of DDWP in FY2022
2. 02 PC-Is processed by NHA in the FY2022, out of which 01 PC-I has been presented/approved in Departmental Development Working Party (DDWP) meetings and 2nd PC-I has to be presented before DDWP. The detail is given in Table 13.3.
Table 13.3: List of PC-I processed by NHA for approval of DDWP in FY2022 Sr. No
Project Name Length (km)
PC-I Cost (Rs million)
Approved by Current Status
1 PC-I for Construction of Bhong Interchange on Sukkur – Multan Motorway (M-5) at its Intersection with Bhong – Sadiqabad Road (Km 520+130)
- 1263.25 DDWP 11.02.2022
PC-I approved by DDWP in its
meeting held on 11-02-22 at a cost
of Rs 1,200.67 million.
2 PC-I for Construction of Flyover at the Junction of N-5 & N-65 at Sukkur 4-Lane Along with Approach Roads
- 1351.547 To be presented
before DDWP
List of PC-II Processed / approved by DDWP in FY2022
1. 20 PC-IIs processed by NHA in the FY2022 for approval of DDWP, out of which 06 PC-II’s have been presented/approved in DDWP meetings.
Project Approved by DDWP
i) PC-II for feasibility study and detailed design for road tunnel across Babusar pass and its link access roads
ii) PC-II for feasibility study and detailed design for development of rest areas along major highways in Balochistan including M-8 (41 Nos rest area approx.)
iii) PC-II for feasibility study and detailed design and preparation of PC-I for construction of road between Shounter to Rattu along with tunnel at Shounter
iv) PC-II/TOR for feasibility study and detailed design for construction of Shadadkot bypass on (N-55)
v) PC-II for Riverine Survey, Hydrology study and coordination for Hydraulic Model Study for construction of additional bridge over river Indus at Ghazi Ghat on N-70
vi) PC-II for feasibility study and detailed design for construction of Wangu Hills tunnel on M-8
China-Pakistan Economic Corridor (CPEC)
CPEC is a flagship and most actively implemented project of the Belt & Road Initiative (BRI) where Pakistan and China have successfully launched 56 projects on the ground. Out of these projects, 26 projects worth approximately US$17 billion have been completed so far and 30 projects worth US$8.5 billion are under construction. Moreover, 36 projects having an estimated cost of US$28.4 billion are also under different stages of negotiations for inclusion in the CPEC framework. This tremendous progress is a sign of
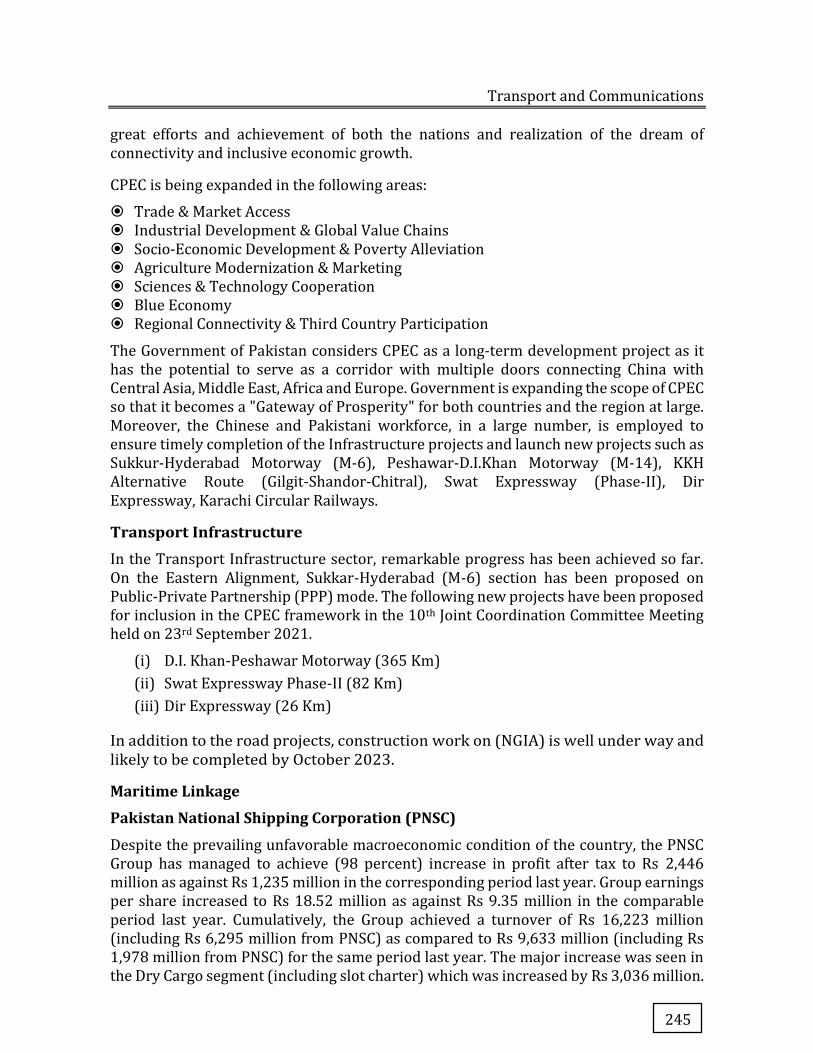
Transport and Communications
245
great efforts and achievement of both the nations and realization of the dream of connectivity and inclusive economic growth.
CPEC is being expanded in the following areas:
� Trade & Market Access � Industrial Development & Global Value Chains � Socio-Economic Development & Poverty Alleviation � Agriculture Modernization & Marketing � Sciences & Technology Cooperation � Blue Economy � Regional Connectivity & Third Country Participation
The Government of Pakistan considers CPEC as a long-term development project as it has the potential to serve as a corridor with multiple doors connecting China with Central Asia, Middle East, Africa and Europe. Government is expanding the scope of CPEC so that it becomes a "Gateway of Prosperity" for both countries and the region at large. Moreover, the Chinese and Pakistani workforce, in a large number, is employed to ensure timely completion of the Infrastructure projects and launch new projects such as Sukkur-Hyderabad Motorway (M-6), Peshawar-D.I.Khan Motorway (M-14), KKH Alternative Route (Gilgit-Shandor-Chitral), Swat Expressway (Phase-II), Dir Expressway, Karachi Circular Railways.
Transport Infrastructure
In the Transport Infrastructure sector, remarkable progress has been achieved so far. On the Eastern Alignment, Sukkar-Hyderabad (M-6) section has been proposed on Public-Private Partnership (PPP) mode. The following new projects have been proposed for inclusion in the CPEC framework in the 10th Joint Coordination Committee Meeting held on 23rd September 2021.
(i) D.I. Khan-Peshawar Motorway (365 Km)
(ii) Swat Expressway Phase-II (82 Km)
(iii) Dir Expressway (26 Km)
In addition to the road projects, construction work on (NGIA) is well under way and likely to be completed by October 2023.
Maritime Linkage
Pakistan National Shipping Corporation (PNSC)
Despite the prevailing unfavorable macroeconomic condition of the country, the PNSC Group has managed to achieve (98 percent) increase in profit after tax to Rs 2,446 million as against Rs 1,235 million in the corresponding period last year. Group earnings per share increased to Rs 18.52 million as against Rs 9.35 million in the comparable period last year. Cumulatively, the Group achieved a turnover of Rs 16,223 million (including Rs 6,295 million from PNSC) as compared to Rs 9,633 million (including Rs 1,978 million from PNSC) for the same period last year. The major increase was seen in the Dry Cargo segment (including slot charter) which was increased by Rs 3,036 million.
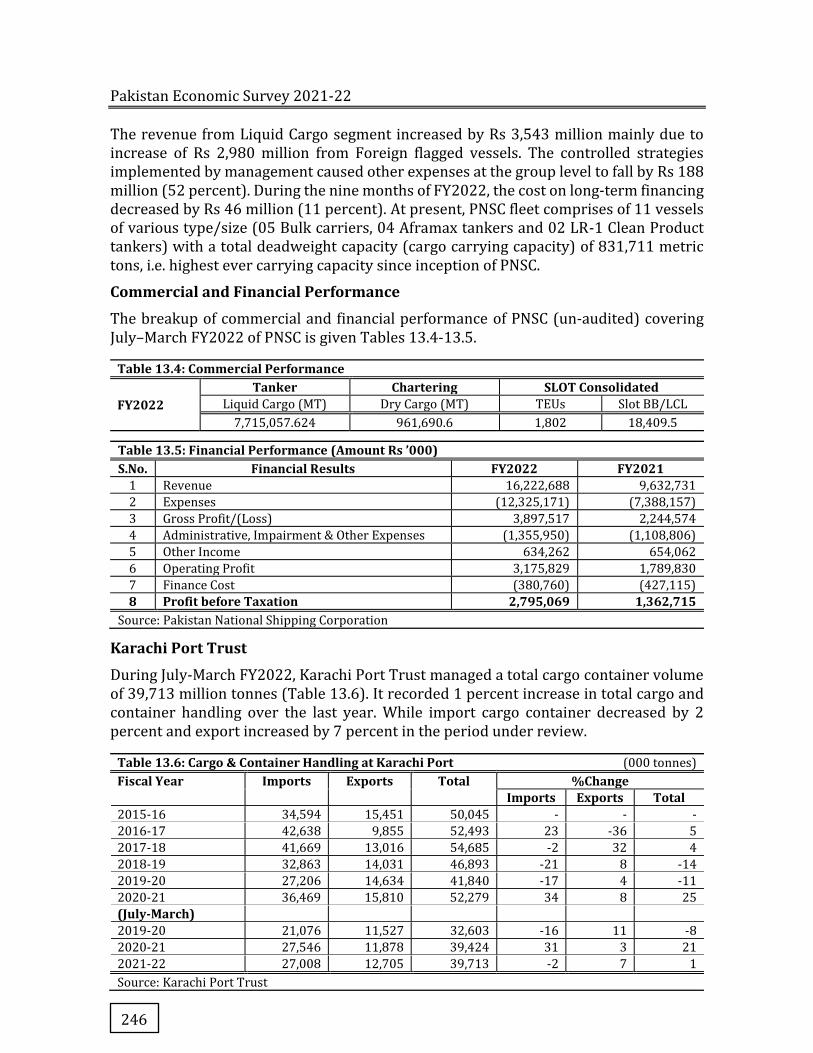
Pakistan Economic Survey 2021-22
246
The revenue from Liquid Cargo segment increased by Rs 3,543 million mainly due to increase of Rs 2,980 million from Foreign flagged vessels. The controlled strategies implemented by management caused other expenses at the group level to fall by Rs 188 million (52 percent). During the nine months of FY2022, the cost on long-term financing decreased by Rs 46 million (11 percent). At present, PNSC fleet comprises of 11 vessels of various type/size (05 Bulk carriers, 04 Aframax tankers and 02 LR-1 Clean Product tankers) with a total deadweight capacity (cargo carrying capacity) of 831,711 metric tons, i.e. highest ever carrying capacity since inception of PNSC.
Commercial and Financial Performance
The breakup of commercial and financial performance of PNSC (un-audited) covering July–March FY2022 of PNSC is given Tables 13.4-13.5.
Table 13.4: Commercial Performance
FY2022 Tanker Chartering SLOT Consolidated
Liquid Cargo (MT) Dry Cargo (MT) TEUs Slot BB/LCL
7,715,057.624 961,690.6 1,802 18,409.5
Table 13.5: Financial Performance (Amount Rs ’000) S.No. Financial Results FY2022 FY2021
1 Revenue 16,222,688 9,632,731
2 Expenses (12,325,171) (7,388,157)
3 Gross Profit/(Loss) 3,897,517 2,244,574
4 Administrative, Impairment & Other Expenses (1,355,950) (1,108,806)
5 Other Income 634,262 654,062
6 Operating Profit 3,175,829 1,789,830
7 Finance Cost (380,760) (427,115)
8 Profit before Taxation 2,795,069 1,362,715 Source: Pakistan National Shipping Corporation
Karachi Port Trust
During July-March FY2022, Karachi Port Trust managed a total cargo container volume of 39,713 million tonnes (Table 13.6). It recorded 1 percent increase in total cargo and container handling over the last year. While import cargo container decreased by 2 percent and export increased by 7 percent in the period under review.
Table 13.6: Cargo & Container Handling at Karachi Port (000 tonnes) Fiscal Year Imports Exports Total %Change
Imports Exports Total 2015-16 34,594 15,451 50,045 - - -
2016-17 42,638 9,855 52,493 23 -36 5
2017-18 41,669 13,016 54,685 -2 32 4
2018-19 32,863 14,031 46,893 -21 8 -14
2019-20 27,206 14,634 41,840 -17 4 -11
2020-21 36,469 15,810 52,279 34 8 25
(July-March)
2019-20 21,076 11,527 32,603 -16 11 -8
2020-21 27,546 11,878 39,424 31 3 21
2021-22 27,008 12,705 39,713 -2 7 1
Source: Karachi Port Trust
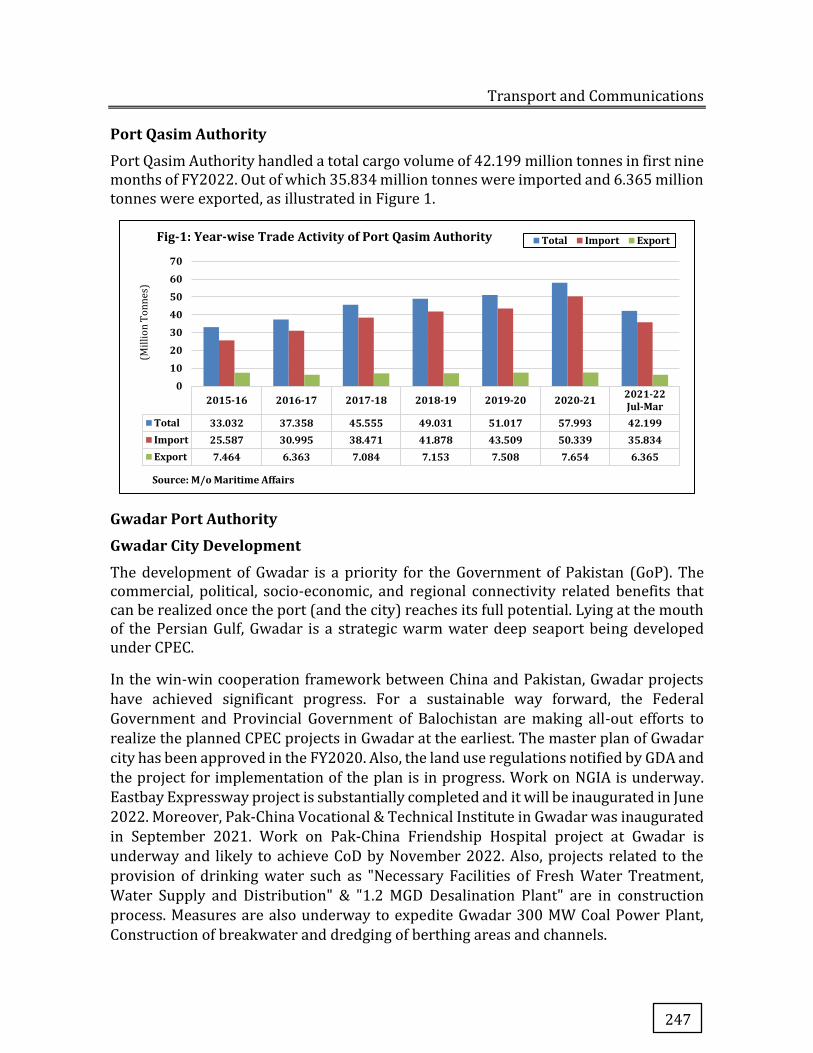
Transport and Communications
247
Port Qasim Authority
Port Qasim Authority handled a total cargo volume of 42.199 million tonnes in first nine months of FY2022. Out of which 35.834 million tonnes were imported and 6.365 million tonnes were exported, as illustrated in Figure 1.
Gwadar Port Authority
Gwadar City Development
The development of Gwadar is a priority for the Government of Pakistan (GoP). The commercial, political, socio-economic, and regional connectivity related benefits that can be realized once the port (and the city) reaches its full potential. Lying at the mouth of the Persian Gulf, Gwadar is a strategic warm water deep seaport being developed under CPEC.
In the win-win cooperation framework between China and Pakistan, Gwadar projects
have achieved significant progress. For a sustainable way forward, the Federal
Government and Provincial Government of Balochistan are making all-out efforts to
realize the planned CPEC projects in Gwadar at the earliest. The master plan of Gwadar
city has been approved in the FY2020. Also, the land use regulations notified by GDA and
the project for implementation of the plan is in progress. Work on NGIA is underway.
Eastbay Expressway project is substantially completed and it will be inaugurated in June
2022. Moreover, Pak-China Vocational & Technical Institute in Gwadar was inaugurated
in September 2021. Work on Pak-China Friendship Hospital project at Gwadar is
underway and likely to achieve CoD by November 2022. Also, projects related to the
provision of drinking water such as "Necessary Facilities of Fresh Water Treatment,
Water Supply and Distribution" & "1.2 MGD Desalination Plant" are in construction
process. Measures are also underway to expedite Gwadar 300 MW Coal Power Plant,
Construction of breakwater and dredging of berthing areas and channels.
2015-16 2016-17 2017-18 2018-19 2019-20 2020-21 2021-22Jul-Mar
Total 33.032 37.358 45.555 49.031 51.017 57.993 42.199Import 25.587 30.995 38.471 41.878 43.509 50.339 35.834Export 7.464 6.363 7.084 7.153 7.508 7.654 6.365
01020
30405060
70
(Mil
lio
n T
on
ne
s)
Fig-1: Year-wise Trade Activity of Port Qasim Authority Total Import Export
Source: M/o Maritime Affairs
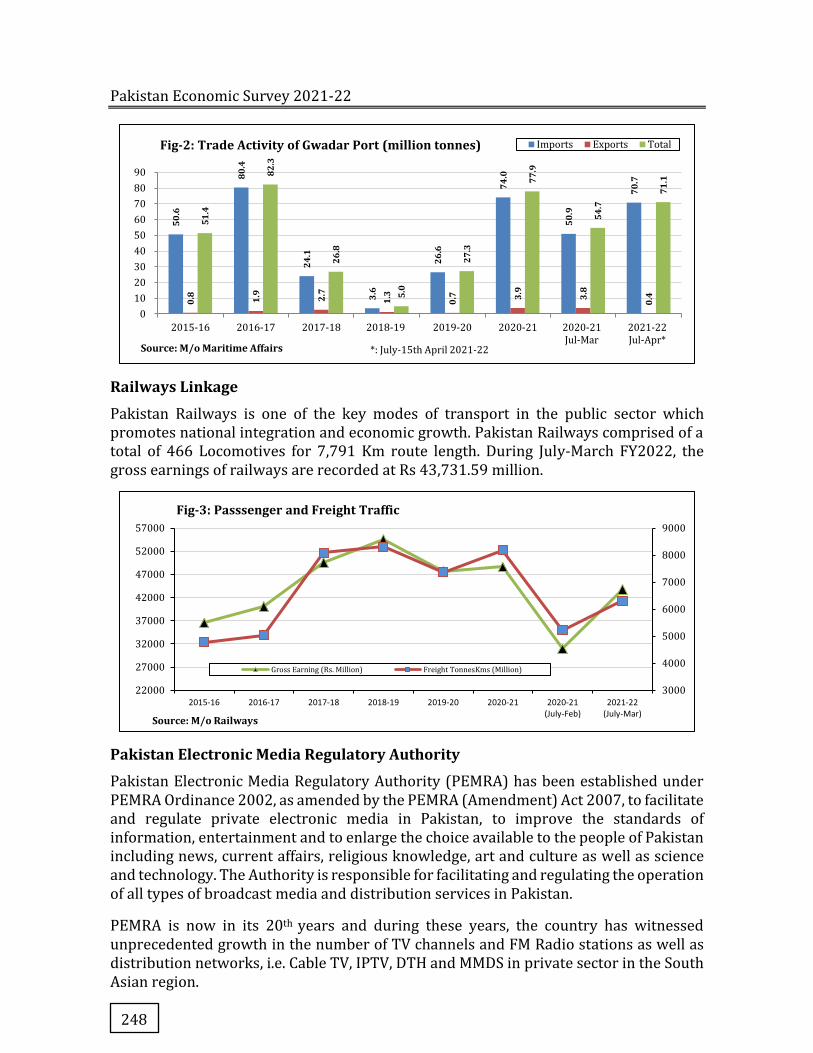
Pakistan Economic Survey 2021-22
248
Railways Linkage
Pakistan Railways is one of the key modes of transport in the public sector which promotes national integration and economic growth. Pakistan Railways comprised of a total of 466 Locomotives for 7,791 Km route length. During July-March FY2022, the gross earnings of railways are recorded at Rs 43,731.59 million.
Pakistan Electronic Media Regulatory Authority
Pakistan Electronic Media Regulatory Authority (PEMRA) has been established under PEMRA Ordinance 2002, as amended by the PEMRA (Amendment) Act 2007, to facilitate and regulate private electronic media in Pakistan, to improve the standards of information, entertainment and to enlarge the choice available to the people of Pakistan including news, current affairs, religious knowledge, art and culture as well as science and technology. The Authority is responsible for facilitating and regulating the operation of all types of broadcast media and distribution services in Pakistan.
PEMRA is now in its 20th years and during these years, the country has witnessed unprecedented growth in the number of TV channels and FM Radio stations as well as distribution networks, i.e. Cable TV, IPTV, DTH and MMDS in private sector in the South Asian region.
50.6
80.4
24.1
3.6
26.6
74.0
50.9
70.7
0.8 1.9
2.7
1.3
0.7 3.
9
3.8
0.4
51.4
82.3
26.8
5.0
27.3
77.9
54.7
71.1
0
10
20
30
40
50
60
70
80
90
2015-16 2016-17 2017-18 2018-19 2019-20 2020-21 2020-21Jul-Mar
2021-22Jul-Apr*
Fig-2: Trade Activity of Gwadar Port (million tonnes) Imports Exports Total
*: July-15th April 2021-22Source: M/o Maritime Affairs
3000
4000
5000
6000
7000
8000
9000
22000
27000
32000
37000
42000
47000
52000
57000
2015-16 2016-17 2017-18 2018-19 2019-20 2020-21 2020-21(July-Feb)
2021-22(July-Mar)
Fig-3: Passsenger and Freight Traffic
Gross Earning (Rs. Million) Freight TonnesKms (Million)
Source: M/o Railways
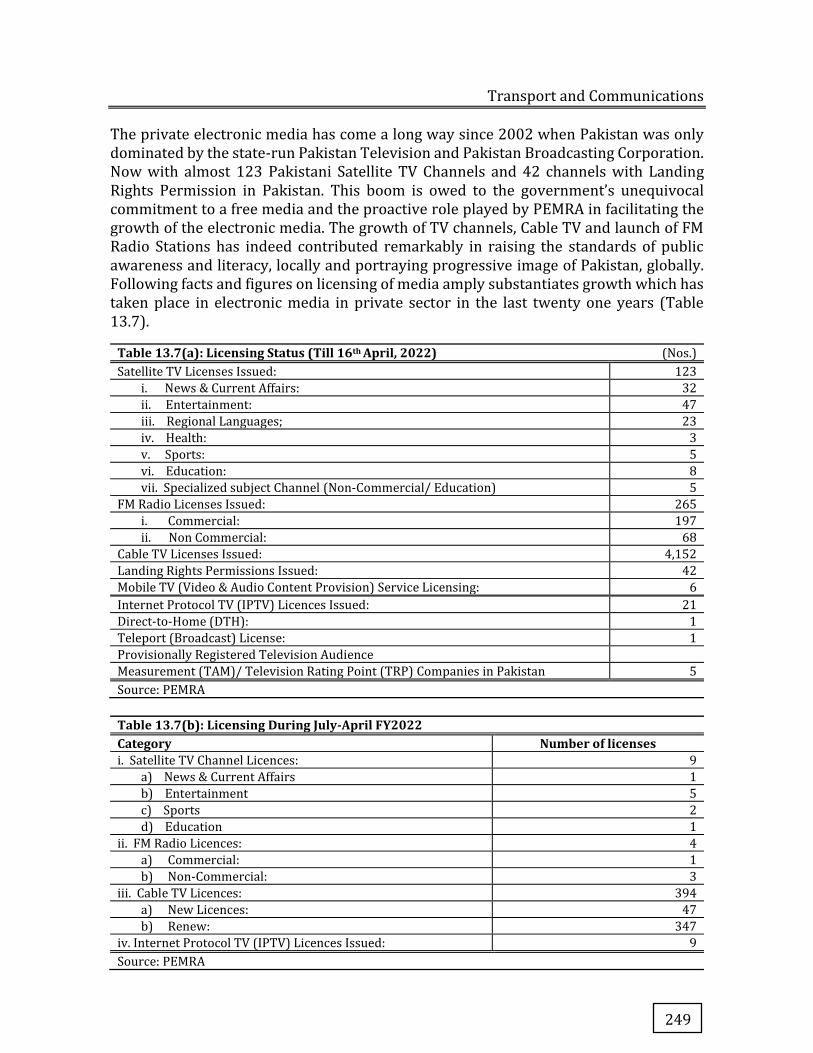
Transport and Communications
249
The private electronic media has come a long way since 2002 when Pakistan was only dominated by the state-run Pakistan Television and Pakistan Broadcasting Corporation. Now with almost 123 Pakistani Satellite TV Channels and 42 channels with Landing Rights Permission in Pakistan. This boom is owed to the government’s unequivocal commitment to a free media and the proactive role played by PEMRA in facilitating the growth of the electronic media. The growth of TV channels, Cable TV and launch of FM Radio Stations has indeed contributed remarkably in raising the standards of public awareness and literacy, locally and portraying progressive image of Pakistan, globally. Following facts and figures on licensing of media amply substantiates growth which has taken place in electronic media in private sector in the last twenty one years (Table 13.7).
Table 13.7(a): Licensing Status (Till 16th April, 2022) (Nos.) Satellite TV Licenses Issued: 123
i. News & Current Affairs: 32
ii. Entertainment: 47
iii. Regional Languages; 23
iv. Health: 3
v. Sports: 5
vi. Education: 8
vii. Specialized subject Channel (Non-Commercial/ Education) 5
FM Radio Licenses Issued: 265
i. Commercial: 197
ii. Non Commercial: 68
Cable TV Licenses Issued: 4,152
Landing Rights Permissions Issued: 42
Mobile TV (Video & Audio Content Provision) Service Licensing: 6
Internet Protocol TV (IPTV) Licences Issued: 21
Direct-to-Home (DTH): 1
Teleport (Broadcast) License: 1
Provisionally Registered Television Audience
Measurement (TAM)/ Television Rating Point (TRP) Companies in Pakistan 5
Source: PEMRA
Table 13.7(b): Licensing During July-April FY2022 Category Number of licenses i. Satellite TV Channel Licences: 9
a) News & Current Affairs 1
b) Entertainment 5
c) Sports 2
d) Education 1
ii. FM Radio Licences: 4
a) Commercial: 1
b) Non-Commercial: 3
iii. Cable TV Licences: 394
a) New Licences: 47
b) Renew: 347
iv. Internet Protocol TV (IPTV) Licences Issued: 9
Source: PEMRA
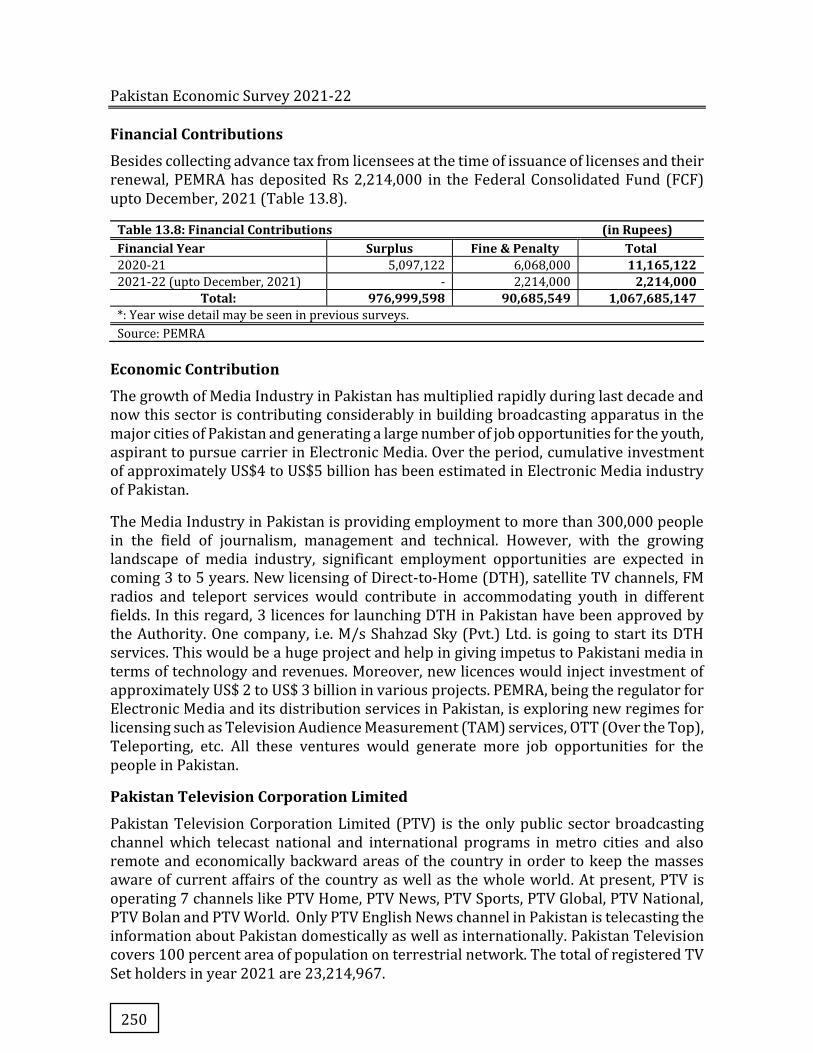
Pakistan Economic Survey 2021-22
250
Financial Contributions
Besides collecting advance tax from licensees at the time of issuance of licenses and their renewal, PEMRA has deposited Rs 2,214,000 in the Federal Consolidated Fund (FCF) upto December, 2021 (Table 13.8).
Table 13.8: Financial Contributions (in Rupees) Financial Year Surplus Fine & Penalty Total 2020-21 5,097,122 6,068,000 11,165,122 2021-22 (upto December, 2021) - 2,214,000 2,214,000
Total: 976,999,598 90,685,549 1,067,685,147 *: Year wise detail may be seen in previous surveys.
Source: PEMRA
Economic Contribution
The growth of Media Industry in Pakistan has multiplied rapidly during last decade and now this sector is contributing considerably in building broadcasting apparatus in the major cities of Pakistan and generating a large number of job opportunities for the youth, aspirant to pursue carrier in Electronic Media. Over the period, cumulative investment of approximately US$4 to US$5 billion has been estimated in Electronic Media industry of Pakistan.
The Media Industry in Pakistan is providing employment to more than 300,000 people in the field of journalism, management and technical. However, with the growing landscape of media industry, significant employment opportunities are expected in coming 3 to 5 years. New licensing of Direct-to-Home (DTH), satellite TV channels, FM radios and teleport services would contribute in accommodating youth in different fields. In this regard, 3 licences for launching DTH in Pakistan have been approved by the Authority. One company, i.e. M/s Shahzad Sky (Pvt.) Ltd. is going to start its DTH services. This would be a huge project and help in giving impetus to Pakistani media in terms of technology and revenues. Moreover, new licences would inject investment of approximately US$ 2 to US$ 3 billion in various projects. PEMRA, being the regulator for Electronic Media and its distribution services in Pakistan, is exploring new regimes for licensing such as Television Audience Measurement (TAM) services, OTT (Over the Top), Teleporting, etc. All these ventures would generate more job opportunities for the people in Pakistan.
Pakistan Television Corporation Limited
Pakistan Television Corporation Limited (PTV) is the only public sector broadcasting channel which telecast national and international programs in metro cities and also remote and economically backward areas of the country in order to keep the masses aware of current affairs of the country as well as the whole world. At present, PTV is operating 7 channels like PTV Home, PTV News, PTV Sports, PTV Global, PTV National, PTV Bolan and PTV World. Only PTV English News channel in Pakistan is telecasting the information about Pakistan domestically as well as internationally. Pakistan Television covers 100 percent area of population on terrestrial network. The total of registered TV Set holders in year 2021 are 23,214,967.
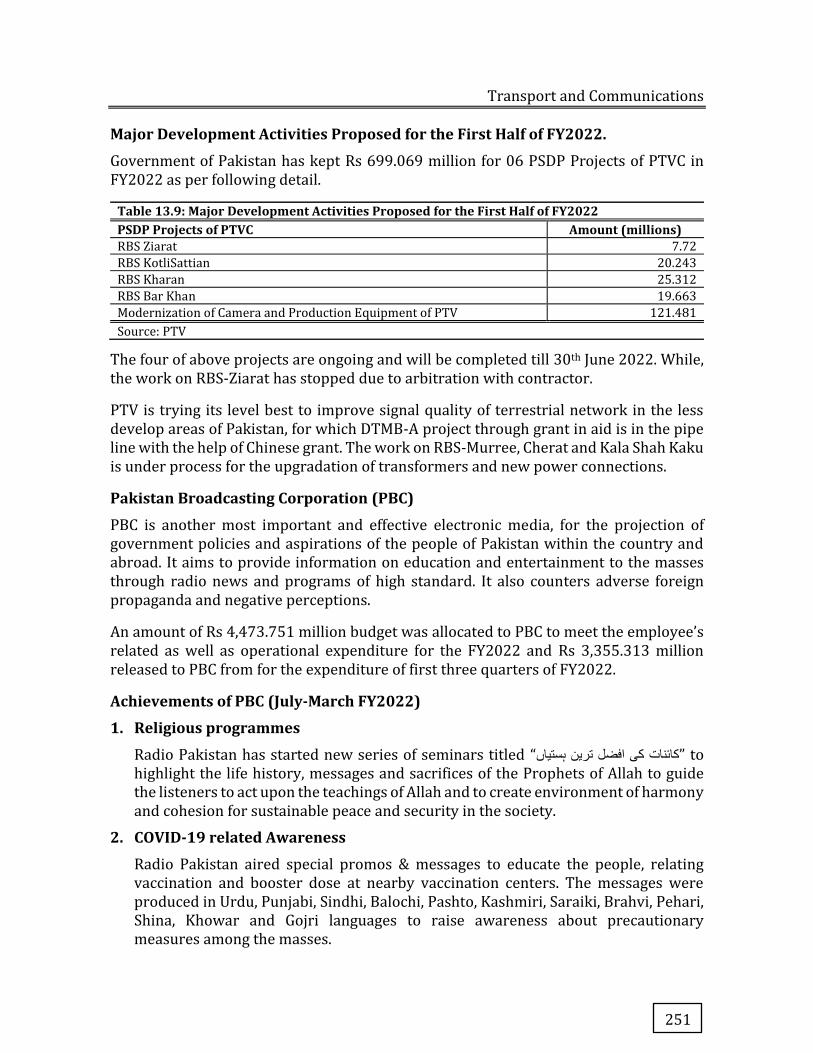
Transport and Communications
251
Major Development Activities Proposed for the First Half of FY2022.
Government of Pakistan has kept Rs 699.069 million for 06 PSDP Projects of PTVC in FY2022 as per following detail.
Table 13.9: Major Development Activities Proposed for the First Half of FY2022 PSDP Projects of PTVC Amount (millions) RBS Ziarat 7.72
RBS KotliSattian 20.243
RBS Kharan 25.312
RBS Bar Khan 19.663
Modernization of Camera and Production Equipment of PTV 121.481
Source: PTV
The four of above projects are ongoing and will be completed till 30th June 2022. While, the work on RBS-Ziarat has stopped due to arbitration with contractor.
PTV is trying its level best to improve signal quality of terrestrial network in the less develop areas of Pakistan, for which DTMB-A project through grant in aid is in the pipe line with the help of Chinese grant. The work on RBS-Murree, Cherat and Kala Shah Kaku is under process for the upgradation of transformers and new power connections.
Pakistan Broadcasting Corporation (PBC)
PBC is another most important and effective electronic media, for the projection of government policies and aspirations of the people of Pakistan within the country and abroad. It aims to provide information on education and entertainment to the masses through radio news and programs of high standard. It also counters adverse foreign propaganda and negative perceptions.
An amount of Rs 4,473.751 million budget was allocated to PBC to meet the employee’s related as well as operational expenditure for the FY2022 and Rs 3,355.313 million released to PBC from for the expenditure of first three quarters of FY2022.
Achievements of PBC (July-March FY2022)
1. Religious programmes
Radio Pakistan has started new series of seminars titled “کائنات کی افضل ترين ہستياں” to highlight the life history, messages and sacrifices of the Prophets of Allah to guide the listeners to act upon the teachings of Allah and to create environment of harmony and cohesion for sustainable peace and security in the society.
2. COVID-19 related Awareness
Radio Pakistan aired special promos & messages to educate the people, relating vaccination and booster dose at nearby vaccination centers. The messages were produced in Urdu, Punjabi, Sindhi, Balochi, Pashto, Kashmiri, Saraiki, Brahvi, Pehari, Shina, Khowar and Gojri languages to raise awareness about precautionary measures among the masses.

Pakistan Economic Survey 2021-22
252
3. Wide Spread Publicity and Coverage of new Government’s Initiatives
Radio Pakistan also playing an effective role in wide spreading the government initiatives to update masses on latest government development on regular basis.
4. Highlighting Kashmir Issue
Broadcast of special exclusive transmission for the Indian Illegally Occupied Jammu & Kashmir (IIOJ&K) started after imposition of curfew and communication blockade by the Indian Oppressing forces in the aftermath of changing the status of Kashmir in August, 2019 was continued as a special cause. All Government’s initiatives to highlight Kashmir issue on international forums were specially highlighted in key programmes.
5. Special Programmes on Climate Change and its Effects
To highlight the dangerous impacts of deforestation and environmental pollution, Radio Pakistan continued broadcast of special weekly programme to sensitize general masses regarding the core issue of global warming. The flagship programmes are “Sarsabz Pakistan”, “Maholiati Tabdiliaur Pakistan”, etc.
6. Laptop Scheme for Youth
PBC broadcast a weekly programme to highlight the initiatives of new Government to create opportunities for youth to empower them in the process of decision making and encourage their representation in all spheres of life and to restart Laptop Scheme for the talented youth of Pakistan.
7. Prime Minister’s Special Focus to Uplift Deprived Communities
Prime Minister is very much focused to promote deprived communities and to safeguard their rights will be highlighted in all national and regional languages programmes from all stations.
8. Rule of Law
All PBC Stations/Channels are highlighting and supporting the determination of Prime Minister to take measures for the establishment of rule of law and to highlight also the efforts of government to curb victimization in future.
9. Special Audience Programmes
PBC is addressing all segments of society and special audiences as well i.e. women, youth, children, laborer and playing its role in enhancing the scale of awareness on social and legal issues, etc.
10. Continuation of Agricultural Programme “Zarkhaiz Pakistan”
Radio Pakistan has launched special agricultural program “Zarkhaiz Pakistan” in collaboration with PARC. In this program, experts from PARC and other agricultural departments are participating to disseminate information to farmer community.
11. Diamond Jubilee Celebrations regarding 75th Anniversary of Pakistan
As Pakistan is going to celebrate its 75th anniversary in August, 2022. Radio Pakistan has started Diamond Jubilee celebrations from August 2021. In this regard, Radio
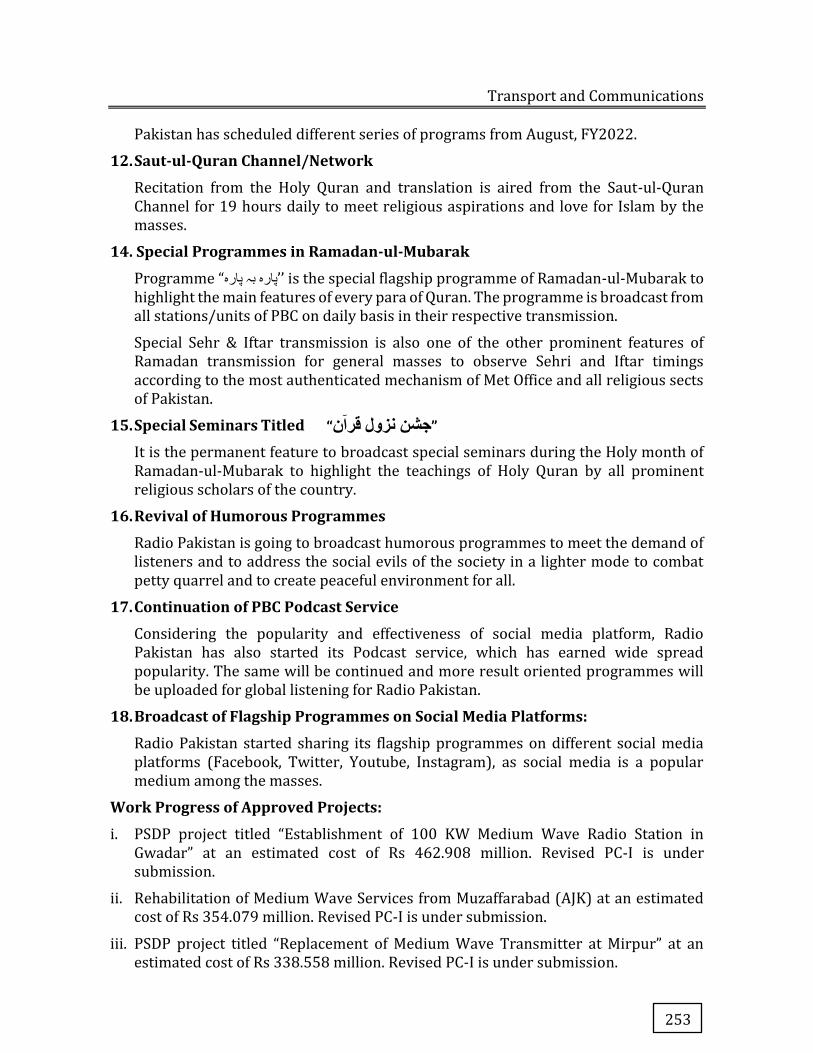
Transport and Communications
253
Pakistan has scheduled different series of programs from August, FY2022.
12. Saut-ul-Quran Channel/Network
Recitation from the Holy Quran and translation is aired from the Saut-ul-Quran Channel for 19 hours daily to meet religious aspirations and love for Islam by the masses.
14. Special Programmes in Ramadan-ul-Mubarak
Programme “پاره بہ پاره’’ is the special flagship programme of Ramadan-ul-Mubarak to highlight the main features of every para of Quran. The programme is broadcast from all stations/units of PBC on daily basis in their respective transmission.
Special Sehr & Iftar transmission is also one of the other prominent features of Ramadan transmission for general masses to observe Sehri and Iftar timings according to the most authenticated mechanism of Met Office and all religious sects of Pakistan.
15. Special Seminars Titled
It is the permanent feature to broadcast special seminars during the Holy month of Ramadan-ul-Mubarak to highlight the teachings of Holy Quran by all prominent religious scholars of the country.
16. Revival of Humorous Programmes
Radio Pakistan is going to broadcast humorous programmes to meet the demand of listeners and to address the social evils of the society in a lighter mode to combat petty quarrel and to create peaceful environment for all.
17. Continuation of PBC Podcast Service
Considering the popularity and effectiveness of social media platform, Radio Pakistan has also started its Podcast service, which has earned wide spread popularity. The same will be continued and more result oriented programmes will be uploaded for global listening for Radio Pakistan.
18. Broadcast of Flagship Programmes on Social Media Platforms:
Radio Pakistan started sharing its flagship programmes on different social media platforms (Facebook, Twitter, Youtube, Instagram), as social media is a popular medium among the masses.
Work Progress of Approved Projects:
i. PSDP project titled “Establishment of 100 KW Medium Wave Radio Station in Gwadar” at an estimated cost of Rs 462.908 million. Revised PC-I is under submission.
ii. Rehabilitation of Medium Wave Services from Muzaffarabad (AJK) at an estimated cost of Rs 354.079 million. Revised PC-I is under submission.
iii. PSDP project titled “Replacement of Medium Wave Transmitter at Mirpur” at an estimated cost of Rs 338.558 million. Revised PC-I is under submission.
”جشن نزول قران“
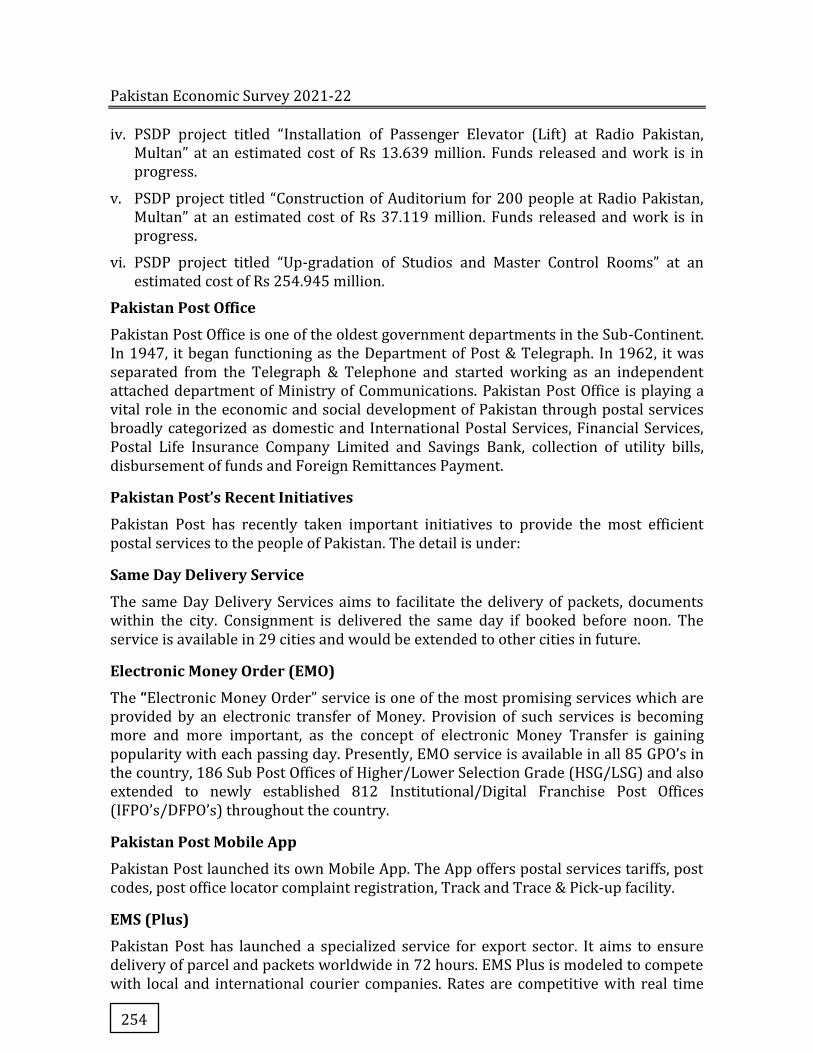
Pakistan Economic Survey 2021-22
254
iv. PSDP project titled “Installation of Passenger Elevator (Lift) at Radio Pakistan, Multan” at an estimated cost of Rs 13.639 million. Funds released and work is in progress.
v. PSDP project titled “Construction of Auditorium for 200 people at Radio Pakistan, Multan” at an estimated cost of Rs 37.119 million. Funds released and work is in progress.
vi. PSDP project titled “Up-gradation of Studios and Master Control Rooms” at an estimated cost of Rs 254.945 million.
Pakistan Post Office
Pakistan Post Office is one of the oldest government departments in the Sub-Continent. In 1947, it began functioning as the Department of Post & Telegraph. In 1962, it was separated from the Telegraph & Telephone and started working as an independent attached department of Ministry of Communications. Pakistan Post Office is playing a vital role in the economic and social development of Pakistan through postal services broadly categorized as domestic and International Postal Services, Financial Services, Postal Life Insurance Company Limited and Savings Bank, collection of utility bills, disbursement of funds and Foreign Remittances Payment.
Pakistan Post’s Recent Initiatives
Pakistan Post has recently taken important initiatives to provide the most efficient postal services to the people of Pakistan. The detail is under:
Same Day Delivery Service
The same Day Delivery Services aims to facilitate the delivery of packets, documents within the city. Consignment is delivered the same day if booked before noon. The service is available in 29 cities and would be extended to other cities in future.
Electronic Money Order (EMO)
The “Electronic Money Order” service is one of the most promising services which are provided by an electronic transfer of Money. Provision of such services is becoming more and more important, as the concept of electronic Money Transfer is gaining popularity with each passing day. Presently, EMO service is available in all 85 GPO’s in the country, 186 Sub Post Offices of Higher/Lower Selection Grade (HSG/LSG) and also extended to newly established 812 Institutional/Digital Franchise Post Offices (IFPO’s/DFPO’s) throughout the country.
Pakistan Post Mobile App
Pakistan Post launched its own Mobile App. The App offers postal services tariffs, post codes, post office locator complaint registration, Track and Trace & Pick-up facility.
EMS (Plus)
Pakistan Post has launched a specialized service for export sector. It aims to ensure delivery of parcel and packets worldwide in 72 hours. EMS Plus is modeled to compete with local and international courier companies. Rates are competitive with real time
Transport and Communications
255
track and trace facility. The service will bring down business cost for small and medium exporters.
Pakistan Post–HBL Alliance
(Digitization of Pakistan Post Financial and Remittance Service)
HBL has been selected after bidding process under PPR-2004. The HBL will invest for deployment of Hardware & Software. HBL will provide training to Pakistan Post’s employees as well as provide ERP Solution, liquidity and invest to improve Look & Feel of GPOs/Post Offices. The HBL will also provide E-Commerce portal and consultancy services for development of PPOD operations. The draft agreement between Pakistan Post and HBL has been vetted by Ministry of Law & Justice and the same is in process of finalization. The following will be co-products of PPO-HBL alliance:
a. Savings Accounts b. Current Accounts c. Salary Accounts d. Pension Accounts e. Collection of All Utility Bills f. Domestic Remittances g. International Remittances h. Social Disbursements i. Collection of Premium under Postal Life Insurance j. Other Collections being offered by HBL k. Any other co-product mutually agreed
Partnership with NADRA
Pakistan Post and NADRA signed an agreement for “Renewal/Modification of CNIC through Post Offices” on 20th June, 2017. Pilot project was launched in 10 Post & extended to 100 post offices. In Phase-I, 40 more Pak ID locations has been established under 2nd Phase. Pak-ID counters have also been established in all 85 GPOs to facilitate general public.
Collaboration between Pakistan Post and M/S Khushali Microfinance Bank Limited
Pakistan Post has earned Rs 2,606,425 as rent of space provided to M/S Khushali Microfinance Bank Limited (KMBL) and disbursed Rs 57,567,461/ recovered Rs 79,974,368 to KMBL clients on commission of Rs 70/. The total commission earned on disbursement/recovery of KMBL loan is Rs 1,655,819/-. The Pakistan Post and KMBL has recently agreed upon increase in rent of space provided to KMBL and addendum of agreement has been issued.
Transaction Advisor for Up-Gradation / Revamping / Re-Engineering of Pakistan Post Logistics Express and Mail Business on PPP Basis
Pakistan Post has hired a qualified Transaction Advisor to assist Pakistan Post in developing, structuring and procuring the Project on PPP basis. The Transaction Advisor will be perform the following tasks:

Pakistan Economic Survey 2021-22
256
a. Carrying-out full-scope feasibility study of the Project and devise transaction structure capable of:
i. Providing financially viable and bankable structure to the private party, and
ii. Offering VFM solution to the public sector
b. Prepare complete bidding documentation package for the Project, including Request for Proposal (RFP), Request for Qualification (RFQ), PPP Contract/Concession Agreement, Project Information Memorandum, etc.
c. Assist Pakistan Post in soliciting technically qualified and financially sound private party through carrying-out transparent and efficient international competitive bidding; and;
d. Assist Pakistan Post in facilitating private party in smooth implementation of the Project including achieving its financial close by the private party, transferring assets and resources under the Project, etc.
Improvement of Pakistan Post Complaint Management System (CMS)
Pakistan Post already has a CMS connecting all controlling and field offices across the country. Pakistan post has also modified the process of following the overflow of Pakistan Citizen Portal (PCP). The responsibility has been decentralized that has enhanced efficiency.
Pakistan Post’s Facebook Page
Pakistan Post is maintaining a Face Book Page to receive feedback and suggestions for improvement in postal operations from general public and takes immediate appropriate remedial steps for further improvement https://www.facebook/pakistan.postoffice
Achievement of Savings Bank
Savings Bank work has been stopped by Pakistan Post Office Department and existing accounts are under transfer to CDNS on the direction of Finance Division.
Western Union (WU) Money Transfer Service:
Pakistan Post, under an Agency Agreement with Western Union, provides international remittance service under the Western Union Money Transfer Service through 2,000 Post Offices in the country. Details of WU remittance paid through PPOD during July-March FY2022 are as follows:
� Amount paid = Rs 7,469.231 million
� Number of transactions processed = 123,849 transactions � Revenue earned = Rs 67.954 million
International Postal Services
Pakistan Post has mail links with all countries of the world except Israel. Exchange of mail is carried out under rules and regulations of the Universal Postal Union. Direct mail links exists with 72 countries and rest of the mail is exchanged by utilizing the transit facilities of intermediary countries.

Transport and Communications
257
Achievements in International Postal Services
Pakistan post received more volume of mail than it dispatched for delivery. Thus, it always remains net-creditor. Pakistan Post received an amount of Rs 610 million during the period from July-March FY2022 on account of Terminal Dues for imbalance of international mail received from and dispatched to other countries.
PPOD-NBP International Remittance Service
Pakistan Post, in collaboration with the National Bank of Pakistan (NBP), provides payment of/disburses foreign remittances under NBP’s remittance service, through 500 designated Post Offices across the country. Details of NBP remittances paid through PPOD during July-March FY2022 are as follows:
� Amount paid = Rs 813.862 million
� Number of transactions processed = 11.632 transactions � Revenue earned = Rs 0.279 million
Postal Life Insurance Company Limited (PLICL)
In order to comply with Financial Action Task Force (FATF) recommendations, Postal Life Insurance an integral part of Pakistan post has been decided to be placed under the regulatory Framework of Securities and Exchange Commission of Pakistan (SECP). Postal Life Insurance Company Limited (PLICL) has been incorporated as Public Limited Company with SECP on 10thMarch-2020.
The information relating to Insurance / PLICL may be sought directly from Chief Executive Officer (CEO) PLICL, 2nd Floor, ECO Postal Staff College Building Islamabad.
No. of Post Offices as on March-2022
The requisite summary of Rural & Urban Post Offices is given in Table 13.10.
Conclusion
Modern transportation and communication system is one of the key inputs for achieving sustainable economic growth. A network of roads, highways, motorways, sea ports, and airlines in a country makes it a center of economic activity by attracting investment, raising productivity and reducing cost of doing business. Government of Pakistan is committed to upgrade the transportation and communication system with the development of new roads, highways motorways, railway tracks and airports to improve connectivity. CPEC is pragmatic step for converting unique geo-strategic location of Pakistan into geo-economics through various transport related projects that will transform road infrastructure of Pakistan and improve access to central Asian, African and European states.
Table 13.10: Number of Post Offices Urban Rural S.O Total 1,510 8,012 9,522

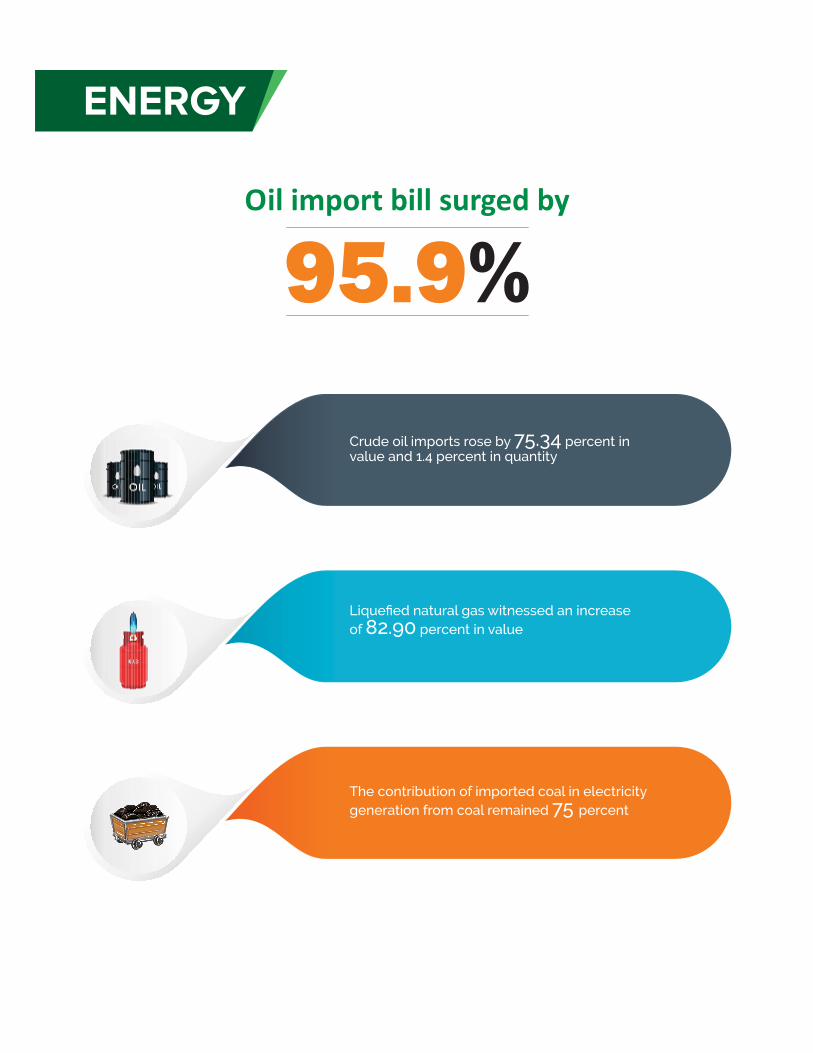


Energy and Economy
Energy sector plays a vital role in the economic development of a country. The recent decades witnessed a manifold increase in the demand for energy. The three principal drivers of increase in energy demand are the surge in economic activities, population growth and rapid technological transformation in the world.
The surge in commodity prices in 2021 and during the initial months of 2022 mainly lifted by the global economic rebound, improved growth prospects and conflict between Russia and Ukraine. According to the International Energy Agency (IEA), the economic recovery from the COVID-19 pandemic, combined with unusual weather conditions led to a sudden jump in electricity demand by more than 6 percent in 2021. The cost of fuel and electricity has enhanced cost of overall production, consequently higher prices have substantially increased cost of living which further eroded the purchasing power of households across the world.
Currently, global economy faces higher energy prices which may remain intact due to the Russian-Ukraine war. The war has led to significant disruptions to the production and trade of commodities for which Russia and Ukraine are key exporters. World Bank’s (WB) latest forecasts indicated that war in Ukraine is set to trigger the largest commodity shock. This would contribute to huge price surge for energy related goods including oil and natural gas. The WB report further revealed that energy prices are set to increase more than 50 percent, pushing up cost for households and businesses. This situation has raised concerns at global level, particularly for the developing economies where provision of energy subsidy has become a major challenge due to weak fiscal position.
Pakistan Energy Profile
Government of Pakistan (GoP) has announced different policies to ensure the smooth supply of energy to the general public and to boost economic growth. These polices include “The National Power Policy 2013”, “The Power Generation Policy 2015” and “Alternative and Renewable Energy Policy 2019”. The National Power Policy 2013 aimed to develop an efficient and consumer-centric power generation, transmission and distribution system that could meet the needs of the people and boost the economy of the country in a sustainable and affordable manner. The main targets included complete elimination of load shedding, decreasing the average cost of electricity generation,
Chapter 14
Energy
Pakistan Economic Survey 2021-22
260
decrease in the transmission & distribution losses, increase in the revenue collection and a reduction in the time required for decision making at the ministry level or other related departments.
In 2015, Government introduced “Power Generation Policy 2015” to facilitate private investment in the power sector. The policy offered incentives to the private sector to set up new power generation projects as well as invest in public sector power generation projects in a different phases of development. The main focus of power generation policy 2015 was to have sufficient least cost power generation capacity in the country, prioritizing utilization of indigenous resources, facilitating all stakeholders involved in the transaction and safeguarding the environment.
In 2019, the Alternative and Renewable Energy Policy was introduced to assist and promote the development of renewable resources in the country. The main objective of the policy was to provide supportive environment for renewable power projects, increase the share of green energy capacity to 20 percent by 2025 and 30 percent by 2030 through attracting private capital in the area of green energy.
Energy sector is prone to certain challenges. For instance, the problem of circular debt in the energy sector is a long awaited issue. Successive governments have strived hard to bring circular debt down but the issue largely remained uncontrolled. In FY2013, circular debt was around Rs 450 billion which reached to Rs 1148 billion in 2018. According to the data of the Central Power Purchasing Authority (CPPA), circular debt stood at Rs 2467 billion by March 2022. This implies that circular debt is equivalent to 3.8 percent of Pakistan’s GDP and represents 5.6 percent of Pakistan’s government debt. Growing at the current pace and if it is allowed to grow unaddressed, it is estimated to reach Rs 4 trillion by 2025, demanding the urgency of reforms in the power sector.
Pakistan’s dependence on liquefied natural gas (LNG) has increased in recent years due to depleting indigenous natural gas deposits. Over the past three years, the stock of circular debt in the gas sector has nearly doubled to Rs 650 billion increased from Rs 350 billion in 2018. The inappropriate response of the government created problems in the import of LNG by the private sector which led to gas crisis in the country, especially in winter. This led to a suspension of gas supply to the captive power plants industries and compressed natural gas (CNG) stations.
Pakistan Energy Mix
Pakistan is producing very limited percentage of oil to meet the overall demand of the country. The indigenous oil production is constrained by technological, technical and financial constraints. This necessitates import of crude oil and other oil products in large quantities to meet significant share of the total demand. Latest data indicates that import bill of oil increased by 95.9 per cent to US$17.03 billion during July-April FY2022 compared to US$8.69 billion during the same period last year. Higher oil prices in the global market and massive depreciation of the Pakistani rupee is making oil more expensive, triggering external sector pressure and widening trade deficit of the country. The surge in oil import bill is attributed to increases in value as well as increase in demand as the import of petroleum products went up by 121.15 percent in value and
Energy
261
24.18 percent in quantity. The Crude oil imports rose by 75.34 percent in value and 1.4 per cent in quantity during the period under review. Similarly, liquefied natural gas witnessed an increase of 82.90 percent in value, while liquefied petroleum gas (LPG) imports also jumped by 39.86 percent during July-April FY2022.
The scarce natural gas reserves of the country are quickly depleting due to substantial increase in the demand for gas, putting huge pressure on the limited natural gas reserves of the country. Government is looking for both short as well as long-term alternatives solutions to respond effectively to the substantial energy requirements. Keeping in view the rising demand for energy, Government is focusing to develop new exploratory wells to increase the supply of national gas. In addition to that, LNG and piped gas are being imported. In the FY2021, around 373 million MMBTU of LNG gas worth around US$3.4 billion was imported. This corresponds to around 30 percent of the total natural gas consumption in the country. During July-Feb FY2022, 75.64 percent gas is domestically produced, while 24.36 percent of gas is being imported.
Coal is also used for electricity generation in Pakistan. Thar has the largest coal reserves in the country which has been actively developed in recent years. The first Thar plant, having capacity of 660 MW, became operational in the first quarter of FY2020. Currently, the overall electricity generation from coal has reached to 5280 MW. Thar coal is contributing 1,320 MW, while imported coal contribution in electricity generation is 3,960 MW which is around 75 percent of the total electricity generation from coal in the country. Electricity generation configuration is relying heavily on the imported coal and this trend is likely to change as units based on the Thar field are added to the electricity generation mix.
Pakistan is very rich in hydropower and has the enormous potential to generate electricity from water. The estimated total hydropower potential of Pakistan is around 60,000 MW. The country is not utilizing full potential and using nearly 16 percent of the total hydropower potential. The high investment cost for the installation of hydroplants, development of electricity transmission network and resettlement of the affected population are few reasons for hydropower not being exploited to its full capacity. Currently, the Hydro installed capacity is 10,251 MW which is around 25 percent of the total installed capacity.
Pakistan has wind corridors as well and there is huge potential to generate electricity from wind. It is estimated that Pakistan can generate 50,000 MW from wind. The contribution of Wind in the total installed capacity is 4.8 percent and currently stood at 1,985 MW. The potential for solar power in Pakistan is also high. The sunlight is available abundantly almost throughout the country. Currently, the capacity share of these renewable resources is small, but it is expected to increase sharply, as reflected in the Alternative and Renewable Energy Policy 2019. The installed capacity of solar is 600 MW which is around 1.4 percent of the total installed capacity.
Pakistan is also producing energy from the nuclear technology whose contribution is increasing gradually. The gross capacity of the nuclear power plants was 2,530 MW that supplied about 7,076 million units of electricity to the national grid during July-March FY2021. The gross capacity of nuclear power plants has increased by 39 percent and it
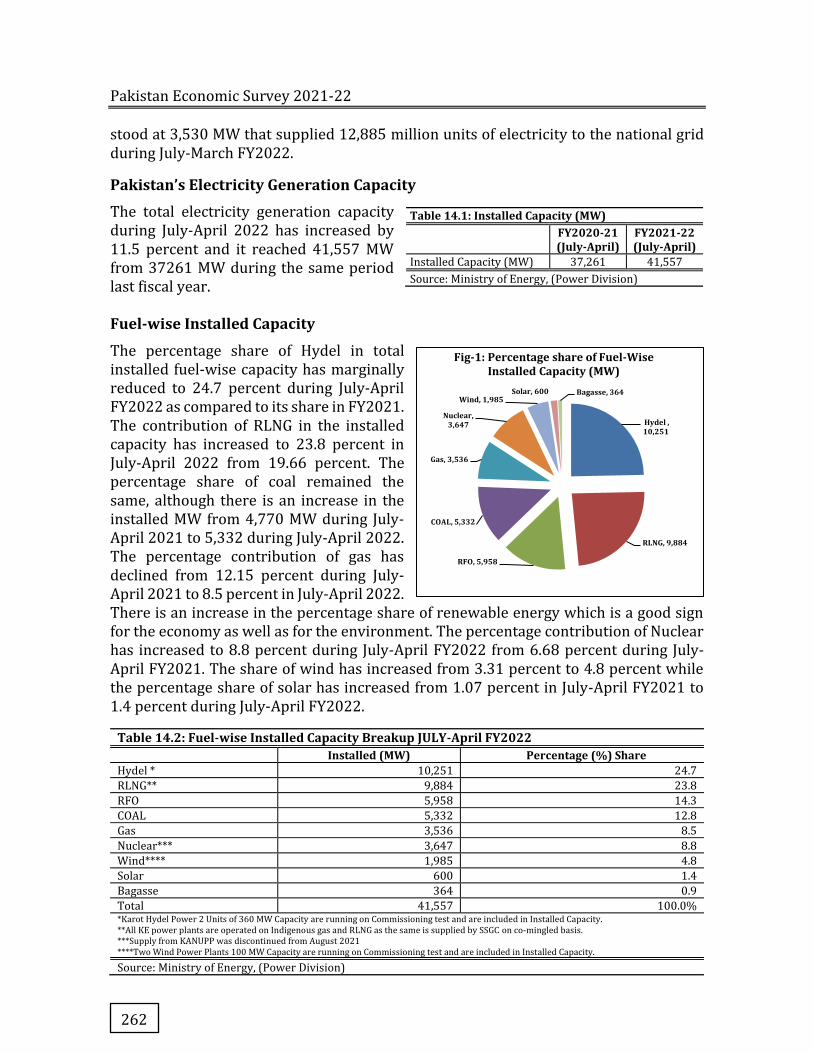
Pakistan Economic Survey 2021-22
262
stood at 3,530 MW that supplied 12,885 million units of electricity to the national grid during July-March FY2022.
Pakistan’s Electricity Generation Capacity
The total electricity generation capacity during July-April 2022 has increased by 11.5 percent and it reached 41,557 MW from 37261 MW during the same period last fiscal year. Fuel-wise Installed Capacity
The percentage share of Hydel in total installed fuel-wise capacity has marginally reduced to 24.7 percent during July-April FY2022 as compared to its share in FY2021. The contribution of RLNG in the installed capacity has increased to 23.8 percent in July-April 2022 from 19.66 percent. The percentage share of coal remained the same, although there is an increase in the installed MW from 4,770 MW during July-April 2021 to 5,332 during July-April 2022. The percentage contribution of gas has declined from 12.15 percent during July-April 2021 to 8.5 percent in July-April 2022. There is an increase in the percentage share of renewable energy which is a good sign for the economy as well as for the environment. The percentage contribution of Nuclear has increased to 8.8 percent during July-April FY2022 from 6.68 percent during July-April FY2021. The share of wind has increased from 3.31 percent to 4.8 percent while the percentage share of solar has increased from 1.07 percent in July-April FY2021 to 1.4 percent during July-April FY2022.
Table 14.2: Fuel-wise Installed Capacity Breakup JULY-April FY2022
Installed (MW) Percentage (%) Share Hydel * 10,251 24.7
RLNG** 9,884 23.8
RFO 5,958 14.3
COAL 5,332 12.8
Gas 3,536 8.5
Nuclear*** 3,647 8.8
Wind**** 1,985 4.8
Solar 600 1.4
Bagasse 364 0.9
Total 41,557 100.0% *Karot Hydel Power 2 Units of 360 MW Capacity are running on Commissioning test and are included in Installed Capacity. **All KE power plants are operated on Indigenous gas and RLNG as the same is supplied by SSGC on co-mingled basis. ***Supply from KANUPP was discontinued from August 2021 ****Two Wind Power Plants 100 MW Capacity are running on Commissioning test and are included in Installed Capacity.
Source: Ministry of Energy, (Power Division)
Table 14.1: Installed Capacity (MW)
FY2020-21 (July-April)
FY2021-22 (July-April)
Installed Capacity (MW) 37,261 41,557
Source: Ministry of Energy, (Power Division)
Hydel , 10,251
RLNG, 9,884
RFO, 5,958
COAL, 5,332
Gas, 3,536
Nuclear, 3,647
Wind, 1,985Solar, 600 Bagasse, 364
Fig-1: Percentage share of Fuel-Wise Installed Capacity (MW)
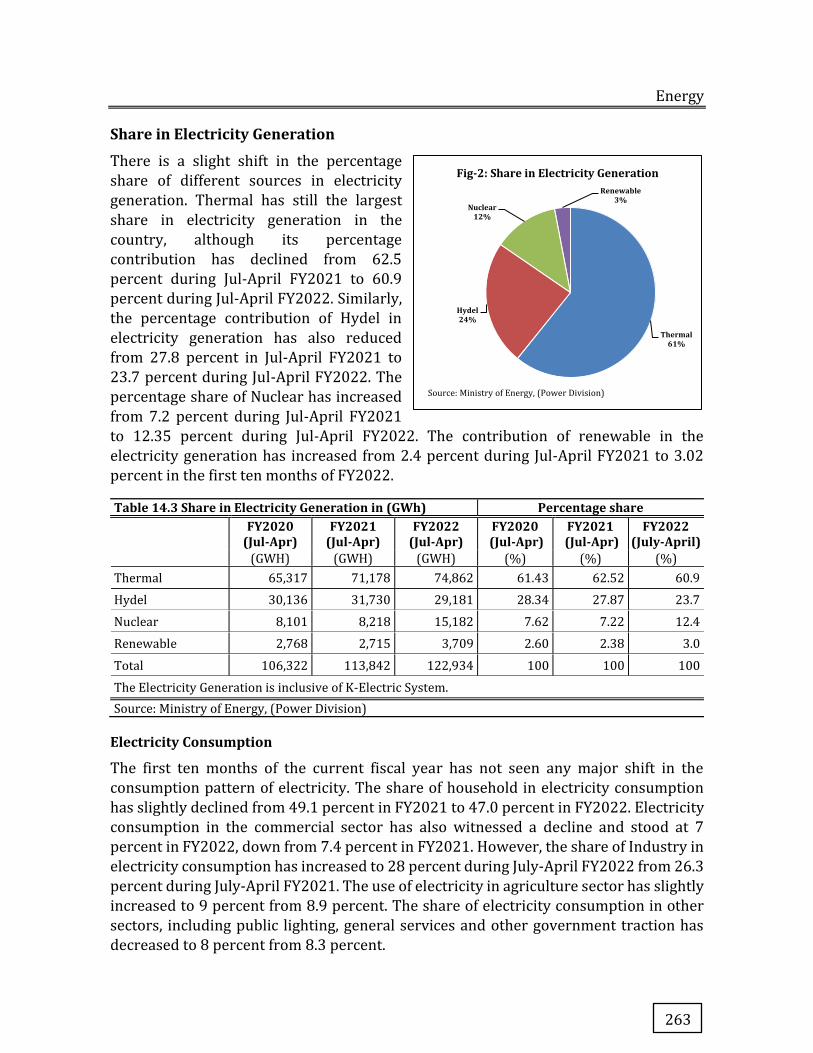
Energy
263
Share in Electricity Generation
There is a slight shift in the percentage
share of different sources in electricity
generation. Thermal has still the largest
share in electricity generation in the
country, although its percentage
contribution has declined from 62.5
percent during Jul-April FY2021 to 60.9
percent during Jul-April FY2022. Similarly,
the percentage contribution of Hydel in
electricity generation has also reduced
from 27.8 percent in Jul-April FY2021 to
23.7 percent during Jul-April FY2022. The
percentage share of Nuclear has increased
from 7.2 percent during Jul-April FY2021
to 12.35 percent during Jul-April FY2022. The contribution of renewable in the
electricity generation has increased from 2.4 percent during Jul-April FY2021 to 3.02
percent in the first ten months of FY2022.
Table 14.3 Share in Electricity Generation in (GWh) Percentage share FY2020
(Jul-Apr) FY2021
(Jul-Apr) FY2022
(Jul-Apr) FY2020
(Jul-Apr) FY2021
(Jul-Apr) FY2022
(July-April) (GWH) (GWH) (GWH) (%) (%) (%)
Thermal 65,317 71,178 74,862 61.43 62.52 60.9 Hydel 30,136 31,730 29,181 28.34 27.87 23.7 Nuclear 8,101 8,218 15,182 7.62 7.22 12.4 Renewable 2,768 2,715 3,709 2.60 2.38 3.0 Total 106,322 113,842 122,934 100 100 100 The Electricity Generation is inclusive of K-Electric System.
Source: Ministry of Energy, (Power Division)
Electricity Consumption
The first ten months of the current fiscal year has not seen any major shift in the
consumption pattern of electricity. The share of household in electricity consumption
has slightly declined from 49.1 percent in FY2021 to 47.0 percent in FY2022. Electricity
consumption in the commercial sector has also witnessed a decline and stood at 7
percent in FY2022, down from 7.4 percent in FY2021. However, the share of Industry in
electricity consumption has increased to 28 percent during July-April FY2022 from 26.3
percent during July-April FY2021. The use of electricity in agriculture sector has slightly
increased to 9 percent from 8.9 percent. The share of electricity consumption in other
sectors, including public lighting, general services and other government traction has
decreased to 8 percent from 8.3 percent.
Source: Ministry of Energy, (Power Division)
Thermal61%
Hydel24%
Nuclear12%
Renewable3%
Fig-2: Share in Electricity Generation
Source: Ministry of Energy, (Power Division)
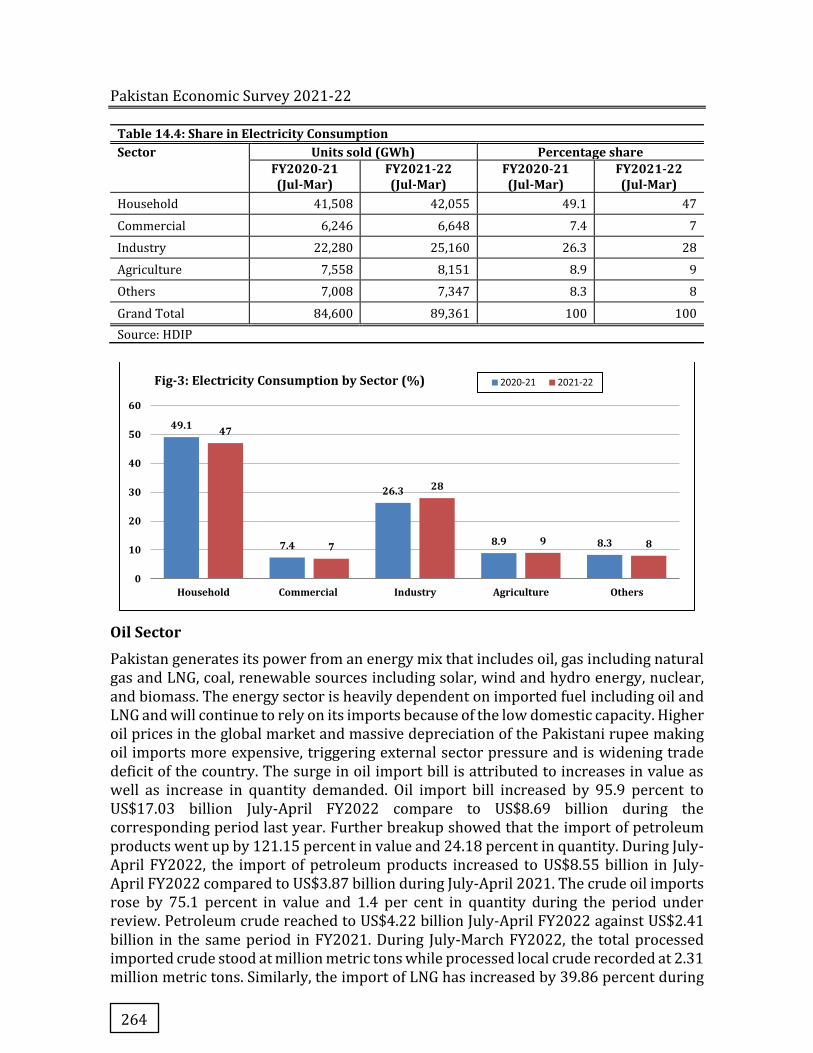
Pakistan Economic Survey 2021-22
264
Table 14.4: Share in Electricity Consumption Sector Units sold (GWh) Percentage share
FY2020-21 (Jul-Mar)
FY2021-22 (Jul-Mar)
FY2020-21 (Jul-Mar)
FY2021-22 (Jul-Mar)
Household 41,508 42,055 49.1 47
Commercial 6,246 6,648 7.4 7
Industry 22,280 25,160 26.3 28
Agriculture 7,558 8,151 8.9 9
Others 7,008 7,347 8.3 8
Grand Total 84,600 89,361 100 100
Source: HDIP
Oil Sector
Pakistan generates its power from an energy mix that includes oil, gas including natural gas and LNG, coal, renewable sources including solar, wind and hydro energy, nuclear, and biomass. The energy sector is heavily dependent on imported fuel including oil and LNG and will continue to rely on its imports because of the low domestic capacity. Higher oil prices in the global market and massive depreciation of the Pakistani rupee making oil imports more expensive, triggering external sector pressure and is widening trade deficit of the country. The surge in oil import bill is attributed to increases in value as well as increase in quantity demanded. Oil import bill increased by 95.9 percent to US$17.03 billion July-April FY2022 compare to US$8.69 billion during the corresponding period last year. Further breakup showed that the import of petroleum products went up by 121.15 percent in value and 24.18 percent in quantity. During July-April FY2022, the import of petroleum products increased to US$8.55 billion in July-April FY2022 compared to US$3.87 billion during July-April 2021. The crude oil imports rose by 75.1 percent in value and 1.4 per cent in quantity during the period under review. Petroleum crude reached to US$4.22 billion July-April FY2022 against US$2.41 billion in the same period in FY2021. During July-March FY2022, the total processed imported crude stood at million metric tons while processed local crude recorded at 2.31 million metric tons. Similarly, the import of LNG has increased by 39.86 percent during
49.1
7.4
26.3
8.9 8.3
47
7
28
9 8
0
10
20
30
40
50
60
Household Commercial Industry Agriculture Others
Fig-3: Electricity Consumption by Sector (%) 2020-21 2021-22
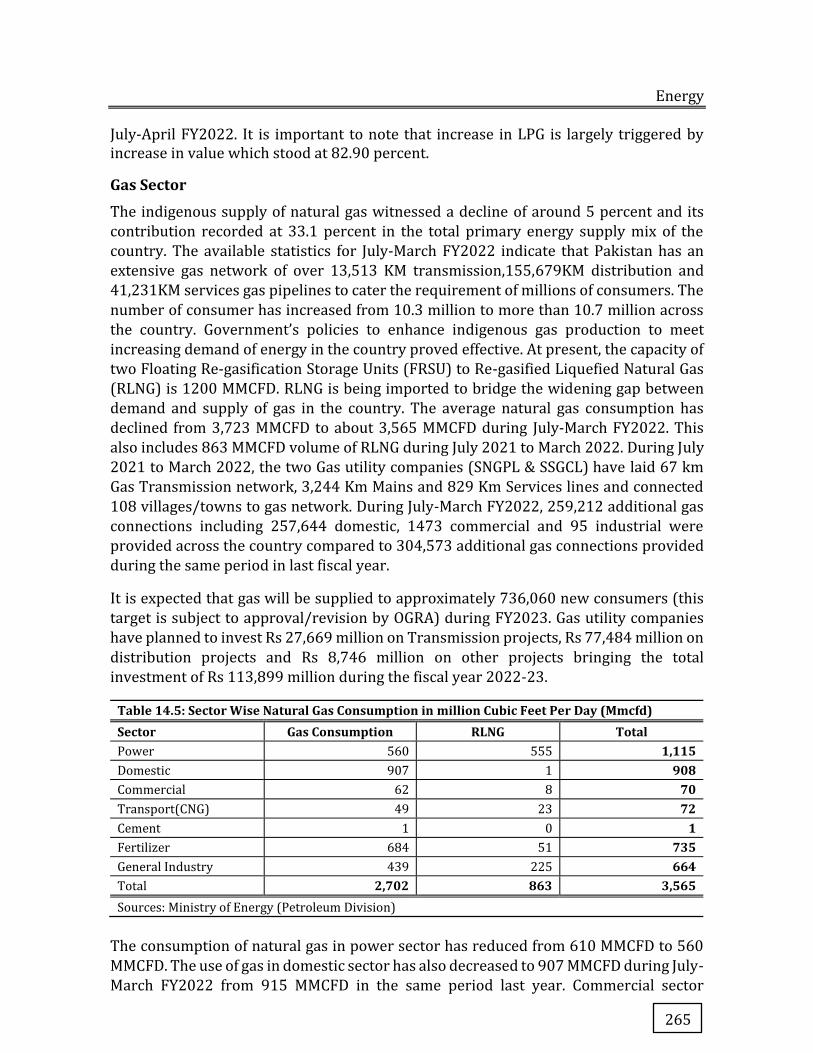
Energy
265
July-April FY2022. It is important to note that increase in LPG is largely triggered by increase in value which stood at 82.90 percent.
Gas Sector
The indigenous supply of natural gas witnessed a decline of around 5 percent and its
contribution recorded at 33.1 percent in the total primary energy supply mix of the
country. The available statistics for July-March FY2022 indicate that Pakistan has an
extensive gas network of over 13,513 KM transmission,155,679KM distribution and
41,231KM services gas pipelines to cater the requirement of millions of consumers. The
number of consumer has increased from 10.3 million to more than 10.7 million across
the country. Government’s policies to enhance indigenous gas production to meet
increasing demand of energy in the country proved effective. At present, the capacity of
two Floating Re-gasification Storage Units (FRSU) to Re-gasified Liquefied Natural Gas
(RLNG) is 1200 MMCFD. RLNG is being imported to bridge the widening gap between
demand and supply of gas in the country. The average natural gas consumption has
declined from 3,723 MMCFD to about 3,565 MMCFD during July-March FY2022. This
also includes 863 MMCFD volume of RLNG during July 2021 to March 2022. During July
2021 to March 2022, the two Gas utility companies (SNGPL & SSGCL) have laid 67 km
Gas Transmission network, 3,244 Km Mains and 829 Km Services lines and connected
108 villages/towns to gas network. During July-March FY2022, 259,212 additional gas
connections including 257,644 domestic, 1473 commercial and 95 industrial were
provided across the country compared to 304,573 additional gas connections provided
during the same period in last fiscal year.
It is expected that gas will be supplied to approximately 736,060 new consumers (this
target is subject to approval/revision by OGRA) during FY2023. Gas utility companies
have planned to invest Rs 27,669 million on Transmission projects, Rs 77,484 million on
distribution projects and Rs 8,746 million on other projects bringing the total
investment of Rs 113,899 million during the fiscal year 2022-23.
Table 14.5: Sector Wise Natural Gas Consumption in million Cubic Feet Per Day (Mmcfd) Sector Gas Consumption RLNG Total Power 560 555 1,115 Domestic 907 1 908 Commercial 62 8 70 Transport(CNG) 49 23 72 Cement 1 0 1 Fertilizer 684 51 735 General Industry 439 225 664 Total 2,702 863 3,565 Sources: Ministry of Energy (Petroleum Division)
The consumption of natural gas in power sector has reduced from 610 MMCFD to 560
MMCFD. The use of gas in domestic sector has also decreased to 907 MMCFD during July-
March FY2022 from 915 MMCFD in the same period last year. Commercial sector
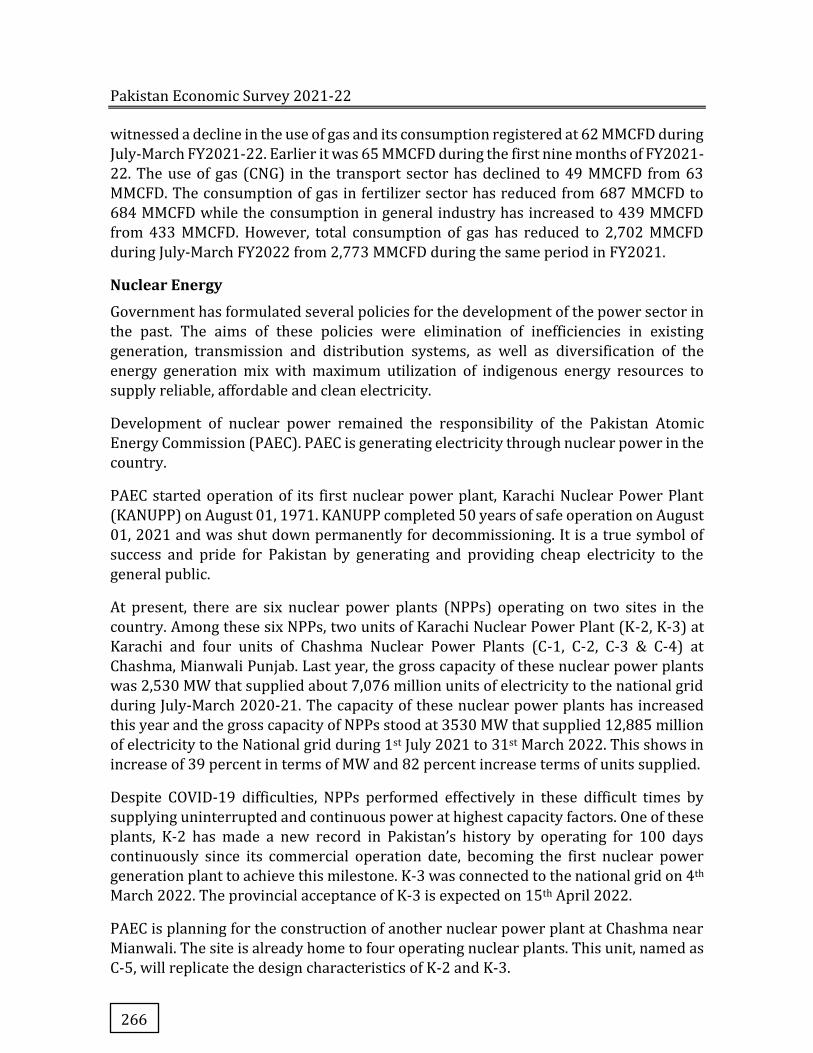
Pakistan Economic Survey 2021-22
266
witnessed a decline in the use of gas and its consumption registered at 62 MMCFD during
July-March FY2021-22. Earlier it was 65 MMCFD during the first nine months of FY2021-
22. The use of gas (CNG) in the transport sector has declined to 49 MMCFD from 63
MMCFD. The consumption of gas in fertilizer sector has reduced from 687 MMCFD to
684 MMCFD while the consumption in general industry has increased to 439 MMCFD
from 433 MMCFD. However, total consumption of gas has reduced to 2,702 MMCFD
during July-March FY2022 from 2,773 MMCFD during the same period in FY2021.
Nuclear Energy
Government has formulated several policies for the development of the power sector in
the past. The aims of these policies were elimination of inefficiencies in existing
generation, transmission and distribution systems, as well as diversification of the
energy generation mix with maximum utilization of indigenous energy resources to
supply reliable, affordable and clean electricity.
Development of nuclear power remained the responsibility of the Pakistan Atomic
Energy Commission (PAEC). PAEC is generating electricity through nuclear power in the
country.
PAEC started operation of its first nuclear power plant, Karachi Nuclear Power Plant
(KANUPP) on August 01, 1971. KANUPP completed 50 years of safe operation on August
01, 2021 and was shut down permanently for decommissioning. It is a true symbol of
success and pride for Pakistan by generating and providing cheap electricity to the
general public.
At present, there are six nuclear power plants (NPPs) operating on two sites in the
country. Among these six NPPs, two units of Karachi Nuclear Power Plant (K-2, K-3) at
Karachi and four units of Chashma Nuclear Power Plants (C-1, C-2, C-3 & C-4) at
Chashma, Mianwali Punjab. Last year, the gross capacity of these nuclear power plants
was 2,530 MW that supplied about 7,076 million units of electricity to the national grid
during July-March 2020-21. The capacity of these nuclear power plants has increased
this year and the gross capacity of NPPs stood at 3530 MW that supplied 12,885 million
of electricity to the National grid during 1st July 2021 to 31st March 2022. This shows in
increase of 39 percent in terms of MW and 82 percent increase terms of units supplied.
Despite COVID-19 difficulties, NPPs performed effectively in these difficult times by
supplying uninterrupted and continuous power at highest capacity factors. One of these
plants, K-2 has made a new record in Pakistan’s history by operating for 100 days
continuously since its commercial operation date, becoming the first nuclear power
generation plant to achieve this milestone. K-3 was connected to the national grid on 4th
March 2022. The provincial acceptance of K-3 is expected on 15th April 2022.
PAEC is planning for the construction of another nuclear power plant at Chashma near
Mianwali. The site is already home to four operating nuclear plants. This unit, named as
C-5, will replicate the design characteristics of K-2 and K-3.
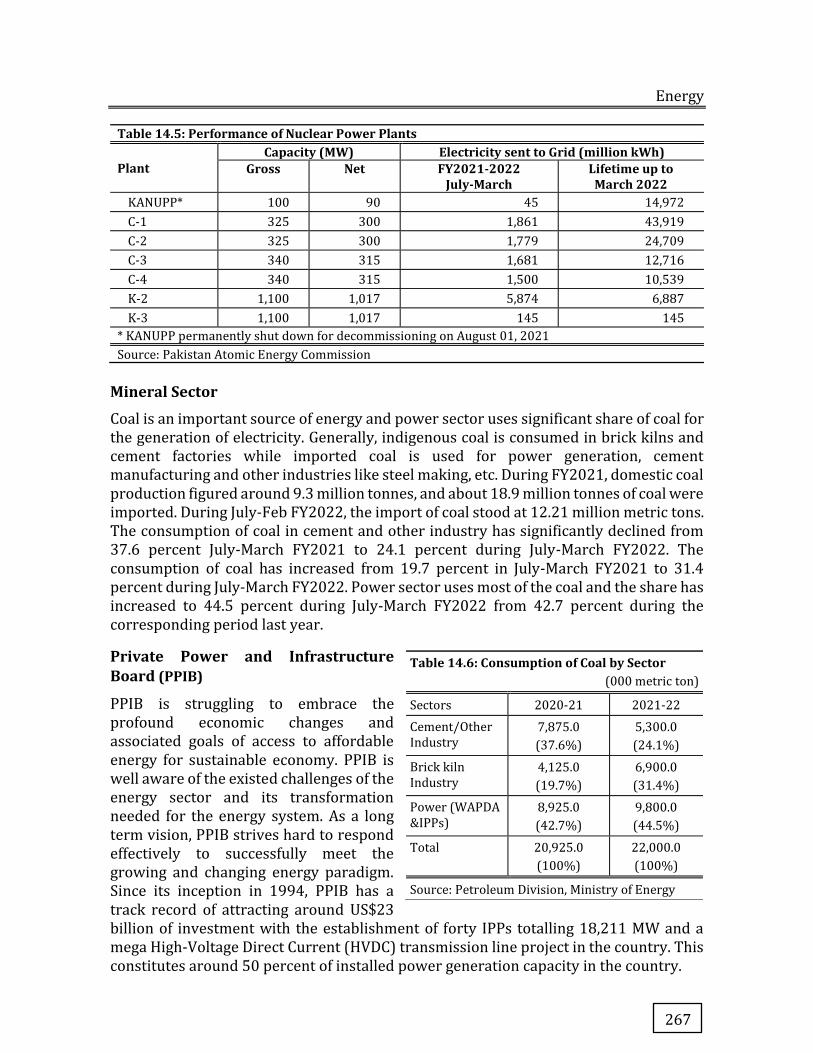
Energy
267
Table 14.5: Performance of Nuclear Power Plants
Plant Capacity (MW) Electricity sent to Grid (million kWh)
Gross Net FY2021-2022 July-March
Lifetime up to March 2022
KANUPP* 100 90 45 14,972
C-1 325 300 1,861 43,919
C-2 325 300 1,779 24,709
C-3 340 315 1,681 12,716
C-4 340 315 1,500 10,539
K-2 1,100 1,017 5,874 6,887
K-3 1,100 1,017 145 145
* KANUPP permanently shut down for decommissioning on August 01, 2021 Source: Pakistan Atomic Energy Commission
Mineral Sector
Coal is an important source of energy and power sector uses significant share of coal for the generation of electricity. Generally, indigenous coal is consumed in brick kilns and cement factories while imported coal is used for power generation, cement manufacturing and other industries like steel making, etc. During FY2021, domestic coal production figured around 9.3 million tonnes, and about 18.9 million tonnes of coal were imported. During July-Feb FY2022, the import of coal stood at 12.21 million metric tons. The consumption of coal in cement and other industry has significantly declined from 37.6 percent July-March FY2021 to 24.1 percent during July-March FY2022. The consumption of coal has increased from 19.7 percent in July-March FY2021 to 31.4 percent during July-March FY2022. Power sector uses most of the coal and the share has increased to 44.5 percent during July-March FY2022 from 42.7 percent during the corresponding period last year.
Private Power and Infrastructure Board (PPIB)
PPIB is struggling to embrace the profound economic changes and associated goals of access to affordable energy for sustainable economy. PPIB is well aware of the existed challenges of the energy sector and its transformation needed for the energy system. As a long term vision, PPIB strives hard to respond effectively to successfully meet the growing and changing energy paradigm. Since its inception in 1994, PPIB has a track record of attracting around US$23 billion of investment with the establishment of forty IPPs totalling 18,211 MW and a mega High-Voltage Direct Current (HVDC) transmission line project in the country. This constitutes around 50 percent of installed power generation capacity in the country.
Table 14.6: Consumption of Coal by Sector (000 metric ton)
Sectors 2020-21 2021-22
Cement/Other Industry
7,875.0
(37.6%)
5,300.0
(24.1%)
Brick kiln Industry
4,125.0
(19.7%)
6,900.0
(31.4%)
Power (WAPDA &IPPs)
8,925.0
(42.7%)
9,800.0
(44.5%)
Total 20,925.0
(100%)
22,000.0
(100%)
Source: Petroleum Division, Ministry of Energy
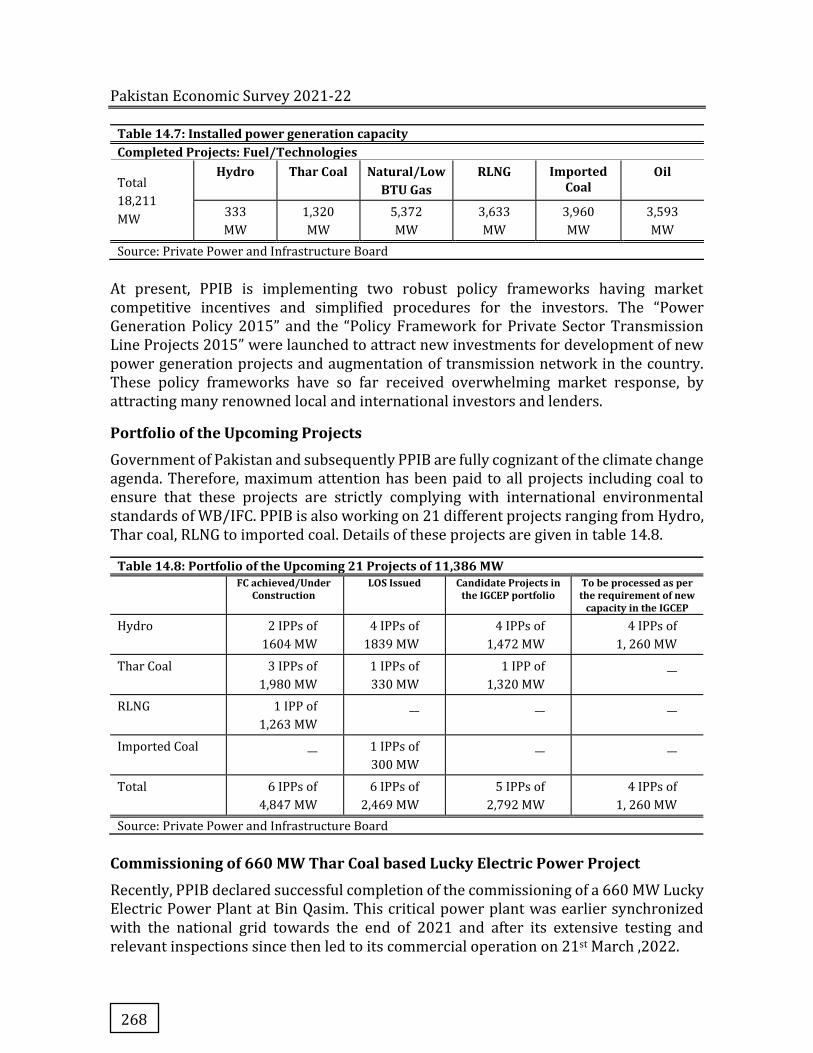
Pakistan Economic Survey 2021-22
268
Table 14.7: Installed power generation capacity
Completed Projects: Fuel/Technologies
Total
18,211
MW
Hydro Thar Coal Natural/Low BTU Gas
RLNG Imported Coal
Oil
333
MW
1,320
MW
5,372
MW
3,633
MW
3,960
MW
3,593
MW
Source: Private Power and Infrastructure Board
At present, PPIB is implementing two robust policy frameworks having market competitive incentives and simplified procedures for the investors. The “Power Generation Policy 2015” and the “Policy Framework for Private Sector Transmission Line Projects 2015” were launched to attract new investments for development of new power generation projects and augmentation of transmission network in the country. These policy frameworks have so far received overwhelming market response, by attracting many renowned local and international investors and lenders.
Portfolio of the Upcoming Projects
Government of Pakistan and subsequently PPIB are fully cognizant of the climate change agenda. Therefore, maximum attention has been paid to all projects including coal to ensure that these projects are strictly complying with international environmental standards of WB/IFC. PPIB is also working on 21 different projects ranging from Hydro, Thar coal, RLNG to imported coal. Details of these projects are given in table 14.8.
Table 14.8: Portfolio of the Upcoming 21 Projects of 11,386 MW
FC achieved/Under Construction
LOS Issued Candidate Projects in the IGCEP portfolio
To be processed as per the requirement of new
capacity in the IGCEP
Hydro 2 IPPs of
1604 MW
4 IPPs of
1839 MW
4 IPPs of
1,472 MW
4 IPPs of
1, 260 MW
Thar Coal 3 IPPs of
1,980 MW
1 IPPs of
330 MW
1 IPP of
1,320 MW
__
RLNG 1 IPP of
1,263 MW
__ __ __
Imported Coal __ 1 IPPs of
300 MW
__ __
Total 6 IPPs of
4,847 MW
6 IPPs of
2,469 MW
5 IPPs of
2,792 MW
4 IPPs of
1, 260 MW
Source: Private Power and Infrastructure Board
Commissioning of 660 MW Thar Coal based Lucky Electric Power Project
Recently, PPIB declared successful completion of the commissioning of a 660 MW Lucky Electric Power Plant at Bin Qasim. This critical power plant was earlier synchronized with the national grid towards the end of 2021 and after its extensive testing and relevant inspections since then led to its commercial operation on 21st March ,2022.
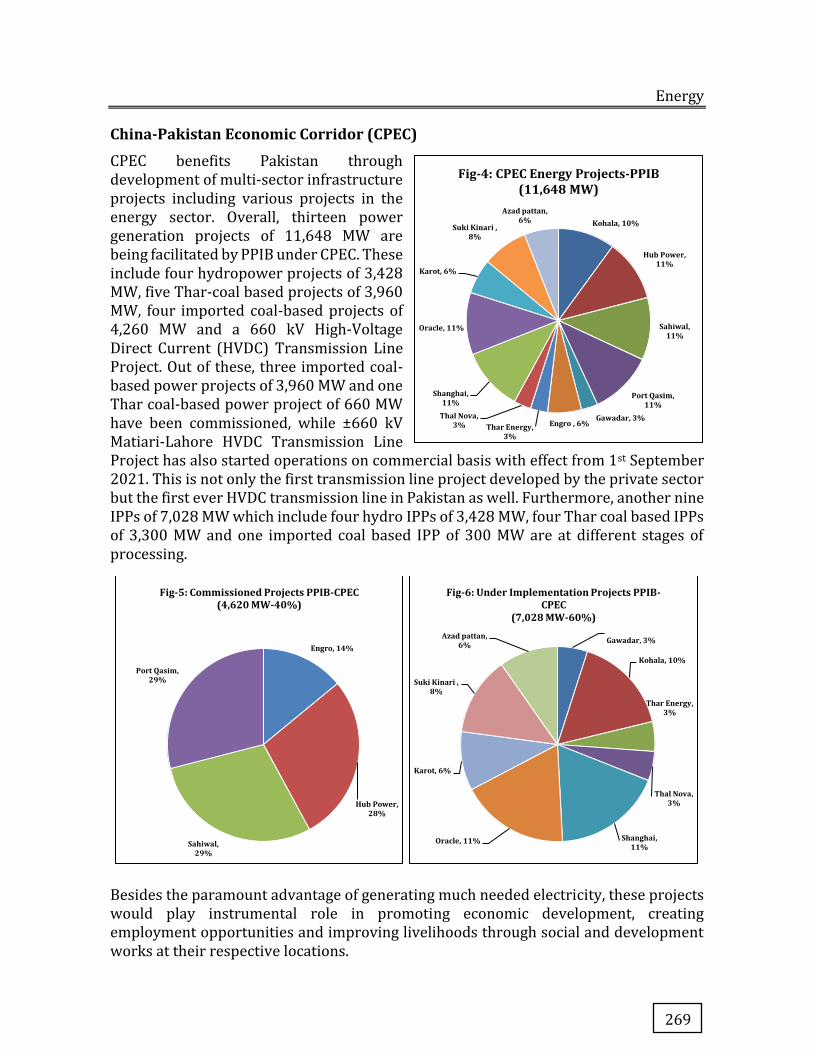
Energy
269
China-Pakistan Economic Corridor (CPEC)
CPEC benefits Pakistan through development of multi-sector infrastructure projects including various projects in the energy sector. Overall, thirteen power generation projects of 11,648 MW are being facilitated by PPIB under CPEC. These include four hydropower projects of 3,428 MW, five Thar-coal based projects of 3,960 MW, four imported coal-based projects of 4,260 MW and a 660 kV High-Voltage Direct Current (HVDC) Transmission Line Project. Out of these, three imported coal-based power projects of 3,960 MW and one Thar coal-based power project of 660 MW have been commissioned, while ±660 kV Matiari-Lahore HVDC Transmission Line Project has also started operations on commercial basis with effect from 1st September 2021. This is not only the first transmission line project developed by the private sector but the first ever HVDC transmission line in Pakistan as well. Furthermore, another nine IPPs of 7,028 MW which include four hydro IPPs of 3,428 MW, four Thar coal based IPPs of 3,300 MW and one imported coal based IPP of 300 MW are at different stages of processing.
Besides the paramount advantage of generating much needed electricity, these projects would play instrumental role in promoting economic development, creating employment opportunities and improving livelihoods through social and development works at their respective locations.
Engro, 14%
Hub Power, 28%
Sahiwal, 29%
Port Qasim, 29%
Fig-5: Commissioned Projects PPIB-CPEC(4,620 MW-40%)
Gawadar, 3%
Kohala, 10%
Thar Energy, 3%
Thal Nova, 3%
Shanghai, 11%
Oracle, 11%
Karot, 6%
Suki Kinari , 8%
Azad pattan, 6%
Fig-6: Under Implementation Projects PPIB-CPEC
(7,028 MW-60%)
Kohala, 10%
Hub Power, 11%
Sahiwal, 11%
Port Qasim, 11%
Gawadar, 3%Engro , 6%Thar Energy,
3%
Thal Nova, 3%
Shanghai, 11%
Oracle, 11%
Karot, 6%
Suki Kinari , 8%
Azad pattan, 6%
Fig-4: CPEC Energy Projects-PPIB(11,648 MW)
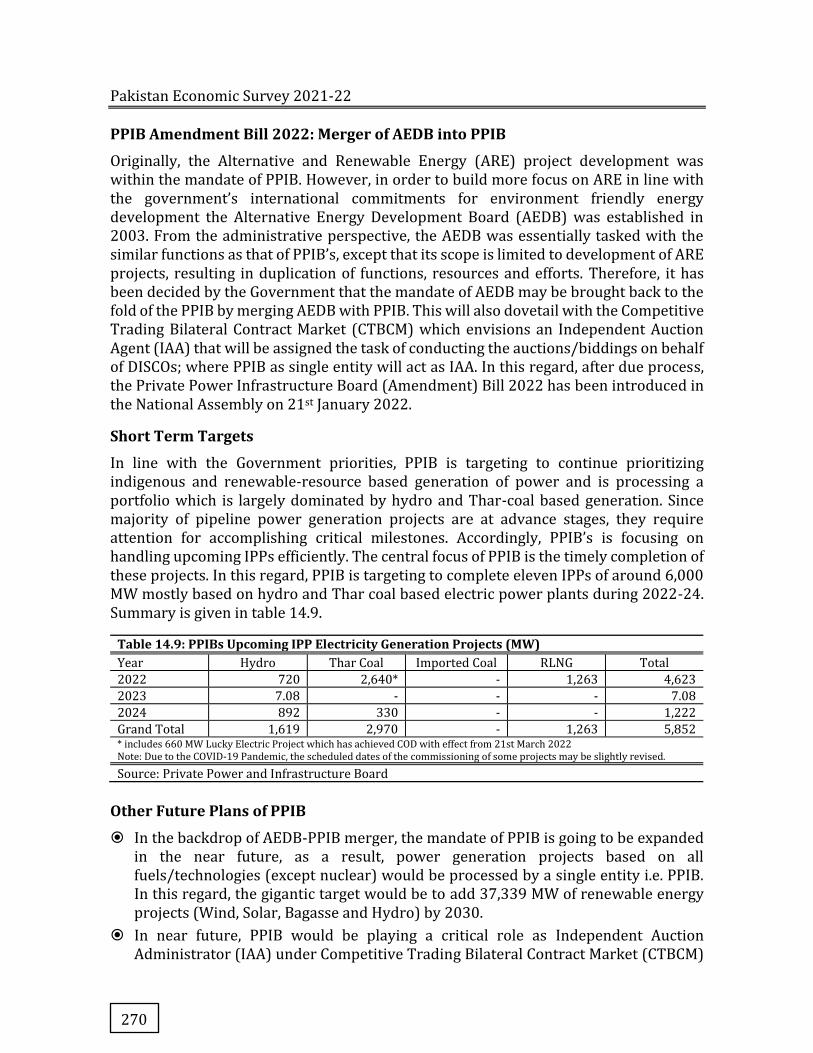
Pakistan Economic Survey 2021-22
270
PPIB Amendment Bill 2022: Merger of AEDB into PPIB
Originally, the Alternative and Renewable Energy (ARE) project development was within the mandate of PPIB. However, in order to build more focus on ARE in line with the government’s international commitments for environment friendly energy development the Alternative Energy Development Board (AEDB) was established in 2003. From the administrative perspective, the AEDB was essentially tasked with the similar functions as that of PPIB’s, except that its scope is limited to development of ARE projects, resulting in duplication of functions, resources and efforts. Therefore, it has been decided by the Government that the mandate of AEDB may be brought back to the fold of the PPIB by merging AEDB with PPIB. This will also dovetail with the Competitive Trading Bilateral Contract Market (CTBCM) which envisions an Independent Auction Agent (IAA) that will be assigned the task of conducting the auctions/biddings on behalf of DISCOs; where PPIB as single entity will act as IAA. In this regard, after due process, the Private Power Infrastructure Board (Amendment) Bill 2022 has been introduced in the National Assembly on 21st January 2022.
Short Term Targets
In line with the Government priorities, PPIB is targeting to continue prioritizing indigenous and renewable-resource based generation of power and is processing a portfolio which is largely dominated by hydro and Thar-coal based generation. Since majority of pipeline power generation projects are at advance stages, they require attention for accomplishing critical milestones. Accordingly, PPIB’s is focusing on handling upcoming IPPs efficiently. The central focus of PPIB is the timely completion of these projects. In this regard, PPIB is targeting to complete eleven IPPs of around 6,000 MW mostly based on hydro and Thar coal based electric power plants during 2022-24. Summary is given in table 14.9.
Table 14.9: PPIBs Upcoming IPP Electricity Generation Projects (MW)
Year Hydro Thar Coal Imported Coal RLNG Total
2022 720 2,640* - 1,263 4,623
2023 7.08 - - - 7.08
2024 892 330 - - 1,222
Grand Total 1,619 2,970 - 1,263 5,852 * includes 660 MW Lucky Electric Project which has achieved COD with effect from 21st March 2022 Note: Due to the COVID-19 Pandemic, the scheduled dates of the commissioning of some projects may be slightly revised.
Source: Private Power and Infrastructure Board
Other Future Plans of PPIB
� In the backdrop of AEDB-PPIB merger, the mandate of PPIB is going to be expanded in the near future, as a result, power generation projects based on all fuels/technologies (except nuclear) would be processed by a single entity i.e. PPIB. In this regard, the gigantic target would be to add 37,339 MW of renewable energy projects (Wind, Solar, Bagasse and Hydro) by 2030.
� In near future, PPIB would be playing a critical role as Independent Auction Administrator (IAA) under Competitive Trading Bilateral Contract Market (CTBCM)
Energy
271
of the Government for turning the existing market from single buyer model to a Competitive Wholesale Power Market.
� PPIB is aiming to undertake small hydropower projects under Tripartite Letter of Support (TLOS) regime so that share of clean and green electricity is increased in the overall energy-mix of country.
� For overcoming transmission constraints, PPIB is planning to undertake additional transmission line projects in the private sector to make this segment reliable and efficient.
For the first time, comprehensive planning has been carried out in Pakistan in the form of the Indicative Generation Capacity Expansion Plan (IGCEP), which includes expansion planning studies which is updated annually in order to retain accuracy in the wake of changing dynamics. PPIB is planning to process new hydro-based IPPs under International Competitive Bidding (ICB) mode in accordance with the findings of IGCEP study so that there is no situation of deficit or excess generation in the country.
Renewable Sector
The GoP is striving hard to embrace the transformational changes in power system. AEDB is taking steps to ensure affordability, sustainability, energy security and energy access for all. Government is taking initiatives for the promotion of alternative and renewable technologies and emphasizing on utilization of indigenous and environmentally clean energy generation resources.
Development of IPP Based Projects
In compliance of the Cabinet Committee on Energy (CCoE), decision, Alternative Energy Development Board has actively been facilitating different projects. The development of large scale grid connected ARE based power generation project is being pursued through private investors. The objective of projects under the umbrella of ARE is to exploit clean energy resources and increase the share of ARE in the energy mix. In compliance of the CCoE’s decisions, AEDB has actively been facilitating these projects. These projects are placed under different categories.
Category- I: Projects under this category are in the pipeline and significant work has been done on these projects. 19 projects of 531 MW that have already been issued LOS subject to revision of tariff in case tariff determination has been done since more than one year or if the tariff validity period has lapsed
Category- II: Four solar PV projects of 250 MW capacities, listed under Category-II of the CCoE decisions, achieved Financial Closing in 2021 and were facilitated to carry out the construction of the projects. Six wind power projects of 300 MW capacity achieved Commercial Operation Date and started supplying electricity to the national grid. Another six wind power projects of 310 MW capacity were under construction and expected to achieve COD by April, 2022.
Category- III: AEDB prepared the Request For Proposal (RFP) package for carrying out competitive bidding for wind and solar projects falling under category-III and carried

Pakistan Economic Survey 2021-22
272
out the revisions in the RFP documents as per the determination of NEPRA. RFP Packages are ready to be floated upon receipt of information pertaining to Interconnection Ready Zones (IRZs) by NTDC/DISCOs. The competitive bidding is planned to be initiated by June/July 2022.
Distributed Generation (Net Metering)
Apart from large scale renewable projects, Government is also encouraging utilization of renewable energy technology at consumer ends across domestic, commercial, industrial sectors. AEDB has been promoting the renewable energy based net-metering deployments under the NEPRA (Alternative & Renewable Energy) Distributed Generation and Net Metering Regulations, 2015.
AEDB has also been carrying certification of service providers, vendors and installers of solar systems under AEDB (Certification) Regulations, 2018 in order to facilitate the consumers and DISCOs. The regulations were revised in August, 2021 with the aim of simplification under Government’s vision of ‘Ease of Doing Business’. AEDB issued certificates to one hundred one installers during July-Mar FY2022. As of March, 2022, the total number of active AEDB certified installers reached up to one hundred sixty two compare to 104 last year which shows an increase of 55 percent.
During July-Mar FY2022, a total of 10,783 net metering based systems of 196.77 MW capacity were installed by different segments of consumers. As of 31st December, 2021, the number of net-metering based solar installations had reached up to 17,950 with a cumulative capacity of 305.79 MW.
Major Activities to be Undertaken in Short-term
i. Facilitating remaining projects under Cat-I and Cat-II of the CCoE’s decision in achievement of their Financial Closing.
ii. Carry out competitive bidding for wind and solar power projects falling under Category-III of the CCoE decision, planned to be initiated by June/July 2022.
iii. Preparation of Annual ARE Procurement Plan by the AEDB Board’s Steering Committee on the basis of approved IGCEP.
iv. Development of RFP package for carrying out competitive bidding in accordance with the approved Annual ARE Procurement Plan.
v. Initiation of competitive bidding process for procurement of new ARE capacity under the ARE Policy 2019 by end of 2022.
Other Initiatives in FY2022
Additional measures to promote ARE technologies and to attract private sector investments are taken. The supportive measures taken by AEDB are as follows:
i. AEDB proactively engaged with WB for carrying out the Pakistan Renewable Energy Competitive Bidding Study that will provide strategic analysis and advice to the AEDB and other relevant sector agencies on the implementation of competitive
Energy
273
bidding for the contracting of renewable energy capacity to achieve the 2025 and 2030 targets in line with the ARE Policy 2019.
ii. Carried out revision of AEDB (Certification) Regulations aimed to simplify the procedures laid therein in order to ensure the implement the present Government’s policy of Ease of Doing Business.
iii. AEDB promoted the net metering concept and facilitated the concerned stakeholders in implementation Net Metering systems under NEPRA’s regulations. For mass deployment of net metering-based systems, several supportive steps have been taken including simplifying the process of acquiring generation license and other approvals/ permissions and shortening the time period required for the same.
iv. Developed the Request for Proposal (RFP) package after stakeholder consultation for carrying out competitive bidding amongst pipeline wind and solar projects are per the decisions of the CCoE.
v. AEDB assisted State Bank of Pakistan in revision of SBP’s Financing Scheme for Renewable Energy in order to make financing available for broader consumer categories and swift implementation.
vi. Assisted NTDC in carrying out the feasibility study of solar water pumping in Balochistan.
vii. Supported Government of Balochistan in preparation of PC-IIs for renewable energy based off-grid electrification projects in districts of southern Balochistan.
Concluding Remarks
Historically, Pakistan’s economic growth is constrained by bottlenecks in the energy sector. Pakistan’s energy requirements are increasing and demand for energy in the coming decades will rise substantially. Energy demand on this scale will put increasing pressure on energy resources and distribution networks. This is unsustainable without a fundamental transformation of the energy system. Dependency on the dominant fossil energy resources, especially oil is risky. Energy security is essential because the kind of disruption we have seen is a potential threat to our economic well-being. Exploration of the more indigenous and renewable resources is key to have energy security.
The Government has been endeavoring to bring in transformational changes in power system by exploring alternate sources of energy in the country. Government is also focusing on the renewable sources of energy to make access to energy affordable. The exploration of alternate and renewable sources of energy will also help to ensure energy security and sustainability. In this connection, Pakistan is actively following the policy of a shift from conventional sources of energy to the utilization of indigenous renewable and environment friendly clean energy generation resources. There is a significant transformation and the contribution of alternate and renewable sources of energy is increasing.

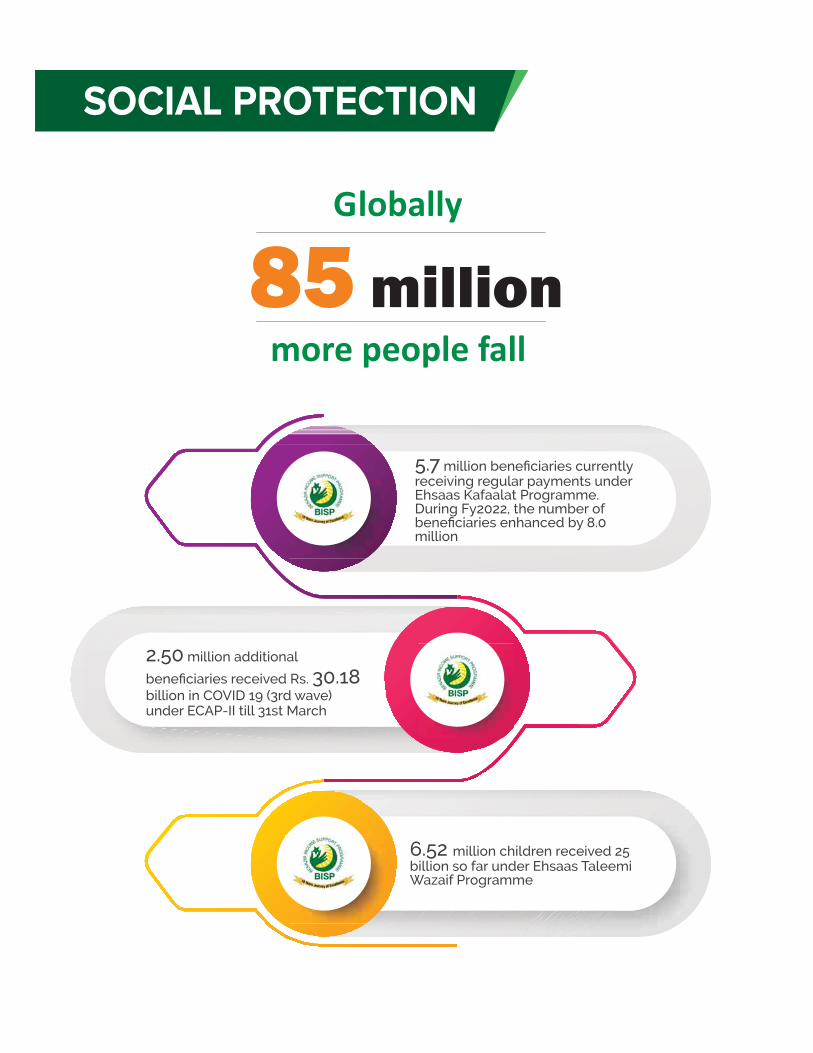

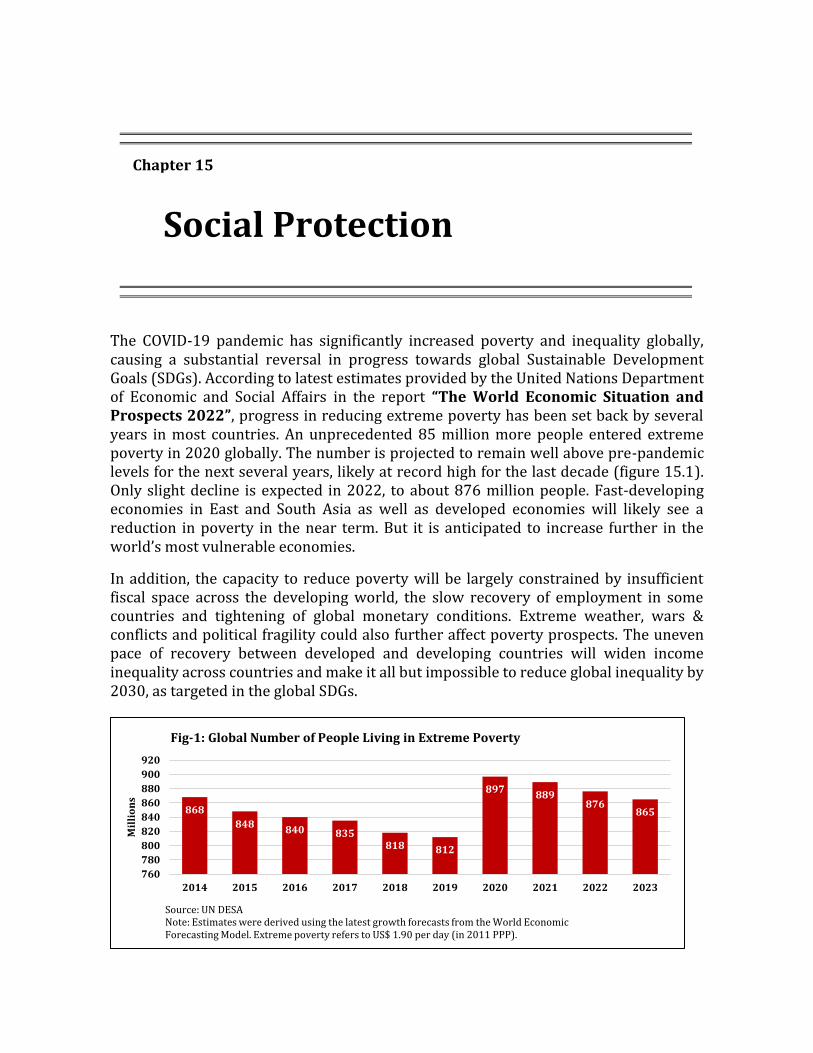
The COVID-19 pandemic has significantly increased poverty and inequality globally, causing a substantial reversal in progress towards global Sustainable Development Goals (SDGs). According to latest estimates provided by the United Nations Department of Economic and Social Affairs in the report “The World Economic Situation and Prospects 2022”, progress in reducing extreme poverty has been set back by several years in most countries. An unprecedented 85 million more people entered extreme poverty in 2020 globally. The number is projected to remain well above pre-pandemic levels for the next several years, likely at record high for the last decade (figure 15.1). Only slight decline is expected in 2022, to about 876 million people. Fast-developing economies in East and South Asia as well as developed economies will likely see a reduction in poverty in the near term. But it is anticipated to increase further in the world’s most vulnerable economies.
In addition, the capacity to reduce poverty will be largely constrained by insufficient fiscal space across the developing world, the slow recovery of employment in some countries and tightening of global monetary conditions. Extreme weather, wars & conflicts and political fragility could also further affect poverty prospects. The uneven pace of recovery between developed and developing countries will widen income inequality across countries and make it all but impossible to reduce global inequality by 2030, as targeted in the global SDGs.
868848 840 835
818 812
897 889876
865
760780800820840860880900920
2014 2015 2016 2017 2018 2019 2020 2021 2022 2023
Mill
ions
Source: UN DESANote: Estimates were derived using the latest growth forecasts from the World Economic Forecasting Model. Extreme poverty refers to US$ 1.90 per day (in 2011 PPP).
Fig-1: Global Number of People Living in Extreme Poverty
Chapter 15
Social Protection
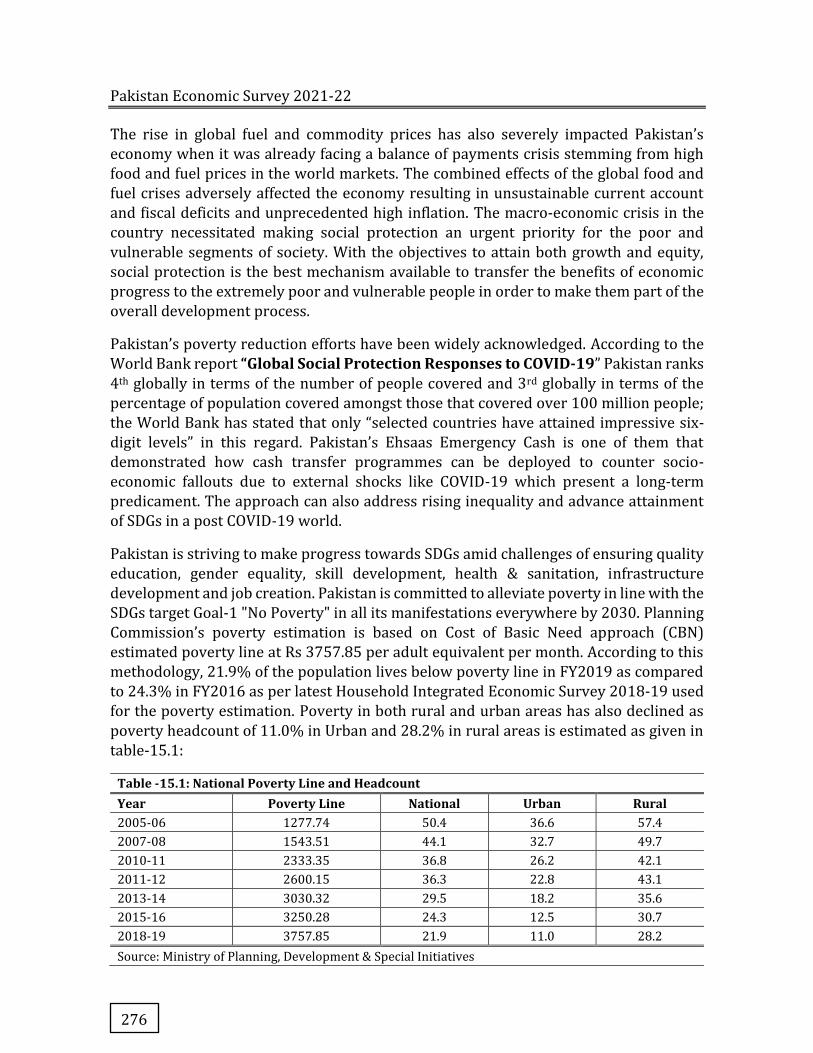
Pakistan Economic Survey 2021-22
276
The rise in global fuel and commodity prices has also severely impacted Pakistan’s
economy when it was already facing a balance of payments crisis stemming from high
food and fuel prices in the world markets. The combined effects of the global food and
fuel crises adversely affected the economy resulting in unsustainable current account
and fiscal deficits and unprecedented high inflation. The macro-economic crisis in the
country necessitated making social protection an urgent priority for the poor and
vulnerable segments of society. With the objectives to attain both growth and equity,
social protection is the best mechanism available to transfer the benefits of economic
progress to the extremely poor and vulnerable people in order to make them part of the
overall development process.
Pakistan’s poverty reduction efforts have been widely acknowledged. According to the
World Bank report “Global Social Protection Responses to COVID-19” Pakistan ranks
4th globally in terms of the number of people covered and 3rd globally in terms of the
percentage of population covered amongst those that covered over 100 million people;
the World Bank has stated that only “selected countries have attained impressive six-
digit levels” in this regard. Pakistan’s Ehsaas Emergency Cash is one of them that
demonstrated how cash transfer programmes can be deployed to counter socio-
economic fallouts due to external shocks like COVID-19 which present a long-term
predicament. The approach can also address rising inequality and advance attainment
of SDGs in a post COVID-19 world.
Pakistan is striving to make progress towards SDGs amid challenges of ensuring quality
education, gender equality, skill development, health & sanitation, infrastructure
development and job creation. Pakistan is committed to alleviate poverty in line with the
SDGs target Goal-1 "No Poverty" in all its manifestations everywhere by 2030. Planning
Commission’s poverty estimation is based on Cost of Basic Need approach (CBN)
estimated poverty line at Rs 3757.85 per adult equivalent per month. According to this
methodology, 21.9% of the population lives below poverty line in FY2019 as compared
to 24.3% in FY2016 as per latest Household Integrated Economic Survey 2018-19 used
for the poverty estimation. Poverty in both rural and urban areas has also declined as
poverty headcount of 11.0% in Urban and 28.2% in rural areas is estimated as given in
table-15.1:
Table -15.1: National Poverty Line and Headcount Year Poverty Line National Urban Rural 2005-06 1277.74 50.4 36.6 57.4
2007-08 1543.51 44.1 32.7 49.7
2010-11 2333.35 36.8 26.2 42.1
2011-12 2600.15 36.3 22.8 43.1
2013-14 3030.32 29.5 18.2 35.6
2015-16 3250.28 24.3 12.5 30.7
2018-19 3757.85 21.9 11.0 28.2
Source: Ministry of Planning, Development & Special Initiatives
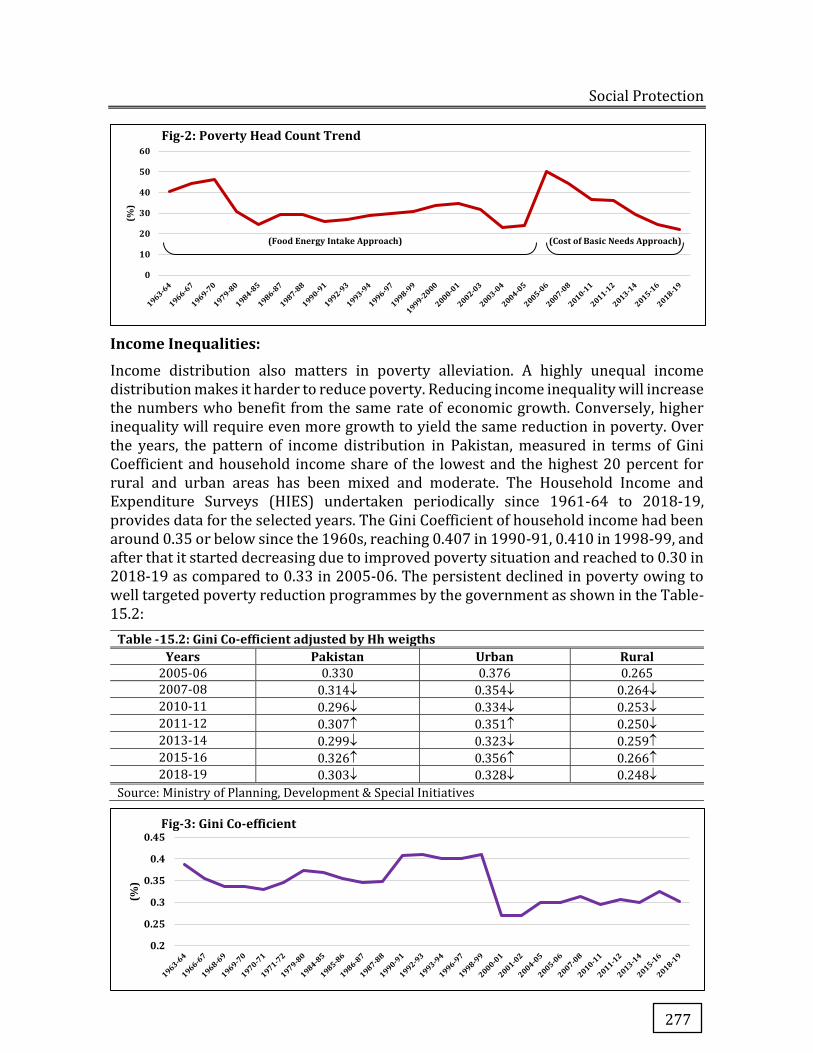
Social Protection
277
Income Inequalities:
Income distribution also matters in poverty alleviation. A highly unequal income distribution makes it harder to reduce poverty. Reducing income inequality will increase the numbers who benefit from the same rate of economic growth. Conversely, higher inequality will require even more growth to yield the same reduction in poverty. Over the years, the pattern of income distribution in Pakistan, measured in terms of Gini Coefficient and household income share of the lowest and the highest 20 percent for rural and urban areas has been mixed and moderate. The Household Income and Expenditure Surveys (HIES) undertaken periodically since 1961-64 to 2018-19, provides data for the selected years. The Gini Coefficient of household income had been around 0.35 or below since the 1960s, reaching 0.407 in 1990-91, 0.410 in 1998-99, and after that it started decreasing due to improved poverty situation and reached to 0.30 in 2018-19 as compared to 0.33 in 2005-06. The persistent declined in poverty owing to well targeted poverty reduction programmes by the government as shown in the Table-15.2:
Table -15.2: Gini Co-efficient adjusted by Hh weigths Years Pakistan Urban Rural
2005-06 0.330 0.376 0.265
2007-08 0.314� 0.354� 0.264�
2010-11 0.296� 0.334� 0.253�
2011-12 0.307� 0.351� 0.250�
2013-14 0.299� 0.323� 0.259�
2015-16 0.326� 0.356� 0.266�
2018-19 0.303� 0.328� 0.248�
Source: Ministry of Planning, Development & Special Initiatives
0
10
20
30
40
50
60
(%)
Fig-2: Poverty Head Count Trend
0.2
0.25
0.3
0.35
0.4
0.45
(%)
Fig-3: Gini Co-efficient
(Cost of Basic Needs Approach) (Food Energy Intake Approach)
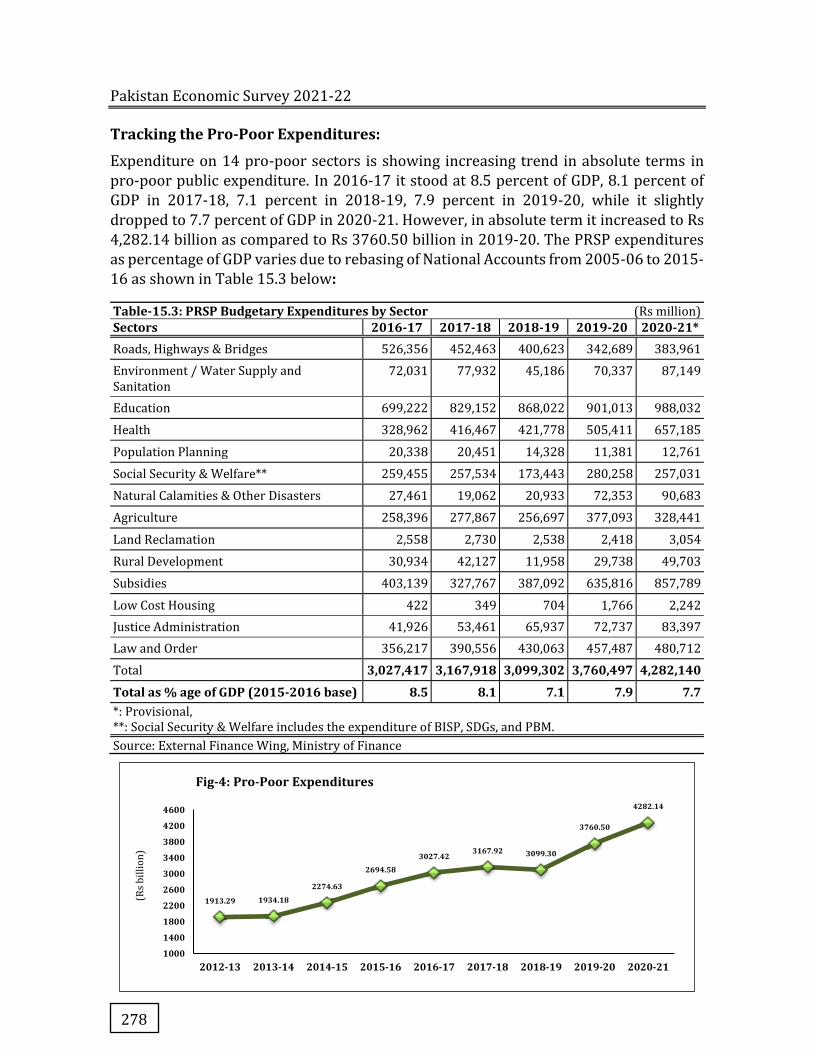
Pakistan Economic Survey 2021-22
278
Tracking the Pro-Poor Expenditures:
Expenditure on 14 pro-poor sectors is showing increasing trend in absolute terms in
pro-poor public expenditure. In 2016-17 it stood at 8.5 percent of GDP, 8.1 percent of
GDP in 2017-18, 7.1 percent in 2018-19, 7.9 percent in 2019-20, while it slightly
dropped to 7.7 percent of GDP in 2020-21. However, in absolute term it increased to Rs
4,282.14 billion as compared to Rs 3760.50 billion in 2019-20. The PRSP expenditures
as percentage of GDP varies due to rebasing of National Accounts from 2005-06 to 2015-
16 as shown in Table 15.3 below:
Table-15.3: PRSP Budgetary Expenditures by Sector (Rs million) Sectors 2016-17 2017-18 2018-19 2019-20 2020-21* Roads, Highways & Bridges 526,356 452,463 400,623 342,689 383,961
Environment / Water Supply and Sanitation
72,031 77,932 45,186 70,337 87,149
Education 699,222 829,152 868,022 901,013 988,032
Health 328,962 416,467 421,778 505,411 657,185
Population Planning 20,338 20,451 14,328 11,381 12,761
Social Security & Welfare** 259,455 257,534 173,443 280,258 257,031
Natural Calamities & Other Disasters 27,461 19,062 20,933 72,353 90,683
Agriculture 258,396 277,867 256,697 377,093 328,441
Land Reclamation 2,558 2,730 2,538 2,418 3,054
Rural Development 30,934 42,127 11,958 29,738 49,703
Subsidies 403,139 327,767 387,092 635,816 857,789
Low Cost Housing 422 349 704 1,766 2,242
Justice Administration 41,926 53,461 65,937 72,737 83,397
Law and Order 356,217 390,556 430,063 457,487 480,712
Total 3,027,417 3,167,918 3,099,302 3,760,497 4,282,140 Total as % age of GDP (2015-2016 base) 8.5 8.1 7.1 7.9 7.7 *: Provisional, **: Social Security & Welfare includes the expenditure of BISP, SDGs, and PBM. Source: External Finance Wing, Ministry of Finance
1913.29 1934.18
2274.63
2694.583027.42
3167.92 3099.30
3760.50
4282.14
1000
1400
1800
2200
2600
3000
3400
3800
4200
4600
2012-13 2013-14 2014-15 2015-16 2016-17 2017-18 2018-19 2019-20 2020-21
(Rs
bil
lio
n)
Fig-4: Pro-Poor Expenditures
Social Protection
279
Social Safety Programmes Social safety net Programmes provide minimal safeguard to the poor and vulnerable which form an essential element of our poverty reduction strategy. These programmes are in the form of direct cash transfers and other services which include both budgetary and non- budgetary programmes. Budgeted social safety net programmes include Benazir Income Support programme (BISP), Pakistan Bait-ul-Mal (PBM) while Zakat, Employees Old-age Benefit Institution (EOBI), Workers Welfare Fund (WWF) and Pakistan Poverty Alleviation Fund (PPAF) is the non-budgetary part of the programme. Microfinance through specialized financial institutions also provides micro finance services to the needy poor.
I. Benazir Income Support Programme (BISP): BISP, a targeted unconditional cash transfer programme, was implemented by focusing on poor women with an immediate objective of consumption smoothing and meeting the targets of SDGs to eradicate extreme & chronic poverty and empowerment of women. BISP provides an extremely important social safety to the poorest segments of the society and its carefully designed schemes add value to the overall mission of empowering women.
Key Policy Measures/Steps Taken: A. Un-Conditional Cash Transfer (UCT) Programme: i) Expansion of Ehsaas Kafaalat Programme: BISP is currently disbursing payments
to around 5.7 million regular beneficiaries under its Ehsaas Kafaalat Programme. During FY2022, the number of regular beneficiaries has been enhanced to 8.0 million.
ii) Ehsaas Cash Assistance Programme Phase-II: Keeping in view the increase in economic hardships due to the 3rd wave of COVID-19, second phase of Ehsaas Emergency Cash Programme (ECAP-II) has been launched in June, 2021. As of 30-03-2022, an amount of Rs 30.18 billion has been disbursed to 2.50 million additional beneficiaries (other than UCT beneficiaries) @ Rs 12,000/- per beneficiaries to ever-married women of the eligible families having valid CNIC.
iii) Emergency Relief Assistance to AJ&K Line of Control (LOC) Affectees: Families living along the LOC are being provided cash assistance by BISP. Under this programme, additional beneficiaries (other than UCT beneficiaries) are being provided emergency cash assistance @ Rs 24,000/- in two installments of Rs 12,000/- each. As on 31-03-2022, an amount of Rs 251.26 million has been disbursed as 1st installment of Rs 12,000/- each to 20,938 beneficiary families.
iv) Harnai Earthquake Relief Programme: In order to mitigate the effects of recent earthquake, BISP provided one-time cash assistance of Rs 12,000/- each, to families belonging to District Harnai appearing in the new database of NSER Survey. Rs 151.88 million was provided to 12,657 beneficiary families @ Rs 12,000/- per beneficiary.
v) Emergency Relief Package for Tirah Valley, Khyber District, KPK: BISP has provided one-time cash assistance of Rs 20,000/- per family to temporary displaced families of Tirah Valley, Khyber District, KPK due to increased militancy/unrest and subsequent operations by Pakistan Army against the terrorists. Under this relief package, Rs 86.86 million was distributed to around 4,343 beneficiary families of
Pakistan Economic Survey 2021-22
280
Tirah Valley.
vi) Payments Related Grievance Redressal System: BISP has developed an automated Payment Complaint Management System (PCMS) through which payments related complaints can be launched and resolved in an automated manner. It is used by the BISP’s Tehsil offices to register and resolve complaints of the beneficiaries. PCMS has been refined to process all types of complaints reported during field activities. Moreover, the PCMS has also been integrated with Complaint Resolution Mechanisms (CRMs) of BISP partner banks to further enhance the efficiency of complaints resolution mechanism.
vii) Financial Inclusion and Financial Literacy Programmes: In pursuance of Ehsaas Financial Inclusion Strategy, BISP has designed and launched a pilot project for opening of Savings Accounts (Mobile Wallets) and provision of Financial Literacy to Ehsaas Kafaalat beneficiaries. After evaluating the pilot, a detailed road map and action plan will be prepared and Mobile Wallet and Financial Literacy programmes will be launched across the country which will pave the way for formal interaction of Kafaalat beneficiaries with the economy.
viii) Hybrid Social Protection Programme (HSP): BISP is also working on HSP Programme which will blend social assistance with social risk mitigation elements to promote savings that informal sector workers can fall back on in case of shocks, while also providing a platform through which the government can more rapidly deploy additional support during a crisis. The basic model, drawn from global experiences, will be a contributory savings scheme with matching incentives, with a short-to-medium term horizon for withdrawals. The HSP scheme will allow exiting BISP beneficiaries to receive support by way of fiscal incentives to save in a platform created to meet their needs. The scheme will rely on existing institutional capacity and digital for efficient delivery and promoting behavioral change. The programme is currently in design phase with the technical assistance of World Bank, Asian Development Bank and other stakeholders.
ix) Indexation of Cash Transfer: In pursuance to fulfill the requirement under IMF’s Extended Fund Facility Program, 2019-20 as well as World Bank’s Second Securing Human Investments to Foster Transformation (SHIFT-II) Policy Reform Framework, BISP in coordination with Finance Division and World Bank has developed an institutional mechanism as well as proposal to increase the cash assistance under Kafaalat @ Rs 166.33/- per month or Rs 500/- per quarter w.e.f 1st
January, 2022 has been approved by the Federal Cabinet.
x) Designing of a New Innovated Payment Model: BISP is striving continuously for improving its payment model and incorporating innovative solutions and new technologies to further improve the service delivery at the beneficiary level. In this regard, BISP has initiated the work for designing a new payment model in consultation with key stakeholders as well as various national and international organizations with experience in designing and executing payment systems, especially in the Social Protection Programmes with particular emphasis on G2P payments.
xi) Imported Service Delivery: BISP is providing assistance and guidance to its beneficiaries regarding all initiatives at tehsil level. BISP has a dedicated call center
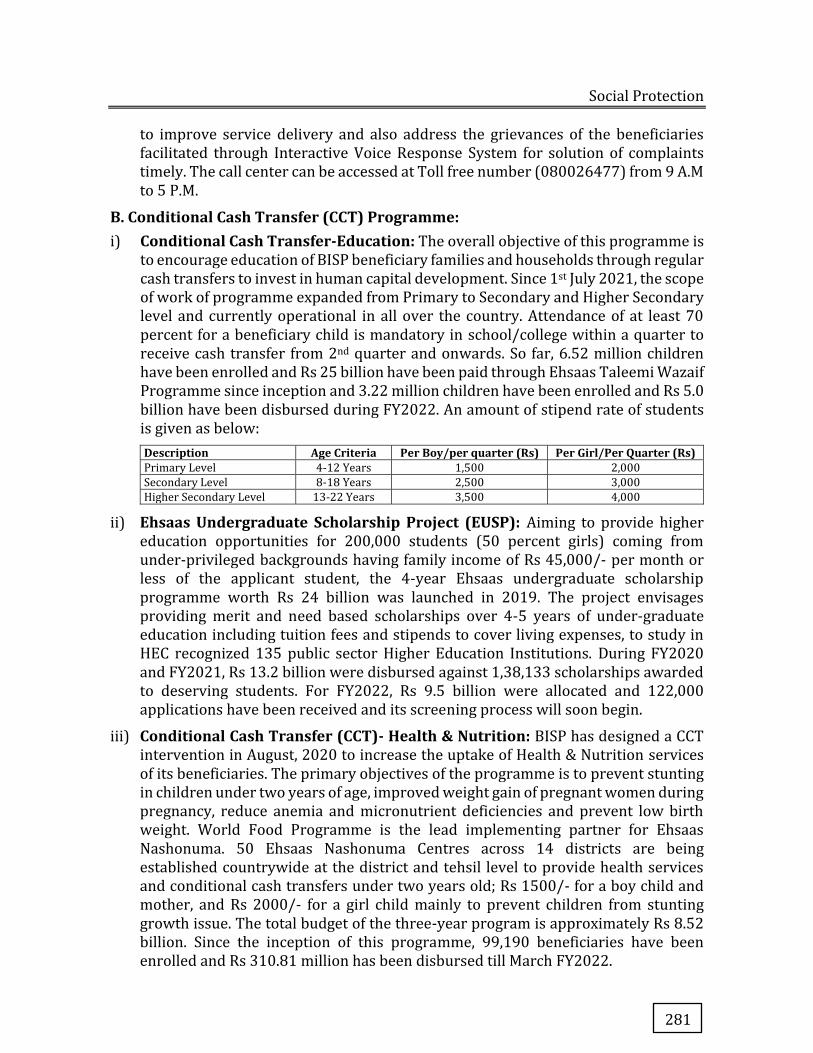
Social Protection
281
to improve service delivery and also address the grievances of the beneficiaries facilitated through Interactive Voice Response System for solution of complaints timely. The call center can be accessed at Toll free number (080026477) from 9 A.M to 5 P.M.
B. Conditional Cash Transfer (CCT) Programme: i) Conditional Cash Transfer-Education: The overall objective of this programme is
to encourage education of BISP beneficiary families and households through regular cash transfers to invest in human capital development. Since 1st July 2021, the scope of work of programme expanded from Primary to Secondary and Higher Secondary level and currently operational in all over the country. Attendance of at least 70 percent for a beneficiary child is mandatory in school/college within a quarter to receive cash transfer from 2nd quarter and onwards. So far, 6.52 million children have been enrolled and Rs 25 billion have been paid through Ehsaas Taleemi Wazaif Programme since inception and 3.22 million children have been enrolled and Rs 5.0 billion have been disbursed during FY2022. An amount of stipend rate of students is given as below:
Description Age Criteria Per Boy/per quarter (Rs) Per Girl/Per Quarter (Rs) Primary Level 4-12 Years 1,500 2,000
Secondary Level 8-18 Years 2,500 3,000
Higher Secondary Level 13-22 Years 3,500 4,000
ii) Ehsaas Undergraduate Scholarship Project (EUSP): Aiming to provide higher education opportunities for 200,000 students (50 percent girls) coming from under-privileged backgrounds having family income of Rs 45,000/- per month or less of the applicant student, the 4-year Ehsaas undergraduate scholarship programme worth Rs 24 billion was launched in 2019. The project envisages providing merit and need based scholarships over 4-5 years of under-graduate education including tuition fees and stipends to cover living expenses, to study in HEC recognized 135 public sector Higher Education Institutions. During FY2020 and FY2021, Rs 13.2 billion were disbursed against 1,38,133 scholarships awarded to deserving students. For FY2022, Rs 9.5 billion were allocated and 122,000 applications have been received and its screening process will soon begin.
iii) Conditional Cash Transfer (CCT)- Health & Nutrition: BISP has designed a CCT intervention in August, 2020 to increase the uptake of Health & Nutrition services of its beneficiaries. The primary objectives of the programme is to prevent stunting in children under two years of age, improved weight gain of pregnant women during pregnancy, reduce anemia and micronutrient deficiencies and prevent low birth weight. World Food Programme is the lead implementing partner for Ehsaas Nashonuma. 50 Ehsaas Nashonuma Centres across 14 districts are being established countrywide at the district and tehsil level to provide health services and conditional cash transfers under two years old; Rs 1500/- for a boy child and mother, and Rs 2000/- for a girl child mainly to prevent children from stunting growth issue. The total budget of the three-year program is approximately Rs 8.52 billion. Since the inception of this programme, 99,190 beneficiaries have been enrolled and Rs 310.81 million has been disbursed till March FY2022.
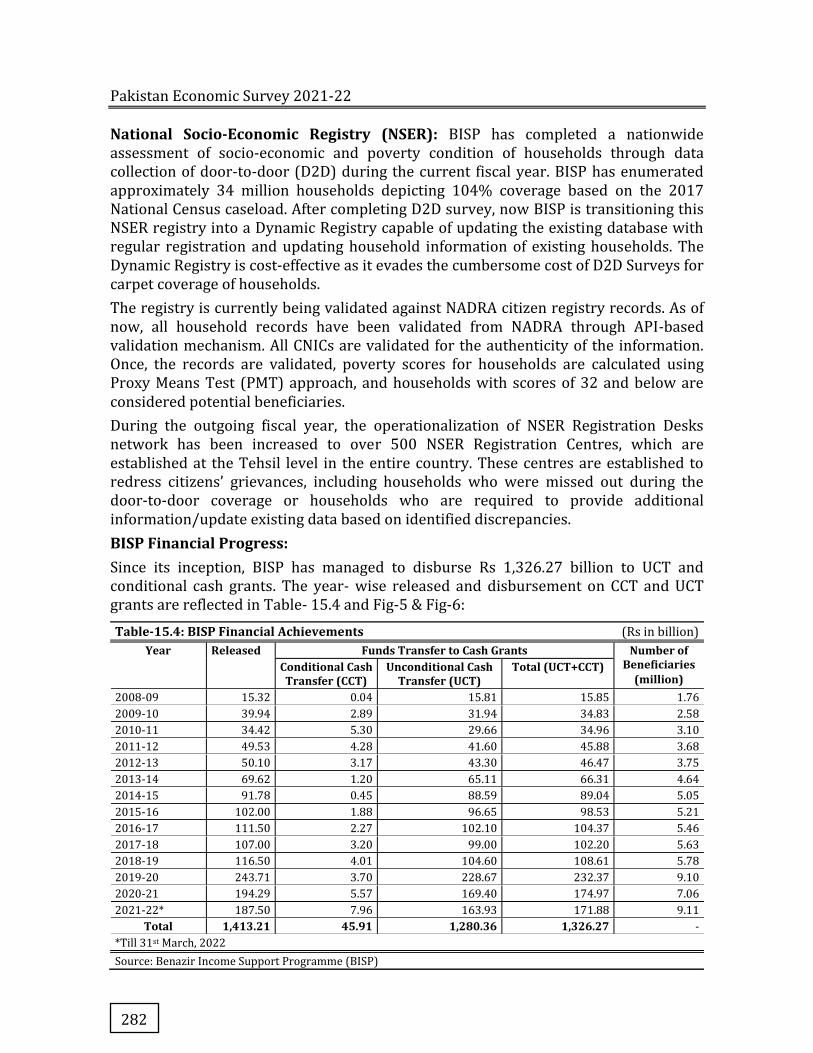
Pakistan Economic Survey 2021-22
282
National Socio-Economic Registry (NSER): BISP has completed a nationwide assessment of socio-economic and poverty condition of households through data collection of door-to-door (D2D) during the current fiscal year. BISP has enumerated approximately 34 million households depicting 104% coverage based on the 2017 National Census caseload. After completing D2D survey, now BISP is transitioning this NSER registry into a Dynamic Registry capable of updating the existing database with regular registration and updating household information of existing households. The Dynamic Registry is cost-effective as it evades the cumbersome cost of D2D Surveys for carpet coverage of households.
The registry is currently being validated against NADRA citizen registry records. As of now, all household records have been validated from NADRA through API-based validation mechanism. All CNICs are validated for the authenticity of the information. Once, the records are validated, poverty scores for households are calculated using Proxy Means Test (PMT) approach, and households with scores of 32 and below are considered potential beneficiaries.
During the outgoing fiscal year, the operationalization of NSER Registration Desks network has been increased to over 500 NSER Registration Centres, which are established at the Tehsil level in the entire country. These centres are established to redress citizens’ grievances, including households who were missed out during the door-to-door coverage or households who are required to provide additional information/update existing data based on identified discrepancies.
BISP Financial Progress: Since its inception, BISP has managed to disburse Rs 1,326.27 billion to UCT and conditional cash grants. The year- wise released and disbursement on CCT and UCT grants are reflected in Table- 15.4 and Fig-5 & Fig-6:
Table-15.4: BISP Financial Achievements (Rs in billion) Year Released Funds Transfer to Cash Grants Number of
Beneficiaries (million)
Conditional Cash Transfer (CCT)
Unconditional Cash Transfer (UCT)
Total (UCT+CCT)
2008-09 15.32 0.04 15.81 15.85 1.76
2009-10 39.94 2.89 31.94 34.83 2.58
2010-11 34.42 5.30 29.66 34.96 3.10
2011-12 49.53 4.28 41.60 45.88 3.68
2012-13 50.10 3.17 43.30 46.47 3.75
2013-14 69.62 1.20 65.11 66.31 4.64
2014-15 91.78 0.45 88.59 89.04 5.05
2015-16 102.00 1.88 96.65 98.53 5.21
2016-17 111.50 2.27 102.10 104.37 5.46
2017-18 107.00 3.20 99.00 102.20 5.63
2018-19 116.50 4.01 104.60 108.61 5.78
2019-20 243.71 3.70 228.67 232.37 9.10
2020-21 194.29 5.57 169.40 174.97 7.06
2021-22* 187.50 7.96 163.93 171.88 9.11
Total 1,413.21 45.91 1,280.36 1,326.27 -
*Till 31st March, 2022
Source: Benazir Income Support Programme (BISP)
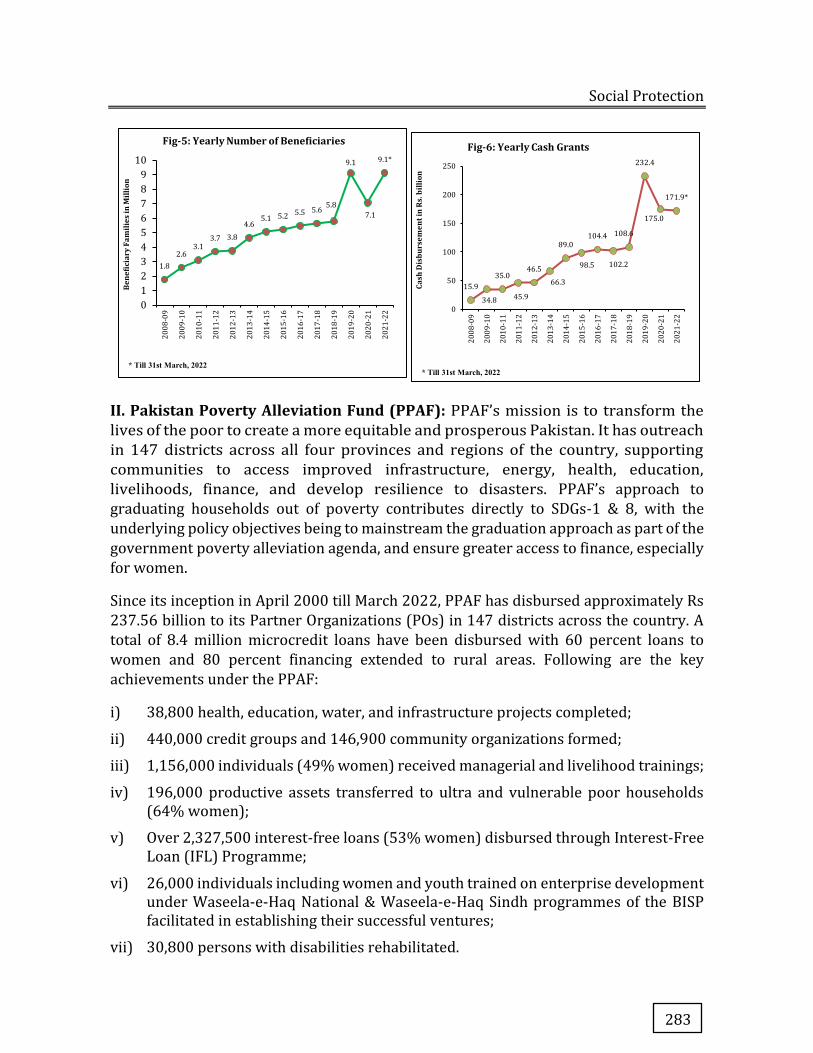
Social Protection
283
II. Pakistan Poverty Alleviation Fund (PPAF): PPAF’s mission is to transform the
lives of the poor to create a more equitable and prosperous Pakistan. It has outreach
in 147 districts across all four provinces and regions of the country, supporting
communities to access improved infrastructure, energy, health, education,
livelihoods, finance, and develop resilience to disasters. PPAF’s approach to
graduating households out of poverty contributes directly to SDGs-1 & 8, with the
underlying policy objectives being to mainstream the graduation approach as part of the
government poverty alleviation agenda, and ensure greater access to finance, especially
for women.
Since its inception in April 2000 till March 2022, PPAF has disbursed approximately Rs
237.56 billion to its Partner Organizations (POs) in 147 districts across the country. A
total of 8.4 million microcredit loans have been disbursed with 60 percent loans to
women and 80 percent financing extended to rural areas. Following are the key
achievements under the PPAF:
i) 38,800 health, education, water, and infrastructure projects completed;
ii) 440,000 credit groups and 146,900 community organizations formed;
iii) 1,156,000 individuals (49% women) received managerial and livelihood trainings;
iv) 196,000 productive assets transferred to ultra and vulnerable poor households (64% women);
v) Over 2,327,500 interest-free loans (53% women) disbursed through Interest-Free Loan (IFL) Programme;
vi) 26,000 individuals including women and youth trained on enterprise development under Waseela-e-Haq National & Waseela-e-Haq Sindh programmes of the BISP facilitated in establishing their successful ventures;
vii) 30,800 persons with disabilities rehabilitated.
1.8
2.63.1
3.7 3.8
4.65.1 5.2 5.5 5.6
5.8
9.1
7.1
9.1*
0
1
2
3
4
5
6
7
8
9
102
00
8-0
9
20
09
-10
20
10
-11
20
11
-12
20
12
-13
20
13
-14
20
14
-15
20
15
-16
20
16
-17
20
17
-18
20
18
-19
20
19
-20
20
20
-21
20
21
-22
Bene
ficia
ry F
amili
es in
Mill
ion
Fig-5: Yearly Number of Beneficiaries
* Till 31st March, 2022
15.9
34.8
35.0
45.9
46.5
66.3
89.0
98.5
104.4
102.2
108.6
232.4
175.0
171.9*
0
50
100
150
200
250
20
08
-09
20
09
-10
20
10
-11
20
11
-12
20
12
-13
20
13
-14
20
14
-15
20
15
-16
20
16
-17
20
17
-18
20
18
-19
20
19
-20
20
20
-21
20
21
-22
Cash
Dis
burs
emen
t in
Rs. b
illio
n
Fig-6: Yearly Cash Grants
* Till 31st March, 2022
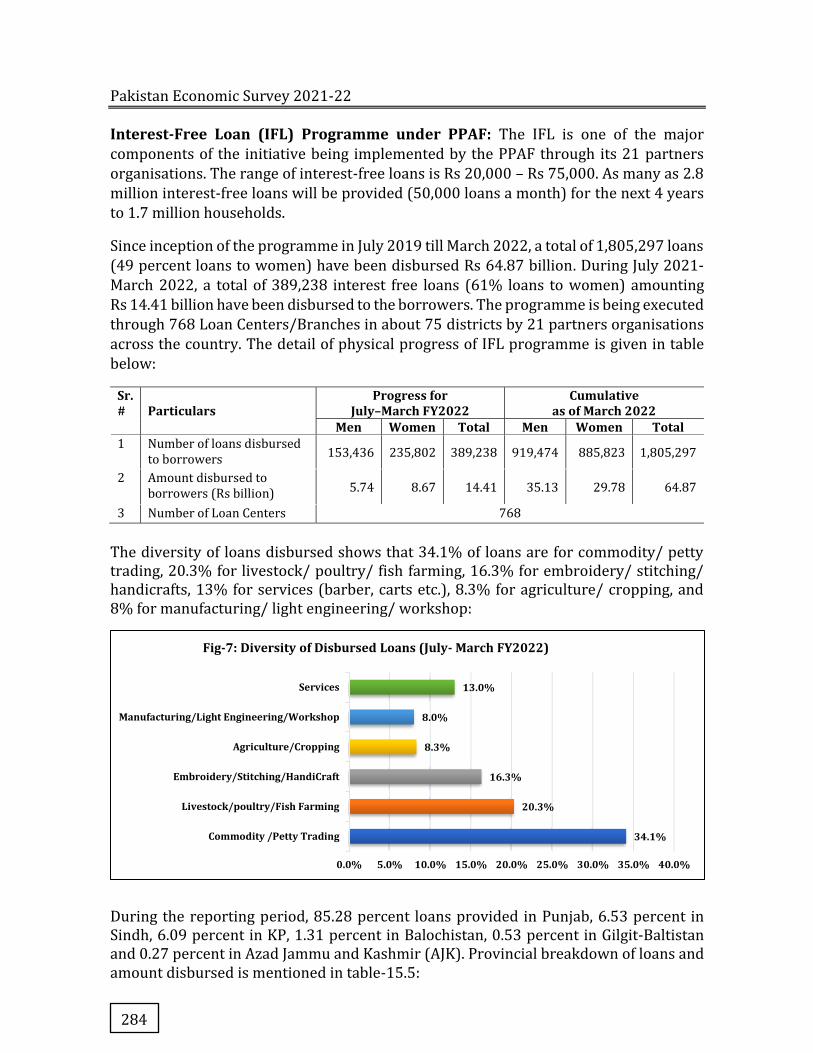
Pakistan Economic Survey 2021-22
284
Interest-Free Loan (IFL) Programme under PPAF: The IFL is one of the major
components of the initiative being implemented by the PPAF through its 21 partners
organisations. The range of interest-free loans is Rs 20,000 – Rs 75,000. As many as 2.8
million interest-free loans will be provided (50,000 loans a month) for the next 4 years
to 1.7 million households.
Since inception of the programme in July 2019 till March 2022, a total of 1,805,297 loans
(49 percent loans to women) have been disbursed Rs 64.87 billion. During July 2021-
March 2022, a total of 389,238 interest free loans (61% loans to women) amounting
Rs 14.41 billion have been disbursed to the borrowers. The programme is being executed
through 768 Loan Centers/Branches in about 75 districts by 21 partners organisations
across the country. The detail of physical progress of IFL programme is given in table
below:
Sr. #
Particulars
Progress for July–March FY2022
Cumulative as of March 2022
Men Women Total Men Women Total 1 Number of loans disbursed
to borrowers 153,436 235,802 389,238 919,474 885,823 1,805,297
2 Amount disbursed to borrowers (Rs billion) 5.74 8.67 14.41 35.13 29.78 64.87
3 Number of Loan Centers 768
The diversity of loans disbursed shows that 34.1% of loans are for commodity/ petty trading, 20.3% for livestock/ poultry/ fish farming, 16.3% for embroidery/ stitching/ handicrafts, 13% for services (barber, carts etc.), 8.3% for agriculture/ cropping, and 8% for manufacturing/ light engineering/ workshop:
During the reporting period, 85.28 percent loans provided in Punjab, 6.53 percent in Sindh, 6.09 percent in KP, 1.31 percent in Balochistan, 0.53 percent in Gilgit-Baltistan and 0.27 percent in Azad Jammu and Kashmir (AJK). Provincial breakdown of loans and amount disbursed is mentioned in table-15.5:
34.1%
20.3%
16.3%
8.3%
8.0%
13.0%
Commodity /Petty Trading
Livestock/poultry/Fish Farming
Embroidery/Stitching/HandiCraft
Agriculture/Cropping
Manufacturing/Light Engineering/Workshop
Services
0.0% 5.0% 10.0% 15.0% 20.0% 25.0% 30.0% 35.0% 40.0%
Fig-7: Diversity of Disbursed Loans (July- March FY2022)
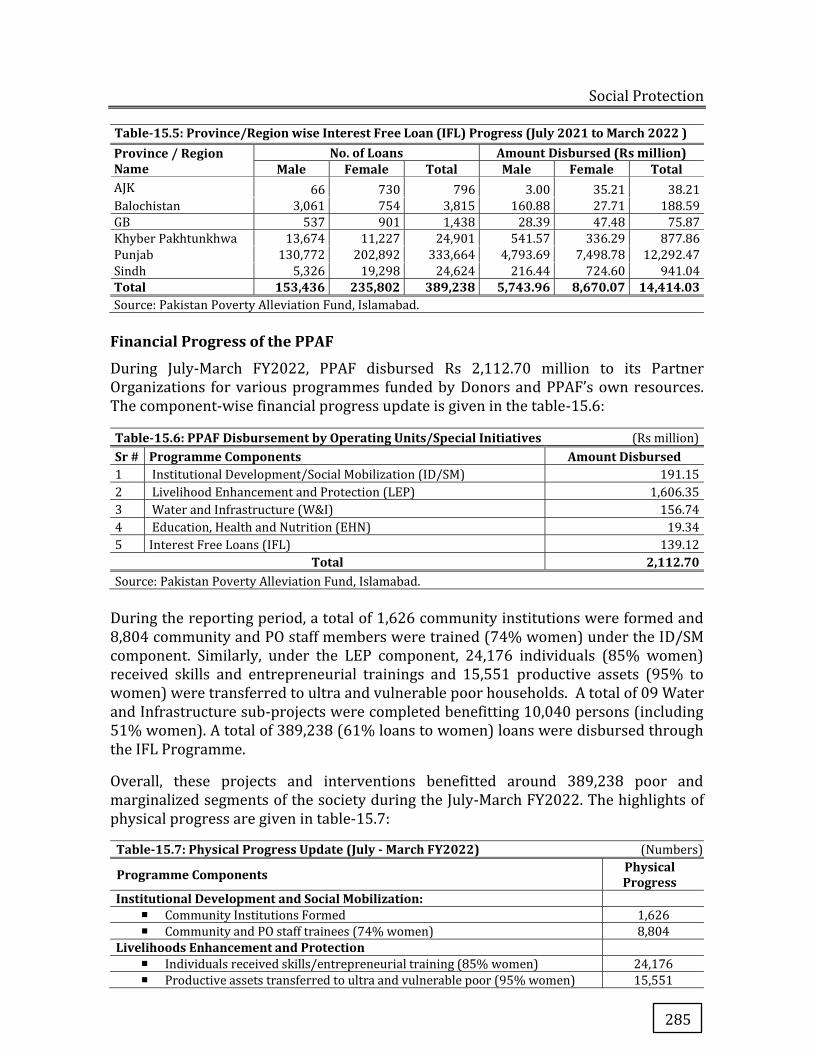
Social Protection
285
Table-15.5: Province/Region wise Interest Free Loan (IFL) Progress (July 2021 to March 2022 ) Province / Region Name
No. of Loans Amount Disbursed (Rs million) Male Female Total Male Female Total
AJK 66 730 796 3.00 35.21 38.21
Balochistan 3,061 754 3,815 160.88 27.71 188.59
GB 537 901 1,438 28.39 47.48 75.87
Khyber Pakhtunkhwa 13,674 11,227 24,901 541.57 336.29 877.86
Punjab 130,772 202,892 333,664 4,793.69 7,498.78 12,292.47
Sindh 5,326 19,298 24,624 216.44 724.60 941.04
Total 153,436 235,802 389,238 5,743.96 8,670.07 14,414.03 Source: Pakistan Poverty Alleviation Fund, Islamabad.
Financial Progress of the PPAF
During July-March FY2022, PPAF disbursed Rs 2,112.70 million to its Partner Organizations for various programmes funded by Donors and PPAF’s own resources. The component-wise financial progress update is given in the table-15.6:
Table-15.6: PPAF Disbursement by Operating Units/Special Initiatives (Rs million) Sr # Programme Components Amount Disbursed 1 Institutional Development/Social Mobilization (ID/SM) 191.15
2 Livelihood Enhancement and Protection (LEP) 1,606.35
3 Water and Infrastructure (W&I) 156.74
4 Education, Health and Nutrition (EHN) 19.34
5 Interest Free Loans (IFL) 139.12
Total 2,112.70 Source: Pakistan Poverty Alleviation Fund, Islamabad.
During the reporting period, a total of 1,626 community institutions were formed and 8,804 community and PO staff members were trained (74% women) under the ID/SM component. Similarly, under the LEP component, 24,176 individuals (85% women) received skills and entrepreneurial trainings and 15,551 productive assets (95% to women) were transferred to ultra and vulnerable poor households. A total of 09 Water and Infrastructure sub-projects were completed benefitting 10,040 persons (including 51% women). A total of 389,238 (61% loans to women) loans were disbursed through the IFL Programme.
Overall, these projects and interventions benefitted around 389,238 poor and marginalized segments of the society during the July-March FY2022. The highlights of physical progress are given in table-15.7:
Table-15.7: Physical Progress Update (July - March FY2022) (Numbers)
Programme Components Physical Progress
Institutional Development and Social Mobilization:
� Community Institutions Formed 1,626
� Community and PO staff trainees (74% women) 8,804
Livelihoods Enhancement and Protection
� Individuals received skills/entrepreneurial training (85% women) 24,176
� Productive assets transferred to ultra and vulnerable poor (95% women) 15,551
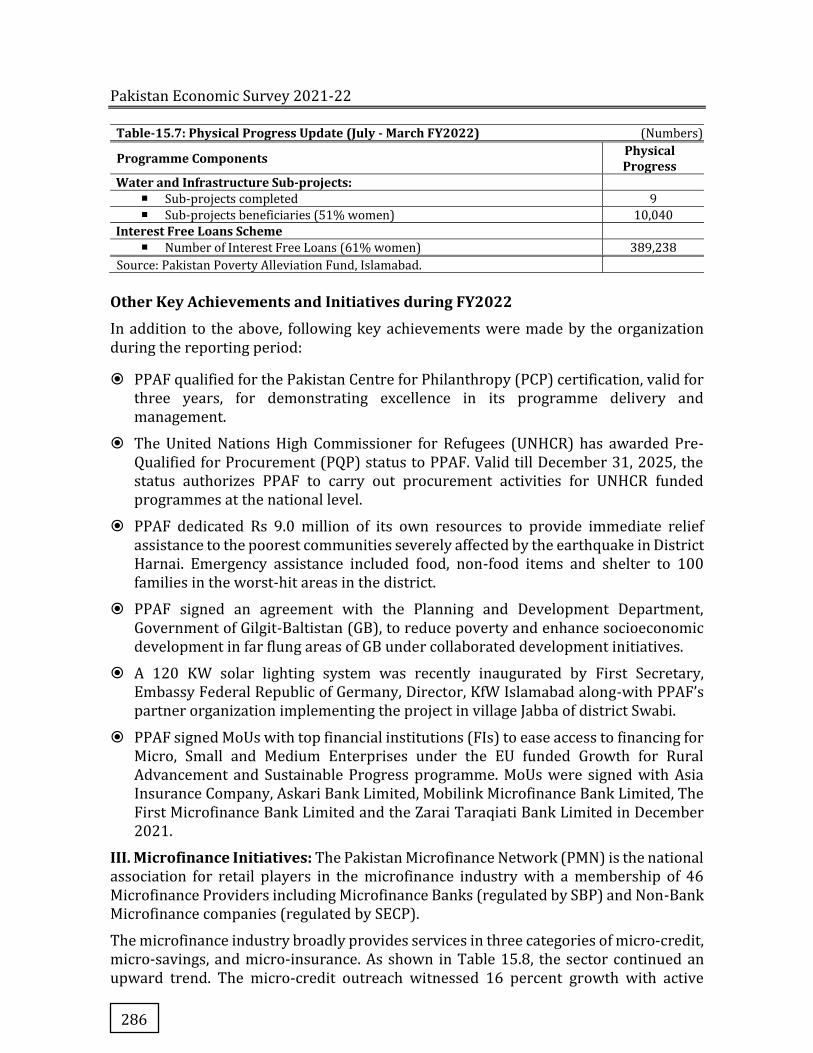
Pakistan Economic Survey 2021-22
286
Table-15.7: Physical Progress Update (July - March FY2022) (Numbers)
Programme Components Physical Progress
Water and Infrastructure Sub-projects:
� Sub-projects completed 9
� Sub-projects beneficiaries (51% women) 10,040
Interest Free Loans Scheme � Number of Interest Free Loans (61% women) 389,238
Source: Pakistan Poverty Alleviation Fund, Islamabad.
Other Key Achievements and Initiatives during FY2022
In addition to the above, following key achievements were made by the organization during the reporting period:
� PPAF qualified for the Pakistan Centre for Philanthropy (PCP) certification, valid for three years, for demonstrating excellence in its programme delivery and management.
� The United Nations High Commissioner for Refugees (UNHCR) has awarded Pre-Qualified for Procurement (PQP) status to PPAF. Valid till December 31, 2025, the status authorizes PPAF to carry out procurement activities for UNHCR funded programmes at the national level.
� PPAF dedicated Rs 9.0 million of its own resources to provide immediate relief assistance to the poorest communities severely affected by the earthquake in District Harnai. Emergency assistance included food, non-food items and shelter to 100 families in the worst-hit areas in the district.
� PPAF signed an agreement with the Planning and Development Department, Government of Gilgit-Baltistan (GB), to reduce poverty and enhance socioeconomic development in far flung areas of GB under collaborated development initiatives.
� A 120 KW solar lighting system was recently inaugurated by First Secretary, Embassy Federal Republic of Germany, Director, KfW Islamabad along-with PPAF’s partner organization implementing the project in village Jabba of district Swabi.
� PPAF signed MoUs with top financial institutions (FIs) to ease access to financing for Micro, Small and Medium Enterprises under the EU funded Growth for Rural Advancement and Sustainable Progress programme. MoUs were signed with Asia Insurance Company, Askari Bank Limited, Mobilink Microfinance Bank Limited, The First Microfinance Bank Limited and the Zarai Taraqiati Bank Limited in December 2021.
III. Microfinance Initiatives: The Pakistan Microfinance Network (PMN) is the national association for retail players in the microfinance industry with a membership of 46 Microfinance Providers including Microfinance Banks (regulated by SBP) and Non-Bank Microfinance companies (regulated by SECP).
The microfinance industry broadly provides services in three categories of micro-credit, micro-savings, and micro-insurance. As shown in Table 15.8, the sector continued an upward trend. The micro-credit outreach witnessed 16 percent growth with active
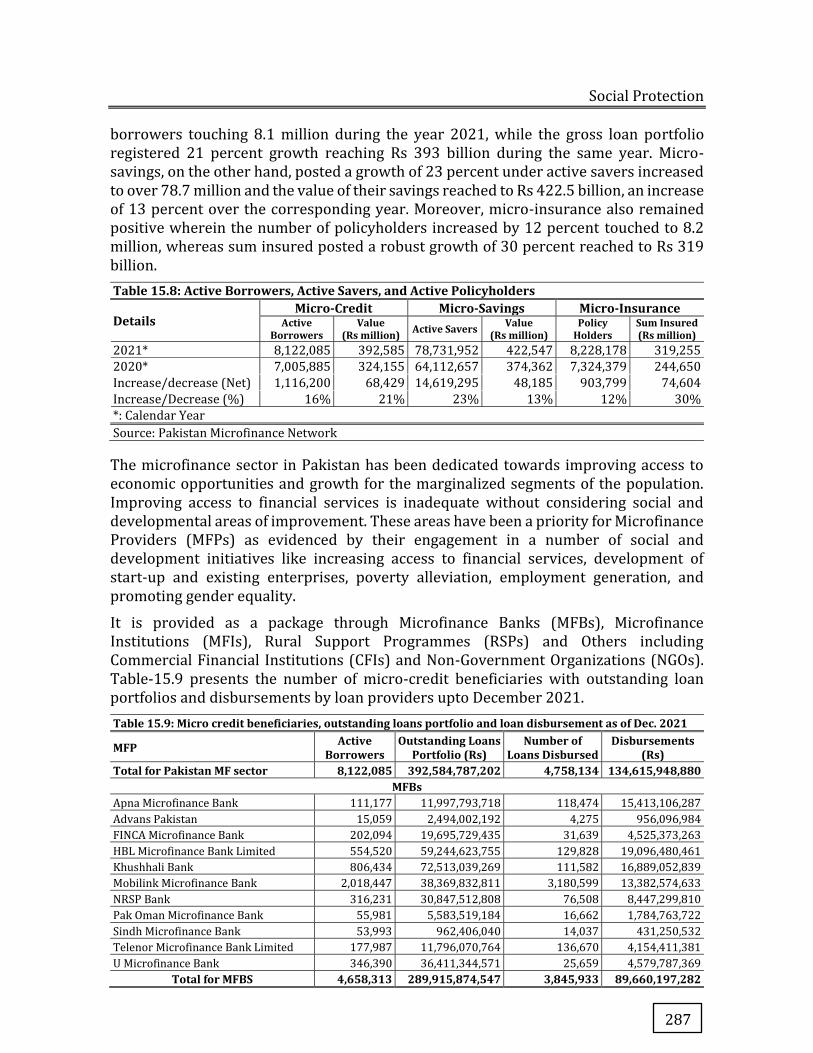
Social Protection
287
borrowers touching 8.1 million during the year 2021, while the gross loan portfolio registered 21 percent growth reaching Rs 393 billion during the same year. Micro-savings, on the other hand, posted a growth of 23 percent under active savers increased to over 78.7 million and the value of their savings reached to Rs 422.5 billion, an increase of 13 percent over the corresponding year. Moreover, micro-insurance also remained positive wherein the number of policyholders increased by 12 percent touched to 8.2 million, whereas sum insured posted a robust growth of 30 percent reached to Rs 319 billion.
Table 15.8: Active Borrowers, Active Savers, and Active Policyholders
Details Micro-Credit Micro-Savings Micro-Insurance
Active Borrowers
Value (Rs million) Active Savers Value
(Rs million) Policy
Holders Sum Insured (Rs million)
2021* 8,122,085 392,585 78,731,952 422,547 8,228,178 319,255
2020* 7,005,885 324,155 64,112,657 374,362 7,324,379 244,650
Increase/decrease (Net) 1,116,200 68,429 14,619,295 48,185 903,799 74,604
Increase/Decrease (%) 16% 21% 23% 13% 12% 30%
*: Calendar Year
Source: Pakistan Microfinance Network The microfinance sector in Pakistan has been dedicated towards improving access to economic opportunities and growth for the marginalized segments of the population. Improving access to financial services is inadequate without considering social and developmental areas of improvement. These areas have been a priority for Microfinance Providers (MFPs) as evidenced by their engagement in a number of social and development initiatives like increasing access to financial services, development of start-up and existing enterprises, poverty alleviation, employment generation, and promoting gender equality.
It is provided as a package through Microfinance Banks (MFBs), Microfinance Institutions (MFIs), Rural Support Programmes (RSPs) and Others including Commercial Financial Institutions (CFIs) and Non-Government Organizations (NGOs). Table-15.9 presents the number of micro-credit beneficiaries with outstanding loan portfolios and disbursements by loan providers upto December 2021.
Table 15.9: Micro credit beneficiaries, outstanding loans portfolio and loan disbursement as of Dec. 2021
MFP Active Borrowers
Outstanding Loans Portfolio (Rs)
Number of Loans Disbursed
Disbursements (Rs)
Total for Pakistan MF sector 8,122,085 392,584,787,202 4,758,134 134,615,948,880 MFBs
Apna Microfinance Bank 111,177 11,997,793,718 118,474 15,413,106,287
Advans Pakistan 15,059 2,494,002,192 4,275 956,096,984
FINCA Microfinance Bank 202,094 19,695,729,435 31,639 4,525,373,263
HBL Microfinance Bank Limited 554,520 59,244,623,755 129,828 19,096,480,461
Khushhali Bank 806,434 72,513,039,269 111,582 16,889,052,839
Mobilink Microfinance Bank 2,018,447 38,369,832,811 3,180,599 13,382,574,633
NRSP Bank 316,231 30,847,512,808 76,508 8,447,299,810
Pak Oman Microfinance Bank 55,981 5,583,519,184 16,662 1,784,763,722
Sindh Microfinance Bank 53,993 962,406,040 14,037 431,250,532
Telenor Microfinance Bank Limited 177,987 11,796,070,764 136,670 4,154,411,381
U Microfinance Bank 346,390 36,411,344,571 25,659 4,579,787,369
Total for MFBS 4,658,313 289,915,874,547 3,845,933 89,660,197,282
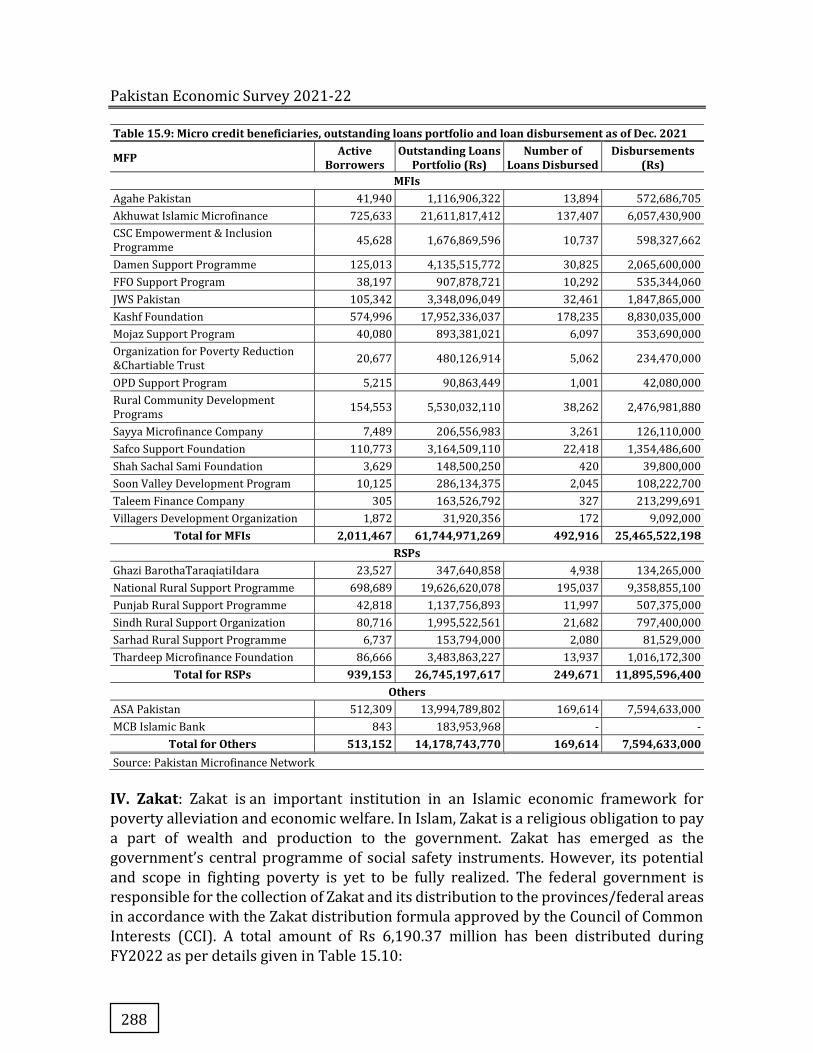
Pakistan Economic Survey 2021-22
288
Table 15.9: Micro credit beneficiaries, outstanding loans portfolio and loan disbursement as of Dec. 2021
MFP Active Borrowers
Outstanding Loans Portfolio (Rs)
Number of Loans Disbursed
Disbursements (Rs)
MFIs Agahe Pakistan 41,940 1,116,906,322 13,894 572,686,705
Akhuwat Islamic Microfinance 725,633 21,611,817,412 137,407 6,057,430,900
CSC Empowerment & Inclusion Programme
45,628 1,676,869,596 10,737 598,327,662
Damen Support Programme 125,013 4,135,515,772 30,825 2,065,600,000
FFO Support Program 38,197 907,878,721 10,292 535,344,060
JWS Pakistan 105,342 3,348,096,049 32,461 1,847,865,000
Kashf Foundation 574,996 17,952,336,037 178,235 8,830,035,000
Mojaz Support Program 40,080 893,381,021 6,097 353,690,000
Organization for Poverty Reduction &Chartiable Trust
20,677 480,126,914 5,062 234,470,000
OPD Support Program 5,215 90,863,449 1,001 42,080,000
Rural Community Development Programs
154,553 5,530,032,110 38,262 2,476,981,880
Sayya Microfinance Company 7,489 206,556,983 3,261 126,110,000
Safco Support Foundation 110,773 3,164,509,110 22,418 1,354,486,600
Shah Sachal Sami Foundation 3,629 148,500,250 420 39,800,000
Soon Valley Development Program 10,125 286,134,375 2,045 108,222,700
Taleem Finance Company 305 163,526,792 327 213,299,691
Villagers Development Organization 1,872 31,920,356 172 9,092,000
Total for MFIs 2,011,467 61,744,971,269 492,916 25,465,522,198 RSPs
Ghazi BarothaTaraqiatiIdara 23,527 347,640,858 4,938 134,265,000
National Rural Support Programme 698,689 19,626,620,078 195,037 9,358,855,100
Punjab Rural Support Programme 42,818 1,137,756,893 11,997 507,375,000
Sindh Rural Support Organization 80,716 1,995,522,561 21,682 797,400,000
Sarhad Rural Support Programme 6,737 153,794,000 2,080 81,529,000
Thardeep Microfinance Foundation 86,666 3,483,863,227 13,937 1,016,172,300
Total for RSPs 939,153 26,745,197,617 249,671 11,895,596,400 Others
ASA Pakistan 512,309 13,994,789,802 169,614 7,594,633,000
MCB Islamic Bank 843 183,953,968 - -
Total for Others 513,152 14,178,743,770 169,614 7,594,633,000 Source: Pakistan Microfinance Network
IV. Zakat: Zakat is an important institution in an Islamic economic framework for
poverty alleviation and economic welfare. In Islam, Zakat is a religious obligation to pay
a part of wealth and production to the government. Zakat has emerged as the
government’s central programme of social safety instruments. However, its potential
and scope in fighting poverty is yet to be fully realized. The federal government is
responsible for the collection of Zakat and its distribution to the provinces/federal areas
in accordance with the Zakat distribution formula approved by the Council of Common
Interests (CCI). A total amount of Rs 6,190.37 million has been distributed during
FY2022 as per details given in Table 15.10:
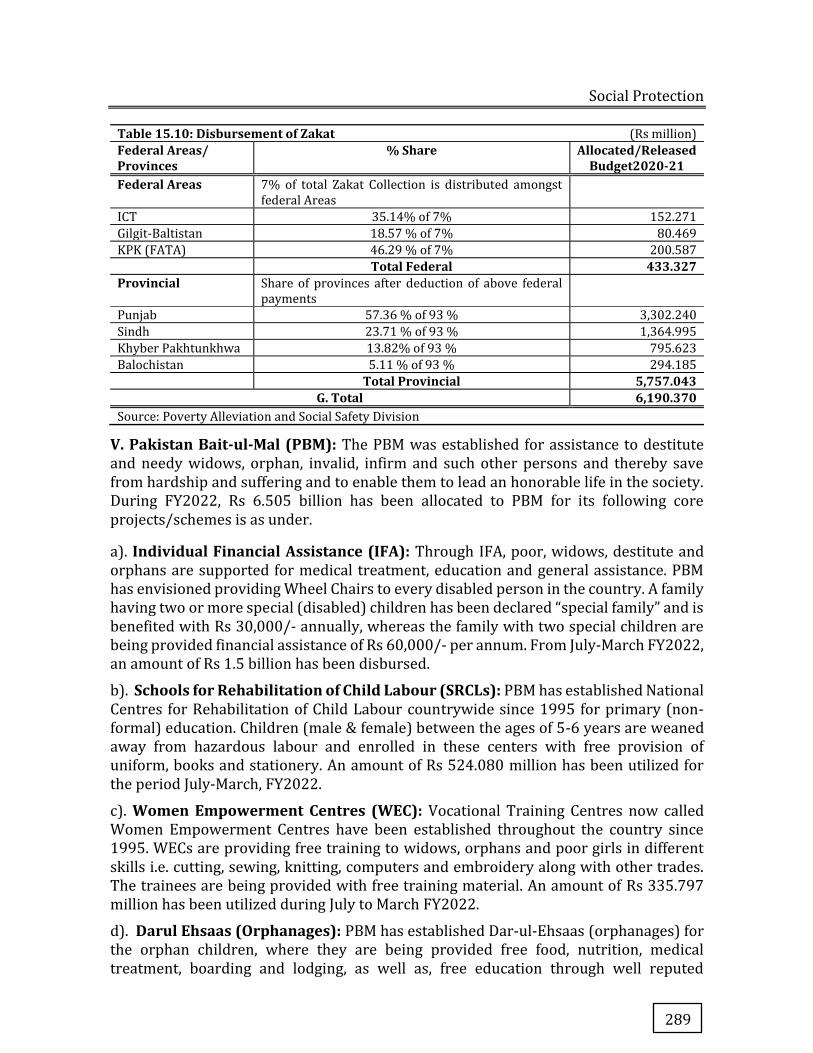
Social Protection
289
Table 15.10: Disbursement of Zakat (Rs million) Federal Areas/ Provinces
% Share Allocated/Released Budget2020-21
Federal Areas 7% of total Zakat Collection is distributed amongst federal Areas
ICT 35.14% of 7% 152.271
Gilgit-Baltistan 18.57 % of 7% 80.469
KPK (FATA) 46.29 % of 7% 200.587
Total Federal 433.327 Provincial Share of provinces after deduction of above federal
payments
Punjab 57.36 % of 93 % 3,302.240
Sindh 23.71 % of 93 % 1,364.995
Khyber Pakhtunkhwa 13.82% of 93 % 795.623
Balochistan 5.11 % of 93 % 294.185
Total Provincial 5,757.043 G. Total 6,190.370
Source: Poverty Alleviation and Social Safety Division
V. Pakistan Bait-ul-Mal (PBM): The PBM was established for assistance to destitute and needy widows, orphan, invalid, infirm and such other persons and thereby save from hardship and suffering and to enable them to lead an honorable life in the society. During FY2022, Rs 6.505 billion has been allocated to PBM for its following core projects/schemes is as under.
a). Individual Financial Assistance (IFA): Through IFA, poor, widows, destitute and orphans are supported for medical treatment, education and general assistance. PBM has envisioned providing Wheel Chairs to every disabled person in the country. A family having two or more special (disabled) children has been declared “special family” and is benefited with Rs 30,000/- annually, whereas the family with two special children are being provided financial assistance of Rs 60,000/- per annum. From July-March FY2022, an amount of Rs 1.5 billion has been disbursed.
b). Schools for Rehabilitation of Child Labour (SRCLs): PBM has established National Centres for Rehabilitation of Child Labour countrywide since 1995 for primary (non-formal) education. Children (male & female) between the ages of 5-6 years are weaned away from hazardous labour and enrolled in these centers with free provision of uniform, books and stationery. An amount of Rs 524.080 million has been utilized for the period July-March, FY2022.
c). Women Empowerment Centres (WEC): Vocational Training Centres now called Women Empowerment Centres have been established throughout the country since 1995. WECs are providing free training to widows, orphans and poor girls in different skills i.e. cutting, sewing, knitting, computers and embroidery along with other trades. The trainees are being provided with free training material. An amount of Rs 335.797 million has been utilized during July to March FY2022.
d). Darul Ehsaas (Orphanages): PBM has established Dar-ul-Ehsaas (orphanages) for the orphan children, where they are being provided free food, nutrition, medical treatment, boarding and lodging, as well as, free education through well reputed
Pakistan Economic Survey 2021-22
290
educational institutes. An amount of Rs 441.649 million has been spent up to month of March FY2022.
e). Ehsaas Kada (for shelter less senior citizen): Presently 02 centers have been established thereafter, this initiative would be up-scaled in phased manner. The enrolled senior citizens (above 60 years of age) are being provided free of cost boarding/lodging, messing and medical care of excellent standard. An amount of Rs 7.100 million has been utilized for the period from July-March, FY2022.
f). Ehsaas Panahgahs: PBM has established Panahgahs under Ehsaas Programme, mainly focus on quality service delivery to the shelter-less persons, by taking care of multiple aspects including health care, safe /secure living environment, hygienic food etc. in a respectable manner. Since inception of the Programme, 39 Ehsaas Panahgahs are functional. So far, an amount of Rs 183.015 million has been utilized up to March FY2022.
g). Ehsaas Koi Bhooka Na Soye (EKBNS): PBM has procured food vehicles to deliver the foods by donors, since inception of the Programme, 40 EKBNS food vehicles are functional. So far, an amount of Rs 161.088 million has been utilized till March FY2022.
h). Institutional Rehabilitation for NGOs: PBM provides grant-in-aid to registered Non-Governmental Organizations (NGOs) having excellent track record aimed at institutional rehabilitation of the poor and deserving persons of the society. An amount of Rs 22.174 million has been disbursed till March FY2022.
VI. Employees Old-Age Benefits Institution (EOBI): The EOBI is playing a vital role in poverty alleviation by paying pension and grants to retired workers and their families. EOBI is the only national pension scheme for employees working in industrial and commercial establishments with at least ten employees. Currently, EOBI has registered 450,375 Old-age pensioners, 234,881 Survivors’ pensioners and 11,837 Invalidity pensioners. EOBI have 137,288 total registered employers out of which 89,840 are active employers. Overall 9,429,281 employees are registered with EOBI. During FY2022, EOBI registered 307,296 new employees.
Main Features of the EOBI Schemes:
� Old-age pension on attaining the age of 60 years in case of male workers and 55 years in case of female and mine workers.
� Invalidity pension on sustaining invalidity affecting insured person’s earning more than one third of normal.
� Survivors’ pension to the following in case of death of insured person/pensioner: � Surviving spouse 100% pension till life, or
� Surviving male children till 18 years of age, or
� Surviving female children till 18 years of age or their marriage, whichever is earlier, or
� Surviving parents for 5 years, if any insured person/pensioner not survived by spouse or children.
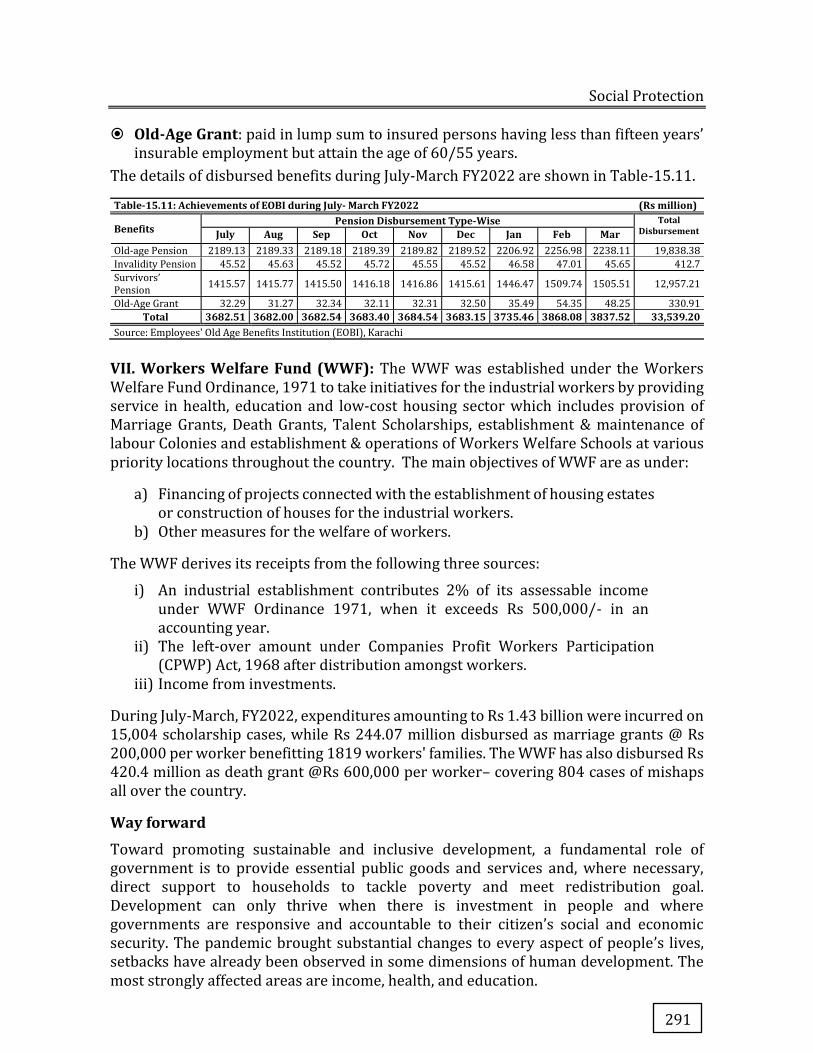
Social Protection
291
� Old-Age Grant: paid in lump sum to insured persons having less than fifteen years’ insurable employment but attain the age of 60/55 years.
The details of disbursed benefits during July-March FY2022 are shown in Table-15.11.
Table-15.11: Achievements of EOBI during July- March FY2022 (Rs million)
Benefits Pension Disbursement Type-Wise Total
Disbursement July Aug Sep Oct Nov Dec Jan Feb Mar Old-age Pension 2189.13 2189.33 2189.18 2189.39 2189.82 2189.52 2206.92 2256.98 2238.11 19,838.38
Invalidity Pension 45.52 45.63 45.52 45.72 45.55 45.52 46.58 47.01 45.65 412.7
Survivors’ Pension
1415.57 1415.77 1415.50 1416.18 1416.86 1415.61 1446.47 1509.74 1505.51 12,957.21
Old-Age Grant 32.29 31.27 32.34 32.11 32.31 32.50 35.49 54.35 48.25 330.91
Total 3682.51 3682.00 3682.54 3683.40 3684.54 3683.15 3735.46 3868.08 3837.52 33,539.20 Source: Employees' Old Age Benefits Institution (EOBI), Karachi
VII. Workers Welfare Fund (WWF): The WWF was established under the Workers Welfare Fund Ordinance, 1971 to take initiatives for the industrial workers by providing service in health, education and low-cost housing sector which includes provision of Marriage Grants, Death Grants, Talent Scholarships, establishment & maintenance of labour Colonies and establishment & operations of Workers Welfare Schools at various priority locations throughout the country. The main objectives of WWF are as under:
a) Financing of projects connected with the establishment of housing estates or construction of houses for the industrial workers.
b) Other measures for the welfare of workers.
The WWF derives its receipts from the following three sources:
i) An industrial establishment contributes 2% of its assessable income under WWF Ordinance 1971, when it exceeds Rs 500,000/- in an accounting year.
ii) The left-over amount under Companies Profit Workers Participation (CPWP) Act, 1968 after distribution amongst workers.
iii) Income from investments.
During July-March, FY2022, expenditures amounting to Rs 1.43 billion were incurred on 15,004 scholarship cases, while Rs 244.07 million disbursed as marriage grants @ Rs 200,000 per worker benefitting 1819 workers' families. The WWF has also disbursed Rs 420.4 million as death grant @Rs 600,000 per worker– covering 804 cases of mishaps all over the country.
Way forward
Toward promoting sustainable and inclusive development, a fundamental role of government is to provide essential public goods and services and, where necessary, direct support to households to tackle poverty and meet redistribution goal. Development can only thrive when there is investment in people and where governments are responsive and accountable to their citizen’s social and economic security. The pandemic brought substantial changes to every aspect of people’s lives, setbacks have already been observed in some dimensions of human development. The most strongly affected areas are income, health, and education.
Pakistan Economic Survey 2021-22
292
Government is committed towards making real improvements in people’s lives and implement policies that are aligned with poverty alleviation and SDGs indicators. The proper implementation of poverty alleviation programmes and social safety net coupled with reduction in the cost of living would go a long way in mitigating poverty and providing relief to the needy in the short run. Their impact, however, needs to be closely monitored to ensure access to the target group. The long-term remedy, however, remains to be sustained high economic growth with equity. The government is making strenuous efforts to achieve higher economic growth with emphasis on human resource development.
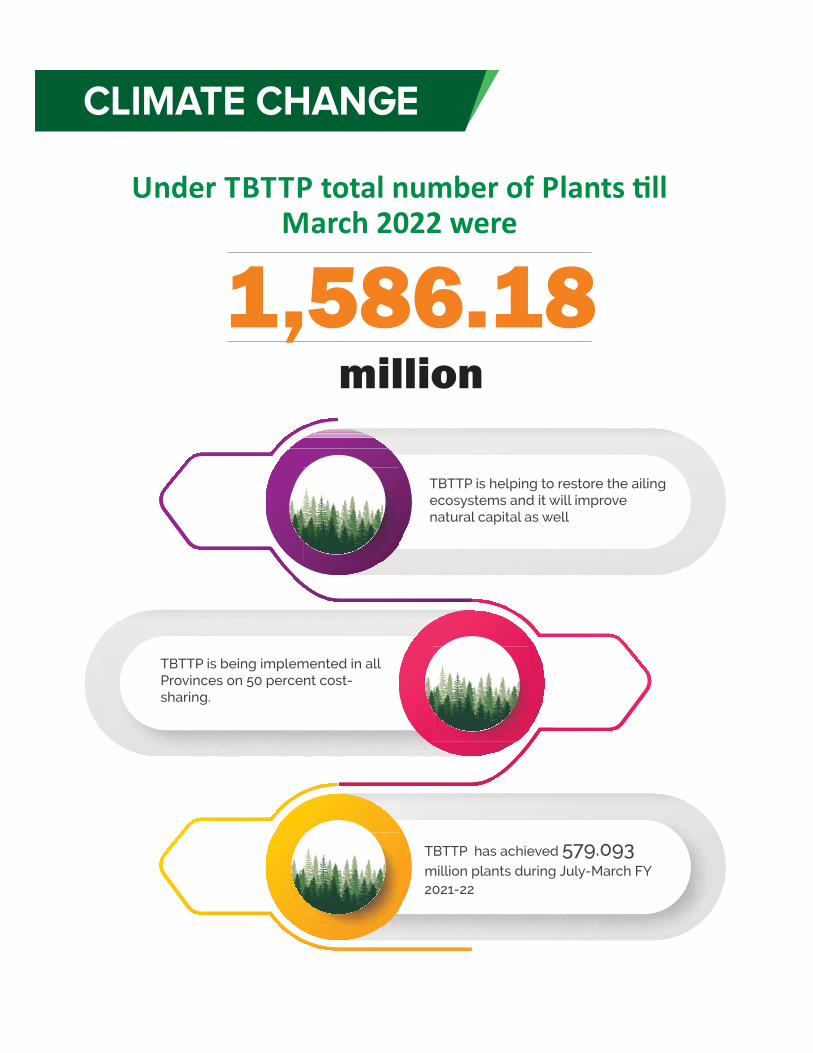

Climate change is caused by an increase of carbon dioxide and other greenhouse gases in earth’s atmosphere mostly from fossil fuel emissions. In Pakistan, the environmental degradation and climate change are adversely affecting the economy, livelihood of the poor and sustainable development. On the one hand, growing population, unplanned urban expansion and dependence on natural resources puts immense pressure on environment that triggered climate change. Moreover, lack of public awareness regarding environmental issues and mismanagement of water and solid waste has aggravated the situation. Consequently, Pakistan continues to suffer from a plethora of natural and human induced hazards that threaten the lives and livelihood of its citizens – natural disasters including floods, earthquakes, landslides, cyclones and drought.
The Government of Pakistan has evolved policy frameworks backed by strategy to address various aspects of the climate change including major policy and climate related interventions. In this context, the Ministry of Climate Change (MoCC) has taken different initiatives to mitigate the effects of environment and climate.
Forests, Wildlife & Biodiversity Resources in Pakistan
According to the National Forest Reference Emissions Level (FREL) findings, the country is maintaining 4.786 million-hectare (5.45 percent) area under forest cover. Within the forest cover area, dry temperate forests hold the largest share (36 percent), followed by sub-tropical broadleaved shrub (19 percent), moist temperate (15 percent), Chir Pine (13 percent), Riverine (4 percent), irrigated plantation (4 percent), thorn (3 percent), mangrove (3 percent) and subalpine forests (2 percent). The meager forest cover area due to growing population, and dependence on the natural resources coupled with deforestation have rendered the country one of the most vulnerable to climate change effects. As a result, natural resources are under tremendous pressure owing to change of land use and habitat destruction and consumption of fuel wood and timber extraction. Such pressures have rendered most of the forests of poor and medium density in need of drastic restocking on war footing.
Ten Billion Tree Tsunami Programme (TBTTP)
The implementation of the TBTTP was initiated in 2019 with a total cost of Rs 125.1843 billion for four years (2019-2023) to plant / regenerate 3.296 billion plants across the country. The programme is being implemented by the provincial forest and wildlife departments through MoCC on 50 percent cost sharing basis except AJ&K and GB which
Chapter 16
Climate Change
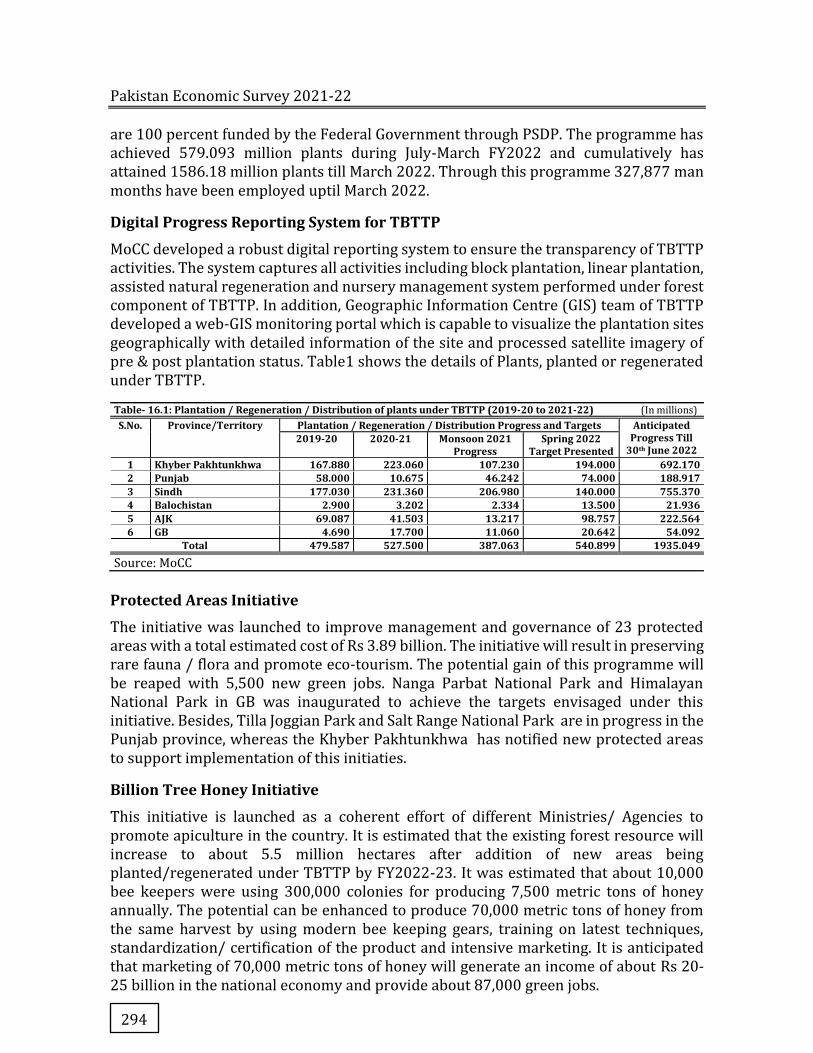
Pakistan Economic Survey 2021-22
294
are 100 percent funded by the Federal Government through PSDP. The programme has achieved 579.093 million plants during July-March FY2022 and cumulatively has attained 1586.18 million plants till March 2022. Through this programme 327,877 man months have been employed uptil March 2022.
Digital Progress Reporting System for TBTTP
MoCC developed a robust digital reporting system to ensure the transparency of TBTTP activities. The system captures all activities including block plantation, linear plantation, assisted natural regeneration and nursery management system performed under forest component of TBTTP. In addition, Geographic Information Centre (GIS) team of TBTTP developed a web-GIS monitoring portal which is capable to visualize the plantation sites geographically with detailed information of the site and processed satellite imagery of pre & post plantation status. Table1 shows the details of Plants, planted or regenerated under TBTTP.
Table- 16.1: Plantation / Regeneration / Distribution of plants under TBTTP (2019-20 to 2021-22) (In millions) S.No. Province/Territory Plantation / Regeneration / Distribution Progress and Targets Anticipated
Progress Till 30th June 2022
2019-20 2020-21 Monsoon 2021 Progress
Spring 2022 Target Presented
1 Khyber Pakhtunkhwa 167.880 223.060 107.230 194.000 692.170 2 Punjab 58.000 10.675 46.242 74.000 188.917 3 Sindh 177.030 231.360 206.980 140.000 755.370 4 Balochistan 2.900 3.202 2.334 13.500 21.936 5 AJK 69.087 41.503 13.217 98.757 222.564 6 GB 4.690 17.700 11.060 20.642 54.092
Total 479.587 527.500 387.063 540.899 1935.049
Source: MoCC
Protected Areas Initiative
The initiative was launched to improve management and governance of 23 protected areas with a total estimated cost of Rs 3.89 billion. The initiative will result in preserving rare fauna / flora and promote eco-tourism. The potential gain of this programme will be reaped with 5,500 new green jobs. Nanga Parbat National Park and Himalayan National Park in GB was inaugurated to achieve the targets envisaged under this initiative. Besides, Tilla Joggian Park and Salt Range National Park are in progress in the Punjab province, whereas the Khyber Pakhtunkhwa has notified new protected areas to support implementation of this initiaties.
Billion Tree Honey Initiative
This initiative is launched as a coherent effort of different Ministries/ Agencies to promote apiculture in the country. It is estimated that the existing forest resource will increase to about 5.5 million hectares after addition of new areas being planted/regenerated under TBTTP by FY2022-23. It was estimated that about 10,000 bee keepers were using 300,000 colonies for producing 7,500 metric tons of honey annually. The potential can be enhanced to produce 70,000 metric tons of honey from the same harvest by using modern bee keeping gears, training on latest techniques, standardization/ certification of the product and intensive marketing. It is anticipated that marketing of 70,000 metric tons of honey will generate an income of about Rs 20-25 billion in the national economy and provide about 87,000 green jobs.

Climate Change
295
The available forest resource shall be used by the bee keepers to produce honey specific to particular flora and shall be branded accordingly. The NAVTTC will provide training to the selected beekeepers along with technical support, follow-up of on-ground activities and product extraction. The certified bee keepers will be provided financial support. The Ministry of Science and Technology shall be responsible for certifying the honey produced under the programme, whereas the Ministry of Commerce shall patent the market brand of ‘Ten Billion Tree Honey’.
REDD+ Readiness and Preparation Project
Reducing Emissions from Deforestation and forest Degradation, conservation of existing forest carbon stocks, sustainable forest management and enhancement of forest carbon stocks is a concept adopted by the countries under United Nations Framework convention on climate change (UNFCCC) in 2010. The concept relates to absorption of atmospheric carbon through forest resource. Due to accumulation of carbon in standing trees their financial value increases. Carbon stocked in forests is traded in carbon markets.
M/o CC is implementing REDD+ Readiness Preparation Project with financial grant of US$7.81 million received under the Forest Carbon Partnership Facility (FCPF) of the World Bank to complete following four essential elements of the REDD+ in order to fulfill the requirements of accessing result-based payments under REDD+ mechanism. The progress made under the project is as under:
i. National Forest Reference Emissions Level (FREL) of deforestation was prepared with the technical assessment of the panel of UNFCCC over the period 2004 to 2012, which endorsed by UNFCCC.
ii. Protocols have been developed for National Forest Monitoring System (NFMS) and Monitoring, Reporting and Verification (MRV) system.
iii. Framework has been developed for Safeguards Information System (SIS) for REDD+ along with Strategic Environmental and Social Assessment, Environmental and Social Management and Feedback Grievance Redressal Mechanism.
iv. Draft National REDD+ Strategy has been prepared.
v. Design of Payment for Ecosystem Services (PES) has been completed for two ecosystems i.e., Mangroves and temperate forests.
Reversing Deforestation and Forest Degradation in High Chilgoza Pine Forests Pakistan - Balochistan Progress
Some of the major achievements of the project over the last two years are given below:
� 8,443 households (includes 6,679 men and 1,764 women) have directly benefited from the project out of the total 25,000 households targeted in the project.
� Assisted Natural Regeneration on 2153 ha in 14 valleys through 48 enclosures (4 million seedlings) achieved out of the 3,600 ha targeted in the project.
� Four Chilgoza Processing units provided to different communities.
� Total of 600 sets of Chilgoza cone collection and storage tools procured against the target of 100 sets.
Pakistan Economic Survey 2021-22
296
� Gasifiers and 2,100 fuel efficient stoves are distributed.
� Different communities have planted fruit and forest seedlings on 653 ha (653,000 plants).
� Management plans for Chilgoza forests over 26,000 ha have been prepared.
Declaration of Marine Protected Areas
Astola Island was declared as first marine protected area of the Pakistan. In this context, consultative process continued on management planning of Astola Island with the involvement of all stakeholders. Moreover, active consultation is in process with other Ministries like Defense, Maritime Affairs and the Provincial Governments to increase Marine Protected Areas in the country.
Membership of International Network on Bamboo and Rattan
INBAR is an Inter-Governmental Organization established in 1997 to promote environmentally sustainable use of Bamboo and Rattan. President of Pakistan signed the Letter of Accession to become 48th state member of INBAR in 2021. The network will support Pakistan in propagation and value chain development of Bamboo in the country with effect from 1st July, 2021. In this association, a cross sectoral working group has been constituted to steer activities of INBAR in Pakistan.
Bio-safety Clearing House Project
National level consultative and capacity building project on Biosafety Clearing House is already in progress. However, the UNEP led process could not be initiated due to COVID-19 outbreak. The first National Capacity Building Workshop was held on 28th Feb to March 2nd, 2022.
Box: Living Indus Initiative–Ecological Restoration of the Indus Basin for a Climate Resilient Future
More than 80% of Pakistan’s population living on the Indus Basin, it has served as the core of the region's socio-cultural and economic life for over a documented 5,000 years. However, the question needs to be addressed; does it be able to do so even for another 100 years? Indus Basin is facing multiple threats ranging from Climate Change due to poor resource management, environmental hazards and unsustainable use of this valuable resource. Unaddressed, the economic cost to Pakistan of poor water resource management is estimated to be USD $12 billion per annum (4% of GDP). In addition, the Indus Basin faces an existential threat in the wake of Climate Change, which is the biggest longer-term and currently unmitigated external risk to Pakistan’s water endowment. Climate change is expected to bring about an increase in the frequency and intensity of extreme weather events, coupled with the increased variability in South Asian Summer Monsoon (SASM) rains causing frequent and intense floods and droughts in the country (IPCC 2013).
United Nations in Pakistan is assisting the Ministry of Climate Change, Government of Pakistan in developing a vision and agenda which aspires to an Indus Basin that can sustain a thriving civilization from its sources to the ocean whose natural resources and ecosystems have been repaired and restored, and are resilient in the face of climate change. Through this initiative, it is intended to establish the health of the Indus Basin at a higher level of urgency and ambition, both through the implementation of a series of new and innovative interventions in the short term and through the identification and deployment of as-yet-untried approaches drawn from and adapting approaches tried in other parts of the world.
Source: Food and Agriculture Organization of the United Nations, Pakistan
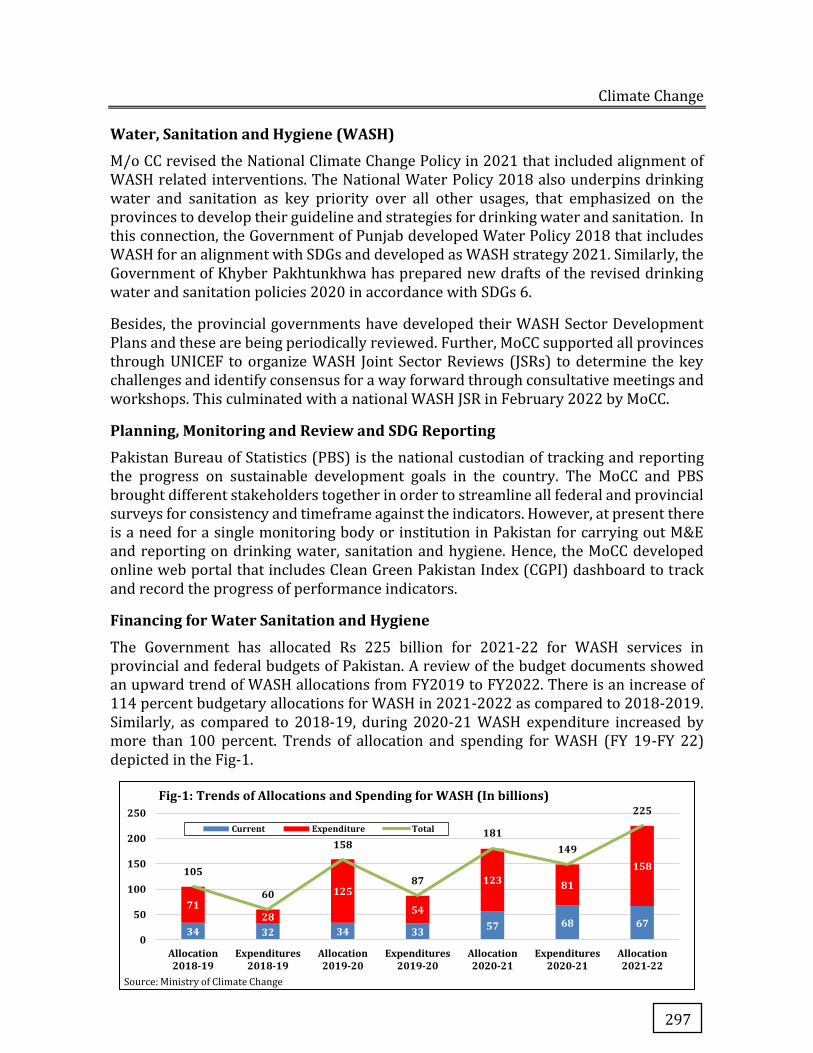
Climate Change
297
Water, Sanitation and Hygiene (WASH)
M/o CC revised the National Climate Change Policy in 2021 that included alignment of WASH related interventions. The National Water Policy 2018 also underpins drinking water and sanitation as key priority over all other usages, that emphasized on the provinces to develop their guideline and strategies for drinking water and sanitation. In this connection, the Government of Punjab developed Water Policy 2018 that includes WASH for an alignment with SDGs and developed as WASH strategy 2021. Similarly, the Government of Khyber Pakhtunkhwa has prepared new drafts of the revised drinking water and sanitation policies 2020 in accordance with SDGs 6.
Besides, the provincial governments have developed their WASH Sector Development Plans and these are being periodically reviewed. Further, MoCC supported all provinces through UNICEF to organize WASH Joint Sector Reviews (JSRs) to determine the key challenges and identify consensus for a way forward through consultative meetings and workshops. This culminated with a national WASH JSR in February 2022 by MoCC.
Planning, Monitoring and Review and SDG Reporting
Pakistan Bureau of Statistics (PBS) is the national custodian of tracking and reporting the progress on sustainable development goals in the country. The MoCC and PBS brought different stakeholders together in order to streamline all federal and provincial surveys for consistency and timeframe against the indicators. However, at present there is a need for a single monitoring body or institution in Pakistan for carrying out M&E and reporting on drinking water, sanitation and hygiene. Hence, the MoCC developed online web portal that includes Clean Green Pakistan Index (CGPI) dashboard to track and record the progress of performance indicators.
Financing for Water Sanitation and Hygiene
The Government has allocated Rs 225 billion for 2021-22 for WASH services in provincial and federal budgets of Pakistan. A review of the budget documents showed an upward trend of WASH allocations from FY2019 to FY2022. There is an increase of 114 percent budgetary allocations for WASH in 2021-2022 as compared to 2018-2019. Similarly, as compared to 2018-19, during 2020-21 WASH expenditure increased by more than 100 percent. Trends of allocation and spending for WASH (FY 19-FY 22) depicted in the Fig-1.
34 32 34 33 57 68 67
7128
125
54
123 81
158105
60
158
87
181149
225
0
50
100
150
200
250
Allocation2018-19
Expenditures2018-19
Allocation2019-20
Expenditures2019-20
Allocation2020-21
Expenditures2020-21
Allocation2021-22
Source: Ministry of Climate Change
Fig-1: Trends of Allocations and Spending for WASH (In billions)
Current Expenditure Total
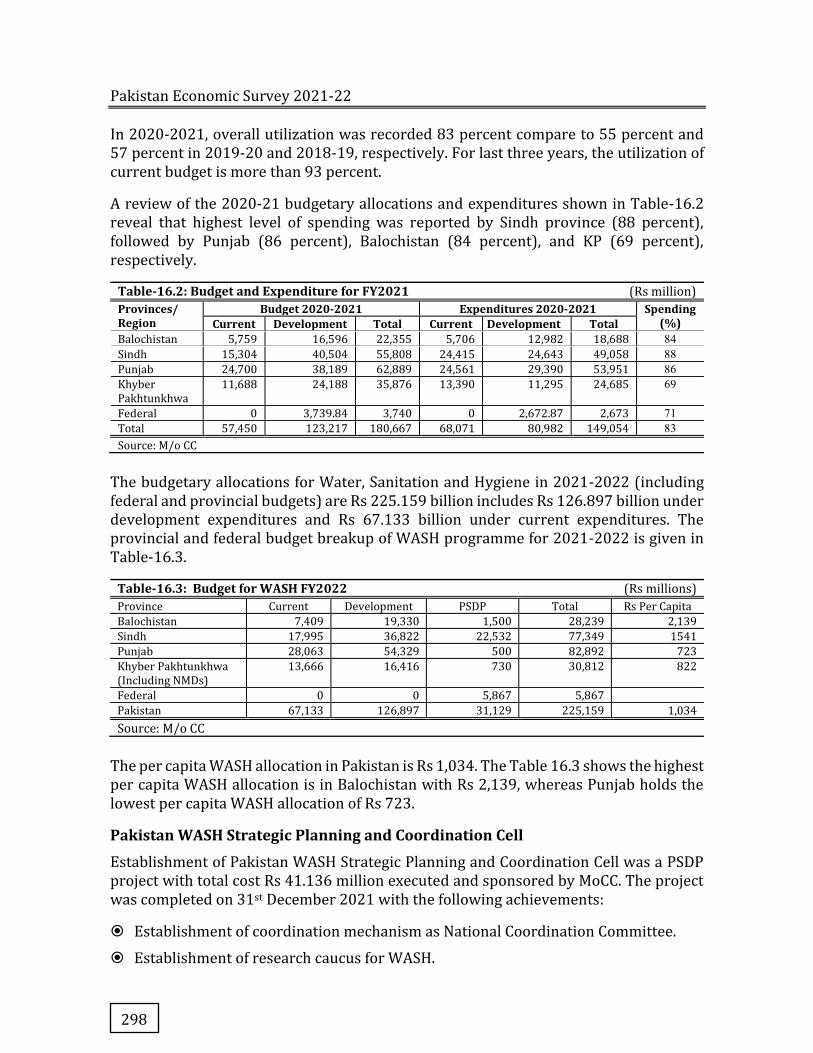
Pakistan Economic Survey 2021-22
298
In 2020-2021, overall utilization was recorded 83 percent compare to 55 percent and 57 percent in 2019-20 and 2018-19, respectively. For last three years, the utilization of current budget is more than 93 percent.
A review of the 2020-21 budgetary allocations and expenditures shown in Table-16.2 reveal that highest level of spending was reported by Sindh province (88 percent), followed by Punjab (86 percent), Balochistan (84 percent), and KP (69 percent), respectively.
Table-16.2: Budget and Expenditure for FY2021 (Rs million)
Provinces/ Region
Budget 2020-2021 Expenditures 2020-2021 Spending (%) Current Development Total Current Development Total
Balochistan 5,759 16,596 22,355 5,706 12,982 18,688 84 Sindh 15,304 40,504 55,808 24,415 24,643 49,058 88 Punjab 24,700 38,189 62,889 24,561 29,390 53,951 86 Khyber Pakhtunkhwa
11,688 24,188 35,876 13,390 11,295 24,685 69
Federal 0 3,739.84 3,740 0 2,672.87 2,673 71 Total 57,450 123,217 180,667 68,071 80,982 149,054 83 Source: M/o CC
The budgetary allocations for Water, Sanitation and Hygiene in 2021-2022 (including federal and provincial budgets) are Rs 225.159 billion includes Rs 126.897 billion under development expenditures and Rs 67.133 billion under current expenditures. The provincial and federal budget breakup of WASH programme for 2021-2022 is given in Table-16.3.
Table-16.3: Budget for WASH FY2022 (Rs millions) Province Current Development PSDP Total Rs Per Capita
Balochistan 7,409 19,330 1,500 28,239 2,139
Sindh 17,995 36,822 22,532 77,349 1541
Punjab 28,063 54,329 500 82,892 723
Khyber Pakhtunkhwa (Including NMDs)
13,666 16,416 730 30,812 822
Federal 0 0 5,867 5,867
Pakistan 67,133 126,897 31,129 225,159 1,034
Source: M/o CC
The per capita WASH allocation in Pakistan is Rs 1,034. The Table 16.3 shows the highest per capita WASH allocation is in Balochistan with Rs 2,139, whereas Punjab holds the lowest per capita WASH allocation of Rs 723.
Pakistan WASH Strategic Planning and Coordination Cell
Establishment of Pakistan WASH Strategic Planning and Coordination Cell was a PSDP project with total cost Rs 41.136 million executed and sponsored by MoCC. The project was completed on 31st December 2021 with the following achievements:
� Establishment of coordination mechanism as National Coordination Committee.
� Establishment of research caucus for WASH.
Climate Change
299
� Regular reporting on SDG-6 that includes reporting on WASH in health care facility, GLAAS survey, JMP reports in close coordination with PBS.
� Development of policy guidelines for drinking water and sanitation.
� Behavior Change Communication (BCC) strategy for WASH addressing all the thematic area of clean green Pakistan has been developed.
Capacity Building on Water Quality Monitoring and SDG 6 (6.1) Reporting under the KOICA Grant
The project will provide support in water quality infrastructure and equipment uplift in the 36 labs of Punjab and 8 divisional labs of KP. The complete staff of water quality labs will be trained on water quality monitoring and compliances frameworks in Punjab, KP, Sindh and Baluchistan. The total cost of the project is Rs 1289.206 million with Rs 102.006 and Rs 1187.2 share of federal and KOICA, respectively.
COVID Response for Hygiene and WASH
Hand washing with soap appeared the most cost-effective approach for COVID-19 response. The Ministry of Climate Change developed and launched a national roadmap for Hand Hygiene for All (HH4A). The provinces have been supported to develop detailed action plans for HH4A.
Climate Resilient WASH
The Ministry of Climate Change has conducted a national study to determine the impact of climate change on children that covers the vulnerability of climate change for different regions of Pakistan along with overall impact of key climate hazards in Pakistan. Findings of the study indicated that the total economic cost of climate change in Pakistan ranges from US$1.3 to US$1.9 billion which is equivalent to 0.5 to 0.7percent of GDP of Pakistan. Air pollution has the highest share in economic costs (30-34 percent), followed by water-related costs (26-27 percent), malnutrition (15-17 percent), temperature related diarrhea (9-17 percent), agricultural productivity (5-7 percent), deaths due to excess heat (2.8-3.2 percent), decrease in exports (1.6-2.3 percent), sanitation-related diarrhea (1.2-1.9 percent), and maternal mortality (0.3-0.4 percent). Based on this work the WASH Strategic unit has worked with sector partners to bring climate resilient WASH services. In this regard, a climate risk and vulnerability assessment of WASH has been conducted in 2021.
International Cooperation
Ministry of Climate Change is responsible for coordination with international environmental agencies on environmental issues, signing & implementation of MOUs. Moreover, it also represents Pakistan at international forums with respect to the signed Conventions and Protocols. In this regard, the MoCC has taken the following initiative during the 2021-22:
� Pakistan Green Diplomacy Initiative (PGDI) document, as policy tool was developed in consultation with Ministry of Foreign Affairs.
Pakistan Economic Survey 2021-22
300
� Study on plastic waste in Pakistan conducted and disseminated findings of the same to all federal and provincial stakeholders.
� Integration of Mobile App on “Ban on Polythene Bags” into the city of Islamabad application initiated and launched.
� Organized First National Dialogue and Stakeholder Convening at Islamabad with the Collect and Recycle (CoRe) Alliance on the topic “Collective action approach to deal with Packaging waste in Pakistan”.
� Signed MOUs with TEVTA Punjab, Sindh, KPK, Balochistan and Punjab Vocational Training Council for transfer to tools and equipment related to Refrigeration and Air Conditioning (RAC) trade. All the TEVTAs nominated 56 institutes for receiving RAC tools and equipment.
� Ratification process for Kigali Amendment is underway and the hired consultancy firm has submitted the initial draft Country Assessment Report (CAR).
� Funds were approved for Pakistan amounting US$ 287,318/- for Phase-XI of the Institutional Strengthening Project for the Implementation of Montreal Protocol preparation in 87th Executive Committee Meeting of the Ozone Secretariat held in July, 2021.
� Working on developing PCT codes for import of HFCs in Pakistan in collaboration with FBR and Ministry of Commerce for consideration in upcoming IPO Amendment 2022.
� Draft legal document including the rules for implementation of Montreal Protocol in Pakistan has been drafted and are under initial review.
� MoU signed with the Government of the Uzbekistan on Cooperation in the field of Environment and Climate Change
� Developed draft National Hazardous Waste Management Policy in Pakistan.
� Issued HCFCs import licenses for 2022. It will enable Pakistan to keep the imports under the scale target of Ozone Secretariat
Policies and Strategies
Updated National Climate Change Policy (2021)
M/o CC updated National Climate Change Policy of Pakistan. The goal of this policy is to steer Pakistan towards climate resilient and low carbon development. Thus, it would provide a comprehensive framework in order to address the issues that Pakistan faces and will face in future due to changing climate. This policy document will be reviewed and updated regularly to address emerging concepts and issues in the ever-evolving science of climate change.
Keeping in view national and international requirements, the updated policy document has been designed in accordance with the requirements of Paris Agreement on climate change, SDGs and Sendai Framework for Disaster Risk Reduction. Hence, appropriate measures relating to disaster preparedness, capacity building, institutional strengthening; technology transfer and international cooperation have also been incorporated as important components of the policy.
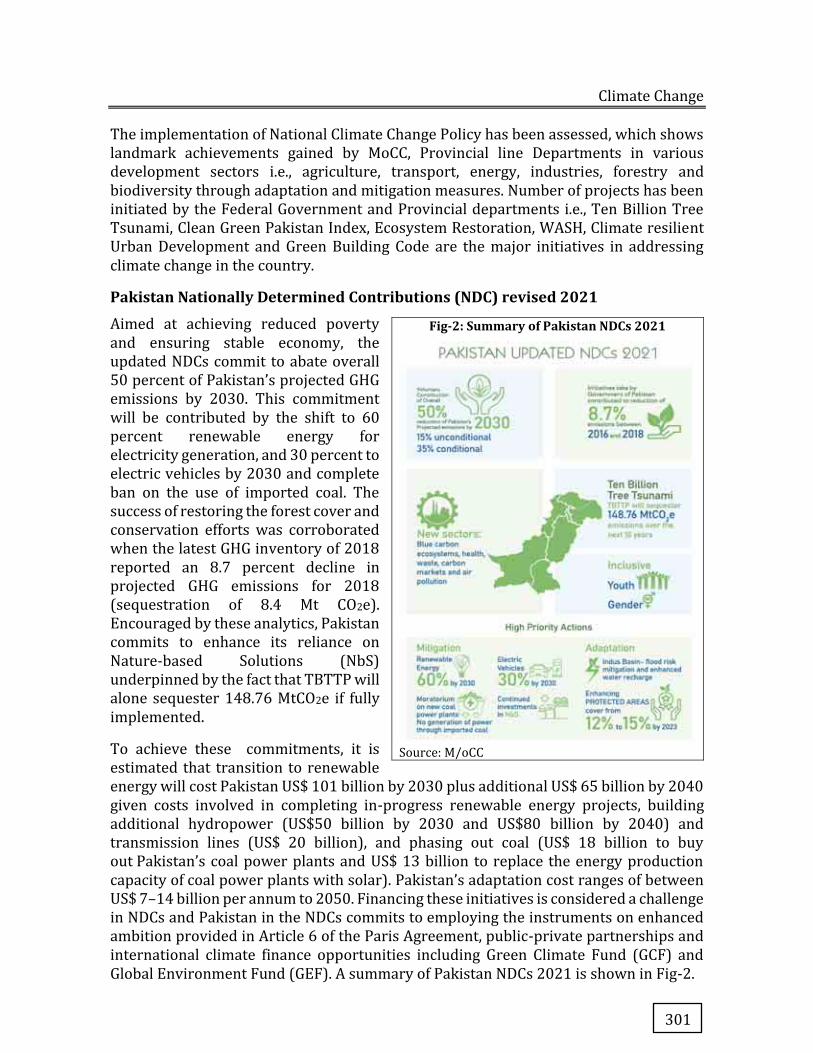
Climate Change
301
The implementation of National Climate Change Policy has been assessed, which shows landmark achievements gained by MoCC, Provincial line Departments in various development sectors i.e., agriculture, transport, energy, industries, forestry and biodiversity through adaptation and mitigation measures. Number of projects has been initiated by the Federal Government and Provincial departments i.e., Ten Billion Tree Tsunami, Clean Green Pakistan Index, Ecosystem Restoration, WASH, Climate resilient Urban Development and Green Building Code are the major initiatives in addressing climate change in the country.
Pakistan Nationally Determined Contributions (NDC) revised 2021
Aimed at achieving reduced poverty and ensuring stable economy, the updated NDCs commit to abate overall 50 percent of Pakistan’s projected GHG emissions by 2030. This commitment will be contributed by the shift to 60 percent renewable energy for electricity generation, and 30 percent to electric vehicles by 2030 and complete ban on the use of imported coal. The success of restoring the forest cover and conservation efforts was corroborated when the latest GHG inventory of 2018 reported an 8.7 percent decline in projected GHG emissions for 2018 (sequestration of 8.4 Mt CO2e). Encouraged by these analytics, Pakistan commits to enhance its reliance on Nature-based Solutions (NbS) underpinned by the fact that TBTTP will alone sequester 148.76 MtCO2e if fully implemented.
To achieve these commitments, it is estimated that transition to renewable energy will cost Pakistan US$ 101 billion by 2030 plus additional US$ 65 billion by 2040 given costs involved in completing in-progress renewable energy projects, building additional hydropower (US$50 billion by 2030 and US$80 billion by 2040) and transmission lines (US$ 20 billion), and phasing out coal (US$ 18 billion to buy out Pakistan’s coal power plants and US$ 13 billion to replace the energy production capacity of coal power plants with solar). Pakistan’s adaptation cost ranges of between US$ 7–14 billion per annum to 2050. Financing these initiatives is considered a challenge in NDCs and Pakistan in the NDCs commits to employing the instruments on enhanced ambition provided in Article 6 of the Paris Agreement, public-private partnerships and international climate finance opportunities including Green Climate Fund (GCF) and Global Environment Fund (GEF). A summary of Pakistan NDCs 2021 is shown in Fig-2.
Fig-2: Summary of Pakistan NDCs 2021
Source: M/oCC
Pakistan Economic Survey 2021-22
302
National Adaptation Plan
Pakistan is in the process of developing National Adaptation Plan (NAP) for building resilience to climate change. NAP is widely seen as one of the most important mechanisms to cope with the challenges of climate change. The core objective is to reduce vulnerabilities to climate impacts by creating comprehensive medium and long-term plans including the integration of adaptation measures into the national policy. Pakistan will use the NAP process and its outcomes to enhance the adaptation elements of the Nationally Determined Contributions (NDCs), which is the central aspect of the Paris Agreement. The NAP Process will be in place by June 2023.
First Biennial Update Report (BUR)
M/o CC has finalized its First Biennial Update Report (BUR) which will be submitted to UNFCCC Secretariat. The scope of the BURs is to provide an update of the most recently submitted National Communication and to provide additional information. This initiative proves beneficial for mitigation actions taken or envisaged to undertake as well as support needed and received. Pakistan’s BUR1 has been developed using the expertise from renowned technical institutions working on the respective themes of climate change. This arrangement has been put in place for strengthening the national reporting process under United Nations Framework Convention on Climate Change (UNFCCC), which was established under previously executed project for preparation of Pakistan’s Second National Communication (SNC).
Gender dimension in Climate action
Pakistan acknowledges that advancing gender-sensitive commitments in climate adaptation and mitigation are synonymous with enhancing adaptive capacity of women, families, and communities, eventually building and achieving the country’s resilience to climate change. Hence, the updated Pakistan’s NDC have a separate chapter on gender reflecting how the harnessing of knowledge and capacity of women is an important tool to design and implement effective solutions. The role of women in decision-making and implementation is proposed to deliver results across various policy sectors.
In addition, Canadian Embassy is supporting MoCC in developing a report for mainstreaming gender into revised policies and also develops gender reporting mechanism within MoCC. The Government with support from International Union for Conservation of Nature (IUCN) will build capacities and innovative approaches through development of a national Climate Change Gender Action Plan (CCGAP). The project will finalize and validate a national CCGAP, anchored around the country’s priority sectors.
Green Jobs
In a green economy, development of green jobs becomes the basis of sustainable economic development. Green jobs are central to sustainable development and respond to the global challenges of environmental protection, economic development, and social inclusion. The ILO defines green jobs as “being decent jobs, either in traditional sectors or in the new green ones, which contribute to preserving or restoring a sustainable environment”. In the context of Pakistan, the following interventions can be termed as green jobs:
Climate Change
303
� Protection of ecosystems and biodiversity
� Minimization of waste pollution and enactment of stringent waste management practices
� Reduced consumption of energy and raw materials
� Minimized GHG emissions
Pakistan, through the MoCC, has increased its reliance on nature-based solutions in recent years, such as the TBTTP, which has also shown an increase in ‘Green Jobs.' Following the pandemic, the MoCC also launched a ‘Green Stimulus' to assist daily wage earners, particularly women and youth, in earning a living through green jobs in a dignified manner. MoCC has also launched a number of interventions to promote green occupations such as protected area management and eco-tourism through the Protected Areas Initiative, Clean Green Pakistan Champions through the Clean Green Pakistan Movement, and so on. MoCC with the support from development sector partners is also developing green jobs roadmap for priority sectors.
In line with the Government's commitment for socio-economic and gender responsive green economy, UNDP Pakistan is supporting MoCC to promote green jobs in Pakistan. The support includes baseline assessment of green jobs future in Pakistan based on existing legislative environment, gaps and challenges to leveraging the potential benefits of green economy and opportunities (like public-private partnerships) to catalyze national green jobs efforts. In addition, the gender analysis is also included in the efforts to create a gender responsive green job strategy for future. The ultimate goal is to formulate green jobs roadmap focusing on guiding relevant stakeholders on creating and promoting green jobs and green skills especially suitable for women, youth and excluded groups.
Climate and Clean Air Initiatives
With rapid population growth and urbanization, Pakistan is facing the worst air quality for many years. Air pollution and climate change result from same sources i.e., fossil fuel burning, industrial processes, transport and agriculture activities. However, anthropogenically induced climate change further increases the threat of exposures to air pollutants by changing the concentrations, transport process and lifetime of local and regional pollutants. These pollutants also include a major category of Short-Lived Climate Pollutants (SLCP) including black carbon and methane. Another significant problem that has emerged in recent years is smog. There is no doubt that urgent and collective action is required in order to tackle the issue of air quality and greenhouse gas emissions. In this connection, following measures have been initiated under the umbrella of the MoCC.
Pakistan Clean Air Programme (PCAP)
Revision was initiated by MoCC that is endeavored to develop the targets for improving air quality as realistic as possible so that they are specific, measurable, achievable, realistic, and time-bound. The revision process highlighted the need for an inventory that will not only help in the development of a roadmap for short, medium, and long-
Pakistan Economic Survey 2021-22
304
term action plan but also to track the implementation of PCAP targets. Therefore, MoCC in partnership with Clean Air Asia (CAA) and Stockholm Environment Institute (SEI) initiated Integrating Short-Lived Climate Pollutants (SLCPs) reduction in the Pakistan's Air Quality Plans and Programme to substantially reduce SLCPs in Pakistan by strengthening the capacity of national partners through training on the use of Low Emissions Analysis Platform system including the Integrated Benefits Calculator (LEAP-IBC1), supporting national partners in the development of the Pakistan LEAP-IBC analysis, and through the development of the LEAP-IBC analysis, identifying and evaluating those mitigation actions, at national and provincial scale, which are most effective at simultaneously improving air quality and mitigating climate change.
In addition, Pakistan recently signed joined Global Methane Pledge initiated by EU and US governments in October 11th, 2021 to slash methane emission and initiate focused intervention. The parties joining the pledge are committing to a goal of reducing global methane emissions by at least 30 percent from 2020 levels by 2030 and moving towards using best available inventory methodologies to quantify methane emissions, with a particular focus on high emission sources.
Pakistan Environmental Protection Agency
Pakistan Environment Protection Agency (Pak-EPA) is mandated to enforce the Pakistan Environmental Protection Act 1997 in the Islamabad Capital Territory. The following major activities have been undertaken:
Water Quality
Pak-EPA constituted an Inspection Committee and sampling team collected 15 up and down stream nullah water samples with nullah flows of KachiAbadis and analyzed in EPA water lab. As EPA mandated for reservoir water quality surveillance and regularly monitored the Islamabad’s natural streams, Simli dam, Rawal lake catchment area and river sides, 13 water samples were collected and analyzed, along with, Margallah hills. Four water samples collected from industrial effluent treatment, slaughter and housing society’s sewage treatment plant. Six water samples collected from CDA filtration plants along with microbial testing. Two Bore water samples received from public Gulberg green and I-8. From July-December 2021, Lab/NEQS Directorate collected 88 water samples and tested in EPA laboratory. From January-March 2022, Lab/NEQS Directorate has also tested 40 water samples in EPA water quality laboratory.
Air quality
Lab/NEQS Directorate reported daily air quality data, for the year 2021-22 and air quality monitoring reports are available on the Pak-EPA website. Pak-EPA has established an active and reliable monitoring system to routinely monitor air emissions of tyre burning units, asphalt plants, steel, aluminum, food industries, brick kilns and construction sites.
At the end of December 2021 to January 2022, Director General EPA-KPK requested
1 LEAP-IBC tool is an integrated modelling and scenario planning tool to help governments jointly assess the emission reduction potential of greenhouse gases, short-lived climate pollutants and other air pollutants emissions in their country.
Climate Change
305
Federal Environmental Protection Agency (Islamabad) to mobilize the Mobile Air Quality Monitoring Station (AQMS) along with EPA team to Peshawar. EPA AQMS system deployed at six different locations for four days and monitored smog and air pollution in Peshawar city.
Pak-EPA Islamabad gathered data on air quality and analyzed on 24-hourly basis and disseminated to the public through Pak-EPA website (wwww.environment.gov.pk), official social and print media accounts. Highest concentrations of PM2.5 were recorded in January. During January-March, especially in winter months, air quality is badly deteriorated and unhealthy due to smog season, agriculture waste burning and Transboundary air pollution.
Hospital Waste Management of ICT
Hospital wastes include different kinds of wastes such as infectious, radioactive, chemical, heavy metals and regular municipal wastes. Pak EPA implemented the HWM Rules 2005 in the ICT and proper management of hospital wastes through an appropriate method of separation from the source, transportation and disposal can prevent environmental pollution. Total 120+ health facilities are under observation within ICT and more than 78 health facilities submitting their monthly waste -management reports to Pak-EPA. Environmental monitoring team visited more than 10 hospital/health facilities during January- March 2022.
National Bio-safety Centre (Cartagena Protocol)
Pakistan ratified Cartagena Protocol on March 02, 2009 under which it is obligatory to devise implementation mechanism for regulating Genetically Modified Organisms (GMOs) and their products. The National Bio-safety Centre (NBC) is working under Pak-EPA. The two committees i.e., Technical Advisory Committee (TAC) and National Bio-safety Committee (NBC) functions for the purpose of granting licenses to the extent of Cartagena Protocol on Bio-safety.
Global Change Impact Studies Centre
The Global Change Impact Studies Centre (GCISC) is governed by the Board of Governors, with the mandate of conducting research on climate change and its impacts and possible remedies. The Centre undertakes and commissions scientific investigations on climate change at regional and sub-regional levels. Specific research themes include the climate change profiles of Pakistan, impacts on critical socio-economic sectors and identification of appropriate adaptation/mitigation strategies. In addition, it arranges capacity building opportunities for young scientists in climate related subjects and engages in outreach and dissemination of research outputs.
Impacts of Climate Change on Water Resources
Globally the incidences of hydrological extreme events are rising. In Pakistan, it is in many different forms, especially flash flooding in mountainous streams in the north. Analysis of the available long-term record (1969-2014) of annual total flow volumes and annual maximum flows of the Indus River at Besham Qila (a flow gauging station upstream of Tarbela Dam), shows no statistical evidence of a significant and sustained
Pakistan Economic Survey 2021-22
306
change in the aggregate average annual flows in the Upper Indus Basin (UIB) upstream of Tarbela Dam. However, there is a significant increase in the annual maximum flows. This has specially been found in the water availability analysis of the Kabul River Basin, a snow melt-fed basin, where there is a sharper peak with a clear shift in the annual peak flow by a month. Other modelling work focused on the Gilgit River Basin, a glacier-fed basin, revealed that faster melting of glaciers under increased temperatures would bring more flow a month earlier but with a flattened peak.
Another highly damaging event is a drought. Climate change has increased its likelihood and spread in Pakistan. The analysis is in progress to devise a computational framework for efficiently monitoring and predicting the future drought events so that appropriate steps are taken in advance so as to minimize loss of human lives and economy.
Impacts of Climate Change on Agriculture
Agriculture is one of the major sectors which is being adversely affected by climate change. Climate change can disrupt food availability, reduce access to food and affect food quality. Projected increases in temperatures, changes in precipitation patterns and reductions in water availability may reduce agricultural productivity. Crop simulation models-based studies depict significant reductions in wheat, rice and maize yields in the arid, semi-arid and rainfed areas of Pakistan under various IPCC climate change scenarios by the mid and end of the century.
Recent findings of GCISC study reveals an increasing trend in the average maximum temperature for the future projections for both RCPs, with 1-2.0 0C for RCP 4.5 & 5-6 0C for RCP 8.5 during Rabi and kharif seasons. Temperature in the South Eastern part of Pakistan exceeds the thresholds at the times of flowering and ripening thereby causing wheat yield losses. Further, increase in temperature is projected to have serious implications for these growing areas. Due to rise in temperature, an increase of 1000 Growing Degree Days (GDDs) between historical and late century extreme scenarios have been observed in case of wheat, implying that South Eastern side of Pakistan are likely to become unsuitable for wheat production.
APSIM Crop Simulation Model, disclosed that wheat production in the arid areas of Pakistan is likely to suffer to the tune of 17 percent in 2020s in case of RCP 4.5, whereas 21 percent and 40 percent in case of RCP 8.5 for 2020s and 2080s, respectively. Aqua Crop Model projected 34 percent and 41 percent decline in Maize yields in case of scenario RCP8.5 by the end of the century in the KPK province, respectively. The results suggest that the aggregate impact of climatic parameters i.e., changes in temperature and rainfall exerted negative impact on cereal crop yields, given that the management practices and use of technology remain unchanged. Studies suggest an imminent need of adaptation interventions to cope with the negative impacts of climate change.
Another study reported that agriculture is the second largest sector contributing to GHG emissions (174 out of 406 Mt CO2 Eq). Baseline emission (of 2015) projections till 2030 under future scenarios of agricultural growth are expected to increase up to 271.9 (56 percent) Mt, 314.3(80 percent) Mt and 362.9 (108 percent) Mt of CO2-equivalent under Business As Usual (BAU), Food Security (FS) and Enhanced Consumption Pattern (ECP)
Climate Change
307
scenarios, respectively. Besides the fact that agricultural emissions are expected to increase in future, it is also true that presently Pakistan has yet to produce more to meet the future needs and preferences of the masses which will lead to emissions at faster rates. Till now, Pakistan has not devoted much of its efforts in curtailing the emissions from agriculture due to limited awareness and low confidence in monitoring/estimation of these emissions. Since agriculture sector offers a lot of opportunities in GHG reduction, the present estimates will aid in designing the future agriculture policy, especially for emission reductions from livestock sector and soils.
Pakistan Biennial Update Report (BUR1)
GCISC has contributed to the preparation of national GHGs inventory and chapters on National Circumstances and Development of Measurement Reporting Verification (MRV) framework for climate change reporting.
Monitoring, Reporting and Verification (MRV) System Development
As a signatory to the Paris Agreement, Pakistan is deeply committed to its implementation. Under Enhanced Transparency Framework (ETF) the countries are required to regularly track the progress on contributions and put in place methodological tools necessary to account for GHG emissions. Further, under the ETF, parties are expected to submit their first Biennial Transparency Reports (BTRs) and National Inventory Reports till 31st December 2024.
In this context, a broader GHG MRV system (RISQ – a web platform for the compilation of the national MRV System database) has been developed by GCISC to establish historical baselines, validate data quality, analysis of mitigation policies implementation and reporting compliance. Efforts are underway to develop the national adaptation M&E system by developing a roadmap for its future setup based on pilot experimentation in the agriculture sector.
Adaptation is a critical concern for developing countries and in particular for Pakistan owing to the fragility of its ecosystems and its vulnerability to the impacts of climate change. Reducing the vulnerability of counties and communities to climate change by increasing their ability to absorb impacts and remain resilient – is a key pillar of the Paris Agreement. The Agreement requires all of its signatories to plan and implement adaptation measures through national adaptation plans, studies, monitoring of climate change effects and investment in a green future. Building resilience to climate change is a key focus of NCCP. Given this, GCISC has taken a step in developing an adaptation tracking mechanism which will not only aid in the national climate change adaptation planning process but also will support in preparing the Adaptation Communication (ADCOM) to the UNFCCC. The platform (on pilot basis) is ready for Agriculture Sector, whereas the platform is being extended for other sectors viz. water and health.
Third National Communication
In accordance with the provision of UNFCCC, each party has an obligation to submit its National Communication which includes the national greenhouse inventory measures taken and to be taken for the implementation of the convention as well as other
Pakistan Economic Survey 2021-22
308
information that the party considers relevant. In this context, Pakistan submitted its Initial National Communication in 2003, and the second National Communication (SNC) in 2019. Pakistan also prepared its First Biennial Update Report which is at its final stage of approval and expected to be submitted in the second quarter of 2022. The work on the 3rd National Communication has just been started to update the Greenhouse Gas Inventory (for 2020-21) coupled with specified outcomes that will be prepared over the course of next 28 months.
Research Activities underway
� Drought is a highly damaging but slow on-set extreme event and climate change has increased its likelihood and spread in Pakistan. For this reason, an analysis is in progress to devise a computational framework to cope challenges and consequences of drought in the future.
� In the Transboundary Indus Basin (TIB) data support process-based hydrological models are limited. Hence, research study is being carried out to use Machine-Learning methods for hydrological modeling a useful complement to physical hydrologic models in the TIB, to make streamflow forecast at 10-day lead time at four sub-catchments; Indus, Jhelum, Chenab and Kabul watersheds in the Indus Basin.
� Assessment of the impact of future growing degree days as simulated by CMIP6 models over major wheat growing areas of Pakistan.
Conclusion
Pakistan is facing growing environmental challenges, which have an obvious socio-economic consequence. Heat waves, impacting crop cycles, floods, drought and degradation of water and air quality posing negative impact quality of life. To cope with the challenge of climate change matters should be addressed on both mitigations and remedies front. In this context, the Government has taken multiple measures. Plantation is the most appealing strategy to expand forest cover area in the country. Forestation will increase the absorption capacity of greenhouse gases, regulate water flows and protect coastal communities from extreme events and sea level rise. In addition, they provide migrating plant and animal species routes to resilient habitats. In Pakistan, the existing meager forest resources being crucial to environmental stability, which appeal for serious interventions supported with commitment for adequate financial flows to improve and enhance the overall forestry, wildlife and biodiversity sector. However, the TBTTP is helping to restore the ailing ecosystems and it will improve natural capital as well.


Contingent liabilities are possible obligation that arises from past events and their existence will be confirmed only by the occurrence or non-occurrence of one or more uncertain future events, not wholly within the control of the government.
Contingent liabilities should be examined in the same manner as a proposal for a loan, taking into account, inter alia, the credit-worthiness of the borrower, the amount and risks sought to be covered by a sovereign guarantee, the terms of the borrowing, justification and public purpose to be served, probabilities that various commitments will become due and possible costs of such liabilities. Hence, such off-balance sheet transactions cannot be overlooked in order to gain a holistic view of a country’s fiscal position and unveil the hidden risks associated with the obligations made by the government outside the budget.
Contingent liabilities of Pakistan are primarily guarantees issued on behalf of Public Sector Enterprises (PSEs). The sovereign guarantee is normally extended to improve financial viability of projects or activities undertaken by the government entities with significant social and economic benefits. It allows public sector companies to borrow money at lower costs or on more favourable terms and in some cases allows to fulfil the requirement where sovereign guarantee is a precondition for concessional loans from bilateral/multilateral agencies to sub-sovereign borrowers.
The volume of new government guarantees issued during a financial year is limited under Fiscal Responsibility and Debt Limitation Act which stipulates that the government shall not give guarantees aggregating to an amount exceeding two percent of the GDP in any financial year including those for rupee lending, rate of return, outright purchase agreements and other claims and commitments provided the renewal of existing guarantees shall be considered as issuing a new guarantee.
Summary of Outstanding Government Guarantees (Rs. bn; unless otherwise stated) Domestic Guarantees (A) 1,587
External Guarantees (B) 1,113
Total Guarantees (A+B) 2,700 Memo: External (US$ in million) 6,066
Exchange Rate (Pak Rupee/US Dollar) 183
Source: Debt Policy Coordination Office, Ministry of Finance
Annex-I
Contingent Liabilities

Pakistan Economic Survey 2021-22
310
During Jul-Mar FY 2021-22, the government issued fresh/rollover guarantees/Letter of Comforts (LoCs) aggregating to Rs.344 billion or 0.5 percent of GDP. The outstanding stock of guarantees was Rs. 2,700 billion at end-March 2022.
Guarantees issued against commodity operations are not included in the stipulated limit of 2 percent of GDP as the loans are secured against the underlying commodity and are essentially self-liquidating. These guarantees are issued against the commodity financing operations undertaken by Trading Corporation of Pakistan (TCP), Pakistan Agriculture Storage & Services Corporation (PASSCO), and Provincial Governments. The outstanding stock of commodity operations was Rs.845 billion at end-March 2022.

Tax Expenditure Estimates – FY2022
Tax expenditure for FY2022 has been estimated at Rs 1,757.035 billion. Detailed estimates are highlighted below:
Income Tax
Tax expenditure in respect of income taxes during FY2022 has been reflected in Table 1:
Table 1: Income Tax Expenditure Summary
Exemption Heads Tax Expenditure (Rs million) Growth Rate
(%) FY2021 FY2022 Allowances 37,318 10,625 -72
Tax Credits 105,342 65,465 -38
Exemptions from Total Income 267,115 232,852 -13
Reduction in Tax Rates 124 195 57
Reduction in Tax Liability 2,839 3,285 16
Exemption from Specific Provisions 2,687 61,076 2,173
Others / Miscellaneous 32,621 26,164 -20
Total Income Tax Expenditure 448,046 399,662 -11 Source: Federal Board of Revenue
Sales Tax
Major exemptions in sales tax and their tax expenditures during FY2022 are presented in Table 2.
Table 2: Sales Tax Expenditure Summary
Exemption Heads Tax Expenditure
(Rs million) Growth
Rate (%) FY2021 FY2022
Zero Rating under 5th Schedule to Sales Tax Act 1990 12,887 11,367 -12
Exemption under 6th Schedule on (Imports) 173,808 527,002 203
Exemption under 6th Schedule on Local supplies 156,134 233,541 50
Reduced Rates Under 8th Schedule (1%) 330 6 -98
Reduced Rates Under 8th Schedule (1.5%) 0 413
Reduced Rates Under 8th Schedule (2%) 90,288 95,460 6
Reduced Rates Under 8th Schedule (5%) 27,108 24,097 -11
Reduced Rates Under 8th Schedule (7%) 496 49 -90
Reduced Rates Under 8th Schedule (7.5%) 0 613
Annex-II
Tax Expenditure
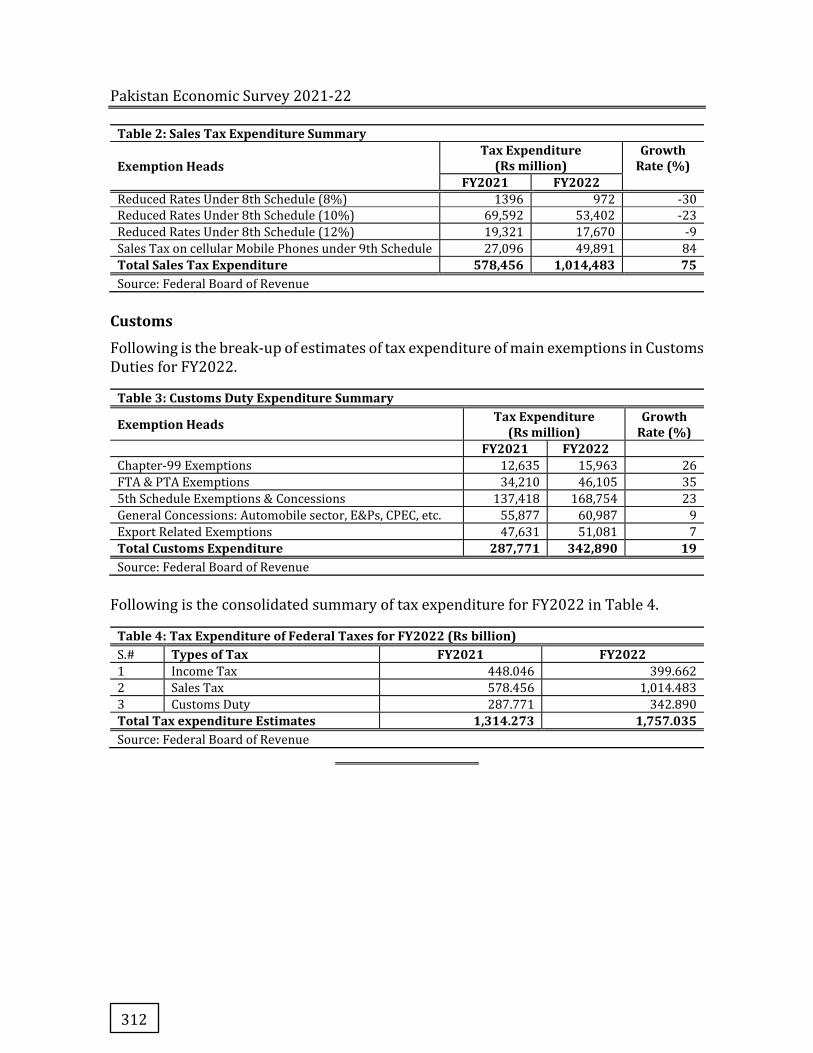
Pakistan Economic Survey 2021-22
312
Table 2: Sales Tax Expenditure Summary
Exemption Heads Tax Expenditure
(Rs million) Growth
Rate (%) FY2021 FY2022
Reduced Rates Under 8th Schedule (8%) 1396 972 -30
Reduced Rates Under 8th Schedule (10%) 69,592 53,402 -23
Reduced Rates Under 8th Schedule (12%) 19,321 17,670 -9
Sales Tax on cellular Mobile Phones under 9th Schedule 27,096 49,891 84
Total Sales Tax Expenditure 578,456 1,014,483 75 Source: Federal Board of Revenue
Customs
Following is the break-up of estimates of tax expenditure of main exemptions in Customs Duties for FY2022.
Table 3: Customs Duty Expenditure Summary
Exemption Heads Tax Expenditure (Rs million)
Growth Rate (%)
FY2021 FY2022 Chapter-99 Exemptions 12,635 15,963 26
FTA & PTA Exemptions 34,210 46,105 35
5th Schedule Exemptions & Concessions 137,418 168,754 23
General Concessions: Automobile sector, E&Ps, CPEC, etc. 55,877 60,987 9
Export Related Exemptions 47,631 51,081 7
Total Customs Expenditure 287,771 342,890 19 Source: Federal Board of Revenue
Following is the consolidated summary of tax expenditure for FY2022 in Table 4.
Table 4: Tax Expenditure of Federal Taxes for FY2022 (Rs billion) S.# Types of Tax FY2021 FY2022 1 Income Tax 448.046 399.662
2 Sales Tax 578.456 1,014.483
3 Customs Duty 287.771 342.890
Total Tax expenditure Estimates 1,314.273 1,757.035 Source: Federal Board of Revenue
Rapid expansion of information Technology (IT) is of crucial importance for economic growth because it enables various participants in economic and social life to have quick and easy access to information and knowledge. IT help companies to reduce cost of information and communication and improve their productivity. It also allow access to new markets, lower capital costs of financial markets. Moreover, the use of IT, in particular, Internet access, can promote entrepreneurial and small and micro business activities which in turn enhance sustainable economic development.
Ministry of Information Technology and Telecommunication (MoITT) is taking concrete steps for the adoption of latest IT tools for the improvement of national IT infrastructure that can be used to raise national productivity and growth.
IT Strategy
Pakistan’s vision 2025 lay special emphasis on Knowledge economy. It is well understood that if Pakistan has to come out of its economic recession, it has to best utilize its youth bulge. Utilizing the 4IR technologies Pakistan economy can be transformed to digital economy. Through Digital Economy, GOP wants to ensure economic prosperity and citizen empowerment.
To achieve above objectives, MoITT has adopted a multipronged strategy that focuses on building the capacity of public and private sector besides establishing of requisite infrastructure and platforms. Key pillars of this strategy are:
1. E-governance
2. IT Infrastructure
3. Human Capital Development
4. Innovation and Entrepreneurship
5. IT/ITeS Development and Export
6. Fintech, E-commerce and Digital Platforms
7. Privacy and Security
8. Partnership and Collaboration
E-Governance remained the key pillar for MoITT’s strategy to assist Federal Government in reshaping the governance structure. Through number of initiatives, MoITT successfully handheld the governance structure in various Federal Ministries/Divisions/ Organizations.
Annex-III
Information Technology (IT)
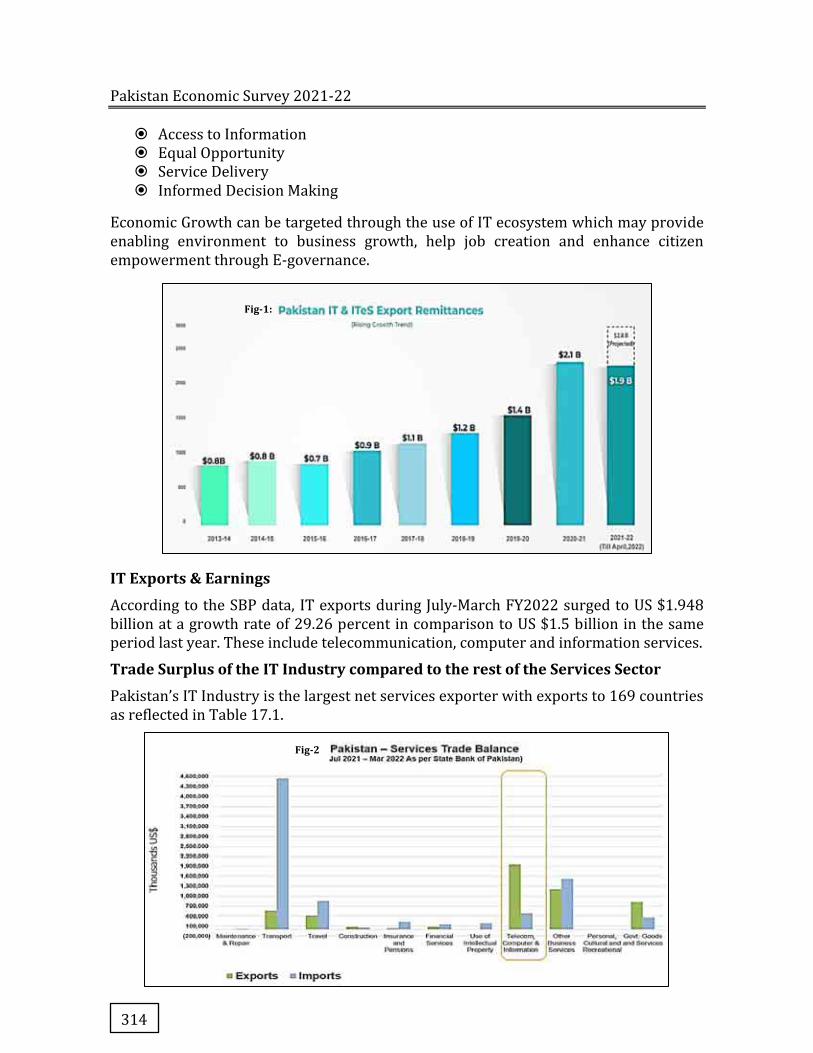
Pakistan Economic Survey 2021-22
314
� Access to Information � Equal Opportunity � Service Delivery � Informed Decision Making
Economic Growth can be targeted through the use of IT ecosystem which may provide enabling environment to business growth, help job creation and enhance citizen empowerment through E-governance.
IT Exports & Earnings
According to the SBP data, IT exports during July-March FY2022 surged to US $1.948 billion at a growth rate of 29.26 percent in comparison to US $1.5 billion in the same period last year. These include telecommunication, computer and information services.
Trade Surplus of the IT Industry compared to the rest of the Services Sector
Pakistan’s IT Industry is the largest net services exporter with exports to 169 countries as reflected in Table 17.1.
Fig-2
Fig-1:

Information Technology
315
Table 17.1: Growth of IT Exports during Period (July 2021 – March 2022) US$ (billion) Period Net Exports % of Total Exports Total Exports-
IT Sector July-March FY2022 1.47 75.56 1.948
July-March FY2021 1.12 74.72 1.5
Source: Ministry of Information Technology & Telecommunication
Incentives for the Industry Growth
The MoITT supports all credible private sector initiatives aimed at bolstering the local IT industry and attracting foreign investment. Government realizes that it has an important role in terms of providing a conducive environment to IT industry through infrastructure and HR development. Government’s incentives for IT industry include:
a. 100 percent tax credit on export income from IT and IT-enabled services until 30th June, 2025.
b. 100 percent tax credit on profits and gains derived by the IT start-ups for the tax year in which a start-up is certified by Pakistan Software Export Board (PSEB) and for the next two years.
c. 100 percent equity ownership allowed to foreign investors, 100 percent repatriation of capital and dividends allowed, and tax holiday for venture capital funds till 2024.
d. Growth Driven Financial Incentive on IT & ITeS export remittances: The main purpose of financial incentive scheme, is to encourage IT & ITeS export remittances through formal banking channels and improve reporting of export remittance receipts in correct IT & ITeS purpose codes, assigned by the State Bank of Pakistan. The government has allocated Rs. 4 billion to PSEB for the first ever financial incentive on IT & ITeS export remittances to be disbursed on the basis of export remittance receipts in FY2021.
Policy Intervention
1. Infrastructure Development
a. Establishment of Software Technology Parks (STPs)
STPs have been a major factor in facilitating IT &ITeS companies. There is a strong demand for STPs in the country due to the booming of IT industry. To meet the demand, STPs are being setup on public-private sector partnership basis. PSEB is also setting up STPs through conversion of unused buildings into state of the art STPs with particular focus on secondary and tertiary cities of Pakistan. This would expand Pakistan’s tech eco system beyond Islamabad, Lahore and Karachi, thus contributing to the local economies through expansion of tech industry, export earnings growth and employment generation. As of December 2021, PSEB has 21 operational STPs with 1.25 million sqft of space serving 170 IT &ITeS companies.
b. Establishment of IT Park
A loan agreement was signed between Economic Affairs Division and EXIM Bank of Korea worth US$ 158 million for establishment of Pakistan’s largest IT Park in
Pakistan Economic Survey 2021-22
316
Karachi. The total cost of the project is estimated at US$ 186 million and would take 48 months to complete. The IT Park building would have 14 floors with a gross floor area of 106,449m2 Park with latest state of the art facilities to ensure that IT companies can operate 24/7 providing services to clients around the globe. In addition to office space, the park would have software testing labs, business incubation centers, technology commercialization centers, exhibition halls, auditorium, day care center and other ancillary facilities.
Digital Economy Enhancement Project (DEEP)
Following initiatives are taken by National Technology Council (NTC) for digitizing the economy of Pakistan from Jul-December FY2022.
Pakistan Emergency Helpline (PEHEL-911)
On initiate of Prime Minister of Pakistan, a centralized service “PEHEL-911” has been envisaged wherein, it has been directed to launch Pakistan’s first toll-free helpline number that will be accessed by people of Federal, Provinces including AJK & GB. The citizens can report emergencies of all natures to this single helpline. The PEHEL-911 will be up front to existing major emergency helplines, i.e. Police 15, Rescue 1122, Fire Brigade and Motorway Police 130, etc. After maturity, all help lines will be merged in 911. This strategy has been framed to avoid existing helplines functions affected.
Inauguration of Disaster Recovery Centre for National Data Centre
Federal Minister for IT & Telecom virtually inaugurated the Disaster Recovery Centre (DRC) Lahore for National Data Centre (NDC) of National Telecommunication Corporation (NTC) on 31st December 2020. The new site is a full-fledged Data center which will not only work as back up for existing Data center facility but will also provide enhanced capacity for provision of cloud-based services to Government of Pakistan with advanced features and security.
Financial Performance
(i) Profit & Loss
Table 17.2: Profit & Loss (Rs million)
Particulars 2016-17 2017-18 2018-19 2019-20 2020-21 (Un-audited)
Revenue 3,252.42 3,234.15 3,558.25 4,084.35 4,228.96
Operating Cost 3,265.91 3,623.21 3,877.48 3,930.46 4,282.70
Operating Profit/(Loss) -13.49 -389.06 -319.24 153.89 53.74 Other Income 338.85 465.62 379.78 358.13 336.35
Profit/(Loss) before bank charges 325.36 76.56 60.54 512.03 282.6 Bank Charges 8.4 7.6 8.2 8.26 7.76
Profit/(Loss) before Taxation 316.96 68.96 52.35 503.77 274.85
Source: National Telecommunication Corporation
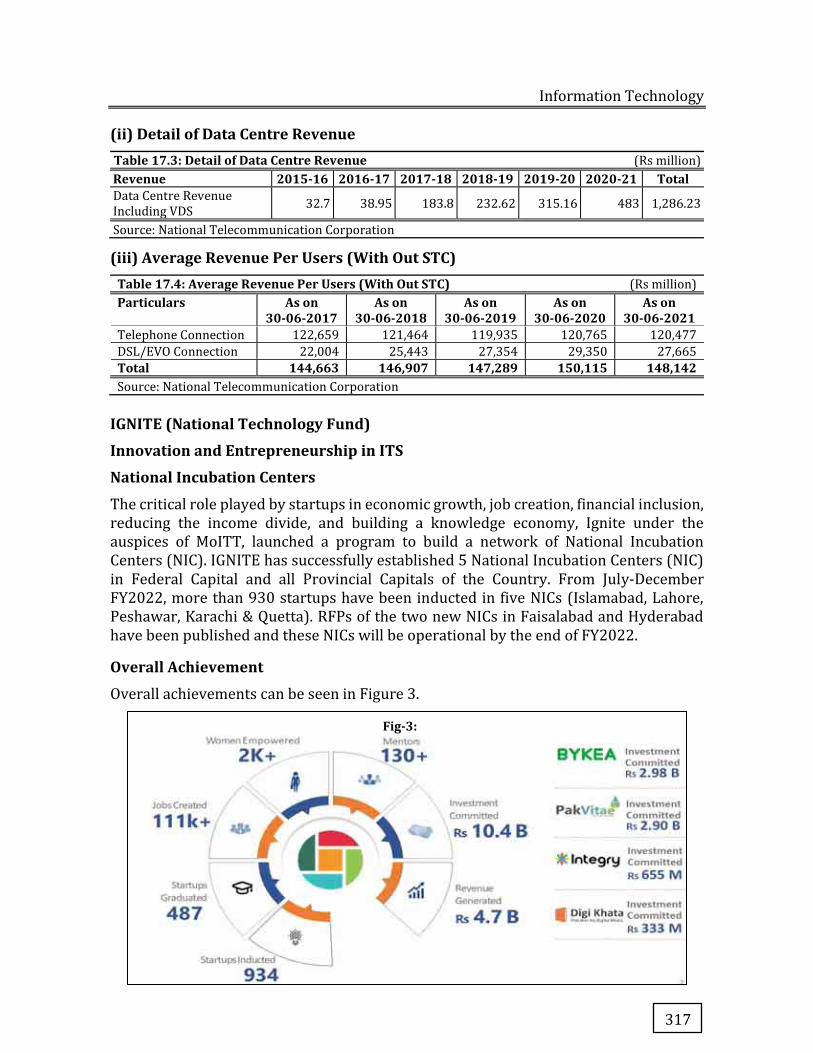
Information Technology
317
(ii) Detail of Data Centre Revenue Table 17.3: Detail of Data Centre Revenue (Rs million) Revenue 2015-16 2016-17 2017-18 2018-19 2019-20 2020-21 Total Data Centre Revenue Including VDS
32.7 38.95 183.8 232.62 315.16 483 1,286.23
Source: National Telecommunication Corporation
(iii) Average Revenue Per Users (With Out STC) Table 17.4: Average Revenue Per Users (With Out STC) (Rs million) Particulars As on
30-06-2017 As on
30-06-2018 As on
30-06-2019 As on
30-06-2020 As on
30-06-2021 Telephone Connection 122,659 121,464 119,935 120,765 120,477
DSL/EVO Connection 22,004 25,443 27,354 29,350 27,665
Total 144,663 146,907 147,289 150,115 148,142 Source: National Telecommunication Corporation
IGNITE (National Technology Fund)
Innovation and Entrepreneurship in ITS
National Incubation Centers
The critical role played by startups in economic growth, job creation, financial inclusion, reducing the income divide, and building a knowledge economy, Ignite under the auspices of MoITT, launched a program to build a network of National Incubation Centers (NIC). IGNITE has successfully established 5 National Incubation Centers (NIC) in Federal Capital and all Provincial Capitals of the Country. From July-December FY2022, more than 930 startups have been inducted in five NICs (Islamabad, Lahore, Peshawar, Karachi & Quetta). RFPs of the two new NICs in Faisalabad and Hyderabad have been published and these NICs will be operational by the end of FY2022.
Overall Achievement
Overall achievements can be seen in Figure 3.
Fig-3:
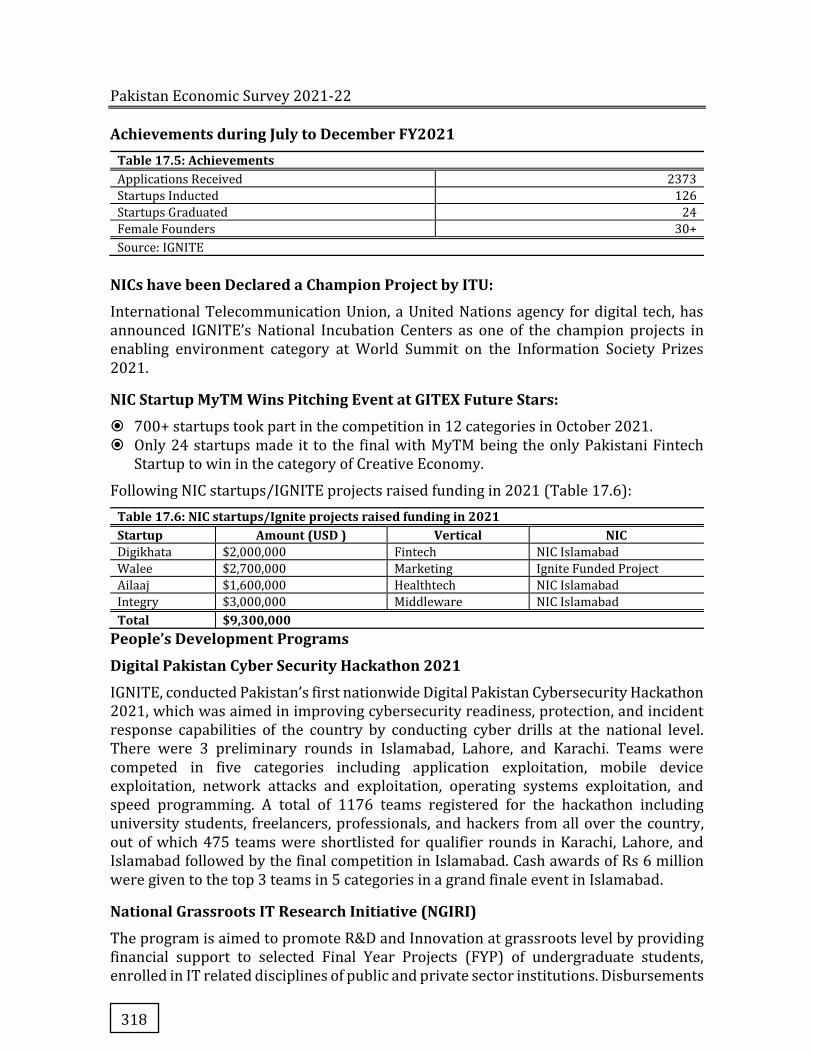
Pakistan Economic Survey 2021-22
318
Achievements during July to December FY2021 Table 17.5: Achievements Applications Received 2373
Startups Inducted 126
Startups Graduated 24
Female Founders 30+
Source: IGNITE
NICs have been Declared a Champion Project by ITU:
International Telecommunication Union, a United Nations agency for digital tech, has announced IGNITE’s National Incubation Centers as one of the champion projects in enabling environment category at World Summit on the Information Society Prizes 2021.
NIC Startup MyTM Wins Pitching Event at GITEX Future Stars:
� 700+ startups took part in the competition in 12 categories in October 2021. � Only 24 startups made it to the final with MyTM being the only Pakistani Fintech
Startup to win in the category of Creative Economy. Following NIC startups/IGNITE projects raised funding in 2021 (Table 17.6):
Table 17.6: NIC startups/Ignite projects raised funding in 2021 Startup Amount (USD ) Vertical NIC Digikhata $2,000,000 Fintech NIC Islamabad
Walee $2,700,000 Marketing Ignite Funded Project
Ailaaj $1,600,000 Healthtech NIC Islamabad
Integry $3,000,000 Middleware NIC Islamabad
Total $9,300,000 People’s Development Programs
Digital Pakistan Cyber Security Hackathon 2021
IGNITE, conducted Pakistan’s first nationwide Digital Pakistan Cybersecurity Hackathon 2021, which was aimed in improving cybersecurity readiness, protection, and incident response capabilities of the country by conducting cyber drills at the national level. There were 3 preliminary rounds in Islamabad, Lahore, and Karachi. Teams were competed in five categories including application exploitation, mobile device exploitation, network attacks and exploitation, operating systems exploitation, and speed programming. A total of 1176 teams registered for the hackathon including university students, freelancers, professionals, and hackers from all over the country, out of which 475 teams were shortlisted for qualifier rounds in Karachi, Lahore, and Islamabad followed by the final competition in Islamabad. Cash awards of Rs 6 million were given to the top 3 teams in 5 categories in a grand finale event in Islamabad.
National Grassroots IT Research Initiative (NGIRI)
The program is aimed to promote R&D and Innovation at grassroots level by providing financial support to selected Final Year Projects (FYP) of undergraduate students, enrolled in IT related disciplines of public and private sector institutions. Disbursements
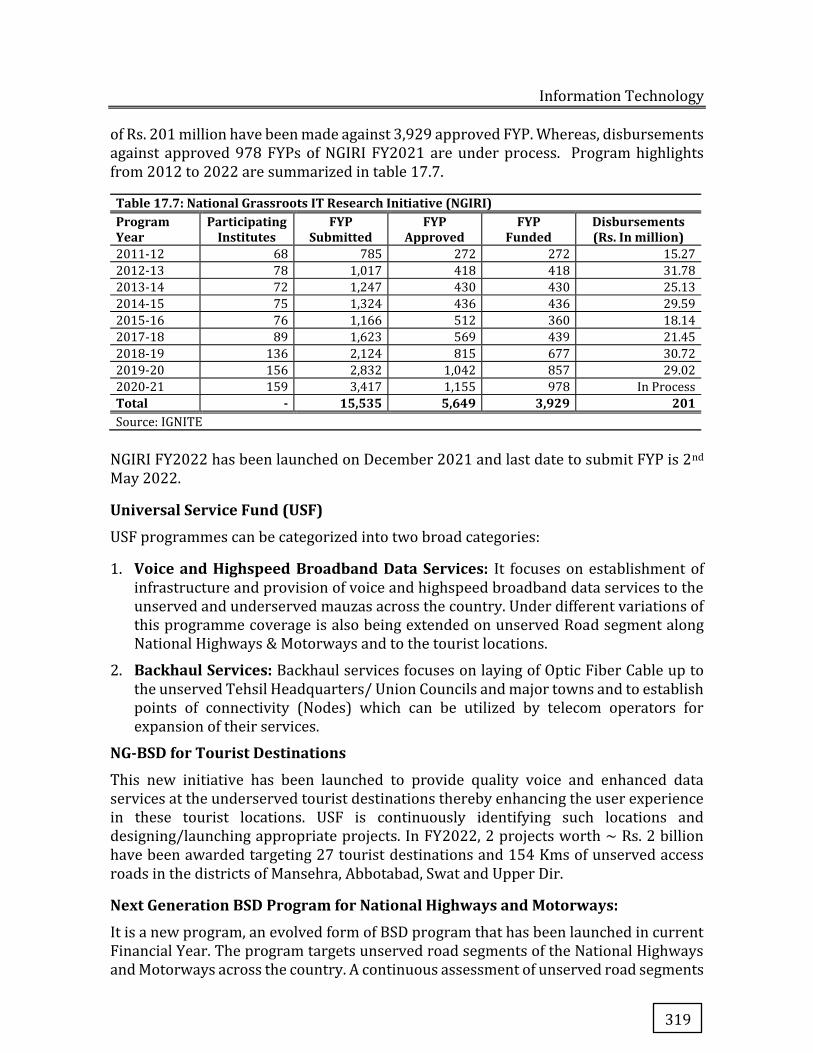
Information Technology
319
of Rs. 201 million have been made against 3,929 approved FYP. Whereas, disbursements against approved 978 FYPs of NGIRI FY2021 are under process. Program highlights from 2012 to 2022 are summarized in table 17.7.
Table 17.7: National Grassroots IT Research Initiative (NGIRI) Program Year
Participating Institutes
FYP Submitted
FYP Approved
FYP Funded
Disbursements (Rs. In million)
2011-12 68 785 272 272 15.27
2012-13 78 1,017 418 418 31.78
2013-14 72 1,247 430 430 25.13
2014-15 75 1,324 436 436 29.59
2015-16 76 1,166 512 360 18.14
2017-18 89 1,623 569 439 21.45
2018-19 136 2,124 815 677 30.72
2019-20 156 2,832 1,042 857 29.02
2020-21 159 3,417 1,155 978 In Process
Total - 15,535 5,649 3,929 201 Source: IGNITE
NGIRI FY2022 has been launched on December 2021 and last date to submit FYP is 2nd May 2022.
Universal Service Fund (USF)
USF programmes can be categorized into two broad categories:
1. Voice and Highspeed Broadband Data Services: It focuses on establishment of infrastructure and provision of voice and highspeed broadband data services to the unserved and underserved mauzas across the country. Under different variations of this programme coverage is also being extended on unserved Road segment along National Highways & Motorways and to the tourist locations.
2. Backhaul Services: Backhaul services focuses on laying of Optic Fiber Cable up to the unserved Tehsil Headquarters/ Union Councils and major towns and to establish points of connectivity (Nodes) which can be utilized by telecom operators for expansion of their services.
NG-BSD for Tourist Destinations
This new initiative has been launched to provide quality voice and enhanced data services at the underserved tourist destinations thereby enhancing the user experience in these tourist locations. USF is continuously identifying such locations and designing/launching appropriate projects. In FY2022, 2 projects worth ~ Rs. 2 billion have been awarded targeting 27 tourist destinations and 154 Kms of unserved access roads in the districts of Mansehra, Abbotabad, Swat and Upper Dir.
Next Generation BSD Program for National Highways and Motorways:
It is a new program, an evolved form of BSD program that has been launched in current Financial Year. The program targets unserved road segments of the National Highways and Motorways across the country. A continuous assessment of unserved road segments
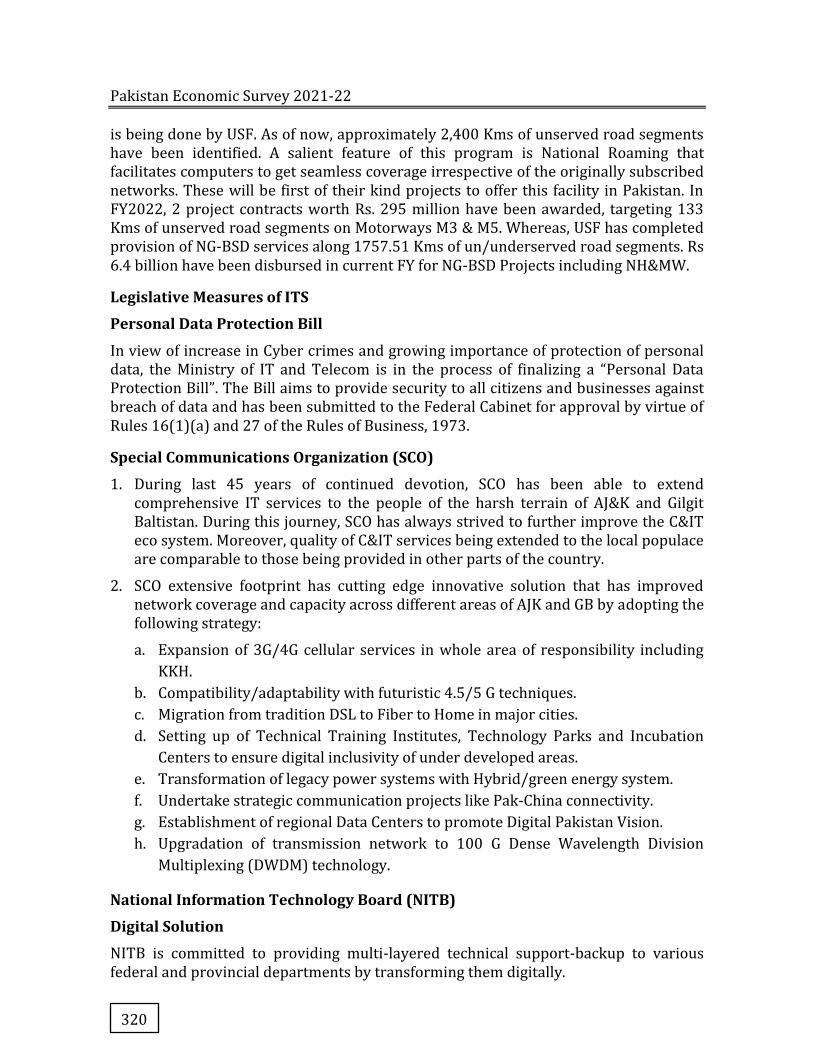
Pakistan Economic Survey 2021-22
320
is being done by USF. As of now, approximately 2,400 Kms of unserved road segments have been identified. A salient feature of this program is National Roaming that facilitates computers to get seamless coverage irrespective of the originally subscribed networks. These will be first of their kind projects to offer this facility in Pakistan. In FY2022, 2 project contracts worth Rs. 295 million have been awarded, targeting 133 Kms of unserved road segments on Motorways M3 & M5. Whereas, USF has completed provision of NG-BSD services along 1757.51 Kms of un/underserved road segments. Rs 6.4 billion have been disbursed in current FY for NG-BSD Projects including NH&MW.
Legislative Measures of ITS
Personal Data Protection Bill
In view of increase in Cyber crimes and growing importance of protection of personal data, the Ministry of IT and Telecom is in the process of finalizing a “Personal Data Protection Bill”. The Bill aims to provide security to all citizens and businesses against breach of data and has been submitted to the Federal Cabinet for approval by virtue of Rules 16(1)(a) and 27 of the Rules of Business, 1973.
Special Communications Organization (SCO)
1. During last 45 years of continued devotion, SCO has been able to extend comprehensive IT services to the people of the harsh terrain of AJ&K and Gilgit Baltistan. During this journey, SCO has always strived to further improve the C&IT eco system. Moreover, quality of C&IT services being extended to the local populace are comparable to those being provided in other parts of the country.
2. SCO extensive footprint has cutting edge innovative solution that has improved network coverage and capacity across different areas of AJK and GB by adopting the following strategy:
a. Expansion of 3G/4G cellular services in whole area of responsibility including
KKH.
b. Compatibility/adaptability with futuristic 4.5/5 G techniques.
c. Migration from tradition DSL to Fiber to Home in major cities.
d. Setting up of Technical Training Institutes, Technology Parks and Incubation
Centers to ensure digital inclusivity of under developed areas.
e. Transformation of legacy power systems with Hybrid/green energy system.
f. Undertake strategic communication projects like Pak-China connectivity.
g. Establishment of regional Data Centers to promote Digital Pakistan Vision.
h. Upgradation of transmission network to 100 G Dense Wavelength Division
Multiplexing (DWDM) technology.
National Information Technology Board (NITB)
Digital Solution
NITB is committed to providing multi-layered technical support-backup to various federal and provincial departments by transforming them digitally.
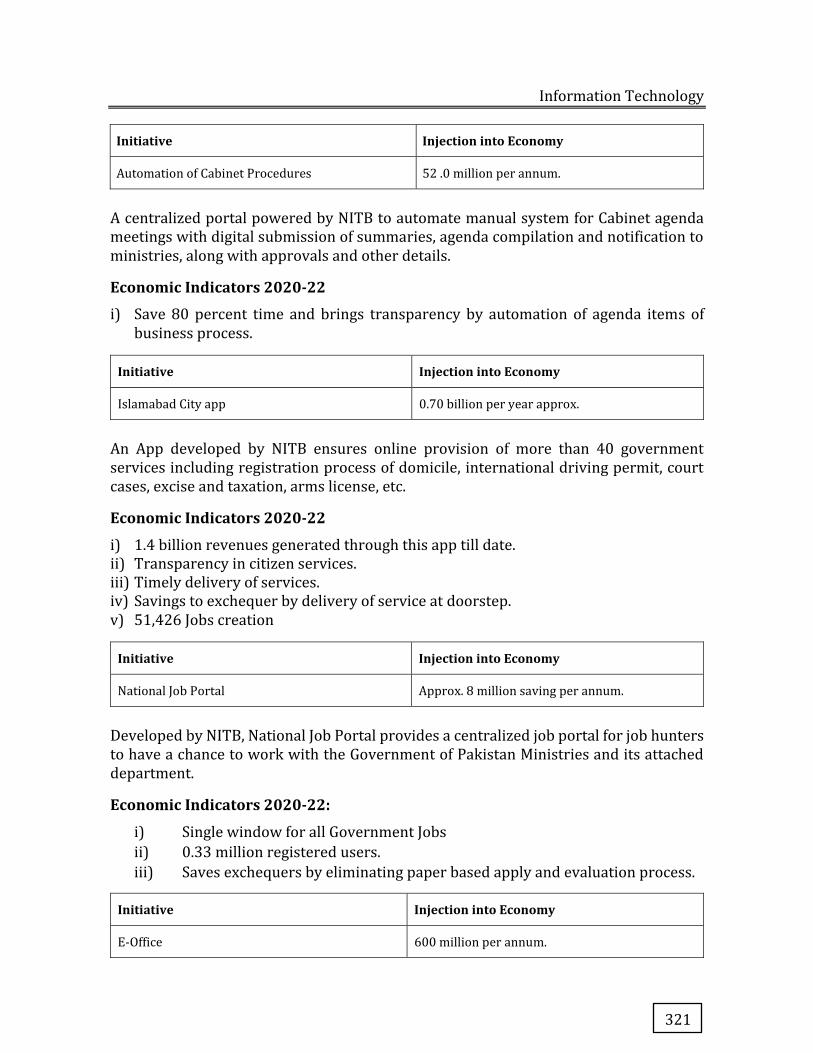
Information Technology
321
Initiative Injection into Economy
Automation of Cabinet Procedures 52 .0 million per annum.
A centralized portal powered by NITB to automate manual system for Cabinet agenda meetings with digital submission of summaries, agenda compilation and notification to ministries, along with approvals and other details.
Economic Indicators 2020-22
i) Save 80 percent time and brings transparency by automation of agenda items of business process.
Initiative Injection into Economy
Islamabad City app 0.70 billion per year approx.
An App developed by NITB ensures online provision of more than 40 government services including registration process of domicile, international driving permit, court cases, excise and taxation, arms license, etc.
Economic Indicators 2020-22
i) 1.4 billion revenues generated through this app till date. ii) Transparency in citizen services. iii) Timely delivery of services. iv) Savings to exchequer by delivery of service at doorstep. v) 51,426 Jobs creation
Initiative Injection into Economy
National Job Portal Approx. 8 million saving per annum.
Developed by NITB, National Job Portal provides a centralized job portal for job hunters to have a chance to work with the Government of Pakistan Ministries and its attached department.
Economic Indicators 2020-22:
i) Single window for all Government Jobs
ii) 0.33 million registered users.
iii) Saves exchequers by eliminating paper based apply and evaluation process.
Initiative Injection into Economy
E-Office 600 million per annum.
Pakistan Economic Survey 2021-22
322
An indigenous E-Government ERP/GRP is developed and being implemented in all the 40 federal ministries/divisions along with underlined 140 departments. E-Office is a complete back-office automation suite.
Economic Indicators 2020-22
i) Up to 25 percent savings on POL ii) Up to 70 percent savings on annual stationery cost (approx. 600 million) iii) 100 percent Transparent, accountable system with executive dashboard for decision
making. iv) 80 percent of time savings in process time. v) Increase government efficiency.
Initiative Injection into Economy
Kamyab Jawan 39.4 billion Transparent distribution.
A youth-centric platform that ensures a smooth online process from submission of loan applications to provision of loan grants for the people of Pakistan under Prime Minister’s Kamyab Jawan Program.
Economic Indicators 2020-22:
i) 46.9 billion allocations.
ii) 39.4 billion loan distribution to create entrepreneurs.
iii) 5426 Jobs created.
All data publicly available at (https://kamyabjawan.gov.pk/kjhome/dashboarddetails).
1. Pass Track
a) Pass Track app by the NITB, as part of Management for traveler coming over to Pakistan.
b) It aids in recording and tracking of passengers' basic information. The application comes with scanning option of National Identity Card and Passport of Pakistan.
2. Think-Tank
Think-Tank Portal is developed for National Security Division (NSD), in which NSD will make/finalize national policies or decisions on the basis of data/queries provided to them.
3. SPPC Treaty Portal
SPPC Treaty Portal ID being developed for NSD in which all agreements and treaty with other countries are listed and also their status is shown.
4. FM Portal
FM Portal is a Complaint Management System for foreigners. Foreigners can file their complaints regarding foreign issues in this portal/application and track their status.
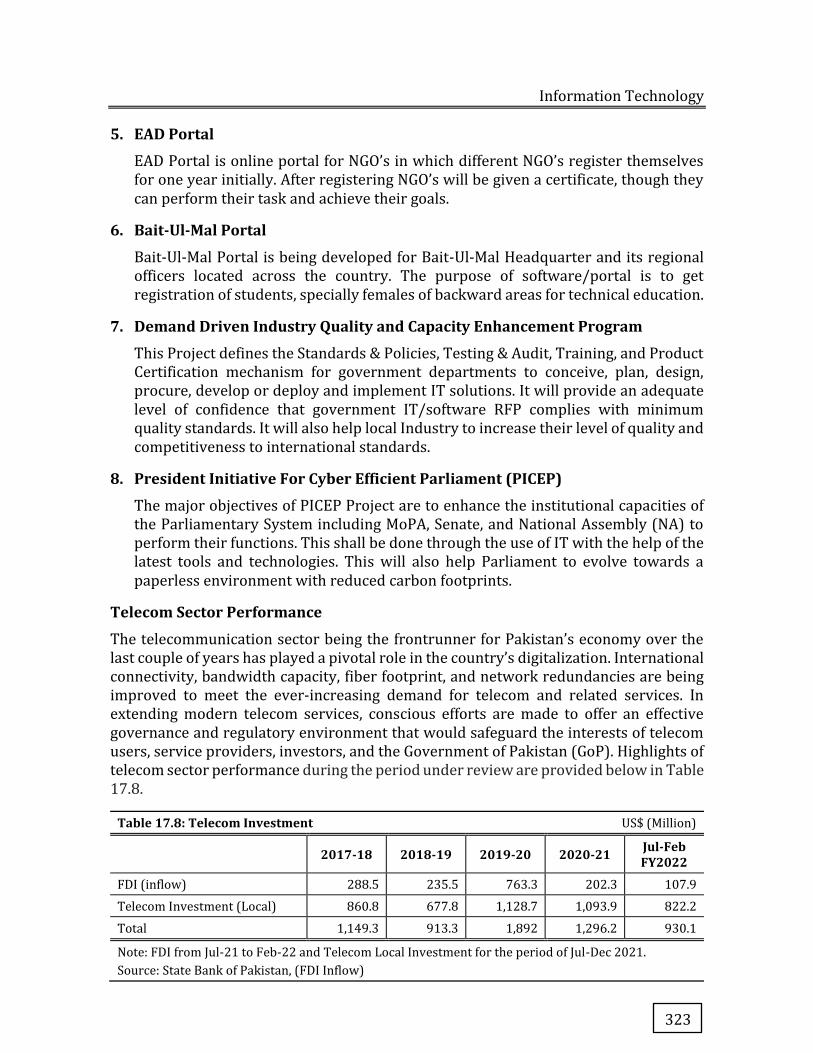
Information Technology
323
5. EAD Portal
EAD Portal is online portal for NGO’s in which different NGO’s register themselves for one year initially. After registering NGO’s will be given a certificate, though they can perform their task and achieve their goals.
6. Bait-Ul-Mal Portal
Bait-Ul-Mal Portal is being developed for Bait-Ul-Mal Headquarter and its regional officers located across the country. The purpose of software/portal is to get registration of students, specially females of backward areas for technical education.
7. Demand Driven Industry Quality and Capacity Enhancement Program
This Project defines the Standards & Policies, Testing & Audit, Training, and Product Certification mechanism for government departments to conceive, plan, design, procure, develop or deploy and implement IT solutions. It will provide an adequate level of confidence that government IT/software RFP complies with minimum quality standards. It will also help local Industry to increase their level of quality and competitiveness to international standards.
8. President Initiative For Cyber Efficient Parliament (PICEP)
The major objectives of PICEP Project are to enhance the institutional capacities of the Parliamentary System including MoPA, Senate, and National Assembly (NA) to perform their functions. This shall be done through the use of IT with the help of the latest tools and technologies. This will also help Parliament to evolve towards a paperless environment with reduced carbon footprints.
Telecom Sector Performance
The telecommunication sector being the frontrunner for Pakistan’s economy over the last couple of years has played a pivotal role in the country’s digitalization. International connectivity, bandwidth capacity, fiber footprint, and network redundancies are being improved to meet the ever-increasing demand for telecom and related services. In extending modern telecom services, conscious efforts are made to offer an effective governance and regulatory environment that would safeguard the interests of telecom users, service providers, investors, and the Government of Pakistan (GoP). Highlights of telecom sector performance during the period under review are provided below in Table 17.8.
Table 17.8: Telecom Investment US$ (Million)
2017-18 2018-19 2019-20 2020-21 Jul-Feb FY2022
FDI (inflow) 288.5 235.5 763.3 202.3 107.9
Telecom Investment (Local) 860.8 677.8 1,128.7 1,093.9 822.2
Total 1,149.3 913.3 1,892 1,296.2 930.1
Note: FDI from Jul-21 to Feb-22 and Telecom Local Investment for the period of Jul-Dec 2021.
Source: State Bank of Pakistan, (FDI Inflow)
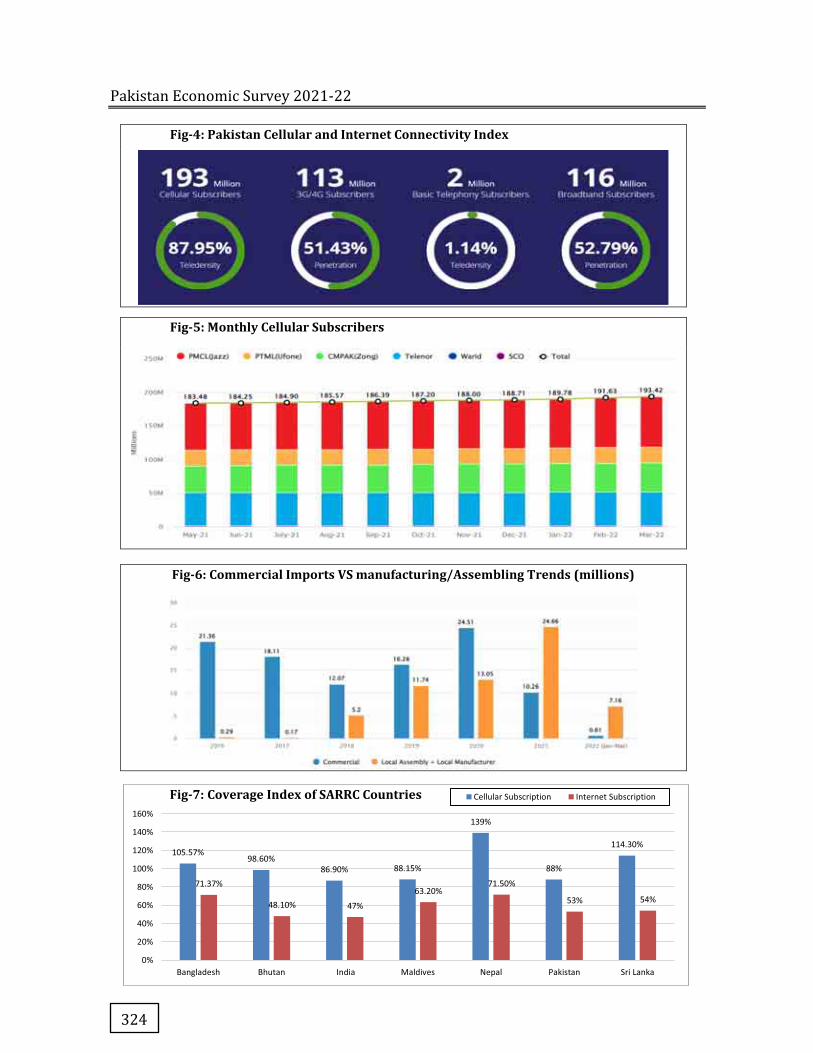
Pakistan Economic Survey 2021-22
324
Fig-4: Pakistan Cellular and Internet Connectivity Index
Fig-5: Monthly Cellular Subscribers
Fig-6: Commercial Imports VS manufacturing/Assembling Trends (millions)
105.57%98.60%
86.90% 88.15%
139%
88%
114.30%
71.37%
48.10% 47%
63.20%71.50%
53% 54%
0%
20%
40%
60%
80%
100%
120%
140%
160%
Bangladesh Bhutan India Maldives Nepal Pakistan Sri Lanka
Fig-7: Coverage Index of SARRC Countries Cellular Subscription Internet Subscription
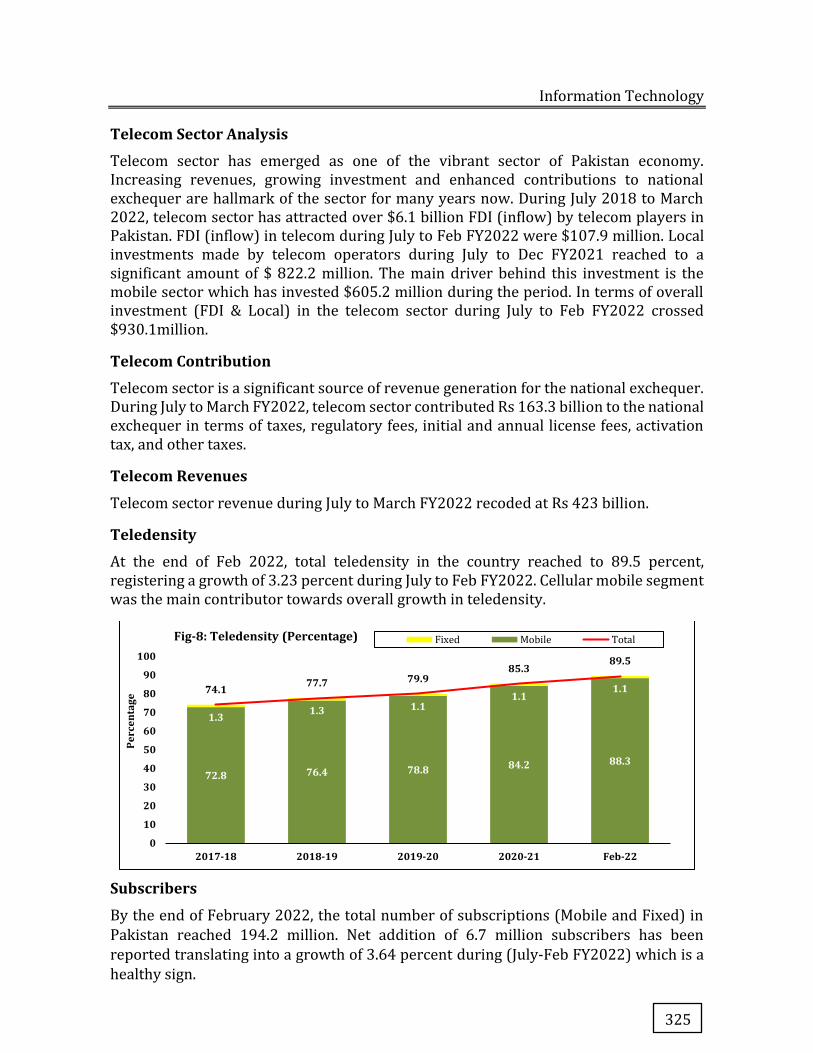
Information Technology
325
Telecom Sector Analysis
Telecom sector has emerged as one of the vibrant sector of Pakistan economy. Increasing revenues, growing investment and enhanced contributions to national exchequer are hallmark of the sector for many years now. During July 2018 to March 2022, telecom sector has attracted over $6.1 billion FDI (inflow) by telecom players in Pakistan. FDI (inflow) in telecom during July to Feb FY2022 were $107.9 million. Local investments made by telecom operators during July to Dec FY2021 reached to a significant amount of $ 822.2 million. The main driver behind this investment is the mobile sector which has invested $605.2 million during the period. In terms of overall investment (FDI & Local) in the telecom sector during July to Feb FY2022 crossed $930.1million.
Telecom Contribution
Telecom sector is a significant source of revenue generation for the national exchequer. During July to March FY2022, telecom sector contributed Rs 163.3 billion to the national exchequer in terms of taxes, regulatory fees, initial and annual license fees, activation tax, and other taxes.
Telecom Revenues
Telecom sector revenue during July to March FY2022 recoded at Rs 423 billion.
Teledensity
At the end of Feb 2022, total teledensity in the country reached to 89.5 percent, registering a growth of 3.23 percent during July to Feb FY2022. Cellular mobile segment was the main contributor towards overall growth in teledensity.
Subscribers
By the end of February 2022, the total number of subscriptions (Mobile and Fixed) in
Pakistan reached 194.2 million. Net addition of 6.7 million subscribers has been
reported translating into a growth of 3.64 percent during (July-Feb FY2022) which is a
healthy sign.
72.8 76.4 78.8 84.2 88.3
1.3 1.3 1.11.1
1.174.1 77.7 79.985.3
89.5
0
10
20
30
40
50
60
70
80
90
100
2017-18 2018-19 2019-20 2020-21 Feb-22
Perc
enta
ge
Fig-8: Teledensity (Percentage) Fixed Mobile Total
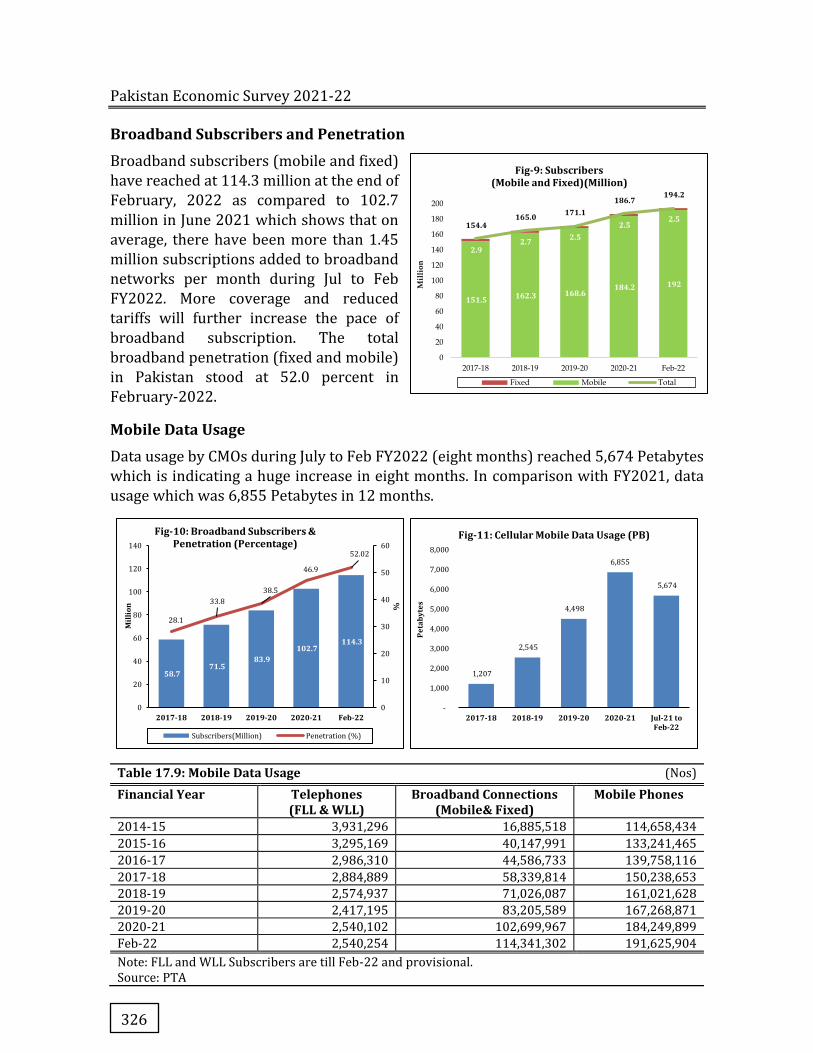
Pakistan Economic Survey 2021-22
326
Broadband Subscribers and Penetration
Broadband subscribers (mobile and fixed)
have reached at 114.3 million at the end of
February, 2022 as compared to 102.7
million in June 2021 which shows that on
average, there have been more than 1.45
million subscriptions added to broadband
networks per month during Jul to Feb
FY2022. More coverage and reduced
tariffs will further increase the pace of
broadband subscription. The total
broadband penetration (fixed and mobile)
in Pakistan stood at 52.0 percent in
February-2022.
Mobile Data Usage
Data usage by CMOs during July to Feb FY2022 (eight months) reached 5,674 Petabytes
which is indicating a huge increase in eight months. In comparison with FY2021, data
usage which was 6,855 Petabytes in 12 months.
Table 17.9: Mobile Data Usage (Nos)
Financial Year Telephones (FLL & WLL)
Broadband Connections (Mobile& Fixed)
Mobile Phones
2014-15 3,931,296 16,885,518 114,658,434
2015-16 3,295,169 40,147,991 133,241,465
2016-17 2,986,310 44,586,733 139,758,116
2017-18 2,884,889 58,339,814 150,238,653
2018-19 2,574,937 71,026,087 161,021,628
2019-20 2,417,195 83,205,589 167,268,871
2020-21 2,540,102 102,699,967 184,249,899
Feb-22 2,540,254 114,341,302 191,625,904
Note: FLL and WLL Subscribers are till Feb-22 and provisional. Source: PTA
58.7 71.5
83.9 102.7
114.3
28.1
33.8
38.5
46.9
52.02
0
10
20
30
40
50
60
0
20
40
60
80
100
120
140
2017-18 2018-19 2019-20 2020-21 Feb-22
Mill
ion %
Fig-10: Broadband Subscribers & Penetration (Percentage)
Subscribers(Million) Penetration (%)
1,207
2,545
4,498
6,855
5,674
-
1,000
2,000
3,000
4,000
5,000
6,000
7,000
8,000
2017-18 2018-19 2019-20 2020-21 Jul-21 toFeb-22
Peta
byte
s
Fig-11: Cellular Mobile Data Usage (PB)
151.5 162.3 168.6 184.2 192
2.9 2.7 2.5
2.5 2.5
154.4 165.0 171.1
186.7 194.2
0
20
40
60
80
100
120
140
160
180
200
2017-18 2018-19 2019-20 2020-21 Feb-22
Million
Fig-9: Subscribers(Mobile and Fixed)(Million)
Fixed Mobile Total
Information Technology
327
Regulatory Activities
National Broadband Forum
Fiberization plays an important role in a world heading towards broadband technologies. In Pakistan, relatively lower speed of fixed broadband networks is causing staggered growth of broadband subscribers and lower Internet speed. To address this issue, PTA and Huawei Technologies Pakistan jointly organized a national broadband network forum themed ‘Broadband for All,’ where local and foreign stakeholders shared their insight on transformative technologies and viable solutions to challenges impeding broadband proliferation in Pakistan. In the forum Pakistan’s Progress was linked to extensive digitalization of all sectors. The forum was followed by a panel discussion on challenges and issues confronting operators in the expansion of fiber networks across the country. The effectiveness of Fiber to the Home (FTTH) and wireless technologies for spread of broadband were highlighted in relation to different geographical areas. The private sector underlined the importance of Government support as efforts to improve the footprint continue. The broadband network forum was the first of its kind arranged by the regulator, and will now be convened on a regular basis to expedite broadband proliferation in the country.
Spectrum Auction in Pakistan
The process for cellular mobile spectrum auction teed off in September 2020. In accordance with timelines mentioned in the ‘Information Memorandum (IM) for the spectrum auction for NGMS in Pakistan 2021’, the opening of applications and sealed bid offers from prospective applicants was completed on September 9, 2021. PTML (Ufone) won the auction upon scrutiny of its submitted bid by PTA. Total spectrum won by Ufone is 9 MHz in 1800 MHz band, which is 70.3 percent of the total offered spectrum in the said band during the current auction. This addition will increase Ufone spectrum holdings from 6 MHz to 15 MHz in 1800 MHz band, thereby enhancing quality and increasing its coverage footprint for voice and data services. This auction has generated revenue of US$ 279 million.
Spectrum Auction in AJ&K and GB
The first-ever cellular spectrum auction for Next Generation Mobile Services (NGMS) in AJ&K and GB successfully concluded at the PTA Headquarters on September 28, 2021. Two operators CMPak (Zong) and PMCL (Jazz) participated in the electronic auction for 1800 MHz band. After 18 rounds, Zong was declared winner of 10 MHz (2 blocks of 5 MHz) in 1800 MHz band against a price of US$ 14.398 million. The spectrum sold in 1800 MHz band constituted 85 percent of the total offered spectrum in the said band for AJ&K and GB. Furthermore, Telenor, Ufone, and Zong also won 1.2 MHz in 1800 MHz band. Telenor Pakistan was declared winner in 2100 MHz band for a spectrum of 15 MHz against the set base price. The spectrum sold in 2100 MHz band constituted 50 percent of the total offered spectrum in the said band. The total revenue generated from the spectrum auction for AJK & GB stood at over US$ 30 million. New licenses were issued to CMPak (Zong), Telenor Pakistan, and Pakistan Telecommunications Mobile Limited (PTML; Ufone) for the spectrum secured in the auction process for AJ&K and GB. The award of licenses for NGMS in the two regions will contribute towards strengthening
Pakistan Economic Survey 2021-22
328
uninterrupted provision of better telecom services to the people of AJ&K and GB in line with GoP’s ‘Digital Pakistan’ vision.
Mobile Termination Rate
In the review of 2019, Mobile Termination Rate (MTR) were fixed at Rs. 0.70 per minute from January 2020 onwards. Still on the higher side while benchmarking, the 2021 review of the MTR determined the rate to be at Rs. 0.50 for Jan 2022- June 2022, which will be further reduced to Rs. 0.40 for period of July 2022 to June 2023 and will be finally set at Rs. 0.30 from July 2023 onwards. PTA issued determination on above rates of MTR on November 24, 2021 and determined these MTR for Pakistan and AJ&K and GB for all types of calls (i.e. local, long distance and international incoming calls) terminated on mobile networks from other mobile networks or fixed networks.
4G Data Sites in Waziristan
PTA conducted a QoS survey in South Waziristan to check the status of telecom services. CMOs were asked to not only improve their services but also upgrade their 3G data sites. Accordingly, Jazz and Ufone which were providing 3G data services in South Waziristan, upgraded all of their 3G sites to 4G, allowing subscribers to enjoy high-speed data services. PTA is continuously following up with CMOs to install more sites in the area so that better voice and data services can be extended to subscribers in line with the vision of the Prime Minister of Pakistan.
National Telecom Computer Emergency Readiness and Response Team (NTCERT)
In its role as a regulator, PTA has been mandated to establish sector-level cyber security capabilities i.e., the National Telecom Security Operations Center and the National Telecom Computer Emergency Response Team Threat Intelligence Center (NTSOC/NTCERT) to safeguard critical telecom infrastructure and to contribute to combatting cyber security threats at the national level. In line with its legal, regulatory, and official mandate, PTA established sector-specific NTCERT in 2020 for coordination with the industry on cyber security and threat intelligence. To automate the CERT processes, a web portal was established in early 2021 for two-way coordination with the industry. The licensee can utilize this portal to share security information, threat intelligence information, and incident/data breach related information, etc.
Table 17.10: PTA Internal NTCERT Advisories Year Q1 Q2 Q3 Q4 Total 2018-19 9 11 9 10 39
2019-20 11 9 10 10 40
2020-21 11 14 12 11 48
2021-22 8 9 8 - 25
Total 39 43 39 31 152
Source: PTA
The following steps have been taken as part of NTCERT functioning so far (Table 17.20).
� As part of local advisory services of Telecom CERT, PTA’s cyber security team issued approximately 152 security advisories and more than 160 security alerts to telecom
Information Technology
329
operators on latest cyber threats and vulnerabilities.
� The portal’s secure access was shared with all licensees. Many telecom operators are currently using the portal for threat intelligence information exchange, security readiness, and compliance.
Device Identification, Registration and Blocking System (DIRBS) Table 17.11: Commercial Imports Trends Calendar Year Commercial Import + Local
Manufactured Quantity (million) 2016 21.60
2017 19.80
2018 17.20
2019 28.02
2020 38.06
2021 34.92
2022 (Jan-Mar) 7.76
Source: PTA
Following is the impact of DIRBS on the status of blocked, banned, and barred devices in Pakistan:
� 29.18 million fake/replica mobile devices blocked. � 175,000 International Mobile Equipment Identity(IMEI) devices (reported stolen)
banned. � 880,780 IMEI devices identified as cloned/duplicated against 5.28 million MSISDN
barred on networks. � Local manufacturing in 2021 surpassed the finished device import for the 1st time in
countries history Local Assembly and Manufacturing Trends
Table 17.12: Local Assembly and Manufacturing Trends Calendar Year
Local Manufacturing Quantity (million)
DIRBS Impact Job Creation (approx)
No. of Companies
2016 0.3
200 3
2017 1.7
600 3
2018 5.2
3000 9
2019 11.7 Increase by 125% from 2018 8000 11
2020 13.1 2.16 Million 4G Smart Phones assembled in Pakistan
600 3
2021 24.7 10.06 Million Smart Phones Manufactured in Pakistan
2,000 30
2022 (Mar)
7.16 2.83 Million 4G smart Phones Manufactured in Pakistan
22,000 30
Source: PTA
DIRBS has created a level playing field for all entities in Pakistan, resulting in establishment of local assembly plants. In view of the successful development of this industry, PTA issued MDM Regulations, 2021, in accordance with the Mobile

Pakistan Economic Survey 2021-22
330
Manufacturing Policy issued by GoP in June 2020. The policy offers incentives including tax exemptions, etc., for all entities that establish manufacturing plants in Pakistan.
As many as 30 local and foreign companies both stand alone and joint ventures have obtained 10-year MDM authorization from PTA and have established manufacturing plants for the purpose. Leading brands including Samsung, Xiaomi, Oppo, Vivo, Nokia, Techno, and Infinix, ZTE, among others, have established their plants in Pakistan. Local manufacturing has enabled smart phone manufacturing in Pakistan, created job opportunities in skilled areas, and promoted affordability for consumers. Table 17.12 provides a summary of local manufacturing and its impact on job creation, and reliability of locally manufactured 4G phones.
Complaint Management System
PTA received 165,610 complaints against Mobile, ISPs, Basic Telephony (fixed line) and Wireless Telephony (WLL) during the 9 months period FY 2021-22with 97.7 percent of the complaints being addressed. Approximately 30 percent of the consumer complaints against CMOs were related to fraudulent Call/SMS reporting.
Table 17.13: Summary/Status of Consumer Complaints Received at PTA (July 2021-March 2022) Service Type Total Complaints Addressed Complaints Redressal/Disposal % Mobile 158411 154,816 97.73
Internet 3,714 3,637 97.93
FLL 3,344 3,302 98.74
WLL 141 134 95.04
Total 165,610 161,889 97.7
Source: PTA
Pakistan Citizen Portal
Prime Minister of Pakistan inaugurated online mobile Application named Pakistan Citizen Portal (PCP), respond in the specific timeline to address their PM Office is overseeing the progress on the Pakistan Citizen Portal (PCP). PTA is in receipt of complaints through PCP since November 12, 2018. To handle these complaints, a dedicated section is available and working to resolve the complaints from concerned telecom operator/licensee on top priority. Status of complaints is given Table 17.14.
Table 17.14: Status of Complaints received at PTA through PCP Portal from 12 November 2018 to 31 March, 2022
Total Complaints Received 61,066
Total Complaints Resolved/ Addressed 60,123
Redressal/ Disposal % 98.4%
Positive Feedback/ Satisfaction % 60%
Source: PTA
Raids on Illegal Gateways
To curb the menace of grey traffic (illegal call termination), PTA with the support of FIA carried out a number of successful raids across Pakistan. During Jan–Dec FY2021, as many as 08 raids were conducted, leading to confiscation of 18 illegal gateways and
Information Technology
331
arrest of 02 persons, against whom further proceedings in the court of law are being carried out by FIA.
Conclusion
The latest information system helps a country integrating domestically and globally by enhancing its capacity in the areas of fast internet access, software development, app development, adoption of technological gadgets, and digitization of economy. Modern IT infrastructure is the corner stone for realizing economic development because it improves access to information, connectivity and ameliorate entrepreneurial efficiency and growth.


(i)
C O N T E N T S ECONOMIC AND SOCIAL INDICATORS ................................................................................... 1-8
1 GROWTH AND INVESTMENT 1.1 Gross National Product at Constant Basic Prices of 2015-16 .................................................. 11
1.2 Sectoral Shares in GDP ........................................................................................................... 12
1.3 Growth Rates (%) .................................................................................................................... 12
1.4 Gross National Product at Current Basic Prices ...................................................................... 13
1.5 Expenditure on Gross National Product At Current Prices .................................................... 14
1.6 Expenditure on Gross National Product At Constant Prices ................................................... 14
1.7 Gross Fixed Capital Formation (GFCF) in Private, Public and
General Government Sectors by Economic Activity At Current Market Prices ..................... 15
1.8 Gross Fixed Capital Formation (GFCF) in Private, Public and General Government
Sectors by Economic Activity At Constant Market Price of 2015-16 ..................................... 17
2 AGRICULTURE 2.1 A Index of Agricultural Production ............................................................................................. 21
2.1 B Basic Data on Agriculture ....................................................................................................... 22
2.2 Land Utilization ....................................................................................................................... 23
2.3 Area under Important Crops .................................................................................................... 24
2.4 Production of Important Crops ................................................................................................ 24
2.5 Yield Per Hectare of Major Agricultural Crops....................................................................... 25
2.6 Production and Export of Fruits .............................................................................................. 25
2.7 Crop-wise Composition of Output of Major Agricultural Crops
(At Constant Basic Prices) ....................................................................................................... 26
2.8 Credit Disbursed by Agencies. ................................................................................................ 26
2.9 Fertilizer Off-Take and Imports of Pesticides ......................................................................... 27
2.10 Average Retail Sale Price of Fertilizers................................................................................... 27
2.11 Area Irrigated by Different Sources ........................................................................................ 28
2.12 Procurement/Support Prices of Agricultural Commodities ..................................................... 28
2.13 Procurement, Releases and Stocks of Wheat .......................................................................... 29
2.14 Livestock Population ............................................................................................................... 29
2.15 Livestock Products .................................................................................................................. 30
3 MANUFACTURING AND MINING 3.1 Reserves and Extraction of Principal Minerals........................................................................ 33
3.2 Production Index of Mining and Manufacturing ..................................................................... 34
3.3 Cotton Textiles Statistics ......................................................................................................... 34
3.4 Production of Fertilizers, Vegetable Ghee, Sugar and Cement ............................................... 35
3.5 Production of Selected Industrial Items ................................................................................... 35
3.6 Percent Growth of Selected Industrial Items ........................................................................... 37
4 FISCAL DEVELOPMENT 4.1 Federal Government Overall Budgetary Position .................................................................... 41

(ii)
4.2 Summary of Public Finance (Consolidated Federal and Provincial Governments) ................. 42
4.3 Consolidated Federal and Provincial Government Revenues .................................................. 43
4.4 Consolidated Federal and Provincial Government Expenditures ............................................ 44
4.5 Debt Servicing ........................................................................................................................ 44
5 MONEY AND CREDIT 5.1 Components of Broad Money (M2) ........................................................................................ 47
5.2 Causative Factors Associated with Broad Money (M2) .......................................................... 48
5.3 Scheduled Banks Consolidated Position Based on Last Weekend Position of Liabilities and Assets ............................................................................................ 49
5.4 List of Domestic, Foreign Banks and DFIs ............................................................................ 50
5.5 Security and Nature Wise Weighted Average Lending Rates (All Scheduled Banks) ............ 51
5.6 Sale of Market Treasury Bills Through Auction ..................................................................... 52
5.7 Sale of Pakistan Investment Bonds Through Auction ............................................................. 53
6 CAPITAL MARKETS & CORPORATE SECTOR 6.1 National Saving Schemes (Net Investment) ............................................................................ 57
6.2 Mark-up Rate/Profit Rate on Federal Government’s Debt Instruments .................................. 57
7 INFLATION 7.1 A Price Indices ........................................................................................................................... 61
7.1 B Head line & Core inflation ...................................................................................................... 62
7.1 C Price Indices ............................................................................................................................ 63
7.2 Monthly Percent Changes in CPI,WPI and SPI ....................................................................... 64
7.3 A Price Indices by Consumer Income Groups ............................................................................ 65
7.3 B Annual Changes in Price Indices and GDP Deflator ............................................................... 66
7.4 Average Retail Prices of Essential Items ................................................................................. 67
7.5 Indices of Wholesale Prices of Selected Commodities............................................................ 69
8 TRADE AND PAYMENTS 8.1 Summary of B.O.P .................................................................................................................. 73
8.2 Components of Balance of Payments (As Percent of GDP) .................................................... 74
8.3 Exports, Imports and Trade Balance ....................................................................................... 74
8.4 Unit Value Indices and Terms of Trade (T.O.T) ..................................................................... 75
8.5 Economic Classification of Exports and Imports .................................................................... 76
8.6 Major Imports .......................................................................................................................... 77
8.7 Major Exports .......................................................................................................................... 78
8.8 Destination of Exports and Origin of Imports ......................................................................... 79
8.9 Workers' Remittances .............................................................................................................. 80
8.10 Gold and Cash Foreign Exchange Reserves held and
controlled by State Bank of Pakistan ....................................................................................... 81
8.11 Exchange Rate Position (Pakistan Rupees in Terms of
One Unit of Foreign Currency) ............................................................................................... 82
9 PUBLIC DEBT 9.1 Public and Publicly Guaranteed debt outstanding as on 31-03-2022 ...................................... 85
(iii)
9.2 Commitments and Disbursements of Loans and Grants (By type) .......................................... 86
9.3 Annual Commitments, Disbursements, Service Payment and External Debt Outstanding ...................................................................................................... 87
9.4 Debt Service Payments on Foreign Loans (paid in foreign exchange) .................................... 88
9.5 Terms of Foreign Loan / Credits contracted by Pakistan ........................................................ 90
9.6 Grant Assistance Agreement Signed ....................................................................................... 93
9.7 Total Loans and Credit Contracted .......................................................................................... 94
10 EDUCATION 10.1 Number of Educational Institutions, by kind, level and sex .................................................... 97
10.2 Enrolment in education institutions by kind, level and sex ..................................................... 97
10.3 Number of teachers in educational institutions in Pakistan, by kind, level and sex ................ 97
11 HEALTH AND NUTRITION 11.1 National Medical and Health Establishment ......................................................................... 101
11.2 Registered Medical and Para Medical Personnel and Expenditure on Health ....................... 101
11.3 Data on Expanded Programme of Immunization Vaccination Performance ........................ 102
11.4 Doctor Clinic Fee in various cities ........................................................................................ 102
12 POPULATION, LABOUR FORCE AND EMPLOYMENT 12.1 Population. ............................................................................................................................. 105
12.2 Population in Rural/Urban Areas. ......................................................................................... 105
12.3 Population in Urban/Rural Areas 1972, 1981 and 1998 Census............................................ 106
12.4 Population by Age, Sex Urban/Rural Areas 1981and 1998 Census ...................................... 107
12.5 Enumerated Population of Pakistan by Province, Land Area
and Percentage Distribution 1951-2017 ................................................................................ 108
12.6 Literacy Ratios of Population by Sex, Region
and Urban/Rural Areas, 1998 and 1981 Census .................................................................... 109
12.7 Land Area and Percent Distribution ...................................................................................... 110
12.8 Percentage Distribution of Population of 10 years and Above and
Civilian Labour Force by Gender, Year2017-18 ................................................................... 111
12.9 Labour Force and Employment ............................................................................................. 112
12.10 Population and Labour Force ................................................................................................ 113
12.11 Distribution of Employed Persons of 10 Years Age
and above by Major Industries .............................................................................................. 113
12.12 Percentage Distribution of Employed Persons of 10 Years Age and above by
Major Industries, 2017-18 ..................................................................................................... 114
12.13 Age Specific Labour Force Participation Rate ...................................................................... 115
12.14 Daily Wages of Construction Workers in Different Cities .................................................... 116
13 TRANSPORT AND COMMUNICATIONS 13.1 A Length of Roads .................................................................................................................... 119
13.1 B Railways ................................................................................................................................ 119
13.1 C Pakistan National Shipping Corporation (PNSC) .................................................................. 120
13.1 D Ports-Cargo Handled ............................................................................................................. 120
13.2 Pakistan International Airlines Corporation (Operational) .................................................... 121
(iv)
13.2 Pakistan International Airlines Corporation (Revenue) ......................................................... 121
13.3 Number of Motor Vehicles Registered .................................................................................. 122
13.4 Motor Vehicles on Road LCV ............................................................................................... 122
13.4 Motor Vehicles on Road HCV .............................................................................................. 123
13.5 Motor Vehicles-Production ................................................................................................... 123
13.6 Motor Vehicles-Import .......................................................................................................... 124
13.7 Post and Telecommunications ............................................................................................... 125
14 ENERGY 14.1 Commercial Energy Consumption ........................................................................................ 129
14.2 Commercial Energy Supplies ................................................................................................ 130
14.3 Commercial Energy Supplies ............................................................................................... 131
14.4 Schedule of Electricity Tariffs ............................................................................................... 132
14.5 Oil Sale Prices ....................................................................................................................... 134
14.6 Gas Sale Prices ...................................................................................................................... 137
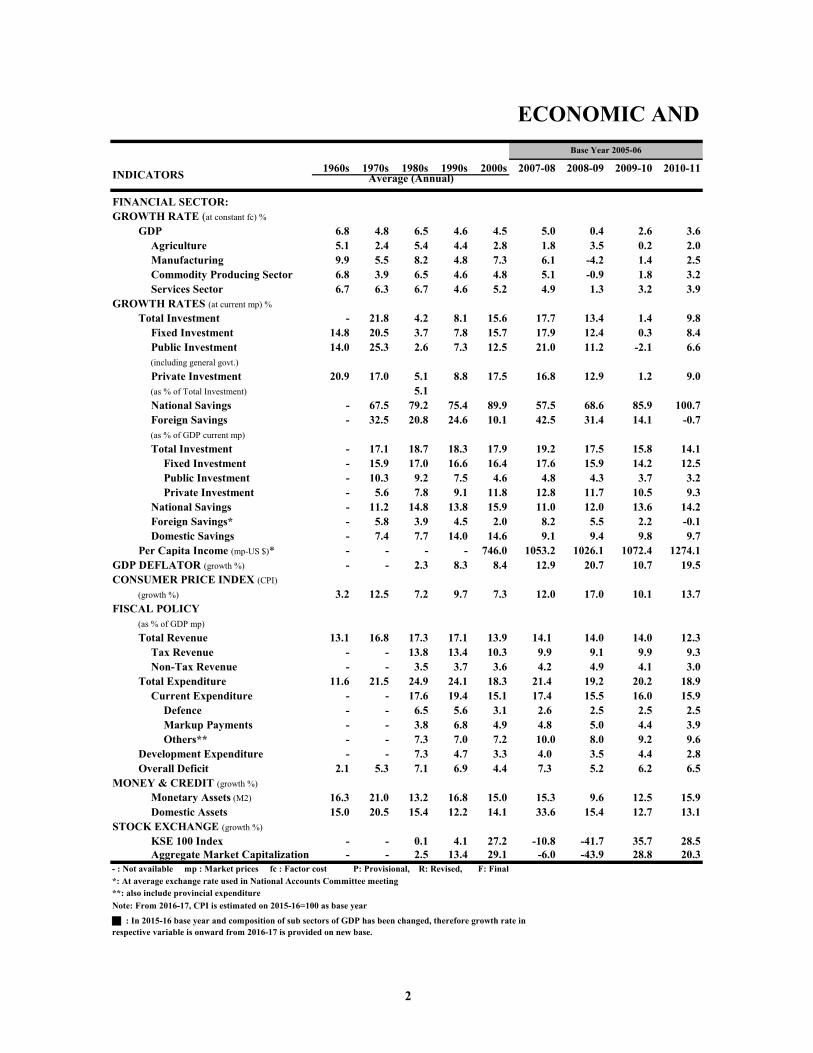
ECONOMIC AND
1960s 1970s 1980s 1990s 2000s 2007-08 2008-09 2009-10 2010-11
FINANCIAL SECTOR:GROWTH RATE (at constant fc) %
GDP 6.8 4.8 6.5 4.6 4.5 5.0 0.4 2.6 3.6Agriculture 5.1 2.4 5.4 4.4 2.8 1.8 3.5 0.2 2.0Manufacturing 9.9 5.5 8.2 4.8 7.3 6.1 -4.2 1.4 2.5Commodity Producing Sector 6.8 3.9 6.5 4.6 4.8 5.1 -0.9 1.8 3.2Services Sector 6.7 6.3 6.7 4.6 5.2 4.9 1.3 3.2 3.9
GROWTH RATES (at current mp) %
Total Investment - 21.8 4.2 8.1 15.6 17.7 13.4 1.4 9.8Fixed Investment 14.8 20.5 3.7 7.8 15.7 17.9 12.4 0.3 8.4Public Investment 14.0 25.3 2.6 7.3 12.5 21.0 11.2 -2.1 6.6(including general govt.)
Private Investment 20.9 17.0 5.1 8.8 17.5 16.8 12.9 1.2 9.0(as % of Total Investment) 5.1National Savings - 67.5 79.2 75.4 89.9 57.5 68.6 85.9 100.7Foreign Savings - 32.5 20.8 24.6 10.1 42.5 31.4 14.1 -0.7(as % of GDP current mp)
Total Investment - 17.1 18.7 18.3 17.9 19.2 17.5 15.8 14.1Fixed Investment - 15.9 17.0 16.6 16.4 17.6 15.9 14.2 12.5Public Investment - 10.3 9.2 7.5 4.6 4.8 4.3 3.7 3.2Private Investment - 5.6 7.8 9.1 11.8 12.8 11.7 10.5 9.3
National Savings - 11.2 14.8 13.8 15.9 11.0 12.0 13.6 14.2Foreign Savings* - 5.8 3.9 4.5 2.0 8.2 5.5 2.2 -0.1Domestic Savings - 7.4 7.7 14.0 14.6 9.1 9.4 9.8 9.7
Per Capita Income (mp-US $)* - - - - 746.0 1053.2 1026.1 1072.4 1274.1GDP DEFLATOR (growth %) - - 2.3 8.3 8.4 12.9 20.7 10.7 19.5CONSUMER PRICE INDEX (CPI)
(growth %) 3.2 12.5 7.2 9.7 7.3 12.0 17.0 10.1 13.7FISCAL POLICY
(as % of GDP mp)
Total Revenue 13.1 16.8 17.3 17.1 13.9 14.1 14.0 14.0 12.3Tax Revenue - - 13.8 13.4 10.3 9.9 9.1 9.9 9.3Non-Tax Revenue - - 3.5 3.7 3.6 4.2 4.9 4.1 3.0
Total Expenditure 11.6 21.5 24.9 24.1 18.3 21.4 19.2 20.2 18.9Current Expenditure - - 17.6 19.4 15.1 17.4 15.5 16.0 15.9
Defence - - 6.5 5.6 3.1 2.6 2.5 2.5 2.5Markup Payments - - 3.8 6.8 4.9 4.8 5.0 4.4 3.9Others** - - 7.3 7.0 7.2 10.0 8.0 9.2 9.6
Development Expenditure - - 7.3 4.7 3.3 4.0 3.5 4.4 2.8Overall Deficit 2.1 5.3 7.1 6.9 4.4 7.3 5.2 6.2 6.5
MONEY & CREDIT (growth %)
Monetary Assets (M2) 16.3 21.0 13.2 16.8 15.0 15.3 9.6 12.5 15.9Domestic Assets 15.0 20.5 15.4 12.2 14.1 33.6 15.4 12.7 13.1
STOCK EXCHANGE (growth %)
KSE 100 Index - - 0.1 4.1 27.2 -10.8 -41.7 35.7 28.5Aggregate Market Capitalization - - 2.5 13.4 29.1 -6.0 -43.9 28.8 20.3
- : Not available mp : Market prices fc : Factor cost P: Provisional, R: Revised, F: Final*: At average exchange rate used in National Accounts Committee meeting**: also include provincial expenditureNote: From 2016-17, CPI is estimated on 2015-16=100 as base year
���: In 2015-16 base year and composition of sub sectors of GDP has been changed, therefore growth rate in respective variable is onward from 2016-17 is provided on new base.
INDICATORS Average (Annual)
Base Year 2005-06
2

SOCIAL INDICATORS
2011-12 2012-13 2013-14 2014-15 2015-16 2016-17 2017-18 2018-19 2019-20 2020-21 2021-22�� F R (Jul-Mar) P
3.8 3.7 4.1 4.1 4.6 4.6 6.1 3.1 -0.9 5.7 6.03.6 2.7 2.5 2.1 0.2 2.2 3.9 0.9 3.9 3.5 4.42.1 4.9 5.7 3.9 3.7 4.9 7.1 4.5 -7.8 10.5 9.83.1 1.7 3.5 3.6 2.9 3.3 6.3 0.6 -0.6 5.4 5.74.4 5.1 4.5 4.4 5.7 5.6 6.0 5.0 -1.2 6.0 6.2
17.1 10.8 10.0 17.0 5.8 11.3 15.2 1.5 3.8 16.0 24.118.1 10.7 9.7 18.0 5.8 11.6 15.8 0.3 3.2 15.8 24.627.2 4.9 1.2 29.0 7.0 29.7 24.4 -24.0 -2.1 23.4 37.9
14.9 12.9 12.8 14.5 5.4 5.9 12.4 10.8 4.7 13.7 20.6
86.3 92.8 91.3 93.4 90.1 77.9 68.5 73.1 90.0 96.2 73.113.8 7.2 8.7 6.6 9.3 22.1 31.5 26.9 10.0 3.8 26.9
15.1 15.0 14.6 15.7 15.9 16.3 17.1 15.5 14.8 14.6 15.113.5 13.4 13.0 14.1 14.2 14.6 15.4 13.8 13.1 12.9 13.43.7 3.5 3.2 3.7 3.4 4.1 4.6 3.1 2.8 3.0 3.49.7 9.8 9.9 10.4 10.8 10.5 10.7 10.7 10.3 10.0 10.0
13.0 13.9 13.4 14.7 14.4 12.7 11.7 11.3 13.3 14.1 11.12.1 1.1 1.3 1.0 1.6 3.6 5.4 4.2 1.5 0.5 4.17.8 8.7 7.7 8.6 9.8 8.6 7.8 6.4 7.6 7.1 4.5
1320.5 1333.7 1388.8 1514.0 1639.7 1723.0 1767.9 1577.6 1457.6 1676.5 1797.55.7 7.1 7.4 4.3 0.5 4.0 3.7 9.2 9.9 10.4 13.3
11.0 7.4 8.6 4.5 2.9 4.8 4.7 6.8 10.7 8.9 11.0
12.8 13.3 14.5 14.3 13.6 13.9 13.3 11.2 13.2 12.4 8.810.2 9.8 10.2 11.0 10.4 10.4 10.8 9.7 9.3 9.4 7.22.6 3.5 4.3 3.3 3.2 3.5 2.5 1.5 3.9 2.9 1.6
21.6 21.5 20.0 19.6 17.7 19.1 19.1 19.1 20.3 18.5 12.617.3 16.4 15.9 16.1 14.3 14.6 14.9 16.2 17.9 16.3 11.02.5 2.4 2.5 2.5 2.3 2.5 2.6 2.6 2.6 2.4 1.34.5 4.5 4.6 4.8 3.9 3.8 3.8 4.8 5.5 4.9 3.2
10.3 9.5 8.9 8.8 8.2 8.3 8.5 8.8 9.9 9.0 6.53.9 5.1 4.9 4.2 4.0 4.8 4.0 2.7 2.4 2.2 1.58.8 8.2 5.5 5.3 4.1 5.2 5.8 7.9 7.1 6.1 3.8
14.1 15.9 12.5 13.2 13.7 13.7 9.7 11.3 17.5 16.2 4.620.2 20.9 9.1 11.7 12.9 18.3 15.9 19.1 11.0 10.0 9.7
10.4 52.2 41.2 16.0 9.8 23.2 -10.0 -19.1 0.1 39.5 -5.16.2 47.6 36.2 5.7 2.3 25.5 -9.0 -20.5 -6.8 29.2 -8.6
(Contd...)
Base Year 2005-06 Base Year 2015-16
3
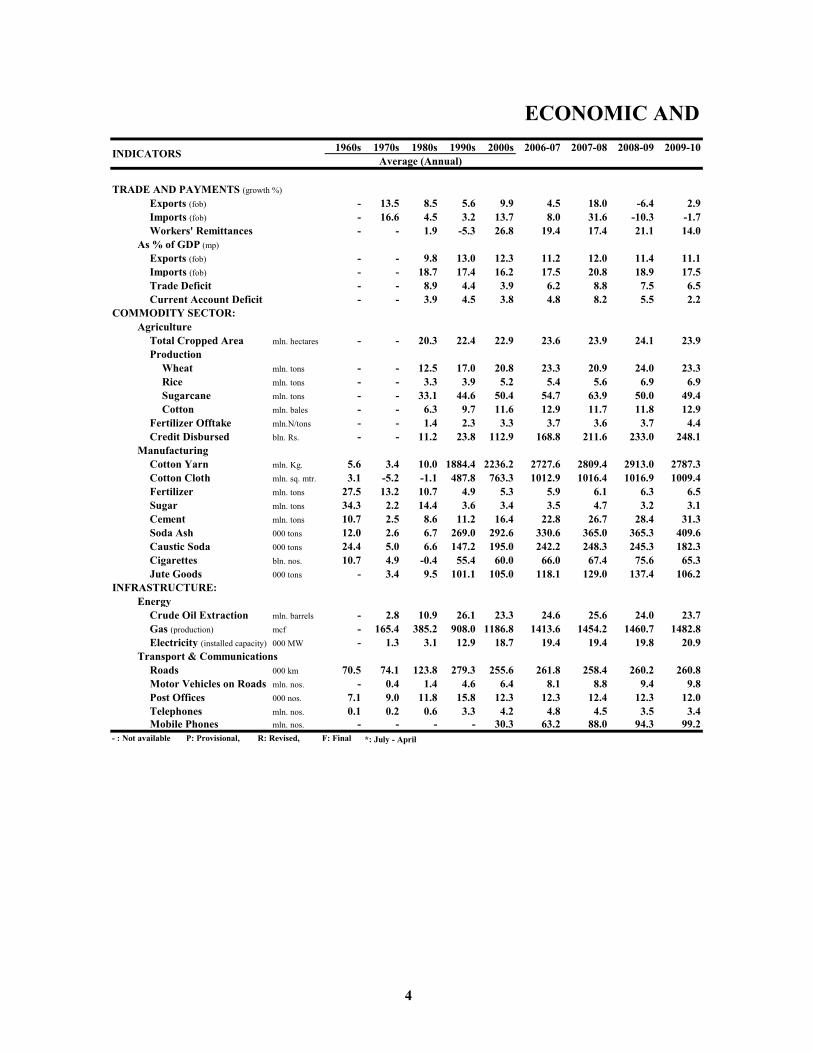
ECONOMIC AND1960s 1970s 1980s 1990s 2000s 2006-07 2007-08 2008-09 2009-10
TRADE AND PAYMENTS (growth %)
Exports (fob) - 13.5 8.5 5.6 9.9 4.5 18.0 -6.4 2.9Imports (fob) - 16.6 4.5 3.2 13.7 8.0 31.6 -10.3 -1.7Workers' Remittances - - 1.9 -5.3 26.8 19.4 17.4 21.1 14.0
As % of GDP (mp)
Exports (fob) - - 9.8 13.0 12.3 11.2 12.0 11.4 11.1Imports (fob) - - 18.7 17.4 16.2 17.5 20.8 18.9 17.5Trade Deficit - - 8.9 4.4 3.9 6.2 8.8 7.5 6.5Current Account Deficit - - 3.9 4.5 3.8 4.8 8.2 5.5 2.2
COMMODITY SECTOR:Agriculture
Total Cropped Area mln. hectares - - 20.3 22.4 22.9 23.6 23.9 24.1 23.9Production
Wheat mln. tons - - 12.5 17.0 20.8 23.3 20.9 24.0 23.3Rice mln. tons - - 3.3 3.9 5.2 5.4 5.6 6.9 6.9Sugarcane mln. tons - - 33.1 44.6 50.4 54.7 63.9 50.0 49.4Cotton mln. bales - - 6.3 9.7 11.6 12.9 11.7 11.8 12.9
Fertilizer Offtake mln.N/tons - - 1.4 2.3 3.3 3.7 3.6 3.7 4.4Credit Disbursed bln. Rs. - - 11.2 23.8 112.9 168.8 211.6 233.0 248.1
ManufacturingCotton Yarn mln. Kg. 5.6 3.4 10.0 1884.4 2236.2 2727.6 2809.4 2913.0 2787.3Cotton Cloth mln. sq. mtr. 3.1 -5.2 -1.1 487.8 763.3 1012.9 1016.4 1016.9 1009.4Fertilizer mln. tons 27.5 13.2 10.7 4.9 5.3 5.9 6.1 6.3 6.5Sugar mln. tons 34.3 2.2 14.4 3.6 3.4 3.5 4.7 3.2 3.1Cement mln. tons 10.7 2.5 8.6 11.2 16.4 22.8 26.7 28.4 31.3Soda Ash 000 tons 12.0 2.6 6.7 269.0 292.6 330.6 365.0 365.3 409.6Caustic Soda 000 tons 24.4 5.0 6.6 147.2 195.0 242.2 248.3 245.3 182.3Cigarettes bln. nos. 10.7 4.9 -0.4 55.4 60.0 66.0 67.4 75.6 65.3Jute Goods 000 tons - 3.4 9.5 101.1 105.0 118.1 129.0 137.4 106.2
INFRASTRUCTURE:Energy
Crude Oil Extraction mln. barrels - 2.8 10.9 26.1 23.3 24.6 25.6 24.0 23.7Gas (production) mcf - 165.4 385.2 908.0 1186.8 1413.6 1454.2 1460.7 1482.8Electricity (installed capacity) 000 MW - 1.3 3.1 12.9 18.7 19.4 19.4 19.8 20.9
Transport & CommunicationsRoads 000 km 70.5 74.1 123.8 279.3 255.6 261.8 258.4 260.2 260.8Motor Vehicles on Roads mln. nos. - 0.4 1.4 4.6 6.4 8.1 8.8 9.4 9.8Post Offices 000 nos. 7.1 9.0 11.8 15.8 12.3 12.3 12.4 12.3 12.0Telephones mln. nos. 0.1 0.2 0.6 3.3 4.2 4.8 4.5 3.5 3.4Mobile Phones mln. nos. - - - - 30.3 63.2 88.0 94.3 99.2
- : Not available P: Provisional, R: Revised, F: Final *: July - April
INDICATORSAverage (Annual)
4
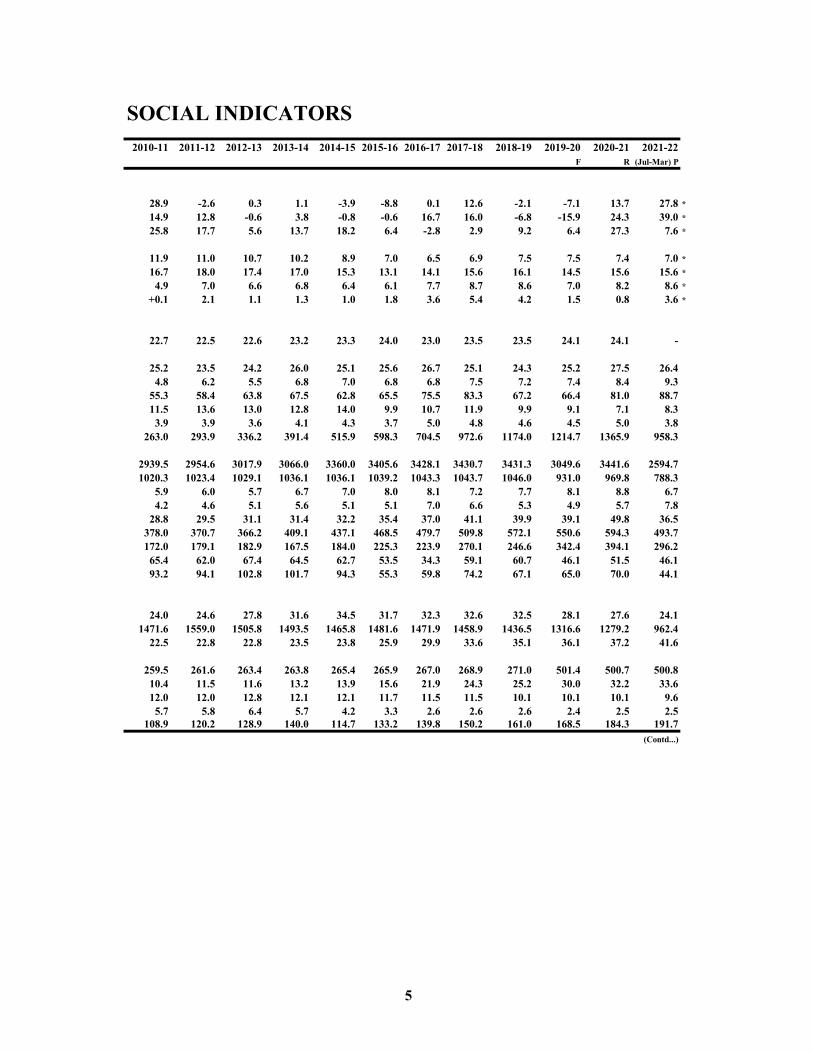
SOCIAL INDICATORS2010-11 2011-12 2012-13 2013-14 2014-15 2015-16 2016-17 2017-18 2018-19 2019-20 2020-21 2021-22
F R (Jul-Mar) P
28.9 -2.6 0.3 1.1 -3.9 -8.8 0.1 12.6 -2.1 -7.1 13.7 27.8 *14.9 12.8 -0.6 3.8 -0.8 -0.6 16.7 16.0 -6.8 -15.9 24.3 39.0 *25.8 17.7 5.6 13.7 18.2 6.4 -2.8 2.9 9.2 6.4 27.3 7.6 *
11.9 11.0 10.7 10.2 8.9 7.0 6.5 6.9 7.5 7.5 7.4 7.0 *16.7 18.0 17.4 17.0 15.3 13.1 14.1 15.6 16.1 14.5 15.6 15.6 *
4.9 7.0 6.6 6.8 6.4 6.1 7.7 8.7 8.6 7.0 8.2 8.6 *+0.1 2.1 1.1 1.3 1.0 1.8 3.6 5.4 4.2 1.5 0.8 3.6 *
22.7 22.5 22.6 23.2 23.3 24.0 23.0 23.5 23.5 24.1 24.1 -
25.2 23.5 24.2 26.0 25.1 25.6 26.7 25.1 24.3 25.2 27.5 26.44.8 6.2 5.5 6.8 7.0 6.8 6.8 7.5 7.2 7.4 8.4 9.3
55.3 58.4 63.8 67.5 62.8 65.5 75.5 83.3 67.2 66.4 81.0 88.711.5 13.6 13.0 12.8 14.0 9.9 10.7 11.9 9.9 9.1 7.1 8.3
3.9 3.9 3.6 4.1 4.3 3.7 5.0 4.8 4.6 4.5 5.0 3.8263.0 293.9 336.2 391.4 515.9 598.3 704.5 972.6 1174.0 1214.7 1365.9 958.3
2939.5 2954.6 3017.9 3066.0 3360.0 3405.6 3428.1 3430.7 3431.3 3049.6 3441.6 2594.71020.3 1023.4 1029.1 1036.1 1036.1 1039.2 1043.3 1043.7 1046.0 931.0 969.8 788.3
5.9 6.0 5.7 6.7 7.0 8.0 8.1 7.2 7.7 8.1 8.8 6.74.2 4.6 5.1 5.6 5.1 5.1 7.0 6.6 5.3 4.9 5.7 7.8
28.8 29.5 31.1 31.4 32.2 35.4 37.0 41.1 39.9 39.1 49.8 36.5378.0 370.7 366.2 409.1 437.1 468.5 479.7 509.8 572.1 550.6 594.3 493.7172.0 179.1 182.9 167.5 184.0 225.3 223.9 270.1 246.6 342.4 394.1 296.2
65.4 62.0 67.4 64.5 62.7 53.5 34.3 59.1 60.7 46.1 51.5 46.193.2 94.1 102.8 101.7 94.3 55.3 59.8 74.2 67.1 65.0 70.0 44.1
24.0 24.6 27.8 31.6 34.5 31.7 32.3 32.6 32.5 28.1 27.6 24.11471.6 1559.0 1505.8 1493.5 1465.8 1481.6 1471.9 1458.9 1436.5 1316.6 1279.2 962.4
22.5 22.8 22.8 23.5 23.8 25.9 29.9 33.6 35.1 36.1 37.2 41.6
259.5 261.6 263.4 263.8 265.4 265.9 267.0 268.9 271.0 501.4 500.7 500.810.4 11.5 11.6 13.2 13.9 15.6 21.9 24.3 25.2 30.0 32.2 33.612.0 12.0 12.8 12.1 12.1 11.7 11.5 11.5 10.1 10.1 10.1 9.6
5.7 5.8 6.4 5.7 4.2 3.3 2.6 2.6 2.6 2.4 2.5 2.5108.9 120.2 128.9 140.0 114.7 133.2 139.8 150.2 161.0 168.5 184.3 191.7
(Contd...)
5
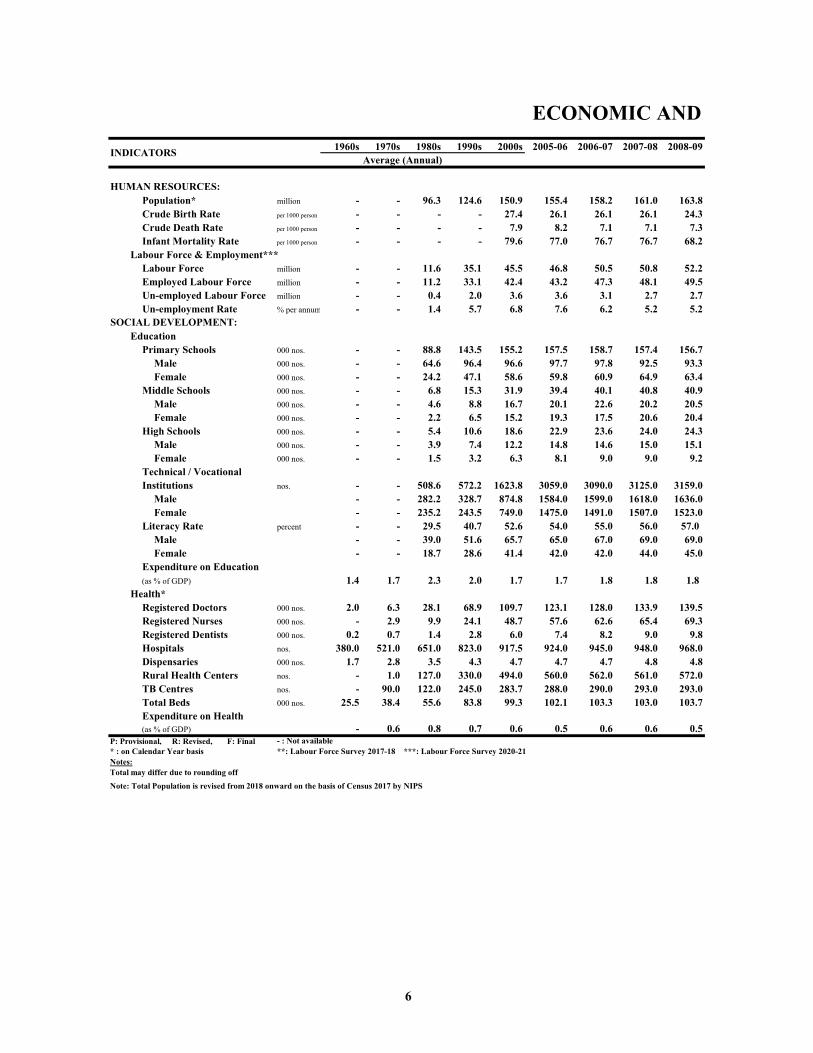
ECONOMIC AND1960s 1970s 1980s 1990s 2000s 2005-06 2006-07 2007-08 2008-09
HUMAN RESOURCES:Population* million - - 96.3 124.6 150.9 155.4 158.2 161.0 163.8Crude Birth Rate per 1000 person - - - - 27.4 26.1 26.1 26.1 24.3Crude Death Rate per 1000 person - - - - 7.9 8.2 7.1 7.1 7.3Infant Mortality Rate per 1000 person - - - - 79.6 77.0 76.7 76.7 68.2
Labour Force & Employment***Labour Force million - - 11.6 35.1 45.5 46.8 50.5 50.8 52.2Employed Labour Force million - - 11.2 33.1 42.4 43.2 47.3 48.1 49.5Un-employed Labour Force million - - 0.4 2.0 3.6 3.6 3.1 2.7 2.7Un-employment Rate % per annum - - 1.4 5.7 6.8 7.6 6.2 5.2 5.2
SOCIAL DEVELOPMENT:Education
Primary Schools 000 nos. - - 88.8 143.5 155.2 157.5 158.7 157.4 156.7Male 000 nos. - - 64.6 96.4 96.6 97.7 97.8 92.5 93.3Female 000 nos. - - 24.2 47.1 58.6 59.8 60.9 64.9 63.4
Middle Schools 000 nos. - - 6.8 15.3 31.9 39.4 40.1 40.8 40.9Male 000 nos. - - 4.6 8.8 16.7 20.1 22.6 20.2 20.5Female 000 nos. - - 2.2 6.5 15.2 19.3 17.5 20.6 20.4
High Schools 000 nos. - - 5.4 10.6 18.6 22.9 23.6 24.0 24.3Male 000 nos. - - 3.9 7.4 12.2 14.8 14.6 15.0 15.1Female 000 nos. - - 1.5 3.2 6.3 8.1 9.0 9.0 9.2
Technical / VocationalInstitutions nos. - - 508.6 572.2 1623.8 3059.0 3090.0 3125.0 3159.0
Male - - 282.2 328.7 874.8 1584.0 1599.0 1618.0 1636.0Female - - 235.2 243.5 749.0 1475.0 1491.0 1507.0 1523.0
Literacy Rate percent - - 29.5 40.7 52.6 54.0 55.0 56.0 57.0 Male - - 39.0 51.6 65.7 65.0 67.0 69.0 69.0Female - - 18.7 28.6 41.4 42.0 42.0 44.0 45.0
Expenditure on Education(as % of GDP) 1.4 1.7 2.3 2.0 1.7 1.7 1.8 1.8 1.8
Health*Registered Doctors 000 nos. 2.0 6.3 28.1 68.9 109.7 123.1 128.0 133.9 139.5Registered Nurses 000 nos. - 2.9 9.9 24.1 48.7 57.6 62.6 65.4 69.3Registered Dentists 000 nos. 0.2 0.7 1.4 2.8 6.0 7.4 8.2 9.0 9.8Hospitals nos. 380.0 521.0 651.0 823.0 917.5 924.0 945.0 948.0 968.0Dispensaries 000 nos. 1.7 2.8 3.5 4.3 4.7 4.7 4.7 4.8 4.8Rural Health Centers nos. - 1.0 127.0 330.0 494.0 560.0 562.0 561.0 572.0TB Centres nos. - 90.0 122.0 245.0 283.7 288.0 290.0 293.0 293.0Total Beds 000 nos. 25.5 38.4 55.6 83.8 99.3 102.1 103.3 103.0 103.7Expenditure on Health(as % of GDP) - 0.6 0.8 0.7 0.6 0.5 0.6 0.6 0.5
P: Provisional, R: Revised, F: Final - : Not available* : on Calendar Year basis **: Labour Force Survey 2017-18 ***: Labour Force Survey 2020-21Notes:Total may differ due to rounding offNote: Total Population is revised from 2018 onward on the basis of Census 2017 by NIPS
INDICATORSAverage (Annual)
6
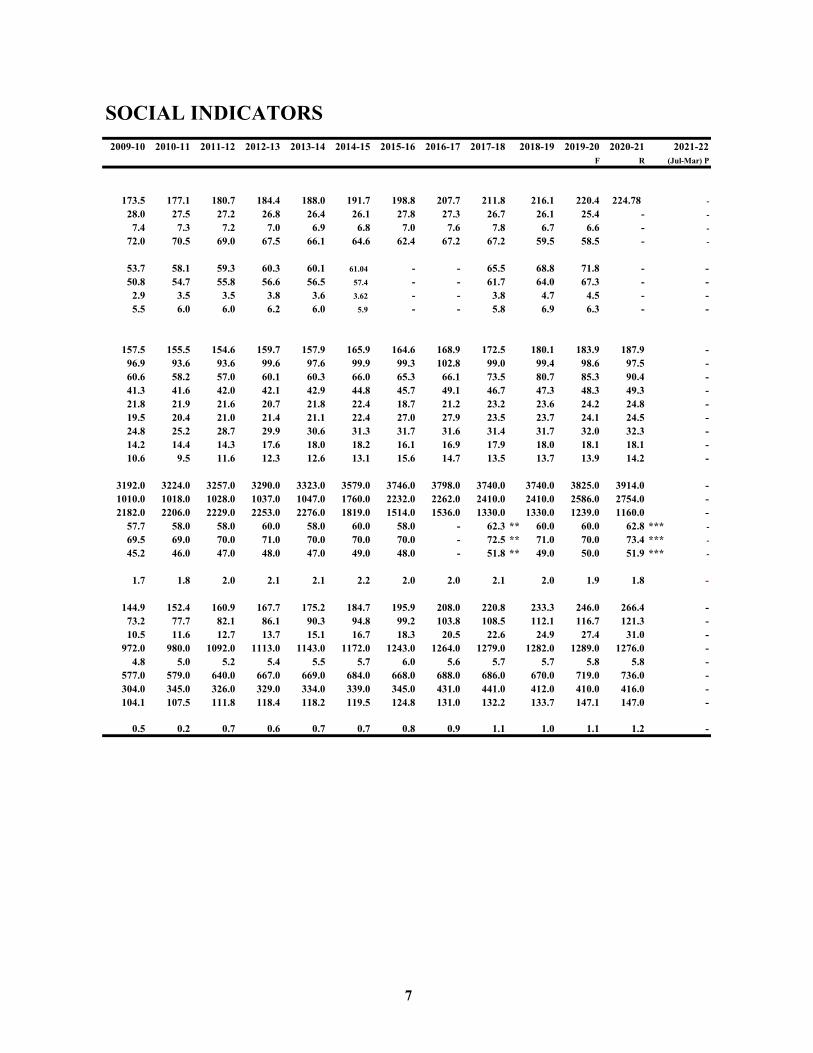
SOCIAL INDICATORS2009-10 2010-11 2011-12 2012-13 2013-14 2014-15 2015-16 2016-17 2017-18 2018-19 2019-20 2020-21 2021-22
F R (Jul-Mar) P
173.5 177.1 180.7 184.4 188.0 191.7 198.8 207.7 211.8 216.1 220.4 224.78 -28.0 27.5 27.2 26.8 26.4 26.1 27.8 27.3 26.7 26.1 25.4 - -
7.4 7.3 7.2 7.0 6.9 6.8 7.0 7.6 7.8 6.7 6.6 - -72.0 70.5 69.0 67.5 66.1 64.6 62.4 67.2 67.2 59.5 58.5 - -
53.7 58.1 59.3 60.3 60.1 61.04 - - 65.5 68.8 71.8 - -50.8 54.7 55.8 56.6 56.5 57.4 - - 61.7 64.0 67.3 - -
2.9 3.5 3.5 3.8 3.6 3.62 - - 3.8 4.7 4.5 - -5.5 6.0 6.0 6.2 6.0 5.9 - - 5.8 6.9 6.3 - -
157.5 155.5 154.6 159.7 157.9 165.9 164.6 168.9 172.5 180.1 183.9 187.9 -96.9 93.6 93.6 99.6 97.6 99.9 99.3 102.8 99.0 99.4 98.6 97.5 -60.6 58.2 57.0 60.1 60.3 66.0 65.3 66.1 73.5 80.7 85.3 90.4 -41.3 41.6 42.0 42.1 42.9 44.8 45.7 49.1 46.7 47.3 48.3 49.3 -21.8 21.9 21.6 20.7 21.8 22.4 18.7 21.2 23.2 23.6 24.2 24.8 -19.5 20.4 21.0 21.4 21.1 22.4 27.0 27.9 23.5 23.7 24.1 24.5 -24.8 25.2 28.7 29.9 30.6 31.3 31.7 31.6 31.4 31.7 32.0 32.3 -14.2 14.4 14.3 17.6 18.0 18.2 16.1 16.9 17.9 18.0 18.1 18.1 -10.6 9.5 11.6 12.3 12.6 13.1 15.6 14.7 13.5 13.7 13.9 14.2 -
3192.0 3224.0 3257.0 3290.0 3323.0 3579.0 3746.0 3798.0 3740.0 3740.0 3825.0 3914.0 -1010.0 1018.0 1028.0 1037.0 1047.0 1760.0 2232.0 2262.0 2410.0 2410.0 2586.0 2754.0 -2182.0 2206.0 2229.0 2253.0 2276.0 1819.0 1514.0 1536.0 1330.0 1330.0 1239.0 1160.0 -
57.7 58.0 58.0 60.0 58.0 60.0 58.0 - 62.3 ** 60.0 60.0 62.8 *** -69.5 69.0 70.0 71.0 70.0 70.0 70.0 - 72.5 ** 71.0 70.0 73.4 *** -45.2 46.0 47.0 48.0 47.0 49.0 48.0 - 51.8 ** 49.0 50.0 51.9 *** -
1.7 1.8 2.0 2.1 2.1 2.2 2.0 2.0 2.1 2.0 1.9 1.8 -
144.9 152.4 160.9 167.7 175.2 184.7 195.9 208.0 220.8 233.3 246.0 266.4 -73.2 77.7 82.1 86.1 90.3 94.8 99.2 103.8 108.5 112.1 116.7 121.3 -10.5 11.6 12.7 13.7 15.1 16.7 18.3 20.5 22.6 24.9 27.4 31.0 -
972.0 980.0 1092.0 1113.0 1143.0 1172.0 1243.0 1264.0 1279.0 1282.0 1289.0 1276.0 -4.8 5.0 5.2 5.4 5.5 5.7 6.0 5.6 5.7 5.7 5.8 5.8 -
577.0 579.0 640.0 667.0 669.0 684.0 668.0 688.0 686.0 670.0 719.0 736.0 -304.0 345.0 326.0 329.0 334.0 339.0 345.0 431.0 441.0 412.0 410.0 416.0 -104.1 107.5 111.8 118.4 118.2 119.5 124.8 131.0 132.2 133.7 147.1 147.0 -
0.5 0.2 0.7 0.6 0.7 0.7 0.8 0.9 1.1 1.0 1.1 1.2 -
7


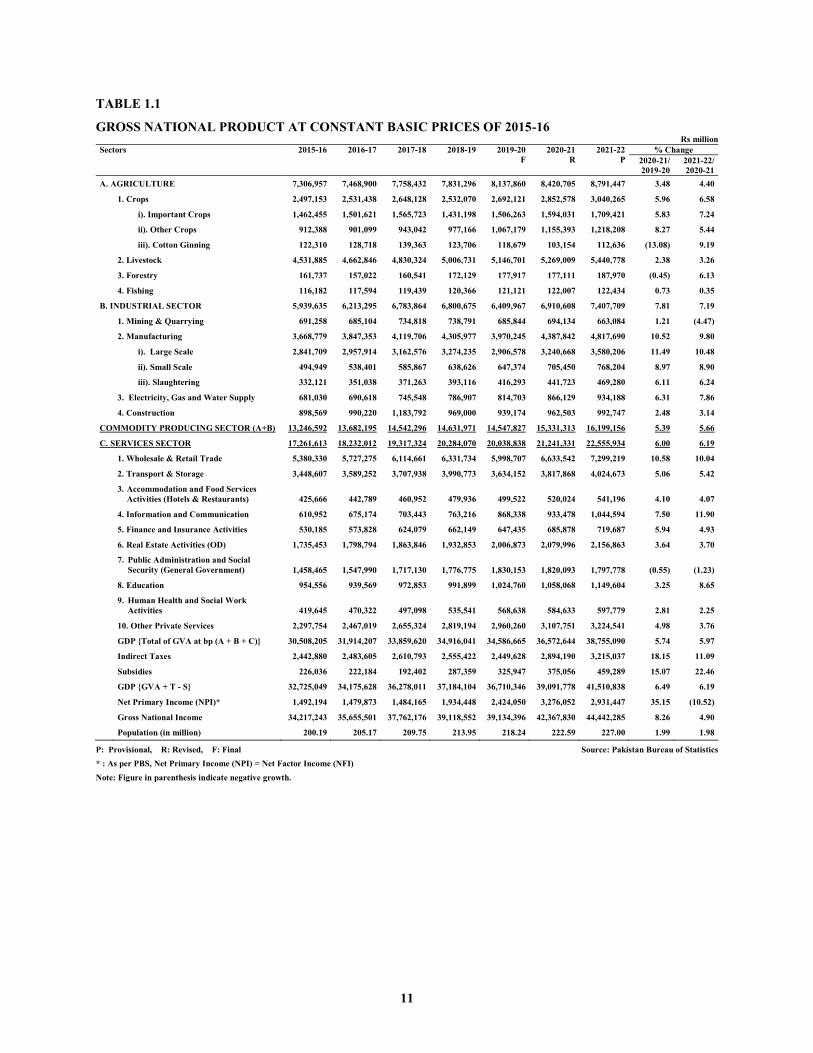
11
TABLE 1.1
GROSS NATIONAL PRODUCT AT CONSTANT BASIC PRICES OF 2015-16 Rs million
Sectors 2015-16 2016-17 2017-18 2018-19 2019-20 F
2020-21 R
2021-22 P
% Change 2020-21/ 2019-20
2021-22/ 2020-21
A. AGRICULTURE 7,306,957 7,468,900 7,758,432 7,831,296 8,137,860 8,420,705 8,791,447 3.48 4.40
1. Crops 2,497,153 2,531,438 2,648,128 2,532,070 2,692,121 2,852,578 3,040,265 5.96 6.58
i). Important Crops 1,462,455 1,501,621 1,565,723 1,431,198 1,506,263 1,594,031 1,709,421 5.83 7.24
ii). Other Crops 912,388 901,099 943,042 977,166 1,067,179 1,155,393 1,218,208 8.27 5.44
iii). Cotton Ginning 122,310 128,718 139,363 123,706 118,679 103,154 112,636 (13.08) 9.19
2. Livestock 4,531,885 4,662,846 4,830,324 5,006,731 5,146,701 5,269,009 5,440,778 2.38 3.26
3. Forestry 161,737 157,022 160,541 172,129 177,917 177,111 187,970 (0.45) 6.13
4. Fishing 116,182 117,594 119,439 120,366 121,121 122,007 122,434 0.73 0.35
B. INDUSTRIAL SECTOR 5,939,635 6,213,295 6,783,864 6,800,675 6,409,967 6,910,608 7,407,709 7.81 7.19
1. Mining & Quarrying 691,258 685,104 734,818 738,791 685,844 694,134 663,084 1.21 (4.47)
2. Manufacturing 3,668,779 3,847,353 4,119,706 4,305,977 3,970,245 4,387,842 4,817,690 10.52 9.80
i). Large Scale 2,841,709 2,957,914 3,162,576 3,274,235 2,906,578 3,240,668 3,580,206 11.49 10.48
ii). Small Scale 494,949 538,401 585,867 638,626 647,374 705,450 768,204 8.97 8.90
iii). Slaughtering 332,121 351,038 371,263 393,116 416,293 441,723 469,280 6.11 6.24
3. Electricity, Gas and Water Supply 681,030 690,618 745,548 786,907 814,703 866,129 934,188 6.31 7.86
4. Construction 898,569 990,220 1,183,792 969,000 939,174 962,503 992,747 2.48 3.14
COMMODITY PRODUCING SECTOR (A+B) 13,246,592 13,682,195 14,542,296 14,631,971 14,547,827 15,331,313 16,199,156 5.39 5.66
C. SERVICES SECTOR 17,261,613 18,232,012 19,317,324 20,284,070 20,038,838 21,241,331 22,555,934 6.00 6.19
1. Wholesale & Retail Trade 5,380,330 5,727,275 6,114,661 6,331,734 5,998,707 6,633,542 7,299,219 10.58 10.04
2. Transport & Storage 3,448,607 3,589,252 3,707,938 3,990,773 3,634,152 3,817,868 4,024,673 5.06 5.42
3. Accommodation and Food Services Activities (Hotels & Restaurants) 425,666 442,789 460,952 479,936 499,522 520,024 541,196 4.10 4.07
4. Information and Communication 610,952 675,174 703,443 763,216 868,338 933,478 1,044,594 7.50 11.90
5. Finance and Insurance Activities 530,185 573,828 624,079 662,149 647,435 685,878 719,687 5.94 4.93 6. Real Estate Activities (OD) 1,735,453 1,798,794 1,863,846 1,932,853 2,006,873 2,079,996 2,156,863 3.64 3.70
7. Public Administration and Social Security (General Government) 1,458,465 1,547,990 1,717,130 1,776,775 1,830,153 1,820,093 1,797,778 (0.55) (1.23)
8. Education 954,556 939,569 972,853 991,899 1,024,760 1,058,068 1,149,604 3.25 8.65
9. Human Health and Social Work Activities 419,645 470,322 497,098 535,541 568,638 584,633 597,779 2.81 2.25
10. Other Private Services 2,297,754 2,467,019 2,655,324 2,819,194 2,960,260 3,107,751 3,224,541 4.98 3.76
GDP {Total of GVA at bp (A + B + C)} 30,508,205 31,914,207 33,859,620 34,916,041 34,586,665 36,572,644 38,755,090 5.74 5.97
Indirect Taxes 2,442,880 2,483,605 2,610,793 2,555,422 2,449,628 2,894,190 3,215,037 18.15 11.09
Subsidies 226,036 222,184 192,402 287,359 325,947 375,056 459,289 15.07 22.46
GDP {GVA + T - S} 32,725,049 34,175,628 36,278,011 37,184,104 36,710,346 39,091,778 41,510,838 6.49 6.19
Net Primary Income (NPI)* 1,492,194 1,479,873 1,484,165 1,934,448 2,424,050 3,276,052 2,931,447 35.15 (10.52)
Gross National Income 34,217,243 35,655,501 37,762,176 39,118,552 39,134,396 42,367,830 44,442,285 8.26 4.90
Population (in million) 200.19 205.17 209.75 213.95 218.24 222.59 227.00 1.99 1.98
P: Provisional, R: Revised, F: Final Source: Pakistan Bureau of Statistics * : As per PBS, Net Primary Income (NPI) = Net Factor Income (NFI) Note: Figure in parenthesis indicate negative growth.
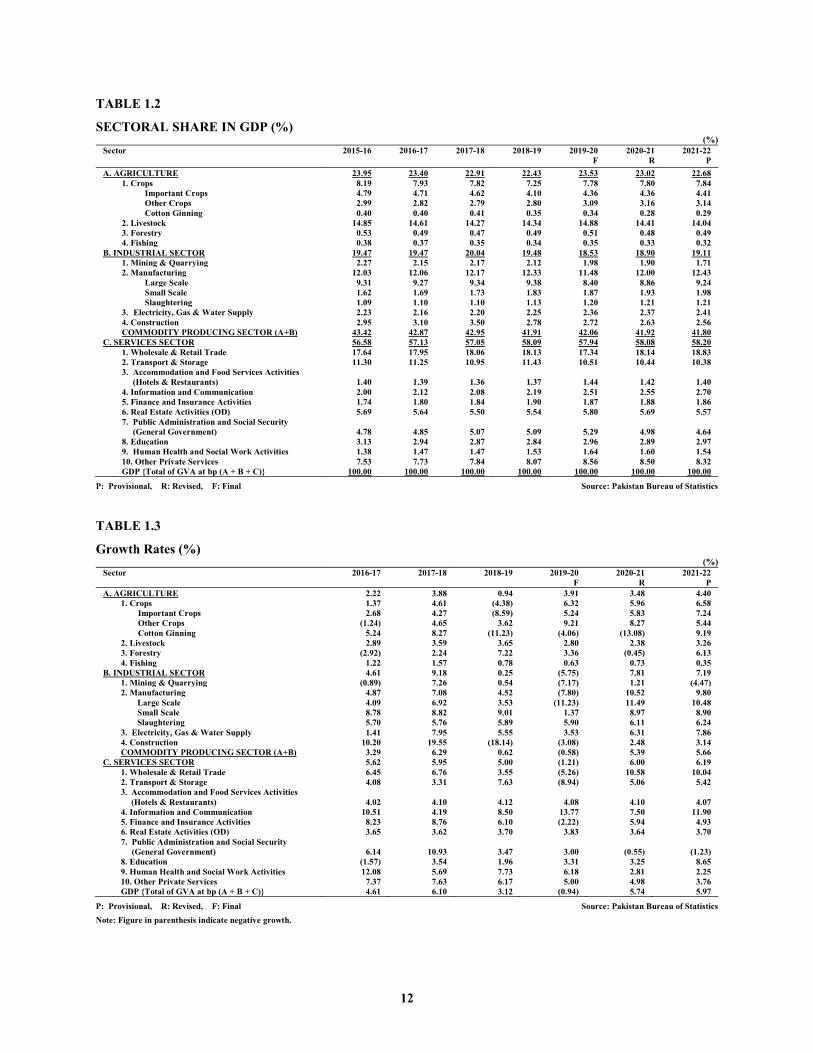
12
TABLE 1.2
SECTORAL SHARE IN GDP (%) (%)
Sector 2015-16 2016-17 2017-18 2018-19 2019-20 F
2020-21 R
2021-22 P
A. AGRICULTURE 23.95 23.40 22.91 22.43 23.53 23.02 22.68 1. Crops 8.19 7.93 7.82 7.25 7.78 7.80 7.84 Important Crops 4.79 4.71 4.62 4.10 4.36 4.36 4.41 Other Crops 2.99 2.82 2.79 2.80 3.09 3.16 3.14 Cotton Ginning 0.40 0.40 0.41 0.35 0.34 0.28 0.29 2. Livestock 14.85 14.61 14.27 14.34 14.88 14.41 14.04 3. Forestry 0.53 0.49 0.47 0.49 0.51 0.48 0.49 4. Fishing 0.38 0.37 0.35 0.34 0.35 0.33 0.32
B. INDUSTRIAL SECTOR 19.47 19.47 20.04 19.48 18.53 18.90 19.11 1. Mining & Quarrying 2.27 2.15 2.17 2.12 1.98 1.90 1.71 2. Manufacturing 12.03 12.06 12.17 12.33 11.48 12.00 12.43 Large Scale 9.31 9.27 9.34 9.38 8.40 8.86 9.24 Small Scale 1.62 1.69 1.73 1.83 1.87 1.93 1.98 Slaughtering 1.09 1.10 1.10 1.13 1.20 1.21 1.21 3. Electricity, Gas & Water Supply 2.23 2.16 2.20 2.25 2.36 2.37 2.41 4. Construction 2.95 3.10 3.50 2.78 2.72 2.63 2.56 COMMODITY PRODUCING SECTOR (A+B) 43.42 42.87 42.95 41.91 42.06 41.92 41.80
C. SERVICES SECTOR 56.58 57.13 57.05 58.09 57.94 58.08 58.20 1. Wholesale & Retail Trade 17.64 17.95 18.06 18.13 17.34 18.14 18.83 2. Transport & Storage 11.30 11.25 10.95 11.43 10.51 10.44 10.38
3. Accommodation and Food Services Activities
(Hotels & Restaurants) 1.40 1.39 1.36 1.37 1.44 1.42 1.40 4. Information and Communication 2.00 2.12 2.08 2.19 2.51 2.55 2.70 5. Finance and Insurance Activities 1.74 1.80 1.84 1.90 1.87 1.88 1.86 6. Real Estate Activities (OD) 5.69 5.64 5.50 5.54 5.80 5.69 5.57
7. Public Administration and Social Security
(General Government) 4.78 4.85 5.07 5.09 5.29 4.98 4.64 8. Education 3.13 2.94 2.87 2.84 2.96 2.89 2.97 9. Human Health and Social Work Activities 1.38 1.47 1.47 1.53 1.64 1.60 1.54 10. Other Private Services 7.53 7.73 7.84 8.07 8.56 8.50 8.32 GDP {Total of GVA at bp (A + B + C)} 100.00 100.00 100.00 100.00 100.00 100.00 100.00
P: Provisional, R: Revised, F: Final Source: Pakistan Bureau of Statistics
TABLE 1.3
Growth Rates (%) (%)
Sector 2016-17 2017-18 2018-19 2019-20 F
2020-21 R
2021-22 P
A. AGRICULTURE 2.22 3.88 0.94 3.91 3.48 4.40 1. Crops 1.37 4.61 (4.38) 6.32 5.96 6.58 Important Crops 2.68 4.27 (8.59) 5.24 5.83 7.24 Other Crops (1.24) 4.65 3.62 9.21 8.27 5.44 Cotton Ginning 5.24 8.27 (11.23) (4.06) (13.08) 9.19 2. Livestock 2.89 3.59 3.65 2.80 2.38 3.26 3. Forestry (2.92) 2.24 7.22 3.36 (0.45) 6.13 4. Fishing 1.22 1.57 0.78 0.63 0.73 0.35 B. INDUSTRIAL SECTOR 4.61 9.18 0.25 (5.75) 7.81 7.19 1. Mining & Quarrying (0.89) 7.26 0.54 (7.17) 1.21 (4.47) 2. Manufacturing 4.87 7.08 4.52 (7.80) 10.52 9.80 Large Scale 4.09 6.92 3.53 (11.23) 11.49 10.48 Small Scale 8.78 8.82 9.01 1.37 8.97 8.90 Slaughtering 5.70 5.76 5.89 5.90 6.11 6.24 3. Electricity, Gas & Water Supply 1.41 7.95 5.55 3.53 6.31 7.86 4. Construction 10.20 19.55 (18.14) (3.08) 2.48 3.14 COMMODITY PRODUCING SECTOR (A+B) 3.29 6.29 0.62 (0.58) 5.39 5.66 C. SERVICES SECTOR 5.62 5.95 5.00 (1.21) 6.00 6.19 1. Wholesale & Retail Trade 6.45 6.76 3.55 (5.26) 10.58 10.04 2. Transport & Storage 4.08 3.31 7.63 (8.94) 5.06 5.42
3. Accommodation and Food Services Activities
(Hotels & Restaurants) 4.02 4.10 4.12 4.08 4.10 4.07 4. Information and Communication 10.51 4.19 8.50 13.77 7.50 11.90 5. Finance and Insurance Activities 8.23 8.76 6.10 (2.22) 5.94 4.93 6. Real Estate Activities (OD) 3.65 3.62 3.70 3.83 3.64 3.70
7. Public Administration and Social Security
(General Government) 6.14 10.93 3.47 3.00 (0.55) (1.23) 8. Education (1.57) 3.54 1.96 3.31 3.25 8.65 9. Human Health and Social Work Activities 12.08 5.69 7.73 6.18 2.81 2.25 10. Other Private Services 7.37 7.63 6.17 5.00 4.98 3.76 GDP {Total of GVA at bp (A + B + C)} 4.61 6.10 3.12 (0.94) 5.74 5.97
P: Provisional, R: Revised, F: Final Source: Pakistan Bureau of Statistics Note: Figure in parenthesis indicate negative growth.
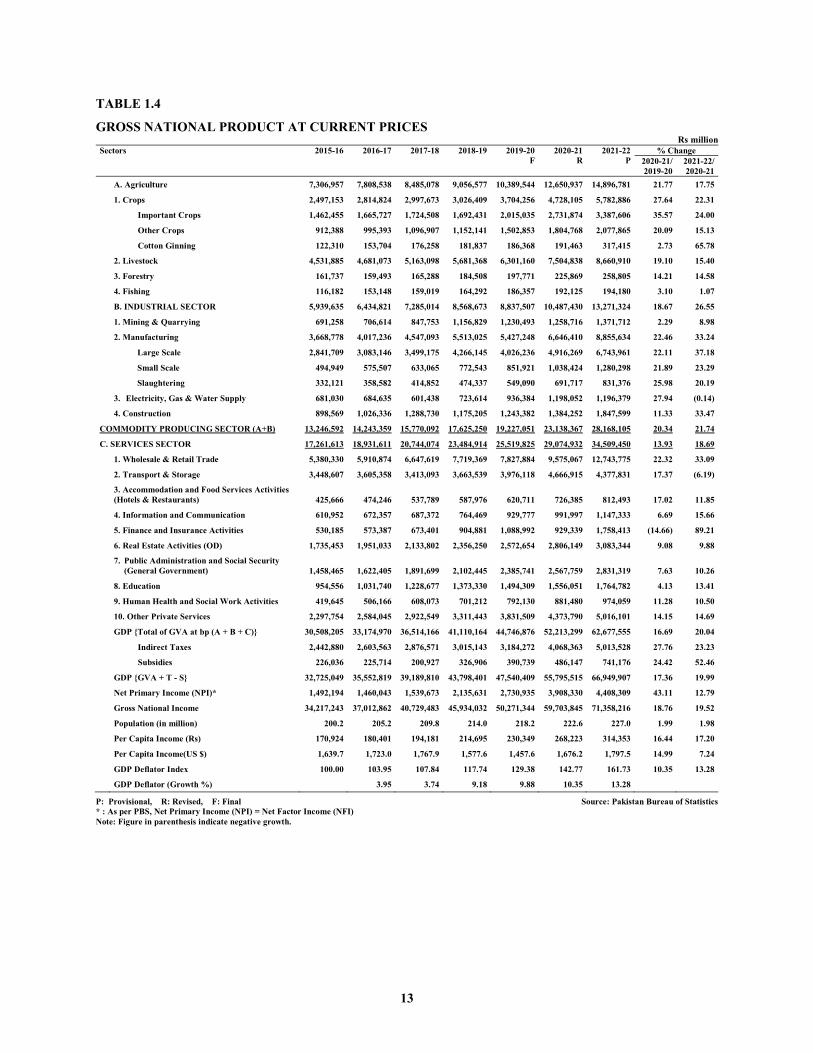
13
TABLE 1.4
GROSS NATIONAL PRODUCT AT CURRENT PRICES Rs million
Sectors 2015-16 2016-17 2017-18 2018-19 2019-20 F
2020-21 R
2021-22 P
% Change 2020-21/ 2019-20
2021-22/ 2020-21
A. Agriculture 7,306,957 7,808,538 8,485,078 9,056,577 10,389,544 12,650,937 14,896,781 21.77 17.75
1. Crops 2,497,153 2,814,824 2,997,673 3,026,409 3,704,256 4,728,105 5,782,886 27.64 22.31
Important Crops 1,462,455 1,665,727 1,724,508 1,692,431 2,015,035 2,731,874 3,387,606 35.57 24.00
Other Crops 912,388 995,393 1,096,907 1,152,141 1,502,853 1,804,768 2,077,865 20.09 15.13
Cotton Ginning 122,310 153,704 176,258 181,837 186,368 191,463 317,415 2.73 65.78
2. Livestock 4,531,885 4,681,073 5,163,098 5,681,368 6,301,160 7,504,838 8,660,910 19.10 15.40
3. Forestry 161,737 159,493 165,288 184,508 197,771 225,869 258,805 14.21 14.58
4. Fishing 116,182 153,148 159,019 164,292 186,357 192,125 194,180 3.10 1.07
B. INDUSTRIAL SECTOR 5,939,635 6,434,821 7,285,014 8,568,673 8,837,507 10,487,430 13,271,324 18.67 26.55
1. Mining & Quarrying 691,258 706,614 847,753 1,156,829 1,230,493 1,258,716 1,371,712 2.29 8.98
2. Manufacturing 3,668,778 4,017,236 4,547,093 5,513,025 5,427,248 6,646,410 8,855,634 22.46 33.24
Large Scale 2,841,709 3,083,146 3,499,175 4,266,145 4,026,236 4,916,269 6,743,961 22.11 37.18
Small Scale 494,949 575,507 633,065 772,543 851,921 1,038,424 1,280,298 21.89 23.29
Slaughtering 332,121 358,582 414,852 474,337 549,090 691,717 831,376 25.98 20.19 3. Electricity, Gas & Water Supply 681,030 684,635 601,438 723,614 936,384 1,198,052 1,196,379 27.94 (0.14)
4. Construction 898,569 1,026,336 1,288,730 1,175,205 1,243,382 1,384,252 1,847,599 11.33 33.47
COMMODITY PRODUCING SECTOR (A+B) 13,246,592 14,243,359 15,770,092 17,625,250 19,227,051 23,138,367 28,168,105 20.34 21.74
C. SERVICES SECTOR 17,261,613 18,931,611 20,744,074 23,484,914 25,519,825 29,074,932 34,509,450 13.93 18.69
1. Wholesale & Retail Trade 5,380,330 5,910,874 6,647,619 7,719,369 7,827,884 9,575,067 12,743,775 22.32 33.09
2. Transport & Storage 3,448,607 3,605,358 3,413,093 3,663,539 3,976,118 4,666,915 4,377,831 17.37 (6.19)
3. Accommodation and Food Services Activities (Hotels & Restaurants) 425,666 474,246 537,789 587,976 620,711 726,385 812,493 17.02 11.85
4. Information and Communication 610,952 672,357 687,372 764,469 929,777 991,997 1,147,333 6.69 15.66
5. Finance and Insurance Activities 530,185 573,387 673,401 904,881 1,088,992 929,339 1,758,413 (14.66) 89.21 6. Real Estate Activities (OD) 1,735,453 1,951,033 2,133,802 2,356,250 2,572,654 2,806,149 3,083,344 9.08 9.88
7. Public Administration and Social Security (General Government) 1,458,465 1,622,405 1,891,699 2,102,445 2,385,741 2,567,759 2,831,319 7.63 10.26
8. Education 954,556 1,031,740 1,228,677 1,373,330 1,494,309 1,556,051 1,764,782 4.13 13.41 9. Human Health and Social Work Activities 419,645 506,166 608,073 701,212 792,130 881,480 974,059 11.28 10.50 10. Other Private Services 2,297,754 2,584,045 2,922,549 3,311,443 3,831,509 4,373,790 5,016,101 14.15 14.69
GDP {Total of GVA at bp (A + B + C)} 30,508,205 33,174,970 36,514,166 41,110,164 44,746,876 52,213,299 62,677,555 16.69 20.04
Indirect Taxes 2,442,880 2,603,563 2,876,571 3,015,143 3,184,272 4,068,363 5,013,528 27.76 23.23
Subsidies 226,036 225,714 200,927 326,906 390,739 486,147 741,176 24.42 52.46
GDP {GVA + T - S} 32,725,049 35,552,819 39,189,810 43,798,401 47,540,409 55,795,515 66,949,907 17.36 19.99
Net Primary Income (NPI)* 1,492,194 1,460,043 1,539,673 2,135,631 2,730,935 3,908,330 4,408,309 43.11 12.79
Gross National Income 34,217,243 37,012,862 40,729,483 45,934,032 50,271,344 59,703,845 71,358,216 18.76 19.52
Population (in million) 200.2 205.2 209.8 214.0 218.2 222.6 227.0 1.99 1.98
Per Capita Income (Rs) 170,924 180,401 194,181 214,695 230,349 268,223 314,353 16.44 17.20
Per Capita Income(US $) 1,639.7 1,723.0 1,767.9 1,577.6 1,457.6 1,676.2 1,797.5 14.99 7.24
GDP Deflator Index 100.00 103.95 107.84 117.74 129.38 142.77 161.73 10.35 13.28
GDP Deflator (Growth %) 3.95 3.74 9.18 9.88 10.35 13.28
P: Provisional, R: Revised, F: Final Source: Pakistan Bureau of Statistics * : As per PBS, Net Primary Income (NPI) = Net Factor Income (NFI) Note: Figure in parenthesis indicate negative growth.

14
TABLE 1.5
EXPENDITURE ON GROSS NATIONAL PRODUCT AT CONSTANT PRICES OF 2015-16 Rs million
Flows 2015-16 2016-17 2017-18 2018-19 2019-20 F
2020-21 R
2021-22 P
% Change 2020-21/ 2019-20
2021-22/ 2020-21
Household Final Consumption Expenditure 26,106,974 27,915,885 29,915,812 31,583,262 30,674,157 33,545,348 36,948,148 9.36 10.14 NPISH Final Consumption Expenditure 296,722 317,125 352,015 370,679 374,912 388,667 368,944 3.67 (5.07) General Government Final Consumption Expenditure 3,471,786 3,627,594 3,826,636 3,766,290 4,086,774 4,161,026 4,019,571 1.82 (3.40) Total Investment 5,214,981 5,601,582 6,153,971 5,557,257 5,220,581 5,465,991 5,625,516 4.70 2.92 Gross Fixed Capital Formation 4,657,149 5,017,178 5,533,617 4,921,409 4,592,834 4,797,521 4,915,681 4.46 2.46 A. Private Sector 3,537,220 3,621,176 3,879,013 3,812,927 3,627,468 3,717,184 3,698,625 2.47 (0.50) B. Public Sector 252,053 353,002 418,721 404,028 257,481 273,532 261,167 6.23 (4.52) C. General Govt. 867,876 1,043,000 1,235,883 704,454 707,885 806,805 955,888 13.97 18.48 Change in Inventories 523,601 546,810 580,448 594,946 587,366 625,468 664,173 6.49 6.19 Valuable 34,231 37,593 39,906 40,903 40,381 43,001 45,662 6.49 6.19 Export of Goods and Non-Factor Services 2,859,095 2,929,753 3,223,918 3,648,583 3,703,874 3,945,411 4,277,537 6.52 8.42 Less Imports of Goods and Non-Factor Services 5,224,509 6,216,310 7,194,340 7,741,968 7,349,952 8,414,664 9,728,877 14.49 15.62 Expenditure on GDP at Market Prices 32,725,049 34,175,628 36,278,011 37,184,104 36,710,346 39,091,778 41,510,838 6.49 6.19 Plus Net Primary Income* 1,492,194 1,479,873 1,484,165 1,934,448 2,424,050 3,276,052 2,931,447 35.15 (10.52) Expenditure on GNP at Market Prices 34,217,243 35,655,501 37,762,176 39,118,552 39,134,396 42,367,830 44,442,285 8.26 4.90 Less Indirect Taxes 2,442,880 2,483,605 2,610,793 2,555,422 2,449,628 2,894,190 3,215,037 18.15 11.09 Plus Subsidies 226,036 222,184 192,402 287,359 325,947 375,056 459,289 15.07 22.46 GNP at Factor Cost 32,000,399 33,394,080 35,343,785 36,850,489 37,010,715 39,848,696 41,686,537 7.67 4.61
P: Provisional, R: Revised, F: Final Source: Pakistan Bureau of Statistics * : As per PBS, Net Primary Income (NPI) = Net Factor Income (NFI) Note: Figure in parenthesis indicate negative growth.
TABLE 1.6
EXPENDITURE ON GROSS NATIONAL PRODUCT AT CURRENT PRICES Rs million
Flows 2015-16 2016-17 2017-18 2018-19 2019-20 F
2020-21 R
2021-22 P
% Change 2020-21/ 2019-20
2021-22/ 2020-21
Household Final Consumption Expenditure 26,106,974 28,800,377 31,906,384 36,301,307 38,265,131 45,959,938 57,065,160 20.11 24.16 NPISH Final Consumption Expenditure 296,722 332,379 386,231 434,362 487,348 546,349 575,331 12.11 5.30 General Government Final Consumption Expenditure 3,471,786 3,823,258 4,308,381 4,708,220 5,604,444 6,102,658 6,794,114 8.89 11.33 Total Investment 5,214,981 5,806,803 6,689,031 6,788,597 7,043,368 8,171,193 10,137,272 16.01 24.06 Gross Fixed Capital Formation 4,657,149 5,198,850 6,018,885 6,039,644 6,230,427 7,217,090 8,992,429 15.84 24.60 A. Private Sector 3,537,220 3,745,750 4,211,187 4,665,930 4,885,372 5,556,780 6,703,572 13.74 20.64 B. Public Sector 252,053 363,686 448,598 475,183 349,556 418,892 481,283 19.84 14.89 C. General Govt. 867,876 1,089,414 1,359,100 898,531 995,499 1,241,418 1,807,574 24.70 45.61 Change in Inventories 523,601 568,845 627,037 700,774 760,647 892,728 1,071,199 17.36 19.99 Valuable 34,231 39,108 43,109 48,178 52,294 61,375 73,645 17.36 19.99 Export of Goods and Non-Factor Services 2,859,095 2,923,015 3,363,191 4,113,048 4,420,573 5,054,072 7,008,316 14.33 38.67 Less Imports of Goods and Non-Factor
Services 5,224,509 6,133,012 7,463,408 8,547,132 8,280,456 10,038,695 14,630,286 21.23 45.74 Expenditure on GDP at Market Prices 32,725,049 35,552,819 39,189,810 43,798,401 47,540,409 55,795,515 66,949,907 17.36 19.99 Plus Net Primary Income* 1,492,194 1,460,043 1,539,673 2,135,631 2,730,935 3,908,330 4,408,309 43.11 12.79 Expenditure on GNP at Market Prices 34,217,243 37,012,862 40,729,483 45,934,032 50,271,344 59,703,845 71,358,216 18.76 19.52 Less Indirect Taxes 2,442,880 2,603,563 2,876,571 3,015,143 3,184,272 4,068,363 5,013,528 27.76 23.23 Plus Subsidies 226,036 225,714 200,927 326,906 390,739 486,147 741,176 24.42 52.46 GNP at Factor Cost 30,508,205 33,174,970 36,514,166 41,110,164 44,746,876 52,213,299 62,677,555 16.69 20.04
P: Provisional, R: Revised, F: Final Source: Pakistan Bureau of Statistics * : As per PBS, Net Primary Income (NPI) = Net Factor Income (NFI)
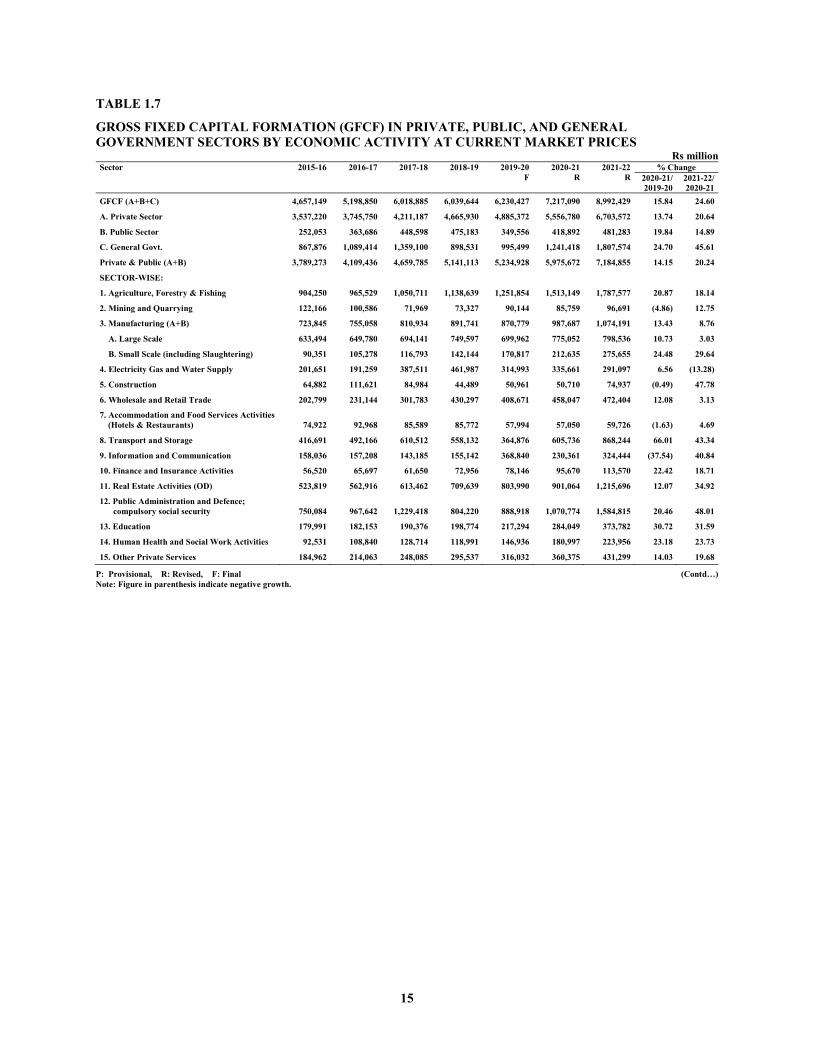
15
TABLE 1.7
GROSS FIXED CAPITAL FORMATION (GFCF) IN PRIVATE, PUBLIC, AND GENERAL GOVERNMENT SECTORS BY ECONOMIC ACTIVITY AT CURRENT MARKET PRICES
Rs million Sector 2015-16 2016-17 2017-18 2018-19 2019-20
F 2020-21
R 2021-22
R % Change
2020-21/ 2019-20
2021-22/ 2020-21
GFCF (A+B+C) 4,657,149 5,198,850 6,018,885 6,039,644 6,230,427 7,217,090 8,992,429 15.84 24.60
A. Private Sector 3,537,220 3,745,750 4,211,187 4,665,930 4,885,372 5,556,780 6,703,572 13.74 20.64
B. Public Sector 252,053 363,686 448,598 475,183 349,556 418,892 481,283 19.84 14.89
C. General Govt. 867,876 1,089,414 1,359,100 898,531 995,499 1,241,418 1,807,574 24.70 45.61
Private & Public (A+B) 3,789,273 4,109,436 4,659,785 5,141,113 5,234,928 5,975,672 7,184,855 14.15 20.24
SECTOR-WISE:
1. Agriculture, Forestry & Fishing 904,250 965,529 1,050,711 1,138,639 1,251,854 1,513,149 1,787,577 20.87 18.14
2. Mining and Quarrying 122,166 100,586 71,969 73,327 90,144 85,759 96,691 (4.86) 12.75
3. Manufacturing (A+B) 723,845 755,058 810,934 891,741 870,779 987,687 1,074,191 13.43 8.76
A. Large Scale 633,494 649,780 694,141 749,597 699,962 775,052 798,536 10.73 3.03
B. Small Scale (including Slaughtering) 90,351 105,278 116,793 142,144 170,817 212,635 275,655 24.48 29.64
4. Electricity Gas and Water Supply 201,651 191,259 387,511 461,987 314,993 335,661 291,097 6.56 (13.28)
5. Construction 64,882 111,621 84,984 44,489 50,961 50,710 74,937 (0.49) 47.78
6. Wholesale and Retail Trade 202,799 231,144 301,783 430,297 408,671 458,047 472,404 12.08 3.13
7. Accommodation and Food Services Activities (Hotels & Restaurants) 74,922 92,968 85,589 85,772 57,994 57,050 59,726 (1.63) 4.69
8. Transport and Storage 416,691 492,166 610,512 558,132 364,876 605,736 868,244 66.01 43.34
9. Information and Communication 158,036 157,208 143,185 155,142 368,840 230,361 324,444 (37.54) 40.84
10. Finance and Insurance Activities 56,520 65,697 61,650 72,956 78,146 95,670 113,570 22.42 18.71
11. Real Estate Activities (OD) 523,819 562,916 613,462 709,639 803,990 901,064 1,215,696 12.07 34.92
12. Public Administration and Defence; compulsory social security 750,084 967,642 1,229,418 804,220 888,918 1,070,774 1,584,815 20.46 48.01
13. Education 179,991 182,153 190,376 198,774 217,294 284,049 373,782 30.72 31.59
14. Human Health and Social Work Activities 92,531 108,840 128,714 118,991 146,936 180,997 223,956 23.18 23.73
15. Other Private Services 184,962 214,063 248,085 295,537 316,032 360,375 431,299 14.03 19.68
P: Provisional, R: Revised, F: Final (Contd…) Note: Figure in parenthesis indicate negative growth.
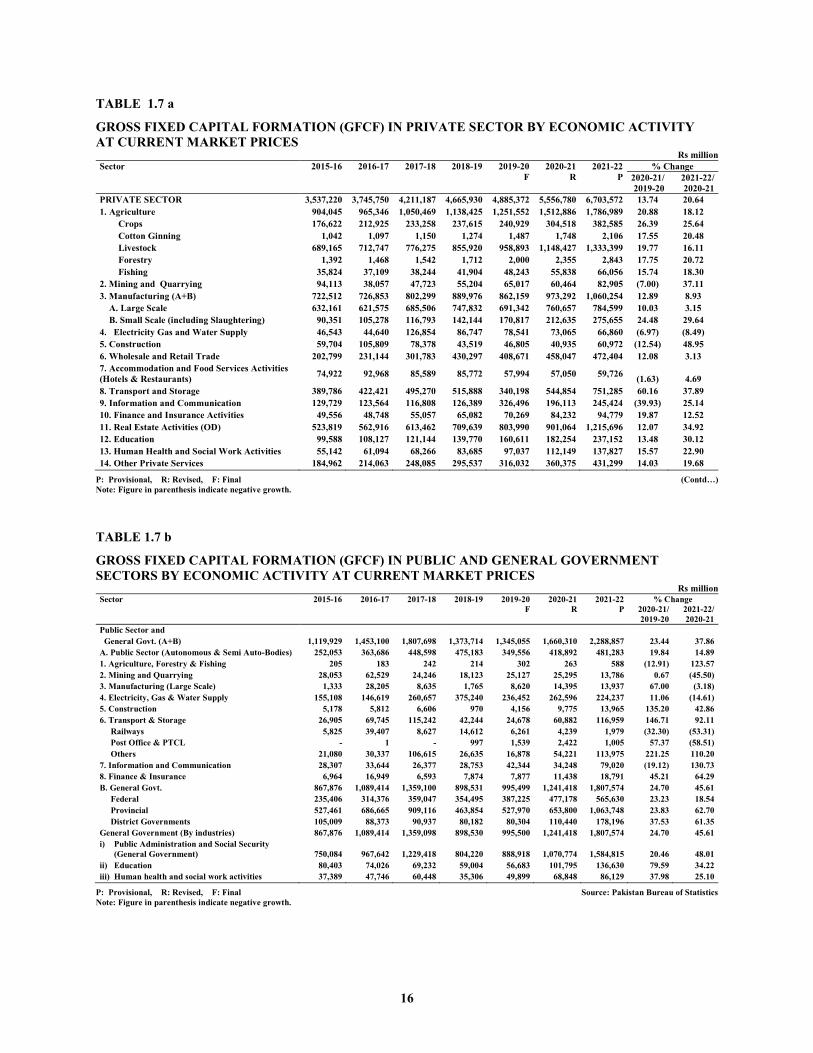
16
TABLE 1.7 a
GROSS FIXED CAPITAL FORMATION (GFCF) IN PRIVATE SECTOR BY ECONOMIC ACTIVITY AT CURRENT MARKET PRICES
Rs million Sector 2015-16 2016-17 2017-18 2018-19 2019-20
F 2020-21
R 2021-22
P % Change
2020-21/ 2019-20
2021-22/ 2020-21
PRIVATE SECTOR 3,537,220 3,745,750 4,211,187 4,665,930 4,885,372 5,556,780 6,703,572 13.74 20.64 1. Agriculture 904,045 965,346 1,050,469 1,138,425 1,251,552 1,512,886 1,786,989 20.88 18.12
Crops 176,622 212,925 233,258 237,615 240,929 304,518 382,585 26.39 25.64 Cotton Ginning 1,042 1,097 1,150 1,274 1,487 1,748 2,106 17.55 20.48 Livestock 689,165 712,747 776,275 855,920 958,893 1,148,427 1,333,399 19.77 16.11 Forestry 1,392 1,468 1,542 1,712 2,000 2,355 2,843 17.75 20.72 Fishing 35,824 37,109 38,244 41,904 48,243 55,838 66,056 15.74 18.30
2. Mining and Quarrying 94,113 38,057 47,723 55,204 65,017 60,464 82,905 (7.00) 37.11 3. Manufacturing (A+B) 722,512 726,853 802,299 889,976 862,159 973,292 1,060,254 12.89 8.93 A. Large Scale 632,161 621,575 685,506 747,832 691,342 760,657 784,599 10.03 3.15 B. Small Scale (including Slaughtering) 90,351 105,278 116,793 142,144 170,817 212,635 275,655 24.48 29.64 4. Electricity Gas and Water Supply 46,543 44,640 126,854 86,747 78,541 73,065 66,860 (6.97) (8.49) 5. Construction 59,704 105,809 78,378 43,519 46,805 40,935 60,972 (12.54) 48.95 6. Wholesale and Retail Trade 202,799 231,144 301,783 430,297 408,671 458,047 472,404 12.08 3.13 7. Accommodation and Food Services Activities (Hotels & Restaurants) 74,922 92,968 85,589 85,772 57,994 57,050 59,726 (1.63) 4.69 8. Transport and Storage 389,786 422,421 495,270 515,888 340,198 544,854 751,285 60.16 37.89 9. Information and Communication 129,729 123,564 116,808 126,389 326,496 196,113 245,424 (39.93) 25.14 10. Finance and Insurance Activities 49,556 48,748 55,057 65,082 70,269 84,232 94,779 19.87 12.52 11. Real Estate Activities (OD) 523,819 562,916 613,462 709,639 803,990 901,064 1,215,696 12.07 34.92 12. Education 99,588 108,127 121,144 139,770 160,611 182,254 237,152 13.48 30.12 13. Human Health and Social Work Activities 55,142 61,094 68,266 83,685 97,037 112,149 137,827 15.57 22.90 14. Other Private Services 184,962 214,063 248,085 295,537 316,032 360,375 431,299 14.03 19.68
P: Provisional, R: Revised, F: Final (Contd…) Note: Figure in parenthesis indicate negative growth.
TABLE 1.7 b
GROSS FIXED CAPITAL FORMATION (GFCF) IN PUBLIC AND GENERAL GOVERNMENT SECTORS BY ECONOMIC ACTIVITY AT CURRENT MARKET PRICES
Rs million Sector 2015-16 2016-17 2017-18 2018-19 2019-20
F 2020-21
R 2021-22
P % Change
2020-21/ 2019-20
2021-22/ 2020-21
Public Sector and General Govt. (A+B) 1,119,929 1,453,100 1,807,698 1,373,714 1,345,055 1,660,310 2,288,857 23.44 37.86 A. Public Sector (Autonomous & Semi Auto-Bodies) 252,053 363,686 448,598 475,183 349,556 418,892 481,283 19.84 14.89 1. Agriculture, Forestry & Fishing 205 183 242 214 302 263 588 (12.91) 123.57 2. Mining and Quarrying 28,053 62,529 24,246 18,123 25,127 25,295 13,786 0.67 (45.50) 3. Manufacturing (Large Scale) 1,333 28,205 8,635 1,765 8,620 14,395 13,937 67.00 (3.18) 4. Electricity, Gas & Water Supply 155,108 146,619 260,657 375,240 236,452 262,596 224,237 11.06 (14.61) 5. Construction 5,178 5,812 6,606 970 4,156 9,775 13,965 135.20 42.86 6. Transport & Storage 26,905 69,745 115,242 42,244 24,678 60,882 116,959 146.71 92.11 Railways 5,825 39,407 8,627 14,612 6,261 4,239 1,979 (32.30) (53.31) Post Office & PTCL - 1 - 997 1,539 2,422 1,005 57.37 (58.51) Others 21,080 30,337 106,615 26,635 16,878 54,221 113,975 221.25 110.20 7. Information and Communication 28,307 33,644 26,377 28,753 42,344 34,248 79,020 (19.12) 130.73 8. Finance & Insurance 6,964 16,949 6,593 7,874 7,877 11,438 18,791 45.21 64.29 B. General Govt. 867,876 1,089,414 1,359,100 898,531 995,499 1,241,418 1,807,574 24.70 45.61 Federal 235,406 314,376 359,047 354,495 387,225 477,178 565,630 23.23 18.54 Provincial 527,461 686,665 909,116 463,854 527,970 653,800 1,063,748 23.83 62.70 District Governments 105,009 88,373 90,937 80,182 80,304 110,440 178,196 37.53 61.35 General Government (By industries) 867,876 1,089,414 1,359,098 898,530 995,500 1,241,418 1,807,574 24.70 45.61 i) Public Administration and Social Security
(General Government) 750,084 967,642 1,229,418 804,220 888,918 1,070,774 1,584,815 20.46 48.01 ii) Education 80,403 74,026 69,232 59,004 56,683 101,795 136,630 79.59 34.22 iii) Human health and social work activities 37,389 47,746 60,448 35,306 49,899 68,848 86,129 37.98 25.10
P: Provisional, R: Revised, F: Final Source: Pakistan Bureau of Statistics Note: Figure in parenthesis indicate negative growth.

17
TABLE 1.8
GROSS FIXED CAPITAL FORMATION (GFCF) IN PRIVATE, PUBLIC, AND GENERAL GOVERNMENT SECTORS BY ECONOMIC ACTIVITY AT CONSTANT PRICES (2015-16)
Rs million Sector 2015-16 2016-17 2017-18 2018-19 2019-20
F 2020-21
R 2021-22
P % Change
2020-21/ 2019-20
2021-22/ 2020-21
GFCF (A+B+C) 4,657,149 5,017,178 5,533,617 4,921,409 4,592,834 4,797,521 4,915,681 4.46 2.46
A. Private Sector 3,537,220 3,621,176 3,879,013 3,812,927 3,627,468 3,717,184 3,698,625 2.47 (0.50)
B. Public Sector 252,053 353,002 418,721 404,028 257,481 273,532 261,167 6.23 (4.52)
C. General Govt. 867,876 1,043,000 1,235,883 704,454 707,885 806,805 955,888 13.97 18.48
Private & Public (A+B) 3,789,273 3,974,178 4,297,734 4,216,955 3,884,949 3,990,716 3,959,792 2.72 (0.77)
SECTOR-WISE:
1. Agriculture, Forestry & Fishing 904,250 954,120 988,985 996,522 996,479 1,037,227 1,074,961 4.09 3.64
2. Mining and Quarrying 122,166 101,274 71,341 57,706 55,167 51,178 52,739 (7.23) 3.05
3. Manufacturing (A+B) 723,845 720,981 739,446 706,175 627,453 645,739 577,816 2.91 (10.52)
A. Large Scale 633,494 622,096 631,209 587,689 497,732 503,705 422,282 1.20 (16.16)
B. Small Scale (including Slaughtering) 90,351 98,885 108,237 118,486 129,721 142,034 155,534 9.49 9.50
4. Electricity Gas and Water Supply 201,651 183,994 363,600 399,832 239,057 220,276 164,355 (7.86) (25.39)
5. Construction 64,882 107,742 78,075 36,618 38,333 35,276 40,063 (7.98) 13.57
6. Wholesale and Retail Trade 202,799 221,295 274,423 337,356 290,600 297,684 249,817 2.44 (16.08)
7. Accommodation and Food Services Activities (Hotels & Restaurants) 74,922 89,007 77,829 67,246 41,238 37,077 31,584 (10.09) (14.82)
8. Transport and Storage 416,691 471,198 555,163 437,579 259,458 393,667 459,145 51.73 16.63
9. Information and Communication 158,036 150,510 130,204 121,632 262,277 149,712 171,573 (42.92) 14.60
10. Finance and Insurance Activities 56,520 62,897 56,060 57,198 55,568 62,175 60,058 11.89 (3.40)
11. Real Estate Activities (OD) 523,819 543,355 563,585 584,065 604,777 626,827 649,931 3.65 3.69
12. Public Administration and Defence; compulsory social security 750,084 926,416 1,117,958 630,514 632,097 695,903 838,088 10.09 20.43
13. Education 179,991 175,242 174,250 161,297 161,121 192,943 199,038 19.75 3.16
14. Human Health and Social Work Activities 92,531 104,203 117,045 93,289 104,484 117,631 118,433 12.58 0.68
15. Other Private Services 184,962 204,944 225,651 234,380 224,726 234,207 228,079 4.22 (2.62)
P: Provisional, R: Revised, F: Final (Contd…) Note: Figure in parenthesis indicate negative growth.

18
TABLE 1.8 a
GROSS FIXED CAPITAL FORMATION (GFCF) IN PRIVATE SECTOR BY ECONOMIC ACTIVITY AT CONSTANT PRICES (2015-16)
Rs million Sector 2015-16 2016-17 2017-18 2018-19 2019-20
F 2020-21
R 2021-22
P % Change
2020-21/ 2019-20
2021-22/ 2020-21
PRIVATE SECTOR 3,537,220 3,621,176 3,879,013 3,812,927 3,627,468 3,717,184 3,698,625 2.47 (0.50) 1. Agriculture 904,045 953,943 988,757 996,336 996,250 1,037,054 1,074,634 4.10 3.62
Crops 176,622 206,283 219,931 206,156 182,757 200,445 213,116 9.68 6.32 Cotton Ginning 1,042 1,063 1,084 1,106 1,128 1,150 1,173 1.95 2.00 Livestock 689,165 709,222 730,231 751,233 774,253 797,154 821,965 2.96 3.11 Forestry 1,392 1,423 1,453 1,485 1,517 1,550 1,584 2.18 2.19 Fishing 35,824 35,952 36,058 36,356 36,595 36,755 36,796 0.44 0.11
2. Mining and Quarrying 94,113 38,317 47,307 43,443 39,790 36,083 45,219 (9.32) 25.32 3. Manufacturing (A+B) 722,512 693,978 731,594 704,791 621,324 636,384 570,446 2.42 (10.36) A. Large Scale 632,161 595,093 623,357 586,305 491,603 494,350 414,912 0.56 (16.07) B. Small Scale (including Slaughtering) 90,351 98,885 108,237 118,486 129,721 142,034 155,534 9.49 9.50 4. Electricity Gas and Water Supply 46,543 41,949 117,837 74,272 59,696 47,425 39,446 (20.56) (16.82) 5. Construction 59,704 102,132 72,006 35,819 35,207 28,476 32,597 (19.12) 14.47 6. Wholesale and Retail Trade 202,799 221,295 274,423 337,356 290,600 297,684 249,817 2.44 (16.08) 7. Accommodation and Food Services
Activities (Hotels & Restaurants) 74,922 89,007 77,829 67,246 41,238 37,077 31,584 (10.09) (14.82) 8. Transport and Storage 389,786 404,424 450,369 404,459 241,910 354,100 397,295 46.38 12.20 9. Information and Communication 129,729 118,300 106,218 99,089 232,167 127,454 129,785 (45.10) 1.83 10. Finance and Insurance Activities 49,556 46,671 50,065 51,025 49,967 54,742 50,121 9.56 (8.44) 11. Real Estate Activities (OD) 523,819 543,355 563,585 584,065 604,777 626,827 649,931 3.65 3.69 12. Education 99,588 104,370 111,295 115,037 120,815 126,785 126,785 4.94 (0.00) 13. Human Health and Social Work Activities 55,142 58,491 62,077 65,609 69,002 72,886 72,886 5.63 0.00 14. Other Private Services 184,962 204,944 225,651 234,380 224,726 234,207 228,079 4.22 (2.62)
P: Provisional, R: Revised, F: Final (Contd…) Note: Figure in parenthesis indicate negative growth.
TABLE 1.8 b
GROSS FIXED CAPITAL FORMATION (GFCF) IN PUBLIC AND GENERAL GOVERNMENT SECTORS BY ECONOMIC ACTIVITY AT CONSTANT PRICES (2015-16)
Rs million Sector 2015-16 2016-17 2017-18 2018-19 2019-20
F 2020-21
R 2021-22
P % Change
2020-21/ 2019-20
2021-22/ 2020-21
Public Sector and General Govt. (A+B) 1,119,929 1,396,002 1,654,604 1,108,482 965,366 1,080,337 1,217,055 11.91 12.66 A. Public Sector (Autonomous & Semi
Auto-Bodies) 252,053 353,002 418,721 404,028 257,481 273,532 261,167 6.23 (4.52) 1. Agriculture, Forestry & Fishing 205 177 228 186 229 173 327 (24.45) 89.02 2. Mining and Quarrying 28,053 62,957 24,034 14,263 15,377 15,095 7,520 (1.83) (50.18) 3. Manufacturing (Large Scale) 1,333 27,003 7,852 1,384 6,129 9,355 7,370 52.64 (21.22) 4. Electricity, Gas & Water Supply 155,108 142,045 245,763 325,560 179,361 172,851 124,909 (3.63) (27.74) 5. Construction 5,178 5,610 6,069 799 3,126 6,800 7,466 117.51 9.79 6. Transport & Storage 26,905 66,774 104,794 33,120 17,548 39,567 61,850 125.48 56.32 Railways 5,825 37,729 7,845 11,456 4,452 2,755 1,047 (38.12) (62.00) Post Office & PTCL 0 1 0 782 1,094 1,574 531 43.88 (66.26) Others 21,080 29,044 96,949 20,882 12,002 35,238 60,272 193.60 71.04 7. Information and Communication 28,307 32,210 23,986 22,543 30,110 22,258 41,788 (26.08) 87.74 8. Finance & Insurance 6,964 16,226 5,995 6,173 5,601 7,433 9,937 32.71 33.69 B. General Govt. 867,876 1,043,000 1,235,883 704,454 707,885 806,805 955,888 13.97 18.48 Federal 235,406 300,982 326,495 277,926 275,350 310,121 299,119 12.63 (3.55) Provincial 527,461 657,410 826,695 363,664 375,432 424,909 562,535 13.18 32.39 District Governments 105,009 84,608 82,693 62,863 57,103 71,776 94234.286 25.69 31.29 General Government (By industries) 867,876 1,043,000 1,235,881 704,453 707,886 806,805 955,888 13.97 18.48 i) Public Administration and Social
Security (General Government) 750,084 926,416 1,117,958 630,514 632,097 695,903 838,088 10.09 20.43 ii) Education 80,403 70,872 62,955 46,260 40,306 66,157 72,253 64.14 9.21 iii) Human health and social work activities 37,389 45,712 54,968 27,680 35,482 44,745 45,547 26.10 1.79
P: Provisional, R: Revised, F: Final Source: Pakistan Bureau of Statistics Note: Figure in parenthesis indicate negative growth.


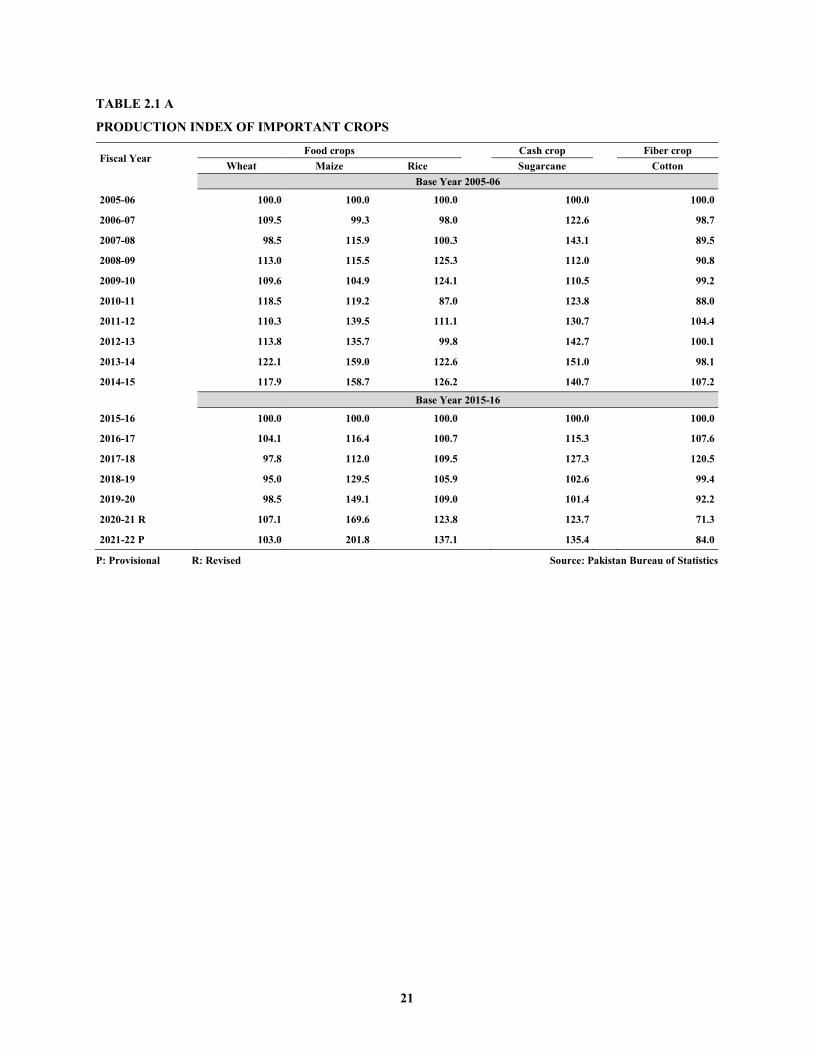
21
TABLE 2.1 A
PRODUCTION INDEX OF IMPORTANT CROPS
Fiscal Year Food crops Cash crop
Fiber crop
Wheat Maize Rice Sugarcane Cotton Base Year 2005-06
2005-06 100.0 100.0 100.0 100.0 100.0
2006-07 109.5 99.3 98.0 122.6 98.7
2007-08 98.5 115.9 100.3 143.1 89.5
2008-09 113.0 115.5 125.3 112.0 90.8
2009-10 109.6 104.9 124.1 110.5 99.2
2010-11 118.5 119.2 87.0 123.8 88.0
2011-12 110.3 139.5 111.1 130.7 104.4
2012-13 113.8 135.7 99.8 142.7 100.1
2013-14 122.1 159.0 122.6 151.0 98.1
2014-15 117.9 158.7 126.2 140.7 107.2
Base Year 2015-16
2015-16 100.0 100.0 100.0 100.0 100.0
2016-17 104.1 116.4 100.7 115.3 107.6
2017-18 97.8 112.0 109.5 127.3 120.5
2018-19 95.0 129.5 105.9 102.6 99.4
2019-20 98.5 149.1 109.0 101.4 92.2
2020-21 R 107.1 169.6 123.8 123.7 71.3
2021-22 P 103.0 201.8 137.1 135.4 84.0
P: Provisional R: Revised Source: Pakistan Bureau of Statistics
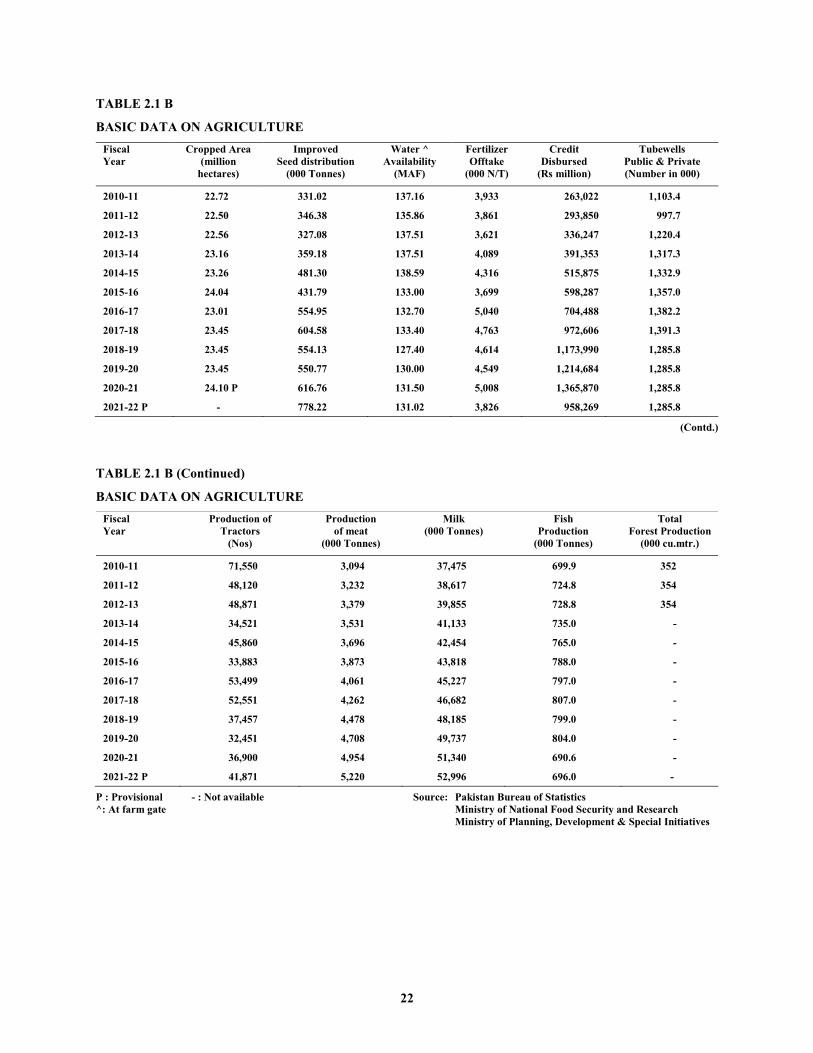
22
TABLE 2.1 B
BASIC DATA ON AGRICULTURE
Fiscal Year
Cropped Area (million
hectares)
Improved Seed distribution
(000 Tonnes)
Water ^ Availability
(MAF)
Fertilizer Offtake
(000 N/T)
Credit Disbursed
(Rs million)
Tubewells Public & Private (Number in 000)
2010-11 22.72 331.02 137.16 3,933 263,022 1,103.4
2011-12 22.50 346.38 135.86 3,861 293,850 997.7
2012-13 22.56 327.08 137.51 3,621 336,247 1,220.4
2013-14 23.16 359.18 137.51 4,089 391,353 1,317.3
2014-15 23.26 481.30 138.59 4,316 515,875 1,332.9
2015-16 24.04 431.79 133.00 3,699 598,287 1,357.0
2016-17 23.01 554.95 132.70 5,040 704,488 1,382.2
2017-18 23.45 604.58 133.40 4,763 972,606 1,391.3
2018-19 23.45 554.13 127.40 4,614 1,173,990 1,285.8
2019-20 23.45 550.77 130.00 4,549 1,214,684 1,285.8
2020-21 24.10 P 616.76 131.50 5,008 1,365,870 1,285.8
2021-22 P - 778.22 131.02 3,826 958,269 1,285.8
(Contd.)
TABLE 2.1 B (Continued)
BASIC DATA ON AGRICULTURE
Fiscal Year
Production of Tractors
(Nos)
Production of meat
(000 Tonnes)
Milk (000 Tonnes)
Fish Production
(000 Tonnes)
Total Forest Production
(000 cu.mtr.)
2010-11 71,550 3,094 37,475 699.9 352
2011-12 48,120 3,232 38,617 724.8 354
2012-13 48,871 3,379 39,855 728.8 354
2013-14 34,521 3,531 41,133 735.0 -
2014-15 45,860 3,696 42,454 765.0 -
2015-16 33,883 3,873 43,818 788.0 -
2016-17 53,499 4,061 45,227 797.0 -
2017-18 52,551 4,262 46,682 807.0 -
2018-19 37,457 4,478 48,185 799.0 -
2019-20 32,451 4,708 49,737 804.0 -
2020-21 36,900 4,954 51,340 690.6 -
2021-22 P 41,871 5,220 52,996 696.0 -
P : Provisional - : Not available Source: Pakistan Bureau of Statistics ^: At farm gate Ministry of National Food Security and Research Ministry of Planning, Development & Special Initiatives
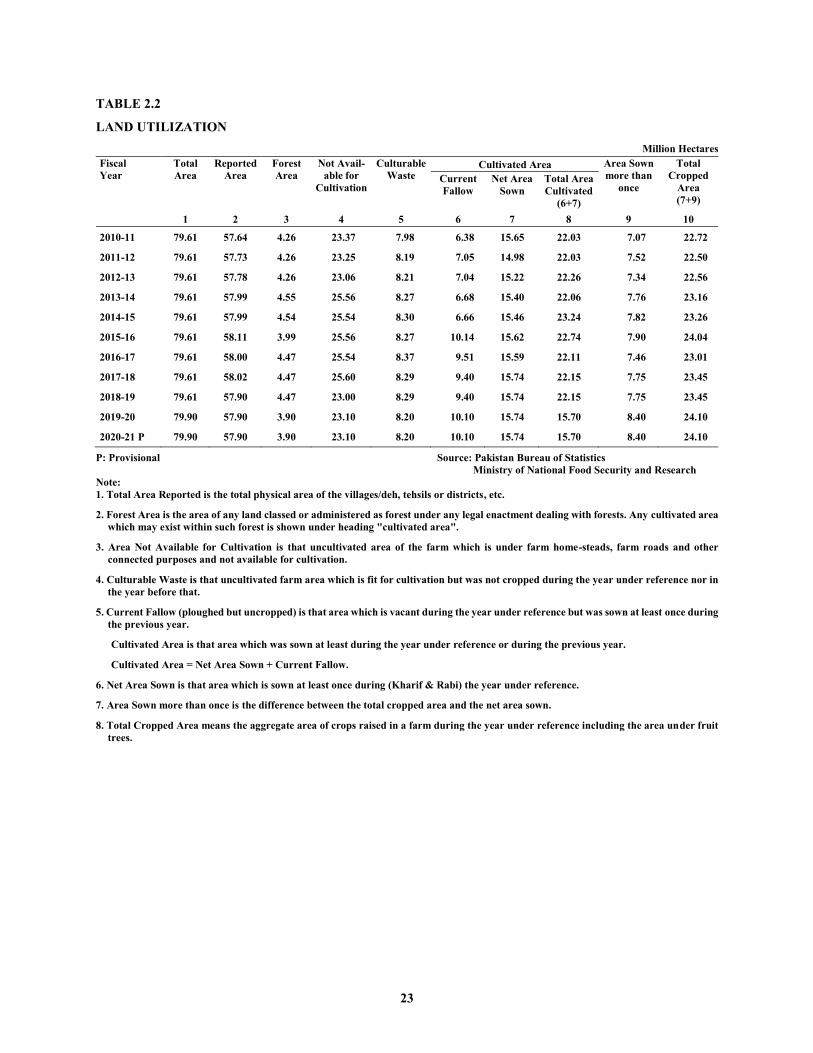
23
TABLE 2.2
LAND UTILIZATION Million Hectares
Fiscal Year
Total Area
Reported Area
Forest Area
Not Avail- able for
Cultivation
Culturable Waste
Cultivated Area Area Sown more than
once
Total Cropped
Area (7+9)
Current Fallow
Net Area Sown
Total Area Cultivated
(6+7) 1 2 3 4 5 6 7 8 9 10
2010-11 79.61 57.64 4.26 23.37 7.98 6.38 15.65 22.03 7.07 22.72
2011-12 79.61 57.73 4.26 23.25 8.19 7.05 14.98 22.03 7.52 22.50
2012-13 79.61 57.78 4.26 23.06 8.21 7.04 15.22 22.26 7.34 22.56
2013-14 79.61 57.99 4.55 25.56 8.27 6.68 15.40 22.06 7.76 23.16
2014-15 79.61 57.99 4.54 25.54 8.30 6.66 15.46 23.24 7.82 23.26
2015-16 79.61 58.11 3.99 25.56 8.27 10.14 15.62 22.74 7.90 24.04
2016-17 79.61 58.00 4.47 25.54 8.37 9.51 15.59 22.11 7.46 23.01
2017-18 79.61 58.02 4.47 25.60 8.29 9.40 15.74 22.15 7.75 23.45
2018-19 79.61 57.90 4.47 23.00 8.29 9.40 15.74 22.15 7.75 23.45
2019-20 79.90 57.90 3.90 23.10 8.20 10.10 15.74 15.70 8.40 24.10
2020-21 P 79.90 57.90 3.90 23.10 8.20 10.10 15.74 15.70 8.40 24.10
P: Provisional Source: Pakistan Bureau of Statistics Ministry of National Food Security and Research Note: 1. Total Area Reported is the total physical area of the villages/deh, tehsils or districts, etc.
2. Forest Area is the area of any land classed or administered as forest under any legal enactment dealing with forests. Any cultivated area which may exist within such forest is shown under heading "cultivated area".
3. Area Not Available for Cultivation is that uncultivated area of the farm which is under farm home-steads, farm roads and other connected purposes and not available for cultivation.
4. Culturable Waste is that uncultivated farm area which is fit for cultivation but was not cropped during the year under reference nor in the year before that.
5. Current Fallow (ploughed but uncropped) is that area which is vacant during the year under reference but was sown at least once during the previous year.
Cultivated Area is that area which was sown at least during the year under reference or during the previous year.
Cultivated Area = Net Area Sown + Current Fallow.
6. Net Area Sown is that area which is sown at least once during (Kharif & Rabi) the year under reference.
7. Area Sown more than once is the difference between the total cropped area and the net area sown.
8. Total Cropped Area means the aggregate area of crops raised in a farm during the year under reference including the area under fruit trees.
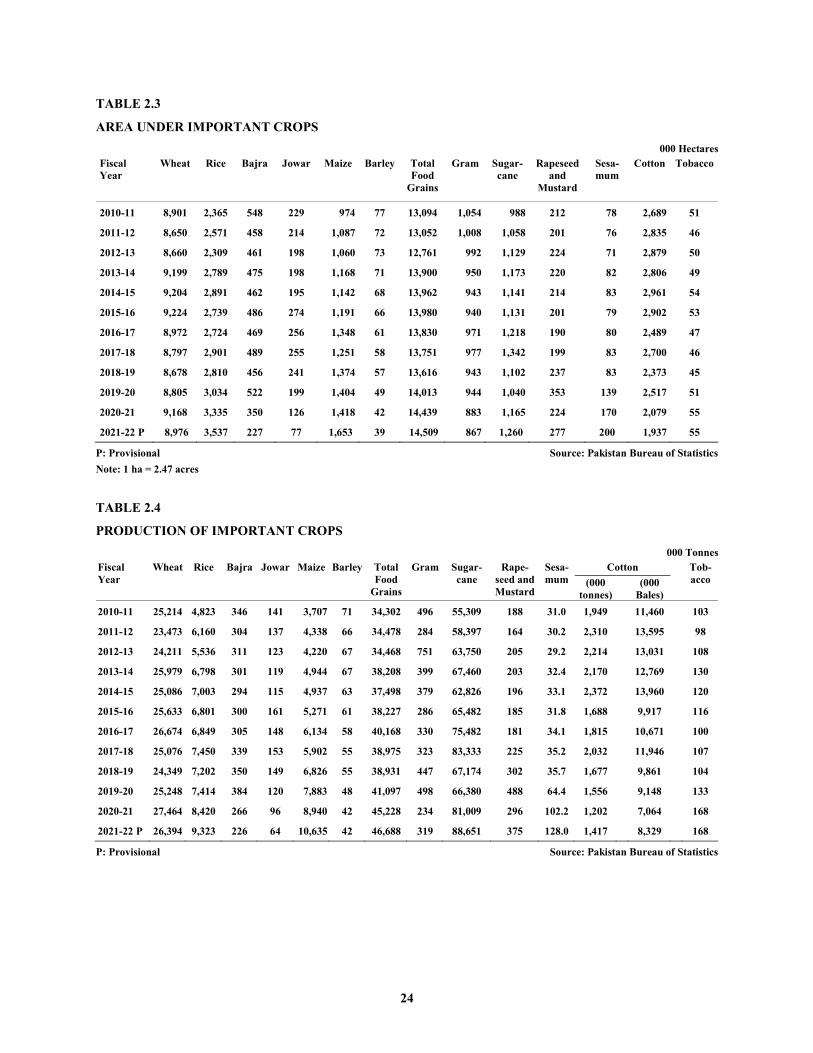
24
TABLE 2.3
AREA UNDER IMPORTANT CROPS
000 Hectares Fiscal Year
Wheat Rice Bajra Jowar Maize Barley Total Food
Grains
Gram Sugar- cane
Rapeseed and
Mustard
Sesa- mum
Cotton Tobacco
2010-11 8,901 2,365 548 229 974 77 13,094 1,054 988 212 78 2,689 51
2011-12 8,650 2,571 458 214 1,087 72 13,052 1,008 1,058 201 76 2,835 46
2012-13 8,660 2,309 461 198 1,060 73 12,761 992 1,129 224 71 2,879 50
2013-14 9,199 2,789 475 198 1,168 71 13,900 950 1,173 220 82 2,806 49
2014-15 9,204 2,891 462 195 1,142 68 13,962 943 1,141 214 83 2,961 54
2015-16 9,224 2,739 486 274 1,191 66 13,980 940 1,131 201 79 2,902 53
2016-17 8,972 2,724 469 256 1,348 61 13,830 971 1,218 190 80 2,489 47
2017-18 8,797 2,901 489 255 1,251 58 13,751 977 1,342 199 83 2,700 46
2018-19 8,678 2,810 456 241 1,374 57 13,616 943 1,102 237 83 2,373 45
2019-20 8,805 3,034 522 199 1,404 49 14,013 944 1,040 353 139 2,517 51
2020-21 9,168 3,335 350 126 1,418 42 14,439 883 1,165 224 170 2,079 55
2021-22 P 8,976 3,537 227 77 1,653 39 14,509 867 1,260 277 200 1,937 55
P: Provisional Source: Pakistan Bureau of Statistics Note: 1 ha = 2.47 acres TABLE 2.4
PRODUCTION OF IMPORTANT CROPS
000 Tonnes Fiscal Year
Wheat Rice Bajra Jowar Maize Barley Total Food
Grains
Gram Sugar- cane
Rape- seed and Mustard
Sesa- mum
Cotton Tob- acco (000
tonnes)
(000
Bales) 2010-11 25,214 4,823 346 141 3,707 71 34,302 496 55,309 188 31.0 1,949 11,460 103
2011-12 23,473 6,160 304 137 4,338 66 34,478 284 58,397 164 30.2 2,310 13,595 98
2012-13 24,211 5,536 311 123 4,220 67 34,468 751 63,750 205 29.2 2,214 13,031 108
2013-14 25,979 6,798 301 119 4,944 67 38,208 399 67,460 203 32.4 2,170 12,769 130
2014-15 25,086 7,003 294 115 4,937 63 37,498 379 62,826 196 33.1 2,372 13,960 120
2015-16 25,633 6,801 300 161 5,271 61 38,227 286 65,482 185 31.8 1,688 9,917 116
2016-17 26,674 6,849 305 148 6,134 58 40,168 330 75,482 181 34.1 1,815 10,671 100
2017-18 25,076 7,450 339 153 5,902 55 38,975 323 83,333 225 35.2 2,032 11,946 107
2018-19 24,349 7,202 350 149 6,826 55 38,931 447 67,174 302 35.7 1,677 9,861 104
2019-20 25,248 7,414 384 120 7,883 48 41,097 498 66,380 488 64.4 1,556 9,148 133
2020-21 27,464 8,420 266 96 8,940 42 45,228 234 81,009 296 102.2 1,202 7,064 168
2021-22 P 26,394 9,323 226 64 10,635 42 46,688 319 88,651 375 128.0 1,417 8,329 168
P: Provisional Source: Pakistan Bureau of Statistics
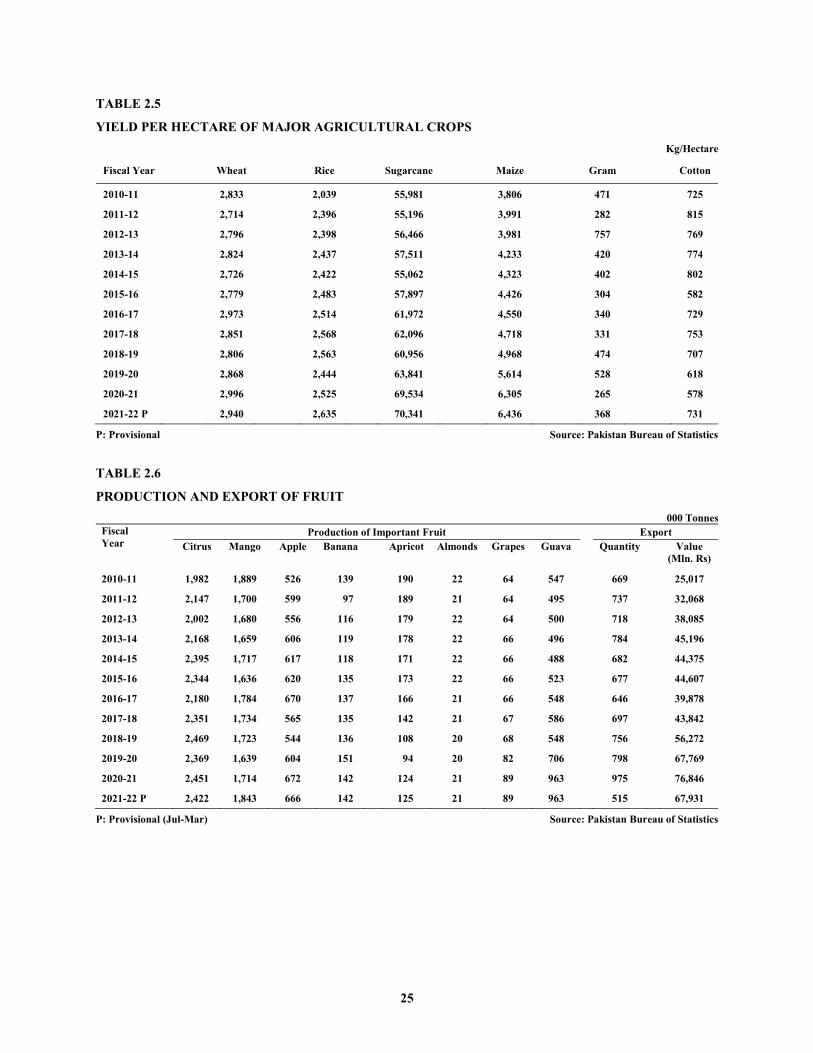
25
TABLE 2.5
YIELD PER HECTARE OF MAJOR AGRICULTURAL CROPS
Kg/Hectare
Fiscal Year Wheat Rice Sugarcane Maize Gram Cotton
2010-11 2,833 2,039 55,981 3,806 471 725
2011-12 2,714 2,396 55,196 3,991 282 815
2012-13 2,796 2,398 56,466 3,981 757 769
2013-14 2,824 2,437 57,511 4,233 420 774
2014-15 2,726 2,422 55,062 4,323 402 802
2015-16 2,779 2,483 57,897 4,426 304 582
2016-17 2,973 2,514 61,972 4,550 340 729
2017-18 2,851 2,568 62,096 4,718 331 753
2018-19 2,806 2,563 60,956 4,968 474 707
2019-20 2,868 2,444 63,841 5,614 528 618
2020-21 2,996 2,525 69,534 6,305 265 578
2021-22 P 2,940 2,635 70,341 6,436 368 731
P: Provisional Source: Pakistan Bureau of Statistics TABLE 2.6
PRODUCTION AND EXPORT OF FRUIT 000 Tonnes
Fiscal Year
Production of Important Fruit
Export Citrus Mango Apple Banana
Apricot Almonds Grapes Guava Quantity
Value
(Mln. Rs)
2010-11 1,982 1,889 526 139 190 22 64 547 669 25,017
2011-12 2,147 1,700 599 97 189 21 64 495 737 32,068
2012-13 2,002 1,680 556 116 179 22 64 500 718 38,085
2013-14 2,168 1,659 606 119 178 22 66 496 784 45,196
2014-15 2,395 1,717 617 118 171 22 66 488 682 44,375
2015-16 2,344 1,636 620 135 173 22 66 523 677 44,607
2016-17 2,180 1,784 670 137 166 21 66 548 646 39,878
2017-18 2,351 1,734 565 135 142 21 67 586 697 43,842
2018-19 2,469 1,723 544 136 108 20 68 548 756 56,272
2019-20 2,369 1,639 604 151 94 20 82 706 798 67,769
2020-21 2,451 1,714 672 142 124 21 89 963 975 76,846
2021-22 P 2,422 1,843 666 142 125 21 89 963 515 67,931
P: Provisional (Jul-Mar) Source: Pakistan Bureau of Statistics
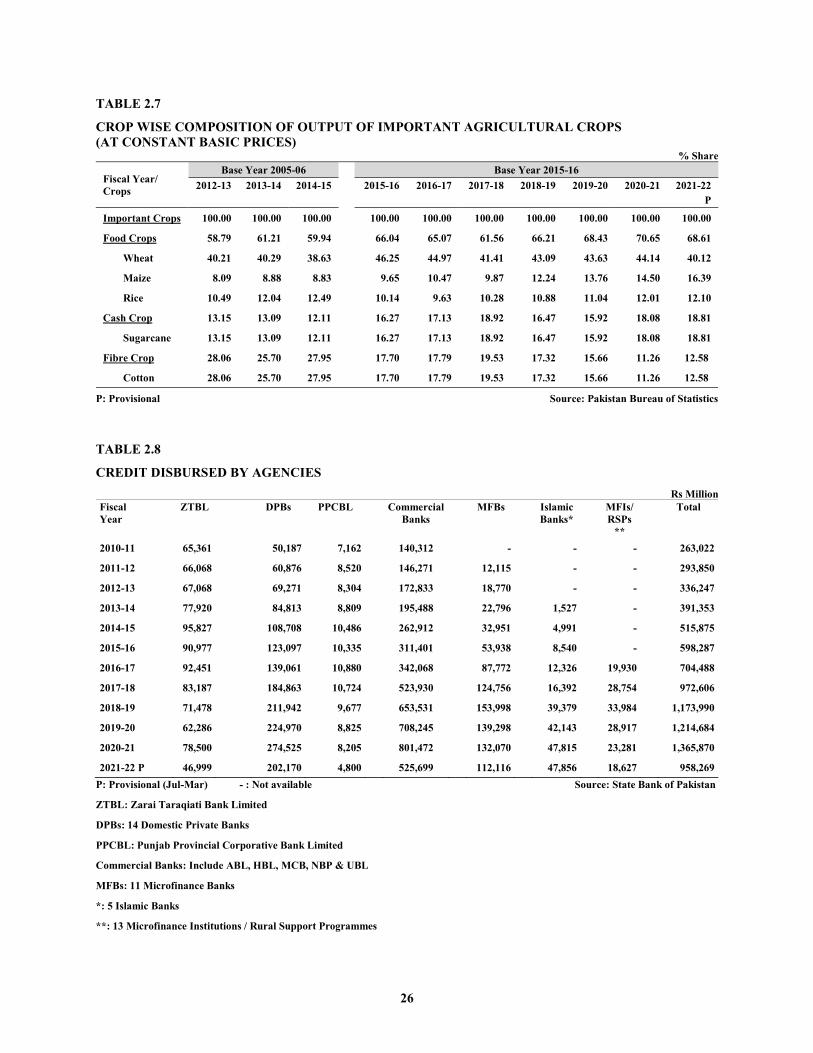
26
TABLE 2.7
CROP WISE COMPOSITION OF OUTPUT OF IMPORTANT AGRICULTURAL CROPS (AT CONSTANT BASIC PRICES)
% Share
Fiscal Year/ Crops
Base Year 2005-06 Base Year 2015-16 2012-13 2013-14 2014-15 2015-16 2016-17 2017-18 2018-19 2019-20 2020-21 2021-22
P
Important Crops 100.00 100.00 100.00 100.00 100.00 100.00 100.00 100.00 100.00 100.00
Food Crops 58.79 61.21 59.94 66.04 65.07 61.56 66.21 68.43 70.65 68.61 Wheat 40.21 40.29 38.63 46.25 44.97 41.41 43.09 43.63 44.14 40.12 Maize 8.09 8.88 8.83 9.65 10.47 9.87 12.24 13.76 14.50 16.39 Rice 10.49 12.04 12.49 10.14 9.63 10.28 10.88 11.04 12.01 12.10
Cash Crop 13.15 13.09 12.11 16.27 17.13 18.92 16.47 15.92 18.08 18.81 Sugarcane 13.15 13.09 12.11 16.27 17.13 18.92 16.47 15.92 18.08 18.81
Fibre Crop 28.06 25.70 27.95 17.70 17.79 19.53 17.32 15.66 11.26 12.58 Cotton 28.06 25.70 27.95 17.70 17.79 19.53 17.32 15.66 11.26 12.58
P: Provisional Source: Pakistan Bureau of Statistics TABLE 2.8
CREDIT DISBURSED BY AGENCIES
Rs Million Fiscal Year
ZTBL DPBs PPCBL
Commercial Banks
MFBs
Islamic Banks*
MFIs/RSPs
**
Total
2010-11 65,361 50,187 7,162 140,312 - - - 263,022
2011-12 66,068 60,876 8,520 146,271 12,115 - - 293,850
2012-13 67,068 69,271 8,304 172,833 18,770 - - 336,247
2013-14 77,920 84,813 8,809 195,488 22,796 1,527 - 391,353
2014-15 95,827 108,708 10,486 262,912 32,951 4,991 - 515,875
2015-16 90,977 123,097 10,335 311,401 53,938 8,540 - 598,287
2016-17 92,451 139,061 10,880 342,068 87,772 12,326 19,930 704,488
2017-18 83,187 184,863 10,724 523,930 124,756 16,392 28,754 972,606
2018-19 71,478 211,942 9,677 653,531 153,998 39,379 33,984 1,173,990
2019-20 62,286 224,970 8,825 708,245 139,298 42,143 28,917 1,214,684
2020-21 78,500 274,525 8,205 801,472 132,070 47,815 23,281 1,365,870
2021-22 P 46,999 202,170 4,800 525,699 112,116 47,856 18,627 958,269 P: Provisional (Jul-Mar) - : Not available Source: State Bank of Pakistan
ZTBL: Zarai Taraqiati Bank Limited
DPBs: 14 Domestic Private Banks
PPCBL: Punjab Provincial Corporative Bank Limited
Commercial Banks: Include ABL, HBL, MCB, NBP & UBL
MFBs: 11 Microfinance Banks
*: 5 Islamic Banks
**: 13 Microfinance Institutions / Rural Support Programmes

27
TABLE 2.9
FERTILIZER OFFTAKE AND IMPORTS OF FERTILIZERS & PESTICIDES 000 N/Tonnes
Fiscal Year
Fertilizer Offtake Import of
Fertilizers Import of Insecticides
Nitrogen Phosphorus Potash Total Quantity Value (Tonnes) (Mln Rs.)
2010-11 3,134 767 32 3,933 645 36,183 13,178
2011-12 3,207 633 21 3,861 1,177 32,152 12,255
2012-13 2,853 747 21 3,621 735 17,882 8,507
2013-14 3,185 881 24 4,089 1,148 23,546 12,572
2014-15 3,309 975 33 4,316 984 23,157 14,058
2015-16 2,672 1,007 20 3,699 901 17,386 15,974
2016-17 3,730 1,269 41 5,040 961 18,088 16,680
2017-18 3,435 1,279 50 4,763 1,191 26,480 19,162
2018-19 3,408 1,153 53 4,614 1,093 29,117 25,909
2019-20 3,415 1,084 50 4,549 890 32,089 29,572
2020-21 3,711 1,228 69 5,008 884 37,441 30,083
2021-22 P 2,861 903 63 3,826 586 24,151 23,296
P: Provisional (Jul-Mar) Source: Pakistan Bureau of Statistics National Fertilizer Development Centre
TABLE 2.10
AVERAGE RETAIL SALE PRICES OF FERTILIZERS
Rs per bag of 50 Kgs
Fiscal Year Urea AN/CAN AS NP SSP(G) DAP SOP
2010-11 1,035 843 1,124 2,108 896 3,236 2,807
2011-12 1,719 1,392 - 2,691 1,260 4,054 3,797
2012-13 1,799 1,443 - 2,524 1,172 3,902 3,945
2013-14 1,827 1,566 - 2,513 1,050 3,640 4,233
2014-15 1,883 1,606 - 2,584 1,012 3,677 4,904
2015-16 1,860 1,564 - 2,339 973 3,343 5,131
2016-17 1,378 1,198 - 1,869 886 2,596 4,100
2017-18 1,386 1,241 - 2,175 890 2,882 3,659
2018-19 1,745 1,571 - 2,829 1,002 3,518 3,945
2019-20 1,850 1,700 - 2,695 1,068 3,558 4,299
2020-21 1,698 1,547 - 3,144 1,249 4,432 4,462
2021-22 P 1,862 1,644 - 5,087 1,809 7,701 6,876
P: Provisional (Jul-Mar) -: Not available Source: Pakistan Bureau of Statistics National Fertilizer Development Centre
AN/CAN: Ammonium Nitrate/Calcium Ammonium Nitrate
AS: Ammonium Sulphate DAP: Diammonium Phosphate
NP: Nitrophosphate SOP: Sulphate of Potash
SSP: Single Super Phosphate
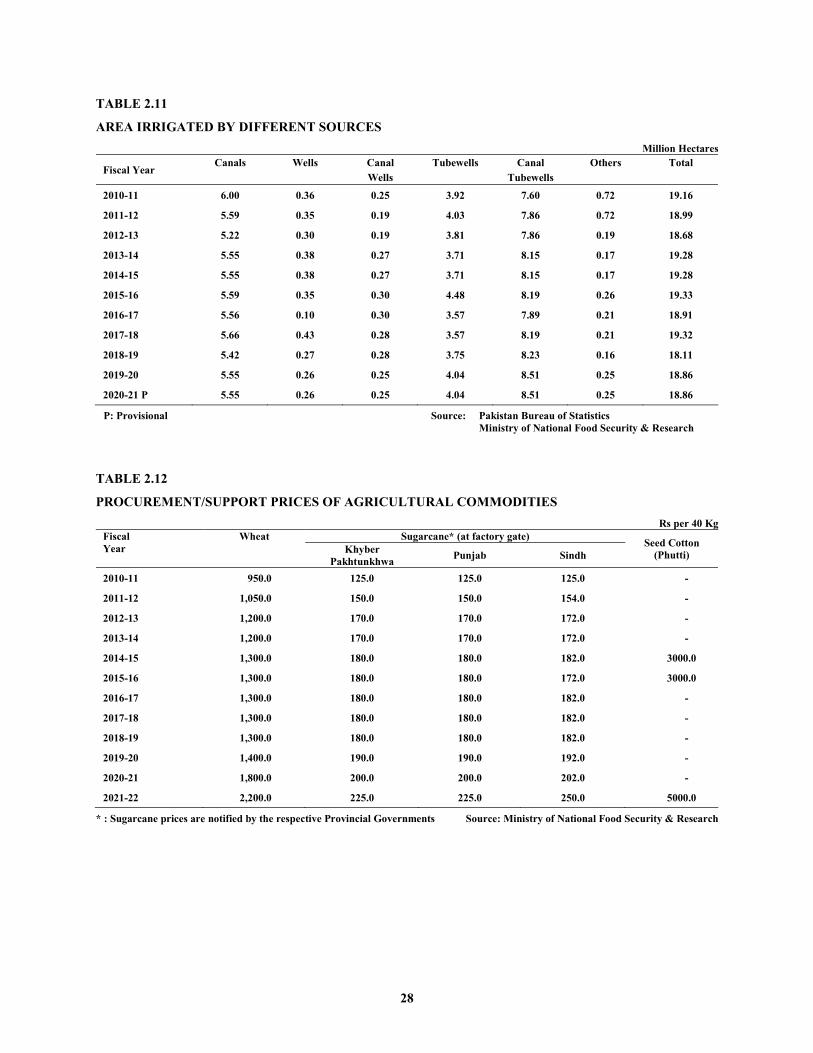
28
TABLE 2.11
AREA IRRIGATED BY DIFFERENT SOURCES
Million Hectares
Fiscal Year Canals Wells Canal Tubewells Canal Others Total
Wells Tubewells
2010-11 6.00 0.36 0.25 3.92 7.60 0.72 19.16
2011-12 5.59 0.35 0.19 4.03 7.86 0.72 18.99
2012-13 5.22 0.30 0.19 3.81 7.86 0.19 18.68
2013-14 5.55 0.38 0.27 3.71 8.15 0.17 19.28
2014-15 5.55 0.38 0.27 3.71 8.15 0.17 19.28
2015-16 5.59 0.35 0.30 4.48 8.19 0.26 19.33
2016-17 5.56 0.10 0.30 3.57 7.89 0.21 18.91
2017-18 5.66 0.43 0.28 3.57 8.19 0.21 19.32
2018-19 5.42 0.27 0.28 3.75 8.23 0.16 18.11
2019-20 5.55 0.26 0.25 4.04 8.51 0.25 18.86
2020-21 P 5.55 0.26 0.25 4.04 8.51 0.25 18.86
P: Provisional Source: Pakistan Bureau of Statistics Ministry of National Food Security & Research
TABLE 2.12
PROCUREMENT/SUPPORT PRICES OF AGRICULTURAL COMMODITIES Rs per 40 Kg
Fiscal Year
Wheat Sugarcane* (at factory gate) Seed Cotton (Phutti) Khyber
Pakhtunkhwa Punjab Sindh
2010-11 950.0 125.0 125.0 125.0 -
2011-12 1,050.0 150.0 150.0 154.0 -
2012-13 1,200.0 170.0 170.0 172.0 -
2013-14 1,200.0 170.0 170.0 172.0 -
2014-15 1,300.0 180.0 180.0 182.0 3000.0
2015-16 1,300.0 180.0 180.0 172.0 3000.0
2016-17 1,300.0 180.0 180.0 182.0 -
2017-18 1,300.0 180.0 180.0 182.0 -
2018-19 1,300.0 180.0 180.0 182.0 -
2019-20 1,400.0 190.0 190.0 192.0 -
2020-21 1,800.0 200.0 200.0 202.0 -
2021-22 2,200.0 225.0 225.0 250.0 5000.0
* : Sugarcane prices are notified by the respective Provincial Governments Source: Ministry of National Food Security & Research
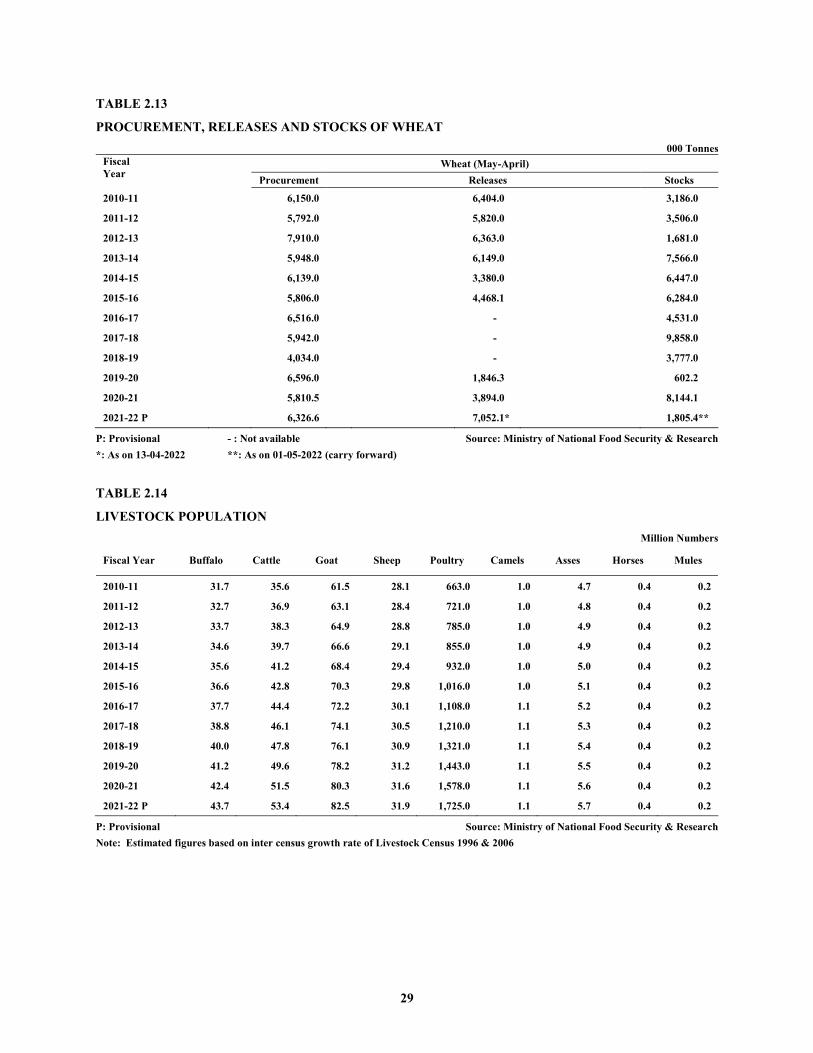
29
TABLE 2.13
PROCUREMENT, RELEASES AND STOCKS OF WHEAT
000 Tonnes Fiscal Year
Wheat (May-April) Procurement Releases Stocks
2010-11 6,150.0 6,404.0 3,186.0
2011-12 5,792.0 5,820.0 3,506.0
2012-13 7,910.0 6,363.0 1,681.0
2013-14 5,948.0 6,149.0 7,566.0
2014-15 6,139.0 3,380.0 6,447.0
2015-16 5,806.0 4,468.1 6,284.0
2016-17 6,516.0 - 4,531.0
2017-18 5,942.0 - 9,858.0
2018-19 4,034.0 - 3,777.0
2019-20 6,596.0 1,846.3 602.2
2020-21 5,810.5 3,894.0 8,144.1
2021-22 P 6,326.6 7,052.1* 1,805.4**
P: Provisional - : Not available Source: Ministry of National Food Security & Research *: As on 13-04-2022 **: As on 01-05-2022 (carry forward) TABLE 2.14
LIVESTOCK POPULATION
Million Numbers
Fiscal Year Buffalo Cattle Goat Sheep Poultry Camels Asses Horses Mules
2010-11 31.7 35.6 61.5 28.1 663.0 1.0 4.7 0.4 0.2
2011-12 32.7 36.9 63.1 28.4 721.0 1.0 4.8 0.4 0.2
2012-13 33.7 38.3 64.9 28.8 785.0 1.0 4.9 0.4 0.2
2013-14 34.6 39.7 66.6 29.1 855.0 1.0 4.9 0.4 0.2
2014-15 35.6 41.2 68.4 29.4 932.0 1.0 5.0 0.4 0.2
2015-16 36.6 42.8 70.3 29.8 1,016.0 1.0 5.1 0.4 0.2
2016-17 37.7 44.4 72.2 30.1 1,108.0 1.1 5.2 0.4 0.2
2017-18 38.8 46.1 74.1 30.5 1,210.0 1.1 5.3 0.4 0.2
2018-19 40.0 47.8 76.1 30.9 1,321.0 1.1 5.4 0.4 0.2
2019-20 41.2 49.6 78.2 31.2 1,443.0 1.1 5.5 0.4 0.2
2020-21 42.4 51.5 80.3 31.6 1,578.0 1.1 5.6 0.4 0.2
2021-22 P 43.7 53.4 82.5 31.9 1,725.0 1.1 5.7 0.4 0.2
P: Provisional Source: Ministry of National Food Security & Research Note: Estimated figures based on inter census growth rate of Livestock Census 1996 & 2006
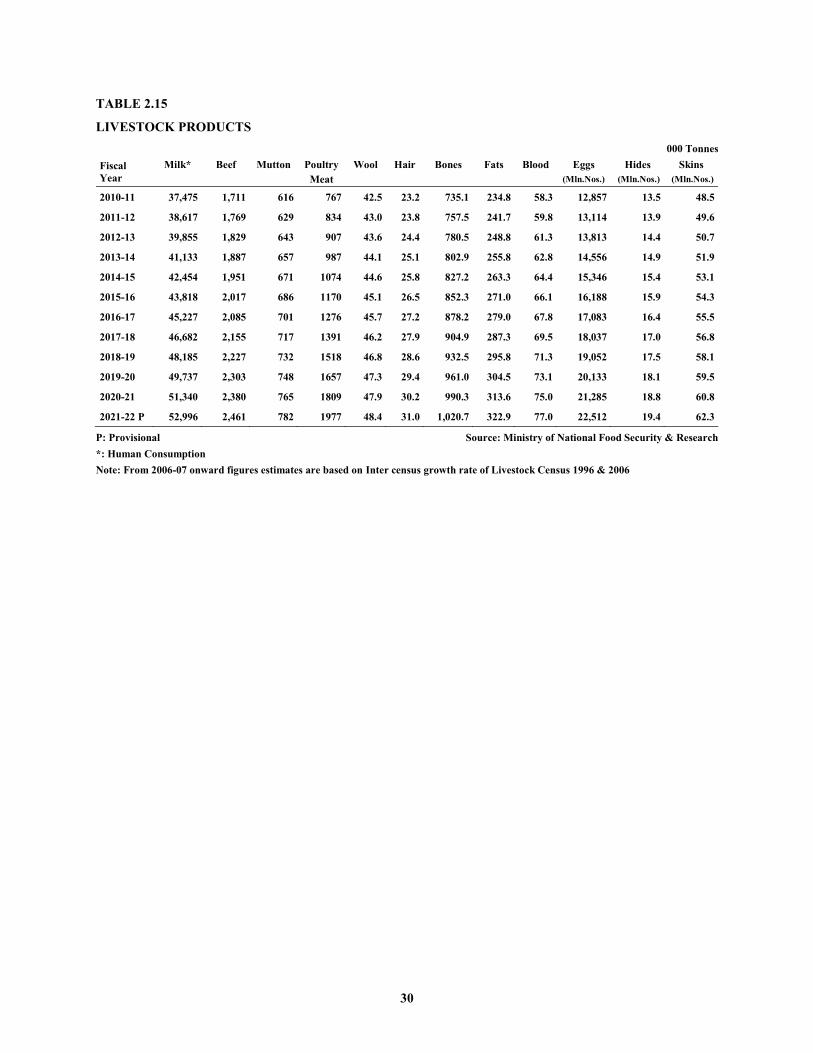
30
TABLE 2.15
LIVESTOCK PRODUCTS
000 Tonnes Fiscal Year
Milk* Beef Mutton Poultry Wool Hair Bones Fats Blood Eggs Hides Skins Meat (Mln.Nos.) (Mln.Nos.) (Mln.Nos.)
2010-11 37,475 1,711 616 767 42.5 23.2 735.1 234.8 58.3 12,857 13.5 48.5
2011-12 38,617 1,769 629 834 43.0 23.8 757.5 241.7 59.8 13,114 13.9 49.6
2012-13 39,855 1,829 643 907 43.6 24.4 780.5 248.8 61.3 13,813 14.4 50.7
2013-14 41,133 1,887 657 987 44.1 25.1 802.9 255.8 62.8 14,556 14.9 51.9
2014-15 42,454 1,951 671 1074 44.6 25.8 827.2 263.3 64.4 15,346 15.4 53.1
2015-16 43,818 2,017 686 1170 45.1 26.5 852.3 271.0 66.1 16,188 15.9 54.3
2016-17 45,227 2,085 701 1276 45.7 27.2 878.2 279.0 67.8 17,083 16.4 55.5
2017-18 46,682 2,155 717 1391 46.2 27.9 904.9 287.3 69.5 18,037 17.0 56.8
2018-19 48,185 2,227 732 1518 46.8 28.6 932.5 295.8 71.3 19,052 17.5 58.1
2019-20 49,737 2,303 748 1657 47.3 29.4 961.0 304.5 73.1 20,133 18.1 59.5
2020-21 51,340 2,380 765 1809 47.9 30.2 990.3 313.6 75.0 21,285 18.8 60.8
2021-22 P 52,996 2,461 782 1977 48.4 31.0 1,020.7 322.9 77.0 22,512 19.4 62.3
P: Provisional Source: Ministry of National Food Security & Research *: Human Consumption Note: From 2006-07 onward figures estimates are based on Inter census growth rate of Livestock Census 1996 & 2006

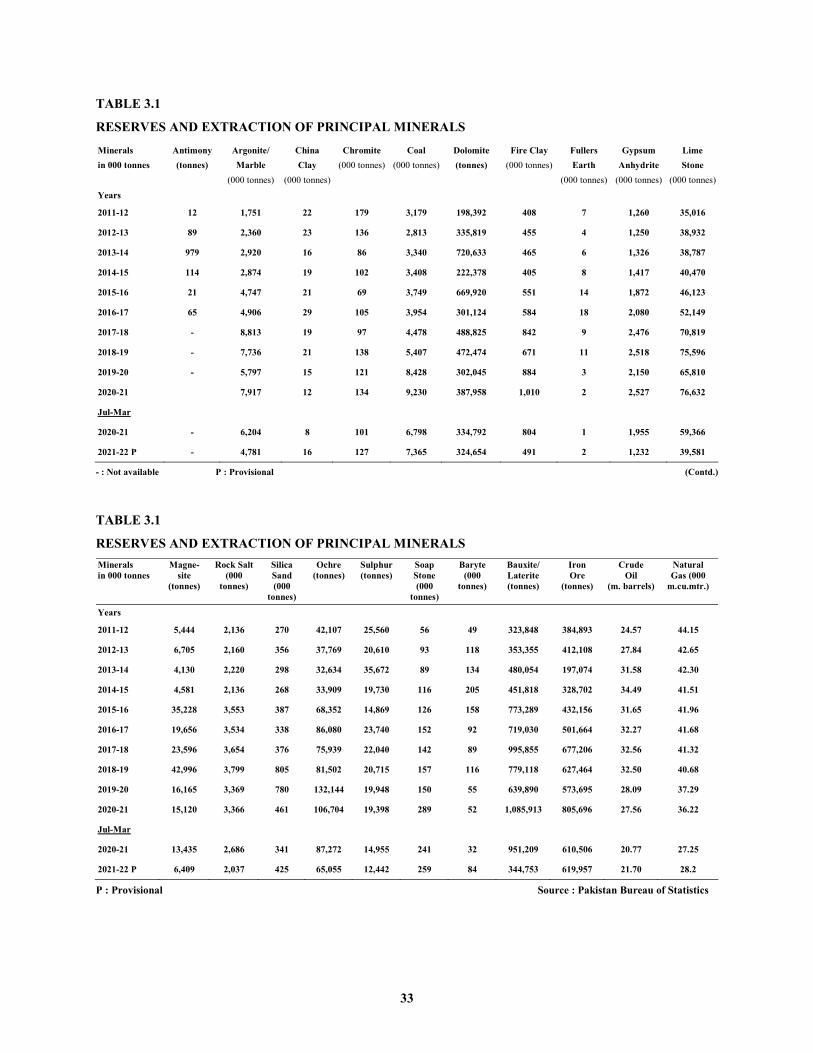
33
TABLE 3.1
RESERVES AND EXTRACTION OF PRINCIPAL MINERALS
Minerals Antimony Argonite/ China Chromite Coal Dolomite Fire Clay Fullers Gypsum Lime in 000 tonnes (tonnes) Marble Clay (000 tonnes) (000 tonnes) (tonnes) (000 tonnes) Earth Anhydrite Stone (000 tonnes) (000 tonnes) (000 tonnes) (000 tonnes) (000 tonnes)
Years
2011-12 12 1,751 22 179 3,179 198,392 408 7 1,260 35,016
2012-13 89 2,360 23 136 2,813 335,819 455 4 1,250 38,932
2013-14 979 2,920 16 86 3,340 720,633 465 6 1,326 38,787
2014-15 114 2,874 19 102 3,408 222,378 405 8 1,417 40,470
2015-16 21 4,747 21 69 3,749 669,920 551 14 1,872 46,123
2016-17 65 4,906 29 105 3,954 301,124 584 18 2,080 52,149
2017-18 - 8,813 19 97 4,478 488,825 842 9 2,476 70,819
2018-19 - 7,736 21 138 5,407 472,474 671 11 2,518 75,596
2019-20 - 5,797 15 121 8,428 302,045 884 3 2,150 65,810
2020-21 7,917 12 134 9,230 387,958 1,010 2 2,527 76,632
Jul-Mar
2020-21 - 6,204 8 101 6,798 334,792 804 1 1,955 59,366
2021-22 P - 4,781 16 127 7,365 324,654 491 2 1,232 39,581
- : Not available P : Provisional (Contd.)
TABLE 3.1
RESERVES AND EXTRACTION OF PRINCIPAL MINERALS Minerals in 000 tonnes
Magne- site
(tonnes)
Rock Salt (000
tonnes)
Silica Sand (000
tonnes)
Ochre (tonnes)
Sulphur (tonnes)
Soap Stone (000
tonnes)
Baryte (000
tonnes)
Bauxite/ Laterite (tonnes)
Iron Ore
(tonnes)
Crude Oil
(m. barrels)
Natural Gas (000
m.cu.mtr.)
Years
2011-12 5,444 2,136 270 42,107 25,560 56 49 323,848 384,893 24.57 44.15
2012-13 6,705 2,160 356 37,769 20,610 93 118 353,355 412,108 27.84 42.65
2013-14 4,130 2,220 298 32,634 35,672 89 134 480,054 197,074 31.58 42.30
2014-15 4,581 2,136 268 33,909 19,730 116 205 451,818 328,702 34.49 41.51
2015-16 35,228 3,553 387 68,352 14,869 126 158 773,289 432,156 31.65 41.96
2016-17 19,656 3,534 338 86,080 23,740 152 92 719,030 501,664 32.27 41.68
2017-18 23,596 3,654 376 75,939 22,040 142 89 995,855 677,206 32.56 41.32
2018-19 42,996 3,799 805 81,502 20,715 157 116 779,118 627,464 32.50 40.68
2019-20 16,165 3,369 780 132,144 19,948 150 55 639,890 573,695 28.09 37.29
2020-21 15,120 3,366 461 106,704 19,398 289 52 1,085,913 805,696 27.56 36.22
Jul-Mar
2020-21 13,435 2,686 341 87,272 14,955 241 32 951,209 610,506 20.77 27.25
2021-22 P 6,409 2,037 425 65,055 12,442 259 84 344,753 619,957 21.70 28.2
P : Provisional Source : Pakistan Bureau of Statistics
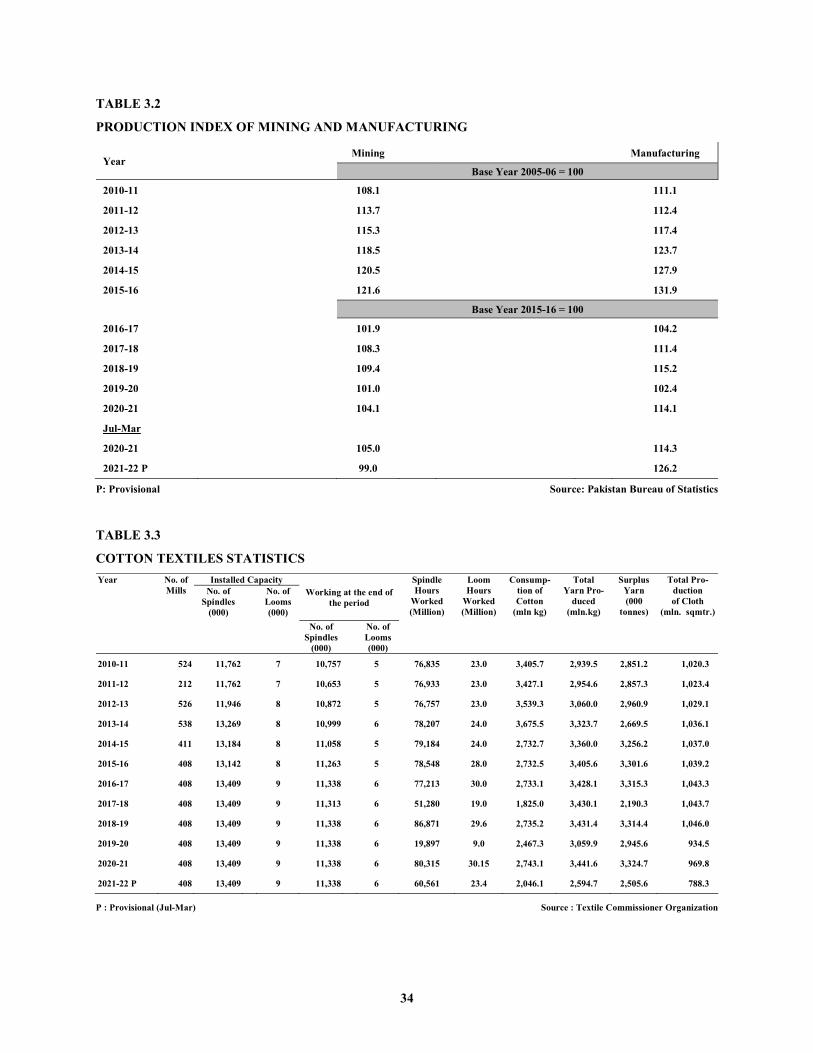
34
TABLE 3.2
PRODUCTION INDEX OF MINING AND MANUFACTURING
Year Mining Manufacturing
Base Year 2005-06 = 100
2010-11 108.1 111.1
2011-12 113.7 112.4
2012-13 115.3 117.4
2013-14 118.5 123.7
2014-15 120.5 127.9
2015-16 121.6 131.9
Base Year 2015-16 = 100
2016-17 101.9 104.2
2017-18 108.3 111.4
2018-19 109.4 115.2
2019-20 101.0 102.4
2020-21 104.1 114.1
Jul-Mar
2020-21 105.0 114.3
2021-22 P 99.0 126.2
P: Provisional Source: Pakistan Bureau of Statistics
TABLE 3.3
COTTON TEXTILES STATISTICS Year No. of
Mills Installed Capacity
Working at the end of the period
Spindle Hours
Worked (Million)
Loom Hours
Worked (Million)
Consump- tion of Cotton
(mln kg)
Total Yarn Pro-
duced (mln.kg)
Surplus Yarn (000
tonnes)
Total Pro- duction of Cloth
(mln. sqmtr.)
No. of Spindles
(000)
No. of Looms (000)
No. of Spindles
(000)
No. of Looms (000)
2010-11 524 11,762 7 10,757 5 76,835 23.0 3,405.7 2,939.5 2,851.2 1,020.3
2011-12 212 11,762 7 10,653 5 76,933 23.0 3,427.1 2,954.6 2,857.3 1,023.4
2012-13 526 11,946 8 10,872 5 76,757 23.0 3,539.3 3,060.0 2,960.9 1,029.1
2013-14 538 13,269 8 10,999 6 78,207 24.0 3,675.5 3,323.7 2,669.5 1,036.1
2014-15 411 13,184 8 11,058 5 79,184 24.0 2,732.7 3,360.0 3,256.2 1,037.0
2015-16 408 13,142 8 11,263 5 78,548 28.0 2,732.5 3,405.6 3,301.6 1,039.2
2016-17 408 13,409 9 11,338 6 77,213 30.0 2,733.1 3,428.1 3,315.3 1,043.3
2017-18 408 13,409 9 11,313 6 51,280 19.0 1,825.0 3,430.1 2,190.3 1,043.7
2018-19 408 13,409 9 11,338 6 86,871 29.6 2,735.2 3,431.4 3,314.4 1,046.0
2019-20 408 13,409 9 11,338 6 19,897 9.0 2,467.3 3,059.9 2,945.6 934.5
2020-21 408 13,409 9 11,338 6 80,315 30.15 2,743.1 3,441.6 3,324.7 969.8
2021-22 P 408 13,409 9 11,338 6 60,561 23.4 2,046.1 2,594.7 2,505.6 788.3
P : Provisional (Jul-Mar) Source : Textile Commissioner Organization
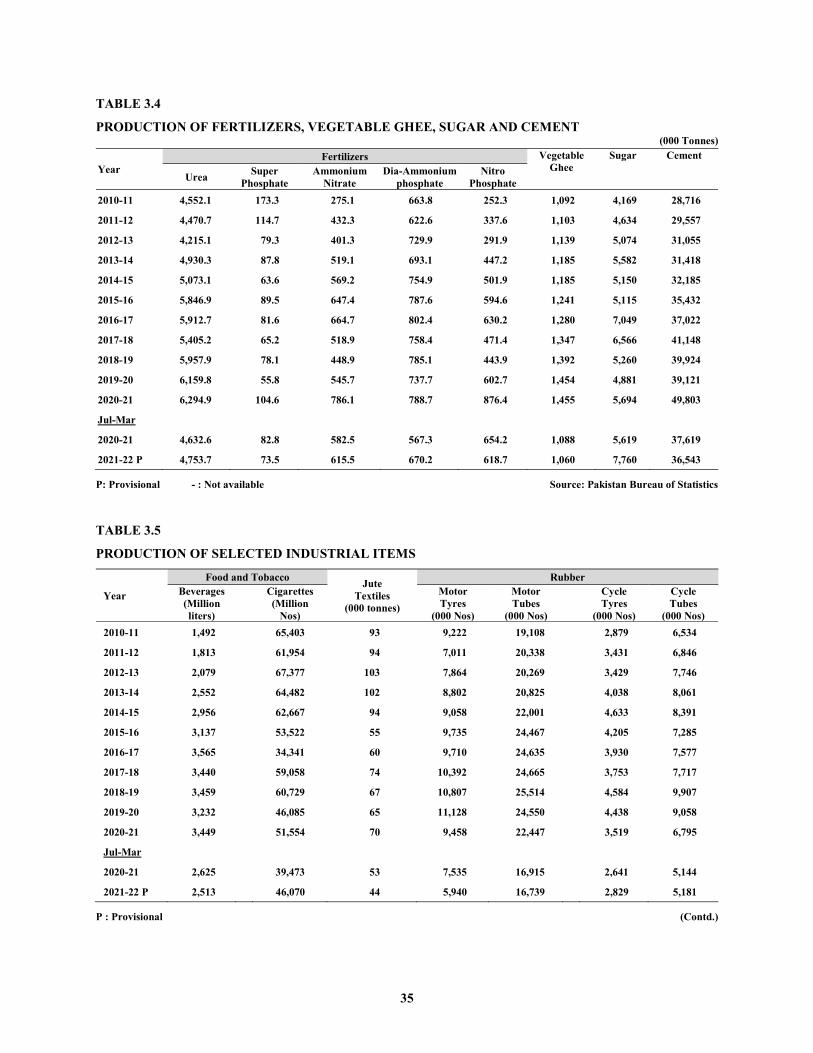
35
TABLE 3.4
PRODUCTION OF FERTILIZERS, VEGETABLE GHEE, SUGAR AND CEMENT (000 Tonnes)
Year Fertilizers Vegetable
Ghee Sugar Cement
Urea Super Phosphate
Ammonium Nitrate
Dia-Ammonium phosphate
Nitro Phosphate
2010-11 4,552.1 173.3 275.1 663.8 252.3 1,092 4,169 28,716
2011-12 4,470.7 114.7 432.3 622.6 337.6 1,103 4,634 29,557
2012-13 4,215.1 79.3 401.3 729.9 291.9 1,139 5,074 31,055
2013-14 4,930.3 87.8 519.1 693.1 447.2 1,185 5,582 31,418
2014-15 5,073.1 63.6 569.2 754.9 501.9 1,185 5,150 32,185
2015-16 5,846.9 89.5 647.4 787.6 594.6 1,241 5,115 35,432
2016-17 5,912.7 81.6 664.7 802.4 630.2 1,280 7,049 37,022
2017-18 5,405.2 65.2 518.9 758.4 471.4 1,347 6,566 41,148
2018-19 5,957.9 78.1 448.9 785.1 443.9 1,392 5,260 39,924
2019-20 6,159.8 55.8 545.7 737.7 602.7 1,454 4,881 39,121
2020-21 6,294.9 104.6 786.1 788.7 876.4 1,455 5,694 49,803
Jul-Mar
2020-21 4,632.6 82.8 582.5 567.3 654.2 1,088 5,619 37,619
2021-22 P 4,753.7 73.5 615.5 670.2 618.7 1,060 7,760 36,543
P: Provisional - : Not available Source: Pakistan Bureau of Statistics
TABLE 3.5
PRODUCTION OF SELECTED INDUSTRIAL ITEMS
Year
Food and Tobacco Jute Textiles
(000 tonnes)
Rubber Beverages (Million liters)
Cigarettes (Million
Nos)
Motor Tyres
(000 Nos)
Motor Tubes
(000 Nos)
Cycle Tyres
(000 Nos)
Cycle Tubes
(000 Nos) 2010-11 1,492 65,403 93 9,222 19,108 2,879 6,534
2011-12 1,813 61,954 94 7,011 20,338 3,431 6,846
2012-13 2,079 67,377 103 7,864 20,269 3,429 7,746
2013-14 2,552 64,482 102 8,802 20,825 4,038 8,061
2014-15 2,956 62,667 94 9,058 22,001 4,633 8,391
2015-16 3,137 53,522 55 9,735 24,467 4,205 7,285
2016-17 3,565 34,341 60 9,710 24,635 3,930 7,577
2017-18 3,440 59,058 74 10,392 24,665 3,753 7,717
2018-19 3,459 60,729 67 10,807 25,514 4,584 9,907
2019-20 3,232 46,085 65 11,128 24,550 4,438 9,058
2020-21 3,449 51,554 70 9,458 22,447 3,519 6,795
Jul-Mar
2020-21 2,625 39,473 53 7,535 16,915 2,641 5,144
2021-22 P 2,513 46,070 44 5,940 16,739 2,829 5,181
P : Provisional (Contd.)
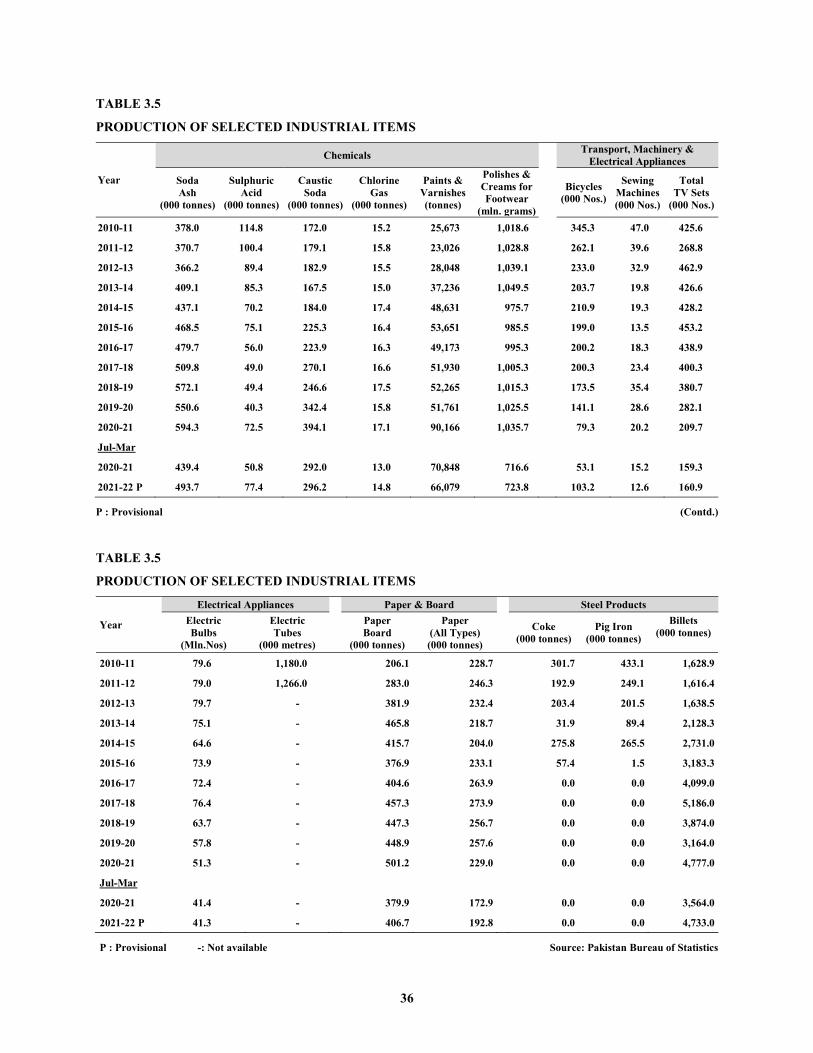
36
TABLE 3.5
PRODUCTION OF SELECTED INDUSTRIAL ITEMS
Year
Chemicals Transport, Machinery & Electrical Appliances
Soda Ash
(000 tonnes)
Sulphuric Acid
(000 tonnes)
Caustic Soda
(000 tonnes)
Chlorine Gas
(000 tonnes)
Paints & Varnishes (tonnes)
Polishes & Creams for Footwear
(mln. grams)
Bicycles (000 Nos.)
Sewing Machines (000 Nos.)
Total TV Sets
(000 Nos.)
2010-11 378.0 114.8 172.0 15.2 25,673 1,018.6 345.3 47.0 425.6
2011-12 370.7 100.4 179.1 15.8 23,026 1,028.8 262.1 39.6 268.8
2012-13 366.2 89.4 182.9 15.5 28,048 1,039.1 233.0 32.9 462.9
2013-14 409.1 85.3 167.5 15.0 37,236 1,049.5 203.7 19.8 426.6
2014-15 437.1 70.2 184.0 17.4 48,631 975.7 210.9 19.3 428.2
2015-16 468.5 75.1 225.3 16.4 53,651 985.5 199.0 13.5 453.2
2016-17 479.7 56.0 223.9 16.3 49,173 995.3 200.2 18.3 438.9
2017-18 509.8 49.0 270.1 16.6 51,930 1,005.3 200.3 23.4 400.3
2018-19 572.1 49.4 246.6 17.5 52,265 1,015.3 173.5 35.4 380.7
2019-20 550.6 40.3 342.4 15.8 51,761 1,025.5 141.1 28.6 282.1
2020-21 594.3 72.5 394.1 17.1 90,166 1,035.7 79.3 20.2 209.7
Jul-Mar
2020-21 439.4 50.8 292.0 13.0 70,848 716.6 53.1 15.2 159.3
2021-22 P 493.7 77.4 296.2 14.8 66,079 723.8 103.2 12.6 160.9
P : Provisional (Contd.)
TABLE 3.5
PRODUCTION OF SELECTED INDUSTRIAL ITEMS
Year
Electrical Appliances
Paper & Board
Steel Products Electric Bulbs
(Mln.Nos)
Electric Tubes
(000 metres)
Paper Board
(000 tonnes)
Paper (All Types) (000 tonnes)
Coke (000 tonnes)
Pig Iron (000 tonnes)
Billets (000 tonnes)
2010-11 79.6 1,180.0 206.1 228.7 301.7 433.1 1,628.9
2011-12 79.0 1,266.0 283.0 246.3 192.9 249.1 1,616.4
2012-13 79.7 - 381.9 232.4 203.4 201.5 1,638.5
2013-14 75.1 - 465.8 218.7 31.9 89.4 2,128.3
2014-15 64.6 - 415.7 204.0 275.8 265.5 2,731.0
2015-16 73.9 - 376.9 233.1 57.4 1.5 3,183.3
2016-17 72.4 - 404.6 263.9 0.0 0.0 4,099.0
2017-18 76.4 - 457.3 273.9 0.0 0.0 5,186.0
2018-19 63.7 - 447.3 256.7 0.0 0.0 3,874.0
2019-20 57.8 - 448.9 257.6 0.0 0.0 3,164.0
2020-21 51.3 - 501.2 229.0 0.0 0.0 4,777.0
Jul-Mar
2020-21 41.4 - 379.9 172.9 0.0 0.0 3,564.0
2021-22 P 41.3 - 406.7 192.8 0.0 0.0 4,733.0
P : Provisional -: Not available Source: Pakistan Bureau of Statistics
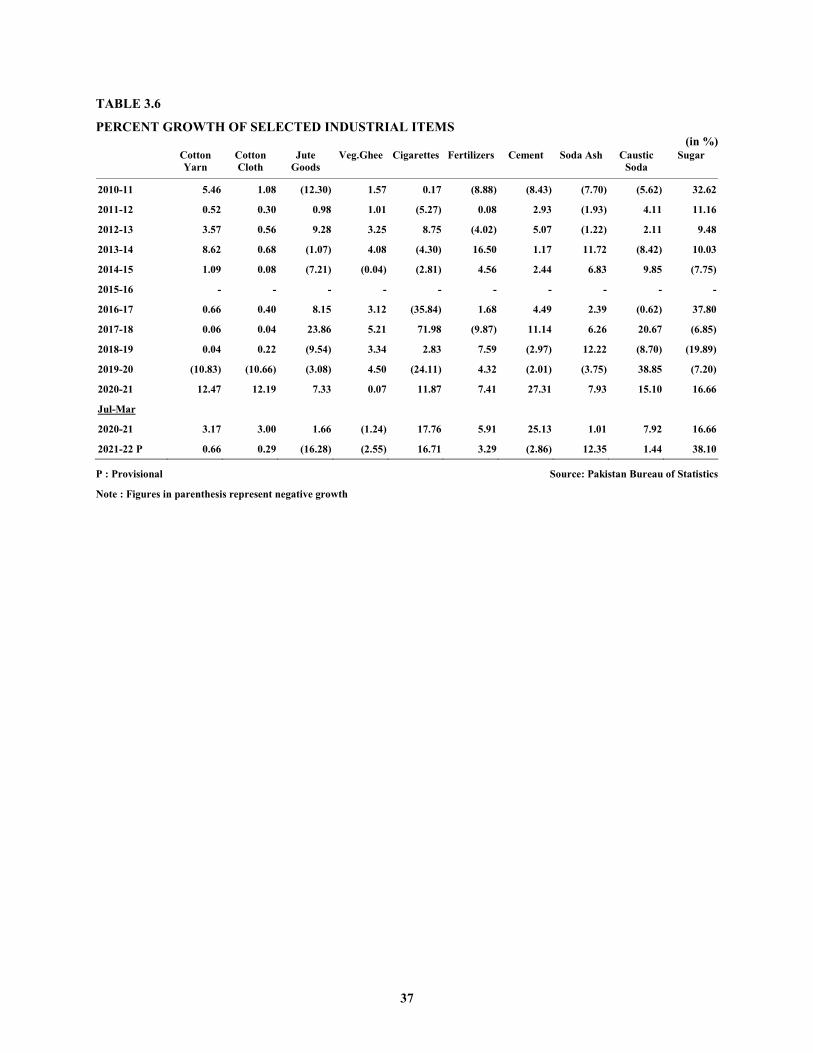
37
TABLE 3.6
PERCENT GROWTH OF SELECTED INDUSTRIAL ITEMS (in %)
Cotton Yarn
Cotton Cloth
Jute Goods
Veg.Ghee Cigarettes Fertilizers Cement Soda Ash Caustic Soda
Sugar
2010-11 5.46 1.08 (12.30) 1.57 0.17 (8.88) (8.43) (7.70) (5.62) 32.62
2011-12 0.52 0.30 0.98 1.01 (5.27) 0.08 2.93 (1.93) 4.11 11.16
2012-13 3.57 0.56 9.28 3.25 8.75 (4.02) 5.07 (1.22) 2.11 9.48
2013-14 8.62 0.68 (1.07) 4.08 (4.30) 16.50 1.17 11.72 (8.42) 10.03
2014-15 1.09 0.08 (7.21) (0.04) (2.81) 4.56 2.44 6.83 9.85 (7.75)
2015-16 - - - - - - - - - -
2016-17 0.66 0.40 8.15 3.12 (35.84) 1.68 4.49 2.39 (0.62) 37.80
2017-18 0.06 0.04 23.86 5.21 71.98 (9.87) 11.14 6.26 20.67 (6.85)
2018-19 0.04 0.22 (9.54) 3.34 2.83 7.59 (2.97) 12.22 (8.70) (19.89)
2019-20 (10.83) (10.66) (3.08) 4.50 (24.11) 4.32 (2.01) (3.75) 38.85 (7.20)
2020-21 12.47 12.19 7.33 0.07 11.87 7.41 27.31 7.93 15.10 16.66
Jul-Mar
2020-21 3.17 3.00 1.66 (1.24) 17.76 5.91 25.13 1.01 7.92 16.66
2021-22 P 0.66 0.29 (16.28) (2.55) 16.71 3.29 (2.86) 12.35 1.44 38.10
P : Provisional Source: Pakistan Bureau of Statistics
Note : Figures in parenthesis represent negative growth


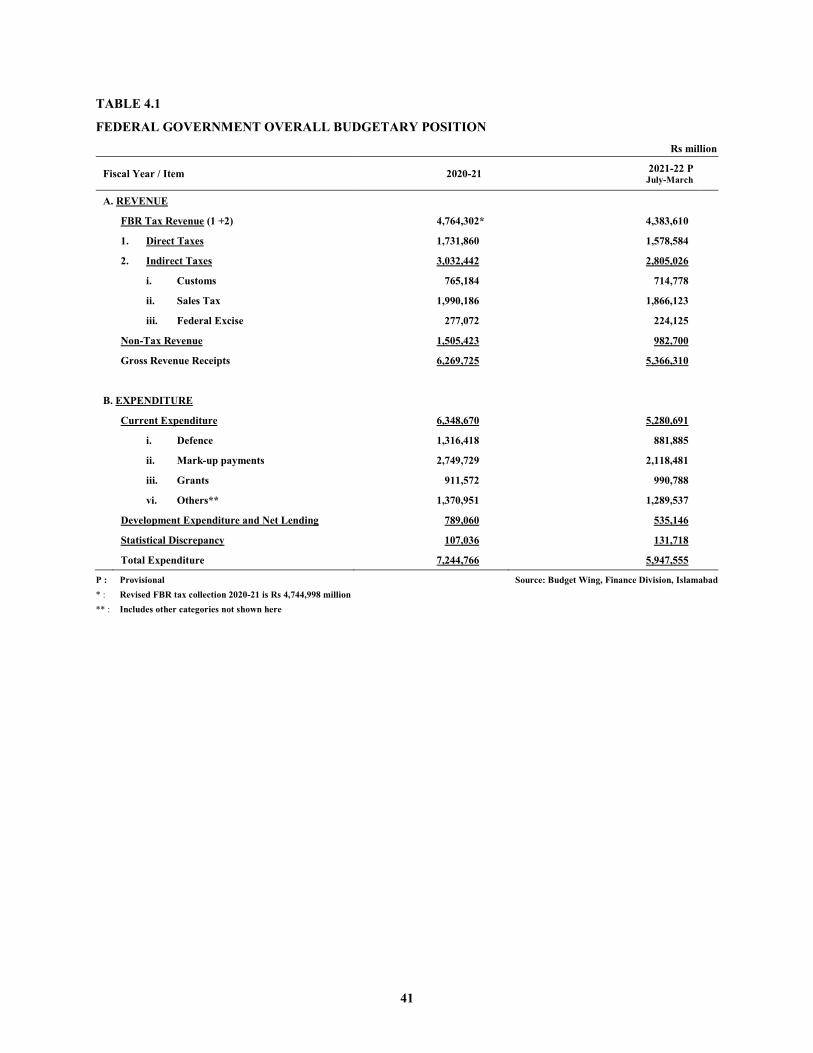
41
TABLE 4.1
FEDERAL GOVERNMENT OVERALL BUDGETARY POSITION
Rs million
Fiscal Year / Item 2020-21 2021-22 P July-March
A. REVENUE
FBR Tax Revenue (1 +2) 4,764,302* 4,383,610
1. Direct Taxes 1,731,860 1,578,584
2. Indirect Taxes 3,032,442 2,805,026
i. Customs 765,184 714,778
ii. Sales Tax 1,990,186 1,866,123
iii. Federal Excise 277,072 224,125
Non-Tax Revenue 1,505,423 982,700
Gross Revenue Receipts 6,269,725 5,366,310
B. EXPENDITURE
Current Expenditure 6,348,670 5,280,691
i. Defence 1,316,418 881,885
ii. Mark-up payments 2,749,729 2,118,481
iii. Grants 911,572 990,788
vi. Others** 1,370,951 1,289,537
Development Expenditure and Net Lending 789,060 535,146
Statistical Discrepancy 107,036 131,718
Total Expenditure 7,244,766 5,947,555
P : Provisional Source: Budget Wing, Finance Division, Islamabad * : Revised FBR tax collection 2020-21 is Rs 4,744,998 million ** : Includes other categories not shown here
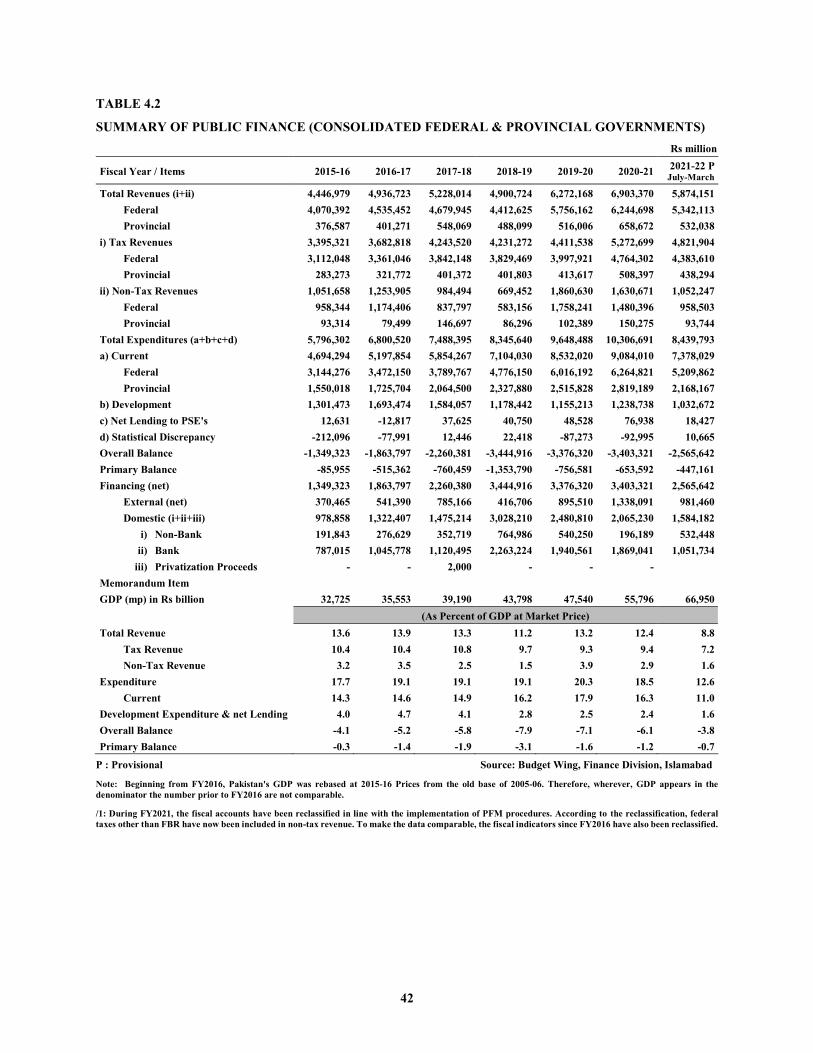
42
TABLE 4.2
SUMMARY OF PUBLIC FINANCE (CONSOLIDATED FEDERAL & PROVINCIAL GOVERNMENTS) Rs million
Fiscal Year / Items 2015-16 2016-17 2017-18 2018-19 2019-20 2020-21 2021-22 P July-March
Total Revenues (i+ii) 4,446,979 4,936,723 5,228,014 4,900,724 6,272,168 6,903,370 5,874,151 Federal 4,070,392 4,535,452 4,679,945 4,412,625 5,756,162 6,244,698 5,342,113 Provincial 376,587 401,271 548,069 488,099 516,006 658,672 532,038
i) Tax Revenues 3,395,321 3,682,818 4,243,520 4,231,272 4,411,538 5,272,699 4,821,904 Federal 3,112,048 3,361,046 3,842,148 3,829,469 3,997,921 4,764,302 4,383,610 Provincial 283,273 321,772 401,372 401,803 413,617 508,397 438,294
ii) Non-Tax Revenues 1,051,658 1,253,905 984,494 669,452 1,860,630 1,630,671 1,052,247 Federal 958,344 1,174,406 837,797 583,156 1,758,241 1,480,396 958,503 Provincial 93,314 79,499 146,697 86,296 102,389 150,275 93,744
Total Expenditures (a+b+c+d) 5,796,302 6,800,520 7,488,395 8,345,640 9,648,488 10,306,691 8,439,793 a) Current 4,694,294 5,197,854 5,854,267 7,104,030 8,532,020 9,084,010 7,378,029
Federal 3,144,276 3,472,150 3,789,767 4,776,150 6,016,192 6,264,821 5,209,862 Provincial 1,550,018 1,725,704 2,064,500 2,327,880 2,515,828 2,819,189 2,168,167
b) Development 1,301,473 1,693,474 1,584,057 1,178,442 1,155,213 1,238,738 1,032,672 c) Net Lending to PSE's 12,631 -12,817 37,625 40,750 48,528 76,938 18,427 d) Statistical Discrepancy -212,096 -77,991 12,446 22,418 -87,273 -92,995 10,665 Overall Balance -1,349,323 -1,863,797 -2,260,381 -3,444,916 -3,376,320 -3,403,321 -2,565,642 Primary Balance -85,955 -515,362 -760,459 -1,353,790 -756,581 -653,592 -447,161 Financing (net) 1,349,323 1,863,797 2,260,380 3,444,916 3,376,320 3,403,321 2,565,642
External (net) 370,465 541,390 785,166 416,706 895,510 1,338,091 981,460 Domestic (i+ii+iii) 978,858 1,322,407 1,475,214 3,028,210 2,480,810 2,065,230 1,584,182 i) Non-Bank 191,843 276,629 352,719 764,986 540,250 196,189 532,448 ii) Bank 787,015 1,045,778 1,120,495 2,263,224 1,940,561 1,869,041 1,051,734 iii) Privatization Proceeds - - 2,000 - - -
Memorandum Item
GDP (mp) in Rs billion 32,725 35,553 39,190 43,798 47,540 55,796 66,950 (As Percent of GDP at Market Price)
Total Revenue 13.6 13.9 13.3 11.2 13.2 12.4 8.8 Tax Revenue 10.4 10.4 10.8 9.7 9.3 9.4 7.2 Non-Tax Revenue 3.2 3.5 2.5 1.5 3.9 2.9 1.6
Expenditure 17.7 19.1 19.1 19.1 20.3 18.5 12.6 Current 14.3 14.6 14.9 16.2 17.9 16.3 11.0
Development Expenditure & net Lending 4.0 4.7 4.1 2.8 2.5 2.4 1.6 Overall Balance -4.1 -5.2 -5.8 -7.9 -7.1 -6.1 -3.8 Primary Balance -0.3 -1.4 -1.9 -3.1 -1.6 -1.2 -0.7
P : Provisional Source: Budget Wing, Finance Division, Islamabad Note: Beginning from FY2016, Pakistan's GDP was rebased at 2015-16 Prices from the old base of 2005-06. Therefore, wherever, GDP appears in the denominator the number prior to FY2016 are not comparable.
/1: During FY2021, the fiscal accounts have been reclassified in line with the implementation of PFM procedures. According to the reclassification, federal taxes other than FBR have now been included in non-tax revenue. To make the data comparable, the fiscal indicators since FY2016 have also been reclassified.
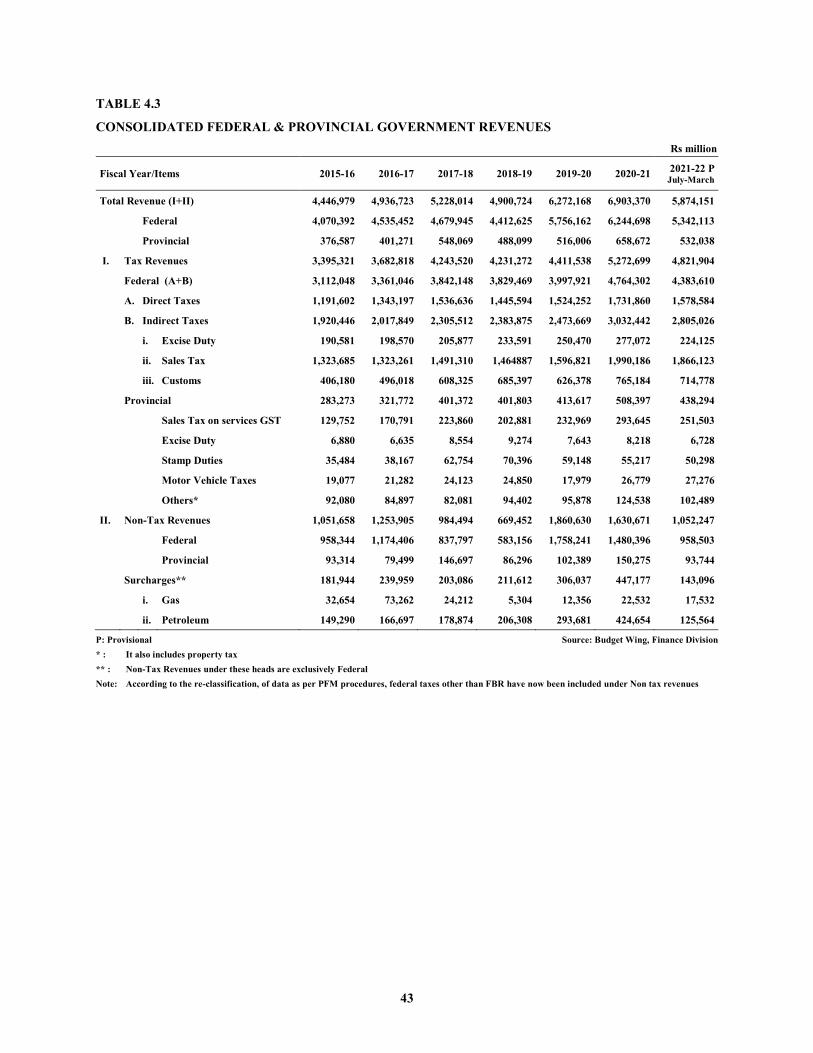
43
TABLE 4.3
CONSOLIDATED FEDERAL & PROVINCIAL GOVERNMENT REVENUES
Rs million
Fiscal Year/Items 2015-16 2016-17 2017-18 2018-19 2019-20 2020-21 2021-22 P July-March
Total Revenue (I+II) 4,446,979 4,936,723 5,228,014 4,900,724 6,272,168 6,903,370 5,874,151 Federal 4,070,392 4,535,452 4,679,945 4,412,625 5,756,162 6,244,698 5,342,113 Provincial 376,587 401,271 548,069 488,099 516,006 658,672 532,038
I. Tax Revenues 3,395,321 3,682,818 4,243,520 4,231,272 4,411,538 5,272,699 4,821,904 Federal (A+B) 3,112,048 3,361,046 3,842,148 3,829,469 3,997,921 4,764,302 4,383,610 A. Direct Taxes 1,191,602 1,343,197 1,536,636 1,445,594 1,524,252 1,731,860 1,578,584 B. Indirect Taxes 1,920,446 2,017,849 2,305,512 2,383,875 2,473,669 3,032,442 2,805,026 i. Excise Duty 190,581 198,570 205,877 233,591 250,470 277,072 224,125 ii. Sales Tax 1,323,685 1,323,261 1,491,310 1,464887 1,596,821 1,990,186 1,866,123 iii. Customs 406,180 496,018 608,325 685,397 626,378 765,184 714,778
Provincial 283,273 321,772 401,372 401,803 413,617 508,397 438,294 Sales Tax on services GST 129,752 170,791 223,860 202,881 232,969 293,645 251,503 Excise Duty 6,880 6,635 8,554 9,274 7,643 8,218 6,728 Stamp Duties 35,484 38,167 62,754 70,396 59,148 55,217 50,298 Motor Vehicle Taxes 19,077 21,282 24,123 24,850 17,979 26,779 27,276 Others* 92,080 84,897 82,081 94,402 95,878 124,538 102,489
II. Non-Tax Revenues 1,051,658 1,253,905 984,494 669,452 1,860,630 1,630,671 1,052,247 Federal 958,344 1,174,406 837,797 583,156 1,758,241 1,480,396 958,503
Provincial 93,314 79,499 146,697 86,296 102,389 150,275 93,744
Surcharges** 181,944 239,959 203,086 211,612 306,037 447,177 143,096
i. Gas 32,654 73,262 24,212 5,304 12,356 22,532 17,532
ii. Petroleum 149,290 166,697 178,874 206,308 293,681 424,654 125,564
P: Provisional Source: Budget Wing, Finance Division * : It also includes property tax ** : Non-Tax Revenues under these heads are exclusively Federal Note: According to the re-classification, of data as per PFM procedures, federal taxes other than FBR have now been included under Non tax revenues
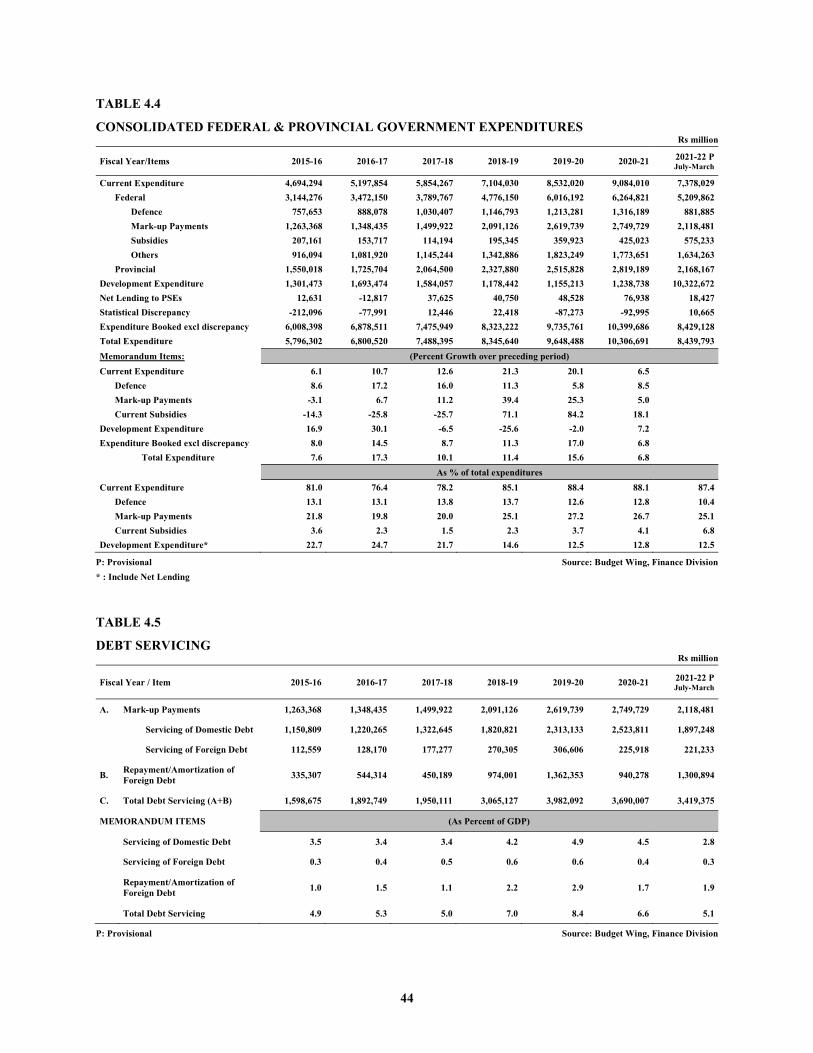
44
TABLE 4.4
CONSOLIDATED FEDERAL & PROVINCIAL GOVERNMENT EXPENDITURES Rs million
Fiscal Year/Items 2015-16 2016-17 2017-18 2018-19 2019-20 2020-21 2021-22 P July-March
Current Expenditure 4,694,294 5,197,854 5,854,267 7,104,030 8,532,020 9,084,010 7,378,029 Federal 3,144,276 3,472,150 3,789,767 4,776,150 6,016,192 6,264,821 5,209,862 Defence 757,653 888,078 1,030,407 1,146,793 1,213,281 1,316,189 881,885 Mark-up Payments 1,263,368 1,348,435 1,499,922 2,091,126 2,619,739 2,749,729 2,118,481 Subsidies 207,161 153,717 114,194 195,345 359,923 425,023 575,233 Others 916,094 1,081,920 1,145,244 1,342,886 1,823,249 1,773,651 1,634,263 Provincial 1,550,018 1,725,704 2,064,500 2,327,880 2,515,828 2,819,189 2,168,167
Development Expenditure 1,301,473 1,693,474 1,584,057 1,178,442 1,155,213 1,238,738 10,322,672 Net Lending to PSEs 12,631 -12,817 37,625 40,750 48,528 76,938 18,427 Statistical Discrepancy -212,096 -77,991 12,446 22,418 -87,273 -92,995 10,665 Expenditure Booked excl discrepancy 6,008,398 6,878,511 7,475,949 8,323,222 9,735,761 10,399,686 8,429,128 Total Expenditure 5,796,302 6,800,520 7,488,395 8,345,640 9,648,488 10,306,691 8,439,793 Memorandum Items: (Percent Growth over preceding period) Current Expenditure 6.1 10.7 12.6 21.3 20.1 6.5 Defence 8.6 17.2 16.0 11.3 5.8 8.5 Mark-up Payments -3.1 6.7 11.2 39.4 25.3 5.0 Current Subsidies -14.3 -25.8 -25.7 71.1 84.2 18.1 Development Expenditure 16.9 30.1 -6.5 -25.6 -2.0 7.2 Expenditure Booked excl discrepancy 8.0 14.5 8.7 11.3 17.0 6.8
Total Expenditure 7.6 17.3 10.1 11.4 15.6 6.8 As % of total expenditures Current Expenditure 81.0 76.4 78.2 85.1 88.4 88.1 87.4
Defence 13.1 13.1 13.8 13.7 12.6 12.8 10.4 Mark-up Payments 21.8 19.8 20.0 25.1 27.2 26.7 25.1 Current Subsidies 3.6 2.3 1.5 2.3 3.7 4.1 6.8
Development Expenditure* 22.7 24.7 21.7 14.6 12.5 12.8 12.5
P: Provisional Source: Budget Wing, Finance Division * : Include Net Lending
TABLE 4.5
DEBT SERVICING Rs million
Fiscal Year / Item 2015-16 2016-17 2017-18 2018-19 2019-20 2020-21 2021-22 P July-March
A. Mark-up Payments 1,263,368 1,348,435 1,499,922 2,091,126 2,619,739 2,749,729 2,118,481
Servicing of Domestic Debt 1,150,809 1,220,265 1,322,645 1,820,821 2,313,133 2,523,811 1,897,248
Servicing of Foreign Debt 112,559 128,170 177,277 270,305 306,606 225,918 221,233
B. Repayment/Amortization of Foreign Debt 335,307 544,314 450,189 974,001 1,362,353 940,278 1,300,894
C. Total Debt Servicing (A+B) 1,598,675 1,892,749 1,950,111 3,065,127 3,982,092 3,690,007 3,419,375
MEMORANDUM ITEMS (As Percent of GDP)
Servicing of Domestic Debt 3.5 3.4 3.4 4.2 4.9 4.5 2.8
Servicing of Foreign Debt 0.3 0.4 0.5 0.6 0.6 0.4 0.3
Repayment/Amortization of Foreign Debt 1.0 1.5 1.1 2.2 2.9 1.7 1.9
Total Debt Servicing 4.9 5.3 5.0 7.0 8.4 6.6 5.1
P: Provisional Source: Budget Wing, Finance Division


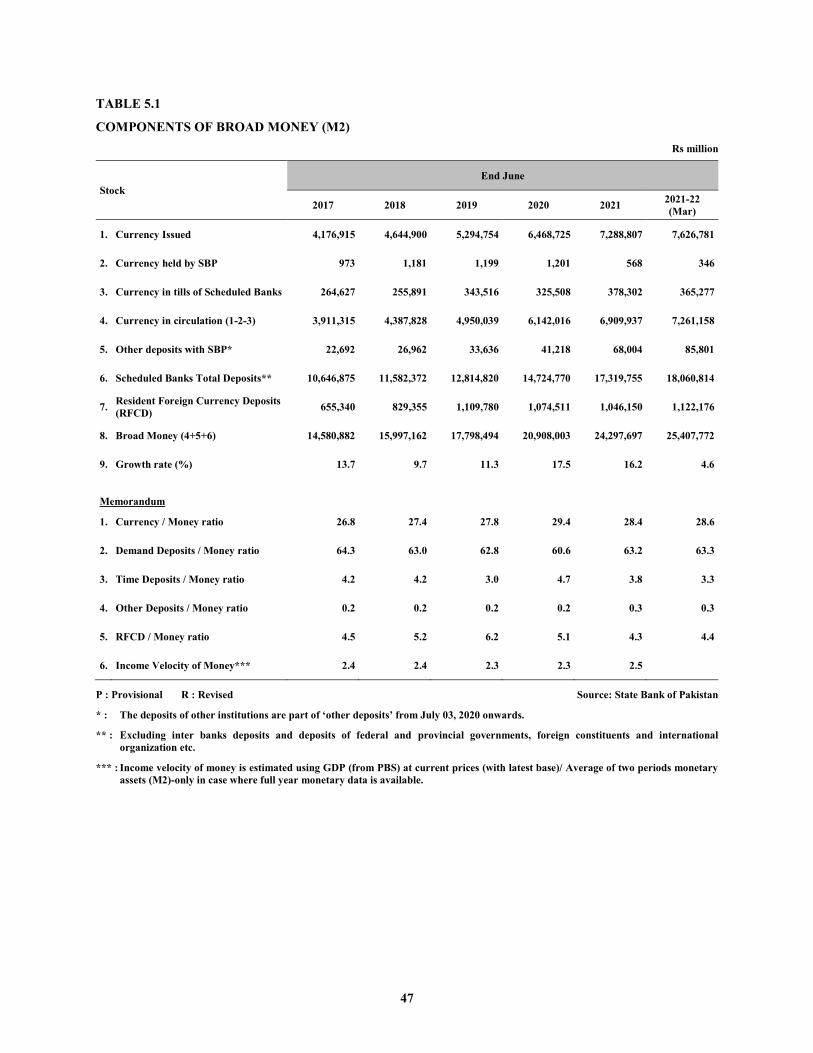
47
TABLE 5.1
COMPONENTS OF BROAD MONEY (M2) Rs million
Stock End June
2017 2018 2019 2020 2021 2021-22 (Mar)
1. Currency Issued 4,176,915 4,644,900 5,294,754 6,468,725 7,288,807 7,626,781
2. Currency held by SBP 973 1,181 1,199 1,201 568 346
3. Currency in tills of Scheduled Banks 264,627 255,891 343,516 325,508 378,302 365,277
4. Currency in circulation (1-2-3) 3,911,315 4,387,828 4,950,039 6,142,016 6,909,937 7,261,158
5. Other deposits with SBP* 22,692 26,962 33,636 41,218 68,004 85,801
6. Scheduled Banks Total Deposits** 10,646,875 11,582,372 12,814,820 14,724,770 17,319,755 18,060,814
7. Resident Foreign Currency Deposits (RFCD) 655,340 829,355 1,109,780 1,074,511 1,046,150 1,122,176
8. Broad Money (4+5+6) 14,580,882 15,997,162 17,798,494 20,908,003 24,297,697 25,407,772
9. Growth rate (%) 13.7 9.7 11.3 17.5 16.2 4.6
Memorandum
1. Currency / Money ratio 26.8 27.4 27.8 29.4 28.4 28.6
2. Demand Deposits / Money ratio 64.3 63.0 62.8 60.6 63.2 63.3
3. Time Deposits / Money ratio 4.2 4.2 3.0 4.7 3.8 3.3
4. Other Deposits / Money ratio 0.2 0.2 0.2 0.2 0.3 0.3
5. RFCD / Money ratio 4.5 5.2 6.2 5.1 4.3 4.4
6. Income Velocity of Money*** 2.4 2.4 2.3 2.3 2.5
P : Provisional R : Revised Source: State Bank of Pakistan
* : The deposits of other institutions are part of ‘other deposits’ from July 03, 2020 onwards.
** : Excluding inter banks deposits and deposits of federal and provincial governments, foreign constituents and international organization etc.
*** : Income velocity of money is estimated using GDP (from PBS) at current prices (with latest base)/ Average of two periods monetary assets (M2)-only in case where full year monetary data is available.
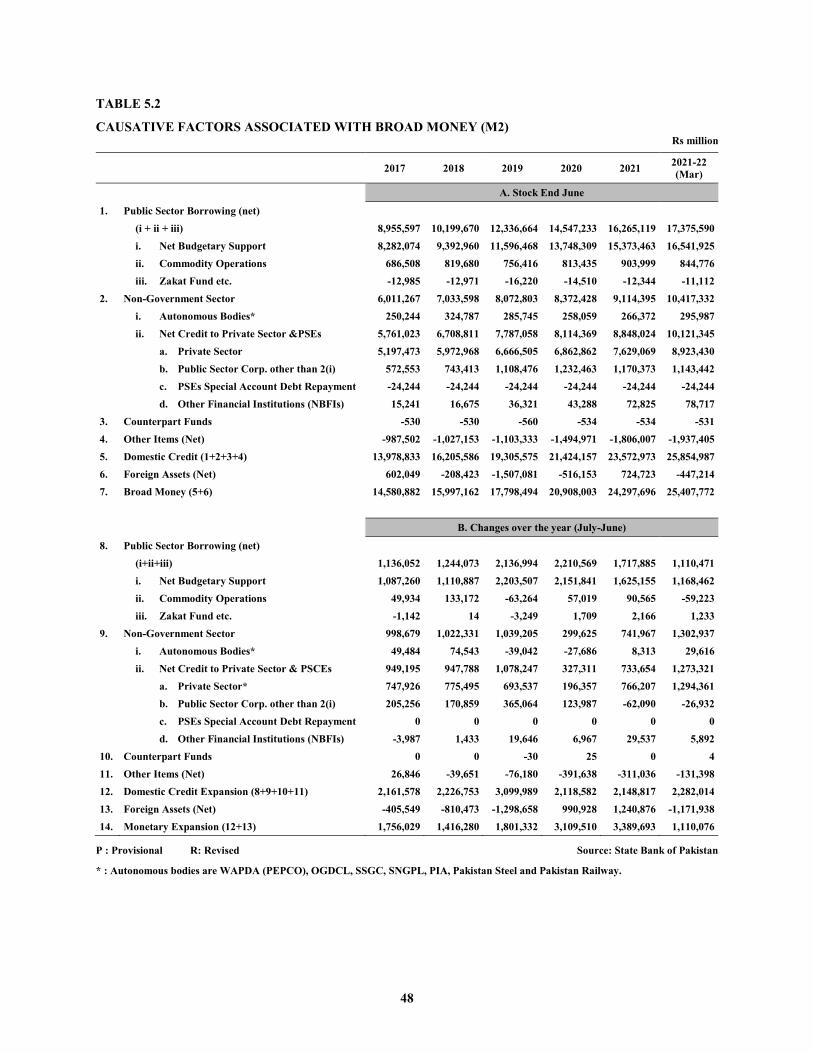
48
TABLE 5.2
CAUSATIVE FACTORS ASSOCIATED WITH BROAD MONEY (M2) Rs million
2017 2018 2019 2020 2021 2021-22 (Mar)
A. Stock End June
1. Public Sector Borrowing (net)
(i + ii + iii) 8,955,597 10,199,670 12,336,664 14,547,233 16,265,119 17,375,590
i. Net Budgetary Support 8,282,074 9,392,960 11,596,468 13,748,309 15,373,463 16,541,925
ii. Commodity Operations 686,508 819,680 756,416 813,435 903,999 844,776
iii. Zakat Fund etc. -12,985 -12,971 -16,220 -14,510 -12,344 -11,112 2. Non-Government Sector 6,011,267 7,033,598 8,072,803 8,372,428 9,114,395 10,417,332 i. Autonomous Bodies* 250,244 324,787 285,745 258,059 266,372 295,987
ii. Net Credit to Private Sector &PSEs 5,761,023 6,708,811 7,787,058 8,114,369 8,848,024 10,121,345
a. Private Sector 5,197,473 5,972,968 6,666,505 6,862,862 7,629,069 8,923,430
b. Public Sector Corp. other than 2(i) 572,553 743,413 1,108,476 1,232,463 1,170,373 1,143,442 c. PSEs Special Account Debt Repayment -24,244 -24,244 -24,244 -24,244 -24,244 -24,244
d. Other Financial Institutions (NBFIs) 15,241 16,675 36,321 43,288 72,825 78,717 3. Counterpart Funds -530 -530 -560 -534 -534 -531 4. Other Items (Net) -987,502 -1,027,153 -1,103,333 -1,494,971 -1,806,007 -1,937,405 5. Domestic Credit (1+2+3+4) 13,978,833 16,205,586 19,305,575 21,424,157 23,572,973 25,854,987 6. Foreign Assets (Net) 602,049 -208,423 -1,507,081 -516,153 724,723 -447,214 7. Broad Money (5+6) 14,580,882 15,997,162 17,798,494 20,908,003 24,297,696 25,407,772
B. Changes over the year (July-June)
8. Public Sector Borrowing (net)
(i+ii+iii) 1,136,052 1,244,073 2,136,994 2,210,569 1,717,885 1,110,471 i. Net Budgetary Support 1,087,260 1,110,887 2,203,507 2,151,841 1,625,155 1,168,462 ii. Commodity Operations 49,934 133,172 -63,264 57,019 90,565 -59,223 iii. Zakat Fund etc. -1,142 14 -3,249 1,709 2,166 1,233 9. Non-Government Sector 998,679 1,022,331 1,039,205 299,625 741,967 1,302,937
i. Autonomous Bodies* 49,484 74,543 -39,042 -27,686 8,313 29,616
ii. Net Credit to Private Sector & PSCEs 949,195 947,788 1,078,247 327,311 733,654 1,273,321
a. Private Sector* 747,926 775,495 693,537 196,357 766,207 1,294,361
b. Public Sector Corp. other than 2(i) 205,256 170,859 365,064 123,987 -62,090 -26,932 c. PSEs Special Account Debt Repayment 0 0 0 0 0 0
d. Other Financial Institutions (NBFIs) -3,987 1,433 19,646 6,967 29,537 5,892 10. Counterpart Funds 0 0 -30 25 0 4 11. Other Items (Net) 26,846 -39,651 -76,180 -391,638 -311,036 -131,398 12. Domestic Credit Expansion (8+9+10+11) 2,161,578 2,226,753 3,099,989 2,118,582 2,148,817 2,282,014 13. Foreign Assets (Net) -405,549 -810,473 -1,298,658 990,928 1,240,876 -1,171,938 14. Monetary Expansion (12+13) 1,756,029 1,416,280 1,801,332 3,109,510 3,389,693 1,110,076
P : Provisional R: Revised Source: State Bank of Pakistan
* : Autonomous bodies are WAPDA (PEPCO), OGDCL, SSGC, SNGPL, PIA, Pakistan Steel and Pakistan Railway.
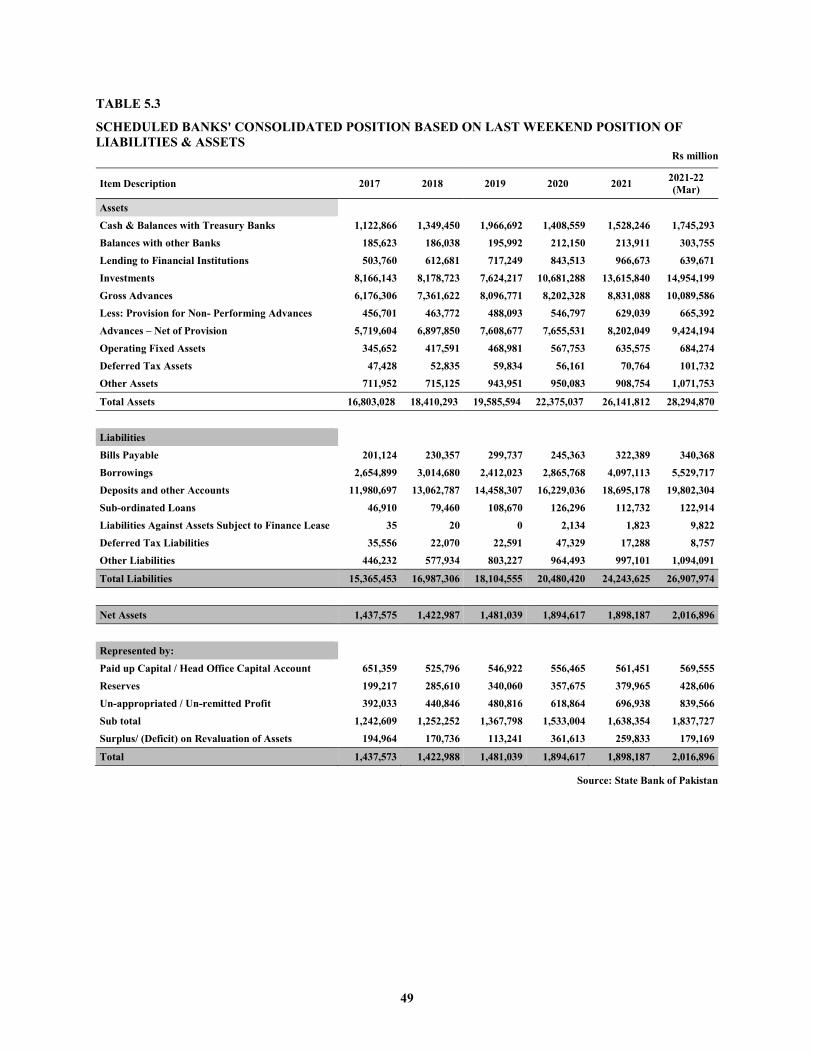
49
TABLE 5.3
SCHEDULED BANKS' CONSOLIDATED POSITION BASED ON LAST WEEKEND POSITION OF LIABILITIES & ASSETS
Rs million
Item Description 2017 2018 2019 2020 2021 2021-22 (Mar)
Assets Cash & Balances with Treasury Banks 1,122,866 1,349,450 1,966,692 1,408,559 1,528,246 1,745,293 Balances with other Banks 185,623 186,038 195,992 212,150 213,911 303,755 Lending to Financial Institutions 503,760 612,681 717,249 843,513 966,673 639,671 Investments 8,166,143 8,178,723 7,624,217 10,681,288 13,615,840 14,954,199 Gross Advances 6,176,306 7,361,622 8,096,771 8,202,328 8,831,088 10,089,586 Less: Provision for Non- Performing Advances 456,701 463,772 488,093 546,797 629,039 665,392 Advances – Net of Provision 5,719,604 6,897,850 7,608,677 7,655,531 8,202,049 9,424,194 Operating Fixed Assets 345,652 417,591 468,981 567,753 635,575 684,274 Deferred Tax Assets 47,428 52,835 59,834 56,161 70,764 101,732 Other Assets 711,952 715,125 943,951 950,083 908,754 1,071,753
Total Assets 16,803,028 18,410,293 19,585,594 22,375,037 26,141,812 28,294,870
Liabilities Bills Payable 201,124 230,357 299,737 245,363 322,389 340,368 Borrowings 2,654,899 3,014,680 2,412,023 2,865,768 4,097,113 5,529,717 Deposits and other Accounts 11,980,697 13,062,787 14,458,307 16,229,036 18,695,178 19,802,304 Sub-ordinated Loans 46,910 79,460 108,670 126,296 112,732 122,914 Liabilities Against Assets Subject to Finance Lease 35 20 0 2,134 1,823 9,822 Deferred Tax Liabilities 35,556 22,070 22,591 47,329 17,288 8,757 Other Liabilities 446,232 577,934 803,227 964,493 997,101 1,094,091
Total Liabilities 15,365,453 16,987,306 18,104,555 20,480,420 24,243,625 26,907,974
Net Assets 1,437,575 1,422,987 1,481,039 1,894,617 1,898,187 2,016,896
Represented by: Paid up Capital / Head Office Capital Account 651,359 525,796 546,922 556,465 561,451 569,555 Reserves 199,217 285,610 340,060 357,675 379,965 428,606 Un-appropriated / Un-remitted Profit 392,033 440,846 480,816 618,864 696,938 839,566 Sub total 1,242,609 1,252,252 1,367,798 1,533,004 1,638,354 1,837,727 Surplus/ (Deficit) on Revaluation of Assets 194,964 170,736 113,241 361,613 259,833 179,169
Total 1,437,573 1,422,988 1,481,039 1,894,617 1,898,187 2,016,896
Source: State Bank of Pakistan
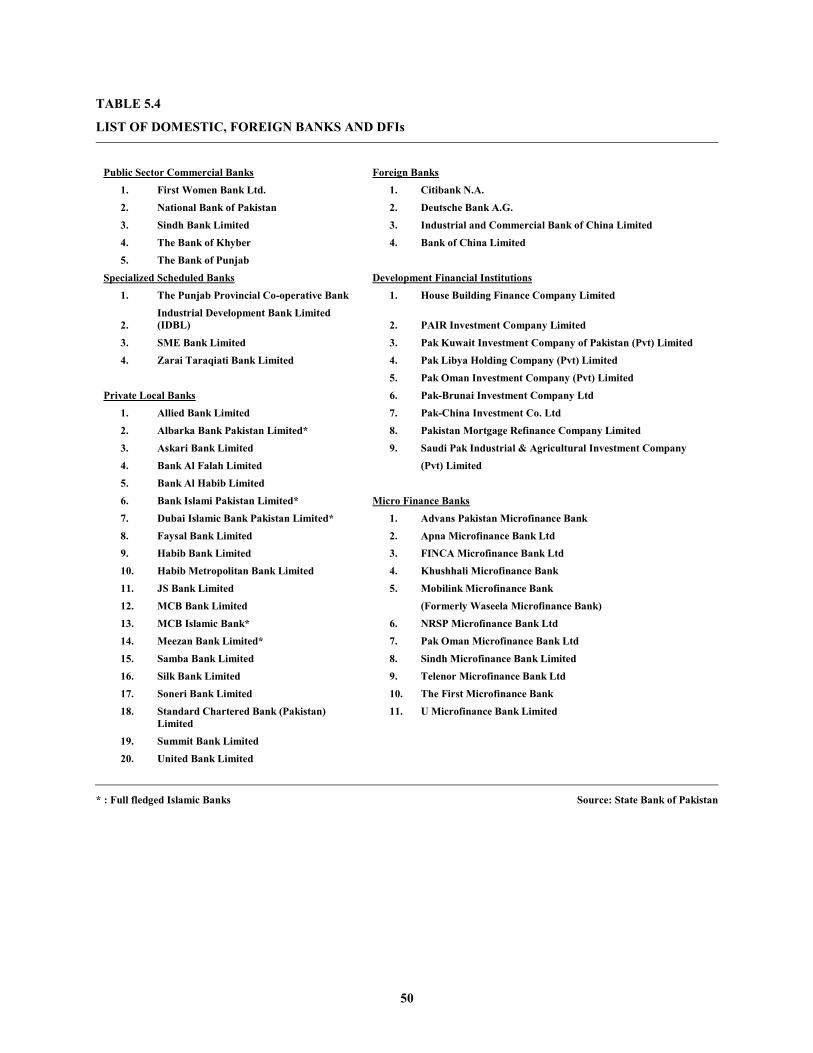
50
TABLE 5.4
LIST OF DOMESTIC, FOREIGN BANKS AND DFIs
Public Sector Commercial Banks Foreign Banks
1. First Women Bank Ltd. 1. Citibank N.A.
2. National Bank of Pakistan 2. Deutsche Bank A.G.
3. Sindh Bank Limited 3. Industrial and Commercial Bank of China Limited
4. The Bank of Khyber 4. Bank of China Limited
5. The Bank of Punjab Specialized Scheduled Banks Development Financial Institutions
1. The Punjab Provincial Co-operative Bank 1. House Building Finance Company Limited
2. Industrial Development Bank Limited (IDBL) 2. PAIR Investment Company Limited
3. SME Bank Limited 3. Pak Kuwait Investment Company of Pakistan (Pvt) Limited
4. Zarai Taraqiati Bank Limited 4. Pak Libya Holding Company (Pvt) Limited
5. Pak Oman Investment Company (Pvt) Limited Private Local Banks 6. Pak-Brunai Investment Company Ltd
1. Allied Bank Limited 7. Pak-China Investment Co. Ltd
2. Albarka Bank Pakistan Limited* 8. Pakistan Mortgage Refinance Company Limited
3. Askari Bank Limited 9. Saudi Pak Industrial & Agricultural Investment Company
4. Bank Al Falah Limited (Pvt) Limited
5. Bank Al Habib Limited
6. Bank Islami Pakistan Limited* Micro Finance Banks
7. Dubai Islamic Bank Pakistan Limited* 1. Advans Pakistan Microfinance Bank
8. Faysal Bank Limited 2. Apna Microfinance Bank Ltd
9. Habib Bank Limited 3. FINCA Microfinance Bank Ltd
10. Habib Metropolitan Bank Limited 4. Khushhali Microfinance Bank
11. JS Bank Limited 5. Mobilink Microfinance Bank
12. MCB Bank Limited (Formerly Waseela Microfinance Bank)
13. MCB Islamic Bank* 6. NRSP Microfinance Bank Ltd
14. Meezan Bank Limited* 7. Pak Oman Microfinance Bank Ltd
15. Samba Bank Limited 8. Sindh Microfinance Bank Limited
16. Silk Bank Limited 9. Telenor Microfinance Bank Ltd
17. Soneri Bank Limited 10. The First Microfinance Bank
18. Standard Chartered Bank (Pakistan) Limited
11. U Microfinance Bank Limited
19. Summit Bank Limited
20. United Bank Limited
* : Full fledged Islamic Banks Source: State Bank of Pakistan
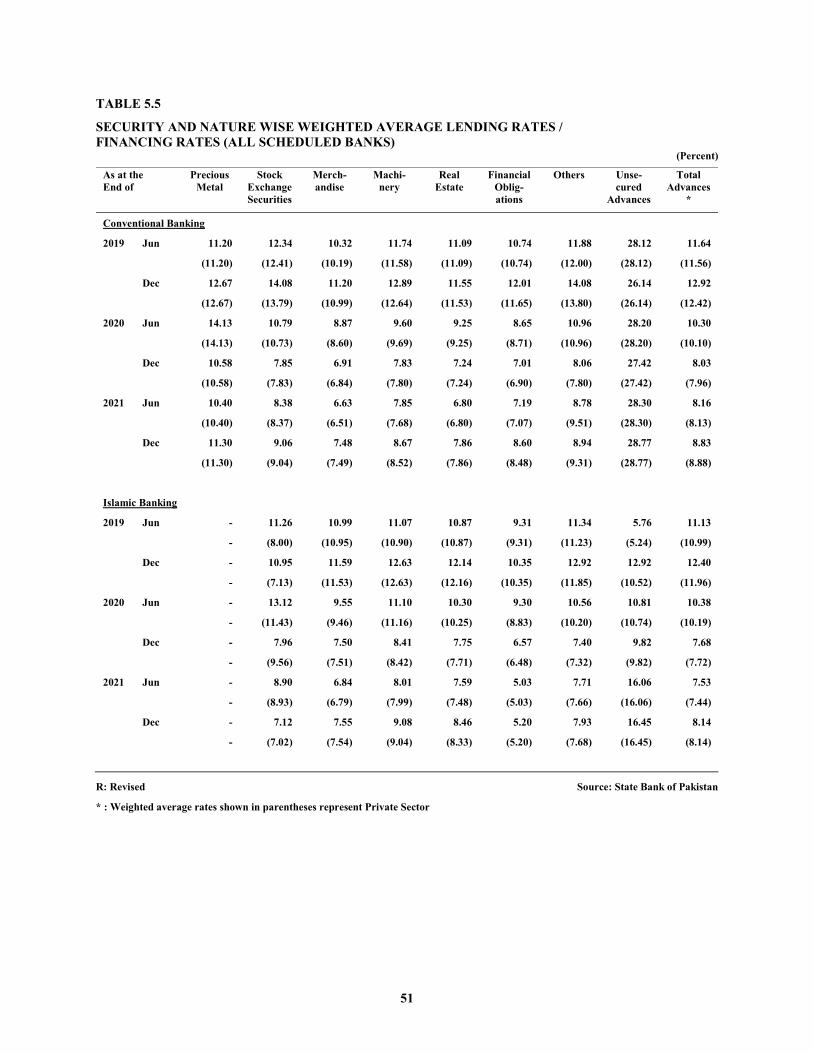
51
TABLE 5.5
SECURITY AND NATURE WISE WEIGHTED AVERAGE LENDING RATES / FINANCING RATES (ALL SCHEDULED BANKS)
(Percent)
As at the End of
Precious Metal
Stock Exchange Securities
Merch-andise
Machi-nery
Real Estate
Financial Oblig-ations
Others Unse-cured
Advances
Total Advances
*
Conventional Banking
2019 Jun 11.20 12.34 10.32 11.74 11.09 10.74 11.88 28.12 11.64 (11.20) (12.41) (10.19) (11.58) (11.09) (10.74) (12.00) (28.12) (11.56) Dec 12.67 14.08 11.20 12.89 11.55 12.01 14.08 26.14 12.92 (12.67) (13.79) (10.99) (12.64) (11.53) (11.65) (13.80) (26.14) (12.42)
2020 Jun 14.13 10.79 8.87 9.60 9.25 8.65 10.96 28.20 10.30 (14.13) (10.73) (8.60) (9.69) (9.25) (8.71) (10.96) (28.20) (10.10) Dec 10.58 7.85 6.91 7.83 7.24 7.01 8.06 27.42 8.03 (10.58) (7.83) (6.84) (7.80) (7.24) (6.90) (7.80) (27.42) (7.96)
2021 Jun 10.40 8.38 6.63 7.85 6.80 7.19 8.78 28.30 8.16
(10.40) (8.37) (6.51) (7.68) (6.80) (7.07) (9.51) (28.30) (8.13)
Dec 11.30 9.06 7.48 8.67 7.86 8.60 8.94 28.77 8.83
(11.30) (9.04) (7.49) (8.52) (7.86) (8.48) (9.31) (28.77) (8.88)
Islamic Banking
2019 Jun - 11.26 10.99 11.07 10.87 9.31 11.34 5.76 11.13 - (8.00) (10.95) (10.90) (10.87) (9.31) (11.23) (5.24) (10.99) Dec - 10.95 11.59 12.63 12.14 10.35 12.92 12.92 12.40 - (7.13) (11.53) (12.63) (12.16) (10.35) (11.85) (10.52) (11.96)
2020 Jun - 13.12 9.55 11.10 10.30 9.30 10.56 10.81 10.38 - (11.43) (9.46) (11.16) (10.25) (8.83) (10.20) (10.74) (10.19) Dec - 7.96 7.50 8.41 7.75 6.57 7.40 9.82 7.68 - (9.56) (7.51) (8.42) (7.71) (6.48) (7.32) (9.82) (7.72)
2021 Jun - 8.90 6.84 8.01 7.59 5.03 7.71 16.06 7.53
- (8.93) (6.79) (7.99) (7.48) (5.03) (7.66) (16.06) (7.44)
Dec - 7.12 7.55 9.08 8.46 5.20 7.93 16.45 8.14
- (7.02) (7.54) (9.04) (8.33) (5.20) (7.68) (16.45) (8.14)
R: Revised Source: State Bank of Pakistan
* : Weighted average rates shown in parentheses represent Private Sector
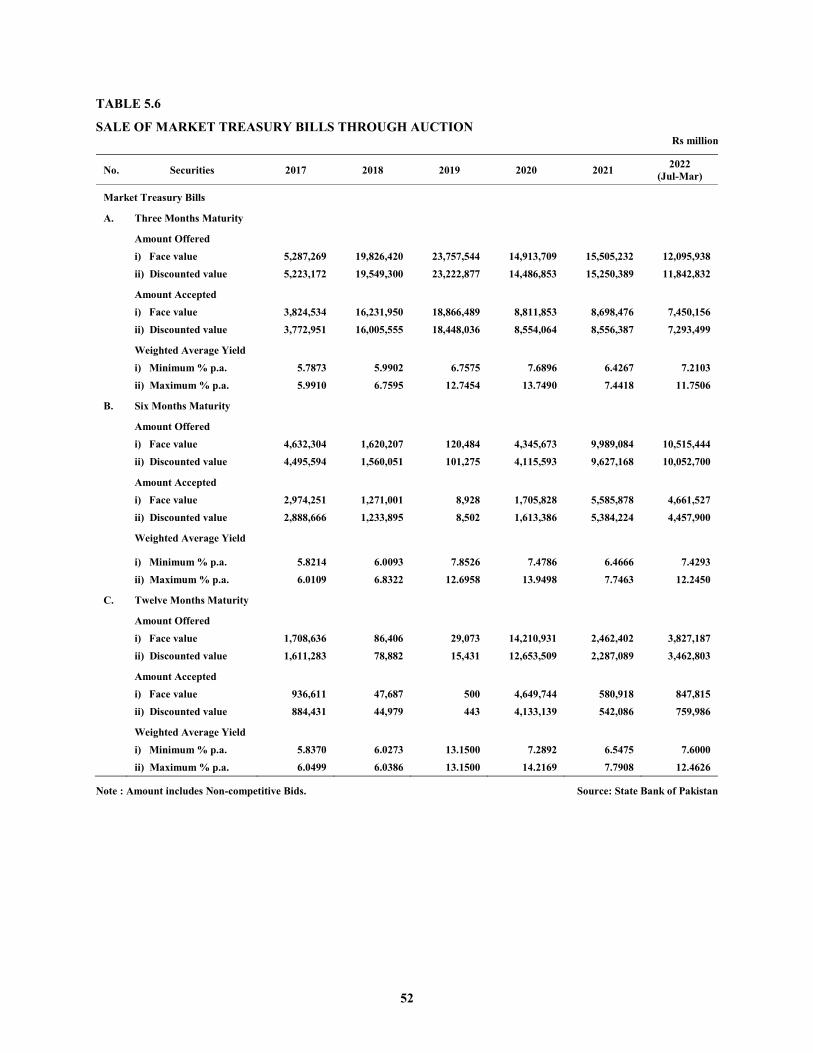
52
TABLE 5.6
SALE OF MARKET TREASURY BILLS THROUGH AUCTION Rs million
No. Securities 2017 2018 2019 2020 2021 2022 (Jul-Mar)
Market Treasury Bills
A. Three Months Maturity
Amount Offered
i) Face value 5,287,269 19,826,420 23,757,544 14,913,709 15,505,232 12,095,938
ii) Discounted value 5,223,172 19,549,300 23,222,877 14,486,853 15,250,389 11,842,832
Amount Accepted
i) Face value 3,824,534 16,231,950 18,866,489 8,811,853 8,698,476 7,450,156
ii) Discounted value 3,772,951 16,005,555 18,448,036 8,554,064 8,556,387 7,293,499
Weighted Average Yield
i) Minimum % p.a. 5.7873 5.9902 6.7575 7.6896 6.4267 7.2103
ii) Maximum % p.a. 5.9910 6.7595 12.7454 13.7490 7.4418 11.7506
B. Six Months Maturity
Amount Offered
i) Face value 4,632,304 1,620,207 120,484 4,345,673 9,989,084 10,515,444
ii) Discounted value 4,495,594 1,560,051 101,275 4,115,593 9,627,168 10,052,700
Amount Accepted
i) Face value 2,974,251 1,271,001 8,928 1,705,828 5,585,878 4,661,527
ii) Discounted value 2,888,666 1,233,895 8,502 1,613,386 5,384,224 4,457,900
Weighted Average Yield
i) Minimum % p.a. 5.8214 6.0093 7.8526 7.4786 6.4666 7.4293
ii) Maximum % p.a. 6.0109 6.8322 12.6958 13.9498 7.7463 12.2450
C. Twelve Months Maturity
Amount Offered
i) Face value 1,708,636 86,406 29,073 14,210,931 2,462,402 3,827,187
ii) Discounted value 1,611,283 78,882 15,431 12,653,509 2,287,089 3,462,803
Amount Accepted
i) Face value 936,611 47,687 500 4,649,744 580,918 847,815
ii) Discounted value 884,431 44,979 443 4,133,139 542,086 759,986
Weighted Average Yield
i) Minimum % p.a. 5.8370 6.0273 13.1500 7.2892 6.5475 7.6000 ii) Maximum % p.a. 6.0499 6.0386 13.1500 14.2169 7.7908 12.4626
Note : Amount includes Non-competitive Bids. Source: State Bank of Pakistan
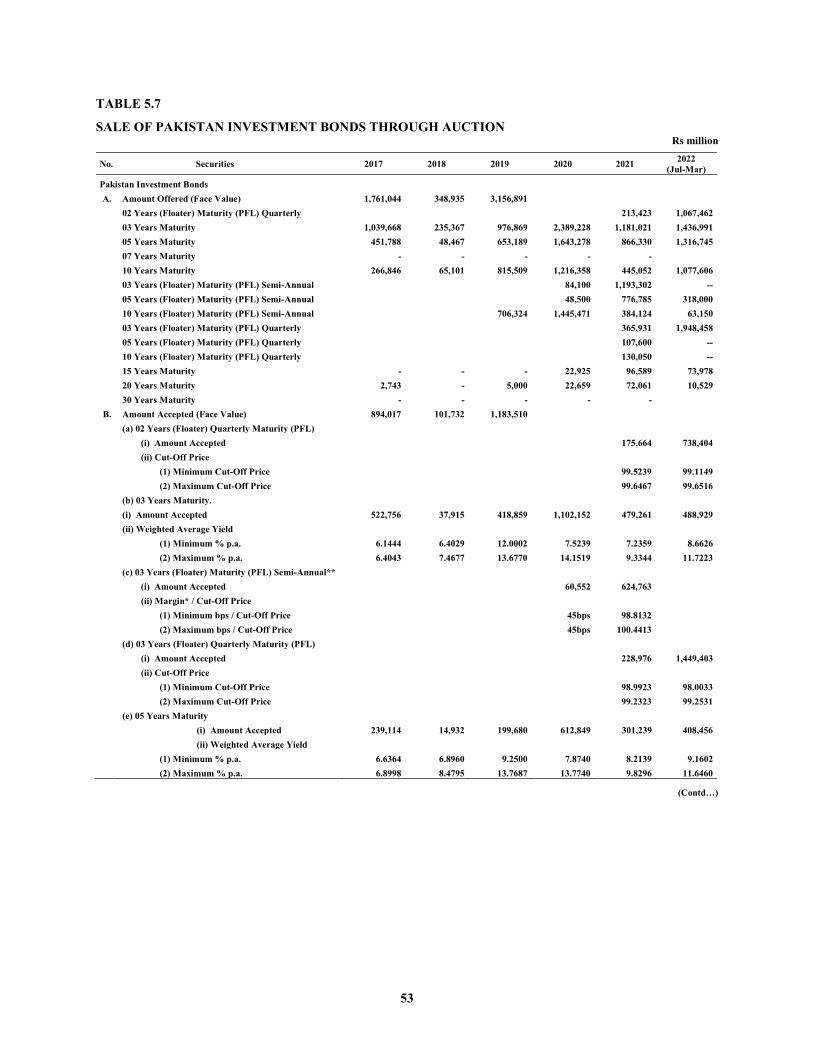
53
TABLE 5.7
SALE OF PAKISTAN INVESTMENT BONDS THROUGH AUCTION Rs million
No. Securities 2017 2018 2019 2020 2021 2022 (Jul-Mar)
Pakistan Investment Bonds
A. Amount Offered (Face Value) 1,761,044 348,935 3,156,891
02 Years (Floater) Maturity (PFL) Quarterly 213,423 1,067,462
03 Years Maturity 1,039,668 235,367 976,869 2,389,228 1,181,021 1,436,991
05 Years Maturity 451,788 48,467 653,189 1,643,278 866,330 1,316,745
07 Years Maturity - - - - -
10 Years Maturity 266,846 65,101 815,509 1,216,358 445,052 1,077,606
03 Years (Floater) Maturity (PFL) Semi-Annual 84,100 1,193,302 --
05 Years (Floater) Maturity (PFL) Semi-Annual 48,500 776,785 318,000
10 Years (Floater) Maturity (PFL) Semi-Annual 706,324 1,445,471 384,124 63,150
03 Years (Floater) Maturity (PFL) Quarterly 365,931 1,948,458
05 Years (Floater) Maturity (PFL) Quarterly 107,600 --
10 Years (Floater) Maturity (PFL) Quarterly 130,050 --
15 Years Maturity - - - 22,925 96,589 73,978
20 Years Maturity 2,743 - 5,000 22,659 72,061 10,529
30 Years Maturity - - - - - B. Amount Accepted (Face Value) 894,017 101,732 1,183,510
(a) 02 Years (Floater) Quarterly Maturity (PFL)
(i) Amount Accepted 175,664 738,404
(ii) Cut-Off Price
(1) Minimum Cut-Off Price 99.5239 99.1149
(2) Maximum Cut-Off Price 99.6467 99.6516
(b) 03 Years Maturity.
(i) Amount Accepted 522,756 37,915 418,859 1,102,152 479,261 488,929
(ii) Weighted Average Yield
(1) Minimum % p.a. 6.1444 6.4029 12.0002 7.5239 7.2359 8.6626
(2) Maximum % p.a. 6.4043 7.4677 13.6770 14.1519 9.3344 11.7223
(c) 03 Years (Floater) Maturity (PFL) Semi-Annual**
(i) Amount Accepted 60,552 624,763
(ii) Margin* / Cut-Off Price
(1) Minimum bps / Cut-Off Price 45bps 98.8132
(2) Maximum bps / Cut-Off Price 45bps 100.4413
(d) 03 Years (Floater) Quarterly Maturity (PFL)
(i) Amount Accepted 228,976 1,449,403
(ii) Cut-Off Price
(1) Minimum Cut-Off Price 98.9923 98.0033
(2) Maximum Cut-Off Price 99.2323 99.2531
(e) 05 Years Maturity
(i) Amount Accepted 239,114 14,932 199,680 612,849 301,239 408,456
(ii) Weighted Average Yield
(1) Minimum % p.a. 6.6364 6.8960 9.2500 7.8740 8.2139 9.1602
(2) Maximum % p.a. 6.8998 8.4795 13.7687 13.7740 9.8296 11.6460
(Contd…)

54
TABLE 5.7
SALE OF PAKISTAN INVESTMENT BONDS THROUGH AUCTION Rs million
No. Securities 2017 2018 2019 2020 2021 2022 (Jul-Mar)
(f) 05 Years (Floater) Maturity (PFL) Semi-Annual**
(i) Amount Accepted 34,500 306,271 129,562
(ii) Margin* / Cut-Off Price
(1) Minimum bps / Cut-Off Price 49bps 98.1794 98.2095
(2) Maximum bps / Cut-Off Price 49bps 100.4845 98.266
(g) 05 Years (Floater) Quarterly Maturity (PFL)
(i) Amount Accepted 90,500
(ii) Cut-Off Price
(1) Minimum Cut-Off Price 97.9779
(2) Maximum Cut-Off Price 98.0119
(h) 7 Years Maturity
(i) Amount Accepted - - -
(ii) Weighted Average Yield
(1) Minimum % p.a. - - -
(2) Maximum % p.a. - - -
(i) 10 Years Maturity
(i) Amount Accepted 132,147 48,885 253,195 332,797 149,729 225,451
(ii) Weighted Average Yield
(1) Minimum % p.a. 7.7222 7.9359 12.8267 8.4767 8.8570 9.8230
(2) Maximum % p.a. 7.9414 8.6999 13.6820 13.4548 10.2140 11.7436
(j) 10 Years (Floater) Maturity (PFL) Semi-Annual**
(i) Amount Accepted - - - 723,417 136,707 64,553
(ii) Margin* / Cut-Off Price
(1) Minimum bps / Cut-Off Price - - - 70 bps 100 100
(2) Maximum bps / Cut-Off Price - - - 75 bps 101.0536 100
(k) 10 Years (Floater) Quarterly Maturity (PFL)
(i) Amount Accepted - - - - 98,542
(ii) Cut-Off Price
(1) Minimum Cut-Off Price - - - - 95.2412
(2) Maximum Cut-Off Price - - - - 95.2853
(l) 15 Years Maturity
(i) Amount Accepted - - - 16,800 64,000 59,000
(ii) Weighted Average Yield
(1) Minimum % p.a. - - - 9.6640 9.7020 10.4000
(2) Maximum % p.a. - - - 10.4540 10.0000 10.4000
(m) 20 Years Maturity -
(i) Amount Accepted - - - 6,113 62,061
(ii) Weighted Average Yield
(1) Minimum % p.a. - - - 10.5100 10.3400
(2) Maximum % p.a. - - - 11.7999 10.5624
(n) 30 Years Maturity
(i) Amount Accepted - - - - - -
(ii) Weighted Average Yield -
(1) Minimum % p.a. - - - - - -
(2) Maximum % p.a. - - - - - -
Source: State Bank of Pakistan
* : The benchmark for coupon rate is defined in clause 'B' of DMMD Circular No. 9 dated May 07, 2018.
** : Margins quoted ober benchmark rate in fresh auctions of floating rate PIB (PFL)
Note: 1: A special issuance in PFL-SA 10 Years Issued by GoP to Independent Power Producer (IPPs) against their receivables from GoP on 4th June, 2021
(Rs 28,905.1 Million) and on 29-Nov-21 (Rs 43,322.80 Million) 2: Amounts include non-competitive bids & short sale accommodation as well.


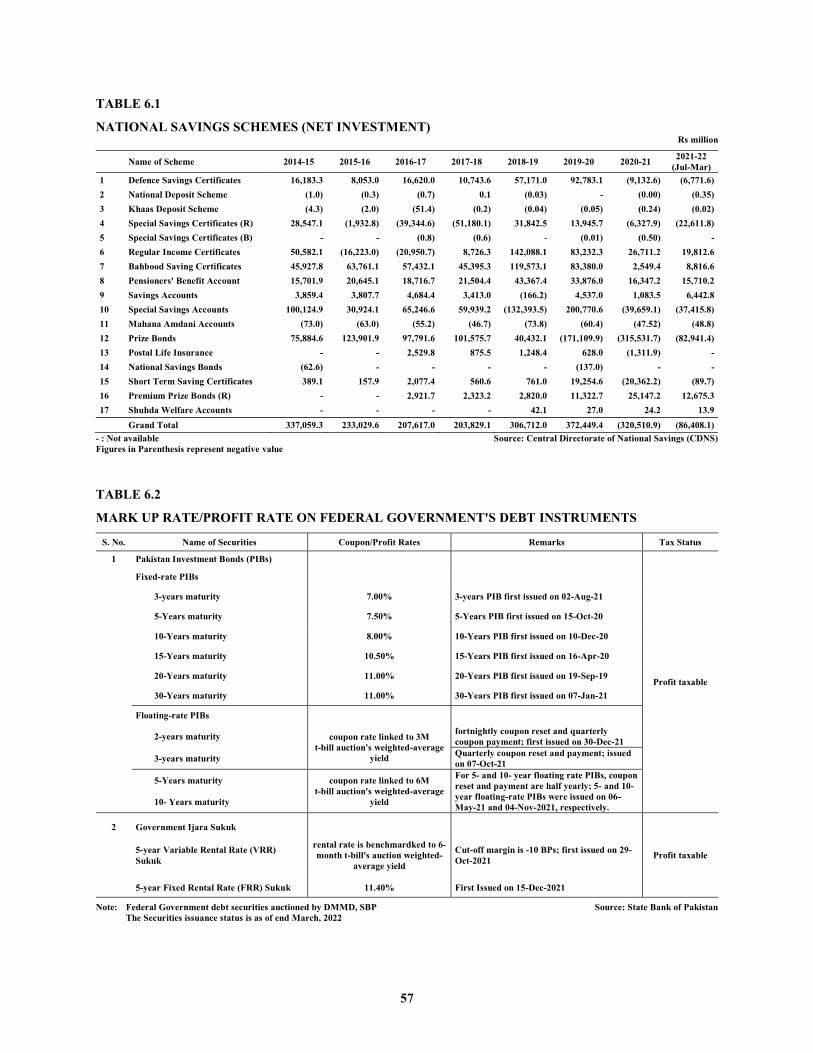
57
TABLE 6.1
NATIONAL SAVINGS SCHEMES (NET INVESTMENT) Rs million
Name of Scheme 2014-15 2015-16 2016-17 2017-18 2018-19 2019-20 2020-21 2021-22 (Jul-Mar)
1 Defence Savings Certificates 16,183.3 8,053.0 16,620.0 10,743.6 57,171.0 92,783.1 (9,132.6) (6,771.6) 2 National Deposit Scheme (1.0) (0.3) (0.7) 0.1 (0.03) - (0.00) (0.35) 3 Khaas Deposit Scheme (4.3) (2.0) (51.4) (0.2) (0.04) (0.05) (0.24) (0.02) 4 Special Savings Certificates (R) 28,547.1 (1,932.8) (39,344.6) (51,180.1) 31,842.5 13,945.7 (6,327.9) (22,611.8) 5 Special Savings Certificates (B) - - (0.8) (0.6) - (0.01) (0.50) - 6 Regular Income Certificates 50,582.1 (16,223.0) (20,950.7) 8,726.3 142,088.1 83,232.3 26,711.2 19,812.6 7 Bahbood Saving Certificates 45,927.8 63,761.1 57,432.1 45,395.3 119,573.1 83,380.0 2,549.4 8,816.6 8 Pensioners' Benefit Account 15,701.9 20,645.1 18,716.7 21,504.4 43,367.4 33,876.0 16,347.2 15,710.2 9 Savings Accounts 3,859.4 3,807.7 4,684.4 3,413.0 (166.2) 4,537.0 1,083.5 6,442.8 10 Special Savings Accounts 100,124.9 30,924.1 65,246.6 59,939.2 (132,393.5) 200,770.6 (39,659.1) (37,415.8) 11 Mahana Amdani Accounts (73.0) (63.0) (55.2) (46.7) (73.8) (60.4) (47.52) (48.8) 12 Prize Bonds 75,884.6 123,901.9 97,791.6 101,575.7 40,432.1 (171,109.9) (315,531.7) (82,941.4) 13 Postal Life Insurance - - 2,529.8 875.5 1,248.4 628.0 (1,311.9) - 14 National Savings Bonds (62.6) - - - - (137.0) - - 15 Short Term Saving Certificates 389.1 157.9 2,077.4 560.6 761.0 19,254.6 (20,362.2) (89.7) 16 Premium Prize Bonds (R) - - 2,921.7 2,323.2 2,820.0 11,322.7 25,147.2 12,675.3 17 Shuhda Welfare Accounts - - - - 42.1 27.0 24.2 13.9 Grand Total 337,059.3 233,029.6 207,617.0 203,829.1 306,712.0 372,449.4 (320,510.9) (86,408.1)
- : Not available Source: Central Directorate of National Savings (CDNS) Figures in Parenthesis represent negative value
TABLE 6.2
MARK UP RATE/PROFIT RATE ON FEDERAL GOVERNMENT'S DEBT INSTRUMENTS
S. No. Name of Securities Coupon/Profit Rates Remarks Tax Status
1 Pakistan Investment Bonds (PIBs)
Profit taxable
Fixed-rate PIBs
3-years maturity 7.00% 3-years PIB first issued on 02-Aug-21
5-Years maturity 7.50% 5-Years PIB first issued on 15-Oct-20
10-Years maturity 8.00% 10-Years PIB first issued on 10-Dec-20
15-Years maturity 10.50% 15-Years PIB first issued on 16-Apr-20
20-Years maturity 11.00% 20-Years PIB first issued on 19-Sep-19
30-Years maturity 11.00% 30-Years PIB first issued on 07-Jan-21
Floating-rate PIBs
2-years maturity coupon rate linked to 3M
t-bill auction's weighted-average yield
fortnightly coupon reset and quarterly coupon payment; first issued on 30-Dec-21
3-years maturity
Quarterly coupon reset and payment; issued on 07-Oct-21
5-Years maturity 10- Years maturity
coupon rate linked to 6M t-bill auction's weighted-average
yield
For 5- and 10- year floating rate PIBs, coupon reset and payment are half yearly; 5- and 10- year floating-rate PIBs were issued on 06-May-21 and 04-Nov-2021, respectively.
2 Government Ijara Sukuk
Profit taxable
5-year Variable Rental Rate (VRR) Sukuk
rental rate is benchmardked to 6-month t-bill's auction weighted-
average yield
Cut-off margin is -10 BPs; first issued on 29-Oct-2021
5-year Fixed Rental Rate (FRR) Sukuk 11.40% First Issued on 15-Dec-2021
Note: Federal Government debt securities auctioned by DMMD, SBP Source: State Bank of Pakistan The Securities issuance status is as of end March, 2022


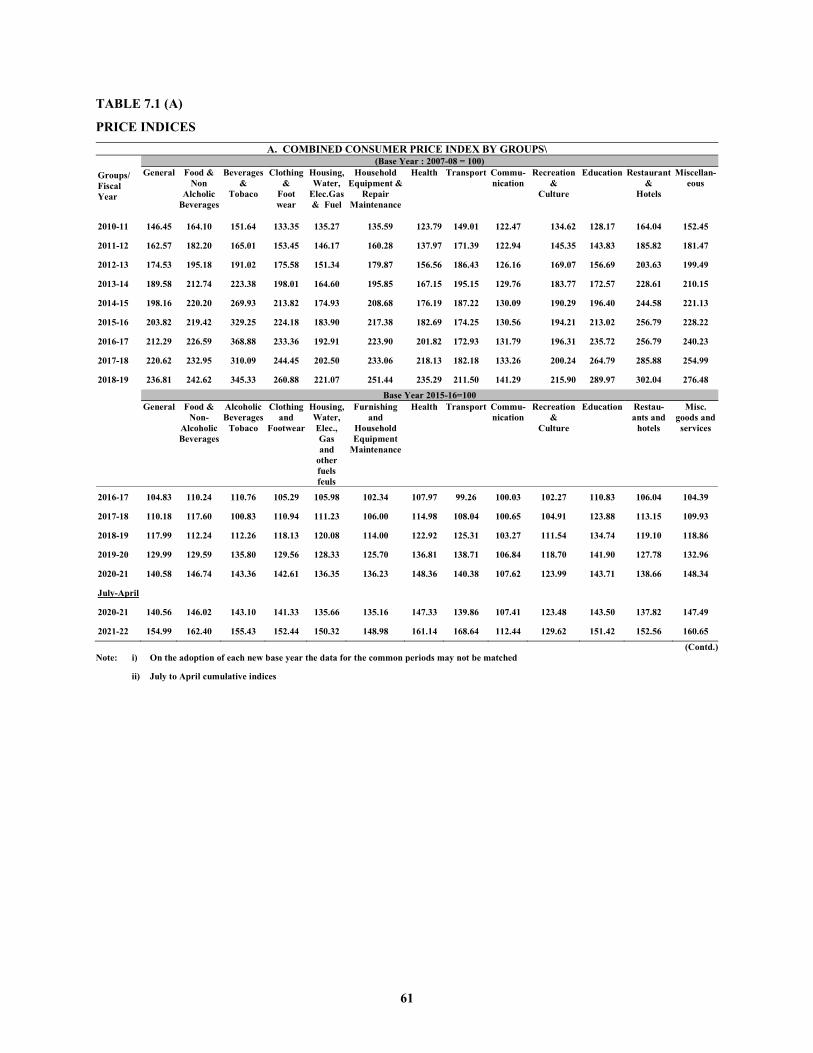
61
TABLE 7.1 (A)
PRICE INDICES
A. COMBINED CONSUMER PRICE INDEX BY GROUPS\
Groups/ Fiscal Year
(Base Year : 2007-08 = 100) General Food &
Non Alcholic
Beverages
Beverages &
Tobaco
Clothing &
Foot wear
Housing, Water,
Elec.Gas & Fuel
Household Equipment &
Repair Maintenance
Health Transport Commu- nication
Recreation &
Culture
Education Restaurant &
Hotels
Miscellan- eous
2010-11 146.45 164.10 151.64 133.35 135.27 135.59 123.79 149.01 122.47 134.62 128.17 164.04 152.45
2011-12 162.57 182.20 165.01 153.45 146.17 160.28 137.97 171.39 122.94 145.35 143.83 185.82 181.47
2012-13 174.53 195.18 191.02 175.58 151.34 179.87 156.56 186.43 126.16 169.07 156.69 203.63 199.49
2013-14 189.58 212.74 223.38 198.01 164.60 195.85 167.15 195.15 129.76 183.77 172.57 228.61 210.15
2014-15 198.16 220.20 269.93 213.82 174.93 208.68 176.19 187.22 130.09 190.29 196.40 244.58 221.13
2015-16 203.82 219.42 329.25 224.18 183.90 217.38 182.69 174.25 130.56 194.21 213.02 256.79 228.22
2016-17 212.29 226.59 368.88 233.36 192.91 223.90 201.82 172.93 131.79 196.31 235.72 256.79 240.23
2017-18 220.62 232.95 310.09 244.45 202.50 233.06 218.13 182.18 133.26 200.24 264.79 285.88 254.99
2018-19 236.81 242.62 345.33 260.88 221.07 251.44 235.29 211.50 141.29 215.90 289.97 302.04 276.48
Base Year 2015-16=100 General Food &
Non- Alcoholic Beverages
Alcoholic Beverages
Tobaco
Clothing and
Footwear
Housing, Water, Elec., Gas and
other fuels feuls
Furnishing and
Household Equipment
Maintenance
Health Transport Commu- nication
Recreation &
Culture
Education Restau- ants and
hotels
Misc. goods and
services
2016-17 104.83 110.24 110.76 105.29 105.98 102.34 107.97 99.26 100.03 102.27 110.83 106.04 104.39
2017-18 110.18 117.60 100.83 110.94 111.23 106.00 114.98 108.04 100.65 104.91 123.88 113.15 109.93
2018-19 117.99 112.24 112.26 118.13 120.08 114.00 122.92 125.31 103.27 111.54 134.74 119.10 118.86
2019-20 129.99 129.59 135.80 129.56 128.33 125.70 136.81 138.71 106.84 118.70 141.90 127.78 132.96
2020-21 140.58 146.74 143.36 142.61 136.35 136.23 148.36 140.38 107.62 123.99 143.71 138.66 148.34
July-April
2020-21 140.56 146.02 143.10 141.33 135.66 135.16 147.33 139.86 107.41 123.48 143.50 137.82 147.49
2021-22 154.99 162.40 155.43 152.44 150.32 148.98 161.14 168.64 112.44 129.62 151.42 152.56 160.65
(Contd.) Note: i) On the adoption of each new base year the data for the common periods may not be matched
ii) July to April cumulative indices
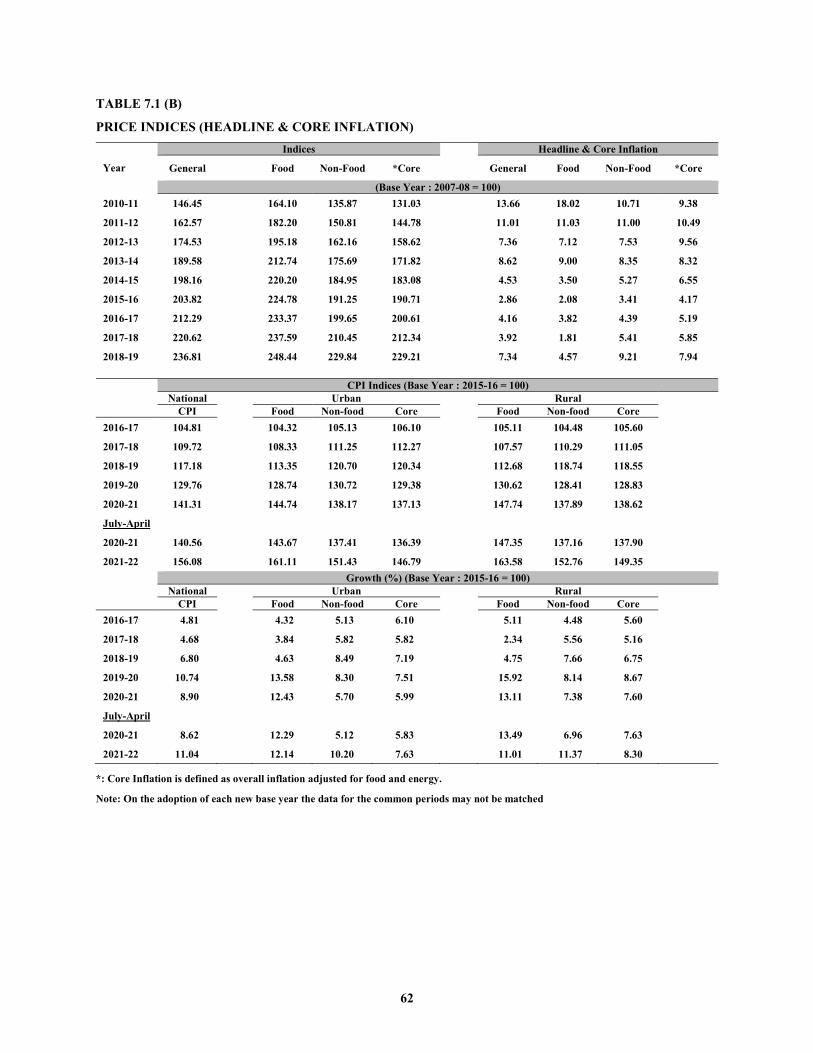
62
TABLE 7.1 (B)
PRICE INDICES (HEADLINE & CORE INFLATION)
Year
Indices
Headline & Core Inflation
General Food Non-Food *Core General Food Non-Food *Core
(Base Year : 2007-08 = 100) 2010-11 146.45 164.10 135.87 131.03 13.66 18.02 10.71 9.38
2011-12 162.57 182.20 150.81 144.78 11.01 11.03 11.00 10.49
2012-13 174.53 195.18 162.16 158.62 7.36 7.12 7.53 9.56
2013-14 189.58 212.74 175.69 171.82 8.62 9.00 8.35 8.32
2014-15 198.16 220.20 184.95 183.08 4.53 3.50 5.27 6.55
2015-16 203.82 224.78 191.25 190.71 2.86 2.08 3.41 4.17
2016-17 212.29 233.37 199.65 200.61 4.16 3.82 4.39 5.19
2017-18 220.62 237.59 210.45 212.34 3.92 1.81 5.41 5.85
2018-19 236.81 248.44 229.84 229.21 7.34 4.57 9.21 7.94
CPI Indices (Base Year : 2015-16 = 100)
National Urban Rural CPI Food Non-food Core Food Non-food Core
2016-17 104.81 104.32 105.13 106.10 105.11 104.48 105.60
2017-18 109.72 108.33 111.25 112.27 107.57 110.29 111.05
2018-19 117.18 113.35 120.70 120.34 112.68 118.74 118.55
2019-20 129.76 128.74 130.72 129.38 130.62 128.41 128.83
2020-21 141.31 144.74 138.17 137.13 147.74 137.89 138.62
July-April
2020-21 140.56 143.67 137.41 136.39 147.35 137.16 137.90
2021-22 156.08 161.11 151.43 146.79 163.58 152.76 149.35 Growth (%) (Base Year : 2015-16 = 100)
National Urban Rural CPI Food Non-food Core Food Non-food Core
2016-17 4.81 4.32 5.13 6.10 5.11 4.48 5.60
2017-18 4.68 3.84 5.82 5.82 2.34 5.56 5.16
2018-19 6.80 4.63 8.49 7.19 4.75 7.66 6.75
2019-20 10.74 13.58 8.30 7.51 15.92 8.14 8.67
2020-21 8.90 12.43 5.70 5.99 13.11 7.38 7.60
July-April
2020-21 8.62 12.29 5.12 5.83 13.49 6.96 7.63
2021-22 11.04 12.14 10.20 7.63 11.01 11.37 8.30
*: Core Inflation is defined as overall inflation adjusted for food and energy.
Note: On the adoption of each new base year the data for the common periods may not be matched
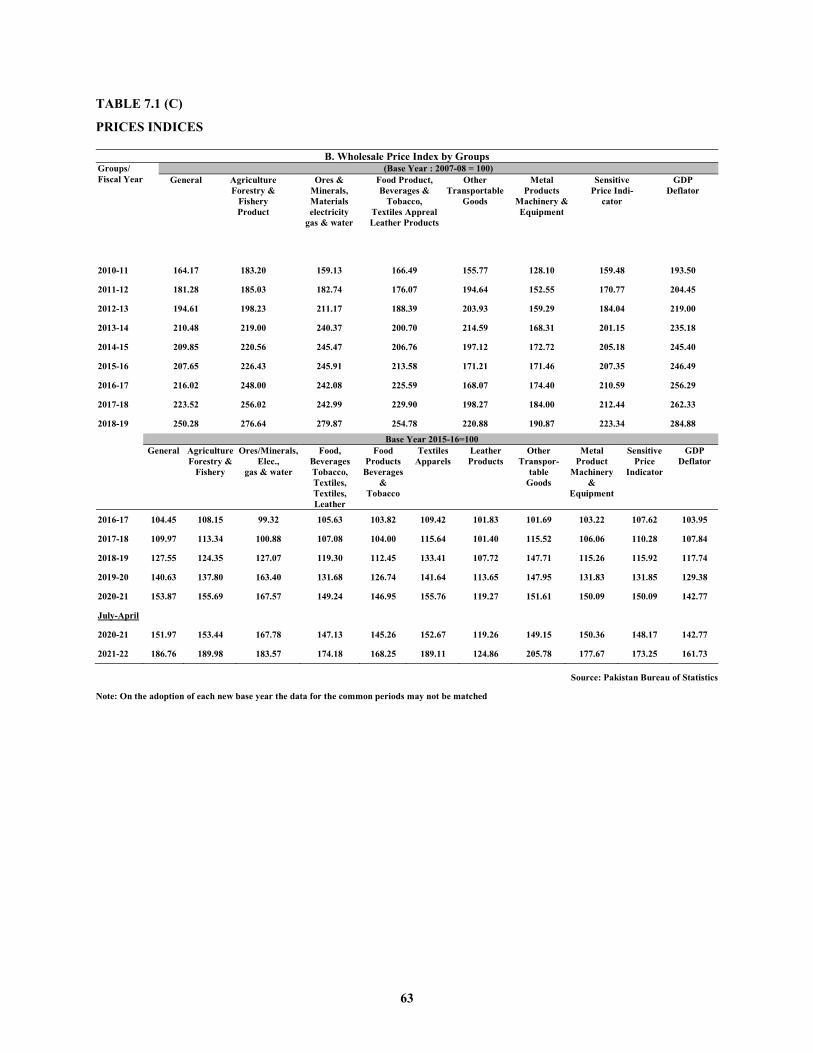
63
TABLE 7.1 (C)
PRICES INDICES
B. Wholesale Price Index by Groups Groups/ Fiscal Year
(Base Year : 2007-08 = 100) General Agriculture
Forestry & Fishery Product
Ores & Minerals, Materials electricity
gas & water
Food Product, Beverages &
Tobacco, Textiles Appreal Leather Products
Other Transportable
Goods
Metal Products
Machinery & Equipment
Sensitive Price Indi-
cator
GDP Deflator
2010-11 164.17 183.20 159.13 166.49 155.77 128.10 159.48 193.50
2011-12 181.28 185.03 182.74 176.07 194.64 152.55 170.77 204.45
2012-13 194.61 198.23 211.17 188.39 203.93 159.29 184.04 219.00
2013-14 210.48 219.00 240.37 200.70 214.59 168.31 201.15 235.18
2014-15 209.85 220.56 245.47 206.76 197.12 172.72 205.18 245.40
2015-16 207.65 226.43 245.91 213.58 171.21 171.46 207.35 246.49
2016-17 216.02 248.00 242.08 225.59 168.07 174.40 210.59 256.29
2017-18 223.52 256.02 242.99 229.90 198.27 184.00 212.44 262.33
2018-19 250.28 276.64 279.87 254.78 220.88 190.87 223.34 284.88
Base Year 2015-16=100 General Agriculture
Forestry & Fishery
Ores/Minerals, Elec.,
gas & water
Food, Beverages Tobacco, Textiles, Textiles, Leather
Food Products
Beverages &
Tobacco
Textiles Apparels
Leather Products
Other Transpor-
table Goods
Metal Product
Machinery &
Equipment
Sensitive Price
Indicator
GDP Deflator
2016-17 104.45 108.15 99.32 105.63 103.82 109.42 101.83 101.69 103.22 107.62 103.95
2017-18 109.97 113.34 100.88 107.08 104.00 115.64 101.40 115.52 106.06 110.28 107.84
2018-19 127.55 124.35 127.07 119.30 112.45 133.41 107.72 147.71 115.26 115.92 117.74
2019-20 140.63 137.80 163.40 131.68 126.74 141.64 113.65 147.95 131.83 131.85 129.38
2020-21 153.87 155.69 167.57 149.24 146.95 155.76 119.27 151.61 150.09 150.09 142.77
July-April
2020-21 151.97 153.44 167.78 147.13 145.26 152.67 119.26 149.15 150.36 148.17 142.77
2021-22 186.76 189.98 183.57 174.18 168.25 189.11 124.86 205.78 177.67 173.25 161.73
Source: Pakistan Bureau of Statistics
Note: On the adoption of each new base year the data for the common periods may not be matched
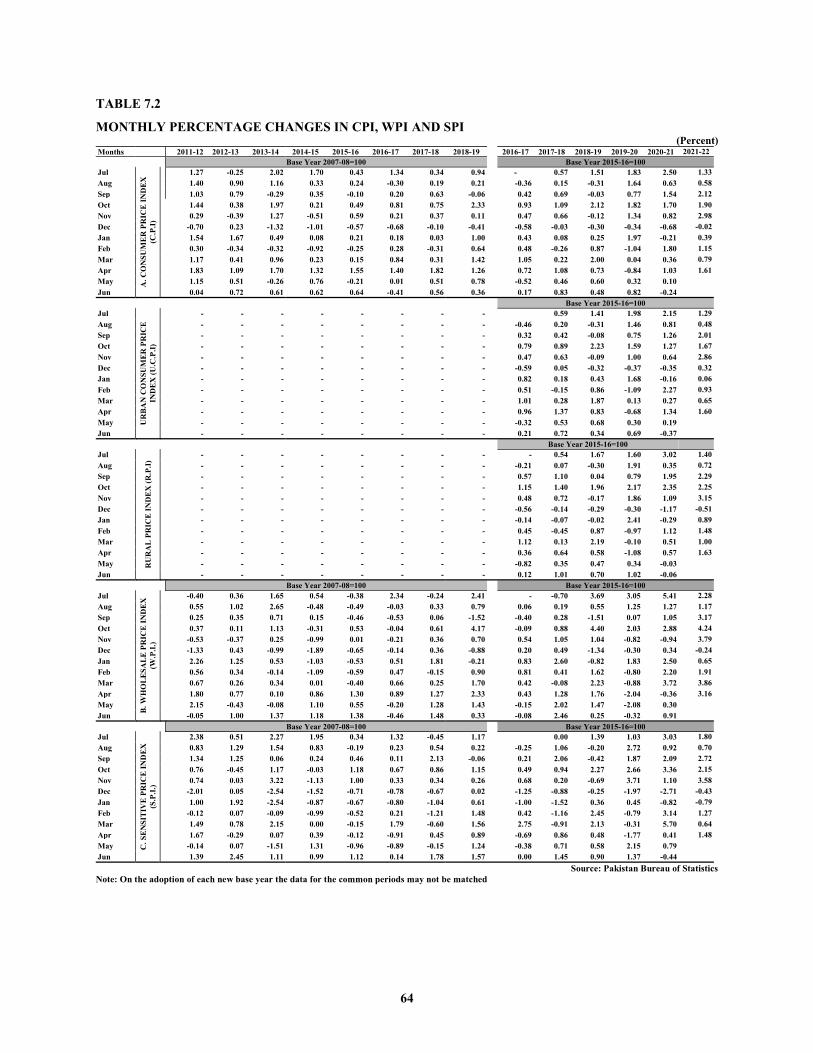
64
TABLE 7.2
MONTHLY PERCENTAGE CHANGES IN CPI, WPI AND SPI (Percent)
Months 2011-12 2012-13 2013-14 2014-15 2015-16 2016-17 2017-18 2018-19 2016-17 2017-18 2018-19 2019-20 2020-21 2021-22 Base Year 2007-08=100 Base Year 2015-16=100
Jul
A. C
ON
SUM
ER P
RIC
E IN
DEX
(C
.P.I)
1.27 -0.25 2.02 1.70 0.43 1.34 0.34 0.94 - 0.57 1.51 1.83 2.50 1.33 Aug 1.40 0.90 1.16 0.33 0.24 -0.30 0.19 0.21 -0.36 0.15 -0.31 1.64 0.63 0.58 Sep 1.03 0.79 -0.29 0.35 -0.10 0.20 0.63 -0.06 0.42 0.69 -0.03 0.77 1.54 2.12 Oct 1.44 0.38 1.97 0.21 0.49 0.81 0.75 2.33 0.93 1.09 2.12 1.82 1.70 1.90 Nov 0.29 -0.39 1.27 -0.51 0.59 0.21 0.37 0.11 0.47 0.66 -0.12 1.34 0.82 2.98 Dec -0.70 0.23 -1.32 -1.01 -0.57 -0.68 -0.10 -0.41 -0.58 -0.03 -0.30 -0.34 -0.68 -0.02 Jan 1.54 1.67 0.49 0.08 0.21 0.18 0.03 1.00 0.43 0.08 0.25 1.97 -0.21 0.39 Feb 0.30 -0.34 -0.32 -0.92 -0.25 0.28 -0.31 0.64 0.48 -0.26 0.87 -1.04 1.80 1.15 Mar 1.17 0.41 0.96 0.23 0.15 0.84 0.31 1.42 1.05 0.22 2.00 0.04 0.36 0.79 Apr 1.83 1.09 1.70 1.32 1.55 1.40 1.82 1.26 0.72 1.08 0.73 -0.84 1.03 1.61 May 1.15 0.51 -0.26 0.76 -0.21 0.01 0.51 0.78 -0.52 0.46 0.60 0.32 0.10 Jun 0.04 0.72 0.61 0.62 0.64 -0.41 0.56 0.36 0.17 0.83 0.48 0.82 -0.24 Base Year 2015-16=100 Jul
UR
BAN
CO
NSU
MER
PR
ICE
IND
EX (U
.C.P
.I)
- - - - - - - - 0.59 1.41 1.98 2.15 1.29 Aug - - - - - - - - -0.46 0.20 -0.31 1.46 0.81 0.48 Sep - - - - - - - - 0.32 0.42 -0.08 0.75 1.26 2.01 Oct - - - - - - - - 0.79 0.89 2.23 1.59 1.27 1.67 Nov - - - - - - - - 0.47 0.63 -0.09 1.00 0.64 2.86 Dec - - - - - - - - -0.59 0.05 -0.32 -0.37 -0.35 0.32 Jan - - - - - - - - 0.82 0.18 0.43 1.68 -0.16 0.06 Feb - - - - - - - - 0.51 -0.15 0.86 -1.09 2.27 0.93 Mar - - - - - - - - 1.01 0.28 1.87 0.13 0.27 0.65 Apr - - - - - - - - 0.96 1.37 0.83 -0.68 1.34 1.60 May - - - - - - - - -0.32 0.53 0.68 0.30 0.19 Jun - - - - - - - - 0.21 0.72 0.34 0.69 -0.37 Base Year 2015-16=100 Jul
RU
RA
L PR
ICE
IND
EX
(R.P
.I)
- - - - - - - - - 0.54 1.67 1.60 3.02 1.40 Aug - - - - - - - - -0.21 0.07 -0.30 1.91 0.35 0.72 Sep - - - - - - - - 0.57 1.10 0.04 0.79 1.95 2.29 Oct - - - - - - - - 1.15 1.40 1.96 2.17 2.35 2.25 Nov - - - - - - - - 0.48 0.72 -0.17 1.86 1.09 3.15 Dec - - - - - - - - -0.56 -0.14 -0.29 -0.30 -1.17 -0.51 Jan - - - - - - - - -0.14 -0.07 -0.02 2.41 -0.29 0.89 Feb - - - - - - - - 0.45 -0.45 0.87 -0.97 1.12 1.48 Mar - - - - - - - - 1.12 0.13 2.19 -0.10 0.51 1.00 Apr - - - - - - - - 0.36 0.64 0.58 -1.08 0.57 1.63 May - - - - - - - - -0.82 0.35 0.47 0.34 -0.03 Jun - - - - - - - - 0.12 1.01 0.70 1.02 -0.06
Base Year 2007-08=100 Base Year 2015-16=100 Jul
B. W
HO
LESA
LE P
RIC
E IN
DEX
(W
.P.I.
)
-0.40 0.36 1.65 0.54 -0.38 2.34 -0.24 2.41 - -0.70 3.69 3.05 5.41 2.28 Aug 0.55 1.02 2.65 -0.48 -0.49 -0.03 0.33 0.79 0.06 0.19 0.55 1.25 1.27 1.17 Sep 0.25 0.35 0.71 0.15 -0.46 -0.53 0.06 -1.52 -0.40 0.28 -1.51 0.07 1.05 3.17 Oct 0.37 0.11 1.13 -0.31 0.53 -0.04 0.61 4.17 -0.09 0.88 4.40 2.03 2.88 4.24 Nov -0.53 -0.37 0.25 -0.99 0.01 -0.21 0.36 0.70 0.54 1.05 1.04 -0.82 -0.94 3.79 Dec -1.33 0.43 -0.99 -1.89 -0.65 -0.14 0.36 -0.88 0.20 0.49 -1.34 -0.30 0.34 -0.24 Jan 2.26 1.25 0.53 -1.03 -0.53 0.51 1.81 -0.21 0.83 2.60 -0.82 1.83 2.50 0.65 Feb 0.56 0.34 -0.14 -1.09 -0.59 0.47 -0.15 0.90 0.81 0.41 1.62 -0.80 2.20 1.91 Mar 0.67 0.26 0.34 0.01 -0.40 0.66 0.25 1.70 0.42 -0.08 2.23 -0.88 3.72 3.86 Apr 1.80 0.77 0.10 0.86 1.30 0.89 1.27 2.33 0.43 1.28 1.76 -2.04 -0.36 3.16 May 2.15 -0.43 -0.08 1.10 0.55 -0.20 1.28 1.43 -0.15 2.02 1.47 -2.08 0.30 Jun -0.05 1.00 1.37 1.18 1.38 -0.46 1.48 0.33 -0.08 2.46 0.25 -0.32 0.91
Base Year 2007-08=100 Base Year 2015-16=100 Jul
C. S
ENSI
TIV
E PR
ICE
IND
EX
(S.P
.I.)
2.38 0.51 2.27 1.95 0.34 1.32 -0.45 1.17 0.00 1.39 1.03 3.03 1.80 Aug 0.83 1.29 1.54 0.83 -0.19 0.23 0.54 0.22 -0.25 1.06 -0.20 2.72 0.92 0.70 Sep 1.34 1.25 0.06 0.24 0.46 0.11 2.13 -0.06 0.21 2.06 -0.42 1.87 2.09 2.72 Oct 0.76 -0.45 1.17 -0.03 1.18 0.67 0.86 1.15 0.49 0.94 2.27 2.66 3.36 2.15 Nov 0.74 0.03 3.22 -1.13 1.00 0.33 0.34 0.26 0.68 0.20 -0.69 3.71 1.10 3.58 Dec -2.01 0.05 -2.54 -1.52 -0.71 -0.78 -0.67 0.02 -1.25 -0.88 -0.25 -1.97 -2.71 -0.43 Jan 1.00 1.92 -2.54 -0.87 -0.67 -0.80 -1.04 0.61 -1.00 -1.52 0.36 0.45 -0.82 -0.79 Feb -0.12 0.07 -0.09 -0.99 -0.52 0.21 -1.21 1.48 0.42 -1.16 2.45 -0.79 3.14 1.27 Mar 1.49 0.78 2.15 0.00 -0.15 1.79 -0.60 1.56 2.75 -0.91 2.13 -0.31 5.70 0.64 Apr 1.67 -0.29 0.07 0.39 -0.12 -0.91 0.45 0.89 -0.69 0.86 0.48 -1.77 0.41 1.48 May -0.14 0.07 -1.51 1.31 -0.96 -0.89 -0.15 1.24 -0.38 0.71 0.58 2.15 0.79 Jun 1.39 2.45 1.11 0.99 1.12 0.14 1.78 1.57 0.00 1.45 0.90 1.37 -0.44
Source: Pakistan Bureau of Statistics Note: On the adoption of each new base year the data for the common periods may not be matched
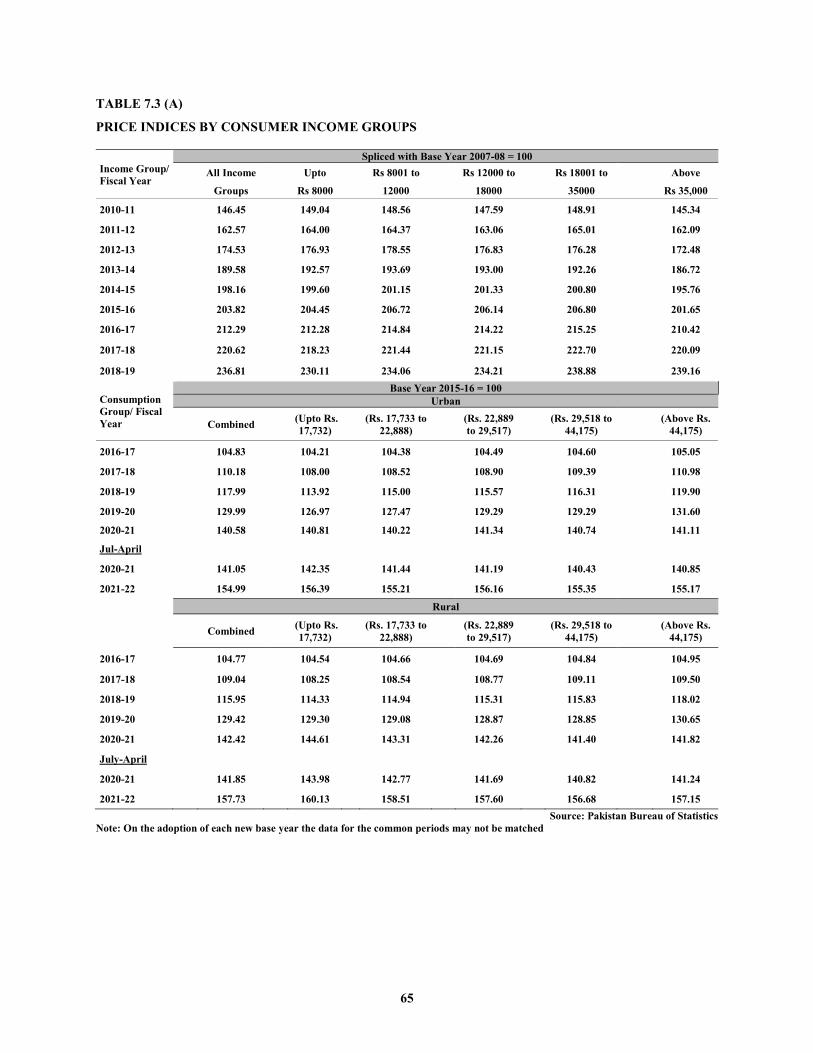
65
TABLE 7.3 (A)
PRICE INDICES BY CONSUMER INCOME GROUPS
Income Group/ Fiscal Year
Spliced with Base Year 2007-08 = 100 All Income Upto Rs 8001 to Rs 12000 to Rs 18001 to Above
Groups Rs 8000 12000 18000 35000 Rs 35,000
2010-11 146.45 149.04 148.56 147.59 148.91 145.34
2011-12 162.57 164.00 164.37 163.06 165.01 162.09
2012-13 174.53 176.93 178.55 176.83 176.28 172.48
2013-14 189.58 192.57 193.69 193.00 192.26 186.72
2014-15 198.16 199.60 201.15 201.33 200.80 195.76
2015-16 203.82 204.45 206.72 206.14 206.80 201.65
2016-17 212.29 212.28 214.84 214.22 215.25 210.42
2017-18 220.62 218.23 221.44 221.15 222.70 220.09
2018-19 236.81 230.11 234.06 234.21 238.88 239.16
Consumption Group/ Fiscal Year
Base Year 2015-16 = 100 Urban
Combined (Upto Rs. 17,732) (Rs. 17,733 to
22,888) (Rs. 22,889 to 29,517) (Rs. 29,518 to
44,175) (Above Rs. 44,175)
2016-17 104.83 104.21 104.38 104.49 104.60 105.05
2017-18 110.18 108.00 108.52 108.90 109.39 110.98
2018-19 117.99 113.92 115.00 115.57 116.31 119.90
2019-20 129.99 126.97 127.47 129.29 129.29 131.60
2020-21 140.58 140.81 140.22 141.34 140.74 141.11
Jul-April
2020-21 141.05 142.35 141.44 141.19 140.43 140.85
2021-22 154.99 156.39 155.21 156.16 155.35 155.17
Rural
Combined (Upto Rs. 17,732) (Rs. 17,733 to
22,888) (Rs. 22,889 to 29,517) (Rs. 29,518 to
44,175) (Above Rs. 44,175)
2016-17 104.77 104.54 104.66 104.69 104.84 104.95
2017-18 109.04 108.25 108.54 108.77 109.11 109.50
2018-19 115.95 114.33 114.94 115.31 115.83 118.02
2019-20 129.42 129.30 129.08 128.87 128.85 130.65
2020-21 142.42 144.61 143.31 142.26 141.40 141.82
July-April
2020-21 141.85 143.98 142.77 141.69 140.82 141.24
2021-22 157.73 160.13 158.51 157.60 156.68 157.15 Source: Pakistan Bureau of Statistics
Note: On the adoption of each new base year the data for the common periods may not be matched
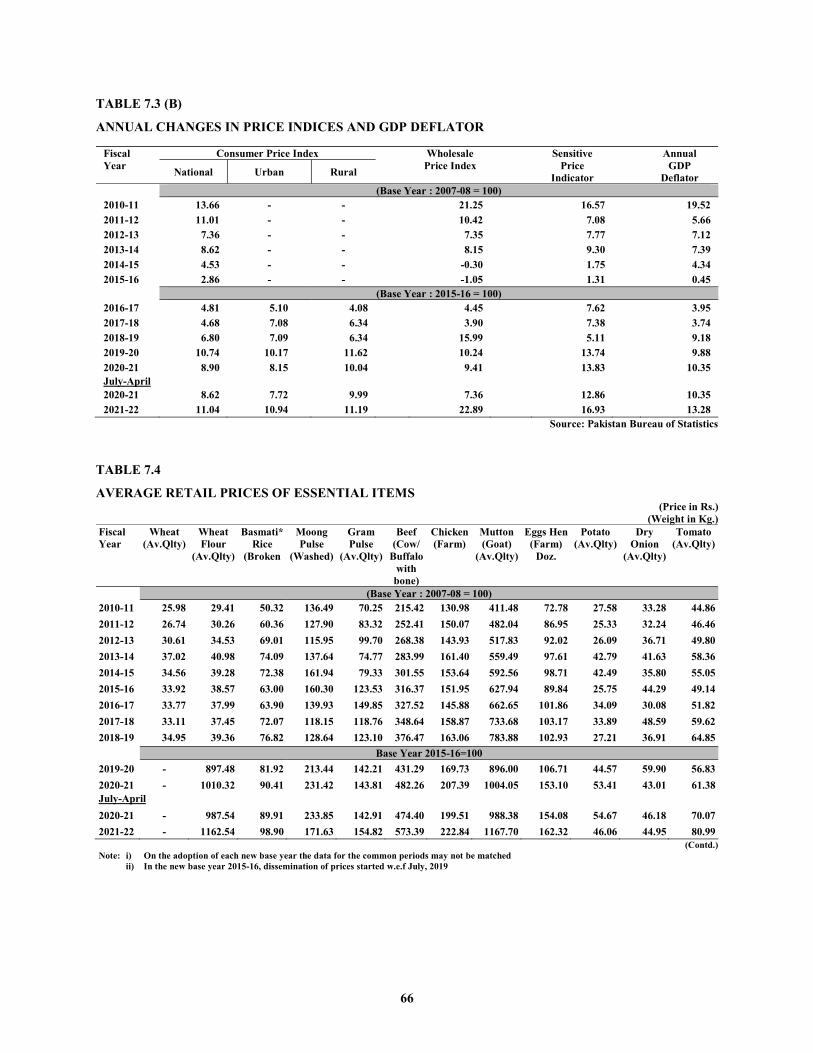
66
TABLE 7.3 (B)
ANNUAL CHANGES IN PRICE INDICES AND GDP DEFLATOR Fiscal Year
Consumer Price Index
Wholesale Price Index
Sensitive Price
Indicator
Annual GDP
Deflator National Urban Rural
(Base Year : 2007-08 = 100) 2010-11 13.66 - - 21.25 16.57 19.52 2011-12 11.01 - - 10.42 7.08 5.66 2012-13 7.36 - - 7.35 7.77 7.12 2013-14 8.62 - - 8.15 9.30 7.39 2014-15 4.53 - - -0.30 1.75 4.34 2015-16 2.86 - - -1.05 1.31 0.45 (Base Year : 2015-16 = 100) 2016-17 4.81 5.10 4.08 4.45 7.62 3.95 2017-18 4.68 7.08 6.34 3.90 7.38 3.74 2018-19 6.80 7.09 6.34 15.99 5.11 9.18 2019-20 10.74 10.17 11.62 10.24 13.74 9.88 2020-21 8.90 8.15 10.04 9.41 13.83 10.35 July-April
2020-21 8.62 7.72 9.99 7.36 12.86 10.35 2021-22 11.04 10.94 11.19 22.89 16.93 13.28
Source: Pakistan Bureau of Statistics
TABLE 7.4
AVERAGE RETAIL PRICES OF ESSENTIAL ITEMS (Price in Rs.)
(Weight in Kg.) Fiscal Year
Wheat (Av.Qlty)
Wheat Flour
(Av.Qlty)
Basmati* Rice
(Broken
Moong Pulse
(Washed)
Gram Pulse
(Av.Qlty)
Beef (Cow/
Buffalo with bone)
Chicken (Farm)
Mutton (Goat)
(Av.Qlty)
Eggs Hen (Farm)
Doz.
Potato (Av.Qlty)
Dry Onion
(Av.Qlty)
Tomato (Av.Qlty)
(Base Year : 2007-08 = 100) 2010-11 25.98 29.41 50.32 136.49 70.25 215.42 130.98 411.48 72.78 27.58 33.28 44.86 2011-12 26.74 30.26 60.36 127.90 83.32 252.41 150.07 482.04 86.95 25.33 32.24 46.46 2012-13 30.61 34.53 69.01 115.95 99.70 268.38 143.93 517.83 92.02 26.09 36.71 49.80 2013-14 37.02 40.98 74.09 137.64 74.77 283.99 161.40 559.49 97.61 42.79 41.63 58.36 2014-15 34.56 39.28 72.38 161.94 79.33 301.55 153.64 592.56 98.71 42.49 35.80 55.05 2015-16 33.92 38.57 63.00 160.30 123.53 316.37 151.95 627.94 89.84 25.75 44.29 49.14 2016-17 33.77 37.99 63.90 139.93 149.85 327.52 145.88 662.65 101.86 34.09 30.08 51.82 2017-18 33.11 37.45 72.07 118.15 118.76 348.64 158.87 733.68 103.17 33.89 48.59 59.62 2018-19 34.95 39.36 76.82 128.64 123.10 376.47 163.06 783.88 102.93 27.21 36.91 64.85
Base Year 2015-16=100 2019-20 - 897.48 81.92 213.44 142.21 431.29 169.73 896.00 106.71 44.57 59.90 56.83 2020-21 - 1010.32 90.41 231.42 143.81 482.26 207.39 1004.05 153.10 53.41 43.01 61.38 July-April
2020-21 - 987.54 89.91 233.85 142.91 474.40 199.51 988.38 154.08 54.67 46.18 70.07 2021-22 - 1162.54 98.90 171.63 154.82 573.39 222.84 1167.70 162.32 46.06 44.95 80.99
(Contd.) Note: i) On the adoption of each new base year the data for the common periods may not be matched ii) In the new base year 2015-16, dissemination of prices started w.e.f July, 2019

67
TABLE 7.4 (A)
AVERAGE RETAIL PRICES OF ESSENTIAL ITEMS (Price in Rs.)
(Weight in Kg.) Fiscal Year
Mustard Oil
(Mill)
Vegeta- ble Ghee (Loose)
Rock Salt
(Powder)
Red Chilies
(Av.Qlty)
Sugar (Open
Market)
Gur (Sup. Qlty)
Milk Fresh Ltr.
Tea in* Packet
(Sup.Qlty) 200 grams
(Base Year : 2007-08 = 100) 2010-11 156.56 150.31 7.28 230.27 72.72 83.86 50.10 123.19 2011-12 178.29 166.26 8.13 299.42 60.99 78.27 58.17 135.15 2012-13 185.88 160.73 8.74 254.06 53.25 74.50 65.24 146.01 2013-14 184.48 160.57 9.37 221.33 53.82 82.83 69.86 154.58 2014-15 183.08 151.90 9.98 261.42 57.14 83.95 76.21 133.80 2015-16 179.67 138.35 10.43 274.03 62.60 89.28 78.24 172.76 2016-17 181.15 143.34 10.64 272.60 64.94 88.20 80.59 177.24 2017-18 183.83 146.22 11.10 266.58 53.70 81.49 82.75 189.44 2018-19 195.43 161.85 12.29 335.21 59.84 85.75 86.74 210.27
Base Year 2015-16=100 2019-20 208.50 225.75 29.90 157.44 76.60 115.20 93.43 225.54 2020-21 254.12 269.95 30.01 318.56 94.21 128.82 105.17 230.17 July-April
2020-21 246.75 263.58 30.01 307.51 93.50 128.39 104.41 230.20 2021-22 363.10 382.88 31.63 317.47 96.15 138.37 113.85 245.63
(Contd.) *: Tea packet prices in bases year 2015-16=100 is quoted of 190 grams packet price. In the new base year 2015-16, prices are disseminated started w.e.f July, 2019.
TABLE 7.4 (B)
AVERAGE RETAIL PRICES OF ESSENTIAL ITEMS (Rs/unit)
Fiscal Year
Cigarettes Pkt
Long Cloth
Mtr.
Georgerette Mtr.
Shoes Gents
Concord Bata*
Firewood (Kikar/ Babul) 40 Kgs.
Match Box (40/
50 Sticks) Each
Washing Soap
707/555 Cake
Life- buoy Soap Cake
(Base Year : 2007-08 = 100) 2010-11 27.44 148.57 72.35 499.00 354.29 1.00 15.14 25.47 2011-12 29.10 111.21 88.07 499.00 441.74 1.06 18.39 30.50 2012-13 32.34 151.14 101.61 549.00 491.55 1.10 21.00 32.29 2013-14 38.45 176.59 112.40 671.92 538.12 1.42 23.34 35.86 2014-15 45.85 200.22 122.90 699.00 566.85 1.74 24.33 36.06 2015-16 57.75 203.29 123.29 699.00 593.42 1.99 24.74 36.16 2016-17 64.85 206.13 124.12 699.00 604.81 2.14 25.74 38.06 2017-18 50.86 215.80 127.34 699.00 621.24 2.24 26.39 40.67 2018-19 57.29 268.31 154.69 699.00 566.61 2.42 36.35 46.66
Base Year 2015-16=100 2019-20 81.24 306.67 146.50 899.00 668.45 2.51 45.13 44.66 2020-21 83.42 359.53 165.77 1013.60 716.92 3.11 53.78 47.04 July-April
2020-21 83.41 355.22 164.46 980.12 713.54 3.06 52.85 46.52 2021-22 83.85 391.72 180.42 1242.01 778.17 3.53 70.46 53.59
(Contd.) Note: In the new base year 2015-16, dissemination of prices started w.e.f July, 2019. *Prices of Gents Sandal Bata has been quoted in base year 2015-16 instead of prices of Shoes Gents Concord Bata in previous
base year.
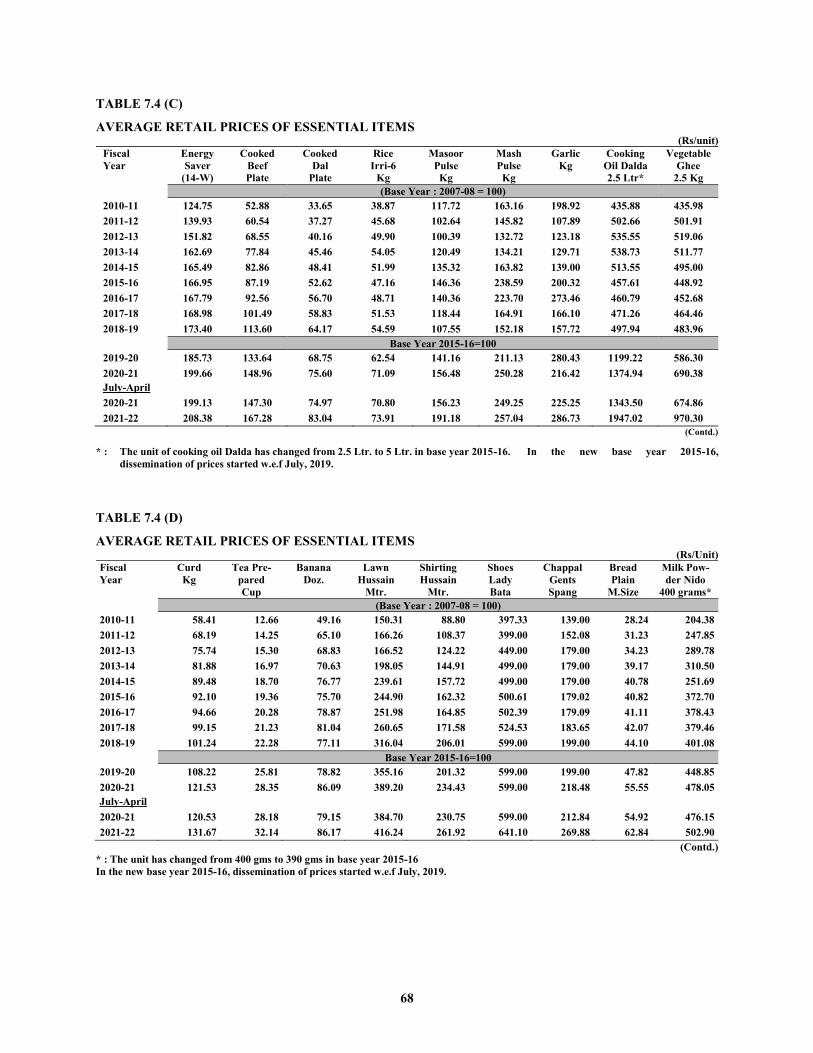
68
TABLE 7.4 (C)
AVERAGE RETAIL PRICES OF ESSENTIAL ITEMS (Rs/unit)
Fiscal Year
Energy Saver
(14-W)
Cooked Beef Plate
Cooked Dal
Plate
Rice Irri-6
Kg
Masoor Pulse Kg
Mash Pulse
Kg
Garlic Kg
Cooking Oil Dalda 2.5 Ltr*
Vegetable Ghee
2.5 Kg (Base Year : 2007-08 = 100)
2010-11 124.75 52.88 33.65 38.87 117.72 163.16 198.92 435.88 435.98 2011-12 139.93 60.54 37.27 45.68 102.64 145.82 107.89 502.66 501.91 2012-13 151.82 68.55 40.16 49.90 100.39 132.72 123.18 535.55 519.06 2013-14 162.69 77.84 45.46 54.05 120.49 134.21 129.71 538.73 511.77 2014-15 165.49 82.86 48.41 51.99 135.32 163.82 139.00 513.55 495.00 2015-16 166.95 87.19 52.62 47.16 146.36 238.59 200.32 457.61 448.92 2016-17 167.79 92.56 56.70 48.71 140.36 223.70 273.46 460.79 452.68 2017-18 168.98 101.49 58.83 51.53 118.44 164.91 166.10 471.26 464.46 2018-19 173.40 113.60 64.17 54.59 107.55 152.18 157.72 497.94 483.96
Base Year 2015-16=100 2019-20 185.73 133.64 68.75 62.54 141.16 211.13 280.43 1199.22 586.30 2020-21 199.66 148.96 75.60 71.09 156.48 250.28 216.42 1374.94 690.38 July-April
2020-21 199.13 147.30 74.97 70.80 156.23 249.25 225.25 1343.50 674.86 2021-22 208.38 167.28 83.04 73.91 191.18 257.04 286.73 1947.02 970.30
(Contd.)
* : The unit of cooking oil Dalda has changed from 2.5 Ltr. to 5 Ltr. in base year 2015-16. In the new base year 2015-16, dissemination of prices started w.e.f July, 2019.
TABLE 7.4 (D)
AVERAGE RETAIL PRICES OF ESSENTIAL ITEMS (Rs/Unit)
Fiscal Year
Curd Kg
Tea Pre- pared Cup
Banana Doz.
Lawn Hussain
Mtr.
Shirting Hussain
Mtr.
Shoes Lady Bata
Chappal Gents Spang
Bread Plain
M.Size
Milk Pow- der Nido
400 grams* (Base Year : 2007-08 = 100)
2010-11 58.41 12.66 49.16 150.31 88.80 397.33 139.00 28.24 204.38 2011-12 68.19 14.25 65.10 166.26 108.37 399.00 152.08 31.23 247.85 2012-13 75.74 15.30 68.83 166.52 124.22 449.00 179.00 34.23 289.78 2013-14 81.88 16.97 70.63 198.05 144.91 499.00 179.00 39.17 310.50 2014-15 89.48 18.70 76.77 239.61 157.72 499.00 179.00 40.78 251.69 2015-16 92.10 19.36 75.70 244.90 162.32 500.61 179.02 40.82 372.70 2016-17 94.66 20.28 78.87 251.98 164.85 502.39 179.09 41.11 378.43 2017-18 99.15 21.23 81.04 260.65 171.58 524.53 183.65 42.07 379.46 2018-19 101.24 22.28 77.11 316.04 206.01 599.00 199.00 44.10 401.08
Base Year 2015-16=100 2019-20 108.22 25.81 78.82 355.16 201.32 599.00 199.00 47.82 448.85 2020-21 121.53 28.35 86.09 389.20 234.43 599.00 218.48 55.55 478.05 July-April
2020-21 120.53 28.18 79.15 384.70 230.75 599.00 212.84 54.92 476.15 2021-22 131.67 32.14 86.17 416.24 261.92 641.10 269.88 62.84 502.90
(Contd.) * : The unit has changed from 400 gms to 390 gms in base year 2015-16 In the new base year 2015-16, dissemination of prices started w.e.f July, 2019.

69
TABLE 7.4 (E)
AVERAGE RETAIL PRICES OF ESSENTIAL ITEMS (Average of 17 Centers) Fiscal Year
Kerosene (per ltr.)
Gas Charges (100 cf)
Elect Charges
(upto 50 units)
Petrol Super
(per ltr.)
Tele Local Call Charges
(per Call) (Base Year : 2007-08 = 100)
2010-11 84.89 110.20 1.84 75.70 3.59 2011-12 104.84 132.73 1.89 92.93 3.59 2012-13 116.07 119.58 2.00 101.26 3.74 2013-14 123.45 124.18 2.00 110.99 3.94 2014-15 100.94 124.18 2.00 88.58 3.94 2015-16 80.62 127.79 2.00 72.31 3.94 2016-17 77.48 128.66 2.00 69.09 3.94 2017-18 98.74 128.70 2.00 80.70 3.94 2018-19 119.97 140.99 2.00 97.00 4.47
Base Year 2015-16=100 2019-20 - 141.57 3.90 106.49 1.55 2020-21 - 141.57 4.63 107.12 1.60 July-April
2020-21 - 141.57 4.39 106.53 1.56 2021-22 - 141.57 6.53 137.53 1.79
-: Not available Source: Pakistan Bureau of Statistics In the new base year 2015-16, prices are disseminated w.e.f July, 2019.
TABLE 7.5
INDICES OF WHOLESALE PRICES OF SELECTED COMMODITIES Fiscal Year
Wheat Rice Gram (Whole)
Sugar Refined
Vegetab- le Ghee
Tea Meat Vegeta- bles
Fresh Milk
Cotton Motor Spirit
(Base Year : 2007-08 = 100) 2010-11 159.53 123.39 169.24 251.13 118.21 165.31 174.86 173.43 157.40 171.48 126.84 2011-12 163.44 149.45 - 229.24 141.37 192.23 214.40 211.52 190.29 189.55 155.00 2012-13 188.52 165.42 - 201.93 141.75 203.24 228.80 216.66 213.81 168.92 168.70 2013-14 227.13 177.67 - 206.98 141.51 215.49 238.93 254.41 225.98 185.58 184.99 2014-15 209.29 172.20 - 189.35 147.13 145.16 236.14 255.40 249.87 208.86 167.79 2015-16 209.07 147.58 - 237.16 119.85 242.82 267.79 258.45 255.23 249.16 120.71 2016-17 208.21 154.49 - 242.70 124.63 243.24 282.23 280.77 266.08 268.07 115.52 2017-18 202.02 172.15 - 201.60 127.22 261.70 311.25 294.16 275.05 262.92 134.99 2018-19 211.14 191.38 - 226.24 135.10 285.16 348.60 293.46 287.20 269.50 164.47
(Base Year 2015-16=100) 2019-20 119.09 145.34 - 123.16 138.46 126.36 139.45 178.87 116.22 127.20* 150.35 2020-21 158.62 166.97 - 150.78 167.12 129.72 162.32 161.91 141.12 138.85* 148.00 July-April
2020-21 159.92 165.39 - 149.19 162.54 129.68 159.73 115.03 140.64 138.32* 147.57 2021-22 171.53 179.12 - 155.99 246.91 140.37 189.42 196.26 146.76 144.20* 194.62
-: Not available (Contd.)
*: In the base year 2015-16 prices of Cotton Seeds has been quoted instead of Cotton prices.
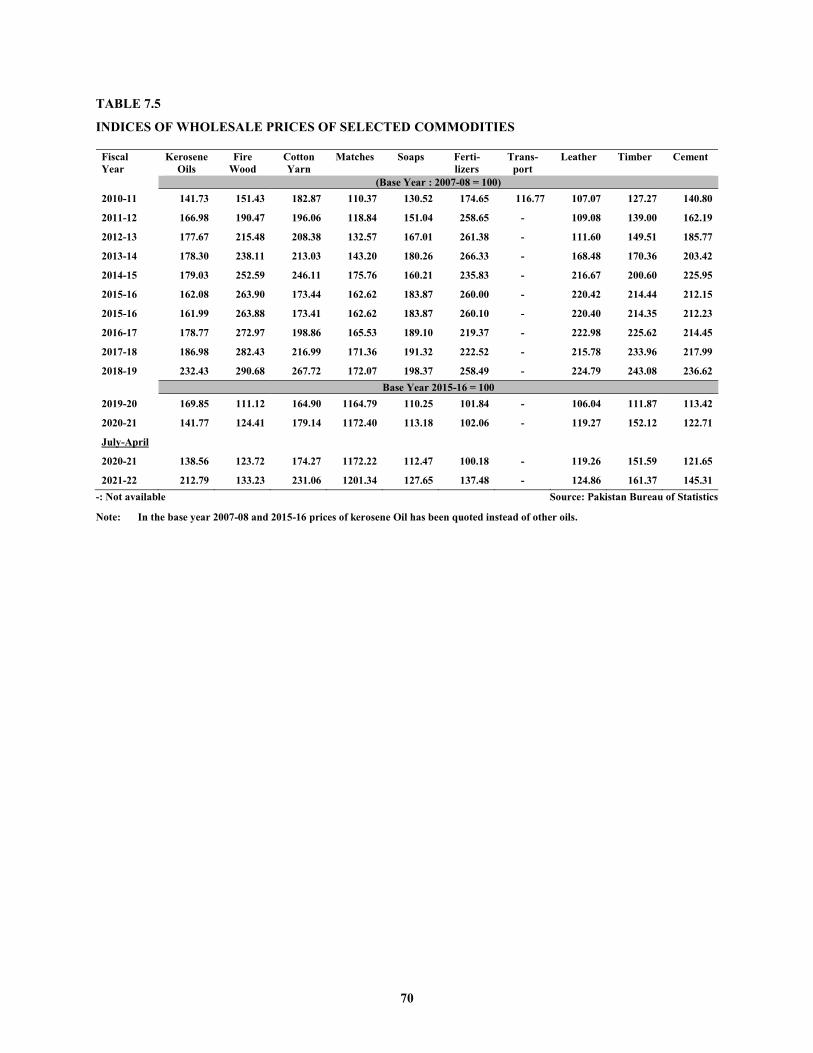
70
TABLE 7.5
INDICES OF WHOLESALE PRICES OF SELECTED COMMODITIES
Fiscal Year
Kerosene Oils
Fire Wood
Cotton Yarn
Matches
Soaps
Ferti- lizers
Trans- port
Leather
Timber
Cement
(Base Year : 2007-08 = 100) 2010-11 141.73 151.43 182.87 110.37 130.52 174.65 116.77 107.07 127.27 140.80
2011-12 166.98 190.47 196.06 118.84 151.04 258.65 - 109.08 139.00 162.19
2012-13 177.67 215.48 208.38 132.57 167.01 261.38 - 111.60 149.51 185.77
2013-14 178.30 238.11 213.03 143.20 180.26 266.33 - 168.48 170.36 203.42
2014-15 179.03 252.59 246.11 175.76 160.21 235.83 - 216.67 200.60 225.95
2015-16 162.08 263.90 173.44 162.62 183.87 260.00 - 220.42 214.44 212.15
2015-16 161.99 263.88 173.41 162.62 183.87 260.10 - 220.40 214.35 212.23
2016-17 178.77 272.97 198.86 165.53 189.10 219.37 - 222.98 225.62 214.45
2017-18 186.98 282.43 216.99 171.36 191.32 222.52 - 215.78 233.96 217.99
2018-19 232.43 290.68 267.72 172.07 198.37 258.49 - 224.79 243.08 236.62 Base Year 2015-16 = 100
2019-20 169.85 111.12 164.90 1164.79 110.25 101.84 - 106.04 111.87 113.42
2020-21 141.77 124.41 179.14 1172.40 113.18 102.06 - 119.27 152.12 122.71
July-April
2020-21 138.56 123.72 174.27 1172.22 112.47 100.18 - 119.26 151.59 121.65
2021-22 212.79 133.23 231.06 1201.34 127.65 137.48 - 124.86 161.37 145.31 -: Not available Source: Pakistan Bureau of Statistics
Note: In the base year 2007-08 and 2015-16 prices of kerosene Oil has been quoted instead of other oils.

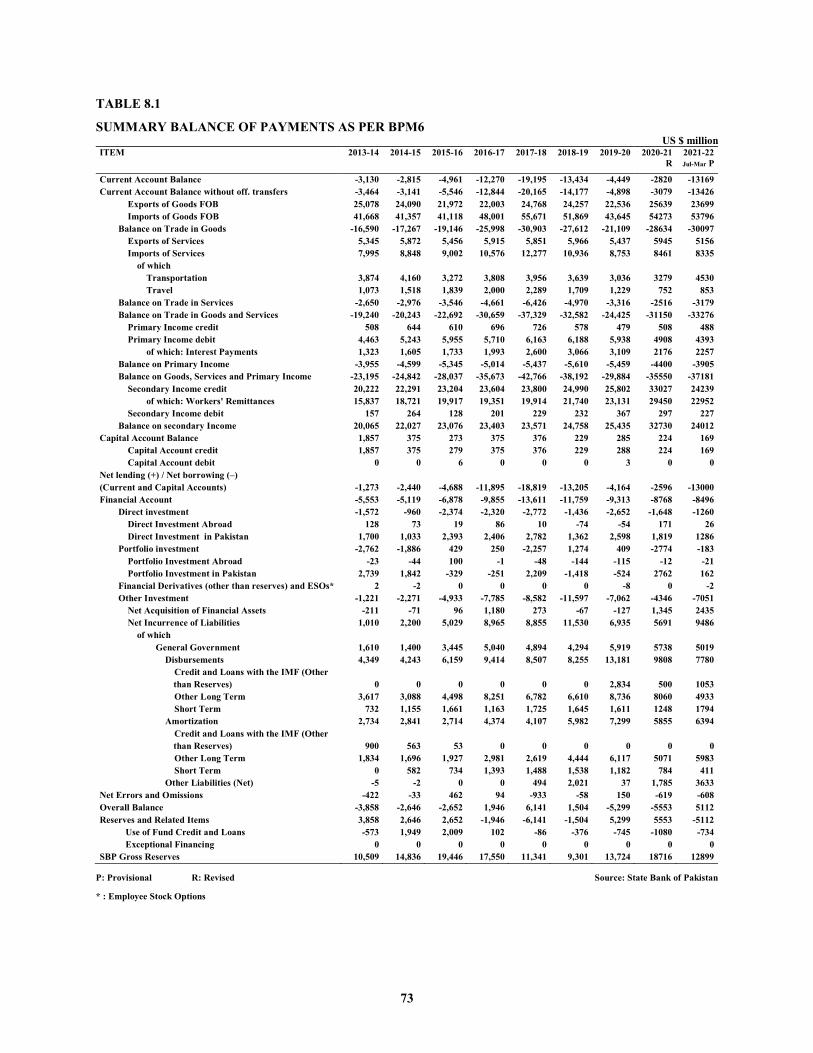
73
TABLE 8.1
SUMMARY BALANCE OF PAYMENTS AS PER BPM6 US $ million
ITEM 2013-14 2014-15 2015-16 2016-17 2017-18 2018-19 2019-20 2020-21 R
2021-22 Jul-Mar P
Current Account Balance -3,130 -2,815 -4,961 -12,270 -19,195 -13,434 -4,449 -2820 -13169 Current Account Balance without off. transfers -3,464 -3,141 -5,546 -12,844 -20,165 -14,177 -4,898 -3079 -13426
Exports of Goods FOB 25,078 24,090 21,972 22,003 24,768 24,257 22,536 25639 23699 Imports of Goods FOB 41,668 41,357 41,118 48,001 55,671 51,869 43,645 54273 53796
Balance on Trade in Goods -16,590 -17,267 -19,146 -25,998 -30,903 -27,612 -21,109 -28634 -30097 Exports of Services 5,345 5,872 5,456 5,915 5,851 5,966 5,437 5945 5156 Imports of Services 7,995 8,848 9,002 10,576 12,277 10,936 8,753 8461 8335
of which
Transportation 3,874 4,160 3,272 3,808 3,956 3,639 3,036 3279 4530 Travel 1,073 1,518 1,839 2,000 2,289 1,709 1,229 752 853
Balance on Trade in Services -2,650 -2,976 -3,546 -4,661 -6,426 -4,970 -3,316 -2516 -3179 Balance on Trade in Goods and Services -19,240 -20,243 -22,692 -30,659 -37,329 -32,582 -24,425 -31150 -33276
Primary Income credit 508 644 610 696 726 578 479 508 488 Primary Income debit 4,463 5,243 5,955 5,710 6,163 6,188 5,938 4908 4393
of which: Interest Payments 1,323 1,605 1,733 1,993 2,600 3,066 3,109 2176 2257 Balance on Primary Income -3,955 -4,599 -5,345 -5,014 -5,437 -5,610 -5,459 -4400 -3905 Balance on Goods, Services and Primary Income -23,195 -24,842 -28,037 -35,673 -42,766 -38,192 -29,884 -35550 -37181
Secondary Income credit 20,222 22,291 23,204 23,604 23,800 24,990 25,802 33027 24239 of which: Workers' Remittances 15,837 18,721 19,917 19,351 19,914 21,740 23,131 29450 22952
Secondary Income debit 157 264 128 201 229 232 367 297 227 Balance on secondary Income 20,065 22,027 23,076 23,403 23,571 24,758 25,435 32730 24012
Capital Account Balance 1,857 375 273 375 376 229 285 224 169 Capital Account credit 1,857 375 279 375 376 229 288 224 169 Capital Account debit 0 0 6 0 0 0 3 0 0
Net lending (+) / Net borrowing (–) (Current and Capital Accounts) -1,273 -2,440 -4,688 -11,895 -18,819 -13,205 -4,164 -2596
-13000
Financial Account -5,553 -5,119 -6,878 -9,855 -13,611 -11,759 -9,313 -8768 -8496 Direct investment -1,572 -960 -2,374 -2,320 -2,772 -1,436 -2,652 -1,648 -1260
Direct Investment Abroad 128 73 19 86 10 -74 -54 171 26 Direct Investment in Pakistan 1,700 1,033 2,393 2,406 2,782 1,362 2,598 1,819 1286
Portfolio investment -2,762 -1,886 429 250 -2,257 1,274 409 -2774 -183 Portfolio Investment Abroad -23 -44 100 -1 -48 -144 -115 -12 -21 Portfolio Investment in Pakistan 2,739 1,842 -329 -251 2,209 -1,418 -524 2762 162
Financial Derivatives (other than reserves) and ESOs* 2 -2 0 0 0 0 -8 0 -2 Other Investment -1,221 -2,271 -4,933 -7,785 -8,582 -11,597 -7,062 -4346 -7051
Net Acquisition of Financial Assets -211 -71 96 1,180 273 -67 -127 1,345 2435 Net Incurrence of Liabilities 1,010 2,200 5,029 8,965 8,855 11,530 6,935 5691 9486
of which
General Government 1,610 1,400 3,445 5,040 4,894 4,294 5,919 5738 5019 Disbursements 4,349 4,243 6,159 9,414 8,507 8,255 13,181 9808 7780
Credit and Loans with the IMF (Other than Reserves) 0 0 0 0 0 0 2,834 500
1053
Other Long Term 3,617 3,088 4,498 8,251 6,782 6,610 8,736 8060 4933 Short Term 732 1,155 1,661 1,163 1,725 1,645 1,611 1248 1794
Amortization 2,734 2,841 2,714 4,374 4,107 5,982 7,299 5855 6394 Credit and Loans with the IMF (Other than Reserves) 900 563 53 0 0 0 0 0
0
Other Long Term 1,834 1,696 1,927 2,981 2,619 4,444 6,117 5071 5983 Short Term 0 582 734 1,393 1,488 1,538 1,182 784 411
Other Liabilities (Net) -5 -2 0 0 494 2,021 37 1,785 3633 Net Errors and Omissions -422 -33 462 94 -933 -58 150 -619 -608 Overall Balance -3,858 -2,646 -2,652 1,946 6,141 1,504 -5,299 -5553 5112 Reserves and Related Items 3,858 2,646 2,652 -1,946 -6,141 -1,504 5,299 5553 -5112
Use of Fund Credit and Loans -573 1,949 2,009 102 -86 -376 -745 -1080 -734 Exceptional Financing 0 0 0 0 0 0 0 0 0
SBP Gross Reserves 10,509 14,836 19,446 17,550 11,341 9,301 13,724 18716 12899
P: Provisional R: Revised Source: State Bank of Pakistan
* : Employee Stock Options
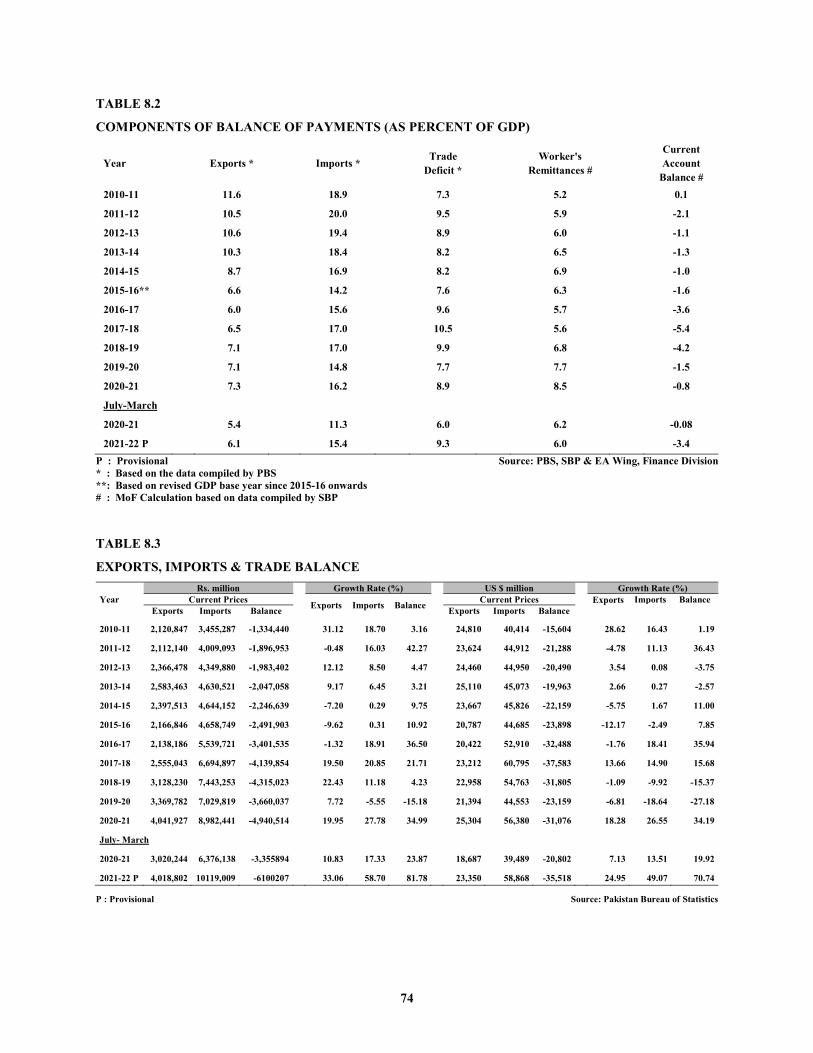
74
TABLE 8.2
COMPONENTS OF BALANCE OF PAYMENTS (AS PERCENT OF GDP)
Year Exports * Imports * Trade Deficit * Worker's
Remittances # Current Account
Balance # 2010-11 11.6 18.9 7.3 5.2 0.1
2011-12 10.5 20.0 9.5 5.9 -2.1
2012-13 10.6 19.4 8.9 6.0 -1.1
2013-14 10.3 18.4 8.2 6.5 -1.3
2014-15 8.7 16.9 8.2 6.9 -1.0
2015-16** 6.6 14.2 7.6 6.3 -1.6
2016-17 6.0 15.6 9.6 5.7 -3.6
2017-18 6.5 17.0 10.5 5.6 -5.4
2018-19 7.1 17.0 9.9 6.8 -4.2
2019-20 7.1 14.8 7.7 7.7 -1.5
2020-21 7.3 16.2 8.9 8.5 -0.8
July-March
2020-21 5.4 11.3 6.0 6.2 -0.08
2021-22 P 6.1 15.4 9.3 6.0 -3.4 P : Provisional Source: PBS, SBP & EA Wing, Finance Division * : Based on the data compiled by PBS **: Based on revised GDP base year since 2015-16 onwards # : MoF Calculation based on data compiled by SBP
TABLE 8.3
EXPORTS, IMPORTS & TRADE BALANCE
Year Rs. million
Growth Rate (%)
US $ million
Growth Rate (%)
Current Prices Exports Imports Balance Current Prices Exports
Imports Balance Exports Imports Balance Exports Imports Balance
2010-11 2,120,847 3,455,287 -1,334,440 31.12 18.70 3.16 24,810 40,414 -15,604 28.62 16.43 1.19
2011-12 2,112,140 4,009,093 -1,896,953 -0.48 16.03 42.27 23,624 44,912 -21,288 -4.78 11.13 36.43
2012-13 2,366,478 4,349,880 -1,983,402 12.12 8.50 4.47 24,460 44,950 -20,490 3.54 0.08 -3.75
2013-14 2,583,463 4,630,521 -2,047,058 9.17 6.45 3.21 25,110 45,073 -19,963 2.66 0.27 -2.57
2014-15 2,397,513 4,644,152 -2,246,639 -7.20 0.29 9.75 23,667 45,826 -22,159 -5.75 1.67 11.00
2015-16 2,166,846 4,658,749 -2,491,903 -9.62 0.31 10.92 20,787 44,685 -23,898 -12.17 -2.49 7.85
2016-17 2,138,186 5,539,721 -3,401,535 -1.32 18.91 36.50 20,422 52,910 -32,488 -1.76 18.41 35.94
2017-18 2,555,043 6,694,897 -4,139,854 19.50 20.85 21.71 23,212 60,795 -37,583 13.66 14.90 15.68
2018-19 3,128,230 7,443,253 -4,315,023 22.43 11.18 4.23 22,958 54,763 -31,805 -1.09 -9.92 -15.37
2019-20 3,369,782 7,029,819 -3,660,037 7.72 -5.55 -15.18 21,394 44,553 -23,159 -6.81 -18.64 -27.18
2020-21 4,041,927 8,982,441 -4,940,514 19.95 27.78 34.99 25,304 56,380 -31,076 18.28 26.55 34.19
July- March
2020-21 3,020,244 6,376,138 -3,355894 10.83 17.33 23.87 18,687 39,489 -20,802 7.13 13.51 19.92
2021-22 P 4,018,802 10119,009 -6100207 33.06 58.70 81.78 23,350 58,868 -35,518 24.95 49.07 70.74
P : Provisional Source: Pakistan Bureau of Statistics
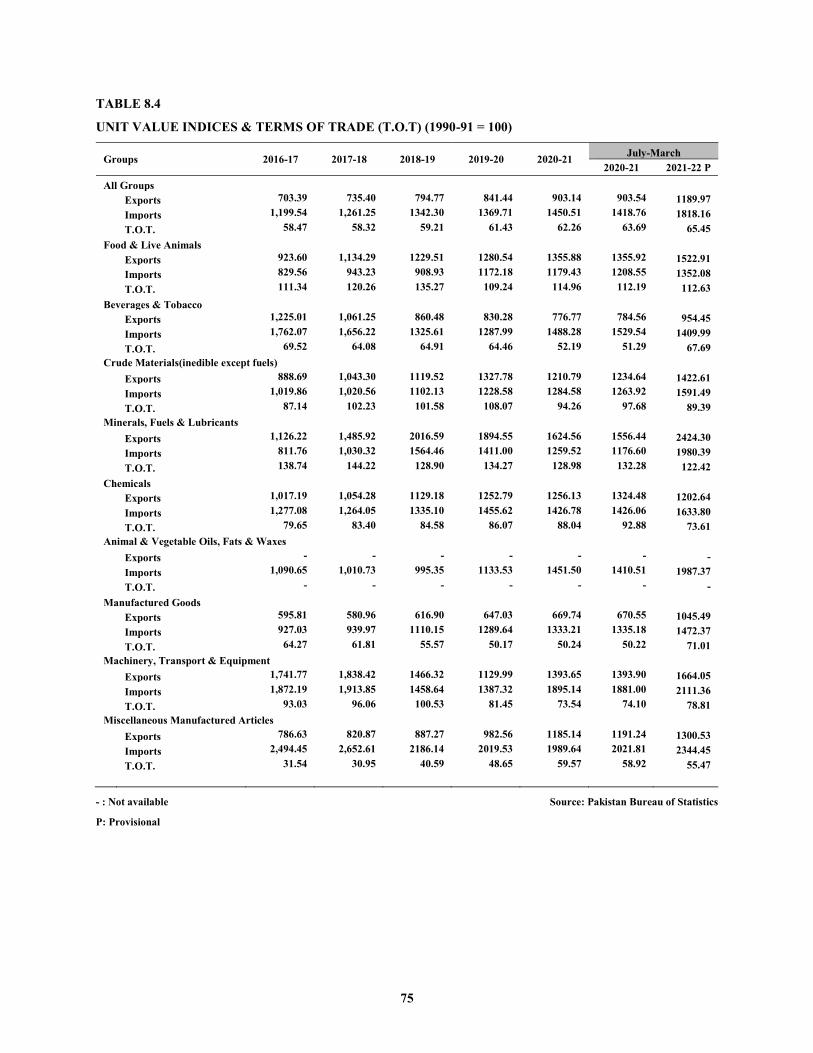
75
TABLE 8.4
UNIT VALUE INDICES & TERMS OF TRADE (T.O.T) (1990-91 = 100)
Groups 2016-17 2017-18 2018-19 2019-20 2020-21 July-March 2020-21 2021-22 P
All Groups Exports 703.39 735.40 794.77 841.44 903.14 903.54 1189.97
Imports 1,199.54 1,261.25 1342.30 1369.71 1450.51 1418.76 1818.16
T.O.T. 58.47 58.32 59.21 61.43 62.26 63.69 65.45 Food & Live Animals
Exports 923.60 1,134.29 1229.51 1280.54 1355.88 1355.92 1522.91
Imports 829.56 943.23 908.93 1172.18 1179.43 1208.55 1352.08
T.O.T. 111.34 120.26 135.27 109.24 114.96 112.19 112.63 Beverages & Tobacco
Exports 1,225.01 1,061.25 860.48 830.28 776.77 784.56 954.45
Imports 1,762.07 1,656.22 1325.61 1287.99 1488.28 1529.54 1409.99
T.O.T. 69.52 64.08 64.91 64.46 52.19 51.29 67.69 Crude Materials(inedible except fuels)
Exports 888.69 1,043.30 1119.52 1327.78 1210.79 1234.64 1422.61
Imports 1,019.86 1,020.56 1102.13 1228.58 1284.58 1263.92 1591.49
T.O.T. 87.14 102.23 101.58 108.07 94.26 97.68 89.39 Minerals, Fuels & Lubricants
Exports 1,126.22 1,485.92 2016.59 1894.55 1624.56 1556.44 2424.30
Imports 811.76 1,030.32 1564.46 1411.00 1259.52 1176.60 1980.39
T.O.T. 138.74 144.22 128.90 134.27 128.98 132.28 122.42 Chemicals
Exports 1,017.19 1,054.28 1129.18 1252.79 1256.13 1324.48 1202.64
Imports 1,277.08 1,264.05 1335.10 1455.62 1426.78 1426.06 1633.80
T.O.T. 79.65 83.40 84.58 86.07 88.04 92.88 73.61 Animal & Vegetable Oils, Fats & Waxes
Exports - - - - - - -
Imports 1,090.65 1,010.73 995.35 1133.53 1451.50 1410.51 1987.37
T.O.T. - - - - - - - Manufactured Goods
Exports 595.81 580.96 616.90 647.03 669.74 670.55 1045.49
Imports 927.03 939.97 1110.15 1289.64 1333.21 1335.18 1472.37
T.O.T. 64.27 61.81 55.57 50.17 50.24 50.22 71.01 Machinery, Transport & Equipment
Exports 1,741.77 1,838.42 1466.32 1129.99 1393.65 1393.90 1664.05
Imports 1,872.19 1,913.85 1458.64 1387.32 1895.14 1881.00 2111.36
T.O.T. 93.03 96.06 100.53 81.45 73.54 74.10 78.81 Miscellaneous Manufactured Articles
Exports 786.63 820.87 887.27 982.56 1185.14 1191.24 1300.53
Imports 2,494.45 2,652.61 2186.14 2019.53 1989.64 2021.81 2344.45
T.O.T. 31.54 30.95 40.59 48.65 59.57 58.92 55.47
- : Not available Source: Pakistan Bureau of Statistics
P: Provisional
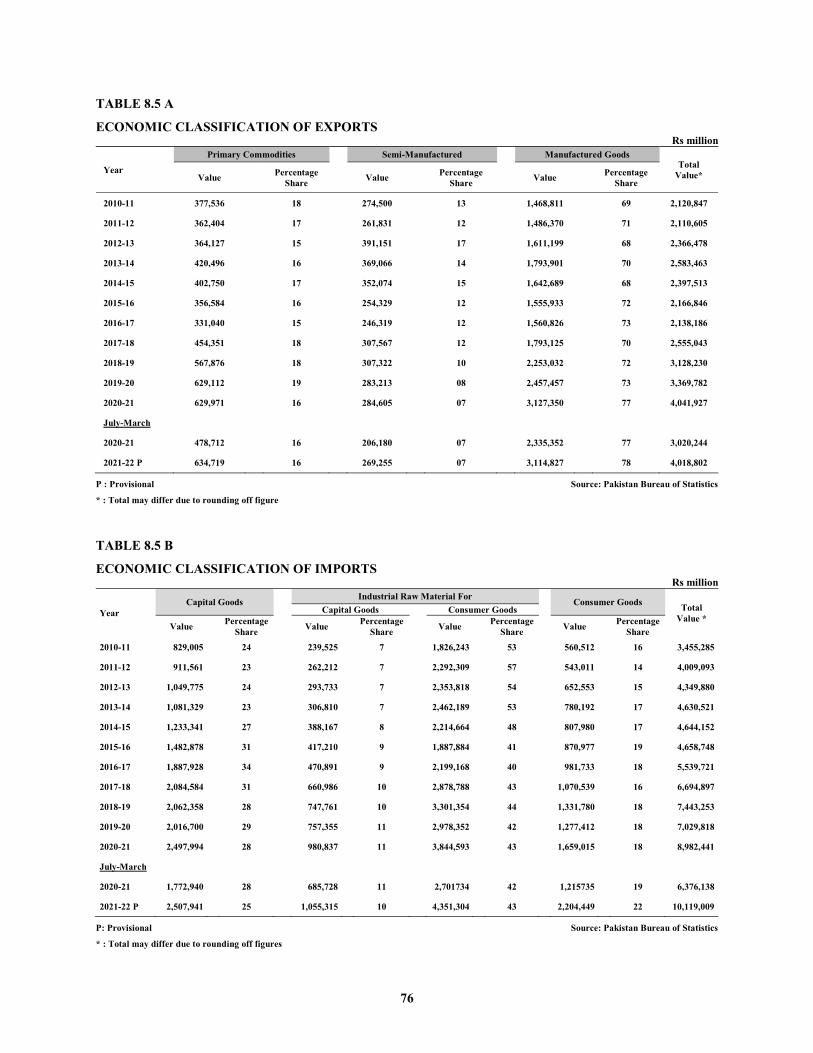
76
TABLE 8.5 A
ECONOMIC CLASSIFICATION OF EXPORTS Rs million
Year
Primary Commodities
Semi-Manufactured
Manufactured Goods Total
Value* Value Percentage Share Value Percentage
Share Value Percentage Share
2010-11 377,536 18 274,500 13 1,468,811 69 2,120,847
2011-12 362,404 17 261,831 12 1,486,370 71 2,110,605
2012-13 364,127 15 391,151 17 1,611,199 68 2,366,478
2013-14 420,496 16 369,066 14 1,793,901 70 2,583,463
2014-15 402,750 17 352,074 15 1,642,689 68 2,397,513
2015-16 356,584 16 254,329 12 1,555,933 72 2,166,846
2016-17 331,040 15 246,319 12 1,560,826 73 2,138,186
2017-18 454,351 18 307,567 12 1,793,125 70 2,555,043
2018-19 567,876 18 307,322 10 2,253,032 72 3,128,230
2019-20 629,112 19 283,213 08 2,457,457 73 3,369,782
2020-21 629,971 16 284,605 07 3,127,350 77 4,041,927
July-March
2020-21 478,712 16 206,180 07 2,335,352 77 3,020,244
2021-22 P 634,719 16 269,255 07 3,114,827 78 4,018,802
P : Provisional Source: Pakistan Bureau of Statistics
* : Total may differ due to rounding off figure
TABLE 8.5 B
ECONOMIC CLASSIFICATION OF IMPORTS Rs million
Year Capital Goods
Industrial Raw Material For
Consumer Goods Total Value *
Capital Goods
Consumer Goods
Value Percentage Share Value Percentage
Share Value Percentage Share Value Percentage
Share
2010-11 829,005 24 239,525 7 1,826,243 53 560,512 16 3,455,285
2011-12 911,561 23 262,212 7 2,292,309 57 543,011 14 4,009,093
2012-13 1,049,775 24 293,733 7 2,353,818 54 652,553 15 4,349,880
2013-14 1,081,329 23 306,810 7 2,462,189 53 780,192 17 4,630,521
2014-15 1,233,341 27 388,167 8 2,214,664 48 807,980 17 4,644,152
2015-16 1,482,878 31 417,210 9 1,887,884 41 870,977 19 4,658,748
2016-17 1,887,928 34 470,891 9 2,199,168 40 981,733 18 5,539,721
2017-18 2,084,584 31 660,986 10 2,878,788 43 1,070,539 16 6,694,897
2018-19 2,062,358 28 747,761 10 3,301,354 44 1,331,780 18 7,443,253
2019-20 2,016,700 29 757,355 11 2,978,352 42 1,277,412 18 7,029,818
2020-21 2,497,994 28 980,837 11 3,844,593 43 1,659,015 18 8,982,441
July-March
2020-21 1,772,940 28 685,728 11 2,701734 42 1,215735 19 6,376,138
2021-22 P 2,507,941 25 1,055,315 10 4,351,304 43 2,204,449 22 10,119,009
P: Provisional Source: Pakistan Bureau of Statistics
* : Total may differ due to rounding off figures
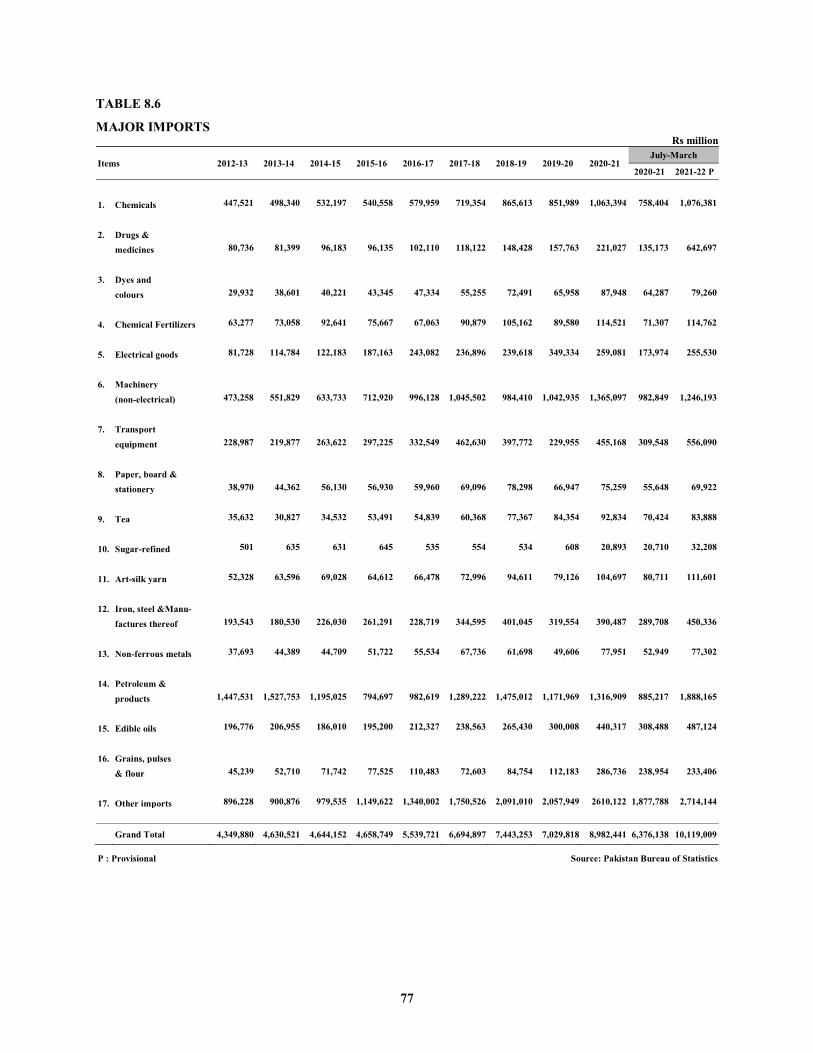
77
TABLE 8.6
MAJOR IMPORTS Rs million
Items 2012-13 2013-14 2014-15 2015-16 2016-17 2017-18 2018-19 2019-20 2020-21 July-March
2020-21 2021-22 P
1. Chemicals 447,521 498,340 532,197 540,558 579,959 719,354 865,613 851,989 1,063,394 758,404 1,076,381
2. Drugs &
medicines 80,736 81,399 96,183 96,135 102,110 118,122 148,428 157,763 221,027 135,173 642,697
3. Dyes and
colours 29,932 38,601 40,221 43,345 47,334 55,255 72,491 65,958 87,948 64,287 79,260
4. Chemical Fertilizers 63,277 73,058 92,641 75,667 67,063 90,879 105,162 89,580 114,521 71,307 114,762
5. Electrical goods 81,728 114,784 122,183 187,163 243,082 236,896 239,618 349,334 259,081 173,974 255,530
6. Machinery
(non-electrical) 473,258 551,829 633,733 712,920 996,128 1,045,502 984,410 1,042,935 1,365,097 982,849 1,246,193
7. Transport
equipment 228,987 219,877 263,622 297,225 332,549 462,630 397,772 229,955 455,168 309,548 556,090
8. Paper, board &
stationery 38,970 44,362 56,130 56,930 59,960 69,096 78,298 66,947 75,259 55,648 69,922
9. Tea 35,632 30,827 34,532 53,491 54,839 60,368 77,367 84,354 92,834 70,424 83,888
10. Sugar-refined 501 635 631 645 535 554 534 608 20,893 20,710 32,208
11. Art-silk yarn 52,328 63,596 69,028 64,612 66,478 72,996 94,611 79,126 104,697 80,711 111,601
12. Iron, steel &Manu-
factures thereof 193,543 180,530 226,030 261,291 228,719 344,595 401,045 319,554 390,487 289,708 450,336
13. Non-ferrous metals 37,693 44,389 44,709 51,722 55,534 67,736 61,698 49,606 77,951 52,949 77,302
14. Petroleum &
products 1,447,531 1,527,753 1,195,025 794,697 982,619 1,289,222 1,475,012 1,171,969 1,316,909 885,217 1,888,165
15. Edible oils 196,776 206,955 186,010 195,200 212,327 238,563 265,430 300,008 440,317 308,488 487,124
16. Grains, pulses
& flour 45,239 52,710 71,742 77,525 110,483 72,603 84,754 112,183 286,736 238,954 233,406
17. Other imports 896,228 900,876 979,535 1,149,622 1,340,002 1,750,526 2,091,010 2,057,949 2610,122 1,877,788 2,714,144
Grand Total 4,349,880 4,630,521 4,644,152 4,658,749 5,539,721 6,694,897 7,443,253 7,029,818 8,982,441 6,376,138 10,119,009
P : Provisional Source: Pakistan Bureau of Statistics
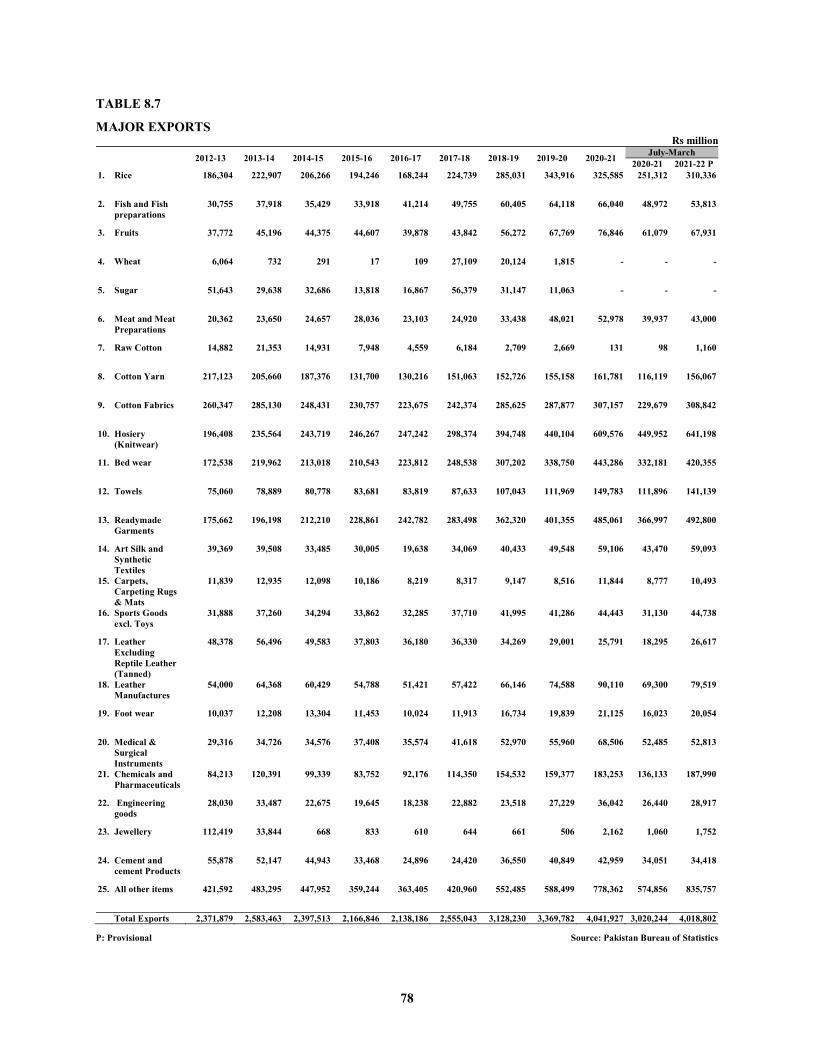
78
TABLE 8.7
MAJOR EXPORTS Rs million
2012-13 2013-14 2014-15 2015-16 2016-17 2017-18 2018-19 2019-20 2020-21 July-March 2020-21 2021-22 P
1. Rice 186,304 222,907 206,266 194,246 168,244 224,739 285,031 343,916 325,585 251,312 310,336
2. Fish and Fish preparations
30,755 37,918 35,429 33,918 41,214 49,755 60,405 64,118 66,040 48,972 53,813
3. Fruits 37,772 45,196 44,375 44,607 39,878 43,842 56,272 67,769 76,846 61,079 67,931
4. Wheat 6,064 732 291 17 109 27,109 20,124 1,815 - - -
5. Sugar 51,643 29,638 32,686 13,818 16,867 56,379 31,147 11,063 - - -
6. Meat and Meat Preparations
20,362 23,650 24,657 28,036 23,103 24,920 33,438 48,021 52,978 39,937 43,000
7. Raw Cotton 14,882 21,353 14,931 7,948 4,559 6,184 2,709 2,669 131 98 1,160
8. Cotton Yarn 217,123 205,660 187,376 131,700 130,216 151,063 152,726 155,158 161,781 116,119 156,067
9. Cotton Fabrics 260,347 285,130 248,431 230,757 223,675 242,374 285,625 287,877 307,157 229,679 308,842
10. Hosiery (Knitwear)
196,408 235,564 243,719 246,267 247,242 298,374 394,748 440,104 609,576 449,952 641,198
11. Bed wear 172,538 219,962 213,018 210,543 223,812 248,538 307,202 338,750 443,286 332,181 420,355
12. Towels 75,060 78,889 80,778 83,681 83,819 87,633 107,043 111,969 149,783 111,896 141,139
13. Readymade Garments
175,662 196,198 212,210 228,861 242,782 283,498 362,320 401,355 485,061 366,997 492,800
14. Art Silk and Synthetic Textiles
39,369 39,508 33,485 30,005 19,638 34,069 40,433 49,548 59,106 43,470 59,093
15. Carpets, Carpeting Rugs & Mats
11,839 12,935 12,098 10,186 8,219 8,317 9,147 8,516 11,844 8,777 10,493
16. Sports Goods excl. Toys
31,888 37,260 34,294 33,862 32,285 37,710 41,995 41,286 44,443 31,130 44,738
17. Leather Excluding Reptile Leather (Tanned)
48,378 56,496 49,583 37,803 36,180 36,330 34,269 29,001 25,791 18,295 26,617
18. Leather Manufactures
54,000 64,368 60,429 54,788 51,421 57,422 66,146 74,588 90,110 69,300 79,519
19. Foot wear 10,037 12,208 13,304 11,453 10,024 11,913 16,734 19,839 21,125 16,023 20,054
20. Medical & Surgical Instruments
29,316 34,726 34,576 37,408 35,574 41,618 52,970 55,960 68,506 52,485 52,813
21. Chemicals and Pharmaceuticals
84,213 120,391 99,339 83,752 92,176 114,350 154,532 159,377 183,253 136,133 187,990
22. Engineering goods
28,030 33,487 22,675 19,645 18,238 22,882 23,518 27,229 36,042 26,440 28,917
23. Jewellery 112,419 33,844 668 833 610 644 661 506 2,162 1,060 1,752
24. Cement and cement Products
55,878 52,147 44,943 33,468 24,896 24,420 36,550 40,849 42,959 34,051 34,418
25. All other items 421,592 483,295 447,952 359,244 363,405 420,960 552,485 588,499 778,362 574,856 835,757
Total Exports 2,371,879 2,583,463 2,397,513 2,166,846 2,138,186 2,555,043 3,128,230 3,369,782 4,041,927 3,020,244 4,018,802
P: Provisional Source: Pakistan Bureau of Statistics
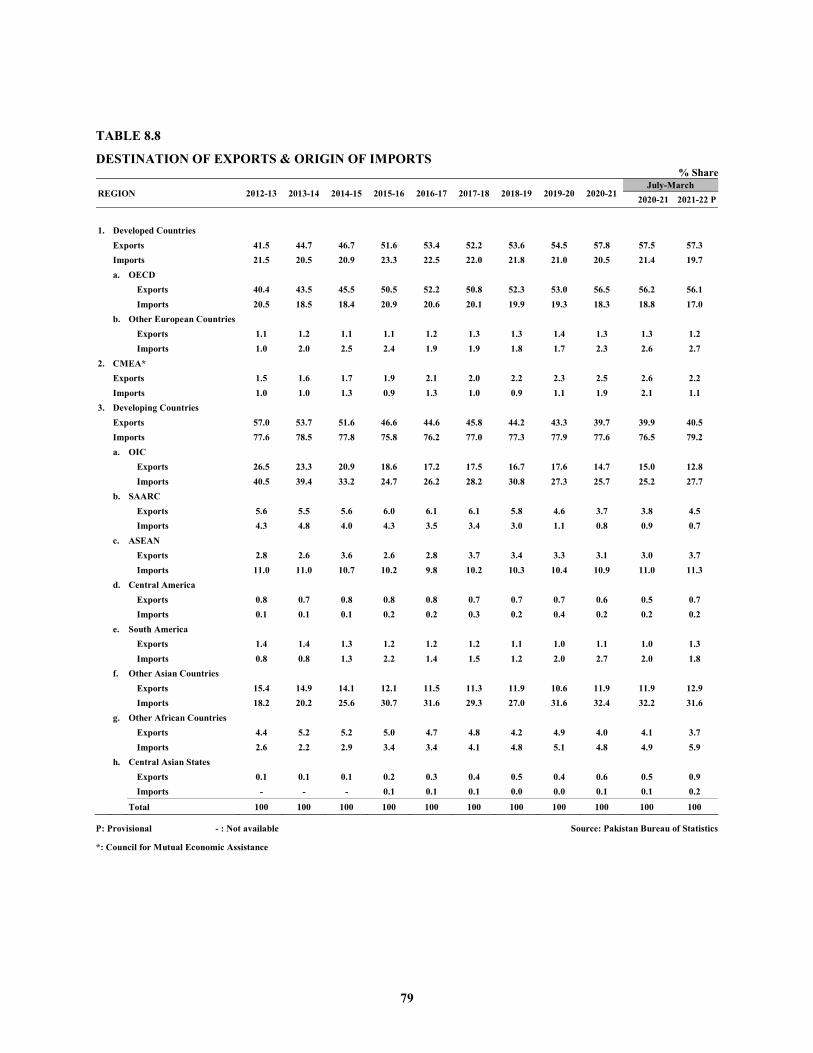
79
TABLE 8.8
DESTINATION OF EXPORTS & ORIGIN OF IMPORTS % Share
REGION 2012-13 2013-14 2014-15 2015-16 2016-17 2017-18 2018-19 2019-20 2020-21 July-March
2020-21 2021-22 P
1. Developed Countries
Exports 41.5 44.7 46.7 51.6 53.4 52.2 53.6 54.5 57.8 57.5 57.3 Imports 21.5 20.5 20.9 23.3 22.5 22.0 21.8 21.0 20.5 21.4 19.7 a. OECD
Exports 40.4 43.5 45.5 50.5 52.2 50.8 52.3 53.0 56.5 56.2 56.1 Imports 20.5 18.5 18.4 20.9 20.6 20.1 19.9 19.3 18.3 18.8 17.0 b. Other European Countries
Exports 1.1 1.2 1.1 1.1 1.2 1.3 1.3 1.4 1.3 1.3 1.2 Imports 1.0 2.0 2.5 2.4 1.9 1.9 1.8 1.7 2.3 2.6 2.7
2. CMEA*
Exports 1.5 1.6 1.7 1.9 2.1 2.0 2.2 2.3 2.5 2.6 2.2 Imports 1.0 1.0 1.3 0.9 1.3 1.0 0.9 1.1 1.9 2.1 1.1
3. Developing Countries
Exports 57.0 53.7 51.6 46.6 44.6 45.8 44.2 43.3 39.7 39.9 40.5 Imports 77.6 78.5 77.8 75.8 76.2 77.0 77.3 77.9 77.6 76.5 79.2 a. OIC
Exports 26.5 23.3 20.9 18.6 17.2 17.5 16.7 17.6 14.7 15.0 12.8 Imports 40.5 39.4 33.2 24.7 26.2 28.2 30.8 27.3 25.7 25.2 27.7 b. SAARC
Exports 5.6 5.5 5.6 6.0 6.1 6.1 5.8 4.6 3.7 3.8 4.5 Imports 4.3 4.8 4.0 4.3 3.5 3.4 3.0 1.1 0.8 0.9 0.7 c. ASEAN
Exports 2.8 2.6 3.6 2.6 2.8 3.7 3.4 3.3 3.1 3.0 3.7 Imports 11.0 11.0 10.7 10.2 9.8 10.2 10.3 10.4 10.9 11.0 11.3 d. Central America
Exports 0.8 0.7 0.8 0.8 0.8 0.7 0.7 0.7 0.6 0.5 0.7 Imports 0.1 0.1 0.1 0.2 0.2 0.3 0.2 0.4 0.2 0.2 0.2 e. South America
Exports 1.4 1.4 1.3 1.2 1.2 1.2 1.1 1.0 1.1 1.0 1.3 Imports 0.8 0.8 1.3 2.2 1.4 1.5 1.2 2.0 2.7 2.0 1.8 f. Other Asian Countries
Exports 15.4 14.9 14.1 12.1 11.5 11.3 11.9 10.6 11.9 11.9 12.9 Imports 18.2 20.2 25.6 30.7 31.6 29.3 27.0 31.6 32.4 32.2 31.6 g. Other African Countries
Exports 4.4 5.2 5.2 5.0 4.7 4.8 4.2 4.9 4.0 4.1 3.7 Imports 2.6 2.2 2.9 3.4 3.4 4.1 4.8 5.1 4.8 4.9 5.9 h. Central Asian States
Exports 0.1 0.1 0.1 0.2 0.3 0.4 0.5 0.4 0.6 0.5 0.9 Imports - - - 0.1 0.1 0.1 0.0 0.0 0.1 0.1 0.2
Total 100 100 100 100 100 100 100 100 100 100 100
P: Provisional - : Not available Source: Pakistan Bureau of Statistics
*: Council for Mutual Economic Assistance
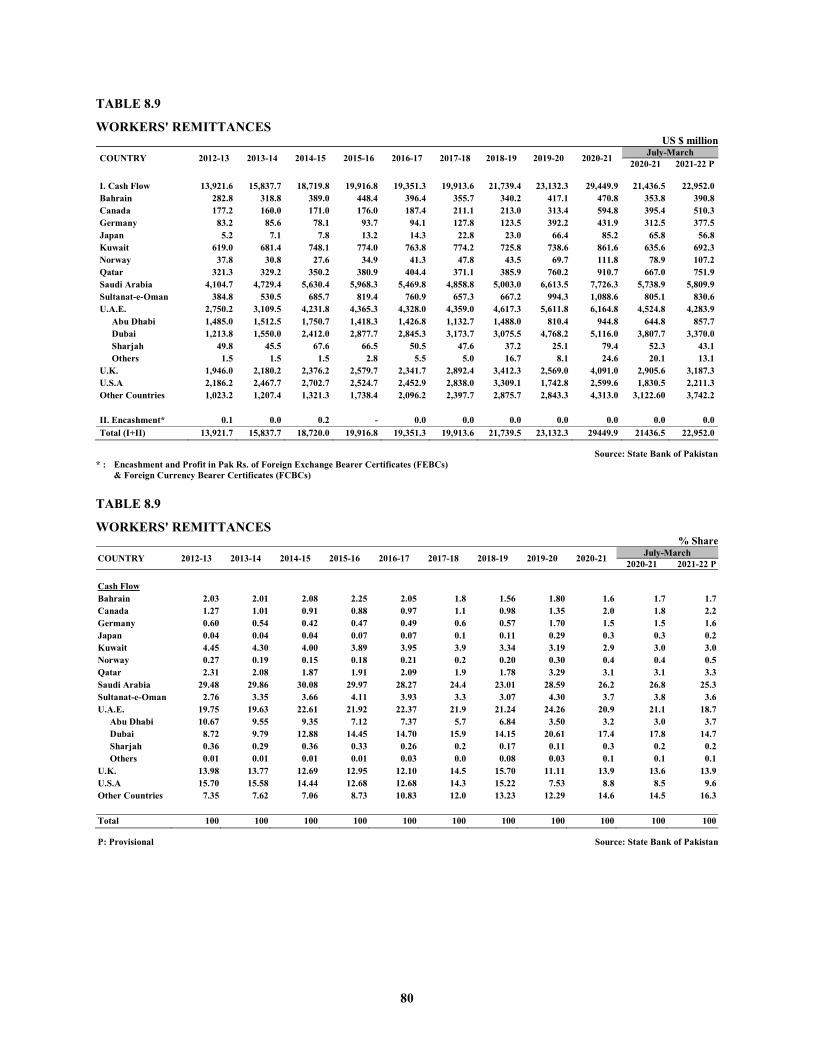
80
TABLE 8.9
WORKERS' REMITTANCES US $ million
COUNTRY 2012-13 2013-14 2014-15 2015-16 2016-17 2017-18 2018-19 2019-20 2020-21 July-March 2020-21 2021-22 P
I. Cash Flow 13,921.6 15,837.7 18,719.8 19,916.8 19,351.3 19,913.6 21,739.4 23,132.3 29,449.9 21,436.5 22,952.0 Bahrain 282.8 318.8 389.0 448.4 396.4 355.7 340.2 417.1 470.8 353.8 390.8 Canada 177.2 160.0 171.0 176.0 187.4 211.1 213.0 313.4 594.8 395.4 510.3 Germany 83.2 85.6 78.1 93.7 94.1 127.8 123.5 392.2 431.9 312.5 377.5 Japan 5.2 7.1 7.8 13.2 14.3 22.8 23.0 66.4 85.2 65.8 56.8 Kuwait 619.0 681.4 748.1 774.0 763.8 774.2 725.8 738.6 861.6 635.6 692.3 Norway 37.8 30.8 27.6 34.9 41.3 47.8 43.5 69.7 111.8 78.9 107.2 Qatar 321.3 329.2 350.2 380.9 404.4 371.1 385.9 760.2 910.7 667.0 751.9 Saudi Arabia 4,104.7 4,729.4 5,630.4 5,968.3 5,469.8 4,858.8 5,003.0 6,613.5 7,726.3 5,738.9 5,809.9 Sultanat-e-Oman 384.8 530.5 685.7 819.4 760.9 657.3 667.2 994.3 1,088.6 805.1 830.6 U.A.E. 2,750.2 3,109.5 4,231.8 4,365.3 4,328.0 4,359.0 4,617.3 5,611.8 6,164.8 4,524.8 4,283.9 Abu Dhabi 1,485.0 1,512.5 1,750.7 1,418.3 1,426.8 1,132.7 1,488.0 810.4 944.8 644.8 857.7 Dubai 1,213.8 1,550.0 2,412.0 2,877.7 2,845.3 3,173.7 3,075.5 4,768.2 5,116.0 3,807.7 3,370.0 Sharjah 49.8 45.5 67.6 66.5 50.5 47.6 37.2 25.1 79.4 52.3 43.1 Others 1.5 1.5 1.5 2.8 5.5 5.0 16.7 8.1 24.6 20.1 13.1 U.K. 1,946.0 2,180.2 2,376.2 2,579.7 2,341.7 2,892.4 3,412.3 2,569.0 4,091.0 2,905.6 3,187.3 U.S.A 2,186.2 2,467.7 2,702.7 2,524.7 2,452.9 2,838.0 3,309.1 1,742.8 2,599.6 1,830.5 2,211.3 Other Countries 1,023.2 1,207.4 1,321.3 1,738.4 2,096.2 2,397.7 2,875.7 2,843.3 4,313.0 3,122.60 3,742.2
II. Encashment* 0.1 0.0 0.2 - 0.0 0.0 0.0 0.0 0.0 0.0 0.0 Total (I+II) 13,921.7 15,837.7 18,720.0 19,916.8 19,351.3 19,913.6 21,739.5 23,132.3 29449.9 21436.5 22,952.0
Source: State Bank of Pakistan * : Encashment and Profit in Pak Rs. of Foreign Exchange Bearer Certificates (FEBCs) & Foreign Currency Bearer Certificates (FCBCs) TABLE 8.9
WORKERS' REMITTANCES % Share
COUNTRY 2012-13 2013-14 2014-15 2015-16 2016-17 2017-18 2018-19 2019-20 2020-21 July-March 2020-21 2021-22 P
Cash Flow
Bahrain 2.03 2.01 2.08 2.25 2.05 1.8 1.56 1.80 1.6 1.7 1.7 Canada 1.27 1.01 0.91 0.88 0.97 1.1 0.98 1.35 2.0 1.8 2.2 Germany 0.60 0.54 0.42 0.47 0.49 0.6 0.57 1.70 1.5 1.5 1.6 Japan 0.04 0.04 0.04 0.07 0.07 0.1 0.11 0.29 0.3 0.3 0.2 Kuwait 4.45 4.30 4.00 3.89 3.95 3.9 3.34 3.19 2.9 3.0 3.0 Norway 0.27 0.19 0.15 0.18 0.21 0.2 0.20 0.30 0.4 0.4 0.5 Qatar 2.31 2.08 1.87 1.91 2.09 1.9 1.78 3.29 3.1 3.1 3.3 Saudi Arabia 29.48 29.86 30.08 29.97 28.27 24.4 23.01 28.59 26.2 26.8 25.3 Sultanat-e-Oman 2.76 3.35 3.66 4.11 3.93 3.3 3.07 4.30 3.7 3.8 3.6 U.A.E. 19.75 19.63 22.61 21.92 22.37 21.9 21.24 24.26 20.9 21.1 18.7
Abu Dhabi 10.67 9.55 9.35 7.12 7.37 5.7 6.84 3.50 3.2 3.0 3.7 Dubai 8.72 9.79 12.88 14.45 14.70 15.9 14.15 20.61 17.4 17.8 14.7 Sharjah 0.36 0.29 0.36 0.33 0.26 0.2 0.17 0.11 0.3 0.2 0.2 Others 0.01 0.01 0.01 0.01 0.03 0.0 0.08 0.03 0.1 0.1 0.1
U.K. 13.98 13.77 12.69 12.95 12.10 14.5 15.70 11.11 13.9 13.6 13.9 U.S.A 15.70 15.58 14.44 12.68 12.68 14.3 15.22 7.53 8.8 8.5 9.6 Other Countries 7.35 7.62 7.06 8.73 10.83 12.0 13.23 12.29 14.6 14.5 16.3
Total 100 100 100 100 100 100 100 100 100 100 100
P: Provisional Source: State Bank of Pakistan
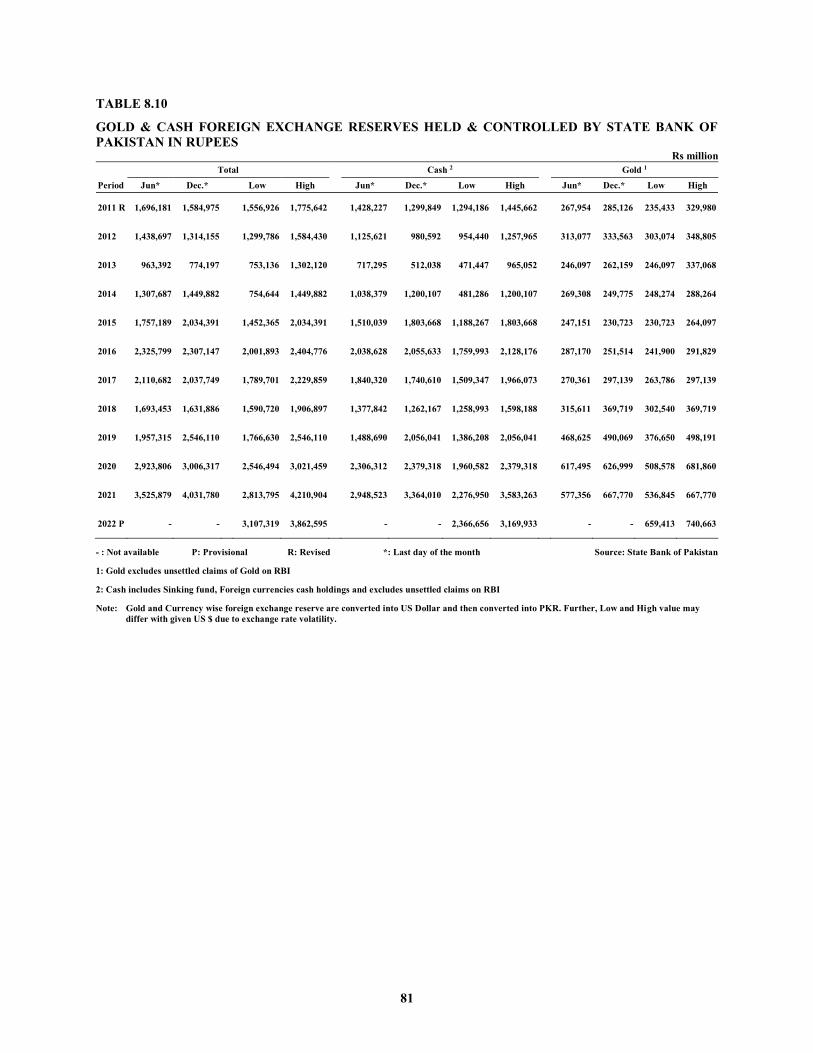
81
TABLE 8.10
GOLD & CASH FOREIGN EXCHANGE RESERVES HELD & CONTROLLED BY STATE BANK OF PAKISTAN IN RUPEES
Rs million Total Cash 2 Gold 1
Period Jun* Dec.* Low High Jun* Dec.* Low High Jun* Dec.* Low High
2011 R 1,696,181 1,584,975 1,556,926 1,775,642 1,428,227 1,299,849 1,294,186 1,445,662 267,954 285,126 235,433 329,980
2012 1,438,697 1,314,155 1,299,786 1,584,430 1,125,621 980,592 954,440 1,257,965 313,077 333,563 303,074 348,805
2013 963,392 774,197 753,136 1,302,120 717,295 512,038 471,447 965,052 246,097 262,159 246,097 337,068
2014 1,307,687 1,449,882 754,644 1,449,882 1,038,379 1,200,107 481,286 1,200,107 269,308 249,775 248,274 288,264
2015 1,757,189 2,034,391 1,452,365 2,034,391 1,510,039 1,803,668 1,188,267 1,803,668 247,151 230,723 230,723 264,097
2016 2,325,799 2,307,147 2,001,893 2,404,776 2,038,628 2,055,633 1,759,993 2,128,176 287,170 251,514 241,900 291,829
2017 2,110,682 2,037,749 1,789,701 2,229,859 1,840,320 1,740,610 1,509,347 1,966,073 270,361 297,139 263,786 297,139
2018 1,693,453 1,631,886 1,590,720 1,906,897 1,377,842 1,262,167 1,258,993 1,598,188 315,611 369,719 302,540 369,719
2019 1,957,315 2,546,110 1,766,630 2,546,110 1,488,690 2,056,041 1,386,208 2,056,041 468,625 490,069 376,650 498,191
2020 2,923,806 3,006,317 2,546,494 3,021,459 2,306,312 2,379,318 1,960,582 2,379,318 617,495 626,999 508,578 681,860
2021 3,525,879 4,031,780 2,813,795 4,210,904 2,948,523 3,364,010 2,276,950 3,583,263 577,356 667,770 536,845 667,770
2022 P - - 3,107,319 3,862,595 - - 2,366,656 3,169,933 - - 659,413 740,663
- : Not available P: Provisional R: Revised *: Last day of the month Source: State Bank of Pakistan
1: Gold excludes unsettled claims of Gold on RBI
2: Cash includes Sinking fund, Foreign currencies cash holdings and excludes unsettled claims on RBI
Note: Gold and Currency wise foreign exchange reserve are converted into US Dollar and then converted into PKR. Further, Low and High value may differ with given US $ due to exchange rate volatility.
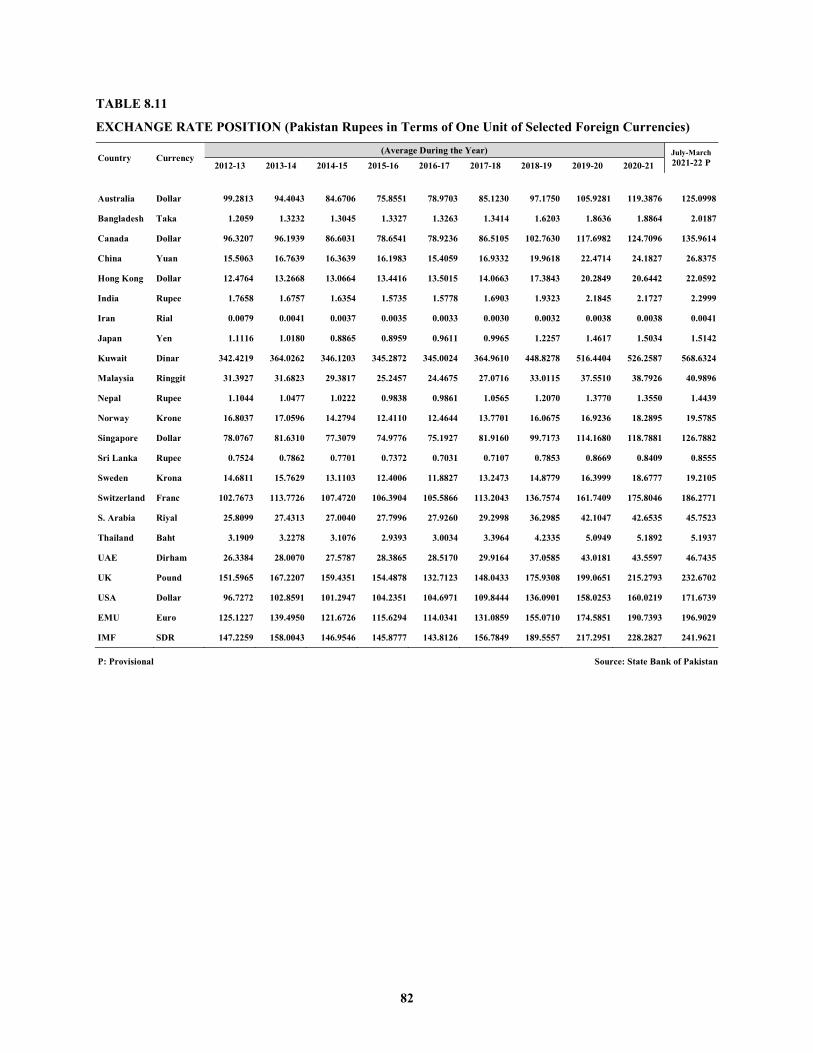
82
TABLE 8.11
EXCHANGE RATE POSITION (Pakistan Rupees in Terms of One Unit of Selected Foreign Currencies)
Country Currency (Average During the Year) July-March
2021-22 P 2012-13 2013-14 2014-15 2015-16 2016-17 2017-18 2018-19 2019-20 2020-21
Australia Dollar 99.2813 94.4043 84.6706 75.8551 78.9703 85.1230 97.1750 105.9281 119.3876 125.0998
Bangladesh Taka 1.2059 1.3232 1.3045 1.3327 1.3263 1.3414 1.6203 1.8636 1.8864 2.0187
Canada Dollar 96.3207 96.1939 86.6031 78.6541 78.9236 86.5105 102.7630 117.6982 124.7096 135.9614
China Yuan 15.5063 16.7639 16.3639 16.1983 15.4059 16.9332 19.9618 22.4714 24.1827 26.8375
Hong Kong Dollar 12.4764 13.2668 13.0664 13.4416 13.5015 14.0663 17.3843 20.2849 20.6442 22.0592
India Rupee 1.7658 1.6757 1.6354 1.5735 1.5778 1.6903 1.9323 2.1845 2.1727 2.2999
Iran Rial 0.0079 0.0041 0.0037 0.0035 0.0033 0.0030 0.0032 0.0038 0.0038 0.0041
Japan Yen 1.1116 1.0180 0.8865 0.8959 0.9611 0.9965 1.2257 1.4617 1.5034 1.5142
Kuwait Dinar 342.4219 364.0262 346.1203 345.2872 345.0024 364.9610 448.8278 516.4404 526.2587 568.6324
Malaysia Ringgit 31.3927 31.6823 29.3817 25.2457 24.4675 27.0716 33.0115 37.5510 38.7926 40.9896
Nepal Rupee 1.1044 1.0477 1.0222 0.9838 0.9861 1.0565 1.2070 1.3770 1.3550 1.4439
Norway Krone 16.8037 17.0596 14.2794 12.4110 12.4644 13.7701 16.0675 16.9236 18.2895 19.5785
Singapore Dollar 78.0767 81.6310 77.3079 74.9776 75.1927 81.9160 99.7173 114.1680 118.7881 126.7882
Sri Lanka Rupee 0.7524 0.7862 0.7701 0.7372 0.7031 0.7107 0.7853 0.8669 0.8409 0.8555
Sweden Krona 14.6811 15.7629 13.1103 12.4006 11.8827 13.2473 14.8779 16.3999 18.6777 19.2105
Switzerland Franc 102.7673 113.7726 107.4720 106.3904 105.5866 113.2043 136.7574 161.7409 175.8046 186.2771
S. Arabia Riyal 25.8099 27.4313 27.0040 27.7996 27.9260 29.2998 36.2985 42.1047 42.6535 45.7523
Thailand Baht 3.1909 3.2278 3.1076 2.9393 3.0034 3.3964 4.2335 5.0949 5.1892 5.1937
UAE Dirham 26.3384 28.0070 27.5787 28.3865 28.5170 29.9164 37.0585 43.0181 43.5597 46.7435
UK Pound 151.5965 167.2207 159.4351 154.4878 132.7123 148.0433 175.9308 199.0651 215.2793 232.6702
USA Dollar 96.7272 102.8591 101.2947 104.2351 104.6971 109.8444 136.0901 158.0253 160.0219 171.6739
EMU Euro 125.1227 139.4950 121.6726 115.6294 114.0341 131.0859 155.0710 174.5851 190.7393 196.9029
IMF SDR 147.2259 158.0043 146.9546 145.8777 143.8126 156.7849 189.5557 217.2951 228.2827 241.9621
P: Provisional Source: State Bank of Pakistan

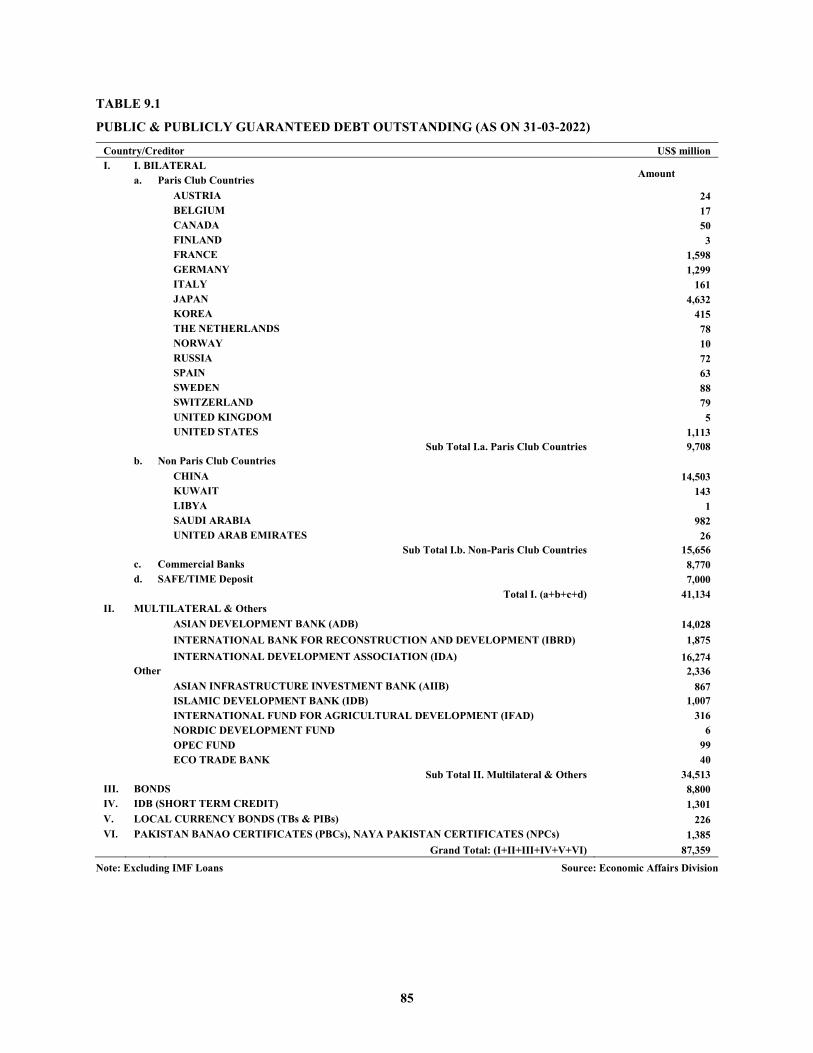
85
TABLE 9.1
PUBLIC & PUBLICLY GUARANTEED DEBT OUTSTANDING (AS ON 31-03-2022)
Country/Creditor US$ million I. I. BILATERAL
Amount a. Paris Club Countries AUSTRIA 24 BELGIUM 17 CANADA 50 FINLAND 3 FRANCE 1,598 GERMANY 1,299 ITALY 161 JAPAN 4,632 KOREA 415 THE NETHERLANDS 78 NORWAY 10 RUSSIA 72 SPAIN 63 SWEDEN 88 SWITZERLAND 79 UNITED KINGDOM 5 UNITED STATES 1,113
Sub Total I.a. Paris Club Countries 9,708 b. Non Paris Club Countries CHINA 14,503 KUWAIT 143 LIBYA 1 SAUDI ARABIA 982 UNITED ARAB EMIRATES 26
Sub Total I.b. Non-Paris Club Countries 15,656 c. Commercial Banks 8,770 d. SAFE/TIME Deposit 7,000
Total I. (a+b+c+d) 41,134 II. MULTILATERAL & Others
ASIAN DEVELOPMENT BANK (ADB) 14,028 INTERNATIONAL BANK FOR RECONSTRUCTION AND DEVELOPMENT (IBRD) 1,875 INTERNATIONAL DEVELOPMENT ASSOCIATION (IDA) 16,274
Other 2,336 ASIAN INFRASTRUCTURE INVESTMENT BANK (AIIB) 867 ISLAMIC DEVELOPMENT BANK (IDB) 1,007 INTERNATIONAL FUND FOR AGRICULTURAL DEVELOPMENT (IFAD) 316 NORDIC DEVELOPMENT FUND 6 OPEC FUND 99 ECO TRADE BANK 40 Sub Total II. Multilateral & Others 34,513
III. BONDS 8,800 IV. IDB (SHORT TERM CREDIT) 1,301 V. LOCAL CURRENCY BONDS (TBs & PIBs) 226 VI. PAKISTAN BANAO CERTIFICATES (PBCs), NAYA PAKISTAN CERTIFICATES (NPCs) 1,385
Grand Total: (I+II+III+IV+V+VI) 87,359
Note: Excluding IMF Loans Source: Economic Affairs Division
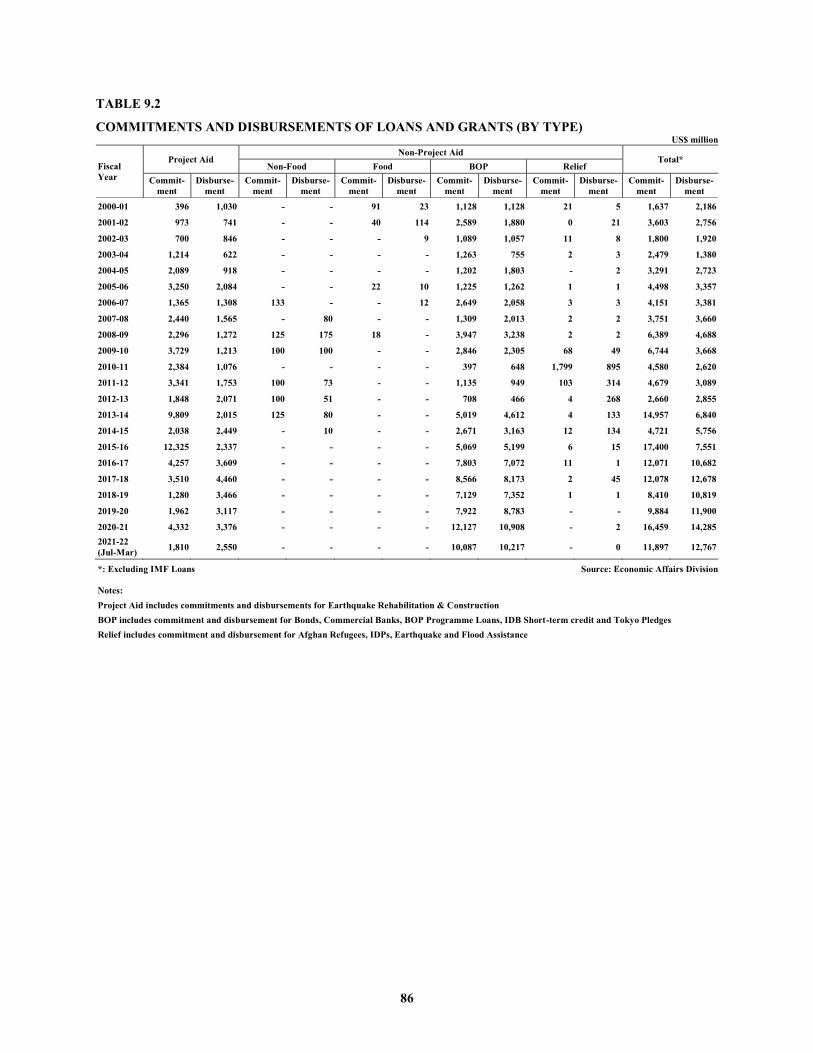
86
TABLE 9.2
COMMITMENTS AND DISBURSEMENTS OF LOANS AND GRANTS (BY TYPE) US$ million
Fiscal Year
Project Aid Non-Project Aid
Total* Non-Food Food BOP Relief
Commit-ment
Disburse-ment
Commit-ment
Disburse-ment
Commit-ment
Disburse-ment
Commit-ment
Disburse-ment
Commit-ment
Disburse-ment
Commit-ment
Disburse-ment
2000-01 396 1,030 - - 91 23 1,128 1,128 21 5 1,637 2,186
2001-02 973 741 - - 40 114 2,589 1,880 0 21 3,603 2,756
2002-03 700 846 - - - 9 1,089 1,057 11 8 1,800 1,920
2003-04 1,214 622 - - - - 1,263 755 2 3 2,479 1,380
2004-05 2,089 918 - - - - 1,202 1,803 - 2 3,291 2,723
2005-06 3,250 2,084 - - 22 10 1,225 1,262 1 1 4,498 3,357
2006-07 1,365 1,308 133 - - 12 2,649 2,058 3 3 4,151 3,381
2007-08 2,440 1,565 - 80 - - 1,309 2,013 2 2 3,751 3,660
2008-09 2,296 1,272 125 175 18 - 3,947 3,238 2 2 6,389 4,688
2009-10 3,729 1,213 100 100 - - 2,846 2,305 68 49 6,744 3,668
2010-11 2,384 1,076 - - - - 397 648 1,799 895 4,580 2,620
2011-12 3,341 1,753 100 73 - - 1,135 949 103 314 4,679 3,089
2012-13 1,848 2,071 100 51 - - 708 466 4 268 2,660 2,855
2013-14 9,809 2,015 125 80 - - 5,019 4,612 4 133 14,957 6,840
2014-15 2,038 2,449 - 10 - - 2,671 3,163 12 134 4,721 5,756
2015-16 12,325 2,337 - - - - 5,069 5,199 6 15 17,400 7,551
2016-17 4,257 3,609 - - - - 7,803 7,072 11 1 12,071 10,682
2017-18 3,510 4,460 - - - - 8,566 8,173 2 45 12,078 12,678
2018-19 1,280 3,466 - - - - 7,129 7,352 1 1 8,410 10,819
2019-20 1,962 3,117 - - - - 7,922 8,783 - - 9,884 11,900
2020-21 4,332 3,376 - - - - 12,127 10,908 - 2 16,459 14,285 2021-22 (Jul-Mar) 1,810 2,550 - - - - 10,087 10,217 - 0 11,897 12,767
*: Excluding IMF Loans Source: Economic Affairs Division Notes: Project Aid includes commitments and disbursements for Earthquake Rehabilitation & Construction
BOP includes commitment and disbursement for Bonds, Commercial Banks, BOP Programme Loans, IDB Short-term credit and Tokyo Pledges Relief includes commitment and disbursement for Afghan Refugees, IDPs, Earthquake and Flood Assistance
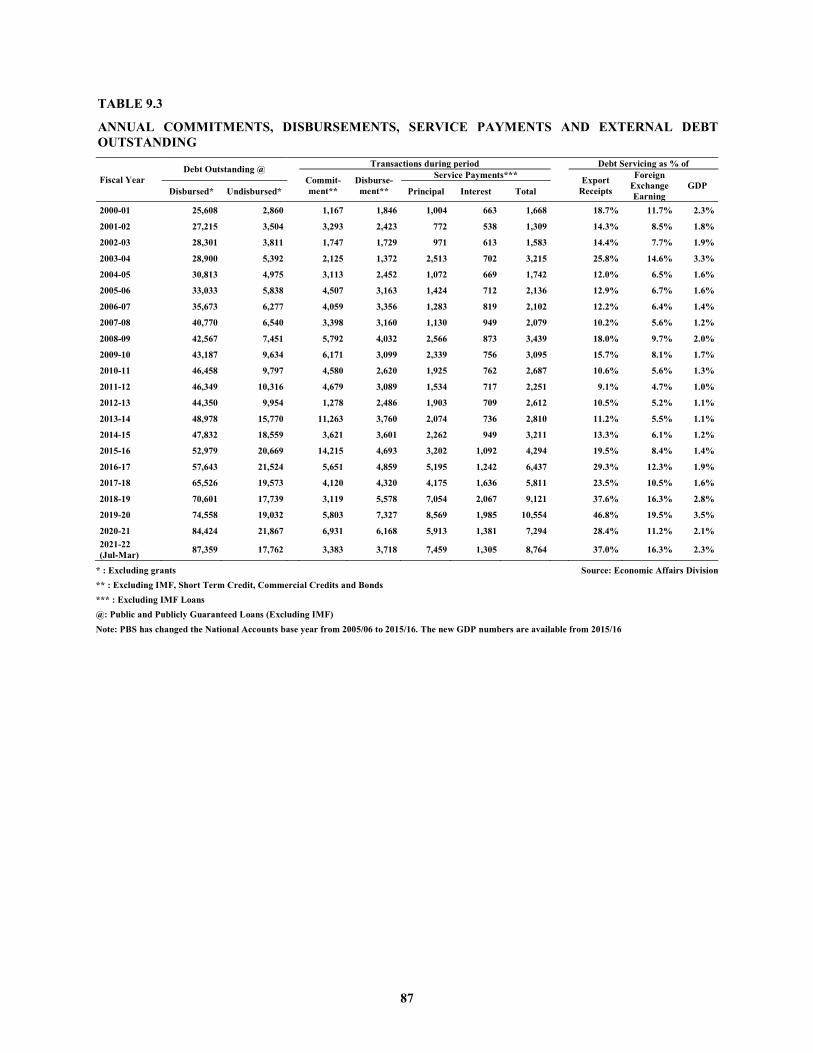
87
TABLE 9.3
ANNUAL COMMITMENTS, DISBURSEMENTS, SERVICE PAYMENTS AND EXTERNAL DEBT OUTSTANDING
Fiscal Year Debt Outstanding @
Transactions during period
Debt Servicing as % of
Commit-ment**
Disburse-ment**
Service Payments*** Export Receipts
Foreign Exchange Earning
GDP Disbursed* Undisbursed* Principal Interest Total
2000-01 25,608 2,860 1,167 1,846 1,004 663 1,668 18.7% 11.7% 2.3%
2001-02 27,215 3,504 3,293 2,423 772 538 1,309 14.3% 8.5% 1.8%
2002-03 28,301 3,811 1,747 1,729 971 613 1,583 14.4% 7.7% 1.9%
2003-04 28,900 5,392 2,125 1,372 2,513 702 3,215 25.8% 14.6% 3.3%
2004-05 30,813 4,975 3,113 2,452 1,072 669 1,742 12.0% 6.5% 1.6%
2005-06 33,033 5,838 4,507 3,163 1,424 712 2,136 12.9% 6.7% 1.6%
2006-07 35,673 6,277 4,059 3,356 1,283 819 2,102 12.2% 6.4% 1.4%
2007-08 40,770 6,540 3,398 3,160 1,130 949 2,079 10.2% 5.6% 1.2%
2008-09 42,567 7,451 5,792 4,032 2,566 873 3,439 18.0% 9.7% 2.0%
2009-10 43,187 9,634 6,171 3,099 2,339 756 3,095 15.7% 8.1% 1.7%
2010-11 46,458 9,797 4,580 2,620 1,925 762 2,687 10.6% 5.6% 1.3%
2011-12 46,349 10,316 4,679 3,089 1,534 717 2,251 9.1% 4.7% 1.0%
2012-13 44,350 9,954 1,278 2,486 1,903 709 2,612 10.5% 5.2% 1.1%
2013-14 48,978 15,770 11,263 3,760 2,074 736 2,810 11.2% 5.5% 1.1%
2014-15 47,832 18,559 3,621 3,601 2,262 949 3,211 13.3% 6.1% 1.2%
2015-16 52,979 20,669 14,215 4,693 3,202 1,092 4,294 19.5% 8.4% 1.4%
2016-17 57,643 21,524 5,651 4,859 5,195 1,242 6,437 29.3% 12.3% 1.9%
2017-18 65,526 19,573 4,120 4,320 4,175 1,636 5,811 23.5% 10.5% 1.6%
2018-19 70,601 17,739 3,119 5,578 7,054 2,067 9,121 37.6% 16.3% 2.8%
2019-20 74,558 19,032 5,803 7,327 8,569 1,985 10,554 46.8% 19.5% 3.5%
2020-21 84,424 21,867 6,931 6,168 5,913 1,381 7,294 28.4% 11.2% 2.1% 2021-22 (Jul-Mar) 87,359 17,762 3,383 3,718 7,459 1,305 8,764 37.0% 16.3% 2.3%
* : Excluding grants Source: Economic Affairs Division ** : Excluding IMF, Short Term Credit, Commercial Credits and Bonds *** : Excluding IMF Loans @: Public and Publicly Guaranteed Loans (Excluding IMF) Note: PBS has changed the National Accounts base year from 2005/06 to 2015/16. The new GDP numbers are available from 2015/16
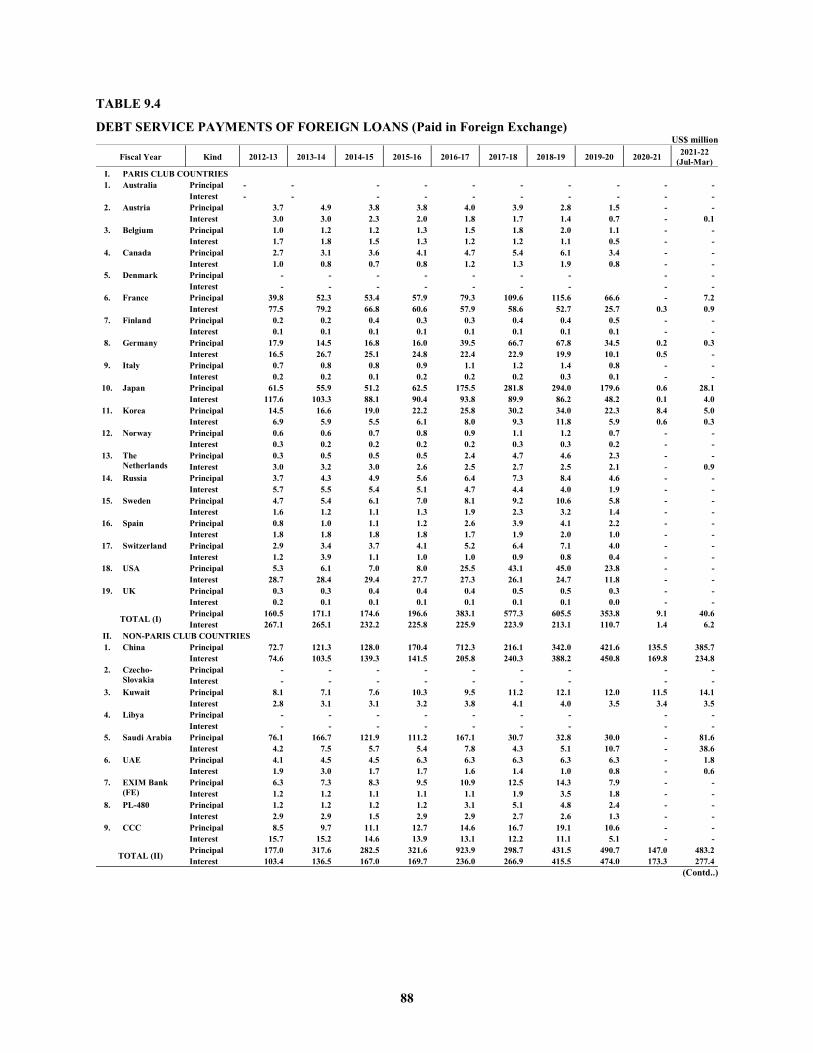
88
TABLE 9.4
DEBT SERVICE PAYMENTS OF FOREIGN LOANS (Paid in Foreign Exchange) US$ million
Fiscal Year Kind 2012-13 2013-14 2014-15 2015-16 2016-17 2017-18 2018-19 2019-20 2020-21 2021-22 (Jul-Mar)
I. PARIS CLUB COUNTRIES 1. Australia Principal - - - - - - - - - -
Interest - - - - - - - - - - 2. Austria Principal 3.7 4.9 3.8 3.8 4.0 3.9 2.8 1.5 - -
Interest 3.0 3.0 2.3 2.0 1.8 1.7 1.4 0.7 - 0.1 3. Belgium Principal 1.0 1.2 1.2 1.3 1.5 1.8 2.0 1.1 - -
Interest 1.7 1.8 1.5 1.3 1.2 1.2 1.1 0.5 - - 4. Canada Principal 2.7 3.1 3.6 4.1 4.7 5.4 6.1 3.4 - -
Interest 1.0 0.8 0.7 0.8 1.2 1.3 1.9 0.8 - - 5. Denmark Principal - - - - - - - - -
Interest - - - - - - - - - 6. France Principal 39.8 52.3 53.4 57.9 79.3 109.6 115.6 66.6 - 7.2
Interest 77.5 79.2 66.8 60.6 57.9 58.6 52.7 25.7 0.3 0.9 7. Finland Principal 0.2 0.2 0.4 0.3 0.3 0.4 0.4 0.5 - -
Interest 0.1 0.1 0.1 0.1 0.1 0.1 0.1 0.1 - - 8. Germany Principal 17.9 14.5 16.8 16.0 39.5 66.7 67.8 34.5 0.2 0.3
Interest 16.5 26.7 25.1 24.8 22.4 22.9 19.9 10.1 0.5 - 9. Italy Principal 0.7 0.8 0.8 0.9 1.1 1.2 1.4 0.8 - -
Interest 0.2 0.2 0.1 0.2 0.2 0.2 0.3 0.1 - - 10. Japan Principal 61.5 55.9 51.2 62.5 175.5 281.8 294.0 179.6 0.6 28.1
Interest 117.6 103.3 88.1 90.4 93.8 89.9 86.2 48.2 0.1 4.0 11. Korea Principal 14.5 16.6 19.0 22.2 25.8 30.2 34.0 22.3 8.4 5.0
Interest 6.9 5.9 5.5 6.1 8.0 9.3 11.8 5.9 0.6 0.3 12. Norway Principal 0.6 0.6 0.7 0.8 0.9 1.1 1.2 0.7 - -
Interest 0.3 0.2 0.2 0.2 0.2 0.3 0.3 0.2 - - 13. The
Netherlands Principal 0.3 0.5 0.5 0.5 2.4 4.7 4.6 2.3 - - Interest 3.0 3.2 3.0 2.6 2.5 2.7 2.5 2.1 - 0.9
14. Russia Principal 3.7 4.3 4.9 5.6 6.4 7.3 8.4 4.6 - - Interest 5.7 5.5 5.4 5.1 4.7 4.4 4.0 1.9 - -
15. Sweden Principal 4.7 5.4 6.1 7.0 8.1 9.2 10.6 5.8 - - Interest 1.6 1.2 1.1 1.3 1.9 2.3 3.2 1.4 - -
16. Spain Principal 0.8 1.0 1.1 1.2 2.6 3.9 4.1 2.2 - - Interest 1.8 1.8 1.8 1.8 1.7 1.9 2.0 1.0 - -
17. Switzerland Principal 2.9 3.4 3.7 4.1 5.2 6.4 7.1 4.0 - - Interest 1.2 3.9 1.1 1.0 1.0 0.9 0.8 0.4 - -
18. USA Principal 5.3 6.1 7.0 8.0 25.5 43.1 45.0 23.8 - - Interest 28.7 28.4 29.4 27.7 27.3 26.1 24.7 11.8 - -
19. UK Principal 0.3 0.3 0.4 0.4 0.4 0.5 0.5 0.3 - - Interest 0.2 0.1 0.1 0.1 0.1 0.1 0.1 0.0 - -
TOTAL (I) Principal 160.5 171.1 174.6 196.6 383.1 577.3 605.5 353.8 9.1 40.6 Interest 267.1 265.1 232.2 225.8 225.9 223.9 213.1 110.7 1.4 6.2
II. NON-PARIS CLUB COUNTRIES 1. China Principal 72.7 121.3 128.0 170.4 712.3 216.1 342.0 421.6 135.5 385.7
Interest 74.6 103.5 139.3 141.5 205.8 240.3 388.2 450.8 169.8 234.8 2. Czecho-
Slovakia Principal - - - - - - - - - Interest - - - - - - - - -
3. Kuwait Principal 8.1 7.1 7.6 10.3 9.5 11.2 12.1 12.0 11.5 14.1 Interest 2.8 3.1 3.1 3.2 3.8 4.1 4.0 3.5 3.4 3.5
4. Libya Principal - - - - - - - - - Interest - - - - - - - - -
5. Saudi Arabia Principal 76.1 166.7 121.9 111.2 167.1 30.7 32.8 30.0 - 81.6 Interest 4.2 7.5 5.7 5.4 7.8 4.3 5.1 10.7 - 38.6
6. UAE Principal 4.1 4.5 4.5 6.3 6.3 6.3 6.3 6.3 - 1.8 Interest 1.9 3.0 1.7 1.7 1.6 1.4 1.0 0.8 - 0.6
7. EXIM Bank (FE)
Principal 6.3 7.3 8.3 9.5 10.9 12.5 14.3 7.9 - - Interest 1.2 1.2 1.1 1.1 1.1 1.9 3.5 1.8 - -
8. PL-480 Principal 1.2 1.2 1.2 1.2 3.1 5.1 4.8 2.4 - - Interest 2.9 2.9 1.5 2.9 2.9 2.7 2.6 1.3 - -
9. CCC Principal 8.5 9.7 11.1 12.7 14.6 16.7 19.1 10.6 - - Interest 15.7 15.2 14.6 13.9 13.1 12.2 11.1 5.1 - -
TOTAL (II) Principal 177.0 317.6 282.5 321.6 923.9 298.7 431.5 490.7 147.0 483.2 Interest 103.4 136.5 167.0 169.7 236.0 266.9 415.5 474.0 173.3 277.4
(Contd..)
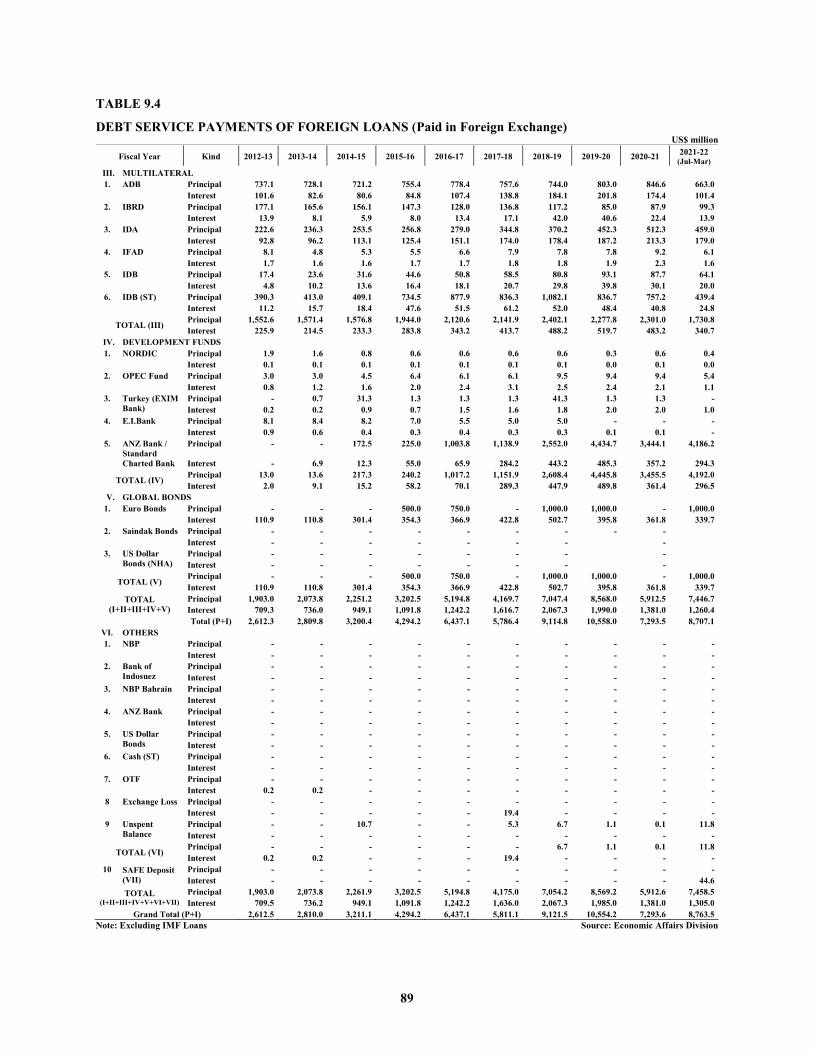
89
TABLE 9.4
DEBT SERVICE PAYMENTS OF FOREIGN LOANS (Paid in Foreign Exchange) US$ million
Fiscal Year Kind 2012-13 2013-14 2014-15 2015-16 2016-17 2017-18 2018-19 2019-20 2020-21 2021-22 (Jul-Mar)
III. MULTILATERAL 1. ADB Principal 737.1 728.1 721.2 755.4 778.4 757.6 744.0 803.0 846.6 663.0
Interest 101.6 82.6 80.6 84.8 107.4 138.8 184.1 201.8 174.4 101.4 2. IBRD Principal 177.1 165.6 156.1 147.3 128.0 136.8 117.2 85.0 87.9 99.3
Interest 13.9 8.1 5.9 8.0 13.4 17.1 42.0 40.6 22.4 13.9 3. IDA Principal 222.6 236.3 253.5 256.8 279.0 344.8 370.2 452.3 512.3 459.0
Interest 92.8 96.2 113.1 125.4 151.1 174.0 178.4 187.2 213.3 179.0 4. IFAD Principal 8.1 4.8 5.3 5.5 6.6 7.9 7.8 7.8 9.2 6.1
Interest 1.7 1.6 1.6 1.7 1.7 1.8 1.8 1.9 2.3 1.6 5. IDB Principal 17.4 23.6 31.6 44.6 50.8 58.5 80.8 93.1 87.7 64.1
Interest 4.8 10.2 13.6 16.4 18.1 20.7 29.8 39.8 30.1 20.0 6. IDB (ST) Principal 390.3 413.0 409.1 734.5 877.9 836.3 1,082.1 836.7 757.2 439.4
Interest 11.2 15.7 18.4 47.6 51.5 61.2 52.0 48.4 40.8 24.8
TOTAL (III) Principal 1,552.6 1,571.4 1,576.8 1,944.0 2,120.6 2,141.9 2,402.1 2,277.8 2,301.0 1,730.8 Interest 225.9 214.5 233.3 283.8 343.2 413.7 488.2 519.7 483.2 340.7
IV. DEVELOPMENT FUNDS 1. NORDIC Principal 1.9 1.6 0.8 0.6 0.6 0.6 0.6 0.3 0.6 0.4
Interest 0.1 0.1 0.1 0.1 0.1 0.1 0.1 0.0 0.1 0.0 2. OPEC Fund Principal 3.0 3.0 4.5 6.4 6.1 6.1 9.5 9.4 9.4 5.4
Interest 0.8 1.2 1.6 2.0 2.4 3.1 2.5 2.4 2.1 1.1 3. Turkey (EXIM
Bank) Principal - 0.7 31.3 1.3 1.3 1.3 41.3 1.3 1.3 - Interest 0.2 0.2 0.9 0.7 1.5 1.6 1.8 2.0 2.0 1.0
4. E.I.Bank Principal 8.1 8.4 8.2 7.0 5.5 5.0 5.0 - - - Interest 0.9 0.6 0.4 0.3 0.4 0.3 0.3 0.1 0.1 -
5. ANZ Bank / Standard Charted Bank
Principal - - 172.5 225.0 1,003.8 1,138.9 2,552.0 4,434.7 3,444.1 4,186.2
Interest - 6.9 12.3 55.0 65.9 284.2 443.2 485.3 357.2 294.3
TOTAL (IV) Principal 13.0 13.6 217.3 240.2 1,017.2 1,151.9 2,608.4 4,445.8 3,455.5 4,192.0 Interest 2.0 9.1 15.2 58.2 70.1 289.3 447.9 489.8 361.4 296.5
V. GLOBAL BONDS 1. Euro Bonds Principal - - - 500.0 750.0 - 1,000.0 1,000.0 - 1,000.0
Interest 110.9 110.8 301.4 354.3 366.9 422.8 502.7 395.8 361.8 339.7 2. Saindak Bonds Principal - - - - - - - - -
Interest - - - - - - - - 3. US Dollar
Bonds (NHA) Principal - - - - - - - - Interest - - - - - - - -
TOTAL (V) Principal - - - 500.0 750.0 - 1,000.0 1,000.0 - 1,000.0 Interest 110.9 110.8 301.4 354.3 366.9 422.8 502.7 395.8 361.8 339.7
TOTAL (I+II+III+IV+V)
Principal 1,903.0 2,073.8 2,251.2 3,202.5 5,194.8 4,169.7 7,047.4 8,568.0 5,912.5 7,446.7 Interest 709.3 736.0 949.1 1,091.8 1,242.2 1,616.7 2,067.3 1,990.0 1,381.0 1,260.4
Total (P+I) 2,612.3 2,809.8 3,200.4 4,294.2 6,437.1 5,786.4 9,114.8 10,558.0 7,293.5 8,707.1 VI. OTHERS 1. NBP Principal - - - - - - - - - -
Interest - - - - - - - - - - 2. Bank of
Indosuez Principal - - - - - - - - - - Interest - - - - - - - - - -
3. NBP Bahrain Principal - - - - - - - - - - Interest - - - - - - - - - -
4. ANZ Bank Principal - - - - - - - - - - Interest - - - - - - - - - -
5. US Dollar Bonds
Principal - - - - - - - - - - Interest - - - - - - - - - -
6. Cash (ST) Principal - - - - - - - - - - Interest - - - - - - - - - -
7. OTF Principal - - - - - - - - - - Interest 0.2 0.2 - - - - - - - -
8 Exchange Loss Principal - - - - - - - - - - Interest - - - - - 19.4 - - - -
9 Unspent Balance
Principal - - 10.7 - - 5.3 6.7 1.1 0.1 11.8 Interest - - - - - - - - - -
TOTAL (VI) Principal - - - - - - 6.7 1.1 0.1 11.8 Interest 0.2 0.2 - - - 19.4 - - - -
10 SAFE Deposit (VII)
Principal - - - - - - - - - - Interest - - - - - - - - - 44.6
TOTAL (I+II+III+IV+V+VI+VII)
Principal 1,903.0 2,073.8 2,261.9 3,202.5 5,194.8 4,175.0 7,054.2 8,569.2 5,912.6 7,458.5 Interest 709.5 736.2 949.1 1,091.8 1,242.2 1,636.0 2,067.3 1,985.0 1,381.0 1,305.0
Grand Total (P+I) 2,612.5 2,810.0 3,211.1 4,294.2 6,437.1 5,811.1 9,121.5 10,554.2 7,293.6 8,763.5 Note: Excluding IMF Loans Source: Economic Affairs Division
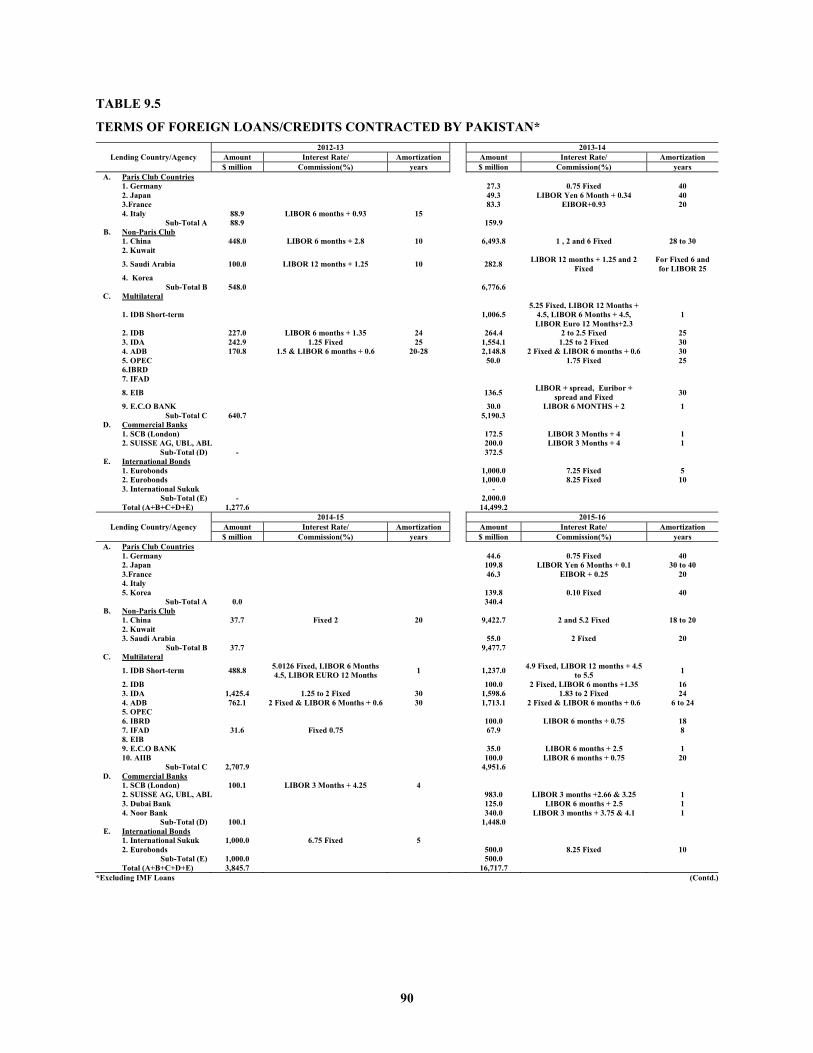
90
TABLE 9.5
TERMS OF FOREIGN LOANS/CREDITS CONTRACTED BY PAKISTAN*
Lending Country/Agency 2012-13 2013-14
Amount Interest Rate/ Amortization Amount Interest Rate/ Amortization $ million Commission(%) years $ million Commission(%) years
A. Paris Club Countries 1. Germany 27.3 0.75 Fixed 40 2. Japan 49.3 LIBOR Yen 6 Month + 0.34 40 3.France 83.3 EIBOR+0.93 20 4. Italy 88.9 LIBOR 6 months + 0.93 15 Sub-Total A 88.9 159.9
B. Non-Paris Club 1. China 448.0 LIBOR 6 months + 2.8 10 6,493.8 1 , 2 and 6 Fixed 28 to 30 2. Kuwait
3. Saudi Arabia 100.0 LIBOR 12 months + 1.25 10 282.8 LIBOR 12 months + 1.25 and 2 Fixed
For Fixed 6 and for LIBOR 25
4. Korea Sub-Total B 548.0 6,776.6
C. Multilateral
1. IDB Short-term 1,006.5 5.25 Fixed, LIBOR 12 Months +
4.5, LIBOR 6 Months + 4.5, LIBOR Euro 12 Months+2.3
1
2. IDB 227.0 LIBOR 6 months + 1.35 24 264.4 2 to 2.5 Fixed 25 3. IDA 242.9 1.25 Fixed 25 1,554.1 1.25 to 2 Fixed 30 4. ADB 170.8 1.5 & LIBOR 6 months + 0.6 20-28 2,148.8 2 Fixed & LIBOR 6 months + 0.6 30 5. OPEC 50.0 1.75 Fixed 25 6.IBRD 7. IFAD
8. EIB 136.5 LIBOR + spread, Euribor + spread and Fixed 30
9. E.C.O BANK 30.0 LIBOR 6 MONTHS + 2 1 Sub-Total C 640.7 5,190.3
D. Commercial Banks 1. SCB (London) 172.5 LIBOR 3 Months + 4 1 2. SUISSE AG, UBL, ABL 200.0 LIBOR 3 Months + 4 1 Sub-Total (D) - 372.5
E. International Bonds 1. Eurobonds 1,000.0 7.25 Fixed 5 2. Eurobonds 1,000.0 8.25 Fixed 10 3. International Sukuk - Sub-Total (E) - 2,000.0 Total (A+B+C+D+E) 1,277.6 14,499.2
Lending Country/Agency 2014-15 2015-16
Amount Interest Rate/ Amortization Amount Interest Rate/ Amortization $ million Commission(%) years $ million Commission(%) years
A. Paris Club Countries 1. Germany 44.6 0.75 Fixed 40 2. Japan 109.8 LIBOR Yen 6 Months + 0.1 30 to 40 3.France 46.3 EIBOR + 0.25 20 4. Italy 5. Korea 139.8 0.10 Fixed 40 Sub-Total A 0.0 340.4
B. Non-Paris Club 1. China 37.7 Fixed 2 20 9,422.7 2 and 5.2 Fixed 18 to 20 2. Kuwait 3. Saudi Arabia 55.0 2 Fixed 20 Sub-Total B 37.7 9,477.7
C. Multilateral
1. IDB Short-term 488.8 5.0126 Fixed, LIBOR 6 Months 4.5, LIBOR EURO 12 Months 1 1,237.0 4.9 Fixed, LIBOR 12 months + 4.5
to 5.5 1 2. IDB 100.0 2 Fixed, LIBOR 6 months +1.35 16 3. IDA 1,425.4 1.25 to 2 Fixed 30 1,598.6 1.83 to 2 Fixed 24 4. ADB 762.1 2 Fixed & LIBOR 6 Months + 0.6 30 1,713.1 2 Fixed & LIBOR 6 months + 0.6 6 to 24 5. OPEC 6. IBRD 100.0 LIBOR 6 months + 0.75 18 7. IFAD 31.6 Fixed 0.75 67.9 8 8. EIB 9. E.C.O BANK 35.0 LIBOR 6 months + 2.5 1 10. AIIB 100.0 LIBOR 6 months + 0.75 20 Sub-Total C 2,707.9 4,951.6
D. Commercial Banks 1. SCB (London) 100.1 LIBOR 3 Months + 4.25 4 2. SUISSE AG, UBL, ABL 983.0 LIBOR 3 months +2.66 & 3.25 1 3. Dubai Bank 125.0 LIBOR 6 months + 2.5 1 4. Noor Bank 340.0 LIBOR 3 months + 3.75 & 4.1 1 Sub-Total (D) 100.1 1,448.0
E. International Bonds 1. International Sukuk 1,000.0 6.75 Fixed 5 2. Eurobonds 500.0 8.25 Fixed 10 Sub-Total (E) 1,000.0 500.0
Total (A+B+C+D+E) 3,845.7 16,717.7 *Excluding IMF Loans (Contd.)
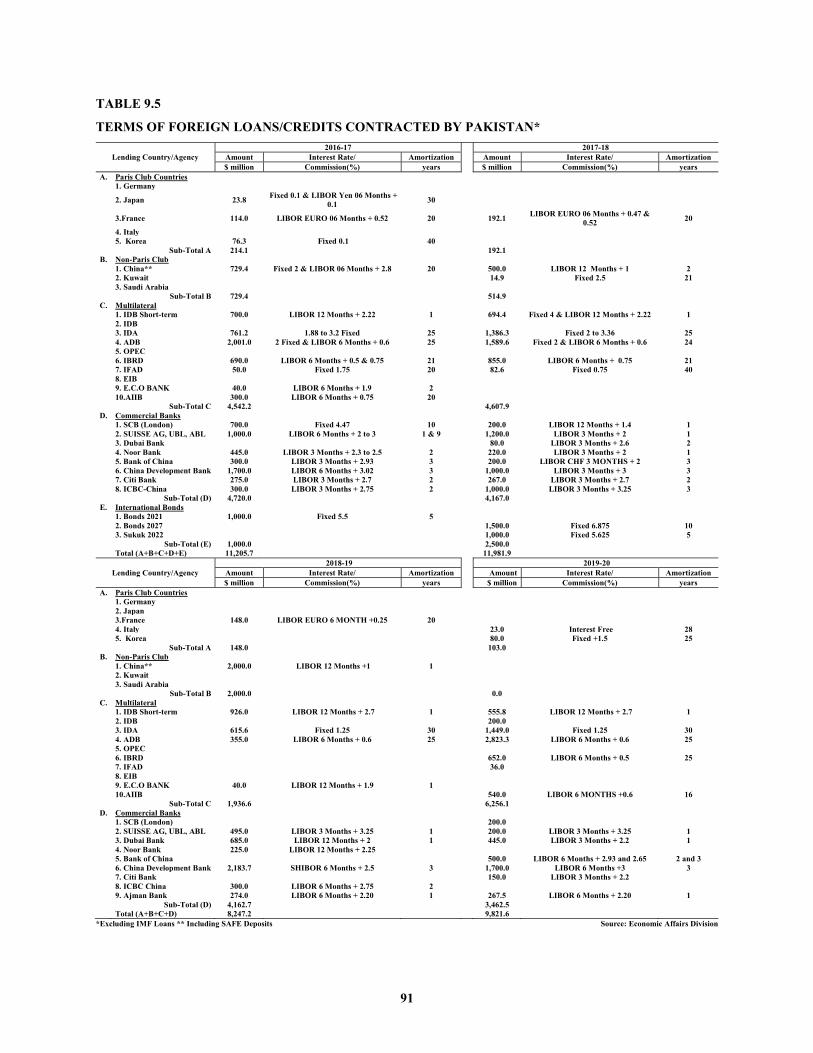
91
TABLE 9.5
TERMS OF FOREIGN LOANS/CREDITS CONTRACTED BY PAKISTAN*
Lending Country/Agency 2016-17 2017-18
Amount Interest Rate/ Amortization Amount Interest Rate/ Amortization $ million Commission(%) years $ million Commission(%) years
A. Paris Club Countries 1. Germany
2. Japan 23.8 Fixed 0.1 & LIBOR Yen 06 Months + 0.1 30
3.France 114.0 LIBOR EURO 06 Months + 0.52 20 192.1 LIBOR EURO 06 Months + 0.47 & 0.52 20
4. Italy 5. Korea 76.3 Fixed 0.1 40 Sub-Total A 214.1 192.1
B. Non-Paris Club 1. China** 729.4 Fixed 2 & LIBOR 06 Months + 2.8 20 500.0 LIBOR 12 Months + 1 2 2. Kuwait 14.9 Fixed 2.5 21 3. Saudi Arabia Sub-Total B 729.4 514.9
C. Multilateral 1. IDB Short-term 700.0 LIBOR 12 Months + 2.22 1 694.4 Fixed 4 & LIBOR 12 Months + 2.22 1 2. IDB 3. IDA 761.2 1.88 to 3.2 Fixed 25 1,386.3 Fixed 2 to 3.36 25 4. ADB 2,001.0 2 Fixed & LIBOR 6 Months + 0.6 25 1,589.6 Fixed 2 & LIBOR 6 Months + 0.6 24 5. OPEC 6. IBRD 690.0 LIBOR 6 Months + 0.5 & 0.75 21 855.0 LIBOR 6 Months + 0.75 21 7. IFAD 50.0 Fixed 1.75 20 82.6 Fixed 0.75 40 8. EIB 9. E.C.O BANK 40.0 LIBOR 6 Months + 1.9 2 10.AIIB 300.0 LIBOR 6 Months + 0.75 20 Sub-Total C 4,542.2 4,607.9
D. Commercial Banks 1. SCB (London) 700.0 Fixed 4.47 10 200.0 LIBOR 12 Months + 1.4 1 2. SUISSE AG, UBL, ABL 1,000.0 LIBOR 6 Months + 2 to 3 1 & 9 1,200.0 LIBOR 3 Months + 2 1 3. Dubai Bank 80.0 LIBOR 3 Months + 2.6 2 4. Noor Bank 445.0 LIBOR 3 Months + 2.3 to 2.5 2 220.0 LIBOR 3 Months + 2 1 5. Bank of China 300.0 LIBOR 3 Months + 2.93 3 200.0 LIBOR CHF 3 MONTHS + 2 3 6. China Development Bank 1,700.0 LIBOR 6 Months + 3.02 3 1,000.0 LIBOR 3 Months + 3 3 7. Citi Bank 275.0 LIBOR 3 Months + 2.7 2 267.0 LIBOR 3 Months + 2.7 2 8. ICBC-China 300.0 LIBOR 3 Months + 2.75 2 1,000.0 LIBOR 3 Months + 3.25 3 Sub-Total (D) 4,720.0 4,167.0
E. International Bonds 1. Bonds 2021 1,000.0 Fixed 5.5 5 2. Bonds 2027 1,500.0 Fixed 6.875 10 3. Sukuk 2022 1,000.0 Fixed 5.625 5 Sub-Total (E) 1,000.0 2,500.0 Total (A+B+C+D+E) 11,205.7 11,981.9
Lending Country/Agency 2018-19 2019-20
Amount Interest Rate/ Amortization Amount Interest Rate/ Amortization $ million Commission(%) years $ million Commission(%) years
A. Paris Club Countries
1. Germany
2. Japan
3.France 148.0 LIBOR EURO 6 MONTH +0.25 20 4. Italy
23.0 Interest Free 28 5. Korea
80.0 Fixed +1.5 25 Sub-Total A 148.0
103.0
B. Non-Paris Club
1. China** 2,000.0 LIBOR 12 Months +1 1 2. Kuwait
3. Saudi Arabia
Sub-Total B 2,000.0
0.0
C. Multilateral
1. IDB Short-term 926.0 LIBOR 12 Months + 2.7 1 555.8 LIBOR 12 Months + 2.7 1 2. IDB
200.0 3. IDA 615.6 Fixed 1.25 30 1,449.0 Fixed 1.25 30 4. ADB 355.0 LIBOR 6 Months + 0.6 25 2,823.3 LIBOR 6 Months + 0.6 25 5. OPEC
6. IBRD 652.0 LIBOR 6 Months + 0.5 25
7. IFAD 36.0
8. EIB
9. E.C.O BANK 40.0 LIBOR 12 Months + 1.9 1 10.AIIB
540.0 LIBOR 6 MONTHS +0.6 16 Sub-Total C 1,936.6
6,256.1
D. Commercial Banks
1. SCB (London)
200.0 2. SUISSE AG, UBL, ABL 495.0 LIBOR 3 Months + 3.25 1 200.0 LIBOR 3 Months + 3.25 1 3. Dubai Bank 685.0 LIBOR 12 Months + 2 1 445.0 LIBOR 3 Months + 2.2 1 4. Noor Bank 225.0 LIBOR 12 Months + 2.25
5. Bank of China 500.0 LIBOR 6 Months + 2.93 and 2.65 2 and 3
6. China Development Bank 2,183.7 SHIBOR 6 Months + 2.5 3 1,700.0 LIBOR 6 Months +3 3 7. Citi Bank
150.0 LIBOR 3 Months + 2.2 8. ICBC China 300.0 LIBOR 6 Months + 2.75 2
9. Ajman Bank 274.0 LIBOR 6 Months + 2.20 1 267.5 LIBOR 6 Months + 2.20 1 Sub-Total (D) 4,162.7
3,462.5 Total (A+B+C+D) 8,247.2 9,821.6
*Excluding IMF Loans ** Including SAFE Deposits Source: Economic Affairs Division

92
TABLE 9.5
TERMS OF FOREIGN LOANS/CREDITS CONTRACTED BY PAKISTAN*
Lending Country/Agency
2020-21 2021-22 (Jul-Mar)
Amount Interest Rate/ Amortization Amount Interest Rate/ Amortization
$ million Commission(%) years $ million Commission(%) years
A. Paris Club Countries 1. Germany 32.1 Fixed 0.75 40
2.France 77.3 Fixed 0.25 Sub-Total A 109.4
B. Non-Paris Club 1. China ** 1,000.0 LIBOR 12 Months + 1.0 1 2. CATIC 534.5 3. Saudi Arabia 1,200.0 Fixed 3.8 1 Sub-Total B 1,000.0 1,734.5
C. Multilateral
1. IDB Short-term 951.5 LIBOR 12 Months + 2.7 1 761.5 LIBOR 12 Months + 2.4 1 2. IDB 252.5 Fixed 2 20 3. IDA 3,633.6 Fixed 2 30 95.8 Fixed 1.5 30 4. ADB 900.0 Fixed 2 & LIBOR 6 Months + 0.6 15, 25 1,105.0 Fixed 2 25 5. OPEC 50.0 Fixed 2 11 6. IBRD 854.0 LIBOR 6 Months + 0.5, 0.25 25 195.0 LIBOR 6 Months + 0.5 30 7. IFAD 62.3 Fixed 1.25 8.AIIB 321.8 LIBOR 6 MONTHS +0.6, 0.25 16, 23 Sub-Total C 6,773.2 2,409.8
D. Commercial Banks - 1. SCB (London) 600.0 LIBOR 12 Months + 2.4 1 400.0 LIBOR 12 Months + 2.4 1 2. SUISSE AG, UBL, ABL 215.0 LIBOR 12 Months + 2.0 1 343.5 LIBOR 12 Months + 2 1 3. DUBAI BANK 825.0 LIBOR 12 Months + 2.05 1 1,140.0 LIBOR 12 Months + 2.05 1 4. CHINA DEV BANK 1,000.0 LIBOR 12 Months + 3.0 1 5. ICBC-CHINA 1,300.0 LIBOR 3 Months + 2.75 2 6. EMIRATES NBD 370.0 LIBOR 12 Months + 2.05 1 600.0 LIBOR 12 Months + 2 1 7. AJMAN BANK PJSC 350.0 LIBOR 12 Months + 2.0 1 8. NBP Bahrain 142.0 LIBOR 3 Months + 4.5 2 Sub-Total (D) 4,802.0 2,484
E. International Bonds
1. Eurobond 1,000.0 Fixed (6.0 percent) 5 300.0 Fixed (6.0 percent) 5
2. Eurobond 1,000.0 Fixed (7.375 percent) 10 400.0 Fixed (7.375 percent) 10
3. Eurobond 500.0 Fixed (8.875 percent) 30 300.0 Fixed (8.875 percent) 30
4. International Sukuk 1,000.0 Fixed (7.95 percent) 7
Sub-Total (E) 2,500.0 2,000.0
F. SFD TIME Deposit 3,000.0 Fixed (4 percent) 1
Total (A+B+C+D+E+F) 15,184.6 11,627.8
* Excluding IMF Source: Economic Affairs Division
** China SAFE Deposit
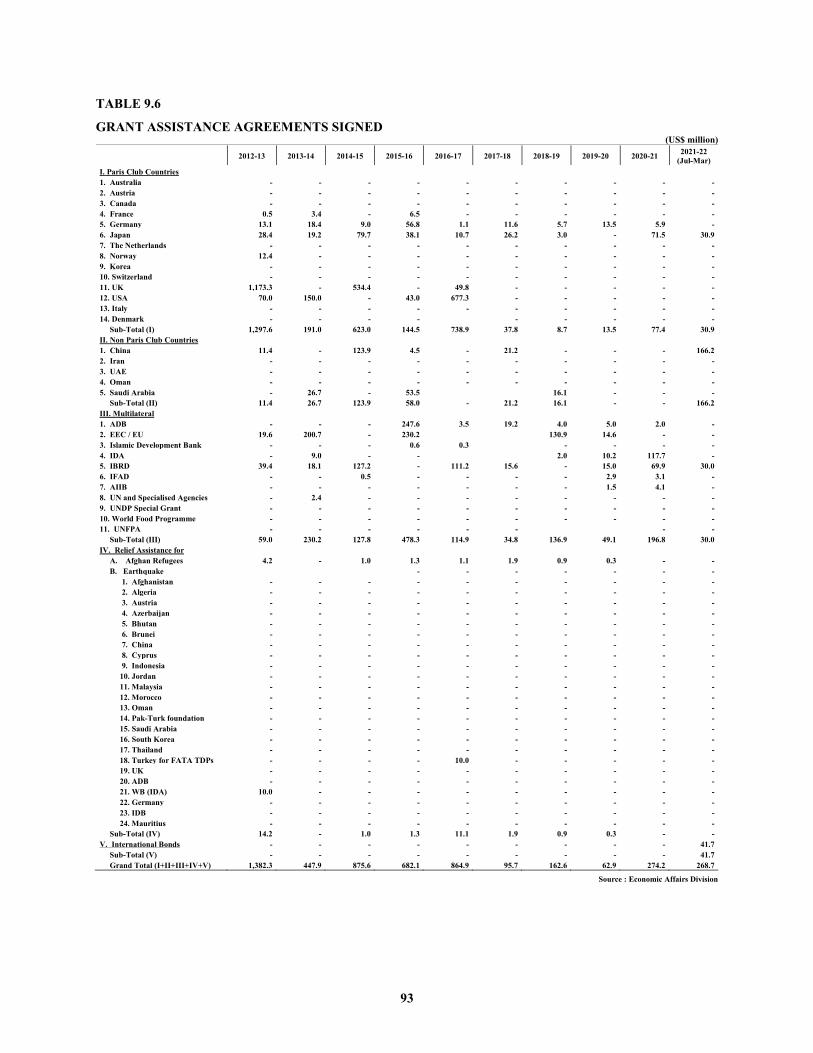
93
TABLE 9.6
GRANT ASSISTANCE AGREEMENTS SIGNED (US$ million)
2012-13 2013-14 2014-15 2015-16 2016-17 2017-18 2018-19 2019-20 2020-21 2021-22 (Jul-Mar)
I. Paris Club Countries
1. Australia - - - - - - - - - - 2. Austria - - - - - - - - - - 3. Canada - - - - - - - - - - 4. France 0.5 3.4 - 6.5 - - - - - - 5. Germany 13.1 18.4 9.0 56.8 1.1 11.6 5.7 13.5 5.9 - 6. Japan 28.4 19.2 79.7 38.1 10.7 26.2 3.0 - 71.5 30.9 7. The Netherlands - - - - - - - - - - 8. Norway 12.4 - - - - - - - - - 9. Korea - - - - - - - - - - 10. Switzerland - - - - - - - - - - 11. UK 1,173.3 - 534.4 - 49.8 - - - - - 12. USA 70.0 150.0 - 43.0 677.3 - - - - - 13. Italy - - - - - - - - - - 14. Denmark - - - - - - - - - Sub-Total (I) 1,297.6 191.0 623.0 144.5 738.9 37.8 8.7 13.5 77.4 30.9 II. Non Paris Club Countries
1. China 11.4 - 123.9 4.5 - 21.2 - - - 166.2 2. Iran - - - - - - - - - - 3. UAE - - - - - - - - - - 4. Oman - - - - - - - - - - 5. Saudi Arabia - 26.7 - 53.5 16.1 - - - Sub-Total (II) 11.4 26.7 123.9 58.0 - 21.2 16.1 - - 166.2 III. Multilateral
1. ADB - - - 247.6 3.5 19.2 4.0 5.0 2.0 - 2. EEC / EU 19.6 200.7 - 230.2 130.9 14.6 - - 3. Islamic Development Bank - - - 0.6 0.3 - - - - 4. IDA - 9.0 - - 2.0 10.2 117.7 - 5. IBRD 39.4 18.1 127.2 - 111.2 15.6 - 15.0 69.9 30.0 6. IFAD - - 0.5 - - - - 2.9 3.1 - 7. AIIB - - - - - - - 1.5 4.1 - 8. UN and Specialised Agencies - 2.4 - - - - - - - - 9. UNDP Special Grant - - - - - - - - - - 10. World Food Programme - - - - - - - - - - 11. UNFPA - - - - - - - - Sub-Total (III) 59.0 230.2 127.8 478.3 114.9 34.8 136.9 49.1 196.8 30.0 IV. Relief Assistance for
A. Afghan Refugees 4.2 - 1.0 1.3 1.1 1.9 0.9 0.3 - - B. Earthquake - - - - - - - 1. Afghanistan - - - - - - - - - - 2. Algeria - - - - - - - - - - 3. Austria - - - - - - - - - - 4. Azerbaijan - - - - - - - - - - 5. Bhutan - - - - - - - - - - 6. Brunei - - - - - - - - - - 7. China - - - - - - - - - - 8. Cyprus - - - - - - - - - - 9. Indonesia - - - - - - - - - - 10. Jordan - - - - - - - - - - 11. Malaysia - - - - - - - - - - 12. Morocco - - - - - - - - - - 13. Oman - - - - - - - - - - 14. Pak-Turk foundation - - - - - - - - - - 15. Saudi Arabia - - - - - - - - - - 16. South Korea - - - - - - - - - - 17. Thailand - - - - - - - - - - 18. Turkey for FATA TDPs - - - - 10.0 - - - - - 19. UK - - - - - - - - - - 20. ADB - - - - - - - - - - 21. WB (IDA) 10.0 - - - - - - - - - 22. Germany - - - - - - - - - - 23. IDB - - - - - - - - - - 24. Mauritius - - - - - - - - - - Sub-Total (IV) 14.2 - 1.0 1.3 11.1 1.9 0.9 0.3 - - V. International Bonds - - - - - - - - - 41.7 Sub-Total (V) - - - - - - - - - 41.7 Grand Total (I+II+III+IV+V) 1,382.3 447.9 875.6 682.1 864.9 95.7 162.6 62.9 274.2 268.7
Source : Economic Affairs Division
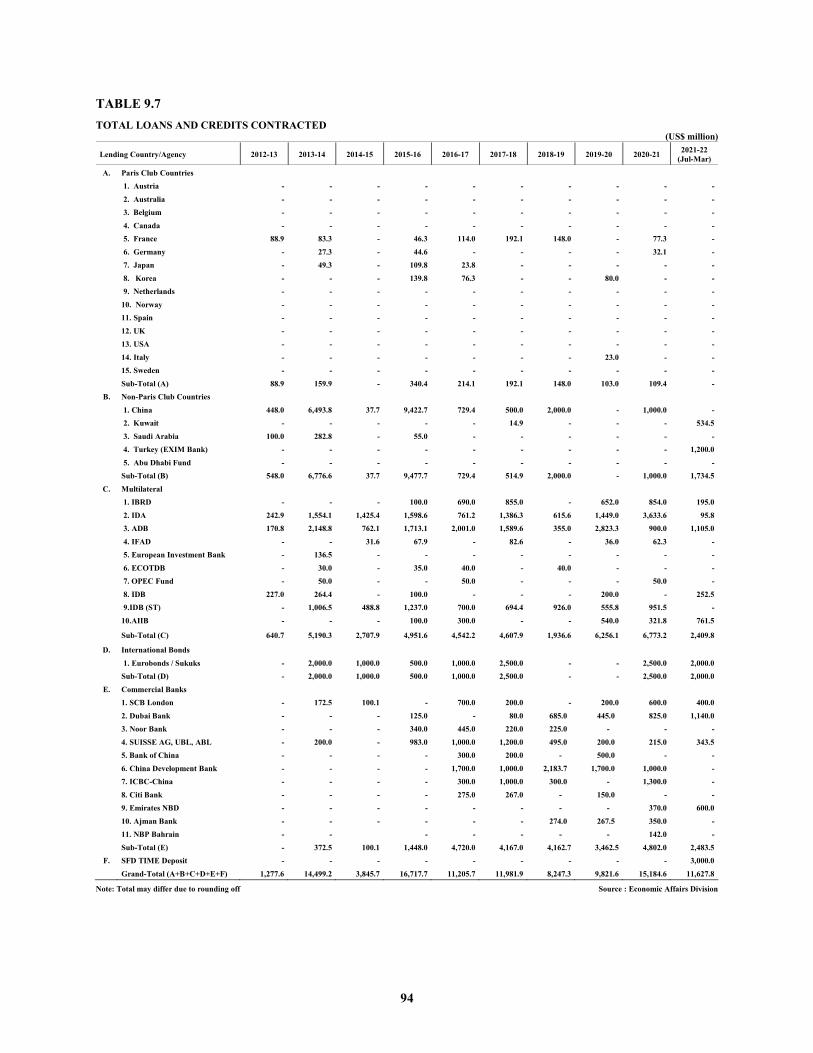
94
TABLE 9.7
TOTAL LOANS AND CREDITS CONTRACTED (US$ million)
Lending Country/Agency 2012-13 2013-14 2014-15 2015-16 2016-17 2017-18 2018-19 2019-20 2020-21 2021-22 (Jul-Mar)
A. Paris Club Countries
1. Austria - - - - - - - - - - 2. Australia - - - - - - - - - - 3. Belgium - - - - - - - - - - 4. Canada - - - - - - - - - - 5. France 88.9 83.3 - 46.3 114.0 192.1 148.0 - 77.3 - 6. Germany - 27.3 - 44.6 - - - - 32.1 - 7. Japan - 49.3 - 109.8 23.8 - - - - - 8. Korea - - - 139.8 76.3 - - 80.0 - - 9. Netherlands - - - - - - - - - - 10. Norway - - - - - - - - - - 11. Spain - - - - - - - - - - 12. UK - - - - - - - - - - 13. USA - - - - - - - - - - 14. Italy - - - - - - - 23.0 - - 15. Sweden - - - - - - - - - - Sub-Total (A) 88.9 159.9 - 340.4 214.1 192.1 148.0 103.0 109.4 -
B. Non-Paris Club Countries 1. China 448.0 6,493.8 37.7 9,422.7 729.4 500.0 2,000.0 - 1,000.0 - 2. Kuwait - - - - - 14.9 - - - 534.5 3. Saudi Arabia 100.0 282.8 - 55.0 - - - - - - 4. Turkey (EXIM Bank) - - - - - - - - - 1,200.0 5. Abu Dhabi Fund - - - - - - - - - - Sub-Total (B) 548.0 6,776.6 37.7 9,477.7 729.4 514.9 2,000.0 - 1,000.0 1,734.5
C. Multilateral
1. IBRD - - - 100.0 690.0 855.0 - 652.0 854.0 195.0 2. IDA 242.9 1,554.1 1,425.4 1,598.6 761.2 1,386.3 615.6 1,449.0 3,633.6 95.8 3. ADB 170.8 2,148.8 762.1 1,713.1 2,001.0 1,589.6 355.0 2,823.3 900.0 1,105.0 4. IFAD - - 31.6 67.9 - 82.6 - 36.0 62.3 - 5. European Investment Bank - 136.5 - - - - - - - - 6. ECOTDB - 30.0 - 35.0 40.0 - 40.0 - - - 7. OPEC Fund - 50.0 - - 50.0 - - - 50.0 - 8. IDB 227.0 264.4 - 100.0 - - - 200.0 - 252.5 9.IDB (ST) - 1,006.5 488.8 1,237.0 700.0 694.4 926.0 555.8 951.5 - 10.AIIB - - - 100.0 300.0 - - 540.0 321.8 761.5 Sub-Total (C) 640.7 5,190.3 2,707.9 4,951.6 4,542.2 4,607.9 1,936.6 6,256.1 6,773.2 2,409.8
D. International Bonds 1. Eurobonds / Sukuks - 2,000.0 1,000.0 500.0 1,000.0 2,500.0 - - 2,500.0 2,000.0 Sub-Total (D) - 2,000.0 1,000.0 500.0 1,000.0 2,500.0 - - 2,500.0 2,000.0
E. Commercial Banks
1. SCB London - 172.5 100.1 - 700.0 200.0 - 200.0 600.0 400.0 2. Dubai Bank - - - 125.0 - 80.0 685.0 445.0 825.0 1,140.0 3. Noor Bank - - - 340.0 445.0 220.0 225.0 - - - 4. SUISSE AG, UBL, ABL - 200.0 - 983.0 1,000.0 1,200.0 495.0 200.0 215.0 343.5 5. Bank of China - - - - 300.0 200.0 - 500.0 - - 6. China Development Bank - - - - 1,700.0 1,000.0 2,183.7 1,700.0 1,000.0 - 7. ICBC-China - - - - 300.0 1,000.0 300.0 - 1,300.0 - 8. Citi Bank - - - - 275.0 267.0 - 150.0 - - 9. Emirates NBD - - - - - - - - 370.0 600.0 10. Ajman Bank - - - - - - 274.0 267.5 350.0 - 11. NBP Bahrain - - - - - - - 142.0 - Sub-Total (E) - 372.5 100.1 1,448.0 4,720.0 4,167.0 4,162.7 3,462.5 4,802.0 2,483.5
F. SFD TIME Deposit - - - - - - - - - 3,000.0
Grand-Total (A+B+C+D+E+F) 1,277.6 14,499.2 3,845.7 16,717.7 11,205.7 11,981.9 8,247.3 9,821.6 15,184.6 11,627.8
Note: Total may differ due to rounding off Source : Economic Affairs Division

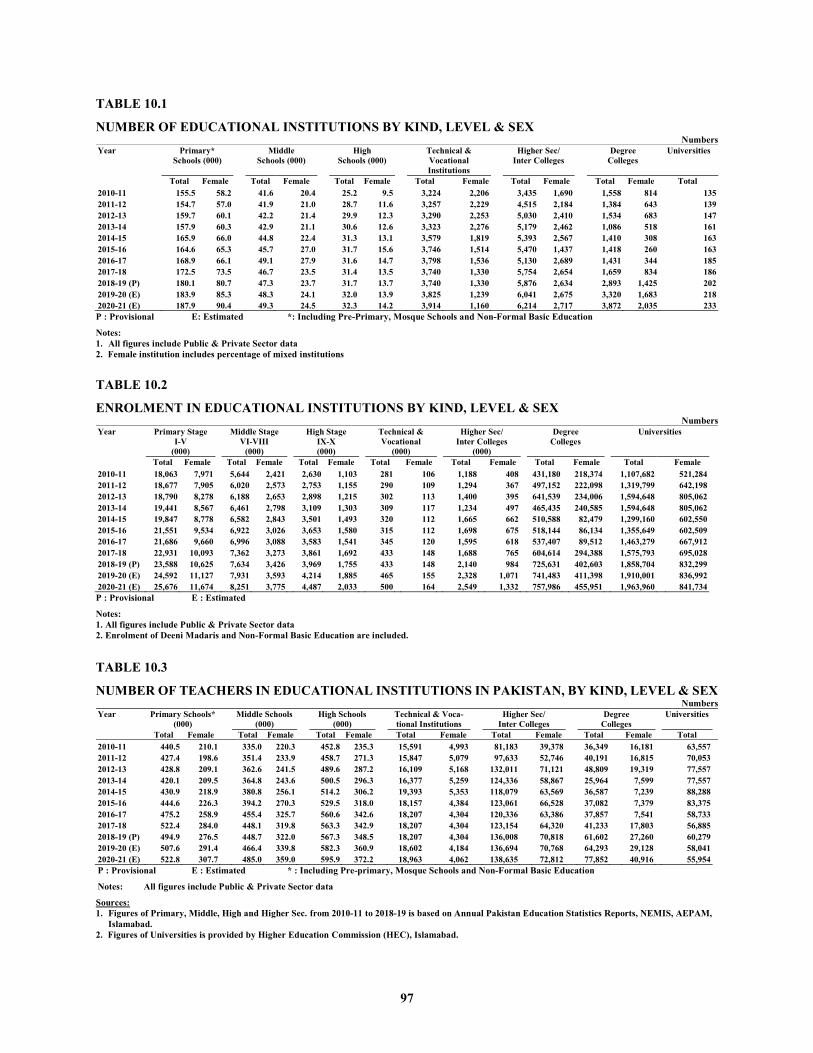
97
TABLE 10.1
NUMBER OF EDUCATIONAL INSTITUTIONS BY KIND, LEVEL & SEX Numbers
Year Primary* Schools (000)
Middle Schools (000)
High Schools (000)
Technical & Vocational Institutions
Higher Sec/ Inter Colleges
Degree Colleges
Universities
Total Female Total Female Total Female Total Female Total Female Total Female Total 2010-11 155.5 58.2 41.6 20.4 25.2 9.5 3,224 2,206 3,435 1,690 1,558 814 135 2011-12 154.7 57.0 41.9 21.0 28.7 11.6 3,257 2,229 4,515 2,184 1,384 643 139 2012-13 159.7 60.1 42.2 21.4 29.9 12.3 3,290 2,253 5,030 2,410 1,534 683 147 2013-14 157.9 60.3 42.9 21.1 30.6 12.6 3,323 2,276 5,179 2,462 1,086 518 161 2014-15 165.9 66.0 44.8 22.4 31.3 13.1 3,579 1,819 5,393 2,567 1,410 308 163 2015-16 164.6 65.3 45.7 27.0 31.7 15.6 3,746 1,514 5,470 1,437 1,418 260 163 2016-17 168.9 66.1 49.1 27.9 31.6 14.7 3,798 1,536 5,130 2,689 1,431 344 185 2017-18 172.5 73.5 46.7 23.5 31.4 13.5 3,740 1,330 5,754 2,654 1,659 834 186 2018-19 (P) 180.1 80.7 47.3 23.7 31.7 13.7 3,740 1,330 5,876 2,634 2,893 1,425 202 2019-20 (E) 183.9 85.3 48.3 24.1 32.0 13.9 3,825 1,239 6,041 2,675 3,320 1,683 218 2020-21 (E) 187.9 90.4 49.3 24.5 32.3 14.2 3,914 1,160 6,214 2,717 3,872 2,035 233 P : Provisional E: Estimated *: Including Pre-Primary, Mosque Schools and Non-Formal Basic Education
Notes: 1. All figures include Public & Private Sector data 2. Female institution includes percentage of mixed institutions
TABLE 10.2
ENROLMENT IN EDUCATIONAL INSTITUTIONS BY KIND, LEVEL & SEX Numbers
Year Primary Stage I-V
(000)
Middle Stage VI-VIII
(000)
High Stage IX-X (000)
Technical & Vocational
(000)
Higher Sec/ Inter Colleges
(000)
Degree Colleges
Universities
Total Female Total Female Total Female Total Female Total Female Total Female Total
Female 2010-11 18,063 7,971 5,644 2,421 2,630 1,103 281 106 1,188 408 431,180 218,374 1,107,682 521,284
2011-12 18,677 7,905 6,020 2,573 2,753 1,155 290 109 1,294 367 497,152 222,098 1,319,799 642,198
2012-13 18,790 8,278 6,188 2,653 2,898 1,215 302 113 1,400 395 641,539 234,006 1,594,648 805,062
2013-14 19,441 8,567 6,461 2,798 3,109 1,303 309 117 1,234 497 465,435 240,585 1,594,648 805,062
2014-15 19,847 8,778 6,582 2,843 3,501 1,493 320 112 1,665 662 510,588 82,479 1,299,160 602,550
2015-16 21,551 9,534 6,922 3,026 3,653 1,580 315 112 1,698 675 518,144 86,134 1,355,649 602,509
2016-17 21,686 9,660 6,996 3,088 3,583 1,541 345 120 1,595 618 537,407 89,512 1,463,279 667,912
2017-18 22,931 10,093 7,362 3,273 3,861 1,692 433 148 1,688 765 604,614 294,388 1,575,793 695,028
2018-19 (P) 23,588 10,625 7,634 3,426 3,969 1,755 433 148 2,140 984 725,631 402,603 1,858,704 832,299
2019-20 (E) 24,592 11,127 7,931 3,593 4,214 1,885 465 155 2,328 1,071 741,483 411,398 1,910,001 836,992
2020-21 (E) 25,676 11,674 8,251 3,775 4,487 2,033 500 164 2,549 1,332 757,986 455,951 1,963,960 841,734 P : Provisional E : Estimated
Notes: 1. All figures include Public & Private Sector data 2. Enrolment of Deeni Madaris and Non-Formal Basic Education are included.
TABLE 10.3
NUMBER OF TEACHERS IN EDUCATIONAL INSTITUTIONS IN PAKISTAN, BY KIND, LEVEL & SEX Numbers
Year Primary Schools* (000)
Middle Schools (000)
High Schools (000)
Technical & Voca- tional Institutions
Higher Sec/
Inter Colleges Degree
Colleges Universities
Total Female Total Female Total Female Total Female Total Female Total Female Total
2010-11 440.5 210.1 335.0 220.3 452.8 235.3 15,591 4,993 81,183 39,378 36,349 16,181 63,557
2011-12 427.4 198.6 351.4 233.9 458.7 271.3 15,847 5,079 97,633 52,746 40,191 16,815 70,053
2012-13 428.8 209.1 362.6 241.5 489.6 287.2 16,109 5,168 132,011 71,121 48,809 19,319 77,557
2013-14 420.1 209.5 364.8 243.6 500.5 296.3 16,377 5,259 124,336 58,867 25,964 7,599 77,557
2014-15 430.9 218.9 380.8 256.1 514.2 306.2 19,393 5,353 118,079 63,569 36,587 7,239 88,288
2015-16 444.6 226.3 394.2 270.3 529.5 318.0 18,157 4,384 123,061 66,528 37,082 7,379 83,375
2016-17 475.2 258.9 455.4 325.7 560.6 342.6 18,207 4,304 120,336 63,386 37,857 7,541 58,733
2017-18 522.4 284.0 448.1 319.8 563.3 342.9 18,207 4,304 123,154 64,320 41,233 17,803 56,885
2018-19 (P) 494.9 276.5 448.7 322.0 567.3 348.5 18,207 4,304 136,008 70,818 61,602 27,260 60,279
2019-20 (E) 507.6 291.4 466.4 339.8 582.3 360.9 18,602 4,184 136,694 70,768 64,293 29,128 58,041
2020-21 (E) 522.8 307.7 485.0 359.0 595.9 372.2 18,963 4,062 138,635 72,812 77,852 40,916 55,954 P : Provisional E : Estimated * : Including Pre-primary, Mosque Schools and Non-Formal Basic Education
Notes: All figures include Public & Private Sector data
Sources: 1. Figures of Primary, Middle, High and Higher Sec. from 2010-11 to 2018-19 is based on Annual Pakistan Education Statistics Reports, NEMIS, AEPAM,
Islamabad. 2. Figures of Universities is provided by Higher Education Commission (HEC), Islamabad.


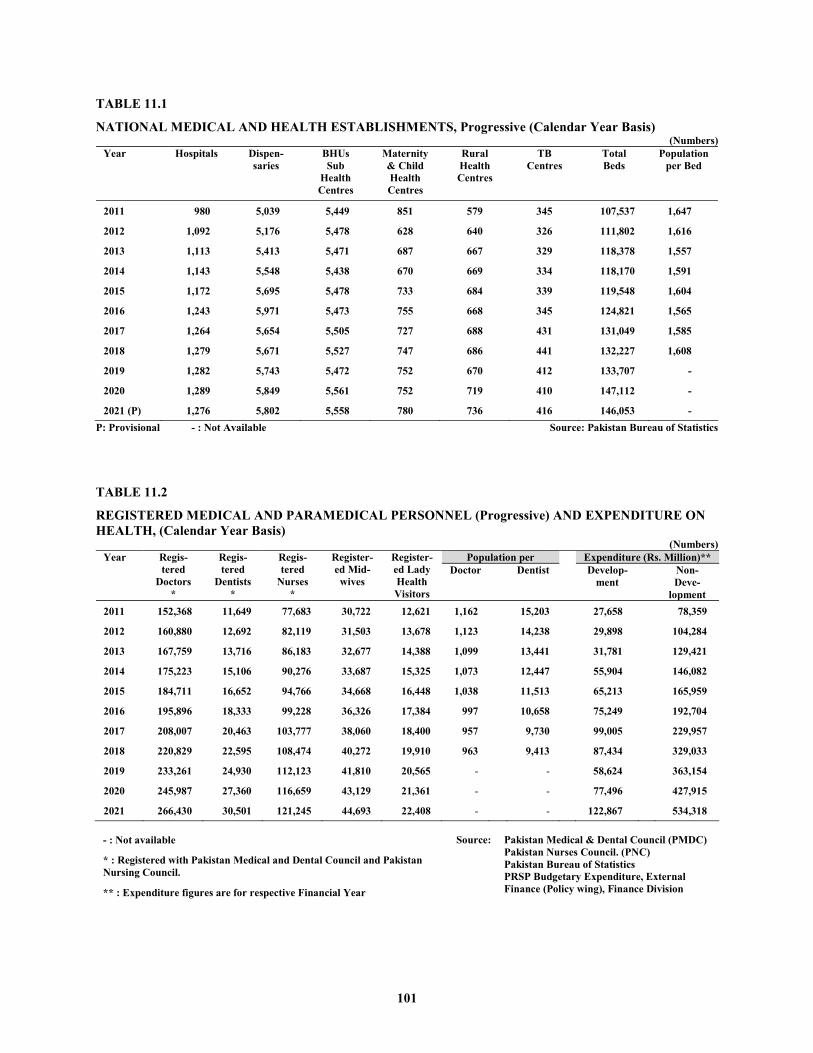
101
TABLE 11.1
NATIONAL MEDICAL AND HEALTH ESTABLISHMENTS, Progressive (Calendar Year Basis) (Numbers)
Year Hospitals Dispen- saries
BHUs Sub
Health Centres
Maternity & Child Health Centres
Rural Health Centres
TB Centres
Total Beds
Population per Bed
2011 980 5,039 5,449 851 579 345 107,537 1,647
2012 1,092 5,176 5,478 628 640 326 111,802 1,616
2013 1,113 5,413 5,471 687 667 329 118,378 1,557
2014 1,143 5,548 5,438 670 669 334 118,170 1,591
2015 1,172 5,695 5,478 733 684 339 119,548 1,604
2016 1,243 5,971 5,473 755 668 345 124,821 1,565
2017 1,264 5,654 5,505 727 688 431 131,049 1,585
2018 1,279 5,671 5,527 747 686 441 132,227 1,608
2019 1,282 5,743 5,472 752 670 412 133,707 -
2020 1,289 5,849 5,561 752 719 410 147,112 -
2021 (P) 1,276 5,802 5,558 780 736 416 146,053 - P: Provisional - : Not Available Source: Pakistan Bureau of Statistics
TABLE 11.2
REGISTERED MEDICAL AND PARAMEDICAL PERSONNEL (Progressive) AND EXPENDITURE ON HEALTH, (Calendar Year Basis)
(Numbers) Year Regis-
tered Doctors
*
Regis- tered
Dentists *
Regis- tered
Nurses *
Register- ed Mid-
wives
Register- ed Lady Health Visitors
Population per Expenditure (Rs. Million)** Doctor Dentist Develop-
ment
Non-Deve-
lopment 2011 152,368 11,649 77,683 30,722 12,621 1,162 15,203 27,658 78,359
2012 160,880 12,692 82,119 31,503 13,678 1,123 14,238 29,898 104,284
2013 167,759 13,716 86,183 32,677 14,388 1,099 13,441 31,781 129,421
2014 175,223 15,106 90,276 33,687 15,325 1,073 12,447 55,904 146,082
2015 184,711 16,652 94,766 34,668 16,448 1,038 11,513 65,213 165,959
2016 195,896 18,333 99,228 36,326 17,384 997 10,658 75,249 192,704
2017 208,007 20,463 103,777 38,060 18,400 957 9,730 99,005 229,957
2018 220,829 22,595 108,474 40,272 19,910 963 9,413 87,434 329,033
2019 233,261 24,930 112,123 41,810 20,565 - - 58,624 363,154
2020 245,987 27,360 116,659 43,129 21,361 - - 77,496 427,915
2021 266,430 30,501 121,245 44,693 22,408 - - 122,867 534,318
- : Not available
* : Registered with Pakistan Medical and Dental Council and Pakistan Nursing Council.
** : Expenditure figures are for respective Financial Year
Source: Pakistan Medical & Dental Council (PMDC) Pakistan Nurses Council. (PNC) Pakistan Bureau of Statistics PRSP Budgetary Expenditure, External Finance (Policy wing), Finance Division
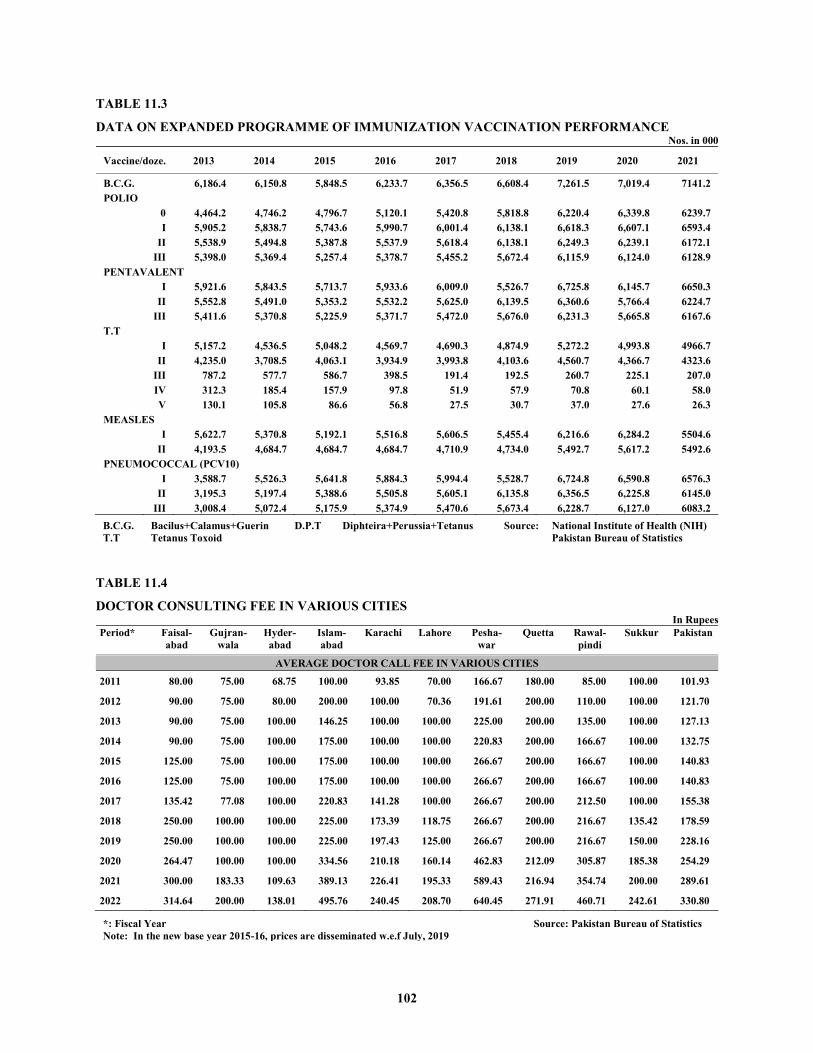
102
TABLE 11.3
DATA ON EXPANDED PROGRAMME OF IMMUNIZATION VACCINATION PERFORMANCE Nos. in 000
Vaccine/doze. 2013 2014 2015 2016 2017 2018 2019 2020 2021
B.C.G. 6,186.4 6,150.8 5,848.5 6,233.7 6,356.5 6,608.4 7,261.5 7,019.4 7141.2 POLIO
0 4,464.2 4,746.2 4,796.7 5,120.1 5,420.8 5,818.8 6,220.4 6,339.8 6239.7 I 5,905.2 5,838.7 5,743.6 5,990.7 6,001.4 6,138.1 6,618.3 6,607.1 6593.4 II 5,538.9 5,494.8 5,387.8 5,537.9 5,618.4 6,138.1 6,249.3 6,239.1 6172.1 III 5,398.0 5,369.4 5,257.4 5,378.7 5,455.2 5,672.4 6,115.9 6,124.0 6128.9
PENTAVALENT
I 5,921.6 5,843.5 5,713.7 5,933.6 6,009.0 5,526.7 6,725.8 6,145.7 6650.3 II 5,552.8 5,491.0 5,353.2 5,532.2 5,625.0 6,139.5 6,360.6 5,766.4 6224.7 III 5,411.6 5,370.8 5,225.9 5,371.7 5,472.0 5,676.0 6,231.3 5,665.8 6167.6
T.T
I 5,157.2 4,536.5 5,048.2 4,569.7 4,690.3 4,874.9 5,272.2 4,993.8 4966.7 II 4,235.0 3,708.5 4,063.1 3,934.9 3,993.8 4,103.6 4,560.7 4,366.7 4323.6 III 787.2 577.7 586.7 398.5 191.4 192.5 260.7 225.1 207.0 IV 312.3 185.4 157.9 97.8 51.9 57.9 70.8 60.1 58.0 V 130.1 105.8 86.6 56.8 27.5 30.7 37.0 27.6 26.3
MEASLES
I 5,622.7 5,370.8 5,192.1 5,516.8 5,606.5 5,455.4 6,216.6 6,284.2 5504.6 II 4,193.5 4,684.7 4,684.7 4,684.7 4,710.9 4,734.0 5,492.7 5,617.2 5492.6
PNEUMOCOCCAL (PCV10) I 3,588.7 5,526.3 5,641.8 5,884.3 5,994.4 5,528.7 6,724.8 6,590.8 6576.3
II 3,195.3 5,197.4 5,388.6 5,505.8 5,605.1 6,135.8 6,356.5 6,225.8 6145.0 III 3,008.4 5,072.4 5,175.9 5,374.9 5,470.6 5,673.4 6,228.7 6,127.0 6083.2
B.C.G. Bacilus+Calamus+Guerin D.P.T Diphteira+Perussia+Tetanus T.T Tetanus Toxoid
Source: National Institute of Health (NIH) Pakistan Bureau of Statistics
TABLE 11.4
DOCTOR CONSULTING FEE IN VARIOUS CITIES In Rupees
Period* Faisal- abad
Gujran- wala
Hyder- abad
Islam- abad
Karachi Lahore Pesha- war
Quetta Rawal- pindi
Sukkur Pakistan
AVERAGE DOCTOR CALL FEE IN VARIOUS CITIES
2011 80.00 75.00 68.75 100.00 93.85 70.00 166.67 180.00 85.00 100.00 101.93
2012 90.00 75.00 80.00 200.00 100.00 70.36 191.61 200.00 110.00 100.00 121.70
2013 90.00 75.00 100.00 146.25 100.00 100.00 225.00 200.00 135.00 100.00 127.13
2014 90.00 75.00 100.00 175.00 100.00 100.00 220.83 200.00 166.67 100.00 132.75
2015 125.00 75.00 100.00 175.00 100.00 100.00 266.67 200.00 166.67 100.00 140.83
2016 125.00 75.00 100.00 175.00 100.00 100.00 266.67 200.00 166.67 100.00 140.83
2017 135.42 77.08 100.00 220.83 141.28 100.00 266.67 200.00 212.50 100.00 155.38
2018 250.00 100.00 100.00 225.00 173.39 118.75 266.67 200.00 216.67 135.42 178.59
2019 250.00 100.00 100.00 225.00 197.43 125.00 266.67 200.00 216.67 150.00 228.16
2020 264.47 100.00 100.00 334.56 210.18 160.14 462.83 212.09 305.87 185.38 254.29
2021 300.00 183.33 109.63 389.13 226.41 195.33 589.43 216.94 354.74 200.00 289.61
2022 314.64 200.00 138.01 495.76 240.45 208.70 640.45 271.91 460.71 242.61 330.80
*: Fiscal Year Note: In the new base year 2015-16, prices are disseminated w.e.f July, 2019
Source: Pakistan Bureau of Statistics


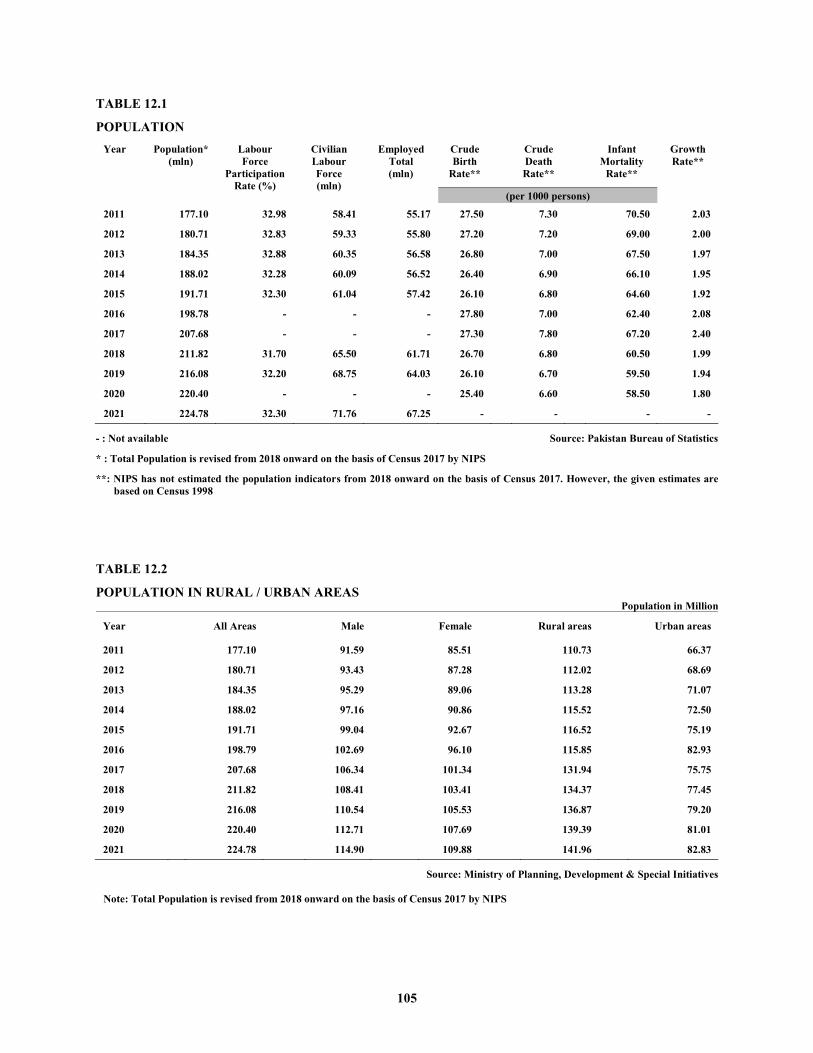
105
TABLE 12.1
POPULATION
Year
Population* (mln)
Labour Force
Participation Rate (%)
Civilian Labour Force (mln)
Employed Total (mln)
Crude Birth
Rate**
Crude Death Rate**
Infant
Mortality Rate**
Growth Rate**
(per 1000 persons)
2011 177.10 32.98 58.41 55.17 27.50 7.30 70.50 2.03
2012 180.71 32.83 59.33 55.80 27.20 7.20 69.00 2.00
2013 184.35 32.88 60.35 56.58 26.80 7.00 67.50 1.97
2014 188.02 32.28 60.09 56.52 26.40 6.90 66.10 1.95
2015 191.71 32.30 61.04 57.42 26.10 6.80 64.60 1.92
2016 198.78 - - - 27.80 7.00 62.40 2.08
2017 207.68 - - - 27.30 7.80 67.20 2.40
2018 211.82 31.70 65.50 61.71 26.70 6.80 60.50 1.99
2019 216.08 32.20 68.75 64.03 26.10 6.70 59.50 1.94
2020 220.40 - - - 25.40 6.60 58.50 1.80
2021 224.78 32.30 71.76 67.25 - - - -
- : Not available Source: Pakistan Bureau of Statistics
* : Total Population is revised from 2018 onward on the basis of Census 2017 by NIPS
**: NIPS has not estimated the population indicators from 2018 onward on the basis of Census 2017. However, the given estimates are based on Census 1998
TABLE 12.2
POPULATION IN RURAL / URBAN AREAS Population in Million
Year All Areas Male Female Rural areas Urban areas
2011 177.10 91.59 85.51 110.73 66.37
2012 180.71 93.43 87.28 112.02 68.69
2013 184.35 95.29 89.06 113.28 71.07
2014 188.02 97.16 90.86 115.52 72.50
2015 191.71 99.04 92.67 116.52 75.19
2016 198.79 102.69 96.10 115.85 82.93
2017 207.68 106.34 101.34 131.94 75.75
2018 211.82 108.41 103.41 134.37 77.45
2019 216.08 110.54 105.53 136.87 79.20
2020 220.40 112.71 107.69 139.39 81.01
2021 224.78 114.90 109.88 141.96 82.83
Source: Ministry of Planning, Development & Special Initiatives
Note: Total Population is revised from 2018 onward on the basis of Census 2017 by NIPS
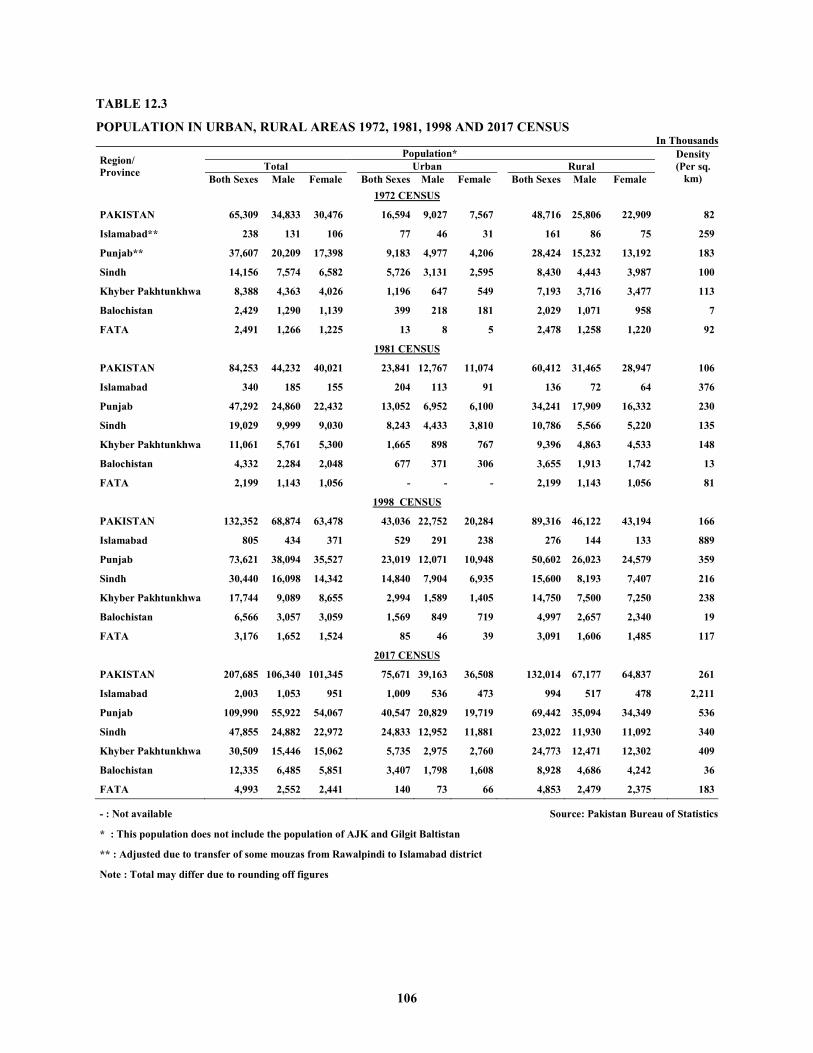
106
TABLE 12.3
POPULATION IN URBAN, RURAL AREAS 1972, 1981, 1998 AND 2017 CENSUS In Thousands
Region/ Province
Population*
Density (Per sq.
km) Total Urban Rural
Both Sexes Male Female Both Sexes Male Female Both Sexes Male Female 1972 CENSUS
PAKISTAN 65,309 34,833 30,476 16,594 9,027 7,567 48,716 25,806 22,909 82
Islamabad** 238 131 106 77 46 31 161 86 75 259
Punjab** 37,607 20,209 17,398 9,183 4,977 4,206 28,424 15,232 13,192 183
Sindh 14,156 7,574 6,582 5,726 3,131 2,595 8,430 4,443 3,987 100
Khyber Pakhtunkhwa 8,388 4,363 4,026 1,196 647 549 7,193 3,716 3,477 113
Balochistan 2,429 1,290 1,139 399 218 181 2,029 1,071 958 7
FATA 2,491 1,266 1,225 13 8 5 2,478 1,258 1,220 92
1981 CENSUS
PAKISTAN 84,253 44,232 40,021 23,841 12,767 11,074 60,412 31,465 28,947 106
Islamabad 340 185 155 204 113 91 136 72 64 376
Punjab 47,292 24,860 22,432 13,052 6,952 6,100 34,241 17,909 16,332 230
Sindh 19,029 9,999 9,030 8,243 4,433 3,810 10,786 5,566 5,220 135
Khyber Pakhtunkhwa 11,061 5,761 5,300 1,665 898 767 9,396 4,863 4,533 148
Balochistan 4,332 2,284 2,048 677 371 306 3,655 1,913 1,742 13
FATA 2,199 1,143 1,056 - - - 2,199 1,143 1,056 81
1998 CENSUS
PAKISTAN 132,352 68,874 63,478 43,036 22,752 20,284 89,316 46,122 43,194 166
Islamabad 805 434 371 529 291 238 276 144 133 889
Punjab 73,621 38,094 35,527 23,019 12,071 10,948 50,602 26,023 24,579 359
Sindh 30,440 16,098 14,342 14,840 7,904 6,935 15,600 8,193 7,407 216
Khyber Pakhtunkhwa 17,744 9,089 8,655 2,994 1,589 1,405 14,750 7,500 7,250 238
Balochistan 6,566 3,057 3,059 1,569 849 719 4,997 2,657 2,340 19
FATA 3,176 1,652 1,524 85 46 39 3,091 1,606 1,485 117
2017 CENSUS
PAKISTAN 207,685 106,340 101,345 75,671 39,163 36,508 132,014 67,177 64,837 261
Islamabad 2,003 1,053 951 1,009 536 473 994 517 478 2,211
Punjab 109,990 55,922 54,067 40,547 20,829 19,719 69,442 35,094 34,349 536
Sindh 47,855 24,882 22,972 24,833 12,952 11,881 23,022 11,930 11,092 340
Khyber Pakhtunkhwa 30,509 15,446 15,062 5,735 2,975 2,760 24,773 12,471 12,302 409
Balochistan 12,335 6,485 5,851 3,407 1,798 1,608 8,928 4,686 4,242 36
FATA 4,993 2,552 2,441 140 73 66 4,853 2,479 2,375 183
- : Not available Source: Pakistan Bureau of Statistics
* : This population does not include the population of AJK and Gilgit Baltistan
** : Adjusted due to transfer of some mouzas from Rawalpindi to Islamabad district
Note : Total may differ due to rounding off figures
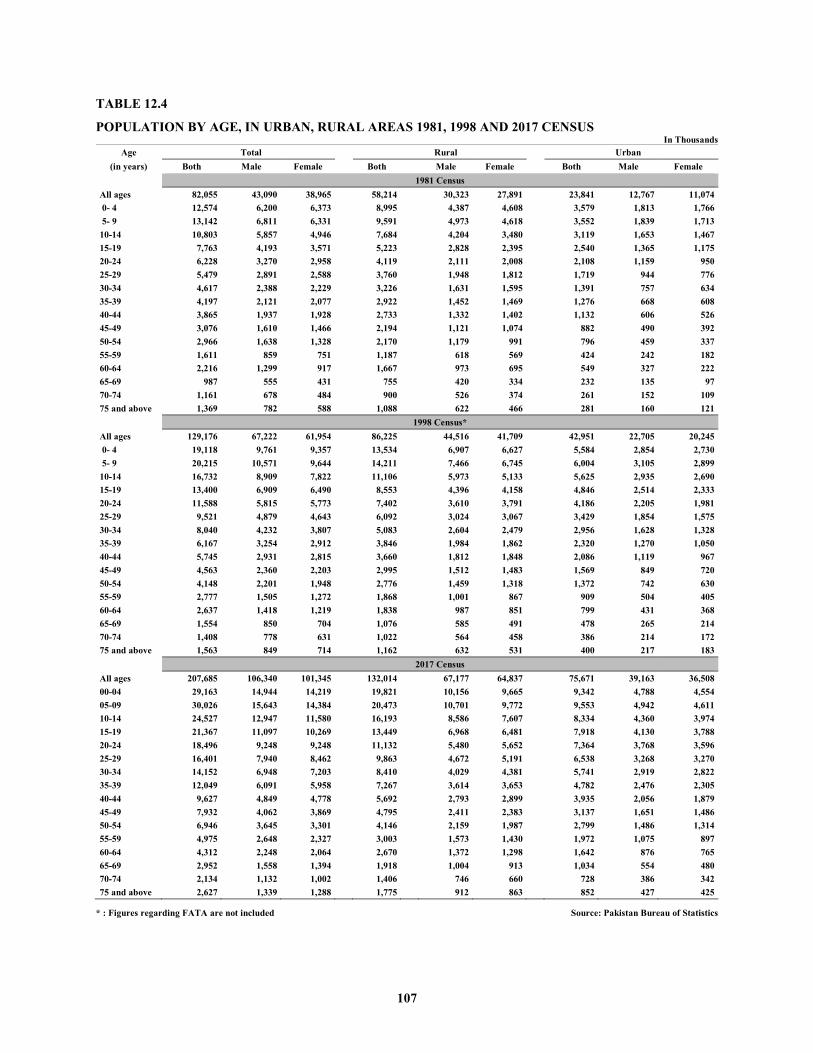
107
TABLE 12.4
POPULATION BY AGE, IN URBAN, RURAL AREAS 1981, 1998 AND 2017 CENSUS In Thousands
Age Total Rural Urban (in years) Both Male Female Both Male Female Both Male Female
1981 Census All ages 82,055 43,090 38,965 58,214 30,323 27,891 23,841 12,767 11,074 0- 4 12,574 6,200 6,373 8,995 4,387 4,608 3,579 1,813 1,766 5- 9 13,142 6,811 6,331 9,591 4,973 4,618 3,552 1,839 1,713 10-14 10,803 5,857 4,946 7,684 4,204 3,480 3,119 1,653 1,467 15-19 7,763 4,193 3,571 5,223 2,828 2,395 2,540 1,365 1,175 20-24 6,228 3,270 2,958 4,119 2,111 2,008 2,108 1,159 950 25-29 5,479 2,891 2,588 3,760 1,948 1,812 1,719 944 776 30-34 4,617 2,388 2,229 3,226 1,631 1,595 1,391 757 634 35-39 4,197 2,121 2,077 2,922 1,452 1,469 1,276 668 608 40-44 3,865 1,937 1,928 2,733 1,332 1,402 1,132 606 526 45-49 3,076 1,610 1,466 2,194 1,121 1,074 882 490 392 50-54 2,966 1,638 1,328 2,170 1,179 991 796 459 337 55-59 1,611 859 751 1,187 618 569 424 242 182 60-64 2,216 1,299 917 1,667 973 695 549 327 222 65-69 987 555 431 755 420 334 232 135 97 70-74 1,161 678 484 900 526 374 261 152 109 75 and above 1,369 782 588 1,088 622 466 281 160 121
1998 Census* All ages 129,176 67,222 61,954 86,225 44,516 41,709 42,951 22,705 20,245 0- 4 19,118 9,761 9,357 13,534 6,907 6,627 5,584 2,854 2,730 5- 9 20,215 10,571 9,644 14,211 7,466 6,745 6,004 3,105 2,899 10-14 16,732 8,909 7,822 11,106 5,973 5,133 5,625 2,935 2,690 15-19 13,400 6,909 6,490 8,553 4,396 4,158 4,846 2,514 2,333 20-24 11,588 5,815 5,773 7,402 3,610 3,791 4,186 2,205 1,981 25-29 9,521 4,879 4,643 6,092 3,024 3,067 3,429 1,854 1,575 30-34 8,040 4,232 3,807 5,083 2,604 2,479 2,956 1,628 1,328 35-39 6,167 3,254 2,912 3,846 1,984 1,862 2,320 1,270 1,050 40-44 5,745 2,931 2,815 3,660 1,812 1,848 2,086 1,119 967 45-49 4,563 2,360 2,203 2,995 1,512 1,483 1,569 849 720 50-54 4,148 2,201 1,948 2,776 1,459 1,318 1,372 742 630 55-59 2,777 1,505 1,272 1,868 1,001 867 909 504 405 60-64 2,637 1,418 1,219 1,838 987 851 799 431 368 65-69 1,554 850 704 1,076 585 491 478 265 214 70-74 1,408 778 631 1,022 564 458 386 214 172 75 and above 1,563 849 714 1,162 632 531 400 217 183
2017 Census All ages 207,685 106,340 101,345 132,014 67,177 64,837 75,671 39,163 36,508 00-04 29,163 14,944 14,219 19,821 10,156 9,665 9,342 4,788 4,554 05-09 30,026 15,643 14,384 20,473 10,701 9,772 9,553 4,942 4,611 10-14 24,527 12,947 11,580 16,193 8,586 7,607 8,334 4,360 3,974 15-19 21,367 11,097 10,269 13,449 6,968 6,481 7,918 4,130 3,788 20-24 18,496 9,248 9,248 11,132 5,480 5,652 7,364 3,768 3,596 25-29 16,401 7,940 8,462 9,863 4,672 5,191 6,538 3,268 3,270 30-34 14,152 6,948 7,203 8,410 4,029 4,381 5,741 2,919 2,822 35-39 12,049 6,091 5,958 7,267 3,614 3,653 4,782 2,476 2,305 40-44 9,627 4,849 4,778 5,692 2,793 2,899 3,935 2,056 1,879 45-49 7,932 4,062 3,869 4,795 2,411 2,383 3,137 1,651 1,486 50-54 6,946 3,645 3,301 4,146 2,159 1,987 2,799 1,486 1,314 55-59 4,975 2,648 2,327 3,003 1,573 1,430 1,972 1,075 897 60-64 4,312 2,248 2,064 2,670 1,372 1,298 1,642 876 765 65-69 2,952 1,558 1,394 1,918 1,004 913 1,034 554 480 70-74 2,134 1,132 1,002 1,406 746 660 728 386 342 75 and above 2,627 1,339 1,288 1,775 912 863 852 427 425
* : Figures regarding FATA are not included Source: Pakistan Bureau of Statistics
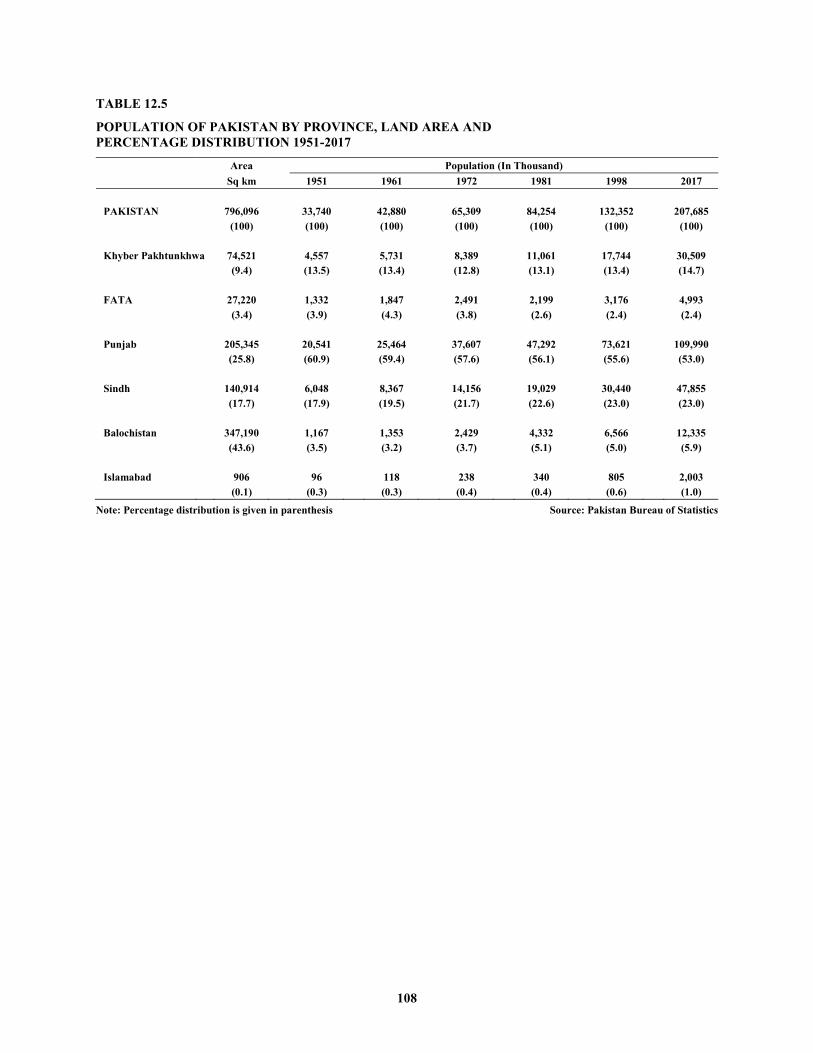
108
TABLE 12.5
POPULATION OF PAKISTAN BY PROVINCE, LAND AREA AND PERCENTAGE DISTRIBUTION 1951-2017
Area Population (In Thousand) Sq km 1951 1961 1972 1981 1998 2017
PAKISTAN 796,096 33,740 42,880 65,309 84,254 132,352 207,685 (100) (100) (100) (100) (100) (100) (100)
Khyber Pakhtunkhwa 74,521 4,557 5,731 8,389 11,061 17,744 30,509 (9.4) (13.5) (13.4) (12.8) (13.1) (13.4) (14.7)
FATA 27,220 1,332 1,847 2,491 2,199 3,176 4,993 (3.4) (3.9) (4.3) (3.8) (2.6) (2.4) (2.4)
Punjab 205,345 20,541 25,464 37,607 47,292 73,621 109,990 (25.8) (60.9) (59.4) (57.6) (56.1) (55.6) (53.0)
Sindh 140,914 6,048 8,367 14,156 19,029 30,440 47,855 (17.7) (17.9) (19.5) (21.7) (22.6) (23.0) (23.0)
Balochistan 347,190 1,167 1,353 2,429 4,332 6,566 12,335 (43.6) (3.5) (3.2) (3.7) (5.1) (5.0) (5.9)
Islamabad 906 96 118 238 340 805 2,003 (0.1) (0.3) (0.3) (0.4) (0.4) (0.6) (1.0)
Note: Percentage distribution is given in parenthesis Source: Pakistan Bureau of Statistics
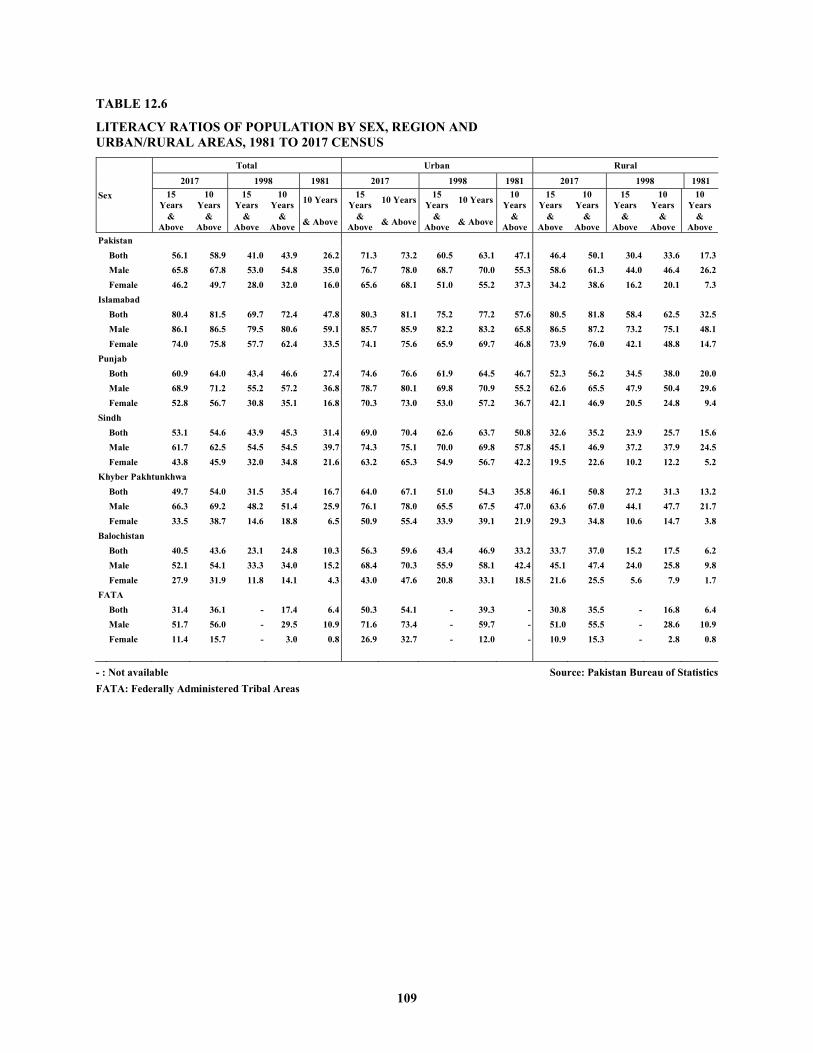
109
TABLE 12.6
LITERACY RATIOS OF POPULATION BY SEX, REGION AND URBAN/RURAL AREAS, 1981 TO 2017 CENSUS
Sex
Total Urban Rural
2017 1998 1981 2017 1998 1981 2017 1998 1981 15
Years 10
Years 15
Years 10
Years 10 Years 15 Years 10 Years 15
Years 10 Years 10 Years
15 Years
10 Years
15 Years
10 Years
10 Years
& Above
& Above
& Above
& Above & Above &
Above & Above & Above & Above &
Above &
Above &
Above &
Above &
Above &
Above Pakistan
Both 56.1 58.9 41.0 43.9 26.2 71.3 73.2 60.5 63.1 47.1 46.4 50.1 30.4 33.6 17.3 Male 65.8 67.8 53.0 54.8 35.0 76.7 78.0 68.7 70.0 55.3 58.6 61.3 44.0 46.4 26.2 Female 46.2 49.7 28.0 32.0 16.0 65.6 68.1 51.0 55.2 37.3 34.2 38.6 16.2 20.1 7.3
Islamabad
Both 80.4 81.5 69.7 72.4 47.8 80.3 81.1 75.2 77.2 57.6 80.5 81.8 58.4 62.5 32.5 Male 86.1 86.5 79.5 80.6 59.1 85.7 85.9 82.2 83.2 65.8 86.5 87.2 73.2 75.1 48.1 Female 74.0 75.8 57.7 62.4 33.5 74.1 75.6 65.9 69.7 46.8 73.9 76.0 42.1 48.8 14.7
Punjab
Both 60.9 64.0 43.4 46.6 27.4 74.6 76.6 61.9 64.5 46.7 52.3 56.2 34.5 38.0 20.0 Male 68.9 71.2 55.2 57.2 36.8 78.7 80.1 69.8 70.9 55.2 62.6 65.5 47.9 50.4 29.6 Female 52.8 56.7 30.8 35.1 16.8 70.3 73.0 53.0 57.2 36.7 42.1 46.9 20.5 24.8 9.4
Sindh
Both 53.1 54.6 43.9 45.3 31.4 69.0 70.4 62.6 63.7 50.8 32.6 35.2 23.9 25.7 15.6 Male 61.7 62.5 54.5 54.5 39.7 74.3 75.1 70.0 69.8 57.8 45.1 46.9 37.2 37.9 24.5 Female 43.8 45.9 32.0 34.8 21.6 63.2 65.3 54.9 56.7 42.2 19.5 22.6 10.2 12.2 5.2
Khyber Pakhtunkhwa Both 49.7 54.0 31.5 35.4 16.7 64.0 67.1 51.0 54.3 35.8 46.1 50.8 27.2 31.3 13.2 Male 66.3 69.2 48.2 51.4 25.9 76.1 78.0 65.5 67.5 47.0 63.6 67.0 44.1 47.7 21.7 Female 33.5 38.7 14.6 18.8 6.5 50.9 55.4 33.9 39.1 21.9 29.3 34.8 10.6 14.7 3.8
Balochistan
Both 40.5 43.6 23.1 24.8 10.3 56.3 59.6 43.4 46.9 33.2 33.7 37.0 15.2 17.5 6.2 Male 52.1 54.1 33.3 34.0 15.2 68.4 70.3 55.9 58.1 42.4 45.1 47.4 24.0 25.8 9.8 Female 27.9 31.9 11.8 14.1 4.3 43.0 47.6 20.8 33.1 18.5 21.6 25.5 5.6 7.9 1.7
FATA
Both 31.4 36.1 - 17.4 6.4 50.3 54.1 - 39.3 - 30.8 35.5 - 16.8 6.4 Male 51.7 56.0 - 29.5 10.9 71.6 73.4 - 59.7 - 51.0 55.5 - 28.6 10.9 Female 11.4 15.7 - 3.0 0.8 26.9 32.7 - 12.0 - 10.9 15.3 - 2.8 0.8
- : Not available Source: Pakistan Bureau of Statistics FATA: Federally Administered Tribal Areas
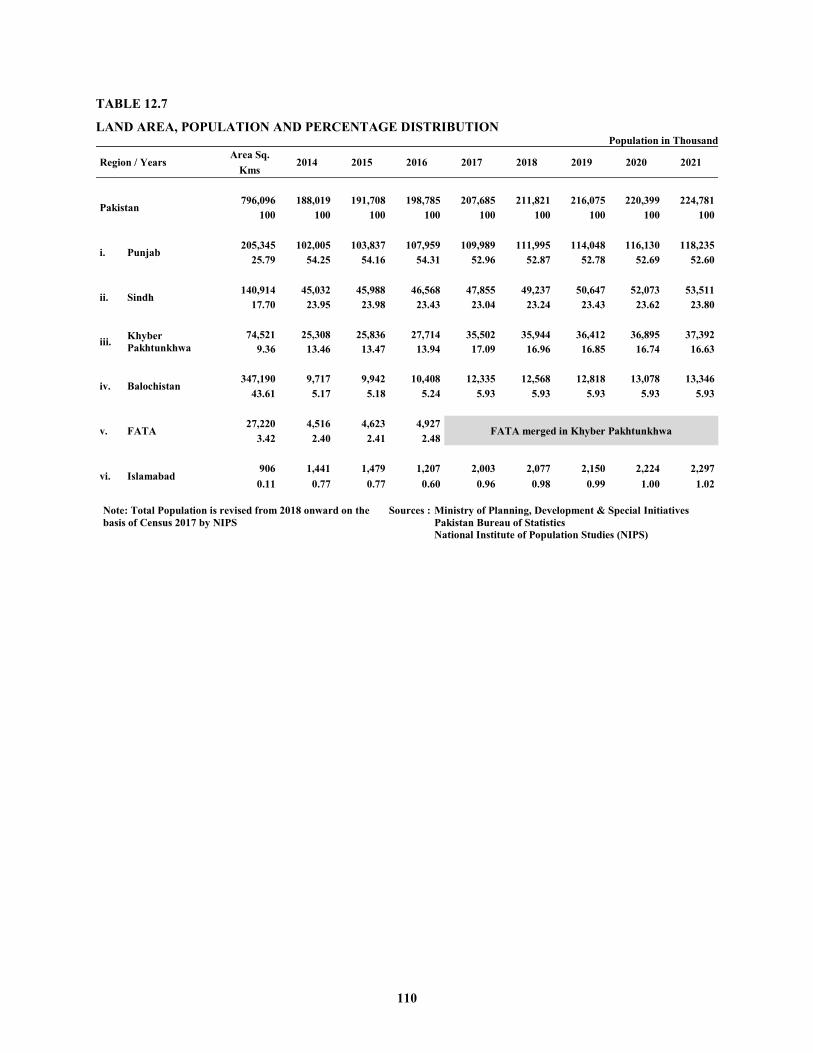
110
TABLE 12.7
LAND AREA, POPULATION AND PERCENTAGE DISTRIBUTION Population in Thousand
Region / Years Area Sq.
2014 2015 2016 2017 2018 2019 2020 2021 Kms
Pakistan 796,096 188,019 191,708 198,785 207,685 211,821 216,075 220,399 224,781
100 100 100 100 100 100 100 100 100
i. Punjab 205,345 102,005 103,837 107,959 109,989 111,995 114,048 116,130 118,235
25.79 54.25 54.16 54.31 52.96 52.87 52.78 52.69 52.60
ii. Sindh 140,914 45,032 45,988 46,568 47,855 49,237 50,647 52,073 53,511
17.70 23.95 23.98 23.43 23.04 23.24 23.43 23.62 23.80
iii. Khyber Pakhtunkhwa
74,521 25,308 25,836 27,714 35,502 35,944 36,412 36,895 37,392 9.36 13.46 13.47 13.94 17.09 16.96 16.85 16.74 16.63
iv. Balochistan 347,190 9,717 9,942 10,408 12,335 12,568 12,818 13,078 13,346
43.61 5.17 5.18 5.24 5.93 5.93 5.93 5.93 5.93
v. FATA 27,220 4,516 4,623 4,927
FATA merged in Khyber Pakhtunkhwa 3.42 2.40 2.41 2.48
vi. Islamabad 906 1,441 1,479 1,207 2,003 2,077 2,150 2,224 2,297 0.11 0.77 0.77 0.60 0.96 0.98 0.99 1.00 1.02
Note: Total Population is revised from 2018 onward on the basis of Census 2017 by NIPS
Sources : Ministry of Planning, Development & Special Initiatives Pakistan Bureau of Statistics National Institute of Population Studies (NIPS)

111
TABLE 12.8
PERCENTAGE DISTRIBUTION OF POPULATION OF 10 YEARS AND ABOVE AND CIVILIAN LABOUR FORCE BY GENDER AND AREA 2020-21
Percent Share
Population
Civilian Labour Force
Total Civilian Labour Force Employed Unemployed
Total Male Female Total Male Female Total Male Female Total Male Female
PAKISTAN 100 50.63 49.37 44.90 34.36 10.54 42.07 32.48 9.60 2.82 1.88 0.94
Rural 100 50.12 49.88 48.56 34.61 13.95 45.75 32.83 12.92 2.81 1.78 1.03
Urban 100 51.48 48.52 38.79 33.93 4.86 35.95 31.88 4.06 2.85 2.05 0.80
Punjab 100 49.85 50.15 47.38 34.21 13.17 44.18 32.12 12.06 3.20 2.09 1.11
Rural 100 49.29 50.71 52.26 34.72 17.54 49.01 32.71 16.30 3.25 2.01 1.24
Urban 100 50.75 49.25 39.45 33.39 6.06 36.32 31.17 5.16 3.12 2.22 0.90
Sindh 100 52.01 47.99 43.83 36.52 7.31 42.14 35.31 6.83 1.69 1.21 0.48
Rural 100 51.76 48.24 49.71 37.79 11.92 48.69 37.05 11.64 1.02 0.74 0.28
Urban 100 52.23 47.77 38.68 35.41 3.27 36.40 33.79 2.61 2.28 1.63 0.66 Khyber Pakhtunkhwa 100 50.08 49.92 39.51 31.65 7.86 36.02 29.39 6.63 3.49 2.26 1.23
Rural 100 49.74 50.26 40.07 31.52 8.55 36.55 29.32 7.23 3.52 2.20 1.32
Urban 100 51.82 48.18 36.65 32.27 4.38 33.35 29.73 3.62 3.30 2.54 0.76
Balochistan 100 54.33 45.67 40.39 34.94 5.45 38.65 33.47 5.18 1.75 1.48 0.27
Rural 100 54.15 45.85 42.75 35.86 6.88 41.39 34.66 6.73 1.36 1.21 0.15
Urban 100 54.78 45.22 34.68 32.71 1.97 31.98 30.58 1.40 2.70 2.13 0.57 Source : Pakistan Bureau of Statistics Labour Force Survey 2020-21
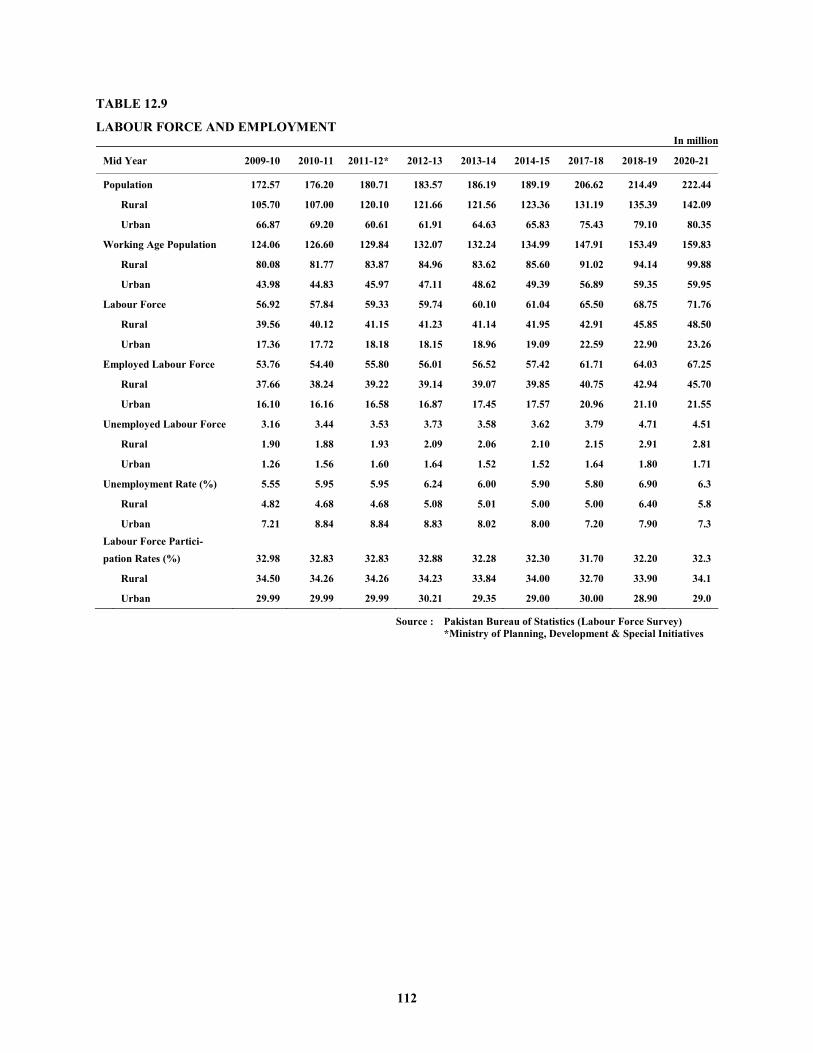
112
TABLE 12.9
LABOUR FORCE AND EMPLOYMENT In million
Mid Year 2009-10 2010-11 2011-12* 2012-13 2013-14 2014-15 2017-18 2018-19 2020-21
Population 172.57 176.20 180.71 183.57 186.19 189.19 206.62 214.49 222.44 Rural 105.70 107.00 120.10 121.66 121.56 123.36 131.19 135.39 142.09 Urban 66.87 69.20 60.61 61.91 64.63 65.83 75.43 79.10 80.35
Working Age Population 124.06 126.60 129.84 132.07 132.24 134.99 147.91 153.49 159.83 Rural 80.08 81.77 83.87 84.96 83.62 85.60 91.02 94.14 99.88 Urban 43.98 44.83 45.97 47.11 48.62 49.39 56.89 59.35 59.95
Labour Force 56.92 57.84 59.33 59.74 60.10 61.04 65.50 68.75 71.76 Rural 39.56 40.12 41.15 41.23 41.14 41.95 42.91 45.85 48.50 Urban 17.36 17.72 18.18 18.15 18.96 19.09 22.59 22.90 23.26
Employed Labour Force 53.76 54.40 55.80 56.01 56.52 57.42 61.71 64.03 67.25 Rural 37.66 38.24 39.22 39.14 39.07 39.85 40.75 42.94 45.70 Urban 16.10 16.16 16.58 16.87 17.45 17.57 20.96 21.10 21.55
Unemployed Labour Force 3.16 3.44 3.53 3.73 3.58 3.62 3.79 4.71 4.51 Rural 1.90 1.88 1.93 2.09 2.06 2.10 2.15 2.91 2.81 Urban 1.26 1.56 1.60 1.64 1.52 1.52 1.64 1.80 1.71
Unemployment Rate (%) 5.55 5.95 5.95 6.24 6.00 5.90 5.80 6.90 6.3 Rural 4.82 4.68 4.68 5.08 5.01 5.00 5.00 6.40 5.8 Urban 7.21 8.84 8.84 8.83 8.02 8.00 7.20 7.90 7.3
Labour Force Partici- pation Rates (%) 32.98 32.83 32.83 32.88 32.28 32.30 31.70 32.20 32.3 Rural 34.50 34.26 34.26 34.23 33.84 34.00 32.70 33.90 34.1
Urban 29.99 29.99 29.99 30.21 29.35 29.00 30.00 28.90 29.0
Source : Pakistan Bureau of Statistics (Labour Force Survey) *Ministry of Planning, Development & Special Initiatives

113
TABLE 12.10
POPULATION AND LABOUR FORCE In million
Years Popula- tion
Crude Activity Rate(%)
Labour Force
Unemp- loyed
Labour Force
Employed Labour Force
Agricul- ture
Mining & Manu- facturing
Const- ruction
Electricity & Gas Distri- bution
Transport Storage
& Commu- cation
Whole- Sale & Retail Trade
Others
2010-11 176.20 32.83 57.84 3.44 54.40 24.51 7.51 3.78 0.26 2.78 8.78 6.78
2011-12* 180.71 32.83 59.33 3.53 55.80 25.14 7.70 3.88 0.27 2.85 8.28 7.68
2012-13 183.57 32.88 60.34 3.76 56.58 24.73 8.03 4.21 0.30 2.82 8.14 8.35
2013-14 186.19 32.28 60.10 3.58 56.52 24.57 8.00 4.15 0.27 3.07 8.24 8.21
2014-15 189.19 32.30 61.04 3.62 57.42 24.27 8.89 4.20 0.45 3.11 8.41 8.09
2017-18 206.62 31.70 65.50 3.79 61.71 23.76 10.05 4.70 0.45 3.50 9.21 10.05
2018-19 214.49 32.10 68.75 4.71 64.03 25.07 9.76 5.13 0.50 3.98 9.28 10.30
2020-21 222.44 32.30 71.76 4.51 67.25 25.18 10.25 6.39 0.43 4.19 9.66 11.13
Source: Pakistan Bureau of Statistics (Labour Force Survey) *Ministry of Planning, Development & Special Initiatives
TABLE 12.11
DISTRIBUTION OF EMPLOYED PERSONS OF 10 YEARS AGE AND ABOVE BY MAJOR INDUSTRIES
in Percentage Years
Agricul- ture
Mining & Manu-
facturing
Const- ruction
Electricity & Gas Distri- bution
Transport Storage
& Commu- cation
Whole- Sale & Retail Trade
Others
2010-11 45.05 13.80 6.95 0.48 5.11 16.15 12.46
2011-12* - - - - - - -
2012-13 43.71 14.20 7.44 0.53 4.98 14.39 14.75
2013-14 43.48 14.16 7.33 0.48 5.44 14.58 14.53
2014-15 42.27 15.49 7.31 0.79 5.00 14.64 14.09
2017-18 38.50 16.28 7.61 0.73 5.67 14.92 16.29
2018-19 39.16 15.25 8.01 0.78 5.76 14.50 16.54
2020-21 37.40 15.20 9.50 0.60 6.30 14.40 16.60
- : Not available * : Labour Force Survey was not conducted in 2011-12
Source: Pakistan Bureau of Statistics
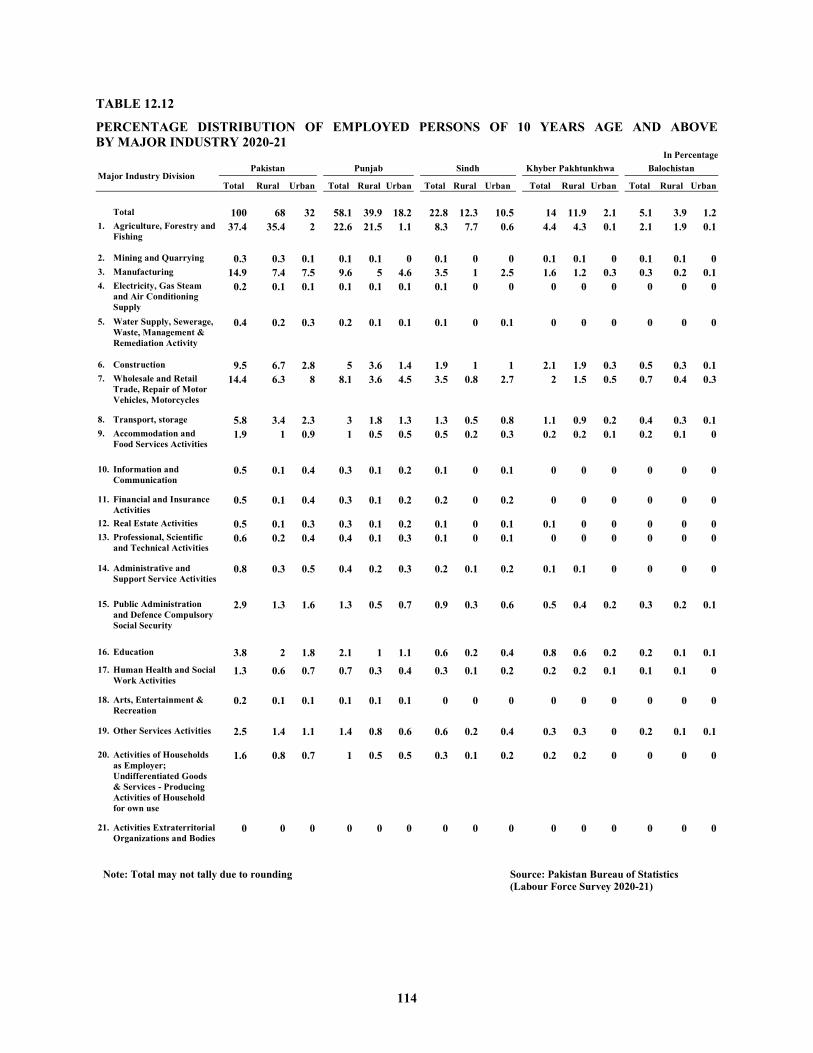
114
TABLE 12.12
PERCENTAGE DISTRIBUTION OF EMPLOYED PERSONS OF 10 YEARS AGE AND ABOVE BY MAJOR INDUSTRY 2020-21
In Percentage
Major Industry Division Pakistan
Punjab
Sindh
Khyber Pakhtunkhwa
Balochistan
Total Rural Urban Total Rural Urban Total Rural Urban Total Rural Urban Total Rural Urban
Total 100 68 32 58.1 39.9 18.2 22.8 12.3 10.5 14 11.9 2.1 5.1 3.9 1.2 1. Agriculture, Forestry and
Fishing 37.4 35.4 2 22.6 21.5 1.1 8.3 7.7 0.6 4.4 4.3 0.1 2.1 1.9 0.1
2. Mining and Quarrying 0.3 0.3 0.1 0.1 0.1 0 0.1 0 0 0.1 0.1 0 0.1 0.1 0 3. Manufacturing 14.9 7.4 7.5 9.6 5 4.6 3.5 1 2.5 1.6 1.2 0.3 0.3 0.2 0.1 4. Electricity, Gas Steam
and Air Conditioning Supply
0.2 0.1 0.1 0.1 0.1 0.1 0.1 0 0 0 0 0 0 0 0
5. Water Supply, Sewerage, Waste, Management & Remediation Activity
0.4 0.2 0.3 0.2 0.1 0.1 0.1 0 0.1 0 0 0 0 0 0
6. Construction 9.5 6.7 2.8 5 3.6 1.4 1.9 1 1 2.1 1.9 0.3 0.5 0.3 0.1 7. Wholesale and Retail
Trade, Repair of Motor Vehicles, Motorcycles
14.4 6.3 8 8.1 3.6 4.5 3.5 0.8 2.7 2 1.5 0.5 0.7 0.4 0.3
8. Transport, storage 5.8 3.4 2.3 3 1.8 1.3 1.3 0.5 0.8 1.1 0.9 0.2 0.4 0.3 0.1 9. Accommodation and
Food Services Activities 1.9 1 0.9 1 0.5 0.5 0.5 0.2 0.3 0.2 0.2 0.1 0.2 0.1 0
10. Information and Communication
0.5 0.1 0.4 0.3 0.1 0.2 0.1 0 0.1 0 0 0 0 0 0
11. Financial and Insurance Activities
0.5 0.1 0.4 0.3 0.1 0.2 0.2 0 0.2 0 0 0 0 0 0
12. Real Estate Activities 0.5 0.1 0.3 0.3 0.1 0.2 0.1 0 0.1 0.1 0 0 0 0 0 13. Professional, Scientific
and Technical Activities 0.6 0.2 0.4 0.4 0.1 0.3 0.1 0 0.1 0 0 0 0 0 0
14. Administrative and Support Service Activities
0.8 0.3 0.5 0.4 0.2 0.3 0.2 0.1 0.2 0.1 0.1 0 0 0 0
15. Public Administration and Defence Compulsory Social Security
2.9 1.3 1.6 1.3 0.5 0.7 0.9 0.3 0.6 0.5 0.4 0.2 0.3 0.2 0.1
16. Education 3.8 2 1.8 2.1 1 1.1 0.6 0.2 0.4 0.8 0.6 0.2 0.2 0.1 0.1 17. Human Health and Social
Work Activities 1.3 0.6 0.7 0.7 0.3 0.4 0.3 0.1 0.2 0.2 0.2 0.1 0.1 0.1 0
18. Arts, Entertainment & Recreation
0.2 0.1 0.1 0.1 0.1 0.1 0 0 0 0 0 0 0 0 0
19. Other Services Activities 2.5 1.4 1.1 1.4 0.8 0.6 0.6 0.2 0.4 0.3 0.3 0 0.2 0.1 0.1
20. Activities of Households as Employer; Undifferentiated Goods & Services - Producing Activities of Household for own use
1.6 0.8 0.7 1 0.5 0.5 0.3 0.1 0.2 0.2 0.2 0 0 0 0
21. Activities Extraterritorial Organizations and Bodies
0 0 0 0 0 0 0 0 0 0 0 0 0 0 0
Note: Total may not tally due to rounding Source: Pakistan Bureau of Statistics
(Labour Force Survey 2020-21)
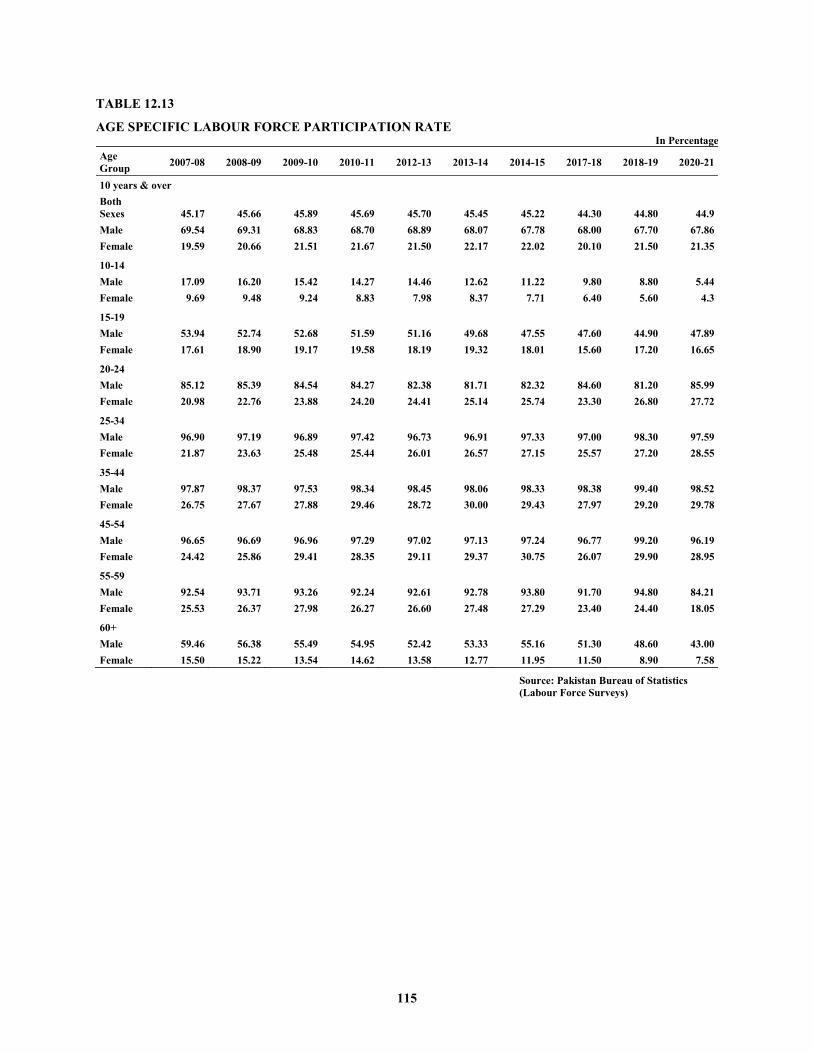
115
TABLE 12.13
AGE SPECIFIC LABOUR FORCE PARTICIPATION RATE In Percentage
Age Group 2007-08 2008-09 2009-10 2010-11 2012-13 2013-14 2014-15 2017-18 2018-19 2020-21
10 years & over Both Sexes 45.17 45.66 45.89 45.69 45.70 45.45 45.22 44.30 44.80 44.9 Male 69.54 69.31 68.83 68.70 68.89 68.07 67.78 68.00 67.70 67.86 Female 19.59 20.66 21.51 21.67 21.50 22.17 22.02 20.10 21.50 21.35
10-14
Male 17.09 16.20 15.42 14.27 14.46 12.62 11.22 9.80 8.80 5.44 Female 9.69 9.48 9.24 8.83 7.98 8.37 7.71 6.40 5.60 4.3
15-19
Male 53.94 52.74 52.68 51.59 51.16 49.68 47.55 47.60 44.90 47.89 Female 17.61 18.90 19.17 19.58 18.19 19.32 18.01 15.60 17.20 16.65
20-24
Male 85.12 85.39 84.54 84.27 82.38 81.71 82.32 84.60 81.20 85.99 Female 20.98 22.76 23.88 24.20 24.41 25.14 25.74 23.30 26.80 27.72
25-34
Male 96.90 97.19 96.89 97.42 96.73 96.91 97.33 97.00 98.30 97.59 Female 21.87 23.63 25.48 25.44 26.01 26.57 27.15 25.57 27.20 28.55
35-44
Male 97.87 98.37 97.53 98.34 98.45 98.06 98.33 98.38 99.40 98.52 Female 26.75 27.67 27.88 29.46 28.72 30.00 29.43 27.97 29.20 29.78
45-54
Male 96.65 96.69 96.96 97.29 97.02 97.13 97.24 96.77 99.20 96.19 Female 24.42 25.86 29.41 28.35 29.11 29.37 30.75 26.07 29.90 28.95
55-59
Male 92.54 93.71 93.26 92.24 92.61 92.78 93.80 91.70 94.80 84.21 Female 25.53 26.37 27.98 26.27 26.60 27.48 27.29 23.40 24.40 18.05
60+
Male 59.46 56.38 55.49 54.95 52.42 53.33 55.16 51.30 48.60 43.00 Female 15.50 15.22 13.54 14.62 13.58 12.77 11.95 11.50 8.90 7.58
Source: Pakistan Bureau of Statistics (Labour Force Surveys)
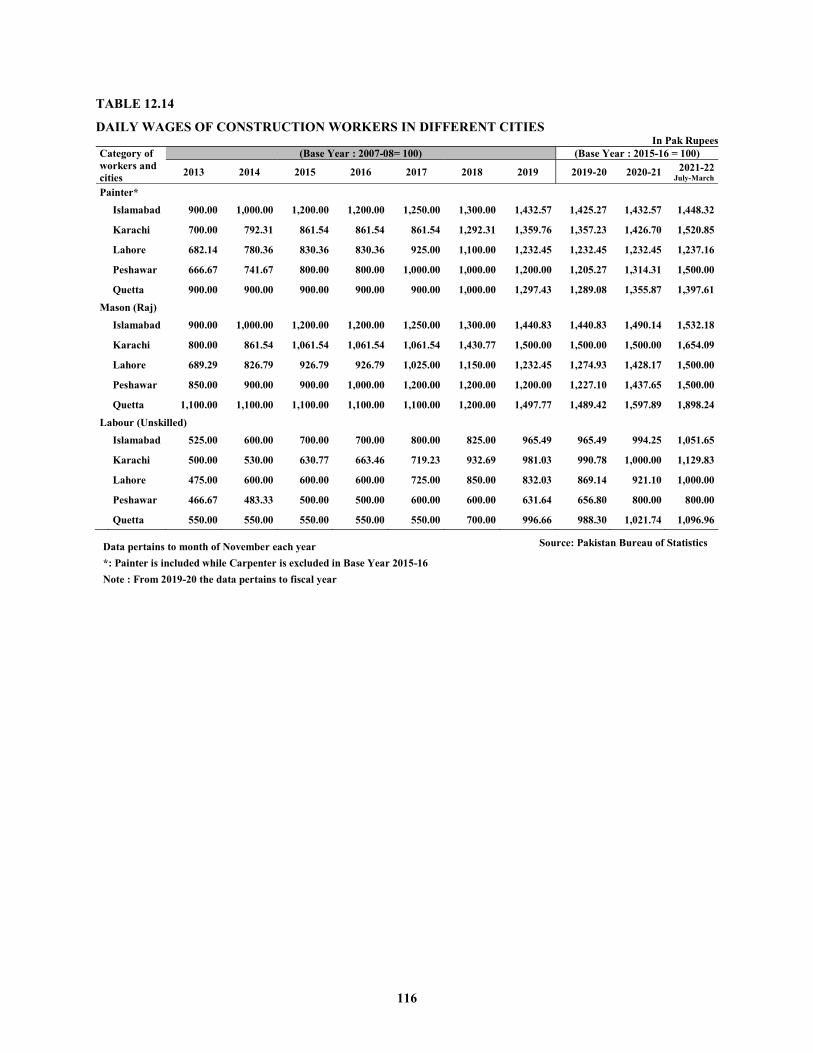
116
TABLE 12.14
DAILY WAGES OF CONSTRUCTION WORKERS IN DIFFERENT CITIES In Pak Rupees
Category of workers and cities
(Base Year : 2007-08= 100) (Base Year : 2015-16 = 100)
2013 2014 2015 2016 2017 2018 2019 2019-20 2020-21 2021-22 July-March
Painter*
Islamabad 900.00 1,000.00 1,200.00 1,200.00 1,250.00 1,300.00 1,432.57 1,425.27 1,432.57 1,448.32 Karachi 700.00 792.31 861.54 861.54 861.54 1,292.31 1,359.76 1,357.23 1,426.70 1,520.85 Lahore 682.14 780.36 830.36 830.36 925.00 1,100.00 1,232.45 1,232.45 1,232.45 1,237.16 Peshawar 666.67 741.67 800.00 800.00 1,000.00 1,000.00 1,200.00 1,205.27 1,314.31 1,500.00 Quetta 900.00 900.00 900.00 900.00 900.00 1,000.00 1,297.43 1,289.08 1,355.87 1,397.61
Mason (Raj)
Islamabad 900.00 1,000.00 1,200.00 1,200.00 1,250.00 1,300.00 1,440.83 1,440.83 1,490.14 1,532.18 Karachi 800.00 861.54 1,061.54 1,061.54 1,061.54 1,430.77 1,500.00 1,500.00 1,500.00 1,654.09 Lahore 689.29 826.79 926.79 926.79 1,025.00 1,150.00 1,232.45 1,274.93 1,428.17 1,500.00 Peshawar 850.00 900.00 900.00 1,000.00 1,200.00 1,200.00 1,200.00 1,227.10 1,437.65 1,500.00 Quetta 1,100.00 1,100.00 1,100.00 1,100.00 1,100.00 1,200.00 1,497.77 1,489.42 1,597.89 1,898.24
Labour (Unskilled)
Islamabad 525.00 600.00 700.00 700.00 800.00 825.00 965.49 965.49 994.25 1,051.65 Karachi 500.00 530.00 630.77 663.46 719.23 932.69 981.03 990.78 1,000.00 1,129.83 Lahore 475.00 600.00 600.00 600.00 725.00 850.00 832.03 869.14 921.10 1,000.00 Peshawar 466.67 483.33 500.00 500.00 600.00 600.00 631.64 656.80 800.00 800.00 Quetta 550.00 550.00 550.00 550.00 550.00 700.00 996.66 988.30 1,021.74 1,096.96
Data pertains to month of November each year *: Painter is included while Carpenter is excluded in Base Year 2015-16 Note : From 2019-20 the data pertains to fiscal year
Source: Pakistan Bureau of Statistics

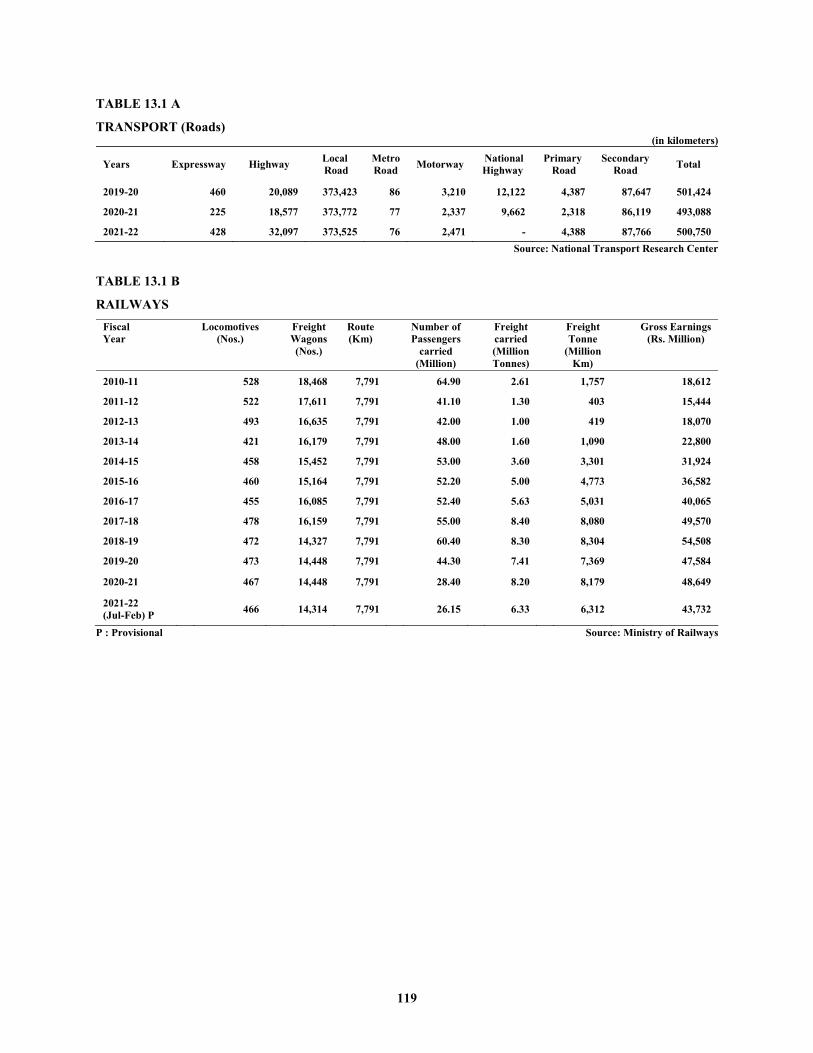
119
TABLE 13.1 A
TRANSPORT (Roads) (in kilometers)
Years Expressway Highway Local Road
Metro Road Motorway National
Highway Primary
Road Secondary
Road Total
2019-20 460 20,089 373,423 86 3,210 12,122 4,387 87,647 501,424
2020-21 225 18,577 373,772 77 2,337 9,662 2,318 86,119 493,088
2021-22 428 32,097 373,525 76 2,471 - 4,388 87,766 500,750 Source: National Transport Research Center
TABLE 13.1 B
RAILWAYS
Fiscal Year
Locomotives (Nos.)
Freight Wagons (Nos.)
Route (Km)
Number of Passengers
carried (Million)
Freight carried (Million Tonnes)
Freight Tonne
(Million Km)
Gross Earnings (Rs. Million)
2010-11 528 18,468 7,791 64.90 2.61 1,757 18,612
2011-12 522 17,611 7,791 41.10 1.30 403 15,444
2012-13 493 16,635 7,791 42.00 1.00 419 18,070
2013-14 421 16,179 7,791 48.00 1.60 1,090 22,800
2014-15 458 15,452 7,791 53.00 3.60 3,301 31,924
2015-16 460 15,164 7,791 52.20 5.00 4,773 36,582
2016-17 455 16,085 7,791 52.40 5.63 5,031 40,065
2017-18 478 16,159 7,791 55.00 8.40 8,080 49,570
2018-19 472 14,327 7,791 60.40 8.30 8,304 54,508
2019-20 473 14,448 7,791 44.30 7.41 7,369 47,584
2020-21 467 14,448 7,791 28.40 8.20 8,179 48,649
2021-22 (Jul-Feb) P 466 14,314 7,791 26.15 6.33 6,312 43,732
P : Provisional Source: Ministry of Railways
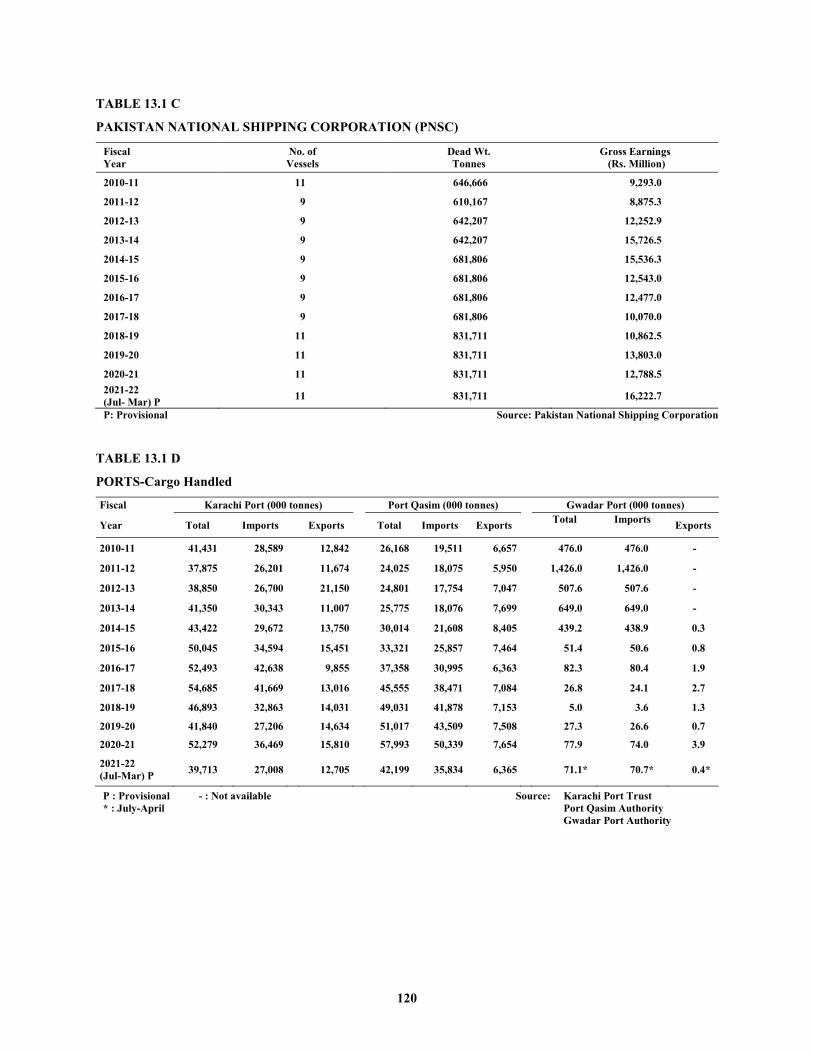
120
TABLE 13.1 C
PAKISTAN NATIONAL SHIPPING CORPORATION (PNSC)
Fiscal Year
No. of Vessels
Dead Wt. Tonnes
Gross Earnings (Rs. Million)
2010-11 11 646,666 9,293.0
2011-12 9 610,167 8,875.3
2012-13 9 642,207 12,252.9
2013-14 9 642,207 15,726.5
2014-15 9 681,806 15,536.3
2015-16 9 681,806 12,543.0
2016-17 9 681,806 12,477.0
2017-18 9 681,806 10,070.0
2018-19 11 831,711 10,862.5
2019-20 11 831,711 13,803.0
2020-21 11 831,711 12,788.5 2021-22 (Jul- Mar) P 11 831,711 16,222.7
P: Provisional Source: Pakistan National Shipping Corporation
TABLE 13.1 D
PORTS-Cargo Handled
Fiscal Karachi Port (000 tonnes) Port Qasim (000 tonnes) Gwadar Port (000 tonnes)
Year Total Imports Exports Total Imports Exports Total
Imports
Exports
2010-11 41,431 28,589 12,842 26,168 19,511 6,657 476.0 476.0 -
2011-12 37,875 26,201 11,674 24,025 18,075 5,950 1,426.0 1,426.0 -
2012-13 38,850 26,700 21,150 24,801 17,754 7,047 507.6 507.6 -
2013-14 41,350 30,343 11,007 25,775 18,076 7,699 649.0 649.0 -
2014-15 43,422 29,672 13,750 30,014 21,608 8,405 439.2 438.9 0.3
2015-16 50,045 34,594 15,451 33,321 25,857 7,464 51.4 50.6 0.8
2016-17 52,493 42,638 9,855 37,358 30,995 6,363 82.3 80.4 1.9
2017-18 54,685 41,669 13,016 45,555 38,471 7,084 26.8 24.1 2.7
2018-19 46,893 32,863 14,031 49,031 41,878 7,153 5.0 3.6 1.3
2019-20 41,840 27,206 14,634 51,017 43,509 7,508 27.3 26.6 0.7
2020-21 52,279 36,469 15,810 57,993 50,339 7,654 77.9 74.0 3.9
2021-22 (Jul-Mar) P 39,713 27,008 12,705 42,199 35,834 6,365 71.1* 70.7* 0.4*
P : Provisional - : Not available * : July-April
Source: Karachi Port Trust Port Qasim Authority Gwadar Port Authority
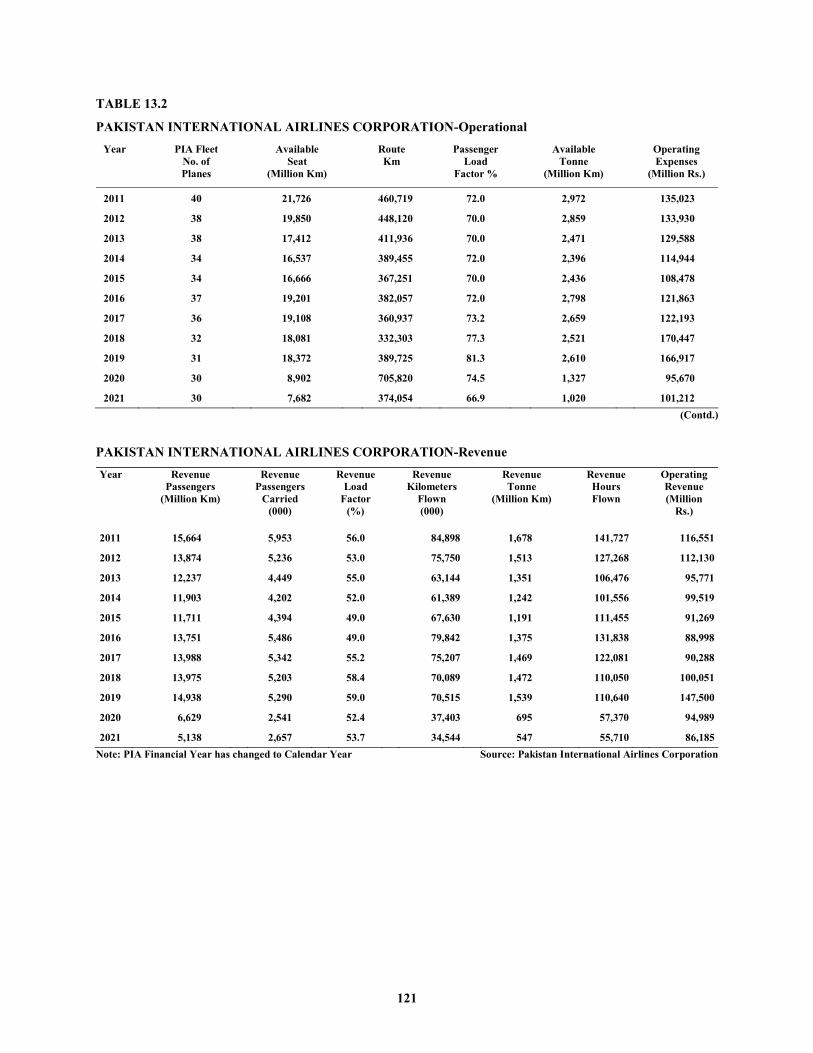
121
TABLE 13.2
PAKISTAN INTERNATIONAL AIRLINES CORPORATION-Operational Year
PIA Fleet
No. of Planes
Available
Seat (Million Km)
Route Km
Passenger
Load Factor %
Available
Tonne (Million Km)
Operating Expenses
(Million Rs.)
2011 40 21,726 460,719 72.0 2,972 135,023
2012 38 19,850 448,120 70.0 2,859 133,930
2013 38 17,412 411,936 70.0 2,471 129,588
2014 34 16,537 389,455 72.0 2,396 114,944
2015 34 16,666 367,251 70.0 2,436 108,478
2016 37 19,201 382,057 72.0 2,798 121,863
2017 36 19,108 360,937 73.2 2,659 122,193
2018 32 18,081 332,303 77.3 2,521 170,447
2019 31 18,372 389,725 81.3 2,610 166,917
2020 30 8,902 705,820 74.5 1,327 95,670
2021 30 7,682 374,054 66.9 1,020 101,212 (Contd.)
PAKISTAN INTERNATIONAL AIRLINES CORPORATION-Revenue
Year
Revenue Passengers
(Million Km)
Revenue
Passengers Carried
(000)
Revenue
Load Factor
(%)
Revenue
Kilometers Flown (000)
Revenue Tonne
(Million Km)
Revenue Hours Flown
Operating Revenue (Million
Rs.)
2011 15,664 5,953 56.0 84,898 1,678 141,727 116,551
2012 13,874 5,236 53.0 75,750 1,513 127,268 112,130
2013 12,237 4,449 55.0 63,144 1,351 106,476 95,771
2014 11,903 4,202 52.0 61,389 1,242 101,556 99,519
2015 11,711 4,394 49.0 67,630 1,191 111,455 91,269
2016 13,751 5,486 49.0 79,842 1,375 131,838 88,998
2017 13,988 5,342 55.2 75,207 1,469 122,081 90,288
2018 13,975 5,203 58.4 70,089 1,472 110,050 100,051
2019 14,938 5,290 59.0 70,515 1,539 110,640 147,500
2020 6,629 2,541 52.4 37,403 695 57,370 94,989
2021 5,138 2,657 53.7 34,544 547 55,710 86,185 Note: PIA Financial Year has changed to Calendar Year Source: Pakistan International Airlines Corporation
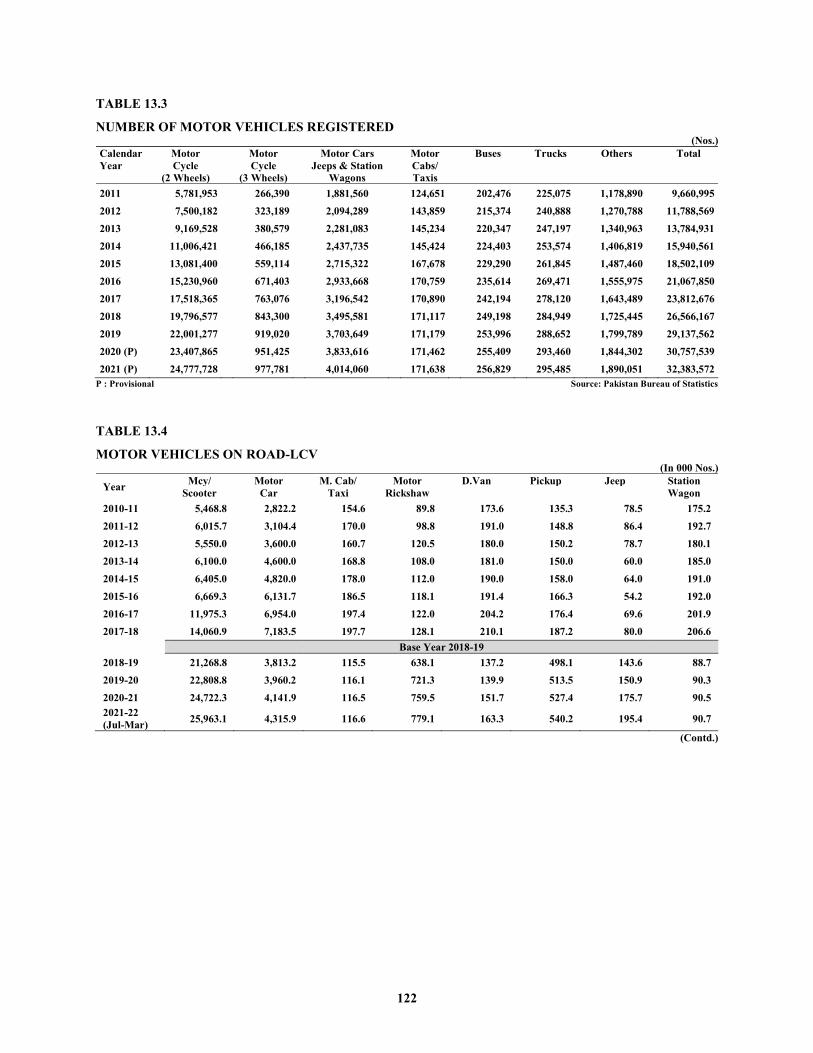
122
TABLE 13.3
NUMBER OF MOTOR VEHICLES REGISTERED (Nos.)
Calendar Year
Motor Cycle
(2 Wheels)
Motor Cycle
(3 Wheels)
Motor Cars
Jeeps & Station Wagons
Motor Cabs/ Taxis
Buses
Trucks
Others
Total
2011 5,781,953 266,390 1,881,560 124,651 202,476 225,075 1,178,890 9,660,995 2012 7,500,182 323,189 2,094,289 143,859 215,374 240,888 1,270,788 11,788,569 2013 9,169,528 380,579 2,281,083 145,234 220,347 247,197 1,340,963 13,784,931 2014 11,006,421 466,185 2,437,735 145,424 224,403 253,574 1,406,819 15,940,561 2015 13,081,400 559,114 2,715,322 167,678 229,290 261,845 1,487,460 18,502,109 2016 15,230,960 671,403 2,933,668 170,759 235,614 269,471 1,555,975 21,067,850 2017 17,518,365 763,076 3,196,542 170,890 242,194 278,120 1,643,489 23,812,676 2018 19,796,577 843,300 3,495,581 171,117 249,198 284,949 1,725,445 26,566,167 2019 22,001,277 919,020 3,703,649 171,179 253,996 288,652 1,799,789 29,137,562 2020 (P) 23,407,865 951,425 3,833,616 171,462 255,409 293,460 1,844,302 30,757,539 2021 (P) 24,777,728 977,781 4,014,060 171,638 256,829 295,485 1,890,051 32,383,572
P : Provisional Source: Pakistan Bureau of Statistics
TABLE 13.4
MOTOR VEHICLES ON ROAD-LCV (In 000 Nos.)
Year Mcy/ Motor M. Cab/ Motor D.Van Pickup Jeep Station Scooter Car Taxi Rickshaw Wagon
2010-11 5,468.8 2,822.2 154.6 89.8 173.6 135.3 78.5 175.2 2011-12 6,015.7 3,104.4 170.0 98.8 191.0 148.8 86.4 192.7 2012-13 5,550.0 3,600.0 160.7 120.5 180.0 150.2 78.7 180.1 2013-14 6,100.0 4,600.0 168.8 108.0 181.0 150.0 60.0 185.0 2014-15 6,405.0 4,820.0 178.0 112.0 190.0 158.0 64.0 191.0 2015-16 6,669.3 6,131.7 186.5 118.1 191.4 166.3 54.2 192.0 2016-17 11,975.3 6,954.0 197.4 122.0 204.2 176.4 69.6 201.9 2017-18 14,060.9 7,183.5 197.7 128.1 210.1 187.2 80.0 206.6 Base Year 2018-19 2018-19 21,268.8 3,813.2 115.5 638.1 137.2 498.1 143.6 88.7 2019-20 22,808.8 3,960.2 116.1 721.3 139.9 513.5 150.9 90.3 2020-21 24,722.3 4,141.9 116.5 759.5 151.7 527.4 175.7 90.5 2021-22 (Jul-Mar) 25,963.1 4,315.9 116.6 779.1 163.3 540.2 195.4 90.7
(Contd.)
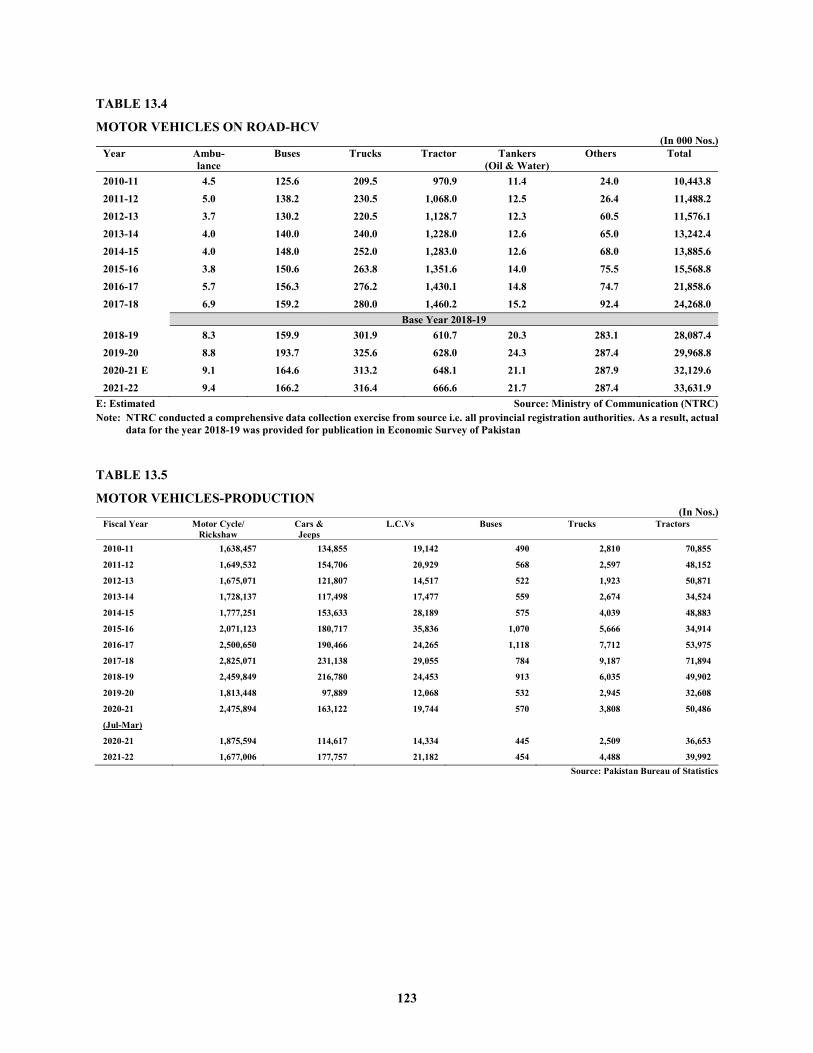
123
TABLE 13.4
MOTOR VEHICLES ON ROAD-HCV (In 000 Nos.)
Year
Ambu- lance
Buses Trucks Tractor Tankers (Oil & Water)
Others Total
2010-11 4.5 125.6 209.5 970.9 11.4 24.0 10,443.8 2011-12 5.0 138.2 230.5 1,068.0 12.5 26.4 11,488.2 2012-13 3.7 130.2 220.5 1,128.7 12.3 60.5 11,576.1 2013-14 4.0 140.0 240.0 1,228.0 12.6 65.0 13,242.4 2014-15 4.0 148.0 252.0 1,283.0 12.6 68.0 13,885.6 2015-16 3.8 150.6 263.8 1,351.6 14.0 75.5 15,568.8 2016-17 5.7 156.3 276.2 1,430.1 14.8 74.7 21,858.6 2017-18 6.9 159.2 280.0 1,460.2 15.2 92.4 24,268.0 Base Year 2018-19 2018-19 8.3 159.9 301.9 610.7 20.3 283.1 28,087.4 2019-20 8.8 193.7 325.6 628.0 24.3 287.4 29,968.8 2020-21 E 9.1 164.6 313.2 648.1 21.1 287.9 32,129.6 2021-22 9.4 166.2 316.4 666.6 21.7 287.4 33,631.9
E: Estimated Source: Ministry of Communication (NTRC) Note: NTRC conducted a comprehensive data collection exercise from source i.e. all provincial registration authorities. As a result, actual
data for the year 2018-19 was provided for publication in Economic Survey of Pakistan
TABLE 13.5
MOTOR VEHICLES-PRODUCTION (In Nos.)
Fiscal Year Motor Cycle/ Rickshaw
Cars & Jeeps
L.C.Vs Buses Trucks Tractors
2010-11 1,638,457 134,855 19,142 490 2,810 70,855
2011-12 1,649,532 154,706 20,929 568 2,597 48,152
2012-13 1,675,071 121,807 14,517 522 1,923 50,871
2013-14 1,728,137 117,498 17,477 559 2,674 34,524
2014-15 1,777,251 153,633 28,189 575 4,039 48,883
2015-16 2,071,123 180,717 35,836 1,070 5,666 34,914
2016-17 2,500,650 190,466 24,265 1,118 7,712 53,975
2017-18 2,825,071 231,138 29,055 784 9,187 71,894
2018-19 2,459,849 216,780 24,453 913 6,035 49,902
2019-20 1,813,448 97,889 12,068 532 2,945 32,608
2020-21 2,475,894 163,122 19,744 570 3,808 50,486
(Jul-Mar) 2020-21 1,875,594 114,617 14,334 445 2,509 36,653
2021-22 1,677,006 177,757 21,182 454 4,488 39,992 Source: Pakistan Bureau of Statistics
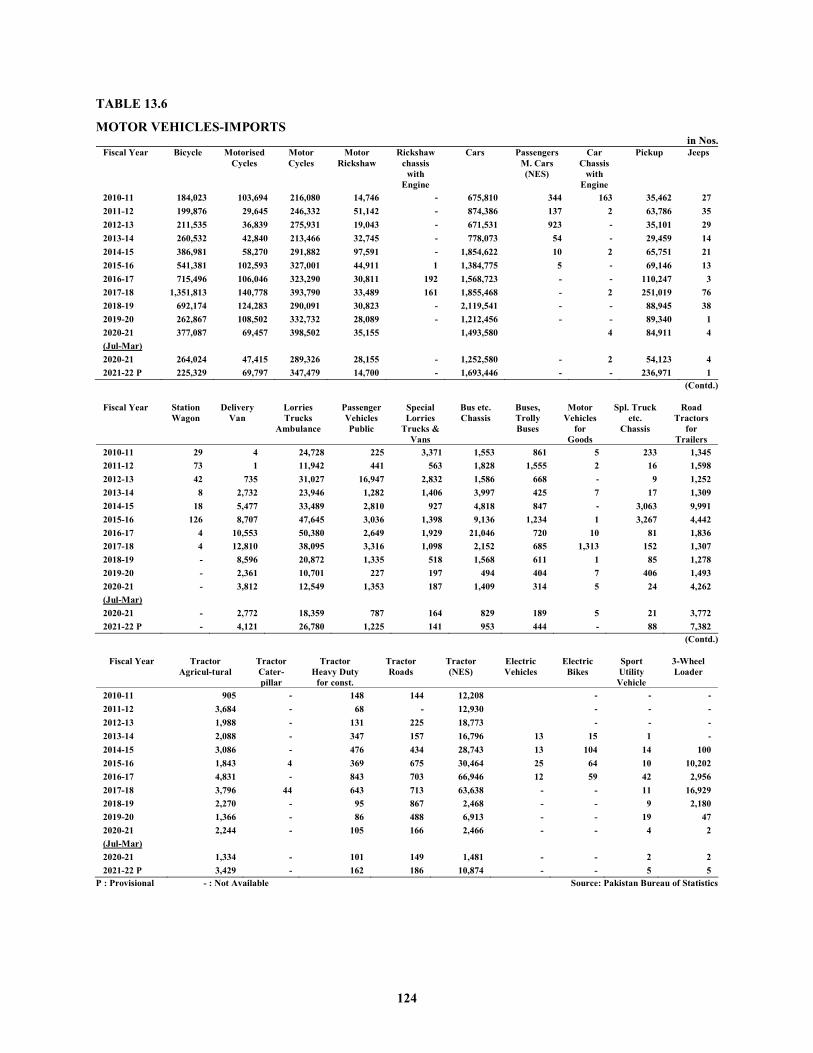
124
TABLE 13.6
MOTOR VEHICLES-IMPORTS in Nos.
Fiscal Year Bicycle Motorised Cycles
Motor Cycles
Motor Rickshaw
Rickshaw chassis
with Engine
Cars Passengers M. Cars (NES)
Car Chassis
with Engine
Pickup Jeeps
2010-11 184,023 103,694 216,080 14,746 -- 675,810 344 163 35,462 27 2011-12 199,876 29,645 246,332 51,142 -- 874,386 137 2 63,786 35 2012-13 211,535 36,839 275,931 19,043 -- 671,531 923 -- 35,101 29 2013-14 260,532 42,840 213,466 32,745 -- 778,073 54 -- 29,459 14 2014-15 386,981 58,270 291,882 97,591 -- 1,854,622 10 2 65,751 21 2015-16 541,381 102,593 327,001 44,911 1 1,384,775 5 -- 69,146 13 2016-17 715,496 106,046 323,290 30,811 192 1,568,723 - -- 110,247 3 2017-18 1,351,813 140,778 393,790 33,489 161 1,855,468 - 2 251,019 76 2018-19 692,174 124,283 290,091 30,823 - 2,119,541 - - 88,945 38 2019-20 262,867 108,502 332,732 28,089 - 1,212,456 - - 89,340 1 2020-21 377,087 69,457 398,502 35,155 1,493,580 4 84,911 4 (Jul-Mar) 2020-21 264,024 47,415 289,326 28,155 - 1,252,580 - 2 54,123 4 2021-22 P 225,329 69,797 347,479 14,700 - 1,693,446 - - 236,971 1
(Contd.)
Fiscal Year Station Wagon
Delivery Van
Lorries Trucks
Ambulance
Passenger Vehicles Public
Special Lorries
Trucks & Vans
Bus etc. Chassis
Buses, Trolly Buses
Motor Vehicles
for Goods
Spl. Truck etc.
Chassis
Road Tractors
for Trailers
2010-11 29 4 24,728 225 3,371 1,553 861 5 233 1,345 2011-12 73 1 11,942 441 563 1,828 1,555 2 16 1,598 2012-13 42 735 31,027 16,947 2,832 1,586 668 -- 9 1,252 2013-14 8 2,732 23,946 1,282 1,406 3,997 425 7 17 1,309 2014-15 18 5,477 33,489 2,810 927 4,818 847 -- 3,063 9,991 2015-16 126 8,707 47,645 3,036 1,398 9,136 1,234 1 3,267 4,442 2016-17 4 10,553 50,380 2,649 1,929 21,046 720 10 81 1,836 2017-18 4 12,810 38,095 3,316 1,098 2,152 685 1,313 152 1,307 2018-19 - 8,596 20,872 1,335 518 1,568 611 1 85 1,278 2019-20 - 2,361 10,701 227 197 494 404 7 406 1,493 2020-21 - 3,812 12,549 1,353 187 1,409 314 5 24 4,262 (Jul-Mar) 2020-21 - 2,772 18,359 787 164 829 189 5 21 3,772 2021-22 P - 4,121 26,780 1,225 141 953 444 - 88 7,382
(Contd.)
Fiscal Year Tractor Agricul-tural
Tractor Cater-pillar
Tractor Heavy Duty
for const.
Tractor Roads
Tractor (NES)
Electric Vehicles
Electric Bikes
Sport Utility Vehicle
3-Wheel Loader
2010-11 905 -- 148 144 12,208 -- -- -- 2011-12 3,684 -- 68 - 12,930 -- -- -- 2012-13 1,988 -- 131 225 18,773 -- -- -- 2013-14 2,088 -- 347 157 16,796 13 15 1 -- 2014-15 3,086 -- 476 434 28,743 13 104 14 100 2015-16 1,843 4 369 675 30,464 25 64 10 10,202 2016-17 4,831 -- 843 703 66,946 12 59 42 2,956 2017-18 3,796 44 643 713 63,638 - - 11 16,929 2018-19 2,270 - 95 867 2,468 - - 9 2,180 2019-20 1,366 - 86 488 6,913 - - 19 47 2020-21 2,244 - 105 166 2,466 - - 4 2 (Jul-Mar) 2020-21 1,334 - 101 149 1,481 - - 2 2 2021-22 P 3,429 - 162 186 10,874 - - 5 5
P : Provisional - : Not Available Source: Pakistan Bureau of Statistics
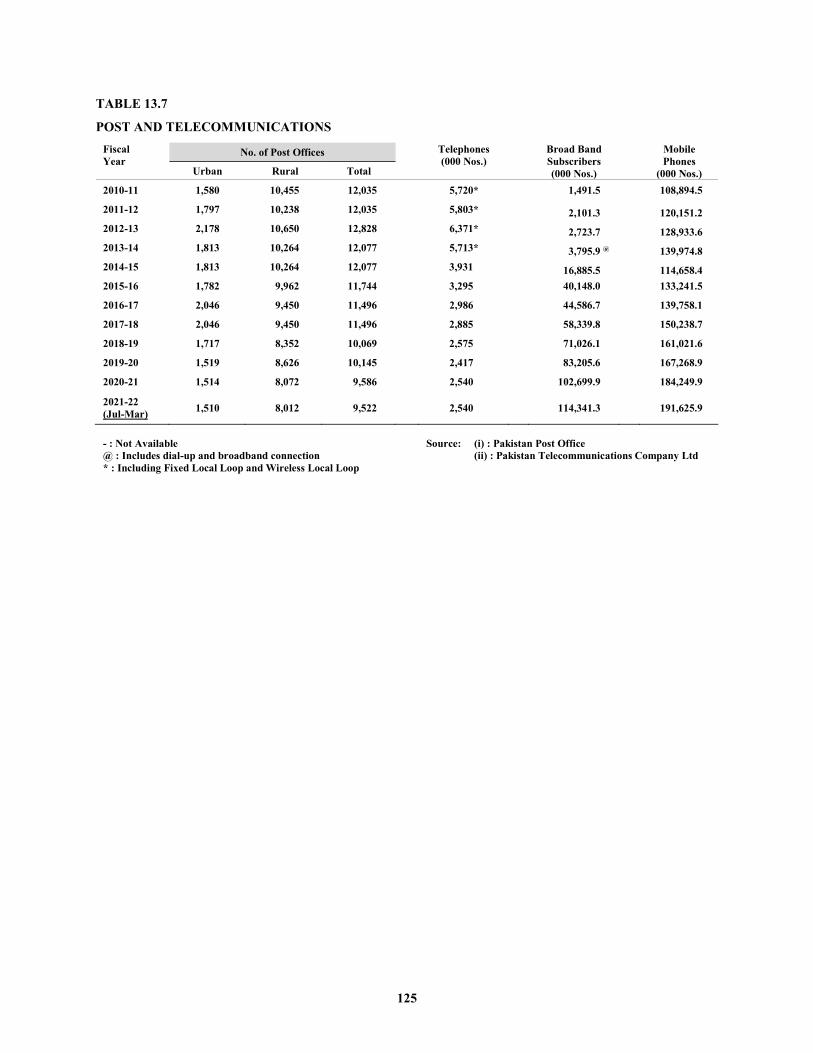
125
TABLE 13.7
POST AND TELECOMMUNICATIONS
Fiscal Year
No. of Post Offices Telephones (000 Nos.)
Broad Band Subscribers (000 Nos.)
Mobile Phones
(000 Nos.) Urban Rural Total
2010-11 1,580 10,455 12,035 5,720* 1,491.5 108,894.5
2011-12 1,797 10,238 12,035 5,803* 2,101.3 120,151.2 2012-13 2,178 10,650 12,828 6,371* 2,723.7 128,933.6 2013-14 1,813 10,264 12,077 5,713* 3,795.9 @ 139,974.8 2014-15 1,813 10,264 12,077 3,931 16,885.5 114,658.4 2015-16 1,782 9,962 11,744 3,295 40,148.0 133,241.5
2016-17 2,046 9,450 11,496 2,986 44,586.7 139,758.1
2017-18 2,046 9,450 11,496 2,885 58,339.8 150,238.7
2018-19 1,717 8,352 10,069 2,575 71,026.1 161,021.6
2019-20 1,519 8,626 10,145 2,417 83,205.6 167,268.9
2020-21 1,514 8,072 9,586 2,540 102,699.9 184,249.9
2021-22 (Jul-Mar) 1,510 8,012 9,522 2,540 114,341.3 191,625.9
- : Not Available @ : Includes dial-up and broadband connection * : Including Fixed Local Loop and Wireless Local Loop
Source: (i) : Pakistan Post Office (ii) : Pakistan Telecommunications Company Ltd


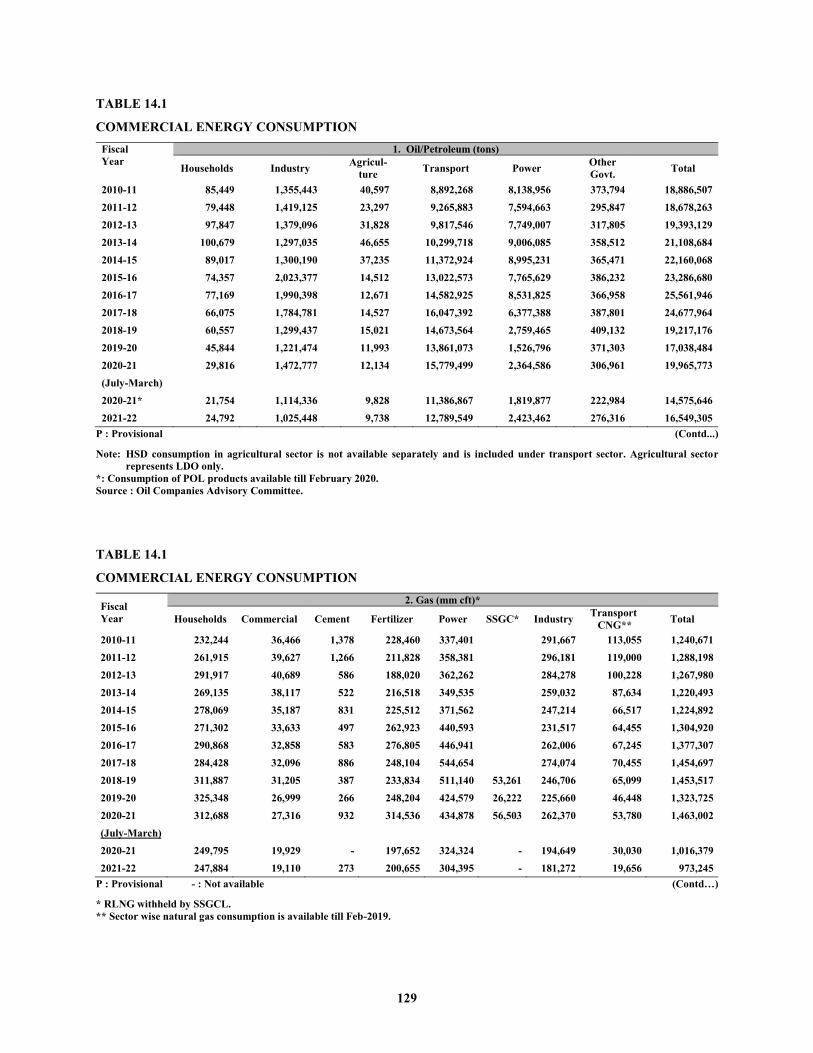
129
TABLE 14.1
COMMERCIAL ENERGY CONSUMPTION Fiscal Year
1. Oil/Petroleum (tons)
Households Industry Agricul-
ture Transport Power Other Govt. Total
2010-11 85,449 1,355,443 40,597 8,892,268 8,138,956 373,794 18,886,507 2011-12 79,448 1,419,125 23,297 9,265,883 7,594,663 295,847 18,678,263 2012-13 97,847 1,379,096 31,828 9,817,546 7,749,007 317,805 19,393,129 2013-14 100,679 1,297,035 46,655 10,299,718 9,006,085 358,512 21,108,684 2014-15 89,017 1,300,190 37,235 11,372,924 8,995,231 365,471 22,160,068 2015-16 74,357 2,023,377 14,512 13,022,573 7,765,629 386,232 23,286,680 2016-17 77,169 1,990,398 12,671 14,582,925 8,531,825 366,958 25,561,946 2017-18 66,075 1,784,781 14,527 16,047,392 6,377,388 387,801 24,677,964 2018-19 60,557 1,299,437 15,021 14,673,564 2,759,465 409,132 19,217,176 2019-20 45,844 1,221,474 11,993 13,861,073 1,526,796 371,303 17,038,484 2020-21 29,816 1,472,777 12,134 15,779,499 2,364,586 306,961 19,965,773 (July-March)
2020-21* 21,754 1,114,336 9,828 11,386,867 1,819,877 222,984 14,575,646 2021-22 24,792 1,025,448 9,738 12,789,549 2,423,462 276,316 16,549,305
P : Provisional (Contd...)
Note: HSD consumption in agricultural sector is not available separately and is included under transport sector. Agricultural sector represents LDO only.
*: Consumption of POL products available till February 2020. Source : Oil Companies Advisory Committee.
TABLE 14.1
COMMERCIAL ENERGY CONSUMPTION
Fiscal Year
2. Gas (mm cft)*
Households Commercial Cement Fertilizer Power SSGC* Industry Transport CNG** Total
2010-11 232,244 36,466 1,378 228,460 337,401 291,667 113,055 1,240,671 2011-12 261,915 39,627 1,266 211,828 358,381 296,181 119,000 1,288,198 2012-13 291,917 40,689 586 188,020 362,262 284,278 100,228 1,267,980 2013-14 269,135 38,117 522 216,518 349,535 259,032 87,634 1,220,493 2014-15 278,069 35,187 831 225,512 371,562 247,214 66,517 1,224,892 2015-16 271,302 33,633 497 262,923 440,593 231,517 64,455 1,304,920 2016-17 290,868 32,858 583 276,805 446,941 262,006 67,245 1,377,307 2017-18 284,428 32,096 886 248,104 544,654 274,074 70,455 1,454,697 2018-19 311,887 31,205 387 233,834 511,140 53,261 246,706 65,099 1,453,517 2019-20 325,348 26,999 266 248,204 424,579 26,222 225,660 46,448 1,323,725 2020-21 312,688 27,316 932 314,536 434,878 56,503 262,370 53,780 1,463,002 (July-March)
2020-21 249,795 19,929 - 197,652 324,324 - 194,649 30,030 1,016,379 2021-22 247,884 19,110 273 200,655 304,395 - 181,272 19,656 973,245
P : Provisional - : Not available (Contd…)
* RLNG withheld by SSGCL. ** Sector wise natural gas consumption is available till Feb-2019.
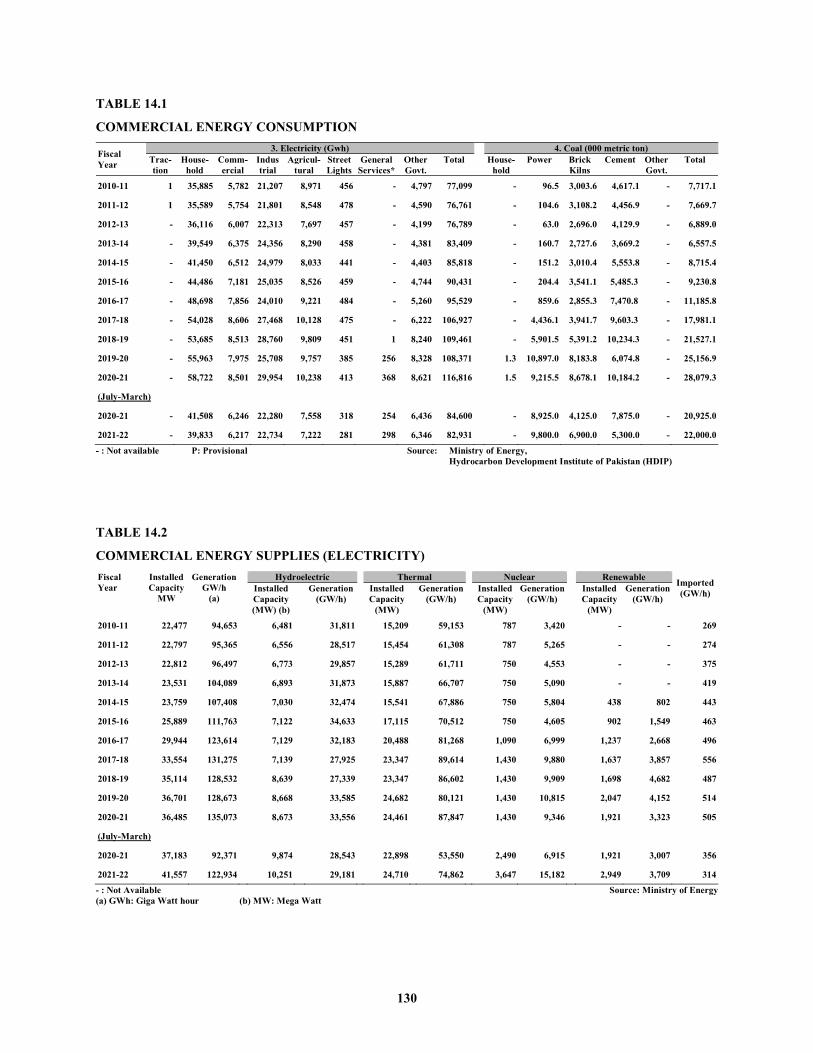
130
TABLE 14.1
COMMERCIAL ENERGY CONSUMPTION
Fiscal Year
3. Electricity (Gwh) 4. Coal (000 metric ton) Trac- House- Comm- Indus Agricul- Street General Other Total House- Power Brick Cement Other Total tion hold ercial trial tural Lights Services* Govt. hold Kilns Govt.
2010-11 1 35,885 5,782 21,207 8,971 456 - 4,797 77,099 - 96.5 3,003.6 4,617.1 - 7,717.1
2011-12 1 35,589 5,754 21,801 8,548 478 - 4,590 76,761 - 104.6 3,108.2 4,456.9 - 7,669.7
2012-13 - 36,116 6,007 22,313 7,697 457 - 4,199 76,789 - 63.0 2,696.0 4,129.9 - 6,889.0
2013-14 - 39,549 6,375 24,356 8,290 458 - 4,381 83,409 - 160.7 2,727.6 3,669.2 - 6,557.5
2014-15 - 41,450 6,512 24,979 8,033 441 - 4,403 85,818 - 151.2 3,010.4 5,553.8 - 8,715.4
2015-16 - 44,486 7,181 25,035 8,526 459 - 4,744 90,431 - 204.4 3,541.1 5,485.3 - 9,230.8
2016-17 - 48,698 7,856 24,010 9,221 484 - 5,260 95,529 - 859.6 2,855.3 7,470.8 - 11,185.8
2017-18 - 54,028 8,606 27,468 10,128 475 - 6,222 106,927 - 4,436.1 3,941.7 9,603.3 - 17,981.1
2018-19 - 53,685 8,513 28,760 9,809 451 1 8,240 109,461 - 5,901.5 5,391.2 10,234.3 - 21,527.1
2019-20 - 55,963 7,975 25,708 9,757 385 256 8,328 108,371 1.3 10,897.0 8,183.8 6,074.8 - 25,156.9
2020-21 - 58,722 8,501 29,954 10,238 413 368 8,621 116,816 1.5 9,215.5 8,678.1 10,184.2 - 28,079.3
(July-March)
2020-21 - 41,508 6,246 22,280 7,558 318 254 6,436 84,600 - 8,925.0 4,125.0 7,875.0 - 20,925.0
2021-22 - 39,833 6,217 22,734 7,222 281 298 6,346 82,931 - 9,800.0 6,900.0 5,300.0 - 22,000.0
- : Not available P: Provisional Source: Ministry of Energy, Hydrocarbon Development Institute of Pakistan (HDIP)
TABLE 14.2
COMMERCIAL ENERGY SUPPLIES (ELECTRICITY)
Fiscal Year
Installed Capacity
MW
Generation GW/h
(a)
Hydroelectric
Thermal
Nuclear
Renewable Imported (GW/h)
Installed Capacity (MW) (b)
Generation
(GW/h) Installed Capacity
(MW)
Generation
(GW/h) Installed Capacity
(MW)
Generation (GW/h)
Installed Capacity
(MW)
Generation (GW/h)
2010-11 22,477 94,653 6,481 31,811 15,209 59,153 787 3,420 - - 269
2011-12 22,797 95,365 6,556 28,517 15,454 61,308 787 5,265 - - 274
2012-13 22,812 96,497 6,773 29,857 15,289 61,711 750 4,553 - - 375
2013-14 23,531 104,089 6,893 31,873 15,887 66,707 750 5,090 - - 419
2014-15 23,759 107,408 7,030 32,474 15,541 67,886 750 5,804 438 802 443
2015-16 25,889 111,763 7,122 34,633 17,115 70,512 750 4,605 902 1,549 463
2016-17 29,944 123,614 7,129 32,183 20,488 81,268 1,090 6,999 1,237 2,668 496
2017-18 33,554 131,275 7,139 27,925 23,347 89,614 1,430 9,880 1,637 3,857 556
2018-19 35,114 128,532 8,639 27,339 23,347 86,602 1,430 9,909 1,698 4,682 487
2019-20 36,701 128,673 8,668 33,585 24,682 80,121 1,430 10,815 2,047 4,152 514
2020-21 36,485 135,073 8,673 33,556 24,461 87,847 1,430 9,346 1,921 3,323 505
(July-March)
2020-21 37,183 92,371 9,874 28,543 22,898 53,550 2,490 6,915 1,921 3,007 356
2021-22 41,557 122,934 10,251 29,181 24,710 74,862 3,647 15,182 2,949 3,709 314
- : Not Available Source: Ministry of Energy (a) GWh: Giga Watt hour (b) MW: Mega Watt
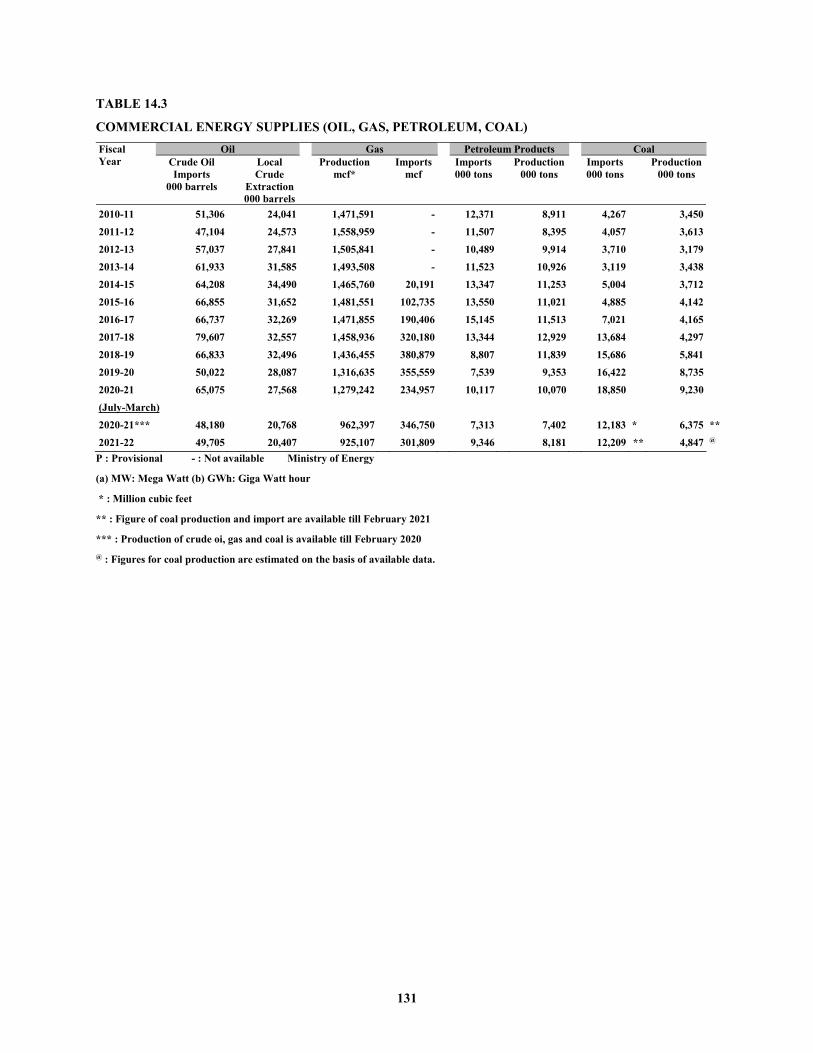
131
TABLE 14.3
COMMERCIAL ENERGY SUPPLIES (OIL, GAS, PETROLEUM, COAL) Fiscal Year
Oil
Gas
Petroleum Products
Coal
Crude Oil Imports
000 barrels
Local Crude
Extraction 000 barrels
Production mcf*
Imports
mcf Imports 000 tons
Production 000 tons
Imports 000 tons
Production
000 tons
2010-11 51,306 24,041 1,471,591 - 12,371 8,911 4,267 3,450
2011-12 47,104 24,573 1,558,959 - 11,507 8,395 4,057 3,613
2012-13 57,037 27,841 1,505,841 - 10,489 9,914 3,710 3,179
2013-14 61,933 31,585 1,493,508 - 11,523 10,926 3,119 3,438
2014-15 64,208 34,490 1,465,760 20,191 13,347 11,253 5,004 3,712
2015-16 66,855 31,652 1,481,551 102,735 13,550 11,021 4,885 4,142
2016-17 66,737 32,269 1,471,855 190,406 15,145 11,513 7,021 4,165
2017-18 79,607 32,557 1,458,936 320,180 13,344 12,929 13,684 4,297
2018-19 66,833 32,496 1,436,455 380,879 8,807 11,839 15,686 5,841
2019-20 50,022 28,087 1,316,635 355,559 7,539 9,353 16,422 8,735
2020-21 65,075 27,568 1,279,242 234,957 10,117 10,070 18,850 9,230 (July-March)
2020-21*** 48,180 20,768 962,397 346,750 7,313 7,402 12,183 * 6,375 ** 2021-22 49,705 20,407 925,107 301,809 9,346 8,181 12,209 ** 4,847 @
P : Provisional - : Not available Ministry of Energy
(a) MW: Mega Watt (b) GWh: Giga Watt hour
* : Million cubic feet
** : Figure of coal production and import are available till February 2021
*** : Production of crude oi, gas and coal is available till February 2020 @ : Figures for coal production are estimated on the basis of available data.
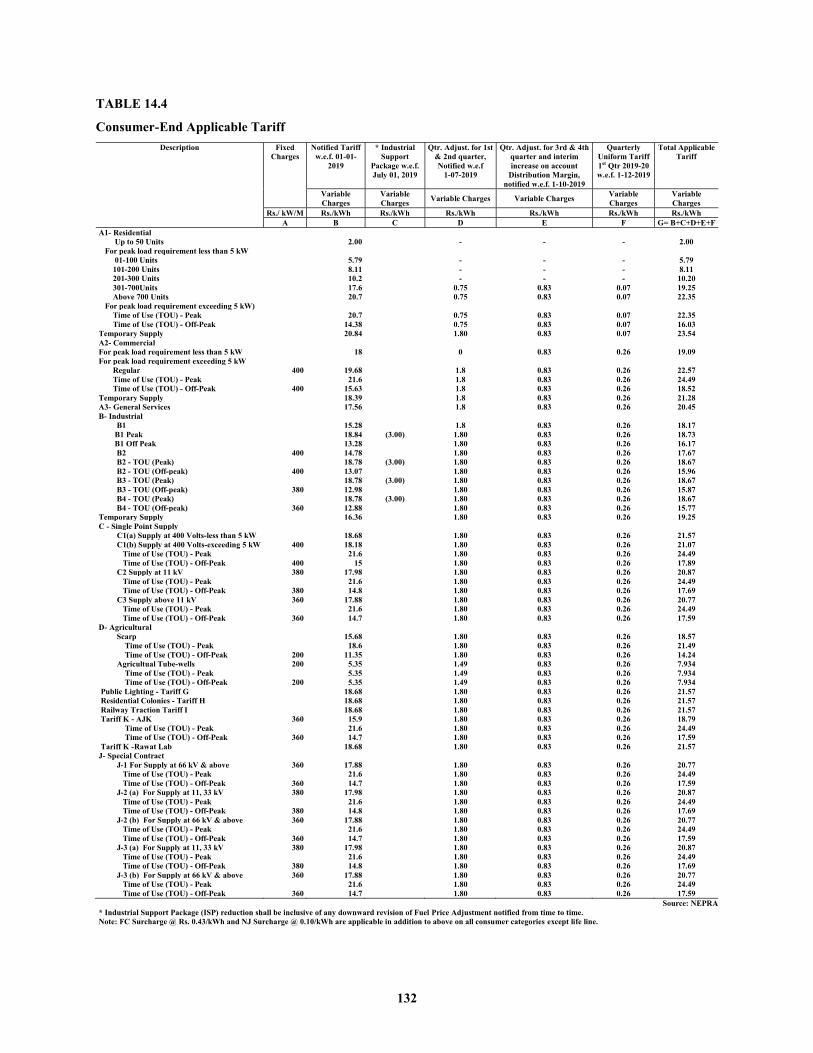
132
TABLE 14.4
Consumer-End Applicable Tariff Description Fixed
Charges Notified Tariff
w.e.f. 01-01-2019
* Industrial Support
Package w.e.f. July 01, 2019
Qtr. Adjust. for 1st & 2nd quarter, Notified w.e.f
1-07-2019
Qtr. Adjust. for 3rd & 4th quarter and interim increase on account
Distribution Margin, notified w.e.f. 1-10-2019
Quarterly Uniform Tariff 1st Qtr 2019-20 w.e.f. 1-12-2019
Total Applicable Tariff
Variable Charges
Variable Charges Variable Charges Variable Charges Variable
Charges Variable Charges
Rs./ kW/M Rs./kWh Rs./kWh Rs./kWh Rs./kWh Rs./kWh Rs./kWh A B C D E F G= B+C+D+E+F
A1- Residential Up to 50 Units 2.00 - - - 2.00 For peak load requirement less than 5 kW 01-100 Units 5.79 - - - 5.79 101-200 Units 8.11 - - - 8.11 201-300 Units 10.2 - - - 10.20 301-700Units 17.6 0.75 0.83 0.07 19.25 Above 700 Units 20.7 0.75 0.83 0.07 22.35 For peak load requirement exceeding 5 kW) Time of Use (TOU) - Peak 20.7 0.75 0.83 0.07 22.35 Time of Use (TOU) - Off-Peak 14.38 0.75 0.83 0.07 16.03 Temporary Supply 20.84 1.80 0.83 0.07 23.54 A2- Commercial For peak load requirement less than 5 kW 18 0 0.83 0.26 19.09 For peak load requirement exceeding 5 kW Regular 400 19.68 1.8 0.83 0.26 22.57 Time of Use (TOU) - Peak 21.6 1.8 0.83 0.26 24.49 Time of Use (TOU) - Off-Peak 400 15.63 1.8 0.83 0.26 18.52 Temporary Supply 18.39 1.8 0.83 0.26 21.28 A3- General Services 17.56 1.8 0.83 0.26 20.45 B- Industrial B1 15.28 1.8 0.83 0.26 18.17 B1 Peak 18.84 (3.00) 1.80 0.83 0.26 18.73 B1 Off Peak 13.28 1.80 0.83 0.26 16.17 B2 400 14.78 1.80 0.83 0.26 17.67 B2 - TOU (Peak) 18.78 (3.00) 1.80 0.83 0.26 18.67 B2 - TOU (Off-peak) 400 13.07 1.80 0.83 0.26 15.96 B3 - TOU (Peak) 18.78 (3.00) 1.80 0.83 0.26 18.67 B3 - TOU (Off-peak) 380 12.98 1.80 0.83 0.26 15.87 B4 - TOU (Peak) 18.78 (3.00) 1.80 0.83 0.26 18.67 B4 - TOU (Off-peak) 360 12.88 1.80 0.83 0.26 15.77 Temporary Supply 16.36 1.80 0.83 0.26 19.25 C - Single Point Supply C1(a) Supply at 400 Volts-less than 5 kW 18.68 1.80 0.83 0.26 21.57 C1(b) Supply at 400 Volts-exceeding 5 kW 400 18.18 1.80 0.83 0.26 21.07 Time of Use (TOU) - Peak 21.6 1.80 0.83 0.26 24.49 Time of Use (TOU) - Off-Peak 400 15 1.80 0.83 0.26 17.89 C2 Supply at 11 kV 380 17.98 1.80 0.83 0.26 20.87 Time of Use (TOU) - Peak 21.6 1.80 0.83 0.26 24.49 Time of Use (TOU) - Off-Peak 380 14.8 1.80 0.83 0.26 17.69 C3 Supply above 11 kV 360 17.88 1.80 0.83 0.26 20.77 Time of Use (TOU) - Peak 21.6 1.80 0.83 0.26 24.49 Time of Use (TOU) - Off-Peak 360 14.7 1.80 0.83 0.26 17.59 D- Agricultural Scarp 15.68 1.80 0.83 0.26 18.57 Time of Use (TOU) - Peak 18.6 1.80 0.83 0.26 21.49 Time of Use (TOU) - Off-Peak 200 11.35 1.80 0.83 0.26 14.24 Agricultual Tube-wells 200 5.35 1.49 0.83 0.26 7.934 Time of Use (TOU) - Peak 5.35 1.49 0.83 0.26 7.934 Time of Use (TOU) - Off-Peak 200 5.35 1.49 0.83 0.26 7.934 Public Lighting - Tariff G 18.68 1.80 0.83 0.26 21.57 Residential Colonies - Tariff H 18.68 1.80 0.83 0.26 21.57 Railway Traction Tariff I 18.68 1.80 0.83 0.26 21.57 Tariff K - AJK 360 15.9 1.80 0.83 0.26 18.79 Time of Use (TOU) - Peak 21.6 1.80 0.83 0.26 24.49 Time of Use (TOU) - Off-Peak 360 14.7 1.80 0.83 0.26 17.59 Tariff K -Rawat Lab 18.68 1.80 0.83 0.26 21.57 J- Special Contract J-1 For Supply at 66 kV & above 360 17.88 1.80 0.83 0.26 20.77 Time of Use (TOU) - Peak 21.6 1.80 0.83 0.26 24.49 Time of Use (TOU) - Off-Peak 360 14.7 1.80 0.83 0.26 17.59 J-2 (a) For Supply at 11, 33 kV 380 17.98 1.80 0.83 0.26 20.87 Time of Use (TOU) - Peak 21.6 1.80 0.83 0.26 24.49 Time of Use (TOU) - Off-Peak 380 14.8 1.80 0.83 0.26 17.69 J-2 (b) For Supply at 66 kV & above 360 17.88 1.80 0.83 0.26 20.77 Time of Use (TOU) - Peak 21.6 1.80 0.83 0.26 24.49 Time of Use (TOU) - Off-Peak 360 14.7 1.80 0.83 0.26 17.59 J-3 (a) For Supply at 11, 33 kV 380 17.98 1.80 0.83 0.26 20.87 Time of Use (TOU) - Peak 21.6 1.80 0.83 0.26 24.49 Time of Use (TOU) - Off-Peak 380 14.8 1.80 0.83 0.26 17.69 J-3 (b) For Supply at 66 kV & above 360 17.88 1.80 0.83 0.26 20.77 Time of Use (TOU) - Peak 21.6 1.80 0.83 0.26 24.49 Time of Use (TOU) - Off-Peak 360 14.7 1.80 0.83 0.26 17.59
Source: NEPRA * Industrial Support Package (ISP) reduction shall be inclusive of any downward revision of Fuel Price Adjustment notified from time to time. Note: FC Surcharge @ Rs. 0.43/kWh and NJ Surcharge @ 0.10/kWh are applicable in addition to above on all consumer categories except life line.
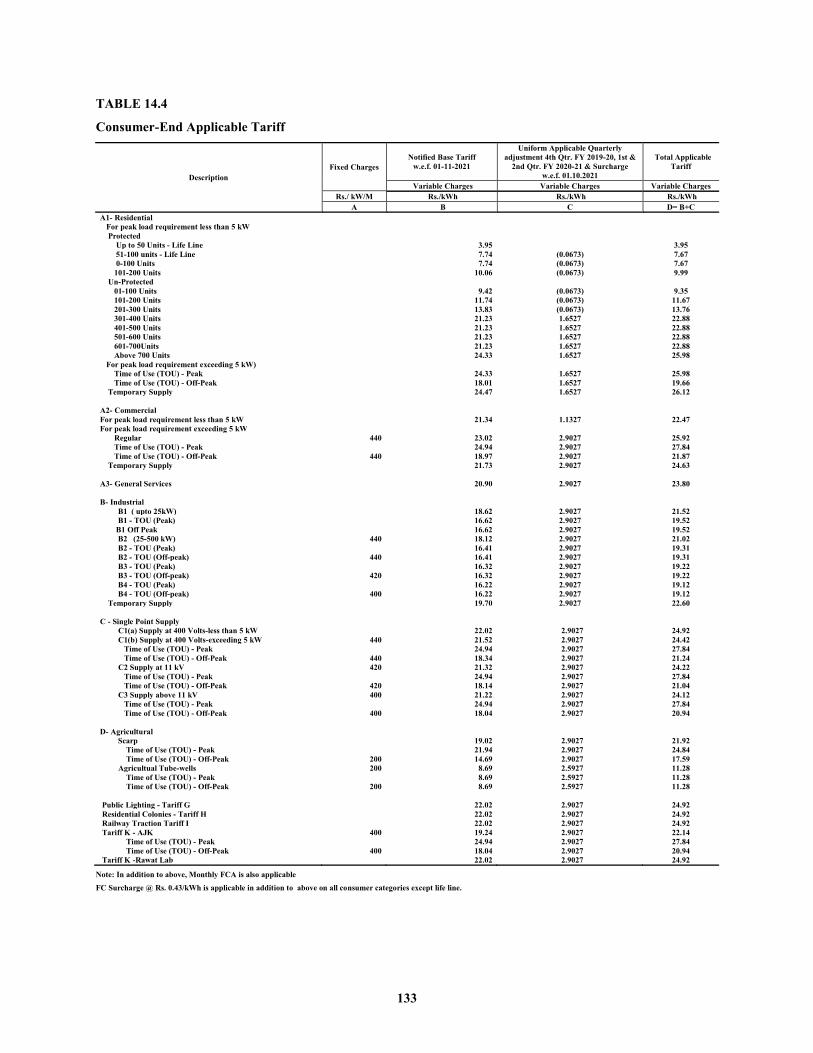
133
TABLE 14.4
Consumer-End Applicable Tariff
Description Fixed Charges
Notified Base Tariff w.e.f. 01-11-2021
Uniform Applicable Quarterly adjustment 4th Qtr. FY 2019-20, 1st &
2nd Qtr. FY 2020-21 & Surcharge w.e.f. 01.10.2021
Total Applicable Tariff
Variable Charges Variable Charges Variable Charges Rs./ kW/M Rs./kWh Rs./kWh Rs./kWh
A B C D= B+C A1- Residential For peak load requirement less than 5 kW Protected Up to 50 Units - Life Line 3.95 3.95
51-100 units - Life Line 7.74 (0.0673) 7.67 0-100 Units 7.74 (0.0673) 7.67 101-200 Units 10.06 (0.0673) 9.99 Un-Protected 01-100 Units 9.42 (0.0673) 9.35 101-200 Units 11.74 (0.0673) 11.67 201-300 Units 13.83 (0.0673) 13.76 301-400 Units 21.23 1.6527 22.88 401-500 Units 21.23 1.6527 22.88 501-600 Units 21.23 1.6527 22.88 601-700Units 21.23 1.6527 22.88 Above 700 Units 24.33 1.6527 25.98 For peak load requirement exceeding 5 kW) Time of Use (TOU) - Peak 24.33 1.6527 25.98 Time of Use (TOU) - Off-Peak 18.01 1.6527 19.66
Temporary Supply 24.47 1.6527 26.12
A2- Commercial For peak load requirement less than 5 kW 21.34 1.1327 22.47 For peak load requirement exceeding 5 kW Regular 440 23.02 2.9027 25.92 Time of Use (TOU) - Peak 24.94 2.9027 27.84 Time of Use (TOU) - Off-Peak 440 18.97 2.9027 21.87
Temporary Supply 21.73 2.9027 24.63
A3- General Services 20.90 2.9027 23.80 B- Industrial B1 ( upto 25kW) 18.62 2.9027 21.52 B1 - TOU (Peak) 16.62 2.9027 19.52 B1 Off Peak 16.62 2.9027 19.52 B2 (25-500 kW) 440 18.12 2.9027 21.02 B2 - TOU (Peak) 16.41 2.9027 19.31 B2 - TOU (Off-peak) 440 16.41 2.9027 19.31 B3 - TOU (Peak) 16.32 2.9027 19.22 B3 - TOU (Off-peak) 420 16.32 2.9027 19.22 B4 - TOU (Peak) 16.22 2.9027 19.12 B4 - TOU (Off-peak) 400 16.22 2.9027 19.12
Temporary Supply 19.70 2.9027 22.60 C - Single Point Supply C1(a) Supply at 400 Volts-less than 5 kW 22.02 2.9027 24.92 C1(b) Supply at 400 Volts-exceeding 5 kW 440 21.52 2.9027 24.42 Time of Use (TOU) - Peak 24.94 2.9027 27.84 Time of Use (TOU) - Off-Peak 440 18.34 2.9027 21.24 C2 Supply at 11 kV 420 21.32 2.9027 24.22 Time of Use (TOU) - Peak 24.94 2.9027 27.84 Time of Use (TOU) - Off-Peak 420 18.14 2.9027 21.04 C3 Supply above 11 kV 400 21.22 2.9027 24.12 Time of Use (TOU) - Peak 24.94 2.9027 27.84 Time of Use (TOU) - Off-Peak 400 18.04 2.9027 20.94
D- Agricultural Scarp 19.02 2.9027 21.92 Time of Use (TOU) - Peak 21.94 2.9027 24.84 Time of Use (TOU) - Off-Peak 200 14.69 2.9027 17.59 Agricultual Tube-wells 200 8.69 2.5927 11.28 Time of Use (TOU) - Peak 8.69 2.5927 11.28 Time of Use (TOU) - Off-Peak 200 8.69 2.5927 11.28
Public Lighting - Tariff G 22.02 2.9027 24.92 Residential Colonies - Tariff H 22.02 2.9027 24.92 Railway Traction Tariff I 22.02 2.9027 24.92 Tariff K - AJK 400 19.24 2.9027 22.14 Time of Use (TOU) - Peak 24.94 2.9027 27.84 Time of Use (TOU) - Off-Peak 400 18.04 2.9027 20.94 Tariff K -Rawat Lab 22.02 2.9027 24.92
Note: In addition to above, Monthly FCA is also applicable
FC Surcharge @ Rs. 0.43/kWh is applicable in addition to above on all consumer categories except life line.
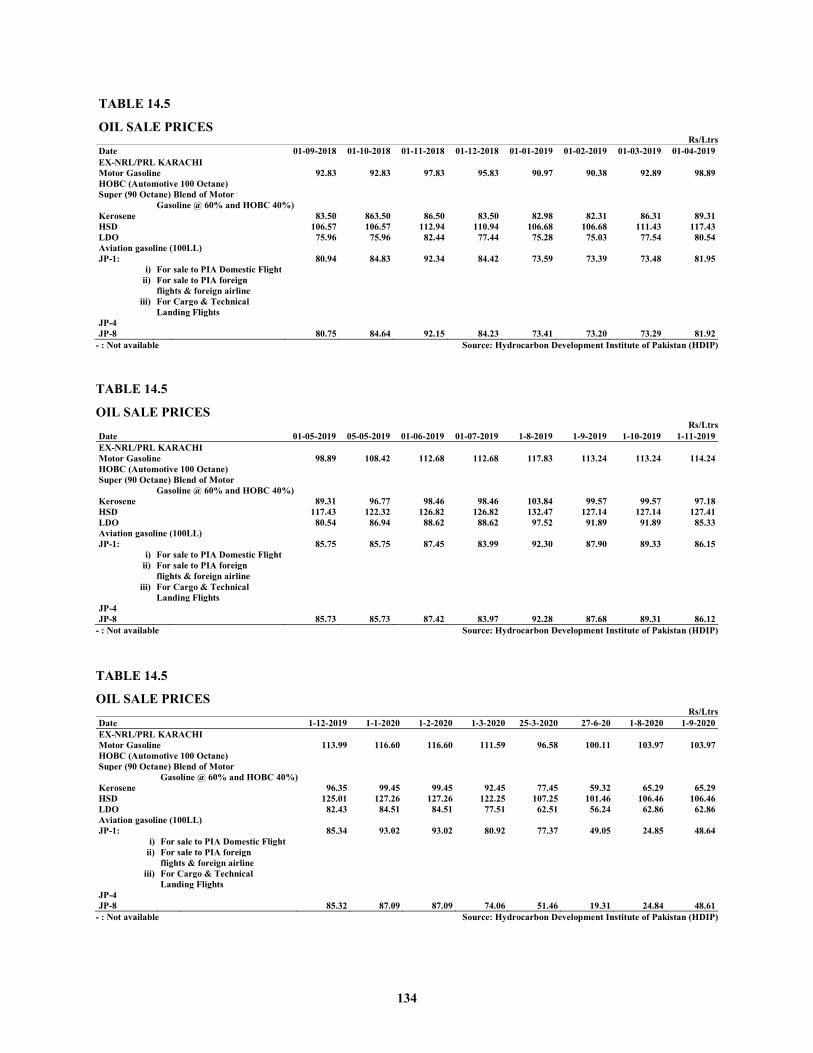
134
TABLE 14.5
OIL SALE PRICES Rs/Ltrs
Date 01-09-2018 01-10-2018 01-11-2018 01-12-2018 01-01-2019 01-02-2019 01-03-2019 01-04-2019 EX-NRL/PRL KARACHI Motor Gasoline 92.83 92.83 97.83 95.83 90.97 90.38 92.89 98.89 HOBC (Automotive 100 Octane) Super (90 Octane) Blend of Motor Gasoline @ 60% and HOBC 40%) Kerosene 83.50 863.50 86.50 83.50 82.98 82.31 86.31 89.31 HSD 106.57 106.57 112.94 110.94 106.68 106.68 111.43 117.43 LDO 75.96 75.96 82.44 77.44 75.28 75.03 77.54 80.54 Aviation gasoline (100LL) JP-1: 80.94 84.83 92.34 84.42 73.59 73.39 73.48 81.95
i) For sale to PIA Domestic Flight ii) For sale to PIA foreign
flights & foreign airline iii) For Cargo & Technical
Landing Flights
JP-4
JP-8 80.75 84.64 92.15 84.23 73.41 73.20 73.29 81.92 - : Not available Source: Hydrocarbon Development Institute of Pakistan (HDIP) TABLE 14.5
OIL SALE PRICES Rs/Ltrs
Date 01-05-2019 05-05-2019 01-06-2019 01-07-2019 1-8-2019 1-9-2019 1-10-2019 1-11-2019 EX-NRL/PRL KARACHI Motor Gasoline 98.89 108.42 112.68 112.68 117.83 113.24 113.24 114.24 HOBC (Automotive 100 Octane) Super (90 Octane) Blend of Motor Gasoline @ 60% and HOBC 40%) Kerosene 89.31 96.77 98.46 98.46 103.84 99.57 99.57 97.18 HSD 117.43 122.32 126.82 126.82 132.47 127.14 127.14 127.41 LDO 80.54 86.94 88.62 88.62 97.52 91.89 91.89 85.33 Aviation gasoline (100LL) JP-1: 85.75 85.75 87.45 83.99 92.30 87.90 89.33 86.15
i) For sale to PIA Domestic Flight ii) For sale to PIA foreign
flights & foreign airline iii) For Cargo & Technical
Landing Flights JP-4
JP-8 85.73 85.73 87.42 83.97 92.28 87.68 89.31 86.12
- : Not available Source: Hydrocarbon Development Institute of Pakistan (HDIP)
TABLE 14.5
OIL SALE PRICES Rs/Ltrs
Date 1-12-2019 1-1-2020 1-2-2020 1-3-2020 25-3-2020 27-6-20 1-8-2020 1-9-2020 EX-NRL/PRL KARACHI Motor Gasoline 113.99 116.60 116.60 111.59 96.58 100.11 103.97 103.97 HOBC (Automotive 100 Octane) Super (90 Octane) Blend of Motor Gasoline @ 60% and HOBC 40%) Kerosene 96.35 99.45 99.45 92.45 77.45 59.32 65.29 65.29 HSD 125.01 127.26 127.26 122.25 107.25 101.46 106.46 106.46 LDO 82.43 84.51 84.51 77.51 62.51 56.24 62.86 62.86 Aviation gasoline (100LL) JP-1: 85.34 93.02 93.02 80.92 77.37 49.05 24.85 48.64
i) For sale to PIA Domestic Flight ii) For sale to PIA foreign
flights & foreign airline iii) For Cargo & Technical
Landing Flights JP-4
JP-8 85.32 87.09 87.09 74.06 51.46 19.31 24.84 48.61
- : Not available Source: Hydrocarbon Development Institute of Pakistan (HDIP)
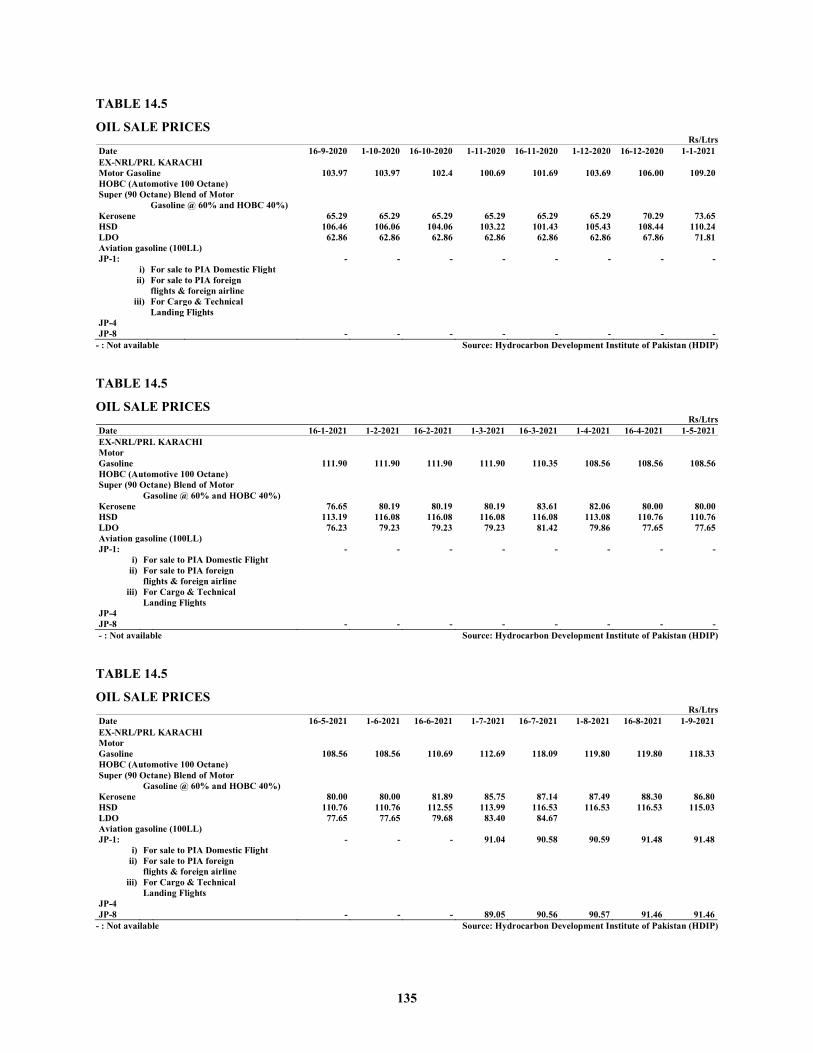
135
TABLE 14.5
OIL SALE PRICES Rs/Ltrs
Date 16-9-2020 1-10-2020 16-10-2020 1-11-2020 16-11-2020 1-12-2020 16-12-2020 1-1-2021 EX-NRL/PRL KARACHI
Motor Gasoline 103.97 103.97 102.4 100.69 101.69 103.69 106.00 109.20 HOBC (Automotive 100 Octane)
Super (90 Octane) Blend of Motor
Gasoline @ 60% and HOBC 40%)
Kerosene 65.29 65.29 65.29 65.29 65.29 65.29 70.29 73.65 HSD 106.46 106.06 104.06 103.22 101.43 105.43 108.44 110.24 LDO 62.86 62.86 62.86 62.86 62.86 62.86 67.86 71.81 Aviation gasoline (100LL) JP-1: - - - - - - - -
i) For sale to PIA Domestic Flight ii) For sale to PIA foreign
flights & foreign airline iii) For Cargo & Technical
Landing Flights JP-4
JP-8 - - - - - - - -
- : Not available Source: Hydrocarbon Development Institute of Pakistan (HDIP)
TABLE 14.5
OIL SALE PRICES Rs/Ltrs
Date 16-1-2021 1-2-2021 16-2-2021 1-3-2021 16-3-2021 1-4-2021 16-4-2021 1-5-2021 EX-NRL/PRL KARACHI Motor Gasoline
111.90 111.90 111.90 111.90 110.35 108.56 108.56 108.56
HOBC (Automotive 100 Octane) Super (90 Octane) Blend of Motor Gasoline @ 60% and HOBC 40%) Kerosene 76.65 80.19 80.19 80.19 83.61 82.06 80.00 80.00 HSD 113.19 116.08 116.08 116.08 116.08 113.08 110.76 110.76 LDO 76.23 79.23 79.23 79.23 81.42 79.86 77.65 77.65 Aviation gasoline (100LL) JP-1: - - - - - - - -
i) For sale to PIA Domestic Flight ii) For sale to PIA foreign
flights & foreign airline iii) For Cargo & Technical
Landing Flights JP-4
JP-8 - - - - - - - - - : Not available Source: Hydrocarbon Development Institute of Pakistan (HDIP)
TABLE 14.5
OIL SALE PRICES Rs/Ltrs Date 16-5-2021 1-6-2021 16-6-2021 1-7-2021 16-7-2021 1-8-2021 16-8-2021 1-9-2021 EX-NRL/PRL KARACHI Motor Gasoline
108.56 108.56 110.69 112.69 118.09 119.80 119.80 118.33
HOBC (Automotive 100 Octane) Super (90 Octane) Blend of Motor Gasoline @ 60% and HOBC 40%) Kerosene 80.00 80.00 81.89 85.75 87.14 87.49 88.30 86.80 HSD 110.76 110.76 112.55 113.99 116.53 116.53 116.53 115.03 LDO 77.65 77.65 79.68 83.40 84.67 Aviation gasoline (100LL) JP-1: - - - 91.04 90.58 90.59 91.48 91.48
i) For sale to PIA Domestic Flight ii) For sale to PIA foreign
flights & foreign airline iii) For Cargo & Technical
Landing Flights JP-4
JP-8 - - - 89.05 90.56 90.57 91.46 91.46
- : Not available Source: Hydrocarbon Development Institute of Pakistan (HDIP)
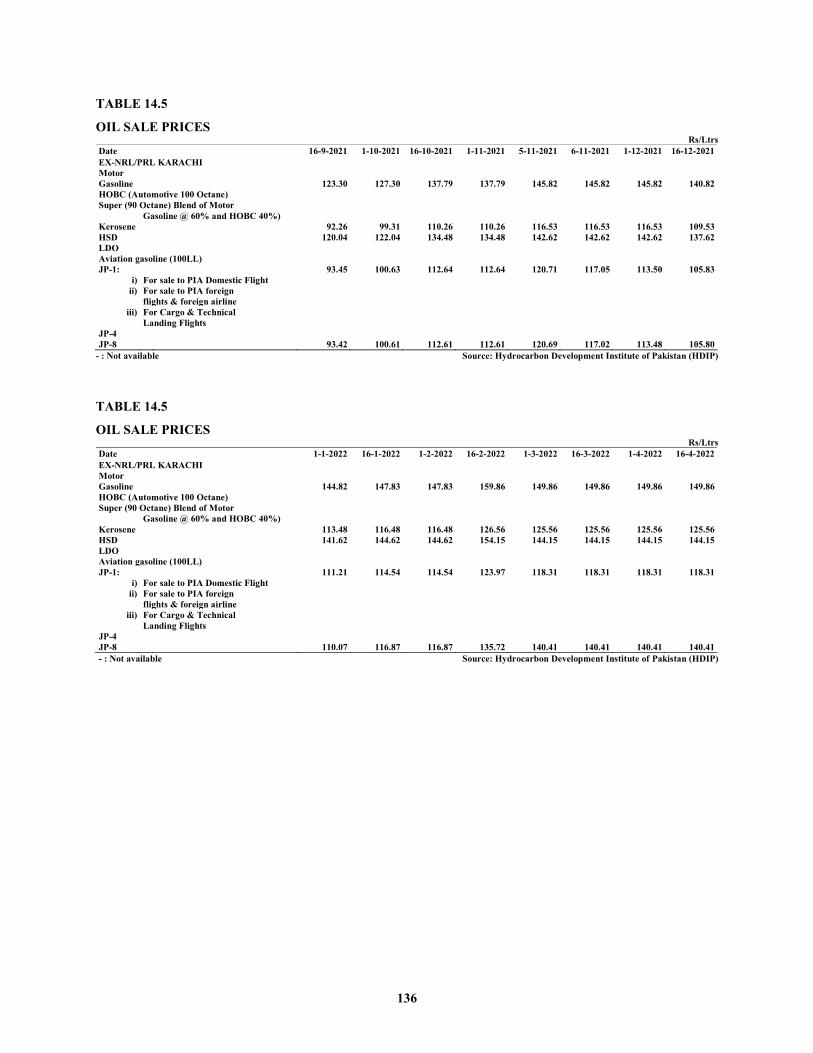
136
TABLE 14.5
OIL SALE PRICES Rs/Ltrs Date 16-9-2021 1-10-2021 16-10-2021 1-11-2021 5-11-2021 6-11-2021 1-12-2021 16-12-2021 EX-NRL/PRL KARACHI Motor Gasoline
123.30 127.30 137.79 137.79 145.82 145.82 145.82 140.82
HOBC (Automotive 100 Octane) Super (90 Octane) Blend of Motor Gasoline @ 60% and HOBC 40%) Kerosene 92.26 99.31 110.26 110.26 116.53 116.53 116.53 109.53 HSD 120.04 122.04 134.48 134.48 142.62 142.62 142.62 137.62 LDO Aviation gasoline (100LL) JP-1: 93.45 100.63 112.64 112.64 120.71 117.05 113.50 105.83
i) For sale to PIA Domestic Flight ii) For sale to PIA foreign
flights & foreign airline iii) For Cargo & Technical
Landing Flights JP-4 JP-8 93.42 100.61 112.61 112.61 120.69 117.02 113.48 105.80
- : Not available Source: Hydrocarbon Development Institute of Pakistan (HDIP)
TABLE 14.5
OIL SALE PRICES Rs/Ltrs Date 1-1-2022 16-1-2022 1-2-2022 16-2-2022 1-3-2022 16-3-2022 1-4-2022 16-4-2022 EX-NRL/PRL KARACHI Motor Gasoline
144.82 147.83 147.83 159.86 149.86 149.86 149.86 149.86
HOBC (Automotive 100 Octane) Super (90 Octane) Blend of Motor Gasoline @ 60% and HOBC 40%) Kerosene 113.48 116.48 116.48 126.56 125.56 125.56 125.56 125.56 HSD 141.62 144.62 144.62 154.15 144.15 144.15 144.15 144.15 LDO Aviation gasoline (100LL) JP-1: 111.21 114.54 114.54 123.97 118.31 118.31 118.31 118.31
i) For sale to PIA Domestic Flight ii) For sale to PIA foreign
flights & foreign airline iii) For Cargo & Technical
Landing Flights JP-4
JP-8 110.07 116.87 116.87 135.72 140.41 140.41 140.41 140.41 - : Not available Source: Hydrocarbon Development Institute of Pakistan (HDIP)
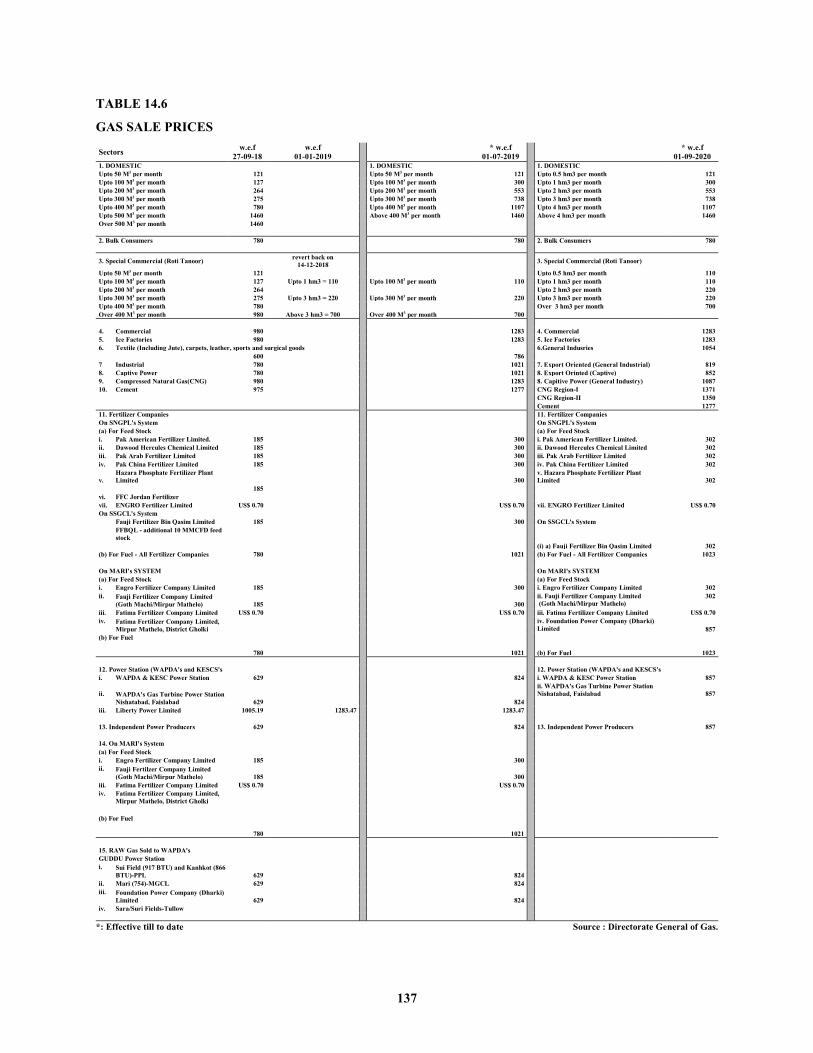
137
TABLE 14.6
GAS SALE PRICES
Sectors w.e.f 27-09-18
w.e.f 01-01-2019
* w.e.f 01-07-2019
* w.e.f 01-09-2020
1. DOMESTIC 1. DOMESTIC 1. DOMESTIC Upto 50 M3 per month 121 Upto 50 M3 per month 121 Upto 0.5 hm3 per month 121 Upto 100 M3 per month 127 Upto 100 M3 per month 300 Upto 1 hm3 per month 300 Upto 200 M3 per month 264 Upto 200 M3 per month 553 Upto 2 hm3 per month 553 Upto 300 M3 per month 275 Upto 300 M3 per month 738 Upto 3 hm3 per month 738 Upto 400 M3 per month 780 Upto 400 M3 per month 1107 Upto 4 hm3 per month 1107 Upto 500 M3 per month 1460 Above 400 M3 per month 1460 Above 4 hm3 per month 1460 Over 500 M3 per month 1460 2. Bulk Consumers 780 780 2. Bulk Consumers 780
3. Special Commercial (Roti Tanoor)
revert back on 14-12-2018 3. Special Commercial (Roti Tanoor)
Upto 50 M3 per month 121 Upto 0.5 hm3 per month 110 Upto 100 M3 per month 127 Upto 1 hm3 = 110 Upto 100 M3 per month 110 Upto 1 hm3 per month 110 Upto 200 M3 per month 264 Upto 2 hm3 per month 220 Upto 300 M3 per month 275 Upto 3 hm3 = 220 Upto 300 M3 per month 220 Upto 3 hm3 per month 220 Upto 400 M3 per month 780 Over 3 hm3 per month 700 Over 400 M3 per month 980 Above 3 hm3 = 700 Over 400 M3 per month 700 4. Commercial 980 1283 4. Commercial 1283 5. Ice Factories 980 1283 5. Ice Factories 1283 6. Textile (Including Jute), carpets, leather, sports and surgical goods 6.General Indusries 1054
600 786 7 Industrial 780 1021 7. Export Oriented (General Industrial) 819 8. Captive Power 780 1021 8. Export Orinted (Captive) 852 9. Compressed Natural Gas(CNG) 980 1283 8. Capitive Power (General Industry) 1087 10. Cement 975 1277 CNG Region-I 1371
CNG Region-II 1350 Cement 1277 11. Fertilizer Companies 11. Fertilizer Companies On SNGPL's System On SNGPL's System (a) For Feed Stock (a) For Feed Stock i. Pak American Fertilizer Limited. 185 300 i. Pak American Fertilizer Limited. 302 ii. Dawood Hercules Chemical Limited 185 300 ii. Dawood Hercules Chemical Limited 302 iii. Pak Arab Fertilizer Limited 185 300 iii. Pak Arab Fertilizer Limited 302 iv. Pak China Fertilizer Limited 185 300 iv. Pak China Fertilizer Limited 302
v. Hazara Phosphate Fertilizer Plant Limited 300
v. Hazara Phosphate Fertilizer Plant Limited 302
185 vi. FFC Jordan Fertilizer vii. ENGRO Fertilizer Limited US$ 0.70 US$ 0.70 vii. ENGRO Fertilizer Limited US$ 0.70 On SSGCL's System Fauji Fertilizer Bin Qasim Limited 185 300 On SSGCL's System
FFBQL - additional 10 MMCFD feed stock
(i) a) Fauji Fertilizer Bin Qasim Limited 302 (b) For Fuel - All Fertilizer Companies 780 1021 (b) For Fuel - All Fertilizer Companies 1023
On MARI's SYSTEM On MARI's SYSTEM (a) For Feed Stock (a) For Feed Stock i. Engro Fertilizer Company Limited 185 300 i. Engro Fertilizer Company Limited 302 ii. Fauji Fertilizer Company Limited
(Goth Machi/Mirpur Mathelo) ii. Fauji Fertilizer Company Limited
(Goth Machi/Mirpur Mathelo) 302
185 300 iii. Fatima Fertilizer Company Limited US$ 0.70 US$ 0.70 iii. Fatima Fertilizer Company Limited US$ 0.70 iv. Fatima Fertilizer Company Limited,
Mirpur Mathelo, District Gholki iv. Foundation Power Company (Dharki)
Limited
857 (b) For Fuel 780
1021 (b) For Fuel 1023
12. Power Station (WAPDA's and KESCS's 12. Power Station (WAPDA's and KESCS's i. WAPDA & KESC Power Station 629 824 i. WAPDA & KESC Power Station 857
ii. WAPDA's Gas Turbine Power Station Nishatabad, Faislabad
ii. WAPDA's Gas Turbine Power Station Nishatabad, Faislabad 857
629 824 iii. Liberty Power Limited 1005.19 1283.47 1283.47 13. Independent Power Producers 629 824 13. Independent Power Producers 857
14. On MARI's System (a) For Feed Stock i. Engro Fertilizer Company Limited 185 300 ii. Fauji Fertilzer Company Limited
(Goth Machi/Mirpur Mathelo)
185 300 iii. Fatima Fertilizer Company Limited US$ 0.70 US$ 0.70 iv. Fatima Fertilizer Company Limited,
Mirpur Mathelo, District Gholki
(b) For Fuel 780
1021
15. RAW Gas Sold to WAPDA's GUDDU Power Station i. Sui Field (917 BTU) and Kanhkot (866
BTU)-PPL
629 824 ii. Mari (754)-MGCL 629 824 iii. Foundation Power Company (Dharki)
Limited
629 824 iv. Sara/Suri Fields-Tullow
*: Effective till to date Source : Directorate General of Gas.


138
WEIGHTS AND MEASURES
RUPEES One Lakh =One hundred thousand =100,000 Ten Lakh =One million =1,000,000 One Crore =Ten million =10,000,000 One Billion =One thousand million One Trillion =One thousand billion
CURRENCY EQUIVALENT Prior to 1972 One Rupee = US$ 0.21 One US$ = Rs. 4.76 With effect from 8th January, 1982, Rupee is floating against Dollar and is linked to a basket of currencies. WEIGHTS One Gram =0.035 Ounce =0.0857 Tola One Pound =16 ounces =453.592 grams One Kilogram =1000 grams =1.07 seers =2.205 pounds One Metric tonne =1000 Kilograms =0.9842 ton =26.792 Maunds One Maund =37.3242 Kilograms One Tonne =2240 pounds =1.016 metric tonnes One cotton bale =375 Ibs. =170.2 kg One bushel =0.73 mds =27.25 kg
LENGTH One yard =3 feet =36 inches =0.914 metre One mile =1760 yards =1.609 kilometres One sq. yard =0.83613 sq. metres One sq. metre =1.196 sq. yards One Acre =4840 sq. yards =0.4049 hectare One Hectare =2.47 Acres VOLUME One cubic metre =35.315 cubic feet LIQUID MEASURE One barrel =36 gallons (imperial) =163.656 litres YEAR Fiscal/Trade/Agriculture Year in Pakistan starts from 1stJuly and ends on 30th June every year CROPPING SEASONS Kharif – Crop sowing from April to June and harvested during October-December Rabi – Crops sowing from October to December and harvested during April-May

139
ABBREVIATIONS A & P Assessment & Processing
ACD Additional Custom Duty
ADB Asian Development Bank
ADP Annual Development Programmes
ADS Assets Declaration Scheme
AECHs Atomic Energy Cancer Hospitals
AEDB Alternative Energy Development Board
AEPAM Academy of Educational Planning & Management
AGHA Agha Steel Industries
AIDS Acquired Immunodeficiency Syndrome
AIIB Asian Infrastructure Investment Bank
AJK Azad Jammu & Kashmir
AMA Asaan Mobile Account
APCMA All Pakistan Cement Manufacturer Association
APTTCA Afghanistan-Pakistan Transit Trade Coordination Authority
ARE Alternative Renewable Energy
ASER Annual Status of Education Report
ATL Active Taxpayer List
AUM Assets Under Management
B2C Business-to-Consumer
BB Branchless Banking
BHUs Basic Health Units
BINO Bahawalpur Institute of Nuclear Oncology
BISP Benazir Income Support Program
BMEC Baluchistan Mineral Exploration Company Limited
BMR Balancing, Modernization and Replacement
BMRL Baluchistan Minerals Resource Company Limited
BOT Built-Operate-Transfer
CAD Current Account Deficit
CAGR Compound Annual Growth Rate
CAN Calcium Ammonium Nitrate
CAR Capital Adequacy Ratio
CBU Completely Built Up
CCI Council of Common Interests
CCOE Cabinet Committee on Energy
CCTs Conditional Cash Transfers
CDNS Central Directorate of National Savings
CFAO Chief Finance and Accounts Officer
CFIs Commercial Financial Institutions
CGPM Clean Green Pakistan Movement
CIA Chief Internal Auditor
CiC Currency in Circulation
CIIE China International Import Expo
CKD Completely Knocked Down
CKO Centralized Know Your Customer Organization
CM & TSA Cash Management and Treasury Single Account
CMI Census of Manufacturing Industries
CMS Complaint Management System
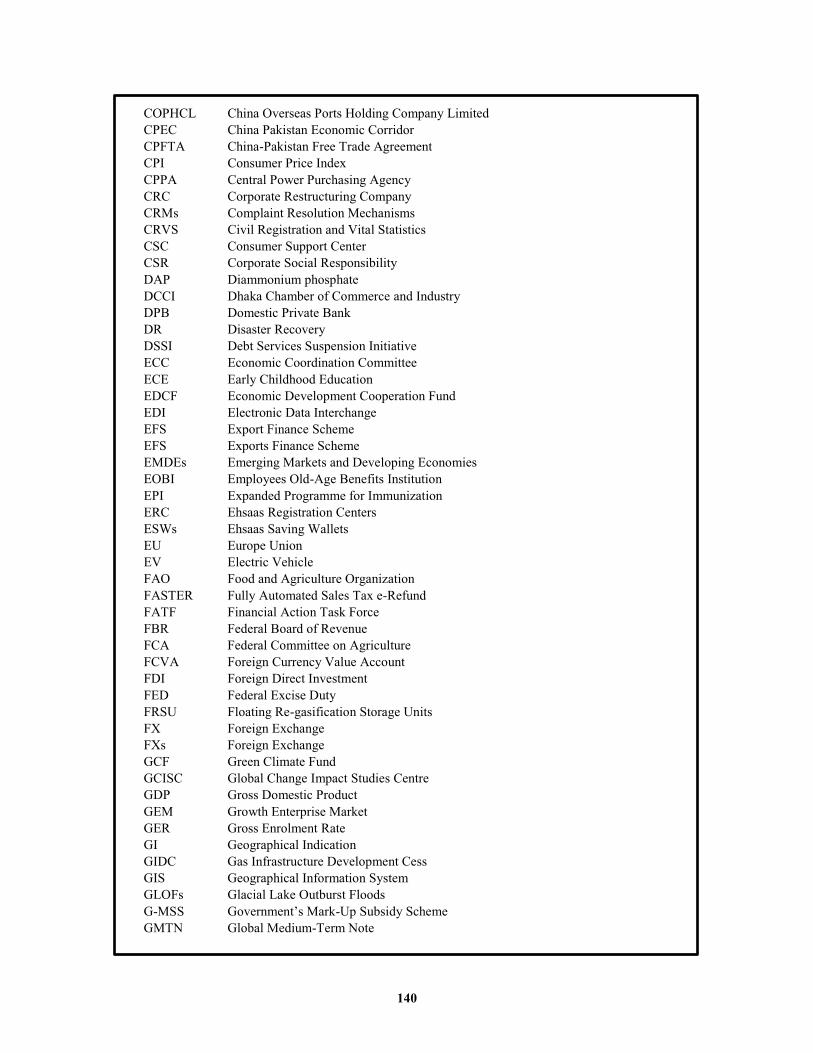
140
COPHCL China Overseas Ports Holding Company Limited
CPEC China Pakistan Economic Corridor
CPFTA China-Pakistan Free Trade Agreement
CPI Consumer Price Index
CPPA Central Power Purchasing Agency
CRC Corporate Restructuring Company
CRMs Complaint Resolution Mechanisms
CRVS Civil Registration and Vital Statistics
CSC Consumer Support Center
CSR Corporate Social Responsibility
DAP Diammonium phosphate
DCCI Dhaka Chamber of Commerce and Industry
DPB Domestic Private Bank
DR Disaster Recovery
DSSI Debt Services Suspension Initiative
ECC Economic Coordination Committee
ECE Early Childhood Education
EDCF Economic Development Cooperation Fund
EDI Electronic Data Interchange
EFS Export Finance Scheme
EFS Exports Finance Scheme
EMDEs Emerging Markets and Developing Economies
EOBI Employees Old-Age Benefits Institution
EPI Expanded Programme for Immunization
ERC Ehsaas Registration Centers
ESWs Ehsaas Saving Wallets
EU Europe Union
EV Electric Vehicle
FAO Food and Agriculture Organization
FASTER Fully Automated Sales Tax e-Refund
FATF Financial Action Task Force
FBR Federal Board of Revenue
FCA Federal Committee on Agriculture
FCVA Foreign Currency Value Account
FDI Foreign Direct Investment
FED Federal Excise Duty
FRSU Floating Re-gasification Storage Units
FX Foreign Exchange
FXs Foreign Exchange
GCF Green Climate Fund
GCISC Global Change Impact Studies Centre
GDP Gross Domestic Product
GEM Growth Enterprise Market
GER Gross Enrolment Rate
GI Geographical Indication
GIDC Gas Infrastructure Development Cess
GIS Geographical Information System
GLOFs Glacial Lake Outburst Floods
G-MSS Government’s Mark-Up Subsidy Scheme
GMTN Global Medium-Term Note

141
GNI Gross National Income
GSP Geological Survey of Pakistan
GST General Sales Tax
HCV Heavy Commercial Vehicle
HDI Human Development Index
HEC Higher Education Commission
HEDP Higher Education Development Programme
HEIs: Higher Education Institutes
HIV Human Immunodeficiency Virus
I & P Investigation & Prosecution Unit
IBB Islamic Banking Branches
IBI Islamic Banking Industry
ICAC International Cotton Advisory Committee
ICTs Information and Communication Technologies
IFA Individual Financial Assistance
IFIs International Financial Institutions
IFL Interest Free Loan
IGCEP Indicative Generation Capacity Expansion Plan
IMR Infant mortality rate
INMOL Institute of Nuclear Medicine & Oncology Lahore
IPOs Initial Public Offerings
IREN Inland Revenue Enforcement Network
ITeS Information Technology enabled Services
ITU International Telecommunications Union
JHPIEGO Johns Hopkins Program for International Education in Gynecology and Obstetrics
JP&VCCs Job Placement and Vocational Counseling Centres
JPCs Job Placement Centres
JPHLEPD Japan-Pakistan High Level Economic Policy Dialogue
KANUPP Karachi Nuclear Power Plant
KPEC Khyber Pass Economic Corridor
LCV Light Commercial Vehicles
LEAs Law Enforcement Agencies
LEG Labour Expert Group
LHW Lady Health Workers
LLITN Long Lasting Insecticide Treated Nets
LMA Limited Mandate Accounts
LMC Lubricant Marketing Company
LPG Liquefied Petroleum Gas
LSM Large Scale Manufacturing
LTFF Long Term Finance Facility
LTFF Long Term Financing Facility
MDAS Ministries, Divisions, Attached Departments, Sub-Ordinate Offices
MDM Mobile Device Manufacturing
MFBs Micro-Finance Banks
MFIs Microfinance Institutions
MMCFD Million Cubic Feet per day
MMF Man Made Fiber
MNFS&R Ministry of National Food Security and Research
MOU Memorandum Of Understanding
MSCI Morgan Stanley Capital International
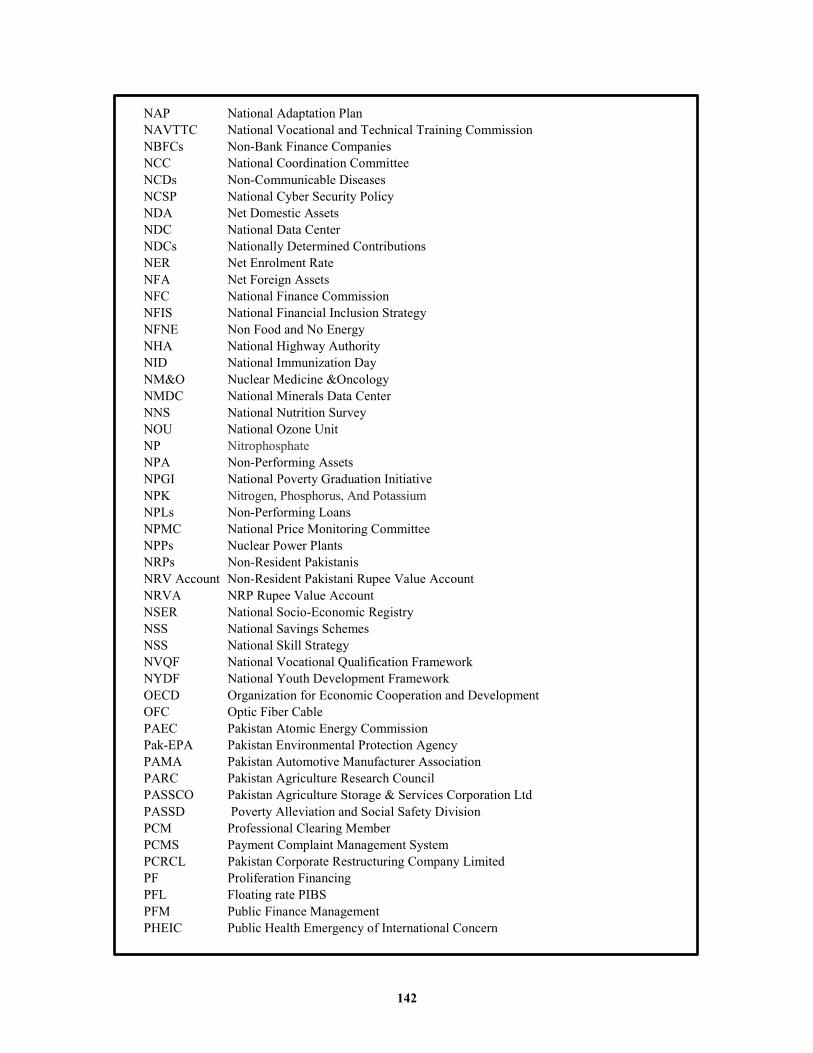
142
NAP National Adaptation Plan
NAVTTC National Vocational and Technical Training Commission
NBFCs Non-Bank Finance Companies
NCC National Coordination Committee
NCDs Non-Communicable Diseases
NCSP National Cyber Security Policy
NDA Net Domestic Assets
NDC National Data Center
NDCs Nationally Determined Contributions
NER Net Enrolment Rate
NFA Net Foreign Assets
NFC National Finance Commission
NFIS National Financial Inclusion Strategy NFNE Non Food and No Energy
NHA National Highway Authority
NID National Immunization Day
NM&O Nuclear Medicine &Oncology
NMDC National Minerals Data Center
NNS National Nutrition Survey
NOU National Ozone Unit
NP Nitrophosphate
NPA Non-Performing Assets
NPGI National Poverty Graduation Initiative
NPK Nitrogen, Phosphorus, And Potassium
NPLs Non-Performing Loans
NPMC National Price Monitoring Committee
NPPs Nuclear Power Plants
NRPs Non-Resident Pakistanis
NRV Account Non-Resident Pakistani Rupee Value Account
NRVA NRP Rupee Value Account
NSER National Socio-Economic Registry
NSS National Savings Schemes
NSS National Skill Strategy
NVQF National Vocational Qualification Framework
NYDF National Youth Development Framework
OECD Organization for Economic Cooperation and Development
OFC Optic Fiber Cable
PAEC Pakistan Atomic Energy Commission
Pak-EPA Pakistan Environmental Protection Agency
PAMA Pakistan Automotive Manufacturer Association
PARC Pakistan Agriculture Research Council
PASSCO Pakistan Agriculture Storage & Services Corporation Ltd
PASSD Poverty Alleviation and Social Safety Division
PCM Professional Clearing Member
PCMS Payment Complaint Management System
PCRCL Pakistan Corporate Restructuring Company Limited
PF Proliferation Financing
PFL Floating rate PIBS
PFM Public Finance Management
PHEIC Public Health Emergency of International Concern
143
PIBs Pakistan Investment Bonds
PITE Provincial Institutes of Teacher Education
PMDC Pakistan Mineral Development Corporation
PMEX Pakistan Mercantile Exchange Limited
PMKJ-YES Prime Minister’s Kamyab Jawan Youth Entrepreneurships Scheme
PMN Pakistan Microfinance Network
PNSC Pakistan National Shipping Corporation
POC Pakistan Origin Card
PODB Pakistan Oilseed Development Board
POs Partner Organizations
POS Point of Sales
PPCBL Punjab Provincial Cooperative Bank Limited
PPIB Private Power and Infrastructure Board
PPP Public-Private Partnership
PPR Programme for Poverty Reduction
PR Pakistan Railways
PSDP Public Sector Development program
PSEs Public Sector Enterprises
PSIC Pakistan Standard Industrial Classification
PSLM Pakistan Social and Living Standards Measurement
PSX Pakistan Stock Exchange
PTL Panther Tyres Limited
QEC Quality Enhancement Cell
QIM Quantum Index of Manufacturing
RAMS Risk based Audit Management System
RAS Regulatory Approval System
RBOD Right Bank Outfall Drain
RBS Risk Based Supervision
RD Regulatory Duty
RDA Roshan Digital Accounts
REER Real Effective Exchange Rate
REITs Real Estate Investment Trusts
RFCC Refinance Facility for Combating COVID-19
RFCD Resident Foreign Currency Deposits
RFI Rapid Financing Instrument
RHCs Rural Health Clinics
RLNG Re-gasified Liquefied Natural Gas
RSPs Rural Support Programmes
RYE Revitalizing Youth Enterprise
SBP State Bank of Pakistan
SBTS Safe Blood Transfusion Services
SDGs Sustainable Development Goals
SECP Security and Exchange Commission of Pakistan
SKD Semi Knocked Down
SMEDA Small and Medium Enterprises Development Authority
SNC Single National Curriculum
SOP Sulphate of Potash
SOPs Standard Operating Procedures
SPI Sensitive Price Indicator
SRCLs Schools for Rehabilitation of Child Labour
144
SSM Small Scale Manufacturing
SSP Single Super Phosphate
STPs Software Technology Parks
STSC Short-Term Savings Certificates
SWIT Saylani Welfare International Trust
TBTTP Ten Billion Tree Tsunami Programme
TCO Textiles Commissioner’s Organization
TDAP Trade Development Authority of Pakistan
TERF Temporary Economic Refinance Facility
THQs Tehsil Headquarters
TOMCL The Organic Meat Company
TPLT TPL Trakker
TPSP Third Party Service Provider
TSA Treasury Single Account
TVET Technical & Vocational Education and Training
TY Tax year
UAN Universal Account Number
UIN Unique Identification Number
UNDP United Nations Development Programme
UNFCCC United Nations Framework Convention on Climate Change
UNHCR United Nation High Commission for Refugees
US United States
USF Universal Service Fund
USSD Unstructured Supplementary Service Data
VPS Voluntary Pension System
WADR Weighted Average Deposit Rate
WALR Weighted Average Lending Rate
WASH Water, Sanitation and Hygiene
WDI World Development Indicators
WeBOC Web Based One Customs
WECs Women Empowerment Centres
WHO World Health Organization
WPI Wholesale Price Index
WWF Workers Welfare Fund
YoY Year on Year
ZTBL Zarai Taraqiati Bank Limited

PCPPI – 5055(22) Fin.Div.— 29-05-2022 — 2900
145
Your Support for Improvement
Economic Adviser’s Wing would appreciate your comments on our
efforts made in presenting Pakistan Economic Survey 2021-22. Your
feedback will be helpful to further improve the quality of this publication.
Kindly forward your comments and suggestions to Economic Adviser’s
Wing, Finance Division, Islamabad.
1. The presentation and order of the chapters is
Good/Satisfactory/ Needs Improvement
2. Descriptive part contains useful information on how Pakistan’s Economy
prevailed during the financial year.
Your rating: 0% --------100%
3. Data provided in the Survey found useful.
Your rating: 0% --------100%
4. Suitable stock of information is given on all the sectors of Pakistan’s Economy.
Your rating: 0% --------100%
5. Economic Survey is a valuable source of information on Pakistan’s Economy.
Your rating: 0% --------100%
6. The overall quality of the Economic Survey is:
Good/Satisfactory/ Needs Improvement
7. Kindly give suggestions for improvement of Pakistan Economic Survey.