Embed Size (px)
Citation preview
Published Ahead of Print 26 September 2011. 10.1128/MCB.05979-11.
2011, 31(23):4692. DOI:Mol. Cell. Biol. Paul C. Dechow, Jonathan M. Graff and Yihong WanWei Wei, Daniel Zeve, Xueqian Wang, Yang Du, Wei Tang,
-Expressing Bone Marrow Cell PopulationγReceptorPeroxisome Proliferator-Activated
Osteoclast Progenitors Reside in the
http://mcb.asm.org/content/31/23/4692Updated information and services can be found at:
These include:
REFERENCEShttp://mcb.asm.org/content/31/23/4692#ref-list-1at:
This article cites 61 articles, 17 of which can be accessed free
CONTENT ALERTS more»articles cite this article),
Receive: RSS Feeds, eTOCs, free email alerts (when new
http://mcb.asm.org/site/misc/reprints.xhtmlInformation about commercial reprint orders: http://journals.asm.org/site/subscriptions/To subscribe to to another ASM Journal go to:
on Novem
ber 8, 2011 by UN
IV T
EX
AS
SW
ME
D C
TR
904http://m
cb.asm.org/
Dow
nloaded from
MOLECULAR AND CELLULAR BIOLOGY, Dec. 2011, p. 4692–4705 Vol. 31, No. 230270-7306/11/$12.00 doi:10.1128/MCB.05979-11Copyright © 2011, American Society for Microbiology. All Rights Reserved.
Osteoclast Progenitors Reside in the Peroxisome Proliferator-ActivatedReceptor �-Expressing Bone Marrow Cell Population�
Wei Wei,1 Daniel Zeve,2 Xueqian Wang,1 Yang Du,1 Wei Tang,2 Paul C. Dechow,5
Jonathan M. Graff,2,3,4 and Yihong Wan1*Department of Pharmacology,1 Department of Developmental Biology,2 Department of Molecular Biology,3 and Department of
Internal Medicine,4 University of Texas Southwestern Medical Center, Dallas, Texas 75390, and Department of BiomedicalSciences, Baylor College of Dentistry, Texas A&M University Health Sciences Center, Dallas, Texas 752465
Received 21 July 2011/Returned for modification 20 August 2011/Accepted 18 September 2011
Osteoclasts are bone-resorbing cells essential for skeletal development, homeostasis, and regeneration. Theyderive from hematopoietic progenitors in the monocyte/macrophage lineage and differentiate in response toRANKL. However, the precise nature of osteoclast progenitors is a longstanding and important question. Usinginducible peroxisome proliferator-activated receptor � (PPAR�)-tTA TRE-GFP (green fluorescent protein)reporter mice, we show that osteoclast progenitors reside specifically in the PPAR�-expressing hematopoieticbone marrow population and identify the quiescent PPAR�� cells as osteoclast progenitors. Importantly, twoPPAR�-tTA TRE-Cre-controlled genetic models provide compelling functional evidence. First, Notch activa-tion in PPAR�� cells causes high bone mass due to impaired osteoclast precursor proliferation. Second,selective ablation of PPAR�� cells by diphtheria toxin also causes high bone mass due to decreased osteoclastnumbers. Furthermore, PPAR�� cells respond to both pathological and pharmacological resorption-enhanc-ing stimuli. Mechanistically, PPAR� promotes osteoclast progenitors by activating GATA2 transcription.These findings not only identify the long-sought-after osteoclast progenitors but also establish unprecedentedtools for their visualization, isolation, characterization, and genetic manipulation.
Bone is a dynamic tissue that constantly remodels itself bybalancing osteoclast-mediated bone resorption and osteoblast-mediated bone formation. Osteoclasts derive from hematopoi-etic progenitors (5) in the monocyte/macrophage lineage (41,47); in contrast, osteoblasts are of mesenchymal lineage (38).Physiological osteoclast functions are essential for skeletal de-velopment, homeostasis, and regeneration in response to in-jury. However, pathological increases in osteoclast activitiesare associated with several diseases, including osteoporosis,arthritis, and bone metastasis of cancers (35).
Osteoclast lineage specification is a multistep process thatrequires osteoclast progenitor commitment (41, 47), macro-phage colony-stimulating factor (M-CSF)-mediated osteoclastprecursor proliferation (57), and RANKL (receptor activatorof NF-�B ligand)-mediated osteoclast differentiation (8, 29,56). Although the discovery of RANKL has revolutionizedresearch in osteoclast biology, RANKL mainly acts at laterstages of osteoclastogenesis. The cellular identity and the pre-cise nature of the bona fide osteoclast progenitors are under-explored. Previous studies have elegantly characterized the cellsurface markers that enrich osteoclast progenitors using flowcytometry (25); however, tools are lacking to label osteoclastprogenitors in vivo for visualization, isolation, and lineage trac-ing, as well as to genetically manipulate osteoclast progenitorsfor functional characterization.
Peroxisome proliferator-activated receptor � (PPAR�) is a
member of the nuclear receptor family of transcription factorsthat can be activated by lipophilic ligands, including the dia-betic drug rosiglitazone (BRL, or Avandia) (18, 49). Previousstudies showed that PPAR� is highly expressed in both mono-cyte/macrophage precursors and mature osteoclasts (39, 48,52). Loss of PPAR� function in mouse hematopoietic lineagescauses osteoclast defects manifested as osteopetrosis (52).Gain of PPAR� function by pharmacological activation en-hances osteoclastogenesis and bone resorption in mice andhumans (52, 53, 59). These findings provide important mech-anistic understanding of the clinically reported bone loss andhigher fracture rates in diabetic patients treated with rosigli-tazone. Here, we hypothesize that osteoclast progenitors residein the PPAR�-expressing hematopoietic bone marrow popu-lation and that PPAR� regulation goes beyond osteoclast dif-ferentiation by also defining the osteoclast progenitors.
MATERIALS AND METHODS
Mice. PPAR�-tTA TRE-H2BGFP mice (46), flox-DTA mice (30), and NICD-flox mice (55) have been described previously. PPAR�-tTA TRE-cre mice werebred with flox-DTA mice to generate PTDTA mice. PPAR�-tTA TRE-cre micewere bred with NICD-flox mice to generate PTNICD mice. All experiments wereperformed using littermate cohorts. All protocols for mouse experiments wereapproved by the Institutional Animal Care and Use Committee of the Universityof Texas Southwestern Medical Center.
Bone analyses. To evaluate bone volume and architecture by micro-computedtomography (�CT), mouse tibiae were fixed in 70% ethanol and scanned usinga Scanco �CT-35 instrument (Scanco Medical) at several resolutions for bothoverall tibial assessment (14-�m resolution) and structural analysis of trabecularand cortical bone (7-�m resolution). Trabecular bone parameters were calcu-lated using the Scanco software to analyze the bone scans from the trabecularregion directly distal to the proximal tibial growth plate. Histomorphometricanalyses were conducted using Bioquant Image Analysis software (Bioquant).TRAP (tartrate-resistant acid phosphatase) staining of osteoclasts was per-formed using a leukocyte acid phosphatase staining kit (Sigma). ALP staining of
* Corresponding author. Mailing address: Department of Pharma-cology, UT Southwestern Medical Center, 6001 Forest Park Road,Room ND8.502B, Dallas, TX 75390-9041. Phone: (214) 645-6062. Fax:(214) 645-6067. E-mail: [email protected].
� Published ahead of print on 26 September 2011.
4692
on Novem
ber 8, 2011 by UN
IV T
EX
AS
SW
ME
D C
TR
904http://m
cb.asm.org/
Dow
nloaded from
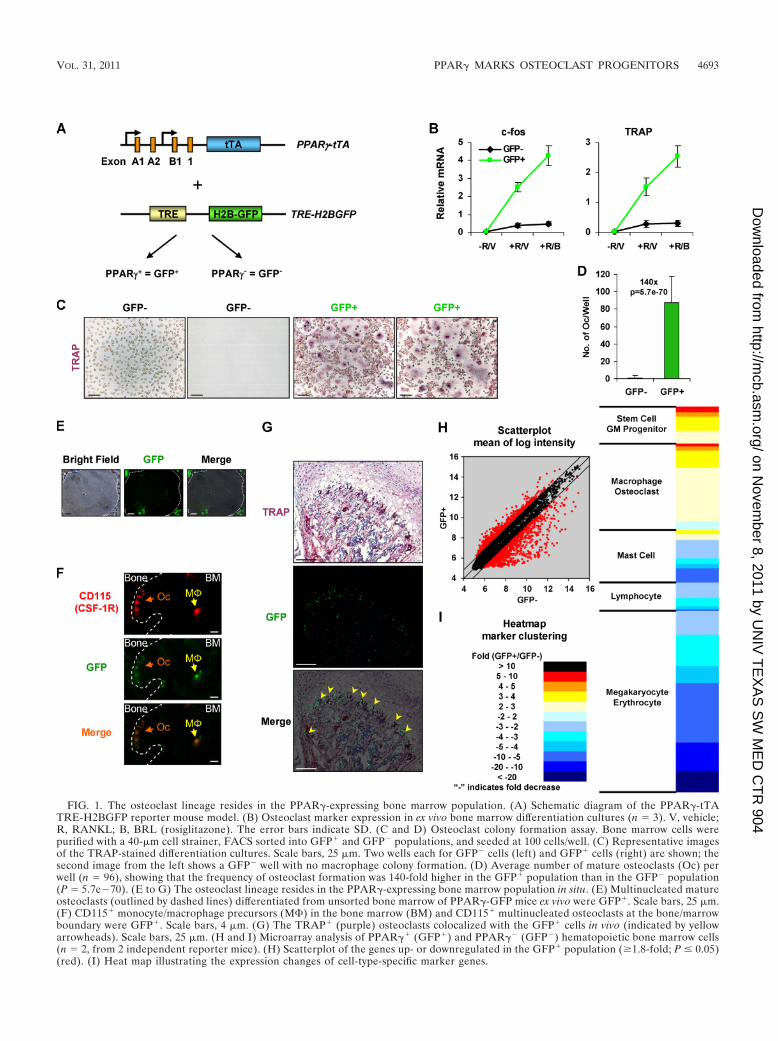
FIG. 1. The osteoclast lineage resides in the PPAR�-expressing bone marrow population. (A) Schematic diagram of the PPAR�-tTATRE-H2BGFP reporter mouse model. (B) Osteoclast marker expression in ex vivo bone marrow differentiation cultures (n � 3). V, vehicle;R, RANKL; B, BRL (rosiglitazone). The error bars indicate SD. (C and D) Osteoclast colony formation assay. Bone marrow cells werepurified with a 40-�m cell strainer, FACS sorted into GFP� and GFP� populations, and seeded at 100 cells/well. (C) Representative imagesof the TRAP-stained differentiation cultures. Scale bars, 25 �m. Two wells each for GFP� cells (left) and GFP� cells (right) are shown; thesecond image from the left shows a GFP� well with no macrophage colony formation. (D) Average number of mature osteoclasts (Oc) perwell (n � 96), showing that the frequency of osteoclast formation was 140-fold higher in the GFP� population than in the GFP� population(P � 5.7e�70). (E to G) The osteoclast lineage resides in the PPAR�-expressing bone marrow population in situ. (E) Multinucleated matureosteoclasts (outlined by dashed lines) differentiated from unsorted bone marrow of PPAR�-GFP mice ex vivo were GFP�. Scale bars, 25 �m.(F) CD115� monocyte/macrophage precursors (M�) in the bone marrow (BM) and CD115� multinucleated osteoclasts at the bone/marrowboundary were GFP�. Scale bars, 4 �m. (G) The TRAP� (purple) osteoclasts colocalized with the GFP� cells in vivo (indicated by yellowarrowheads). Scale bars, 25 �m. (H and I) Microarray analysis of PPAR�� (GFP�) and PPAR�� (GFP�) hematopoietic bone marrow cells(n � 2, from 2 independent reporter mice). (H) Scatterplot of the genes up- or downregulated in the GFP� population (�1.8-fold; P � 0.05)(red). (I) Heat map illustrating the expression changes of cell-type-specific marker genes.
VOL. 31, 2011 PPAR� MARKS OSTEOCLAST PROGENITORS 4693
on Novem
ber 8, 2011 by UN
IV T
EX
AS
SW
ME
D C
TR
904http://m
cb.asm.org/
Dow
nloaded from
osteoblasts was performed using an alkaline phosphatase staining kit (Sigma). Asa bone resorption marker, urinary C-terminal telopeptide fragments of the typeI collagen (CTX-1) was measured with the RatLaps enzyme immunoassay (EIA)kit (Immunodiagnostic Systems) and normalized by urinary creatinine measuredwith the Infinity Creatinine Reagent (Thermo Scientific). As a bone formationmarker, serum osteocalcin was measured with the mouse osteocalcin EIA kit(Biomedical Technologies Inc.).
Ex vivo osteoclast differentiation. Osteoclasts were differentiated from mousebone marrow cells as described previously (52, 53). Briefly, bone marrow cellswere purified with a 40-�m cell strainer to remove mesenchymal cells, differen-tiated with 40 ng/ml of M-CSF (R&D Systems) in � minimal essential medium(�-MEM) containing 10% fetal bovine serum (FBS) for 3 days and then with 40ng/ml of M-CSF and 100 ng/ml of RANKL (R&D Systems) for 3 days (unlessotherwise stated), with or without BRL (1 �M) throughout the time course.Mature osteoclasts were identified as multinucleated (3 nuclei) TRAP� cells.Osteoclast differentiation was quantified by the RNA expression of RANKL-induced transcription factors and osteoclast function genes using reverse tran-scription-quantitative PCR (RT-QPCR) analysis.
Osteoclast precursor proliferation assay. Osteoclast precursor proliferationwas quantified using a bromodeoxyuridine (BrdU) cell proliferation assay kit(GE Healthcare Life Sciences) (6). Mouse bone marrow cells were treated withM-CSF (40 ng/ml) for 3 days to stimulate osteoclast precursor expansion. On day4, the cells were M-CSF starved for 6 h to synchronize the cell cycle. The cellswere then restimulated with M-CSF for 4 h to induce S phase, during whichBrdU was provided in the culture medium and integrated into the DNA of theproliferating cells. Osteoclast precursor proliferation was quantified as BrdUincorporation using the BrdU enzyme-linked immunosorbent assay (ELISA) inthe kit.
Gene expression analyses. RNA was reverse transcribed into cDNA using anABI High Capacity cDNA RT Kit and analyzed using real-time quantitative PCR(SYBR green) in triplicate. All RNA expression was normalized by ribosomalprotein L19.
Promoter analyses. Promoter sequence alignment was performed using Vec-tor NTI Advanced 11 AlignX software (Invitrogen). Chromatin immunoprecipi-tation (ChIP) assays were performed using fluorescence-activated cell sorter(FACS)-sorted green fluorescent protein-positive (GFP�) and GFP� mousebone marrow cells as previously described (52). The antibodies used werePPAR�, PU.1 (Santa Cruz), acetyl-histone H3 (Upstate/Millipore), and IgGnegative control (BD Biosciences). ChIP output was quantified by real-time PCRin triplicate and normalized by 10% input.
Transfection. Bone marrow cells were purified with a 40-�m cell strainer toremove mesenchymal cells, sorted by FACS into GFP� and GFP� populations,and cultured with 40 ng/ml M-CSF overnight. Cells in suspension were removed,and adherent cells were transfected in the presence of 40 ng/ml M-CSF, usingFuGene HD (Roche) for 3 days before RANKL-induced osteoclast differenti-ation. The transfection efficiency was 50%. For GATA2 gain of function, aplasmid encoding full-length GATA2 (Open Biosystems) or vector control wastransfected. For GATA2 loss of function, small interfering RNA (siRNA) forGATA2 (siGATA2) or control siRNA (siCtrl) (Santa Cruz) was transfected.
Flow cytometry. The FACS analyses of bone marrow cells were performedusing a BD FACScan flow cytometer and phycoerythrin (PE)-conjugated anti-bodies (all from BD Pharmingen). The FACS sorting of GFP� and GFP� bonemarrow cell populations was performed using a MoFlo Cell Sorter (BeckmanCoulter).
Statistical analyses. All statistical analyses were performed with Student’s ttest, and the results are represented as means and standard deviations (SD).
RESULTS
Identification of osteoclast progenitors by in vivo labeling.To test this hypothesis, we employed our PPAR�-GFP re-porter mice (PPAR�-tTA TRE-H2BGFP) (46). In these mice,a tet transactivator cassette (tTA) was inserted into the endog-enous PPAR� locus. When combined with the tTA-responsiveH2BGFP transgenic allele (TRE-H2BGFP) (26, 51), the big-enic mice marked PPAR�-expressing cells with GFP (Fig. 1A).We isolated GFP� cells from the hematopoietic bone marrowpopulation by FACS (http://www4.utsouthwestern.edu/wanlab/publications.htm) and compared their osteoclastogenic poten-tial with that of GFP� cells using an ex vivo osteoclast differ-
entiation assay. Expression of the osteoclast markers c-fos andTRAP (Fig. 1B), as well as Ctsk, Calcr, and CAR2 (notshown), indicated that GFP� cells differentiated into oste-oclasts, while such activity appeared to be lacking in GFP�
cells.To quantify osteoclast colony formation, we sorted GFP�
and GFP� bone marrow cells, plated them at 100 cells/well in96-well plates, and cultured them with M-CSF until 50% con-fluence before RANKL stimulation. After 11 days, we stainedthe cells for TRAP and quantified mature osteoclasts (TRAP�
and 3 nuclei) in each well. The majority of the GFP� cells ineach well had already formed osteoclasts, and the remainingmononuclear cells were TRAP� preosteoclasts in the processof maturation (Fig. 1C). For GFP� wells, both macrophageand osteoclast colonies developed at 100% (96/96); in contrast,55% (53/96) of GFP� wells developed TRAP� macrophagecolonies, and only 7% (4/96) formed osteoclasts. The numberof osteoclasts per well was also significantly higher for GFP�
than for GFP� wells; as a result, the frequency of osteoclastformation was 140-fold higher for GFP� cells (Fig. 1D), indi-cating that 99% of osteoclast progenitors/precursors werePPAR��. These results show that the osteoclast lineage re-sides in the GFP� bone marrow population ex vivo.
Imaging analyses further supported the notion that the os-teoclast lineage was derived from GFP� cells ex vivo and invivo. First, we performed ex vivo osteoclast differentiation usingthe unsorted bone marrow cells of PPAR�-GFP mice. Themultinucleated osteoclasts developed in culture were all GFP�
(Fig. 1E). Second, we performed immunostaining of the fem-oral sections for CD115 (M-CSF receptor [M-CSFR]), amarker for the monocyte/macrophage lineage. The CD115�
multinucleated osteoclasts at the bone/marrow junction wereGFP�, and notably, the CD115� monocyte/macrophage pre-cursors in the bone marrow also expressed GFP (Fig. 1F).Third, we performed TRAP staining as an independentmethod to identify osteoclasts. The TRAP� osteoclasts alsocolocalized with GFP� cells (Fig. 1G). We also observedGFP� bone marrow cells that were TRAP�, which representputative osteoclast progenitors and precursors (Fig. 1G). Thus,the osteoclast lineage resides in the GFP� bone marrow pop-ulation in situ.
To compare the gene expression profiles of GFP� andGFP� cells, we performed microarray analysis. Approximately800 genes were up- or downregulated in the GFP� populationby �1.8-fold (P � 0.05) (Fig. 1H). The GFP� cells displayedincreased expression of stem cell/granulocyte-monocyte (GM)progenitor (26 genes) and macrophage/osteoclast (61 genes)markers and decreased expression of lymphocyte (20 genes),mast cell (37 genes), and megakaryocyte/erythrocyte (128genes) markers (Fig. 1I) (http://www4.utsouthwestern.edu/wanlab/publications.htm). This suggests that (i) the PPAR��
population is enriched for stem/progenitor cells and (ii)PPAR� expression specifically directs hematopoiesis towardthe monocyte/macrophage lineage but away from lymphoid orother myeloid lineages, including megakaryocytes, erythro-cytes, and mast cells. Consistently, methylcellulose colony-forming assays showed that GFP� cells generated moremacrophage colonies but fewer granulocyte, erythrocyte,and lymphocyte colonies than GFP� cells (http://www4.utsouthwestern.edu/wanlab/publications.htm). Together, these data
4694 WEI ET AL. MOL. CELL. BIOL.
on Novem
ber 8, 2011 by UN
IV T
EX
AS
SW
ME
D C
TR
904http://m
cb.asm.org/
Dow
nloaded from
indicate that we have identified the osteoclast progenitors inthe PPAR�-expressing hematopoietic bone marrow cell pop-ulation, and we can prospectively visualize, isolate, and char-acterize the osteoclast progenitors using the PPAR�-GFP re-porter mice.
Osteoclast progenitors reside in quiescent PPAR�� bonemarrow cells. The inducible PPAR�-tTA TRE-H2BGFP re-porter mice afforded a tool for osteoclast stem/progenitorcell marking by H2BGFP label retention, a quality that isoften indicative of quiescent stem/progenitor cell popula-
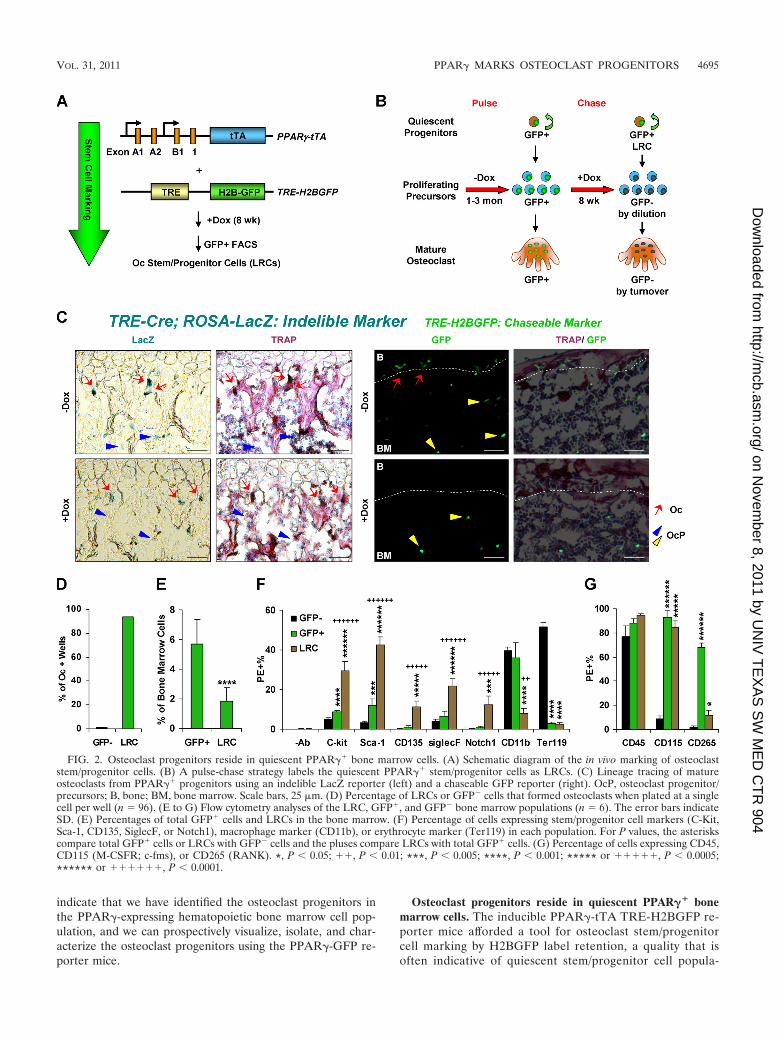
FIG. 2. Osteoclast progenitors reside in quiescent PPAR�� bone marrow cells. (A) Schematic diagram of the in vivo marking of osteoclaststem/progenitor cells. (B) A pulse-chase strategy labels the quiescent PPAR�� stem/progenitor cells as LRCs. (C) Lineage tracing of matureosteoclasts from PPAR�� progenitors using an indelible LacZ reporter (left) and a chaseable GFP reporter (right). OcP, osteoclast progenitor/precursors; B, bone; BM, bone marrow. Scale bars, 25 �m. (D) Percentage of LRCs or GFP� cells that formed osteoclasts when plated at a singlecell per well (n � 96). (E to G) Flow cytometry analyses of the LRC, GFP�, and GFP� bone marrow populations (n � 6). The error bars indicateSD. (E) Percentages of total GFP� cells and LRCs in the bone marrow. (F) Percentage of cells expressing stem/progenitor cell markers (C-Kit,Sca-1, CD135, SiglecF, or Notch1), macrophage marker (CD11b), or erythrocyte marker (Ter119) in each population. For P values, the asteriskscompare total GFP� cells or LRCs with GFP� cells and the pluses compare LRCs with total GFP� cells. (G) Percentage of cells expressing CD45,CD115 (M-CSFR; c-fms), or CD265 (RANK). *, P 0.05; ��, P 0.01; ***, P 0.005; ****, P 0.001; ***** or �����, P 0.0005;****** or ������, P 0.0001.
VOL. 31, 2011 PPAR� MARKS OSTEOCLAST PROGENITORS 4695
on Novem
ber 8, 2011 by UN
IV T
EX
AS
SW
ME
D C
TR
904http://m
cb.asm.org/
Dow
nloaded from
4696 WEI ET AL. MOL. CELL. BIOL.
on Novem
ber 8, 2011 by UN
IV T
EX
AS
SW
ME
D C
TR
904http://m
cb.asm.org/
Dow
nloaded from
tions (51). Histone H2B-GFP has been well characterized asa stable protein and a sensitive marker for chromosomedynamics in living cells (26, 51). In the absence of doxycy-cline (Dox), all PPAR�� cells are labeled with GFP. WhentTA activity is suppressed by Dox, only postmitotic andquiescent stem/progenitor cells retain the label, as H2BGFPis diluted in proliferating cells (26; http://www4.utsouthwestern.edu/wanlab/publications.htm) (Fig. 2A).Thus, we employed a pulse-chase strategy to distinguishslow-cycling (quiescent progenitor) from fast-cycling (pro-liferating precursor) cells (Fig. 2B). We first pulsed thereporter mice by allowing GFP expression in all PPAR��
cells (�Dox) and then chased with Dox for 8 weeks to blocknew H2BGFP expression and thus mark only the label-retaining cells (LRCs). Terminally differentiated osteoclastsare also GFP� and no longer proliferate. However, oste-oclasts undergo constant turnover, with a half-life of 1.3days in mice (32). Thus, the initial GFP� osteoclasts wereeliminated by apoptosis and replaced by osteoclasts differ-entiated from GFP� precursors by the end of the 8-weekDox chase (Fig. 2B). Previous studies have shown that 4weeks to 4 months of Dox chase is sufficient to label pro-genitors as LRCs (26). In our study, we consistently Doxchased the mice for 8 weeks to ensure both proliferatingprecursors and mature osteoclasts became GFP�. There-fore, this pulse-chase strategy labels osteoclast progenitorsas LRCs in the bone marrow.
To determine whether mature osteoclasts can be lineagetraced to PPAR�� progenitors, we employed both a prolifer-ation-sensitive chaseable marker (H2BGFP) and a prolifera-tion-insensitive indelible marker (LacZ) for PPAR�� cells(http://www4.utsouthwestern.edu/wanlab/publications.htm). Inthe PPAR�-tTA TRE-H2BGFP reporter, only quiescentPPAR�� progenitors remain GFP� after Dox suppression oftTA activity, whereas in the PPAR�-tTA TRE-Cre ROSA-LacZ reporter, all cells that originate from PPAR�� progen-itors before Dox suppression at postnatal day 2 (P2) remainLacZ�, since the cre-flox recombination event is irreversible(http://www4.utsouthwestern.edu/wanlab/publications.htm). Thus,the combination of these two markers allows lineage tracing ofPPAR�� progenitors. The results showed that mature oste-oclasts indeed originated from PPAR�� progenitors, becausethey became GFP� but still remained LacZ� after the Doxchase (Fig. 2C). To quantify the purity of osteoclast progeni-tors in the hematopoietic LRC population, we FACS sortedLRCs and plated them at a single cell per well in 96-well plates
to assess their ability to differentiate into osteoclasts. The re-sults showed that 94% of LRCs (�Dox) formed osteoclasts(90/96) whereas only 1% of GFP� cells (�Dox) formed oste-oclasts (1/96) (Fig. 2D), indicating that the LRCs specificallylabeled osteoclast progenitors.
We next further characterized the LRC (�Dox), GFP�
(�Dox), and GFP� (�Dox) populations by FACS analysis.First, LRCs represented �1/3 of the total GFP� cells (Fig.2E). Second, stem/progenitor cell markers, including c-Kit(2, 24, 60), Sca-1 (44), CD135 (33), Siglec-F (3), andNotch-1 (6), were further enriched in the LRCs comparedwith either total GFP� or GFP� (Fig. 2F) cells, whereas themacrophage marker CD11b was reduced in LRCs (Fig. 2F),indicating an increase in non-lineage-committed progenitors(4). Third, the erythrocyte marker Ter119 was excludedfrom both total GFP� cells and LRCs (Fig. 2F). Fourth,95% of LRCs expressed the leukocyte common antigenCD45, a marker found on all cells of hematopoietic originexcept mature erythrocytes and platelets (23) but not oncells of mesenchymal origin (9), demonstrating that theLRCs purified by our method did not contain significantmesenchymal cell types (Fig. 2G). Fifth, 93% of total GFP�
cells and 85% of LRCs expressed CD115 (M-CSFR; c-fms),and 68% of total GFP� cells and 12% of LRCs expressedCD265 (RANK), a receptor required for osteoclast precur-sors but not for myeloid progenitors or macrophages (15)(Fig. 2G). These results not only confirmed the microarrayanalysis (Fig. 1I) showing that the GFP� population washighly enriched for the stem/progenitor cells of the mono-cyte/macrophage lineage, but also identified the LRC sub-population as the osteoclast progenitors.
Constitutive activation of Notch signaling in PPAR�� cellscauses high bone mass. Notch signaling is a key regulator ofosteoblastogenesis (17); however, the cell-autonomous func-tion of Notch in osteoclastogenesis is incompletely understood.We found that Notch1 expression was 15-fold higher in LRCsthan in total GFP� cells (Fig. 2F), indicating that Notch sig-naling may regulate the quiescence-to-proliferation switch ofthe osteoclast progenitors. A previous study showed that lossof Notch function by Notch1 to -3 deletion enhances osteoclas-togenesis by promoting osteoclast precursor proliferation (6).Nonetheless, the effect of gain of Notch function in the oste-oclast lineage is unknown. Thus, if PPAR�� cells are bona fideosteoclast progenitors, then Notch activation in these cellsshould impair osteoclastogenesis by restraining the quies-cence-to-proliferation switch. To test this hypothesis, we ex-
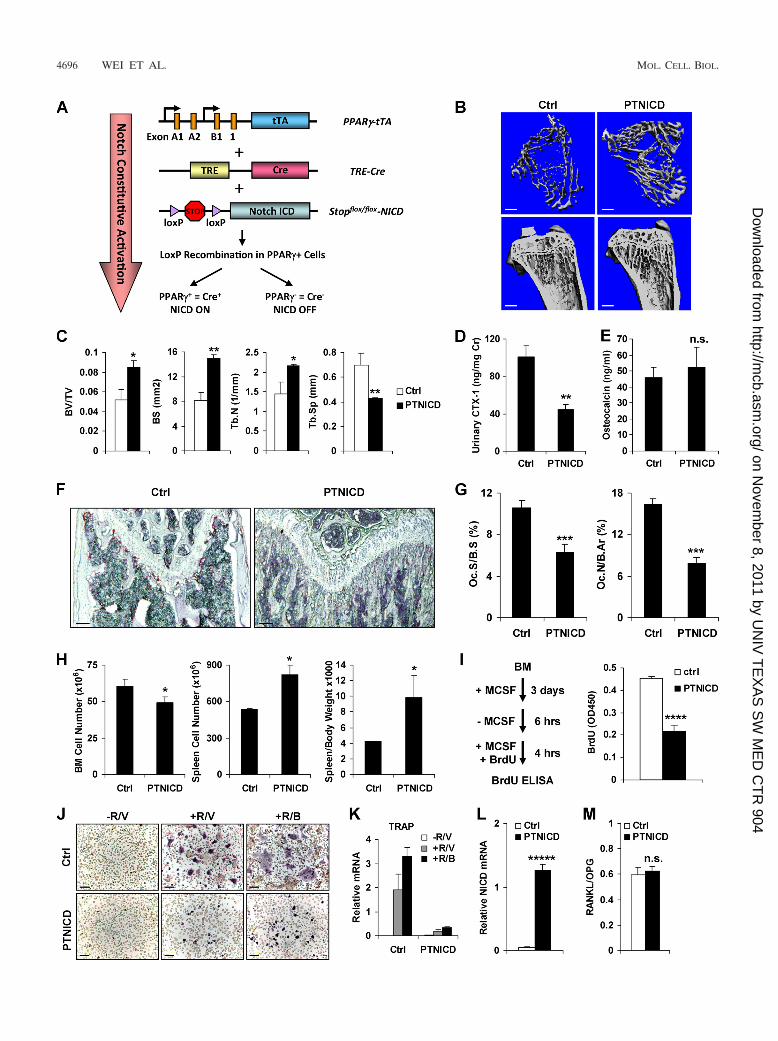
FIG. 3. Notch activation in PPAR�-expressing cells causes high bone mass. (A) Schematic diagram of PTNICD mice. (B and C) �CT analysisof the tibiae from PTNICD or control mice (5 months old; male; n � 6). (B) Representative images of the trabecular bone of the tibial metaphysis(top; scale bar, 10 �m) and the entire proximal tibia (bottom; scale bar, 1 mm). Ctrl, control. (C) Quantification of trabecular bone volume andarchitecture. BS, bone surface; Tb.N, trabecular number; Tb.Sp, trabecular separation. The error bars indicate SD. (D) Urinary CTX-1 (normal-ized to urinary creatinine) (n � 6). (E) Serum osteocalcin (n � 6). (F and G) Bone histomorphometry (n � 6). (F) Representative images ofTRAP-stained femoral sections. Scale bar, 100 �m. (G) Quantification of osteoclast surface (Oc.S/B.S) and number (Oc.N/B.Ar); B.Ar, bone area.(H) PTNICD mice exhibited extramedullary hematopoiesis in the spleen (n � 6). (I) Osteoclast precursor proliferation was decreased in thePTNICD cultures. (Left) Schematic diagram of the proliferation assay. (Right) Quantification of BrdU incorporation (n � 3). (J and K) Osteoclastdifferentiation was blunted in the PTNICD culture. (J) Representative images of TRAP-stained osteoclast differentiation cultures. Scale bar, 25�m. (K) Representative osteoclast marker expression (n � 3). R, RANKL; V, vehicle; B, BRL. (L) NICD expression in control or PTNICDdifferentiation culture (n � 3). (M) Tibial RANKL/OPG mRNA ratio in control or PTNICD mice (n � 3). *, P 0.05; **, P 0.01; ***, P 0.005; ****, P 0.001; *****, P 0.0005; n.s., nonsignificant (P 0.05).
VOL. 31, 2011 PPAR� MARKS OSTEOCLAST PROGENITORS 4697
on Novem
ber 8, 2011 by UN
IV T
EX
AS
SW
ME
D C
TR
904http://m
cb.asm.org/
Dow
nloaded from
4698
on Novem
ber 8, 2011 by UN
IV T
EX
AS
SW
ME
D C
TR
904http://m
cb.asm.org/
Dow
nloaded from
ploited the PPAR�-tTA system, which enables not only oste-oclast progenitor marking but also genetic manipulationtherein. Specifically, PPAR�-tTA TRE-Cre mice permit rapidtranslation to in vivo models harboring flox-mediated induciblegene deletion or activation in osteoclast progenitors. To ex-press a constitutively active Notch intracellular domain(NICD) in the osteoclast lineage, we bred PPAR�-tTA TRE-Cre mice with Stopflox/flox-NICD mice (55) to generatePTNICD mice (Fig. 3A).
Skeletal examinations indicated that the PTNICD mice de-veloped high bone mass due to osteoclast defects. First, �CTimaging revealed a significant increase in trabecular bone inthe PTNICD mice (Fig. 3B and C). Second, ELISA analysesshowed that the bone resorption marker CTX-1 was markedlydecreased by 56% (Fig. 3D) while the bone formation markerosteocalcin was unaltered (Fig. 3E). Third, histomorphometryshowed that osteoclast surface and number (Oc.S/B.S andOc.N/B.Ar) were significantly reduced (Fig. 3F and G), whileosteoblast surface and number (Ob.S/B.S and Ob.N/B.Ar)were unaltered (http://www4.utsouthwestern.edu/wanlab/publications.htm). As often observed in osteopetrotic mice,PTNICD mice also exhibited extramedullary hematopoiesis inthe spleen (Fig. 3H). These data suggested that the increasedbone mass resulted mainly from decreased osteoclast numbersand bone resorption.
To assess the stage at which Notch activation blocks oste-oclastogenesis and the cell-autonomous nature of the effects,we analyzed the osteoclast progenitors ex vivo. M-CSF-medi-ated osteoclast precursor proliferation was markedly reducedin the PTNICD cultures (Fig. 3I). Consistently, the bone mar-row cells from PTNICD mice exhibited lower expression ofRANK, PPAR�1, and c-fms than controls (http://www4.utsouthwestern.edu/wanlab/publications.htm). Moreover,RANKL-mediated and BRL-stimulated osteoclast differentia-tion was also blunted (Fig. 3J), and induction of osteoclastmarker genes was severely decreased (Fig. 3K). NICD expres-sion was significantly increased (Fig. 3L). In contrast, the tibialRANKL/OPG mRNA ratio was unaltered (Fig. 3M). Theseresults all indicate that the impaired bone resorption inPTNICD mice was due to an osteoclast-autonomous defect.The simultaneous reduction in precursor proliferation and os-teoclast differentiation suggested that Notch activation inPPAR�� cells prevented the quiescence-to-proliferationswitch of the osteoclast progenitors. This was consistent withthe previous loss-of-function study showing that Notch is re-quired to maintain the osteoclast stem cell fate (6). Impor-tantly, these results demonstrated that osteoclast progenitorsindeed reside in the PPAR�� bone marrow population in vivo
and can be marked and genetically manipulated by thePPAR�-tTA system.
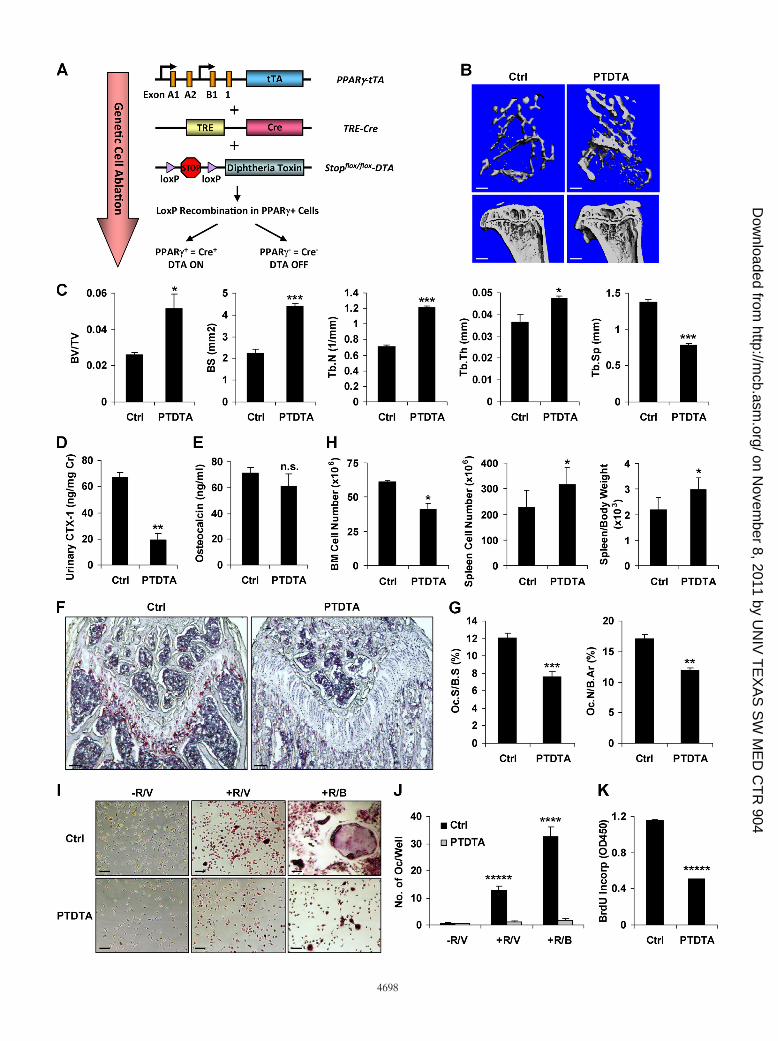
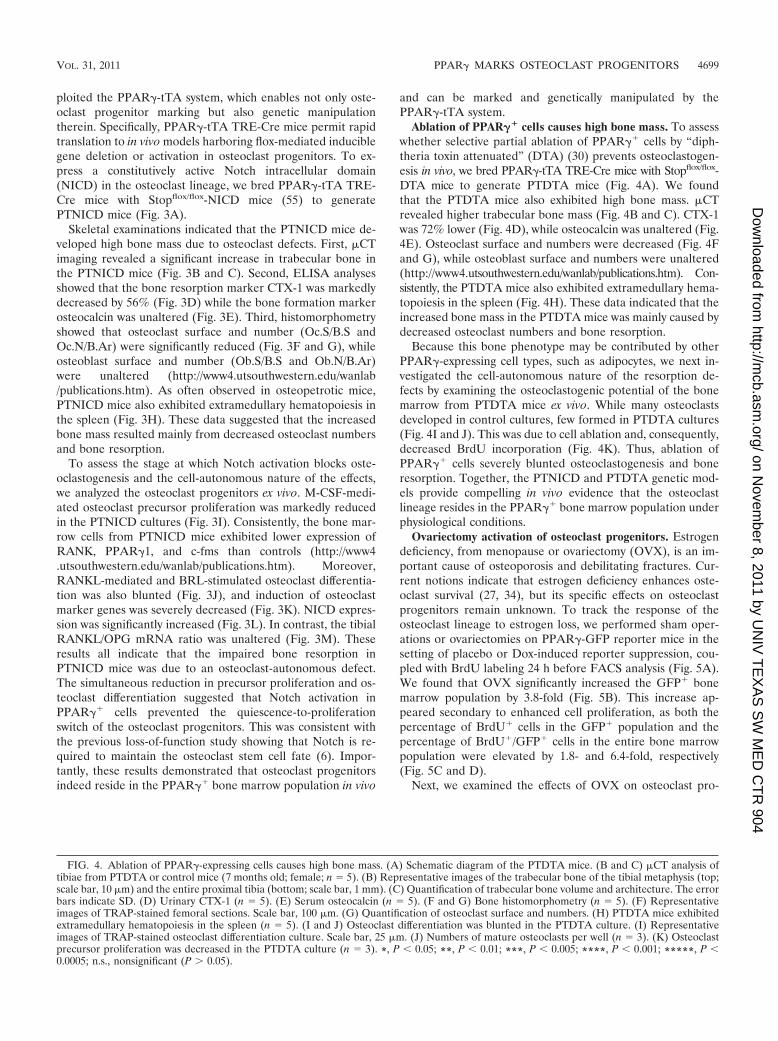
Ablation of PPAR�� cells causes high bone mass. To assesswhether selective partial ablation of PPAR�� cells by “diph-theria toxin attenuated” (DTA) (30) prevents osteoclastogen-esis in vivo, we bred PPAR�-tTA TRE-Cre mice with Stopflox/flox-DTA mice to generate PTDTA mice (Fig. 4A). We foundthat the PTDTA mice also exhibited high bone mass. �CTrevealed higher trabecular bone mass (Fig. 4B and C). CTX-1was 72% lower (Fig. 4D), while osteocalcin was unaltered (Fig.4E). Osteoclast surface and numbers were decreased (Fig. 4Fand G), while osteoblast surface and numbers were unaltered(http://www4.utsouthwestern.edu/wanlab/publications.htm). Con-sistently, the PTDTA mice also exhibited extramedullary hema-topoiesis in the spleen (Fig. 4H). These data indicated that theincreased bone mass in the PTDTA mice was mainly caused bydecreased osteoclast numbers and bone resorption.
Because this bone phenotype may be contributed by otherPPAR�-expressing cell types, such as adipocytes, we next in-vestigated the cell-autonomous nature of the resorption de-fects by examining the osteoclastogenic potential of the bonemarrow from PTDTA mice ex vivo. While many osteoclastsdeveloped in control cultures, few formed in PTDTA cultures(Fig. 4I and J). This was due to cell ablation and, consequently,decreased BrdU incorporation (Fig. 4K). Thus, ablation ofPPAR�� cells severely blunted osteoclastogenesis and boneresorption. Together, the PTNICD and PTDTA genetic mod-els provide compelling in vivo evidence that the osteoclastlineage resides in the PPAR�� bone marrow population underphysiological conditions.
Ovariectomy activation of osteoclast progenitors. Estrogendeficiency, from menopause or ovariectomy (OVX), is an im-portant cause of osteoporosis and debilitating fractures. Cur-rent notions indicate that estrogen deficiency enhances oste-oclast survival (27, 34), but its specific effects on osteoclastprogenitors remain unknown. To track the response of theosteoclast lineage to estrogen loss, we performed sham oper-ations or ovariectomies on PPAR�-GFP reporter mice in thesetting of placebo or Dox-induced reporter suppression, cou-pled with BrdU labeling 24 h before FACS analysis (Fig. 5A).We found that OVX significantly increased the GFP� bonemarrow population by 3.8-fold (Fig. 5B). This increase ap-peared secondary to enhanced cell proliferation, as both thepercentage of BrdU� cells in the GFP� population and thepercentage of BrdU�/GFP� cells in the entire bone marrowpopulation were elevated by 1.8- and 6.4-fold, respectively(Fig. 5C and D).
Next, we examined the effects of OVX on osteoclast pro-
FIG. 4. Ablation of PPAR�-expressing cells causes high bone mass. (A) Schematic diagram of the PTDTA mice. (B and C) �CT analysis oftibiae from PTDTA or control mice (7 months old; female; n � 5). (B) Representative images of the trabecular bone of the tibial metaphysis (top;scale bar, 10 �m) and the entire proximal tibia (bottom; scale bar, 1 mm). (C) Quantification of trabecular bone volume and architecture. The errorbars indicate SD. (D) Urinary CTX-1 (n � 5). (E) Serum osteocalcin (n � 5). (F and G) Bone histomorphometry (n � 5). (F) Representativeimages of TRAP-stained femoral sections. Scale bar, 100 �m. (G) Quantification of osteoclast surface and numbers. (H) PTDTA mice exhibitedextramedullary hematopoiesis in the spleen (n � 5). (I and J) Osteoclast differentiation was blunted in the PTDTA culture. (I) Representativeimages of TRAP-stained osteoclast differentiation culture. Scale bar, 25 �m. (J) Numbers of mature osteoclasts per well (n � 3). (K) Osteoclastprecursor proliferation was decreased in the PTDTA culture (n � 3). *, P 0.05; **, P 0.01; ***, P 0.005; ****, P 0.001; *****, P 0.0005; n.s., nonsignificant (P 0.05).
VOL. 31, 2011 PPAR� MARKS OSTEOCLAST PROGENITORS 4699
on Novem
ber 8, 2011 by UN
IV T
EX
AS
SW
ME
D C
TR
904http://m
cb.asm.org/
Dow
nloaded from
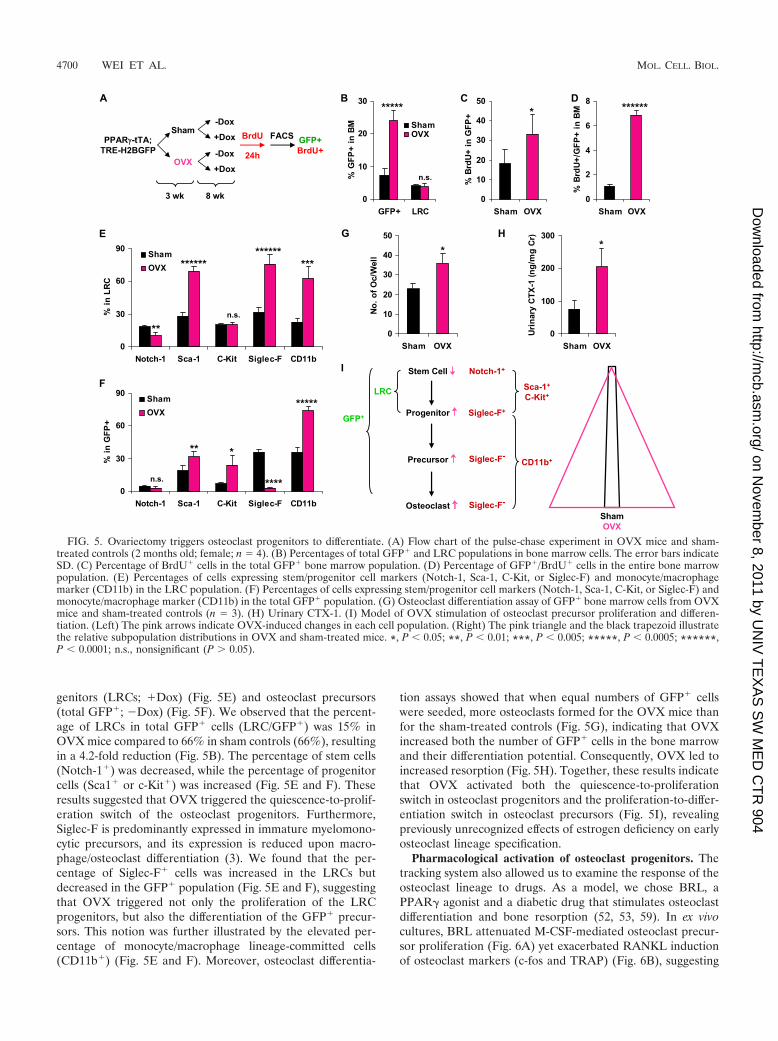
genitors (LRCs; �Dox) (Fig. 5E) and osteoclast precursors(total GFP�; �Dox) (Fig. 5F). We observed that the percent-age of LRCs in total GFP� cells (LRC/GFP�) was 15% inOVX mice compared to 66% in sham controls (66%), resultingin a 4.2-fold reduction (Fig. 5B). The percentage of stem cells(Notch-1�) was decreased, while the percentage of progenitorcells (Sca1� or c-Kit�) was increased (Fig. 5E and F). Theseresults suggested that OVX triggered the quiescence-to-prolif-eration switch of the osteoclast progenitors. Furthermore,Siglec-F is predominantly expressed in immature myelomono-cytic precursors, and its expression is reduced upon macro-phage/osteoclast differentiation (3). We found that the per-centage of Siglec-F� cells was increased in the LRCs butdecreased in the GFP� population (Fig. 5E and F), suggestingthat OVX triggered not only the proliferation of the LRCprogenitors, but also the differentiation of the GFP� precur-sors. This notion was further illustrated by the elevated per-centage of monocyte/macrophage lineage-committed cells(CD11b�) (Fig. 5E and F). Moreover, osteoclast differentia-
tion assays showed that when equal numbers of GFP� cellswere seeded, more osteoclasts formed for the OVX mice thanfor the sham-treated controls (Fig. 5G), indicating that OVXincreased both the number of GFP� cells in the bone marrowand their differentiation potential. Consequently, OVX led toincreased resorption (Fig. 5H). Together, these results indicatethat OVX activated both the quiescence-to-proliferationswitch in osteoclast progenitors and the proliferation-to-differ-entiation switch in osteoclast precursors (Fig. 5I), revealingpreviously unrecognized effects of estrogen deficiency on earlyosteoclast lineage specification.
Pharmacological activation of osteoclast progenitors. Thetracking system also allowed us to examine the response of theosteoclast lineage to drugs. As a model, we chose BRL, aPPAR� agonist and a diabetic drug that stimulates osteoclastdifferentiation and bone resorption (52, 53, 59). In ex vivocultures, BRL attenuated M-CSF-mediated osteoclast precur-sor proliferation (Fig. 6A) yet exacerbated RANKL inductionof osteoclast markers (c-fos and TRAP) (Fig. 6B), suggesting
FIG. 5. Ovariectomy triggers osteoclast progenitors to differentiate. (A) Flow chart of the pulse-chase experiment in OVX mice and sham-treated controls (2 months old; female; n � 4). (B) Percentages of total GFP� and LRC populations in bone marrow cells. The error bars indicateSD. (C) Percentage of BrdU� cells in the total GFP� bone marrow population. (D) Percentage of GFP�/BrdU� cells in the entire bone marrowpopulation. (E) Percentages of cells expressing stem/progenitor cell markers (Notch-1, Sca-1, C-Kit, or Siglec-F) and monocyte/macrophagemarker (CD11b) in the LRC population. (F) Percentages of cells expressing stem/progenitor cell markers (Notch-1, Sca-1, C-Kit, or Siglec-F) andmonocyte/macrophage marker (CD11b) in the total GFP� population. (G) Osteoclast differentiation assay of GFP� bone marrow cells from OVXmice and sham-treated controls (n � 3). (H) Urinary CTX-1. (I) Model of OVX stimulation of osteoclast precursor proliferation and differen-tiation. (Left) The pink arrows indicate OVX-induced changes in each cell population. (Right) The pink triangle and the black trapezoid illustratethe relative subpopulation distributions in OVX and sham-treated mice. *, P 0.05; **, P 0.01; ***, P 0.005; *****, P 0.0005; ******,P 0.0001; n.s., nonsignificant (P 0.05).
4700 WEI ET AL. MOL. CELL. BIOL.
on Novem
ber 8, 2011 by UN
IV T
EX
AS
SW
ME
D C
TR
904http://m
cb.asm.org/
Dow
nloaded from
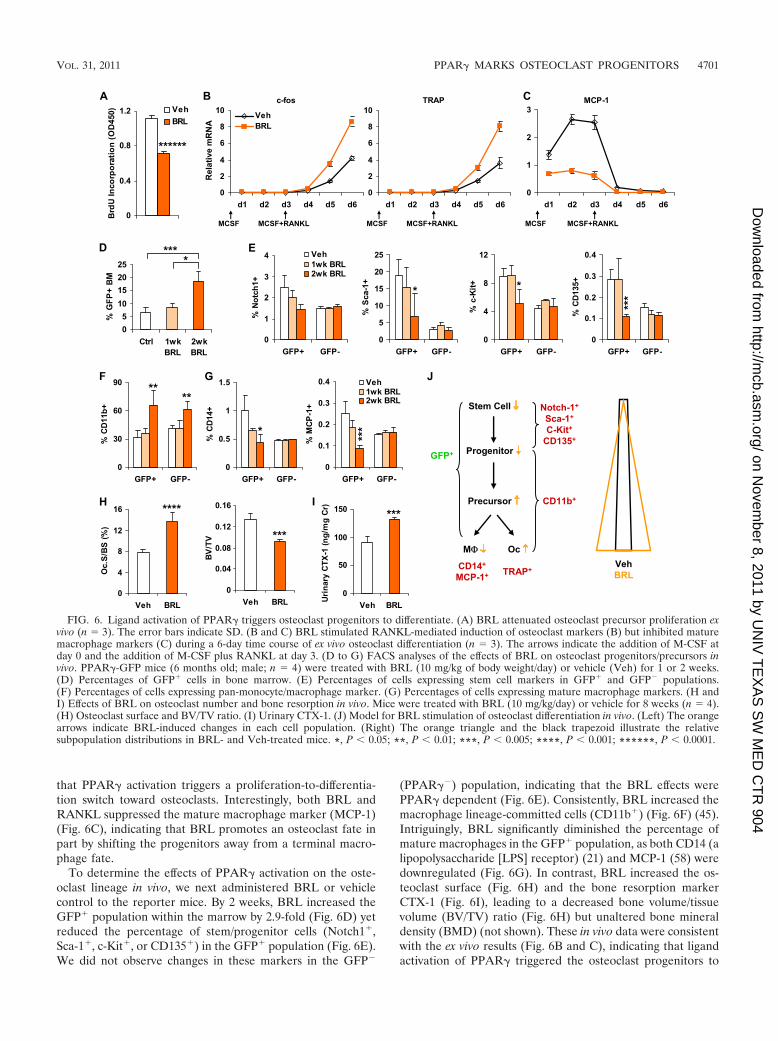
that PPAR� activation triggers a proliferation-to-differentia-tion switch toward osteoclasts. Interestingly, both BRL andRANKL suppressed the mature macrophage marker (MCP-1)(Fig. 6C), indicating that BRL promotes an osteoclast fate inpart by shifting the progenitors away from a terminal macro-phage fate.
To determine the effects of PPAR� activation on the oste-oclast lineage in vivo, we next administered BRL or vehiclecontrol to the reporter mice. By 2 weeks, BRL increased theGFP� population within the marrow by 2.9-fold (Fig. 6D) yetreduced the percentage of stem/progenitor cells (Notch1�,Sca-1�, c-Kit�, or CD135�) in the GFP� population (Fig. 6E).We did not observe changes in these markers in the GFP�
(PPAR��) population, indicating that the BRL effects werePPAR� dependent (Fig. 6E). Consistently, BRL increased themacrophage lineage-committed cells (CD11b�) (Fig. 6F) (45).Intriguingly, BRL significantly diminished the percentage ofmature macrophages in the GFP� population, as both CD14 (alipopolysaccharide [LPS] receptor) (21) and MCP-1 (58) weredownregulated (Fig. 6G). In contrast, BRL increased the os-teoclast surface (Fig. 6H) and the bone resorption markerCTX-1 (Fig. 6I), leading to a decreased bone volume/tissuevolume (BV/TV) ratio (Fig. 6H) but unaltered bone mineraldensity (BMD) (not shown). These in vivo data were consistentwith the ex vivo results (Fig. 6B and C), indicating that ligandactivation of PPAR� triggered the osteoclast progenitors to
FIG. 6. Ligand activation of PPAR� triggers osteoclast progenitors to differentiate. (A) BRL attenuated osteoclast precursor proliferation exvivo (n � 3). The error bars indicate SD. (B and C) BRL stimulated RANKL-mediated induction of osteoclast markers (B) but inhibited maturemacrophage markers (C) during a 6-day time course of ex vivo osteoclast differentiation (n � 3). The arrows indicate the addition of M-CSF atday 0 and the addition of M-CSF plus RANKL at day 3. (D to G) FACS analyses of the effects of BRL on osteoclast progenitors/precursors invivo. PPAR�-GFP mice (6 months old; male; n � 4) were treated with BRL (10 mg/kg of body weight/day) or vehicle (Veh) for 1 or 2 weeks.(D) Percentages of GFP� cells in bone marrow. (E) Percentages of cells expressing stem cell markers in GFP� and GFP� populations.(F) Percentages of cells expressing pan-monocyte/macrophage marker. (G) Percentages of cells expressing mature macrophage markers. (H andI) Effects of BRL on osteoclast number and bone resorption in vivo. Mice were treated with BRL (10 mg/kg/day) or vehicle for 8 weeks (n � 4).(H) Osteoclast surface and BV/TV ratio. (I) Urinary CTX-1. (J) Model for BRL stimulation of osteoclast differentiation in vivo. (Left) The orangearrows indicate BRL-induced changes in each cell population. (Right) The orange triangle and the black trapezoid illustrate the relativesubpopulation distributions in BRL- and Veh-treated mice. *, P 0.05; **, P 0.01; ***, P 0.005; ****, P 0.001; ******, P 0.0001.
VOL. 31, 2011 PPAR� MARKS OSTEOCLAST PROGENITORS 4701
on Novem
ber 8, 2011 by UN
IV T
EX
AS
SW
ME
D C
TR
904http://m
cb.asm.org/
Dow
nloaded from
undergo differentiation, but toward osteoclasts and away frommature macrophages (Fig. 6J). Thus, PPAR�� cells are oste-oclast progenitors, yet PPAR� is also a molecular switch thattranslates an increased local concentration of PPAR� agonistsinto enhanced osteoclast differentiation. Importantly, bothOVX and BRL, representing pathological and pharmacologi-cal resorption-enhancing stimuli, triggered the PPAR�� cellsto proliferate and differentiate, further supporting the notionthat osteoclast progenitors reside in the PPAR�� bone mar-row population in vivo.
PPAR� promotes osteoclast progenitors by activatingGATA2 transcription. The GATA family of zinc finger tran-scription factors is an important regulator of hematopoiesis.GATA2 is required to generate osteoclast progenitors (50, 54),while GATA1 is dispensable for osteoclastogenesis but essen-tial for erythropoiesis and megakaryocyte maturation (20, 37,43). Therefore, the GATA2/GATA1 ratio in hematopoieticprogenitors controls lineage divergence between osteoclastsand erythrocytes/megakaryocytes. In our microarray analysis,we found that this key GATA2/GATA1 ratio was 12.9-foldhigher in the PPAR�� (GFP�) cells than in the PPAR��
(GFP�) cells (Fig. 7A), owing to elevated GATA2 expressionand diminished GATA1 expression (Fig. 7B). Since PPAR� isalso critical for osteoclastogenesis (52), it may promote oste-oclast progenitor commitment by activating GATA2 transcrip-tion.
To test this hypothesis, we examined the GATA2 promoterand identified three highly conserved PPAR response elements(PPREs) (Fig. 7C). To determine whether PPAR� directlybinds to the mouse GATA2 promoter and induces its tran-scription, we performed a ChIP assay with antibodies forPPAR� or acetylated histone H3, a chromatin marker foractivated transcription. In GFP� cells, but not GFP� controlcells, PPAR� bound to all three PPREs in the mGATA2 pro-moter, accompanied by elevated levels of acetylated histoneH3 (Fig. 7D); in contrast, PPAR� did not bind to the GATA1promoter (not shown), suggesting that PPAR� inhibitsGATA1 expression via an indirect mechanism. PU.1 bindingwas also detected in these GATA2 regions, suggesting thatPPAR� colocalization with PU.1 in the GFP� cells specifiedGATA2 expression and osteoclast progenitors (Fig. 7D). Wenext assessed the functional requirement for GATA2 by bothgain- and loss-of-function analyses. Ectopic GATA2 expres-sion in PPAR�� cells to a level comparable to that in PPAR��
cells partially rescued the osteoclast differentiation blockade(Fig. 7E). Conversely, GATA2 knockdown severely diminishedboth RANKL-mediated and BRL-stimulated osteoclast differ-entiation in the PPAR�� cells (Fig. 7F). Together, these re-sults indicate that PPAR� promotes osteoclast progenitorcommitment, at least in part, by directly binding to the GATA2promoter and activating its transcription (Fig. 7G).
DISCUSSION
The cellular identity and precise nature of osteoclast pro-genitors are longstanding and important biological questions.Based on our cellular, molecular, genetic, pathological, andpharmacological evidence, in vivo and ex vivo, we conclude thatthe osteoclast lineage resides in the PPAR�-expressing hema-topoietic bone marrow cell population, and we have identified
the quiescent PPAR�� bone marrow cells as the osteoclastprogenitors. Importantly, we have established PPAR�-tTATRE-H2BGFP reporter mice as an unprecedented tool tovisualize, isolate, quantify, and trace the lineage of osteoclastprogenitors. As a complement, we have also establishedPPAR�-tTA TRE-Cre mice as a genetic tool to interrogate thefunction and regulation of osteoclast progenitors in vivo byinducing flox-mediated gene deletion or activation. Usingthese tools, we have uncovered previously unrecognized effectsof ovariectomy and rosiglitazone, two resorption-enhancingstimuli, on the early osteoclast lineage. Mechanistically, wehave identified GATA2 as a novel yet critical PPAR� targetgene in osteoclast progenitors. Therefore, both conceptuallyand technically, this study opens an exciting new path to thefundamental understanding of both osteoclast lineage specifi-cation and PPAR� function.
In the PPAR�-tTA TRE-H2BGFP reporter mice, GFP�
cells also label adipocyte progenitors and mature adipocytes(46). Intriguingly, several reports show that mammalian cells ofthe adipocyte lineage and the macrophage lineage share nu-merous functional and antigenic properties. Gene expressionprofiling revealed that preadipocytes share a surprisingly closersignature with macrophages than with adipocytes, and preadi-pocytes can be effectively converted to macrophages in a mac-rophage environment (10). This appears to be an evolution-arily conserved phenomenon, because in invertebrates, such asDrosophila, hemocytes (blood cells) and fat bodies also sharethe expression of fate-determining genes (14). Our findingsthat PPAR�� cells label both adipocyte progenitors and mac-rophage/osteoclast progenitors provided mechanistic evidencefor convergence and/or plasticity in the adipocyte and macro-phage lineage specification. Together with the dual roles ofPPAR� ligand in stimulating both adipogenesis and osteoclas-togenesis, our findings illuminate a potential molecular basisfor the close correlation between insulin-sensitizing effects andbone loss effects, as well as the emerging connections betweenfat and bone.
Stem/progenitor cells are defined as multipotent; hence, inorder to target osteoclast progenitors experimentally, it is im-possible to completely rule out other differentiation outcomes,and specificity is only relative. For example, Tie2 labels notonly osteoclast progenitors, but also all other hematopoieticprogenitors, as well as endothelial cells (13, 52), whereasPPAR� labels osteoclast and adipocyte progenitors but notother hematopoietic lineages (Fig. 1 and 2). The advantages ofthe PPAR�-tTA-based mouse models include the following: (i)they distinguish macrophages/osteoclasts from other hemato-poietic lineages; (ii) they target the entire osteoclast lineage,including osteoclast progenitors and mature osteoclasts; and(iii) they permit temporal control of inducible cell labeling andgenetic manipulations in the osteoclast lineage. Our resultsshow that osteoclast progenitors are 140-fold enriched in thePPAR�� bone marrow cell population, and thus, only 1% ofosteoclast progenitors may be derived from PPAR�low orPPAR�� cells. Moreover, previous studies have documentedthat Notch activation in lymphoid progenitors causes T-celllymphoblastic leukemia in humans and mice (16, 36). In ourstudy, PTNICD mice did not develop lymphoma, which furthersupports the notion that PPAR� specifically directs hemato-poiesis toward the monocyte/macrophage lineage and that the
4702 WEI ET AL. MOL. CELL. BIOL.
on Novem
ber 8, 2011 by UN
IV T
EX
AS
SW
ME
D C
TR
904http://m
cb.asm.org/
Dow
nloaded from
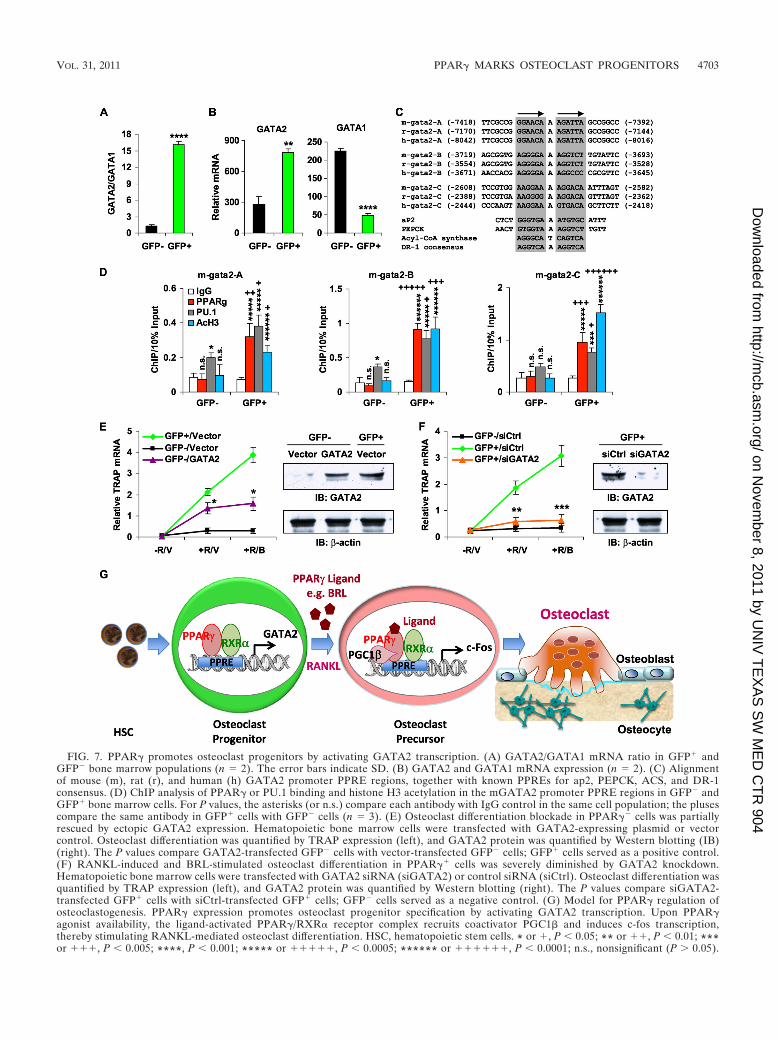
FIG. 7. PPAR� promotes osteoclast progenitors by activating GATA2 transcription. (A) GATA2/GATA1 mRNA ratio in GFP� andGFP� bone marrow populations (n � 2). The error bars indicate SD. (B) GATA2 and GATA1 mRNA expression (n � 2). (C) Alignmentof mouse (m), rat (r), and human (h) GATA2 promoter PPRE regions, together with known PPREs for ap2, PEPCK, ACS, and DR-1consensus. (D) ChIP analysis of PPAR� or PU.1 binding and histone H3 acetylation in the mGATA2 promoter PPRE regions in GFP� andGFP� bone marrow cells. For P values, the asterisks (or n.s.) compare each antibody with IgG control in the same cell population; the plusescompare the same antibody in GFP� cells with GFP� cells (n � 3). (E) Osteoclast differentiation blockade in PPAR�� cells was partiallyrescued by ectopic GATA2 expression. Hematopoietic bone marrow cells were transfected with GATA2-expressing plasmid or vectorcontrol. Osteoclast differentiation was quantified by TRAP expression (left), and GATA2 protein was quantified by Western blotting (IB)(right). The P values compare GATA2-transfected GFP� cells with vector-transfected GFP� cells; GFP� cells served as a positive control.(F) RANKL-induced and BRL-stimulated osteoclast differentiation in PPAR�� cells was severely diminished by GATA2 knockdown.Hematopoietic bone marrow cells were transfected with GATA2 siRNA (siGATA2) or control siRNA (siCtrl). Osteoclast differentiation wasquantified by TRAP expression (left), and GATA2 protein was quantified by Western blotting (right). The P values compare siGATA2-transfected GFP� cells with siCtrl-transfected GFP� cells; GFP� cells served as a negative control. (G) Model for PPAR� regulation ofosteoclastogenesis. PPAR� expression promotes osteoclast progenitor specification by activating GATA2 transcription. Upon PPAR�agonist availability, the ligand-activated PPAR�/RXR� receptor complex recruits coactivator PGC1� and induces c-fos transcription,thereby stimulating RANKL-mediated osteoclast differentiation. HSC, hematopoietic stem cells. * or �, P 0.05; ** or ��, P 0.01; ***or ���, P 0.005; ****, P 0.001; ***** or �����, P 0.0005; ****** or ������, P 0.0001; n.s., nonsignificant (P 0.05).
VOL. 31, 2011 PPAR� MARKS OSTEOCLAST PROGENITORS 4703
on Novem
ber 8, 2011 by UN
IV T
EX
AS
SW
ME
D C
TR
904http://m
cb.asm.org/
Dow
nloaded from
PPAR�-expressing bone marrow population does not containlymphoid progenitors. Since PPAR� also labels adipocyte pro-genitors (46), it is possible that Notch constitutive activation inPTNICD mice may also affect other PPAR�� cells, such asadipocytes, in addition to osteoclast progenitors.
Several drivers targeting macrophage precursors or matureosteoclasts have been elegantly described; nonetheless, be-cause they do not target osteoclast progenitors, they are notsuitable for in vivo study of early osteoclast lineage specifica-tion. For example, CD11b or lysozyme drivers are useful totarget macrophage precursors because they are upregulatedonly upon macrophage differentiation (12, 19, 25). In addition,Ctsk or TRAP drivers are useful to target preosteoclasts andmature osteoclasts because they are upregulated only uponosteoclast differentiation (11, 34). Therefore, the PPAR�-tTA-based models represent a novel osteoclast progenitor-targetingstrategy that is complementary to other existing models for thecomprehensive investigation of osteoclast lineage specificationand differentiation.
Indeed, the PTNICD and PTDTA genetic models providecompelling in vivo evidence that the osteoclast lineage residesin the PPAR�� bone marrow population under physiologicalconditions; in particular, the PTNICD model supports the no-tion that PPAR�� cells represent osteoclast progenitors. In thePTDTA model, the DTA was an “attenuated” version of diph-theria toxin, thus explaining the relatively mild bone pheno-type, which was supported by the survival of the PTDTA micein contrast to the embryonic lethality in the global PPAR�knockout (KO) mice (7, 28, 40). Furthermore, both OVX andBRL, representing pathological and pharmacological resorp-tion-enhancing stimuli, triggered the PPAR�� cells to prolif-erate and differentiate, further supporting the notion that os-teoclast progenitors reside in the PPAR�� bone marrowpopulation in vivo. The rapid increase (1 to 2 weeks) in thepercentage of GFP� bone marrow cells in response to BRLtreatment in vivo indicates that this effect was not likely sec-ondary to any BRL alteration of adipocytes followed bychanges in hematopoiesis, which takes at least 4 weeks (1).
The Ets family transcription factor PU.1 is essential for thedevelopment of both myeloid and B-lymphoid cells (42). Thissuggests that additional transcription factors are required tofunction in combination with PU.1 and confer lineage speci-ficity (22). Since osteoclasts are of myeloid lineage, PU.1 is alsoessential for the generation of osteoclast progenitors. Indeed,PU.1 deletion in mice precludes osteoclast development, lead-ing to arrested bone resorption and osteopetrosis (47). A re-cent study revealed that, in macrophages, PPAR� colocalizeswith PU.1 in areas of open chromatin and histone acetylationnear a distinct set of hematopoietic genes (31). Our resultssuggest that in the PPAR�� cells, PPAR� cooperates withPU.1 to activate the transcription of a subset of genes, includ-ing GATA2, thereby directing macrophage/osteoclast lineagecommitment. In contrast, in the PPAR�� cells, the absence ofPPAR� prevents GATA2 transcription and alters the subset ofgenes regulated by PU.1, thereby directing B-lymphoid lineagecommitment. Therefore, our identification of PPAR�� bonemarrow cells as osteoclast progenitors provides in vivo evi-dence for the notion that the collaborative interaction betweenPPAR� and PU.1 on a subset of promoters is essential toactivate the transcriptional program required for macrophage/
osteoclast lineage commitment. Furthermore, our results sug-gest that the expression of PPAR�, rather than the ligandactivation of PPAR�, promotes osteoclast progenitor specifi-cation by enhancing GATA2 expression, which is downregu-lated during the quiescence-to-proliferation switch and thusis absent in osteoclast precursors (53a) (Fig. 7G). Together,our current and previous studies reveal that PPAR� playsdual roles in osteoclastogenesis that involve multiple mech-anisms and target genes (Fig. 7G): PPAR� expression pro-motes osteoclast progenitors by inducing GATA2, andPPAR� ligand activation stimulates osteoclast differentia-tion by inducing c-fos.
ACKNOWLEDGMENTS
We thank J. Zerwekh for assistance with bone histomorphometry, L.Smith for assistance with �CT, and D. Mangelsdorf and S. Kliewer forhelpful discussion.
This work was supported by the University of Texas SouthwesternMedical Center Endowed Scholar Startup Fund (Y.W.), a BD Biosci-ences Research Grant Award (Y.W.), CPRIT (RP100841 [Y.W.]), theMarch of Dimes (5-FY10-1 [Y.W.]), The Welch Foundation (I-1751[Y.W.]), NIH (R01 DK089113 [Y.W.] and R01 DK066556, R01DK064261, and R01 DK088220 [J.M.G.]), and a postdoctoral fellow-ship (W.T.) and a predoctoral fellowship (D.Z.) from the AmericanHeart Association South Central Affiliate. Y.W. is a Virginia Murchi-son Linthicum Scholar in Medical Research.
J.M.G. is a founder of Reata Pharmaceuticals. We declare that wehave no financial conflict of interest.
REFERENCES
1. Ali, A. A., et al. 2005. Rosiglitazone causes bone loss in mice by suppressingosteoblast differentiation and bone formation. Endocrinology 146:1226–1235.
2. Anderson, D. M., et al. 1990. Molecular cloning of mast cell growth factor, ahematopoietin that is active in both membrane bound and soluble forms.Cell 63:235–243.
3. Angata, T., R. Hingorani, N. M. Varki, and A. Varki. 2001. Cloning andcharacterization of a novel mouse Siglec, mSiglec-F: differential evolution ofthe mouse and human (CD33) Siglec-3-related gene clusters. J. Biol. Chem.276:45128–45136.
4. Arai, F., et al. 1999. Commitment and differentiation of osteoclast precursorcells by the sequential expression of c-Fms and receptor activator of nuclearfactor kappaB (RANK) receptors. J. Exp. Med. 190:1741–1754.
5. Ash, P., J. F. Loutit, and K. M. Townsend. 1980. Osteoclasts derived fromhaematopoietic stem cells. Nature 283:669–670.
6. Bai, S., et al. 2008. NOTCH1 regulates osteoclastogenesis directly in oste-oclast precursors and indirectly via osteoblast lineage cells. J. Biol. Chem.283:6509–6518.
7. Barak, Y., et al. 1999. PPAR gamma is required for placental, cardiac, andadipose tissue development. Mol. Cell 4:585–595.
8. Boyle, W. J., W. S. Simonet, and D. L. Lacey. 2003. Osteoclast differentiationand activation. Nature 423:337–342.
9. Chamberlain, G., J. Fox, B. Ashton, and J. Middleton. 2007. Concise review:mesenchymal stem cells: their phenotype, differentiation capacity, immuno-logical features, and potential for homing. Stem Cells 25:2739–2749.
10. Charriere, G., et al. 2003. Preadipocyte conversion to macrophage. Evidenceof plasticity. J. Biol. Chem. 278:9850–9855.
11. Chiu, W. S., et al. 2004. Transgenic mice that express Cre recombinase inosteoclasts. Genesis 39:178–185.
12. Clausen, B. E., C. Burkhardt, W. Reith, R. Renkawitz, and I. Forster. 1999.Conditional gene targeting in macrophages and granulocytes using LysMcremice. Transgenic Res. 8:265–277.
13. Constien, R., et al. 2001. Characterization of a novel EGFP reporter mouseto monitor Cre recombination as demonstrated by a Tie2 Cre mouse line.Genesis 30:36–44.
14. de Velasco, B., L. Mandal, M. Mkrtchyan, and V. Hartenstein. 2006. Sub-division and developmental fate of the head mesoderm in Drosophila mela-nogaster. Dev. Genes Evol. 216:39–51.
15. Dougall, W. C., et al. 1999. RANK is essential for osteoclast and lymph nodedevelopment. Genes Dev. 13:2412–2424.
16. Ellisen, L. W., et al. 1991. TAN-1, the human homolog of the Drosophilanotch gene, is broken by chromosomal translocations in T lymphoblasticneoplasms. Cell 66:649–661.
17. Engin, F., et al. 2008. Dimorphic effects of Notch signaling in bone homeo-stasis. Nat. Med. 14:299–305.
4704 WEI ET AL. MOL. CELL. BIOL.
on Novem
ber 8, 2011 by UN
IV T
EX
AS
SW
ME
D C
TR
904http://m
cb.asm.org/
Dow
nloaded from
18. Evans, R. M., G. D. Barish, and Y. X. Wang. 2004. PPARs and the complexjourney to obesity. Nat. Med. 10:355–361.
19. Ferron, M., and J. Vacher. 2005. Targeted expression of Cre recombinase inmacrophages and osteoclasts in transgenic mice. Genesis 41:138–145.
20. Fujiwara, Y., C. P. Browne, K. Cunniff, S. C. Goff, and S. H. Orkin. 1996.Arrested development of embryonic red cell precursors in mouse embryoslacking transcription factor GATA-1. Proc. Natl. Acad. Sci. U. S. A. 93:12355–12358.
21. Haziot, A., et al. 1996. Resistance to endotoxin shock and reduced dissem-ination of gram-negative bacteria in CD14-deficient mice. Immunity 4:407–414.
22. Heinz, S., et al. 2010. Simple combinations of lineage-determining transcrip-tion factors prime cis-regulatory elements required for macrophage and Bcell identities. Mol. Cell 38:576–589.
23. Hermiston, M. L., J. Zikherman, and J. W. Zhu. 2009. CD45, CD148, andLyp/Pep: critical phosphatases regulating Src family kinase signaling net-works in immune cells. Immunol. Rev. 228:288–311.
24. Huang, E., et al. 1990. The hematopoietic growth factor KL is encoded bythe Sl locus and is the ligand of the c-kit receptor, the gene product of theW locus. Cell 63:225–233.
25. Jacquin, C., D. E. Gran, S. K. Lee, J. A. Lorenzo, and H. L. Aguila. 2006.Identification of multiple osteoclast precursor populations in murine bonemarrow. J. Bone Miner. Res. 21:67–77.
26. Kanda, T., K. F. Sullivan, and G. M. Wahl. 1998. Histone-GFP fusionprotein enables sensitive analysis of chromosome dynamics in living mam-malian cells. Curr. Biol. 8:377–385.
27. Krum, S. A., et al. 2008. Estrogen protects bone by inducing Fas ligand inosteoblasts to regulate osteoclast survival. EMBO J. 27:535–545.
28. Kubota, N., et al. 1999. PPAR gamma mediates high-fat diet-inducedadipocyte hypertrophy and insulin resistance. Mol. Cell 4:597–609.
29. Lacey, D. L., et al. 1998. Osteoprotegerin ligand is a cytokine that regulatesosteoclast differentiation and activation. Cell 93:165–176.
30. Lee, P., et al. 1998. Conditional lineage ablation to model human diseases.Proc. Natl. Acad. Sci. U. S. A. 95:11371–11376.
31. Lefterova, M. I., et al. 2010. Cell-specific determinants of PPAR{gamma}function in adipocytes and macrophages. Mol. Cell. Biol. 30:2078–2089.
32. Marshall, M. J., and M. W. Davie. 1991. An immunocytochemical methodfor studying the kinetics of osteoclast nuclei on intact mouse parietal bone.Histochem. J. 23:402–408.
33. Matthews, W., C. T. Jordan, G. W. Wiegand, D. Pardoll, and I. R. Lemis-chka. 1991. A receptor tyrosine kinase specific to hematopoietic stem andprogenitor cell-enriched populations. Cell 65:1143–1152.
34. Nakamura, T., et al. 2007. Estrogen prevents bone loss via estrogen receptoralpha and induction of Fas ligand in osteoclasts. Cell 130:811–823.
35. Novack, D. V., and S. L. Teitelbaum. 2008. The osteoclast: friend or foe?Annu. Rev. Pathol. 3:457–484.
36. Pear, W. S., et al. 1996. Exclusive development of T cell neoplasms in micetransplanted with bone marrow expressing activated Notch alleles. J. Exp.Med. 183:2283–2291.
37. Pevny, L., et al. 1991. Erythroid differentiation in chimaeric mice blocked bya targeted mutation in the gene for transcription factor GATA-1. Nature349:257–260.
38. Pittenger, M. F., et al. 1999. Multilineage potential of adult human mesen-chymal stem cells. Science 284:143–147.
39. Ricote, M., A. C. Li, T. M. Willson, C. J. Kelly, and C. K. Glass. 1998. Theperoxisome proliferator-activated receptor-gamma is a negative regulator ofmacrophage activation. Nature 391:79–82.
40. Rosen, E. D., et al. 1999. PPAR gamma is required for the differentiation ofadipose tissue in vivo and in vitro. Mol. Cell 4:611–617.
41. Scheven, B. A., J. W. Visser, and P. J. Nijweide. 1986. In vitro osteoclastgeneration from different bone marrow fractions, including a highly enrichedhaematopoietic stem cell population. Nature 321:79–81.
42. Scott, E. W., M. C. Simon, J. Anastasi, and H. Singh. 1994. Requirement oftranscription factor PU.1 in the development of multiple hematopoieticlineages. Science 265:1573–1577.
43. Shivdasani, R. A., Y. Fujiwara, M. A. McDevitt, and S. H. Orkin. 1997. Alineage-selective knockout establishes the critical role of transcription factorGATA-1 in megakaryocyte growth and platelet development. EMBO J.16:3965–3973.
44. Spangrude, G. J., S. Heimfeld, and I. L. Weissman. 1988. Purification andcharacterization of mouse hematopoietic stem cells. Science 241:58–62.
45. Springer, T., G. Galfre, D. S. Secher, and C. Milstein. 1979. Mac-1: amacrophage differentiation antigen identified by monoclonal antibody. Eur.J. Immunol. 9:301–306.
46. Tang, W., et al. 2008. White fat progenitor cells reside in the adiposevasculature. Science 322:583–586.
47. Tondravi, M. M., et al. 1997. Osteopetrosis in mice lacking haematopoietictranscription factor PU. 1. Nature 386:81–84.
48. Tontonoz, P., L. Nagy, J. G. Alvarez, V. A. Thomazy, and R. M. Evans. 1998.PPARgamma promotes monocyte/macrophage differentiation and uptake ofoxidized LDL. Cell 93:241–252.
49. Tontonoz, P., and B. M. Spiegelman. 2008. Fat and beyond: the diversebiology of PPARgamma. Annu. Rev. Biochem. 77:289–312.
50. Tsai, F. Y., et al. 1994. An early haematopoietic defect in mice lacking thetranscription factor GATA-2. Nature 371:221–226.
51. Tumbar, T., et al. 2004. Defining the epithelial stem cell niche in skin.Science 303:359–363.
52. Wan, Y., L. W. Chong, and R. M. Evans. 2007. PPAR-gamma regulatesosteoclastogenesis in mice. Nat. Med. 13:1496–1503.
53. Wei, W., et al. 2010. PGC1beta mediates PPARgamma activation of oste-oclastogenesis and rosiglitazone-induced bone loss. Cell Metab. 11:503–516.
53a.Wei, W., et al. 2011. Biphasic and dosage-dependent regulation of osteoclas-togenesis by �-catenin. Mol. Cell. Biol. 31:4706–4719.
54. Yamane, T., et al. 2000. Sequential requirements for SCL/tal-1, GATA-2,macrophage colony-stimulating factor, and osteoclast differentiation factor/osteoprotegerin ligand in osteoclast development. Exp. Hematol. 28:833–840.
55. Yang, X., et al. 2004. Notch activation induces apoptosis in neural progenitorcells through a p53-dependent pathway. Dev. Biol. 269:81–94.
56. Yasuda, H., et al. 1998. Osteoclast differentiation factor is a ligand forosteoprotegerin/osteoclastogenesis-inhibitory factor and is identical toTRANCE/RANKL. Proc. Natl. Acad. Sci. U. S. A. 95:3597–3602.
57. Yoshida, H., et al. 1990. The murine mutation osteopetrosis is in the codingregion of the macrophage colony stimulating factor gene. Nature 345:442–444.
58. Yoshimura, T., et al. 1989. Human monocyte chemoattractant protein-1(MCP-1). Full-length cDNA cloning, expression in mitogen-stimulatedblood mononuclear leukocytes, and sequence similarity to mouse compe-tence gene JE. FEBS Lett. 244:487–493.
59. Zinman, B., et al. 2010. Effect of rosiglitazone, metformin, and glyburide onbone biomarkers in patients with type 2 diabetes. J. Clin. Endocrinol. Metab.95:134–142.
60. Zsebo, K. M., et al. 1990. Stem cell factor is encoded at the Sl locus of themouse and is the ligand for the c-kit tyrosine kinase receptor. Cell 63:213–224.
VOL. 31, 2011 PPAR� MARKS OSTEOCLAST PROGENITORS 4705
on Novem
ber 8, 2011 by UN
IV T
EX
AS
SW
ME
D C
TR
904http://m
cb.asm.org/
Dow
nloaded from


