Embed Size (px)
Citation preview
UNIVERSIDADE DE LISBOA
INSTITUTO SUPERIOR DE ECONOMIA E GESTÃO
Organisational Maturity and Information Systems
and Technology Projects in Healthcare: The
Mediation of Project Management
Jorge Manuel Vareda Gomes
Orientador: Professor Doutor Mário José Batista Romão
Tese especialmente elaborada para obtenção do grau de Doutor em
Gestão
2018
ii
UNIVERSIDADE DE LISBOA INSTITUTO SUPERIOR DE ECONOMIA E GESTÃO
Organisational Maturity and Information Systems and
Technology Projects in Healthcare: The Mediation of
Project Management
Jorge Manuel Vareda Gomes
Orientador: Doutor Mário José Batista Romão
Tese especialmente elaborada para obtenção do grau de Doutor em Gestão
Júri:
Presidente: Doutora Maria do Rosário Lourenço Grossinho
Professora Catedrática e Presidente do Conselho Científico
(ISEG-UL).
Vogais: Doutor Mário Fernando Maciel Caldeira
Professor Catedrático (ISEG-UL)
Doutora Helena Maria Barroso Carvalho
Professora Associada com Agregação (ISCTE-IUL)
Doutor Henrique José Rocha O’Neil
Professor Associado (ISCTE-IUL)
Doutor Mário José Batista Romão
Professor Associado (ISEG-UL)
2018

iii
Acknowledgement
First, I would like to express my deepest thanks to my supervisor, Prof. Mário Romão,
for the mentoring, commitment, dedication, availability and friendship. Always present on
this long journey, which started in 2011 with the master's thesis and ends now with the
presentation of this dissertation. This is not the end but the beginning, our friendship remains
strong, reinforced by the participation in common projects and academic work.
Additionally, I am grateful to Prof. Helena Carvalho by the unlimited support and for
his advice which contributed to make more accessible the statistical techniques applied to
the research. Also, to ISEG teachers and colleagues by the discussions, opinions, comments
and critical reflections which at certain moments were decisive for the development of the
study. Special thanks to Prof. Mário Caldeira and Prof. James Werbel who helped me find
my way in times of indecision.
Finally, I would like to thank my family. My wife, who always encouraged me and
gave me the strength to overcome all adversities. Our daughters Rita and Joana, for being an
inexhaustible source of joy. My parents, by the unconditional love, and a final tribute to my
mother that left us during this period.
Thank you all for the support and friendship.

iv
“Do the difficult things while they are easy and do the great things while they
are small. A journey of a thousand miles must begin with a single step.”
Lao Tzu (531-604 BC)
v
Abstract
The challenges that health organisations face today is to get better organisational
performance, reliable information, faster quality services at prices that should be affordable
to the entire population. To fulfil this important goal, health organisations require more
comprehensive and integrated approaches such as, but not limited to, optimise their available
resources, eliminate inefficiencies and achieve the planned benefits from investments in
Information Systems and Technology (IS/IT). Healthcare organisations must improve their
management practices and internal procedures to answer the increasing demand of
managers, health professionals and the public in general, for more and better information.
Health organisations adopt a patient-centred care approach and invest massively in IS/IT,
hoping that these investments will improve medical care and patient needs. The main
objective of our research is to analyse how the Organisational Maturity affect IS/IT Project
Success in Healthcare and if that success is enhanced by using Project Management
practices. There is evidence that there is a direct relationship between these variables and
that Project Management practices can mediate it, helping to increase the effectiveness of
IS/IT projects. Furthermore, the application of the Project Management practices can also
improve confidence that the results of these investments meet stakeholders’ expectations,
both by the benefits accomplishment and by adding a perceived value to organisations. This
study develops and validates an instrument to analyse the data collected from a survey to
professionals’ perceptions about the IS/IT Project Success in Healthcare organisations. The
results confirm that Project Management has a mediating effect on the relationship between
Organizational Maturity and success of IS/IT projects and higher levels of Organisational
Maturity will generate more successfully IS/IT projects, although the presence of the
mediator Project Management can, in specific situations, affect negatively the correlation
between Organisational Maturity and IS/IT Project Success.
Keywords: Organisational Maturity; Project Management; IS/IT Project Success; Health
IS/IT investments; Healthcare Information Systems.
vi
Resumo
Os desafios que enfrentam atualmente as organizações de saúde estão diretamente
relacionados com o fato de ambicionarem um melhor desempenho, mais e melhor
informação de saúde, serviços de qualidade mais céleres. a custos acesíveis à maioria da
população. Para o total cumprimento deste desiderato as organizações de saúde têm investido
em soluções tecnológicas mais abrangentes e integradas de forma a otimizar os recursos
disponíveis, eliminar ineficiências e atingir os benefícios plenos dos investimentos em
Sistemas e Tecnologias da Informação (SI/TI). As organizações de saúde procuram melhorar
as suas práticas de gestão para dar resposta a uma crescente procura de informação de saúde
por parte de gestores, profissionais e público em geral. As organizações de saúde adotaram
uma abordagem centrada no paciente e realizaram significativos investimentos em SI/TI na
expetativa de que estes trouxessem melhorias ao nível assistencial e na satisfação das
expetativas dos seus utilizadores. O principal objetivo deste trabalho é analisar como a
Maturidade Organizacional afeta o sucesso do projeto em SI/TI em saúde e se esse sucesso
é potenciado pela utilização de práticas de gestão de projetos. Há evidências da existência
de uma relação direta entre esstas duas variáveis e que as práticas de Gestão de Projetos a
podem mediar, ajudando a aumentar a eficácia dos projetos de SI/TI. Além disso, a aplicação
das práticas de Gestão de Projetos podem melhorar a confiança nos resultados dos
investimentos e atender às expectativas das diferentes partes interessadas, tanto pela
realização de benefícios quanto pela criação de valor percebido para as organizações. Este
estudo analisa os dados recolhidos de um questionário à perceção dos profissionais sobre o
sucesso dos projetos IS/IT nas organizações de saúde. Os resultados obtidos confirmam. Os
resultados confirmam que o Gestão de Projetos tem um efeito mediador na relação entre
Maturidade Organizacional e Sucesso de Projetos de SI/TI e níveis mais elevados de
Maturidade Organizacional gerarão projetos SI/TI mais bem-sucedidos, embora a presença
do mediador Gestão de Projetos, possa, em circunstâncias específicas situações, afetar
negativamente a correlação entre as duas variáveis.
Palavras-chave: Maturidade Organizacional, Gestão de Projetos, Sucesso dos
Projetos de TIC, Investimentos TIC, Sistema de Informação de Saúde.
vii
Table of contents
Abstract .............................................................................................................................. v
Resumo ............................................................................................................................. vi
Table of contents .............................................................................................................. vii
List of Tables .................................................................................................................... xi
List of Figures .................................................................................................................. xii
List of Acronyms ............................................................................................................ xiii
Chapter 1. Introduction .................................................................................................. 1
1.1 Overview ...................................................................................................................... 1
1.2 Research context and motivation ................................................................................. 4
1.3 Research objective and research questions .................................................................. 8
1.4 Relevance of the study ................................................................................................. 8
1.5 Dissertation structure ................................................................................................... 9
Chapter 2. Literature Review ...................................................................................... 11
2.1 Overview .................................................................................................................... 11
2.2 Project Management .................................................................................................. 12
2.2.1 Overview ................................................................................................................. 12
2.2.2 Project Management background ........................................................................... 13
2.2.3 Project Management: Limitations, trends and challenges ...................................... 16
2.3 Maturity Models ........................................................................................................ 23
2.3.1 Overview ................................................................................................................. 23
2.3.2 Maturity Models background .................................................................................. 25
2.3.3 Maturity Models: Benefits, limitations and challenges .......................................... 30
2.3.4 Project Management Maturity ................................................................................ 33
viii
2.3.5 Maturity Models examples ..................................................................................... 38
2.4 Project Success .......................................................................................................... 59
2.4.1 Overview ................................................................................................................. 59
2.4.2 Project Success background .................................................................................... 60
2.4.3 Critical Success Factors and Project Success Criteria ............................................ 68
2.5 IS/IT challenges ......................................................................................................... 77
2.5.1 Overview ................................................................................................................. 77
2.5.2 IS/IT Investments background ................................................................................ 79
2.6 IS/IT Project Success ................................................................................................. 90
2.6.1 Overview ................................................................................................................. 90
2.6.2 IS/IT Project Success in Healthcare ........................................................................ 92
2.7 Healthcare Sector ....................................................................................................... 96
2.7.1 Overview ................................................................................................................. 96
2.7.2 IS/IT in Healthcare sector ..................................................................................... 102
2.7.3 IS/IT Failures in Healthcare .................................................................................. 109
2.7.4 Health information system security ...................................................................... 111
2.7.5 Portuguese National Health System Overview ..................................................... 112
2.7.6 SPMS - Serviços Partilhados do Ministério da Saúde, EPE ................................. 120
2.7.7 National Strategy for the Health Information Ecosystem 2020 ............................ 122
Chapter 3. Philosophical Perspective and Research Approach ................................. 123
3.1 Overview .................................................................................................................. 123
3.2 Research paradigm ................................................................................................... 125
3.3 Research design ....................................................................................................... 133
3.3.1 Overview ............................................................................................................... 133
ix
3.3.2 The adopted research strategy ............................................................................... 134
Chapter 4. Research model, hypotheses and contructs .............................................. 137
4.1 Introduction .............................................................................................................. 137
4.2 The conceptual model and hypothesis ..................................................................... 138
4.3 Constructs ................................................................................................................ 139
4.3.1 Organisational Maturity construct ........................................................................ 139
4.3.2 IS/IT Project Success construct ............................................................................ 141
4.3.3 Project Management construct .............................................................................. 143
Chapter 5. Research methodology and design .......................................................... 147
5.1 Overview .................................................................................................................. 147
5.2 Pretest ....................................................................................................................... 147
5.3 Participants ............................................................................................................... 148
5.4 Instrument ................................................................................................................ 149
5.5 Pretest procedure ...................................................................................................... 150
5.6 Pretest data analysis ................................................................................................. 150
5.7 Pretest results ........................................................................................................... 151
5.8 General discussion ................................................................................................... 153
Chapter 6. Survey ...................................................................................................... 154
6.1 General procedure .................................................................................................... 154
6.2 Analysing the survey dataset ................................................................................... 155
6.3 Descriptive statistics ................................................................................................ 157
6.4 Survey results ........................................................................................................... 159
6.4.1 Sample size ........................................................................................................... 159
6.4.2 Internal consistency .............................................................................................. 160
x
6.4.3 Construct validity .................................................................................................. 161
6.4.4 Confirmatory Factor Analysis (CFA) ................................................................... 163
6.4.5 Indices of goodness of fit ...................................................................................... 165
6.4.6 Structural Equation Modelling (SEM) .................................................................. 166
Chapter 7. Discussion ................................................................................................ 170
Chapter 8. Conclusions .............................................................................................. 177
8.1 Background .............................................................................................................. 177
8.2 Limitations ............................................................................................................... 182
8.3 Contributions and recommendations ....................................................................... 182
8.3 Future studies ........................................................................................................... 184
References ...................................................................................................................... 185
Appendix A Project definitions ................................................................................ 281
Appendix B Publications and citations ..................................................................... 283
Appendix C Exploratory meetings and interviews ................................................... 300
Appendix D Questionnaire (Portuguese version) ..................................................... 301
Appendix E Pretest exploratory meetings ................................................................ 312
Appendix F Scale variability discussion ................................................................. 313
Appendix G SPMS/ISEG agreement ........................................................................ 315
Appendix H Presentation letter and reminders ......................................................... 320
Appendix I Comparison between samples ................................................................. 323
Appendix J Confirmatory Factor Analysis of Project Management ....................... 325
Appendix K Confirmatory Factor Analysis of Organisational Maturity .................. 330
Appendix L Confirmatory Factor Analysis of Project Success................................ 334
Appendix M Structural Equation Modeling (SEM) .................................................. 340
xi
List of Tables
Table 1 - project management maturity definitions ............................................................ 35
Table 2 - Empirical studies of project maturity ................................................................... 37
Table 3 – Maturity levels description .................................................................................. 39
Table 4– Continuous and staged representation (adapted from CMMI©, 2010) ................ 42
Table 5- Maturity models (adapted from CMMI©, 2010) .................................................. 43
Table 6- P3M3© maturity levels (OGC, 2010a) ................................................................. 51
Table 7 – P3M3© Process Perspectives (OGC, 2010a) ...................................................... 52
Table 8 – P3M3© Models (OGC, 2010b) ........................................................................... 53
Table 9 - Maturity levels practices (Sowden et al.,2010) .................................................... 56
Table 10 - Main aspects of Maturity Models ...................................................................... 58
Table 11 – Project Success concept ..................................................................................... 68
Table 12- Project success over the time (Ika, 2009)............................................................ 76
Table 13 - Current healthcare expenditure, 2013 (Eurostat, 2013) ..................................... 99
Table 14 – European health system objectives (European Commission, 2004b) ............. 100
Table 15- Classification of health information systems (adopted from Yusof, 2008) ...... 106
Table 16 – Paradigms of inquiry (adapted from Guba and Lincoln, 1994)....................... 126
Table 17 - Quantitative and qualitative research strategies (Bryman and Bell, 2003) ...... 129
Table 18 - Different research strategies (Yin, 2003) ........................................................ 134
Table 19 - Summary of the research design choices ......................................................... 136
Table 20 – Organisational maturity levels description ...................................................... 140
Table 21 - P3M3© perspectives ........................................................................................ 140
Table 22 – Project Success items ...................................................................................... 143
Table 23 - Summary statistics for items distribution (Gomes et al., 2016b) ..................... 151
Table 24 – Reliability assessment (Gomes et al., 2016a, 2016b) ...................................... 152
Table 25 - Internal consistency of the scales (Gomes et., 2016a, 2016b) ......................... 152
Table 26 – Sociodemographic statistics ............................................................................ 158
Table 27- Descriptive statistics.......................................................................................... 159
xii
Table 28 - Reliability values .............................................................................................. 161
Table 29 - Correlations Items/Scale .................................................................................. 163
Table 30 – Range of correlations Items/scale .................................................................... 163
Table 31 – Construct reliability ......................................................................................... 163
Table 32 – Scales fit indices .............................................................................................. 166
Table 33 - SEM fit indices ................................................................................................. 167
Table 34 – Project Success domains ................................................................................. 173
List of Figures
Figure 1- OPM3© Levels (source: OPM Experts LLC, 2015) ........................................... 45
Figure 2- P3M3© structure (adapted from AXELOS, 2016) .............................................. 50
Figure 3 - Threads concept (AXELOS, 2016) ..................................................................... 57
Figure 4 – Worldwide IT spending is forecast (source: Gartner, 2016) .............................. 81
Figure 5 - How IS/IT creates business value (adapted from Soh and Markus, 1995) ......... 82
Figure 6- Modified Model for the Realisation of Business Value (Marshall et al., 2005) .. 84
Figure 7 – Process Model of Benefits Management (adopted Ward and Daniel, 2012) ..... 85
Figure 8 - Information Systems Success Model (DeLone, and McLean, 1992) ................. 91
Figure 9 – SNS (source: blog SNS. Saude? Nós Sabemos …) ......................................... 115
Figure 10 - Mediation Model............................................................................................. 138
Figure 11 – The research model ........................................................................................ 146
Figure 12 - Process of designing and implementing a survey ........................................... 147
Figure 13 – Factor structure of the three scales ................................................................. 164
Figure 14 – Results for the SEM with standardized regression weights. .......................... 168
Figure 15 – Partial Mediation ............................................................................................ 176
xiii
List of Acronyms
AGFI Adjusted goodness of fit index
APM Association for Project Management
ARS Área Regional de Saúde
AVE Average Variance Extracted
CAIC Comissão de Acompanhamento para a Informatização Clínica
CFA Confirmatory Factor Analysis
CFI Comparative Fit Index
CHWS Centre for Health Workforce Studies
CMM Capability Maturity Model
CMM-SW Capability Maturity Model for Software
CMMI Capability Maturity Model Integration
CPM Critical Path Method
CR Composite Reliability
CSFs Critical Success Factors
DGS Direção Geral de Saúde
EC European Commission
EHR Electronic Health Record
ERP Enterprise Resource Planning
EU European Union
EU27 European Union 27 countries (period 2007–2013)
GFI Goodness of Fit Index
GDP Gross Domestic Product
IBM International Business Machines
IDC International Data Corporation
IHME Institute for Health Metrics and Evaluation
ILO International Labour Office
IPMA International Project Management Association
IPPD Integrated product and process development
xiv
IS Information System
IS/IT Information Systems and Information Technology
IT Information Technology
ISO International Organization for Standardization
KPI Key Performance Indicator
KU Kurtosis
ML Maximum Likelihood
MSP Managing Successful Programmes
NCVHS National Committee on Vital and Health Statistics
NFI Normed-fit index
NHS National Health System
OECD Organization for Economic Co-operation and Development
OGC Office of Government Commerce
OPM3 Organisational Project Management Maturity Model
OPSS Observatório Português dos Sistemas de Saúde
P3M3 Portfolio, Programme and Project Management Maturity Model
PERT Program Evaluation and Review Technique
PDS Plataforma de Dados de Saúde
PMBOK Project Management Body of Knowledge
PMI Project Management Institute
PSC Project Success Criteria
PwC PricewaterhouseCoopers
RMR Root mean square residual
RMSEA Root Mean Square Error of Approximation
SD Standard Error
SI Systems Engineering
SEI Software Engineering Institute
SEM Structural Equation Modelling
SK Skewness
SPMS Serviços Partilhados do Ministério da Saúde

xv
SPSS Statistical Package for the Social Sciences
SRMR Standardized root mean square residual
SS Supplier sourcing
SW Software engineering
TLI Tucker-Lewis Index
USD United States Dollar
WHO World Health Organization
1
Chapter 1. Introduction
1.1 Overview
Information Systems and Information Technology (IS/IT) has been referred to, as a
key instrument in healthcare delivery and public health (Drury, 2005).
IS/IT for healthcare refers to any tool or framework that enhances the
communication, processing or transmission of information by electronic means for
improving human health (Bukachi and Pakenham-Walsh, 2007).
The use of IS/IT has rapidly grown in several contexts, including healthcare. There
have been two major drivers for the IS/IT investments in healthcare (Gomes and Romão,
2016a; WHO1, 2002, 2011, 2015):
₋ The ever-increasing burden from chronic disease with costs growing significantly
faster;
₋ The recognition of the need for greatly improved quality and safety in the delivery
of healthcare.
Both key drivers have led to very heavy investments in IS/IT to enable timely
information-sharing for clinical decisions.
The evolution that is underway in healthcare is mainly driven by demographic
changes, which included the increase of the aging population, chronic diseases, cultural
changes, progress in sciences and technologies and the recognition of the need for greatly
improved quality and safety in the delivery of healthcare (EC2, 2009; Lymberis and
Dittmar, 2007; OECD3, 2006; Scholtz, 1999; Weingarten et al., 2002: Wilkinson, 2002;
WHO, 2011, 2015).
1World Health Organization 2 European Commission 3 Organisation for Economic Co-operation and Development
2
Health organisations today are under pressure to provide more and better health
information, faster services, at prices that are expected to be reduce, as well as complying
with the public health regulations in terms of security and many other requirements (Gomes
and Romão, 2015a; OECD, 2016; Rechel et al., 2009; WHO, 2012). Externally, these
organisations face a scenario of intense competition, coupled with a changing environment
which is full of challenges and uncertainty. Internally, organisations must deal with limited
resources, whilst at the same time comply with increasing requirements and strategic
demands.
Many hospitals around the world are moving away from paper-based health
information and implementing technological solutions to facilitate and improve the process
of patient care via the generation of electronic health records (Caldeira et al., 2012; Ting-
Ting, 2004). The main goal of IS/IT is to manage information from all healthcare-related
activities, including planning, monitoring, coordination, and decision making. The real-
time access, exchange and receipt of clinical data provided by the system have improved
clinical documentation, reduced the duplication of care services, and supported better
decision making related to patient care (Mäenpää et al., 2009). IS/IT are designed to support
clinicians in accessing and working with a variety of patient information (Gruber et al.,
2009) and promoting healthcare quality information sharing (Beuscart-Ze´phir et., 2001).
With the development of IS/IT, the related data have grown larger and faster in the
past decade. This information is more operational and complex than previous information.
However, larger and more complex data are not necessarily better data. The most important
issue in this field is the use of high-quality information to improve patient care.
Implementations of IS/IT in the healthcare industry are one of the main assets that has
helped improve the end-users care and proved to be essential for professionals and
managers alike in decision making (Bindakheel and Rosnah, 2010).
Nowadays projects are regarded as an important tool for value creation in the
organisations (Gomes and Romão 2016b; Ingason and Jónasson, 2009; Williams and
Samset, 2010; Winter et al., 2006), improve business success (Forsberg, et al., 2000; Pinto,
3
2002; Poli and Shenhar, 2003), and for helping the process of change and that when used
timely, it can lead to the problem solving of critical issues for an organization (Clarke,
1999).
The term project is described in different ways in the research literature (Appendix
A), although some topics are common, namely, be unique in their output, having a definite
starting and ending point, are temporary in nature and are carried out to develop the
organisation’s strategic objectives (Ali, 2010).
There is a significant growth in the adoption of project management disciplines to
accomplish work in different sectors and industries (Winter and Szczepanek, 2008). Project
management approaches are required for the success of healthcare IS/IT projects,
especially initiatives that involves the integration of complex systems. Project management
coordinates a set of competencies, skills and organisational knowledge, and carries out the
monitoring of pre-established activities to evaluate the project progress (Kerzner, 2013;
Kronbichel, et al., 2009). These skills enable project managers to achieve the pre-defined
objectives. Project management also creates value and provides relevant information to
help organisations respond quickly and more effectively to customers, thus improving their
own performance (PMI4, 2015; Zwikael and Smyrk, 2011).
As organisations are continuously looking at improving project management
practices, they have increasingly adopted maturity models even though these have received
numerous criticisms (Albrecht and Spang, 2014). The basic concept of maturity drives
organizational processes to continuous improvement and so requires a thorough
understanding of an organization’s current position and where it aims to be in the future.
The maturity models are based on the premise that entities (people, organisations,
functional areas or processes) evolve through a process of growth or development towards
a more advanced maturity, across several distinct stages (Becker et al., 2009). Maturity will
affect the value which an organization can gain by implementing project management (Shi,
4 Project Management Institute
4
2011). Given the numerous best practices and capabilities involved, improving maturity
requires a properly structured action plan (Crawford, 2005).
As the success of a project depends on the perception of the different stakeholders,
the absolute success of a project does not really exist, but only the perceived success (Baker
et al., 1988). The project success concept has evolved over the past few decades, and a new
understanding of the concept is emerging which gives it a wider and more comprehensive
definition (e.g. Atkinson, 1999; Dvir at al., 1999; Globerson and Zwikael, 2002, Ika, 2009;
Ika, 2015; Shenhar et al., 2001; Senhar, Dvir and Levy, 1997; Senhar & Dvir, 2007).
The focus of this study, analyse the relation between different variables through a
mediation model based on a survey perform on a health professional simple. The goal is to
understand how practices of Project Management has a mediation effect on the relation
between Organisational Maturity and IS/IT Project Success in healthcare sector. To fulfil
this goal, the research follows several steps documented ahead.
1.2 Research context and motivation
Does IS/IT spending’s in fact lead to higher productivity? This is a fundamental issue
that has been studied by scholars and practitioners over the last four decades and became
known as productivity paradox? (Brynjolfsson, 1993; David, 1990; Dewan and Kraemer,
1998).
The inability to realize value from IS/IT investments is in part due to the lack of
alignment between organisations’ business and IS/IT strategies (Henderson and
Venkatraman, 1993). Whilst there is general agreement that IS/IT does indeed contribute
to adding business value, there is uncertainty as to how these contributions were really
obtained (Devaraj and Kohli, 2003; Henderson and Venkatraman, 1993; Melville, Kraemer
and Gurbaxani, 2004).
The business value of investments IS/IT is predicted to remain, one of the major topic
for the researchers (Dehning et al., 2004; Roztocki and Weistroffer, 2008). Some early
studies (Dos Santos et al., 1993; Hitt and Brynjolfsson, 1996; Im et al., 2001; Rai et al.,
5
1997; West and Courtney, 1993) doubt from the economic value of IS/IT, the vast majority
of authors find empirical evidence and theoretical arguments in favour of both the
operational and strategic relevance of IS/IT (e.g. Aral et al., 2007; Beccalli, 2007; Dedrick
et al., 2003; Dehning et al., 2003; Dehning et al., 2008; Han et al., 2011; Kim et al., 2009;
Kohli and Grover, 2008; Lee et al., 2011; Lin and Shao, 2006; Mahmood and Mann, 2005;
Neirotti and Paolucci, 2007; Peslak, 2003; Ramirez et al., 2010; Santhanam and Hartono,
2003; Shin, 2006; Swierczek and Shrestha, 2003; Zhang, 2005).
The last years have seen the publication of several articles about maturity models
(Wendler, 2012). Maturity models have become an important evaluation tool for measuring
the internal and external organisations capabilities, providing a framework which helps
organisations to increase their ability to deliver projects on schedule and within the
established budget, according to the technical requirements and the agreed levels of quality
(Levin and Skulmoski, 2000). Mature organisations exhibit specific elements that reflects
their maturity, namely in the levels of performance, degrees of competence and focus on
the customer satisfactions (Barber, 2004; Cooke-Davies and Arzymanow, 2003; Jung and
Wang, 2006). Mature organisations have ability to manage initiatives based on the
standardized and defined management processes (AXELOS5, 2016). Organisations with
higher maturity levels are expected to be more successful in terms of project effectiveness
and efficiency and also have a superior competitive advantage in the marketplace although
the current research offers little to support this argument (Yazici, 2009). Measuring the
maturity of organisations is a difficult and somewhat subjective task; as such an audit
process focuses mainly on individuals’ tasks (Andersen and Jessen, 2003). Evaluating the
current performance, skills and capabilities of an organization is not easy to do; in fact, the
use of maturity models simplifies our interpretation of the entire organization and makes
this task possible (Kalantjakos, 2001). In IS/IT context, maturity is considered to be a
measure for evaluating an organization’s capabilities (De Bruin and Rosemann, 2005).
5 AXELOS is a joint venture company, created in 2013 by the Cabinet Office on behalf of Her Majesty’s
Government in the UK and Capita plc, to manage, develop and grow the Global Best Practice portfolio.
6
Skulmoski (2001) reinforces the idea in which competence and maturity should be
linked and focused on project success. Atkinson (1999) notes that while there may be
differences in project management definition, the authors agree on the inclusion for the
achievement or accomplishment of the project objectives of cost, time and quality in their
definitions. The essence of project management is to support the implementation of
temporal initiatives, under the organization’s strategy framework, to successfully deliver
the expected outcomes (Milosevic, 2003; Shenhar and Dvir, 2007). The main purpose of
using a project management framework is to increase organisational value (Dalcher, 2012).
There is a significant growth in the adoption of project management disciplines to
accomplish work in different sectors and industries (Winter and Szczepanek, 2008).
Determine whether a project is a success, or a failure is something which is very
complex. Success is perceived differently by the different project stakeholders (Freeman
and Beale, 1992; Egorova et., 2009). The differences in success criteria definition should
reflect the different interests and points of view, which leads to conclude that project
success is a multidimensional approach with interrelated technical, economic, behavioural,
business and strategic dimensions (Bannerman, 2008; Cao and Hoffman, 2011; Freeman
and Beale, 1992; Ika, 2009; Jugdev and Müller, 2005; Shenhar et al., 2001; Pinto and
Mantel, 1990; Thomas and Fernandez, 2008).
The success criteria known as the iron triangle or triple constraint have been
criticised for their exclusive focus on the project management process, to the detriment of
including the vision and goals of the different stakeholders (Atkinson, 1999; Baccarini,
1999; Bannerman, 2008; Meredith and Mantel, 2000; Papke-Shields et al., 2010; Pinto and
Slevin, 1987). Kerzner (2013) has described a successful project when several
characteristics, the Critical Success Factors (CSFs) were met:
- The planned time;
- The predicted budget;
- The alignment with expected performance accepted by the client;
- The agreed scope;
7
- Minimizing the impact on the work flow of the organization;
- Reducing the effect on the corporate culture.
The improvement in the project success projects results from increased maturity and
organizational competence (Sergeant et al., 2010; Skulmoski, 2001). Higher levels of
maturity will in most cases lead to an improvement of project outcomes (PwC, 2004).
The results of Atkinson (1999) study on the success of IS/IT projects revealed that
the success can be categorized in the following four areas:
1. Project performance: time, cost, and quality;
2. Project results; system maintainability, reliability, validity and information-
quality use;
3. Benefits for the organization: improved efficiency, improved effectiveness,
increased profits, strategic goals, organisational learning and reduced waste;
4. Benefits for the stakeholders: satisfied users, social and environmental impact,
personal development, professional learning, content project team, and
economic impact on the surrounding community.
Kagioglou et al. (2000) claimed that project success relies on the right people having
the right information, at the right time, supported by the active involvement of all
participants, especially during the early phase of a project.
Miller and Oliver (2015) highlighted that the participation of different stakeholders’
groups in the design and development process can be essential for a project’s success. The
understanding of the concept of project success has evolved over recent decades, and a
gradual understanding is now emerging that project success requires a broader and more
comprehensive definition.
The present research aims at fulfilling the existing gap in the literature regarding to
the relation between the organisational maturity, project management practices and project
success in healthcare sector.
8
1.3 Research objective and research questions
Based on the health professionals’ perceptions the study aims at contributing to
clarify the understanding of the following research topics:
₋ The concept of Organisational Maturity and IS/IT project success for health
organisations;
₋ The degree of dissemination of Project Management practices on the health
organisations;
And, in meanwhile answer to the following questions:
1. How Organisational Maturity affected IS/IT Project Success in Healthcare?
2. How Project Management affected IS/IT Project Success in Healthcare?
3. How Organisational Maturity affected the Project Management?
4. How Organisational Maturity affected IS/IT Project Success through the
effect of Project Management on IS/IT Project Success?
1.4 Relevance of the study
Today’s technology plays a significant role, permitting the storage and rapid retrieval
of patient records and other important information. At the same time, patients expect that
their sensitive personal information to be handled appropriately, to ensure accuracy and
confidentiality (Hall, 2014). Healthcare organisations become more and more challenged
on how to assure a fair return from investments in IS/IT. The study of the success or failure
of these initiatives has become vitally important for the performance of these organisations
(Delpierre et al., 2004; Rahimi and Vimarlund, 2007).
The improvement of the projects results is mostly due to improved maturity of
organisations (Skulmoski, 2001; Sergeant et al., 2010) although, here is little evidence to
suggest that process capability improvement results in improvement of project success,
some studies are promising in this respect (Mullaly, 2006; Lee and Anderson, 2006).
9
Several works recognized the benefits of investment in project management skills in
organisations (Ibbs and Kwak, 1997, 2000; Ibbs and Reginato, 2002) and discussed the
correlation between maturity and the projects performance (Mullaly, 2006; Ibbs and Kwak,
2000; Jiang et al., 2004).
A key to success is the successful management of organisational projects.
Organisations recognise project management as being a fundamental tool for the
development of initiatives that lead to the implementation of their own strategies
(Crawford, 2005; Hodgson, 2002).
Our research focuses on the exploration of the project management practices and
organisational maturity, as a means of strengthening the final results of IS/IT projects in
the healthcare sector.
1.5 Dissertation structure
The dissertation is structured into eight chapters. A summary of these chapters is
given below:
₋ Chapter 1. Introduction – A brief overview of the context, research objective,
research questions, motivation and relevance of the study.
₋ Chapter 2. Literature Review – Presents a comprehensive review of the literature
related to the main theoretical topics and provides the theoretical and empirical
background for the identification of research issues and the development of the
research questions.
₋ Chapter 3. Philosophical Perspective and Research Approach – Discussing the
research paradigm and the philosophical perspective.
₋ Chapter 4. Research model, hypotheses and constructs - Present the research
model, hypotheses and the constructs.
₋ Chapter 5. Research methodology and design - Research methodology and
design that was used to carry out this research.
10
₋ Chapter 6. Survey – Procedures and analysis of data from the application of the
questionnaire.
₋ Chapter 7. Discussion – Discuss the key findings from the collected data.
Implications of the results analysis.
₋ Chapter 8. Conclusions – Summarises the overall research context, comprises
the research conclusions, contributions, limitations and future research
opportunities.
11
Chapter 2. Literature Review
2.1 Overview
The literature review is a comprehensive reading and analyses of the published and
unpublished work from secondary sources around interest for the research (Sekaran and
Bougie, 2009). It represents an autonomous process with the objective of critically
analysing the existing literature, providing the foundations for the research (Palvia et al.,
2006). The literature review produced four main outcomes:
1. Assessment of the current state of research on a topic. This is probably the most
valuable aspect of the literature review.
2. Identification of the experts on a specific area or topic. One of the additional
benefits is that it will quickly reveal which researchers have written the most on
a topic.
3. Identification of key questions about a topic that need further research. In many
cases, it´s possible to discover new issues that need further exploration.
4. Determination of methodologies used in past studies as a means of determining
what approaches might be of most benefit in further developing a topic.
Upon completion of the literature review, the researcher should have a solid
knowledge of the area or topic and a good feel for the direction any new research should
take. Reviewing the literature critically provides the basis upon which your research will
be built (Saunders et al., 2009). The literature review encompasses the following topics:
₋ Project Management (2.2);
₋ Maturity Models (2.3);
₋ Project Success (2.4);
₋ IS/IT Challenges (2.5);
₋ IS/IT Project Success (2.6);
₋ Healthcare Sector (2.7);
12
Much of the work in this dissertation was submitted for peer review in academic
journals, national and international conferences, and doctoral consortia (Appendix B).
2.2 Project Management
2.2.1 Overview
In nowadays, there is a need to work with faster and more flexible organisational
structures, which force companies to operate through projects which usually help them to
successfully achieve their objectives (Gomes and Romão, 2014a). Furthermore, in an
increasingly competitive business environment, it is necessary to ensure that the successful
results of one project can be extended to future initiatives and investments, using
standardised procedures.
Organisations need to deliver more complex solutions, in a better, faster, and cheaper
way. The business problems addressed today require enterprise-wide solutions that call for
an integrated approach and effective management of all the organisational resources to
achieve the expected objectives and related benefits. In a competitive environment,
organisations need flexibility to meet customers’ demands, by offering customized and
high-quality products and services.
Last decades have showed an increased interest for project management in many
organisations, due to increased project work in all types of industries (Besner and Hobbs,
2006; Jacques, Garger, and Thomas, 2008; Shim and Lee, 2001; Söderlund, 2005; Turner
and Müller, 2005)
There is an emerging body of literature that identifies project management as a
powerful, generic management approach with broad application beyond projects (Laszlo,
1999; Pinto and Rouhiainen, 2001).
Pinto and Rouhiainen (2001) also recognized the power and flexibility brought to
organisations and the constraints and challenges that accompany the role of project
manager. Project management has been increasingly viewed as a part of overall
13
organisational management practices, similar in importance to other practices in the
financial, marketing, or human resource management areas (Kenny, 2003).
Managing projects, organizing people and working in an appropriate way seems to
be a key success factor. In view of this challenge experienced by organisations in
implementing their strategies, projects have been used as a facilitator in these developments
(Dietrich and Lehtonen, 2005; Grundy, 2000; Meskendahl, 2010).
The last decade has witnessed an increase complexity of projects being undertaken
by organisations in both the public and private sectors (Baccarini, 1999; Williams, 2002).
2.2.2 Project Management background
Changes in technology and in the business environment has meant that greater
demands are required from traditional management models, which have difficulty in giving
a rapid response to changing markets. Three main key characteristics of modern
organisations and society which reflects the increased adoption of project-based work
across several industrial sectors are the following (Lundin and Söderholm, 1998; Midler,
1995; Sydow and Staber, 2002):
- Rapidly changing environments and markets;
- The increasing complexity of products and services;
- The knowledge intensity in production processes.
Organisations have adopted the project form as an important economic and social
process on which the emerging knowledge economy has been supported (Cleland and
Ireland, 2006; Meredith and Mantel, 2009).
Project management is the process within organization where temporary endeavours
are undertaken for beneficial change and added value (Nokes, 2007), requiring a multi-
dimensional set of skills and a professional practice of managerial knowledge (Hodgson,
2002; Kerzner, 2013).
14
Project management has experienced a very important growth and its economic
impact is considerable in different sectors, industries and countries (Turner et al, 2010;
Winter et al, 2006). The projects have become a tool for organizing and structuring work
in most of the organisations on which they depend (Bakker, 2010), constituting one of the
most important organisational developments of the last decades (Winter et al., 2006).
One main reason for this diffusion seems to be that the project-viewed as a task-
specific and time-limited form of working – is perceived as a controllable way of avoiding
all the classic problems which most the organisations are struggle (e.g. bureaucracy)
(Cicmil et al., 2009; Packendorff, 1995; Hodgson, 2004).
The origin of project management is strongly linked to the demands of planned
military projects in the United States, and it emerged during the post-war period, as there
was a need to coordinate a wide range of activities. In this way, traditional project
management skills were developed from the requirements of construction and defence
industries to plan, control and manage large and complex tangible projects (Bourne and
Walker, 2004; Morris, 1994).
Several writers attribute the roots of research and project management knowledge to
various types of planning techniques, such as CPM6 or PERT7 (Packendorff, 1995).
The PMI (2016) defined project management as “the application of knowledge,
skills, tools and techniques in activities project to meet project requirements” (p.9). Kerzner
(2013) and APM8 (2012) highlighted the importance of project management in planning,
organizing and control the organisations resources to accomplish short-term targets to
complete specific goals and wider objectives. Project management is then the process of
applying the skills, knowledge and techniques and tools to assure that the project meets the
required standards.
6Critical Path Method 7 Program Evaluation and Review Technique 8 Association for Project Management
15
Practices and techniques of project management are recognised by many
organisations in various industries as being essential skills, which benefit businesses and
conducted the project to an end of success (Shenhar and Dvir, 2007). Project Management
received increasing attention in the business and academic world, as projects are important
tools for change and organisational development. In an environment where projects are
increasingly becoming the fundamental component of the business, project management
has recently been the subjected to a closer scrutiny.
Over the last decades, more organisations are employing project management as a
way of developing a competitive advantage, although projects do not always progress as
planned (Grant and Pennypacker, 2006).
A survey performed by KPMG in 600 organisations across 22 countries showed that
project complexity, in the IS/IT domain, increased in 88% and budgets increased in 79%
on the organisations surveyed. The study also finds that 86% of respondents had project
outcomes that are not within the planned expectations (KPMG, 2005).
Although some improvement has been seen in terms of project success, a relatively
high frequency of project failures has been reported elsewhere as well (Cicmil and
Hodgson, 2006; Pich et al., 2002; Xia and Lee, 2005).
Traditionally project management success focused on the development of the process
dimensions of time, cost and quality (Redmill, 1999; Globerson and Zwikael, 2002).
Further research found that the achievement of those requirements was not sufficient to
measure project management success and evaluated dimensions such as the quality of the
project management process or the satisfaction of the project stakeholder’s expectations
(Baccarini, 1999; Schwalbe, 2012).
This process should be careful planned, and actions monitored until objectives and
benefits were achieved to fulfil the project successfully. Project management should be
able to identify the goals and benefits, and the right combination of organisational changes
and IS/IT investments to clearly mapping the way to get them (Gomes, Romão and
16
Caldeira, 2013a; Ward and Daniel, 2006). These approaches require an integrated business-
oriented methodology and focusing management attention to IS/IT throughout the
investment life cycle. Developing this competence within an organization also requires the
integration of several specialized areas of knowledge, such as change management, risk
management, project management, systems development, investment evaluation or
portfolio management.
The underlying assumption is that the use of commonly accepted Project
Management practices will enhance project performance (Papke-Shields et al., 2010.
Although previous studies provide evidence of the relationship between using project
management practices and improving project performance, a more thorough review is
needed (Thomas and Mullaly, 2007).
Project performance targets are tied to the well-coordinated control of project
activities, with relation to schedule, cost and quality, so that project can be fulfilled within
the planned scope of the project (Taderdoost and Keshavarzsaleh, 2016).
2.2.3 Project Management: Limitations, trends and challenges
Traditionally, project management relies on several bodies of knowledge that make
a description of what is generally recognized as good practice (e.g. PMI, IPMA, APM).
Traditional project management approaches refer to a structured, mechanistic and top-
down, system model-based that rely on systems design, tools, methods, and procedures
(Blomquist et al., 2010). A growing body of literature, as well as a growing body of
empirical evidence and the voices of numerous practitioners indicate that accepting and
applying this widely-promoted project management of good practice standards does not
eliminate project failures, nor does it guarantee project success (Williams, 2004). Hodgson
and Cicmil (2008) claimed that the paradox of project management as universal solution
to the acknowledged challenges of the new economic and social era becomes apparent.
Over the past few years, an alternative to the best practice approach has been argued.
Cicmil and Hodgson (2006) argue that the iron triangle criterion, one of the important
streams of research in projects, disturbs the research in project management. Smyth and
17
Morris (2007) complaint the weaknesses of the dominant research methodologies
frequently used in project management studies. Cicmil (2006) stated that project theory
should be served by a qualitative approach with a critical interpretive approach that could
generate alternative understandings of what goes on in project practice and how managers
participate and manage the complex organisational arrangements. Ivory and Alderman
(2005) argued that project management theory needs to distance itself from prevailing
rationalistic assumptions. Bresnen, Goussevskaia and Swan (2005) conclude that there is
still much to discuss about project organization and events that are relevant to
understanding organisational change. Bredillet (2005) highlighted the need for studies that
focus on who we are and where we are going. Cooke-Davies (2004) argued that the
underlying theory of project management practice is rarely articulated. Project
management is an immature field of research, and many of the normative and traditional
contributions lack substantial support when it comes to understanding what is actually
occurring in projects (Winter et al, 2006).
Studies provide important insights into the multiplicity of potential benefits that
executives, practitioners, and consultants found with the implementation of project
management but make no effort to quantify these values (Thomas et al., 2002). Empirical
evidence does exist, although, fragmented and incomplete (e.g. Bryde, 2003; Cooke-
Davies, 2002; Ibbs et al., 2004; Kwak and Ibbs, 2000; Mullaly, 2004; Reginato and Ibbs,
2002).
Kolltveit et al (2015) based many years of practice observed the existence of several
perspectives applied to project management:
₋ The task perspective – The focus is on the project object that should be delivered
as specified within budget and on time. Planning and control. A dominant theory
18
is based on the Scientific Management9 (Gray and Larson, 2003; Maylor, 2010;
Meredith and Mantel, 2009; Turner, 2008).
₋ The leadership perspective - The focuses is on the leadership aspect of project
management and human processes. This perspective is based on theories of
leadership, communication, process, organisational change, and team
organization (Kerzner, 2013).
₋ The system perspective- This perspective implies that problems should be solved
by considering the total rather than individual components. The system theory
dominates this perspective (Kerzner, 2013; Senge, 2006; Schoderbek et al.,
1990).
₋ The stakeholder perspective - The focus is on the effective management of the
relationship between the project and its stakeholders. The agency theory is
dominant in this perspective (Håkansson and Snehota, 1995; Savage et al., 1991)
₋ The transaction cost perspective - Based on the assumption that a project can
be considered an economic transaction. The main theories that influencing this
perspective are the incentive theory, contract theory and the theory of innovation
(Winch, 2006).
₋ The business by project perspective - Focuses on project investments and
benefits. The main theories are the strategy theory, the financial theory, the
investment theory, the portfolio theory and the marketing theory (Artto et al.,
1998; Turner, 2008).
Academic research confirms the tendency to increase the numbers of new
developments and new initiatives being pursued through projects and programmes
(Whittington et al., 1999). Recent industry report highlighted the growing adoption of
9 Scientific management is a theory of management that analyzes and synthesizes workflows. Its main
objective is improving economic efficiency, especially labor productivity. One early approach to scientific
management is known as Taylorism (Mitcham, 2005).
19
project management standards and practices across large numbers of organisations
(KPMG, 2013).
White and Fortune (2002) performed a survey over project managers and the results
showed that most of the respondents used a limited number of methods, tools and
techniques. The Gant Charts are the most used techniques between project managers. A
half of the respondents reported drawback to the methods, tools and techniques they had
employed. The criteria to judge the project success most cited is directly related with the
iron triangle.
In contrast to the substantial increase in importance and dissemination of projects, its
conceptual basis for project management model and methodology has remained rather
static (Koskela and Howell, 2002) and has been dominated by a technocratic and rationalist
point of view (Morris et al., 2011, Packendorff, 1995). Resuming some criticism
highlighted by academics and professional:
₋ As a subject, is highly prescriptive and frequently ignores context (Maylor,
2001);
₋ Methodologically inconsistent (Meredith, 2002);
₋ The based-theory is obsolete (Koskela and Howell, 2002);
₋ Highly normative (Sydow, Lindkvist, and DeFillippi, 2004).
₋ The failure to recognize and provide guidance in managing different types of
projects, particularly for projects with a high degree of uncertainty (Lenfle and
Loch, 2010).
Particularly influential is the Scandinavian School of Project Studies (Sahlin-
Anderson and Söderholm, 2002) which raises several vital themes which move beyond
traditional understandings of projects and their management, positing among other things
the conceptualisation of projects as temporary organisations (Lundin and Söderholm, 1995)
and the recognition of the historically-embedded nature of projects (Kreiner, 1995;
Engwall, 2003).
20
The most dominant strand of project management thinking is the rational, universal,
deterministic model, emphasising the planning and control dimensions of project
management (e.g. Morris, 2002; Winch, 2004; Yeo, 1993). Another strand more
theoretically based and emerged in the late 1960s and 1970s from the literature on
organisational design, which focused on organisational structure as a means of achieving
integration and task accomplishment (e.g. Galbraith, 1973; Lundin and Soderholm, 1995;
Mintzberg, 1983; Sydow et al., 2004; Toffler, 1997).
Researchers have argued that the benefits of project management practice are not all
captured by ROI metrics. The underestimation of the impact on innovation (Turner and
Keegan, 2004), process improvements (Winch, 2004) or on personnel (Thamhain, 2004),
could be a possible reason for the past research has failed to identify the factors that truly
determine project success. Although this issue is certainly complex, current research efforts
should help clarify this issue. More recent perspectives explored the interplay between
projects and the strategic direction of the business enterprise (Morris and Jamieson, 2004;
Flowers, 2004) and a view of projects as information-processing systems (Winch, 2002).
A review of practices issues identified topics of increasing interest to include: portfolio
management; programme management; integrated performance metrics; governance,
project leadership, project sponsorship, strategy, value management and benefits
management; building enterprise-wide project management competence and capability
(Morris, 2004).
To determine the state of art of project management research and identifying the key
trends, a study reviewed more than 3,500 articles, journals, and papers reemphasized the
focus at project processes, technology and skills, as the major key trends, namely
(Kloppenborg and Opfer, 2002):
₋ Processes and tools standardization;
₋ Web-based technologies for communication and collaboration;
₋ Use of generally accepted project management practices and philosophies
required through specific language in contracts;
21
₋ Outsourcing of project management by major companies;
₋ Challenges of non-traditional projects, such as volunteers, fund-raising, etc.;
₋ Project manager’s role;
₋ Super projects analysis;
₋ Refinement of project scope focuses on business requirements and measurable
benefits;
₋ Evolution of project selection and prioritization as a key issue;
₋ Emphasis on formal project management training and accreditation;
₋ Emphasis on risk management and more opportunities for project managers to
receive risk management training;
₋ Focuses on communications and communications planning, particularly
stakeholder management.
Söderlund (2011) in a literature review of the 305 articles published over the last five
decades in thirty top management journals, proposes a categorization into seven schools of
thought concerning the main focus, project concept, major research questions,
methodological approaches and type of theorizing:
₋ Optimization School – Included diverse fields, such as, network planning
research and systems analysis. The contributions share a common view on
projects as complex activities to be planned by management-science techniques
and models (e.g. Cooper, 1976; Eppinger, 2001; Holloway et al., 1979; King
and Wilson, 1967; Taylor and Moore, 1980).
₋ Factor School – Gather the contributions of the research on the criteria for
project success and, also the factors that lead to either success or failure in
projects and project management (e.g. Avots, 1969; Bryson and Bromiley, 1993;
DeCotiis and Dyer, 1997; Ericksen and Dyer, 2004; Grewal et al., 2006; Hoegl
and Weinkauf, 2005; Müller and Turner, 2007; Pinto et al., 1993, Pinto and
Prescott, 1988, 1990; Shenhar et al., 2001).
₋ Contingency School - Contributions that seek a balance between developing the
theory of project management and its applicability to a wide variety of projects.
22
Contingency School draws on a long and strong tradition in organisational
theory relating to a variety of contingency dimensions affecting organizational
design and structure (e.g. Dailey 1978; De Meyer et al., 2002; Dvir et al., 1998;
Lawrence and Lorsch, 1967; Kolodny, 1979; Middleton, 1967; Nutt, 1982,
1983; Pich et al., 2002; Shenhar, 1998, 2001; Shenhar and Dvir, 1996).
₋ Behaviour School – A stream of research in organization-theory, namely
research on project organization, organisational behaviour and organization
processes. Research at this school typically recognizes the process and the
dynamic nature of the project and investigates time pressure, confidence,
problem solving, learning, dimensions to accommodate an analysis of the nature
and process of project behavior (Brady and Davies, 2004; Gemmill and
Wilemon, 1970; Engwall, 2003, Goodman and Goodman, 1972, 1976; Kim and
Wilemon 2007; Lundin and Söderholm, 1995; Melcher and Kayser, 1970).
₋ Governance School - Contributions on the use an economics approach on
projects and project management. The Governance School aims to analyze why
there are projects and define the appropriate government project mechanisms as
a particular type of administrative problem and complex transaction (Roman,
1964, Gerwin and Ferris, 2004; Goodman, 1967; Hodgetts,1969; Lorenzen and
Frederiksen, 2005; Meinhart and Delionback,1968; Winch at al., 2000).
₋ Relationship School – The research draws on alternative theories taken primarily
from the fields of inter-organisational relations and marketing The Relationship
School gives an alternative to the conventional static view of projects and
stresses the relational embeddedness of projects and its social construction
(Cova and Hoskins, 1997; Elias et al. 2002; Hellgren and Stjernberg, 1995;
Larson and Wikström 2007; Skaates et al. 2002; Starkey et al., 2000; Staber
2004; Welch, et al., 1996; Welch, 2005).
₋ Decision School - Contributions to explain why projects that do not follow a
rational model work successfully and why some projects that seem to be unwise
get implemented despite the bad indicators. Decision School research focuses
primarily on the early stages of projects and underlines the value of in-depth
23
analysis of single cases. (Davis, 1985; Lovallo and Kahneman 2003; Matta and
Ashkenas 2003; Ross and Staw 1986, 1993; Staw and Ross 1978).
2.3 Maturity Models
2.3.1 Overview
Academic literature has paid a considerable attention to the concept of maturity
models (Clarke, 1999; Crawford, 2002; Kerzner, 2005: Kwak & Ibbs, 2002, Pennypacker
& Grant, 2003).
“Maturity models have become an essential tool in assessing organisations' current
capabilities and helping them to implement change and improvement in a structured way”
(Jia et al., 2011, p. 834). Maturity model is a set of characteristics, attributes, indicators, or
patterns that represent progression and achievement in a specific domain or discipline
(Caralli et al., 2012).
Maturity models provide an assessment framework that enables an organization to
compare, for instance, its project delivery with best practice criteria. More generally, that
assessment allows the organization to gauge its value against competitors, ultimately
defining a planned and structured route to improvement (Ghorbanali et al., 2010).
The use of maturity models provides a framework for continuous improvement in
many areas of business. They drive strategically-linked continuous improvement and
require a prior thorough understanding of an organization’s current position and an idea of
where it aims to be in the future (Brookes and Clark, 2009). Maturity models aim to
integrate, assess and improve project management practices. Maturity models are designed
to provide a framework that an organization needs to develop its capabilities, to deliver
projects successfully in the long term (Jugdev and Thomas, 2002; Mittermaier and Steyn,
2009). Recognition of the maturity models approach is also evidenced by the large
investments made by businesses, governments and the third sector in developing skills and
abilities in this area (Söderlund and Maylor, 2012).
24
The concept of process maturity was born out of Total Quality Management, where
the application of statistical process control techniques showed that enhancing the maturity
of any technical process leads to a reduction of the inherent variability in the process and
to an improvement in the mean performance of the process (Cooke-Davies, 2002).
Maturity models focus on the organization know-what, codifying the explicit knowledge
and formally documented internal processes (Jugdev and Thomas, 2002).
The value of a generic methodology like the maturity models lies on the ability to
develop a model which is characterized by a high generalisability and standardization,
rather than in a specific stage-model (De Bruin and Rosemann, 2005). Use of a standard
methodology enables a state of model development to be reached and for incremental
improvements to be made over time. The value to organisations of applying such a model
lies in the ability to measure and assess domain capabilities at a certain point in time, thus
achieving sustainability (De Bruin and Rosemann., 2005). Overall, maturity models reflect
the characteristics of an organization as they move through different stages in a change
cycle, providing conceptual guidelines on essential requirements and components at each
stage, including key success drivers and indicators (Duffy 2001; Kim and Grant, 2010)
The assessment procedures helped an organization understand where they have been,
where they are now, and what processes they need to implement, to continue their
implementation of management methodologies. As organisations mature in business and
project management processes, and their use of information technology, they implement
centralized solutions to facilitate these processes (Smith, 2010). Working with different
types of projects within an organization requires standard models to deliver successful
future projects repeatedly, improve both the quality of future projects and gain knowledge
and learn from past successes and mistakes (Hellered, 2010).
Change management is a central topic as well as ways of measuring long term
achievement for the organization’s customer satisfaction through delegation of
responsibilities and coordination between several projects (Gomes, Romão and Caldeira,
2013a; D’Ortenzio, 2012). For achieving a high maturity rating within project
25
management, frequent collection and analysis of the performance metrics should be made
for improvement of future projects.
2.3.2 Maturity Models background
Maturity models approach has become a popular way for organisations to build
capabilities ever since the CMM10 was developed in 1991 (Paulk et al., 1993).
Conceptually, most of models are based on the CMM from SEI11 (Rosenstock, Johnston
and Anderson, 2000; Skulmoski, 2001).
Maturity models are widely accepted by the bodies of the project management
knowledge (e.g. PMI or IPMA12), however the evidence of the extent of use and impact of
the models is in some way limited (Brooks and Clark 2009).
The purpose of the maturity models is to provide a framework for improving an
organization’s business result by assessing the organization’s strengths and weaknesses,
enabling comparisons with similar organisations, and a measure of the correlation between
organisations (Combe, 1998; Gomes and Romão 2014b); Hartman, 1997; Ibbs and Kwak,
2000; Hillson, 2001). The object of these comparisons is to gain critical information that
enables an organization to become more competitive in the marketplace (Kerzner, 2001).
Organisations can use maturity models to compare their capabilities with a standard and
identify areas for improvement and development (Jugdev and Thomas, 2002). The
proposition behind most maturity models is that organisations develop capabilities by
achieving each level of capability in a sequence across a range of capability dimensions
(Crawford, 2006). The activities improvement required guidance on how to improve and
what efforts are required (Mullaly, 2014).
Levin and Skulmoski (2000) point out that the maturity models provides a framework
to help enable organisations to increase their capability to deliver projects on schedule,
10 Capability Maturity Model, a tool for assessing processes in organisations during software development 11 Software Engineering Institute, located at Carnegie Mellon University, USA 12 International Project Management Association
26
within budget and according to the desired technical specifications. Working with different
types of projects within an organization requires standard models to deliver successful
future projects repeatedly, improve both the quality of future projects and gain knowledge
and learn from past mistakes. A survey conducted in 30 countries collected 200 respondents
among top, senior and project managers’ professionals and draw the following main
conclusions (PwC13, 2004):
₋ Organisational maturity is directly correlated with organisational success;
₋ Higher maturity yielded higher performance within the five key performance
indicators (quality, scope, budget, time, business benefits).
₋ Organization with higher maturity levels enhances overall project performance;
₋ Project fails because of organisational issues and project managers have little
influence on these failures;
₋ Organisational structure has a big influence in overall project performance;
₋ Staff development and professional certification enhance overall project
performance;
₋ A systematic approach to change management in projects is fundamental for
superior performance;
₋ Projects become more efficient and effective with higher levels of maturity and
that eventually contributed to successful projects.
Maturity models have become an important evaluation tool for measuring the internal
and external organization capabilities and describe the development of an entity over time
(Klimko, 2001). Maturity models represent a structured collection of elements which
highlight the characteristics of effective processes at different stages of development
(Pullen, 2007). Maturity models approach is the evolutionary progress in demonstrating
the specific ability or accomplishment of a target from an initial to a final desired stage
(Mettler and Rohner, 2009).
13 PricewaterhouseCoopers
27
Skulmoski (2001) and Sergeant et al. (2010) recommend a view where competence
and maturity should be linked together for project success and not focusing only on action
and where competence should be regarded as a combination of knowledge, skills and
attitudes that supports performance. In general, three specific objectives can be attributed
to maturity models (Becker et al., 2009, De Bruin and Rosemann., 2005, Maier et al., 2009):
₋ Descriptive: a maturity model has a descriptive purpose when it is applied to the
assessments as-is, where entities' ability under current observation are evaluated
against certain criteria (Becker et al., 2009).
₋ Prescriptive: a maturity model has a prescriptive purpose when it allows
identifying desirable levels of maturity and provides guidance on improvement
measures (Becker et al., 2009).
₋ Comparative: a maturity model presents a comparative view when adopted to
allow a comparative analysis internal or external.
AXELOS (2016) highlighted a set of reasons why organisations might need to use
maturity model to assess their current performance, such as:
₋ Justifying investments in portfolio;
₋ Justifying programme or project management improvements;
₋ Gaining recognition of service quality to support proposals;
₋ Gaining a better understanding of their strengths and weaknesses to enable
improvement to happen.
₋ Assist organisations after a merger or acquisition
₋ Reduce costs and delivery benefits
The maturity models approach has tools for evaluating organisations on various
aspects, (Wetering and Batenburg, 2009; Duffy, 2001; Sharma, 2008) such as:
₋ Identifying when and why the organization should follow a specific orientation;
₋ Providing relevant information about necessary actions;
₋ Setting goals to achieve and measure progress.
28
Crawford (2006) defines maturity as being the stage at where an organization finds
itself, after assessing its efficiency in performing tasks and the level of development of its
practices, processes and behaviours which can impact on results.
The main focus of investment in IS/IT lies not only in technology implementation,
but mainly in improvements in organisational performance and business efficiency, in other
words, improving processes and changing the ways the work is performed. Concerning the
IS/IT environment, maturity is regarded as a measure to evaluate the capabilities of an
organization (De Bruin and Rosemann, 2005). Maturity models in IS/IT are understood as
tools that facilitate internal and/or external benchmarking while also showcasing future
improvement and providing guidelines through the evolutionary process of organisational
development and growth (Mettler et al., 2010).
In project management for IS/IT projects, various stages of growth have been
presented by researchers to map the organisational evolution (Galliers and Sutherland,
1991; Nolan, 1979).
Maturity models has been used in diverse application areas encompassing product
development, software management, project management, patient safety culture,
information management, risk management and others (Maier et al., 2009; Becker, 2009;
Mettler and Rohner, 2009). In a systemic mapping study concerning relevant publications
of journals and IS conferences from 1993 to 2010, Wendler (2012) found 237 articles
showing that current maturity model research is applicable to more than 20 domains. The
study also revealed that most publications deal with empirical and development studies
identifying gaps in evaluating and validating the developed maturity models. Examples of
maturity models’ applicability:
₋ Business process management (Rohloff, 2011; Van Looy et al., 2011)
₋ Business development maturity model (BDII, 2003).
₋ Collaboration (Fraser et al., 2003; Fraser and Gregory, 2002; Maier et al., 2012);
₋ Contract management (Garrett and Rendon, 2005);
29
₋ Enterprise risk management (Abrams et al., 2007; Zhao, Hwang and Low,
2013);
₋ Healthcare usability maturity model (HIMSS, 2011);
₋ Innovation (Aiman-Smith et al., 2005) ;
₋ IS/IT risk management (Carcary, 2013, Elmaallam and Kriouile, 2011);
₋ IT in the engineering and construction industry (Hinks et al., 1997);
₋ Knowledge management (Isaai, 2006)
₋ Leadership (Hogan, 2008).
₋ Legal assurance process (Buglione et al., 2009);
₋ People capability maturity model (Curtis et al., 2009);
₋ Product development (Dooley et al., 2001; McGrath and Romeri, 1994);
₋ Product reliability (Sander and Brombacher, 1999; Tiku, et al., 2007);
₋ Project management (AXELOS, 2016; AIPM, 2004; PMI, 2003; OGC14,
2010a) ;
₋ Project success (Skulmoski, 2001) ;
₋ Quality management (Crosby, 1979, 1996; Maier et al., 2012) ;
₋ R&D effectiveness (Berg et al., 2000 ; 2004 ; 2006) ;
₋ Risk management (Hillson, 1997) ;
₋ Risk Management Capability Maturity Model (Yeo and Ren, 2009);
₋ Software development process (Niazi et al., 2005 ; Paulk et al., 1993 ; Zhou,
2003);
₋ Strategic management (De Vries and Margaret, 2003) ;
₋ Supplier relationships (Done, 2011; Lockamy III and McCormack, 2004);
₋ System safety analysis maturity levels (Gunderson, 2005).
Studies have shown significant correlation between maturity and tangible and
intangible values (Thomas and Mulally, 2008), which reinforces the value of applying this
tool. Due to their nature maturity models are an important managerial tool, and while they
14 Office of Government Commerce. UK Government Office established as part of the HM Treasury.
30
have been used extensively in information system development, they offer important
insights into health information systems (Kim and Grant 2010; Wetering and Batenburg
2009; Crawford 2006). Sharma (2008) describes an immature healthcare organization as
one that is reactive, with personnel focussing on solving immediate crises, with no
objective basis for judging product quality or solving process problems. Haux (2006) has
proposed seven different stages in the development of health information systems:
1. Shift from paper-based systems to computer-based processing and storage and
increased data processing;
2. Shift from local to global information system architectures;
3. Health information system used by professionals and patients/consumers;
4. Data used for patient care and administration, and also increasingly used for
healthcare planning and clinical research;
5. Shift of focus from technical health information system problems to change
management and strategic information management
6. Shift from alpha-numerical data to clinical images and data on a molecular level
7. Steady increase in new technologies for continuous monitoring of health status.
Each stage of a maturity model represents greater expectations and complexity of
environments, as well as tracking improvement and transformation over time and the
capabilities at each stage (Wetering and Batenburg, 2009; Sharma, 2008).
2.3.3 Maturity Models: Benefits, limitations and challenges
According to Caralli et al., (2012) some benefits are recognized to the maturity
models:
- Using a standard measurement approach based on the model content,
organisations can determine where they are in their improvement process and
set targets for future investments in performance improvement.
- By taking measurements against the model over a period, organisations can use
the model as the basis for continuous performance improvement.
31
- Organisations can not only compare their performance against peer
organisations but also determine performance profile.
- Maturity models often create a consistent way of thinking and communicating
about a certain domain.
Maturity models help integrate traditionally separate organisational functions, set
process improvement goals and priorities, provide guidance for quality processes, and
provide benchmark for appraising current processes outcomes (Gomes, Romão and
Caldeira, 2013a). There is little evidence suggesting that process capability improvement
results in improved project success although a few studies are promising (Mullaly, 2006;
Lee and Anderson, 2006). No studies have been able to show that using maturity models
or assessing project management maturity results in a sustained competitive advantage for
an organization (Jugdev and Thomas, 2002).
Lee and Anderson (2006) used a Delphi study to research factors not covered by
maturity models, which influence project management capability. One of the most widely
cited maturity studies asserted no statistically significant correlation between maturity and
performance (Kwak and Ibbs, 2000), whereas Jugdev and Thomas (2002) could not find a
correlation between process capability and project success for many maturity models. A
longitudinal study of maturity in organisations demonstrated no credible link between
maturity and organisational performance and highlighted significant concerns about the
challenges of sustaining organisational maturity over time (Mullaly, 2006). The outcomes
expected by adhering to the practices of maturity models are unable to support or
demonstrate that they will bring successful outcomes (Killen and Hunt, 2008).
Maturity models claim to represent all processes available for a project to be
successful (Sergeant et al., 2010; Kerzner, 1998). Unfortunately, this assertion is not
supported by evidence, with many models either lacking empirical evidence to support the
use of specific measures or lacking a theoretical basis (Anderson and Jessen, 2003; Jugdev
and Thomas, 2002). Many factors that impact performance is not specifically addressed by
maturity models (Sergeant et al., 2010; Lee and Anderson, 2006).
32
Another underpinning assumption is that an improvement in process maturity will
yield an improvement in overall organisational maturity. Neither of these assumptions has
been empirically tested. Maturity models are characterized as step-by-step recipes that
oversimplify reality and lack empirical foundation (Benbasat et al, 1984; De Bruin and
Rosemann, 2005; King and Kraemer, 1984; McCormack, et al, 2009). Maturity models
should be configurable because internal and external characteristics may constrain a
maturity model’s applicability in its standardized version (Iversen, Nielsen and Norbjerg,
1999; Mettler and Rohner, 2009). Gareis and Hueman (2000) reject the notion of a maturity
ladder of stages: the argument being that a ladder model might be too rigid. Instead he goes
for a spider web presentation to allow for more differentiation in describing the needed
competencies in handling the specific processes of the project-oriented organization.
No statistically significant correlation was demonstrated between process capability
and project success, project management maturity and project success, based on cost and
schedule performance, or in terms of contributing to the organization's success as a means
of competitive advantage (Grant and Pennypacker, 2006; Ibbs and Kwak, 2000; Jugdev
and Thomas, 2002; Mullaly, 2006).
Andersen and Jessen (2003) highlighted that the maturity models have in some way
a rigid structure for performing assessment of project management standards and practices.
Mullaly (2014) concluded one of major weakness of using maturity models was that all
presume that the projects within an organization must be performed and managed in a
similar way. Studies have shown that more than a hundred different maturity models have
been proposed (De Bruin and Rosemann, 2005). Albeit with some criticism, maturity
models have still to be adopted in organisations for the improvement projects management
(Albrecht and Spang, 2014).
To mitigate this criticism, research increasingly deals with maturity models from a
design process and a design product perspective (Röglinger et al., 2012). Concernig the
design process approaches several models have been proposed (e.g., Becker et al., 2009,
de Bruin et al., 2005, Maier et al., 2009, van Steenbergen et al., 2010, Solli-Sæther and
33
Gottschalk, 2010, Mettler, 2011). For maturity models as design products, Simonsson et
al. (2007) suggested qualities particularly geared to capability assessment models/methods.
According to Simonsson et al. (2007), a good capability assessment model/method must
be valid, reliable, and cost efficient. As for the components of maturity models, de Bruin
et al. (2005) suggest to structure maturity models hierarchically into multiple layers.
Although the maturity models are now worldwide spread, it must be acknowledged
that maturity models are not a silver bullet and do not in themselves result in success or
performance improvements to an organization (Young et al, 2014).
2.3.4 Project Management Maturity
Not surprisingly, the concept of maturity was also diffused to the project management
field. Different views exist on maturity related to project management. A significant
number of competing perspectives attempt to describe mature project management
practices (Cooke-Davies and Arzymanow, 2003; Hillson, 2003a; Ibbs and Kwak, 2000;
Jachimowicz, 2003; Mullaly, 2006; PMI, 2003; Sawaya and Trapanese, 2004; Skulmoski,
2001).
These approaches assume that increases in project management maturity will lead to
more consistent and more successful project outcomes. Many project maturity models
emerged last decades and have been described in project management literature (Hillson
2001; Kerzner 2001; Crawford 2006; Ibbs et al., 2004).
Some studies have discussed the correlation between the level of project management
maturity and project performance (Ibbs and Kwak 1997; Jiang et al., 2004; Ibbs and Kwak
2000). The theory highlighted that investment in project management increases an
organization's project management maturity standing and this improvement results in
enhanced project performance that should translate into cost saving and other benefits
(Ghorbanali et al., 2010).
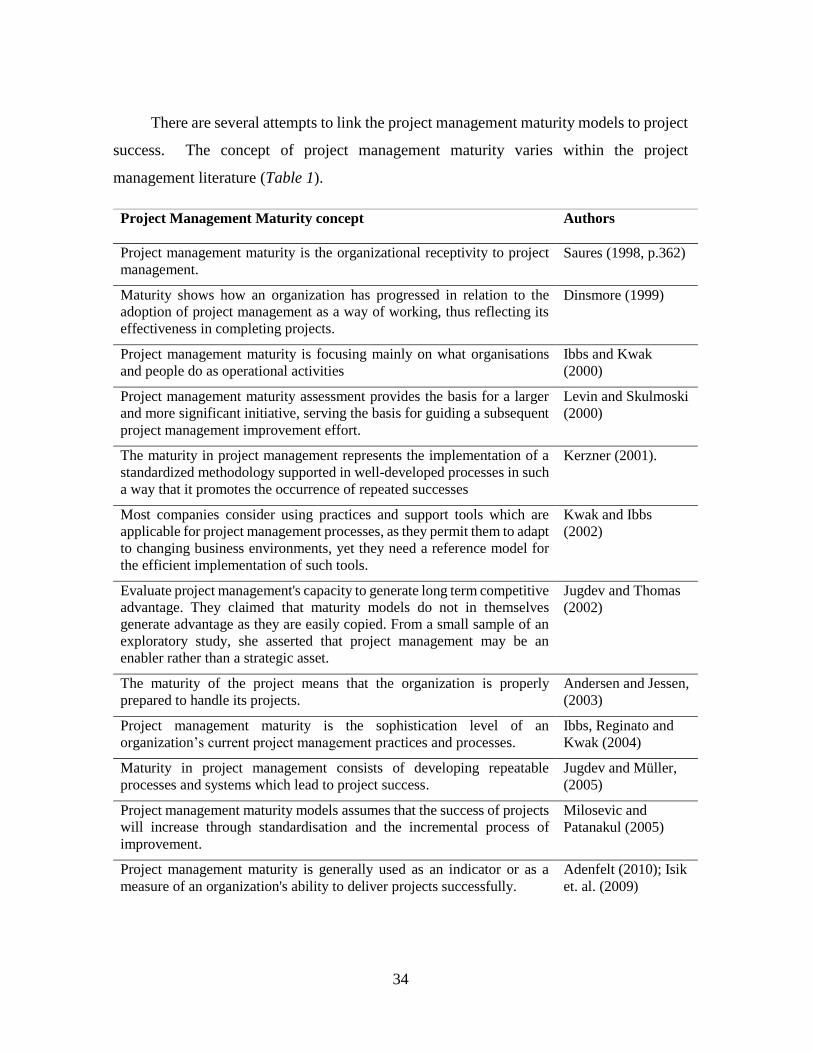
34
There are several attempts to link the project management maturity models to project
success. The concept of project management maturity varies within the project
management literature (Table 1).
Project Management Maturity concept Authors
Project management maturity is the organizational receptivity to project
management.
Saures (1998, p.362)
Maturity shows how an organization has progressed in relation to the
adoption of project management as a way of working, thus reflecting its
effectiveness in completing projects.
Dinsmore (1999)
Project management maturity is focusing mainly on what organisations
and people do as operational activities
Ibbs and Kwak
(2000)
Project management maturity assessment provides the basis for a larger
and more significant initiative, serving the basis for guiding a subsequent
project management improvement effort.
Levin and Skulmoski
(2000)
The maturity in project management represents the implementation of a
standardized methodology supported in well-developed processes in such
a way that it promotes the occurrence of repeated successes
Kerzner (2001).
Most companies consider using practices and support tools which are
applicable for project management processes, as they permit them to adapt
to changing business environments, yet they need a reference model for
the efficient implementation of such tools.
Kwak and Ibbs
(2002)
Evaluate project management's capacity to generate long term competitive
advantage. They claimed that maturity models do not in themselves
generate advantage as they are easily copied. From a small sample of an
exploratory study, she asserted that project management may be an
enabler rather than a strategic asset.
Jugdev and Thomas
(2002)
The maturity of the project means that the organization is properly
prepared to handle its projects.
Andersen and Jessen,
(2003)
Project management maturity is the sophistication level of an
organization’s current project management practices and processes.
Ibbs, Reginato and
Kwak (2004)
Maturity in project management consists of developing repeatable
processes and systems which lead to project success.
Jugdev and Müller,
(2005)
Project management maturity models assumes that the success of projects
will increase through standardisation and the incremental process of
improvement.
Milosevic and
Patanakul (2005)
Project management maturity is generally used as an indicator or as a
measure of an organization's ability to deliver projects successfully.
Adenfelt (2010); Isik
et. al. (2009)
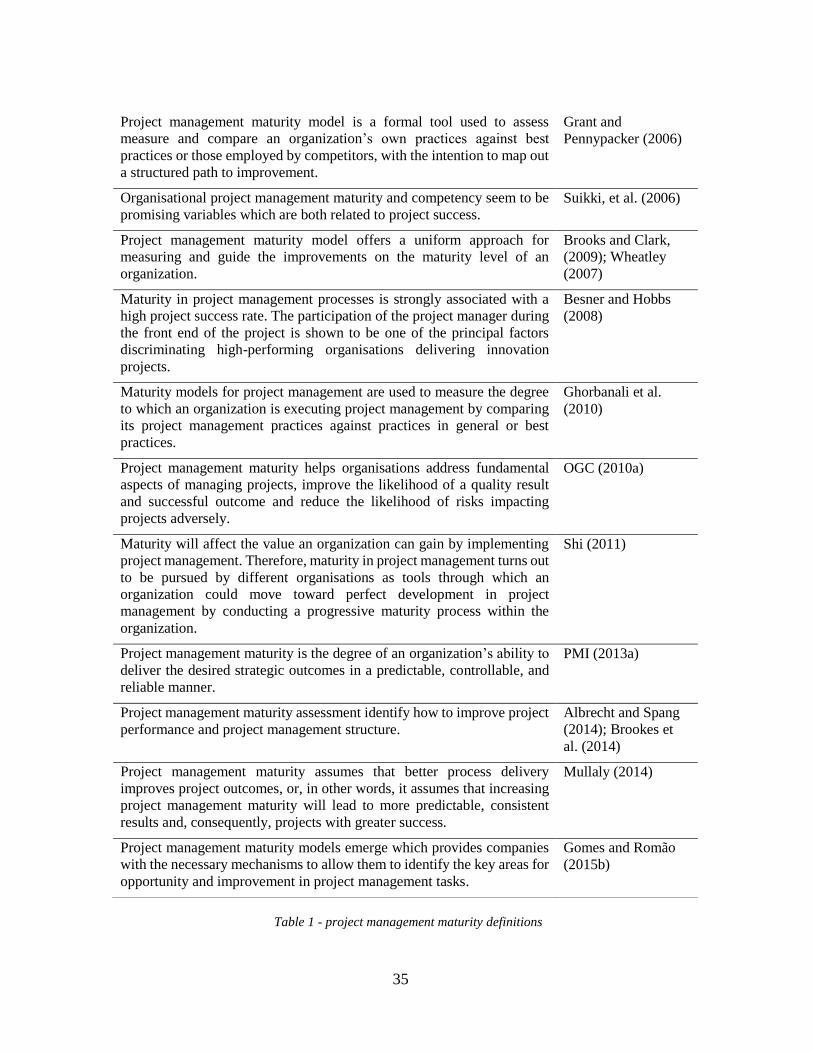
35
Project management maturity model is a formal tool used to assess
measure and compare an organization’s own practices against best
practices or those employed by competitors, with the intention to map out
a structured path to improvement.
Grant and
Pennypacker (2006)
Organisational project management maturity and competency seem to be
promising variables which are both related to project success.
Suikki, et al. (2006)
Project management maturity model offers a uniform approach for
measuring and guide the improvements on the maturity level of an
organization.
Brooks and Clark,
(2009); Wheatley
(2007)
Maturity in project management processes is strongly associated with a
high project success rate. The participation of the project manager during
the front end of the project is shown to be one of the principal factors
discriminating high-performing organisations delivering innovation
projects.
Besner and Hobbs
(2008)
Maturity models for project management are used to measure the degree
to which an organization is executing project management by comparing
its project management practices against practices in general or best
practices.
Ghorbanali et al.
(2010)
Project management maturity helps organisations address fundamental
aspects of managing projects, improve the likelihood of a quality result
and successful outcome and reduce the likelihood of risks impacting
projects adversely.
OGC (2010a)
Maturity will affect the value an organization can gain by implementing
project management. Therefore, maturity in project management turns out
to be pursued by different organisations as tools through which an
organization could move toward perfect development in project
management by conducting a progressive maturity process within the
organization.
Shi (2011)
Project management maturity is the degree of an organization’s ability to
deliver the desired strategic outcomes in a predictable, controllable, and
reliable manner.
PMI (2013a)
Project management maturity assessment identify how to improve project
performance and project management structure.
Albrecht and Spang
(2014); Brookes et
al. (2014)
Project management maturity assumes that better process delivery
improves project outcomes, or, in other words, it assumes that increasing
project management maturity will lead to more predictable, consistent
results and, consequently, projects with greater success.
Mullaly (2014)
Project management maturity models emerge which provides companies
with the necessary mechanisms to allow them to identify the key areas for
opportunity and improvement in project management tasks.
Gomes and Romão
(2015b)
Table 1 - project management maturity definitions
36
Kwak and Ibbs (2000) examined the relationship between cost performance and
schedule performance and the level of maturity of the organization. Their research
outcomes supported the assumption that there is a positive correlation between maturity
and project success; however, this was not statistically significant, most probably because
of the small sample size (e.g. Mullaly, 2006). Additionally, these models serve to develop
comparative indicators for the application of project management practices and techniques
across organisations which operate in the same business environment or sector (Gomes and
Romão, 2015b). These skills are measured using benchmarking process15. Ibbs and
Reginato (2002) and Dooley et al. (2001) found that, on average, higher levels of project
management maturity are associated with better cost and schedule results. More generally,
project management maturity models provide several main advantages:
₋ A normative description of good practices. That is, the maturity levels set an
ideal standard that organisations can strive for (Tiku et al., 2007).
₋ A discussion tool for engaging interviewees and enabling reflection on the
current status of an organization (Jugdev and Thomas, 2002).
₋ The resulting identification of strengths and weaknesses provides a logical path
for progressive development and a strategic plan for advancing project
management improvement within the organization (Crawford, 2006).
₋ Benchmarking against best practices (Marshall, 2010).
Maturity has been expressed by organisations as a potential key factor for increasing
performance, for achieving goals and for being successful. Several studies recognize the
benefits from investments in project management skills in organisations and others have
discussed the issue of the correlation between level of maturity and the performance of
projects (Ibbs and Kwak, 2000; Ibbs and Reginato, 2002; Mullaly, 2006). There are two
main reasons for organisations to adopt a maturity model for their project management
(Ghorbanali et al., 2010):
15 The benchmarking process aims to diagnose strengths and weaknesses, to measure the current capacity and
to identify areas for improvement (Hillson, 2003a).
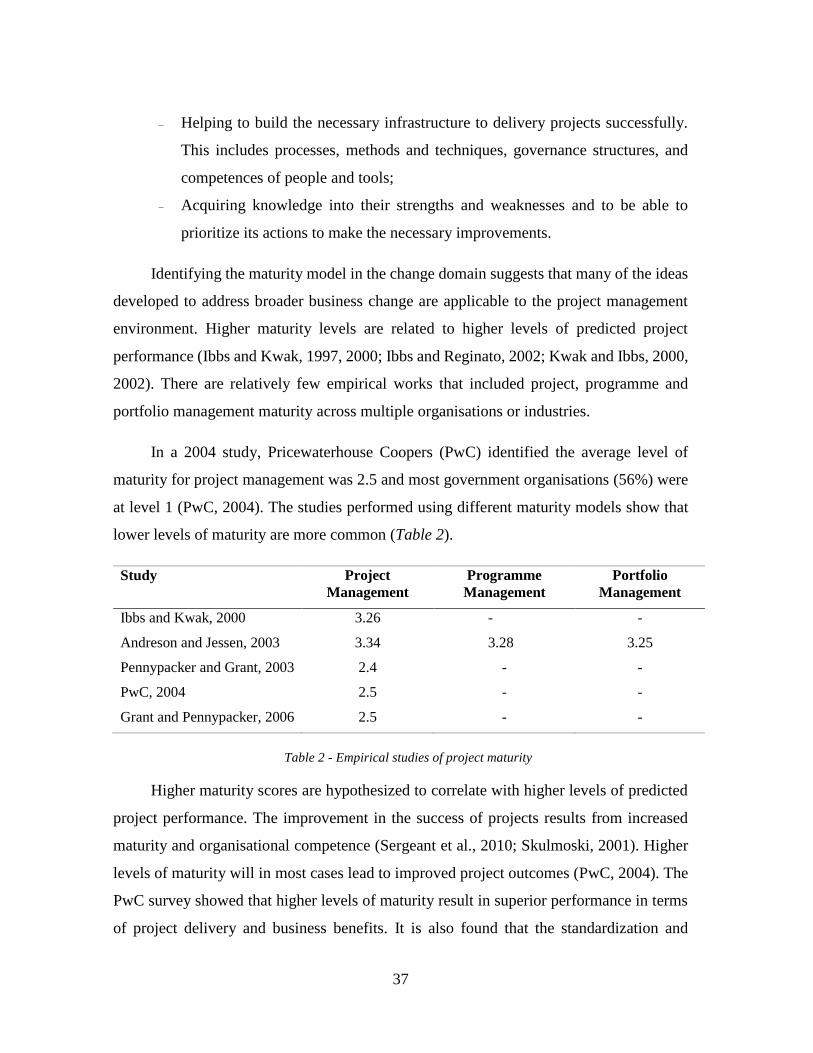
37
₋ Helping to build the necessary infrastructure to delivery projects successfully.
This includes processes, methods and techniques, governance structures, and
competences of people and tools;
₋ Acquiring knowledge into their strengths and weaknesses and to be able to
prioritize its actions to make the necessary improvements.
Identifying the maturity model in the change domain suggests that many of the ideas
developed to address broader business change are applicable to the project management
environment. Higher maturity levels are related to higher levels of predicted project
performance (Ibbs and Kwak, 1997, 2000; Ibbs and Reginato, 2002; Kwak and Ibbs, 2000,
2002). There are relatively few empirical works that included project, programme and
portfolio management maturity across multiple organisations or industries.
In a 2004 study, Pricewaterhouse Coopers (PwC) identified the average level of
maturity for project management was 2.5 and most government organisations (56%) were
at level 1 (PwC, 2004). The studies performed using different maturity models show that
lower levels of maturity are more common (Table 2).
Study Project
Management
Programme
Management
Portfolio
Management
Ibbs and Kwak, 2000 3.26 - -
Andreson and Jessen, 2003 3.34 3.28 3.25
Pennypacker and Grant, 2003 2.4 - -
PwC, 2004 2.5 - -
Grant and Pennypacker, 2006 2.5 - -
Table 2 - Empirical studies of project maturity
Higher maturity scores are hypothesized to correlate with higher levels of predicted
project performance. The improvement in the success of projects results from increased
maturity and organisational competence (Sergeant et al., 2010; Skulmoski, 2001). Higher
levels of maturity will in most cases lead to improved project outcomes (PwC, 2004). The
PwC survey showed that higher levels of maturity result in superior performance in terms
of project delivery and business benefits. It is also found that the standardization and
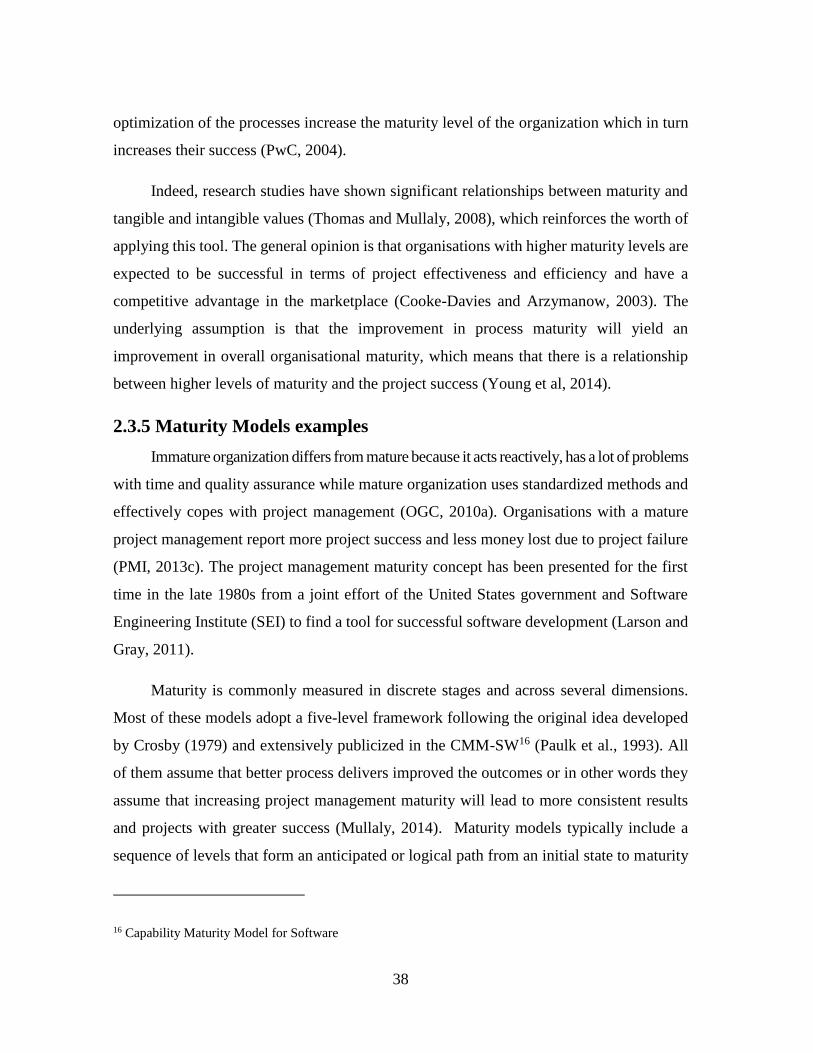
38
optimization of the processes increase the maturity level of the organization which in turn
increases their success (PwC, 2004).
Indeed, research studies have shown significant relationships between maturity and
tangible and intangible values (Thomas and Mullaly, 2008), which reinforces the worth of
applying this tool. The general opinion is that organisations with higher maturity levels are
expected to be successful in terms of project effectiveness and efficiency and have a
competitive advantage in the marketplace (Cooke-Davies and Arzymanow, 2003). The
underlying assumption is that the improvement in process maturity will yield an
improvement in overall organisational maturity, which means that there is a relationship
between higher levels of maturity and the project success (Young et al, 2014).
2.3.5 Maturity Models examples
Immature organization differs from mature because it acts reactively, has a lot of problems
with time and quality assurance while mature organization uses standardized methods and
effectively copes with project management (OGC, 2010a). Organisations with a mature
project management report more project success and less money lost due to project failure
(PMI, 2013c). The project management maturity concept has been presented for the first
time in the late 1980s from a joint effort of the United States government and Software
Engineering Institute (SEI) to find a tool for successful software development (Larson and
Gray, 2011).
Maturity is commonly measured in discrete stages and across several dimensions.
Most of these models adopt a five-level framework following the original idea developed
by Crosby (1979) and extensively publicized in the CMM-SW16 (Paulk et al., 1993). All
of them assume that better process delivers improved the outcomes or in other words they
assume that increasing project management maturity will lead to more consistent results
and projects with greater success (Mullaly, 2014). Maturity models typically include a
sequence of levels that form an anticipated or logical path from an initial state to maturity
16 Capability Maturity Model for Software
39
(Becker et al., 2009; Gottschalk, 2009). An organization’s current maturity level represents
its capabilities about a specific class of objects and application domain (de Bruin and
Rosemann, 2005). Maturity assessment usually involves variation over five stages of
development (Jugdev and Thomas, 2002), and assessment procedures which help
organisations understand their current position and which determine their future direction
(Table 3).
Level Description
Initial Processes are not usually documented
Repeatable Basic management practices have been established
Defined The management and technical processes necessary to achieve the
organisational purpose will be documented, standardized and integrated to
some extent with other business processes.
Managed There will be evidence of quantitative objectives for quality and process
performance, and these will be used as criteria in managing processes.
Optimized The organization will focus on optimization of its quantitatively managed
processes to consider changing business needs and external factors.
Table 3 – Maturity levels description
Measurement is based on subjective assessments of what people are doing
operationally, with each being scored or allocated a level of maturity, usually from a graded
step model (Young et al, 2014). Despite all their similarities, maturity models differ from
each other with respect to their assessment methodology, such as: the number of aspects
and dimensions covered and the evaluation process, how they aggregate results and levels
of maturity. These differences are based on different studies regarding best practices in
project management (Killen and Hunt, 2008) and has resulted in recurring discussions
about what is or should be a theoretical construction project management maturity (Pasian
et al., 2012).
Thus, choosing a maturity model approach is a management decision and the
organisational context must be considered to ensure the adequacy of the model chosen
(Wendler, 2012). Each organization should decide their optimal maturity level depending
40
on their business needs and prioritise process improvement effort accordingly (OGC,
2010a). Following, a brief description of the three of the most popular maturity models.
CMMI©17
Despite the diversity of models and except for some differences, they converge on a
conceptual framework, comprising well-established processes through which an
organization develops itself in a systemic and planned way to achieve a desired future state.
Nowadays, CMMI© is one of the most widely cited and used. CMMI© can be used
for process improvement and maturity/capability determination (Yucalar and Erdogan,
2009). Studies performed highlighted that the CMMI© usage reduced costs, improved
productivity and result in less quality assurance issues providing a significant return on
investment (Gibson et al., 2006; Goldenson and Gibson, 2003).
The CMMI© emerged in 1987 as the Capability Maturity Model a project at the
Software Engineering Institute (SEI), which is a research centre at Carnegie-Mellon
University (Paulk, 1993). This centre was established and funded by the United States
Department of Defence.
The CMM for Software was first published in 1991 (Chrissis, 2011) and is based on
a checklist of critical success factors in software development projects during the late 70s
and early 80s. CMM has achieved considerable adoption and undergone several revisions
and iterations. Its success led to the development of CMMs for a variety of subjects beyond
software. The proliferation of new models was confusing, so the government financed a
two-year project that involved more than 200 industries and academic experts to create a
single, extensible framework that integrated systems engineering, software engineering and
product development. The result was CMMI©.
This framework defines sets of best practices grouped into process areas that product
development organisations implement to improve the predictability of their project costs
17 Capability Maturity Model Integration
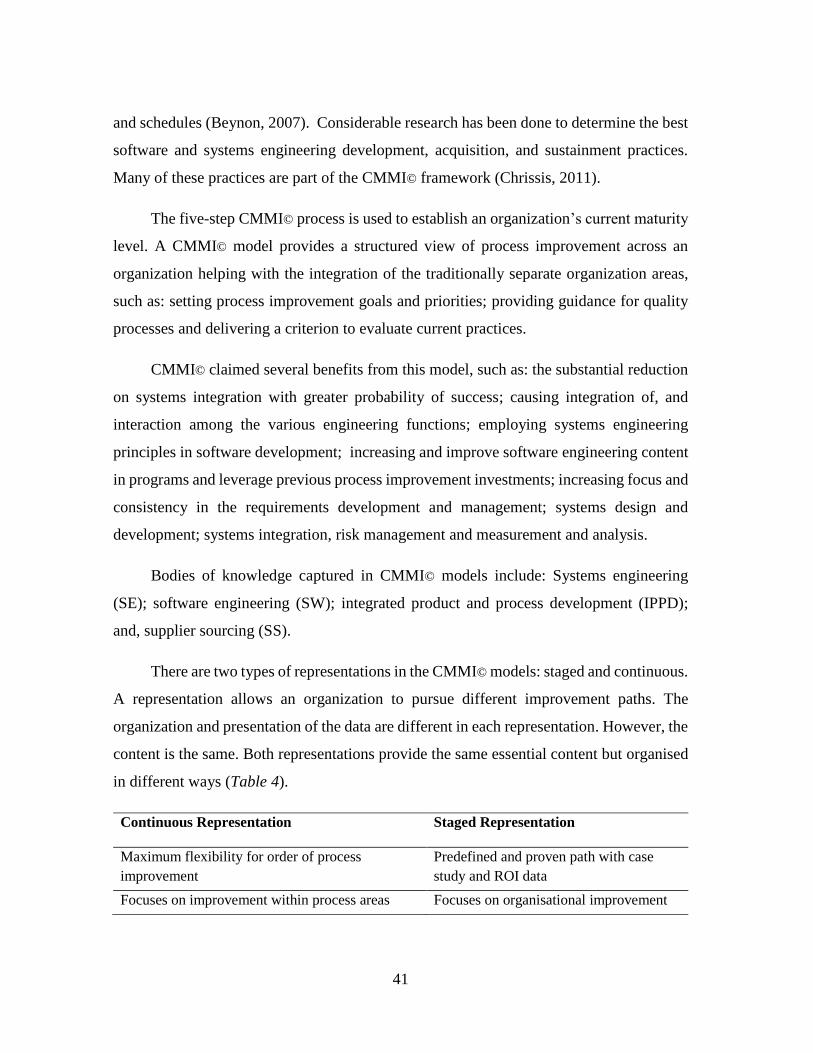
41
and schedules (Beynon, 2007). Considerable research has been done to determine the best
software and systems engineering development, acquisition, and sustainment practices.
Many of these practices are part of the CMMI© framework (Chrissis, 2011).
The five-step CMMI© process is used to establish an organization’s current maturity
level. A CMMI© model provides a structured view of process improvement across an
organization helping with the integration of the traditionally separate organization areas,
such as: setting process improvement goals and priorities; providing guidance for quality
processes and delivering a criterion to evaluate current practices.
CMMI© claimed several benefits from this model, such as: the substantial reduction
on systems integration with greater probability of success; causing integration of, and
interaction among the various engineering functions; employing systems engineering
principles in software development; increasing and improve software engineering content
in programs and leverage previous process improvement investments; increasing focus and
consistency in the requirements development and management; systems design and
development; systems integration, risk management and measurement and analysis.
Bodies of knowledge captured in CMMI© models include: Systems engineering
(SE); software engineering (SW); integrated product and process development (IPPD);
and, supplier sourcing (SS).
There are two types of representations in the CMMI© models: staged and continuous.
A representation allows an organization to pursue different improvement paths. The
organization and presentation of the data are different in each representation. However, the
content is the same. Both representations provide the same essential content but organised
in different ways (Table 4).
Continuous Representation Staged Representation
Maximum flexibility for order of process
improvement
Predefined and proven path with case
study and ROI data
Focuses on improvement within process areas Focuses on organisational improvement
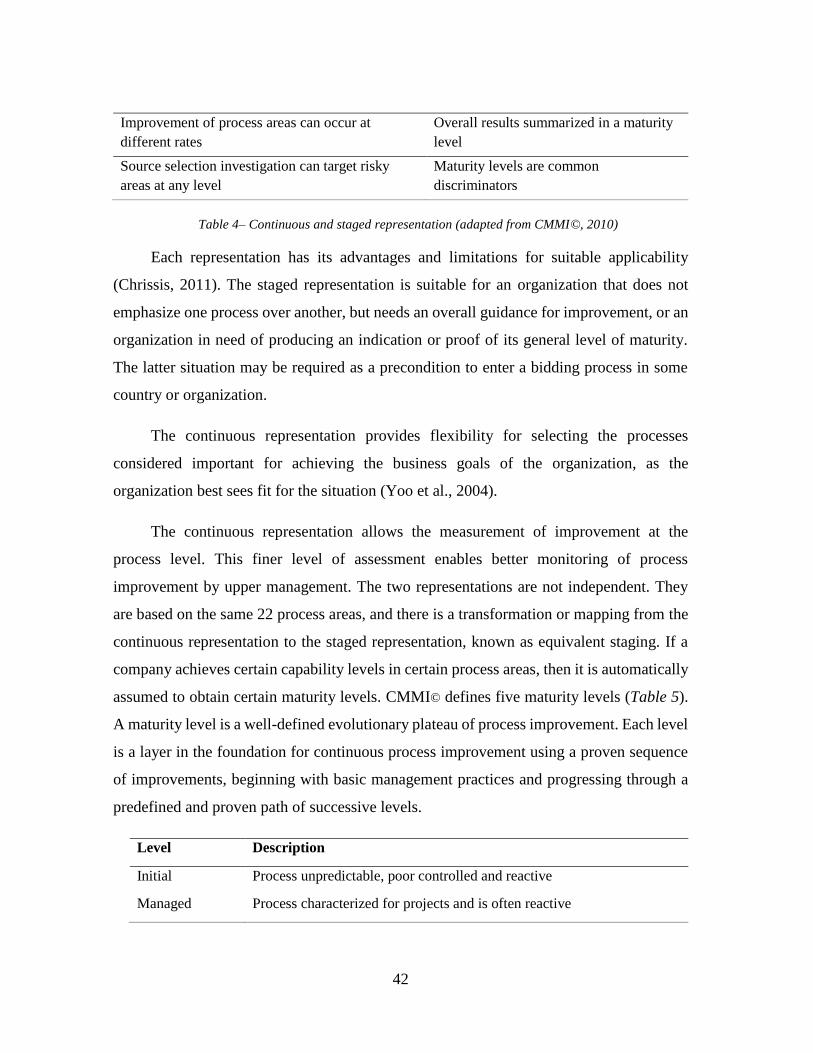
42
Improvement of process areas can occur at
different rates
Overall results summarized in a maturity
level
Source selection investigation can target risky
areas at any level
Maturity levels are common
discriminators
Table 4– Continuous and staged representation (adapted from CMMI©, 2010)
Each representation has its advantages and limitations for suitable applicability
(Chrissis, 2011). The staged representation is suitable for an organization that does not
emphasize one process over another, but needs an overall guidance for improvement, or an
organization in need of producing an indication or proof of its general level of maturity.
The latter situation may be required as a precondition to enter a bidding process in some
country or organization.
The continuous representation provides flexibility for selecting the processes
considered important for achieving the business goals of the organization, as the
organization best sees fit for the situation (Yoo et al., 2004).
The continuous representation allows the measurement of improvement at the
process level. This finer level of assessment enables better monitoring of process
improvement by upper management. The two representations are not independent. They
are based on the same 22 process areas, and there is a transformation or mapping from the
continuous representation to the staged representation, known as equivalent staging. If a
company achieves certain capability levels in certain process areas, then it is automatically
assumed to obtain certain maturity levels. CMMI© defines five maturity levels (Table 5).
A maturity level is a well-defined evolutionary plateau of process improvement. Each level
is a layer in the foundation for continuous process improvement using a proven sequence
of improvements, beginning with basic management practices and progressing through a
predefined and proven path of successive levels.
Level Description
Initial Process unpredictable, poor controlled and reactive
Managed Process characterized for projects and is often reactive
43
Defined Process characterised for the organization and is proactive
Quantitatively Process measured and controlled
Optimizing Focus on continuous improvement
Table 5- Maturity models (adapted from CMMI©, 2010)
Each maturity level provides a necessary foundation for effective implementation of
processes at the next level. Higher level processes have less chance of success without the
discipline provided by lower levels. The effect of innovation can be obscured in a noisy
process. Higher maturity level processes may be performed by organisations at lower
maturity levels, with the risk of not being consistently applied in a crisis. Both
representations provide ways of implementing process improvement to achieve business
goals.
OPM3©18
Following the CMM development, the concept of maturity has expanded in
organisations reaching the project management area, which aroused the interest of PMI
members (Project Management Institute) to develop a standard for the maturity model on
projects (Zhang et al., 2012).
PMI released the first edition of the OPM3© standard in 2003 (PMI, 2003). OPM3©
is meant to enable organisations to bridge the gap between organisational strategy and
successful projects (Schlichter, 2001).
OPM3© focuses on the comparison of organisational activities to best practices,
defined by PMI as the optimal method of meeting a specific stated objective (Crawford,
2006). The OPM3©´s intent is (Fahrenkrog et al., 2004):
18 Organizational Project Management Maturity Model
44
₋ To guide the development of capabilities necessary to execute organisational
strategy through successful projects, distinguished from capabilities associated
only with the management of individual projects; and
₋ To be able to be used by organisations of all sizes and types, in virtually any
industry or culture.
OPM3© assesses best practices in Project, Programme and Portfolio management
by analysing:
₋ Capabilities – Presence of specific organisational activities that have been
identified as part of a best practice.
₋ Outcomes – The beneficial results that organisations obtain from performance
of those activities.
₋ Key Performance Indicators (KPIs) – Measures that are used to determine the
existence and strength of a capability.
Organisations can then be classified into four stages of development in each process
area at the Project, Programme and Portfolio level (Figure 1):
₋ Standardize: Structured processes are adopted.
₋ Measure: Data is used to evaluate process performance.
₋ Control: Control plan developed for measures.
₋ Continuously Improve: Processes are optimized.
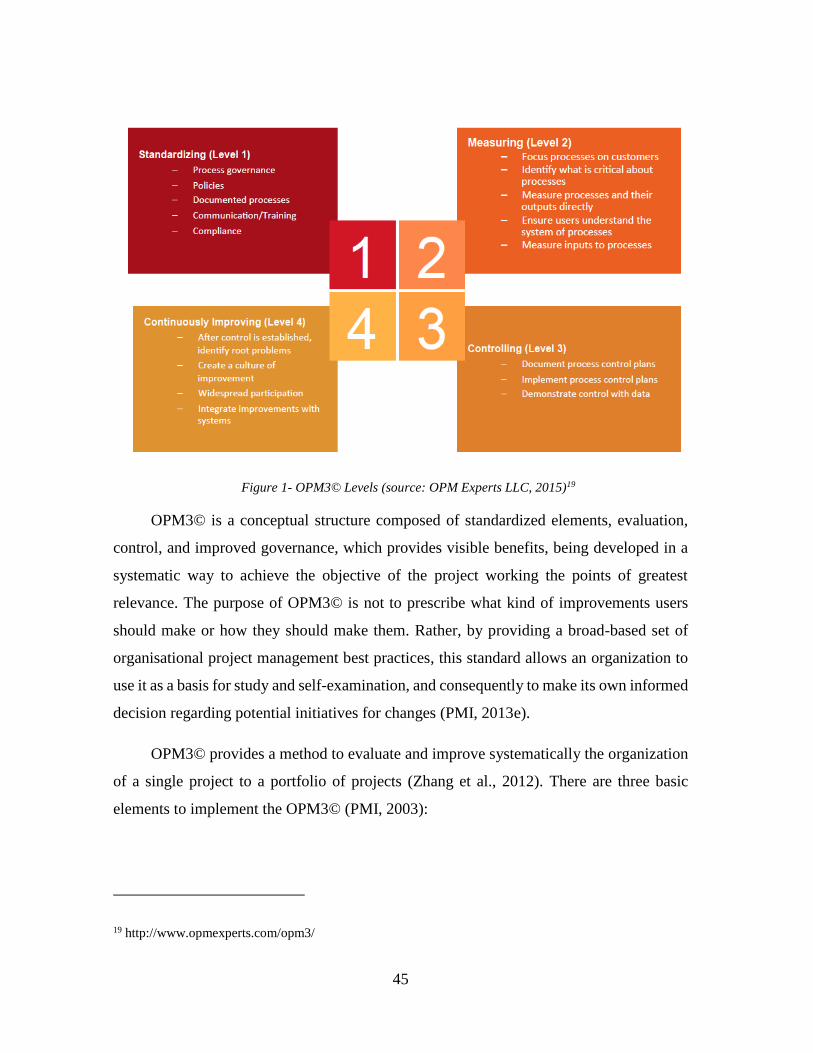
45
Figure 1- OPM3© Levels (source: OPM Experts LLC, 2015)19
OPM3© is a conceptual structure composed of standardized elements, evaluation,
control, and improved governance, which provides visible benefits, being developed in a
systematic way to achieve the objective of the project working the points of greatest
relevance. The purpose of OPM3© is not to prescribe what kind of improvements users
should make or how they should make them. Rather, by providing a broad-based set of
organisational project management best practices, this standard allows an organization to
use it as a basis for study and self-examination, and consequently to make its own informed
decision regarding potential initiatives for changes (PMI, 2013e).
OPM3© provides a method to evaluate and improve systematically the organization
of a single project to a portfolio of projects (Zhang et al., 2012). There are three basic
elements to implement the OPM3© (PMI, 2003):
19 http://www.opmexperts.com/opm3/
46
₋ Knowledge: The description of the contents of the management and
organisational maturity model projects;
₋ Evaluation: The methods, processes and procedures that serve as the basis for
organizing self-diagnose of the maturity of the project. This review is carried
out through a questionnaire with 151 questions that allows verify the strengths
and weaknesses of the project against the “best practices”;
₋ Improvement: Considering a continuous improvement process that helps
managers to modify the organization of the current stage for a more mature
stage.
The PMBOK20 Guide describes a process model for the execution of single projects
with five process groups including thirty-nine processes, divided into core and facilitating
processes PMI (2003). Organisational project management, as defined in OPM3©, requires
an understanding of not only project management and its processes but also portfolio and
programme management. The development of this standard was inspired by the increasing
interest in a maturity model that shows a step-by-step method of improving and
maintaining an organization’s ability to translate organisational strategy into the successful
and consistent delivery of projects.
The OPM3© program aims to support organisations to improve the capabilities that
strengthen the enterprise-wide processes used in the domains of Portfolio, Programme, and
Project management within the organization in alignment with the strategic objectives
(Grant and Pennypacker, 2006).
The concept of organisational project management is based on the idea that there is
a correlation between an organization capability in project, programme and portfolio
management, and its effectiveness in implementing strategy. The degree to which an
organization practices this type of project management is referred to as its organisational
project management maturity (PMI, 2003).
20Project Management Body of Knowledge
47
OPM3© does not measure the maturity of the organization by assigning an achieved
level, like most maturity models, but as a percentage of best practices achieved. A good
understanding of OPM3© contents should be developed before carrying out an assessment.
A framework cycle constitutes following steps for measuring maturity:
₋ Acquire knowledge – this component of OPM3© cycle requires preparation for
assessment of project management maturity;
₋ Perform assessment – involves gathering all the data required for measurement
of maturity assessment;
₋ Manage improvements – the results from perform assessment stage are
compared against best practices standard of project, programme and portfolio
management.
Because project management practices may vary from organization to organization,
a set of best practices have been defined by PMI (2013e) for the comparison and
improvement. According to the PMI (2003), the model brings the following benefits to the
organization:
₋ Helps organisations who wish to increase their maturity to plan improvements;
₋ Helps the organization assess its maturity compared with best practices to be
used in project management;
₋ Enables greater consistency with the PMBOK;
₋ Provides the application of the model in any kind of independent of their size,
industry or segmentation;
₋ Provides discussions of programme management and portfolio;
₋ Helps organisations implement projects correctly aligned strategically in a
dynamic and global economy;
₋ Improved schedule and budget predictability;
₋ Integration of separate organisational functions:
₋ Improved quality and customer satisfaction;
48
₋ Provide guidance for quality process and provide point of reference for appraisal
(benchmarking21).
The OPM3© model consists of three dimensions or ways to visualize an
organization's maturity level:
₋ The first dimension involves the stages of improvement processes that enable
organisations to visualize best practices. Standardization, measurement, control
and continuous improvement;
₋ The second dimension is the relationship between best practices and its
management domain capabilities in project, programme and portfolio;
₋ The third dimension involves the stages of process improvement. Initiating,
planning, executing, controlling and closing
Ghoddousi et al., 2011 presented some reasons to explain why an organization
chooses the OPM3© to assess their maturity in project management, namely:
₋ Continuous approach with a percentage score. Most of other models used a
process divided into five levels;
₋ Supported on PMI standards
₋ Applied in all business sectors;
₋ Results based on the industry feedback and has been modified repeatedly;
₋ Great emphasis to the determination of weaknesses and continual improvement.
OPM3© is by far the most sophisticated and the most resource intensive of the
maturity models in the discipline of project management (Hillson, 2003b; Cooke-Davies,
2004; Backlund et al., 2014). Some inconsistencies are noted:
₋ Lack a well-researched and theoretical understanding of what is needed for
successful project management outcomes;
21 Benchmarking is comparing one's business processes and performance metrics to industry bests and best
practices from other companies
49
₋ Founded on the assumption that there is an ideal path of development towards
maturity that most organisations should pursue regardless of discipline area,
project scope, competitive marketplace context or chosen strategy;
₋ The lack of reference processes for the areas of programme and portfolio, which
became the Best Practices22 repetitive causing difficulty in their interpretation;
₋ The self-assessment questionnaire that is too bureaucratic and repetitive and the
absence of a rating scale of measurable maturity as used in other models, which
make it difficult to understand, internal communication, targets and
commitments for the improvement of organisational maturity through the
OPM3©.
In 2008, the model was updated with the publication of the second edition (PMI,
2008), and the number of questions was reduced to 125. The main change from the first to
the second edition was that the latter assessed the organisational facilitators criteria as well
as its suitability with the standard from PMI for portfolio management (PMI, 2006)
launched in 2006. The third edition (PMI 2013e) was released in 2013.
The most important change of this third edition was the compatibility with the
structure of PMI standards, such as, PMBOK Guide (5th edition) (PMI 2013a), The
Standard of Program Management (3th edition) (PMI 2013c) and The Standard for
Portfolio Management (PMI 2013d).
In 2015, PMI stopped selling the OPM3© Capability Statements and suddenly
entered the maturity assessment consulting business directly, competing with OPM3©
users and promoting an alternative proprietary model used only by their own consultants.23
22 Best Practices refer to the methods, currently recognized within a given industry or discipline, to achieve
a stated goal or objective (PMI, 2008). 23 http://www.opmexperts.com/pmi
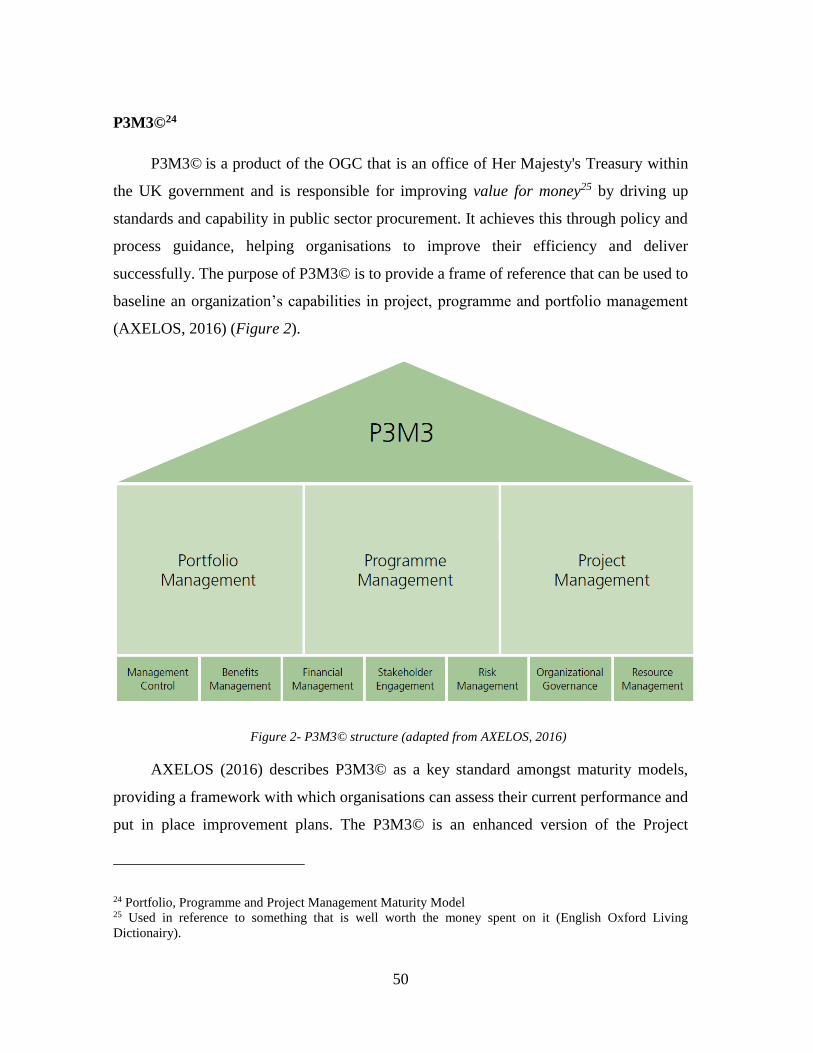
50
P3M3©24
P3M3© is a product of the OGC that is an office of Her Majesty's Treasury within
the UK government and is responsible for improving value for money25 by driving up
standards and capability in public sector procurement. It achieves this through policy and
process guidance, helping organisations to improve their efficiency and deliver
successfully. The purpose of P3M3© is to provide a frame of reference that can be used to
baseline an organization’s capabilities in project, programme and portfolio management
(AXELOS, 2016) (Figure 2).
Figure 2- P3M3© structure (adapted from AXELOS, 2016)
AXELOS (2016) describes P3M3© as a key standard amongst maturity models,
providing a framework with which organisations can assess their current performance and
put in place improvement plans. The P3M3© is an enhanced version of the Project
24 Portfolio, Programme and Project Management Maturity Model 25 Used in reference to something that is well worth the money spent on it (English Oxford Living
Dictionairy).
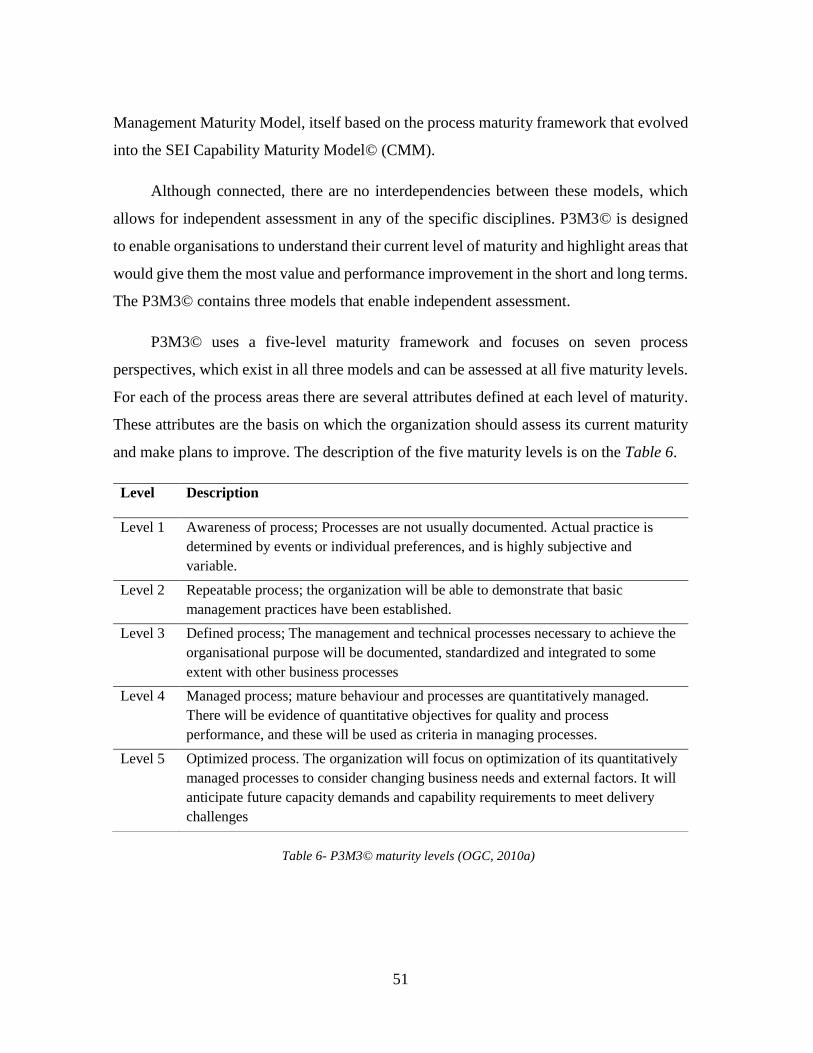
51
Management Maturity Model, itself based on the process maturity framework that evolved
into the SEI Capability Maturity Model© (CMM).
Although connected, there are no interdependencies between these models, which
allows for independent assessment in any of the specific disciplines. P3M3© is designed
to enable organisations to understand their current level of maturity and highlight areas that
would give them the most value and performance improvement in the short and long terms.
The P3M3© contains three models that enable independent assessment.
P3M3© uses a five-level maturity framework and focuses on seven process
perspectives, which exist in all three models and can be assessed at all five maturity levels.
For each of the process areas there are several attributes defined at each level of maturity.
These attributes are the basis on which the organization should assess its current maturity
and make plans to improve. The description of the five maturity levels is on the Table 6.
Level Description
Level 1 Awareness of process; Processes are not usually documented. Actual practice is
determined by events or individual preferences, and is highly subjective and
variable.
Level 2 Repeatable process; the organization will be able to demonstrate that basic
management practices have been established.
Level 3 Defined process; The management and technical processes necessary to achieve the
organisational purpose will be documented, standardized and integrated to some
extent with other business processes
Level 4 Managed process; mature behaviour and processes are quantitatively managed.
There will be evidence of quantitative objectives for quality and process
performance, and these will be used as criteria in managing processes.
Level 5 Optimized process. The organization will focus on optimization of its quantitatively
managed processes to consider changing business needs and external factors. It will
anticipate future capacity demands and capability requirements to meet delivery
challenges
Table 6- P3M3© maturity levels (OGC, 2010a)
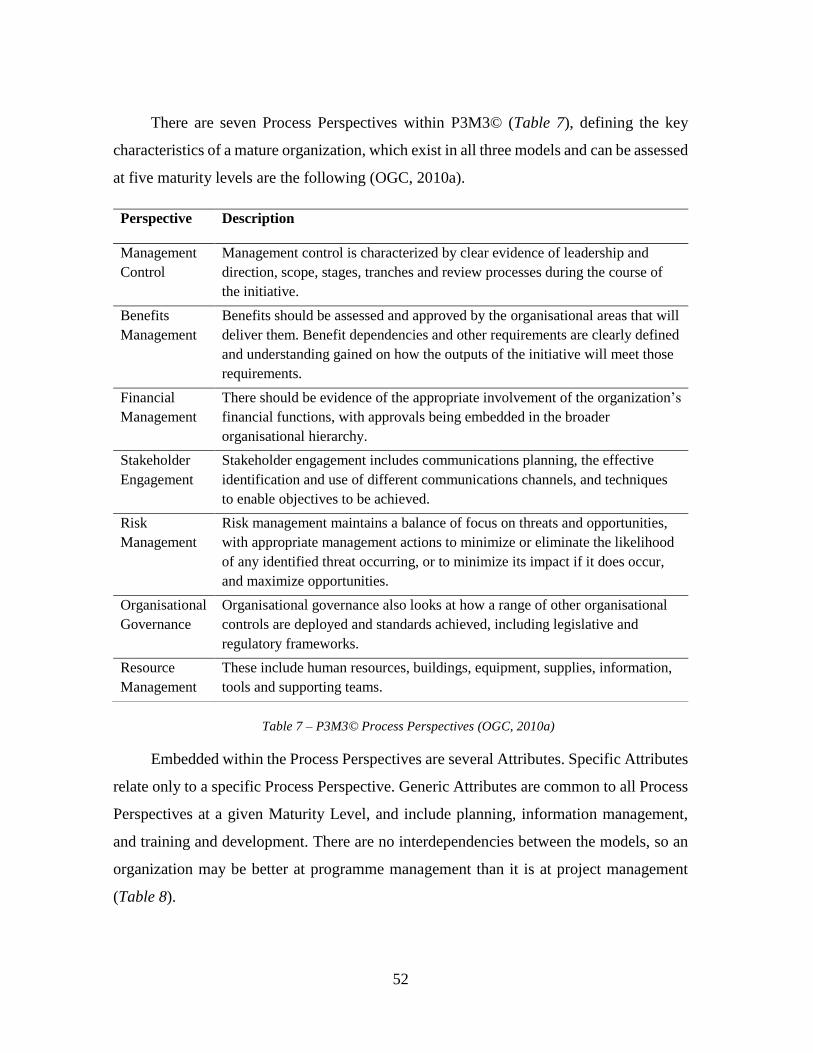
52
There are seven Process Perspectives within P3M3© (Table 7), defining the key
characteristics of a mature organization, which exist in all three models and can be assessed
at five maturity levels are the following (OGC, 2010a).
Perspective Description
Management
Control
Management control is characterized by clear evidence of leadership and
direction, scope, stages, tranches and review processes during the course of
the initiative.
Benefits
Management
Benefits should be assessed and approved by the organisational areas that will
deliver them. Benefit dependencies and other requirements are clearly defined
and understanding gained on how the outputs of the initiative will meet those
requirements.
Financial
Management
There should be evidence of the appropriate involvement of the organization’s
financial functions, with approvals being embedded in the broader
organisational hierarchy.
Stakeholder
Engagement
Stakeholder engagement includes communications planning, the effective
identification and use of different communications channels, and techniques
to enable objectives to be achieved.
Risk
Management
Risk management maintains a balance of focus on threats and opportunities,
with appropriate management actions to minimize or eliminate the likelihood
of any identified threat occurring, or to minimize its impact if it does occur,
and maximize opportunities.
Organisational
Governance
Organisational governance also looks at how a range of other organisational
controls are deployed and standards achieved, including legislative and
regulatory frameworks.
Resource
Management
These include human resources, buildings, equipment, supplies, information,
tools and supporting teams.
Table 7 – P3M3© Process Perspectives (OGC, 2010a)
Embedded within the Process Perspectives are several Attributes. Specific Attributes
relate only to a specific Process Perspective. Generic Attributes are common to all Process
Perspectives at a given Maturity Level, and include planning, information management,
and training and development. There are no interdependencies between the models, so an
organization may be better at programme management than it is at project management
(Table 8).
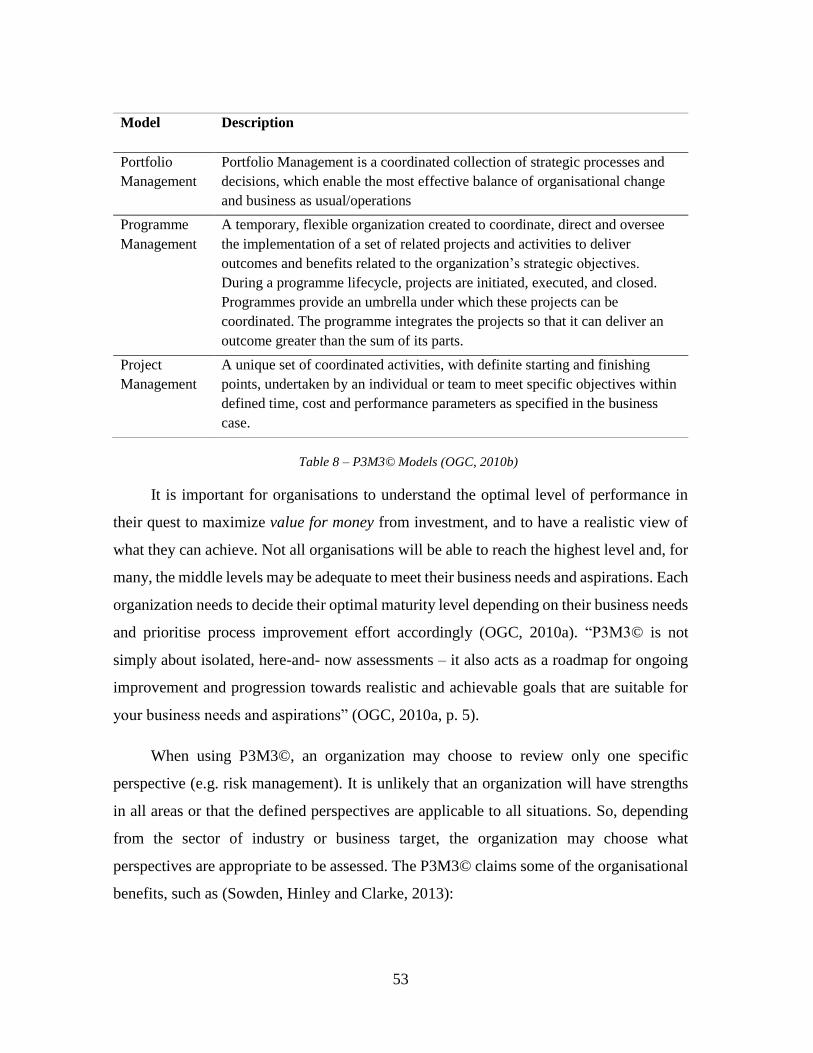
53
Model Description
Portfolio
Management
Portfolio Management is a coordinated collection of strategic processes and
decisions, which enable the most effective balance of organisational change
and business as usual/operations
Programme
Management
A temporary, flexible organization created to coordinate, direct and oversee
the implementation of a set of related projects and activities to deliver
outcomes and benefits related to the organization’s strategic objectives.
During a programme lifecycle, projects are initiated, executed, and closed.
Programmes provide an umbrella under which these projects can be
coordinated. The programme integrates the projects so that it can deliver an
outcome greater than the sum of its parts.
Project
Management
A unique set of coordinated activities, with definite starting and finishing
points, undertaken by an individual or team to meet specific objectives within
defined time, cost and performance parameters as specified in the business
case.
Table 8 – P3M3© Models (OGC, 2010b)
It is important for organisations to understand the optimal level of performance in
their quest to maximize value for money from investment, and to have a realistic view of
what they can achieve. Not all organisations will be able to reach the highest level and, for
many, the middle levels may be adequate to meet their business needs and aspirations. Each
organization needs to decide their optimal maturity level depending on their business needs
and prioritise process improvement effort accordingly (OGC, 2010a). “P3M3© is not
simply about isolated, here-and- now assessments – it also acts as a roadmap for ongoing
improvement and progression towards realistic and achievable goals that are suitable for
your business needs and aspirations” (OGC, 2010a, p. 5).
When using P3M3©, an organization may choose to review only one specific
perspective (e.g. risk management). It is unlikely that an organization will have strengths
in all areas or that the defined perspectives are applicable to all situations. So, depending
from the sector of industry or business target, the organization may choose what
perspectives are appropriate to be assessed. The P3M3© claims some of the organisational
benefits, such as (Sowden, Hinley and Clarke, 2013):
54
₋ The strengths and weaknesses are judged against an objective standard, not just
against other organisations;
₋ Helps organisations to decide what level of performance capability they need to
achieve to meet their business needs;
₋ Focuses on the organization’s maturity rather than specific initiatives;
₋ Recognizes achievements from investment;
₋ Justifies investment in portfolio, programme and project management
infrastructure;
₋ Provides a roadmap for continual progression and improvement;
₋ Increased productivity, cost predictability, higher-quality outcomes, improved
customer satisfaction and enhanced employee morale.
Although there has been no systematic study to determine the actual benefits,
organisations using P3M3© are supposedly able to achieve (Goldenson and Gibson, 2003):
₋ A higher rate of return on investment and greater production efficiency;
₋ Lower production costs and better-quality outcomes;
₋ Improved customer satisfaction and enhanced employee morale.
Some critics are also pointed out:
₋ One of the most weeknesses of the P3M3© model is that it is based on the OGC
project management maturity model and therefore emphasises concerns related
to project management success, i.e. delivery on-time on-budget on-quality
(Morris and Pinto, 2007).
₋ Young et al. (2014) argue that another deficiency of the P3M3© model is that it
uses a single number to represent maturity at the project, programme and
portfolio level, with this number being the lowest score in either generic
attributes or the process perspectives across each sub-model.
₋ The generic attributes evaluated in all three P3M3© domains are claimed as
essential to achieving improvement in project management maturity. It is
doubtful however whether these generic attributes are appropriate for
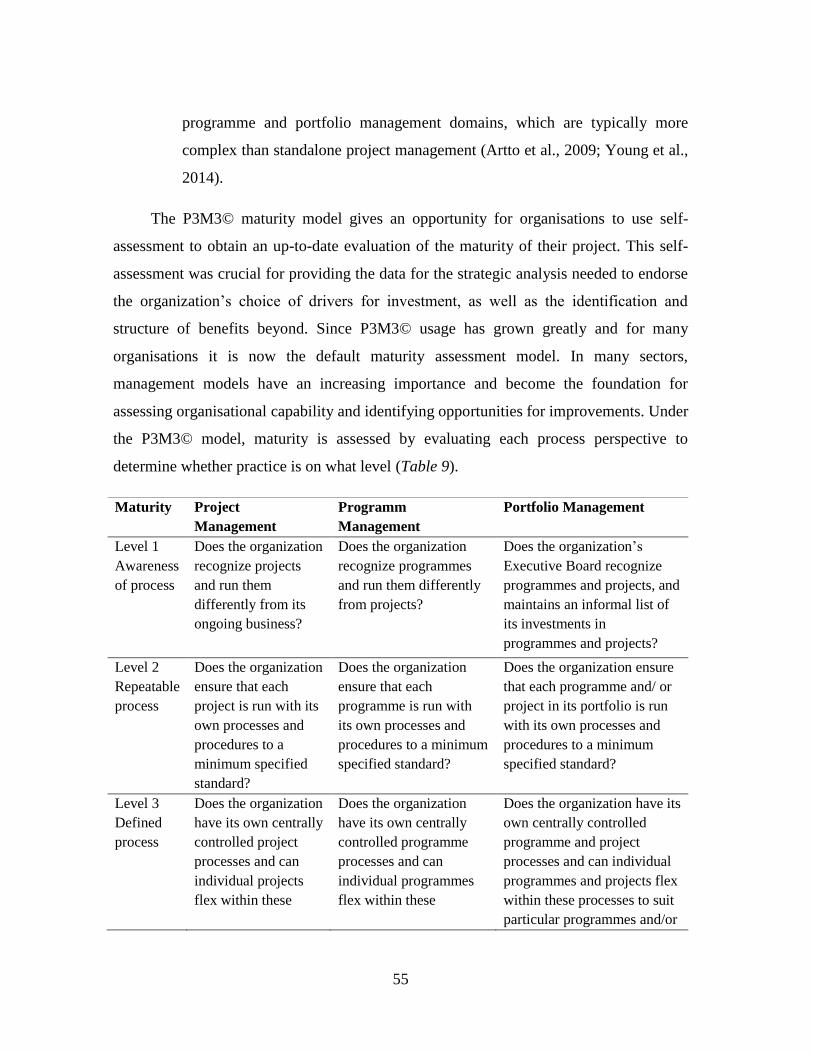
55
programme and portfolio management domains, which are typically more
complex than standalone project management (Artto et al., 2009; Young et al.,
2014).
The P3M3© maturity model gives an opportunity for organisations to use self-
assessment to obtain an up-to-date evaluation of the maturity of their project. This self-
assessment was crucial for providing the data for the strategic analysis needed to endorse
the organization’s choice of drivers for investment, as well as the identification and
structure of benefits beyond. Since P3M3© usage has grown greatly and for many
organisations it is now the default maturity assessment model. In many sectors,
management models have an increasing importance and become the foundation for
assessing organisational capability and identifying opportunities for improvements. Under
the P3M3© model, maturity is assessed by evaluating each process perspective to
determine whether practice is on what level (Table 9).
Maturity Project
Management
Programm
Management
Portfolio Management
Level 1
Awareness
of process
Does the organization
recognize projects
and run them
differently from its
ongoing business?
Does the organization
recognize programmes
and run them differently
from projects?
Does the organization’s
Executive Board recognize
programmes and projects, and
maintains an informal list of
its investments in
programmes and projects?
Level 2
Repeatable
process
Does the organization
ensure that each
project is run with its
own processes and
procedures to a
minimum specified
standard?
Does the organization
ensure that each
programme is run with
its own processes and
procedures to a minimum
specified standard?
Does the organization ensure
that each programme and/ or
project in its portfolio is run
with its own processes and
procedures to a minimum
specified standard?
Level 3
Defined
process
Does the organization
have its own centrally
controlled project
processes and can
individual projects
flex within these
Does the organization
have its own centrally
controlled programme
processes and can
individual programmes
flex within these
Does the organization have its
own centrally controlled
programme and project
processes and can individual
programmes and projects flex
within these processes to suit
particular programmes and/or
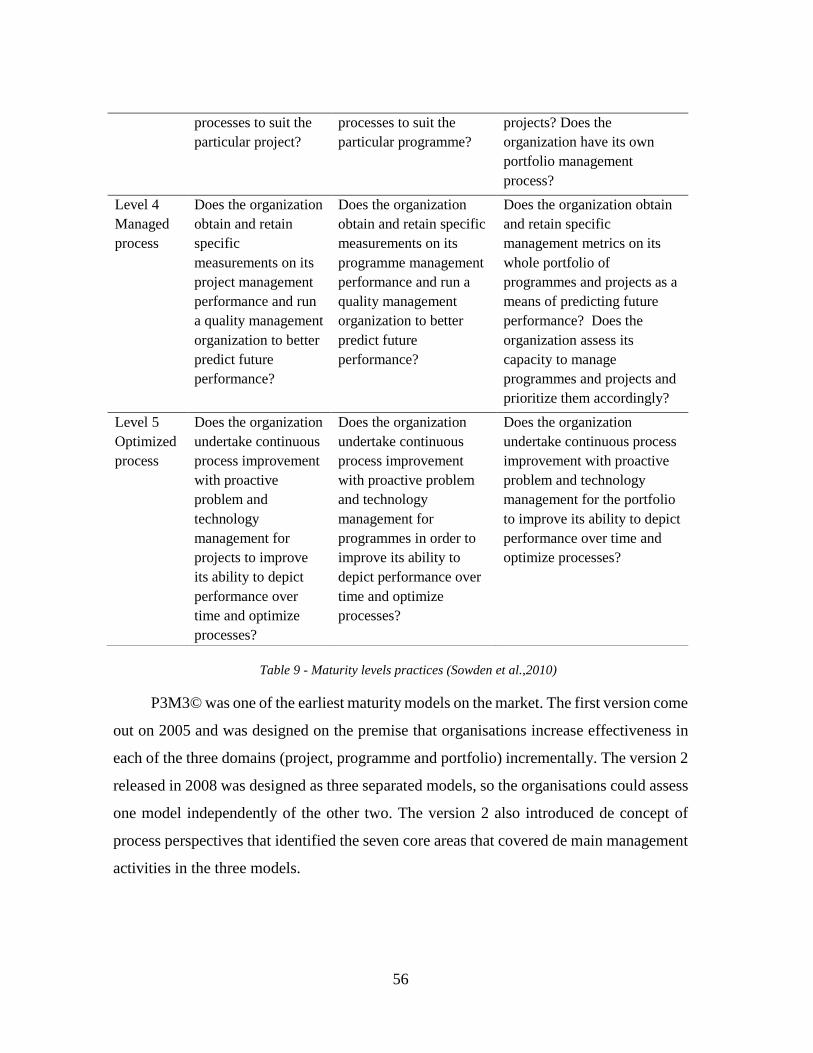
56
processes to suit the
particular project?
processes to suit the
particular programme?
projects? Does the
organization have its own
portfolio management
process?
Level 4
Managed
process
Does the organization
obtain and retain
specific
measurements on its
project management
performance and run
a quality management
organization to better
predict future
performance?
Does the organization
obtain and retain specific
measurements on its
programme management
performance and run a
quality management
organization to better
predict future
performance?
Does the organization obtain
and retain specific
management metrics on its
whole portfolio of
programmes and projects as a
means of predicting future
performance? Does the
organization assess its
capacity to manage
programmes and projects and
prioritize them accordingly?
Level 5
Optimized
process
Does the organization
undertake continuous
process improvement
with proactive
problem and
technology
management for
projects to improve
its ability to depict
performance over
time and optimize
processes?
Does the organization
undertake continuous
process improvement
with proactive problem
and technology
management for
programmes in order to
improve its ability to
depict performance over
time and optimize
processes?
Does the organization
undertake continuous process
improvement with proactive
problem and technology
management for the portfolio
to improve its ability to depict
performance over time and
optimize processes?
Table 9 - Maturity levels practices (Sowden et al.,2010)
P3M3© was one of the earliest maturity models on the market. The first version come
out on 2005 and was designed on the premise that organisations increase effectiveness in
each of the three domains (project, programme and portfolio) incrementally. The version 2
released in 2008 was designed as three separated models, so the organisations could assess
one model independently of the other two. The version 2 also introduced de concept of
process perspectives that identified the seven core areas that covered de main management
activities in the three models.
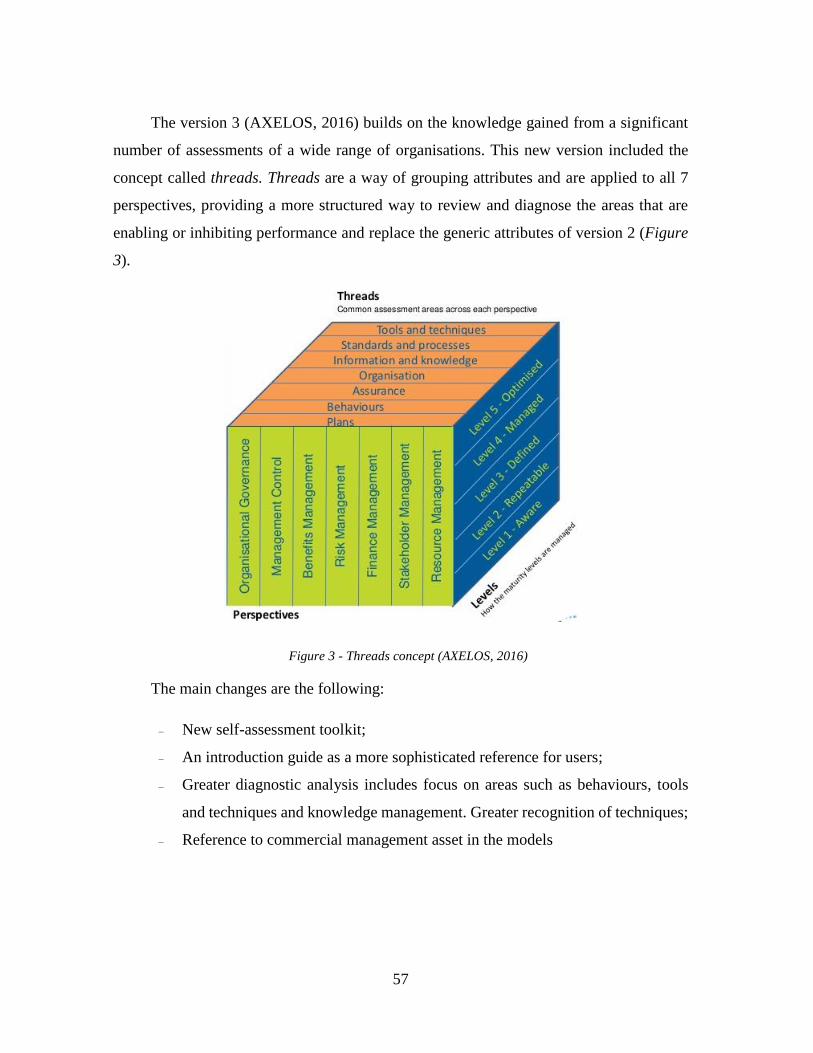
57
The version 3 (AXELOS, 2016) builds on the knowledge gained from a significant
number of assessments of a wide range of organisations. This new version included the
concept called threads. Threads are a way of grouping attributes and are applied to all 7
perspectives, providing a more structured way to review and diagnose the areas that are
enabling or inhibiting performance and replace the generic attributes of version 2 (Figure
3).
Figure 3 - Threads concept (AXELOS, 2016)
The main changes are the following:
₋ New self-assessment toolkit;
₋ An introduction guide as a more sophisticated reference for users;
₋ Greater diagnostic analysis includes focus on areas such as behaviours, tools
and techniques and knowledge management. Greater recognition of techniques;
₋ Reference to commercial management asset in the models
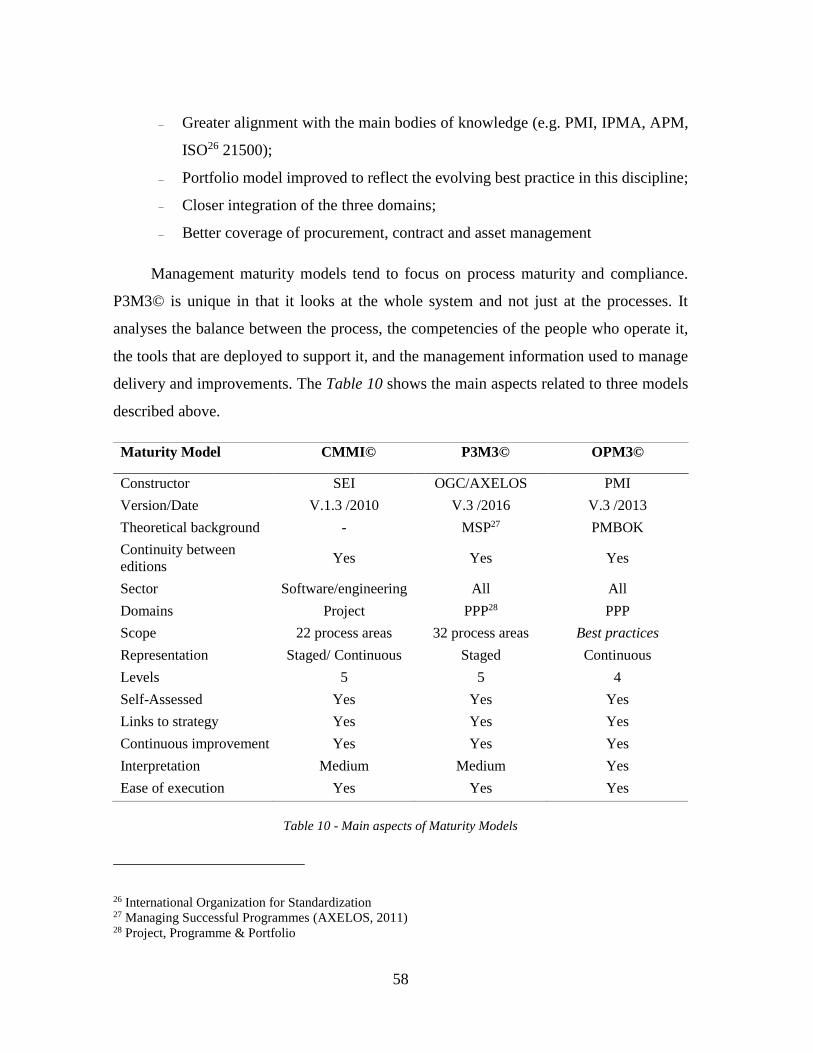
58
₋ Greater alignment with the main bodies of knowledge (e.g. PMI, IPMA, APM,
ISO26 21500);
₋ Portfolio model improved to reflect the evolving best practice in this discipline;
₋ Closer integration of the three domains;
₋ Better coverage of procurement, contract and asset management
Management maturity models tend to focus on process maturity and compliance.
P3M3© is unique in that it looks at the whole system and not just at the processes. It
analyses the balance between the process, the competencies of the people who operate it,
the tools that are deployed to support it, and the management information used to manage
delivery and improvements. The Table 10 shows the main aspects related to three models
described above.
Maturity Model CMMI© P3M3© OPM3©
Constructor SEI OGC/AXELOS PMI
Version/Date V.1.3 /2010 V.3 /2016 V.3 /2013
Theoretical background - MSP27 PMBOK
Continuity between
editions Yes Yes Yes
Sector Software/engineering All All
Domains Project PPP28 PPP
Scope 22 process areas 32 process areas Best practices
Representation Staged/ Continuous Staged Continuous
Levels 5 5 4
Self-Assessed Yes Yes Yes
Links to strategy Yes Yes Yes
Continuous improvement Yes Yes Yes
Interpretation Medium Medium Yes
Ease of execution Yes Yes Yes
Table 10 - Main aspects of Maturity Models
26 International Organization for Standardization 27 Managing Successful Programmes (AXELOS, 2011) 28 Project, Programme & Portfolio
59
2.4 Project Success
2.4.1 Overview
What is success? Success is a highly subjective term and is defined by English Oxford
Living Dictionaries29 as “the accomplishment of an aim or purpose”.
The concept of project success remains vague and ambiguous, to the point that the
literature on project management does not reach a broader consensus on its definition and
measurement. So, project success is not easily defined or determined. Some believe that a
project is successful when it meets budget, schedule and quality constraints even though it
may not have met factors such as customer needs or achieved a quality of the final product
(Dvir et al., 1998).
These criteria were and still widely accepted but is criticised for being insufficient to
fully define project success (Dvir et al., 1998; Milis et al., 2003; Ika, 2009). The notion of
success is one of the most controversial topics in the field of project management (Pinto
and Slevin, 1988; Yu, 2005). However, there is no agreement upon a single universal
definition of success that fits all projects (McLeod et al., 2012).
The understanding of the concept of project success has evolved over recent decades,
and a gradual understanding is now emerging that project success requires a broader and
more comprehensive definition. To reduce the subjectivity relating to project success,
common criteria should be defined in the initiating phase of the project (PMI, 2013a).
Researchers have been made different distinctions:
- Between project success and project management success. Where project
management success is also described as a narrow view of success. The success
of the project is measured against the general objectives of the project, while
the success of the project management is generally measured according to the
29 https://en.oxforddictionaries.com/definition/success
60
criteria of cost, time and quality (De Wit, 1988; Munns and Bjeirmi, 1996;
Cooke-Davies, 2002; Westerveld, 2003).
- Between project management success and product success. Where product
success measures the benefits of a project's final product (Baccarini, 1999).
- Between micro and macro success. The micro perspective refers to the success
perceived by the contractor or performing organization and the developer,
during the implementation phase. The macro perspective refers to the success
appreciated by other stakeholders and users over the entire project life cycle
(Lim and Mohamed, 1999).
Bushuyev and Wagner (2014) argue that the processes, methods and tools are
important elements to building a solid and structured organization, but the success of
projects requires other factors to deliver projects efficiently.
2.4.2 Project Success background
“The right project will succeed almost without the success of project management,
but successful project management could enhance its success” (Munns and Bjeirmi, 1996,
p.86).
The success of the project is a relevant factor in project management, it is one of the
most frequently debated topics among academics, and there is no consensus on the criteria
by which it can be judged (Baccarini 1999; Crawford, 2006; Freeman and Beale 1992; Ika,
2009; Pinto and Slevin 1988; Shenhar, Levy and Dvir 1997).
Finding a consensus about the criteria for project success does not seem to be an easy
task (Yu, Flett and Bowers, 2005). However, the professional bodies of knowledge, like
PMBOK Guide (PMI, 2013a) or Individual Competence Baseline (IPMA 2015),
emphasized that key project stakeholder’s satisfaction should be included on the overall
project success criteria of the projects.
The success or failure of a project can be perceived differently by different
stakeholders of the project (Cleland and Ireland, 2006; Toor and Ogunlana, 2010).
61
Stakeholders have distinct interests in different projects and therefore the perception of
success vary differently across the various stakeholders (Bryde and Brown, 2005). There
can be ambiguity in determining and measuring the success or failure of a project
(Baccarini, 1999; Fowler and Walsh, 1999; Hyväri, 2006, Ika, 2009; Jugdev and Müller,
2005; Thomas and Fernandez, 2008).
Projects which have multiple stakeholders, with different perspectives about the
purpose of the project, usually have different expectations as to what the project should
achieve (Andersen and Jessen, 2003; Davis, 2014; Lim and Mohamed, 1999; Lyytinen and
Hirschheim, 1987). It is not surprising that different participants in a project think
differently while they evaluate the project performance (Cox et al., 2003).
Different perceptions, criteria and success factors are required at different stages of
the project lifecycle (Shenhar et al., 2001; McLeod et al., 2012). The participation of
different stakeholders’ groups in the design and development process can be essential for
a project’s success (Miller and Oliver, 2015; Walsham, 1993). To ensure that a project is
successfully completed, the project plans need to be updated regularly and objectives
clearly defined early in the project (Clarke, 1999).
Pinto and Slevin (1988) in a research involving more than 650 project managers, they
concluded that the success of the project is something much more complex. The satisfaction
of different stakeholders with the outcome has much to do with the perceived success or
failure of the projects.
Another survey performed during 2002 using 236 project managers highlighted that
iron triangle criteria were still the most commonly cited measures of project success
(White and Fortune, 2002).
According to PwC (2012) study, 97% of the surveyed companies believe that project
management is critical to business performance and organisational success, and 94%
agreed that project management enables business growth.
62
One of the key findings of KPMG 2013 survey is that the organisations that
consistently adopt good project management practices achieved dramatically higher
success rates compare with those who did not. The practices that are particularly important
to increase this project success rates, includes (KPMG, 2013):
₋ The consistent application of an appropriate methodology throughout the project
lifecycle;
₋ The effective project risk management;
₋ The use of a Project Management Office;
₋ The use of programme and/or portfolio-management techniques, in addition to
project management;
₋ Projects supported in a high-quality business case, and tracking the associated
benefits.
Amongst the several project success criteria that are mentioned in the literature, iron
triangle seems to be the basis of the most of project success approaches (Agarwal and
Rathod, 2006; Fortune and White, 2006) because fulfilling the criteria for the completion
of a project on time, within budget and according to performance specifications are easy to
assess (Jugdev and Müller, 2005).
These classic criteria remain as the most widely used measure of project success and
its main value is in offering a simple, direct measure of performance of the project, but it
neglects whether the deliverables fulfilled the objectives of the project (Bannerman, 2008).
In addition, many studies have expanded project success criteria into other aspects, such as
organisational objectives, stakeholder’s satisfaction, customer’s benefit, or future potential
to organization.
Project success criteria have evolved from simple quantifiable iron triangle criteria,
which primarily are related to project efficiency (Bryde, 2005), to measures that have a
longer-term perspective directly relating to effectiveness and organisational impact
(Belout, 1998; Jugdev et al., 2001; Shenhar et al., 1997). Baccarini (1999) agrees with the
existence of success-related factors for projects, which can be divided into two groups:
63
1. Project Success Criteria (PSC): This refers to a group of principles or standards
used to determine project success;
2. Critical Success Factors (CSFs): This refers specifically to the conditions and
circumstances that contribute to project results.
Horine (2005) believes that although the projects are all different, there exists always
a shared core of common principles that are repeatable in any successful project:
- Be aligned with organisational objectives;
- Have the top-management support;
- Have an effective and competent leadership;
- Address all key stakeholders’shared common vision;
- Agreeing on the purpose, goals and scope;
- Manage and validate stakeholders’ expectations;
- Make a proper planning;
- Having clearly defined and agreed upon scope, approach, and deliverables;
- Communicate effectively with each stakeholder;
- Clearly definition of the team member's roles and responsibilities;
- Perform work estimates accurate and complete;
- Develop and agree upon a realistic schedule;
- Project team strongly focused on project, results and customer;
- Measure project progress correctly from the baseline;
- Pursue consistently project issues and subsequent action items;
- Develop an environment of collaboration and teamwork;
- Manage closely expectations and changes concerning the scope, quality,
schedule, and cost;
- Whenever necessary involve competent resources;
- Identify proactively risk and determine mitigation strategies to reduce project
exposure;
- Anticipate and overcome obstacles to ensure project meets objectives.
64
According to Bannerman (2008), research on the concept of project success was
developed around three different strands:
3. The identification of factors that contributed to project success (Baker et al.,
1988; Cooke-Davies, 2002; Pinto and Covin, 1989; Pinto and Slevin, 1988;
Schultz, Slevin, and Pinto, 1987; Slevin and Pinto, 1986);
4. The identification of other relevant variables which can influence the results of
a project, such as: size (Yourdon, 1999); type (Pinto and Covin, 1989; Shenhar
et al., 2002); life cycle phases (Pinto and Mantel, 1990); or, complexity
(Shenhar, Renier and Wideman, 1996).
5. The definition of the criteria by which a project is considered to be a success or
a failure (Collins and Bacccarini, 2004; Chan et al., 2002).
Given the strategic importance of the projects, it is becoming increasingly important
to investigate to what extent the results obtained contribute to the achievement of the
organisations' strategies (Jugdev and Müller, 2005).
The formula for project management success has not yet been discovered, and there
probably will not be a single best solution (Rolstadås, 2014).
Serrador and Turner (2015) found a significant correlation between project efficiency
and overall project success, arguing that efficiency should not be the final measure of
success but neither can it be ignored. The last decades experienced a gradual understanding
that project success requires broader definition than project management success (Jugdev
and Müller, 2005).
The success and failure in projects represents two sides of the same coin as the link
between the use of project management and project success.
Following we presented some definitions of the Project Success concept (Table 11).
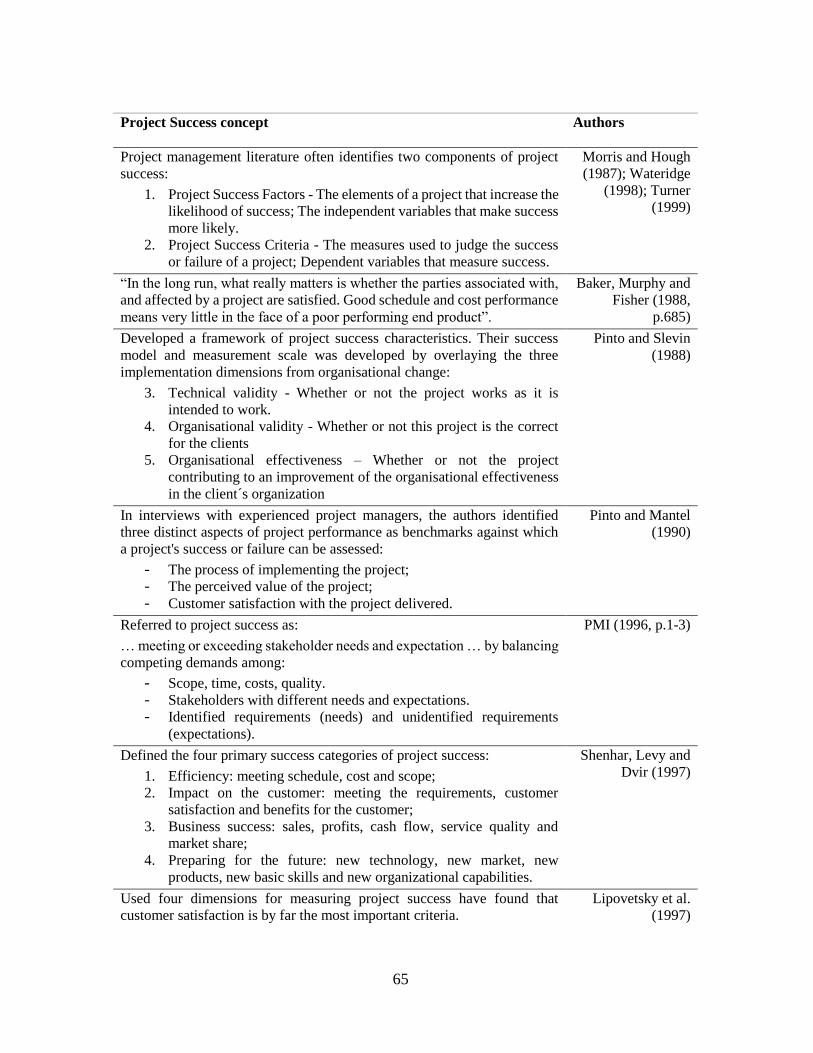
65
Project Success concept Authors
Project management literature often identifies two components of project
success:
1. Project Success Factors - The elements of a project that increase the
likelihood of success; The independent variables that make success
more likely.
2. Project Success Criteria - The measures used to judge the success
or failure of a project; Dependent variables that measure success.
Morris and Hough
(1987); Wateridge
(1998); Turner
(1999)
“In the long run, what really matters is whether the parties associated with,
and affected by a project are satisfied. Good schedule and cost performance
means very little in the face of a poor performing end product”.
Baker, Murphy and
Fisher (1988,
p.685)
Developed a framework of project success characteristics. Their success
model and measurement scale was developed by overlaying the three
implementation dimensions from organisational change:
3. Technical validity - Whether or not the project works as it is
intended to work.
4. Organisational validity - Whether or not this project is the correct
for the clients
5. Organisational effectiveness – Whether or not the project
contributing to an improvement of the organisational effectiveness
in the client´s organization
Pinto and Slevin
(1988)
In interviews with experienced project managers, the authors identified
three distinct aspects of project performance as benchmarks against which
a project's success or failure can be assessed:
- The process of implementing the project;
- The perceived value of the project;
- Customer satisfaction with the project delivered.
Pinto and Mantel
(1990)
Referred to project success as:
… meeting or exceeding stakeholder needs and expectation … by balancing
competing demands among:
- Scope, time, costs, quality.
- Stakeholders with different needs and expectations.
- Identified requirements (needs) and unidentified requirements
(expectations).
PMI (1996, p.1-3)
Defined the four primary success categories of project success:
1. Efficiency: meeting schedule, cost and scope;
2. Impact on the customer: meeting the requirements, customer
satisfaction and benefits for the customer;
3. Business success: sales, profits, cash flow, service quality and
market share;
4. Preparing for the future: new technology, new market, new
products, new basic skills and new organizational capabilities.
Shenhar, Levy and
Dvir (1997)
Used four dimensions for measuring project success have found that
customer satisfaction is by far the most important criteria.
Lipovetsky et al.
(1997)
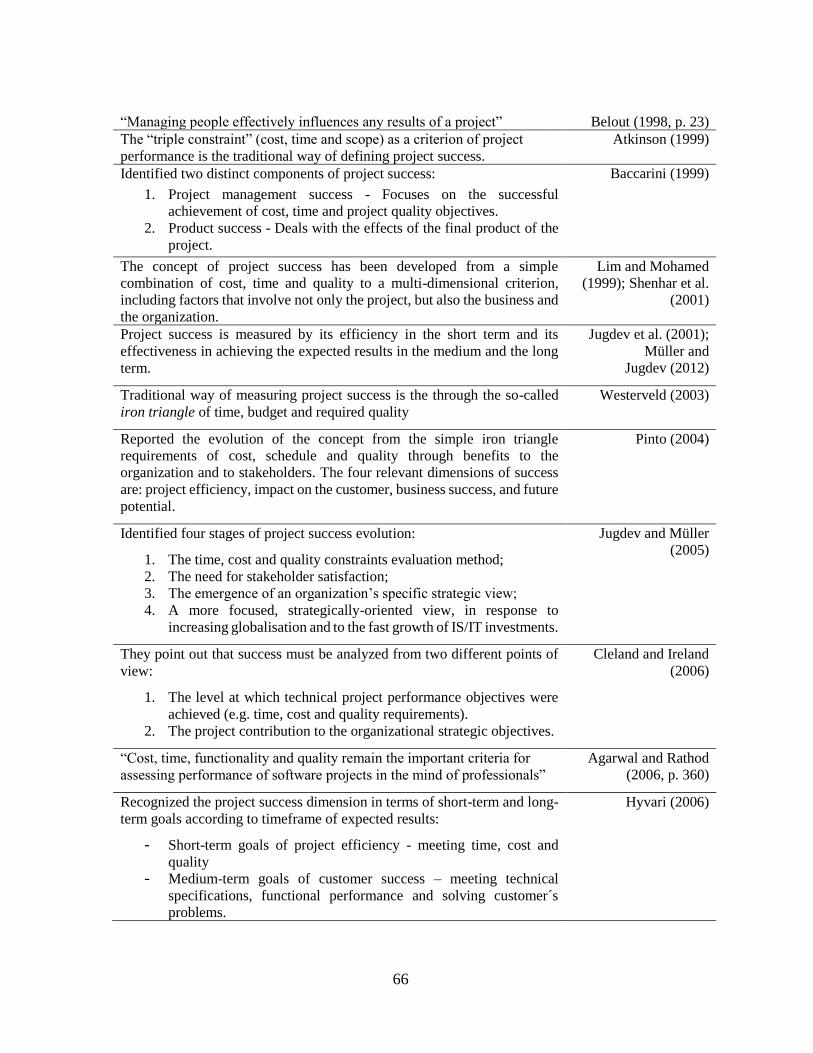
66
“Managing people effectively influences any results of a project” Belout (1998, p. 23)
The “triple constraint” (cost, time and scope) as a criterion of project
performance is the traditional way of defining project success.
Atkinson (1999)
Identified two distinct components of project success:
1. Project management success - Focuses on the successful
achievement of cost, time and project quality objectives.
2. Product success - Deals with the effects of the final product of the
project.
Baccarini (1999)
The concept of project success has been developed from a simple
combination of cost, time and quality to a multi-dimensional criterion,
including factors that involve not only the project, but also the business and
the organization.
Lim and Mohamed
(1999); Shenhar et al.
(2001)
Project success is measured by its efficiency in the short term and its
effectiveness in achieving the expected results in the medium and the long
term.
Jugdev et al. (2001);
Müller and
Jugdev (2012)
Traditional way of measuring project success is the through the so-called
iron triangle of time, budget and required quality
Westerveld (2003)
Reported the evolution of the concept from the simple iron triangle
requirements of cost, schedule and quality through benefits to the
organization and to stakeholders. The four relevant dimensions of success
are: project efficiency, impact on the customer, business success, and future
potential.
Pinto (2004)
Identified four stages of project success evolution:
1. The time, cost and quality constraints evaluation method;
2. The need for stakeholder satisfaction;
3. The emergence of an organization’s specific strategic view;
4. A more focused, strategically-oriented view, in response to
increasing globalisation and to the fast growth of IS/IT investments.
Jugdev and Müller
(2005)
They point out that success must be analyzed from two different points of
view:
1. The level at which technical project performance objectives were
achieved (e.g. time, cost and quality requirements).
2. The project contribution to the organizational strategic objectives.
Cleland and Ireland
(2006)
“Cost, time, functionality and quality remain the important criteria for
assessing performance of software projects in the mind of professionals”
Agarwal and Rathod
(2006, p. 360)
Recognized the project success dimension in terms of short-term and long-
term goals according to timeframe of expected results:
- Short-term goals of project efficiency - meeting time, cost and
quality
- Medium-term goals of customer success – meeting technical
specifications, functional performance and solving customer´s
problems.
Hyvari (2006)
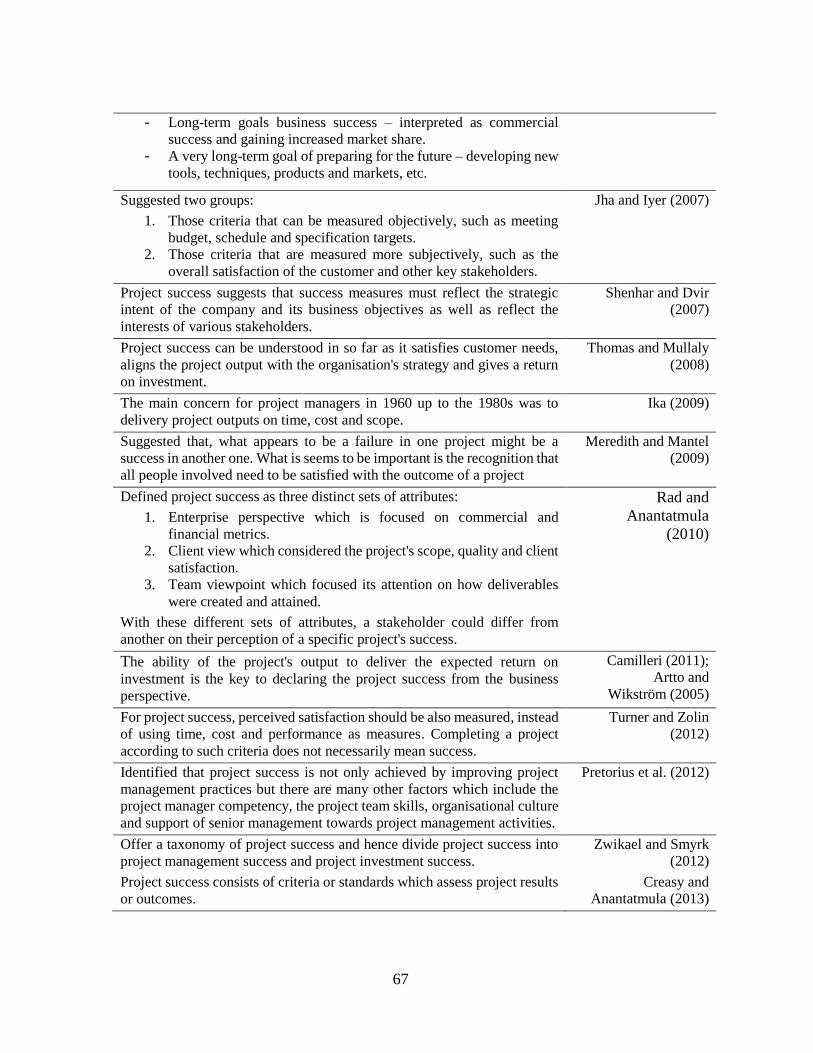
67
- Long-term goals business success – interpreted as commercial
success and gaining increased market share.
- A very long-term goal of preparing for the future – developing new
tools, techniques, products and markets, etc.
Suggested two groups:
1. Those criteria that can be measured objectively, such as meeting
budget, schedule and specification targets.
2. Those criteria that are measured more subjectively, such as the
overall satisfaction of the customer and other key stakeholders.
Jha and Iyer (2007)
Project success suggests that success measures must reflect the strategic
intent of the company and its business objectives as well as reflect the
interests of various stakeholders.
Shenhar and Dvir
(2007)
Project success can be understood in so far as it satisfies customer needs,
aligns the project output with the organisation's strategy and gives a return
on investment.
Thomas and Mullaly
(2008)
The main concern for project managers in 1960 up to the 1980s was to
delivery project outputs on time, cost and scope.
Ika (2009)
Suggested that, what appears to be a failure in one project might be a
success in another one. What is seems to be important is the recognition that
all people involved need to be satisfied with the outcome of a project
Meredith and Mantel
(2009)
Defined project success as three distinct sets of attributes:
1. Enterprise perspective which is focused on commercial and
financial metrics.
2. Client view which considered the project's scope, quality and client
satisfaction.
3. Team viewpoint which focused its attention on how deliverables
were created and attained.
With these different sets of attributes, a stakeholder could differ from
another on their perception of a specific project's success.
Rad and
Anantatmula
(2010)
The ability of the project's output to deliver the expected return on
investment is the key to declaring the project success from the business
perspective.
Camilleri (2011);
Artto and
Wikström (2005)
For project success, perceived satisfaction should be also measured, instead
of using time, cost and performance as measures. Completing a project
according to such criteria does not necessarily mean success.
Turner and Zolin
(2012)
Identified that project success is not only achieved by improving project
management practices but there are many other factors which include the
project manager competency, the project team skills, organisational culture
and support of senior management towards project management activities.
Pretorius et al. (2012)
Offer a taxonomy of project success and hence divide project success into
project management success and project investment success.
Zwikael and Smyrk
(2012)
Project success consists of criteria or standards which assess project results
or outcomes.
Creasy and
Anantatmula (2013)
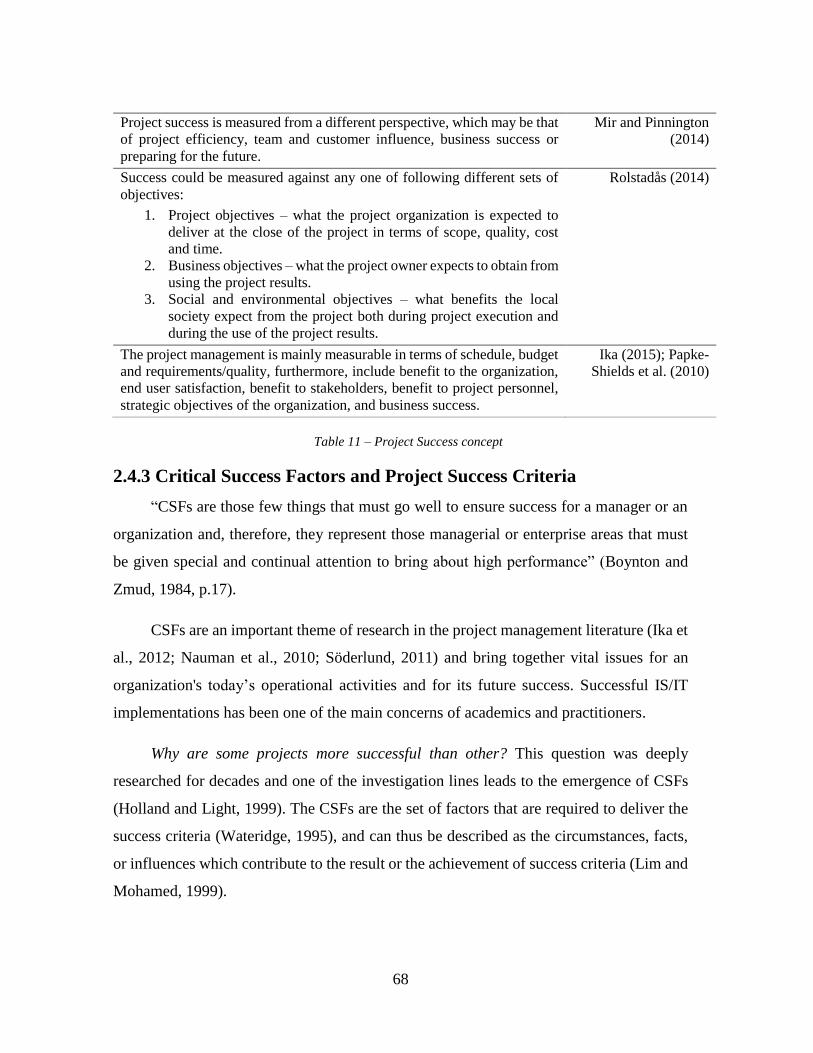
68
Project success is measured from a different perspective, which may be that
of project efficiency, team and customer influence, business success or
preparing for the future.
Mir and Pinnington
(2014)
Success could be measured against any one of following different sets of
objectives:
1. Project objectives – what the project organization is expected to
deliver at the close of the project in terms of scope, quality, cost
and time.
2. Business objectives – what the project owner expects to obtain from
using the project results.
3. Social and environmental objectives – what benefits the local
society expect from the project both during project execution and
during the use of the project results.
Rolstadås (2014)
The project management is mainly measurable in terms of schedule, budget
and requirements/quality, furthermore, include benefit to the organization,
end user satisfaction, benefit to stakeholders, benefit to project personnel,
strategic objectives of the organization, and business success.
Ika (2015); Papke-
Shields et al. (2010)
Table 11 – Project Success concept
2.4.3 Critical Success Factors and Project Success Criteria
“CSFs are those few things that must go well to ensure success for a manager or an
organization and, therefore, they represent those managerial or enterprise areas that must
be given special and continual attention to bring about high performance” (Boynton and
Zmud, 1984, p.17).
CSFs are an important theme of research in the project management literature (Ika et
al., 2012; Nauman et al., 2010; Söderlund, 2011) and bring together vital issues for an
organization's today’s operational activities and for its future success. Successful IS/IT
implementations has been one of the main concerns of academics and practitioners.
Why are some projects more successful than other? This question was deeply
researched for decades and one of the investigation lines leads to the emergence of CSFs
(Holland and Light, 1999). The CSFs are the set of factors that are required to deliver the
success criteria (Wateridge, 1995), and can thus be described as the circumstances, facts,
or influences which contribute to the result or the achievement of success criteria (Lim and
Mohamed, 1999).
69
What are the influences of CSFs on project success? The answer to this question has
resulted in the extensive research around the project CSFs. Research on CSFs can be traced
back to some decades ago, where Daniel (1961) first discussed the CSFs in management
literature. “Usually three to six factors determine success; these key jobs must be done
exceedingly well for a company to be successful” (Daniel, 1961, p.50). In a broad approach,
he focused on industry-related CSFs which are relevant for any company in a specific
industry. Anthony et al. (1972) went a step further by emphasizing the need to tailor CSFs
to both a company’s strategic objectives and its managers. Management planning and
control systems are responsible for reporting those CSFs that are perceived by the managers
as important for a particular industry.
Combining the perspective of both Daniel (1961) and Anthony et al. (1972), Rockart
(1979) first developed a CSFs approach that concentrates on information needs for
management control and seeks to identify data which can be used to monitor and improve
existing areas of business. Rockart (1979) defined CSFs as the limited number of key areas
of activity in which results are absolutely necessary for the achievement of the objectives.
Bullen and Rochart (1981) extend the CSFs definition and present those as a management
information system planning tool. Today, Rockart’s (1979) CSF approach is particularly
relevant within the limits of project management and IS/IT implementation and therefore
often used by managers and executives. Bullen and Rochart (1981) distinguished CSFs
into five major sources:
₋ The industry – Characteristics of an industry determines the success factors of
the companies within the industry.
₋ Competitive strategy and company’s position – Company’s history and
competitive strategy determine its position in an industry.
₋ Environmental factors – These are macroeconomic factors over which an
organization has little or no influence.
₋ Temporal factors – Areas which suddenly appeared an unexpected happening.
₋ Managerial position – Various functional managerial positions have generic sets
of CSFs.
70
According to Ward and Griffith (1996) CSFs enable management to use their
judgment in two ways:
1. By assessing the relative importance of systems opportunities in terms of how
well they support the achievement of business objectives;
2. By identifying the information required to manage and plan the information
needs of business executives.
Rowlinson (1999) developed the concept and states that CSFs are fundamental issues
that must be maintained for team working to take place in an efficient and effective manner.
This concept has been applied to project environments (Cooke-Davies, 2002) and analysis
of the literature found that most studies have focused on deriving CSFs that are applicable
to a specific industry, such as construction or IS/IT (Lyer and Jha, 2005). This suggests a
need for further study to identify generic CSFs for projects. Researchers have used this
method to improve the performance of the management process (e.g. Chan et al., 2001;
Jefferies et al., 2002; Yu et al., 2006). Some authors agree that a wide range of variables
can affect the success of a project (Dvir et al., 1998). However, these authors emphasise
that success factors are dependent on the type of project, thus challenging the idea of a
universal set of valid factors for all projects. In parallel, others criticized the CSFs as
offering an over-simplified solution that ignores the contextual circumstances that
influence the projects, making extremely difficult to apply on day-to-day companies’
operation (e.g. Berg, 2001; Wagner et al., 2006; Yusof et al., 2008).
The CSFs research deals with the identification and assessment of factors that might
explain why an organisation, or a project was successfully (Krcmar et al., 2004). An
outcome which is common to most studies of project CSFs is a list of factors. Another
criticism is that this CSFs studies are often exclusively focused on the identification of this
factors (Nah et al., 2001) and often there is a lack of research analysing how these factors
can be handled in different contexts (Remus and Wiener, 2010).
From a project management perspective, CSFs are “characteristics, conditions, or
variables that can have a significant impact on the success of the project when properly
71
sustained, maintained, or managed” (Milosevic and Patanakul, 2005, p. 183). It is difficult
for project managers to evaluate which key factors impact on performance (Belassi and
Tukel, 1996). In response to this difficulty, these authors proposed the development of
frameworks that group CSFs.
To identify the relevant CSF several research methods can be used (Esteves, 2004),
namely, action research (Jenkins et al., 1999), case studies (Holland and Light, 1999;
Sumner, 1999), Delphi technique (McCarthy and Atthirawong, 2003; Brancheau et al.,
1996), group interviews (Khandewal and Miller, 1992), literature review (Esteves and
Pastor, 1999; Umble et al., 2003), multivariate analysis (Dvir et al., 1996), scenario analysis
(Barat, 1992), structured interviews (Rockart and Van Bullen, 1986), and most used
method, the questionnaire (Shah and Siddiqui, 2006).
The iron triangle criteria have been criticized for their exclusive focus on the project
management process, to the detriment of including the vision and goals of the different
stakeholders (Baccarini, 1999; Bannerman, 2008).
Numerous research studies have been performed around project management to
identify critical success factors that influence the success and/or failure of projects (e.g.
Pinto and Slevin, 1987; Pinto and Mantel, 1990; Belassi and Tukel, 1996; Tukel and Rom,
2001; Westerveld, 2003: Diallo and Thuillier, 2004, 2005, Fortune and White, 2006). These
studies show that these factors are interrelated and sometimes overlapping each other’s.
Pinto and Prescott (1988) argued that “most of the studies in the critical success factor
research stream have been theoretical and have assumed a static view of the importance of
various factors over the life of a project.” (p. 5). Khang and Moe (2008) group the CSFs
factors studies on three generic ways:
₋ Skills and competencies - technical, interpersonal, and administrative
competencies of the project manager and the team members.
₋ Objectives - understanding of the project goals, objectives, mission and the
commitments to the project success by all the project team.
72
₋ Relationships - an environment with adequate support from key stakeholders,
adequate resources, and creates favourable conditions with support from top
management.
Fortune and White (2006) reviewed 63 publications that focus on CSFs and found a
limited agreement among authors and listed the three most cited factors:
₋ The importance of the support from senior management;
₋ The importance of having clear and realistic objectives;
₋ The importance of producing an efficient plan and kept up to date.
In public sector, several studies were performed concerning CSFs, namely:
₋ Extensive literature reviews of CSFs in government IS/IT projects identified,
top management commitment, linkage to business, technical alignment,
knowledge-able personnel, and user involvement as key factors (Gil-García and
Pardo, 2005; Ho and Pardo, 2004).
₋ The need to involve users in a sustainable way as highlighted as a key issue
(Carter and Belanger, 2005; Chan and Pan, 2008).
₋ Focusing on the differences between public and private organisations (Rosacker
and Olson, 2008).
₋ Focusing on CSFs of Healthcare information systems implementation projects
and results point out in the same way (Øvretveit et al., 2007).
Success is far more complex to achieve than the factors just addressed by these
criteria. In fact, there are some degree of agreement with the definition provided by Baker
et al. (1988), which states that project success is a matter of perception and that a project
will be most likely to be perceived as an "overall success".
Projects differ in size, uniqueness and complexity, so the criteria for measuring
success vary from project to project, making it unlikely that there is a universal set of
criteria for project success. (Müller and Turner, 2007; Westerveld, 2003). Individuals and
stakeholders often interpret project success in different ways (Cleland and Ireland, 2006;
73
Lim and Mohamed, 1999). Bredillet (2007) assume that projects are reasonably
homogeneousbut that there is a growing understanding that projects are different, that
success can be judged in different ways, and that different projects require different
competence profiles. In addition, performance views also vary across industries (Chan and
Chan, 2004). Projects vary, depending on the subject, and criteria must be developed to
evaluate a project’s outcome that is specific for each project.
Recently, it has been realised that success cannot be effectively evaluated simply by
the iron triangle criterion alone and many researchers have tried to improve the situation
by adding new dimensions. The PSC may therefore refer to a group of principles or
standards used to determine or judge project success (Baccarini and Collins, 2004; Ika,
2009). Murphy et al. (1974) used a sample of project managers' data on the factors that
contributed to the success of the project, deduced ten factors that were considered strongly
related to perceived success. Dvir et al. (1998) suggest that PSC are not universal for all
projects.
While the achievement of objectives is useful for evaluating the outcome of a project,
this is not enough to evaluate a project’s success. Defining project success criteria upfront
is helpful to establish agreement on how and when a project will be evaluated, which helps
create a common vision about the outcome, which is in itself a significant driver of project
management success. Otherwise team members and the project leader will find that they
are heading in different directions and the result of the project will not be successfully
determined, owing to differences in perception, emphasis and objectives (Baccarini, 1999;
Christenson and Walker, 2004). Jugdev and Müller (2005) supported this view and
recommended defining a project’s success criteria at the start as good project management
practice. Over time, various attempts have been made to either add more dimensions to the
basic criteria, or to reduce them to less dimensions (Atkinson, 1999; Globerson and
Zwikael, 2002). Although not strongly supported by empirical research, many papers exist
which address the issue of PSC. These papers tend to highlight that there is a lack of
consensous concerning the criteria by which success is judged, (Freeman and Beale, 1992;
Shenhar, Levy and Dvir, 1997; Baccarini, 1999; Pinto and Slevin, 1988; Prabhakar, 2008).
74
In the academic literature, we found examples of projects that have successfully
completed the criteria of the iron triangle, but resulted in disappointing business
experiences (Shenhar et al., 2005). On the other hand, initiatives that did not meet the
constraints of cost and time later proved to be successful (e.g. Sydney Opera House30).
Researchers also agree that there are differences in project management success among
different industry types (Cooke-Davies and Arzymanow, 2003; Ibbs and Kwak, 2000;
Zwikael and Globerson, 2006).
Pinto and Slevin (1988) suggested that the importance of each dimension changes
along time. Internal factors, such as budget, time schedule and technical performance are
important at the beginning of a project but in more advanced phases the external factors,
such as customer satisfaction, tend to become more relevant. Baker et al. (1988) suggested
that overruns in budget and time cease to be important after the project is terminated, while
customer satisfaction, and its relation to the project organization, continues to be important
in the termination phase, and beyond. Pinto and Covin (1989) claimed that not only does
the relative importance of success dimensions vary with the project’s progress, but the
CSFs are different for each phase of the project. The research into PSCs can be grouped
into three major classes (Hussein, 2013):
1. The project success criteria research - A body of research that focuses on
defining what constitutes project success, and a clear rational for deciding
whether the project was a success or failure. Including categories that deal with
stakeholders, timeline, project size or type (Baccarini, 1999; Lim and Mohamed,
1999; Lipovetsky et al, 1997; Shenhar et al, 2001). Also, examining how the
perception of success has changed over the years (Collins and Baccarini, 2004;
De Wit, 1988; Ika, 2009; Jugdev and Müller, 2005; Wateridge, 1995).
30 Budgeted initially to $7 million ended up costing more than $100 million. Originally scheduled for 4 years
took 14 years to be completed. A recent study reveals that Opera House adds $775 million to the Australian
economy every year in direct ticket sales, retail and food spending and by boost to tourism to Australia.
75
2. The rational of success criteria - This body of research considers the significance
of the criteria as a tool for shaping and managing a project. Creating a common
reference point for how projects will be evaluated, and an important factor to
align the project team, establishing commitment to the project objectives
(Christenson and Walker, 2004; Dvir and Lechler, 2004; Jugdev and Müller,
2005).
3. Identifying risk factors associated with success criteria - The literature review
has shown that there are several risk factors that contribute to poor management
and complications during identification, management and evaluation of project
success criteria.
This body of research considers the potential threats and challenges influencing the
initial definition of criteria, as well as the implementation and evaluation phases, namely:
₋ The narrowness of the criteria (Belassi and Tukel, 1996; Ingason and Jónasson,
2009; Yang et al, 2010; Williams and Samset, 2010; Winter et al, 2006);
₋ Criteria ambiguity (Crawford and Pollack, 2004; Duimering et al, 2006);
₋ Diversity (Westerveld, 2003; Hussein, 2012);
₋ Incompleteness (Atkinson et al, 2006; Young, 2006)
₋ Changes (Kutsch and Hall, 2010)
₋ Unrealistic targets (Chapman et al, 2006; Smithson and Hirschheim, 1998).
₋ Poor alignment of the performing to success criteria (Couillard, 1995; Thomas
and Fernández, 2008)
₋ Lack of organisational commitment to project success criteria (Cooke-Davies,
2002; Hartman, 2000; Munns and Bjeirmi,1996; Thomas and Fernández, 2008,
Young, 2001).
The understanding of project success is evolving, and it is useful to see how the field
of research on project success developed over the last decades. According to Jugdev and
Müller (2005), the evolution is as follow:
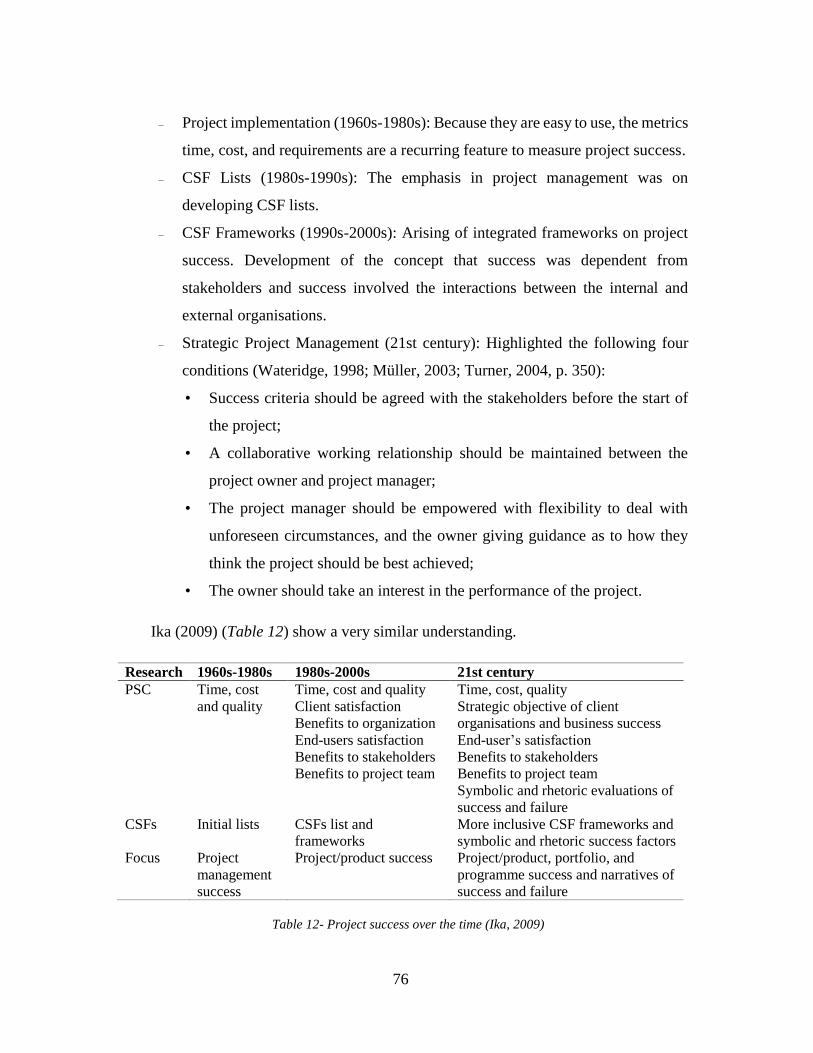
76
₋ Project implementation (1960s-1980s): Because they are easy to use, the metrics
time, cost, and requirements are a recurring feature to measure project success.
₋ CSF Lists (1980s-1990s): The emphasis in project management was on
developing CSF lists.
₋ CSF Frameworks (1990s-2000s): Arising of integrated frameworks on project
success. Development of the concept that success was dependent from
stakeholders and success involved the interactions between the internal and
external organisations.
₋ Strategic Project Management (21st century): Highlighted the following four
conditions (Wateridge, 1998; Müller, 2003; Turner, 2004, p. 350):
• Success criteria should be agreed with the stakeholders before the start of
the project;
• A collaborative working relationship should be maintained between the
project owner and project manager;
• The project manager should be empowered with flexibility to deal with
unforeseen circumstances, and the owner giving guidance as to how they
think the project should be best achieved;
• The owner should take an interest in the performance of the project.
Ika (2009) (Table 12) show a very similar understanding.
Research 1960s-1980s 1980s-2000s 21st century
PSC Time, cost
and quality
Time, cost and quality
Client satisfaction
Benefits to organization
End-users satisfaction
Benefits to stakeholders
Benefits to project team
Time, cost, quality
Strategic objective of client
organisations and business success
End-user’s satisfaction
Benefits to stakeholders
Benefits to project team
Symbolic and rhetoric evaluations of
success and failure
CSFs Initial lists CSFs list and
frameworks
More inclusive CSF frameworks and
symbolic and rhetoric success factors
Focus Project
management
success
Project/product success Project/product, portfolio, and
programme success and narratives of
success and failure
Table 12- Project success over the time (Ika, 2009)
77
Summarizing PSCs are used to measure success, whilst CSFs facilitate the
achievement of success (Collins and Baccarini, 2004; Turner, 2008).
2.5 IS/IT challenges
2.5.1 Overview
The idea that something was wrong with the investments in IS/IT is not new.
Nevertheless, it gained more visibility when Solow (1987), Nobel Prize in Economics, said
ironically “we see computers everywhere except in the productivity statistics” (p.36). This
sentence highlights the inability to demonstrate that investments in IS/IT result in
organisations productivity improvements and was been firmly supported with empirical
evidence from the 1970s to the early 1990s. This apparent contradiction becomes known
as the productivity paradox31. Solow was followed by others, Strassmann (1990) reports
some evidence of disappointments in several studies and concludes that there is no direct
relation between computers expenditures, organisational profits and productivity.
Brynjolfsson (1993) introduces the mismanagement of information and technology as one
explanation for the paradox. In line with his argument, other researchers argue that most
organisations focus primarily on the implementation of technology rather than on the
realization of the stakeholder’s expectations and the previously identified benefits. The
notion that the IS/IT function serves different roles in different organisations and that such
roles may evolve over time has been extensively discussed in past research. IS/IT has
become an extremely important tool for the sustainability and business growth of
organisations.
Recently, the focus of the IS/IT literature has shifted from the importance of IS/IT
and its potential to change a whole range of strategic and industry structure variables
(Porter, 1985; Clemons and Kimbrough, 1986) to the relationship between IS/IT and
specific components of firm strategy, such as, business environment (Maier, Rainer and
31 The information technology (IT) productivity paradox is the perceived discrepancy between IT investment
and IT performance, between input and output (Macdonald et al., 2000).
78
Snyder, 1997), competitive advantage (Mata, Fuerst and Barney, 1995), organisational
performance (Powell and Dent-Micallef, 1997; Bharadwaj, 2000), and knowledge
accumulation (Grant, 1996). Hitt and Brynjolfsson (1996) emphasize that productivity is
not the same thing as profitability. Their research indicates that IS/IT increases value to
consumers and organisational productivity but does not increase organisational
profitability. Lately, IT-driven productivity has been identified as an essential driver of the
very strong economy (Reingold and Stepanek, 2000). Devaraj and Kohli (2002) provide
some possible explanations for the productivity paradox, such as:
₋ Time lag - Many IS/IT investments pay off only after a long time. It takes at least
5- 6 years before CRM benefits are large (Reichheld and Scheffer, 2000).
₋ Inconsistent evidence - Several large IS/IT failures (e.g. ERP), received lots of
publicity. On the other hand, there are many unpublicized success stories.
₋ Difficulties in isolating the IS/IT effect - Improvements in results at organisational
levels may be the result of several factors, some of which are external. It is difficult
to isolate the specific effect of IS/IT from the others.
Turban et al. (2008) states that understanding the paradox requires an understanding
of the concept of productivity.
In the industrial era, the economy was based on tangible assets and organisations
could determine and document their business strategy using financial tools. In the current
information era, businesses began to create and develop intangible assets, such as:
customer relationships, skills, knowledge, information technology and a corporate culture,
which encourages innovation, problem solving and decision making. The current context
of uncertainty, rapid business change, globalization and market liberalization has
contributed to growing competitiveness, supported strongly by IS/IT investments, which
are now regarded as being an essential tool for the operational and strategic survival of
organisations.
Nowadays, with the enormous technological changes, the organisations face new
opportunities from IS/IT implementations, hoping that these investments can help to
79
increase productivity and business prosperity. Meanwhile, several studies performed in
public and private sectors have proven that the investments done in IS/IT have not brought
the expected benefits. Some authors argue that related investments in IS/IT with an
increasing performance of the organisations in the last decades were far from true. The
perception of the continuous unsuccessful IS/IT investments found a new way and
approach for how projects are undertaken (Gomes, Romão and Caldeira, 2013b). The focus
should be on the realization of the benefits, since that is the main reason for organisations
to invest (Ward and Daniel, 2006).
2.5.2 IS/IT Investments background
Essentially, the purpose of investment in IS/IT is to improve the operational
efficiency of an organisation, reducing costs and improving levels of profit. Thus, many
traditional appraisal techniques are used to evaluate tangible benefits, which are based on
direct project costs. Firms in almost every industry rely on investments in IS/IT to realise
benefits after their successful implementation (Gomes and Romão 2015b). Since the 1980s,
IS/IT has positioned itself as a strategic tool that through flexibility and innovative ways
of conducting business that can produce superior performance (Farbey et al., 1993; Glenn,
2009; McFarland, 1984; Porter, 2001). As a result, the relationship between investments in
IS/IT and improving organisational performance has been the subject of many studies
(Melville et al., 2004). The issue remains controversial, as evidenced by articles in major
business magazines (Carr, 2003; Farrell, 2003). Carr (2003) argues that emergent
technologies may offer opportunities to those who can exploit them effectively in the early
stages of their development.
Organisations are being put under increasing pressure to justify the large amount of
financial resources spent on IS/IT assets (Madeira, Gomes and Romão, 2017). As
competition increases because of globalization and other market factors, it is even more
important that an organization performs at its best capabilities (Ashurst and Doherty, 2003).
The decision-making process over IS/IT investments is not as objective and transparent as
it is claimed to be, creating significant failures on achievement of the objectives and their
related benefits (Berghout et al., 2005). Organisations seek benefits and value only in
80
monetary terms, which have resulted in a lot of wasted energy, time and money. It is very
common that organisations place their focus on the technical aspects such as does it work?
rather than the social aspects such as is this adopted successfully? or from a business
perspective is this delivering value? (Gomes and Romão, 2017).
The difficulties due to the implementation of IS/IT solutions and assessment of their
performance have been acknowledged by several scholars (Lueg and Lu, 2012, 2013;
Martinsons et al., 1999). Therefore, finding means to overcome these issues and to improve
the performance and return from investments in IS/IT has been a research focus of the last
decades. Grounded by theory of competitive strategy, several authors argued that IS/IT can
contribute to more profits if it cannot be replicated easily or it can make product
differentiation (Brooke, 1992; Mithas et al., 2012). Although many studies have focused
on the consequences of IS/IT investments, fewer studies have examined factors that impact
the IS/IT capabilities (Devaraj and Kohli, 2003; Brynjolfsson, 1993).
According to IDC32 (2016) “Worldwide IT spending is forecast to reach nearly $2.4
trillion in 2017, up 3.5% over 2016”. Worldwide surveys highlighted the significant global
increasing of IS/IT expenditure and referred the large financial resources spent by
organisations for the next years (e.g. Gartner, 201633) (Figure 4).
32 Worldwide Semiannual IT Spending Guide: Industry and Company Size, International Data Corporation
(IDC). http://www.idc.com/getdoc.jsp?containerId=IDC_P33207 33 Gartner Worldwide IT Spending Forecast. http://www.gartner.com/technology/research/it-spending-
forecast/
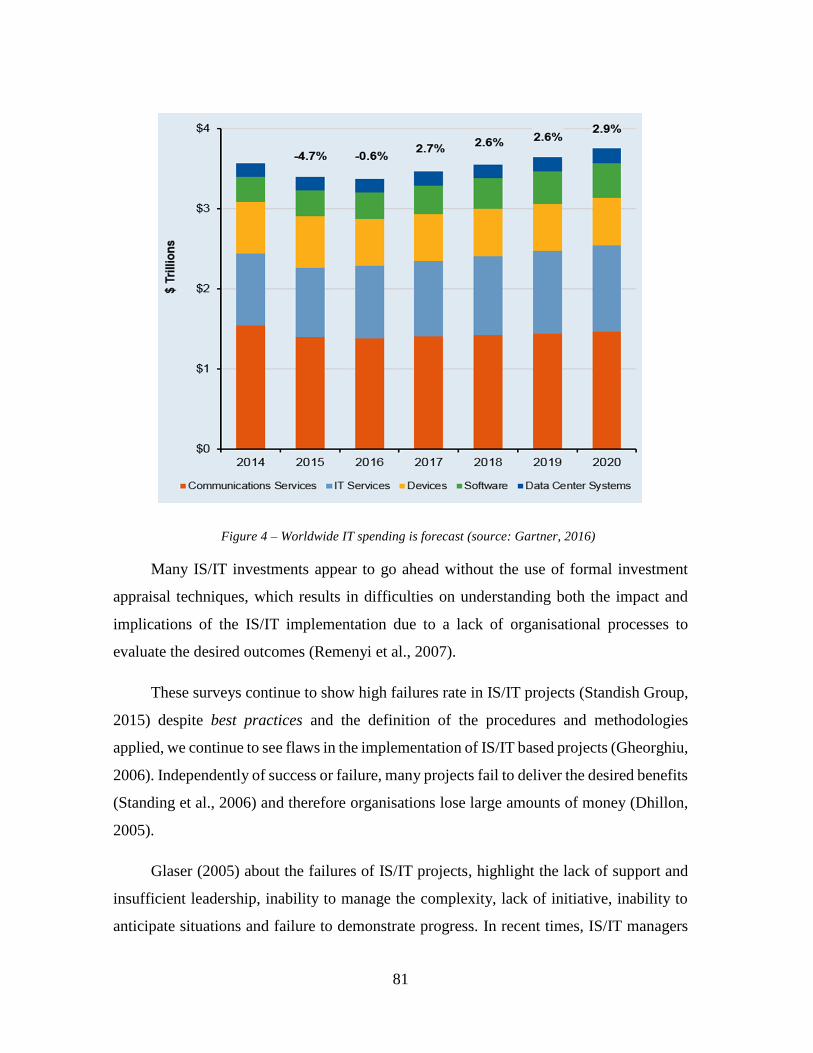
81
Figure 4 – Worldwide IT spending is forecast (source: Gartner, 2016)
Many IS/IT investments appear to go ahead without the use of formal investment
appraisal techniques, which results in difficulties on understanding both the impact and
implications of the IS/IT implementation due to a lack of organisational processes to
evaluate the desired outcomes (Remenyi et al., 2007).
These surveys continue to show high failures rate in IS/IT projects (Standish Group,
2015) despite best practices and the definition of the procedures and methodologies
applied, we continue to see flaws in the implementation of IS/IT based projects (Gheorghiu,
2006). Independently of success or failure, many projects fail to deliver the desired benefits
(Standing et al., 2006) and therefore organisations lose large amounts of money (Dhillon,
2005).
Glaser (2005) about the failures of IS/IT projects, highlight the lack of support and
insufficient leadership, inability to manage the complexity, lack of initiative, inability to
anticipate situations and failure to demonstrate progress. In recent times, IS/IT managers
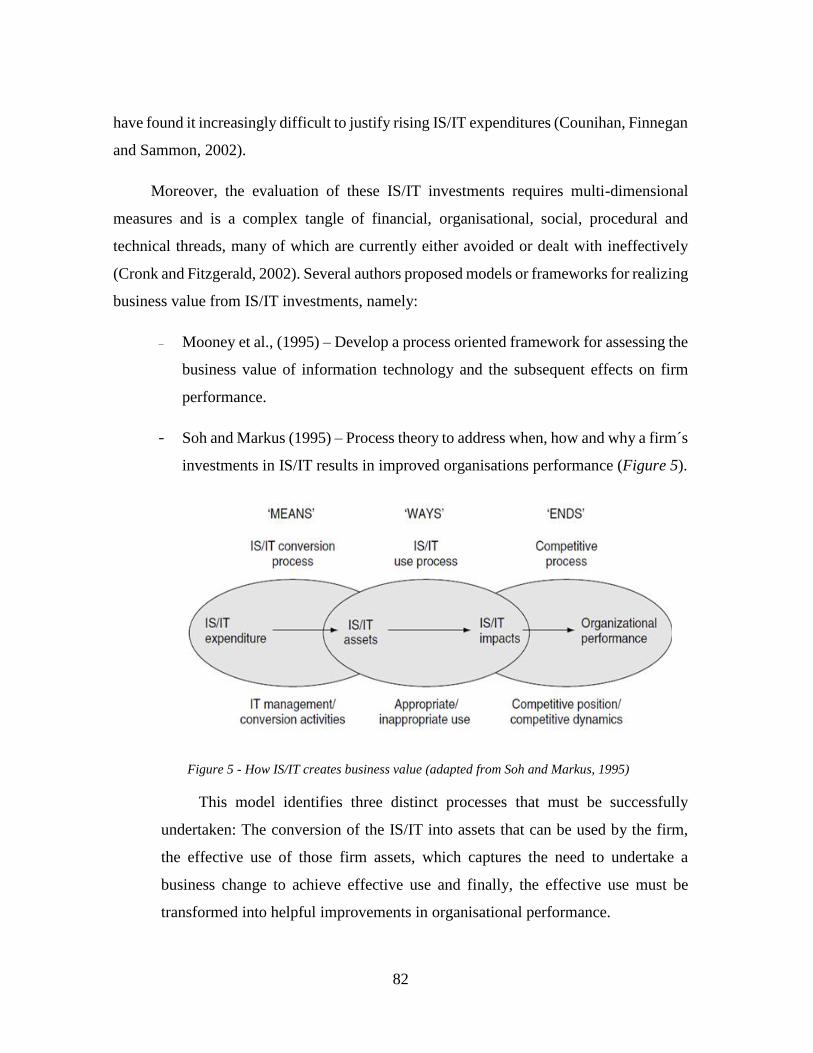
82
have found it increasingly difficult to justify rising IS/IT expenditures (Counihan, Finnegan
and Sammon, 2002).
Moreover, the evaluation of these IS/IT investments requires multi-dimensional
measures and is a complex tangle of financial, organisational, social, procedural and
technical threads, many of which are currently either avoided or dealt with ineffectively
(Cronk and Fitzgerald, 2002). Several authors proposed models or frameworks for realizing
business value from IS/IT investments, namely:
₋ Mooney et al., (1995) – Develop a process oriented framework for assessing the
business value of information technology and the subsequent effects on firm
performance.
- Soh and Markus (1995) – Process theory to address when, how and why a firm´s
investments in IS/IT results in improved organisations performance (Figure 5).
Figure 5 - How IS/IT creates business value (adapted from Soh and Markus, 1995)
This model identifies three distinct processes that must be successfully
undertaken: The conversion of the IS/IT into assets that can be used by the firm,
the effective use of those firm assets, which captures the need to undertake a
business change to achieve effective use and finally, the effective use must be
transformed into helpful improvements in organisational performance.
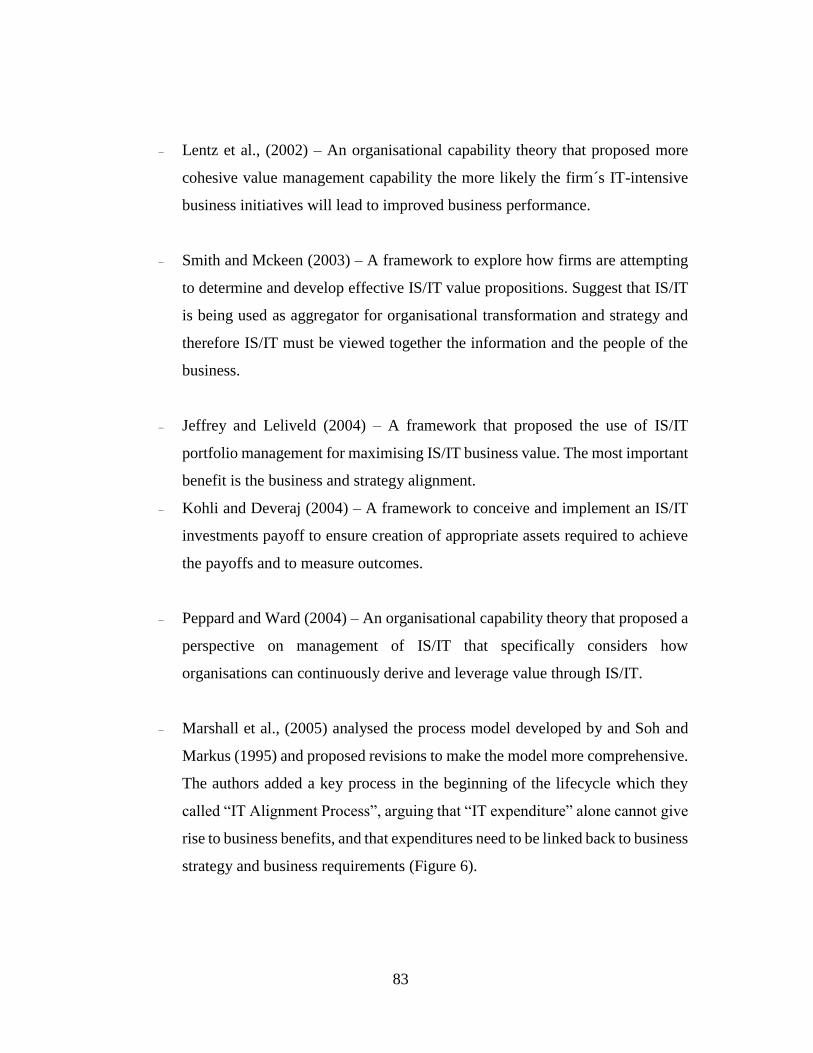
83
₋ Lentz et al., (2002) – An organisational capability theory that proposed more
cohesive value management capability the more likely the firm´s IT-intensive
business initiatives will lead to improved business performance.
₋ Smith and Mckeen (2003) – A framework to explore how firms are attempting
to determine and develop effective IS/IT value propositions. Suggest that IS/IT
is being used as aggregator for organisational transformation and strategy and
therefore IS/IT must be viewed together the information and the people of the
business.
₋ Jeffrey and Leliveld (2004) – A framework that proposed the use of IS/IT
portfolio management for maximising IS/IT business value. The most important
benefit is the business and strategy alignment.
₋ Kohli and Deveraj (2004) – A framework to conceive and implement an IS/IT
investments payoff to ensure creation of appropriate assets required to achieve
the payoffs and to measure outcomes.
₋ Peppard and Ward (2004) – An organisational capability theory that proposed a
perspective on management of IS/IT that specifically considers how
organisations can continuously derive and leverage value through IS/IT.
₋ Marshall et al., (2005) analysed the process model developed by and Soh and
Markus (1995) and proposed revisions to make the model more comprehensive.
The authors added a key process in the beginning of the lifecycle which they
called “IT Alignment Process”, arguing that “IT expenditure” alone cannot give
rise to business benefits, and that expenditures need to be linked back to business
strategy and business requirements (Figure 6).
84
Figure 6- Modified Model for the Realisation of Business Value (Marshall et al., 2005)
₋ Ashurst et al. (2008) developed a benefits realization competence framework that
conceptualizes the lifecycle of IT projects as comprising the following key phases:
• Benefits planning - where the planned outcomes of an IT project are
identified, and the means of means by which they will be achieved are
stipulated;
• Benefits delivery, where the actual design and execution of what they called
the program of organisational change necessary to realize all the benefits
specified in the benefits realization plan takes place.
• Benefits review - where the assessment of the success of an IS/IT project
takes place, and where the identification of the ways and means by which
further benefits might be realised takes place.
• Benefits exploitation - where what they called the adoption of the portfolio
of practices required to realize the potential benefits from information,
applications and IS/IT services, over their operational life take place.
₋ Ward and Daniel (2012) incorporating their earlier research of 200634 developed
a process-driven model consisting of five major iterative steps (Figure 7):
34 Ward, J., & Daniel, E. (2006). Benefits Management, Delivering Value from IS and IT Investments. John
Wiley and Sons: Chichester, UK: John Wiley and Sons.
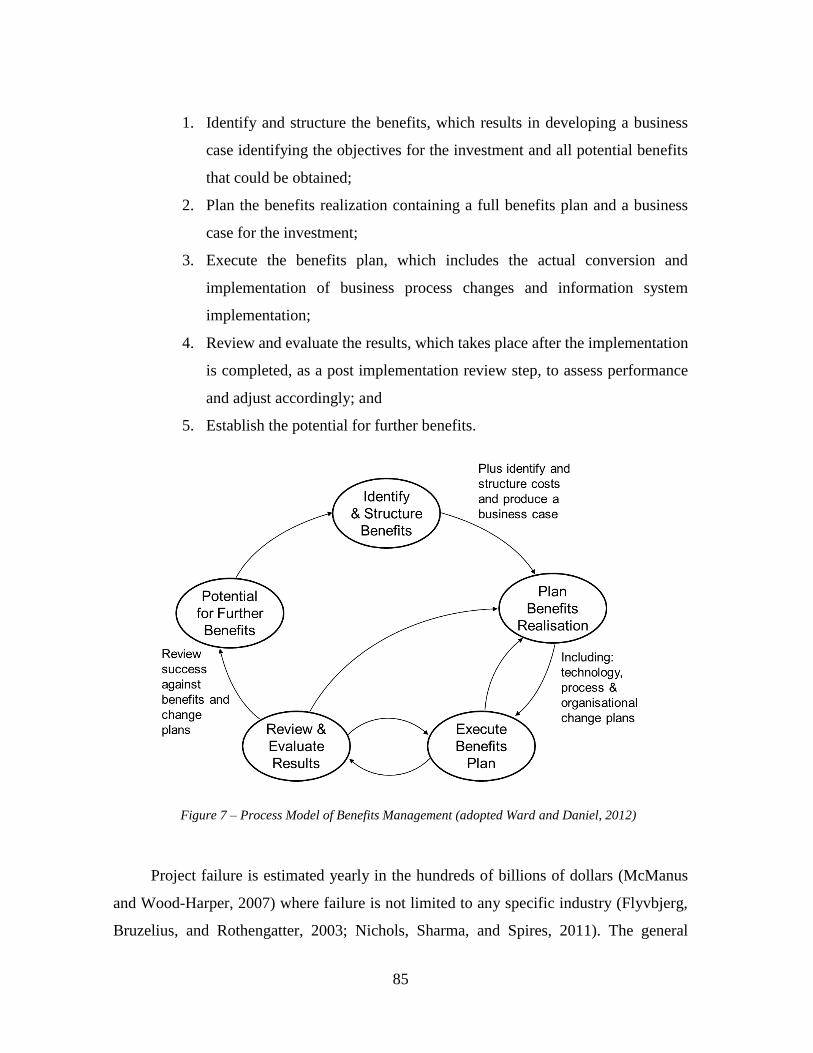
85
1. Identify and structure the benefits, which results in developing a business
case identifying the objectives for the investment and all potential benefits
that could be obtained;
2. Plan the benefits realization containing a full benefits plan and a business
case for the investment;
3. Execute the benefits plan, which includes the actual conversion and
implementation of business process changes and information system
implementation;
4. Review and evaluate the results, which takes place after the implementation
is completed, as a post implementation review step, to assess performance
and adjust accordingly; and
5. Establish the potential for further benefits.
Figure 7 – Process Model of Benefits Management (adopted Ward and Daniel, 2012)
Project failure is estimated yearly in the hundreds of billions of dollars (McManus
and Wood-Harper, 2007) where failure is not limited to any specific industry (Flyvbjerg,
Bruzelius, and Rothengatter, 2003; Nichols, Sharma, and Spires, 2011). The general
86
perception of the continuous failures of IS/IT investments has forced organisations to seek
new ways and approaches to achieving successful projects. The major reason for failures
in implementing IS/IT includes (Lorenzi and Riley, 2000; Kaplan and Shaw, 2002):
₋ Ineffective outgoing communication;
₋ Underestimation of complexity;
₋ Scope creep;
₋ Systems and technology;
₋ Organisational and leadership issues.
The focus should be on obtaining benefits since this is the main justification for the
investment (Ward and Daniel, 2006). Peppard et al. (2007) claims five principles for
realizing benefits through IS/IT:
1. Just having the technology does not give any benefit or create value;
2. IS/IT enables people to do things differently;
3. Benefits result from changes and innovations in ways of working and only the
relevant stakeholders can make these changes;
4. All IS/IT projects have outcomes, but not all outcomes are benefits.
5. Benefits must be actively pursued to be obtained.
In these five principles, it is suggested that the value of IS / IT implementation lies
in the interaction between IS / IT and the organization, not its inherent value. Against this
backdrop, efforts have been made to understand the value that IS/IT brings and how to
increase that value.
The challenges faced by organisations to increase value from their IS/IT investments,
the low-level of organisational competencies in exploiting IS/IT was revealed and an
underlying cause of the difficulty in dealing with these challenges. Several studies
indicated that there is a need for complementary investments in organization and internal
87
training for the companies' IS/IT investments to achieve their full impact (e.g. Van Ark,
2005; Brynjolfsson and Hitt, 2003).
The business problems that the organisations address today require enterprise-wide
solutions that call for an integrated approach and effective management of organisational
resources to achieve the business objectives. Organisations still exhibit silver bullet
thinking when it comes to IS/IT (Thorp, 2001). They act as if, once an investment in an
IS/IT solution is made, the benefits associated with it will automatically happen. However,
simply identifying and estimating benefits will not necessarily make them happen (Thorp,
2001).
The evolution of IS/IT and its application within organisations has led to viewing
IS/IT as a strategic tool, which assume an increasingly prevalent role in the carrying out
organisational activities. Whilst there is general agreement that IS/IT does indeed
contribute to adding business value, there is uncertainty as to how these contributions were
really obtained (Melville, Kraemer and Gurbaxani, 2004; Devaraj and Kholi, 2003).
Although many researchers have focused on the consequences of IS/IT investments
(Devaraj and Kohli, 2003), there have been fewer studies examining factors that impact the
IS/IT capability. The general perception of the continuous failures of IS/IT investments has
forced organisations to seek new ways and approaches to achieving successful projects.
There has been a trend for rising expenditure in IS/IT over the last decades, which
corresponds to the plethora of IS/IT products now available in the market. Well-managed
IS/IT investments, which have been carefully selected and which are focused on meeting
business needs, can have a positive impact on an organization’s performance. Essentially,
the purpose of investment in IS/IT is to improve the operational efficiency of an
organization, to reduce costs and improve levels of profit. Firms in almost every industry
rely on investments in IS/IT to realize benefits after their successful implementation.
However, many IS/IT projects fail to deliver the desired benefits (Peppard et al., 2007).
Although organisations continue to make substantial investments in IS/IT, the successful
realization of value, namely, in the form of benefits from such investments, has consistently
88
been reported as a major organisational challenge. To respond to the constraints of the new
business environment, successful organisations have basically developed three important
strategies (Gomes and Romão, 2013):
₋ Training employees in the use of IS/IT, to provide organisations with the
knowledge and ability to respond to the pressures to change;
₋ Participating in collaborative platforms which involve all relevant stakeholders
in the business process;
₋ Finding ways of obtaining superior performance by using frameworks that assist
management processes.
Any organisational strategy should address both external and internal domains
(Henderson and Venkatraman, 1993). The external domain is characterized by the business
environment in which the organisations competes and is concerned with decisions such as
product/service offering and the distinctive strategy attributes that differentiate the
organization from the others. By opposition, the internal domain is concerned with choices
of the administrative structure and the specific rationale of critical business processes.
From the alignment perspective, the IS/IT strategy incorporates a fit between the
business and IS/IT strategic domains by acknowledging that IS/IT capabilities can both
shape or support the business strategy. Additionally, the functional alignment is concerned
with the integration of the internal business and IS/IT domains.
It has been argued that the lack of alignment between IS/IT and business is the reason
why unrealistic benefits are identified, or not identified at all, and also why the
operationalisation of measures is incorrectly specified, activities and resources are
improperly planned, and required organisational changes are not carried out (Henderson
and Venkatraman, 1993).
From the perspective of IS/IT, the problems of non-alignment with the business
strategy typically result in reactive postures against IS/IT investments being seen as a cost
centre and not as a strategic business partner. From the point of view of business, the non-
89
alignment of IS/IT result in a decreasing income arising from investments in technology
and a reduction of competitive capabilities for the organization (Tallon, Kraemer and
Gurbaxani, 2000).
With the shift from traditional industrial economy to this new business environment
with great predominance of intangible assets such as knowledge or innovation,
organisations must manage increasing levels of complexity, mobility and uncertainty
(Voelpel et al., 2005). The management of knowledge has generated considerable interest
in business and management circles due to its capability to deliver to organisations,
strategic results relating to profitability, competitiveness and capacity enhancement (Chua,
2009; Jeon, Kim and Koh 2011).
For many companies, the competitive advantage is a continuous process of
performance improvement, looking for best practices and enhancing new capabilities,
including the search for new products or services and for more efficiently processes and
procedures developing the dynamic capabilities (Teece, Pisano and Shuen, 1997), to
quickly respond to the external challenges and effectively continuous changes, adapting to
new industry trends.
Traditional appraisal techniques are often unable to capture many of the qualitative
benefits that are brought about by IS/IT investments (Farbey, Land and Targett, 1993; Irani
and Love, 1999; Lin et al, 2005; Maskell, 1991; Murphy and Simon, 2002; Ward, Taylor
and Bond, 1996). These techniques also ignore the impact that the system may have in
human and organisational terms. Strassmann (1997) suggested that the IS/IT investments
produce negligible benefits. Otherwise, some studies report a positive relationship between
the performance of organisations and IS/IT expenditure (e.g. Lee and Barua, 1999; Sircar
et al, 2000).
Apparently, several reasons can cause the confusion over IS/IT benefits, namely, the
mismeasurement of outputs and inputs, the difficulty of establishing the overall value of
IS/IT, the choice of inappropriate methods of evaluation, lags in learning and adjustments,
mismanagement by developers and users of IS/IT, and lack of effective IS/IT evaluation
90
and benefits realization management practices amongst others (Hitt and Brynjolfsson,
1996; Lin et al., 2005; Rai, Patnayakuni and Patnayakuni, 1997) .
To achieve that the benefits from IS/IT investments materialise, the following two
questions need to be answered: “What benefits are we seeking?” and “How will achieve
them?” Most value from IS/IT investments come from the business changes that enable an
organization to carry out some of the following actions (Gomes, Romão and Caldeira,
2013c; Ward and Daniel, 2006):
₋ The adoption of new or redefined processes;
₋ The new roles and responsibilities;
₋ The operation of new teams, groups or divisions;
₋ The new governance arrangements;
₋ The use of new measures and metrics;
₋ The use of new appraisal and reward schemes;
₋ The new practices for managing and sharing information.
The achievement of benefits obviously depends on the effective implementation of
technology, however evidence from project successes and failures suggests that it is an
organisations’ inability to accommodate and exploit the capabilities of technology that
usually causes a poor return from many investments. While business changes may be
considered as being the way that an organization intends to work for ever more, it is
recognised that organization will also carry out other investments and changes (Ward and
Daniel, 2006).
2.6 IS/IT Project Success
2.6.1 Overview
Although the increasing role and importance of IS/IT, the understanding of why,
how, and when technology enables the productivity improvement is in its early stages,
resulting in a delay in productivity growth (Jorgenson and Stiroh, 2000).
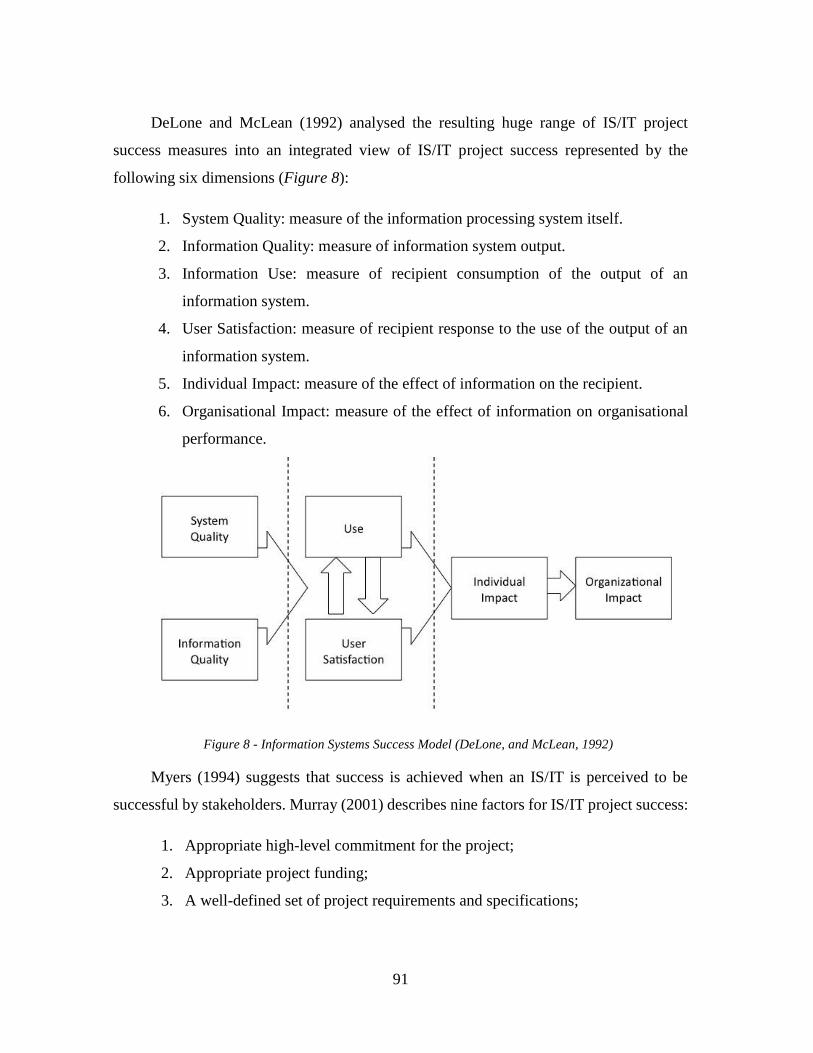
91
DeLone and McLean (1992) analysed the resulting huge range of IS/IT project
success measures into an integrated view of IS/IT project success represented by the
following six dimensions (Figure 8):
1. System Quality: measure of the information processing system itself.
2. Information Quality: measure of information system output.
3. Information Use: measure of recipient consumption of the output of an
information system.
4. User Satisfaction: measure of recipient response to the use of the output of an
information system.
5. Individual Impact: measure of the effect of information on the recipient.
6. Organisational Impact: measure of the effect of information on organisational
performance.
Figure 8 - Information Systems Success Model (DeLone, and McLean, 1992)
Myers (1994) suggests that success is achieved when an IS/IT is perceived to be
successful by stakeholders. Murray (2001) describes nine factors for IS/IT project success:
1. Appropriate high-level commitment for the project;
2. Appropriate project funding;
3. A well-defined set of project requirements and specifications;
92
4. Careful development of a comprehensive project plan that incorporates
sufficient time and flexibility to anticipate and deal with unforeseen difficulties
as they arise;
5. An appropriate commitment of time and attention by those outside the IT
department;
6. Accurate reporting of project status and potential difficulties as they arise;
7. A critical assessment of the risks inherent in the project;
8. The development of appropriate contingency plans that can be employed if the
project encounters problems;
9. An objective assessment of the organization's ability and willingness to
maintain the course of the project
The IS/IT is becoming so central to modern organisations that implementation of
large projects is synonymous of huge changes within organisations (Kuruppuarachchi et
al, 2002). This means that an organization’s IS/IT projects are part of deep changes
involving business systems, organisational structure, and people. In these cases, customer
acceptance rather than technical, time, or budget requirements, more often determines
project success.
2.6.2 IS/IT Project Success in Healthcare
Hospitals are complex organisations and this complexity magnifies the opportunity
for inevitable human errors (Weick, 2001). A poorly integrated system can increase the
frequency of medical errors, decrease operational efficiency, and reduce the quality of
healthcare services (Themistocleous, Mantzana and Morabito, 2009).
The IS/IT implementations are part of the continuous quality improvement of
healthcare and there are three key success factors in a robust IS/IT implementation
(Brandrud et al., 2011):
₋ Reliable information;
₋ Engagement of all stakeholders in all phases of the work improvement;
₋ A proper infrastructure involving multidisciplinary teams.
93
Success in the strategic use of IS/IT project success in healthcare relies on the
integration of all systems, such as patient records, clinical decision support, transaction
processing, digital imaging, and information reporting (Jensen, 2013; Kim and
Mitchelman, 1990). When diverse information systems are interoperable on a standardized
platform, all stakeholders can streamline the implementation process, and improve the
system quality (Gross and Ginzberg, 1984).
IS/IT project success also refers to user satisfaction, system use, perceived usefulness
and system quality (Sabherwal, Jeyaraj and Chowla, 2006).
A comprehensive literature review on large-scale IS/IT projects executed in ten
different countries identified eighteen frequently cited critical success factors (CSFs) for
inter-enterprise systems implementations (Negi, Law and Wat, 2008). Five of them are the
same as identified by the above-mentioned healthcare IS/IT implementations. These CSFs
are top management support, information systems adjustments, business process
adjustments, organisational resistance, and the capability of key team members. Top
management support has been argued to be the most critical factor for IS/IT project success
(Iacovou and Katsu, 2008; Liu et al., 2010). Extant research largely focuses on the
consequences of management support for IS/ IT projects (Dong et al., 2009; Liang et al.,
2007; Sharma and Yetton, 2003).
Must has been written in last decades regarding the development of IS/IT initiatives
in healthcare sector (Lorenzi and Riley, 1995, 2000; Lorenzi et al., 1997; Leonard and
Winkelman, 2002; Stiell et al., 2003). The publications emphasized two main aspects: The
slowness of adoption of these initiatives and the resistance to change (Leonard, 2000;
Treister, 1998). There are also reported innovative approaches concerning the improvement
of the IS/IT in healthcare adoption (Dixon, 1999; Dixon and Dixon, 1994).
Lorenzi and Riley (1995) claimed that the IS/IT interventions are perceived as an
interference in the traditional physician role. The resistance is higher when the IS/IT
interventions does not generate additional value for physicians’ practices (Leonard and
94
Winkelman, 2002). Treister (1998) highlighted a set of reasons why physicians failed on
IS/IT acceptance, namely:
₋ On an adequate base support;
₋ Absence of user friendly interfaces;
₋ Difficulties on the information collection process;
₋ In adequate training plan;
₋ Lack of leadership in IS/IT that was respected by physicians, organization
control default over the clinical practices.
The research developed by these authors focused mainly on the identification of the
elements with the hope those will effective ensure the IS/IT implementations. Some
examples are the following:
₋ Identifying information insufficiencies and difficulties that are healthcare
exclusively;
₋ Identifying areas where the IS/IT implementations can make most difference;
₋ Building systems that support shared objectives;
₋ Designing and developing scalable tools, provider-patient interfaces and
Internet applications;
₋ Investing in existing resources.
Since success can be judged in many dimensions, such as; effectiveness, efficiency,
organisational attitudes and commitment, employee satisfaction, and patient satisfaction,
existing CSF lists could be problematic, making the situation very complex and offer a
more simplified solution than what is needed in practice (Berg, 2001). Leonard (2004)
identifies a set of CSFs for new technological adoption, such as:
₋ Resistance to change or industry experience in using technology
₋ Training before and during the transition
₋ Buy-in or contribution from stakeholder groups
95
₋ Level of effective reporting on outcome measures during and after
implementation
₋ Level of effectiveness in dealing with the implementation
According to the research done by Robinson (2007), appropriate leadership, good
communication, detailed roadmap of implementation, setting measurable goals and
specific attention to the preparation of human resources in terms of motivation and training
were considered as the most important factors affecting the success of the implementation
of these systems. Reyes-Alcázar et al. (2012) noted the CSFs that need to be considered for
the Health sector are the following:
₋ A patient-centred approach: needs and expectations of end-users (Mead and
Bower, 2010);
₋ Leadership: the importance on improving the quality of healthcare (West, 2004);
₋ Team work: a multidisciplinary process focussed on a healthcare team that
shares common goals (Mickan, 2005);
₋ Autonomy and responsibility: the need for more autonomy amongst health
professionals (Harrison and Dowswell, 2002);
₋ An integrated view of healthcare; the quality of patient care as perceived by end-
users is a key element (Torres-Olivera, 2003);
₋ Professional skills: promoting skills encourages professional development
(Reyes-Alcázar et al., 2012);
₋ Results focussed: the measurement and evaluation of clinical performance,
hospital management and end-user satisfaction (Patton, 2008);
₋ Internal and external audits: the concept of continuous quality improvement
(Chovil, 2010; Hyrkäs and Lehti, 2003; Le Brasseur, Whissell, and Ojha, 2002).
CSFs have been criticized as offering over-simplified solutions that are difficult to
realize in practice, since many contextual circumstances also influence the outcome (e.g.
Berg, 2001; Wagner et al., 2006).
96
2.7 Healthcare Sector
2.7.1 Overview
While promoting population health has been the classic goal of public health practice
and policy (Dawson and Verweij, 2007), in recent decades, new objectives in terms of
autonomy and equality have been introduced (Munthe, 2008).
Improving the health of the population is the defining goal of health systems; health
system performance should therefore be viewed primarily from the perspective of how
health systems manage to improve the overall average level of population health and reduce
inequalities in health (WHO, 2007).
Healthcare systems play a clear role in the European Union and are key to achieving
stronger growth and creating highly qualified jobs in a dynamic knowledge-based
economy. This vision was set out by the Lisbon European Council in 2000 (European
Council, 2000). Nowadays the healthcare systems face major challenges, namely:
₋ In a rising demand for health and social services due to an ageing population
(Appleby, 2013; CHWS35, 2006; Braun et al., 2003; Rechel et al., 2009;
Townsend, 2016; WHO, 2015);
₋ In the increasing expectations of citizens who want the best care available (EC,
2004c);
₋ In the expectations for increasing citizen participation in healthcare regulation
(Adams et al., 2015);
₋ In the increasing mobility of patients and health professionals (Buchan et al.,
2014; EC, 2004a);
35 Center for Health Workforce Studies, School of Public Health, University at Albany, USA
97
₋ In the need to reduce the so-called disease burden36 (IHME37, 2016; Murray et
al., 2013; WHO, 2015);
₋ In matching investment in technology with investment in the complex
organisational changes needed to exploit its potential (Cresswell et al., 2013;
Lorenzi and Riley, 2000; Lluch, 2011);
₋ In the need to limit occupational accidents and diseases (Hämäläinen et al.,
2006; ILO38, 2015);
₋ In the management of huge amounts of digital health information that need to
be available securely and accessibly (Baker and Masys, 1999; Fernando and
Dawson, 2009; van de Haak et al., 2003);
₋ In the need to provide the best possible healthcare (Sturmberg and Lanham,
2014)
The demographic changes in the last decades are leading to a marked aging of the
population in general (Koch, 2006) requiring more care, suffering from more health issues,
lifestyles creating chronic diseases, ever increasing limits for the medical science’ ability
to treat patients, and shrinking budgets (Saha, 2011).
Life expectancy at birth continues to increase remarkably in EU countries, reflecting
reductions in mortality rates at all ages. Average life expectancy at birth for the years 2005-
2007 across the 27 countries of the European Union reached 74.3 years for men and 80.8
years for women (OECD, 2010). The proportion of people over 65 is expected to almost
double by 205039. Furthermore, chronic diseases are on the increase, as are their
management costs.
36 The impact of a health problem as measured by financial cost, mortality, morbidity, or other indicators. It
is often quantified in terms of quality-adjusted life years (QALYs) or disability-adjusted life years (DALYs),
both of which quantify the number of years lost due to disease (YLDs). 37 Institute for Health Metrics and Evaluation 38 International Labour Office 39 Eurostat news release 48/2005, 8 April 2005
98
All these factors are starting to place additional strain on European healthcare
systems. Almost a decade since the global financial and economic crisis starts. The total
health spending fell in 11 out of the 34 OECD countries (Table 13). Expenditure on
prevention and public health decrease and in several countries, patients are now expected
to assume a share of health costs (OECD, 2013).
“Healthcare systems are organised and financed in different ways across the EU
Member States, but most Europeans would agree that universal access to quality healthcare,
at an affordable cost to both individuals and society at large, is a basic need. Moreover, this
is one of the common values and principles in EU health systems” (Eurostat, 2013).
“An analysis of the financing of healthcare suggests that compulsory contributory
health insurance schemes and compulsory medical saving accounts were a fairly common
means for funding healthcare within the EU Member States” (Eurostat, 2013).
By 2050, average public spending for health and long-term care in countries of the
OECD may rise to 10-13% of GDP40 (OECD, 2006). The emerging situation will not be
sustainable unless action is taken at all levels to change the way healthcare is delivered
(EC, 2006). While average per capita health spending in OECD countries has increased
slowly since 2010, spending in Portugal has severely contracted between 2010 and 2013 in
real terms (OECD, 2015a). Portugal spent the equivalent of $2482 (USD) per person on
health in 2013, compared with an OECD average of $3453 (USD).
40 Gross Domestic Product
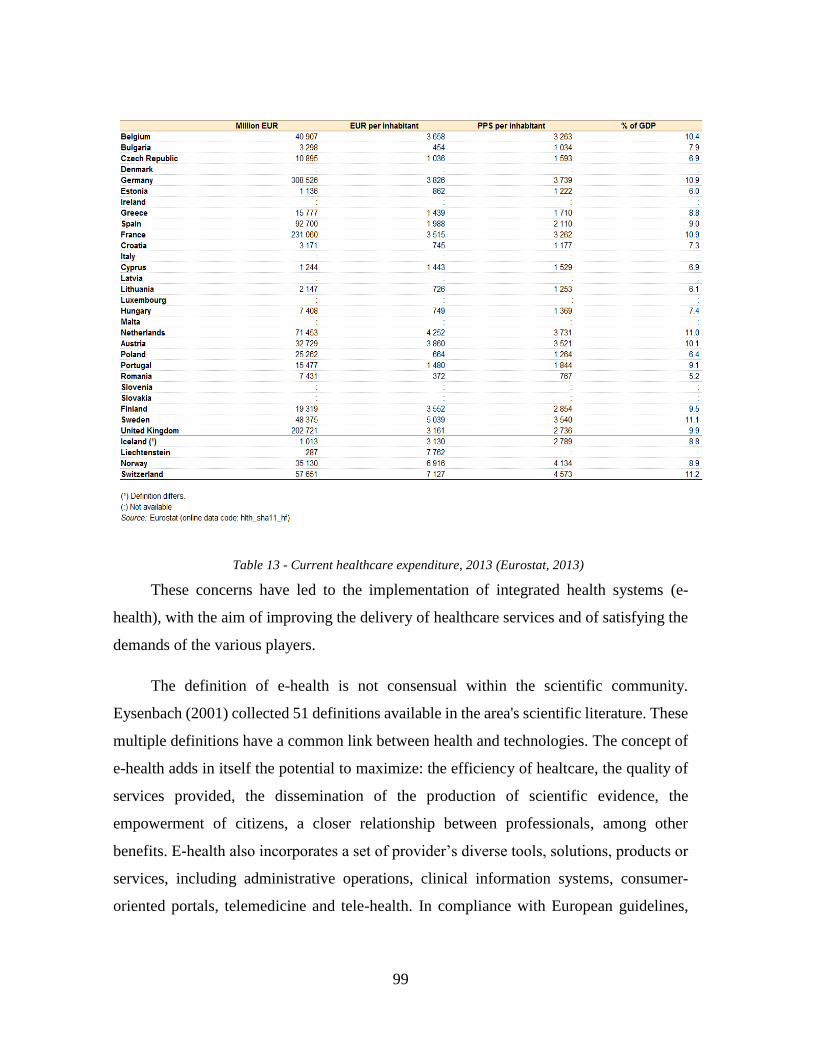
99
Table 13 - Current healthcare expenditure, 2013 (Eurostat, 2013)
These concerns have led to the implementation of integrated health systems (e-
health), with the aim of improving the delivery of healthcare services and of satisfying the
demands of the various players.
The definition of e-health is not consensual within the scientific community.
Eysenbach (2001) collected 51 definitions available in the area's scientific literature. These
multiple definitions have a common link between health and technologies. The concept of
e-health adds in itself the potential to maximize: the efficiency of healtcare, the quality of
services provided, the dissemination of the production of scientific evidence, the
empowerment of citizens, a closer relationship between professionals, among other
benefits. E-health also incorporates a set of provider’s diverse tools, solutions, products or
services, including administrative operations, clinical information systems, consumer-
oriented portals, telemedicine and tele-health. In compliance with European guidelines,
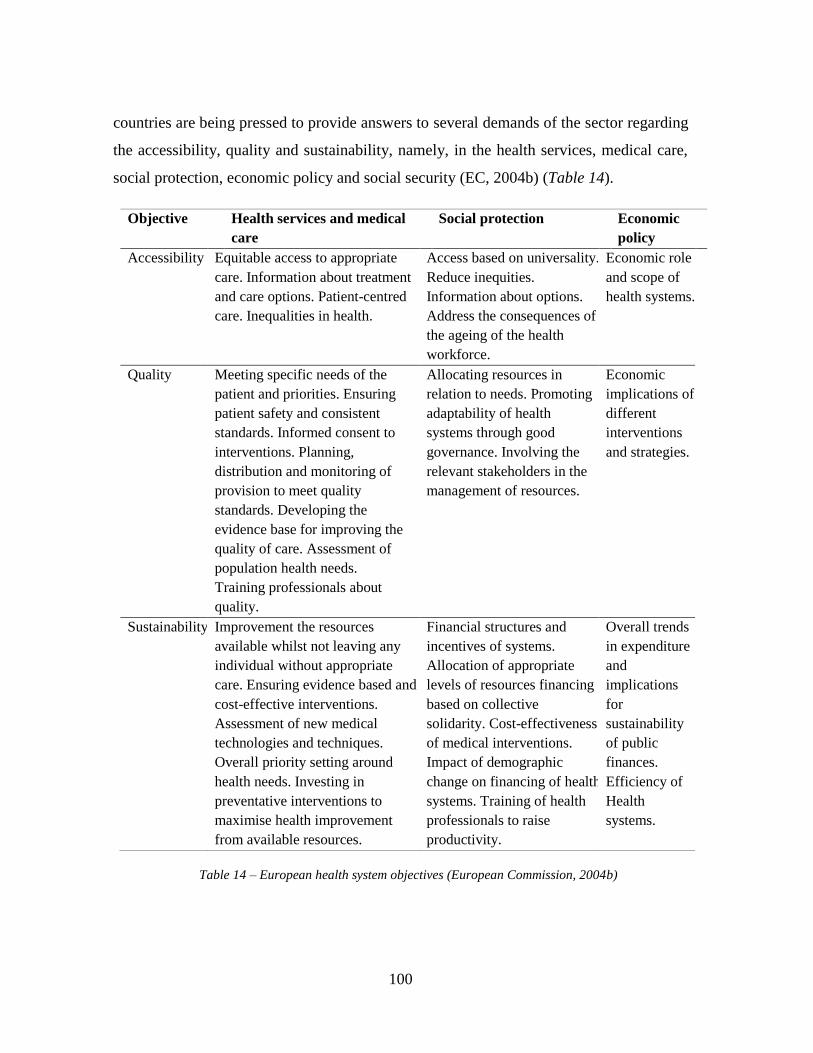
100
countries are being pressed to provide answers to several demands of the sector regarding
the accessibility, quality and sustainability, namely, in the health services, medical care,
social protection, economic policy and social security (EC, 2004b) (Table 14).
Objective
Health services and medical
care
Social protection Economic
policy
Accessibility Equitable access to appropriate
care. Information about treatment
and care options. Patient-centred
care. Inequalities in health.
Access based on universality.
Reduce inequities.
Information about options.
Address the consequences of
the ageing of the health
workforce.
Economic role
and scope of
health systems.
Quality Meeting specific needs of the
patient and priorities. Ensuring
patient safety and consistent
standards. Informed consent to
interventions. Planning,
distribution and monitoring of
provision to meet quality
standards. Developing the
evidence base for improving the
quality of care. Assessment of
population health needs.
Training professionals about
quality.
Allocating resources in
relation to needs. Promoting
adaptability of health
systems through good
governance. Involving the
relevant stakeholders in the
management of resources.
Economic
implications of
different
interventions
and strategies.
Sustainability Improvement the resources
available whilst not leaving any
individual without appropriate
care. Ensuring evidence based and
cost-effective interventions.
Assessment of new medical
technologies and techniques.
Overall priority setting around
health needs. Investing in
preventative interventions to
maximise health improvement
from available resources.
Financial structures and
incentives of systems.
Allocation of appropriate
levels of resources financing
based on collective
solidarity. Cost-effectiveness
of medical interventions.
Impact of demographic
change on financing of health
systems. Training of health
professionals to raise
productivity.
Overall trends
in expenditure
and
implications
for
sustainability
of public
finances.
Efficiency of
Health
systems.
Table 14 – European health system objectives (European Commission, 2004b)
101
The benefits of these implementations are expected to promote the improvement of
the following aspects (EC, 2006):
₋ Citizens' access to health systems;
₋ Reduce the risk of errors due to lack of information;
₋ Reduce the time required for the provision of clinical reports;
₋ Reduce costs by avoiding replication of effort and resources.
The challenges expected by the authorities to implement these systems are (EC,
2006):
₋ Interoperability;
₋ Timeliness, integrity, availability and confidentiality of information;
₋ Alignment of software with principles of architecture and content structures;
₋ Establishment of rules that allow the user informed consent for access to their data
by professionals;
₋ Ensure the difficulties of change process.
Today, healthcare organisations are amazingly focus on IS/IT investment, with the
goal of achieving the minimum level of benefits that these projects can provide. The study
of the success or failure of these initiatives has become vitally important for the
performance of these organisations (Rahimi and Vimarlund, 2007). Healthcare
organisations must improve their business practices and internal procedures to answer the
increase demanding of health professionals and the public in general for better information.
The interest about the potential that IS/IT offers for improving healthcare services
has resulted in large investments. The expectation of realizing the potential of technology
assets to improve the quality, safety reducing costs and creating new service innovations
often leads to the introduction of the huge solutions, with a limited evidence-base in support
of the systems’ overall effectiveness and safety (Shekelle et al., 2006).
Several reports have systemically shown that most software projects, including
healthcare sector, are delivered late and over budget (e.g. Standish Group, 2015), namely,
102
software applications strangle organisations rather than quickly improve internal processes.
(Stead el al., 2005).
Hospitals adopt a patient-centred care approach and invest massively in IS/IT
solutions, in the hope that these investments will improve medical care and patient
demands. The concept of patient-centred care can be defined as the creation of more value
for patients through the removal of all non-value-added steps or actions.
An important precondition of optimal patient-centred care is that patient information
is completely and accurately recorded and accessible (Ammenwerth, et al., 2001). The most
important issue in this field is the use of high-quality information.
A model of information system success provided by DeLone and McLean (2003)
showed that information quality and system quality affect organisational services. System
quality in patient-centred care measures important characteristics such as timeliness,
reliability, completeness, accuracy and relevance (Haslina and Sharifah, 2005; William and
Ephraim, 2003).
From the point of view of public service, the focus of healthcare system is the patient;
therefore, any intervention should be based on their needs and expectations (Reyes-Alcázar
et al., 2012). It becomes more and more important that IS/IT investments support, not only
satisfied short-term objectives, but also long-term benefits, to provide organisational
sustainability and a proper service for organisations, professionals and end-users.
2.7.2 IS/IT in Healthcare sector
IS/IT are now spread worldwide, adopted and used in many sectors, including the
health sector. According to the (WHO, 2005), the use of IS/IT in health is not merely about
technology but is a means to reach a series of desired outcomes across the entire health
system. The aim of IS/IT for Health is to improve significantly the quality, access and
efficacy of healthcare for all citizens (EC, 2006). The move toward computer information
systems began from the 1970s that ultimate goal of these systems is access to Electronic
Health Record (EHR) (Shortliffe and Baenett, 2014). EHR implementation results in the
103
improved quality of care, cost effectiveness, customer-orientation and timely access to
complete and precise information (Gagnon, 2014). Despite the potential benefits of EHR,
its implementation is a difficult and complex task whose success and productivity depends
on many factors (Yusof et al., 2008; Terry et al., 2008).
Since the 1990´s, the health sector has sought to improve its effectiveness and
efficiency by adopting IS/IT to increase the levels of services quality, namely, patient
safety, organisational efficiency and patient satisfaction (Bates and Gawande, 2000; Pan et
al., 2005; Raghupathi and Tan, 1999). The use of these systems provides an important
support for specialised services, and increases the efficiency, quality, safety and also
reduces medical errors (Low and Chen, 2012).
According to several studies, there is a growing use of information and
communication technologies by citizens and their families regarding the search for health
information (Andreassen, 2007; Fox, 2011). IS/IT in healthcare represents the integrated
effort to collect, process, report and use health information and knowledge to influence
policy-making, program action and research and further states that they are essential to the
effective functioning of health systems worldwide (WHO, 2006). The broader meaning of
this system refers to any system that captures, stores, manages or transmits information
related to the health of individuals or the activities of organisations that work within the
health sector. Despite remarkable technical progress, failures have still been reported when
integrating technically sound systems into processes of care (Lorenzi and Riley, 2003).
We live in times where healthcare providers generate significant amounts of personal
data about patients and the major obstacle to the management of this increasing volume of
information is the difficulty, or inability, of sharing information across systems and
between organisations (Grimson et al., 2000). Medical information needed for clinical
decision making has increased significantly, however the accessibility of health data is still
poor, resulting in inappropriate decisions and sometimes in medical errors (Tierney, 2001).
The greatest evolution in the role of information in the health system, namely on the
doctor-patient relationship, is related to the enormous flow of medical or health information
104
that is present on the Internet (Katz and Rice, 2002; Netlleton, 2011, Murray et al., 2003).
In this new reality patients play a more active role in their own healthcare (Collste, 2002,
p. 123). The informatics tools have been developed to increase the accessibility and
management of medical information (Bleich, Beckley and Horowitz, 1985), with the aim
of supporting medical decision, of increasing the coordination between different healthcare
providers, and of promoting the use of guidelines, thereby improving the global quality of
care (Pringle, 1988; Shiffmann et al., 1999).
However, in addition to providing new capabilities, new technologies also impact the
technical, social, organisational, economic, cultural, and political dimensions of work in
new and different ways (Anderson and Aydin, 1994). Observations of new technology
implementations have shown that a change in technology alters roles, strategies, and paths
to failure (Sarter, Woods and Billings, 1997). Kohn, Corrigan and Donaldson (2000)
highlighted that in the recognition of these new trends, the Institute of Medicine of the USA
recommends the examination of the new technologies for avoiding threats to safety and
redesigning them to prevent undesirable accidents.
IS/IT processes have the potential to significantly reduce the rate of these medical
errors by providing relevant information in real time to all who need it (Bates et al., 2001;
Chaudhry et al., 2006; McDonald et al., 1984). An important challenge for the future is to
seek for a real clinical integration of systems. Clinical integration between providers and
hospitals has historically been a goal which is continually sought, but rarely achieved. It
will become crucial that the design of future applications be integrated easier into existing
systems, through open communication interface (Geissbuhler et al., 2001). There is a
growing consensus that organisational factors are far more critical for the successful
implementation of IS/IT, than technical considerations (Gomes and Romão, 2016a; Markus
et al., 2000). Achieving successful change is much easier if all stakeholders are committed,
and the earlier this commitment is achieved, the smoother is the path to a successful
outcome (Bradley, 2006).
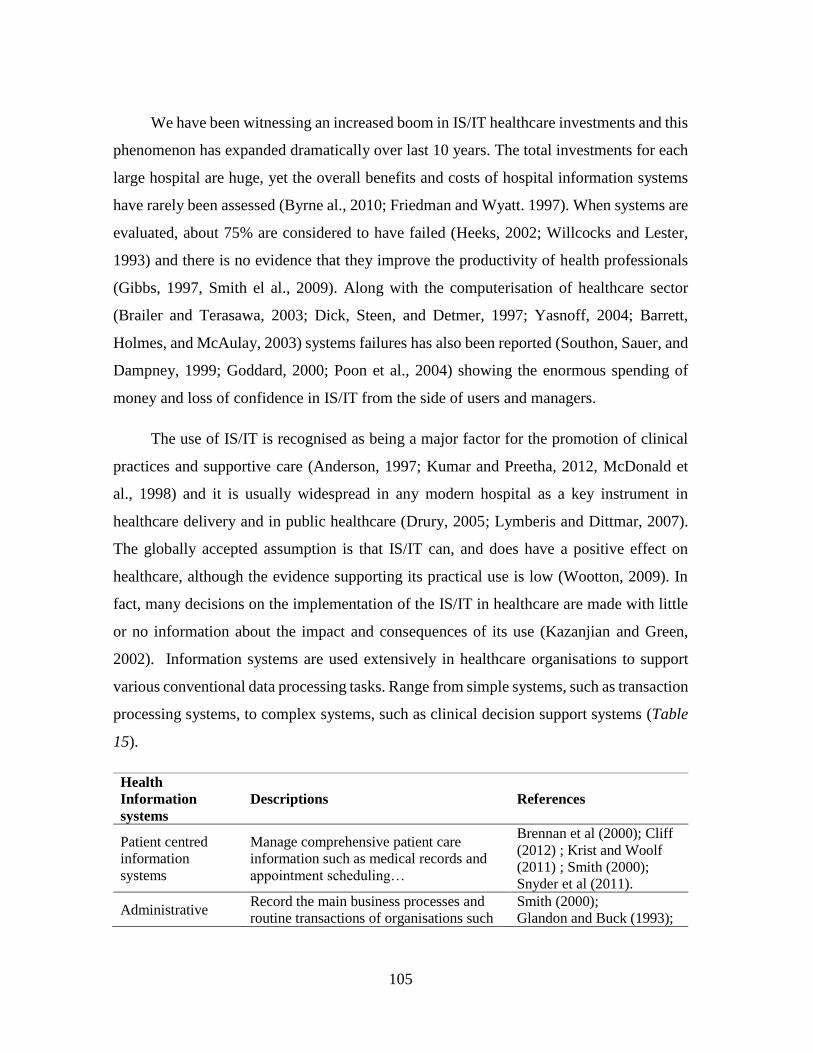
105
We have been witnessing an increased boom in IS/IT healthcare investments and this
phenomenon has expanded dramatically over last 10 years. The total investments for each
large hospital are huge, yet the overall benefits and costs of hospital information systems
have rarely been assessed (Byrne al., 2010; Friedman and Wyatt. 1997). When systems are
evaluated, about 75% are considered to have failed (Heeks, 2002; Willcocks and Lester,
1993) and there is no evidence that they improve the productivity of health professionals
(Gibbs, 1997, Smith el al., 2009). Along with the computerisation of healthcare sector
(Brailer and Terasawa, 2003; Dick, Steen, and Detmer, 1997; Yasnoff, 2004; Barrett,
Holmes, and McAulay, 2003) systems failures has also been reported (Southon, Sauer, and
Dampney, 1999; Goddard, 2000; Poon et al., 2004) showing the enormous spending of
money and loss of confidence in IS/IT from the side of users and managers.
The use of IS/IT is recognised as being a major factor for the promotion of clinical
practices and supportive care (Anderson, 1997; Kumar and Preetha, 2012, McDonald et
al., 1998) and it is usually widespread in any modern hospital as a key instrument in
healthcare delivery and in public healthcare (Drury, 2005; Lymberis and Dittmar, 2007).
The globally accepted assumption is that IS/IT can, and does have a positive effect on
healthcare, although the evidence supporting its practical use is low (Wootton, 2009). In
fact, many decisions on the implementation of the IS/IT in healthcare are made with little
or no information about the impact and consequences of its use (Kazanjian and Green,
2002). Information systems are used extensively in healthcare organisations to support
various conventional data processing tasks. Range from simple systems, such as transaction
processing systems, to complex systems, such as clinical decision support systems (Table
15).
Health
Information
systems
Descriptions References
Patient centred
information
systems
Manage comprehensive patient care
information such as medical records and
appointment scheduling…
Brennan et al (2000); Cliff
(2012) ; Krist and Woolf
(2011) ; Smith (2000);
Snyder et al (2011).
Administrative Record the main business processes and
routine transactions of organisations such
Smith (2000);
Glandon and Buck (1993);
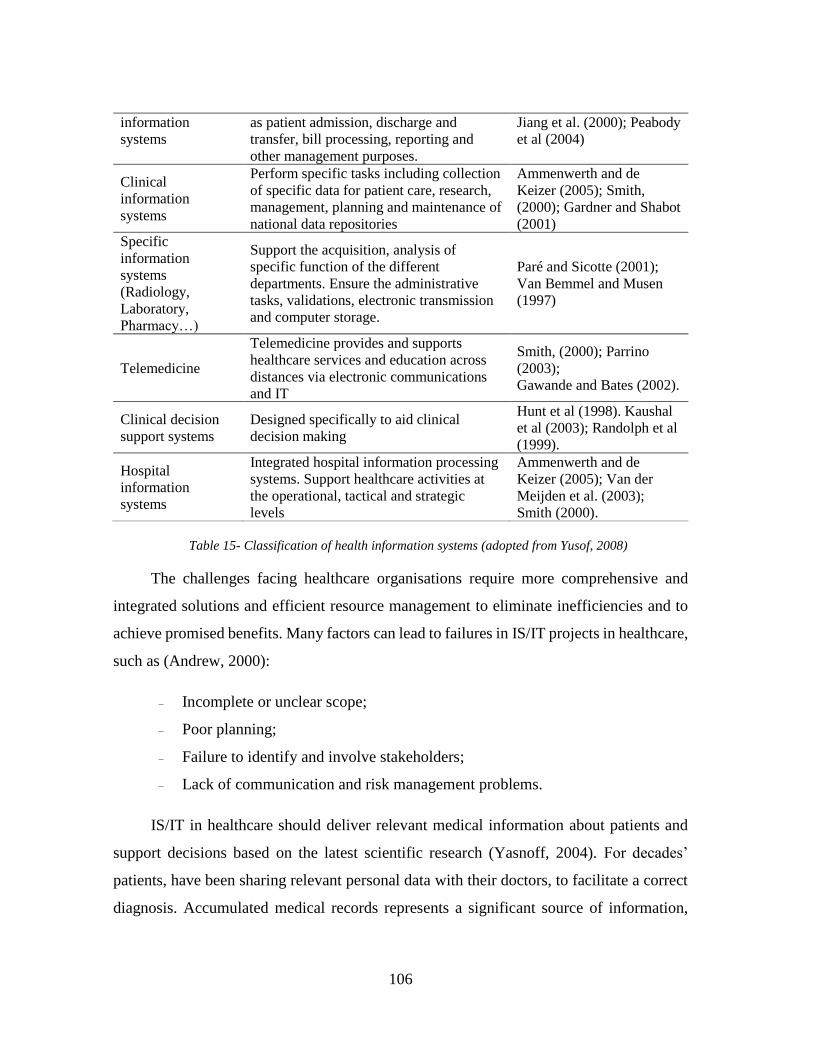
106
information
systems
as patient admission, discharge and
transfer, bill processing, reporting and
other management purposes.
Jiang et al. (2000); Peabody
et al (2004)
Clinical
information
systems
Perform specific tasks including collection
of specific data for patient care, research,
management, planning and maintenance of
national data repositories
Ammenwerth and de
Keizer (2005); Smith,
(2000); Gardner and Shabot
(2001)
Specific
information
systems
(Radiology,
Laboratory,
Pharmacy…)
Support the acquisition, analysis of
specific function of the different
departments. Ensure the administrative
tasks, validations, electronic transmission
and computer storage.
Paré and Sicotte (2001);
Van Bemmel and Musen
(1997)
Telemedicine
Telemedicine provides and supports
healthcare services and education across
distances via electronic communications
and IT
Smith, (2000); Parrino
(2003);
Gawande and Bates (2002).
Clinical decision
support systems
Designed specifically to aid clinical
decision making
Hunt et al (1998). Kaushal
et al (2003); Randolph et al
(1999).
Hospital
information
systems
Integrated hospital information processing
systems. Support healthcare activities at
the operational, tactical and strategic
levels
Ammenwerth and de
Keizer (2005); Van der
Meijden et al. (2003);
Smith (2000).
Table 15- Classification of health information systems (adopted from Yusof, 2008)
The challenges facing healthcare organisations require more comprehensive and
integrated solutions and efficient resource management to eliminate inefficiencies and to
achieve promised benefits. Many factors can lead to failures in IS/IT projects in healthcare,
such as (Andrew, 2000):
₋ Incomplete or unclear scope;
₋ Poor planning;
₋ Failure to identify and involve stakeholders;
₋ Lack of communication and risk management problems.
IS/IT in healthcare should deliver relevant medical information about patients and
support decisions based on the latest scientific research (Yasnoff, 2004). For decades’
patients, have been sharing relevant personal data with their doctors, to facilitate a correct
diagnosis. Accumulated medical records represents a significant source of information,
107
which includes personal identification, medical history, records of treatments and
medication, together with an analysis of psychological profiles and subjective assessments
of patients’ personality or mental state, amongst others (Mercuri, 2004). This information
can be shared, to improve efficiency in the health system, and can be used to carry out
research for the advancement of medical science (Hodge, 2003). However, it can also be
used by other healthcare providers, such as clinics, laboratories, the pharmaceutical
industry, health authorities, or insurances companies, which raise some issues about the
protection of this strictly personal information.
The investments in IS/IT has the potential to dramatically change the way individuals
or society see the healthcare sector, and also provide tremendous opportunities for
supporting professionals, and for improving effectiveness and efficiency in this sector,
namely, by accessing a large amount of information regarding patients, support for the
clinical decisions and direct access to vast resource and knowledge data bases
(Ammenwerth et al., 2006; Gomes and Romão, 2016c; Kohn et al., 2000). But are not
always investments in IS/IT that result in efficiency and effectiveness gains. So, it also
becomes essential to evaluate the factors that limit performance and to identify
opportunities for enhancing their use. IS/IT provides an important impact on administrative
operations, namely, in a decrease of paperwork and the workload of the professionals, and
it also increases efficiency and expands access to affordable care (Caldeira et al., 2012).
The effective integration of IS/IT practices for health professional applications tends
to be influenced by several factors, which are related to individuals, professional groups,
organisational and contextual characteristics, as well as to the nature of their own
intervention (Aarts et al., 2004; Grol et al., 2007; Reyes-Alcázar et al., 2012; Mead, 2000;
West et al., 2004; Mickan, 2005).
One of the most critical factors that are recognised by the academic literature is
resistance to change by healthcare professionals, particularly amongst doctors (West et al.,
2004; Lapointe and Rivard, 2006; Mickan, 2005; Phansalker et al., 2008). The complexity
of systems, organisational diversity and the amount of investment needed, and also the
108
difficulties on the successful IS/IT adoption, are all largely justified by the way that IS/IT
is implemented, and by the need to identify best practices and to act on a number of critical
factors in order to reduce the chance of failure (Harrison and Dowswell, 2002; Olson and
Zhao, 2007; Torres-Olivera, 2003).
Project Management methodologies are crucial for the success of IS/IT investments
in healthcare, mainly in the areas that experience complex system integration, such as IS/IT
projects. Today, healthcare organisations are increasing focusing on the need for
investment in IS/IT, with the goal of achieving the maximum level of benefits that these
projects can attain. The study of the success or failure of these initiatives has become vitally
important for the performance of these organisations (Delpierre et al., 2004; Rahimi and
Vimarlund, 2007).
Health processes rely heavily on both information and knowledge. In this context,
management information plays a crucial role. Numerous studies have shown the positive
effects of using IS/IT in healthcare (Lenz and Reichert, 2007). The growing use of IS/IT in
healthcare has been recognised as being one of the major factors for the improvement of
clinical practice, and for care in general (Anderson, 1997; McDonald et al., 1998). The
support of these systems provides an important asset for specialised services, which
increases the quality and safety of patient care by minimising the likelihood of medical
errors (Low and Chen, 2012; McDonald et al., 1984). Supported on IS/IT, the complex
process of medical decision making could be significantly improved in several ways (Lenz
and Reichert, 2007), such as:
₋ Contributing to improve data quality, such as timeliness (Van Walraven et al.,
2002) or completeness (Hogan and Wagner, 1997);
₋ Contributing to better monitor the current state of a patient (Bates et al., 2001);
₋ Detecting mismatches between existing guidelines and the actual patient
treatment process (e.g. Gross et al., 2001; Shiffman et al., 2004).
₋ Generating reminders to ensure that planned actions are not forgotten
(McDonald, 1976);
109
₋ Helping to calculate drug dosage from previously entered data (Ambrisko and
Nemeth, 2004; Muller, 2003);
₋ Calculating disease probabilities (Hejlesen, et al., 2005).
Achieving a successful change will definitely be easier if all stakeholders are engaged
and motivated around the same goal. The sooner that we achieve this commitment, the
smoother the change will be for a good result (Bradley, 2006).
2.7.3 IS/IT Failures in Healthcare
There is a widespread feeling that a significant proportion of initiatives in IS/IT
healthcare have failed (Heeks and Davies, 1999). Studies have identified high failure rates
in IS/IT projects in various sectors, particularly in hospitals (Kaplan and Harris-Salamone,
2009; Wears and Berg, 2005).
The investments on IS/IT for healthcare are financially relevant and still growing
worldwide. While the potential and benefits from the use of technological innovation in
health are large, the risks are also substantial. Therefore, it seems wise that the
organisations should give more attention to adopting formal project evaluations and
benefits management methodologies to ensure that the expected benefits from investments
are eventually realised (Dibb, 2001; Schultz, 2006; Ward, Taylor and Bond, 1996).
Heeks (2008) states that 35% of IS/IT projects are total failures and 50% partial
failures, with only 15% being considered successful. A study by Gheorghiu (2006) found
that 70% to 80% of all information technology and information systems fail. Similarly,
Kaplan and Harris-Salamone (2009) confirmed a value greater than 30% for the failure
rates of major health information technology projects.
The results of the implementation of IS/IT projects in healthcare have revealed a
waste of financial resources in acquiring large sized systems, which are totally ineffective
(Heeks, 2006). In various aspects, these implementations are different from other projects,
in other industries. The key main differences were related to the environment, the diversity
of systems and the devices that need to work, together with the challenge of integration and
110
interoperability which is required to meet the expectations of different stakeholder groups
regarding that which constitutes project success (Abouzhara, 2011).
Why do IS/IT systems implementations fail in health organisations? Healthcare
projects are a complex undertaking, which depends largely on the quality of existing
information (Bose, 2003).
Organisations need to have three types of skills to produce successful projects
(Lorenzi and Riley, 2003):
1. Technical skills, which include a broad range of skills, such as the technical
knowledge, experience, and abilities.
2. Project management skills, which include the knowledge, techniques, and skills
necessary to manage successfully the IS/IT projects.
3. People and organisational skills, which include the wide range of skills necessary
to effectively interface with all of the IS/IT stakeholders.
Project failures in healthcare are in part due to several reasons, namely (Lewis et al.,
2011):
₋ Lack of senior management commitment being incomplete or missing
altogether (Dorsey, 2000; Bukachi and Pakenham-Walsh, 2007);
₋ Difficulties in the engagement of health professionals, and a lack of focus on
end-users (Elder and Clarke, 2007);
₋ Incorrect specification requirements (Lucas, 2008; Gauld, 2007);
₋ An absent or inadequate process of change (Yeo, 2002);
₋ Poor knowledge of the complexity of health systems (Al-Ahmad et al., 2009);
₋ Missing investments in human resources (Elder and Clarke, 2007; Bukachi and
Pakenham-Walsh, 2007).
Proper training is a major determinant for success in the adoption of IS/IT by health
professionals, and it has a great influence on the integration of technologies in clinical
practice (Allen et al., 2000).
111
Cooke-Davies and Arzymanow (2003) identify organisational culture as exerting a
positive influence on the development of superior project management practices. These
profound changes implicate important ethical challenges.
Reyes-Alcázar et al., (2012) point out that critical success factors are specific
elements of the organization of the internal and external environment, which is necessary
to ensure goal attainment and the success of a project.
2.7.4 Health information system security
Today’s digital technology plays a significant role, permitting the storage and rapid
retrieval of patient records and other important information.
When IS/IT is successfully developed, and implemented, there is wide consensus that
it offers tremendous opportunities to help healthcare professionals in their daily operations
and with the efficiency and effectiveness of care (NCVHS41, 2001; WHO, 2002). A reliable
patient information system is crucial for the quality of care and is one of the key factors of
a patient-centred approach. The computer-based patient information system has the
potential to store and retrieved large amounts of information and it is a reality that its use
improves the effectiveness and efficiency of patient care (Gomes and Romão, 2016a).
Healthcare organisations require interdisciplinary cooperation and coordination. It
needs to be highlighted that insufficient communication and missing information are
among the major issues that have contributed to unintentional injury caused by medical
mismanagement (Lenz and Reichert, 2007).
Securing private patient information remains one of the more pressing problems in
modern health care provision (Fernando and Dawson, 2008). Privacy concerns control over
access to oneself and associated information, including health information, while security
refers to all measures that protect information privacy (Cheong, 1996). Privacy security
implementations are those preserving the data confidentiality, data integrity and the data
41 National Committee on Vital and Health Statistics.

112
availability of patient information on a health information system. As more practices adopt
health information system, robust privacy and security implementations have become
increasingly relevant in-patient care settings (Fernando, 2004).
Patients expect their sensitive personal information to be handled appropriately, to
ensure accuracy and confidentiality (Hall, 2014). Privacy and security are big concerns for
a hospital’s network infrastructure. Implementing security systems to prevent data breaches
and leaks, keep patient health information secure, and managing the secure transmission of
electronic medical record data are all major issues in the industry. Management must
continue addressing ethical and legal issues regarding control of information.
Health care organisations need to safeguard patient information with secure storage
of all compliance-related documentation. This includes ensuring the ability to control
access, add, or modify records from patient information.
2.7.5 Portuguese National Health System Overview
The Portuguese population enjoys good health and increasing life expectancy. All
residents in Portugal have access to health care provided by the National Health Service
(SNS), financed mainly through taxation.
Financial resources directed towards health care have reached a high-level relative to
the country’s wealth. Approximately 10% of GDP is devoted to health expenditure, which
puts Portugal among the countries with the highest level of health spending within the
EU27 and the OECD (Barros et al., 2011).
About 34%t of healthcare costs are financed by private entities and citizens. The NHS
is funded mostly by general taxation (co-payments represent less than 1%), while
subsystems and supplemental insurance operate on individual and employer contributions.
Approximately 17 % of the population is covered under a subsystem and 21% under
a voluntary insurance plan. The healthcare sector represents about 10% of the gross
domestic product (GDP) and almost 6% of the public budget and recorded constant growth
over the last decade (Deloitte, 2011). Main characteristics of the NHS are the following:
113
- Regulated, planned and managed at the central level although the delivery of
health care services has been structured at the regional level;
- Guaranteeing universal coverage mostly free of charge at the point of service;
- Mainly public financing of healthcare – out of general taxation
- Mixed service provision – public and private; various public and private ‘sub-
systems’ complement the national system
At the end of the first decade of the 21st century, health in Portugal faced several
challenges:
- A major increase in health expenditure and difficulties with cost control;
- Technology and innovation in medical practice, with its impact on the growth
of expenditures;
- The increasing role of IS/IT in health promotion and healthcare delivery, to
make them effective tools to bring the population in remote locations closer to
healthcare services;
- An ageing population, with the associated pressures on continued and long-term
care, among others;
- Difficulty in reducing mortality due to traffic accidents and lifestyle related
diseases.
Portugal citizens have enjoyed substantial improvements in their health status over
the last 25 years. Life expectancy is approaching the European Union42 average, and rates
of perinatal and infant mortality have gone from being the worst through the 1980s and
1990s to among the best in 2003 (WHO, 2009). “Portugal has a well-developed quality
infrastructure, with the health data system and use of clinical guidelines standing out as
areas of excellence” (OECD, 2015b, p.20). In line with its European partners’ expectations,
Portugal has shown a growing concern amongst its citizens, health professionals, hospital
42 The EU 15 group comprises the countries that were EU Member States before 2004: Austria, Belgium,
Denmark, Finland, France, Germany, Greece, Ireland, Italy, Luxembourg, the Netherlands, Portugal, Spain,
Sweden and the United Kingdom.
114
managers, policy makers, and others, for obtaining more and better information about
health in general.
This concern led to several developments and technological investments as a means
of improving the delivery of health services and for meeting the requirements of the various
stakeholders, whilst complying with the strategic guidelines of the Government’s National
Health Plan 2012-2016 and also with European Union commitments (Andreassen et al.,
2007; DGS43, 2013). This model advocates a patient-centred approach, and also an
integrated disease management, which both contribute to achieving more and better health
for all in a sustainable way (Andreassen et al., 2007). However, many uncertainties and
challenges still exist, as well as constraints, which range from a lack of funding, through to
the diversity of subsystems, low information system interoperability and other restrictions
that may well prevent the successful implementation of this integrated data platform.
After the revolution of 1974, a process of health services restructuring began, which
culminated in the establishment of the SNS44 in 1979. According to the Portuguese
Constitution45 approved in 1976 (article 64), health policies should promote equality of
access to healthcare for the citizens, ensuring everyone access to adequate medical care,
irrespective of socio-economic condition or geographic location and tending to be free. The
main values of the SNS are the following (CGF46, 2014):
- Universality – no one is excluded from healthcare.
- Access to quality care – everyone has equal acess to quality care.
- Equity – everyone has equal access to care, according to their needs, regardless
of gender, religion, ethnic origin, age, social status or ability to pay for such care
43 Direção Geral de Saúde 44 Serviço Nacional de Saúde, Lei n.º 56/79, Diário da República n.º 214/1979, Série I de 1979-09-15.
Available at: https://dre.pt/web/guest/legislacao-consolidada/-
/lc/75079849/view?q=Servi%C3%A7o+Nacional+de+Sa%C3%BAde, 19/07/2017. 45 Constituição da República Portuguesa, Decreto de aprovação da Constituição, Diário da República n.º
86/1976, Série I de 1976-04-10. Available at: https://dre.pt/web/guest/legislacao-consolidada/-
/lc/34520775/view?q=constitui%C3%A7%C3%A3o+portuguesa, 19/07/2017. 46 Calouste Gulbenkian Foundation
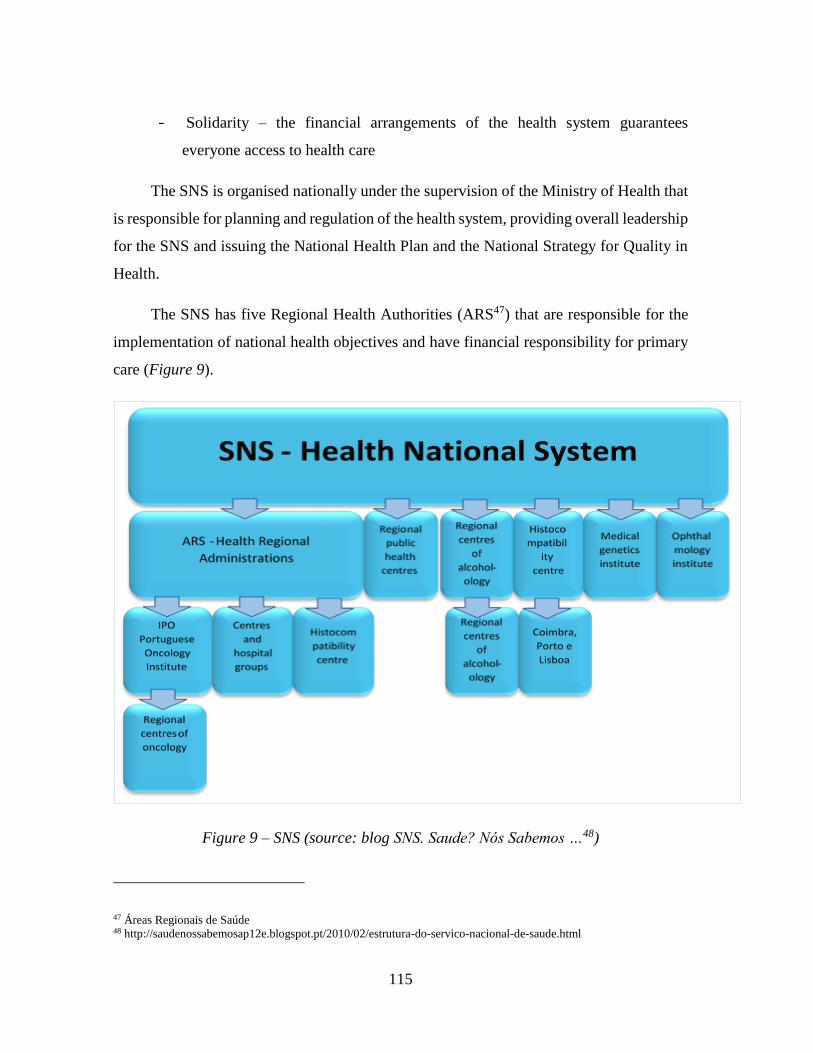
115
- Solidarity – the financial arrangements of the health system guarantees
everyone access to health care
The SNS is organised nationally under the supervision of the Ministry of Health that
is responsible for planning and regulation of the health system, providing overall leadership
for the SNS and issuing the National Health Plan and the National Strategy for Quality in
Health.
The SNS has five Regional Health Authorities (ARS47) that are responsible for the
implementation of national health objectives and have financial responsibility for primary
care (Figure 9).
Figure 9 – SNS (source: blog SNS. Saude? Nós Sabemos …48)
47 Áreas Regionais de Saúde 48 http://saudenossabemosap12e.blogspot.pt/2010/02/estrutura-do-servico-nacional-de-saude.html
116
The SNS is complemented by private healthcare provision. Alongside the SNS, there
are both special health insurance schemes (health subsystems) and voluntary private health
insurance.
Decentralization is formally a keyword of the SNS. In fact, the Portuguese
Constitution, the Basic Law on Health49 approved in 1990 and the Statute of the SNS50
approved in 1993 provide the political and normative support to the decentralization of the
health service.
In practice, however, responsibility for planning and resource allocation in the
Portuguese healthcare system has remained highly centralized, even after the current five
ARS were established in 1993. The Basic Law on Health comprised the decentralization
of the system’s operation and management at the regional level, integration of health
centres and hospitals in health units and the contracting out of health services funded by
national taxation. The other European countries have regarded decentralization as an
effective means to improve service delivery, to better allocate resources according to need,
to involve the community in health decision-making and to reduce inequities in health
(Saltman et al., 2007).
The key main findings of the 2011 survey about the consumer perceptions of
Portugal’s healthcare system performance (Deloitte, 2011) are the following:
₋ Users believe that the Portuguese healthcare system is wasteful, complex, and
performs poorly – A half of users believe that 50% or more of healthcare
spending is wasted, mostly attributed to redundant paperwork (67%).
49 Lei de Bases da Saúde, Lei n.º 48/90, Diário da República n.º 195/1990, Série I de 1990-08-24. Available at:
https://dre.pt/web/guest/legislacao-consolidada/-/lc/57483775/201707171752/57494523/diploma/indice?q=48%2F90,
19/07/2017. 50 Estatuto do Serviço Nacional de Saúde, Decreto-Lei n.º 11/93, Diário da República n.º 12/1993, Série I-A de 1993-
01-15. Available at: https://dre.pt/web/guest/legislacao-consolidada/-
/lc/34544275/view?q=estatuto+do+servi%C3%A7o+nacional+de+sa%C3%BAde, 19/07/2017.
117
₋ Satisfaction overall is low - 13% of users are satisfied with the performance of
the healthcare system, mainly with modern technology (41%) and innovation
(40%); 22% are not at all satisfied, mostly are dissatisfied with wait times (70%).
₋ Almost 8 in 10 Portuguese users are cautious about spending on healthcare. 3 in
10 are concerned about future healthcare costs.
₋ Users are concerned about their ability to meet future healthcare costs; 43% say
they spent more on healthcare products and services than in the prior year.
₋ Overall, users feel there is substantial room for improvement in SNS; 41% agree
it is possible to improve quality and reduce costs simultaneously in the current
healthcare system.
₋ Most users believe that the system should increase access to primary healthcare
services; 77% say they are in favour of expanding the number of providers by
training more primary care practitioners and more specialist medical
practitioners (75%).
Portugal has implemented a comprehensive set of structural reforms and introduced
an extensive range of quality initiatives aimed at providing fiscal sustainability, improving
efficiency and achieving better quality across the healthcare system (Biscaia and Heleno,
2017; Monteiro et al., 2017; OECD, 2015b; Pisco 2011) such as:
₋ The 2007 Primary Healthcare Reform led to the establishment of the innovative
Family Health Unit, aimed at encouraging more multidisciplinary team working
and at achieving greater co-ordination between providers.
₋ Rationalisation of the hospital sector started in the early 1990s and is an ongoing
process characterised by the concentration of services into fewer, larger hospital
centres and hospitals groups complemented with the expansion of the Local
Health Units.
₋ The expansion of the National Continuous Care Network, a joint initiative of
the Ministry of Health and the Ministry of Labour and Social Solidarity, which
aims to provide care to citizens in situations of dependency and/or rehabilitation,
mostly used by the elderly population.
118
₋ The new drug policy, a set of measures aimed, among other things, at reducing
prices and encouraging the use of generics to reduce drug costs.
Portugal has made sustained progress in containing spending whilst maintaining
efforts to continuously improve care quality (OECD, 2015b).
To go forward and meet both targets of increasing value for money and improving
quality in care, it will be important to maintain the efforts on the improvement health
performance. Structural reform concerning where and how care is delivered is also needed,
with an emphasis on shifting care out of hospitals into less-expensive units. Portugal focus
in near future will be on clinical processes and pathways, as well as to use more effectively
the Portuguese healthcare workforce (OECD, 2015b).
The OECD document (OECD, 2015b) reported remaining challenges remain to
improve the quality of care in Portugal, namely:
₋ Although the reorganization of the hospital system is an ongoing process, the
SNS still relies on the hospital sector. To relieve pressure on hospital sector, the
SNS need expand their capacity at community level.
₋ The SNS needs to evolve towards a more comprehensive delivery approach of
health involving more partnership between health and social care providers.
₋ An appropriate balance between traditional Primary Healthcare Units and
Family Health Units needs to be taken at system-level.
₋ To meet reforms targets, the use of quality-based payment could be extended.
₋ Ensuring that the ongoing reforms are monitored and evaluated
SNS, aligned with the other European countries, is going through major changes,
with some major disruptive trends affecting the way of think health, challenging the very
ways of organising and delivering health services that have been built up over these years
of great expansion. These trends are:
119
₋ The growth in long-term conditions and non-communicable diseases51
₋ Citizens better educated, more demanding and less deferential towards health
professionals and less likely to simply follow their advice or prescription
without question.
₋ The start of personalised medicine, with genetic testing and biological
diagnoses, changing the way patients with a range of different conditions are
treated.
₋ Information and communications technology bringing us new imaging and
diagnostic techniques and the ability to monitor and treat patients remotely and
at earlier stages in the development of their conditions.
₋ Increasing globalisation and global interdependence in health and healthcare.
Examples has already shown how new diseases can spread rapidly around the
world.
A suggested list of design principles for a high quality and sustainable health and health
care system in the 21st Century could be the following (CGF, 2014):
₋ Broad base - Designed on a shared vision that addresses the different
determinants of health;
₋ Values-oriented - ensuring that the entire population is provided equitably;
₋ Inclusive - involving all sectors of society in a new social model for health;
₋ Responsible - Clear definition of responsibilities, authority and reports to the
public;
₋ Open and transparent - Allowing citizens access to health information and costs
of service;
₋ Person-centered - A sensitive, safe, integrated and personalized care, with
patients fully involved in decision making process;
51 A non-communicable disease (NCD) is a disease that is not infectious and cannot be transferred to others.
Some of these are diseases that progress slowly or cause chronic symptoms while others progress very
rapidly. The World Health Organization estimates that NCDs are the leading cause of death worldwide,
accounting for 60 percent of deaths in all humans (e.g. Diabetes, Hypertension, Osteoporosis, Alzheimer’s…)
120
₋ Local and accessible - Whenever possible with locally accessible services;
₋ Team-based - Cooperation and sharing of knowledge among health
professionals, citizens and other partners;
₋ Evidence-based - Evidence available and used throughout the system;
₋ Continuous improvement - Focused continuous quality improvement and
learning;
₋ Capable and efficient - making the most of available resources and avoiding
waste.
2.7.6 SPMS - Serviços Partilhados do Ministério da Saúde, EPE
The centralization of the public purchases has been increasingly a strategic trend,
particularly in the health sector (Aperta et al., 2015). The centralization of the procurement
is driven be the cost savings and process efficiency (Karjalainen, 2009; Cousins et al,
2008). The SPMS was established in 2010 as a central purchasing entity for the Portuguese
Health Minister. The SPMS is a public business organization that ensures the provision of
shared services in the level of procurement and logistics, financial management,
specialized human resources and IS/IT systems for the entities that integrate the National
Health Service. SPMS assignments52 are the following:
- The provision of health-specific shared services in procurement and logistics,
financial services, human resources and information and communication
systems and technologies to the establishments and services of the National
Health Service (NHS), regardless of their legal entities, as well as to the organs
and services of the Ministry of Health and any other entities, when carrying out
specific activities in the health area.
- In the context of shared purchasing and logistics services, the mission is to
centralize, optimize and rationalize the acquisition of goods and services and to
provide logistics services, with responsibilities for procurement strategy, pre-
52 https://www.sns.gov.pt/entidades-de-saude/servicos-partilhados-do-ministerio-da-saude/
121
contractual procedures, public procurement, internal logistics, payments and
performance monitoring.
- In shared financial services, its mission is to cooperate, share knowledge and
information, and develop service activities in the areas of financial and
accounting management, with responsibilities for budget planning and
preparation, budget control, contract management, analytical accounting,
general accounting, payments and collections and treasury.
- In the scope of shared human resources services, the mission is to provide a
shared service of high efficiency human resources and levels of automation,
with responsibilities for information gathering and diagnosis, salary processing
and management indicators.
- In the context of shared services of information and communication systems and
technologies, its mission is to cooperate, share knowledge and information and
develop activities in the areas of information and communication systems and
technologies, ensuring the infrastructure of information systems of the Ministry
of Health and promoting the definition and use of standards, methodologies and
requirements that guarantee the interoperability and interconnection of health
information systems among each other and with information systems that are
transversal to public administration.
SPMS was also equipped with new mechanisms which aims to facilitate the
procurement procedures on health and enable a more effective functioning in the context
of all public procurement, particularly in the context of aggregation of information
(Mimoso, 2014). Thus, the whole procurement process must be based on a single integrated
information system53. Centralized purchases in health are a relatively recent process in
Portugal. In some situations, the centralization of purchases can offer competitive and
efficiency advantages through the capacity of negotiation and the reduction of the resources
used.
53 https://community.vortal.biz/PRODSTS/Users/Login/Index?SkinName=SPMS
122
Several disadvantages were also reported, namely, possibility of oligopoly by
suppliers, generated by imperfect competition; decreased suppliers' ability to respond in
the medium or long term may lead to a decrease in competition and a possible increase in
prices; and, difficulties in controlling the purchasing process, which may compromise its
effectiveness (Aperta et al., 2015).
2.7.7 National Strategy for the Health Information Ecosystem 202054
The adoption of a strategy for Health Information Systems within the 2016-2020
timeframe, is aligned with the strategic initiatives promoted by Government’s National
Health Plan, the Health guidelines designed by the WHO and European Union. The
National Strategy for the Health Information Ecosystem 2020 – ENESIS 2020 (eSIS) add
a set of technologies, people and processes involved in the life cycle of information related
to all dimensions of citizen health and other related areas, including the organisations where
healthcare is provided. eSIS is an approach that goes beyond the NHS and extends to the
health system, in line with the general understanding arising from the Basic Law on Health
approved in 1990 and reinforced through the despacho No. 3156/2017 which establishes a
clear intention to introduce principles of governance and management of the National
Strategy for the Health Information Ecosystem.
The SPSM is responsible for the coordination and supervision of eSIS under
guidance of the respective ministry, guaranteeing the promotion of the eSIS and ensuring
its operational implementation under the NHS. The result is a shared vision for the area of
the Systems and Information Technology for Health that, when integrated in the Sectorial
Plan of the Ministry of Health, and founded on participatory management and governance,
allows the strategies and initiatives of the various actors of the ecosystem to be steered, and
to progress in a collaborative or separate manner towards common goals.
54 Despacho n.º 3156/2017, Diário da República n.º 74/2017, Série II de 2017-04-13, Ministry of Health.
Available at: https://dre.pt/home/-/dre/106881538/details/4/maximized?serie=II&dreId=106872363, 19/07/2017.
123
Chapter 3. Philosophical Perspective and Research
Approach
3.1 Overview
“The goal of research in social sciences is to produce a reliable body of knowledge
that enables us to understand and explain the social world. The identification of a
philosophical perspective is important. It exposes the researcher’s assumptions about the
nature of the phenomena under investigation (ontology) and his/ her point of view of the
ways in which is possible to acquire knowledge (epistemology)” (Caldeira, 2000, p. 73).
Business and management research provides conclusions that enhance knowledge
and understanding but also address contemporary business issues and practical managerial
problems (Saunders et al., 2009). Business and management research is defined as the
methodical and objective procedure of getting the necessary information to facilitate the
decision-making procedure regarding various organisational issues (Zikmund, 2010).
It is not easy to conduct a research today, heightened by the incoherent classification
of research philosophies such as epistemology, ontology, axiology and by debates about
quantitative versus qualitative research (Mkansi and Acheampong, 2012). Several studies
have used different descriptions, categorisations and classifications of research paradigms
and philosophies in relation to research methods with overlapping emphasis and meanings
(Saunders et al., 2009; Ritchie and Lewis, 2003; Guba, 1990; Guba and Lincoln, 1989).
There has been widespread debate in recent years within many of the social sciences
regarding the relative merits of quantitative and qualitative strategies for research. The
positions taken by individual researchers vary considerably, from those who see the two
strategies as entirely separate and based on alternative views of the world, to those who are
happy to mix these strategies within their research projects.
Bryman (1988) argued for a best of both worlds approach and suggested that
qualitative and quantitative approaches should be combined. Hughes (1997), nevertheless,
124
warns that such solutions underestimate the politics of legitimacy that are associated with
choice of methods.
Historically, research in information systems, particularly in the US, is mostly
supported in a positivist philosophy (Mingers, 2004), as demonstrated by several studies
(e. g. Orlikowski and Baroudi, 1991; Chen and Hirschheim, 2004).
Each research paradigm provides a set of specific attributes to achieve different
scientific research objectives. If on one hand the positivist paradigm points to replicability
and generalization, the interpretative paradigm increases understanding through the in-
depth analysis of the phenomenon studied (Orlikowski and Baroudi, 1991).
Chen and Hirschheim (2004) argue that the methodologies or alternative paradigms
such as interpretivism and qualitative methods should be encouraged because they provide
different dimensions to the research that the positivist paradigm and its quantitative
methods would not be able to accomplish.
What distinguishes information systems from other fields is its concern for the use
of artefacts in human-machine systems. This domain of interest locates the discipline of
IS/IT “at the intersection of knowledge of the properties of physical objects (machines) and
knowledge of human behaviour” Gregor (2006; p. 4). Therefore, according to the same
author, to understand IS/IT, theory is required that links the natural world, the social world
and the artificial world of human constructions.
In the IS/IT discipline, political and professional contexts have changed significantly
(Chen and Hirschheim, 2004) and the alternative paradigms such as interpretivist have
become more widely accepted even in the mainstream journals such as MIS Quarterly,
traditionally positivist-oriented (Trauth and Jessup, 2000; Walsham, 1995a).
Research diversity and methodological pluralism has received substantial attention
during the last decades (Galliers, 1991; Klein et al., 1991; Walsham, 1995b; Mingers, 2001)
being advocated for any serious IS/IT research agenda (Klein et al., 1991). In contrast to
125
the dominant quantitative methods, qualitative research methods have also become more
popular in the IS/IT field (Lee, 1989; Walsham, 1995b; Silverman, 1998).
3.2 Research paradigm
“Research paradigms inherently reflect our beliefs about the world we live in and
want to live in” (Lather, 1986, p. 259).
According to Kuhn (1970) paradigm refers to a research culture with a set of beliefs,
values, and assumptions that a community of researchers has in common regarding the
nature and conduct of research.
Research paradigms can be interpreted as worldviews or as a set of beliefs that
underpin an individual understanding of the world and their place and relationship within
in (Guba and Lincoln, 1994). As such, a paradigm represents a consensus across the
relevant scientific community about the theoretical and methodological rules to be
followed, the instruments to be used, and the problems to be investigated, and the standards
by which research is to be judged (Marshall and Rossman, 2006).
Paradigms can be revealed by the researcher’s responses to the following three
questions (Guba and Lincoln, 1994, p.108):
₋ “What is the form and nature of reality, and therefore what can be known about
it?” (Ontological question);
₋ “What is the nature of the relationship between the researcher, and what can be
known?” (Epistemological question);
₋ “How can the researcher go about finding whatever he believes can be known?”
(Methodological question).
Guba and Lincoln (1994) have made a very useful contribution to articulating and
differentiating competing paradigms of inquiry.
According to these authors there are four main paradigms of inquiry: (1) positivism,
(2) post-positivism, (3) critical theory, and (4) constructivism (Table 16).
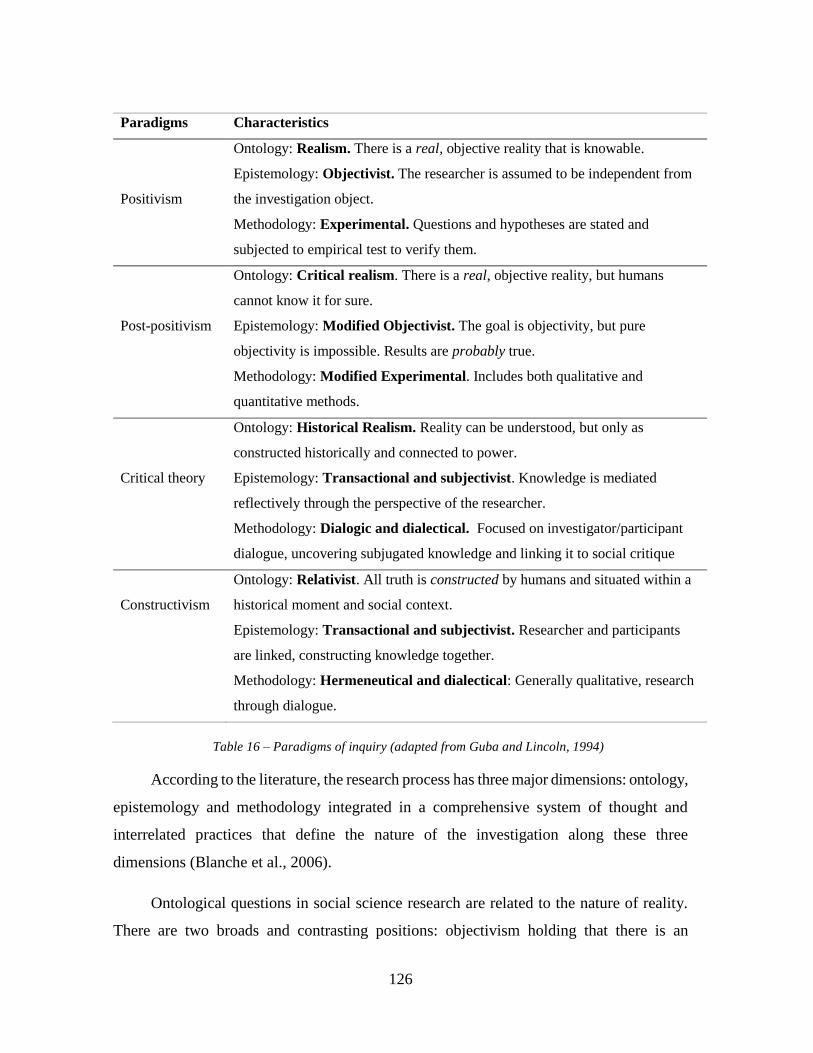
126
Paradigms Characteristics
Positivism
Ontology: Realism. There is a real, objective reality that is knowable.
Epistemology: Objectivist. The researcher is assumed to be independent from
the investigation object.
Methodology: Experimental. Questions and hypotheses are stated and
subjected to empirical test to verify them.
Post-positivism
Ontology: Critical realism. There is a real, objective reality, but humans
cannot know it for sure.
Epistemology: Modified Objectivist. The goal is objectivity, but pure
objectivity is impossible. Results are probably true.
Methodology: Modified Experimental. Includes both qualitative and
quantitative methods.
Critical theory
Ontology: Historical Realism. Reality can be understood, but only as
constructed historically and connected to power.
Epistemology: Transactional and subjectivist. Knowledge is mediated
reflectively through the perspective of the researcher.
Methodology: Dialogic and dialectical. Focused on investigator/participant
dialogue, uncovering subjugated knowledge and linking it to social critique
Constructivism
Ontology: Relativist. All truth is constructed by humans and situated within a
historical moment and social context.
Epistemology: Transactional and subjectivist. Researcher and participants
are linked, constructing knowledge together.
Methodology: Hermeneutical and dialectical: Generally qualitative, research
through dialogue.
Table 16 – Paradigms of inquiry (adapted from Guba and Lincoln, 1994)
According to the literature, the research process has three major dimensions: ontology,
epistemology and methodology integrated in a comprehensive system of thought and
interrelated practices that define the nature of the investigation along these three
dimensions (Blanche et al., 2006).
Ontological questions in social science research are related to the nature of reality.
There are two broads and contrasting positions: objectivism holding that there is an
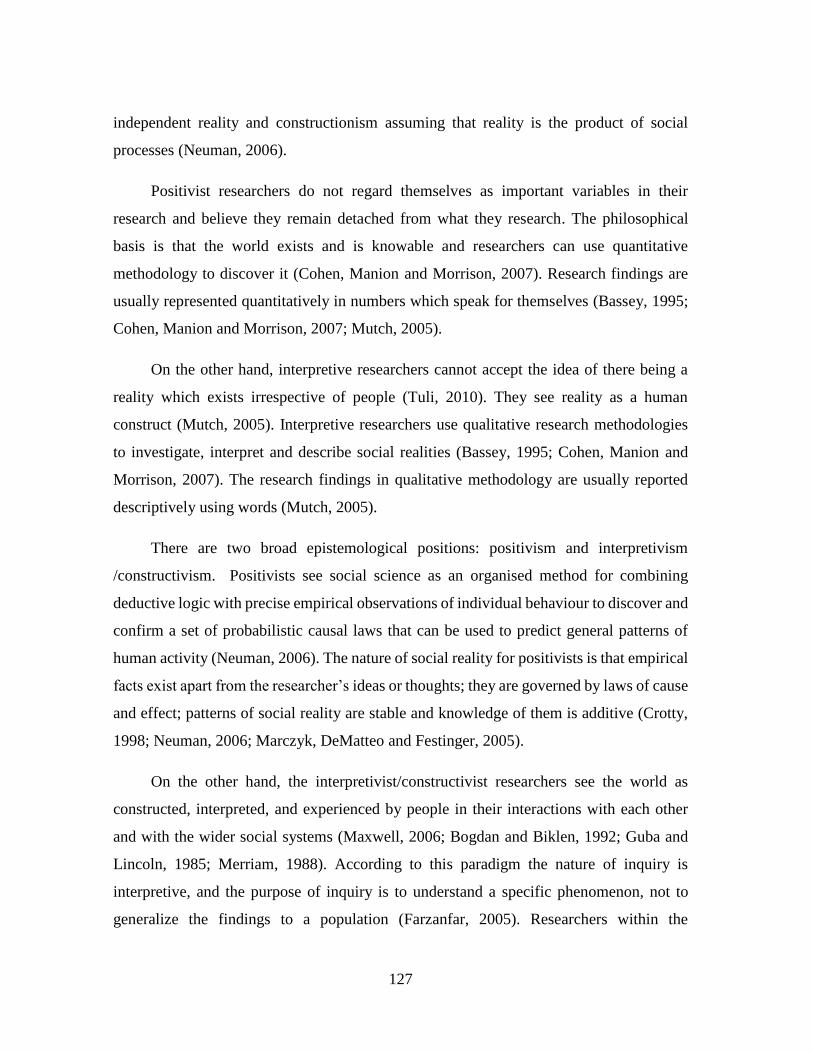
127
independent reality and constructionism assuming that reality is the product of social
processes (Neuman, 2006).
Positivist researchers do not regard themselves as important variables in their
research and believe they remain detached from what they research. The philosophical
basis is that the world exists and is knowable and researchers can use quantitative
methodology to discover it (Cohen, Manion and Morrison, 2007). Research findings are
usually represented quantitatively in numbers which speak for themselves (Bassey, 1995;
Cohen, Manion and Morrison, 2007; Mutch, 2005).
On the other hand, interpretive researchers cannot accept the idea of there being a
reality which exists irrespective of people (Tuli, 2010). They see reality as a human
construct (Mutch, 2005). Interpretive researchers use qualitative research methodologies
to investigate, interpret and describe social realities (Bassey, 1995; Cohen, Manion and
Morrison, 2007). The research findings in qualitative methodology are usually reported
descriptively using words (Mutch, 2005).
There are two broad epistemological positions: positivism and interpretivism
/constructivism. Positivists see social science as an organised method for combining
deductive logic with precise empirical observations of individual behaviour to discover and
confirm a set of probabilistic causal laws that can be used to predict general patterns of
human activity (Neuman, 2006). The nature of social reality for positivists is that empirical
facts exist apart from the researcher’s ideas or thoughts; they are governed by laws of cause
and effect; patterns of social reality are stable and knowledge of them is additive (Crotty,
1998; Neuman, 2006; Marczyk, DeMatteo and Festinger, 2005).
On the other hand, the interpretivist/constructivist researchers see the world as
constructed, interpreted, and experienced by people in their interactions with each other
and with the wider social systems (Maxwell, 2006; Bogdan and Biklen, 1992; Guba and
Lincoln, 1985; Merriam, 1988). According to this paradigm the nature of inquiry is
interpretive, and the purpose of inquiry is to understand a specific phenomenon, not to
generalize the findings to a population (Farzanfar, 2005). Researchers within the
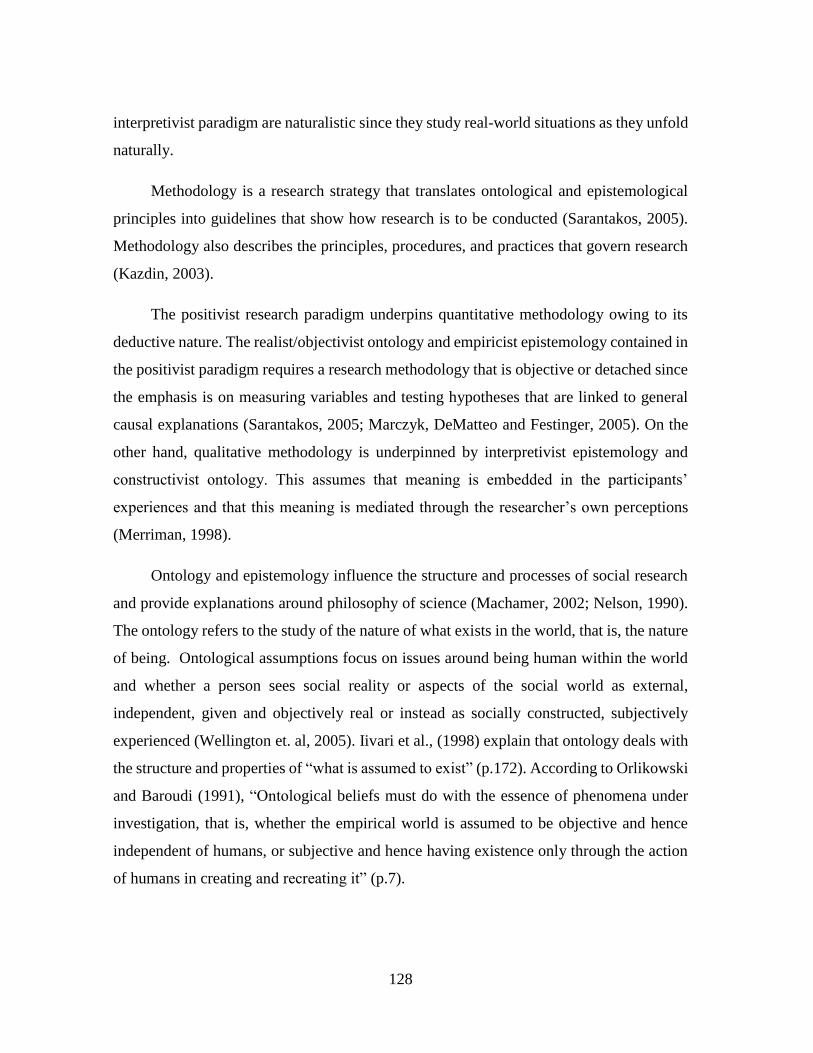
128
interpretivist paradigm are naturalistic since they study real-world situations as they unfold
naturally.
Methodology is a research strategy that translates ontological and epistemological
principles into guidelines that show how research is to be conducted (Sarantakos, 2005).
Methodology also describes the principles, procedures, and practices that govern research
(Kazdin, 2003).
The positivist research paradigm underpins quantitative methodology owing to its
deductive nature. The realist/objectivist ontology and empiricist epistemology contained in
the positivist paradigm requires a research methodology that is objective or detached since
the emphasis is on measuring variables and testing hypotheses that are linked to general
causal explanations (Sarantakos, 2005; Marczyk, DeMatteo and Festinger, 2005). On the
other hand, qualitative methodology is underpinned by interpretivist epistemology and
constructivist ontology. This assumes that meaning is embedded in the participants’
experiences and that this meaning is mediated through the researcher’s own perceptions
(Merriman, 1998).
Ontology and epistemology influence the structure and processes of social research
and provide explanations around philosophy of science (Machamer, 2002; Nelson, 1990).
The ontology refers to the study of the nature of what exists in the world, that is, the nature
of being. Ontological assumptions focus on issues around being human within the world
and whether a person sees social reality or aspects of the social world as external,
independent, given and objectively real or instead as socially constructed, subjectively
experienced (Wellington et. al, 2005). Iivari et al., (1998) explain that ontology deals with
the structure and properties of “what is assumed to exist” (p.172). According to Orlikowski
and Baroudi (1991), “Ontological beliefs must do with the essence of phenomena under
investigation, that is, whether the empirical world is assumed to be objective and hence
independent of humans, or subjective and hence having existence only through the action
of humans in creating and recreating it” (p.7).
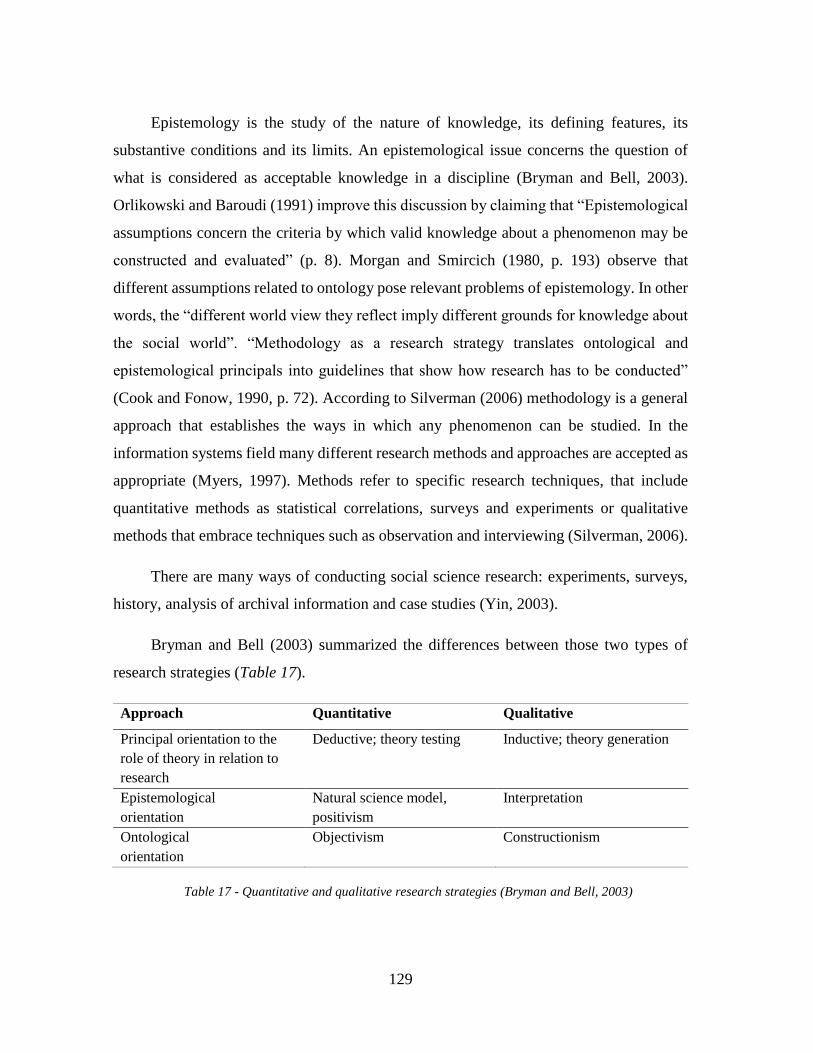
129
Epistemology is the study of the nature of knowledge, its defining features, its
substantive conditions and its limits. An epistemological issue concerns the question of
what is considered as acceptable knowledge in a discipline (Bryman and Bell, 2003).
Orlikowski and Baroudi (1991) improve this discussion by claiming that “Epistemological
assumptions concern the criteria by which valid knowledge about a phenomenon may be
constructed and evaluated” (p. 8). Morgan and Smircich (1980, p. 193) observe that
different assumptions related to ontology pose relevant problems of epistemology. In other
words, the “different world view they reflect imply different grounds for knowledge about
the social world”. “Methodology as a research strategy translates ontological and
epistemological principals into guidelines that show how research has to be conducted”
(Cook and Fonow, 1990, p. 72). According to Silverman (2006) methodology is a general
approach that establishes the ways in which any phenomenon can be studied. In the
information systems field many different research methods and approaches are accepted as
appropriate (Myers, 1997). Methods refer to specific research techniques, that include
quantitative methods as statistical correlations, surveys and experiments or qualitative
methods that embrace techniques such as observation and interviewing (Silverman, 2006).
There are many ways of conducting social science research: experiments, surveys,
history, analysis of archival information and case studies (Yin, 2003).
Bryman and Bell (2003) summarized the differences between those two types of
research strategies (Table 17).
Approach Quantitative Qualitative
Principal orientation to the
role of theory in relation to
research
Deductive; theory testing Inductive; theory generation
Epistemological
orientation
Natural science model,
positivism
Interpretation
Ontological
orientation
Objectivism Constructionism
Table 17 - Quantitative and qualitative research strategies (Bryman and Bell, 2003)
130
The deductive orientation applies to this work given that the research paradigm is the
positivism epistemology following the objectivism ontological orientation. The deductive
theory research, based on what is known about a particular subject and theoretical
considerations in relation to that subject, deduces hypotheses that must be subjected to
empirical tests (Bryman and Bell, 2003).
The goal of methodological assumption is to indicate the research methods and
techniques that help the researcher gather empirical evidence (Orlikowski and Baroudi,
1991). There are several ways of conducting social science research: experiments, surveys,
history, analysis of archival information, case study (Yin, 2003).
The research method can be qualitative or quantitative. There are three main
differences in qualitative and quantitative research (Stake, 1995, p.37):
1. The distinction between explanation and understanding as the purpose of
enquiry;
2. The distinction between personal and impersonal role for the researcher;
3. A distinction between knowledge discovered and knowledge constructed.
Traditionally, there are two research methods: survey and experiment. Survey is a
kind of research that uses predefined and structured questionnaires to capture data from
individuals (Palvia et al., 2003).
Qualitative methods are powerful especially when used to build new or refine
existing theories (Shah and Corley, 2006). The purpose of quantitative research approach
is to generalize from a sample to a population so that inferences can be made about
characteristics, attitudes, or behaviours of this population (Babbie, 1990; Creswell, 2003).
Quantitative researchers seek scientific explanations using this method to reach the
following objectives:
₋ Develop the understanding of causal relations;
₋ Describe group tendencies;
₋ Determine whether the predictive generalization of a theory holds true.
131
Surveys are widely used by quantitative researchers, including the following types:
self-administered questionnaires, structured interviews by telephone or face-to-face,
structured reviews to collect information, and structured observations (Fink, 1995).
Recently, researchers started to use web-based or internet survey and administering it
online (Buchanan and Smith, 1999; Nesbary, 2000). According to Schmidt (1997), there
are several advantages in terms of accessibility, time, and cost. Creswell (2003)
recommends the following procedures for data collection:
₋ Identify the purpose of survey research;
₋ Indicate why a survey is the preferred type of data collection for the study;
₋ Indicate whether the study will be cross sectional or longitudinal;
₋ Specify the form of data collection stressing its strengths and weaknesses.
A researcher should characterize the population and the sampling procedures as
follows:
₋ Identify the population in the study;
₋ Identify if the sampling design is single or multistage/clustering;
₋ Identify the selection process for individuals;
₋ Identify if the study will involve stratification of the population before selecting
the sample;
₋ Discuss the procedures for selecting the samples from available lists; and
₋ Indicate the number of people in the sample and the procedures used to compute
this number.
The research paradigm will result from the ontology and epistemology followed by
the researcher. All these elements are interconnected. Orlikowski and Baroudi (1991)
believe that all three research philosophies - positivism, realism and interpretivism – can
offer an insightful perspective on the phenomena of interest in IS/IT research.
Researchers adopt a positivism philosophical perspective when believe that facts and
values are distinct, and scientific knowledge consists almost exclusively of observable
132
facts. Positivist studies follow the premise related to the “existence of a priori fixed
relationships within phenomena which are typically investigated with structured
instrumentation” (Orlikowski and Baroudi, 1991, p.5). Lee and Baskerville (2003) discuss
the positivist need to discover universal laws that govern the studied phenomena.
The critical realist paradigm can be characterised by the critical intention to change
reality and the wish to emancipate alienated individuals. Researchers following a realist
perspective focus on understanding the mechanisms and structures that rule social
behaviour (Caldeira, 2000).
A realist researcher thinks that social phenomena exist not only in the mind but also
in the objective world. Moreover, that some plausible relationships are to be found among
them (Miles and Huberman, 1994).
Orlikowski and Baroudi (1991) reflect that critical realists “aim to critique the status
quo, through the exposure of what are believed to be deep-seated, structural contradictions
within social systems, and thereby to transform these alienating and restrictive social
conditions” (p.6).
Caldeira (2000), analysing critical realism literature, concludes that this is a unique
philosophical perspective, although different research methods can be used and combined.
For Mingers (2004) critical realism includes the qualitative or quantitative description of
the phenomenon and, mainly, it wants to “get beneath the surface to understand and explain
why things are as they are, to hypothesise the structures and mechanisms that shape
observable events” (p. 100).
According to Walsham (1993), an interpretivist epistemological position is
concerned with the understanding of reality and states that knowledge is subjective, being
a social construction.
Orlikowski and Baroudi (1991) observe that interpretive studies “assume that people
create and associate their own subjective and intersubjective meanings as they interact with
133
the world around them. Interpretive researchers thus attempt to understand phenomena
through accessing the meaning that participants assign to them” (p. 5).
For Walsham (2006), our knowledge of reality (including the domain of human
action) is a social human construction. In this case, it is important to observe that
interpretivist researchers are no more detached from their objects of study than are their
informants. Miles and Huberman (1994) argue that researchers have “their own
understandings, their own convictions, their own conceptual orientations; they too, are
members of a particular culture at a specific historical moment” (p. 8).
3.3 Research design
3.3.1 Overview
Research design is the “logical plan for getting from here to there, where here is the
initial set of research questions to be answered, and there are the conclusions” (Yin, 2003;
p.20).
Research design is the science of planning procedures for conducting studies to get
the most valid findings (Vogt and Johnson, 2011). Bryman (2012) has defined research
design as the framework for collection and analysis of data.
According to Yin (1984) the methodological design must be suitable to: “The
research problem; the extent of control the researcher has over actual behavioural events;
and the time-focus of the phenomena observed, i.e. contemporary or historical.” (p.13)
To be successful when performing research, it is essential to select appropriate
research methods. As emphasised by Barnes (2001) any research method inevitably has
both advantages and disadvantages, and there is unlikely to be one best way of approaching
the task. There are several different research strategies to follow while doing a research
study within applied sciences. The research design includes a range of dimensions of the
research process such as (Bryman and Bell, 2003):
₋ Expression of interrelationships between variables;
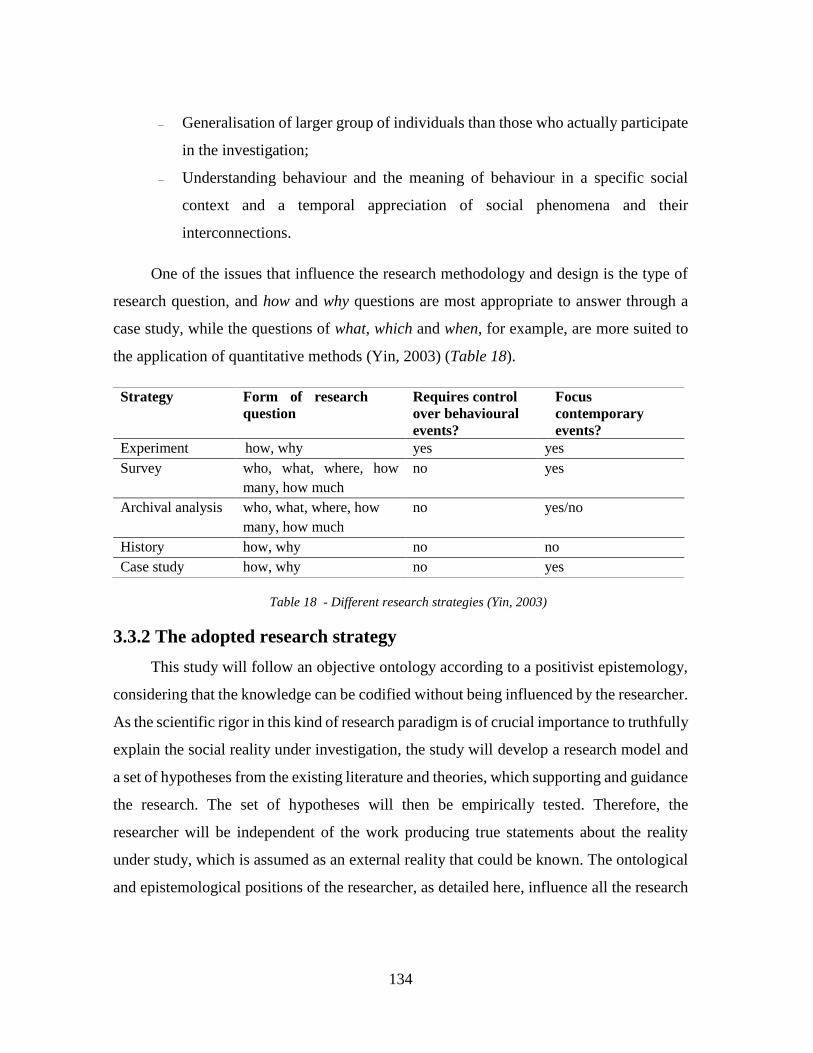
134
₋ Generalisation of larger group of individuals than those who actually participate
in the investigation;
₋ Understanding behaviour and the meaning of behaviour in a specific social
context and a temporal appreciation of social phenomena and their
interconnections.
One of the issues that influence the research methodology and design is the type of
research question, and how and why questions are most appropriate to answer through a
case study, while the questions of what, which and when, for example, are more suited to
the application of quantitative methods (Yin, 2003) (Table 18).
Strategy Form of research
question
Requires control
over behavioural
events?
Focus
contemporary
events?
Experiment how, why yes yes
Survey who, what, where, how
many, how much
no yes
Archival analysis who, what, where, how
many, how much
no yes/no
History how, why no no
Case study how, why no yes
Table 18 - Different research strategies (Yin, 2003)
3.3.2 The adopted research strategy
This study will follow an objective ontology according to a positivist epistemology,
considering that the knowledge can be codified without being influenced by the researcher.
As the scientific rigor in this kind of research paradigm is of crucial importance to truthfully
explain the social reality under investigation, the study will develop a research model and
a set of hypotheses from the existing literature and theories, which supporting and guidance
the research. The set of hypotheses will then be empirically tested. Therefore, the
researcher will be independent of the work producing true statements about the reality
under study, which is assumed as an external reality that could be known. The ontological
and epistemological positions of the researcher, as detailed here, influence all the research
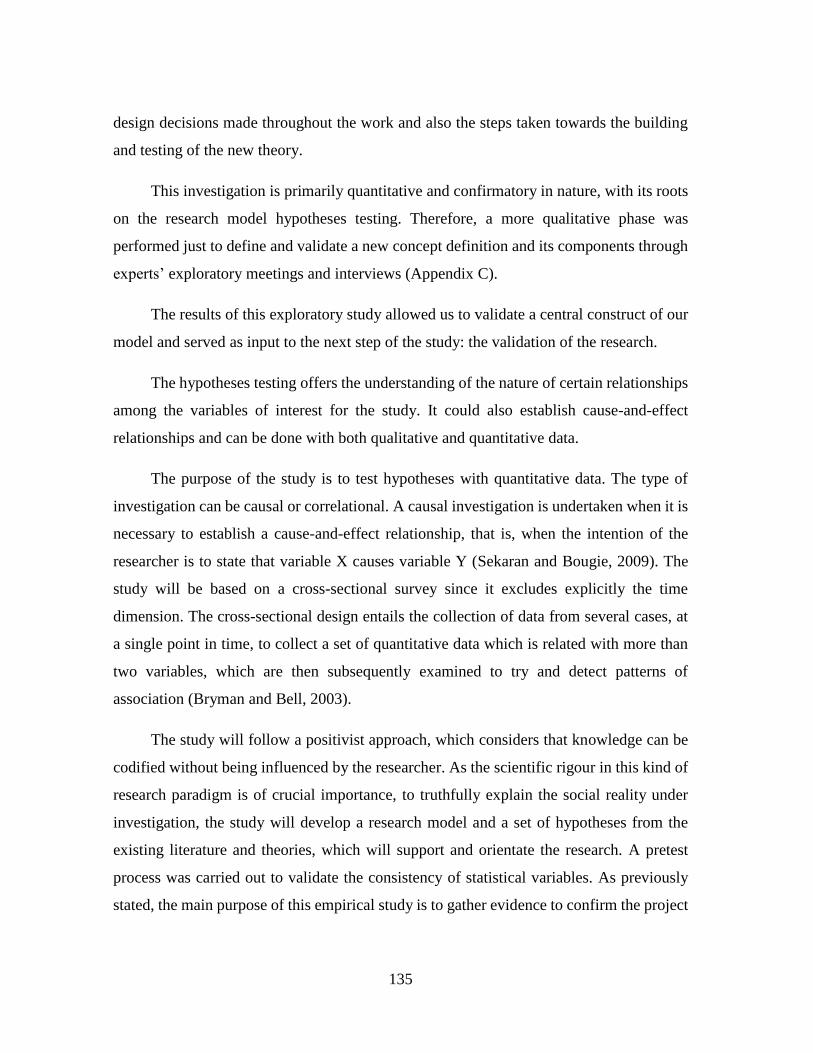
135
design decisions made throughout the work and also the steps taken towards the building
and testing of the new theory.
This investigation is primarily quantitative and confirmatory in nature, with its roots
on the research model hypotheses testing. Therefore, a more qualitative phase was
performed just to define and validate a new concept definition and its components through
experts’ exploratory meetings and interviews (Appendix C).
The results of this exploratory study allowed us to validate a central construct of our
model and served as input to the next step of the study: the validation of the research.
The hypotheses testing offers the understanding of the nature of certain relationships
among the variables of interest for the study. It could also establish cause-and-effect
relationships and can be done with both qualitative and quantitative data.
The purpose of the study is to test hypotheses with quantitative data. The type of
investigation can be causal or correlational. A causal investigation is undertaken when it is
necessary to establish a cause-and-effect relationship, that is, when the intention of the
researcher is to state that variable X causes variable Y (Sekaran and Bougie, 2009). The
study will be based on a cross-sectional survey since it excludes explicitly the time
dimension. The cross-sectional design entails the collection of data from several cases, at
a single point in time, to collect a set of quantitative data which is related with more than
two variables, which are then subsequently examined to try and detect patterns of
association (Bryman and Bell, 2003).
The study will follow a positivist approach, which considers that knowledge can be
codified without being influenced by the researcher. As the scientific rigour in this kind of
research paradigm is of crucial importance, to truthfully explain the social reality under
investigation, the study will develop a research model and a set of hypotheses from the
existing literature and theories, which will support and orientate the research. A pretest
process was carried out to validate the consistency of statistical variables. As previously
stated, the main purpose of this empirical study is to gather evidence to confirm the project
136
management mediation effect on the relation between organisational maturity and project
success in healthcare and value testable hypotheses. In the Table 19 we have a summary of
the research design choices made in the present work.
Purpose of research Explanation and prediction
Type of study Mediation approach
Level of analysis Individual level
Time dimension Cross-sectional
Data collection Survey
Table 19 - Summary of the research design choices
At this point we recall the research questions that were stated in Chapter 1.
1. How Organisational Maturity affected IS/IT Project Success in Healthcare?
2. How Project Management affected IS/IT Project Success in Healthcare?
3. How Organisational Maturity affected the Project Management?
4. How Organisational Maturity affected IS/IT Project Success through the effect
of Project Management on IS/IT Project Success?
How, what and which questions aiming at validating an existing theory, and thus
suited to be analysed with data collected through a survey (Yin, 2003).
137
Chapter 4. Research model, hypotheses and contructs
4.1 Introduction
A theory is “a set of interrelated constructs, definitions, and propositions that presents
a systematic view of phenomena by specifying relations among variables, with the purpose
of explaining natural phenomena” (Kerlinger’s, 1979, p. 64).
A conceptual model can guide research by providing a visual representation of
theoretical constructs and variables of interest. The design of the conceptual model results
from research conducting a thorough the review of the literature.
Peer-reviewed journal articles, books/monographs, conference papers, and other
relevant references were the source. As mentioned before the aim of the study is to
investigate whether health institutions’ maturity has an influence on the Success of IS/IT
Projects and whether the application of Project Management practices mediates this
relationship.
Mediation analysis is frequently of interest to social science researches as a means of
testing processes and hypothetical mechanisms through which an independent variable, X,
can induce a dependent variable, Y, indirectly through the mediator variable, M (Hayes
and Preacher, 2014; Iacobucci et al., 2007).
The mediation analysis explains how, or why, two variables are related, where an
intervening or mediating variable, M, is hypothesised to be intermediate in the relation
between an independent variable, X, and an outcome, Y (Baron and Kenny, 1986; Fairchild
and Mackinnon, 2009; Fritz et al., 2012; Hayes and Preacher, 2014; Hayes, 2015;
Iacobucci, 2008; MacKinnon et al., 2007; Rucker et al., 2011).
In the mediation analysis, the total effect, path c, is examined from the relationship
between independent variable, X, and dependent variable, Y, and the mediation is
examined for the same previous relationship, but with intervening variable acting as the
mediator. According to the mediation perspective, an intervening variable exists between
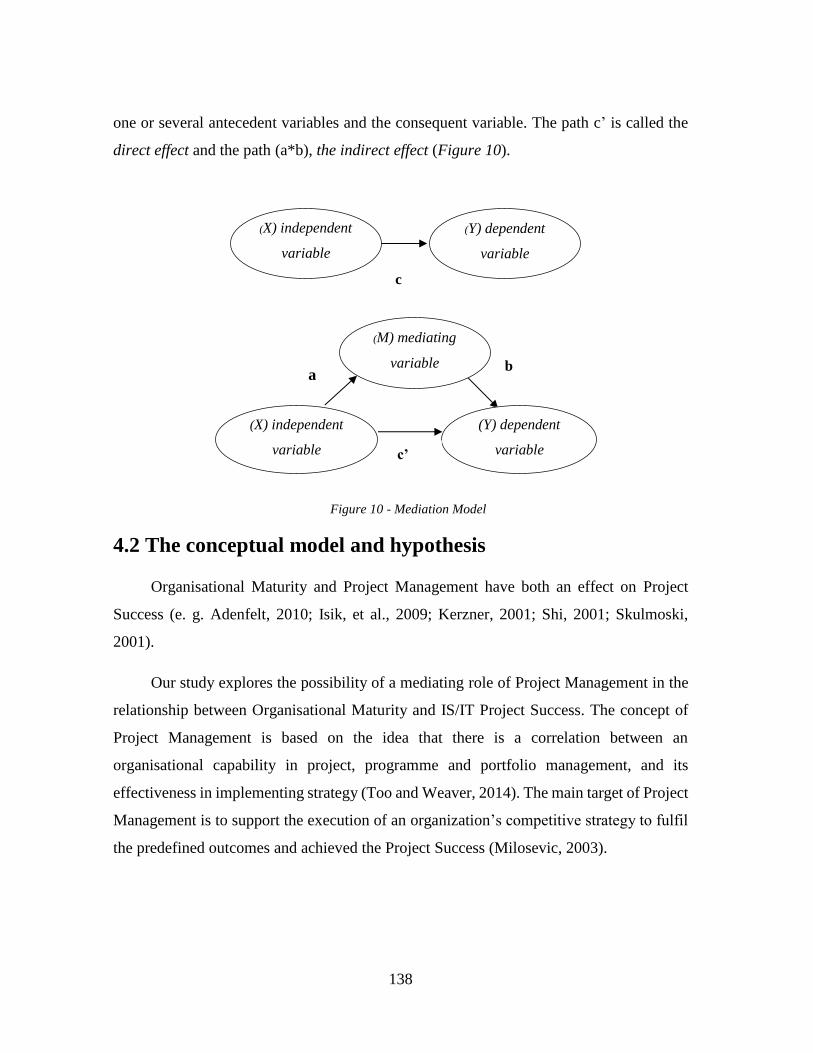
138
one or several antecedent variables and the consequent variable. The path c’ is called the
direct effect and the path (a*b), the indirect effect (Figure 10).
Figure 10 - Mediation Model
4.2 The conceptual model and hypothesis
Organisational Maturity and Project Management have both an effect on Project
Success (e. g. Adenfelt, 2010; Isik, et al., 2009; Kerzner, 2001; Shi, 2001; Skulmoski,
2001).
Our study explores the possibility of a mediating role of Project Management in the
relationship between Organisational Maturity and IS/IT Project Success. The concept of
Project Management is based on the idea that there is a correlation between an
organisational capability in project, programme and portfolio management, and its
effectiveness in implementing strategy (Too and Weaver, 2014). The main target of Project
Management is to support the execution of an organization’s competitive strategy to fulfil
the predefined outcomes and achieved the Project Success (Milosevic, 2003).
(M) mediating
variable a
b
(X) independent
variable
(Y) dependent
variable c’
(X) independent
variable
(Y) dependent
variable
c
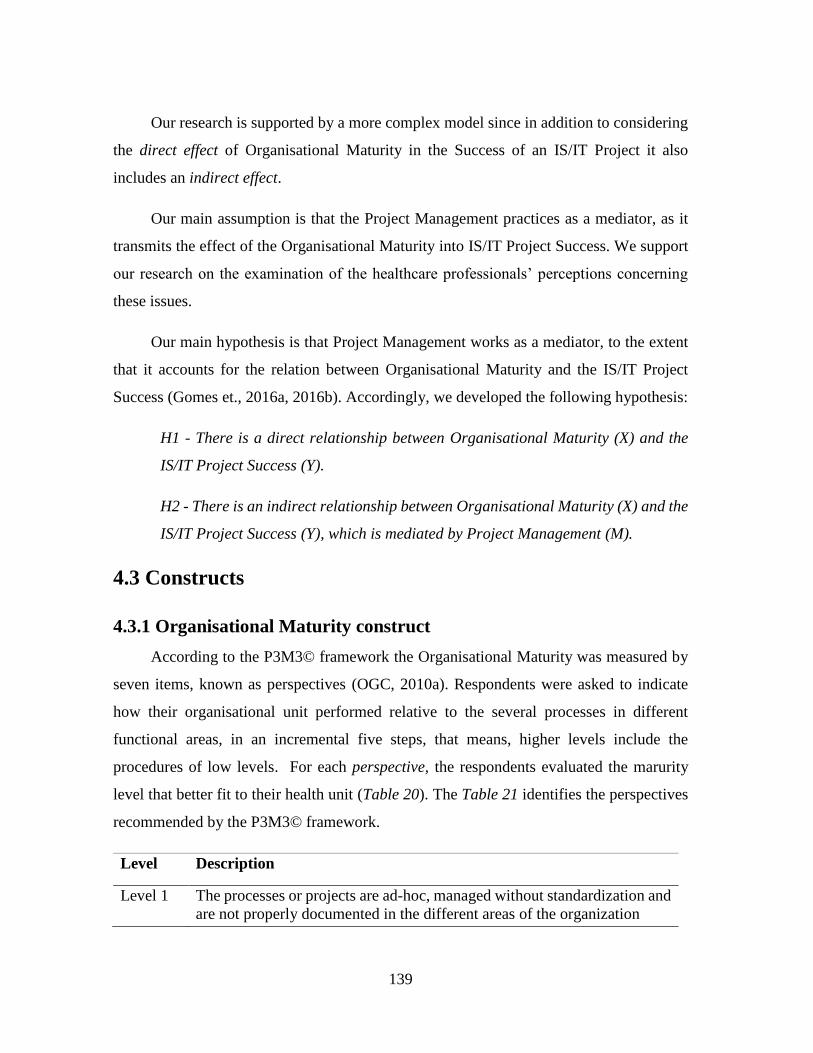
139
Our research is supported by a more complex model since in addition to considering
the direct effect of Organisational Maturity in the Success of an IS/IT Project it also
includes an indirect effect.
Our main assumption is that the Project Management practices as a mediator, as it
transmits the effect of the Organisational Maturity into IS/IT Project Success. We support
our research on the examination of the healthcare professionals’ perceptions concerning
these issues.
Our main hypothesis is that Project Management works as a mediator, to the extent
that it accounts for the relation between Organisational Maturity and the IS/IT Project
Success (Gomes et., 2016a, 2016b). Accordingly, we developed the following hypothesis:
H1 - There is a direct relationship between Organisational Maturity (X) and the
IS/IT Project Success (Y).
H2 - There is an indirect relationship between Organisational Maturity (X) and the
IS/IT Project Success (Y), which is mediated by Project Management (M).
4.3 Constructs
4.3.1 Organisational Maturity construct
According to the P3M3© framework the Organisational Maturity was measured by
seven items, known as perspectives (OGC, 2010a). Respondents were asked to indicate
how their organisational unit performed relative to the several processes in different
functional areas, in an incremental five steps, that means, higher levels include the
procedures of low levels. For each perspective, the respondents evaluated the marurity
level that better fit to their health unit (Table 20). The Table 21 identifies the perspectives
recommended by the P3M3© framework.
Level Description
Level 1 The processes or projects are ad-hoc, managed without standardization and
are not properly documented in the different areas of the organization
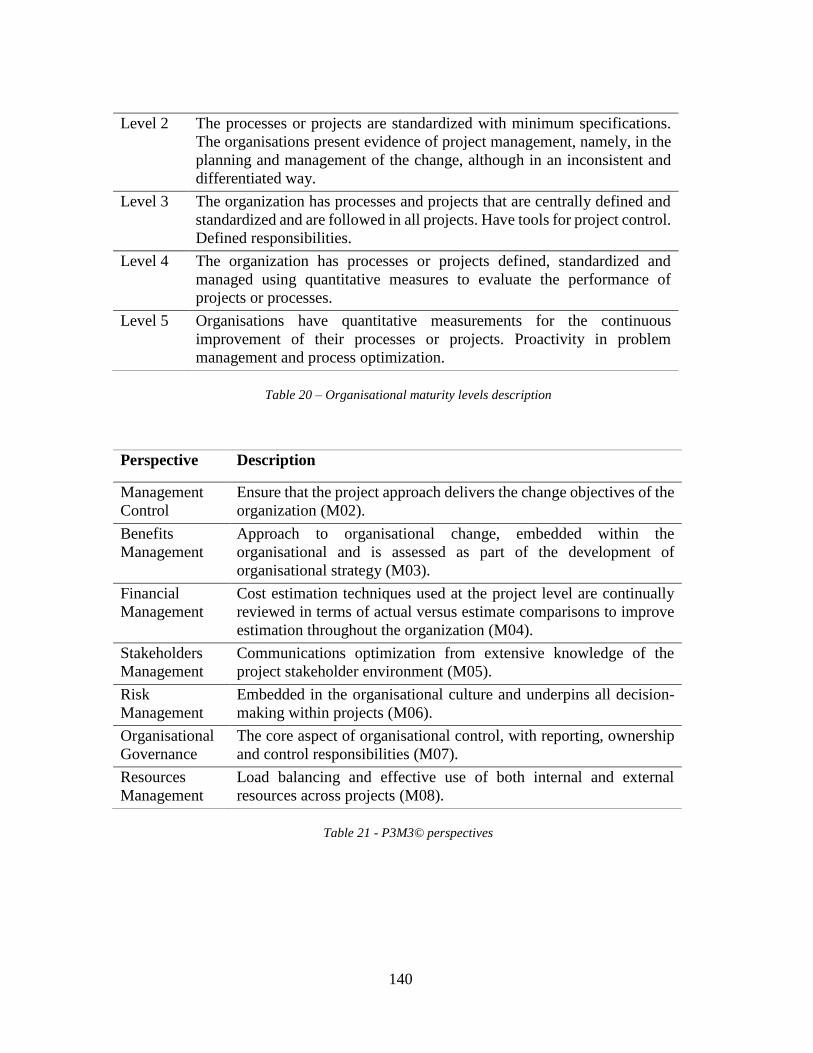
140
Level 2 The processes or projects are standardized with minimum specifications.
The organisations present evidence of project management, namely, in the
planning and management of the change, although in an inconsistent and
differentiated way.
Level 3 The organization has processes and projects that are centrally defined and
standardized and are followed in all projects. Have tools for project control.
Defined responsibilities.
Level 4 The organization has processes or projects defined, standardized and
managed using quantitative measures to evaluate the performance of
projects or processes.
Level 5 Organisations have quantitative measurements for the continuous
improvement of their processes or projects. Proactivity in problem
management and process optimization.
Table 20 – Organisational maturity levels description
Perspective Description
Management
Control
Ensure that the project approach delivers the change objectives of the
organization (M02).
Benefits
Management
Approach to organisational change, embedded within the
organisational and is assessed as part of the development of
organisational strategy (M03).
Financial
Management
Cost estimation techniques used at the project level are continually
reviewed in terms of actual versus estimate comparisons to improve
estimation throughout the organization (M04).
Stakeholders
Management
Communications optimization from extensive knowledge of the
project stakeholder environment (M05).
Risk
Management
Embedded in the organisational culture and underpins all decision-
making within projects (M06).
Organisational
Governance
The core aspect of organisational control, with reporting, ownership
and control responsibilities (M07).
Resources
Management
Load balancing and effective use of both internal and external
resources across projects (M08).
Table 21 - P3M3© perspectives
141
4.3.2 IS/IT Project Success construct
Similarly, IS/IT Project Success was conceptualized as a construct consisting in the
following four subscales and measured by a 5-item Likert scale that checks the levels of
agreement with the item statement. Were considered the following subscales:
₋ Project Management Success - Measured against iron triangle criteria (time,
cost and requirements/quality).
₋ Strategic alignment - Linking process between the overall goals and the goals
of each project that contribute to the success.
₋ Organisational change - The process in which the organization transforms its
structure, strategies, operational methods, technologies, or organisational
culture to affect change within the organization and the effects of these changes
on the organization.
₋ Stakeholders expectations - In this subscale we include the two main
stakeholder’s groups, the health professionals and the organization:
• Health professionals – There is widespread academic agreement on the
need to maintain a certain degree of autonomy for healthcare professionals
to improve not only their ability to cope with everyday challenges, but also
as a fundamental aspect of their personal performance, motivation and
realization (Harrison and Dowswell, 2002). So, the satisfaction of the
professionals’ expectations becomes a crucial issue for the project success.
• Organisational - Process-focused approach to the management of
organisational change enables collaboration between leaders, managers and
staff in the implementation of technology and business process changes
(D’Ortenzio, 2012).
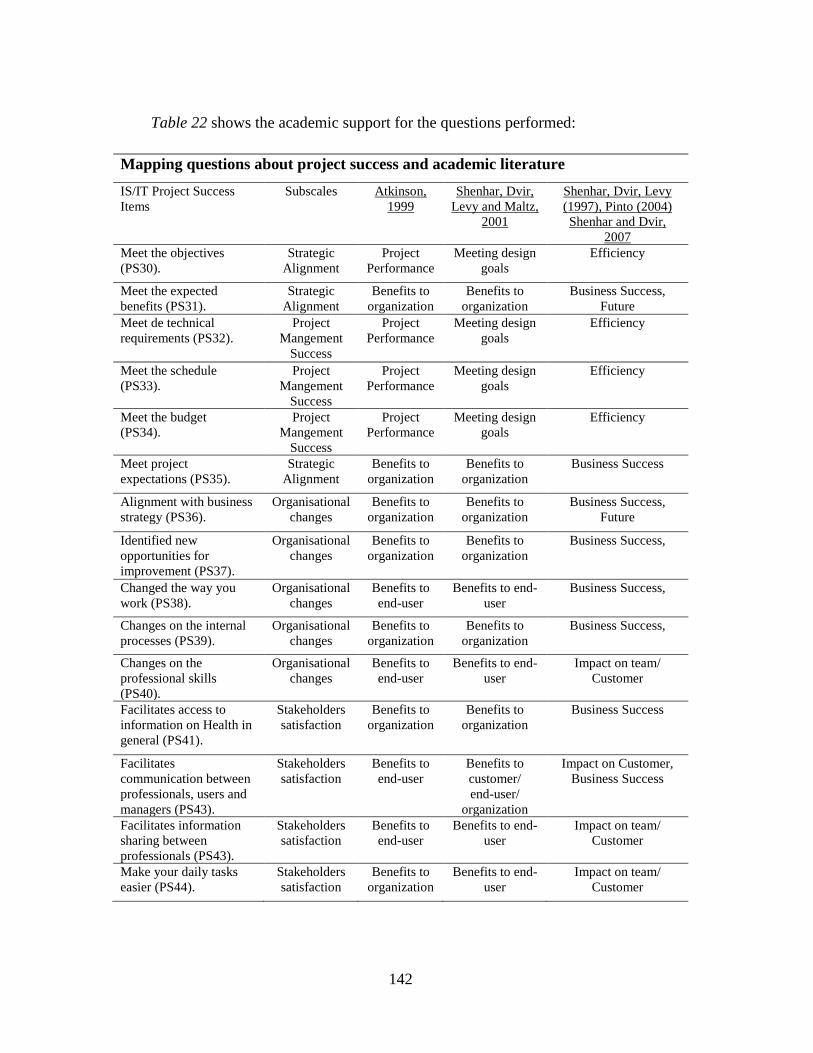
142
Table 22 shows the academic support for the questions performed:
Mapping questions about project success and academic literature
IS/IT Project Success
Items
Subscales Atkinson,
1999
Shenhar, Dvir,
Levy and Maltz,
2001
Shenhar, Dvir, Levy
(1997), Pinto (2004)
Shenhar and Dvir,
2007
Meet the objectives
(PS30).
Strategic
Alignment
Project
Performance
Meeting design
goals
Efficiency
Meet the expected
benefits (PS31).
Strategic
Alignment
Benefits to
organization
Benefits to
organization
Business Success,
Future
Meet de technical
requirements (PS32).
Project
Mangement
Success
Project
Performance
Meeting design
goals
Efficiency
Meet the schedule
(PS33).
Project
Mangement
Success
Project
Performance
Meeting design
goals
Efficiency
Meet the budget
(PS34).
Project
Mangement
Success
Project
Performance
Meeting design
goals
Efficiency
Meet project
expectations (PS35).
Strategic
Alignment
Benefits to
organization
Benefits to
organization
Business Success
Alignment with business
strategy (PS36).
Organisational
changes
Benefits to
organization
Benefits to
organization
Business Success,
Future
Identified new
opportunities for
improvement (PS37).
Organisational
changes
Benefits to
organization
Benefits to
organization
Business Success,
Changed the way you
work (PS38).
Organisational
changes
Benefits to
end-user
Benefits to end-
user
Business Success,
Changes on the internal
processes (PS39).
Organisational
changes
Benefits to
organization
Benefits to
organization
Business Success,
Changes on the
professional skills
(PS40).
Organisational
changes
Benefits to
end-user
Benefits to end-
user
Impact on team/
Customer
Facilitates access to
information on Health in
general (PS41).
Stakeholders
satisfaction
Benefits to
organization
Benefits to
organization
Business Success
Facilitates
communication between
professionals, users and
managers (PS43).
Stakeholders
satisfaction
Benefits to
end-user
Benefits to
customer/
end-user/
organization
Impact on Customer,
Business Success
Facilitates information
sharing between
professionals (PS43).
Stakeholders
satisfaction
Benefits to
end-user
Benefits to end-
user
Impact on team/
Customer
Make your daily tasks
easier (PS44).
Stakeholders
satisfaction
Benefits to
organization
Benefits to end-
user
Impact on team/
Customer
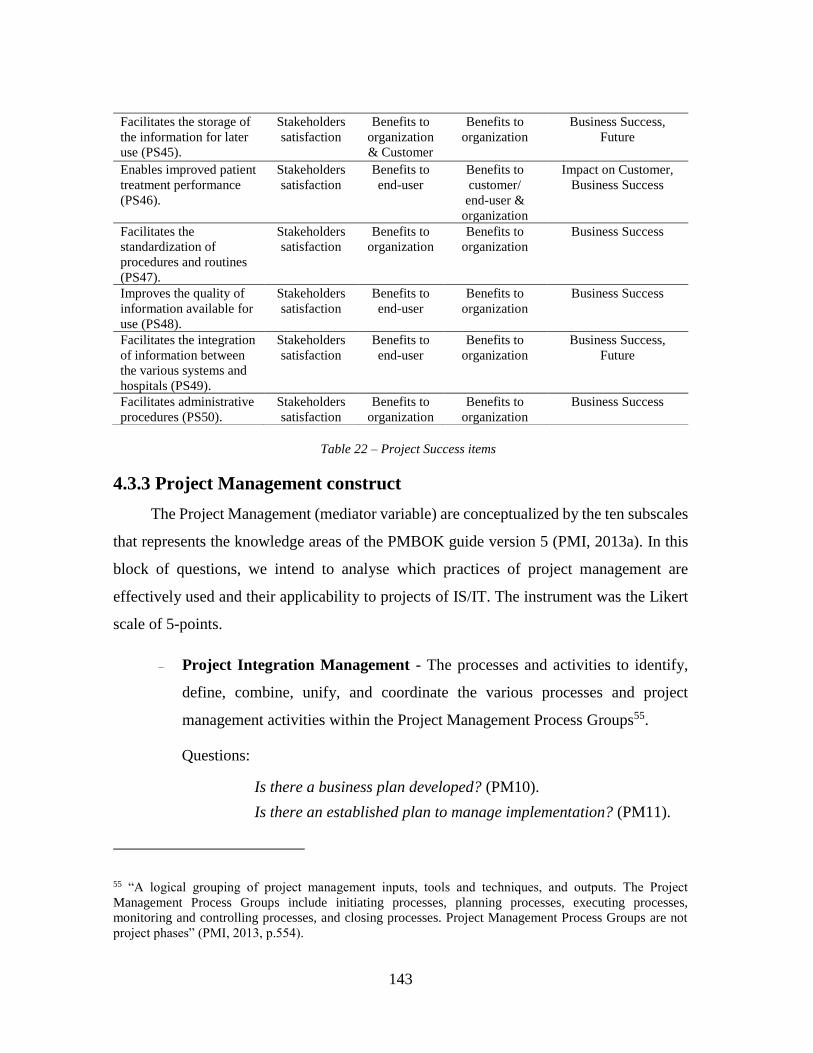
143
Facilitates the storage of
the information for later
use (PS45).
Stakeholders
satisfaction
Benefits to
organization
& Customer
Benefits to
organization
Business Success,
Future
Enables improved patient
treatment performance
(PS46).
Stakeholders
satisfaction
Benefits to
end-user
Benefits to
customer/
end-user &
organization
Impact on Customer,
Business Success
Facilitates the
standardization of
procedures and routines
(PS47).
Stakeholders
satisfaction
Benefits to
organization
Benefits to
organization
Business Success
Improves the quality of
information available for
use (PS48).
Stakeholders
satisfaction
Benefits to
end-user
Benefits to
organization
Business Success
Facilitates the integration
of information between
the various systems and
hospitals (PS49).
Stakeholders
satisfaction
Benefits to
end-user
Benefits to
organization
Business Success,
Future
Facilitates administrative
procedures (PS50).
Stakeholders
satisfaction
Benefits to
organization
Benefits to
organization
Business Success
Table 22 – Project Success items
4.3.3 Project Management construct
The Project Management (mediator variable) are conceptualized by the ten subscales
that represents the knowledge areas of the PMBOK guide version 5 (PMI, 2013a). In this
block of questions, we intend to analyse which practices of project management are
effectively used and their applicability to projects of IS/IT. The instrument was the Likert
scale of 5-points.
₋ Project Integration Management - The processes and activities to identify,
define, combine, unify, and coordinate the various processes and project
management activities within the Project Management Process Groups55.
Questions:
Is there a business plan developed? (PM10).
Is there an established plan to manage implementation? (PM11).
55 “A logical grouping of project management inputs, tools and techniques, and outputs. The Project
Management Process Groups include initiating processes, planning processes, executing processes,
monitoring and controlling processes, and closing processes. Project Management Process Groups are not
project phases” (PMI, 2013, p.554).
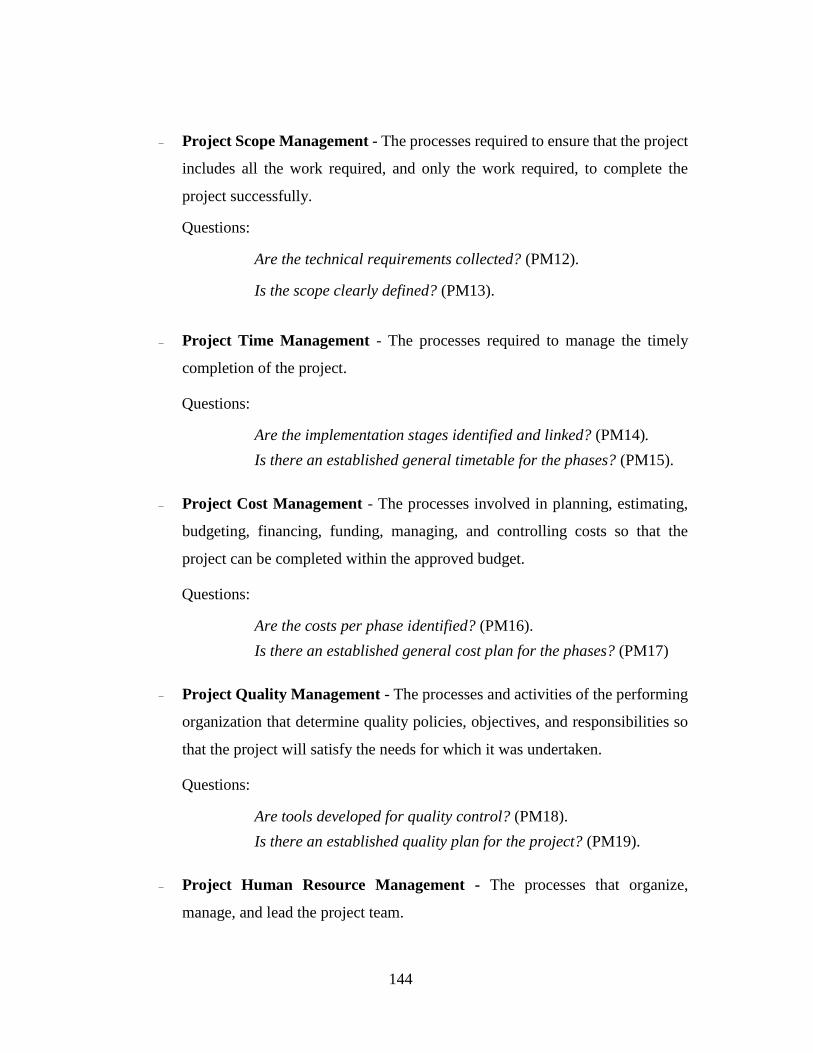
144
₋ Project Scope Management - The processes required to ensure that the project
includes all the work required, and only the work required, to complete the
project successfully.
Questions:
Are the technical requirements collected? (PM12).
Is the scope clearly defined? (PM13).
₋ Project Time Management - The processes required to manage the timely
completion of the project.
Questions:
Are the implementation stages identified and linked? (PM14).
Is there an established general timetable for the phases? (PM15).
₋ Project Cost Management - The processes involved in planning, estimating,
budgeting, financing, funding, managing, and controlling costs so that the
project can be completed within the approved budget.
Questions:
Are the costs per phase identified? (PM16).
Is there an established general cost plan for the phases? (PM17)
₋ Project Quality Management - The processes and activities of the performing
organization that determine quality policies, objectives, and responsibilities so
that the project will satisfy the needs for which it was undertaken.
Questions:
Are tools developed for quality control? (PM18).
Is there an established quality plan for the project? (PM19).
₋ Project Human Resource Management - The processes that organize,
manage, and lead the project team.
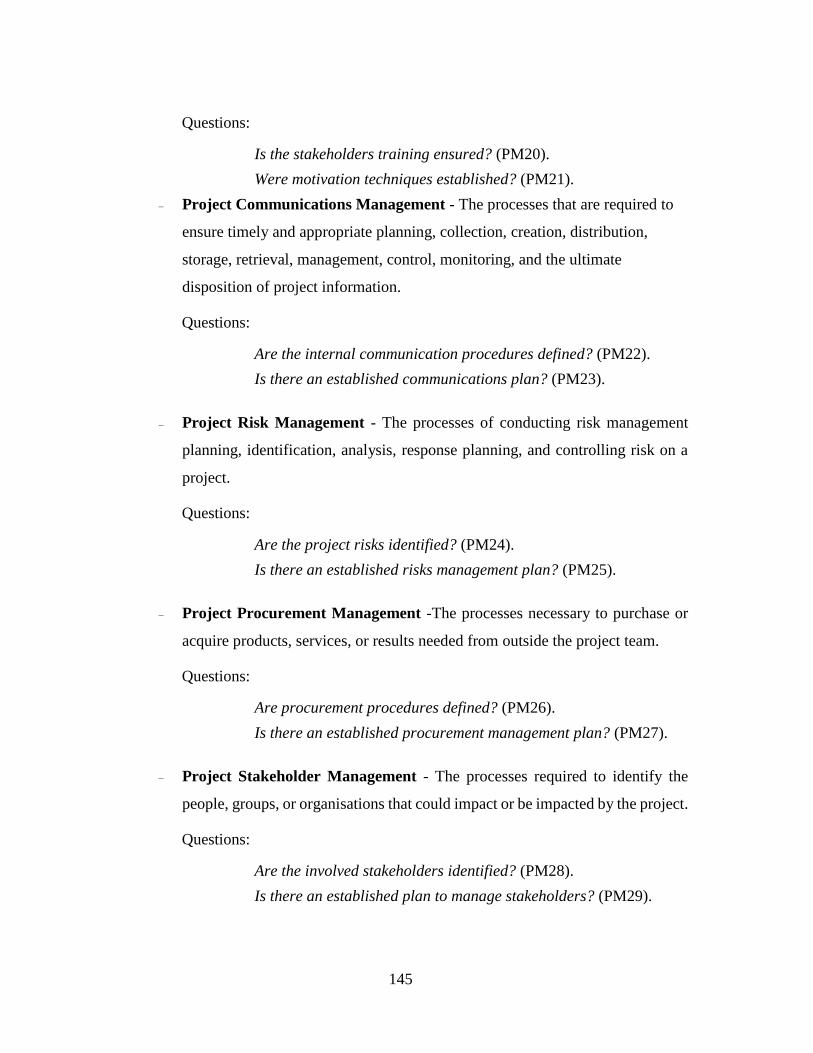
145
Questions:
Is the stakeholders training ensured? (PM20).
Were motivation techniques established? (PM21).
₋ Project Communications Management - The processes that are required to
ensure timely and appropriate planning, collection, creation, distribution,
storage, retrieval, management, control, monitoring, and the ultimate
disposition of project information.
Questions:
Are the internal communication procedures defined? (PM22).
Is there an established communications plan? (PM23).
₋ Project Risk Management - The processes of conducting risk management
planning, identification, analysis, response planning, and controlling risk on a
project.
Questions:
Are the project risks identified? (PM24).
Is there an established risks management plan? (PM25).
₋ Project Procurement Management -The processes necessary to purchase or
acquire products, services, or results needed from outside the project team.
Questions:
Are procurement procedures defined? (PM26).
Is there an established procurement management plan? (PM27).
₋ Project Stakeholder Management - The processes required to identify the
people, groups, or organisations that could impact or be impacted by the project.
Questions:
Are the involved stakeholders identified? (PM28).
Is there an established plan to manage stakeholders? (PM29).
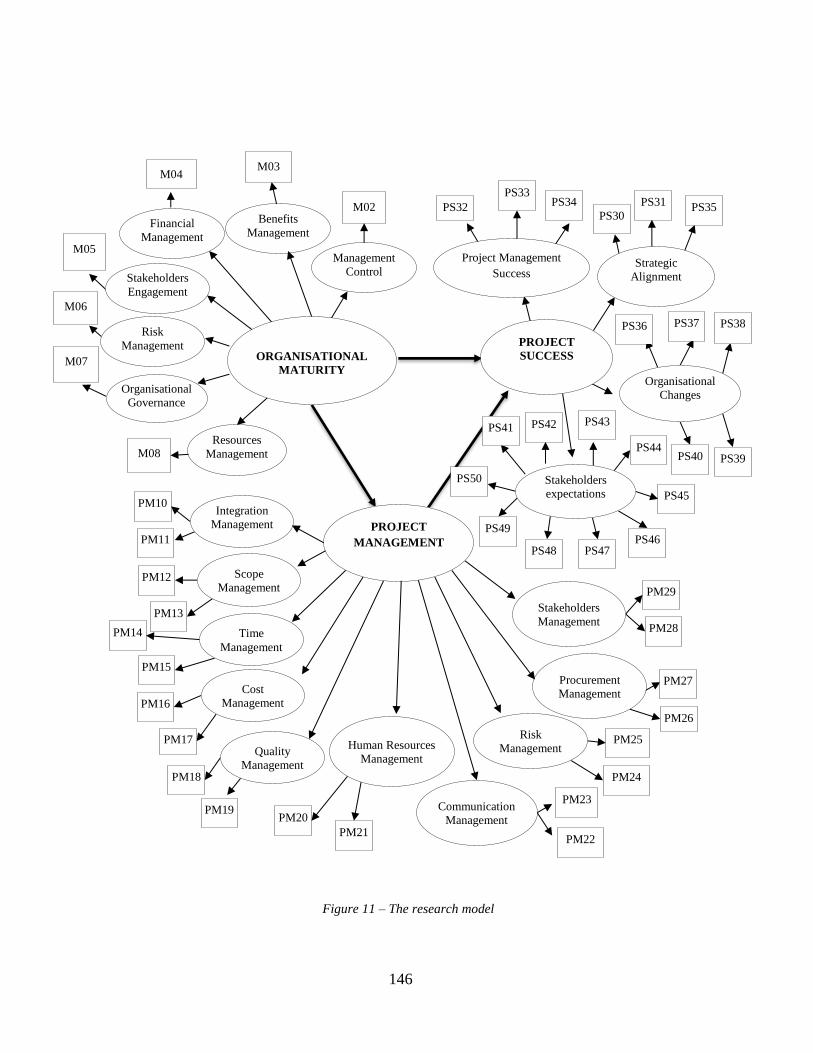
146
Figure 11 – The research model
Organisational
Governance
Risk
Management
Stakeholders
Engagement
Management
Control
Benefits
Management Financial
Management
Resources
Management
PM10
PM11
Integration
Management
Scope
Management PM12
PM13
Time
Management
PM15
PM14
Cost
Management PM16
PM17 Quality
Management
PM19
PM18
Human Resources
Management
PM20
PM21
Communication
Management
PM23
PM22
Risk
Management PM25
PM24
Procurement
Management PM27
PM26
PM29
PM28
Stakeholders
Management
M02
M03
M04
M05
M06
M07
M08
ORGANISATIONAL
MATURITY
PROJECT
MANAGEMENT
Strategic
Alignment
Stakeholders
expectations
Project Management
Success
Organisational
Changes
PROJECT
SUCCESS
PS32
PS33 PS34
PS30
PS31 PS35
PS36 PS37 PS38
PS39 PS40
PS41 PS42 PS43
PS44
PS45
PS46 PS47 PS48
PS49
PS50
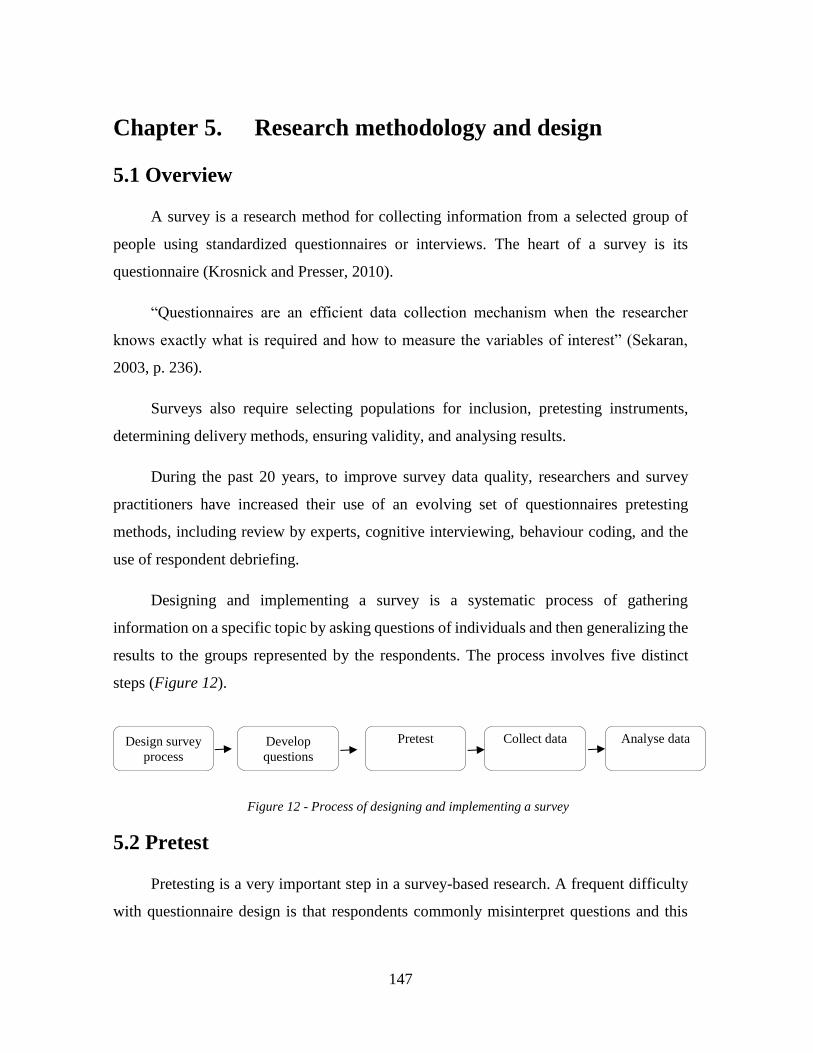
147
Chapter 5. Research methodology and design
5.1 Overview
A survey is a research method for collecting information from a selected group of
people using standardized questionnaires or interviews. The heart of a survey is its
questionnaire (Krosnick and Presser, 2010).
“Questionnaires are an efficient data collection mechanism when the researcher
knows exactly what is required and how to measure the variables of interest” (Sekaran,
2003, p. 236).
Surveys also require selecting populations for inclusion, pretesting instruments,
determining delivery methods, ensuring validity, and analysing results.
During the past 20 years, to improve survey data quality, researchers and survey
practitioners have increased their use of an evolving set of questionnaires pretesting
methods, including review by experts, cognitive interviewing, behaviour coding, and the
use of respondent debriefing.
Designing and implementing a survey is a systematic process of gathering
information on a specific topic by asking questions of individuals and then generalizing the
results to the groups represented by the respondents. The process involves five distinct
steps (Figure 12).
Figure 12 - Process of designing and implementing a survey
5.2 Pretest
Pretesting is a very important step in a survey-based research. A frequent difficulty
with questionnaire design is that respondents commonly misinterpret questions and this
Design survey process
Develop
questions
Pretest Collect data Analyse data
148
difficulty has been consistently recognised within the literature (Belson, 1981). Pretesting
can help you identify questions that don’t make sense to participants, or problems with the
questionnaire that might lead to biased answers. Pretesting is a method of checking that
questions work as intended and are understood by those individuals who are likely to
respond to them (Hilton, 2017). It is also the case that pretesting has the capacity to reduce
sampling error and increase questionnaire response rates (Drennan, 2003).
In this context, the questionnaire pretesting process must look for an answer to the
following questions (Babonea and Voicu, 2011):
- Does every survey question measure what it should measure?
- Do respondents understand all the terms?
- Are questions interpreted in the same manner by all the respondents?
- Did closed questions provide at least one answer choice that would apply to
every respondent?
- Does the questionnaire create a positive impression, thus motivating people to
answer?
- Are the answer choices to be selected correct?
- Does any aspect of the questionnaire suggest any biasing attempt from the
researcher?
5.3 Participants
The participants were healthcare professionals from seven different hospitals, which
are geographically distributed across Portugal. The professionals’ profile was controlled,
to select the respondents most qualified to answer the questionnaire. This process was
supported in several exploratory interviews which lead to the conclusion that the most
appropriate profile for the respondent would be based on the two main characteristics:
₋ Possessing a comprehensive knowledge of the organization's operational
processes
149
₋ Having been involved and participated in the implementation of an information
or technology system.
5.4 Instrument
The final version of questionnaire has four different sections (Gomes et al., 2016a,
2016b) (Appendix D):
1. Participant’s Profile - Personal and professional data (gender, age, formal
education, role in the organization, workplace, health region and project
involvement).
2. Organisational Maturity - A self-assessment questionnaire from the P3M3©
framework (OGC, 2010b) was applied, which comprised 7 items, whereby
participants were asked to rate the level of maturity in ordinal scale, were 1 is
“awareness of process” and 5 is “optimized process”.
3. Project Management - This was evaluated by a 10-item, answered on a 7-point
Likert56 scale from 1 to 7 (1=never; 7 =always). The questions highlight the main
issues of the PMBOK Guide knowledge areas (PMI, 2013).
4. Project Success - Assessed with an 18-item scale, asking participants to evaluate
health professional’s perceptions concerning the success of the IS/IT projects on
a 7-point Likert scale, from 1 to 7 (1=never; 7 =always).
These last three sections of the questionnaire correspond to the dimensions of the
conceptual model.
56 Likert scales allow interviewees to indicate to what extent they agree with a statement and are thus useful
when measuring perceptions (Saunders, et al. 2009).
150
5.5 Pretest procedure
The questionnaire described above was strictly developed for this research, and
various procedures were developed to ensure its accuracy. First, it was important to certify
respondents’ ability to interpret the issues appropriately, in accordance with the objectives
of the questionnaire. To ensure this target, exploratory interviews (Appendix E) were
carried out with healthcare professionals to validate the questions’ content. After
concluding the questionnaire design, a pretest was applied.
As are well-known, pretesting tools can be used to improve the quality of survey data
(Collins, 2003). The pretest allows for the identification of problems regarding question
content, namely the misinterpretation of individual terms or concepts, to list what can be
eliminated, or what needs to be redone.
Questionnaire formatting is particularly relevant for self-administered
questionnaires. At the end of the pretest, each respondent gave their opinion about
interpretability issues, completeness, size, and time spent in filling it out.
For the purposes of validity considerations, participants were encouraged to
comment on the complete test measure including formatting, presentation and relevance of
its intended use at the end of the questionnaire.
We applied the initial version of the questionnaire on a small sample which had a
similar profile to that of the final sample.
5.6 Pretest data analysis
To close the final version of the questionnaire, special attention was given to data
collected through the pretest. Firstly, a screening of data was made prior to the analysis of
each scale’s reliability. Frequency analyses were performed to assess the distribution of
each item and to characterize its variability. Skewness and kurtosis measures and respective
standard errors were considered to examine the answers distribution. Box-plots were also
used for checking the presence of outliers.
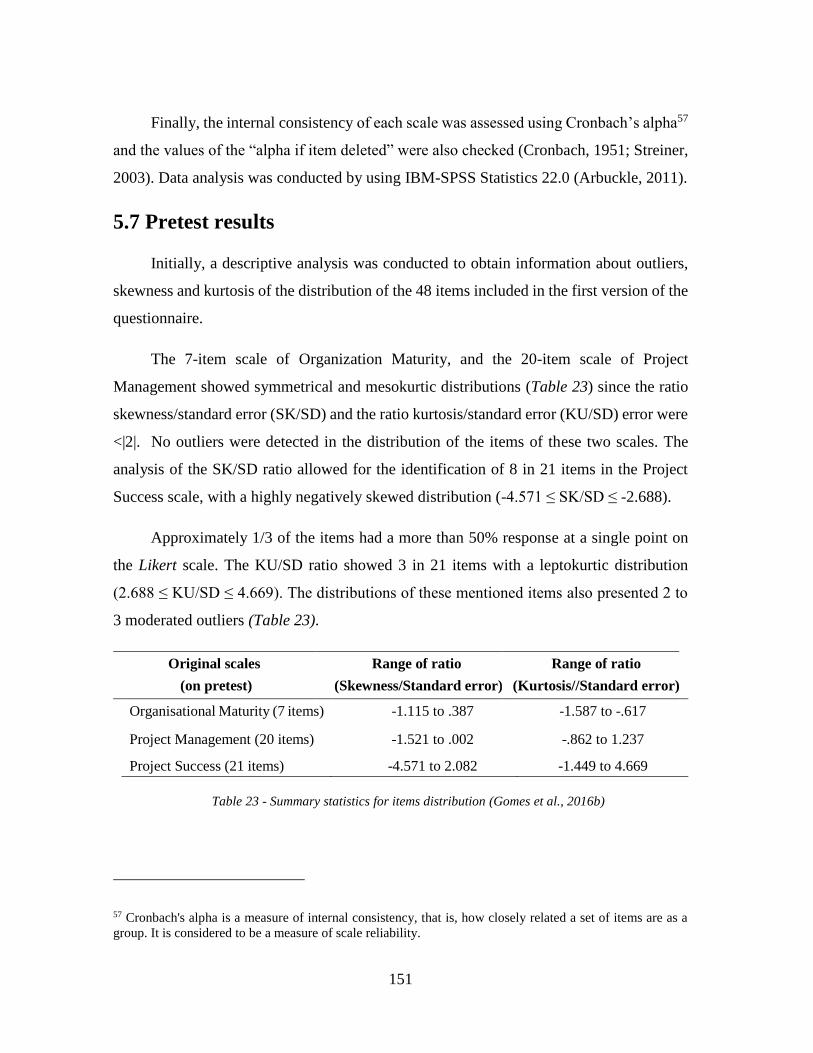
151
Finally, the internal consistency of each scale was assessed using Cronbach’s alpha57
and the values of the “alpha if item deleted” were also checked (Cronbach, 1951; Streiner,
2003). Data analysis was conducted by using IBM-SPSS Statistics 22.0 (Arbuckle, 2011).
5.7 Pretest results
Initially, a descriptive analysis was conducted to obtain information about outliers,
skewness and kurtosis of the distribution of the 48 items included in the first version of the
questionnaire.
The 7-item scale of Organization Maturity, and the 20-item scale of Project
Management showed symmetrical and mesokurtic distributions (Table 23) since the ratio
skewness/standard error (SK/SD) and the ratio kurtosis/standard error (KU/SD) error were
<|2|. No outliers were detected in the distribution of the items of these two scales. The
analysis of the SK/SD ratio allowed for the identification of 8 in 21 items in the Project
Success scale, with a highly negatively skewed distribution (-4.571 ≤ SK/SD ≤ -2.688).
Approximately 1/3 of the items had a more than 50% response at a single point on
the Likert scale. The KU/SD ratio showed 3 in 21 items with a leptokurtic distribution
(2.688 ≤ KU/SD ≤ 4.669). The distributions of these mentioned items also presented 2 to
3 moderated outliers (Table 23).
Original scales
(on pretest)
Range of ratio
(Skewness/Standard error)
Range of ratio
(Kurtosis//Standard error)
Organisational Maturity (7 items) -1.115 to .387 -1.587 to -.617
Project Management (20 items) -1.521 to .002 -.862 to 1.237
Project Success (21 items) -4.571 to 2.082 -1.449 to 4.669
Table 23 - Summary statistics for items distribution (Gomes et al., 2016b)
57 Cronbach's alpha is a measure of internal consistency, that is, how closely related a set of items are as a
group. It is considered to be a measure of scale reliability.
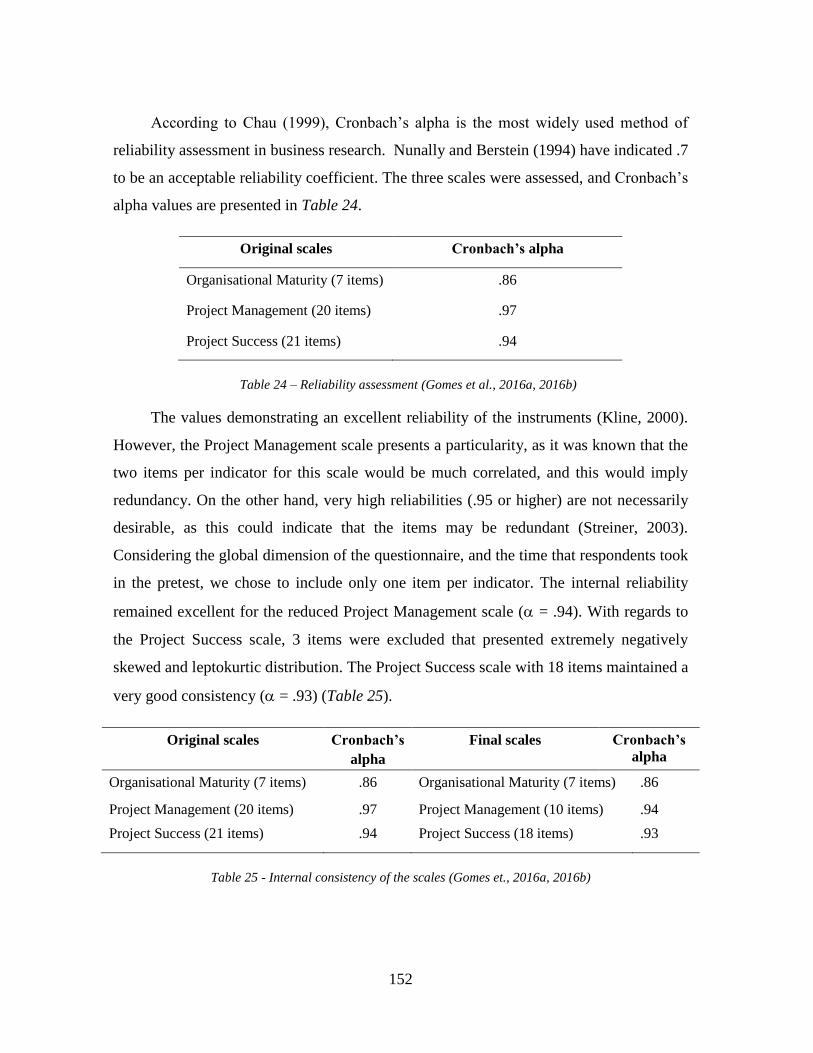
152
According to Chau (1999), Cronbach’s alpha is the most widely used method of
reliability assessment in business research. Nunally and Berstein (1994) have indicated .7
to be an acceptable reliability coefficient. The three scales were assessed, and Cronbach’s
alpha values are presented in Table 24.
Original scales Cronbach’s alpha
Organisational Maturity (7 items) .86
Project Management (20 items) .97
Project Success (21 items) .94
Table 24 – Reliability assessment (Gomes et al., 2016a, 2016b)
The values demonstrating an excellent reliability of the instruments (Kline, 2000).
However, the Project Management scale presents a particularity, as it was known that the
two items per indicator for this scale would be much correlated, and this would imply
redundancy. On the other hand, very high reliabilities (.95 or higher) are not necessarily
desirable, as this could indicate that the items may be redundant (Streiner, 2003).
Considering the global dimension of the questionnaire, and the time that respondents took
in the pretest, we chose to include only one item per indicator. The internal reliability
remained excellent for the reduced Project Management scale ( = .94). With regards to
the Project Success scale, 3 items were excluded that presented extremely negatively
skewed and leptokurtic distribution. The Project Success scale with 18 items maintained a
very good consistency ( = .93) (Table 25).
Original scales Cronbach’s
alpha
Final scales Cronbach’s
alpha
Organisational Maturity (7 items) .86 Organisational Maturity (7 items) .86
Project Management (20 items) .97 Project Management (10 items) .94
Project Success (21 items) .94 Project Success (18 items) .93
Table 25 - Internal consistency of the scales (Gomes et., 2016a, 2016b)
153
5.8 General discussion
The questionnaire for validating the contents was performed the same way in the
pretest, as it will be administered for the main study. Some ambiguities and difficult
questions were identified. Whether each question gives an adequate range of responses was
also verified, and any questions were re-worded that are not answered as expected. Some
were shortening and revised. It was perceived that there was a degree of lack of familiarity
of the respondents about certain theoretical concepts presented in the pretest.
In general, healthcare organisations do not invest in engaging or motivating
healthcare professionals about the advantages that IS/IT solutions could bring to the
organisations and themselves, and consequently, it was difficult to catch their attention.
The involved IS/IT projects have low participation and little involvement from
healthcare professionals, and thus most the projects were largely unknown to most people.
A final issue concerns the specificity of the theoretical questions, which required the
respondents to have both a comprehensive knowledge of their own organization, and a
cross-sectional view of the topics covered.
Findings from the pretest mainly showed a lack of symmetry in the distribution of
various items. Given that the pretest data was still under review, this was admitted being a
greater error and, as suggested by Hair et al. (2010), it could be possibly up to 10%.
Therefore, in line with this criterion only three items were excluded, ensuring the same
internal consistency of the scale. Another dropout exercise was made to define a more
parsimonious scale, thus avoiding redundancy between items. A lack of variability was
also in evidence, particularly in one part of the items. According to several authors, using
longer Likert scales could minimize this problem (Cook and Beckman, 2009; Dawes, 2008)
(Appendix F). Thus, the analysis of the pretest results also led to adopting a 7-point Likert
scale, instead of the 5-point scale for the Project Management and Project Success
constructs.
154
Chapter 6. Survey
6.1 General procedure
The survey was supported under a signed agreement between ISEG and SPMS58 of
the Ministry of Health specifically for this purpose (Appendix G).
Emails were sent to the respondents together with a presentation letter (Appendix H).
In each letter, the research objectives and the importance of each respondent’s answer were
described, and a link to the questionnaire provided.
To achieve a greater number of responses, two follow-ups to non-respondents were
made (Appendix H). According to Bryman and Bell (2003) the follow-up reminders have
a demonstrable effect on the response rate.
The mails used to two main sources of contacts:
1. SPMS databases:
• Plataforma de Dados de Saúde (PDS);
• Comissão de Acompanhamento para a Informatização Clínica (CAIC);
2. Direct emails (e.g. health administrations, informatics directories, heads of
clinical service, nursing directorates, health schools and academics).
According to the pretest conclusions, the questionnaire was sent to the professionals
who apparently have a more suitable profile for answer. Several explanations were
included in the main body of the questionnaire to facilitate the understanding of concepts
and content, improving the validity of the answers.
The questionnaire was developed with the LimeSurvey59 software and available to
answer from November 2015 to July 2016.
58 Serviços Partilhados do Ministério da Saúde 59 LimeSurvey (formerly PHPSurveyor) is an Open Source PHP web application to develop, publish and
collect responses to online & offline surveys
155
6.2 Analysing the survey dataset
The questionnaire was accessed by 610 professionals but only 242 fulfil completely
the questions.
Initially, we have plan the survey to be online about 6 months, but due to difficulty
in obtain answers we had to extended more 2 months.
The two email databases provided by the SPMS did not bring the response number
that would be expectable. The sending was accompanied by an explanatory letter,
appealing to the questionnaire completion. A new refreshment was made 3 months after
the first sending, but also without great success. To increase the answers number, the
strategy adopted was to identify all potential target respondents across the health sector and
send personalized emails. This action reverses the low response rate.
The data collected by the survey was checked for completeness and outliers. Some
improvements will be needed to go ahead with study:
₋ Answers to questionnaire
Although the respondents fulfil completely the questionnaire, the existence of the
answers I don´t know, obliges to decide between excluding the respondent or re-
using the answer by filling the answer with a value that represents the mean or the
median of the item. After analysed the pros and cons was decided to simple remove
the respondents.
₋ Items
Concerns to the excessive answer I don´t know in several items we found that
probably some items were not applicable to the practices on the Portuguese
Healthcare organisations (e.g. Benefits Management).
₋ Organisational Maturity construct
Although the P3M3© were developed to assess the maturity of the UK public
organisations, namely the National Healthcare System (NHS) the applicability in
Portuguese context is much different, we have not found any evidence of their use
156
on the Portuguese health organisations and for that reason we decided to not include
the Benefits Management item to explain this construct.
₋ Project Management construct
Most of the projects refereed by the respondents are decided and set up centrally by
the Health Ministry, (SPMS), so the items like Cost Management are not a
management practice applicable to the present situation. The item was also
excluded.
₋ Project Success construct
In according with the justification given on the previous bullet, the item costs
fulfilment was also excluded
₋ Redundancy
Analysing the 18 items from Project Success there are some questions that could
generated redundancy. To optimize this construct, we have decided to reshape it to
13 items.
₋ Model simplification
We proceeded to model simplification, removing the subscales on the construct
Project Success. Like the other two construct the items are now directly related with
the variable without the need subscale. In the reality, this subscale didn´t bring any
additional value to the model.
₋ Database adjustments
Were removed from database all the items mentioned above and all the respondents
that have at least one answer I don´t know. The final sample has 139 respondents.
The new respondent’s database has naturally some differences from the initial one,
namely in following main aspects (Appendix I):
• More respondents from Hospital Administration (+3.9%) and IS/IT staff
(+4.2%).
• More respondents directly involved with Project Management practices
(+13.2%) to the detriment of the so-called project users and others.
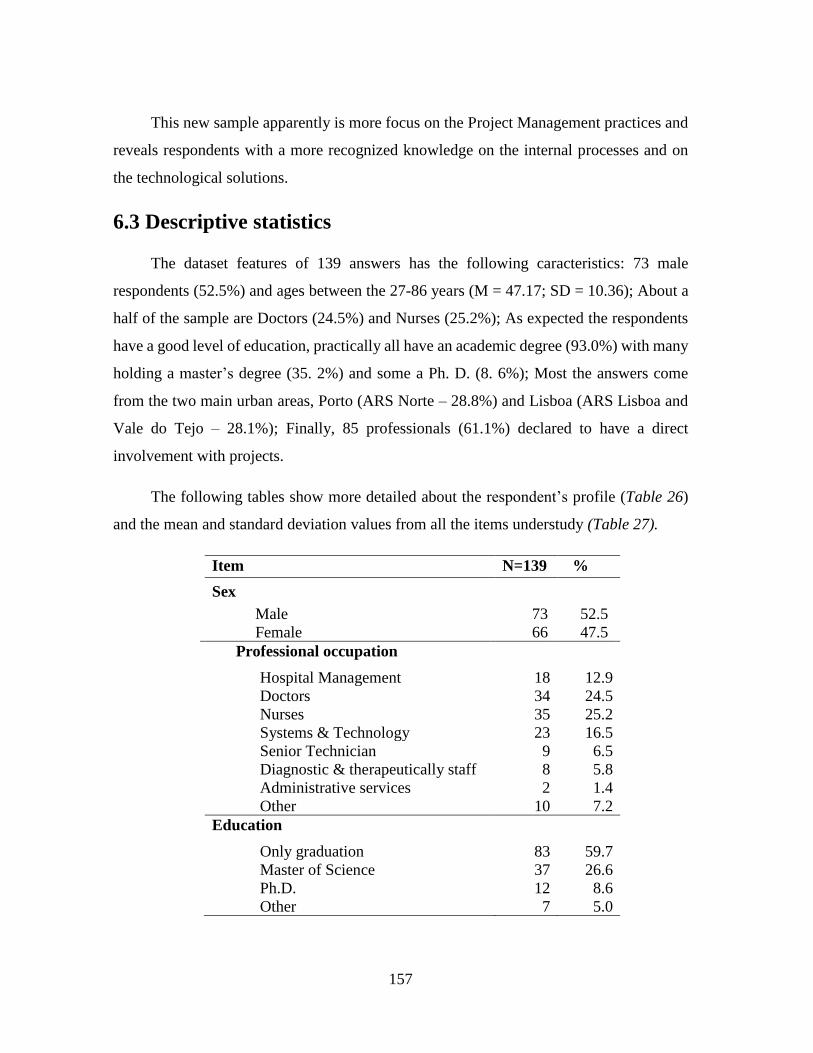
157
This new sample apparently is more focus on the Project Management practices and
reveals respondents with a more recognized knowledge on the internal processes and on
the technological solutions.
6.3 Descriptive statistics
The dataset features of 139 answers has the following caracteristics: 73 male
respondents (52.5%) and ages between the 27-86 years (M = 47.17; SD = 10.36); About a
half of the sample are Doctors (24.5%) and Nurses (25.2%); As expected the respondents
have a good level of education, practically all have an academic degree (93.0%) with many
holding a master’s degree (35. 2%) and some a Ph. D. (8. 6%); Most the answers come
from the two main urban areas, Porto (ARS Norte – 28.8%) and Lisboa (ARS Lisboa and
Vale do Tejo – 28.1%); Finally, 85 professionals (61.1%) declared to have a direct
involvement with projects.
The following tables show more detailed about the respondent’s profile (Table 26)
and the mean and standard deviation values from all the items understudy (Table 27).
Item N=139 %
Sex
Male 73 52.5
Female 66 47.5
Professional occupation
Hospital Management 18 12.9
Doctors 34 24.5
Nurses 35 25.2
Systems & Technology 23 16.5
Senior Technician 9 6.5
Diagnostic & therapeutically staff 8 5.8
Administrative services 2 1.4
Other 10 7.2
Education
Only graduation 83 59.7
Master of Science 37 26.6
Ph.D. 12 8.6
Other 7 5.0
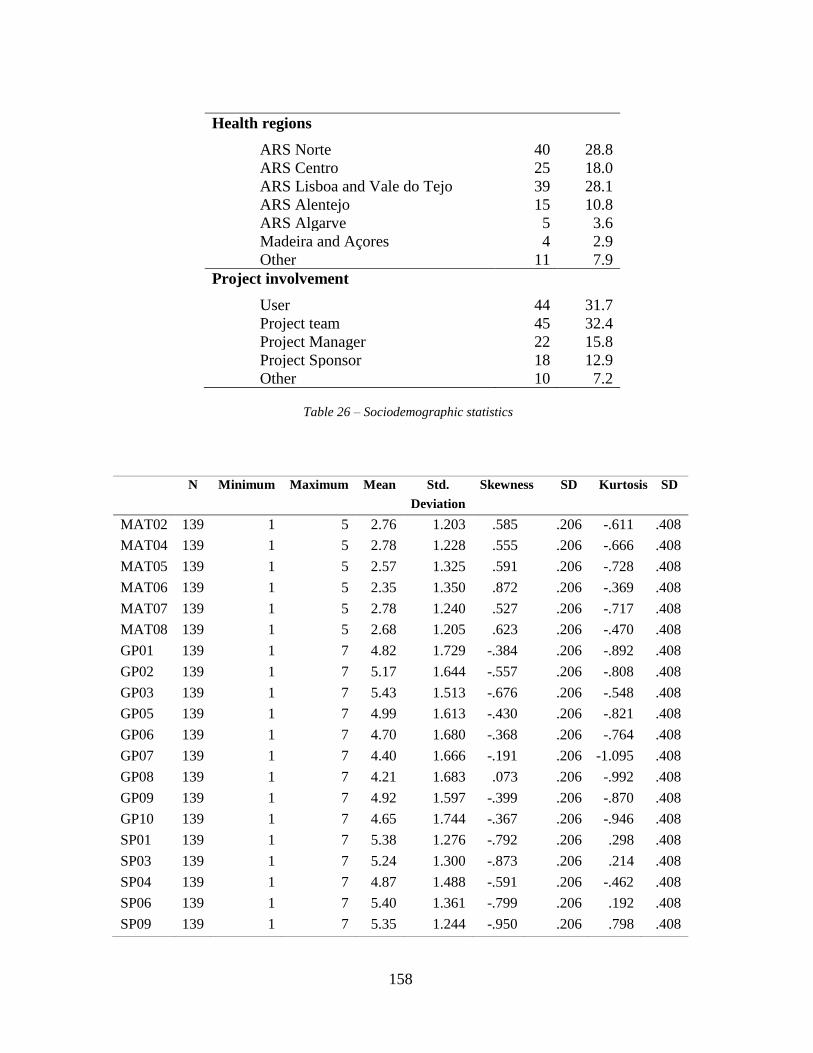
158
Health regions
ARS Norte 40 28.8
ARS Centro 25 18.0
ARS Lisboa and Vale do Tejo 39 28.1
ARS Alentejo 15 10.8
ARS Algarve 5 3.6
Madeira and Açores 4 2.9
Other 11 7.9
Project involvement
User 44 31.7
Project team 45 32.4
Project Manager 22 15.8
Project Sponsor 18 12.9
Other 10 7.2
Table 26 – Sociodemographic statistics
N Minimum Maximum Mean Std.
Deviation
Skewness SD
Kurtosis SD
MAT02 139 1 5 2.76 1.203 .585 .206 -.611 .408
MAT04 139 1 5 2.78 1.228 .555 .206 -.666 .408
MAT05 139 1 5 2.57 1.325 .591 .206 -.728 .408
MAT06 139 1 5 2.35 1.350 .872 .206 -.369 .408
MAT07 139 1 5 2.78 1.240 .527 .206 -.717 .408
MAT08 139 1 5 2.68 1.205 .623 .206 -.470 .408
GP01 139 1 7 4.82 1.729 -.384 .206 -.892 .408
GP02 139 1 7 5.17 1.644 -.557 .206 -.808 .408
GP03 139 1 7 5.43 1.513 -.676 .206 -.548 .408
GP05 139 1 7 4.99 1.613 -.430 .206 -.821 .408
GP06 139 1 7 4.70 1.680 -.368 .206 -.764 .408
GP07 139 1 7 4.40 1.666 -.191 .206 -1.095 .408
GP08 139 1 7 4.21 1.683 .073 .206 -.992 .408
GP09 139 1 7 4.92 1.597 -.399 .206 -.870 .408
GP10 139 1 7 4.65 1.744 -.367 .206 -.946 .408
SP01 139 1 7 5.38 1.276 -.792 .206 .298 .408
SP03 139 1 7 5.24 1.300 -.873 .206 .214 .408
SP04 139 1 7 4.87 1.488 -.591 .206 -.462 .408
SP06 139 1 7 5.40 1.361 -.799 .206 .192 .408
SP09 139 1 7 5.35 1.244 -.950 .206 .798 .408
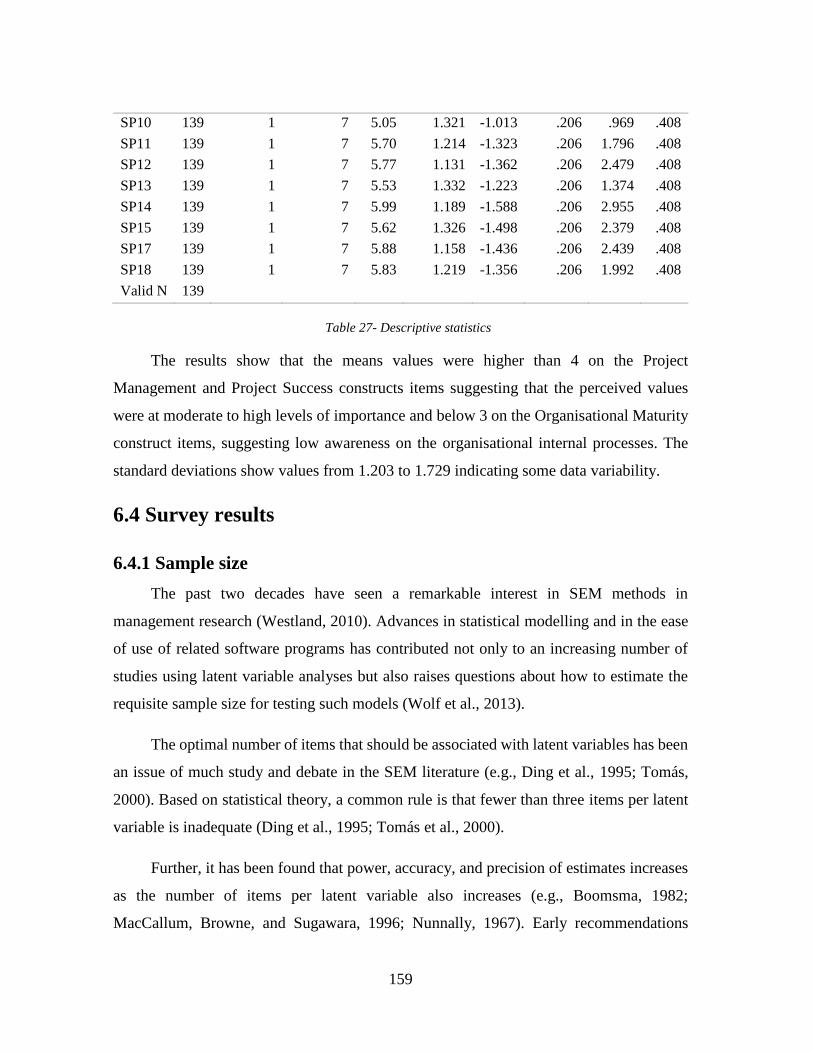
159
SP10 139 1 7 5.05 1.321 -1.013 .206 .969 .408
SP11 139 1 7 5.70 1.214 -1.323 .206 1.796 .408
SP12 139 1 7 5.77 1.131 -1.362 .206 2.479 .408
SP13 139 1 7 5.53 1.332 -1.223 .206 1.374 .408
SP14 139 1 7 5.99 1.189 -1.588 .206 2.955 .408
SP15 139 1 7 5.62 1.326 -1.498 .206 2.379 .408
SP17 139 1 7 5.88 1.158 -1.436 .206 2.439 .408
SP18 139 1 7 5.83 1.219 -1.356 .206 1.992 .408
Valid N 139
Table 27- Descriptive statistics
The results show that the means values were higher than 4 on the Project
Management and Project Success constructs items suggesting that the perceived values
were at moderate to high levels of importance and below 3 on the Organisational Maturity
construct items, suggesting low awareness on the organisational internal processes. The
standard deviations show values from 1.203 to 1.729 indicating some data variability.
6.4 Survey results
6.4.1 Sample size
The past two decades have seen a remarkable interest in SEM methods in
management research (Westland, 2010). Advances in statistical modelling and in the ease
of use of related software programs has contributed not only to an increasing number of
studies using latent variable analyses but also raises questions about how to estimate the
requisite sample size for testing such models (Wolf et al., 2013).
The optimal number of items that should be associated with latent variables has been
an issue of much study and debate in the SEM literature (e.g., Ding et al., 1995; Tomás,
2000). Based on statistical theory, a common rule is that fewer than three items per latent
variable is inadequate (Ding et al., 1995; Tomás et al., 2000).
Further, it has been found that power, accuracy, and precision of estimates increases
as the number of items per latent variable also increases (e.g., Boomsma, 1982;
MacCallum, Browne, and Sugawara, 1996; Nunnally, 1967). Early recommendations
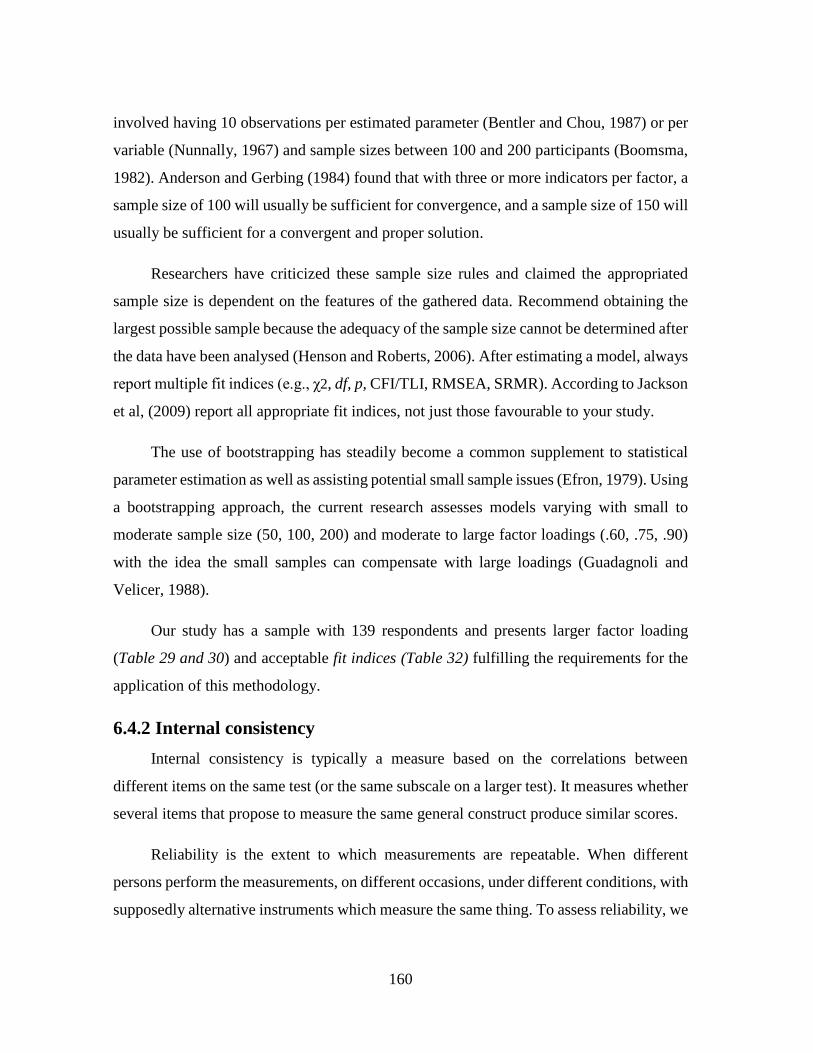
160
involved having 10 observations per estimated parameter (Bentler and Chou, 1987) or per
variable (Nunnally, 1967) and sample sizes between 100 and 200 participants (Boomsma,
1982). Anderson and Gerbing (1984) found that with three or more indicators per factor, a
sample size of 100 will usually be sufficient for convergence, and a sample size of 150 will
usually be sufficient for a convergent and proper solution.
Researchers have criticized these sample size rules and claimed the appropriated
sample size is dependent on the features of the gathered data. Recommend obtaining the
largest possible sample because the adequacy of the sample size cannot be determined after
the data have been analysed (Henson and Roberts, 2006). After estimating a model, always
report multiple fit indices (e.g., χ2, df, p, CFI/TLI, RMSEA, SRMR). According to Jackson
et al, (2009) report all appropriate fit indices, not just those favourable to your study.
The use of bootstrapping has steadily become a common supplement to statistical
parameter estimation as well as assisting potential small sample issues (Efron, 1979). Using
a bootstrapping approach, the current research assesses models varying with small to
moderate sample size (50, 100, 200) and moderate to large factor loadings (.60, .75, .90)
with the idea the small samples can compensate with large loadings (Guadagnoli and
Velicer, 1988).
Our study has a sample with 139 respondents and presents larger factor loading
(Table 29 and 30) and acceptable fit indices (Table 32) fulfilling the requirements for the
application of this methodology.
6.4.2 Internal consistency
Internal consistency is typically a measure based on the correlations between
different items on the same test (or the same subscale on a larger test). It measures whether
several items that propose to measure the same general construct produce similar scores.
Reliability is the extent to which measurements are repeatable. When different
persons perform the measurements, on different occasions, under different conditions, with
supposedly alternative instruments which measure the same thing. To assess reliability, we
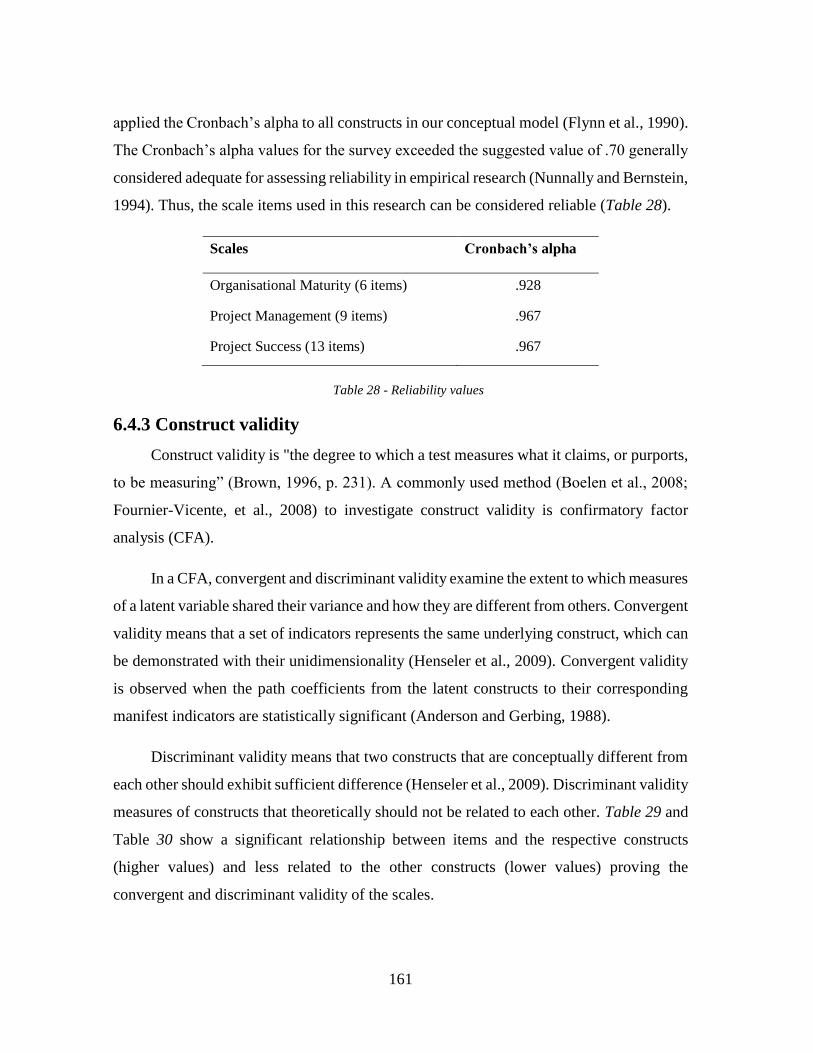
161
applied the Cronbach’s alpha to all constructs in our conceptual model (Flynn et al., 1990).
The Cronbach’s alpha values for the survey exceeded the suggested value of .70 generally
considered adequate for assessing reliability in empirical research (Nunnally and Bernstein,
1994). Thus, the scale items used in this research can be considered reliable (Table 28).
Scales Cronbach’s alpha
Organisational Maturity (6 items) .928
Project Management (9 items) .967
Project Success (13 items) .967
Table 28 - Reliability values
6.4.3 Construct validity
Construct validity is "the degree to which a test measures what it claims, or purports,
to be measuring” (Brown, 1996, p. 231). A commonly used method (Boelen et al., 2008;
Fournier-Vicente, et al., 2008) to investigate construct validity is confirmatory factor
analysis (CFA).
In a CFA, convergent and discriminant validity examine the extent to which measures
of a latent variable shared their variance and how they are different from others. Convergent
validity means that a set of indicators represents the same underlying construct, which can
be demonstrated with their unidimensionality (Henseler et al., 2009). Convergent validity
is observed when the path coefficients from the latent constructs to their corresponding
manifest indicators are statistically significant (Anderson and Gerbing, 1988).
Discriminant validity means that two constructs that are conceptually different from
each other should exhibit sufficient difference (Henseler et al., 2009). Discriminant validity
measures of constructs that theoretically should not be related to each other. Table 29 and
Table 30 show a significant relationship between items and the respective constructs
(higher values) and less related to the other constructs (lower values) proving the
convergent and discriminant validity of the scales.
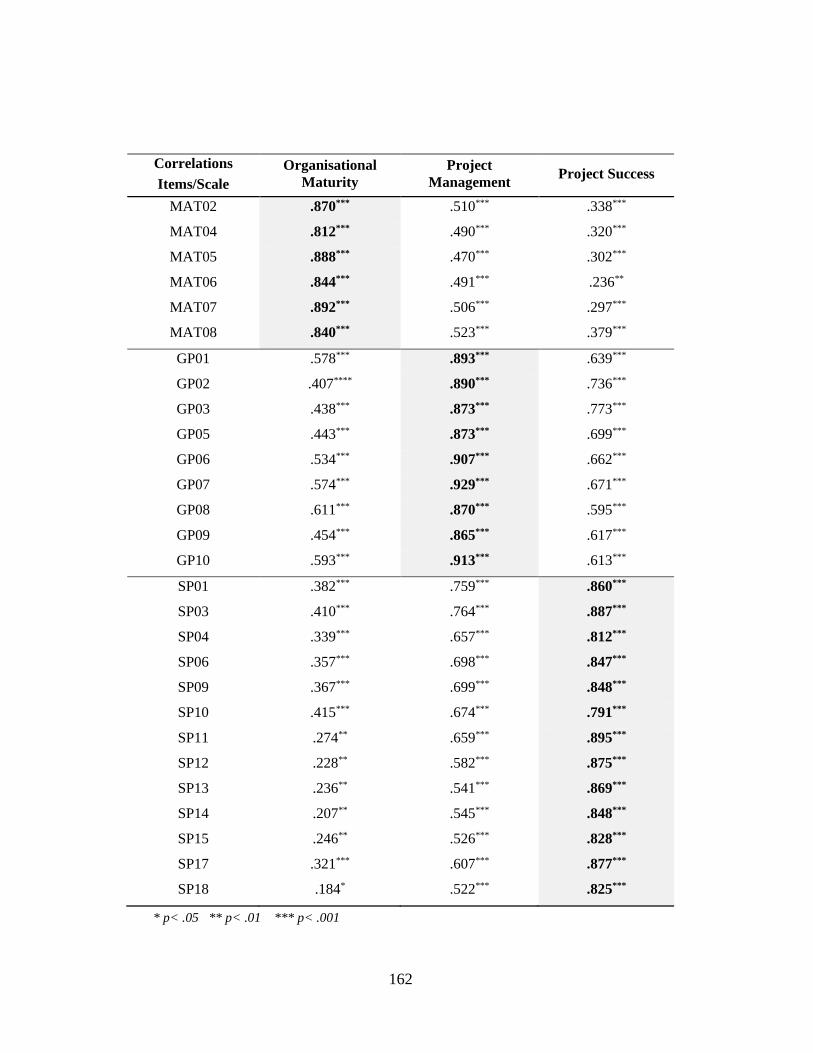
162
Correlations
Items/Scale
Organisational
Maturity
Project
Management Project Success
MAT02 .870*** .510*** .338***
MAT04 .812*** .490*** .320***
MAT05 .888*** .470*** .302***
MAT06 .844*** .491*** .236**
MAT07 .892*** .506*** .297***
MAT08 .840*** .523*** .379***
GP01 .578*** .893*** .639***
GP02 .407**** .890*** .736***
GP03 .438*** .873*** .773***
GP05 .443*** .873*** .699***
GP06 .534*** .907*** .662***
GP07 .574*** .929*** .671***
GP08 .611*** .870*** .595***
GP09 .454*** .865*** .617***
GP10 .593*** .913*** .613***
SP01 .382*** .759*** .860***
SP03 .410*** .764*** .887***
SP04 .339*** .657*** .812***
SP06 .357*** .698*** .847***
SP09 .367*** .699*** .848***
SP10 .415*** .674*** .791***
SP11 .274** .659*** .895***
SP12 .228** .582*** .875***
SP13 .236** .541*** .869***
SP14 .207** .545*** .848***
SP15 .246** .526*** .828***
SP17 .321*** .607*** .877***
SP18 .184* .522*** .825***
* p< .05 ** p< .01 *** p< .001
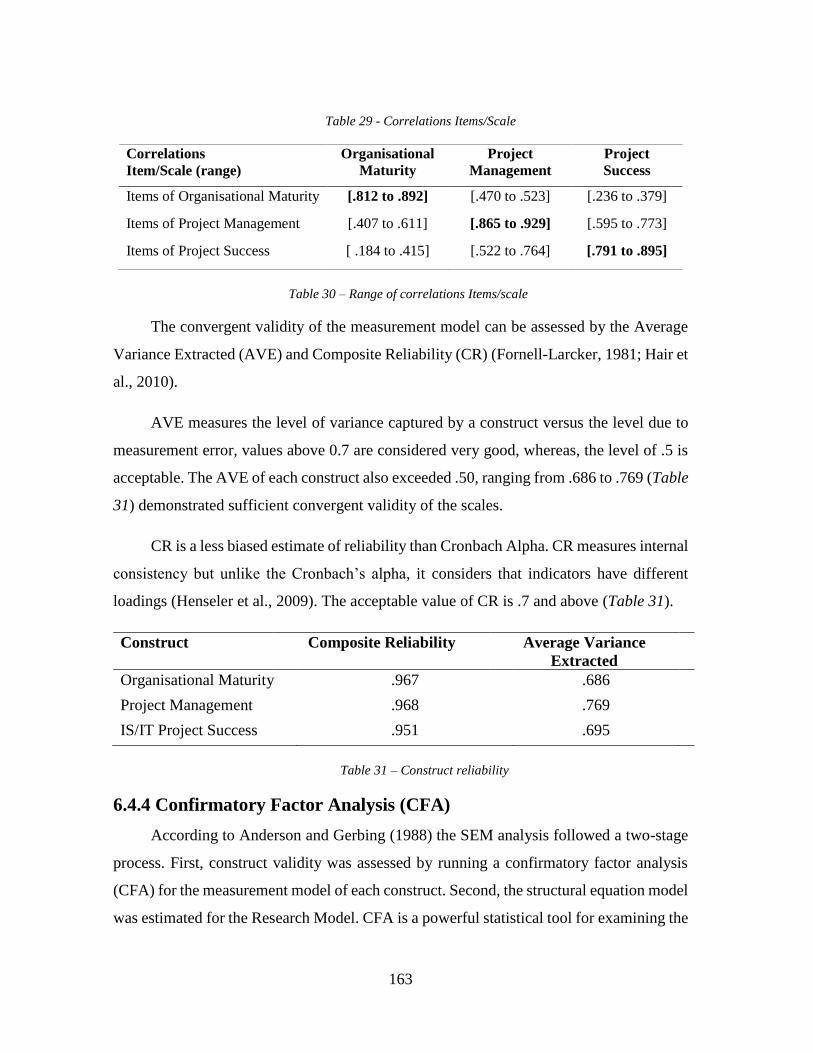
163
Table 29 - Correlations Items/Scale
Correlations
Item/Scale (range)
Organisational
Maturity
Project
Management
Project
Success
Items of Organisational Maturity [.812 to .892] [.470 to .523] [.236 to .379]
Items of Project Management [.407 to .611] [.865 to .929] [.595 to .773]
Items of Project Success [ .184 to .415] [.522 to .764] [.791 to .895]
Table 30 – Range of correlations Items/scale
The convergent validity of the measurement model can be assessed by the Average
Variance Extracted (AVE) and Composite Reliability (CR) (Fornell-Larcker, 1981; Hair et
al., 2010).
AVE measures the level of variance captured by a construct versus the level due to
measurement error, values above 0.7 are considered very good, whereas, the level of .5 is
acceptable. The AVE of each construct also exceeded .50, ranging from .686 to .769 (Table
31) demonstrated sufficient convergent validity of the scales.
CR is a less biased estimate of reliability than Cronbach Alpha. CR measures internal
consistency but unlike the Cronbach’s alpha, it considers that indicators have different
loadings (Henseler et al., 2009). The acceptable value of CR is .7 and above (Table 31).
Construct Composite Reliability Average Variance
Extracted
Organisational Maturity .967 .686
Project Management .968 .769
IS/IT Project Success .951 .695
Table 31 – Construct reliability
6.4.4 Confirmatory Factor Analysis (CFA)
According to Anderson and Gerbing (1988) the SEM analysis followed a two-stage
process. First, construct validity was assessed by running a confirmatory factor analysis
(CFA) for the measurement model of each construct. Second, the structural equation model
was estimated for the Research Model. CFA is a powerful statistical tool for examining the
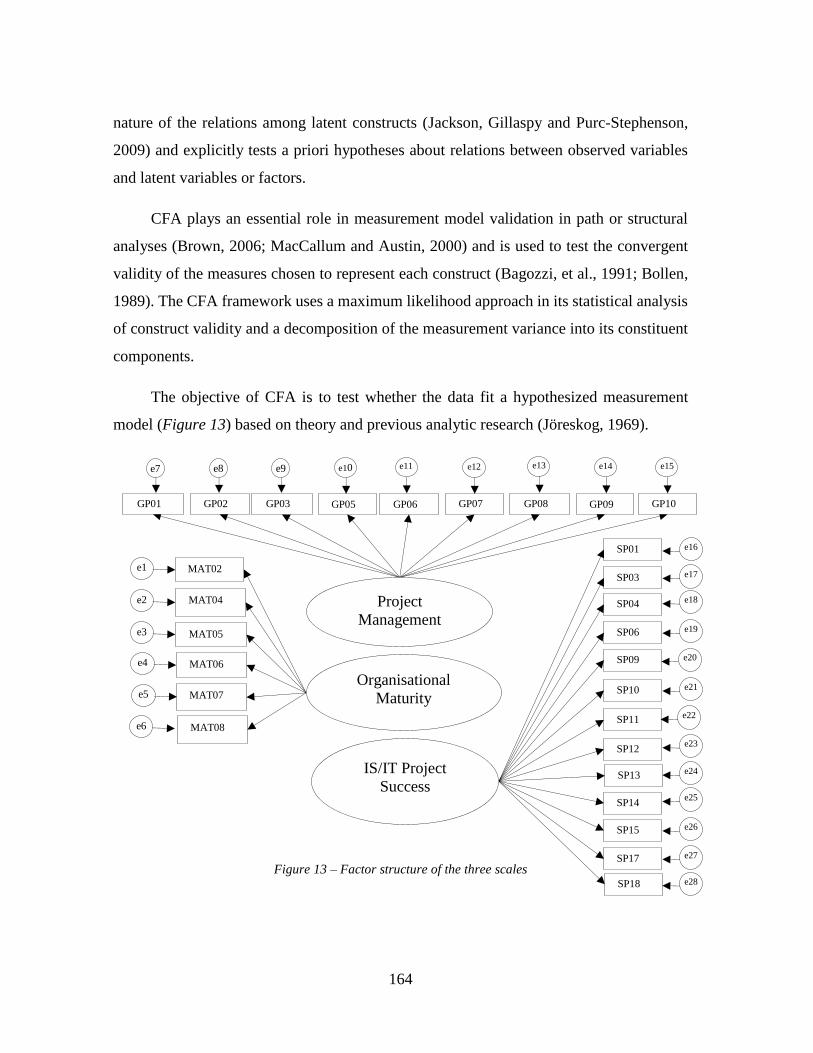
164
nature of the relations among latent constructs (Jackson, Gillaspy and Purc-Stephenson,
2009) and explicitly tests a priori hypotheses about relations between observed variables
and latent variables or factors.
CFA plays an essential role in measurement model validation in path or structural
analyses (Brown, 2006; MacCallum and Austin, 2000) and is used to test the convergent
validity of the measures chosen to represent each construct (Bagozzi, et al., 1991; Bollen,
1989). The CFA framework uses a maximum likelihood approach in its statistical analysis
of construct validity and a decomposition of the measurement variance into its constituent
components.
The objective of CFA is to test whether the data fit a hypothesized measurement
model (Figure 13) based on theory and previous analytic research (Jöreskog, 1969).
Figure 13 – Factor structure of the three scales
GP01 GP02 GP03 GP05 GP06 GP07 GP08 GP09 GP10
e7 e8 e9 e10 e11
07
e12 e13
0
e14
07
e15
Project
Management
SP03
SP04
SP06
SP09
SP01
SP10
SP11
SP12
SP13
SP14
SP15
SP17
SP18
IS/IT Project
Success
e16
e17
e18
e19
e20
e21
e22
e23
e24
e25
e26
e27
e28
Organisational
Maturity
MAT02
MAT04
MAT05
MAT06
MAT07
MAT08
e1
e2
e3
e4
e5
e6
165
All items loaded significantly on their corresponding latent construct, thereby
providing evidence of convergent validity. The AMOS (version 20) software was used to
test whether data fit the proposed model. Constructs with one observed measure were
constrained to exactly equal the value of the measure, as suggested by Bollen (1989). The
variance of each construct was constrained to unity so that the parameters for each observed
variable could be freely estimated. The CFA results indicate good convergent validity
(Appendices J to L).
6.4.5 Indices of goodness of fit
There are several indicators of goodness of fit and most SEM scholars recommend
evaluating the models by observing more than one of these indicators (Hair et al., 2010).
To determine how well the models fit the sample data (Hooper et al., 2008) the following
recommended goodness of fit indices and respective cut-off values were used.
The fit indices establish whether, overall, the model is acceptable. If the model is
acceptable, then establish whether specific paths are significant. Acceptable fit indices do
not imply the relationships are strong. Indeed, high fit indices are often easier to obtain
when the relationships between variables are low rather than high, because the power to
detect discrepancies from predictions are amplified.
While there is no consensus on the appropriate index for assessing overall goodness
of fit of a model, the chi-square statistic has been the most widely used fit index (Ping
2004). The so called absolute fit indices determine how well an a priori model fits the
sample data (McDonald and Ho, 2002) and demonstrates which proposed model has the
most superior fit. These measures determine the degree to which the overall model
(structural and measurement models) predicts the observed covariance or correlation
matrix. Some of the best known are: Chi-squared test, RMSEA, GFI, AGFI, RMR, and
SRMR (Hooper et al., 2008).
The relative fit indices compare the chi-square for the hypothesized model to one
from a null model (McDonald and Ho, 2002). This null model almost always contains a
model in which all the variables are uncorrelated, and as a result, has a very large chi-
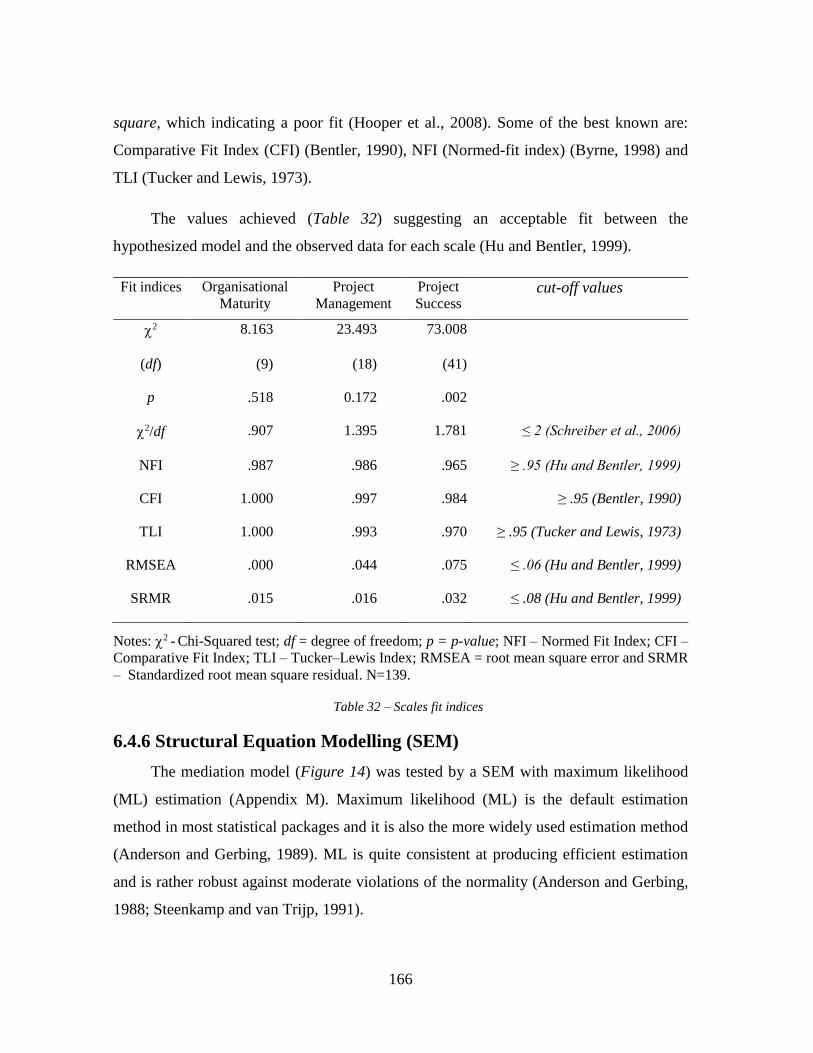
166
square, which indicating a poor fit (Hooper et al., 2008). Some of the best known are:
Comparative Fit Index (CFI) (Bentler, 1990), NFI (Normed-fit index) (Byrne, 1998) and
TLI (Tucker and Lewis, 1973).
The values achieved (Table 32) suggesting an acceptable fit between the
hypothesized model and the observed data for each scale (Hu and Bentler, 1999).
Fit indices Organisational
Maturity
Project
Management
Project
Success cut-off values
2 8.163 23.493 73.008
(df) (9) (18) (41)
p .518 0.172 .002
2/df .907 1.395 1.781 ≤ 2 (Schreiber et al., 2006)
NFI .987 .986 .965 ≥ .95 (Hu and Bentler, 1999)
CFI 1.000 .997 .984 ≥ .95 (Bentler, 1990)
TLI 1.000 .993 .970 ≥ .95 (Tucker and Lewis, 1973)
RMSEA .000 .044 .075 ≤ .06 (Hu and Bentler, 1999)
SRMR .015 .016 .032 ≤ .08 (Hu and Bentler, 1999)
Notes: 2 - Chi-Squared test; df = degree of freedom; p = p-value; NFI – Normed Fit Index; CFI –
Comparative Fit Index; TLI – Tucker–Lewis Index; RMSEA = root mean square error and SRMR
– Standardized root mean square residual. N=139.
Table 32 – Scales fit indices
6.4.6 Structural Equation Modelling (SEM)
The mediation model (Figure 14) was tested by a SEM with maximum likelihood
(ML) estimation (Appendix M). Maximum likelihood (ML) is the default estimation
method in most statistical packages and it is also the more widely used estimation method
(Anderson and Gerbing, 1989). ML is quite consistent at producing efficient estimation
and is rather robust against moderate violations of the normality (Anderson and Gerbing,
1988; Steenkamp and van Trijp, 1991).
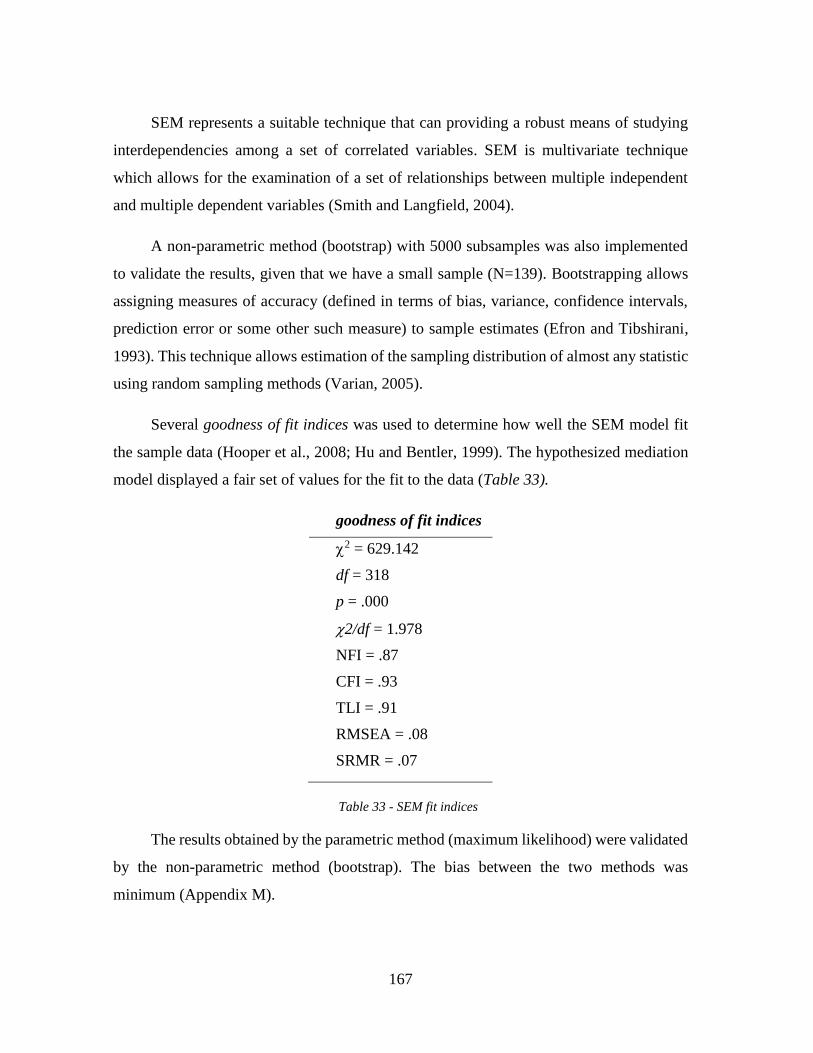
167
SEM represents a suitable technique that can providing a robust means of studying
interdependencies among a set of correlated variables. SEM is multivariate technique
which allows for the examination of a set of relationships between multiple independent
and multiple dependent variables (Smith and Langfield, 2004).
A non-parametric method (bootstrap) with 5000 subsamples was also implemented
to validate the results, given that we have a small sample (N=139). Bootstrapping allows
assigning measures of accuracy (defined in terms of bias, variance, confidence intervals,
prediction error or some other such measure) to sample estimates (Efron and Tibshirani,
1993). This technique allows estimation of the sampling distribution of almost any statistic
using random sampling methods (Varian, 2005).
Several goodness of fit indices was used to determine how well the SEM model fit
the sample data (Hooper et al., 2008; Hu and Bentler, 1999). The hypothesized mediation
model displayed a fair set of values for the fit to the data (Table 33).
goodness of fit indices
2 = 629.142
df = 318
p = .000
2/df = 1.978
NFI = .87
CFI = .93
TLI = .91
RMSEA = .08
SRMR = .07
Table 33 - SEM fit indices
The results obtained by the parametric method (maximum likelihood) were validated
by the non-parametric method (bootstrap). The bias between the two methods was
minimum (Appendix M).
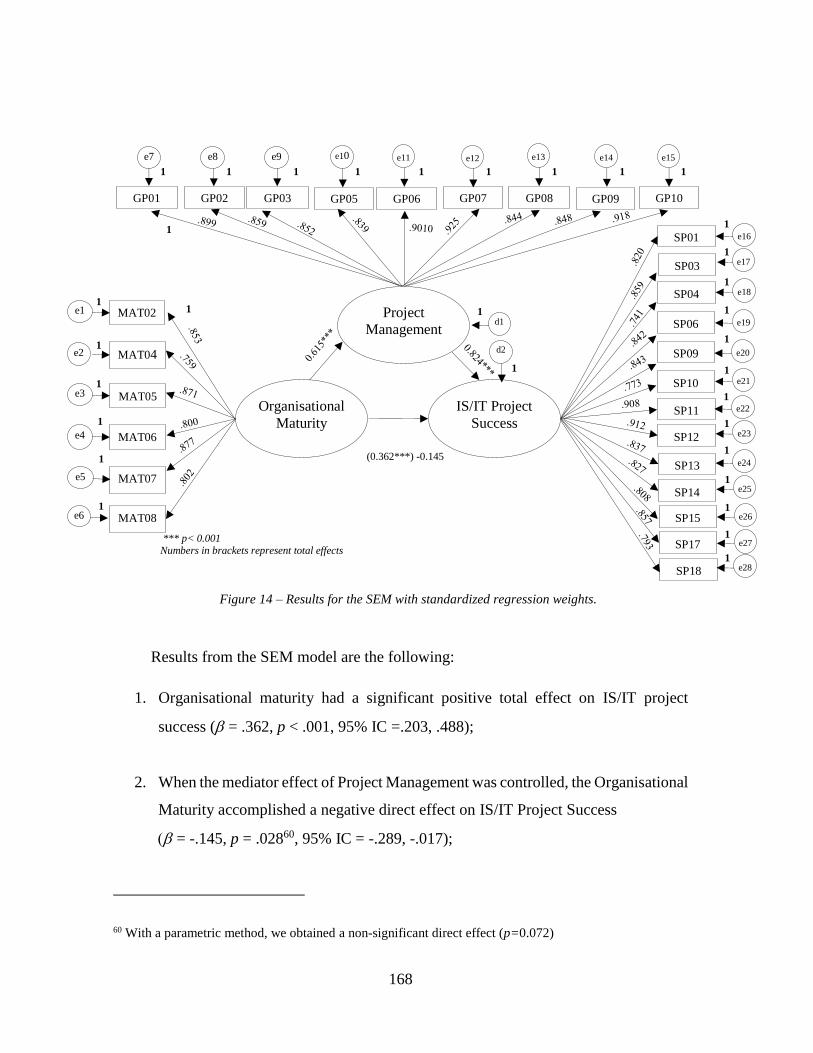
168
*** p< 0.001 Numbers in brackets represent total effects
Figure 14 – Results for the SEM with standardized regression weights.
Results from the SEM model are the following:
1. Organisational maturity had a significant positive total effect on IS/IT project
success ( = .362, p < .001, 95% IC =.203, .488);
2. When the mediator effect of Project Management was controlled, the Organisational
Maturity accomplished a negative direct effect on IS/IT Project Success
= -.145, p = .02860, 95% IC = -.289, -.017);
60 With a parametric method, we obtained a non-significant direct effect (p=0.072)
1
1
1
1
1
1
1
1
1
1
1
1
1 1 1 1 1 1 1 1
1
1
1
1
1
1
1
1
1
1
1
(0.362***) -0.145
MAT02
MAT04
MAT05
MAT06
MAT07
MAT08
e1
e2
e3
e4
e5
e6
GP01 GP02 GP03 GP05 GP06 GP07 GP08 GP09 GP10
e7 e8 e9 e10
71
e11 e12 e13 e14 e15
SP03
SP04
SP06
SP09
SP10
SP11
SP12
SP13
SP14
SP15
SP17
SP18
Organisational
Maturity
IS/IT Project
Success
Project
Management
e16
e17
e18
e19
e20
e21
e22
e23
e24
e25
e26
e27
e28
SP01
d2
d1
1
169
3. Organisational Maturity had a significant and positive indirect effect on IS/IT
Project Success. More Organisational Maturity and more Project Management
brings more IS/IT Project Success;
( = .507, p < .001, 95% IC = .366, .644).
4. Project Management had a mediating effect on the relationship between
Organisational Maturity and IS/IT Project Success.
However, it was a partial mediation because the direct effect of Organisational
Maturity remained significant.
170
Chapter 7. Discussion
In this chapter, we discuss the research results and relate them with the existing
literature. We also discuss results from the hypotheses tests using the data collected by
means of an instrument administered through a web survey to health professionals.
In an initial phase of the work, the author had to carry out a set of conversations and
exploratory meetings with the main intention of collecting information that would allow
him to go ahaed with the development of the model that supports the study. This qualitative
part of the research provided an important input for the research model construction and to
later quantitative research, in terms of the model components. As presented before, our
study explores the relation between Organisational Maturity and the Success of the IS/IT
Projects in Healthcare. The research model explored the presence of a mediation effect
exerted by Project Management practices.
The psychometric properties of the measurement scales were assessed in accordance
with accepted practices (Gerbing and Anderson, 1988) and included establishment of
content validity, reliability, discriminant and convergent validity.
Content validity was established through exploratory interviews with knowledgeable
experts. Considerable effort was made during this field-based validation to ensure that the
scale items were relevant and generalizable across the health sector in our sample.
All scales achieved good coefficient alphas (> .70) (Nunnally, 1978). Discriminant
validity was assessed through CFA by comparing the 2 differences between a constrained
confirmatory factor model (where the correlation factor is set to 1, indicating they are the
same construct) and an unconstrained model (where the correlation factor was free). All 2
differences were found to be significant, providing evidence of discriminant validity
(Anderson and Gerbing, 1988). CFA was also used to establish convergent validity by
confirming that all scale items loaded significantly on their hypothesized construct factors
(Anderson and Gerbing, 1988).
171
Following the two-step modelling method, a confirmatory factor analysis was put
forward to test measurement equation and the hypothesized relationships between observed
variables were tested and replaced in structural equation model.
SEM was applied to test the research model, highlighting the following advantages:
SEM models can contain both measured and latent variables; measurement errors can be
effectively dealt with and explicitly considered in the theoretical models. The use of latent
variables improves the accuracy of the mediated effect measurement. The main findings
answered to the research questions (see p. 137) and were now presented and discussed.
Finding 1: Organisational Maturity had a significant positive total effect on IS/IT
Project Success.
For organisations to succeed in the today's global business competition, it is
necessary that they accomplish a high standard of performance. A maturity model approach
is a process-driven improvement with the essential elements for effective organisational
change (Gomes et al., 2014; Stelzer and Mellis, 1998). Since when projects have been
recognized as critical tools to organisational success, the maturity models are an essential
framework that support the improvement of project management within organisations
(Mullaly, 2014). Basically, a maturity model is a framework describing the idea of
progression towards desired improvement using several successive stages or levels
(Ghorbanali et., 2010). The understanding of the possible impact of the health
organisational maturity on the success of the IS/IT projects is relevant to leverage the
potential of benefits these investments could deliver to these organisations and their
stakeholders. Scientific and academic literature establishes some bridges between
organisational maturity and project success (e.g. Levin and Skulmoski, 2000; PwC, 2004;
PwC, 2012; Sergeant et al., 2010; Skulmoski, 2001) although some criticism has been
reported.
Khan and Spand (2013) found that organisational maturity has a significant positive
relationship with project success. Their study identifies the importance of project related
factors and organization maturity for achieving project success. It is suggested that
172
organisations should address the project related factors during the planning phase of their
project. They should focus on reducing the following three things: the complexity involved
in the project; the potential risks in the project and the overall duration of the project.
In the present study, the Organisational Maturity construct was measured using the
P3M3© framework. This approach is supported on a set of organisational perspectives
(OGC, 2010a). Embedded within these perspectives were defined several attributes. The
specific attributes are related only to a specific process perspective. The generic attributes
are common to all process perspectives at a given maturity level, and include planning,
information management, training and development.
When using P3M3© framework, an organization may choose to review only one
specific or several perspectives. It is unlikely that an organization will have strengths in all
areas or that the defined perspectives are applicable to all situations. So, depending on the
sector of industry or business target, the organization may choose what perspectives are
appropriate to be assessed.
Our research initially considered all the seven perspectives, but later we abandoned
the benefits management perspective, since there is no clear evidence of the usage of these
practices on Portuguese Health organisations. The answers to the survey compute a
considerable level of I don’t know answers (21.5%) for this perspective.
From the descriptive statistical point of view, the mean values for perspectives range
between 2.35 to 2.78, where the Financial Management and Organisational Governance
has the highest values and Risk Management the lowest. The standard deviation range
between 1.203 to 1.350.
The internal consistency has an excellent score (= .928), and values of convergent
validity and discriminant validity proof clearly a strong connection to the construct (Tables
29 and 30). Table 31 and 32 show a good fit with the data collected with the comparative
indices are near 1.00 and the absolute indices close to .00.
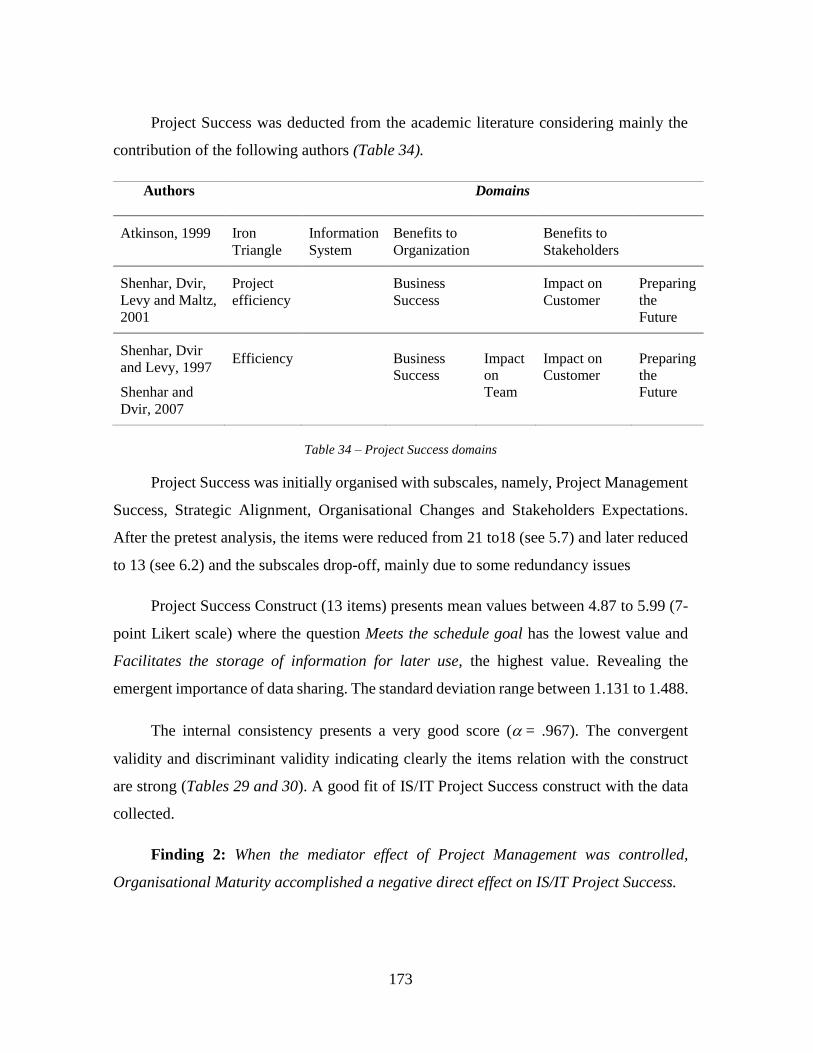
173
Project Success was deducted from the academic literature considering mainly the
contribution of the following authors (Table 34).
Authors Domains
Atkinson, 1999 Iron
Triangle
Information
System
Benefits to
Organization
Benefits to
Stakeholders
Shenhar, Dvir,
Levy and Maltz,
2001
Project
efficiency
Business
Success
Impact on
Customer
Preparing
the
Future
Shenhar, Dvir
and Levy, 1997
Shenhar and
Dvir, 2007
Efficiency Business
Success
Impact
on
Team
Impact on
Customer
Preparing
the
Future
Table 34 – Project Success domains
Project Success was initially organised with subscales, namely, Project Management
Success, Strategic Alignment, Organisational Changes and Stakeholders Expectations.
After the pretest analysis, the items were reduced from 21 to18 (see 5.7) and later reduced
to 13 (see 6.2) and the subscales drop-off, mainly due to some redundancy issues
Project Success Construct (13 items) presents mean values between 4.87 to 5.99 (7-
point Likert scale) where the question Meets the schedule goal has the lowest value and
Facilitates the storage of information for later use, the highest value. Revealing the
emergent importance of data sharing. The standard deviation range between 1.131 to 1.488.
The internal consistency presents a very good score (= .967). The convergent
validity and discriminant validity indicating clearly the items relation with the construct
are strong (Tables 29 and 30). A good fit of IS/IT Project Success construct with the data
collected.
Finding 2: When the mediator effect of Project Management was controlled,
Organisational Maturity accomplished a negative direct effect on IS/IT Project Success.
174
Project management is an emerging discipline in business and management (Fabian,
2000) and its purpose is to ensure the success, promoting improvements in the
professionals’ skills while planning, deploying and managing activities in compliance with
the objectives of the organization, by means of several tools (Jha and Iyer, 2006).
The search for excellence in project management by organisations is measured by its
maturity level in managing their projects, by measuring how much the processes of
companies are dedicated to their projects (Berssaneti, et al, 2012). Project management best
practices are recognized as key tools for planning, structuring and tracking projects to
achieve the objectives (schedule, budget, quality) and a means to achieve full stakeholder
satisfaction.
The academic literature acknowledges a positive effect of the Organisational
Maturity on IS/IT Project Success. So, there was an expectation that the introduction of
Project Management practices could improve this effect in the Health organisations.
Although, the study shows that when Project Management practices are present, the
Organisational Maturity affects negatively the IS/IT Project Success.
A possible explanation could be found on the excessive centralization of the
procurement decisions (SPMS). For this reason, Health organisations do not correctly
appropriate the projects, do not get the ownership of the projects, and this stance apparently
generates a misalignment between the internal processes and the Project Management
practices.
Finding 3: Organisational Maturity had a significant and positive indirect effect on
IS/IT Project Success.
Finding 4: Project Management practices had a mediating effect on the relationship
between Organisational Maturity and IS/IT Project Success. However, it was a partial
mediation because the direct effect of Organisational Maturity remained significant.
175
The Project Management construct considered the ten knowledge areas of PMBoK
(version 5). In a closer analysis, we verify that the Cost Management item had a high level
of I don’t know answers (17.8%).
Apparently, the high rate of I don’t know answers could be, again, due to a
concentrated way of taking investment decisions on IS/IT projects and the related centrally
decided procurement process. The IS/IT projects are centrally decided (SPMS) and the
issues like cost are not really managed locally. The health professionals have little or no
involvement in what relates to project costs. So, we've decided to remove this item from
the Project Management construct.
Project Management was initially defined with ten subscales, with two items per
subscale. Due to some redundancy concerns we were taken to consider only one item per
knowledge area (see 5.7). Project Management construct presents mean values between
4.21 to 5.43 (7-point Likert scale) where the question related to Risk Management has the
lowest value and the Time Management question the highest value. The standard deviation
range between 1.513 to 1.744.
The internal consistency was very good (= .967). The values of convergent validity
and discriminant validity shows a strong connection with the construct (Tables 29 and 30).
Table 31 and 32 show an acceptable fit of IS/IT Project Success construct with the data
collected. The comparative indices are near 1.00 and the absolute indices close to .00.
Study shows that the Organisational Maturity has an indirect effect on IS/IT Project
Success ( = .615 × .824 = .507, p < .001), which means that the Organisational Maturity
has a positive effect on Project Management which in turn has also a positive effect on
IS/IT Project Success.
Although the Project Management mediation, the Organisational Maturity compute
a significative effect on IS/IT Project Success. In this case, the Organisational Maturity
compute a direct and indirect effect on IS/IT Project Success and for this reason we have a
partial mediation (Figure 15).
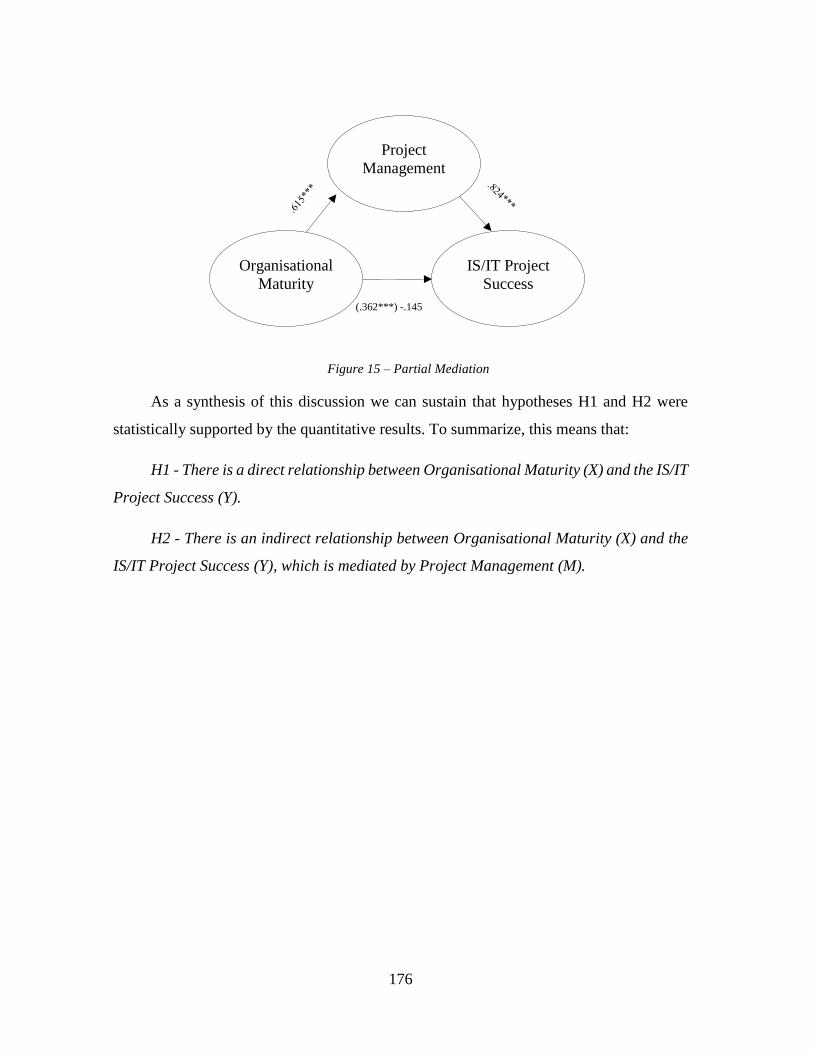
176
Figure 15 – Partial Mediation
As a synthesis of this discussion we can sustain that hypotheses H1 and H2 were
statistically supported by the quantitative results. To summarize, this means that:
H1 - There is a direct relationship between Organisational Maturity (X) and the IS/IT
Project Success (Y).
H2 - There is an indirect relationship between Organisational Maturity (X) and the
IS/IT Project Success (Y), which is mediated by Project Management (M).
(.362***) -.145
Organisational
Maturity
IS/IT Project
Success
Project
Management
177
Chapter 8. Conclusions
8.1 Background
All countries in Europe are experiencing an ageing of their populations, with a
decrease in the number of workers per employee retired. Expenditure on long-term
healthcare is certainly going to increase with the current ageing of the population. Because
of this, the growth effects on healthcare expenses are critical to governments. It seems to
be consensual that appropriate measures should be implemented in time. Significant
improvements in Portuguese population health status and in healthcare outcomes were
achieved in the past decade. Although, some important challenges remain to be resolved,
namely:
- Inequalities in health status between men and women and among geographical
regions (OPSS61, 2017; van Doorslaer & Koolman, 2004);
- Health expenditure both as a percentage of GDP and on a per-capita basis, has
increased significantly over the past decade. The end users are concerned about
healthcare costs in a near future (Barros, 2011; Delloite, 2011).
- Some surveys62 suggest that the Portuguese have no confidence in the ability of
the health system to provide good quality and affordable health care;
- Privacy and security risks are a concern to Portuguese healthcare end users;
- Studies63 reported health information limitations that could restrict the capacity
to develop, analyse and monitor the effectiveness of the policies and strategy for
the sector.
61 Observatório Português dos Sistemas de Saúde 62 Deloitte (2011). 2011 Survey of Health Care Consumers in Portugal: Key Findings, Strategic Implications.
Deloitte Center for Health Solutions. Washington, DC, USA: Deloitte. 63 OECD (2015). OECD Reviews of Health Care Quality: Portugal 2015: Raising Standards. Paris: OECD
Publishing. Available at: http://dx.doi.org/10.1787/9789264225985-en, 19/07/2017.
178
IS/IT have great potential to improve healthcare by enhancing access to health
information and making health services more efficient. They can also contribute to
improving the quality of services and reducing their cost.
A patient-centred information system can track individual health problems and
treatment over time, giving insights about optimal diagnosis and treatment of the
individual, as well as improving the delivery of services. As previously mentioned, the
IS/IT investments in healthcare brings many benefits to day-by-day of the organisations.
As also previously referred, these implementations have a large impact on all areas of the
health organisations, professional staff, managers, politicians and public. Some of the
following incidents remain current and actions are required for their minimization and
resolution, namely:
- Increased speed in the provision of health services;
- Improved accuracy, completeness, and consistency of health care;
- Reducing costs, time and resources;
- Improved corporate memory to support the organization's learning ability;
- Quick identification of service gaps and inefficiencies;
- Rapid risk analysis;
- Automated compilation of areas for improvement;
- Maintaining and updating the information easier;
- Information in multiple formats to serve different end user;
- Management of the online information;
- Support for multiple users.
The challenge for the SNS is to maintain and improve the gains in health status,
together with improving equity in healthcare, and be more responsive to the expectations
and concerns of the Portuguese population. Enhancing health system performance with
limited resources require the capacity of having health policy choices on allocating
resources to the areas where they can be most effective.
179
Studies64 confirms that the health management practices are strongly related to a
quality of patient care and productivity outcomes. Managing the healthcare information
systems become increasingly crucial to quality improvement in healthcare.
The understanding of the possible impact of Organisational Maturity through
Projects Management practices on the IS/IT Project Succes is important to leverage its
potential value. This is particularly important in the Healthcare, where the systems
technologies involved are usually of a cutting-edge nature ands requires substantial
investments.
Academics and practioners stressed the importance of the Organisational Maturity
and Project Management on the IS/IT Project Success. Several studies recognise that these
two constructs have a positive effect on IS/IT Project Success.
Nevertheless, it had not acknowledged a negative effect between Organisational
Maturity and IS/IT Project Success when the Project Management practices are present.
The introduction of IS/IT in Health promotes greater dissemination of information to all
individuals, which ultimately facilitates the different internal processes and disseminates
the information and knowledge across the organisations.
IS/IT implementations fosters the effects of an open organization and, as a result,
information to all of the individuals is disseminated more widely.
Systematizing what was studied and evaluated, the present study adopted a mediation
models to test the following hypotheses:
H1 - There is a direct relationship between Organisational Maturity (X) and the IS/IT
Project Success (Y).
64 Dorgan, S., Layton, D., Bloom, N., Homkes, R., Sadun, R., & Van Reenen, J. (2011). Management in
Healthcare: Why good practice really matters. LSE Research Online 2011.
http://cep.lse.ac.uk/textonly/_new/research/productivity/management/PDF/Management_in_Healthcare_Re
port.pdf.
180
H2 - There is an indirect relationship between Organisational Maturity (X) and the
IS/IT Project Success (Y), which is mediated by Project Management (M).
The methodology used an online questionnaire to collect the perception of health
professionals, which was previously validated by a pretest. The content, convergent and
discriminant validation and reliability analysis were performed.
The confirmatory factor analysis (CFA) assessed the constructs validity. All items
loaded significantly on their corresponding latent construct, thereby providing evidence of
convergent validity and confirmed that the data fited the hypothesized measurement model
based on theory and previous analytic research.
The values achieved by the indices of goodness-of-fit suggested an acceptable fit
between the hypothesized model and the observed data for each scale. The mediation model
tested by a SEM with maximum likelihood (ML) estimation and a non-parametric method
(bootstrap) with 5000 subsamples validated the results. Bootstrapping allowed us to assign
accuracy to the measurements. The hypothesized mediation model displayed a fair set of
values for the fit to the data.
Both hypotheses were confirmed, and a partial mediation were achieved. The
influence of the Organizational Maturity on IS/IT Project Success remains significant
despite the mediation of Project Management.
The study has shown that Organizational Maturity had a significant total effect on
IS/IT Project Success. Organisational Maturity acknowledges a direct and an indirect effect
on the IS/IT Project Success.
The research also shows that Organisational Maturity has a positive effect on Project
Management and Project Management has a positive effect on the IS/IT Project Success.
An interesting, although unexpected, part of our research came out from how
Organisational Maturity influenced the IS/IT Project Success, in the strict context of the
study, the public health sector (public hospitals).
181
The research confirmed some of the previous assumptions:
₋ Public health organisations behave similarly to organisations from other industries,
or in other words, mature public health organisations have more chances to increase
the likelihood of having IS/IT successful projects.
₋ More mature health organisations facilitate the use of methods and tools, namely,
Project Management practices, which in turn will enhance the success of IS/IT
projects.
₋ In general, the Project Management practices adopted n public health organisations
and used according to the main practitioner standards (PMBOK, NCB, amongst
others) enhance the likelihood of successful projects in IS/IT.
₋ The mediation testing reveals that in presence of Project Management, the
Organisational Maturity continues to make its influence on the success of IS/IT
projects, although negatively in certain circumstances.
Finally, the study highlighted that when the Project Management practices are
present as a mediator, the Organisational Maturity has a significant effect on the IS/IT
Project Success but with a negative signal/effect.
Some testimonials recorded in conversations, interviews (Appendix E) and
information collected in the pretest questionnaire already pointed out some problems that
could be the origin of the obtained results, namely:
₋ The centralised decision-making process concerning investments in large IS/IT
projects, where some key stakeholders (e.g. members of the board of hospitals)
are not part of the decision-making process.
₋ The considerable lack of active communication between the central health
administration and the distributed health units, namely the central and regional
hospitals
₋ Lack of training programs on the systems and technologies in use.
₋ Few information sessions about the potential impacts of the new strategic IS/IT
applications, or even about the systems and technologies which support them.
182
This has caused a lack of active involvement, participation and diffusion effect
from the part of the key users of those applications, with a strong influence on
feedback for IS/IT project success
₋ Lack of motivational sessions showing the pros of the needed changes.
₋ Absence of a strategic alignment between the different levels of the health
sector. A centralized decision-making process on investments for IS/IT
applications creates a difficult consensus about the more adjusted projects
portfolio for this type of investments. Consequently, this has a strong impact on
the ownership process concerning the adoption of the IS/IT applications caming
out from the centralized IS/IT organisation that develops and deploys them
(SPMS).
8.2 Limitations
The study was developed in the Portuguese public Healthcare organisations, in a
specific context of strong rationalization and cost containment. This is, nowadays, a reality
also shared by most European countries.
According to the OECD (2015a) the health spending in Portugal dropped in 2013 by
3.7%. Public health spending has been continuously reduced since 2010 after moderate
growth in previous years. Several cost-containment measures have been taken in the wake
of the economic crisis to reduce public spending on health, but with prospects for
improvement in the short to medium term. This situation led to sector reorganization with
the creation of a public body that centralizes and manages all health expenditures. On one
hand, centralization of the procurement has the potential to reduce costs. But on other hand,
it reduces or completely removes autonomy from health organisations, causing a huge gap
between the internal processes of organisations and initiatives emanating superiorly that
end up interfering with the day-to-day activities of organisations.
8.3 Contributions and recommendations
The results provide several theoretical contributions:
183
₋ Through the literature review process, it was possible to systematize the
academic topics of Organizational Maturity, Project Management and IS/IT
Project Success in the context of the healthcare;
₋ To understand the different relations and their respective effects among the
different variables;
₋ Analyze the observed results and confront them with the results of the academic
literature;
₋ Deduce some recommendations that derive directly from the results that were
obtained from the present study.
In terms of recommendations, we think some initiatives could be performed:
₋ Disseminating good Project Management practices, both those centrally (e.g.
better communication, better stakeholder management…), as well as at the level
of decentralized organizations.
₋ As far as we know and has been publicly assumed, the Health Ministry has
published a decree-law establishing the provisions and determines the principles
of governance and management of the National Strategy for Health Information
Ecosystem (ENESIS) 2020, where some of these concerns are addressed and
partially to be solved. We claim that these governance principles should be
extended and aligned with the governance of IS/IT, letting clear the way IS/IT
investments are managed and whose stakeholders are to be considered in the
complex decision-making process.
₋ About of the portfolio of the most relevant applications of health, should be clear
who defines, selection criteria, and who establishes the priorities for this type of
valuation of projects in the portfolio.
The study also identifies several opportunities for improvement, namely:
₋ More participation of the health unities on the decision process concerning the
IS/IT investments
184
₋ Promoting the internal IS/IT initiatives, explaining the reasons for the
investments, expected benefits for the organisations and for the professionals
₋ Engaging the health professionals in the IS/IT adoption and knowledge
dissemination.
₋ A sustainable adoption of project management practices in new initiatives
concerning IS/IT application developments, following the entire project life
cycle, and aimed at collecting the promised benefits.
8.3 Future studies
Enterprise Governance of IS/IT was not scoped for this research project. Then, our
first proposal for a further phase of the research is to consider this specific dimension in
our research model. As we could see from the achieved results, this can generate useful
explanations about the effects of a decision-making centrality for the investments in IS/IT
applications process.
Second proposal is to analyse the effect of each of the Organizational Maturity
perspectives, according to de P3M3 on IS/IT Project Success.
185
References
Aarts, J., Doorewaard, H., & Berg, M. (2004). Understanding implementation: The case of a
computerized physician order entry system in a large Dutch University Medical Center.
Journal of the American Medical Informatics Association, 11(3), 207-216.
Abouzhara, M. (2011). Causes of failure in Healthcare IT projects. In Proceedings of the 3th
International Conference on Advance Management Science, IPEDR, 19, IACSIT,
Singapore.
Abrams, C., von Kanel, J., Muller, S., Pfitzmann, B., & Ruschka-Taylor, S. (2007). Optimized
enterprise risk management. IBM Systems Journal, 46(2), 219-234.
Adams, S. A., van de Bovenkamp, H., & Robben, P. (2015). Including citizens in institutional
reviews: Expectations and experiences from the Dutch Healthcare Inspectorate. Health
Expectations, 18(5), 1463-1473.
Adenfelt, M. (2010). Exploring the performance of transnational projects: Shared knowledge,
coordination and communication. International Journal of Project Management, 28(6),
529-538.
Agarwal, N., & Rathod, U. (2006). Defining success for software projects: an exploratory
revelation. International Journal of Project Management, 24, 358–370.
Aiman-Smith, L., Goodrich, N., Roberts, D., & Scinta, J. (2005). Assessing your
organization’s potential for value innovation. Research Technology Management, 4(2),
37-42.
AIPM (2004). National Competency Standards for Project Management. Australian National
Training Authority.
Al-Ahmad, A., Al-Fagih, K., Khanfar, K., Alsamara, K., Abuleil, S., & Abu-Salem, H. (2009).
A taxonomy of an IT project failure: Root causes. International Management Review,
5(1), 93-104.
186
Albrecht, J. C., & Spang, K. (2014). Linking the benefits of project management maturity to
project complexity: Insights from a multiple case study. International Journal of
Managing Projects in Business, 7(2), 285-301.
Ali, A. (2010). Investigating Project Management Practices in Public Sector Organisations
of a Less Developed Country. Thesis submitted in fulfilment of requirements for the
degree of Doctor of Philosophy at the School of Property Construction and Project
Management, RMIT University, Melbourne, Australia.
Allen, M. J., Kaufmann, D. M, Barret, A., Paterson, D. Sargeant, J., & McLeod, R. (2000).
Self-reported effects of computer workshops on physicians’ computer use. Journal of
Continuing Education in the Health Professions, 20(1), 20-26.
Ambrisko, T. D., & Nemeth, T. (2004). A computer program for calculating of doses and
prices of injectable medications based on body weight or body surface area. Canadian
Journal of Veterinary Research, 68(1), 62-65.
Ammenwerth, E., & de Keizer, N. (2005). An inventory of evaluation studies of information
technology in healthcare: trends in evaluation research 1982–2002. Methods of
Information in Medicine, 44, 44–56.
Ammenwerth, E., Kutscha, U., Kutscha, A., Mahler, C., Eichstadter, R., & Haux, R. (2001).
Nursing process documentation systems in clinical routine–prerequisites and
experiences. International Journal of Medical Informatics, 64(2), 187- 200.
Ammenwerth, E., Iller, C., & Mahler, C. (2006). IT-adoption and the interaction of task,
technology and individuals: a fit framework and a case study. BMC Medical Informatics
and Decision Making, 6(3).
Andersen, E. S., & Jessen, S. A. (2003). Project maturity in organisations. International
Journal of Project Management, 21(6), 457-461.
187
Anderson, J. C., & Gerbing, D. W. (1984). The effect of sampling error on convergence,
improper solutions, and goodness of fit indices for MLE CFA. Psychometrika, 49, 155-
173.
Anderson, J. C., & Gerbing, D. W. (1988). Structural equation modeling in practice: A review
and recommended two-step approach. Psychological Bulletin, 103, 411–423.
Anderson, J. G. (1997). Clearing the way for physicians’ use of clinical information systems.
Communications of the ACM, 40(8), 83-90.
Anderson, J. G., & Aydin, C. E. (1994). Overview: Theoretical perspectives and
methodologies for the evaluation of health care information systems. In J. G. Anderson,
C. E. Aydin and S. J. Jay (eds.) Evaluating health care information systems: Methods
and applications. Thousand Oaks, CA, USA: Sage Publications, Inc. 5-29.
Andreassen, H. K., Bujnowska-Fedak, M. M., Chronaki, C.E., Duritru, R. C., Pudele, I.
Santana, S., Voss, H., & Wynn, R. (2007). European citizens’ use of E-health services:
A study of seven countries. BMC Public Health, 7(53).
Andrew, T. (2000). IT projects: sink or swim. Computer Bulletin, 42, 24-26.
Anthony, R. N., Dearden, J., & Vancil, R. F. (1972). Management Control Systems.
Homewood: Irwin.
Aperta, J., Borges, A., Cadilha, D., Dimas, F., Dinis, C., Feio, J., Fonseca, O., Garcia, M.,
Marques, F., Ribeiro, J., Rodrigues, C., Santos, C., Teixeira, C., & Dimitrovová, K.
(2015). Compras Centralizadas na Saúde. Revista Portuguesa de Farmacoterapia, 7,
214-220
Appleby, J. (2013). Spending on health and social care over the next 50 years: Why think long
term? London, UK: The King’s Fund.
APM (2012). Body of Knowledge (6th Edition). Buckinghamshire, UK: Association for Project
Management.
188
Aral, S., Brynjolfsson, E., & Van Alstyne, M. (2007) Information, Technology and
Information Worker Productivity Task Level Evidence. Information System Research.
Available at: SSRN: https://ssrn.com/abstract=942310, 19/07/2017.
Arbuckle, J. L. (2011). IBM® SPSS® Amos™ 20 User’s Guide. IBM Amos Development
Corporation.
Artto, K., Heinonen, R., Arenius, M., Kovanen, V., & Nyberg T. (1998). Gobal project
business and dynamics of change. Finland: Tecnhology Development Centre Finland
and PMI Finland.
Artto, K., Martinsuo, M., Gemünden, H.G., Murtoaro, J. (2009). Foundations of program
management: A bibliometric view. International Journal of Project Management, 27,
1–18.
Artto, K., & Wikström, K. (2005). What is project business? International Journal of Project
Management, 23 (5), 343–353.
Ashurst, C., & Doherty, N. F. (2003). Establishing an Organisational Capability to Succeed
in Realizing Benefits from IT Investments: An Exploratory Analysis. In Bergout, E. and
Remenyi, D. E. (Eds) ECITE, 10th European Conference on Information Technology
Evaluation, Madrid, Spain, 1-11.
Ashurst, C., Doherty, N. F., & Peppard, J. (2008). Improving the impact of IT development
projects: the benefits realization capability model. European Journal of Information
Systems, 17(4), 352-370.
Atkinson, R. (1999). Project management: cost, time and quality, two best guesses and a
phenomenon, it’s time to accept other success criteria. International Journal of Project
Management, 17(6), 337-342.
Atkinson, R., Crawford, L., & Ward, S. (2006). Fundamental uncertainties in projects and the
scope of project management. International Journal of Project Management, 24, 687-
698.
189
Avots, I. (1969). Why does project management fail? California Management Review, 12,
77–82.
AXELOS (2016). Introduction to P3M3©, version 3. UK: AXELOS Limited
Babbie, E. R. (1990). Survey Research Methods (2nd Edition). Belmont, CA: Wadsworth.
Babonea, A.M., & Voicu M.C. (2011). Questionnaires Pretesting in Marketing Research.
Challenges of the Knowledge Society,1, 1323-1330.
Baccarini, D. (1999). The logical framework method for defining project success. Project
Management Journal, 30(4), 25-32.
Baccarini, D., & Collins, A. (2004). The concept of project success - what 150 Australian
project managers think. Australian Institute of Project Management (AIPM)
Conference, 10-12th October, Perth, Australia.
Backlund, F., Chronéer, D., & Sundqvist, E. (2014). Project management maturity models -
A critical review: a case study within Swedish engineering and construction
organisations. Procedia Social and Behavioural Sciences, 119, 837-846.
Bagozzi, R. P., Yi, Y., & Phillips, L. W. (1991). Assessing construct validity in organizational
research. Administrative Science Quarterly, 36, 421-458.
Baker, B. N., Murphy, D. C. & Fisher, D. (1983). Factors affecting project success. In
Cleland, D. I. and King, W. R. (Eds). Project Management Handbook. New York: Van
Nostrand Reinhold, 669-685.
Baker, B. N., Murphy, D. C., & Fisher, D. (1988). Factors affecting project success. In
Cleland, D. I. and King, W. R. (Eds). Project Management Handbook, (2nd Edition).
New York: Van Nostrand Reinhold, 902-909.
Bannerman, P. (2008). Defining project success: a multilevel framework. In Proceedings of
PMI Research Conference. Newtown Square, PA: PMI, 1-14.
190
Barat, J. (1992). Scenario Playing for Critical Success Factor Analysis. Journal of Information
Technology, 7(1), 12-19.
Barber, E. (2004). Benchmarking the Management of Projects: A Review of Current
Thinking. International Journal of Project Management, 22(4), 301- 307.
Barnes, D. (2001). Research methods for the empirical investigation of the process of
formation of operation strategy. International Journal of Operations and Production
Management, 21(8), 1076-1095.
Baron, R. M., & Kenny, D. A. (1986). The moderator-mediator variable distinction in social
psychological research: Conceptual, strategic and statistical considerations. Journal of
Personality and Social Psychology, 51, 1173-1182.
Barrett, M. J., Holmes, B. J., & McAulay, S. E. (2003). Electronic Medical Records: A Buyer’s
Guide for Small Physician Practices. Oakland, CA: California HealthCare Foundation.
Barros, P. P., Machado, S. R., & Simões, J. A. (2011). Portugal: Health System Review.
Health Systems in Transition. Copenhagen, Denmark: European Observatory on Health
Systems and Policies, World Health Organization.
Bassey, M. (1995). Creating Education through Research: A Global Perspective of
Educational Research in the 21st Century. Newark: Kirklington Moor Press
Bates, D. W., Cohen, M., Leape, L. L., Overhage, J. M., Shabot, M. M., & Sheridan, T. (2001).
Reducing the frequency of errors in medicine using information technology. Journal of
the American Medical Informatics Association, 8(4), 299-308.
Bates D.W., & Gawande, A.A. (2002). Error in medicine: what have we learned? Annals of
Internal Medicine, 132(9), 763-767.
BDII (2003). Capability Maturity Model® for Business Development, Version 1.0. Phoenix,
Arizona: Business Development Institute International.
191
Baker, D. B., & Masys, D. R. (1999). PCASSO: a design for secure communication of
personal health information via the internet. International Journal of Medical
Informatics, 54(2), 97–104.
Bakker, R. M. (2010). Taking stock of temporary organizational forms: a systematic review
and research agenda. International Journal of Management Reviews, 12, 466–486.
Beccalli, E. (2007). Does IT investment improve bank performance? Evidence from Europe.
Journal of Banking & Finance, 31(7), 2205-2230.
Becker, J., Knackstedt, R., & Pöppelbuß, J. (2009). Developing Maturity Models for IT
Management: A Procedure Model and its Application. Business and Information
Systems Engineering, 1(3), 213-222.
Belassi, W., & Tukel, O. (1996). A new framework for determining critical success/failure
factors in project. International Journal of Project Management, 14(3), 141-151.
Belout, A. (1998). Effects of human resource management on project effectiveness and
success: toward a new conceptual framework. International Journal of Project
Management, 16(1), 21-26.
Belson, W. A. (1981). The design and understanding of survey questions. Aldershot: Gower.
Benbasat, I., Dexter, A.S., Drury, D. H., & Goldstein, R. C. (1984). A critique of the stage
hypothesis: theory and empirical evidence. Communications of the ACM, 27(5), 476-
485.
Bendig, A. W. (1954). Reliability and the number of rating scale categories. Journal of
Applied Psychology, 38, 38–40.
Bentler, P. M. (1990). Comparative fit indexes in structural models. Psychological Bulletin,
107, 238–246.
Berg, M. (2001). Implementing information systems in health care organisations: myths and
challenges. International Journal of Medical Informatics, 64, 143-156.
192
Berg, P., Leinonen, M., Leivo, V., & Pihlajamaa, J. (2000). Assessment of quality and
maturity level of RandD. International Journal of Production Economics, 78(1), 29–35.
Berg, P., Pihlajamaa, J., & Nummi, J. (2004). Measurement of the quality and maturity of the
innovation process: methodology and case of a medium sized Finnish company.
International Journal of Entrepreneurship and Innovation Management, 4(4).
Berg, P., Pihlajamaa, J., Poskela, J., & Smedlund, A. (2006). Benchmarking of quality and
maturity of innovation activities in a networked environment. International Journal of
Entrepreneurship and Innovation Management, 33 (2-3).
Berghout, E., Nijland, M., & Grant, K. (2005). Seven ways to get your favoured IT project
accepted-politics in IT evaluation. The Electronic Journal of Information System
Evaluation, 8(1), 31-40.
Berssaneti, F. T, Carvalho, M. M., & Muscat, A.R.N. (2012). Impact of reference model for
project management and project management maturity models on performance: an
exploratory study in information technology projects. Produção, 22(3), 421-435.
Besner, C., & Hobbs, B. (2006). The perceived value and potential contribution of project
management practices to project success. Project Management Journal, 37(3), 37-48.
Besner, C., & Hobbs, B. (2008). Discriminating Contexts and Project Management Best
Practices on Innovative and Non-innovative Projects. Project Management Journal, 39,
supplement, S123-S134.
Beuscart-Ze´phir, M. C., Anceaux, F., Crinquette, V., & Renard, J. M. (2001). Integrating
users’ activity modeling in the design and assessment of hospital electronic patient
records: the example of anesthesia. International Journal of Medical Informatics, 64(3),
157-171.
Beynon, D. R. (2007). Interpreting Capability Maturity Model Integration (CMMI) for
Business Development Organisations in the Government and Industrial Business
193
Sectors. Technical Note CMU/SEI-2007-TN-004. Carnegie Mellon University,
Pennsylvania, US: Software Engineering Institute.
Bharadwaj, A. S. (2000). A Resource Based Perspective on Information Technology and Firm
Performance: An Empirical Investigation, MIS Quarterly, 24(1), 169-196.
Bindakheel, A., & Rosnah, N. (2010). Adoption of ICT at Hospital: A case study of UMMC.
In Proceedings of the 2nd International Conference on Electronic Computer Technology
(ICET 2010), 7-10 May, Kuala Lumpur, Malaysia, 157-167.
Birkett, N. J. (1986). Selecting the number of response categories for a Likert-type scale. In
Proceedings of the American Statistical Association, January 1986, 488–492.
Biscaia, A. R., & Heleno, L. C. V. (2017). Primary Health Care Reform in Portugal;
Portuguese, modern and innovative. Ciência & Saúde Colectiva, 22(3), 701-711.
Blanche, M. T., Durrheim, K., & Painter, D. (2006). Research in Practice: Applied Methods
for Social Sciences, (2nd Edition). University of Cape Town, Cape Town, South Africa:
UCT Press.
Bleich, H. L., Beckley, R. F., Horowitz, G. L., Jackson, J. D., Moody, E. S., Franklin, C.,
Goodman, S. R., McKay, M.W., Pope, R. A., Walden, T., Bloom, S. M., & Slack, W.
V. (1985). Clinical computing in a teaching hospital. The New England Journal of
Medicine, 312(12), 756–764.
Blomquist, T., Hällgren, M. Nilsson, A, & Söderholm, A. (2010) Project-as-practice: In search
of project management research that matters. Project Management Journal, 41(1), 5-
16.
Boelen, P.A., van den Hout M. A., & van den Bout, J. (2008). The factor structure of
posttraumatic stress disorder symptoms among bereaved individuals: aconfirmatory
factor analysis study. Journal of Anxiety Disorders, 22, 1377–1383.
Bogdan, R., & Biklen, S. K. (1992). Qualitative Research for Education: An Introduction to
Theory and Methods. London: Allwyn and Bacon.
194
Bollen, K. A. (1989). Structural Equations with Latent Variables. New York: John Wiley &
Sons.
Boomsma, A. (1982). Robustness of LISREL against small sample sizes in factor analysis
models. In K. G. Joreskog & H. Wold (Eds.), Systems under indirect observation:
Causality, structure, prediction (Part 1), 149-173. Amsterdam: North Holland.
Bose, R. (2003). Knowledge management-enabled health care management: capabilities,
infrastructure, and decision-making. Expert Systems with Applications, 24, 59-71.
Bourne, L., & Walker D. H. T. (2004). Advancing Project Management in Learning
Organisations. The Learning Organization, 11(3), 226-243.
Boynton, A.C., and Zmud, R.W. (1984). An Assessment of Critical Success Factors. Sloan
Management Review (25), 17-27.
Bradley, G. (2006). Benefit Realization Management: A Practical Guide for Achieving
Benefits through Change. Aldershot, Hants, England: Gower Publishing.
Brady, T., & Davies, A. (2004). Building project capabilities: from exploratory to exploitative
learning. Organization Studies, 25, 1601–1621.
Brailer, D. J., & Terasawa, E.L. (2003). Use and Adoption of Computer-Based Patient
Records. Oakland, CA: California HealthCare Foundation.
Brancheau, J., Janz, B., & Wetherbe J. (1996). Key Issues in Information Systems
Management: 1994-95 SIM Delphi Result. MIS Quarterly, 20(2), 225-236.
Brandrud, A. S., Schreiner, A., Hjortdahl, P., Helljesen, G. S., Nyen, B., & Nelson, E. C.
(2011). Three Success Factors for Continual Improvement in Healthcare: An Analysis
of the Reports of Improvement Team Members. BMJ Quality and Safety, 20(3), 251-
259.
195
Braun, A., Constantelou, A., Karounou, V., Ligtoet, A., & Burgelman, J. C. (2003)
Prospecting ehealth in the context of a European Ageing Society: Quantifying and
qualifying needs. IPTS/ESTO final report. Sevilla, Spain.
Bredillet, C. (2005). Where do we come from? What are we? Where are we going? Project
Management Journal, 36(2), 3-4.
Bredillet, C. (2007). Exploring research in project management: nine schools of project
management research. Project Management Journal, 38(4), 2-4.
Brennan F. P., Kuang, Y.S., & Volrathongchai, K. (2000). Patient-centered Information
Systems. Year of Medical Informatics, 1, 79-86.
Bresnen, M., Goussevskaia, A., & Swan, J., 2005. Organizational routines, situated learning
and processes of change in project based organisations. Project Management Journal,
36(3), 27-42.
Brooke, G. M. (1992). The Economics of information Technology: Explaining the productivity
paradox. Center for Information Systems Research. Cambridge, MA: MIT.
Brookes, N., Butler, M., Dey, P., & Clark, R. (2014). The use of maturity models in improving
project management performance. International Journal of Managing Projects in
Business, 7(2), 231–246
Brookes, N., & Clark, A. (2009). Using Maturity Models to Improve Project Management
Practice. In Proceedings of the 20th Annual Conference - Production and Operations
Management Society (POMS), May 1-4, Orlando, Florida, USA.
Brown, T. A. (2006). Confirmatory factor analysis for applied research. New York: Guilford.
Brown, J. D. (1996). Testing in language programs. Upper Saddle River, NJ: Prentice Hall
Regents.
Bryde, D. J. (2003). Modelling project management performance. International Journal of
Quality and Reliability Management, 20(2), 229-254.
196
Bryde, D. J., & Brown, D. (2005). The influence of a project performance measurement
system on the success of a contract for maintaining motorways and trunk roads. Project
Management Journal, 35(4), 57–65.
Bryman, A. (1988). Quantity and Quality in Social Research. London: Routledge.
Bryman, A., & Bell, E. (2003). Business Research Methods. New York: Oxford University
Press Inc.
Brynjolfsson, E. (1993). The Productivity Paradox of Information Technology.
Communications of the ACM, 36(12), 67-77.
Brynjolfsson, E., & Hitt, L. (1996). Paradox Lost? Firm-level Evidence on the Returns to
Information Systems Spending. Management Science, 42(4), 541-558.
Brynjolfsson, E., & Hitt, L. (2003). Computing Productivity: Firm Level Evidence. MIT Sloan
Working Paper 4210-01, MIT Sloan School of Management.
Bryson, J. M., & Bromiley, P. (1993). Critical factors affecting the planning and
implementation of major projects. Strategic Management Journal, 14, 319–337.
Buchan, J., Wismar, M., Glinos, I. A., & Bremner, J. (2014). Health professional mobility in
a changing Europe: New dynamics, mobile individuals and diverse responses.
Observatory Studies Series, II (32). Copenhagen, Denmark: The European Observatory
on Health Systems and Policies hosted by WHO Regional Office for Europe.
Buchanan, T., & Smith, J. L. (1999). Using the Internet for psychological research: Personality
testing on the World Wide Web. British Journal of Psychology, 90 (1), 125-144.
Buglione, L., Rejas-Muslera, R. J., & Gallego, J. J.C. (2009). Strengthening maturity levels
by a legal assurance process. Software Process Improvement and Practice, 14(6), 305-
314.
Bukachi F., & Pakenham-Walsh, N. (2007). Information technology for health in developing
countries. Chest Journal, 132(5), 1624-1630.
197
Bullen, C. V., & Rockart, J.F. (1981). A primer on Critical Success Factors. Working Paper
nº 69. Center for Information Systems Research, Sloan School of Management, MIT
Cambridge.
Bushuyev, S. D., & Wagner, R. F. (2014). IPMA Delta and IPMA Organisational Competence
Baseline (OCB). International Journal of Managing Projects in Business, 7(2), 302–
310.
Byrne, B. M. (1994). Structural equation modeling with EQS and EQS/Windows. Thousand
Oaks, CA: Sage Publications.
Byrne, B. M. (1998). Structural Equation Modeling with LISREL, PRELIS and SIMPLIS:
Basic Concepts, Applications and Programming. Mahwah, New Jersey: Lawrence
Erlbaum Associates.
Byrne, C. M., Mercincavage, L. M., Pan, E. C., Vincent, A. G., Johnston, D. S., & Middleton,
B. (2010). The value from investments in health information technology at the U.S.
Department of Veterans Affairs. Health Affairs, 29(4), 629-638.
Caldeira, M. (2000) Critical realism: a philosophical perspective for case study research in
social sciences. Episteme, 5(6), 73-89.
Caldeira, M., Serrano, A., Quaresma, R., Pedron, C., & Romão, M. (2012) Information and
Communication Technology Adoption for Business Benefits: a case analysis of an
integrated paperless system. International Journal of Information Management, 32(2),
196-202.
Camilleri, E. (2011). Project Success: Critical Factors and Behaviours (First Edition).
Farnham, UK: Gower Publishing, Ltd.,
Cao, Q., & Hoffman, J. J. (2011). A case study approach for developing a project performance
evaluation system, International Journal of Project Management, 29(2), 155–164.
198
Caralli, R., Knight, M., & Montgomery, A. (2012). Maturity Models 101: A Primer for
Applying Maturity Models to Smart Grid Security, Resilience, and Interoperability.
CERT, Software Engineering Institute, Carnegie Mellon University.
Carcary, M. (2013). IT Risk Management: A Capability Maturity Model. The Electronic
Journal Information Systems Evaluation,16(1), 3-13.
Carr, N. G. (2003). It doesn't matter. Harvard Business Review, 81(5), 41-49.
Carter, L., & Belanger, F. (2005). The Utilization of e-government Services: Citizen Trust,
Innovation and Acceptance Factors. Information Systems Journal, 15(1), 5-25.
CGF (2014). The Future for Health: Everone has a role to play. Lisboa: Calouste Gulbenkian
Foundation.
Chapman, C., Ward, S., & Harwood, I. (2006). Minimising the effects of dysfunctional
corporate culture in estimation and evaluation processes: A constructively simple
approach. International Journal of Project Management, 24, 106-115.
Chan, A.P.C., & Chan, A.P.L. (2004). Key performance indicators for measuring construction
success. Benchmarking: An International Journal, 11(2), 203–221.
Chan, A., Scott, D., & Lam, E. (2002). Framework of Success Criteria for Design/Build
Projects. Journal of Management in Engineering, 18(3), 120-128.
Chan, C. M. L., & Pan, S. L. (2008). User engagement in e-government systems
implementation: a comparative case study of two Singaporean e-government initiatives.
Journal of Strategic Information Systems, 17(2), 124-139.
Chan, P. C. A., Ho, C. K. D., & Tam, C. M. (2001). Design and build project success factors:
multivariate analysis. Journal of Construction Engineering and Management,
March/April 93-100.
Chau, P. Y. (1999). On the Use of Construct Reliability in MIS Research: A Meta-Analysis.
Information and Management, 35, 217-227.
199
Chaudhry, B., Wang, J., Wu, S., Maglione, M., Mojica, W., Roth, E., Morton, S. C., &
Shekelle, P.G. (2006). Systematic Review: Impact of Health Information Technology
on Quality, Efficiency, and Costs of Medical Care. Annals of Internal Medicine, 144,
742-752.
Chen, W., & Hirschheim, R. (2004). A paradigmatic and methodological examination of
information systems research from 1991 to 2001. Information Systems Journal, 14(3),
197–235.
Chovil, N. (2010). One small step at a time: implementing continuous quality improvement
in child and youth health services. Child and Youth Services, 31(1), 21-34.
Chrissis, M. B., Konrad, M., & Shrum, S. (2011). CMMI for Development: Guidelines for
Process Integration and Product Improvement (3rd Edition). Boston, MA: Pearson
Education Inc.
Christenson, D., & Walker, D. H. T. (2004). Understanding the role of "vision" in project
success. Engineering Management Review, IEEE, 32, 57-73.
Chua, A.Y. K. (2009). The dark side of successful knowledge management initiatives. Journal
of Knowledge Management, 13(4), 32-40.
CHWS (2006). The Impact of the Aging Population on the Health Workforce in the United
States: Summary of Key Findings. National Center for Health Workforce Analysis,
Bureau of Health Professions, Health Resources & Services Administration, USA.
Cicmil, S. (2006). Understanding project management practice through interpretative and
critical research perspectives. Project Management Journal, 37(2), 27–37.
Cicmil, S., & Hodgson, D. (2006). New Possibilities for Project Management Theory: A
Critical Engagement. Project Management Journal 37(3), 111-122.
Cicmil, S., Hodgson, D., Lindgren, M., & Packendorff, J. (2009). Project management behind
the facade. Ephemera: Theory & Politics in Organization, 9(2), 78–92.
200
Clarke, A. (1999). A practical use of key success factors to improve the effectiveness of
project management. International Journal of Project Management, 17(3), 139-145.
Cheong, I. (1996). Privacy and security of personal health. information Journal of Informatics
in Primary Care, 15-19.
Cleland, D. I., & Ireland, L. R. (2006). Project Management Strategic Design and
Implementation (5th Edition). New York: McGraw-Hill International.
Clemons, E. K., & Kimbrough, S. O. (1986). Information Systems, Telecommunications, and
their Effects on Industrial Organization. In Proceedings of 7th International Conference
on Information Systems (ICIS 1986), San Diego, CA, 99-108. Avalaible at:
http://aisel.aisnet.org/icis1986/27
Cliff, B. (2012). Using Technology to Enhance Patient-Centered Care. Journal of Healthcare
Management, 57(5), September/October.
CMMI (2010). CMMI® for Development: Improving processes for developing better
products and services (version 1.3). Technical report CMU/SEI-2010-TR-033.
Carnegie Mellon University, Pennsylvania, US: Software Engineering Institute.
Cohen, L., Manion, L., & Morrison. (2007). Research Methods in Education (6th Edition).
London: Routledge, Taylor and Francis Group.
Collins, D. (2003). Pretesting survey instruments: An overview of cognitive methods. Quality
of Life Research, 12, 229-38.
Collins, A., & Baccarini, D. (2004). Project Success: A Survey. Journal of Construction
Research, 5(2), 211-231.
Collste, G. (2002). The Internet doctor and medical ethics Ethical implications of the
introduction of the Internet into medical encounters. Medicine, Health Care and
Philosophy, 5(2), 121-125.
201
Combe, M. W. (1998). Standards Committee Tackles Project Management Maturity Model.
PM Network, 12(8).
Cook, D. A., & Beckman, T. J. (2009). Does scale length matter? A comparison of nine-versus
five-point rating scales for the mini-CEX. Advances in Health Science Education,14,
655–664.
Cook, J. A., & Fonow, M. M. (1990). Knowledge and Women’s Interests: Issues of
Epistemology and Methodology in Feminist Sociological Research. In McCarl Nielsen,
J. (Eds), Feminist Research Methods: Exemplary Readings in Social Sciences. Boulder,
CO: Westview.
Cooke-Davies, T. J. (2001) Towards Improved Project Management Practice: Uncovering
the evidence for effective practices through empirical research. Thesis submitted in
fulfilment of requirements for the degree of Doctor of Philosophy at Leeds Metropolitan
University, Leeds.
Cooke-Davies, T. J. (2002). The “real” success factors on projects. International Journal of
Project Management, 20(3), 185-190.
Cooke-Davies, T. J. (2004). Measurement of organizational maturity: what are the relevant
questions about maturity and metrics for a project based organization to ask, and what
do these imply for project management research? In Slevin, D.I. Cleland and J.K. Pinto
(eds.) Innovations, project management research. Newton Square, Pennsylvania USA:
Project Management Institute, 211-228.
Cooke-Davies, T. J., & Arzymanow, A. (2003). The maturity of project management in
different industries - An investigation into variations between project management
models. International Journal of Project Management, 21(6), 471-478.
Counihan, A., Finnegan, P., & Sammon, D. (2002). Towards a framework for evaluating
investments in data warehousing. Information Systems Journal, 12(4), 321-338.
202
Cousins, P., Lamming, R., Lawson, B., & Squire, B. (2008). Strategic Supply Management:
Principles, Theories and Practice. London, UK: FT Prentice Hall.
Cova, B., & Hoskins, S. (1997). A twin-track networking approach to project marketing.
European Management Journal, 15, 546–556.
Crawford, J. K. (2002). Project management maturity model: providing a proven path to
project management excellence. Basel, Switzerland: Marcel Dekker, Inc.
Crawford, J. K. (2006). The Project Management Maturity Model. Information Systems
Management, 23(4), 50-58.
Crawford, L. (2005). Senior management perceptions of project management competence.
International Journal of Project Management, 23, 7-16.
Crawford, L., & Pollack, J. (2004). Hard and soft projects: a framework for analysis.
International Journal of Project Management, 22, 645-653.
Creasy, T., & Anantatmula, V. S. (2013). From every direction—how personality traits and
dimensions of project managers can conceptually affect project success. Project
Management Journal, 44(6), 36–51.
Creswell, J. W. (2003). Research Design: Qualitative, Quantitative, and Mixed Methods
Approaches. Thousand Oaks, CA: Sage.
Cresswell, K. M., Bates, D. W., & Sheikh, A. (2013). Ten key considerations for the
successful implementation and adoption of large-scale health information technology.
Journal of the American Medical Informatics Association, 20, e9–e13.
Cooper, D. F. (1976). Heuristics for scheduling resource constrained projects: an experimental
investigation. Management Science, 22, 1186–1194.
Couillard, J. (1995). The role of project risk in determining project management approach.
Project Management Journal, 26(3).
203
Cox, R. F., Issa, R.R.A., & Aherns, D., 2003. Management’s perception of key performance
indicators for construction. Journal of Construction Engineering and Management,
129(2), 142–151.
Cronbach, L. (1951). Coefficient alpha and the internal structure of tests. Psychomerika, 16,
97-234.
Cronk, M. C., & Fitzgerald, E. P. (1999). Understanding “IS business value”: derivation of
dimensions. Logistics Information Management, 12(1-2), 40 – 49.
Crosby, P. B. (1979). Quality is free. (1979). New York: McGraw-Hill.
Crosby, P. B. (1996). Quality is still free: making quality certain in uncertain times. 1996,
New York: McGraw-Hill.
Crotty, M. (1998). The Foundations of Social Research: Meaning and Perspective in the
Research Process. Australia: Allen and Unwin.
Curtis, B., Hefley, B., & Miller, S. A. (2009). People Capability Maturity Model (P-CMM),
Version 2.0. Technical Report, CMU/SEI-2009-TR-003, Carnegie Mellon University,
Software Engineering Institute.
Dailey, R.C. (1978). The role of team and task characteristics in R&D team collaborative
problem solving and productivity. Management Science, 24, 1579–1588.
Dalcher, D., 2012. Project management for the creation of organisational value. Project
Mangement Journal, 43(3), 79.
Daniel, D. R. (1961). Management Information Crisis. Harvard Business Review, 39(5), 111-
116.
David, P. A. (1990). The Dynamo and the Computer: An Historical Perspective on the Modern
Productivity Paradox. The American Economic Review, 80 (2). In Proceedings of the
102th Annual Meeting of the American Economic Association, 355-361.
204
Davis, D. (1985). New projects: beware of false economies. Harvard Business Review, 63,
95–101.
Davis, K. (2014). Different stakeholder groups and their perceptions of project success.
International Journal of Project Management, 32(2), 189–201.
Dawes J. (2008). Do Data Characteristics Change According to the Number of Points Used?
An Experiment Using 5-point, 7-point and 10-point Scales. International Journal of
Market Research, 50, 61-77.
Dawson, A., & Verweij, M. (eds.) (2007). Ethics, Prevention, and Public Health. UK: Oxford
University Press.
de Bruin, T. (2009). Business process management: theory on progression and maturity.
Thesis submitted in fulfilment of requirements for the degree of Doctor of Philosophy
at Queensland University of Technology.
de Bruin, T., & Rosemann, M. (2005) Towards a Business Process Management Maturity
Model. In Bartmann, D, Rajola, F, Kallinikos, J, Avison, D, Winter, R, Ein-Dor, P,
(eds.). In Proceedings of the 13th European Conference on Information Systems (ECIS
2005), Germany, Regensburg. Available at: http://eprints.qut.edu.au/25194/,
19/07/2017.
De Meyer, A., Loch, C. and Pich, M. (2002). Managing project uncertainty: from variation to
chaos. Sloan Management Review, 43, 60–67.
De Vries, H., & Margaret, J. (2003). The development of a model to assess the strategic
management capability of small and medium-size businesses. Journal of American
Academy of Business, Cambridge, 3(1-2).
De Wit, A. (1988). Measurement of project success. International Journal of Project
Management, 6(3), 164-170.
DeCotiis, T.A. and Dyer, L. (1977). The dimensions and determinants of project performance.
Industrial Marketing Management, 6, 370–378.
205
Dedrick, J., Gurbaxani, V., & Kraemer, K. L. (2003). Information technology and economic
performance: A critical review of the empirical evidence. ACM Computing Surveys,
35(1), 1-28.
Dehning, B., Richardson, V.J., Smith, R. E., & Zmud, R. W. (2008). Using accounting-based
performance measures to assess the business value of information technologies and
systems. In Kauffmann, R. J., & Tallon, P.P. (Eds) Economics, Information Systems and
Electronic Commerce Research II: Advanced Empirical Methodologies, 135-154,
Armonk, NY: M.E. Sharpe.
Dehning, B., Richardson, V.J., Urbaczewski, A., & Wells, J. D. (2004). Re-examining the
Value Relevance of Ecommerce Initiatives. Journal of Management Information
Systems, 21(1), 57-84.
Dehning, B., Richardson, V.J., & Zmud, R. W. (2003). The Value Relevance of
Announcements of Transformational Information Technology Investments. MIS
Quarterly, 27(4), 637-656.
DeLone, W. H., & McLean, E. R. (1992). Information Systems Success: The Quest for the
Dependent Variable. Information Systems Research, 3(1), 60-95.
DeLone, W.H. and McLean, E.R. (2003). The DeLone and McLean model of information
systems success: A ten-year update. Journal of Management Information Systems,
19(4), 9-30.
Deloitte (2011). 2011 Survey of Health Care Consumers in Portugal: Key Findings, Strategic
Implications. Deloitte Center for Health Solutions. Washington, DC, USA: Deloitte.
Delpierre, C., Cuzin, L., Fillaux, J. Alvarez, M., Massip, P., & Lang, T. (2004). A systematic
review of computer-based patient record systems and quality of care: more randomized
clinical trials or a broader approach? International Journal for Quality in Health Care,
16(5), 407-416.
Devaraj, S., & Kohli, R. (2002). The IT Payoff. New York: Financial Times/Prentice Hall.
206
Devaraj, S., & Kohli, R. (2003). Performance Impacts of Information Technology: Is Actual
Usage the Missing Link? Management Science, 49(3), 273-289.
Dewan, S., & Kraemer, K. L. (1998). International dimensions of the productivity paradox.
Communications of the ACM, 41(8), 56-62.
DGS (2013). National Health Plan 2012-2016. Ministry of Health. Available at:
http://pns.dgs.pt/nhp-in-english/, 12-12-2014
Dhillon, G. (2005). Gaining benefits from IS/IT implementation: Interpretations from case
studies. International Journal of Information Management, 25(5), 502-515.
Diallo, A., & Thuillier, D. (2004). The success dimensions of international development
projects: The perceptions of African project coordinators. International Journal of
Project Management, 22, 19–31.
Diallo A., & Thuillier, D. (2005). The success of international projects, trust, and
communication: An African perspective. International Journal of Project Management,
23(3), 237–252.
Dibb, S. (2001). Customer Relationship Management and Barriers to the One Segment.
Journal of Financial Services Marketing, 6(1), 10-23.
Dick, R. S., Steen, E. B., & Detmer, D. E. (Eds) (1997). The Computer-Based Patient Record:
An Essential Technology for Health Care (revised edition). Washington, DC:
Committee on Improving the Patient Record, National Academy of Sciences.
Dietrich, P., & Lehtonen, P. (2005). Successful management of strategic intentions through
multiple projects – Reflections from empirical study. International Journal of Project
Management, 23(5), 386-391.
Ding, L., Velicer, W. F., & Harlow, L. L. (1995). Effects of estimation methods, number of
indicators per factor, and improper solutions on structural equation modeling fit indices.
Structural Equation Modeling, 2(2), 119-144.
207
Dinsmore, P. C. (1999). Winning in Business with Enterprise Project Management. New
York: Amacom.
Dixon, D. R. (1999). The behavioral side of information technology. International Journal of
Medical Informatics, 56(1-3), 117–123.
Dixon, D. R., & Dixon, B. J. (1994). Adoption of information technology enabled innovations
by primary care physicians: model and questionnaire development. Annual Symposium
on Computer Application in Medical Care, 631–635.
Done, A. (2011). Developing Suplly Chain Maturity. Working Paper, WP-898, IESE Business
School, University of Navarra.
Dong, L., Neufeld, D., & Higgins, C. (2009). Top management support of enterprise systems
implementations. Journal of Information Technology, 24(1), 55–80.
Dooley, K., Subra, A., & Anderson, J. (2001). Maturity and its Impact on New Product
Development Project Performance. Research in Engineering Design, 13, 23-29.
Dorgan, S., Layton, D., Bloom, N., Homkes, R., Sadun, R., & Van Reenen, J. (2011).
Management in Healthcare: Why good practice really matters. Mackinsey and
Company & The London School of Economics and Political Science. Available at:
http://cep.lse.ac.uk/textonly/_new/research/productivity/management/PDF/Manageme
nt_in_Healthcare_Report.pdf, 06/06/2017.
Dorsey, P. (2000). Top 10 reasons why systems Projects Fail. Dulcian Incorporated.
Available at: http://www.hks.harvard.edu/m-
rcbg/ethiopia/Publications/Top%2010%20Reasons%20Why%20Systems%20Projects
%20Fail.pdf, 06/06/2017.
Dos Santos, B. L., Peffers, K. G., & Mauer, D. C. (1993). The Impact of Information
Technology Investment Announcements on the Market Value of the Firm. Information
Systems Research, 4(1), 1-23.
208
D’Ortenzio, C. (2012). Understanding Change and Change Management Processes: A Case
Study. Thesis submitted in fulfilment of requirements for the degree of Doctor of
Philosophy at the University of Canberra, Australia.
DRE (2017) Despacho n. º 3156/2017. Diário da República n. º 74/2017, Série II de 2017-04-
13. Saúde - Gabinete do Ministro, 7083 – 7087.
Drennan, J. (2003). Cognitive interviewing: Verbal data in the design and pretesting of
questionnaires. Journal of Advanced Nursing, 42, 57–63.
Drury, P. (2005). The eHealth agenda for developing countries. World Hospitals and Health
Services, 41(4), 38-40.
Duffy, J. (2001). Maturity Models: Blueprints for e-Volution. Strategy and Leadership, 29(6),
19-26.
Duimering, P. R., Ran, B., Derbentseva, N., & Poile, C. (2006). The effects of ambiguity on
project task structure in new product development. Knowledge and Process
Management, 13, 239-251.
Dvir, D., & Lechler, T. (2004). Plans are nothing, changing plans is everything: the impact of
changes on project success. Research Policy, 33, 1-15.
Dvir, D., Lipovetsky, S., Shenhar, A., & Tishler, A. (1996). Identifying Critical Success
Factors in Defense Development Projects: A Multivariate Analysis. Technological
Forecasting and Social Change, 51(2), 151-171.
Dvir, D., Lipovetskey, S., Shenhar, A., & Tishler, A. (1998). In search of project
classification: A non-uniform mapping of project success factors. Research Policy, 27,
915-935.
EC (2004a). Follow-up to the high-level reflection process on patient mobility and healthcare
developments in the European Union. Communication from the Commission.
Commission of the European Communities. Available at: https://ec.europa.eu/digital-
209
single-market/en/news/follow-high-level-reflection-process-patient-mobility-and-
healthcare-developments-european, 19/07/2017.
EC (2004b). High level group on health services and medical care. Health & Consumer
Protection Directorate-General, European Commission. Available at:
http://ec.europa.eu/health/ph_overview/co_operation/mobility/docs/highlevel_2004_0
26_en.pdf, 19/07/2017.
EC (2004c). e-Health - making healthcare better for European citizens: An action plan for a
European e-Health Area. Commission of The European Communities. Available at:
http://eur-
lex.europa.eu/LexUriServ/LexUriServ.do?uri=COM:2004:0356:FIN:EN:PDF,
19/07/2017.
EC (2006). ICT for Health and i2010: Transforming the European healthcare landscape -
Towards a strategy for ICT for Health. Information Society & Media Directorate
General, European Commission. Available at: https://ec.europa.eu/digital-single-
market/en/news/ict-health-and-i2010-transforming-european-healthcare-landscape,
19/07/2017.
EC (2009). Ageing report: Economic and Budgetary projections for the EU-27 Member
States (2008-2060). Directorate General for Economic and Financial Affairs - DG
ECFIN, European Commission. Available at:
http://ec.europa.eu/economy_finance/publications/pages/publication14992_en.pdf,
19/07/2017.
Efron, B. (1979) Bootstrap methods: another look at the jackknife. The Annals of Statistics
7(1), 1- 26
Efron, B., & Tibshirani, R. (1993). An Introduction to the Bootstrap. Boca Raton, FL:
Chapman & Hall/CRC.
210
Egorova, E., Wholin, C., Aurum, A., & Berntsson, R. (2009). Stakeholders Perception of
Success: An Empirical Investigation. In Proceedings of the 35th Euromicro Conference
on Software Engineering and Advanced Applications (SEAA’09), August, Patras,
Greece, 27-29.
Elder, L., & Clarke, M. (2007). Past, present and future: experiences and lessons from
telehealth projects. Open Medicine, 1(3), 166-170.
Elias, A., Cavana, R., & Jackson, L.S. (2002). Stakeholder analysis for R&D project
management. R&D Management, 32, 301–310.
Elmaallam., & Kriouile, A (2011). Towards am Model of Maturity for IS Risk Management.
International Journal of Computer Science and Information Technology, 3(4).
Engwall, M. (2003). No project is an island: Linking projects to history and context. Research
Policy, 32(5), 879-808.
Eppinger, S. D. (2001). Innovation at the speed of information. Harvard Business Review,
79(1), 149–158.
Ericksen, J., & Dyer, L. (2004). Right from the start: exploring the effects of early team events
on subsequent project team development and performance. Administrative Science
Quarterly, 49, 438–471.
Esteves, J. (2004). Definition and Analysis of Critical Success Factors for ERP
Implementation Projects. Thesis submitted in fulfilment of requirements for the degree
of Doctor of Philosophy at the Universitat Politècnica de Catalunya, Barcelona.
Esteves, J., & Pastor, J. (1999). An ERP Lifecycle-based Research Agenda. In Proceedings of
the First International workshop in Enterprise Management and Resource Planning:
Methods, Tools and Architectures (EMRPS’99), Venice, Italy, 359-371.
European Council (2000). Presidency Conclusions. Lisbon European Council, March 23-24,
Lisbon, Portugal. Available at: http://www.europarl.europa.eu/summits/lis1_en.htm,
19/07/2017.
211
Eurostat (2013). Statistics Explained: Healthcare expenditure statistics. Eurostat. Available
at: http://ec.europa.eu/eurostat/statistics-
explained/index.php/Healthcare_expenditure_statistics, 19/07/2017.
Eysenbach, G. (2001). What is e-health? Journal of Medical Internet Research, 3(2).
Fabian, F. H. (2000). Keeping the tension: Pressures to keep the controversy in the
management discipline. Academy of Management Review, 25, 350–372.
Fahrenkrog, S. L., Kruszewski, L. M., Baca, C., & Lewandowski, A. (2004). The past, the
present and the future of OPM3. In Proceedings of PMI Global Congress 2004 – North
America.
Fairchild, A. J., & Mackinnon, D. P. (2009). A General Model for Testing Mediation and
Moderation Effects. Society for Prevention Research, 10(2), 87-99.
Farbey, B., Land, F., & Targett, D. (1993). IT investment: A study of methods and practice.
Oxford: Butterworth-Heinemann.
Farzanfar, R. (2005). Using Qualitative Research Methods to Evaluate Automated Health
Promotion/Disease Prevention Technologies: A Procedures’ Manual. Boston
University: Robert Wood Johnson Foundation.
Farrell, D. (2003). The real new economy. Harvard Business Review, 81(9), 105-112.
Fernando, J, I. (2004). Factors that have contributed to a lack of integration in health
information system security. Journal on Information Technology in Healthcare, 2(5),
313–328.
Fernando, J. I., & Dawson, L. L. (2008). Clinician assessments of workplace security training-
an informatics perspective. e-Journal of Health Informatics, 3(1).
Fernando, J. I., & Dawson, L. L. (2009). The health information system security threat
lifecycle: An informatics theory. International Journal of Medical Informatics, 78(12),
815–826.
212
Fink, A. (1995). How to Analyze Survey Data. Thousand Oaks, CA: Sage publications.
Flowers, S. (2004). Contingent capabilities and the procurement of complex product systems.
International Journal of Innovation Management,8(1), 1-20.
Flyvbjerg, B., Bruzelius, N., & Rothengatter, W. (2003). Megaprojects and Risk: An Anatomy
of Ambition. Cambridge, England: Cambridge University Press.
Flynn, B., Sakakibara, S. Schroeder, R., Bates, K., & Flynn, E. 1990). Empirical Research
Methods in Operations Management. Journal of Operations Management, 9(2), 250-
285.
Fornell, C., & Larcker D. F. (1981). Evaluating structural equation models with unobservable
variables and measure. Journal of Marketing Research, 18, 000001; ABI/INFORM
Global, p.39.
Forsberg, K., Mooz, H., & Cotterman, H. (2000). Visualizing project management. New York:
John Wiley & Sons, Inc.
Fortune J., & White, D. (2006). Framing of project success critical success factors by a system
model. International Journal of Project Management, 24(1), 53–65.
Fournier-Vicente S, Larigauderie P., & Gaonac'h D. (2008). More dissociations and
interactiosn with central executive functioning: a comprehensive latent-variable
analysis. Acta Psychologica, 129, 32-48.
Fowler, A., & Walsh, M. (1999). Conflicting perceptions of success in an information systems
project. International Journal of Project Management, 17(1), 1–10.
Fox, S. (2011). The Social Life of Health Information, 2011. Washington, USA: Pew Research
Center’s Internet & American Life Project. Available at:
http://www.pewinternet.org/files/old-
media/Files/Reports/2011/PIP_Social_Life_of_Health_Info.pdf, 19/07/2017.
213
Fraser, P., & Gregory, M. (2002). A maturity grid approach to the assessment of product
development collaboration. In Proceedings of the 9th International Product Development
Management Collaborations, Sophia Antiplis. France.
Fraser, P., Farrukh, C., & Gregory, M. (2003). Managing product development collaborations:
A process maturity approach. In Proceedings of the Institution of Mechanical Engineers,
Part B, Journal of Engineering Manufacture, 217(11), 1499-1519.
Fritz, M. S., Taylor, A. B., & MacKinnon, D. P. (2012). Explanation of two anomolous results
in statistical mediation analysis. Multivariate Behavioral Research, 47, 61–87.
Freeman, M., & Beale, P. (1992). Measuring Project Success. Project Management Journal,
23(1), 8-17.
Friedman, C., & Wyatt, J. (1997). Evaluation methods in medical informatics. New York:
Springer-Verlag.
Gaddis, P. O. (1959). The project manager. Harvard Business Review, May–June 89–97.
Gagnon, M.P., Ghandour, E.K., Talla, P. K., Simonyan, D., Godin, G., Labrecque, M.,
Ouimet, M., & Rousseau, M. (2014). Electronic health record acceptance by physicians:
testing an integrated theoretical model. Journal of Biomedical Informatics, 48, 17-27.
Galbraith, J. (1973). Designing Complex Organisations. Reading, MA: Addison-Wesley.
Galliers, R. D. (1991). Choosing appropriate information systems research approaches: A
revised taxonomy. In: H-E, Nissan, H. Klein and R. Hirschheim, (Eds), (1991),
Information Systems Research: Contemporary Approaches and Emergent Traditions, p.
327–345, North Holland, Amesterdam: Elsevier Science Publishers.
Galliers, R. D., & Sutherland, A.R. (1991). Information Systems Management and Strategy
Formulation: The “Stages of Growth” Model Revisited. Journal of Informations
Systems, 1, 89-114.
214
Gardner, R.M., & Shabot, M.M. (2001). Patient-monitoring Systems. in Shortliffe, E.H.
Perreault, L.E., Wiederhold, G., & Fagan L.M. (eds.) Biomedical Informatics:
Computer Applications in Health care and Biomedicin. New York: Springer
Science+Business Media, LLC, 443–484.
Gareis, R., & Hueman, M. (2000). Project Management Competences in the Project-Oriented
Organization. In Turner, J. R. and Sinister, S. J. (Eds), Gower Handbook of Project
Management. Aldershot, Hants, England: Gower, 709-721.
Garner, W. R. (1960). Rating Scales, Discriminability, and Information Transmission.
Psychological Review, 67, 343-52.
Garrett, G. A., & Rendon, R.G. (2005). Managing contracts in turbulent times: the contract
management maturity model. Contract Management, 45(9), 48-57.
Gartner (2016). Gartner Worldwide IT Spending Forecast. Special report. Available at:
http://www.gartner.com/technology/research/it-spending-forecast/, 06/06/2017.
Gauld, R. (2007). Public sector information systems project failures: Lessons from a New
Zealand hospital organization. Government Information Quarterly, 24(1), 102-114.
Gawande, A.A., & Bates, D.W. (2000). The use of information technology in improving
medical performance. Part II. Physician-support tools. Medscape General Medicine.
2(1), E13.
Gemmill, G., & Wilemon, D.L. (1970). The power spectrum in project management. Sloan
Management Review, 12, 15–25.
Geissbuhler, A. Lovis, C., Lamb, A., & Spahni, S. (2001). Experience with an XML/HTTP-
based federative approach to develop a hospital-wide clinical information system.
Studies in Health Technology and Informatics, 84(1), 735-739.
Gerwin, D., & Ferris, J. S. (2004). Organizing new product development projects in strategic
alliances. Organization Science, 15, 22–37.
215
Gheorghiu, F. (2006). Why companies fail on the way to implementing project management
methodology. Project Management Today, 8(10), 1-7.
Ghoddousi, P., Amini, Z., & Hosseini, M. R. (2011). A Survey on the Maturity State of Iranian
Grade One Construction Companies utilizing OPM3 Maturity Model. Technics
Technologies Education Management-Ttem, 6(1), 69-77.
Ghorbanali, A., Khosravi, S., Afshari, H., Borzabadi, M., & Valipour, M. (2010). Improving
project management competency by using an OPM3 approach. In Proceedings of the
International Conference on Economics, Business and Management, IPEDR vol.2,
(2011) IAC S IT Press, Manila, Philippines.
Gibbs, W. (1997). Taking computers to task. Scientific American, 278, 64-71.
Gibson, D., Goldenson, D., & Kost, K. (2006). Performance Results of CMMI-Based Process
Improvement. Carnegie Melon University, Pittsburgh, PA.
Gil-García, J. R., & Pardo, T.A. (2005). E-government success factors: Mapping practical
tools to theoretical foundations. Government Information Quarterly, 22(2), 187-216.
Givon, M. M., & Shapira, Z. (1984). Response to rating scales: A theoretical model and its
application to the number of categories problem. Journal of Marketing Research, 21,
410–419.
Glandon, G. L., & Buck, T. L. (1993). Cost-benefit analysis of medical information systems:
a critique. In Anderson, J.G. Aydin, C.E., & Jay S.J. (eds.) Evaluating Health Care
Information Systems: Methods and Applications. Thousand Oaks, CA, USA: Sage
Publications, 164–189.
Glaser, J. (2005). More on management’s role in IT project failure. Healthcare Financial
Management, 59(1), 82-84.
Glenn, M (2009). Organisational agility: how businesses can survive and thrive in turbulent
times. London: Economist Intelligence Unit, EMC.
216
Globerson, S., & Zwikael, O. (2002). The Impact of the Project Manager on Project
Management Planning Processes. Project Management Journal, 33(3), 58-64.
Goddard, B. L. (2000). Termination of a contract to implement an enterprise electronic
medical record system. Journal of the American Informatics Association, 7, 564-568.
Goodman, L. P., & Goodman, R.A. (1972). Theater as a temporary system. California
Management Review, 15, pp. 103–108.
Goodman, R. A. (1967). Ambiguous authority definition in project management. Academy of
Management Journal, 10, 395–407.
Goodman, R. A., & Goodman, L.P. (1976). Some management issues in temporary systems:
a study of professional development and manpower: the theater case. Administrative
Science Quarterly, 21, 494–501.
Goldenson, D. R., & Gibson, D.L. (2003). Demonstrating the Impact and Benefit of CMMI:
An Update and Preliminary Result. Carnegie Mellon Software Engineering Institute,
Carnegie Mellon University, Pittsburgh, PA.
Gomes, J., & Romão, M. (2013). How benefits management helps Balanced Scorecard to deal
with business dynamic environments. Tourism and Management Studies, 9(1), 129-138.
Gomes, J., & Romão, M. (2014a). Advantages and Limitations of Performance Measurement
Tools: The Balanced Scorecard. In Proceedings of the 7th IADIS International
Conference (IS 2014), 28 Feb - 2 Mar 2014, Madrid, Spain, 19-26.
Gomes, J., & Romão, M. (2014b). How Organizational Maturity and Project Management can
cooperate for Project Success. In Santos, J.A., Correia, M., Santos, M. and Serra, F.
(Eds), Contemporary Issues in Tourism and Management Studies. Faro: UALg ESGHT.
Gomes, J., & Romão, M. (2015a). The success of IS/IT projects in the healthcare sector:
stakeholders' perceptions. In Proceedings of 10ª Conferência Ibérica de Sistemas e
Tecnologias de Informação (CISTI'2015), AISTI, 17-20 June, Aveiro, Portugal.
217
Gomes, J., & Romão, M. (2015b). Maturity, Benefits and Project Management shaping
Project Success. In Vol. 353 of the series Advances in Intelligent Systems and
Computing, pp 435-448, New Contributions in Information Systems and Technologies,
Vol. 1. DOI 10.1007/978-3-319-16486-1_43, ISSN: 2194-5357. © Springer
International Publishing AG, Part of Springer Science+Business Media.
Gomes, J., & Romão, M. (2016a). Improving the success of IS/IT projects in Healthcare:
Benefits and Project Management approaches. In Vol. 444 of the series Advances in
Intelligent Systems and Computing, pp. 547-556. New Advances in Information
Systems and Technologies, Part II. DOI: 10.1007/978-3-319-31232-3_51. ©Springer
International Publishing AG, Part of Springer Science+Business Media.
Gomes, J., & Romão, M. (2016b). Improving project success: A case study using benefits and
project management. Procedia Computer Science, 100, 489-497. DOI:
10.1016/j.procs.2016.09.187
Gomes, J. and Romão, M. (2016c). Investments in information systems and technology in the
healthcare: Project management mediation. Journal of Information Systems
Engineering & Management, 1(1), 15-24. DOI: 10.20897/lectito.201606.
Gomes, J., & Romão, M. (2017). Aligning Information Systems and Technology with Benefit
Management and Balanced Scorecard. In S. De Haes, & W. Van Grembergen (eds.)
Strategic IT Governance and Alignment in Business Settings. pp. 112-131. Hershey,
PA: IGI Global.
Gomes, J., Romão, M., & Caldeira, M. (2013a). Linking Benefits to Maturity Models. In
Proceedings of the 15th International Conference of Academy of Management and
Business (IAMB 2013), 17-19 April, ISEG, Lisboa.
Gomes, J., Romão, M., & Caldeira, M. (2013b). The Benefits Management and Balanced
Scorecard Strategy Map: How they match. International Journal of IT/Business
Alignment and Governance, 4(1), 44-54.
218
Gomes, J., Romão, M., & Caldeira, M. (2013c). Linking Benefits to Balanced Scorecard
Strategy Map. In Volume 206 of the series Advances in Intelligent Systems and
Computing, pp 357-369. New Perspectives in Information Systems and Technologies:
Advances in Intelligent Systems and Computing. DOI: 10.1007/978-3-642-36981-0_34.
©Springer International Publishing AG, Part of Springer Science+Business Media.
Gomes, J., Romão, M., & Carvalho, H. (2016a). Organisational Maturity and Project Success
in Healthcare: The Mediation of Project Management. In Proceedings of the 9th
International Joint Conference on Biomedical Engineering Systems and Technologies
(BIOSTEC 2016), HEALTHINF, February 21- 23, Rome, Italy, vol. 5, 359-364.
Gomes, J., Romão, M., & Carvalho, H. (2016b). Successful IS/IT projects in Healthcare:
Pretesting a questionnaire. Procedia Computer Science, 100, 375-382.
Gomes, J., Romão, M., Carvalho, H., & Caldeira, M. (2014). Organizational Maturity and
Projects Performance: The Mediation of Benefits Management. In Proceedings of the
10th International Conference on Web Information Systems and Technologies
(WEBIST2014), April 3-5, Barcelona, Spain, 375-380.
Gottschalk, P. (2009). Maturity levels for interoperability in digital government. Government
Information Quarterly, 26(1), 75-81.
Grant, R. M. (1996). Toward a knowledge-based theory of the firm. Strategic Management
Journal, 17 (special issue), 109-122.
Grant, K. P., & Pennypacker, J. S. (2006). Project Management Maturity: An assessment of
Project Management Capabilities among and between Selected Industries. IEEE
Transaction on Engineering Management, 53(1), 59-68.
Gray, C. E., & Larson, E.W. (2003). Project management: the managerial process. New
York: McGraw-Hill.
Gregor, S. (2006). The Nature of Theory in Information Systems, MIS Quarterly, 30(3), 611-
642.
219
Grewal, R., Lilien, G., & Mallapragada, G. (2006). Location, location, location: how network
embeddedness affects project success in open source systems. Management Science, 52,
1043–1056.
Grimson, J., Grimson, W., & Hasselbring, W. (2000). The system integration challenge in
health care. Communications of the ACM, 43(6), 49-55.
Grol, R., Bosch, M. C., Hulscher, M. Eccles, M. P., & Wensing, M. (2007). Planning and
Studying Improvement in Patient Care: The use of theoretical perspectives. The Milbank
Quarterly, 83(1), 93-138.
Gross, P. A., Greenfield, S., Cretin, S., Ferguson, J., Grimshaw, J., Grol, R., Klazinga, N.,
Lorenz, W., Meyer, G. S., Riccobono, C., Schoenbaum, S. C., Schyve, P., & Shaw, C.
(2001). Optimal methods for guideline implementation: conclusions from Leeds castle
meeting. Medical Care,39 (8 Suppl 2), II85-II92.
Gross, P. H. B., & Ginzberg, M. J. (1984). Barriers to the Adaptation of Application Software
Packages. Systems, Objectives, Solutions, 4(4), 211-226.
Gruber, D., Cummings, G. G., Leblanc, L., & Smith, D. L. (2009). Factors Influencing
Outcomes of Clinical Information Systems Implementation: A Systematic Review.
Computers, Informatics, Nursing, 27(3), 151-163.
Grundy, T. (2000). Strategic project management and strategic behavior. International
Journal of Project Management, 18(2), 93-103.
Guadagnoli, E., & Velicer, W. F. (1988). Relation to sample size to the stability of component
patterns. Psychological Bulletin, 103(2), 265-275.
Guba, E. G. (1990). The Paradigm Dialog. Newbury Park, CA: Sage publications Ltd.
Guba, E. G., & Lincoln, Y. S. (1989). Fourth Generation Evaluation. Newbury Pak, CA: Sage
publications Ltd.
220
Guba, E. G., & Lincoln, Y. S. (1994). Competing paradigms in qualitative research. In Denzin,
N. K., & Lincoln, Y. S. (eds.) Handbook of Qualitative Research Thousand Oaks, CA:
Sage publications Ltd, 105-117.
Gunderson, S. (2005). A review of organizational factors and maturity measures for system
safety analysis. Systems Engineering, 8(3), 234–244.
Hair, J., Black, W., Babin, B., & Anderson, R. (2010). Multivariate data analysis (7th Edition).
Upper Saddle River, NJ, USA: Prentice-Hall, Inc.
Hall, A. (2014). Security trends in cloud computing part 2: Addressing data challenges in
health care. Available at:
https://blogs.microsoft.com/microsoftsecure/2014/05/01/security-trends-in-cloud-
computing-part-2-addressing-data-challenges-in-healthcare/, 19/07/2017.
Hämäläinen, P., Takala, J., & Saarela, K. L. (2006). Global estimates of occupational
accidents. Safety Science, 44, 137–156.
Håkansson, H., & Snehota, I. (1995). Analysing business relationships. In Håkansson, H., &
Snehota, I. (editors). Developing relationships in business networks. London:
Routledge, 24–49.
Han, K., Chang, Y. B., & Hahn, J. (2011). Information Technology Spillover and
Productivity: The Role of Information Technology Intensity and Competition. Journal
of Management Information Systems, 28(1), 115-145.
Harrison, S. R., & Dowswell, G. (2002). Autonomy and bureaucratic accountability in
primary care: what English general practitioners say. Sociology of Health and Illness,
24(2), 208-226.
Hartman, F. T. (1997). Trends and Improvements: Looking Beyond Modern Project
Management. 28th Annual Project Management Institute, Seminars and Symposium,
Chicago: Project Management Institute, 398-402.
221
Hartman, F. T. (2000). Don't park your brain outside: a practical guide to improving
shareholder value with SMART management. Newtown Square, Pa.: Project
Management Institute.
Haslina, M., & Sharifah, M. S. M. (2005). Acceptance Model of Electronic Medical Record.
Journal of Advancing Information and Management Studies, 2(1), 75-92.
Hayes, A. F. (2015). An Index and Test of Linear Moderated Mediation. Multivariate
Behavioral Research, 50, 1-22.
Hayes, A. F., & Preacher, K. J. (2014). Statistical mediation analysis with a multicategorical
independent variable. British Journal of Mathematical and Statistical Psychology, 67,
451-470
Haux, R. (2006). Health information systems – past, present, future. International Journal of
Medical Informatics, 75(3-4), 268-281.
Heeks, R. B. (2002). Information Systems and Developing Countries: Failure, Success, and
Local Improvisations. The Information Society, 18, 101-112.
Heeks, R. B. (2006). Health Information Systems: failure, success and improvisation.
International Journal of Medical Information, 75(2), 125-137.
Heeks, R. B. (2008). Success and failure rates of e-Government in developing/transitional
countries: Overview. Building Digital Opportunities Programme, Information
Exchange, University of Manchester's Institute for Development Policy and
Management, UK: Department for International Development’s.
Heeks, R. B., & Davies, A. (1999). Different approaches to information age, in R.B. Heeks
(ed.) Reinventing Government in the Information Age. London: Routledge.
Hejlesen, O. K., Olesen, K. G., Dessau, R., Beltoft, I., & Trangeled, M. (2005). Decision
support for diagnosis of lyme disease. Studies in Health Technology and Informatics,
116, 205-210.
222
Hellered, C. (2010). Benchmarking project management maturity in two organisations: A case
study focusing on the value of having an established project management model in an
organisation. Master of Science Thesis, Chalmers University of Technology, Göteborg,
Sweden.
Hellgren, B., & Stjernberg, T. (1995). Design and implementation in major investments: a
project network approach. Scandinavian Journal of Management, 11, 377–394
Henderson, J., & Venkatraman, N. (1993). Strategic alignment: Levering information
technology for transforming organisations. IBM Systems Journal, 32(1), 4-16.
Henseler, J., Ringle, C. M., &. Sinkovics, R. R. (2009), The use of partial least squares path
modeling in international marketing, in Sinkovics, R., R., & Ghauri, P. N. (ed.) New
Challenges to International Marketing (Advances in International Marketing, Vol. 20)
Emerald Group Publishing Limited, pp. 277 – 319.
Henson, R., & Roberts, J. (2006). Use of exploratory factor analysis in published research:
Common errors and some comment on improved practice. Educational and
Psychological Measurement, 66, 393-416.
Hillson, D. (1997). Towards a risk maturity model. The International Journal of Project &
Business Management, 1(1), 35–45
Hillson, D. (2001). Benchmarking Organizational Project Management Capability. In
Proceedings of the Project Management Institute Annual Seminars & Symposium,
November 1–10, Nashville, Tenn., USA
Hillson, D. (2003a). Effective Opportunity Management for Projects. New York: Marcel
Decker.
Hillson, D. (2003b). Assessing Organisational Project Management Capability. Journal of
Facilities Management. 2(3), 298-311.
223
Hilton, C. E. (2017). The importance of pretesting questionnaires: a field research example of
cognitive pretesting the Exercise Referral Quality of Life Scale (ER-QLS). International
Journal of Social Research Methodology, 20(1), 21–34.
HIMSS (2011). Promoting Usability in Health Organisations: Initial Steps and Progress
Toward a Healthcare Usability Maturity Model. Healthcare Information and
Management Systems Society.
Hinks, J., Aouad, G., Cooper, R., Sheath, D., Kagioglou, M., & Sexton, M. (1997). IT and the
design and construction process: a conceptual model of co-maturation. International
Journal of Construction Information Technology, 5(1), 1–25.
Hitt, L. M., & Brinjolfsson, E. (1996). Productivity, business profitability, and consumer
surplus: Three different measures of information technology value. MIS Quarterly,
20(2), 121–142.
Ho, J., & Pardo, T.A. (2004). Toward the Success of eGovernment Initiatives: Mapping
Known Success Factors to the Design of Practical Tools. In Proceedings of the 37th
Hawaii International Conference on Systems Sciences, 5-8 Jan, Big Island, HI, USA.
Hodge, J. G. (2003). Health Information Privacy and Public Health. Journal of Law, Medicine
and Ethics, 31(4), 663-671.
Hodgson, D. (2002). Disciplining the professional: the case of project management. Journal
of Management Studies, 39, 803-821.
Hodgson, D. (2004). Project work: the legacy of bureaucratic control in the post-bureaucratic
organization. Organization, 11(1), 81–100.
Hodgson, D., & Cicmil, S. (2008) The other side of projects: The case for critical project
studies. International Journal of Managing Projects in Business, 1(1), 142-152.
Hodgetts, R.M. (1969). Leadership techniques in project organization. Academy of
Management Journal, 11, 211–219.
224
Hoegl, M., & Weinkauf, K. (2005). Managing task interdependencies in multi-team projects:
a longitudinal study. Journal of Management Studies, 42, 1287–1308.
Hogan, T. (2008). The adaptive leadership maturity model. Organization Development
Journal, 26(1), 55-61.
Hogan, W. R., & Wagner, M. M. (1997). Accuracy of data in computer-based patient records.
Journal of the American Medical Informatics Association, 4(5), 342-354.
Holland, C. P., & Light, B. (1999). A Critical Success Factors Model for ERP Implementation.
IEEE Software, May-June 30-36.
Holloway, C.A., Nelson, R. and Suraphongschai, V. (1979). Comparison of a multi-pass
heuristic decomposition procedure with other resource-constrained project scheduling
procedures. Management Science, 25, 862–872.
Hooper, D., Coughlan, J., Mullen, M. (2008). Structural Equation Modelling: Guidelines for
Determining Model Fit. Electronic Journal of Business Research Methods, 6(1), 53-60.
Horine, G. (2005). Absolute Beginner's Guide to Project Management. Indianapolis, IN: Que
Publishing.
Hu, L. T., & Bentler, P. M. (1998). Fit indices in covariance structure modelling: Sensitivity
to underparameterized model misspecification. Psychological Methods, 3, 424–445.
Hu, L. T., & Bentler, P. M. (1999). Cutoff criteria for fit indexes in covariance structure
analysis: Conventional criteria versus new alternatives. Structural Equation Modeling,
6 (1), 1-55.
Hughes, J., & Sharrock, W. (1997). The Philosophy of Social Research. London, UK:
Longman.
Hunt, D. L., Haynes, R. B., Hanna, S. E., & Smith, K. (1998). Effects of Computer-Based
Clinical Decision Support Systems on Physician Performance and Patient Outcomes: A
Systematic Review. JAMA, 280(15), 1339-1346.
225
Hussein, B. A. (2012). Causes of change to project success criteria: a study based on project
management practices in Norway. PMI Research and Education Conference, Limerick,
Ireland.
Hussein, B. A. (2013). Factors Influencing Project Success Criteria. In Proceedings of the 7th
IEEE International Conference on Intelligent Data Acquisition and Advanced
Computing Systems: Technology and Applications (IDAACS), 12-14 Sept, Berlin,
Germany
Hyrkäs, K., & Lehti, K. (2003). Continuous quality improvement through team supervision
supported by continuous self-monitoring of work and systematic patient feedback.
Journal of Nursing Management, 11(2), 208-226.
Hyvari, I. (2006). Success of Projects in Different Organizational Conditions. Project
Management Journal, 37(4), 31–41.
Iacobucci, D. (2008). Mediation analysis. Thousand Oaks, CA: Sage
Iacobucci, D., Saldanha, N., & Deng, X. (2007). A Meditation on Mediation: Evidence That
Structural Equations Models Perform Better Than Regressions. Journal of Consumer
Pstchology, 17(2), 140–154.
Iacovou, C. L., & Nakatsu, R. (2008). A risk profile of offshore-outsourced development
projects. Communications of the ACM, 51(6), 89–94.
Ibbs, C. W., & Kwak, Y. H. (1997). Measuring Project Management's Return on Investment.
PM Network, 36-38.
Ibbs, C. W., & Kwak, Y. H. (2000). Assessing project management maturity. Project
Management Journal, 31(1), 32-43.
Ibbs, C. W., & Reginato, J. M. (2002). Quantifying the value of Project Management.
Pennsylvania, Newton Square: Project Management Institute, Inc.
226
Ibbs, C. W., Reginato, J. M., & Kwak, Y. H. (2004). Developing Project Management
Capability: Benchmarking, Maturity, Modeling, Gap Analyses, and ROI Studies. In
Morris, P., & Pinto, J. K. (Eds), The Wiley Guide to Managing Projects. John Wiley and
Sons, Inc., Hoboken, NJ, USA.
IDC (2016). Worldwide Semiannual IT Spending Guide: Industry and Company Size.
Available at: http://www.idc.com/getdoc.jsp?containerId=IDC_P33207, 19/07/2017.
Iivari, J., Hirschheim, R., & Klein, H. K. (1998). A Paradigmatic Analysis Contrasting
Information Systems Development Approaches and Methodologies. Information
Systems Research, 9 (2), 164-193.
Ika, L. A. (2009). Project success as a topic in project management journals. Project
Management Journal, 40, 6-19.
Ika, L. A. (2015). Opening the black box of project management: does World Bank project
supervision influence project impact? International Journal of Project Management
33(5), 1111–1123.
Ika, L. A, Diallo, A., Thuillier, D. (2012). Critical success factors for World Bank projects:
an empirical investigation. International Journal of Project Management, 30 (1), 105–
116.
IHME (2016). Rethinking Development and Health: Findings from the Global Burden of
Disease Study. Seattle, WA: Institute for Health Metrics and Evaluation. Available at:
http://www.healthdata.org/sites/default/files/files/images/news_release/2016/IHME_G
BD2015.pdf, 19/07/2017.
ILO (2015). Investigation of occupational accidents and diseases: A practical guide for
labour inspectors. Geneva, Switzerland; International Labour Office. Available at:
http://www.ilo.org/wcmsp5/groups/public/@ed_dialogue/@lab_admin/documents/pub
lication/wcms_346714.pdf, 19/07/2017.
227
Im, K. S., Dow, K. E., & Grover, V. (2001). A reexamination of IT investment and the market
value of the firm - An event study methodology. Information Systems Research, 12(1),
103-117.
IPMA (2015). Individual Competence Baseline (version 4.0). Zurich, Switzerland:
International Project Management Association.
Ingason, H., & Jónasson, H. (2009). Contemporary Knowledge and Skill Requirements in
Project Management. Project Management Journal, 40(2), 59-69.
Irani, Z., Love, P. E. D., & Li, H. (1999). IT/IS investment barriers to the decision-making
process. In Proceeding of the Business Information Technology World Conference
(BITWorld 99) Conference, 30th June-2nd July, Cape Town, South Africa.
Isaai, M. T. (2006). A framework to the assessment and promotion of knowledge management
maturity level in enterprise: modelling and case study. IEEE International Conference
on Management of Innovation and Technology (1), 163–165
Isik, Z., Arditi, D., Dikmen, I., & Birgonul, M. T. (2009). Impact of corporate
strengths/weaknesses on project management competencies. International Journal of
Project Management, 27(7), 629-637.
ISO 10006:2003 (2016, December 13). Quality management systems - Guidelines for quality
management in projects. ISO - The International Organization for Standardization,
Section 3.5. Available at: https://www.iso.org/obp/ui/#iso:std:iso:10006:ed-
2:v1:en:term:3.5, 19/07/2017.
Iversen, J., Nielsen, P. A., & Norbjerg, J. (1999). Situated assessment of problems in software
development. Database for Advances in Information Systems, 30(2), 66-81.
Ivory, C., & Alderman, N. (2005). Can project management learn anything from studies in
complex systems? Project Management Journal, 36(3), 5–16.
Jachimowicz, V. A. (2003). Project management maturity model. Project Management
Journal, 34(1), 55.
228
Jackson, D., Gillaspy, Jr., J., & Purc-Stephenson, R. (2009). Reporting Practices in
Confirmatory Factor Analysis : An Overview and Some Recommendation.
Psychological Methods, 14(1), 6–23.
Jacques, P., Garger, J., & Thomas, M. (2008). Assessing leader behaviours in project
managers. Management Research News, 31(1), 4-11.
Jefferies, M., Gameson, R., & Rowlinson, S. (2002). Critical success factors of the BOOT
procurement system: reflection from the Stadium Australia case study. Engineering,
Construction and Architectural Management, 9(4), 352–361.
Jeffrey, M., & Leliveld, I. (2004). Best Practices in IT Portfolio Management. MIT Sloan
Management Review, 45(3), 41-49.
Jensen, T. B. (2013). Design Principles for Achieving Integrated Healthcare Information
Systems. Health Informatics Journal, 19(1), 29-45.
Jeon, S., Kim, Y., & Koh, J. (2011). An integrative model for knowledge sharing in
communities-of-practice. Journal of Knowledge Management, 15(2), 251-269.
Jha, K. N., & Iyer, K. C. (2006). Critical determinants of project coordination. International
Journal of Project Management, 24(4), 314-322.
Jha, K. N., & Iyer, K. C. (2007). Commitment, coordination, competence and the iron triangle.
International Journal of Project Management, 25(5), 527–540.
Jia, G., Chen, Y., Xue, X., Chen, J., Cao, J., & Tang, K. (2011). Program management
organization maturity integrated model for mega construction programs in China.
International Journal of Project Management, 29(7), 834-845.
Jiang, J. J., Muhanna, W. A., & Klenin, G. (2000). User resistance and strategies for promoting
acceptance across system types, Information & Management, 37(1), 25–36.
229
Jiang, J. J., Klein, G., Hwang, H.G., Huang, J., & Hung, S.Y. (2004). An exploration of the
relationship between software development process maturity and project performance.
Information and Management, 41(3), 279-288.
Jenkins, A., Kock, N., & Wellington, R. (1999). A Field Study of Success and Failure Factors
in Asynchronous Groupware Supported Process Improvement Groups. Business
Process Management Journal, 5(3), 238-253.
Jorgenson, D.W., & Stiroh, K.J. (2000). Raising the speed limit: US economic growth in the
information age. In Jorgenson (eds) Economic growth in the information age, 3, 71-146,
Cambridge, Massachusetts: MIT Press.
Jöreskog, K. G. (1969). A general approach to confirmatory maximum likelihood factor
analysis. Psychometrika, 34(2), 183-202.
Jugdev, K., & Müller, R. (2005). A retrospective look at our evolving understanding of project
success. Project Management Journal, 36(4), 19-31.
Jugdev, K., & Thomas, J. (2002). Project management maturity models: The silver bullets of
competitive advantage? Project Management Journal, 33(4), 4-14.
Jugdev, K., Thomas, J., & Delisle, C.L. (2001). Rethinking project management: old truths
and new insights. Project Management Journal, 7(1), 36–43.
Jung J. Y., & Wang, Y. J. (2006). Relationship between total quality management (TQM)
and continuous improvement of international project management (CIIPM).
Technovation, 16, 716-722.
Kagioglou, M., Cooper, R., Aouad, G., & Sexton, M. (2000). Rethinking Construction: The
Generic Design and Construction Process Protocol. Engineering, Construction and
Architectural Management Journal, 7(2), 141-153.
Kalantjakos, N. J. (2001). Assessing Organizational Project Management Maturity. In
Proceedings of Project Management Institute Annual Seminars & Symposium 2001,
Nashville, Tenn., USA.
230
Kaplan, B., & Harris-Salamone, K. D. (2009). Health IT success and failure:
recommendations from literature and an AMIA workshop. Journal of the American
Medical Informatics Association, 16(3), 291-299.
Kaplan, B., & Shaw, N. T. (2002). People, organization, and social issues: evaluation as an
exemplar. In R. Haux, C. Kulikowski (eds.) Yearbook of Medical Informatics,
Schattauer, Stuttgart/New York.
Karjalainen, K. (2009). Challenges of Purchasing Centralisation: Empirical Evidence from
Public Procurement. Thesis submitted in fulfilment of requirements for the degree of
Doctor of Philosophy at the Helsinki School of Economics.
Katz, J. E., & Rice, R.E. (2002). Social Consequences of Internet Use: access, involvement,
and interaction. Cambridge: MIT Press.
Kaushal, R., Shojania, K. G., Bates, D. W. (2003). Effects of Computerized Physician Order
Entry and Clinical Decision Support Systems on Medication Safety. A Systematic
Review. Archives of Internal Medicine, 163(12), 1409-1416.
Kazanjian, A., & Green, C. (2002). Beyond effectiveness: the evaluation of information
systems using a comprehensive health technology assessment framework. Computers in
Biology and Medicine, 32, 165-177.
Kazdin, A. E. (2003). Research Dedign in Clinical Phychology (4th Edition). Boston: Allyn
and Bacon.
Kenny, J. (2003). Effective Project Management for Strategic Innovation and Change in an
Organizational Context. Project Management Journal, 34(1), 43-53.
Kerlinger, F. N. (1979). Behavioral research: A conceptual approach. New York: Holt,
Rinehart & Winston.
Kerzner, H. (1998). Project Management: a systems approach to planning, scheduling and
controlling. New York: John Wiley and Sons, Inc.
231
Kerzner, H. (2001). Applied Project Management: Best Practices on Implementation. New
York: John Wiley and Sons, Inc.
Kerzner, H. (2005). Using the project management maturity model: strategic planning for
project management (2nd Edition). New Jersey, USA: John Wiley & Sons.
Kerzner, H. (2009) Project Management: a systems approach to planning, scheduling and
controlling (10th Edition). New York: John Wiley and Sons.
Kerzner, H. (2013). Project Management: a systems approach to planning, scheduling and
controlling (11th Edition). New York: John Wiley and Sons.
Kerzner, H. (2014). Project Management - Best Practices: Achieving Global Excellence (3rd
Edition). New York: John Wiley and Sons.
Khan, R, A., & Spang, K. (2013). An exploratory study of the association of project success
with project characteristics and organization maturity. In Proceedings of the
International Scientific Conference New Challenges of Economic and Business
Development, May 9 - 11, Riga, University of Latvia.
Khandewal, V., & Miller, J. (1992). Information System Study, Opportunity Management
Program. New York: IBM Corporation.
Khang, D., & Moe, T. L. (2008). Success Criteria and factors for international development
projects: A life-cycle-based framework. Project Management Journal, 39(1), 72-84.
Killen, C. P., & Hunt, R. A. (2008). Project portfolio management maturity model for dynamic
environments. In Proceedings of the Australian Institute of Project Management
Conference (AIPM), 11 - 14 October, Adelaide, Australia.
Killen, C. P., Hunt, R. A., & Kleinschmidt, E.J. (2008). Project portfolio management for
product innovation. International Journal of Quality and Reliability, 25(1), 24-38.
Kim, D., & Grant, G. (2010). E-government maturity model using the capability maturity
model. Journal of Systems and Information Technology, 12(3), 230-244.
232
Kim, J. K., Xiang, J.Y., & Lee, S. (2009). The impact of IT investment on firm performance
in China: An empirical investigation of the Chinese electronics industry. Technological
Forecasting and Social Change, 76(5), 678-687.
Kim, K. K., & Mitchelman, J. E. (1990). An Examination of Factors for the Strategic Use of
Information Systems in the Healthcare Industry. MIS Quarterly, 14(2), 201-215.
Kim, J., & Wilemon, D. (2007). The learning organization as facilitator of complex NPD
projects. Creativity and Innovation Management, 16, 176–191.
King, J, L., & Kraemer, K. L. (1984). Evolution and organizational information systems: an
assessment of Nolan's stage model. Communications of the Association for Computing
Machinery, 27(5), 466–475.
King, W. R., & Wilson, T. (1967). Subjective time estimates in Critical Path planning: a
preliminary analysis. Management Science, 13, 307–320.
Klein, H., Hirschheim, R., & Nissen, H-E. (1991). A Pluralist Perspective of the Information
Systems Research Arena' In H-E. Nissen et al., (eds.) Information Systems Research:
Contemporary Approaches and Emergent Traditions. In Proceedings of IFIP TC8/WG
8.2 Conference, Denmark 1990, North Holland: Elsevier, 1-26.
Klimbo, G. (2001). Knowledge Management and Maturity Models: Building Common
Understanding. In Proceedings of the 2nd European Conference on Knowledge
Management, November 8-9, Bled School of Management, Slovenia.
Kline P. (2000). Handbook of psychological testing (2nd Edition). New York: Routledge.
Kloppenborg, T., & Opfer, W. (2002). The current state of project management research:
Trends, interpretations, and predictions. Project Management Journal, 33(2), 5-18.
Koch, S. (2006). Home telehealth: Current state and future trends. International Journal of
Medical Informatics, 75, 565-576.
233
Kohli, R., & Devaraj, S. (2004). Realizing the Business Value of Information Technology
Investments: An Organizational Process. MIS Quarterly Executive, 3(1), 55-70.
Kohli, R., & Grover, V. (2008). Business value of IT: An essay on expanding research
directions to keep up with the times. Journal of the Association for Information Systems,
9(1), 23-39.
Kohn, L., Corrigan, M., & Donaldson (Eds) (2000). To Err is Human: Building a Safer Health
System. Washington DC: National Academy Press.
Kolltveit, B. J., Karlsen, J. T., & Grønhaug, K. (2015). Perspectives on project management.
International Journal of Project Management, 25, 3–9.
Kolodny, H.F. (1979). Evolution to a matrix organization. Academy of Management Review,
4, 543–553.
Komorita, S. S., & Graham, W. K. (1965). Number of scale points and the reliability of scales.
Educational and Psychological Measurement, 25, 987–995.
Koskela, L. & Howell, G. A. (2002). The underlying theory of project management is obsolete.
In Proccedings of PMI Research Conference 2002: Frontiers of Project Management
Research and Applications, Seattle, Washington. Newtown Square, PA: Project
Management Institute.
KPMG (2005). Global IT Project Management Survey: How committed are you? Sydney,
Australia: KPMG.
KPMG (2013). Project Management Survey Report: Strategies to Capture Business Value.
New Zealand: KPMG.
Krcmar, H., Leimeister, J. M., & Sidiras, (2004). Success factors of virtual communities from
the perspective of members and operators: An empirical study. In Proceedings of the
37th Hawaii International Conference on System Sciences (HICSS), Big Island, HI,
USA.
234
Kreiner, K. (1995). In search of relevance: Project management in drifting environments.
Scandinavian Journal of Management, 11(4), 335-346.
Krist, A. H., & Woolf, S. H. (2011). A Vision for Patient-Centered Health Information
Systems. JAMA, 305(3), 300–301.
Kronbichel, S. A., Ostermann, H., & Staudinger, R. (2009). A review of critical success
factors for ERP-projects. The Open Information Systems Journal, 3, 14-25.
Krosnick, J. A., & Presser, S. (2010). Question and Questionnaire Design. In Handbook of
Survey Research, 2nd Ed. UK: Emerald Group Publishing Limited, pp. 263-313.
Kuhn, T. (1970). The Structure of Scientific Revolution (2nd Edition). Chicago: University of
Chicago Press.
Kumar, S., & Preetha, G.S. (2012). Health Promotion: An Effective Tool for Global Health.
Indian Journal of Community Medicine, Jan-Mar 37(1), 5–12.
Kuruppuarachchi, P., Mandal, P., & Smith, R. (2002). IT project implementation strategies
for effective changes: a critical review. Logistics Information Management, 15(2), 126-
137.
Kutsch, E., & Hall, M. (2010). Deliberate ignorance in project risk management. International
Journal of Project Management, 28(3), 245-255.
Kwak, Y. H., & Ibbs, C. W. (2000). The Berkley Project Management Process Maturity
Model: Measuring the Value of Project Management. Proceedings of the 2000 IEEE
Engineering Management Society, 13-15 Aug, Albuquerque, NM, USA.
Kwak, Y. H., & Ibbs, C. W. (2002). Project management process maturity (PM)2 model.
Journal of Management in Engineering, 18(3), 150-155.
Lapointe, L., & Rivard, S. (2006). Getting physicians to accept new information technology:
insights from case studies. Canadian Medical Association, 174(11), 1573-1578.
235
Larson, E. W., & Gray, C. F. (2011). Project management: the managerial process. New
York: McGraw-Hill.
Larson, M., & Wikström, E. (2007). Relational interaction processes in project networks: the
consent and negotiation perspectives. Scandinavian Journal of Management, 23, 327–
352.
Laszlo, G. P. (1999). Project management: a quality management approach. The TQM
Magazine, 11(3), 157- 160.
Lather, P. (1986). Research as Praxis. Harvard Educational Review, 56(3), 257-278.
Lawrence, P. R., & Lorsch, J. W. (1967) Differentiation and integration in complex
organizations. Administrative Science Quarterly, 13, 1–47.
Le Brasseur, R., Whissell, R., & Ojha, A. (2002). Organizational learning, transformational
leardship, and implementation of continuous quality improvement in Canadian
Hospitals. Australian Journal of Management, 27(2), 141-162.
Lee, A. (1989). A Scientific Methodology for MIS Case Studies, MIS Quarterly, 13(1), 33-
50.
Lee, A. S., & Baskerville, R. L. (2003). Generalizing Generalizability in Information Systems
Research. Information Systems Research, 14 (3), 221-243.
Lee, B., & Barua, A. (1999). An Integrated Assessment of Productivity and Efficiency Impacts
of Information Technology Investments: Old Data, New Analyses and Evidence.
Journal of Productivity Analysis, 121, 21-43.
Lee, L. S., & Anderson, R. M. (2006). An exploratory investigation of the antecedents of the
IT project management capability. E-Service Journal, 5(1), 27-42.
Lee, S., Xiang, J. Y., & Kim, J. K. (2011). Information Technology and Productivity:
Empirical Evidence from the Chinese Electronics Industry. Information & Management
48(2/3), 79-87.
236
Lenfle, S., & Loch, C. (2010). Lost roots: how project management came to emphasize control
over flexibility and novelty. California Management Review, 53(1), 32-55.
Lentz, C. M. A., Gogan, J. L., & Henderson, J. C. (2002). A Comprehensive and Cohesive IT
Value Management Capability: Case Studies in the North American Life Insurance
Industry. In Proceedings of the 35th Annual Hawaii International Conference on System
Sciences (HICSS), Big Island, HI, USA.
Lenz, R., & Reichert, M. (2007). IT support for healthcare processes: premises, challenges,
perspectives. Data and Knowledge Engineering, 61, 39–58.
Leonard, K. J. (2000). Information Systems for Healthcare: Why we haven't had more success:
The Top 15 Reasons. Healthcare Management Forum, 13(3), 45–51.
Leonard, K. J. (2004). Critical Success Factors Relating to Healthcare's Adoption of New
Technology: A Guide to Increasing the Likelihood of Successful Implementation.
Electronic Healthcare, 2(4), 72-81.
Leonard, K. J., & Winkelman, W. (2002). Developing Electronic Patient Records: Employing
Interactive Methods to Ensure Patient Involvement. In Proceedings fo the Proceedings
of the 28th Meeting of the European Working Group on Operational Research Applied
to Health Services (ORAHS), Toronto, Canada, 241-255.
Levin, G., & Skulmoski, G. (2000). The project management maturity. ESI Horizons, 2(3),
1-7.
Lewis, D., Hodge, N., Gamage, D., & Whittaker, M. (2011). Understanding the role of
technology in health information systems. Pacific Health Dialog, 18(1), 144-154.
Lewis, J. R. (1993). Multipoint Scales: Mean and Median Differences and Observed
Significance Levels. International Journal of Human-Computer Interaction, 5(4), 383-
392.
237
Liang, H., Saraf, N., Hu, Q., & Xue, Y. (2007). Assimilation of enterprise systems: the effect
of institutional pressures and the mediating role of top management. MIS Quarterly,
31(1), 59–87.
Likert, R. (1932). A Technique for the Measurement of Attitudes. Archives of Psychology,
140, 1-55.
Lim, C. S., & Mohamed, M. Z. (1999). Criteria of project success: An explanatory re-
examination. International Journal of Project Management, 17(4), 243-248.
Lin, K., Lin, C., & Tsao, H. (2005). IS/IT Investment Evaluation and Benefit Realization
Pratices in Taiwanese SMEs. Journal of Information Science and Technology, 2(4), 44-
71.
Lin, W. T., & Shao, B. B. (2006). Assessing the input effect on productive efficiency in
production systems the value of information technology capital. International Journal
of Production Research, 44(9), 1799-1819.
Lipovetsky, S., Tishler, A., Dvir, D., & Shenhar, A. (1997). The relative importance of project
success dimensions. R&D Management, 27(2), 97-106.
Lissitz, R. W., & Green, S. B. (1975). Effect of the number of scale points on reliability: A
Monte Carlo approach. Journal of Applied Psychology, 60, 10–13.
Liu, S., Zhang, J., Keil, M., & Chen, T. (2010). Comparing senior executive and project
manager perceptions of IT project risk: a Chinese Delphi study. Information System
Journal, 20(4), 319–355.
Lluch, M. (2011). Healthcare professionals’ organisational barriers to health information
technologies: A literature review. International Journal of Medical Informatics, 80(12),
849–862.
Lockamy III, A., & McCormack, K. (2004). Development of a supply chain management
process maturity model. Supply Chain Management: An International Journal, 9(4),
272-278.
238
Lorenzen, M., & Frederiksen, L. (2005). The Management of Projects and Product
Experimentation: Examples from the Music Industry. European Management Review,
2, 198–211.
Lorenzi, N. M., & Riley, R. T. (1995). Organizational Aspects of Health Informatics:
Managing Technological Change. New York: Springer-Verlag.
Lorenzi, N. M. Riley, R. T., Blyth, A. J., Southon, G., & Dixon, B. J. (1997). Antecedents of
the people and organizational aspects of medical informatics: review of the literature.
Journal of the American Medical Informatics Association, 4(2), 79-93.
Lorenzi, N. M., & Riley, R. T. (2000). Managing change: an overview. Journal of the
American Medical Informatics Association, 7(2), 116-124.
Lorenzi, M. M., & Riley, R. T. (2003). Organizational issues = change, International Journal
of Medical Informatics, 69, 197-203.
Lovallo, D., & Kahneman, D. (2003). Delusions of success: how optimism undermines
executives’ decisions. Harvard Business Review, 81, 56–63.
Low, C., & Chen, Y. H. (2012). Criteria for the evaluation of a cloud-based hospital
information system outsourcing provider. Journal of Medical Systems, 36(6), 3543-
3553.
Lucas, H. (2008). Information and communications technology for future health systems in
developing countries. Social and Medicine, 66 (10), 2122-2132.
Lueg, R., & Lu, S. (2012). Improving efficiency in budgeting: An interventionist approach to
spreadsheet accuracy testing. Problems and Perspectives in Management, 10, 32-41.
Lueg, R., & Lu, S. (2013). How to improve efficiency in budgeting: The case of business
intelligence in SMEs. European Journal of Management, 13(2), 109-120.
Lundin, R., & Soderholm, A. (1995). A theory of the temporary organization. Scandinavian
Journal of Management, 11(4), 437-455.
239
Lundin, R. A., & Söderholm, A. (1998). Conceptualising a projectified society: Discussion of
an eco-institutional approach to a theory on temporary organisations. In R. A. Lundin
and C. Midler (Eds.), Projects as arenas for renewal and learning processes (13-23).
Boston: Kluwer Academic Publishers.
Lyer, K. C., & Jha, K. N. (2005). Factors affecting cost performance: Evidence from Indian
Construction Projects. International Journal of Project Management, 23(4), 283-295.
Lymberis, A., & Dittmar, A. (2007). Advanced Wearable Health Systems and Applications:
Research and Development Efforts in the European Union. IEEE Engineering in
Medicine and Biology Magazine, 26, 29-33.
Lyytinen, K., & Hirschheim, R. (1987). Information systems Failures: A Survey and
Classification of the Empirical Literature. New York, NY: Oxford Surveys in
Information Technology, Oxford University Press, 4, 257-309.
MacCallum, R. C., & Austin, J. T. (2000). Applications of structural equation modeling in
psychological research. Annual Review of Psychology, 51, 201–226.
MacCallum, R. C., Browne, M. W., & Sugawara, H. M. (1996). Power analysis and
determination of sample size for covariance structure modeling. Psychological Methods,
1(2), 130-149.
MacCarthy, B. L., & Atthirawong, W. (2003). Factors affecting location decisions in
international operations: A Delphi study. International Journal of Operations &
Production Management, 23(7), 794-818.
Macdonald, S., Anderson, P., & Kimbel, D. (2000). Measurement or management? Revisiting
the productivity paradox of information technology. Vierteljahrshefte zur
Wirtschaftsforschung, 69(4), 601-617.
Machamer, P. (2002). A Brief Historical Introduction to the Philosophy of Science. In P.
Machamer and M. Silberstein (eds), The Blackwell Guide to the Philosophy of Science,
Oxford: Blackwell, 1-17.
240
MacKinnon, D. P., Fritz, M. S., Williams, J., & Lockwood, C. M. (2007). Distribution of the
product confidence limits for the indirect effect: Program prodclin. Behavior Research
Methods, 39(3), 384–389.
Madeira, B., Gomes, J., & Romão, M. (2017). Applying Benefits Management to the
Implementation of a Copy Point: A Case Study. International Journal of Strategic
Decision Sciences (IJSDS) 8(1), 13-26.
Mäenpää, T., Suominen, T., Asikainen, P., Maass, M., & Rostila, I. (2009). The outcomes of
regional healthcare information systems in health care: A review of the research
literature. International Journal of Medical Informatics, 78(11), 757-771.
Mahmood, M.A., & Mann, G. J. (2005). Information technology investments and
organizational productivity and performance: An empirical investigation. Journal of
Organizational Computing and Electronic Commerce, 15(3), 185-202.
Maier, A. M., Moultrie, J., & Clarkson, P. J. (2009). Developing maturity grids for assessing
organizational capabilities: Practitioner guidance. In Proceedings of the 4th
International Conference on Management Consulting: The Changing Paradigm of
Consulting, June 11-13, Academy of Management, Vienna, Austria.
Maier, A. M., Moultrie, J., & Clarkson, P. J. (2012). Assessing Organizational Capabilities:
Reviewing and Guiding the Development of Maturity Grids. IEEE Transactions on
Engineering Management, 59(1), 138 - 159.
Maier, J. L., Rainer, R. K., & Snyder, C. A. (1997). Environmental scanning for information
technology: An empirical investigation. Journal of Management Information System,
14(2), 177-201.
Marczyk, G., DeMatteo, D., & Festinger, D. (2005). Essentials of Research Design and
Methodology. New Jersey: John Wiley and Sons, Inc.
241
Markus, M. L., Axline, S., Petrie, D., & Tanis, C. (2000). Learning from adopters’ experiences
with ERP: Problems encountered, and success achieved. Journal of Information
Technology, 14(4), 245–265.
Marshall. S. (2010). A quality framework for continuous improvement of e-learning: The e-
learning maturity model. The Journal of Distance Education, 24 (1), 143 - 166.
Marshall, C., & Rossman, G. B. (2006). Designing Qualitative Research (4th Edition).
Thousand Oaks, CA: Sage.
Marshall, P., McKay, J., & Prananto, A. (2005). Business value creation from IT investments:
Towards a process theory of IT governance. Australasian Journal of Information
Systems, 12(2), 192-206.
Martinsons, M., Davison, R., & Tse, D. (1999). The balanced scorecard: a foundation for the
strategic management of information systems. Decision Support Systems, 25, 71–88.
Maskell, B. H. (1991). Performance Measurement for World Class Manufacturing.
Cambridge, MA: Productivity Press.
Masters, J. R. (1974). The relationship between number of response categories and reliability
of Likert-type questionnaires. Journal of Educational Measurement, 11, 49–53.
Mata, F., Fuerst, W., & Barney, J. (1995). Information Technology and Sustained Competitive
Advantage: A Resource-Based Analysis. MIS Quarterly, 19(4), 487-505.
Matell, M. S., & Jacoby, J. (1971). Is there an optimal number of alternatives for Likert scale
items? Study I: Reliability and validity. Educational and Psychological Measurement,
31, 657–674.
Matta, N., & Ashkenas, R.N. (2003). Why good projects fail anyway. Harvard Business
Review, 81, 109–114.
Maxwell, J. A. (2006). Qualitative Research Design: An Interactive Approach (2nd Edition)
Thousand Islands: Sage.
242
Maylor, H. (2001). Beyond the Gantt chart: Project management moving on. European
Management Journal, 19(1), 92-100.
Maylor, H. (2010). Project management (4th Edition). Essex: Pearson Education Limited.
McCormack, K., Willems, J., van den Bergh, J., Deschoolmeester, D., Willaert, P.,
Štemberger, M. I., Škrinjar, R., Trkman, P., Ladeira, M. B., Valadares de Oliveira, M.
P., Vuksic, V. B., & Vlahovic, N. (2009). A global investigation of key turning points
in business process maturity. Business Process Management Journal, 15(5), 792-815.
McDonald, C. J. (1976). Protocol-based computer reminders, the quality of care and the non-
perfectibility of man. New England Journal of Medicine, 295(24), 1351-1355.
McDonald, C. J., Overhage, J. M., Dexter, P. R., Blevins, L. Meeks-Johnson, J., Suico, J. G.,
Tucker, M.C., & Schadow, G. (1998). Canopy computing: using the web in clinical
practice. Journal of the American Medical Association, 280(15), 1325-1329.
McDonald, C. J., Hui, S. L., Smith, D. M., Tierney, W. M., Cohen, S. J., Weinberger, M., &
McCabe, G. P. (1984). Reminders to physicians from an introspective computer medical
record. A two-year randomized trial. Annals of Intern Medicine, 100(1), 130-138.
McDonald, R. P., & Ho, M.-H.R. (2002). Principles and Practice in Reporting Statistical
Equation Analyses. Psychological Methods, 7 (1), 64-82.
McFarlan, W. (1984). Information Technology changes the way you compete. Harvard
Business Review,62(3), 98-103.
McGrath, M.E., & Romeri, M. N. (1994). The RandD effectiveness index: A metric for
product development performance. Journal of Product Innovation Management, 11(3),
213-220.
McLeod, L., Doolin, B. and MacDonell, S. G. (2012). A Perspective-Based Understanding of
Project Success. Project Management Journal, 43(5), 68-86.
243
McManus, J., & Wood-Harper, T. (2008). Understanding the Success of Information Systems
Project Failure: A Study in Project Failure. Management Services, Autumn, 38-43.
Mead, N., & Bower, P. (2000). Patient-centredness: A conceptual framework and review of
emprirical literature. Social Science and Medicine, 51(7), 1087-1110.
Meinhart, W.A., & Delionback, L.M. (1968). Project management: an incentive contracting
decision model. Academy of Management Journal, 11, 427–434.
Melcher, A.J., & Kayser, T.A. (1970). Leadership without formal authority: the project group.
California Management Review, 13, 57–64.
Melville, N., Kraemer, K. L., & Gurbaxani, V. (2004). Information Technology and
Organizational Performance: An Integrative Model of IT Business Value. MIS
Quarterly, 28(2), 283-321.
Mercuri, R. T. (2004). The HIPAA-potamus in Health Care Data Security. Communications
of the ACM, 47(7), 25-28.
Meredith, J. R. (2002). Developing project management theory for managerial application:
The view of a research journal’s editor. In Proceedings of PMI Research Conference
2002: Frontiers of Project Management Research and Application, Seattle, WA.
Newtown Square, PA: Project Management Institute.
Meredith, J., & Mantel, S. J. (2009). Project Management: A managerial approach (7th
Edition). Hoboken, NJ: John Wiley and Sons, Inc.
Merna, T., & AL-Thani, F. (eds) (2012). Corporate Risk Management (2nd Edition). John
Wiley & Sons, Inc., Hoboken, NJ, USA.
Merriam, S. (1998). Qualitative Research and Case Study Applications in Education (2nd
Edition). San Francisco: Jossey-Bass.
244
Meskendahl, S. (2010). The influence on business strategy on project portfolio management
and its success: A conceptual framework. International Journal of Project Management,
28(8), 807-817.
Mettler, T. (2011). Maturity Assessment Models: A Design Science Research Approach.
International Journal of Society Systems Science, 3 (1/2), 81-98.
Mettler, T., & Rohner, P. (2009). Situational Maturity Models as Instrumental Artifacts for
Organizational Design. In Proceedings of the 4th International Conference on Design
Science Research in Information Systems and Technology (DESRIST'09), May 7-8,
Malvern, PA, USA.
Mettler T., Rohner P., & Winter R. (2010) Towards a Classification of Maturity Models in
Information Systems. In: D'Atri A., De Marco M., Braccini A., Cabiddu F. (eds)
Management of the Interconnected World. Physica-Verlag HD.
Mickan, S. M. (2005). Evaluating the effectiveness of health care teams. Australian Health
Review, 29(2), 211-217.
Middleton, C.J. (1967). How to set up a project organization. Harvard Business Review, 45,
73–82.
Midler, C. (1995). ‘Projectification’ of the firm: The Renault case. Scandinavian Journal of
Management, 11(4), 363-373.
Miles, M. B., & Huberman, A. M. (1994). Qualitative Data Analysis: an expanded
sourcebook. Sage Publications, USA.
Milis, K., Meulders, M., & Mercken, R. (2003). A quasi-experimental approach to
determining success criteria for ICT projects. In Proceedings of the 36th Annual Hawaii
International Conference on System Sciences, 6-9 Jan, Big Island, HI, USA.
Miller, D., & Oliver, M. (2015). Engaging Stakeholders for Project Success. White paper.
Project Management Institute, Inc.
245
Milosevic, D. Z. (2003). Project management toolbox: tools and techniques for the practicing
project manager. Hoboken: John Wiley and Sons.
Milosevic, D. Z., & Pantanakul, P. (2005). Standardised Project Management may increase
the development of Project Success. International Journal of Project Management, 23,
181-192.
Mimoso, A. (2014). Compras Públicas Centralizadas: Acordos Quadro. SPMS - Serviços
Partilhados do Ministério da Saúde, EPE. http://www.opet.pt/8CCPE/SPMS.pdf.
Mingers, J. (2001). Combining IS Research Methods: Towards a Pluralist Methodology.
Information Systems Research, 12(3), 240-259.
Mingers, J. (2003). The paucity of multimethod research: a review of the information systems
literature. Information Systems Journal, 13(3), 233-249.
Mingers, J. (2004). Realizing information systems: critical realism as an underpinning
philosophy for information systems. Information and Organizational, 14(2), 87-103.
Mintzberg H. (1983). Structure in fives: designing effective organisations. Englewood Cliffs
(NJ): Prentice-Hall.
Mir, F. A., & Pinnington, A. H. (2014). Exploring the value of project management: linking
project management performance and project success. International Journal of Project
Management, 32(2), 202–217.
Mitcham, C. (2005). Management. Encyclopedia of Science, Technology, and Ethics, 3,
Detroit: Macmillan Reference USA.
Mithas, S., Tafti, A., Bardhan, T., & Goh, J. M. (2012). Information Technology and Firm
Profitability: Mechanisms and Empirical Evidence. MIS Quarterly, 36, 205-224.
Mittermaier, H. K., & Steyn, H. (2009). Project management maturity: an assessment of
maturity for developing pilot plants. South African Journal of Industrial Engineering,
20(1), 95-107.
246
Mkansi, M., & Acheampong, E. A. (2012). Research Philosophy Debates and Classifications:
Students’ Dilemma. Electronic Journal of Business Research Methods, 10(2), 141-153.
Monteiro, B. R., Pisco, A. M., Candoso, F., Bastos, S., & Reis, M. (2017). Primary healthcare
in Portugal: 10 years of contractualization oh health services in the region of Lisboa.
Ciência & Saúde Colectiva, 22(3), 725-736.
Mooney, J., Gurbaxani, V., & Kraemer, K. L. (1995). A Process Oriented Framework for
Assessing the Business Value of Information Technology. In Proceedings of the 16th
International Conference on Information Systems (ICIS 1995), Amsterdam,
Netherlands. Available at: http://aisel.aisnet.org/icis1995/3/, 19/07/2017.
Morin, R. (1993). Ask and you might deceive: The wording of presidential approval questions
might be producing skewed results. The Washington Post National Weekly Edition,
December 6–12, 37.
Morgan, G., & Smircich, L. (1980). The Case for Qualitative Research. Academy of
Management, 5 (4), 491-500.
Morris, P. (1994). The Management of Projects. London: Thomas Telford Services Ltd.
Morris, P. (2002). Science, objective knowledge and the theory of project management.
Proceedings of the Institution of Civil Engineers - Civil Engineering, 150(2), 82-90.
Morris, P., & Hough, G. (1987). The Anatomy of Major Projects: A Study of the Reality of
Project Management. United Kingdom: John Wiley and Sons.
Morris, P., & Jamieson, A. (2004). Translating corporate strategy into project strategy:
realizing corporate strategy through project management. Newton Square, PA: PMI.
Morris, P., & Pinto, J. K. (2007). The Wiley Guide to Managing Projects. Hoboken, New
Jersey; Wiley and Sons.

247
Morris, P., Pinto, J. K., & Söderlund, J. (2011). Introduction: towards the third wave of project
management. In: Morris, P., Pinto, J.K., Söderlund, J. (eds.), The Oxford handbook of
project management. Oxford University Press, Oxford, 1–11.
Mullaly, M. (2004). Executive Summary of the 2003 Organizational Project Management
Baseline Study. Edmonton, Interthink Consulting Incorporated.
Mullaly, M. (2006). Longitudinal Analysis of Project Management Maturity. Project
Management Journal, 36, 62-73.
Mullaly, M. (2014). If maturity is the answer, then exactly what was the question?
International Journal of Managing Projects in Business, 7(2), 169 - 185
Muller, T. (2003). Typical Medication errors in oncology; analysis and prevention strategies.
Onkologie, 26(6), 539-544.
Müller, R., & Jugdev, K. (2012). Critical success factors in projects: Pinto, Slevin, and
Prescott-the elucidation of project success. International Journal of Managing Projects
in Business, 5 (4), 757–775.
Müller, R., & Turner, R. (2007). Matching the project manager’s leadership style to project
type. International Journal of Project Management, 25, 21–32
Munns, A. K., & Bjeirmi, B. F. (1996). The role of project management in achieving project
success. International Journal of Project Management, 14(2), 81-87.
Munthe, C. (2008). The Goals of Public Health: An Integrated, Multidimensional Model.
Public Health Ethics, 1(1), 39-52.
Murphy, D., Baker, N., & Fisher, D. (1974). Determinants of Project Success. Boston, USA:
Boston College, National Aeronautics and Space Administration.
Murphy, K. E., & Simon, S. J. (2002). Intangible benefits valuation in ERP projects.
Information Systems Journal, 12(4), 301–320.
248
Murray, C. J. L., Phil, D., & Lopez, A. D. (2013). Measuring the Global Burden of Disease.
The New England Journal of Medicine, 369, 448-457.
Murray, E., Lo, B., Pollack, L., Donelan, K., Catania, J., Lee, K., Zapert, K., & Turner, R.
(2003). The Impact of Health Information on the Internet on Health Care and the
Physician-Patient Relationship: National U.S. Survey among 1.050 U.S. Physicians.
Journal of Medical Internet Research, 5(3), e17.
Murray, J. P. (2001). Recognizing the Responsibility of a Failed Information Technology
Project as a Shared Failure. Information Systems Management, 18(2), 25-29.
Mutch, C. (2005) Doing Educational Research: A Practitioner’s Guide to Getting Started.
Wellington: NZCER Press.
Myers, M. D. (1994). Dialectic hermeneutics: a theoretical framework for the implementation
of information systems. Information System Journal, 5, 51-70.
Myers, M. D. (1997). Qualitative Research in Information Systems, MIS Quarterly, 21(2),
241-241.
Nagi, E. W. T., Law, C. C. H., & Wat, F.K.T. (2008). Examining the Critical Success Factors
in the Adoption of Enterprise Resource Planning. Computers in Industry, 59(6), 548-
564.
Nah, F. F., Lau, J. L., & Kuang, J. (2001). Critical factors for successful implementation of
enterprise systems. Business Process Management Journal, 7(3), 285–296.
Nauman, S., Mansur Khan, A., & Ehsan, N. (2010). Patterns of empowerment and leadership
style in project environment. International Journal of Project Management, 28 (7), 638–
649.
NCVHS (2001). Information for Health: a strategy for building the National Health
Information Infrastructure. Washington, DC: National Committee on Vital and Health
Statistics. Available at: https://aspe.hhs.gov/pdf-report/information-health-strategy-
building-national-health-information-infrastructure, 19/07/2017.
249
Neirotti, P., & Paolucci, E. (2007). Assessing the strategic value of Information Technology:
An analysis on the insurance sector. Information & Management, 44(6), 568-582.
Nelson, L. H. (1990). Who Knows: From Quine to Feminist Empiricism. Philadelphia: Temple
University Press
Nesbary, D. (2000). Survey Research and the World Wide Web. Boston, MA: Allyn and
Bacon.
Netlleton, Burrows, S., O' Malley, L., & Watt, I. (2011). Health e-types? Information,
Communication & Society, 7(4), 531-553.
Neuman, W. L. (2006). Social Research Methods: Qualitative and Quantitative Approaches
(6th Edition). London, UK: Pearson International Edition.
Niazi, M., Wilson, D., & Zowghi, D. (2005). A maturity model for the implementation of
software process improvement: an empirical study. The Journal of Systems and
Software, 74(2).
Nichols, K., Sharma, S., & Spires, R. (2011). Seven imperatives for success in IT
megaprojects. McKinsey on Government, USA.
Nokes, S. (2007). The Definitive Guide to Project Management: The Fast Track to Getting
the Job Done on Time and on Budget (2nd Edition). Pearson Education Limited,
Harlow.
Nolan, R. L. (1979). Managing the Crises in Data Processing. Harvard Business Review,
March-April 115-126.
Nunnally, J. C. (1967). Psychometric theory. New York: McGraw-Hill
Nunnally, J. C., & Bernstein, I. H. (1994). Psychonometric Theory. New York: McGraw- Hill.
Nutt, P.C. (1982). Hybrid planning methods. Academy of Management Review, 7, 442–454.
250
Nutt, P.C. (1983). Implementation approaches for project. planning. Academy of Management
Review, 8, 600-611.
OECD (2006). Projecting OECD health and long-term care expenditures: What are the main
drivers? ECO/WKP (2006) 5, working paper No. 477. Economics Department,
Organisation for Economic Co-operation and Development. Available at:
https://www.oecd.org/eco/public-finance/36085940.pdf, 19/07/2017.
OECD (2010). Health at a Glance: Europe 2010. Paris: OECD Publishing. Available at:
http://dx.doi.org/10.1787/health_glance-2010-en, 19/07/2017.
OECD (2013). Health at a Glance 2013: OECD Indicators. Paris: OECD Publishing.
Available at: http://dx.doi.org/10.1787/health_glance-2013-en, 19/07/2017.
OECD (2015a). Focus on the health spending. OECD Health Statistics 2015 © OECD 2015.
Available at: www.oecd.org/health/health-systems/Focus-Health-Spending-2015.pdf,
19/07/2017.
OECD (2015b). OECD Reviews of Health Care Quality: Portugal 2015: Raising Standards.
Paris: OECD Publishing. Available at: http://dx.doi.org/10.1787/9789264225985-en,
19/07/2017.
OECD (2016). Health at a Glance: Europe 2016 – State of Health in the EU Cycle. Paris:
OECD Publishing. Available at: http://dx.doi.org/10.1787/9789264265592-en,
19/07/2017.
OGC (2010a). Portfolio, Programme and Project Management Maturity Model (P3M3©):
Introduction and Guide to P3M3©, Version 2.1. London, UK: Office of Government
Commerce.
OGC (2010b). P3M3©, Project Management Self-Assessment. London, UK: Office of
Government Commerce.
Olsen, R. P. (1971). Can project management be defined? Project Management
Quarterly, 2(1), 12-14.
251
Olson, D. L., & Zhao, F. (2007). CIO´s perspectives of critical success factors in ERP upgrade
projects. Enterprise Information Systems, 1(1), 129-138.
OPSS (2017). Viver em tempos incertos: Sustentabilidade e Equidade na Saúde. Relatório da
Primavera 2017, Observatório Português dos Sistemas de Saúde.
Orlikowski, W. J., & Baroudi, J. J. (1991). Studying Information Technology in
Organisations: Research Approaches and Assumptions. Information Systems Research,
2(1), 1-28.
Osgood, C. E., Suci, G. J., & Tannenbaum, P. H. (1957). The measurement of meaning.
Urbana, IL: University of Illinois Press.
Øvretveit, J., Scott, T., Rundall, T.G., Shortell, S. M., & Brommels, M. (2007). Improving
quality through effective implementation of information technology in healthcare.
International Journal for Quality in Health Care, 19(5), 259-266.
Packendorff, J. (1995). Inquiring into the temporary organization: new directions for project
management research. Scandinanvian Journal of Management, 11, 319–333.
Palvia, P., Mao, E., & Soliman, K. S. (2003). Management Information Systems Research:
What’s there in a methodology? Communications of the Association for Information
Systems, 11(16), 289-309.
Palvia, P., Midha, V., & Pinjani, P. (2006). Research models in information systems.
Communications of the Association for Information Systems, 17(47), 2-33.
Papke-Shields, K. E., Beise, C., & Quan, J. (2010). Do Project Managers Practice what they
Preach, and does it matter to Project Success? International Journal of Project
Management, 28(7), 650-662.
Pan, E., Johnston, D., Walker, J., Adler-Milstein, J., Bates, D. W., & Middleton, B. (2005).
The Value of Healthcare Information Exchange and Interoperability. Chicago: Health
Information Management and Systems Society.
252
Paré, G., & Sicotte, G. (2001). Information technology sophistication in health care: an
instrument validation study among Canadian hospitals. International Journal of
Medical Informatics, 63, 205–223.
Parrino, T. (2003). Information technology and primary care at the VA: making good things
better. VA Health Services Research & Development Service
Pasian, B., Sankaran, S., & Boydell, S. (2012). Project management maturity: a critical
analysis of existing and emergent factors. International Journal of Managing Projects
in Business, 5(1), 146-157.
Patton, M. Q. (2008). Utilization-Focused Evaluation (4th Edition). Thousand Oaks,
California, USA; Sage Publications.
Paulk, M. C., Curtis, B., Chrissis, M. B., & Weber, C. V. (1993). The Capability Maturity
Model for Software (version 1.1). Technical Report CMU/SEI-93-TR-024. Carnegie
Mellon University, Pennsylvania, US: Software Engineering Institute.
Peabody, J. W., Luck, J., Jain, S., Bertenthal, D., & Glassman, P. (2004). Assessing the
Accuracy of Administrative Data in Health Information Systems. Medical Care, 42(11),
1066-1072
Peppard, P., Ward, J., & Daniel, E. (2007). Managing the Realization of Business Benefits
from IT Investments. MIS Quarterly Executive, 6(1), 1–11.
Peppard, P., & Ward, J. (2004). Beyond Strategic Information Systems: Towards an IS
Capability. Journal of Strategic Information Systems, 13, 167-194.
Pemsel, S., Wiewior A., Muller R., Aubry M., & Brown K. (2014). A Conceptual of
Knowledge Governance in Project-Based Organisations. International Journal of
Project Management, 32, 1411-1422.
Pennypacker, J., & Grant, K. (2003). Project Management Maturity: An Industry Benchmark.
Project Management Journal, 34(1), 4-12.
253
Peslak, A. R. (2003). A firm level study of information technology productivity using
financial and market based measures. Journal of Computer Information Systems, 43(4),
72-80.
Phansalker, S., Weir, C. R., Morris, A. H., & Warner, H. R. (2008). Clinicians’ perceptions
about use of computerized protocols: A multicenter study. International Journal of
Medical Informatics, 77(3), 184-193.
Pich, M. T., Loch, C. H., & de Meyer, A. (2002). On Uncertainty, Ambiguity, and Complexity
in Project Management. Management Science, 48(8), 1008 – 1023.
Ping Jr, R. A. (2004). On assuring valid measures for theoretical models using survey data.
Journal of Business Research, 57(2), 125–141.
Pinto, J. K. (2002). Project management 2002. Research Technology Management, 45(2),
22−37.
Pinto, J. K. (2004). The Elements of Project Success. In Cleland, D. I. (Eds). Field Guide to
Project Management, (2nd Edition). Hokoben, New Jersey: John Wiley and Sons, Inc.
Pinto, J. K., & Covin, J. C. (1989). Critical factors in project implementation: A comparison
of construction and R & D projects. Technovation, 9(1), 49-62.
Pinto, J. K., & Prescott, J. (1988). Variations in Critical Success Factors over the Stages in the
Project Lifecycle. Journal of Management, 14(1), 5-18.
Pinto, J. K., & Mantel, S. J. (1990). The Causes of Project Failure. IEEE Transactions on
Engineering Management, 34, 67-72.
Pinto, J. K., & Rouhiainen, P. (2001). Building customer-based project organisations. New
York: John Wiley & Sons.
Pinto, J. K., & Slevin, D. P. (1987). Critical factors in successful project implementation.
IEEE Transactions on Engineering Management, 34(1), 22–27.
254
Pinto J. K., & Slevin, D. P. (1988). Critical success factors across the project life cycle. Project
Management Journal, 19(1), 67–72.
Pinto, M. B., Pinto, J. K., & Prescott, J. E. (1993). Antecedents and consequences of project
team cross-functional cooperation. Management Science, 39, 1281–1297.
Pisco, L. (2011). Reforma da Atenção Promária em Portugal em duplo movimento: Unidades
assistenciais de saúde familiar e gestão em agrupamentos de Centros de Saúde. Ciência
& Saúde Colectiva, 16(6), 2841-2852.
Poli, M., & Shenhar, A. J. (2003). Project strategy: The key to project success. In Proceedings
of the Portland International Conference on Management of Engeneering and
Technology (PICMET´03), July 24-24, Portland, Oregon, 231–235.
Poon, E. G., Blumenthal, T., Jaggi, M., Honour, M. N., Bates, D. W., & Kaushal, R. (2004).
Overcoming barriers to adopting and implementing computerized physician order entry
in US hospitals. Health Affairs, 23(4), 184-190.
Porter, M.E. (1985). Competitive Advantage. New York: Free Press.
Porter, M.E. (2001). Strategy and the Internet. Harvard Business Review, 79(3), 63-78.
Powell, T. C., & Dent-Micallef, A. (1997). Information technology as competitive advantage:
the role of human, business, and technology resources. Strategic Management Journal,
18(5), 375-405.
PMI (1996). A Guide to the Project Management Body of Knowledge. PMBOK® guide.
Newtown Square, Pennsylvania, USA: Project Management Institute Inc.
PMI (2003). Organizational Project Management Maturity Model (OPM3): Knowledge
Foundations. Newtown Square, Pennsylvania, USA: Project Management Institute Inc.
PMI (2006). The Standard for Portfolio Management: Knowledge Foundation. Newtown
Square, Pennsylvania, USA: Project Management Institute, Inc.
255
PMI (2008). Organizational Project Management Maturity Model (OPM3): Knowledge
Foundation (2nd Edition). Newtown Square, Pennsylvania, USA: Project Management
Institute, Inc.
PMI (2013a). A Guide to the Project Management Body of Knowledge: PMBOK® guide
(version 5.0). Newtown Square, Pennsylvania, USA: Project Management Institute Inc.
PMI (2013b). Managing Change through Project Management: A Practitioners Guide.
Newton Square, Pennsylvania: Project Management Institute.
PMI (2013c). PMI´s Pulse of the Profession: The High Cost of Low Performance. Newton
Square, Pennsylvania: Project Management Institute.
PMI (2013d). The Standard for Portfolio Management (3rd Edition). Newton Square,
Pennsylvania: Project Management Institute.
PMI (2013e). Organizational project management maturity model (OPM3): Knowledge
Foundation, 3rd edition. Newton Square, Pennsylvania: Project Management Institute.
PMI (2015). PMI´s Pulse of the Profession: Capturing the Value of Project Management.
Newton Square, Pennsylvania: Project Management Institute.
PMI (2016). PMI Lexicon of Project Management Terms (version 3.1). Newtown Square,
Pennsylvania, USA: Project Management Institute Inc.
Pullen, W. (2007). A public-sector HPT maturity model. Performance Improvement, 46(4),
9-15.
Prabhakar, G. P. (2008). What is project success: A literature review. International Journal
of Business and Management, 3(9), 3-10.
Preston, C. C., & Colman, A. M. (2000). Optimal number of response categories in rating
scales: Reliability, validity, discriminating power, and respondent preferences. Acta
Psychologica, 104, 1-15.
256
Pretorius, S., Steyn, H., & Jordaan, J. (2012). Project Management Maturity and Project
Management Success in the Engineering and Construction Industries in Southern
Africa. The South African Journal of Industrial Engineering, 23(3),1-12.
Pringle, M. (1988). Using computers to take patient histories. BMJ, 297(6650), 697–698.
PwC (2004). Boosting Business Performance through Programme and Project Management:
A first global survey on the current state of Project Management Maturity in
Organisations across the World. London, UK: PricewaterhouseCoopers.
PwC (2012). Insights and trends: Current portfolio, programme, and project management
practices. The third global survey on the current state of project management. London,
UK: PricewaterhouseCoopers.
Rad, P. F., & Anantatmula, V. S. (2010). Successful Project Management Practices. Bingley,
UK: Emerald Group Publishing.
Raghupathi, W., & Tan, J. (1999). Strategic use of information technology in healthcare: a
state-of-the-art. Topics in Health Information Management,1(1), 1-15.
Rahimi, B., Safdari, R., & Jebraeily, M. (2014). Development of Hospital Information
Systems: User Participation and Factors Affecting It. Acta Informatica Medica, 22(6),
398–401.
Rahimi, B., & Vimarlund, V. (2007). Methods to evaluate health information systems in
health care settings: a literature review. Journal of Medical Systems, 35(5), 397-432.
Rai, A., Patnayakuni, R., & Patnayakuni, N. (1997): Technology investment and business
performance. Communications of the ACM, July 40(7), 89–97.
Ramirez, R., Melville, N., & Lawler, E. (2010). Information technology infrastructure,
organizational process redesign, and business value: An empirical analysis. Decision
Support Systems, 49(4), 417-429.
257
Randolph, A. G., Haynes, R. B., Wyatt, J. C., Cook, D. J., & Guyatt, G. H. (1999). Users’
guides to the medical literature: XVIII. How to use an article evaluating the clinical
impact of a computer-based clinical decision support system, JAMA, 282(1), 67–74.
Rechel, B., Doyle, Y., Grundy, E., McKee, M. (2009). How can health systems respond to
population ageing? World Health Organization 2009 & World Health Organization, on
behalf of the European Observatory on Health Systems and Policies.
Redmill, F. (1999). Software projects: evolutionary vs. big-bang delivery. New York, NY,
USA: John Wiley and Sons, Inc.
Reichheld, F., & Schefter, P. (2000). E‐Loyalty: Your Secret Weapon on the Web. Harvard
Business Review, July-August, 105‐113.
Reingold, J., & Stepanek, M. (2000). Why the productivity revolution will spread. Business
Week, Feb. 14, 112-118.
Reginato, J., & Ibbs, W. (2002). Project management as a core competency. In Proceedings
at the PMl Research Conference, Seattle, WA.
Remenyi, D., Bannister, F., & Money, A. (2007). The Effective Measurement and
Management of ICT Costs and Benefits (3rd Edition). Oxford, UK: Elsevier, CIMA
Publishing.
Remus, U., & Wiener, M. (2010). A multi-method, holistic strategy for researching critical
success factors in IT projects. Information Systems Journal, 20(1), 25-52.
Revilla, M. A., Saris, W.E., Krosnick, J.A. (2014). Choosing the Number of Categories in
Agree Disagree Scales. Sociological Methods & Research, 43(1), 73-97.
Reyes-Alcázar, V., Torres-Olivera, A. Núñes-García, D., & Almuedo-Paz, A. (2012). Critical
Success Factors for Quality Assurance in Healthcare Organisations. In Mehmet Savsar
(Eds), Quality Assurance Management.
258
Ritchie, J., & Lewis, J. (2003). Qualitative Research Practice: A Guide for Social Science
Students and Researchers. London, UK: Sage Publications Ltd.
Robinson, C. (2007). Clinician adoption of healthcare information technology. Canadian
Nursing Informatics, 2(1), 4-21.
Robson, C. (2002), Real World Research (2nd Edition). Oxford: Blackwell.
Rockart, J. (1979). Chief Executives Define Their Own Information Needs. Harvard Business
Review, March-April 81-92.
Rockart, J., & Bullen, V. C. (1986). A Primer on Critical Success Factors. In Rockart, J. and
Bullen, V. C. (Ed.), The Rise of Management Computing, Chapter 16, Homewood,
Illinois: Dow Jones Irwin, 325-353.
Röglinger, M., Pöppelbu, J., & Becker, J. (2012) Maturity Models in Business Process
Management. Business Process Management Journal, 18(2), 1-19.
Rohloff, M. (2011). Advances in business process management implementation based on a
maturity assessment and best practice exchange. Information Systems E-Business
Management, 9(3), 383-403.
Rolstadås, A. (2014). Understanding project success through analysis of project management
approach. International Journal of Managing Projects in Business, 7(4), 638- 660.
Roman, D. (1964). Project management recognizes R&D performance. Academy of
Management Journal, 7(1), 7–20.
Rosacker, K. M., & Olson, D. L. (2008). Public sector information system critical success
factors. Transforming Government: People, Process and Policy, 2(1), 60-70.
Rosenstock, C., Johnston, R. S., & Anderson, L. M. (2000). Maturity model implementation
and use: A case study. In Proceedings of the 31st Annual PMI Seminars and Symposium,
Houston, TX. Newtown Square, PA: Project Management Institute.
259
Rosenstone, S. J., Hansen, J. M., & Kinder, D. R. (1986). Measuring change in personal
economic well-being. Public Opinion Quarterly, 50, 176–192.
Ross, J., & Staw, B. (1986). Expo 86: an escalation prototype. Administrative Science
Quarterly, 31(2), 274–297.
Ross, J., & Staw, B. (1993). Organizational escalation and exit: lessons from the Shoreham
nuclear power plant. Academy of Management Journal, 36(4), 701–732.
Rowlinson, S. (1999). Selection Criteria. In Rowlinson S. and P. McDermott (eds)
Procurement Systems a Guide to Best Practice in Construction. London: E & FN Spon:
p 276–299.
Roztocki, N., & Weistroffer, H. R. (2008). Event Studies in Information Systems Research: A
Review. In Proceedings of the Americas Conference on Information Systems (AMCIS
2008), Toronto, Canada. Available at: http://aisel.aisnet.org/amcis2008/248,
19/07/2017.
Rucker, D. D., Preacher, K. J., Tormala, Z. L., & Petty, R. E. (2011). Mediation analysis in
social psychology: Current practices and new recommendations. Social and Personality
Psychology Compass, 5(6), 359–371.
Sabherwal, R., Jeyaraj, A., & Chowa, C. (2006). Information System Success: Individual and
Organizational Determinants. Management Science, 52(12), 1849-1864.
Saha, P. (2011) Architecting for Business Insight and Strategic Foresight: A Systems
Approach to Management of Chronic Diseases in Singapore. Research Publication of
National University of Singapore.
Sahlin-Andersson, K., & Söderholm, A. (Eds.). (2002) Beyond project management: New
perspectives on the temporary-permanent dilemma. Copenhagen: Liber.
Saltman, R. B., Bankauskaite, V., & Vrangbæk, K. (2007). Decentralisation in Health Care:
Strategies and outcomes. England: European Observatory on Health Systems and
260
Policies Series, WHO. Available at:
http://www.euro.who.int/__data/assets/pdf_file/0004/98275/E89891.pdf, 19/07/2017.
Sander, C. P., & Brombacher, C. A. (1999). Analysis of quality information flows in the
product creation process of high-volume consumer products. International Journal of
Production Economics, 67(1), 37-52.
Santhanam, R., & Hartono, E. (2003). Issues in linking information technology capability to
firm performance. MIS Quarterly, 27(1), 125-153.
Sarantakos, S. (2005). Social Research (3rd Edition). Melbourne: Macmillan Education
Sarter, N, B., Woods, D. D., & Billings, C. E. (1997). Automation surprises. In: Salvendy, G.
(Ed.) Handbook of human factors and ergonomics, (2nd Edition), 1926-1943. New York:
John Wiley and Sons.
Saunders, M., Lewis, P., & Thornhill, A. (2009). Research methods for business students (5th
Edition). Harlow, UK: Pearson Education.
Saures, I. (1998). A real world look at achieving project management maturity. In Proceeding
of the 29th Annual Seminars/Symposium, October: 9 – 15, Long Beach, California:
Project Management Institute.
Savage, G. T., Nix, T. W., Whitehead, C. J., & Blair, J. D. (1991). Strategies for assessing and
managing organizational stakeholders. Academy of Management Perspectives, 5(2), 61–
75.
Sawaya, N., & Trapanese, P. (2004). Measuring project management maturity. Security
Distributing and Marketing, 34(1), 44-66.
Schlichter, J. (2001). PMI’s organizational project management maturity model: emerging
standards. Project Management Institute Annual Seminars & Symposium, Nashville,
TN. Newtown Square, PA: Project Management Institute.
261
Schmidt, W. C. (1997). World-Wide Web survey research: Benefits, potential problems, and
solutions. Behavior Research Methods, Instruments, and Computers, 29(2), 274-279.
Scholtz, M. (1999). Addressing the global demands for improved healthcare. In Proceedings
Telemedicine 21st Century, Opportunities Citizens, Society, Industry, 11-18.
Schultz, J. R. (2006). Measuring Service Industry Performance; Some Basic Concepts.
Performance Improvement, 45(4), 13-19.
Schultz, R. L., Slevin, D. P., & Pinto, J. K. (1987). Strategy and tactics in a process model of
project implementation. Interfaces, 17(3), 34-46.
Schuman, H., & Presser, S. (1981). Questions and answers in attitude surveys: Experiments
on question form, wording and context. New York: Academic Press.
Schoderbek, P. P., Schoderbek, C. G., & Kefalas, A. G. (1990). Management systems:
conceptual considerations (4th Edition). Boston: Irwin.
Schwalbe, K. (2012). Information technology project management (7th Edition). Course
Technology, Boston: Cengage Learning.
Schreiber, J. B., Nora, A., Stage, F. K., Barlow, E. A., & King, J. (2006). Reporting Structural
Equation Modeling and Confirmatory Factor Analysis Results: A Review. The Journal
of Educational Research, 99(6), 323-337.
Sekaran, U. (2003) Research methods for business: A skill building approach. John Wiley &
Sons, Inc.
Sekaran, U., & Bougie, J. R. G. (2009). Research Methods for Business: A Skill Building
Aapproach (5th Edition). Tilburg University, Den Haag: Wiley Publishers
Senge, P. M. (2006). The fifth discipline: the art and practice of the learning organization (2nd
Edition). New York: Doubleday.
262
Sergeant, R., Hatcher, C., Trigunarsyah, B., Coffey, V., & Kraatz, J. (2010). Creating value
in Project Management using PRINCE 2. Research Project of Queenland University of
Technology, Australia and Office of Government Commerce, UK.
Serrador, P., & Turner, J. R. (2015). The relationship between project success and project
efficiency. Project Management Journal, 46(1), 30-39.
Sharma, B. (2008). Electronic Healthcare Maturity Model (eHMM): White paper. Chennai,
India: Quintegra Solutions Limited.
Sharma, R., & Yetton, P. (2003). The contingent effects of management support and task
interdependence on successful information systems implementation. MIS Quarterly,
27(4), 533–556.
Shah, M. H., & Siddiqui, F. A. (2006). Organisational critical success factors in adoption of
e-banking at the Woolwich bank. International Journal of Information Management,
26(6), 442–456.
Shat, S. K., & Corley, K. G. (2006). Building Better Theory by Bridging the Quantitative-
Qualitative Divide. Journal of Management Studies, 43(8), 1821-1835.
Shekelle, G., Morton, S. C., & Keeler, E. B. (2006). Costs and Benefits of Health Information
Technology. Evidence Report/ Technology Assessment No. 132, Rockville, MD:
Agency for Healthcare Research and Quality, Southern California Evidence-based
Practice Center, Santa Monica, CA.
Shenhar, A. J. (1998). From theory to practice: toward a typology of project-management
styles. IEEE Transactions on Engineering Management, 45(1), 33–48.
Shenhar, A. J. (2001). One size does not fit all projects: exploring classical contingency
domains. Management Science, 47(3), 394–414.
Shenhar, A. J., & Dvir, D. (1996). Toward a typological theory of project management.
Research Policy, 25(4), 607–632.
263
Shenhar, A. J., & Dvir, D. (2007). Reinventing Project Management: The Diamond Approach
to Successful Growth and Innovation. Boston: Harvard Business School Press.
Shenhar, A. J., Dvir, D., Guth, W., Lechler, T., Patanakul, P., Poli, M., & Stefanivic, J. (2005).
Project strategy: the missing link. In: In Proceedings of Annual Meeting of the Academy
of Management in the 21st Century, Honolulu, HI, USA.
Shenhar, A. J., Dvir, D., Levy, O., & Maltz, A. C. (2001). Project Success: A
Multidimensional Strategic Concept. Long Range Planning, 34, 699-725.
Shenhar, A. J., Levy, O., & Dvir, D. (1997). Mapping the dimensions of project success.
Project Management Journal, 28(2), 5-13.
Shenhar, A. J., Tishler, V., Dvir, D., Lipovetsky, S., & Lechler, T. (2002). Refining the search
for project success factors: A multivariate, typological approach. R&D Management,
32(2), 111-126.
Shenhar, A. J., Renier, J. J., & Wideman, R. M. (1996). Project management: from genesis
to content to classification. INFORMS conference, Washington DC.
Shi, Q. (2011). Rethinking the implementation of project management: a value adding path
map approach. International Journal of Project Management, 29(3), 295-302.
Shiffman, R., Liaw, Y., Brandt, C., & Corb, G. (1999). Computer-based guideline
implementation systems: a systematic review of functionality and effectiveness. Journal
of American Medical Informatics Association, 6(2), 104–114.
Shiffman, R., Michel, G., Essaihi, A., & Thornquist, E. (2004). Bridging the guideline
implementation gap: a systematic, document-centered approach to guideline
implementation. Journal of American Medical Informatics Association, 11(5), 418–426.
Shim, D., & Lee, M. (2001). Upward influence styles of R&D project leaders. IEEE
Transactions on Engineering Management, 48(4), 394-413.
264
Shin, N. (2006). The impact of information technology on the financial performance of
diversified firms. Decision Support Systems, 41(4), 698-707.
Shortliffe, E. H., & Barnett, G.O. (2014). Biomedical data: their acquisition, storage and use.
In: Biomedical informatics. London, England: Springer, pp. 39-66.
Silverman, D. (1998). Harvey Sacks: Social science and conversation analysis. Oxford
University Press.
Silverman, D. (2006). Interpreting Qualitative Data: Methods for Analysing Talk, Text and
Interaction (3rd Edition). London: Sage Publications Inc.
Simonsson, M., Johnson, P. and Wijkström, H. (2007). Model-based IT Governance Maturity
Assessment with CobiT. European Conference on Information Systems (ECIS 2007). In
Proceedings, 77. St. Gallen, Switzerland. Available at: http://aisel.aisnet.org/ecis2007,
19/07/2017.
Sircar, S., Turnbow, J. L., & Bordoloi, B. (2000): A framework for assessing the relationship
between information technology investments and firm performance. Journal
Management Information Systems, 16(4), 69–89.
Skaates, M.A., Tikkanen, H., & Alajoutsijärvi, K. (2002). Social and cultural capital in project
marketing service firms: Danish architectural firms on the German market.
Scandinavian Journal of Management, 18, 589–609.
Skulmoski, G. (2001). Project maturity and competence interface. Cost Engineers, 43(6), 11-
18.
Slevin, D. P., & Pinto, J. K. (1986). The project implementation profile: New tool for project
managers. Project Management Journal, 17(4), 57-70.
Smith, D., & Langfield-Smith, K. (2004). Structural Equation Modeling in Management
Accounting Research: Critical Analysis and Opportunities. Journal of Accounting
Literature, 23, 49-86.
265
Smith, D. A. (2010). Knowledge Management as an indicator of Organizational Maturity in
Project Management: An enhancement of OPM3 Model. Thesis submitted in fulfilment
of requirements for the degree of Doctor of Philosophy at the Capella University,
Minneapolis, USA.
Smith, H. A., & McKeen, J. D. (2003). Developments in Practice VII: Developing and
Delivering the IT Value Proposition. Communications of the Association for
Information Systems, 12, 69-79.
Smith, J. (2000). Health Management Information Systems: A Handbook for Decision
Makers. Buckingham, London: Open University Press, Buckingham.
Smith, P. C., Mossialos, E., Papanicolas, I., & Leatherman, S. (2009). Performance
measurement for health system improvement: experiences, challenges and prospects.
Cambridge, UK: Cambridge University Press.
Smith, T. W. (1984). Non-attitudes: A review and evaluation. In: C. F. Turner & E. Martin
(Eds), Surveying subjective phenomena (215–255). New York: Russell Sage.
Smithson, S., & Hirschheim, R. (1998). Analysing information systems evaluation: Another
look at an old problem. European Journal of Information Systems, 7(3), 158-174.
Smyth, H. J., & Morris, P. W. G. (2007). An epistemological evaluation of research into
projects and their management: Methodological issues. International Journal of Project
Management, 25(4), 423–436.
Snyder, C. F., Wu, A. W., Miller, R. S., Jensen, R. E., Bantug, E. T., & Wolff, A.C. (2011).
The role of informatics in promoting patient-centered care. Cancer Journal, 17(4), 211–
218.
Söderlund, J. (2005). Developing project competence: empirical regularities in competitive
project operations. International Journal of Innovation Management, 9(4), 451-480.
266
Söderlund, J. (2011). Pluralism in project management: navigating the crossroads of
specialization and fragmentation. International of Journal Management Reviews, 13(2),
153–176.
Söderlund, J., & Maylor, H. (2012). Project management scholarship: Relevance, impact and
five integrative challenges for business and management schools. International Journal
of Project Management, 30(6), 686-696.
Soh, C., & Markus, M. L. (1995). How IT creates business value: a process theory synthesis.
In Proceedings of the 16th International Conference on Information Systems,
Amsterdam, Netherlands, 29-41.
Solli-Sæther, H., & Gottschalk, P. (2010). The Modeling Process for Stage Models. Journal
of Organizational Computing and Electronic Commerce, 20(3), 279-293.
Solow, R. (1987). We’d better watch out. New York Times Book Review (July 12), 36.
Southon, F., Sauer, C., & Dampney, C. (1999). Lessons from a failed information systems
initiative: Issues for complex organisations. International Journal of Medical
Informatics, 55(1), 33-46.
Sowden, R., Hinley, D., & Clarke, S. (2010). Portfolio, programme and project management
maturity model (P3M3). Horse Guards Road, London: OGC.
Staber, U. (2004). Networking beyond organizational boundaries: the case of project
organizations. Creativity and Innovation Management, 13(1), 30–40.
Stake, R. E. (1995). The Art of Case Study Research. Thousand Oaks: Sage Publications.
Standing, C., Guilfoyle, A., Lin, C., & Love, P. (2006). The Attribution of Success and Failure
by IS Project Professionals. Industrial Management and Data Systems, 106(8), 1148-
1165.
Standish Group (2015). CHAOS report. Boston: The Standish Group International.
267
Starkey, K., Barnatt, C., & Tempest, S. (2000). Beyond networks and hierarchies: latent
organizations in the UK television industry. Organization Science, 11(3), 299–305.
Stead, W.W., Kelly, B.J., & Kolodner, R.M. (2005). Achievable Steps Toward Building a
National Health Information Infrastructure in the United States. Journal of the American
Medical Informatics Association, 12(2), 113–120.
Steenkamp, J. E. M., & Van Trijp, H. C. M. (1991). The use of LISREL in validating
marketing constructs. International Journal of Research in Maketing, 8(4), 283-299.
Stelzer, D., & Mellis, W. (1998). Success factors of organizational change in software process
improvement. Software Process Improvement and Practice, 4(4), 227-250.
Stiell, A., Forster, A. J., Stiell, I. G., & van Walraven, C. (2003). Prevalence of information
gaps in the emergency department and the effect on patient outcomes. Canadian
Medical Association Journal, 169(10), 1023–1028.
Strassmann, P. A. (1990). The Business Value of Computers: An Executive’s Guide. New
Canaan, CT, USA: Information Economics Press.
Strassmann, P. A. (1997). The squandered computer: evaluating the business alignment of
information technologies. New Canaan, CT, USA: Information Economics Press.
Streiner, D. L. (2003). Being inconsistent about consistency: When coefficient alpha does and
doesn’t matter. Journal of Personality Assessment, 80(3), 17-22.
Sturmberg, J., & Lanham, H. J. (2014). Understanding health care delivery as a complex
system: achieving best possible health outcomes for individuals and communities by
focusing on interdependencies. Journal of Evolution in Clinical Practice, 20(6), 1005-
1009.
Suikki, R., Tromstedt, R., & Haapasalo, H. (2006). Project management competence
development framework in turbulent business environment. Technovation, 26(5-6),
723–738.
268
Sumner, M. (1999). Critical Success Factors in Enterprise Wide Information Management
Systems Projects. Paper presented at the Americas Conference on Information Systems,
Milwaukee, USA.
Sussman, B. (1978). President’s popularity in the polls is distorted by rating questions. The
Washington Post.
Sydow, J., Lindkvist, L., & DeFillippi, R. (2004). Project-based organisations, embeddedness
and repositories of knowledge. Organization Studies, 25(9), 1475–1489.
Sydow, J., & Staber, U. (2002). The Institutional Embeddedness of Project Networks: The
Case of Content Production in German Television. Regional Studies, 36(3), 215-227.
Swierczek, F. W., & Shrestha, P. K. (2003). Information technology and productivity: a
comparison of Japanese and Asia-Pacific banks. The Journal of High Technology
Management Research, 14(2), 269-288.
Taderdoost, H., & Keshavarzsaleh, A. (2016). Critical Factors that lead to Projects’
Success/Failure in Global Marketplace. In Proceedings of the 9th International
Conference Interdisciplanary in Engineering (INTER-ENG 2015), Tirgu-Mures,
Romania.
Tallon, P. P., Kraemer, K. L., & Gurbaxani, V. (2000). Executives Perceptions of the
Contribution of Information Technology to Firm Performance: A Process- Oriented
Approach. Journal of Management Information Systems,16(4), 137-165.
Taylor, B.W., & Moore, L. (1980). R&D project planning with Q-GERT network modeling
and simulation. Management Science, 26(1), 44–59.
Teece, D. J., Pisano, G., & Shuen, A. (1997). Dynamic Capabilities and Strategic
Management. Strategic Management Journal, 18(7), 509-533.
Terry, A. L., Thorpe, C. F., Giles, G., Brown, J. B., Harris, S. B., Reid, G. J., Thind, A., &
Stewart, M. (2008). Implementing electronic health records: Key factors in primary
care. Canadian Family Physician, 54(5), 730-736.
269
Thamhain, H. J. (2004). Linkages of project environment to performance: Lessons for team
leadership. International Journal of Project Management, 22(7), 533- 544.
Themistocleous, M., Mantzana, V., & Morabito, V. (2009). Achieving Knowledge
Management Integration through EAI: A Case Study from Healthcare Sector.
International Journal of Technology Management, 47(1-3), 114-126.
Thomas, G., & Fernández, W. (2008). Success in IT projects: A matter of definition?
International Journal of Project Management, 26(7), 733–742.
Thomas, J., Delisle, C, Jugdev, K., & Buckle, P (2002). Selling project management to senior
executives. Newtown, PA: Project Management Institute.
Thomas, J., & Mullaly, M. (2007). Understanding the value of project management: first steps
on an international investigation in search of value. Project Management Journal, 38(3),
74–89.
Thomas, J., & Mullaly, M. (2008). Researching the value of project management. Newtown
Square: Project Management Institute.
Thorp, J. (2001). A benefits realization approach to IT investments. In Grembergen (eds.),
Information technology evaluation methods and management. Idea Group Publising,
22-43.
Tierney, W. (2001). Improving clinical decisions and outcomes with information: a review.
International Journal of Medical Informatics, 62(1), 1-9.
Tiku, S., Azarian, M., & Pecht, M. (2007). Using a reliability capability maturity model to
benchmark electronics companies. International Journal of Quality and Reliability
Management, 24(5), 547-563.
Ting-Ting, L. (2004). Evaluation of Computerized Nursing Care Plan: Instrument
Development. Journal of Professional Nursing, 20(4), 230-238.
Toffler A. (1997). Future shock. New York: Bantam Book.
270
Tomás, J. M., Hontangas, P. M., & Oliver, A. (2000). Linear confirmatory factor models to
evaluate multitrait-multimethod matrices: The effects of number of indicators and
correlation among methods. Multivariate Behavioral Research, 35(4), 469-499.
Too, E. G., & Weaver, P. (2014). The management of project management: A Conceptual
framework for project governance. International Journal of Project Management,
32(8), 1382-1394.
Toor, S.-U.-R., & Ogunlana, S. O. (2010). Beyond the ‘iron triangle’: Stakeholder perception
of key performance indicators (KPIs) for large-scale public sector development projects.
International Journal of Project Management, 28(3), 228–236.
Torres Olivera, A. (2003). La gestión por procesos asistenciales integrales: una estrategia
necesaria. Atención. Primária, 31(9), 561-563.
Townsend, M (2016). The Impact of an Ageing Population on End of Life Care Costs. PSSRU
Discussion Paper 2912, Personal Social Services Research Unit, London School of
Economics and Political Science. UK.
Trauth, E., & Jessup, L. (2000). Understanding computer-mediated discussions: positivist and
interpretive analyses of group support system use. MIS Quarterly, 24(1), 43–79.
Treister N. W. (1998). Physician acceptance of new medical information systems: the field of
dreams. Physician Executive, 24(3), 20-34.
Tucker, L. R., & Lewis, C. (1973). A reliability coefficient for maximum likelihood factor
analysis. Psychometrika, 38, 1–10.
Tukel, O. I., & Rom, W. O. (2001). An empirical investigation of project evaluation criteria.
International Journal of Operations and Production Management, 21(3), 400- 416.
Tuli, F. (2010). The basis of distinction between Qualitative and Quantitative Research in
Social Science: Reflection on Ontological, Epistemological and Methodological
Perspectives. Ethiopian Journal of Education and Science, 6(1), 97-108.
271
Turban, E., Leidner, D., Mclean, E., & Wetherbe, J. (2008). Information Technology for
Management: Transforming Organisations in the Digital Economy (6th Edition). New
York: Wiley.
Turner, J. R. (1999). Handbook of Project-Based Management: Improving the Process for
Achieving Strategic Objectives, (2nd edition). London, UK: McGraw-Hill.
Turner, J. R. (2008). The Handbook of Project-Based Management: Leading Strategic Chance
in Organisations (3rd Edition). New York: McGraw-Hill.
Turner, J. R., & Keegan, A. E. (2004). Managing technology: Innovation, learning, and
maturity. In Morris, P. W. G. and Pinto, J. K. (eds.) The Wiley Guide to Managing
Projects Hoboken, NJ: John Wiley and Sons, pp. 576 - 590.
Turner, J. R., & Müller, R. (2003). On the Nature of the Project as a Temporary Organization.
International Journal of Project Management, 21(1), 1–8.
Turner J. R., & Müller, R. (2005). The project manager’s leadership style as a success factor
on projects: a literature review. Project Management Journal, 36(2), 49-61.
Turner, J. R., Huemann, M., Anbari, F., & Bredillet, C. (2010). Perspectives on projects.
London: Routledge.
Turner, J. R., & Zolin, R. (2012). Forecasting Success on Large Projects: Developing Reliable
Scales to Predict Multiple Perspectives by Multiple Stakeholders over Multiple Time
Frames. Project Management Journal, 43(5), 87-99.
Umble, E. J., Haft, R. R., & Umble, M. M. (2003). Enterprise resource planning:
Implementation procedures and critical success factors. European Journal of
Operational Research, 146, 241–257.
Van Ark, B. (2005). Europe’s Productivity Gap: Catching Up or Getting Stuck? International
Symposium on Productivity, Competitiveness and Globalisation, Banque de France,
Paris.
272
Van Bemmel, J. H., & Musen M. A. (eds.) (1997). Handbook of Medical Informatics.
Heidelberg: Springer-Verlag.
van der Haak, M., Wolff, A.C., Brandner, R., Drings, P., Wannenmacher, M., Wetter, Th.
(2003). Data security and protection in cross-institutional electronic patient records.
International Journal of Medical Informatics, 70(2-3), 117- 130.
Van der Meijden, M.J., Tange, H. J., Troost, J., & Hasman, A. (2003). Determinants of success
of inpatient clinical information systems: a literature review. Journal of the American
Medical Informatics Association. 10(3), 235–243.
van Doorslaer, E., & Koolman, X. (2004). Explaining the di¡erences in income-related health
inequalities across European countries. Health Economics,13(7), 609–628
Van Looy, A., De Backer, M., & Poels, G. (2011). Defining business process maturity: a
journey towards excellence. Total Quality Management, 22(11), 1119-1137.
van Steenbergen, M., Bos, R., Brinkkemper, S., Inge van de Weerd, I., & Bekkers, W. (2010).
The Design of Focus Area Maturity Models. In Proceedings of the International
Conference on Design Science Research in Information Systems: Global Perspectives
on Design Science Research (DESRIST 2010), St. Gallen, Switzerland, pp. 317-332.
van Walraven, C. Seth, R. Austin, P. C., & Laupacis, A. (2002). Effect of discharge summary
availability during post-discharge visits on hospital readmission. Journal of General
Internal Medicine, 17(3),186–192.
Varian, H. (2005). Bootstrap Tutorial. Mathematica Journal, 9(4), 768-775.
Voelpel, S., Leibold, M., Eckhoff, R., & Davenport, T., (2005). The Tyranny of the Balanced
Scorecard in the Innovation Economy. In Proceedings of the 4th International Critical
Management Studies Conference - Intellectual Capital Stream, Cambridge University,
United Kingdom, July 4-6.
273
Vogt, W. P., & Johnson, R. B. (2011). Dictionary of Statistics and Methodology: A
Nontechnical Guide for the Social Sciences (4th Edition). Thousand Oaks, CA, USA:
Sage Publications
Wagner, E., Scott, S., & Galliers, R. (2006). The creation of 'best practice' software: Myth,
reality and ethics. Information and Organization, 16(3), 251-275.
Walsham, G. (1993). Interpreting Information Systems in Organisations. New York, NY:
John Wiley and Sons, Inc.
Walsham, G. (1995a). The emergence of interpretivism in IS research. Information Systems
Research, 6(4), 376–394.
Walsham, G. (1995b). Interpretive case studies in IS research: nature and method. European
Journal of Information Systems, 4(2), 74–81.
Walsham, G. (2006). Doing interpretive research. European Journal of Information Systems,
15(3), 320-330.
Ward, J., & Daniel, E. (2006). Benefits Management, Delivering Value from IS and IT
Investments. John Wiley and Sons: Chichester, UK: John Wiley and Sons.
Ward, J., & Daniel, E. (2012). Benefits Management: How to increase the Business Value of
Your IT Projects, (2nd Edition). Chichester, UK: John Wiley and Sons.
Ward, J., & Griffith, P. (1996). Strategic Planning for Information Systems (2nd Edition).
London, UK: John Wiley and Son, Inc.
Ward, J., Taylor, P., & Bond, P. (1996). Evaluation and realization of IS/IT benefits: An
empirical study of current practice. European Journal of Information Systems, 4, 214-
225.
Wateridge, J. (1995). IT projects: A basis for success. International Journal of Project
Management, 13(3), 169-172.
274
Wateridge, J. (1998). How can IS/IT projects be measured for success. International Journal
of Project Management, 16(1), 59-63.
Wears, R. L., & Berg, M. (2005). Computer technology and clinical works: still waiting for
Godot. Journal of the American Medical Association, 293(10), 1261-1263.
Wedell, D. H., & Parducci, A. (1988). The category effect in social judgment: Experimental
ratings of happiness. Journal of Personality and Social Psychology, 55(39, 41-356.
Wedell, D. H., Parducci, A., & Lane, M. (1990). Reducing the dependence of clinical
judgment on the immediate context: Effects of number of categories and types of
anchors. Journal of Personality and Social Psychology, 58(2), 319–329.
Weick, K. E., & Sutcliffe, K.M. (2001). Managing the unexpected: Assuring high
performance in an age of complexity. San Francisco: Jossey-Bass.
Weingarten, S., Henning, J., Badamgarav, E., Knight, K., Hasselblad, V., Gano Jr. A., &
Ofman, J. J. (2002). Intervention used in disease management programs for patient with
chronic illness: Which ones’ work? Meta-analysis of published reports. British Medical
Journal, 325, 925-928.
Welch, C. (2005). Multilateral organizations and international project marketing.
International Business Review, 14(3), 289–305.
Welch, D., Welch, L., & Young, L. (1996). Network development in international project
marketing and the impact of external facilitation. International Business Review, 5(6),
579–602.
Wellington, J., Bathmaker, A-M., Hunt, C., McCulloch, G., & Sikes, P. (2005) Succeeding
with your Doctorate (1st Ed). London: Sage Publications
Wendler, R. (2012). The Maturity of Maturity Model Research: A systematic mapping study.
Information and Software Technology, 54(12), 1317-1339.
275
West, B., Lyon, M. H., McBain, M., & Gass, J. (2004). Evaluation of a clinical leadership
initiative. Nursing Standard, 19(5), 33-41.
West, L. A., & Courtney, J. F. (1993). The Information Problems in Organisations - A
Research Model for the Value of Information and Information Systems. Decision
Sciences 24(2), 229-251.
Westland, J. C. (2010). Lower bounds on sample size in structural equation modeling.
Electronic Commerce Research and Applications, 9(6), 476-487.
Westerveld, E. (2003). The project excellence model: Linking success criteria and critical
success factors. International Journal of Project Management, 21(6), 411–418.
Wetering, R., & Batenburg, R. (2009). A PACS maturity model: A systematic meta-analytic
review on maturation and evolvability of PACS in hospital enterprise. International
Journal of Medical Informatics, 78(2), 127-140.
Wheatley, M. (2007). Maturity Matters. PM Network, 48-53.
Whittington, R., Pettigrew, A., Peck, S. Fenton, E., & Conyon, M. (1999) Change and
Complementarities in the New Competitive Landscape: A European Panel Study, 1992–
1996. Organization Science 10(5), 583-600.
White, D., & Fortune, J. (2002). Current Practice in Project Management: An empirical study.
International Journal of Project Management, 20(1), 1-11.
WHO (2002). Innovative care for chronic conditions: Building blocks for action. France:
World Health Organization. Available at:
http://apps.who.int/iris/bitstream/10665/42500/1/WHO_NMC_CCH_02.01.pdf,
19/07/2017.
WHO (2005). Connecting for Health: Global Vision, Local Insight. Report for the World
Summit on the Information Society. Geneva, Switzerland: World Health Organization.
Available at: http://www.who.int/ehealth/resources/wsis_report/en/, 19/07/2017.
276
WHO (2006). Building foundations for eHealth: Progress of Member States. Geneva,
Switzerland: World Health Organization. Available at:
http://www.who.int/goe/publications/build_foundations/en/, 19/07/2017.
WHO (2007). Everybody business: strengthening health systems to improve health outcomes:
WHO’s framework for action. Geneva, Switzerland: World Health Organization.
Available at: http://www.who.int/healthsystems/strategy/everybodys_business.pdf,
19/07/2017.
WHO (2009). The European Health report 2009. Copenhagen: WHO Regional Office for
Europe. Available at:
http://www.euro.who.int/__data/assets/pdf_file/0009/82386/E93103.pdf, 19/07/2017.
WHO (2011). Global Health and Ageing. National Institutes of Health publication
nº.11.7737/oct.2011. National Institute on Aging, World Health Organization.
Available at: http://www.who.int/ageing/publications/global_health.pdf, 19/07/2017.
WHO (2012). Management of patient information: trends and challenges in Member States:
based on the findings of the second global survey on eHealth. Switzerland: Global
Observatory for Health, 6, World Health Organization. Available at:
http://apps.who.int/iris/bitstream/10665/76794/1/9789241504645_eng.pdf,
19/07/2017.
WHO (2015). World report on ageing and health. Geneva, Switzerland: World Health
Organization. Available at:
http://apps.who.int/iris/bitstream/10665/186463/1/9789240694811_eng.pdf?ua=1,
19/07/2017.
William, H. D., & Ephraim, R. M. (2003). The DeLone and McLean Model of Information
Systems Success: A Ten-Year Update. Management Information Systems, 19(4), 9-30.
Williams, T. (2002). Modelling complex projects. West Sussex, UK, John Wiley & Sons.
277
Williams, T., & Samset, K. (2010). Issues in Front-End Decision Making on Projects. Project
Management Journal, 41(2), 38-49.
Williams, T. M. (2004). Assessing and building on the underlying theory of project
management in the light of badly over-run projects. Management Science, theory,
method and practice series; working paper 2004/07. Dept. of Management Science,
University of Strathclyde, Glasgow.
Willcocks, L., & Lester, S. (1993). Evaluating the feasibility of information technology,
research. Discussion paper DDP 93/1. Oxford: Oxford Institute of Information Mana
gement.
Wilkinson, J. M. (2002). Medical Market for Microsystems. International Newsletter on
Microsystems and MEMS, 4(2), 37, September.
Winch, G. (2002). Managing construction projects. Blackwell.
Winch, G. (2004). Rethinking project management: Project organisations as information
processing systems? In Proceedings of the 3rd PMI Research Conference, July 2004.
London, UK.
Winch, G. (2006). The construction firm and the construction project: a transaction cost
approach. Journal Construction Management and Economics, 34 (2), 331-345.
Winch, G., Clifton, N., & Millar, C. (2000). Organization and management in an Anglo-
French consortium: the case of Transmanche link. Journal of Management Studies,
37(59), 663–685.
Winter, M., Smith, C., Morris, P., & Cicmil, S. (2006). Directions for future research in project
management: The main findings of a UK government-funded research network.
International Journal of Project Management, 24(8), 638-649.
Winter, M., & Szczepanek, T. (2008). Projects and programmes as value creation processes:
A new perspective and some practical implications. International Journal of Project
Management, 26(1), 95-103.
278
Wolf, E. J., Harrington, K. M., Clark, S. L., & Miller, M. W. (2013). Sample Size
Requirements for Structural Equation Models: An Evaluation of Power, Bias, and
Solution Propriety. Educational and Psychological Measurement, 76(6), 913–934.
Wootton, R. (2009). The future use of telehealth in the developing world. In, Wootton, R.
Patil, N. Scott, R. and Ho, K. (eds.) Telehealth in the Developing World. London, United
Kingdom: Royal Society of Medicine Press.
Wysocki, R. K., Beck, R., & Crane, D. B. (2000). Effective project management. New York:
Wiley.
Xia, W., & Lee, G. (2005). Complexity of Information Systems Development Projects:
Conceptualization and Measurement Development. Journal of Management
Information Systems, 22(1), 45-84.
Yang, J., Shen, G. Q., Drew, D. S., & Ho, M. (2010). Critical success factors for stakeholder
management: Construction practitioners' perspectives. Journal of Construction
Engineering and Management, 136(7), 778-786.
Yasnoff, W. A., Humpheys, B. L., Overhage, J. M., Detmer, D. E., Brennan, P, F., Morris, R.
W., Middleton, B., Bates, D. W., & Fanning, J, P. (2004). A consensus action agenda
for achieving the national health information infrastructure. Journal of the American
Medical Informatics Association, 11(49, 332-338.
Yazici, H. J. (2009). The Role of Project Management Maturity and Organizational Culture
in Perceived Performance. Project Management Journal, 40(3), 14-33.
Yeo, K. T. (1993). Systems thinking and project management – time to reunite. International
Journal of Project Management,11(2), 111-117.
Yeo, K. T. (2002). Critical failure factors in information system projects. International
Journal of Project Management, 20(3), 241–246.
Yeo, K. T., & Ren, Y. T. (2009). Risk management capability maturity model for Complex
Product Systems (CoPS) projects. Systems Engineering, 12(4), 275–294.
279
Yin, R. K. (2003). Case Study Research, Design and Methods (3rd Edition). Thousand Oaks,
California, USA: Sage Publications, Inc.
Yoo, C., Yoon J., Lee B., Lee C., Lee J., Hyun S., & Wu C. (2004). An Integrated Model of
ISO 9001: 2000 and CMMI for ISO Registered Organisations. In Proceedings of the
11th Asia-Pacific Software Engineering Conference, IEEE Computer Society,
Washington, DC, USA.
Young, M., Young, R., & Zapata, J. R. (2014). Project, programme and portfolio maturity: a
case study of Australian Federal Government, International Journal of Managing
Projects in Business, 7(2), 215 – 230.
Young, R. R. (2001). Effective requirements practices. Boston. MA: Addison-Wesley
Young, R. R. (2006). Project Requirements: A Guide to Best Practices. Vienna, VA:
Management Concepts Inc.
Yourdon, E. (1999). Death march: The complete software developer’s guide to surviving
“mission impossible” projects. Upper Saddle River, New Jersey, USA: Prentice Hall
PTR.
Yu, A. G., Fleett, P. D., & Bowers, J.A. (2005). Developing a value-centered proposal for
assessing project success. International Journal of Project Management, 23(6), 428-
436.
Yu, T. W., Shen, Q. P., Kelly, J., & Hunter, K. (2006). Investigation of critical success factors
in construction project briefing by way of content analysis. Journal of Construction
Engineering and Management, 132(11), 1178-1186.
Yucalar, F., & Erdogan, S. Z. (2009). A Questionnaire Based Method for CMMI level 2
Maturity Assessment. Journal of Aeronautics and Space Technologies, 4(2), 39-46.
Yusof, M. M., Kuljis, J., Papazafeiropoulou, A., & Stergioulas, L. K. (2008). An evaluation
framework for health information systems: human, organization and technology-fit
factors (HOT-fit). International Journal of Medical Informatics, 77(6), 386-398.
280
Zhang, L.Y., He, J., & Zhang, X. X. (2012). The Project Management Maturity Model and
Application Based on PRINCE2. In Proceedings of International Workshop on
Information and Electronics Engineering, 29, 3691-3697.
Zhang, M. J. (2005). Information systems, strategic flexibility and firm performance: An
empirical investigation. Journal of Engineering and Technology Management, 22(3),
163-184.
Zhao, X., Hwang, B., & Low, S. (2013). Developing Fuzzy Enterprise Risk Management
Maturity Model for Construction Firms. Journal of Construction Engineering and
Management, 139(9), 1179-1189.
Zikmund, W. G., Babin, B. J., Carr, J. C., & Griffin, M. (2010). Business Research Methods,
(8th Edition). Mason, Ohio: South Western Publishing.
Zhou, Z. Y. (2003). CMM in uncertain environments. Communications of the ACM, 46(8),
115–119.
Zwikael, O., & Globerson, S. (2006). Benchmarking of project planning and success in
selected industries. Benchmarking: An International Journal, 13(6), 688 – 700.
Zwikael, O., & Smyrk, J. (2011). Project Management for the Creation of Organisational
Value. London: Springer-Verlag.
Zwikael, O., & Smyrk, J. (2012). A general framework for gauging the performance of
initiatives to enhance organizational value British Journal of Management, 23 (S1), S6-
S22.
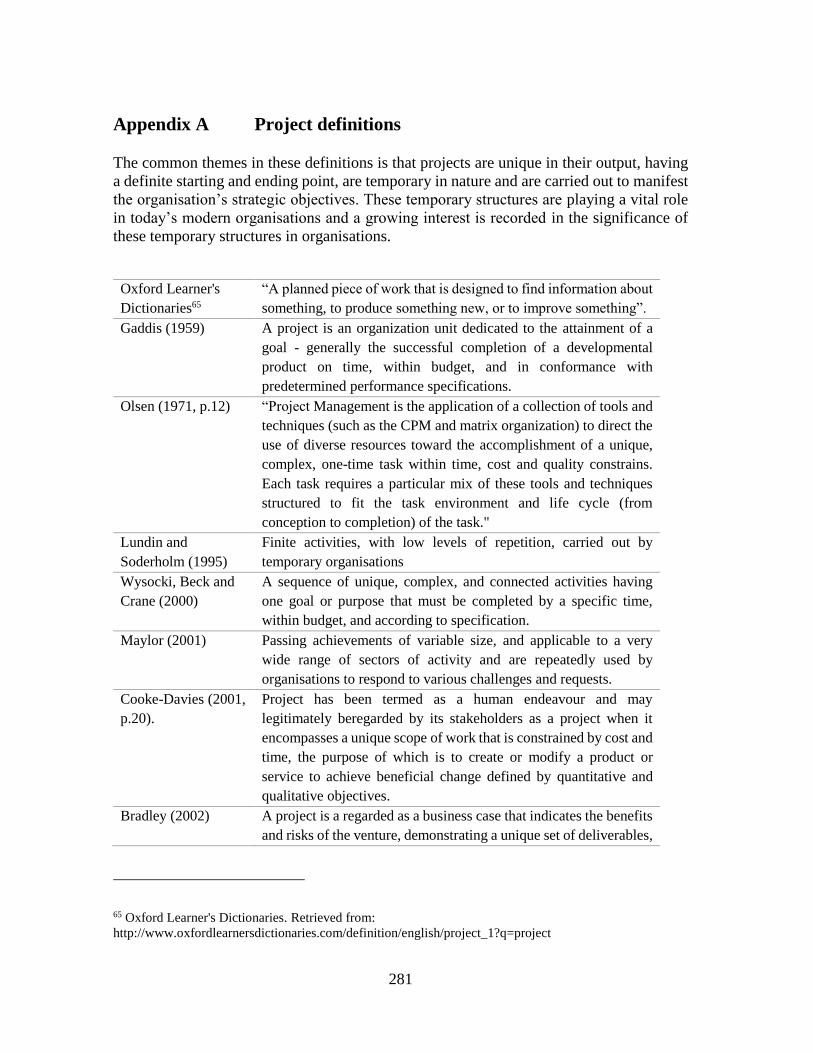
281
Appendix A Project definitions
The common themes in these definitions is that projects are unique in their output, having
a definite starting and ending point, are temporary in nature and are carried out to manifest
the organisation’s strategic objectives. These temporary structures are playing a vital role
in today’s modern organisations and a growing interest is recorded in the significance of
these temporary structures in organisations.
Oxford Learner's
Dictionaries65
“A planned piece of work that is designed to find information about
something, to produce something new, or to improve something”.
Gaddis (1959) A project is an organization unit dedicated to the attainment of a
goal - generally the successful completion of a developmental
product on time, within budget, and in conformance with
predetermined performance specifications.
Olsen (1971, p.12) “Project Management is the application of a collection of tools and
techniques (such as the CPM and matrix organization) to direct the
use of diverse resources toward the accomplishment of a unique,
complex, one-time task within time, cost and quality constrains.
Each task requires a particular mix of these tools and techniques
structured to fit the task environment and life cycle (from
conception to completion) of the task."
Lundin and
Soderholm (1995)
Finite activities, with low levels of repetition, carried out by
temporary organisations
Wysocki, Beck and
Crane (2000)
A sequence of unique, complex, and connected activities having
one goal or purpose that must be completed by a specific time,
within budget, and according to specification.
Maylor (2001) Passing achievements of variable size, and applicable to a very
wide range of sectors of activity and are repeatedly used by
organisations to respond to various challenges and requests.
Cooke-Davies (2001,
p.20).
Project has been termed as a human endeavour and may
legitimately beregarded by its stakeholders as a project when it
encompasses a unique scope of work that is constrained by cost and
time, the purpose of which is to create or modify a product or
service to achieve beneficial change defined by quantitative and
qualitative objectives.
Bradley (2002) A project is a regarded as a business case that indicates the benefits
and risks of the venture, demonstrating a unique set of deliverables,
65 Oxford Learner's Dictionaries. Retrieved from:
http://www.oxfordlearnersdictionaries.com/definition/english/project_1?q=project
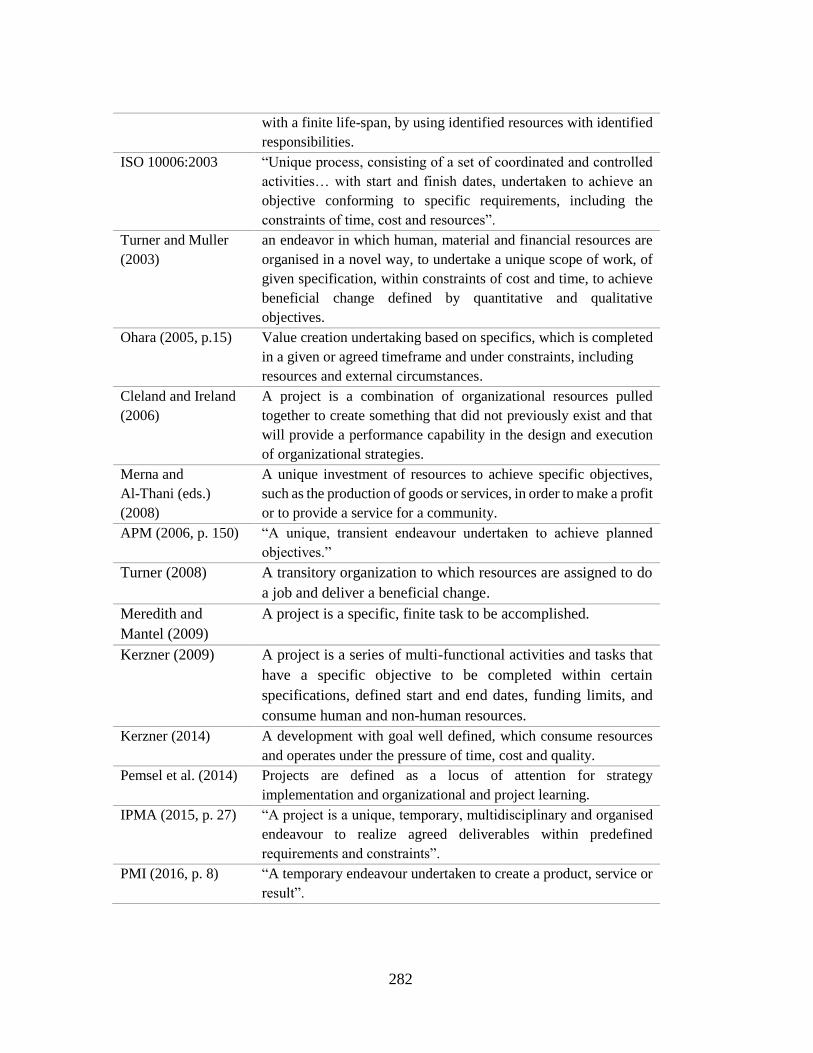
282
with a finite life-span, by using identified resources with identified
responsibilities.
ISO 10006:2003 “Unique process, consisting of a set of coordinated and controlled
activities… with start and finish dates, undertaken to achieve an
objective conforming to specific requirements, including the
constraints of time, cost and resources”.
Turner and Muller
(2003)
an endeavor in which human, material and financial resources are
organised in a novel way, to undertake a unique scope of work, of
given specification, within constraints of cost and time, to achieve
beneficial change defined by quantitative and qualitative
objectives.
Ohara (2005, p.15) Value creation undertaking based on specifics, which is completed
in a given or agreed timeframe and under constraints, including
resources and external circumstances.
Cleland and Ireland
(2006)
A project is a combination of organizational resources pulled
together to create something that did not previously exist and that
will provide a performance capability in the design and execution
of organizational strategies.
Merna and
Al-Thani (eds.)
(2008)
A unique investment of resources to achieve specific objectives,
such as the production of goods or services, in order to make a profit
or to provide a service for a community.
APM (2006, p. 150) “A unique, transient endeavour undertaken to achieve planned
objectives.”
Turner (2008) A transitory organization to which resources are assigned to do
a job and deliver a beneficial change.
Meredith and
Mantel (2009)
A project is a specific, finite task to be accomplished.
Kerzner (2009) A project is a series of multi-functional activities and tasks that
have a specific objective to be completed within certain
specifications, defined start and end dates, funding limits, and
consume human and non-human resources.
Kerzner (2014) A development with goal well defined, which consume resources
and operates under the pressure of time, cost and quality.
Pemsel et al. (2014) Projects are defined as a locus of attention for strategy
implementation and organizational and project learning.
IPMA (2015, p. 27) “A project is a unique, temporary, multidisciplinary and organised
endeavour to realize agreed deliverables within predefined
requirements and constraints”.
PMI (2016, p. 8) “A temporary endeavour undertaken to create a product, service or
result”.
283
Appendix B Publications and citations
Gomes, J., & Romão, M. (2018). Achieving dynamic capabilities through the benefits
management approach. International Journal of Information Systems in the Service,
10(2), 53-68. doi:10.4018/IJISSS.2018040104.
Gomes, J., & Romão, M. (2018). Information Systems and Technology Projects in
Healthcare Organisations. Encyclopedia of Information Science and Technology 4th
Edition, chapter 326. Hershey, PA: Information Science Reference. p. 3756- 3766.
DOI: 10.4018/978-1-5225-2255-3.ch326.
Gomes, J., & Romão, M. (2018). Sustainable Competitive Advantage with the Balanced
Scorecard approach. Encyclopedia of Information Science and Technology, 4th
Edition, chapter 496. Hershey, PA: Information Science Reference. p. 5714 – 5725.
DOI:10.4018/978-1-5225-2255-3.ch496.
Mendes, D., Gomes., & Romão, M. (2017). Creating Intangible Value through a
Corporate Employee Portal. Special Issue: Knowledge Management – Current Trends
and Challenges. Journal of Entrepreneurship, Management and Innovation, 13(3),
125-149. DOI:10.7341/20171335.
Fernandes, T., Gomes, J., & Romão, M. (2017). Investments in E-Government: A
Benefit Management Case Study. International Journal of Electronic Government
Research, 13(3), 1-17. DOI:10.4018/IJEGR.2017070101.
Simplicio, R., Gomes, J., & Romão, M. (2017). Projects Selection and Prioritization: A
Portuguese Navy pilot model. ProjMAN - International Conference on Project
MANagement, 8-10 November 2017, Barcelona, Spain
Gomes, J., & Romão, M. (2017). The Balanced Scorecard: Keeping Updated and
Aligned with Today´s Business Trends. International Journal of Productivity
Management and Assessment Technologies (IJPMAT), 5(2), 1-15.
DOI:10.4018/IJPMAT.2017070101.
284
Madeira, B., Gomes, J., & Romão, M. (2017). Applying Benefits Management to the
implementation of a Copy Point: A Case Study. International Journal of Strategic
Decision Sciences (IJSDS) 8(1). DOI:10.4018/IJSDS.2017010102.
Gomes, J., & Romão, M. (2017). Balanced Scorecard: Today’s Challenges. In: Rocha
Á., Correia A., Adeli H., Reis L., Costanzo S. (eds) Recent Advances in Information
Systems and Technologies. Vol. 1, pp 648-657. Advances in Intelligent Systems and
Computing, vol 569. Springer, Cham. DOI: 10.1007/978-3-319-56535-4_64.
Gomes, J., & Romão, M. (2017). Aligning Information Systems and Technology with
Benefit Management and Balanced Scorecard. In S. De Haes, & W. Van Grembergen
(eds.) Strategic IT Governance and Alignment in Business Settings. pp. 112-131.
Hershey, PA: IGI Global. DOI:10.4018/978-1-5225-0861-8.ch005.
Cited by:
Bhattarai, R. K. (2018). Enterprise Resiliency in the Continuum of Change: Emerging
Research and Opportunities (pp. 1-186). Hershey, PA: IGI Global. doi:10.4018/978-1-5225-
2627-8.
Tantau, A., & Staiger, R. (2018). Business Models for Renewable Energy Initiatives:
Emerging Research and Opportunities (pp. 1-194). Hershey, PA: IGI Global.
doi:10.4018/978-1-5225-2688-9
Roos, G. (2017). Technology-Driven Productivity Improvements and the Future of Work:
Emerging Research and Opportunities (pp. 1-255). Hershey, PA: IGI Global.
DOI:10.4018/978-1-5225-2179-2.
Kaufmann, H. R., & Manarioti, A. (2017). Encouraging Participative Consumerism Through
Evolutionary Digital Marketing: Emerging Research and Opportunities (pp. 1-222).
Hershey, PA: IGI Global. doi:10.4018/978-1-68318-012-8.
Gomes, J., & Romão, M. (2017). Enhancing Organisational Maturity with Benefits
Management. In Information Resources Management Association (Eds.), Project
285
Management: Concepts, Methodologies, Tools, and Applications, chapter 83, pp.
1689-1703. Hershey, PA: IGI Global. DOI: 10.4018/978-1-5225-0196-1.ch083.
Gomes, J., & Romão, M. (2016). Improving project success: A case study using benefits
and project management. Procedia Computer Science, 100, 489-497. DOI:
10.1016/j.procs.2016.09.187.
Cited by:
Faria, A., Macêdo, F., & Oliveira, S. (2018). Process-Based Project Management for
Implementation of an ERP System at a Brazilian Teaching Institution. In Proceedings of the
International Conference on Information Technology & Systems (ICITS 2018), 10-12
January 2018, Universidad Estatal Península de Santa Elena, Ecuador, pp. 40-49.
Faria A.G., de Oliveira S.B., & Macêdo F.C. (2018). Process-Based Project Management for
Implementation of an ERP System at a Brazilian Teaching Institution. In: Rocha Á., Guarda
T. (eds). Advances in Intelligent Systems and Computing, vol 721. Springer, Cham.
Fonseca, V. (2017). Gestão de Benefícios num projeto desenvolvido com abordagem Agile.
Dissertação de Mestrado em Gestão de Projetos. Lisboa: ISEG, Universidade de Lisboa.
Rouhiainen, H. (2017). Supporting and developing project management within specialist
organization. Master’s Thesis in information Systems, University of Jyväskylä, Finland.
Miguita, K. (2017). The Linking between Project Management practices and Project Success.
Dissertação de Mestrado em Gestão de Projetos. Lisboa: ISEG, Universidade de Lisboa.
Simplicio, R., Gomes, J., & Romão, M. (2017). Projects Selection and Prioritization: A
Portuguese Navy pilot model. In Proceedings of the International Conference on Project
MANagement (ProjMAN), 8-10 November 2017, Barcelona, Spain.
Hurtado, M., Dueñas, J. F., Orjuela, J. D., & Gómez, D. (2017). Identificación y análisis de
factores de éxito en la gerencia de proyectos con equipos virtuales en el sector de tecnologías
de la información (TI). Maestría en Desarrollo y Gerencia Integral de Proyectos. Escuela
Colombiana de Ingeniería Julio Garavito, Bogotá, Colombia..
286
Gomes, J., Romão, M., & Carvalho, H. (2016). Successful IS/IT projects in Healthcare:
Pretesting a questionnaire. Procedia Computer Science, 100, 375-382. DOI:
10.1016/j.procs.2016.09.172.
Cited by:
Reis, A., Oliveira, P., & Castro, C. (2018). Logística Hospitalar: Uma Síntese do Estado da
Arte.. Revista Gestão e Desenvolvimento, Novo Hamburgo, 15(1), 205-231.
doi:https://doi.org/10.25112/rgd.v15i1.1276.
Nematollahi, M., Ahmadzadeh, M., Baniasadi, T., & Sedigh Marvasti, F. (2017). Application
of triangulation approach in requirements engineering process: A study in analysis and design
of the pediatrics epilepsy information systems. Hormozgan Medical Journal, 21(1), 65-76.
Schönberger, M., & Čirjevskis, A. (2017). Successful IT/IS Projects in Healthcare: Evaluation
of Critical Success Factors. Journal of e-health Management, Article ID 956068. DOI:
10.5171/2017.956068.
Schönberger, M., & Čirjevskis, A. (2017). Evaluation of interrelationships between critical
success factors of IT/IS projects in the healthcare sector. In Proceedings of the 29th
International Business Information Management Association Conference (IBIMA 2017) -
Education Excellence and Innovation Management through Vision 2020: From Regional
Development Sustainability to Global Economic Growth (2017), Vienna; Austria; 3 -4 May
2017.
Mendes, D. S., Gomes, J., & Romão, M. (2016). Creating Value from Intangible Assets:
An Employee Portal Case Study. In the Proceedings of the ECKM-17th European
Conference on Knowledge Management, 1- 2 September. Northern Ireland, UK: Ulster
University.
Gomes, J., & Romão, M. (2016). Improving the success of IS/IT projects in Healthcare:
Benefits and Project Management approaches. In Vol. 444 of the series Advances in
Intelligent Systems and Computing, pp. 547-556. New Advances in Information
Systems and Technologies, Part II. DOI: 10.1007/978-3-319-31232-3_51. ISBN: 978-
287
3-319-31231-6. © Springer International Publishing AG, Part of Springer
Science+Business Media.
Gomes, J., & Romão, M. (2016). Strategic Alignment with a Balanced Scorecard
Approach. In the Proceedings of the 9th IADIS International Conference -
Information’s Systems 2016, 9-11 April, Vilamoura, Algarve.
Gomes, J., & Romão, M. (2016). Investments in information systems and technology in
the healthcare: Project management mediation. Journal of Information Systems
Engineering & Management, 1(1), p. 15-24. DOI: 10.20897/lectito.201606.
Gomes, J., Romão, M., & Carvalho, H. (2016). Organisational Maturity and Project
Success in Healthcare: The Mediation of Project Management. In Proceedings of
Healthinf 2016 - 9th International Conference on Health Informatics, Rome, Italy, 21-
23 Feb 2016.
Cited by:
Schönberger, M., & Čirjevskis, A. (2017). Successful IT/IS Projects in Healthcare: Evaluation
of Critical Success Factors. Journal of e-health Management, Article ID 956068. DOI:
10.5171/2017.956068.
Schönberger, M., & Čirjevskis, A. (2017). Evaluation of interrelationships between critical
success factors of IT/IS projects in the healthcare sector. In Proceedings of the 29th
International Business Information Management Association Conference (IBIMA 2017) -
Education Excellence and Innovation Management through Vision 2020: From Regional
Development Sustainability to Global Economic Growth (2017), Vienna; Austria; 3 -4 May
2017.
Linden, A., Bitencourt, C., Tondolo, V., Gomes, J., & Romão, M. (2015). Dealing with
Knowledge Management to Build a Safer Health Care. In the Proceedings of the 16th
European Conference on Knowledge Management – ECKM 2015, Udine, Italy.
Gomes, J., & Romão, M. (2015). The success of IS/IT projects in the healthcare sector:
stakeholders' perceptions. IEEE Xplore Digital Library. DOI:
10.1109/CISTI.2015.7170516.
288
Gomes, J., & Romão, M. (2015). Maturity, Benefits and Project Management shaping
Project Success. In Vol. 353 of the series Advances in Intelligent Systems and
Computing, pp 435-448, New Contributions in Information Systems and Technologies,
Vol. 1. DOI 10.1007/978-3-319-16486-1_43, ISSN: 2194-5357. © Springer
International Publishing AG, Part of Springer Science+Business Media.
Cited by:
Faria, A., Macêdo, F., & Oliveira, S. (2018). Process-Based Project Management for
Implementation of an ERP System at a Brazilian Teaching Institution. In Proceedings of the
International Conference on Information Technology & Systems (ICITS 2018), 10-12
January 2018, Universidad Estatal Península de Santa Elena, Ecuador, pp. 40-49.
Faria A.G., de Oliveira S.B., & Macêdo F.C. (2018). Process-Based Project Management for
Implementation of an ERP System at a Brazilian Teaching Institution. In: Rocha Á., Guarda
T. (eds). Advances in Intelligent Systems and Computing, vol 721. Springer, Cham.
Nanthagopan, Y, Williams, N. L., & Page, S. (2016). Understanding the nature of Project
Management capacity in Sri Lankan non-governmental organisations (NGOs): A Resource
Based Perspective. International Journal of Project Management, 34(8), 1608–1624.
Sousa, M. J., Moço, I., Saldanha, A. S., & Dias, I. (2016). Leadership Skills for Project
Managers. 17th International UFHRD (University Forum for Human Resource
Development) 2016: Leadership, Diversity & Changing Practices in HRD in Global Context.
Manchester Metropolitan University Business School, Manchester, UK, June.
Sargent, W. H. (2016). Strategies to Improve Project Management Maturity Processes.
Doctoral Dissertation in Business Administration, College of Management and Technology,
Walden University.
Gomes, J., & Romão, M. (2015). Achieving project success through alignment with
organizational strategy: Balanced Scorecard approach. In the Proceedings of the 8th
IADIS International Conference - Information’s Systems 2015, Funchal, March 2015.
Cited by:
289
Schönberger, M., & Čirjevskis, A. (2017). Successful IT/IS Projects in Healthcare: Evaluation
of Critical Success Factors. Journal of e-health Management, Article ID 956068. DOI:
10.5171/2017.956068.
Schönberger, M., & Čirjevskis, A. (2017). Evaluation of interrelationships between critical
success factors of IT/IS projects in the healthcare sector. In Proceedings of the 29th
International Business Information Management Association Conference (IBIMA 2017) -
Education Excellence and Innovation Management through Vision 2020: From Regional
Development Sustainability to Global Economic Growth (2017), Vienna; Austria; 3 -4 May
2017.
Gomes, J., & Romão, M. (2015). The success of IS/IT projects in the healthcare sector:
stakeholders' perceptions. In the Proceedings of the CISTI'2015 - 10ª Conferência
Ibérica de Sistemas e Tecnologias de Informação, Aveiro, AISTI, 17-20 de Junho.
DOI: 10.1109/CISTI.2015.7170516.
Gomes, J., & Romão, M. (2015). Enhancing Organisational Maturity with Benefits
Management. International Journal of Information Technology Project Management,
Vol. 6, Issue 4. ISSN: 1938-0232, EISSN: 1938-0240, DOI: 10.4018/IJITPM.
Cited by:
Fernandes, T., Gomes, J., & Romão, M. (2017). Investments in E-Government: A Benefit
Management Case Study. International Journal of Electronic Government Research
(IJEGR) 13(3), 1-17 DOI: 10.4018/IJEGR.2017070101
Pereira, C., Ferreira, C., & Amaral, L. (2017). Shape a Business Case Process: An IT
Governance and IT Value Management Practices Viewpoint with COBIT 5.0. In the
Proceedings of the 17.ª Conferência da Associação Portuguesa de Sistemas de Informação
(CAPSI’2017), 6 a 7 de Junho de 2017, Guimarães, Portugal. DOI
http://dx.doi.org/10.18803/capsi.v17.60-75.
Bartolomeu, M., Gomes, J., & Romão, M. (2017). Applying Benefits Management to the
implementation of a Copy Point: A Case Study. International Journal of Strategic Decision
Sciences, 8(1), 13-26. DOI: 10.4018/IJSDS.2017010102.
290
Al-Saqqa, A. H. (2017). The Role of Marketing Intelligence in Achieving Competitive
Advantage Case Study: Internet Service Provider Companies in The Gaza Strip. Master of
Business Administration, Research and Postgraduate Affairs, Faculty of Commerce, The
Islamic University–Gaza.
Gomes, J., & Romão, M. (2014). How Organizational Maturity and Project
Management can cooperate for Project Success. In Contemporary Issues in Tourism
& Management Studies, November 2014, ISBN: 978-898-8472-55-7.
Gomes, J., & Romão, M. (2014). Looking for Project Success: IS/IT Projects in Health
Sector. In the Proceedings of the CAPSI 2014 - 14ª Conferência da Associação
Portuguesa de Sistemas de Informação, Santarém, September 2014.
Gomes, J., & Romão, M. (2014). Gaining Competitive Advantage through the Balanced
Scorecard. In M. Khosrow-Pour (Ed.), Encyclopedia of Information Science and
Technology, Third Edition, pp. 5046-5055, Hershey, PA: Information Science
Reference. DOI:10.4018/978-1-4666-5888-2. ch498.
Cited by:
Bruijl, G. (2017). The Concept and Use of the Balanced Scorecard in a Competitive
Environment. Available at SSRN: https://ssrn.com/abstract=3062934 or
http://dx.doi.org/10.2139/ssrn.3062934.
Tima, C. (2016). Application of The Balanced Score Card In Performance Measurement By
Kajiado County Government. Master of Business Administration, School of Business,
University of Nairobi.
Quach, A. H. (2015). Improving Competitiveness for ABC HR Consulting Company Through
the Application of The Balanced Scorecard. A dissertation presented in partial fulfilment of
the requirements for the degree of Master of Science, Tomas Bata University in Zlín, Faculty
of Management and Economics, Czech Republic.
Were, K. K. (2015). Application of The Balanced ScoreCard as a Strategic Management Tool
at The Kenya Bureau of Standards. A dissertation presented in partial fulfilment of the
291
requirements for the Award of the degree of Master of Business Administration, School of
Business, University of Nairobi, Kenya.
Gomes, J., & Romão, M. (2014). Benefits management enhances the organizational
competitive advantage. In New Perspectives in Information Systems and
Technologies: Advances in Intelligent Systems and Computing, Vol. 1. DOI:
10.1007/978-3-319-05951-8_14, ISBN: 978-3-319-05950-1, April 2014, Copyright ©
Springer International Publishing.
Cited by:
Bartolomeu, M., Gomes, J., & Romão, M. (2017). Applying Benefits Management to the
implementation of a Copy Point: A Case Study. International Journal of Strategic Decision
Sciences, 8(1), 13-26.
Belarbi, H. (2016). Improving Project Portfolio Decision Making in Theory and Practice.
Research Papers, paper 67, ECIS 2016 - Proceedings at AIS Electronic Library. Available
at: http://aisel.aisnet.org/ecis2016_rp/67, 19/07/2017.
Dakhil, A., Underwood, J., & Al Shawi, M. (2016). BIM benefits-maturity relationship
awareness among UK construction clients. In the Proceedings of the of the First
International Conference of the BIM Academic Forum Held at Glasgow Caledonian
University, Glasgow, September 13-15, 2016.
Gomes, J., Romão, M., Carvalho, H., & Caldeira, M. (2014). Organizational Maturity
and Projects Performance: The Mediation of Benefits Management. In Proceedings of
the WEBIST2014 - 10th International Conference on Web Information Systems and
Technologies, pp. 375-380, DOI: 10.5220/0004939403750380, Barcelona, Spain,
Copyright © SCITEPRESS.
Gomes, J., & Romão, M. (2014). Advantages and Limitations of Performance
Measurement Tools: The Balanced Scorecard. In the Proceedings of the 7th IADIS
International Conference - Information Systems 2014, ISBN 978-989-8704-04-7,
pp.19-26, Madrid, Spain, Feb-Mar 2014, Copyright © IADIS Press.
292
Cited by:
Jonyo, D. O., & Jonyo, B. O. (2017). Performance Management in Kenyan Public Schools:
Implications and Challenges. European Journal of Educational Sciences (EJES), 4(3). doi:
10.19044/ejes.v4no3a3 URL:http://dx.doi.org/10.19044/ejes.v4no3a3.
Al Sarmi, A. M., & Al-Hemyari, Z. A. (2017). Al-Farahidi Performative Framework to Assess
the HEIs. In the Proceedings of the Conference on Quality Management & Enhancement in
Higher Education, 21 - 22 March 2017, Oman Tourism College, Muscat, Oman.
Dey, A., & Giri, I. (2017). Approaches for measuring performance of employees. Project Guru
on January 18, Available at: https://www.projectguru.in/publications/approaches-measuring-
performance-employees/, 19/07/2017.
Khairat, G. M. (2016). The Balanced Scorecard Approach as a Tool for Performance Evaluation
in the Airline Companies. Journal of Faculty of Tourism and Hotels, Fayoum University, 10
(2/2), September.
Hunter, N. (2016). Marketing Metrics and the Balanced Scorecard. Deakin Business School.
University in Victoria, Australia. Available at:
https://mpk732t12016clustera.wordpress.com/2016/05/22/marketing-metrics-and-the-
balanced-scorecard/, 19/07/2017.
Abdulsamie, H. (2015). Assessing the balanced scorecard as a performance measurement system
in travel agencies. Journal of Faculty of Tourism and Hotels- Alexandria University. 12. 135-
153.
Mbhanyele R. E. (2015). A Performance Management System Application Model for public
institutions: The Case of the Regional Land Claims Commissioner, Limpopo Province. Master
Dissertation in Public Management and Governance, Potchefstroom Campus of North-West
University, South Africa.
Rezaei, M. (2015). Combining Balanced Score Card and Data Envelopment Analysis for
Analyzing the Performance of Small Scale Fisheries. Master of Science in Systems Science,
Faculty of Graduate and Postdoctoral Studies, University of Ottawa, Canadá
293
Blatnik, T. (2014). Uravnotezeno Merjenje Upesnosti v Velikih Slovenskih Podjetjih-Empiricna
Raziskava. Magistrsko Delo, Ekonomska Faculteta, Univerza v Lljubljani, Eslovenia.
Gomes, J., & Romão, M. (2013). How Benefits Management helps Balanced Scorecard
to deal with business dynamic environments. Tourism & Management Studies, 9 (1),
129- 141, ISSN: 2182-8458. http://tmstudies.net/index.php/ectms/article/view/558.
Cited by:
Oliveira, C., Pinho, J. C., & Silva, A. (2017). The relevance of learning and growth in
organizations that adopt and do not adopt the BSC‐characterization of the cultural profile. In
Proceedings of the International Conference Theory and Applications in the Knowledge
Economy, TAKE 2017, 12 to 14 July, Zagreb, Croatia.
Mendes, D. S., Gomes, J., & Romão, M. (2017). Creating Intangible Value through a
Corporate Employee Portal. Journal of Entrepreneurship Management and Innovation,
Nowy Sacz School of Business, National-Louis University, Poland.
Otom, D. (2017). The influence of ICT outsourcing on performanceof profit making Parastatals
in Nairobi. Master Science dissertation, School of Business, University of Nairobi.
Walsh, J. L. (2016). An Introduction to Linking Theory. Review of Business & Finance Studies,
7(2), 91-100.
Mendes, D. S., Gomes, J., & Romão, M. (2016). Creating Value from Intangible Assets: An
Employee Portal Case Study. In the Proceedings of the ECKM-17th European Conference
on Knowledge Management, 1- 2 September. Northern Ireland, UK: Ulster University.
Whitcomb, V. J. (2016). Exploring Critical Success Factors of Learning Management System
Implementations in Membership Associations. Dissertation Submitted in Partial Fulfilment
of the Requirements for the Degree of Doctor of Philosophy Applied Management and
Decision Sciences. USA: Walden University.
Oliveira, C. (2016). The Influence of Organizational Culture on the BSC Implementation and
Organizational Performance. In Proceedings of the International Conference TAKE 2016 -
294
Theory and Applications in the Knowledge Economy Aveiro, Portugal, 6 to 8 July 2016, pp
413-426,
Torabi, M. S. (2016). Development of Top Key Performance Indicators for Enhancing Hse
Commitment in Selected Companies. PhD Thesis, Faculty of Engineering, University of
Malaya, Kuala Lumpur.
Pereira, M. C., & Neto, M. T. R. (2014). A Implementação da Estratégia em Pequenas e
Médias Empresas. Desafio online, 2 (3), 856-866.
Mendes, D. S., & Romão, M. (2013). How Employee Portal Contributes for the Intangible
Assets Value Creation: Empirical Investigation and Theoretical Framework. In Proceedings
of 15th International Conference of Academy of Management and Business.
Mendes, D. S. (2013). How Employee Portal Contributes for the Intangible Assets Value
Creation. A dissertation presented in partial fulfilment of the requirements for the degree of
Master of Science in Information Systems Management. Lisboa: ISCTE-IUL.
Gomes, J., Romão, M., & Caldeira, M. (2013). Linking Benefits to Maturity Models. In
Proceedings of the 15th International Conference of Academy of Management and
Business, ISEG, Lisboa, April 2013.
Cited by:
Hassan, A. A. (2016). Framework to assess the level of readiness for TQM implementation in
girls’ secondary schools in Saudi Arabia. A dissertation presented in partial fulfilment of the
requirements for the degree of PhD. The School of Aerospace, Transport and Manufacturing.
Cranfield University.
Kalidindi, V. S. (2015). Process Visibility Requirements and Capabilities - Conceptual
Perspectives and Operationalization. A dissertation presented in partial fulfilment of the
requirements for the degree of Master of Science in Information Systems, Germany:
University of Mannheim.
295
Mendes, D. S. (2013). How Employee Portal Contributes for the Intangible Assets Value
Creation. A dissertation presented in partial fulfilment of the requirements for the degree of
Master of Science in Information Systems Management. Lisboa: ISCTE-IUL.
Gomes, J., Romão, M., & Caldeira, M. (2013). Linking Benefits to Balanced Scorecard
Strategy Map. In Volume 206 of the series Advances in Intelligent Systems and
Computing, pp 357-369. New Perspectives in Information Systems and Technologies:
Advances in Intelligent Systems and Computing. ISBN: 978-3-642-36981-0. DOI:
10.1007/978-3-642-36981-0_34. ©Springer International Publishing AG, Part of
Springer Science+Business Media.
Cited by:
Mendes, D. S., Gomes, J., & Romão, M. (2017). Creating Intangible Value through a
Corporate Employee Portal. Journal of Entrepreneurship Management and Innovation,
Nowy Sacz School of Business, National-Louis University, Poland.
Al-Aama, A. Y. (2013). Using Balanced Scorecards to Manage IT Strategies in Public
Organisations: The Case of Jeddah Municipality. Engineering Management Research, 2 (1),
p. 111-121.
Gomes, J., Romão, M., & Caldeira, M. (2013). The Benefits Management and Balanced
Scorecard Strategy Map: How They Match. International Journal of IT/Business
Alignment and Governance, 4(1), p. 44-54. DOI: 10.4018/jitbag. 2013010104.
Cited by:
Bartolomeu, M., Gomes, J., & Romão, M. (2017). Applying Benefits Management to the
implementation of a Copy Point: A Case Study. International Journal of Strategic Decision
Sciences, 8(1), 13-26.
Drost, S. E. (2016). Towards an international Corporate Sustainability Performance
Measurement System: Applied to the Dairy Sustainability Framework by means of an
internship at Friesland Campina. Master Thesis, Faculty of Geosciences Theses, Utrecht
University.
296
Waluyo, M., Huda, S., Soetjipto, N., Sumiati., & Handoyo. (2016). Analysis of Balance
Scorecards Model Performance and Perspective Strategy Synergized by SEM. MATEC,
Web of Conferences, 58. DOI:10.1051/ matecconf/20165802003.
Meng, D. (2016). Program Management Mechanism from Pull Management Perspective: An
Exploration Based on Benefits Management Theory. Science and Technology Management
Research, 36(9), 186-191. DOI: 10.3969/j.issn.1000-7695.2016.09.35.
Waluyo, M., & Soetjipto, N. (2015). Case Studies in Research: Analysis on Performance
Model Using Balanced Score Card, Strategic Objective and Sustainable Competitive
Advantage Synergized with SEM. Australian Journal of Basic and Applied Sciences, 9(36),
229-240
Madeira, B. (2015). Aplicação de uma Abordagem Gestão de Benefícios aplicada à iniciativa
Copy Point: Um Estudo de Caso. Dissertação submetida como requisito parcial para
obtenção do grau de Mestre em Gestão. Lisboa: ISCTE-IUL.
Giustiniano, L., Marchegiani, L., Peruffo, E., & Pirolo, L. (2014). Understanding
Outsourcing of Information Systems. In T. Tsiakis, T. Kargidis, & P. Katsaros (Eds.),
Approaches and Processes for Managing the Economics of Information Systems (pp. 199-
220). Hershey, PA: IGI Global. doi:10.4018/978-1-4666-4983-5.ch012
Gomes, J., & Romão. (2012). How Benefits Management helps Balanced Scorecard to
deal with business dynamic environments. In the Proceedings of the TMS2012 -
Management Studies International Conference, Algarve, November 2012.
Cited by:
Mendes, D. S., Gomes, J., & Romão, M. (2016). Creating Value from Intangible Assets: An
Employee Portal Case Study. In the Proceedings of the ECKM-17th European Conference
on Knowledge Management, 1- 2 September. Northern Ireland, UK: Ulster University.
Ribeiro, F., Del Fiaco, R., Silva, W., & Leobons, C. (2016). Transporte Individual de
Passageiros por Carona Remunerada: Contextualização e Aplicação de Ferramenta para
Análise de Viabilidade Econômica de Negócio. XXX Congresso Nacional de Pesquisa em
Transporte da ANPET, 16 a 18 de Novembro, Rio de Janeiro, Brazil.
297
Gomes, J., & Romão, M. (2012). Seleção de uma abordagem de gestão de investimentos
em Sistemas e Tecnologias da Informação. RISTI - Revista Ibérica de Sistemas e
Tecnologias de Informação, nº10 12/2012 DOI:10.4304/risti.10.35-50 Copyright @
2006-2014 by Academy Publisher.
Cited by:
Fernandes, T. M., Gomes, J., & Romão, M. (2017). Investments in E-Government: A Benefit
Management Case Study. International Journal of Electronic Government Research
(IJEGR) 13(3), 1-17. DOI:10.4018/IJEGR.2017070101
Bartolomeu, M., Gomes, J., & Romão, M. (2017). Applying Benefits Management to the
implementation of a Copy Point: A Case Study. International Journal of Strategic Decision
Sciences, 8(1), 13-26.
Fernandes, T. M. (2016). Gestão de Benefícios dos investimentos em e-Government. Um estudo
de caso. Dissertação de Mestrado em Gestão de Sistemas de Informação. Lisboa: ISEG,
Universidade de Lisboa.
Pereira, R. (2016). Gestão de Benefícios em Programas de Projetos de I&D em Colaboração
Universidade-Indústria. Dissertação de Mestrado em Engenharia Industrial, Escola de
Engenharia, Universidade do Minho.
Pereira, C., & Ferreira, C. (2015). Identificação de Práticas e Recursos de Gestão do Valor
das TI no COBIT 5. Revista Ibérica de Sistemas e Tecnologias de Informação, 15, 17-33.
Delgado, A. P., & Velthuis, M. P. (2015). Propuesta de marco de mejora continua de gobierno
TI en entidades financieras, Revista Ibérica de Sistemas e Tecnologias de Informação, 15,
51-67.
Madeira, B (2015). Aplicação de uma Abordagem Gestão de Benefícios aplicada à iniciativa
Copy Point: Um Estudo de Caso. Dissertação submetida como requisito parcial para
obtenção do grau de Mestre em Gestão. Lisboa: ISCTE-IUL.
298
Oliveira, I. D., Hékis, H. R., Valentim, R. A. M., Ramos, A. S. M., Araújo, G.F., & Silva,
J. L. R. (2014). Sistema de Apoio à Gestão de Cursos de Graduação à Distância: Relato de
uma Experiência na SEDIS/UFRN. Sistemas & Gestão, 9 (1), 60-70.
Matias, M (2014). Eficiência nos Investimentos em TI. Dissertação de Mestrado em Gestão de
Sistemas de Informação. Lisboa: ISEG, Universidade de Lisboa.
Mendes, D. S. (2013). How Employee Portal Contributes for the Intangible Assets Value
Creation. A dissertation presented in partial fulfilment of the requirements for the degree
of Master of Science in Information Systems Management. Lisboa: ISCTE-IUL.
Correia, A. S. M. (2013). Gestão de Benefícios e a Medida 6 – Um Estudo de Caso. A
dissertation presented in partial fulfilment of the requirements for the degree of Master of
Science in Information Systems Management. Lisboa: ISCTE-IUL.
Dias, P. E. T. (2013). Gestão de Benefícios do CRM – Um Estudo de Caso. A dissertation
presented in partial fulfilment of the requirements for the degree of Master of Science in
Information Systems Management. Lisboa: ISCTE-IUL.
Gomes, J., Romão, M., & Caldeira, M. (2012). Integração de benefícios no mapa
estratégico do Balanced Scorecard. In the Proceedings of the 10ª Conferência da
Associação Portuguesa de Sistemas de Informação (CAPSI’ 2010), Guimarães, 7 de
Setembro 2012. DOI: http://dx.doi.org/10.18803/capsi.v12.%25p.
Cited by:
Silva, V. L. G., & Fernandes, J. C. (2017). Utilização da Metodologia de Gestão de Benefícios
numa empresa seguradora: um estudo de caso. In the Proceedings of the 17.ª Conferência
da Associação Portuguesa de Sistemas de Informação (CAPSI’2017), 6 a 7 de Junho de 2017,
Guimarães, Portugal. DOI http://dx.doi.org/10.18803/capsi.v17.218-232.
Silva, V. L. G. (2016). Aplicação de Método de Gestão de Beneficios ao Investimento em
Sistema de Informação numa Empresa Seguradora. A dissertation presented in partial
fulfilment of the requirements for the degree of Master of Science in Management and
Industrial Strategy. Lisboa: ISEG.
299
Gomes, J., & Romão, M. (2012). Gestão de Benefícios numa Empresa de
GeoEngenharia. Master thesis, ISCTE-IUL.
Cited by:
Silva, V. L. G. (2016). Aplicação de Método de Gestão de Beneficios ao Investimento em
Sistema de Informação numa Empresa Seguradora. A dissertation presented in partial
fulfilment of the requirements for the degree of Master of Science in Management and
Industrial Strategy. Lisboa: ISEG.
Soulé, C. A. V. (2015). Otimização da gestão de sistemas de abastecimento de água às
grandes cidades – O caso de Lisboa. A dissertation presented in partial fulfilment of the
requirements for the degree of Master of Science in Information Systems Management.
Lisboa: ISCTE-IUL.
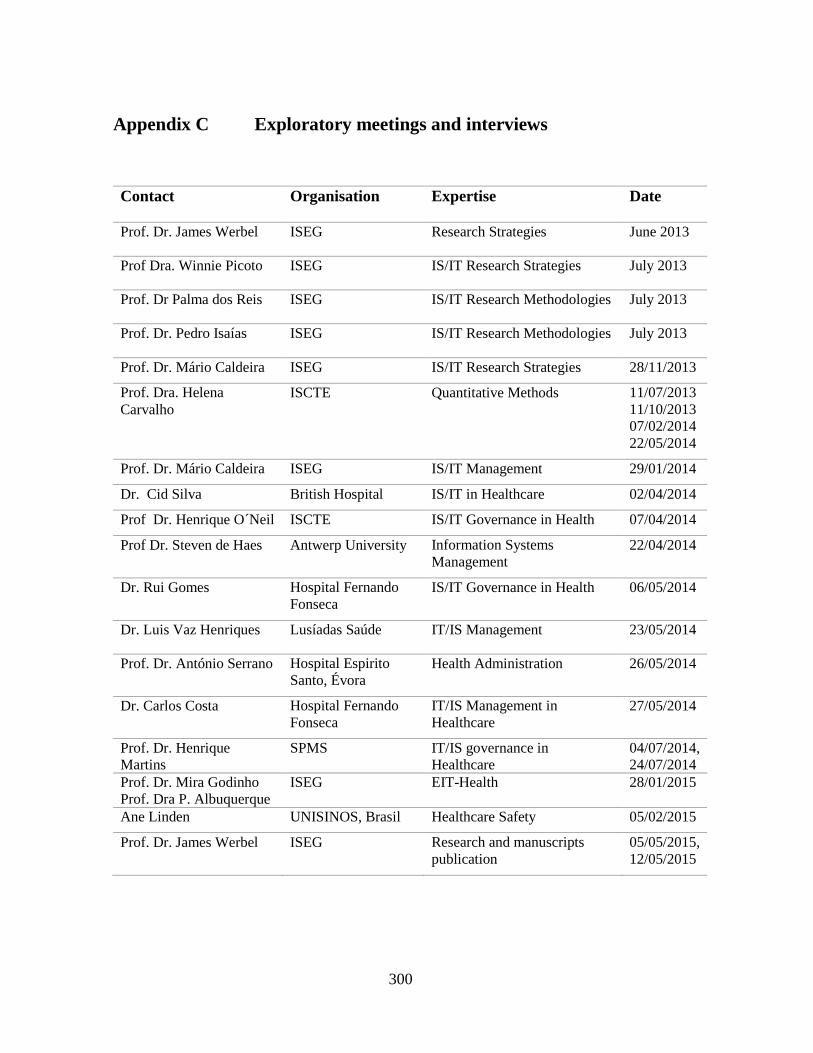
300
Appendix C Exploratory meetings and interviews
Contact Organisation Expertise Date
Prof. Dr. James Werbel ISEG Research Strategies June 2013
Prof Dra. Winnie Picoto ISEG IS/IT Research Strategies July 2013
Prof. Dr Palma dos Reis ISEG IS/IT Research Methodologies July 2013
Prof. Dr. Pedro Isaías ISEG IS/IT Research Methodologies July 2013
Prof. Dr. Mário Caldeira ISEG IS/IT Research Strategies 28/11/2013
Prof. Dra. Helena
Carvalho
ISCTE Quantitative Methods 11/07/2013
11/10/2013
07/02/2014
22/05/2014
Prof. Dr. Mário Caldeira ISEG IS/IT Management 29/01/2014
Dr. Cid Silva British Hospital IS/IT in Healthcare 02/04/2014
Prof Dr. Henrique O´Neil ISCTE IS/IT Governance in Health 07/04/2014
Prof Dr. Steven de Haes Antwerp University Information Systems
Management
22/04/2014
Dr. Rui Gomes Hospital Fernando
Fonseca
IS/IT Governance in Health 06/05/2014
Dr. Luis Vaz Henriques Lusíadas Saúde IT/IS Management 23/05/2014
Prof. Dr. António Serrano Hospital Espirito
Santo, Évora
Health Administration 26/05/2014
Dr. Carlos Costa Hospital Fernando
Fonseca
IT/IS Management in
Healthcare
27/05/2014
Prof. Dr. Henrique
Martins
SPMS IT/IS governance in
Healthcare
04/07/2014,
24/07/2014
Prof. Dr. Mira Godinho
Prof. Dra P. Albuquerque
ISEG EIT-Health 28/01/2015
Ane Linden UNISINOS, Brasil Healthcare Safety 05/02/2015
Prof. Dr. James Werbel ISEG Research and manuscripts
publication
05/05/2015,
12/05/2015
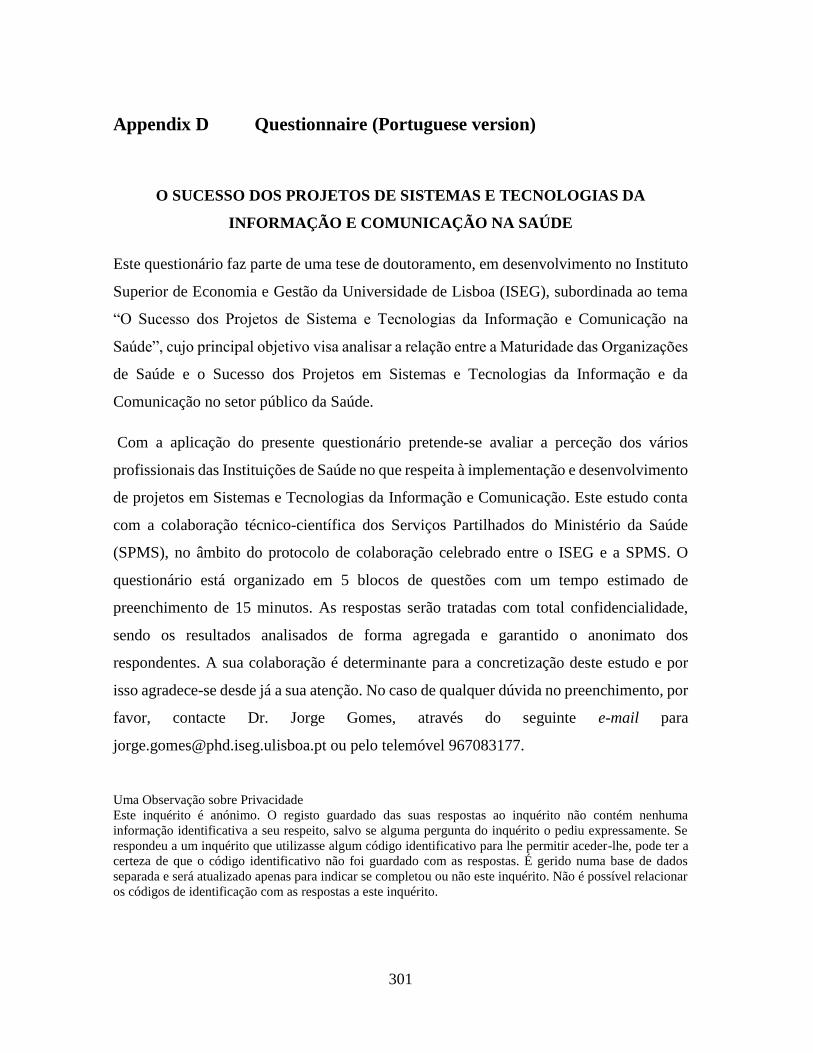
301
Appendix D Questionnaire (Portuguese version)
O SUCESSO DOS PROJETOS DE SISTEMAS E TECNOLOGIAS DA
INFORMAÇÃO E COMUNICAÇÃO NA SAÚDE
Este questionário faz parte de uma tese de doutoramento, em desenvolvimento no Instituto
Superior de Economia e Gestão da Universidade de Lisboa (ISEG), subordinada ao tema
“O Sucesso dos Projetos de Sistema e Tecnologias da Informação e Comunicação na
Saúde”, cujo principal objetivo visa analisar a relação entre a Maturidade das Organizações
de Saúde e o Sucesso dos Projetos em Sistemas e Tecnologias da Informação e da
Comunicação no setor público da Saúde.
Com a aplicação do presente questionário pretende-se avaliar a perceção dos vários
profissionais das Instituições de Saúde no que respeita à implementação e desenvolvimento
de projetos em Sistemas e Tecnologias da Informação e Comunicação. Este estudo conta
com a colaboração técnico-científica dos Serviços Partilhados do Ministério da Saúde
(SPMS), no âmbito do protocolo de colaboração celebrado entre o ISEG e a SPMS. O
questionário está organizado em 5 blocos de questões com um tempo estimado de
preenchimento de 15 minutos. As respostas serão tratadas com total confidencialidade,
sendo os resultados analisados de forma agregada e garantido o anonimato dos
respondentes. A sua colaboração é determinante para a concretização deste estudo e por
isso agradece-se desde já a sua atenção. No caso de qualquer dúvida no preenchimento, por
favor, contacte Dr. Jorge Gomes, através do seguinte e-mail para
[email protected] ou pelo telemóvel 967083177.
Uma Observação sobre Privacidade
Este inquérito é anónimo. O registo guardado das suas respostas ao inquérito não contém nenhuma
informação identificativa a seu respeito, salvo se alguma pergunta do inquérito o pediu expressamente. Se
respondeu a um inquérito que utilizasse algum código identificativo para lhe permitir aceder-lhe, pode ter a
certeza de que o código identificativo não foi guardado com as respostas. É gerido numa base de dados
separada e será atualizado apenas para indicar se completou ou não este inquérito. Não é possível relacionar
os códigos de identificação com as respostas a este inquérito.
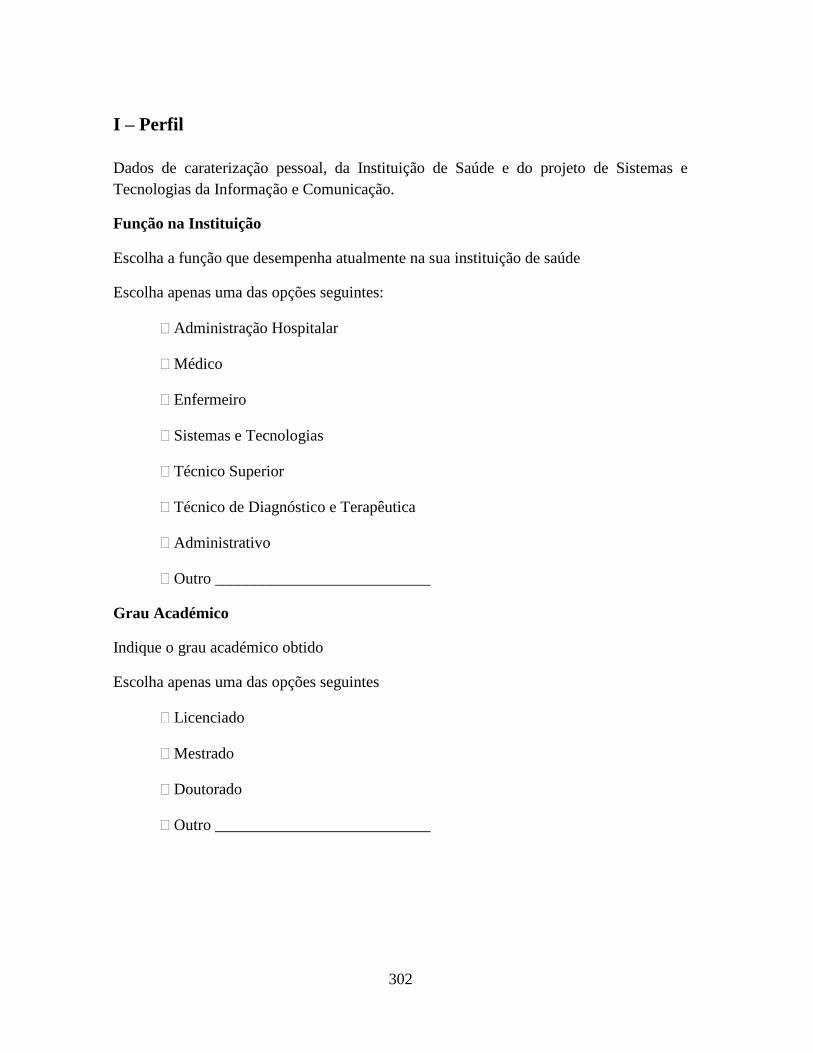
302
I – Perfil
Dados de caraterização pessoal, da Instituição de Saúde e do projeto de Sistemas e
Tecnologias da Informação e Comunicação.
Função na Instituição
Escolha a função que desempenha atualmente na sua instituição de saúde
Escolha apenas uma das opções seguintes:
Administração Hospitalar
Médico
Enfermeiro
Sistemas e Tecnologias
Técnico Superior
Técnico de Diagnóstico e Terapêutica
Administrativo
Outro ___________________________
Grau Académico
Indique o grau académico obtido
Escolha apenas uma das opções seguintes
Licenciado
Mestrado
Doutorado
Outro ___________________________
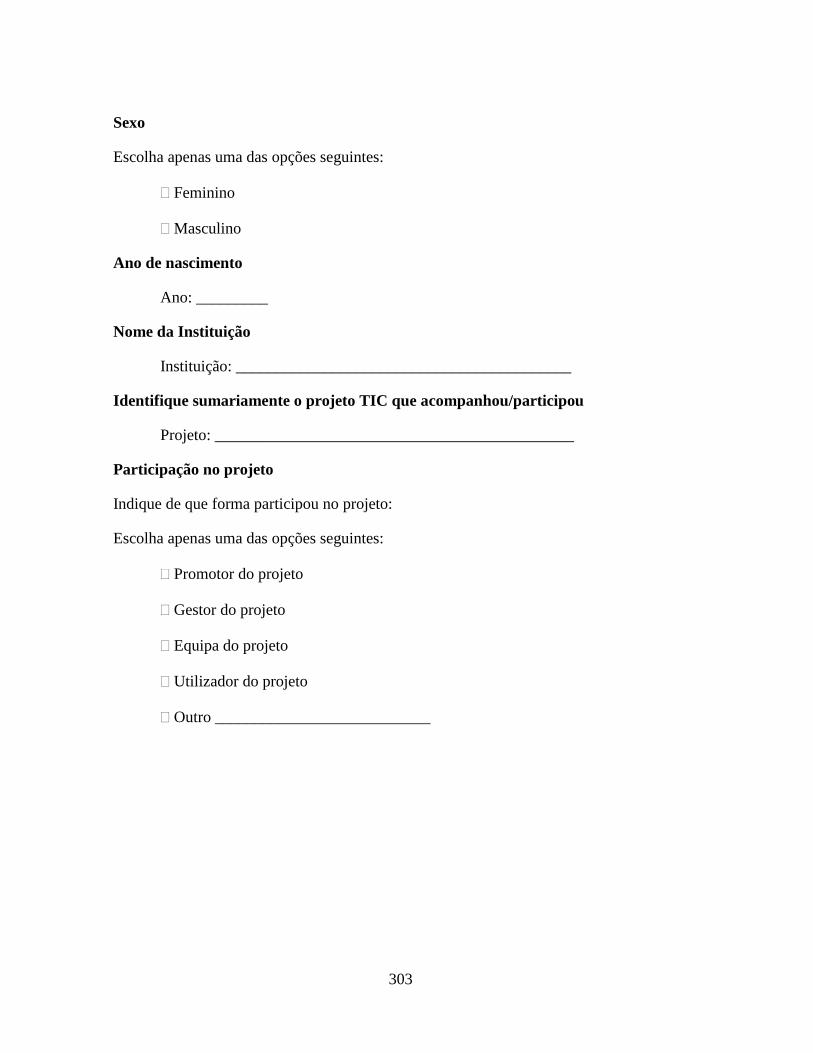
303
Sexo
Escolha apenas uma das opções seguintes:
Feminino
Masculino
Ano de nascimento
Ano: _________
Nome da Instituição
Instituição: __________________________________________
Identifique sumariamente o projeto TIC que acompanhou/participou
Projeto: _____________________________________________
Participação no projeto
Indique de que forma participou no projeto:
Escolha apenas uma das opções seguintes:
Promotor do projeto
Gestor do projeto
Equipa do projeto
Utilizador do projeto
Outro ___________________________
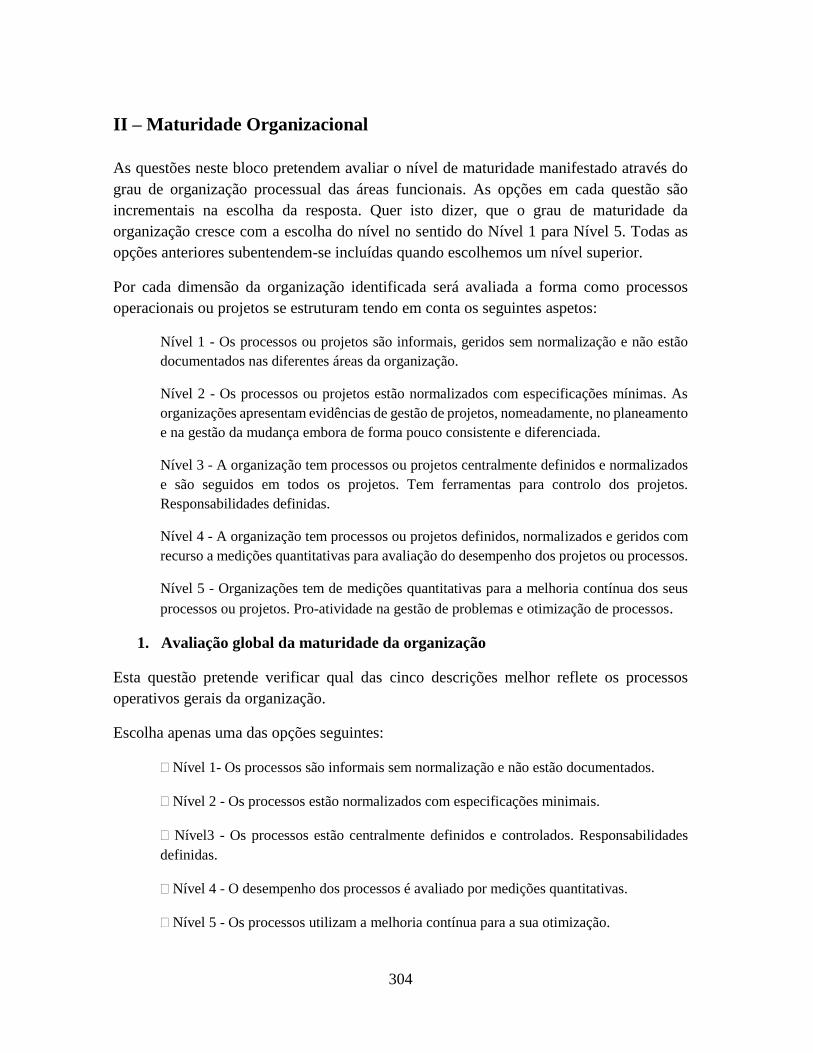
304
II – Maturidade Organizacional
As questões neste bloco pretendem avaliar o nível de maturidade manifestado através do
grau de organização processual das áreas funcionais. As opções em cada questão são
incrementais na escolha da resposta. Quer isto dizer, que o grau de maturidade da
organização cresce com a escolha do nível no sentido do Nível 1 para Nível 5. Todas as
opções anteriores subentendem-se incluídas quando escolhemos um nível superior.
Por cada dimensão da organização identificada será avaliada a forma como processos
operacionais ou projetos se estruturam tendo em conta os seguintes aspetos:
Nível 1 - Os processos ou projetos são informais, geridos sem normalização e não estão
documentados nas diferentes áreas da organização.
Nível 2 - Os processos ou projetos estão normalizados com especificações mínimas. As
organizações apresentam evidências de gestão de projetos, nomeadamente, no planeamento
e na gestão da mudança embora de forma pouco consistente e diferenciada.
Nível 3 - A organização tem processos ou projetos centralmente definidos e normalizados
e são seguidos em todos os projetos. Tem ferramentas para controlo dos projetos.
Responsabilidades definidas.
Nível 4 - A organização tem processos ou projetos definidos, normalizados e geridos com
recurso a medições quantitativas para avaliação do desempenho dos projetos ou processos.
Nível 5 - Organizações tem de medições quantitativas para a melhoria contínua dos seus
processos ou projetos. Pro-atividade na gestão de problemas e otimização de processos.
1. Avaliação global da maturidade da organização
Esta questão pretende verificar qual das cinco descrições melhor reflete os processos
operativos gerais da organização.
Escolha apenas uma das opções seguintes:
Nível 1- Os processos são informais sem normalização e não estão documentados.
Nível 2 - Os processos estão normalizados com especificações minimais.
Nível3 - Os processos estão centralmente definidos e controlados. Responsabilidades
definidas.
Nível 4 - O desempenho dos processos é avaliado por medições quantitativas.
Nível 5 - Os processos utilizam a melhoria contínua para a sua otimização.
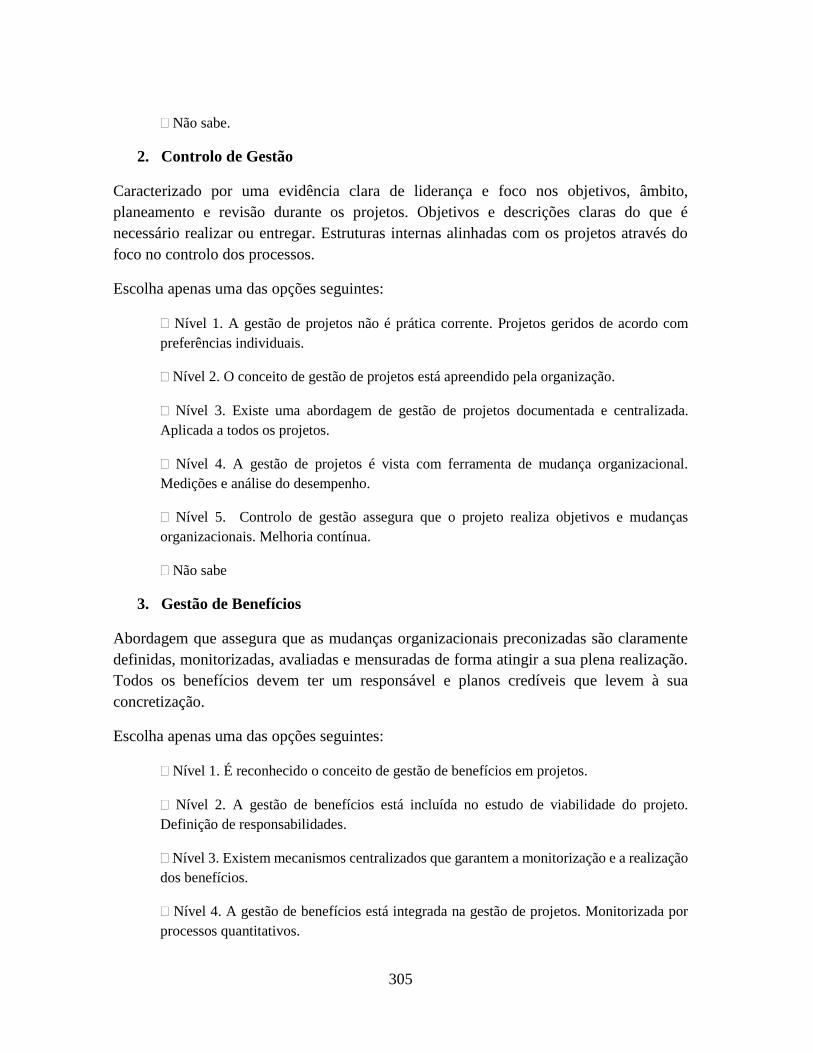
305
Não sabe.
2. Controlo de Gestão
Caracterizado por uma evidência clara de liderança e foco nos objetivos, âmbito,
planeamento e revisão durante os projetos. Objetivos e descrições claras do que é
necessário realizar ou entregar. Estruturas internas alinhadas com os projetos através do
foco no controlo dos processos.
Escolha apenas uma das opções seguintes:
Nível 1. A gestão de projetos não é prática corrente. Projetos geridos de acordo com
preferências individuais.
Nível 2. O conceito de gestão de projetos está apreendido pela organização.
Nível 3. Existe uma abordagem de gestão de projetos documentada e centralizada.
Aplicada a todos os projetos.
Nível 4. A gestão de projetos é vista com ferramenta de mudança organizacional.
Medições e análise do desempenho.
Nível 5. Controlo de gestão assegura que o projeto realiza objetivos e mudanças
organizacionais. Melhoria contínua.
Não sabe
3. Gestão de Benefícios
Abordagem que assegura que as mudanças organizacionais preconizadas são claramente
definidas, monitorizadas, avaliadas e mensuradas de forma atingir a sua plena realização.
Todos os benefícios devem ter um responsável e planos credíveis que levem à sua
concretização.
Escolha apenas uma das opções seguintes:
Nível 1. É reconhecido o conceito de gestão de benefícios em projetos.
Nível 2. A gestão de benefícios está incluída no estudo de viabilidade do projeto.
Definição de responsabilidades.
Nível 3. Existem mecanismos centralizados que garantem a monitorização e a realização
dos benefícios.
Nível 4. A gestão de benefícios está integrada na gestão de projetos. Monitorizada por
processos quantitativos.
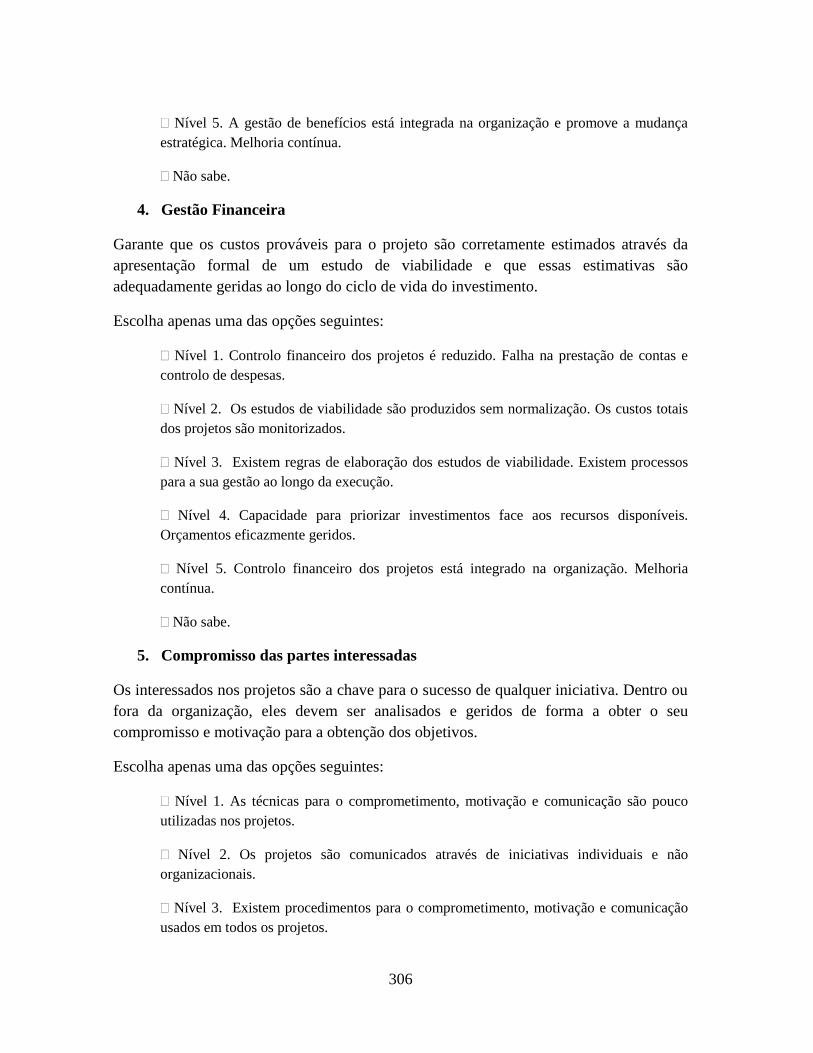
306
Nível 5. A gestão de benefícios está integrada na organização e promove a mudança
estratégica. Melhoria contínua.
Não sabe.
4. Gestão Financeira
Garante que os custos prováveis para o projeto são corretamente estimados através da
apresentação formal de um estudo de viabilidade e que essas estimativas são
adequadamente geridas ao longo do ciclo de vida do investimento.
Escolha apenas uma das opções seguintes:
Nível 1. Controlo financeiro dos projetos é reduzido. Falha na prestação de contas e
controlo de despesas.
Nível 2. Os estudos de viabilidade são produzidos sem normalização. Os custos totais
dos projetos são monitorizados.
Nível 3. Existem regras de elaboração dos estudos de viabilidade. Existem processos
para a sua gestão ao longo da execução.
Nível 4. Capacidade para priorizar investimentos face aos recursos disponíveis.
Orçamentos eficazmente geridos.
Nível 5. Controlo financeiro dos projetos está integrado na organização. Melhoria
contínua.
Não sabe.
5. Compromisso das partes interessadas
Os interessados nos projetos são a chave para o sucesso de qualquer iniciativa. Dentro ou
fora da organização, eles devem ser analisados e geridos de forma a obter o seu
compromisso e motivação para a obtenção dos objetivos.
Escolha apenas uma das opções seguintes:
Nível 1. As técnicas para o comprometimento, motivação e comunicação são pouco
utilizadas nos projetos.
Nível 2. Os projetos são comunicados através de iniciativas individuais e não
organizacionais.
Nível 3. Existem procedimentos para o comprometimento, motivação e comunicação
usados em todos os projetos.
307
Nível 4. Utilização de técnicas para medição quantitativa do compromisso das partes
interessadas no projeto.
Nível 5. Comunicação é otimizada para disseminação de conhecimento na organização.
Melhoria contínua.
Não sabe.
6. Gestão do Risco
A forma como a organização trata as ameaças e oportunidades dos projetos. Mantém o foco
no equilíbrio entre ameaças e oportunidades, através de ações de gestão apropriadas para
minimizar a probabilidade da ocorrência de qualquer ameaça, ou para minimizar o seu
impacto e maximizar as oportunidades.
Escolha apenas uma das opções seguintes:
Nível 1. Evidência minimal da utilização da gestão de riscos em projetos.
Nível 2. A gestão de risco é reconhecida e usada em projetos. As abordagens não são
normalizadas.
Nível 3. A gestão de risco é suportada em processos definidos e normalizados e é usada
consistentemente.
Nível 4. A gestão de risco funciona eficazmente e é possível demonstrar o seu valor.
Nível 5. A gestão de riscos está integrada na cultura da organização e sustenta as decisões.
Melhoria contínua.
Não sabe.
7. Governo Organizacional
Análise da forma como a realização dos projetos segue a estratégia da organização.
Controlo da iniciação e encerramento aos projetos e monitorização do cumprimento do
ciclo de vida estabelecido para o projeto.
Escolha apenas uma das opções seguintes:
Nível 1. Governação informal dos projetos sem ligação ao controlo organizacional.
Nível 2. Gestão de projetos em fase inicial com controlo pouco consistente.
Nível 3. Controlo organizacional centralizado e aplicado consistentemente a todos os
projetos.
308
Nível 4. Alinhamento do processo de decisão com a governação da organização.
Medições quantitativas.
Nível 5. A governação dos projetos é central no controlo organizacional. Melhoria
contínua.
Não sabe.
8. Gestão de Recursos
A gestão de recursos humanos, equipamentos, ferramentas, informação, consumíveis e
equipas de suporte. O elemento chave é o processo de aquisição e a forma como a cadeia
de fornecimento é gerida com foco na maximização do uso efetivo dos recursos.
Escolha apenas uma das opções seguintes:
Nível 1. A organização reconhece a necessidade de gerir os recursos para potenciar o
sucesso dos projetos.
Nível 2. Os recursos são distribuídos pelos projetos. Processo de aquisições sem
planeamento.
Nível 3. Sistema centralizado para os processos de aquisições, planeamento e gestão de
recursos.
Nível 4. Gestão de recursos é considerada estratégica na organização. Medições
quantitativas.
Nível 5. Otimização dos recursos. Gestão equilibrada entre recursos externos e internos.
Melhoria Contínua.
Não sabe.
9. Avaliação global da gestão de projetos
Esta questão pretende verificar qual das cinco descrições melhor reflete a gestão de projetos
na organização.
Escolha apenas uma das opções seguintes:
Nível 1. A organização reconhece os projetos, mas faz uma gestão diferenciada e
informal.
Nível 2. A organização assegura a execução dos seus projetos de acordos com processos
normalizados.
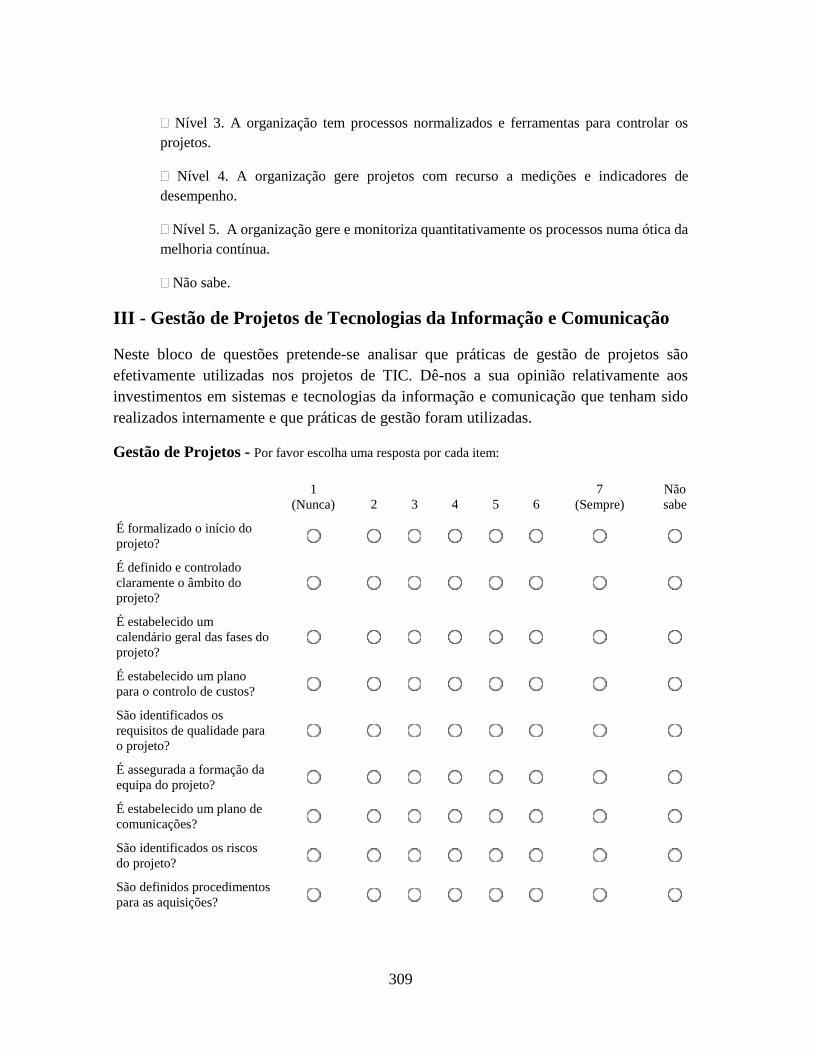
309
Nível 3. A organização tem processos normalizados e ferramentas para controlar os
projetos.
Nível 4. A organização gere projetos com recurso a medições e indicadores de
desempenho.
Nível 5. A organização gere e monitoriza quantitativamente os processos numa ótica da
melhoria contínua.
Não sabe.
III - Gestão de Projetos de Tecnologias da Informação e Comunicação
Neste bloco de questões pretende-se analisar que práticas de gestão de projetos são
efetivamente utilizadas nos projetos de TIC. Dê-nos a sua opinião relativamente aos
investimentos em sistemas e tecnologias da informação e comunicação que tenham sido
realizados internamente e que práticas de gestão foram utilizadas.
Gestão de Projetos - Por favor escolha uma resposta por cada item:
1
(Nunca) 2 3 4 5 6
7
(Sempre)
Não
sabe
É formalizado o início do
projeto?
É definido e controlado
claramente o âmbito do
projeto?
É estabelecido um
calendário geral das fases do
projeto?
É estabelecido um plano
para o controlo de custos?
São identificados os
requisitos de qualidade para
o projeto?
É assegurada a formação da
equipa do projeto?
É estabelecido um plano de
comunicações?
São identificados os riscos
do projeto?
São definidos procedimentos
para as aquisições?
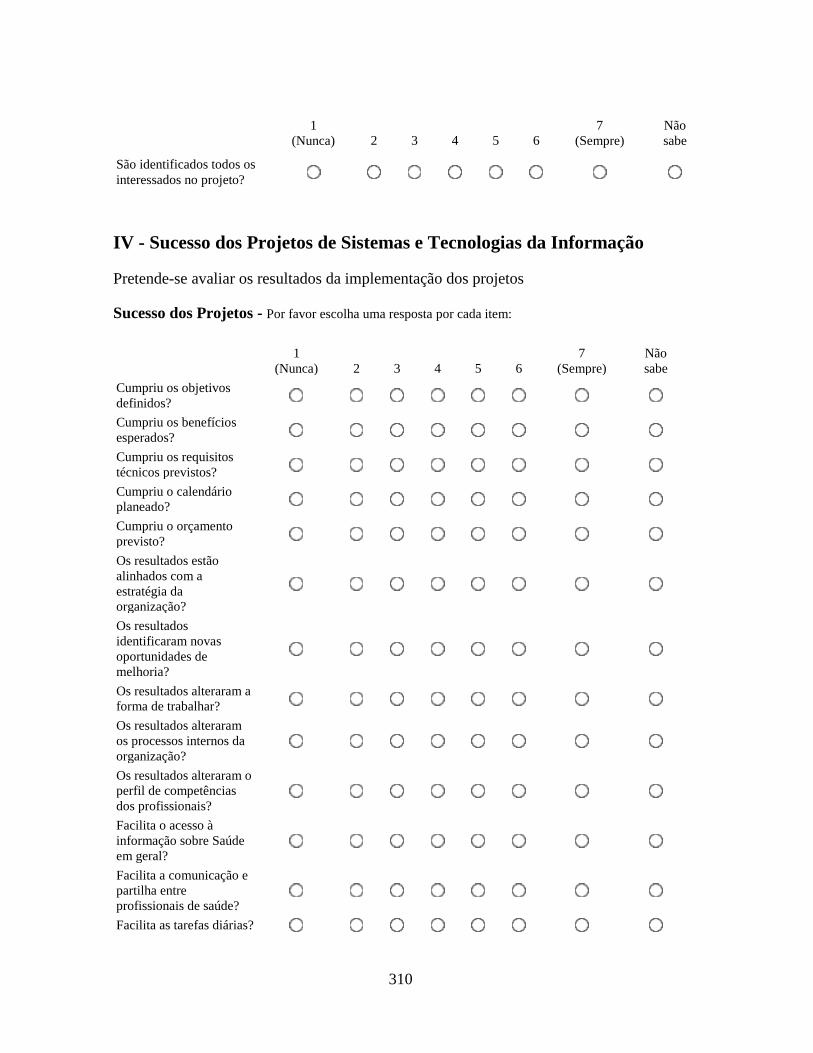
310
1
(Nunca) 2 3 4 5 6
7
(Sempre)
Não
sabe
São identificados todos os
interessados no projeto?
IV - Sucesso dos Projetos de Sistemas e Tecnologias da Informação
Pretende-se avaliar os resultados da implementação dos projetos
Sucesso dos Projetos - Por favor escolha uma resposta por cada item:
1
(Nunca) 2 3 4 5 6
7
(Sempre)
Não
sabe
Cumpriu os objetivos
definidos?
Cumpriu os benefícios
esperados?
Cumpriu os requisitos
técnicos previstos?
Cumpriu o calendário
planeado?
Cumpriu o orçamento
previsto?
Os resultados estão
alinhados com a
estratégia da
organização?
Os resultados
identificaram novas
oportunidades de
melhoria?
Os resultados alteraram a
forma de trabalhar?
Os resultados alteraram
os processos internos da
organização?
Os resultados alteraram o
perfil de competências
dos profissionais?
Facilita o acesso à
informação sobre Saúde
em geral?
Facilita a comunicação e
partilha entre
profissionais de saúde?
Facilita as tarefas diárias?
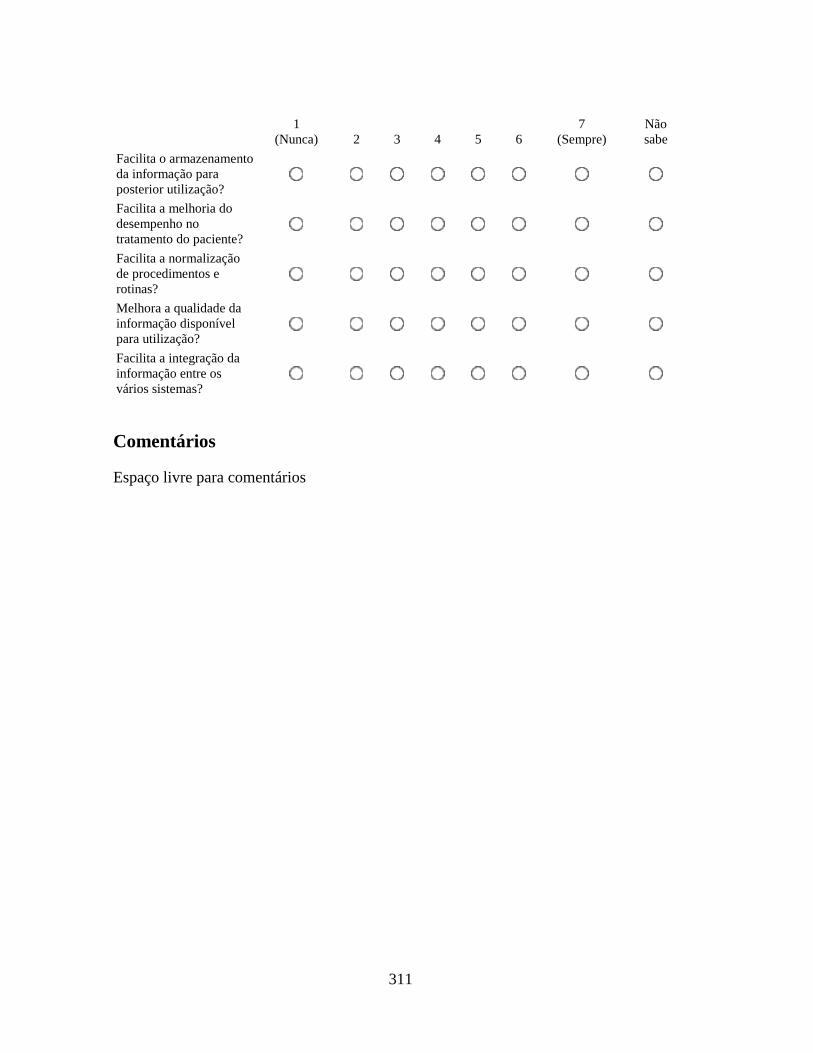
311
1
(Nunca) 2 3 4 5 6
7
(Sempre)
Não
sabe
Facilita o armazenamento
da informação para
posterior utilização?
Facilita a melhoria do
desempenho no
tratamento do paciente?
Facilita a normalização
de procedimentos e
rotinas?
Melhora a qualidade da
informação disponível
para utilização?
Facilita a integração da
informação entre os
vários sistemas?
Comentários
Espaço livre para comentários
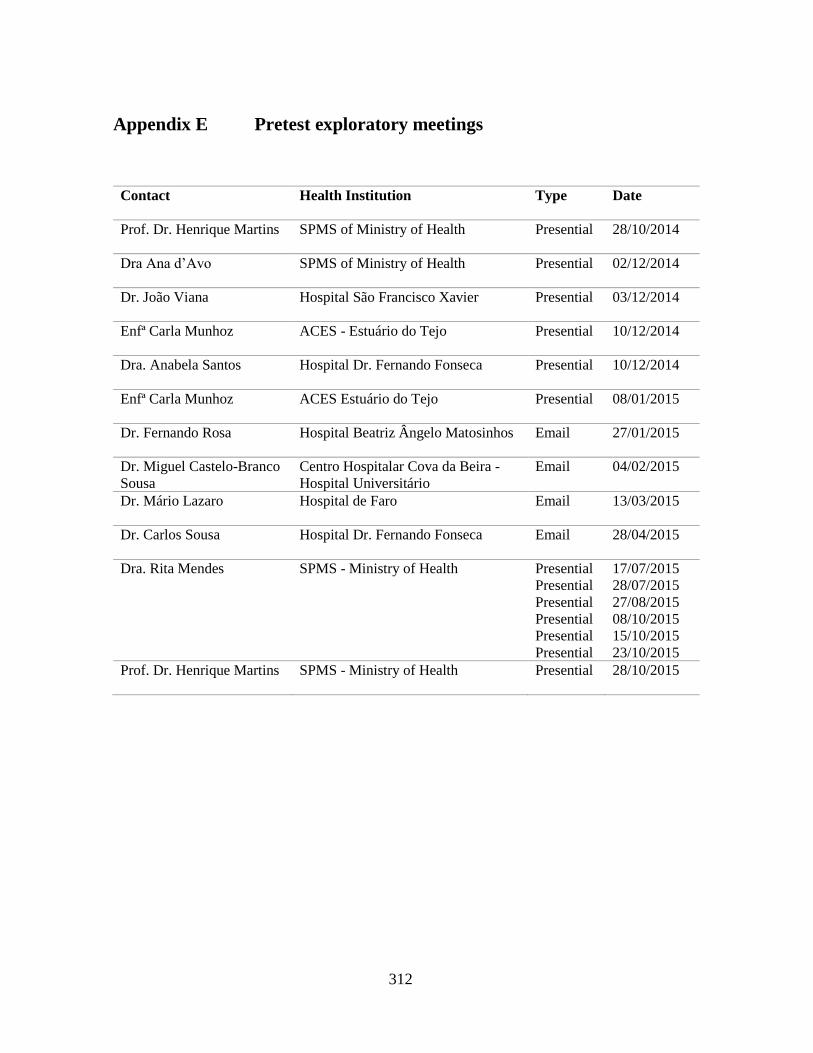
312
Appendix E Pretest exploratory meetings
Contact Health Institution Type Date
Prof. Dr. Henrique Martins SPMS of Ministry of Health Presential 28/10/2014
Dra Ana d’Avo SPMS of Ministry of Health Presential 02/12/2014
Dr. João Viana Hospital São Francisco Xavier Presential 03/12/2014
Enfª Carla Munhoz ACES - Estuário do Tejo Presential 10/12/2014
Dra. Anabela Santos Hospital Dr. Fernando Fonseca Presential 10/12/2014
Enfª Carla Munhoz ACES Estuário do Tejo Presential 08/01/2015
Dr. Fernando Rosa Hospital Beatriz Ângelo Matosinhos Email 27/01/2015
Dr. Miguel Castelo-Branco
Sousa
Centro Hospitalar Cova da Beira -
Hospital Universitário
Email 04/02/2015
Dr. Mário Lazaro Hospital de Faro Email 13/03/2015
Dr. Carlos Sousa Hospital Dr. Fernando Fonseca Email 28/04/2015
Dra. Rita Mendes SPMS - Ministry of Health Presential
Presential
Presential
Presential
Presential
Presential
17/07/2015
28/07/2015
27/08/2015
08/10/2015
15/10/2015
23/10/2015
Prof. Dr. Henrique Martins SPMS - Ministry of Health Presential 28/10/2015
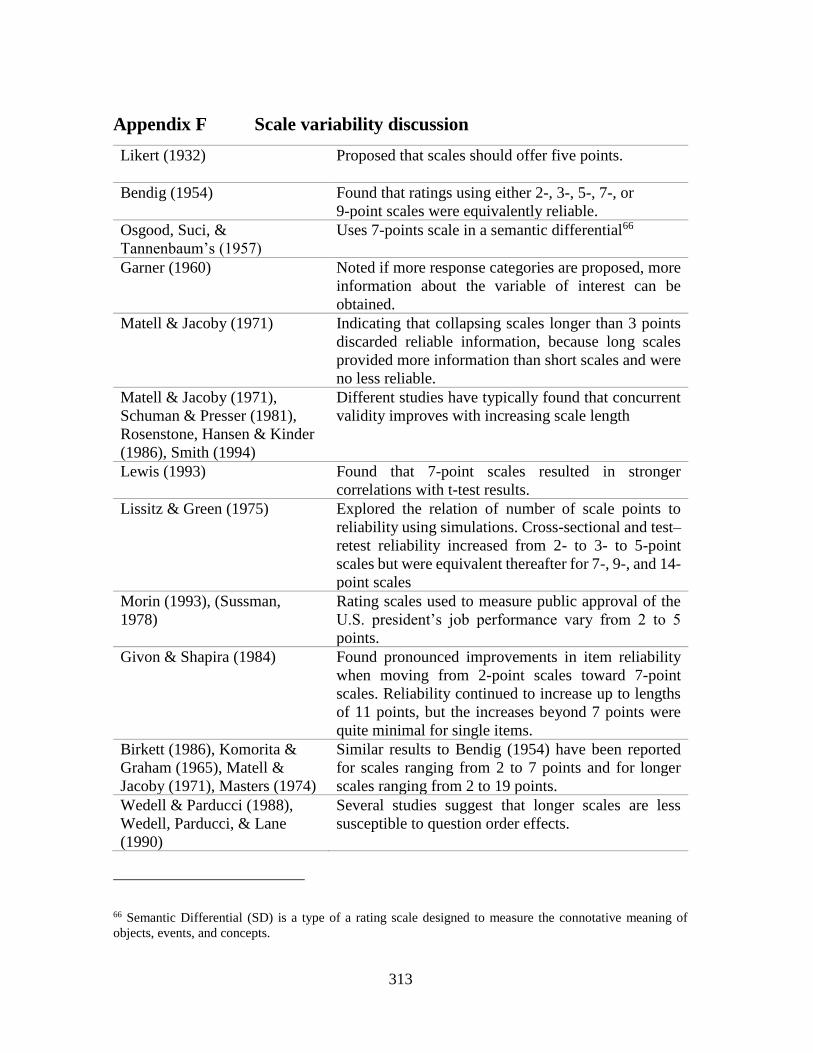
313
Appendix F Scale variability discussion
Likert (1932) Proposed that scales should offer five points.
Bendig (1954) Found that ratings using either 2-, 3-, 5-, 7-, or
9-point scales were equivalently reliable.
Osgood, Suci, &
Tannenbaum’s (1957)
Uses 7-points scale in a semantic differential66
Garner (1960) Noted if more response categories are proposed, more
information about the variable of interest can be
obtained.
Matell & Jacoby (1971) Indicating that collapsing scales longer than 3 points
discarded reliable information, because long scales
provided more information than short scales and were
no less reliable.
Matell & Jacoby (1971),
Schuman & Presser (1981),
Rosenstone, Hansen & Kinder
(1986), Smith (1994)
Different studies have typically found that concurrent
validity improves with increasing scale length
Lewis (1993) Found that 7-point scales resulted in stronger
correlations with t-test results.
Lissitz & Green (1975) Explored the relation of number of scale points to
reliability using simulations. Cross-sectional and test–
retest reliability increased from 2- to 3- to 5-point
scales but were equivalent thereafter for 7-, 9-, and 14-
point scales
Morin (1993), (Sussman,
1978)
Rating scales used to measure public approval of the
U.S. president’s job performance vary from 2 to 5
points.
Givon & Shapira (1984) Found pronounced improvements in item reliability
when moving from 2-point scales toward 7-point
scales. Reliability continued to increase up to lengths
of 11 points, but the increases beyond 7 points were
quite minimal for single items.
Birkett (1986), Komorita &
Graham (1965), Matell &
Jacoby (1971), Masters (1974)
Similar results to Bendig (1954) have been reported
for scales ranging from 2 to 7 points and for longer
scales ranging from 2 to 19 points.
Wedell & Parducci (1988),
Wedell, Parducci, & Lane
(1990)
Several studies suggest that longer scales are less
susceptible to question order effects.
66 Semantic Differential (SD) is a type of a rating scale designed to measure the connotative meaning of
objects, events, and concepts.
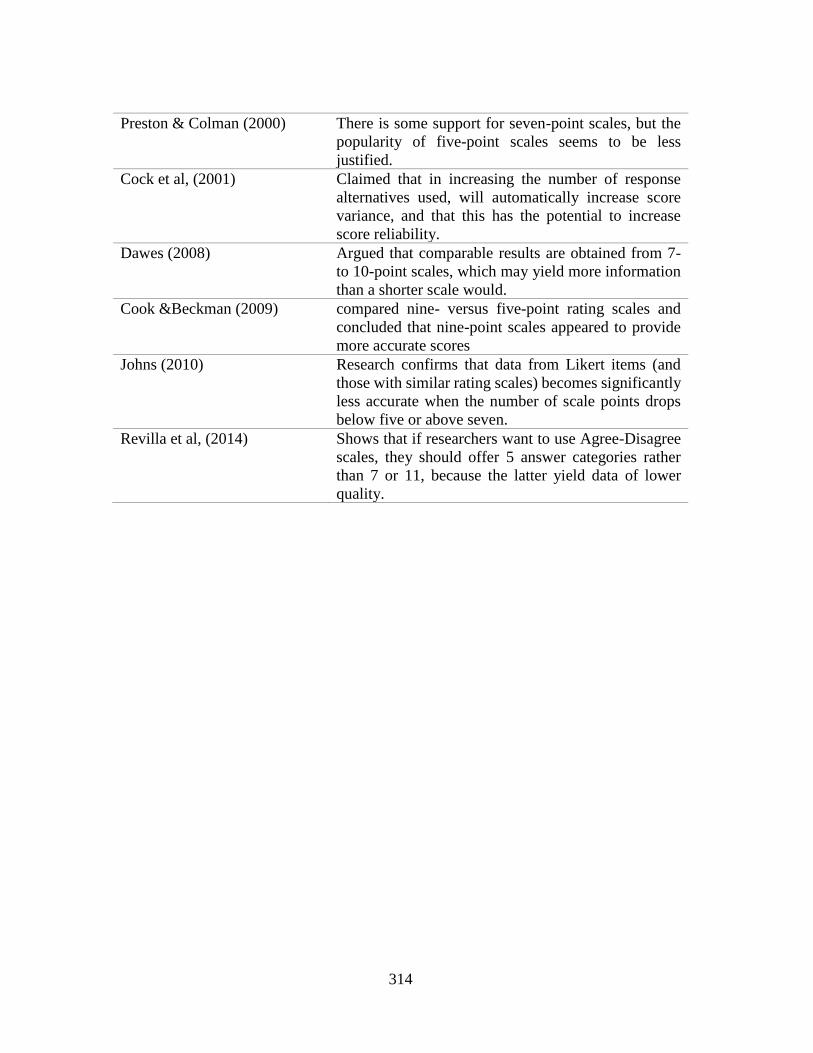
314
Preston & Colman (2000) There is some support for seven-point scales, but the
popularity of five-point scales seems to be less
justified.
Cock et al, (2001) Claimed that in increasing the number of response
alternatives used, will automatically increase score
variance, and that this has the potential to increase
score reliability.
Dawes (2008) Argued that comparable results are obtained from 7-
to 10-point scales, which may yield more information
than a shorter scale would.
Cook &Beckman (2009) compared nine- versus five-point rating scales and
concluded that nine-point scales appeared to provide
more accurate scores
Johns (2010) Research confirms that data from Likert items (and
those with similar rating scales) becomes significantly
less accurate when the number of scale points drops
below five or above seven.
Revilla et al, (2014) Shows that if researchers want to use Agree-Disagree
scales, they should offer 5 answer categories rather
than 7 or 11, because the latter yield data of lower
quality.

315
Appendix G SPMS/ISEG agreement
316
317
318
319
320
Appendix H Presentation letter and reminders
Caro (a) profissional de saúde,
O meu nome é Jorge Gomes sou estudante do Programa de Doutoramento em Gestão do Instituto Superior de Economia e Gestão e estou a desenvolver uma tese no âmbito dos Sistemas e Tecnologias da informação e Comunicação na Saúde, denominados TIC.
Atendendo à ausência de informação disponível para a realização deste estudo foi assinado um protocolo assinado entre o ISEG e a SPMS para dar enquadramento ao processo de investigação. Neste sentido apela-se à sua colaboração para a dinamização e mobilização dos profissionais de saúde da sua Instituição para o preenchimento de um questionário on-line cujo objetivo principal é o de analisar a relação entre a Maturidade das Instituições de Saúde e o Sucesso dos Projetos de Sistemas e Tecnologias da Informação e Comunicação, e a eventual utilização de práticas de Gestão de Projetos na implementação destes investimentos.
A sua colaboração é fundamental para o sucesso deste estudo. Solicito desta forma a sua disponibilidade para contatar dentro da sua unidade de saúde, os profissionais de saúde, que de alguma forma tiveram contato com implementações de Projetos nas áreas dos Sistemas e Tecnologias da Informação e Comunicação (TIC).
Uma participação representativa é essencial para que o estudo apresente a fiabilidade necessária ao subsequente tratamento estatístico e para que possam ser extraídas conclusões relevantes e desta forma permitam melhorias em futuros investimentos nestas áreas. Queria ainda sublinhar alguns aspetos que identifico como fundamentais para o bom desenvolvimento deste estudo:
1) Os respondentes devem um bom conhecimento dos processos internos da sua Instituição.
2) Ter acompanhado de alguma forma o desenvolvimento e/ou implementação de um projeto de Sistemas e Tecnologias da Informação e Comunicação.
3) Os respondentes podem ser todos os profissionais das Instituições de Saúde (Administração Hospitalar, Médicos, Enfermeiros, profissionais das Tecnologias, Técnicos Superiores, Administrativos…)
4) O número esperado de questionários preenchidos por unidade de saúde é de 12.
5) O presente estudo representa um processo de investigação académico, isento é da total responsabilidade do ISEG sendo garantido o anonimato dos respondentes.
Poderá encontrar o questionário neste endereço eletrónico http://pascal.iseg.utl.pt/lsinq/index.php?sid=74554&lang=pt
Informa-se ainda que o questionário só será considerado válido se for devidamente preenchido. O tempo médio estimado para responder a este questionário é de 15 min.
Grato pela atenção dispensada, apresento os meus melhores cumprimentos,
Jorge Manuel Vareda Gomes
321
Exmos Senhores,
O meu nome é Jorge Gomes, sou aluno do Programa de Doutoramento em Gestão do ISEG (Instituto Superior de Economia e Gestão) e estou a desenvolver uma tese no âmbito dos Sistemas e Tecnologias da informação e Comunicação na Saúde, denominados TIC.
Atendendo à ausência de informação relevante para a realização do estudo foi assinado um protocolo entre o ISEG e a SPMS para dar enquadramento técnico-científico ao processo de investigação. Neste sentido apelo à sua colaboração na dinamização e mobilização dos profissionais de saúde da sua Instituição para o preenchimento de um questionário on-line.
O objetivo principal do estudo é o de estabelecer uma relação entre a Maturidade das Instituições de Saúde e o Sucesso dos Projetos de Sistemas e Tecnologias da Informação e Comunicação, e a eventual utilização de práticas de Gestão de Projetos na implementação destes investimentos.
A sua colaboração é fundamental para o sucesso deste estudo. Solicito desta forma a sua atenção e disponibilidade para contatar dentro da sua unidade de saúde, os profissionais de saúde, que de alguma forma tiveram contato com este tipo de implementações. Uma participação representativa é essencial para que o estudo apresente a fiabilidade necessária ao subsequente tratamento estatístico e para que possam ser extraídas conclusões relevantes para eventuais melhorias em futuros investimentos nestas áreas. No que respeita aos potenciais respondentes identifico alguns aspetos que considero fundamentais para o bom desenvolvimento do estudo:
• O conhecimento dos processos internos da Instituição em que colabora e ter acompanhado de alguma forma o desenvolvimento e/ou implementação de um projeto de Sistemas e Tecnologias da Informação e Comunicação.
• Todos os profissionais das Instituições de Saúde, nomeadamente; Administração Hospitalar, Médicos, Enfermeiros, Sistemas e Tecnologias, Técnicos Superiores, Técnicos de Diagnóstico e Terapêutica, Administrativos, entre outros.
O presente estudo representa um processo de investigação académico, isento é da total responsabilidade do ISEG sendo garantido o anonimato dos respondentes. O questionário está disponível no seguinte endereço eletrónico.
http://pascal.iseg.utl.pt/lsinq/index.php?sid=74554&lang=pt
A duração estimada para o total preenchimento é de 15 mn.
Grato pela atenção dispensada, apresento os meus melhores cumprimentos,
Jorge Gomes Aluno do Programa de Doutoramento em Gestão - ISEG [email protected] 967083177
322
Exmo(a) Senhor(a),
Serve o presente para recordar que está disponível até ao final do mês de Julho de 2016, o questionário online, cujo objetivo principal é o estudo da relação entre a Maturidade das Instituições de Saúde e o Sucesso dos Projetos de Sistemas e Tecnologias da Informação e Comunicação, com a eventual utilização de práticas de Gestão de Projetos.
A sua participação é fundamental para a viabilização do estudo.
Pode encontrar o questionário no endereço eletrónico seguinte.
http://pascal.iseg.utl.pt/lsinq/index.php?sid=74554&lang=pt
Grato pela atenção dispensada, apresento os meus melhores cumprimentos,
Jorge Manuel Vareda Gomes
Instituto Superior de Economia e Gestão, Universidade de Lisboa
Tel.: 967083177
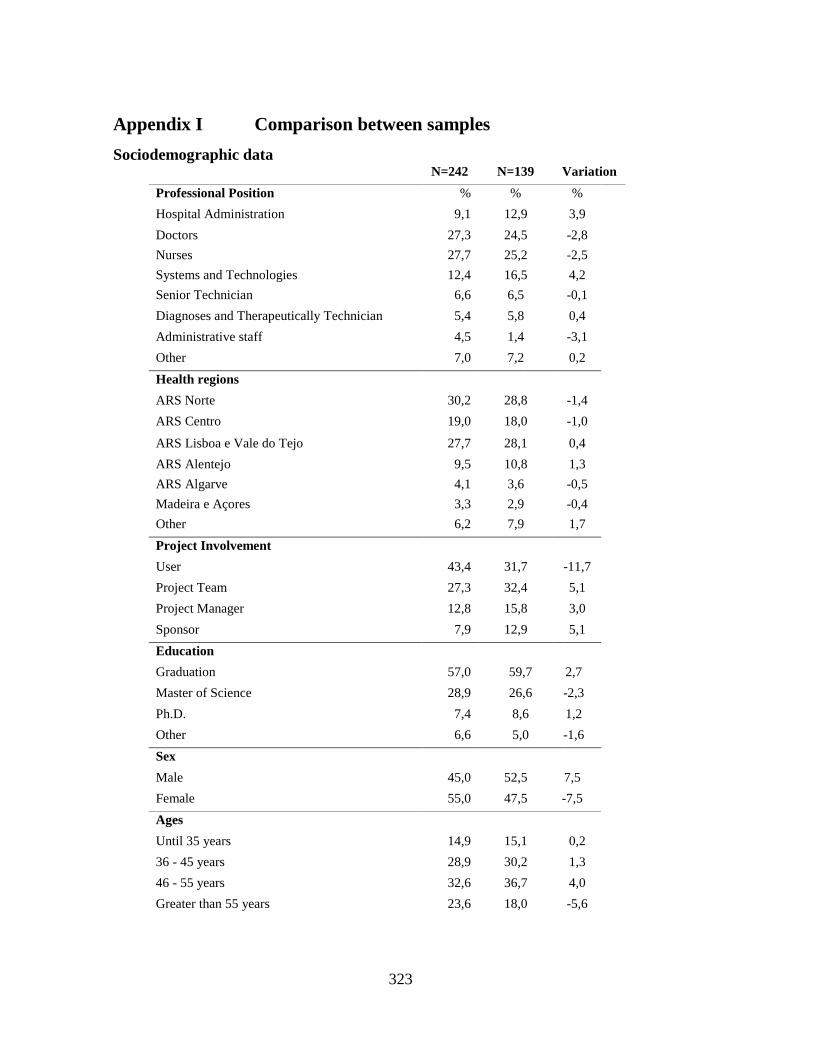
323
Appendix I Comparison between samples
Sociodemographic data N=242 N=139 Variation
Professional Position % % %
Hospital Administration 9,1 12,9 3,9
Doctors 27,3 24,5 -2,8
Nurses 27,7 25,2 -2,5
Systems and Technologies 12,4 16,5 4,2
Senior Technician 6,6 6,5 -0,1
Diagnoses and Therapeutically Technician 5,4 5,8 0,4
Administrative staff 4,5 1,4 -3,1
Other 7,0 7,2 0,2
Health regions
ARS Norte 30,2 28,8 -1,4
ARS Centro 19,0 18,0 -1,0
ARS Lisboa e Vale do Tejo 27,7 28,1 0,4
ARS Alentejo 9,5 10,8 1,3
ARS Algarve 4,1 3,6 -0,5
Madeira e Açores 3,3 2,9 -0,4
Other 6,2 7,9 1,7
Project Involvement
User 43,4 31,7 -11,7
Project Team 27,3 32,4 5,1
Project Manager 12,8 15,8 3,0
Sponsor 7,9 12,9 5,1
Education
Graduation 57,0 59,7 2,7
Master of Science 28,9 26,6 -2,3
Ph.D. 7,4 8,6 1,2
Other 6,6 5,0 -1,6
Sex
Male 45,0 52,5 7,5
Female 55,0 47,5 -7,5
Ages
Until 35 years 14,9 15,1 0,2
36 - 45 years 28,9 30,2 1,3
46 - 55 years 32,6 36,7 4,0
Greater than 55 years 23,6 18,0 -5,6
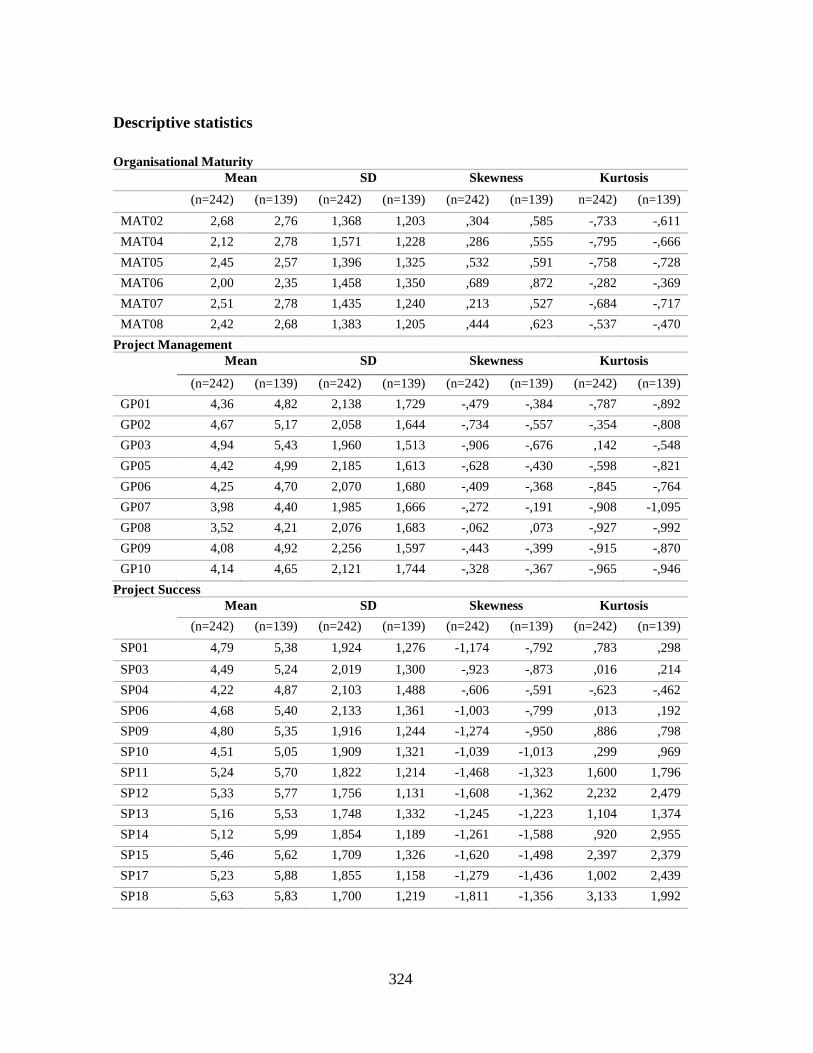
324
Descriptive statistics
Organisational Maturity
Mean SD Skewness Kurtosis
(n=242) (n=139) (n=242) (n=139) (n=242) (n=139) n=242) (n=139)
MAT02 2,68 2,76 1,368 1,203 ,304 ,585 -,733 -,611
MAT04 2,12 2,78 1,571 1,228 ,286 ,555 -,795 -,666
MAT05 2,45 2,57 1,396 1,325 ,532 ,591 -,758 -,728
MAT06 2,00 2,35 1,458 1,350 ,689 ,872 -,282 -,369
MAT07 2,51 2,78 1,435 1,240 ,213 ,527 -,684 -,717
MAT08 2,42 2,68 1,383 1,205 ,444 ,623 -,537 -,470
Project Management
Mean SD Skewness Kurtosis
(n=242) (n=139) (n=242) (n=139) (n=242) (n=139) (n=242) (n=139)
GP01 4,36 4,82 2,138 1,729 -,479 -,384 -,787 -,892
GP02 4,67 5,17 2,058 1,644 -,734 -,557 -,354 -,808
GP03 4,94 5,43 1,960 1,513 -,906 -,676 ,142 -,548
GP05 4,42 4,99 2,185 1,613 -,628 -,430 -,598 -,821
GP06 4,25 4,70 2,070 1,680 -,409 -,368 -,845 -,764
GP07 3,98 4,40 1,985 1,666 -,272 -,191 -,908 -1,095
GP08 3,52 4,21 2,076 1,683 -,062 ,073 -,927 -,992
GP09 4,08 4,92 2,256 1,597 -,443 -,399 -,915 -,870
GP10 4,14 4,65 2,121 1,744 -,328 -,367 -,965 -,946
Project Success
Mean SD Skewness Kurtosis
(n=242) (n=139) (n=242) (n=139) (n=242) (n=139) (n=242) (n=139)
SP01 4,79 5,38 1,924 1,276 -1,174 -,792 ,783 ,298
SP03 4,49 5,24 2,019 1,300 -,923 -,873 ,016 ,214
SP04 4,22 4,87 2,103 1,488 -,606 -,591 -,623 -,462
SP06 4,68 5,40 2,133 1,361 -1,003 -,799 ,013 ,192
SP09 4,80 5,35 1,916 1,244 -1,274 -,950 ,886 ,798
SP10 4,51 5,05 1,909 1,321 -1,039 -1,013 ,299 ,969
SP11 5,24 5,70 1,822 1,214 -1,468 -1,323 1,600 1,796
SP12 5,33 5,77 1,756 1,131 -1,608 -1,362 2,232 2,479
SP13 5,16 5,53 1,748 1,332 -1,245 -1,223 1,104 1,374
SP14 5,12 5,99 1,854 1,189 -1,261 -1,588 ,920 2,955
SP15 5,46 5,62 1,709 1,326 -1,620 -1,498 2,397 2,379
SP17 5,23 5,88 1,855 1,158 -1,279 -1,436 1,002 2,439
SP18 5,63 5,83 1,700 1,219 -1,811 -1,356 3,133 1,992
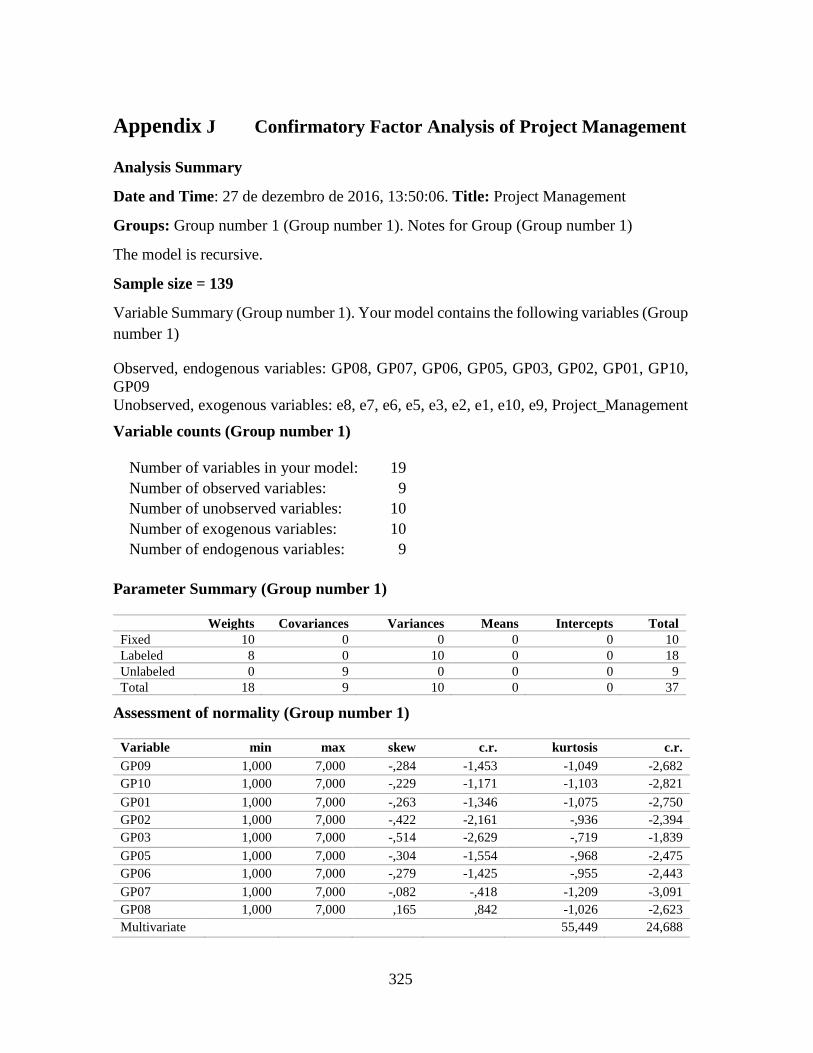
325
Appendix J Confirmatory Factor Analysis of Project Management
Analysis Summary
Date and Time: 27 de dezembro de 2016, 13:50:06. Title: Project Management
Groups: Group number 1 (Group number 1). Notes for Group (Group number 1)
The model is recursive.
Sample size = 139
Variable Summary (Group number 1). Your model contains the following variables (Group
number 1)
Observed, endogenous variables: GP08, GP07, GP06, GP05, GP03, GP02, GP01, GP10,
GP09
Unobserved, exogenous variables: e8, e7, e6, e5, e3, e2, e1, e10, e9, Project_Management
Variable counts (Group number 1)
Number of variables in your model: 19
Number of observed variables: 9
Number of unobserved variables: 10
Number of exogenous variables: 10
Number of endogenous variables: 9
Parameter Summary (Group number 1)
Weights Covariances Variances Means Intercepts Total
Fixed 10 0 0 0 0 10
Labeled 8 0 10 0 0 18
Unlabeled 0 9 0 0 0 9
Total 18 9 10 0 0 37
Assessment of normality (Group number 1)
Variable min max skew c.r. kurtosis c.r.
GP09 1,000 7,000 -,284 -1,453 -1,049 -2,682
GP10 1,000 7,000 -,229 -1,171 -1,103 -2,821
GP01 1,000 7,000 -,263 -1,346 -1,075 -2,750
GP02 1,000 7,000 -,422 -2,161 -,936 -2,394
GP03 1,000 7,000 -,514 -2,629 -,719 -1,839
GP05 1,000 7,000 -,304 -1,554 -,968 -2,475
GP06 1,000 7,000 -,279 -1,425 -,955 -2,443
GP07 1,000 7,000 -,082 -,418 -1,209 -3,091
GP08 1,000 7,000 ,165 ,842 -1,026 -2,623
Multivariate
55,449 24,688
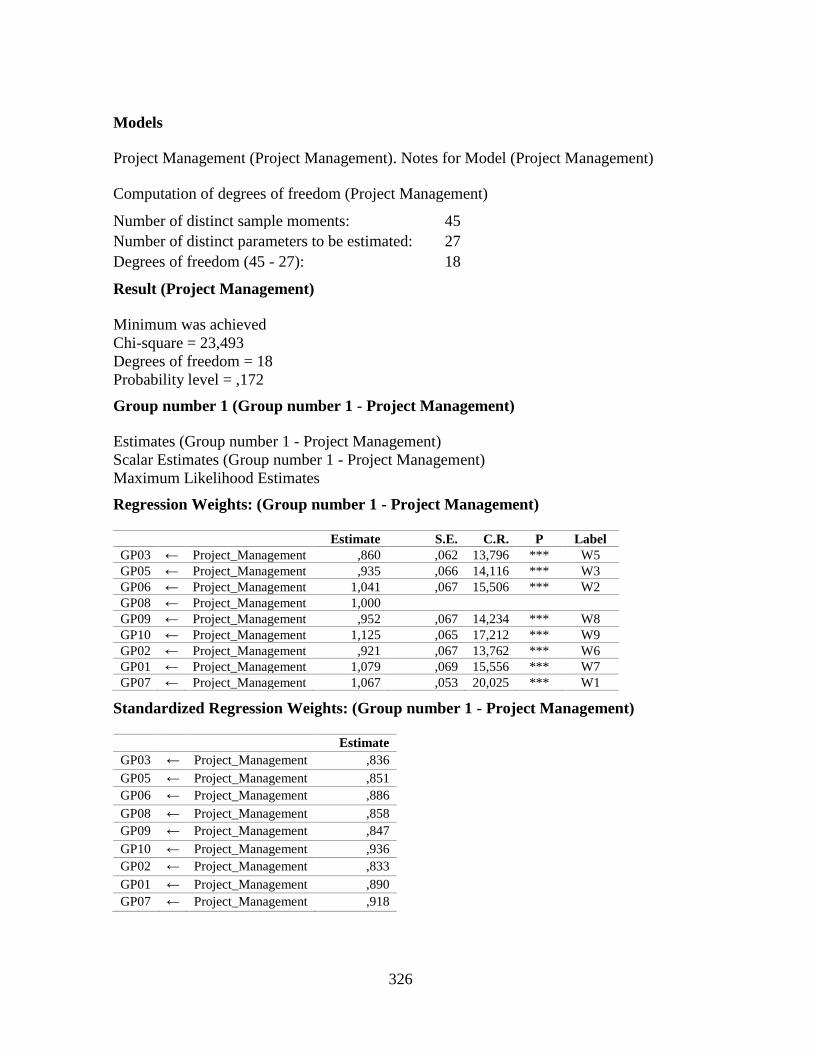
326
Models
Project Management (Project Management). Notes for Model (Project Management)
Computation of degrees of freedom (Project Management)
Number of distinct sample moments: 45
Number of distinct parameters to be estimated: 27
Degrees of freedom (45 - 27): 18
Result (Project Management)
Minimum was achieved
Chi-square = 23,493
Degrees of freedom = 18
Probability level = ,172
Group number 1 (Group number 1 - Project Management)
Estimates (Group number 1 - Project Management)
Scalar Estimates (Group number 1 - Project Management)
Maximum Likelihood Estimates
Regression Weights: (Group number 1 - Project Management)
Estimate S.E. C.R. P Label
GP03 ← Project_Management ,860 ,062 13,796 *** W5
GP05 ← Project_Management ,935 ,066 14,116 *** W3
GP06 ← Project_Management 1,041 ,067 15,506 *** W2
GP08 ← Project_Management 1,000
GP09 ← Project_Management ,952 ,067 14,234 *** W8
GP10 ← Project_Management 1,125 ,065 17,212 *** W9
GP02 ← Project_Management ,921 ,067 13,762 *** W6
GP01 ← Project_Management 1,079 ,069 15,556 *** W7
GP07 ← Project_Management 1,067 ,053 20,025 *** W1
Standardized Regression Weights: (Group number 1 - Project Management)
Estimate
GP03 ← Project_Management ,836
GP05 ← Project_Management ,851
GP06 ← Project_Management ,886
GP08 ← Project_Management ,858
GP09 ← Project_Management ,847
GP10 ← Project_Management ,936
GP02 ← Project_Management ,833
GP01 ← Project_Management ,890
GP07 ← Project_Management ,918
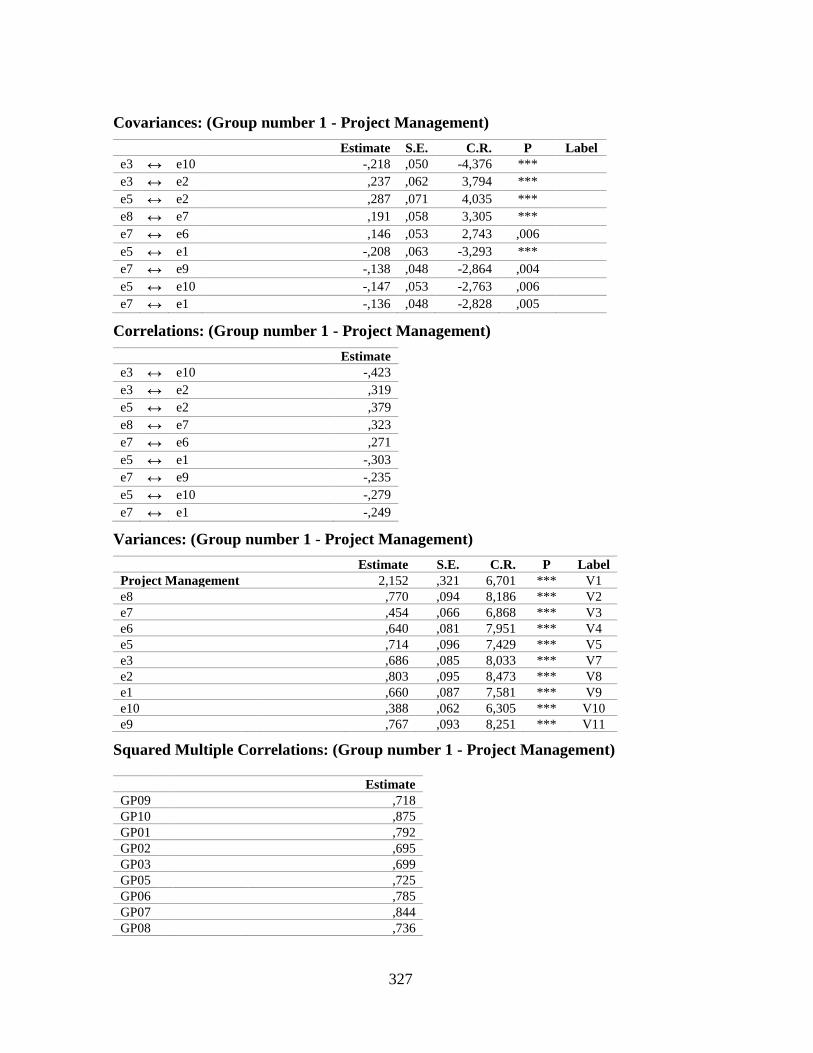
327
Covariances: (Group number 1 - Project Management)
Estimate S.E. C.R. P Label
e3 ↔ e10 -,218 ,050 -4,376 ***
e3 ↔ e2 ,237 ,062 3,794 ***
e5 ↔ e2 ,287 ,071 4,035 ***
e8 ↔ e7 ,191 ,058 3,305 ***
e7 ↔ e6 ,146 ,053 2,743 ,006
e5 ↔ e1 -,208 ,063 -3,293 ***
e7 ↔ e9 -,138 ,048 -2,864 ,004
e5 ↔ e10 -,147 ,053 -2,763 ,006
e7 ↔ e1 -,136 ,048 -2,828 ,005
Correlations: (Group number 1 - Project Management)
Estimate
e3 ↔ e10 -,423
e3 ↔ e2 ,319
e5 ↔ e2 ,379
e8 ↔ e7 ,323
e7 ↔ e6 ,271
e5 ↔ e1 -,303
e7 ↔ e9 -,235
e5 ↔ e10 -,279
e7 ↔ e1 -,249
Variances: (Group number 1 - Project Management)
Estimate S.E. C.R. P Label
Project Management
2,152 ,321 6,701 *** V1
e8
,770 ,094 8,186 *** V2
e7
,454 ,066 6,868 *** V3
e6
,640 ,081 7,951 *** V4
e5
,714 ,096 7,429 *** V5
e3
,686 ,085 8,033 *** V7
e2
,803 ,095 8,473 *** V8
e1
,660 ,087 7,581 *** V9
e10
,388 ,062 6,305 *** V10
e9
,767 ,093 8,251 *** V11
Squared Multiple Correlations: (Group number 1 - Project Management)
Estimate
GP09
,718
GP10
,875
GP01
,792
GP02
,695
GP03
,699
GP05
,725
GP06
,785
GP07
,844
GP08
,736
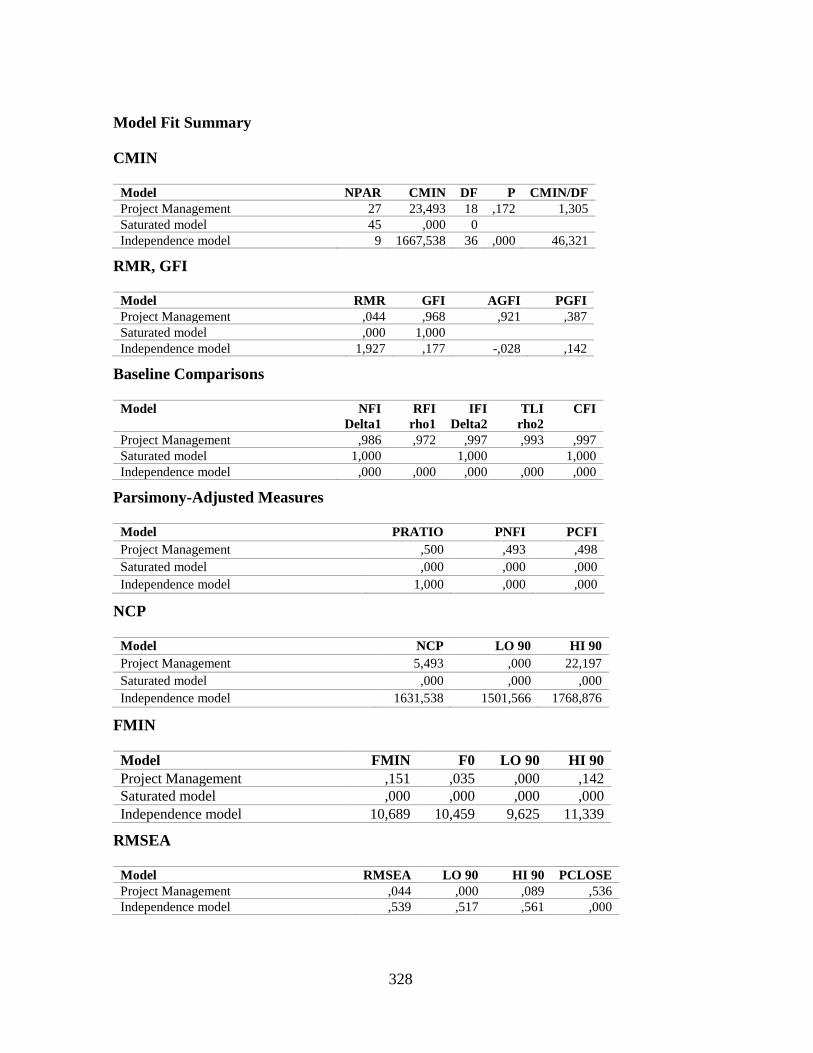
328
Model Fit Summary
CMIN
Model NPAR CMIN DF P CMIN/DF
Project Management 27 23,493 18 ,172 1,305
Saturated model 45 ,000 0
Independence model 9 1667,538 36 ,000 46,321
RMR, GFI
Model RMR GFI AGFI PGFI
Project Management ,044 ,968 ,921 ,387
Saturated model ,000 1,000
Independence model 1,927 ,177 -,028 ,142
Baseline Comparisons
Model NFI
Delta1
RFI
rho1
IFI
Delta2
TLI
rho2
CFI
Project Management ,986 ,972 ,997 ,993 ,997
Saturated model 1,000
1,000
1,000
Independence model ,000 ,000 ,000 ,000 ,000
Parsimony-Adjusted Measures
Model PRATIO PNFI PCFI
Project Management ,500 ,493 ,498
Saturated model ,000 ,000 ,000
Independence model 1,000 ,000 ,000
NCP
Model NCP LO 90 HI 90
Project Management 5,493 ,000 22,197
Saturated model ,000 ,000 ,000
Independence model 1631,538 1501,566 1768,876
FMIN
Model FMIN F0 LO 90 HI 90
Project Management ,151 ,035 ,000 ,142
Saturated model ,000 ,000 ,000 ,000
Independence model 10,689 10,459 9,625 11,339
RMSEA
Model RMSEA LO 90 HI 90 PCLOSE
Project Management ,044 ,000 ,089 ,536
Independence model ,539 ,517 ,561 ,000
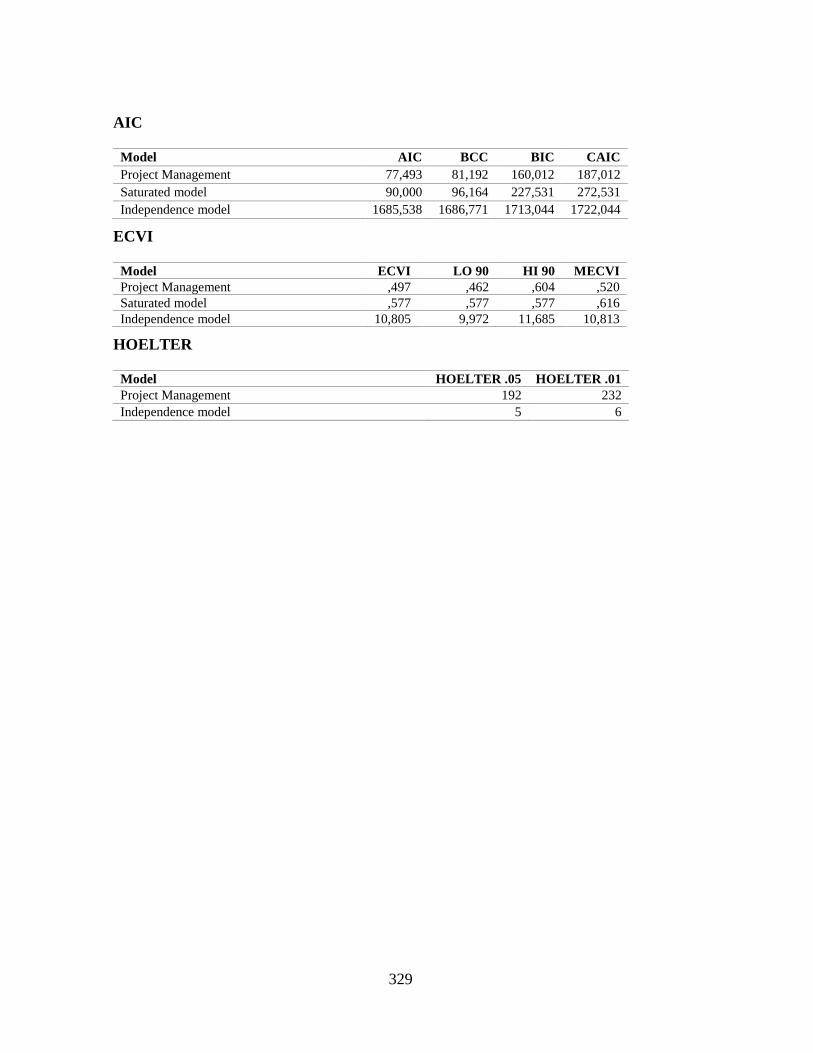
329
AIC
Model AIC BCC BIC CAIC
Project Management 77,493 81,192 160,012 187,012
Saturated model 90,000 96,164 227,531 272,531
Independence model 1685,538 1686,771 1713,044 1722,044
ECVI
Model ECVI LO 90 HI 90 MECVI
Project Management ,497 ,462 ,604 ,520
Saturated model ,577 ,577 ,577 ,616
Independence model 10,805 9,972 11,685 10,813
HOELTER
Model HOELTER .05 HOELTER .01
Project Management 192 232
Independence model 5 6
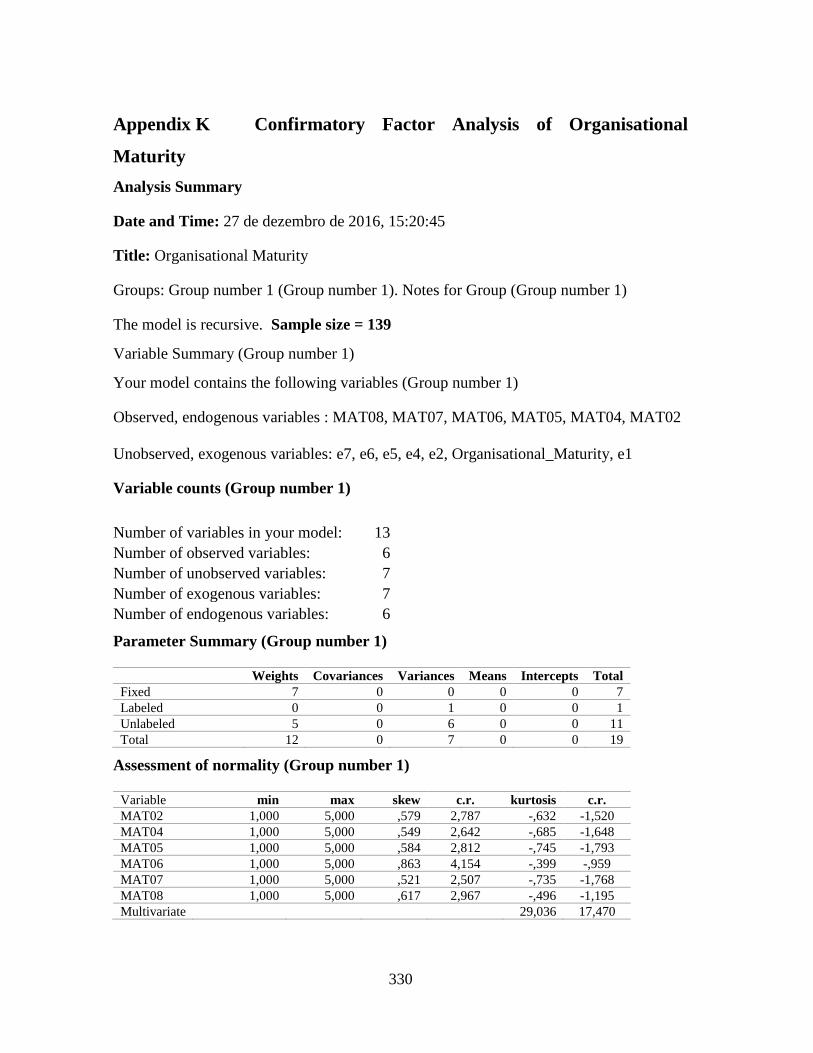
330
Appendix K Confirmatory Factor Analysis of Organisational
Maturity
Analysis Summary
Date and Time: 27 de dezembro de 2016, 15:20:45
Title: Organisational Maturity
Groups: Group number 1 (Group number 1). Notes for Group (Group number 1)
The model is recursive. Sample size = 139
Variable Summary (Group number 1)
Your model contains the following variables (Group number 1)
Observed, endogenous variables : MAT08, MAT07, MAT06, MAT05, MAT04, MAT02
Unobserved, exogenous variables: e7, e6, e5, e4, e2, Organisational_Maturity, e1
Variable counts (Group number 1)
Number of variables in your model: 13
Number of observed variables: 6
Number of unobserved variables: 7
Number of exogenous variables: 7
Number of endogenous variables: 6
Parameter Summary (Group number 1)
Weights Covariances Variances Means Intercepts Total
Fixed 7 0 0 0 0 7
Labeled 0 0 1 0 0 1
Unlabeled 5 0 6 0 0 11
Total 12 0 7 0 0 19
Assessment of normality (Group number 1)
Variable min max skew c.r. kurtosis c.r.
MAT02 1,000 5,000 ,579 2,787 -,632 -1,520
MAT04 1,000 5,000 ,549 2,642 -,685 -1,648
MAT05 1,000 5,000 ,584 2,812 -,745 -1,793
MAT06 1,000 5,000 ,863 4,154 -,399 -,959
MAT07 1,000 5,000 ,521 2,507 -,735 -1,768
MAT08 1,000 5,000 ,617 2,967 -,496 -1,195
Multivariate
29,036 17,470
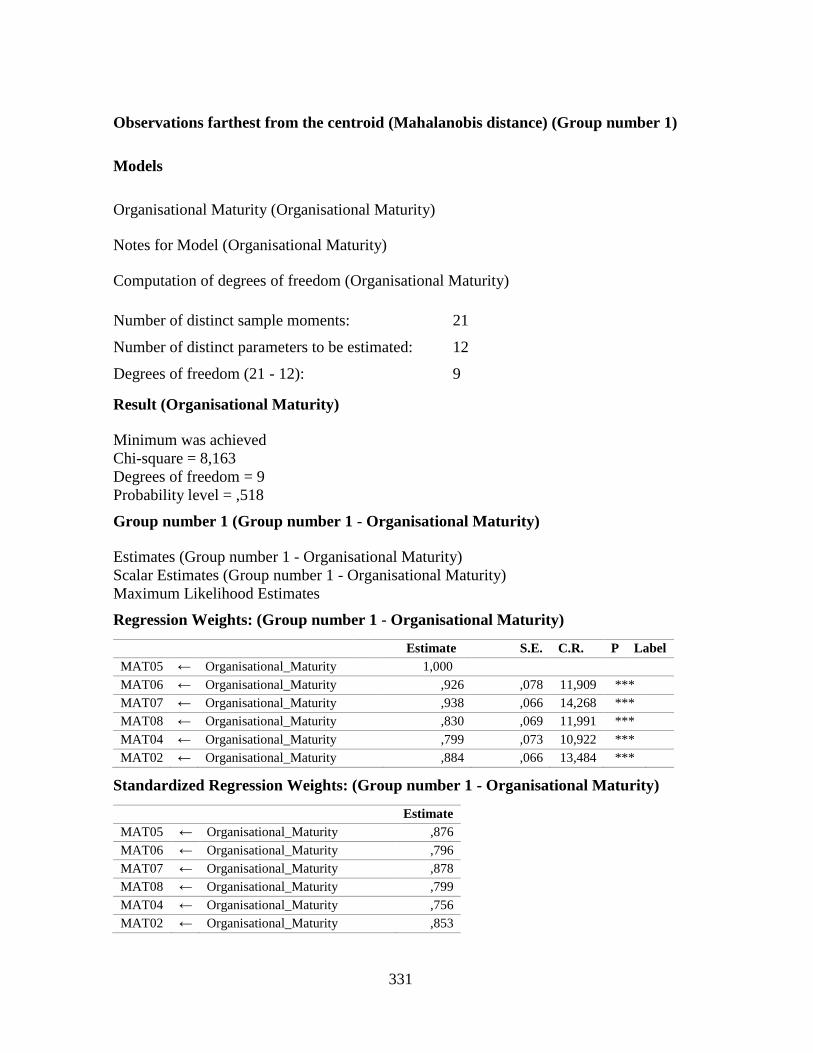
331
Observations farthest from the centroid (Mahalanobis distance) (Group number 1)
Models
Organisational Maturity (Organisational Maturity)
Notes for Model (Organisational Maturity)
Computation of degrees of freedom (Organisational Maturity)
Number of distinct sample moments: 21
Number of distinct parameters to be estimated: 12
Degrees of freedom (21 - 12): 9
Result (Organisational Maturity)
Minimum was achieved
Chi-square = 8,163
Degrees of freedom = 9
Probability level = ,518
Group number 1 (Group number 1 - Organisational Maturity)
Estimates (Group number 1 - Organisational Maturity)
Scalar Estimates (Group number 1 - Organisational Maturity)
Maximum Likelihood Estimates
Regression Weights: (Group number 1 - Organisational Maturity)
Estimate S.E. C.R. P Label
MAT05 ← Organisational_Maturity 1,000
MAT06 ← Organisational_Maturity ,926 ,078 11,909 ***
MAT07 ← Organisational_Maturity ,938 ,066 14,268 ***
MAT08 ← Organisational_Maturity ,830 ,069 11,991 ***
MAT04 ← Organisational_Maturity ,799 ,073 10,922 ***
MAT02 ← Organisational_Maturity ,884 ,066 13,484 ***
Standardized Regression Weights: (Group number 1 - Organisational Maturity)
Estimate
MAT05 ← Organisational_Maturity ,876
MAT06 ← Organisational_Maturity ,796
MAT07 ← Organisational_Maturity ,878
MAT08 ← Organisational_Maturity ,799
MAT04 ← Organisational_Maturity ,756
MAT02 ← Organisational_Maturity ,853
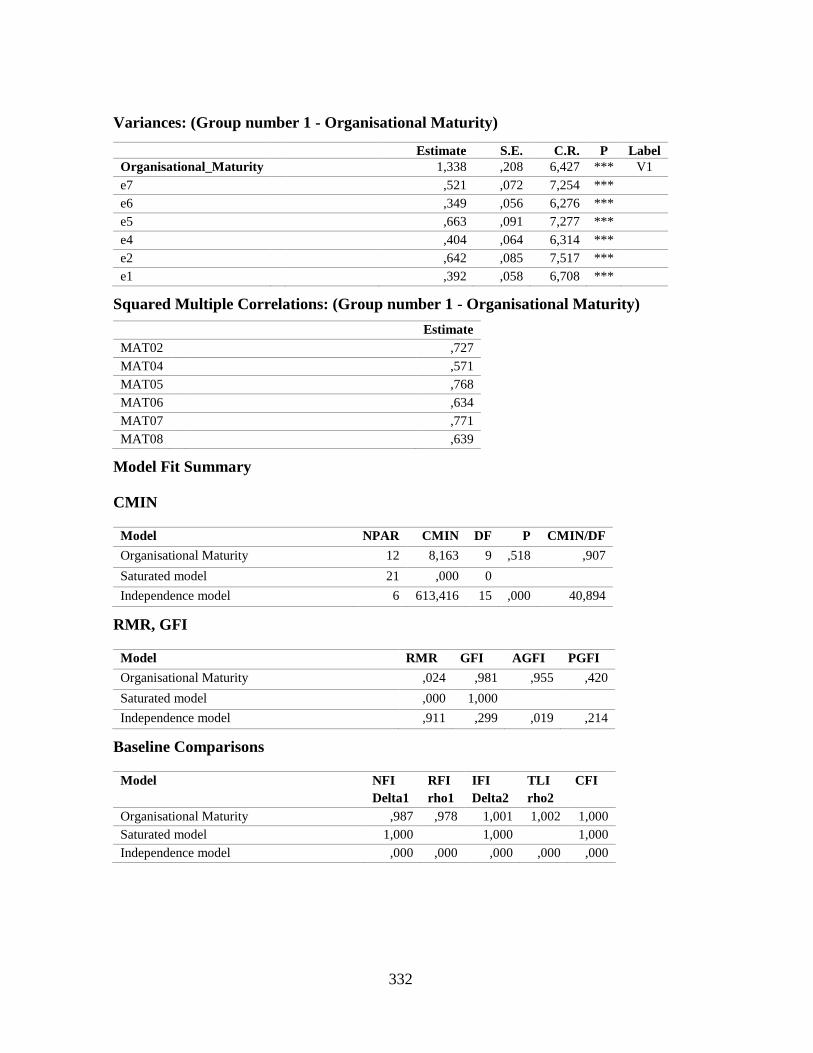
332
Variances: (Group number 1 - Organisational Maturity)
Estimate S.E. C.R. P Label
Organisational_Maturity
1,338 ,208 6,427 *** V1
e7
,521 ,072 7,254 ***
e6
,349 ,056 6,276 ***
e5
,663 ,091 7,277 ***
e4
,404 ,064 6,314 ***
e2
,642 ,085 7,517 ***
e1
,392 ,058 6,708 ***
Squared Multiple Correlations: (Group number 1 - Organisational Maturity)
Estimate
MAT02
,727
MAT04
,571
MAT05
,768
MAT06
,634
MAT07
,771
MAT08
,639
Model Fit Summary
CMIN
Model NPAR CMIN DF P CMIN/DF
Organisational Maturity 12 8,163 9 ,518 ,907
Saturated model 21 ,000 0
Independence model 6 613,416 15 ,000 40,894
RMR, GFI
Model RMR GFI AGFI PGFI
Organisational Maturity ,024 ,981 ,955 ,420
Saturated model ,000 1,000
Independence model ,911 ,299 ,019 ,214
Baseline Comparisons
Model NFI
Delta1
RFI
rho1
IFI
Delta2
TLI
rho2
CFI
Organisational Maturity ,987 ,978 1,001 1,002 1,000
Saturated model 1,000
1,000
1,000
Independence model ,000 ,000 ,000 ,000 ,000
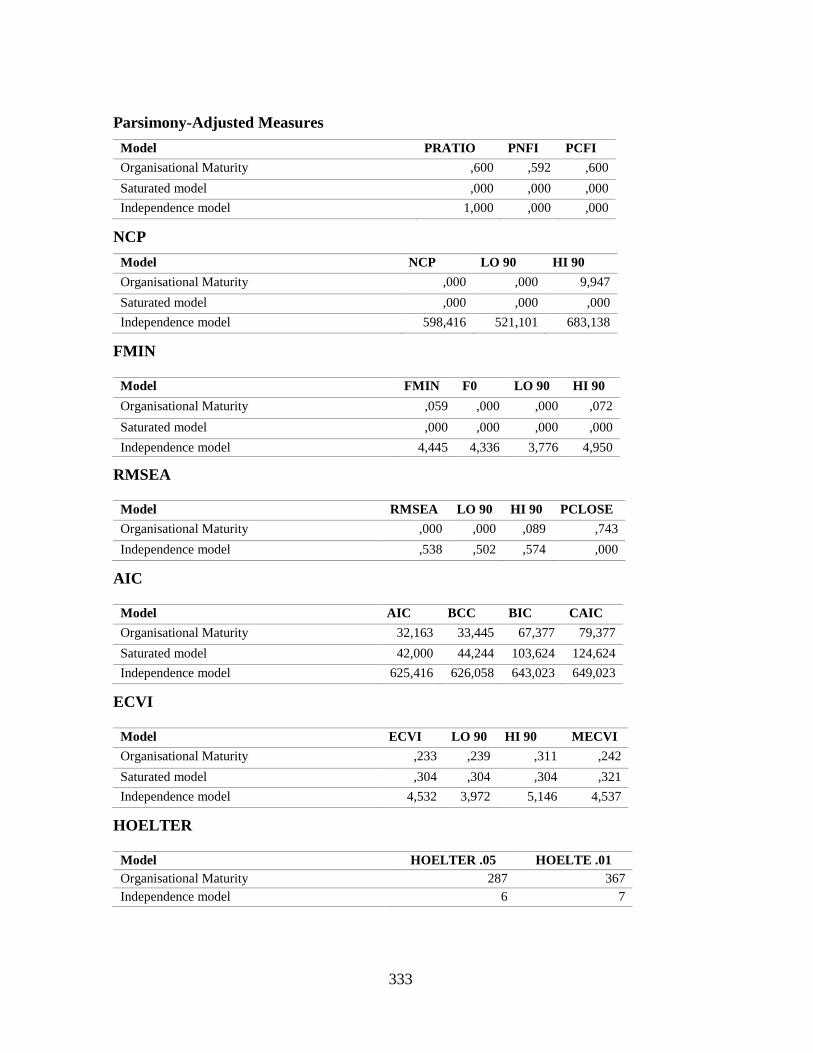
333
Parsimony-Adjusted Measures
Model PRATIO PNFI PCFI
Organisational Maturity ,600 ,592 ,600
Saturated model ,000 ,000 ,000
Independence model 1,000 ,000 ,000
NCP
Model NCP LO 90 HI 90
Organisational Maturity ,000 ,000 9,947
Saturated model ,000 ,000 ,000
Independence model 598,416 521,101 683,138
FMIN
Model FMIN F0 LO 90 HI 90
Organisational Maturity ,059 ,000 ,000 ,072
Saturated model ,000 ,000 ,000 ,000
Independence model 4,445 4,336 3,776 4,950
RMSEA
Model RMSEA LO 90 HI 90 PCLOSE
Organisational Maturity ,000 ,000 ,089 ,743
Independence model ,538 ,502 ,574 ,000
AIC
Model AIC BCC BIC CAIC
Organisational Maturity 32,163 33,445 67,377 79,377
Saturated model 42,000 44,244 103,624 124,624
Independence model 625,416 626,058 643,023 649,023
ECVI
Model ECVI LO 90 HI 90 MECVI
Organisational Maturity ,233 ,239 ,311 ,242
Saturated model ,304 ,304 ,304 ,321
Independence model 4,532 3,972 5,146 4,537
HOELTER
Model HOELTER .05 HOELTE .01
Organisational Maturity 287 367
Independence model 6 7
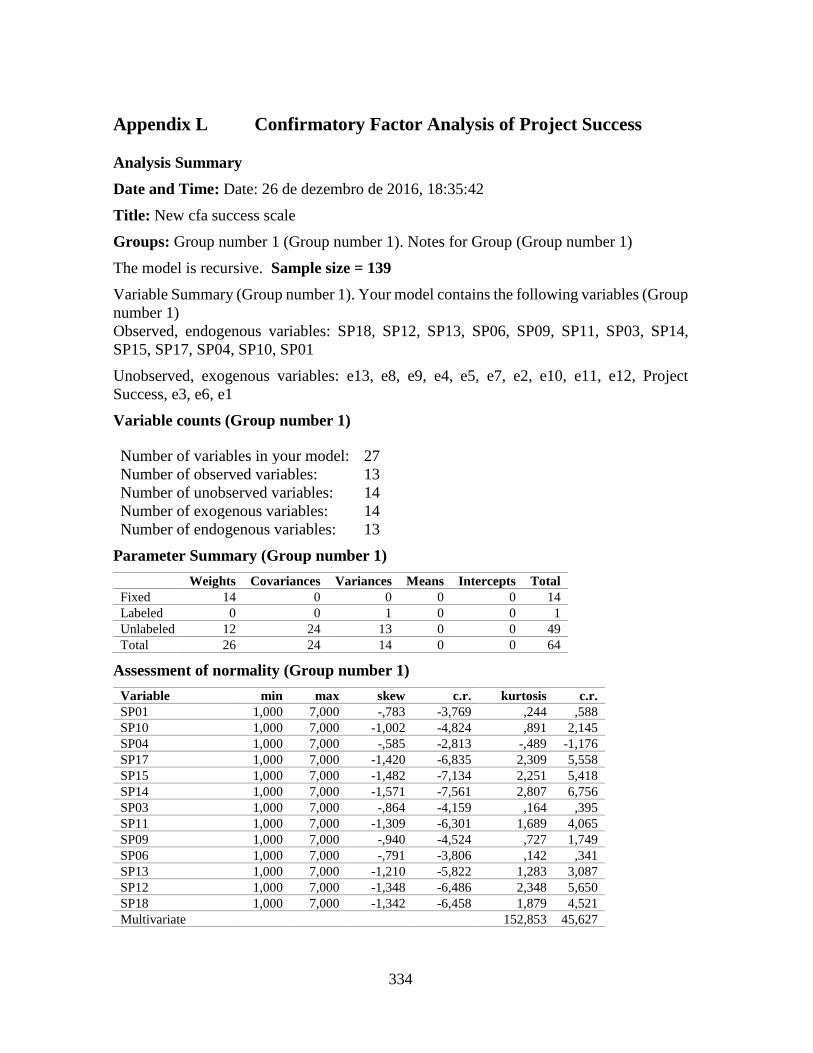
334
Appendix L Confirmatory Factor Analysis of Project Success
Analysis Summary
Date and Time: Date: 26 de dezembro de 2016, 18:35:42
Title: New cfa success scale
Groups: Group number 1 (Group number 1). Notes for Group (Group number 1)
The model is recursive. Sample size = 139
Variable Summary (Group number 1). Your model contains the following variables (Group
number 1)
Observed, endogenous variables: SP18, SP12, SP13, SP06, SP09, SP11, SP03, SP14,
SP15, SP17, SP04, SP10, SP01
Unobserved, exogenous variables: e13, e8, e9, e4, e5, e7, e2, e10, e11, e12, Project
Success, e3, e6, e1
Variable counts (Group number 1)
Number of variables in your model: 27
Number of observed variables: 13
Number of unobserved variables: 14
Number of exogenous variables: 14
Number of endogenous variables: 13
Parameter Summary (Group number 1)
Weights Covariances Variances Means Intercepts Total
Fixed 14 0 0 0 0 14
Labeled 0 0 1 0 0 1
Unlabeled 12 24 13 0 0 49
Total 26 24 14 0 0 64
Assessment of normality (Group number 1)
Variable min max skew c.r. kurtosis c.r.
SP01 1,000 7,000 -,783 -3,769 ,244 ,588
SP10 1,000 7,000 -1,002 -4,824 ,891 2,145
SP04 1,000 7,000 -,585 -2,813 -,489 -1,176
SP17 1,000 7,000 -1,420 -6,835 2,309 5,558
SP15 1,000 7,000 -1,482 -7,134 2,251 5,418
SP14 1,000 7,000 -1,571 -7,561 2,807 6,756
SP03 1,000 7,000 -,864 -4,159 ,164 ,395
SP11 1,000 7,000 -1,309 -6,301 1,689 4,065
SP09 1,000 7,000 -,940 -4,524 ,727 1,749
SP06 1,000 7,000 -,791 -3,806 ,142 ,341
SP13 1,000 7,000 -1,210 -5,822 1,283 3,087
SP12 1,000 7,000 -1,348 -6,486 2,348 5,650
SP18 1,000 7,000 -1,342 -6,458 1,879 4,521
Multivariate
152,853 45,627
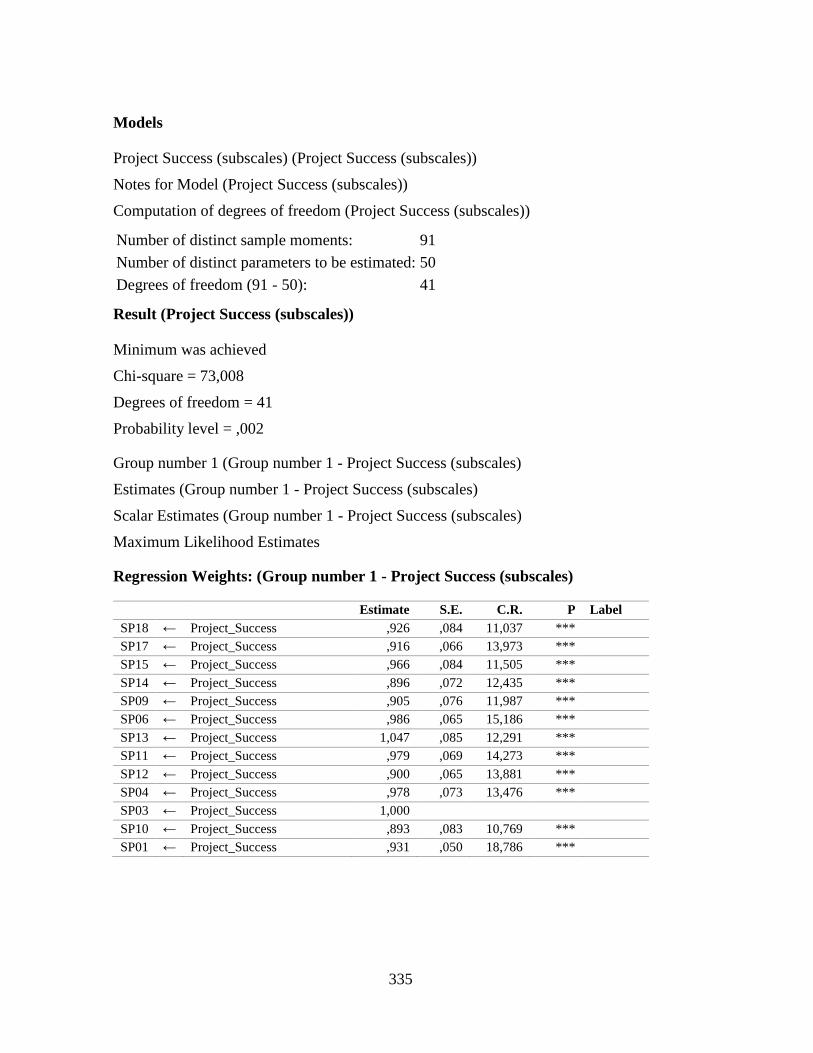
335
Models
Project Success (subscales) (Project Success (subscales))
Notes for Model (Project Success (subscales))
Computation of degrees of freedom (Project Success (subscales))
Number of distinct sample moments: 91
Number of distinct parameters to be estimated: 50
Degrees of freedom (91 - 50): 41
Result (Project Success (subscales))
Minimum was achieved
Chi-square = 73,008
Degrees of freedom = 41
Probability level = ,002
Group number 1 (Group number 1 - Project Success (subscales)
Estimates (Group number 1 - Project Success (subscales)
Scalar Estimates (Group number 1 - Project Success (subscales)
Maximum Likelihood Estimates
Regression Weights: (Group number 1 - Project Success (subscales)
Estimate S.E. C.R. P Label
SP18 ← Project_Success ,926 ,084 11,037 ***
SP17 ← Project_Success ,916 ,066 13,973 ***
SP15 ← Project_Success ,966 ,084 11,505 ***
SP14 ← Project_Success ,896 ,072 12,435 ***
SP09 ← Project_Success ,905 ,076 11,987 ***
SP06 ← Project_Success ,986 ,065 15,186 ***
SP13 ← Project_Success 1,047 ,085 12,291 ***
SP11 ← Project_Success ,979 ,069 14,273 ***
SP12 ← Project_Success ,900 ,065 13,881 ***
SP04 ← Project_Success ,978 ,073 13,476 ***
SP03 ← Project_Success 1,000
SP10 ← Project_Success ,893 ,083 10,769 ***
SP01 ← Project_Success ,931 ,050 18,786 ***
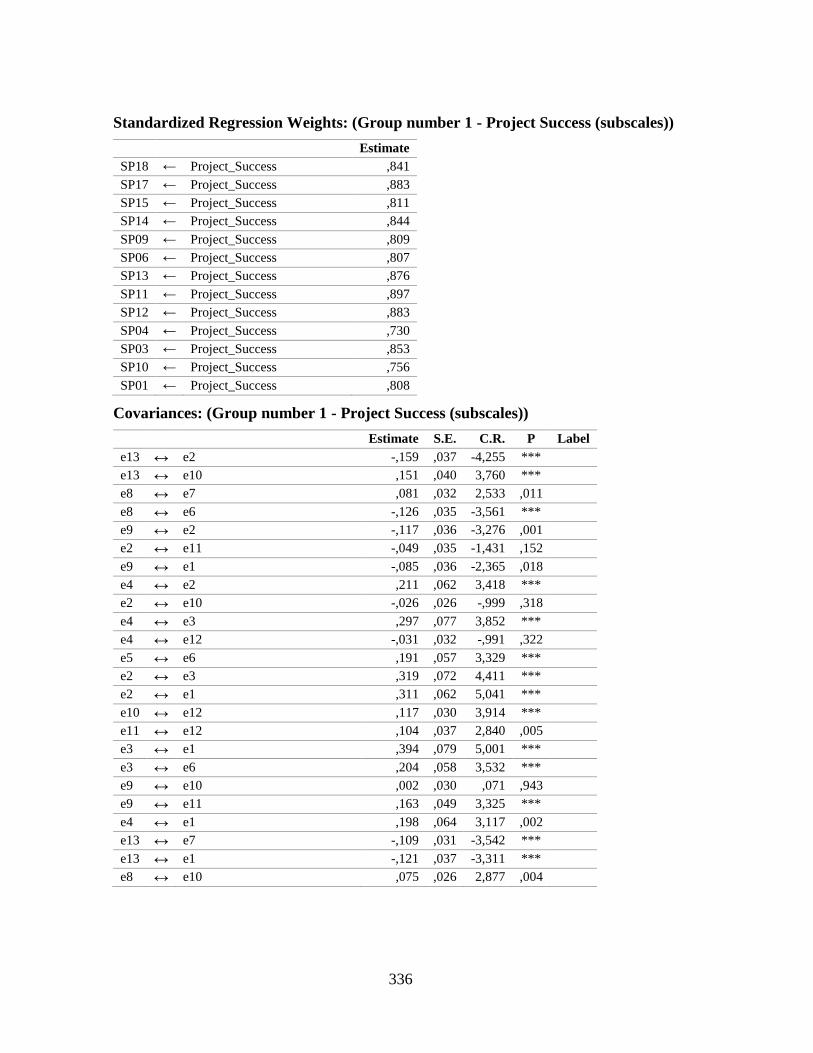
336
Standardized Regression Weights: (Group number 1 - Project Success (subscales))
Estimate
SP18 ← Project_Success ,841
SP17 ← Project_Success ,883
SP15 ← Project_Success ,811
SP14 ← Project_Success ,844
SP09 ← Project_Success ,809
SP06 ← Project_Success ,807
SP13 ← Project_Success ,876
SP11 ← Project_Success ,897
SP12 ← Project_Success ,883
SP04 ← Project_Success ,730
SP03 ← Project_Success ,853
SP10 ← Project_Success ,756
SP01 ← Project_Success ,808
Covariances: (Group number 1 - Project Success (subscales))
Estimate S.E. C.R. P Label
e13 ↔ e2 -,159 ,037 -4,255 ***
e13 ↔ e10 ,151 ,040 3,760 ***
e8 ↔ e7 ,081 ,032 2,533 ,011
e8 ↔ e6 -,126 ,035 -3,561 ***
e9 ↔ e2 -,117 ,036 -3,276 ,001
e2 ↔ e11 -,049 ,035 -1,431 ,152
e9 ↔ e1 -,085 ,036 -2,365 ,018
e4 ↔ e2 ,211 ,062 3,418 ***
e2 ↔ e10 -,026 ,026 -,999 ,318
e4 ↔ e3 ,297 ,077 3,852 ***
e4 ↔ e12 -,031 ,032 -,991 ,322
e5 ↔ e6 ,191 ,057 3,329 ***
e2 ↔ e3 ,319 ,072 4,411 ***
e2 ↔ e1 ,311 ,062 5,041 ***
e10 ↔ e12 ,117 ,030 3,914 ***
e11 ↔ e12 ,104 ,037 2,840 ,005
e3 ↔ e1 ,394 ,079 5,001 ***
e3 ↔ e6 ,204 ,058 3,532 ***
e9 ↔ e10 ,002 ,030 ,071 ,943
e9 ↔ e11 ,163 ,049 3,325 ***
e4 ↔ e1 ,198 ,064 3,117 ,002
e13 ↔ e7 -,109 ,031 -3,542 ***
e13 ↔ e1 -,121 ,037 -3,311 ***
e8 ↔ e10 ,075 ,026 2,877 ,004
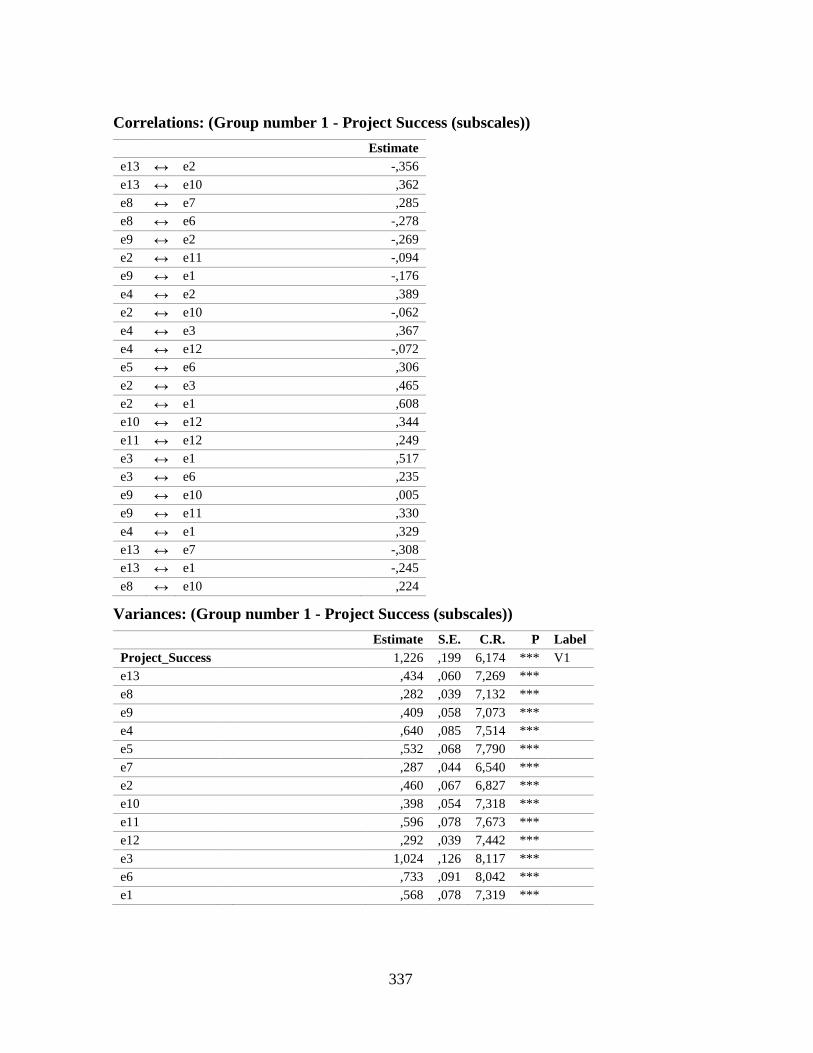
337
Correlations: (Group number 1 - Project Success (subscales))
Estimate
e13 ↔ e2 -,356
e13 ↔ e10 ,362
e8 ↔ e7 ,285
e8 ↔ e6 -,278
e9 ↔ e2 -,269
e2 ↔ e11 -,094
e9 ↔ e1 -,176
e4 ↔ e2 ,389
e2 ↔ e10 -,062
e4 ↔ e3 ,367
e4 ↔ e12 -,072
e5 ↔ e6 ,306
e2 ↔ e3 ,465
e2 ↔ e1 ,608
e10 ↔ e12 ,344
e11 ↔ e12 ,249
e3 ↔ e1 ,517
e3 ↔ e6 ,235
e9 ↔ e10 ,005
e9 ↔ e11 ,330
e4 ↔ e1 ,329
e13 ↔ e7 -,308
e13 ↔ e1 -,245
e8 ↔ e10 ,224
Variances: (Group number 1 - Project Success (subscales))
Estimate S.E. C.R. P Label
Project_Success
1,226 ,199 6,174 *** V1
e13
,434 ,060 7,269 ***
e8
,282 ,039 7,132 ***
e9
,409 ,058 7,073 ***
e4
,640 ,085 7,514 ***
e5
,532 ,068 7,790 ***
e7
,287 ,044 6,540 ***
e2
,460 ,067 6,827 ***
e10
,398 ,054 7,318 ***
e11
,596 ,078 7,673 ***
e12
,292 ,039 7,442 ***
e3
1,024 ,126 8,117 ***
e6
,733 ,091 8,042 ***
e1
,568 ,078 7,319 ***
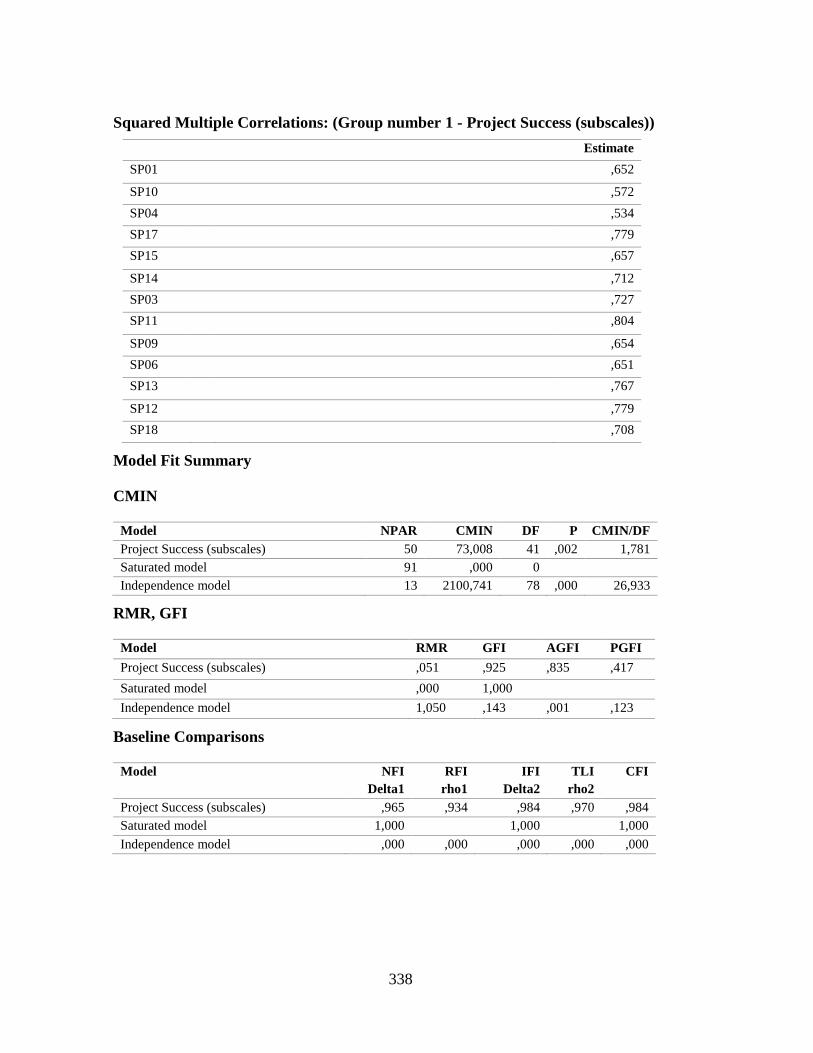
338
Squared Multiple Correlations: (Group number 1 - Project Success (subscales))
Estimate
SP01
,652
SP10
,572
SP04
,534
SP17
,779
SP15
,657
SP14
,712
SP03
,727
SP11
,804
SP09
,654
SP06
,651
SP13
,767
SP12
,779
SP18
,708
Model Fit Summary
CMIN
Model NPAR CMIN DF P CMIN/DF
Project Success (subscales) 50 73,008 41 ,002 1,781
Saturated model 91 ,000 0
Independence model 13 2100,741 78 ,000 26,933
RMR, GFI
Model RMR GFI AGFI PGFI
Project Success (subscales) ,051 ,925 ,835 ,417
Saturated model ,000 1,000
Independence model 1,050 ,143 ,001 ,123
Baseline Comparisons
Model NFI
Delta1
RFI
rho1
IFI
Delta2
TLI
rho2
CFI
Project Success (subscales) ,965 ,934 ,984 ,970 ,984
Saturated model 1,000
1,000
1,000
Independence model ,000 ,000 ,000 ,000 ,000
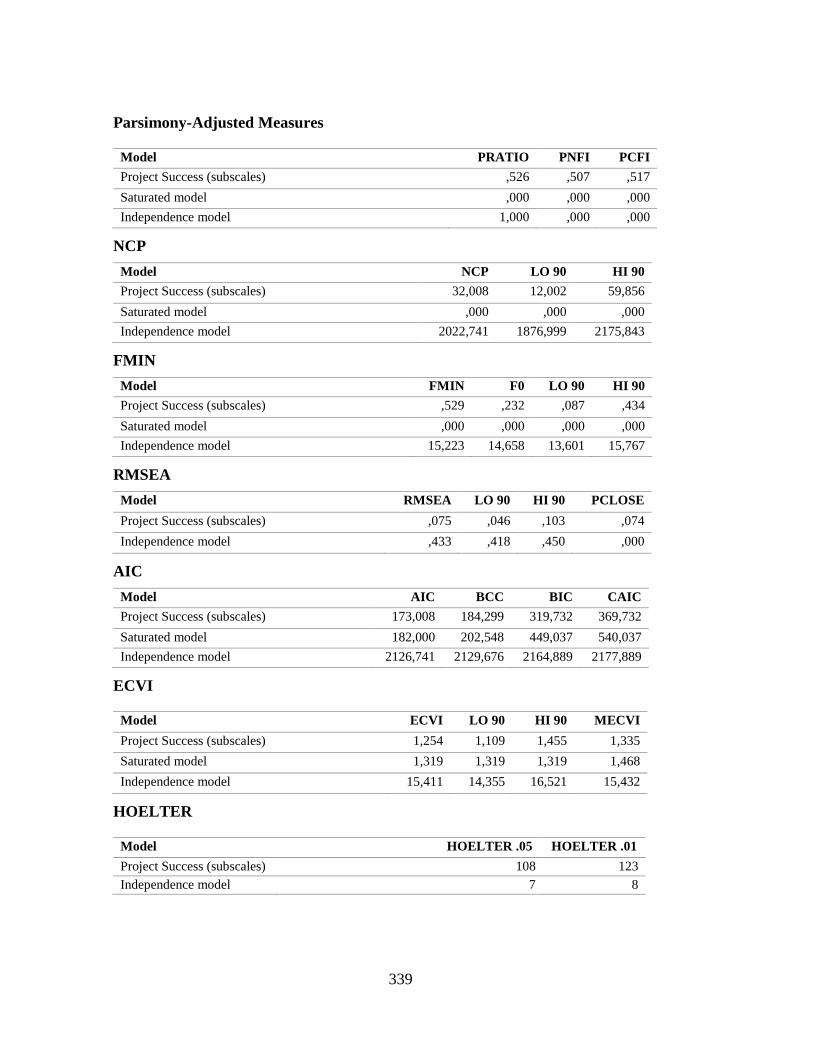
339
Parsimony-Adjusted Measures
Model PRATIO PNFI PCFI
Project Success (subscales) ,526 ,507 ,517
Saturated model ,000 ,000 ,000
Independence model 1,000 ,000 ,000
NCP
Model NCP LO 90 HI 90
Project Success (subscales) 32,008 12,002 59,856
Saturated model ,000 ,000 ,000
Independence model 2022,741 1876,999 2175,843
FMIN
Model FMIN F0 LO 90 HI 90
Project Success (subscales) ,529 ,232 ,087 ,434
Saturated model ,000 ,000 ,000 ,000
Independence model 15,223 14,658 13,601 15,767
RMSEA
Model RMSEA LO 90 HI 90 PCLOSE
Project Success (subscales) ,075 ,046 ,103 ,074
Independence model ,433 ,418 ,450 ,000
AIC
Model AIC BCC BIC CAIC
Project Success (subscales) 173,008 184,299 319,732 369,732
Saturated model 182,000 202,548 449,037 540,037
Independence model 2126,741 2129,676 2164,889 2177,889
ECVI
Model ECVI LO 90 HI 90 MECVI
Project Success (subscales) 1,254 1,109 1,455 1,335
Saturated model 1,319 1,319 1,319 1,468
Independence model 15,411 14,355 16,521 15,432
HOELTER
Model HOELTER .05 HOELTER .01
Project Success (subscales) 108 123
Independence model 7 8
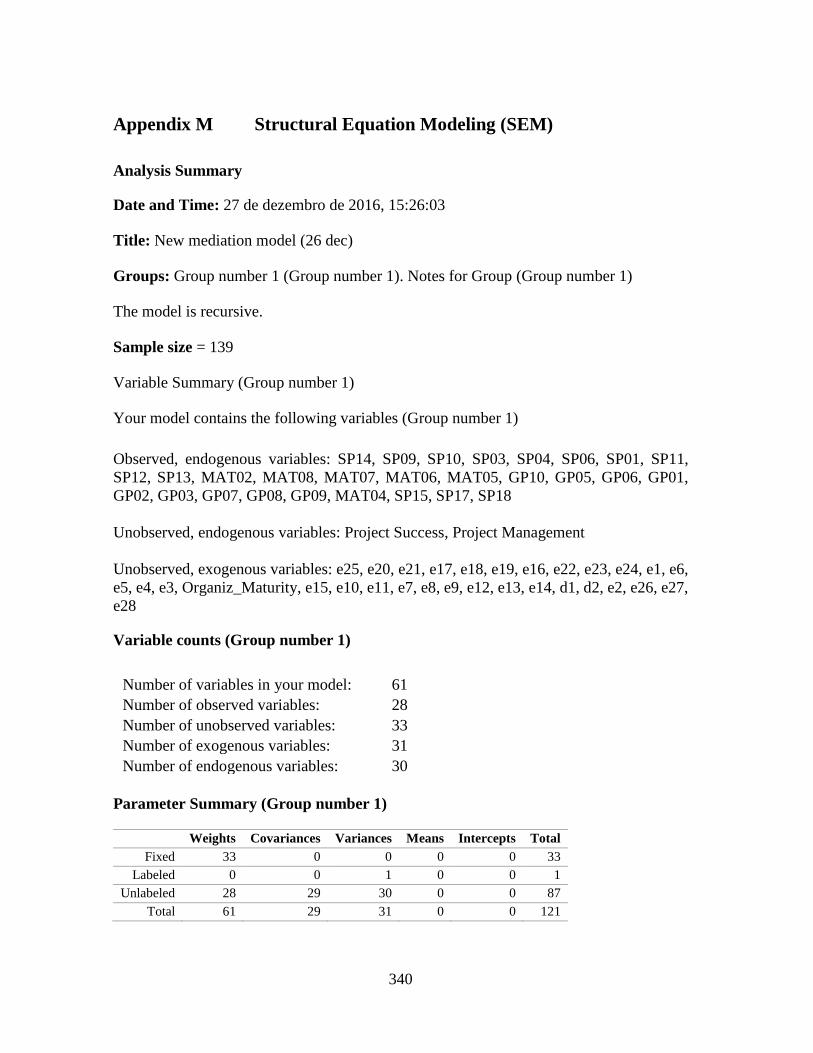
340
Appendix M Structural Equation Modeling (SEM)
Analysis Summary
Date and Time: 27 de dezembro de 2016, 15:26:03
Title: New mediation model (26 dec)
Groups: Group number 1 (Group number 1). Notes for Group (Group number 1)
The model is recursive.
Sample size = 139
Variable Summary (Group number 1)
Your model contains the following variables (Group number 1)
Observed, endogenous variables: SP14, SP09, SP10, SP03, SP04, SP06, SP01, SP11,
SP12, SP13, MAT02, MAT08, MAT07, MAT06, MAT05, GP10, GP05, GP06, GP01,
GP02, GP03, GP07, GP08, GP09, MAT04, SP15, SP17, SP18
Unobserved, endogenous variables: Project Success, Project Management
Unobserved, exogenous variables: e25, e20, e21, e17, e18, e19, e16, e22, e23, e24, e1, e6,
e5, e4, e3, Organiz_Maturity, e15, e10, e11, e7, e8, e9, e12, e13, e14, d1, d2, e2, e26, e27,
e28
Variable counts (Group number 1)
Parameter Summary (Group number 1)
Weights Covariances Variances Means Intercepts Total
Fixed 33 0 0 0 0 33
Labeled 0 0 1 0 0 1
Unlabeled 28 29 30 0 0 87
Total 61 29 31 0 0 121
Number of variables in your model: 61
Number of observed variables: 28
Number of unobserved variables: 33
Number of exogenous variables: 31
Number of endogenous variables: 30
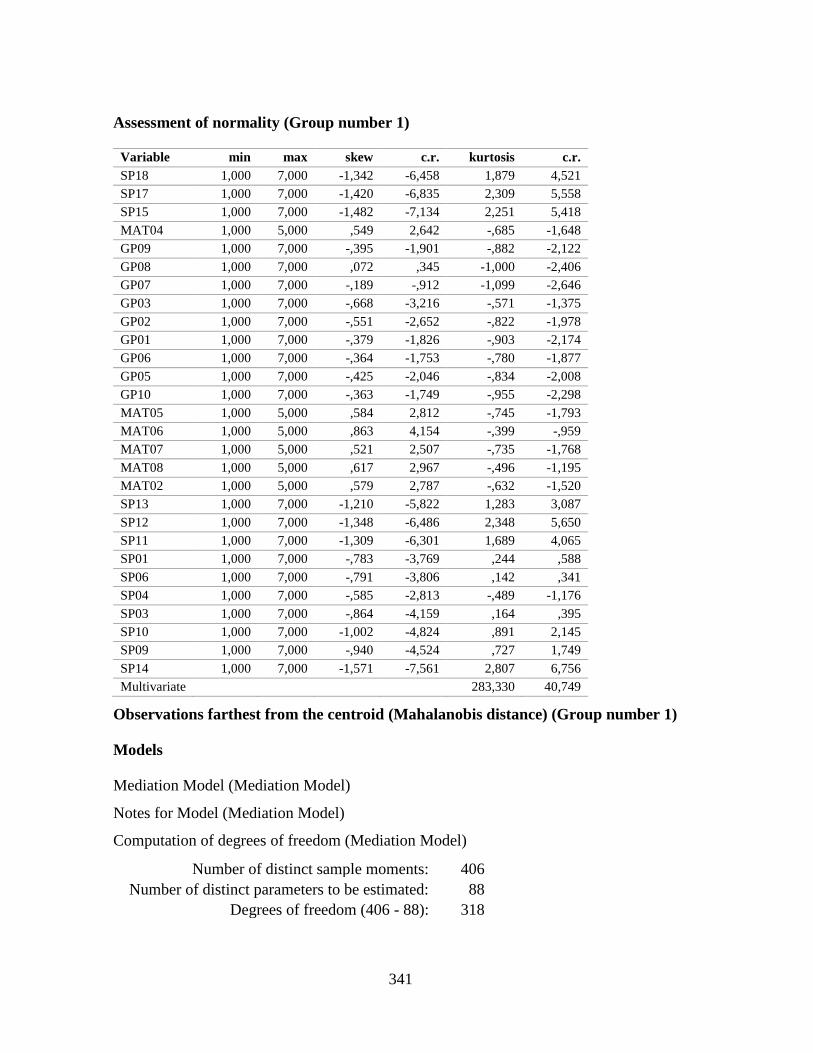
341
Assessment of normality (Group number 1)
Variable min max skew c.r. kurtosis c.r.
SP18 1,000 7,000 -1,342 -6,458 1,879 4,521
SP17 1,000 7,000 -1,420 -6,835 2,309 5,558
SP15 1,000 7,000 -1,482 -7,134 2,251 5,418
MAT04 1,000 5,000 ,549 2,642 -,685 -1,648
GP09 1,000 7,000 -,395 -1,901 -,882 -2,122
GP08 1,000 7,000 ,072 ,345 -1,000 -2,406
GP07 1,000 7,000 -,189 -,912 -1,099 -2,646
GP03 1,000 7,000 -,668 -3,216 -,571 -1,375
GP02 1,000 7,000 -,551 -2,652 -,822 -1,978
GP01 1,000 7,000 -,379 -1,826 -,903 -2,174
GP06 1,000 7,000 -,364 -1,753 -,780 -1,877
GP05 1,000 7,000 -,425 -2,046 -,834 -2,008
GP10 1,000 7,000 -,363 -1,749 -,955 -2,298
MAT05 1,000 5,000 ,584 2,812 -,745 -1,793
MAT06 1,000 5,000 ,863 4,154 -,399 -,959
MAT07 1,000 5,000 ,521 2,507 -,735 -1,768
MAT08 1,000 5,000 ,617 2,967 -,496 -1,195
MAT02 1,000 5,000 ,579 2,787 -,632 -1,520
SP13 1,000 7,000 -1,210 -5,822 1,283 3,087
SP12 1,000 7,000 -1,348 -6,486 2,348 5,650
SP11 1,000 7,000 -1,309 -6,301 1,689 4,065
SP01 1,000 7,000 -,783 -3,769 ,244 ,588
SP06 1,000 7,000 -,791 -3,806 ,142 ,341
SP04 1,000 7,000 -,585 -2,813 -,489 -1,176
SP03 1,000 7,000 -,864 -4,159 ,164 ,395
SP10 1,000 7,000 -1,002 -4,824 ,891 2,145
SP09 1,000 7,000 -,940 -4,524 ,727 1,749
SP14 1,000 7,000 -1,571 -7,561 2,807 6,756
Multivariate
283,330 40,749
Observations farthest from the centroid (Mahalanobis distance) (Group number 1)
Models
Mediation Model (Mediation Model)
Notes for Model (Mediation Model)
Computation of degrees of freedom (Mediation Model)
Number of distinct sample moments: 406
Number of distinct parameters to be estimated: 88
Degrees of freedom (406 - 88): 318
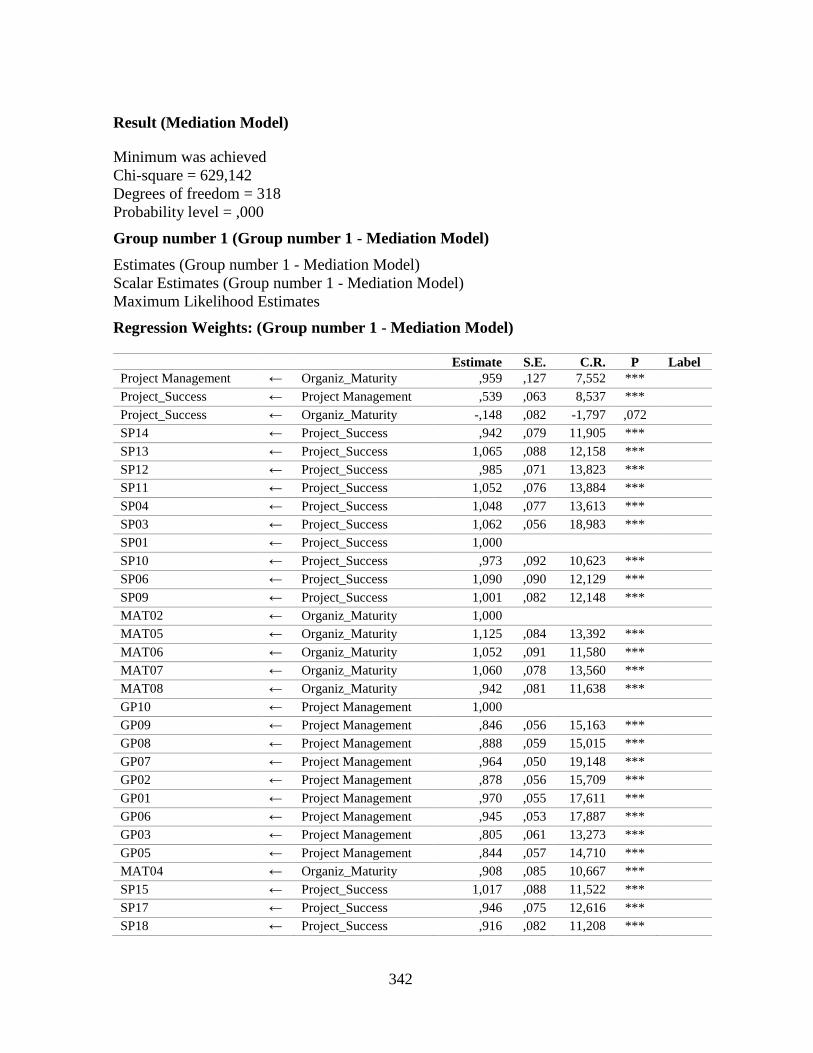
342
Result (Mediation Model)
Minimum was achieved
Chi-square = 629,142
Degrees of freedom = 318
Probability level = ,000
Group number 1 (Group number 1 - Mediation Model)
Estimates (Group number 1 - Mediation Model)
Scalar Estimates (Group number 1 - Mediation Model)
Maximum Likelihood Estimates
Regression Weights: (Group number 1 - Mediation Model)
Estimate S.E. C.R. P Label
Project Management ← Organiz_Maturity ,959 ,127 7,552 ***
Project_Success ← Project Management ,539 ,063 8,537 ***
Project_Success ← Organiz_Maturity -,148 ,082 -1,797 ,072
SP14 ← Project_Success ,942 ,079 11,905 ***
SP13 ← Project_Success 1,065 ,088 12,158 ***
SP12 ← Project_Success ,985 ,071 13,823 ***
SP11 ← Project_Success 1,052 ,076 13,884 ***
SP04 ← Project_Success 1,048 ,077 13,613 ***
SP03 ← Project_Success 1,062 ,056 18,983 ***
SP01 ← Project_Success 1,000
SP10 ← Project_Success ,973 ,092 10,623 ***
SP06 ← Project_Success 1,090 ,090 12,129 ***
SP09 ← Project_Success 1,001 ,082 12,148 ***
MAT02 ← Organiz_Maturity 1,000
MAT05 ← Organiz_Maturity 1,125 ,084 13,392 ***
MAT06 ← Organiz_Maturity 1,052 ,091 11,580 ***
MAT07 ← Organiz_Maturity 1,060 ,078 13,560 ***
MAT08 ← Organiz_Maturity ,942 ,081 11,638 ***
GP10 ← Project Management 1,000
GP09 ← Project Management ,846 ,056 15,163 ***
GP08 ← Project Management ,888 ,059 15,015 ***
GP07 ← Project Management ,964 ,050 19,148 ***
GP02 ← Project Management ,878 ,056 15,709 ***
GP01 ← Project Management ,970 ,055 17,611 ***
GP06 ← Project Management ,945 ,053 17,887 ***
GP03 ← Project Management ,805 ,061 13,273 ***
GP05 ← Project Management ,844 ,057 14,710 ***
MAT04 ← Organiz_Maturity ,908 ,085 10,667 ***
SP15 ← Project_Success 1,017 ,088 11,522 ***
SP17 ← Project_Success ,946 ,075 12,616 ***
SP18 ← Project_Success ,916 ,082 11,208 ***
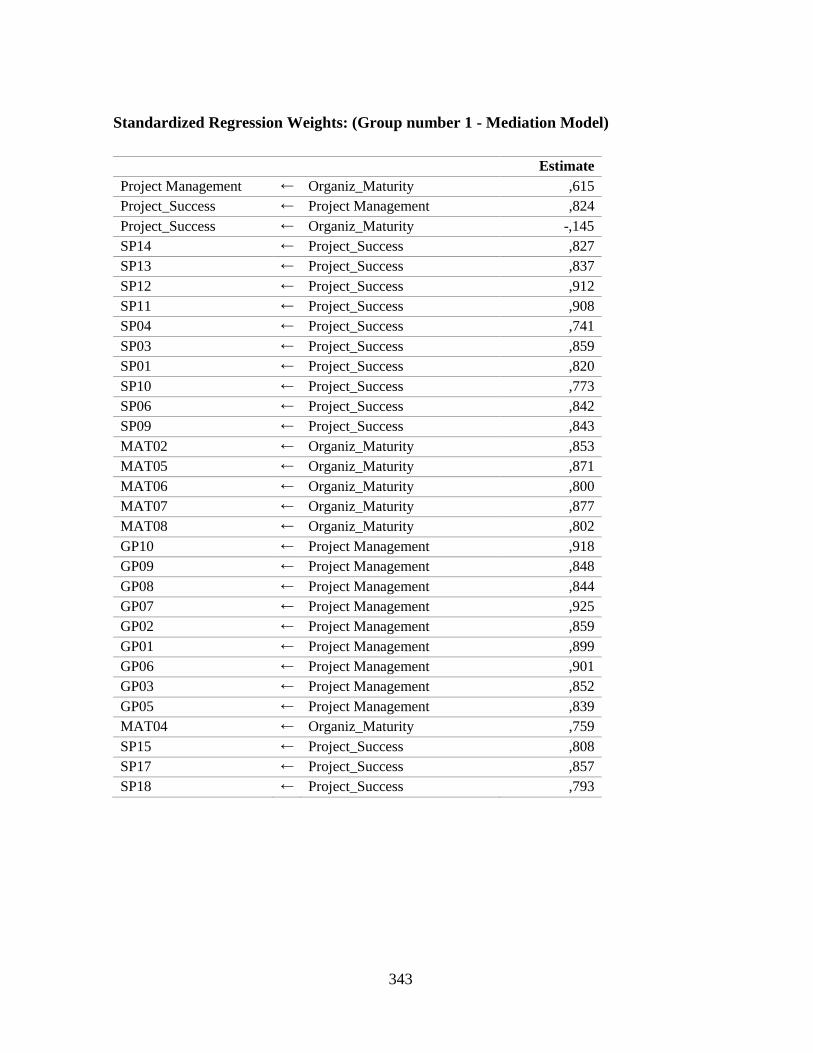
343
Standardized Regression Weights: (Group number 1 - Mediation Model)
Estimate
Project Management ← Organiz_Maturity ,615
Project_Success ← Project Management ,824
Project_Success ← Organiz_Maturity -,145
SP14 ← Project_Success ,827
SP13 ← Project_Success ,837
SP12 ← Project_Success ,912
SP11 ← Project_Success ,908
SP04 ← Project_Success ,741
SP03 ← Project_Success ,859
SP01 ← Project_Success ,820
SP10 ← Project_Success ,773
SP06 ← Project_Success ,842
SP09 ← Project_Success ,843
MAT02 ← Organiz_Maturity ,853
MAT05 ← Organiz_Maturity ,871
MAT06 ← Organiz_Maturity ,800
MAT07 ← Organiz_Maturity ,877
MAT08 ← Organiz_Maturity ,802
GP10 ← Project Management ,918
GP09 ← Project Management ,848
GP08 ← Project Management ,844
GP07 ← Project Management ,925
GP02 ← Project Management ,859
GP01 ← Project Management ,899
GP06 ← Project Management ,901
GP03 ← Project Management ,852
GP05 ← Project Management ,839
MAT04 ← Organiz_Maturity ,759
SP15 ← Project_Success ,808
SP17 ← Project_Success ,857
SP18 ← Project_Success ,793
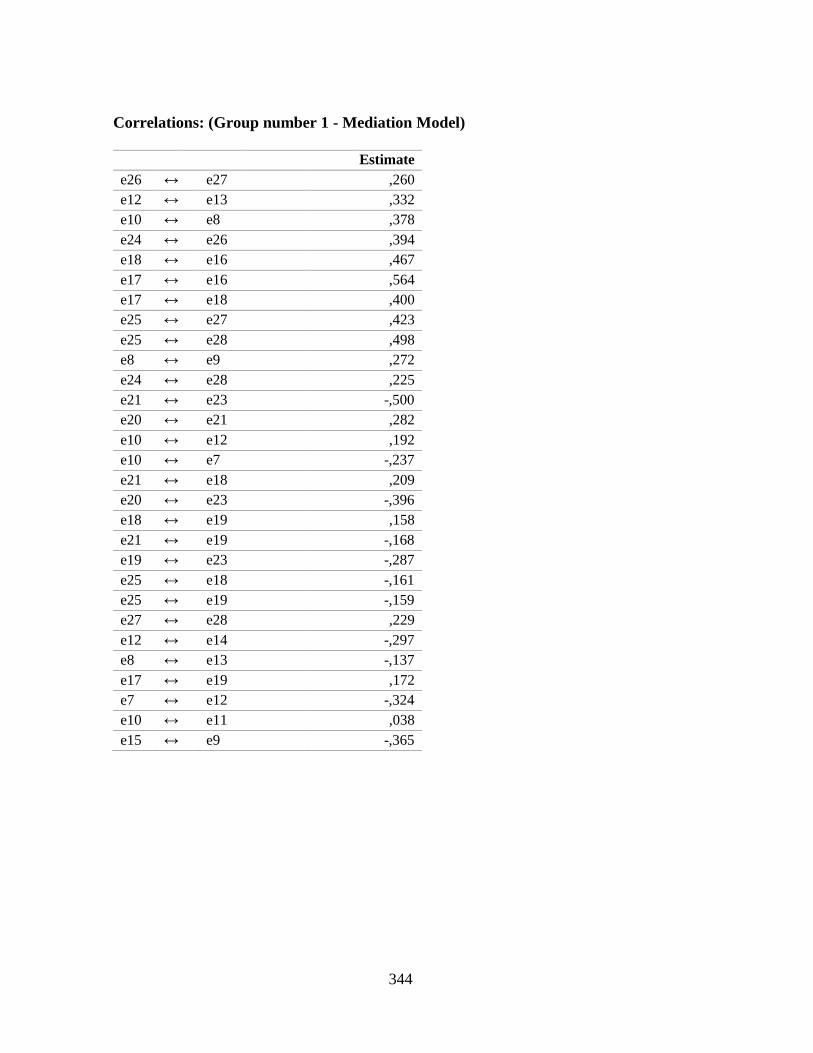
344
Correlations: (Group number 1 - Mediation Model)
Estimate
e26 ↔ e27 ,260
e12 ↔ e13 ,332
e10 ↔ e8 ,378
e24 ↔ e26 ,394
e18 ↔ e16 ,467
e17 ↔ e16 ,564
e17 ↔ e18 ,400
e25 ↔ e27 ,423
e25 ↔ e28 ,498
e8 ↔ e9 ,272
e24 ↔ e28 ,225
e21 ↔ e23 -,500
e20 ↔ e21 ,282
e10 ↔ e12 ,192
e10 ↔ e7 -,237
e21 ↔ e18 ,209
e20 ↔ e23 -,396
e18 ↔ e19 ,158
e21 ↔ e19 -,168
e19 ↔ e23 -,287
e25 ↔ e18 -,161
e25 ↔ e19 -,159
e27 ↔ e28 ,229
e12 ↔ e14 -,297
e8 ↔ e13 -,137
e17 ↔ e19 ,172
e7 ↔ e12 -,324
e10 ↔ e11 ,038
e15 ↔ e9 -,365
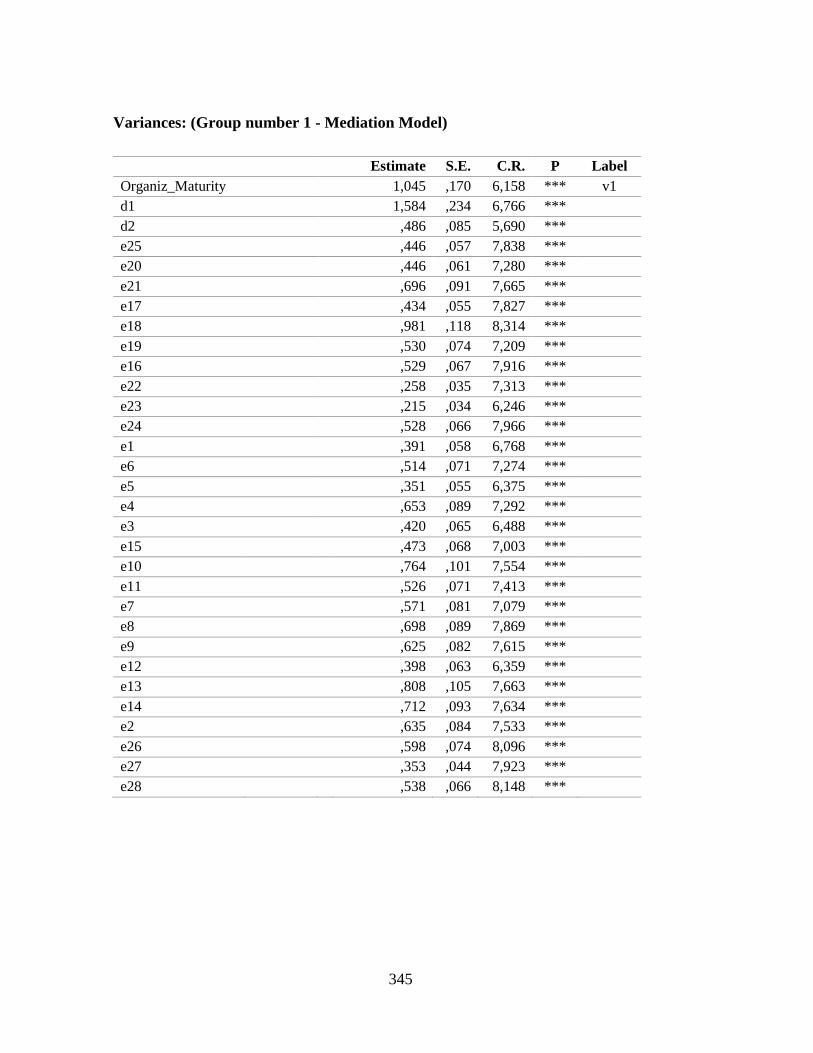
345
Variances: (Group number 1 - Mediation Model)
Estimate S.E. C.R. P Label
Organiz_Maturity
1,045 ,170 6,158 *** v1
d1
1,584 ,234 6,766 ***
d2
,486 ,085 5,690 ***
e25
,446 ,057 7,838 ***
e20
,446 ,061 7,280 ***
e21
,696 ,091 7,665 ***
e17
,434 ,055 7,827 ***
e18
,981 ,118 8,314 ***
e19
,530 ,074 7,209 ***
e16
,529 ,067 7,916 ***
e22
,258 ,035 7,313 ***
e23
,215 ,034 6,246 ***
e24
,528 ,066 7,966 ***
e1
,391 ,058 6,768 ***
e6
,514 ,071 7,274 ***
e5
,351 ,055 6,375 ***
e4
,653 ,089 7,292 ***
e3
,420 ,065 6,488 ***
e15
,473 ,068 7,003 ***
e10
,764 ,101 7,554 ***
e11
,526 ,071 7,413 ***
e7
,571 ,081 7,079 ***
e8
,698 ,089 7,869 ***
e9
,625 ,082 7,615 ***
e12
,398 ,063 6,359 ***
e13
,808 ,105 7,663 ***
e14
,712 ,093 7,634 ***
e2
,635 ,084 7,533 ***
e26
,598 ,074 8,096 ***
e27
,353 ,044 7,923 ***
e28
,538 ,066 8,148 ***
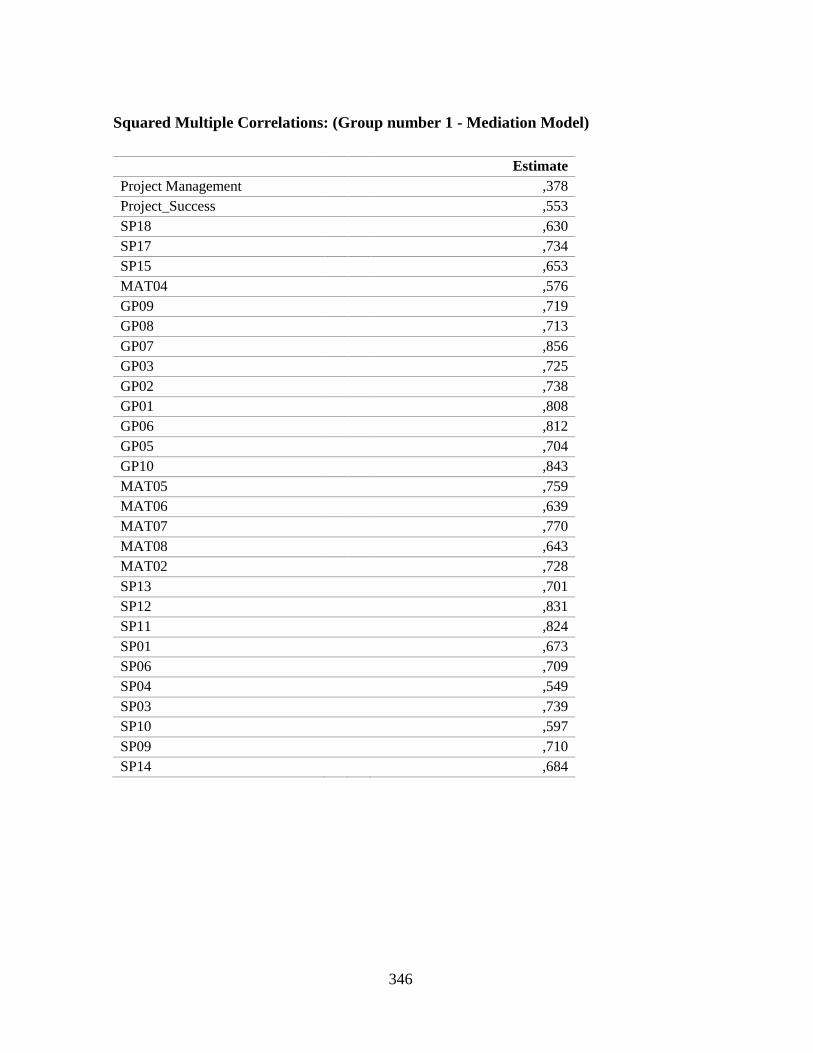
346
Squared Multiple Correlations: (Group number 1 - Mediation Model)
Estimate
Project Management
,378
Project_Success
,553
SP18
,630
SP17
,734
SP15
,653
MAT04
,576
GP09
,719
GP08
,713
GP07
,856
GP03
,725
GP02
,738
GP01
,808
GP06
,812
GP05
,704
GP10
,843
MAT05
,759
MAT06
,639
MAT07
,770
MAT08
,643
MAT02
,728
SP13
,701
SP12
,831
SP11
,824
SP01
,673
SP06
,709
SP04
,549
SP03
,739
SP10
,597
SP09
,710
SP14
,684
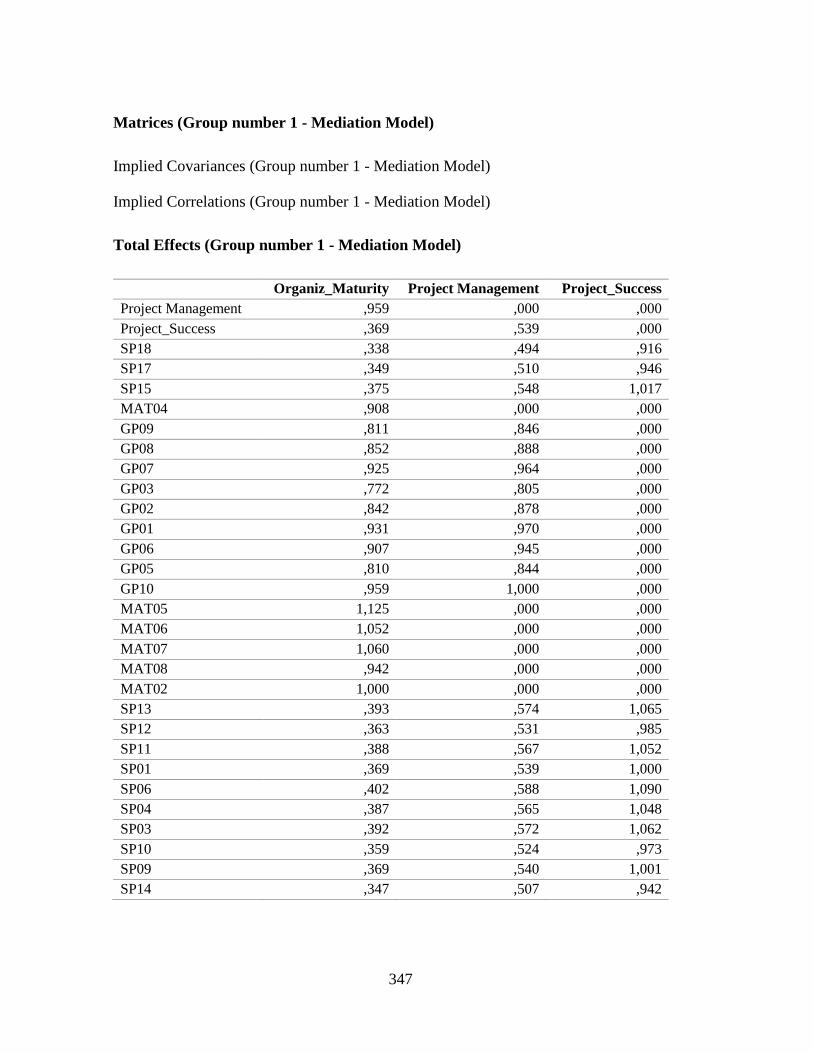
347
Matrices (Group number 1 - Mediation Model)
Implied Covariances (Group number 1 - Mediation Model)
Implied Correlations (Group number 1 - Mediation Model)
Total Effects (Group number 1 - Mediation Model)
Organiz_Maturity Project Management Project_Success
Project Management ,959 ,000 ,000
Project_Success ,369 ,539 ,000
SP18 ,338 ,494 ,916
SP17 ,349 ,510 ,946
SP15 ,375 ,548 1,017
MAT04 ,908 ,000 ,000
GP09 ,811 ,846 ,000
GP08 ,852 ,888 ,000
GP07 ,925 ,964 ,000
GP03 ,772 ,805 ,000
GP02 ,842 ,878 ,000
GP01 ,931 ,970 ,000
GP06 ,907 ,945 ,000
GP05 ,810 ,844 ,000
GP10 ,959 1,000 ,000
MAT05 1,125 ,000 ,000
MAT06 1,052 ,000 ,000
MAT07 1,060 ,000 ,000
MAT08 ,942 ,000 ,000
MAT02 1,000 ,000 ,000
SP13 ,393 ,574 1,065
SP12 ,363 ,531 ,985
SP11 ,388 ,567 1,052
SP01 ,369 ,539 1,000
SP06 ,402 ,588 1,090
SP04 ,387 ,565 1,048
SP03 ,392 ,572 1,062
SP10 ,359 ,524 ,973
SP09 ,369 ,540 1,001
SP14 ,347 ,507 ,942
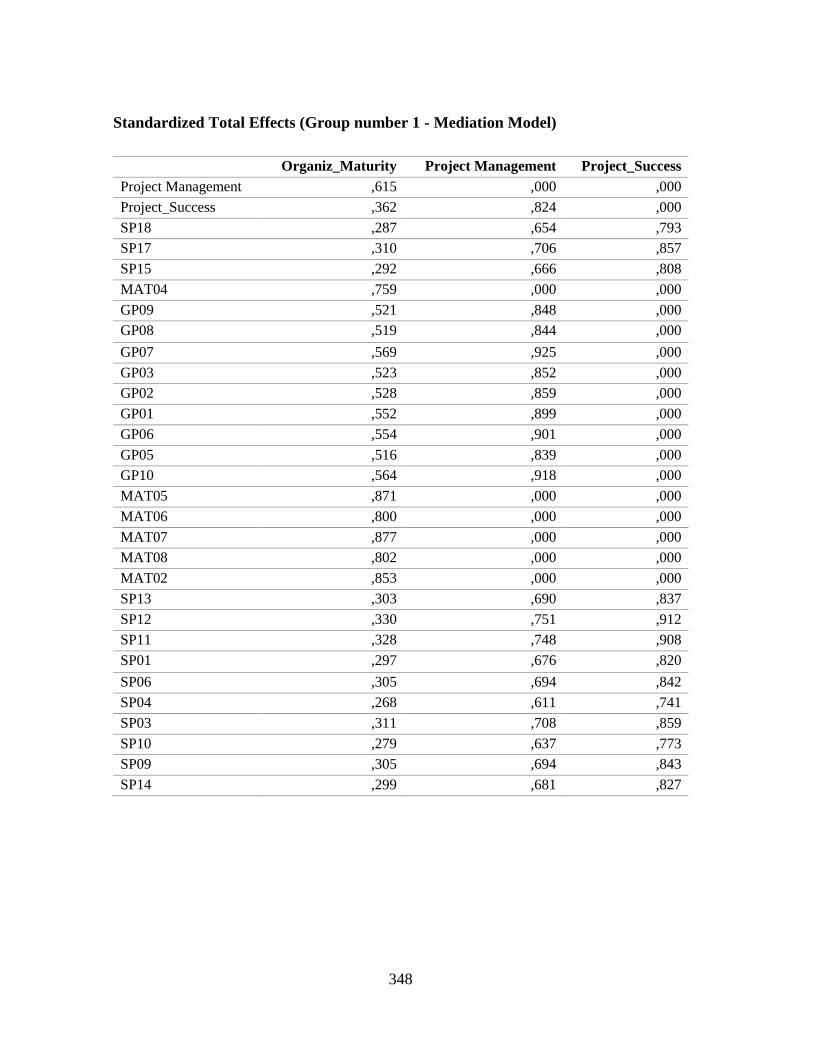
348
Standardized Total Effects (Group number 1 - Mediation Model)
Organiz_Maturity Project Management Project_Success
Project Management ,615 ,000 ,000
Project_Success ,362 ,824 ,000
SP18 ,287 ,654 ,793
SP17 ,310 ,706 ,857
SP15 ,292 ,666 ,808
MAT04 ,759 ,000 ,000
GP09 ,521 ,848 ,000
GP08 ,519 ,844 ,000
GP07 ,569 ,925 ,000
GP03 ,523 ,852 ,000
GP02 ,528 ,859 ,000
GP01 ,552 ,899 ,000
GP06 ,554 ,901 ,000
GP05 ,516 ,839 ,000
GP10 ,564 ,918 ,000
MAT05 ,871 ,000 ,000
MAT06 ,800 ,000 ,000
MAT07 ,877 ,000 ,000
MAT08 ,802 ,000 ,000
MAT02 ,853 ,000 ,000
SP13 ,303 ,690 ,837
SP12 ,330 ,751 ,912
SP11 ,328 ,748 ,908
SP01 ,297 ,676 ,820
SP06 ,305 ,694 ,842
SP04 ,268 ,611 ,741
SP03 ,311 ,708 ,859
SP10 ,279 ,637 ,773
SP09 ,305 ,694 ,843
SP14 ,299 ,681 ,827
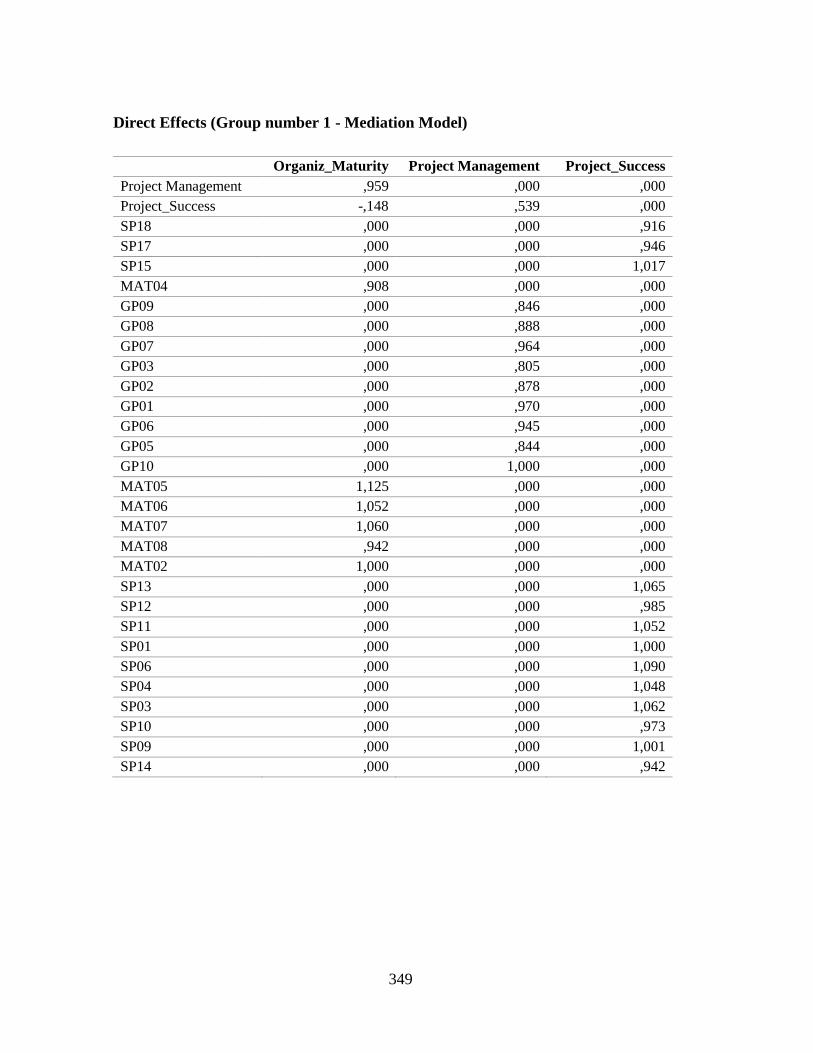
349
Direct Effects (Group number 1 - Mediation Model)
Organiz_Maturity Project Management Project_Success
Project Management ,959 ,000 ,000
Project_Success -,148 ,539 ,000
SP18 ,000 ,000 ,916
SP17 ,000 ,000 ,946
SP15 ,000 ,000 1,017
MAT04 ,908 ,000 ,000
GP09 ,000 ,846 ,000
GP08 ,000 ,888 ,000
GP07 ,000 ,964 ,000
GP03 ,000 ,805 ,000
GP02 ,000 ,878 ,000
GP01 ,000 ,970 ,000
GP06 ,000 ,945 ,000
GP05 ,000 ,844 ,000
GP10 ,000 1,000 ,000
MAT05 1,125 ,000 ,000
MAT06 1,052 ,000 ,000
MAT07 1,060 ,000 ,000
MAT08 ,942 ,000 ,000
MAT02 1,000 ,000 ,000
SP13 ,000 ,000 1,065
SP12 ,000 ,000 ,985
SP11 ,000 ,000 1,052
SP01 ,000 ,000 1,000
SP06 ,000 ,000 1,090
SP04 ,000 ,000 1,048
SP03 ,000 ,000 1,062
SP10 ,000 ,000 ,973
SP09 ,000 ,000 1,001
SP14 ,000 ,000 ,942
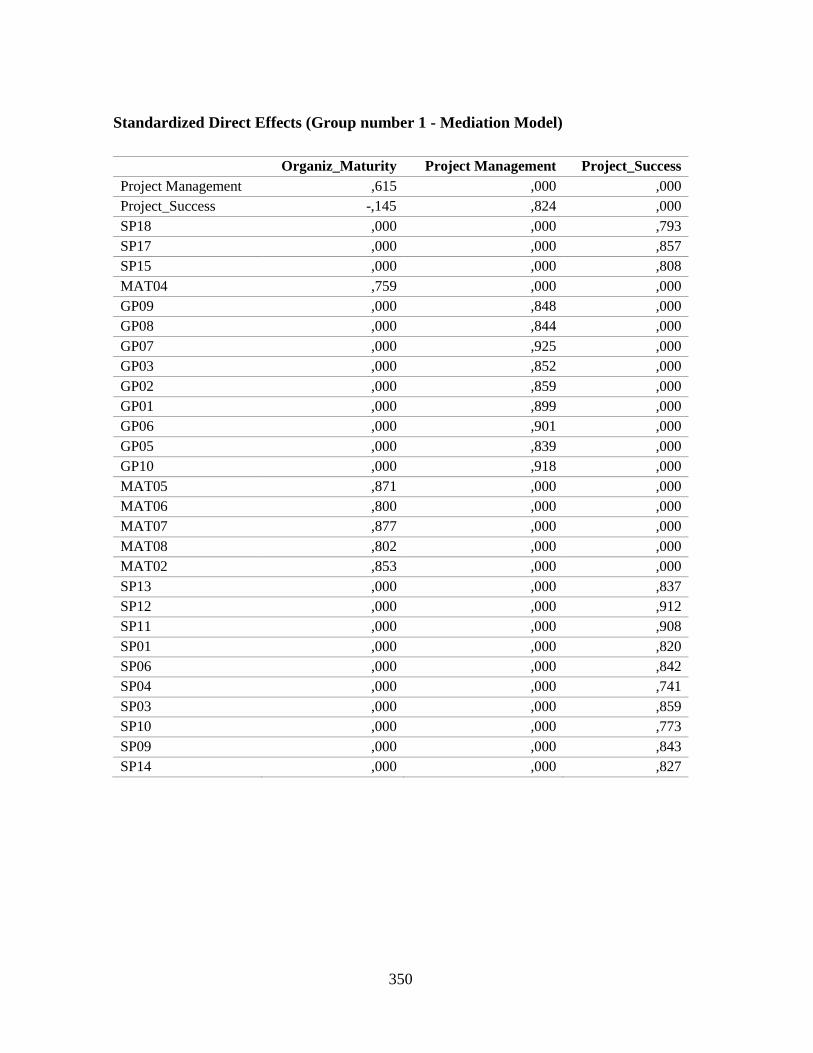
350
Standardized Direct Effects (Group number 1 - Mediation Model)
Organiz_Maturity Project Management Project_Success
Project Management ,615 ,000 ,000
Project_Success -,145 ,824 ,000
SP18 ,000 ,000 ,793
SP17 ,000 ,000 ,857
SP15 ,000 ,000 ,808
MAT04 ,759 ,000 ,000
GP09 ,000 ,848 ,000
GP08 ,000 ,844 ,000
GP07 ,000 ,925 ,000
GP03 ,000 ,852 ,000
GP02 ,000 ,859 ,000
GP01 ,000 ,899 ,000
GP06 ,000 ,901 ,000
GP05 ,000 ,839 ,000
GP10 ,000 ,918 ,000
MAT05 ,871 ,000 ,000
MAT06 ,800 ,000 ,000
MAT07 ,877 ,000 ,000
MAT08 ,802 ,000 ,000
MAT02 ,853 ,000 ,000
SP13 ,000 ,000 ,837
SP12 ,000 ,000 ,912
SP11 ,000 ,000 ,908
SP01 ,000 ,000 ,820
SP06 ,000 ,000 ,842
SP04 ,000 ,000 ,741
SP03 ,000 ,000 ,859
SP10 ,000 ,000 ,773
SP09 ,000 ,000 ,843
SP14 ,000 ,000 ,827
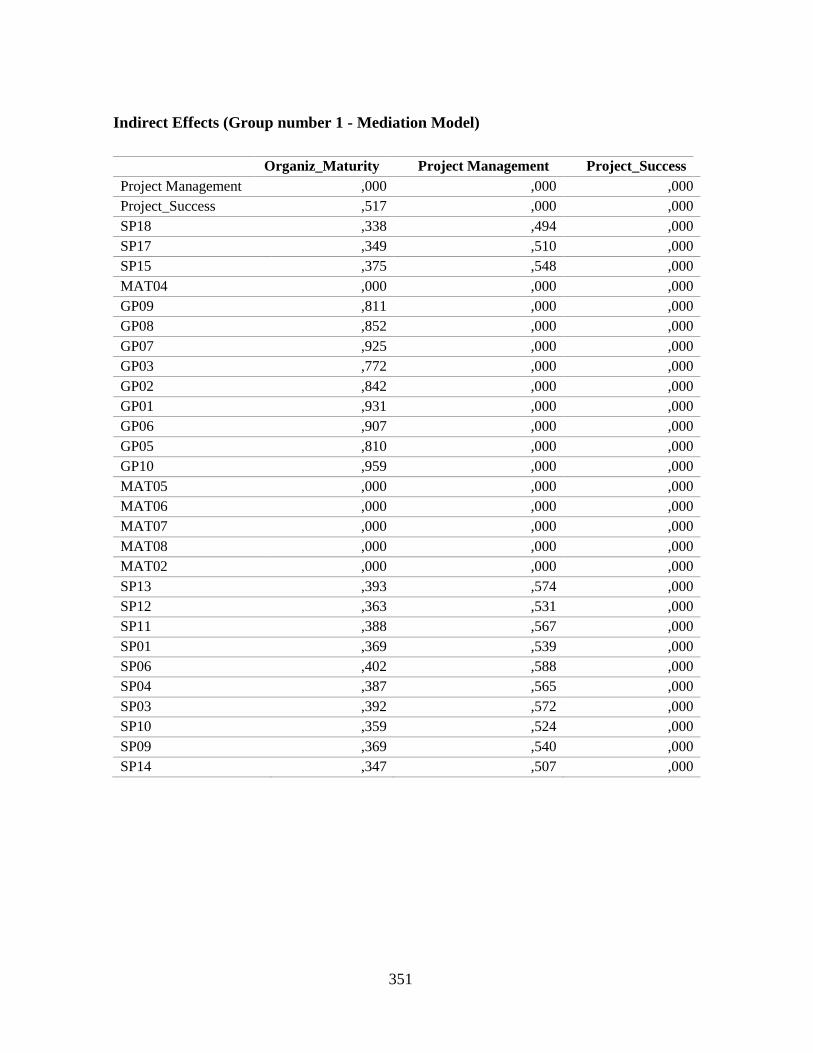
351
Indirect Effects (Group number 1 - Mediation Model)
Organiz_Maturity Project Management Project_Success
Project Management ,000 ,000 ,000
Project_Success ,517 ,000 ,000
SP18 ,338 ,494 ,000
SP17 ,349 ,510 ,000
SP15 ,375 ,548 ,000
MAT04 ,000 ,000 ,000
GP09 ,811 ,000 ,000
GP08 ,852 ,000 ,000
GP07 ,925 ,000 ,000
GP03 ,772 ,000 ,000
GP02 ,842 ,000 ,000
GP01 ,931 ,000 ,000
GP06 ,907 ,000 ,000
GP05 ,810 ,000 ,000
GP10 ,959 ,000 ,000
MAT05 ,000 ,000 ,000
MAT06 ,000 ,000 ,000
MAT07 ,000 ,000 ,000
MAT08 ,000 ,000 ,000
MAT02 ,000 ,000 ,000
SP13 ,393 ,574 ,000
SP12 ,363 ,531 ,000
SP11 ,388 ,567 ,000
SP01 ,369 ,539 ,000
SP06 ,402 ,588 ,000
SP04 ,387 ,565 ,000
SP03 ,392 ,572 ,000
SP10 ,359 ,524 ,000
SP09 ,369 ,540 ,000
SP14 ,347 ,507 ,000
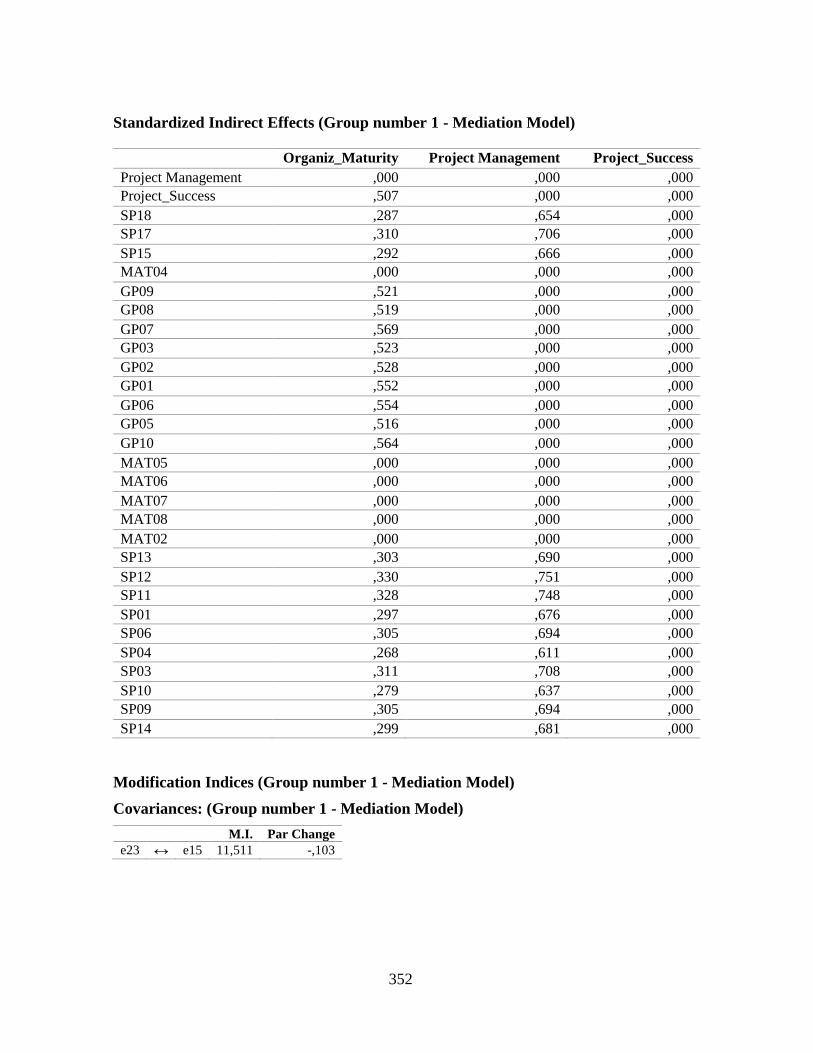
352
Standardized Indirect Effects (Group number 1 - Mediation Model)
Organiz_Maturity Project Management Project_Success
Project Management ,000 ,000 ,000
Project_Success ,507 ,000 ,000
SP18 ,287 ,654 ,000
SP17 ,310 ,706 ,000
SP15 ,292 ,666 ,000
MAT04 ,000 ,000 ,000
GP09 ,521 ,000 ,000
GP08 ,519 ,000 ,000
GP07 ,569 ,000 ,000
GP03 ,523 ,000 ,000
GP02 ,528 ,000 ,000
GP01 ,552 ,000 ,000
GP06 ,554 ,000 ,000
GP05 ,516 ,000 ,000
GP10 ,564 ,000 ,000
MAT05 ,000 ,000 ,000
MAT06 ,000 ,000 ,000
MAT07 ,000 ,000 ,000
MAT08 ,000 ,000 ,000
MAT02 ,000 ,000 ,000
SP13 ,303 ,690 ,000
SP12 ,330 ,751 ,000
SP11 ,328 ,748 ,000
SP01 ,297 ,676 ,000
SP06 ,305 ,694 ,000
SP04 ,268 ,611 ,000
SP03 ,311 ,708 ,000
SP10 ,279 ,637 ,000
SP09 ,305 ,694 ,000
SP14 ,299 ,681 ,000
Modification Indices (Group number 1 - Mediation Model)
Covariances: (Group number 1 - Mediation Model)
M.I. Par Change
e23 ↔ e15 11,511 -,103
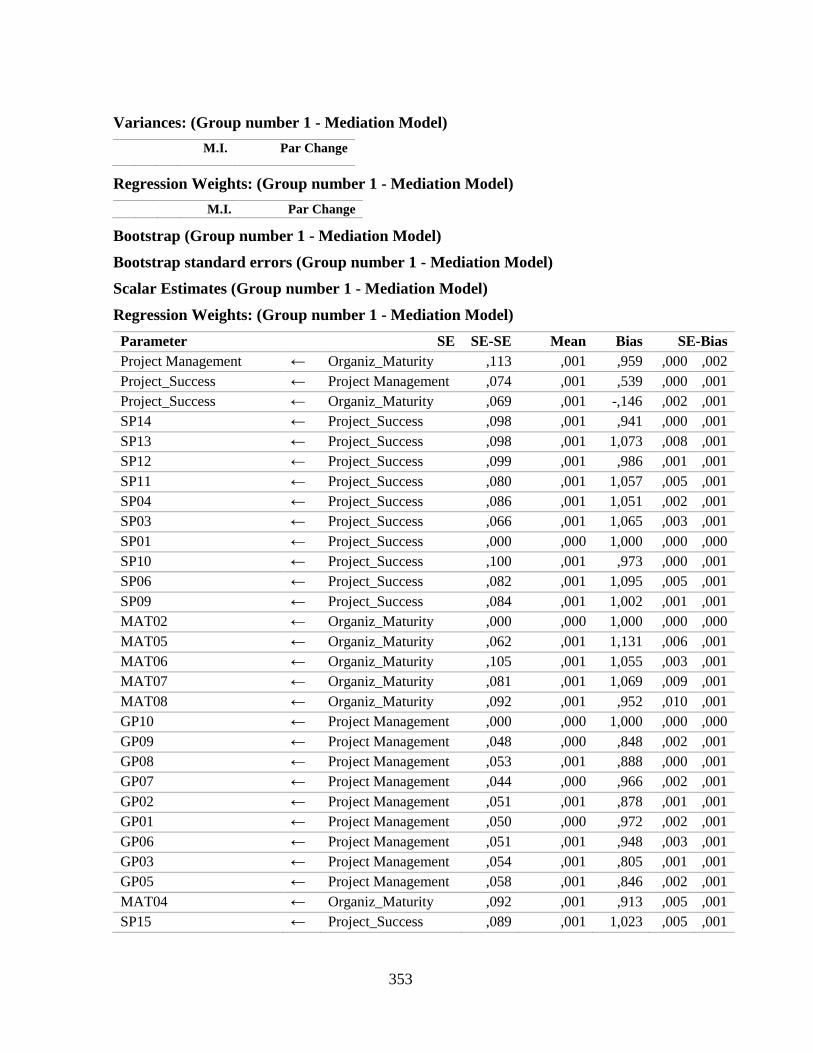
353
Variances: (Group number 1 - Mediation Model)
M.I. Par Change
Regression Weights: (Group number 1 - Mediation Model)
M.I. Par Change
Bootstrap (Group number 1 - Mediation Model)
Bootstrap standard errors (Group number 1 - Mediation Model)
Scalar Estimates (Group number 1 - Mediation Model)
Regression Weights: (Group number 1 - Mediation Model)
Parameter SE SE-SE Mean Bias SE-Bias
Project Management ← Organiz_Maturity ,113 ,001 ,959 ,000 ,002
Project_Success ← Project Management ,074 ,001 ,539 ,000 ,001
Project_Success ← Organiz_Maturity ,069 ,001 -,146 ,002 ,001
SP14 ← Project_Success ,098 ,001 ,941 ,000 ,001
SP13 ← Project_Success ,098 ,001 1,073 ,008 ,001
SP12 ← Project_Success ,099 ,001 ,986 ,001 ,001
SP11 ← Project_Success ,080 ,001 1,057 ,005 ,001
SP04 ← Project_Success ,086 ,001 1,051 ,002 ,001
SP03 ← Project_Success ,066 ,001 1,065 ,003 ,001
SP01 ← Project_Success ,000 ,000 1,000 ,000 ,000
SP10 ← Project_Success ,100 ,001 ,973 ,000 ,001
SP06 ← Project_Success ,082 ,001 1,095 ,005 ,001
SP09 ← Project_Success ,084 ,001 1,002 ,001 ,001
MAT02 ← Organiz_Maturity ,000 ,000 1,000 ,000 ,000
MAT05 ← Organiz_Maturity ,062 ,001 1,131 ,006 ,001
MAT06 ← Organiz_Maturity ,105 ,001 1,055 ,003 ,001
MAT07 ← Organiz_Maturity ,081 ,001 1,069 ,009 ,001
MAT08 ← Organiz_Maturity ,092 ,001 ,952 ,010 ,001
GP10 ← Project Management ,000 ,000 1,000 ,000 ,000
GP09 ← Project Management ,048 ,000 ,848 ,002 ,001
GP08 ← Project Management ,053 ,001 ,888 ,000 ,001
GP07 ← Project Management ,044 ,000 ,966 ,002 ,001
GP02 ← Project Management ,051 ,001 ,878 ,001 ,001
GP01 ← Project Management ,050 ,000 ,972 ,002 ,001
GP06 ← Project Management ,051 ,001 ,948 ,003 ,001
GP03 ← Project Management ,054 ,001 ,805 ,001 ,001
GP05 ← Project Management ,058 ,001 ,846 ,002 ,001
MAT04 ← Organiz_Maturity ,092 ,001 ,913 ,005 ,001
SP15 ← Project_Success ,089 ,001 1,023 ,005 ,001
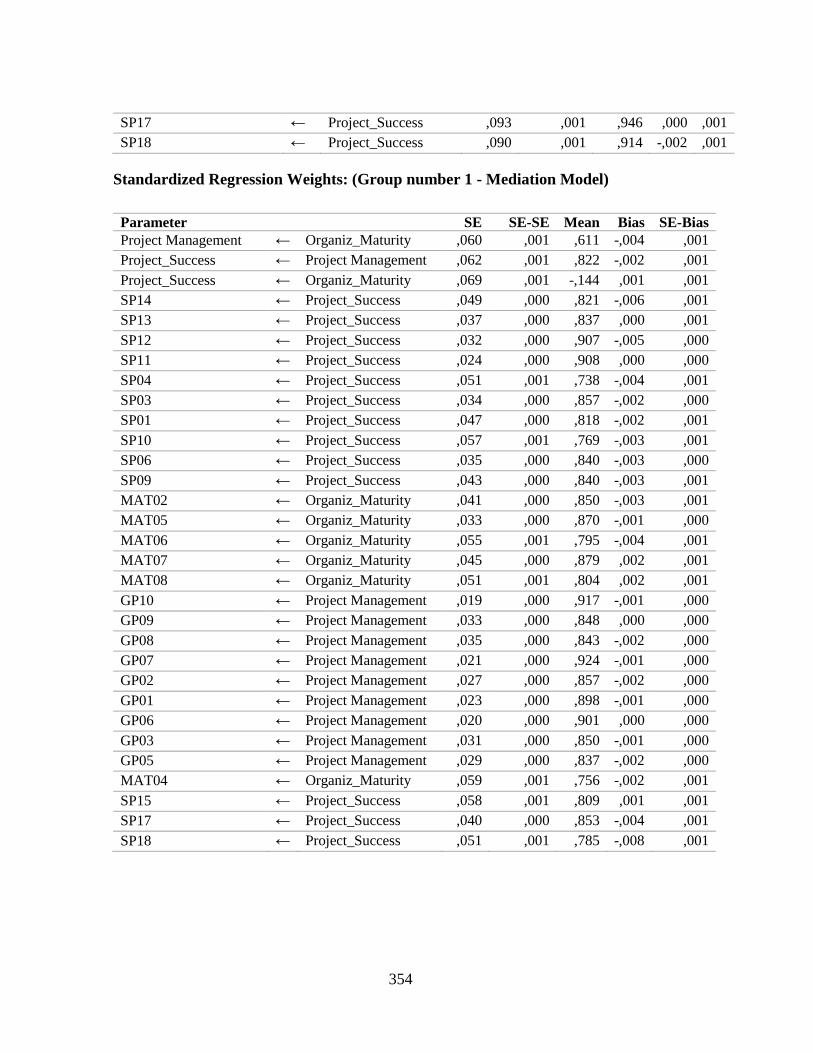
354
SP17 ← Project_Success ,093 ,001 ,946 ,000 ,001
SP18 ← Project_Success ,090 ,001 ,914 -,002 ,001
Standardized Regression Weights: (Group number 1 - Mediation Model)
Parameter SE SE-SE Mean Bias SE-Bias
Project Management ← Organiz_Maturity ,060 ,001 ,611 -,004 ,001
Project_Success ← Project Management ,062 ,001 ,822 -,002 ,001
Project_Success ← Organiz_Maturity ,069 ,001 -,144 ,001 ,001
SP14 ← Project_Success ,049 ,000 ,821 -,006 ,001
SP13 ← Project_Success ,037 ,000 ,837 ,000 ,001
SP12 ← Project_Success ,032 ,000 ,907 -,005 ,000
SP11 ← Project_Success ,024 ,000 ,908 ,000 ,000
SP04 ← Project_Success ,051 ,001 ,738 -,004 ,001
SP03 ← Project_Success ,034 ,000 ,857 -,002 ,000
SP01 ← Project_Success ,047 ,000 ,818 -,002 ,001
SP10 ← Project_Success ,057 ,001 ,769 -,003 ,001
SP06 ← Project_Success ,035 ,000 ,840 -,003 ,000
SP09 ← Project_Success ,043 ,000 ,840 -,003 ,001
MAT02 ← Organiz_Maturity ,041 ,000 ,850 -,003 ,001
MAT05 ← Organiz_Maturity ,033 ,000 ,870 -,001 ,000
MAT06 ← Organiz_Maturity ,055 ,001 ,795 -,004 ,001
MAT07 ← Organiz_Maturity ,045 ,000 ,879 ,002 ,001
MAT08 ← Organiz_Maturity ,051 ,001 ,804 ,002 ,001
GP10 ← Project Management ,019 ,000 ,917 -,001 ,000
GP09 ← Project Management ,033 ,000 ,848 ,000 ,000
GP08 ← Project Management ,035 ,000 ,843 -,002 ,000
GP07 ← Project Management ,021 ,000 ,924 -,001 ,000
GP02 ← Project Management ,027 ,000 ,857 -,002 ,000
GP01 ← Project Management ,023 ,000 ,898 -,001 ,000
GP06 ← Project Management ,020 ,000 ,901 ,000 ,000
GP03 ← Project Management ,031 ,000 ,850 -,001 ,000
GP05 ← Project Management ,029 ,000 ,837 -,002 ,000
MAT04 ← Organiz_Maturity ,059 ,001 ,756 -,002 ,001
SP15 ← Project_Success ,058 ,001 ,809 ,001 ,001
SP17 ← Project_Success ,040 ,000 ,853 -,004 ,001
SP18 ← Project_Success ,051 ,001 ,785 -,008 ,001
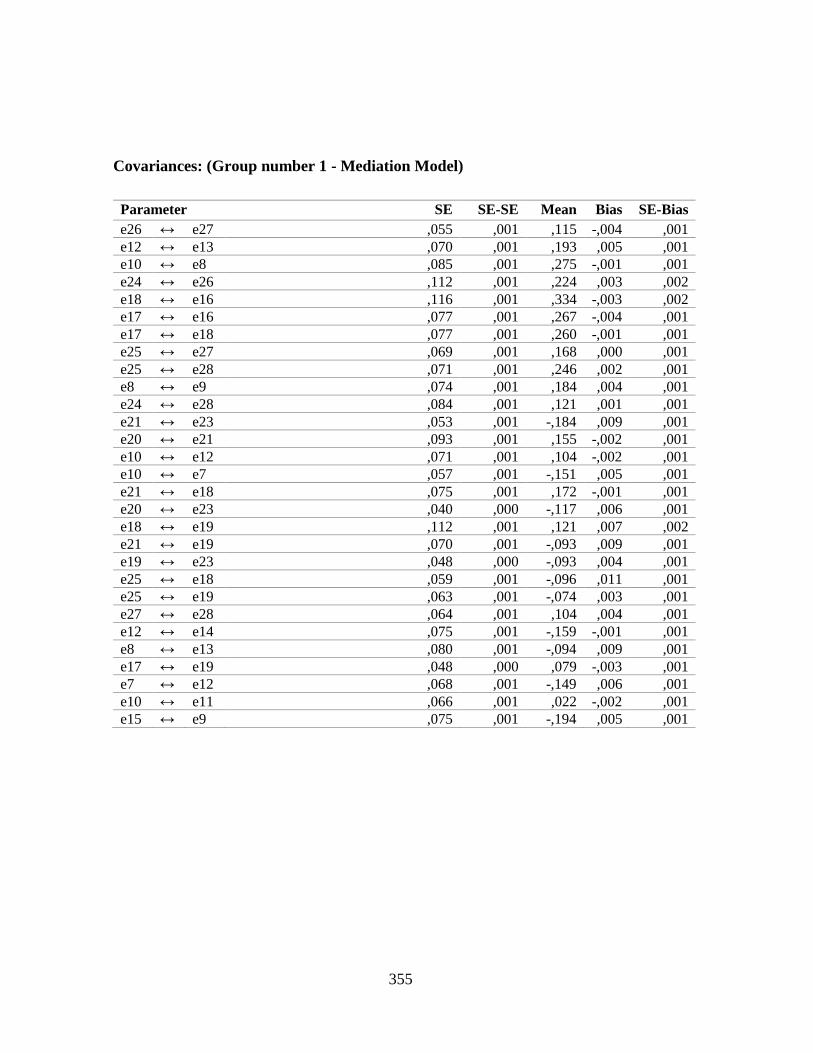
355
Covariances: (Group number 1 - Mediation Model)
Parameter SE SE-SE Mean Bias SE-Bias
e26 ↔ e27 ,055 ,001 ,115 -,004 ,001
e12 ↔ e13 ,070 ,001 ,193 ,005 ,001
e10 ↔ e8 ,085 ,001 ,275 -,001 ,001
e24 ↔ e26 ,112 ,001 ,224 ,003 ,002
e18 ↔ e16 ,116 ,001 ,334 -,003 ,002
e17 ↔ e16 ,077 ,001 ,267 -,004 ,001
e17 ↔ e18 ,077 ,001 ,260 -,001 ,001
e25 ↔ e27 ,069 ,001 ,168 ,000 ,001
e25 ↔ e28 ,071 ,001 ,246 ,002 ,001
e8 ↔ e9 ,074 ,001 ,184 ,004 ,001
e24 ↔ e28 ,084 ,001 ,121 ,001 ,001
e21 ↔ e23 ,053 ,001 -,184 ,009 ,001
e20 ↔ e21 ,093 ,001 ,155 -,002 ,001
e10 ↔ e12 ,071 ,001 ,104 -,002 ,001
e10 ↔ e7 ,057 ,001 -,151 ,005 ,001
e21 ↔ e18 ,075 ,001 ,172 -,001 ,001
e20 ↔ e23 ,040 ,000 -,117 ,006 ,001
e18 ↔ e19 ,112 ,001 ,121 ,007 ,002
e21 ↔ e19 ,070 ,001 -,093 ,009 ,001
e19 ↔ e23 ,048 ,000 -,093 ,004 ,001
e25 ↔ e18 ,059 ,001 -,096 ,011 ,001
e25 ↔ e19 ,063 ,001 -,074 ,003 ,001
e27 ↔ e28 ,064 ,001 ,104 ,004 ,001
e12 ↔ e14 ,075 ,001 -,159 -,001 ,001
e8 ↔ e13 ,080 ,001 -,094 ,009 ,001
e17 ↔ e19 ,048 ,000 ,079 -,003 ,001
e7 ↔ e12 ,068 ,001 -,149 ,006 ,001
e10 ↔ e11 ,066 ,001 ,022 -,002 ,001
e15 ↔ e9 ,075 ,001 -,194 ,005 ,001
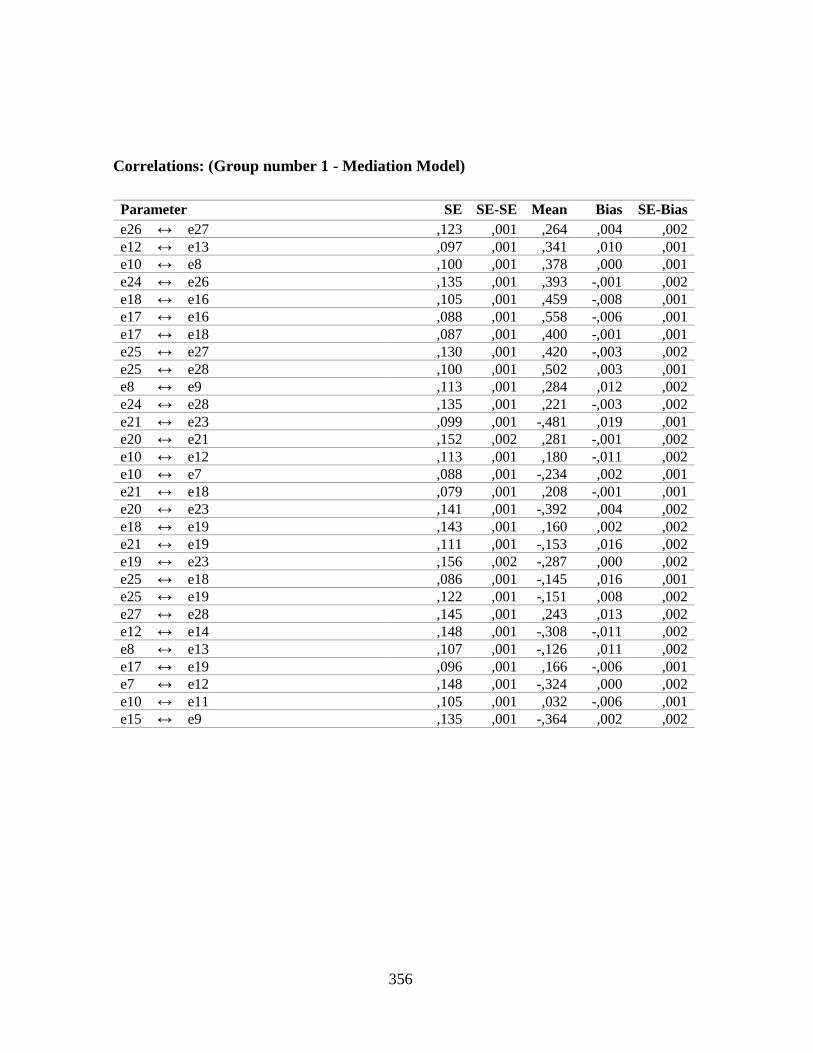
356
Correlations: (Group number 1 - Mediation Model)
Parameter SE SE-SE Mean Bias SE-Bias
e26 ↔ e27 ,123 ,001 ,264 ,004 ,002
e12 ↔ e13 ,097 ,001 ,341 ,010 ,001
e10 ↔ e8 ,100 ,001 ,378 ,000 ,001
e24 ↔ e26 ,135 ,001 ,393 -,001 ,002
e18 ↔ e16 ,105 ,001 ,459 -,008 ,001
e17 ↔ e16 ,088 ,001 ,558 -,006 ,001
e17 ↔ e18 ,087 ,001 ,400 -,001 ,001
e25 ↔ e27 ,130 ,001 ,420 -,003 ,002
e25 ↔ e28 ,100 ,001 ,502 ,003 ,001
e8 ↔ e9 ,113 ,001 ,284 ,012 ,002
e24 ↔ e28 ,135 ,001 ,221 -,003 ,002
e21 ↔ e23 ,099 ,001 -,481 ,019 ,001
e20 ↔ e21 ,152 ,002 ,281 -,001 ,002
e10 ↔ e12 ,113 ,001 ,180 -,011 ,002
e10 ↔ e7 ,088 ,001 -,234 ,002 ,001
e21 ↔ e18 ,079 ,001 ,208 -,001 ,001
e20 ↔ e23 ,141 ,001 -,392 ,004 ,002
e18 ↔ e19 ,143 ,001 ,160 ,002 ,002
e21 ↔ e19 ,111 ,001 -,153 ,016 ,002
e19 ↔ e23 ,156 ,002 -,287 ,000 ,002
e25 ↔ e18 ,086 ,001 -,145 ,016 ,001
e25 ↔ e19 ,122 ,001 -,151 ,008 ,002
e27 ↔ e28 ,145 ,001 ,243 ,013 ,002
e12 ↔ e14 ,148 ,001 -,308 -,011 ,002
e8 ↔ e13 ,107 ,001 -,126 ,011 ,002
e17 ↔ e19 ,096 ,001 ,166 -,006 ,001
e7 ↔ e12 ,148 ,001 -,324 ,000 ,002
e10 ↔ e11 ,105 ,001 ,032 -,006 ,001
e15 ↔ e9 ,135 ,001 -,364 ,002 ,002
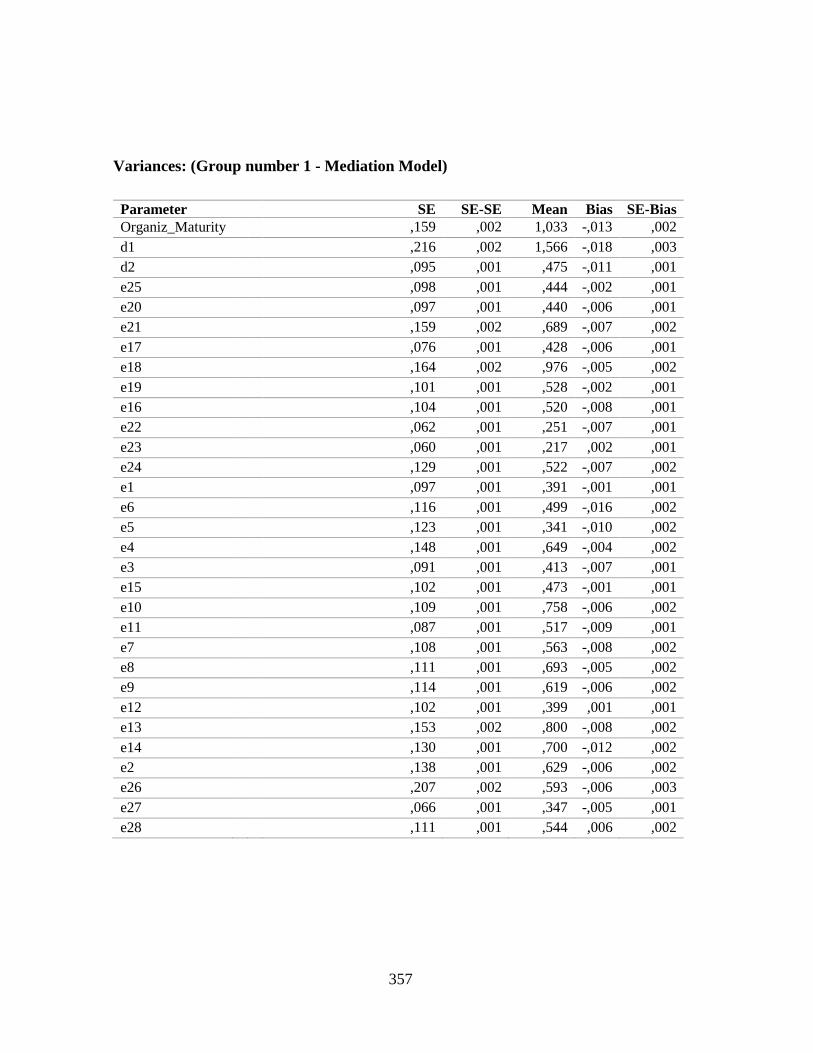
357
Variances: (Group number 1 - Mediation Model)
Parameter SE SE-SE Mean Bias SE-Bias
Organiz_Maturity
,159 ,002 1,033 -,013 ,002
d1
,216 ,002 1,566 -,018 ,003
d2
,095 ,001 ,475 -,011 ,001
e25
,098 ,001 ,444 -,002 ,001
e20
,097 ,001 ,440 -,006 ,001
e21
,159 ,002 ,689 -,007 ,002
e17
,076 ,001 ,428 -,006 ,001
e18
,164 ,002 ,976 -,005 ,002
e19
,101 ,001 ,528 -,002 ,001
e16
,104 ,001 ,520 -,008 ,001
e22
,062 ,001 ,251 -,007 ,001
e23
,060 ,001 ,217 ,002 ,001
e24
,129 ,001 ,522 -,007 ,002
e1
,097 ,001 ,391 -,001 ,001
e6
,116 ,001 ,499 -,016 ,002
e5
,123 ,001 ,341 -,010 ,002
e4
,148 ,001 ,649 -,004 ,002
e3
,091 ,001 ,413 -,007 ,001
e15
,102 ,001 ,473 -,001 ,001
e10
,109 ,001 ,758 -,006 ,002
e11
,087 ,001 ,517 -,009 ,001
e7
,108 ,001 ,563 -,008 ,002
e8
,111 ,001 ,693 -,005 ,002
e9
,114 ,001 ,619 -,006 ,002
e12
,102 ,001 ,399 ,001 ,001
e13
,153 ,002 ,800 -,008 ,002
e14
,130 ,001 ,700 -,012 ,002
e2
,138 ,001 ,629 -,006 ,002
e26
,207 ,002 ,593 -,006 ,003
e27
,066 ,001 ,347 -,005 ,001
e28
,111 ,001 ,544 ,006 ,002
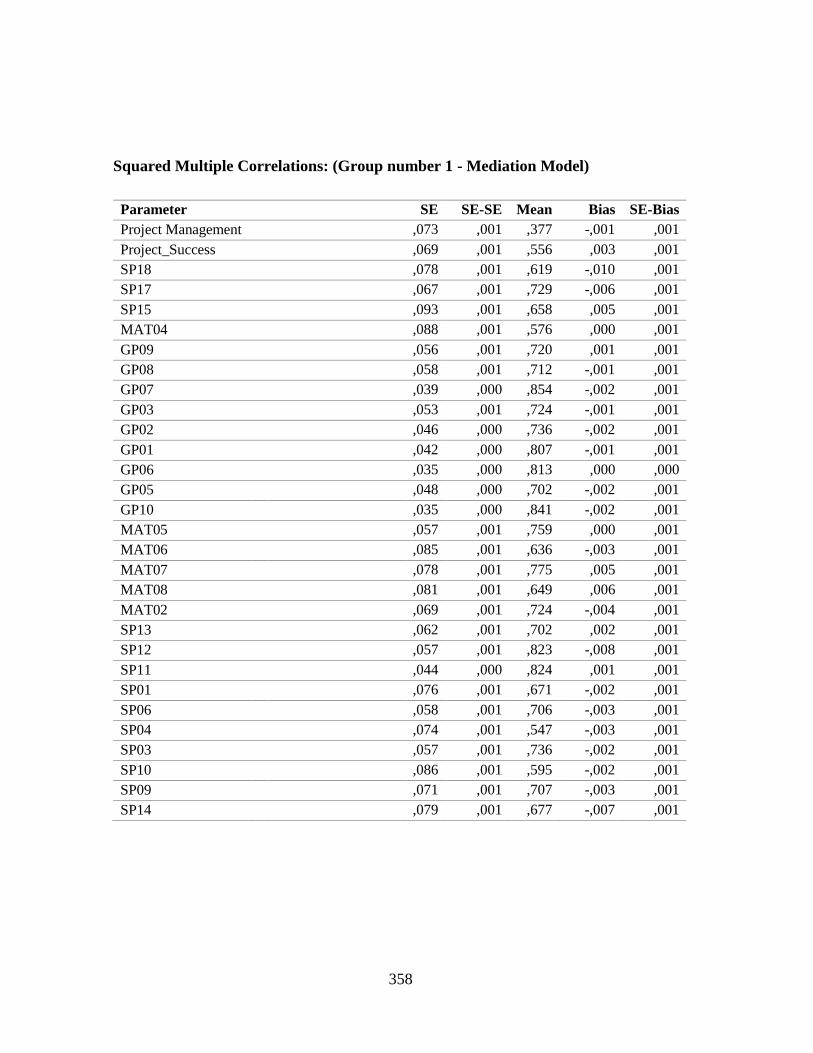
358
Squared Multiple Correlations: (Group number 1 - Mediation Model)
Parameter SE SE-SE Mean Bias SE-Bias
Project Management
,073 ,001 ,377 -,001 ,001
Project_Success
,069 ,001 ,556 ,003 ,001
SP18
,078 ,001 ,619 -,010 ,001
SP17
,067 ,001 ,729 -,006 ,001
SP15
,093 ,001 ,658 ,005 ,001
MAT04
,088 ,001 ,576 ,000 ,001
GP09
,056 ,001 ,720 ,001 ,001
GP08
,058 ,001 ,712 -,001 ,001
GP07
,039 ,000 ,854 -,002 ,001
GP03
,053 ,001 ,724 -,001 ,001
GP02
,046 ,000 ,736 -,002 ,001
GP01
,042 ,000 ,807 -,001 ,001
GP06
,035 ,000 ,813 ,000 ,000
GP05
,048 ,000 ,702 -,002 ,001
GP10
,035 ,000 ,841 -,002 ,001
MAT05
,057 ,001 ,759 ,000 ,001
MAT06
,085 ,001 ,636 -,003 ,001
MAT07
,078 ,001 ,775 ,005 ,001
MAT08
,081 ,001 ,649 ,006 ,001
MAT02
,069 ,001 ,724 -,004 ,001
SP13
,062 ,001 ,702 ,002 ,001
SP12
,057 ,001 ,823 -,008 ,001
SP11
,044 ,000 ,824 ,001 ,001
SP01
,076 ,001 ,671 -,002 ,001
SP06
,058 ,001 ,706 -,003 ,001
SP04
,074 ,001 ,547 -,003 ,001
SP03
,057 ,001 ,736 -,002 ,001
SP10
,086 ,001 ,595 -,002 ,001
SP09
,071 ,001 ,707 -,003 ,001
SP14
,079 ,001 ,677 -,007 ,001
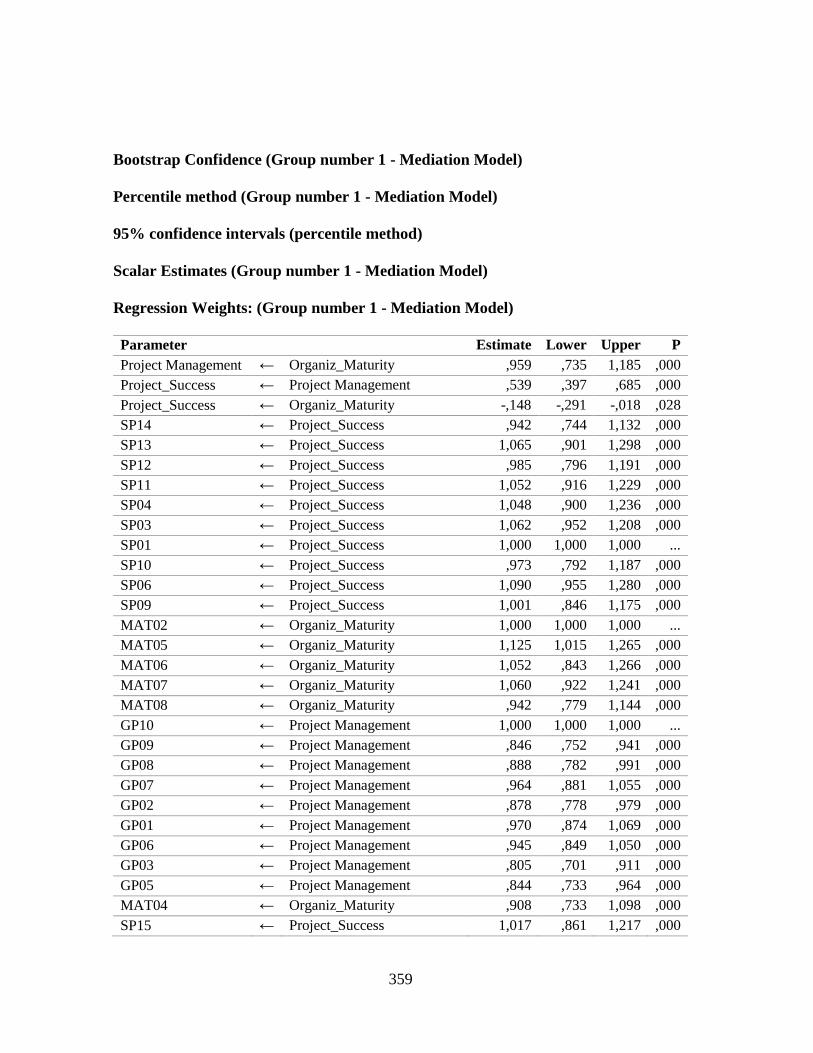
359
Bootstrap Confidence (Group number 1 - Mediation Model)
Percentile method (Group number 1 - Mediation Model)
95% confidence intervals (percentile method)
Scalar Estimates (Group number 1 - Mediation Model)
Regression Weights: (Group number 1 - Mediation Model)
Parameter Estimate Lower Upper P
Project Management ← Organiz_Maturity ,959 ,735 1,185 ,000
Project_Success ← Project Management ,539 ,397 ,685 ,000
Project_Success ← Organiz_Maturity -,148 -,291 -,018 ,028
SP14 ← Project_Success ,942 ,744 1,132 ,000
SP13 ← Project_Success 1,065 ,901 1,298 ,000
SP12 ← Project_Success ,985 ,796 1,191 ,000
SP11 ← Project_Success 1,052 ,916 1,229 ,000
SP04 ← Project_Success 1,048 ,900 1,236 ,000
SP03 ← Project_Success 1,062 ,952 1,208 ,000
SP01 ← Project_Success 1,000 1,000 1,000 ...
SP10 ← Project_Success ,973 ,792 1,187 ,000
SP06 ← Project_Success 1,090 ,955 1,280 ,000
SP09 ← Project_Success 1,001 ,846 1,175 ,000
MAT02 ← Organiz_Maturity 1,000 1,000 1,000 ...
MAT05 ← Organiz_Maturity 1,125 1,015 1,265 ,000
MAT06 ← Organiz_Maturity 1,052 ,843 1,266 ,000
MAT07 ← Organiz_Maturity 1,060 ,922 1,241 ,000
MAT08 ← Organiz_Maturity ,942 ,779 1,144 ,000
GP10 ← Project Management 1,000 1,000 1,000 ...
GP09 ← Project Management ,846 ,752 ,941 ,000
GP08 ← Project Management ,888 ,782 ,991 ,000
GP07 ← Project Management ,964 ,881 1,055 ,000
GP02 ← Project Management ,878 ,778 ,979 ,000
GP01 ← Project Management ,970 ,874 1,069 ,000
GP06 ← Project Management ,945 ,849 1,050 ,000
GP03 ← Project Management ,805 ,701 ,911 ,000
GP05 ← Project Management ,844 ,733 ,964 ,000
MAT04 ← Organiz_Maturity ,908 ,733 1,098 ,000
SP15 ← Project_Success 1,017 ,861 1,217 ,000
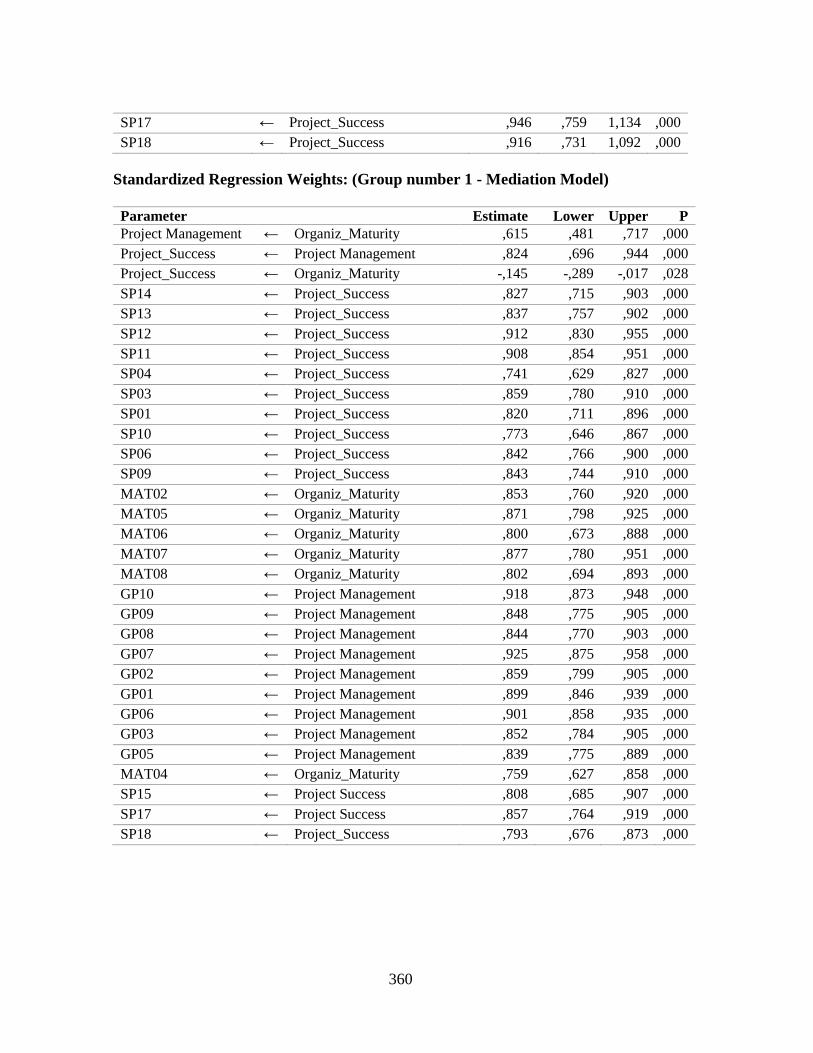
360
SP17 ← Project_Success ,946 ,759 1,134 ,000
SP18 ← Project_Success ,916 ,731 1,092 ,000
Standardized Regression Weights: (Group number 1 - Mediation Model)
Parameter Estimate Lower Upper P
Project Management ← Organiz_Maturity ,615 ,481 ,717 ,000
Project_Success ← Project Management ,824 ,696 ,944 ,000
Project_Success ← Organiz_Maturity -,145 -,289 -,017 ,028
SP14 ← Project_Success ,827 ,715 ,903 ,000
SP13 ← Project_Success ,837 ,757 ,902 ,000
SP12 ← Project_Success ,912 ,830 ,955 ,000
SP11 ← Project_Success ,908 ,854 ,951 ,000
SP04 ← Project_Success ,741 ,629 ,827 ,000
SP03 ← Project_Success ,859 ,780 ,910 ,000
SP01 ← Project_Success ,820 ,711 ,896 ,000
SP10 ← Project_Success ,773 ,646 ,867 ,000
SP06 ← Project_Success ,842 ,766 ,900 ,000
SP09 ← Project_Success ,843 ,744 ,910 ,000
MAT02 ← Organiz_Maturity ,853 ,760 ,920 ,000
MAT05 ← Organiz_Maturity ,871 ,798 ,925 ,000
MAT06 ← Organiz_Maturity ,800 ,673 ,888 ,000
MAT07 ← Organiz_Maturity ,877 ,780 ,951 ,000
MAT08 ← Organiz_Maturity ,802 ,694 ,893 ,000
GP10 ← Project Management ,918 ,873 ,948 ,000
GP09 ← Project Management ,848 ,775 ,905 ,000
GP08 ← Project Management ,844 ,770 ,903 ,000
GP07 ← Project Management ,925 ,875 ,958 ,000
GP02 ← Project Management ,859 ,799 ,905 ,000
GP01 ← Project Management ,899 ,846 ,939 ,000
GP06 ← Project Management ,901 ,858 ,935 ,000
GP03 ← Project Management ,852 ,784 ,905 ,000
GP05 ← Project Management ,839 ,775 ,889 ,000
MAT04 ← Organiz_Maturity ,759 ,627 ,858 ,000
SP15 ← Project Success ,808 ,685 ,907 ,000
SP17 ← Project Success ,857 ,764 ,919 ,000
SP18 ← Project_Success ,793 ,676 ,873 ,000
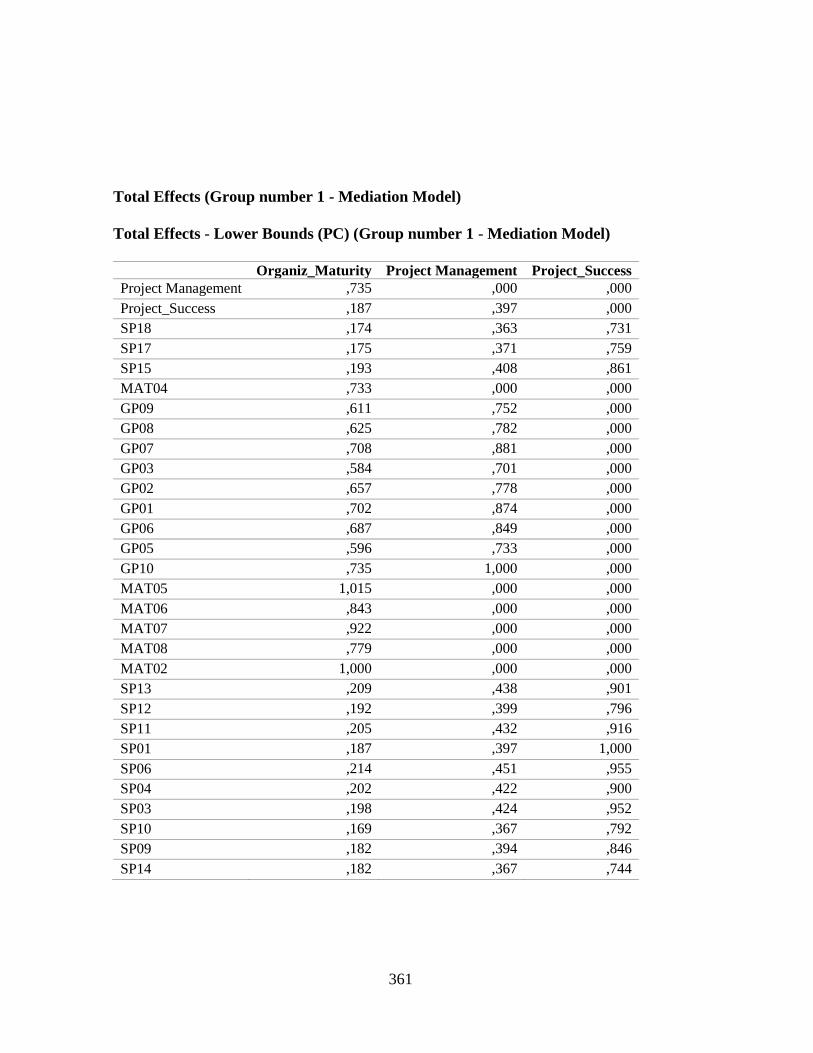
361
Total Effects (Group number 1 - Mediation Model)
Total Effects - Lower Bounds (PC) (Group number 1 - Mediation Model)
Organiz_Maturity Project Management Project_Success
Project Management ,735 ,000 ,000
Project_Success ,187 ,397 ,000
SP18 ,174 ,363 ,731
SP17 ,175 ,371 ,759
SP15 ,193 ,408 ,861
MAT04 ,733 ,000 ,000
GP09 ,611 ,752 ,000
GP08 ,625 ,782 ,000
GP07 ,708 ,881 ,000
GP03 ,584 ,701 ,000
GP02 ,657 ,778 ,000
GP01 ,702 ,874 ,000
GP06 ,687 ,849 ,000
GP05 ,596 ,733 ,000
GP10 ,735 1,000 ,000
MAT05 1,015 ,000 ,000
MAT06 ,843 ,000 ,000
MAT07 ,922 ,000 ,000
MAT08 ,779 ,000 ,000
MAT02 1,000 ,000 ,000
SP13 ,209 ,438 ,901
SP12 ,192 ,399 ,796
SP11 ,205 ,432 ,916
SP01 ,187 ,397 1,000
SP06 ,214 ,451 ,955
SP04 ,202 ,422 ,900
SP03 ,198 ,424 ,952
SP10 ,169 ,367 ,792
SP09 ,182 ,394 ,846
SP14 ,182 ,367 ,744
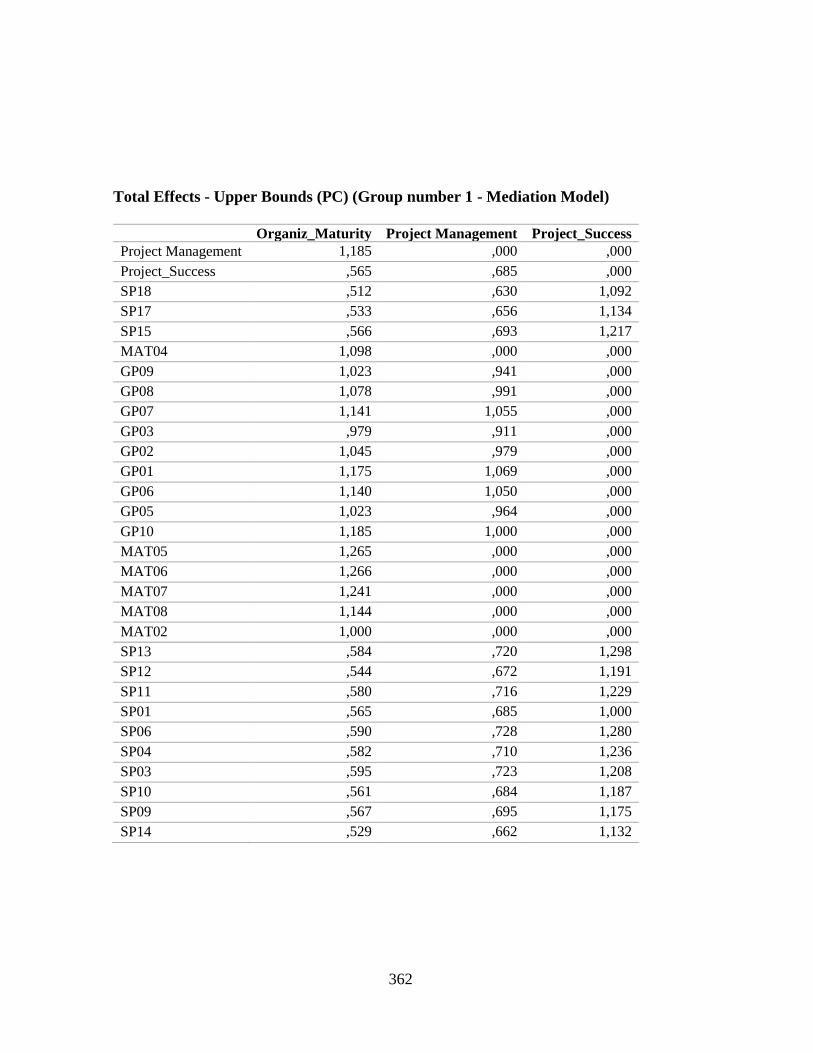
362
Total Effects - Upper Bounds (PC) (Group number 1 - Mediation Model)
Organiz_Maturity Project Management Project_Success
Project Management 1,185 ,000 ,000
Project_Success ,565 ,685 ,000
SP18 ,512 ,630 1,092
SP17 ,533 ,656 1,134
SP15 ,566 ,693 1,217
MAT04 1,098 ,000 ,000
GP09 1,023 ,941 ,000
GP08 1,078 ,991 ,000
GP07 1,141 1,055 ,000
GP03 ,979 ,911 ,000
GP02 1,045 ,979 ,000
GP01 1,175 1,069 ,000
GP06 1,140 1,050 ,000
GP05 1,023 ,964 ,000
GP10 1,185 1,000 ,000
MAT05 1,265 ,000 ,000
MAT06 1,266 ,000 ,000
MAT07 1,241 ,000 ,000
MAT08 1,144 ,000 ,000
MAT02 1,000 ,000 ,000
SP13 ,584 ,720 1,298
SP12 ,544 ,672 1,191
SP11 ,580 ,716 1,229
SP01 ,565 ,685 1,000
SP06 ,590 ,728 1,280
SP04 ,582 ,710 1,236
SP03 ,595 ,723 1,208
SP10 ,561 ,684 1,187
SP09 ,567 ,695 1,175
SP14 ,529 ,662 1,132
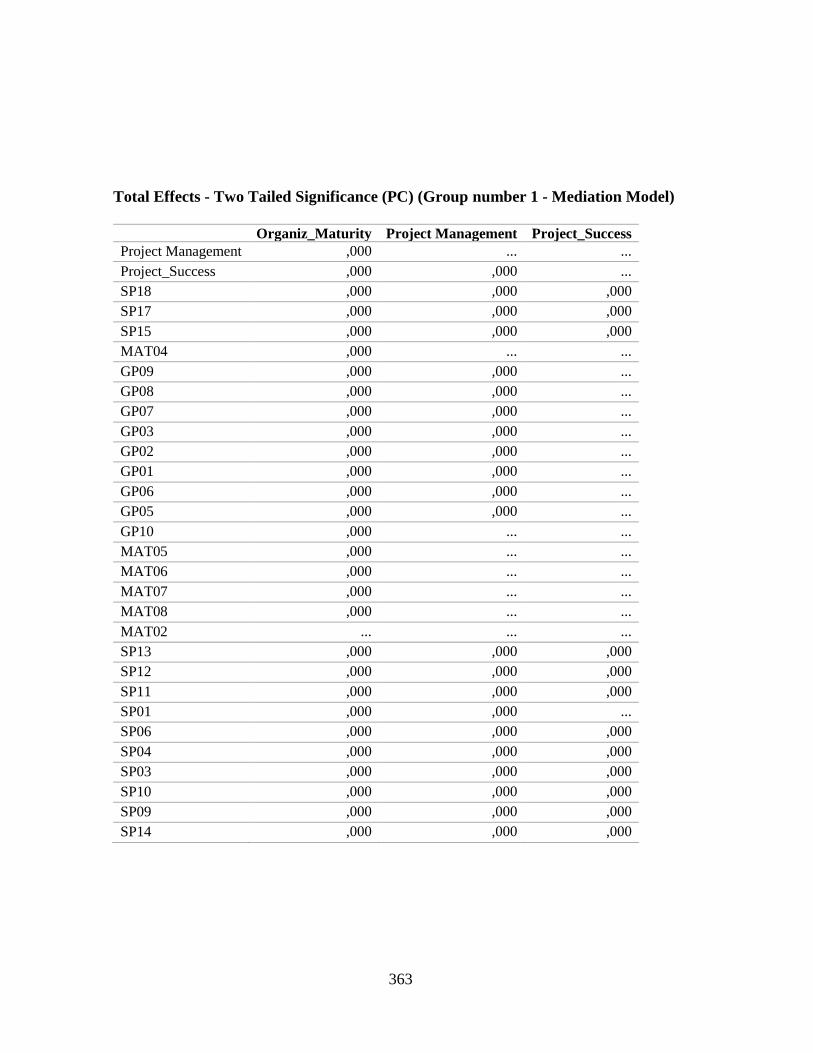
363
Total Effects - Two Tailed Significance (PC) (Group number 1 - Mediation Model)
Organiz_Maturity Project Management Project_Success
Project Management ,000 ... ...
Project_Success ,000 ,000 ...
SP18 ,000 ,000 ,000
SP17 ,000 ,000 ,000
SP15 ,000 ,000 ,000
MAT04 ,000 ... ...
GP09 ,000 ,000 ...
GP08 ,000 ,000 ...
GP07 ,000 ,000 ...
GP03 ,000 ,000 ...
GP02 ,000 ,000 ...
GP01 ,000 ,000 ...
GP06 ,000 ,000 ...
GP05 ,000 ,000 ...
GP10 ,000 ... ...
MAT05 ,000 ... ...
MAT06 ,000 ... ...
MAT07 ,000 ... ...
MAT08 ,000 ... ...
MAT02 ... ... ...
SP13 ,000 ,000 ,000
SP12 ,000 ,000 ,000
SP11 ,000 ,000 ,000
SP01 ,000 ,000 ...
SP06 ,000 ,000 ,000
SP04 ,000 ,000 ,000
SP03 ,000 ,000 ,000
SP10 ,000 ,000 ,000
SP09 ,000 ,000 ,000
SP14 ,000 ,000 ,000
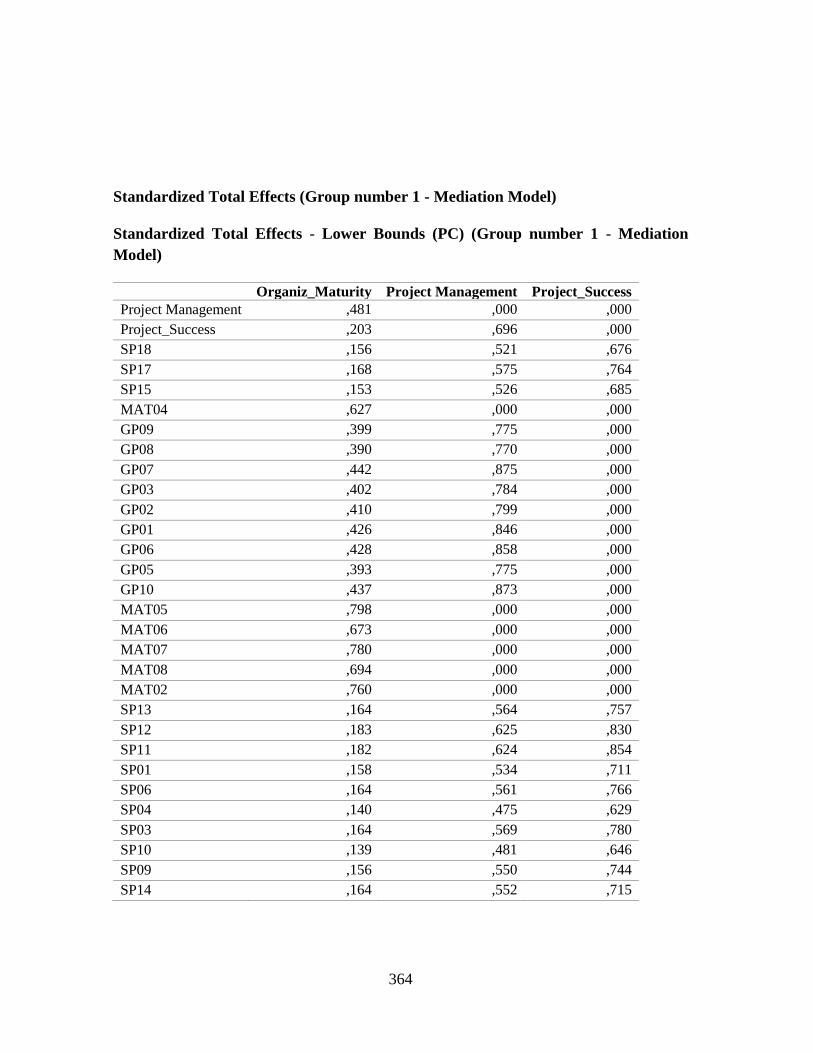
364
Standardized Total Effects (Group number 1 - Mediation Model)
Standardized Total Effects - Lower Bounds (PC) (Group number 1 - Mediation
Model)
Organiz_Maturity Project Management Project_Success
Project Management ,481 ,000 ,000
Project_Success ,203 ,696 ,000
SP18 ,156 ,521 ,676
SP17 ,168 ,575 ,764
SP15 ,153 ,526 ,685
MAT04 ,627 ,000 ,000
GP09 ,399 ,775 ,000
GP08 ,390 ,770 ,000
GP07 ,442 ,875 ,000
GP03 ,402 ,784 ,000
GP02 ,410 ,799 ,000
GP01 ,426 ,846 ,000
GP06 ,428 ,858 ,000
GP05 ,393 ,775 ,000
GP10 ,437 ,873 ,000
MAT05 ,798 ,000 ,000
MAT06 ,673 ,000 ,000
MAT07 ,780 ,000 ,000
MAT08 ,694 ,000 ,000
MAT02 ,760 ,000 ,000
SP13 ,164 ,564 ,757
SP12 ,183 ,625 ,830
SP11 ,182 ,624 ,854
SP01 ,158 ,534 ,711
SP06 ,164 ,561 ,766
SP04 ,140 ,475 ,629
SP03 ,164 ,569 ,780
SP10 ,139 ,481 ,646
SP09 ,156 ,550 ,744
SP14 ,164 ,552 ,715
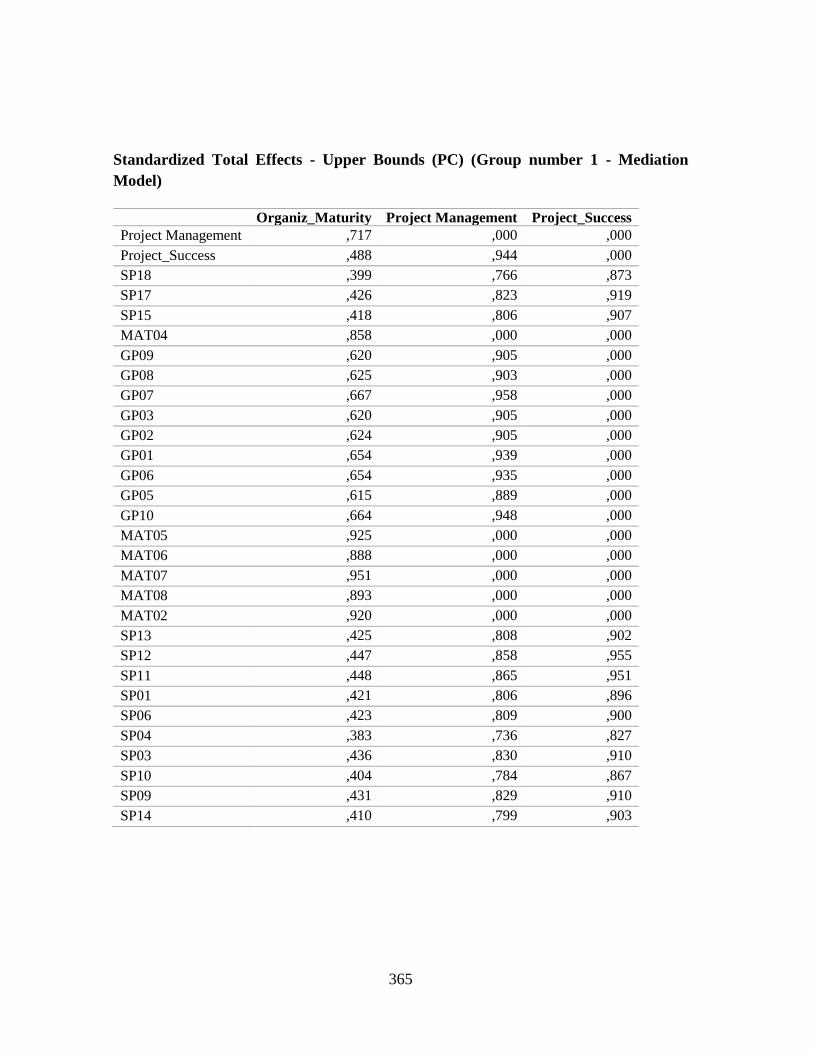
365
Standardized Total Effects - Upper Bounds (PC) (Group number 1 - Mediation
Model)
Organiz_Maturity Project Management Project_Success
Project Management ,717 ,000 ,000
Project_Success ,488 ,944 ,000
SP18 ,399 ,766 ,873
SP17 ,426 ,823 ,919
SP15 ,418 ,806 ,907
MAT04 ,858 ,000 ,000
GP09 ,620 ,905 ,000
GP08 ,625 ,903 ,000
GP07 ,667 ,958 ,000
GP03 ,620 ,905 ,000
GP02 ,624 ,905 ,000
GP01 ,654 ,939 ,000
GP06 ,654 ,935 ,000
GP05 ,615 ,889 ,000
GP10 ,664 ,948 ,000
MAT05 ,925 ,000 ,000
MAT06 ,888 ,000 ,000
MAT07 ,951 ,000 ,000
MAT08 ,893 ,000 ,000
MAT02 ,920 ,000 ,000
SP13 ,425 ,808 ,902
SP12 ,447 ,858 ,955
SP11 ,448 ,865 ,951
SP01 ,421 ,806 ,896
SP06 ,423 ,809 ,900
SP04 ,383 ,736 ,827
SP03 ,436 ,830 ,910
SP10 ,404 ,784 ,867
SP09 ,431 ,829 ,910
SP14 ,410 ,799 ,903
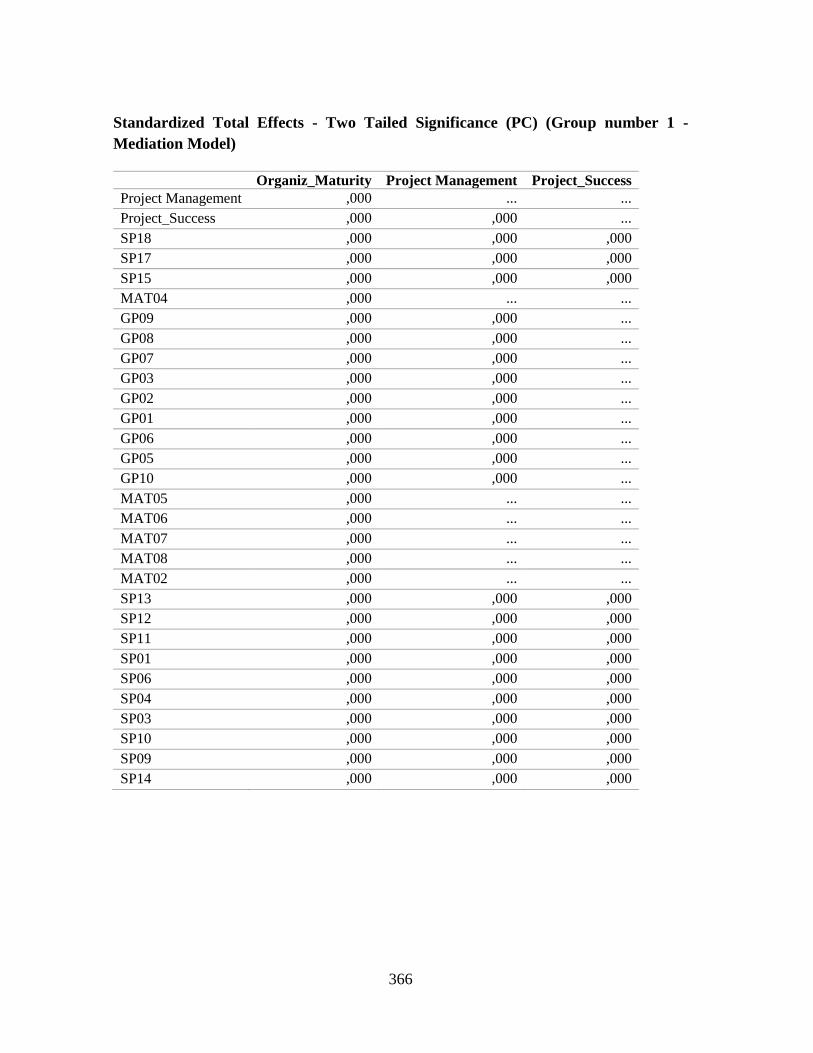
366
Standardized Total Effects - Two Tailed Significance (PC) (Group number 1 -
Mediation Model)
Organiz_Maturity Project Management Project_Success
Project Management ,000 ... ...
Project_Success ,000 ,000 ...
SP18 ,000 ,000 ,000
SP17 ,000 ,000 ,000
SP15 ,000 ,000 ,000
MAT04 ,000 ... ...
GP09 ,000 ,000 ...
GP08 ,000 ,000 ...
GP07 ,000 ,000 ...
GP03 ,000 ,000 ...
GP02 ,000 ,000 ...
GP01 ,000 ,000 ...
GP06 ,000 ,000 ...
GP05 ,000 ,000 ...
GP10 ,000 ,000 ...
MAT05 ,000 ... ...
MAT06 ,000 ... ...
MAT07 ,000 ... ...
MAT08 ,000 ... ...
MAT02 ,000 ... ...
SP13 ,000 ,000 ,000
SP12 ,000 ,000 ,000
SP11 ,000 ,000 ,000
SP01 ,000 ,000 ,000
SP06 ,000 ,000 ,000
SP04 ,000 ,000 ,000
SP03 ,000 ,000 ,000
SP10 ,000 ,000 ,000
SP09 ,000 ,000 ,000
SP14 ,000 ,000 ,000
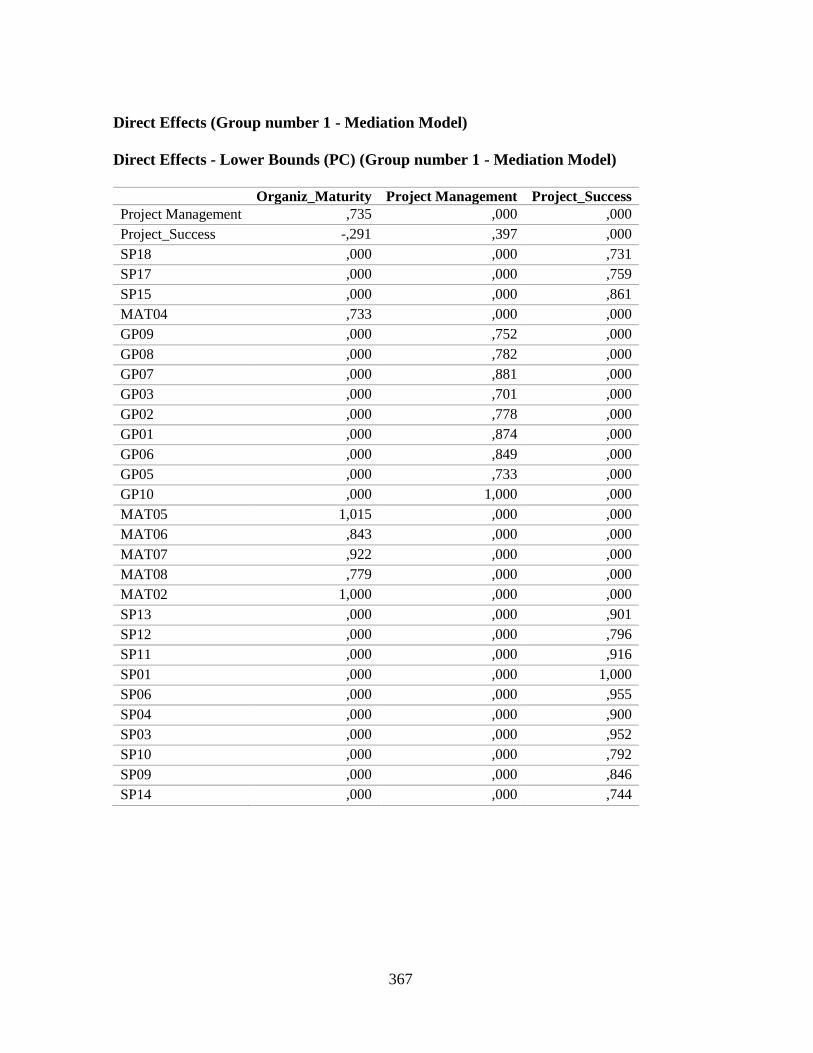
367
Direct Effects (Group number 1 - Mediation Model)
Direct Effects - Lower Bounds (PC) (Group number 1 - Mediation Model)
Organiz_Maturity Project Management Project_Success
Project Management ,735 ,000 ,000
Project_Success -,291 ,397 ,000
SP18 ,000 ,000 ,731
SP17 ,000 ,000 ,759
SP15 ,000 ,000 ,861
MAT04 ,733 ,000 ,000
GP09 ,000 ,752 ,000
GP08 ,000 ,782 ,000
GP07 ,000 ,881 ,000
GP03 ,000 ,701 ,000
GP02 ,000 ,778 ,000
GP01 ,000 ,874 ,000
GP06 ,000 ,849 ,000
GP05 ,000 ,733 ,000
GP10 ,000 1,000 ,000
MAT05 1,015 ,000 ,000
MAT06 ,843 ,000 ,000
MAT07 ,922 ,000 ,000
MAT08 ,779 ,000 ,000
MAT02 1,000 ,000 ,000
SP13 ,000 ,000 ,901
SP12 ,000 ,000 ,796
SP11 ,000 ,000 ,916
SP01 ,000 ,000 1,000
SP06 ,000 ,000 ,955
SP04 ,000 ,000 ,900
SP03 ,000 ,000 ,952
SP10 ,000 ,000 ,792
SP09 ,000 ,000 ,846
SP14 ,000 ,000 ,744
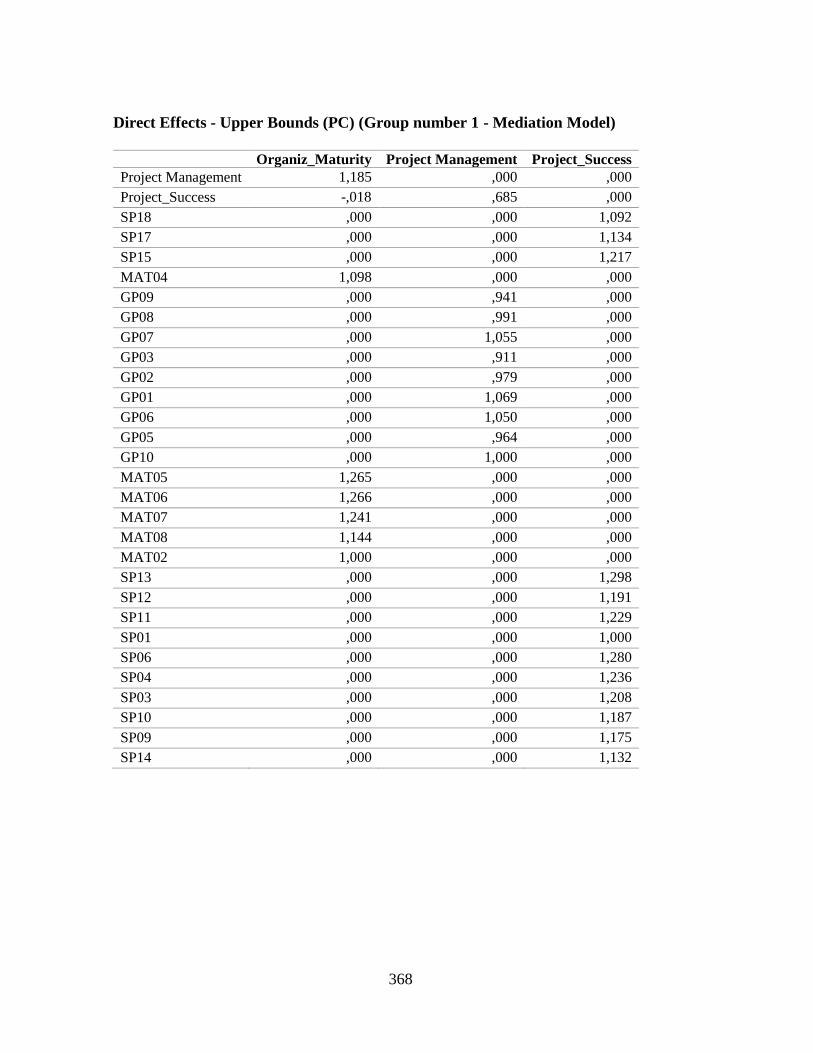
368
Direct Effects - Upper Bounds (PC) (Group number 1 - Mediation Model)
Organiz_Maturity Project Management Project_Success
Project Management 1,185 ,000 ,000
Project_Success -,018 ,685 ,000
SP18 ,000 ,000 1,092
SP17 ,000 ,000 1,134
SP15 ,000 ,000 1,217
MAT04 1,098 ,000 ,000
GP09 ,000 ,941 ,000
GP08 ,000 ,991 ,000
GP07 ,000 1,055 ,000
GP03 ,000 ,911 ,000
GP02 ,000 ,979 ,000
GP01 ,000 1,069 ,000
GP06 ,000 1,050 ,000
GP05 ,000 ,964 ,000
GP10 ,000 1,000 ,000
MAT05 1,265 ,000 ,000
MAT06 1,266 ,000 ,000
MAT07 1,241 ,000 ,000
MAT08 1,144 ,000 ,000
MAT02 1,000 ,000 ,000
SP13 ,000 ,000 1,298
SP12 ,000 ,000 1,191
SP11 ,000 ,000 1,229
SP01 ,000 ,000 1,000
SP06 ,000 ,000 1,280
SP04 ,000 ,000 1,236
SP03 ,000 ,000 1,208
SP10 ,000 ,000 1,187
SP09 ,000 ,000 1,175
SP14 ,000 ,000 1,132
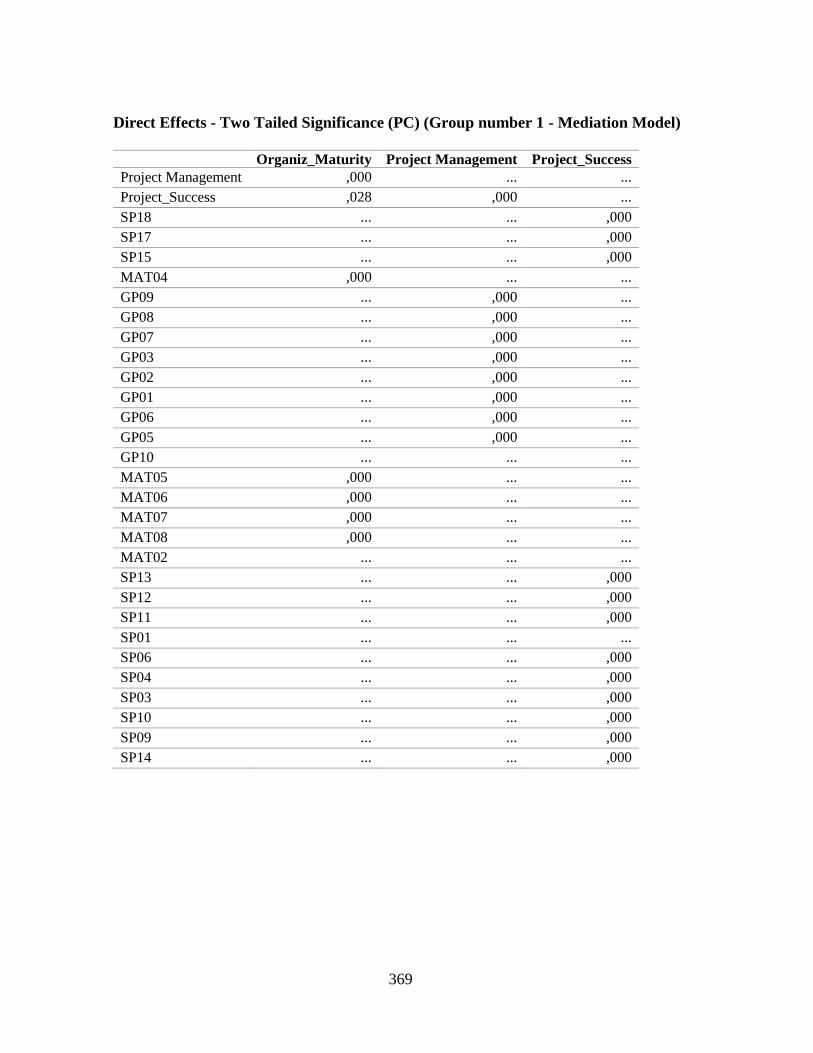
369
Direct Effects - Two Tailed Significance (PC) (Group number 1 - Mediation Model)
Organiz_Maturity Project Management Project_Success
Project Management ,000 ... ...
Project_Success ,028 ,000 ...
SP18 ... ... ,000
SP17 ... ... ,000
SP15 ... ... ,000
MAT04 ,000 ... ...
GP09 ... ,000 ...
GP08 ... ,000 ...
GP07 ... ,000 ...
GP03 ... ,000 ...
GP02 ... ,000 ...
GP01 ... ,000 ...
GP06 ... ,000 ...
GP05 ... ,000 ...
GP10 ... ... ...
MAT05 ,000 ... ...
MAT06 ,000 ... ...
MAT07 ,000 ... ...
MAT08 ,000 ... ...
MAT02 ... ... ...
SP13 ... ... ,000
SP12 ... ... ,000
SP11 ... ... ,000
SP01 ... ... ...
SP06 ... ... ,000
SP04 ... ... ,000
SP03 ... ... ,000
SP10 ... ... ,000
SP09 ... ... ,000
SP14 ... ... ,000
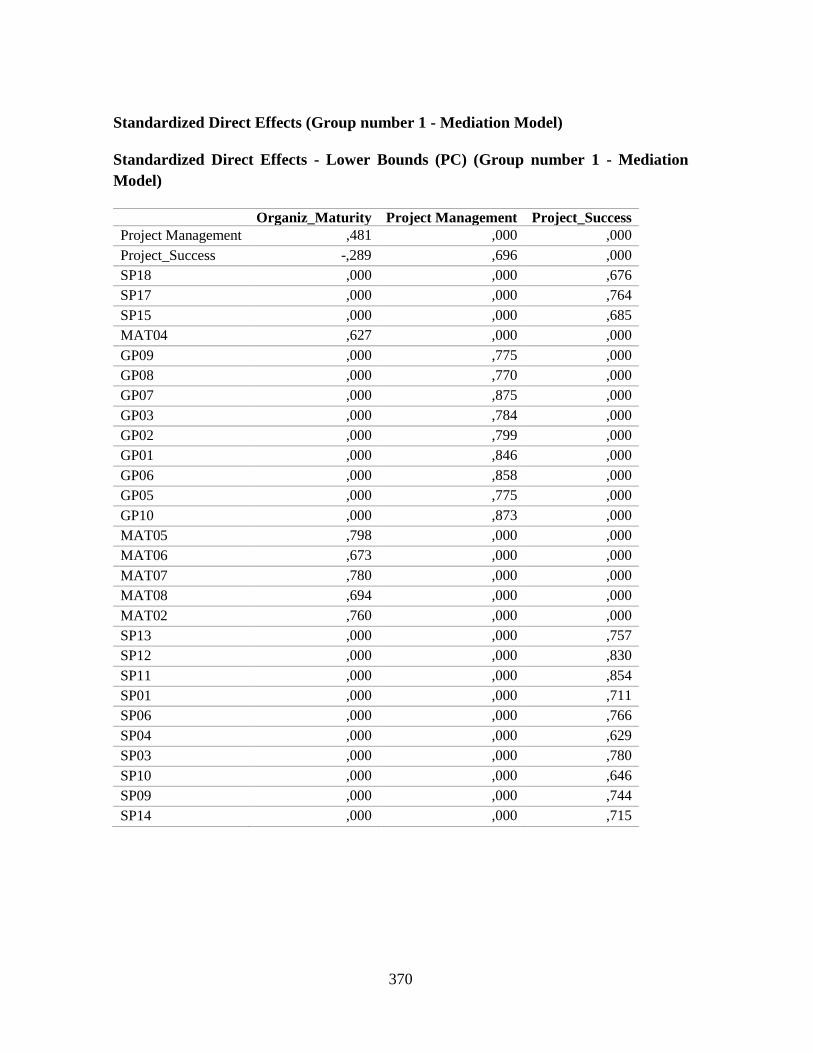
370
Standardized Direct Effects (Group number 1 - Mediation Model)
Standardized Direct Effects - Lower Bounds (PC) (Group number 1 - Mediation
Model)
Organiz_Maturity Project Management Project_Success
Project Management ,481 ,000 ,000
Project_Success -,289 ,696 ,000
SP18 ,000 ,000 ,676
SP17 ,000 ,000 ,764
SP15 ,000 ,000 ,685
MAT04 ,627 ,000 ,000
GP09 ,000 ,775 ,000
GP08 ,000 ,770 ,000
GP07 ,000 ,875 ,000
GP03 ,000 ,784 ,000
GP02 ,000 ,799 ,000
GP01 ,000 ,846 ,000
GP06 ,000 ,858 ,000
GP05 ,000 ,775 ,000
GP10 ,000 ,873 ,000
MAT05 ,798 ,000 ,000
MAT06 ,673 ,000 ,000
MAT07 ,780 ,000 ,000
MAT08 ,694 ,000 ,000
MAT02 ,760 ,000 ,000
SP13 ,000 ,000 ,757
SP12 ,000 ,000 ,830
SP11 ,000 ,000 ,854
SP01 ,000 ,000 ,711
SP06 ,000 ,000 ,766
SP04 ,000 ,000 ,629
SP03 ,000 ,000 ,780
SP10 ,000 ,000 ,646
SP09 ,000 ,000 ,744
SP14 ,000 ,000 ,715
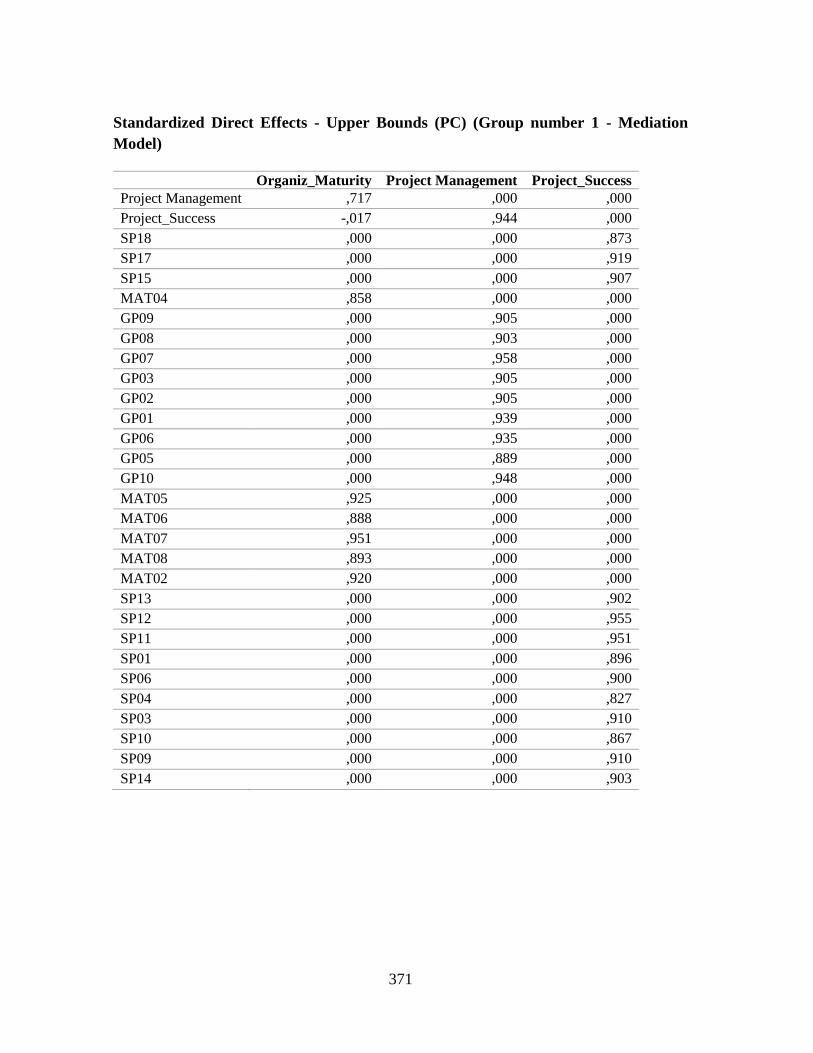
371
Standardized Direct Effects - Upper Bounds (PC) (Group number 1 - Mediation
Model)
Organiz_Maturity Project Management Project_Success
Project Management ,717 ,000 ,000
Project_Success -,017 ,944 ,000
SP18 ,000 ,000 ,873
SP17 ,000 ,000 ,919
SP15 ,000 ,000 ,907
MAT04 ,858 ,000 ,000
GP09 ,000 ,905 ,000
GP08 ,000 ,903 ,000
GP07 ,000 ,958 ,000
GP03 ,000 ,905 ,000
GP02 ,000 ,905 ,000
GP01 ,000 ,939 ,000
GP06 ,000 ,935 ,000
GP05 ,000 ,889 ,000
GP10 ,000 ,948 ,000
MAT05 ,925 ,000 ,000
MAT06 ,888 ,000 ,000
MAT07 ,951 ,000 ,000
MAT08 ,893 ,000 ,000
MAT02 ,920 ,000 ,000
SP13 ,000 ,000 ,902
SP12 ,000 ,000 ,955
SP11 ,000 ,000 ,951
SP01 ,000 ,000 ,896
SP06 ,000 ,000 ,900
SP04 ,000 ,000 ,827
SP03 ,000 ,000 ,910
SP10 ,000 ,000 ,867
SP09 ,000 ,000 ,910
SP14 ,000 ,000 ,903
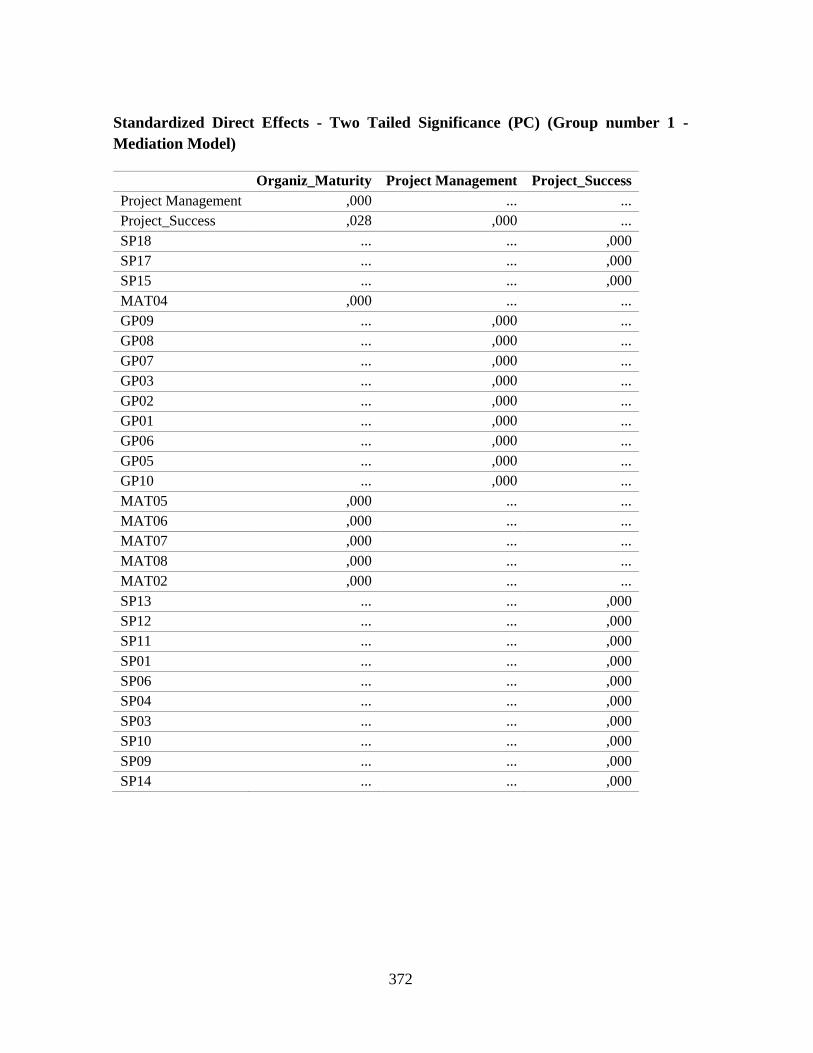
372
Standardized Direct Effects - Two Tailed Significance (PC) (Group number 1 -
Mediation Model)
Organiz_Maturity Project Management Project_Success
Project Management ,000 ... ...
Project_Success ,028 ,000 ...
SP18 ... ... ,000
SP17 ... ... ,000
SP15 ... ... ,000
MAT04 ,000 ... ...
GP09 ... ,000 ...
GP08 ... ,000 ...
GP07 ... ,000 ...
GP03 ... ,000 ...
GP02 ... ,000 ...
GP01 ... ,000 ...
GP06 ... ,000 ...
GP05 ... ,000 ...
GP10 ... ,000 ...
MAT05 ,000 ... ...
MAT06 ,000 ... ...
MAT07 ,000 ... ...
MAT08 ,000 ... ...
MAT02 ,000 ... ...
SP13 ... ... ,000
SP12 ... ... ,000
SP11 ... ... ,000
SP01 ... ... ,000
SP06 ... ... ,000
SP04 ... ... ,000
SP03 ... ... ,000
SP10 ... ... ,000
SP09 ... ... ,000
SP14 ... ... ,000
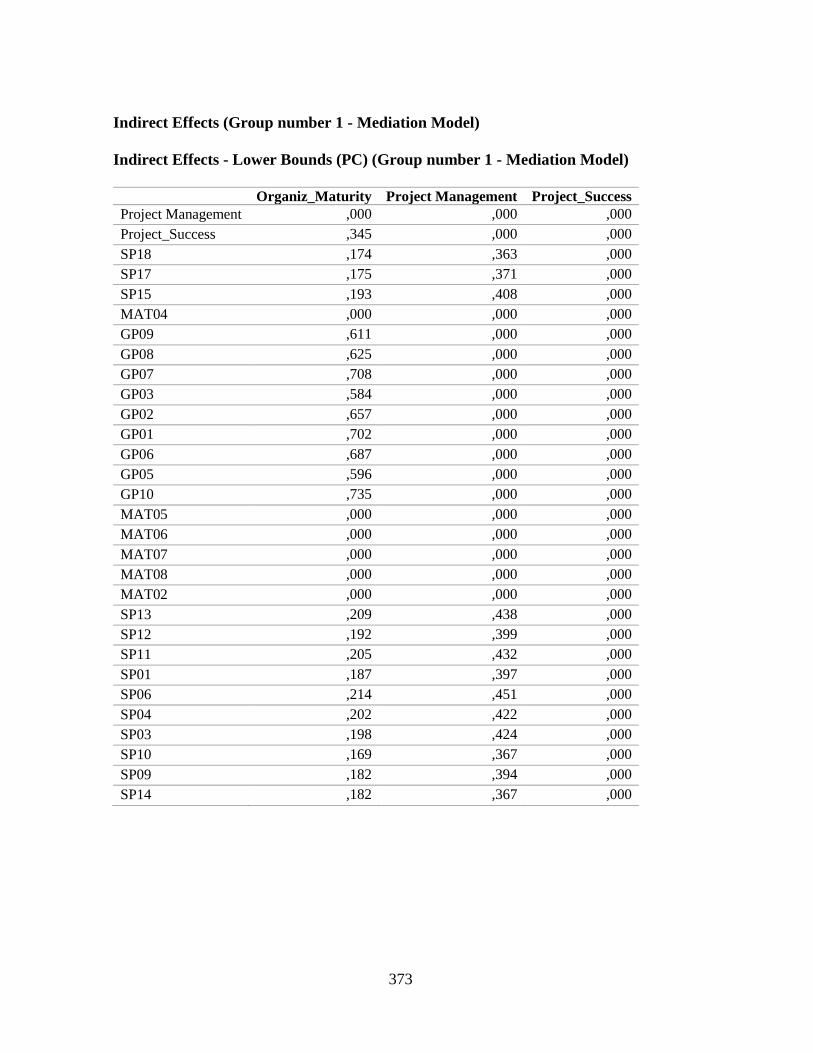
373
Indirect Effects (Group number 1 - Mediation Model)
Indirect Effects - Lower Bounds (PC) (Group number 1 - Mediation Model)
Organiz_Maturity Project Management Project_Success
Project Management ,000 ,000 ,000
Project_Success ,345 ,000 ,000
SP18 ,174 ,363 ,000
SP17 ,175 ,371 ,000
SP15 ,193 ,408 ,000
MAT04 ,000 ,000 ,000
GP09 ,611 ,000 ,000
GP08 ,625 ,000 ,000
GP07 ,708 ,000 ,000
GP03 ,584 ,000 ,000
GP02 ,657 ,000 ,000
GP01 ,702 ,000 ,000
GP06 ,687 ,000 ,000
GP05 ,596 ,000 ,000
GP10 ,735 ,000 ,000
MAT05 ,000 ,000 ,000
MAT06 ,000 ,000 ,000
MAT07 ,000 ,000 ,000
MAT08 ,000 ,000 ,000
MAT02 ,000 ,000 ,000
SP13 ,209 ,438 ,000
SP12 ,192 ,399 ,000
SP11 ,205 ,432 ,000
SP01 ,187 ,397 ,000
SP06 ,214 ,451 ,000
SP04 ,202 ,422 ,000
SP03 ,198 ,424 ,000
SP10 ,169 ,367 ,000
SP09 ,182 ,394 ,000
SP14 ,182 ,367 ,000

374
Indirect Effects - Upper Bounds (PC) (Group number 1 - Mediation Model)
Organiz_Maturity Project Management Project_Success
Project Management ,000 ,000 ,000
Project_Success ,717 ,000 ,000
SP18 ,512 ,630 ,000
SP17 ,533 ,656 ,000
SP15 ,566 ,693 ,000
MAT04 ,000 ,000 ,000
GP09 1,023 ,000 ,000
GP08 1,078 ,000 ,000
GP07 1,141 ,000 ,000
GP03 ,979 ,000 ,000
GP02 1,045 ,000 ,000
GP01 1,175 ,000 ,000
GP06 1,140 ,000 ,000
GP05 1,023 ,000 ,000
GP10 1,185 ,000 ,000
MAT05 ,000 ,000 ,000
MAT06 ,000 ,000 ,000
MAT07 ,000 ,000 ,000
MAT08 ,000 ,000 ,000
MAT02 ,000 ,000 ,000
SP13 ,584 ,720 ,000
SP12 ,544 ,672 ,000
SP11 ,580 ,716 ,000
SP01 ,565 ,685 ,000
SP06 ,590 ,728 ,000
SP04 ,582 ,710 ,000
SP03 ,595 ,723 ,000
SP10 ,561 ,684 ,000
SP09 ,567 ,695 ,000
SP14 ,529 ,662 ,000
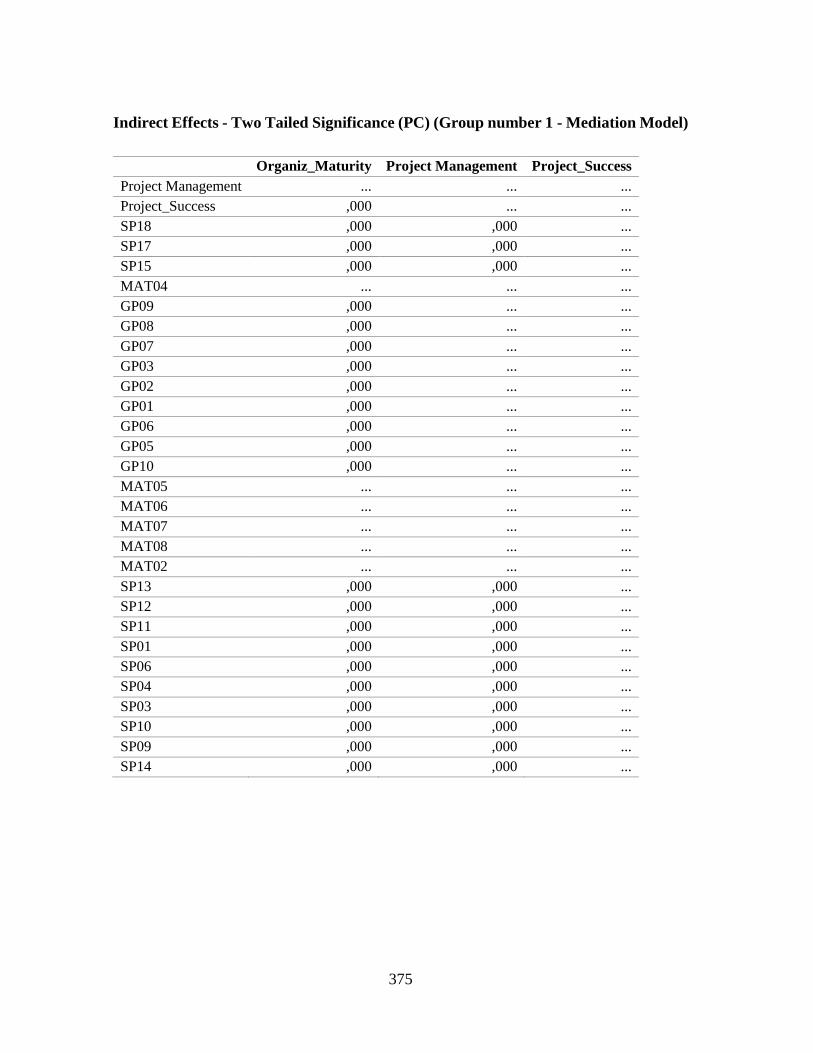
375
Indirect Effects - Two Tailed Significance (PC) (Group number 1 - Mediation Model)
Organiz_Maturity Project Management Project_Success
Project Management ... ... ...
Project_Success ,000 ... ...
SP18 ,000 ,000 ...
SP17 ,000 ,000 ...
SP15 ,000 ,000 ...
MAT04 ... ... ...
GP09 ,000 ... ...
GP08 ,000 ... ...
GP07 ,000 ... ...
GP03 ,000 ... ...
GP02 ,000 ... ...
GP01 ,000 ... ...
GP06 ,000 ... ...
GP05 ,000 ... ...
GP10 ,000 ... ...
MAT05 ... ... ...
MAT06 ... ... ...
MAT07 ... ... ...
MAT08 ... ... ...
MAT02 ... ... ...
SP13 ,000 ,000 ...
SP12 ,000 ,000 ...
SP11 ,000 ,000 ...
SP01 ,000 ,000 ...
SP06 ,000 ,000 ...
SP04 ,000 ,000 ...
SP03 ,000 ,000 ...
SP10 ,000 ,000 ...
SP09 ,000 ,000 ...
SP14 ,000 ,000 ...
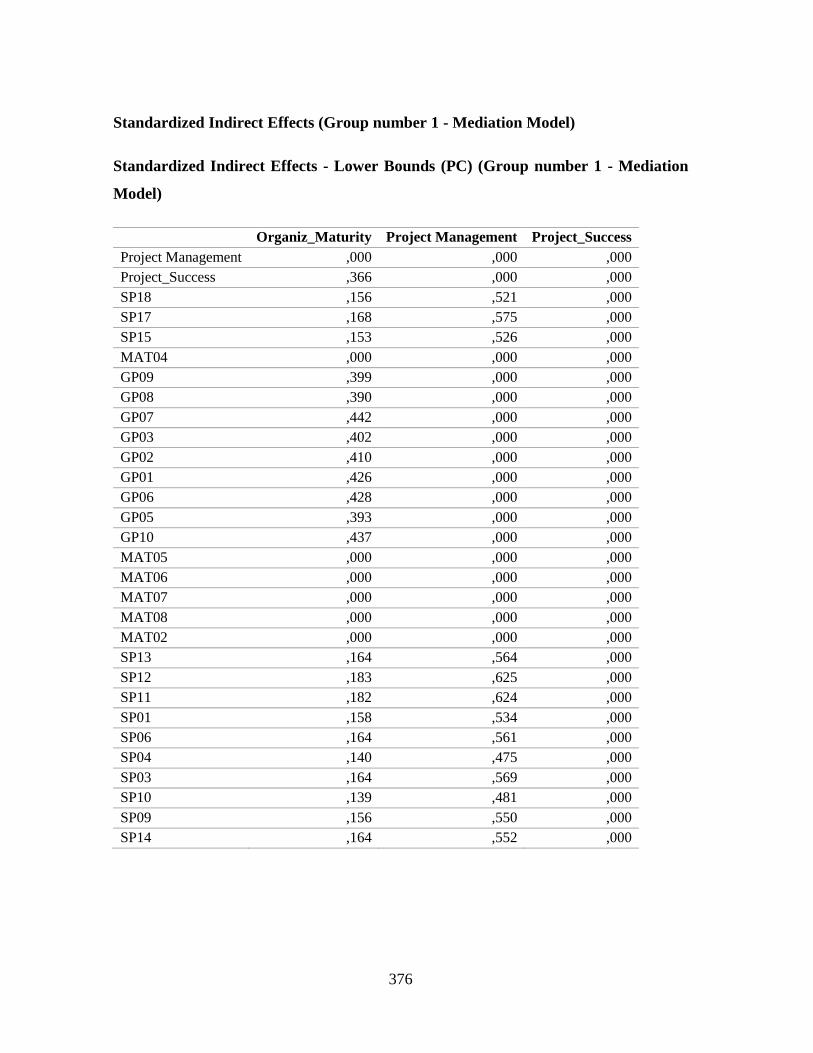
376
Standardized Indirect Effects (Group number 1 - Mediation Model)
Standardized Indirect Effects - Lower Bounds (PC) (Group number 1 - Mediation
Model)
Organiz_Maturity Project Management Project_Success
Project Management ,000 ,000 ,000
Project_Success ,366 ,000 ,000
SP18 ,156 ,521 ,000
SP17 ,168 ,575 ,000
SP15 ,153 ,526 ,000
MAT04 ,000 ,000 ,000
GP09 ,399 ,000 ,000
GP08 ,390 ,000 ,000
GP07 ,442 ,000 ,000
GP03 ,402 ,000 ,000
GP02 ,410 ,000 ,000
GP01 ,426 ,000 ,000
GP06 ,428 ,000 ,000
GP05 ,393 ,000 ,000
GP10 ,437 ,000 ,000
MAT05 ,000 ,000 ,000
MAT06 ,000 ,000 ,000
MAT07 ,000 ,000 ,000
MAT08 ,000 ,000 ,000
MAT02 ,000 ,000 ,000
SP13 ,164 ,564 ,000
SP12 ,183 ,625 ,000
SP11 ,182 ,624 ,000
SP01 ,158 ,534 ,000
SP06 ,164 ,561 ,000
SP04 ,140 ,475 ,000
SP03 ,164 ,569 ,000
SP10 ,139 ,481 ,000
SP09 ,156 ,550 ,000
SP14 ,164 ,552 ,000
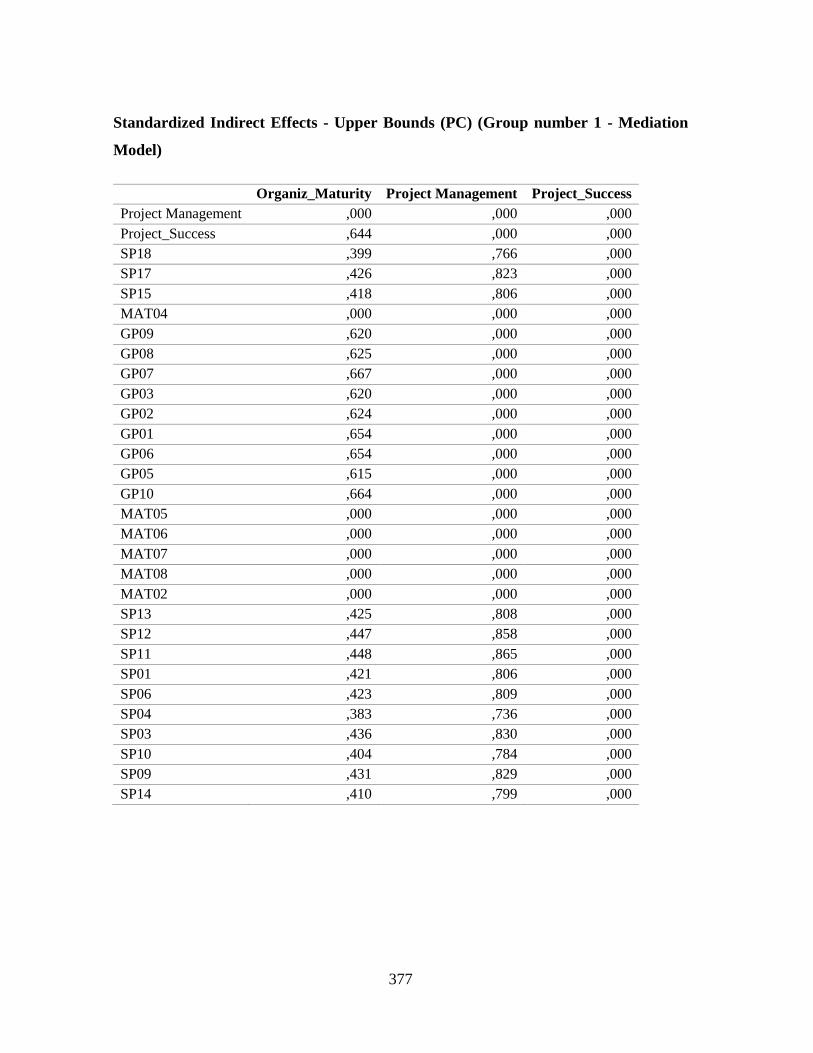
377
Standardized Indirect Effects - Upper Bounds (PC) (Group number 1 - Mediation
Model)
Organiz_Maturity Project Management Project_Success
Project Management ,000 ,000 ,000
Project_Success ,644 ,000 ,000
SP18 ,399 ,766 ,000
SP17 ,426 ,823 ,000
SP15 ,418 ,806 ,000
MAT04 ,000 ,000 ,000
GP09 ,620 ,000 ,000
GP08 ,625 ,000 ,000
GP07 ,667 ,000 ,000
GP03 ,620 ,000 ,000
GP02 ,624 ,000 ,000
GP01 ,654 ,000 ,000
GP06 ,654 ,000 ,000
GP05 ,615 ,000 ,000
GP10 ,664 ,000 ,000
MAT05 ,000 ,000 ,000
MAT06 ,000 ,000 ,000
MAT07 ,000 ,000 ,000
MAT08 ,000 ,000 ,000
MAT02 ,000 ,000 ,000
SP13 ,425 ,808 ,000
SP12 ,447 ,858 ,000
SP11 ,448 ,865 ,000
SP01 ,421 ,806 ,000
SP06 ,423 ,809 ,000
SP04 ,383 ,736 ,000
SP03 ,436 ,830 ,000
SP10 ,404 ,784 ,000
SP09 ,431 ,829 ,000
SP14 ,410 ,799 ,000
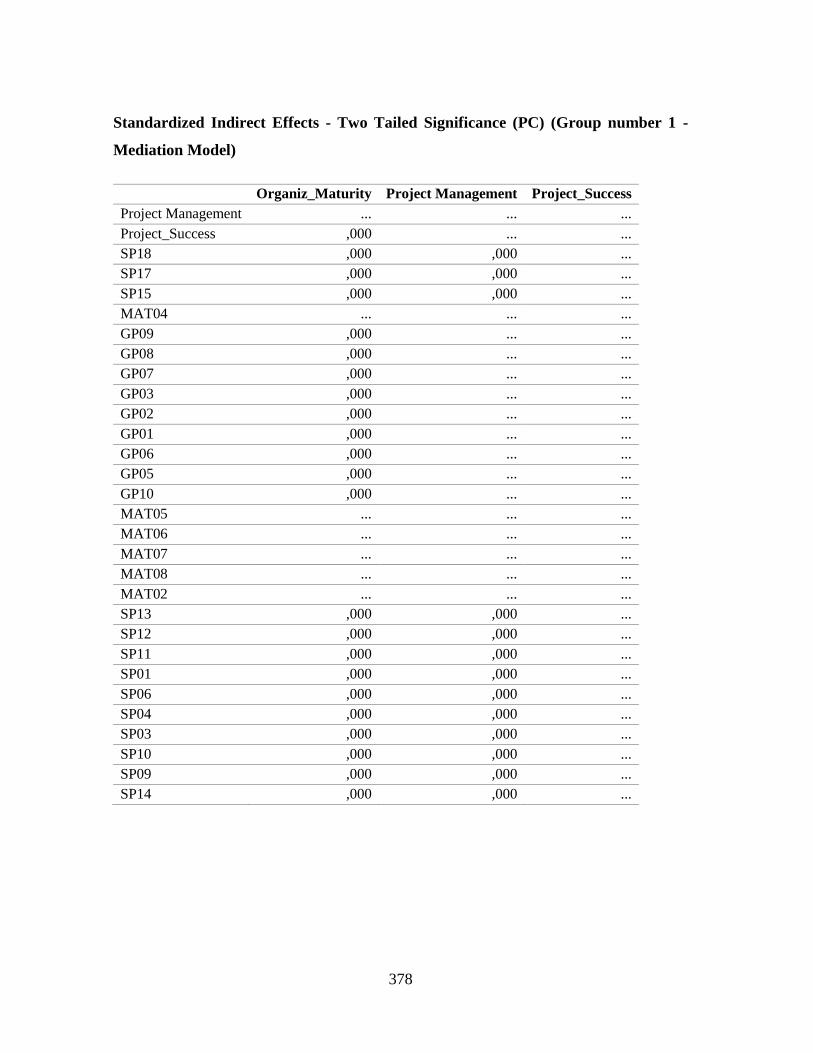
378
Standardized Indirect Effects - Two Tailed Significance (PC) (Group number 1 -
Mediation Model)
Organiz_Maturity Project Management Project_Success
Project Management ... ... ...
Project_Success ,000 ... ...
SP18 ,000 ,000 ...
SP17 ,000 ,000 ...
SP15 ,000 ,000 ...
MAT04 ... ... ...
GP09 ,000 ... ...
GP08 ,000 ... ...
GP07 ,000 ... ...
GP03 ,000 ... ...
GP02 ,000 ... ...
GP01 ,000 ... ...
GP06 ,000 ... ...
GP05 ,000 ... ...
GP10 ,000 ... ...
MAT05 ... ... ...
MAT06 ... ... ...
MAT07 ... ... ...
MAT08 ... ... ...
MAT02 ... ... ...
SP13 ,000 ,000 ...
SP12 ,000 ,000 ...
SP11 ,000 ,000 ...
SP01 ,000 ,000 ...
SP06 ,000 ,000 ...
SP04 ,000 ,000 ...
SP03 ,000 ,000 ...
SP10 ,000 ,000 ...
SP09 ,000 ,000 ...
SP14 ,000 ,000 ...
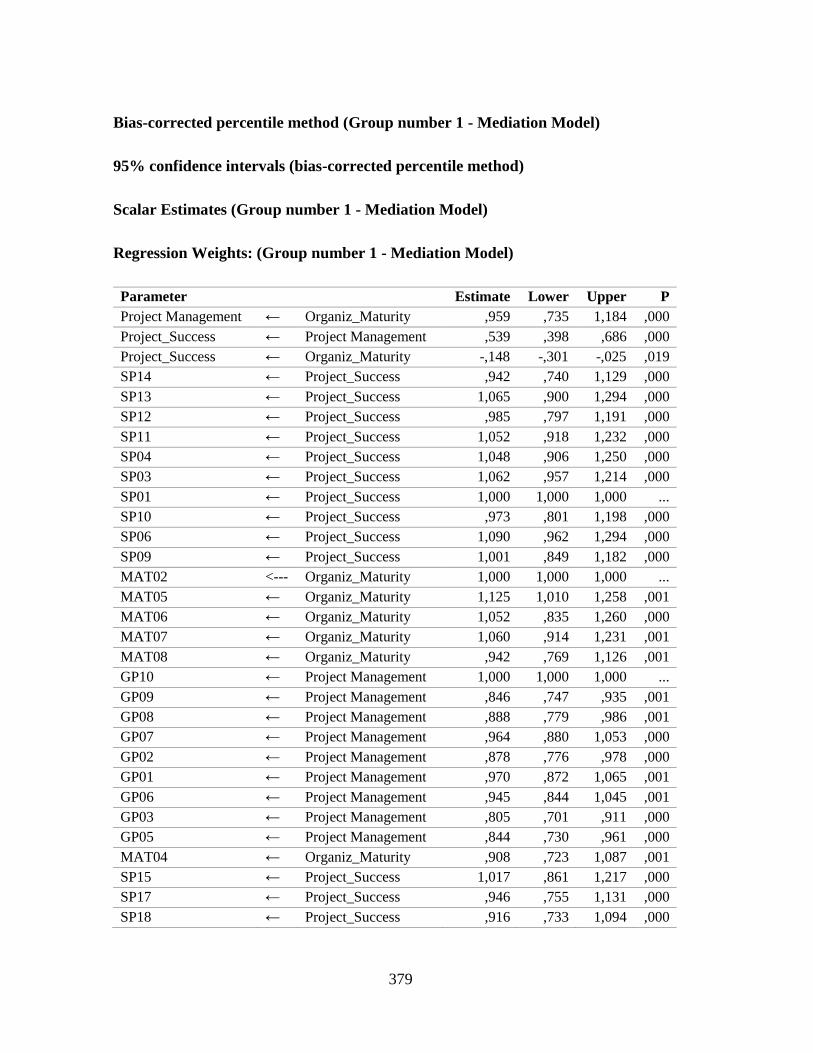
379
Bias-corrected percentile method (Group number 1 - Mediation Model)
95% confidence intervals (bias-corrected percentile method)
Scalar Estimates (Group number 1 - Mediation Model)
Regression Weights: (Group number 1 - Mediation Model)
Parameter Estimate Lower Upper P
Project Management ← Organiz_Maturity ,959 ,735 1,184 ,000
Project_Success ← Project Management ,539 ,398 ,686 ,000
Project_Success ← Organiz_Maturity -,148 -,301 -,025 ,019
SP14 ← Project_Success ,942 ,740 1,129 ,000
SP13 ← Project_Success 1,065 ,900 1,294 ,000
SP12 ← Project_Success ,985 ,797 1,191 ,000
SP11 ← Project_Success 1,052 ,918 1,232 ,000
SP04 ← Project_Success 1,048 ,906 1,250 ,000
SP03 ← Project_Success 1,062 ,957 1,214 ,000
SP01 ← Project_Success 1,000 1,000 1,000 ...
SP10 ← Project_Success ,973 ,801 1,198 ,000
SP06 ← Project_Success 1,090 ,962 1,294 ,000
SP09 ← Project_Success 1,001 ,849 1,182 ,000
MAT02 <--- Organiz_Maturity 1,000 1,000 1,000 ...
MAT05 ← Organiz_Maturity 1,125 1,010 1,258 ,001
MAT06 ← Organiz_Maturity 1,052 ,835 1,260 ,000
MAT07 ← Organiz_Maturity 1,060 ,914 1,231 ,001
MAT08 ← Organiz_Maturity ,942 ,769 1,126 ,001
GP10 ← Project Management 1,000 1,000 1,000 ...
GP09 ← Project Management ,846 ,747 ,935 ,001
GP08 ← Project Management ,888 ,779 ,986 ,001
GP07 ← Project Management ,964 ,880 1,053 ,000
GP02 ← Project Management ,878 ,776 ,978 ,000
GP01 ← Project Management ,970 ,872 1,065 ,001
GP06 ← Project Management ,945 ,844 1,045 ,001
GP03 ← Project Management ,805 ,701 ,911 ,000
GP05 ← Project Management ,844 ,730 ,961 ,000
MAT04 ← Organiz_Maturity ,908 ,723 1,087 ,001
SP15 ← Project_Success 1,017 ,861 1,217 ,000
SP17 ← Project_Success ,946 ,755 1,131 ,000
SP18 ← Project_Success ,916 ,733 1,094 ,000
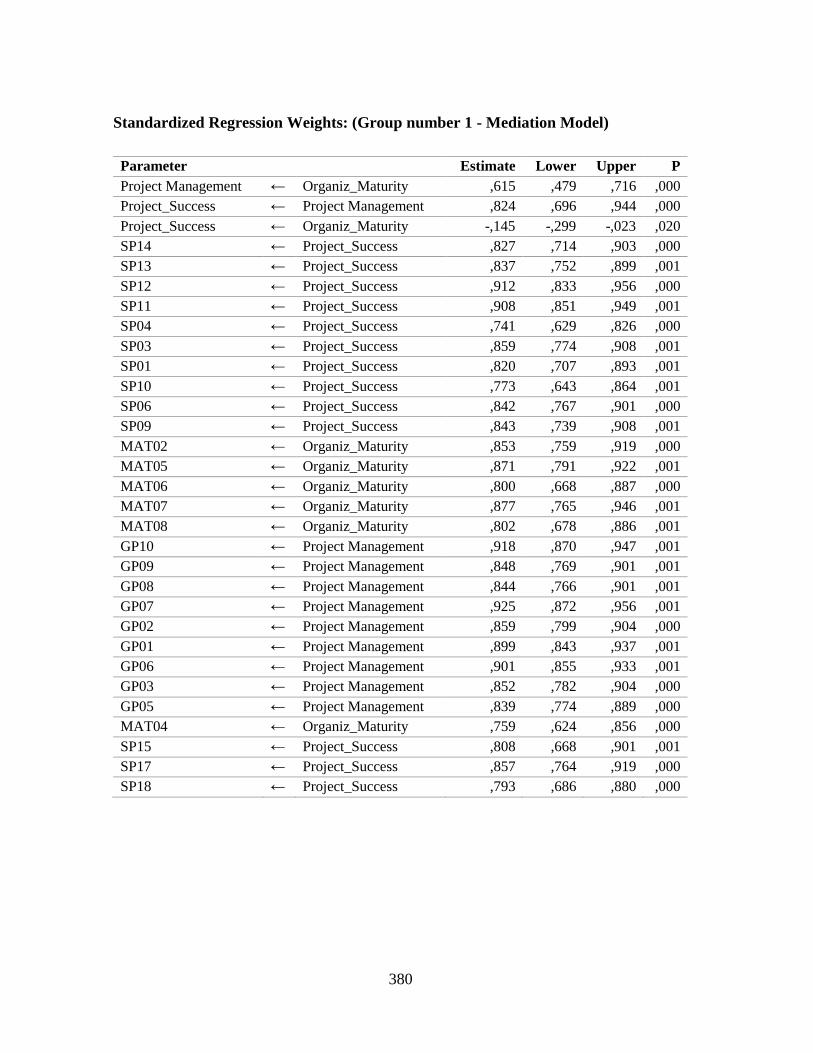
380
Standardized Regression Weights: (Group number 1 - Mediation Model)
Parameter Estimate Lower Upper P
Project Management ← Organiz_Maturity ,615 ,479 ,716 ,000
Project_Success ← Project Management ,824 ,696 ,944 ,000
Project_Success ← Organiz_Maturity -,145 -,299 -,023 ,020
SP14 ← Project_Success ,827 ,714 ,903 ,000
SP13 ← Project_Success ,837 ,752 ,899 ,001
SP12 ← Project_Success ,912 ,833 ,956 ,000
SP11 ← Project_Success ,908 ,851 ,949 ,001
SP04 ← Project_Success ,741 ,629 ,826 ,000
SP03 ← Project_Success ,859 ,774 ,908 ,001
SP01 ← Project_Success ,820 ,707 ,893 ,001
SP10 ← Project_Success ,773 ,643 ,864 ,001
SP06 ← Project_Success ,842 ,767 ,901 ,000
SP09 ← Project_Success ,843 ,739 ,908 ,001
MAT02 ← Organiz_Maturity ,853 ,759 ,919 ,000
MAT05 ← Organiz_Maturity ,871 ,791 ,922 ,001
MAT06 ← Organiz_Maturity ,800 ,668 ,887 ,000
MAT07 ← Organiz_Maturity ,877 ,765 ,946 ,001
MAT08 ← Organiz_Maturity ,802 ,678 ,886 ,001
GP10 ← Project Management ,918 ,870 ,947 ,001
GP09 ← Project Management ,848 ,769 ,901 ,001
GP08 ← Project Management ,844 ,766 ,901 ,001
GP07 ← Project Management ,925 ,872 ,956 ,001
GP02 ← Project Management ,859 ,799 ,904 ,000
GP01 ← Project Management ,899 ,843 ,937 ,001
GP06 ← Project Management ,901 ,855 ,933 ,001
GP03 ← Project Management ,852 ,782 ,904 ,000
GP05 ← Project Management ,839 ,774 ,889 ,000
MAT04 ← Organiz_Maturity ,759 ,624 ,856 ,000
SP15 ← Project_Success ,808 ,668 ,901 ,001
SP17 ← Project_Success ,857 ,764 ,919 ,000
SP18 ← Project_Success ,793 ,686 ,880 ,000

381
Covariances: (Group number 1 - Mediation Model)
Parameter Estimate Lower Upper P
e26 ↔ e27 ,120 ,019 ,237 ,021
e12 ↔ e13 ,188 ,060 ,333 ,005
e10 ↔ e8 ,276 ,117 ,452 ,000
e24 ↔ e26 ,221 ,052 ,495 ,004
e18 ↔ e16 ,337 ,147 ,612 ,000
e17 ↔ e16 ,270 ,147 ,456 ,000
e17 ↔ e18 ,261 ,134 ,444 ,000
e25 ↔ e27 ,168 ,046 ,320 ,005
e25 ↔ e28 ,244 ,123 ,411 ,000
e8 ↔ e9 ,180 ,045 ,328 ,010
e24 ↔ e28 ,120 -,006 ,325 ,068
e21 ↔ e23 -,193 -,324 -,106 ,000
e20 ↔ e21 ,157 -,003 ,364 ,056
e10 ↔ e12 ,106 -,019 ,259 ,098
e10 ↔ e7 -,156 -,277 -,053 ,003
e21 ↔ e18 ,173 ,042 ,341 ,007
e20 ↔ e23 -,123 -,213 -,055 ,001
e18 ↔ e19 ,114 -,079 ,364 ,250
e21 ↔ e19 -,102 -,271 ,013 ,080
e19 ↔ e23 -,097 -,204 -,013 ,025
e25 ↔ e18 -,106 -,253 -,009 ,035
e25 ↔ e19 -,077 -,229 ,028 ,145
e27 ↔ e28 ,100 -,011 ,235 ,084
e12 ↔ e14 -,158 -,301 -,009 ,037
e8 ↔ e13 -,103 -,277 ,039 ,156
e17 ↔ e19 ,082 -,003 ,185 ,060
e7 ↔ e12 -,154 -,317 -,041 ,009
e10 ↔ e11 ,024 -,092 ,168 ,625
e15 ↔ e9 -,199 -,359 -,061 ,003
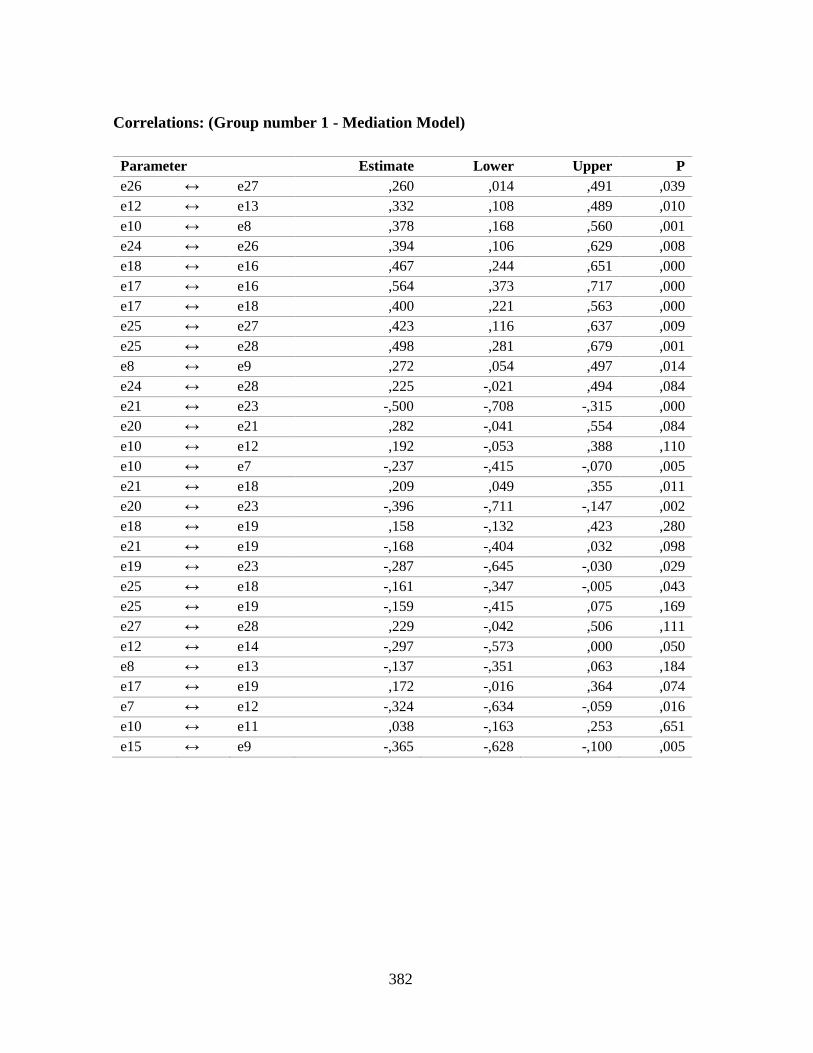
382
Correlations: (Group number 1 - Mediation Model)
Parameter Estimate Lower Upper P
e26 ↔ e27 ,260 ,014 ,491 ,039
e12 ↔ e13 ,332 ,108 ,489 ,010
e10 ↔ e8 ,378 ,168 ,560 ,001
e24 ↔ e26 ,394 ,106 ,629 ,008
e18 ↔ e16 ,467 ,244 ,651 ,000
e17 ↔ e16 ,564 ,373 ,717 ,000
e17 ↔ e18 ,400 ,221 ,563 ,000
e25 ↔ e27 ,423 ,116 ,637 ,009
e25 ↔ e28 ,498 ,281 ,679 ,001
e8 ↔ e9 ,272 ,054 ,497 ,014
e24 ↔ e28 ,225 -,021 ,494 ,084
e21 ↔ e23 -,500 -,708 -,315 ,000
e20 ↔ e21 ,282 -,041 ,554 ,084
e10 ↔ e12 ,192 -,053 ,388 ,110
e10 ↔ e7 -,237 -,415 -,070 ,005
e21 ↔ e18 ,209 ,049 ,355 ,011
e20 ↔ e23 -,396 -,711 -,147 ,002
e18 ↔ e19 ,158 -,132 ,423 ,280
e21 ↔ e19 -,168 -,404 ,032 ,098
e19 ↔ e23 -,287 -,645 -,030 ,029
e25 ↔ e18 -,161 -,347 -,005 ,043
e25 ↔ e19 -,159 -,415 ,075 ,169
e27 ↔ e28 ,229 -,042 ,506 ,111
e12 ↔ e14 -,297 -,573 ,000 ,050
e8 ↔ e13 -,137 -,351 ,063 ,184
e17 ↔ e19 ,172 -,016 ,364 ,074
e7 ↔ e12 -,324 -,634 -,059 ,016
e10 ↔ e11 ,038 -,163 ,253 ,651
e15 ↔ e9 -,365 -,628 -,100 ,005
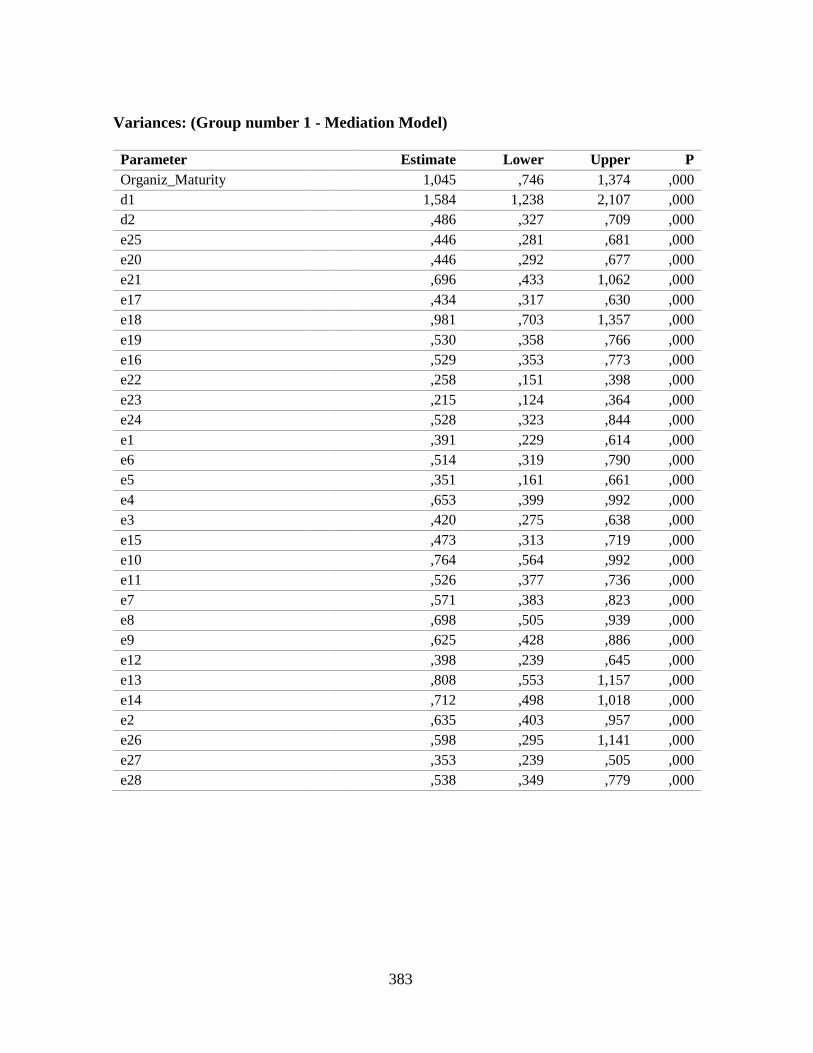
383
Variances: (Group number 1 - Mediation Model)
Parameter Estimate Lower Upper P
Organiz_Maturity
1,045 ,746 1,374 ,000
d1
1,584 1,238 2,107 ,000
d2
,486 ,327 ,709 ,000
e25
,446 ,281 ,681 ,000
e20
,446 ,292 ,677 ,000
e21
,696 ,433 1,062 ,000
e17
,434 ,317 ,630 ,000
e18
,981 ,703 1,357 ,000
e19
,530 ,358 ,766 ,000
e16
,529 ,353 ,773 ,000
e22
,258 ,151 ,398 ,000
e23
,215 ,124 ,364 ,000
e24
,528 ,323 ,844 ,000
e1
,391 ,229 ,614 ,000
e6
,514 ,319 ,790 ,000
e5
,351 ,161 ,661 ,000
e4
,653 ,399 ,992 ,000
e3
,420 ,275 ,638 ,000
e15
,473 ,313 ,719 ,000
e10
,764 ,564 ,992 ,000
e11
,526 ,377 ,736 ,000
e7
,571 ,383 ,823 ,000
e8
,698 ,505 ,939 ,000
e9
,625 ,428 ,886 ,000
e12
,398 ,239 ,645 ,000
e13
,808 ,553 1,157 ,000
e14
,712 ,498 1,018 ,000
e2
,635 ,403 ,957 ,000
e26
,598 ,295 1,141 ,000
e27
,353 ,239 ,505 ,000
e28
,538 ,349 ,779 ,000
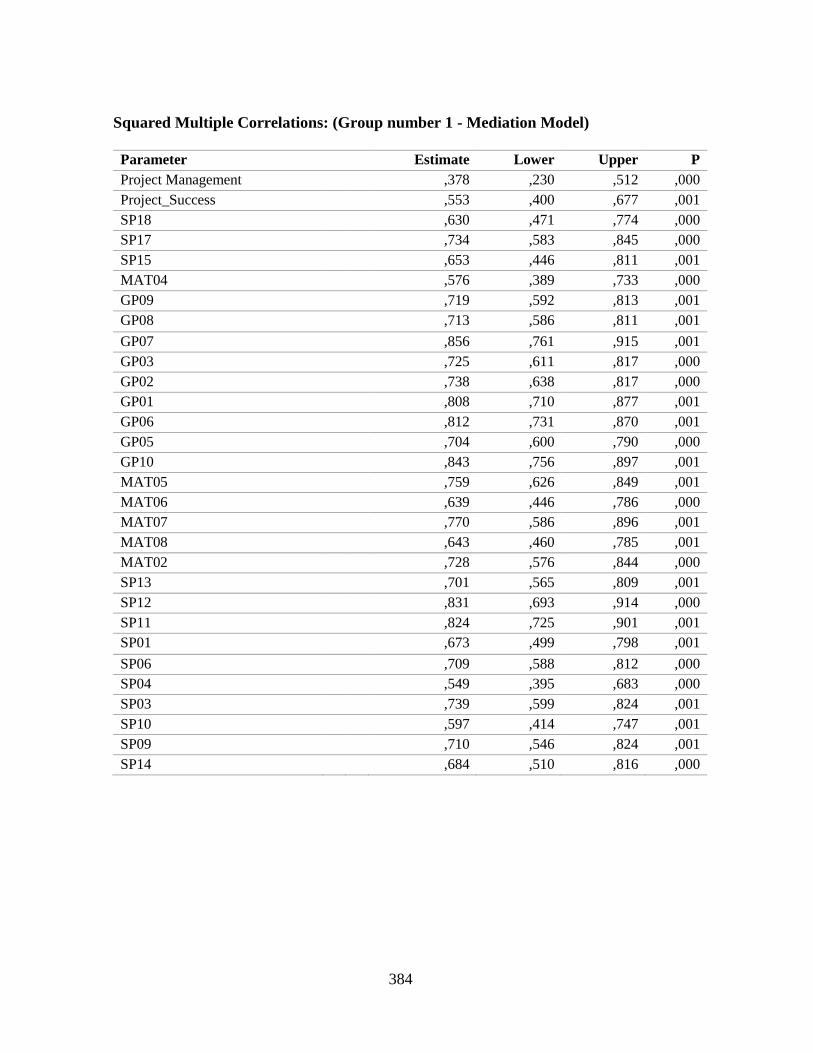
384
Squared Multiple Correlations: (Group number 1 - Mediation Model)
Parameter Estimate Lower Upper P
Project Management
,378 ,230 ,512 ,000
Project_Success
,553 ,400 ,677 ,001
SP18
,630 ,471 ,774 ,000
SP17
,734 ,583 ,845 ,000
SP15
,653 ,446 ,811 ,001
MAT04
,576 ,389 ,733 ,000
GP09
,719 ,592 ,813 ,001
GP08
,713 ,586 ,811 ,001
GP07
,856 ,761 ,915 ,001
GP03
,725 ,611 ,817 ,000
GP02
,738 ,638 ,817 ,000
GP01
,808 ,710 ,877 ,001
GP06
,812 ,731 ,870 ,001
GP05
,704 ,600 ,790 ,000
GP10
,843 ,756 ,897 ,001
MAT05
,759 ,626 ,849 ,001
MAT06
,639 ,446 ,786 ,000
MAT07
,770 ,586 ,896 ,001
MAT08
,643 ,460 ,785 ,001
MAT02
,728 ,576 ,844 ,000
SP13
,701 ,565 ,809 ,001
SP12
,831 ,693 ,914 ,000
SP11
,824 ,725 ,901 ,001
SP01
,673 ,499 ,798 ,001
SP06
,709 ,588 ,812 ,000
SP04
,549 ,395 ,683 ,000
SP03
,739 ,599 ,824 ,001
SP10
,597 ,414 ,747 ,001
SP09
,710 ,546 ,824 ,001
SP14
,684 ,510 ,816 ,000
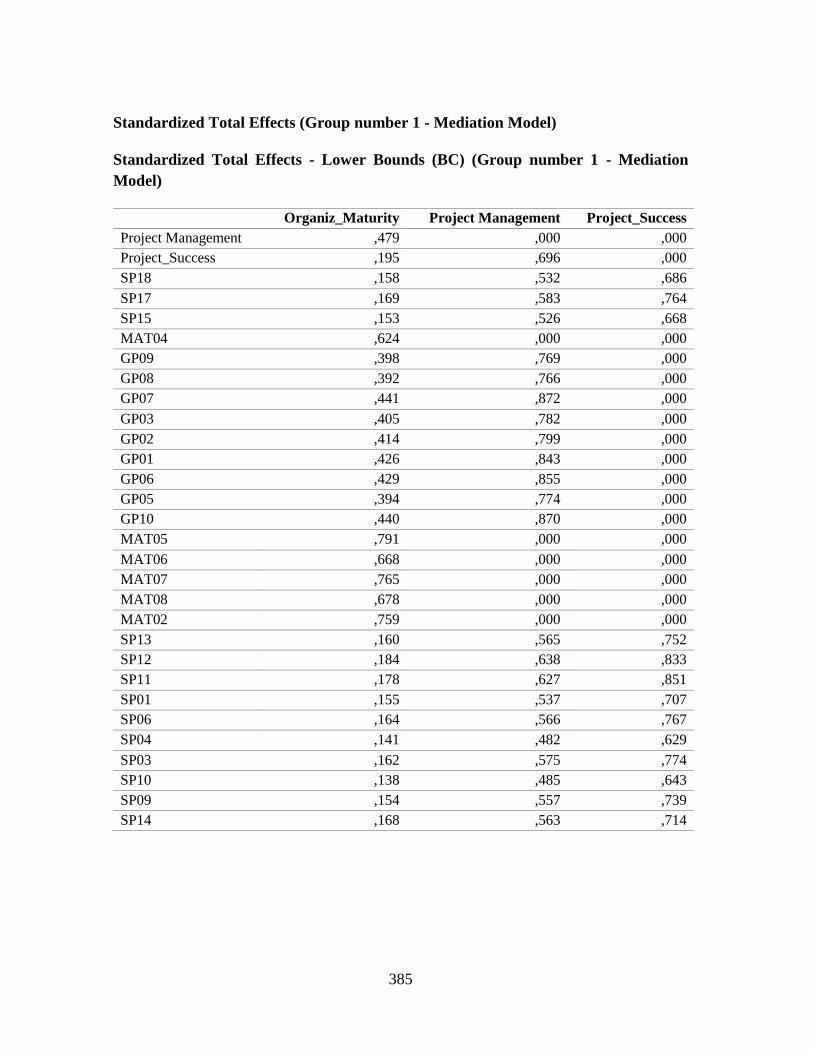
385
Standardized Total Effects (Group number 1 - Mediation Model)
Standardized Total Effects - Lower Bounds (BC) (Group number 1 - Mediation
Model)
Organiz_Maturity Project Management Project_Success
Project Management ,479 ,000 ,000
Project_Success ,195 ,696 ,000
SP18 ,158 ,532 ,686
SP17 ,169 ,583 ,764
SP15 ,153 ,526 ,668
MAT04 ,624 ,000 ,000
GP09 ,398 ,769 ,000
GP08 ,392 ,766 ,000
GP07 ,441 ,872 ,000
GP03 ,405 ,782 ,000
GP02 ,414 ,799 ,000
GP01 ,426 ,843 ,000
GP06 ,429 ,855 ,000
GP05 ,394 ,774 ,000
GP10 ,440 ,870 ,000
MAT05 ,791 ,000 ,000
MAT06 ,668 ,000 ,000
MAT07 ,765 ,000 ,000
MAT08 ,678 ,000 ,000
MAT02 ,759 ,000 ,000
SP13 ,160 ,565 ,752
SP12 ,184 ,638 ,833
SP11 ,178 ,627 ,851
SP01 ,155 ,537 ,707
SP06 ,164 ,566 ,767
SP04 ,141 ,482 ,629
SP03 ,162 ,575 ,774
SP10 ,138 ,485 ,643
SP09 ,154 ,557 ,739
SP14 ,168 ,563 ,714
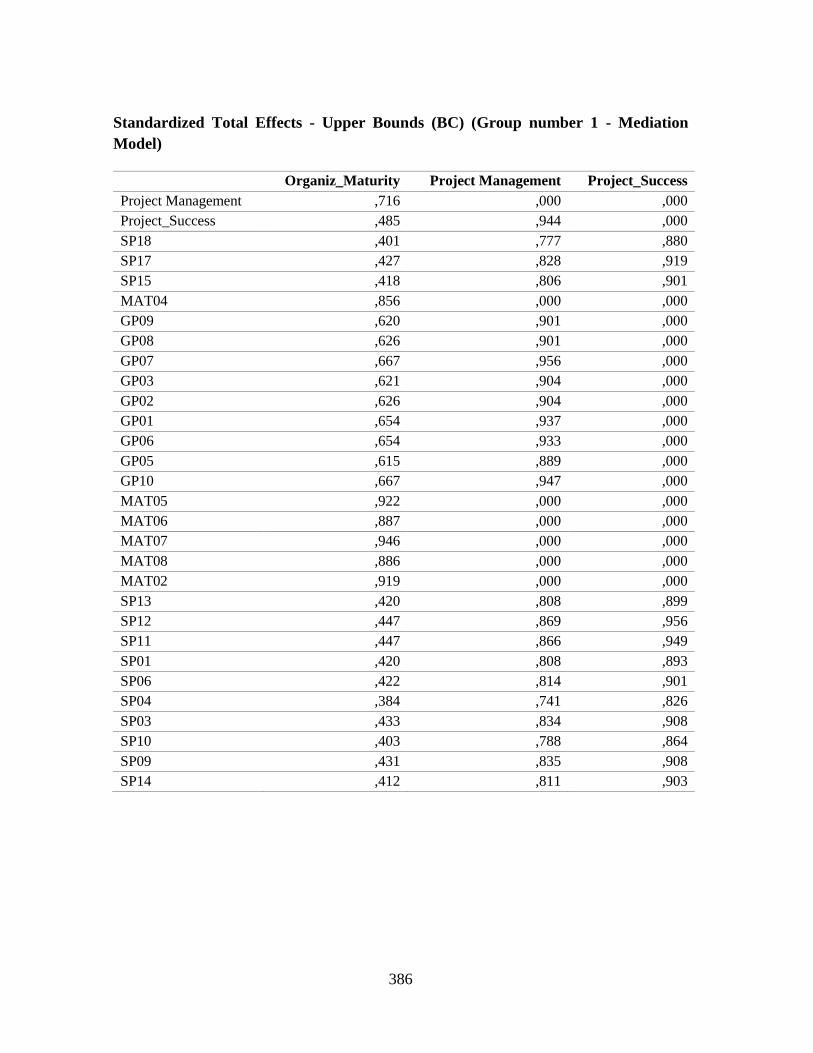
386
Standardized Total Effects - Upper Bounds (BC) (Group number 1 - Mediation
Model)
Organiz_Maturity Project Management Project_Success
Project Management ,716 ,000 ,000
Project_Success ,485 ,944 ,000
SP18 ,401 ,777 ,880
SP17 ,427 ,828 ,919
SP15 ,418 ,806 ,901
MAT04 ,856 ,000 ,000
GP09 ,620 ,901 ,000
GP08 ,626 ,901 ,000
GP07 ,667 ,956 ,000
GP03 ,621 ,904 ,000
GP02 ,626 ,904 ,000
GP01 ,654 ,937 ,000
GP06 ,654 ,933 ,000
GP05 ,615 ,889 ,000
GP10 ,667 ,947 ,000
MAT05 ,922 ,000 ,000
MAT06 ,887 ,000 ,000
MAT07 ,946 ,000 ,000
MAT08 ,886 ,000 ,000
MAT02 ,919 ,000 ,000
SP13 ,420 ,808 ,899
SP12 ,447 ,869 ,956
SP11 ,447 ,866 ,949
SP01 ,420 ,808 ,893
SP06 ,422 ,814 ,901
SP04 ,384 ,741 ,826
SP03 ,433 ,834 ,908
SP10 ,403 ,788 ,864
SP09 ,431 ,835 ,908
SP14 ,412 ,811 ,903
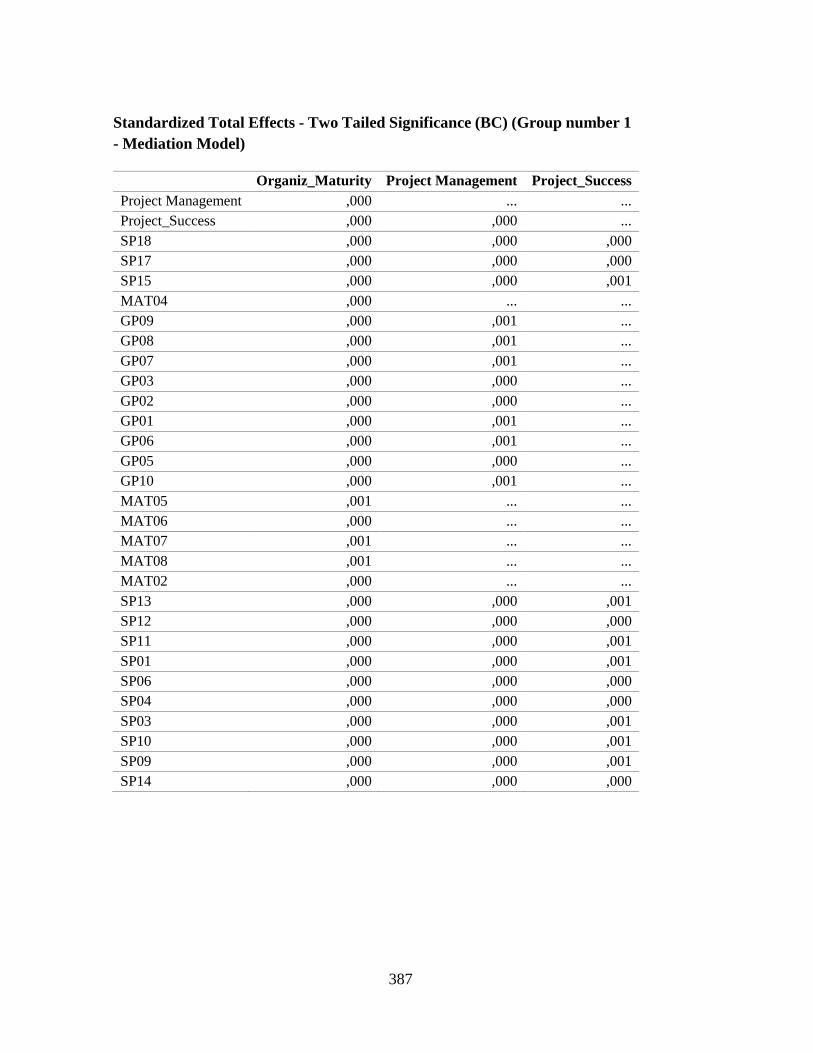
387
Standardized Total Effects - Two Tailed Significance (BC) (Group number 1
- Mediation Model)
Organiz_Maturity Project Management Project_Success
Project Management ,000 ... ...
Project_Success ,000 ,000 ...
SP18 ,000 ,000 ,000
SP17 ,000 ,000 ,000
SP15 ,000 ,000 ,001
MAT04 ,000 ... ...
GP09 ,000 ,001 ...
GP08 ,000 ,001 ...
GP07 ,000 ,001 ...
GP03 ,000 ,000 ...
GP02 ,000 ,000 ...
GP01 ,000 ,001 ...
GP06 ,000 ,001 ...
GP05 ,000 ,000 ...
GP10 ,000 ,001 ...
MAT05 ,001 ... ...
MAT06 ,000 ... ...
MAT07 ,001 ... ...
MAT08 ,001 ... ...
MAT02 ,000 ... ...
SP13 ,000 ,000 ,001
SP12 ,000 ,000 ,000
SP11 ,000 ,000 ,001
SP01 ,000 ,000 ,001
SP06 ,000 ,000 ,000
SP04 ,000 ,000 ,000
SP03 ,000 ,000 ,001
SP10 ,000 ,000 ,001
SP09 ,000 ,000 ,001
SP14 ,000 ,000 ,000
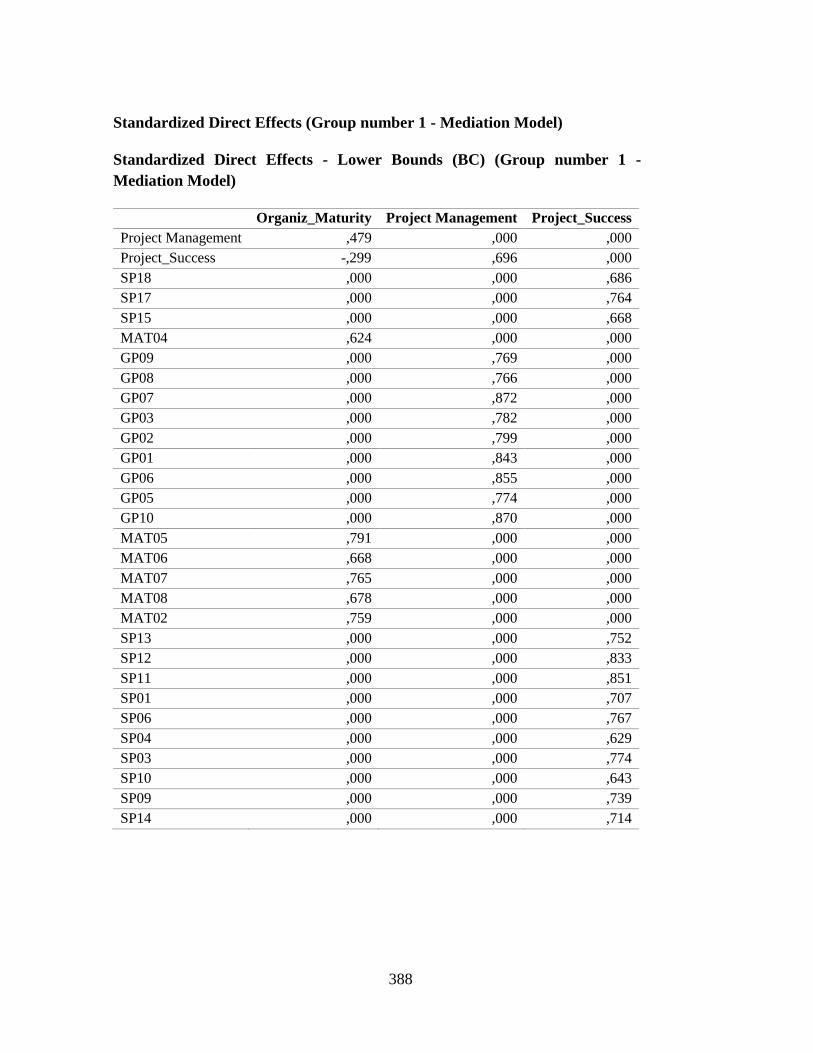
388
Standardized Direct Effects (Group number 1 - Mediation Model)
Standardized Direct Effects - Lower Bounds (BC) (Group number 1 -
Mediation Model)
Organiz_Maturity Project Management Project_Success
Project Management ,479 ,000 ,000
Project_Success -,299 ,696 ,000
SP18 ,000 ,000 ,686
SP17 ,000 ,000 ,764
SP15 ,000 ,000 ,668
MAT04 ,624 ,000 ,000
GP09 ,000 ,769 ,000
GP08 ,000 ,766 ,000
GP07 ,000 ,872 ,000
GP03 ,000 ,782 ,000
GP02 ,000 ,799 ,000
GP01 ,000 ,843 ,000
GP06 ,000 ,855 ,000
GP05 ,000 ,774 ,000
GP10 ,000 ,870 ,000
MAT05 ,791 ,000 ,000
MAT06 ,668 ,000 ,000
MAT07 ,765 ,000 ,000
MAT08 ,678 ,000 ,000
MAT02 ,759 ,000 ,000
SP13 ,000 ,000 ,752
SP12 ,000 ,000 ,833
SP11 ,000 ,000 ,851
SP01 ,000 ,000 ,707
SP06 ,000 ,000 ,767
SP04 ,000 ,000 ,629
SP03 ,000 ,000 ,774
SP10 ,000 ,000 ,643
SP09 ,000 ,000 ,739
SP14 ,000 ,000 ,714
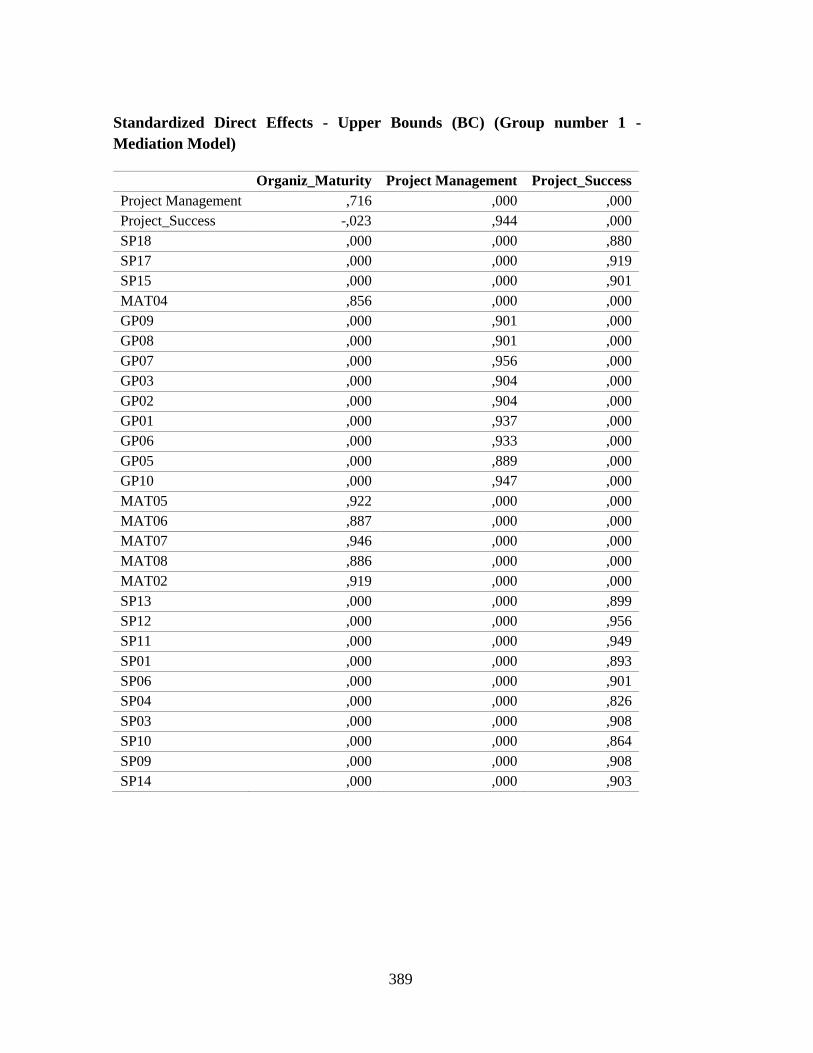
389
Standardized Direct Effects - Upper Bounds (BC) (Group number 1 -
Mediation Model)
Organiz_Maturity Project Management Project_Success
Project Management ,716 ,000 ,000
Project_Success -,023 ,944 ,000
SP18 ,000 ,000 ,880
SP17 ,000 ,000 ,919
SP15 ,000 ,000 ,901
MAT04 ,856 ,000 ,000
GP09 ,000 ,901 ,000
GP08 ,000 ,901 ,000
GP07 ,000 ,956 ,000
GP03 ,000 ,904 ,000
GP02 ,000 ,904 ,000
GP01 ,000 ,937 ,000
GP06 ,000 ,933 ,000
GP05 ,000 ,889 ,000
GP10 ,000 ,947 ,000
MAT05 ,922 ,000 ,000
MAT06 ,887 ,000 ,000
MAT07 ,946 ,000 ,000
MAT08 ,886 ,000 ,000
MAT02 ,919 ,000 ,000
SP13 ,000 ,000 ,899
SP12 ,000 ,000 ,956
SP11 ,000 ,000 ,949
SP01 ,000 ,000 ,893
SP06 ,000 ,000 ,901
SP04 ,000 ,000 ,826
SP03 ,000 ,000 ,908
SP10 ,000 ,000 ,864
SP09 ,000 ,000 ,908
SP14 ,000 ,000 ,903
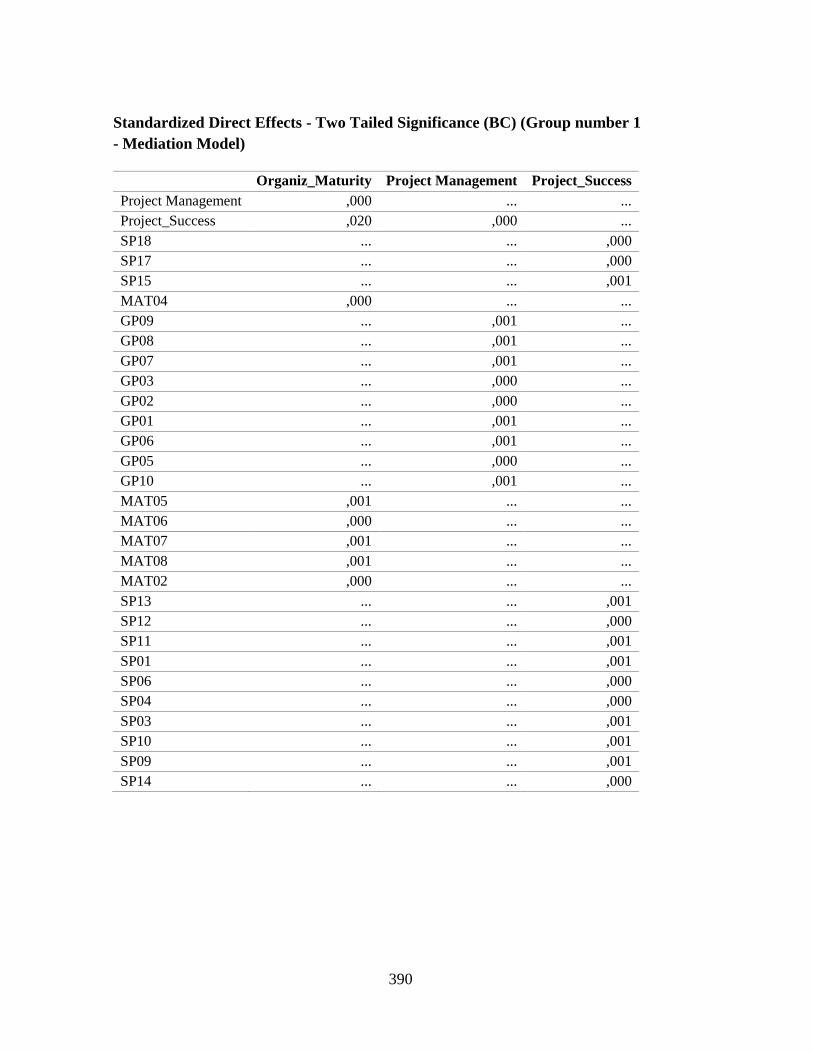
390
Standardized Direct Effects - Two Tailed Significance (BC) (Group number 1
- Mediation Model)
Organiz_Maturity Project Management Project_Success
Project Management ,000 ... ...
Project_Success ,020 ,000 ...
SP18 ... ... ,000
SP17 ... ... ,000
SP15 ... ... ,001
MAT04 ,000 ... ...
GP09 ... ,001 ...
GP08 ... ,001 ...
GP07 ... ,001 ...
GP03 ... ,000 ...
GP02 ... ,000 ...
GP01 ... ,001 ...
GP06 ... ,001 ...
GP05 ... ,000 ...
GP10 ... ,001 ...
MAT05 ,001 ... ...
MAT06 ,000 ... ...
MAT07 ,001 ... ...
MAT08 ,001 ... ...
MAT02 ,000 ... ...
SP13 ... ... ,001
SP12 ... ... ,000
SP11 ... ... ,001
SP01 ... ... ,001
SP06 ... ... ,000
SP04 ... ... ,000
SP03 ... ... ,001
SP10 ... ... ,001
SP09 ... ... ,001
SP14 ... ... ,000
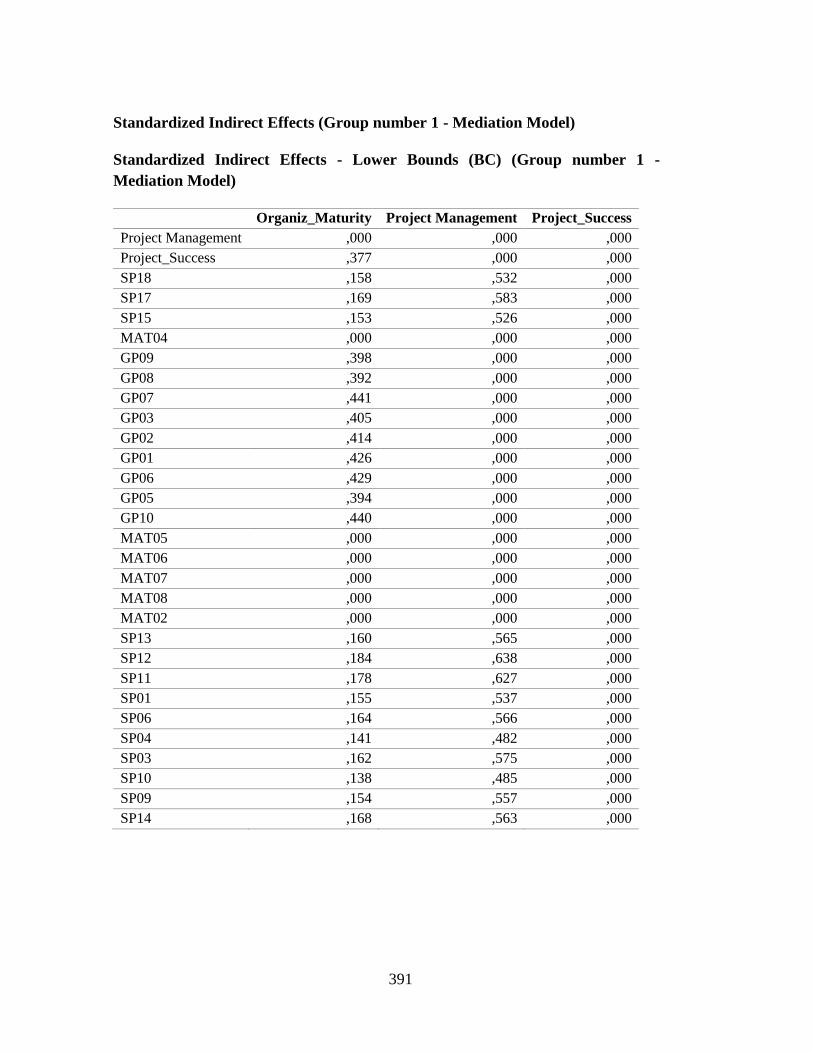
391
Standardized Indirect Effects (Group number 1 - Mediation Model)
Standardized Indirect Effects - Lower Bounds (BC) (Group number 1 -
Mediation Model)
Organiz_Maturity Project Management Project_Success
Project Management ,000 ,000 ,000
Project_Success ,377 ,000 ,000
SP18 ,158 ,532 ,000
SP17 ,169 ,583 ,000
SP15 ,153 ,526 ,000
MAT04 ,000 ,000 ,000
GP09 ,398 ,000 ,000
GP08 ,392 ,000 ,000
GP07 ,441 ,000 ,000
GP03 ,405 ,000 ,000
GP02 ,414 ,000 ,000
GP01 ,426 ,000 ,000
GP06 ,429 ,000 ,000
GP05 ,394 ,000 ,000
GP10 ,440 ,000 ,000
MAT05 ,000 ,000 ,000
MAT06 ,000 ,000 ,000
MAT07 ,000 ,000 ,000
MAT08 ,000 ,000 ,000
MAT02 ,000 ,000 ,000
SP13 ,160 ,565 ,000
SP12 ,184 ,638 ,000
SP11 ,178 ,627 ,000
SP01 ,155 ,537 ,000
SP06 ,164 ,566 ,000
SP04 ,141 ,482 ,000
SP03 ,162 ,575 ,000
SP10 ,138 ,485 ,000
SP09 ,154 ,557 ,000
SP14 ,168 ,563 ,000
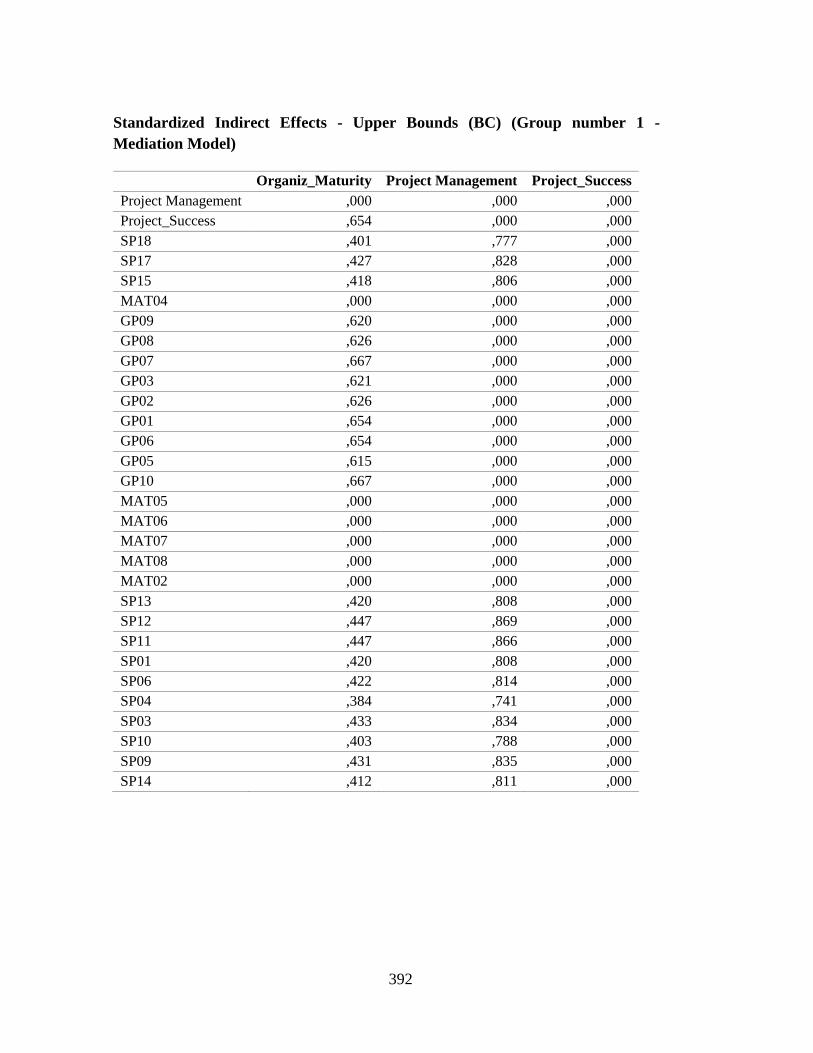
392
Standardized Indirect Effects - Upper Bounds (BC) (Group number 1 -
Mediation Model)
Organiz_Maturity Project Management Project_Success
Project Management ,000 ,000 ,000
Project_Success ,654 ,000 ,000
SP18 ,401 ,777 ,000
SP17 ,427 ,828 ,000
SP15 ,418 ,806 ,000
MAT04 ,000 ,000 ,000
GP09 ,620 ,000 ,000
GP08 ,626 ,000 ,000
GP07 ,667 ,000 ,000
GP03 ,621 ,000 ,000
GP02 ,626 ,000 ,000
GP01 ,654 ,000 ,000
GP06 ,654 ,000 ,000
GP05 ,615 ,000 ,000
GP10 ,667 ,000 ,000
MAT05 ,000 ,000 ,000
MAT06 ,000 ,000 ,000
MAT07 ,000 ,000 ,000
MAT08 ,000 ,000 ,000
MAT02 ,000 ,000 ,000
SP13 ,420 ,808 ,000
SP12 ,447 ,869 ,000
SP11 ,447 ,866 ,000
SP01 ,420 ,808 ,000
SP06 ,422 ,814 ,000
SP04 ,384 ,741 ,000
SP03 ,433 ,834 ,000
SP10 ,403 ,788 ,000
SP09 ,431 ,835 ,000
SP14 ,412 ,811 ,000
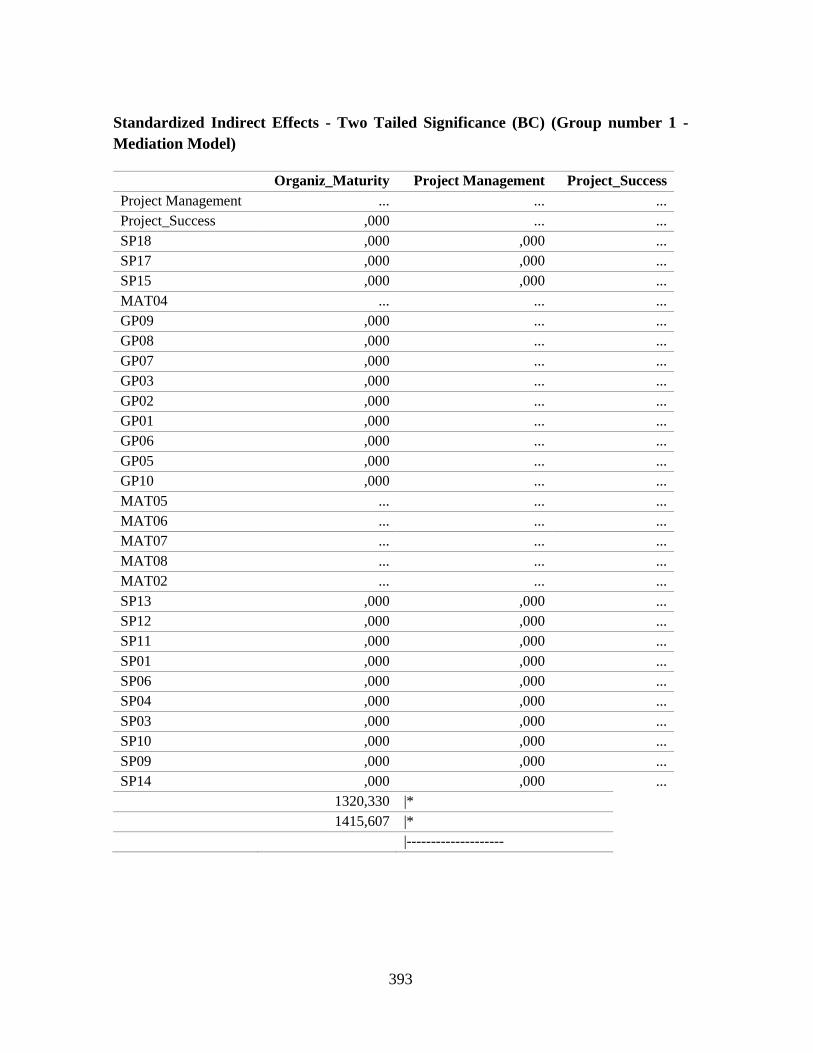
393
Standardized Indirect Effects - Two Tailed Significance (BC) (Group number 1 -
Mediation Model)
Organiz_Maturity Project Management Project_Success
Project Management ... ... ...
Project_Success ,000 ... ...
SP18 ,000 ,000 ...
SP17 ,000 ,000 ...
SP15 ,000 ,000 ...
MAT04 ... ... ...
GP09 ,000 ... ...
GP08 ,000 ... ...
GP07 ,000 ... ...
GP03 ,000 ... ...
GP02 ,000 ... ...
GP01 ,000 ... ...
GP06 ,000 ... ...
GP05 ,000 ... ...
GP10 ,000 ... ...
MAT05 ... ... ...
MAT06 ... ... ...
MAT07 ... ... ...
MAT08 ... ... ...
MAT02 ... ... ...
SP13 ,000 ,000 ...
SP12 ,000 ,000 ...
SP11 ,000 ,000 ...
SP01 ,000 ,000 ...
SP06 ,000 ,000 ...
SP04 ,000 ,000 ...
SP03 ,000 ,000 ...
SP10 ,000 ,000 ...
SP09 ,000 ,000 ...
SP14 ,000 ,000 ... 1320,330 |* 1415,607 |*
|--------------------
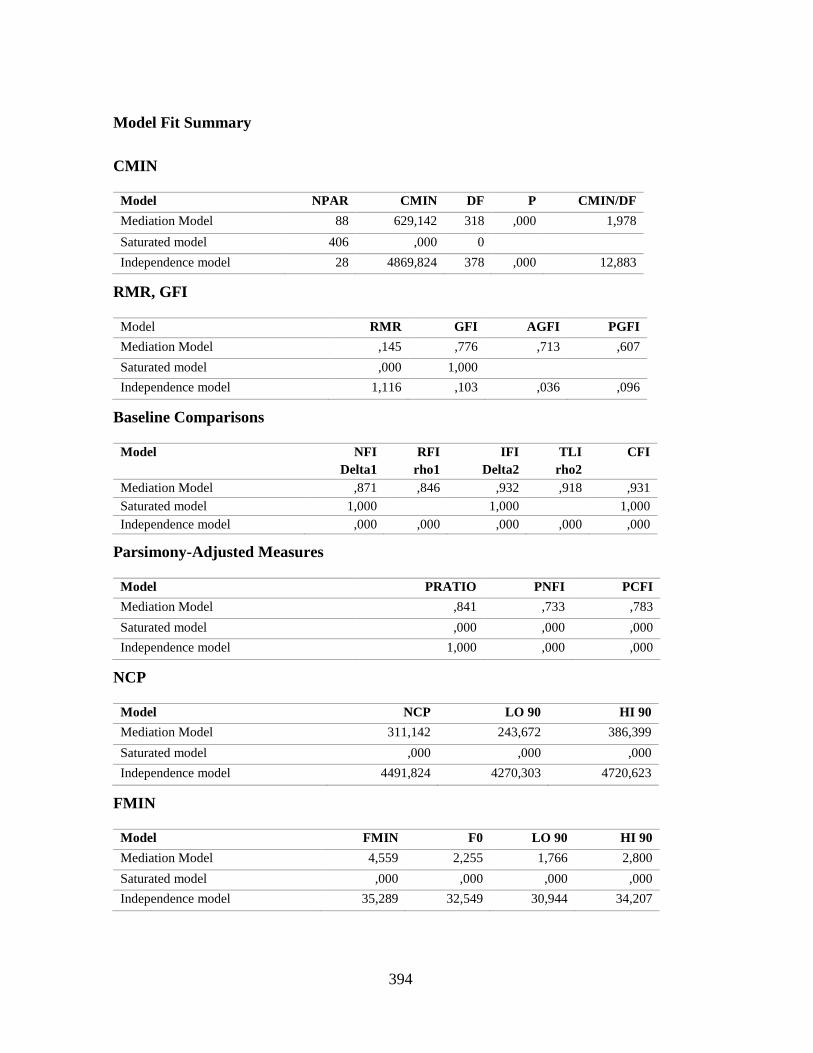
394
Model Fit Summary
CMIN
Model NPAR CMIN DF P CMIN/DF
Mediation Model 88 629,142 318 ,000 1,978
Saturated model 406 ,000 0
Independence model 28 4869,824 378 ,000 12,883
RMR, GFI
Model RMR GFI AGFI PGFI
Mediation Model ,145 ,776 ,713 ,607
Saturated model ,000 1,000
Independence model 1,116 ,103 ,036 ,096
Baseline Comparisons
Model NFI
Delta1
RFI
rho1
IFI
Delta2
TLI
rho2
CFI
Mediation Model ,871 ,846 ,932 ,918 ,931
Saturated model 1,000
1,000
1,000
Independence model ,000 ,000 ,000 ,000 ,000
Parsimony-Adjusted Measures
Model PRATIO PNFI PCFI
Mediation Model ,841 ,733 ,783
Saturated model ,000 ,000 ,000
Independence model 1,000 ,000 ,000
NCP
Model NCP LO 90 HI 90
Mediation Model 311,142 243,672 386,399
Saturated model ,000 ,000 ,000
Independence model 4491,824 4270,303 4720,623
FMIN
Model FMIN F0 LO 90 HI 90
Mediation Model 4,559 2,255 1,766 2,800
Saturated model ,000 ,000 ,000 ,000
Independence model 35,289 32,549 30,944 34,207
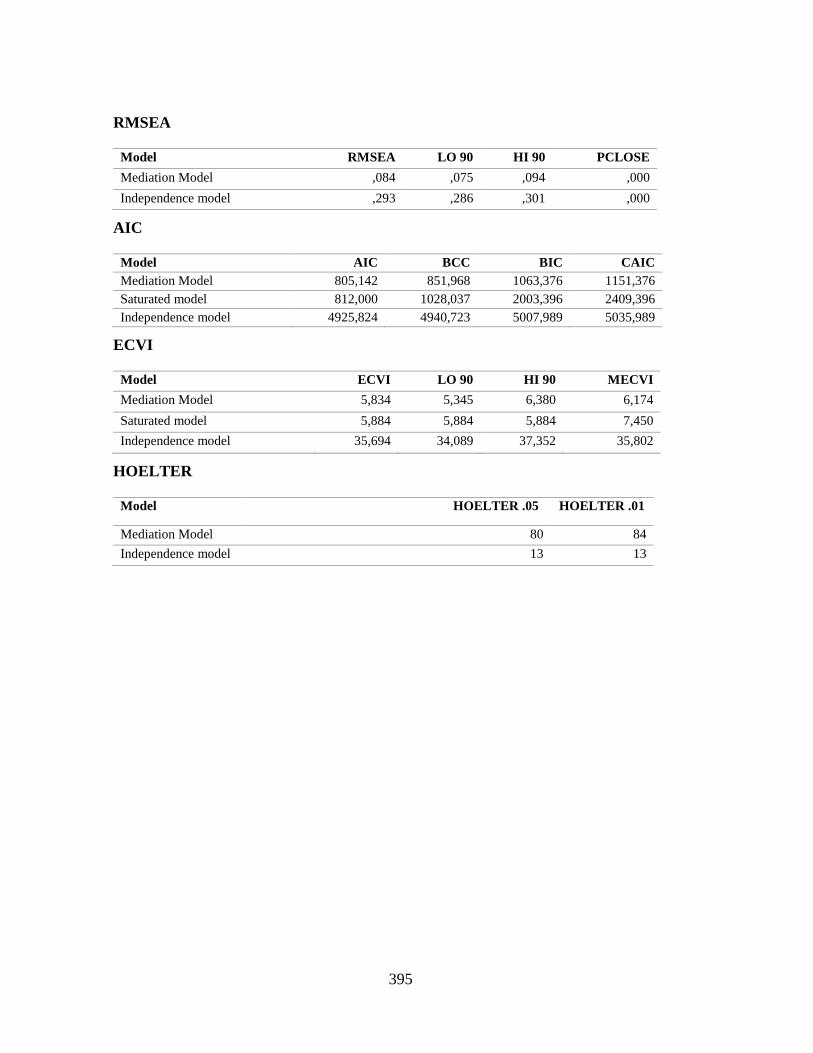
395
RMSEA
Model RMSEA LO 90 HI 90 PCLOSE
Mediation Model ,084 ,075 ,094 ,000
Independence model ,293 ,286 ,301 ,000
AIC
Model AIC BCC BIC CAIC
Mediation Model 805,142 851,968 1063,376 1151,376
Saturated model 812,000 1028,037 2003,396 2409,396
Independence model 4925,824 4940,723 5007,989 5035,989
ECVI
Model ECVI LO 90 HI 90 MECVI
Mediation Model 5,834 5,345 6,380 6,174
Saturated model 5,884 5,884 5,884 7,450
Independence model 35,694 34,089 37,352 35,802
HOELTER
Model HOELTER .05 HOELTER .01
Mediation Model 80 84
Independence model 13 13