Embed Size (px)
Citation preview

Organelle Transport along Microtubules in Xenopus Melanophores:Evidence for Cooperation between Multiple Motors
Valeria Levi,* Anna S. Serpinskaya,y Enrico Gratton,* and Vladimir Gelfandy
*Laboratory for Fluorescence Dynamics, University of Illinois at Urbana-Champaign, Urbana, Illinois; andyDepartment of Cell and Molecular Biology, Feinberg School of Medicine, Northwestern University, Chicago, Illinois
ABSTRACT Xenopus melanophores have pigment organelles or melanosomes which, in response to hormones, disperse in
the cytoplasm or aggregate in the perinuclear region. Melanosomes are transported by microtubule motors, kinesin-2 and
cytoplasmic dynein, and an actin motor, myosin-V. We explored the regulation of melanosome transport along microtubules in
vivo by using a new fast-tracking routine, which determines the melanosome position every 10 ms with 2-nm precision. The
velocity distribution of melanosomes transported by cytoplasmic dynein or kinesin-2 under conditions of aggregation and
dispersion presented several peaks and could not be fit with a single Gaussian function. We postulated that the melanosome
velocity depends linearly on the number of active motors. According to this model, one to three dynein molecules transport each
melanosome in the minus-end direction. The transport in the plus-end direction is mainly driven by one to two copies of kinesin-
2. The number of dyneins transporting a melanosome increases during aggregation, whereas the number of active kinesin-2
stays the same during aggregation and dispersion. Thus, the number of active dynein molecules regulates the net direction of
melanosome transport. The model also shows that multiple motors of the same polarity cooperate during the melanosome
transport, whereas motors of opposite polarity do not compete.
INTRODUCTION
Organization of the cytoplasm of eukaryotic cells depends on
the function of molecular motors that move organelles and
other cellular cargoes along microtubules and microfilaments
to their correct destination in the cytoplasm. A large number
of molecular motors belonging to the kinesin, dynein, and
myosin superfamilies have been identified using genetic and
cell biological techniques and the atomic structures of some
of these motors were solved by x-ray crystallography (see
references in Howard (1)).
The common core structure of most of these motors con-
sists of two motor domains connected by a stalk to a globular
tail that binds to the cargo. The motor domains attach to the
microtubules in a coordinate manner and undergo conforma-
tional changes, driven by ATP hydrolysis, which propel the
motor molecule (for recent reviews, see Welte (2) and Vale
(3)). For some members of the myosin and kinesin super-
families, it has been shown that the motion follows a hand-
over-hand mechanism in which both heads alternate in the
lead while moving along the cytoskeleton element (4–6). The
biophysical properties of molecular motors have been ex-
tensively analyzed in the past several years and, in many
cases, we know how the energy provided by ATP hydrolysis
is coupled to the mechanical work exerted by the motor
moving along actin filaments or microtubules (see, for
example, Schnitzer et al. (7)).
Despite detailed knowledge of the structure and the working
cycle of many individual motors in vitro, little is known about
the molecular mechanisms involved in the precise spatial and
temporal control of the motors during organelle transport. The
presence ofmotors of the opposite polarity on the surface of the
cargo raises the question of their coordination. In the absence of
such coordination, differentmotorswould be involved in a tug-
of-war, thus preventing effective transport. Indeed, several
recent studies using a number of biological models demon-
strated that plus- and minus-end-directed microtubule motors
are not involved in a tug-of-war and do not work against each
other, although molecular mechanisms of such coordination
still remained a mystery (8). Even less is known about the
contribution of multiple molecules of motors of the same
polarity to a net movement of cargo. One recent study suggests
that multiple kinesins or multiple dyneins on the surface of
peroxisomes could work in a cooperative fashion (9), but it is
not clear how general is this observation or what is the mech-
anism of such cooperation.
Questions of motor cooperativity can be conveniently
addressed using pigment cells or melanophores, cells that
have been successfully used in the past to study the
mechanism and regulation of intracellular transport (reviewed
in Nascimento et al. (10)). The major physiological task of
these cells is to move pigment organelles calledmelanosomes
in the cytoplasm, allowing animals to display color change.
Xenopus melanophores have melanosomes filled with the
black pigment melanin, and therefore these organelles can be
easily imaged and discriminated from other cellular compo-
nents using brightfield transmission light microscopy without
the need of any contrast generation technique or the use of
fluorescent probes.
Submitted June 2, 2005, and accepted for publication September 20, 2005.
Address reprint requests to Enrico Gratton, Laboratory for Fluorescence
Dynamics, University of Illinois at Urbana-Champaign, 1110 West Green
St., Urbana, IL 61801. Tel.: 217-244-5620; Fax: 217-244-7187; E-mail:
� 2006 by the Biophysical Society
0006-3495/06/01/318/10 $2.00 doi: 10.1529/biophysj.105.067843
318 Biophysical Journal Volume 90 January 2006 318–327
Pigment organelles can be distributed in the cells in two
different configurations—either aggregated in the perinu-
clear region or homogeneously dispersed in the cytoplasm.
The transport of pigment organelles during aggregation and
dispersion is regulated by signaling cascades initiated by the
binding of specific hormones to cell-surface receptors, which
results in the modulation of cAMP concentrations (11,12).
Therefore, one can stimulate melanosome movement toward
or away from the cell center by using appropriate hormones
to decrease or increase, respectively, the concentration of
cAMP in the cytoplasm.
Furthermore, melanosome transport in Xenopus melano-
phores is well characterized in terms of molecular motors
participating in themovement. Pigment dispersion requires the
plus-end-directed microtubule motor kinesin-2 (13) and the
actin motor myosin-V (14), whereas aggregation is powered
by the minus-end-directed motor cytoplasmic dynein (15).
The net movement of melanosomes results from the com-
bined action of these three motors. It is possible to eliminate
the contribution of myosin-V to melanosome movement by
depolymerizing actin filaments by treating the cells with
latrunculin B. The remaining movement is entirely microtu-
bule-dependent and, therefore, latrunculin-treated cells can be
used to study the contribution of microtubule motors cyto-
plasmic dynein and kinesin-2 to the organelle transport
without the contribution of the second transport system.
In this study, we used a newmethod of precise tracking and
rapid image acquisition to compare the movement of individ-
ual melanosomes along microtubules in latrunculin-treated
cells stimulated for either dispersion with the melanocyte-
stimulating hormone (MSH) or aggregation with melatonin.
Analysis of these data demonstrated that the velocity of mela-
nosomesalongmicrotubulesdoesnot followasingleGaussian
function but displays several peaks. Such a distribution can be
explained by a model that considers that a small number of
molecules of the plus- or minus-end motors transport each or-
ganelle away or toward the cell center, respectively. Com-
parison of the velocity distributions of melanosomes moving
in the minus and plus directions demonstrates that the average
number of active dynein molecules transporting an individual
organelle increases during aggregation. In contrast, the av-
erage number of active kinesin-2 molecules per melanosome
remains the sameduring dispersion and aggregation. Thus,we
postulate that the movement of melanosomes along micro-
tubules is regulated by activation of dynein molecules on the
melanosome surface, whereas the transport mediated by
kinesin-2 is not regulated.
MATERIALS AND METHODS
Cell culture and sample preparation for imaging
Immortalized Xenopus laevis melanophores were cultured as described (16).
To track the movement of individual organelles, the number of melano-
somes in the cell was reduced by treatment with phenylthiourea (17).
For microscopy measurements, the cells were grown for 2 days on
25-mm round polylysine-coated coverslips placed into 35-mm plates in
2.5 ml of the medium. Before observation, the coverslips were washed in serum-
free 70% L-15 medium and mounted in a custom-made chamber specially
designed for the microscope. The cells were treated with 10 mM latrunculin
B (Biomol International, Plymouth Meeting, PA) for at least 30 min to
depolymerize actin filaments. The cells were stimulated for aggregation or
dispersion with 10 nM melatonin or 100 nM MSH, respectively. The
samples were observed between 5 and 15 min after stimulation. All the
measurements were performed at 21�C.
Generation of melanophore cell line with
EGFP-labeled microtubules
To analyze microtubule distribution and organelle movement in the same
cell, we have selected a cell line of melanophores permanently transfected
with enhanced green fluorescent protein (EGFP)-tagged XTP, a Xenopus
homolog of tau protein (18). XTP cDNA (a kind gift from Dr. Ole Olesen,
Curix Biotech, Copenhagen, Denmark) was cut from pET5-XTP plasmid
using EcoRI and then cloned into the multiple cloning site of pEGFP-C1
vector (BD Biosciences, Palo Alto, CA). Melanophores were transfected
with EGFP-XTP construct, and 48 h later all microtubules in the transfected
cells were labeled with EGFP. Transfected cells were selected using G418
(0.2 mg/ml) and subcloned twice. Clones showing a microtubule-specific
pattern of labeling in every cell were selected and used as a stable line in the
experiments. Staining with the tubulin antibody DM1 alpha and a rhoda-
mine-labeled secondary antibody revealed a normal microtubule distribution
and demonstrated that every microtubule in the cells was homogeneously
labeled by EGFP-XTP (not shown). Expression of EGFP-XTP did not affect
movement of melanosomes and had no effect on melanosome dispersion and
aggregation by MSH and melatonin, respectively. The rate of movement of
melanosomes on microtubules was not affected by EGFP-XTP expression.
Therefore we could use melanophores stably expressing EGFP-XTP for
simultaneous visualization of microtubules and melanosomes in live cells.
Microscope setup
The tracking experiments using the pattern recognition routine were carried
out in an Olympus IX70 microscope using a 603water-immersion objective
(numerical aperture¼ 1.2) under illumination with a tungsten-halogen lamp.
A cMOS camera (Pixelink, Ottawa, Ontario, Canada) was attached to the
video port of the microscope for imaging the cells. The movies were
registered at a speed of 100 frames/s except as indicated.
Two-photon microscopy experiments were carried out using an Olympus
IX70 microscope, described previously (19). The excitation source was
a mode-locked titanium-sapphire laser (Mira 900, Coherent, Palo Alto, CA)
pumped by an argon ion laser (Innova 300, Coherent) and tuned at 915 nm,
except when indicated. The average power at the sample was ;1 mW. The
light is directed into the microscope by two galvomotor-driven scanning
mirrors (Cambridge Technologies, Watertown, MA) through a scanning
lens. The laser light is reflected with a low-pass dichroic mirror (trans-
mission from 370 to 630 nm, Chroma Technology, Brattleboro, VT) and
focused on the sample with a 633 oil-immersion plan apochromat objective
(numerical aperture ¼ 1.4). Fluorescence emission is collected by the
objective and passes through a dichroic and short-pass filter to eliminate any
reflected excitation light. It then exits the microscope to the detector
(Hamamatsu H7422P-40 photomultiplier tube) on the side port. The output
of this unit is amplified and passed through a discriminator (PX01 Photon
Counting Electronics, ISS, Champaign, IL). Photons were counted with
a data acquisition card (ISS).
The experiments are controlled by a custom-made data acquisition
program (SimFCS, Laboratory for Fluorescence Dynamics, Champaign, IL).
This program, which also contains the tools used for trajectory analysis, can
be downloaded from the Laboratory for Fluorescence Dynamics website
(www.lfd.uiuc.edu).
Organelle Transport along Microtubules 319
Biophysical Journal 90(1) 318–327

Pattern-recognition algorithm for
tracking melanosomes
To start the tracking routine, the program displays the first frame of the
image stack under analysis. The operator chooses the target melanosome by
simply clicking on top of its image. Doing so, the program sets the initial
coordinates of the melanosome and generates an intensity pattern that
consists of the average intensity obtained from the first 10 frames of a region
containing the melanosome image. Generally, the image size of the pattern is
123 12 pixels; however, the operator can select smaller or larger areas. This
pattern is stored in the computer memory to be used during the calculation of
the melanosome position through the image stack. Since the pattern contains
all the details of the intensity profile of the particular melanosome and the
background, it would fit almost perfectly the intensity profile of the organelle
in the successive frames, if it is not moving perpendicular to the focal plane.
The difference between the pattern and the melanosome image will be given
by the shot noise of each individual pixel of the image.
To calculate the melanosome position in the next frame, the algorithm
compares the intensity distributions of the pattern and five areas of the frame.
These areas have the same size as the pattern and their positions are the
following: one is exactly centered at the coordinates determined for the
melanosome in the previous frame, two are located n pixels to the left and
right of the center area, and two are positioned n pixels above and below the
center area. In the experiments presented in this work, n ¼ 1, however, this
number can be adjusted by the operator.
For each of these areas, the weighted deviation (d) is calculated as
follows:
d ¼ +i;j
ffiffiffiffiffiffiffiffiffiffiffiffiffiffiffiffiffiffiffiffiffiffiffiffiffiffiffiffiffiffiffiffiffiffiffiffiffiffiffiffiffiffiffiffiffiffiffiffiffiffiffiffiffiffiffiffi
ðIimageði; jÞ � Ipatternði; jÞ � BÞ2
q
3 wði; jÞ; (1)
where I(i,j) is the intensity at position (i,j), B is the difference between the
average backgrounds of the local image and the pattern, and w(i,j) is the
weighting factor that attributes more weight to points with higher contrast.
This last parameter is calculated as follows:
wði; jÞ ¼
ffiffiffiffiffiffiffiffiffiffiffiffiffiffiffiffiffiffiffiffiffiffiffiffiffiffiffiffiffiffiffiffiffiffiffiffiffiffiffi
ðIpatternði; jÞ � IborderÞ2
q
; (2)
where Iborder represents the average intensity at the border of the pattern.
The values of d obtained for the three areas in the x (horizontal) and y
(vertical) directions are interpolated with parabolic functions. From the
interpolations, a minimum value of d can be determined in the x and y
directions. Then, the center area is repositioned to the new coordinates and
the minimization routine is repeated as explained until the particle position is
determined with a given tolerance, typically 1/100 of a pixel. Since the
minimum of the parabolas can be located at fractional values of a pixel, the
intensity of the image needs to be interpolated at the overlapping positions;
this operation is done with a bilinear interpolation.
Melanosome tracking using the
two-photon microscope
The tracking routine used to follow the melanosomes was that described by
Levi et al. (19), with the exception that the particle motion was followed in
two dimensions instead of three dimensions. This method has 20-nm
precision and a time resolution of 32 ms.
Calculation of melanosome velocity
Each of the trajectories is first carefully observed and divided into fragments
corresponding to motion toward the minus or plus end of the microtubules or
oscillations at an approximately same position. These last fragments are not
considered in the further analysis. The melanosome is considered to be
moving in the minus or plus directions when.200 contiguous points of the
trajectory present the same general direction, despite the small noise
obtained from point to point; it is considered to be oscillating in the same
position if this criterion is not fitted. If the melanosome is moving but
the direction is uncertain, the fragment is also excluded from the further
analysis.
After this initial classification, a plot of distance along the trajectory from
the initial point as a function of time is constructed for each of the minus or
plus selected fragments of the trajectory. This local trajectory is generally
rectilinear, although at an angle with respect to the microscope coordinates.
For the analysis, it is unimportant whether or not the trajectory is rectilinear
provided that it is not changing abruptly.
Each of these distance plots is further divided in segments of 40–80 points
and a linear equation is fit to determine the local velocity in the segment. The
fitting of the linear equation in each segment is observed and the segment
velocity is included in the statistics if the value of r2 is$0.98.
If the fitting is not adequate due to a sudden change in velocity in the
middle of a given segment, we further divide the fragment under analysis into
subfragments (one before and one after the change in velocity) and repeat the
segmentation in each of the subfragments. Fig. 1 represents schematically the
procedure to determine velocities applied to a trajectory obtained after stim-
ulating the cell for aggregation. In this example, we calculated the velocity of
the melanosome during a minus-end run. As can be observed, the residuals
obtained from the analysis (Fig. 1 B, bottom) are within 40 nm and were
homogeneous along the run, showing that the fit was highly satisfactory.
Data analysis
To select the model that best describes the experimental data, we calculated
the Akaike index (AIC) as follows (20):
AIC ¼ nD 3 ln ðsminÞ1 2 3 nP (3)
where Smin is the sum of the square deviations between the experimental data
and the model predictions and nD and np are the number of data points and
parameters, respectively. The best model was chosen as the one that gives
the least biased fit and the lowest AIC.
RESULTS
Performance of the tracking by the
pattern-recognition routine
To check the performance of the tracking method, we
mounted a nanometric stage on the microscope (Nano-Bio 2
(Mad City Labs, Madison, WI), with 0.7 nm position
accuracy, used in closed-loop scanning mode). We placed
a slide with a dried suspension of 500-nm-diameter poly-
styrene microspheres (Molecular Probes, Eugene, OR) on top
of the stage and moved the slide in steps of 10–50 nm. Fig. 2
shows the trajectory recovered for one of the microspheres
moving in steps of 10 nmwith a time interval between steps of
100 ms. The recovered step size was linearly related to the
input step size, with a slope of 1.046 0.04 (Fig. 2, inset). The
resolution of the method—calculated as the standard de-
viation in the position of a fixed microsphere in a movie of
20 frames acquired at 100 frames/s—was better than 2 nm.
We also calculated the signal/noise (S/N) ratios on in-
verted brightfield images of melanosomes in cells and fixed
beads and verified that the S/N ratio of melanosomes is 50%
higher than that of the beads. Thus, the performance of the
method should be equally good when tracking melanosomes.
320 Levi et al.
Biophysical Journal 90(1) 318–327

This was confirmed by tracking melanosomes in cells fixed
with 4% formaldehyde (not shown).
Velocity distribution of melanosomes
during aggregation
Melanophoreswere incubated for 30min at room temperature
in serum-free medium in the presence of 10mM latrunculin B
to depolymerize the actin filaments. The movement of the
melanosomes was induced by addition of melatonin from
a 10-mM stock in ethanol to a final concentration of 10 nM.
After incubating the cells with melatonin for 5 min, we
recorded 10–20 movies per cell, from which we determined
an average of 100melanosome trajectories. All the recordings
weremadewith cells incubated inmelatonin for 5–15min. As
an example, the inset to Fig. 3 shows the first frame of amovie
overlapped with the trajectory of one of the melanosomes. In
this particular case, the cell nucleus was located at the top left
of the frame. Since the minus ends of the microtubules are
attached to the centrosome, which is located near the nucleus,
we can conclude that the melanosome depicted in the figure
was moving toward the minus end of the microtubule.
Fig. 3 shows the distance traveled by the same melano-
some as a function of time. As can be observed from the plot,
the velocity—i.e., the slope of the curve—remains approx-
imately constant for long periods of time, indicating that
there is a constant force driving the transport of the melano-
some during these intervals. To quantitatively analyze the
velocity in the trajectories, we divided each trajectory into
segments of at least 40 data points (i.e., 0.4 s) and fit a linear
equation from which we calculated the average velocity in
each segment (for details in the procedure for segmentation
of the trajectories, see Materials and Methods). We did not
consider those segments in which the fitting was not sat-
isfactory or if the velocity was lower than 100 nm/s. This
value was the minimum velocity measured for melanosomes
presenting a defined directional motion.
We classified the segments of constant velocity according
to whether they were moving toward or away from the
nucleus and constructed velocity histograms for these two
sets of data. As mentioned before, the motion toward the
nucleus is mainly due to melanosomes moving in the minus-
end direction by the action of cytoplasmic dynein, whereas
the motion away from the nucleus is due to melanosomes
moving toward the plus end of microtubules by the action of
kinesin-2.
Fig. 4 A shows the velocity histogram obtained in one of
the cells for melanosomes moving in the minus-end
direction. We tried to fit the histograms corresponding to
melanosomes moving in the minus- or plus-end directions
FIGURE 1 Determination of local velocities. The tra-
jectory and individual coordinates obtained for the
melanosome were classified under minus-end run (green),
plus-end run (blue), or oscillations in position (red)
according to the criteria described (scale bar, 0.5 mm).
(A). The fragment corresponding to the minus-end run
(black line) was divided into segments of 40 points and
a linear equation was fitted to each of these segments
(green line). From the slope of the best-fitting equation, the
velocities were obtained for each of the segments (red).
The bottom part of B shows the residuals obtained from the
fitting. The velocity data were binned and included in the
corresponding histogram (C).
Organelle Transport along Microtubules 321
Biophysical Journal 90(1) 318–327

with single Gaussian distribution functions, since this would
be the distribution expected for a homogeneous population
of motors moving a cargo (21). However, the experimental
distributions present clear deviations from this function,
suggesting that a more complex distribution function is re-
quired to satisfactorily fit the experimental data.
Also, we determined that 63% of the data points corre-
spond to melanosomes driven in the minus-end direction,
reflecting a lower relative contribution of kinesin-2 to mela-
nosome transport after melatonin treatment.
Distribution of melanosome velocity
during dispersion
To study the motion of melanosomes during dispersion, we
treated the cells as described above, with the exception that
we added 100 nM MSH instead of melatonin. Movies of the
cells were recorded and analyzed as described in the previous
section. As was verified for the aggregation process, the
experimental velocity distribution of minus- and plus-end
directed melanosomes could not be correctly fit by single
Gaussian distribution functions (Fig. 4 B). The percentage of
melanosomes moving toward the minus end after MSH
stimulation was 32%, indicating a lower relative contribution
of dynein to melanosome transport during dispersion and
demonstrating that movement of melanosomes along micro-
tubules is regulated even in the absence of contribution from
actin and myosin-V.
FIGURE 3 Tracking melanosomes in cells. The distance traveled by one
of the melanosomes in a cell stimulated with melatonin was measured as
described in the text and is represented as a function of time. The continuous
lines represent the fit of a linear equation in two regions of the trajectories.
From the fitting, we calculated the following velocities in the segments:
0.922 6 0.003 (I) and 0.551 6 0.001 (II) mm/s. (Inset) Initial frame of
a movie recorded for the same cell at 100 frames/s. The melanosomes
appears in the image as black circles. The trajectory of the chosen
melanosome is overlapped with the image (black line). (Scale bar,1 mm.)
FIGURE 2 Tracking performance. A nanometric stage placed on top of
the microscope was programmed to move a slide containing a dried
suspension of microspheres in steps of 10–50 nm. Movies of the beads were
registered as described in Materials and Methods at 200 frames/s and the
particle trajectories were obtained by using the pattern-recognition
algorithm. The trajectory of one of the beads moving in steps of 10 nm is
plotted as a function of time. (Inset) Size of the step obtained by analyzing
the particles trajectories as a function of the input step.
FIGURE 4 Distribution of velocities of melanosomes. Movies of different
regions of two cells stimulated for aggregation (A) or dispersion (B) were
recorded as described and the organelle trajectories and velocities calculated.
The histograms of velocities were constructed from data of melanosomes
moving toward the minus (A) or plus (B) ends of the microtubules. The
continuous lines correspond to the fitting of Eq. 5 with the following best-
fitting parameters: v1 ¼ 0.2506 0.009 mm/s, s ¼ 0.0786 0.006 mm, A1 ¼
15206 240, A2 ¼ 12306 220, A3 ¼ 3606 140, and A4 ¼ 2406 140 (A);
and v1 ¼ 0.260 6 0.007 mm/s, s ¼ 0.098 6 0.007 mm/s, A1 ¼ 000 6 300,
A2 ¼ 700 6 140, A3 ¼ 115 6 113, and A4 ¼ 60 6 100 (B). The gray lines
show the contribution of each peak to the total distributions. The inset to A
shows the AIC values calculated by fitting Eq. 5 to the histogram con-
sidering n values from 1 to 6.
322 Levi et al.
Biophysical Journal 90(1) 318–327
Melanosome motion along
EGFP-labeled microtubules
To determine if themodulation ofmelanosome velocity is due
to changes in the number of microtubule tracks used by the
melanosomes, we followed the motion of the melanosomes in
melanophores in which the microtubules were labeled by
EGFP-tagged XTP, a Xenopus homolog of mammalian
microtubule-associated protein tau (18). This approach
allowed us to follow the motion of melanosomes and to
register the microtubule tracks along which the melanosomes
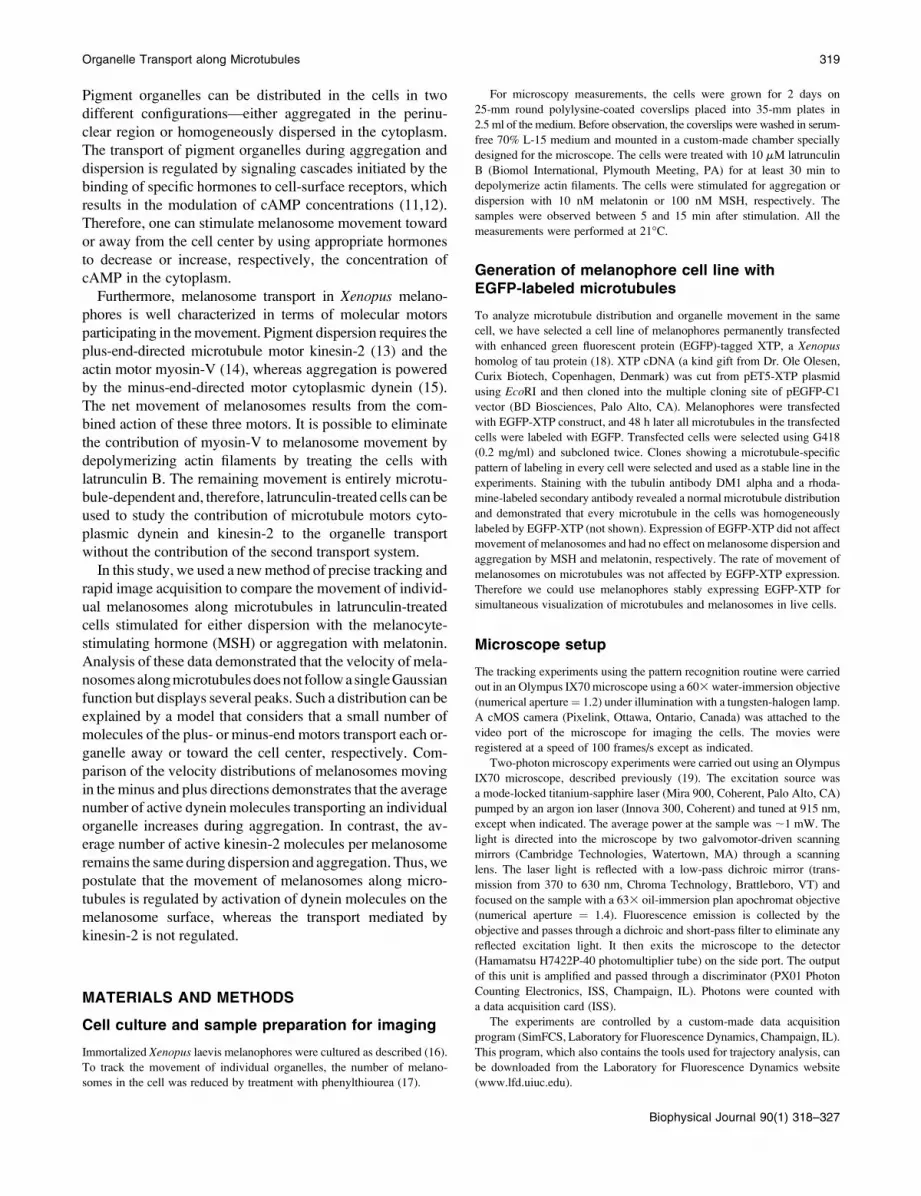
are moving. Fig. 5, A and C, shows fluorescence images of
labeled cells treated with latrunculin and melatonin obtained
under two-photon excitation. It can be observed that the
microtubules presented a highly homogeneous staining; we
consider that those cytoskeleton tracks presenting a higher
intensity represent two or more microtubules very close to
each other, whereas those tracks with lowest intensity corre-
spond to single microtubules.
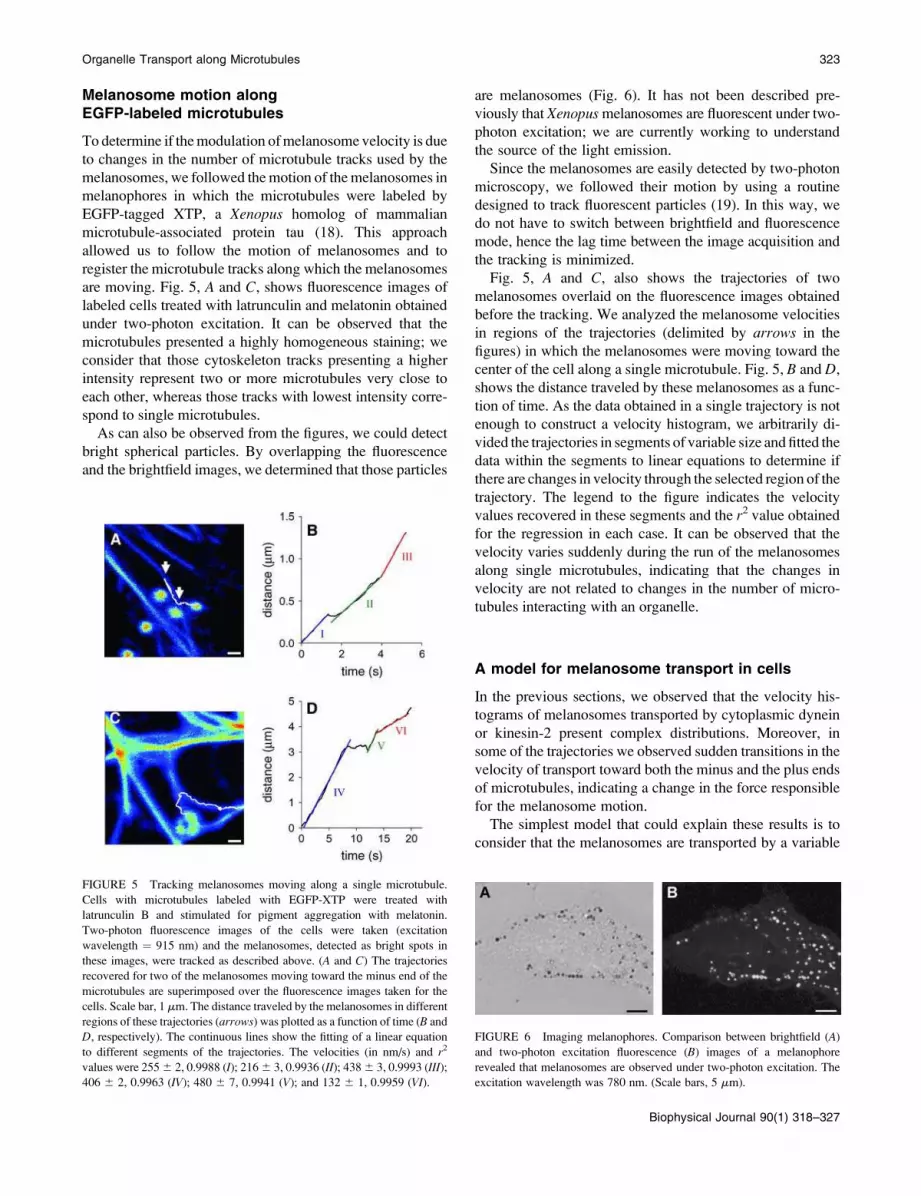
As can also be observed from the figures, we could detect
bright spherical particles. By overlapping the fluorescence
and the brightfield images, we determined that those particles
are melanosomes (Fig. 6). It has not been described pre-
viously that Xenopusmelanosomes are fluorescent under two-
photon excitation; we are currently working to understand
the source of the light emission.
Since the melanosomes are easily detected by two-photon
microscopy, we followed their motion by using a routine
designed to track fluorescent particles (19). In this way, we
do not have to switch between brightfield and fluorescence
mode, hence the lag time between the image acquisition and
the tracking is minimized.
Fig. 5, A and C, also shows the trajectories of two
melanosomes overlaid on the fluorescence images obtained
before the tracking. We analyzed the melanosome velocities
in regions of the trajectories (delimited by arrows in the
figures) in which the melanosomes were moving toward the
center of the cell along a single microtubule. Fig. 5, B and D,
shows the distance traveled by these melanosomes as a func-
tion of time. As the data obtained in a single trajectory is not
enough to construct a velocity histogram, we arbitrarily di-
vided the trajectories in segments of variable size andfitted the
data within the segments to linear equations to determine if
there are changes in velocity through the selected region of the
trajectory. The legend to the figure indicates the velocity
values recovered in these segments and the r2 value obtained
for the regression in each case. It can be observed that the
velocity varies suddenly during the run of the melanosomes
along single microtubules, indicating that the changes in
velocity are not related to changes in the number of micro-
tubules interacting with an organelle.
A model for melanosome transport in cells
In the previous sections, we observed that the velocity his-
tograms of melanosomes transported by cytoplasmic dynein
or kinesin-2 present complex distributions. Moreover, in
some of the trajectories we observed sudden transitions in the
velocity of transport toward both the minus and the plus ends
of microtubules, indicating a change in the force responsible
for the melanosome motion.
The simplest model that could explain these results is to
consider that the melanosomes are transported by a variable
FIGURE 5 Tracking melanosomes moving along a single microtubule.
Cells with microtubules labeled with EGFP-XTP were treated with
latrunculin B and stimulated for pigment aggregation with melatonin.
Two-photon fluorescence images of the cells were taken (excitation
wavelength ¼ 915 nm) and the melanosomes, detected as bright spots in
these images, were tracked as described above. (A and C) The trajectories
recovered for two of the melanosomes moving toward the minus end of the
microtubules are superimposed over the fluorescence images taken for the
cells. Scale bar, 1 mm. The distance traveled by the melanosomes in different
regions of these trajectories (arrows) was plotted as a function of time (B and
D, respectively). The continuous lines show the fitting of a linear equation
to different segments of the trajectories. The velocities (in nm/s) and r2
values were 2556 2, 0.9988 (I); 2166 3, 0.9936 (II); 4386 3, 0.9993 (III);
406 6 2, 0.9963 (IV); 480 6 7, 0.9941 (V); and 132 6 1, 0.9959 (VI).
FIGURE 6 Imaging melanophores. Comparison between brightfield (A)
and two-photon excitation fluorescence (B) images of a melanophore
revealed that melanosomes are observed under two-photon excitation. The
excitation wavelength was 780 nm. (Scale bars, 5 mm).
Organelle Transport along Microtubules 323
Biophysical Journal 90(1) 318–327

number of copies of the motor molecule. If each of the motor
molecules contributes equally to the transport, the velocity
of the melanosome (vi) is related to the number of motors (ni)
as follows:
vi ¼niFmotor
a; (4)
where Fmotor is the force exerted by a single molecular motor,
and a is the friction coefficient. This equation is similar to
that proposed by Grill et al. (22).
According to this model, the velocity histogram of
melanosomes transported by a given motor will present
peaks located at integer multiples of the velocity correspond-
ing to a melanosome transported by a single copy of the
motor (v1). If we consider that each peak presents a Gaussian
distribution,
N ¼ +n
ni�1
Aie�ðv�v1 niÞ
2
2s2
; (5)
where N is the number of data points with velocity v, Ai is the
amplitude of the peak corresponding to melanosomes trans-
ported by ni motors, and s is the half-width of the peaks.
In this equation, we consider the same width for all the
peaks, since this parameter mainly depends on the intra-
cellular motion, which increases the noise in the velocity
determination, the size distribution of the melanosomes, and
the viscosity variations in the cell cytoplasm.
The model was fit to the histograms obtained for individual
cells during aggregation or dispersion considering n values
between 1 and 6.We verified that the best fit of the histograms
is obtained with n ¼ 4, indicating that each melanosome
moving in the minus or plus direction is transported by four or
fewer active motors. The continuous line in Fig. 4 shows the
fitting of the model.
The v1 ands values calculated for kinesin-2 by fitting Eq. 5
to the histograms of the observed cells were 280 6 60 nm/s
and 120 6 40 mm/s during aggregation and 240 6 65 nm/s
and 100 6 20 nm/s during dispersion. In the case of
cytoplasmic dynein, the calculated v1 and s were 260 6 50
nm/s and 100 6 25 nm/s during aggregation and 240 6 30
nm/s and 906 25 nm/s during dispersion. The errors in v1 and
s were calculated as the standard deviations of the parameter
values determined in the different cells. It can be observed that
the velocity of melanosomes transported by one dynein
molecule is not significantly different from the velocity of
those transported by one kinesin-2. Also, the values of v1measured for each motor during aggregation and dispersion
are similar, considering the error in v1 determination.
Our model is based on the observation of peaks located at
regular intervals in the histograms of melanosome velocity.
However, this can result from errors due to the finite sam-
pling of a unimodal distribution. To test if this is the case, we
applied a statistical autocorrelation method proposed by
Stratford et al. (23) to study whether the peaks obtained in
synaptic amplitude frequency histograms result from a
quantal distribution.
In this method, the test histogram is smoothed using a fast
Fourier transform (FFT) filter to obtain a unimodal distribu-
tion in which individual peaks are eliminated. The difference
function between the histogram and the unimodal distribu-
tion is lightly smoothed by FFT filtering and its autocorre-
lation function is computed. An autocorrelation score (AC) is
calculated as the difference between the value of the first
peak and that of the first valley of the autocorrelation func-
tions. This score depends on the sharpness of the histogram
peaks, the equality of their spacing, and the number of data.
Hence, it is related to the probability that the test histogram
arises from a multimodal distribution. The spacing between
the peaks can be obtained from the period of the auto-
correlation function.
Fig. 7 shows the results obtained from this analysis applied
to the histogram of dynein-driven melanosomes in a cell
stimulated for aggregation. The autocorrelation function
shows a characteristic ‘‘damped sinusoid’’ shape expected
for a multimodal distribution. The first peak is located at
;250 nm/s, with subsequent peaks occurring approximately
every 250 nm/s. This result agrees with the peak periodicity
obtained from the proposed model.
We also run control simulations in which we applied the
autocorrelation analysis to histograms generated from ran-
dom velocity data. The distribution of these simulated data
followed a unimodal Weibull function the parameter values
of which were obtained by fitting this function to the
experimentally determined test histogram (for details of the
simulation procedure, see Stratford et al. (23)). Then, we
performed the autocorrelation analysis in these simulated
histograms using the same FFT filters used for the test
histograms. The correlation plot of these histograms did not
FIGURE 7 Autocorrelation analysis. A histogram of dynein-driven
melanosomes obtained after stimulating the cells for aggregation was finely
binned and filtered as described in the text until a unimodal curve (inset) was
obtained. The difference function resulting from subtraction of the unimodal
curve from the histogram was lightly smoothed, and the autocorrelation of
the smoothed difference function was calculated. The arrow points the valley
and peak used to calculate the AC score.
324 Levi et al.
Biophysical Journal 90(1) 318–327

show oscillatory behavior (not shown). The AC scores of the
simulated histograms were 20-fold lower than the experi-
mental AC score (N ¼ 5), indicating that the experimental
histograms do not arise from a unimodal distribution.
To quantify the contribution to the transport of melano-
somes with a different number of active motors, we constructed
histograms for dynein- and kinesin-2-driven melanosomes
by adding the individual histograms obtained for each cell.
As there are small variations from cell to cell in the velocity
of the melanosomes attached to a single copy of the motor,
we divided the velocity in each histogram by v1 and added
the normalized histograms of the different cells. We fit to the
histograms obtained for dynein or kinesin-driven melano-
somes a normalized distribution equation:
N ¼ +i
Ai e�ð vv1
�niÞ2
2s92
: (6)
Fig. 8 represents the amplitude of the peaks relative to the
amplitude measured for the peak corresponding to melano-
somes attached to one active motor. These values are directly
related to the probability of finding a melanosome dragged
by ni motors. It can be observed that the melanosomes are
transported in the minus-end direction mainly by the action
of one or two active dynein motors, with a lower probability
of three or four motors contributing to the movement. The
figure also shows that the relative number of melanosomes
moved by more than one dynein is higher during aggre-
gation. In the case of kinesin-2, the transport toward the plus
end of the microtubules is mainly due to melanosomes bound
to one or two active motors and has the same characteristics
during aggregation and dispersion.
DISCUSSION
In this article, we studied the properties of organelle transport
in live cells employing a new fast-tracking method. We used
pigment cells for this study because the pigment organelles
can be tracked with a high S/N ratio. In addition, pigment
organelle transport can be biased toward the plus or minus
ends of microtubules by treating the cells with MSH or
melatonin, respectively, allowing us to analyze the regula-
tion of organelle transport.
To have a precise description of melanosome motion, we
designed a newmethod for fast imaging and accurate tracking
of particles, which uses an inverted microscope under wide-
field illumination. As melanosomes are black and relatively
big organelles, they can be easily detected in these conditions.
The high natural contrast of melanosomes allows us to
improve the image acquisition rate and the precision of the
trackingwith respect to previousworks inwhich the organelle
tracking required labeling with a fluorescent probe and ob-
servation with, for example, a confocal scanning microscope.
In these conditions, the rate of movie acquisition is on the
order of one image per second (2).
The tracking method used in this work does not require the
assumption of an intensity distribution function for the
particle; instead, it uses the particle’s own intensity profile to
determine its position as a function of time. This approach
enhances the precision when tracking particles such as mela-
nosomes in which the intensity cannot be fit with a Gaussian
distribution function.
The main limitation of the method used in this work is that
the tracking is in two dimensions. However, as we are
measuring transport along microtubules and they are radially
distributed in the cell and mainly extended parallel to the cell
surface we would expect the motion in the z direction to be
considerably less than in the x,y plane.
The experimental approach described previously allowed
us to measure the velocity distribution of melanosomes mov-
ing along microtubules by the action of cytoplasmic dynein
and kinesin-2 motors after stimulating the cells for either
aggregation or dispersion. We eliminated the contribution of
transport along actin filaments by treating the cells with
latrunculin B, which binds to actin monomer, resulting in de-
polymerization of actin filaments (24).
As mentioned above, we would expect melanosome
velocities to follow a single Gaussian distribution function
if each of these organelles is transported by a single copy
of a motor protein. However, the experimental velocity
FIGURE 8 Relative population of melanosomes attached to a different
number of active motors. The relative amplitude of the peaks in the nor-
malized histograms corresponding to melanosomes attached to dynein (A)
and kinesin-2 (B) motors is represented as a function of the number of active
motors during aggregation (solid symbols) and dispersion ( open symbols).
Organelle Transport along Microtubules 325
Biophysical Journal 90(1) 318–327

histograms of either kinesin-2- or dynein-driven melano-
somes could not be fit by such a distribution function. In fact,
the histograms presented multiple peaks distant from each
other in regular velocity intervals, suggesting that a more
complex process is responsible for the motion of melano-
somes in vivo.
One possible explanation to the observed distributions is
that the differences in the melanosome velocity are mainly
due to variations of the viscosity of the cell cytoplasm.
However, these variations are expected to be continuous (25),
and therefore they cannot be the cause of the discrete distri-
butions observed in Fig. 4. Also, several authors explored the
viscoelasticity of the cytoplasm of different cell lines using
vesicles or beads similar in size to the melanosomes (see, for
example, Bausch et al. (25) and Hill et al. (26)) and found
viscosity values at least 1000 times higher than the water
viscosity. Using this kind of probes, Bausch et al. (25)
determined that there are not significant differences in the
viscoelastic properties through the cytoplasm. Extrapolating
these results to melanophores, the high viscosity of the
cytoplasm results in a viscous drag sufficient to slow down the
melanosomes.
Recently, it has been shown that cytoplasmic dynein
decrease the step size in response to an increasing load (27).
This gear mechanism could contribute in vivo to regulate the
velocity of the motor. However, the step size of dynein in
Drosophila S2 cells is constant and equal to 8 nm, indicating
that the motor is working at high load (9) and suggesting that
the gear mechanism is not responsible for the velocity
distribution observed in this work for dynein.
A simple model to explain our experimental results is that
there are different melanosome populations, which are trans-
ported by a different number of copies of the given motor
protein. The binding of organelles to microtubules by the
action of more than one motor protein, has been suggested by
Ashkin et al. (28), who observed by electron microscopy that
mitochondria of 320-nm diameter have 1–4 molecular cross-
bridges to microtubules in the giant amoeba Reticulomyxa.
Welte et al. (29) observed that the force driving lipid droplets
in Drosophila embryos changes during development in
a quantized fashion and proposed that this phenomenon is
due to variations in the number of active motors. More
recently, Kural et al. (9) have demonstrated that up to 11
kinesins or dyneins work together during the transport of
peroxisomes in Drosophila S2 cells, moving the cargo more
quickly than one motor could by itself.
Hunt et al. (30) assayed the motion of microtubules of
different lengths moving across high-density kinesin-coated
glass surfaces through a medium of viscosity similar to that
of the cytoplasm. In this case, the number of motors bound to
the microtubule increases in proportion to the microtubule
length. They found that the microtubule speeds were
independent of their lengths, indicating that all the active
motors bound to the microtubule contribute equally to its
transport. Taking this data into account, we presume that
a single melanosome would double its velocity if the number
of active motors moving it doubles (Eq. 4).
As seen in Figs. 4 and 6, the model proposed in this work
could explain the experimental velocity distributions of
melanosomes in vivo. Our results demonstrate that the active
motion of melanosomes in melanophores is regulated at the
level of a single organelle. We found that the velocity
distribution of melanosomes moving toward the cell center
changes depending on the state of the cell. In contrast, the
movement of melanosomes away from the center has the
same properties in the presence of signals for aggregation
and dispersion. If our model is correct, this result implies that
the average number of active dynein motors transporting
a melanosome increases during aggregation, whereas the
number of kinesin-2 molecules does not change. These data
agree very well with our earlier results (17), which showed
that only the minus-end component of the microtubule-
dependent transport is regulated, whereas the plus-end
component is constitutively active.
Taking into account the results shown in Fig. 8 and the
velocity of the organelles carried by single copies of either
dynein or kinesin-2 (v1 values), we determined the average
velocity for minus- and plus-end-directed melanosomes
during aggregation and dispersion. These values agree with
the mean velocities previously reported for melanosomes
moving in similar conditions (17).
Gross et al. (17) demonstrated that the stimulation with
melatonin increases the run length (‘‘processivity’’) of
minus-end directed melanosome movement along micro-
tubules. According to our results, this phenomenon can be
explained by an increase in the number of active motors
moving the organelle. The transport powered by multiple
motors would be more processive since the probability of
detaching the motor from the microtubule will decrease with
an increase in the number of active motors (2). Therefore, the
increase of the average number of active dynein motors will
increase the run length.
It is worth mentioning that the direct measurement of
dynein and kinesin-2 contents on the surface of melano-
somes did not show any measurable differences between
organelles purified from cells undergoing aggregation and
dispersion (17), suggesting that the increase in the number of
active motors transporting the melanosome does not result
from an increased binding of the motor to the melanosome
surface. Therefore, one can suggest that cytoplasmic dynein
is activated or inhibited without ever dissociating from the
organelle. The molecular mechanism involved in this
activation may include structural modifications of the motor
itself, changes in the associated proteins such as the dynactin
complex, or a redistribution of dynein in the organelle
membrane.
Two different mechanisms have been postulated to
explain the unidirectional transport of vesicles attached
simultaneously to two opposing motors. In the first model,
the motors are involved in a tug-of-war with the stronger
326 Levi et al.
Biophysical Journal 90(1) 318–327

motor determining the direction of motion at any particular
moment. In the second model, the motors are coordinated,
so that when the melanosome moves in one direction, the
opposing motors are inactive (31).
The performance of dynein in kinesin-2 dominant
negative melanophores did not improve with respect to
wild-type melanophores (17), suggesting that cytoplasmic
dynein and kinesin-2 are not involved in the tug-of-war with
each other (for detailed analysis of the possible mechanisms
of motor coordination during transport of melanosomes and
other organelles see Welte (2) and Gross (31)). Our results
also agree with the coordination model since the positions of
the peaks observed in the velocity histogram of melano-
somes attached to either dynein or kinesin-2 are the same
during aggregation and dispersion. This result indicates that
no matter how many copies of the motor of one polarity
move an organelle in one direction, this movement is not
counteracted by the motor of opposite polarity.
This research was supported by the Division of Research Resources of the
National Institutes of Health (PHS 5 P41-RR03155), by a grant from the
National Institute of General Medical Sciences to V.I.G. (GM-52111), and
by the University of Illinois at Urbana-Champaign.
REFERENCES
1. Howard, J. 2001. Structures of motor proteins. In Mechanics of MotorProteins and the Cytoskeleton. Sinauer Associates, Sunderland, MA.197–212.
2. Welte, M. A. 2004. Bidirectional transport along microtubules. Curr.Biol. 14:R525–R537.
3. Vale, R. D. 2003. The molecular motor toolbox for intracellulartransport. Cell. 112:467–480.
4. Yildiz, A., J. N. Forkey, S. A. McKinney, T. Ha, Y. E. Goldman, andP. R. Selvin. 2003. Myosin V walks hand-over-hand: singlefluorophore imaging with 1.5-nm localization. Science. 300:2061–2065.
5. Yildiz, A., H. Park, D. Safer, Z. Yang, L. Q. Chen, P. R. Selvin, andH. L. Sweeney. 2004. Myosin VI steps via a hand-over-hand mech-anism with its lever arm undergoing fluctuations when attached toactin. J. Biol. Chem. 279:37223–37226.
6. Yildiz, A., M. Tomishige, R. D. Vale, and P. R. Selvin. 2004. Kinesinwalks hand-over-hand. Science. 303:676–678.
7. Schnitzer, M. J., K. Visscher, and S. M. Block. 2000. Force productionby single kinesin motors. Nat. Cell Biol. 2:718–723.
8. Mallik, R., and S. P. Gross. 2004. Molecular motors: strategies toget along. Curr. Biol. 14:R971–R982.
9. Kural, C., H. Kim, S. Syed, G. Goshima, V. I. Gelfand, and P. R.Selvin. 2005. Kinesin and dynein move a peroxisome in vivo: a tug-of-war or coordinated movement? Science. 308:1469–1472.
10. Nascimento, A. A., J. T. Roland, and V. I. Gelfand. 2003. Pigmentcells: a model for the study of organelle transport. Annu. Rev. Cell Dev.Biol. 19:469–491.
11. Rozdzial, M. M., and L. T. Haimo. 1986. Bidirectional pigmentgranule movements of melanophores are regulated by proteinphosphorylation and dephosphorylation. Cell. 47:1061–1070.
12. Sammak, P. J., S. R. Adams, A. T. Harootunian, M. Schliwa, and R. Y.Tsien. 1992. Intracellular cyclic AMP not calcium, determines thedirection of vesicle movement in melanophores: direct measurement byfluorescence ratio imaging. J. Cell Biol. 117:57–72.
13. Tuma, M. C., A. Zill, N. Le Bot, I. Vernos, and V. Gelfand. 1998.Heterotrimeric kinesin II is the microtubule motor protein responsiblefor pigment dispersion in Xenopus melanophores. J. Cell Biol.143:1547–1558.
14. Rogers, S. L., and V. I. Gelfand. 1998. Myosin cooperates withmicrotubule motors during organelle transport in melanophores. Curr.Biol. 8:161–164.
15. Nilsson, H., and M. Wallin. 1997. Evidence for several roles of dyneinin pigment transport in melanophores. Cell Motil. Cytoskeleton.38:397–409.
16. Rogers, S. L., I. S. Tint, P. C. Fanapour, and V. I. Gelfand. 1997.Regulated bidirectional motility of melanophore pigment granulesalong microtubules in vitro. Proc. Natl. Acad. Sci. USA. 94:3720–3725.
17. Gross, S. P., M. C. Tuma, S. W. Deacon, A. S. Serpinskaya, A. R.Reilein, and V. I. Gelfand. 2002. Interactions and regulation ofmolecular motors in Xenopusmelanophores. J. Cell Biol. 156:855–865.
18. Olesen, O. F., H. Kawabata-Fukui, K. Yoshizato, and N. Noro. 2002.Molecular cloning of XTP, a tau-like microtubule-associated proteinfrom Xenopus laevis tadpoles. Gene. 283:299–309.
19. Levi, V., Q. Ruan, and E. Gratton. 2005. 3-D particle tracking in a twophoton microscope. application to the study of molecular dynamics incells. Biophys. J. 88:2919–2928.
20. Akaike, H. 1974. A new look at the statistical model identification.IEEE Trans. Automat. Control. 19:716–723.
21. Badoual, M., F. Julicher, and J. Prost. 2002. Bidirectional cooperativemotion of molecular motors. Proc. Natl. Acad. Sci. USA. 99:6696–6701.
22. Grill, S. W., J. Howard, E. Schaffer, E. H. Stelzer, and A. A. Hyman.2003. The distribution of active force generators controls mitoticspindle position. Science. 301:518–521.
23. Stratford, K. J., J. J. Jack, and A. U. Larkman. 1997. Calibration of anautocorrelation-based method for determining amplitude histogramreliability and quantal size. J. Physiol. 505:425–442.
24. Spector, I., N. R. Shochet, D. Blasberger, and Y. Kashman. 1989.Latrunculins—novel marine macrolides that disrupt microfilamentorganization and affect cell growth: I. Comparison with cytochalasin D.Cell Motil. Cytoskel. 13:127–144.
25. Bausch, A. R., W. Moller, and E. Sackmann. 1999. Measurement oflocal viscoelasticity and forces in living cells by magnetic tweezers.Biophys. J. 76:573–579.
26. Hill, D. B., M. J. Plaza, K. Bonin, and G. Holzwarth. 2004. Fast vesicletransport in PC12 neurites: velocities and forces. Eur. Biophys. J.33:623–632.
27. Mallik, R., B. C. Carter, S. A. Lex, S. J. King, and S. P. Gross. 2004.Cytoplasmic dynein functions as a gear in response to load. Nature.427:649–652.
28. Ashkin, A., K. Schutze, J. M. Dziedzic, U. Euteneuer, and M. Schliwa.1990. Force generation of organelle transport measured in vivo by aninfrared laser trap. Nature. 348:346–348.
29. Welte, M. A., S. P. Gross, M. Postner, S. M. Block, and E. F.Wieschaus. 1998. Developmental regulation of vesicle transport inDrosophila embryos: forces and kinetics. Cell. 92:547–557.
30. Hunt, A. J., F. Gittes, and J. Howard. 1994. The force exerted bya single kinesin molecule against a viscous load. Biophys. J. 67:766–781.
31. Gross, S. P. 2003. Dynactin: coordinating motors with oppositeinclinations. Curr. Biol. 13:R320–R322.
Organelle Transport along Microtubules 327
Biophysical Journal 90(1) 318–327


