Embed Size (px)
Citation preview

Bioresource Technology xxx (2015) xxx–xxx
Contents lists available at ScienceDirect
Bioresource Technology
journal homepage: www.elsevier .com/locate /bior tech
Optimization and characterization of bio-oil produced by microwaveassisted pyrolysis of oil palm shell waste biomass with microwaveabsorber
http://dx.doi.org/10.1016/j.biortech.2015.02.0550960-8524/� 2015 Elsevier Ltd. All rights reserved.
⇑ Corresponding author. Tel.: +60 7 5534715; fax: +60 7 5566159.E-mail address: [email protected] (F.N. Ani).
Please cite this article in press as: Mushtaq, F., et al. Optimization and characterization of bio-oil produced by microwave assisted pyrolysis of oshell waste biomass with microwave absorber. Bioresour. Technol. (2015), http://dx.doi.org/10.1016/j.biortech.2015.02.055
Faisal Mushtaq a,c, Tuan Amran Tuan Abdullah a, Ramli Mat a, Farid Nasir Ani b,⇑a Faculty of Chemical Engineering, Universiti Teknologi Malaysia, UTM 81310, Skudai, Johor Bahru, Johor Darul T’azim, Malaysiab Department of Thermodynamics and Fluid Mechanics, Faculty of Mechanical Engineering, Universiti Teknologi Malaysia, UTM 81310, Skudai, Johor Bahru, Johor DarulT’azim, Malaysiac Faculty of Engineering, Department of Chemical Engineering, Balochistan University of Information Technology, Engineering and Management Sciences, Quetta, Balochistan, Pakistan
h i g h l i g h t s
�Microwave assisted pyrolysis of biomass was carried out with MWA.� Bio-oil was optimized with uniformly distributed MWA for the first time.� Effects of MWA loading, microwave power and N2 flow rate were examined on bio-oil.� Largest effects on bio-oil were observed from N2 flow rate.� Bio-oil was improved in terms of phenol and 1,1-dimethyl hydrazine.
a r t i c l e i n f o
Article history:Received 13 December 2014Received in revised form 7 February 2015Accepted 9 February 2015Available online xxxx
Keywords:Oil palm shellCoconut activated carbonMicrowave assisted pyrolysisBio-oilOptimization and characterization
a b s t r a c t
In this study, solid oil palm shell (OPS) waste biomass was subjected to microwave pyrolysis conditionswith uniformly distributed coconut activated carbon (CAC) microwave absorber. The effects of CACloading (wt%), microwave power (W) and N2 flow rate (LPM) were investigated on heating profile, bio-oil yield and its composition. Response surface methodology based on central composite design was usedto study the significance of process parameters on bio-oil yield. The coefficient of determination (R2) forthe bio-oil yield is 0.89017 indicating 89.017% of data variability is accounted to the model. The largesteffect on bio-oil yield is from linear and quadratic terms of N2 flow rate. The phenol content in bio-oil is32.24–58.09% GC–MS area. The bio-oil also contain 1,1-dimethyl hydrazine of 10.54–21.20% GC–MS area.The presence of phenol and 1,1-dimethyl hydrazine implies that the microwave pyrolysis of OPS withcarbon absorber has the potential to produce valuable fuel products.
� 2015 Elsevier Ltd. All rights reserved.
1. Introduction
The fossil fuel energy resources play a vital role in the socioeco-nomic uplift of the country. The socioeconomic stability of thecountry is connected to sustainable fuel energy supply. Theconventional fossil fuel resources, such as oil and Natural Gas(NG) are considered valuable supply of natural energy. However,increasing supply and exploited production of convectional fuelresources have shown concerns over source depletion. Malaysiaeconomic growth is also connected to sustainable fuel energy sup-ply. The industrial and transportation sectors of the country
remained heavily dependent on oil and NG supply. Among thesepower sectors, the fuel energy demand is increasing in industrialsector due to its rapid growth (NEB, 2012).
Malaysia total primary energy supply was estimated at 81.23Metric tonnes of oil equivalent (Mtoe) by the end-2012, an increaseof 170% over 1992 (IEA, 2015), whereas the total primary energyconsumption of the country rose at an annual growth rate of5.44% from 1992 to end-2012. Industrial and transportation sectorsremained the dominant energy consumer of oil and NG with 31.10Mtoe in end-2012 (NEB, 2012). Furthermore, the country futureenergy demand is expected to grow at an annual growth rate of5–7.9% for the next 20 years (Ong et al., 2011). More importantly,the life expectancy of the country fossil fuel energy reserves isalarming. Oil is the fastest depleting fuel with 15.4 years of
il palm

2 F. Mushtaq et al. / Bioresource Technology xxx (2015) xxx–xxx
reserves left, whereas NG reserves are estimated for 19.9 years ofproduction based on reserves to production ratio of end-2012(BP, 2013; Mushtaq et al., 2013). Malaysia energy insecurity isgrowing due to its limited and quickly deleting fossil fuel reserves.Energy security is a challenging issue and its insecurity can bereduced; by decreasing dependence on oil and NG through utiliza-tion of indigenous energy resource and their mix, substituting oiland NG with renewable resources such as bio-fuels and waste(Mushtaq et al., 2013; Ong et al., 2011).
Malaysia is blessed with 17.98 million hectares of natural forestand 7.61 million hectares of agriculture land (MTIB, 2012). Theagricultural sector produces rubber, palm oil, rice, cocoa andcoconut. Malaysian land is rich in palm oil biomass resources.The world 46% of the palm oil comes from this land (MPOB,2013). Being the world leading palm oil producer and exporter,the country palm oil sector generates huge quantity of palm oilwaste residue, which is discarded as empty fruit bunches, meso-carp fiber, oil palm shell (OPS) and palm oil mill effluent (GGS,2011). For this reason, proper utilization of solid waste biomassis necessary for environmental and economic reasons. In addition,the solid palm oil waste biomass, which is considered of no eco-nomic value, is commonly leftover around the palm oil mill sur-rounding area to decompose naturally or burned without energyrecovery. In this concern, the solid palm waste biomass appearsthe most promising and potential renewable feedstock availablefor the conversion into valuable fuels and energy products.
Among several biomass energy conversion methods, microwaveassisted pyrolysis offers low temperature and energy efficientroute to convert solid waste biomass resources to energy products(Luque et al., 2012; Shuttleworth et al., 2012). The microwaveassisted pyrolysis products, such as bio-oil was found rich in valu-able chemicals, such as phenol (Abubakar et al., 2013; Bu et al.,2013), high content syngas (Dominguez et al., 2007; Fernándezand Menéndez, 2011) and high quality bio-char (Salema and Ani,2011). Recently, Mushtaq et al. (2014d) reviewed the researchand development efforts on fuel production from microwaveassisted pyrolysis of biomass without and with solid MicrowaveAbsorber (MWA). The presence of carbon based MWA with bio-mass showed improved process heating rate and product selectiv-ity. However, most microwave assisted pyrolysis techniquesdeveloped previously focused towards intimately mixing of MWAand biomass solids with much less attention towards uniform dis-tribution method. The non-uniform distribution of MWA with bio-mass under microwave irradiation conditions initiate hotspotsphenomena (a high temperature region formed where the micro-wave energy is more frequently absorbed by the MWA than thesurrounded biomass material). These hotspots create non-uniformprocess heating and deteriorate pyrolysis reaction mechanism. Inour previous work (Mushtaq et al., 2014b), we compared thepyrolysis performance of intimately mixed and uniformly dis-tributed MWA with solid palm oil biomass. The pyrolysis perfor-mance of uniform distribution method was reported to improvemicrowave penetration depth, biomass heating profile and bio-oilyield. Moreover, it was suggested that the uniform distributionmethod can serve as alternative heating method to the commonlyused intimately mixed method. The use of rice husk, sawdust andbagasse residue with uniformly distributed MWA under micro-wave irradiation conditions improved bio-oil yield and itscomposition (Mushtaq et al., 2014a). The effects of microwavepower and N2 flow rate with uniformly distributed MWA withOPS was reported to influence process heating rate and finalpyrolysis temperature, which can affect bio-oil yield and composi-tion (Mushtaq et al., 2014c).
Previous studies on microwave assisted pyrolysis of waste bio-mass indicated that the process factors influencing bio-oil yieldare: MWA loading (Bu et al., 2012; Salema and Ani, 2012a) and
Please cite this article in press as: Mushtaq, F., et al. Optimization and charactshell waste biomass with microwave absorber. Bioresour. Technol. (2015), htt
microwave power (Wang et al., 2012). In addition, factors thatare assumed to have minimal effects on bio-oil yield can be elimi-nated, as well as the factors that are categorical (Mushtaq et al.,2014d). The primary aim of the present work was to investigatethe effects of uniformly distributed coconut activated carbon(CAC) with OPS biomass at various levels of CAC loading, micro-wave power and N2 flow rate on heating profile, bio-oil yield andits composition. The response surface methodology was used toestablish model to predict bio-oil yield. Moreover, bio-oil obtainedunder various microwave operating conditions was analyzed usingGC–MS for phenol and other chemicals.
2. Methodology
The OPS waste biomass was acquired from Felda Kulai Palm OilMill located in Johor Bahru, Malaysia. The as-received OPS nutswere grinded to 0.00118–0.0003 m. The inherent moisture contentof as-received OPS was 8.2 wt%. The volatile matter, fixed carbonand ash content of as-received OPS was 69.5 wt%, 20.3 wt% and2.3 wt% respectively, whereas carbon, hydrogen, nitrogen and oxy-gen content was 55.4 wt%, 6.3 wt%, 0.4 wt% and 38 wt%, respec-tively. The microwave heating material of commercial grade CAC0.002 m particle size was obtained from Kekwa Indah Snd Bhd,Malaysia.
The microwave assisted pyrolysis experiments were carried outin Samsung MW71B modified Multimode Microwave (MMW) ovenrated with maximum microwave output power capacity of 800 Woperated at 2.54 GHz. The experimental system consisted of modi-fied MMW, cylindrical quartz glass reactor (0.1 m ID and 0.15 mheight), N2 supply, glass condensers, water chiller (Lauda AlphaRA-8), pyrolysis oil collector and data acquisition system (Picologdata logger and acquisition system model TC-08) as illustrated inFig. 1. A steel distributor sieve was facilitated at the reactor bottomto support the pyrolysis sample. The three-neck glass cover at thereactor top was used to insert probe K-type high temperaturethermocouples (Coleparmer, model 0507979B-K) and N2 gas sup-ply. N2 gas was supplied from the reactor top to facilitate the vola-tile removal from pyrolysis sample through single-neck glassprovided at the reactor bottom. Similar arrangement of introducingN2 gas was found effective to reduce pyrolysis vapor depositioninside the reactor (Abubakar et al., 2013). The chilled water wascirculated counter current wise in glass condensers to avoid ther-mal stresses. The pyrolysis experiments were carried out using100 g of OPS. During pyrolysis sample preparation, OPS biomasswas placed and distributed uniformly at the reactor bottom withsuccessive CAC material, which then was covered by another OPSand CAC materials. N2 gas was supplied at 10 Liter per Minute(LPM) for the maximum duration of 15 min before experiment toensure inert atmospheric conditions.
The accurate measurement of online reaction temperature inmicrowave devices has been reviewed by (Kappe, 2013). Infraredoptical pyrometers can be used to measure the pyrolysis processtemperature. However, these devices can only reflect the tempera-ture of outer surface of pyrolysis sample. Optical fiber-optic probesprovide fast and accurate temperature measurement, but overmuch limited temperature range (Luque et al., 2012). The use ofmetallic thermocouple in microwave cavity is not usually preferredsince it can cause electric discharge from metal surface. However,Menéndez et al. (1999) and Liu et al. (2004) suggested that the useof thermocouple in microwave cavity environment can measureaccurate temperature provided that it is thin with grounded metalsheath and held exactly at 90� to the electric field component ofmicrowave. In this study, the pyrolysis process temperature wasmeasured by 0.001 m diameter thin probe high temperatureK-type thermocouple probes (MgO filled Inconel 600 sheath with
erization of bio-oil produced by microwave assisted pyrolysis of oil palmp://dx.doi.org/10.1016/j.biortech.2015.02.055

Fig. 1. Microwave assisted pyrolysis setup.
F. Mushtaq et al. / Bioresource Technology xxx (2015) xxx–xxx 3
grounded junction). The thermocouples were carefully insertedinto the upper and middle biomass solid layers to measure theprocess temperature labeled as TUBL and TMBL, respectively. Thethermocouples were connected to Picolog data acquisition systemand linked to personal computer for real time monitoring of pro-cess temperature. In addition, thermocouples and microwave ovenwere grounded to avoid inconsistency in temperature reading andarcing during experiment. The microwave irradiation time of40 min was used. The circulating water temperature was main-tained at 2–6oC. The pyrolysis bio-oil yield was determined usingEq. (1).
Bio-oil yield ðwt%Þ ¼ Weight of oil ðgÞWeight of biomass ðgÞ � 100 ð1Þ
The Central Composite Design (CCD) was used to model theexperimental data. Three factors were selected; CAC loading,microwave power and N2 flow rate to demonstrate the effects onbio-oil yield. The second order polynomial model for bio-oil yieldwas developed, tested and validated. The necessary runs to fitquadratic polynomial model was generated by response surfacemap. The number of experimental runs, N with k number of factorsand M number of center points was calculated using Eq. (2).
N ¼ 2kþ 2k þM ð2Þ
The axial point a is based on the Eq. (3), which represents thedistance from center point to axial point.
a ¼ ð2kÞ1=4
ð3Þ
The effects of CAC loading (wt%), microwave power (W) and N2
gas flow rate (LPM) were investigated at five levels i.e. star low,low, medium, high and star high, coded as –a,–1, 0, +1, +a, respec-tively. For k = 3, 2k = 23 = 8 and M = 6 (6 center point tests) at fivelevels require 20 experiments with a = 1.6818. The Design ofExperiment (DoE) required to perform necessary runs are shownin Table 1 with coded formats at various levels and response.Block 1 consists of 2k factorial design points plus center pointsreplicating nF, whereas block 2 contains 2k axial points plus center
Please cite this article in press as: Mushtaq, F., et al. Optimization and charactshell waste biomass with microwave absorber. Bioresour. Technol. (2015), htt
points replicating nA. The second order polynomial model was usedto describe the effects of independent variables. The predictedmodel to generate the response (Yi) is based on Eq. (4).
Yi ¼ b0 þX3
i¼1
bixi þX3
i¼1
biix2i þ
X2
i¼1
X3
j¼iþ1
bijxixj ð4Þ
where Yi, xi, b0, bi, bii, and bij are predicted response, independentvariables, intercept coefficients, and coefficients of linear, quadraticand interaction effects, respectively. This experimental design used9 coefficients to predict response surfaces given in Eq. (5).
Yi ¼ b0 þ b1x1 þ b2x2 þ b3x3 þ b11x21 þ b22x2
2 þ b33x23 þ b12x1x2
þ b13x1x3 þ b23x2x3 ð5Þ
where x1, x2, x3 are linear effects, x12, x2
2, x33 are quadratic effects, x1x2,
x1x3, x2x3 are interaction effects, b0, b1, b2, b3 coefficients of offsetterm and b12, b13, b23 are the interaction coefficients.
STATISTICA� software was utilized to perform regression mod-eling of bio-oil yield. The standard least square model was used torun the full model as described in Eq. (5). The model results wereanalyzed statistically and graphically. The deviation of actualexperimental data was observed from the predicted values. Theoverall fitness of the predicted model was checked by the coeffi-cient of determination R2 value, which provides the percentage ofvalid model. Moreover, the significance of higher R2 value wasreviewed by F-test method using ANOVA table. The mean squareis based on degree of freedom and sum of square of regressionmodel. The degree of freedom is the number of estimated modelbased parameters and the number of observations. The Fvalue calcu-lated from table was compared with F0.05, which account for degreeof freedom and desired confidence level. For this study, 95% confi-dence level or p value60.05 was selected for all experimental runs.
2.1. GC–MS analysis of bio-oil
The bio-oil chemical composition were analyzed using AgilentTechnologies 6890 GC–MS with HP-5MS capillary column 30 mlength and 0.00025 m diameter. The GC oven temperature was
erization of bio-oil produced by microwave assisted pyrolysis of oil palmp://dx.doi.org/10.1016/j.biortech.2015.02.055
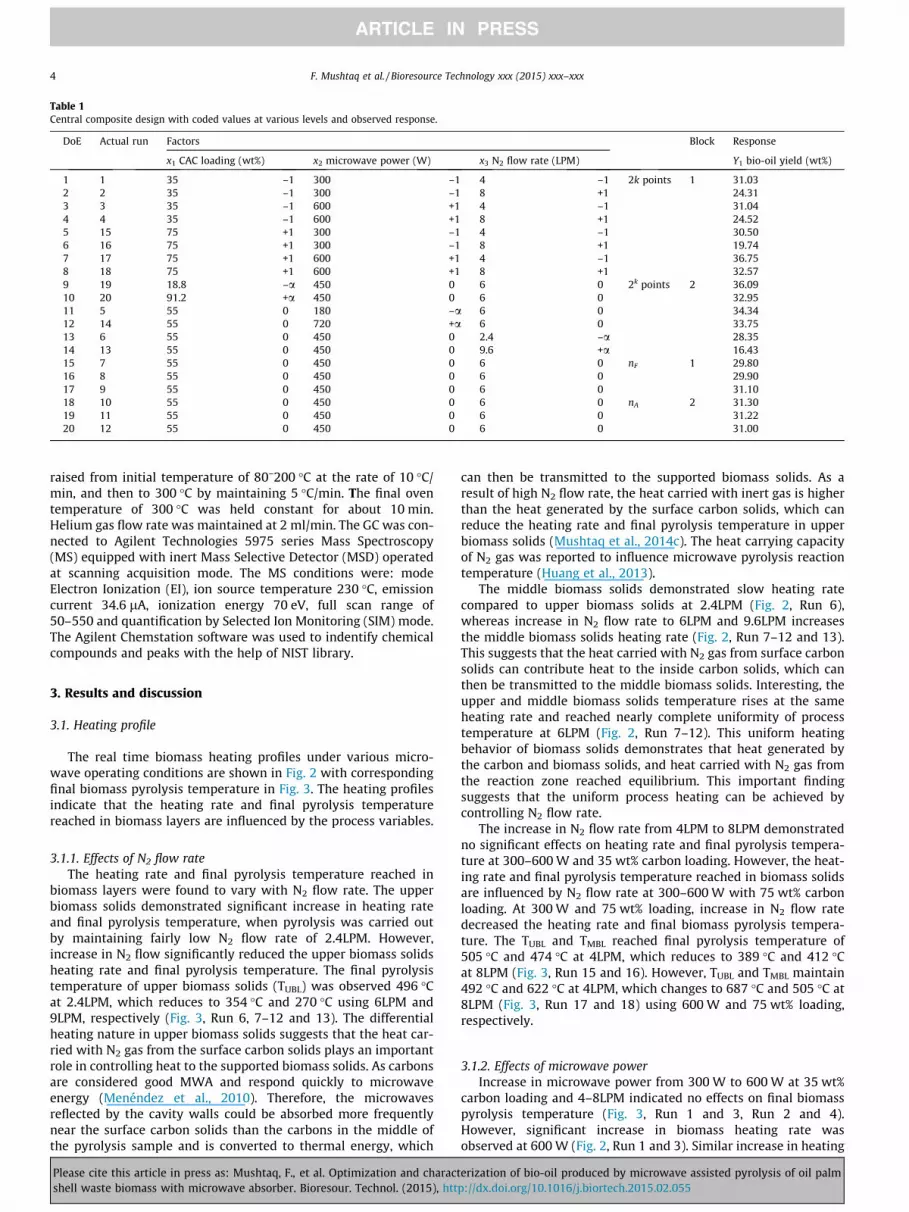
Table 1Central composite design with coded values at various levels and observed response.
DoE Actual run Factors Block Response
x1 CAC loading (wt%) x2 microwave power (W) x3 N2 flow rate (LPM) Y1 bio-oil yield (wt%)
1 1 35 –1 300 –1 4 –1 2k points 1 31.032 2 35 –1 300 –1 8 +1 24.313 3 35 –1 600 +1 4 –1 31.044 4 35 –1 600 +1 8 +1 24.525 15 75 +1 300 –1 4 –1 30.506 16 75 +1 300 –1 8 +1 19.747 17 75 +1 600 +1 4 –1 36.758 18 75 +1 600 +1 8 +1 32.579 19 18.8 –a 450 0 6 0 2k points 2 36.0910 20 91.2 +a 450 0 6 0 32.9511 5 55 0 180 –a 6 0 34.3412 14 55 0 720 +a 6 0 33.7513 6 55 0 450 0 2.4 –a 28.3514 13 55 0 450 0 9.6 +a 16.4315 7 55 0 450 0 6 0 nF 1 29.8016 8 55 0 450 0 6 0 29.9017 9 55 0 450 0 6 0 31.1018 10 55 0 450 0 6 0 nA 2 31.3019 11 55 0 450 0 6 0 31.2220 12 55 0 450 0 6 0 31.00
4 F. Mushtaq et al. / Bioresource Technology xxx (2015) xxx–xxx
raised from initial temperature of 80–200 �C at the rate of 10 �C/min, and then to 300 �C by maintaining 5 �C/min. The final oventemperature of 300 �C was held constant for about 10 min.Helium gas flow rate was maintained at 2 ml/min. The GC was con-nected to Agilent Technologies 5975 series Mass Spectroscopy(MS) equipped with inert Mass Selective Detector (MSD) operatedat scanning acquisition mode. The MS conditions were: modeElectron Ionization (EI), ion source temperature 230 �C, emissioncurrent 34.6 lA, ionization energy 70 eV, full scan range of50–550 and quantification by Selected Ion Monitoring (SIM) mode.The Agilent Chemstation software was used to indentify chemicalcompounds and peaks with the help of NIST library.
3. Results and discussion
3.1. Heating profile
The real time biomass heating profiles under various micro-wave operating conditions are shown in Fig. 2 with correspondingfinal biomass pyrolysis temperature in Fig. 3. The heating profilesindicate that the heating rate and final pyrolysis temperaturereached in biomass layers are influenced by the process variables.
3.1.1. Effects of N2 flow rateThe heating rate and final pyrolysis temperature reached in
biomass layers were found to vary with N2 flow rate. The upperbiomass solids demonstrated significant increase in heating rateand final pyrolysis temperature, when pyrolysis was carried outby maintaining fairly low N2 flow rate of 2.4LPM. However,increase in N2 flow significantly reduced the upper biomass solidsheating rate and final pyrolysis temperature. The final pyrolysistemperature of upper biomass solids (TUBL) was observed 496 �Cat 2.4LPM, which reduces to 354 �C and 270 �C using 6LPM and9LPM, respectively (Fig. 3, Run 6, 7–12 and 13). The differentialheating nature in upper biomass solids suggests that the heat car-ried with N2 gas from the surface carbon solids plays an importantrole in controlling heat to the supported biomass solids. As carbonsare considered good MWA and respond quickly to microwaveenergy (Menéndez et al., 2010). Therefore, the microwavesreflected by the cavity walls could be absorbed more frequentlynear the surface carbon solids than the carbons in the middle ofthe pyrolysis sample and is converted to thermal energy, which
Please cite this article in press as: Mushtaq, F., et al. Optimization and charactshell waste biomass with microwave absorber. Bioresour. Technol. (2015), htt
can then be transmitted to the supported biomass solids. As aresult of high N2 flow rate, the heat carried with inert gas is higherthan the heat generated by the surface carbon solids, which canreduce the heating rate and final pyrolysis temperature in upperbiomass solids (Mushtaq et al., 2014c). The heat carrying capacityof N2 gas was reported to influence microwave pyrolysis reactiontemperature (Huang et al., 2013).
The middle biomass solids demonstrated slow heating ratecompared to upper biomass solids at 2.4LPM (Fig. 2, Run 6),whereas increase in N2 flow rate to 6LPM and 9.6LPM increasesthe middle biomass solids heating rate (Fig. 2, Run 7–12 and 13).This suggests that the heat carried with N2 gas from surface carbonsolids can contribute heat to the inside carbon solids, which canthen be transmitted to the middle biomass solids. Interesting, theupper and middle biomass solids temperature rises at the sameheating rate and reached nearly complete uniformity of processtemperature at 6LPM (Fig. 2, Run 7–12). This uniform heatingbehavior of biomass solids demonstrates that heat generated bythe carbon and biomass solids, and heat carried with N2 gas fromthe reaction zone reached equilibrium. This important findingsuggests that the uniform process heating can be achieved bycontrolling N2 flow rate.
The increase in N2 flow rate from 4LPM to 8LPM demonstratedno significant effects on heating rate and final pyrolysis tempera-ture at 300–600 W and 35 wt% carbon loading. However, the heat-ing rate and final pyrolysis temperature reached in biomass solidsare influenced by N2 flow rate at 300–600 W with 75 wt% carbonloading. At 300 W and 75 wt% loading, increase in N2 flow ratedecreased the heating rate and final biomass pyrolysis tempera-ture. The TUBL and TMBL reached final pyrolysis temperature of505 �C and 474 �C at 4LPM, which reduces to 389 �C and 412 �Cat 8LPM (Fig. 3, Run 15 and 16). However, TUBL and TMBL maintain492 �C and 622 �C at 4LPM, which changes to 687 �C and 505 �C at8LPM (Fig. 3, Run 17 and 18) using 600 W and 75 wt% loading,respectively.
3.1.2. Effects of microwave powerIncrease in microwave power from 300 W to 600 W at 35 wt%
carbon loading and 4–8LPM indicated no effects on final biomasspyrolysis temperature (Fig. 3, Run 1 and 3, Run 2 and 4).However, significant increase in biomass heating rate wasobserved at 600 W (Fig. 2, Run 1 and 3). Similar increase in heating
erization of bio-oil produced by microwave assisted pyrolysis of oil palmp://dx.doi.org/10.1016/j.biortech.2015.02.055

Fig. 2. Heating profile of oil palm shell with coconut activated carbon under various microwave operating conditions.
Fig. 3. Final pyrolysis temperature of biomass solids.
F. Mushtaq et al. / Bioresource Technology xxx (2015) xxx–xxx 5
Please cite this article in press as: Mushtaq, F., et al. Optimization and characterization of bio-oil produced by microwave assisted pyrolysis of oil palmshell waste biomass with microwave absorber. Bioresour. Technol. (2015), http://dx.doi.org/10.1016/j.biortech.2015.02.055

Fig. 4. Coefficient of determination and observed versus predicated values of bio-oil yield (wt%).
6 F. Mushtaq et al. / Bioresource Technology xxx (2015) xxx–xxx
rate was observed when pyrolysis was carried at 600 W using75 wt% carbon loading and 4–8LPM. Moreover, the final biomasspyrolysis temperature under these conditions was found to varywith microwave power (Fig. 3, Run 14 and 17, Run 15 and 18).The increased heating rate can be attributed to increase inmicrowave energy absorption of carbon solids at higher power.In addition, the synergistic effects of microwave coupling withmicrowave absorber loading can encourage biomass heating rateand final pyrolysis temperature (Mushtaq et al., 2014a).
Another noticeable development is the significant increase inbiomass heating rate and final pyrolysis temperature using720 W, 55 wt% carbon loading and 6LPM. The TUBL and TMBL
reached 781 �C and 247 �C in less than 1 min, respectively (Fig. 2,Run 14). Moreover, comparison of heating profiles under similarcarbon loading and N2 flow rate with 180 W and 450 W showedmuch lower heating rate. The final TUBL and TUML were observedat 864 �C and 704 �C at 720 W, which reduces to 354 �C and364 �C, and 311 �C and 354 �C using 450 W and 180 W,respectively.
Previously, Salema and Ani (2012a) reported complete absenceof pyrolysis conditions when OPS biomass was intimately mixedwith carbon absorber loading with 10–25–50–75 wt% using300 W and 5LPM. However, this study attained pyrolysis conditionat 300 W under various operating conditions. More interestingly, afairly low microwave power output source of 180 W with 55 wt%carbon loading and 6LPM achieved pyrolysis conditions. This sug-gests that uniform distribution of MWA with biomass materialcan improve pyrolysis conditions at fairly low microwave power,which can save process energy. Salema and Ani (2012a,b) reportedthat uneven distribution of MWA with biomass and the formationof hotspots are primarily responsible of uneven process heatingrate, which can affect uniformity of process temperature.However, this study achieved fairly smooth biomass heating rate,a unique way of limiting the hotspots to carbon layers only.
3.1.3. Effects of microwave absorber loadingComparison of biomass heating profiles with increase in carbon
loading showed no significant effects on heating rate. However, thefinal pyrolysis temperature reached in biomass solids withincreased carbon loading maintains much higher temperature.The final TUBL and TMBL reached 298 �C and 304 �C at 35 wt%(Fig. 3, Run 1), which increases to 505 �C and 474 �C at 55 wt%(Fig. 3, Run 15), whereas it maintains 327 �C and 320 �C at35 wt% (Fig. 3, Run 3), which changes to 494 �C and 622 �C at75 wt% (Fig. 3, Run 17), respectively. Similar increase in finalpyrolysis temperature can be observed by comparing Run 2 with16, Run 4 with 18, and Run 7–12 with 20.
It is also important to note that the microwave absorber loadingeffects carbon layer thickness. The carbon layer thickness variedfrom 0.002 m, 0.004 m, 0.006 m and 0.0073 m using 35 wt%,55 wt%, 75 wt% and 91.2 wt% carbon loading, respectively. Thetotal sample thickness was measured 0.0520 m and 0.0573 m at35 wt% and 91.2 wt% carbon loading, respectively. At fairly low car-bon loading of 18.8 wt%, the upper biomass solids temperaturevaried unevenly (Fig. 2, Run 9). This non-uniform heating behaviorof biomass solids can be associated to insufficient carbon loading,which lacked to fully cover the supported biomass solids. This par-tially covered biomass solids produced several micro-plasmas fromsurface carbons, which raised the maximum TUBL to 1349 �C.Several other researchers reported significant increase in maxi-mum pyrolysis temperature when solid microwave absorbers wereused during microwave pyrolysis of; sewage sludge (Menéndezet al., 2002), OPS biomass (Salema and Ani, 2011), empty fruitbunch pellets (Salema and Ani, 2012b) and shale oil (El harfiet al., 2000). In the present study, micro-plasma formation wasobserved more frequently near the surface carbon solids than
Please cite this article in press as: Mushtaq, F., et al. Optimization and charactshell waste biomass with microwave absorber. Bioresour. Technol. (2015), htt
inside carbons at 450 W and above. This might be the result ofstrong coupling of carbon absorber with higher microwave power.Limited or essentially no plasma formation was observed, whenthe pyrolysis sample was irritated at 180 W and 300 W.
3.2. Response surface methodology
Statistical response surface methodology provides rapid andreliable method of analyzing process conditions and interactioneffects. The design of experiment at various levels with twentyexperiments is given in Table 1. The level and range of process vari-ables are based on the information gathered using the engineeringdesign of microwave pyrolysis experimental setup. Furthermore,MMW oven shows limitation in selecting the star high and starlow microwave power.
3.2.1. Model analysisThe bio-oil yield response (Y1) was tested for CAC loading (x1),
microwave power (x2) and N2 flow rate (x3). The observed responseis given in Table 1. The second order polynomial model for thebio-oil yield is given in Eq. (5).
Y1 ¼ 50:60769� 0:56263x1 � 0:08269x2 þ 5:69065x3
þ 0:00228x21 þ 0:00003x2
2 � 0:69831x23 þ 0:00079x1x2
� 0:00531x1x3 þ 0:00282x2x3 ð6Þ
The observed and predicted value for bio-oil yield is displayedin Fig. 4. The graph demonstrates that the observed and predictedvalues are close to each other. The coefficient of determination (R2)for bio-oil yield is 0.89017 indicating that 89.017% of variability indata is accounted to the model described in Eq. (5). It also indicatesthat only 10.983% variation in data for bio-oil yield was notaccounted by the model components.
The analysis of variance (ANOVA) shown in Table 2 indicatesthat the observed model for bio-oil yield gives good prediction at95% confident level. For the bio-oil yield model, Fvalue is higher thanF0.05 rejecting the null hypothesis. The student’s t-distribution andp-values of the model factors are shown in Table 3. The significanceof each model coefficient can be analyzed by comparing smaller p-value of 6 0.05 or greater t-value. The largest effects on bio-oilyield is from linear and quadratic terms of N2 flow rate with high-est t-values (�5.60711, �5.0994) and lowest p-values (0.000225,0.000464) at 99.98% and 99.95% significance levels, respectively.The interaction term CAC loading and microwave power (x1x2)can also be regarded as significant factor on bio-oil yield at98.32% significant level.
erization of bio-oil produced by microwave assisted pyrolysis of oil palmp://dx.doi.org/10.1016/j.biortech.2015.02.055
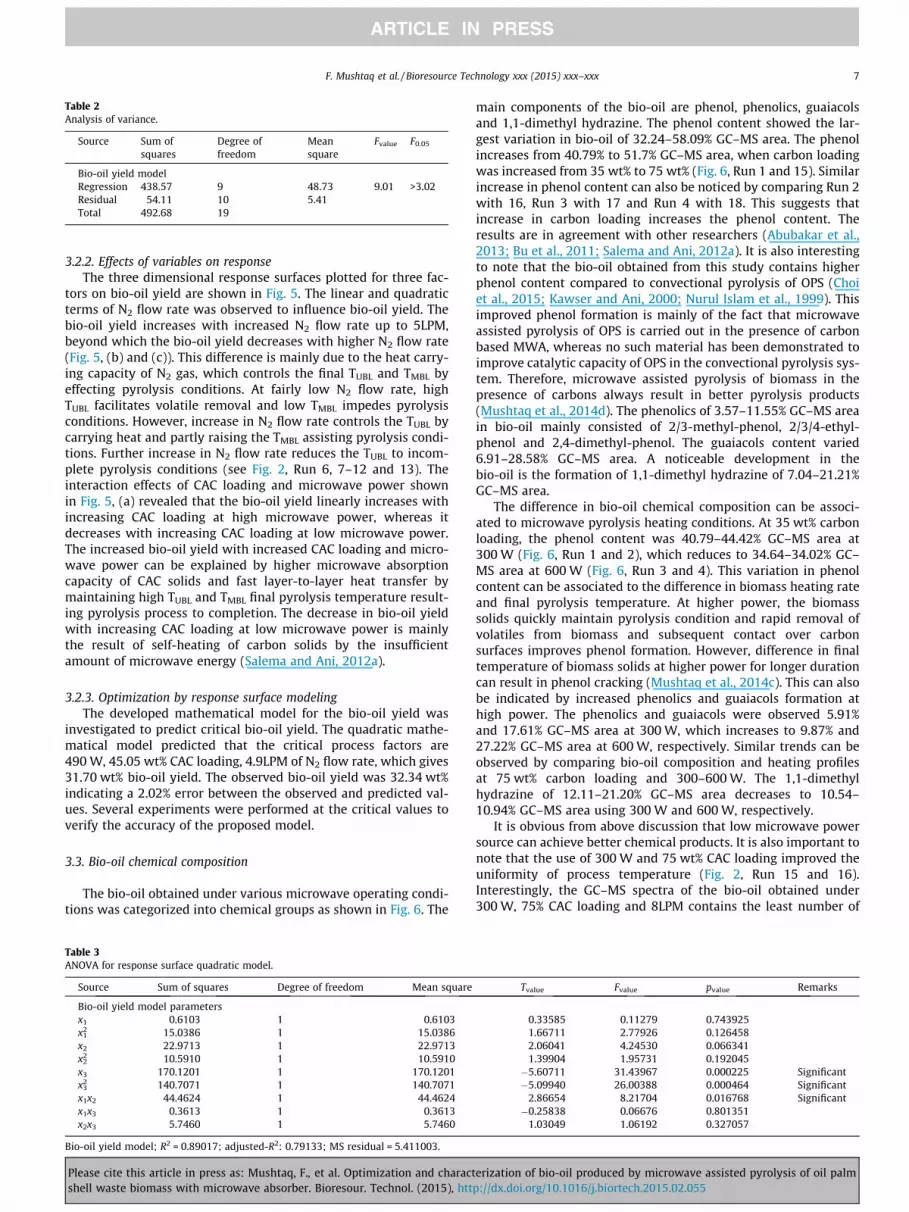
Table 2Analysis of variance.
Source Sum ofsquares
Degree offreedom
Meansquare
Fvalue F0.05
Bio-oil yield modelRegression 438.57 9 48.73 9.01 >3.02Residual 54.11 10 5.41Total 492.68 19
F. Mushtaq et al. / Bioresource Technology xxx (2015) xxx–xxx 7
3.2.2. Effects of variables on responseThe three dimensional response surfaces plotted for three fac-
tors on bio-oil yield are shown in Fig. 5. The linear and quadraticterms of N2 flow rate was observed to influence bio-oil yield. Thebio-oil yield increases with increased N2 flow rate up to 5LPM,beyond which the bio-oil yield decreases with higher N2 flow rate(Fig. 5, (b) and (c)). This difference is mainly due to the heat carry-ing capacity of N2 gas, which controls the final TUBL and TMBL byeffecting pyrolysis conditions. At fairly low N2 flow rate, highTUBL facilitates volatile removal and low TMBL impedes pyrolysisconditions. However, increase in N2 flow rate controls the TUBL bycarrying heat and partly raising the TMBL assisting pyrolysis condi-tions. Further increase in N2 flow rate reduces the TUBL to incom-plete pyrolysis conditions (see Fig. 2, Run 6, 7–12 and 13). Theinteraction effects of CAC loading and microwave power shownin Fig. 5, (a) revealed that the bio-oil yield linearly increases withincreasing CAC loading at high microwave power, whereas itdecreases with increasing CAC loading at low microwave power.The increased bio-oil yield with increased CAC loading and micro-wave power can be explained by higher microwave absorptioncapacity of CAC solids and fast layer-to-layer heat transfer bymaintaining high TUBL and TMBL final pyrolysis temperature result-ing pyrolysis process to completion. The decrease in bio-oil yieldwith increasing CAC loading at low microwave power is mainlythe result of self-heating of carbon solids by the insufficientamount of microwave energy (Salema and Ani, 2012a).
3.2.3. Optimization by response surface modelingThe developed mathematical model for the bio-oil yield was
investigated to predict critical bio-oil yield. The quadratic mathe-matical model predicted that the critical process factors are490 W, 45.05 wt% CAC loading, 4.9LPM of N2 flow rate, which gives31.70 wt% bio-oil yield. The observed bio-oil yield was 32.34 wt%indicating a 2.02% error between the observed and predicted val-ues. Several experiments were performed at the critical values toverify the accuracy of the proposed model.
3.3. Bio-oil chemical composition
The bio-oil obtained under various microwave operating condi-tions was categorized into chemical groups as shown in Fig. 6. The
Table 3ANOVA for response surface quadratic model.
Source Sum of squares Degree of freedom Mean square
Bio-oil yield model parametersx1 0.6103 1 0.6103x1
2 15.0386 1 15.0386x2 22.9713 1 22.9713x2
2 10.5910 1 10.5910x3 170.1201 1 170.1201x3
2 140.7071 1 140.7071x1x2 44.4624 1 44.4624x1x3 0.3613 1 0.3613x2x3 5.7460 1 5.7460
Bio-oil yield model; R2 = 0.89017; adjusted-R2: 0.79133; MS residual = 5.411003.
Please cite this article in press as: Mushtaq, F., et al. Optimization and charactshell waste biomass with microwave absorber. Bioresour. Technol. (2015), htt
main components of the bio-oil are phenol, phenolics, guaiacolsand 1,1-dimethyl hydrazine. The phenol content showed the lar-gest variation in bio-oil of 32.24–58.09% GC–MS area. The phenolincreases from 40.79% to 51.7% GC–MS area, when carbon loadingwas increased from 35 wt% to 75 wt% (Fig. 6, Run 1 and 15). Similarincrease in phenol content can also be noticed by comparing Run 2with 16, Run 3 with 17 and Run 4 with 18. This suggests thatincrease in carbon loading increases the phenol content. Theresults are in agreement with other researchers (Abubakar et al.,2013; Bu et al., 2011; Salema and Ani, 2012a). It is also interestingto note that the bio-oil obtained from this study contains higherphenol content compared to convectional pyrolysis of OPS (Choiet al., 2015; Kawser and Ani, 2000; Nurul Islam et al., 1999). Thisimproved phenol formation is mainly of the fact that microwaveassisted pyrolysis of OPS is carried out in the presence of carbonbased MWA, whereas no such material has been demonstrated toimprove catalytic capacity of OPS in the convectional pyrolysis sys-tem. Therefore, microwave assisted pyrolysis of biomass in thepresence of carbons always result in better pyrolysis products(Mushtaq et al., 2014d). The phenolics of 3.57–11.55% GC–MS areain bio-oil mainly consisted of 2/3-methyl-phenol, 2/3/4-ethyl-phenol and 2,4-dimethyl-phenol. The guaiacols content varied6.91–28.58% GC–MS area. A noticeable development in thebio-oil is the formation of 1,1-dimethyl hydrazine of 7.04–21.21%GC–MS area.
The difference in bio-oil chemical composition can be associ-ated to microwave pyrolysis heating conditions. At 35 wt% carbonloading, the phenol content was 40.79–44.42% GC–MS area at300 W (Fig. 6, Run 1 and 2), which reduces to 34.64–34.02% GC–MS area at 600 W (Fig. 6, Run 3 and 4). This variation in phenolcontent can be associated to the difference in biomass heating rateand final pyrolysis temperature. At higher power, the biomasssolids quickly maintain pyrolysis condition and rapid removal ofvolatiles from biomass and subsequent contact over carbonsurfaces improves phenol formation. However, difference in finaltemperature of biomass solids at higher power for longer durationcan result in phenol cracking (Mushtaq et al., 2014c). This can alsobe indicated by increased phenolics and guaiacols formation athigh power. The phenolics and guaiacols were observed 5.91%and 17.61% GC–MS area at 300 W, which increases to 9.87% and27.22% GC–MS area at 600 W, respectively. Similar trends can beobserved by comparing bio-oil composition and heating profilesat 75 wt% carbon loading and 300–600 W. The 1,1-dimethylhydrazine of 12.11–21.20% GC–MS area decreases to 10.54–10.94% GC–MS area using 300 W and 600 W, respectively.
It is obvious from above discussion that low microwave powersource can achieve better chemical products. It is also important tonote that the use of 300 W and 75 wt% CAC loading improved theuniformity of process temperature (Fig. 2, Run 15 and 16).Interestingly, the GC–MS spectra of the bio-oil obtained under300 W, 75% CAC loading and 8LPM contains the least number of
Tvalue Fvalue pvalue Remarks
0.33585 0.11279 0.7439251.66711 2.77926 0.1264582.06041 4.24530 0.0663411.39904 1.95731 0.192045�5.60711 31.43967 0.000225 Significant�5.09940 26.00388 0.000464 Significant
2.86654 8.21704 0.016768 Significant�0.25838 0.06676 0.801351
1.03049 1.06192 0.327057
erization of bio-oil produced by microwave assisted pyrolysis of oil palmp://dx.doi.org/10.1016/j.biortech.2015.02.055
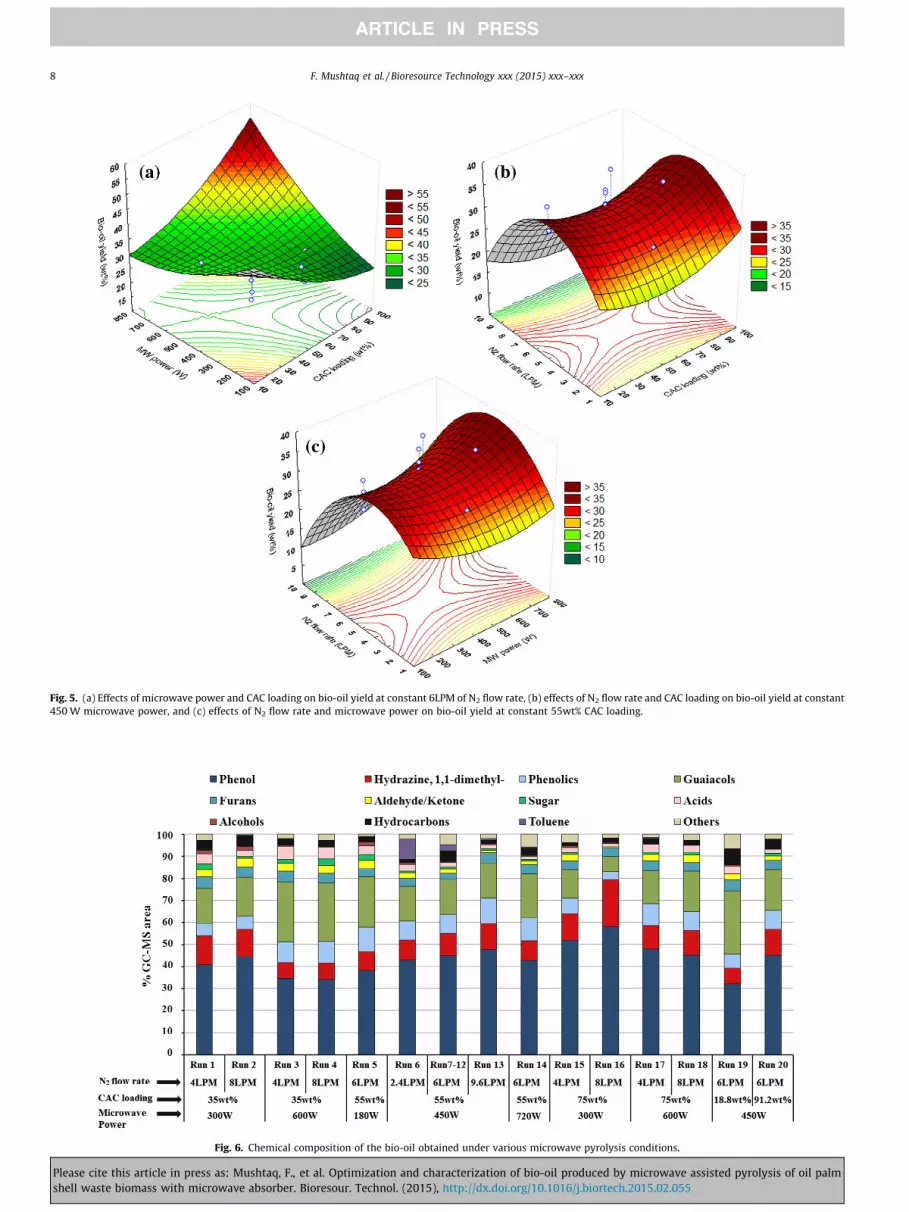
Fig. 5. (a) Effects of microwave power and CAC loading on bio-oil yield at constant 6LPM of N2 flow rate, (b) effects of N2 flow rate and CAC loading on bio-oil yield at constant450 W microwave power, and (c) effects of N2 flow rate and microwave power on bio-oil yield at constant 55wt% CAC loading.
Fig. 6. Chemical composition of the bio-oil obtained under various microwave pyrolysis conditions.
8 F. Mushtaq et al. / Bioresource Technology xxx (2015) xxx–xxx
Please cite this article in press as: Mushtaq, F., et al. Optimization and characterization of bio-oil produced by microwave assisted pyrolysis of oil palmshell waste biomass with microwave absorber. Bioresour. Technol. (2015), http://dx.doi.org/10.1016/j.biortech.2015.02.055

F. Mushtaq et al. / Bioresource Technology xxx (2015) xxx–xxx 9
peaks. The bio-oil under these conditions was found enriched intwo pure chemical compounds of phenol and 1,1-dimethyl hydra-zine of 58.09% and 21.20% GC–MS area, respectively. At this stage,it is therefore suggested that the complete uniformity of micro-wave heating process involving biomass and carbon absorber isessential to improve bio-oil selectivity. The cumulative area of phe-nol and 1,1-dimethyl hydrazine in the bio-oil varied 39.40–79.30%GC–MS area, respectively. However, most bio-oil contains morethan 50% GC–MS area suggesting potential use as alternative fuels.
4. Conclusions
This study investigated the microwave assisted pyrolysis of oilpalm shell with uniformly distributed coconut activated carbonunder various operating conditions. The results showed that N2
atmosphere control the biomass solids temperature, microwavepower influenced the biomass heating rate and coconut activatedcarbon loading raised final pyrolysis temperature. The layer-to-layer method achieved nearly complete uniformity of process tem-perature at high microwave absorber loading. The bio-oil wasfound rich in phenol and 1,1-dimethyl hydrazine. The presence ofcarbon absorber with biomass in microwave pyrolysis systemdemonstrates improved process heating, bio-oil yield and productselectivity. However, there is strong need to explore more conven-tional and non-conventional surface modified carbonaceous micro-wave absorbers to improve bio-oil selectivity. Moreover, uniformprocess heating of biomass solids with absorber medium wasfound essential to improve biomass conversion and selectivity.The addition of absorber to biomass solids is supposed to influencemicrowave penetration depth, which in turn limits bulk heatingand process scale up. Therefore, optimum bed thickness of hetero-geneous solids needs to be evaluated during preliminary stagesdue to the non-availability of sufficient penetration data of bio-mass with absorber medium. In addition, hotpots formation inmicrowave heating process involving carbons causes a number ofserious problems. However, uniform distribution of carbons withpyrolysis material can minimize hotspots activity, which canimprove biomass conversion and bio-oil chemical profile. Theeffects of increasing number of carbon surfaces with biomass onuniform process heating, product yield and its composition is thesubject of our on-going research.
Acknowledgements
Authors gratefully acknowledge the support of Ministry ofHigher Education Malaysia and Universiti Teknologi Malaysia forthe award of UTM-Research University Grant Q.J.130000.2524.01H03 and Q.J.130000.2544.04H68.
References
Abubakar, Z., Salema, A.A., Ani, F.N., 2013. A new technique to pyrolyse biomass in amicrowave system: effect of stirrer speed. Bioresour. Technol. 128, 578–585.
BP. Statistical review of world energy, 2013 (cited 10th Sept. 2013). Available from:<http://www.bp.com/en/global/corporate/about-bp/statistical-review-of-world-energy-2013.html>.
Bu, Q., Lei, H., Ren, S., Wang, L., Holladay, J., Zhang, Q., Tang, J., Ruan, R., 2011. Phenoland phenolics from lignocellulosic biomass by catalytic microwave pyrolysis.Bioresour. Technol. 102 (13), 7004–7007.
Bu, Q., Lei, H., Ren, S., Wang, L., Zhang, Q., Tang, J., Ruan, R., 2012. Production ofphenols and biofuels by catalytic microwave pyrolysis of lignocellulosicbiomass. Bioresour. Technol. 108, 274–279.
Please cite this article in press as: Mushtaq, F., et al. Optimization and charactshell waste biomass with microwave absorber. Bioresour. Technol. (2015), htt
Bu, Q., Lei, H., Wang, L., Wei, Y., Zhu, L., Liu, Y., Liang, J., Tang, J., 2013. Renewablephenols production by catalytic microwave pyrolysis of Douglas fir sawdustpellets with activated carbon catalysts. Bioresour. Technol. 142, 546–552.
Choi, G.-G., Oh, S.-J., Lee, S.-J., Kim, J.-S., 2015. Production of bio-based phenolic resinand activated carbon from bio-oil and biochar derived from fast pyrolysis ofpalm kernel shells. Bioresour. Technol. 178, 99–107.
Dominguez, A., Menéndez, J., Fernandez, Y., Pis, J., Nabais, J., Carrott, P., Carrott, M.,2007. Conventional and microwave induced pyrolysis of coffee hulls for theproduction of a hydrogen rich fuel gas. J. Anal. Appl. Pyrol. 79 (1), 128–135.
El harfi, K., Mokhlisse, A., Chanâa, M.B., Outzourhit, A., 2000. Pyrolysis of theMoroccan (Tarfaya) oil shales under microwave irradiation. Fuel 79 (7), 733–742.
Fernández, Y., Menéndez, J., 2011. Influence of feed characteristics on themicrowave-assisted pyrolysis used to produce syngas from biomass wastes. J.Anal. Appl. Pyrol. 91 (2), 316–322.
GGS, 2011. Global Green Synergy Sdn Bhd: Products (cited 7th Sept. 2012).Available from: <http://www.ggs.my/index.php/palm-biomass>.
Huang, Y.F., Kuan, W.H., Chang, C.C., Tzou, Y.M., 2013. Catalytic and atmosphericeffects on microwave pyrolysis of corn stover. Bioresour. Technol. 131, 274–280.
IEA, 2015. Statistics (cited 16th Jan. 2015). Available from: <http://www.iea.org/statistics/statisticssearch/>.
Kappe, C.O., 2013. How to measure reaction temperature in microwave-heatedtransformations. Chem. Soc. Rev. 42 (12), 4977–4990.
Kawser, M.D., Ani, F.N., 2000. Oil palm shell as a source of phenol. J. Oil Palm Res. 12,86–94.
Liu, X., Quan, X., Bo, L., Chen, S., Zhao, Y., Chang, M., 2004. Temperaturemeasurement of GAC and decomposition of PCP loaded on GAC and GAC-supported copper catalyst in microwave irradiation. Appl. Catal. A 264 (1), 53–58.
Luque, R., Menéndez, J.A., Arenillas, A., Cot, J., 2012. Microwave-assisted pyrolysis ofbiomass feedstocks: the way forward? Energy Environ. Sci. 5 (2), 5481–5488.
Menéndez, J., Menéndez, E., Garcia, A., Parra, J., Pis, J., 1999. Thermal treatment ofactive carbons: a comparison between microwave and electrical heating. J.Microwave Power Electromagn. Energy 34 (3), 137–143.
Menéndez, J.A., Arenillas, A., Fidalgo, B., Fernández, Y., Zubizarreta, L., Calvo, E.G.,Bermúdez, J.M., 2010. Microwave heating processes involving carbon materials.Fuel Process. Technol. 91 (1), 1–8.
Menéndez, J.A., Inguanzo, M., Pis, J.J., 2002. Microwave-induced pyrolysis of sewagesludge. Water Res. 36 (13), 3261–3264.
MPOB, 2013. Malaysian Palm Oil Industry. Washington, DC (cited 23rd Oct. 2013).Available from: <http://www.palmoilworld.org/about_malaysian-industry.html>.
MTIB, 2012. Malaysian Timber Statistics 2009–2011. Malaysian Timber IndustryBoard.
Mushtaq, F., Channa, A.S., Mat, R., Ani, F.N. 2014a. Microwave Assisted Pyrolysis ofWaste Biomass Resources for Bio-Oil Production. Applied Mechanics andMaterials. Trans Tech Publ. pp. 307–311.
Mushtaq, F., Maqbool, W., Mat, R., Ani, F.N., 2013. Fossil fuel energy scenario inMalaysia-prospect of indigenous renewable biomass and coal resources. CleanEnergy and Technology (CEAT), 2013 IEEE Conference on. IEEE. pp. 232–237.
Mushtaq, F., Mat, R., Ani, F.N., 2014b. The Performances of Intimately Mix and LayerMethods in Microwave Assisted Pyrolysis System. Applied Mechanics andMaterials. Trans Tech Publ. pp. 150–154.
Mushtaq, F., Mat, R., Ani, F.N., 2014c. Pyrolysis of Solid Palm Waste Biomass withMicrowave Absorber under Microwave Irradiation. Applied Mechanics andMaterials. Trans Tech Publ. pp. 73–77.
Mushtaq, F., Mat, R., Ani, F.N., 2014d. A review on microwave assisted pyrolysis ofcoal and biomass for fuel production. Renew. Sustain. Energy Rev. 39, 555–574.
NEB, 2012. National Energy balance. Suruhanjaya Tenaga Energy Comission,Malaysia.
Nurul Islam, M., Zailani, R., Nasir Ani, F., 1999. Pyrolytic oil from fluidised bedpyrolysis of oil palm shell and its characterisation. Renewable Energy 17 (1),73–84.
Ong, H., Mahlia, T., Masjuki, H., 2011. A review on energy scenario and sustainableenergy in Malaysia. Renew. Sustain. Energy Rev. 15 (1), 639–647.
Salema, A.A., Ani, F.N., 2012a. Microwave-assisted pyrolysis of oil palm shellbiomass using an overhead stirrer. J. Anal. Appl. Pyrol. 96, 162–172.
Salema, A.A., Ani, F.N., 2011. Microwave induced pyrolysis of oil palm biomass.Bioresour. Technol. 102 (3), 3388–3395.
Salema, A.A., Ani, F.N., 2012b. Pyrolysis of oil palm empty fruit bunch biomasspellets using multimode microwave irradiation. Bioresour. Technol. 125, 102–107.
Shuttleworth, P., Budarin, V., Gronnow, M., Clark, J.H., Luque, R., 2012. Lowtemperature microwave-assisted vs conventional pyrolysis of various biomassfeedstocks. J. Nat. Gas Chem. 21 (3), 270–274.
Wang, X., Morrison, W., Du, Z., Wan, Y., Lin, X., Chen, P., Ruan, R., 2012. Biomasstemperature profile development and its implications under the microwave-assisted pyrolysis condition. Appl. Energy 99, 386–392.
erization of bio-oil produced by microwave assisted pyrolysis of oil palmp://dx.doi.org/10.1016/j.biortech.2015.02.055


