Embed Size (px)
Citation preview
ANNUAL REPORT 2016-17
OPTIMISING STRONG GROWTH AND STABILITY


TABLE OFCONTENTS
CORPORATE REVIEW06 Our Enterprise08 Measures of Success10 Our Path11 Our Values12 Board of Directors
STRATEGIC REVIEW18 Chairman’s Letter20 Executive President’s Letter24 Business Review
MANAGEMENT DISCUSSION AND ANALYSIS28 Max Financial Services30 Max Life44 Business Responsibility Review
52 CORPORATE GOVERNANCE REPORT
64 GENERAL SHAREHOLDER INFORMATION
69 FINANCIAL REVIEW Max Financial Services - Standalone Max Financial Services - Consolidated

4
5
CORPORATEREVIEWOUR ENTERPRISEMEASURES OF SUCCESSOUR PATHOUR VALUESBOARD OF DIRECTORS
6
OURENTERPRISE
Max Financial Services owns and actively manages a majority stake in Max Life Insurance Company Limited, making it India’s first listed company focused exclusively on life insurance. Max Life is a joint venture with Mitsui Sumitomo Insurance (MSI), a Japan headquartered global leader in life insurance.
Corporate Review
Launched in 2000, Max Life offers comprehensive long term savings, protection and retirement solutions through its high quality agency distribution and multi-channel distribution partners. It is India’s largest non-bank private life insurer, with revenues of ` 12,937 crore and a customer base of 3.9 million across 210 offices in 143 cities in India.

7
Max Ventures & Industries (MaxVIL) is the holding company of Max Speciality Films and serves as the Group’s entrepreneurial arm to explore the ‘wider world of business’, especially taking cues from the economic and commercial reforms agenda of the present Government, including ‘Make in India’, ‘Skill India’, ‘Digital India’, among others.
Launched in 1988, Max Speciality Films is a subsidiary of MaxVIL, based in Railmajra, Punjab. It is a leading manufacturer of speciality packaging films, with revenues of ` 666 crore.
Max Estates will leverage the Max Group’s in-house experience in activities aligned with Real Estate and its access to the sponsor’s private and Group land bank. The Company has already commenced work on its maiden project in Dehradun.
Max I. LimitedMax I. Ltd, a wholly owned subsidiary, will provide intellectual and financial capital to early-stage organizations, with sound business models and proven revenue stream, across identified sectors.
Max LearningMaxVIL’s Education vertical recognises the gap in provision of quality education and views this as a genuine opportunity not merely in terms of business but also in terms of making a significant positive social impact.
Launched in 2008, Max India Foundation (MIF) represents the Max Group’s social responsibility aspirations. The Foundation’s work is focussed on healthcare for the underprivileged and has benefitted over 28,00,000 people in over 730 locations since its inception.
Max India Limited, a multi-business corporate, owns and actively manages a 45.95% stake in Max Healthcare, a 51% stake in Max Bupa Health Insurance and a 100% stake in Antara Senior Living.
Launched in 2000, Max Healthcare is an equal JV partnership between Max India and Life Healthcare, South Africa. It is a leading provider of standardised, seamless and world-class healthcare services, focused on tertiary and quaternary care. Max Healthcare has revenues of ` 2,567 crore from over 2,500 beds across 14 hospitals.
Launched in 2008, Max Bupa is a 51:49 JV with Bupa Finance Plc., UK. It is one of India’s leading standalone health insurance companies with Gross Written Premium (GWP) of ` 594 crore, about 17,000 agents and tie-ups with over 3,600 quality hospitals across over 350 cities in India.
Launched in 2013, Antara is a 100% subsidiary of Max India. It is pioneering the concept of ‘Age in Place’ for people over 55, by developing Senior Living communities in India. The first Antara community was launched in April 2017 near Dehradun, Uttarakhand.

8
MEASURES OF SUCCESS
Corporate Review
# Excludes Max Life Unit Investment Income* As at 31st March, 2017
Consolidated Revenues: ` 12,971 Cr.#, grew 19% Consolidated PBT:
` 702 Cr., grew 51%
Max Life Embedded Value (MCEV): ` 6,590 Cr*; operating RoEV 20%
Max Life Value of New Business: ` 499 Cr., grew 29% and New Business Margin of 18.8%
Max Life Assets Under Management*:
` 44,370 Cr., grew 24%
9
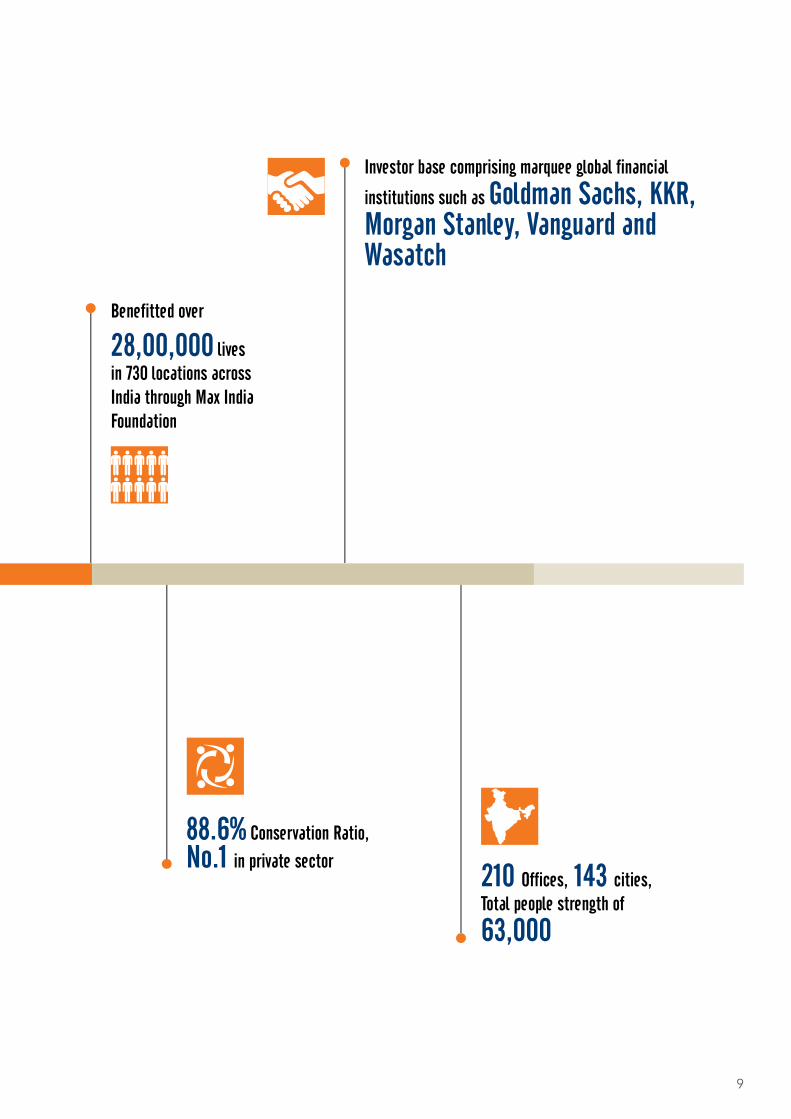
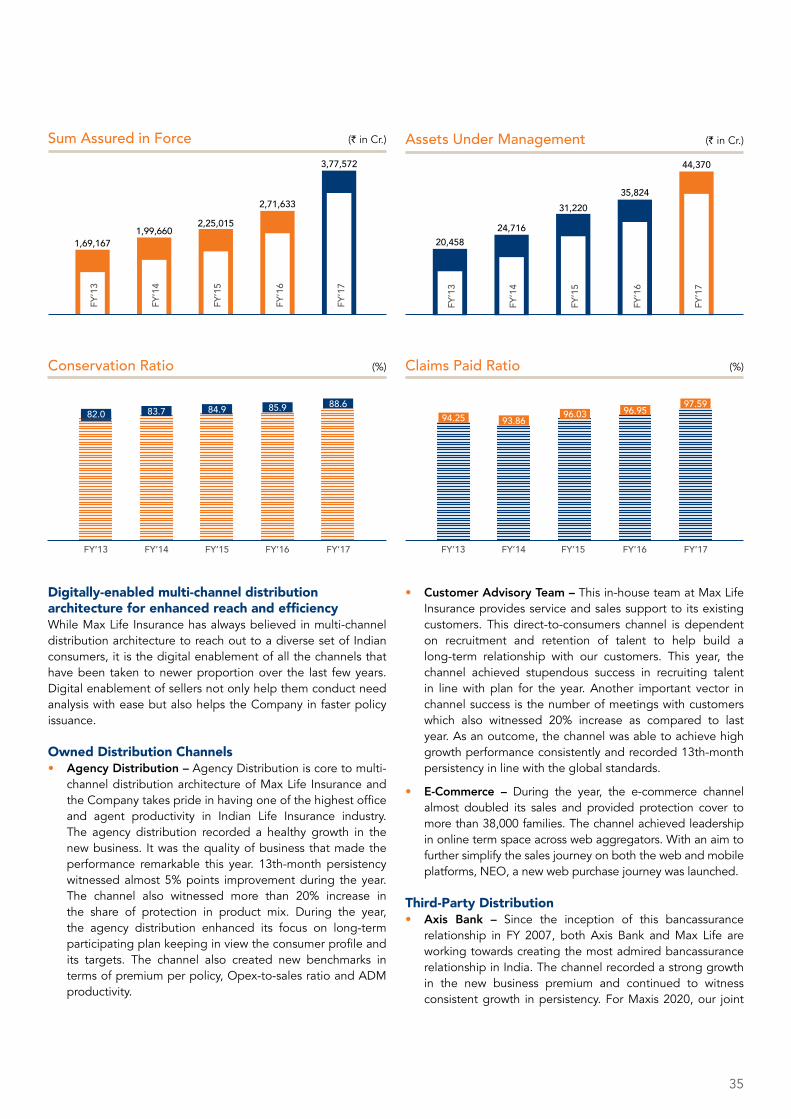
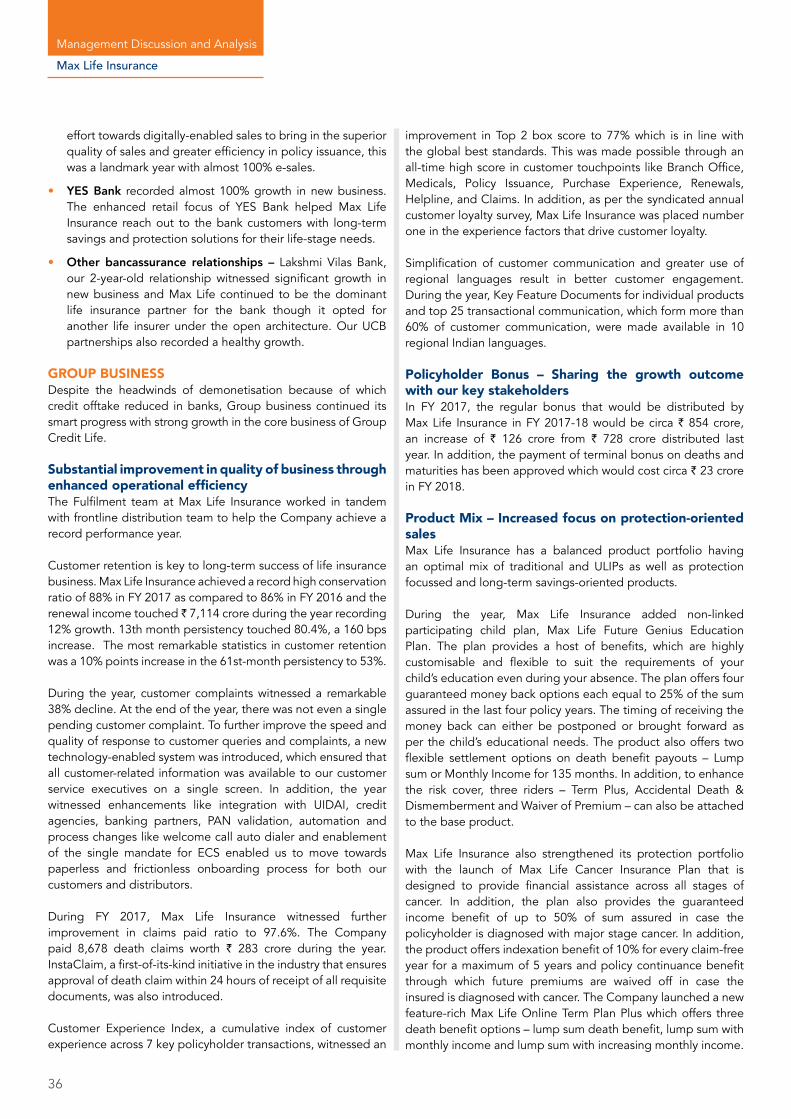
88.6% Conservation Ratio, No.1 in private sector
210 Offices, 143 cities, Total people strength of
63,000
Investor base comprising marquee global financial
institutions such as Goldman Sachs, KKR, Morgan Stanley, Vanguard and Wasatch
Benefitted over
28,00,000 lives in 730 locations across India through Max India Foundation

10
OURPATH
Our Vision Our MissionTo be the most admired company for protecting and enhancing the financial future of its customers
• Be the most preferred category choice for customers, policy holders, shareholders and employees
• Do what is right for our customers, and treat them fairly
• Lead the market in quality and reputation
• Be the go-to standard for partnerships and alliances with all distributors and partners
• Maintain cutting edge standards of governance
Corporate Review

11
OURVALUES
Sevabhav
Excellence
Credibility
We encourage a culture of service and helpfulness so that our actions positively impact society. Our commitment to Seva defines and differentiates us.
We gather the experts and the expertise to deliver the best solutions for life’s many moments of truth. We never settle for good enough.
We give you our word. And we stand by it. No matter what. A ‘No’ uttered with the deepest conviction is better than a ‘Yes’ merely uttered to please, or worse, to avoid trouble. Our words are matched by our actions and behaviour.
12
Corporate Review
BOARD OF DIRECTORS
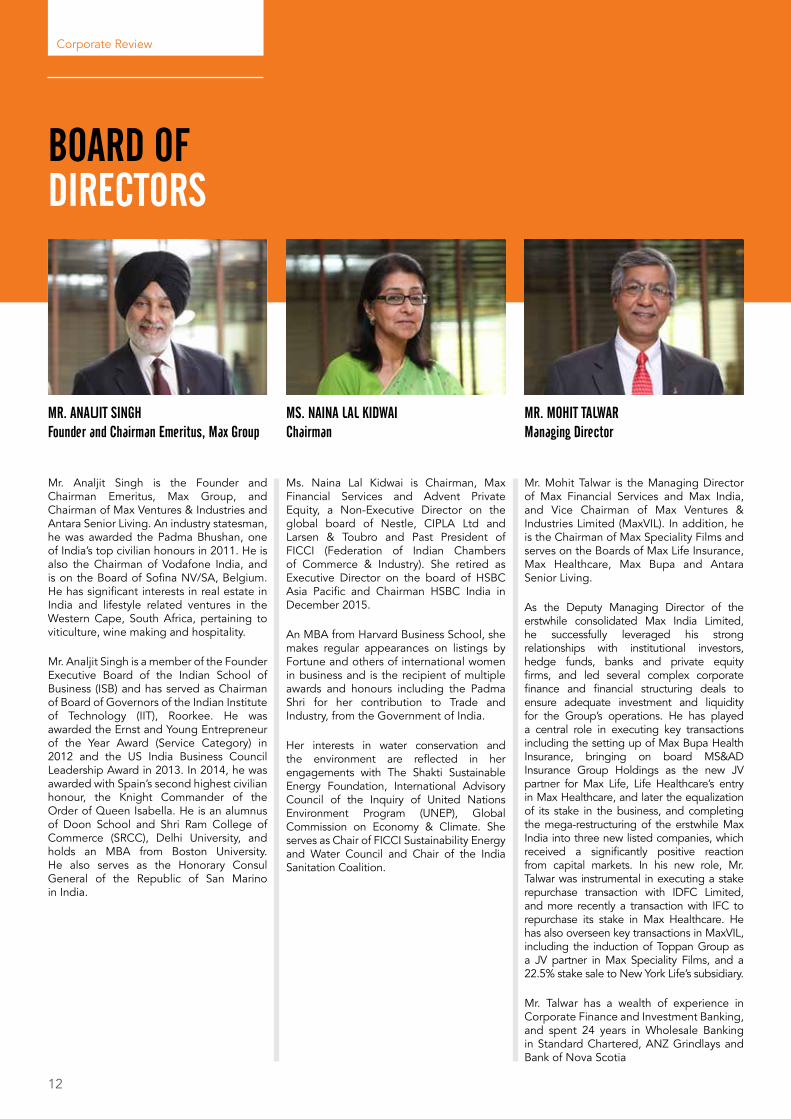
MR. ANALjIT SINGHFounder and Chairman Emeritus, Max Group
MS. NAINA LAL KIDWAIChairman
MR. MOHIT TALWARManaging Director
Mr. Analjit Singh is the Founder and Chairman Emeritus, Max Group, and Chairman of Max Ventures & Industries and Antara Senior Living. An industry statesman, he was awarded the Padma Bhushan, one of India’s top civilian honours in 2011. He is also the Chairman of Vodafone India, and is on the Board of Sofina NV/SA, Belgium. He has significant interests in real estate in India and lifestyle related ventures in the Western Cape, South Africa, pertaining to viticulture, wine making and hospitality.
Mr. Analjit Singh is a member of the Founder Executive Board of the Indian School of Business (ISB) and has served as Chairman of Board of Governors of the Indian Institute of Technology (IIT), Roorkee. He was awarded the Ernst and Young Entrepreneur of the Year Award (Service Category) in 2012 and the US India Business Council Leadership Award in 2013. In 2014, he was awarded with Spain’s second highest civilian honour, the Knight Commander of the Order of Queen Isabella. He is an alumnus of Doon School and Shri Ram College of Commerce (SRCC), Delhi University, and holds an MBA from Boston University. He also serves as the Honorary Consul General of the Republic of San Marino in India.
Ms. Naina Lal Kidwai is Chairman, Max Financial Services and Advent Private Equity, a Non-Executive Director on the global board of Nestle, CIPLA Ltd and Larsen & Toubro and Past President of FICCI (Federation of Indian Chambers of Commerce & Industry). She retired as Executive Director on the board of HSBC Asia Pacific and Chairman HSBC India in December 2015.
An MBA from Harvard Business School, she makes regular appearances on listings by Fortune and others of international women in business and is the recipient of multiple awards and honours including the Padma Shri for her contribution to Trade and Industry, from the Government of India.
Her interests in water conservation and the environment are reflected in her engagements with The Shakti Sustainable Energy Foundation, International Advisory Council of the Inquiry of United Nations Environment Program (UNEP), Global Commission on Economy & Climate. She serves as Chair of FICCI Sustainability Energy and Water Council and Chair of the India Sanitation Coalition.
Mr. Mohit Talwar is the Managing Director of Max Financial Services and Max India, and Vice Chairman of Max Ventures & Industries Limited (MaxVIL). In addition, he is the Chairman of Max Speciality Films and serves on the Boards of Max Life Insurance, Max Healthcare, Max Bupa and Antara Senior Living.
As the Deputy Managing Director of the erstwhile consolidated Max India Limited, he successfully leveraged his strong relationships with institutional investors, hedge funds, banks and private equity firms, and led several complex corporate finance and financial structuring deals to ensure adequate investment and liquidity for the Group’s operations. He has played a central role in executing key transactions including the setting up of Max Bupa Health Insurance, bringing on board MS&AD Insurance Group Holdings as the new JV partner for Max Life, Life Healthcare’s entry in Max Healthcare, and later the equalization of its stake in the business, and completing the mega-restructuring of the erstwhile Max India into three new listed companies, which received a significantly positive reaction from capital markets. In his new role, Mr. Talwar was instrumental in executing a stake repurchase transaction with IDFC Limited, and more recently a transaction with IFC to repurchase its stake in Max Healthcare. He has also overseen key transactions in MaxVIL, including the induction of Toppan Group as a JV partner in Max Speciality Films, and a 22.5% stake sale to New York Life’s subsidiary.
Mr. Talwar has a wealth of experience in Corporate Finance and Investment Banking, and spent 24 years in Wholesale Banking in Standard Chartered, ANZ Grindlays and Bank of Nova Scotia
13
MR. AMAN MEHTAIndependent Director
MR. ASHWANI WINDLASSNon-Executive Director
MR. D.K. MITTALIndependent Director
Mr. Aman Mehta retired as CEO of HSBC Asia Pacific in January 2004, after a global career of 35 years, and returned to India on permanent resettlement. He serves as an Independent, Non-Executive Director on the boards of numerous public companies and institutions in India as well as overseas.
Mr. Ashwani Windlass was part of the founding team at the erstwhile Max India, having served the Max Group in different capacities including as its Joint MD as well as MD, Hutchison Max Telecom from 1994 until 1998. He has continued as a Board member of the Company ever since. He has been the Chairman, MGRM (Asia-Pac) and Vice Chairman, and the MD of Reliance Telecom. He serves on leading advisory and statutory Boards, including acting as Chairman SA&JVs, MGRM Inc., USA, and member at Antara Senior Living Limited, Max Ventures Pvt. Ltd., Vodafone India Ltd. and Hindustan Media Ventures Ltd. He holds degrees in B.Com (Gold Medal), Bachelor of Journalism and MBA.
Mr. D. K. Mittal is a former Indian Administrative Service (IAS) officer from the batch of 1977 and has served the Government of India in various capacities, including Secretary, Department of Financial Services, Secretary, Ministry of Corporate Affairs and Additional Secretary, Department of Commerce. Mr. Mittal has hands on experience in Infrastructure, International Trade, Urban Development, Renewable Energy, Agriculture Development and Micro-Credit, Corporate Governance, Banking, Insurance, Pension and Finance. He holds a Master’s degree in physics with specialisation in Electronics from the University of Allahabad, India.

14
Corporate Review
MR. RAjESH KHANNAIndependent Director
MR. SANjAy NAyARNon-Executive Director
Mr. Rajesh Khanna is the founder and CEO of Arka Capital Advisors Pvt. Ltd, and is an investor in various companies. He is a Director of Max Life Insurance Company Limited. Mr. Khanna is a member of the Equity Investment Committee of Piramal Fund Management Pvt. Ltd and is a Senior Advisor of Kae Capital. He is on the Advisory Committee of Annamrita Foundation, an NGO which serves 1.2 million meals through its 20 kitchens across India, to school children and others. Previously, he served as a Managing Director and India Head of Warburg Pincus, a global private equity firm, and was a member of its global Executive Management Group. He received a PGDM from the Indian Institute of Management, Ahmedabad and is a Chartered Accountant.
MR. RAHUL KHOSLAPermanent Invitee
Mr. Rahul Khosla is a seasoned business leader with deep management experience, broad leadership skills and wide business perspectives developed over the last 35 years of working in India and globally. He is currently President of the Max Group, and also serves as Executive President, Max Financial Services; Chairman, Max India; Chairman, Max Life Insurance; and Chairman, Max Healthcare. He also serves on the Boards of Antara Senior Living and Max Bupa Health Insurance Company.
Under his leadership, the Max Group has delivered superior financial performance, significantly grown market capitalization, and concluded seminal corporate transactions. He also led the mega-restructuring of the erstwhile Max India into three new listed entities. Before joining Max, Mr. Khosla spent 11 years based in Singapore as the Group Head of Products at Visa Inc for Asia Pacific, Central Europe, Middle East and Africa, following his role at Visa Inc as Chief Operating Officer for the Asia Pacific region. He held several senior roles prior to this – as Country Head for ANZ Grindlays’ consumer banking businesses in India; Head of Retail Assets, Strategy, Finance and Legal at Bank of America.
Mr. Rahul Khosla served as President, NatHealth, India’s leading multi-stakeholder platform for healthcare organizations in 2016, and is the President of the FICCI Committee on Health Services. In addition, he serves on the Executive Board of the Indian School of Business (ISB), one of Asia’s top B-Schools.
Mr. Sanjay Nayar (Mumbai) joined KKR in 2009 and is a Member and CEO of KKR India. He is also a member of the Asia Portfolio Management Committee and the Asia Investment Committee. He is on the board of KKR’s portfolio companies Magma Financial Services, Gland, Apollo Hospitals, and Coffee Day Holdings, Avendus Capital and Max Financial Services, and has had significant involvement with KKR’s investment in Avantha. He also supports expanding the range of KKR’s credit and capital markets offerings across the region.
Prior to joining KKR, he served as CEO of Citigroup’s Indian and South Asian operations and as a member of Citigroup’s Management Committee and Asia Executive Operating Committee. Mr. Nayar was the deputy chairman of the Indian Banks Association (IBA), a member of the board of US-India Business Council (USIBC), and co-chairman of the Banking Committee for the Federation of Indian Chambers of Commerce and Industry (FICCI) and SEBI’s Board of NISM and Alternative Investment Fund (AIF). He also served on the Committee of the Reserve Bank of India tasked with building a Centre for Advanced Financial Learning (CAFL). Currently, he is on the board of Habitat for Humanity, Pratham and Grameen Capital and ISB, and is a founding member of the Brookings Foundation, India. He was recently appointed to the Board of Emerging Markets Private Equity Association (EMPEA), and served until recently as the Chairman of the Indian Private Venture Capital Association.
Board of Directors
15
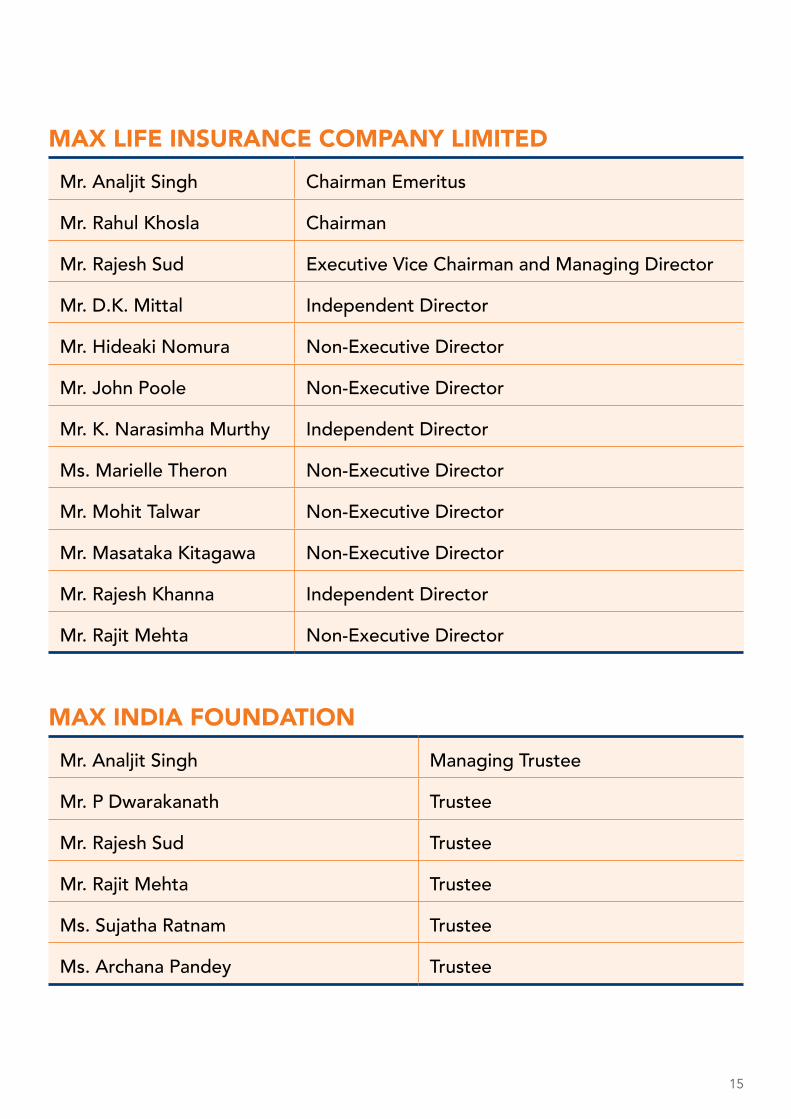
MAX LIFE INSURANCE COMPANY LIMITEDMr. Analjit Singh Chairman Emeritus
Mr. Rahul Khosla Chairman
Mr. Rajesh Sud Executive Vice Chairman and Managing Director
Mr. D.K. Mittal Independent Director
Mr. Hideaki Nomura Non-Executive Director
Mr. John Poole Non-Executive Director
Mr. K. Narasimha Murthy Independent Director
Ms. Marielle Theron Non-Executive Director
Mr. Mohit Talwar Non-Executive Director
Mr. Masataka Kitagawa Non-Executive Director
Mr. Rajesh Khanna Independent Director
Mr. Rajit Mehta Non-Executive Director
MAX INDIA FOUNDATIONMr. Analjit Singh Managing Trustee
Mr. P Dwarakanath Trustee
Mr. Rajesh Sud Trustee
Mr. Rajit Mehta Trustee
Ms. Sujatha Ratnam Trustee
Ms. Archana Pandey Trustee

16

STRATEGICREVIEWCHAIRMAN’S LETTERExECUTIVE PRESIDENT’S LETTERBUSINESS REVIEw

18
Dear Shareholders,
I am pleased to present this year’s Annual Report, which showcases one of Max Life’s best years in terms of financial performance since the Company’s inception.Your Company remains one of the only two listed companies in the country giving investors pure access to the high-growth life insurance sector.
CHAIRMAN’S
LETTER
Strategic Review
19
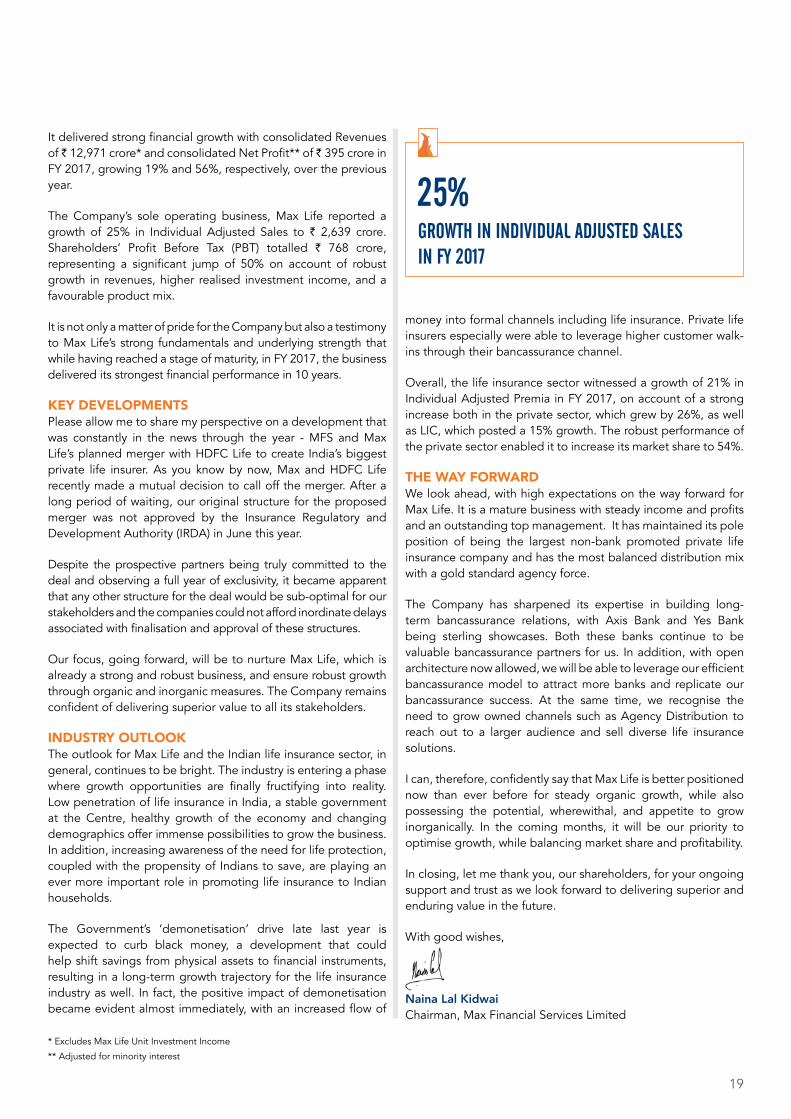
It delivered strong financial growth with consolidated Revenues of ̀ 12,971 crore* and consolidated Net Profit** of ̀ 395 crore in FY 2017, growing 19% and 56%, respectively, over the previous year.
The Company’s sole operating business, Max Life reported a growth of 25% in Individual Adjusted Sales to ` 2,639 crore. Shareholders’ Profit Before Tax (PBT) totalled ` 768 crore, representing a significant jump of 50% on account of robust growth in revenues, higher realised investment income, and a favourable product mix.
It is not only a matter of pride for the Company but also a testimony to Max Life’s strong fundamentals and underlying strength that while having reached a stage of maturity, in FY 2017, the business delivered its strongest financial performance in 10 years.
KEY DEVELOPMENTSPlease allow me to share my perspective on a development that was constantly in the news through the year - MFS and Max Life’s planned merger with HDFC Life to create India’s biggest private life insurer. As you know by now, Max and HDFC Life recently made a mutual decision to call off the merger. After a long period of waiting, our original structure for the proposed merger was not approved by the Insurance Regulatory and Development Authority (IRDA) in June this year.
Despite the prospective partners being truly committed to the deal and observing a full year of exclusivity, it became apparent that any other structure for the deal would be sub-optimal for our stakeholders and the companies could not afford inordinate delays associated with finalisation and approval of these structures.
Our focus, going forward, will be to nurture Max Life, which is already a strong and robust business, and ensure robust growth through organic and inorganic measures. The Company remains confident of delivering superior value to all its stakeholders.
INDUSTRY OUTLOOKThe outlook for Max Life and the Indian life insurance sector, in general, continues to be bright. The industry is entering a phase where growth opportunities are finally fructifying into reality. Low penetration of life insurance in India, a stable government at the Centre, healthy growth of the economy and changing demographics offer immense possibilities to grow the business. In addition, increasing awareness of the need for life protection, coupled with the propensity of Indians to save, are playing an ever more important role in promoting life insurance to Indian households.
The Government’s ‘demonetisation’ drive late last year is expected to curb black money, a development that could help shift savings from physical assets to financial instruments, resulting in a long-term growth trajectory for the life insurance industry as well. In fact, the positive impact of demonetisation became evident almost immediately, with an increased flow of
money into formal channels including life insurance. Private life insurers especially were able to leverage higher customer walk-ins through their bancassurance channel.
Overall, the life insurance sector witnessed a growth of 21% in Individual Adjusted Premia in FY 2017, on account of a strong increase both in the private sector, which grew by 26%, as well as LIC, which posted a 15% growth. The robust performance of the private sector enabled it to increase its market share to 54%.
THE WAY FORWARDWe look ahead, with high expectations on the way forward for Max Life. It is a mature business with steady income and profits and an outstanding top management. It has maintained its pole position of being the largest non-bank promoted private life insurance company and has the most balanced distribution mix with a gold standard agency force.
The Company has sharpened its expertise in building long-term bancassurance relations, with Axis Bank and Yes Bank being sterling showcases. Both these banks continue to be valuable bancassurance partners for us. In addition, with open architecture now allowed, we will be able to leverage our efficient bancassurance model to attract more banks and replicate our bancassurance success. At the same time, we recognise the need to grow owned channels such as Agency Distribution to reach out to a larger audience and sell diverse life insurance solutions.
I can, therefore, confidently say that Max Life is better positioned now than ever before for steady organic growth, while also possessing the potential, wherewithal, and appetite to grow inorganically. In the coming months, it will be our priority to optimise growth, while balancing market share and profitability.
In closing, let me thank you, our shareholders, for your ongoing support and trust as we look forward to delivering superior and enduring value in the future.
With good wishes,
Naina Lal Kidwai Chairman, Max Financial Services Limited
GROWTH IN INDIVIDUAL ADjUSTED SALES IN Fy 2017
25%
* Excludes Max Life Unit Investment Income
** Adjusted for minority interest

20
Dear Shareholders,
In recognition of the strength of Max Life’s business and MFS’s unique position as a listed entity operating solely in the life insurance sector, HDFC Life had approached Max with a proposition to merge Max Financial Services, Max Life and HDFC Life. Undoubtedly, such a merger would have leveraged the highly complementary strengths of each entity, bringing all-round benefits to customers, employees and investors.
EXECUTIVE PRESIDENT’S LETTER
Strategic Review

21
For most of the last year, we were engaged in the process of attempting to create the country’s largest private life insurance company with the proposed merger. However, that proposal was not accepted by the Insurance regulator on the basis that the proposal did not satisfy the conditions of Section 35 of the Insurance Act. Since approval for the proposal was taking inordinate time despite committed efforts from the prospective partners, we recently decided to call off the merger to re-establish certainty amongst policyholders, staff and the broader market.
The merger proposition is a testimony to the reputation that Max Life has built for being a well-run, well-managed company with strong fundamentals, high level of governance and ethics, motivated and capable employees, led by a high-calibre leadership team, a customer-first orientation, an attractive product portfolio marketed through a balanced distribution network and strong brand equity.
The decision to call off the merger, therefore, does not deter us in the slightest way from continuing our profitable growth journey. Max Life will aggressively keep pursuing growth through investments in its own channels such as agency and digital, enhancing policyholder experience, leveraging bancassurance partnerships and forging new distribution alliances. In addition, in a market with more than 20 players, the opportunities from consolidation are inevitable and we will continue to pursue such opportunities as the industry consolidates further.
STRONG FINANCIAL PERFORMANCESpeaking of strong fundamentals, allow me now to share a brief overview of what has been one of the best years in Max Life’s financial history since its inception.
Apart from reporting robust revenue growth of 19% and a stellar 50% increase in Shareholders’ Profit Before Tax (PBT), Max Life witnessed remarkable improvements in its key health metrics such as Embedded Value (EV), Value of New Business (VNB) and New Business Margin (NBM).
Max Life’s Embedded Value stood at ` 6,590 crore as of 31st March, 2017, with a Return on Embedded Value (RoEV) of 20%. The Value of New Business (VNB) written during FY 2017 was ` 499 crore, growing 29% over the previous year, and the New Business Margin stood at 18.8%.
Max Life’s Assets Under Management (AUM) stood at ` 44,370 crore as of 31st March, 2017, increasing by 24% over the last year. I am pleased to share that the performance of both traditional and unit-linked funds have been commensurate with the risks assumed in the respective funds, and overall, the funds outperformed the benchmarks during the year.
Max Life achieved a record high conservation ratio of 88% in FY 2017, compared to 86% in the previous year, clearly demonstrating the business’ customer-centric focus. The renewal income touched ` 7,114 crore, growing 12%. While the 13th-month persistency showed some improvement, more
remarkable was the 10 percentage point jump in the 61st-month persistency to 53%. This growth is a clear reflection of Max Life’s steadfast commitment towards ensuring quality and achieving business excellence without compromising on its core policy of ‘Treating Customers Fairly’.
The holding company, Max Financial Services, reported consolidated Revenues of ` 12,971 crore* and consolidated Net Profit of ` 395 crore in FY 2017, growing 19% and 56%, respectively, over the previous year.
I would like to take a moment to congratulate the leadership, management, and employees of Max Life, whose efforts continued to garner multiple external accolades for the company during the year. Some of the awards won by Max Life in FY 2017 and during the last few months include:
• ET Best BFSI Brand Award for 2016
• Asia’s Most Admired Brand by White Page International
• ASQ 2017 Bronze Award as well as two Certificates of Recognition for various projects
• Ranked 46th in Best Companies to Work For by ET and Great Places to Work and best amongst life insurance companies
• Golden Peacock Award 2016, for excellence in Corporate Governance
• Celent Model Insurer Award in the Asia-Pacific Region
• Celent Asia Award for Best Technology Insurer
• World Finance Global Insurance Awards - Winner for India
These are just a few reminders of the all-round success that Max Life has achieved in the last few years.
OUTLOOKAs we prepare ourselves for a somewhat different future from the one we envisaged last year, we must acknowledge and leverage our existing strengths in the form of a robust business that has continued to differentiate itself time and again in an otherwise cluttered market.
In FY 2017, Max Life notched a significant growth of 87% in its e-commerce business in the past year, acquiring nearly a fifth of its new customers through its ‘Direct-Digital’ channel. Behind this
GROWTH IN VALUE OF NEW BUSINESS
IN Fy 2017
29%
* Excludes Max Life Unit Investment Income
22
success is the exceptional digital eco-system that Max Life has created, to help navigate its customers effortlessly in each step of their decision-making journey while buying insurance online. As a result, the Company’s customer experience ranks among the best in the industry, as does its claims promise. In the coming months, we will invest significant time and resources towards progressing the business’ digitisation agenda and achieving significant improvements not only in the customers’ journey but also in deploying digital assets to make internal processes simpler, more efficient and paperless for our employees as well as our agents and bancassurance partners.
Over the years, Max Life has cemented its reputation as a benchmark for the life insurance industry in India across several dimensions including market-leading sales, a high-performing agency channel, enviable relationships with distribution partners such as Axis Bank and Yes Bank, strong and tenured management,
focus on long-term savings and protection products and superior management of costs. The industry environment is also more positive now, and the general sentiment across the economy is better under the current government. Against this backdrop, Max Life is very well capitalised and is poised to take advantage of consolidation opportunities in the life insurance industry landscape in India.
I am confident that Max Life will continue to scale new peaks across key dimensions. At the same time, no vision can come to fruition without a bedrock of core values which each stakeholder must live by, in letter and spirit. It is this foundation that drives us to seek continual improvement in service excellence and to be the best-in-class for quality, care, and ethics and makes us the preferred life insurance partner for our customers.
I am deeply thankful to our nearly 10,000 employees and more than 50,000 agents across the country who have helped us realise this vision every single day for the last 17 years.
With warm regards and best wishes
Rahul KhoslaExecutive President, Max Financial Services LimitedChairman, Max Life Insurance
The industry environment is also more positive now, and the general sentiment across the economy is better under the current government. Against this backdrop, Max Life is very well capitalised and is poised to take advantage of consolidation opportunities in the life insurance industry landscape in India.
Strategic Review
Executive President’s Letter

23
24
1,769
FY’14
1,513
FY’13 FY’15
1,948
FY’16
2,103
FY’17
2,639
Corporate Review
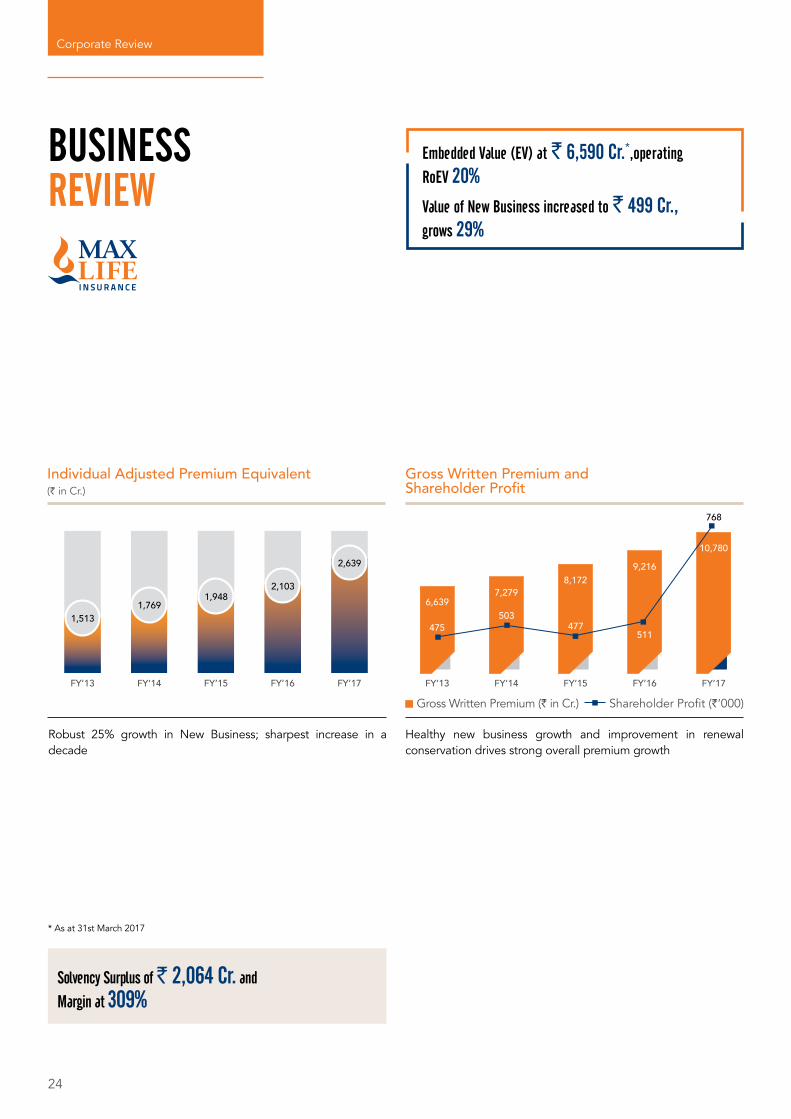
BUSINESS REVIEW
Embedded Value (EV) at ` 6,590 Cr.*,operating RoEV 20%Value of New Business increased to ` 499 Cr., grows 29%
Solvency Surplus of ` 2,064 Cr. and Margin at 309%
Robust 25% growth in New Business; sharpest increase in a decade
Individual Adjusted Premium Equivalent (` in Cr.)
Healthy new business growth and improvement in renewal conservation drives strong overall premium growth
Gross Written Premium and Shareholder Profit
Gross Written Premium (` in Cr.) Shareholder Profit (`‘000)
* As at 31st March 2017
FY’13 FY’14 FY’15 FY’17
6,6397,279
8,172
10,7809,216
FY’16
475503
477511
768

25
New Business Margin grows 90 bps to 18.8%
Over 3.9 million policies in force with sum assured at ` 3,77,572 Cr.
Maintained Private Market Share at 9%
24% growth in AUM led by growth in controlled fund
Assets Under Management (` in Cr.)
44,370
FY’17FY’16
35,824
FY’15
31,220
FY’14
24,716
FY’13
20,458
Concerted cost optimisation efforts continue to bear results
Operating Expenditure Ratio (Opex/Net Premium) (%)
FY’1
516.50
FY’1
6
15.00
FY’1
4
17.80
FY’1
3
19.40
FY’1
7
14.5*
* Normalised for one-off expenses

MANAGEMENT DISCUSSIONAND ANALySISMAx FINANCIAL SERVICESMAx LIFEBUSINESS RESPONSIBILITy REVIEw
28
Management Discussion and Analysis
Max Financial Services
MS. ARCHANA PANDEy Sr. Director - Corporate Affairs
MR. RAHUL KHOSLA Executive President
MR. MOHIT TALWAR Managing Director
MR. SANDEEP PATHAK Company Secretary
MS. SUjATHA RATNAM Chief Financial Officer
MS. VANDANA TREHAN EA to Executive President

29
Max Financial Services Limited (‘MFSL’ or ‘the Company’), a part of the US$ 3 billion Max Group, is the holding company for Max Life Insurance Company Limited (“Max Life”), India’s largest non-bank owned, private life insurance company. It is committed to attaining the highest standards of service in protecting and enhancing the financial future of its customers by adhering to a set of values that are shared across the Group – Sevabhav (spirit of service), Excellence and Credibility.
After the demerger of the erstwhile Max India Limited in January 2016, MFSL became the first listed company in India focussed exclusively on life insurance, thus providing an opportunity for Indian investors to get access to a pure life insurance business. The Company currently holds 70.01% stake in Max Life.
In FY 2017, MFSL, which is currently one of the only two listed companies in the private life insurance sector, reported strong financial growth with consolidated revenues of ` 15,249 crore and consolidated Net Profit of ` 395 crore in FY 2017, growing 30% and 56%, respectively, over the previous year.
MFSL’s sole operating subsidiary Max Life Insurance showcased robust growth on all business parameters, marking FY 2017 as its strongest performance of the decade. In FY 2017, Max Life reported Individual Adjusted Sales of ̀ 2,639 crore, growing 25% and revenues of ̀ 12,937 crore, growing 19%. Max Life reported Shareholders’ Profit Before Tax of ` 768 crore, growing 50% due to strong revenue growth, higher realised investment income, and favourable product mix. Max Life’s Embedded Value stood at ̀ 6,590 crore as at 31st March, 2017 with an Operating Return on EV (RoEV) of 20%. The Value of New Business (VNB) written during FY 2017 was ` 499 crore, growing 29% over the previous year, and the new business margin stood at 18.8%, Max Life’s Assets Under Management (AUM) stood at ` 44,370 crore as at 31st March, 2017, growing 24% over the last year.
While Max Life maintained its overall market share at 9% in FY 2017, it hit an important milestone in its digital journey by transitioning from a challenger to a market leader in Online Term Sales. Max Life’s e-Commerce channel reported an overall growth of 89% in FY 2017.
CORPORATE DEVELOPMENTSIn June 2016, the Company had entered into a confidentiality, exclusivity and standstill agreement to evaluate a potential combination through a merger of Max Life and Max Financial Services into HDFC Life by way of a scheme of arrangement.
Later, the Board approved a composite scheme of amalgamation and arrangement (“Scheme”) on 8th August, 2016, which inter alia contemplated (a) merger of Max Life Insurance Company Limited with the Company; (b) demerger of the life insurance
undertaking of MFSL and merger of the said undertaking with HDFC Standard Life Insurance Company Limited; and (c) merger of MFSL (holding the non-life insurance business) with Max India Limited.
However, Insurance Regulatory and Development Authority of India (“IRDAI”) expressed reservations on the structure as contemplated under the Scheme. The proposed Scheme and the applications filed in this regard with the Stock Exchanges were subsequently withdrawn in July 2017.
HUMAN RESOURCESMFSL has made concerted efforts in establishing a robust talent management framework and a strong performance management mechanism to ensure that the Company consistently develops credible, strong and inspiring leadership. The focus of the Company has also been to ensure effective corporate governance, availability of critical talent for key positions, engagement of key talent and leveraging progressive methods of employee learning and development. The Company has established an organisational structure which is agile, focussed on delivering results and performing effectively in the dynamic business environment. The Company strongly believes in fostering a culture of mutual respect and trust and we have strived to ensure effective communication channels so that all employees are aligned to the common business objectives.
There were 13 permanent employees in MFSL as on 31st March, 2017.
OUTLOOKWith the cancellation of the proposed merger, MFSL’s key focus will now be to leverage Max Life’s position as a mature business with steady income and earnings and able leadership. It is the largest non-bank promoted private life insurance company and has the most well-balanced distribution mix with a gold standard agency force and a highly productive Bancassurance channel. It is poised for steady organic growth and also has the potential via inorganic growth in the light of likely consolidation in the industry. Its priority, therefore, is to optimise growth while balancing market share and profitability.
GROWTH IN CONSOLIDATED NET PROFIT
IN Fy 2017.
56%
30
Management Discussion and Analysis
Max Life Insurance
MR. RAjESH SUD Executive Vice Chairman and Managing Director
MR. AALOK BHAN Director & Chief Distribution Officer
MR. AMITABH LAL DAS Director & Head - Legal, Compliance & Regulatory Affairs
31
MR. jOSE C. jOHN Director & Appointed Actuary
MR. SHAILESH SINGH Director and Chief People Officer
MR. MANIK NANGIA Director- Marketing & Chief Digital Officer
MR. MIHIR VORA Director & Chief Investment Officer
MR. PRASHANT TRIPATHy Senior Director & Chief Financial Officer
MR. V. VISWANAND Senior Director & Chief Operations Officer
32
LIFE INSURANCE INDUSTRY – GROWTH IS BACKFY 2017 was a year of high growth for the Indian Life Insurance industry after almost half a decade. New Business (Adjusted Individual First Year Premium) recorded 21% growth in FY 2017. During the year, 17 life insurers, including LIC, recorded double digit growth and only three life insurers recorded a decline in new business. LIC recorded 15% growth, while private life insurers recorded a growth of 26% resulting in an increase in market share of private life insurers to 54%.
The impact of open architecture regulations started to take shape in FY 2017 with a few banks opting for a second life insurance partner. However, the impact is still minimal. During the year the Insurance Regulatory and Development Authority of India (IRDAI) issued new guidelines for Corporate Governance and Public Disclosures with an aim to bring greater transparency in the industry. Indian Insurance industry witnessed some noteworthy corporate developments as well. With the IPO of ICICI Prudential Life Insurance, investors now have another opportunity, besides Max Financial Services, to invest in a pure play life insurance business. IRDAI also granted certificate of registration to five global reinsurers to open offices in India. This is a major step towards building a robust reinsurance market in India.
REGULATORY UPDATEGuidelines on Insurance E-commerceAs the e-commerce channel is gaining traction in Indian insurance industry, the need was felt to change regulation to be aligned with the fast-changing digital world and expectations of digital natives. The new guidelines specify several new requirements such as the creation of an e-insurance account within 15 days post sales and immediate issuance of e-premium receipts. In addition, e-KYC and e-PAN have been allowed now and disclosure requirements have been prescribed for the entity and products.
Guidelines on Information & Cybersecurity for InsurersCybersecurity assumes significant importance as more and more transactions and customer information is managed digitally. IRDAI through these guidelines has issued a detailed check list for effective implementation of cybersecurity. The insurer is required to appoint a Chief Information Security Officer who will be responsible for articulating and implementing policies to protect the information assets. The insurer shall also form an Information Security Committee. Members of this Committee shall include the head of Operations, Information Technology, Legal, Compliance, Finance, HR, and Risk.
Payment of Commission or Remuneration or Reward to Insurance Agents and Insurance IntermediariesThis regulation related to Commission / Remuneration and Rewards became applicable from 1st April, 2017. This requires a Board-approved policy on payment of commission or remuneration to insurance agents and intermediaries. As per the regulation, a limit of 20% of the first year commission or remuneration paid to them has been set on rewards that can be paid to insurance agents or intermediaries. In addition, no
rewards shall be paid to insurance intermediaries whose revenue from other than insurance intermediation exceeds 50% of the total revenue from all activities.
Operationalisation of Central KYCThe Central Registry of Securitisation and Asset Reconstruction and Security Interest of India (CERSAI) has been authorised to act as and perform the functions of the Central KYC Records Registry. Life insurers are now required to upload KYC records in respect of individual policyholders wherein policies mature on or after 15th July, 2016. This will help in creating a centralised KYC repository which can be used in all components of the BFSI industry.
Guidelines for Corporate Governance for Insurers in IndiaIRDAI continued to work on improving corporate governance standards in the Indian insurance industry. The new guidelines on corporate governance issued in FY 2016 require some changes in the Board and Committee structures and introduced new sections on critical issues like merging of committees, conflict of interest of Board and disclosure of financial statements. The new guidelines have also changed the definition of Key Management Personnel (KMP) and all outsourcing agreements have now to be approved by the Committee of KMP. As per these guidelines, the Company needs to formulate a Consumer Education Policy.
STRATEGISING FOR SUSTAINABLE AND PROFITABLE GROWTHOver the years, Max Life Insurance has maintained its position amongst the top 4 private life insurers and as the largest non-bank owned private life insurer. This has been made possible by remaining ahead of the curve and developing the Company’s strategies based on a thorough understanding of the environment and life insurance consumers. The Company strengthened its long-term growth strategy with clearly identified focus areas for FY 2017. The Company decided to focus on the following themes:
• Capitalise on underserved opportunity – Around 35% of the Indian households, which form the mass market of India, are underpenetrated in terms of life insurance. The Company improved its distribution efficiency using digital tools and enhanced its focus on direct channels to reach out to a larger set of consumers.
• Create digital ecosystem – Indian consumers are adopting digital technology at a fast pace and by FY 2020, 600 million Indians are expected to be internet users. This opens up new opportunities for the life insurance industry as well. Max Life Insurance decided to focus on acquiring context to enable superior conversations with our consumers and digitally enable our sellers to leverage the new ecosystem.
Over the years, Max Life Insurance has maintained its position amongst the top 4 private life insurers and as the largest non-bank owned private life insurer.
Management Discussion and Analysis
Max Life Insurance
33
• Build health and retirement ecosystem – India is a young country but the other reality is that the greying population of India is also growing at a fast pace. By FY 2020, 60+ population of India is expected to double, increasing the requirement for both retirement planning and healthcare services. During the year, Max Life Insurance augmented its health and well-being proposition by launching Max Life Cancer Insurance Plan.
• Protection focus – Protection is core to a life insurance business. Max Life Insurance strengthened its protection portfolio by launching enhanced online term plan, cancer insurance plan and a plan for children education that offers triple protection benefit. The Protection business contributed almost 15% of all the individual policies sold by Max Life Insurance during FY 2017.
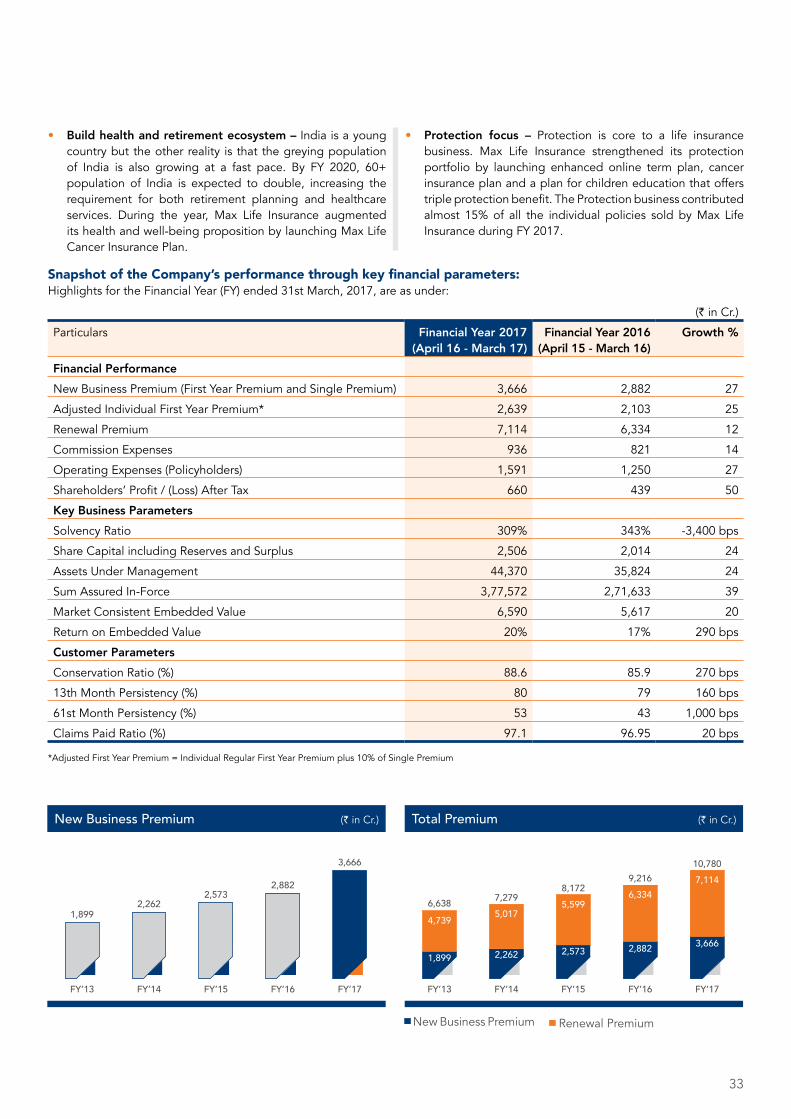
Snapshot of the Company’s performance through key financial parameters:Highlights for the Financial Year (FY) ended 31st March, 2017, are as under:
(` in Cr.)
Particulars Financial Year 2017 (April 16 - March 17)
Financial Year 2016 (April 15 - March 16)
Growth %
Financial PerformanceNew Business Premium (First Year Premium and Single Premium) 3,666 2,882 27
Adjusted Individual First Year Premium* 2,639 2,103 25
Renewal Premium 7,114 6,334 12
Commission Expenses 936 821 14
Operating Expenses (Policyholders) 1,591 1,250 27
Shareholders’ Profit / (Loss) After Tax 660 439 50
Key Business ParametersSolvency Ratio 309% 343% -3,400 bps
Share Capital including Reserves and Surplus 2,506 2,014 24
Assets Under Management 44,370 35,824 24
Sum Assured In-Force 3,77,572 2,71,633 39
Market Consistent Embedded Value 6,590 5,617 20
Return on Embedded Value 20% 17% 290 bps
Customer ParametersConservation Ratio (%) 88.6 85.9 270 bps
13th Month Persistency (%) 80 79 160 bps
61st Month Persistency (%) 53 43 1,000 bps
Claims Paid Ratio (%) 97.1 96.95 20 bps
*Adjusted First Year Premium = Individual Regular First Year Premium plus 10% of Single Premium
6,638
1,899
FY’13
7,279
2,262
FY’14
10,780
3,666
FY’17
8,172
2,573
9,216
2,882
FY’15 FY’16
Total Premium (` in Cr.)
4,739 5,017
7,114
5,5996,334
1,899
FY’13
2,262
FY’14
3,666
FY’17
2,5732,882
FY’15 FY’16
New Business Premium (` in Cr.)
New Business Premium Renewal Premium
34
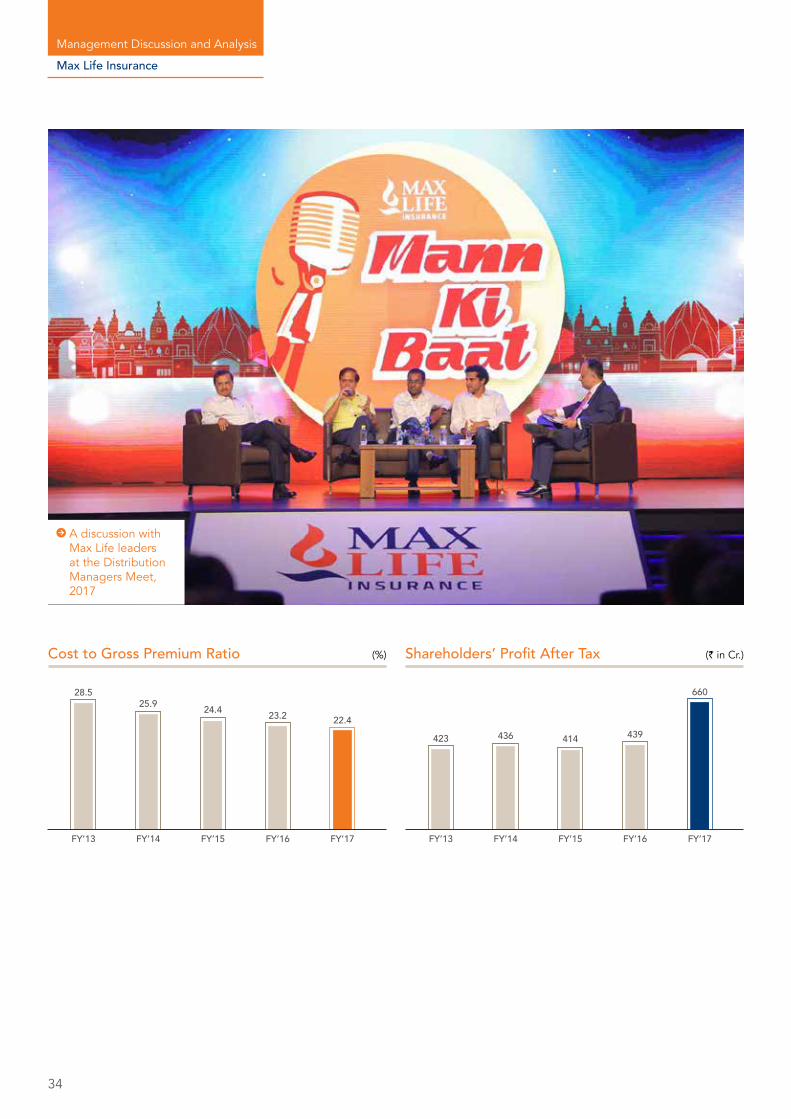
Cost to Gross Premium Ratio
22.4
FY’17FY’16
23.2
FY’15
24.4
FY’14
25.9
FY’13
28.5
(%) Shareholders’ Profit After Tax
660
FY’17FY’16
439
FY’15
414
FY’14
436
FY’13
423
(` in Cr.)
Management Discussion and Analysis
Max Life Insurance
A discussion with Max Life leaders at the Distribution Managers Meet, 2017
35
Digitally-enabled multi-channel distribution architecture for enhanced reach and efficiencyWhile Max Life Insurance has always believed in multi-channel distribution architecture to reach out to a diverse set of Indian consumers, it is the digital enablement of all the channels that have been taken to newer proportion over the last few years. Digital enablement of sellers not only help them conduct need analysis with ease but also helps the Company in faster policy issuance.
Owned Distribution Channels• Agency Distribution – Agency Distribution is core to multi-
channel distribution architecture of Max Life Insurance and the Company takes pride in having one of the highest office and agent productivity in Indian Life Insurance industry. The agency distribution recorded a healthy growth in the new business. It was the quality of business that made the performance remarkable this year. 13th-month persistency witnessed almost 5% points improvement during the year. The channel also witnessed more than 20% increase in the share of protection in product mix. During the year, the agency distribution enhanced its focus on long-term participating plan keeping in view the consumer profile and its targets. The channel also created new benchmarks in terms of premium per policy, Opex-to-sales ratio and ADM productivity.
• Customer Advisory Team – This in-house team at Max Life Insurance provides service and sales support to its existing customers. This direct-to-consumers channel is dependent on recruitment and retention of talent to help build a long-term relationship with our customers. This year, the channel achieved stupendous success in recruiting talent in line with plan for the year. Another important vector in channel success is the number of meetings with customers which also witnessed 20% increase as compared to last year. As an outcome, the channel was able to achieve high growth performance consistently and recorded 13th-month persistency in line with the global standards.
• E-Commerce – During the year, the e-commerce channel almost doubled its sales and provided protection cover to more than 38,000 families. The channel achieved leadership in online term space across web aggregators. With an aim to further simplify the sales journey on both the web and mobile platforms, NEO, a new web purchase journey was launched.
Third-Party Distribution• Axis Bank – Since the inception of this bancassurance
relationship in FY 2007, both Axis Bank and Max Life are working towards creating the most admired bancassurance relationship in India. The channel recorded a strong growth in the new business premium and continued to witness consistent growth in persistency. For Maxis 2020, our joint
Assets Under Management (` in Cr.)
FY’1
5
31,220
FY’1
6
35,824
FY’1
4
24,716
FY’1
3
20,458
FY’1
7
44,370
Sum Assured in Force (` in Cr.)
FY’1
52,25,015
FY’1
6
2,71,633
FY’1
4
1,99,660
FY’1
3
1,69,167
FY’1
7
3,77,572
(%)Conservation Ratio
FY’13 FY’17FY’16
88.685.984.983.782.0
(%)Claims Paid Ratio
FY’15FY’15 FY’14FY’14 FY’13 FY’17FY’16
97.5996.9596.0393.8694.25
36
effort towards digitally-enabled sales to bring in the superior quality of sales and greater efficiency in policy issuance, this was a landmark year with almost 100% e-sales.
• YES Bank recorded almost 100% growth in new business. The enhanced retail focus of YES Bank helped Max Life Insurance reach out to the bank customers with long-term savings and protection solutions for their life-stage needs.
• Other bancassurance relationships – Lakshmi Vilas Bank, our 2-year-old relationship witnessed significant growth in new business and Max Life continued to be the dominant life insurance partner for the bank though it opted for another life insurer under the open architecture. Our UCB partnerships also recorded a healthy growth.
GROUP BUSINESSDespite the headwinds of demonetisation because of which credit offtake reduced in banks, Group business continued its smart progress with strong growth in the core business of Group Credit Life.
Substantial improvement in quality of business through enhanced operational efficiencyThe Fulfilment team at Max Life Insurance worked in tandem with frontline distribution team to help the Company achieve a record performance year.
Customer retention is key to long-term success of life insurance business. Max Life Insurance achieved a record high conservation ratio of 88% in FY 2017 as compared to 86% in FY 2016 and the renewal income touched ̀ 7,114 crore during the year recording 12% growth. 13th month persistency touched 80.4%, a 160 bps increase. The most remarkable statistics in customer retention was a 10% points increase in the 61st-month persistency to 53%.
During the year, customer complaints witnessed a remarkable 38% decline. At the end of the year, there was not even a single pending customer complaint. To further improve the speed and quality of response to customer queries and complaints, a new technology-enabled system was introduced, which ensured that all customer-related information was available to our customer service executives on a single screen. In addition, the year witnessed enhancements like integration with UIDAI, credit agencies, banking partners, PAN validation, automation and process changes like welcome call auto dialer and enablement of the single mandate for ECS enabled us to move towards paperless and frictionless onboarding process for both our customers and distributors.
During FY 2017, Max Life Insurance witnessed further improvement in claims paid ratio to 97.6%. The Company paid 8,678 death claims worth ` 283 crore during the year. InstaClaim, a first-of-its-kind initiative in the industry that ensures approval of death claim within 24 hours of receipt of all requisite documents, was also introduced.
Customer Experience Index, a cumulative index of customer experience across 7 key policyholder transactions, witnessed an
improvement in Top 2 box score to 77% which is in line with the global best standards. This was made possible through an all-time high score in customer touchpoints like Branch Office, Medicals, Policy Issuance, Purchase Experience, Renewals, Helpline, and Claims. In addition, as per the syndicated annual customer loyalty survey, Max Life Insurance was placed number one in the experience factors that drive customer loyalty.
Simplification of customer communication and greater use of regional languages result in better customer engagement. During the year, Key Feature Documents for individual products and top 25 transactional communication, which form more than 60% of customer communication, were made available in 10 regional Indian languages.
Policyholder Bonus – Sharing the growth outcome with our key stakeholdersIn FY 2017, the regular bonus that would be distributed by Max Life Insurance in FY 2017-18 would be circa ` 854 crore, an increase of ` 126 crore from ` 728 crore distributed last year. In addition, the payment of terminal bonus on deaths and maturities has been approved which would cost circa ` 23 crore in FY 2018.
Product Mix – Increased focus on protection-oriented salesMax Life Insurance has a balanced product portfolio having an optimal mix of traditional and ULIPs as well as protection focussed and long-term savings-oriented products.
During the year, Max Life Insurance added non-linked participating child plan, Max Life Future Genius Education Plan. The plan provides a host of benefits, which are highly customisable and flexible to suit the requirements of your child’s education even during your absence. The plan offers four guaranteed money back options each equal to 25% of the sum assured in the last four policy years. The timing of receiving the money back can either be postponed or brought forward as per the child’s educational needs. The product also offers two flexible settlement options on death benefit payouts – Lump sum or Monthly Income for 135 months. In addition, to enhance the risk cover, three riders – Term Plus, Accidental Death & Dismemberment and Waiver of Premium – can also be attached to the base product.
Max Life Insurance also strengthened its protection portfolio with the launch of Max Life Cancer Insurance Plan that is designed to provide financial assistance across all stages of cancer. In addition, the plan also provides the guaranteed income benefit of up to 50% of sum assured in case the policyholder is diagnosed with major stage cancer. In addition, the product offers indexation benefit of 10% for every claim-free year for a maximum of 5 years and policy continuance benefit through which future premiums are waived off in case the insured is diagnosed with cancer. The Company launched a new feature-rich Max Life Online Term Plan Plus which offers three death benefit options – lump sum death benefit, lump sum with monthly income and lump sum with increasing monthly income.
Management Discussion and Analysis
Max Life Insurance
37
Information Technology – Facilitating Improvement in Business EfficiencyDuring FY 2017, Information Technology focussed on creating a solid technology backbone to simplify the life of our employees, distributors, and customers.
Max Life Insurance moved to Office 365 to provide its employees with efficiency tools like Skype for Business which has simplified remote video conferencing, chats and document sharing. Interactive employee portal, eCube was also launched which provides knowledge management features and multiple engagements and two-way communication opportunities.
To enhance distribution efficiency, mApp and CSG were introduced in select markets and will be rolled out across the country in the first half of FY 2018. Through these applications, our agent advisors can offer multiple life insurance solutions based on need analysis and can directly load customer documents for speedy policy issuance.
Focus on Engaging and Retaining TalentOur efforts towards improving employee experience and making people practices more contemporary at Max Life Insurance received strong validation as the Company was ranked 46th amongst the top 100 Indian companies and first amongst
Max Life Insurance Company Limited is a joint venture between Max Financial Services Ltd. and Mitsui Sumitomo Insurance Co. Ltd. Max Life Insurance Co. Ltd., 11th Floor, DLF Square Building, Jacaranda Marg, DLF City Phase II, Gurugram (Haryana) – 122002. For more details on the risk factors, Terms and Conditions, please read the sales brochure, available on www.maxlifeinsurance.com, carefully before concluding a sale. Insurance is the subject matter of solicitation. Trade logos displayed belong to Max Financial Services Ltd. and Mitsui Sumitomo Insurance Co. Ltd. respectively and are used by Max Life Insurance Co. Ltd. under a license. Contact us on our nation-wide toll free no. 1800-200-5577.
ARN - Max Life/Ads/Ogilvy/MLI CIP Poster/August 2017 IRDAI Regn. No - 104.
Beware of spurious phone calls and fictitious / fraudulent offers
IRDAI clarifies to public that• IRDAI or its officials do not involve in activities like sale of any
kind of insurance or financial products nor invest premiums.
• IRDAI does not announce any bonus.
• Public receiving such phone calls are requested to lodge a police complaint along with details of phone call, number.
the insurance industry by Great Place to Work Institute and & Economic Times study.
During the year, the Human Resources (HR) function gave significant attention to effective employee communication and engagement. All employee surveys and regular pulse surveys were conducted with the help of an external agency to monitor engagement levels. Communication platforms such as dedicated intranet site, leadership webcasts and employee town halls were deployed to proactively disseminate information and build two-way communication.
Through the year, there was continued focus towards enabling employees and building a high-performance workplace. Digitisation of key people processes via robust implementation of HR Management System and launch of Mobile Apps, Distribution capability-building, especially at supervisory levels and talent retention / deployment, were some of the areas of focus.
Pehal, an employee volunteering programme, was launched during the year. Around 2,000 employees participated in various social causes such as financial literacy for under-privileged students via school tie-ups, green plantation drive and sanitation drives.
38
Marketing Support to Drive Business After the announcement of proposed merger of Max Life Insurance and HDFC Life in the first quarter of the year, the focus of marketing efforts was primarily on enabling sales. The marketing team created a comprehensive strategy for new Online Term Plan launched during the year and promoted Max Life Cancer Insurance Plan.
The key highlights of the year were innovative and industry first digital marketing efforts. The Company directly engaged with Google to deploy industry first insight-led prospecting and chase campaign to strengthen the direct business. An integrated digital marketing campaign was launched in the last quarter of the year and the video was the 5th most watched advertisement on YouTube in January 2017.
Customer communication and media relations efforts focussed on educating customers on various aspects of life insurance to enable them to take informed decisions. Simplification to improve ease of understanding was the other area of attention. During the year, Key Features Documents in 10 regional languages were also implemented and top 25 documents, covering almost 80% of customer communication, were simplified.
Superior Investment PerformanceThe Company’s Assets under Management (AUM) of ` 44,370 crore recorded a growth of 24% over the last year. The performance of both the traditional and unit-linked funds has been commensurate with the risks assumed in respective funds. Overall, the funds outperformed the benchmarks during the year.
The traditional funds are invested safely, with over 99% of the debt investments in AAA or equivalent instruments and a minimum of 70% of equity exposure to quality large cap equities which are expected to provide superior returns over the long term.
Generating Insurance Awareness amongst our Customers and Public-at-largeMax Life Insurance continued to work towards increasing awareness about life insurance and financial concepts amongst its existing customers and prospective life insurance customers. In line with the IRDAI focus, the Company worked on four specific themes:
• Campaign on the benefits of life insurance During the year, Max Life Insurance’ major focus was on
promoting protection as an important concept related to life insurance. In the last quarter of the year, the Company carried a television campaign to educate consumers about the need for protection against unforeseen events of life. Throughout the year, the Company worked towards imparting knowledge to policyholders and prospects through authored articles in national and regional dailies, knowledge articles through the own website, social media assets and direct electronic mailers. As a special initiative, during the last quarter of the year, the Company distributed leaflets about basic concepts of life insurance to policyholders who walked into our offices.
• Campaign focussing on protection to consumers Fraudulent activities and spurious calling to fleece genuine
life insurance consumers of their hard-earned money are spoiling the reputation of life insurance industry. There is a need to make concerted efforts to overcome this menace. Max Life Insurance made its contribution by educating consumers about such activities through authored articles in print media, direct mailers to existing consumers and social media campaigns. In addition, Max Life Insurance also took legal measures to take action against unscrupulous elements who are engaged in such activities.
• Campaign for children and youth Max Life Insurance launched a special campaign of teaching
the youth of India about the basic financial concepts. We believe that if they are introduced to financial planning early in their life, these people will be in a better position to implement these concepts in real life to their benefit. Max Life Insurance employees educated more than 3,000 students of 22 schools in Gurugram, Jammu and Srinagar. This campaign was extremely successful as students actively participated in these financial literacy class. They were also provided the information about Government-promoted financial schemes so that the students could share those with their parents which could benefit the household.
• Campaign for the under-privileged and rural and socially backward
Max Life Insurance adopted Dhakrani village in Uttarakhand in FY 2015. Our employees and agent advisors have been carrying out door-to-door financial literacy campaign in the village. During the year, our employees reached out to 450 households – conducted need analysis and educated them about the financial products suitable for their identified needs.
CORPORATE SOCIAL RESPONSIBILITYThe Company continued to work with Max India Foundation to implement its CSR programme which has a focus on healthcare, sanitation, safe drinking water, environment protection, financial literacy & insurance awareness and village adoption. The work on the first three phases of the sewerage system, which covers almost 50% of the village households, has almost been completed in the Company-adopted Dhakrani village in Uttarakhand and is expected to be fully operational by the second quarter of FY 2018. The Company increased its activities in the areas of immunisation, health camps, and health awareness and continued providing surgeries & treatment and artificial limbs to the under-privileged people. During the year, the Board Committee for Corporate Social Responsibility met twice in the year to approve the CSR Strategy and Policy for FY 2017 and review the progress made on the agenda. More details about the Company’s CSR initiatives are mentioned under the Business Responsibility Report in the Annual Report and as part of the Annexure to Directors’ Report.
Management Discussion and Analysis
Max Life Insurance

39
A ROBUST RISK MANAGEMENT FRAMEWORK TO ADDRESS ENTERPRISE-WIDE RISKSThe Company’s overall approach to managing risks is based on the ‘three lines of defence’ model with clear segregation of roles and responsibilities for all the lines.
Risk management is integral to all aspects of the Company’s activities and is the responsibility of all staff. Managers have a particular responsibility to evaluate their risk environment and put in place appropriate controls. The risk management culture emphasises due analysis and management of risk in all business processes. This constitutes the first line of defence.
The Company has an operationally independent Risk Management Function in place, headed by a Chief Risk Officer (CRO). The Risk Management Function together with the Compliance Function form the second line of defence, under the aegis of the Board and the Statutory Risk Management Committee. The Risk Management Function is responsible for monitoring and reporting the firm’s risk exposures and the extent to which the risks inherent in any proposed business strategy and plans are consistent with the Company’s risk appetite and tolerance. The Compliance Function is responsible for monitoring the compliance levels across the Company and for highlighting any potential compliance risks to the risk function as well as to the management teams. Compliance includes compliance with both external obligations and internal standards and the latter includes standards on ethical behaviour.
The Internal Audit Function guided by the Audit Committee is the third line of defence and provides an independent assurance to the Board. The majority of the members of the Audit Committee are independent directors, one of whom chairs the Committee. The Audit Committee has a particular responsibility in relation to financial statement risks and would also provide assurance that the Risk Management Framework has been implemented. The Statutory Auditors, as well as regulatory oversight aided by the Appointed Actuary in his fiduciary capacity, is also construed to provide an additional third line of defence.
RISK MANAGEMENT FRAMEWORKThe Company has developed a risk management framework which defines the Company’s approach to enterprise-wide risk management. The implementation of the framework is a continuous cycle of improvement over the Company’s existing risk management elements which are progressively integrated into the framework. The Company has the vision of a matured state of risk culture where every individual takes responsibility for risks and has a thorough understanding of all the risk tolerances. The key elements of risk management framework include:
Risk Identification and AppetiteThe Company has identified the material risks to which it is exposed, categorised them under the headings of Strategic, Insurance, Investment and Operational Risks and the degree of risk the Company is willing to accept for each in pursuit of its strategic objectives, business plans and the interests of the policyholders.
Risk Management StrategyA Risk Management Strategy has been developed which defines the Company’s approach to managing each material risk through acceptance, avoidance, transfer and/or mitigation. The degree and intensity of the management action are guided by comparing the risk appetite with the potential impact of the risk, the likelihood of its occurrence and the cost of implementing the controls. The strategy also defines the governance structure for risk management practices at various levels including the roles and responsibilities of the risk management function.
Policies and ProceduresThe functional owners with assistance from the risk management function develop policies and procedures consistent with the risk appetite and risk management strategy as well as ensure implementation thereof to manage the risks. The policies cover processes for identification, monitoring, measurement, reporting of risks in respective functions.
Risk-based Business PlanningThe Company has a robust business planning process which includes forward-looking scenario analysis based on severe but plausible scenarios including economic stress. The analysis assesses the impact on key financial outcomes including solvency. The Chief Risk Officer reviews the plan independently to ensure that it is within the Company’s risk appetite and also comments upon the risks and opportunities embedded therein.
Risk-based Capital AssessmentA detailed annual assessment of the Company’s capital position and requirements is carried out which takes into account the Company’s risk exposures and appetite for risks. The outcomes from this assessment are presented to the Risk, Ethics and Asset Liability Management (REALM) Committee by the Appointed Actuary through the Financial Condition Report as well as the Economic Capital Assessment.
Risk Monitoring and ReportingRisk-oriented management information is monitored by the risk function and an independent assessment of top risks as well as emerging risks is monitored and reported to the statutory Risk Committee on a quarterly basis along with identified critical risk measures.
Review of FrameworkThe implementation of risk management framework is subject to both internal and external assurance reviews periodically and is also tested for effectiveness during the review of entity level controls under the Company’s Internal Control Framework.
RISK GOVERNANCE STRUCTUREThe Company follows a multi-layered governance approach for execution and monitoring the risk management activities performed across all of its three lines of defence. The Board of Directors, Risk, Ethics and ALM Committee, Management Risk Committee, Risk Management Function and Functional Managers have distinct roles and responsibilities.

40
Key Risk Exposures and Risk Mitigation StrategyAs an insurer, the Company is in the business of accepting the risk. The risk management framework ensures that the level of risk accepted is within the Company’s risk management capacity and the level of capital adequacy is in excess of the level prescribed in the public interest via legislation. The key risk exposures have been summarised below along with a brief approach adopted by the Company to manage those risks.
1. Strategic Risks The Company accepts these risks inherent with the key
business decisions and plans in areas of product strategies, distribution models, regulatory and legislative changes. The Company’s planning process includes forward-looking scenario analysis and stress-testing to assess the potential impact of the strategic choices being made.
2. Insurance Risks The Company accepts various insurance risks as a core
reason for its existence, including mortality and discontinuity. The Company manages mortality risks by use of sound underwriting norms defined in the Underwriting Policy & Manuals and leverages technology to deploy business intelligence in decision-making. The Company transfers mortality risks above certain threshold to reinsurers based on its annual Reinsurance Programme. The Company has put in place appropriate controls in the sales process and practices and products are also assessed for fairness against predetermined benchmarks. The Policyholder Protection Committee reviews borderline cases.
The Company also accepts risks inherent in the pricing of insurance products with long-term financial obligations. A Product Steering Committee governs a defined process
and structure for the development of products covering all stages of product development including pricing as well as approvals. The Company follows a ‘Treat Customer Fairly’ policy, principles and considerations of which are tested at the time of pricing of products.
3. Investment Risks The Company manages a substantial level of assets in
support of its obligations to policyholders and shareholders and is exposed to investment risks of Credit, Market, Liquidity and increasing complexities like derivatives and alternate investment funds. In addition, the make-up of investment portfolios may not conform with the characteristics of the liabilities such investments are intended to support, leading to ALM risks. For effective management of such risks, a structured approach is in place comprising active oversight by Investment Committee and Risk, Ethics and Asset Liability Committee with detailed management through a Working Investment Committee and an ALM Group, besides regular checks by the concurrent auditor under the regulatory framework. This is complemented by external reviews as needed to ensure that the Company’s processes are aligned to contemporary best practices. The ALM policy defines the constraints on Investment Policy arising from the nature of the liabilities that invested assets support. The Investment Policy defines in appropriate detail the specific limits on various forms of investment arising from Regulations, the ALM Policy and the Company’s specific investment-related risk appetites on various forms of investment. The Company has a well-defined disclosure policy in accordance with which it discloses details of portfolios of both non-linked and linked business on its website at monthly and quarterly intervals.
4. Operational Risks The Company is exposed to various areas of operational
risks, including mis-selling, technology, business continuance, information security, fraud, business processes, outsourcing, and compliance. These are mitigated by regular review and monitoring of operating, reporting processes and procedures. A range of policies and procedures to manage these risks is in place including Business Continuity Management, Information Security, Outsourcing, Anti-Fraud, Anti-Corruption and Anti-Bribery, and Anti-Money Laundering Policies together with a Business Code of Conduct. The first line of defence, through the departmental self-assessments, identifies all potential areas of inherent as well as residual risks along with the mitigation actions. The progress against these is monitored closely by respective functions and is followed up by monitoring and reviews by the second and the third line of defence.
Management Discussion and Analysis
Max Life Insurance
41
5. Other Emerging Risks Operating models continue to evolve based on contemporary
technologies, changing stakeholder preferences as well as regulatory requirements. The pace of these changes, together with the impact of innovative business models and emerging technologies, create additional risk exposures for the Company. The Company is also conscious of potential risks driven by changes in the geopolitical environment. The Company scans its operating environment continuously and its risk capabilities and controls are augmented accordingly. The emerging risks are monitored and reported to the Risk, Ethics and ALM Committee on a quarterly basis along with the potential implication and management’s identified action plan to manage these risks early.
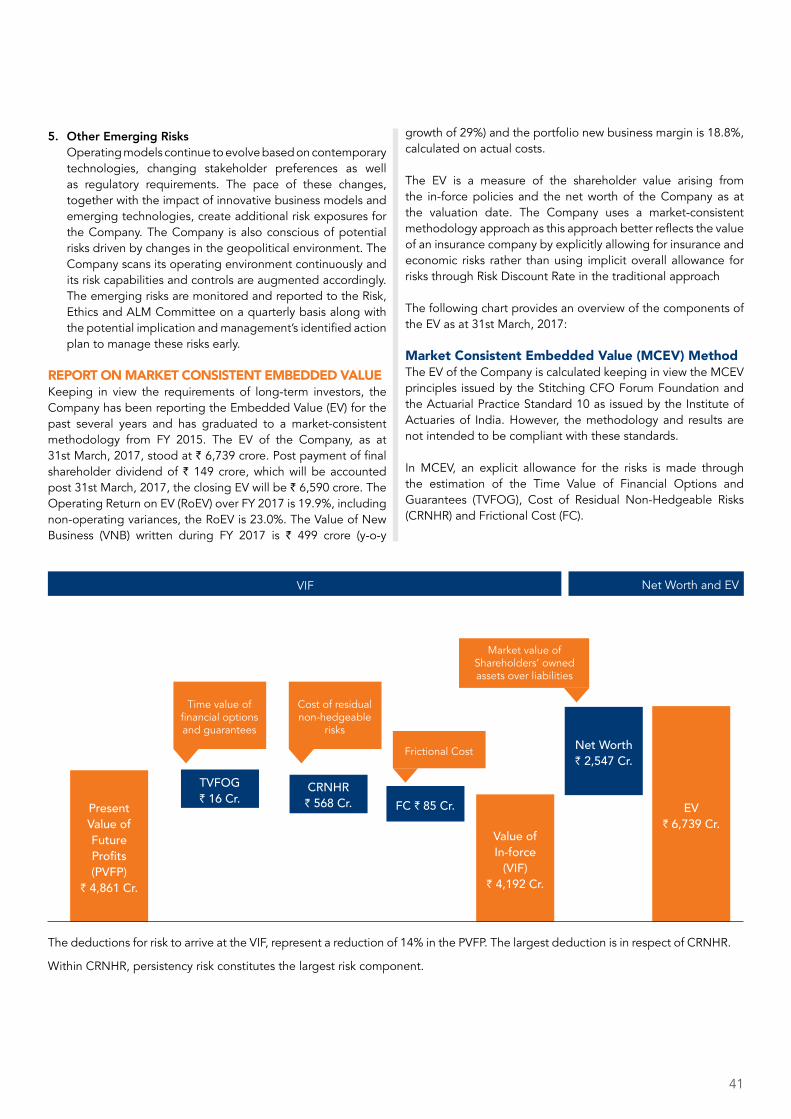
REPORT ON MARKET CONSISTENT EMBEDDED VALUEKeeping in view the requirements of long-term investors, the Company has been reporting the Embedded Value (EV) for the past several years and has graduated to a market-consistent methodology from FY 2015. The EV of the Company, as at 31st March, 2017, stood at ` 6,739 crore. Post payment of final shareholder dividend of ` 149 crore, which will be accounted post 31st March, 2017, the closing EV will be ` 6,590 crore. The Operating Return on EV (RoEV) over FY 2017 is 19.9%, including non-operating variances, the RoEV is 23.0%. The Value of New Business (VNB) written during FY 2017 is ` 499 crore (y-o-y
growth of 29%) and the portfolio new business margin is 18.8%, calculated on actual costs.
The EV is a measure of the shareholder value arising from the in-force policies and the net worth of the Company as at the valuation date. The Company uses a market-consistent methodology approach as this approach better reflects the value of an insurance company by explicitly allowing for insurance and economic risks rather than using implicit overall allowance for risks through Risk Discount Rate in the traditional approach
The following chart provides an overview of the components of the EV as at 31st March, 2017:
Market Consistent Embedded Value (MCEV) MethodThe EV of the Company is calculated keeping in view the MCEV principles issued by the Stitching CFO Forum Foundation and the Actuarial Practice Standard 10 as issued by the Institute of Actuaries of India. However, the methodology and results are not intended to be compliant with these standards.
In MCEV, an explicit allowance for the risks is made through the estimation of the Time Value of Financial Options and Guarantees (TVFOG), Cost of Residual Non-Hedgeable Risks (CRNHR) and Frictional Cost (FC).
Net Worth and EVVIF
Market value of Shareholders’ owned assets over liabilities
Time value of financial options and guarantees
Cost of residual non-hedgeable
risks
Frictional Cost
Present Value of Future Profits (PVFP)
` 4,861 Cr.
Value of In-force
(VIF) ` 4,192 Cr.
EV ` 6,739 Cr.
Net Worth ` 2,547 Cr.
FC ` 85 Cr.CRNHR
` 568 Cr.TVFOG ` 16 Cr.
The deductions for risk to arrive at the VIF, represent a reduction of 14% in the PVFP. The largest deduction is in respect of CRNHR.
Within CRNHR, persistency risk constitutes the largest risk component.
42
EV movement analysis: March 2016 to March 2017
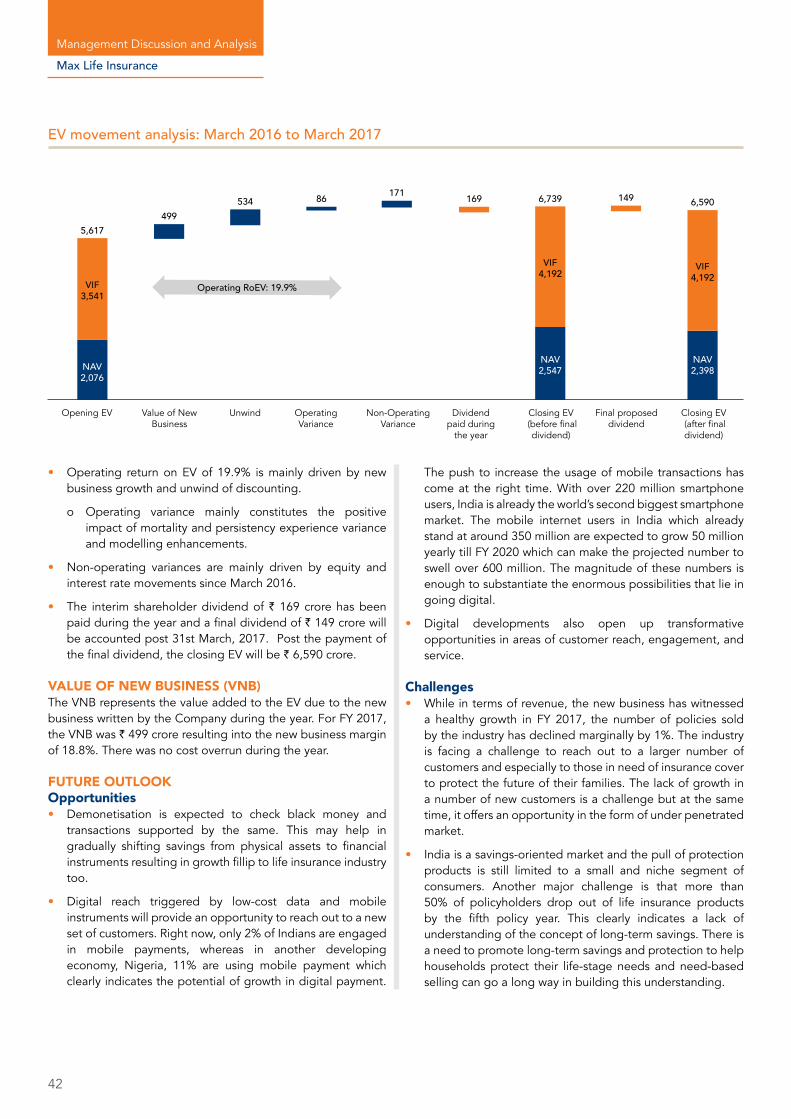
• Operating return on EV of 19.9% is mainly driven by new business growth and unwind of discounting.
o Operating variance mainly constitutes the positive impact of mortality and persistency experience variance and modelling enhancements.
• Non-operating variances are mainly driven by equity and interest rate movements since March 2016.
• The interim shareholder dividend of ` 169 crore has been paid during the year and a final dividend of ` 149 crore will be accounted post 31st March, 2017. Post the payment of the final dividend, the closing EV will be ` 6,590 crore.
VALUE OF NEW BUSINESS (VNB)The VNB represents the value added to the EV due to the new business written by the Company during the year. For FY 2017, the VNB was ` 499 crore resulting into the new business margin of 18.8%. There was no cost overrun during the year.
FUTURE OUTLOOKOpportunities• Demonetisation is expected to check black money and
transactions supported by the same. This may help in gradually shifting savings from physical assets to financial instruments resulting in growth fillip to life insurance industry too.
• Digital reach triggered by low-cost data and mobile instruments will provide an opportunity to reach out to a new set of customers. Right now, only 2% of Indians are engaged in mobile payments, whereas in another developing economy, Nigeria, 11% are using mobile payment which clearly indicates the potential of growth in digital payment.
The push to increase the usage of mobile transactions has come at the right time. With over 220 million smartphone users, India is already the world’s second biggest smartphone market. The mobile internet users in India which already stand at around 350 million are expected to grow 50 million yearly till FY 2020 which can make the projected number to swell over 600 million. The magnitude of these numbers is enough to substantiate the enormous possibilities that lie in going digital.
• Digital developments also open up transformative opportunities in areas of customer reach, engagement, and service.
Challenges• While in terms of revenue, the new business has witnessed
a healthy growth in FY 2017, the number of policies sold by the industry has declined marginally by 1%. The industry is facing a challenge to reach out to a larger number of customers and especially to those in need of insurance cover to protect the future of their families. The lack of growth in a number of new customers is a challenge but at the same time, it offers an opportunity in the form of under penetrated market.
• India is a savings-oriented market and the pull of protection products is still limited to a small and niche segment of consumers. Another major challenge is that more than 50% of policyholders drop out of life insurance products by the fifth policy year. This clearly indicates a lack of understanding of the concept of long-term savings. There is a need to promote long-term savings and protection to help households protect their life-stage needs and need-based selling can go a long way in building this understanding.
Management Discussion and Analysis
Max Life Insurance
Opening EV Value of New Business
Unwind Operating Variance
Non-Operating Variance
Dividend paid during
the year
Closing EV (before final
dividend)
Closing EV (after final dividend)
Final proposed dividend
5,617
VIF 3,541
VIF 4,192 VIF
4,192
NAV 2,076
NAV 2,547
NAV 2,398
499
Operating RoEV: 19.9%
534 86 171 169 6,739 149 6,590
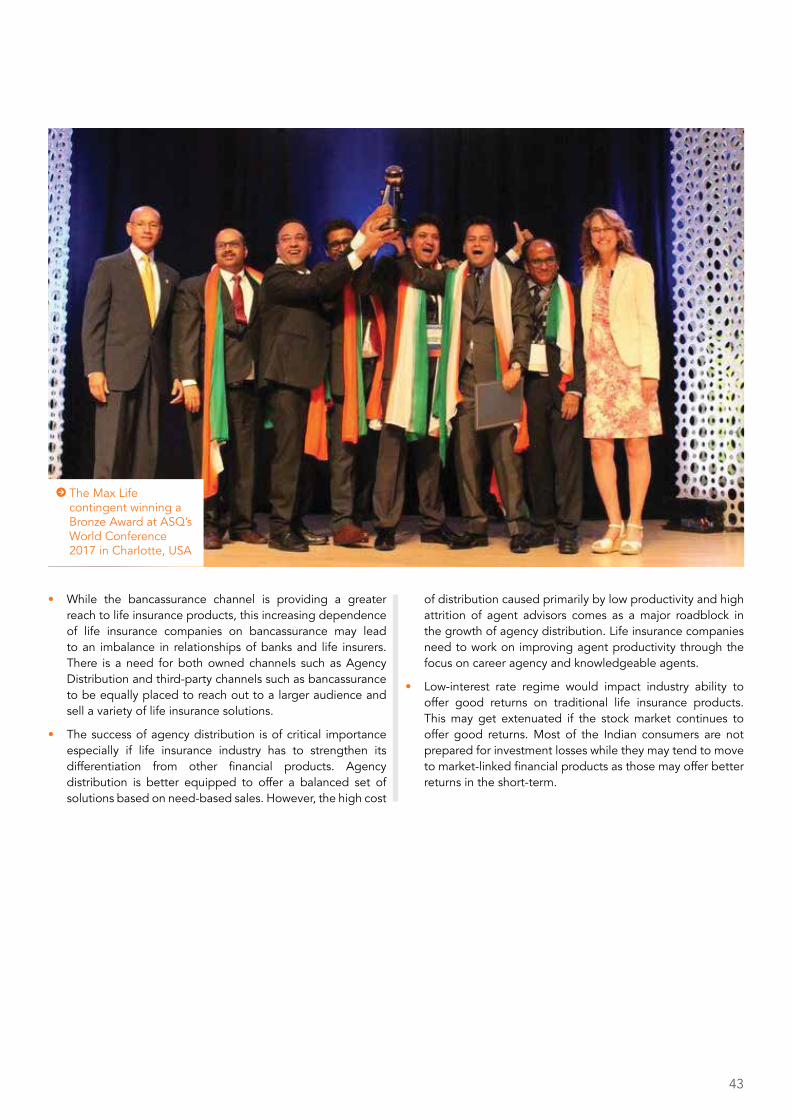
43
• While the bancassurance channel is providing a greater reach to life insurance products, this increasing dependence of life insurance companies on bancassurance may lead to an imbalance in relationships of banks and life insurers. There is a need for both owned channels such as Agency Distribution and third-party channels such as bancassurance to be equally placed to reach out to a larger audience and sell a variety of life insurance solutions.
• The success of agency distribution is of critical importance especially if life insurance industry has to strengthen its differentiation from other financial products. Agency distribution is better equipped to offer a balanced set of solutions based on need-based sales. However, the high cost
of distribution caused primarily by low productivity and high attrition of agent advisors comes as a major roadblock in the growth of agency distribution. Life insurance companies need to work on improving agent productivity through the focus on career agency and knowledgeable agents.
• Low-interest rate regime would impact industry ability to offer good returns on traditional life insurance products. This may get extenuated if the stock market continues to offer good returns. Most of the Indian consumers are not prepared for investment losses while they may tend to move to market-linked financial products as those may offer better returns in the short-term.
The Max Life contingent winning a Bronze Award at ASQ’s World Conference 2017 in Charlotte, USA
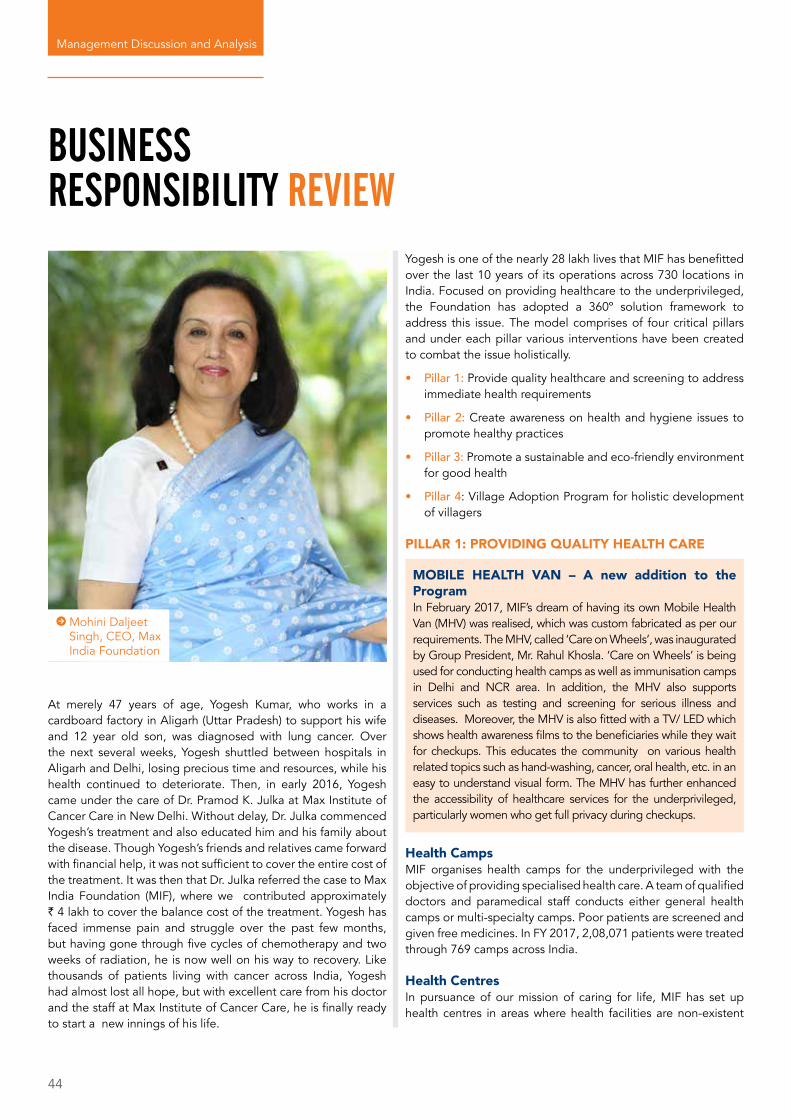
44
At merely 47 years of age, Yogesh Kumar, who works in a cardboard factory in Aligarh (Uttar Pradesh) to support his wife and 12 year old son, was diagnosed with lung cancer. Over the next several weeks, Yogesh shuttled between hospitals in Aligarh and Delhi, losing precious time and resources, while his health continued to deteriorate. Then, in early 2016, Yogesh came under the care of Dr. Pramod K. Julka at Max Institute of Cancer Care in New Delhi. Without delay, Dr. Julka commenced Yogesh’s treatment and also educated him and his family about the disease. Though Yogesh’s friends and relatives came forward with financial help, it was not sufficient to cover the entire cost of the treatment. It was then that Dr. Julka referred the case to Max India Foundation (MIF), where we contributed approximately ` 4 lakh to cover the balance cost of the treatment. Yogesh has faced immense pain and struggle over the past few months, but having gone through five cycles of chemotherapy and two weeks of radiation, he is now well on his way to recovery. Like thousands of patients living with cancer across India, Yogesh had almost lost all hope, but with excellent care from his doctor and the staff at Max Institute of Cancer Care, he is finally ready to start a new innings of his life.
Yogesh is one of the nearly 28 lakh lives that MIF has benefitted over the last 10 years of its operations across 730 locations in India. Focused on providing healthcare to the underprivileged, the Foundation has adopted a 360º solution framework to address this issue. The model comprises of four critical pillars and under each pillar various interventions have been created to combat the issue holistically.
• Pillar 1: Provide quality healthcare and screening to address immediate health requirements
• Pillar 2: Create awareness on health and hygiene issues to promote healthy practices
• Pillar 3: Promote a sustainable and eco-friendly environment for good health
• Pillar 4: Village Adoption Program for holistic development of villagers
PIllAR 1: PRovIdIng QuAlIty HEAltH CARE
MOBILE HEALTH VAN – A new addition to the ProgramIn February 2017, MIF’s dream of having its own Mobile Health Van (MHV) was realised, which was custom fabricated as per our requirements. The MHV, called ‘Care on Wheels’, was inaugurated by Group President, Mr. Rahul Khosla. ‘Care on Wheels’ is being used for conducting health camps as well as immunisation camps in Delhi and NCR area. In addition, the MHV also supports services such as testing and screening for serious illness and diseases. Moreover, the MHV is also fitted with a TV/ LED which shows health awareness films to the beneficiaries while they wait for checkups. This educates the community on various health related topics such as hand-washing, cancer, oral health, etc. in an easy to understand visual form. The MHV has further enhanced the accessibility of healthcare services for the underprivileged, particularly women who get full privacy during checkups.
Health CampsMIF organises health camps for the underprivileged with the objective of providing specialised health care. A team of qualified doctors and paramedical staff conducts either general health camps or multi-specialty camps. Poor patients are screened and given free medicines. In FY 2017, 2,08,071 patients were treated through 769 camps across India.
Health CentresIn pursuance of our mission of caring for life, MIF has set up health centres in areas where health facilities are non-existent
BUSINESS RESPONSIBILITy REVIEW
Management Discussion and Analysis
Mohini Daljeet Singh, CEO, Max India Foundation
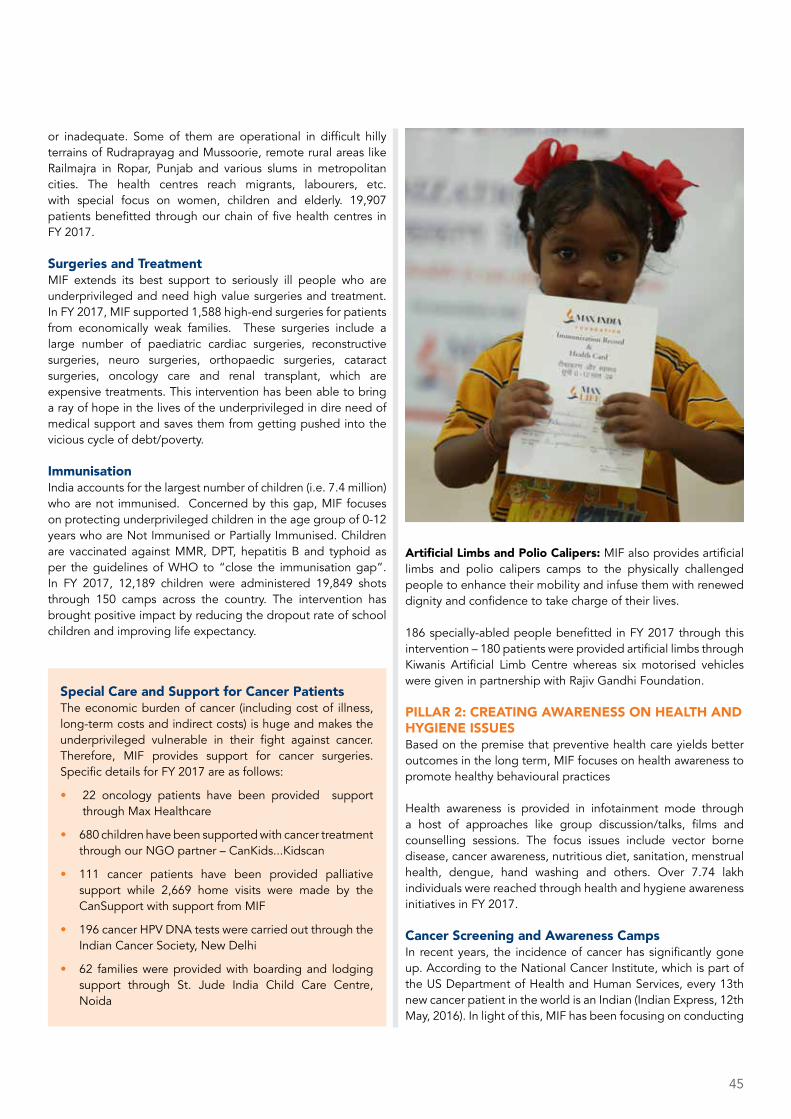
45
or inadequate. Some of them are operational in difficult hilly terrains of Rudraprayag and Mussoorie, remote rural areas like Railmajra in Ropar, Punjab and various slums in metropolitan cities. The health centres reach migrants, labourers, etc. with special focus on women, children and elderly. 19,907 patients benefitted through our chain of five health centres in FY 2017.
Surgeries and TreatmentMIF extends its best support to seriously ill people who are underprivileged and need high value surgeries and treatment. In FY 2017, MIF supported 1,588 high-end surgeries for patients from economically weak families. These surgeries include a large number of paediatric cardiac surgeries, reconstructive surgeries, neuro surgeries, orthopaedic surgeries, cataract surgeries, oncology care and renal transplant, which are expensive treatments. This intervention has been able to bring a ray of hope in the lives of the underprivileged in dire need of medical support and saves them from getting pushed into the vicious cycle of debt/poverty.
ImmunisationIndia accounts for the largest number of children (i.e. 7.4 million) who are not immunised. Concerned by this gap, MIF focuses on protecting underprivileged children in the age group of 0-12 years who are Not Immunised or Partially Immunised. Children are vaccinated against MMR, DPT, hepatitis B and typhoid as per the guidelines of WHO to “close the immunisation gap”. In FY 2017, 12,189 children were administered 19,849 shots through 150 camps across the country. The intervention has brought positive impact by reducing the dropout rate of school children and improving life expectancy.
Artificial limbs and Polio Calipers: MIF also provides artificial limbs and polio calipers camps to the physically challenged people to enhance their mobility and infuse them with renewed dignity and confidence to take charge of their lives.
186 specially-abled people benefitted in FY 2017 through this intervention – 180 patients were provided artificial limbs through Kiwanis Artificial Limb Centre whereas six motorised vehicles were given in partnership with Rajiv Gandhi Foundation.
PIllAR 2: CREAtIng AwAREnESS on HEAltH And HYGIENE ISSUESBased on the premise that preventive health care yields better outcomes in the long term, MIF focuses on health awareness to promote healthy behavioural practices
Health awareness is provided in infotainment mode through a host of approaches like group discussion/talks, films and counselling sessions. The focus issues include vector borne disease, cancer awareness, nutritious diet, sanitation, menstrual health, dengue, hand washing and others. Over 7.74 lakh individuals were reached through health and hygiene awareness initiatives in FY 2017.
Cancer Screening and Awareness CampsIn recent years, the incidence of cancer has significantly gone up. According to the National Cancer Institute, which is part of the US Department of Health and Human Services, every 13th new cancer patient in the world is an Indian (Indian Express, 12th May, 2016). In light of this, MIF has been focusing on conducting
Special Care and Support for Cancer PatientsThe economic burden of cancer (including cost of illness, long-term costs and indirect costs) is huge and makes the underprivileged vulnerable in their fight against cancer. Therefore, MIF provides support for cancer surgeries. Specific details for FY 2017 are as follows:
• 22 oncology patients have been provided support through Max Healthcare
• 680 children have been supported with cancer treatment through our NGO partner – CanKids...Kidscan
• 111 cancer patients have been provided palliative support while 2,669 home visits were made by the CanSupport with support from MIF
• 196 cancer HPV DNA tests were carried out through the Indian Cancer Society, New Delhi
• 62 families were provided with boarding and lodging support through St. Jude India Child Care Centre, Noida
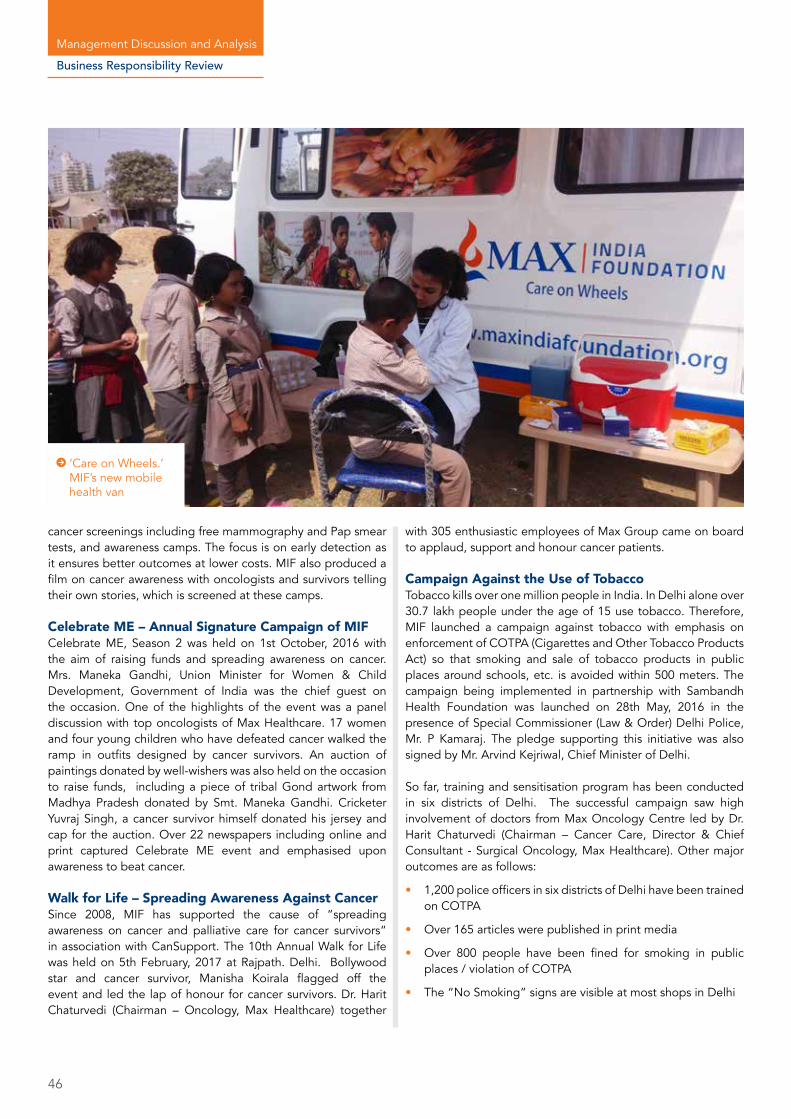
46
cancer screenings including free mammography and Pap smear tests, and awareness camps. The focus is on early detection as it ensures better outcomes at lower costs. MIF also produced a film on cancer awareness with oncologists and survivors telling their own stories, which is screened at these camps.
Celebrate ME – Annual Signature Campaign of MIFCelebrate ME, Season 2 was held on 1st October, 2016 with the aim of raising funds and spreading awareness on cancer. Mrs. Maneka Gandhi, Union Minister for Women & Child Development, Government of India was the chief guest on the occasion. One of the highlights of the event was a panel discussion with top oncologists of Max Healthcare. 17 women and four young children who have defeated cancer walked the ramp in outfits designed by cancer survivors. An auction of paintings donated by well-wishers was also held on the occasion to raise funds, including a piece of tribal Gond artwork from Madhya Pradesh donated by Smt. Maneka Gandhi. Cricketer Yuvraj Singh, a cancer survivor himself donated his jersey and cap for the auction. Over 22 newspapers including online and print captured Celebrate ME event and emphasised upon awareness to beat cancer.
Walk for Life – Spreading Awareness Against CancerSince 2008, MIF has supported the cause of “spreading awareness on cancer and palliative care for cancer survivors” in association with CanSupport. The 10th Annual Walk for Life was held on 5th February, 2017 at Rajpath. Delhi. Bollywood star and cancer survivor, Manisha Koirala flagged off the event and led the lap of honour for cancer survivors. Dr. Harit Chaturvedi (Chairman – Oncology, Max Healthcare) together
with 305 enthusiastic employees of Max Group came on board to applaud, support and honour cancer patients.
Campaign Against the Use of TobaccoTobacco kills over one million people in India. In Delhi alone over 30.7 lakh people under the age of 15 use tobacco. Therefore, MIF launched a campaign against tobacco with emphasis on enforcement of COTPA (Cigarettes and Other Tobacco Products Act) so that smoking and sale of tobacco products in public places around schools, etc. is avoided within 500 meters. The campaign being implemented in partnership with Sambandh Health Foundation was launched on 28th May, 2016 in the presence of Special Commissioner (Law & Order) Delhi Police, Mr. P Kamaraj. The pledge supporting this initiative was also signed by Mr. Arvind Kejriwal, Chief Minister of Delhi.
So far, training and sensitisation program has been conducted in six districts of Delhi. The successful campaign saw high involvement of doctors from Max Oncology Centre led by Dr. Harit Chaturvedi (Chairman – Cancer Care, Director & Chief Consultant - Surgical Oncology, Max Healthcare). Other major outcomes are as follows:
• 1,200 police officers in six districts of Delhi have been trained on COTPA
• Over 165 articles were published in print media
• Over 800 people have been fined for smoking in public places / violation of COTPA
• The “No Smoking” signs are visible at most shops in Delhi
Business Responsibility Review
‘Care on Wheels.’ MIF’s new mobile health van
Management Discussion and Analysis

47
PIllAR 3: CREAtIng A SuStAInABlE & ECo-FRIENDLY ENVIRONMENT MIF believes that good environment is a precursor to good health. Therefore, creating a sustainable and eco-friendly environment remains one of the core pillars for us. The focus is on environment awareness as well as making environment friendly choices in whatever work is being done. Key initiatives are as follows:
Tree Plantation DrivesMIF has been conducting regular tree plantation drives in Delhi, Haryana, Punjab and Dehradun. Further, we also promote tree plantation through our vast network of employees as well as NGO partners. MIF has planted fruit trees as well as trees with medicinal / herbal value for the betterment of future generations.
Environment Awareness Campaigns MIF has been spearheading environment awareness campaigns on a structured manner through monthly campaigns focused on Max Group employees as well as its vast network of NGO partners on the ground. These well-researched and compelling environment awareness campaigns are also promoted across Max Hospitals and offices in Delhi and NCR.
PIllAR 4: vIllAgE AdoPtIon PRogRAm foR HOLISTIC DEVELOPMENT OF VILLAGERSMIF adopted the villages of Dhakrani and Chandrothi Gram Sabha in the outskirts of Dehradun, the capital city of Uttrakhand in 2015. Various community interventions have been implemented across these villages especially in the area of health, education and environment to improve the quality of life of over 20,000 residents. Village specific initiatives are highlighted below:
Dhakrani VillageSewage treatment Plant: A sustainable underground sewerage system is being laid at Dhakrani. This was done as the village had no sewerage system in place and waste water spilled onto the streets as well as polluted the sources of drinking water supply. Accumulated waste water led to breeding of mosquitoes and flies and made villagers vulnerable to innumerable diseases. Under the project, all waste water and sewerage waste will be diverted through pipelines in a phased manner. So far, over 59,000 feet of pipeline has been laid and pilot testing is ongoing. Sand filters
and septic tanks have been built from which waste water will be treated and will be suitable for agricultural purpose.
Healthcare Services for the villagers: Multi-Specialty health camps are held every month at Dhakrani in association with Max Super Speciality Hospital, Dehradun and employee volunteers from Max Life Insurance. These - include oral, gynaecological, paediatric, ophthalmology health camps among others where patients are given complete medical advice and free medication if needed. Till date 20 camps have been held with 5,447 beneficiaries. MIF also engaged with Bella Healthcare, a local NGO to conduct bi-weekly general health check-up camps in Dhakrani with special focus on women and children. In addition, Bella Healthcare is conducting immunisation camps for children in the age group of 0-12 years. 1,245 children have been immunised against MMR whereas 1,125 children have been immunised for typhoid.
Solid Waste Management: To keep the village clean, waste is being collected daily from households. Two different coloured dustbins have been distributed in 1,884 households for segregation of waste as organic and inorganic. Two tractor trolleys with cleaning teams have been deployed for the same. A machine has been procured for segregation of waste and the organic waste will be converted into compost. The intervention has made surroundings much cleaner, thus reducing the risk of diseases and thereby creating a healthier environment.
Sanitary Production Unit for Local Women: A sanitary napkin production unit has been facilitated in the village by donating relevant machinery to a women’s group. The women from the village are making low cost sanitary napkins, which are being sold to the women in the village and neighbouring areas. By making available hygienic sanitary protection the health status of women and adolescent girls is expected to improve. 15,000 sanitary pads have been made till date.
volunteering Initiatives: Employee/agent advisor volunteers from Max Life Insurance’s Dehradun office have been actively engaged in making household visits. Promoting the philosophy of ‘Swacch Raho, Swasth Raho’, the volunteers speak about waste management, cleanliness, hygiene and also introduce the community to financial literacy.
Chandrothi Gram Sabha• The streets in Chandrothi Gram Sabha did not have any
lighting. Keeping the environment in mind, 310 high quality solar street lights have been installed on the road stretch of over 8 kms. The initiative has been highly applauded by villagers particularly ladies for making night travel safer.
• Further, there was no street cleaning happening in the village, therefore a cleaning vehicle has been commissioned in the village along with cleaning staff who keep the streets and area clean. The initiative is a small contribution towards furthering Swach Bharat Mission.
Anti Tobacco Flip bookIn order to sensitise the population against the ill effects of tobacco and provide valuable information on quitting tobacco, MIF developed a flip book against tobacco use. An effective tool in preventing tobacco consumption, the flip book has pictures on one side and self explanatory information in simple Hindi on the other side.

48
• MIF has set up a Health Centre for the benefit of villagers. The Centre is being operationalised by a team comprising doctor, nurse and pharmacist. Free medicine is given to the patients.
• The senior secondary government school in the village had major infrastructural issues – unpainted school walls, inadequate toilet facilities, lack of provision of safe drinking water, and non-functional computers being some of the serious concerns. . MIF stepped in and major upgradation has been made in the sanitation, sports and educational facilities of the school for the health, well-being and all-round development of children, as per following details:
• An Audio Visual hall at the school has been upgraded with installation of projector, TV, library kits, etc. for the students
• Four toilets have been constructed for girl students
• An RO water system has been installed to provide safe drinking water for the students
• Five computers have been donated to the school to provide computer enabled learning opportunities
• A cleaner has been engaged for cleaning the toilets and classrooms to ensure better health and hygiene of the children
• A badminton court has been constructed to encourage physical fitness in children
• The school exterior walls and some classrooms have been painted
otHER CSR InItIAtIvES:Life Line Express – Health on Wheels The Life Line Express, the world’s first hospital on a train is a flagship initiative of Impact India Foundation to serve the underprivileged in partnership with the Indian Railways. Doctors from Max Hospital Patparganj and Saket served at the Life Line Express camp in Shivpuri, Madhya Pradesh from 2nd – 22nd April, 2016. 21,174 OPDs (outpatient department) and 614 operations were conducted. 6,700 spectacles and 575 hearing aids were also distributed.
Multi Speciality Camp at Bodh GayaMIF in association with His Holiness Karmapa’s Kagyupa International Monlam Trust organised a Multi Speciality health camp benefitting 4,145 people from 14th-18th February, 2017 at Bodh Gaya. 4 doctors from Max Healthcare, 3 Tibetan lady doctors, 8 Tibetan nurses from Delhi and Sikkim, 2 doctors from Gaya Medical College along with volunteers from Max Life Insurance (Team Gaya) and the Trust helped in conducting the camp. Awareness films on dangers of smoking, importance of hand-washing, breast cancer, TB awareness and prevention of malaria, hepatitis, and typhoid were also screened.
Capacity Building of Health Workers Since a substantial section of the India population lives in remote areas, institutional births are not always possible. Training for traditional birth attendants (Dai) have been organised by NGO partner Seva Mandir, Udaipur that works towards improving maternal health in the tribal population of southern Rajasthan. The maternal mortality rate and infant mortality rate has been significantly reduced due to these specialised trainings. With
Business Responsibility Review
The Max India Foundation Team at a Health Camp
Management Discussion and Analysis
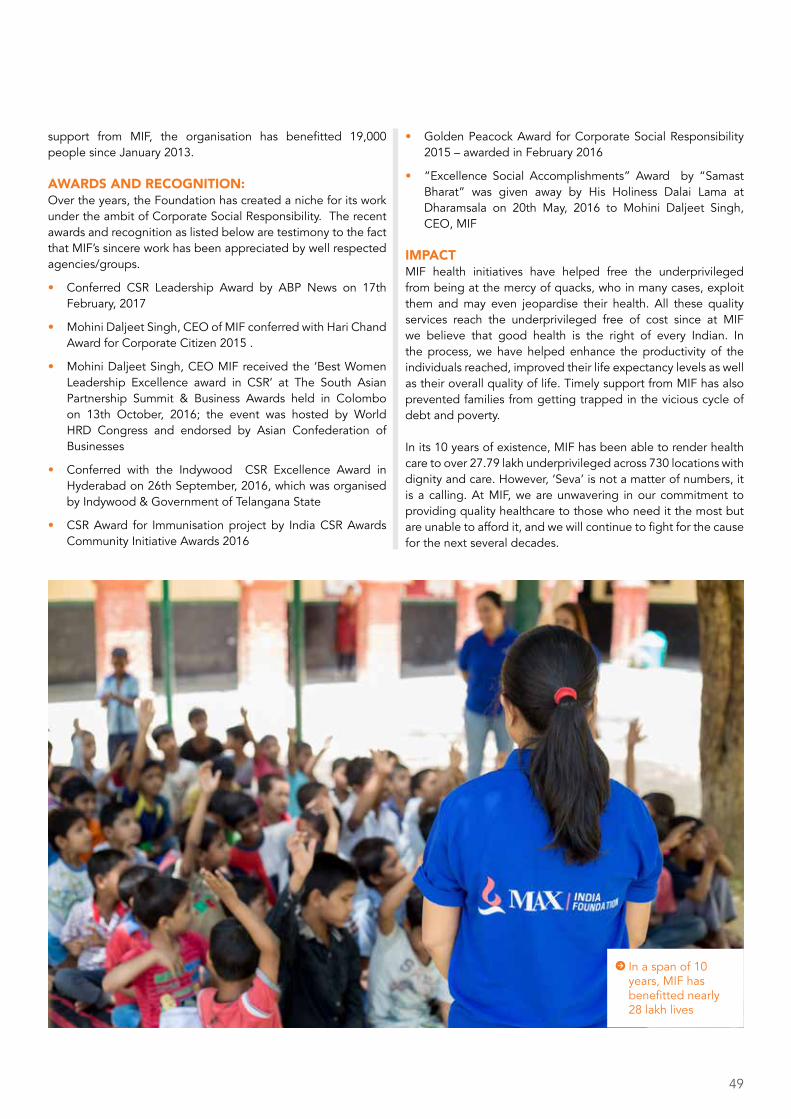
49
support from MIF, the organisation has benefitted 19,000 people since January 2013.
AwARdS And RECognItIon:Over the years, the Foundation has created a niche for its work under the ambit of Corporate Social Responsibility. The recent awards and recognition as listed below are testimony to the fact that MIF’s sincere work has been appreciated by well respected agencies/groups.
• Conferred CSR Leadership Award by ABP News on 17th February, 2017
• Mohini Daljeet Singh, CEO of MIF conferred with Hari Chand Award for Corporate Citizen 2015 .
• Mohini Daljeet Singh, CEO MIF received the ‘Best Women Leadership Excellence award in CSR’ at The South Asian Partnership Summit & Business Awards held in Colombo on 13th October, 2016; the event was hosted by World HRD Congress and endorsed by Asian Confederation of Businesses
• Conferred with the Indywood CSR Excellence Award in Hyderabad on 26th September, 2016, which was organised by Indywood & Government of Telangana State
• CSR Award for Immunisation project by India CSR Awards Community Initiative Awards 2016
• Golden Peacock Award for Corporate Social Responsibility 2015 – awarded in February 2016
• “Excellence Social Accomplishments” Award by “Samast Bharat” was given away by His Holiness Dalai Lama at Dharamsala on 20th May, 2016 to Mohini Daljeet Singh, CEO, MIF
IMPACT MIF health initiatives have helped free the underprivileged from being at the mercy of quacks, who in many cases, exploit them and may even jeopardise their health. All these quality services reach the underprivileged free of cost since at MIF we believe that good health is the right of every Indian. In the process, we have helped enhance the productivity of the individuals reached, improved their life expectancy levels as well as their overall quality of life. Timely support from MIF has also prevented families from getting trapped in the vicious cycle of debt and poverty.
In its 10 years of existence, MIF has been able to render health care to over 27.79 lakh underprivileged across 730 locations with dignity and care. However, ‘Seva’ is not a matter of numbers, it is a calling. At MIF, we are unwavering in our commitment to providing quality healthcare to those who need it the most but are unable to afford it, and we will continue to fight for the cause for the next several decades.
In a span of 10 years, MIF has benefitted nearly 28 lakh lives

CORPORATE GOVERNANCEREPORT
52
Corporate Governance Report
CORPORATE GOVERNANCE REPORTOUR CORPORATE GOVERNANCE PHILOSOPHYMax Financial Services Limited continues to be committed towards maintaining the highest standards of Corporate Governance recognizing that in today’s environment, it is a critical driver for achieving excellence, attracting high-quality talent, and optimizing capital sourcing and allocation.
To ensure strong discipline in capital management, robust performance management of the businesses and sustained value creation across all stakeholders, Max Financial Services embarked upon a journey over the last few years, to implement a comprehensive governance framework across the Group entailing implementation of various transformational initiatives across three key facets of governance:
• Board Architecture Boards in each of the Group’s operating companies stood
re-configured to create the right composition with an ideal number of independent Directors, ensuring board diversity with respect to functional and industry expertise, having an active and engaged lead Director on each Board, and separating the role of the respective CEOs and the Chairmen. In addition, a clear role for the Board has been articulated on areas like strategy formulation, monitoring financial health, leadership development, risk management and succession planning.
• Board Processes Various people processes of the Board have been optimized
(viz. on-boarding of Directors, Board education and business engagement, enabling independence, adherence to code of conduct etc.). Key operational aspects such as ensuring a comprehensive and well-balanced meeting agenda, timely and adequate information-flow to the Board, inviting external speakers to take Board sessions, are in place to ensure that the Board time is spent optimally on all critical areas of the business. To enable this, detailed Standard Operating Procedures are in place to ensure that the Board materials are comprehensive, crisp and relevant for strategic discussions.
All material matters to be considered by each Board are reviewed in specific sub-committees of the Board that are composed of the right balance between executive, non-executive and independent Directors, who add value to and are specifically qualified for the particular sub-committee. Detailed charters are published for every sub-committee of the Board.
• Board Effectiveness To enhance ‘Board Effectiveness’ and assess the Board’s
performance, an annual evaluation of Board Members is conducted and inter-Company Board movements are also effected, as may be required, to ensure that each Board is well-equipped and engaged to take the right decisions for the business. In addition, various mechanisms have been implemented to improve the performance of the Board, which involves establishing clear standards of conduct & behaviour, setting a calendar of key governance interventions (like strategy setting sessions, risk management sessions etc.), consequence management etc.
BOARD OF DIRECTORSAs on 31st March, 2017, the Board comprised of eight members with one Executive Director and seven Non-Executive Directors of which four were independent. In addition, Ms. Lavanya Ashok was acting as an alternate Director to Mr. Sanjeev Kishen Mehra. Mrs. Naina Lal Kidwai, Chairman of the Board of Directors of the Company is an Independent Director.
Effective 19th May, 2017, Mr. Sanjeev Kishen Mehra resigned from the directorship of the Company. Simultaneously, Ms. Lavanya Ashok also ceased to be alternate director with effect from that date.
None of the Director is a member in more than ten committees or the Chairman of more than five committees, across all public companies in which he / she is a Director.

53
The details of the Directors and their attendance at the Board meeting during FY 2016-17 and at the last annual general meeting, including the details of their Directorships and Committee Memberships, as of 31st March, 2017, are given below:
Name of Director Number of Board meetings during the
year 2016-17
Attendance at last AGM held on 27th September,
2016
Number of Directorships in other companies as on 31st
March, 2017*
Number of committee positions held in
public companies as on 31st March, 2017**
Held Attended Chairman Member
Mrs. Naina Lal Kidwai [Independent Director & Chairman]
6 5 Yes 3 - 2
Mr. Mohit Talwar [Managing Director]
6 6 Yes 7 1 5
Mr. Rajesh Khanna [Independent Director]
6 6 No 3 - 1
Mr. Aman Mehta [Independent Director]
6 5 No 6 2 4
Mr. Ashwani Windlass [Non-Executive Director]
6 5 No 5 4 -
Mr. Dinesh Kumar Mittal [Independent Director]
6 5 Yes 12 1 9
Mr. Sanjay Omprakash Nayar [Non-Executive Director]
6 3^ No 17 - 1
Mr. Sanjeev Kishen Mehra@ [Non-Executive Director]
6 0 No - - -
Ms. Lavanya Ashok [Alternate Director to Mr. Sanjeev Kishen Mehra]
6 0 No 3 - -
* Excluding Foreign Companies and Companies formed under Section 8 of the Companies Act, 2013 / Section 25 of the Companies Act, 1956.
** Represents Memberships/Chairmanships of Audit Committee and Stakeholders’ Relationship Committee of Indian Public Limited Companies, other than companies formed under Section 8 of the Companies Act, 2013 / Section 25 of the Companies Act, 1956.
@ Nominee of Goldman Sachs.
# Appointed as an Alternate Director effective 1st April, 2016.
^ Two meetings attended through Video Conferencing
Details of Board meetings held during the year ended 31st march, 2017:S. No.
Date Board Strength
No. of Directors present
1 30th May, 2016 8 6
2 17th June, 2016 8 4
3 8th August, 2016 8 7
4 4th November, 2016 8 7
5 10th February, 2017 8 7
6 27th March, 2017 8 4
There are no inter-se relationships between our Board members.
The details of equity shares of ` 2/- each held by Directors of the Company as on 31st March, 2017 are: (a) Mr. Ashwani Windlass – 1,62,850 shares, (b) Mr. Aman Mehta – 29,000 shares, (c) Mr. Rajesh Khanna – 25,000 shares and (d) Mr. Mohit Talwar – 35,438 shares.
How do we make sure our board is effective?The calendar for the Board and Committee meetings is fixed in advance for the whole year, along with significant agenda
items. At least one Board meeting is held within 45 days from the close of each quarter to review financial results and business performance and the gap between two Board meetings does not exceed four calendar months, as required by law. Apart from the aforesaid four meetings, additional Board meetings are also convened to meet business exigencies, as required. Matters of exigency are approved by the Directors by resolutions passed by circulation as permissible under the provisions of the Companies Act, 2013.
Meetings of Committees of Board are generally held prior to the Board meeting. The Chairpersons of the respective Committees brief the Board about the proceedings of the Committee meetings and its recommendations on matters that the Board needs to consider and approve.
All Agenda items are accompanied by comprehensive notes on the related subject and in certain areas such as business plans / business reviews and financial results, detailed presentations are made to the Board members. The materials for the Board and committee meetings are generally published (electronically in a secure dedicated portal) seven days in advance. The Board is regularly updated on the key risks and the steps and process

54
initiated for managing, reducing and, if feasible, eliminating various risks. Business risk evaluation and management is an ongoing process with the Company.
To enable the Board to discharge its responsibilities effectively, members of the Board are apprised on the overall performance of the Company and its subsidiary at every Board meeting. The Board has complete access to all the relevant information within the Company and all its employees. Senior Management is invited to attend the Board / Committee meetings to provide detailed insight into the items being discussed.
Code of GovernanceIn compliance with Regulation 26(3) of SEBI (Listing Obligations and Disclosure Requirements) Regulations, 2015 (“Listing Regulations”), the Company had adopted a Code of Conduct for the Directors and senior management of the Company (‘the Code’), a copy of which is available on the Company’s website www.maxfinancialservices.com. All the members of the Board of Directors and senior management personnel had affirmed compliance with the above mentioned regulation including Code for the financial year ended 31st March, 2017 and a declaration to this effect signed by the Managing Director forms part of this report as Annexure- I.
Pursuant to the requirements of the SEBI (Prohibition of Insider Trading) Regulations, 2015 as amended, the Company has adopted an Insider Trading Policy for prevention of insider trading, which is applicable to all the Directors, Promoters, Key Managerial Personnel and designated employees / persons.
COMMITTEES OF THE BOARDThe composition of the Committees of the Board of Directors of the Company remained same during the year under review.
Audit CommitteeAs on 31st March, 2017, this Committee comprised of Mr. D.K. Mittal (Chairman), Mr. Aman Mehta, Mr. Rajesh Khanna and Mr. Mohit Talwar. All members of the Committee, except Mr. Mohit Talwar, are Independent Directors. Mr. Rahul Khosla, Executive President of the Company is a permanent invitee to the Committee. The Company Secretary of the Company acts as the Secretary to this Committee.
The scope of the Audit Committee has been defined by the Board of Directors in accordance with Regulation 18 and Part C of Schedule II of the Listing Regulations and applicable provisions of the Companies Act, 2013. This Committee inter alia, recommends appointment and remuneration of statutory auditors – secretarial auditors – internal auditors; reviews Company’s financial reporting processes and systems and internal financial controls, financial and risk management policies, Company’s financial statements, including annual and quarterly financial results and financial accounting practices & policies and reviews the functioning of the whistle blower mechanism.
The representatives of Internal Auditors and Statutory Auditors are invited to the meetings of the Committee, as required. Mr. D. K.
Mittal, Chairman of the Audit Committee, was present at the last Annual General Meeting.
Meetings & attendance during the year ended 31st March, 2017:
Name of Director Number of meetings held
Number of meetings attended
Mr. D.K. Mittal 4 4
Mr. Aman Mehta 4 4
Mr. Rajesh Khanna 4 4
Mr. Mohit Talwar 4 4
nomination and Remuneration Committee:As on 31st March, 2017, this Committee comprised of Mr. Rajesh Khanna (Chairman), Mr. Aman Mehta, Mr. Ashwani Windlass and Mrs. Naina Lal Kidwai. All the members are Independent Directors, except Mr. Ashwani Windlass who is a Non-executive non-independent Director. Mr. Rahul Khosla, Executive President of the Company is a permanent invitee to the Committee.
The scope of the Nomination and Remuneration Committee has been defined by the Board of Directors in accordance with Regulation 19 and Part D of Schedule II to the Listing Regulations and applicable provisions of the Companies Act, 2013. This Committee inter alia, evaluates the compensation and benefits for Executive Directors and Senior Executives at one level below the Board, recruitment of key managerial personnel and finalization of their compensation, induction of Executive and Non-Executive Directors and fixing the method, criteria and quantum of compensation to be paid to the Non-Executive Directors. It also administers the ESOP Scheme(s) of the Company including allotment of equity shares arising from exercise of stock options. The remuneration policy of the Company is aimed at attracting and retaining the best talent to leverage performance in a significant manner. The strategy takes into account, the remuneration trends, talent market and competitive requirements.
Meetings & attendance during the year ended 31st March, 2017:
Name of Director Number of meetings held
Number of meetings attended
Mr. Rajesh Khanna 3 3
Mrs. Naina Lal Kidwai 3 3
Mr. Aman Mehta 3 3
Mr. Ashwani Windlass 3 2
Remuneration paid to Directors during FY 2016 - 17During FY 2016–17, the Company paid sitting fees of ̀ 1,00,000/- per meeting to its Non Executive / Independent Directors for attending the meetings of Board and Committees of the Board and separate meeting(s) of Independent Directors. There were no pecuniary relationships between the Company and its Non-
Corporate Governance Report

55
Executive / Independent Directors, except the sitting fees. Details of the sitting fees paid during FY 2016-17 are as under:
S. No. Name of the Director Sitting Fee paid (in `)
1 Mrs. Naina Lal Kidwai 9,00,000.00
2 Mr. Ashwani Windlass 18,00,000.00
3 Mr. Rajesh Khanna 20,00,000.00
4 Mr. Aman Mehta 15,00,000.00
5 Mr. Dinesh Kumar Mittal 21,00,000.00
The remuneration payable to Managing Director of the Company, including performance incentives and grant of ESOPs / PSPs, were determined from time to time by the Nomination and Remuneration Committee, within the limits approved by the Board of Directors and shareholders of the Company, in terms of applicable provisions of the Companies Act, 1956 and Companies Act, 2013 read with the Company’s remuneration policy. The details of the remuneration policy form part of the Directors’ Report attached as part of this Annual Report.
Details of the remuneration of Mr. Mohit Talwar as Managing Director for the period from 1st April, 2016 to 31st March, 2017 are as under:
(Amount in `)
Description Mr. Mohit Talwar
Salary and allowances 2,91,82,596
Other Benefits (Perquisites) 1,73,03,732
Performance Incentive / special payments 1,96,00,800
Retirals 15,36,000
Service contract 5 years
Notice period 3 months
Stock options granted (in numbers) 29,235
The severance fee, if any, shall be payable as per the provisions of Companies Act, 2013. The Variable Compensation / Performance Incentive shall be paid depending on the performance rating and Company’s performance within the limits approved by shareholders of the Company.
During FY 2016-17, 29,235 stock options were granted to Mr. Mohit Talwar on 1st April, 2016 entitling him to receive 29,235 equity shares of ` 2/- at an exercise price of ` 2/- per equity share with a graded vesting over a four year period. No other Director was granted any stock options during FY 2016-17.
The performance evaluation procedure for Directors is detailed in the Directors’ Report attached as part of this Annual Report.
Stakeholders Relationship Committee As on 31st March, 2017, this Committee earlier known as ‘Shareholders / Investors Grievance Committee’, comprised of Mr. Ashwani Windlass (Chairman), Mr. D.K. Mittal and Mr. Mohit Talwar. Key responsibilities of this Committee are formulation of procedures, in line with the statutory guidelines, for ensuring speedy disposal of various requests received from shareholders from time to time and redressal of shareholders’ and investors’ complaints/ grievances. The Committee also approves the transfer and transmission of securities; and issuance of duplicate certificates etc.
Meetings & attendance during the year ended 31st March, 2017:
Name of the Director Number of meetings held
Number of meetings attended
Mr. Ashwani Windlass 5 5
Mr. Mohit Talwar 5 5
Mr. D.K. Mittal 5 5
The Committee has delegated the authority to effect transfer and transmission of shares up to 1000 per folio to Company Secretary / Compliance Officer, and such transfers are subsequently ratified in next meeting of the Committee. The Company has normally attended to the Shareholders / Investors complaints within a period of 7 working days except in cases which were under legal proceedings / disputes. During the financial year ended 31st March, 2017, 16 complaints/ queries were received by the Company, which were general in nature viz. issues relating to non-receipt of dividend, annual reports, share certificates etc., all of those were resolved to the satisfaction of the respective shareholders (including 1 complaint which was pending as on 31st March, 2017 and resolved in April 2017).
Mr. Sandeep Pathak was appointed as Company Secretary and Compliance Officer effective 5th July, 2016 and acts as the Secretary to this Committee.
Investment & Finance CommitteeAs on 31st March, 2017, this Committee comprised of Mr. Ashwani Windlass (Chairman), Mr. D.K. Mittal, Mr. Rajesh Khanna, Mr. Sanjeev Kishen Mehra and Mr. Mohit Talwar. Mr. Rahul Khosla, Executive President of the Company, is a permanent invitee to the Committee. The responsibilities of this Committee are to review financial performance of businesses carried on by the Company and its subsidiary, review and recommend revenue and capital budgets of the Company and its subsidiary, review and recommend various fund raising options and financial resources allocation to Company’s subsidiary and to review proposals on business restructuring, mergers, consolidations acquisitions, investments, establishment of joint ventures and divestments of any businesses, etc.
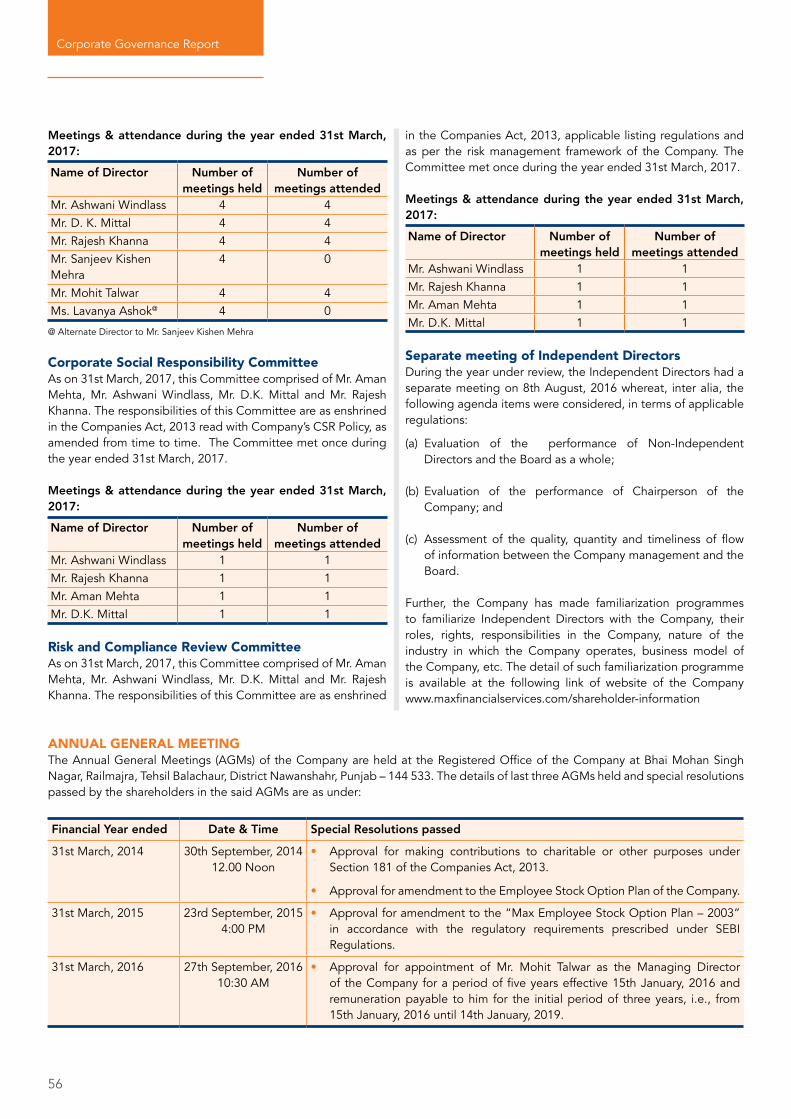
56
Meetings & attendance during the year ended 31st March, 2017:
Name of Director Number of meetings held
Number of meetings attended
Mr. Ashwani Windlass 4 4Mr. D. K. Mittal 4 4Mr. Rajesh Khanna 4 4Mr. Sanjeev Kishen Mehra
4 0
Mr. Mohit Talwar 4 4Ms. Lavanya Ashok@ 4 0
@ Alternate Director to Mr. Sanjeev Kishen Mehra
Corporate Social Responsibility CommitteeAs on 31st March, 2017, this Committee comprised of Mr. Aman Mehta, Mr. Ashwani Windlass, Mr. D.K. Mittal and Mr. Rajesh Khanna. The responsibilities of this Committee are as enshrined in the Companies Act, 2013 read with Company’s CSR Policy, as amended from time to time. The Committee met once during the year ended 31st March, 2017.
Meetings & attendance during the year ended 31st March, 2017:
Name of Director Number of meetings held
Number of meetings attended
Mr. Ashwani Windlass 1 1Mr. Rajesh Khanna 1 1Mr. Aman Mehta 1 1Mr. D.K. Mittal 1 1
Risk and Compliance Review CommitteeAs on 31st March, 2017, this Committee comprised of Mr. Aman Mehta, Mr. Ashwani Windlass, Mr. D.K. Mittal and Mr. Rajesh Khanna. The responsibilities of this Committee are as enshrined
in the Companies Act, 2013, applicable listing regulations and as per the risk management framework of the Company. The Committee met once during the year ended 31st March, 2017.
Meetings & attendance during the year ended 31st March, 2017:
Name of Director Number of meetings held
Number of meetings attended
Mr. Ashwani Windlass 1 1Mr. Rajesh Khanna 1 1Mr. Aman Mehta 1 1Mr. D.K. Mittal 1 1
Separate meeting of Independent DirectorsDuring the year under review, the Independent Directors had a separate meeting on 8th August, 2016 whereat, inter alia, the following agenda items were considered, in terms of applicable regulations:
(a) Evaluation of the performance of Non-Independent Directors and the Board as a whole;
(b) Evaluation of the performance of Chairperson of the Company; and
(c) Assessment of the quality, quantity and timeliness of flow of information between the Company management and the Board.
Further, the Company has made familiarization programmes to familiarize Independent Directors with the Company, their roles, rights, responsibilities in the Company, nature of the industry in which the Company operates, business model of the Company, etc. The detail of such familiarization programme is available at the following link of website of the Company www.maxfinancialservices.com/shareholder-information
ANNUAL GENERAL MEETINGThe Annual General Meetings (AGMs) of the Company are held at the Registered Office of the Company at Bhai Mohan Singh Nagar, Railmajra, Tehsil Balachaur, District Nawanshahr, Punjab – 144 533. The details of last three AGMs held and special resolutions passed by the shareholders in the said AGMs are as under:
Financial Year ended Date & Time Special Resolutions passed
31st March, 2014 30th September, 2014 12.00 Noon
• Approval for making contributions to charitable or other purposes under Section 181 of the Companies Act, 2013.
• Approval for amendment to the Employee Stock Option Plan of the Company.
31st March, 2015 23rd September, 2015 4:00 PM
• Approval for amendment to the “Max Employee Stock Option Plan – 2003” in accordance with the regulatory requirements prescribed under SEBI Regulations.
31st March, 2016 27th September, 2016 10:30 AM
• Approval for appointment of Mr. Mohit Talwar as the Managing Director of the Company for a period of five years effective 15th January, 2016 and remuneration payable to him for the initial period of three years, i.e., from 15th January, 2016 until 14th January, 2019.
Corporate Governance Report
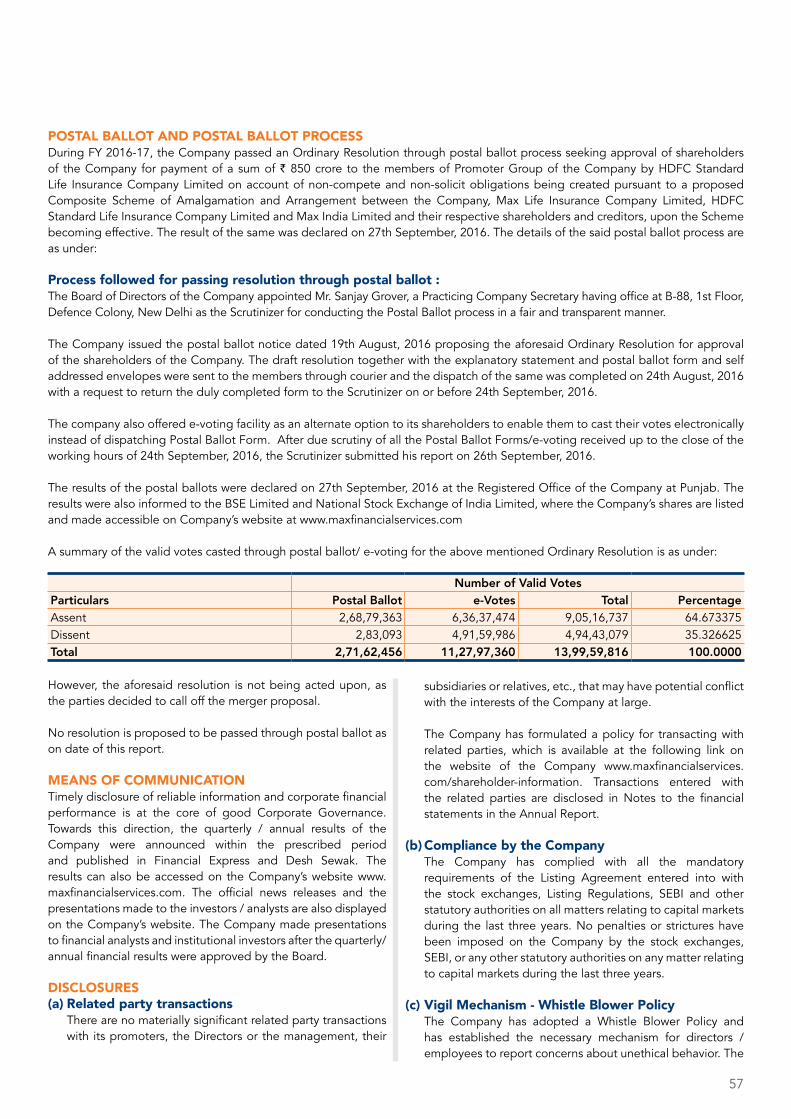
57
POSTAL BALLOT AND POSTAL BALLOT PROCESSDuring FY 2016-17, the Company passed an Ordinary Resolution through postal ballot process seeking approval of shareholders of the Company for payment of a sum of ` 850 crore to the members of Promoter Group of the Company by HDFC Standard Life Insurance Company Limited on account of non-compete and non-solicit obligations being created pursuant to a proposed Composite Scheme of Amalgamation and Arrangement between the Company, Max Life Insurance Company Limited, HDFC Standard Life Insurance Company Limited and Max India Limited and their respective shareholders and creditors, upon the Scheme becoming effective. The result of the same was declared on 27th September, 2016. The details of the said postal ballot process are as under:
Process followed for passing resolution through postal ballot : The Board of Directors of the Company appointed Mr. Sanjay Grover, a Practicing Company Secretary having office at B-88, 1st Floor, Defence Colony, New Delhi as the Scrutinizer for conducting the Postal Ballot process in a fair and transparent manner.
The Company issued the postal ballot notice dated 19th August, 2016 proposing the aforesaid Ordinary Resolution for approval of the shareholders of the Company. The draft resolution together with the explanatory statement and postal ballot form and self addressed envelopes were sent to the members through courier and the dispatch of the same was completed on 24th August, 2016 with a request to return the duly completed form to the Scrutinizer on or before 24th September, 2016.
The company also offered e-voting facility as an alternate option to its shareholders to enable them to cast their votes electronically instead of dispatching Postal Ballot Form. After due scrutiny of all the Postal Ballot Forms/e-voting received up to the close of the working hours of 24th September, 2016, the Scrutinizer submitted his report on 26th September, 2016.
The results of the postal ballots were declared on 27th September, 2016 at the Registered Office of the Company at Punjab. The results were also informed to the BSE Limited and National Stock Exchange of India Limited, where the Company’s shares are listed and made accessible on Company’s website at www.maxfinancialservices.com
A summary of the valid votes casted through postal ballot/ e-voting for the above mentioned Ordinary Resolution is as under:
Number of Valid VotesParticulars Postal Ballot e-Votes Total PercentageAssent 2,68,79,363 6,36,37,474 9,05,16,737 64.673375Dissent 2,83,093 4,91,59,986 4,94,43,079 35.326625Total 2,71,62,456 11,27,97,360 13,99,59,816 100.0000
However, the aforesaid resolution is not being acted upon, as the parties decided to call off the merger proposal.
No resolution is proposed to be passed through postal ballot as on date of this report.
MEANS OF COMMUNICATIONTimely disclosure of reliable information and corporate financial performance is at the core of good Corporate Governance. Towards this direction, the quarterly / annual results of the Company were announced within the prescribed period and published in Financial Express and Desh Sewak. The results can also be accessed on the Company’s website www.maxfinancialservices.com. The official news releases and the presentations made to the investors / analysts are also displayed on the Company’s website. The Company made presentations to financial analysts and institutional investors after the quarterly/ annual financial results were approved by the Board.
DISCLOSURES(a) Related party transactions There are no materially significant related party transactions
with its promoters, the Directors or the management, their
subsidiaries or relatives, etc., that may have potential conflict with the interests of the Company at large.
The Company has formulated a policy for transacting with related parties, which is available at the following link on the website of the Company www.maxfinancialservices.com/shareholder-information. Transactions entered with the related parties are disclosed in Notes to the financial statements in the Annual Report.
(b) Compliance by the Company The Company has complied with all the mandatory
requirements of the Listing Agreement entered into with the stock exchanges, Listing Regulations, SEBI and other statutory authorities on all matters relating to capital markets during the last three years. No penalties or strictures have been imposed on the Company by the stock exchanges, SEBI, or any other statutory authorities on any matter relating to capital markets during the last three years.
(c) Vigil Mechanism - Whistle Blower Policy The Company has adopted a Whistle Blower Policy and
has established the necessary mechanism for directors / employees to report concerns about unethical behavior. The
58
policy provides adequate safeguards against victimization of directors / employees. It is hereby affirmed that no person has been denied access to the Chairman of the Audit Committee on matters relating to Whistle Blower Policy of the Company.
(d) Disclosure of compliance with corporate governance requirements
The Company has complied with all the mandatory requirements specified in Regulations 17 to 27 and clauses (b) to (i) of sub-regulation (2) of Regulation 46 of the SEBI (Listing Obligations and Disclosure Requirements) Regulations, 2015.
SUBSIDIARY COMPANY The Company had one material unlisted subsidiary company viz., Max Life Insurance Company Limited (“Max Life”) during FY 2016-17. Further, the Company has formulated a policy for determining ‘material subsidiaries’ which is disclosed at the following link on the website of the Company www.maxfinancialservices.com/shareholder-information.
Mr. Rajesh Khanna and Mr. D K Mittal are the common Independent Directors for the Company and Max Life. Further, Mr. Mohit Talwar – Managing Director of the Company is a non-executive director on the Board of Max Life.
GENERAL SHAREHOLDER INFORMATIONA section on the ‘General Shareholder Information’ is annexed, and forms part of this Annual Report.
MANAGEMENT DISCUSSION & ANALYSISA section on the ‘Management Discussion & Analysis’ is annexed and forms part of this Annual Report.
COMPLIANCE CERTIFICATE ON CORPORATE GOVERNANCEThe certification by the Managing Director and Chief Financial Officer of the Company, in compliance of Regulation 17(8) read
with Part B, Schedule II of the Listing Regulations, is enclosed as Annexure II.
M/s. Chandrasekaran Associates, Practicing Company Secretaries have certified that the Company has complied with the conditions of Corporate Governance as stipulated in Schedule V of the Listing Regulations and the said certificate is annexed to the Report as Annexure-III.
DISCLOSURE ON NON-MANDATORY REQuIREmEntSThe Company has duly complied with all the mandatory requirements under Listing Regulations and the status of compliance with the non-mandatory recommendations under Part E of Schedule II of the Listing Regulations is given below:
Shareholders’ Rights:The quarterly, half-yearly and annual financial results of the Company are published in newspapers and also posted on the Company’s website.
Audit Qualification:It has always been the Company’s endeavor to present unqualified financial statements. There is no audit qualification in respect of financial statements of the Company for FY 2016-17.
Separate posts of Chairman and CEOThe Company has separate persons to the post of Chairman and Managing Director. Mrs. Naina Lal Kidwai, Independent Director is the Chairman and Mr. Mohit Talwar is the Managing Director of the Company.
Reporting of Internal AuditorThe Internal Auditors report directly to the Audit Committee, which defines the scope of Internal Audit.
For Max Financial Services Limited(formerly Max India Limited)
Naina Lal Kidwai Place: New Delhi ChairmanDate : 9th August, 2017 DIN: 00017806
Corporate Governance Report
59
ANNEXURE- I
Declaration by the Managing Director on code of conduct as required by Regulation 26(3) of SEBI (Listing Obligations and Disclosure Requirements) Regulations, 2015.
This is to declare and confirm that the Company has received affirmations of compliance with the provisions of Company’s Code of Conduct for the financial year ended 31st March, 2017 from all Directors and Senior Management personnel of the Company.
For Max Financial Services Limited(formerly Max India Limited)
Mohit TalwarPlace: New Delhi Managing Director Date : 9th August, 2017 DIN: 02394694

60
Corporate Governance Report
ANNEXURE - I ICERTIFICATION BY MANAGING DIRECTOR AND CHIEF FINANCIAL OFFICER
ToThe Board of Directors,Max Financial Services Limited (Formerly Max India Limited)
We, Mohit Talwar, Managing Director and Sujatha Ratnam, Chief Financial Officer of Max Financial Services Limited (Formerly Max India Limited) (“the Company”) certify that:
A. We have reviewed the financial statements and the cash flow statement of the Company for the financial year ended 31st March, 2017 and that to the best of our knowledge and belief:
(a) these statements do not contain any materially untrue statement or omit any material fact or contain statements that are misleading; and
(b) these statements together present a true and fair view of the Company’s affairs and are in compliance with existing accounting standards, applicable laws and regulations.
B. There are, to the best of our knowledge and belief, no transactions entered into by the Company during the year which are fraudulent, illegal or violative of the Company’s code of conduct.
C. We accept responsibility for establishing and maintaining internal controls for financial reporting and that we have evaluated the effectiveness of internal control systems of the Company pertaining to financial reporting and we have disclosed to the Auditors and the Audit Committee, wherever applicable, deficiencies in the design or operation of such internal controls, if any, of which we are aware of, and the steps we have taken or propose to take to rectify these deficiencies.
D. We have indicated to the Auditors and the Audit Committee, wherever applicable:
(i) significant changes in internal control over financial reporting during the year;
(ii) significant changes in accounting policies during the year and that the same have been disclosed in the notes to the financial statements; and
(iii) instances of significant fraud of which we have become aware and the involvement therein, if any, of the management or any employee having a significant role in the Company’s internal control system over financial reporting.
For Max Financial Services Limited(formerly Max India Limited)
Mohit Talwar Sujatha RatnamPlace: New Delhi Managing Director Chief Financial OfficerDate : 9th August, 2017 DIN: 02394694
61
ANNEXURE- III CORPORATE GOVERNANCE CERTIFICATE
To The Members Max Financial Services Limited (Formerly Max India Limited)Bhai Mohan Singh Nagar,Rail Majra, Tehsil Balachaur,District Nawanshahr, Punjab - 144 533
We have examined all relevant records of Max Financial Services Limited (“the Company”) for the purpose of certifying all the conditions of the Corporate Governance under SEBI (Listing Obligations and Disclosure Requirements) Regulations, 2015 for the financial year ended 31st March 2017. We have obtained all the information and explanations which to the best of our knowledge and belief were necessary for the purposes of certification.
The compliance of the conditions of Corporate Governance is the responsibility of the management. Our examination was limited to the procedures and implementation thereof. This certificate is neither an assurance as to the future viability of the Company nor of the efficacy or effectiveness with which the management has conducted the affairs of the Company.
On the basis of our examination of the records produced explanations and information furnished, we certify that the Company has complied with the conditions of the Corporate Governance under SEBI (Listing Obligations and Disclosure Requirements) Regulations, 2015.
For Chandrasekaran AssociatesCompany Secretaries
Rupesh AgarwalPartnerMembership No. ACS 16302Certificate of Practice No. 5673
Date : August 9, 2017Place: Delhi

GENERAL SHAREHOLDERINFORMATION

64
General Shareholder Information
GENERAL SHAREHOLDER INFORMATIONREgIStEREd offICE:Bhai Mohan Singh Nagar, Railmajra, Tehsil Balachaur, District Nawanshahr, Punjab - 144 533.
InvEStoR HElPlInE:Max House, 1, Dr. Jha Marg, Okhla, Phase III, New Delhi–110 020Phone–011 42598000, Fax–011 26324126 e-mail: [email protected]
SHARE tRAnSfER AgEnt:Mas Services Limited, T-34, 2nd Floor, Okhla Industrial Area, Phase - II New Delhi–110 020, Tel–011 26387281/82/83, Fax–011 26387384e-mail: [email protected]
AnnuAl gEnERAl mEEtIng:Date and Time: Tuesday, 26th September, 2017 at 1030 hrs.
Venue: Registered Office of the Company at Bhai Mohan Singh Nagar, Railmajra, Tehsil Balachaur, District Nawanshahr, Punjab-144 533.
Book Closure: Wednesday, 20th September, 2017 to Tuesday, 26th September, 2017 (both days inclusive)
fInAnCIAl yEAR: The financial year of the Company starts from 1st April of a year and ends on 31st March of the following year.
fInAnCIAl CAlEndAR – 2017-18:1 First quarter
resultsBy second week of August, 2017
2 Second quarter & half yearly results
By second week of November, 2017
3 Third quarter results
By second week of February, 2018
4 Annual results By 30th May, 2018
lIStIng on StoCK EXCHAngES:The Equity Shares of the Company are listed on the BSE Limited (‘BSE’) and the National Stock Exchange of India Limited (‘NSE’).
BSE Limited Phiroze Jeejeebhoy Towers, Dalal Street, Mumbai- 400 001Phones : 91-22-22721233/4Fax : 91-22-22721919
National Stock Exchange of India Ltd.Exchange Plaza, C-1, Block G,Bandra Kurla Complex, Bandra (E), Mumbai – 400 051Tel No: (022) 26598100 – 8114Fax No: (022) 26598120
The Company confirms that it has paid annual listing fees due to BSE and NSE for the year 2017-18.
ConnECtIvIty wItH dEPoSItoRIES:The Company’s shares are in dematerialized mode through National Securities Depository Limited (‘NSDL’) and Central Depository Services (India) Limited (‘CDSL’).
StoCK CodE:BSE 500271
NSE MFSL
Demat ISIN No. for NSDL and CDSL INE180A01020
Reuters BloombergBSE MAXI.BO MAXF:INNSE MAXI.NS NMAX:IN
SHARE PRICE DATA - MONTHLY HIGH AND LOW ON NSE AND BSE Month NSE BSE
High (`)
Low (`)
High (`)
Low (`)
April, 2016 379.00 333.00 377.40 334.40May, 2016 390.85 345.00 391.50 347.50June, 2016 564.70 345.00 563.40 360.00July, 2016 618.00 423.00 618.20 425.75August, 2016 585.45 476.70 585.90 477.40September, 2016 628.00 536.25 627.40 536.00October, 2016 573.75 533.70 574.40 534.10November, 2016 580.00 485.95 579.75 482.00December, 2016 568.00 516.75 564.90 517.60January, 2017 579.00 537.20 578.80 538.00February, 2017 639.00 559.20 638.00 559.05March, 2017 586.95 512.30 586.50 513.00
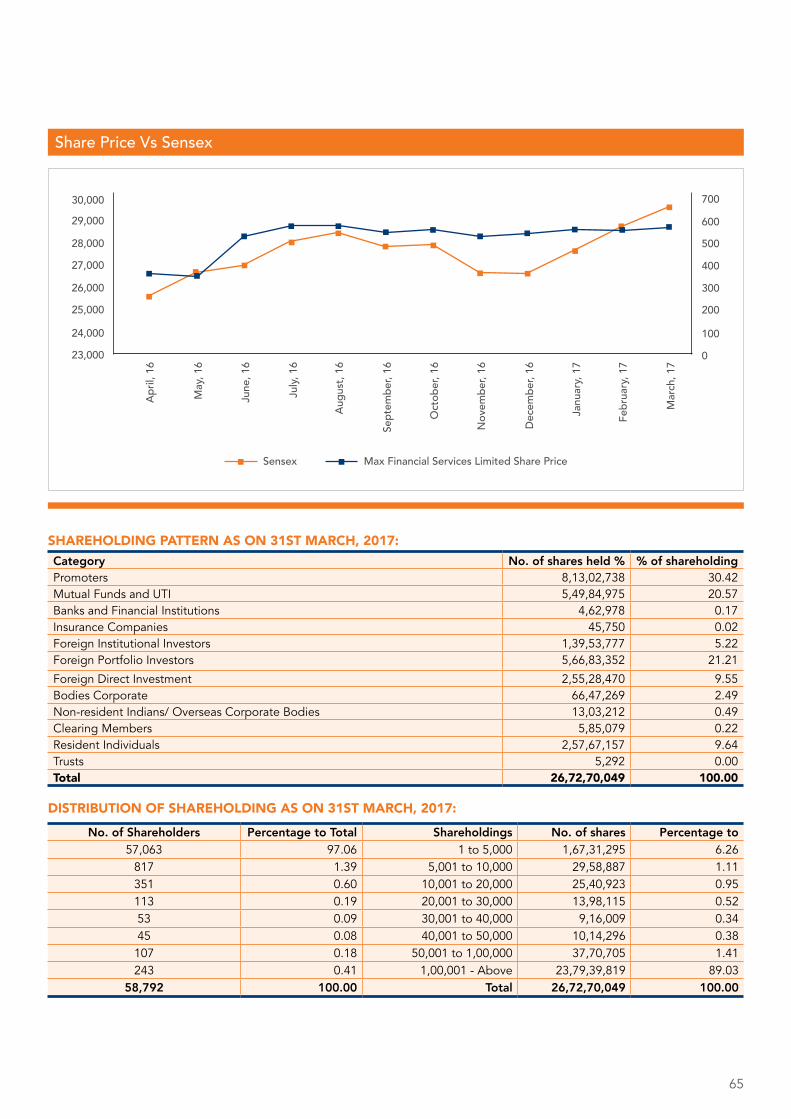
65
Share Price Vs Sensex
30,000
100
200
300
400
500
0
29,000
28,000
27,000
26,000
25,000
24,000
23,000
April
, 16
Sensex Max Financial Services Limited Share Price
May
, 16
June
, 16
July,
16
Augu
st, 1
6
Sept
embe
r, 16
Oct
ober
, 16
Nove
mbe
r, 16
Dece
mbe
r, 16
Janu
ary,
17
Febr
uary,
17
Mar
ch, 1
7
700
600
SHAREHoldIng PAttERn AS on 31St mARCH, 2017:Category No. of shares held % % of shareholdingPromoters 8,13,02,738 30.42Mutual Funds and UTI 5,49,84,975 20.57Banks and Financial Institutions 4,62,978 0.17Insurance Companies 45,750 0.02Foreign Institutional Investors 1,39,53,777 5.22Foreign Portfolio Investors 5,66,83,352 21.21
Foreign Direct Investment 2,55,28,470 9.55Bodies Corporate 66,47,269 2.49Non-resident Indians/ Overseas Corporate Bodies 13,03,212 0.49Clearing Members 5,85,079 0.22Resident Individuals 2,57,67,157 9.64Trusts 5,292 0.00Total 26,72,70,049 100.00
dIStRIButIon of SHAREHoldIng AS on 31St mARCH, 2017:
No. of Shareholders Percentage to Total Shareholdings No. of shares Percentage to57,063 97.06 1 to 5,000 1,67,31,295 6.26
817 1.39 5,001 to 10,000 29,58,887 1.11351 0.60 10,001 to 20,000 25,40,923 0.95113 0.19 20,001 to 30,000 13,98,115 0.5253 0.09 30,001 to 40,000 9,16,009 0.3445 0.08 40,001 to 50,000 10,14,296 0.38107 0.18 50,001 to 1,00,000 37,70,705 1.41243 0.41 1,00,001 - Above 23,79,39,819 89.03
58,792 100.00 Total 26,72,70,049 100.00

66
General Shareholder Information
DEMATERIALISATION STATUS AS ON 31ST MARCH, 2017:(i) Shareholding in dematerialised mode 99.18%
(ii) Shareholding in physical mode 0.82%
RECONCILIATION OF SHARE CAPITAL AUDITAs stipulated by the Regulation 55A of SEBI (Depositories and Participants) Regulations, 1996, a practicing Company Secretary carries out the Reconciliation of Share Capital Audit, on a quarterly basis, to reconcile the total admitted capital with National Securities Depository Limited (‘NSDL’) and Central Depository Services (India) Limited (‘CDSL’) with the total listed and paid-up capital. The audit report, inter alia, confirms that the total listed and paid up capital of the Company is in agreement with the aggregate of the total number of shares in dematerialized form and total number of shares in physical form.
FOR SHAREHOLDERS HOLDING SHARES IN DEMATERIALISED MODEShareholders holding shares in dematerialised mode are requested to intimate all changes with respect to bank details, mandate, nomination, power of attorney, change of address, change of name etc. to their Depository Participant (DP). These changes will be reflected in the Company’s records on the downloading of information from Depositories, which will help the Company provide better service to its shareholders.
SHARE TRANSFER SYSTEMIn respect of shares upto 1000 per folio, transfers are effected on a weekly basis. For others, the transfers are effected within limits prescribed by law. The average turnaround time for processing registration of transfers is 15 days from the date of receipt of requests. The processing activities with respect to requests received for dematerialisation are completed within 7 -10 days.
UNCLAIMED FINAL DIVIDEND FOR FY 2015-16The Board of Directors of the Company had recommended a 90% Final Dividend of ` 1.80/- per equity share on a face value of ` 2/- per share on 30th May, 2016 for the year ended 31st March, 2016, which was approved by the shareholders of the Company at the Twenty Eighth Annual General Meeting held on 27th September, 2016. The Final Dividend was paid to the shareholders on 12th October, 2016 and remaining unpaid amount was transferred to the unpaid Dividend Account. In respect of the unpaid/unclaimed Final Dividend for the FY 2015-16, the shareholders are requested to write to the Registrar and Share Transfer Agent of the Company. Further, Section 205A of the Companies Act, 1956 and/ or section 124 of the Companies Act, 2013, mandates companies to transfer Dividend that remains unclaimed for a period of seven years to the Investor Education and Protection Fund (‘IEPF’). Therefore, balance if any remaining unclaimed/ unpaid against the Final Dividend 2015-16, will be transferred to IEPF within the statutory period prescribed under the Act.
OUTSTANDING GDRS/ADRS/ WARRANTS OR ANY CONVERTIBLE INSTRUMENTS, CONVERSION DATE And lIKEly ImPACt on EQuItyNot Applicable
COMMODITY PRICE RISK OR FOREIGN EXCHANGE RISK AND HEDGING ACTIVITIESNot Applicable
PLANT LOCATIONSNot Applicable
COMMUNICATION OF FINANCIAL RESULTSThe unaudited quarterly financial results and the audited annual accounts are normally published in the Financial Express (English) and Desh Sewak (Punjabi). The financial results, press releases and presentations etc. are regularly displayed on the Company’s website- www.maxfinancialservices.com.
ADDRESS FOR CORRESPONDENCE WITH THE COMPANYInvestors and shareholders can correspond with the office of the share transfer agent of the Company or the Corporate Office of the Company at the following addresses:
Mas Services Limited (Registrar & Share Transfer Agent)T-34, 2nd FloorOkhla Industrial Area, Phase – IINew Delhi – 110 020
Contact PersonsMr. Sharwan ManglaTel No.:-011-26387281/82/83Fax No.:- 011 – 26387384e-mail : [email protected]
max financial Services limited (Corporate office)Secretarial DepartmentMax House, 1, Dr. Jha MargOkhla Industrial Area, Phase – IIINew Delhi – 110 020
Company Secretary and Compliance officerMr. Sandeep PathakTel. No.:- 011-42598000Fax No.:- 011-26324126e-mail:- [email protected]
Please visit us at www.maxfinancialservices.com for financial and other information about your Company.
For Max Financial Services Limited(formerly Max India Limited)
Mohit Talwar Place: New Delhi Managing Director Date: 9th August, 2017 DIN: 02394694


Financial Review
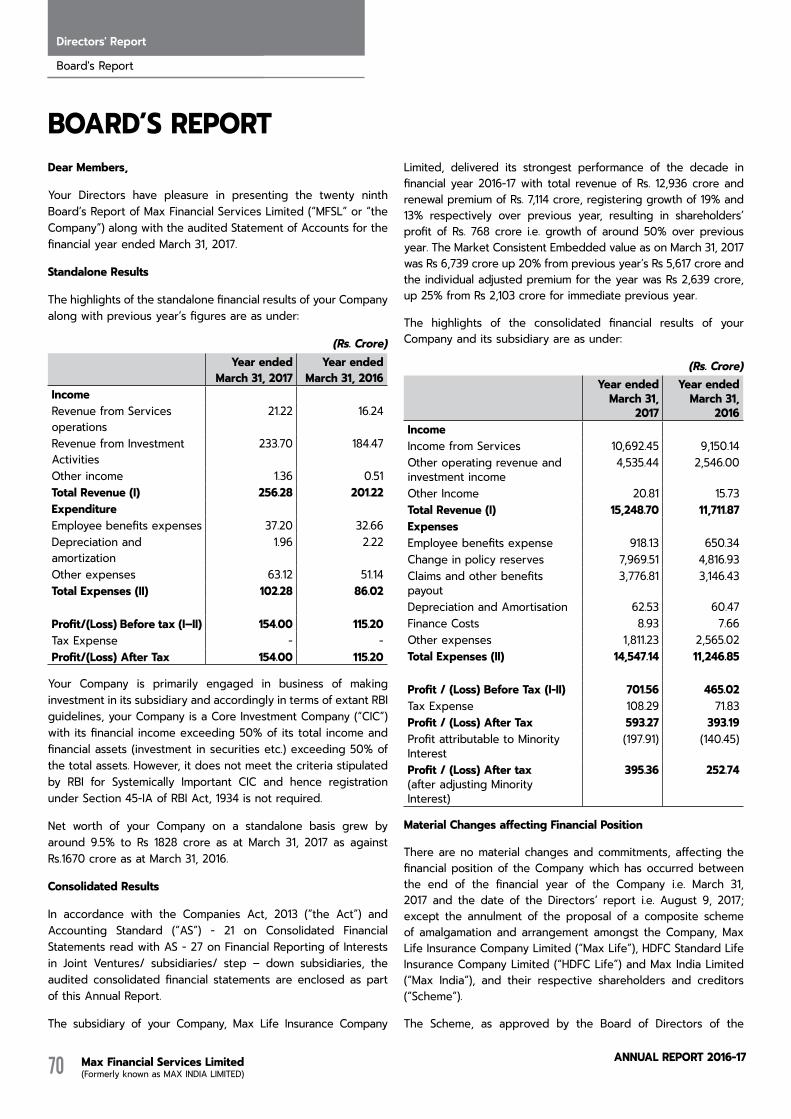
Max Financial Services Limited (Formerly known as MAX INDIA LIMITED)
AnnuAL RepoRt 2016-1770
Directors' Report
Board's Report
Dear Members,
Your Directors have pleasure in presenting the twenty ninth Board’s Report of Max Financial Services Limited (“MFSL” or “the Company”) along with the audited Statement of Accounts for the financial year ended March 31, 2017.
Standalone Results
The highlights of the standalone financial results of your Company along with previous year’s figures are as under:
(Rs. Crore)Year ended
March 31, 2017Year ended
March 31, 2016IncomeRevenue from Services operations
21.22 16.24
Revenue from Investment Activities
233.70 184.47
Other income 1.36 0.51Total Revenue (I) 256.28 201.22ExpenditureEmployee benefits expenses 37.20 32.66Depreciation and amortization
1.96 2.22
Other expenses 63.12 51.14Total Expenses (II) 102.28 86.02
Profit/(Loss) Before tax (I–II) 154.00 115.20Tax Expense - -Profit/(Loss) After Tax 154.00 115.20
Your Company is primarily engaged in business of making investment in its subsidiary and accordingly in terms of extant RBI guidelines, your Company is a Core Investment Company (“CIC”) with its financial income exceeding 50% of its total income and financial assets (investment in securities etc.) exceeding 50% of the total assets. However, it does not meet the criteria stipulated by RBI for Systemically Important CIC and hence registration under Section 45-IA of RBI Act, 1934 is not required.
Net worth of your Company on a standalone basis grew by around 9.5% to Rs 1828 crore as at March 31, 2017 as against Rs.1670 crore as at March 31, 2016.
Consolidated Results
In accordance with the Companies Act, 2013 (“the Act”) and Accounting Standard (“AS”) - 21 on Consolidated Financial Statements read with AS - 27 on Financial Reporting of Interests in Joint Ventures/ subsidiaries/ step – down subsidiaries, the audited consolidated financial statements are enclosed as part of this Annual Report.
The subsidiary of your Company, Max Life Insurance Company
Limited, delivered its strongest performance of the decade in financial year 2016-17 with total revenue of Rs. 12,936 crore and renewal premium of Rs. 7,114 crore, registering growth of 19% and 13% respectively over previous year, resulting in shareholders’ profit of Rs. 768 crore i.e. growth of around 50% over previous year. The Market Consistent Embedded value as on March 31, 2017 was Rs 6,739 crore up 20% from previous year’s Rs 5,617 crore and the individual adjusted premium for the year was Rs 2,639 crore, up 25% from Rs 2,103 crore for immediate previous year.
The highlights of the consolidated financial results of your Company and its subsidiary are as under:
(Rs. Crore) Year ended
March 31, 2017
Year endedMarch 31,
2016IncomeIncome from Services 10,692.45 9,150.14Other operating revenue and investment income
4,535.44 2,546.00
Other Income 20.81 15.73Total Revenue (I) 15,248.70 11,711.87ExpensesEmployee benefits expense 918.13 650.34Change in policy reserves 7,969.51 4,816.93Claims and other benefits payout
3,776.81 3,146.43
Depreciation and Amortisation 62.53 60.47Finance Costs 8.93 7.66Other expenses 1,811.23 2,565.02Total Expenses (II) 14,547.14 11,246.85
Profit / (Loss) Before Tax (I-II) 701.56 465.02Tax Expense 108.29 71.83Profit / (Loss) After Tax 593.27 393.19Profit attributable to Minority Interest
(197.91) (140.45)
Profit / (Loss) After tax(after adjusting Minority Interest)
395.36 252.74
Material Changes affecting Financial Position
There are no material changes and commitments, affecting the financial position of the Company which has occurred between the end of the financial year of the Company i.e. March 31, 2017 and the date of the Directors’ report i.e. August 9, 2017; except the annulment of the proposal of a composite scheme of amalgamation and arrangement amongst the Company, Max Life Insurance Company Limited (“Max Life”), HDFC Standard Life Insurance Company Limited (“HDFC Life”) and Max India Limited (“Max India”), and their respective shareholders and creditors (“Scheme”).
The Scheme, as approved by the Board of Directors of the
BoArd’s rePorT

Max Financial Services Limited (Formerly known as MAX INDIA LIMITED)
AnnuAL RepoRt 2016-17 71
Company in August 2016, inter alia contemplated consolidation of the life insurance business of Max Life into HDFC Life. The parties to the proposed Scheme had applied for various regulatory approvals. However, Insurance Regulatory and Development Authority of India (“IRDAI”) expressed reservations on the structure as contemplated under the Scheme. The proposed Scheme and the applications filed in this regard with the Stock exchanges were subsequently withdrawn on July 31, 2017.
subsidiaries, Associates & Joint Venture companies
As on March 31, 2017, your Company had only 1 (one) subsidiary i.e. Max Life Insurance Company Limited (“MLIC”). There were no other associate or joint venture companies. The basic details of subsidiary form part of Form MGT–9 attached as Annexure-1.
During the year under review, your Company acquired 3,83,00,000 equity shares of Rs. 10/- each in MLIC (being 2% of its equity capital) viz. 1,91,50,000 equity shares in June, 2016 and another 1,91,50,000 equity shares in November, 2016. Accordingly, the equity stake of the Company in MLIC was 70.01% as at March 31, 2017.
A report on the performance and financial position of MLIC, included in the consolidated financial statements, presented in Form AOC–1 is attached as Annexure-2 to this Report as per Rule 8(1) of the Companies (Accounts) Rules, 2014.
Further, a detailed update on the business achievements of MLIC, being the key operating subsidiary, is furnished as part of Management Discussion and Analysis section which forms part of this Annual Report.
As provided in Section 136 of the Companies Act, 2013, the financial statements and other documents of the subsidiary company Max Life Insurance Company Limited are not being attached with the financial statements of the Company. The complete set of financial statements including financial statements of the subsidiary of the Company is available on our website www.maxfinancialservices.com. These documents will also be available for inspection during business hours at the registered office of the Company and shall also be made available to the shareholders of the Company in hard copy, on demand.
Dividend
Your Directors have not recommended any dividend for the financial year 2016-17.
Transfer to reserves
The Company has not transferred any amount to reserves during the year under review.
Share Capital
The Authorized share capital of the Company as on March 31, 2017 was Rs. 60,00,00,000/- (Rupees Sixty Crores only) comprising of 30,00,00,000 equity shares of Rs. 2/- each.
During the year under review, 2,86,050 equity shares of Rs.2/-
each were allotted to the option-holders under the ‘Max Employee Stock Plan 2003’ (‘2003 Plan’).
The Paid up capital of the Company as on March 31, 2017 was Rs. 53,45,40,098/- (Rupees Fifty three crores forty five lacs forty thousand and ninety eight only) comprising of 26,72,70,049 equity shares of Rs. 2/- each.
Further, after end of the financial year on March 31, 2017 till the date of this report i.e. August 9, 2017, your Company had allotted 41,210 equity shares of Rs.2/- each to the option-holders under the aforesaid 2003 Plan.
employee stock option Plan
Your Company has an employee stock option plan viz. ‘Max Employee Stock Plan 2003’ (‘2003 Plan’) in place. The 2003 Plan provides for grant of stock options aggregating not more than 5% of number of issued equity shares of the Company to eligible employees and Directors of the Company. The 2003 Plan is administered by the Nomination and Remuneration Committee constituted by the Board of Directors of the Company.
Details of options granted up to March 31, 2017 and other disclosures as required under SEBI (Share Based Employee Benefits) Regulations, 2014 are enclosed as Annexure-3 to this Report.
Further during the year under review, the Nomination and Remuneration Committee of Directors of the Company granted 143,052 phantom stock units to Mr. Rahul Khosla – Executive President of the Company, which vest over a period of 4 years and shall be settled in cash.
Directors
As on date of this report, the Board of Directors of your Company comprised of 7 (seven) members with 1 (one) Executive Director and 6 (six) Non-Executive Directors of which 4 (four) are independent. Mrs. Naina Lal Kidwai, Chairman of the Company is a Non Executive Independent Director.
Mr. Sanjeev Kishen Mehra resigned from the Board of the Company effective May 19, 2017. Simultaneously, the position held by Ms. Lavanya Ashok as an Alternate Director to Mr. Sanjeev Kishen Mehra on the Board of the Company stood vacated with effect from that date.
Your Directors place their deep appreciation for the valuable contributions made by Mr. Sanjeev Kishen Mehra and Ms. Lavanya Ashok during their association with the Company.
In terms of Section 152 of the Act and the Articles of Association of the Company, Mr. Ashwani Windlass and Mr. Sanjay Omprakash Nayar are liable to retire by rotation at the ensuing Annual General Meeting. Mr. Ashwani Windlass and Mr. Sanjay Omprakash Nayar being eligible have offered themselves for re-appointment at the ensuing Annual General Meeting. Brief profiles of these directors are annexed to the Notice convening the Annual General Meeting.
The Board met six times during the financial year 2016-17:
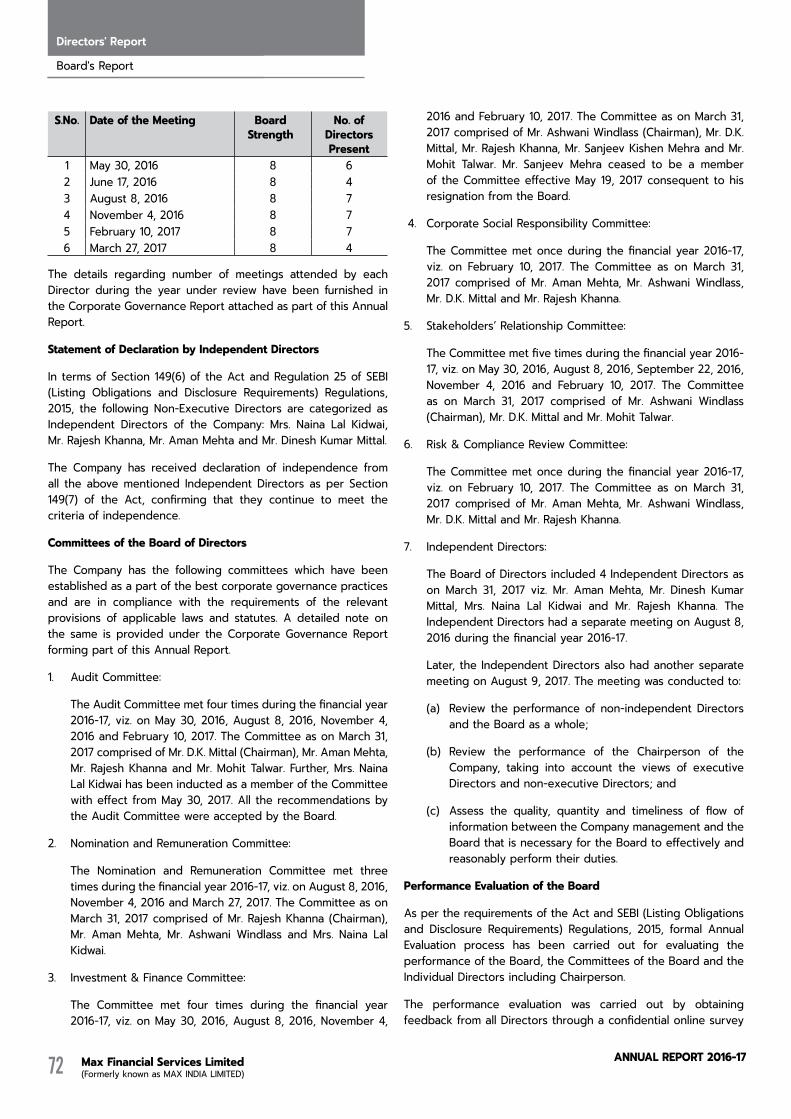
Max Financial Services Limited (Formerly known as MAX INDIA LIMITED)
AnnuAL RepoRt 2016-1772
Directors' Report
Board's Report
S.No. date of the Meeting Board Strength
No. of Directors Present
1 May 30, 2016 8 62 June 17, 2016 8 43 August 8, 2016 8 74 November 4, 2016 8 75 February 10, 2017 8 76 March 27, 2017 8 4
The details regarding number of meetings attended by each Director during the year under review have been furnished in the Corporate Governance Report attached as part of this Annual Report.
statement of declaration by Independent directors
In terms of Section 149(6) of the Act and Regulation 25 of SEBI (Listing Obligations and Disclosure Requirements) Regulations, 2015, the following Non-Executive Directors are categorized as Independent Directors of the Company: Mrs. Naina Lal Kidwai, Mr. Rajesh Khanna, Mr. Aman Mehta and Mr. Dinesh Kumar Mittal.
The Company has received declaration of independence from all the above mentioned Independent Directors as per Section 149(7) of the Act, confirming that they continue to meet the criteria of independence.
Committees of the Board of directors
The Company has the following committees which have been established as a part of the best corporate governance practices and are in compliance with the requirements of the relevant provisions of applicable laws and statutes. A detailed note on the same is provided under the Corporate Governance Report forming part of this Annual Report.
1. Audit Committee:
The Audit Committee met four times during the financial year 2016-17, viz. on May 30, 2016, August 8, 2016, November 4, 2016 and February 10, 2017. The Committee as on March 31, 2017 comprised of Mr. D.K. Mittal (Chairman), Mr. Aman Mehta, Mr. Rajesh Khanna and Mr. Mohit Talwar. Further, Mrs. Naina Lal Kidwai has been inducted as a member of the Committee with effect from May 30, 2017. All the recommendations by the Audit Committee were accepted by the Board.
2. Nomination and Remuneration Committee:
The Nomination and Remuneration Committee met three times during the financial year 2016-17, viz. on August 8, 2016, November 4, 2016 and March 27, 2017. The Committee as on March 31, 2017 comprised of Mr. Rajesh Khanna (Chairman), Mr. Aman Mehta, Mr. Ashwani Windlass and Mrs. Naina Lal Kidwai.
3. Investment & Finance Committee:
The Committee met four times during the financial year 2016-17, viz. on May 30, 2016, August 8, 2016, November 4,
2016 and February 10, 2017. The Committee as on March 31, 2017 comprised of Mr. Ashwani Windlass (Chairman), Mr. D.K. Mittal, Mr. Rajesh Khanna, Mr. Sanjeev Kishen Mehra and Mr. Mohit Talwar. Mr. Sanjeev Mehra ceased to be a member of the Committee effective May 19, 2017 consequent to his resignation from the Board.
4. Corporate Social Responsibility Committee:
The Committee met once during the financial year 2016-17, viz. on February 10, 2017. The Committee as on March 31, 2017 comprised of Mr. Aman Mehta, Mr. Ashwani Windlass, Mr. D.K. Mittal and Mr. Rajesh Khanna.
5. Stakeholders’ Relationship Committee:
The Committee met five times during the financial year 2016-17, viz. on May 30, 2016, August 8, 2016, September 22, 2016, November 4, 2016 and February 10, 2017. The Committee as on March 31, 2017 comprised of Mr. Ashwani Windlass (Chairman), Mr. D.K. Mittal and Mr. Mohit Talwar.
6. Risk & Compliance Review Committee:
The Committee met once during the financial year 2016-17, viz. on February 10, 2017. The Committee as on March 31, 2017 comprised of Mr. Aman Mehta, Mr. Ashwani Windlass, Mr. D.K. Mittal and Mr. Rajesh Khanna.
7. Independent Directors:
The Board of Directors included 4 Independent Directors as on March 31, 2017 viz. Mr. Aman Mehta, Mr. Dinesh Kumar Mittal, Mrs. Naina Lal Kidwai and Mr. Rajesh Khanna. The Independent Directors had a separate meeting on August 8, 2016 during the financial year 2016-17.
Later, the Independent Directors also had another separate meeting on August 9, 2017. The meeting was conducted to:
(a) Review the performance of non-independent Directors and the Board as a whole;
(b) Review the performance of the Chairperson of the Company, taking into account the views of executive Directors and non-executive Directors; and
(c) Assess the quality, quantity and timeliness of flow of information between the Company management and the Board that is necessary for the Board to effectively and reasonably perform their duties.
Performance evaluation of the Board
As per the requirements of the Act and SEBI (Listing Obligations and Disclosure Requirements) Regulations, 2015, formal Annual Evaluation process has been carried out for evaluating the performance of the Board, the Committees of the Board and the Individual Directors including Chairperson.
The performance evaluation was carried out by obtaining feedback from all Directors through a confidential online survey

Max Financial Services Limited (Formerly known as MAX INDIA LIMITED)
AnnuAL RepoRt 2016-17 73
mechanism through Diligent, a secured electronic medium through which the Company interfaces with its Directors. The outcome of this performance evaluation was placed before the meetings of the Nomination and Remuneration Committee and Independent Directors’ and the Board meeting for the consideration of the members.
The review concluded by affirming that the Board as a whole as well as its Chairman, all of its members, individually and the Committees of the Board continued to display commitment to good governance by ensuring a constant improvement of processes and procedures and contributed their best in overall growth of the organization.
Key Managerial Personnel
As on the date of this Report, Mr. Mohit Talwar - Managing Director, Mrs. Sujatha Ratnam - Chief Financial Officer and Mr. Sandeep Pathak - Company Secretary are the Key Managerial Personnel (KMP) of the Company, pursuant to the provisions of the Companies Act, 2013.
Mr. Sandeep Pathak was appointed as the Company Secretary with effect from July 5, 2016.
Human Resources
We are primarily engaged in growing and nurturing business investment as a holding Company in the business of life insurance and providing management advisory services to group companies. The remuneration of our employees is competitive with the market and rewards high performers across levels. The remuneration to Directors, Key Managerial Personnel and Senior Management are a balance between fixed, incentive pay and long-term equity program based on the performance objectives appropriate to the working of the Company and its goals and is reviewed periodically and approved by the Nomination and Remuneration Committee of the Board.
Details pursuant to Section 197 (12) of the Act, read with the Rule 5(1) and Rule 5(2) of Companies (Appointment and Remuneration of Managerial Personnel) Rules, 2014 are attached as Annexure-4a and Annexure-4b.
As on March 31, 2017, there were 13 employees on the rolls of the Company.
Nomination and Remuneration Policy
In adherence to the provisions of Sections 134(3)(e) and 178(1) & (3) of the Act, the Board of Directors on the recommendation of the Nomination and Remuneration Committee, had approved a policy on Directors’ appointment and remuneration including criteria for determining qualifications, positive attributes, independence of a Director and other matters provided and the same is available on the website of the Company at www.maxfinancialservices.com.
Corporate Social Responsibility (“CSR”)
The Board of Directors of your Company has constituted a Corporate Social Responsibility Committee and adopted
a CSR policy, as approved by the CSR Committee, copy of which is available on the website of the Company at www.maxfinancialservices.com. The CSR Policy comprises Vision and Mission Statement, philosophy and objectives. It also explains the governance structure along with clarity on roles and responsibilities.
In terms of Section 135 of the Act read with Companies (Corporate Social Responsibility Policy) Rules, 2014, all Companies meeting the prescribed threshold criteria, i.e., net worth of Rs. 500 crores or more or turnover of Rs. 1,000 crores or more or net profits of Rs. 5 crore or more in any financial year are required to spend 2% of the average net profits of the Company for immediately preceding 3 financial years.
As per rule 2(f) of the Companies (Corporate Social Responsibility Policy) Rules, 2014, any dividend received from other companies in India which are already covered and complying with the provisions of the CSR, shall not be included for the purposes of computation of ‘net profits’ for a company.
As Max Life Insurance Company Limited (“Max Life”) from whom the Company has been receiving dividend, from time to time, discharged its CSR responsibilities for the financial year 2016–17, the dividend income received by the Company will be excluded for the purposes of computation of its ‘net profits’. After excluding the dividend income received from Max Life, the Company does not have net profits computed as per the CSR rules. Therefore, it is not mandatorily required for the Company to spend on Corporate Social Responsibility for the financial year 2016-17. However, the Company has voluntarily given donations to various charitable institutions.
Business responsibility report
In terms of Clause 34(2)(f) of SEBI (Listing Obligations & Disclosure Requirements) Regulations, 2015, a Business Responsibility Report, on various initiatives taken by the Company, is enclosed as Annexure -5.
Policy for Prevention of sexual Harassment
Your Company has requisite policy for Prevention of Sexual Harassment, which is available on the website of the Company at www.maxfinancialservices.com.The comprehensive policy ensures gender equality and the right to work with dignity. An Internal Complaints Committee has been constituted as per provisions of the Sexual Harassment of Women at Workplace (Prevention, Prohibition and Redressal) Act, 2013. No case was reported to the Committee during the year under review.
Loans, Guarantees or Investments in securities
The details of loans given and investments made by the company pursuant to the provisions of Section 186 of the Act are provided in Notes 12 and 13 to the standalone financial statements of the Company for the FY 2016-17.
Management discussion & Analysis
In terms of Regulation 34 of SEBI (Listing Obligations and

Max Financial Services Limited (Formerly known as MAX INDIA LIMITED)
AnnuAL RepoRt 2016-1774
Directors' Report
Board's Report
Disclosure Requirements) Regulations, 2015, a review of the performance of the Company, including those of your Company’s subsidiary, is provided in the Management Discussion & Analysis section, which forms part of this Annual Report.
report on Corporate Governance
The Company has complied with all the mandatory requirements of Corporate Governance specified by the Securities and Exchange Board of India through Part C of Schedule V of SEBI (Listing Obligations and Disclosure Requirements) Regulations, 2015. As required by the said Clause, a separate Report on Corporate Governance forms part of the Annual Report of the Company.
A certificate from M/s Chandrasekaran Associates, Practicing Company Secretaries regarding compliance with the conditions of Corporate Governance pursuant to Part E of Schedule V of SEBI (Listing Obligations and Disclosure Requirements) Regulations, 2015 and a certificate from the Managing Director and Chief Financial Officer on compliance of Part B of Schedule II of SEBI (Listing Obligations and Disclosure Requirements) Regulations, 2015 form part of the Corporate Governance Report.
Public Deposits
During the year under review, the Company has not accepted or renewed any deposits from the public.
statutory Auditors and Auditors’ report
Pursuant to Sections 139 & 142 of the Act, M/s Deloitte Haskins and Sells, LLP, Chartered Accountants, were appointed as the Statutory Auditors of the Company at Annual General Meeting held on September 23, 2015 for a period of five years, subject to ratification of their appointment in every Annual General Meeting held during their tenure.
M/s Deloitte Haskins and Sells, LLP, Statutory Auditors, have provided a certificate that their appointment, if ratified, will be in conformity with the provisions of Section 141 of Companies Act, 2013. The Board recommends the ratification of the appointment of M/s Deloitte Haskins and Sells, LLP, Chartered Accountants as the Statutory Auditors of the Company for financial year 2017-18.
There are no audit qualifications, reservations, disclaimers or adverse remarks or reporting of fraud in the Statutory Auditors Report given by M/s Deloitte Haskins and Sells, LLP, Statutory Auditors of the Company for the financial year 2016-17 as annexed elsewhere in this Annual Report.
secretarial Auditors and secretarial Audit report
Pursuant to Section 204 of the Act, your Company had appointed M/s Chandrasekaran Associates, Practicing Company Secretaries, New Delhi as its Secretarial Auditors to conduct the secretarial audit of the Company for the FY 2016-17. The Company provided all assistance and facilities to the Secretarial Auditor for conducting their audit. The Report of Secretarial Auditor for the FY 2016-17 is annexed to this report as Annexure-6.
There are no audit qualifications, reservations, disclaimers or
adverse remarks in the said Secretarial Audit Report.
Internal Auditors
The Company follows a robust Internal Audit process and audits are conducted on a regular basis, throughout the year, as per agreed audit plan. During the year under review, M/s MGC and KNAV, Global Risk Advisory LLP were appointed as Internal Auditors for conducting the Internal Audit of key functions and assessment of Internal Financial Controls etc. They were also engaged for conducting Cyber Security Audit for the Company.
Internal Financial Controls
The Company has in place adequate internal financial controls with reference to financial statements. During the year, such controls were tested and no reportable material weaknesses in the design or operation were observed. The Management has reviewed the existence of various risk-based controls in the Company and also tested the key controls towards assurance for compliance for the present fiscal. In the opinion of the Board, the existing internal control framework is adequate and commensurate with the size and nature of the business of the Company. Further, the testing of adequacy of internal financial controls over financial reporting has been also been carried out independently by the Statutory Auditors as mandated under the provisions of the Act. During the year under review, there were no instances of fraud reported by the auditors to the Audit Committee or the Board of Directors.
Risk Management
Your Company considers that risk is an integral part of its business and therefore, it takes proper steps to manage all risks in a proactive and efficient manner. The Board has formed a Risk and Compliance Review Committee to identify the risks impacting the business, formulate strategies/ policies aimed at risk mitigation as part of risk management. Further, a core team comprising of senior management has also been formed to identify and assess key risks, risk appetite, tolerance levels and formulate strategies for mitigation of risks identified in consultation with process owners.
On the recommendation of the Committee, the Company has adopted a Risk Management policy, whereby, risks are broadly categorized into Strategic, Operational, Compliance and Financial & Reporting Risks. The Policy outlines the parameters of identification, assessment, monitoring and mitigation of various risks which are key to the business performance.
Vigil Mechanism
The Company has a vigil mechanism pursuant to which a Whistle Blower Policy has been adopted and is in place. The Policy ensures that strict confidentiality is maintained whilst dealing with concerns raised and also that no discrimination will be meted out to any person for a genuinely raised concern in respect of any unethical and improper practices, fraud or violation of Company’s Code of Conduct.
The said Policy covering all employees, Directors and other

Max Financial Services Limited (Formerly known as MAX INDIA LIMITED)
AnnuAL RepoRt 2016-17 75
persons having association with the Company is hosted on the Company’s website www.maxfinancialservices.com.
A brief note on Vigil Mechanism / Whistle Blower Policy is also provided in the Report on Corporate Governance, which forms part of this Annual Report.
Contracts or Arrangements with related Parties
All transactions entered by the Company during the financial year with related parties were in the ordinary course of business and on an arm’s length basis, except one transaction with Max Life Insurance Company Limited for allowing usage of trademarks without any consideration and an approval was obtained from shareholders for the Company for the said transaction. There is no material contract or arrangement in terms of SEBI (Listing Obligations and Disclosure Requirements) Regulations, 2015. Form AOC-2 furnishing particulars of contracts or arrangements entered into by the Company with related parties referred in Section 188(1) of the Companies Act, 2013, is annexed to this report as annexure 7.
The details of all the Related Party Transactions form part of Note no. 31 to the standalone financial statements attached to this Annual Report.
The Policy on materiality of related party transactions and dealing with related party transactions as approved by the Board may be accessed on the Company’s website www.maxfinancialservices.com.
Particulars of Conservation of energy, Technology Absorption and Foreign exchange earnings & outgo
The information on conservation of energy, technology absorption and foreign exchange earnings & outgo as stipulated under Section 134(3)(m) of the Act read with Companies (Accounts) Rules, 2014 is as follows:
a) Conservation of energy
(i) the steps taken or impact on conservation of energy: Regular efforts are made to conserve the energy through various means such as use of low energy consuming lightings, etc.
(ii) the steps taken by the Company for using alternate sources of energy: Since your Company is not an energy intensive unit, utilization of alternate source of energy may not be feasible.
(iii) capital investment on energy conservation equipment : Nil
b) Technology Absorption
Your Company is not engaged in manufacturing activities, therefore there is no specific information to be furnished in this regard.
There was no expenditure incurred on Research and Development during the period under review.
c) Foreign exchange earnings and outgo
The foreign exchange earnings and outgo are given below:
Total Foreign Exchange earned : NilTotal Foreign Exchange used : Rs. 615.29 Lacs
extracts of Annual return
Pursuant to Section 134(3)(a) and Section 92(3) of the Act read with Rule 12 of the Companies (Management and Administration) Rules, 2014, the extracts of the Annual Return as at March 31, 2017 forms part of this report as Annexure 1.
directors’ responsibility statement
Pursuant to Section 134(5) of the Companies Act, 2013, it is hereby confirmed that:
(a) In the preparation of the annual accounts, the applicable accounting standards had been followed along with proper explanation relating to material departures, if any;
(b) The Directors had selected such accounting policies and applied them consistently and made judgments and estimates that are reasonable and prudent so as to give a true and fair view of the state of affairs of the Company at the end of the financial year and of the profit of the Company for that period;
(c) The Directors had taken proper and sufficient care for the maintenance of adequate accounting records in accordance with the provisions of the Act for safeguarding the assets of the Company and for preventing and detecting fraud and other irregularities;
(d) The Directors had prepared the annual accounts on a going concern basis;
(e) The Directors had laid down internal financial controls to be followed by the Company and that such internal financial controls are adequate and were operating effectively; and
(f) The Directors had devised proper systems to ensure compliance with the provisions of all applicable laws and that such systems were adequate and operating effectively.
significant and material orders passed by the regulators or courts or tribunals
During the year under review, there were no such significant and material orders passed by the regulators or courts or tribunals which could impact the going concern status and company’s operations in future.
Unclaimed Shares
Regulation 39(4) of the SEBI (Listing Obligations & Disclosure Requirements) Regulations, 2015 inter alia requires every listed company to comply with certain procedure in respect of shares issued by it in physical form, pursuant to a public issue or any other issue and which remained unclaimed for any reason whatsoever.

Max Financial Services Limited (Formerly known as MAX INDIA LIMITED)
AnnuAL RepoRt 2016-1776
Directors' Report
Board's Report
The face value of the shares of the Company was split from Rs. 10/- each to Rs. 2/- each in the year 2007. Certain share certificates were returned undelivered and were lying unclaimed. The Company had sent 3 reminders to concerned shareholders, and subsequently such shares (2203 folios comprising 475310 equity shares) have been transferred to the Unclaimed Suspense Account.
The voting rights on the equity shares lying in the said Unclaimed Suspense Account shall remain frozen till the rightful owner claims such shares. Further, all corporate benefits in terms of securities accruing on the said unclaimed shares viz. bonus shares, split, etc., if any, shall also be credited to the said Unclaimed Suspense Account. The concerned shareholder(s) are requested to write to the Registrar and Share Transfer Agent to claim the said equity shares. On receipt of such claim, additional documents may be called for and subject to its receipt and verification, the said shares lying in the said Unclaimed Suspense Account shall be transferred to the depository account provided by the concerned shareholder(s) or the physical share certificate shall be delivered to the registered address of the concerned shareholder(s).
Cautionary Statement
Statements in this Report, particularly those which relate to Management Discussion and Analysis describing the Company’s
objectives, projections, estimates and expectations may constitute “forward looking statements” within the meaning of applicable laws and regulations. Actual results might differ materially from those either expressed or implied in the statement depending on the circumstances.
Acknowledgements
Your Directors would like to place on record their appreciation of the contribution made by its management and its employees who through their competence and commitment have enabled the Company to achieve impressive growth. Your Directors acknowledge with thanks the co-operation and assistance received from various agencies of the Central and State Governments, Financial Institutions and Banks, Shareholders, Joint Venture partners and all other business associates.
On behalf of the Board of Directors Max Financial services Limited
(Formerly Max India Limited)
New Delhi Naina Lal KidwaiAugust 9, 2017 Chairman
DIN: 00017806
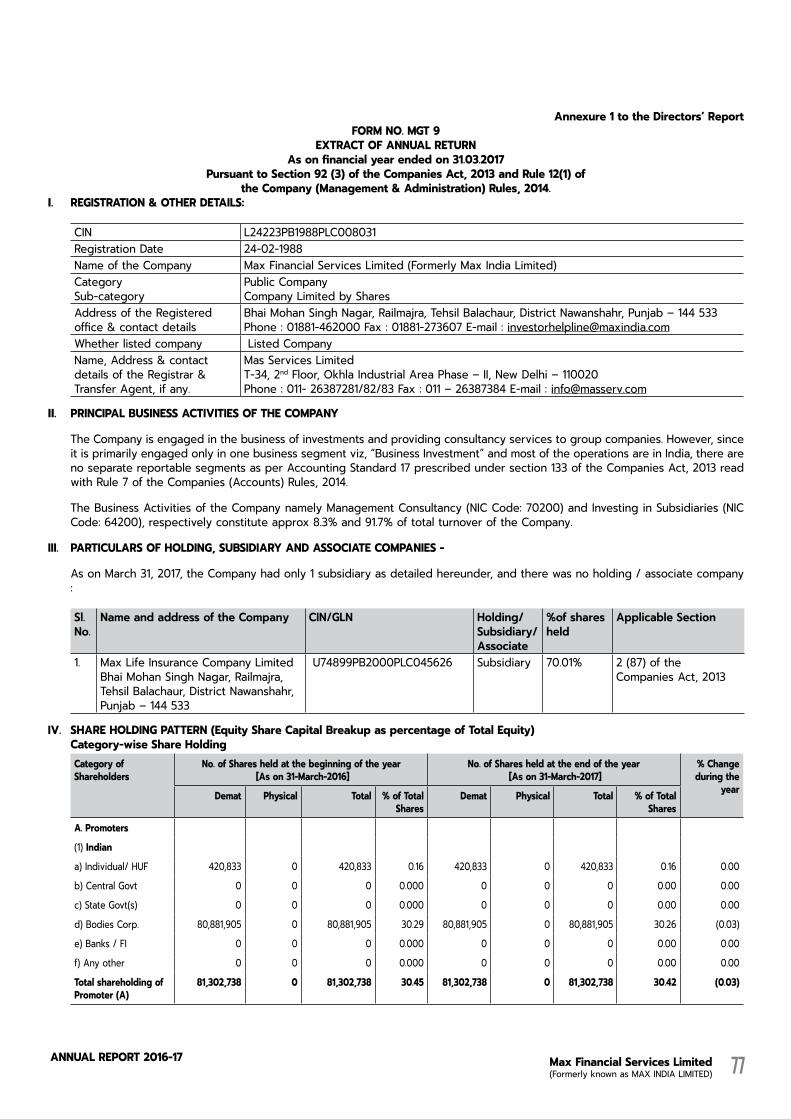
Max Financial Services Limited (Formerly known as MAX INDIA LIMITED)
AnnuAL RepoRt 2016-17 77
Annexure 1 to the directors’ reportForM No. MGT 9
eXTrACT oF ANNUAL reTUrNAs on financial year ended on 31.03.2017
Pursuant to section 92 (3) of the Companies Act, 2013 and rule 12(1) of the Company (Management & Administration) rules, 2014.
I. reGIsTrATIoN & oTHer deTAILs:
CIN L24223PB1988PLC008031Registration Date 24-02-1988Name of the Company Max Financial Services Limited (Formerly Max India Limited)CategorySub-category
Public CompanyCompany Limited by Shares
Address of the Registered office & contact details
Bhai Mohan Singh Nagar, Railmajra, Tehsil Balachaur, District Nawanshahr, Punjab – 144 533Phone : 01881-462000 Fax : 01881-273607 E-mail : [email protected]
Whether listed company Listed CompanyName, Address & contact details of the Registrar & Transfer Agent, if any.
Mas Services LimitedT-34, 2nd Floor, Okhla Industrial Area Phase – II, New Delhi – 110020Phone : 011- 26387281/82/83 Fax : 011 – 26387384 E-mail : [email protected]
II. PrINCIPAL BUsINess ACTIVITIes oF THe CoMPANY
The Company is engaged in the business of investments and providing consultancy services to group companies. However, since it is primarily engaged only in one business segment viz, “Business Investment” and most of the operations are in India, there are no separate reportable segments as per Accounting Standard 17 prescribed under section 133 of the Companies Act, 2013 read with Rule 7 of the Companies (Accounts) Rules, 2014.
The Business Activities of the Company namely Management Consultancy (NIC Code: 70200) and Investing in Subsidiaries (NIC Code: 64200), respectively constitute approx 8.3% and 91.7% of total turnover of the Company.
III. PArTICULArs oF HoLdING, sUBsIdIArY ANd AssoCIATe CoMPANIes -
As on March 31, 2017, the Company had only 1 subsidiary as detailed hereunder, and there was no holding / associate company :
Sl. no.
name and address of the company cin/Gln Holding/Subsidiary/ associate
%of shares held
applicable Section
1. Max Life Insurance Company LimitedBhai Mohan Singh Nagar, Railmajra, Tehsil Balachaur, District Nawanshahr, Punjab – 144 533
U74899PB2000PLC045626 Subsidiary 70.01% 2 (87) of the Companies Act, 2013
IV. sHAre HoLdING PATTerN (equity share Capital Breakup as percentage of Total equity) Category-wise share Holding
Category of Shareholders
No. of shares held at the beginning of the year [As on 31-March-2016]
No. of shares held at the end of the year [As on 31-March-2017]
% Change during the
yearDemat Physical Total % of Total Shares
Demat Physical Total % of Total Shares
A. Promoters
(1) Indian
a) Individual/ HUF 420,833 0 420,833 0.16 420,833 0 420,833 0.16 0.00
b) Central Govt 0 0 0 0.000 0 0 0 0.00 0.00
c) State Govt(s) 0 0 0 0.000 0 0 0 0.00 0.00
d) Bodies Corp. 80,881,905 0 80,881,905 30.29 80,881,905 0 80,881,905 30.26 (0.03)
e) Banks / FI 0 0 0 0.000 0 0 0 0.00 0.00
f) Any other 0 0 0 0.000 0 0 0 0.00 0.00
Total shareholding of Promoter (A)
81,302,738 0 81,302,738 30.45 81,302,738 0 81,302,738 30.42 (0.03)

Max Financial Services Limited (Formerly known as MAX INDIA LIMITED)
AnnuAL RepoRt 2016-1778
Directors' Report
Category of Shareholders
No. of shares held at the beginning of the year [As on 31-March-2016]
No. of shares held at the end of the year [As on 31-March-2017]
% Change during the
yearDemat Physical Total % of Total Shares
Demat Physical Total % of Total Shares
B. Public shareholding
1. Institutions
a) Mutual Funds 38,829,150 5,565 38,834,715 14.54 54,979,410 5,565 54,984,975 20.57 6.03
b) Banks / FI 19,137 14,450 33,587 0.01 448,528 14,450 462,978 0.17 0.16
c) Central Govt 0 0 0 0.000 0 0 0 0 0.00
d) State Govt(s) 0 0 0 0.000 0 0 0 0 0.00
e) Venture Capital Funds
0 0 0 0.000 0 0 0 0 0.00
f) Insurance Companies 0 45,750 45,750 0.02 0 45,750 45,750 0.02 0.00
g) FIIs 89,356,885 55 89,356,940 33.47 13,953,722 55 13,953,777 5.22 (28.25)
h) Foreign Portfolio Investors
0 0 0 0 56,683,352 0 56,683,352 21.21 21.21
h) Foreign Venture Capital Funds
0 0 0 0.000 0 0 0 0 0.00
i) Others (specify) FDI 32,340,749 0 32,340,749 12.12 25,528,470 0 25,528,470 9.55 (2.57)
sub-total (B)(1):- 160,545,921 65,820 160,611,741 60.16 151593,482 65,820 151,659,302 56.74 (3.42)
2. Non-Institutions
a) Bodies Corp.
i) Indian 3,953,892 68,905 4,022,797 1.51 6,579,789 67,480 6,647,269 2.49 0.98
ii) Overseas 0 0 0 0.000 0 0 0 0 0.00
b) Individuals 0 0 0 0.000 0 0 0 0 0.00
i) Individual shareholders holding nominal share capital upto Rs. 2 lakh
13,746,305 2,189,105 15,935,410 5.97 21,412,263 2,016,980 234,29,243 8.77 2.80
ii) Individual shareholders holding nominal share capital in excess of Rs 2 lakh
2,231,992 0 2,231,992 0.84 2,085,626 0 2,085,626 0.78 (0.06)
c) Others (specify)
Non Resident Indians 2,186,443 64,995 2,251,438 0.84 1,269,024 33,670 1,302,694 0.49 (0.35)
Overseas Corporate Bodies
0 0 0 0.000 518 0 518 0 0.00
Foreign Nationals 0 0 0 0.000 0 0 0 0 0.00
Clearing Members 267,576 0 267,576 0.10 585,079 0 585,079 0.22 0.12
Trusts 3,351 0 3,351 0.00 5,292 0 5,292 0.00 0.00
Foreign Bodies - D R 0 0 0.000 0 0 0 0 0.00
Directors 308,456 48,500 356,956 0.13 252,288 0 252,288 0.09 (0.04)
sub-total (B)(2):- 22,698,015 2,371,505 25,069,520 9.39 32,189,879 2,118,130 34,308,009 12.84 3.45
Total Public shareholding (B)=(B)(1)+ (B)(2)
183,243,936 2,437,325 185,681,261 69.55 183,783,361 2,183,950 185,967,311 69.58 0.03
C. Shares held by Custodian for Gdrs & Adrs
0 0 0 0.00 0 0 0 0 0.00
Grand Total (A+B+C) 264,546,674 2,437,325 266,983,999 100.00 265,086,099 2,183,950 267,270,049 100.00 0.00
Annexure - 1
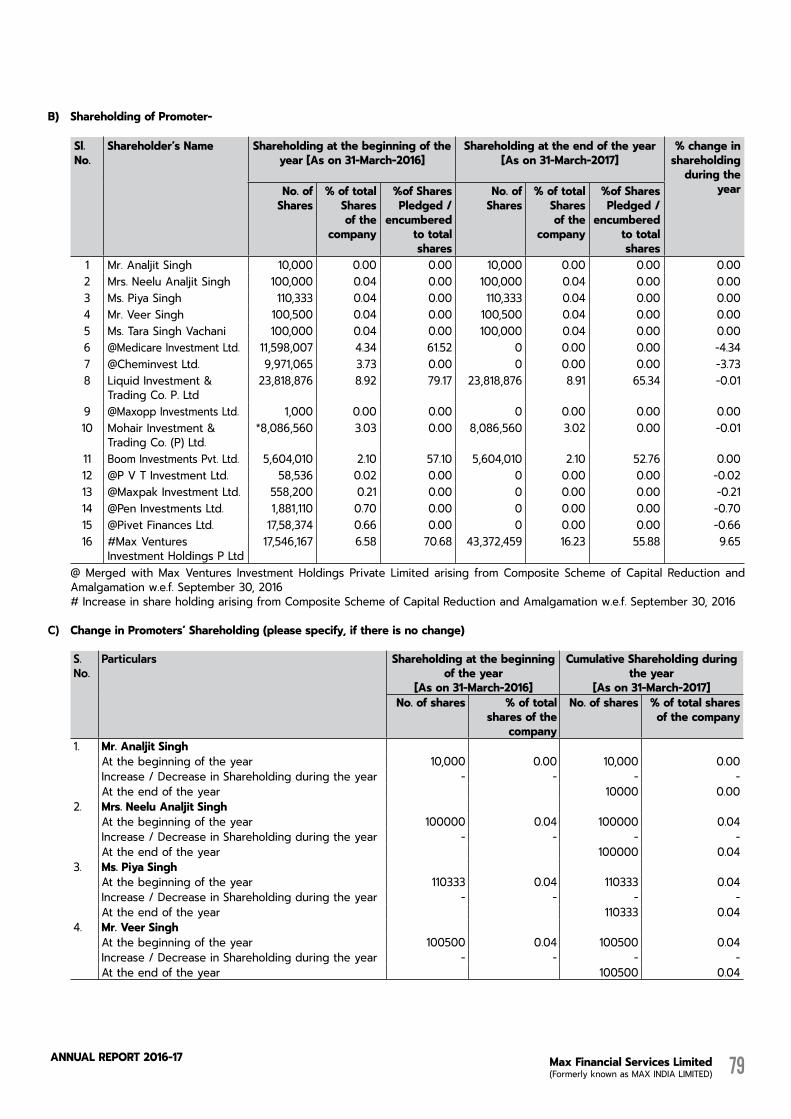
Max Financial Services Limited (Formerly known as MAX INDIA LIMITED)
AnnuAL RepoRt 2016-17 79
B) shareholding of Promoter-
Sl. No.
shareholder’s Name
shareholding at the beginning of the year [As on 31-March-2016]
shareholding at the end of the year[As on 31-March-2017]
% change in shareholding
during the yearNo. of
Shares% of total
Shares of the
company
%of shares Pledged /
encumbered to total shares
No. of Shares
% of total Shares of the
company
%of shares Pledged /
encumbered to total shares
1 Mr. Analjit Singh 10,000 0.00 0.00 10,000 0.00 0.00 0.002 Mrs. Neelu Analjit Singh 100,000 0.04 0.00 100,000 0.04 0.00 0.003 Ms. Piya Singh 110,333 0.04 0.00 110,333 0.04 0.00 0.004 Mr. Veer Singh 100,500 0.04 0.00 100,500 0.04 0.00 0.005 Ms. Tara Singh Vachani 100,000 0.04 0.00 100,000 0.04 0.00 0.006 @Medicare Investment Ltd. 11,598,007 4.34 61.52 0 0.00 0.00 -4.347 @Cheminvest Ltd. 9,971,065 3.73 0.00 0 0.00 0.00 -3.738 Liquid Investment &
Trading Co. P. Ltd23,818,876 8.92 79.17 23,818,876 8.91 65.34 -0.01
9 @Maxopp Investments Ltd. 1,000 0.00 0.00 0 0.00 0.00 0.0010 Mohair Investment &
Trading Co. (P) Ltd.*8,086,560 3.03 0.00 8,086,560 3.02 0.00 -0.01
11 Boom Investments Pvt. Ltd. 5,604,010 2.10 57.10 5,604,010 2.10 52.76 0.0012 @P V T Investment Ltd. 58,536 0.02 0.00 0 0.00 0.00 -0.0213 @Maxpak Investment Ltd. 558,200 0.21 0.00 0 0.00 0.00 -0.2114 @Pen Investments Ltd. 1,881,110 0.70 0.00 0 0.00 0.00 -0.7015 @Pivet Finances Ltd. 17,58,374 0.66 0.00 0 0.00 0.00 -0.6616 #Max Ventures
Investment Holdings P Ltd17,546,167 6.58 70.68 43,372,459 16.23 55.88 9.65
@ Merged with Max Ventures Investment Holdings Private Limited arising from Composite Scheme of Capital Reduction and Amalgamation w.e.f. September 30, 2016
# Increase in share holding arising from Composite Scheme of Capital Reduction and Amalgamation w.e.f. September 30, 2016
c) Change in Promoters’ shareholding (please specify, if there is no change)
S. no.
Particulars Shareholding at the beginning of the year
[As on 31-March-2016]
Cumulative Shareholding during the year
[As on 31-March-2017]No. of shares % of total
shares of the company
No. of shares % of total shares of the company
1. Mr. Analjit singh At the beginning of the year 10,000 0.00 10,000 0.00Increase / Decrease in Shareholding during the year - - - -At the end of the year 10000 0.00
2. Mrs. Neelu Analjit singh At the beginning of the year 100000 0.04 100000 0.04Increase / Decrease in Shareholding during the year - - - -At the end of the year 100000 0.04
3. Ms. Piya Singh At the beginning of the year 110333 0.04 110333 0.04Increase / Decrease in Shareholding during the year - - - -At the end of the year 110333 0.04
4. Mr. Veer singh At the beginning of the year 100500 0.04 100500 0.04Increase / Decrease in Shareholding during the year - - - -At the end of the year 100500 0.04
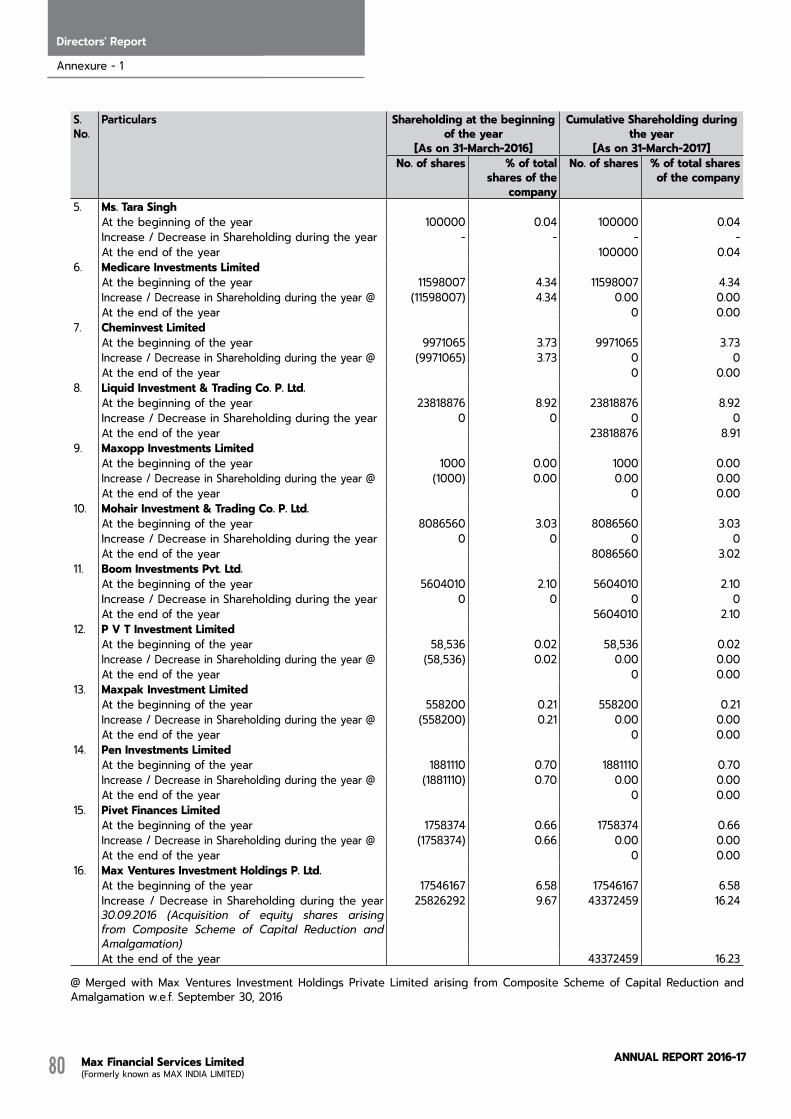
Max Financial Services Limited (Formerly known as MAX INDIA LIMITED)
AnnuAL RepoRt 2016-1780
Directors' Report
S. no.
Particulars Shareholding at the beginning of the year
[As on 31-March-2016]
Cumulative Shareholding during the year
[As on 31-March-2017]No. of shares % of total
shares of the company
No. of shares % of total shares of the company
5. Ms. Tara Singh At the beginning of the year 100000 0.04 100000 0.04Increase / Decrease in Shareholding during the year - - - -At the end of the year 100000 0.04
6. Medicare Investments LimitedAt the beginning of the year 11598007 4.34 11598007 4.34Increase / Decrease in Shareholding during the year @ (11598007) 4.34 0.00 0.00At the end of the year 0 0.00
7. Cheminvest Limited At the beginning of the year 9971065 3.73 9971065 3.73Increase / Decrease in Shareholding during the year @ (9971065) 3.73 0 0At the end of the year 0 0.00
8. Liquid Investment & Trading Co. P. Ltd.At the beginning of the year 23818876 8.92 23818876 8.92Increase / Decrease in Shareholding during the year 0 0 0 0At the end of the year 23818876 8.91
9. Maxopp Investments LimitedAt the beginning of the year 1000 0.00 1000 0.00Increase / Decrease in Shareholding during the year @ (1000) 0.00 0.00 0.00At the end of the year 0 0.00
10. Mohair Investment & Trading Co. P. Ltd.At the beginning of the year 8086560 3.03 8086560 3.03Increase / Decrease in Shareholding during the year 0 0 0 0At the end of the year 8086560 3.02
11. Boom Investments Pvt. Ltd. At the beginning of the year 5604010 2.10 5604010 2.10Increase / Decrease in Shareholding during the year 0 0 0 0At the end of the year 5604010 2.10
12. P V T Investment LimitedAt the beginning of the year 58,536 0.02 58,536 0.02Increase / Decrease in Shareholding during the year @ (58,536) 0.02 0.00 0.00At the end of the year 0 0.00
13. Maxpak Investment LimitedAt the beginning of the year 558200 0.21 558200 0.21Increase / Decrease in Shareholding during the year @ (558200) 0.21 0.00 0.00At the end of the year 0 0.00
14. Pen Investments LimitedAt the beginning of the year 1881110 0.70 1881110 0.70Increase / Decrease in Shareholding during the year @ (1881110) 0.70 0.00 0.00At the end of the year 0 0.00
15. Pivet Finances LimitedAt the beginning of the year 1758374 0.66 1758374 0.66Increase / Decrease in Shareholding during the year @ (1758374) 0.66 0.00 0.00At the end of the year 0 0.00
16. Max Ventures Investment Holdings P. Ltd.At the beginning of the year 17546167 6.58 17546167 6.58Increase / Decrease in Shareholding during the year 30.09.2016 (Acquisition of equity shares arising from Composite Scheme of Capital Reduction and Amalgamation)
25826292 9.67 43372459 16.24
At the end of the year 43372459 16.23
@ Merged with Max Ventures Investment Holdings Private Limited arising from Composite Scheme of Capital Reduction and Amalgamation w.e.f. September 30, 2016
Annexure - 1

Max Financial Services Limited (Formerly known as MAX INDIA LIMITED)
AnnuAL RepoRt 2016-17 81
d) shareholding Pattern of top ten shareholders: (other than directors, Promoters and Holders of Gdrs and Adrs):
S. no.
For each of the Top 10 shareholders Shareholding at the beginningof the year
[As on 31-March-2016]
Cumulative Shareholding during the Year
[As on 31-March-2017]No. of shares % of total
shares of thecompany
No. of shares % of totalshares of the
company1. Moneyline Portfolio Investments Limited
At the beginning of the year 26570048 9.95 26570048 9.95Increase / Decrease in Shareholding during the year - - -At the end of the year 26570048 9.94
2. Xenok LimitedAt the beginning of the year 24079700 9.02 24079700 9.02Increase / Decrease in Shareholding during the year 0 0 0 0At the end of the year 24079700 9.01
3. reliance Capital Trustee Co. Ltd A/C reliance equity opportunities Fund
At the beginning of the year 3628979 1.36 3628979 1.36Increase / Decrease in Shareholding during the year 20.05.201610.06.201617.06.201624.06.201630.06.201622.07.201621.10.201604.11.201611.11.201617.02.201731.03.2017
(45000)(170800)(29200)1699999750001167000(59498)13000
(133000)(31250)
(566500)
0.020.060.010.630.280.060.020.000.050.010.21
35839793413179
338397950839785833979600097959414815954481582148157902315223731
1.341.281.271.902.182.242.222.222.172.161.95
At the end of the year 5223731 1.954. Motilal oswal Most Focused Multicap 35 Fund
At the beginning of the year 3106280 1.16 3106280 1.16Increase / Decrease in Shareholding during the year 29.04.201617.06.201624.06.201630.06.201615.07.201622.07.201629.07.201605.08.201612.08.201619.08.201609.09.201616.09.201620.09.201630.09.201607.10.201621.10.201618.11.201625.11.201609.12.201616.12.201606.01.201713.01.201703.02.201717.02.201724.02.201703.03.201710.03.201724.03.2017
25498(314313)19230885787
(220900)(109042)
54063139576537695760382938
(18324)83300
25000082328
100000229000
39544214920338415(91929)
(50000)(33664)83000
29209340217
13897387967
0.010.120.080.030.080.040.020.050.020.020.030.000.030.090.030.030.090.010.080.130.030.020.010.030.110.010.050.03
3131778281746530097733095560287466027656182819681295925730130263070629315356731352433218543346854335508713650871387987139194154134335447275043808214330821429715743801574672250471246748514404939407
1.171.051.131.161.081.041.061.111.131.151.181.181.211.301.331.361.451.461.541.671.641.621.611.641.751.761.811.85
At the end of the year 4939407 1.85

Max Financial Services Limited (Formerly known as MAX INDIA LIMITED)
AnnuAL RepoRt 2016-1782
Directors' Report
S. no.
For each of the Top 10 shareholders Shareholding at the beginningof the year
[As on 31-March-2016]
Cumulative Shareholding during the Year
[As on 31-March-2017]No. of shares % of total
shares of thecompany
No. of shares % of totalshares of the
company5. ICICI Prudential Value discovery Fund
At the beginning of the year 4517866 1.69 4517866 1.69Increase / Decrease in Shareholding during the year 0 0 0 0At the end of the year 4517866 1.69
6. Kotak select Focus Fund At the beginning of the year 2260000 0.85 2260000 0.85Increase / Decrease in Shareholding during the year 06.05.201613.05.201620.05.201603.06.201610.06.201624.06.201608.07.201605.08.201619.08.201626.08.201607.10.201621.10.201602.12.201609.12.201630.12.201613.01.201720.01.201710.03.2017
1000006500025000136876
1312450000100004000060215397857647
423539367
18153416
335411799
90000
0.030.020.010.060.000.020.000.010.020.010.000.020.000.000.070.000.000.03
2360000242500024500002586876
26000002650000266000027000002760215
2800000280764728500002859367285938530128013016155
30279243117954
0.880.900.910.970.970.990.991.001.031.041.041.061.061.061.131.131.131.16
At the end of the year 3117954 1.167. Government Pension Fund Global
At the beginning of the year 3322952 1.24 3322952 1.24Increase / Decrease in Shareholding during the year 24.06.201602.09.201616.09.201609.12.201616.12.201623.12.2016
(134719)30231
(30231)(132100)
(269062)(94000)
0.050.010.010.050.100.35
318823332184643188233305613327870712693071
1.191.201.191.141.041.01
At the end of the year 2693071 1.018. HdFC Trustee Company Limited – A/C HdFC MId –
Cap opportunities FundAt the beginning of the year 2400000 0.90 2400000 0.90Increase / Decrease in Shareholding during the year - - -At the end of the year 2400000 0.90
9. sBI Magnum Balanced FundAt the beginning of the year 2300000 0.86 2300000 0.86Increase / Decrease in Shareholding during the year - - - -At the end of the year 2300000 0.86
10. Gs Mace Holdings LimitedAt the beginning of the year 17196381 6.44 17196381 6.44Increase / Decrease in Shareholding during the year 24.02.2017
(15000000) 5.62 2196381 0.82
At the end of the year 2196381 0.82
Annexure - 1

Max Financial Services Limited (Formerly known as MAX INDIA LIMITED)
AnnuAL RepoRt 2016-17 83
e) shareholding of directors and Key Managerial Personnel:
S.No shareholding of each directors and each Key Managerial Personnel
Shareholding at the beginningof the year
[As on 31-March-2016]
Cumulative Shareholding during the year
[As on 31-March-2017]No. of shares
% of totalshares of the
company
No. of shares % of totalshares of the
company1 Mr. Mohit Talwar, Managing director
At the beginning of the year 1,40,106 0.05 1,40,106 0.05Increase / Decrease in Shareholding during the year *20.04.2016 *06.09.2016 **29.03.2017
23,90011,432
(1,40,000)
0.010.000.05
1,64,0061,75,43835,438
0.060.060.01
At the end of the year 35,438 0.012 Mr. Ashwani Windlass, Ned
At the beginning of the year 162,850 0.06 162,850 0.06Increase / Decrease in Shareholding during the year
- - - -
At the end of the year 162,850 0.063 Mr. rajesh Khanna, Id
At the beginning of the year 25,000 0.01 25,000 0.01Increase / Decrease in Shareholding during the year
- - - -
At the end of the year 25,000 0.014 Mr. Aman Mehta, Id
At the beginning of the year 29,000 0.01 29,000 0.01Increase / Decrease in Shareholding during the year
- - - -
At the end of the year 29,000 0.015 Mrs. sujatha ratnam, CFo
At the beginning of the year 35,000 0.01 35,000 0.01Increase / Decrease in Shareholding during the year
- - - -
At the end of the year 35,000 0.01* Allotment of equity shares under ESOP** Sale of shares in open market
V. INdeBTedNess: NIL
VI. reMUNerATIoN oF dIreCTors ANd KeY MANAGerIAL PersoNNeL
A. Remuneration to Managing Director, Whole-time Director and / or Manager: Details covered in Corporate Governance Report
B. Remuneration to other directors: Only sitting fees paid, details covered in Corporate Governance Report
C. Remuneration to Key Managerial Personnel other than MD/Manager/ WTD : Details covered in Annexure to the Directors’ Report
VII. PeNALTIes / PUNIsHMeNT/CoMPoUNdING oF oFFeNCes: N.A.

Max Financial Services Limited (Formerly known as MAX INDIA LIMITED)
AnnuAL RepoRt 2016-1784
Directors' Report
Anne
xure
2 to
the
dire
ctor
s’ re
port
Form
AoC
-1(P
ursu
ant t
o fir
st p
rovi
so to
sub
sec
tion
(3) o
f sec
tion
129
read
with
rule
5 o
f Com
pani
es (A
ccou
nts)
rul
es, 2
014)
stat
emen
t con
tain
ing
salie
nt fe
atur
es o
f the
Fin
anci
al s
tate
men
t of s
ubsid
iarie
s /
asso
ciat
e co
mpa
nies
/ jo
int v
entu
res
Part
“A”
- su
bsid
iarie
s
(Info
rmat
ion
in re
spec
t of e
ach
subs
idia
ry to
be
pres
ente
d w
ith a
mou
nts
in r
s)
(Am
t in
Rs L
acs)
Sl. No
. Na
me of
subs
idiary
Co
mpan
y Re
porti
ng pe
riod
for th
e sub
sidiar
y co
ncern
ed
Repo
rting
Cu
rrenc
y and
Ex
chan
ge ra
te as
on
the l
ast d
ate of
rel
evan
t fina
ncial
ye
ar in
the
case
of fo
reign
su
bsidi
aries
Share
Ca
pital
rese
rves &
Su
rplus
Total
Asse
tsTo
tal
Liabil
ities
Inves
tmen
ts Tu
rnove
rPr
ofit
befor
e tax
ation
Prov
ision
for
taxa
tion
Profi
t aft
er tax
ation
Prop
osed
Div
idend
%
of sh
are
holdi
ng
1Ma
x Life
Insu
rance
Co.
Ltd31-
Mar-1
7INR
191,8
81.29
58
,671.6
8 4,
644,3
36.71
4,3
93,78
3.74
4,436
,950.8
6 1,5
21,92
5.85
76,82
1.71
10,82
9.00
65,99
2.71
- 70
.01%
Part
“B”
- As
soci
ate
Com
pani
es a
nd Jo
int-V
entu
res
Not A
pplic
able
, as
ther
e ar
e no
Ass
ocia
tes
/ Jo
int V
entu
res
Annexure - 2
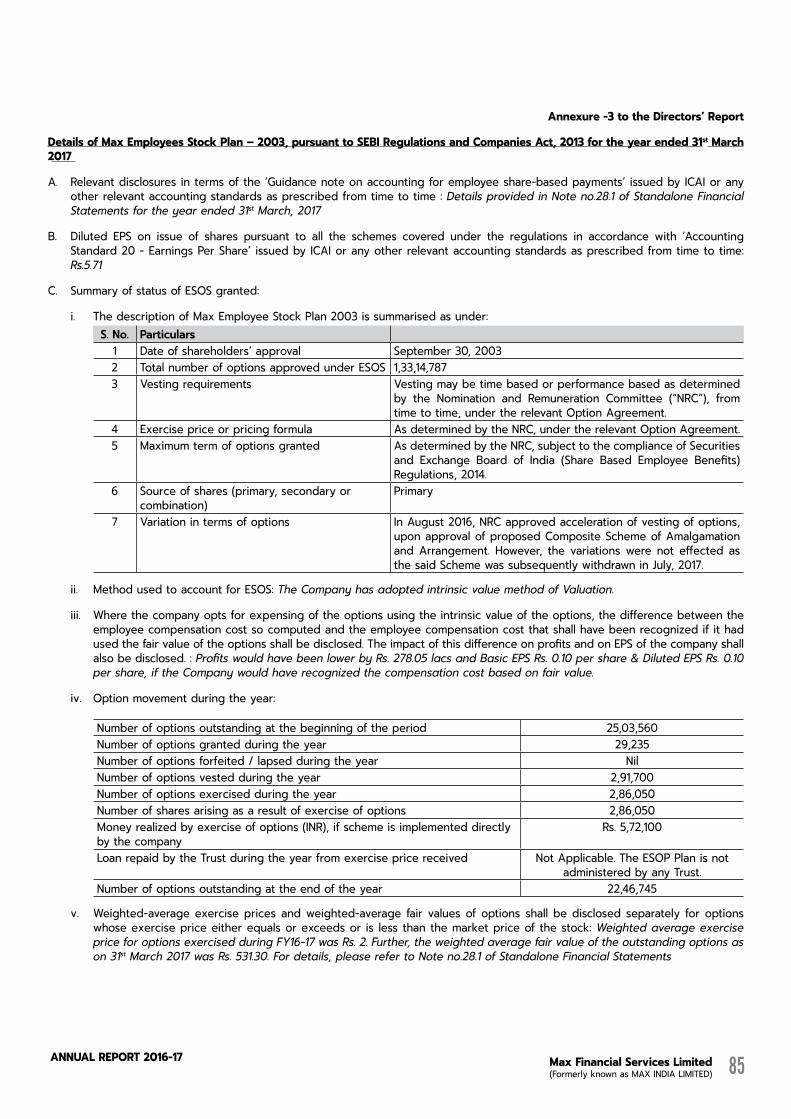
Max Financial Services Limited (Formerly known as MAX INDIA LIMITED)
AnnuAL RepoRt 2016-17 85
Annexure -3 to the directors’ report
Details of Max Employees Stock Plan – 2003, pursuant to seBI Regulations and Companies Act, 2013 for the year ended 31st March 2017
A. Relevant disclosures in terms of the ‘Guidance note on accounting for employee share-based payments’ issued by ICAI or any other relevant accounting standards as prescribed from time to time : Details provided in Note no.28.1 of Standalone Financial Statements for the year ended 31st March, 2017
B. Diluted EPS on issue of shares pursuant to all the schemes covered under the regulations in accordance with ‘Accounting Standard 20 - Earnings Per Share’ issued by ICAI or any other relevant accounting standards as prescribed from time to time: Rs.5.71
C. Summary of status of ESOS granted:
i. The description of Max Employee Stock Plan 2003 is summarised as under:S. no. Particulars
1 Date of shareholders’ approval September 30, 2003 2 Total number of options approved under ESOS 1,33,14,7873 Vesting requirements Vesting may be time based or performance based as determined
by the Nomination and Remuneration Committee (“NRC”), from time to time, under the relevant Option Agreement.
4 Exercise price or pricing formula As determined by the NRC, under the relevant Option Agreement.5 Maximum term of options granted As determined by the NRC, subject to the compliance of Securities
and Exchange Board of India (Share Based Employee Benefits) Regulations, 2014.
6 Source of shares (primary, secondary or combination)
Primary
7 Variation in terms of options In August 2016, NRC approved acceleration of vesting of options, upon approval of proposed Composite Scheme of Amalgamation and Arrangement. However, the variations were not effected as the said Scheme was subsequently withdrawn in July, 2017.
ii. Method used to account for ESOS: The Company has adopted intrinsic value method of Valuation.
iii. Where the company opts for expensing of the options using the intrinsic value of the options, the difference between the employee compensation cost so computed and the employee compensation cost that shall have been recognized if it had used the fair value of the options shall be disclosed. The impact of this difference on profits and on EPS of the company shall also be disclosed. : Profits would have been lower by Rs. 278.05 lacs and Basic EPS Rs. 0.10 per share & Diluted EPS Rs. 0.10 per share, if the Company would have recognized the compensation cost based on fair value.
iv. Option movement during the year:
Number of options outstanding at the beginning of the period 25,03,560Number of options granted during the year 29,235Number of options forfeited / lapsed during the year NilNumber of options vested during the year 2,91,700Number of options exercised during the year 2,86,050Number of shares arising as a result of exercise of options 2,86,050Money realized by exercise of options (INR), if scheme is implemented directly by the company
Rs. 5,72,100
Loan repaid by the Trust during the year from exercise price received Not Applicable. The ESOP Plan is not administered by any Trust.
Number of options outstanding at the end of the year 22,46,745
v. Weighted-average exercise prices and weighted-average fair values of options shall be disclosed separately for options whose exercise price either equals or exceeds or is less than the market price of the stock: Weighted average exercise price for options exercised during FY16-17 was Rs. 2. Further, the weighted average fair value of the outstanding options as on 31st March 2017 was Rs. 531.30. For details, please refer to Note no.28.1 of Standalone Financial Statements

Max Financial Services Limited (Formerly known as MAX INDIA LIMITED)
AnnuAL RepoRt 2016-1786
Directors' Report
Annexure - 3
vi. Employee wise details of options granted to -
a) Senior Managerial Personnel Name Mr. Mohit TalwarDesignation Managing DirectorNumber of options granted during the year
29,235
Exercise Price Rs.2b) Any other employee who receives a grant in any one
year of option amounting to 5% or more of option granted during that year; and
Mr. Mohit Talwar is the only person who received grant of options during the year under review.
c) Identified employees who were granted option during any one year, equal to or exceeding 1% of the issued capital (excluding outstanding warrants and conversions) of the company at the time of grant.
No employee of the Company was granted options during the year exceeding 1% of the issued capital (excluding outstanding warrants and conversions) of the Company at the time of grant.
vii. A description of the method and significant assumptions used during the year to estimate the fair value of options including the following information: weighted-average values of share price(at time of grant)
Rs. 322.00 – 349.40
exercise price Rs. 2expected volatility 36.82expected option life (in years) 3 to 6expected dividends Nilrisk-free interest rate 7.49% - 7.91%any other inputs to the model Nil
the method used and the assumptions made to incorporate the effects of expected early exercise
Not Applicable
how expected volatility was determined, including an explanation of the extent to which expected volatility was based on historical volatility; and
The calculation of expected volatility is based on historical stock prices. Volatility was calculated using standard deviation of daily change in stock price.
whether and how any other features of the option grant were incorporated into the measurement of fair value, such as a market condition.
No other feature has been considered for fair valuation of options except as mentioned above.
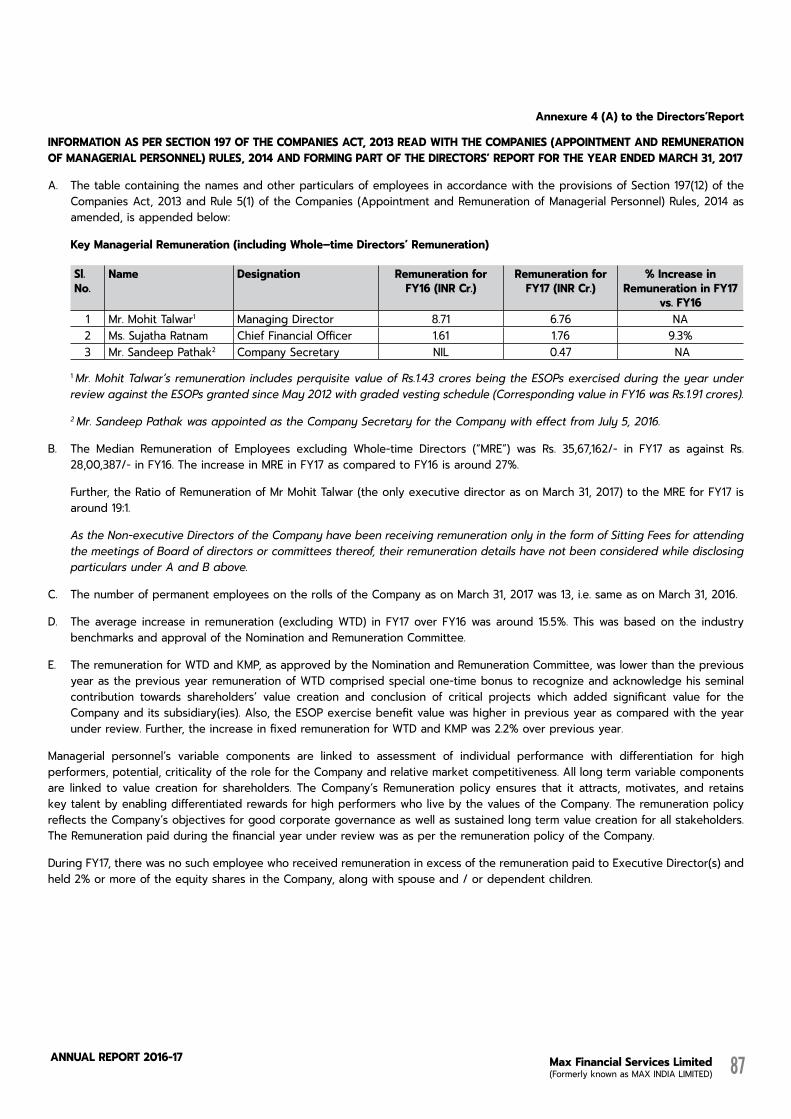
Max Financial Services Limited (Formerly known as MAX INDIA LIMITED)
AnnuAL RepoRt 2016-17 87
Annexure 4 (A) to the Directors’Report
INForMATIoN As Per seCTIoN 197 oF THe CoMPANIes ACT, 2013 reAd WITH THe CoMPANIes (APPoINTMeNT ANd reMUNerATIoN oF MANAGerIAL PersoNNeL) rULes, 2014 ANd ForMING PArT oF THe dIreCTors’ rePorT For THe YeAr eNded MArCH 31, 2017
A. The table containing the names and other particulars of employees in accordance with the provisions of Section 197(12) of the Companies Act, 2013 and Rule 5(1) of the Companies (Appointment and Remuneration of Managerial Personnel) Rules, 2014 as amended, is appended below:
Key Managerial Remuneration (including Whole–time Directors’ Remuneration)
Sl.No.
Name Designation remuneration for FY16 (INr Cr.)
remuneration for FY17 (INr Cr.)
% Increase in remuneration in FY17
vs. FY161 Mr. Mohit Talwar1 Managing Director 8.71 6.76 NA2 Ms. Sujatha Ratnam Chief Financial Officer 1.61 1.76 9.3%3 Mr. Sandeep Pathak2 Company Secretary NIL 0.47 NA
1 Mr. Mohit Talwar’s remuneration includes perquisite value of Rs.1.43 crores being the ESOPs exercised during the year under review against the ESOPs granted since May 2012 with graded vesting schedule (Corresponding value in FY16 was Rs.1.91 crores).
2 Mr. Sandeep Pathak was appointed as the Company Secretary for the Company with effect from July 5, 2016.
B. The Median Remuneration of Employees excluding Whole-time Directors (“MRE”) was Rs. 35,67,162/- in FY17 as against Rs. 28,00,387/- in FY16. The increase in MRE in FY17 as compared to FY16 is around 27%.
Further, the Ratio of Remuneration of Mr Mohit Talwar (the only executive director as on March 31, 2017) to the MRE for FY17 is around 19:1.
As the Non-executive Directors of the Company have been receiving remuneration only in the form of Sitting Fees for attending the meetings of Board of directors or committees thereof, their remuneration details have not been considered while disclosing particulars under A and B above.
C. The number of permanent employees on the rolls of the Company as on March 31, 2017 was 13, i.e. same as on March 31, 2016.
D. The average increase in remuneration (excluding WTD) in FY17 over FY16 was around 15.5%. This was based on the industry benchmarks and approval of the Nomination and Remuneration Committee.
E. The remuneration for WTD and KMP, as approved by the Nomination and Remuneration Committee, was lower than the previous year as the previous year remuneration of WTD comprised special one-time bonus to recognize and acknowledge his seminal contribution towards shareholders’ value creation and conclusion of critical projects which added significant value for the Company and its subsidiary(ies). Also, the ESOP exercise benefit value was higher in previous year as compared with the year under review. Further, the increase in fixed remuneration for WTD and KMP was 2.2% over previous year.
Managerial personnel’s variable components are linked to assessment of individual performance with differentiation for high performers, potential, criticality of the role for the Company and relative market competitiveness. All long term variable components are linked to value creation for shareholders. The Company’s Remuneration policy ensures that it attracts, motivates, and retains key talent by enabling differentiated rewards for high performers who live by the values of the Company. The remuneration policy reflects the Company’s objectives for good corporate governance as well as sustained long term value creation for all stakeholders. The Remuneration paid during the financial year under review was as per the remuneration policy of the Company.
During FY17, there was no such employee who received remuneration in excess of the remuneration paid to Executive Director(s) and held 2% or more of the equity shares in the Company, along with spouse and / or dependent children.
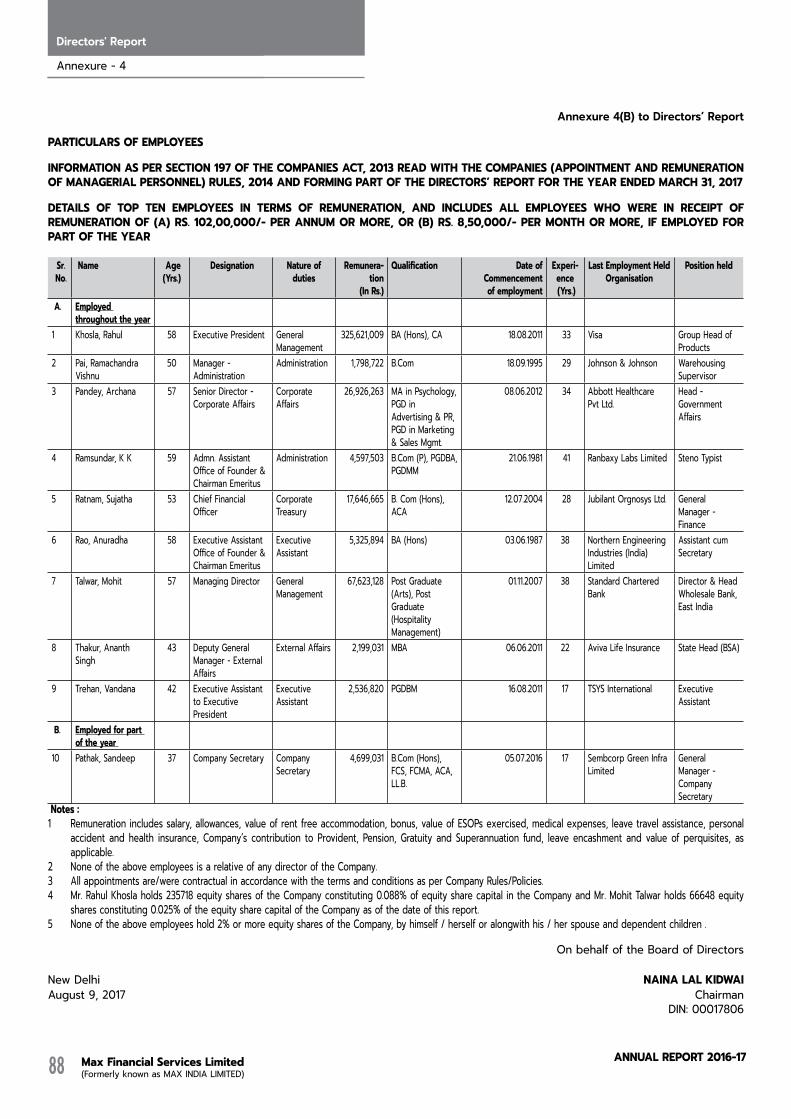
Max Financial Services Limited (Formerly known as MAX INDIA LIMITED)
AnnuAL RepoRt 2016-1788
Directors' Report
Annexure - 4
annexure 4(B) to Directors’ Report
PArTICULArs oF eMPLoYees
INForMATIoN As Per seCTIoN 197 oF THe CoMPANIes ACT, 2013 reAd WITH THe CoMPANIes (APPoINTMeNT ANd reMUNerATIoN oF MANAGerIAL PersoNNeL) rULes, 2014 ANd ForMING PArT oF THe dIreCTors’ rePorT For THe YeAr eNded MArCH 31, 2017
deTAILs oF ToP TeN eMPLoYees IN TerMs oF reMUNerATIoN, ANd INCLUdes ALL eMPLoYees WHo Were IN reCeIPT oF reMUNerATIoN oF (A) rs. 102,00,000/- Per ANNUM or More, or (B) rs. 8,50,000/- Per MoNTH or More, IF eMPLoYed For PArT oF THe YeAr
Sr. No.
Name Age(Yrs.)
Designation Nature of duties
Remunera-tion
(In Rs.)
Qualification date ofCommencementof employment
Experi-ence (Yrs.)
Last employment Heldorganisation
Position held
A. Employed throughout the year
1 Khosla, Rahul 58 Executive President General Management
325,621,009 BA (Hons), CA 18.08.2011 33 Visa Group Head of Products
2 Pai, Ramachandra Vishnu
50 Manager - Administration
Administration 1,798,722 B.Com 18.09.1995 29 Johnson & Johnson Warehousing Supervisor
3 Pandey, Archana 57 Senior Director - Corporate Affairs
Corporate Affairs
26,926,263 MA in Psychology, PGD in Advertising & PR, PGD in Marketing & Sales Mgmt.
08.06.2012 34 Abbott Healthcare Pvt Ltd.
Head - Government Affairs
4 Ramsundar, K K 59 Admn. Assistant Office of Founder & Chairman Emeritus
Administration 4,597,503 B.Com (P), PGDBA, PGDMM
21.06.1981 41 Ranbaxy Labs Limited Steno Typist
5 Ratnam, Sujatha 53 Chief Financial Officer
Corporate Treasury
17,646,665 B. Com (Hons), ACA
12.07.2004 28 Jubilant Orgnosys Ltd. General Manager - Finance
6 Rao, Anuradha 58 Executive Assistant Office of Founder & Chairman Emeritus
Executive Assistant
5,325,894 BA (Hons) 03.06.1987 38 Northern Engineering Industries (India) Limited
Assistant cum Secretary
7 Talwar, Mohit 57 Managing Director General Management
67,623,128 Post Graduate (Arts), Post Graduate (Hospitality Management)
01.11.2007 38 Standard Chartered Bank
Director & Head Wholesale Bank, East India
8 Thakur, Ananth Singh
43 Deputy General Manager - External Affairs
External Affairs 2,199,031 MBA 06.06.2011 22 Aviva Life Insurance State Head (BSA)
9 Trehan, Vandana 42 Executive Assistant to Executive President
Executive Assistant
2,536,820 PGDBM 16.08.2011 17 TSYS International Executive Assistant
B. employed for part of the year
10 Pathak, Sandeep 37 Company Secretary Company Secretary
4,699,031 B.Com (Hons), FCS, FCMA, ACA, LL.B.
05.07.2016 17 Sembcorp Green Infra Limited
General Manager - Company Secretary
Notes : 1 Remuneration includes salary, allowances, value of rent free accommodation, bonus, value of ESOPs exercised, medical expenses, leave travel assistance, personal
accident and health insurance, Company’s contribution to Provident, Pension, Gratuity and Superannuation fund, leave encashment and value of perquisites, as applicable.
2 None of the above employees is a relative of any director of the Company.3 All appointments are/were contractual in accordance with the terms and conditions as per Company Rules/Policies.4 Mr. Rahul Khosla holds 235718 equity shares of the Company constituting 0.088% of equity share capital in the Company and Mr. Mohit Talwar holds 66648 equity
shares constituting 0.025% of the equity share capital of the Company as of the date of this report.5 None of the above employees hold 2% or more equity shares of the Company, by himself / herself or alongwith his / her spouse and dependent children .
On behalf of the Board of Directors
New Delhi NAINA LAL KIdWAIAugust 9, 2017 Chairman
DIN: 00017806
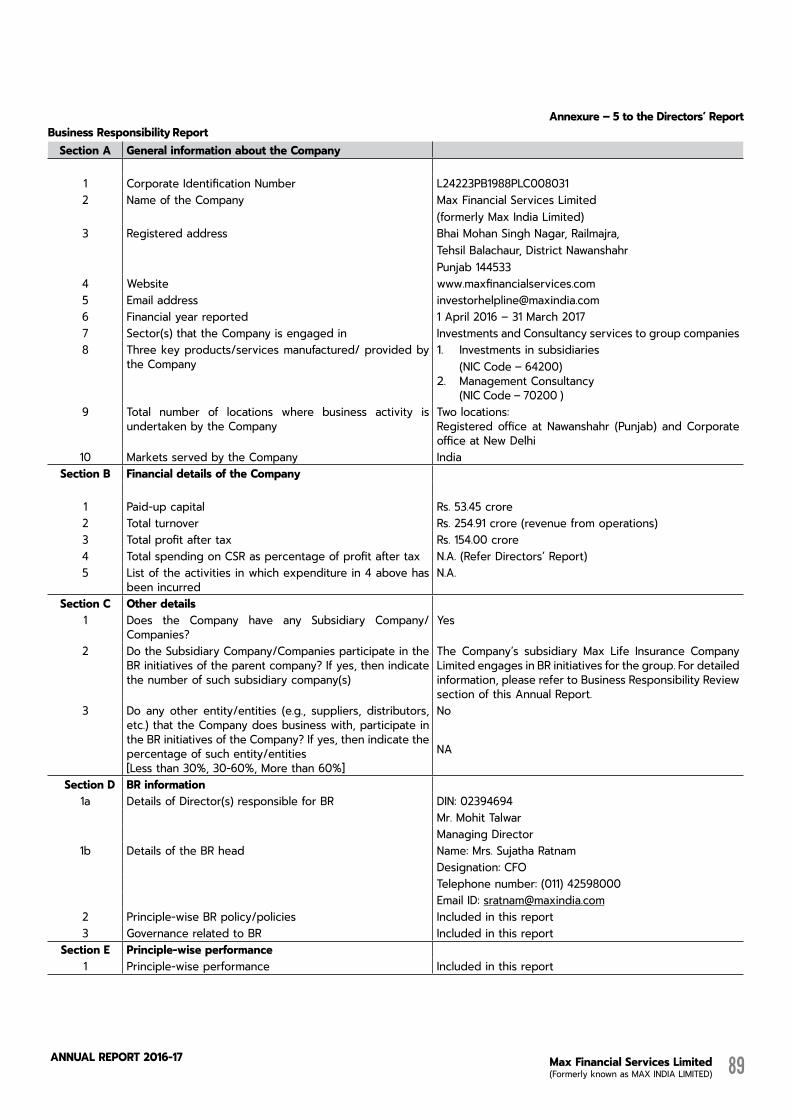
Max Financial Services Limited (Formerly known as MAX INDIA LIMITED)
AnnuAL RepoRt 2016-17 89
Annexure – 5 to the directors’ report Business responsibility report
section A General information about the Company
1 Corporate Identification Number L24223PB1988PLC0080312 Name of the Company Max Financial Services Limited
(formerly Max India Limited) 3 Registered address Bhai Mohan Singh Nagar, Railmajra,
Tehsil Balachaur, District NawanshahrPunjab 144533
4 Website www.maxfinancialservices.com5 Email address [email protected] Financial year reported 1 April 2016 – 31 March 20177 Sector(s) that the Company is engaged in Investments and Consultancy services to group companies8 Three key products/services manufactured/ provided by
the Company1. Investments in subsidiaries (NIC Code – 64200)2. Management Consultancy (NIC Code – 70200 )
9 Total number of locations where business activity is undertaken by the Company
Two locations:Registered office at Nawanshahr (Punjab) and Corporate office at New Delhi
10 Markets served by the Company Indiasection B Financial details of the Company
1 Paid-up capital Rs. 53.45 crore2 Total turnover Rs. 254.91 crore (revenue from operations)3 Total profit after tax Rs. 154.00 crore4 Total spending on CSR as percentage of profit after tax N.A. (Refer Directors’ Report) 5 List of the activities in which expenditure in 4 above has
been incurredN.A.
Section C other details1 Does the Company have any Subsidiary Company/
Companies?Yes
2 Do the Subsidiary Company/Companies participate in the BR initiatives of the parent company? If yes, then indicate the number of such subsidiary company(s)
The Company’s subsidiary Max Life Insurance Company Limited engages in BR initiatives for the group. For detailed information, please refer to Business Responsibility Review section of this Annual Report.
3 Do any other entity/entities (e.g., suppliers, distributors, etc.) that the Company does business with, participate in the BR initiatives of the Company? If yes, then indicate the percentage of such entity/entities[Less than 30%, 30-60%, More than 60%]
No
NA
Section D Br information1a Details of Director(s) responsible for BR DIN: 02394694
Mr. Mohit TalwarManaging Director
1b Details of the BR head Name: Mrs. Sujatha RatnamDesignation: CFOTelephone number: (011) 42598000Email ID: [email protected]
2 Principle-wise BR policy/policies Included in this report3 Governance related to BR Included in this report
Section E Principle-wise performance1 Principle-wise performance Included in this report
Max Financial Services Limited (Formerly known as MAX INDIA LIMITED)
AnnuAL RepoRt 2016-1790
Directors' Report
Annexure - 5
PrefaceAs mandated by Securities and Exchange Board of India (SEBI), India’s top 500 listed entities based on market capitalisation on the BSE and NSE, are required to submit a ‘Business Responsibility Report’ (BRR) along with their Annual Report for 2016-17. Max Financial Services Limited (MFSL) presents its first BRR in line with the requirements of SEBI. This BRR provides information on key initiatives undertaken by the Company and / or its subsidiary.
MFSL is the holding company of Max Life Insurance Company Limited (an unlisted material subsidiary), which continued to work with Max India Foundation to implement its CSR programme which has a focus on healthcare, sanitation, safe drinking water, environment protection, financial literacy & insurance awareness and village adoption. It is committed to attaining the highest standards of service in protecting and enhancing the financial future of its customers by adhering to a set of values that is shared across the Group – Sevabhav (spirit of service), Excellence and Credibility.
Principle 1: Businesses should conduct and govern themselves with ethics, Transparency and AccountabilityMFSL continues to adopt high standards of corporate governance, adhering to all applicable guidelines with transparent disclosures about the Company’s performance. As the holding company of life insurance business, MFSL considers ethics, transparency and accountability to be its top-most priority.
MFSL has a Code of Conduct for the Company’s Directors and Senior Management. A declaration of the Directors and Senior Management’s affirmation to this Code of Conduct is communicated to all stakeholders by the Managing Director in the Annual Report.
MFSL has established a Whistle Blower Policy, which lays down the process to report any unethical behaviour or violation of the Code of Conduct. Employees can report to the Management any instances of unethical behaviour, or suspected fraud or violation of the Code of Conduct. Adequate measures are in place to ensure safeguards against victimization of employees who report any unethical behaviour. There is also a provision for direct access to the Chairman of the Audit Committee in exceptional cases. All whistle blower complaints are investigated and action is initiated, wherever required.
No complaints linked to the Code of Conduct adherence were received in the reporting year.
Principle 2: Businesses should provide goods and services that are safe and contribute to sustainability throughout their life cycleMFSL endeavors to contribute to sustainability and conservation of resources in all possible manners. All Board level meetings have been paperless for more than 4 years, with Directors and other participants accessing relevant material electronically.
Principle 3: Businesses should promote the well-being of all employeesAs of 31st March 2017, MFSL had a total of 13 employees, which included 5 women employees. There were no temporary
or contractual employees in the reporting year. As a holding company with limited areas of operations, the Company’s staffing is adequate and commensurate with the scale of its business. The Company believes its employees are its greatest strength and invests in the growth and development of all its employees and engages with them on a regular basis. Employees are also given opportunities to move across other Group companies to get wider exposure.
MFSL has policies and procedures in place to prevent any kind of discrimination. It has a ‘Policy on Prevention of Sexual Harassment at Workplace’ in place to ensure the safety and security of its female employees. The Company did not receive any complaint relating to child labor, forced labor, involuntary labor or sexual harassment in 2016-17 and none are pending as of 31 March 2017.
Principle 4: Businesses should respect the interests of, and be responsive towards all stakeholders, especially those who are disadvantaged, vulnerable and marginalisedMFSL is an equal opportunity employer. Remuneration practices are based on merit, without regard to the person’s ethnic background or gender, and are periodically updated based on market benchmarks. The Company ensures there is no discrimination of any type against socially disadvantaged sections in the work place.
Principle 5: Businesses should respect and promote human rightsMFSL is dedicated to upholding the human rights of all its employees, and it strictly ensures compliance with all applicable laws of the land pertaining to human rights. The Company did not receive any complaint relating to violation of human rights in 2016-17.
Principle 6: Businesses should respect, protect, and make efforts to restore the environmentMFSL is committed to conducting its business in a manner that protects the natural environment. Given that MFSL is a holding company with no direct business operations and small number of employees, the Company does not have any significant direct environmental impacts.
Principle 7: Businesses, when engaged in influencing public and regulatory policy, should do so in a responsible mannerMFSL is a holding company with no direct business operations however its subsidiary Max Life actively engages in policy advocacy to balance the interests of various stakeholders.
Principle 8: Businesses should support inclusive growth and equitable developmentFor detailed information on steps taken towards inclusive growth and equitable development, please refer to the Business Responsibility Review section of this Annual Report.
Principle 9: Businesses should engage with and provide value to their customers and consumers in a responsible mannerMFSL, being a holding company, does not have any direct customers or consumers under the scope of this BRR.
Max Financial Services Limited (Formerly known as MAX INDIA LIMITED)
AnnuAL RepoRt 2016-17 91
We have conducted the secretarial audit of the compliance of applicable statutory provisions and the adherence to good corporate practices by Max Financial Services Limited, formerly known as Max India Limited (hereinafter called the “Company’’). Secretarial Audit was conducted in a manner that provided us a reasonable basis for evaluating the corporate conducts / statutory compliances and expressing our opinion thereon.
Based on our verification of the Company’s books, papers, minute books, forms and returns filed and other records maintained by the Company and also the information provided by the Company, its officers, agents and authorized representatives during the conduct of secretarial audit, we hereby report that in our opinion, the Company has, during the audit period covering the financial year ended on March 31, 2017 complied with the statutory provisions listed hereunder and also that the Company has proper Board-processes and compliance-mechanism in place to the extent, in the manner and subject to the reporting made hereinafter:
We have examined the books, papers, minute books, forms and returns filed and other records maintained by the Company for the financial year ended on March 31, 2017 according to the provisions of:
(i) The Companies Act, 2013 (the Act) and the rules made thereunder;
(ii) The Securities Contracts (Regulation) Act, 1956 (‘SCRA’) and the rules made thereunder;
(iii) The Depositories Act, 1996 and the Regulations and Bye-laws framed thereunder to the extent of Regulation 55A;
(iv) Foreign Exchange Management Act, 1999 and the rules and regulations made thereunder to the extent of Foreign Direct Investment, Overseas Direct Investment and External Commercial Borrowings;
(v) The following Regulations and Guidelines prescribed under the Securities and Exchange Board of India Act, 1992 (‘SEBI Act’):-
a) The Securities and Exchange Board of India (Substantial Acquisition of Shares and Takeovers) Regulations, 2011;
b) The Securities and Exchange Board of India (Prohibition of Insider Trading) Regulations, 2015;
Annexure – 6 to the directors’report
seCreTArIAL AUdIT rePorTFOR THE FINANCIAL YEAR ENDED MARCH 31, 2017
To,The Members, Max Financial services Limited(Formerly Known as Max India Limited) Bhai Mohan Singh Nagar, Rail Majra, Tehsil Balachaur, Distt. Nawanshahr, Punjab-144533
c) The Securities and Exchange Board of India (Issue of Capital and Disclosure Requirements) Regulations, 2009;
d) The Securities and Exchange Board of India (Share Based Employee Benefits) Regulations, 2014;
e) The Securities and Exchange Board of India (Issue and Listing of Debt Securities) Regulations, 2008; Not Applicable
f) The Securities and Exchange Board of India (Registrars to an Issue and Share Transfer Agents) Regulations, 1993 regarding the Companies Act and dealing with client to the extent of securities issued;
g) The Securities and Exchange Board of India (Delisting of Equity Shares) Regulations, 2009; and Not Applicable
h) The Securities and Exchange Board of India (Buyback of Securities) Regulations, 1998. Not Applicable
(vi) As confirmed and certified by the management, there is no sectoral law specifically applicable to the Company based on the Sectors / Businesses. Further, the management confirmed that the Company is a non-systemically important Core Investment Company and hence does not require registration as a NBFC.
We have also examined compliance with the applicable clauses of the following:
a) Secretarial Standards issued by The Institute of Company Secretaries of India and notified by Ministry of Corporate Affairs.
b) SEBI (Listing Obligations and Disclosure Requirements) Regulations, 2015.
During the period under review the Company has generally complied with the provisions of the Act, Rules, Regulations, Guidelines, Standards, etc. mentioned above.
We further report that,
The Board of Directors of the Company is duly constituted with proper balance of Executive Directors, Non-Executive Directors and Independent Directors. The changes in the composition of the Board of Directors that took place during the period under review were carried out in compliance with the provisions of the Act.
Max Financial Services Limited (Formerly known as MAX INDIA LIMITED)
AnnuAL RepoRt 2016-1792
Directors' Report
Annexure - 6
Adequate notice is given to all directors to schedule the Board Meetings, agenda and detailed notes on agenda were sent in advance(and at a shorter notice for which necessary approvals obtained), and a system exists for seeking and obtaining further information and clarifications on the agenda items before the meeting and for meaningful participation at the meeting.
All decisions at Board Meetings and Committee Meetings are carried out unanimously as recorded in the minutes of the meetings of the Board of Directors or Committee of the Board, as the case may be.
We further report that there are adequate systems and processes in the Company commensurate with the size and operations of the Company to monitor and ensure compliance with applicable laws, rules, regulations and guidelines.
We further report that during the audit period following major events have happened which are deemed to have major bearing on the Company’s affairs in pursuance of the above referred laws, rules, regulations, guidelines, standards, etc.
1. The Company has acquired 38,300,000 Equity Shares of Rs 10/- each in Max Life Insurance Company Limited.
2. The Board of Directors of the Company has approved a composite scheme of amalgamation and arrangement on August 8, 2016 which inter alia contemplated (a) merger of Max Life Insurance Company Limited with the Company; (b) demerger of the life insurance undertaking of MFSL and merger of the said undertaking with HDFC Standard Life Insurance Company Limited; and (c) merger of MFSL (holding the non-life insurance business) with Max India Limited.
However, the proposed Scheme and the applications filed in this regard with the Stock exchanges were subsequently withdrawn on July 31, 2017.
Date: 09.08.2017 Place: Delhi
Chandrasekaran AssociatesCompany Secretaries
Rupesh agarwal Partner
Membership No.:16302 Certificate of Practice No.:5673
Note: This report is to be read with our letter of even date which is annexed as Annexure-A to this report and forms an integral part of this report.

Max Financial Services Limited (Formerly known as MAX INDIA LIMITED)
AnnuAL RepoRt 2016-17 93
annexure-a to the Secretarial audit Report
To,The Members, Max Financial services Limited(Formerly Known as Max India Limited) Bhai Mohan Singh Nagar, Rail Majra, Tehsil Balachaur, Distt. Nawanshahr, Punjab-144533
1. Maintenance of secretarial record is the responsibility of the management of the Company. Our responsibility is to express an opinion on these secretarial records based on our audit.
2. We have followed the audit practices and processes as were appropriate to obtain reasonable assurance about the correctness of the contents of the secretarial records. The verification was done on the random test basis to ensure that correct facts are reflected in secretarial records. We believe that the processes and practices, we followed provide a reasonable basis for our opinion.
3. We have not verified the correctness and appropriateness of financial records and Books of Accounts of the Company.
4. Where ever required, we have obtained the Management representation about the compliance of laws, rules and regulations and happening of events etc.
5. The compliance of the provisions of Corporate and other applicable laws, rules, regulations, standards is the responsibility of management. Our examination was limited to the verification of procedures on the random test basis.
6. The Secretarial Audit report is neither an assurance as to the future viability of the company nor of the efficacy or effectiveness with which the management has conducted the affairs of the Company.
Date: 09.08.2017 Place: Delhi
Chandrasekaran AssociatesCompany Secretaries
Rupesh AgarwalPartner
Membership No.:16302 Certificate of Practice No.: 5673
Max Financial Services Limited (Formerly known as MAX INDIA LIMITED)
AnnuAL RepoRt 2016-1794
Directors' Report
Annexure - 7
Annexure – 7 to the directors’reportForm No. AoC-2
(Pursuant to clause (h) of sub-section (3) of section 134 of the Act and Rule 8(2) of the Companies (Accounts) Rules, 2014)
Form for disclosure of particulars of contracts/arrangements entered into by the company with related parties referred to in sub-section (1) of section 188 of the Companies Act, 2013 including certain arms length transactions under third proviso thereto
1. Details of contracts or arrangements or transactions not at arm’s length basis:
a) Name(s) of the related party and nature of relationship: Max Life Insurance Company Limited (Subsidiary company)
b) Nature of contracts/arrangements/transactions: Sub-licensing of trademarks
c) Duration of the contracts / arrangements/transactions: 10 years
d) Salient terms of the contracts or arrangements or transactions including the value, if any: The contract for sub-licensing of trademarks has been entered into with subsidiary company, pursuant to a Scheme of Demerger approved by Hon’ble High Court of Punjab at Chandigarh, which allows usage of trademarks without any consideration.
e) Justification for entering into such contracts or arrangements or transactions: The trademarks have been licensed to the Company for limited usage. Prior to the Scheme of Demerger, Max Life Insurance Company Limited had been using such trademarks. It was contemplated to allow usage of such trademarks by Max Life, without impacting the ownership of such trademarks.
f) date(s) of approval by the Board: August 8, 2016
g) Amount paid as advances, if any: NIL
h) Date on which the resolution was passed in general meeting as required under first proviso to section 188: September 27, 2016
2. Details of material contracts or arrangement or transactions at arm’s length basis: N.A.
a) Name(s) of the related party and nature of relationship: b) Nature of contracts/arrangements/transactions: c) Duration of the contracts / arrangements/transactions: d) Salient terms of the contracts or arrangements or transactions including the value, if any: e) Date(s) of approval by the Board, if any: f) Amount paid as advances, if any:
Place : New Delhi Mrs. Naina Lal KidwaiDate : August 9, 2017 Chairman
DIN: 00017806

StanDalone Financial
StatementS
Standalone Financial Statements
Max Financial Services Limited (Formerly known as MAX INDIA LIMITED)
AnnuAL RepoRt 2016-1796
Auditor's Report
To THe MeMBers oF Max Financial services Limited (Formerly known as MAX INdIA LIMITed)
report on the standalone Financial statements
We have audited the accompanying standalone financial statements of Max Financial services Limited (Formerly known as MAX INdIA LIMITed) (“the Company”), which comprise the Balance Sheet as at 31 March, 2017, the Statement of Profit and Loss and the Cash Flow Statement for the year then ended, and a summary of the significant accounting policies and other explanatory information.
Management’s responsibility for the standalone Financial Statements
The Company’s Board of Directors is responsible for the matters stated in Section 134(5) of the Companies Act, 2013 (“the Act”) with respect to the preparation of these standalone financial statements that give a true and fair view of the financial position, financial performance and cash flows of the Company in accordance with the accounting principles generally accepted in India, including the Accounting Standards prescribed under section 133 of the Act.
This responsibility also includes maintenance of adequate accounting records in accordance with the provisions of the Act for safeguarding the assets of the Company and for preventing and detecting frauds and other irregularities; selection and application of appropriate accounting policies; making judgments and estimates that are reasonable and prudent; and design, implementation and maintenance of adequate internal financial controls, that were operating effectively for ensuring the accuracy and completeness of the accounting records, relevant to the preparation and presentation of the standalone financial statements that give a true and fair view and are free from material misstatement, whether due to fraud or error.
Auditor’s responsibility
Our responsibility is to express an opinion on these standalone financial statements based on our audit.
In conducting our audit, we have taken into account the provisions of the Act, the accounting and auditing standards and matters which are required to be included in the audit report under the provisions of the Act and the Rules made thereunder.
We conducted our audit of the standalone financial statements in accordance with the Standards on Auditing specified under Section 143(10) of the Act. Those Standards require that we comply with ethical requirements and plan and perform the audit to obtain reasonable assurance about whether the standalone financial statements are free from material misstatement.
An audit involves performing procedures to obtain audit evidence about the amounts and the disclosures in the standalone
INdePeNdeNT AUdITor’s rePorT financial statements. The procedures selected depend on the auditor’s judgment, including the assessment of the risks of material misstatement of the standalone financial statements, whether due to fraud or error. In making those risk assessments, the auditor considers internal financial control relevant to the Company’s preparation of the standalone financial statements that give a true and fair view in order to design audit procedures that are appropriate in the circumstances. An audit also includes evaluating the appropriateness of the accounting policies used and the reasonableness of the accounting estimates made by the Company’s Directors, as well as evaluating the overall presentation of the standalone financial statements.
We believe that the audit evidence obtained by us, is sufficient and appropriate to provide a basis for our audit opinion on the standalone financial statements.
opinion
In our opinion and to the best of our information and according to the explanations given to us, the aforesaid standalone financial statements give the information required by the Act in the manner so required and give a true and fair view in conformity with the accounting principles generally accepted in India, of the state of affairs of the Company as at 31 March, 2017, and its profit and its cash flows for the year ended on that date.
report on other Legal and regulatory requirements
1. As required by Section 143 (3) of the Act, we report, to the extent applicable that:
a) We have sought and obtained all the information and explanations which to the best of our knowledge and belief were necessary for the purposes of our audit.
b) In our opinion, proper books of account as required by law have been kept by the Company so far as it appears from our examination of those books.
c) The Balance Sheet, the Statement of Profit and Loss, and the Cash Flow Statement dealt with by this Report are in agreement with the books of account.
d) In our opinion, the aforesaid standalone financial statements comply with the Accounting Standards prescribed under section 133 of the Act.
e) On the basis of the written representations received from the directors as on 31 March, 2017 taken on record by the Board of Directors, none of the directors is disqualified as on 31 March, 2017 from being appointed as a director in terms of Section 164 (2) of the Act.
f) With respect to the adequacy of the internal financial controls over financial reporting of the Company and the operating effectiveness of such controls, refer to our
Max Financial Services Limited (Formerly known as MAX INDIA LIMITED)
AnnuAL RepoRt 2016-17 97
separate Report in “Annexure A”. Our report expresses an unmodified opinion on the adequacy and operating effectiveness of the Company’s internal financial controls over financial reporting.
g) With respect to the other matters to be included in the Auditor’s Report in accordance with Rule 11 of the Companies (Audit and Auditors) Rules, 2014, as amended, in our opinion and to the best of our information and according to the explanations given to us:
i. The Company has disclosed the impact of pending litigations on its financial position in its standalone financial statements – Refer Note 24 of the standalone financial statements.
ii. The Company did not have any long-term contracts including derivative contracts for which there were any material foreseeable losses – Refer Note 34 of the standalone financial statements.
iii. There has been no delay in transferring amounts, required to be transferred, to the Investor Education and Protection Fund by the Company - Refer Note 35 of the standalone financial statements.
iv. The Company has provided requisite disclosures in the standalone financial statements as regards its
holding and dealings in Specified Bank Notes as defined in the Notification S.O. 3407(E) dated the 8th November, 2016 of the Ministry of Finance, during the period from 8th November 2016 to 30th December 2016. Based on audit procedures performed and the representations provided to us by the management we report that the disclosures are in accordance with the books of account maintained by the Company and as produced to us by the Management - Refer Note 17.C of the standalone financial statements.
2. As required by the Companies (Auditor’s Report) Order, 2016 (“the Order”) issued by the Central Government in terms of Section 143(11) of the Act, we give in “Annexure B” a statement on the matters specified in paragraphs 3 and 4 of the Order.
For deloitte Haskins & sells LLPChartered Accountants
(Firm’s Registration No. 117366W/W-100018)
satpal singh AroraPartner
(Membership No. 98564)Place: New DelhiDate: May 30, 2017

Standalone Financial Statements
Max Financial Services Limited (Formerly known as MAX INDIA LIMITED)
AnnuAL RepoRt 2016-1798
ANNeXUre “A” To THe INdePeNdeNT AUdITor’s rePorT (referred to in paragraph 1(f) under ‘report on other Legal and regulatory requirements’ section of our report of even date)
report on the Internal Financial Controls over Financial reporting under Clause (i) of sub-section 3 of section 143 of the Companies Act, 2013 (“the Act”)
We have audited the internal financial controls over financial reporting of Max Financial services Limited (Formerly known as MAX INdIA LIMITed) (“the Company”) as of 31 March, 2017 in conjunction with our audit of the standalone financial statements of the Company for the year ended on that date.
Management’s responsibility for Internal Financial Controls
The Company’s management is responsible for establishing and maintaining internal financial controls based on “the internal control over financial reporting criteria established by the Company considering the essential components of internal control stated in the Guidance Note on Audit of Internal Financial Controls Over Financial Reporting issued by the Institute of Chartered Accountants of India.” These responsibilities include the design, implementation and maintenance of adequate internal financial controls that were operating effectively for ensuring the orderly and efficient conduct of its business, including adherence to company’s policies, the safeguarding of its assets, the prevention and detection of frauds and errors, the accuracy and completeness of the accounting records, and the timely preparation of reliable financial information, as required under the Companies Act, 2013.
Auditor’s responsibility
Our responsibility is to express an opinion on the Company’s internal financial controls over financial reporting based on our audit. We conducted our audit in accordance with the Guidance Note on Audit of Internal Financial Controls Over Financial Reporting (the “Guidance Note”) issued by the Institute of Chartered Accountants of India and the Standards on Auditing prescribed under Section 143(10) of the Companies Act, 2013, to the extent applicable to an audit of internal financial controls. Those Standards and the Guidance Note require that we comply with ethical requirements and plan and perform the audit to obtain reasonable assurance about whether adequate internal financial controls over financial reporting was established and maintained and if such controls operated effectively in all material respects.
Our audit involves performing procedures to obtain audit evidence about the adequacy of the internal financial controls system over financial reporting and their operating effectiveness. Our audit of internal financial controls over financial reporting included obtaining an understanding of internal financial controls over financial reporting, assessing the risk that a material weakness exists, and testing and evaluating the design and operating effectiveness of internal control based on the assessed risk. The procedures selected depend on the auditor’s judgement, including the assessment of the risks of material misstatement of the financial statements, whether due to fraud or error.
We believe that the audit evidence we have obtained is sufficient and appropriate to provide a basis for our audit opinion on the Company’s internal financial controls system over financial reporting.
Meaning of Internal Financial Controls over Financial reporting
A company’s internal financial control over financial reporting is a process designed to provide reasonable assurance regarding the reliability of financial reporting and the preparation of financial statements for external purposes in accordance with generally accepted accounting principles. A company’s internal financial control over financial reporting includes those policies and procedures that (1) pertain to the maintenance of records that, in reasonable detail, accurately and fairly reflect the transactions and dispositions of the assets of the company; (2) provide reasonable assurance that transactions are recorded as necessary to permit preparation of financial statements in accordance with generally accepted accounting principles, and that receipts and expenditures of the company are being made only in accordance with authorisations of management and directors of the company; and (3) provide reasonable assurance regarding prevention or timely detection of unauthorised acquisition, use, or disposition of the company’s assets that could have a material effect on the financial statements.
Inherent Limitations of Internal Financial Controls over Financial Reporting
Because of the inherent limitations of internal financial controls over financial reporting, including the possibility of collusion or improper management override of controls, material misstatements due to error or fraud may occur and not be detected. Also, projections of any evaluation of the internal financial controls over financial reporting to future periods are subject to the risk that the internal financial control over financial reporting may become inadequate because of changes in conditions, or that the degree of compliance with the policies or procedures may deteriorate.
opinion
In our opinion, to the best of our information and according to the explanations given to us, the Company has, in all material respects, an adequate internal financial controls system over financial reporting and such internal financial controls over financial reporting were operating effectively as at 31 March, 2017, based on “the internal control over financial reporting criteria established by the Company considering the essential components of internal control stated in the Guidance Note on Audit of Internal Financial Controls Over Financial Reporting issued by the Institute of Chartered Accountants of India”.
For deloitte Haskins & sells LLPChartered Accountants
(Firm’s Registration No. 117366W/W-100018)
satpal singh AroraPartner
(Membership No. 98564)Place: New DelhiDate: May 30, 2017
Auditor's Report

Max Financial Services Limited (Formerly known as MAX INDIA LIMITED)
AnnuAL RepoRt 2016-17 99
ANNeXUre “B” To THe INdePeNdeNT AUdITor’s rePorT
(referred to in paragraph 2 under ‘report on other Legal and regulatory requirements’ section of our report of even date)
(i) (a) The Company has maintained proper records showing full particulars, including quantitative details and situation of fixed assets.
(b) The fixed assets were physically verified during the year by the Management in accordance with a regular programme of verification which, in our opinion, provides for physical verification of all the fixed assets at reasonable intervals. According to the information and explanations given to us, no material discrepancies were noticed on such verification.
(c) According to the information and explanations given to us and the records examined by us and based on the examination of the registered sale deed / transfer deed / conveyance deed provided to us, we report that, the title deeds of the building is held in the erstwhile name of the Company (i.e ‘MAX INDIA LIMITED’) as at the balance sheet date. We are informed that the Company is in the process of getting the name changed to Max Financial Services Limited.
The Company does not have any immovable properties of freehold or leasehold land.
(ii) The Company does not have any inventory and hence reporting under clause (ii) of the CARO 2016 is not applicable.
(iii) The Company has not granted any loans, secured or unsecured, to companies, firms, Limited Liability Partnerships or other parties covered in the register maintained under section 189 of the Companies Act, 2013.
(iv) In our opinion and according to the information and explanations given to us, the Company has complied with the provisions of Sections 185 and 186 of the Companies Act, 2013 in respect of grant of loans, making investments and providing guarantees and securities, as applicable.
(v) According to the information and explanations given to us, the Company has not accepted any deposit from public.
(vi) The maintenance of cost records has not been specified by the Central Government under section 148(1) of the Companies Act, 2013.
(vii) According to the information and explanations given to us, in respect of statutory dues:
(a) The Company has generally been regular in depositing undisputed statutory dues, including Provident Fund, Income-tax, Service Tax, cess and other material statutory dues applicable to it to the appropriate authorities.
(b) There were no undisputed amounts payable in respect of Provident Fund, Income-tax, Service Tax, cess and other material statutory dues in arrears as at 31 March, 2017 for a period of more than six months from the date they became payable.
(c) Details of dues of Income-tax, Sales Tax, Service Tax and Customs Duty which have not been deposited as on 31 March, 2017 on account of disputes are given below:
Name of statute Nature of dues Forum where dispute is Pending
Period to which the Amount Relates
Amount involved
(Rs. in Lacs)
Amount unpaid(Rs. in Lacs)
Customs Act, 1962 Custom Duty Demand on non-fulfillment of export obligation
Directorate General of Foreign Trade
FY 1994-95 418.26 418.26
Finance Act, 1994 (Service tax)
Service Tax Demand on consultancy services
Commissioner (Central Excise), Chandigarh
FY 1997-98ToFY 2000-01
213.00 201.00
Finance Act, 1994 (Service tax)
Service Tax Demand on Banking and Financial Services
Joint/Additional Commissioner, Service Tax Commissionerate Delhi-II
FY 2011-12ToFY 2015-16
139.58 139.58
Income Tax Act, 1961 Income tax demand in respect of Penalty under 271 (c)
Commissioner of Income Tax (Appeals), New Delhi
AY 1992-93AY 1993-94
33.42 33.42
Income Tax Act, 1961 Income Tax Demand in disallowance made on various matters
High Court, Punjab AY 2003-04 159.04 159.04

Standalone Financial Statements
Max Financial Services Limited (Formerly known as MAX INDIA LIMITED)
AnnuAL RepoRt 2016-17100
We are informed that the provisions of Employees State Insurance Act, 1948 are not applicable to the Company and that the operations of the Company do not give rise to any liability for Sales Tax, Excise Duty and Value Added Tax.
(viii) The Company has not taken any loans or borrowings from financial institutions, banks and government or has not issued any debentures. Hence reporting under clause (viii) of CARO 2016 is not applicable to the Company.
(ix) The Company has not raised moneys by way of initial public offer or further public offer (including debt instruments) or term loans and hence reporting under clause (ix) of the CARO 2016 Order is not applicable.
(x) To the best of our knowledge and according to the information and explanations given to us, no fraud by the Company and no material fraud on the Company by its officers or employees has been noticed or reported during the year.
(xi) In our opinion and according to the information and explanations given to us, the Company has paid / provided managerial remuneration in accordance with the requisite approvals mandated by the provisions of section 197 read with Schedule V to the Companies Act, 2013.
(xii) The Company is not a Nidhi Company and hence reporting under clause (xii) of the CARO 2016 Order is not applicable.
(xiii) In our opinion and according to the information and explanations given to us the Company is in compliance with Section 188 and 177 of the Companies Act, 2013, where applicable, for all transactions with the related parties and the details of related party transactions have been disclosed in the financial statements etc. as required by the applicable accounting standards.
(xiv) During the year the Company has not made any preferential allotment or private placement of shares or fully or partly convertible debentures and hence reporting under clause (xiv) of CARO 2016 is not applicable to the Company.
(xv) In our opinion and according to the information and explanations given to us, during the year the Company has not entered into any non-cash transactions with its directors or persons connected with him and hence provisions of section 192 of the Companies Act, 2013 are not applicable.
(xvi) As per section 45-IA of the Reserve Bank of India Act, 1934 read with RBI / 2006-07 / 158 DNBS (PD) C.C. No. 81 / 03.05.002 / 2006-07 dated 19 October, 2006, a Company whose 50% of total assets and 50% of total income is from financial activity, as at the last audited balance sheet, is said to carry on financial activity as its principal business and hence is required to obtain registration as a Non-Banking Finance Company (NBFC).
As indicated in note 38, the Company is of the view supported by legal opinion that the Company is a ‘Core Investment Company’ (‘CIC’) and does not meet the criteria for Systemically Important Core Investment Company (‘CIC-SI’) as laid down in the CIC Master Circular dated 1 July, 2015 and hence registration under section 45-IA of the Reserve Bank of India Act, 1934 is not required. We report as such.
For deloitte Haskins & sells LLPChartered Accountants
(Firm’s Registration No. 117366W/W-100018)
satpal singh AroraPartner
(Membership No. 58564)Place: New DelhiDate: May 30, 2017
Auditor's Report

Max Financial Services Limited (Formerly known as MAX INDIA LIMITED)
AnnuAL RepoRt 2016-17 101
(Rs. in Lacs)Particulars Note No. As at As at
March 31, 2017 March 31, 2016 A. equity and liabilities
1. shareholders' funds(a) Share capital 3 5,345.40 5,339.68 (b) Reserves and surplus 4 177,483.55 161,652.55
182,828.95 166,992.23 2. Non-current liabilities
(a) Trade payables 5 212.18 - (b) Deferred tax liabilities (net) 6 - - (c) Long-term provisions 7 116.15 265.07
328.33 265.07 3. Current liabilities
(a) Trade payables 8i. total outstanding dues to micro enterprises and small enterprises - - ii. total outstanding dues to creditors other than micro enterprises
and small enterprises 1,336.25 887.77
(b) Other current liabilities 9 945.96 899.39 (c) Short-term provisions 10 250.38 4,883.41
2,532.59 6,670.57 Total 185,689.87 173,927.87
B. Assets1. Non-current assets
(a) Fixed assets(i) Tangible assets 11 619.63 826.55 (ii) Intangible assets 11 33.88 46.76
653.51 873.31 (b) Non-current investments 12 179,343.99 143,480.74 (c) Long term loans and advances 13 756.45 874.17 (d) Other non-current assets 14 9.38 8.79
180,763.33 145,237.01 2. Current assets
(a) Current investments 15 2,840.00 26,997.65 (b) Trade receivables 16 769.06 923.10 (c) Cash and cash equivalents 17 978.44 299.52 (d) Short term loans and advances 18 339.04 470.59
4,926.54 28,690.86 Total 185,689.87 173,927.87
See accompanying notes forming part of the financial statements 1 to 43
In terms of our report attachedFor deloitte Haskins & sells LLP For and on behalf of the Board of directorsChartered Accountants
satpal singh Arora Naina Lal Kidwai Mohit TalwarPartner (Chairman) (Managing Director)
DIN No - 00017806 DIN No - 02394694
sujatha ratnam Sandeep Pathak(Chief Financial Officer) (Company Secretary)
M.No. - FCS-5351Place : New Delhi Place : New DelhiDate : May 30, 2017 Date : May 30, 2017
BALANCe sHeeTAs AT MArCH 31, 2017
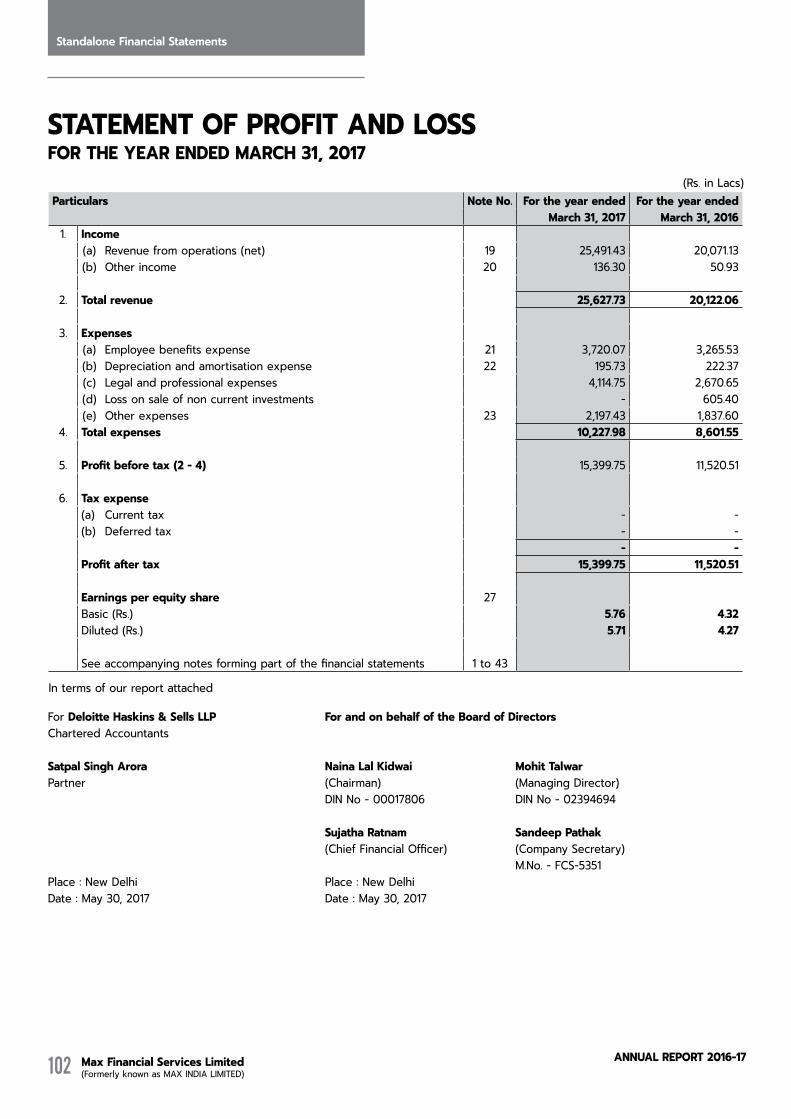
Standalone Financial Statements
Max Financial Services Limited (Formerly known as MAX INDIA LIMITED)
AnnuAL RepoRt 2016-17102
(Rs. in Lacs)Particulars Note No. For the year ended For the year ended
March 31, 2017 March 31, 20161. Income
(a) Revenue from operations (net) 19 25,491.43 20,071.13 (b) Other income 20 136.30 50.93
2. Total revenue 25,627.73 20,122.06
3. Expenses(a) Employee benefits expense 21 3,720.07 3,265.53 (b) Depreciation and amortisation expense 22 195.73 222.37 (c) Legal and professional expenses 4,114.75 2,670.65 (d) Loss on sale of non current investments - 605.40 (e) Other expenses 23 2,197.43 1,837.60
4. Total expenses 10,227.98 8,601.55
5. Profit before tax (2 - 4) 15,399.75 11,520.51
6. Tax expense(a) Current tax - - (b) Deferred tax - -
- - Profit after tax 15,399.75 11,520.51
earnings per equity share 27Basic (Rs.) 5.76 4.32 Diluted (Rs.) 5.71 4.27
See accompanying notes forming part of the financial statements 1 to 43
In terms of our report attached
sTATeMeNT oF ProFIT ANd Loss For THe YeAr eNded MArCH 31, 2017
For deloitte Haskins & sells LLP For and on behalf of the Board of directorsChartered Accountants
satpal singh Arora Naina Lal Kidwai Mohit TalwarPartner (Chairman) (Managing Director)
DIN No - 00017806 DIN No - 02394694
sujatha ratnam Sandeep Pathak(Chief Financial Officer) (Company Secretary)
M.No. - FCS-5351Place : New Delhi Place : New DelhiDate : May 30, 2017 Date : May 30, 2017
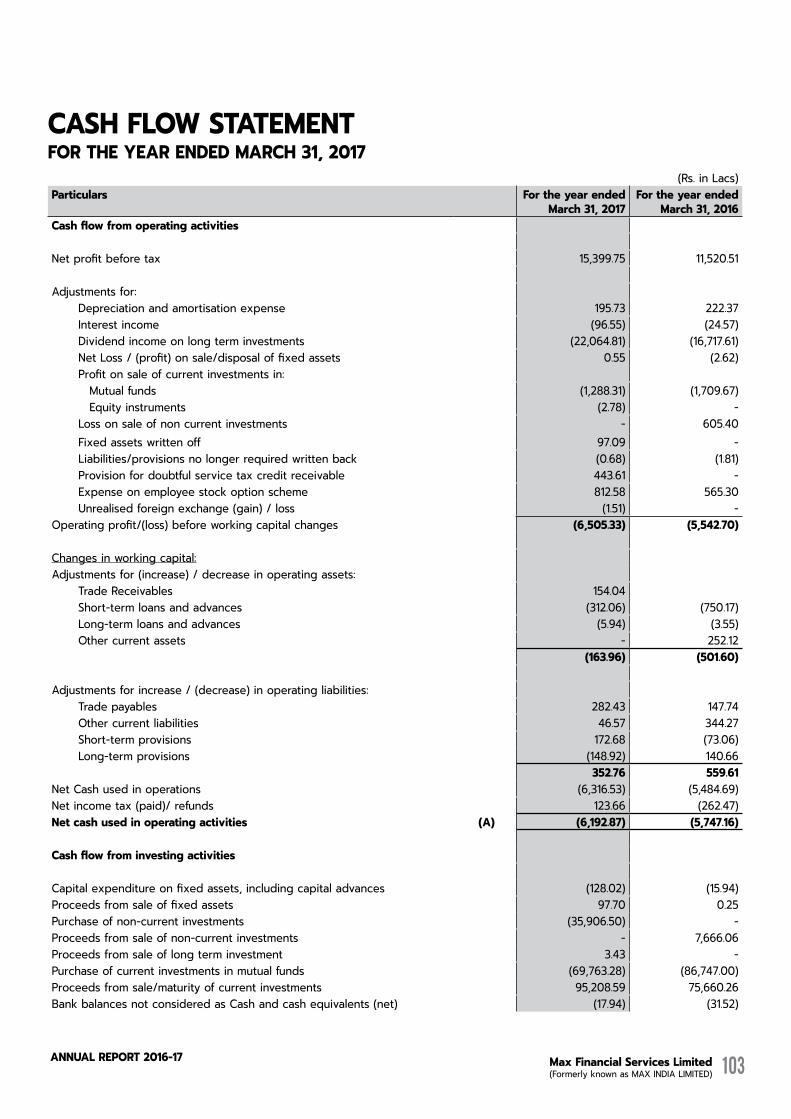
Max Financial Services Limited (Formerly known as MAX INDIA LIMITED)
AnnuAL RepoRt 2016-17 103
(Rs. in Lacs)Particulars For the year ended
March 31, 2017For the year ended
March 31, 2016Cash flow from operating activities
Net profit before tax 15,399.75 11,520.51
Adjustments for: Depreciation and amortisation expense 195.73 222.37 Interest income (96.55) (24.57) Dividend income on long term investments (22,064.81) (16,717.61) Net Loss / (profit) on sale/disposal of fixed assets 0.55 (2.62) Profit on sale of current investments in:
Mutual funds (1,288.31) (1,709.67)Equity instruments (2.78) -
Loss on sale of non current investments - 605.40 Fixed assets written off 97.09 - Liabilities/provisions no longer required written back (0.68) (1.81) Provision for doubtful service tax credit receivable 443.61 - Expense on employee stock option scheme 812.58 565.30 Unrealised foreign exchange (gain) / loss (1.51) -
Operating profit/(loss) before working capital changes (6,505.33) (5,542.70)
Changes in working capital:Adjustments for (increase) / decrease in operating assets:
Trade Receivables 154.04 Short-term loans and advances (312.06) (750.17) Long-term loans and advances (5.94) (3.55) Other current assets - 252.12
(163.96) (501.60)
Adjustments for increase / (decrease) in operating liabilities: Trade payables 282.43 147.74 Other current liabilities 46.57 344.27 Short-term provisions 172.68 (73.06) Long-term provisions (148.92) 140.66
352.76 559.61 Net Cash used in operations (6,316.53) (5,484.69)Net income tax (paid)/ refunds 123.66 (262.47)Net cash used in operating activities (A) (6,192.87) (5,747.16)
Cash flow from investing activities
Capital expenditure on fixed assets, including capital advances (128.02) (15.94)Proceeds from sale of fixed assets 97.70 0.25 Purchase of non-current investments (35,906.50) - Proceeds from sale of non-current investments - 7,666.06 Proceeds from sale of long term investment 3.43 - Purchase of current investments in mutual funds (69,763.28) (86,747.00)Proceeds from sale/maturity of current investments 95,208.59 75,660.26 Bank balances not considered as Cash and cash equivalents (net) (17.94) (31.52)
CAsH FLoW sTATeMeNTFor THe YeAr eNded MArCH 31, 2017

Standalone Financial Statements
Max Financial Services Limited (Formerly known as MAX INDIA LIMITED)
AnnuAL RepoRt 2016-17104
(Rs. in Lacs)Particulars For the year ended
March 31, 2017For the year ended
March 31, 2016Dividend received 22,064.81 16,717.61 Interest received 95.96 23.97 Net cash flow from investing activities (B) 11,654.75 13,273.69 Cash flow from financing activitiesProceeds from ESOPs exercised 5.72 9.62 Dividend paid (4,806.62) (7,475.26)Net cash flow (used in) financing activities (C) (4,800.90) (7,465.64)
Net Increase/(decrease) in cash and cash equivalents (A + B + C) 660.98 60.89 Cash and cash equivalents at the beginning of the year 67.53 1,160.88 Less: Transferred pursuant to demerger - (1,154.24)Cash and cash equivalents at the end of the year 728.51 67.53
Particulars For the year endedMarch 31, 2017
For the year endedMarch 31, 2016
Components of cash and cash equivalent (refer note 17)Cash on hand 0.38 1.14 Cheques/drafts on hand - 1.06 Balances with banks in current account 728.13 65.33 Total cash and cash equivalents 728.51 67.53
See accompanying notes forming part of the financial statements 1 to 43
In terms of our report attached
For deloitte Haskins & sells LLP For and on behalf of the Board of directorsChartered Accountants
satpal singh Arora Naina Lal Kidwai Mohit TalwarPartner (Chairman) (Managing Director)
DIN No - 00017806 DIN No - 02394694
sujatha ratnam Sandeep Pathak(Chief Financial Officer) (Company Secretary)
M.No. - FCS-5351Place : New Delhi Place : New DelhiDate : May 30, 2017 Date : May 30, 2017
Max Financial Services Limited (Formerly known as MAX INDIA LIMITED)
AnnuAL RepoRt 2016-17 105
NoTes ForMING PArT oF THe FINANCIAL sTATeMeNTs 1. Corporate information
Max Financial Services Limited [formerly known as MAX INDIA LIMITED] ("the Company") is a public company domiciled in India. Its shares are listed on two stock exchanges in India. The Company is primarily engaged in making business investment in its subsidiary and providing management advisory services to the group companies.
The name of the Company has been changed from MAX INDIA LIMITED to Max Financial Services Limited with effect from February 1, 2016.
2. significant accounting policies
2.1 Basis of preparation
The financial statements of the Company have been prepared in accordance with the Generally Accepted Accounting Principles in India (Indian GAAP) to comply with the Accounting Standards specified under Section 133 of the Companies Act, 2013, and the relevant provisions of the Companies Act, 2013 ("the 2013 Act"). The financial statements have been prepared on accrual basis under the historical cost convention. The accounting policies adopted in the preparation of the financial statements are consistent with those followed in the previous year.
The Board of Directors of the Company at its meeting held on January 27, 2015 had approved a Composite scheme of Arrangement (‘Scheme’) to vertically split the Company through a demerger, into three separate listed companies. The existing company, Max India Limited, has been renamed as ‘Max Financial Services Limited’ and focuses on the group’s life insurance business. The second vertical, has been renamed as ‘Max India Limited (‘MIL’)(formerly known as ‘Taurus Ventures Limited’) which manages investments in the high growth potential Health and Allied businesses, primarily comprising of Max Healthcare Institue Ltd, Max Bupa Health Insurance Co. Limited, Antara Senior Living Limited. The third vertical houses the investment activity in the group’s manufacturing businesses, Max Speciality Films Limited, and has been renamed Max Ventures and Industries Limited (‘MVIL’)(formerly known as Capricorn Ventures Limited’). All the assets and liabilities pertaining to each of the demerged undertakings (i.e MIL and MVIL) has been transferred with effect from April 1, 2015 (Appointed date). The Scheme became effective from January 15, 2016 i.e. the date of filing of the certified copy of the Order of the Hon’ble High Court of Punjab and Haryana with the Registrar of Companies, Chandigarh and Shimla. The Company has accounted for the demerger as per the High Court Order.
2.2 Use of estimates
The preparation of the financial statements in conformity with Indian GAAP requires the Management to make estimates and assumptions considered in the reported amounts of assets and liabilities (including contingent liabilities) and the reported income and expenses during the year. The Management believes that the estimates used in preparation of the financial statements are prudent and reasonable. Future results could differ due to these estimates and the differences between the actual results and the estimates are recognised in the periods in which the results are known / materialise.
2.3 Cash and cash equivalents (for purposes of Cash Flow statement)
Cash comprises cash on hand and demand deposits with banks. Cash equivalents are short-term balances (with an original maturity of three months or less from the date of acquisition), highly liquid investments that are readily convertible into known amounts of cash and which are subject to insignificant risk of changes in value.
2.4 Cash flow statement
Cash flows are reported using the indirect method, whereby profit / (loss) before extraordinary items and tax is adjusted for the effects of transactions of non-cash nature and any deferrals or accruals of past or future cash receipts or payments. The cash flows from operating, investing and financing activities of the Company are segregated based on the available information.
Max Financial Services Limited (Formerly known as MAX INDIA LIMITED)
AnnuAL RepoRt 2016-17106
Standalone Financial StatementsNotes forming part of the Financial Statements
2.5 Depreciation and amortisation
Depreciable amount for assets is the cost of an asset, or other amount substituted for cost, less its estimated residual value.
Depreciation on tangible fixed assets has been provided on the straight-line method as per the useful life prescribed in Schedule II to the Companies Act, 2013 except in respect of leasehold improvements which is amortised over the initial duration of the lease.
Intangible assets are amortised over their estimated useful life of 3 years on straight line method. The estimated useful life of the intangible assets and the amortisation period are reviewed at the end of each financial year and the amortisation period is revised to reflect the changed pattern, if any.
2.6 Revenue recognition
Revenue is recognised to the extent that it is probable that the economic benefits will flow to the Company and the revenue can be reliably measured. The following specific recognition criteria must also be met before revenue is recognised:
Income from servicesRevenue from shared services contracts are recognised over the period of the contract as and when services are rendered.
Interest incomeInterest income is recognised on a time proportion basis taking into account the amount outstanding and the applicable interest rate.
DividendDividend income is recognised when the company’s right to receive dividend is established by the reporting date.
2.7 Tangible fixed assets
Fixed assets are carried at cost less accumulated depreciation, amortisation and impairment loss, if any. The cost of fixed assets includes interest on borrowings attributable to acquisition of qualifying fixed assets upto the date the asset is ready for its intended use. Exchange difference arising on restatement/settlement of long term foreign currency borrowings relating to acquisition of depreciable fixed assets are adjusted to the cost of the respective assets and depreciated over the remaining life of fixed assets. Subsequent expenditure on fixed assets after its purchase/ completion is capitalised only if such expenditure results in increase in the future benefits from such asset beyond its previously assessed standard of performance.
Fixed assets acquired and put to use for project purpose are capitalised and depreciation thereon is included in the project cost till the project is ready for its intended use.
Capital work-in-progress:The assets which are not ready for their intended use and other capital work in progress are carried at cost, comprising direct cost, related incidental expenses and attributable interest.
2.8 Intangible assets
Intangible assets are carried at cost less accumulated amortisation and impairment losses, if any. The cost of an intangible asset comprises its purchase price, including any import duties and other taxes (other than those subsequently recoverable from the taxing authorities), and any directly attributable expenditure on making the asset ready for its intended use and net of any trade discounts and rebates. Subsequent expenditure on an intangible asset after its purchase / completion is recognised as an expense when incurred unless it is probable that such expenditure will enable the asset to generate future economic benefits in excess of its originally assessed standards of performance and such expenditure can be measured and attributed to the asset reliably, in which case such expenditure is added to the cost of the asset.
Max Financial Services Limited (Formerly known as MAX INDIA LIMITED)
AnnuAL RepoRt 2016-17 107
2.9 Foreign currency transactions and translations
Initial recognitionTransactions in foreign currencies entered into by the Company are accounted at the exchange rates prevailing on the date of the transaction or at rates that closely approximate the rate at the date of the transaction.
Measurement at the balance sheet dateForeign currency monetary items (other than derivative contracts) of the Company, outstanding at the balance sheet date are restated at the year end rates. Non-monetary items of the Company are carried at historical cost.
Treatment of exchange differences Exchange differences arising on settlement / restatement of foreign currency monetary assets and liabilities of the Company are recognised as income or expense in the Statement of Profit and Loss.
2.10 Investments
Long-term investments (excluding investment properties), are carried individually at cost less provision for diminution, other than temporary, in the value of such investments. Current investments are carried individually, at the lower of cost and fair value. Cost of investments include acquisition charges such as brokerage, fees and duties.
Investment properties are carried individually at cost less accumulated depreciation and impairment, if any. Investment properties are capitalised and depreciated in accordance with the policy stated for Fixed assets. Impairment of investment property is determined in accordance with the policy stated for Impairment of Assets.
2.11 employee benefits
Employee benefits include provident fund, gratuity fund and compensated absences.
a) Post employment benefit plan
Contributions to defined contribution retirement benefit schemes are recognised as an expense when employees have rendered services entitling them to such benefits.
For defined benefit plan in the form of gratuity fund, the cost of providing benefits is determined using the Projected Unit Credit method, with actuarial valuations being carried out at each Balance Sheet date. Actuarial gains and losses are recognised in the Statement of Profit and Loss in the period in which they occur. Past service cost is recognised immediately to the extent that the benefits are already vested and otherwise is amortised on a straight-line basis over the average period until the benefits become vested. The retirement benefit obligation recognised in the Balance Sheet represents the present value of the defined benefit obligation as adjusted for unrecognised past service cost, as reduced by the fair value of scheme assets. Any asset resulting from this calculation is limited to past service cost, plus the present value of available refunds and reductions in future contributions to the schemes.
b) short-term employee benefits
The undiscounted amount of short-term employee benefits expected to be paid in exchange for the services rendered by employees are recognised during the year when the employees render the service. These benefits include performance incentive and compensated absences which are expected to occur within twelve months after the end of the period in which the employee renders the related service.
The cost of short-term compensated absences is accounted as under :
(a) in case of accumulated compensated absences, when employees render the services that increase their entitlement of future compensated absences; and
(b) in case of non-accumulating compensated absences, when the absences occur.
c) Long-term employee benefits
Compensated absences which are not expected to occur within twelve months after the end of the period in which the employee renders the related service are recognised as a liability at the present value of the defined benefit obligation as at the balance sheet date less the fair value of the plan assets out of which the obligations are expected to be settled.
Max Financial Services Limited (Formerly known as MAX INDIA LIMITED)
AnnuAL RepoRt 2016-17108
Standalone Financial StatementsNotes forming part of the Financial Statements
2.12 Employee share based payments
“The Company has formulated Employee Stock Option Schemes (ESOS) in accordance with the SEBI (Employee Stock Option Scheme and Employee Stock Purchase Scheme) Guidelines, 1999. The Schemes provide for grant of options to employees of the Company and its subsidiaries to acquire equity shares of the Company that vest in a graded manner and that are to be exercised within a specified period. In accordance with the SEBI Guidelines; the excess, if any, of the closing market price on the day prior to the grant of the options under ESOS over the exercise price is amortised on a straight-line basis over the vesting period.
The Company has consituted a Phantom Stock Option Plan which will be settled in cash. The Company is required to make provisions for estimated cash requirement for settlement on the basis of Fair Market Value of equity shares of the Company, Max India Limited and Max Ventures India Limited as at end of each financial period/year till the estimated life of phantom stocks. As and when any cash payment is made on account of settlement of phantom stock, the provision is accordingly adjusted.
2.13 Segment reporting
The Company identifies primary segments based on the dominant source, nature of risks and returns and the internal or-ganisation and management structure. The operating segments are the segments for which separate financial information is available and for which operating profit / loss amounts are evaluated regularly by the executive management in deciding how to allocate resources and in assessing performance.
2.14 Leases
Where the Company as a lessor leases assets under finance leases, such amounts are recognised as receivables at an amount equal to the net investment in the lease and the finance income is recognised based on a constant rate of return on the outstanding net investment.
Assets leased by the Company in its capacity as a lessee, where substantially all the risks and rewards of ownership vest in the Company are classified as finance leases. Such leases are capitalised at the inception of the lease at the lower of the fair value and the present value of the minimum lease payments and a liability is created for an equivalent amount. Each lease rental paid is allocated between the liability and the interest cost so as to obtain a constant periodic rate of interest on the outstanding liability for each year.
Lease arrangements where the risks and rewards incidental to ownership of an asset substantially vest with the lessor are recognised as operating leases. Lease rentals under operating leases are recognised in the Statement of Profit and Loss on a straight-line basis over the lease term.
2.15 Earnings per share
Basic earnings per share is computed by dividing the profit / (loss) after tax (including the post tax effect of extraordinary items, if any) by the weighted average number of equity shares outstanding during the year. Diluted earnings per share is computed by dividing the profit / (loss) after tax (including the post tax effect of extraordinary items, if any) as adjusted for dividend, interest and other charges to expense or income (net of any attributable taxes) relating to the dilutive potential equity shares, by the weighted average number of equity shares considered for deriving basic earnings per share and the weighted average number of equity shares which could have been issued on the conversion of all dilutive potential equity shares. Potential equity shares are deemed to be dilutive only if their conversion to equity shares would decrease the net profit per share from continuing ordinary operations. Potential dilutive equity shares are deemed to be converted as at the beginning of the period, unless they have been issued at a later date. The dilutive potential equity shares are adjusted for the proceeds receivable had the shares been actually issued at fair value (i.e. average market value of the outstanding shares). Dilutive potential equity shares are determined independently for each period presented. The number of equity shares and potentially dilutive equity shares are adjusted for share splits / reverse share splits and bonus shares, as appropriate.
2.16 Taxes on incomeCurrent tax is the amount of tax payable on the taxable income for the year as determined in accordance with the applicable tax rates and the provisions of the Income Tax Act, 1961 and other applicable tax laws.

Max Financial Services Limited (Formerly known as MAX INDIA LIMITED)
AnnuAL RepoRt 2016-17 109
Deferred tax expense or benefit is recognised on timing differences being the difference between taxable income and accounting income that originate in one period and is likely to reverse in one or more subsequent periods. Deferred tax assets and liabilities are measured using the tax rates and tax laws that have been enacted or substantively enacted by the balance sheet date.
In the event of unabsorbed depreciation and carry forward of losses, deferred tax assets are recognised only to the extent that there is virtual certainty supported by convincing evidence that sufficient future taxable income will be available to realise such assets. In other situations, deferred tax assets are recognised only to the extent that there is reasonable certainty that sufficient future taxable income will be available to realise these assets.
The Company offsets deferred tax assets and deferred tax liabilities if it has a legally enforceable right and these relate to taxes on income levied by the same governing taxation laws.
Minimum Alternate Tax (MAT) paid in accordance with the tax laws, which gives future economic benefits in the form of adjustment to future income tax liability, is considered as an asset if there is convincing evidence that the Company will pay normal income tax. Accordingly, MAT is recognised as an asset in the Balance Sheet when it is highly probable that future economic benefit associated with it will flow to the Company.
2.17 impairement of assets
The carrying values of assets / cash generating units at each balance sheet date are reviewed for impairment if any indication of impairment exists.
If the carrying amount of the assets exceed the estimated recoverable amount, an impairment is recognised for such excess amount. The impairment loss is recognised as an expense in the Statement of Profit and Loss, unless the asset is carried at revalued amount, in which case any impairment loss of the revalued asset is treated as a revaluation decrease to the extent a revaluation reserve is available for that asset.
The recoverable amount is the greater of the net selling price and their value in use. Value in use is arrived at by discounting the future cash flows to their present value based on an appropriate discount factor.
When there is indication that an impairment loss recognised for an asset (other than a revalued asset) in earlier accounting periods no longer exists or may have decreased, such reversal of impairment loss is recognised in the Statement of Profit and Loss, to the extent the amount was previously charged to the Statement of Profit and Loss. In case of revalued assets such reversal is not recognised.
2.18 Provisions and contingencies
A provision is recognised when the Company has a present obligation as a result of past events and it is probable that an outflow of resources will be required to settle the obligation in respect of which a reliable estimate can be made. Provisions (excluding retirement benefits) are not discounted to their present value and are determined based on the best estimate required to settle the obligation at the balance sheet date. These are reviewed at each balance sheet date and adjusted to reflect the current best estimates. Contingent liabilities are disclosed in the Notes. Contingent assets are not recognised in the financial statements.
2.19 Service tax input credit
Service tax input credit is accounted for in the books in the period in which the underlying service received is accounted and when there is reasonable certainty in availing / utilising the credits.
2.20 operating Cycle
Based on the nature of products / activities of the Company and the normal time between acquisition of assets and their realisation in cash or cash equivalents, the Company has determined its operating cycle as 12 months for the purpose of classification of its assets and liabilities as current and non-current.
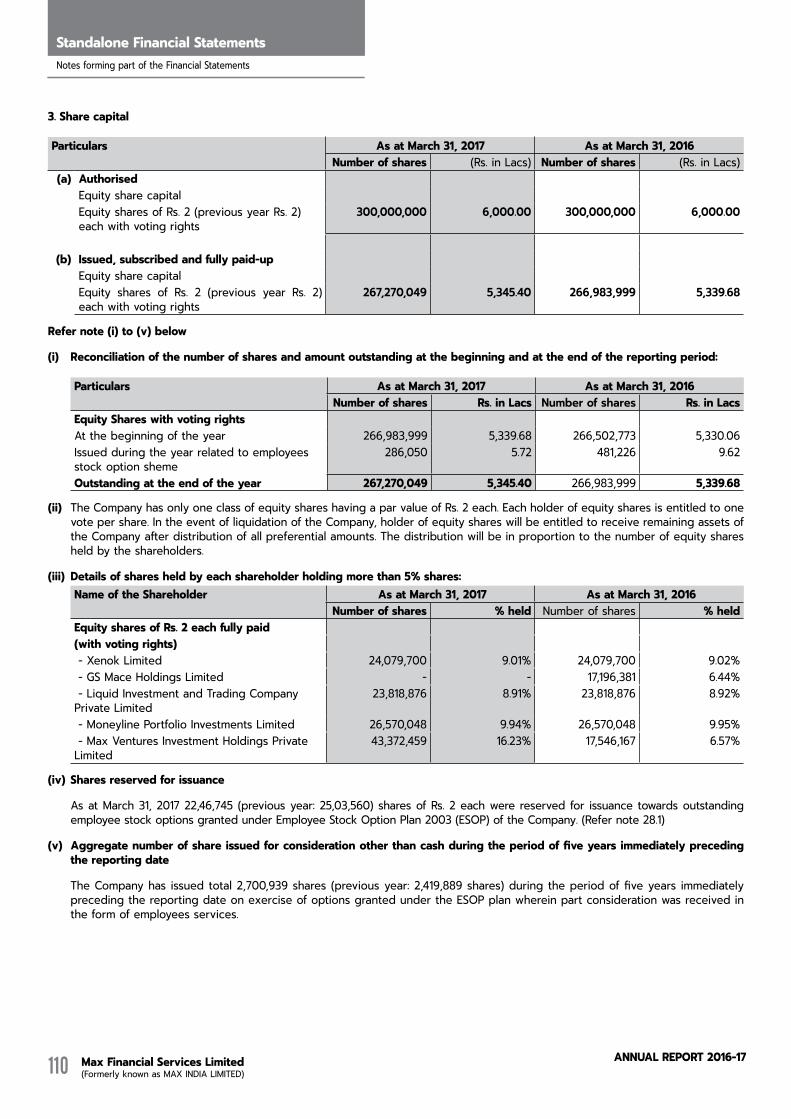
Max Financial Services Limited (Formerly known as MAX INDIA LIMITED)
AnnuAL RepoRt 2016-17110
Standalone Financial StatementsNotes forming part of the Financial Statements
3. Share capital
Particulars As at March 31, 2017 As at March 31, 2016Number of shares (Rs. in Lacs) Number of shares (Rs. in Lacs)
(a) AuthorisedEquity share capitalEquity shares of Rs. 2 (previous year Rs. 2) each with voting rights
300,000,000 6,000.00 300,000,000 6,000.00
(b) Issued, subscribed and fully paid-upEquity share capitalEquity shares of Rs. 2 (previous year Rs. 2) each with voting rights
267,270,049 5,345.40 266,983,999 5,339.68
refer note (i) to (v) below
(i) reconciliation of the number of shares and amount outstanding at the beginning and at the end of the reporting period:
Particulars As at March 31, 2017 As at March 31, 2016Number of shares rs. in Lacs number of shares rs. in Lacs
equity shares with voting rightsAt the beginning of the year 266,983,999 5,339.68 266,502,773 5,330.06 Issued during the year related to employees stock option sheme
286,050 5.72 481,226 9.62
outstanding at the end of the year 267,270,049 5,345.40 266,983,999 5,339.68
(ii) The Company has only one class of equity shares having a par value of Rs. 2 each. Each holder of equity shares is entitled to one vote per share. In the event of liquidation of the Company, holder of equity shares will be entitled to receive remaining assets of the Company after distribution of all preferential amounts. The distribution will be in proportion to the number of equity shares held by the shareholders.
(iii) details of shares held by each shareholder holding more than 5% shares:Name of the shareholder As at March 31, 2017 As at March 31, 2016
Number of shares % held Number of shares % heldequity shares of rs. 2 each fully paid (with voting rights) - Xenok Limited 24,079,700 9.01% 24,079,700 9.02% - GS Mace Holdings Limited - - 17,196,381 6.44% - Liquid Investment and Trading Company Private Limited
23,818,876 8.91% 23,818,876 8.92%
- Moneyline Portfolio Investments Limited 26,570,048 9.94% 26,570,048 9.95% - Max Ventures Investment Holdings Private Limited
43,372,459 16.23% 17,546,167 6.57%
(iv) shares reserved for issuance
As at March 31, 2017 22,46,745 (previous year: 25,03,560) shares of Rs. 2 each were reserved for issuance towards outstanding employee stock options granted under Employee Stock Option Plan 2003 (ESOP) of the Company. (Refer note 28.1)
(v) Aggregate number of share issued for consideration other than cash during the period of five years immediately preceding the reporting date
The Company has issued total 2,700,939 shares (previous year: 2,419,889 shares) during the period of five years immediately preceding the reporting date on exercise of options granted under the ESOP plan wherein part consideration was received in the form of employees services.

Max Financial Services Limited (Formerly known as MAX INDIA LIMITED)
AnnuAL RepoRt 2016-17 111
4. Reserves and surplus(Rs. in Lacs)
Particulars As at March 31, 2017
As at March 31, 2016
(a) Capital reserve Opening balance - 50.00 Less : Transfer of reserves on account of demerger (Refer note 36) - 50.00 Closing balance - -
(b) Securities premium accountOpening balance 31,709.03 211,362.64 Add : Premium on shares issued during the year 555.98 925.72 Less : Transfer of reserves on account of demerger (Refer note 36) 180,579.33 Closing balance 32,265.01 31,709.03
(c) Employee stock option outstandingOpening balance 927.43 1,509.83 Add : Compensation expensed during the year 812.58 871.42 Less : Transferred to securities premium account on excercise 555.98 925.72 Less : Transfer of reserves on account of demerger (Refer note 36) - 217.54 Less : Stock options forfeited during the year 310.56 Closing balance 803.61 927.43
(d) General reserveOpening balance 16,418.22 16,418.22 Add: Transferred from surplus in Statement of Profit and Loss - - Closing balance 16,418.22 16,418.22
(e) surplus in the statement of Profit and LossOpening balance 112,597.87 110,693.30 Profit for the year 15,399.75 11,520.51 Less : Appropriations
Interim dividend distributed to equity shareholders Rs. Nil (previous year Rs. 1.80) per share *
- 4,805.53
Dividend proposed to be distributed to equity shareholders Rs. Nil (previous year Rs. 1.80) per share *
- 4,805.71
Final dividend of earlier year 0.91 4.70 Total appropriations 0.91 9,615.94 Closing balance 127,996.71 112,597.87 Total reserves and surplus 177,483.55 161,652.55
* During the previous year ended, the corporate dividend tax paid by the Max Life Insurance Company Limited (subsidiary company) on dividend paid to the Company was in excess of company’s obligation of corporate dividend tax on dividend paid/declared by the Company. Accordingly, the Company has taken credit of corporate dividend tax as per section 115O of the Income Tax Act, 1961 and no provision of corporate dividend tax has been recognised in the financial statements.
5. Long term trade payables(Rs. in Lacs)
Particulars as at as at march 31, 2017 march 31, 2016
Trade payables 212.18 - 212.18 -
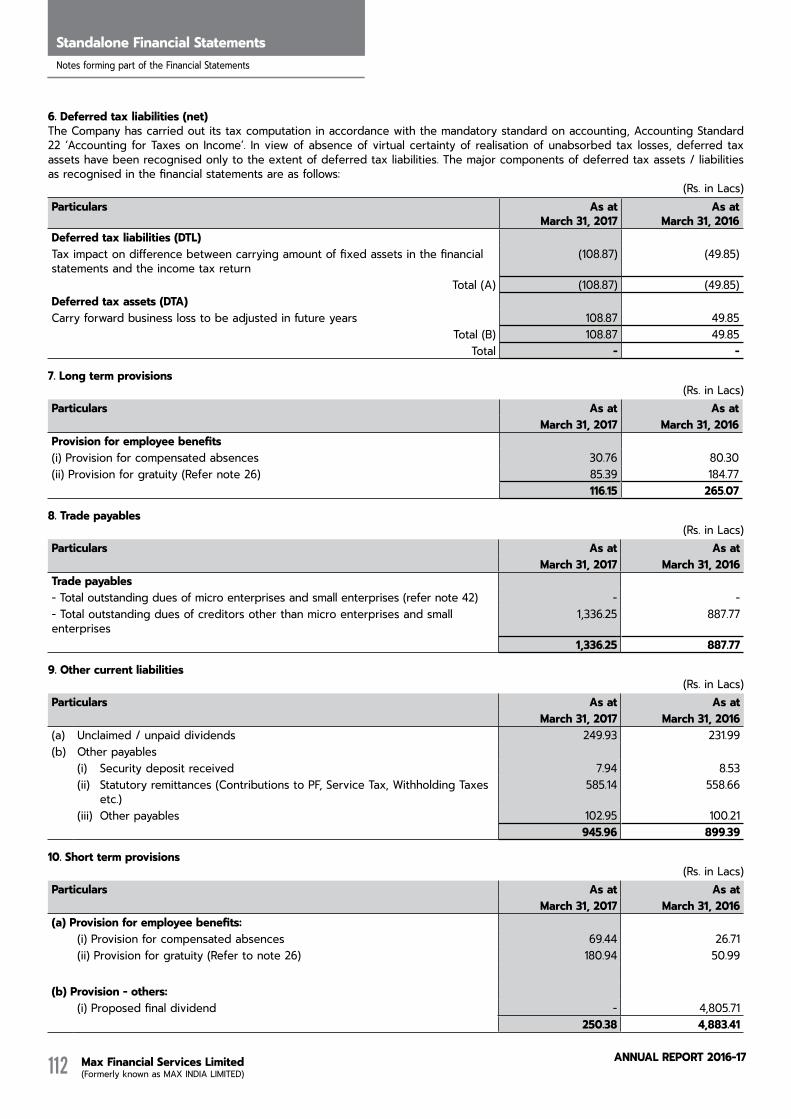
Max Financial Services Limited (Formerly known as MAX INDIA LIMITED)
AnnuAL RepoRt 2016-17112
Standalone Financial StatementsNotes forming part of the Financial Statements
6. deferred tax liabilities (net)The Company has carried out its tax computation in accordance with the mandatory standard on accounting, Accounting Standard 22 ‘Accounting for Taxes on Income’. In view of absence of virtual certainty of realisation of unabsorbed tax losses, deferred tax assets have been recognised only to the extent of deferred tax liabilities. The major components of deferred tax assets / liabilities as recognised in the financial statements are as follows:
(Rs. in Lacs)Particulars As at
March 31, 2017 As at
March 31, 2016 deferred tax liabilities (dTL) Tax impact on difference between carrying amount of fixed assets in the financial statements and the income tax return
(108.87) (49.85)
Total (A) (108.87) (49.85)deferred tax assets (dTA) Carry forward business loss to be adjusted in future years 108.87 49.85
Total (B) 108.87 49.85 Total - -
7. Long term provisions(Rs. in Lacs)
Particulars As at As at March 31, 2017 March 31, 2016
Provision for employee benefits(i) Provision for compensated absences 30.76 80.30 (ii) Provision for gratuity (Refer note 26) 85.39 184.77
116.15 265.07
8. Trade payables(Rs. in Lacs)
Particulars As at As at March 31, 2017 March 31, 2016
Trade payables- Total outstanding dues of micro enterprises and small enterprises (refer note 42) - - - Total outstanding dues of creditors other than micro enterprises and small enterprises
1,336.25 887.77
1,336.25 887.77
9. other current liabilities(Rs. in Lacs)
Particulars As at As at March 31, 2017 March 31, 2016
(a) Unclaimed / unpaid dividends 249.93 231.99 (b) Other payables
(i) Security deposit received 7.94 8.53 (ii) Statutory remittances (Contributions to PF, Service Tax, Withholding Taxes
etc.) 585.14 558.66
(iii) Other payables 102.95 100.21 945.96 899.39
10. Short term provisions(Rs. in Lacs)
Particulars As at As at March 31, 2017 March 31, 2016
(a) Provision for employee benefits:(i) Provision for compensated absences 69.44 26.71 (ii) Provision for gratuity (Refer to note 26) 180.94 50.99
(b) Provision - others:(i) Proposed final dividend - 4,805.71
250.38 4,883.41
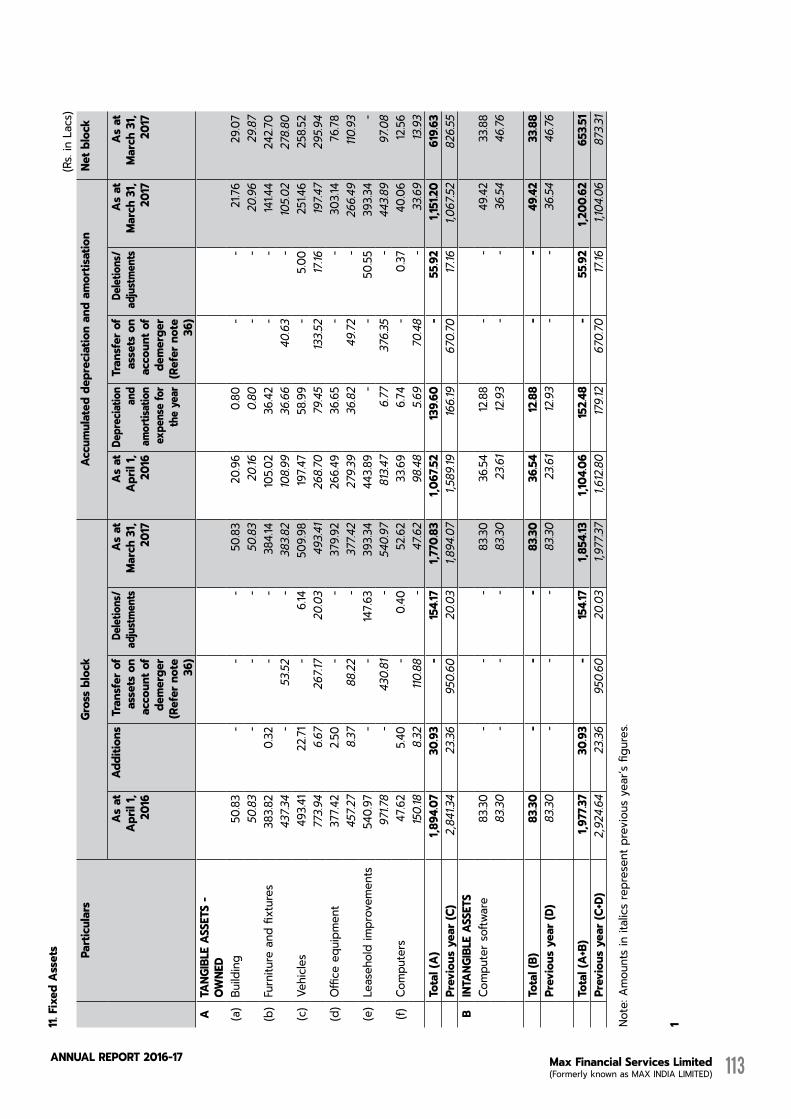
Max Financial Services Limited (Formerly known as MAX INDIA LIMITED)
AnnuAL RepoRt 2016-17 113
11. F
ixed
Ass
ets
(Rs.
in L
acs)
Part
icul
ars
Gros
s bl
ock
Accu
mul
ated
dep
reci
atio
n an
d am
ortis
atio
nNe
t blo
ck
As a
t Ap
ril 1,
20
16
Addi
tions
Tran
sfer
of
asse
ts o
n ac
coun
t of
dem
erge
r(r
efer
not
e 36
)
delet
ions
/ad
justm
ents
As a
t M
arch
31,
2017
As a
t Ap
ril 1,
20
16
Depr
eciat
ion
and
amor
tisat
ion
expe
nse
for
the
year
Tran
sfer
of
asse
ts o
n ac
coun
t of
dem
erge
r (r
efer
not
e 36
)
delet
ions
/ad
justm
ents
As a
t M
arch
31,
2017
As a
t M
arch
31,
2017
ATA
NGIB
Le A
sseT
s -
oWNe
d(a
)Bu
ildin
g 5
0.83
-
- -
50.
83
20.
96
0.80
-
- 2
1.76
29.
07
50.
83
- -
- 5
0.83
2
0.16
0
.80
- -
20.
96
29.
87
(b)
Furn
iture
and
fixt
ures
383
.82
0.32
-
- 3
84.14
10
5.02
36.
42
- -
141.4
4 2
42.70
4
37.34
-
53.5
2 -
383
.82
108.9
9 3
6.66
4
0.63
-
105.0
2 2
78.80
(c
)Ve
hicle
s 4
93.41
2
2.71
- 6
.14
509
.98
197.4
7 5
8.99
- 5
.00
251
.46
258
.52
773
.94
6.6
7 2
67.17
2
0.03
4
93.41
2
68.70
7
9.45
13
3.52
17.16
19
7.47
295
.94
(d)
Offi
ce e
quip
men
t 3
77.42
2
.50
- -
379
.92
266
.49
36.
65
- -
303
.14
76.
78
457
.27
8.37
8
8.22
- 3
77.42
2
79.39
3
6.82
4
9.72
-
266
.49
110.
93
(e)
Leas
ehol
d im
prov
emen
ts 5
40.9
7 -
- 14
7.63
393
.34
443
.89
- -
50.
55
393
.34
- 9
71.78
-
430
.81
- 5
40.9
7 8
13.47
6
.77
376
.35
- 4
43.89
9
7.08
(f)Co
mpu
ters
47.6
2 5
.40
- 0
.40
52.6
2 3
3.69
6.74
-
0.37
4
0.06
12
.56
150.
18
8.32
11
0.88
-
47.6
2 9
8.48
5.6
9 7
0.48
-
33.6
9 13
.93
Tota
l (A)
1,89
4.07
30.
93
- 15
4.17
1,77
0.83
1,
067.5
2 13
9.60
-
55.9
2 1,
151.2
0 6
19.6
3 Pr
evio
us y
ear (
C) 2
,841
.34
23.3
6 9
50.6
0 2
0.03
1,
894.0
7 1,
589.
19
166.
19
670
.70
17.16
1,
067.5
2 8
26.55
B
INTA
NGIB
Le A
sseT
sCo
mpu
ter s
oftw
are
83.3
0 -
- -
83.3
0 3
6.54
12
.88
- -
49.
42
33.8
8 8
3.30
- -
- 8
3.30
23.6
1 12
.93
- -
36.
54
46.
76
Tota
l (B)
83.3
0 -
- -
83.3
0 3
6.54
12
.88
- -
49.
42
33.8
8 Pr
evio
us y
ear (
D) 8
3.30
- -
- 8
3.30
23.6
1 12
.93
- -
36.
54
46.
76
Tota
l (A+
B) 1,
977.3
7 3
0.93
-
154.1
7 1,
854.1
3 1,
104.0
6 15
2.48
- 5
5.92
1,20
0.62
6
53.51
Pr
evio
us y
ear (
C+D)
2,9
24.6
4 2
3.36
950
.60
20.
03
1,97
7.37
1,61
2.80
179.
12
670
.70
17.16
1,
104.0
6 8
73.31
Note
: Am
ount
s in
ital
ics re
pres
ent p
revi
ous
year
’s fig
ures
.
1
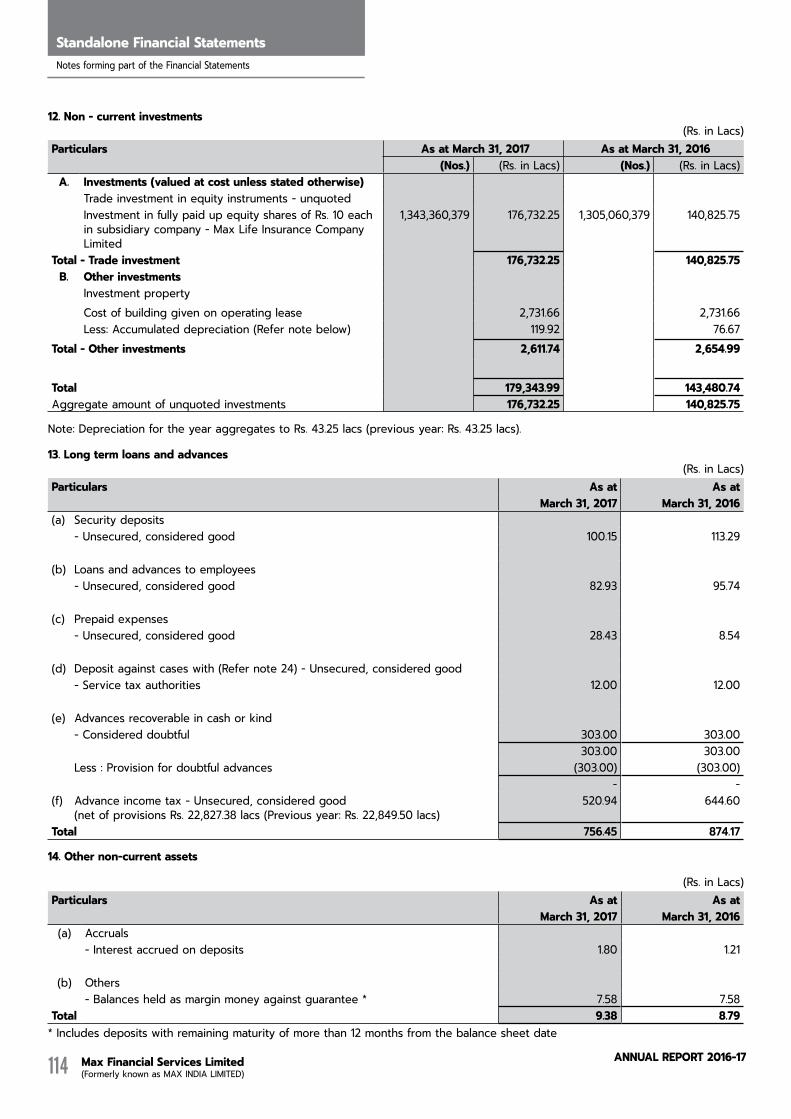
Max Financial Services Limited (Formerly known as MAX INDIA LIMITED)
AnnuAL RepoRt 2016-17114
Standalone Financial StatementsNotes forming part of the Financial Statements
12. Non - current investments(Rs. in Lacs)
Particulars As at March 31, 2017 As at March 31, 2016 (Nos.) (Rs. in Lacs) (Nos.) (Rs. in Lacs)
A. Investments (valued at cost unless stated otherwise)Trade investment in equity instruments - unquotedInvestment in fully paid up equity shares of Rs. 10 each in subsidiary company - Max Life Insurance Company Limited
1,343,360,379 176,732.25 1,305,060,379 140,825.75
Total - Trade investment 176,732.25 140,825.75 B. other investments
Investment propertyCost of building given on operating lease 2,731.66 2,731.66 Less: Accumulated depreciation (Refer note below) 119.92 76.67
Total - other investments 2,611.74 2,654.99
Total 179,343.99 143,480.74 Aggregate amount of unquoted investments 176,732.25 140,825.75
Note: Depreciation for the year aggregates to Rs. 43.25 lacs (previous year: Rs. 43.25 lacs).
13. Long term loans and advances(Rs. in Lacs)
Particulars As at As at March 31, 2017 March 31, 2016
(a) Security deposits - Unsecured, considered good 100.15 113.29
(b) Loans and advances to employees - Unsecured, considered good 82.93 95.74
(c) Prepaid expenses - Unsecured, considered good 28.43 8.54
(d) Deposit against cases with (Refer note 24) - Unsecured, considered good - Service tax authorities 12.00 12.00
(e) Advances recoverable in cash or kind - Considered doubtful 303.00 303.00
303.00 303.00 Less : Provision for doubtful advances (303.00) (303.00)
- - (f) Advance income tax - Unsecured, considered good (net of provisions Rs. 22,827.38 lacs (Previous year: Rs. 22,849.50 lacs)
520.94 644.60
Total 756.45 874.17
14. other non-current assets
(Rs. in Lacs)Particulars As at As at
March 31, 2017 March 31, 2016 (a) Accruals
- Interest accrued on deposits 1.80 1.21
(b) Others- Balances held as margin money against guarantee * 7.58 7.58
Total 9.38 8.79 * Includes deposits with remaining maturity of more than 12 months from the balance sheet date
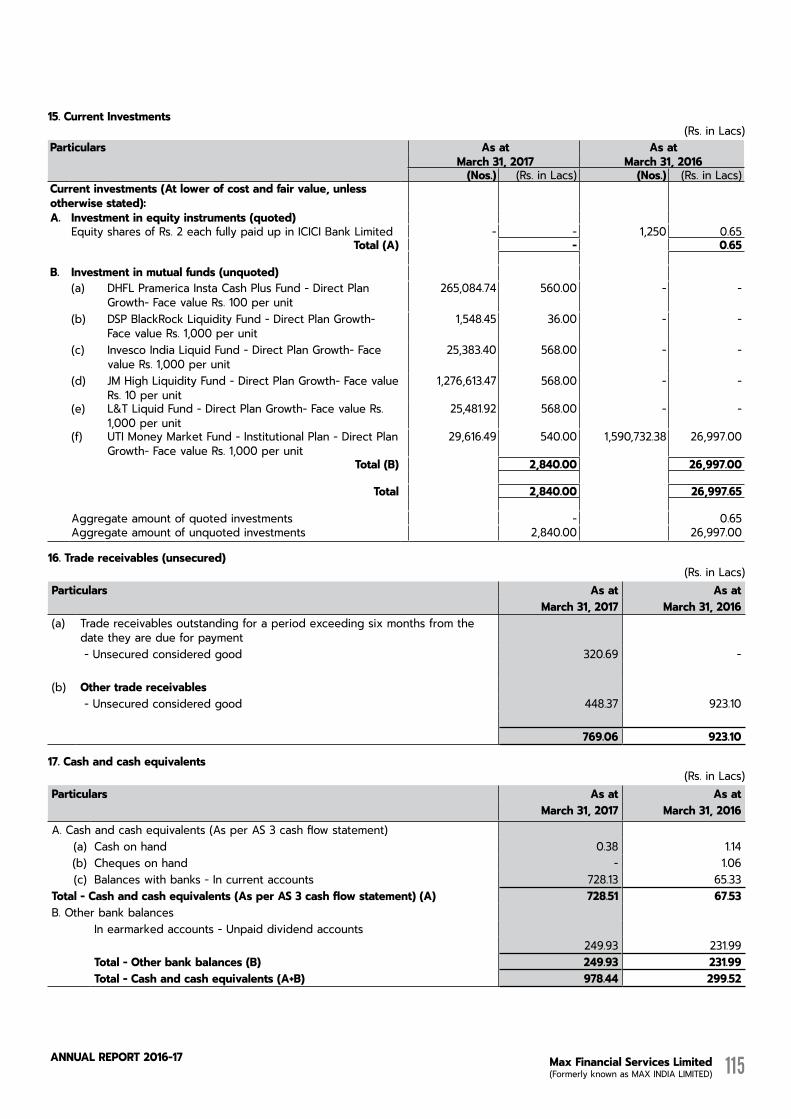
Max Financial Services Limited (Formerly known as MAX INDIA LIMITED)
AnnuAL RepoRt 2016-17 115
15. Current Investments(Rs. in Lacs)
Particulars As at March 31, 2017
As at March 31, 2016
(Nos.) (Rs. in Lacs) (Nos.) (Rs. in Lacs) Current investments (At lower of cost and fair value, unless otherwise stated):A. Investment in equity instruments (quoted)
Equity shares of Rs. 2 each fully paid up in ICICI Bank Limited - - 1,250 0.65 Total (A) - 0.65
B. Investment in mutual funds (unquoted)(a) DHFL Pramerica Insta Cash Plus Fund - Direct Plan
Growth- Face value Rs. 100 per unit 265,084.74 560.00 - -
(b) DSP BlackRock Liquidity Fund - Direct Plan Growth- Face value Rs. 1,000 per unit
1,548.45 36.00 - -
(c) Invesco India Liquid Fund - Direct Plan Growth- Face value Rs. 1,000 per unit
25,383.40 568.00 - -
(d) JM High Liquidity Fund - Direct Plan Growth- Face value Rs. 10 per unit
1,276,613.47 568.00 - -
(e) L&T Liquid Fund - Direct Plan Growth- Face value Rs. 1,000 per unit
25,481.92 568.00 - -
(f) UTI Money Market Fund - Institutional Plan - Direct Plan Growth- Face value Rs. 1,000 per unit
29,616.49 540.00 1,590,732.38 26,997.00
Total (B) 2,840.00 26,997.00
Total 2,840.00 26,997.65
Aggregate amount of quoted investments - 0.65 Aggregate amount of unquoted investments 2,840.00 26,997.00
16. Trade receivables (unsecured)(Rs. in Lacs)
Particulars As at As at March 31, 2017 March 31, 2016
(a) Trade receivables outstanding for a period exceeding six months from the date they are due for payment - Unsecured considered good 320.69 -
(b) other trade receivables - Unsecured considered good 448.37 923.10
769.06 923.10
17. Cash and cash equivalents(Rs. in Lacs)
Particulars As at As at March 31, 2017 March 31, 2016
A. Cash and cash equivalents (As per AS 3 cash flow statement)(a) Cash on hand 0.38 1.14 (b) Cheques on hand - 1.06 (c) Balances with banks - In current accounts 728.13 65.33
Total - Cash and cash equivalents (As per As 3 cash flow statement) (A) 728.51 67.53 B. Other bank balances
In earmarked accounts - Unpaid dividend accounts 249.93 231.99
Total - other bank balances (B) 249.93 231.99 Total - Cash and cash equivalents (A+B) 978.44 299.52

Max Financial Services Limited (Formerly known as MAX INDIA LIMITED)
AnnuAL RepoRt 2016-17116
Standalone Financial StatementsNotes forming part of the Financial Statements
C. Details of transaction in Specified bank notes (SBNs) and other denomination notes during the period 8 November, 2016 to 30 December, 2016
(Rupees)Particulars sBNs other denomination
notesTotal
Closing Cash in hand as on November 8, 2016 50,000 35,930 85,930 Add : Permitted Receipts - 180,283 180,283 Less : Permitted Payments - 190,951 190,951 Less : Amount deposited in Banks 50,000 - 50,000 Closing Cash in hand as on December 30, 2016 - 25,262 25,262
*For the purposes of this note, the term ‘Specified Bank Notes’ shall have the same meaning provided in the notification of the Government of India, in the Ministry of Finance, Department of Economic Affairs number S.O. 3407(E), dated 8 November, 2016.
18. Short term loans and advances
(Rs. in Lacs)Particulars As at
March 31, 2017 As at
March 31, 2016 (a) Loans and advances to related parties (Refer note 31)
- Unsecured, considered good 5.65 17.63
(b) Loans and advances to employees - Unsecured, considered good 12.80 12.76
(c) Prepaid expenses - Unsecured, considered good 37.76 126.42
(d) Advances recoverable in cash or kind - Unsecured, considered good 22.63 27.27
(e) Balances with statutory/government authorities (unsecured) - Considered good 260.20 286.51 - Considered doubtful 443.61 -
703.81 286.51 - Provision for doubtful balances (443.61) -
260.20 286.51 Total 339.04 470.59
19. revenue from operations (net)(Rs. in Lacs)
Particulars For the year ended For the year ended March 31, 2017 March 31, 2016
(a) Sale of services - Income from shared services 2,121.65 1,623.78
(b) Other operating revenues (Refer note below) 23,369.78 18,447.35 revenue from operations 25,491.43 20,071.13 Note:Other operating revenues comprises:
(a) Dividend income on long term investments* 22,064.81 16,717.61 (b) Interest income on
- Fixed deposits 13.88 20.07 (c) Profit on sale of current investment in:
(i) mutual funds 1,288.31 1,709.67 (ii) equity instruments 2.78 -
Total - Other operating revenues 23,369.78 18,447.35
* The Company has recognised dividend income of Rs. 22,064.81 Lacs (Previous year: Rs. 16,717.61 Lacs) of its share of interim dividend declared during the year and final dividend in the previous year by Max Life Insurance Company Limited.

Max Financial Services Limited (Formerly known as MAX INDIA LIMITED)
AnnuAL RepoRt 2016-17 117
20. other Income(Rs. in Lacs)
Particulars For the year ended For the year ended March 31, 2017 March 31, 2016
(a) Interest income(i) income tax refund 78.72 - (ii) loan to employees 3.95 4.50
(b) Other non operating income(i) Liabilities / provisions no longer required written back 0.68 1.81 (ii) Net profit on sale / disposal of fixed assets - 2.62 (iii) Net gain on foreign currency transactions and translation 10.45 - (iv) Rental income 42.00 42.00 (v) Miscellaneous income 0.50 -
Total 136.30 50.93
21. employee benefits expense(Rs. in Lacs)
Particulars For the year ended For the year ended March 31, 2017 March 31, 2016
(a) Salaries and wages 2,730.19 2,495.12 (b) Contribution to provident and other funds (Refer to note 26) 117.17 137.95 (c) Expense on employee stock option scheme (Refer note 28) 812.58 565.30 (d) Staff welfare expenses 60.13 67.16 Total 3,720.07 3,265.53
22. Depreciation and amortisation expense(Rs. in Lacs)
Particulars For the year ended For the year ended March 31, 2017 March 31, 2016
(a) Depreciation of tangible assets (Refer note 11) 139.60 166.19 (b) Amortization of intangible assets (Refer note 11) 12.88 12.93 (c) Depreciation of investment property (refer note 12) 43.25 43.25 Total 195.73 222.37
23. other expenses(Rs. in Lacs)
Particulars For the year ended For the year ended March 31, 2017 March 31, 2016
(a) Recruitment and training expenses 10.51 39.37 (b) Rent including lease rentals (Refer note 29) 313.35 293.73 (c) Insurance 26.68 29.09 (d) Rates and taxes 3.14 3.63 (e) Repairs and maintenance - others 298.72 298.33 (f) Power & Fuel 48.31 47.39 (g) Printing and stationery 32.53 43.51 (h) Travelling and conveyance 469.28 424.93 (i) Communication 63.85 91.76 (j) Director's sitting fees 83.42 137.29 (k) Business promotion 53.42 172.43 (l) Advertisement and publicity 99.59 207.35 (m) Net loss on sale/disposal of fixed assets 0.55 - (n) Provision for doubtful service tax credit receivable 443.61 - (o) Fixed assets written off 97.09 - (p) Charity and donation 106.00 1.82 (q) Net loss on foreign currency transactions and translations - 0.13 (r) Miscellaneous expenses 47.38 46.84 Total 2,197.43 1,837.60

Max Financial Services Limited (Formerly known as MAX INDIA LIMITED)
AnnuAL RepoRt 2016-17118
Standalone Financial StatementsNotes forming part of the Financial Statements
24. Commitments and contingent liabilities (Rs. in Lacs)
Particulars As at As atMarch 31, 2017 March 31, 2016
A. Commitments(i) Estimated amount of contracts remaining to be executed on tangible
assets and not provided for (net of advances) - -
(ii) The Company has entered into a tripartite agreement between Axis Bank Limited, Mitsui Sumitomo Insurance Company Limited and the Company, whereby the Company will buy back the stake held by Axis Bank Limited in Max Life Insurance Company Limited. (Refer note 37)
B. Contingent liabilitiesClaims against the Company not acknowledged as debts (Refer note a)
(i) Disputed demands raised by custom authorities 418.26 407.12 (ii) Disputed demand raised by service tax authorities (Refer note b) 352.58 213.00 (iii) Disputed demand raised by income tax authorities (Refer note d) 159.04 159.04 (iv) Penalty levied under section 271(1)(c) of the Income Tax Act, 1961 (Refer
note d) 33.42 33.42
(v) Litigation in an erstwhile subsidiary of the Company, Max Telecom Ven-tures Limited (“MTVL”) (since merged with the Company with effect from December 1, 2005) (Refer note e)
(vi) Litigation against the Company relating to Company Law matters (Refer note c)
Note :
a. Claims against the Company not acknowledged as debts represent the cases pending with judicial forums / authorities. Based on management estimation and opinions from legal advisors, management believes that its position will likely to be upheld in appellate process. The Company has not made any provisions for the demand since the management believes that the ultimate outcome of the proceedings will not have material adverse effect on the Company’s financial position and result of operations.
b. The Company has not made any provision for the demands in service tax cases as the Company believes that they have a good case based on existing judicial pronouncements. The advance paid against the same is Rs. 12.00 Lacs (Previous year: Rs. 12.00 Lacs).
c. During the year 2006, the Ministry of Corporate Affairs had carried out an inspection, wherein certain technical offences were alleged by the Inspection Officer based on which prosecution proceedings were initiated against the Company, its erstwhile Whole-time Directors and the Company Secretary at Chief Judicial Magistrate, Chandigarh. The Company filed writ petition against the prosecution proceedings with the Hon’ble High Court of Punjab and Haryana. The High Court stayed the proceedings and listed the case for arguments.
d. Income tax cases represent the cases pending with income tax authorities/appellate authorities. Based on management estimation, future cash outflow in respect of these cases are determinable only on receipt of judgments / decisions pending with various courts/authorities. The Company has not made any provision for the demands in income tax cases as the Company believes that they have a good case based on existing judicial pronouncements.
e. Litigation in an erstwhile subsidiary of the Company, Max Telecom Ventures Limited (“MTVL”) (since merged with the Company with effect from December 1, 2005)
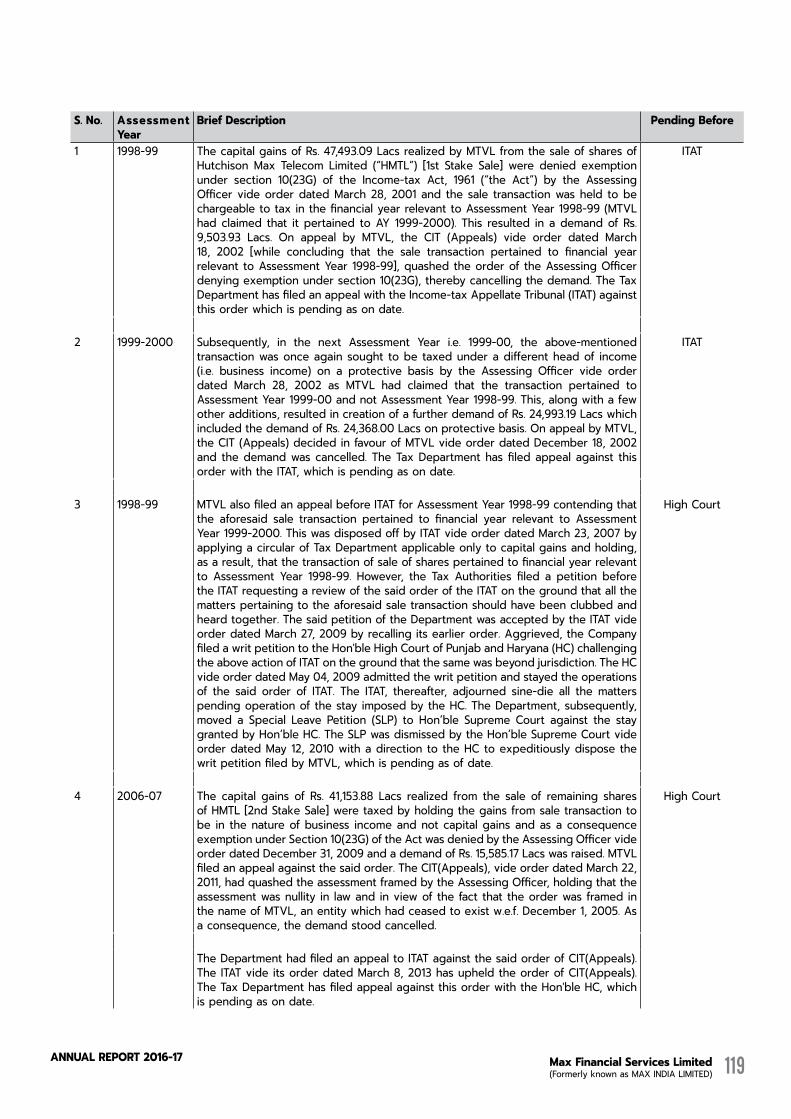
Max Financial Services Limited (Formerly known as MAX INDIA LIMITED)
AnnuAL RepoRt 2016-17 119
S. No. Assessment Year
Brief description Pending Before
1 1998-99 The capital gains of Rs. 47,493.09 Lacs realized by MTVL from the sale of shares of Hutchison Max Telecom Limited (“HMTL”) [1st Stake Sale] were denied exemption under section 10(23G) of the Income-tax Act, 1961 (“the Act”) by the Assessing Officer vide order dated March 28, 2001 and the sale transaction was held to be chargeable to tax in the financial year relevant to Assessment Year 1998-99 (MTVL had claimed that it pertained to AY 1999-2000). This resulted in a demand of Rs. 9,503.93 Lacs. On appeal by MTVL, the CIT (Appeals) vide order dated March 18, 2002 [while concluding that the sale transaction pertained to financial year relevant to Assessment Year 1998-99], quashed the order of the Assessing Officer denying exemption under section 10(23G), thereby cancelling the demand. The Tax Department has filed an appeal with the Income-tax Appellate Tribunal (ITAT) against this order which is pending as on date.
ITAT
2 1999-2000 Subsequently, in the next Assessment Year i.e. 1999-00, the above-mentioned transaction was once again sought to be taxed under a different head of income (i.e. business income) on a protective basis by the Assessing Officer vide order dated March 28, 2002 as MTVL had claimed that the transaction pertained to Assessment Year 1999-00 and not Assessment Year 1998-99. This, along with a few other additions, resulted in creation of a further demand of Rs. 24,993.19 Lacs which included the demand of Rs. 24,368.00 Lacs on protective basis. On appeal by MTVL, the CIT (Appeals) decided in favour of MTVL vide order dated December 18, 2002 and the demand was cancelled. The Tax Department has filed appeal against this order with the ITAT, which is pending as on date.
ITAT
3 1998-99 MTVL also filed an appeal before ITAT for Assessment Year 1998-99 contending that the aforesaid sale transaction pertained to financial year relevant to Assessment Year 1999-2000. This was disposed off by ITAT vide order dated March 23, 2007 by applying a circular of Tax Department applicable only to capital gains and holding, as a result, that the transaction of sale of shares pertained to financial year relevant to Assessment Year 1998-99. However, the Tax Authorities filed a petition before the ITAT requesting a review of the said order of the ITAT on the ground that all the matters pertaining to the aforesaid sale transaction should have been clubbed and heard together. The said petition of the Department was accepted by the ITAT vide order dated March 27, 2009 by recalling its earlier order. Aggrieved, the Company filed a writ petition to the Hon'ble High Court of Punjab and Haryana (HC) challenging the above action of ITAT on the ground that the same was beyond jurisdiction. The HC vide order dated May 04, 2009 admitted the writ petition and stayed the operations of the said order of ITAT. The ITAT, thereafter, adjourned sine-die all the matters pending operation of the stay imposed by the HC. The Department, subsequently, moved a Special Leave Petition (SLP) to Hon’ble Supreme Court against the stay granted by Hon’ble HC. The SLP was dismissed by the Hon’ble Supreme Court vide order dated May 12, 2010 with a direction to the HC to expeditiously dispose the writ petition filed by MTVL, which is pending as of date.
High Court
4 2006-07 The capital gains of Rs. 41,153.88 Lacs realized from the sale of remaining shares of HMTL [2nd Stake Sale] were taxed by holding the gains from sale transaction to be in the nature of business income and not capital gains and as a consequence exemption under Section 10(23G) of the Act was denied by the Assessing Officer vide order dated December 31, 2009 and a demand of Rs. 15,585.17 Lacs was raised. MTVL filed an appeal against the said order. The CIT(Appeals), vide order dated March 22, 2011, had quashed the assessment framed by the Assessing Officer, holding that the assessment was nullity in law and in view of the fact that the order was framed in the name of MTVL, an entity which had ceased to exist w.e.f. December 1, 2005. As a consequence, the demand stood cancelled.
High Court
The Department had filed an appeal to ITAT against the said order of CIT(Appeals). The ITAT vide its order dated March 8, 2013 has upheld the order of CIT(Appeals). The Tax Department has filed appeal against this order with the Hon'ble HC, which is pending as on date.
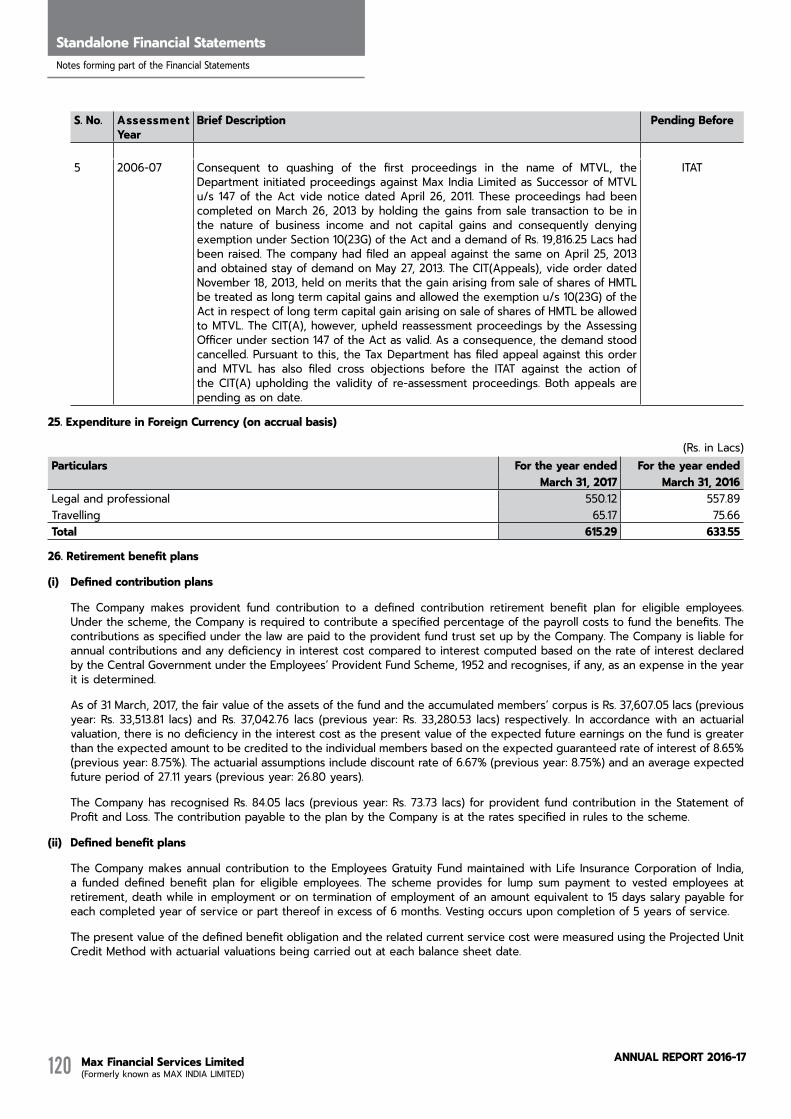
Max Financial Services Limited (Formerly known as MAX INDIA LIMITED)
AnnuAL RepoRt 2016-17120
Standalone Financial StatementsNotes forming part of the Financial Statements
S. No. Assessment Year
Brief description Pending Before
5 2006-07 Consequent to quashing of the first proceedings in the name of MTVL, the Department initiated proceedings against Max India Limited as Successor of MTVL u/s 147 of the Act vide notice dated April 26, 2011. These proceedings had been completed on March 26, 2013 by holding the gains from sale transaction to be in the nature of business income and not capital gains and consequently denying exemption under Section 10(23G) of the Act and a demand of Rs. 19,816.25 Lacs had been raised. The company had filed an appeal against the same on April 25, 2013 and obtained stay of demand on May 27, 2013. The CIT(Appeals), vide order dated November 18, 2013, held on merits that the gain arising from sale of shares of HMTL be treated as long term capital gains and allowed the exemption u/s 10(23G) of the Act in respect of long term capital gain arising on sale of shares of HMTL be allowed to MTVL. The CIT(A), however, upheld reassessment proceedings by the Assessing Officer under section 147 of the Act as valid. As a consequence, the demand stood cancelled. Pursuant to this, the Tax Department has filed appeal against this order and MTVL has also filed cross objections before the ITAT against the action of the CIT(A) upholding the validity of re-assessment proceedings. Both appeals are pending as on date.
ITAT
25. expenditure in Foreign Currency (on accrual basis)
(Rs. in Lacs)Particulars For the year ended For the year ended
March 31, 2017 March 31, 2016 Legal and professional 550.12 557.89 Travelling 65.17 75.66 Total 615.29 633.55
26. retirement benefit plans
(i) defined contribution plans
The Company makes provident fund contribution to a defined contribution retirement benefit plan for eligible employees. Under the scheme, the Company is required to contribute a specified percentage of the payroll costs to fund the benefits. The contributions as specified under the law are paid to the provident fund trust set up by the Company. The Company is liable for annual contributions and any deficiency in interest cost compared to interest computed based on the rate of interest declared by the Central Government under the Employees’ Provident Fund Scheme, 1952 and recognises, if any, as an expense in the year it is determined.
As of 31 March, 2017, the fair value of the assets of the fund and the accumulated members’ corpus is Rs. 37,607.05 lacs (previous year: Rs. 33,513.81 lacs) and Rs. 37,042.76 lacs (previous year: Rs. 33,280.53 lacs) respectively. In accordance with an actuarial valuation, there is no deficiency in the interest cost as the present value of the expected future earnings on the fund is greater than the expected amount to be credited to the individual members based on the expected guaranteed rate of interest of 8.65% (previous year: 8.75%). The actuarial assumptions include discount rate of 6.67% (previous year: 8.75%) and an average expected future period of 27.11 years (previous year: 26.80 years).
The Company has recognised Rs. 84.05 lacs (previous year: Rs. 73.73 lacs) for provident fund contribution in the Statement of Profit and Loss. The contribution payable to the plan by the Company is at the rates specified in rules to the scheme.
(ii) defined benefit plans
The Company makes annual contribution to the Employees Gratuity Fund maintained with Life Insurance Corporation of India, a funded defined benefit plan for eligible employees. The scheme provides for lump sum payment to vested employees at retirement, death while in employment or on termination of employment of an amount equivalent to 15 days salary payable for each completed year of service or part thereof in excess of 6 months. Vesting occurs upon completion of 5 years of service.
The present value of the defined benefit obligation and the related current service cost were measured using the Projected Unit Credit Method with actuarial valuations being carried out at each balance sheet date.
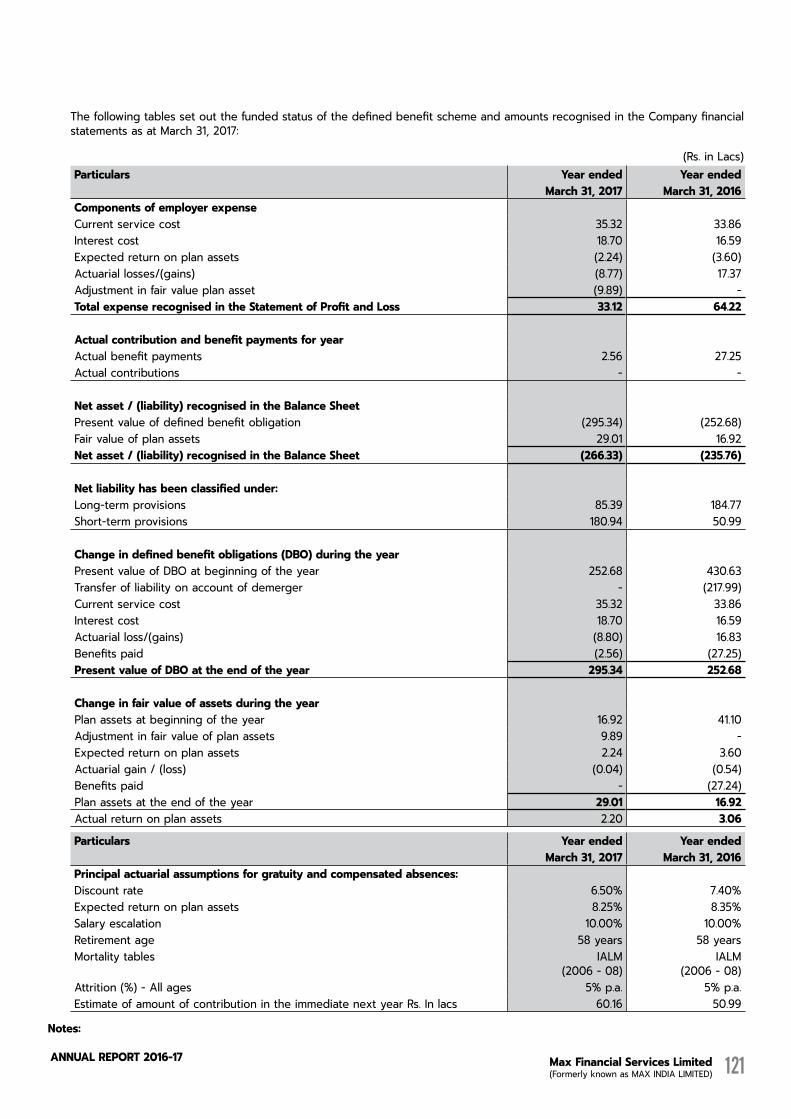
Max Financial Services Limited (Formerly known as MAX INDIA LIMITED)
AnnuAL RepoRt 2016-17 121
The following tables set out the funded status of the defined benefit scheme and amounts recognised in the Company financial statements as at March 31, 2017:
(Rs. in Lacs)Particulars Year ended Year ended
March 31, 2017 March 31, 2016Components of employer expenseCurrent service cost 35.32 33.86 Interest cost 18.70 16.59 Expected return on plan assets (2.24) (3.60)Actuarial losses/(gains) (8.77) 17.37 Adjustment in fair value plan asset (9.89) - Total expense recognised in the statement of Profit and Loss 33.12 64.22
Actual contribution and benefit payments for yearActual benefit payments 2.56 27.25 Actual contributions - -
Net asset / (liability) recognised in the Balance sheetPresent value of defined benefit obligation (295.34) (252.68)Fair value of plan assets 29.01 16.92 Net asset / (liability) recognised in the Balance sheet (266.33) (235.76)
Net liability has been classified under:Long-term provisions 85.39 184.77 Short-term provisions 180.94 50.99
Change in defined benefit obligations (dBo) during the yearPresent value of DBO at beginning of the year 252.68 430.63 Transfer of liability on account of demerger - (217.99)Current service cost 35.32 33.86 Interest cost 18.70 16.59 Actuarial loss/(gains) (8.80) 16.83 Benefits paid (2.56) (27.25)Present value of dBo at the end of the year 295.34 252.68
Change in fair value of assets during the year Plan assets at beginning of the year 16.92 41.10 Adjustment in fair value of plan assets 9.89 - Expected return on plan assets 2.24 3.60 Actuarial gain / (loss) (0.04) (0.54)Benefits paid - (27.24)Plan assets at the end of the year 29.01 16.92 Actual return on plan assets 2.20 3.06
Particulars Year ended Year endedMarch 31, 2017 March 31, 2016
Principal actuarial assumptions for gratuity and compensated absences:Discount rate 6.50% 7.40%Expected return on plan assets 8.25% 8.35%Salary escalation 10.00% 10.00%Retirement age 58 years 58 yearsMortality tables IALM
(2006 - 08) IALM
(2006 - 08) Attrition (%) - All ages 5% p.a. 5% p.a. Estimate of amount of contribution in the immediate next year Rs. In lacs 60.16 50.99
Notes:

Max Financial Services Limited (Formerly known as MAX INDIA LIMITED)
AnnuAL RepoRt 2016-17122
Standalone Financial StatementsNotes forming part of the Financial Statements
a. The discount rate is based on the prevailing market yields of Indian Government securities as at the balance sheet date for the estimated term of obligations.
b. The estimates of future salary increases considered takes into account the inflation, seniority, promotion and other relevant factors.
c. The planned assets of the Company are managed by the Life Insurance Corporation of India in terms of an insurance policy taken to fund obligations of the Company with respect to its gratuity plan. Information on categories of plan assets is not available with the Company.
d. Experience on actuarial gain/(loss) for benefit obligations and plan assets:
(Rs. in Lacs)Particulars Gratuity
March 31, 2017 March 31, 2016 March 31, 2015 March 31, 2014 March 31, 2013Present value of DBO 295.34 252.68 430.63 828.63 830.86 Fair value of plan assets 29.01 16.92 41.10 360.97 340.23 Funded status [Surplus / (Deficit)] (266.33) (235.76) (389.53) (467.66) (490.63)Experience gain / (loss) adjustments on plan liabilities
8.80 (14.69) (74.40) 16.03 (71.23)
Experience gain / (loss) adjustments on plan assets
(0.04) (0.54) (1.76) (1.70) (1.56)
27. Calculation of earnings per share (ePs) - Basic and diluted
Particulars For the year ended For the year endedMarch 31, 2017 March 31, 2016
Basic ePsProfit attributable to shareholders (Rs. in lacs) 15,399.75 11,520.51 Weighted average number of equity shares outstanding during the year (Nos.) 267,137,946 266,800,977 Face value per equity share (Rs.) 2.00 2.00 Basic earnings Per share (rs.) 5.76 4.32 Diluted EPSEquivalent weighted average number of employee stock options outstanding (Nos) 2,378,848 2,769,196 Weighted average number of equity shares outstanding during the year for dilutive earnings per share (Nos)
269,516,794 269,570,173
Diluted Earnings Per Share (Rs.) 5.71 4.27
28. employee stock option Plan
28.1. employee stock option Plan – 2003 (“the 2003 Plan”):
The Company had instituted the 2003 Plan, which was approved by the Board of Directors in August 25, 2003 and by the shareholders in September 30, 2003. The 2003 Plan provides for grant of stock options aggregating not more than 5% of number of issued equity shares of the Company to eligible employees of the Company. The 2003 Plan is administered by the Nomination and Remuneration Committee appointed by the Board of Directors. Under the plan, the employees receive shares of the Company upon completion of vesting conditions such as rendering of services across vesting period. Vesting period ranges from one to five years and options can be exercised within two years from vesting date. As amended in the 2003 Plan and approved the shareholders in Annual General Meeting held on September 30, 2014, the Option Price will be determined by the Nomination and Remuneration Committee, from time to time, in accordance with the provisions of applicable law, provided that the Option Price shall not be below the face value of the equity shares of the Company.
Particulars March 31, 2017 March 31, 2016 Number of options Weighted Average
exercise price (Rs.)Number of options Weighted Average
exercise price (Rs.)Option outstanding at the beginning of the year 2,503,560 279.61 3,039,166 230.69 Granted during the year 29,235 2.00 99,620 2.00 Forfeited during the year - 2.00 (154,000) 2.00 Exercised during the year (286,050) 2.00 (481,226) 2.00 Outstanding at the end of the year 2,246,745 311.34 2,503,560 279.61 Exercisable at the end of the year - - 5,000 2.00
For the period, the weighted average share price at the exercise date was Rs. 531.30 (previous year: Rs. 540.68)

Max Financial Services Limited (Formerly known as MAX INDIA LIMITED)
AnnuAL RepoRt 2016-17 123
The weighted average remaining contractual life for the stock options outstanding as at March 31, 2017 is 1.63 years (March 31, 2016: 1.69 years). The range of exercise prices for options outstanding at the end of the year was 2.00 to 394.00 (March 31, 2016: 2.00 to 394.00).
Stock compensation expense under the Fair Value method has been determined based on fair value of the stock options. The fair value of stock options was determined using the Black Scholes option pricing model with the following assumptions.
Particulars March 31, 2017 March 31, 2016 Date of option granted 1-Apr-16 18-Aug-15Stock Price Now (in Rupees) 344.05 564.15 Exercise Price (X) (in Rupees) 2.00 2.00 Expected Volatility (Standard Dev - Annual) 36.82% 38.49%Life of the options granted (Vesting and exercise period) in years 3.00-6.00 3.00-7.00 Expected Dividend 0.51% 0%Average Risk- Free Interest Rate 7.49%-7.91% 7.98%-8.13%Weighted average fair value of options granted 332.46 - 337.24 562.58 - 563.02
The expected life of the stock is based on historical data and current expectations and is not necessarily indicative of exercise patterns that may occur. The expected volatility reflects the assumption that the historical volatility over a period similar to the life of the options is indicative of future trends, which may also not necessarily be the actual outcome.
28.2 employees Phantom Stock Plan (PSP Plan)
The Company had instituted the PSP Plan, which was approved by the Board of Directors in January 15, 2016. The PSP Plan provides for issue of units to eligible employees of the Company. The PSP Plan is administered by the Nomination and Remuneration Committee approved by the Board of Directors. Under the Plan, eligible employee receives cash equivalent to fair market value of units upon completion of vesting conditions such as rendering of services across vesting period. Vesting period ranges from 1 to 5 years.
Accordingly Rs. 380.42 Lacs (previous year: Rs. Nil) has been accrued as expense in the Statement of Profit and Loss account as applicable. The details of the units granted during the year are as under:
Particulars March 31, 2017 March 31, 2016Number of
optionsWeighted Average
Number of options
Weighted Average
exercise price (Rs.)
exercise price (Rs.)
Option outstanding at the beginning of the year - - - - Granted during the Year 143,052 634.00 - - Forfeited during the year - - - - Exercised during the year - - - - Outstanding at the end of the year 143,052 634.00 - - Exercisable at the end of the year - - - -
For the period, the weighted average share price at the exercise date was Rs. Nil (previous year: Rs. Nil)
The weighted average remaining contractual life for the stock options outstanding as at March 31, 2017 is 1.59 years (March 31, 2016: Nil).
Stock compensation expense under the fair value method has been determined based on fair value of the stock options. The fair value of stock options was determined using the Black Scholes option pricing model with the following assumptions.
Particulars March 31, 2017 March 31, 2016 Date of option granted 8-Aug-16 - Stock price now (in rupees) 551.60 - Exercise price (X) (in rupees) 6.00 - Expected volatility (standard dev - annual) 49.00% - Life of the options granted (vesting and exercise period) in years 3.00-5.65 - Expected dividend 0.32% - Average risk- free interest rate 7.05%-7.32% - Weighted average fair value of options granted 537.84 - 541.52 - The Company measures the cost of ESOP and PSP using intrinsic value method. Had the company used the fair value model to determine compensation, its profit after tax and EPS as reported would have changed to amount indicated below:
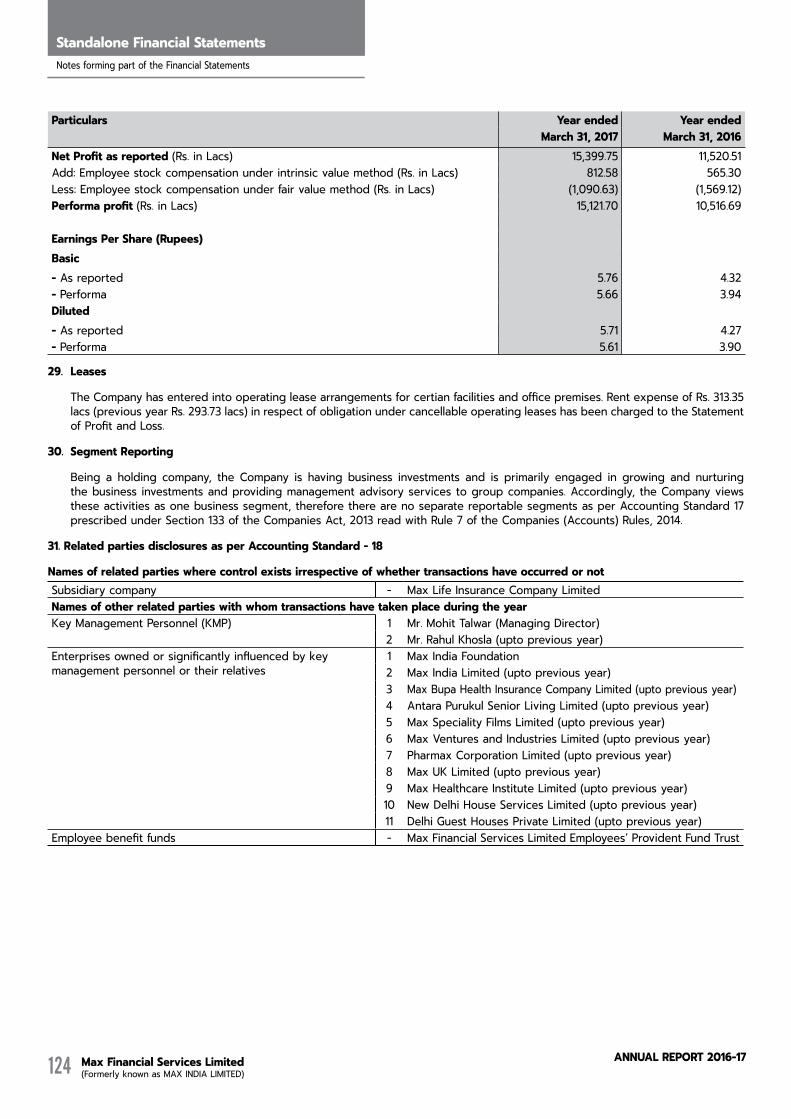
Max Financial Services Limited (Formerly known as MAX INDIA LIMITED)
AnnuAL RepoRt 2016-17124
Standalone Financial StatementsNotes forming part of the Financial Statements
Particulars Year ended Year ended March 31, 2017 March 31, 2016
Net Profit as reported (Rs. in Lacs) 15,399.75 11,520.51 Add: Employee stock compensation under intrinsic value method (Rs. in Lacs) 812.58 565.30 Less: Employee stock compensation under fair value method (Rs. in Lacs) (1,090.63) (1,569.12)Performa profit (Rs. in Lacs) 15,121.70 10,516.69
Earnings Per Share (Rupees)Basic- As reported 5.76 4.32 - Performa 5.66 3.94 Diluted- As reported 5.71 4.27 - Performa 5.61 3.90
29. Leases
The Company has entered into operating lease arrangements for certian facilities and office premises. Rent expense of Rs. 313.35 lacs (previous year Rs. 293.73 lacs) in respect of obligation under cancellable operating leases has been charged to the Statement of Profit and Loss.
30. Segment Reporting
Being a holding company, the Company is having business investments and is primarily engaged in growing and nurturing the business investments and providing management advisory services to group companies. Accordingly, the Company views these activities as one business segment, therefore there are no separate reportable segments as per Accounting Standard 17 prescribed under Section 133 of the Companies Act, 2013 read with Rule 7 of the Companies (Accounts) Rules, 2014.
31. related parties disclosures as per Accounting standard - 18
Names of related parties where control exists irrespective of whether transactions have occurred or notSubsidiary company - Max Life Insurance Company LimitedNames of other related parties with whom transactions have taken place during the yearKey Management Personnel (KMP) 1 Mr. Mohit Talwar (Managing Director)
2 Mr. Rahul Khosla (upto previous year)Enterprises owned or significantly influenced by key management personnel or their relatives
1 Max India Foundation2 Max India Limited (upto previous year)3 Max Bupa Health Insurance Company Limited (upto previous year)4 Antara Purukul Senior Living Limited (upto previous year)5 Max Speciality Films Limited (upto previous year)6 Max Ventures and Industries Limited (upto previous year)7 Pharmax Corporation Limited (upto previous year)8 Max UK Limited (upto previous year)9 Max Healthcare Institute Limited (upto previous year)10 New Delhi House Services Limited (upto previous year)11 Delhi Guest Houses Private Limited (upto previous year)
Employee benefit funds - Max Financial Services Limited Employees’ Provident Fund Trust

Max Financial Services Limited (Formerly known as MAX INDIA LIMITED)
AnnuAL RepoRt 2016-17 125
31.1 Transactions with related parties during the year:(Rs. in Lacs)
Particulars Subsidiary Key Management
Personnel
Enterprises owned or
significantly influenced by
key management personnel or
their relatives
employee Benefit Fund
Total
reimbursement of expenses (received from)Max Life Insurance Company Limited 19.88 - - - 19.88
(26.87) - - - (26.87)Max Healthcare Institute Limited - - - - -
- - (26.71) - (26.71)Max Bupa Health Insurance Company Limited
- - - - -
- - (23.45) - (23.45)Antara Purukul Senior Living Limited - - - - -
- - (7.53) - (7.53)Max Speciality Films Limited - - - - -
- - (5.97) - (5.97)Rahul Khosla - - - - -
- (33.25) - - (33.25)Max Ventures and Industries Limited - - - - -
- - (3.50) - (3.50)Income from shared servicesMax India Limited - - - - -
- - (741.38) - (741.38)Max Life Insurance Company Limited 892.90 - - - 892.90
(484.00) - - - (484.00)Max Healthcare Institute Limited - - - - -
- - (223.00) - (223.00)Max Ventures and Industries Limited - - - - -
- - (90.00) - (90.00)reimbursement of expenses (Paid to) - - - - Max India Limited - - - - -
- - (1,606.63) - (1,606.63)Max Life Insurance Company Limited 0.54 - - - 0.54
(4.59) - - - (4.59)New Delhi House Services Limited - - - - -
- - (8.45) - (8.45)Delhi Guest Houses Private Limited - - - - -
- - (40.34) - (40.34) Services received Insurance related - - - - Max Life Insurance Company Limited 8.30 - - - 8.30
(14.84) - - - (14.84) Rent paid Pharmax Corporation Limited - - - - -
- - (41.58) - (41.58) Delhi Guest Houses Private Limited - - - - -
- - (247.25) - (247.25) Repair and maintenance New Delhi Houses Services Limited - - - - -
- - (121.98) - (121.98)

Max Financial Services Limited (Formerly known as MAX INDIA LIMITED)
AnnuAL RepoRt 2016-17126
Standalone Financial StatementsNotes forming part of the Financial Statements
Particulars Subsidiary Key Management
Personnel
Enterprises owned or
significantly influenced by
key management personnel or
their relatives
employee Benefit Fund
Total
Managerial remunerationRahul Khosla - - - - -
- (2,214.29) - - (2,214.29)Mohit Talwar - 676.23 - - 676.23
- (871.39) - - (871.39)Donation paidMax India Foundation - - 55.00 - 55.00
- - - - - Company's contribution to Provident Fund Trust
- - - 84.05 84.05
- - - (71.04) (71.04)Security deposit givenDelhi Guest Houses Private Limited - - - - -
- - (12.00) - (12.00)Dividend incomeMax Life Insurance Company Limited 22,064.81 - - - 22,064.81
(16,717.61) - - - (16,717.61)investments madeMax Life Insurance Company Limited 35,906.50 - - - 35,906.50
- - - - - Investments soldMax Life Insurance Company Limited - - - - -
(8,261.46) - - - (8,261.46)
31.2 Balance outstanding as at the year end:Particulars Subsidiary Key
Management Personnel
Enterprises owned or
significantly influenced
by key management personnel or
their relatives
Employee Benefit Fund
Total
loans and advances GivenMax Life Insurance Company Limited 5.65 - - - 5.65
(17.63) - - - (17.63)Pharmax Corporation Limited - - - - -
- - (36.24) - (36.24)Delhi Guest House Private Limited - - - - -
- - (66.00) - (66.00)trade receivablesMax Life Insurance Company Limited 235.73 - - - 235.73
(572.66) - - - (572.66)Max Healthcare Institute Limited - - - - -
- - (239.22) - (239.22)Max Bupa Health Insurance Company Limited
- - - - -
- - (6.23) - (6.23)Antara Purukul Senior Living Limited - - - - -
- - (3.76) - (3.76)
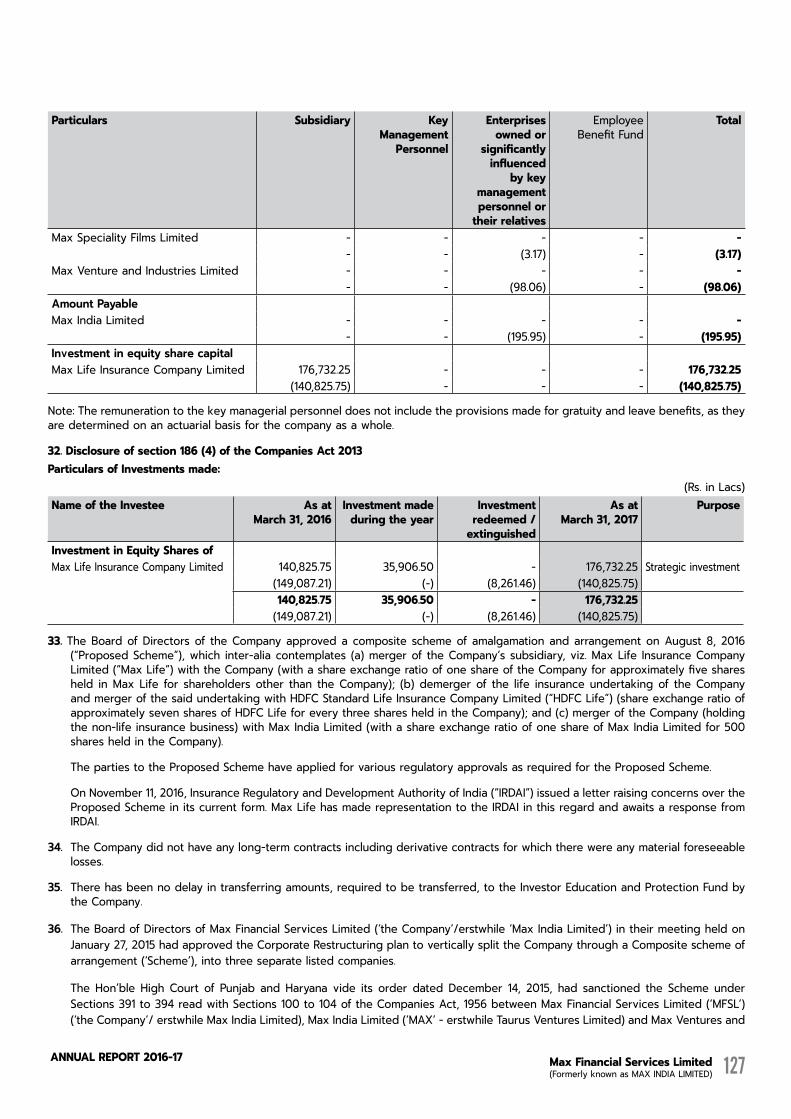
Max Financial Services Limited (Formerly known as MAX INDIA LIMITED)
AnnuAL RepoRt 2016-17 127
Particulars Subsidiary Key Management
Personnel
Enterprises owned or
significantly influenced
by key management personnel or
their relatives
Employee Benefit Fund
Total
Max Speciality Films Limited - - - - - - - (3.17) - (3.17)
Max Venture and Industries Limited - - - - - - - (98.06) - (98.06)
amount PayableMax India Limited - - - - -
- - (195.95) - (195.95)investment in equity share capitalMax Life Insurance Company Limited 176,732.25 - - - 176,732.25
(140,825.75) - - - (140,825.75)
Note: The remuneration to the key managerial personnel does not include the provisions made for gratuity and leave benefits, as they are determined on an actuarial basis for the company as a whole.
32. disclosure of section 186 (4) of the Companies Act 2013Particulars of Investments made:
(Rs. in Lacs)Name of the Investee As at
March 31, 2016 Investment made
during the year Investment redeemed /
extinguished
As at March 31, 2017
Purpose
Investment in equity shares of Max Life Insurance Company Limited 140,825.75 35,906.50 - 176,732.25 Strategic investment
(149,087.21) (-) (8,261.46) (140,825.75) 140,825.75 35,906.50 - 176,732.25
(149,087.21) (-) (8,261.46) (140,825.75)
33. The Board of Directors of the Company approved a composite scheme of amalgamation and arrangement on August 8, 2016 (“Proposed Scheme”), which inter-alia contemplates (a) merger of the Company’s subsidiary, viz. Max Life Insurance Company Limited (“Max Life”) with the Company (with a share exchange ratio of one share of the Company for approximately five shares held in Max Life for shareholders other than the Company); (b) demerger of the life insurance undertaking of the Company and merger of the said undertaking with HDFC Standard Life Insurance Company Limited (“HDFC Life”) (share exchange ratio of approximately seven shares of HDFC Life for every three shares held in the Company); and (c) merger of the Company (holding the non-life insurance business) with Max India Limited (with a share exchange ratio of one share of Max India Limited for 500 shares held in the Company).
The parties to the Proposed Scheme have applied for various regulatory approvals as required for the Proposed Scheme.
On November 11, 2016, Insurance Regulatory and Development Authority of India (“IRDAI”) issued a letter raising concerns over the Proposed Scheme in its current form. Max Life has made representation to the IRDAI in this regard and awaits a response from IRDAI.
34. The Company did not have any long-term contracts including derivative contracts for which there were any material foreseeable losses.
35. There has been no delay in transferring amounts, required to be transferred, to the Investor Education and Protection Fund by the Company.
36. The Board of Directors of Max Financial Services Limited (‘the Company’/erstwhile ‘Max India Limited’) in their meeting held on January 27, 2015 had approved the Corporate Restructuring plan to vertically split the Company through a Composite scheme of arrangement (‘Scheme’), into three separate listed companies.
The Hon’ble High Court of Punjab and Haryana vide its order dated December 14, 2015, had sanctioned the Scheme under Sections 391 to 394 read with Sections 100 to 104 of the Companies Act, 1956 between Max Financial Services Limited (‘MFSL’) (‘the Company’/ erstwhile Max India Limited), Max India Limited (‘MAX’ - erstwhile Taurus Ventures Limited) and Max Ventures and
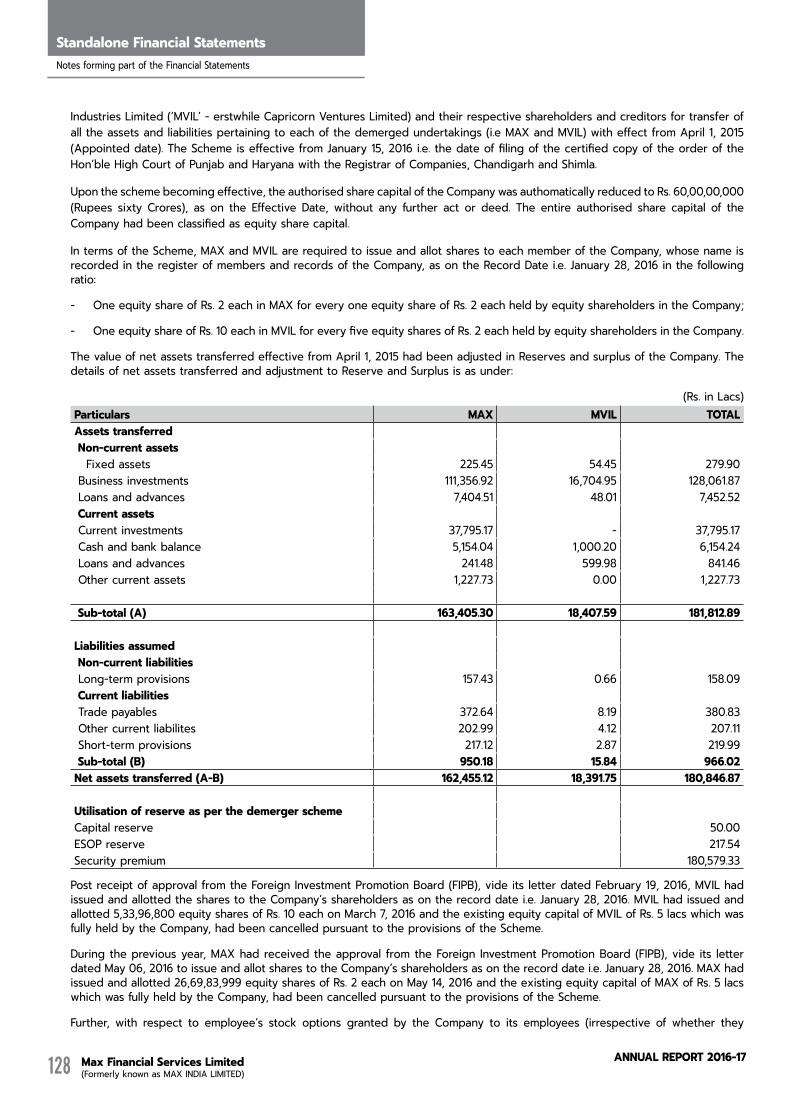
Max Financial Services Limited (Formerly known as MAX INDIA LIMITED)
AnnuAL RepoRt 2016-17128
Standalone Financial StatementsNotes forming part of the Financial Statements
Industries Limited (‘MVIL’ - erstwhile Capricorn Ventures Limited) and their respective shareholders and creditors for transfer of all the assets and liabilities pertaining to each of the demerged undertakings (i.e MAX and MVIL) with effect from April 1, 2015 (Appointed date). The Scheme is effective from January 15, 2016 i.e. the date of filing of the certified copy of the order of the Hon’ble High Court of Punjab and Haryana with the Registrar of Companies, Chandigarh and Shimla.
Upon the scheme becoming effective, the authorised share capital of the Company was authomatically reduced to Rs. 60,00,00,000 (Rupees sixty Crores), as on the Effective Date, without any further act or deed. The entire authorised share capital of the Company had been classified as equity share capital.
In terms of the Scheme, MAX and MVIL are required to issue and allot shares to each member of the Company, whose name is recorded in the register of members and records of the Company, as on the Record Date i.e. January 28, 2016 in the following ratio:
- One equity share of Rs. 2 each in MAX for every one equity share of Rs. 2 each held by equity shareholders in the Company;
- One equity share of Rs. 10 each in MVIL for every five equity shares of Rs. 2 each held by equity shareholders in the Company.
The value of net assets transferred effective from April 1, 2015 had been adjusted in Reserves and surplus of the Company. The details of net assets transferred and adjustment to Reserve and Surplus is as under:
(Rs. in Lacs)Particulars MAX MVIL ToTALAssets transferred Non-current assets Fixed assets 225.45 54.45 279.90 Business investments 111,356.92 16,704.95 128,061.87 Loans and advances 7,404.51 48.01 7,452.52 Current assets Current investments 37,795.17 - 37,795.17 Cash and bank balance 5,154.04 1,000.20 6,154.24 Loans and advances 241.48 599.98 841.46 Other current assets 1,227.73 0.00 1,227.73
sub-total (A) 163,405.30 18,407.59 181,812.89
Liabilities assumed Non-current liabilities Long-term provisions 157.43 0.66 158.09 Current liabilities Trade payables 372.64 8.19 380.83 Other current liabilites 202.99 4.12 207.11 Short-term provisions 217.12 2.87 219.99 sub-total (B) 950.18 15.84 966.02Net assets transferred (A-B) 162,455.12 18,391.75 180,846.87
Utilisation of reserve as per the demerger schemeCapital reserve 50.00ESOP reserve 217.54Security premium 180,579.33
Post receipt of approval from the Foreign Investment Promotion Board (FIPB), vide its letter dated February 19, 2016, MVIL had issued and allotted the shares to the Company’s shareholders as on the record date i.e. January 28, 2016. MVIL had issued and allotted 5,33,96,800 equity shares of Rs. 10 each on March 7, 2016 and the existing equity capital of MVIL of Rs. 5 lacs which was fully held by the Company, had been cancelled pursuant to the provisions of the Scheme.
During the previous year, MAX had received the approval from the Foreign Investment Promotion Board (FIPB), vide its letter dated May 06, 2016 to issue and allot shares to the Company’s shareholders as on the record date i.e. January 28, 2016. MAX had issued and allotted 26,69,83,999 equity shares of Rs. 2 each on May 14, 2016 and the existing equity capital of MAX of Rs. 5 lacs which was fully held by the Company, had been cancelled pursuant to the provisions of the Scheme.
Further, with respect to employee’s stock options granted by the Company to its employees (irrespective of whether they

Max Financial Services Limited (Formerly known as MAX INDIA LIMITED)
AnnuAL RepoRt 2016-17 129
continue to be employees of the Company or become employees of MAX/MVIL) each option holder has been allotted stock option by MAX/MVIL under the new ESOP scheme for every stock option held in the Company. Accordingly, ESOP outstanding as on the Effective Date (i.e January 15, 2016) in the Company was allocated between the Company, MAX and MVIL.
37. The Board of Directors of the Company in its meeting held on October 23, 2015 had approved the proposal to transfer certain equity shares of Max Life Insurance Company Limited (‘MLIC’) held by the Company to Axis Bank Limited (‘Axis’) (along with Mitsui Sumitomo Insurance Company Limited (‘MSI’)), subject to approval from Insurance Regulatory and Development Authority of India (‘IRDAI’). On February 29, 2016 (pursuant to receipt of approval from IRDAI), the Company and Mitsui Sumitomo Insurance Company Limited (MSI) had transferred 76,560,635 equity shares (3.99% of equity stake in MLIC) and 19,188,127 equity shares (1% of equity stake in MLIC) respectively of MLIC to Axis Bank at face value of Rs. 10 per equity share. Consequent to this transaction, the equity stake of the Company in MLIC had reduced to 68.01%. Further, the Company along with MSI had entered into an Option agreement with Axis on October 23, 2015, whereby the Company and MSI have agreed to offer a ‘put option’ to Axis and Axis had agreed to grant ‘call option’ to repurchase / sell the aforesaid equity shares in the ratio as mutually agreed upon between MSI and the Company in 5 equal tranches at a price linked to fair market value.
During the year, the Company acquired 19,150,000 equity shares of Max Life Insurance Company Limited (‘MLIC’) at a consideration of Rs. 14,650 lacs from Infrastructure Development Finance Company Limited (‘IDFC’) and 19,150,000 equity shares of MLIC at a consideration of Rs. 21,256 lacs from Axis Bank Limited, thereby increasing its stake in MLIC from 68.01% to 70.01%.
38. The Company is primarily engaged in the business of making business investment in its subsidiaries. The investments (financial assets) and dividend income (financial income) on the same has resulted in financial income to be in excess of 50% of its total income and its financial assets to be more than 50% of total assets. The Company is of the view supported by legal opinion that the Company is a ‘Core Investment Company’ (‘CIC’) and does not meet the criteria for Systemically Important Core Investment Company (‘CIC-SI’) as laid down in the CIC Master Circular dated July 1, 2015. Hence, registration under Section 45-IA of the Reserve Bank of India Act, 1934 is not required.
39. In terms of Companies (Indian Accounting Standards) Rules 2015, as amended, the Non Banking Finance Companies (NBFCs), including Core Investment Companies (CIC), having a net worth of Rs 500 crores or more are required to prepare Ind-AS based financial statements for accounting periods beginning on or after April 1, 2018 with comparatives for the periods ending March 31, 2018 or thereafter. Hence, the current financials have been drawn in accordance with Indian GAAP as Ind-AS provisions are not applicable to the Company for the current accounting year, the Company being a Core Investment Company (non-systemically important CIC).
40. At the year end, unhedged foreign currency exposures are as follows:
Particulars As at March 31, 2017 As at March 31, 2016Foreign
CurrencyExchange
RateIndian Rupee Foreign
CurrencyExchange Rate Indian Rupee
(in Lacs) (Rupee) (in Lacs) (in Lacs) (Rupee) (in Lacs)Trade payables (USD) 0.01 64.84 0.88 - - - Trade payables (GBP) 1.41 80.88 114.04 1.29 95.09 122.96
41. Payment to auditor (excluding service tax) (included in legal and professional)
(Rs. in Lacs)Particulars For the year ended For the year ended
March 31, 2017 March 31, 2016To statutory auditor:For audit 18.00 15.00 For other services 5.00 - Reimbursement of expenses 1.47 0.91 Total 24.47 15.91
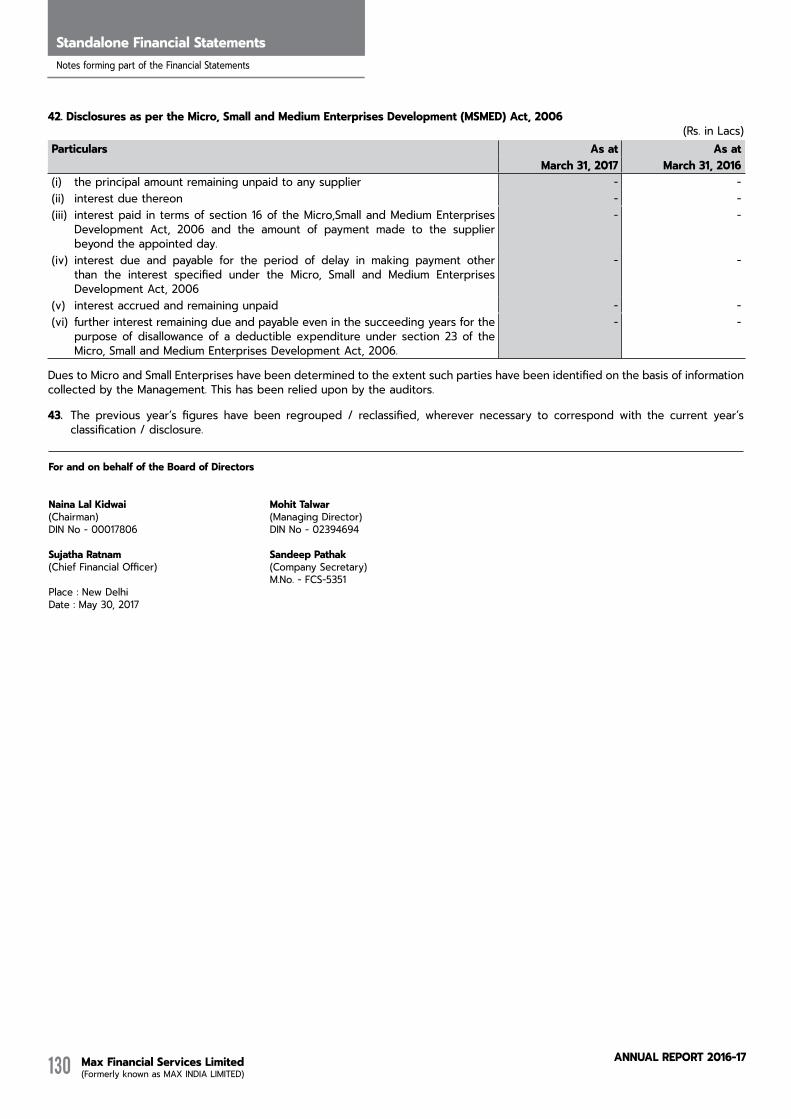
Max Financial Services Limited (Formerly known as MAX INDIA LIMITED)
AnnuAL RepoRt 2016-17130
Standalone Financial StatementsNotes forming part of the Financial Statements
42. disclosures as per the Micro, small and Medium enterprises development (MsMed) Act, 2006(Rs. in Lacs)
Particulars As at As at March 31, 2017 March 31, 2016
(i) the principal amount remaining unpaid to any supplier - - (ii) interest due thereon - - (iii) interest paid in terms of section 16 of the Micro,Small and Medium Enterprises
Development Act, 2006 and the amount of payment made to the supplier beyond the appointed day.
- -
(iv) interest due and payable for the period of delay in making payment other than the interest specified under the Micro, Small and Medium Enterprises Development Act, 2006
- -
(v) interest accrued and remaining unpaid - - (vi) further interest remaining due and payable even in the succeeding years for the
purpose of disallowance of a deductible expenditure under section 23 of the Micro, Small and Medium Enterprises Development Act, 2006.
- -
Dues to Micro and Small Enterprises have been determined to the extent such parties have been identified on the basis of information collected by the Management. This has been relied upon by the auditors.
43. The previous year’s figures have been regrouped / reclassified, wherever necessary to correspond with the current year’s classification / disclosure.
For and on behalf of the Board of directors
Naina Lal Kidwai Mohit Talwar(Chairman) (Managing Director)DIN No - 00017806 DIN No - 02394694
sujatha ratnam Sandeep Pathak(Chief Financial Officer) (Company Secretary)
M.No. - FCS-5351Place : New DelhiDate : May 30, 2017

Max Financial Services Limited (Formerly known as MAX INDIA LIMITED)
AnnuAL RepoRt 2016-17 131
conSoliDateDFinancial
StatementS
Max Financial Services Limited (Formerly known as MAX INDIA LIMITED)
AnnuAL RepoRt 2016-17132
Consolidated Financial StatementsAuditor's Report
To THe MeMBers oF Max Financial services Limited (formerly known as ‘MAX INdIA LIMITed”)
report on the Consolidated Financial statements
We have audited the accompanying consolidated financial statements of Max Financial services Limited (formerly known as ‘MAX INdIA LIMITed”) (hereinafter referred to as “the Holding Company”) and its subsidiary (the Holding Company and its subsidiary together referred to as “the Group”), comprising of the Consolidated Balance Sheet as at 31 March, 2017, the Consolidated Statement of Profit and Loss, the Consolidated Cash Flow Statement for the year then ended, and a summary of the significant accounting policies and other explanatory information (hereinafter referred to as “the consolidated financial statements”).
Management’s responsibility for the Consolidated Financial Statements
The Holding Company’s Board of Directors is responsible for the preparation of these consolidated financial statements in terms of the requirements of the Companies Act, 2013 (hereinafter referred to as “the Act”) that give a true and fair view of the consolidated financial position, consolidated financial performance and consolidated cash flows of the Group in accordance with the accounting principles generally accepted in India, including the Accounting Standards prescribed under Section 133 of the Act. The respective Board of Directors of the companies included in the Group are responsible for maintenance of adequate accounting records in accordance with the provisions of the Act for safeguarding the assets of the Group and for preventing and detecting frauds and other irregularities; the selection and application of appropriate accounting policies; making judgments and estimates that are reasonable and prudent; and the design, implementation and maintenance of adequate internal financial controls, that were operating effectively for ensuring the accuracy and completeness of the accounting records, relevant to the preparation and presentation of the financial statements that give a true and fair view and are free from material misstatement, whether due to fraud or error, which have been used for the purpose of preparation of the consolidated financial statements by the Directors of the Holding Company, as aforesaid.
Auditor’s responsibility
Our responsibility is to express an opinion on these consolidated financial statements based on our audit. In conducting our audit, we have taken into account the provisions of the Act, the accounting and auditing standards and matters which are required to be included in the audit report under the provisions of the Act and the Rules made thereunder.
We conducted our audit in accordance with the Standards on Auditing specified under Section 143(10) of the Act. Those Standards require that we comply with ethical requirements and plan and perform the audit to obtain reasonable assurance about
INdePeNdeNT AUdITor’s rePorT whether the consolidated financial statements are free from material misstatement.
An audit involves performing procedures to obtain audit evidence about the amounts and the disclosures in the consolidated financial statements. The procedures selected depend on the auditor’s judgment, including the assessment of the risks of material misstatement of the consolidated financial statements, whether due to fraud or error. In making those risk assessments, the auditor considers internal financial control relevant to the Holding Company’s preparation of the consolidated financial statements that give a true and fair view in order to design audit procedures that are appropriate in the circumstances. An audit also includes evaluating the appropriateness of the accounting policies used and the reasonableness of the accounting estimates made by the Holding Company’s Board of Directors, as well as evaluating the overall presentation of the consolidated financial statements.
We believe that the audit evidence obtained by us and the audit evidence obtained by the other auditors in terms of their reports referred to in sub-paragraph (a) of the Other Matter paragraph below, is sufficient and appropriate to provide a basis for our audit opinion on the consolidated financial statements.
opinion
In our opinion and to the best of our information and according to the explanations given to us, the aforesaid consolidated financial statements give the information required by the Act in the manner so required and give a true and fair view in conformity with the accounting principles generally accepted in India, of the consolidated state of affairs of the Group, as at 31 March, 2017, and their consolidated profit and their consolidated cash flows for the year ended on that date.
other Matter
The auditors of Max Life Insurance Company Limited (‘MLIC’), subsidiary company have reported that the actuarial valuation of liabilities for life policies in force and for policies in respect of which premium has been discontinued but liability exists as at 31 March, 2017 is the responsibility of the Company’s Appointed Actuary (the “Appointed Actuary”). The actuarial valuation of these liabilities for life policies in force and for policies in respect of which premium has been discontinued but liability exists as at 31 March, 2017 has been duly certified by the Appointed Actuary and in his opinion, the assumptions for such valuation are in accordance with the guidelines and norms issued by the IRDAI and the Institute of Actuaries of India in concurrence with the IRDAI. We have relied upon Appointed Actuary’s certificate in this regard for forming our opinion on the Consolidated Financial Statements of the Group.
Our opinion on the consolidated financial statements and our report on Other Legal and Regulatory Requirements below, is not modified in respect of the above matter.

Max Financial Services Limited (Formerly known as MAX INDIA LIMITED)
AnnuAL RepoRt 2016-17 133
report on other Legal and regulatory requirements
As required by Section 143(3) of the Act, based on our audit, we report, to the extent applicable, that:
(a) We have sought and obtained all the information and explanations which to the best of our knowledge and belief were necessary for the purposes of our audit of the aforesaid consolidated financial statements.
(b) In our opinion, proper books of account as required by law relating to preparation of the aforesaid consolidated financial statements have been kept so far as it appears from our examination of those books, returns and the reports of the other auditors.
(c) The Consolidated Balance Sheet, the Consolidated Statement of Profit and Loss, and the Consolidated Cash Flow Statement dealt with by this Report are in agreement with the relevant books of account maintained for the purpose of preparation of the consolidated financial statements.
(d) In our opinion, the aforesaid consolidated financial statements comply with the Accounting Standards prescribed under Section 133 of the Act.
(e) On the basis of the written representations received from the directors of the Holding Company as on 31 March, 2017 taken on record by the Board of Directors of the Holding Company and the reports of the statutory auditors of its subsidiary company, none of the directors of the Group companies is disqualified as on 31 March, 2017 from being appointed as a director in terms of Section 164 (2) of the Act.
(f) With respect to the adequacy of the internal financial controls over financial reporting and the operating effectiveness of such controls, refer to our separate Report in “Annexure A”, which is based on the auditors’ reports of the Holding company and subsidiary company. Our report expresses an unmodified opinion on the adequacy and operating effectiveness of the Holding company’s/ subsidiary company’s internal financial controls over financial reporting.
(g) With respect to the other matters to be included in the Auditor’s Report in accordance with Rule 11 of the Companies (Audit and Auditor’s) Rules, 2014, as amended, in our opinion and to the best of our information and according to the explanations given to us:
i. The consolidated financial statements disclose the impact of pending litigations on the consolidated financial position of the Group - Refer Note 30 to the consolidated financial statements.
ii. The liability for insurance contracts related to its subsidiary company is determined by the subsidiary’s Appointed Actuary as per Note 37 to the consolidated financial statements, and is covered by the Appointed Actuary’s certificate, referred to in Other Matter paragraph above, on which we have placed reliance; and the Company did not have any long-term contracts including derivative contracts for which there were any material foreseeable losses – Refer Note 45 to the consolidated financial statements.
iii. There has been no delay in transferring amounts, required to be transferred, to the Investor Education and Protection Fund by the Holding Company and its subsidiary company – Refer Note 46 to the consolidated financial statements.
iv. The Holding Company has provided requisite disclosures in the consolidated financial statements as regards the holding and dealings in Specified Bank Notes as defined in the Notification S.O. 3407(E) dated the 8 November, 2016 of the Ministry of Finance, during the period from 8 November, 2016 to 30 December, 2016 of the Group entities to which this disclosure is applicable. Based on audit procedures performed and the representations provided to us by the management we report that the disclosures are in accordance with the relevant books of accounts maintained by parent for the purpose of preparation of the consolidated financial statements and as produced to us by the Management.
For deloitte Haskins & sells LLPChartered Accountants
(Firm’s Registration No. 117366W/W-100018)
satpal singh AroraPartner
(Membership No. 98564)Place: New DelhiDate: May 30, 2017

Max Financial Services Limited (Formerly known as MAX INDIA LIMITED)
AnnuAL RepoRt 2016-17134
Consolidated Financial StatementsAuditor's Report
“ANNeXUre A” To THe INdePeNdeNT AUdITor’s rePorT
(Referred to in paragraph 1(f) under ‘Report on Other Legal and Regulatory Requirements’ section of our report of even date)
report on the Internal Financial Controls over Financial reporting under Clause (i) of sub-section 3 of section 143 of the Companies Act, 2013 (“the Act”)
In conjunction with our audit of the consolidated financial statements of the Company as of and for the year ended 31 March, 2017, we have audited the internal financial controls over financial reporting of Max Financial services Limited (formerly known as ‘MAX INdIA LIMITed”) (hereinafter referred to as “the Holding Company” / “Parent”) and its subsidiary company, which includes internal financial controls over financial reporting of the Company’s and its subsidiary as of that date.
The actuarial valuation of liabilities for life policies in force and policies where premium is discontinued but liability exists as at 31 March, 2017 is required to be certified by the Appointed Actuary as per the Insurance Regulatory and Development Authority (Preparation of Financial Statements and Auditor’s Report of Insurance Companies) Regulations, 2002 (the “IRDA Financial Statements Regulations”), and has been relied upon by us, as mentioned in “Other Matter” para of our audit report on the financial statements of the Company as at and for the year ended 31 March, 2017. Accordingly, we have not audited the internal financial controls over financial reporting in respect of the valuation and accuracy of the aforesaid actuarial valuation.
Management’s responsibility for Internal Financial Controls
The respective Board of Directors of the Holding company and its subsidiary company, which are companies incorporated in India, are responsible for establishing and maintaining internal financial controls based on the internal control over financial reporting criteria established by the respective Companies considering the essential components of internal control stated in the Guidance Note on Audit of Internal Financial Controls Over Financial Reporting issued by the Institute of Chartered Accountants of India (ICAI). These responsibilities include the design, implementation and maintenance of adequate internal financial controls that were operating effectively for ensuring the orderly and efficient conduct of its business, including adherence to the respective company’s policies, the safeguarding of its assets, the prevention and detection of frauds and errors, the accuracy and completeness of the accounting records, and the timely preparation of reliable financial information, as required under the Companies Act, 2013.
Auditor’s responsibility
Our responsibility is to express an opinion on the internal financial controls over financial reporting of the Holding Company, its subsidiary company, which are companies incorporated in India, based on our audit. We conducted our audit in accordance with the Guidance Note on Audit of Internal Financial Controls Over Financial Reporting (the “Guidance Note”) issued by the Institute of Chartered Accountants of India and the Standards
on Auditing, prescribed under Section 143(10) of the Companies Act, 2013, to the extent applicable to an audit of internal financial controls. Those Standards and the Guidance Note require that we comply with ethical requirements and plan and perform the audit to obtain reasonable assurance about whether adequate internal financial controls over financial reporting was established and maintained and if such controls operated effectively in all material respects.
Our audit involves performing procedures to obtain audit evidence about the adequacy of the internal financial controls system over financial reporting and their operating effectiveness. Our audit of internal financial controls over financial reporting included obtaining an understanding of internal financial controls over financial reporting, assessing the risk that a material weakness exists, and testing and evaluating the design and operating effectiveness of internal control based on the assessed risk. The procedures selected depend on the auditor’s judgement, including the assessment of the risks of material misstatement of the financial statements, whether due to fraud or error.
We believe that the audit evidence we have obtained and the audit evidence obtained by other auditors of the subsidiary company, which is a company incorporated in India, in terms of their reports referred to in the Other Matters paragraph below, is sufficient and appropriate to provide a basis for our audit opinion on the internal financial controls system over financial reporting of the Holding Company, its subsidiary company.
Meaning of Internal Financial Controls over Financial reporting
A company’s internal financial control over financial reporting is a process designed to provide reasonable assurance regarding the reliability of financial reporting and the preparation of financial statements for external purposes in accordance with generally accepted accounting principles. A company’s internal financial control over financial reporting includes those policies and procedures that (1) pertain to the maintenance of records that, in reasonable detail, accurately and fairly reflect the transactions and dispositions of the assets of the company; (2) provide reasonable assurance that transactions are recorded as necessary to permit preparation of financial statements in accordance with generally accepted accounting principles, and that receipts and expenditures of the company are being made only in accordance with authorisations of management and directors of the company; and (3) provide reasonable assurance regarding prevention or timely detection of unauthorised acquisition, use, or disposition of the company’s assets that could have a material effect on the financial statements.
Inherent Limitations of Internal Financial Controls over Financial Reporting
Because of the inherent limitations of internal financial controls over financial reporting, including the possibility of collusion or improper management override of controls, material misstatements due to error or fraud may occur and not be detected. Also, projections of any evaluation of the internal financial controls over financial reporting to future periods are subject to the risk
Max Financial Services Limited (Formerly known as MAX INDIA LIMITED)
AnnuAL RepoRt 2016-17 135
that the internal financial control over financial reporting may become inadequate because of changes in conditions, or that the degree of compliance with the policies or procedures may deteriorate.
opinion
In our opinion to the best of our information and according to the explanations given to us and based on the consideration of the reports of the branch auditors and other auditors referred to in the Other Matters paragraph below, the Holding Company, its subsidiary company, which are companies incorporated in India, have, in all material respects, an adequate internal financial controls system over financial reporting and such internal financial controls over financial reporting were operating effectively as at 31 March, 2017, based on the internal control over financial reporting criteria established by the respective companies considering the essential components of internal control stated in the Guidance Note on Audit of Internal Financial Controls Over Financial Reporting issued by the Institute of Chartered Accountants of India.
other Matters
Our aforesaid report under Section 143(3)(i) of the Act on the adequacy and operating effectiveness of the internal financial controls over financial reporting insofar as it relates to 1 subsidiary company, which is a company incorporated in India, is based solely on the corresponding reports of the auditors of such companies incorporated in India.
Our opinion is not modified in respect of the above matters.
For deloitte Haskins & sells LLPChartered Accountants
(Firm’s Registration No. 117366W/W-100018)
satpal singh AroraPartner
(Membership No. 98564)Place: New DelhiDate: May 30, 2017
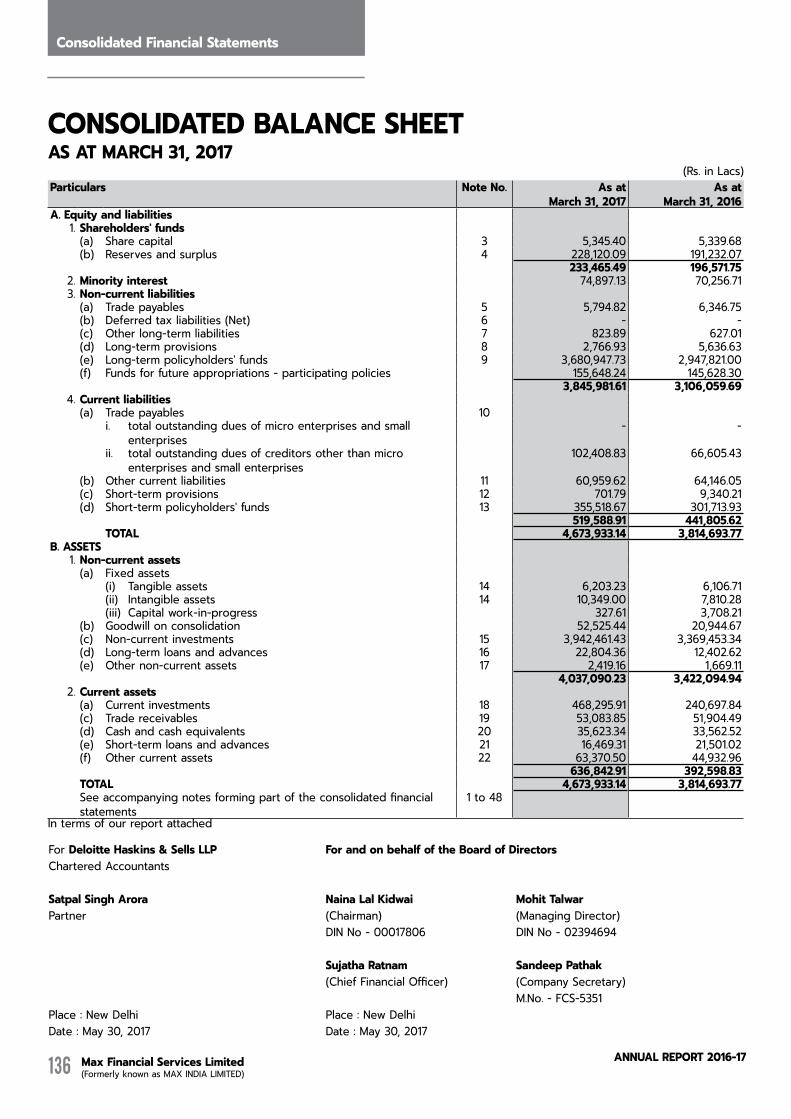
Max Financial Services Limited (Formerly known as MAX INDIA LIMITED)
AnnuAL RepoRt 2016-17136
Consolidated Financial Statements
(Rs. in Lacs) Particulars Note No. As at
March 31, 2017As at
March 31, 2016A. equity and liabilities
1. shareholders' funds(a) Share capital 3 5,345.40 5,339.68(b) Reserves and surplus 4 228,120.09 191,232.07
233,465.49 196,571.752. Minority interest 74,897.13 70,256.713. Non-current liabilities
(a) Trade payables 5 5,794.82 6,346.75(b) Deferred tax liabilities (Net) 6 - - (c) Other long-term liabilities 7 823.89 627.01(d) Long-term provisions 8 2,766.93 5,636.63(e) Long-term policyholders' funds 9 3,680,947.73 2,947,821.00(f) Funds for future appropriations - participating policies 155,648.24 145,628.30
3,845,981.61 3,106,059.694. Current liabilities
(a) Trade payables 10i. total outstanding dues of micro enterprises and small
enterprises - -
ii. total outstanding dues of creditors other than micro enterprises and small enterprises
102,408.83 66,605.43
(b) Other current liabilities 11 60,959.62 64,146.05(c) Short-term provisions 12 701.79 9,340.21(d) Short-term policyholders' funds 13 355,518.67 301,713.93
519,588.91 441,805.62ToTAL 4,673,933.14 3,814,693.77
B. AsseTs1. Non-current assets
(a) Fixed assets(i) Tangible assets 14 6,203.23 6,106.71(ii) Intangible assets 14 10,349.00 7,810.28(iii) Capital work-in-progress 327.61 3,708.21
(b) Goodwill on consolidation 52,525.44 20,944.67(c) Non-current investments 15 3,942,461.43 3,369,453.34(d) Long-term loans and advances 16 22,804.36 12,402.62(e) Other non-current assets 17 2,419.16 1,669.11
4,037,090.23 3,422,094.942. Current assets
(a) Current investments 18 468,295.91 240,697.84(c) Trade receivables 19 53,083.85 51,904.49(d) Cash and cash equivalents 20 35,623.34 33,562.52(e) Short-term loans and advances 21 16,469.31 21,501.02(f) Other current assets 22 63,370.50 44,932.96
636,842.91 392,598.83ToTAL 4,673,933.14 3,814,693.77See accompanying notes forming part of the consolidated financial statements
1 to 48
In terms of our report attached
CoNsoLIdATed BALANCe sHeeTAs AT MArCH 31, 2017
For deloitte Haskins & sells LLP For and on behalf of the Board of directorsChartered Accountants
satpal singh Arora Naina Lal Kidwai Mohit TalwarPartner (Chairman) (Managing Director)
DIN No - 00017806 DIN No - 02394694
sujatha ratnam Sandeep Pathak(Chief Financial Officer) (Company Secretary)
M.No. - FCS-5351Place : New Delhi Place : New DelhiDate : May 30, 2017 Date : May 30, 2017
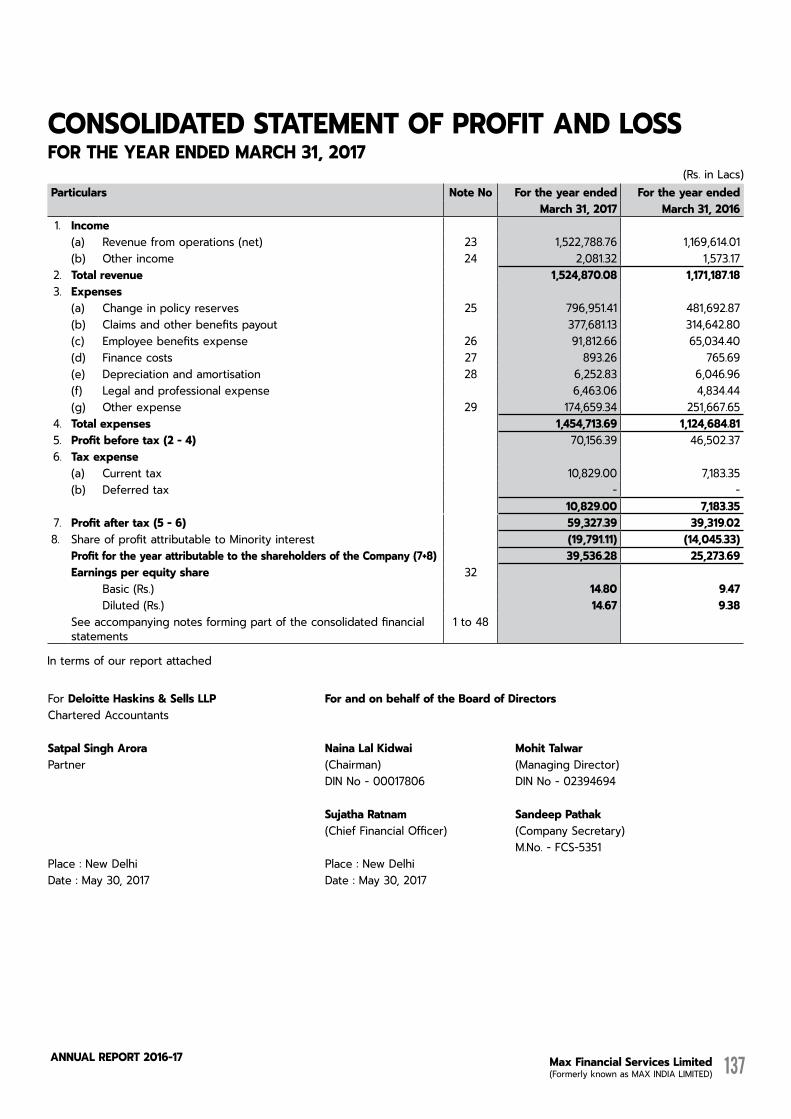
Max Financial Services Limited (Formerly known as MAX INDIA LIMITED)
AnnuAL RepoRt 2016-17 137
(Rs. in Lacs) Particulars Note No For the year ended For the year ended
March 31, 2017 March 31, 20161. Income
(a) Revenue from operations (net) 23 1,522,788.76 1,169,614.01 (b) Other income 24 2,081.32 1,573.17
2. Total revenue 1,524,870.08 1,171,187.18 3. Expenses
(a) Change in policy reserves 25 796,951.41 481,692.87 (b) Claims and other benefits payout 377,681.13 314,642.80 (c) Employee benefits expense 26 91,812.66 65,034.40 (d) Finance costs 27 893.26 765.69 (e) Depreciation and amortisation 28 6,252.83 6,046.96 (f) Legal and professional expense 6,463.06 4,834.44 (g) Other expense 29 174,659.34 251,667.65
4. Total expenses 1,454,713.69 1,124,684.81 5. Profit before tax (2 - 4) 70,156.39 46,502.37 6. Tax expense
(a) Current tax 10,829.00 7,183.35 (b) Deferred tax - -
10,829.00 7,183.35 7. Profit after tax (5 - 6) 59,327.39 39,319.02 8. Share of profit attributable to Minority interest (19,791.11) (14,045.33)
Profit for the year attributable to the shareholders of the Company (7+8) 39,536.28 25,273.69 earnings per equity share 32
Basic (Rs.) 14.80 9.47 Diluted (Rs.) 14.67 9.38
See accompanying notes forming part of the consolidated financial statements
1 to 48
In terms of our report attached
CoNsoLIdATed sTATeMeNT oF ProFIT ANd Loss For THe YeAr eNded MArCH 31, 2017
For deloitte Haskins & sells LLP For and on behalf of the Board of directorsChartered Accountants
satpal singh Arora Naina Lal Kidwai Mohit TalwarPartner (Chairman) (Managing Director)
DIN No - 00017806 DIN No - 02394694
sujatha ratnam Sandeep Pathak(Chief Financial Officer) (Company Secretary)
M.No. - FCS-5351Place : New Delhi Place : New DelhiDate : May 30, 2017 Date : May 30, 2017

Max Financial Services Limited (Formerly known as MAX INDIA LIMITED)
AnnuAL RepoRt 2016-17138
Consolidated Financial Statements
(Rs. in Lacs)Particulars For the year ended
March 31, 2017For the year ended
March 31, 2016Cash flow from operating activitiesNet Profit / (loss) before tax 70,156.39 46,502.37
adjustments for:Depreciation and amortisation expenses 6,252.83 6,046.96 Interest income (222,235.64) (182,919.47)Amortisation of discount/(premium) - (1,890.88)Dividend income on long term investments (14,401.82) (13,814.71)Net loss / (profit) on sale/disposal of fixed assets (55.58) 0.18 Profit on sale of current investments in:- mutual funds (114,226.26) (55,975.39)- equity instruments (2.78) - Unrealised (gain) / loss on long term investments (103,750.11) 102,014.14 Fixed assets written off 97.09 50.06 Doubtful advances written off 49.20 163.62 Provision for doubtful debts and service tax credit receivable 443.61 236.58 Liabilities/provisions no longer required written back (0.68) (1.81)Expense on employee stock option scheme 8,994.31 3,245.15
Net unrealised exchange loss (1.51) 6.40 Change in policy reserves 796,951.49 481,722.24 Operating profit before working capital changes 428,270.54 385,385.44 changes in working capital:Adjustments for (increase)/decrease in operating assets:
Trade receivables (553.96) (12,421.53)Short-term loans and advances 4,533.24 1,364.75 Long-term loans and advances (4,873.03) (815.34)Other current assets (3,405.22) 252.11 Other non-current assets (749.46) -
(5,048.43) (11,620.01)Adjustments for increase/(decrease) in operating liabilities:
Long-term trade payables (764.11) (1,033.03)Short-term trade payables 18,449.13 (2,951.45)Other current liabilities (781.34) 16,041.05 Other long-term liabilities 196.88 112.20 Short-term provisions (121.77) 324.14 Long-term provisions (2,869.69) 1,424.62
14,109.10 13,917.53 net cash generated from operations 437,331.21 387,682.96 net income tax paid (10,705.34) (7,476.14)Net cash flow from operating activities (A) 426,625.87 380,206.82
Cash flow from investing activitiesCapital expenditure on fixed assets including capital advances (8,106.88) (8,873.36)Proceeds from sale of fixed assets 227.90 108.57 Purchase of non-current investments (35,906.50) - Proceeds from sale of non-current investment 3.43 - Proceeds from loans against policies (5,692.33) - Proceeds from sale of non- current investments in subsidiary - 7,656.06 Purchase of current investments (40,136,218.83) (26,929,025.12)
CoNsoLIdATed CAsH FLoW sTATeMeNTFor THe YeAr eNded MArCH 31, 2017
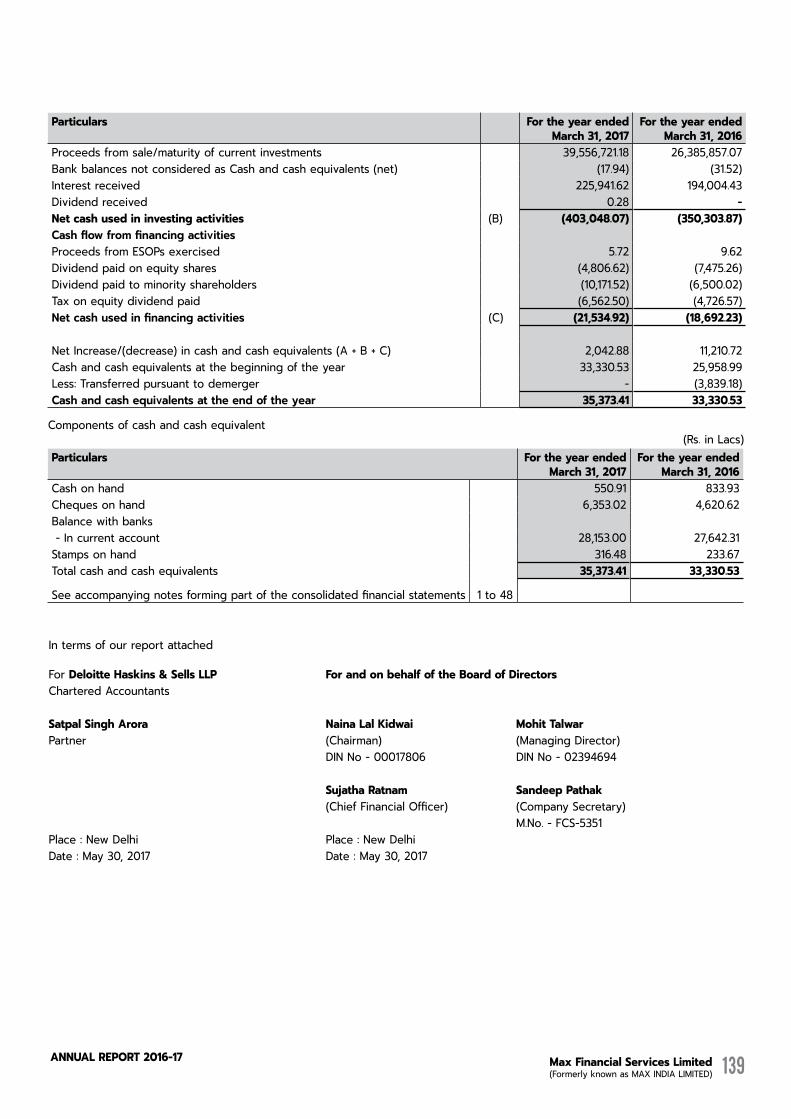
Max Financial Services Limited (Formerly known as MAX INDIA LIMITED)
AnnuAL RepoRt 2016-17 139
Particulars For the year endedMarch 31, 2017
For the year endedMarch 31, 2016
Proceeds from sale/maturity of current investments 39,556,721.18 26,385,857.07 Bank balances not considered as Cash and cash equivalents (net) (17.94) (31.52)Interest received 225,941.62 194,004.43 Dividend received 0.28 - Net cash used in investing activities (B) (403,048.07) (350,303.87)Cash flow from financing activitiesProceeds from ESOPs exercised 5.72 9.62 Dividend paid on equity shares (4,806.62) (7,475.26)Dividend paid to minority shareholders (10,171.52) (6,500.02)Tax on equity dividend paid (6,562.50) (4,726.57)Net cash used in financing activities (C) (21,534.92) (18,692.23)
Net Increase/(decrease) in cash and cash equivalents (A + B + C) 2,042.88 11,210.72 Cash and cash equivalents at the beginning of the year 33,330.53 25,958.99 Less: Transferred pursuant to demerger - (3,839.18)cash and cash equivalents at the end of the year 35,373.41 33,330.53
Components of cash and cash equivalent(Rs. in Lacs)
Particulars For the year ended March 31, 2017
For the year ended March 31, 2016
Cash on hand 550.91 833.93 Cheques on hand 6,353.02 4,620.62 Balance with banks - In current account 28,153.00 27,642.31 Stamps on hand 316.48 233.67 Total cash and cash equivalents 35,373.41 33,330.53
See accompanying notes forming part of the consolidated financial statements 1 to 48
In terms of our report attached
For deloitte Haskins & sells LLP For and on behalf of the Board of directorsChartered Accountants
satpal singh Arora Naina Lal Kidwai Mohit TalwarPartner (Chairman) (Managing Director)
DIN No - 00017806 DIN No - 02394694
sujatha ratnam Sandeep Pathak(Chief Financial Officer) (Company Secretary)
M.No. - FCS-5351Place : New Delhi Place : New DelhiDate : May 30, 2017 Date : May 30, 2017
Max Financial Services Limited (Formerly known as MAX INDIA LIMITED)
AnnuAL RepoRt 2016-17140
Consolidated Financial StatementsNotes forming part of the Consolidated Financial Statements
1. Corporate Information
Max Financial Services Limited [formerly known as MAX INDIA LIMITED] (“the Company/ the Parent”) is a public company domiciled in India. Its shares are listed on two stock exchanges in India. The Company is primarily engaged in making business investment in its subsidiary and providing management advisory services to the group companies.
The name of the Company has been changed from MAX INDIA LIMITED to Max Financial Services Limited with effect from February 1, 2016.
Max Life Insurance Company Limited (‘the Subsidairy Company’) was incorporated on July 11, 2000 as a public limited company under the Companies Act, 1956 to undertake and carry on the business of life insurance and annuity. The Subsidiary Company obtained a license from the Insurance Regulatory and Development Authority of India (‘IRDAI’) for carrying on life insurance business on November 15, 2000. The license has been renewed regularly and is in force as at March 31, 2017. The Subsidiary Company offers a range of participating, non participating and linked products covering life insurance, pension and health benefits including riders for individual and group segments. These products are distributed by individual agents, corporate agents, banks, brokers and other channels.
2. summary of significant accounting policies
2.1 Basis of preparation
The Consolidated Financial Statements (CFS) comprises the financial statements of Max Financial Services Limited (“the Company”) and its Subsidiary Company ( together the “Group”). The CFS of the Group have been prepared in accordance with Generally Accepted Accounting Principles in India (Indian GAAP) to comply with the Accounting Standards specified under Section 133 of the Companies Act, 2013, and the relevant provisions of the Companies Act, 2013 (“the 2013 Act”).
The Board of Directors of the Company at its meeting held on January 27, 2015 had approved a Composite scheme of Arrangement (‘Scheme’) to vertically split the Company through a demerger, into three separate listed companies. The existing company, Max India Limited, has been renamed as ‘Max Financial Services Limited’ and focuses on the group’s life insurance business. The second vertical, has been renamed as ‘Max India Limited (‘MIL’)(formerly known as ‘Taurus Ventures Limited’) which manages investments in the high growth potential Health and Allied businesses, primarily comprising of Max Healthcare Institue Ltd, Max Bupa Health Insurance Co. Limited, Antara Senior Living Limited. The third vertical houses the investment activity in the group’s manufacturing businesses, Max Speciality Films Limited, and has been renamed Max Ventures and Industries Limited (‘MVIL’)(formerly known as Capricorn Ventures Limited’). All the assets and liabilities pertaining to each of the demerged undertakings (i.e MIL and MVIL) has been transferred with effect from April 1, 2015 (Appointed date). The Scheme became effective from January 15, 2016 i.e. the date of filing of the certified copy of the Order of the Hon’ble High Court of Punjab and Haryana with the Registrar of Companies, Chandigarh and Shimla. The Company has accounted for the demerger as per the High Court Order.
The financial statements of Max Life Insurance Company Limited, a subsidiary of the Company, which are included in these CFS, are prepared and presented under the historical cost convention, unless otherwise stated, and on accrual basis of accounting, in accordance with accounting principles generally accepted in India (Indian GAAP). The subsidiary has prepared the financial statements in compliance with the accounting standards notified under section 133 of the Companies Act 2013 and other accounting principles generally accepted in India, to the extent considered relevant and appropriate for the purpose of financial reporting and are consistent with the accounting principles as prescribed with the provisions of the Insurance Act, 1938 (amended by the Insurance Laws (Amendment) Act, 2015), Insurance Regulatory and Development Authority Act, 1999, Insurance Regulatory and Development Authority of India (Preparation of Financial Statements and Auditor’s Report of Insurance Companies) Regulations, 2002, (‘the Financial Statements Regulations’), the Master Circular on Preparation of Financial Statements and Filing of Returns of Life Insurance Business Ref No. IRDA/F&A/ Cir/232/12/2013 dated December 11, 2013, (‘the Master Circular’), the regulations framed thereunder and various orders/directions/circulars issued by the IRDAI and the practices prevailing within the insurance industry in India.
The accounting policies adopted in the preparation of the financial statements are consistent with those followed in the previous year.
2.2 Principles of Consolidation
The consolidated financial statements relate to Max Financial Services Limited (‘formerly Max India Limited’) (the ‘Company’) and its subsidiary company. The consolidated financial statements have been prepared on the following basis:
(i) The financial statements of the subsidiary company used in the consolidation are drawn upto the same reporting date as that of the Company i.e., 31 March, 2017.
(ii) The financial statements of the Company and its subsidiary company have been combined on a line-by-line basis by adding together like items of assets, liabilities, income and expenses, after eliminating intra-group balances, intra-group transactions
NoTes ForMING PArT oF THe CoNsoLIdATed FINANCIAL sTATeMeNTs
Max Financial Services Limited (Formerly known as MAX INDIA LIMITED)
AnnuAL RepoRt 2016-17 141
and resulting unrealised profits or losses, unless cost cannot be recovered.
(iii) The intra-group balances, intra-group transactions and unrealised profits or losses have been eliminated to the extent of the Group’s share in the entity.
(iv) The excess of cost to the Group of its investments in the subsidiary company over its share of equity of the subsidiary company, at the dates on which the investments in the subsidiary company were made, is recognised as ‘Goodwill’ being an asset in the consolidated financial statements and is tested for impairment on annual basis. On the other hand, where the share of equity in the subsidiary company as on the date of investment is in excess of cost of investments of the Group, it is recognised as ‘Capital Reserve’ and shown under the head ‘Reserves and Surplus’, in the consolidated financial statements.
(v) Minority Interest in the net assets of the consolidated subsidiary consists of the amount of equity attributable to the minority shareholders at the date on which investments in the subsidiary company were made and further movements in their share in the equity, subsequent to the dates of investments. Net profit / (loss) for the year of the subsidiaries attributable to minority interest is identified and adjusted against the profit after tax of the Group in order to arrive at the income attributable to shareholders of the Company.
(vi) Goodwill arising on consolidation is not amortised but tested for impairment.
(vii) Following subsidiary company have been considered in the preparation of the consolidated financial statements.
Name of the subsidiary Country of Incorporation
Proportion of ownership as at March 31, 2017
Proportion of ownership as at March 31, 2016
Max Life Insurance Company Limited India 70.01% 68.01%
2.3 Use of estimates
The preparation of the consolidated financial statements in conformity with Indian GAAP requires the Management to make estimates and assumptions considered in the reported amounts of assets and liabilities (including contingent liabilities) and the reported income and expenses during the year. The Management believes that the estimates used in preparation of the consolidated financial statements are prudent and reasonable. Future results could differ due to these estimates and the differences between the actual results and the estimates are recognised in the periods in which the results are known / materialise.
2.4 cash and cash equivalents (for purposes of cash Flow Statement)
Cash comprises cash on hand and demand deposits with banks. Cash equivalents are short-term balances (with an original maturity of three months or less from the date of acquisition), highly liquid investments that are readily convertible into known amounts of cash and which are subject to insignificant risk of changes in value.
2.5 Cash flow statement
Cash flows are reported using the indirect method, whereby profit / (loss) before extraordinary items and tax is adjusted for the effects of transactions of non-cash nature and any deferrals or accruals of past or future cash receipts or payments. The cash flows from operating, investing and financing activities of the Group are segregated based on the available information.
2.6 Depreciation and amortisation
Depreciable amount for assets is the cost of an asset, or other amount substituted for cost, less its estimated residual value. Depreciation on tangible fixed assets of the Company and its subsidiary company has been provided on the straight-line method as per the useful life prescribed in Schedule II to the Companies Act, 2013 except in respect of the following categories of assets, in whose case the life of assets has been assessed as under based on technical advice, taking into account the nature of asset, the estimated usage of asset, the operating conditions of the asset, past history of replacement, anticipated technological changes, manufacturers warranties and maintenance support, etc:
(i) Vehicles - 5 to 8 years (ii) Handheld devices (included in office equipment) - 1 year (iii) IT equipment including server and network - 4 years (iv) Leasehold improvements are amortised over the duration of the lease.
Intangible assets are amortised over their estimated useful life on straight line method as follows:
(i) Software (excluding policy administration system and satellite systems) - 3 to 4 years
(ii) Policy administration and satellite systems - 6 years

Max Financial Services Limited (Formerly known as MAX INDIA LIMITED)
AnnuAL RepoRt 2016-17142
Consolidated Financial StatementsNotes forming part of the Consolidated Financial Statements
The estimated useful life of the intangible assets and the amortisation period are reviewed at the end of each financial year and the amortisation period is revised to reflect the changed pattern, if any.
In the subsidiary company, fixed assets at third party locations and not under direct physical control of the subsidiary are fully depreciated over twelve months when it is available for use in the manner intended by management.
2.7 Revenue recognition
Revenue is recognised to the extent that it is probable that the economic benefits will flow to the Company and the revenue can be reliably measured. The following specific recognition criteria must also be met before revenue is recognised:
a) income from services
Revenues from shared services contracts are recognised over the period of the contract as and when services are rendered.
b) interest income
Interest income is recognised on a time proportion basis taking into account the amount outstanding and the applicable interest rate.
c) Dividend
Dividend income is recognised when the Company’s right to receive dividend is established by the reporting date.
For life insurance Business (Subsidiary company)
a) Premium income
Premium is recognised as income when due from policyholders, if there is no uncertainty of collectability. For linked business, premium income is recognised when the associated units are created. Premium on lapsed policies is recognised as income when such policies are reinstated. Top-up premiums are recognised as single premium.
b) income from linked policies
Income on linked policies including fund management charges, policy administration charges, surrender penalty charges, mortality charges, and other charges, wherever applicable are recovered from the linked fund and recognised when due in accordance with the terms and conditions mentioned in the policies.
c) income earned on investments
Other than Linked Business
Interest income from investments is recognised on accrual basis. Amortisation of premium/accretion of discount on debt securities including money market instruments is recognised over the maturity period on its intrinsic yield. Dividend income is recognised when the right to receive dividend is established. Realised gains/loss on debt securities is the difference between the sale consideration and the amortised cost computed on weighted average basis on the date of sale. Sale consideration for the purpose of realised gain/loss excludes interest accrued till transaction settlement date and is net of brokerage and statutory levies, if any.
In case of listed shares, mutual fund units, alternate investment funds and additional tier-1 bonds the profit/loss on actual sale of investment includes the accumulated changes in the fair value, previously recognised under “”Fair Value Change Account”” in the Balance Sheet. Unrealised gains/losses due to change in fair value of listed equity shares ,mutual funds, additional tier-1 bonds and alternate investment funds units are credited / debited to the ‘Fair Value Change Account’. Income from alternative investment fund is recognised when a right to receive payment is established.
Linked Business
Interest income from investments is recognised on an accrual basis. Amortisation of premium/accretion of discount on debt securities with a residual maturity upto 182 days and money market instruments is recognised uniformly over the remaining maturity period. Dividend income is recognised on the ex-dividend date.
Realised gain/loss on securities is the difference between the sale consideration and the book value, which is computed on weighted average basis, on the date of sale. Sale consideration for the purpose of realised gain/loss excludes interest accrued till transaction settlement date and is net of brokerage and statutory levies, if any. Unrealised gains and losses are recognised in the respective fund’s Revenue Account.

Max Financial Services Limited (Formerly known as MAX INDIA LIMITED)
AnnuAL RepoRt 2016-17 143
d) income earned on loans
Interest income on loans is recognised on an accrual basis. Fees and charges also include policy reinstatement fees and loan processing fees which are recognised on receipt basis.
e) interest income on derivative instruments
Income & expense are accounted for on accrual basis calculated on a specified notional amount and defined interest rates.
2.8 Tangible fixed assets
Fixed assets are carried at costs less accumulated depreciation, amortisation and impairment loss, if any. The cost of fixed assets includes interest on borrowings attributable to acquisition of qualifying fixed assets upto the date the asset is ready for its intended use. Exchange difference arising on restatement/settlement of long term foreign currency borrowings relating to acquisition of depreciable fixed assets are adjusted to the cost of the respective assets and depreciated over the remaining life of fixed assets. Subsequent expenditure on fixed assets after its purchase/ completion is capitalised only if such expenditure results in increase in the future benefits from such asset beyond its previously assessed standard of performance.
Fixed assets acquired and put to use for project purpose are capitalised and depreciation thereon is included in the project cost till the project is ready for its intended use.
Capital work-in-progress:
The assets which are not ready for their intended use and other capital work in progress are carried at cost, comprising direct cost, related incidental expenses and attributable interest.
2.9 Intangible fixed assets
Intangible assets are carried at cost less accumulated amortisation and impairment losses, if any. The cost of an intangible asset comprises its purchase price, including any import duties and other taxes (other than those subsequently recoverable from the taxing authorities), and any directly attributable expenditure on making the asset ready for its intended use and net of any trade discounts and rebates. Subsequent expenditure on an intangible asset after its purchase / completion is recognised as an expense when incurred unless it is probable that such expenditure will enable the asset to generate future economic benefits in excess of its originally assessed standards of performance and such expenditure can be measured and attributed to the asset reliably, in which case such expenditure is added to the cost of the asset.
2.10 Foreign currency transactions and translations
Initial recognition
Transactions in foreign currencies entered into by the Company are accounted at the exchange rates prevailing on the date of the transaction or at rates that closely approximate the rate at the date of the transaction.
Measurement at the Balance Sheet date
Foreign currency monetary items (other than derivative contracts) of the Company, outstanding at the balance sheet date are restated at the year end rates. Non-monetary items of the Company are carried at historical cost.
Treatment of exchange differences
Exchange differences arising on settlement / restatement of foreign currency monetary assets and liabilities of the Company are recognised as income or expense in the Statement of Profit and Loss.
2.11 investments
Long-term investments (excluding investment properties), are carried individually at cost less provision for diminution, other than temporary, in the value of such investments. Current investments are carried individually, at the lower of cost and fair value. Cost of investments include acquisition charges such as brokerage, fees and duties.
Investment properties are carried individually at cost less accumulated depreciation and impairment, if any. Investment properties are capitalised and depreciated (where applicable) in accordance with the policy stated for Fixed assets. Impairment of investment property is determined in accordance with the policy stated for impairment of Assets.”
For life insurance Business (Subsidiary company)
Investments are made in accordance with the provision of the Insurance Act, 1938 and the Insurance Regulatory & Development Authority (Investment) Regulations, 2000 as amended and subsequent circulars/notifications issued by the IRDAI from time to
Max Financial Services Limited (Formerly known as MAX INDIA LIMITED)
AnnuAL RepoRt 2016-17144
Consolidated Financial StatementsNotes forming part of the Consolidated Financial Statements
time. Investments are recorded at cost on date of purchase, which includes brokerage and statutory levies, if any and excludes interest paid, if any, on purchase. Diminution in the value of investment (non-linked), other than temporary decline, is charged to Revenue Acccount / Profit and Loss Account as applicable.
Classification
Investments intended to be held for a period less than twelve months or maturing within twelve months from the balance sheet date are classified as short term investments. All other investments are classified as long-term investments.
valuation - Shareholder’s Investments and Non-linked Policyholder’s Investments
Debt securities, which include government securities and redeemable preference shares are considered as ‘held to maturity’ and measured at historical cost subject to amortisation. The premium/discount, if any, on purchase of debt securities including money market instruments is recognised and amortised in the Statement of Profit and Loss, over the remaining period to maturity on the basis of their intrinsic yield.
Reverse repos are valued at cost. Fixed deposits are valued at cost till the date of maturity.
Listed shares, as at balance sheet date, are valued at fair value, being the last quoted closing price on National Stock Exchange (NSE) and in case the same is not available, then on the Bombay Stock Exchange Ltd (BSE). Unlisted equity shares (including awaiting listing) are stated at historical cost subject to diminution, if any, determined separately for each individual investment. Investments in Mutual fund units are valued at previous day’s net asset value of the respective funds. Gain or loss on account of fair valuation is recorded in Fair Value Change Account. However, for the purpose of Consolidated financial statements of the Company, the fair value change account has been adjusted in the value of investments to record it at historical cost.
Alternate Investment Funds are valued at Net Asset Value (NAV) if applicable or Historical Cost less diminution in value of Investments.
Additional Tier-1 bonds are valued on the basis of values generated by bond valuer based on matrix released by Credit Rating Information Services of India Limited (CRISIL) on daily basis.
Money market instruments like Commercial Papers, Certificate of Deposit, Treasury Bills (T-Bills) and Collaterised Borrowing and Lending Obligation (CBLO) are valued at historical cost, subject to amortisation of premium or accretion of discount over the period of maturity/holding on a straight line basis.
Securities with call options are valued at the lower of the values as obtained by valuing the security to the final maturity date or to the call option date by using the benchmark rate based on the matrix released by CRISIL on daily basis. Securities with put options are valued at the higher of the value as obtained by valuing the security to the final maturity date or to the put option date by using the benchmark rate based on the matrix released by CRISIL on daily basis.
Land or building or part of a building or both held to earn rental income or capital appreciation or for both, if any, rather than for use in services or for administrative purposes is classified as real estate investment property and is valued at historical cost (including cost of improvements and other incidental costs) subject to revaluation on an annual basis. The change in the carrying amount of the investment property shall be taken to Revaluation Reserve. The depreciation charge shall be ignored for the valuation of Investment Property.
Rights are valued at fair value, being last quoted closing price on National Stock Exchange (NSE) and in case the same is not available, then on BSE. Unlisted rights are valued at a price computed as a difference between offer price and valuation price of the parent security.
Bonus entitlements are recognised as investments on the ‘ex- bonus date’.
valuation - linked investments
Government securities are valued at the prices obtained from CRISIL Limited. Debt securities other than Government Securities are valued on the basis of values generated by bond valuer based on matrix released by the CRISIL Limited on daily basis.
Listed shares are valued at fair value, being the last quoted closing price on National Stock Exchange (NSE) and in case the same is not available, then on the BSE Ltd (BSE). Unlisted equity shares (including awaiting listing) are stated at historical cost subject to diminution, if any, determined separately for each individual investment. Mutual fund units are taken at the previous day’s net asset values.
Compulsory Convertible Debentures (CCD’s) are valued at fair value, being the last quoted closing price on National Stock Exchange (NSE) and in case the same is not available, then on the BSE Ltd(BSE).

Max Financial Services Limited (Formerly known as MAX INDIA LIMITED)
AnnuAL RepoRt 2016-17 145
Reverse repos are valued at cost. Fixed deposits are valued at cost till the date of maturity.
Money market and debt securities with a residual maturity upto 182 days are valued at amortised cost being the difference between the redemption value and historical cost/last valuation price, spread uniformly over the remaining maturity period of the instrument.
Rights are valued at fair value, last quoted closing price on National Stock Exchange (NSE) and in case the same is not available, then on Bombay Stock Exchange (BSE). Unlisted rights are valued at a price computed as a difference between offer price and valuation price of the parent security.
Bonus entitlements are recognised as investments on the ‘ex- bonus date’.
valuation of Derivative instrument:-
Interest rate swaps are contractual agreements between two parties to exchange fixed rate and floating rate interest by means of periodic payments, calculated on a specified notional amount and defined interest rates. Interest payments are netted against each other, with the difference between the fixed and floating rate payments paid by one party.
For cash flow hedges, a forecast transaction that is the subject of the hedge must be highly probable and must present an exposure to variations in cash flows that could ultimately affect Revenue/Profit or loss.
At the inception of the transaction, the Company documents the relationship between the hedging instrument and the hedged item, as well as the risk management objective and the strategy for undertaking the hedge transaction. The Company also documents its assessment of whether the hedge is expected to be, and has been, highly effective in offsetting the risk in the hedged item, both at inception and on an ongoing basis.
Hedge effectiveness is the degree to which changes in cash flows of the hedged item that are attributable to a hedged risk are offset by changes in the cash flows of the hedging instrument. Hedge effectiveness is ascertained at the time of inception of the hedge and periodically thereafter. The portion of fair value gain/loss on the Interest Rate Derivative that is determined to be an effective hedge is recognised directly in appropriate equity account i.e. ‘Hedge Fluctuation Reserve’ which is included in ‘Credit/(Debit) Fair Value Change Account’ under Policyholders funds in the balance sheet. The ineffective portion of the change in fair value of such instruments is recognised in the Revenue Account in the period in which they arise. If the hedging relationship ceases to be effective or it becomes probable that the expected forecast transaction will no longer occur, hedge accounting is discontinued and accumulated gains or losses that were recognised directly in the Hedge Fluctuation Reserve are reclassified into Revenue Account.
All derivatives are initially recognised in the Balance sheet at their fair value, which usually represents their cost. They are subsequently re-measured at their fair value, with the method of recognising movements in this value depending on whether they are designated as hedging instruments and, if so, the nature of the item being hedged. Fair values are obtained from quoted market prices. All derivatives are carried as assets when the fair values are positive and as liabilities when the fair values are negative. The notional or contractual amounts associated with derivative financial instruments are not recorded as assets or liabilities on the statement of financial position as they do not represent the fair value of these transactions.
transfer of investments
Investments in debt securities are transferred from shareholders to policyholders at the lower of the market price and net amortised cost. Investments other than debt securities are transferred from shareholders to policyholders at lower of book value or market value. Transfers of investments between unit linked funds are effected at prevailing market price. No transfer of investments is carried out between different policyholders’ funds.
impairment of investments
The Company assesses at each Balance Sheet date, using internal and external sources, whether there is any indication that any investment may be impaired. In case of impairment, any loss is accounted for as an expense and disclosed under the head ‘Provision of diminution’ in the value of investment (net) in the Revenue/Profit and Loss Account. Any reversal of impairment loss, earlier recognised is accounted in Revenue/Profit and Loss Account.
2.12 Employee benefits
Employee benefits include provident fund, gratuity fund, compensated absences and long-term incentive plan.
a) Post employment benefit plan
Contributions to defined contribution retirement benefit schemes are recognised as an expense when employees have rendered services entitling them to such benefits.

Max Financial Services Limited (Formerly known as MAX INDIA LIMITED)
AnnuAL RepoRt 2016-17146
Consolidated Financial StatementsNotes forming part of the Consolidated Financial Statements
For defined benefit plan in the form of gratuity fund, the cost of providing benefits is determined using the Projected Unit Credit method, with actuarial valuations being carried out at each Balance Sheet date. Actuarial gains and losses are recognised in the Statement of Profit and Loss in the period in which they occur. Past service cost is recognised immediately to the extent that the benefits are already vested and otherwise is amortised on a straight-line basis over the average period until the benefits become vested. The retirement benefit obligation recognised in the Balance Sheet represents the present value of the defined benefit obligation as adjusted for unrecognised past service cost, as reduced by the fair value of scheme assets. Any asset resulting from this calculation is limited to past service cost, plus the present value of available refunds and reductions in future contributions to the schemes.
b) Short-term employee benefits
The undiscounted amount of short-term employee benefits expected to be paid in exchange for the services rendered by employees are recognised during the year when the employees render the service. These benefits include performance incentive and compensated absences which are expected to occur within twelve months after the end of the period in which the employee renders the related service.
The cost of short-term compensated absences is accounted as under :
(a) in case of accumulated compensated absences, when employees render the services that increase their entitlement of future compensated absences; and
(b) in case of non-accumulating compensated absences, when the absences occur.
c) Long-term employee benefits
Compensated absences which are not expected to occur within twelve months after the end of the period in which the employee renders the related service are recognised as a liability at the present value of the defined benefit obligation as at the balance sheet date less the fair value of the plan assets out of which the obligations are expected to be settled.
d) long term incentive
The liability towards Long Term Incentive Plan is accounted for on the basis of independent actuarial valuations carried out as per ‘Projected Unit Credit Method’ at the balance sheet date. Actuarial gains / losses related thereof are recognised in the revenue account.
2.13 employee share based payments
The Company has formulated Employee Stock Option Schemes (ESOS) in accordance with the SEBI (Employee Stock Option Scheme and Employee Stock Purchase Scheme) Guidelines, 1999. The Schemes provide for grant of options to employees of the Company and its subsidiaries to acquire equity shares of the Company that vest in a graded manner and that are to be exercised within a specified period. In accordance with the SEBI Guidelines; the excess, if any, of the closing market price on the day prior to the grant of the options under ESOS over the exercise price is amortised on a straight-line basis over the vesting period.
The Company has consituted a Phantom Stock Option Plan which will be settled in cash. The Company is required to make provisions for estimated cash requirement for settlement on the basis of Fair Market Value of equity shares of the Company, Max India Limited and Max Ventures India Limited as at end of each financial period/year till the estimated life of phantom stocks. As and when any cash payment is made on account of settlement of phantom stock, the provision is accordingly adjusted.
For life insurance Business (Subsidiary company)
The options are accounted for on an intrinsic value basis in accordance with the Guidance Note on Accounting for Employee Share based Payments, issued by the Institute of Chartered Accountants of India (ICAI). Intrinsic value of option, which is the difference between derived market price of the underlying stock and the exercise price on the grant date is amortised over the vesting period. The intrinsic value is being measured at each reporting date and at the date of settlement, with any changes in such value being recognised in the Statement of Profit and Loss. Options that lapse are reversed by a credit to Statement of Profit and Loss equal to the amortised portion of the value of the lapsed options. In a cash settled employee share based payment plan, the Subsidiary company recognises expense for the services received, as employees render services over the vesting period.
2.14 Segment reporting
The Group identifies primary segments based on the dominant source, nature of risks and returns and the internal organisation and management structure. The operating segments are the segments for which separate financial information is available and for which operating profit / loss amounts are evaluated regularly by the executive Management in deciding how to allocate resources and in assessing performance.
Max Financial Services Limited (Formerly known as MAX INDIA LIMITED)
AnnuAL RepoRt 2016-17 147
The accounting policies adopted for segment reporting are in line with the accounting policies of the Group. Segment revenue, segment expenses, segment assets and segment liabilities have been identified to segments on the basis of their relationship to the operating activities of the segment.
Inter-segment revenue is accounted on the basis of transactions which are primarily determined based on market / fair value factors. Revenue, expenses, assets and liabilities which relate to the Group as a whole and are not allocable to segments on reasonable basis have been included under ‘unallocated revenue / expenses / assets / liabilities’.
2.15 leases
Where the Group as a lessor leases assets under finance leases, such amounts are recognised as receivables at an amount equal to the net investment in the lease and the finance income is recognised based on a constant rate of return on the outstanding net investment. Assets leased by the Group in its capacity as a lessee, where substantially all the risks and rewards of ownership vest in the Group are classified as finance leases. Such leases are capitalised at the inception of the lease at the lower of the fair value and the present value of the minimum lease payments and a liability is created for an equivalent amount. Each lease rental paid is allocated between the liability and the interest cost so as to obtain a constant periodic rate of interest on the outstanding liability for each year. Lease arrangements where the risks and rewards incidental to ownership of an asset substantially vest with the lessor are recognised as operating leases. Lease rentals under operating leases are recognised in the Consolidated Statement of Profit and Loss on a straight-line basis over the lease term.
2.16 earnings per share
Basic earnings per share is computed by dividing the profit / (loss) for the year by the weighted average number of equity shares outstanding during the year. Diluted earnings per share is computed by dividing the profit / (loss) for the year as adjusted for dividend, interest and other charges to expense or income (net of any attributable taxes) relating to the dilutive potential equity shares, by the weighted average number of equity shares considered for deriving basic earnings per share and the weighted average number of equity shares which could have been issued on the conversion of all dilutive potential equity shares. Potential equity shares are deemed to be dilutive only if their conversion to equity shares would decrease the net profit per share from continuing ordinary operations. Potential dilutive equity shares are deemed to be converted as at the beginning of the period, unless they have been issued at a later date. The dilutive potential equity shares are adjusted for the proceeds receivable had the shares been actually issued at fair value (i.e. average market value of the outstanding shares). Dilutive potential equity shares are determined independently for each period presented. The number of equity shares and potentially dilutive equity shares are adjusted for share splits / reverse share splits and bonus shares, as appropriate.
2.17 taxes on income
Current tax is determined on the basis of taxable income and tax credits computed for each of the entities in the Group in accordance with the applicable tax rates and the provisions of Income Tax Act, 1961 and other applicable tax laws.
Deferred tax expense or benefit is recognised on timing differences being the difference between taxable income and accounting income that originate in one period and is likely to reverse in one or more subsequent periods. Deferred tax assets and liabilities are measured using the tax rates and tax laws that have been enacted or substantively enacted by the balance sheet date.
In the event of unabsorbed depreciation and carry forward of losses, deferred tax assets are recognised only to the extent that there is virtual certainty supported by convincing evidence that sufficient future taxable income will be available to realise such assets. In other situations, deferred tax assets are recognised only to the extent that there is reasonable certainty that sufficient future taxable income will be available to realise these assets.
The Group offsets deferred tax assets and deferred tax liabilities, and advance income tax and provision for tax, if it has a legally enforceable right and these relate to taxes in income levies by the same governing taxation laws.
Minimum Alternate Tax (MAT) paid in accordance with the tax laws, which gives future economic benefits in the form of adjustment to future income tax liability, is considered as an asset if there is convincing evidence that the entity will pay normal income tax. Accordingly, MAT is recognised as an asset in the Consolidated Balance Sheet when it is highly probable that future economic benefit associated with it will flow to the entity.
2.18 impairment of assets
The carrying values of assets / cash generating units at each balance sheet date are reviewed for impairment if any indication of impairment exists.
If the carrying amount of the assets exceed the estimated recoverable amount, an impairment is recognised for such excess amount. The impairment loss is recognised as an expense in the Consolidated Statement of Profit and Loss, unless the asset is carried at revalued amount, in which case any impairment loss of the revalued asset is treated as a revaluation decrease to the
Max Financial Services Limited (Formerly known as MAX INDIA LIMITED)
AnnuAL RepoRt 2016-17148
Consolidated Financial StatementsNotes forming part of the Consolidated Financial Statements
extent a revaluation reserve is available for that asset.
The recoverable amount is the greater of the net selling price and their value in use. Value in use is arrived at by discounting the future cash flows to their present value based on an appropriate discount factor.
When there is indication that an impairment loss recognised for an asset (other than a revalued asset) in earlier accounting periods no longer exists or may have decreased, such reversal of impairment loss is recognised in the Consolidated Statement of Profit and Loss, to the extent the amount was previously charged to the Consolidated Statement of Profit and Loss. In case of revalued assets such reversal is not recognised.
2.19 Provisions and contingencies
A provision is recognised when the Group has a present obligation as a result of past events and it is probable that an outflow of resources will be required to settle the obligation in respect of which a reliable estimate can be made. Provisions (excluding retirement benefits) are not discounted to their present value and are determined based on the best estimate required to settle the obligation at the Balance Sheet date. These are reviewed at each Balance Sheet date and adjusted to reflect the current best estimates. Contingent liabilities are disclosed in the Notes. Contingent assets are not recognised in the financial statements.
2.20 Service tax input credit
Service tax input credit is accounted for in the books in the period in which the underlying service received is accounted and when there is reasonable certainty in availing / utilising the credits.
2.21 operating cycle
Based on the nature of products / activities of the Group and the normal time between acquisition of assets and their realisation in cash or cash equivalents, the Company has determined its operating cycle as 12 months for the purpose of classification of its assets and liabilities as current and non-current.
2.22 Other Life Insurance business specific accounting policies
a) Reinsurance Premium
Reinsurance premium ceded is accounted for at the time of recognition of premium income in accordance with the treaty or in-principle arrangement with the reinsurer. Profit commission on reinsurance ceded is netted off against premium ceded on reinsurance.
b) acquisition costs
Acquisition costs include expenses which are incurred to solicit and underwrite insurance contracts such as commission, medical fee, stamp duty, policy printing expenses, and other related expenses. These costs are expensed in the year in which they are incurred. Clawback of the commission paid, if any, is accounted for in the year in which it becomes recoverable.
c) Benefits Paid
Benefits paid include policy benefit amount and the direct costs of settlement if any. Reinsurance recoverable thereon, if any, is accounted for in the same period as the related claim. Repudiated claims disputed before judicial authorities are provided for based on management judgement considering the facts and evidences available in respect of such claims.
Death and other claims are accounted for, when notified. Surrenders / withdrawal under non linked policies are accounted on the receipt of the consent from the policyholder. Surrenders / withdrawals under linked policies are accounted in the respective schemes when the associated units are cancelled. Surrenders, withdrawals and lapsation are disclosed net of charges recoverable. Amount payable on lapsed and discontinued policies are accounted for an expiry of lock in period.
Survival and maturity benefits are accounted for when due for payment to the policyholders.
d) liability for Policies
The actuarial liability for policies in-force as at the valuation date is determined using appropriate methods and assumptions that conform to the regulations issued by the IRDAI and the Actuarial Practice Standards (APS) issued by the Institute of Actuaries of India (IAI). Specifically, the key principles considered for the valuation relate to the IRDA (Assets, Liabilities and Solvency Margin) Regulations, 2000 and the APS 1, APS 2 and APS 7 issued by the IAI.
The liability, valued on a policy by policy basis, is so calculated that together with future premium payments and investment income, the Company is able to meet all future claims (including bonus entitlements to policyholders, if applicable) and expenses, on the basis of actuarial estimates.
Max Financial Services Limited (Formerly known as MAX INDIA LIMITED)
AnnuAL RepoRt 2016-17 149
A brief description of the methodology used for valuing key categories of products is provided below:
1. The liability for individual non-linked business is valued using gross premium reserving methodology. For participating business, a reference is also made to the asset share of the policies as at the valuation date in order to appropriately allow for policyholders’ reasonable expectations. The liability is floored to zero or the surrender value payable under the policies, if any.
2. The liability for individual (and group) unit linked business comprises of two parts – a unit reserve and a non-unit reserve. Unit reserve represents the value of units using the net asset value at the valuation date. Non-unit reserve is calculated using a discounted cashflow method and is similar to gross premium reserves.
3. The liability for group one year renewable term business is calculated using an unearned premium approach where the premium representing the unexpired policy term is held as a liability. For longer term group business, gross premium reserving methodology is used.
4. The liability for riders attached to a non-linked policy is calculated as higher of gross premium reserves and unearned premium reserves.
The liabilities above also allow (either explicitly or implicitly) for any cost of guarantees/options inherent in the products.
The regulations also require the insurers to hold certain additional reserves. The key additional reserves cover the following sources of liability:
i) Additional source of liability for policies which are lapsed as at the valuation date but represent a potential source of future liability if they revive within their revival period (generally termed as lapse revival reserves). The reserves are calculated using an assumption of revival probability, based on Company experience.
ii) Additional source of liability for policies which may exercise their option of cancelling the policy within the free look period offered (generally termed as free look cancellation reserves). The reserves are calculated using an assumption of free look cancellation, based on Company experience.
iii) Liability against policies for which the insured event has already occurred but the claim has not been reported to the Company (generally termed as incurred but not reported reserves).
e) contribution to Policyholders’ account (technical account)
Contribution to Policyholders’ Account (Technical Account), if any, is made as decided by the Board of Directors of the Subsidiary.
f) loans
Loans against policies are valued at the aggregate of book values (net of repayments) plus capitalised interest, subject to provision for impairment, if any
g) Funds for future appropriations
Non-Linked:- Funds for future appropriations in non linked account represents funds, the allocation of which, either to participating policyholders or to shareholders, has not been determined at the balance sheet date. Transfers to and from the fund reflect the excess or deficit of income over expenses and appropriations in each accounting period arising in the Company’s policyholder fund.
Unit-Linked:- The FFA in the linked segment represents an amount that is estimated by the Appointed Actuary in respect of lapsed unit linked policies and is set aside in the Balance Sheet. This amount is required to be held within the policyholder fund till the time policyholder are eligible for revival of their policies and this amount is not made available for distribution to Shareholders until the expiry of the maximum revival period. After expiry of the revival period, the Company may appropriate FFA amount as a surplus on the Appointed Actuary’s recommendation.

Max Financial Services Limited (Formerly known as MAX INDIA LIMITED)
AnnuAL RepoRt 2016-17150
Consolidated Financial StatementsNotes forming part of the Consolidated Financial Statements
3. Share Capital(Rs. in Lacs)
Particulars As at March 31, 2017 As at March 31, 2016"Number of
shares"rs. In Lacs "Number of
shares"rs. In Lacs
(a) AuthorisedEquity share capital 300,000,000 6,000.00 300,000,000 6,000.00 Equity shares of Rs. 2 (previous year Rs. 2) each with voting rights(b) Issued, subscribed and fully paid-upEquity share capital 267,270,049 5,345.40 266,983,999 5,339.68 Equity shares of Rs. 2 (previous year Rs. 2) each with voting rights
Refer note (i) to (iv) below (i) Reconciliation of the number of shares and amount outstanding at the beginning and at the end of the reporting period:
Particulars As at March 31, 2017 As at March 31, 2016Number of shares rs. In Lacs Number of shares rs. In Lacs
equity shares of with voting rightsAt the beginning of the year 266,983,999 5,339.68 266,502,773 5,330.06 Issued during the year relating to Employee Stock Option Scheme
286,050 5.72 481,226 9.62
outstanding at the end of the year 267,270,049 5,345.40 266,983,999 5,339.68
(ii) The Company has only one class of equity shares having a par value of Rs. 2 each. Each holder of equity shares is entitled to one vote per share. In the event of liquidation of the Company, holder of equity shares will be entitled to receive remaining assets of the Company after distribution of all preferential amounts. The distribution will be in proportion to the number of equity shares held by the shareholders.
(iii) details of shares held by each shareholder holding more than 5% shares:
Name of the shareholder As at March 31, 2017 As at March 31, 2016 No. of shares % held No. of shares % held
equity shares of rs. 2/- each fully paid (with voting rights)- Xenok Limited 24,079,700 9.01% 24,079,700 9.02%- GS Mace Holdings Limited - - 17,196,381 6.44%- Liquid Investment and Trading Company Private Limited 23,818,876 8.91% 23,818,876 8.92%- Moneyline Portfolio Investments Limited 26,570,048 9.94% 26,570,048 9.95%- Max Ventures Investment Holdings Private Limited 43,372,459 16.23% 17,546,167 6.57%
(iv) shares reserved for issuance
As at March 31, 2017 22,46,745 (previous year: 25,03,560) shares of Rs. 2 each were reserved for issuance towards outstanding employee stock options granted under Employee Stock Option Plan 2003 (ESOP) of the Company. (Refer note 33)
(v) Aggregate number of share issued for consideration other than cash during the period of five years immediately preceding the reporting date
The Company has issued total 2,700,939 shares (previous year: 2,419,889 shares) during the period of five years immediately preceding the reporting date on exercise of options granted under the ESOP plan wherein part consideration was received in the form of employees services.
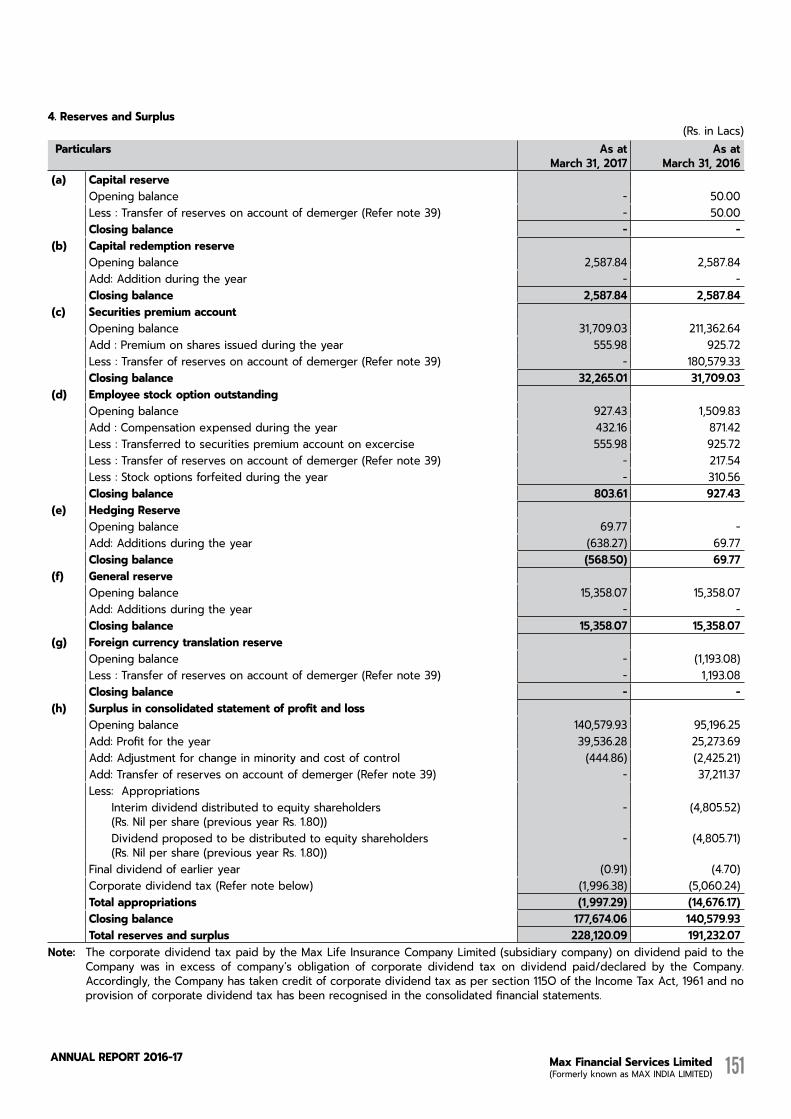
Max Financial Services Limited (Formerly known as MAX INDIA LIMITED)
AnnuAL RepoRt 2016-17 151
4. Reserves and Surplus(Rs. in Lacs)
Particulars as atmarch 31, 2017
as atmarch 31, 2016
(a) Capital reserve Opening balance - 50.00 Less : Transfer of reserves on account of demerger (Refer note 39) - 50.00 Closing balance - -
(b) Capital redemption reserve Opening balance 2,587.84 2,587.84 Add: Addition during the year - - Closing balance 2,587.84 2,587.84
(c) Securities premium accountOpening balance 31,709.03 211,362.64 Add : Premium on shares issued during the year 555.98 925.72 Less : Transfer of reserves on account of demerger (Refer note 39) - 180,579.33 Closing balance 32,265.01 31,709.03
(d) Employee stock option outstandingOpening balance 927.43 1,509.83 Add : Compensation expensed during the year 432.16 871.42 Less : Transferred to securities premium account on excercise 555.98 925.72 Less : Transfer of reserves on account of demerger (Refer note 39) - 217.54 Less : Stock options forfeited during the year - 310.56 Closing balance 803.61 927.43
(e) Hedging ReserveOpening balance 69.77 - Add: Additions during the year (638.27) 69.77 Closing balance (568.50) 69.77
(f) General reserveOpening balance 15,358.07 15,358.07 Add: Additions during the year - - Closing balance 15,358.07 15,358.07
(g) Foreign currency translation reserveOpening balance - (1,193.08)Less : Transfer of reserves on account of demerger (Refer note 39) - 1,193.08 Closing balance - -
(h) surplus in consolidated statement of profit and lossOpening balance 140,579.93 95,196.25 Add: Profit for the year 39,536.28 25,273.69 Add: Adjustment for change in minority and cost of control (444.86) (2,425.21)Add: Transfer of reserves on account of demerger (Refer note 39) - 37,211.37 Less: Appropriations
Interim dividend distributed to equity shareholders (Rs. Nil per share (previous year Rs. 1.80))
- (4,805.52)
Dividend proposed to be distributed to equity shareholders (Rs. Nil per share (previous year Rs. 1.80))
- (4,805.71)
Final dividend of earlier year (0.91) (4.70)Corporate dividend tax (Refer note below) (1,996.38) (5,060.24)Total appropriations (1,997.29) (14,676.17)Closing balance 177,674.06 140,579.93 Total reserves and surplus 228,120.09 191,232.07
note: The corporate dividend tax paid by the Max Life Insurance Company Limited (subsidiary company) on dividend paid to the Company was in excess of company’s obligation of corporate dividend tax on dividend paid/declared by the Company. Accordingly, the Company has taken credit of corporate dividend tax as per section 115O of the Income Tax Act, 1961 and no provision of corporate dividend tax has been recognised in the consolidated financial statements.
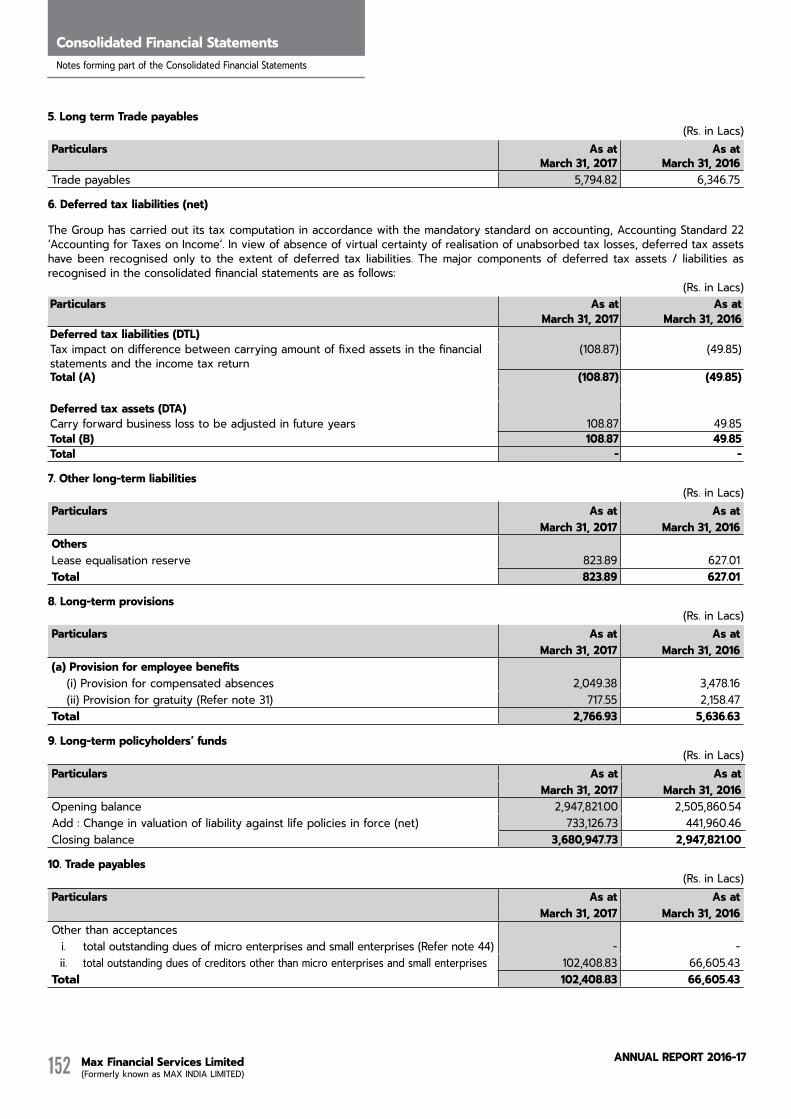
Max Financial Services Limited (Formerly known as MAX INDIA LIMITED)
AnnuAL RepoRt 2016-17152
Consolidated Financial StatementsNotes forming part of the Consolidated Financial Statements
5. Long term Trade payables(Rs. in Lacs)
Particulars As atMarch 31, 2017
As atMarch 31, 2016
Trade payables 5,794.82 6,346.75
6. deferred tax liabilities (net)
The Group has carried out its tax computation in accordance with the mandatory standard on accounting, Accounting Standard 22 ‘Accounting for Taxes on Income’. In view of absence of virtual certainty of realisation of unabsorbed tax losses, deferred tax assets have been recognised only to the extent of deferred tax liabilities. The major components of deferred tax assets / liabilities as recognised in the consolidated financial statements are as follows:
(Rs. in Lacs)Particulars As at As at
March 31, 2017 March 31, 2016deferred tax liabilities (dTL)Tax impact on difference between carrying amount of fixed assets in the financial statements and the income tax return
(108.87) (49.85)
Total (A) (108.87) (49.85)
deferred tax assets (dTA)Carry forward business loss to be adjusted in future years 108.87 49.85 Total (B) 108.87 49.85 Total - -
7. other long-term liabilities(Rs. in Lacs)
Particulars As at As atMarch 31, 2017 March 31, 2016
othersLease equalisation reserve 823.89 627.01 Total 823.89 627.01
8. Long-term provisions(Rs. in Lacs)
Particulars As at As atMarch 31, 2017 March 31, 2016
(a) Provision for employee benefits(i) Provision for compensated absences 2,049.38 3,478.16 (ii) Provision for gratuity (Refer note 31) 717.55 2,158.47
Total 2,766.93 5,636.63
9. Long-term policyholders’ funds(Rs. in Lacs)
Particulars As at As atMarch 31, 2017 March 31, 2016
Opening balance 2,947,821.00 2,505,860.54 Add : Change in valuation of liability against life policies in force (net) 733,126.73 441,960.46 Closing balance 3,680,947.73 2,947,821.00
10. Trade payables(Rs. in Lacs)
Particulars As at As atMarch 31, 2017 March 31, 2016
Other than acceptancesi. total outstanding dues of micro enterprises and small enterprises (Refer note 44) - - ii. total outstanding dues of creditors other than micro enterprises and small enterprises 102,408.83 66,605.43
Total 102,408.83 66,605.43
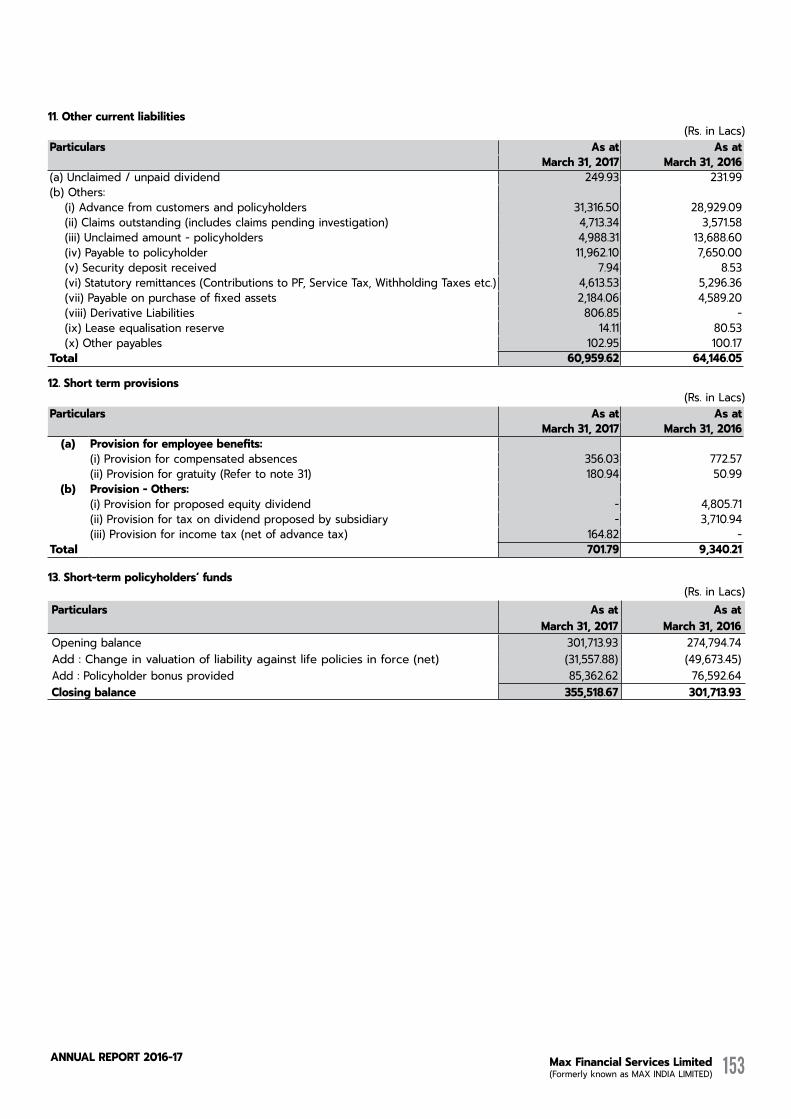
Max Financial Services Limited (Formerly known as MAX INDIA LIMITED)
AnnuAL RepoRt 2016-17 153
11. other current liabilities(Rs. in Lacs)
Particulars As at As atMarch 31, 2017 March 31, 2016
(a) Unclaimed / unpaid dividend 249.93 231.99 (b) Others:
(i) Advance from customers and policyholders 31,316.50 28,929.09 (ii) Claims outstanding (includes claims pending investigation) 4,713.34 3,571.58 (iii) Unclaimed amount - policyholders 4,988.31 13,688.60 (iv) Payable to policyholder 11,962.10 7,650.00 (v) Security deposit received 7.94 8.53 (vi) Statutory remittances (Contributions to PF, Service Tax, Withholding Taxes etc.) 4,613.53 5,296.36 (vii) Payable on purchase of fixed assets 2,184.06 4,589.20 (viii) Derivative Liabilities 806.85 - (ix) Lease equalisation reserve 14.11 80.53 (x) Other payables 102.95 100.17
Total 60,959.62 64,146.05
12. Short term provisions(Rs. in Lacs)
Particulars As at As atMarch 31, 2017 March 31, 2016
(a) Provision for employee benefits:(i) Provision for compensated absences 356.03 772.57 (ii) Provision for gratuity (Refer to note 31) 180.94 50.99
(b) Provision - others:(i) Provision for proposed equity dividend - 4,805.71 (ii) Provision for tax on dividend proposed by subsidiary - 3,710.94 (iii) Provision for income tax (net of advance tax) 164.82 -
Total 701.79 9,340.21
13. short-term policyholders’ funds(Rs. in Lacs)
Particulars As at As atMarch 31, 2017 March 31, 2016
Opening balance 301,713.93 274,794.74 Add : Change in valuation of liability against life policies in force (net) (31,557.88) (49,673.45)Add : Policyholder bonus provided 85,362.62 76,592.64 Closing balance 355,518.67 301,713.93
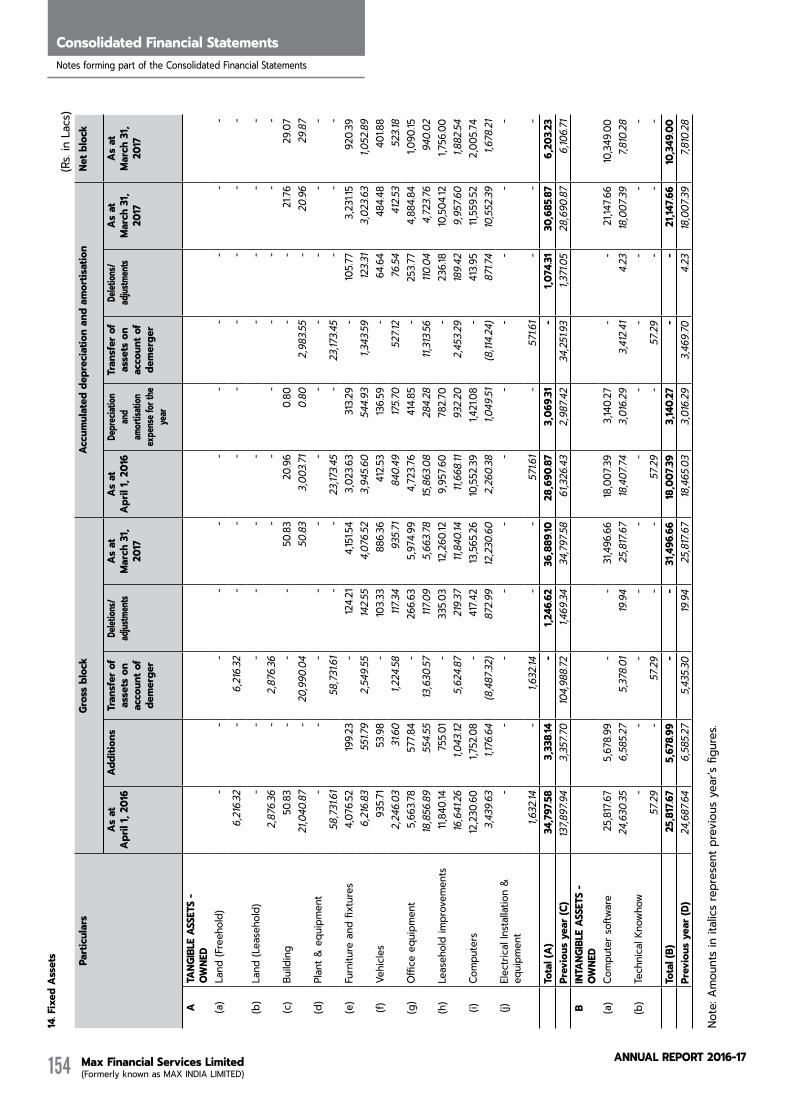
Max Financial Services Limited (Formerly known as MAX INDIA LIMITED)
AnnuAL RepoRt 2016-17154
Consolidated Financial StatementsNotes forming part of the Consolidated Financial Statements
14. F
ixed
Ass
ets
(Rs.
in L
acs)
Part
icul
ars
Gros
s bl
ock
Accu
mul
ated
dep
reci
atio
n an
d am
ortis
atio
nNe
t blo
ck
As a
t Ap
ril 1,
201
6Ad
ditio
nsTr
ansf
er o
f as
sets
on
acco
unt o
f de
mer
ger
delet
ions/
adjus
tmen
tsAs
at
Mar
ch 3
1, 20
17
As a
t Ap
ril 1,
201
6De
prec
iation
an
d am
ortis
ation
ex
pens
e for
the
year
Tran
sfer
of
asse
ts o
n ac
coun
t of
dem
erge
r
delet
ions/
adjus
tmen
tsAs
at
Mar
ch 3
1, 20
17
As a
t M
arch
31,
2017
ATA
NGIB
Le A
sseT
s -
oWNe
d(a
)La
nd (F
reeh
old)
--
--
--
--
--
-6,
216.
32-
6,21
6.32
--
--
--
--
(b)
Land
(Lea
seho
ld)
--
--
--
--
--
2,87
6.36
-2,
876.
36-
--
--
--
(c)
Build
ing
50.83
--
-50
.8320
.96
0.80
--
21.76
29.0
721
,040
.87-
20,9
90.0
450
.833,
003.7
10.
802,
983.5
5-
20.9
629
.87(d
)Pl
ant &
equ
ipm
ent
--
--
--
--
--
-58
,731
.61
58,7
31.6
1-
-23
,173.4
5-
23,17
3.45
--
-(e
)Fu
rnitu
re a
nd fi
xtur
es4,
076.
5219
9.23
-12
4.21
4,151
.543,
023.6
331
3.29
-10
5.77
3,23
1.15
920.
396,
216.
8355
1.79
2,54
9.55
142.5
54,
076.
523,
945.6
054
4.93
1,343
.5912
3.31
3,02
3.63
1,052
.89(f)
Vehi
cles
935.7
153
.98
-10
3.33
886.
3641
2.53
136.
59-
64.6
448
4.48
401.8
82,
246.
0331
.60
1,224
.58117
.3493
5.71
840.
4917
5.70
527.1
276
.5441
2.53
523.1
8(g
)O
ffice
equ
ipm
ent
5,66
3.78
577.8
4-
266.
635,
974.9
94,
723.7
641
4.85
-25
3.77
4,88
4.84
1,090
.1518
,856
.8955
4.55
13,6
30.57
117.0
95,
663.7
815
,863
.08
284.2
811,
313.5
6110
.04
4,72
3.76
940.
02(h
)Le
aseh
old
impr
ovem
ents
11,84
0.14
755.0
1-
335.0
312
,260
.129,
957.6
078
2.70
-23
6.18
10,5
04.12
1,756
.00
16,6
41.26
1,043
.125,
624.8
721
9.37
11,84
0.14
11,66
8.11
932.2
02,
453.2
918
9.42
9,95
7.60
1,882
.54(i)
Com
pute
rs12
,230
.60
1,752
.08
-41
7.42
13,5
65.26
10,5
52.39
1,421
.08
-41
3.95
11,55
9.52
2,00
5.74
3,43
9.63
1,176
.64
(8,4
87.32
)87
2.99
12,2
30.6
02,
260.
381,0
49.51
(8,11
4.24)
871.7
410
,552
.391,6
78.21
(j)El
ectri
cal I
nsta
llatio
n &
equi
pmen
t-
--
--
--
--
--
1,632
.14-
1,632
.14-
-57
1.61
-57
1.61
--
-To
tal (
A)34
,797
.583,
338.
14-
1,246
.62
36,8
89.10
28,6
90.8
73,
069.
31-
1,074
.3130
,685
.87
6,20
3.23
Prev
ious
yea
r (C)
137,8
97.9
43,
357.7
010
4,98
8.72
1,469
.3434
,797
.5861
,326
.432,
987.4
234
,251
.93
1,371
.05
28,6
90.87
6,10
6.71
BIN
TANG
IBLe
Ass
eTs
- oW
Ned
(a)
Com
pute
r sof
twar
e25
,817
.67
5,67
8.99
--
31,4
96.6
618
,007
.393,
140.
27-
-21
,147.6
610
,349
.00
24,6
30.35
6,58
5.27
5,37
8.01
19.9
425
,817
.67
18,4
07.74
3,01
6.29
3,41
2.41
4.23
18,0
07.39
7,810
.28(b
)Te
chni
cal K
now
how
--
--
--
--
--
-57
.29-
57.29
--
57.29
-57
.29-
--
Tota
l (B)
25,8
17.6
75,
678.
99-
-31
,496
.66
18,0
07.39
3,14
0.27
--
21,14
7.66
10,3
49.0
0Pr
evio
us y
ear (
D) 2
4,68
7.64
6,5
85.27
5
,435
.30
19.9
4 2
5,81
7.67
18,4
65.0
3 3
,016
.29
3,4
69.70
4
.23
18,0
07.39
7
,810
.28
Note
: Am
ount
s in
ital
ics re
pres
ent p
revi
ous
year
’s fig
ures
.
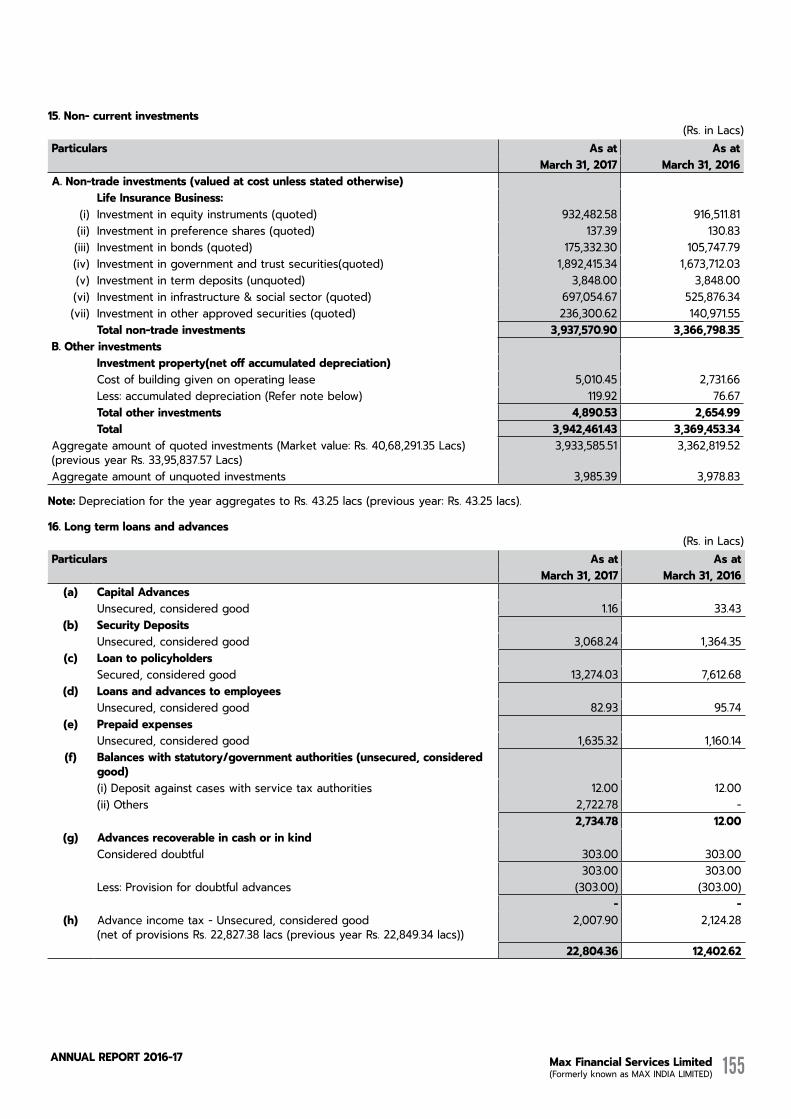
Max Financial Services Limited (Formerly known as MAX INDIA LIMITED)
AnnuAL RepoRt 2016-17 155
15. Non- current investments(Rs. in Lacs)
Particulars As at As atMarch 31, 2017 March 31, 2016
A. Non-trade investments (valued at cost unless stated otherwise) Life Insurance Business:(i) Investment in equity instruments (quoted) 932,482.58 916,511.81 (ii) Investment in preference shares (quoted) 137.39 130.83 (iii) Investment in bonds (quoted) 175,332.30 105,747.79 (iv) Investment in government and trust securities(quoted) 1,892,415.34 1,673,712.03 (v) Investment in term deposits (unquoted) 3,848.00 3,848.00 (vi) Investment in infrastructure & social sector (quoted) 697,054.67 525,876.34 (vii) Investment in other approved securities (quoted) 236,300.62 140,971.55
Total non-trade investments 3,937,570.90 3,366,798.35 B. other investments
Investment property(net off accumulated depreciation)Cost of building given on operating lease 5,010.45 2,731.66 Less: accumulated depreciation (Refer note below) 119.92 76.67 Total other investments 4,890.53 2,654.99 Total 3,942,461.43 3,369,453.34
Aggregate amount of quoted investments (Market value: Rs. 40,68,291.35 Lacs) (previous year Rs. 33,95,837.57 Lacs)
3,933,585.51 3,362,819.52
Aggregate amount of unquoted investments 3,985.39 3,978.83
Note: Depreciation for the year aggregates to Rs. 43.25 lacs (previous year: Rs. 43.25 lacs).
16. Long term loans and advances(Rs. in Lacs)
Particulars As at As atMarch 31, 2017 March 31, 2016
(a) Capital AdvancesUnsecured, considered good 1.16 33.43
(b) Security DepositsUnsecured, considered good 3,068.24 1,364.35
(c) Loan to policyholdersSecured, considered good 13,274.03 7,612.68
(d) Loans and advances to employeesUnsecured, considered good 82.93 95.74
(e) Prepaid expensesUnsecured, considered good 1,635.32 1,160.14
(f) Balances with statutory/government authorities (unsecured, considered good)(i) Deposit against cases with service tax authorities 12.00 12.00 (ii) Others 2,722.78 -
2,734.78 12.00 (g) Advances recoverable in cash or in kind
Considered doubtful 303.00 303.00 303.00 303.00
Less: Provision for doubtful advances (303.00) (303.00) - -
(h) Advance income tax - Unsecured, considered good (net of provisions Rs. 22,827.38 lacs (previous year Rs. 22,849.34 lacs))
2,007.90 2,124.28
22,804.36 12,402.62
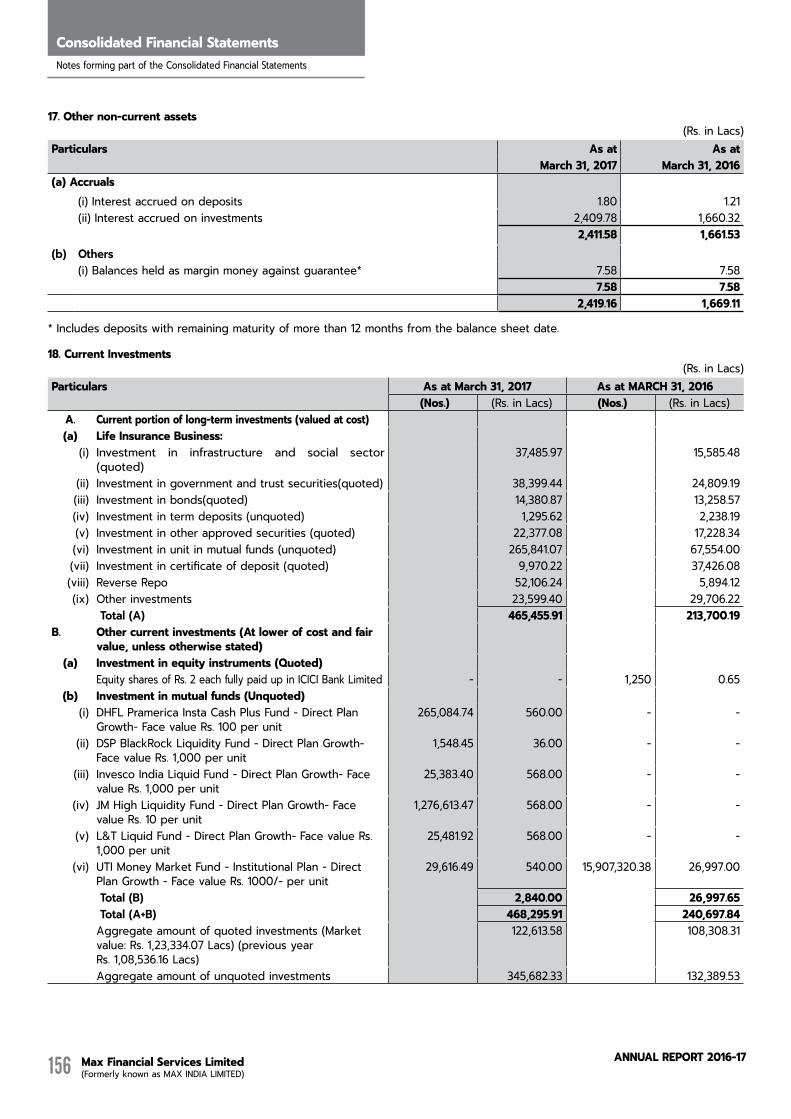
Max Financial Services Limited (Formerly known as MAX INDIA LIMITED)
AnnuAL RepoRt 2016-17156
Consolidated Financial StatementsNotes forming part of the Consolidated Financial Statements
17. other non-current assets(Rs. in Lacs)
Particulars As at As atMarch 31, 2017 March 31, 2016
(a) Accruals(i) Interest accrued on deposits 1.80 1.21 (ii) Interest accrued on investments 2,409.78 1,660.32
2,411.58 1,661.53 (b) others
(i) Balances held as margin money against guarantee* 7.58 7.58 7.58 7.58
2,419.16 1,669.11
* Includes deposits with remaining maturity of more than 12 months from the balance sheet date.
18. Current Investments(Rs. in Lacs)
Particulars As at March 31, 2017 As at MArCH 31, 2016 (Nos.) (Rs. in Lacs) (Nos.) (Rs. in Lacs)
A. Current portion of long-term investments (valued at cost)(a) Life Insurance Business:
(i) Investment in infrastructure and social sector (quoted)
37,485.97 15,585.48
(ii) Investment in government and trust securities(quoted) 38,399.44 24,809.19 (iii) Investment in bonds(quoted) 14,380.87 13,258.57 (iv) Investment in term deposits (unquoted) 1,295.62 2,238.19 (v) Investment in other approved securities (quoted) 22,377.08 17,228.34 (vi) Investment in unit in mutual funds (unquoted) 265,841.07 67,554.00 (vii) Investment in certificate of deposit (quoted) 9,970.22 37,426.08 (viii) Reverse Repo 52,106.24 5,894.12 (ix) Other investments 23,599.40 29,706.22
total (a) 465,455.91 213,700.19 B. other current investments (At lower of cost and fair
value, unless otherwise stated)(a) Investment in equity instruments (Quoted)
Equity shares of Rs. 2 each fully paid up in ICICI Bank Limited - - 1,250 0.65 (b) Investment in mutual funds (Unquoted)
(i) DHFL Pramerica Insta Cash Plus Fund - Direct Plan Growth- Face value Rs. 100 per unit
265,084.74 560.00 - -
(ii) DSP BlackRock Liquidity Fund - Direct Plan Growth- Face value Rs. 1,000 per unit
1,548.45 36.00 - -
(iii) Invesco India Liquid Fund - Direct Plan Growth- Face value Rs. 1,000 per unit
25,383.40 568.00 - -
(iv) JM High Liquidity Fund - Direct Plan Growth- Face value Rs. 10 per unit
1,276,613.47 568.00 - -
(v) L&T Liquid Fund - Direct Plan Growth- Face value Rs. 1,000 per unit
25,481.92 568.00 - -
(vi) UTI Money Market Fund - Institutional Plan - Direct Plan Growth - Face value Rs. 1000/- per unit
29,616.49 540.00 15,907,320.38 26,997.00
total (B) 2,840.00 26,997.65 total (a+B) 468,295.91 240,697.84 Aggregate amount of quoted investments (Market value: Rs. 1,23,334.07 Lacs) (previous year Rs. 1,08,536.16 Lacs)
122,613.58 108,308.31
Aggregate amount of unquoted investments 345,682.33 132,389.53

Max Financial Services Limited (Formerly known as MAX INDIA LIMITED)
AnnuAL RepoRt 2016-17 157
19. Trade receivables (unsecured)(Rs. in Lacs)
Particulars As at As atMarch 31, 2017 March 31, 2016
(a) Trade receivables outstanding for a period exceeding six months from the date they are due for payment - Considered good 320.69 -
320.69 - (b) other trade receivables
- Considered good 52,763.16 51,904.49 - Considered doubtful 272.07 324.62
53,035.23 52,229.11 Less: Provision for doubtful receivables (272.07) (324.62)
52,763.16 51,904.49 total 53,083.85 51,904.49
20. Cash and cash equivalents (Rs. in Lacs)
Particulars As at As atMarch 31, 2017 March 31, 2016
A. Cash and cash equivalents (As per As 3 cash flow statement)(a) Cash on hand 550.91 833.93 (b) Cheques/drafts on hand 6,353.02 4,620.62 (c) Balances with banks
in current accounts 28,153.00 27,642.31 (d) Stamps on hand 316.48 233.67
Total - Cash and cash equivalents (As per As 3 cash flow statement) 35,373.41 33,330.53 B. other bank balances
- In earmarked accounts - unpaid dividend accounts 249.93 231.99Total - other bank balances 249.93 231.99 Total 35,623.34 33,562.52
C. Details of transactions in Specified bank notes (SBNs) and other denomination notes during the period 8 November, 2016 to 30 December, 2016
(In Rupees)Particulars sBNs* other
Denomination notes
Total
Closing Cash in hand as on November 8, 2016 50,000 35,930 85,930 Add : Permitted receipts - 180,283 180,283 Less : Permitted payments - 190,951 190,951 Less : Amount deposited in banks 50,000 - 50,000 Closing Cash in hand as on December 30, 2016 - 25,262 25,262
For the purposes of this note, the term ‘Specified Bank Notes’ shall have the same meaning provided in the notification of the Government of India, in the Ministry of Finance, Department of Economic Affairs number S.O. 3407(E), dated 8 November, 2016.
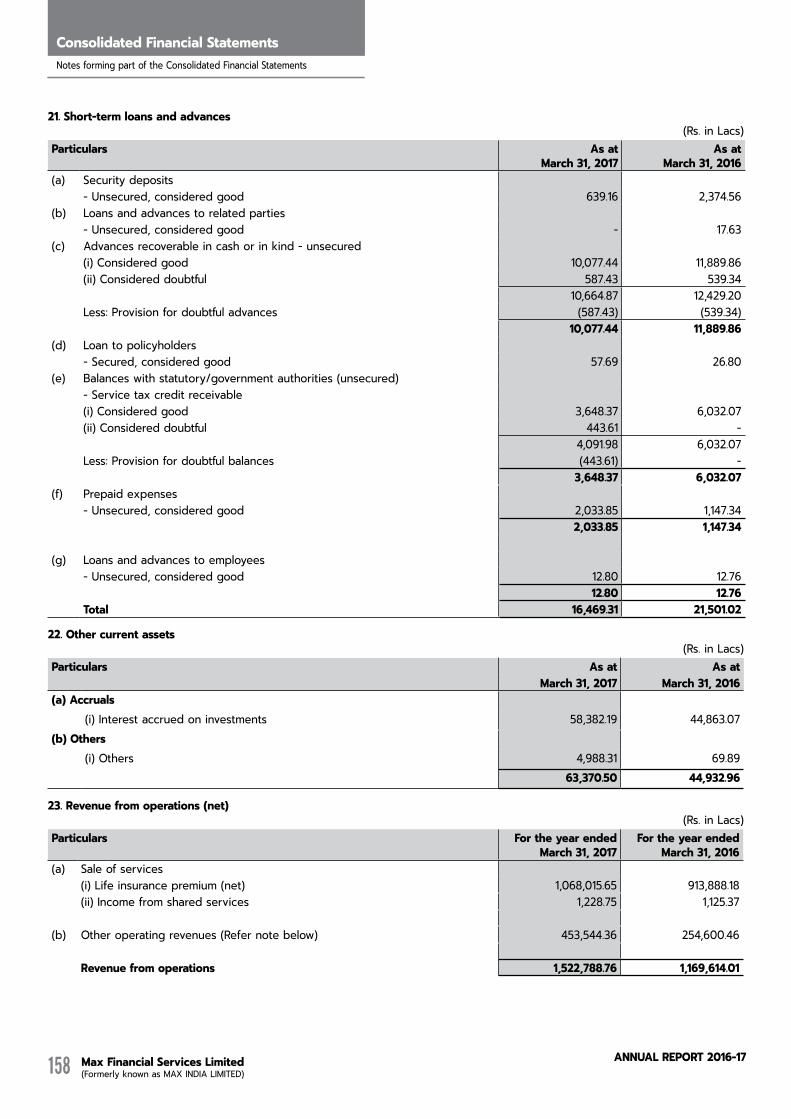
Max Financial Services Limited (Formerly known as MAX INDIA LIMITED)
AnnuAL RepoRt 2016-17158
Consolidated Financial StatementsNotes forming part of the Consolidated Financial Statements
21. short-term loans and advances(Rs. in Lacs)
Particulars As atMarch 31, 2017
As atMarch 31, 2016
(a) Security deposits- Unsecured, considered good 639.16 2,374.56
(b) Loans and advances to related parties- Unsecured, considered good - 17.63
(c) Advances recoverable in cash or in kind - unsecured(i) Considered good 10,077.44 11,889.86(ii) Considered doubtful 587.43 539.34
10,664.87 12,429.20Less: Provision for doubtful advances (587.43) (539.34)
10,077.44 11,889.86(d) Loan to policyholders
- Secured, considered good 57.69 26.80(e) Balances with statutory/government authorities (unsecured)
- Service tax credit receivable(i) Considered good 3,648.37 6,032.07(ii) Considered doubtful 443.61 -
4,091.98 6,032.07Less: Provision for doubtful balances (443.61) -
3,648.37 6,032.07(f) Prepaid expenses
- Unsecured, considered good 2,033.85 1,147.342,033.85 1,147.34
(g) Loans and advances to employees- Unsecured, considered good 12.80 12.76
12.80 12.76Total 16,469.31 21,501.02
22. other current assets(Rs. in Lacs)
Particulars As at As atMarch 31, 2017 March 31, 2016
(a) Accruals(i) Interest accrued on investments 58,382.19 44,863.07
(b) others(i) Others 4,988.31 69.89
63,370.50 44,932.96
23. revenue from operations (net)(Rs. in Lacs)
Particulars For the year endedMarch 31, 2017
For the year endedMarch 31, 2016
(a) Sale of services(i) Life insurance premium (net) 1,068,015.65 913,888.18 (ii) Income from shared services 1,228.75 1,125.37
(b) Other operating revenues (Refer note below) 453,544.36 254,600.46
revenue from operations 1,522,788.76 1,169,614.01

Max Financial Services Limited (Formerly known as MAX INDIA LIMITED)
AnnuAL RepoRt 2016-17 159
Particulars For the year endedMarch 31, 2017
For the year endedMarch 31, 2016
Note:other operating revenue comprise:(i) Dividend income on long term investments 14,401.82 13,814.71 (ii) Interest income on
(a) Government securities 178,764.40 146,862.60 (b) Bonds 40,460.69 34,939.06 (c) Fixed deposits 579.55 635.04 (d) Others 1,358.75 482.78
(iii) Amortisation of discount/(premium) - 1,890.88 (iv) Unrealised gain on long term investments 103,750.11 - (v) Profit on sale of current investments in:
(a) mutual funds 114,226.26 55,975.39 (b) equity instruments 2.78 -
Total other operating revenues 453,544.36 254,600.46
24. other Income(Rs. in Lacs)
Particulars For the year ended For the year endedMarch 31, 2017 March 31, 2016
(a) Interest income on(i) Income tax refund 78.72 - (ii) Loans to employees 3.95 4.50 (iii) Policy loans 989.58 714.64
(b) other non operating income(i) Liabilities/provisions no longer required written back 5.15 1.81 (ii) Policy reinstatement charges 810.96 656.21 (iii) Net Profit on Sale/Disposal of Fixed Assets 56.13 2.62 (iv) Net gain on foreign currency transactions and translation 10.45 - (v) Scrap sales 48.49 55.67 (vi) Rental income 42.00 42.00 (vii) Miscellaneous income 35.89 95.72
total 2,081.32 1,573.17
25. Change in policy reserves(Rs. in Lacs)
Particulars For the year ended For the year endedMarch 31, 2017 March 31, 2016
(a) Change in policy reserves 786,931.47 468,879.70 (b) Transfer to/from Fund for future appropriations-participating policies 10,019.94 12,813.17 total 796,951.41 481,692.87
26. employee benefits expense(Rs. in Lacs)
Particulars For the year ended For the year endedMarch 31, 2017 March 31, 2016
(a) Salaries, wages and bonus 78,503.21 57,451.85 (b) Contribution to provident and other funds (Refer to note 31) 2,860.36 2,991.16 (c) Expense on employee stock option scheme (Refer note 33) 8,994.31 3,245.15 (d) Staff welfare expenses 1,454.78 1,346.24 total 91,812.66 65,034.40

Max Financial Services Limited (Formerly known as MAX INDIA LIMITED)
AnnuAL RepoRt 2016-17160
Consolidated Financial StatementsNotes forming part of the Consolidated Financial Statements
27. Finance cost(Rs. in Lacs)
Particulars For the year ended For the year endedMarch 31, 2017 March 31, 2016
Bank charges 893.26 765.69 total 893.26 765.69
28. Depreciation and amortisation(Rs. in Lacs)
Particulars For the year ended For the year endedMarch 31, 2017 March 31, 2016
(a) Depreciation of tangible assets (Refer note 14) 3,069.31 2,987.42 (b) Amortization of intangible assets (Refer note 14) 3,140.27 3,016.29 (c) Depreciation of investment property (Refer note 15) 43.25 43.25 total 6,252.83 6,046.96
29. other expenses(Rs. in Lacs)
Particulars For the year ended For the year endedMarch 31, 2017 March 31, 2016
(a) Agents' commission for insurance business 93,642.73 82,101.36 (b) Policy issuance cost 17,675.23 9,711.06 (c) Power and fuel 2,587.35 2,212.47 (d) Unrealised loss on long term investment - 102,014.14 (e) Recruitment and training expenses 8,573.31 9,245.39 (f) Rent including lease rentals (Refer note 34) 6,865.07 6,446.06 (g) Insurance 524.23 624.76 (h) Rates and taxes 11,134.56 9,321.55 (i) Repairs and maintenance:
- Building 0.86 0.45 - Others 6,385.02 5,773.27
(j) Printing and stationery 1,074.95 1,215.51 (k) Travelling and conveyance 5,062.39 4,451.00 (l) Communication 4,044.52 2,848.65 (m) Directors' sitting fee 83.42 137.29 (n) Freight and forwarding expenses 607.52 2,385.25 (o) Branding, advertisement and publicity 13,652.60 10,874.17 (p) Provision for doubtful debts and service tax credit receivable 443.61 236.58 (q) Net loss on sale/disposal of fixed assets 0.55 - (r) Doubtful advances written off 49.20 163.62 (s) Fixed assets written off 97.09 50.06 (t) Charity and donation 106.00 1.82 (u) Net loss on foreign currency transactions and translation 4.36 6.53 (v) CSR Expenditure (Refer note (i) below) 1,003.97 979.31 (w) Miscellaneous expenses 1,040.80 867.35
Total 174,659.34 251,667.65
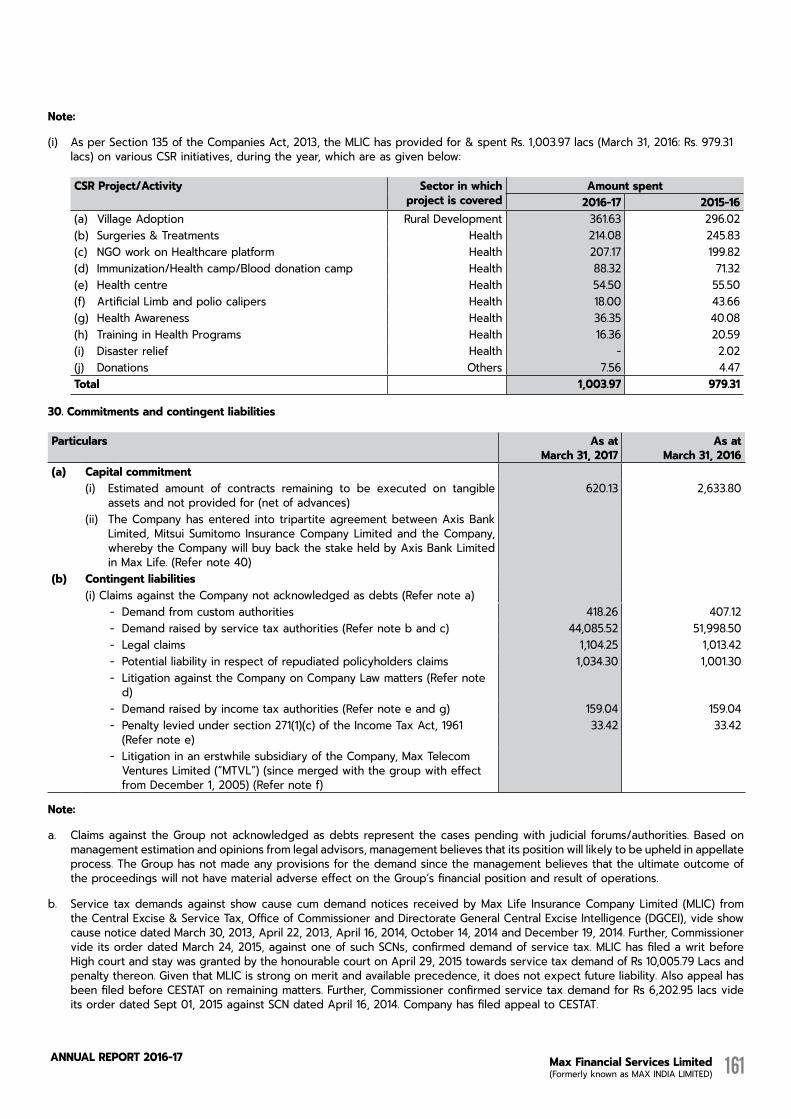
Max Financial Services Limited (Formerly known as MAX INDIA LIMITED)
AnnuAL RepoRt 2016-17 161
Note:
(i) As per Section 135 of the Companies Act, 2013, the MLIC has provided for & spent Rs. 1,003.97 lacs (March 31, 2016: Rs. 979.31 lacs) on various CSR initiatives, during the year, which are as given below:
Csr Project/Activity sector in which project is covered
Amount spent2016-17 2015-16
(a) Village Adoption Rural Development 361.63 296.02(b) Surgeries & Treatments Health 214.08 245.83(c) NGO work on Healthcare platform Health 207.17 199.82(d) Immunization/Health camp/Blood donation camp Health 88.32 71.32(e) Health centre Health 54.50 55.50(f) Artificial Limb and polio calipers Health 18.00 43.66(g) Health Awareness Health 36.35 40.08(h) Training in Health Programs Health 16.36 20.59(i) Disaster relief Health - 2.02(j) Donations Others 7.56 4.47Total 1,003.97 979.31
30. Commitments and contingent liabilities
Particulars As atMarch 31, 2017
As atMarch 31, 2016
(a) Capital commitment(i) Estimated amount of contracts remaining to be executed on tangible
assets and not provided for (net of advances) 620.13 2,633.80
(ii) The Company has entered into tripartite agreement between Axis Bank Limited, Mitsui Sumitomo Insurance Company Limited and the Company, whereby the Company will buy back the stake held by Axis Bank Limited in Max Life. (Refer note 40)
(b) Contingent liabilities(i) Claims against the Company not acknowledged as debts (Refer note a)
- Demand from custom authorities 418.26 407.12 - Demand raised by service tax authorities (Refer note b and c) 44,085.52 51,998.50 - Legal claims 1,104.25 1,013.42 - Potential liability in respect of repudiated policyholders claims 1,034.30 1,001.30
- Litigation against the Company on Company Law matters (Refer note d)
- Demand raised by income tax authorities (Refer note e and g) 159.04 159.04 - Penalty levied under section 271(1)(c) of the Income Tax Act, 1961
(Refer note e) 33.42 33.42
- Litigation in an erstwhile subsidiary of the Company, Max Telecom Ventures Limited (“MTVL”) (since merged with the group with effect from December 1, 2005) (Refer note f)
Note:
a. Claims against the Group not acknowledged as debts represent the cases pending with judicial forums/authorities. Based on management estimation and opinions from legal advisors, management believes that its position will likely to be upheld in appellate process. The Group has not made any provisions for the demand since the management believes that the ultimate outcome of the proceedings will not have material adverse effect on the Group’s financial position and result of operations.
b. Service tax demands against show cause cum demand notices received by Max Life Insurance Company Limited (MLIC) from the Central Excise & Service Tax, Office of Commissioner and Directorate General Central Excise Intelligence (DGCEI), vide show cause notice dated March 30, 2013, April 22, 2013, April 16, 2014, October 14, 2014 and December 19, 2014. Further, Commissioner vide its order dated March 24, 2015, against one of such SCNs, confirmed demand of service tax. MLIC has filed a writ before High court and stay was granted by the honourable court on April 29, 2015 towards service tax demand of Rs 10,005.79 Lacs and penalty thereon. Given that MLIC is strong on merit and available precedence, it does not expect future liability. Also appeal has been filed before CESTAT on remaining matters. Further, Commissioner confirmed service tax demand for Rs 6,202.95 lacs vide its order dated Sept 01, 2015 against SCN dated April 16, 2014. Company has filed appeal to CESTAT.

Max Financial Services Limited (Formerly known as MAX INDIA LIMITED)
AnnuAL RepoRt 2016-17162
Consolidated Financial StatementsNotes forming part of the Consolidated Financial Statements
c. The Group has not made any provision for the demands in Excise, Service Tax, Sales Tax, Customs, Entry Tax and legal claims as the Group believes that they have a favourable case based on existing judicial pronouncements. The advance paid against the above is Rs. 12.00 Lacs (previous year: Rs. 12.00 Lacs).
d. On an inspection carried out by the Ministry of Corporate Affairs in the year 2006, certain technical offences were alleged by the Inspection Officer based on which prosecution proceedings were initiated against the Company, its erstwhile Whole-time Directors and the Company Secretary at Chief Judicial Magistrate, Chandigarh. The group filed writ petitions against the prosecution proceedings with the Hon’ble High Court of Punjab & Haryana. The High Court stayed the proceedings and listed the case for arguments. The amount of liability/fine or penalty on account of the above is currently unascertainable. Based on the legal opinion obtained by the group management believes that the group have a good case and no provision is required to be made in the financials statements.
e. Income tax cases represent the cases pending with Income Tax authorities/Appellate authorities. Based on management estimation, future cash outflow in respect of these cases are determinable only on receipt of judgments / decisions pending with various courts/authorities. The Company has not made any provision for the demands in income tax cases as the group believes that they have a good case based on existing judicial pronouncements.
f. Litigation in an erstwhile subsidiary of the Company, Max Telecom Ventures Limited (“MTVL”) (since merged with the Company with effect from December 1, 2005)
S. No. Assessment Year
Brief description Pending Before
1 1998-99 The capital gains realized by MTVL from the sale of shares of Hutchison Max Telecom Limited (“HMTL”) [1st Stake Sale] were denied exemption under section 10(23G) of the Income-tax Act, 1961 (“the Act”) by the Assessing Officer vide order dated March 28, 2001 and the sale transaction was held to be chargeable to tax in the financial year relevant to Assessment Year 1998-99 (MTVL had claimed that it pertained to AY 1999-2000). This resulted in a demand of Rs. 9,503.93 Lacs. On appeal by MTVL, the CIT (Appeals) vide order dated March 18, 2002 [while concluding that the sale transaction pertained to financial year relevant to Assessment Year 1998-99], quashed the order of the Assessing Officer denying exemption under section 10(23G), thereby cancelling the demand. The Tax Department has filed an appeal with the Income-tax Appellate Tribunal (ITAT) against this order which is pending as on date.
ITAT
2 1999-2000 Subsequently, in the next Assessment Year i.e. 1999-00, the above-mentioned transaction was once again sought to be taxed both as capital gains and under a different head of income (i.e. business income) on a protective basis by the Assessing Officer vide order dated March 28, 2002 as MTVL had claimed that the transaction pertained to Assessment Year 1999-00 and not Assessment Year 1998-99. This, along with a few other additions, resulted in creation of a further demand of Rs. 24,993.19 Lacs which included the demand of Rs. 24,368.00 Lacs on protective basis. On appeal by MTVL, the CIT (Appeals) decided in favour of MTVL vide order dated December 18, 2002 and the demand was cancelled. The Tax Department has filed appeal against this order with the ITAT, which is pending as on date.
ITAT
3 1998-99 MTVL also filed an appeal before ITAT for Assessment Year 1998-99 contending that the aforesaid sale transaction pertained to financial year relevant to Assessment Year 1999-2000. This was disposed off by ITAT vide order dated March 23, 2007 by applying a circular of Tax Department applicable only to capital gains and holding, as a result, that the transaction of sale of shares pertained to financial year relevant to Assessment Year 1998-99. However, the Tax Authorities filed a petition before the ITAT requesting a review of the said order of the ITAT on the ground that all the matters pertaining to the aforesaid sale transaction should have been clubbed and heard together. The said petition of the Department was accepted by the ITAT vide order dated March 27, 2009 by recalling its earlier order. Aggrieved, the Company filed a writ petition to the Hon'ble High Court of Punjab and Haryana (HC) challenging the above action of ITAT on the ground that the same was beyond jurisdiction. The HC vide order dated May 04, 2009 admitted the writ petition and stayed the operations of the said order of ITAT. The ITAT, thereafter, adjourned sine-die all the matters pending operation of the stay imposed by the HC. The Department, subsequently, moved a Special Leave Petition (SLP) to Hon’ble Supreme Court against the stay granted by Hon’ble HC. The SLP was dismissed by the Hon’ble Supreme Court vide order dated May 12, 2010 with a direction to the HC to expeditiously dispose the writ petition filed by MTVL, which is pending as of date.
High Court
4 2006-07 The capital gains realized from the sale of remaining shares of HMTL [2nd Stake Sale] were taxed by holding the gains from sale transaction to be in the nature of business income and not capital gains and as a consequence exemption under Section 10(23G) of the Act was denied by the Assessing Officer vide order dated December 31, 2009 and a demand of Rs. 15,585.17 Lacs was raised. MTVL filed an appeal against the said order. The CIT(Appeals), vide order dated March 22, 2011, had quashed the assessment framed by the Assessing Officer, holding that the assessment was nullity in law and in view of the fact that the order was framed in the name of MTVL, an entity which had ceased to exist w.e.f. December 1, 2005. As a consequence, the demand stood cancelled.
High Court

Max Financial Services Limited (Formerly known as MAX INDIA LIMITED)
AnnuAL RepoRt 2016-17 163
The Department had filed an appeal to ITAT against the said order of CIT(Appeals). The ITAT vide its order dated March 8, 2013 has upheld the order of CIT(Appeals). The Tax Department has filed appeal against this order with the Hon'ble HC, which is pending as on date and listed for hearing on July 7, 2015.
5 2006-07 Consequent to quashing of the first proceedings in the name of MTVL, the Department initiated proceedings against Max India Limited as Successor of MTVL u/s 147 of the Act vide notice dated April 26, 2011. These proceedings had been completed on March 26, 2013 by holding the gains from sale transaction to be in the nature of business income and not capital gains and consequently denying exemption under Section 10(23G) of the Act and a demand of Rs. 19,816.25 Lacs had been raised. The company had filed an appeal against the same on April 25, 2013 and obtained stay of demand on May 27, 2013. The CIT(Appeals), vide order dated November 18, 2013, held on merits that the gain arising from sale of shares of HMTL be treated as long term capital gains and allowed the exemption u/s 10(23G) of the Act in respect of long term capital gain arising on sale of shares of HMTL be allowed to MTVL. The CIT(A), however, upheld reassessment proceedings by the Assessing Officer under section 147 of the Act as valid. As a consequence, the demand stood cancelled. Pursuant to this, the Tax Department has filed appeal against this order and MTVL has also filed cross objections before the ITAT against the action of the CIT(A) upholding the validity of re-assessment proceedings. Both appeals are pending as on date.
ITAT
g) Max Life Insurance Company Limited (“MLIC”)
A.Y. Issue Pending before2002-2003 The Assessing Officer has reduced the returned loss of Rs. 6,684.09 Lacs to Rs. 6,482.08 Lacs
by making disallowance of Rs. 202.01 Lacs u/s 92CA(3) of the Income-tax Act, 1961 relating to Transfer Pricing.
ITAT
2003-04 The returned losses have been reduced from Rs. 7,408.37 Lacs to Rs. 7,331.92 Lacs by the Assessing Officer.
ITAT
2004-05 The returned losses have been reduced from Rs. 7,563.42 Lacs to Rs. 7,285.17 Lacs by the Assessing Officer.
ITAT
2005-06 The returned loss has been reduced from Rs. 9,427.20 Lacs to Rs. 9,199.80 Lacs by making disallowance of Rs. 121.70 Lacs u/s 92CA(3) of the Income Tax Act, 1961 relating to Transfer Pricing and Rs. 105.70 Lacs due to disallowance of loss on sale of investment. CIT (Appeals) has passed favourable orders for all the above mentioned assessment years i.e 2002-03 to 2005-06.
ITAT
2006-07 The returned loss has been reduced from Rs. 5,805.44 Lacs to Rs. 5414.09 Lacs by making disallowance of Rs. 11.83 Lacs u/s 92CA(3) of the Income Tax Act, 1961 relating to Transfer Pricing, Rs. 90.48 Lacs due to disallowance of loss on sale of investment, Rs. 255.75 Lacs on provision for FBT and Rs. 33.28 Lacs on provision for bad & doubtful debts.
ITAT
2007-08 the returned loss has been reduced from Rs. 5,671.22 Lacs to Rs. 5023.02 Lacs by making disallowance of Rs. 270.19 Lacs on account of loss on sale of investment, Rs. 311.43 Lacs on provision for FBT and Rs. 58.08 Lacs on provision for bad & doubtful debts & Rs. 8.50 Lacs on donation paid. CIT(A) has decided in favour of company except on disallowance of FBT provision & income on sale of investment. The company has filled the appeal with ITAT also we have filed cross objections with ITAT against the appeal filed by DCIT to ITAT.
ITAT
2008-09 The returned loss for AY 2008-09 has been reduced from Rs. 14,684.45 Lacs to Rs. 13,471.61 Lacs by making disallowance of Rs. 635.02 Lacs on account of loss on sale of investment, Rs. 468.91 Lacs on provision for FBT and Rs. 100.03 Lacs on provision for bad & doubtful debts & Rs. 8.88 Lacs on donation paid. CIT(A) has decided in favour of company except on disallowance of FBT provision & income on sale of investment. The company has filled the appeal with ITAT also we have filed cross objections with ITAT against the appeal filed by DCIT to ITAT.
ITAT
2009-10 The returned loss has been reduced from Rs. 32,270.85 Lacs to Rs. 30,449.38 Lacs by making disallowance of Rs. 653.53 Lacs on account of loss on sale of investment, Rs. 794.30 Lacs for provision for FBT, Rs. 132.13 Lacs for provision for bad & doubtful debts & Rs.241.51 Lacs for donation paid. CIT(A) has decided in favour of company except on disallowance of FBT provision & income on sale of investment. The company has filled the appeal with ITAT also we have filed cross objections with ITAT against the appeal filed by DCIT to ITAT.
ITAT
2010-11 Assessing Officer has increased the returned income from Rs. 4,005.06 Lacs to Rs. 5,684.41 Lacs by adding back Rs. 710.43 Lacs on account of profit on sale of investment & making disallowance of Rs. 21.60 Lacs for provision for Bad debts, Rs.250 Lacs for donation paid, Rs. 695.65 Lacs for Short deduction and payment of TDS and Rs. 1.67 Lacs for Penalties/Fine paid & Share issue expenses. CIT(A) has passed order whereby allowed Income on Sale of Investments, Provision for bad Debts in PH account, short deduction of TDS. CIT(A) has raised certain other additional issues on which Max Life has approached ITAT.
ITAT

Max Financial Services Limited (Formerly known as MAX INDIA LIMITED)
AnnuAL RepoRt 2016-17164
Consolidated Financial StatementsNotes forming part of the Consolidated Financial Statements
A.Y. Issue Pending before2011-12 Assessing Officer has increased the returned income from Rs. 27,141.14 Lacs to Rs. 28,586.14. Lacs
by adding back Rs. 751.62 Lacs on account of profit on sale of investment & making disallowance of Rs. 314.71 Lacs for provision for Bad debts, Rs.250.01 Lacs for donation paid and Rs. 128.66 Lacs for Short deduction and payment of TDS.
CIT (Appeals)
2012-13 Assessing Officer has increased the returned income from Rs. 49,182.04 Lacs to Rs. 51,931.77. Lacs by adding back Rs. 1505.52 Lacs on account of profit on sale of investment & making disallowance of Rs. 194.21 Lacs for provision for Bad debts, Rs.1050.00 Lacs for donation paid .
CIT (Appeals)
2013-14 Assessing Officer has increased the returned income from Rs. 44,927.02 Lacs to Rs. 47,249.28 Lacs by adding back Rs. 1,845.42 Lacs on account of profit on sale of investment, disallowance of Rs. 276.84 Lacs for provision for Bad debts & Rs.200.00 Lacs for donation paid .
CIT (Appeals)
2014-15 Assessing Officer has increased the returned income from Rs. 47,419.55 Lacs to Rs. 95,367.68 Lacs by making certain disallowances.
CIT (Appeals)
The Company is hopeful that above appeals will be disposed off in its favour.
31. retirement benefit plans
(i) defined contribution plans
The Group makes provident fund and employees state insurance scheme contributions which are defined contribution plans for qualifying employees. Under the schemes, the Group is required to contribute a specified percentage of the payroll costs to fund the benefits. The contribution as specified under the law are paid to the provident fund trust set up by the Group. The Group is liable for annual PF contributions and any deficiency in interest cost compared to interest computed based on the rate of interest declared by the Central Government under the Employees’ Provident Fund Scheme, 1952 and recognises, if any, as an expense in the year it is determined.
As of 31 March, 2017, the fair value of the assets of the fund and the accumulated members’ corpus is Rs. 37,607.05 lacs (previous year: Rs. 33,513.81 lacs) and Rs. 37,042.76 lacs (previous year: Rs. 33,280.53 lacs) respectively. In accordance with an actuarial valuation, there is no deficiency in the interest cost as the present value of the expected future earnings on the fund is greater than the expected amount to be credited to the individual members based on the expected guaranteed rate of interest of 8.65%. The actuarial assumptions include discount rate of 6.67% and an average expected future period of 27.11 years.
The Group recognised Rs. 2,042.72 lacs (previous year: Rs. 1,862.75 lacs) for provident fund and Rs. 153.06 lacs (previous year: Rs. 51.16 lacs) for employee state insurance scheme contributions in the Statement of Profit and Loss. The contributions payable to these plans by the Group are at rates specified in the rules to the scheme.
(ii) Defined benefit plans
The Company and its subsidiary makes annual contribution to their Employees Gratuity Fund maintained with Life Insurance Corporation of India and Max Life Insurance Company Limited respectively, a funded defined benefit plan for eligible employees. The scheme provides for lump sum payment to vested employees at retirement, death while in employment or on termination of employment of an amount equivalent to 15 days salary payable for each completed year of service or part thereof in excess of 6 months. Vesting occurs upon completion of 5 years of service.
The present value of the defined benefit obligation and the related current service cost were measured using the Projected Unit Credit Method with actuarial valuations being carried out at each balance sheet date.
The following tables set out the funded status of the defined benefit scheme and amounts recognised in the Company financial statements as at March 31, 2017:
(Rs. in Lacs)Particulars Year ended
March 31, 2017Year ended
March 31, 2016Components of employer expenseCurrent service cost 525.40 474.93 Interest cost 227.40 213.76 Expected return on plan assets (153.92) (113.54)Actuarial losses/(gains) 75.59 502.10 Adjustment in fair value of plan assets (9.89) -Total expense recognised in the statement of Profit and Loss 664.58 1,077.25 Actual contribution and benefit payments for yearActual benefit payments (447.22) 504.00 Actual contributions - - Net asset / (liability) recognised in the Balance sheet

Max Financial Services Limited (Formerly known as MAX INDIA LIMITED)
AnnuAL RepoRt 2016-17 165
(Rs. in Lacs)Particulars Year ended
March 31, 2017Year ended
March 31, 2016Present value of defined benefit obligation 3,546.86 3,281.14 Fair value of plan assets 2,648.37 1,071.68 Net asset / (liability) recognised in the Balance sheet (898.49) (2,209.46)Net liability has been classified under:Long-term provisions 717.55 2,158.47 Short-term provisions 180.94 50.99 Change in defined benefit obligations (dBo) during the yearPresent value of DBO at beginning of the year 3,281.14 4,725.49 Transfer of liability on account of demerger - (2,050.13)Current service cost 525.40 474.93 Interest cost 227.40 213.76 Actuarial loss/(gains) 111.75 421.09 Benefits paid (598.83) (504.00)Present value of dBo at the end of the year 3,546.86 3,281.14 Change in fair value of assets during the yearPlan assets at the beginning of the year 1,071.68 2,107.09 Transfer of assets on account of demerger - (563.94)Expected return on plan assets 153.92 113.54 Adjustment in fair value of plan assets 9.89 - Actual group contributions 1,827.24 - Actuarial (loss)/gains 35.42 (81.01)Benefits paid (449.78) (504.00)Plan assets at the end of the year 2,648.37 1,071.68
Particulars Year ended Year endedMarch 31, 2017 March 31, 2016
Principal actuarial assumptions for gratuity and compensated absences:Discount rate 6.50%-7.40% 7.40%-7.50%Expected return on plan assets 8.35%-8.70% 8.35%-8.70%Salary escalation 7.50%-10% 7.50%-10%Retirement age 58 years 58 yearsMortality tables IALM
(2006 - 08) IALM
(2006 - 08) Attrition (%)All Ages 5%-25% per annum 5%-25% per annum Estimate of amount of contribution in the immediate next year Rs. in Lacs 692.32 363.19
Notes:
a. The discount rate is based on the prevailing market yields of Indian Government securities as at the balance sheet date for the estimated term of obligations.
b. The estimates of future salary increases considered takes into account the inflation, seniority, promotion and other relevant factors.
c. The planned assets of the Group are managed by the Life Insurance Corporation of India and Max Life Insurance Company Limited in terms of an insurance policy taken to fund obligations of the Group with respect to its gratuity plan. Information on categories of plan assets is not available with the Group.
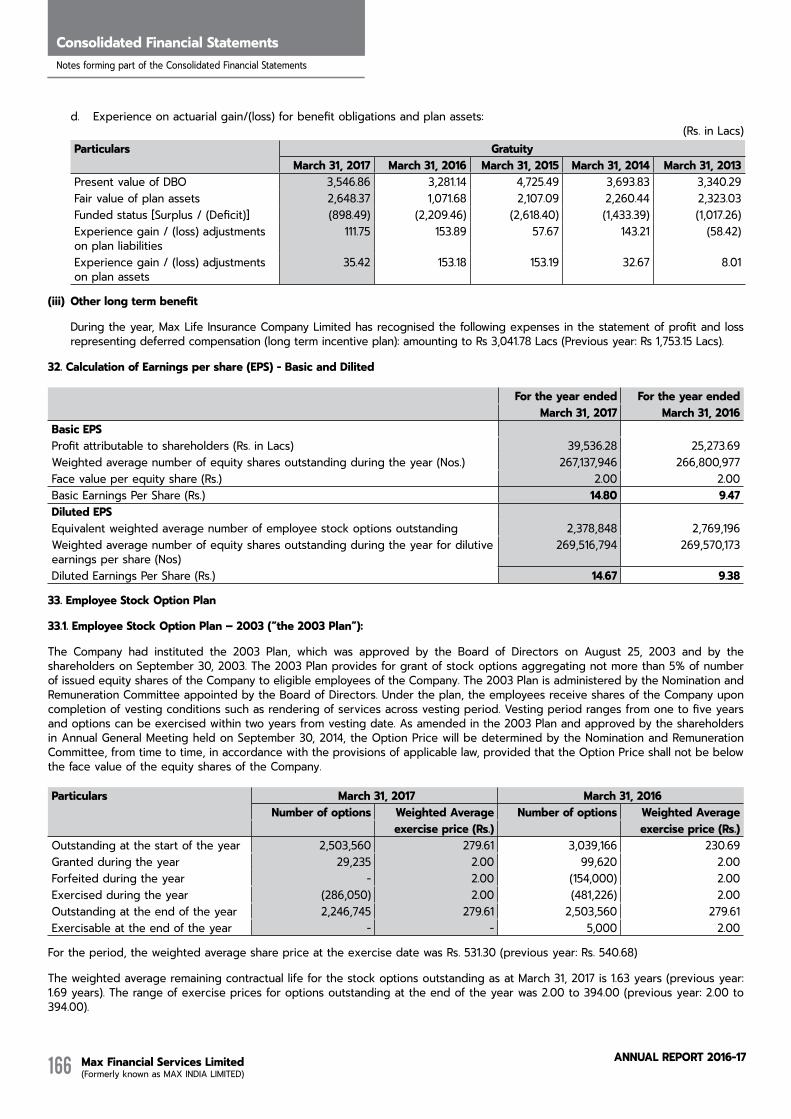
Max Financial Services Limited (Formerly known as MAX INDIA LIMITED)
AnnuAL RepoRt 2016-17166
Consolidated Financial StatementsNotes forming part of the Consolidated Financial Statements
d. Experience on actuarial gain/(loss) for benefit obligations and plan assets:(Rs. in Lacs)
Particulars GratuityMarch 31, 2017 March 31, 2016 March 31, 2015 March 31, 2014 March 31, 2013
Present value of DBO 3,546.86 3,281.14 4,725.49 3,693.83 3,340.29 Fair value of plan assets 2,648.37 1,071.68 2,107.09 2,260.44 2,323.03 Funded status [Surplus / (Deficit)] (898.49) (2,209.46) (2,618.40) (1,433.39) (1,017.26)Experience gain / (loss) adjustments on plan liabilities
111.75 153.89 57.67 143.21 (58.42)
Experience gain / (loss) adjustments on plan assets
35.42 153.18 153.19 32.67 8.01
(iii) other long term benefit
During the year, Max Life Insurance Company Limited has recognised the following expenses in the statement of profit and loss representing deferred compensation (long term incentive plan): amounting to Rs 3,041.78 Lacs (Previous year: Rs 1,753.15 Lacs).
32. Calculation of earnings per share (ePs) - Basic and dilited
For the year ended For the year endedMarch 31, 2017 March 31, 2016
Basic ePsProfit attributable to shareholders (Rs. in Lacs) 39,536.28 25,273.69 Weighted average number of equity shares outstanding during the year (Nos.) 267,137,946 266,800,977 Face value per equity share (Rs.) 2.00 2.00 Basic Earnings Per Share (Rs.) 14.80 9.47 Diluted EPSEquivalent weighted average number of employee stock options outstanding 2,378,848 2,769,196 Weighted average number of equity shares outstanding during the year for dilutive earnings per share (Nos)
269,516,794 269,570,173
Diluted Earnings Per Share (Rs.) 14.67 9.38
33. employee stock option Plan
33.1. employee stock option Plan – 2003 (“the 2003 Plan”):
The Company had instituted the 2003 Plan, which was approved by the Board of Directors on August 25, 2003 and by the shareholders on September 30, 2003. The 2003 Plan provides for grant of stock options aggregating not more than 5% of number of issued equity shares of the Company to eligible employees of the Company. The 2003 Plan is administered by the Nomination and Remuneration Committee appointed by the Board of Directors. Under the plan, the employees receive shares of the Company upon completion of vesting conditions such as rendering of services across vesting period. Vesting period ranges from one to five years and options can be exercised within two years from vesting date. As amended in the 2003 Plan and approved by the shareholders in Annual General Meeting held on September 30, 2014, the Option Price will be determined by the Nomination and Remuneration Committee, from time to time, in accordance with the provisions of applicable law, provided that the Option Price shall not be below the face value of the equity shares of the Company.
Particulars March 31, 2017 March 31, 2016 Number of options Weighted Average Number of options Weighted Average
exercise price (Rs.) exercise price (Rs.)Outstanding at the start of the year 2,503,560 279.61 3,039,166 230.69 Granted during the year 29,235 2.00 99,620 2.00 Forfeited during the year - 2.00 (154,000) 2.00 Exercised during the year (286,050) 2.00 (481,226) 2.00 Outstanding at the end of the year 2,246,745 279.61 2,503,560 279.61 Exercisable at the end of the year - - 5,000 2.00
For the period, the weighted average share price at the exercise date was Rs. 531.30 (previous year: Rs. 540.68)
The weighted average remaining contractual life for the stock options outstanding as at March 31, 2017 is 1.63 years (previous year: 1.69 years). The range of exercise prices for options outstanding at the end of the year was 2.00 to 394.00 (previous year: 2.00 to 394.00).
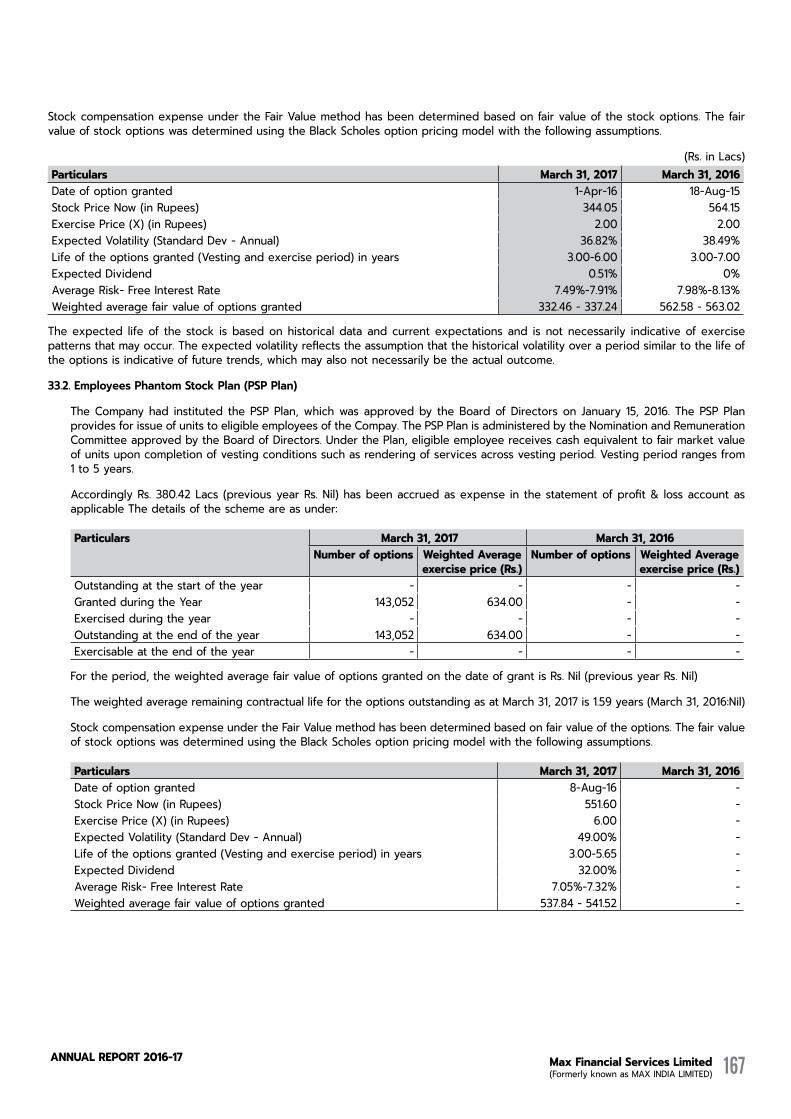
Max Financial Services Limited (Formerly known as MAX INDIA LIMITED)
AnnuAL RepoRt 2016-17 167
Stock compensation expense under the Fair Value method has been determined based on fair value of the stock options. The fair value of stock options was determined using the Black Scholes option pricing model with the following assumptions.
(Rs. in Lacs)Particulars March 31, 2017 March 31, 2016 Date of option granted 1-Apr-16 18-Aug-15Stock Price Now (in Rupees) 344.05 564.15 Exercise Price (X) (in Rupees) 2.00 2.00 Expected Volatility (Standard Dev - Annual) 36.82% 38.49%Life of the options granted (Vesting and exercise period) in years 3.00-6.00 3.00-7.00 Expected Dividend 0.51% 0%Average Risk- Free Interest Rate 7.49%-7.91% 7.98%-8.13%Weighted average fair value of options granted 332.46 - 337.24 562.58 - 563.02
The expected life of the stock is based on historical data and current expectations and is not necessarily indicative of exercise patterns that may occur. The expected volatility reflects the assumption that the historical volatility over a period similar to the life of the options is indicative of future trends, which may also not necessarily be the actual outcome.
33.2. employees Phantom Stock Plan (PSP Plan)
The Company had instituted the PSP Plan, which was approved by the Board of Directors on January 15, 2016. The PSP Plan provides for issue of units to eligible employees of the Compay. The PSP Plan is administered by the Nomination and Remuneration Committee approved by the Board of Directors. Under the Plan, eligible employee receives cash equivalent to fair market value of units upon completion of vesting conditions such as rendering of services across vesting period. Vesting period ranges from 1 to 5 years.
Accordingly Rs. 380.42 Lacs (previous year Rs. Nil) has been accrued as expense in the statement of profit & loss account as applicable The details of the scheme are as under:
Particulars March 31, 2017 March 31, 2016Number of options Weighted Average
exercise price (Rs.)Number of options Weighted Average
exercise price (Rs.)Outstanding at the start of the year - - - - Granted during the Year 143,052 634.00 - - Exercised during the year - - - - Outstanding at the end of the year 143,052 634.00 - - Exercisable at the end of the year - - - -
For the period, the weighted average fair value of options granted on the date of grant is Rs. Nil (previous year Rs. Nil)
The weighted average remaining contractual life for the options outstanding as at March 31, 2017 is 1.59 years (March 31, 2016:Nil)
Stock compensation expense under the Fair Value method has been determined based on fair value of the options. The fair value of stock options was determined using the Black Scholes option pricing model with the following assumptions.
Particulars March 31, 2017 March 31, 2016 Date of option granted 8-Aug-16 - Stock Price Now (in Rupees) 551.60 - Exercise Price (X) (in Rupees) 6.00 - Expected Volatility (Standard Dev - Annual) 49.00% - Life of the options granted (Vesting and exercise period) in years 3.00-5.65 - Expected Dividend 32.00% - Average Risk- Free Interest Rate 7.05%-7.32% - Weighted average fair value of options granted 537.84 - 541.52 -

Max Financial Services Limited (Formerly known as MAX INDIA LIMITED)
AnnuAL RepoRt 2016-17168
Consolidated Financial StatementsNotes forming part of the Consolidated Financial Statements
33.3. Max Life Insurance Company Limited
employee Phantom option Plan (Cash settled):
During the year ended March 31, 2013, the Company had issued Employee Phantom Stock Plan (EPOP) w.e.f. August 1, 2012.
During the previous year ended March 31, 2015, the Company had issued Employee Phantom Stock Plan (EPOP) w.e.f. July 01, 2014, September 25, 2014 and December 01, 2014. Further, during the year ended March 31, 2016, the Company issued Employee Phantom Stock Plan (EPOP) w.e.f. October 30th, 2015 and January 1st, 2016. Accordingly Rs. 8,181.73 Lacs (previous year Rs. 2679.85 Lacs) has been accrued as expense in the statement of profit & loss account as applicable The details of the scheme are as under:
Particulars March 31, 2017 March 31, 2016Number of options Weighted Average
exercise price (Rs.)Number of options Weighted Average
exercise price (Rs.)Outstanding at the start of the year 34,681,000 32.09 23,969,000 32.09 Granted during the Year - 0.00 14,585,000 50.48 Forfeited during the year (2,896,000) 32.09 (2,428,000) 32.09Exercised during the year (7,869,000) 32.09 (1,445,000) 32.09 Outstanding at the end of the year 23,916,000 32.09 34,681,000 39.82
The Key assumptions used to estimate fair value of options are:
Particulars March 31, 2017 March 31, 2016Risk-free interest rate 6.44%-6.85% 7.13%-7.89%Expected life 1.25-4.67 Years 0.33-5.67 YearsExpected Volatility 36.82% 17.22%Expected dividend yield 1.22% 1.95%
The expected life of the stock is based on historical data and current expectations and is not necessarily indicative of exercise patterns that may occur. The expected volatility reflects the assumption that the historical volatility over a period similar to the life of the options is indicative of future trends, which may also not necessarily be the actual outcome.
The Group measures the cost of ESOP using the intrinsic value method. Had the company used the fair value model to determine compensation, its profit after tax and earnings per share as reported would have changed to the amounts indicated below:
Particulars For the year ended For the year ended March 31, 2017 March 31, 2016
Net Profit after tax and minority interest as reported (Rs. in Lacs) 39,536.28 25,273.69 Add: Employee stock compensation under intrinsic value method (Rs. in Lacs) 8,994.31 3,245.15 Less: Employee stock compensation under fair value method (Rs. in Lacs) (10,114.80) (4,689.15)Proforma profit (Rs. in Lacs) 38,415.79 23,829.69
Earnings Per ShareBasic - As reported 14.80 9.47 - Performa 14.38 8.93 Diluted - As reported 14.67 9.38 - Performa 14.25 8.84
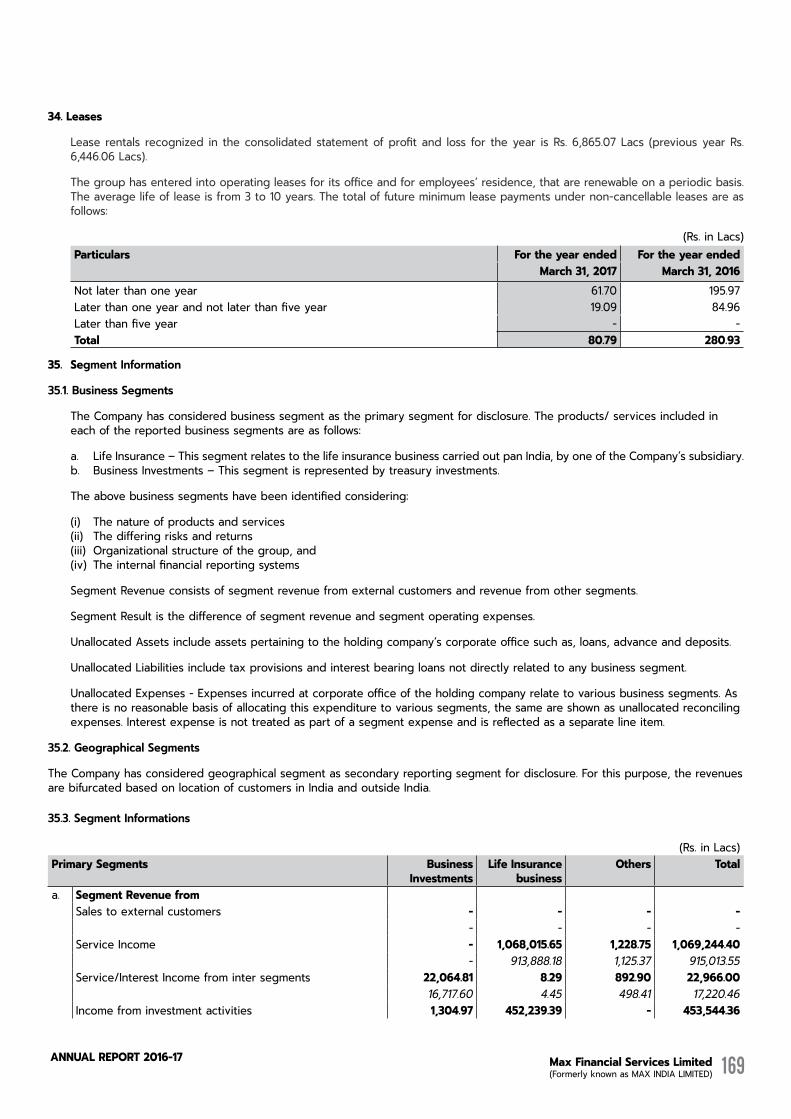
Max Financial Services Limited (Formerly known as MAX INDIA LIMITED)
AnnuAL RepoRt 2016-17 169
34. Leases
Lease rentals recognized in the consolidated statement of profit and loss for the year is Rs. 6,865.07 Lacs (previous year Rs. 6,446.06 Lacs).
The group has entered into operating leases for its office and for employees’ residence, that are renewable on a periodic basis. The average life of lease is from 3 to 10 years. The total of future minimum lease payments under non-cancellable leases are as follows:
(Rs. in Lacs)Particulars For the year ended For the year ended
March 31, 2017 March 31, 2016Not later than one year 61.70 195.97 Later than one year and not later than five year 19.09 84.96 Later than five year - - Total 80.79 280.93
35. Segment information
35.1. Business Segments
The Company has considered business segment as the primary segment for disclosure. The products/ services included in each of the reported business segments are as follows:
a. Life Insurance – This segment relates to the life insurance business carried out pan India, by one of the Company’s subsidiary.b. Business Investments – This segment is represented by treasury investments.
The above business segments have been identified considering:
(i) The nature of products and services(ii) The differing risks and returns(iii) Organizational structure of the group, and(iv) The internal financial reporting systems
Segment Revenue consists of segment revenue from external customers and revenue from other segments.
Segment Result is the difference of segment revenue and segment operating expenses.
Unallocated Assets include assets pertaining to the holding company’s corporate office such as, loans, advance and deposits.
Unallocated Liabilities include tax provisions and interest bearing loans not directly related to any business segment.
Unallocated Expenses - Expenses incurred at corporate office of the holding company relate to various business segments. As there is no reasonable basis of allocating this expenditure to various segments, the same are shown as unallocated reconciling expenses. Interest expense is not treated as part of a segment expense and is reflected as a separate line item.
35.2. Geographical Segments
The Company has considered geographical segment as secondary reporting segment for disclosure. For this purpose, the revenues are bifurcated based on location of customers in India and outside India.
35.3. Segment informations
(Rs. in Lacs)Primary Segments Business
InvestmentsLife Insurance
businessothers Total
a. segment revenue fromSales to external customers - - - -
- - - - Service Income - 1,068,015.65 1,228.75 1,069,244.40
- 913,888.18 1,125.37 915,013.55 Service/Interest Income from inter segments 22,064.81 8.29 892.90 22,966.00
16,717.60 4.45 498.41 17,220.46 Income from investment activities 1,304.97 452,239.39 - 453,544.36
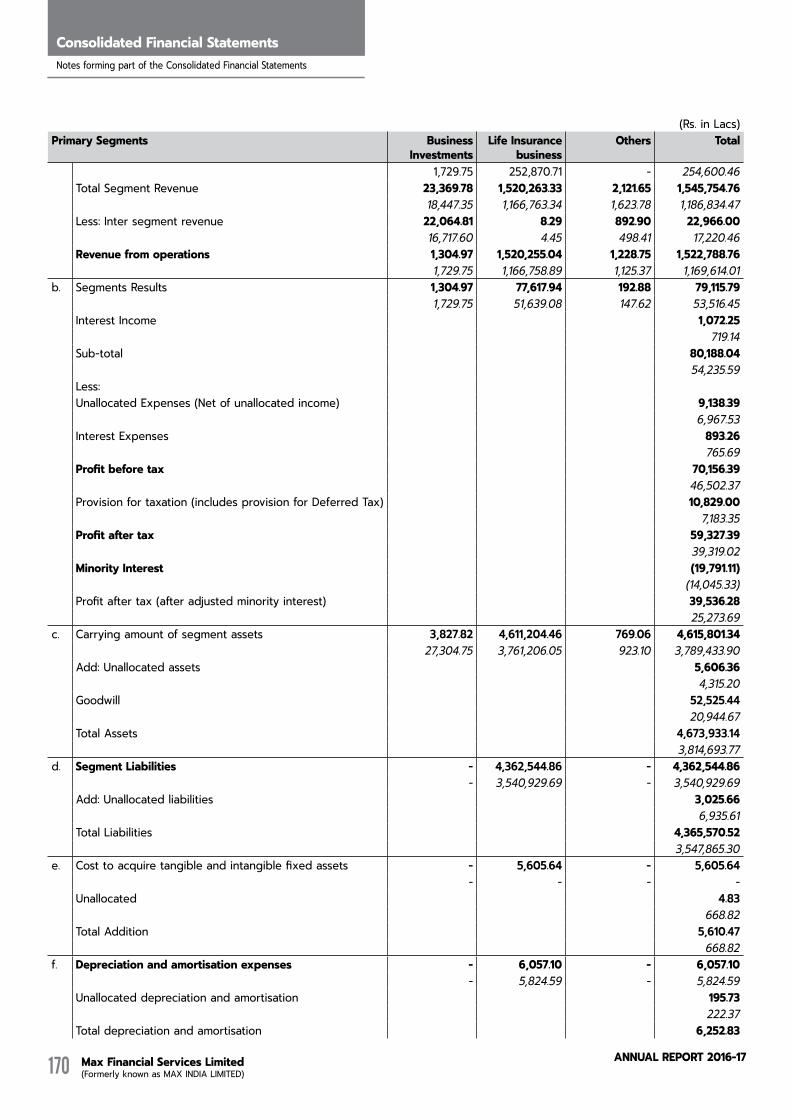
Max Financial Services Limited (Formerly known as MAX INDIA LIMITED)
AnnuAL RepoRt 2016-17170
Consolidated Financial StatementsNotes forming part of the Consolidated Financial Statements
(Rs. in Lacs)Primary Segments Business
InvestmentsLife Insurance
businessothers Total
1,729.75 252,870.71 - 254,600.46 Total Segment Revenue 23,369.78 1,520,263.33 2,121.65 1,545,754.76
18,447.35 1,166,763.34 1,623.78 1,186,834.47 Less: Inter segment revenue 22,064.81 8.29 892.90 22,966.00
16,717.60 4.45 498.41 17,220.46 revenue from operations 1,304.97 1,520,255.04 1,228.75 1,522,788.76
1,729.75 1,166,758.89 1,125.37 1,169,614.01 b. Segments Results 1,304.97 77,617.94 192.88 79,115.79
1,729.75 51,639.08 147.62 53,516.45 Interest Income 1,072.25
719.14 Sub-total 80,188.04
54,235.59 Less:Unallocated Expenses (Net of unallocated income) 9,138.39
6,967.53 Interest Expenses 893.26
765.69 Profit before tax 70,156.39
46,502.37 Provision for taxation (includes provision for Deferred Tax) 10,829.00
7,183.35 Profit after tax 59,327.39
39,319.02 Minority Interest (19,791.11)
(14,045.33)Profit after tax (after adjusted minority interest) 39,536.28
25,273.69 c. Carrying amount of segment assets 3,827.82 4,611,204.46 769.06 4,615,801.34
27,304.75 3,761,206.05 923.10 3,789,433.90 Add: Unallocated assets 5,606.36
4,315.20 Goodwill 52,525.44
20,944.67 Total Assets 4,673,933.14
3,814,693.77 d. segment Liabilities - 4,362,544.86 - 4,362,544.86
- 3,540,929.69 - 3,540,929.69 Add: Unallocated liabilities 3,025.66
6,935.61 Total Liabilities 4,365,570.52
3,547,865.30 e. Cost to acquire tangible and intangible fixed assets - 5,605.64 - 5,605.64
- - - - Unallocated 4.83
668.82 Total Addition 5,610.47
668.82 f. Depreciation and amortisation expenses - 6,057.10 - 6,057.10
- 5,824.59 - 5,824.59 Unallocated depreciation and amortisation 195.73
222.37 Total depreciation and amortisation 6,252.83
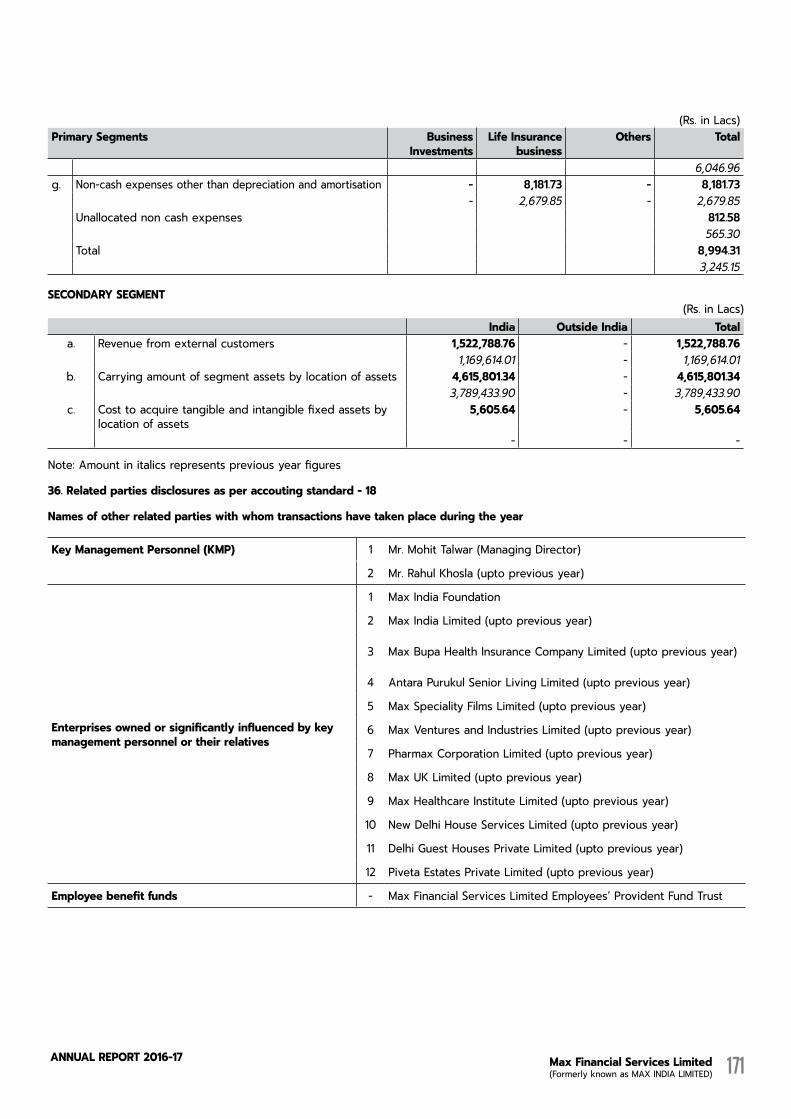
Max Financial Services Limited (Formerly known as MAX INDIA LIMITED)
AnnuAL RepoRt 2016-17 171
(Rs. in Lacs)Primary Segments Business
InvestmentsLife Insurance
businessothers Total
6,046.96 g. Non-cash expenses other than depreciation and amortisation - 8,181.73 - 8,181.73
- 2,679.85 - 2,679.85 Unallocated non cash expenses 812.58
565.30 Total 8,994.31
3,245.15
seCoNdArY seGMeNT(Rs. in Lacs)
India outside India Totala. Revenue from external customers 1,522,788.76 - 1,522,788.76
1,169,614.01 - 1,169,614.01 b. Carrying amount of segment assets by location of assets 4,615,801.34 - 4,615,801.34
3,789,433.90 - 3,789,433.90 c. Cost to acquire tangible and intangible fixed assets by
location of assets 5,605.64 - 5,605.64
- - -
Note: Amount in italics represents previous year figures
36. related parties disclosures as per accouting standard - 18
Names of other related parties with whom transactions have taken place during the year
Key Management Personnel (KMP) 1 Mr. Mohit Talwar (Managing Director)
2 Mr. Rahul Khosla (upto previous year)
enterprises owned or significantly influenced by key management personnel or their relatives
1 Max India Foundation
2 Max India Limited (upto previous year)
3 Max Bupa Health Insurance Company Limited (upto previous year)
4 Antara Purukul Senior Living Limited (upto previous year)
5 Max Speciality Films Limited (upto previous year)
6 Max Ventures and Industries Limited (upto previous year)
7 Pharmax Corporation Limited (upto previous year)
8 Max UK Limited (upto previous year)
9 Max Healthcare Institute Limited (upto previous year)
10 New Delhi House Services Limited (upto previous year)
11 Delhi Guest Houses Private Limited (upto previous year)
12 Piveta Estates Private Limited (upto previous year)
employee benefit funds - Max Financial Services Limited Employees’ Provident Fund Trust
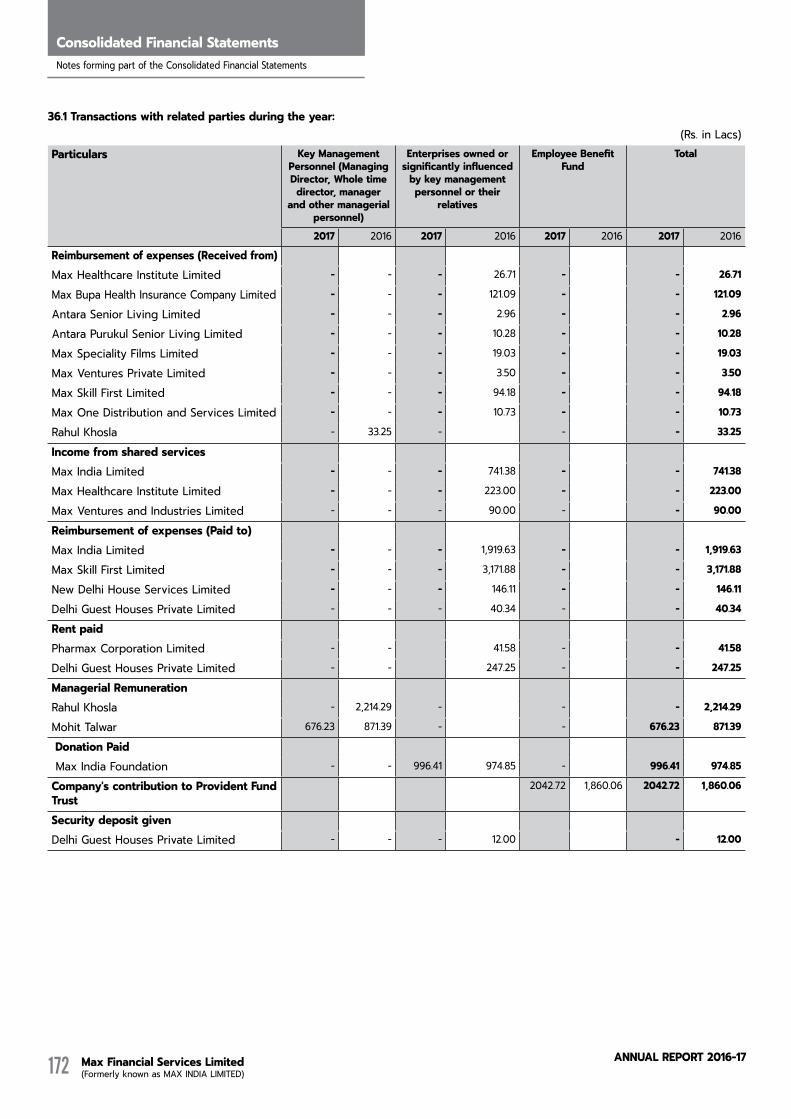
Max Financial Services Limited (Formerly known as MAX INDIA LIMITED)
AnnuAL RepoRt 2016-17172
Consolidated Financial StatementsNotes forming part of the Consolidated Financial Statements
36.1 Transactions with related parties during the year:(Rs. in Lacs)
Particulars Key Management Personnel (Managing director, Whole time director, manager
and other managerial personnel)
enterprises owned or significantly influenced
by key management personnel or their
relatives
employee Benefit Fund
Total
2017 2016 2017 2016 2017 2016 2017 2016
reimbursement of expenses (received from)Max Healthcare Institute Limited - - - 26.71 - - 26.71
Max Bupa Health Insurance Company Limited - - - 121.09 - - 121.09
Antara Senior Living Limited - - - 2.96 - - 2.96
Antara Purukul Senior Living Limited - - - 10.28 - - 10.28
Max Speciality Films Limited - - - 19.03 - - 19.03
Max Ventures Private Limited - - - 3.50 - - 3.50
Max Skill First Limited - - - 94.18 - - 94.18
Max One Distribution and Services Limited - - - 10.73 - - 10.73
Rahul Khosla - 33.25 - - - 33.25
Income from shared servicesMax India Limited - - - 741.38 - - 741.38
Max Healthcare Institute Limited - - - 223.00 - - 223.00
Max Ventures and Industries Limited - - - 90.00 - - 90.00
reimbursement of expenses (Paid to)Max India Limited - - - 1,919.63 - - 1,919.63
Max Skill First Limited - - - 3,171.88 - - 3,171.88
New Delhi House Services Limited - - - 146.11 - - 146.11
Delhi Guest Houses Private Limited - - - 40.34 - - 40.34
Rent paidPharmax Corporation Limited - - 41.58 - - 41.58
Delhi Guest Houses Private Limited - - 247.25 - - 247.25
Managerial RemunerationRahul Khosla - 2,214.29 - - - 2,214.29
Mohit Talwar 676.23 871.39 - - 676.23 871.39
Donation Paid Max India Foundation - - 996.41 974.85 - 996.41 974.85
Company's contribution to Provident Fund Trust
2042.72 1,860.06 2042.72 1,860.06
Security deposit givenDelhi Guest Houses Private Limited - - - 12.00 - 12.00
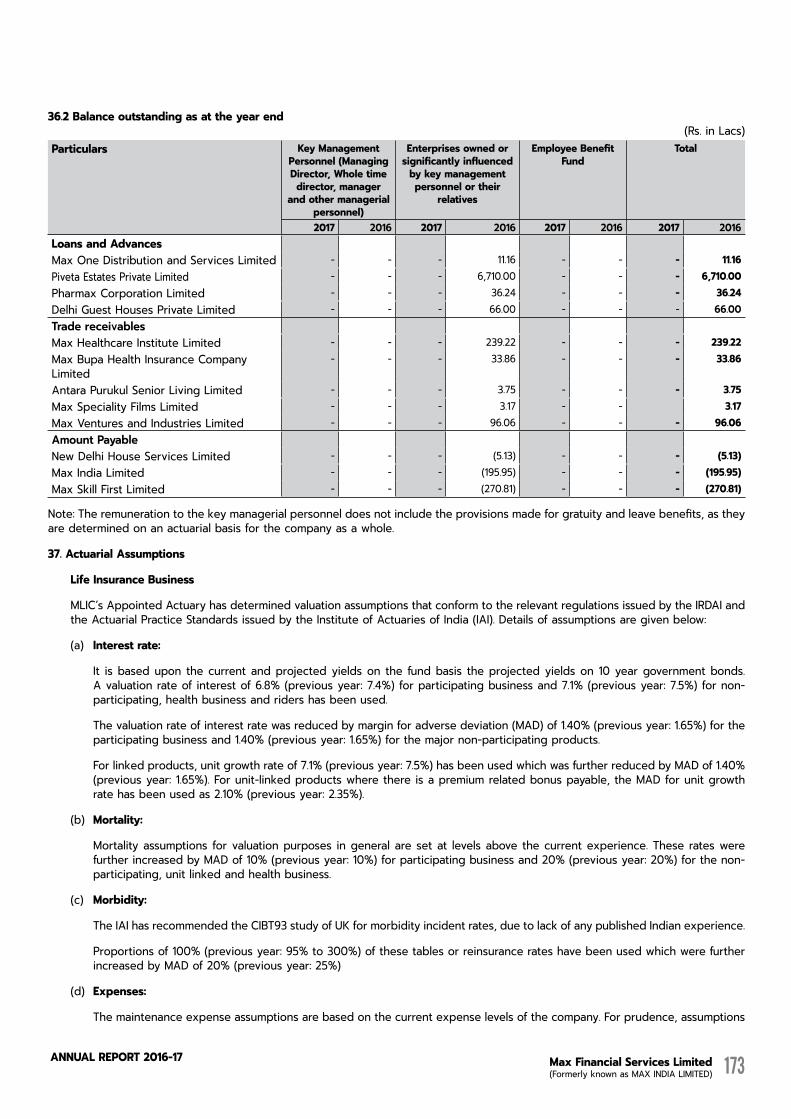
Max Financial Services Limited (Formerly known as MAX INDIA LIMITED)
AnnuAL RepoRt 2016-17 173
36.2 Balance outstanding as at the year end(Rs. in Lacs)
Particulars Key Management Personnel (Managing director, Whole time director, manager
and other managerial personnel)
enterprises owned or significantly influenced
by key management personnel or their
relatives
employee Benefit Fund
Total
2017 2016 2017 2016 2017 2016 2017 2016Loans and AdvancesMax One Distribution and Services Limited - - - 11.16 - - - 11.16 Piveta Estates Private Limited - - - 6,710.00 - - - 6,710.00 Pharmax Corporation Limited - - - 36.24 - - - 36.24 Delhi Guest Houses Private Limited - - - 66.00 - - - 66.00 trade receivablesMax Healthcare Institute Limited - - - 239.22 - - - 239.22 Max Bupa Health Insurance Company Limited
- - - 33.86 - - - 33.86
Antara Purukul Senior Living Limited - - - 3.75 - - - 3.75 Max Speciality Films Limited - - - 3.17 - - 3.17 Max Ventures and Industries Limited - - - 96.06 - - - 96.06 amount PayableNew Delhi House Services Limited - - - (5.13) - - - (5.13)Max India Limited - - - (195.95) - - - (195.95)Max Skill First Limited - - - (270.81) - - - (270.81)
Note: The remuneration to the key managerial personnel does not include the provisions made for gratuity and leave benefits, as they are determined on an actuarial basis for the company as a whole.
37. Actuarial Assumptions
Life Insurance Business
MLIC’s Appointed Actuary has determined valuation assumptions that conform to the relevant regulations issued by the IRDAI and the Actuarial Practice Standards issued by the Institute of Actuaries of India (IAI). Details of assumptions are given below:
(a) Interest rate:
It is based upon the current and projected yields on the fund basis the projected yields on 10 year government bonds. A valuation rate of interest of 6.8% (previous year: 7.4%) for participating business and 7.1% (previous year: 7.5%) for non-participating, health business and riders has been used.
The valuation rate of interest rate was reduced by margin for adverse deviation (MAD) of 1.40% (previous year: 1.65%) for the participating business and 1.40% (previous year: 1.65%) for the major non-participating products.
For linked products, unit growth rate of 7.1% (previous year: 7.5%) has been used which was further reduced by MAD of 1.40% (previous year: 1.65%). For unit-linked products where there is a premium related bonus payable, the MAD for unit growth rate has been used as 2.10% (previous year: 2.35%).
(b) Mortality:
Mortality assumptions for valuation purposes in general are set at levels above the current experience. These rates were further increased by MAD of 10% (previous year: 10%) for participating business and 20% (previous year: 20%) for the non-participating, unit linked and health business.
(c) Morbidity:
The IAI has recommended the CIBT93 study of UK for morbidity incident rates, due to lack of any published Indian experience.
Proportions of 100% (previous year: 95% to 300%) of these tables or reinsurance rates have been used which were further increased by MAD of 20% (previous year: 25%)
(d) expenses:
The maintenance expense assumptions are based on the current expense levels of the company. For prudence, assumptions

Max Financial Services Limited (Formerly known as MAX INDIA LIMITED)
AnnuAL RepoRt 2016-17174
Consolidated Financial StatementsNotes forming part of the Consolidated Financial Statements
do not allow for future expected savings in expenses. The assumptions were increased by MAD of 10% (previous year: 10%) for participating business and 10% (previous year: 10%) for non-participating, health and unit-linked business.
(e) Inflation:
An assumption of 6.00% pa (previous year: 6.25% pa) for expense inflation has been used.
(f) Commission:
It is based on the actual commission rates paid.
(g) Lapses:
Lapse assumptions for valuation purposes in general are set at levels below the current experience. Further, MAD of 20% (previous year: 20%) for participating business, 50% (previous year: 50%) for non-participating and unit-linked business and 20% (previous year: 20%) for health business is applied.
(h) Free look cancellation:
Provisions are made for the strain that may arise in the event of cancellation during the free look period. The free look cancellation assumption is 7% (previous year: 6.5%) for participating business, 4.0% (previous year: 3.0%) for non participating business and 7.5% (previous year: 7.0%) for the unit linked business. The assumptions were increased by MAD of 20% (previous year: 20.0%) for participating and non-participating business and 20% (previous year: 20.0%) for unit linked business.
(i) Future bonuses:
Provision is made for future bonuses based on expected bonus payouts consistent with the valuation assumptions and policyholders’ reasonable expectations.
(j) Linked Liabilities:
Liabilities under unit linked policies comprise of a unit liability representing the fund value of in force policies, the amount payable to discontinued policies; and, a non unit liability for meeting future claims and expenses in excess of future charges. In respect of the fund value and the amount payable for the discontinued policies component, the question of assumptions does not arise and in respect of the non unit liability the assumptions used are consistent with the comments above.
38. The Board of Directors of the Company approved a composite scheme of amalgamation and arrangement on August 8, 2016 (“Proposed Scheme”), which inter-alia contemplates (a) merger of the Company’s subsidiary, viz. Max Life Insurance Company Limited (“Max Life”) with the Company (with a share exchange ratio of one share of the Company for approximately five shares held in Max Life for shareholders other than the Company); (b) demerger of the life insurance undertaking of the Company and merger of the said undertaking with HDFC Standard Life Insurance Company Limited (“HDFC Life”) (share exchange ratio of approximately seven shares of HDFC Life for every three shares held in the Company); and (c) merger of the Company (holding the non-life insurance business) with Max India Limited (with a share exchange ratio of one share of Max India Limited for 500 shares held in the Company).
The parties to the Proposed Scheme have applied for various regulatory approvals as required for the Proposed Scheme.
On November 11, 2016, Insurance Regulatory and Development Authority of India (“IRDAI”) issued a letter raising concerns over the Proposed Scheme in its current form. Max Life has made representation to the IRDAI in this regard and awaits a response from IRDAI.
39. The Board of Directors of Max Financial Services Limited (‘the Company’/erstwhile ‘Max India Limited’) in their meeting held on January 27, 2015 had approved the Corporate Restructuring plan to vertically split the Company through a Composite scheme of arrangement (‘Scheme’), into three separate listed companies.
The Hon’ble High Court of Punjab and Haryana vide its order dated December 14, 2015, had sanctioned the Scheme under Sections 391 to 394 read with Sections 100 to 104 of the Companies Act, 1956 between Max Financial Services Limited (‘MFSL’) (‘the Company’ - erstwhile Max India Limited), Max India Limited (‘MAX’ - erstwhile Taurus Ventures Limited) and Max Ventures and Industries Limited (‘MVIL’ - erstwhile Capricorn Ventures Limited) and their respective shareholders and creditors for transfer of all the assets and liabilities pertaining to each of the demerged undertakings (i.e MAX and MVIL) with effect from April 1, 2015 (Appointed date). The Scheme is effective from January 15, 2016 i.e. the date of filing of the certified copy of the order of the Hon’ble High Court of Punjab and Haryana with the Registrar of Companies, Chandigarh and Shimla.
Upon the scheme becoming effective, the authorised share capital of the Company was authomatically reduced to Rs. 60,00,00,000 (Rupees sixty Crores), as on the Effective Date, without any further act or deed. The entire authorised share capital of the Company had been classified as equity share capital.
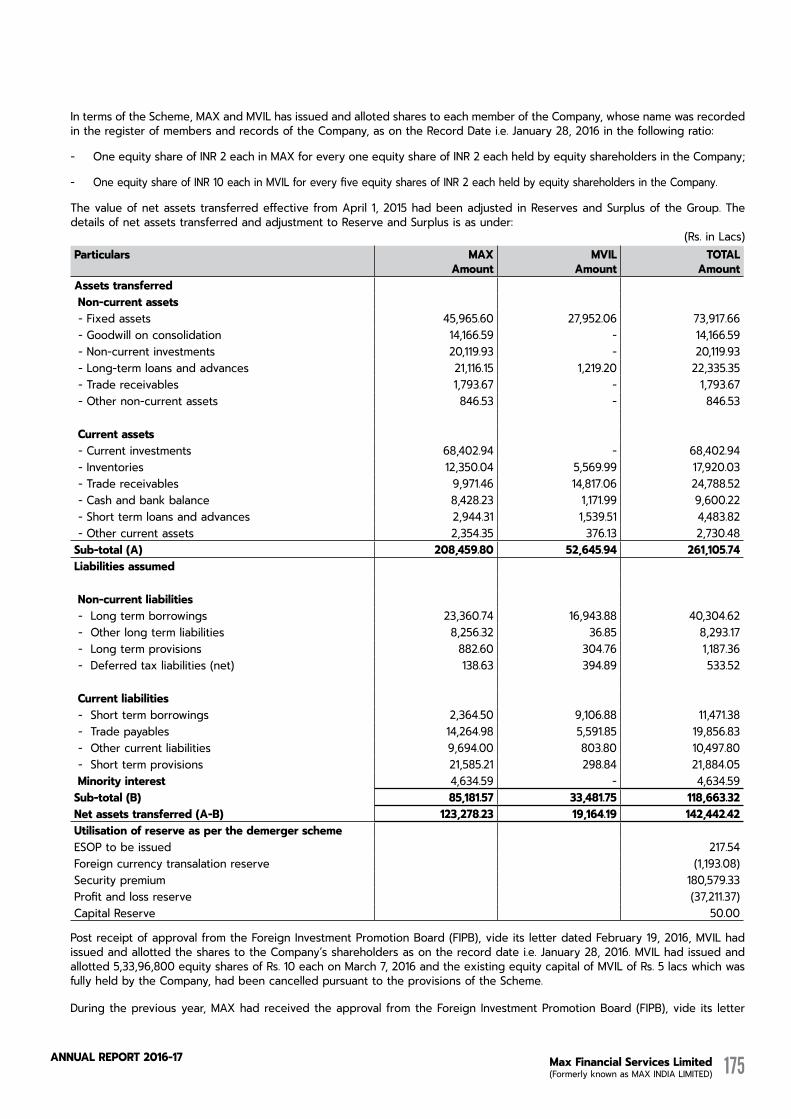
Max Financial Services Limited (Formerly known as MAX INDIA LIMITED)
AnnuAL RepoRt 2016-17 175
In terms of the Scheme, MAX and MVIL has issued and alloted shares to each member of the Company, whose name was recorded in the register of members and records of the Company, as on the Record Date i.e. January 28, 2016 in the following ratio:
- One equity share of INR 2 each in MAX for every one equity share of INR 2 each held by equity shareholders in the Company;
- One equity share of INR 10 each in MVIL for every five equity shares of INR 2 each held by equity shareholders in the Company.
The value of net assets transferred effective from April 1, 2015 had been adjusted in Reserves and Surplus of the Group. The details of net assets transferred and adjustment to Reserve and Surplus is as under:
(Rs. in Lacs)Particulars MAX
AmountMVIL
AmountToTAL
AmountAssets transferred Non-current assets - Fixed assets 45,965.60 27,952.06 73,917.66 - Goodwill on consolidation 14,166.59 - 14,166.59 - Non-current investments 20,119.93 - 20,119.93 - Long-term loans and advances 21,116.15 1,219.20 22,335.35 - Trade receivables 1,793.67 - 1,793.67 - Other non-current assets 846.53 - 846.53
Current assets - Current investments 68,402.94 - 68,402.94 - Inventories 12,350.04 5,569.99 17,920.03 - Trade receivables 9,971.46 14,817.06 24,788.52 - Cash and bank balance 8,428.23 1,171.99 9,600.22 - Short term loans and advances 2,944.31 1,539.51 4,483.82 - Other current assets 2,354.35 376.13 2,730.48 sub-total (A) 208,459.80 52,645.94 261,105.74Liabilities assumed
Non-current liabilities - Long term borrowings 23,360.74 16,943.88 40,304.62 - Other long term liabilities 8,256.32 36.85 8,293.17 - Long term provisions 882.60 304.76 1,187.36 - Deferred tax liabilities (net) 138.63 394.89 533.52
Current liabilities - Short term borrowings 2,364.50 9,106.88 11,471.38 - Trade payables 14,264.98 5,591.85 19,856.83 - Other current liabilities 9,694.00 803.80 10,497.80 - Short term provisions 21,585.21 298.84 21,884.05 Minority interest 4,634.59 - 4,634.59 sub-total (B) 85,181.57 33,481.75 118,663.32Net assets transferred (A-B) 123,278.23 19,164.19 142,442.42Utilisation of reserve as per the demerger schemeESOP to be issued 217.54Foreign currency transalation reserve (1,193.08)Security premium 180,579.33 Profit and loss reserve (37,211.37)Capital Reserve 50.00
Post receipt of approval from the Foreign Investment Promotion Board (FIPB), vide its letter dated February 19, 2016, MVIL had issued and allotted the shares to the Company’s shareholders as on the record date i.e. January 28, 2016. MVIL had issued and allotted 5,33,96,800 equity shares of Rs. 10 each on March 7, 2016 and the existing equity capital of MVIL of Rs. 5 lacs which was fully held by the Company, had been cancelled pursuant to the provisions of the Scheme.
During the previous year, MAX had received the approval from the Foreign Investment Promotion Board (FIPB), vide its letter
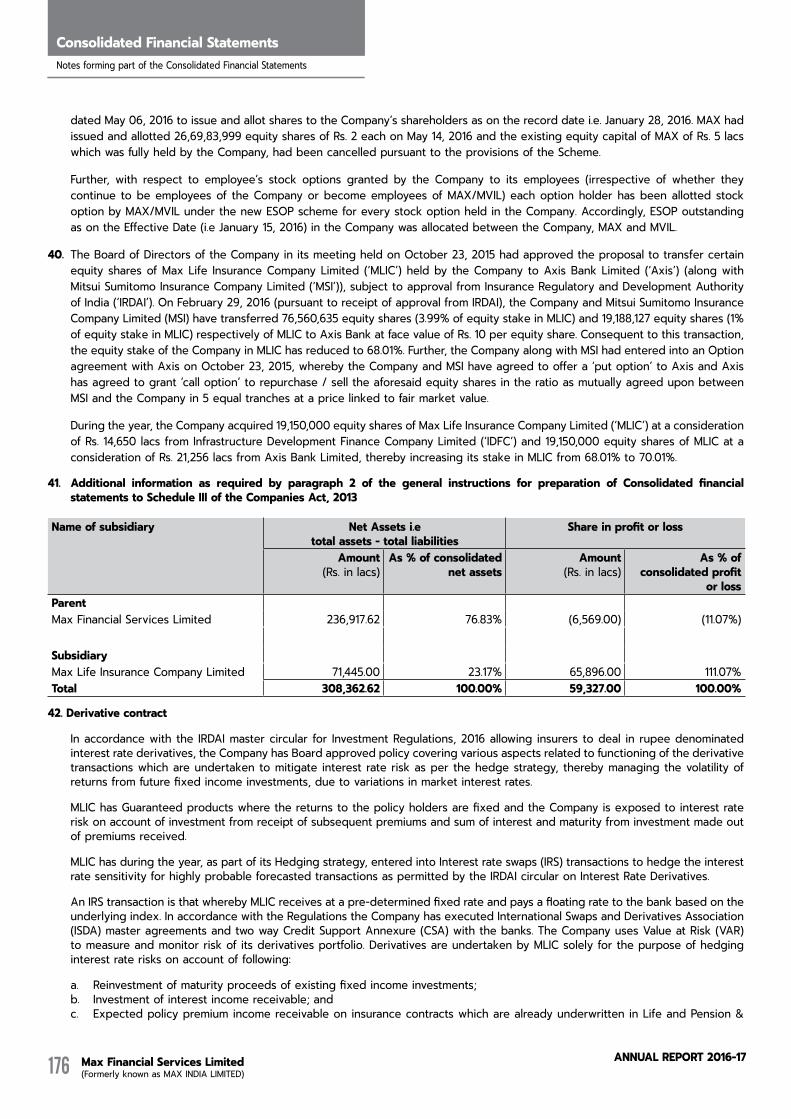
Max Financial Services Limited (Formerly known as MAX INDIA LIMITED)
AnnuAL RepoRt 2016-17176
Consolidated Financial StatementsNotes forming part of the Consolidated Financial Statements
dated May 06, 2016 to issue and allot shares to the Company’s shareholders as on the record date i.e. January 28, 2016. MAX had issued and allotted 26,69,83,999 equity shares of Rs. 2 each on May 14, 2016 and the existing equity capital of MAX of Rs. 5 lacs which was fully held by the Company, had been cancelled pursuant to the provisions of the Scheme.
Further, with respect to employee’s stock options granted by the Company to its employees (irrespective of whether they continue to be employees of the Company or become employees of MAX/MVIL) each option holder has been allotted stock option by MAX/MVIL under the new ESOP scheme for every stock option held in the Company. Accordingly, ESOP outstanding as on the Effective Date (i.e January 15, 2016) in the Company was allocated between the Company, MAX and MVIL.
40. The Board of Directors of the Company in its meeting held on October 23, 2015 had approved the proposal to transfer certain equity shares of Max Life Insurance Company Limited (‘MLIC’) held by the Company to Axis Bank Limited (‘Axis’) (along with Mitsui Sumitomo Insurance Company Limited (‘MSI’)), subject to approval from Insurance Regulatory and Development Authority of India (‘IRDAI’). On February 29, 2016 (pursuant to receipt of approval from IRDAI), the Company and Mitsui Sumitomo Insurance Company Limited (MSI) have transferred 76,560,635 equity shares (3.99% of equity stake in MLIC) and 19,188,127 equity shares (1% of equity stake in MLIC) respectively of MLIC to Axis Bank at face value of Rs. 10 per equity share. Consequent to this transaction, the equity stake of the Company in MLIC has reduced to 68.01%. Further, the Company along with MSI had entered into an Option agreement with Axis on October 23, 2015, whereby the Company and MSI have agreed to offer a ‘put option’ to Axis and Axis has agreed to grant ‘call option’ to repurchase / sell the aforesaid equity shares in the ratio as mutually agreed upon between MSI and the Company in 5 equal tranches at a price linked to fair market value.
During the year, the Company acquired 19,150,000 equity shares of Max Life Insurance Company Limited (‘MLIC’) at a consideration of Rs. 14,650 lacs from Infrastructure Development Finance Company Limited (‘IDFC’) and 19,150,000 equity shares of MLIC at a consideration of Rs. 21,256 lacs from Axis Bank Limited, thereby increasing its stake in MLIC from 68.01% to 70.01%.
41. Additional information as required by paragraph 2 of the general instructions for preparation of Consolidated financial statements to schedule III of the Companies Act, 2013
Name of subsidiary Net Assets i.e total assets - total liabilities
share in profit or loss
Amount (Rs. in lacs)
As % of consolidated net assets
Amount (Rs. in lacs)
As % of consolidated profit
or lossParentMax Financial Services Limited 236,917.62 76.83% (6,569.00) (11.07%)
SubsidiaryMax Life Insurance Company Limited 71,445.00 23.17% 65,896.00 111.07%Total 308,362.62 100.00% 59,327.00 100.00%
42. Derivative contract
In accordance with the IRDAI master circular for Investment Regulations, 2016 allowing insurers to deal in rupee denominated interest rate derivatives, the Company has Board approved policy covering various aspects related to functioning of the derivative transactions which are undertaken to mitigate interest rate risk as per the hedge strategy, thereby managing the volatility of returns from future fixed income investments, due to variations in market interest rates.
MLIC has Guaranteed products where the returns to the policy holders are fixed and the Company is exposed to interest rate risk on account of investment from receipt of subsequent premiums and sum of interest and maturity from investment made out of premiums received.
MLIC has during the year, as part of its Hedging strategy, entered into Interest rate swaps (IRS) transactions to hedge the interest rate sensitivity for highly probable forecasted transactions as permitted by the IRDAI circular on Interest Rate Derivatives.
An IRS transaction is that whereby MLIC receives at a pre-determined fixed rate and pays a floating rate to the bank based on the underlying index. In accordance with the Regulations the Company has executed International Swaps and Derivatives Association (ISDA) master agreements and two way Credit Support Annexure (CSA) with the banks. The Company uses Value at Risk (VAR) to measure and monitor risk of its derivatives portfolio. Derivatives are undertaken by MLIC solely for the purpose of hedging interest rate risks on account of following:
a. Reinvestment of maturity proceeds of existing fixed income investments;b. Investment of interest income receivable; andc. Expected policy premium income receivable on insurance contracts which are already underwritten in Life and Pension &

Max Financial Services Limited (Formerly known as MAX INDIA LIMITED)
AnnuAL RepoRt 2016-17 177
General Annuity business.
The Company uses hedge accounting as per the accounting standards 30 issued by the Institute of Chartered Accountants of India.
The following table sets forth, for the period indicated, the details of derivative positions.(Rs. in Lacs)
Particulars At March 31, 2017 At March 31, 2016Interest rate derivatives
Interest rate derivatives
Cash Flow derivatives1 Derivatives (Notional principal amount) 68,307,609 22,084,7452 Marked to market positions
a) Asset (+) - 6,989 b) Liability (-) (80,685) -
3 Credit exposurea) Current Credit Exposure (80,685) 6,989b) Potential Future Credit Exposure 1,474,751 525,587
Benchmark wise derivative position
Nature of the derivative Contract Benchmark No of deals
Notional amount of derivative
Contract o/s at the beginning of
the Year
Fresh derivative contracts/
position taken during the Year
Derivative contracts/ positions
terminated/ matured/ expired
during the Year
Notional amount of derivative
Contract o/s at the end of the
Year
(a) Forward Rate Agreements (FRA) MIBOR/OIS/INBMK - NA - - -(b) Interest Rate Swaps (IRS) MIOIS/ MIBOR* 28 22,084,745 46,222,864 - 68,307,609(c) Interest Rate Futures (IRF) GOI - NA - - -
43. Payment to auditor (excluding service tax) (included in legal and professional)(Rs. in Lacs)
Particulars For the year ended For the year endedMarch 31, 2017 March 31, 2016
To statutory auditor:For audit 18.00 15.00 For other services 5.00 - Reimbursement of expenses 1.47 0.91 Total 24.47 15.91
44. Disclosures as per the Micro, Small and Medium Enterprises Development (MSMED) Act, 2006
(Rs. in Lacs)Particulars As at As at
March 31, 2017 March 31, 2016 (i) the principal amount remaining unpaid to any supplier - - (ii) interest due thereon - - (iii) interest paid in terms of section 16 of the Micro,Small and Medium Enterprises
Development Act, 2006 and the amount of payment made to the supplier beyond the appointed day.
- -
(iv) interest due and payable for the period of delay in making payment other than the interest specified under the Micro, Small and Medium Enterprises Development Act, 2006
- -
(v) interest accrued and remaining unpaid - - (vi) further interest remaining due and payable even in the succeeding years for the
purpose of disallowance of a deductible expenditure under section 23 of the Micro, Small and Medium Enterprises Development Act, 2006.
- -
Dues to Micro and Small Enterprises have been determined to the extent such parties have been identified on the basis of information collected by the Management. This has been relied upon by the auditors.

Max Financial Services Limited (Formerly known as MAX INDIA LIMITED)
AnnuAL RepoRt 2016-17178
Consolidated Financial StatementsNotes forming part of the Consolidated Financial Statements
45. The Group did not have any long-term contracts including derivative contracts for which there were any material foreseeable losses.
46. There has been no delay in transferring amounts, required to be transferred, to the Investor Education and Protection Fund by the Group.
47. At the year end, unhedged foreign currency exposures are as follows:
Particulars As at March 31, 2017 As at March 31, 2016Foreign
CurrencyExchange
RateIndian Rupee Foreign
CurrencyExchange Rate Indian Rupee
(in Lacs) (Rupee) (in Lacs) (in Lacs) (Rupee) (in Lacs)Trade payables (USD) 0.01 64.84 0.88 - - - Trade payables (GBP) 1.41 80.88 114.04 1.29 95.09 122.96
48. The previous year’s figures have been regrouped / reclassified, wherever necessary to correspond with the current year’s classification / disclosure.
For and on behalf of the Board of directors
Naina Lal Kidwai Mohit Talwar(Chairman) (Managing Director)DIN No - 00017806 DIN No - 02394694
sujatha ratnam Sandeep Pathak(Chief Financial Officer) (Company Secretary)
M.No. - FCS-5351Place : New DelhiDate : May 30, 2017
Financial Review
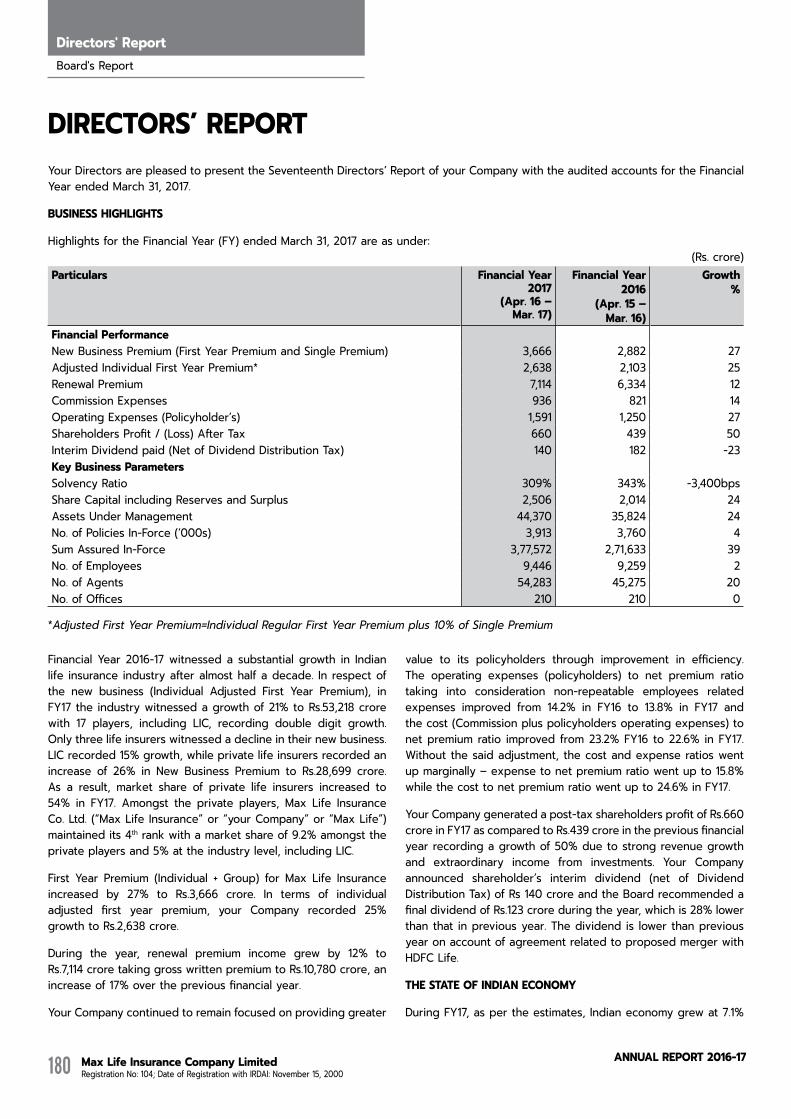
Max Life Insurance Company Limited Registration No: 104; Date of Registration with IRDAI: November 15, 2000
AnnuAL RepoRt 2016-17180
Directors' Report
Your Directors are pleased to present the Seventeenth Directors’ Report of your Company with the audited accounts for the Financial Year ended March 31, 2017.
BUSINESS HIGHLIGHTS
Highlights for the Financial Year (FY) ended March 31, 2017 are as under: (Rs. crore)
Particulars Financial Year 2017
(Apr. 16 – Mar. 17)
Financial Year 2016
(Apr. 15 – Mar. 16)
Growth %
Financial PerformanceNew Business Premium (First Year Premium and Single Premium) 3,666 2,882 27Adjusted Individual First Year Premium* 2,638 2,103 25Renewal Premium 7,114 6,334 12Commission Expenses 936 821 14Operating Expenses (Policyholder’s) 1,591 1,250 27Shareholders Profit / (Loss) After Tax 660 439 50Interim Dividend paid (Net of Dividend Distribution Tax) 140 182 -23Key Business ParametersSolvency Ratio 309% 343% -3,400bpsShare Capital including Reserves and Surplus 2,506 2,014 24Assets Under Management 44,370 35,824 24No. of Policies In-Force (‘000s) 3,913 3,760 4Sum Assured In-Force 3,77,572 2,71,633 39No. of Employees 9,446 9,259 2No. of Agents 54,283 45,275 20No. of Offices 210 210 0
*Adjusted First Year Premium=Individual Regular First Year Premium plus 10% of Single Premium
DIRECTORS’ REPORT
Financial Year 2016-17 witnessed a substantial growth in Indian life insurance industry after almost half a decade. In respect of the new business (Individual Adjusted First Year Premium), in FY17 the industry witnessed a growth of 21% to Rs.53,218 crore with 17 players, including LIC, recording double digit growth. Only three life insurers witnessed a decline in their new business. LIC recorded 15% growth, while private life insurers recorded an increase of 26% in New Business Premium to Rs.28,699 crore. As a result, market share of private life insurers increased to 54% in FY17. Amongst the private players, Max Life Insurance Co. Ltd. (“Max Life Insurance” or “your Company” or “Max Life”) maintained its 4th rank with a market share of 9.2% amongst the private players and 5% at the industry level, including LIC.
First Year Premium (Individual + Group) for Max Life Insurance increased by 27% to Rs.3,666 crore. In terms of individual adjusted first year premium, your Company recorded 25% growth to Rs.2,638 crore.
During the year, renewal premium income grew by 12% to Rs.7,114 crore taking gross written premium to Rs.10,780 crore, an increase of 17% over the previous financial year.
Your Company continued to remain focused on providing greater
value to its policyholders through improvement in efficiency. The operating expenses (policyholders) to net premium ratio taking into consideration non-repeatable employees related expenses improved from 14.2% in FY16 to 13.8% in FY17 and the cost (Commission plus policyholders operating expenses) to net premium ratio improved from 23.2% FY16 to 22.6% in FY17. Without the said adjustment, the cost and expense ratios went up marginally – expense to net premium ratio went up to 15.8% while the cost to net premium ratio went up to 24.6% in FY17.
Your Company generated a post-tax shareholders profit of Rs.660 crore in FY17 as compared to Rs.439 crore in the previous financial year recording a growth of 50% due to strong revenue growth and extraordinary income from investments. Your Company announced shareholder’s interim dividend (net of Dividend Distribution Tax) of Rs 140 crore and the Board recommended a final dividend of Rs.123 crore during the year, which is 28% lower than that in previous year. The dividend is lower than previous year on account of agreement related to proposed merger with HDFC Life.
THE STATE OF INDIAN ECONOMY
During FY17, as per the estimates, Indian economy grew at 7.1%
Board's Report
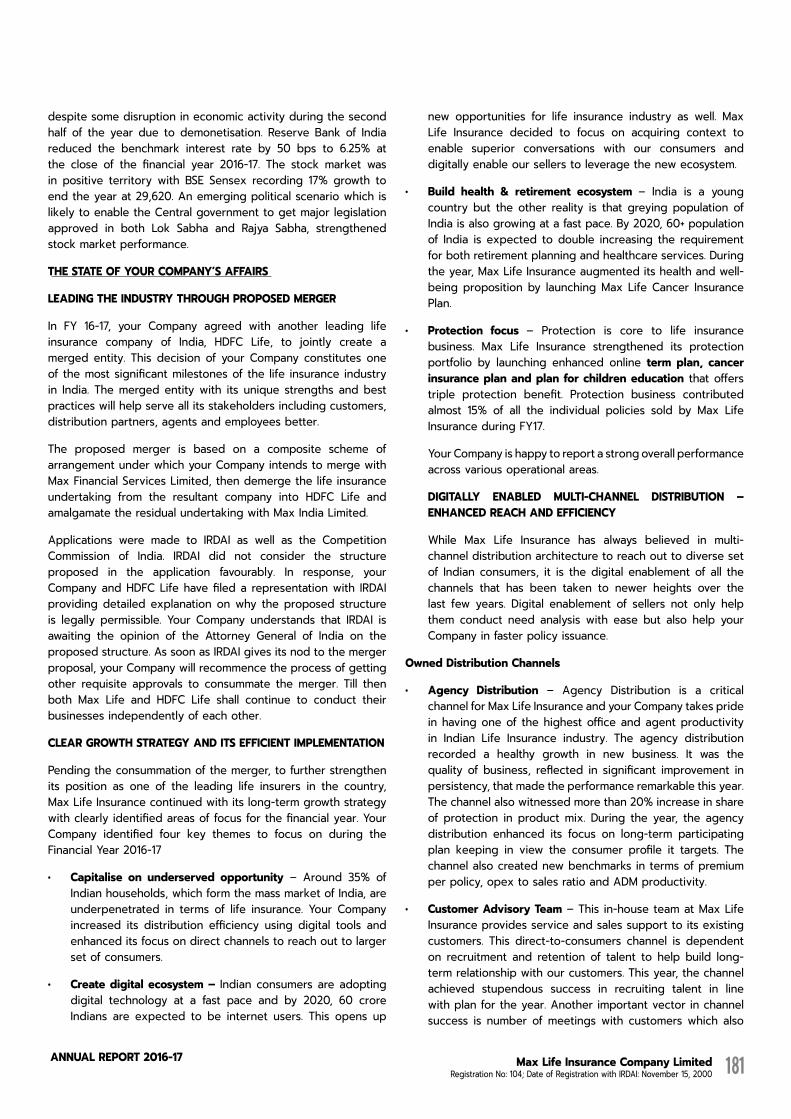
Max Life Insurance Company Limited Registration No: 104; Date of Registration with IRDAI: November 15, 2000
AnnuAL RepoRt 2016-17 181
despite some disruption in economic activity during the second half of the year due to demonetisation. Reserve Bank of India reduced the benchmark interest rate by 50 bps to 6.25% at the close of the financial year 2016-17. The stock market was in positive territory with BSE Sensex recording 17% growth to end the year at 29,620. An emerging political scenario which is likely to enable the Central government to get major legislation approved in both Lok Sabha and Rajya Sabha, strengthened stock market performance.
THE STATE OF YOUR COMPANY’S AFFAIRS
LEADING THE INDUSTRY THROUGH PROPOSED MERGER
In FY 16-17, your Company agreed with another leading life insurance company of India, HDFC Life, to jointly create a merged entity. This decision of your Company constitutes one of the most significant milestones of the life insurance industry in India. The merged entity with its unique strengths and best practices will help serve all its stakeholders including customers, distribution partners, agents and employees better.
The proposed merger is based on a composite scheme of arrangement under which your Company intends to merge with Max Financial Services Limited, then demerge the life insurance undertaking from the resultant company into HDFC Life and amalgamate the residual undertaking with Max India Limited.
Applications were made to IRDAI as well as the Competition Commission of India. IRDAI did not consider the structure proposed in the application favourably. In response, your Company and HDFC Life have filed a representation with IRDAI providing detailed explanation on why the proposed structure is legally permissible. Your Company understands that IRDAI is awaiting the opinion of the Attorney General of India on the proposed structure. As soon as IRDAI gives its nod to the merger proposal, your Company will recommence the process of getting other requisite approvals to consummate the merger. Till then both Max Life and HDFC Life shall continue to conduct their businesses independently of each other.
CLEAR GROWTH STRATEGY AND ITS EFFICIENT IMPLEMENTATION
Pending the consummation of the merger, to further strengthen its position as one of the leading life insurers in the country, Max Life Insurance continued with its long-term growth strategy with clearly identified areas of focus for the financial year. Your Company identified four key themes to focus on during the Financial Year 2016-17
• Capitalise on underserved opportunity – Around 35% of Indian households, which form the mass market of India, are underpenetrated in terms of life insurance. Your Company increased its distribution efficiency using digital tools and enhanced its focus on direct channels to reach out to larger set of consumers.
• Createdigitalecosystem– Indian consumers are adopting digital technology at a fast pace and by 2020, 60 crore Indians are expected to be internet users. This opens up
new opportunities for life insurance industry as well. Max Life Insurance decided to focus on acquiring context to enable superior conversations with our consumers and digitally enable our sellers to leverage the new ecosystem.
• Build health & retirement ecosystem – India is a young country but the other reality is that greying population of India is also growing at a fast pace. By 2020, 60+ population of India is expected to double increasing the requirement for both retirement planning and healthcare services. During the year, Max Life Insurance augmented its health and well-being proposition by launching Max Life Cancer Insurance Plan.
• Protection focus – Protection is core to life insurance business. Max Life Insurance strengthened its protection portfolio by launching enhanced online term plan, cancer insuranceplanandplanforchildreneducation that offers triple protection benefit. Protection business contributed almost 15% of all the individual policies sold by Max Life Insurance during FY17.
Your Company is happy to report a strong overall performance across various operational areas.
DIGITALLY ENABLED MULTI-CHANNEL DISTRIBUTION – ENHANCED REACH AND EFFICIENCY
While Max Life Insurance has always believed in multi-channel distribution architecture to reach out to diverse set of Indian consumers, it is the digital enablement of all the channels that has been taken to newer heights over the last few years. Digital enablement of sellers not only help them conduct need analysis with ease but also help your Company in faster policy issuance.
OwnedDistributionChannels
• Agency Distribution – Agency Distribution is a critical channel for Max Life Insurance and your Company takes pride in having one of the highest office and agent productivity in Indian Life Insurance industry. The agency distribution recorded a healthy growth in new business. It was the quality of business, reflected in significant improvement in persistency, that made the performance remarkable this year. The channel also witnessed more than 20% increase in share of protection in product mix. During the year, the agency distribution enhanced its focus on long-term participating plan keeping in view the consumer profile it targets. The channel also created new benchmarks in terms of premium per policy, opex to sales ratio and ADM productivity.
• CustomerAdvisoryTeam – This in-house team at Max Life Insurance provides service and sales support to its existing customers. This direct-to-consumers channel is dependent on recruitment and retention of talent to help build long-term relationship with our customers. This year, the channel achieved stupendous success in recruiting talent in line with plan for the year. Another important vector in channel success is number of meetings with customers which also

Board's Report
Max Life Insurance Company Limited Registration No: 104; Date of Registration with IRDAI: November 15, 2000
AnnuAL RepoRt 2016-17182
Directors' Report
witnessed a major increase as compared to last year. As an outcome, the channel was able to achieve high growth performance consistently.
• E-Commerce – During the year, the e-commerce channel almost doubled its sales and provided protection cover to more than 38,000 families. The channel achieved leadership in online term space across web aggregators. With an aim to further simplify the sales journey on both web and mobile platforms, NEO, a new web purchase journey was launched.
ThirdPartyDistribution
• AxisBank – Since inception of this bancassurance relationship in 2007, both Axis Bank and Max Life are working towards creating the most admired bancassurance relationship in India. The channel recorded a strong growth in new business premium and continued to witness consistent growth in persistency. For Maxis 2020, our joint effort towards digitally enabled sales to bring in superior quality of sales and greater efficiency in policy issuance, this was a landmark year with 100% e-sales.
• Bancassurance –YES Bank, Lakshmi Vilas Bank and Urban Co-operative Banks (UCB) – Our long-standing relationship with YES Bank recorded stupendous growth and almost doubled the new business premium with continued improvement in 13th month persistency. The retail focus of YES Bank resulted in increase in offering long-term savings and protection solutions to their retail consumers. Lakshmi Vilas Bank, our 2-year old relationship also witnessed a healthy growth in new business and Max Life continued to be the dominant life insurance partner for the bank though it opted for another life insurer under the open architecture. Our UCB partnerships also recorded a strong growth.
Group Business
Despite the head-winds of demonetization because of which credit offtake reduced in banks, Group business continued its progress with strong growth in core business of Group Credit Life.
IMPROVEMENT IN QUALITY OF BUSINESS THROUGH ENCHANCED OPERATIONAL EFFICIENCY
Customer retention is key to long-term success of life insurance business. Max Life Insurance achieved a record high conservation ratio of 88.6% in FY17 as compared to 86% in FY16 and the renewal income increased by 12% to touch Rs.7,114 crore. 13th month persistency at 82.3% recorded a 231 bps increase whereas 61st month persistency at 53% recorded a 14 percentage point increase over the previous year.
During the year, customer complaints witnessed 38% decline with not even a single pending customer complaint at the end of the year. Several digital enhancements, automation and process changes were implemented to enable paperless and frictionless onboarding process for both our customers and distributors.
During FY17, your Company further improved its claims paid ratio to 97.18%. Your Company paid 8,678 death claims, worth Rs.283 crore in FY17. Your Company introduced InstaClaim, first of its kind initiative in the industry to ensure approval of claim within 24 hours of receipt of all requisite documents.
Customer Experience Index, a cumulative index of customer experience across 7 key policyholder transactions, witnessed an improvement in Top Two Box score to 77% which is in line with global best standards. Your Company achieved all-time high scores in customer touchpoints like Branch Office, Medicals, Policy Issuance, Purchase Experience, Renewals, Helpline and Claims. In addition, as per a syndicated annual customer loyalty survey, Max Life Insurance was placed number one in experience factors that drive customer loyalty.
Simplification of customer communication and greater use of regional languages results in better customer engagement. During the year, Key Feature Documents for individual products top 25 documents, which form more than 60% of customer communication, were also made available in 10 regional languages.
INCREASED FOCUS ON PROTECTION ORIENTED SALES
Max Life Insurance has a balanced product portfolio having an optimal mix of traditional and ULIPs as well as protection focused and long-term savings oriented products. Your Company added three new products, viz., Max Life Future Genius Education Plan, Max Life Online Term Plan Plus and Max Life Cancer Insurance Plan which contributed around around 15% of new policies sold.
COST MANAGEMENT
Your Company continued focus on cost efficiency resulted in the operating expenses (policyholders) to net premium ratio taking into consideration non-repeatable employees related expenses improving from 14.2% in FY16 to 13.8% in FY17 and the cost (Commission plus policyholders operating expenses) to net premium ratio improving from 23.2% FY16 to 22.6% in FY17. Without the said adjustment, the cost and expense ratios went up marginally – expense to net premium ratio to 15.8% while the cost to net premium ratio to 24.6% in FY17.
INFORMATION TECHNOLOGY – FACILITATING IMPROVEMENT IN BUSINESS EFFICIENCY
During the year FY17, Information Technology focused on creating a solid technology backbone to simplify the life of our employees, distributors and customers.
Max Life Insurance moved to Office 365 to provide its employees with efficiency tools Interactive employee portal, eCube was also launched which provides knowledge management features and multiple engagement and two-way communication opportunities. To enhance distribution efficiency, Apps such as mApp and CSG were introduced in select markets and will be rolled out across the country in first half of FY18. During the year, IT moved its system to a superior in-house server which has enhanced our transaction capacity.
Max Life Insurance Company Limited Registration No: 104; Date of Registration with IRDAI: November 15, 2000
AnnuAL RepoRt 2016-17 183
FOCUS ON ENGAGING AND RETAINING TALENT
Improving employee experience and making people practices at Max Life Insurance more contemporary received strong validation as your Company was ranked 46th amongst the top 100 Indian companies and 1st amongst insurance industry by Great Place to Work institute and Economic Times study.
The focus of the Human Resources (HR) function was towards effective employee communication and engagement post announcement of proposed merger your Company with HDFC Life. All Employee survey and regular Pulse surveys were conducted with help of an external agency to monitor engagement levels. Communication platforms such as dedicated intranet site, leadership webcasts and employee town halls were deployed to proactively disseminate information and build two-way communication.
Through the year, there was continued focus towards enabling employees and building a high performance workplace. Digitization of key people processes via robust implementation of HR Management System and launch of Mobile Apps, Distribution capability building especially at supervisory levels and talent retention / deployment were some of the areas of focus.
Employees volunteering towards social causes, under the umbrella of Corporate Social Responsibility, was encouraged. Initiatives were launched around financial literacy for under-privileged students via school tie ups, Green plantation drive and Swachh Bharat campaign. Skill development centers were also operationalized in 3 of 5 villages adopted under Smart-Gram Initiative by President of India.
INVESTMENT PERFORMANCE
Your Company ensures the management of its investment assets in accordance with its Asset Liability Management policy for traditional plans and a market oriented approach for its unit linked plans. The performance of both traditional and unit linked funds has been commensurate with the risks assumed in respective funds.
While focusing on delivering maximum returns to policyholders, the investment function follows a prudent philosophy. The traditional funds are invested keeping in mind the safety of capital and consistent returns over the long-term. The debt portfolio of Controlled Fund of your Company is of highest credit quality with circa 99% of rated debt portfolio carrying a rating of AAA/P1+. Your Company also maintained a minimum of 70% of equity exposure to quality large cap equities.
The investment function of your Company continued to make improvements in the systems and processes. Your Company made the first investments in Commercial Real Estate and Alternative Investment Funds to begin the process of improving long-term yields on the investment book. In a volatile and eventful year, the equities exposure in the portfolio was managed dynamically to adjust for risk and volatility, improving the overall returns during the year.
Your Company’s Assets under Management (AUM) of Rs. 44,370 crore as on 31st March 2017 recorded a growth of 24% over the same time last year.
AWARDS AND RECOGNITIONS
Max Life’s all round business performance continued to receive external recognition. During FY17, your Company received multiple awards and recognition.
ADOPTION OF INDIAN ACCOUNTING STANDARDS FOR FINANCIAL REPORTING
The Ministry of Corporate Affairs (MCA), Government of India notified the Companies (Indian Accounting Standards) Rules 2015 on February 16, 2015. Further, IRDAI issued circular no IRDA/F&A/CIR/IFRS/038/03/2016 dated March 01, 2016 advising the Insurers to follow the said rules subject to any guideline and directions issued by the IRDAI.
Your Company has formed a Steering Committee headed by the Vice Chairman and Managing Director of your Company to implement the changes, the progress of which is being overseen by the Audit & Ethics Committee of the Board every quarter.
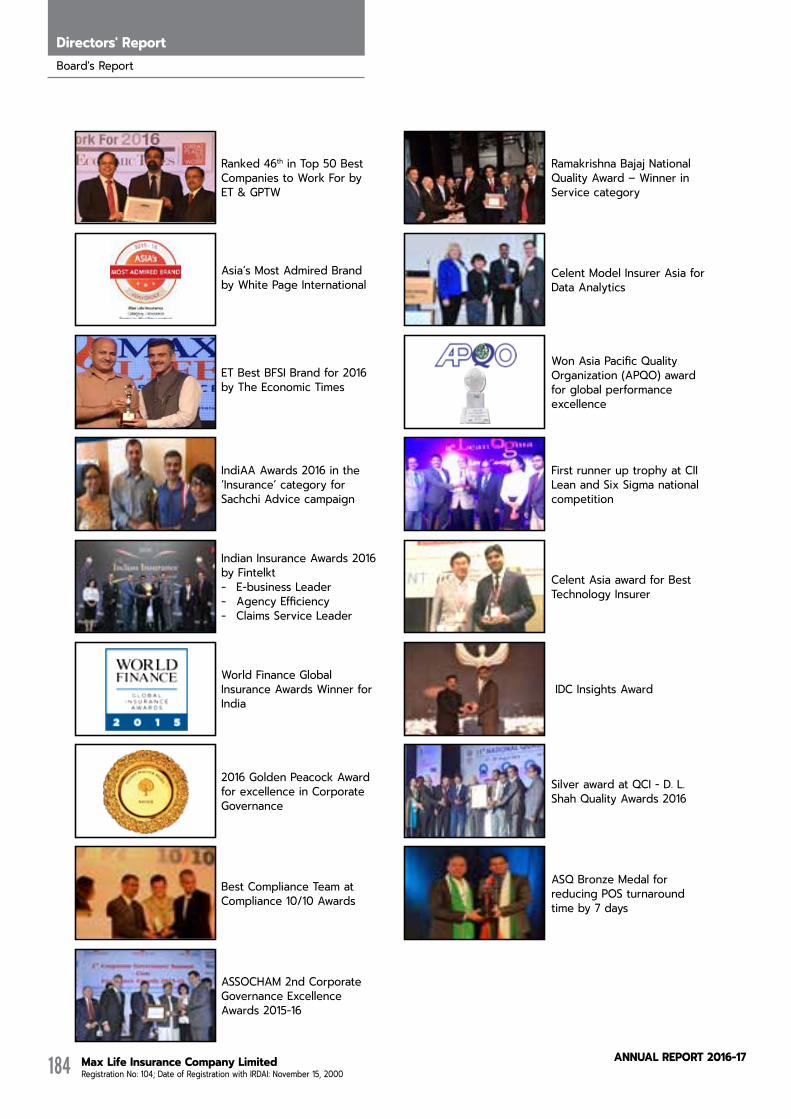
Board's Report
Max Life Insurance Company Limited Registration No: 104; Date of Registration with IRDAI: November 15, 2000
AnnuAL RepoRt 2016-17184
Directors' Report
Ranked 46th in Top 50 Best Companies to Work For by ET & GPTW
Ramakrishna Bajaj National Quality Award – Winner in Service category
Celent Model Insurer Asia for Data Analytics
Won Asia Pacific Quality Organization (APQO) award for global performance excellence
First runner up trophy at CII Lean and Six Sigma national competition
Celent Asia award for Best Technology Insurer
IDC Insights Award
Silver award at QCI - D. L. Shah Quality Awards 2016
ASQ Bronze Medal for reducing POS turnaround time by 7 days
Asia’s Most Admired Brand by White Page International
ET Best BFSI Brand for 2016 by The Economic Times
IndiAA Awards 2016 in the ‘Insurance’ category for Sachchi Advice campaign
Indian Insurance Awards 2016 by Fintelkt- E-business Leader- Agency Efficiency- Claims Service Leader
World Finance Global Insurance Awards Winner for India
2016 Golden Peacock Award for excellence in Corporate Governance
Best Compliance Team at Compliance 10/10 Awards
ASSOCHAM 2nd Corporate Governance Excellence Awards 2015-16
Max Life Insurance Company Limited Registration No: 104; Date of Registration with IRDAI: November 15, 2000
AnnuAL RepoRt 2016-17 185
Management has appointed the S.R.Batliboi & Associates LLP who is supporting in the journey to converge to IND AS. The Company has already submitted first pro-forma financial statements as per IND AS for the period Dec 31, 2016 to the IRDAI. A cross functional team has been formed, necessary training imparted to relevant staff members and suited changes made to systems in this regard.
The first set of financial statements under IND AS will be starting April 1, 2018 with comparatives for financial year ended March 31, 2018.
A ROBUST RISK MANAGEMENT FRAMEWORK TO ADDRESS ENTERPRISE WIDE RISKS
Your Company’s overall approach to managing risk is based on the ‘three lines of defence’ model with a clear segregation of roles and responsibilities for all the lines. Business Managers are part of the first line of defence and have the responsibility to evaluate their risk environment and put in place appropriate controls to mitigate such risks or avoid them. The Risk Management Function, along with the Compliance Function, form the second line of defence. The Internal Audit Function guided by the Audit Committee is the third line of defence and provides independent assurance to the Board. The Statutory Auditors and regulatory oversight aided by the Appointed Actuary in his/her fiduciary capacity is also construed to provide an additional third line of defence.
Risk management activities are supervised on behalf of the Board by the Risk, Ethics and Asset Liability Management (REALM) Committee, whose responsibilities conform to those prescribed by the IRDAI. The Management Risk Committee chaired by the Executive Vice Chairman and Managing Director and supported by the Operational Risk and Asset Liability Management Groups, assist the Board Committee in overseeing the risk management activities across the Company.
Your Company has an operationally independent Risk Management Function in place, headed by a Chief Risk Officer. The function is responsible for the supervision of all risk management activities in the Company, including developing the risk appetite, maintaining an aggregated risk view across the Company, and monitoring the residual risks to ensure that they remain within tolerance levels. It also reviews the appropriateness and adequacy of the risk management strategy and develops recommendations to the REALM Committee as necessary. Finally, the Risk Management function ensures that, through various management submissions, the Board is adequately informed on key emerging risk related issues and if necessary, provides supplementary advice to the Board through REALM Committee.
Your Company has developed a risk management framework which defines its approach to enterprise wide risk management. The implementation is a continuous cycle of improvement whereby the Company’s risk management elements are progressively integrated into the framework. The Company’s vision is to create a mature risk culture where every individual takes responsibility of risks and has a thorough understanding of all risk tolerances.
Within the framework, a Risk Appetite Statement is in place which identifies and addresses each material risk to which the
Company is exposed and establishes the degree of risk that the Company is willing to accept in pursuit of its strategic objectives, business plans and the interest of its policyholders. These material risks have been categorized in the areas of Strategic, Insurance, Investment and Operational Risks. A Risk Management Strategy has been developed which defines the Company’s approach to manage the identified material risks through acceptance, avoidance, transfer and/or mitigation. The degree and intensity of the management action is guided by comparing the risk appetite with the potential impact of the risk, likelihood of its occurrence and the costs of implementing the controls. This is supplemented by various policies and procedures in respective operating areas which help to identify, mitigate and monitor risks.
The risk management framework ensures that the level of risk accepted is within the Company’s risk capacity and the level of capital adequacy is in excess of the level prescribed in the public interest via legislation.
NUMBER OF CASES FILED AND THEIR DISPOSAL UNDER SECTION 22 OF THE SEXUAL HARASSMENT OF WOMEN AT WORKPLACE (PREVENTION, PROHIBITION AND REDRESSAL) ACT, 2013
Your Company is committed towards providing a safe and alleviating working environment for all and in particular weeding out sexual harassment against women at the work place. Your Company is very sensitive towards any complaints related to sexual harassment and your Company has in place a well-defined Policy on Prevention of Sexual Harassment against women at the workplace. During the FY17, your Company received 23 complaints under the Sexual Harassment category. All these complaints were investigated and save one case all were resolved. The unresolved case remained under investigation at year end. Of the complaints resolved during the year, two complaints were resolved beyond 90 days due to complexity of the matter and receipt of additional evidences during the course of investigation. All other complaints were resolved within the stipulated period. Your Company makes the requisite filings to the competent authority in this regard.
NAMES OF COMPANIES WHICH HAVE BECOME OR CEASED TO BE ITS SUBSIDIARIES, JOINT VENTURES OR ASSOCIATE COMPANIES DURING THE YEAR ALONG WITH REASONS THEREOF:
Your Company did not have any subsidiaries, joint ventures or associate companies during the year.
CORPORATE SOCIAL RESPONSIBILITY
Your Company and its Directors firmly believe in Corporate Social Responsibility (CSR) and have set up well defined agenda for your Company and its employees. During the financial year 2016-17, Corporate Social Responsibility Committee met twice to review your Company’s progress in the area of CSR.
Your Company continued to focus on healthcare, which included immunization, healthcare and artificial limbs and polio caliper camps, surgeries and treatments, cancer awareness and treatment support, health awareness, support to permanent health centers and disaster relief, financial literacy and village adoption.

Board's Report
Max Life Insurance Company Limited Registration No: 104; Date of Registration with IRDAI: November 15, 2000
AnnuAL RepoRt 2016-17186
Directors' Report
During the year, Max Life Insurance further increased the work undertaken by your Company in Dhakrani village in District Dehradun, Uttarakhand, which was adopted by your Company in FY15. During FY17 your Company, along with Max India Foundation, conducted 11 multi-specialty health camps and 100 bi-weekly health camps which had 6,743 beneficiaries from Dhakrani village. Through 18 immunisation camps, vaccines were administered to 1,223 children. Three phases of sewerage management work is almost on its completion and of those two phases are expected to be fully operational in Q2 FY18.
During the year, 12,189 children were administered 19,849 immunization vaccines through 150 camps. Your Company also organized 769 health camps that benefited 2,08,071 people. Your Company continued to support Kiwanis Club to provide artificial limbs to 186 people. Through six permanent health centers, more than 19,901 underprivileged people were provided health services and medicines. 1,588 patients were provided monetary support for surgeries and treatments.
To promote volunteering by the employees and agent advisors of your Company, an employees’ volunteering programme – Pehal- was launched by your Company on 27th May 2016. The employees participated in varied activities including financial literacy programme in schools, environment protection initiatives, collection of clothes, books, games etc. for children, healthcare activities like immunization, healthcare and artificial limbs camps and participation in CanSupport Walk for Life and Max Bupa Walk for Health. This initiative resulted in around 2,000 employees and agent advisors volunteering in FY17.
In line with the requirements under section 135 of the Companies Act, 2013, your Company contributed Rs. 9.95 crore towards these CSR activities during FY17 of which Rs.9.84 crore was spent by its CSR partners till March 31, 2017 and balance Rs.0.11 crore has been assigned to school related initiatives and will be spent in the first few months of FY18.
The detailed Annual Report on the CSR activities undertaken by your Company is placed at AnnexureII.
CORPORATE GOVERNANCE
Your Company has a combination of Executive, Non-Executive and Independent Directors on its Board which comprises of 1 Executive, 7 Non–Executive and 3 Independent Directors. Your Company believes that well informed and Independent Board is essential to ensure the high standards of Corporate Governance.
Your Company believes that a strong foundation of corporate governance is essential for smooth operation of business. It also aids effective decision making to support the achievement of your Company’s objectives. Further, your Company has always believed that an able leadership and strong corporate governance systems play a critical role in the ability of a company to effectively focus, develop and create value for the enterprise and its stakeholders.
Your Company believes that retaining and enhancing stakeholder trust is essential for sustained corporate growth. For Max Life, adherence to Corporate Governance stems not only from the letter of law but also from our inherent belief in doing business
in the right way. Corporate Governance encompasses practically every sphere of management of your Company, from action plans and internal controls to performance measurement and corporate disclosures.
Your Company remains committed to excellence in its Corporate Governance and recognizes that it is the result of value driven leadership and high standards of accountability, transparency and ethics across your Company.
In line with the requirements under the IRDAI Corporate Governance Guidelines (‘Guidelines’) issued by IRDAI on May 18, 2016 and subsequent amendments till date, the disclosures under Corporate Governance guideline are made in AnnexureI.
Your Company’s commitment to Corporate Governance is also reflected in the composition and structure of its Board of Directors, as enumerated in AnnexureI.
Your Company believes in implementing the highest standards of governance and transparency across all spheres of its operations, be it in the area of disclosure, compliances, dealing with stakeholders including its Customers, Vendors, Employees and paying back to the society through CSR initiatives. Your Company gives utmost importance to regulatory and statutory compliances and in this pursuit, your Company has implemented an automated Compliance Management System (COMS) across all of its corporate functions and over 134 branch offices across India, thereby establishing accountability, ownership and strengthening the compliance culture across the organization.
BOARD OF DIRECTORS AND COMMITTEES
There were conscious efforts to continue to strengthen the Board of Directors, in terms of its effectiveness and corporate governance. The following changes were made in the Board and Committee composition of your Company:
1. In accordance with the provisions of the Companies Act, 2013, Mr. Hideaki Nomura, Mr. Masataka Kitagawa and Mr. John Poole shall retire by rotation, and being eligible, have offered themselves for reappointment in the ensuing Annual General Meeting.
A resolution seeking reappointment of Mr. Hideaki Nomura, Mr. Masataka Kitagawa and Mr. John Poole, have been included in the notice convening the forthcoming Annual General Meeting of your Company.
2. In accordance with Companies Act, 2013 and new Corporate Governance Guidelines issued by IRDAI dated May 18, 2016, it was necessary to restructure the composition of various Committees of the Board as under:
a. The Audit & Ethics Committee of the Board was renamed as Audit Committee effective May 18, 2016.
In accordance with the provisions of new Corporate Governance Guidelines, the scope and terms of reference of the Audit Committee have been amended as mandated by the Corporate Governance Guidelines.
b. The Investment Committee of your Company was
Max Life Insurance Company Limited Registration No: 104; Date of Registration with IRDAI: November 15, 2000
AnnuAL RepoRt 2016-17 187
reconstituted, wherein Mr. Sandeep Kher, Chief Risk Officer of the Company, was appointed as member of the Committee effective May 18, 2016, post which Mr. Kher resigned from his post and ceased to be a member of the Committee effective November 16, 2016. Further, Mr. Sanjeev Sood, SVP Head Internal Assurance, was designated as SVP Head Internal Assurance and Chief Risk Officer of the Company effective November 16, 2016 and appointed as a member of the Committee effective December 31, 2016.
c. The Product, Actuarial and Risk Management Committee was divided in two Committees, Risk, Ethics and ALM Committee and Product & Actuarial Committee effective May 18, 2016.
Risk, Ethics and ALM Committee became standalone committee with its own charter and members, composition thereof is mentioned in Annexure I. The obligation of a Risk Management Committee and Asset Liability Management Committee has been carved out from Product, Actuarial and Risk Management Committee and the obligation of Ethics Committee has been carved out from the Audit & Ethics Committee and consolidated into a Risk, Ethics and ALM Committee.
Risk, Ethics & ALM Committee was reconstituted wherein Mr. K. Narasimha Murthy was appointed as a member of the Committee effective August 04, 2016.
Product & Actuarial Committee, in continuation of Product, Actuarial and Risk Management Committee, was retained as a Board appointed Committee but with a revised and more concise charter.
d. Merger Committee of the Board was constituted during the year comprising of Mr. Rahul Khosla [DIN: 03597562], Chairman, Ms. Marielle Thereon [DIN: 02667356], Director, Mr. Rajesh Sud [DIN: 02395182], Executive Vice Chairman & Managing Director and Mr. D K Mittal [DIN: 00040000], Director to consider and approve the final Scheme of Arrangement, for and on behalf of the Board. During the year no merger committee meeting was convened except one circular resolution passed on September 06, 2016, to approve the scheme of amalgamation & arrangement.
Further disclosures, as per Corporate Governance Guidelines forms part of the Directors’ Report as AnnexureI.
The details regarding number of meetings of the Board and its Committees as required under Section 134(3)(b) of the Companies Act also form part of the aforesaid AnnexureI.
KEY MANAGERIAL PERSONNEL (“KMP”) U/S SECTION 203 OF THE COMPANIES ACT, 2013
In accordance with Section 2 (51) of the Companies Act, Key Managerial Personnel, in relation to a Company, means the Chief Executive Officer/Managing Director/Manager, Company Secretary, the Whole-Time Directors and the Chief Financial Officer of your Company.
During the year, the following employees of your Company were holding the position of Key Managerial Personnel of your Company:
a) Mr. Rajesh Sud (Executive Vice Chairman and Managing Director);
b) Mr. Prashant Tripathy (Chief Financial Officer);
c) Mr. Rajat Bajaj (Company Secretary) till September 26, 2016; and
d) Mr. Anurag Chauhan (Company Secretary) effective October 26, 2016.
Mr. Rajat Bajaj, Vice President –Compliance and Company Secretary, resigned from his post effective September 26, 2016. Accordingly, Mr. Bajaj ceased to be the Company Secretary of your Company under Section 203 of the Companies Act, 2013. Further, he also ceased to act as the Compliance Officer under the Corporate Governance Guidelines issued by IRDAI.
In place of Mr. Rajat Bajaj, the Board of Directors at its meeting held on October 26, 2016 appointed Mr. Anurag Chauhan, SVP & Head - Legal of the Company, as the Company Secretary and designated as SVP & Head – Legal and Company Secretary. Mr. Chauhan is an Associate Member of Institute of Company Secretaries of India and holds a degree in Law. He joined Max Life in April 2013 as Corporate Vice President – Legal and has a total post qualification work experience of 17 years. Since his joining the Company, he has been heading the Legal team, managing litigation, negotiating and executing contracts & issuing legal advice to various stakeholders within the Company. Prior to joining Max Life, he worked with Deutsche Bank, Bharti Airtel and Escort Finance Ltd.
ANNUAL EVALUATION
During FY17, the Annual Evaluation of the performance of the Board, the Committees, Individual Directors and Chairperson has been carried out in line with requirements under the Companies Act, 2013. This was carried out by obtaining feedback from all directors through an online survey mechanism. The outcome of the said performance evaluation was placed at the Nomination and Remuneration Committee of your Company held on May 19, 2017 and at the Board meeting held on May 19, 2017.
Inaddition,theIndependentDirectorsmetseparatelywithoutthe attendance of non-independent directors and membersof management, where they discussed and reviewed theperformanceofnon-independentdirectors,andtheBoardasawhole;andalsoperformanceoftheChairperson.Theyfurtherassessedthequality,quantityandtimelinesinrespectofflowofinformationbetweentheCompanymanagementandtheBoard.Overall,theIndependentDirectorsexpressedtheirsatisfactionontheperformanceandeffectivenessoftheBoard,individualNon-IndependentBoardMembers, and theChairman, as alsoon the quality, quantity and timelines of flow of informationbetweentheCompanymanagementandtheBoard.

Board's Report
Max Life Insurance Company Limited Registration No: 104; Date of Registration with IRDAI: November 15, 2000
AnnuAL RepoRt 2016-17188
Directors' Report
A STATEMENT ON DECLARATION GIVEN BY INDEPENDENT DIRECTORS UNDER SUB-SECTION (6) OF SECTION 149 THE COMPANIES ACT, 2013
Your Company has received declarations from the Independent Directors of the Company confirming that they meet with the criteria of independence as prescribed under Section 149(6) of the Companies Act, 2013.
DETAILS IN RESPECT OF ADEQUACY OF INTERNAL FINANCIAL CONTROLS WITH REFERENCE TO THE FINANCIAL STATEMENTS
Your Company’s internal control system is commensurate with the size and scale of the business operations.
Your Company has disclosed, based on its most recent evaluation of your Company’s internal control of financial reporting, wherever applicable, to your Company’s Auditors and the Audit Committee, that there were no deficiencies in the design or operation of internal controls, which could adversely affect your Company’s ability to control, process, summarize and report financial data, and there has been no material weakness in internal controls over financial reporting including need for any corrective actions with regard to deficiencies.
There were no instances of known material financial fraud, that involve the Management or other employees who have a significant role in your Company’s internal control systems.
Your Company believes that internal control is a necessary prerequisite of the principle of Governance and that freedom should be exercised within a framework of checks and balances. There is a strong and independent in house Internal Audit department that is commensurate with the nature of the business and the size of its operations. The scope and authority of the Internal Audit department are well defined in the Internal Audit Charter, which is approved by the Audit Committee. To ensure independence, the Internal Audit department has a reporting line to the Chairperson of the Audit Committee of the Board. There is a well-defined risk based internal audit plan, which is prepared in consultation with the Management, Statutory Auditors and approved by the Audit Committee. Internal audit department is responsible for independently evaluating the adequacy of all internal controls, adherence to internal processes and procedures, regulatory and legal requirements. The internal audit function also carries out management self-assessment of adequacy of the Company’s internal financial controls and operating effectiveness of such controls in terms of Companies Act, 2013. Internal Audit Department is the third line of defense which undertakes an independent review of the first and second lines and reports its findings and follow-up status on these findings to the Audit Committee on a quarterly basis. The Audit Committee reviews the performance of the audit function, provides strategic guidance, reviews the key findings of the audit reports, meets your Company’s Statutory Auditors to ascertain their views on the adequacy of internal controls, and ensures that the Board of Directors is fully informed of major observations. Your Company’s Management closely monitors the internal control environment and ensures that the recommendations are effectively implemented.
In addition, your Company also has a dedicated compliance
team that ensures that the Company maintains highest standards of Corporate Governance and Integrity, both internally and externally and runs its business in Ethical & Compliant manner. The experienced and diversified compliance team has expertise in the areas of Regulatory Compliance, Compliance Investigation, Compliance Testing and Monitoring. The team works very closely with the business for implementation of various regulations and legislations. It also carries out various compliance reviews and testing to ensure that various policies, procedures and legislative requirements are duly implemented and gaps, if any, are adequately addressed. Annual Compliance Programme is approved by the Risk, Ethics and Asset Liability Management (REALM) Committee of your Company. The Committee also monitors the progress of the Programme on a regular basis. Key compliance risks are highlighted to the Board via the REALM Committee.
CODEOFCONDUCT&WHISTLEBLOWERPOLICY
In order to uphold the highest standards of ethical behaviour, employees are required to observe the Code of Conduct applicable across the organization. Your Company, through the Whistle Blower Policy, has provided employees a channel for communicating any breaches of your Company’s Values, Code of Conduct, Anti Money Laundering Policy and other regulatory and statutory requirements. Appropriate disciplinary actions are considered for any violation of the values, code or policies of your Company.
During the year under review, all new employees were provided with an easy to understand, written in simple English, compliance handbook, which contains a brief of all compliance policies and emphasizes the need to further promote use of whistleblower mechanism, in case of any compliance breach, unethical conduct or misbehaviour. Besides, significant focus was placed upon ethical practices, compliance and governance at all levels through multiple modes of training such as class room trainings, on-line modules, webcasts, employee town- halls etc.
CONTRACTS OR ARRANGEMENTS WITH RELATED PARTY U/S 188(1) OF THE COMPANIES ACT, 2013
Most of the related party transactions that were entered into during the financial year were on an arm’s length basis and were in the ordinary course of business. The requisite disclosure of the related party transaction has been made in the Notes to Accounts of your Company. In addition, the particulars of contracts or arrangements as entered with related parties of your Company are enclosed herewith in the prescribed format i.e. AOC-2, as AnnexureIII.
EXTRACT OF THE ANNUAL RETURN AS PROVIDED UNDER SUB-SECTION (3) OF SECTION 92 OF THE COMPANIES ACT, 2013
The extract of the Annual Return in the prescribed format i.e. Form MGT-9 is enclosed herewith as AnnexureIV.
COMPANY’S POLICY ON DIRECTORS’ APPOINTMENT AND REMUNERATION INCLUDING CRITERIA FOR DETERMINING QUALIFICATIONS, POSITIVE ATTRIBUTES, INDEPENDENCE OF A DIRECTOR AND OTHER MATTERS PROVIDED UNDER SUB-SECTION (3) OF SECTION 178 OF THE COMPANIES ACT, 2013 AND IRDAI
Max Life Insurance Company Limited Registration No: 104; Date of Registration with IRDAI: November 15, 2000
AnnuAL RepoRt 2016-17 189
GUIDELINES ON REMUNERATION OF NON-EXECUTIVE DIRECTORS AND MANAGING DIRECTOR /CHIEF EXECUTIVE OFFICER / WHOLE-TIME DIRECTORS OF INSURERS DATED AUGUST 05, 2016
Your Company has a relevant framework and a Nomination & Remuneration Policy as required under section 178, IRDAI Corporate Governance guidelines and IRDAI issued guidelines on remuneration of Non Executive Directors, Managing Director, Chief Executive Officer and Whole Time Directors dated 5th August 2016 (“Remuneration Guidelines”). Any shareholder, interested in obtaining a copy of the Policy, may access the same from the website of your Company. The Nomination & Remuneration Policy is enclosed herewith asAnnexureV.
a. Information relating to the design and structure ofremunerationprocessesandthekeyfeaturesandobjectiveof remuneration policy.
The level and composition of remuneration is reasonable and sufficient to attract, retain and motivate Directors of the quality required to run the Company successfully. The interests of CEO/MD/WTD are aligned with the business strategy, risk tolerance and adjusted for risk parameters as mentioned in Nomination & Remuneration Policy. The remuneration of CEO and Managing Director/WTD/Manager is inclusive of fixed pay, perquisites, bonus, guaranteed pay, allowances, short term/long-term incentives, retirals (superannuation or any other pension plan, gratuity, provident fund), stock, Employee Phantom Stock Option, severance package (by whatever name called) and other components. Your Company’s Remuneration structure does not have guaranteed bonus of any kind as part of the remuneration plan of CEO/MD/WTD except sign on/joining bonus if required. Nomination & Remuneration Policy is attached herewith this report as AnnexureV for more details.
b. Descriptionof theways inwhichcurrentand future risksaretakenintoaccountintheremunerationprocesses.
Remuneration of MD/CEO/WTD will be linked to performance parameters such that it is adjusted for all types of risks like persistency, solvency, grievance redressal, expenses of management, claim settlement, claim repudiations, overall compliance status and overall financial position such as networth position, asset under management (AUM) etc. Remuneration outcomes are symmetrical with risk outcomes. The payouts are sensitive to the time horizon of the risk. Pay mix should be consistent with risk alignment. Total payout of variable pay will be directly proportional to the financial performance of the Company and the risk parameters mentioned above. In case there is deterioration in the same, the variable payout will contract in accordance with adjustment for these parameters. Nomination & Remuneration Policy is attached herewith this report as AnnexureV for more details.
c. Descriptionofthewaysinwhichtheinsurerseekstolinkperformance during a performance measurement periodwithlevelsofremuneration.
Relationship of remuneration to performance is clear, meeting appropriate performance benchmarks and consistent with the “pay-for-performance” principle. Remuneration to Directors and Key Managerial Personnel involves a balance between fixed and incentive pay reflecting short and long-term performance objectives, appropriate to the working of the Company and its goals. NRC / Board track performance of the risk parameters or of the relevant line of business every year. In case of negative performance, NRC/Board will review the same and based on appropriate facts, may consider appropriate measures for clawback. [For further details please refer Nomination & Remuneration Policy]
SECRETARIAL AUDIT REPORT
Your Company, in a meeting held on August 04, 2016, appointed M/s Chandrasekaran Associates, Company Secretaries, Delhi, to conduct Secretarial Audit for FY17 as per the requirement under Section 204 of the Companies Act, 2013. M/s Chandrasekaran Associates, Company Secretaries, Delhi, has shared its report in the prescribed format i.e. Form No. MR-3. Form MR-3 is enclosed herewith as AnnexureVI for your reference.
DIRECTORS’ COMMENTS ON QUALIFICATION, RESERVATION, DISCLAIMERS AND ADVERSE REMARKS
(a) StatutoryAudit
StatutoryAuditorsi.e.Fraser and Ross, Chartered Accountants and M/s. B. K. Khare& Co., Chartered Accountants, have no qualification, reservation, disclaimers and adverse remarks in the Auditors Report for FY17.
(b) SecretarialAudit
M/s. Chandrasekaran Associates, Company Secretaries, Delhi, Secretarial Auditors of the Company have no qualification, reservation, disclaimers and adverse remarks in the Auditors Report for FY17.
RURAL&SOCIALSECTOROBLIGATIONS
Your Company has issued 109,130 policies in rural areas during the year, contributing to 21.68% of the total policy issuance. In addition, your Company has covered 136,280 of social lives under the social sector category. Your Company thereby exceeded the statutory requirements in both of these areas.
EMPLOYEE STOCK OPTION PLAN
Your Company has not formulated any stock option scheme.
EMPLOYEE PHANTOM STOCK OPTION PLANS
At present, the Company has four employee phantom stock plans in force namely, “Employee Phantom Stock Plan 2014 (PSP- 2014)”, “Amended Employee Phantom Stock Plan 2014 (PSP- 2014)”, “Employee Phantom Stock Plan 2012 (PSP- 2012)” and “Amended Employee Phantom Stock Plan 2012 (Amended PSP- 2012)”. The said schemes provide for issuance of Phantom Stock Units to eligible employees and directors, in accordance with the terms thereof.

Board's Report
Max Life Insurance Company Limited Registration No: 104; Date of Registration with IRDAI: November 15, 2000
AnnuAL RepoRt 2016-17190
Directors' Report
CAPITAL
The paid-up share capital of your Company is Rs. 1918.81 crore and including reserves is Rs. 2,506 crore as on 31st March 2017.
As your Company continues to be one of the well-capitalized private life insurance companies in India, no further capital infusion was required during the year.
SHAREHOLDERS DIVIDEND
The Board of Directors of your Company in its meeting held on October 26, 2016, announced an interim dividend of 7.3% of the face value of each share for its shareholders amounting to Rs.140.07 crore, net of Dividend Distribution Tax (DDT), based on the performance of your Company during the first half of FY17.
The Board of Directors at its meeting held on May 19, 2017, recommended final shareholder’s dividend of 6.4% of the face value of each share, which will amount to Rs.123 crore net of Dividend Distribution Tax during FY17, subject to shareholder’s approval at the ensuing Annual General Meeting.
This will take the total dividend distribution to 13.7% of the face value of each share, amounting to Rs.263 crore (net of DDT) during the FY17.
POLICYHOLDER BONUS
The Board of Directors took advice from your Company’s Appointed Actuary and approved the recommendation to maintain the 2016 regular bonus rates for all participating products closed to new business. For four products which are open to new business - Life Gain Premier (LGP), Whole Life Super (WLS), Life Perfect Partner Super (LPPS) and Future Secure II (FSII), the recommendation is to reduce the 2016 regular bonus rates by 5%. For Monthly Income Advantage Plan (MIAP), which has its first bonus declaration in 2017, the recommendation is to maintain the bonus rates in line with the bonuses illustrated at 8% investment return.
The cost of regular bonus that would be distributed in the next financial year would be circa Rs. 854 crore, an increase of circa Rs. 126 crore from the amount distributed last year of Rs. 728 crore. In addition, the payment of terminal bonus on deaths and maturities has been approved, the cost of which would be circa Rs. 23 crore for the period FY 2017-18.
GENERAL RESERVES
The reserves of your Company for current year stand at Rs. 95 crore which is same as in the previous year. Also we need to mention if any amount is proposed to carry to any reserves.
SOLVENCY
Your Company regularly monitors its solvency margin andensures that the margin is maintained at higher than thestatutory required level, as prescribed in the IRDA (Assets,Liabilities,andSolvencyMarginofInsurers)Regulations,2000.AttheendofFY17,thesolvencyratio(100%)stoodat309%.
PARTICULARS OF DEPOSITS
Your Company has not accepted any deposits under Section 73 of the Companies Act, 2013.
PARTICULARS OF LOANS, GUARANTEES OR INVESTMENTS UNDER SECTION 186 OF THE 2013 ACT
In accordance with Section 186(11)(a) read with clarification issued by Ministry of Corporate Affairs on February 13, 2015, Section 186 does not apply to an Insurance Company. Accordingly, your Company does not have any loan given, investment made or guarantee given or security provided as required under Section 186 of the Companies Act, 2013.
CHANGE IN THE NATURE OF BUSINESS, DURING THE FINANCIAL YEAR
There was no change in the nature of business during the financial year.
MATERIAL CHANGES AND COMMITMENT
During the year there are no material changes and /or commitments that have an effect on the financial position of the Company.
DETAILS OF SIGNIFICANT AND MATERIAL ORDERS PASSED BY THE REGULATORS OR COURTS OR TRIBUNALS IMPACTING THE GOING CONCERN STATUS AND COMPANY’S OPERATIONS IN FUTURE
There were no significant and material orders passed by the regulators or courts or tribunals impacting the going concern status and company’s operations during the year as well as in the future.
AUDITORS
The Statutory Auditors of the Company viz; M/s B.K. Khare& Co., Chartered Accountants and Fraser and Ross, Chartered Accountants, shall retire at the conclusion of the ensuing Annual General Meeting.
Fraser and Ross and M/s. B. K. Khare, Chartered Accountants have expressed their willingness to be re-appointed respectively at the forthcoming Annual General Meeting.
The members may note that Fraser and Ross, Chartered Accountants, have acted as Joint Statutory Auditors of the Company for the last four years, and M/s B.K. Khare & Co., Chartered Accountants, have acted a Joint Statutory Auditors of the Company for last two years.
Your Company proposes to ratify the re-appointment of M/s B.K. Khare & Co., Chartered Accountants and Fraser and Ross, Chartered Accountant and, as Joint Statutory Auditors at the conclusion of the ensuing Annual General Meeting till the conclusion of the 18th Annual General Meeting.
Your Company has received certificates from the respective Statutory Auditors that their re-appointment as Auditors, if made, shall be in accordance with the conditions laid down in the Companies (Audit
Max Life Insurance Company Limited Registration No: 104; Date of Registration with IRDAI: November 15, 2000
AnnuAL RepoRt 2016-17 191
and Auditors) Rules, 2014 and Annexure 7 of Corporate Governance Guidelines issued by IRDAI and satisfies the criteria provided in Section 141 and Section 144 of the Companies Act, 2013.
CAUTIONARY STATEMENT
Statements in this Report, particularly those which relate to management discussion describing your Company’s objectives and expectations, may constitute “forward looking statements” within the meaning of applicable laws and regulations. Actual results might differ materially from those either expressed or implied in the statements, depending on the circumstances.
DIRECTORS’ RESPONSIBILITY STATEMENT
The Board of Directors of your Company confirms that:
a) In the preparation of the annual accounts for the financial year ended March 31, 2017, the applicable accounting standards had been followed along with proper explanation relating to material departures;
b) The Directors had selected such accounting policies and applied them consistently and made judgments and estimates that are reasonable and prudent so as to give a true and fair view of the state of affairs of your Company at the end of the financial year and of the profit and loss of the company for that period;
c) The Directors had taken proper and sufficient care for the maintenance of adequate accounting records in accordance with the provisions of Companies Act, 2013, for safeguarding the assets of your Company and for preventing and detecting fraud and other irregularities;
d) The Directors had prepared the annual accounts on a going concern basis; and
e) The Directors had devised proper systems to ensure compliance with the provisions of all applicable laws and that such systems were adequate and operating effectively.
ADDITIONAL INFORMATION
Information in accordance with the provisions of Section 134(3)(m) of the Companies Act, 2013 read with the Companies (Accounts) Rules, 2014 for the year ended March 31, 2017, is as follows:
A. Conservation of energy NAB. Technology absorption As belowC. Foreign Exchange Earnings/Inflow and
OutgoYear ended 31.03.2017(Rs. Crores)
Earnings/Inflow (including equity infusion)
17.45
Outgo 64.57Activities relating to exports, initiatives taken to increase exports, develop new export markets, export plan, etc.
NA
TECHNOLOGY ABSORPTION
a) The efforts made towards technology absorption:
Max Life has made significant technological advances to improve
its customers’, distributors’ and employees’ experiences amidst driving the digital transformational agenda. Continuous efforts are in progress in areas of leveraging mobile technology, redesigning systems and processes for better customer and user experience, optimizing costs, strengthening the security posture of your Company with a roadmap for futuristic innovations.
b) The benefits derived from technology improvement, cost reduction, new technological development and import substitution
Technology has helped your Company to leverage advances in online policy purchase process, ancillary mobile and analytic technologies, enable sales through on-line mode, significant improvement in policy processing time, reduction in usage of paper and travel time by digitizing customer acquisition processes, increase end user productivity and consequently the customer satisfaction. In addition, technology initiatives have helped employees connect better with each other, share knowledge and complete various day to day activities with ease and speed. Driving cost reduction initiatives has helped your Company in channelizing investment towards building better applications for improved customer experience.
c) In case of imported technology (imported during the last three years reckoned from the beginning of the financial year).
i. the details of technology imported – Not Applicable ii. the year of import- Not Applicable iii. whether the technology been fully absorbed -Not
Applicable
The section is not applicable as the Company did not import any technology during the last three years
d) The expenditure incurred during the year on Research and Development- NIL.
ACKNOWLEDGMENTS
The Directors wish to place on record their deep appreciation for the hard work, dedicated efforts, teamwork and professionalism shown by the employees and the agent advisors, its Corporate Agents and other intermediaries and channel partners which have enabled your Company to establish itself amongst the leading private life insurance companies in India.
Your Directors take this opportunity to express their sincere thanks to valued customers for their continued patronage.
Your Directors also express gratitude to the Insurance Regulatory and Development Authority of India, the Reserve Bank of India, Central and State Governments and the joint venture partners, Max Financial Services Limited and Mitsui Sumitomo Insurance Co. Ltd. for their continued cooperation, support and assistance.
ForandonbehalfoftheBoardofDirectors
Sd/-Rahul Khosla
ChairmanDIN: 03597562
Date: May 19, 2017Place: New Delhi

Board's Report
Max Life Insurance Company Limited Registration No: 104; Date of Registration with IRDAI: November 15, 2000
AnnuAL RepoRt 2016-17192
Directors' Report
LIST OF ANNEXURESS. No. Particulars RelevantRules RelevantForm Annexure
No. 1 Disclosures for Financial Year
2017IRDAI Corporate Governance Guidelines - I
2 Corporate Social Responsibility Report
Section 134(3)(o) of the Companies Act, 2013 and Rule 8 of the Companies (Corporate Social Responsibility) Rules, 2014]
Prescribed Format
II
3 Contracts and arrangements with Related Parties
Section 188 (1) read with Section 134(3)(h) of Companies Act, 2013
Form AOC-2 III
4 Extract of Annual Return Section 92(3) read with Section 134(3)(a)] of Companies Act, 2013
Form MGT-9 IV
5 Nomination & Remuneration Policy
Section 178(4) of Companies Act, 2013 NR Policy V
6 Secretarial Audit Report Section 204(1) of the Companies Act, 2013 read with Rule 9 of the Companies (Appointment & Remuneration of Managerial Personnel) Rules, 2014]
Form MR-3 VI

Max Life Insurance Company Limited Registration No: 104; Date of Registration with IRDAI: November 15, 2000
AnnuAL RepoRt 2016-17 193
Certification from the Compliance Officer in the format prescribedI, Anurag Chauhan, hereby certify that your Company has complied with the Corporate Governance Guidelines for Insurance Companies as amended from time to time and nothing has been concealed or suppressed.
Sd/-Anurag ChauhanCompany Secretary(Membership No. ACS16169)
Place: New DelhiDate: May 19, 2017

Max Life Insurance Company Limited Registration No: 104; Date of Registration with IRDAI: November 15, 2000
AnnuAL RepoRt 2016-17194
Directors' ReportAnnexure-I
Annexure I: Disclosures as per the Corporate GovernanceGuidelines
Following are the disclosures as mandated by the Corporate Governance Guidelines:
a. During FY17, the Board of Directors met six times as follows:
• May 18, 2016• June 17, 2016• August 04, 2016• August 08, 2016• October 26, 2016• February 01, 2017
Number of meetings held and attended by the Directors as on March 31, 2017.
Name of the Director No.ofBoardMeetingsheld
No.ofBoardMeetingsattended
Rahul Khosla 6 6Marielle Theron 6 6Rajesh Sud 6 5Rajit Mehta 6 4Masataka Kitagawa 6 5Hideaki Nomura 6 6John Poole 6 4Rajesh Khanna 6 6K. Narasimha Murthy 6 5D.K. Mittal 6 6Mohit Talwar 6 4
b. During FY17, the Audit Committee met 6 times as follows:
• May 9, 2016• May 17, 2016• August 03, 2016• August 08, 2016• October 25, 2016• January 31, 2017
Constitution of the Audit Committee, number of meetings held and attended by the Members.
NameoftheMember No.ofMeetingsheld
No.ofMeetingsattended
K. Narasimha Murthy 6 6Marielle Theron 6 6Mr. D. K. Mittal 6 5
During FY2017, there was no such incident happened when your Company’s Board of Directors did not accept any recommendation of the Audit Committee.
c. During FY17, the Investment Committee met 4 times as follows:
• May 17, 2016• August 03, 2016• October 25, 2016• January 31, 2017
Constitution of the Investment Committee, number of meetings held and attended by the Members.
NameoftheMember No. of Meetingsheld
No. of Meetingsattended
Marielle Theron 4 4John Poole 4 4Mohit Talwar 4 2Rajesh Khanna 4 4Hideaki Nomura 4 4Rajesh Sud 4 4Jose John 4 4Prashant Tripathy 4 4Mihir Vora 4 4Sandeep Kher* 2 2Sanjeev Sood** 1 1
* Mr. Sandeep Kher was appointed as a member on May 18, 2016 and ceased to be a member on November 16, 2016.
** Mr. Sanjeev Sood was appointed as a member on December 30, 2016.
d. During FY17, the Policyholder Protection Committee met 5 times as follows:
• May 16, 2016• August 03, 2016• August 08, 2016• October 25, 2016• January 31, 2017
Constitution of the Policyholder Protection Committee, number of meetings held and attended by the Members.
NameoftheMember No. of Meetingsheld
No. of Meetingsattended
Marielle Theron 5 5John Poole 5 4Hideaki Nomura 5 5Jose John 5 5V. Viswanand 5 5D.K. Mittal 5 3
e. During FY17, the Risk, Ethics and ALM Committee met 4 times as follows:
• August 03, 2016• August 08, 2016• October 25, 2016• January 31, 2017
Annexure-I to the Directors’ Report

Max Life Insurance Company Limited Registration No: 104; Date of Registration with IRDAI: November 15, 2000
AnnuAL RepoRt 2016-17 195
Constitution of the Risk, Ethics and ALM Committee, number of meetings held and attended by the Members.
NameoftheMember No.ofMeetingsheld
No.ofMeetingsattended
Marielle Theron 4 4John Poole 4 3Rajesh Sud 4 4Jose John 4 4Hideaki Nomura 4 4K. Narasimha Murthy* 3 3
* Mr. K. Narasimha Murthy was appointed as a member on August 04, 2016.
f. During FY17, the Product & Actuarial Committee met 2 times as follows:• May 16, 2016• February 01, 2017
Constitution of the Product & Actuarial Committee, number of meetings held and attended by the Members.
NameoftheMember No.ofMeetingsheld
No.ofMeetingsattended
Marielle Theron 2 2John Poole 2 2Rajesh Sud 2 2Jose John 2 2Hideaki Nomura 2 2
g. During FY17, the Nomination and Remuneration Committee met 5 times as follows:
• May 17, 2016• August 03, 2016• August 08, 2016• October 26, 2016• January 31, 2017
Constitution of the Nomination and Remuneration Committee, number of meetings held and attended by the Members.
NameoftheMember No.ofMeetingsheld
No.ofMeetingsattended
K. Narasimha Murthy 5 5Rahul Khosla 5 4Masataka Kitagawa 5 4Rajesh Khanna 5 5
h. During FY17, the With Profit Committee met 1 time as follows:
• May 17, 2016
Constitution of the With Profit Committee, number of meetings held and attended by the Members.
NameoftheMember No.ofMeetingsheld
No.ofMeetingsattended
K. Narasimha Murthy 1 1Rajesh Sud 1 1Jose John 1 1M.G. Diwan 1 1
i. During FY17, the Corporate Social Responsibility Committee met 2 times as follows:
• May 17, 2016• February 01, 2017

Max Life Insurance Company Limited Registration No: 104; Date of Registration with IRDAI: November 15, 2000
AnnuAL RepoRt 2016-17196
Directors' Report
Constitution of the Corporate Social Responsibility Committee, number of meetings held and attended by the Members.
NameoftheMember No.ofMeetingsheld No.ofMeetingsattendedD.K. Mittal 2 2Rajit Mehta 2 1Hideaki Nomura 2 2
j. During FY17, the Independent Directors met on May 18, 2016, attendance by members is as follows:
NameoftheMember No.ofMeetingsheld
No.ofMeetingsattended
D.K. Mittal 1 1Rajesh Khanna 1 1K. Narasimha Murthy 1 1
k. Details of Board of Directors and other Committee Members, designation, qualifications.
Name DIN Designation QualificationsMr. Rahul Khosla 03597562 Chairman Chartered Accountant and Honors in Economics from St Stephen’s
College, DelhiMr. Rajesh Sud 02395182 Executive Vice Chairman
and Managing DirectorMBA from FMS, Delhi University, Honours in Commerce from Sri Ram College of Commerce, Delhi and also attended Advance Management Program at Wharton School of Business, University of Pennsylvania, USA
Mr. Rajit Mehta 01604819 Non Executive Director Graduate in Commerce, post graduate in Human Resources and has also attended an Advanced Management Program at INSEAD – France
Ms. Marielle Theron 02667356 Non Executive Director Fellow of Society of Actuaries, USA and B.Sc. majored in Actuarial Science, Laval University, Canada
Mr. Mohit Talwar 02394694 Non Executive Director Postgraduate from St. Stephen’s College and completed his Management Studies in Hospitality from the Oberoi School
Mr. John Poole 05303908 Non Executive Director Fellow of the Institute and Faculty of Actuaries (UK); Fellow of the Institute of Actuaries of Australia and B.Sc (Hons) in Mathematics from University College London
Mr. Masataka Kitagawa
07236354 Non Executive Director Bachelor of Sociology from Hitotsubashi University, Tokyo.
Mr. Hideaki Nomura 05304525 Non Executive Director MBA from Graduate School of International Corporate Strategy, Hitotsubashi University, Japan
Mr. Rajesh Khanna 00032562 Independent, Non Executive Director
MBA from the Indian Institute of Management, Ahmedabad and is a Chartered Accountant.
Mr. K. Narasimha Murthy
00023046 Independent, Non Executive Director
B.Sc, Fellow member of the Institute of Chartered Accountants of India (ICAI), Fellow member of Institute of Cost & Works Accountants of India (ICWAI).
Mr. D. K. Mittal 00040000 Independent, Non Executive Director
M.Sc. Physics with specialization in Electronics from the University of Allahabad India
Prashant Tripathy Chief Financial Officer B TECH - IIT Kharagpur, PGDBM – IIM BangaloreMihir Vora Chief Investment Officer B.E., Mechanical - Maharaja Sayajirao University, Baroda, 1991;
Post Graduate Diploma in Management - IIM, Lucknow, 1994; andChartered Financial Analyst - Association for Investment Management and Research (AIMR), USA, 2004
Jose John Appointed Actuary B TECH-1990-1994;MBA (Finance), Cardiff Business School-1997-1999; and Fellow member of Institute and Faculty of Actuaries, UK 2000-2005
Sandeep Kher* Chief Risk Officer 1995 - B.Com (Hons.), Delhi University, 1997- Chartered Accountant Sanjeev Sood** SVP Head Internal
Assurance & Chief Risk officer
B.Com from Delhi University, 1990, Chartered Accountant, 1997, Certified Internal Auditor (CIA), Certified Information Security Auditor (CISA), Certified Fraud Examiner (CFE)
V. Viswanand Chief Operations Officer MMS-BITS PilaniM.G. Diwan Independent Actuary Fellow member of the Institute of Actuaries of India, Fellow
member of the Institute and Faculty of Actuaries, UK and a Fellow member of the Insurance Institute of India.
* Mr. Sandeep Kher was appointed as a member of Investment Committee on May 18, 2016 and ceased to be a member effective November 16, 2016.
** Mr. Sanjeev Sood was appointed as a member of Investment Committee effective December 30, 2016.
Annexure-I
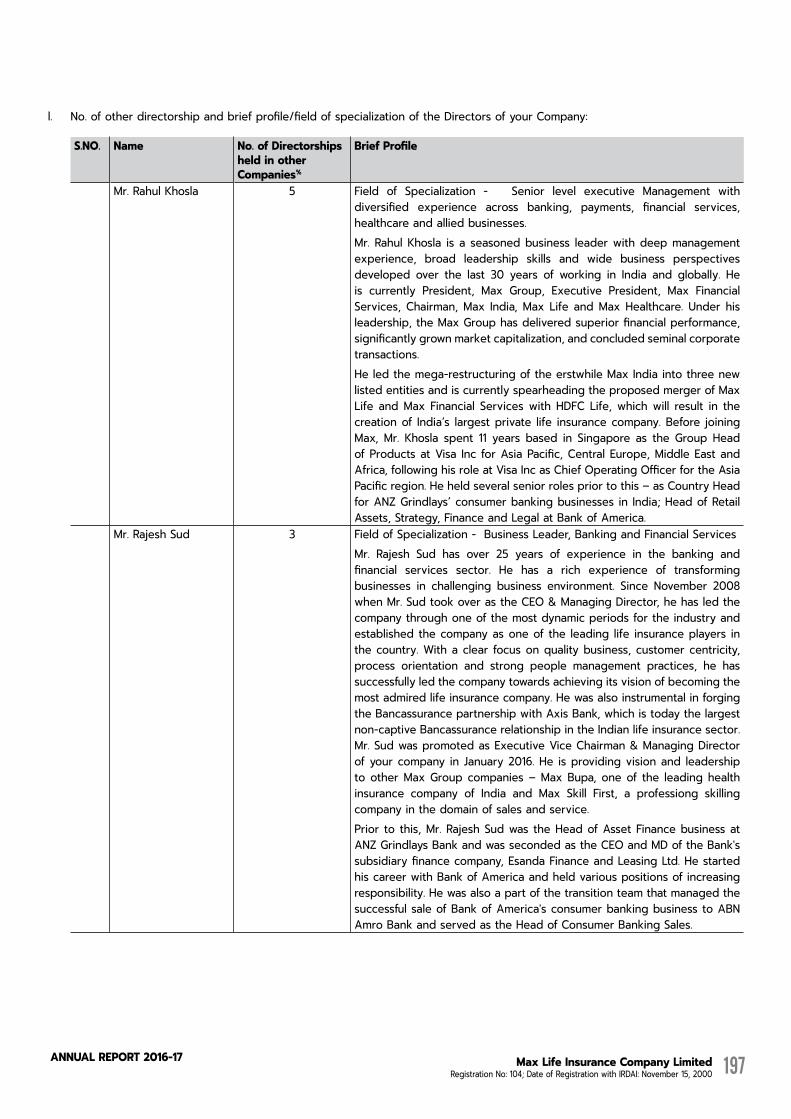
Max Life Insurance Company Limited Registration No: 104; Date of Registration with IRDAI: November 15, 2000
AnnuAL RepoRt 2016-17 197
l. No. of other directorship and brief profile/field of specialization of the Directors of your Company:
S.NO. Name No. of Directorships heldinotherCompanies%
BriefProfile
Mr. Rahul Khosla 5 Field of Specialization - Senior level executive Management with diversified experience across banking, payments, financial services, healthcare and allied businesses. Mr. Rahul Khosla is a seasoned business leader with deep management experience, broad leadership skills and wide business perspectives developed over the last 30 years of working in India and globally. He is currently President, Max Group, Executive President, Max Financial Services, Chairman, Max India, Max Life and Max Healthcare. Under his leadership, the Max Group has delivered superior financial performance, significantly grown market capitalization, and concluded seminal corporate transactions. He led the mega-restructuring of the erstwhile Max India into three new listed entities and is currently spearheading the proposed merger of Max Life and Max Financial Services with HDFC Life, which will result in the creation of India’s largest private life insurance company. Before joining Max, Mr. Khosla spent 11 years based in Singapore as the Group Head of Products at Visa Inc for Asia Pacific, Central Europe, Middle East and Africa, following his role at Visa Inc as Chief Operating Officer for the Asia Pacific region. He held several senior roles prior to this – as Country Head for ANZ Grindlays’ consumer banking businesses in India; Head of Retail Assets, Strategy, Finance and Legal at Bank of America.
Mr. Rajesh Sud 3 Field of Specialization - Business Leader, Banking and Financial Services Mr. Rajesh Sud has over 25 years of experience in the banking and financial services sector. He has a rich experience of transforming businesses in challenging business environment. Since November 2008 when Mr. Sud took over as the CEO & Managing Director, he has led the company through one of the most dynamic periods for the industry and established the company as one of the leading life insurance players in the country. With a clear focus on quality business, customer centricity, process orientation and strong people management practices, he has successfully led the company towards achieving its vision of becoming the most admired life insurance company. He was also instrumental in forging the Bancassurance partnership with Axis Bank, which is today the largest non-captive Bancassurance relationship in the Indian life insurance sector. Mr. Sud was promoted as Executive Vice Chairman & Managing Director of your company in January 2016. He is providing vision and leadership to other Max Group companies – Max Bupa, one of the leading health insurance company of India and Max Skill First, a professiong skilling company in the domain of sales and service. Prior to this, Mr. Rajesh Sud was the Head of Asset Finance business at ANZ Grindlays Bank and was seconded as the CEO and MD of the Bank's subsidiary finance company, Esanda Finance and Leasing Ltd. He started his career with Bank of America and held various positions of increasing responsibility. He was also a part of the transition team that managed the successful sale of Bank of America's consumer banking business to ABN Amro Bank and served as the Head of Consumer Banking Sales.
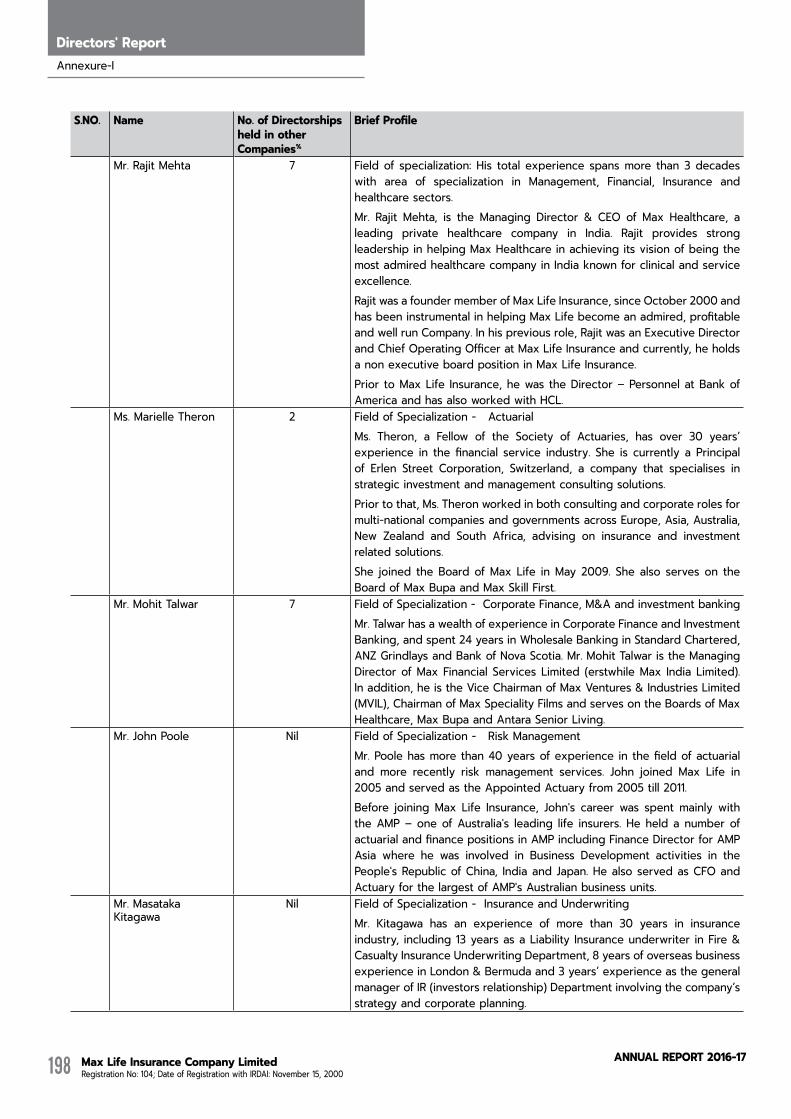
Max Life Insurance Company Limited Registration No: 104; Date of Registration with IRDAI: November 15, 2000
AnnuAL RepoRt 2016-17198
Directors' Report
S.NO. Name No. of Directorships heldinotherCompanies%
BriefProfile
Mr. Rajit Mehta 7 Field of specialization: His total experience spans more than 3 decades with area of specialization in Management, Financial, Insurance and healthcare sectors.Mr. Rajit Mehta, is the Managing Director & CEO of Max Healthcare, a leading private healthcare company in India. Rajit provides strong leadership in helping Max Healthcare in achieving its vision of being the most admired healthcare company in India known for clinical and service excellence.Rajit was a founder member of Max Life Insurance, since October 2000 and has been instrumental in helping Max Life become an admired, profitable and well run Company. In his previous role, Rajit was an Executive Director and Chief Operating Officer at Max Life Insurance and currently, he holds a non executive board position in Max Life Insurance. Prior to Max Life Insurance, he was the Director – Personnel at Bank of America and has also worked with HCL.
Ms. Marielle Theron 2 Field of Specialization - ActuarialMs. Theron, a Fellow of the Society of Actuaries, has over 30 years’ experience in the financial service industry. She is currently a Principal of Erlen Street Corporation, Switzerland, a company that specialises in strategic investment and management consulting solutions.Prior to that, Ms. Theron worked in both consulting and corporate roles for multi-national companies and governments across Europe, Asia, Australia, New Zealand and South Africa, advising on insurance and investment related solutions.She joined the Board of Max Life in May 2009. She also serves on the Board of Max Bupa and Max Skill First.
Mr. Mohit Talwar 7 Field of Specialization - Corporate Finance, M&A and investment bankingMr. Talwar has a wealth of experience in Corporate Finance and Investment Banking, and spent 24 years in Wholesale Banking in Standard Chartered, ANZ Grindlays and Bank of Nova Scotia. Mr. Mohit Talwar is the Managing Director of Max Financial Services Limited (erstwhile Max India Limited). In addition, he is the Vice Chairman of Max Ventures & Industries Limited (MVIL), Chairman of Max Speciality Films and serves on the Boards of Max Healthcare, Max Bupa and Antara Senior Living.
Mr. John Poole Nil Field of Specialization - Risk Management Mr. Poole has more than 40 years of experience in the field of actuarial and more recently risk management services. John joined Max Life in 2005 and served as the Appointed Actuary from 2005 till 2011.Before joining Max Life Insurance, John's career was spent mainly with the AMP – one of Australia's leading life insurers. He held a number of actuarial and finance positions in AMP including Finance Director for AMP Asia where he was involved in Business Development activities in the People's Republic of China, India and Japan. He also served as CFO and Actuary for the largest of AMP's Australian business units.
Mr. Masataka Kitagawa
Nil Field of Specialization - Insurance and UnderwritingMr. Kitagawa has an experience of more than 30 years in insurance industry, including 13 years as a Liability Insurance underwriter in Fire & Casualty Insurance Underwriting Department, 8 years of overseas business experience in London & Bermuda and 3 years’ experience as the general manager of IR (investors relationship) Department involving the company’s strategy and corporate planning.
Annexure-I
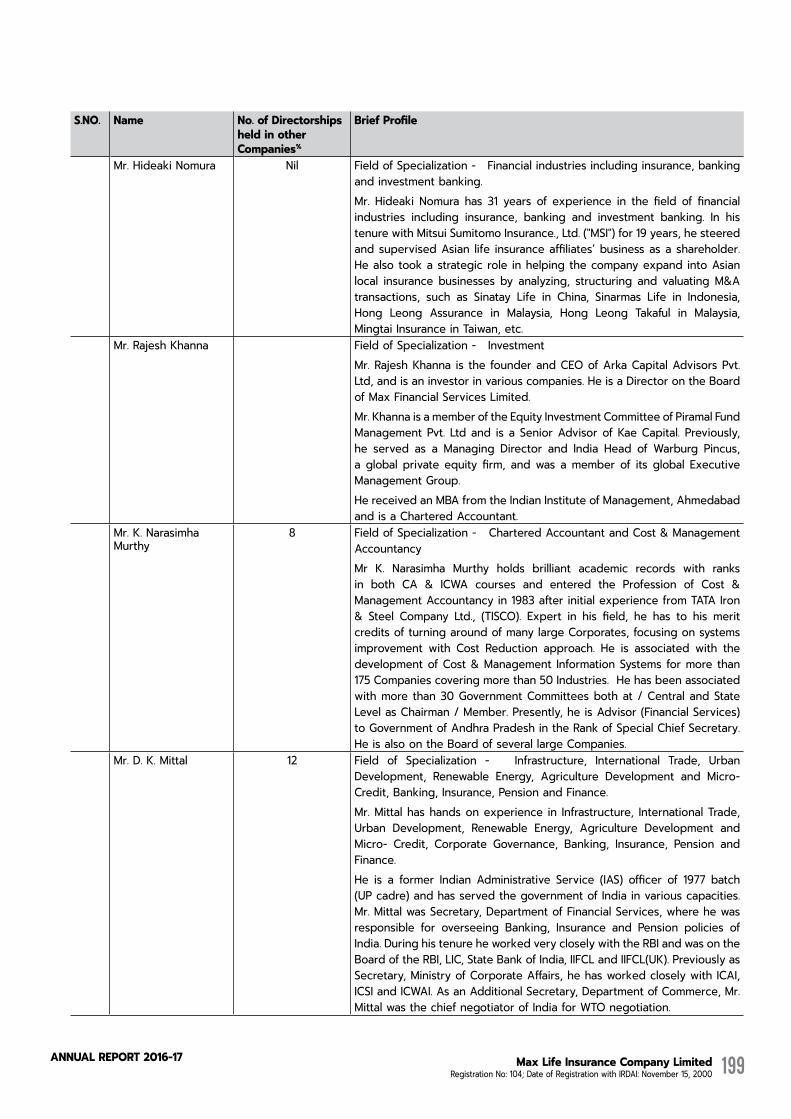
Max Life Insurance Company Limited Registration No: 104; Date of Registration with IRDAI: November 15, 2000
AnnuAL RepoRt 2016-17 199
S.NO. Name No. of Directorships heldinotherCompanies%
BriefProfile
Mr. Hideaki Nomura Nil Field of Specialization - Financial industries including insurance, banking and investment banking.Mr. Hideaki Nomura has 31 years of experience in the field of financial industries including insurance, banking and investment banking. In his tenure with Mitsui Sumitomo Insurance., Ltd. ("MSI") for 19 years, he steered and supervised Asian life insurance affiliates’ business as a shareholder. He also took a strategic role in helping the company expand into Asian local insurance businesses by analyzing, structuring and valuating M&A transactions, such as Sinatay Life in China, Sinarmas Life in Indonesia, Hong Leong Assurance in Malaysia, Hong Leong Takaful in Malaysia, Mingtai Insurance in Taiwan, etc.
Mr. Rajesh Khanna Field of Specialization - InvestmentMr. Rajesh Khanna is the founder and CEO of Arka Capital Advisors Pvt. Ltd, and is an investor in various companies. He is a Director on the Board of Max Financial Services Limited. Mr. Khanna is a member of the Equity Investment Committee of Piramal Fund Management Pvt. Ltd and is a Senior Advisor of Kae Capital. Previously, he served as a Managing Director and India Head of Warburg Pincus, a global private equity firm, and was a member of its global Executive Management Group. He received an MBA from the Indian Institute of Management, Ahmedabad and is a Chartered Accountant.
Mr. K. Narasimha Murthy
8 Field of Specialization - Chartered Accountant and Cost & Management AccountancyMr K. Narasimha Murthy holds brilliant academic records with ranks in both CA & ICWA courses and entered the Profession of Cost & Management Accountancy in 1983 after initial experience from TATA Iron & Steel Company Ltd., (TISCO). Expert in his field, he has to his merit credits of turning around of many large Corporates, focusing on systems improvement with Cost Reduction approach. He is associated with the development of Cost & Management Information Systems for more than 175 Companies covering more than 50 Industries. He has been associated with more than 30 Government Committees both at / Central and State Level as Chairman / Member. Presently, he is Advisor (Financial Services) to Government of Andhra Pradesh in the Rank of Special Chief Secretary. He is also on the Board of several large Companies.
Mr. D. K. Mittal 12 Field of Specialization - Infrastructure, International Trade, Urban Development, Renewable Energy, Agriculture Development and Micro- Credit, Banking, Insurance, Pension and Finance.Mr. Mittal has hands on experience in Infrastructure, International Trade, Urban Development, Renewable Energy, Agriculture Development and Micro- Credit, Corporate Governance, Banking, Insurance, Pension and Finance. He is a former Indian Administrative Service (IAS) officer of 1977 batch (UP cadre) and has served the government of India in various capacities. Mr. Mittal was Secretary, Department of Financial Services, where he was responsible for overseeing Banking, Insurance and Pension policies of India. During his tenure he worked very closely with the RBI and was on the Board of the RBI, LIC, State Bank of India, IIFCL and IIFCL(UK). Previously as Secretary, Ministry of Corporate Affairs, he has worked closely with ICAI, ICSI and ICWAI. As an Additional Secretary, Department of Commerce, Mr. Mittal was the chief negotiator of India for WTO negotiation.

Max Life Insurance Company Limited Registration No: 104; Date of Registration with IRDAI: November 15, 2000
AnnuAL RepoRt 2016-17200
Directors' Report
% No. of other directorship includes directorships in public limited Companies, private Companies and Companies incorporated under Section 8 of the Companies Act, 2013 excluding Max Life Insurance Company Limited.
m. During FY17, your Company paid profit-based commission to the independent directors for FY16, not exceeding 1% of net profits the Company, amounting as follows:
IndependentDirector CommissionpaidinFY17forFY16Mr. K. Narasimha Murthy : Rs.25 lacs Mr. D.K. Mittal : Rs.25 lacs Mr. Rajesh Khanna : Rs.25 lacs
In addition to the above, your Company paid sitting fees to its Independent Directors for attending the Board and Committees meetings of your Company held during FY17. Details of which is hereunder:
IndependentDirector TotalMeetingsattended TotalamountpaidinRs.Mr. K Narasimha Murthy 21 21,00,000Mr. Rajesh Khanna 16 16,00,000Mr. D. K. Mittal 17 17,00,000
Besides, your Company also proposes to pay the independent directors with a profit-based commission, not exceeding 1% of net profits of your Company for FY17 as under:
IndependentDirector CommissionexpectedtobepaidinFY18forFY17Mr. K. Narasimha Murthy : Rs.25 lacs Mr. D.K. Mittal : Rs.25 lacs Mr. Rajesh Khanna : Rs.25 lacs
The profit-based commission shall be in addition to the sitting fees being paid to your Company’s Independent Directors. A proposal in this regard has been passed at the Annual General Meeting of the Company, held on May 18, 2016.
n. All pecuniary relationships or transactions of the Non-Executive Directors.
Mr. John Poole, Non–Executive Director of the Company has received Rs.0.47 crore to provide professional services to your Company. The professional engagement complies with section 197 of the Companies Act, 2013.
o. Details in respect of remuneration paid to the Executive Director:
Remarksi.) Number of MD/ CEO/ WTDs having received a variable remuneration
award during the financial yearOne
ii.) Number and total amount of sign on awards made during the financial year
N/A
iii.) Details of guaranteed bonus, if any , paid as joining 1 signing bonus N/Aiv.) Total amount of outstanding deferred remuneration, split into cash,
shares and share linked instruments and other forms.Outstanding Units (under PSP 2012) – 67,30,000Outstanding Units (under PSP 2014) – 44,64,000
v.) Total amount of deferred remuneration paid out in the financial year.
Nil
vi.) Breakup of amount of remuneration awarded for the financial year to show fixed and variable, deferred and non - deferred.
(In Rs.)Salary (including NPS) 3,90,92,051Benefit 2,63,232Profits in lieu of salary NilBonus / Performance base incentive
2,90,75,000NPS Employer Contribution 13,27,389Employee Stock option Not Applicable
vii. Details of fixed component and performance linked incentives along with the performance criteria;
The performance of the Managing Director is linked to the achievement vis-à-vis, the Measure of Success (“MOS”) for the respective year, duly approved in advance by the Nomination & Remuneration Committee each year. The payout of incentive / bonus is subject to approval of Insurance Regulatory Development Authority of India (IRDAI).
Annexure-I

Max Life Insurance Company Limited Registration No: 104; Date of Registration with IRDAI: November 15, 2000
AnnuAL RepoRt 2016-17 201
viii. Service contracts, key terms;
Mr. Rajesh Sud was re-appointed as the Managing Director and Chief Executive Officer of the Company effective November 01, 2013 for a period of five (5) years valid till October 31, 2018. Subsequently he has been designated as Executive Vice Chairman & Managing Director effective January 29, 2016.
ix. Disclosure in respect of remuneration or commission, if any, received by Managing or whole-time director of your Company from the holding company or subsidiary company, who is also in receipt of commission from the Company.
Mr. Rajesh Sud, Executive Vice Chairman and Managing Director of the Company did not receive any commission from your Company during the FY 2017. However, Mr. Rajesh Sud has been paid Rs. 60 Lac from Max Financial Services Limited (erstwhile Max India Limited), holding company of your Company as for consultancy services.
p. Elements of remuneration package (including incentives) of MD & CEO and all other directors and Key Management Persons as per clause 9 of the IRDAI Corporate Governance guidelines:
In Rs.TotalFixedPay Includes Basic, Retirals (PF, Gratuity), Flexible Benefits Plan (including expenses on account of Car, Medical Reimbursement, Communication
13,62,40,267
Total Bonus Variable Plan contingent on Company and Individual Performance…@182.7% Bonus pool for FY17 7,20,15,027
Note:RemunerationdetailsForMD&CEOandforotherDirectorsarementionedinFormMGT-9(AnnexureIV)
ForandonbehalfoftheBoardofDirectors
Sd/-Rahul Khosla
ChairmanPlace: New Delhi DIN: 03597562Date: May 19, 2017

Max Life Insurance Company Limited Registration No: 104; Date of Registration with IRDAI: November 15, 2000
AnnuAL RepoRt 2016-17202
Directors' Report
AnnualReportonCorporateSocialResponsibilityActivities
1. A brief outline of the company’s Corporate SocialResponsibility (CSR) policy, including overview ofprojectsorprogramsproposedtobeundertakenanda reference to the web-link to the CSR policy andprojectsorprograms:
Your Company’s Corporate Social Responsibility (CSR) Policy was presented in the 6th CSR Committee Meeting held on 17th May 2016 in New Delhi and was approved by the Committee. As per the CSR Policy, your Company has identified Health & Hygiene, Nutrition, Livelihood, Education, Financial Literacy & Insurance Awareness and Environment as the key areas for CSR initiative. As per the CSR Policy, your Company decided to execute and undertake healthcare, which includes pan-India immunization, surgeries and treatments, health camps, medicinal support, health awareness, environment awareness and disability support for artificial limbs and polio calipers and other disability. In the area of sanitation your company decided to undertake sewerage management, waste management and correct disposal as well as the safe drinking water. Your Company also undertake health & hygiene, sanitation and drinking water in the adopted village. Your company also decided to provide nutrition support and livelihood training such as birth attendants and general duty attendants training. Your company also added education and financial literacy & insurance awareness with an aim to provide financial literacy & insurance awareness to students of schools and colleges and provide support to schools to promote education.
Keyhighlights of the variousCSR initiativesmaybenotedasunder:
1. Immunization and Health Camps – During FY17, 150 immunization camps were organized benefitting 12,189 children. 19,849 immunization vaccines were administered during these camps. During this period, 769 health camps were organized which benefited 2,08,071 people. Blood donation camps were organised in which 201 units were donated by employees of Max Life Insurance. Rs. 0.72 crore was spent on these camps.
Max Life Insurance also purchased a mobile medical unit which will be utilised for conducting immunisation and health camps. A sum of Rs. 0.19 crore was spent on purchasing and running cost for this mobile medical unit.
2. Surgeries and treatments – Max Life Insurance supported 1,588 cases of surgeries and treatments. Of these 22 cases were related to oncology, 32 cases related to pediatric cardiology and 149 cases
were related to cataract. Cancer treatment was provided to 926 patients through various NGOs working in this area. A sum of Rs. 2.12 crore was spent on surgeries and treatments during FY17.
3. Max Life Insurance supported six health centres, one each in Ukhimath, Dehradun, Mussorie (all in Uttarakhand) and Rail Majra (Punjab) and two in Delhi. In addition, the company supported home visit programme conducted by Can Support for palliative care. Through these health centres 24,684 patients were provided medical care. A total of Rs. 0.56 cr. was spent on these health centres and patient support programme.
4. During the Financial Year 2017, Rs. 1.97 cr. was contributed to NGOs to carry out healthcare activities. Another Rs. 0.35 cr. was spent on health awareness and environment awareness & protection programmes.
5. Artificial Limbs were provided to 186 beneficiaries through Kiwanis Rehabilitation Centre and some other NGOs. Rs. 0.18 cr. was spent on this activity.
6. Rs. 0.16 cr. was spent on training of Trained Birth Attendants and General Duty Attendants and another Rs. 0.10 cr. was spent on hygiene and nutrition.
7. A sum of Rs. 2.62 crore was allocated for village adoption activity during the year and Rs. 1.59 crore from previous year allocated for this project was brought forward for spent in the first few months of the year.
Max Life Insurance has adopted Dhakrani village in Dehradun district in Uttrakhand. During the year, the Company organised 11 multi-speciality health camps with support from Max Healthcare and 18 immunization camps in the village with 2,796 and 1,223 beneficiaries respectively. The company also organised bi-weekly health camps, one each in Upper Dhakrani and Lower Dhakrani, through Bella Healthcare. During the year 100 camps were organised which benefited 3,947 women and children. Awareness programme is also run along with these health camps which covered 5,289 people.
• Solid waste management was initiated and waste bins were distributed to all households of the village. Daily waste collection, segregated in organic and inorganic waste, was also initiated. A small amount is collected as charges for waste collection and the money so collected is used in the village. Community waste bins have been put up in village streets. Segregation of waste has also been implemented with dry waste like plastic is being recycled and organic waste being converted into compost. The process of composting has started with installation of trommel machine during the year.
The second and third phase of sanitation programme, involving laying out 62,100 feet of sewerage pipelines
AnnexureII
Annexure-II

Max Life Insurance Company Limited Registration No: 104; Date of Registration with IRDAI: November 15, 2000
AnnuAL RepoRt 2016-17 203
and connecting those with sewage treatment plant was completed. So far 925 households of the 1,100 households covered in these two phases are now connected to sewer lines.
The employees and agent advisors of your company conducted three financial literacy and insurance awareness camps in the village. The employees and agents visited 825 households and explained them the benefit of financial planning, explained the feature of financial products and also conducted need analysis to help the households understand their financial needs.
8. During the Financial Year 2016-17 with an objective to increase employees’ participation in CSR activities, Pehal, an employees’ volunteering programme was launched on 27th May 2016. Regional chapters of Pehal were also added during the year. More than 2,000 employees of Max Life Insurance participated in various activities conducted over the year across multiple locations. Key activities undertaken under this initiative included the following:
• Financial Literacy – During FY17, financial literacy camps were organised in 22 schools in Gurugram, Jammu and Srinagar in which 3,359 students of class 9-12 participated. In addition, the company promoted financial literacy and insurance awareness through mass media programming also in which members of senior management provided relevant information to both in-studio audience and consumers at large through telecast of the programme on leading business channel.
• Skill Development – Max Life Insurance supported training centres in 5 villages of Gurugram district. Your Company provided equipment such as computers, projectors, screens, digital cameras, computer tables and chairs. These training centres are utilised for conducting training programmes mainly related to cutting and tailoring to help the participants be gainfully employed.
• Employees of Max Life Insurance also engaged in tree plantation in the cities of Gurugram, Bhubaneshwar, Jaipur, Bikaner, Alwar and Gwalior. Employees of 66 offices collected material such as clothes, toys and stationary and distributed those to underprivileged children. Max Life also supported country-wide cycle trip of one of our women agent and her cycling partner from Patna
office to promote women safety. These two women have already travelled more than 8,000 kilometer passing through 21 states of the country.
• ` 0.98 cr. has been booked as expenses under this head of which ` 0.87 cr. was spent in FY17 and ` 0.11 cr. has been allocated for school support for sports & education and financial literacy related activities to be executed in the schools in Gurgaon and Jammu during the first few months of FY18.
The CSR Policy of your Company has been posted on http://www.maxlifeinsurance.com/pdf/csr-policy-fy15%20.pdf
2. The composition of the CSR Committee:
The CSR Committee of Max Life Insurance is headed by Mr. D K Mittal, Independent Director and has Mr. Rajit Mehta, Director and Mr. Hideaki Nomura, Director as members.
3. AveragenetprofitofthecompanyforlastthreefinancialyearsandprescribedCSRExpenditure:
During the Financial Year 2017, your Company decided to spend Rs. 9.96 crore on CSR initiatives. This amount is equal to 2% of the average Profit Before Tax of your Company in the last three years. The calculation of the CSR expenditure for the Financial Year 2016-17 is as follows:
AnnualCSRExpenditureFY17–MaxLifeInsuranceCompanyLimited
Profit Before Tax FY14Profit Before Tax FY15Profit Before Tax FY16
Rs. 503.07 croreRs. 477.59 croreRs. 510.94 crore
Average Profit Before Tax Rs. 497.20 croreCSRBudgetFY17(2%ofAveragePBT) Rs. 9.94 crore
4. DetailsofCSRspentduringthefinancialyear:
a. Total amount to be spent for the financial year;
During the Financial Year 2017, ` 9.95 crore was paid to our execution partner Max India Foundation of which ` 9.84 crore was spent till 31st March 2017.
b. Amount unspent, if any;
Balance Rs.0.11 crore has been allocated to the school support for sports & education and financial literacy related activities to be executed in the schools in Gurugram and Jammu. These activities will be completed in first few months of the financial year 2017-18.
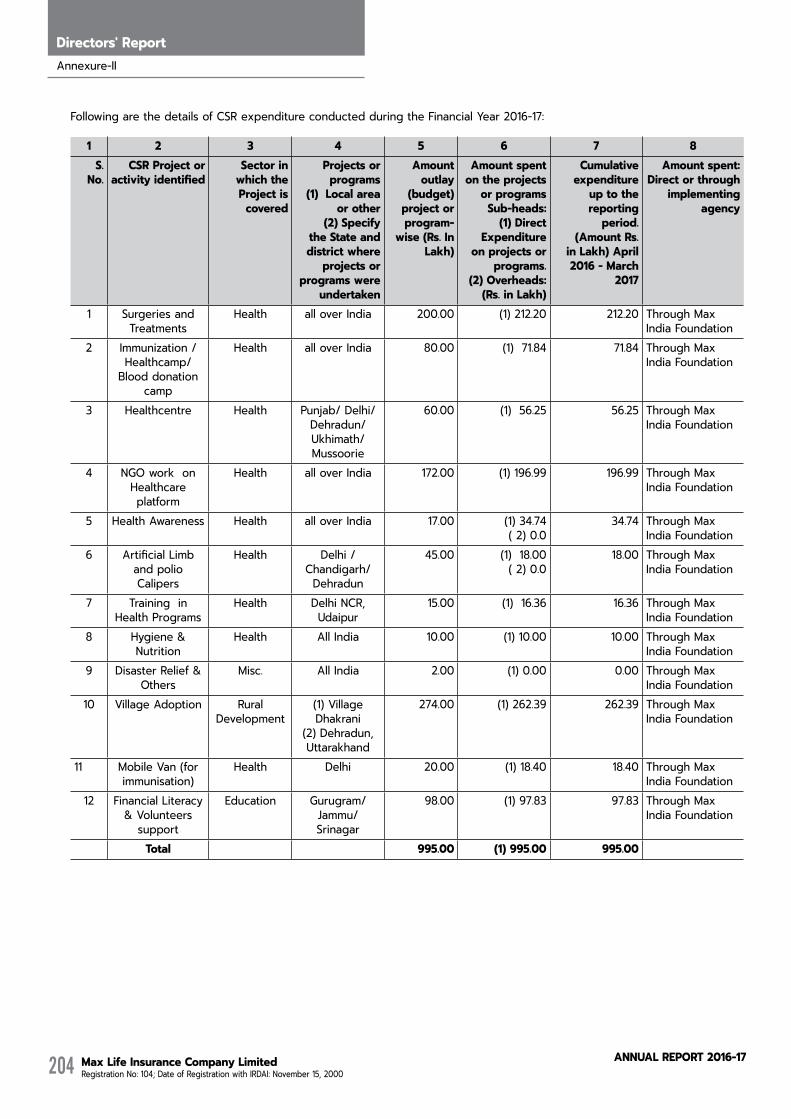
Max Life Insurance Company Limited Registration No: 104; Date of Registration with IRDAI: November 15, 2000
AnnuAL RepoRt 2016-17204
Directors' Report
Following are the details of CSR expenditure conducted during the Financial Year 2016-17:
1 2 3 4 5 6 7 8 S. No.
CSRProjectoractivityidentified
Sector in which the Projectiscovered
Projectsorprograms
(1) Local area or other
(2) Specify theStateanddistrictwhere
projectsorprogramswere
undertaken
Amount outlay
(budget)projectorprogram-
wise (Rs. In Lakh)
Amount spent ontheprojects
orprograms Sub-heads:
(1) Direct Expenditure
onprojectsorprograms.
(2)Overheads:(Rs.inLakh)
Cumulativeexpenditure
up to the reportingperiod.
(Amount Rs. inLakh)April2016 - March
2017
Amount spent: Directorthrough
implementingagency
1 Surgeries and Treatments
Health all over India 200.00 (1) 212.20 212.20 Through Max India Foundation
2 Immunization /Healthcamp/
Blood donation camp
Health all over India 80.00 (1) 71.84 71.84 Through Max India Foundation
3 Healthcentre Health Punjab/ Delhi/Dehradun/Ukhimath/Mussoorie
60.00 (1) 56.25 56.25 Through Max India Foundation
4 NGO work on Healthcare platform
Health all over India 172.00 (1) 196.99 196.99 Through Max India Foundation
5 Health Awareness Health all over India 17.00 (1) 34.74 ( 2) 0.0
34.74 Through Max India Foundation
6 Artificial Limb and polio Calipers
Health Delhi /Chandigarh/Dehradun
45.00 (1) 18.00( 2) 0.0
18.00 Through Max India Foundation
7 Training in Health Programs
Health Delhi NCR, Udaipur
15.00 (1) 16.36 16.36 Through Max India Foundation
8 Hygiene & Nutrition
Health All India 10.00 (1) 10.00 10.00 Through Max India Foundation
9 Disaster Relief & Others
Misc. All India 2.00 (1) 0.00 0.00 Through Max India Foundation
10 Village Adoption Rural Development
(1) Village Dhakrani
(2) Dehradun, Uttarakhand
274.00 (1) 262.39 262.39 Through Max India Foundation
11 Mobile Van (for immunisation)
Health Delhi 20.00 (1) 18.40 18.40 Through Max India Foundation
12 Financial Literacy & Volunteers
support
Education Gurugram/Jammu/ Srinagar
98.00 (1) 97.83 97.83 Through Max India Foundation
Total 995.00 (1) 995.00 995.00
Annexure-II

Max Life Insurance Company Limited Registration No: 104; Date of Registration with IRDAI: November 15, 2000
AnnuAL RepoRt 2016-17 205
5. Mannerinwhichtheamountwasspentduringthefinancialyearisdetailedbelow:
CSR initiatives by your Company were implemented through Max India Foundation, an independent Trust that is involved in the societal activities since 2006.
6. Incasethecompanyhasfailedtospendthetwopercentoftheaveragenetprofitofthelastthreefinancialyearsoranypartthereof,thecompanyshallprovidethereasonsfornotspendingtheamountinitsBoardreport.
Balance Rs.0.11 crore has been allocated to the education, sports, school support and financial literacy related activities to be executed in the schools in Gurugram and Jammu. These activities will be completed in first few months of the financial year 2017-18.
7. AresponsibilitystatementoftheCSRCommitteethattheimplementationandmonitoringofCSRPolicy,isincompliancewithCSRobjectivesandPolicyofthecompany:
This is to confirm that the implementation and monitoring of CSR Policy is in compliance with CSR objectives and policy of your Company.
Sd/-Rajesh SudExecutive Vice Chairman and Managing DirectorDIN: 02395182
Date: May 19, 2017Place: New Delhi
Sd/-Dinesh Kumar Mittal Chairman, CSR CommitteeDIN: 00040000
Date: May 18, 2017Place: New Delhi
Sd/-Mr. Rahul KhoslaChairmanDIN: 03597562
Date: May 19, 2017Place: New Delhi
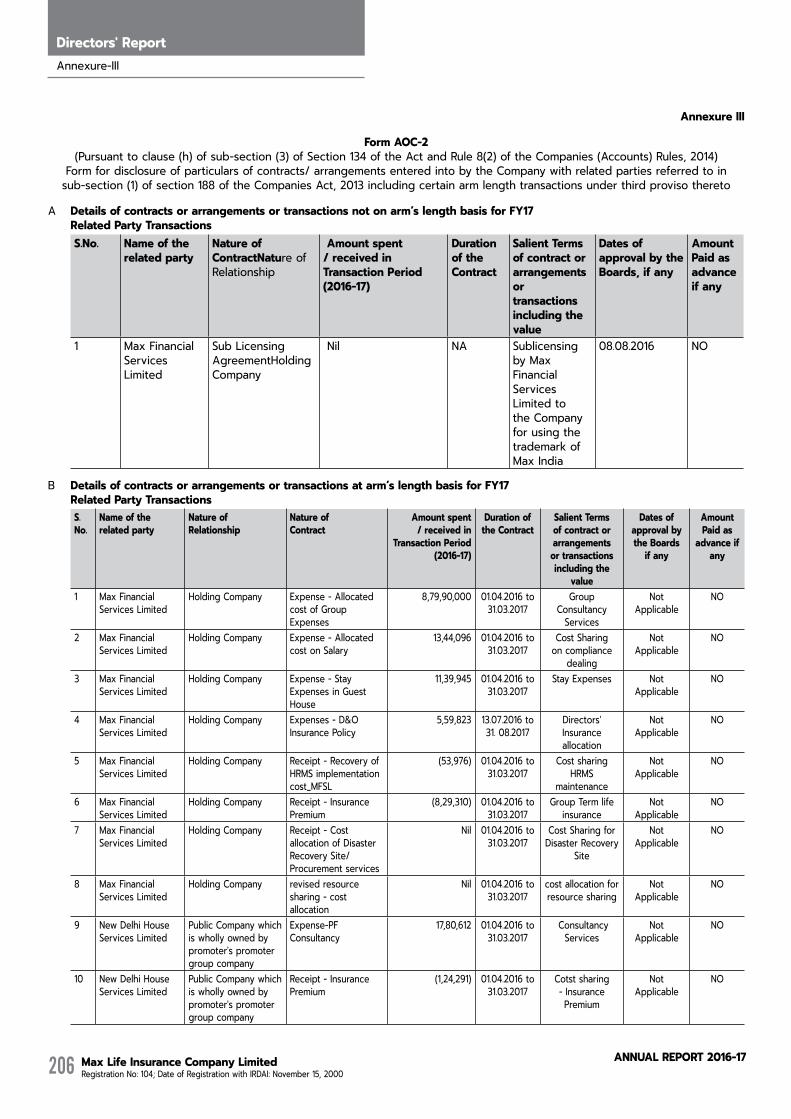
Max Life Insurance Company Limited Registration No: 104; Date of Registration with IRDAI: November 15, 2000
AnnuAL RepoRt 2016-17206
Directors' Report
AnnexureIII
Form AOC-2(Pursuant to clause (h) of sub-section (3) of Section 134 of the Act and Rule 8(2) of the Companies (Accounts) Rules, 2014)
Form for disclosure of particulars of contracts/ arrangements entered into by the Company with related parties referred to in sub-section (1) of section 188 of the Companies Act, 2013 including certain arm length transactions under third proviso thereto
A Detailsofcontractsorarrangementsortransactionsnotonarm’slengthbasisforFY17RelatedPartyTransactionsS.No. Name of the
relatedpartyNature of ContractNature of Relationship
Amount spent /receivedinTransactionPeriod(2016-17)
Duration of the Contract
Salient Terms of contract or arrangementsor transactions includingthevalue
Dates of approvalbytheBoards,ifany
Amount Paidasadvanceif any
1 Max Financial Services Limited
Sub Licensing AgreementHolding Company
Nil NA Sublicensing by Max Financial Services Limited to the Company for using the trademark of Max India
08.08.2016 NO
B Detailsofcontractsorarrangementsortransactionsatarm’slengthbasisforFY17 RelatedPartyTransactions
S. No.
Name of the relatedparty
Nature of Relationship
Nature of Contract
Amount spent /receivedin
TransactionPeriod(2016-17)
Duration of the Contract
Salient Terms of contract or arrangementsor transactions includingthe
value
Dates of approvalbytheBoards
if any
Amount Paidas
advanceifany
1 Max Financial Services Limited
Holding Company Expense - Allocated cost of Group Expenses
8,79,90,000 01.04.2016 to 31.03.2017
Group Consultancy
Services
Not Applicable
NO
2 Max Financial Services Limited
Holding Company Expense - Allocated cost on Salary
13,44,096 01.04.2016 to 31.03.2017
Cost Sharing on compliance
dealing
Not Applicable
NO
3 Max Financial Services Limited
Holding Company Expense - Stay Expenses in Guest House
11,39,945 01.04.2016 to 31.03.2017
Stay Expenses Not Applicable
NO
4 Max Financial Services Limited
Holding Company Expenses - D&O Insurance Policy
5,59,823 13.07.2016 to 31. 08.2017
Directors' Insurance allocation
Not Applicable
NO
5 Max Financial Services Limited
Holding Company Receipt - Recovery of HRMS implementation cost_MFSL
(53,976) 01.04.2016 to 31.03.2017
Cost sharing HRMS
maintenance
Not Applicable
NO
6 Max Financial Services Limited
Holding Company Receipt - Insurance Premium
(8,29,310) 01.04.2016 to 31.03.2017
Group Term life insurance
Not Applicable
NO
7 Max Financial Services Limited
Holding Company Receipt - Cost allocation of Disaster Recovery Site/Procurement services
Nil 01.04.2016 to 31.03.2017
Cost Sharing for Disaster Recovery
Site
Not Applicable
NO
8 Max Financial Services Limited
Holding Company revised resource sharing - cost allocation
Nil 01.04.2016 to 31.03.2017
cost allocation for resource sharing
Not Applicable
NO
9 New Delhi House Services Limited
Public Company which is wholly owned by promoter's promoter group company
Expense-PF Consultancy
17,80,612 01.04.2016 to 31.03.2017
Consultancy Services
Not Applicable
NO
10 New Delhi House Services Limited
Public Company which is wholly owned by promoter's promoter group company
Receipt - Insurance Premium
(1,24,291) 01.04.2016 to 31.03.2017
Cotst sharing - Insurance Premium
Not Applicable
NO
Annexure-III

Max Life Insurance Company Limited Registration No: 104; Date of Registration with IRDAI: November 15, 2000
AnnuAL RepoRt 2016-17 207
S. No.
Name of the relatedparty
Nature of Relationship
Nature of Contract
Amount spent /receivedin
TransactionPeriod(2016-17)
Duration of the Contract
Salient Terms of contract or arrangementsor transactions includingthe
value
Dates of approvalbytheBoards
if any
Amount Paidas
advanceifany
11 *Antara Senior Living Limited
Fellow Subsidiary Company
Receipt - Recovery of HRMS implementation cost_Antara
(10,995) 01.04.2016 to 31.03.2017
Cost sharing HRMS
maintenance
Not Applicable
NO
12 *Max Skill First Limited
Fellow Subsidiary Company
Expenses - Training Services
3,49,81,304 01.05.2015 to 30.04.2018
Cost Allocation towards training
services
Not Applicable
NO
13 *Max Skill First Limited
Fellow Subsidiary Company
Receipt - Rental of office space
(7,88,201) 01.05.2015 to 30.04.2018
Rental Sharing Not Applicable
NO
14 *Max Skill First Limited
Fellow Subsidiary Company
Receipt - IT support (46,652) 01.05.2015 to 30.04.2018
IT support Not Applicable
NO
15 *Max Bupa Health Insurance Limited
Fellow Subsidiary Company
Receipt - Rental of office space_Bupa
(3,43,514) 01.05.2015 to 30.04.2017
Rental Sharing Not Applicable
NO
16 *Max Bupa Health Insurance Limited
Fellow Subsidiary Company
Receipt - Analytics Services
(2,95,601) 01.05.2015 to 30.04.2017
Ananytical services
Not Applicable
NO
17 *Max Bupa Health Insurance Limited
Fellow Subsidiary Company
Receipt - Recovery of HRMS implementation cost_Max Bupa
(2,63,883) 01.05.2015 to 30.04.2017
Cost sharing HRMS
maintenance
Not Applicable
NO
18 *Max One Distribution And Service Limited
Fellow Subsidiary Company
Receipt - Rental of office space_Max One
(87,130) 01.04.2016 to 31.03.2017
Rental Sharing Not Applicable
NO
19 Max India Foundation
Other entities of which any of the Directors of the company is a member or owner
Receipt - Insurance Premium_MIF
(84,104) 01.04.2016 to 31.03.2017
Group Life Insuarance
Not Applicable
NO
20 Max India Foundation
Other entities of which any of the Directors of the company is a member or owner
Donation for CSR activity
9,51,26,935 01.04.2016 to 31.03.2017
Payment towards CSR activities
Not Applicable
NO
21 Mr. John Poole Non Executive Director
Consultancy services 47,57,709 01.04.2016 to 31.03.2017
Consultancy Services
18.05.2016 NO
*Parties ceased to be a related party as at May 14, 2016 and the amount shown above is upto that period
ForandonbehalfofBoardofMaxLifeInsuranceCompanyLimited
Rahul KhoslaChairman
DIN: 03597562Date: May 19, 2017Place: New delhi
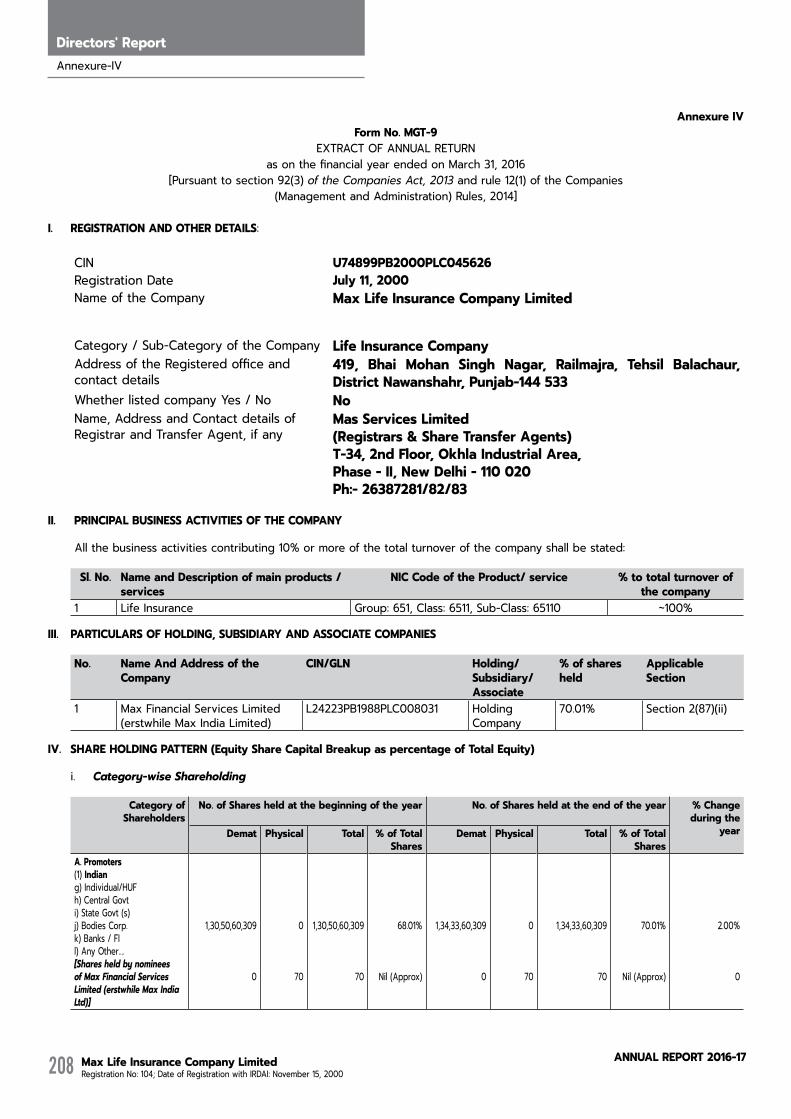
Max Life Insurance Company Limited Registration No: 104; Date of Registration with IRDAI: November 15, 2000
AnnuAL RepoRt 2016-17208
Directors' Report
AnnexureIVForm No. MGT-9
EXTRACT OF ANNUAL RETURNas on the financial year ended on March 31, 2016
[Pursuant to section 92(3) of the Companies Act, 2013 and rule 12(1) of the Companies(Management and Administration) Rules, 2014]
I. REGISTRATION AND OTHER DETAILS:
CIN U74899PB2000PLC045626Registration Date July 11, 2000Name of the Company MaxLifeInsuranceCompanyLimited
Category / Sub-Category of the Company Life Insurance CompanyAddress of the Registered office and contact details
419, Bhai Mohan Singh Nagar, Railmajra, Tehsil Balachaur,DistrictNawanshahr,Punjab-144533
Whether listed company Yes / No NoName, Address and Contact details of Registrar and Transfer Agent, if any
MasServicesLimited(Registrars&ShareTransferAgents)T-34,2ndFloor,OkhlaIndustrialArea,Phase - II, New Delhi - 110 020Ph:- 26387281/82/83
II. PRINCIPAL BUSINESS ACTIVITIES OF THE COMPANY
All the business activities contributing 10% or more of the total turnover of the company shall be stated:
Sl. No. NameandDescriptionofmainproducts/services
NICCodeoftheProduct/service %tototalturnoverofthe company
1 Life Insurance Group: 651, Class: 6511, Sub-Class: 65110 ~100%
III. PARTICULARS OF HOLDING, SUBSIDIARY AND ASSOCIATE COMPANIES
No. NameAndAddressoftheCompany
CIN/GLN Holding/Subsidiary/Associate
% of shares held
ApplicableSection
1 Max Financial Services Limited (erstwhile Max India Limited)
L24223PB1988PLC008031 Holding Company
70.01% Section 2(87)(ii)
IV. SHAREHOLDINGPATTERN(EquityShareCapitalBreakupaspercentageofTotalEquity)
i. Category-wise Shareholding
CategoryofShareholders
No.ofSharesheldatthebeginningoftheyear No.ofSharesheldattheendoftheyear %Changeduringthe
yearDemat Physical Total % of Total Shares
Demat Physical Total % of Total Shares
A. Promoters (1) Indiang) Individual/HUF h) Central Govti) State Govt (s) j) Bodies Corp.k) Banks / FI l) Any Other…. [Shares held by nominees of Max Financial Services Limited (erstwhile Max India Ltd)]
1,30,50,60,309
0
0
70
1,30,50,60,309
70
68.01%
Nil (Approx)
1,34,33,60,309
0
0
70
1,34,33,60,309
70
70.01%
Nil (Approx)
2.00%
0
Annexure-IV

Max Life Insurance Company Limited Registration No: 104; Date of Registration with IRDAI: November 15, 2000
AnnuAL RepoRt 2016-17 209
CategoryofShareholders
No.ofSharesheldatthebeginningoftheyear No.ofSharesheldattheendoftheyear %Changeduringthe
yearDemat Physical Total % of Total Shares
Demat Physical Total % of Total Shares
Sub-total(A)(1):- 1,30,50,60,309 70 1,30,50,60,379 68.01% 1,34,33,60,309 70 1,34,33,60,379 70.01% 2.00%
(2) Foreigna) NRIs - Individuals b) Other – Individuals c) Bodies Corp. d) Banks / FI e) Any Other….
- - - - - - - - -
Sub-total(A)(2):- - - - - - - - - -TotalshareholdingofPromoter (A) = (A)(1)+(A)(2)
1,30,50,60,309 70 1,30,50,60,379 68.01% 1,34,33,60,309 70 1,34,33,60,379 70.01% 2.00%
B. PublicShareholding1. Institutions a) Mutual Funds b) Banks / FI c) Central Govtd) State Govt(s) e) Venture Capital Funds f) Insurance Companies g) FIIs h) Foreign Venture Capital Funds i) Others (specify)
- NBFC
11,48,98,762
1,91,50,000
0
0
11,48,98,762
1,91,50,000
5.99%
1.00%
9,57,48,762
0
0
0
9,57,48,762
0
4.99%
0
(1.00%)
(1.00%)
Sub-total(B)(1):- 13,40,48,762 0 13,40,48,762 6.99% 9,57,48,762 0 9,57,48,762 4.99% (2.00%)
2. Non-Institutions a) Bodies Corp. i) Indian ii) Overseas
b) Individualsi) Individual shareholders holding nominal share capital upto Rs.1 lakh ii) Individual shareholders holding nominal share capital in excess of Rs.1 lakh c) Others
47,97,03,215
0
0
500
47,97,03,215
500
25.00%
0%
47,97,03,215
0
0
500
47,97,03,215
500
25.00%
0.00%
0.00%
0.00%
Sub-total(B)(2):- 47,97,03,215 500 47,97,03,715 25.00% 47,97,03,215 500 47,97,03,715 25.00% 0.00%Total Public Shareholding (B)=(B)(1)+ (B)(2)
61,37,51,977 500 61,37,52,477 31.99% 57,54,51,977 500 57,54,52,477 29.99% (2.00%)
C. Shares held by Custodian for GDRs & ADRs
- - - - - - - - -
GrandTotal(A+B+C) 1,91,88,12,286 570 1,91,88,12,856 100.00% 1,91,88,12,286 570 1,91,88,12,856 100.00% 0.00%

Max Life Insurance Company Limited Registration No: 104; Date of Registration with IRDAI: November 15, 2000
AnnuAL RepoRt 2016-17210
Directors' Report
ii. Shareholding of Promoters
Sl No. Share-holder’sName
Shareholdingatthebeginningoftheyear Shareholdingattheendoftheyear %changein share holding
duringtheyear
No. of Shares % of total Shares of the
company
%of Shares Pledged/encumbered
to total shares
No. of Shares % of total Shares of the
company
%of Shares Pledged/encumbered
to total shares
1 Max Financial Services Limited (erstwhile Max India Limited)
1,30,50,60,309 68.01% Nil 1,34,33,60,309 70.01% Nil 2.00%
2 Shares held by nominees of Max Financial Services Limited (erstwhile Max India Limited)
70 Nil (Approx) Nil 70 Nil (Approx) Nil Nil
Total 1,30,50,60,379 68.01% Nil 1,34,33,60,379 70.01% Nil 2.00%
iii. Change in Promoters’ Shareholding (please specify, if there is no change)
Sl. No. Shareholdingatthebeginningoftheyear CumulativeShareholdingduringthe year
No. of shares % of total shares of the
company
No. of shares % of total shares of the company
1
2
At the beginning of the year MaxFinancialServicesLimited(erstwhileMaxIndiaLimited)SharesheldbynomineesofMaxFinancialServicesLimited
1,30,50,60,309
70
68.01%
Nil (Approx)
1,30,50,60,379 68.01%
Date wise Increase / Decrease in Promoters Shareholding during the year specifying the reasons for increase / decrease (e.g. allotment / transfer / bonus/ sweat equity etc):
MaxFinancialServicesLimited(erstwhileMaxIndiaLimited)
Percentage of Shareholding changed due to transfer of shares as under:
June 21, 2016, IDFC Limited transferred its 1,91,50,000 equity shares amounting to ~1.00% of paid-up equity share capital to Max Financial Services Limited through demat mode.
November 18, 2016, Axis Bank Limited transferred its 1,91,50,000 equity shares amounting to ~1.00% of paid-up equity share capital to Max Financial Services Limited through demat mode.
1
2
At the end of the year
MaxFinancialServicesLimited(erstwhileMaxIndiaLimited)SharesheldbynomineesofMaxFinancialServicesLimited
1,34,33,60,309
70
70.01%
Nil (Approx)
1,34,33,60,379 70.01%
Annexure-IV
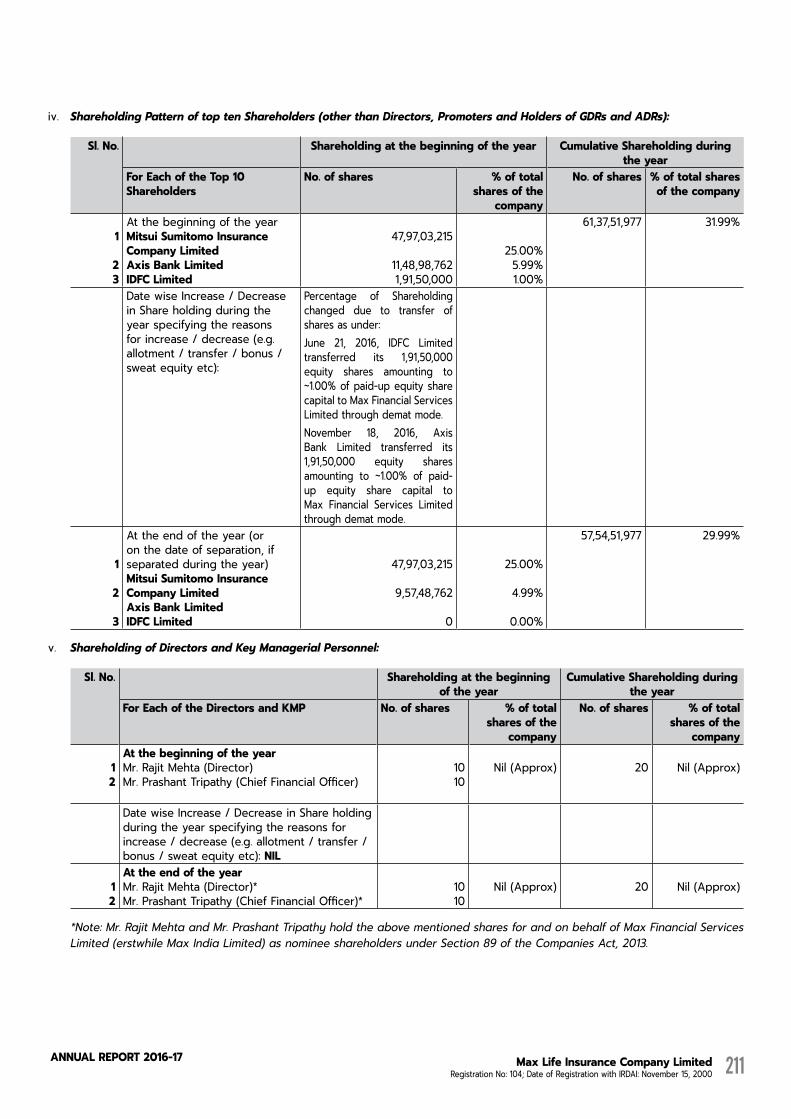
Max Life Insurance Company Limited Registration No: 104; Date of Registration with IRDAI: November 15, 2000
AnnuAL RepoRt 2016-17 211
iv. Shareholding Pattern of top ten Shareholders (other than Directors, Promoters and Holders of GDRs and ADRs):
Sl. No. Shareholdingatthebeginningoftheyear CumulativeShareholdingduringthe year
For Each of the Top 10 Shareholders
No. of shares % of total shares of the
company
No. of shares % of total shares of the company
1
23
At the beginning of the year Mitsui Sumitomo Insurance CompanyLimitedAxisBankLimitedIDFCLimited
47,97,03,215
11,48,98,7621,91,50,000
25.00%5.99%1.00%
61,37,51,977 31.99%
Date wise Increase / Decrease in Share holding during the year specifying the reasons for increase / decrease (e.g. allotment / transfer / bonus / sweat equity etc):
Percentage of Shareholding changed due to transfer of shares as under:June 21, 2016, IDFC Limited transferred its 1,91,50,000 equity shares amounting to ~1.00% of paid-up equity share capital to Max Financial Services Limited through demat mode.November 18, 2016, Axis Bank Limited transferred its 1,91,50,000 equity shares amounting to ~1.00% of paid-up equity share capital to Max Financial Services Limited through demat mode.
1
2
3
At the end of the year (or on the date of separation, if separated during the year) Mitsui Sumitomo Insurance CompanyLimitedAxisBankLimitedIDFCLimited
47,97,03,215
9,57,48,762
0
25.00%
4.99%
0.00%
57,54,51,977 29.99%
v. Shareholding of Directors and Key Managerial Personnel:
Sl. No. Shareholdingatthebeginningof the year
CumulativeShareholdingduringthe year
ForEachoftheDirectorsandKMP No. of shares % of total shares of the
company
No. of shares % of total shares of the
company
12
AtthebeginningoftheyearMr. Rajit Mehta (Director)Mr. Prashant Tripathy (Chief Financial Officer)
1010
Nil (Approx) 20 Nil (Approx)
Date wise Increase / Decrease in Share holding during the year specifying the reasons for increase / decrease (e.g. allotment / transfer / bonus / sweat equity etc): NIL
12
AttheendoftheyearMr. Rajit Mehta (Director)*Mr. Prashant Tripathy (Chief Financial Officer)*
1010
Nil (Approx) 20 Nil (Approx)
*Note: Mr. Rajit Mehta and Mr. Prashant Tripathy hold the above mentioned shares for and on behalf of Max Financial Services Limited (erstwhile Max India Limited) as nominee shareholders under Section 89 of the Companies Act, 2013.
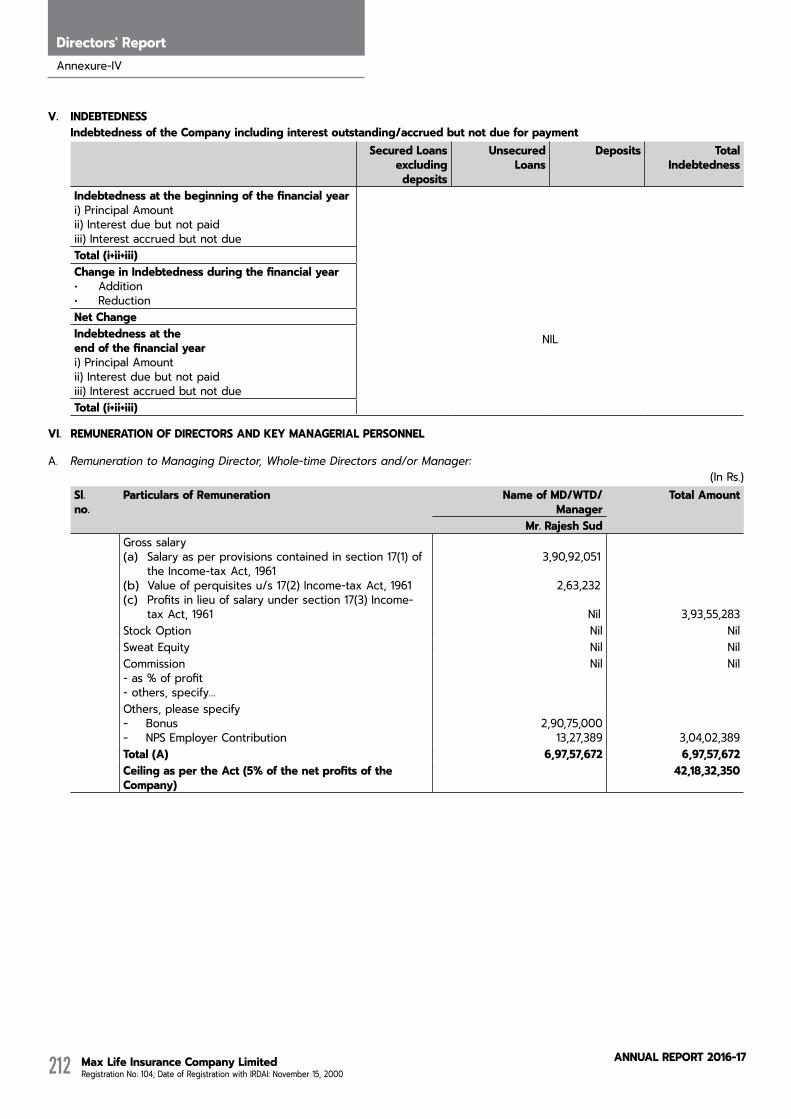
Max Life Insurance Company Limited Registration No: 104; Date of Registration with IRDAI: November 15, 2000
AnnuAL RepoRt 2016-17212
Directors' Report
V. INDEBTEDNESS IndebtednessoftheCompanyincludinginterestoutstanding/accruedbutnotdueforpayment
SecuredLoansexcludingdeposits
UnsecuredLoans
Deposits Total Indebtedness
Indebtednessatthebeginningofthefinancialyeari) Principal Amount ii) Interest due but not paid iii) Interest accrued but not due
NIL
Total (i+ii+iii) ChangeinIndebtednessduringthefinancialyear• Addition • Reduction NetChangeIndebtednessattheendofthefinancialyeari) Principal Amount ii) Interest due but not paid iii) Interest accrued but not due Total (i+ii+iii)
VI. REMUNERATION OF DIRECTORS AND KEY MANAGERIAL PERSONNEL
A. Remuneration to Managing Director, Whole-time Directors and/or Manager:(In Rs.)
Sl. no.
Particulars of Remuneration Name of MD/WTD/ Manager
Total Amount
Mr.RajeshSudGross salary (a) Salary as per provisions contained in section 17(1) of
the Income-tax Act, 1961 (b) Value of perquisites u/s 17(2) Income-tax Act, 1961 (c) Profits in lieu of salary under section 17(3) Income-
tax Act, 1961
3,90,92,051
2,63,232
Nil 3,93,55,283Stock Option Nil NilSweat Equity Nil NilCommission - as % of profit - others, specify…
Nil Nil
Others, please specify - Bonus- NPS Employer Contribution
2,90,75,00013,27,389 3,04,02,389
Total (A) 6,97,57,672 6,97,57,672CeilingaspertheAct(5%ofthenetprofitsoftheCompany)
42,18,32,350
Annexure-IV
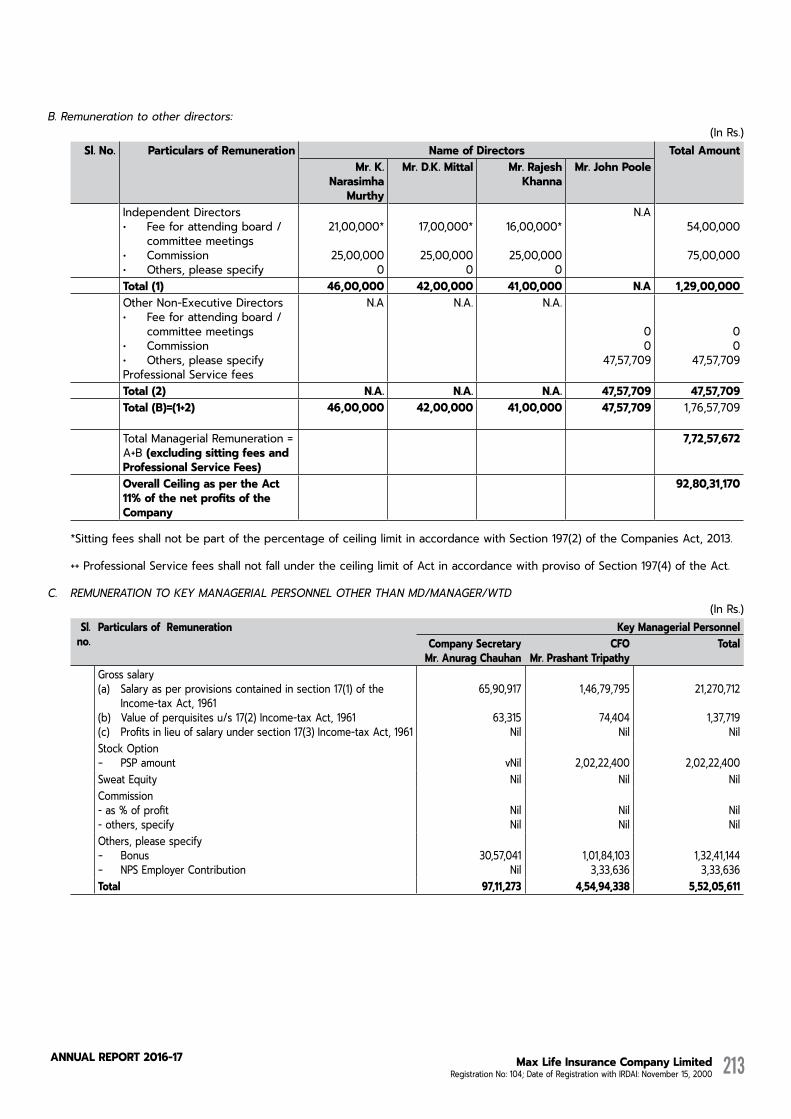
Max Life Insurance Company Limited Registration No: 104; Date of Registration with IRDAI: November 15, 2000
AnnuAL RepoRt 2016-17 213
B. Remuneration to other directors:(In Rs.)
Sl. No. Particulars of Remuneration Name of Directors Total Amount Mr. K.
Narasimha Murthy
Mr. D.K. Mittal Mr.RajeshKhanna
Mr. John Poole
Independent Directors • Fee for attending board /
committee meetings • Commission • Others, please specify
21,00,000*
25,00,0000
17,00,000*
25,00,0000
16,00,000*
25,00,0000
N.A54,00,000
75,00,000
Total (1) 46,00,000 42,00,000 41,00,000 N.A 1,29,00,000Other Non-Executive Directors • Fee for attending board /
committee meetings • Commission • Others, please specify Professional Service fees
N.A N.A. N.A.
00
47,57,709
00
47,57,709
Total (2) N.A. N.A. N.A. 47,57,709 47,57,709Total (B)=(1+2) 46,00,000 42,00,000 41,00,000 47,57,709 1,76,57,709
Total Managerial Remuneration = A+B (excludingsittingfeesandProfessionalServiceFees)
7,72,57,672
OverallCeilingaspertheAct11%ofthenetprofitsoftheCompany
92,80,31,170
*Sitting fees shall not be part of the percentage of ceiling limit in accordance with Section 197(2) of the Companies Act, 2013.
++ Professional Service fees shall not fall under the ceiling limit of Act in accordance with proviso of Section 197(4) of the Act.
C. REMUNERATION TO KEY MANAGERIAL PERSONNEL OTHER THAN MD/MANAGER/WTD (In Rs.)
Sl. no.
Particulars of Remuneration KeyManagerialPersonnelCompany Secretary Mr.AnuragChauhan
CFO Mr. Prashant Tripathy
Total
Gross salary (a) Salary as per provisions contained in section 17(1) of the
Income-tax Act, 1961 (b) Value of perquisites u/s 17(2) Income-tax Act, 1961 (c) Profits in lieu of salary under section 17(3) Income-tax Act, 1961
65,90,917
63,315Nil
1,46,79,795
74,404Nil
21,270,712
1,37,719Nil
Stock Option - PSP amount vNil 2,02,22,400 2,02,22,400Sweat Equity Nil Nil NilCommission - as % of profit - others, specify
NilNil
NilNil
NilNil
Others, please specify - Bonus- NPS Employer Contribution
30,57,041Nil
1,01,84,1033,33,636
1,32,41,1443,33,636
Total 97,11,273 4,54,94,338 5,52,05,611

Max Life Insurance Company Limited Registration No: 104; Date of Registration with IRDAI: November 15, 2000
AnnuAL RepoRt 2016-17214
Directors' Report
VII. Penalties/Punishment/Compoundingofoffences:
Type Section of the Companies
Act
Brief Description
Details of Penalty/
Punishment/ Compoundingfeesimposed
Authority [RD / NCLT
/ COURT]
Appealmade,ifany(give
Details)
A. COMPANY Penalty NIlPunishment NilCompounding NilB. DIRECTORS Penalty NilPunishment NilCompounding 621A read with
Section 300 of Companies Act, 1956
The below stated directors participated in the discussion and voted in the meeting of Board of directors of the company held on 01.11.2012 and 22.10.2013 in which it was resolved to pay donation of Rs. 2.00 Crores & Rs. 3.00 Crore respectively to MIF, thereby violating the provisions of the Section 300 of the Co. Act, 1956.1. Mr. Analjit Singh (Former
Chairman/ Director), 2. Mr. Rajesh Sud (Executive Vice
Chairman & Managing Director) and
3. Mr. Rajit Mehta (Director) of the company,
were Managing Trustee/ Trustee of Max India Foundation (“MIF”).
Rs. 60,000/- (Rupees Sixty Thousand Only) was imposed on each petitioner in the RD order dated January 19, 2017
Regional Director (Northern Region)
Compounding fees paid
C. OTHER OFFICERS IN DEFAULT Penalty NilPunishment NilCompounding Nil
ForandonbehalfoftheBoardofDirectors
Sd/-Rahul Khosla
ChairmanDIN: 03597562
Date: May 19, 2017Place: New Delhi
Annexure-IV

Max Life Insurance Company Limited Registration No: 104; Date of Registration with IRDAI: November 15, 2000
AnnuAL RepoRt 2016-17 215
NOMINATION AND REMUNERATION POLICY
Max Life Insurance Company Limited
I. PREAMBLE
Pursuant to Section 178 of the Companies Act, 2013 and corporate governance guidelines of Insurance Regulatory Development Authority of India (IRDAI) dated 18th May 2016 (“Corporate Governance Guidelines”), the Board of Directors of Max Life Insurance Company Limited (“Max Life” or “Company”) requires to constitute a Nomination and Remuneration Committee which will report to the Board. The Company has in place a Human Resource Organisation and Compensation Committee (“HRCC”) comprising of 4(four) non-executive Directors, of which 2(two) are Independent Directors as required under section 178 of the Companies Act, 2013, for discharging all obligations of NRC.
In order to align with the provisions of the Companies Act, 2013 and the Corporate Governance Guidelines, the Board on 21st May 2015 changed the nomenclature of the “Human Resource Organisation and Compensation Committee” to “Nomination and Remuneration Committee”.
The remuneration payable to Chief Executive Officer (“CEO”)/ Whole Time Directors (“WTD”)/ Managing Director (“MD”) is governed by the provisions of Section 34A of the Insurance Act, 1938. Further in exercise of its powers under Section 14 of the IRDA Act, 1999, IRDAI has issued guidelines on remuneration of Non Executive Directors, MD, CEO and WTD Dated 5th August 2016 (“Remuneration Guidelines”) that require the Company to formulate a sound remuneration policy.
This Policy is formulated in compliance with Section 178 of the Companies Act, 2013 read along with Corporate Governance Guidelines and Remuneration Guidelines.
This Policy shall be effective from October 1, 2016 or in the case of MD/CEO/WTD and Non- Executive Directors, from the date of appointment/re-appointment of MD/CEO/WTD and Non-Executive Directors, whichever is later or upon any amendment in the remuneration of the incumbents at the MD/CEO/WTD/ Non executive Directors positions.
II. DEFINITIONS
“Board” means Board of Directors of the Company. “Company” means “Max Life Insurance Company Limited.”
“Employee Phantom Stock Schemes” means the Employee Phantom Stock Plan 2014 or Employee Phantom Stock Plan 2012 - Amended or such other scheme approved or amended by Board from time to time.
“Independent Director” means a director referred to in Section 149 (6) of the Companies Act, 2013.
“Key Management Persons”/ “KMPs” means members of the core management team of an insurer including all WTD/ MD/ CEO and the functional heads one level below the MD/CEO, including the CFO, Appointed Actuary, Chief Investment Officer, Chief Risk Officer, Chief Compliance Officer and Company Secretary.”
“Nomination and Remuneration Committee or NRC or Committee” shall mean a Nomination and Remuneration Committee constituted by the Board of Directors of the Company, in accordance with the provisions of Section 178 of the Companies Act, 2013 read with the Corporate Governance Guidelines.
“Policy or This Policy” means, “Nomination and Remuneration Policy.”
“Remuneration” means any money or its equivalent/benefit/amenity/perquisite given (in whatever form) or passed to any person for services rendered by him / her and includes perquisites as defined under the Income-tax Act, 1961.
III. GUIDING PRINCIPLES
The Policy ensures that
1. There is effective governance of remuneration by active Board oversight;
2. There is effective alignment of remuneration to prudent risk taking;
3. It effectively covers Board members, CEO/MD/WTD and KMPs whose actions may have material impact on the risk;
4. The level and composition of remuneration is reasonable and sufficient to attract, retain and motivate Directors of the quality required to run the Company successfully;
5. The interests of CEO/MD/WTD are aligned with the business strategy, risk tolerance and adjusted for risk parameters (as mentioned in Section X.1.3., objectives, values and long-term interests of the Company;
6. Relationship of remuneration to performance is clear, meeting appropriate performance benchmarks and consistent with the “pay-for-performance” principle;
7. Remuneration to Directors and Key Managerial Personnel involves a balance between fixed and incentive pay reflecting short and long-term performance objectives, appropriate to the working of the Company and its goals; and,
8. The Policy will be reviewed annually to ensure alignment with statutory and regulatory requirements.
AnnexureV
Max Life Insurance Company Limited Registration No: 104; Date of Registration with IRDAI: November 15, 2000
AnnuAL RepoRt 2016-17216
Directors' Report
IV. ROLE OF THE COMMITTEE
The role of the Committee shall be to fullfill the obligations as set out in this Policy and to ensure compliance of the relevant provisions of the Companies Act, 2013, Corporate Governance Guidelines, Remuneration Guidelines, and various other obligations as mentioned in the charter of the Nomination and Remuneration Committee as approved by the Board of Directors from time to time.
V. APPOINTMENT AND REMOVAL OF DIRECTOR/MD /CEO AND KMP
Appointment criteria and qualifications:
1. Any appointment (including the criteria therefore), reappointment, termination of appointment of Directors (both executive and non-executive including independent directors) shall be in accordance with the Companies Act, 2013, the Corporate Governance Guidelines and Remuneration Guidelines.
2. Any appointment, reappointment, termination of appointment of a MD/CEO/WTD (by whatever name called) will have effect only after prior approval of IRDAI has been taken.
3. The Committee shall identify and ascertain the integrity, qualification, expertise and experience of the person being appointed as Director or KMP and recommend to the Board his / her appointment.
4. A Director or KMP should possess adequate qualification, expertise and experience for the position he / she is considered for appointment as Director or KMP. The Committee has the discretion to decide whether the qualification, expertise and experience possessed by a person are sufficient / satisfactory for the concerned position.
5. The Company shall not appoint or continue the employment of any person as MD /WTD/ CEO who has attained the retirement age as per Company Policy.
6. The Committee shall ensure that a requisite framework exists for appointments and qualification requirements for the human resources and which ensures that the incentive structure does not encourage imprudent behavior.
7. Any amendment made to any provision relating to appointment, re-appointment or termination of appointment of a MD/WTD/CEO (by whatever name called) will have effect only after prior approval of IRDAI has been taken.
VI. TERM AND TENURE
1. MD/WTD: The Company shall appoint or re-appoint any person as its MD/WTD for a term not exceeding five years at a time. No re-appointment shall be made earlier
than one year before the expiry of term.
2. Independent Director:
2.1. An Independent Director shall hold office for a term up to five consecutive years on the Board of the Company and will be eligible for appointment on passing of a special resolution by the Company and disclosure of such appointment in the Board’s report. No Independent Director shall hold office for more than two consecutive terms, but such Independent Director shall be eligible for appointment after expiry of three years of ceasing to become an Independent Director.
2.2. For the purpose of determining term of independent directors, the existing term of the Independent Directors as on April 1, 2014 shall not be counted a term for above clauses.
VII. EVALUATION:
The Committee shall carry out evaluation of performance of every Director at a yearly interval, in accordance with Section 178 of the Companies Act, 2013, and present a report thereon to the Board of Directors.
VIII. REMOVAL
Due to reasons of any disqualification mentioned in the Companies Act, 2013, rules made there under or under any other applicable Act, rules and regulations, the Committee may recommend, to the Board with reasons recorded in writing, removal of a Director or KMP subject to the provisions and compliance of the said Act, rules and regulations.
IX. RETIREMENT
The Director or KMP shall retire as per the applicable provisions of the Companies Act, 2013 and the prevailing policy of the Company. The Board will have the discretion to retain the Director/ KMP in the same position / remuneration or otherwise even after attaining the retirement age, for the benefit of the Company.
X. PROVISIONS RELATING TO REMUNERATION OF MD/WTD/CEO/KMP
1. Remuneration of CEO and MD/WTD:
1.1. Applicable Acts, Guidelines and Required Approvals
a. Any provision relating to remuneration of CEO/MD/WTD will be determined by the Committee, recommended to the Board for approval and will necessarily require prior approval of IRDAI.
b. The NRC/ Board would always maintain a fine balance between reasonableness and fairness, while making remuneration-related decisions.
c. The remuneration and commission to be paid to CEO and MD /WTD shall be as per the applicable
Annexure-V
Max Life Insurance Company Limited Registration No: 104; Date of Registration with IRDAI: November 15, 2000
AnnuAL RepoRt 2016-17 217
statutory provisions of the Companies Act, 2013 read with the Insurance Act, 1938 and amendments and rules made thereunder for the time being in force including the Remuneration Guidelines.
1.2. Components of Remuneration
The remuneration of CEO and MD/WTD may be structured to include fixed pay, perquisites, bonus, guaranteed pay, allowances, short term/long-term incentives, retirals (superannuation or any other pension plan, gratuity, provident fund), employee stock options, Employee Phantom Stock Option, severance package (by whatever name called) and other components, as discussed below, in accordance with applicable law.
1.3. Risk and Reward
a. Remuneration of MD/CEO/WTD will be linked to performance parameters such that
i. It is adjusted for all types of risks (as mentioned in Section X.1.3.b).
ii. Remuneration outcomes are symmetrical with risk outcomes, and
iii. The payouts are sensitive to the time horizon of the risk.
iv. Pay mix (i.e. cash, equity and other forms of remuneration) should be consistent with risk alignment
b. The minimum risk parameters that will be considered by NRC and Board for assessing performance and suitable risk adjustment will cover aspects related to:
i. Persistency
ii. Solvency
iii. Grievance Redressal
iv. Expenses of Management
v. Claim Settlement
vi. Claim repudiations
vii. Overall compliance status
viii. Overall financial position such as net worth position, assets under management (“AUM”) etc.)
1.4. Pay Mix
a. Total Remuneration
i. It will have a fixed component (inclusive of guaranteed cash and retirals), and a variable component linked to individual and
organizational performance in the form of cash or stock linked payout or mix of both.
ii. Proper balance between fixed and variable components will be ensured and as determined by the NRC/Board and in accordance with the IRDAI guidelines.
b. Fixed Pay – Fixed portion of the compensation will be a reasonable amount, as determined by NRC/Board.
c. Variable Pay –
i. To ensure that any future grants (by whatever name called) that are given, if construed as variable pay, should have a proper balance of pay mix in line with Guideline (X)(1)(1.4)(a)(ii).
ii. Variable pay could be in cash or stock linked instruments or mix of both. However, for the remuneration of MD/WTD/CEO, ESOPS shall not be included for the purposes of calculation of variable pay.
iii. It will be ensured that in case any fresh grant or payout given has both cash and stock linked components, a reasonable balance is maintained between the two types of components.
iv. In case Variable Pay constitutes a substantial portion of the Total Remuneration, then at least 40% of the same shall be deferred over a minimum period of 3 years. The NRC may, if it deems fit, recommend any higher proportion of variable pay to be deferred. In this regard, ‘substantial portion’ shall mean 50% or more of the Total Remuneration The payout of such deferred portion should not vest faster than on pro rata basis.
v. Total payout of variable pay will be directly proportional to the financial performance of the Company and the risk parameters defined in this sub section. In case there is deterioration in the same, the variable payout will contract in accordance with adjustment for these parameters.
1.5. Stock or Shares
a. If given as ESOP
i. ESOP will be kept outside the computation of total remuneration for the purposes of calculation of total pay as specified under the Remuneration Guidelines. However, ESOPs for CEO/MD/Director/WTD shall require the prior approval of IRDAI;
ii. The extent of ESOP grant will be reasonable as
Max Life Insurance Company Limited Registration No: 104; Date of Registration with IRDAI: November 15, 2000
AnnuAL RepoRt 2016-17218
Directors' Report
approved by NRC/Board;
iii. Details of ESOP grants will be disclosed in line with disclosure requirements stipulated for the financial statements of the Company;
iv. If ESOPs are issued to the CEO/MD/Director/WTD/Manager who is one of the promoters / investors or directly related to the promoters, then the grants will be governed by the provisions of SEBI (Issue of Sweat Equity) Regulations, 2002. In other cases, the same will be governed by the SEBI’s ESOP guidelines.
b. If given as Sweat Equity:
If the CEO/MD/WTD is one of the promoters / investors or directly related to the promoters, then the grants will be governed by the provisions of SEBI (Issue of Sweat Equity) Regulations, 2002 as amended from time to time except those relating to pricing of shares. The manner of pricing of shares shall be disclosed upfront to IRDAI.
1.6. Clawback
a. In case of the unvested and unpaid portion of the deferred variable pay, appropriate mechanism will be put into place with respect to clawback, which will be appropriately linked to parameters as defined in Section X 1.3.
b. NRC / Board will track performance of the parameters given in Section X 1.3 or of the relevant line of business in every year during the vesting period. In case of negative performance observed in any year (based on appropriate facts including observation and verification of risk outcomes), such unvested / unpaid portions will be subject to clawback. However, while exercising such provisions due consideration will be given to actual / realised performance of the Company.
1.7. Guaranteed Bonus
The Remuneration structure will not include guaranteed bonus of any kind as part of the remuneration plan of CEO/MD/WTD except sign on/joining bonus, if required. The same will be governed by the following principles in line with the Remuneration Guidelines:
c. Sign on bonus or Joining Bonus will be given only to new hires;
d. Grant will be limited to first year;
e. Grant will be in the form of ESOP only;
f. The payout may be deferred beyond the year of joining.
g. It will be given with prior approval of NRC/ Board.
1.8. Severance Pay
a. Any severance pay for involuntary separation without cause or due to change of control etc. to MD/CEO/WTD, other than accrued benefits (gratuity, pension etc.) will be paid with prior approval of the Board/NRC and IRDAI and in accordance with contractual obligations and Companies Act, 2013. Notice period pay is not to be construed as severance pay.
1.9. Miscellaneous
a. No revision in remuneration will be permitted till the expiry of one year from the date of approval.
b. No remuneration will be paid to MD/CEO/WTD by any of the promoters / investors or by the group companies of the promoters’ / investors’ companies.
2. Remuneration to KMPs:
KMPs (other than MD/ CEO/ WTD) shall be eligible for a remuneration inclusive of fixed pay, perquisites, allowances, short term/ long term incentives, retrials, Employee Phantom Stock Option and other components as may be approved by NRC and as per compensation strategy / framework of the Company from time to time. Remuneration guidelines for all KMPs who are MD/CEO/WTD will be in line with Section X of this policy.
XI. REMUNERATION TO NON-EXECUTIVE / INDEPENDENT DIRECTOR
1. Commission to Independent Director
Subject to the approval of Board and Shareholders in accordance with the statutory provisions of the Companies Act, 2013, and the rules made thereunder, the Independent Directors may be paid profit linked commission from time to time. Any remuneration shall not exceed Rs Ten Lakh per annum (excluding to the independent Chairman, if applicable) or such amount as may be specified by IRDAI for each of such Independent Director.
Subject to the overall limit in this regard, the Board may, with mutual agreement with such director, determine and pay different commission, to each independent director.
2. Commission to Non Executive Director
a. Subject to the approval of the Board, the Non Executive Directors may be paid remuneration in the form of profit linked commission from time to time, provided that the Company makes profits. Such remuneration shall not exceed Rs. Ten Lakh per annum (excluding to the Chairman) or such amount as may be specified by IRDAI for each of
Annexure-V
Max Life Insurance Company Limited Registration No: 104; Date of Registration with IRDAI: November 15, 2000
AnnuAL RepoRt 2016-17 219
such Non Executive Director.
b. The remuneration for the Chairman may be decided by the Board of Directors of the Company. It has no prescribed cap.
3. Commission to non-executive Chairman shall be as decided by the Board of Directors.
4. Stock Options:
An Independent Director shall not be entitled to any units under Employee Phantom Stock Schemes of the Company.
The Company may, in line with applicable provisions of Companies Act, 2013 read with Insurance Act, 1938 and amendments and rules thereunder, wherever applicable, grant units under Employee Phantom Stock Schemes of the Company to any non-executive director other than independent director.
5. Engagement for Professional Services
The Company may, in line with applicable provisions of Companies Act, 1938, read with Insurance Act, 1938 and amendments and rules thereunder, wherever applicable, engage any non – executive director and Independent Director to provide professional services from time to time. Any such engagement for professional services, shall be made if NRC of the Company is of the opinion that the Director possesses the requisite qualification for practise of profession.
XII. SITTING FEES
a) A Director may receive remuneration by way of fees for attending meetings of Board or Committee thereof as may be decided by the Board. Provided that the amount
of such fees shall not exceed the maximum amount as provided in the Companies Act, 2013, per meeting of the Board or Committee or such amount as may be prescribed by the Central Government from time to time. Only Non-executive Directors and Independent Directors shall, in addition to the sitting fees, also be entitled for reimbursement of their expenses for participation in the Board and Committee meetings, as may be decided by the Board.
b) The Board may pay different sitting fee, to each director, as may be mutually agreed with such director.
c) For Independent Directors and woman director, the sitting fees should not be less than the sitting fees payable to other directors.
XIII. DISCLOSURE
Details of managerial remuneration, including qualitative and quantitative disclosures as mentioned in the Remuneration Guidelines will be disclosed annually in Company’s annual report in accordance with Companies Act, 2013 read along with Corporate Governance Guidelines and Remuneration Guidelines.
XIV. DEVIATIONS FROM THIS POLICY
Deviations on elements of this policy in extraordinary circumstances, when deemed necessary, in the interests of the Company, will be made if there are specific reasons to do so in an individual case, subject to the provisions of applicable law.
XV. OWNER OF THE POLICY
The Policy is owned by Nomination and Remuneration Committee of the Company and shall be administered by the Chief People Officer.
Max Life Insurance Company Limited Registration No: 104; Date of Registration with IRDAI: November 15, 2000
AnnuAL RepoRt 2016-17220
Directors' Report
FOR THE FINANCIAL YEAR ENDED MRACH 31, 2017The MembersMaxLifeInsuranceCompanyLimited419, Bhai Mohan Singh Nagar,Railmajra, Tehsil Balachaur Nawan Shehar, Punjab 144533
We have conducted the secretarial audit of the compliance of applicable statutory provisions and the adherence to good corporate practices by Max Life Insurance Company Limited (hereinafter called the company). Secretarial Audit was conducted in a manner that provided us a reasonable basis for evaluating the corporate conducts/ statutory compliances and expressing our opinion thereon.
Based on our verification of the Company’s books, papers, minute books, forms and returns filed and other records maintained by the company and also the information provided by the Company, its officers, agents and authorized representatives during the conduct of secretarial audit, We hereby report that in our opinion, the company has, during the audit period covering the financial year ended March 31, 2017 complied with the statutory provisions listed hereunder and also that the Company has proper Board-processes and compliance-mechanism in place to the extent, in the manner and subject to the reporting made hereinafter.
We have examined the books, papers, minute books, forms and returns filed and other records maintained by Max Life Insurance Company Limited (“the Company”) for the financial year ended on March 31, 2017 according to the provisions of:
(i) The Companies Act, 2013 (the Act) and the rules made thereunder; (ii) The Securities Contracts (Regulation) Act, 1956 (‘SCRA’) and the
rules made thereunder; Not Applicable(iii) The Depositories Act, 1996 and the Regulations and Bye-laws framed
thereunder; Not Applicable(iv) Foreign Exchange Management Act, 1999 and the rules and
regulations made thereunder to the extent of Foreign Direct Investment, Overseas Direct Investment and External Commercial Borrowings;
(v) The following Regulations and Guidelines prescribed under the Securities and Exchange Board of India Act, 1992 (‘SEBI Act’): Not Applicable
(a) The Securities and Exchange Board of India (Substantial Acquisition of Shares and Takeovers) Regulations, 2011;
(b) The Securities and Exchange Board of India (Prohibition of Insider Trading) Regulations, 1992;
(c) The Securities and Exchange Board of India (Issue of Capital and Disclosure Requirements) Regulations, 2009;
(d) The Securities and Exchange Board of India (Employee Stock Option Scheme and Employee Stock Purchase Scheme) Guidelines, 1999;
(e) The Securities and Exchange Board of India (Issue and Listing of Debt Securities) Regulations, 2008;
(f) The Securities and Exchange Board of India (Registrars to an Issue and Share Transfer Agents) Regulations, 1993 regarding the Companies Act and dealing with client;
(g) The Securities and Exchange Board of India (Delisting of Equity Shares) Regulations, 2009; and
(h) The Securities and Exchange Board of India (Buyback of Securities) Regulations, 1998;
(vi) The other laws, as informed and certified by the management of the Company which are specifically applicable to the Company based on their sector/ industry are:1. Insurance Regulatory and Development Authority of India Act,
1999,
2. Insurance Act, 1938 and various Rules, Regulations & Guidelines issued thereunder, including circulars issued from time to time
We have also examined compliance with the applicable clauses of the following: (i) Secretarial Standards issued by The Institute of Company
Secretaries of India.(ii) The Listing Agreements entered into by the Company with
Stock Exchange(s), if applicable: Not Applicable
During the period under review the Company has complied with the provisions of the Act, Rules, Regulations, Guidelines, Standards, etc. of para (i) to (v) including Secretarial Standards as mentioned above. We have satisfied ourselves that there are appropriate Board processes as well as systems in the company to monitor and ensure the compliances of the applicable laws mentioned at para (vi) above.
We further report that
The Board of Directors of the Company is duly constituted with proper balance of Executive Directors, Non-Executive Directors and Independent Directors. The changes in the composition of the Board of Directors that took place during the period under review were carried out in compliance with the provisions of the Act.
Adequate notice is given to all directors to schedule the Board Meetings, agenda and detailed notes on agenda were sent in advance, and a system exists for seeking and obtaining further information and clarifications on the agenda items before the meeting and for meaningful participation at the meeting.
All decisions at Board Meetings and Committee Meetings are carried out unanimously as recorded in the minutes of the meetings of the Board of Directors or Committee of the Board, as the case may be.
We further report that there are adequate systems and processes in the company commensurate with the size and operations of the company to monitor and ensure compliance with applicable laws, rules, regulations and guidelines.
We further report that during the audit period the company has the following specific events / actions having major bearing on the company’s affairs in pursuance of the above referred laws, rules, regulations, guidelines, standards, etc:
1. shifting of registered office of the Company from Delhi to Punjab;
2. proposed merger of Max Life Insurance Company Limited into HDFC Standard Life Insurance Company Limited by way of a scheme of arrangement subject to necessary approvals;
3. amendment in the Articles of Association of the Company
For Chandrasekaran AssociatesCompany SecretariesMembership No. A16302Certificate of Practice No. 5673
Sd/-RupeshAgarwalPartner
Date: 08/05/2017Place: New Delhi
AnnexureVISECRETARIAL AUDIT REPORT
Annexure-VI
FINANCIAL STATEMENTS
Max Life Insurance Company Limited Registration No: 104; Date of Registration with IRDAI: November 15, 2000
AnnuAL RepoRt 2016-17222
Directors' ReportFinancial Statements
TO THE MEMBERS OF
MAX LIFE INSURANCE COMPANY LIMITED
ReportontheStandaloneFinancialStatements
We have audited the accompanying standalone financial statements of MAX LIFE INSURANCE COMPANY LIMITED (the “Company”) which comprise the Balance Sheet as at March 31, 2017, the related Revenue Account (also called the “Policyholder’s Account” or the “Technical Account”), the Profit and Loss Account (also called the “Shareholder’s Account” or “Non-Technical Account”), the Receipts and Payments Account for the year ended March 31, 2017 and a summary of significant accounting policies and other explanatory information, annexed thereto (these statements have hereinafter together been referred to as the “Financial Statements”).
Management’s Responsibility for the Standalone FinancialStatements
The Company’s Board of Directors is responsible for the matters stated in Section 134(5) of the Companies Act, 2013 (the “Act”) with respect to the preparation of these financial statements that give a true and fair view of the Financial position, Financial performance and the Receipts and Payments Account of the Company in accordance with the accounting principles generally accepted in India, including the provisions of the Insurance Act, 1938 as amended by the Insurance Laws (Amendment) Act, 2015 (the “Insurance Act”), the Insurance Regulatory and Development Authority Act, 1999 (the “IRDA Act”), the Insurance Regulatory and Development Authority (Preparation of Financial Statements and Auditor’s Report of Insurance Companies) Regulations, 2002 (the “IRDA Financial Statements Regulations”), orders/directions/circulars issued by the Insurance Regulatory and Development Authority of India (the “IRDAI”) in this regard, the Accounting Standards specified under Section 133 of the Act, to the extent applicable.
This responsibility also includes maintenance of adequate accounting records, in accordance with the provisions of the Act, for safeguarding the assets of the Company and for preventing and detecting frauds and other irregularities; selection and application of appropriate accounting policies; making judgments and estimates that are reasonable and prudent; and design, implementation and maintenance of adequate internal financial controls, that were operating effectively for ensuring the accuracy and completeness of the accounting records, relevant to the preparation and presentation of the financial statements that give a true and fair view and are free from material misstatement, whether due to fraud or error.
Auditors’Responsibility
Our responsibility is to express an opinion on these Standalone Financial Statements based on our audit.
In conducting our audit we have taken into account the provisions of the Act, the Insurance Act, the IRDA Act, the IRDA Financial Statements Regulations, orders / directions/ circulars issued by the IRDAI, the accounting and auditing standards and matters
which are required to be included in the audit report under the provisions of the Act and the Rules made thereunder.
We conducted our audit in accordance with the Standards on Auditing specified under Section 143(10) of the Act and other applicable authorities. Those Standards are pronouncements issued by the Institute of Chartered Accountants of India, which require that we comply with ethical requirements and plan and perform the audit to obtain reasonable assurance about whether the standalone financial statements are free from material misstatement.
An audit involves performing procedures to obtain audit evidence about the amounts and disclosures in the Standalone Financial Statements. The procedures selected depend on the auditor’s judgment, including the assessment of the risks of material misstatement of the Standalone Financial Statements, whether due to fraud or error. In making those risk assessments, the auditors consider internal controls relevant to the Company’s preparation and fair presentation of the Standalone Financial Statements that gives true and fair view in order to design audit procedures that are appropriate in the circumstances. An audit also includes evaluating the appropriateness of accounting policies used and the reasonableness of the accounting estimates made by the Company’s Directors, as well as evaluating the overall presentation of the Standalone Financial Statements.
We believe that the audit evidence we have obtained is sufficient and appropriate to provide a basis for our audit opinion.
Opinion
In our opinion and to the best of our information and according to the explanations given to us, the aforesaid financial statements give the information required in accordance with the Insurance Act, the IRDA Act, the IRDA Financial Statements Regulations, the orders/directions/circulars issued by the IRDAI and the Act to the extent applicable in the manner so required and give a true and fair view in conformity with the accounting principles generally accepted in India, as applicable to the Insurance Companies:
i. in the case of the Balance Sheet, of the state of affairs of the Company as at March 31, 2017;
ii. in the case of the Revenue Account, of the net surplus for the year ended March 31, 2017;
iii. in the case of the Profit and Loss Account, of the profit for the year ended March 31, 2017; and
iv. in the case of the Receipts and Payments Account, of the receipts and payments for the year ended March 31, 2017.
Other Matter
The actuarial valuation of liabilities for life policies in force and for policies in respect of which premium has been discontinued but liability exists as at March 31, 2017 is the responsibility of the Company’s Appointed Actuary (the “Appointed Actuary”). The
INDEPENDENT AUDITOR’S REPORT
Auditor's Report

Max Life Insurance Company Limited Registration No: 104; Date of Registration with IRDAI: November 15, 2000
AnnuAL RepoRt 2016-17 223
ForFRASER&ROSS ForB.K.Khare&Co.Chartered Accountants Chartered AccountantsICAI Firm’s Registration No: 000829S ICAI Firm’s Registration No: 105102W
S. Ganesh PadminiKhareKaickerPartner PartnerMembership No: 204108 Membership No: 044784Place : Bangalore Place : MumbaiMay 19, 2017 May 19, 2017
actuarial valuation of these liabilities for life policies in force and for policies in respect of which premium has been discontinued but liability exists as at March 31, 2017 has been duly certified by the Appointed Actuary and in his opinion, the assumptions for such valuation are in accordance with the guidelines and norms issued by the IRDAI and the Institute of Actuaries of India in concurrence with the IRDAI. We have relied upon Appointed Actuary’s certificate in this regard for forming our opinion on the Standalone Financial Statements of the Company.
ReportonOtherLegalandRegulatoryRequirements
1. As required by the IRDA Financial Statements Regulations, we have issued a separate certificate dated May 18, 2017 certifying the matters specified in paragraphs 3 and 4 of Schedule C to the IRDA Financial Statements Regulations.
2. As required by the IRDA Financial Statements Regulations, read with Section 143 (3) of the Act, we report that:
(a) We have sought and obtained all the information and explanations, which to the best of our knowledge and belief were necessary for the purposes of the audit and have found them to be satisfactory;
(b) In our opinion and to the best of our information and according to the explanations given to us, proper books of account as required by law have been kept by the Company, so far as it appears from our examination of those books;
(c) As the Company’s financial accounting system is centralized, no returns for the purposes of our audit are prepared at the branches of the Company;
(d) The Balance Sheet, the Revenue Account, the Profit and Loss Account and the Receipts and Payments Account dealt with by this report are in agreement with the books of account;
(e) In our opinion, the aforesaid standalone financial statements comply with the Accounting Standards specified under Section 133 of the Act to the extent not inconsistent with the accounting principles prescribed in the IRDA Financial Statements Regulations and orders/directions issued by the IRDAI in this regard;
(f) In our opinion and to the best of our information and according to the explanations given to us, investments have been valued in accordance with the provisions of the Insurance Act, the IRDA Financial Statements Regulations and/or orders/directions/ circulars issued
by the IRDAI in this regard.
(g) In our opinion, the accounting policies selected by the Company are appropriate and are in compliance with the applicable Accounting Standards specified under Section 133 of the Act and with the accounting principles as prescribed in the IRDA Financial Statements Regulations and orders/directions issued by the IRDAI in this regard.
(h) On the basis of the written representations received from the directors as on March 31, 2017 taken on record by the Board of Directors, none of the directors is disqualified as on March 31, 2017 from being appointed as a director in terms of Section 164 (2) of the Act.
(i) With respect to the adequacy of the internal financial controls over financial reporting of the Company and the operating effectiveness of such controls, refer to our separate Report in “Annexure A”. Our report expresses an unmodified opinion on the adequacy and operating effectiveness of the Company’s internal financial controls over financial reporting.
(j) With respect to the other matters to be included in the Auditors’ Report in accordance with Rule 11 of the Companies (Audit and Auditors) Rules, 2014, in our opinion and to the best of our information and according to the explanations given to us:
i. The Company has disclosed the impact of pending litigations on its financial position in its financial statements.
ii. The liability for insurance contracts, is determined by the Company’s Appointed Actuary as per Note II (18) Schedule 1 to the financial statements, and is covered by the Appointed Actuary’s certificate, referred to in Other Matter paragraph above, on which we have placed reliance; and the Company did not have any long-term contracts including derivative contracts for which there were any material foreseeable losses.
iii. There were no amounts which were required to be transferred to the Investor Education and Protection Fund by the Company during the year.
iv. The disclosure requirement as envisaged in Notification G.S.R 308(E) dated March 30, 2017 is not applicable to the Company. Refer note 46 of Schedule 16 (II) - Notes to accounts to the financial statements of the Company.
Max Life Insurance Company Limited Registration No: 104; Date of Registration with IRDAI: November 15, 2000
AnnuAL RepoRt 2016-17224
Directors' ReportFinancial Statements
ANNEXURE “A” TO THE INDEPENDENT AUDITOR’S REPORT (Referredtoinparagraph2(i)under‘ReportonOtherLegalandRegulatoryRequirement’sofourreportofevendate)
ReportontheInternalFinancialControlsOverFinancialReportingunderClause(i)ofSub-section3ofSection143oftheCompaniesAct, 2013 (the “Act”)
We have audited the internal financial controls over financial reporting of MAX LIFE INSURANCE COMPANY LIMITED (the “Company”) as of March 31, 2017 in conjunction with our audit of the standalone financial statements of the Company for the year ended on that date.
The actuarial valuation of liabilities for life policies in force and policies where premium is discontinued but liability exists as at March 31, 2017 is required to be certified by the Appointed Actuary as per the Insurance Regulatory and Development Authority (Preparation of Financial Statements and Auditor’s Report of Insurance Companies) Regulations, 2002 (the “IRDA Financial Statements Regulations”, and has been relied upon by us, as mentioned in “Other Matter” para of our audit report on the financial statements of the Company as at and for the year ended March 31, 2017. Accordingly, we have not audited the internal financial controls over financial reporting in respect of the valuation and accuracy of the aforesaid actuarial valuation.
Management’sResponsibilityforInternalFinancialControls
The Company’s management is responsible for establishing and maintaining internal financial controls based on the internal control over financial reporting criteria established by the Company considering the essential components of internal control stated in the Guidance Note on Audit of Internal Financial Controls over Financial Reporting issued by the Institute of Chartered Accountants of India (the “Guidance Note”). These responsibilities include the design, implementation and maintenance of adequate internal financial controls that were operating effectively for ensuring the orderly and efficient conduct of its business, including adherence to company’s policies, the safeguarding of its assets, the prevention and detection of frauds and errors, the accuracy and completeness of the accounting records, and the timely preparation of reliable financial information, as required under the Companies Act, 2013 including the provisions of the Insurance Act, 1938 as amended by the Insurance Laws (Amendment) Act, 2015 read with Insurance Regulatory and Development Authority of India circular IRDA/F&A/CIR/CPM/056/03/2016 dated April 4, 2016 (the “Insurance Act”), the Insurance Regulatory and Development Authority Act, 1999 (the “IRDA Act”), the IRDA Financial Statements Regulations, orders/directions issued by the Insurance Regulatory and Development Authority of India (the “IRDAI”) in this regard.
Auditor’sResponsibility
Our responsibility is to express an opinion on the Company’s internal financial controls over financial reporting based on our audit. We conducted our audit in accordance with the Guidance Note issued by the Institute of Chartered Accountants of India and the Standards on Auditing prescribed under Section 143(10) of the Companies Act, 2013, to the extent applicable to an audit of internal financial controls. Those Standards and the Guidance Note require that we comply with ethical requirements and plan and perform the audit to obtain reasonable assurance about whether adequate internal financial controls over financial reporting was established and maintained and if such controls operated effectively in all material respects.
Our audit involves performing procedures to obtain audit evidence about the adequacy of the internal financial controls system over financial reporting and their operating effectiveness. Our audit of internal financial controls over financial reporting included obtaining an understanding of internal financial controls over financial reporting, assessing the risk that a material weakness exists, and testing and evaluating the design and operating effectiveness of internal control based on the assessed risk. The procedures selected depend on the auditor’s judgement, including the assessment of the risks of material misstatement of the financial statements, whether due to fraud or error.
We believe that the audit evidence we have obtained is sufficient and appropriate to provide a basis for our audit opinion on the Company’s internal financial controls system over financial reporting.
MeaningofInternalFinancialControlsOverFinancialReporting
A company’s internal financial control over financial reporting is a process designed to provide reasonable assurance regarding the reliability of financial reporting and the preparation of financial statements for external purposes in accordance with generally accepted accounting principles. A company’s internal financial control over financial reporting includes those policies and procedures that (1) pertain to the maintenance of records that, in reasonable detail, accurately and fairly reflect the transactions and dispositions of the assets of the company; (2) provide reasonable assurance that transactions are recorded as necessary to permit preparation of financial statements in accordance with generally accepted accounting principles, and that receipts and expenditures of the company
Auditor's Report
Max Life Insurance Company Limited Registration No: 104; Date of Registration with IRDAI: November 15, 2000
AnnuAL RepoRt 2016-17 225
are being made only in accordance with authorisations of management and directors of the company; and (3) provide reasonable assurance regarding prevention or timely detection of unauthorised acquisition, use, or disposition of the company’s assets that could have a material effect on the financial statements.
InherentLimitationsofInternalFinancialControlsOverFinancialReporting
Because of the inherent limitations of internal financial controls over financial reporting, including the possibility of collusion or improper management override of controls, material misstatements due to error or fraud may occur and not be detected. Also, projections of any evaluation of the internal financial controls over financial reporting to future periods are subject to the risk that the internal financial control over financial reporting may become inadequate because of changes in conditions, or that the degree of compliance with the policies or procedures may deteriorate.
Opinion
In our opinion, to the best of our information and according to the explanations given to us, the Company has, in all material respects, an adequate internal financial controls system over financial reporting and such internal financial controls over financial reporting were operating effectively as at March 31, 2017 based on the internal control over financial reporting criteria established by the Company considering the essential components of internal control stated in the Guidance Note issued by the Institute of Chartered Accountants of India.
ForFRASER&ROSS ForB.K.Khare&Co.Chartered Accountants Chartered AccountantsICAI Firm’s Registration No: 000829S ICAI Firm’s Registration No: 105102W
S. Ganesh PadminiKhareKaickerPartner PartnerMembership No: 204108 Membership No: 044784Place : Bangalore Place : MumbaiMay 19, 2017 May 19, 2017
Max Life Insurance Company Limited Registration No: 104; Date of Registration with IRDAI: November 15, 2000
AnnuAL RepoRt 2016-17226
Directors' ReportFinancial Statements
To,The Board of Directors,Max Life Insurance Company Limited,11th Floor, DLF Square Building,Jacaranda Marg,DLF City Phase II,Gurgaon – 122 002
Dear Sir’s,
[Ref:IndependentAuditor’sCertificateinaccordancewithRegulation7–ScheduleI(B)(11)(d)oftheInsuranceRegulatoryandDevelopmentAuthorityofIndia(Investment)Regulations,2016(the“IRDAIRegulations”)]
1. This Certificate is issued to MAX LIFE INSURANCE COMPANY LIMITED (the “Company”) in accordance with the terms of engagement letters dated June 15, 2016 (between Fraser & Ross and the Company) and dated June 15, 2016 (between B.K. Khare & Co. and the Company).
2. We, the Statutory Auditors’ of the Company have been requested by the Management of the Company to issue a certificate regarding the declaration and application of the Net Asset Value (“NAV”) of the schemes as at March 31, 2017 in terms Regulation 7 - Schedule I (B) (11) (d) of the IRDAI Regulations.
Management’sResponsibility
3. The Management of the Company is responsible for compliance with the IRDAI Regulations for declaration and application of NAV of the schemes as at March 31, 2017, including preparation and maintenance of all accounting and other relevant supporting records and documents. This responsibility includes collecting, collating and validating data and the design, implementation and maintenance of internal control relevant to declaration and application of NAV of the schemes that is free from material misstatement, whether due to fraud or error and applying an appropriate basis of preparation; and making estimates that are reasonable in the circumstances.
IndependentAuditor’sResponsibility
4. Pursuant to the requirements of Schedule I (B) (11) (d) of the IRDAI Regulations, our responsibility is to provide a reasonable assurance as to whether:
a) The Company has declared NAV for March 31, 2017;
b) The applications received on Friday, March 31, 2017 up to 3.00 p.m. has been stamped as such that the NAV of March 31, 2017 is applied for proposals received up to 3.00 p.m.;
c) The applications received on Friday, March 31, 2017 after 3.00 p.m. has been stamped as such that the NAV of the immediate next business day i.e. April 03, 2017 is applied for proposals received after 3.00 p.m.
5. We have conducted our examination in the following manner:
a) Obtained representation from the Management that the Company has declared NAV for March 31, 2017;
b) Obtained the list of applications for New Business, Renewal premium, Top up, Surrender, Free – Look Cancellation, Fund Switches, Withdrawal, and Partial Withdrawal in respect of Unit Linked Products on March 31, 2017 (together referred to as “Application Forms”), from the Management;
c) Selected samples of Application Forms from the listing mentioned in paragraph 5(b) above and verified whether:
i) The applications received on Friday, March 31, 2017, up to 3.00 p.m. have been appropriately stamped; and the NAV of March 31, 2017 is applied for such applications for the selected samples; and
ii) The applications received on Friday, March 31, 2017, after 3.00 p.m. have been appropriately stamped; and the NAV of April 3, 2017 is applied for such applications for the selected samples.
6. We conducted our examination in accordance with the Guidance Note on Reports or Certificates for Special Purposes (Revised
INDEPENDENT AUDITOR’S CERTIFICATE
Auditor's Report
Max Life Insurance Company Limited Registration No: 104; Date of Registration with IRDAI: November 15, 2000
AnnuAL RepoRt 2016-17 227
2016) and Standards on Auditing issued by the Institute of Chartered Accountants of India (ICAI) in so far as applicable for the purpose of this Certificate. This Guidance Note requires that we comply with the ethical requirements of the Code of Ethics issued by the ICAI.
7. We have complied with the relevant applicable requirements of the Standard on Quality Control (SQC) 1, Quality Control for Firms that Perform Audits and Reviews of Historical Financial Information, and Other Assurance and Related Services Engagements.
Opinion
8. On the basis of our examination and the information and explanations provided to us by the Company, we certify the following:
(a) The Company has declared NAV for March 31, 2017;
(b) The applications received on Friday March 31 2017 up to 3.00 p.m. have been stamped as such and that the NAV of March 31, 2017 is applied for proposals received up to 3.00 p.m.; and
(c) The application received on Friday, March 31, 2017 after 3.00 p.m. have been stamped as such and that the NAV of immediate next business day i.e. April 03, 2017 is applied for proposal received after 3.00 p.m.
Restriction on Use
9. This certificate is issued at the request of the Company solely for use of the Company for inclusion in the annual accounts as per Regulation 7 - Schedule I (B) (11) (d) of the IRDAI Regulations and is not intended to be and should not be used for any other purpose without our prior consent. Accordingly, we do not accept or assume any liability or any duty of care for any other purpose or to any other person to whom this Certificate is shown or into whose hands it may come without our prior consent in writing.
ForFRASER&ROSS ForB.K.Khare&Co.Chartered Accountants Chartered AccountantsICAI Firm’s Registration No: 000829S ICAI Firm’s Registration No: 105102W
S. Ganesh PadminiKhareKaickerPartner PartnerMembership No: 204108 Membership No: 044784Place : Bangalore Place : MumbaiMay 19, 2017 May 19, 2017

Max Life Insurance Company Limited Registration No: 104; Date of Registration with IRDAI: November 15, 2000
AnnuAL RepoRt 2016-17228
Directors' ReportFinancial Statements
INDEPENDENT AUDITOR’S CERTIFICATETo,The Board of DirectorsMax Life Insurance Company11th Floor, DLF Square Building,Jacaranda Marg,DLF City Phase II,Gurgaon – 122 002
Dear Sir’s,
[Ref:IndependentAuditors’Certificateasreferredtoinparagraph1under‘ReportonOtherLegalandRegulatoryRequirements’formingpartoftheIndependentAuditors’ReportdatedMay19,2017.]
1. This certificate is issued to MAX LIFE INSURANCE COMPANY LIMITED (the “Company”) in accordance with the terms of engagement letters dated June 15, 2016 (between Fraser & Ross and the Company) and dated June 15, 2016 (between B.K.Khare & Co. and the Company).
2. This certificate is issued to comply with the provisions of paragraph 3 and 4 of Schedule C of the Insurance Regulatory and Development Authority (Preparation of Financial Statements and Auditor’s Report of Insurance Companies) Regulations 2002, (the “IRDA Financial Statements Regulations”) read with Regulation 3 of the IRDA Financial Statements Regulations.
Management’sResponsibility
3. The Company’s Management is responsible for complying with the provisions of the Insurance Act, 1938 as amended by the Insurance Laws (Amendment) Act, 2015 (the “Insurance Act”), the Insurance Regulatory and Development Authority Act, 1999 (the “IRDA Act”), the IRDA Financial Statements Regulations, orders/directions issued by the Insurance Regulatory and Development Authority of India (the “IRDAI”) which includes the preparation of the Management Report. This includes collecting, collating and validating data and designing, implementing and monitoring of internal controls suitable for ensuring compliance as aforesaid and applying an appropriate basis of preparation; and making estimates that are reasonable in the circumstances.
IndependentAuditor’sResponsibility
4. Our responsibility for the purpose of this certificate, is to provide reasonable assurance on the matters contained in paragraphs 3 and 4 of Schedule C of the Regulations read with Regulation 3 of the IRDA Financial Statements Regulations.
5. We conducted our examination in accordance with the Guidance Note on Audit Reports or Certificates for Special Purposes (Revised 2016) and Standards on Auditing issued by the Institute of Chartered Accountants of India (the “ICAI”), in so far as applicable for the purpose of this Certificate. This Guidance Note requires that we comply with the ethical requirements of the Code of Ethics issued by the ICAI.
6. We have complied with the relevant applicable requirements of the Standard on Quality Control (SQC) 1, Quality Control for Firms that Perform Audits and Reviews of Historical Financial Information, and Other Assurance and Related Services Engagements.
Opinion
7. In accordance with the information and explanations and representations given to us and to the best of our knowledge and belief and based on our examination of the books of account and other records maintained by the Company for the year ended March 31, 2017, we certify that:
a) We have reviewed the Management Report attached to the financial statements for the year ended March 31, 2017, and on the basis of our review, there is no apparent mistake or material inconsistencies with the financial statements;
b) Based on the Management representations and compliance certificates submitted to the Board of Directors by the officers of the Company charged with compliance and the same being noted by the Board, we certify that the Company has complied with the terms and conditions of registration stipulated by IRDAI;
c) We have verified the cash balances, to the extent considered necessary, and securities relating to the Company’s loans and investments as at March 31, 2017, by actual inspection or on the basis of certificates/confirmations received from the Custodian and/ or Depository Participants appointed by the Company, as the case may be. As at March 31, 2017, the Company does not have reversions and life interests;
Auditor's Report

Max Life Insurance Company Limited Registration No: 104; Date of Registration with IRDAI: November 15, 2000
AnnuAL RepoRt 2016-17 229
d) Based on the management representation the Company is not a trustee of any trust; and
e) No part of the assets of the Policyholder’s Funds has been directly or indirectly applied in contravention to the provisions of the Insurance Act, relating to the application and investments of the Policyholder’s Funds.
ForFRASER&ROSS ForB.K.Khare&Co.Chartered Accountants Chartered AccountantsICAI Firm’s Registration No: 000829S ICAI Firm’s Registration No: 105102W
S. Ganesh PadminiKhareKaickerPartner PartnerMembership No: 204108 Membership No: 044784Place : Bangalore Place : MumbaiMay 19, 2017 May 19, 2017

Max Life Insurance Company Limited Registration No: 104; Date of Registration with IRDAI: November 15, 2000
AnnuAL RepoRt 2016-17230
Directors' ReportFinancial Statements
All amounts in thousands of Indian Rupees
Particulars Schedule As at March 31, 2017
As at March 31, 2016
SOURCES OF FUNDS SHAREHOLDER’S FUNDS: Share Capital 5 19,188,129 19,188,129
19,188,129 19,188,129 RESERVES AND SURPLUS 6 5,867,168 953,786 CREDIT/(DEBIT) FAIR VALUE CHANGE ACCOUNT 38,070 96,710 Sub-Total 25,093,367 20,238,625 BORROWINGS 7 - - POLICYHOLDER’S FUNDS: CREDIT/ (DEBIT) FAIR VALUE CHANGE ACCOUNT 3,045,254 100,573 POLICY LIABILITIES 245,295,876 190,417,763 [Refer to Note II (2), (17) & (18) on Schedule 16] PROVISION FOR LINKED LIABILITIES 152,204,164 130,369,954 [Refer to Note II (2), (17) & (18) on Schedule 16] FUND FOR DISCONTINUED POLICIES 6,146,607 4,165,785 [Refer to Note II (2), (17), (18) (33) & (38) on Schedule 16] Sub-Total 406,691,901 325,054,075 FUNDS FOR FUTURE APPROPRIATIONS - Linked [Refer to Note II (34) on Schedule 16] 83,453 - - Non Linked 15,481,371 14,562,830 TOTAL 447,350,092 359,855,530 APPLICATION OF FUNDS: INVESTMENTS Shareholder’s Investments 8 32,303,071 23,918,248 Policyholder’s Investments 8A 255,482,506 202,784,060 [Refer to Note II (38) on Schedule 16] ASSETS HELD TO COVER LINKED LIABILITIES 8B 155,909,509 131,537,852 [Refer to Note II (38) on Schedule 16] LOANS 9 1,333,172 763,949 FIXED ASSETS 10 1,622,746 1,678,532 CURRENT ASSETS: Cash and Bank Balances 11 3,464,490 3,326,300 Advances and Other Assets 12 14,318,177 12,301,998 Sub-Total(A) 17,782,667 15,628,298 CURRENT LIABILITIES 13 16,773,359 13,649,703 PROVISIONS 14 310,220 2,805,706 Sub-Total (B) 17,083,579 16,455,409 NET CURRENT ASSETS (C) = (A) – (B) 699,088 (827,111)MISCELLANEOUS EXPENDITURE (to the extent not written off or adjusted) 15 - - DEBIT BALANCE IN PROFIT AND LOSS ACCOUNT (Shareholder’s ACCOUNT) - - [Refer to Note II (39) on Schedule 16] Total 447,350,092 359,855,530 Notes to the Financial Statements 16Contingent Liability (Refer Note II (1) on schedule 16) 4,587,149 5,378,382 The Schedules referred to above form an integral part of the Balance Sheet.
BALANCE SHEETAS AT MARCH 31, 2017
In terms of our report attached For and on behalf of the Board of Directors of Max Life Insurance Company Limited
For Fraser&Ross For B.K.Khare&Co. Rahul Khosla K Narasimha Murthy RajeshSudChartered Accountants Chartered Accountants Chairman Independent Director Executive Vice Chairman & ICAI Firm Registration No. 000829S ICAI Firm Registration No. 105102W DIN: 03597562 DIN: 00023046 Managing Director
DIN: 02395182
S. Ganesh PadminiKhareKaicker Marielle Theron HideakiNomura Prashant Tripathy Partner Partner Director Director Chief Financial Officer Membership No. 204108 Membership No. 044784 DIN: 02667356 DIN: 05304525 PAN: ABTPT2026P
Place : Bangalore Place : Mumbai Jose John AnuragChauhanDate : May 19, 2017 Date : May 19, 2017 Appointed Actuary Company Secretary
Membership No. A16169Place : New DelhiDate : May 19, 2017
Form A-BS
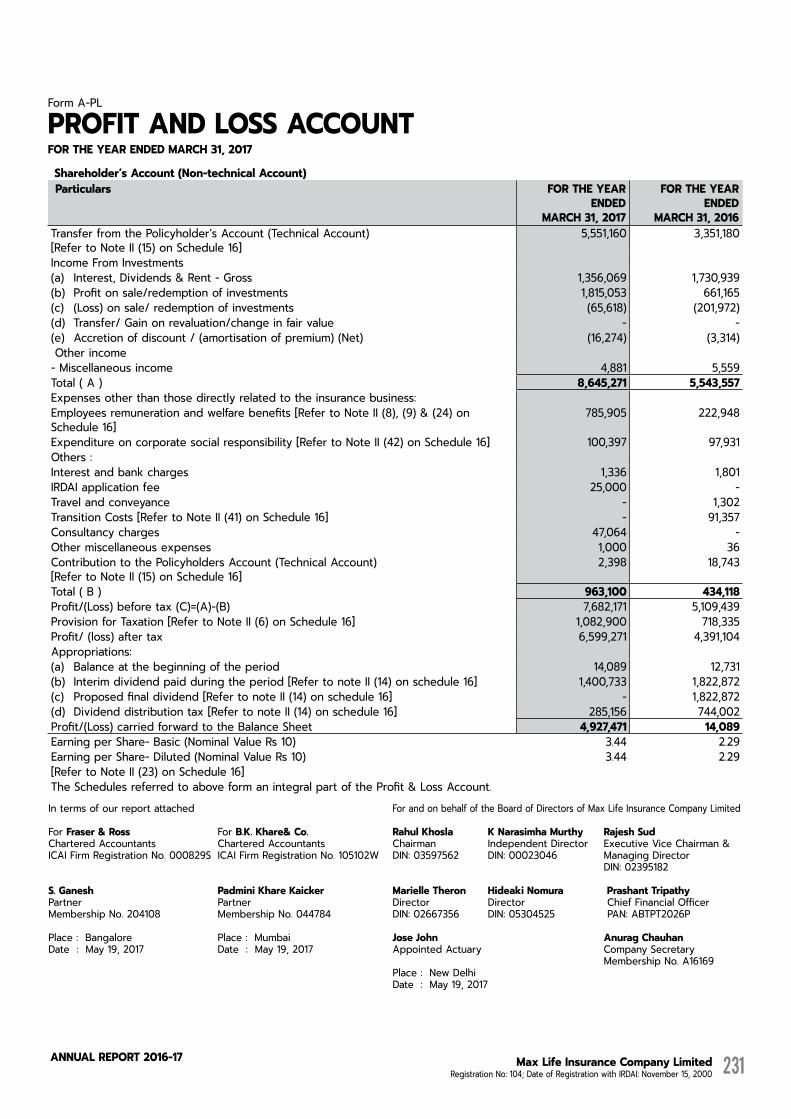
Max Life Insurance Company Limited Registration No: 104; Date of Registration with IRDAI: November 15, 2000
AnnuAL RepoRt 2016-17 231
Shareholder’sAccount(Non-technicalAccount) Particulars FOR THE YEAR
ENDED MARCH 31, 2017
FOR THE YEAR ENDED
MARCH 31, 2016 Transfer from the Policyholder’s Account (Technical Account) [Refer to Note II (15) on Schedule 16]
5,551,160 3,351,180
Income From Investments (a) Interest, Dividends & Rent - Gross 1,356,069 1,730,939 (b) Profit on sale/redemption of investments 1,815,053 661,165 (c) (Loss) on sale/ redemption of investments (65,618) (201,972)(d) Transfer/ Gain on revaluation/change in fair value - - (e) Accretion of discount / (amortisation of premium) (Net) (16,274) (3,314) Other income - Miscellaneous income 4,881 5,559 Total ( A ) 8,645,271 5,543,557 Expenses other than those directly related to the insurance business:Employees remuneration and welfare benefits [Refer to Note II (8), (9) & (24) on Schedule 16]
785,905 222,948
Expenditure on corporate social responsibility [Refer to Note II (42) on Schedule 16] 100,397 97,931 Others : Interest and bank charges 1,336 1,801 IRDAI application fee 25,000 - Travel and conveyance - 1,302 Transition Costs [Refer to Note II (41) on Schedule 16] - 91,357 Consultancy charges 47,064 - Other miscellaneous expenses 1,000 36 Contribution to the Policyholders Account (Technical Account) [Refer to Note II (15) on Schedule 16]
2,398 18,743
Total ( B ) 963,100 434,118 Profit/(Loss) before tax (C)=(A)-(B) 7,682,171 5,109,439 Provision for Taxation [Refer to Note II (6) on Schedule 16] 1,082,900 718,335 Profit/ (loss) after tax 6,599,271 4,391,104 Appropriations: (a) Balance at the beginning of the period 14,089 12,731 (b) Interim dividend paid during the period [Refer to note II (14) on schedule 16] 1,400,733 1,822,872 (c) Proposed final dividend [Refer to note II (14) on schedule 16] - 1,822,872 (d) Dividend distribution tax [Refer to note II (14) on schedule 16] 285,156 744,002 Profit/(Loss) carried forward to the Balance Sheet 4,927,471 14,089 Earning per Share- Basic (Nominal Value Rs 10) 3.44 2.29 Earning per Share- Diluted (Nominal Value Rs 10) 3.44 2.29 [Refer to Note II (23) on Schedule 16] The Schedules referred to above form an integral part of the Profit & Loss Account.
PROFIT AND LOSS ACCOUNTFOR THE YEAR ENDED MARCH 31, 2017
In terms of our report attached For and on behalf of the Board of Directors of Max Life Insurance Company Limited
For Fraser&Ross For B.K.Khare&Co. Rahul Khosla K Narasimha Murthy RajeshSudChartered Accountants Chartered Accountants Chairman Independent Director Executive Vice Chairman & ICAI Firm Registration No. 000829S ICAI Firm Registration No. 105102W DIN: 03597562 DIN: 00023046 Managing Director
DIN: 02395182
S. Ganesh PadminiKhareKaicker Marielle Theron HideakiNomura Prashant Tripathy Partner Partner Director Director Chief Financial Officer Membership No. 204108 Membership No. 044784 DIN: 02667356 DIN: 05304525 PAN: ABTPT2026P
Place : Bangalore Place : Mumbai Jose John AnuragChauhanDate : May 19, 2017 Date : May 19, 2017 Appointed Actuary Company Secretary
Membership No. A16169Place : New DelhiDate : May 19, 2017
Form A-PL
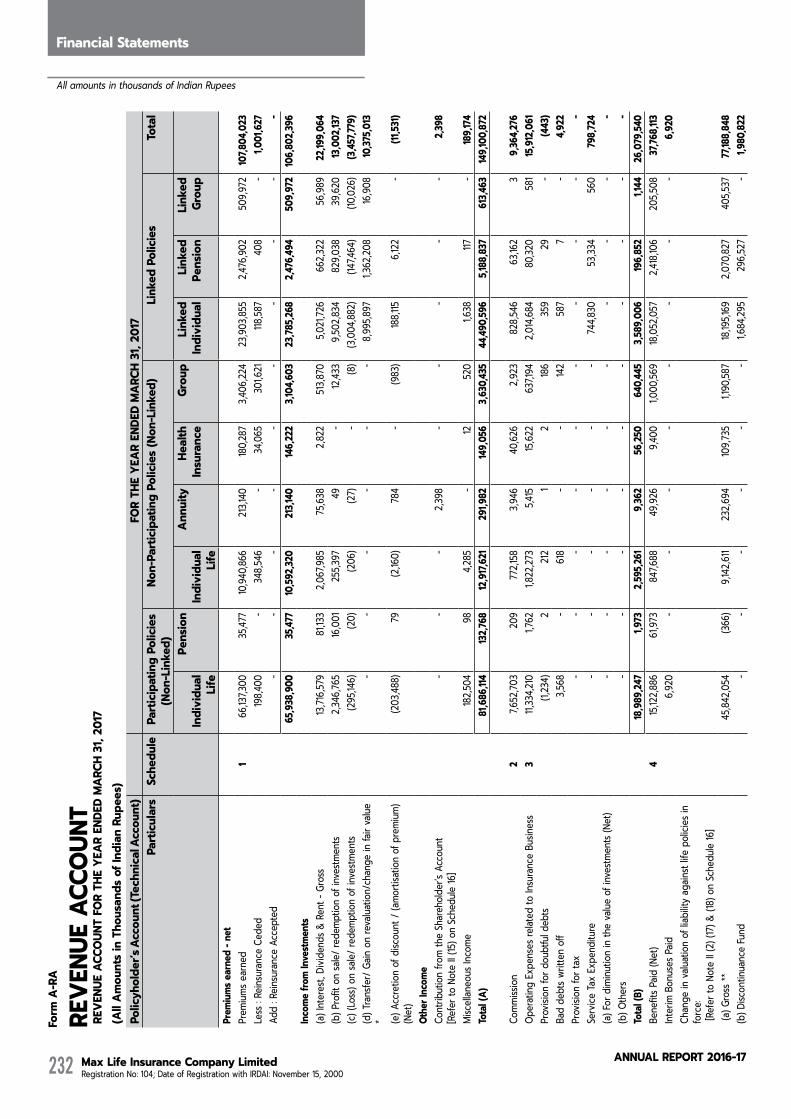
Max Life Insurance Company Limited Registration No: 104; Date of Registration with IRDAI: November 15, 2000
AnnuAL RepoRt 2016-17232
Directors' ReportFinancial Statements
All amounts in thousands of Indian Rupees
Form
A-R
A
REVE
NUE
ACCO
UNT
REV
ENUE
ACC
OUN
T FO
R TH
E YE
AR E
NDED
MAR
CH 3
1, 20
17
(AllAm
ountsinThousandsofIndianRupees)
Policyholder’sAccount(TechnicalAccount)
FO
R TH
E YE
AR E
NDED
MAR
CH 3
1, 20
17
Par
ticul
ars
Schedule
ParticipatingPolicies
(Non-Linked)
Non-ParticipatingPolicies(Non-Linked)
LinkedPolicies
Tot
al
Individual
Life
Pen
sion
Individual
Life
Ann
uity
H
ealth
In
sura
nce
Gro
up
Linked
Individual
Linked
Pens
ion
Linked
Grou
p
Prem
iums
earned-n
et
Prem
iums e
arne
d 1
66,1
37,30
0 3
5,477
10
,940,8
66
213
,140
180,2
87
3,40
6,224
2
3,903
,855
2,47
6,902
5
09,97
2 10
7,804
,023
Le
ss :
Reins
uran
ce C
eded
19
8,400
-
348
,546
- 3
4,065
3
01,62
1 11
8,587
4
08
- 1,
001,6
27
Add
: Rein
sura
nce
Acce
pted
-
- -
- -
- -
- -
- 6
5,938
,900
3
5,477
10
,592,
320
213
,140
146,
222
3,10
4,603
2
3,785
,268
2
,476,4
94
509
,972
10
6,80
2,39
6 Inc
omefro
mInv
estments
(a) I
nter
est,
Divid
ends
& R
ent -
Gro
ss
13,71
6,579
8
1,133
2
,067
,985
75,6
38
2,82
2 5
13,87
0 5
,021
,726
662
,322
56,9
89
22,1
99,0
64
(b) P
rofit
on
sale/
rede
mptio
n of
inve
stmen
ts 2
,346,7
65
16,0
01
255
,397
49
- 12
,433
9,50
2,834
8
29,0
38
39,6
20
13,0
02,13
7 (c)
(Los
s) on
sale/
rede
mptio
n of
inve
stmen
ts (2
95,14
6) (2
0) (2
06)
(27)
- (8
) (3
,004
,882)
(147
,464)
(10,0
26)
(3,45
7,779
)(d
) Tra
nsfe
r/ Ga
in on
reva
luatio
n/ch
ange
in fa
ir va
lue
* -
- -
- -
- 8
,995,8
97
1,36
2,208
16
,908
10,37
5,013
(e) A
ccre
tion
of d
iscou
nt /
(amo
rtisa
tion
of p
remi
um)
(Net
) (2
03,48
8) 7
9 (2
,160)
784
-
(983
) 18
8,115
6
,122
- (1
1,531
)
Othe
r Inc
ome
Cont
ribut
ion fr
om th
e Sh
areh
older
’s Ac
coun
t [Re
fer t
o No
te II
(15) o
n Sc
hedu
le 16
] -
- -
2,39
8 -
- -
- -
2,39
8
Misc
ellan
eous
Inco
me
182,5
04
98
4,28
5 -
12
520
1,
638
117
- 18
9,17
4 To
tal (
A)
81,6
86,11
4 13
2,76
8 12
,917,
621
291
,982
14
9,05
6 3
,630
,435
44,4
90,59
6 5,
188,
837
613
,463
149,
100,
872
Comm
ission
2
7,65
2,703
2
09
772
,158
3,94
6 4
0,626
2
,923
828
,546
63,1
62
3
9,36
4,276
Op
erat
ing E
xpen
ses r
elate
d to
Insu
ranc
e Bu
sines
s 3
11,33
4,210
1,
762
1,82
2,273
5
,415
15,62
2 6
37,19
4 2
,014
,684
80,3
20
581
15
,912
,061
Pr
ovisi
on fo
r dou
btfu
l deb
ts (1
,234)
2
212
1
2
186
359
2
9 -
(443
)Ba
d de
bts w
ritte
n of
f 3
,568
- 6
18
- -
142
587
7
-
4,9
22
Prov
ision
for t
ax
- -
- -
- -
- -
- -
Serv
ice Ta
x Ex
pend
iture
-
- -
- -
- 7
44,83
0 5
3,334
5
60
798,
724
(a) F
or d
iminu
tion
in th
e va
lue o
f inv
estm
ents
(Net
) -
- -
- -
- -
- -
- (b
) Oth
ers
- -
- -
- -
- -
- -
Tota
l (B)
18
,989
,247
1,
973
2,59
5,261
9
,362
56,
250
640
,445
3,58
9,00
6 19
6,85
2 1,
144
26,
079,
540
Bene
fits P
aid (N
et)
4 15
,122,8
86
61,9
73
847
,688
49,9
26
9,40
0 1,
000,5
69
18,0
52,0
57
2,41
8,106
2
05,50
8 3
7,768
,113
Inter
im B
onus
es P
aid
6,92
0 -
- -
- -
- -
- 6
,920
Ch
ange
in v
aluat
ion o
f liab
ility
again
st life
poli
cies i
n fo
rce:
[Ref
er to
Not
e II (
2) (1
7) &
(18) o
n Sc
hedu
le 16
] (a
) Gro
ss **
4
5,842
,054
(3
66)
9,14
2,611
232
,694
109,7
35
1,19
0,587
18
,195,1
69
2,0
70,82
7 4
05,53
7 77
,188,
848
(b) D
iscon
tinua
nce
Fund
-
- -
- -
- 1,
684,2
95
296
,527
- 1,
980,
822

Max Life Insurance Company Limited Registration No: 104; Date of Registration with IRDAI: November 15, 2000
AnnuAL RepoRt 2016-17 233
Policyholder’sAccount(TechnicalAccount)
FO
R TH
E YE
AR E
NDED
MAR
CH 3
1, 20
17
Par
ticul
ars
Schedule
ParticipatingPolicies
(Non-Linked)
Non-ParticipatingPolicies(Non-Linked)
LinkedPolicies
Tot
al
Individual
Life
Pen
sion
Individual
Life
Ann
uity
H
ealth
In
sura
nce
Gro
up
Linked
Individual
Linked
Pens
ion
Linked
Grou
p
(c) A
moun
t ced
ed in
Rein
sura
nce
(29,2
21)
- (3
30,89
2) -
(53,8
65)
(62,5
47)
- -
- (4
76,52
5)(d
) Amo
unt a
ccep
ted
in Re
insur
ance
-
- -
- -
- -
- -
- To
tal (
C )
60,
942,
639
61,6
07
9,6
59,40
7 2
82,6
20
65,2
70
2,12
8,60
9 3
7,931
,521
4,78
5,460
6
11,04
5 11
6,468
,178
SURP
LUS/
(DEF
ICIT)
(D)=(
A)-(B
)-(C)
1,
754,2
28
69,
188
662
,953
-
27,5
36
861
,381
2,9
70,0
69
206
,525
1,27
4 6
,553,1
54
Open
ing b
alanc
e of
Fund
s ava
ilable
for F
utur
e Ap
prop
riatio
n 14
,283,9
68
278
,862
- -
- -
- -
- 14
,562,8
30
SURP
LUS
/ (DE
FICIT)
AVA
ILABL
E FO
R AP
PROP
RIAT
ION
16,0
38,19
6 3
48,0
50
662
,953
-
27,5
36
861
,381
2,9
70,0
69
206
,525
1,27
4 2
1,115
,984
AP
PROP
RIAT
IONS
: Tra
nsfe
r to
Shar
ehold
er’s
Acco
unt
[Refe
r to
Note
II (16
) on
Sche
dule
16]
903
,402
1,47
3 6
62,95
3 -
27,5
36
861
,381
2,89
1,729
2
01,41
2 1,
274
5,55
1,160
Trans
fer t
o Ot
her R
eser
ves
- -
- -
- -
- -
- -
Fund
s ava
ilable
for F
utur
e Ap
prop
riatio
ns
15,13
4,794
3
46,57
7 -
- -
- 7
8,340
5
,113
- 15
,564,8
24
Balan
ceca
rriedforwardtotheBalan
ceSheet
- -
- -
- -
- -
- -
Deta
ils o
f Sur
plus
(a
) Int
erim
Bon
us P
aid
6,92
0 -
- -
- -
- -
- 6
,920
(b
) Allo
catio
n of
Bon
us to
Poli
cyho
lders
[Refe
r to
Note
II (17
) on
Sche
dule
16]
8,52
2,709
13
,553
- -
- -
- -
- 8
,536,
262
(c) S
urplu
s Sho
wn in
the
Reve
nue
Acco
unt
16,0
38,19
6 3
48,0
50
662
,953
- 2
7,536
8
61,38
1 2
,970,0
69
206
,525
1,27
4 2
1,115
,984
(d
) Tot
al Su
rplus
: [(a
)+(b)
+(c)]
24,5
67,82
5 3
61,60
3 6
62,95
3 -
27,5
36
861
,381
2,97
0,069
2
06,52
5 1,
274
29,
659,
166
* Re
pres
ents
the
deem
ed re
alise
d ga
in/(lo
ss) a
s per
nor
ms sp
ecifie
d by
the
Auth
ority
. **
Rep
rese
nts M
athe
matic
al Re
serv
e co
nsid
ering
allo
catio
n of
Bon
us.
As r
equir
ed b
y Se
ction
40
B(4)
of th
e Ins
uran
ce A
ct, 19
38 w
e ce
rtify
that
all e
xpen
ses o
f man
agem
ent i
n re
spec
t of l
ife in
suran
ce b
usine
ss in
India
by
the
Insur
er h
ave
been
fully
deb
ited
to Po
licyh
older
Rev
enue
Acc
ount
as e
xpen
ses.
.The
Sche
dules
refe
rred
to a
bove
form
an
integ
ral p
art o
f the
Rev
enue
Acc
ount
In te
rms
of o
ur re
port
atta
ched
For a
nd o
n be
half
of th
e Bo
ard
of D
irect
ors o
f Max
Life
Insu
ranc
e Co
mpan
y Lim
ited
For Fraser&
Ross
For B
.K.Khare&Co.
Rahu
l Kho
slaK
Nara
simha
Mur
thy
RajeshSud
Char
tere
d Ac
coun
tant
s
Cha
rtere
d Ac
coun
tant
sCh
airm
anIn
depe
nden
t Dire
ctor
Exec
utiv
e Vi
ce C
hairm
an &
IC
AI F
irm R
egist
ratio
n No
. 000
829S
ICA
I Firm
Reg
istra
tion
No. 1
0510
2WDI
N: 0
3597
562
DIN:
000
2304
6M
anag
ing
Dire
ctor
DIN:
023
9518
2
S. Ga
nesh
Padm
iniKhareKaicker
Mar
ielle
The
ron
HideakiNom
ura
Pra
shan
t Trip
athy
Pa
rtner
Partn
er
Dire
ctor
Dire
ctor
Chi
ef F
inan
cial
Offi
cer
Mem
bers
hip
No. 2
0410
8
Mem
bers
hip
No. 0
4478
4DI
N: 0
2667
356
DIN:
053
0452
5 P
AN: A
BTPT
2026
P
Plac
e :
Bang
alor
ePl
ace
: M
umba
iJo
se Jo
hnAn
uragChauhan
Date
: M
ay 19
, 201
7Da
te :
May
19, 2
017
Appo
inte
d Ac
tuar
yCo
mpa
ny S
ecre
tary
Mem
bers
hip
No. A
1616
9Pl
ace
: Ne
w D
elhi
Date
: M
ay 19
, 201
7

Max Life Insurance Company Limited Registration No: 104; Date of Registration with IRDAI: November 15, 2000
AnnuAL RepoRt 2016-17234
Directors' ReportFinancial Statements
All amounts in thousands of Indian Rupees
FO
RM A
-RA
REV
ENUE
ACC
OUN
T FO
R TH
E YE
AR E
NDED
MAR
CH 3
1, 20
16
(All
Amou
nts
in T
hous
ands
of I
ndia
n Ru
pees
) Policyhold
er’sAccount(Technic
alAccount)
FOR
THE
YEAR
END
ED M
ARCH
31,
2016
P
artic
ulars
Schedule
ParticipatingPolicies
(Non-Linked)
Non-ParticipatingPolicies
(Non-Linked)
LinkedPolicies
Tota
l
Individual
Life
Pen
sion
Individual
Life
Ann
uity
H
ealth
Ins
uran
ce
Gro
up
Linked
Individual
Linked
Pens
ion
Linked
Grou
p Premium
searned-n
et
Pre
mium
s 1
57,6
47,29
0 4
2,311
8,89
9,282
2
25,34
1 3
1,236
2
,843,4
06
19,93
0,679
2
,434,8
97
107,2
00
92,1
61,6
42
Less
: Re
insur
ance
Ced
ed
175,2
92
28
220
,192
- 9
,207
240
,384
126,8
20
439
14
77
2,37
6 A
dd :
Reins
uran
ce A
ccep
ted
- -
- -
- -
- -
- -
57,4
71,9
98
42,
283
8,6
79,0
90
225
,341
22,
029
2,6
03,0
22
19,8
03,8
59
2,43
4,458
10
7,186
9
1,389
,266
Income
from
Investm
ents
(a) I
nter
est,
Divid
ends
& R
ent -
Gro
ss
10,74
1,108
7
7,153
1,
496,3
82
58,5
67
2,46
8 4
21,34
9 4
,492,6
37
603
,500
47,3
08
17,9
40,47
2 (b
) Pro
fit o
n sa
le/ re
demp
tion
of in
vestm
ents
2,0
50,0
77
349
13
,585
153
- 2
,606
8,59
1,435
8
34,33
3 2
3,968
11
,516,
506
(c) (
Loss
) on
sale/
rede
mptio
n of
inve
stmen
ts (7
63,88
8) (1
0) (2
95)
(523
) -
- (5
,351,0
49)
(419
,010
) (1
4,353
) (6
,549,
128)
(d) T
rans
fer/
Gain
on re
valua
tion/
chan
ge in
fai
r valu
e *
- -
- -
- -
(9,0
89,15
0) (1
,091
,325)
(20,9
39)
(10,
201,4
14)
(e) A
ccre
tion
of d
iscou
nt /
(amo
rtisa
tion
of
prem
ium) (
Net)
(13,1
49)
255
3
,793
824
2
(1
,612)
199,9
88
2,25
2 4
9 19
2,402
Oth
er In
come
C
ontri
butio
n fro
m th
e Sh
areh
older
’s Ac
coun
t [Re
fer t
o No
te II
(15) o
n Sc
hedu
le 16
] -
- -
13,96
8 -
- -
- 4
,775
18,74
3
Misc
ellan
eous
Inco
me
141,0
00
47
2,54
0 1
19
185
2,69
6 17
0 8
14
6,66
6 To
tal (
A)
69,
627,1
46
120,
077
10,19
5,095
2
98,33
1 2
4,518
3
,025
,550
18,6
50,41
6 2
,364,3
78
148,
002
104,4
53,51
3 C
ommi
ssion
2
6,70
1,857
3
51
733
,796
3,98
0 9
81
3,19
3 7
01,79
4 6
4,089
8
5 8
,210
,126
Ope
ratin
g Ex
pens
es re
lated
to In
sura
nce
Busin
ess
3 9
,220,9
71
5,92
1 1,
250,1
89
2,36
1 4
,272
371
,461
1,55
9,333
7
7,629
3
,622
12,49
5,759
Pro
vision
for d
oubt
ful d
ebts
14,91
6 2
1 3
82
9
47
152
7,23
5 8
77
18
23,6
57
Bad
deb
ts wr
itten
off
12,17
7 -
1,71
1 2
-
684
1,
790
- -
16,36
4 P
rovis
ion fo
r Tax
-
- -
- -
- -
- -
- S
ervic
e Ta
x Ex
pend
iture
-
- -
- -
- 6
51,22
7 7
1,186
4
42
722,
855
Pro
vision
(oth
er th
an ta
xatio
n)
(a) F
or d
iminu
tion
in th
e va
lue o
f inv
estm
ents(
Ne
t) -
- -
- -
- -
- -
-
(b) O
ther
s -
- -
- -
- -
- -
- To
tal (
B)
15,9
49,9
21
6,2
93
1,98
6,07
8 6
,352
5,30
0 3
75,49
0 2
,921
,379
213
,781
4,16
7 2
1,468
,761
Ben
efits
Paid
(Net
) 4
11,90
6,117
6
7,729
6
51,23
9 4
4,695
11
,948
681
,921
15,52
7,153
2
,430,3
47
139,4
34
31,4
60,58
3 In
terim
Bon
uses
Paid
3
,697
- -
- -
- -
- -
3,6
97
Cha
nge
in va
luatio
n of
liabi
lity a
gains
t life
po
licies
in fo
rce:
[Refe
r to
Note
II (2
) (17
) & (1
8)
on S
ched
ule 16
] (a
) Gro
ss **
3
9,831
,477
(9,59
5) 7,
666,0
19
247
,284
(181
) 1,
090,3
06
(2,99
6,737
) (5
39,16
4) 4
,401
45,2
93,8
10
(b) D
iscon
tinua
nce
Fund
-
- -
- -
- 1,
658,0
13
132,7
31
- 1,
790,
744
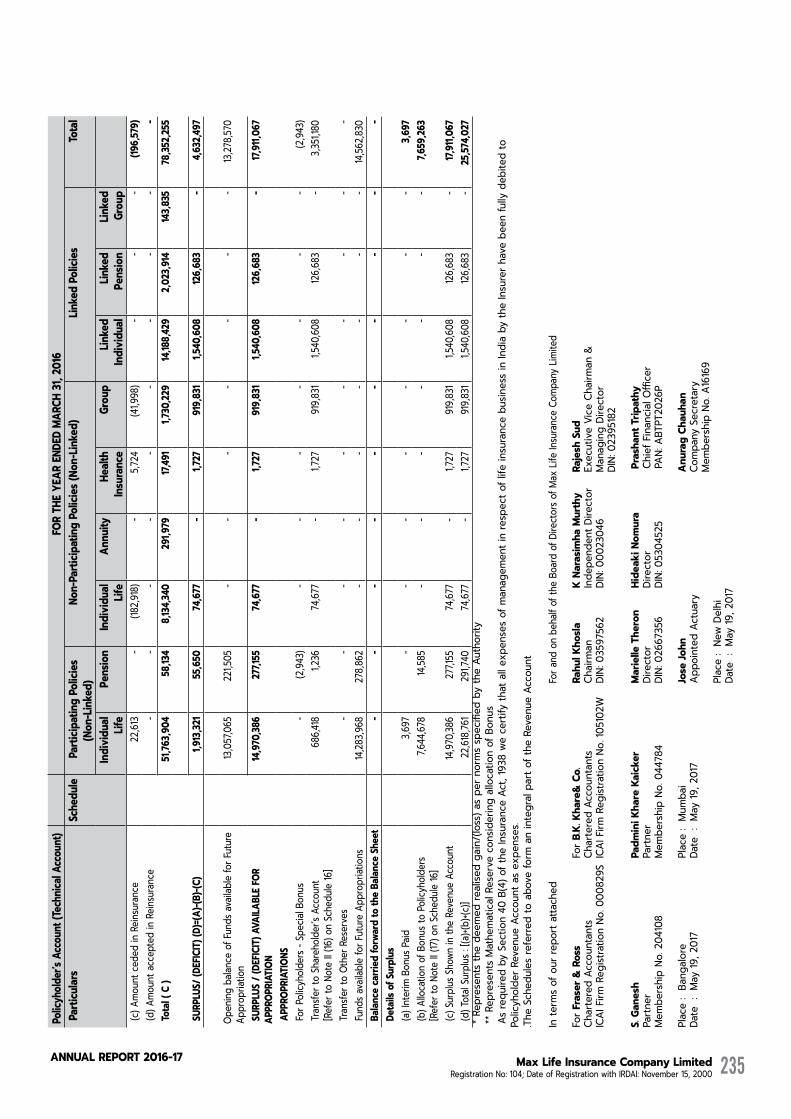
Max Life Insurance Company Limited Registration No: 104; Date of Registration with IRDAI: November 15, 2000
AnnuAL RepoRt 2016-17 235
Policyhold
er’sAccount(Technic
alAccount)
FOR
THE
YEAR
END
ED M
ARCH
31,
2016
P
artic
ulars
Schedule
ParticipatingPolicies
(Non-Linked)
Non-ParticipatingPolicies
(Non-Linked)
LinkedPolicies
Tota
l
Individual
Life
Pen
sion
Individual
Life
Ann
uity
H
ealth
Ins
uran
ce
Gro
up
Linked
Individual
Linked
Pens
ion
Linked
Grou
p (c
) Amo
unt c
eded
in R
einsu
ranc
e 2
2,613
-
(182
,918)
- 5
,724
(41,9
98)
- -
- (1
96,57
9) (d
) Amo
unt a
ccep
ted
in Re
insur
ance
-
- -
- -
- -
- -
- To
tal (
C )
51,7
63,9
04
58,
134
8,13
4,340
2
91,9
79
17,49
1 1,
730,
229
14,18
8,429
2
,023
,914
14
3,835
78
,352,
255
SUR
PLUS
/ (DE
FICIT)
(D)=(
A)-(B
)-(C)
1,
913,3
21
55,6
50
74,6
77
- 1,
727
919
,831
1,
540,
608
126,
683
- 4
,632
,497
Open
ing b
alanc
e of
Fund
s ava
ilable
for F
utur
e Ap
prop
riatio
n 13
,057
,065
2
21,50
5 -
- -
- -
- -
13,27
8,570
SUR
PLUS
/ (D
EFIC
IT) A
VAILA
BLE
FOR
APPR
OPRI
ATIO
N 14
,970
,386
277
,155
74,6
77
- 1,
727
919
,831
1,
540,
608
126,
683
- 17
,911,
067
APP
ROPR
IATIO
NS
For P
olicy
holde
rs - S
pecia
l Bon
us
- (2
,943)
- -
- -
- -
- (2
,943)
Tran
sfer t
o Sh
areh
older
’s Ac
coun
t [R
efer
to N
ote
II (16
) on
Sche
dule
16]
686
,418
1,23
6 7
4,677
-
1,72
7 9
19,83
1 1,
540,6
08
126,6
83
- 3
,351,1
80
Tran
sfer t
o Ot
her R
eser
ves
- -
- -
- -
- -
- -
Fund
s ava
ilable
for F
utur
e Ap
prop
riatio
ns
14,28
3,968
2
78,86
2 -
- -
- -
- -
14,56
2,830
Bala
ncecarriedforwardtotheBalan
ceSheet
- -
- -
- -
- -
- -
Det
ails o
f Sur
plus
(a
) Int
erim
Bon
us P
aid
3,69
7 -
- -
- -
- -
- 3
,697
(b
) Allo
catio
n of
Bon
us to
Poli
cyho
lders
[Ref
er to
Not
e II (
17) o
n Sc
hedu
le 16
] 7,
644,6
78
14,58
5 -
- -
- -
- -
7,65
9,26
3
(c) S
urplu
s Sho
wn in
the
Reve
nue
Acco
unt
14,97
0,386
2
77,15
5 7
4,677
-
1,72
7 9
19,83
1 1,
540,6
08
126,6
83
- 17
,911,
067
(d) T
otal
Surp
lus :
[(a)+(
b)+(c
)] 2
2,618
,761
291
,740
74,6
77
- 1,
727
919
,831
1,54
0,608
12
6,683
-
25,5
74,0
27
* R
epre
sent
s th
e de
emed
real
ised
gain
/(lo
ss) a
s pe
r nor
ms
spec
ified
by
the
Auth
ority
*
* Re
pres
ents
Mat
hem
atica
l Res
erve
con
sider
ing
allo
catio
n of
Bon
us
As
requ
ired
by S
ectio
n 40
B(4
) of t
he In
sura
nce
Act,
1938
we
certi
fy th
at a
ll ex
pens
es o
f man
agem
ent i
n re
spec
t of l
ife in
sura
nce
busin
ess
in In
dia
by th
e In
sure
r hav
e be
en fu
lly d
ebite
d to
Po
licyh
olde
r Rev
enue
Acc
ount
as
expe
nses
. .Th
e Sc
hedu
les
refe
rred
to a
bove
form
an
inte
gral
par
t of t
he R
even
ue A
ccou
nt
In te
rms
of o
ur re
port
atta
ched
For a
nd o
n be
half
of th
e Bo
ard
of D
irect
ors o
f Max
Life
Insu
ranc
e Co
mpan
y Lim
ited
For Fraser&
Ross
For B
.K.Khare&Co.
Rahu
l Kho
slaK
Nara
simha
Mur
thy
RajeshSud
Char
tere
d Ac
coun
tant
s
Cha
rtere
d Ac
coun
tant
sCh
airm
anIn
depe
nden
t Dire
ctor
Exec
utiv
e Vi
ce C
hairm
an &
IC
AI F
irm R
egist
ratio
n No
. 000
829S
ICA
I Firm
Reg
istra
tion
No. 1
0510
2WDI
N: 0
3597
562
DIN:
000
2304
6M
anag
ing
Dire
ctor
DIN:
023
9518
2
S. Ga
nesh
Padm
iniKhareKaicker
Mar
ielle
The
ron
HideakiNom
ura
Pra
shan
t Trip
athy
Pa
rtner
Partn
er
Dire
ctor
Dire
ctor
Chi
ef F
inan
cial
Offi
cer
Mem
bers
hip
No. 2
0410
8
Mem
bers
hip
No. 0
4478
4DI
N: 0
2667
356
DIN:
053
0452
5 P
AN: A
BTPT
2026
P
Plac
e :
Bang
alor
ePl
ace
: M
umba
iJo
se Jo
hnAn
uragChauhan
Date
: M
ay 19
, 201
7Da
te :
May
19, 2
017
Appo
inte
d Ac
tuar
yCo
mpa
ny S
ecre
tary
Mem
bers
hip
No. A
1616
9Pl
ace
: Ne
w D
elhi
Date
: M
ay 19
, 201
7
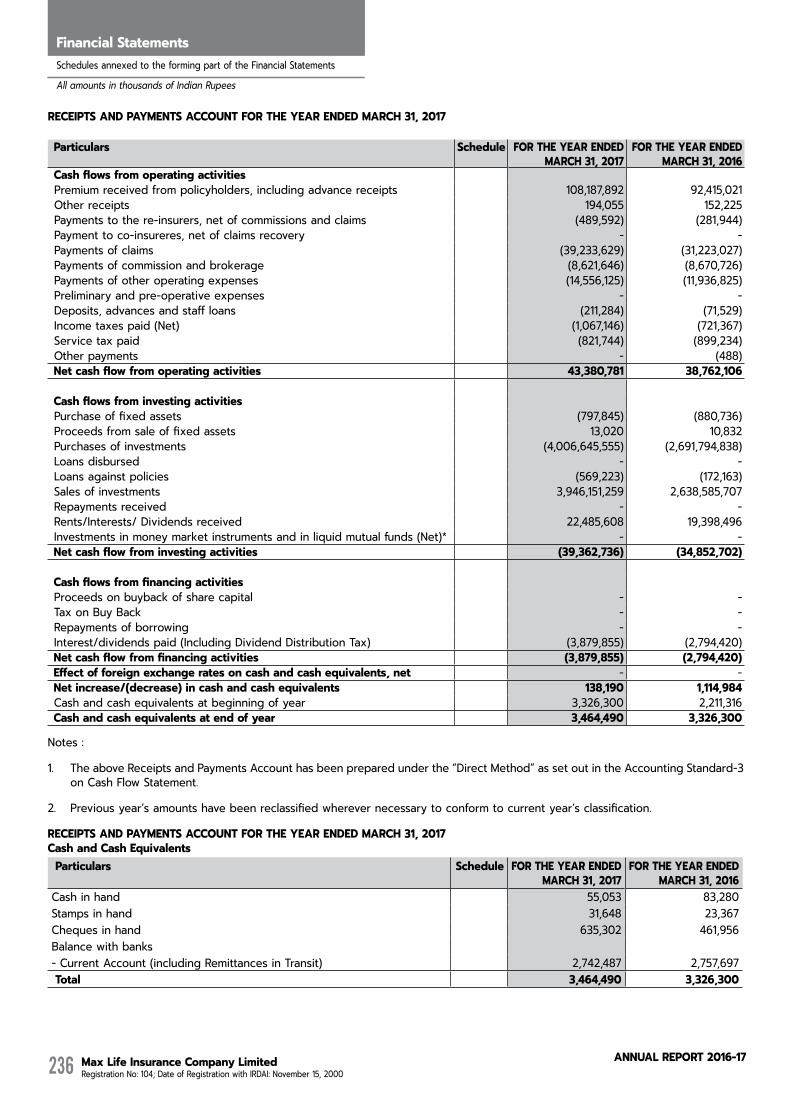
Max Life Insurance Company Limited Registration No: 104; Date of Registration with IRDAI: November 15, 2000
AnnuAL RepoRt 2016-17236
Directors' ReportFinancial StatementsSchedules annexed to the forming part of the Financial Statements
All amounts in thousands of Indian Rupees
Particulars Schedule FOR THE YEAR ENDED MARCH 31, 2017
FOR THE YEAR ENDED MARCH 31, 2016
Cashflowsfromoperatingactivities Premium received from policyholders, including advance receipts 108,187,892 92,415,021 Other receipts 194,055 152,225 Payments to the re-insurers, net of commissions and claims (489,592) (281,944) Payment to co-insureres, net of claims recovery - - Payments of claims (39,233,629) (31,223,027) Payments of commission and brokerage (8,621,646) (8,670,726) Payments of other operating expenses (14,556,125) (11,936,825) Preliminary and pre-operative expenses - - Deposits, advances and staff loans (211,284) (71,529) Income taxes paid (Net) (1,067,146) (721,367) Service tax paid (821,744) (899,234) Other payments - (488)Netcashflowfromoperatingactivities 43,380,781 38,762,106
Cashflowsfrominvestingactivities Purchase of fixed assets (797,845) (880,736) Proceeds from sale of fixed assets 13,020 10,832 Purchases of investments (4,006,645,555) (2,691,794,838) Loans disbursed - - Loans against policies (569,223) (172,163) Sales of investments 3,946,151,259 2,638,585,707 Repayments received - - Rents/Interests/ Dividends received 22,485,608 19,398,496 Investments in money market instruments and in liquid mutual funds (Net)* - - Netcashflowfrominvestingactivities (39,362,736) (34,852,702)
Cashflowsfromfinancingactivities Proceeds on buyback of share capital - - Tax on Buy Back - - Repayments of borrowing - - Interest/dividends paid (Including Dividend Distribution Tax) (3,879,855) (2,794,420)Netcashflowfromfinancingactivities (3,879,855) (2,794,420)Effectofforeignexchangeratesoncashandcashequivalents,net - - Netincrease/(decrease)incashandcashequivalents 138,190 1,114,984 Cash and cash equivalents at beginning of year 3,326,300 2,211,316 Cashandcashequivalentsatendofyear 3,464,490 3,326,300
Notes :
1. The above Receipts and Payments Account has been prepared under the “Direct Method” as set out in the Accounting Standard-3 on Cash Flow Statement.
2. Previous year’s amounts have been reclassified wherever necessary to conform to current year’s classification.
RECEIPTS AND PAYMENTS ACCOUNT FOR THE YEAR ENDED MARCH 31, 2017CashandCashEquivalents Particulars Schedule FOR THE YEAR ENDED
MARCH 31, 2017 FOR THE YEAR ENDED
MARCH 31, 2016 Cash in hand 55,053 83,280 Stamps in hand 31,648 23,367 Cheques in hand 635,302 461,956 Balance with banks- Current Account (including Remittances in Transit) 2,742,487 2,757,697 Total 3,464,490 3,326,300
RECEIPTS AND PAYMENTS ACCOUNT FOR THE YEAR ENDED MARCH 31, 2017

Max Life Insurance Company Limited Registration No: 104; Date of Registration with IRDAI: November 15, 2000
AnnuAL RepoRt 2016-17 237
SCHEDULE 1
PREMIUM FOR THE YEAR ENDED MARCH 31, 2017 ParticipatingPolicies
(Non-Linked)Non-ParticipatingPolicies(Non-Linked) LinkedPolicies Total
IndividualLife
Pension IndividualLife
Annuity Health Group LinkedIndividual
LinkedPension
LinkedGroup
First year premiums 14,412,790 (370) 2,952,527 - 155,407 317,642 7,609,478 507,459 509,972 26,464,905 Renewal premiums 44,834,175 23,044 7,988,339 - 24,880 334,163 16,077,188 1,858,685 - 71,140,474 Single premiums 6,890,335 12,803 - 213,140 - 2,754,419 217,189 110,758 - 10,198,644 Total premium 66,137,300 35,477 10,940,866 213,140 180,287 3,406,224 23,903,855 2,476,902 509,972 107,804,023 Business % 61.35% 0.03% 10.15% 0.20% 0.17% 3.16% 22.17% 2.30% 0.47% 100.00%
TotalpremiuminIndia 66,137,300 35,477 10,940,866 213,140 180,287 3,406,224 23,903,855 2,476,902 509,972 107,804,023 TotalPremiumoutsideIndia
- - - - - - - - - -
PREMIUM FOR THE YEAR ENDED MARCH 31, 2016ParticipatingPolicies
(Non-Linked)Non-ParticipatingPolicies(Non-Linked) LinkedPolicies Total
IndividualLife
Pension IndividualLife
Annuity Health Group LinkedIndividual
LinkedPension
LinkedGroup
PREMIUM FOR THE YEAR ENDED MARCH 31, 2016 First year premiums 12,227,966 - 2,575,854 - (24) 259,293 5,090,711 566,917 107,200 20,827,917 Renewal premiums 40,315,138 29,406 6,323,428 - 31,260 265,813 14,694,244 1,685,237 - 63,344,526 Single premiums 5,104,186 12,905 - 225,341 - 2,318,300 145,724 182,743 - 7,989,199 Total premium 57,647,290 42,311 8,899,282 225,341 31,236 2,843,406 19,930,679 2,434,897 107,200 92,161,642
Business % 62.55% 0.05% 9.66% 0.24% 0.03% 3.09% 21.63% 2.64% 0.12% 100.00%TotalpremiuminIndia 57,647,290 42,311 8,899,282 225,341 31,236 2,843,406 19,930,679 2,434,897 107,200 92,161,642 TotalPremiumoutsideIndia
- - - - - - - - - -
SCHEDULE 2 COMMISSION FOR THE YEAR ENDED MARCH 31, 2017
ParticipatingPolicies(Non-Linked)
Non-ParticipatingPolicies(Non-Linked) LinkedPolicies
Total
IndividualLife
Pension IndividualLife
Annuity Health Group LinkedIndividual
LinkedPension
LinkedGroup
Commission paid Direct - First Year Premiums
4,971,011 (54) 583,274 - 39,980 1,229 583,005 35,495 3 6,213,943
-Renewal Premiums 2,681,562 263 188,884 - 646 331 241,846 25,898 - 3,139,430 -Single Premiums 130 - - 3,946 - 1,363 3,695 1,769 - 10,903 Total (A) 7,652,703 209 772,158 3,946 40,626 2,923 828,546 63,162 3 9,364,276 Add : Commission on Re-insurance Accepted
- - - - - - - - - -
Less : Commission on Re-insurance Ceded
- - - - - - - - - -
Net Commission 7,652,703 209 772,158 3,946 40,626 2,923 828,546 63,162 3 9,364,276

Max Life Insurance Company Limited Registration No: 104; Date of Registration with IRDAI: November 15, 2000
AnnuAL RepoRt 2016-17238
Directors' ReportFinancial StatementsSchedules annexed to the forming part of the Financial Statements
All amounts in thousands of Indian Rupees
COMMISSION FOR THE YEAR ENDED MARCH 31, 2017 ParticipatingPolicies
(Non-Linked)Non-ParticipatingPolicies(Non-Linked) LinkedPolicies
Total
IndividualLife
Pension IndividualLife
Annuity Health Group LinkedIndividual
LinkedPension
LinkedGroup
Break-upofcommissionexpenses(gross)incurredtoprocurebusinessisasperdetailsbelow:
Agents 2,155,669 139 128,547 745 6,996 (472) 111,278 651 3 2,403,556 Brokers 1,669 1 75 - 2 2,132 (701) 52 - 3,230 Corporate Agency 245,804 3 9,687 - 388 0 44,755 360 (0) 300,997 Referrals - - - - - - - - - - Bancassurance 5,249,561 65 633,849 3,201 33,239 1,263 673,214 62,100 0 6,656,492 Total (B) 7,652,703 209 772,158 3,946 40,626 2,923 828,546 63,162 3 9,364,276
COMMISSION FOR THE YEAR ENDED MARCH 31, 2016 ParticipatingPolicies
(Non-Linked)Non-ParticipatingPolicies(Non-Linked) LinkedPolicies
Total
IndividualLife
Pension IndividualLife
Annuity Health Group LinkedIndividual
LinkedPension
LinkedGroup
COMMISSION Commission paid Direct - First Year Premiums
4,236,548 1 601,094 - (8) 1,098 432,719 40,353 85 5,311,890
- Renewal Premiums 2,465,141 350 132,651 - 989 1,390 266,501 20,857 - 2,887,879 - Single Premiums 168 - 51 3,980 - 705 2,574 2,879 - 10,357 Total (A) 6,701,857 351 733,796 3,980 981 3,193 701,794 64,089 85 8,210,126 Add : Commission on Re-insurance Accepted
- - - - - - - - - -
Less : Commission on Re-insurance Ceded
- - - - - - - - - -
Net Commission 6,701,857 351 733,796 3,980 981 3,193 701,794 64,089 85 8,210,126
COMMISSION FOR THE YEAR ENDED MARCH 31, 2016 ParticipatingPolicies
(Non-Linked)Non-ParticipatingPolicies(Non-Linked) LinkedPolicies
Total
IndividualLife
Pension IndividualLife
Annuity Health Group LinkedIndividual
LinkedPension
LinkedGroup
Break-upofcommissionexpenses(gross)incurredtoprocurebusinessisasperdetailsbelow:Agents 1,610,679 279 108,674 1,343 774 (142) 102,824 4,567 49 1,829,046 Brokers 4,598 1 64 - 3 2,002 317 43 2 7,029 Corporate Agency 400,106 4 1,266 - 15 40 89,319 461 (1) 491,210 Referrals (17) - 8 - - - (12) 10 - (12)Bancassurance 4,686,492 66 623,785 2,637 189 1,294 509,346 59,009 34 5,882,852 Total (B) 6,701,857 351 733,796 3,980 981 3,193 701,794 64,089 85 8,210,126
SCHEDULE 3
Particulars FOR THE YEAR ENDED MARCH 31, 2017 ParticipatingPolicies
(Non-Linked)Non-ParticipatingPolicies(Non-Linked) LinkedPolicies Total
IndividualLife
Pension IndividualLife
Annuity Health Group LinkedIndividual
LinkedPension
LinkedGroup
Employees remuneration and welfare benefits[Refer to Note II (8), (9) & (24) on Schedule 16]
5,761,194 912 836,813 1,223 1,896 294,910 1,079,811 46,218 344 8,023,321
Travel, conveyance and vehicle running expenses
289,840 42 42,794 68 82 17,450 51,264 1,999 9 403,548
Training expenses (including Agent advisors)
418,569 - 64,229 68 - 23,234 53,152 (2) - 559,250
Rent, rates & taxes 471,286 58 72,124 104 109 28,787 80,033 2,656 19 655,176 Repairs & Maintenance 186,270 20 28,453 36 41 11,204 31,770 1,054 6 258,854
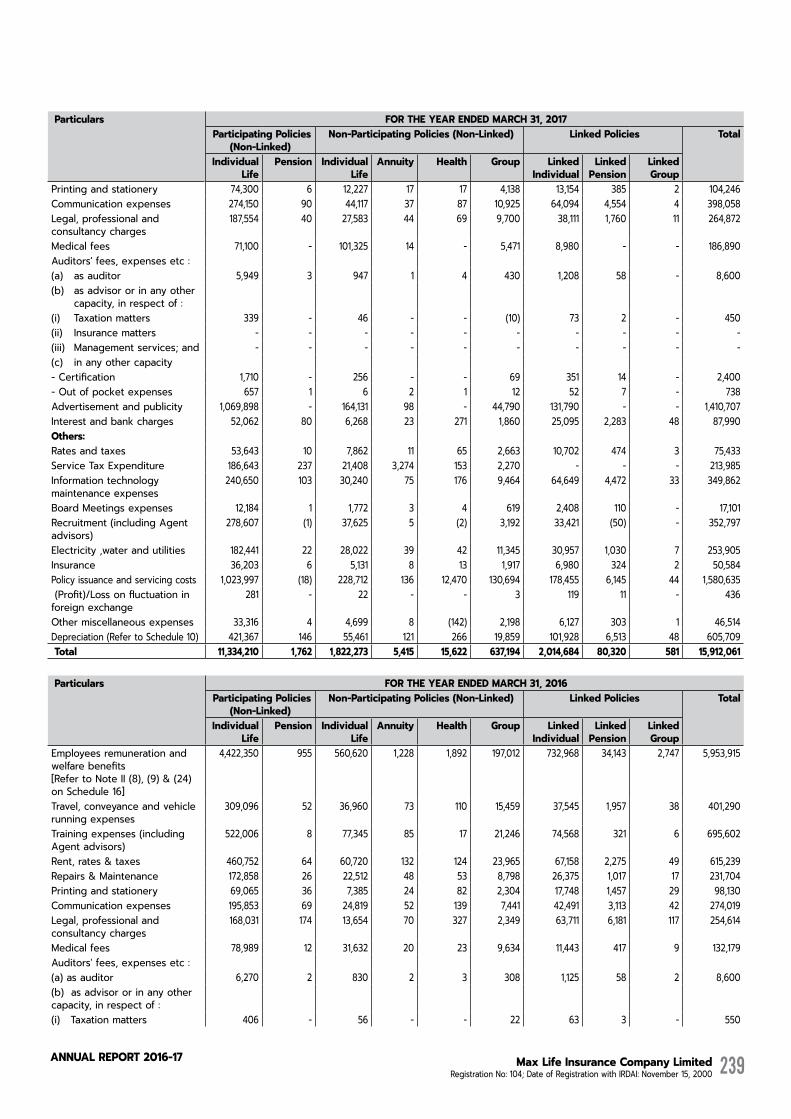
Max Life Insurance Company Limited Registration No: 104; Date of Registration with IRDAI: November 15, 2000
AnnuAL RepoRt 2016-17 239
Particulars FOR THE YEAR ENDED MARCH 31, 2017 ParticipatingPolicies
(Non-Linked)Non-ParticipatingPolicies(Non-Linked) LinkedPolicies Total
IndividualLife
Pension IndividualLife
Annuity Health Group LinkedIndividual
LinkedPension
LinkedGroup
Printing and stationery 74,300 6 12,227 17 17 4,138 13,154 385 2 104,246 Communication expenses 274,150 90 44,117 37 87 10,925 64,094 4,554 4 398,058 Legal, professional and consultancy charges
187,554 40 27,583 44 69 9,700 38,111 1,760 11 264,872
Medical fees 71,100 - 101,325 14 - 5,471 8,980 - - 186,890 Auditors' fees, expenses etc : (a) as auditor 5,949 3 947 1 4 430 1,208 58 - 8,600 (b) as advisor or in any other
capacity, in respect of : (i) Taxation matters 339 - 46 - - (10) 73 2 - 450 (ii) Insurance matters - - - - - - - - - - (iii) Management services; and - - - - - - - - - - (c) in any other capacity - Certification 1,710 - 256 - - 69 351 14 - 2,400 - Out of pocket expenses 657 1 6 2 1 12 52 7 - 738 Advertisement and publicity 1,069,898 - 164,131 98 - 44,790 131,790 - - 1,410,707 Interest and bank charges 52,062 80 6,268 23 271 1,860 25,095 2,283 48 87,990 Others: Rates and taxes 53,643 10 7,862 11 65 2,663 10,702 474 3 75,433 Service Tax Expenditure 186,643 237 21,408 3,274 153 2,270 - - - 213,985 Information technology maintenance expenses
240,650 103 30,240 75 176 9,464 64,649 4,472 33 349,862
Board Meetings expenses 12,184 1 1,772 3 4 619 2,408 110 - 17,101 Recruitment (including Agent advisors)
278,607 (1) 37,625 5 (2) 3,192 33,421 (50) - 352,797
Electricity ,water and utilities 182,441 22 28,022 39 42 11,345 30,957 1,030 7 253,905 Insurance 36,203 6 5,131 8 13 1,917 6,980 324 2 50,584 Policy issuance and servicing costs 1,023,997 (18) 228,712 136 12,470 130,694 178,455 6,145 44 1,580,635 (Profit)/Loss on fluctuation in foreign exchange
281 - 22 - - 3 119 11 - 436
Other miscellaneous expenses 33,316 4 4,699 8 (142) 2,198 6,127 303 1 46,514 Depreciation (Refer to Schedule 10) 421,367 146 55,461 121 266 19,859 101,928 6,513 48 605,709 Total 11,334,210 1,762 1,822,273 5,415 15,622 637,194 2,014,684 80,320 581 15,912,061
Particulars FOR THE YEAR ENDED MARCH 31, 2016ParticipatingPolicies
(Non-Linked)Non-ParticipatingPolicies(Non-Linked) LinkedPolicies Total
IndividualLife
Pension IndividualLife
Annuity Health Group LinkedIndividual
LinkedPension
LinkedGroup
Employees remuneration and welfare benefits[Refer to Note II (8), (9) & (24) on Schedule 16]
4,422,350 955 560,620 1,228 1,892 197,012 732,968 34,143 2,747 5,953,915
Travel, conveyance and vehicle running expenses
309,096 52 36,960 73 110 15,459 37,545 1,957 38 401,290
Training expenses (including Agent advisors)
522,006 8 77,345 85 17 21,246 74,568 321 6 695,602
Rent, rates & taxes 460,752 64 60,720 132 124 23,965 67,158 2,275 49 615,239 Repairs & Maintenance 172,858 26 22,512 48 53 8,798 26,375 1,017 17 231,704 Printing and stationery 69,065 36 7,385 24 82 2,304 17,748 1,457 29 98,130 Communication expenses 195,853 69 24,819 52 139 7,441 42,491 3,113 42 274,019 Legal, professional and consultancy charges
168,031 174 13,654 70 327 2,349 63,711 6,181 117 254,614
Medical fees 78,989 12 31,632 20 23 9,634 11,443 417 9 132,179 Auditors' fees, expenses etc : (a) as auditor 6,270 2 830 2 3 308 1,125 58 2 8,600 (b) as advisor or in any other capacity, in respect of : (i) Taxation matters 406 - 56 - - 22 63 3 - 550

Max Life Insurance Company Limited Registration No: 104; Date of Registration with IRDAI: November 15, 2000
AnnuAL RepoRt 2016-17240
Directors' ReportFinancial StatementsSchedules annexed to the forming part of the Financial Statements
All amounts in thousands of Indian Rupees
Particulars FOR THE YEAR ENDED MARCH 31, 2016ParticipatingPolicies
(Non-Linked)Non-ParticipatingPolicies(Non-Linked) LinkedPolicies Total
IndividualLife
Pension IndividualLife
Annuity Health Group LinkedIndividual
LinkedPension
LinkedGroup
(ii) Insurance matters - - - - - - - - - - (iii) Management services; and - - - - - - - - - - (c) in any other capacity - Certification 1,074 - 87 1 - 33 193 12 - 1,400 - Out of pocket expenses 771 - 112 - 1 43 122 8 - 1,057 Advertisement and publicity 979,127 - 123,626 124 - 31,718 107,475 - - 1,242,070 Interest and bank charges 49,585 56 4,830 21 82 1,199 17,338 1,611 46 74,768 Others: Rates and taxes 35,287 39 2,789 18 104 388 14,986 1,524 35 55,170 Service Tax Expenditure 127,904 3,817 19,066 9 25 2,949 - - - 153,770 Information technology maintenance expenses
207,675 114 22,246 77 257 6,892 54,371 4,500 94 296,226
Board Meetings 20,628 5 2,576 4 8 937 4,160 184 2 28,504 Recruitment (including Agent advisors)
174,137 (1) 30,686 10 (3) 2,861 17,217 (41) - 224,866
Electricity ,water and utilities 162,013 22 21,538 45 44 8,514 23,526 790 17 216,509 Insurance 43,847 14 5,349 11 21 1,974 8,349 437 9 60,011 Policy issuance and servicing costs 558,905 252 129,466 147 524 8,111 131,573 9,752 195 838,925 (Profit)/Loss on fluctuation in foreign exchange
388 - 11 - 1 1 210 29 - 640
Other miscellaneous expenses 36,468 31 2,874 12 51 741 12,237 1,108 20 53,542 Depreciation (Refer to Schedule 10) 417,486 174 48,400 148 387 16,562 92,381 6,773 148 582,459 Total 9,220,971 5,921 1,250,189 2,361 4,272 371,461 1,559,333 77,629 3,622 12,495,759
SCHEDULE 4BENEFITS PAID [NET] Particulars FOR THE YEAR ENDED MARCH 31, 2017
ParticipatingPolicies(Non-Linked)
Non-ParticipatingPolicies(Non-Linked) LinkedPolicies Total
IndividualLife
Pension IndividualLife
Annuity Health Group LinkedIndividual
LinkedPension
LinkedGroup
Insurance Claims * (a) By death, 1,694,251 1,177 598,195 5,421 - 992,079 787,514 42,795 - 4,121,432 (b) By Maturity, 2,037,710 13,671 966 - - 4,042 1,401,332 63,632 93,197 3,614,550 (c) Annuities/ Pension payment, - - - 44,505 - - - - - 44,505 (d) Other benefits Surrenders 3,100,806 31,919 439,355 - - 302,976 15,811,710 2,303,897 112,314 22,102,977 Health - - 2,600 - 18,632 2,526 - - - 23,758 Survival Benefit 411,107 - 118 - - - - - - 411,225 Bonus to Policyholders [Refer to Note II (17) on Schedule 16]
7,943,722 13,255 - - - - - - - 7,956,977
Others 35,348 1,951 17,823 - 59 25 137,715 8,032 - 200,953 Totalpaid 15,222,944 61,973 1,059,057 49,926 18,691 1,301,648 18,138,271 2,418,356 205,511 38,476,377 (Amount ceded in re-insurance): (a) By death, (100,058) - (210,219) - (400) (301,079) (86,214) (250) (3) (698,223)(b) By Maturity, - - - - - - - - - - (c) Annuities/ Pension payment, - - - - - - - - - - (d) Other benefits - Health - - (1,150) - (8,891) - - - - (10,041)Totalceded (100,058) - (211,369) - (9,291) (301,079) (86,214) (250) (3) (708,264)Amount accepted in re-insurance : (a) By death, - - - - - - - - - - (b) By Maturity, - - - - - - - - - - (c) Annuities/ Pension payment, - - - - - - - - - - (d) Other benefits - - - - - - - - - - Totalaccepted - - - - - - - - - - NetPaid 15,122,886 61,973 847,688 49,926 9,400 1,000,569 18,052,057 2,418,106 205,508 37,768,113
* Including claim investigation expenses amounting to Rs.8,656
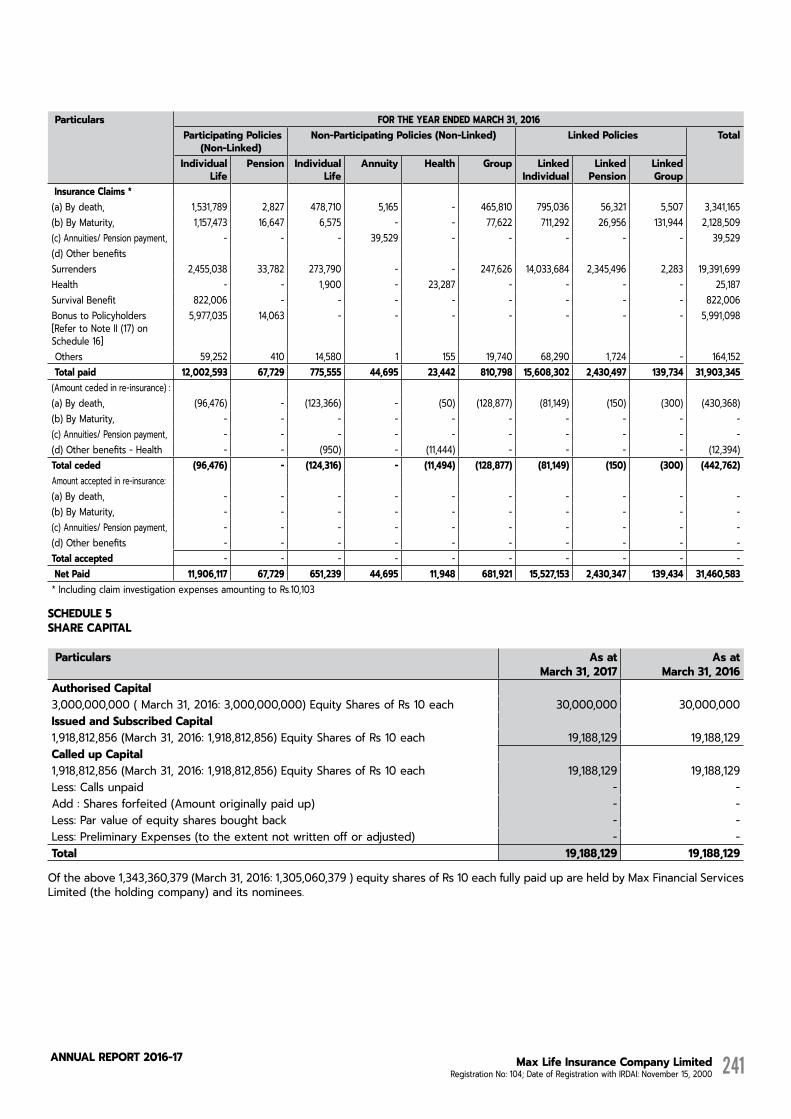
Max Life Insurance Company Limited Registration No: 104; Date of Registration with IRDAI: November 15, 2000
AnnuAL RepoRt 2016-17 241
Particulars FOR THE YEAR ENDED MARCH 31, 2016 ParticipatingPolicies
(Non-Linked)Non-ParticipatingPolicies(Non-Linked) LinkedPolicies
Total
IndividualLife
Pension IndividualLife
Annuity Health Group LinkedIndividual
LinkedPension
LinkedGroup
Insurance Claims * (a) By death, 1,531,789 2,827 478,710 5,165 - 465,810 795,036 56,321 5,507 3,341,165 (b) By Maturity, 1,157,473 16,647 6,575 - - 77,622 711,292 26,956 131,944 2,128,509 (c) Annuities/ Pension payment, - - - 39,529 - - - - - 39,529 (d) Other benefits Surrenders 2,455,038 33,782 273,790 - - 247,626 14,033,684 2,345,496 2,283 19,391,699 Health - - 1,900 - 23,287 - - - - 25,187 Survival Benefit 822,006 - - - - - - - - 822,006 Bonus to Policyholders [Refer to Note II (17) on Schedule 16]
5,977,035 14,063 - - - - - - - 5,991,098
Others 59,252 410 14,580 1 155 19,740 68,290 1,724 - 164,152 Totalpaid 12,002,593 67,729 775,555 44,695 23,442 810,798 15,608,302 2,430,497 139,734 31,903,345 (Amount ceded in re-insurance) : (a) By death, (96,476) - (123,366) - (50) (128,877) (81,149) (150) (300) (430,368)(b) By Maturity, - - - - - - - - - - (c) Annuities/ Pension payment, - - - - - - - - - - (d) Other benefits - Health - - (950) - (11,444) - - - - (12,394)Totalceded (96,476) - (124,316) - (11,494) (128,877) (81,149) (150) (300) (442,762)Amount accepted in re-insurance: (a) By death, - - - - - - - - - - (b) By Maturity, - - - - - - - - - - (c) Annuities/ Pension payment, - - - - - - - - - - (d) Other benefits - - - - - - - - - - Totalaccepted - - - - - - - - - - NetPaid 11,906,117 67,729 651,239 44,695 11,948 681,921 15,527,153 2,430,347 139,434 31,460,583 * Including claim investigation expenses amounting to Rs.10,103
SCHEDULE 5SHARE CAPITAL
Particulars As at March 31, 2017
As at March 31, 2016
AuthorisedCapital3,000,000,000 ( March 31, 2016: 3,000,000,000) Equity Shares of Rs 10 each 30,000,000 30,000,000 IssuedandSubscribedCapital1,918,812,856 (March 31, 2016: 1,918,812,856) Equity Shares of Rs 10 each 19,188,129 19,188,129 CalledupCapital1,918,812,856 (March 31, 2016: 1,918,812,856) Equity Shares of Rs 10 each 19,188,129 19,188,129 Less: Calls unpaid - - Add : Shares forfeited (Amount originally paid up) - - Less: Par value of equity shares bought back - - Less: Preliminary Expenses (to the extent not written off or adjusted) - - Total 19,188,129 19,188,129
Of the above 1,343,360,379 (March 31, 2016: 1,305,060,379 ) equity shares of Rs 10 each fully paid up are held by Max Financial Services Limited (the holding company) and its nominees.

Max Life Insurance Company Limited Registration No: 104; Date of Registration with IRDAI: November 15, 2000
AnnuAL RepoRt 2016-17242
Directors' ReportFinancial StatementsSchedules annexed to the forming part of the Financial Statements
All amounts in thousands of Indian Rupees
SCHEDULE 5APATTERNOFSHAREHOLDING(ascertifiedbyManagement) Particulars AS AT MARCH 31, 2017 AS AT MARCH 31, 2016 Shareholder NumberofShares
of Rs 10 each fully paidup
%ofHolding NumberofSharesof Rs 10 each fully
paidup
%ofHolding
Promoters - Indian 1,343,360,379 70.01% 1,305,060,379 68.01%Foreign Shareholders 479,703,215 25.00% 479,703,215 25.00%Others 95,749,262 4.99% 134,049,262 6.99%Total 1,918,812,856 100% 1,918,812,856 100%
SCHEDULE 6RESERVE AND SURPLUS Particulars As at
March 31, 2017 As at
March 31, 2016 Capital Redemption Reserve Opening Balance 258,784 258,784 Add: Transfer from / (to) Profit and Loss Appropriations - - Closing Balance 258,784 258,784 Share Premium Opening Balance 680,913 680,913 Add / (less) : Premium on equity shares bought back - - Closing Balance 680,913 680,913 Revaluation Reserve - - General Reserve : Opening Balance - - Add: Transfer from / (to) Profit and Loss Appropriations - - Closing Balance of General Reserve - - Catastrophe Reserve - - Other Reserves - - Balance of profit/ (loss) in Profit and Loss Account 4,927,471 14,089 Total 5,867,168 953,786
SCHEDULE 7BORROWINGS Particulars As at
March 31, 2017 As at
March 31, 2016 Debentures/ Bonds - - Banks - - Financial Institutions - - Others - - Total - -
SCHEDULE 8SHAREHOLDERS INVESTMENTS[Refer to Note II (7) on Schedule 16] Particulars As at
March 31, 2017 As at
March 31, 2016 LONG TERM INVESTMENTSGovernment securities and Government guaranteed bonds including Treasury Bills 30,22,899 80,89,967 Other Approved Securities 75,70,374 43,96,702 Other Approved investments(a) Shares
(aa) Equity 8,20,345 24,51,107 (bb) Preference Shares - -
(b) Mutual Funds - - (c) Derivative Instruments - - (d) Debentures/ Bonds 25,62,518 4,96,135

Max Life Insurance Company Limited Registration No: 104; Date of Registration with IRDAI: November 15, 2000
AnnuAL RepoRt 2016-17 243
Particulars As at March 31, 2017
As at March 31, 2016
(e) Other Securities - Deposits with Bank - - (f) Subsidiaries - - (g) Investment Properties-Real Estate - - Investments in Infrastructure and Social Sector 92,73,338 39,40,614 Other Investments Debentures/ Bonds - - Equity Shares 40,364 1,92,084 Preference - - Investments in Infrastructure and Social Sector - 27,772 SHORT TERM INVESTMENTSGovernment securities and Government guaranteed bonds including Treasury Bills 2,557 5 Other Approved Securities - - Other Approved investments(a) Shares
(aa) Equity - - (bb) Preference Shares - -
(b) Mutual Funds 79,90,000 27,97,000 (c) Derivative Instruments - - (d) Debentures/ Bonds 2,44,835 1,19,997 (e) Other Securities Commercial Paper - - Certificate of Deposits 4,289 9,98,970 Deposits with Bank 1,29,562 2,23,819 Reverse Repo 1,72,520 2,426 (f) Subsidiaries - - (g) Investment Properties-Real Estate - - Investments in Infrastructure and Social Sector 4,69,470 1,81,650 Other Investments - - Mutual Fund - Total 3,23,03,071 2,39,18,248 Aggregate Amount of Investments other than listed equity securities 3,12,83,971 2,09,68,005 Aggregate Market Value of Investments other than listed equity securities 3,17,27,737 2,15,89,142
SCHEDULE 8APOLICYHOLDERS INVESTMENTS [Refer to Note II (7) on Schedule 16] Particulars As at
March 31, 2017 As at
March 31, 2016 LONG TERM INVESTMENTSGovernment securities and Government guaranteed bonds including Treasury Bills 16,38,31,115 12,91,49,594 Other Approved Securities 1,08,58,856 97,09,771 Other Approved Investments(a) Shares
(aa) Equity 1,93,74,542 1,66,35,498 (bb) Preference 1 -
(b) Mutual Funds - - (c) Derivative Instruments - - (d) Debentures/ Bonds 65,57,660 51,98,760 (e) Other Securities Commercial Paper - - Deposits with Bank 2,89,800 2,89,800 (f) Subsidiaries - - (g) Investment Properties-Real Estate 2,27,879 - Investments in Infrastructure and Social Sector 3,72,80,425 3,08,15,279 Other Investments

Max Life Insurance Company Limited Registration No: 104; Date of Registration with IRDAI: November 15, 2000
AnnuAL RepoRt 2016-17244
Directors' ReportFinancial StatementsSchedules annexed to the forming part of the Financial Statements
All amounts in thousands of Indian Rupees
Particulars As at March 31, 2017
As at March 31, 2016
Debentures/ Bonds - - Equity Shares 7,11,757 12,53,155 Alternate Investment Funds 75,170 - Investments in Infrastructure and Social Sector 1,72,564 2,68,743
SHORT TERM INVESTMENTSGovernment securities and Government guaranteed bonds including Treasury Bills 19,67,777 21,53,025 Other Approved Securities 1,00,000 99,931 Other Approved Investments(a) Shares
(aa) Equity - - (bb) Preference - -
(b) Mutual Funds 76,64,107 31,50,000 (c) Derivative Instruments - - (d) Debentures/ Bonds 7,29,793 8,96,454 (e) Other Securities Commercial Paper - - Certificate of Deposits 8,37,023 18,44,568 Reverse Repo 30,48,845 2,54,311 (f) Subsidiaries - - (g) Investment Properties-Real Estate - - Investments in Infrastructure and Social Sector 17,55,192 10,36,003 Other Investments Debentures/ Bonds - 29,168 Investments in Infrastructure and Social Sector - - Mutual Fund - - Total 25,54,82,506 20,27,84,060 Aggregate Amount of Investments other than listed equity securities 23,28,22,557 18,22,04,784 Aggregate Market Value of Investments other than listed equity securities 24,60,34,235 18,83,06,995
SCHEDULE 8BASSETS HELD TO COVER LINK LIABILITIES[Refer to Note II (7) on Schedule 16] Particulars As at
March 31, 2017 As at
March 31, 2016 LONG TERM INVESTMENTSGovernment securities and Government guaranteed bonds including Treasury Bills 2,24,25,589 3,02,28,353 Other Approved Securities 82,46,086 91,255 Other Approved Investments(a) Shares (aa) Equity 6,79,11,137 6,58,88,311 (bb) Preference 13,736 13,082 (b) Mutual Funds - - (c) Derivative Instruments - - (d) Debentures/ Bonds 82,02,619 48,71,185 (e) Other Securities Deposits with Banks 95,000 95,000 (f) Subsidiaries - - Investments in Infrastructure and Social Sector 2,27,65,880 1,59,60,151 Other Investments Debentures/ Bonds 2,10,433 8,700 Equity Shares 43,96,147 52,24,049 Preference Shares - - Investments in Infrastructure and Social Sector 2,13,261 15,75,075 SHORT TERM INVESTMENTSGovernment securities and Government guaranteed bonds including Treasury Bills 18,69,609 3,27,888 Other Approved Securities - - Other Approved investments(a) Shares
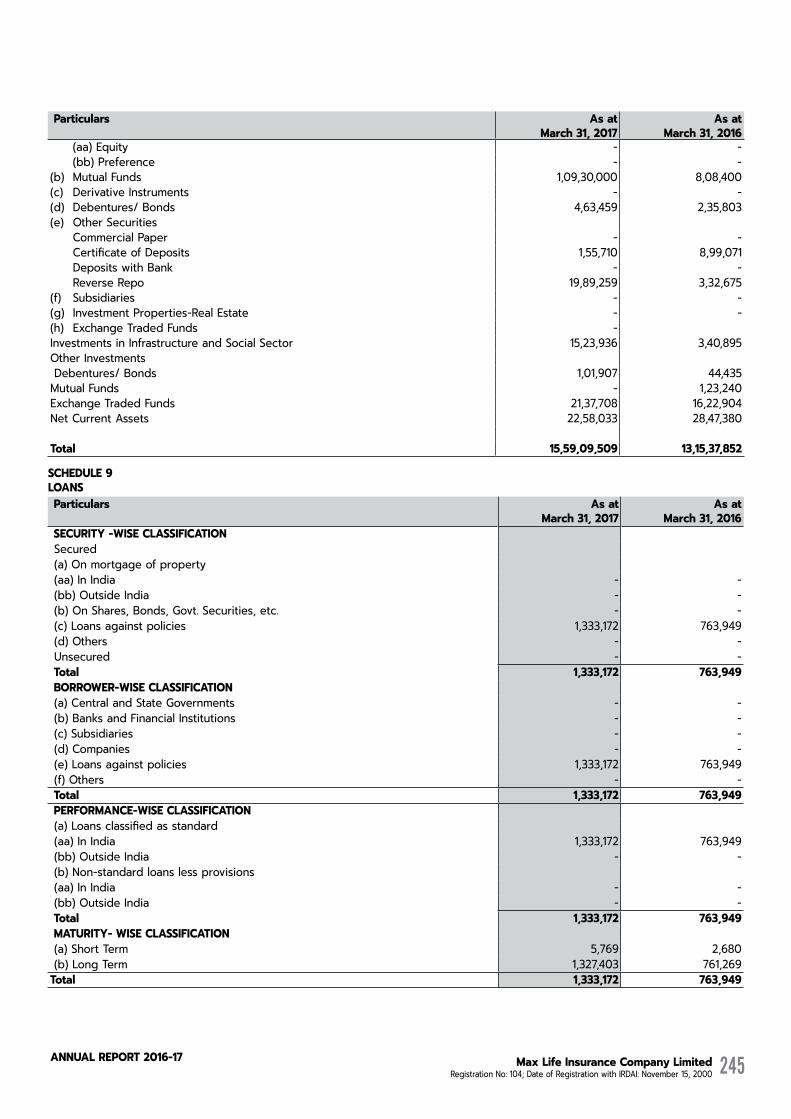
Max Life Insurance Company Limited Registration No: 104; Date of Registration with IRDAI: November 15, 2000
AnnuAL RepoRt 2016-17 245
Particulars As at March 31, 2017
As at March 31, 2016
(aa) Equity - - (bb) Preference - -
(b) Mutual Funds 1,09,30,000 8,08,400 (c) Derivative Instruments - - (d) Debentures/ Bonds 4,63,459 2,35,803 (e) Other Securities Commercial Paper - - Certificate of Deposits 1,55,710 8,99,071 Deposits with Bank - - Reverse Repo 19,89,259 3,32,675 (f) Subsidiaries - - (g) Investment Properties-Real Estate - - (h) Exchange Traded Funds - Investments in Infrastructure and Social Sector 15,23,936 3,40,895 Other Investments Debentures/ Bonds 1,01,907 44,435 Mutual Funds - 1,23,240 Exchange Traded Funds 21,37,708 16,22,904 Net Current Assets 22,58,033 28,47,380
Total 15,59,09,509 13,15,37,852
SCHEDULE 9LOANS Particulars As at
March 31, 2017 As at
March 31, 2016 SECURITY -WISE CLASSIFICATION Secured (a) On mortgage of property (aa) In India - - (bb) Outside India - - (b) On Shares, Bonds, Govt. Securities, etc. - - (c) Loans against policies 1,333,172 763,949 (d) Others - - Unsecured - - Total 1,333,172 763,949 BORROWER-WISE CLASSIFICATION (a) Central and State Governments - - (b) Banks and Financial Institutions - - (c) Subsidiaries - - (d) Companies - - (e) Loans against policies 1,333,172 763,949 (f) Others - - Total 1,333,172 763,949 PERFORMANCE-WISE CLASSIFICATION (a) Loans classified as standard (aa) In India 1,333,172 763,949 (bb) Outside India - - (b) Non-standard loans less provisions (aa) In India - - (bb) Outside India - - Total 1,333,172 763,949 MATURITY- WISE CLASSIFICATION (a) Short Term 5,769 2,680 (b) Long Term 1,327,403 761,269 Total 1,333,172 763,949

Max Life Insurance Company Limited Registration No: 104; Date of Registration with IRDAI: November 15, 2000
AnnuAL RepoRt 2016-17246
Directors' ReportFinancial StatementsSchedules annexed to the forming part of the Financial Statements
All amounts in thousands of Indian Rupees
SCHEDULE 10FIXED ASSETSParticulars GrossBlock Depreciation NetBlock
As At April 1,
2016
AdditionsFor The PeriodEnded
March 31, 2017
Sale/ Disposal For The PeriodEnded
March 31, 2017
As At March 31,
2017
As At April 1,
2016
AdditionsFor The PeriodEnded
March 31, 2017
Sale/ Disposal For ThePeriod
EndedMarch 31,
2017
As At March 31,
2017
As At March 31,
2017
As At March 31,
2016
Goodwill - - - - - - - - - - Intangibles - Software
2,573,437 567,900 - 3,141,336 1,797,085 312,739 - 2,109,824 1,031,512 776,352
Leasehold Property
- - - - - - - - - -
Leasehold improvements
1,129,917 75,501 18,740 1,186,678 951,371 78,270 18,563 1,011,078 175,600 178,546
Buildings - - - - - - - - - - Furniture and fixtures
369,270 19,891 12,421 376,740 291,861 27,686 10,577 308,971 67,769 77,409
Information Technology equipment (Including communication networks and servers )
1,218,296 174,668 41,703 1,351,262 1,051,867 141,434 41,357 1,151,944 199,318 166,429
Vehicles 44,230 3,127 9,719 37,638 21,506 7,760 5,964 23,301 14,337 22,724 Office equipment 528,636 57,534 26,663 559,507 445,728 37,819 25,377 458,171 101,336 82,908 Total 5,863,786 898,621 109,246 6,653,161 4,559,418 605,709 101,839 5,063,289 1,589,872 1,304,368 Capital Work in Progress (including Capital advances)
32,874 374,164
GrandTotal 5,863,786 898,621 109,246 6,653,161 4,559,418 605,709 101,839 5,063,289 1,622,746 1,678,532 Previousyear(FY15-16)
5,018,752 991,961 146,927 5,863,786 4,112,773 582,459 135,814 4,559,418 1,678,532
Note:1. Internally generated Intangibles is Rs. NIL. (Mar 31, 2016 - Rs. NIL)
SCHEDULE 11 CASH AND BANK BALANCES Particulars As at
March 31, 2017 As at
March 31, 2016 Cash [Including Insurance Stamp Rs. 31,648 (March 31, 2016 : Rs. 23,367)] Cheques in hand of Rs. 635,302 (March 31, 2016 : Rs. 4,61,956)
722,003 568,603
Balances with banks in India* (a) Deposit accounts (aa) Short-term fixed deposit (i.e. maturing in 12 months) - - (bb) Others - - (b) Current accounts 2,742,487 2,757,697 (c) Others - - Money at call and short notice (a) With Banks - - (b) With other Institutions - - Others - - Total 3,464,490 3,326,300 *Balances with non-scheduled bank included in (b) above is Rs Nil (March 31, 2016 Rs Nil) *Balances with bank outside India included in (b) above is Rs Nil (March 31, 2016 Rs Nil)

Max Life Insurance Company Limited Registration No: 104; Date of Registration with IRDAI: November 15, 2000
AnnuAL RepoRt 2016-17 247
SCHEDULE 12 ADVANCES AND OTHER ASSETS Particulars As at
March 31, 2017 As at
March 31, 2016 ADVANCES Reserve deposit with ceding companies - - Application money for investments - - Prepayments 360,299 223,314 Advances to Directors / Officers - - Advance tax paid and taxes deducted at source (Net of provision for taxation)
148,697 147,969
Others Advances to suppliers 1,039,798 1,175,981 Less : Provision for doubtful advances 40,102 999,696 44,848 1,131,133 Advances to employees for imprest, travel, etc. 24,427 24,850 Less : Provision for doubtful advances 18,641 5,786 9,086 15,764 Total (A) 1,514,478 1,518,180 OTHER ASSETS Income accrued on investments 6,079,198 4,652,340 Outstanding premiums 4,857,143 5,002,271 Agents' balances 39,035 36,729 Less : Provision for doubtful agents' balances 27,210 11,825 32,462 4,267 Foreign agencies balances - - Due from other entities carrying on insurance business (including reinsurers)
386,082 147,505
Due from subsidiaries / holding company - - Deposits with Reserve Bank of India - - Others: - Service tax unutilised credit 338,817 516,599 - Security and other deposits 359,525 362,562 - Outstanding trades - Investment - 33,328 - Derivative Assets [Refer to Note II (43) on Schedule 16] - 6,989 - Derivative margin money investment - - - Asset held for unclaimed amount [Refer to Note II (32) on Schedule 16] 498,831 - - Service Tax Deposits [Refer to Note II (30) on Schedule 16] 103,020 57,957 - Income Tax Deposits 169,258 - Total (B) 12,803,699 10,783,818 Total (C) = (A) + (B) 14,318,177 12,301,998
SCHEDULE 13 CURRENT LIABILITIES Particulars As at
March 31, 2017 AS AT
MARCH 31, 2016 Agents balances 3,075,924 2,180,988 Balance due to other insurance companies 281,215 238,867 Deposits held on reinsurance companies - - Premium received in advance 172,442 168,550 Unallocated premium 1,621,476 973,135 Sundry creditors 5,846,973 4,300,127 Due to holding company 24,138 51,524
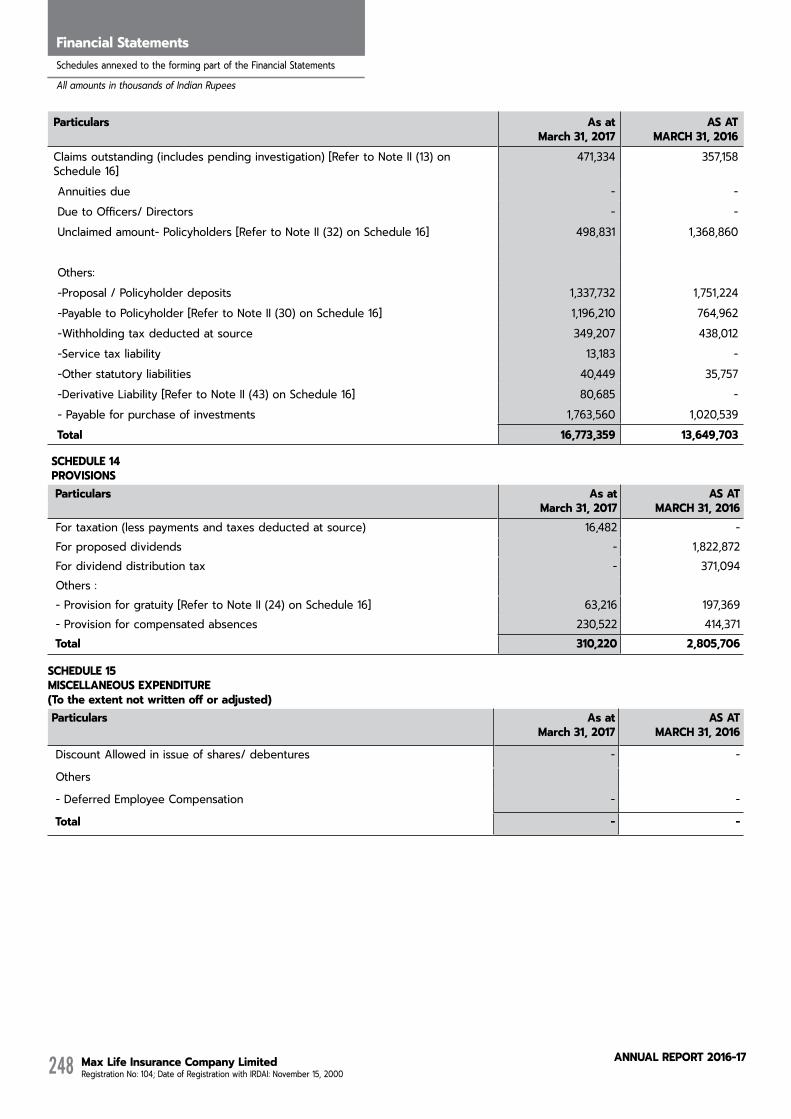
Max Life Insurance Company Limited Registration No: 104; Date of Registration with IRDAI: November 15, 2000
AnnuAL RepoRt 2016-17248
Directors' ReportFinancial StatementsSchedules annexed to the forming part of the Financial Statements
All amounts in thousands of Indian Rupees
Particulars As at March 31, 2017
AS AT MARCH 31, 2016
Claims outstanding (includes pending investigation) [Refer to Note II (13) on Schedule 16]
471,334 357,158
Annuities due - - Due to Officers/ Directors - - Unclaimed amount- Policyholders [Refer to Note II (32) on Schedule 16] 498,831 1,368,860
Others: -Proposal / Policyholder deposits 1,337,732 1,751,224 -Payable to Policyholder [Refer to Note II (30) on Schedule 16] 1,196,210 764,962 -Withholding tax deducted at source 349,207 438,012 -Service tax liability 13,183 - -Other statutory liabilities 40,449 35,757 -Derivative Liability [Refer to Note II (43) on Schedule 16] 80,685 - - Payable for purchase of investments 1,763,560 1,020,539 Total 16,773,359 13,649,703
SCHEDULE 14 PROVISIONS Particulars As at
March 31, 2017 AS AT
MARCH 31, 2016 For taxation (less payments and taxes deducted at source) 16,482 - For proposed dividends - 1,822,872 For dividend distribution tax - 371,094 Others : - Provision for gratuity [Refer to Note II (24) on Schedule 16] 63,216 197,369 - Provision for compensated absences 230,522 414,371 Total 310,220 2,805,706
SCHEDULE 15 MISCELLANEOUS EXPENDITURE(Totheextentnotwrittenofforadjusted)Particulars As at
March 31, 2017 AS AT
MARCH 31, 2016
Discount Allowed in issue of shares/ debentures - -
Others
- Deferred Employee Compensation - -
Total - -

Max Life Insurance Company Limited Registration No: 104; Date of Registration with IRDAI: November 15, 2000
AnnuAL RepoRt 2016-17 249
ANNEXURE TO REVENUE ACCOUNT-BREAK UP OF UNIT LINKED BUSINESS (UL) (All Amounts in Thousands of Indian Rupees)REVENUE ACCOUNT FOR THE YEAR ENDED MARCH 31, 2017Policyholder’sAccount(TechnicalAccount)Particulars Schedule LinkedLife LinkedPension LinkedGroup Total Unit
Linked Non-Unit Unit Total Non-Unit Unit Total Non-Unit Unit Total
(1) (2) (3)=(1)+(2) (4) (5) (6)=(4)+(5) (7) (8) (9)=(7)+(8) (10)=(3)+(6)+(9)Premiumsearned–net(a) Premium 8,62,211 2,30,41,644 2,39,03,855 30,516 24,46,386 24,76,902 - 5,09,972 5,09,972 2,68,90,729(b) Reinsurance ceded (1,18,587) - (1,18,587) (408) - (408) - - - (1,18,995)IncomefromInvestments(a) Interest, Dividend & Rent - Gross
4,30,858 45,90,868 50,21,726 34,401 6,27,921 6,62,322 - 56,989 56,989 57,41,037
(b) Profit on sale/redemption of investments
97,764 94,05,070 95,02,834 24,108 8,04,930 8,29,038 1,633 37,987 39,620 1,03,71,492
(c) Loss on sale/redemption of investments
(185) (30,04,697) (30,04,882) 60 (1,47,524) (1,47,464) 13 (10,039) (10,026) (31,62,372)
(d) Unrealised gain/(loss) (752) 89,96,649 89,95,897 (16,361) 13,78,569 13,62,208 (1,522) 18,430 16,908 1,03,75,013 (e) Amortisation of discount/(premium)
88,919 99,196 1,88,115 (1,702) 7,824 6,122 (124) 124 - 1,94,237
Other income:(a) Linked Income UL1 40,96,517 (40,96,517) - 3,07,437 (3,07,437) - 2,650 (2,650) - -(b ) Contribution from the Shareholder’s Account
- - - - - - - - - -
(c ) Others 1,386 252 1,638 117 - 117 - - - 1,755TOTAL (A) 54,58,131 3,90,32,465 4,44,90,596 3,78,168 48,10,669 51,88,837 2,650 6,10,813 6,13,463 5,02,92,896Commission Paid 8,28,546 - 8,28,546 63,162 - 63,162 3 - 3 8,91,711Operating Expenses related to Insurance Business
20,14,684 - 20,14,684 80,320 - 80,320 581 - 581 20,95,585
Provision for Tax - Fringe Benefit Tax
- - - - - - - - - -
Provision for doubtful debts 359 - 359 29 - 29 - - - 388Bad debts written off 587 - 587 7 - 7 - - - 594Service Tax 30,813 7,14,017 7,44,830 1,099 52,235 53,334 (14) 574 560 7,98,724TOTAL (B) 28,74,989 7,14,017 35,89,006 1,44,617 52,235 1,96,852 570 574 1,144 37,87,002Benefits Paid (Net) UL2 7,71,133 1,72,80,924 1,80,52,057 3,822 24,14,284 24,18,106 (2) 2,05,510 2,05,508 2,06,75,671Interim Bonus Paid - - - - - - - - - -Change in Valuation Liability (11,58,060) 2,10,37,524 1,98,79,464 23,204 23,44,150 23,67,354 808 4,04,729 4,05,537 2,26,52,355TOTAL (C) (3,86,927) 3,83,18,448 3,79,31,521 27,026 47,58,434 47,85,460 806 6,10,239 6,11,045 4,33,28,026SURPLUS/ (DEFICIT) (D) =(A)-(B)-(C)
29,70,069 - 29,70,069 2,06,525 - 2,06,525 1,274 - 1,274 31,77,868
APPROPRIATIONSTransfer to Shareholder’s Account - - - - - - - - - -Funds available for future appropriations
- - - - - - - - - -
Total (D) - - - - - - - - - -
REVENUE ACCOUNT FOR THE YEAR ENDED MARCH 31, 2016 Policyholder’sAccount(TechnicalAccount)Particulars Schedule LinkedLife LinkedPension LinkedGroup Total Unit
LinkedNon-Unit Unit Total Non-Unit Unit Total Non-Unit Unit Total
(1) (2) (3)=(1)+(2) (4) (5) (6)=(4)+(5) (7) (8) (9)=(7)+(8) (10)=(3)+(6)+(9)Premiumsearned–net(a) Premium 6,97,616 1,92,33,063 1,99,30,679 24,438 24,10,459 24,34,897 - 1,07,200 1,07,200 2,24,72,776(b) Reinsurance ceded (1,26,820) - (1,26,820) (439) - (439) (14) - (14) (1,27,273)IncomefromInvestments(a) Interest, Dividend & Rent - Gross
3,87,090 41,05,547 44,92,637 39,802 5,63,698 6,03,500 - 47,308 47,308 51,43,445
(b) Profit on sale/redemption of investments
6,920 85,84,515 85,91,435 438 8,33,895 8,34,333 (2) 23,970 23,968 94,49,736
(c) Loss on sale/redemption of investments
- (53,51,049) (53,51,049) - (4,19,010) (4,19,010) - (14,353) (14,353) (57,84,412)
(d) Unrealised gain/(loss) (1) (90,89,149) (90,89,150) - (10,91,325) (10,91,325) 2 (20,941) (20,939) (1,02,01,414)(e) Amortisation of discount/(premium)
1,66,299 33,689 1,99,988 1,437 815 2,252 (1) 50 49 2,02,289
(f) App / Exp Adj Account

Max Life Insurance Company Limited Registration No: 104; Date of Registration with IRDAI: November 15, 2000
AnnuAL RepoRt 2016-17250
Directors' ReportFinancial StatementsSchedules annexed to the forming part of the Financial Statements
All amounts in thousands of Indian Rupees
SchedulestoAnnexuretoRevenueAccount(UL)formingpartofFinancialStatements NAME OF THE INSURER: MAX LIFE INSURANCE COMPANY LIMITED REGISTRATION NO: 104; DATE OF REGISTRATION WITH IRDAI : NOVEMBER 15, 2000 (All Amounts in Thousands of Indian Rupees) Schedule-UL1LinkedIncome(recoveredfromlinkedfunds)* FOR THE YEAR ENDED MARCH 31, 2017 (AUDITED)Particulars LifeLinkedUnit PensionLinkedUnit LinkedGroupUnit Total
(1) (2) (3) (4)= (1)+(2)+(3)Fund Administration charges - - - - Fund Management charge 14,93,269 1,96,991 3,697 16,93,957 Policy Administration charge 10,03,751 98,073 - 11,01,824 Surrender charge 1,32,509 10,799 - 1,43,308 Switching charge 367 3 - 370 Mortality charge 14,46,537 5,251 - 14,51,788 Rider Premium charge - - - - Partial withdrawal charge - - - - Miscellaneous charge 20,084 (3,680) (1,047) 15,357 TOTAL (UL-1) 40,96,517 3,07,437 2,650 44,06,604 * (net of service tax, if any)Schedule-UL1LinkedIncome(recoveredfromlinkedfunds)* FOR THE YEAR ENDED MARCH 31, 2016 Particulars LifeLinkedUnit PensionLinkedUnit LinkedGroupUnit Total
(1) (2) (3) (4)= (1)+(2)+(3)Fund Administration charges - - - - Fund Management charge 13,78,134 1,81,065 2,968 15,62,167 Policy Administration charge 9,16,727 99,872 - 10,16,599 Surrender charge 1,84,467 20,330 - 2,04,797 Switching charge 541 2 - 543 Mortality charge 14,26,455 6,199 - 14,32,654 Rider Premium charge - - - - Partial withdrawal charge - - - - Miscellaneous charge (1,419) (31,117) 58 (32,478)TOTAL (UL-1) 39,04,905 2,76,350 3,026 41,84,281
Particulars Schedule LinkedLife LinkedPension LinkedGroup Total Unit Linked
Non-Unit Unit Total Non-Unit Unit Total Non-Unit Unit Total(1) (2) (3)=(1)+(2) (4) (5) (6)=(4)+(5) (7) (8) (9)=(7)+(8) (10)=(3)+(6)+(9)
Other income:(a) Linked Income UL1 39,04,905 (39,04,905) - 2,76,350 (2,76,350) - 3,026 (3,026) - -(b ) Contribution from the Shareholder’s Account
- - - - - - 4,775 - 4,775 4,775
(c ) Others 2,444 252 2,696 170 - 170 8 8 2,874TOTAL (A) 50,38,453 1,36,11,963 1,86,50,416 3,42,196 20,22,182 23,64,378 7,794 1,40,208 1,48,002 2,11,62,796Commission Paid 7,01,794 - 7,01,794 64,089 - 64,089 85 - 85 7,65,968Operating Expenses related to Insurance Business
15,59,333 - 15,59,333 77,629 - 77,629 3,622 - 3,622 16,40,584
Provision for Tax - Fringe Benefit Tax
- - - - - - - - - -
Provision for doubtful debts 7,235 - 7,235 877 - 877 18 - 18 8,130Bad debts written off 1,790 - 1,790 - - - - - - 1,790Service Tax 1,00,861 5,50,366 6,51,227 320 70,866 71,186 7 435 442 7,22,855TOTAL (B) 23,71,013 5,50,366 29,21,379 1,42,915 70,866 2,13,781 3,732 435 4,167 31,39,327Benefits Paid (Net) UL2 7,50,368 1,47,76,785 1,55,27,153 2,470 24,27,877 24,30,347 5,207 1,34,227 1,39,434 1,80,96,934Interim Bonus Paid - - - - - - - - - -Change in Valuation Liability 3,76,465 (17,15,188) (13,38,723) 70,128 (4,76,561) (4,06,431) (1,145) 5,546 4,401 (17,40,755)TOTAL (C) 11,26,833 1,30,61,597 1,41,88,430 72,598 19,51,316 20,23,914 4,062 1,39,773 1,43,835 1,63,56,179SURPLUS/ (DEFICIT) (D) =(A)-(B)-(C) 15,40,607 - 15,40,607 1,26,683 - 1,26,683 - - - 16,67,290APPROPRIATIONSTransfer to Shareholder’s Account - - - - - - - - - -Funds available for future appropriations
- - - - - - - - - -
Total (D) - - - - - - - - - -

Max Life Insurance Company Limited Registration No: 104; Date of Registration with IRDAI: November 15, 2000
AnnuAL RepoRt 2016-17 251
NAME OF THE INSURER: MAX LIFE INSURANCE COMPANY LIMITED REGISTRATION NO: 104; DATE OF REGISTRATION WITH IRDAI : NOVEMBER 15, 2000 (All Amounts in Thousands of Indian Rupees) Schedule–UL2 BENEFITS PAID [NET]Sl. No. Particulars FOR THE YEAR ENDED MARCH 31, 2017 (AUDITED)
LinkedLife LinkedPension LinkedGroup Total Unit LinkedNon Unit Unit Total Non-Unit Unit Total Non-Unit Unit Total
(1) (2) (3)=(1)+(2) (4) (5) (6)=(4)+(5) (7) (8) (9)=(7)+(8) (10)=(3)+(6)+(9)1 Insurance Claims
(a) Claims by Death 5,48,396 2,39,118 7,87,514 3,182 39,613 42,795 1 - 1 8,30,310(b) Claims by Maturity - 14,01,332 14,01,332 - 63,632 63,632 - 93,196 93,196 15,58,160(c) Annuities /
Pension payment - - - - - - - - - -
(d) Other benefits - - - - - - - - - - - Surrender 1,71,236 1,56,40,474 1,58,11,710 890 23,03,007 23,03,897 - 1,12,314 1,12,314 1,82,27,921 - Survival - - - - - - - - - - - Others 1,37,715 - 1,37,715 - 8,032 8,032 - - - 1,45,747SubTotal(A) 8,57,347 1,72,80,924 1,81,38,271 4,072 24,14,284 24,18,356 1 2,05,510 2,05,511 2,07,62,138
2 Amount Ceded in reinsurance
- - - - - - - - - -
(a) Claims by Death 86,214 - 86,214 250 - 250 3 - 3 86,467(b) Claims by Maturity - - - - - - - - - -(c) Annuities /
Pension payment - - - - - - - - - -
(d) Other benefits - - - - - - - - - - - Surrender - - - - - - - - - - - Survival - - - - - - - - - -SubTotal(B) 86,214 - 86,214 250 - 250 3 - 3 86,467TOTAL (A) - (B) 7,71,133 1,72,80,924 1,80,52,057 3,822 24,14,284 24,18,106 (2) 2,05,510 2,05,508 2,06,75,671Benefitspaidtoclaimants:
- - - - - - - - - -
In India 8,57,347 1,72,80,924 1,81,38,271 4,072 24,14,284 24,18,356 1 2,05,510 2,05,511 2,07,62,138Outside India - - - - - - - - - -TOTAL (UL2) 8,57,347 1,72,80,924 1,81,38,271 4,072 24,14,284 24,18,356 1 2,05,510 2,05,511 2,07,62,138
Schedule–UL2BENEFITS PAID [NET]Sl. No. Particulars FOR THE YEAR ENDED MARCH 31, 2017 (AUDITED)
LinkedLife LinkedPension LinkedGroup Total Unit LinkedNon Unit Unit Total Non-Unit Unit Total Non-Unit Unit Total
(1) (2) (3)=(1)+(2) (4) (5) (6)=(4)+(5) (7) (8) (9)=(7)+(8) (10)=(3)+(6)+(9)1 Insurance Claims
(a) Claims by Death 5,80,917 2,14,119 7,95,036 2,569 53,752 56,321 5,507 - 5,507 8,56,864(b) Claims by Maturity - 7,11,292 7,11,292 - 26,956 26,956 - 1,31,944 1,31,944 8,70,192(c) Annuities /
Pension payment - - - - - - - - - -
(d) Other benefits - Surrender 1,82,310 1,38,51,374 1,40,33,684 51 23,45,445 23,45,496 - 2,283 2,283 1,63,81,463 - Survival - - - - - - - - - - - Others 68,290 - 68,290 - 1,724 1,724 - - - 70,014SubTotal(A) 8,31,517 1,47,76,785 1,56,08,302 2,620 24,27,877 24,30,497 5,507 1,34,227 1,39,734 1,81,78,533
2 Amount Ceded in reinsurance
(a) Claims by Death 81,149 - 81,149 150 - 150 300 - 300 81,599(b) Claims by Maturity - - - - - - - - - -(c) Annuities /
Pension payment - - - - - - - - - -
(d) Other benefits - Surrender - - - - - - - - - - - Survival - - - - - - - - - -SubTotal(B) 81,149 - 81,149 150 - 150 300 - 300 81,599TOTAL (A) - (B) 7,50,368 1,47,76,785 1,55,27,153 2,470 24,27,877 24,30,347 5,207 1,34,227 1,39,434 1,80,96,934Benefitspaidtoclaimants: In India 8,31,517 1,47,76,785 1,56,08,302 2,620 24,27,877 24,30,497 5,507 1,34,227 1,39,734 1,81,78,533 Outside India - - - - - - - - - - TOTAL (UL2) 8,31,517 1,47,76,785 1,56,08,302 2,620 24,27,877 24,30,497 5,507 1,34,227 1,39,734 1,81,78,533

Max Life Insurance Company Limited Registration No: 104; Date of Registration with IRDAI: November 15, 2000
AnnuAL RepoRt 2016-17252
Directors' ReportFinancial StatementsSchedules annexed to the forming part of the Financial Statements
All amounts in thousands of Indian Rupees, unless otherwise stated
Form A-BS(UL)NAME OF THE INSURER: MAX LIFE INSURANCE COMPANY LIMITEDREGISTRATION NO: 104; DATE OF REGISTRATION WITH IRDA : NOVEMBER 15, 2000(All Amounts in Thousands of Indian Rupees)Fund Balance Sheet As at Mar 31, 2017Particulars Schedule Funds FundsFundName Balanced Conservative Growth Secured Growth Super HighGrowth Dynamic Oppor-
tunitiesGuaranteedFundDynamic
GuaranteedFundIncome
Money Mar-ket
Secure Plus Discontinued Individual
Pension Balanced
Pension Conservative
Pension Growth Pension Secured Pension Growth Super
Lifemaker Pension
Preserver
Lifemaker Pension
Maximiser
Discontinued Pension
Group Gratuity Balanced
Group Gratuity Conservative
Group Gratuity Growth
Group Gratuity Bond
Group Su-perannuation
Balanced
Group Superan-nuation Conser-
vative
Group Superan-nuation Growth
Total
SFIN ULIF00225/06/04LIFEBALANC104 ULIF00325/06/04LIFECONSER104 ULIF00125/06/04LIFEGROWTH104 ULIF00425/06/04LIFESECURE104 ULIF01108/02/07LIFEGRWSUP104 ULIF01311/02/08LIFEHIGHGR104 ULIF01425/03/08LIFEDYNOPP104 ULIF01004/10/06AMSRGUADYN104 ULIF00904/10/06AMSRGUAINC104 ULIF01528/04/09LIFEMONEYM104 ULIF01628/04/09LIFESECPLS104 ULIF02021/06/13LIFEDISCON104 ULIF00625/11/05PENSBALANC104 ULIF00725/11/05PENSCONSER104 ULIF00525/11/05PENSGROWTH104 ULIF00825/11/05PENSSECURE104 ULIF01213/08/07PENSGRWSUP104 ULIF01815/02/13PENSPRESER104 ULIF01715/02/13PENSMAXIMI104 ULIF01912/08/13PENSDISCON104 ULGF00217/04/06GRATBALANC104 ULGF00317/04/06GRATCONSER104 ULGF00117/04/06GRATGROWTH104 ULGF00707/02/13GRATPLBOND104 ULGF00523/01/07SANNBALANC104 ULGF00623/01/07SANNCONSER104 ULGF00423/01/07SANNGROWTH104Sources of FundsPolicyholder’s Funds: Policyholder contri-bution
F-1 1,39,48,167 9,29,825 1,88,57,941 34,27,994 1,54,51,448 82,541 50,80,594 22,581 6,491 1,66,507 11,92,727 30,33,257 7,39,956 22,334 23,45,762 3,04,963 14,33,127 17,50,752 18,62,477 4,21,538 1,06,371 2,91,787 1,71,469 9,283 26 (7,977) (69) 7,16,51,872
Revenue Account 66,40,228 5,60,075 3,90,06,292 16,86,771 2,16,76,011 3,69,830 48,93,141 21,081 5,059 1,40,578 3,16,302 2,22,391 8,41,397 96,365 35,56,248 3,74,708 27,44,644 2,72,980 2,50,938 28,161 1,70,799 2,62,733 96,845 2,071 97 21,620 272 8,42,57,637 Total 2,05,88,395 14,89,900 5,78,64,233 51,14,765 3,71,27,459 4,52,371 99,73,735 43,662 11,550 3,07,085 15,09,029 32,55,648 15,81,353 1,18,699 59,02,010 6,79,671 41,77,771 20,23,732 21,13,415 4,49,699 2,77,170 5,54,520 2,68,314 11,354 123 13,643 203 15,59,09,509 Application of Funds Investments F-2 2,00,50,064 14,24,960 5,71,59,186 50,02,104 3,69,29,221 4,37,988 99,14,272 42,571 11,246 3,06,591 13,74,259 31,00,140 15,52,498 1,15,557 58,96,343 6,61,170 41,78,683 19,58,392 20,31,954 4,15,061 2,60,131 5,39,851 2,64,531 11,051 118 13,338 196
15,36,51,476 Current Assets F-3 7,45,149 79,721 10,66,015 2,77,750 1,98,239 29,821 2,45,079 1,091 317 494 1,90,844 1,55,508 30,204 5,489 62,286 29,059 517 65,340 81,461 34,638 22,356 14,669 3,783 303 5 305 7 33,40,450 Less: Current Liabilities and Provisions
F-4 2,06,818 14,781 3,60,968 1,65,089 1 15,438 1,85,616 - 13 - 56,074 - 1,349 2,347 56,619 10,558 1,429 - - - 5,317 - - - - - - 10,82,417
Net current assets 5,38,331 64,940 7,05,047 1,12,661 1,98,238 14,383 59,463 1,091 304 494 1,34,770 1,55,508 28,855 3,142 5,667 18,501 (912) 65,340 81,461 34,638 17,039 14,669 3,783 303 5 305 7 22,58,033 Total 2,05,88,395 14,89,900 5,78,64,233 51,14,765 3,71,27,459 4,52,371 99,73,735 43,662 11,550 3,07,085 15,09,029 32,55,648 15,81,353 1,18,699 59,02,010 6,79,671 41,77,771 20,23,732 21,13,415 4,49,699 2,77,170 5,54,520 2,68,314 11,354 123 13,643 203 15,59,09,509 Net Asset Value (NAV) per Unit:
38.42 32.66 49.58 27.50 28.37 25.54 23.38 20.60 19.94 15.94 19.25 13.01 26.31 25.12 31.04 24.35 18.37 14.99 15.18 13.18 28.92 24.84 27.37 13.89 21.90 19.36 21.84
(a) Net Asset as per Bal-ance Sheet (Total Assets less Current Liabilities and Provisions) (Rs. In '000)
2,05,88,395 14,89,900 5,78,64,233 51,14,765 3,71,27,459 4,52,371 99,73,735 43,662 11,550 3,07,085 15,09,029 32,55,648 15,81,353 1,18,699 59,02,010 6,79,671 41,77,771 20,23,732 21,13,415 4,49,699 2,77,170 5,54,520 2,68,314 11,354 123 13,643 203 15,59,09,509
(b)NumberofUnitsoutstanding
53,58,73,679 4,56,15,706 1,16,70,64,665 18,60,23,332 1,30,87,02,517 1,77,13,920 42,66,83,314 21,19,470 5,79,288 1,92,61,347 7,83,98,387 25,03,18,514 6,01,05,508 47,25,365 19,01,15,188 2,79,16,264 22,74,00,422 13,50,01,048 13,92,44,568 3,41,27,803 95,84,160 2,23,21,692 98,02,314 8,17,249 5,631 7,04,619 9,290
(c) NAV per Unit (a)/(b)(Rs.)
38.42 32.66 49.58 27.50 28.37 25.54 23.38 20.60 19.94 15.94 19.25 13.01 26.31 25.12 31.04 24.35 18.37 14.99 15.18 13.18 28.92 24.84 27.37 13.89 21.90 19.36 21.84
The Schedules referred to above form an integral part of the Fund Balance Sheet.
FUND BALANCE SHEET AS AT MARCH 31, 2016 Particulars Schedule Funds FundsFundName Balanced Conservative Growth Secured Growth Super HighGrowth Dynamic Oppor-
tunitiesGuaranteedFundDynamic
GuaranteedFundIncome
Money Mar-ket
Secure Plus Discontinued Individual
Pension Bal-anced
Pension Con-servative
Pension Growth
Pension Se-cured
Pension Growth Super
Lifemaker Pension Pre-
server
Lifemaker Pension Max-
imiser
Discontinued Pension
Group Gratuity Balanced
Group Gratuity Conservative
Group Gratuity Growth
Group Gratuity Bond
Group Su-perannuation
Balanced
Group Su-perannuation Conservative
Group Su-perannuation
Growth
Total
SFIN ULIF00225/06/04LIFEBALANC104 ULIF00325/06/04LIFECONSER104 ULIF00125/06/04LIFEGROWTH104 ULIF00425/06/04LIFESECURE104 ULIF01108/02/07LIFEGRWSUP104 ULIF01311/02/08LIFEHIGHGR104 ULIF01425/03/08LIFEDYNOPP104 ULIF01004/10/06AMSRGUADYN104 ULIF00904/10/06AMSRGUAINC104 ULIF01528/04/09LIFEMONEYM104 ULIF01628/04/09LIFESECPLS104 ULIF02021/06/13LIFEDISCON104 ULIF00625/11/05PENSBALANC104 ULIF00725/11/05PENSCONSER104 ULIF00525/11/05PENSGROWTH104 ULIF00825/11/05PENSSECURE104 ULIF01213/08/07PENSGRWSUP104 ULIF01815/02/13PENSPRESER104 ULIF01715/02/13PENSMAXIMI104 ULIF01912/08/13PENSDISCON104 ULGF00217/04/06GRATBALANC104 ULGF00317/04/06GRATCONSER104 ULGF00117/04/06GRATGROWTH104 ULGF00707/02/13GRATPLBOND104 ULGF00523/01/07SANNBALANC104 ULGF00623/01/07SANNCONSER104 ULGF00423/01/07SANNGROWTH104Sources of FundsPolicyholder’s Funds: Policyholder contribution F-1 1,08,33,872 7,28,534 2,16,27,769 29,01,750 1,47,03,617 1,34,061 59,28,081 25,181 7,695 2,06,113 8,33,236 9,58,254 9,33,894 53,216 31,77,070 3,57,220 19,53,344 12,35,864 11,15,059 1,46,084 80,810 2,04,659 (20,810) 8,068 27 (7,282) (68) 6,81,25,318 Revenue Account 44,60,285 4,20,868 3,14,90,479 12,17,054 1,55,27,828 2,77,361 34,42,387 16,661 4,000 1,23,208 2,00,630 56,472 6,28,488 82,228 26,29,366 3,03,392 19,31,315 92,911 45,317 7,089 1,39,412 2,14,033 80,037 1,110 85 20,277 241 6,34,12,534 Total 1,52,94,157 11,49,402 5,31,18,248 41,18,804 3,02,31,445 4,11,422 93,70,468 41,842 11,695 3,29,321 10,33,866 10,14,726 15,62,382 1,35,444 58,06,436 6,60,612 38,84,659 13,28,775 11,60,376 1,53,173 2,20,222 4,18,692 59,227 9,178 112 12,995 173 13,15,37,852 Application of Funds Investments F-2 1,45,51,915 10,88,563 5,23,61,779 39,40,618 2,97,04,527 4,11,651 92,42,945 40,811 11,506 3,28,756 8,62,510 9,91,990 15,43,317 1,31,891 57,60,055 6,49,444 38,84,583 12,46,916 10,88,799 1,45,807 2,10,686 4,10,808 58,626 9,021 109 12,666 171 12,86,90,470 Current Assets F-3 8,41,332 62,723 13,43,855 1,78,186 8,76,304 3,840 2,54,725 1,031 203 565 1,71,356 22,736 24,137 3,553 74,680 14,223 10,427 81,859 71,577 7,366 9,536 7,884 602 157 3 329 2 40,63,191 Less: Current Liabilities and Provisions
F-4 99,090 1,884 5,87,386 0 3,49,386 4,069 1,27,202 - 14 - - - 5,072 - 28,299 3,055 10,351 - - - - - 1 - - - - 12,15,809
Net current assets 7,42,242 60,839 7,56,469 1,78,186 5,26,918 (229) 1,27,523 1,031 189 565 1,71,356 22,736 19,065 3,553 46,381 11,168 76 81,859 71,577 7,366 9,536 7,884 601 157 3 329 2 28,47,382 Total 1,52,94,157 11,49,402 5,31,18,248 41,18,804 3,02,31,445 4,11,422 93,70,468 41,842 11,695 3,29,321 10,33,866 10,14,726 15,62,382 1,35,444 58,06,436 6,60,612 38,84,659 13,28,775 11,60,376 1,53,173 2,20,222 4,18,692 59,227 9,178 112 12,995 173 13,15,37,852 Net Asset Value (NAV) per Unit:
33.80 29.17 43.26 24.72 23.60 20.60 20.13 18.61 18.25 15.10 17.26 12.05 22.96 22.43 26.46 21.90 15.01 13.34 13.21 12.19 25.27 22.33 23.02 12.49 19.61 17.54 18.54
(a) Net Asset as per Bal-ance Sheet (Total Assets less Current Liabilities and Provisions)
1,52,94,157 11,49,402 5,31,18,248 41,18,804 3,02,31,445 4,11,422 93,70,468 41,842 11,695 3,29,321 10,33,866 10,14,726 15,62,382 1,35,444 58,06,436 6,60,612 38,84,659 13,28,775 11,60,376 1,53,173 2,20,222 4,18,692 59,227 9,178 112 12,995 173 13,15,37,852
(b)NumberofUnitsout-standing
45,25,47,300 3,93,99,059 1,22,79,17,465 16,66,18,538 1,28,12,31,222 1,99,73,529 46,56,11,685 22,48,569 6,40,975 2,18,15,630 5,98,82,992 8,42,05,103 6,80,38,502 60,38,675 21,94,07,378 3,01,71,586 25,87,84,585 9,96,42,586 8,78,40,877 1,25,68,805 87,13,248 1,87,54,332 25,73,293 7,34,524 5,690 7,40,821 9,312
(c) NAV per Unit (a)/(b)(Rs.)
33.80 29.17 43.26 24.72 23.60 20.60 20.13 18.61 18.25 15.10 17.26 12.05 22.96 22.43 26.46 21.90 15.01 13.34 13.21 12.19 25.27 22.33 23.02 12.49 19.61 17.54 18.54
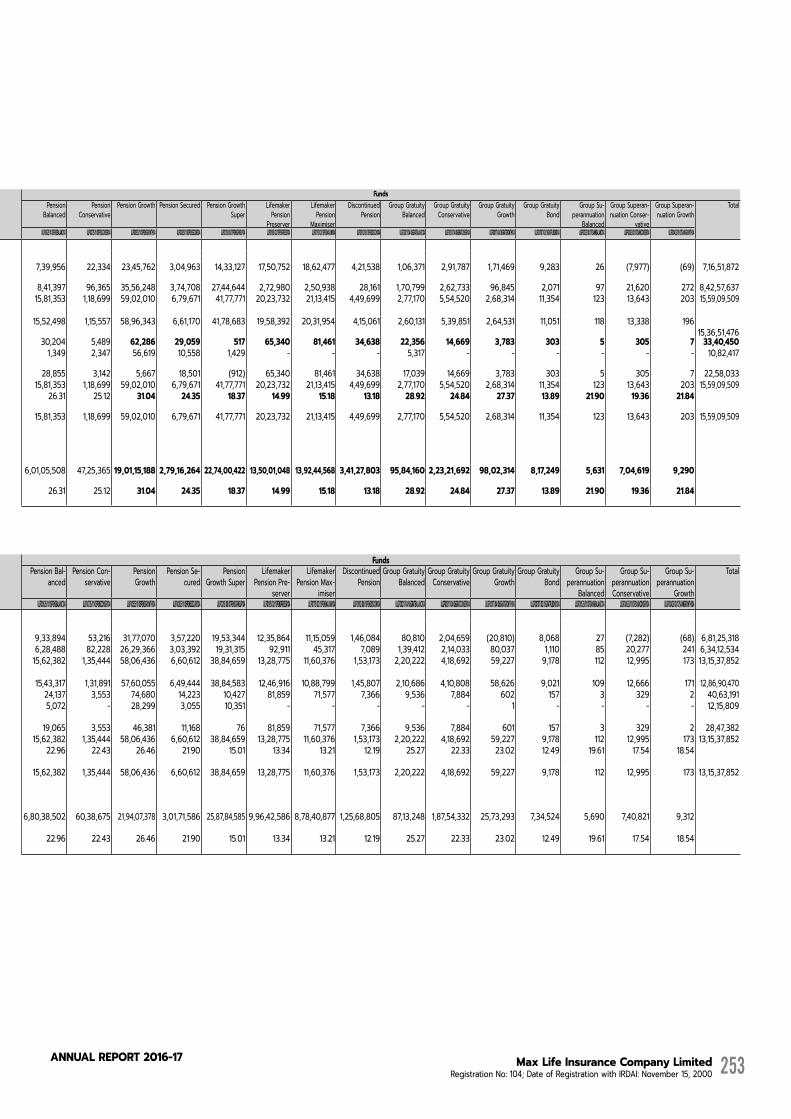
Max Life Insurance Company Limited Registration No: 104; Date of Registration with IRDAI: November 15, 2000
AnnuAL RepoRt 2016-17 253
Form A-BS(UL)NAME OF THE INSURER: MAX LIFE INSURANCE COMPANY LIMITEDREGISTRATION NO: 104; DATE OF REGISTRATION WITH IRDA : NOVEMBER 15, 2000(All Amounts in Thousands of Indian Rupees)Fund Balance Sheet As at Mar 31, 2017Particulars Schedule Funds FundsFundName Balanced Conservative Growth Secured Growth Super HighGrowth Dynamic Oppor-
tunitiesGuaranteedFundDynamic
GuaranteedFundIncome
Money Mar-ket
Secure Plus Discontinued Individual
Pension Balanced
Pension Conservative
Pension Growth Pension Secured Pension Growth Super
Lifemaker Pension
Preserver
Lifemaker Pension
Maximiser
Discontinued Pension
Group Gratuity Balanced
Group Gratuity Conservative
Group Gratuity Growth
Group Gratuity Bond
Group Su-perannuation
Balanced
Group Superan-nuation Conser-
vative
Group Superan-nuation Growth
Total
SFIN ULIF00225/06/04LIFEBALANC104 ULIF00325/06/04LIFECONSER104 ULIF00125/06/04LIFEGROWTH104 ULIF00425/06/04LIFESECURE104 ULIF01108/02/07LIFEGRWSUP104 ULIF01311/02/08LIFEHIGHGR104 ULIF01425/03/08LIFEDYNOPP104 ULIF01004/10/06AMSRGUADYN104 ULIF00904/10/06AMSRGUAINC104 ULIF01528/04/09LIFEMONEYM104 ULIF01628/04/09LIFESECPLS104 ULIF02021/06/13LIFEDISCON104 ULIF00625/11/05PENSBALANC104 ULIF00725/11/05PENSCONSER104 ULIF00525/11/05PENSGROWTH104 ULIF00825/11/05PENSSECURE104 ULIF01213/08/07PENSGRWSUP104 ULIF01815/02/13PENSPRESER104 ULIF01715/02/13PENSMAXIMI104 ULIF01912/08/13PENSDISCON104 ULGF00217/04/06GRATBALANC104 ULGF00317/04/06GRATCONSER104 ULGF00117/04/06GRATGROWTH104 ULGF00707/02/13GRATPLBOND104 ULGF00523/01/07SANNBALANC104 ULGF00623/01/07SANNCONSER104 ULGF00423/01/07SANNGROWTH104Sources of FundsPolicyholder’s Funds: Policyholder contri-bution
F-1 1,39,48,167 9,29,825 1,88,57,941 34,27,994 1,54,51,448 82,541 50,80,594 22,581 6,491 1,66,507 11,92,727 30,33,257 7,39,956 22,334 23,45,762 3,04,963 14,33,127 17,50,752 18,62,477 4,21,538 1,06,371 2,91,787 1,71,469 9,283 26 (7,977) (69) 7,16,51,872
Revenue Account 66,40,228 5,60,075 3,90,06,292 16,86,771 2,16,76,011 3,69,830 48,93,141 21,081 5,059 1,40,578 3,16,302 2,22,391 8,41,397 96,365 35,56,248 3,74,708 27,44,644 2,72,980 2,50,938 28,161 1,70,799 2,62,733 96,845 2,071 97 21,620 272 8,42,57,637 Total 2,05,88,395 14,89,900 5,78,64,233 51,14,765 3,71,27,459 4,52,371 99,73,735 43,662 11,550 3,07,085 15,09,029 32,55,648 15,81,353 1,18,699 59,02,010 6,79,671 41,77,771 20,23,732 21,13,415 4,49,699 2,77,170 5,54,520 2,68,314 11,354 123 13,643 203 15,59,09,509 Application of Funds Investments F-2 2,00,50,064 14,24,960 5,71,59,186 50,02,104 3,69,29,221 4,37,988 99,14,272 42,571 11,246 3,06,591 13,74,259 31,00,140 15,52,498 1,15,557 58,96,343 6,61,170 41,78,683 19,58,392 20,31,954 4,15,061 2,60,131 5,39,851 2,64,531 11,051 118 13,338 196
15,36,51,476 Current Assets F-3 7,45,149 79,721 10,66,015 2,77,750 1,98,239 29,821 2,45,079 1,091 317 494 1,90,844 1,55,508 30,204 5,489 62,286 29,059 517 65,340 81,461 34,638 22,356 14,669 3,783 303 5 305 7 33,40,450 Less: Current Liabilities and Provisions
F-4 2,06,818 14,781 3,60,968 1,65,089 1 15,438 1,85,616 - 13 - 56,074 - 1,349 2,347 56,619 10,558 1,429 - - - 5,317 - - - - - - 10,82,417
Net current assets 5,38,331 64,940 7,05,047 1,12,661 1,98,238 14,383 59,463 1,091 304 494 1,34,770 1,55,508 28,855 3,142 5,667 18,501 (912) 65,340 81,461 34,638 17,039 14,669 3,783 303 5 305 7 22,58,033 Total 2,05,88,395 14,89,900 5,78,64,233 51,14,765 3,71,27,459 4,52,371 99,73,735 43,662 11,550 3,07,085 15,09,029 32,55,648 15,81,353 1,18,699 59,02,010 6,79,671 41,77,771 20,23,732 21,13,415 4,49,699 2,77,170 5,54,520 2,68,314 11,354 123 13,643 203 15,59,09,509 Net Asset Value (NAV) per Unit:
38.42 32.66 49.58 27.50 28.37 25.54 23.38 20.60 19.94 15.94 19.25 13.01 26.31 25.12 31.04 24.35 18.37 14.99 15.18 13.18 28.92 24.84 27.37 13.89 21.90 19.36 21.84
(a) Net Asset as per Bal-ance Sheet (Total Assets less Current Liabilities and Provisions) (Rs. In '000)
2,05,88,395 14,89,900 5,78,64,233 51,14,765 3,71,27,459 4,52,371 99,73,735 43,662 11,550 3,07,085 15,09,029 32,55,648 15,81,353 1,18,699 59,02,010 6,79,671 41,77,771 20,23,732 21,13,415 4,49,699 2,77,170 5,54,520 2,68,314 11,354 123 13,643 203 15,59,09,509
(b)NumberofUnitsoutstanding
53,58,73,679 4,56,15,706 1,16,70,64,665 18,60,23,332 1,30,87,02,517 1,77,13,920 42,66,83,314 21,19,470 5,79,288 1,92,61,347 7,83,98,387 25,03,18,514 6,01,05,508 47,25,365 19,01,15,188 2,79,16,264 22,74,00,422 13,50,01,048 13,92,44,568 3,41,27,803 95,84,160 2,23,21,692 98,02,314 8,17,249 5,631 7,04,619 9,290
(c) NAV per Unit (a)/(b)(Rs.)
38.42 32.66 49.58 27.50 28.37 25.54 23.38 20.60 19.94 15.94 19.25 13.01 26.31 25.12 31.04 24.35 18.37 14.99 15.18 13.18 28.92 24.84 27.37 13.89 21.90 19.36 21.84
The Schedules referred to above form an integral part of the Fund Balance Sheet.
FUND BALANCE SHEET AS AT MARCH 31, 2016 Particulars Schedule Funds FundsFundName Balanced Conservative Growth Secured Growth Super HighGrowth Dynamic Oppor-
tunitiesGuaranteedFundDynamic
GuaranteedFundIncome
Money Mar-ket
Secure Plus Discontinued Individual
Pension Bal-anced
Pension Con-servative
Pension Growth
Pension Se-cured
Pension Growth Super
Lifemaker Pension Pre-
server
Lifemaker Pension Max-
imiser
Discontinued Pension
Group Gratuity Balanced
Group Gratuity Conservative
Group Gratuity Growth
Group Gratuity Bond
Group Su-perannuation
Balanced
Group Su-perannuation Conservative
Group Su-perannuation
Growth
Total
SFIN ULIF00225/06/04LIFEBALANC104 ULIF00325/06/04LIFECONSER104 ULIF00125/06/04LIFEGROWTH104 ULIF00425/06/04LIFESECURE104 ULIF01108/02/07LIFEGRWSUP104 ULIF01311/02/08LIFEHIGHGR104 ULIF01425/03/08LIFEDYNOPP104 ULIF01004/10/06AMSRGUADYN104 ULIF00904/10/06AMSRGUAINC104 ULIF01528/04/09LIFEMONEYM104 ULIF01628/04/09LIFESECPLS104 ULIF02021/06/13LIFEDISCON104 ULIF00625/11/05PENSBALANC104 ULIF00725/11/05PENSCONSER104 ULIF00525/11/05PENSGROWTH104 ULIF00825/11/05PENSSECURE104 ULIF01213/08/07PENSGRWSUP104 ULIF01815/02/13PENSPRESER104 ULIF01715/02/13PENSMAXIMI104 ULIF01912/08/13PENSDISCON104 ULGF00217/04/06GRATBALANC104 ULGF00317/04/06GRATCONSER104 ULGF00117/04/06GRATGROWTH104 ULGF00707/02/13GRATPLBOND104 ULGF00523/01/07SANNBALANC104 ULGF00623/01/07SANNCONSER104 ULGF00423/01/07SANNGROWTH104Sources of FundsPolicyholder’s Funds: Policyholder contribution F-1 1,08,33,872 7,28,534 2,16,27,769 29,01,750 1,47,03,617 1,34,061 59,28,081 25,181 7,695 2,06,113 8,33,236 9,58,254 9,33,894 53,216 31,77,070 3,57,220 19,53,344 12,35,864 11,15,059 1,46,084 80,810 2,04,659 (20,810) 8,068 27 (7,282) (68) 6,81,25,318 Revenue Account 44,60,285 4,20,868 3,14,90,479 12,17,054 1,55,27,828 2,77,361 34,42,387 16,661 4,000 1,23,208 2,00,630 56,472 6,28,488 82,228 26,29,366 3,03,392 19,31,315 92,911 45,317 7,089 1,39,412 2,14,033 80,037 1,110 85 20,277 241 6,34,12,534 Total 1,52,94,157 11,49,402 5,31,18,248 41,18,804 3,02,31,445 4,11,422 93,70,468 41,842 11,695 3,29,321 10,33,866 10,14,726 15,62,382 1,35,444 58,06,436 6,60,612 38,84,659 13,28,775 11,60,376 1,53,173 2,20,222 4,18,692 59,227 9,178 112 12,995 173 13,15,37,852 Application of Funds Investments F-2 1,45,51,915 10,88,563 5,23,61,779 39,40,618 2,97,04,527 4,11,651 92,42,945 40,811 11,506 3,28,756 8,62,510 9,91,990 15,43,317 1,31,891 57,60,055 6,49,444 38,84,583 12,46,916 10,88,799 1,45,807 2,10,686 4,10,808 58,626 9,021 109 12,666 171 12,86,90,470 Current Assets F-3 8,41,332 62,723 13,43,855 1,78,186 8,76,304 3,840 2,54,725 1,031 203 565 1,71,356 22,736 24,137 3,553 74,680 14,223 10,427 81,859 71,577 7,366 9,536 7,884 602 157 3 329 2 40,63,191 Less: Current Liabilities and Provisions
F-4 99,090 1,884 5,87,386 0 3,49,386 4,069 1,27,202 - 14 - - - 5,072 - 28,299 3,055 10,351 - - - - - 1 - - - - 12,15,809
Net current assets 7,42,242 60,839 7,56,469 1,78,186 5,26,918 (229) 1,27,523 1,031 189 565 1,71,356 22,736 19,065 3,553 46,381 11,168 76 81,859 71,577 7,366 9,536 7,884 601 157 3 329 2 28,47,382 Total 1,52,94,157 11,49,402 5,31,18,248 41,18,804 3,02,31,445 4,11,422 93,70,468 41,842 11,695 3,29,321 10,33,866 10,14,726 15,62,382 1,35,444 58,06,436 6,60,612 38,84,659 13,28,775 11,60,376 1,53,173 2,20,222 4,18,692 59,227 9,178 112 12,995 173 13,15,37,852 Net Asset Value (NAV) per Unit:
33.80 29.17 43.26 24.72 23.60 20.60 20.13 18.61 18.25 15.10 17.26 12.05 22.96 22.43 26.46 21.90 15.01 13.34 13.21 12.19 25.27 22.33 23.02 12.49 19.61 17.54 18.54
(a) Net Asset as per Bal-ance Sheet (Total Assets less Current Liabilities and Provisions)
1,52,94,157 11,49,402 5,31,18,248 41,18,804 3,02,31,445 4,11,422 93,70,468 41,842 11,695 3,29,321 10,33,866 10,14,726 15,62,382 1,35,444 58,06,436 6,60,612 38,84,659 13,28,775 11,60,376 1,53,173 2,20,222 4,18,692 59,227 9,178 112 12,995 173 13,15,37,852
(b)NumberofUnitsout-standing
45,25,47,300 3,93,99,059 1,22,79,17,465 16,66,18,538 1,28,12,31,222 1,99,73,529 46,56,11,685 22,48,569 6,40,975 2,18,15,630 5,98,82,992 8,42,05,103 6,80,38,502 60,38,675 21,94,07,378 3,01,71,586 25,87,84,585 9,96,42,586 8,78,40,877 1,25,68,805 87,13,248 1,87,54,332 25,73,293 7,34,524 5,690 7,40,821 9,312
(c) NAV per Unit (a)/(b)(Rs.)
33.80 29.17 43.26 24.72 23.60 20.60 20.13 18.61 18.25 15.10 17.26 12.05 22.96 22.43 26.46 21.90 15.01 13.34 13.21 12.19 25.27 22.33 23.02 12.49 19.61 17.54 18.54
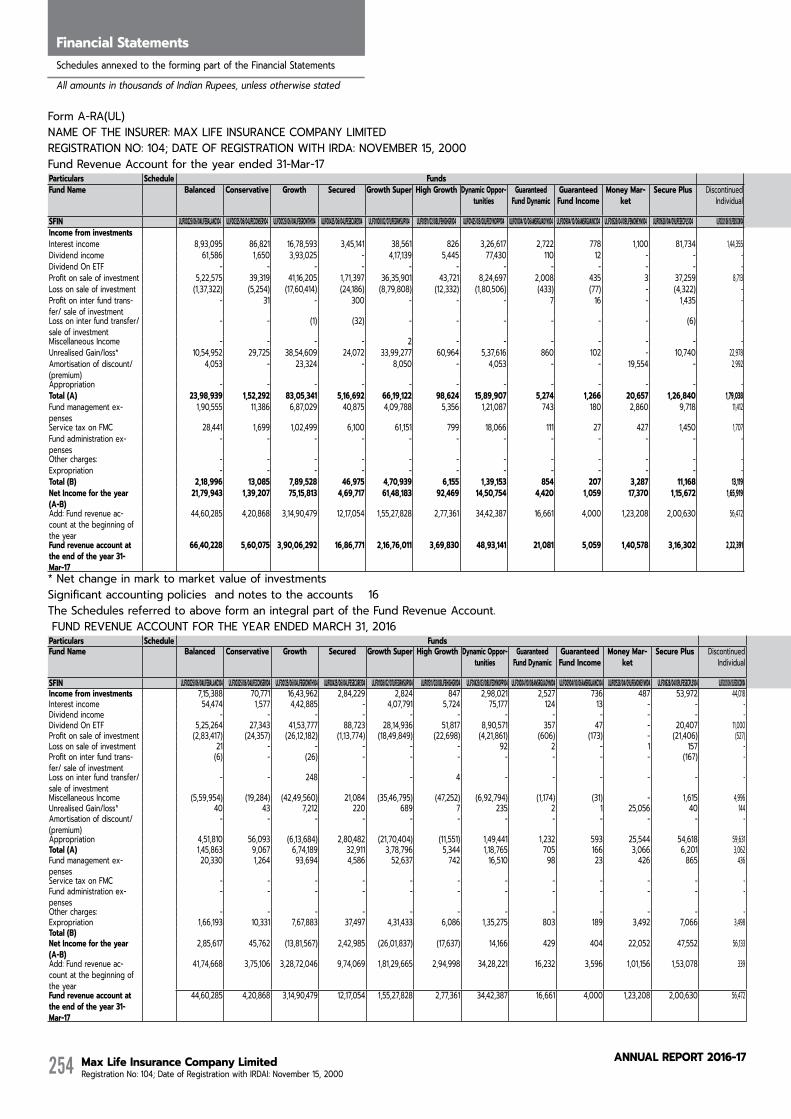
Max Life Insurance Company Limited Registration No: 104; Date of Registration with IRDAI: November 15, 2000
AnnuAL RepoRt 2016-17254
Directors' ReportFinancial StatementsSchedules annexed to the forming part of the Financial Statements
All amounts in thousands of Indian Rupees, unless otherwise stated
Form A-RA(UL)NAME OF THE INSURER: MAX LIFE INSURANCE COMPANY LIMITEDREGISTRATION NO: 104; DATE OF REGISTRATION WITH IRDA: NOVEMBER 15, 2000Fund Revenue Account for the year ended 31-Mar-17Particulars Schedule Funds FundsFundName Balanced Conservative Growth Secured Growth Super HighGrowth Dynamic Oppor-
tunitiesGuaranteedFundDynamic
GuaranteedFundIncome
Money Mar-ket
Secure Plus Discontinued Individual
Pension Balanced
Pension Conservative
Pension Growth
Pension Secured
Pension Growth Super
Lifemaker Pension
Preserver
Lifemaker Pension
Maximiser
Discontinued Pension
Group Gratuity Balanced
Group Gratuity Conservative
Group Gratuity Growth
Group Gratuity Bond
Group Su-perannuation
Balanced
Group Su-perannuation Conservative
Group Su-perannuation
Growth
Total
SFIN ULIF00225/06/04LIFEBALANC104 ULIF00325/06/04LIFECONSER104 ULIF00125/06/04LIFEGROWTH104 ULIF00425/06/04LIFESECURE104 ULIF01108/02/07LIFEGRWSUP104 ULIF01311/02/08LIFEHIGHGR104 ULIF01425/03/08LIFEDYNOPP104 ULIF01004/10/06AMSRGUADYN104 ULIF00904/10/06AMSRGUAINC104 ULIF01528/04/09LIFEMONEYM104 ULIF01628/04/09LIFESECPLS104 ULIF02021/06/13LIFEDISCON104 ULIF00625/11/05PENSBALANC104 ULIF00725/11/05PENSCONSER104 ULIF00525/11/05PENSGROWTH104 ULIF00825/11/05PENSSECURE104 ULIF01213/08/07PENSGRWSUP104 ULIF01815/02/13PENSPRESER104 ULIF01715/02/13PENSMAXIMI104 ULIF01912/08/13PENSDISCON104 ULGF00217/04/06GRATBALANC104 ULGF00317/04/06GRATCONSER104 ULGF00117/04/06GRATGROWTH104 ULGF00707/02/13GRATPLBOND104 ULGF00523/01/07SANNBALANC104 ULGF00623/01/07SANNCONSER104 ULGF00423/01/07SANNGROWTH104IncomefrominvestmentsInterest income 8,93,095 86,821 16,78,593 3,45,141 38,561 826 3,26,617 2,722 778 1,100 81,734 1,44,355 83,195 8,523 1,74,139 52,258 6,055 96,531 68,072 19,753 13,026 35,270 4,975 721 6 1,050 8 41,63,925Dividend income 61,586 1,650 3,93,025 - 4,17,139 5,445 77,430 110 12 - - - 6,383 242 45,152 - 59,660 2,484 5,472 - 954 - 978 - 1 - 1 10,77,724Dividend On ETF - - - - - - - - - - - - - - - - - - - - - - - - - - - -Profit on sale of investment 5,22,575 39,319 41,16,205 1,71,397 36,35,901 43,721 8,24,697 2,008 435 3 37,259 8,713 44,746 7,319 3,13,427 25,139 3,50,645 44,344 35,853 45 15,565 10,639 11,893 195 6 258 24 1,02,62,331Loss on sale of investment (1,37,322) (5,254) (17,60,414) (24,186) (8,79,808) (12,332) (1,80,506) (433) (77) - (4,322) - (6,024) (889) (53,641) (3,057) (69,056) (5,261) (9,405) - (4,638) (2,282) (2,703) (43) (3) (72) (3) (31,61,731)Profit on inter fund trans-fer/ sale of investment
- 31 - 300 - - - 7 16 - 1,435 - 219 317 581 124 - - - 143 572 33 430 4 - - - 4,212
Loss on inter fund transfer/ sale of investment
- - (1) (32) - - - - - - (6) - - (35) - (35) - - - - (227) - (55) - - - - (391)
Miscellaneous Income - - - - 2 - - - - - - - - 1 - - 1 - - - - - - - - - - 4Unrealised Gain/loss* 10,54,952 29,725 38,54,609 24,072 33,99,277 60,964 5,37,616 860 102 - 10,740 22,978 1,04,228 (45) 5,30,461 3,966 5,23,367 65,804 1,31,664 2,763 7,343 7,165 2,038 130 3 226 3 1,03,75,011Amortisation of discount/(premium)
4,053 - 23,324 - 8,050 - 4,053 - - 19,554 - 2,992 - - - - - 3,046 3,046 - - - - - - - - 68,118
Appropriation - - - - - - - - - - - - - - - - - - - - - - - - - - - -Total (A) 23,98,939 1,52,292 83,05,341 5,16,692 66,19,122 98,624 15,89,907 5,274 1,266 20,657 1,26,840 1,79,038 2,32,747 15,433 10,10,119 78,395 8,70,672 2,06,948 2,34,702 22,704 32,595 50,825 17,556 1,007 13 1,462 33 2,27,89,203Fund management ex-penses
1,90,555 11,386 6,87,029 40,875 4,09,788 5,356 1,21,087 743 180 2,860 9,718 11,412 17,263 1,128 72,432 6,160 49,899 23,387 25,302 1,420 1,051 1,849 651 40 1 104 2 16,91,678
Service tax on FMC 28,441 1,699 1,02,499 6,100 61,151 799 18,066 111 27 427 1,450 1,707 2,575 168 10,805 919 7,444 3,492 3,779 212 157 276 97 6 - 15 - 2,52,422Fund administration ex-penses
- - - - - - - - - - - - - - - - - - - - - - - - - - - -
Other charges: - - - - - - - - - - - - - - - - - - - - - - - - - - - -Expropriation - - - - - - - - - - - - - - - - - - - - - - - - - - - -Total (B) 2,18,996 13,085 7,89,528 46,975 4,70,939 6,155 1,39,153 854 207 3,287 11,168 13,119 19,838 1,296 83,237 7,079 57,343 26,879 29,081 1,632 1,208 2,125 748 46 1 119 2 19,44,100Net Income for the year (A-B)
21,79,943 1,39,207 75,15,813 4,69,717 61,48,183 92,469 14,50,754 4,420 1,059 17,370 1,15,672 1,65,919 2,12,909 14,137 9,26,882 71,316 8,13,329 1,80,069 2,05,621 21,072 31,387 48,700 16,808 961 12 1,343 31 2,08,45,103
Add: Fund revenue ac-count at the beginning of the year
44,60,285 4,20,868 3,14,90,479 12,17,054 1,55,27,828 2,77,361 34,42,387 16,661 4,000 1,23,208 2,00,630 56,472 6,28,488 82,228 26,29,366 3,03,392 19,31,315 92,911 45,317 7,089 1,39,412 2,14,033 80,037 1,110 85 20,277 241 6,34,12,534
Fundrevenueaccountattheendoftheyear31-Mar-17
66,40,228 5,60,075 3,90,06,292 16,86,771 2,16,76,011 3,69,830 48,93,141 21,081 5,059 1,40,578 3,16,302 2,22,391 8,41,397 96,365 35,56,248 3,74,708 27,44,644 2,72,980 2,50,938 28,161 1,70,799 2,62,733 96,845 2,071 97 21,620 272 8,42,57,637
* Net change in mark to market value of investments Significant accounting policies and notes to the accounts 16 The Schedules referred to above form an integral part of the Fund Revenue Account. FUND REVENUE ACCOUNT FOR THE YEAR ENDED MARCH 31, 2016 Particulars Schedule Funds FundsFundName Balanced Conservative Growth Secured Growth Super HighGrowth Dynamic Oppor-
tunitiesGuaranteedFundDynamic
GuaranteedFundIncome
Money Mar-ket
Secure Plus Discontinued Individual
Pension Balanced
Pension Conservative
Pension Growth
Pension Secured
Pension Growth Super
Lifemaker Pension Pre-
server
Lifemaker Pension Max-
imiser
Discontinued Pension
Group Gratuity Balanced
Group Gratuity Conservative
Group Gratuity Growth
Group Gratuity Bond
Group Su-perannuation
Balanced
Group Su-perannuation Conservative
Group Su-perannuation
Growth
Total
SFIN ULIF00225/06/04LIFEBALANC104 ULIF00325/06/04LIFECONSER104 ULIF00125/06/04LIFEGROWTH104 ULIF00425/06/04LIFESECURE104 ULIF01108/02/07LIFEGRWSUP104 ULIF01311/02/08LIFEHIGHGR104 ULIF01425/03/08LIFEDYNOPP104 ULIF01004/10/06AMSRGUADYN104 ULIF00904/10/06AMSRGUAINC104 ULIF01528/04/09LIFEMONEYM104 ULIF01628/04/09LIFESECPLS104 ULIF02021/06/13LIFEDISCON104 ULIF00625/11/05PENSBALANC104 ULIF00725/11/05PENSCONSER104 ULIF00525/11/05PENSGROWTH104 ULIF00825/11/05PENSSECURE104 ULIF01213/08/07PENSGRWSUP104 ULIF01815/02/13PENSPRESER104 ULIF01715/02/13PENSMAXIMI104 ULIF01912/08/13PENSDISCON104 ULGF00217/04/06GRATBALANC104 ULGF00317/04/06GRATCONSER104 ULGF00117/04/06GRATGROWTH104 ULGF00707/02/13GRATPLBOND104 ULGF00523/01/07SANNBALANC104 ULGF00623/01/07SANNCONSER104 ULGF00423/01/07SANNGROWTH104Incomefrominvestments 7,15,388 70,771 16,43,962 2,84,229 2,824 847 2,98,021 2,527 736 487 53,972 44,018 91,557 11,728 1,82,207 54,215 2,488 60,508 38,697 5,796 12,200 29,297 2,700 500 6 1,234 6 36,10,921 Interest income 54,474 1,577 4,42,885 - 4,07,791 5,724 75,177 124 13 - - - 6,504 243 48,572 - 56,141 1,522 3,520 - 652 - 712 - - - 1 11,05,632 Dividend income - - - - - - - - - - - - - - - - - - - - - - - - - - - - Dividend On ETF 5,25,264 27,343 41,53,777 88,723 28,14,936 51,817 8,90,571 357 47 - 20,407 11,000 49,493 5,861 3,61,489 17,639 3,69,520 15,100 13,308 937 6,080 6,957 10,317 62 2 423 1 94,41,431 Profit on sale of investment (2,83,417) (24,357) (26,12,182) (1,13,774) (18,49,849) (22,698) (4,21,861) (606) (173) - (21,406) (527) (25,230) (4,321) (1,65,843) (13,785) (1,63,756) (26,573) (19,352) (123) (4,503) (7,262) (1,875) (90) (1) (230) (2) (57,83,796)Loss on sale of investment 21 - - - - - 92 2 - 1 157 - 51 376 - 120 - - - 1 13 - 63 2 - 50 - 949 Profit on inter fund trans-fer/ sale of investment
(6) - (26) - - - - - - - (167) - (10) (8) - (9) - - - - (67) - (281) (10) - (32) - (616)
Loss on inter fund transfer/ sale of investment
- - 248 - - 4 - - - - - - - - - - - - - - - - - - - - - 252
Miscellaneous Income (5,59,954) (19,284) (42,49,560) 21,084 (35,46,795) (47,252) (6,92,794) (1,174) (31) - 1,615 4,996 (81,893) (5,246) (4,76,214) (2,136) (5,06,904) (1,428) (17,957) 453 (6,872) (1,621) (12,004) (17) (4) (414) (9) (1,02,01,415)Unrealised Gain/loss* 40 43 7,212 220 689 7 235 2 1 25,056 40 144 12 3 368 3 144 201 83 1 3 39 7 - - 1 - 34,554 Amortisation of discount/(premium)
- - - - - - - - - - - - - - - - - - - - - - - - - - - -
Appropriation 4,51,810 56,093 (6,13,684) 2,80,482 (21,70,404) (11,551) 1,49,441 1,232 593 25,544 54,618 59,631 40,484 8,636 (49,421) 56,047 (2,42,367) 49,330 18,299 7,065 7,506 27,410 (361) 447 3 1,032 (3) (17,92,088)Total (A) 1,45,863 9,067 6,74,189 32,911 3,78,796 5,344 1,18,765 705 166 3,066 6,201 3,062 17,926 1,500 76,439 6,216 51,830 13,624 13,139 391 929 1,483 413 25 1 114 2 15,62,167 Fund management ex-penses
20,330 1,264 93,694 4,586 52,637 742 16,510 98 23 426 865 436 2,491 207 10,618 864 7,196 1,909 1,842 56 129 207 57 4 0 16 - 2,17,207
Service tax on FMC - - - - - - - - - - - - - - - - - - - - - - - - - - - - Fund administration ex-penses
- - - - - - - - - - - - - - - - - - - - - - - - - - - -
Other charges: - - - - - - - - - - - - - - - - - - - - - - - - - - - - Expropriation 1,66,193 10,331 7,67,883 37,497 4,31,433 6,086 1,35,275 803 189 3,492 7,066 3,498 20,417 1,707 87,057 7,080 59,026 15,533 14,981 447 1,058 1,690 470 29 1 130 2 17,79,374 Total (B)Net Income for the year (A-B)
2,85,617 45,762 (13,81,567) 2,42,985 (26,01,837) (17,637) 14,166 429 404 22,052 47,552 56,133 20,067 6,929 (1,36,478) 48,967 (3,01,393) 33,797 3,318 6,618 6,448 25,720 (831) 418 2 902 (5) (35,71,462)
Add: Fund revenue ac-count at the beginning of the year
41,74,668 3,75,106 3,28,72,046 9,74,069 1,81,29,665 2,94,998 34,28,221 16,232 3,596 1,01,156 1,53,078 339 6,08,421 75,299 27,65,844 2,54,425 22,32,708 59,114 41,999 471 1,32,964 1,88,313 80,868 692 83 19,375 246 6,69,83,996
Fundrevenueaccountattheendoftheyear31-Mar-17
44,60,285 4,20,868 3,14,90,479 12,17,054 1,55,27,828 2,77,361 34,42,387 16,661 4,000 1,23,208 2,00,630 56,472 6,28,488 82,228 26,29,365 3,03,392 19,31,315 92,911 45,317 7,089 1,39,412 2,14,033 80,037 1,110 85 20,277 241 6,34,12,534

Max Life Insurance Company Limited Registration No: 104; Date of Registration with IRDAI: November 15, 2000
AnnuAL RepoRt 2016-17 255
Form A-RA(UL)NAME OF THE INSURER: MAX LIFE INSURANCE COMPANY LIMITEDREGISTRATION NO: 104; DATE OF REGISTRATION WITH IRDA: NOVEMBER 15, 2000Fund Revenue Account for the year ended 31-Mar-17Particulars Schedule Funds FundsFundName Balanced Conservative Growth Secured Growth Super HighGrowth Dynamic Oppor-
tunitiesGuaranteedFundDynamic
GuaranteedFundIncome
Money Mar-ket
Secure Plus Discontinued Individual
Pension Balanced
Pension Conservative
Pension Growth
Pension Secured
Pension Growth Super
Lifemaker Pension
Preserver
Lifemaker Pension
Maximiser
Discontinued Pension
Group Gratuity Balanced
Group Gratuity Conservative
Group Gratuity Growth
Group Gratuity Bond
Group Su-perannuation
Balanced
Group Su-perannuation Conservative
Group Su-perannuation
Growth
Total
SFIN ULIF00225/06/04LIFEBALANC104 ULIF00325/06/04LIFECONSER104 ULIF00125/06/04LIFEGROWTH104 ULIF00425/06/04LIFESECURE104 ULIF01108/02/07LIFEGRWSUP104 ULIF01311/02/08LIFEHIGHGR104 ULIF01425/03/08LIFEDYNOPP104 ULIF01004/10/06AMSRGUADYN104 ULIF00904/10/06AMSRGUAINC104 ULIF01528/04/09LIFEMONEYM104 ULIF01628/04/09LIFESECPLS104 ULIF02021/06/13LIFEDISCON104 ULIF00625/11/05PENSBALANC104 ULIF00725/11/05PENSCONSER104 ULIF00525/11/05PENSGROWTH104 ULIF00825/11/05PENSSECURE104 ULIF01213/08/07PENSGRWSUP104 ULIF01815/02/13PENSPRESER104 ULIF01715/02/13PENSMAXIMI104 ULIF01912/08/13PENSDISCON104 ULGF00217/04/06GRATBALANC104 ULGF00317/04/06GRATCONSER104 ULGF00117/04/06GRATGROWTH104 ULGF00707/02/13GRATPLBOND104 ULGF00523/01/07SANNBALANC104 ULGF00623/01/07SANNCONSER104 ULGF00423/01/07SANNGROWTH104IncomefrominvestmentsInterest income 8,93,095 86,821 16,78,593 3,45,141 38,561 826 3,26,617 2,722 778 1,100 81,734 1,44,355 83,195 8,523 1,74,139 52,258 6,055 96,531 68,072 19,753 13,026 35,270 4,975 721 6 1,050 8 41,63,925Dividend income 61,586 1,650 3,93,025 - 4,17,139 5,445 77,430 110 12 - - - 6,383 242 45,152 - 59,660 2,484 5,472 - 954 - 978 - 1 - 1 10,77,724Dividend On ETF - - - - - - - - - - - - - - - - - - - - - - - - - - - -Profit on sale of investment 5,22,575 39,319 41,16,205 1,71,397 36,35,901 43,721 8,24,697 2,008 435 3 37,259 8,713 44,746 7,319 3,13,427 25,139 3,50,645 44,344 35,853 45 15,565 10,639 11,893 195 6 258 24 1,02,62,331Loss on sale of investment (1,37,322) (5,254) (17,60,414) (24,186) (8,79,808) (12,332) (1,80,506) (433) (77) - (4,322) - (6,024) (889) (53,641) (3,057) (69,056) (5,261) (9,405) - (4,638) (2,282) (2,703) (43) (3) (72) (3) (31,61,731)Profit on inter fund trans-fer/ sale of investment
- 31 - 300 - - - 7 16 - 1,435 - 219 317 581 124 - - - 143 572 33 430 4 - - - 4,212
Loss on inter fund transfer/ sale of investment
- - (1) (32) - - - - - - (6) - - (35) - (35) - - - - (227) - (55) - - - - (391)
Miscellaneous Income - - - - 2 - - - - - - - - 1 - - 1 - - - - - - - - - - 4Unrealised Gain/loss* 10,54,952 29,725 38,54,609 24,072 33,99,277 60,964 5,37,616 860 102 - 10,740 22,978 1,04,228 (45) 5,30,461 3,966 5,23,367 65,804 1,31,664 2,763 7,343 7,165 2,038 130 3 226 3 1,03,75,011Amortisation of discount/(premium)
4,053 - 23,324 - 8,050 - 4,053 - - 19,554 - 2,992 - - - - - 3,046 3,046 - - - - - - - - 68,118
Appropriation - - - - - - - - - - - - - - - - - - - - - - - - - - - -Total (A) 23,98,939 1,52,292 83,05,341 5,16,692 66,19,122 98,624 15,89,907 5,274 1,266 20,657 1,26,840 1,79,038 2,32,747 15,433 10,10,119 78,395 8,70,672 2,06,948 2,34,702 22,704 32,595 50,825 17,556 1,007 13 1,462 33 2,27,89,203Fund management ex-penses
1,90,555 11,386 6,87,029 40,875 4,09,788 5,356 1,21,087 743 180 2,860 9,718 11,412 17,263 1,128 72,432 6,160 49,899 23,387 25,302 1,420 1,051 1,849 651 40 1 104 2 16,91,678
Service tax on FMC 28,441 1,699 1,02,499 6,100 61,151 799 18,066 111 27 427 1,450 1,707 2,575 168 10,805 919 7,444 3,492 3,779 212 157 276 97 6 - 15 - 2,52,422Fund administration ex-penses
- - - - - - - - - - - - - - - - - - - - - - - - - - - -
Other charges: - - - - - - - - - - - - - - - - - - - - - - - - - - - -Expropriation - - - - - - - - - - - - - - - - - - - - - - - - - - - -Total (B) 2,18,996 13,085 7,89,528 46,975 4,70,939 6,155 1,39,153 854 207 3,287 11,168 13,119 19,838 1,296 83,237 7,079 57,343 26,879 29,081 1,632 1,208 2,125 748 46 1 119 2 19,44,100Net Income for the year (A-B)
21,79,943 1,39,207 75,15,813 4,69,717 61,48,183 92,469 14,50,754 4,420 1,059 17,370 1,15,672 1,65,919 2,12,909 14,137 9,26,882 71,316 8,13,329 1,80,069 2,05,621 21,072 31,387 48,700 16,808 961 12 1,343 31 2,08,45,103
Add: Fund revenue ac-count at the beginning of the year
44,60,285 4,20,868 3,14,90,479 12,17,054 1,55,27,828 2,77,361 34,42,387 16,661 4,000 1,23,208 2,00,630 56,472 6,28,488 82,228 26,29,366 3,03,392 19,31,315 92,911 45,317 7,089 1,39,412 2,14,033 80,037 1,110 85 20,277 241 6,34,12,534
Fundrevenueaccountattheendoftheyear31-Mar-17
66,40,228 5,60,075 3,90,06,292 16,86,771 2,16,76,011 3,69,830 48,93,141 21,081 5,059 1,40,578 3,16,302 2,22,391 8,41,397 96,365 35,56,248 3,74,708 27,44,644 2,72,980 2,50,938 28,161 1,70,799 2,62,733 96,845 2,071 97 21,620 272 8,42,57,637
* Net change in mark to market value of investments Significant accounting policies and notes to the accounts 16 The Schedules referred to above form an integral part of the Fund Revenue Account. FUND REVENUE ACCOUNT FOR THE YEAR ENDED MARCH 31, 2016 Particulars Schedule Funds FundsFundName Balanced Conservative Growth Secured Growth Super HighGrowth Dynamic Oppor-
tunitiesGuaranteedFundDynamic
GuaranteedFundIncome
Money Mar-ket
Secure Plus Discontinued Individual
Pension Balanced
Pension Conservative
Pension Growth
Pension Secured
Pension Growth Super
Lifemaker Pension Pre-
server
Lifemaker Pension Max-
imiser
Discontinued Pension
Group Gratuity Balanced
Group Gratuity Conservative
Group Gratuity Growth
Group Gratuity Bond
Group Su-perannuation
Balanced
Group Su-perannuation Conservative
Group Su-perannuation
Growth
Total
SFIN ULIF00225/06/04LIFEBALANC104 ULIF00325/06/04LIFECONSER104 ULIF00125/06/04LIFEGROWTH104 ULIF00425/06/04LIFESECURE104 ULIF01108/02/07LIFEGRWSUP104 ULIF01311/02/08LIFEHIGHGR104 ULIF01425/03/08LIFEDYNOPP104 ULIF01004/10/06AMSRGUADYN104 ULIF00904/10/06AMSRGUAINC104 ULIF01528/04/09LIFEMONEYM104 ULIF01628/04/09LIFESECPLS104 ULIF02021/06/13LIFEDISCON104 ULIF00625/11/05PENSBALANC104 ULIF00725/11/05PENSCONSER104 ULIF00525/11/05PENSGROWTH104 ULIF00825/11/05PENSSECURE104 ULIF01213/08/07PENSGRWSUP104 ULIF01815/02/13PENSPRESER104 ULIF01715/02/13PENSMAXIMI104 ULIF01912/08/13PENSDISCON104 ULGF00217/04/06GRATBALANC104 ULGF00317/04/06GRATCONSER104 ULGF00117/04/06GRATGROWTH104 ULGF00707/02/13GRATPLBOND104 ULGF00523/01/07SANNBALANC104 ULGF00623/01/07SANNCONSER104 ULGF00423/01/07SANNGROWTH104Incomefrominvestments 7,15,388 70,771 16,43,962 2,84,229 2,824 847 2,98,021 2,527 736 487 53,972 44,018 91,557 11,728 1,82,207 54,215 2,488 60,508 38,697 5,796 12,200 29,297 2,700 500 6 1,234 6 36,10,921 Interest income 54,474 1,577 4,42,885 - 4,07,791 5,724 75,177 124 13 - - - 6,504 243 48,572 - 56,141 1,522 3,520 - 652 - 712 - - - 1 11,05,632 Dividend income - - - - - - - - - - - - - - - - - - - - - - - - - - - - Dividend On ETF 5,25,264 27,343 41,53,777 88,723 28,14,936 51,817 8,90,571 357 47 - 20,407 11,000 49,493 5,861 3,61,489 17,639 3,69,520 15,100 13,308 937 6,080 6,957 10,317 62 2 423 1 94,41,431 Profit on sale of investment (2,83,417) (24,357) (26,12,182) (1,13,774) (18,49,849) (22,698) (4,21,861) (606) (173) - (21,406) (527) (25,230) (4,321) (1,65,843) (13,785) (1,63,756) (26,573) (19,352) (123) (4,503) (7,262) (1,875) (90) (1) (230) (2) (57,83,796)Loss on sale of investment 21 - - - - - 92 2 - 1 157 - 51 376 - 120 - - - 1 13 - 63 2 - 50 - 949 Profit on inter fund trans-fer/ sale of investment
(6) - (26) - - - - - - - (167) - (10) (8) - (9) - - - - (67) - (281) (10) - (32) - (616)
Loss on inter fund transfer/ sale of investment
- - 248 - - 4 - - - - - - - - - - - - - - - - - - - - - 252
Miscellaneous Income (5,59,954) (19,284) (42,49,560) 21,084 (35,46,795) (47,252) (6,92,794) (1,174) (31) - 1,615 4,996 (81,893) (5,246) (4,76,214) (2,136) (5,06,904) (1,428) (17,957) 453 (6,872) (1,621) (12,004) (17) (4) (414) (9) (1,02,01,415)Unrealised Gain/loss* 40 43 7,212 220 689 7 235 2 1 25,056 40 144 12 3 368 3 144 201 83 1 3 39 7 - - 1 - 34,554 Amortisation of discount/(premium)
- - - - - - - - - - - - - - - - - - - - - - - - - - - -
Appropriation 4,51,810 56,093 (6,13,684) 2,80,482 (21,70,404) (11,551) 1,49,441 1,232 593 25,544 54,618 59,631 40,484 8,636 (49,421) 56,047 (2,42,367) 49,330 18,299 7,065 7,506 27,410 (361) 447 3 1,032 (3) (17,92,088)Total (A) 1,45,863 9,067 6,74,189 32,911 3,78,796 5,344 1,18,765 705 166 3,066 6,201 3,062 17,926 1,500 76,439 6,216 51,830 13,624 13,139 391 929 1,483 413 25 1 114 2 15,62,167 Fund management ex-penses
20,330 1,264 93,694 4,586 52,637 742 16,510 98 23 426 865 436 2,491 207 10,618 864 7,196 1,909 1,842 56 129 207 57 4 0 16 - 2,17,207
Service tax on FMC - - - - - - - - - - - - - - - - - - - - - - - - - - - - Fund administration ex-penses
- - - - - - - - - - - - - - - - - - - - - - - - - - - -
Other charges: - - - - - - - - - - - - - - - - - - - - - - - - - - - - Expropriation 1,66,193 10,331 7,67,883 37,497 4,31,433 6,086 1,35,275 803 189 3,492 7,066 3,498 20,417 1,707 87,057 7,080 59,026 15,533 14,981 447 1,058 1,690 470 29 1 130 2 17,79,374 Total (B)Net Income for the year (A-B)
2,85,617 45,762 (13,81,567) 2,42,985 (26,01,837) (17,637) 14,166 429 404 22,052 47,552 56,133 20,067 6,929 (1,36,478) 48,967 (3,01,393) 33,797 3,318 6,618 6,448 25,720 (831) 418 2 902 (5) (35,71,462)
Add: Fund revenue ac-count at the beginning of the year
41,74,668 3,75,106 3,28,72,046 9,74,069 1,81,29,665 2,94,998 34,28,221 16,232 3,596 1,01,156 1,53,078 339 6,08,421 75,299 27,65,844 2,54,425 22,32,708 59,114 41,999 471 1,32,964 1,88,313 80,868 692 83 19,375 246 6,69,83,996
Fundrevenueaccountattheendoftheyear31-Mar-17
44,60,285 4,20,868 3,14,90,479 12,17,054 1,55,27,828 2,77,361 34,42,387 16,661 4,000 1,23,208 2,00,630 56,472 6,28,488 82,228 26,29,365 3,03,392 19,31,315 92,911 45,317 7,089 1,39,412 2,14,033 80,037 1,110 85 20,277 241 6,34,12,534
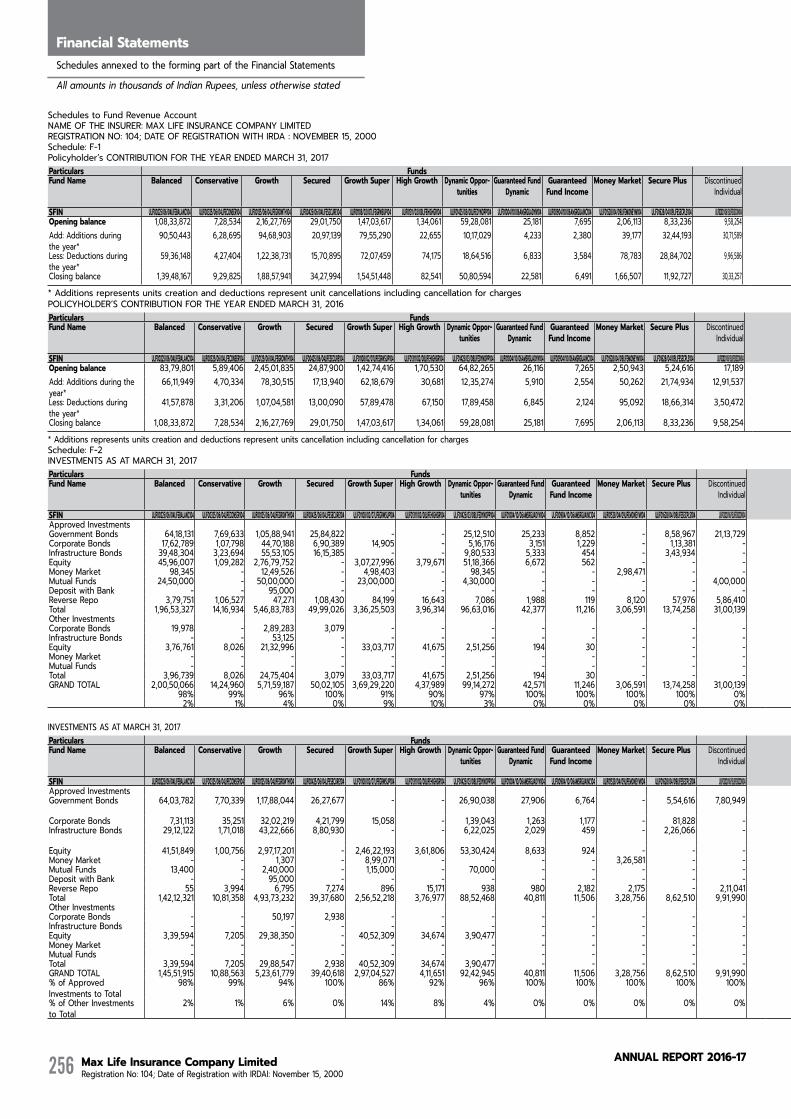
Max Life Insurance Company Limited Registration No: 104; Date of Registration with IRDAI: November 15, 2000
AnnuAL RepoRt 2016-17256
Directors' ReportFinancial StatementsSchedules annexed to the forming part of the Financial Statements
All amounts in thousands of Indian Rupees, unless otherwise stated
Schedules to Fund Revenue AccountNAME OF THE INSURER: MAX LIFE INSURANCE COMPANY LIMITEDREGISTRATION NO: 104; DATE OF REGISTRATION WITH IRDA : NOVEMBER 15, 2000Schedule: F-1Policyholder’s CONTRIBUTION FOR THE YEAR ENDED MARCH 31, 2017 Particulars Funds FundsFundName Balanced Conservative Growth Secured Growth Super HighGrowth Dynamic Oppor-
tunitiesGuaranteedFund
DynamicGuaranteedFundIncome
MoneyMarket Secure Plus Discontinued Individual
Pension Balanced
Pension Conservative
Pension Growth
Pension Secured
Pension Growth Super
Lifemaker Pension
Preserver
Lifemaker Pension
Maximiser
Discontinued Pension
Group Gratuity
Balanced
Group Gratuity
Conservative
Group Gratuity Growth
Group Gratuity Bond
Group Superannua-
tion Balanced
Group Su-perannuation Conservative
Group Su-perannuation
Growth
Total
SFIN ULIF00225/06/04LIFEBALANC104 ULIF00325/06/04LIFECONSER104 ULIF00125/06/04LIFEGROWTH104 ULIF00425/06/04LIFESECURE104 ULIF01108/02/07LIFEGRWSUP104 ULIF01311/02/08LIFEHIGHGR104 ULIF01425/03/08LIFEDYNOPP104 ULIF01004/10/06AMSRGUADYN104 ULIF00904/10/06AMSRGUAINC104 ULIF01528/04/09LIFEMONEYM104 ULIF01628/04/09LIFESECPLS104 ULIF02021/06/13LIFEDISCON104 ULIF00625/11/05PENSBALANC104 ULIF00725/11/05PENSCONSER104 ULIF00525/11/05PENSGROWTH104 ULIF00825/11/05PENSSECURE104 ULIF01213/08/07PENSGRWSUP104 ULIF01815/02/13PENSPRESER104 ULIF01715/02/13PENSMAXIMI104 ULIF01912/08/13PENSDISCON104 ULGF00217/04/06GRATBALANC104 ULGF00317/04/06GRATCONSER104 ULGF00117/04/06GRATGROWTH104 ULGF00707/02/13GRATPLBOND104 ULGF00523/01/07SANNBALANC104 ULGF00623/01/07SANNCONSER104 ULGF00423/01/07SANNGROWTH104Openingbalance 1,08,33,872 7,28,534 2,16,27,769 29,01,750 1,47,03,617 1,34,061 59,28,081 25,181 7,695 2,06,113 8,33,236 9,58,254 9,33,894 53,216 31,77,070 3,57,220 19,53,344 12,35,864 11,15,059 1,46,084 80,810 2,04,659 (20,810) 8,068 27 (7,282) (68) 6,81,25,318Add: Additions during the year*
90,50,443 6,28,695 94,68,903 20,97,139 79,55,290 22,655 10,17,029 4,233 2,380 39,177 32,44,193 30,71,589 1,46,920 10,520 5,03,403 1,27,150 3,40,534 11,04,319 12,21,129 4,50,743 1,56,361 1,16,828 2,54,321 9,725 - 117 - 4,10,43,796
Less: Deductions during the year*
59,36,148 4,27,404 1,22,38,731 15,70,895 72,07,459 74,175 18,64,516 6,833 3,584 78,783 28,84,702 9,96,586 3,40,858 41,402 13,34,711 1,79,407 8,60,751 5,89,431 4,73,711 1,75,289 1,30,800 29,700 62,042 8,510 1 812 1 3,75,17,242
Closing balance 1,39,48,167 9,29,825 1,88,57,941 34,27,994 1,54,51,448 82,541 50,80,594 22,581 6,491 1,66,507 11,92,727 30,33,257 7,39,956 22,334 23,45,762 3,04,963 14,33,127 17,50,752 18,62,477 4,21,538 1,06,371 2,91,787 1,71,469 9,283 26 (7,977) (69) 7,16,51,872
* Additions represents units creation and deductions represent unit cancellations including cancellation for charges POLICYHOLDER’S CONTRIBUTION FOR THE YEAR ENDED MARCH 31, 2016Particulars Funds FundsFundName Balanced Conservative Growth Secured Growth Super HighGrowth Dynamic Oppor-
tunitiesGuaranteedFund
DynamicGuaranteedFundIncome
MoneyMarket Secure Plus Discontinued Individual
Pension Balanced
Pension Conservative
Pension Growth
Pension Secured
Pension Growth Super
Lifemaker Pension
Preserver
Lifemaker Pension
Maximiser
Discontinued Pension
Group Gratuity
Balanced
Group Gratuity
Conservative
Group Gratuity Growth
Group Gratuity Bond
Group Su-perannuation
Balanced
Group Su-perannuation Conservative
Group Su-perannuation
Growth
Total
SFIN ULIF00225/06/04LIFEBALANC104 ULIF00325/06/04LIFECONSER104 ULIF00125/06/04LIFEGROWTH104 ULIF00425/06/04LIFESECURE104 ULIF01108/02/07LIFEGRWSUP104 ULIF01311/02/08LIFEHIGHGR104 ULIF01425/03/08LIFEDYNOPP104 ULIF01004/10/06AMSRGUADYN104 ULIF00904/10/06AMSRGUAINC104 ULIF01528/04/09LIFEMONEYM104 ULIF01628/04/09LIFESECPLS104 ULIF02021/06/13LIFEDISCON104 ULIF00625/11/05PENSBALANC104 ULIF00725/11/05PENSCONSER104 ULIF00525/11/05PENSGROWTH104 ULIF00825/11/05PENSSECURE104 ULIF01213/08/07PENSGRWSUP104 ULIF01815/02/13PENSPRESER104 ULIF01715/02/13PENSMAXIMI104 ULIF01912/08/13PENSDISCON104 ULGF00217/04/06GRATBALANC104 ULGF00317/04/06GRATCONSER104 ULGF00117/04/06GRATGROWTH104 ULGF00707/02/13GRATPLBOND104 ULGF00523/01/07SANNBALANC104 ULGF00623/01/07SANNCONSER104 ULGF00423/01/07SANNGROWTH104Openingbalance 83,79,801 5,89,406 2,45,01,835 24,87,900 1,42,74,416 1,70,530 64,82,265 26,116 7,265 2,50,943 5,24,616 17,189 10,97,564 1,22,547 38,23,187 4,66,911 23,07,060 6,34,162 5,35,502 19,970 84,449 1,72,024 26,943 5,257 28 3,880 (68) 6,70,11,698Add: Additions during the year*
66,11,949 4,70,334 78,30,515 17,13,940 62,18,679 30,681 12,35,274 5,910 2,554 50,262 21,74,934 12,91,537 2,13,707 29,352 7,74,648 1,11,792 4,34,302 9,31,039 8,07,509 1,81,704 60,144 80,317 2,652 5,188 - 276 - 3,12,69,199
Less: Deductions during the year*
41,57,878 3,31,206 1,07,04,581 13,00,090 57,89,478 67,150 17,89,458 6,845 2,124 95,092 18,66,314 3,50,472 3,77,377 98,683 14,20,765 2,21,483 7,88,018 3,29,337 2,27,952 55,590 63,783 47,682 50,405 2,377 1 11,438 - 3,01,55,579
Closing balance 1,08,33,872 7,28,534 2,16,27,769 29,01,750 1,47,03,617 1,34,061 59,28,081 25,181 7,695 2,06,113 8,33,236 9,58,254 9,33,894 53,216 31,77,070 3,57,220 19,53,344 12,35,864 11,15,059 1,46,084 80,810 2,04,659 (20,810) 8,068 27 (7,282) (68) 6,81,25,318
* Additions represents units creation and deductions represent units cancellation including cancellation for chargesSchedule: F-2INVESTMENTS AS AT MARCH 31, 2017Particulars Funds FundsFundName Balanced Conservative Growth Secured Growth Super HighGrowth Dynamic Oppor-
tunitiesGuaranteedFund
DynamicGuaranteedFundIncome
MoneyMarket Secure Plus Discontinued Individual
Pension Balanced
Pension Conservative
Pension Growth
Pension Secured
Pension Growth Super
Lifemaker Pension Pre-
server
Lifemaker Pension Maxi-
miser
Discontinued Pension
Group Gratuity
Balanced
Group Gratuity
Conservative
Group Gratuity Growth
Group Gratuity Bond
Group Superannua-
tion Balanced
Group Su-perannuation Conservative
Group Su-perannuation
Growth
Total
SFIN ULIF00225/06/04LIFEBALANC104 ULIF00325/06/04LIFECONSER104 ULIF00125/06/04LIFEGROWTH104 ULIF00425/06/04LIFESECURE104 ULIF01108/02/07LIFEGRWSUP104 ULIF01311/02/08LIFEHIGHGR104 ULIF01425/03/08LIFEDYNOPP104 ULIF01004/10/06AMSRGUADYN104 ULIF00904/10/06AMSRGUAINC104 ULIF01528/04/09LIFEMONEYM104 ULIF01628/04/09LIFESECPLS104 ULIF02021/06/13LIFEDISCON104 ULIF00625/11/05PENSBALANC104 ULIF00725/11/05PENSCONSER104 ULIF00525/11/05PENSGROWTH104 ULIF00825/11/05PENSSECURE104 ULIF01213/08/07PENSGRWSUP104 ULIF01815/02/13PENSPRESER104 ULIF01715/02/13PENSMAXIMI104 ULIF01912/08/13PENSDISCON104 ULGF00217/04/06GRATBALANC104 ULGF00317/04/06GRATCONSER104 ULGF00117/04/06GRATGROWTH104 ULGF00707/02/13GRATPLBOND104 ULGF00523/01/07SANNBALANC104 ULGF00623/01/07SANNCONSER104 ULGF00423/01/07SANNGROWTH104Approved InvestmentsGovernment Bonds 64,18,131 7,69,633 1,05,88,941 25,84,822 - - 25,12,510 25,233 8,852 - 8,58,967 21,13,729 5,14,349 65,309 10,62,592 3,53,220 - 12,76,471 8,41,437 2,96,096 1,04,371 3,62,078 69,944 10,715 59 9,769 57 3,08,47,285Corporate Bonds 17,62,789 1,07,798 44,70,188 6,90,389 14,905 - 5,16,176 3,151 1,229 - 1,13,381 - 1,59,717 14,714 3,45,610 96,608 - 1,56,866 99,233 - 18,174 76,121 17,886 - 16 1,126 - 86,66,077Infrastructure Bonds 39,48,304 3,23,694 55,53,105 16,15,385 - - 9,80,533 5,333 454 - 3,43,934 - 3,32,714 22,916 6,05,514 2,04,046 - 1,38,773 1,63,865 - 55,556 88,113 36,229 234 10 1,354 14 1,44,20,080Equity 45,96,007 1,09,282 2,76,79,752 - 3,07,27,996 3,79,671 51,18,366 6,672 562 - - - 4,88,411 12,380 33,49,711 - 37,55,817 2,35,246 6,56,019 - 57,573 - 1,29,280 - 32 - 105 7,73,02,882Money Market 98,345 - 12,49,526 - 4,98,403 - 98,345 - - 2,98,471 - - - - - - - 49,173 49,173 - - - - - - - - 23,41,436Mutual Funds 24,50,000 - 50,00,000 - 23,00,000 - 4,30,000 - - - - 4,00,000 - - 3,50,000 - - - - - - - - - - - - 1,09,30,000Deposit with Bank - - 95,000 - - - - - - - - - - - - - - - - - - - - - - - - 95,000Reverse Repo 3,79,751 1,06,527 47,271 1,08,430 84,199 16,643 7,086 1,988 119 8,120 57,976 5,86,410 35,847 135 3,432 7,295 1,26,747 77,815 1,76,107 1,18,965 21,007 13,540 2,643 102 1 1,090 14 19,89,260Total 1,96,53,327 14,16,934 5,46,83,783 49,99,026 3,36,25,503 3,96,314 96,63,016 42,377 11,216 3,06,591 13,74,258 31,00,139 15,31,038 1,15,454 57,16,859 6,61,169 38,82,564 19,34,344 19,85,834 4,15,061 2,56,681 5,39,852 2,55,982 11,051 118 13,339 190 14,65,92,020Other InvestmentsCorporate Bonds 19,978 - 2,89,283 3,079 - - - - - - - - - - - - - - - - - - - - - - - 3,12,340Infrastructure Bonds - - 53,125 - - - - - - - - - - - - - - - - - - - - - - - - 53,125Equity 3,76,761 8,026 21,32,996 - 33,03,717 41,675 2,51,256 194 30 - - - 21,460 102 1,79,484 - 2,96,119 24,048 46,120 - 3,448 - 8,549 - - - 6 66,93,991Money Market - - - - - - - - - - - - - - - - - - - - - - - - - - - -Mutual Funds - - - - - - - - - - - - - - - - - - - - - - - - - - - -Total 3,96,739 8,026 24,75,404 3,079 33,03,717 41,675 2,51,256 194 30 - - - 21,460 102 1,79,484 - 2,96,119 24,048 46,120 - 3,448 - 8,549 - - - 6 70,59,456GRAND TOTAL 2,00,50,066 14,24,960 5,71,59,187 50,02,105 3,69,29,220 4,37,989 99,14,272 42,571 11,246 3,06,591 13,74,258 31,00,139 15,52,498 1,15,556 58,96,343 6,61,169 41,78,683 19,58,392 20,31,954 4,15,061 2,60,129 5,39,852 2,64,531 11,051 118 13,339 196 15,36,51,476
98% 99% 96% 100% 91% 90% 97% 100% 100% 100% 100% 0% 99% 100% 97% 100% 93% 99% 98% 100% 99% 100% 97% 100% 100% 100% 97% 95%2% 1% 4% 0% 9% 10% 3% 0% 0% 0% 0% 0% 1% 0% 3% 0% 7% 1% 2% 0% 1% 0% 3% 0% 0% 0% 3% 5%
INVESTMENTS AS AT MARCH 31, 2017Particulars Funds FundsFundName Balanced Conservative Growth Secured Growth Super HighGrowth Dynamic Oppor-
tunitiesGuaranteedFund
DynamicGuaranteedFundIncome
MoneyMarket Secure Plus Discontinued Individual
PensionBalanced
Pension Conservative
Pension Growth
Pension Secured
Pension Growth Super
Lifemaker Pension
Preserver
Lifemaker Pension
Maximiser
Discontinued Pension
Group Gratuity Bal-
anced
Group Gratuity Con-
servative
Group Gratuity Growth
Group Gratuity Bond
Group Su-perannuation
Balanced
Group Su-perannuation Conservative
Group Su-perannuation
Growth
Total
SFIN ULIF00225/06/04LIFEBALANC104 ULIF00325/06/04LIFECONSER104 ULIF00125/06/04LIFEGROWTH104 ULIF00425/06/04LIFESECURE104 ULIF01108/02/07LIFEGRWSUP104 ULIF01311/02/08LIFEHIGHGR104 ULIF01425/03/08LIFEDYNOPP104 ULIF01004/10/06AMSRGUADYN104 ULIF00904/10/06AMSRGUAINC104 ULIF01528/04/09LIFEMONEYM104 ULIF01628/04/09LIFESECPLS104 ULIF02021/06/13LIFEDISCON104 ULIF00625/11/05PENSBALANC104 ULIF00725/11/05PENSCONSER104 ULIF00525/11/05PENSGROWTH104 ULIF00825/11/05PENSSECURE104 ULIF01213/08/07PENSGRWSUP104 ULIF01815/02/13PENSPRESER104 ULIF01715/02/13PENSMAXIMI104 ULIF01912/08/13PENSDISCON104 ULGF00217/04/06GRATBALANC104 ULGF00317/04/06GRATCONSER104 ULGF00117/04/06GRATGROWTH104 ULGF00707/02/13GRATPLBOND104 ULGF00523/01/07SANNBALANC104 ULGF00623/01/07SANNCONSER104 ULGF00423/01/07SANNGROWTH104Approved InvestmentsGovernment Bonds 64,03,782 7,70,339 1,17,88,044 26,27,677 - - 26,90,038 27,906 6,764 - 5,54,616 7,80,949 6,78,377 90,905 15,09,250 3,91,635 - 9,09,354 5,81,262 1,01,766 83,556 2,98,963 7,259 8,542 51 8,520 51
3,03,19,606 Corporate Bonds 7,31,113 35,251 32,02,219 4,21,799 15,058 - 1,39,043 1,263 1,177 - 81,828 - 96,373 9,020 2,13,518 82,690 - 10,907 2,190 - 13,319 42,347 4,734 - 14 3,125 - 51,06,988 Infrastructure Bonds 29,12,122 1,71,018 43,22,666 8,80,930 - - 6,22,025 2,029 459 - 2,26,066 - 3,42,692 16,822 3,95,023 1,48,809 - 42,879 38,674 - 53,318 66,702 11,640 - 9 1,015 8
1,02,54,906 Equity 41,51,849 1,00,756 2,97,17,201 - 2,46,22,193 3,61,806 53,30,424 8,633 924 - - - 3,89,780 14,450 31,61,782 - 35,41,044 1,58,864 2,99,475 - 55,872 - 32,363 - 33 - 83 7,19,47,532 Money Market - - 1,307 - 8,99,071 - - - - 3,26,581 - - - - - - - - - - - - - - - - - 12,26,959 Mutual Funds 13,400 - 2,40,000 - 1,15,000 - 70,000 - - - - - - - 1,80,000 26,000 60,000 55,000 49,000 - - - - - - - - 8,08,400 Deposit with Bank - - 95,000 - - - - - - - - - - - - - - - - - - - - - - - - 95,000 Reverse Repo 55 3,994 6,795 7,274 896 15,171 938 980 2,182 2,175 - 2,11,041 3,719 227 7,020 310 136 4,812 15,100 44,041 1,893 2,796 604 479 2 6 29 3,32,675 Total 1,42,12,321 10,81,358 4,93,73,232 39,37,680 2,56,52,218 3,76,977 88,52,468 40,811 11,506 3,28,756 8,62,510 9,91,990 15,10,941 1,31,424 54,66,593 6,49,444 36,01,180 11,81,816 9,85,701 1,45,807 2,07,958 4,10,808 56,600 9,021 109 12,666 171 12,00,92,066 Other InvestmentsCorporate Bonds - - 50,197 2,938 - - - - - - - - - - - - - - - - - - - - - - - 53,135 Infrastructure Bonds - - - - - - - - - - - - - - - - - - - - - - - - - - - - Equity 3,39,594 7,205 29,38,350 - 40,52,309 34,674 3,90,477 - - - - - 32,376 467 2,93,462 - 2,83,403 15,100 29,858 - 2,728 - 2,026 - - - - 84,22,029 Money Market - - - - - - - - - - - - - - - - - - - - - - - - - - - - Mutual Funds - - - - - - - - - - - - - - - - - 50,000 73,240 - - - - - - - - 1,23,240 Total 3,39,594 7,205 29,88,547 2,938 40,52,309 34,674 3,90,477 - - - - - 32,376 467 2,93,462 - 2,83,403 65,100 1,03,098 - 2,728 - 2,026 - - - - 85,98,404 GRAND TOTAL 1,45,51,915 10,88,563 5,23,61,779 39,40,618 2,97,04,527 4,11,651 92,42,945 40,811 11,506 3,28,756 8,62,510 9,91,990 15,43,317 1,31,891 57,60,055 6,49,444 38,84,583 12,46,916 10,88,799 1,45,807 2,10,686 4,10,808 58,626 9,021 109 12,666 171 12,86,90,470 % of Approved Investments to Total
98% 99% 94% 100% 86% 92% 96% 100% 100% 100% 100% 100% 98% 100% 95% 100% 93% 95% 91% 100% 99% 100% 97% 100% 100% 100% 100% 93%
% of Other Investments to Total
2% 1% 6% 0% 14% 8% 4% 0% 0% 0% 0% 0% 2% 0% 5% 0% 7% 5% 9% 0% 1% 0% 3% 0% 0% 0% 0% 7%
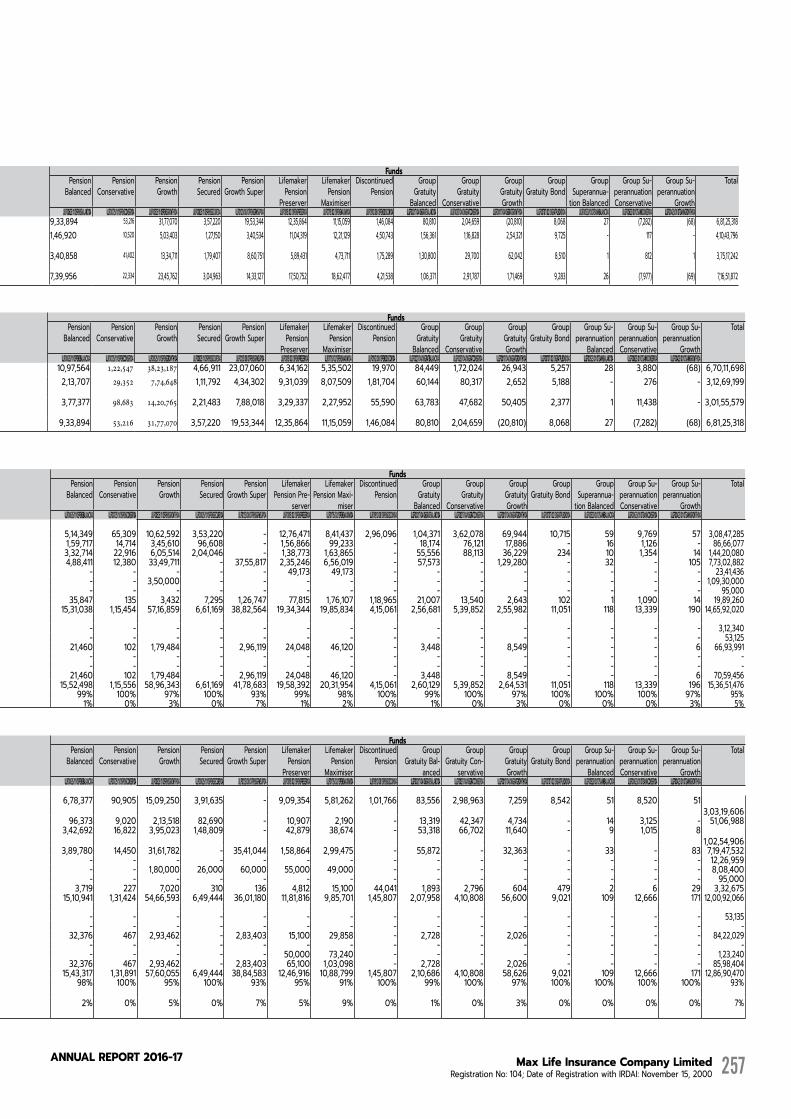
Max Life Insurance Company Limited Registration No: 104; Date of Registration with IRDAI: November 15, 2000
AnnuAL RepoRt 2016-17 257
Schedules to Fund Revenue AccountNAME OF THE INSURER: MAX LIFE INSURANCE COMPANY LIMITEDREGISTRATION NO: 104; DATE OF REGISTRATION WITH IRDA : NOVEMBER 15, 2000Schedule: F-1Policyholder’s CONTRIBUTION FOR THE YEAR ENDED MARCH 31, 2017 Particulars Funds FundsFundName Balanced Conservative Growth Secured Growth Super HighGrowth Dynamic Oppor-
tunitiesGuaranteedFund
DynamicGuaranteedFundIncome
MoneyMarket Secure Plus Discontinued Individual
Pension Balanced
Pension Conservative
Pension Growth
Pension Secured
Pension Growth Super
Lifemaker Pension
Preserver
Lifemaker Pension
Maximiser
Discontinued Pension
Group Gratuity
Balanced
Group Gratuity
Conservative
Group Gratuity Growth
Group Gratuity Bond
Group Superannua-
tion Balanced
Group Su-perannuation Conservative
Group Su-perannuation
Growth
Total
SFIN ULIF00225/06/04LIFEBALANC104 ULIF00325/06/04LIFECONSER104 ULIF00125/06/04LIFEGROWTH104 ULIF00425/06/04LIFESECURE104 ULIF01108/02/07LIFEGRWSUP104 ULIF01311/02/08LIFEHIGHGR104 ULIF01425/03/08LIFEDYNOPP104 ULIF01004/10/06AMSRGUADYN104 ULIF00904/10/06AMSRGUAINC104 ULIF01528/04/09LIFEMONEYM104 ULIF01628/04/09LIFESECPLS104 ULIF02021/06/13LIFEDISCON104 ULIF00625/11/05PENSBALANC104 ULIF00725/11/05PENSCONSER104 ULIF00525/11/05PENSGROWTH104 ULIF00825/11/05PENSSECURE104 ULIF01213/08/07PENSGRWSUP104 ULIF01815/02/13PENSPRESER104 ULIF01715/02/13PENSMAXIMI104 ULIF01912/08/13PENSDISCON104 ULGF00217/04/06GRATBALANC104 ULGF00317/04/06GRATCONSER104 ULGF00117/04/06GRATGROWTH104 ULGF00707/02/13GRATPLBOND104 ULGF00523/01/07SANNBALANC104 ULGF00623/01/07SANNCONSER104 ULGF00423/01/07SANNGROWTH104Openingbalance 1,08,33,872 7,28,534 2,16,27,769 29,01,750 1,47,03,617 1,34,061 59,28,081 25,181 7,695 2,06,113 8,33,236 9,58,254 9,33,894 53,216 31,77,070 3,57,220 19,53,344 12,35,864 11,15,059 1,46,084 80,810 2,04,659 (20,810) 8,068 27 (7,282) (68) 6,81,25,318Add: Additions during the year*
90,50,443 6,28,695 94,68,903 20,97,139 79,55,290 22,655 10,17,029 4,233 2,380 39,177 32,44,193 30,71,589 1,46,920 10,520 5,03,403 1,27,150 3,40,534 11,04,319 12,21,129 4,50,743 1,56,361 1,16,828 2,54,321 9,725 - 117 - 4,10,43,796
Less: Deductions during the year*
59,36,148 4,27,404 1,22,38,731 15,70,895 72,07,459 74,175 18,64,516 6,833 3,584 78,783 28,84,702 9,96,586 3,40,858 41,402 13,34,711 1,79,407 8,60,751 5,89,431 4,73,711 1,75,289 1,30,800 29,700 62,042 8,510 1 812 1 3,75,17,242
Closing balance 1,39,48,167 9,29,825 1,88,57,941 34,27,994 1,54,51,448 82,541 50,80,594 22,581 6,491 1,66,507 11,92,727 30,33,257 7,39,956 22,334 23,45,762 3,04,963 14,33,127 17,50,752 18,62,477 4,21,538 1,06,371 2,91,787 1,71,469 9,283 26 (7,977) (69) 7,16,51,872
* Additions represents units creation and deductions represent unit cancellations including cancellation for charges POLICYHOLDER’S CONTRIBUTION FOR THE YEAR ENDED MARCH 31, 2016Particulars Funds FundsFundName Balanced Conservative Growth Secured Growth Super HighGrowth Dynamic Oppor-
tunitiesGuaranteedFund
DynamicGuaranteedFundIncome
MoneyMarket Secure Plus Discontinued Individual
Pension Balanced
Pension Conservative
Pension Growth
Pension Secured
Pension Growth Super
Lifemaker Pension
Preserver
Lifemaker Pension
Maximiser
Discontinued Pension
Group Gratuity
Balanced
Group Gratuity
Conservative
Group Gratuity Growth
Group Gratuity Bond
Group Su-perannuation
Balanced
Group Su-perannuation Conservative
Group Su-perannuation
Growth
Total
SFIN ULIF00225/06/04LIFEBALANC104 ULIF00325/06/04LIFECONSER104 ULIF00125/06/04LIFEGROWTH104 ULIF00425/06/04LIFESECURE104 ULIF01108/02/07LIFEGRWSUP104 ULIF01311/02/08LIFEHIGHGR104 ULIF01425/03/08LIFEDYNOPP104 ULIF01004/10/06AMSRGUADYN104 ULIF00904/10/06AMSRGUAINC104 ULIF01528/04/09LIFEMONEYM104 ULIF01628/04/09LIFESECPLS104 ULIF02021/06/13LIFEDISCON104 ULIF00625/11/05PENSBALANC104 ULIF00725/11/05PENSCONSER104 ULIF00525/11/05PENSGROWTH104 ULIF00825/11/05PENSSECURE104 ULIF01213/08/07PENSGRWSUP104 ULIF01815/02/13PENSPRESER104 ULIF01715/02/13PENSMAXIMI104 ULIF01912/08/13PENSDISCON104 ULGF00217/04/06GRATBALANC104 ULGF00317/04/06GRATCONSER104 ULGF00117/04/06GRATGROWTH104 ULGF00707/02/13GRATPLBOND104 ULGF00523/01/07SANNBALANC104 ULGF00623/01/07SANNCONSER104 ULGF00423/01/07SANNGROWTH104Openingbalance 83,79,801 5,89,406 2,45,01,835 24,87,900 1,42,74,416 1,70,530 64,82,265 26,116 7,265 2,50,943 5,24,616 17,189 10,97,564 1,22,547 38,23,187 4,66,911 23,07,060 6,34,162 5,35,502 19,970 84,449 1,72,024 26,943 5,257 28 3,880 (68) 6,70,11,698Add: Additions during the year*
66,11,949 4,70,334 78,30,515 17,13,940 62,18,679 30,681 12,35,274 5,910 2,554 50,262 21,74,934 12,91,537 2,13,707 29,352 7,74,648 1,11,792 4,34,302 9,31,039 8,07,509 1,81,704 60,144 80,317 2,652 5,188 - 276 - 3,12,69,199
Less: Deductions during the year*
41,57,878 3,31,206 1,07,04,581 13,00,090 57,89,478 67,150 17,89,458 6,845 2,124 95,092 18,66,314 3,50,472 3,77,377 98,683 14,20,765 2,21,483 7,88,018 3,29,337 2,27,952 55,590 63,783 47,682 50,405 2,377 1 11,438 - 3,01,55,579
Closing balance 1,08,33,872 7,28,534 2,16,27,769 29,01,750 1,47,03,617 1,34,061 59,28,081 25,181 7,695 2,06,113 8,33,236 9,58,254 9,33,894 53,216 31,77,070 3,57,220 19,53,344 12,35,864 11,15,059 1,46,084 80,810 2,04,659 (20,810) 8,068 27 (7,282) (68) 6,81,25,318
* Additions represents units creation and deductions represent units cancellation including cancellation for chargesSchedule: F-2INVESTMENTS AS AT MARCH 31, 2017Particulars Funds FundsFundName Balanced Conservative Growth Secured Growth Super HighGrowth Dynamic Oppor-
tunitiesGuaranteedFund
DynamicGuaranteedFundIncome
MoneyMarket Secure Plus Discontinued Individual
Pension Balanced
Pension Conservative
Pension Growth
Pension Secured
Pension Growth Super
Lifemaker Pension Pre-
server
Lifemaker Pension Maxi-
miser
Discontinued Pension
Group Gratuity
Balanced
Group Gratuity
Conservative
Group Gratuity Growth
Group Gratuity Bond
Group Superannua-
tion Balanced
Group Su-perannuation Conservative
Group Su-perannuation
Growth
Total
SFIN ULIF00225/06/04LIFEBALANC104 ULIF00325/06/04LIFECONSER104 ULIF00125/06/04LIFEGROWTH104 ULIF00425/06/04LIFESECURE104 ULIF01108/02/07LIFEGRWSUP104 ULIF01311/02/08LIFEHIGHGR104 ULIF01425/03/08LIFEDYNOPP104 ULIF01004/10/06AMSRGUADYN104 ULIF00904/10/06AMSRGUAINC104 ULIF01528/04/09LIFEMONEYM104 ULIF01628/04/09LIFESECPLS104 ULIF02021/06/13LIFEDISCON104 ULIF00625/11/05PENSBALANC104 ULIF00725/11/05PENSCONSER104 ULIF00525/11/05PENSGROWTH104 ULIF00825/11/05PENSSECURE104 ULIF01213/08/07PENSGRWSUP104 ULIF01815/02/13PENSPRESER104 ULIF01715/02/13PENSMAXIMI104 ULIF01912/08/13PENSDISCON104 ULGF00217/04/06GRATBALANC104 ULGF00317/04/06GRATCONSER104 ULGF00117/04/06GRATGROWTH104 ULGF00707/02/13GRATPLBOND104 ULGF00523/01/07SANNBALANC104 ULGF00623/01/07SANNCONSER104 ULGF00423/01/07SANNGROWTH104Approved InvestmentsGovernment Bonds 64,18,131 7,69,633 1,05,88,941 25,84,822 - - 25,12,510 25,233 8,852 - 8,58,967 21,13,729 5,14,349 65,309 10,62,592 3,53,220 - 12,76,471 8,41,437 2,96,096 1,04,371 3,62,078 69,944 10,715 59 9,769 57 3,08,47,285Corporate Bonds 17,62,789 1,07,798 44,70,188 6,90,389 14,905 - 5,16,176 3,151 1,229 - 1,13,381 - 1,59,717 14,714 3,45,610 96,608 - 1,56,866 99,233 - 18,174 76,121 17,886 - 16 1,126 - 86,66,077Infrastructure Bonds 39,48,304 3,23,694 55,53,105 16,15,385 - - 9,80,533 5,333 454 - 3,43,934 - 3,32,714 22,916 6,05,514 2,04,046 - 1,38,773 1,63,865 - 55,556 88,113 36,229 234 10 1,354 14 1,44,20,080Equity 45,96,007 1,09,282 2,76,79,752 - 3,07,27,996 3,79,671 51,18,366 6,672 562 - - - 4,88,411 12,380 33,49,711 - 37,55,817 2,35,246 6,56,019 - 57,573 - 1,29,280 - 32 - 105 7,73,02,882Money Market 98,345 - 12,49,526 - 4,98,403 - 98,345 - - 2,98,471 - - - - - - - 49,173 49,173 - - - - - - - - 23,41,436Mutual Funds 24,50,000 - 50,00,000 - 23,00,000 - 4,30,000 - - - - 4,00,000 - - 3,50,000 - - - - - - - - - - - - 1,09,30,000Deposit with Bank - - 95,000 - - - - - - - - - - - - - - - - - - - - - - - - 95,000Reverse Repo 3,79,751 1,06,527 47,271 1,08,430 84,199 16,643 7,086 1,988 119 8,120 57,976 5,86,410 35,847 135 3,432 7,295 1,26,747 77,815 1,76,107 1,18,965 21,007 13,540 2,643 102 1 1,090 14 19,89,260Total 1,96,53,327 14,16,934 5,46,83,783 49,99,026 3,36,25,503 3,96,314 96,63,016 42,377 11,216 3,06,591 13,74,258 31,00,139 15,31,038 1,15,454 57,16,859 6,61,169 38,82,564 19,34,344 19,85,834 4,15,061 2,56,681 5,39,852 2,55,982 11,051 118 13,339 190 14,65,92,020Other InvestmentsCorporate Bonds 19,978 - 2,89,283 3,079 - - - - - - - - - - - - - - - - - - - - - - - 3,12,340Infrastructure Bonds - - 53,125 - - - - - - - - - - - - - - - - - - - - - - - - 53,125Equity 3,76,761 8,026 21,32,996 - 33,03,717 41,675 2,51,256 194 30 - - - 21,460 102 1,79,484 - 2,96,119 24,048 46,120 - 3,448 - 8,549 - - - 6 66,93,991Money Market - - - - - - - - - - - - - - - - - - - - - - - - - - - -Mutual Funds - - - - - - - - - - - - - - - - - - - - - - - - - - - -Total 3,96,739 8,026 24,75,404 3,079 33,03,717 41,675 2,51,256 194 30 - - - 21,460 102 1,79,484 - 2,96,119 24,048 46,120 - 3,448 - 8,549 - - - 6 70,59,456GRAND TOTAL 2,00,50,066 14,24,960 5,71,59,187 50,02,105 3,69,29,220 4,37,989 99,14,272 42,571 11,246 3,06,591 13,74,258 31,00,139 15,52,498 1,15,556 58,96,343 6,61,169 41,78,683 19,58,392 20,31,954 4,15,061 2,60,129 5,39,852 2,64,531 11,051 118 13,339 196 15,36,51,476
98% 99% 96% 100% 91% 90% 97% 100% 100% 100% 100% 0% 99% 100% 97% 100% 93% 99% 98% 100% 99% 100% 97% 100% 100% 100% 97% 95%2% 1% 4% 0% 9% 10% 3% 0% 0% 0% 0% 0% 1% 0% 3% 0% 7% 1% 2% 0% 1% 0% 3% 0% 0% 0% 3% 5%
INVESTMENTS AS AT MARCH 31, 2017Particulars Funds FundsFundName Balanced Conservative Growth Secured Growth Super HighGrowth Dynamic Oppor-
tunitiesGuaranteedFund
DynamicGuaranteedFundIncome
MoneyMarket Secure Plus Discontinued Individual
PensionBalanced
Pension Conservative
Pension Growth
Pension Secured
Pension Growth Super
Lifemaker Pension
Preserver
Lifemaker Pension
Maximiser
Discontinued Pension
Group Gratuity Bal-
anced
Group Gratuity Con-
servative
Group Gratuity Growth
Group Gratuity Bond
Group Su-perannuation
Balanced
Group Su-perannuation Conservative
Group Su-perannuation
Growth
Total
SFIN ULIF00225/06/04LIFEBALANC104 ULIF00325/06/04LIFECONSER104 ULIF00125/06/04LIFEGROWTH104 ULIF00425/06/04LIFESECURE104 ULIF01108/02/07LIFEGRWSUP104 ULIF01311/02/08LIFEHIGHGR104 ULIF01425/03/08LIFEDYNOPP104 ULIF01004/10/06AMSRGUADYN104 ULIF00904/10/06AMSRGUAINC104 ULIF01528/04/09LIFEMONEYM104 ULIF01628/04/09LIFESECPLS104 ULIF02021/06/13LIFEDISCON104 ULIF00625/11/05PENSBALANC104 ULIF00725/11/05PENSCONSER104 ULIF00525/11/05PENSGROWTH104 ULIF00825/11/05PENSSECURE104 ULIF01213/08/07PENSGRWSUP104 ULIF01815/02/13PENSPRESER104 ULIF01715/02/13PENSMAXIMI104 ULIF01912/08/13PENSDISCON104 ULGF00217/04/06GRATBALANC104 ULGF00317/04/06GRATCONSER104 ULGF00117/04/06GRATGROWTH104 ULGF00707/02/13GRATPLBOND104 ULGF00523/01/07SANNBALANC104 ULGF00623/01/07SANNCONSER104 ULGF00423/01/07SANNGROWTH104Approved InvestmentsGovernment Bonds 64,03,782 7,70,339 1,17,88,044 26,27,677 - - 26,90,038 27,906 6,764 - 5,54,616 7,80,949 6,78,377 90,905 15,09,250 3,91,635 - 9,09,354 5,81,262 1,01,766 83,556 2,98,963 7,259 8,542 51 8,520 51
3,03,19,606 Corporate Bonds 7,31,113 35,251 32,02,219 4,21,799 15,058 - 1,39,043 1,263 1,177 - 81,828 - 96,373 9,020 2,13,518 82,690 - 10,907 2,190 - 13,319 42,347 4,734 - 14 3,125 - 51,06,988 Infrastructure Bonds 29,12,122 1,71,018 43,22,666 8,80,930 - - 6,22,025 2,029 459 - 2,26,066 - 3,42,692 16,822 3,95,023 1,48,809 - 42,879 38,674 - 53,318 66,702 11,640 - 9 1,015 8
1,02,54,906 Equity 41,51,849 1,00,756 2,97,17,201 - 2,46,22,193 3,61,806 53,30,424 8,633 924 - - - 3,89,780 14,450 31,61,782 - 35,41,044 1,58,864 2,99,475 - 55,872 - 32,363 - 33 - 83 7,19,47,532 Money Market - - 1,307 - 8,99,071 - - - - 3,26,581 - - - - - - - - - - - - - - - - - 12,26,959 Mutual Funds 13,400 - 2,40,000 - 1,15,000 - 70,000 - - - - - - - 1,80,000 26,000 60,000 55,000 49,000 - - - - - - - - 8,08,400 Deposit with Bank - - 95,000 - - - - - - - - - - - - - - - - - - - - - - - - 95,000 Reverse Repo 55 3,994 6,795 7,274 896 15,171 938 980 2,182 2,175 - 2,11,041 3,719 227 7,020 310 136 4,812 15,100 44,041 1,893 2,796 604 479 2 6 29 3,32,675 Total 1,42,12,321 10,81,358 4,93,73,232 39,37,680 2,56,52,218 3,76,977 88,52,468 40,811 11,506 3,28,756 8,62,510 9,91,990 15,10,941 1,31,424 54,66,593 6,49,444 36,01,180 11,81,816 9,85,701 1,45,807 2,07,958 4,10,808 56,600 9,021 109 12,666 171 12,00,92,066 Other InvestmentsCorporate Bonds - - 50,197 2,938 - - - - - - - - - - - - - - - - - - - - - - - 53,135 Infrastructure Bonds - - - - - - - - - - - - - - - - - - - - - - - - - - - - Equity 3,39,594 7,205 29,38,350 - 40,52,309 34,674 3,90,477 - - - - - 32,376 467 2,93,462 - 2,83,403 15,100 29,858 - 2,728 - 2,026 - - - - 84,22,029 Money Market - - - - - - - - - - - - - - - - - - - - - - - - - - - - Mutual Funds - - - - - - - - - - - - - - - - - 50,000 73,240 - - - - - - - - 1,23,240 Total 3,39,594 7,205 29,88,547 2,938 40,52,309 34,674 3,90,477 - - - - - 32,376 467 2,93,462 - 2,83,403 65,100 1,03,098 - 2,728 - 2,026 - - - - 85,98,404 GRAND TOTAL 1,45,51,915 10,88,563 5,23,61,779 39,40,618 2,97,04,527 4,11,651 92,42,945 40,811 11,506 3,28,756 8,62,510 9,91,990 15,43,317 1,31,891 57,60,055 6,49,444 38,84,583 12,46,916 10,88,799 1,45,807 2,10,686 4,10,808 58,626 9,021 109 12,666 171 12,86,90,470 % of Approved Investments to Total
98% 99% 94% 100% 86% 92% 96% 100% 100% 100% 100% 100% 98% 100% 95% 100% 93% 95% 91% 100% 99% 100% 97% 100% 100% 100% 100% 93%
% of Other Investments to Total
2% 1% 6% 0% 14% 8% 4% 0% 0% 0% 0% 0% 2% 0% 5% 0% 7% 5% 9% 0% 1% 0% 3% 0% 0% 0% 0% 7%

Max Life Insurance Company Limited Registration No: 104; Date of Registration with IRDAI: November 15, 2000
AnnuAL RepoRt 2016-17258
Directors' ReportFinancial StatementsSchedules annexed to the forming part of the Financial Statements
All amounts in thousands of Indian Rupees, unless otherwise stated
Schedules to Fund Revenue AccountNAME OF THE INSURER: MAX LIFE INSURANCE COMPANY LIMITEDREGISTRATION NO: 104; DATE OF REGISTRATION WITH IRDA : NOVEMBER 15, 2000Schedule: F - 3CURRENT ASSETSAS AT MARCH 31, 2017Particulars Funds FundsFundName Balanced Conservative Growth Secured Growth Super HighGrowth Dynamic
OpportunitiesGuaranteedFund
DynamicGuaranteedFundIncome
MoneyMarket Secure Plus Discontinued Individual
Pension Balanced
Pension Conservative
Pension Growth
Pension Secured
Pension Growth Super
Lifemaker Pension Pre-
server
Lifemaker Pension Maxi-
miser
Discontinued Pension
Group Gratuity
Balanced
Group Gratuity
Conservative
Group Gratuity Growth
Group Gratuity Bond
Group Superannua-
tion Balanced
Group Su-perannuation Conservative
Group Su-perannuation
Growth
Total
SFIN ULIF00225/06/04LIFEBALANC104 ULIF00325/06/04LIFECONSER104 ULIF00125/06/04LIFEGROWTH104 ULIF00425/06/04LIFESECURE104 ULIF01108/02/07LIFEGRWSUP104 ULIF01311/02/08LIFEHIGHGR104 ULIF01425/03/08LIFEDYNOPP104 ULIF01004/10/06AMSRGUADYN104 ULIF00904/10/06AMSRGUAINC104 ULIF01528/04/09LIFEMONEYM104 ULIF01628/04/09LIFESECPLS104 ULIF02021/06/13LIFEDISCON104 ULIF00625/11/05PENSBALANC104 ULIF00725/11/05PENSCONSER104 ULIF00525/11/05PENSGROWTH104 ULIF00825/11/05PENSSECURE104 ULIF01213/08/07PENSGRWSUP104 ULIF01815/02/13PENSPRESER104 ULIF01715/02/13PENSMAXIMI104 ULIF01912/08/13PENSDISCON104 ULGF00217/04/06GRATBALANC104 ULGF00317/04/06GRATCONSER104 ULGF00117/04/06GRATGROWTH104 ULGF00707/02/13GRATPLBOND104 ULGF00523/01/07SANNBALANC104 ULGF00623/01/07SANNCONSER104 ULGF00423/01/07SANNGROWTH104AccruedInterest 3,55,134 33,705 6,98,723 1,44,851 497 3 1,13,378 1,042 261 1 30,852 47,754 30,123 3,454 61,775 18,332 22 42,125 29,570 7,302 4,854 12,625 3,649 302 3 303 2 16,40,642 UL Interest Accr on Appl Money
- - - - - - - - - - - - - - - - - - - - - - - - - - - -
Cash & Bank Balance 1,004 43 13,898 111 2,484 1,902 16,838 3 1 8 34 39 73 2,035 374 16 271 88 111 6 23 41 26 1 2 2 - 39,434 Unit Subscription Recievable
- - - - - - - - - - - - - - - - - - - - - - - - - - - -
Dividend Recievable 51 2 3,381 - 591 4 593 - - - - - 8 - 137 - 224 9 22 - 7 - 16 - - - - 5,045 Receivable for Sale of Investments
31,942 14,906 86,816 63,884 - 24,531 76,418 - 8 - 4,752 - - - - 10,647 - - - - 1,166 - - - - - 5 3,15,075
Unit Collection A/c 3,57,018 31,065 2,63,197 68,904 1,94,667 646 14,322 46 47 485 1,55,206 1,07,715 - - - 64 - 23,118 51,758 27,330 16,306 2,003 92 - - - - 13,13,989 Other Current Assets (for Investments)
- - - - - 2,735 23,530 - - - - - - - - - - - - - - - - - - - - 26,265
Appropriation (Expropriation) Asset
- - - - - - - - - - - - - - - - - - - - - - - - - - - -
Total 7,45,149 79,721 10,66,015 2,77,750 1,98,239 29,821 2,45,079 1,091 317 494 1,90,844 1,55,508 30,204 5,489 62,286 29,059 517 65,340 81,461 34,638 22,356 14,669 3,783 303 5 305 7 33,40,450
CURRENT ASSETS AS AT MARCH 31, 2016Particulars Funds FundsFundName Balanced Conservative Growth Secured Growth Super HighGrowth Dynamic Oppor-
tunitiesGuaranteedFund
DynamicGuaranteedFundIncome
MoneyMarket Secure Plus Discontinued Individual
Pension Bal-anced
Pension Con-servative
Pension Growth
Pension Se-cured
Pension Growth Super
Lifemaker Pension Pre-
server
Lifemaker Pension Max-
imiser
Discontinued Pension
Group Gratu-ity Balanced
Group Gra-tuity Conser-
vative
Group Gratu-ity Growth
Group Gratu-ity Bond
Group Su-perannuation
Balanced
Group Su-perannuation Conservative
Group Su-perannuation
Growth
Total
SFIN ULIF00225/06/04LIFEBALANC104 ULIF00325/06/04LIFECONSER104 ULIF00125/06/04LIFEGROWTH104 ULIF00425/06/04LIFESECURE104 ULIF01108/02/07LIFEGRWSUP104 ULIF01311/02/08LIFEHIGHGR104 ULIF01425/03/08LIFEDYNOPP104 ULIF01004/10/06AMSRGUADYN104 ULIF00904/10/06AMSRGUAINC104 ULIF01528/04/09LIFEMONEYM104 ULIF01628/04/09LIFESECPLS104 ULIF02021/06/13LIFEDISCON104 ULIF00625/11/05PENSBALANC104 ULIF00725/11/05PENSCONSER104 ULIF00525/11/05PENSGROWTH104 ULIF00825/11/05PENSSECURE104 ULIF01213/08/07PENSGRWSUP104 ULIF01815/02/13PENSPRESER104 ULIF01715/02/13PENSMAXIMI104 ULIF01912/08/13PENSDISCON104 ULGF00217/04/06GRATBALANC104 ULGF00317/04/06GRATCONSER104 ULGF00117/04/06GRATGROWTH104 ULGF00707/02/13GRATPLBOND104 ULGF00523/01/07SANNBALANC104 ULGF00623/01/07SANNCONSER104 ULGF00423/01/07SANNGROWTH104AccruedInterest 2,53,649 21,665 5,89,511 76,312 485 3 81,230 770 201 - 16,769 18,778 24,018 3,202 50,611 14,208 - 18,184 10,070 2,779 4,200 7,783 597 156 3 328 2 11,95,514Cash & Bank Balance 6,503 256 30,335 86 15,411 511 8,579 2 2 8 90 14 42 4 3,427 15 1,252 44 44 8 16 27 5 1 0 1 - 66,683Dividend Receivable 363 10 2,004 - 2,790 4 1,193 1 - - - - 77 2 605 - 528 9 19 - 9 - - - - - - 7,614Receivable for Sale of Investments
71,788 - 2,78,280 - 5,21,397 - 1,01,159 - - - - - - - 13,353 - - - - - - - - - - - - 9,85,977
Unit Collection A/c 4,99,323 40,458 3,96,821 1,01,788 3,12,467 2,601 47,341 258 - 557 1,54,497 3,944 - 345 1,461 - 6,680 63,622 61,444 4,579 5,311 74 - - - - - 17,03,571Other Current Assets (for Investments)
9,706 334 46,904 - 23,754 721 15,223 - - - - - - - 5,223 - 1,967 - - - - - - - - - - 1,03,832
Appropriation (Expropriation) Asset
- - - - - - - - - - - - - - - - - - - - - - - - - - - -
Total 8,41,332 62,723 13,43,855 1,78,186 8,76,304 3,840 2,54,725 1,031 203 565 1,71,356 22,736 24,137 3,553 74,680 14,223 10,427 81,859 71,577 7,366 9,536 7,884 602 157 3 329 2 40,63,191
Schedule: F - 4CURRENT LIABILITIES AS AT MARCH 31, 2017Particulars Funds FundsFundName Balanced Conservative Growth Secured Growth Super HighGrowth Dynamic Oppor-
tunitiesGuaranteedFund
DynamicGuaranteedFundIncome
MoneyMarket Secure Plus Discontinued Individual
Pension Balanced
Pension Conservative
Pension Growth
Pension Secured
Pension Growth Super
Lifemaker Pension Pre-
server
Lifemaker Pension Maxi-
miser
Discontinued Pension
Group Gratuity
Balanced
Group Gratuity Con-
servative
Group Gratuity Growth
Group Gratu-ity Bond
Group Superannua-
tion Balanced
Group Su-perannuation Conservative
Group Su-perannuation
Growth
Total
SFIN ULIF00225/06/04LIFEBALANC104 ULIF00325/06/04LIFECONSER104 ULIF00125/06/04LIFEGROWTH104 ULIF00425/06/04LIFESECURE104 ULIF01108/02/07LIFEGRWSUP104 ULIF01311/02/08LIFEHIGHGR104 ULIF01425/03/08LIFEDYNOPP104 ULIF01004/10/06AMSRGUADYN104 ULIF00904/10/06AMSRGUAINC104 ULIF01528/04/09LIFEMONEYM104 ULIF01628/04/09LIFESECPLS104 ULIF02021/06/13LIFEDISCON104 ULIF00625/11/05PENSBALANC104 ULIF00725/11/05PENSCONSER104 ULIF00525/11/05PENSGROWTH104 ULIF00825/11/05PENSSECURE104 ULIF01213/08/07PENSGRWSUP104 ULIF01815/02/13PENSPRESER104 ULIF01715/02/13PENSMAXIMI104 ULIF01912/08/13PENSDISCON104 ULGF00217/04/06GRATBALANC104 ULGF00317/04/06GRATCONSER104 ULGF00117/04/06GRATGROWTH104 ULGF00707/02/13GRATPLBOND104 ULGF00523/01/07SANNBALANC104 ULGF00623/01/07SANNCONSER104 ULGF00423/01/07SANNGROWTH104Payable for Purchase of Investments
2,06,818 14,781 3,60,968 1,65,089 1 15,438 1,85,616 - 13 - 56,074 - - 2,152 51,514 10,558 - - - - 5,317 - - - - - - 10,74,339
Unit Redemption Payable - - - - - - - - - - - - - - - - - - - - - - - - - - - - Other Current Liabilities - - - - - - - - - - - - - - - - - - - - - - - - - - - - Unit Payable A/c - - - - - - - - - - - - 1,349 195 5,105 - 1,429 - - - - - - - - - - 8,078 Appropriation (Expropriation) Liability
- - - - - - - - - - - - - - - - - - - - - - - - - - - -
Total 2,06,818 14,781 3,60,968 1,65,089 1 15,438 1,85,616 - 13 - 56,074 - 1,349 2,347 56,619 10,558 1,429 - - - 5,317 - - - - - - 10,82,417
CURRENT LIABILITIES AS AT MARCH 31, 2016Particulars Funds FundsFundName Balanced Conservative Growth Secured Growth Super HighGrowth Dynamic Oppor-
tunitiesGuaranteedFund
DynamicGuaranteedFundIncome
MoneyMarket Secure Plus Discontinued Individual
Pension Balanced
Pension Conservative
Pension Growth
Pension Secured
Pension Growth Super
Lifemaker Pension
Preserver
Lifemaker Pension
Maximiser
Discontinued Pension
Group Gratu-ity Balanced
Group Gratuity
Conservative
Group Gratuity Growth
Group Gratu-ity Bond
Group Su-perannuation
Balanced
Group Su-perannuation Conservative
Group Su-perannuation
Growth
Total
SFIN ULIF00225/06/04LIFEBALANC104 ULIF00325/06/04LIFECONSER104 ULIF00125/06/04LIFEGROWTH104 ULIF00425/06/04LIFESECURE104 ULIF01108/02/07LIFEGRWSUP104 ULIF01311/02/08LIFEHIGHGR104 ULIF01425/03/08LIFEDYNOPP104 ULIF01004/10/06AMSRGUADYN104 ULIF00904/10/06AMSRGUAINC104 ULIF01528/04/09LIFEMONEYM104 ULIF01628/04/09LIFESECPLS104 ULIF02021/06/13LIFEDISCON104 ULIF00625/11/05PENSBALANC104 ULIF00725/11/05PENSCONSER104 ULIF00525/11/05PENSGROWTH104 ULIF00825/11/05PENSSECURE104 ULIF01213/08/07PENSGRWSUP104 ULIF01815/02/13PENSPRESER104 ULIF01715/02/13PENSMAXIMI104 ULIF01912/08/13PENSDISCON104 ULGF00217/04/06GRATBALANC104 ULGF00317/04/06GRATCONSER104 ULGF00117/04/06GRATGROWTH104 ULGF00707/02/13GRATPLBOND104 ULGF00523/01/07SANNBALANC104 ULGF00623/01/07SANNCONSER104 ULGF00423/01/07SANNGROWTH104Payable for Purchase of Investments
99,090 1,884 5,87,386 0 3,49,386 4,069 1,27,202 - - - - - - - 28,299 1 10,351 - - - - 0 - - - - - 12,07,668
Fund Mgmt Charges PayableOther Current Liabilities (for Investments)
- - - - - - - - - - - - - - - - - - - - - - - - - - - -
Unit Payable A/c - - - - - - - - 14 - - - 5,072 - - 3,054 - - - - - - 1 - - - - 8,141 Appropriation (Expropriation) Liability
- - - - - - - - - - - - - - - - - - - - - - - - - - - -
Total 99,090 1,884 5,87,386 0 3,49,386 4,069 1,27,202 - 14 - - - 5,072 - 28,299 3,055 10,351 - - - - 0 1 - - - - 12,15,809
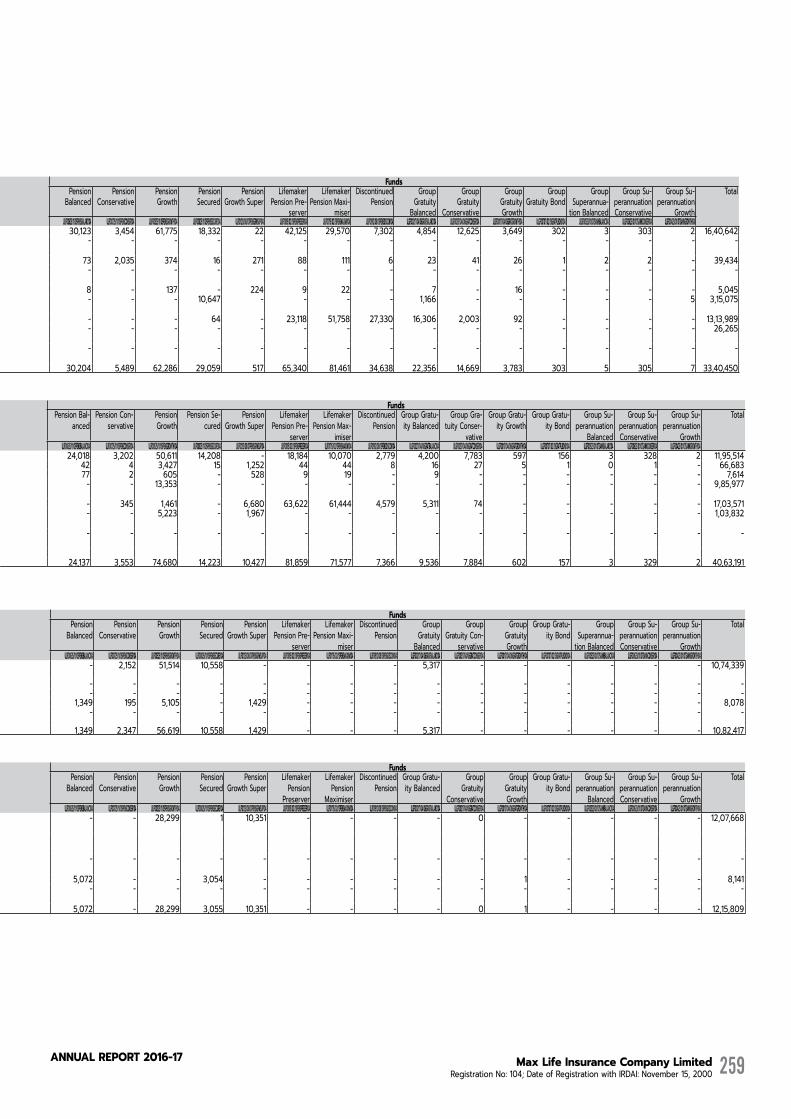
Max Life Insurance Company Limited Registration No: 104; Date of Registration with IRDAI: November 15, 2000
AnnuAL RepoRt 2016-17 259
Schedules to Fund Revenue AccountNAME OF THE INSURER: MAX LIFE INSURANCE COMPANY LIMITEDREGISTRATION NO: 104; DATE OF REGISTRATION WITH IRDA : NOVEMBER 15, 2000Schedule: F - 3CURRENT ASSETSAS AT MARCH 31, 2017Particulars Funds FundsFundName Balanced Conservative Growth Secured Growth Super HighGrowth Dynamic
OpportunitiesGuaranteedFund
DynamicGuaranteedFundIncome
MoneyMarket Secure Plus Discontinued Individual
Pension Balanced
Pension Conservative
Pension Growth
Pension Secured
Pension Growth Super
Lifemaker Pension Pre-
server
Lifemaker Pension Maxi-
miser
Discontinued Pension
Group Gratuity
Balanced
Group Gratuity
Conservative
Group Gratuity Growth
Group Gratuity Bond
Group Superannua-
tion Balanced
Group Su-perannuation Conservative
Group Su-perannuation
Growth
Total
SFIN ULIF00225/06/04LIFEBALANC104 ULIF00325/06/04LIFECONSER104 ULIF00125/06/04LIFEGROWTH104 ULIF00425/06/04LIFESECURE104 ULIF01108/02/07LIFEGRWSUP104 ULIF01311/02/08LIFEHIGHGR104 ULIF01425/03/08LIFEDYNOPP104 ULIF01004/10/06AMSRGUADYN104 ULIF00904/10/06AMSRGUAINC104 ULIF01528/04/09LIFEMONEYM104 ULIF01628/04/09LIFESECPLS104 ULIF02021/06/13LIFEDISCON104 ULIF00625/11/05PENSBALANC104 ULIF00725/11/05PENSCONSER104 ULIF00525/11/05PENSGROWTH104 ULIF00825/11/05PENSSECURE104 ULIF01213/08/07PENSGRWSUP104 ULIF01815/02/13PENSPRESER104 ULIF01715/02/13PENSMAXIMI104 ULIF01912/08/13PENSDISCON104 ULGF00217/04/06GRATBALANC104 ULGF00317/04/06GRATCONSER104 ULGF00117/04/06GRATGROWTH104 ULGF00707/02/13GRATPLBOND104 ULGF00523/01/07SANNBALANC104 ULGF00623/01/07SANNCONSER104 ULGF00423/01/07SANNGROWTH104AccruedInterest 3,55,134 33,705 6,98,723 1,44,851 497 3 1,13,378 1,042 261 1 30,852 47,754 30,123 3,454 61,775 18,332 22 42,125 29,570 7,302 4,854 12,625 3,649 302 3 303 2 16,40,642 UL Interest Accr on Appl Money
- - - - - - - - - - - - - - - - - - - - - - - - - - - -
Cash & Bank Balance 1,004 43 13,898 111 2,484 1,902 16,838 3 1 8 34 39 73 2,035 374 16 271 88 111 6 23 41 26 1 2 2 - 39,434 Unit Subscription Recievable
- - - - - - - - - - - - - - - - - - - - - - - - - - - -
Dividend Recievable 51 2 3,381 - 591 4 593 - - - - - 8 - 137 - 224 9 22 - 7 - 16 - - - - 5,045 Receivable for Sale of Investments
31,942 14,906 86,816 63,884 - 24,531 76,418 - 8 - 4,752 - - - - 10,647 - - - - 1,166 - - - - - 5 3,15,075
Unit Collection A/c 3,57,018 31,065 2,63,197 68,904 1,94,667 646 14,322 46 47 485 1,55,206 1,07,715 - - - 64 - 23,118 51,758 27,330 16,306 2,003 92 - - - - 13,13,989 Other Current Assets (for Investments)
- - - - - 2,735 23,530 - - - - - - - - - - - - - - - - - - - - 26,265
Appropriation (Expropriation) Asset
- - - - - - - - - - - - - - - - - - - - - - - - - - - -
Total 7,45,149 79,721 10,66,015 2,77,750 1,98,239 29,821 2,45,079 1,091 317 494 1,90,844 1,55,508 30,204 5,489 62,286 29,059 517 65,340 81,461 34,638 22,356 14,669 3,783 303 5 305 7 33,40,450
CURRENT ASSETS AS AT MARCH 31, 2016Particulars Funds FundsFundName Balanced Conservative Growth Secured Growth Super HighGrowth Dynamic Oppor-
tunitiesGuaranteedFund
DynamicGuaranteedFundIncome
MoneyMarket Secure Plus Discontinued Individual
Pension Bal-anced
Pension Con-servative
Pension Growth
Pension Se-cured
Pension Growth Super
Lifemaker Pension Pre-
server
Lifemaker Pension Max-
imiser
Discontinued Pension
Group Gratu-ity Balanced
Group Gra-tuity Conser-
vative
Group Gratu-ity Growth
Group Gratu-ity Bond
Group Su-perannuation
Balanced
Group Su-perannuation Conservative
Group Su-perannuation
Growth
Total
SFIN ULIF00225/06/04LIFEBALANC104 ULIF00325/06/04LIFECONSER104 ULIF00125/06/04LIFEGROWTH104 ULIF00425/06/04LIFESECURE104 ULIF01108/02/07LIFEGRWSUP104 ULIF01311/02/08LIFEHIGHGR104 ULIF01425/03/08LIFEDYNOPP104 ULIF01004/10/06AMSRGUADYN104 ULIF00904/10/06AMSRGUAINC104 ULIF01528/04/09LIFEMONEYM104 ULIF01628/04/09LIFESECPLS104 ULIF02021/06/13LIFEDISCON104 ULIF00625/11/05PENSBALANC104 ULIF00725/11/05PENSCONSER104 ULIF00525/11/05PENSGROWTH104 ULIF00825/11/05PENSSECURE104 ULIF01213/08/07PENSGRWSUP104 ULIF01815/02/13PENSPRESER104 ULIF01715/02/13PENSMAXIMI104 ULIF01912/08/13PENSDISCON104 ULGF00217/04/06GRATBALANC104 ULGF00317/04/06GRATCONSER104 ULGF00117/04/06GRATGROWTH104 ULGF00707/02/13GRATPLBOND104 ULGF00523/01/07SANNBALANC104 ULGF00623/01/07SANNCONSER104 ULGF00423/01/07SANNGROWTH104AccruedInterest 2,53,649 21,665 5,89,511 76,312 485 3 81,230 770 201 - 16,769 18,778 24,018 3,202 50,611 14,208 - 18,184 10,070 2,779 4,200 7,783 597 156 3 328 2 11,95,514Cash & Bank Balance 6,503 256 30,335 86 15,411 511 8,579 2 2 8 90 14 42 4 3,427 15 1,252 44 44 8 16 27 5 1 0 1 - 66,683Dividend Receivable 363 10 2,004 - 2,790 4 1,193 1 - - - - 77 2 605 - 528 9 19 - 9 - - - - - - 7,614Receivable for Sale of Investments
71,788 - 2,78,280 - 5,21,397 - 1,01,159 - - - - - - - 13,353 - - - - - - - - - - - - 9,85,977
Unit Collection A/c 4,99,323 40,458 3,96,821 1,01,788 3,12,467 2,601 47,341 258 - 557 1,54,497 3,944 - 345 1,461 - 6,680 63,622 61,444 4,579 5,311 74 - - - - - 17,03,571Other Current Assets (for Investments)
9,706 334 46,904 - 23,754 721 15,223 - - - - - - - 5,223 - 1,967 - - - - - - - - - - 1,03,832
Appropriation (Expropriation) Asset
- - - - - - - - - - - - - - - - - - - - - - - - - - - -
Total 8,41,332 62,723 13,43,855 1,78,186 8,76,304 3,840 2,54,725 1,031 203 565 1,71,356 22,736 24,137 3,553 74,680 14,223 10,427 81,859 71,577 7,366 9,536 7,884 602 157 3 329 2 40,63,191
Schedule: F - 4CURRENT LIABILITIES AS AT MARCH 31, 2017Particulars Funds FundsFundName Balanced Conservative Growth Secured Growth Super HighGrowth Dynamic Oppor-
tunitiesGuaranteedFund
DynamicGuaranteedFundIncome
MoneyMarket Secure Plus Discontinued Individual
Pension Balanced
Pension Conservative
Pension Growth
Pension Secured
Pension Growth Super
Lifemaker Pension Pre-
server
Lifemaker Pension Maxi-
miser
Discontinued Pension
Group Gratuity
Balanced
Group Gratuity Con-
servative
Group Gratuity Growth
Group Gratu-ity Bond
Group Superannua-
tion Balanced
Group Su-perannuation Conservative
Group Su-perannuation
Growth
Total
SFIN ULIF00225/06/04LIFEBALANC104 ULIF00325/06/04LIFECONSER104 ULIF00125/06/04LIFEGROWTH104 ULIF00425/06/04LIFESECURE104 ULIF01108/02/07LIFEGRWSUP104 ULIF01311/02/08LIFEHIGHGR104 ULIF01425/03/08LIFEDYNOPP104 ULIF01004/10/06AMSRGUADYN104 ULIF00904/10/06AMSRGUAINC104 ULIF01528/04/09LIFEMONEYM104 ULIF01628/04/09LIFESECPLS104 ULIF02021/06/13LIFEDISCON104 ULIF00625/11/05PENSBALANC104 ULIF00725/11/05PENSCONSER104 ULIF00525/11/05PENSGROWTH104 ULIF00825/11/05PENSSECURE104 ULIF01213/08/07PENSGRWSUP104 ULIF01815/02/13PENSPRESER104 ULIF01715/02/13PENSMAXIMI104 ULIF01912/08/13PENSDISCON104 ULGF00217/04/06GRATBALANC104 ULGF00317/04/06GRATCONSER104 ULGF00117/04/06GRATGROWTH104 ULGF00707/02/13GRATPLBOND104 ULGF00523/01/07SANNBALANC104 ULGF00623/01/07SANNCONSER104 ULGF00423/01/07SANNGROWTH104Payable for Purchase of Investments
2,06,818 14,781 3,60,968 1,65,089 1 15,438 1,85,616 - 13 - 56,074 - - 2,152 51,514 10,558 - - - - 5,317 - - - - - - 10,74,339
Unit Redemption Payable - - - - - - - - - - - - - - - - - - - - - - - - - - - - Other Current Liabilities - - - - - - - - - - - - - - - - - - - - - - - - - - - - Unit Payable A/c - - - - - - - - - - - - 1,349 195 5,105 - 1,429 - - - - - - - - - - 8,078 Appropriation (Expropriation) Liability
- - - - - - - - - - - - - - - - - - - - - - - - - - - -
Total 2,06,818 14,781 3,60,968 1,65,089 1 15,438 1,85,616 - 13 - 56,074 - 1,349 2,347 56,619 10,558 1,429 - - - 5,317 - - - - - - 10,82,417
CURRENT LIABILITIES AS AT MARCH 31, 2016Particulars Funds FundsFundName Balanced Conservative Growth Secured Growth Super HighGrowth Dynamic Oppor-
tunitiesGuaranteedFund
DynamicGuaranteedFundIncome
MoneyMarket Secure Plus Discontinued Individual
Pension Balanced
Pension Conservative
Pension Growth
Pension Secured
Pension Growth Super
Lifemaker Pension
Preserver
Lifemaker Pension
Maximiser
Discontinued Pension
Group Gratu-ity Balanced
Group Gratuity
Conservative
Group Gratuity Growth
Group Gratu-ity Bond
Group Su-perannuation
Balanced
Group Su-perannuation Conservative
Group Su-perannuation
Growth
Total
SFIN ULIF00225/06/04LIFEBALANC104 ULIF00325/06/04LIFECONSER104 ULIF00125/06/04LIFEGROWTH104 ULIF00425/06/04LIFESECURE104 ULIF01108/02/07LIFEGRWSUP104 ULIF01311/02/08LIFEHIGHGR104 ULIF01425/03/08LIFEDYNOPP104 ULIF01004/10/06AMSRGUADYN104 ULIF00904/10/06AMSRGUAINC104 ULIF01528/04/09LIFEMONEYM104 ULIF01628/04/09LIFESECPLS104 ULIF02021/06/13LIFEDISCON104 ULIF00625/11/05PENSBALANC104 ULIF00725/11/05PENSCONSER104 ULIF00525/11/05PENSGROWTH104 ULIF00825/11/05PENSSECURE104 ULIF01213/08/07PENSGRWSUP104 ULIF01815/02/13PENSPRESER104 ULIF01715/02/13PENSMAXIMI104 ULIF01912/08/13PENSDISCON104 ULGF00217/04/06GRATBALANC104 ULGF00317/04/06GRATCONSER104 ULGF00117/04/06GRATGROWTH104 ULGF00707/02/13GRATPLBOND104 ULGF00523/01/07SANNBALANC104 ULGF00623/01/07SANNCONSER104 ULGF00423/01/07SANNGROWTH104Payable for Purchase of Investments
99,090 1,884 5,87,386 0 3,49,386 4,069 1,27,202 - - - - - - - 28,299 1 10,351 - - - - 0 - - - - - 12,07,668
Fund Mgmt Charges PayableOther Current Liabilities (for Investments)
- - - - - - - - - - - - - - - - - - - - - - - - - - - -
Unit Payable A/c - - - - - - - - 14 - - - 5,072 - - 3,054 - - - - - - 1 - - - - 8,141 Appropriation (Expropriation) Liability
- - - - - - - - - - - - - - - - - - - - - - - - - - - -
Total 99,090 1,884 5,87,386 0 3,49,386 4,069 1,27,202 - 14 - - - 5,072 - 28,299 3,055 10,351 - - - - 0 1 - - - - 12,15,809
Max Life Insurance Company Limited Registration No: 104; Date of Registration with IRDAI: November 15, 2000
AnnuAL RepoRt 2016-17260
Directors' ReportFinancial StatementsSchedules annexed to the forming part of the Financial Statements
All amounts in thousands of Indian Rupees, unless otherwise stated
SCHEDULE 16
SignificantAccountingPoliciesandNotestoAccounts
Corporate Information
Max Life Insurance Company Limited (‘the Company’) was incorporated on July 11, 2000 as a public limited company under the Companies Act, 1956 to undertake and carry on the business of life insurance and annuity. The Company obtained a license from the Insurance Regulatory and Development Authority of India (‘IRDAI’) for carrying on life insurance business on November 15, 2000. The license has been renewed regularly and is in force as at March 31, 2017. The Company offers a range of participating, non participating and linked products covering life insurance, pension and health benefits including riders for individual and group segments. These products are distributed by individual agents, corporate agents, banks, brokers and other channels.
On April 12, 2012 Japan’s Mitsui Sumitomo Insurance Company Limited (a MS & AD insurance group Company) signed a definitive tripartite agreement with New York Life Enterprises (‘NYLE’) and Max India Limited to acquire 26% stake in Max New York Life Insurance Company Limited. Accordingly the stake of NYLE had been transferred to Mitsui Sumitomo Insurance Company Limited on June 27, 2012. Consequently, the name of the Company had been changed to Max Life Insurance Company Limited from erstwhile Max New York Life Insurance Company Limited w.e.f. July 6, 2012.
Pursuant to order of Hon’ble High Court of Punjab and Haryana dated December 14, 2015 for approval of Max India’s Composite Scheme of Arrangement, Max India Limited the holding company has demerged into three separate companies on January 15, 2016 – Max Financial Services Limited (MFS), Max India Limited & Max Ventures and Industries (MVIL). As a result of which, Max Financial Services Limited (MFS) becomes holding company of Max Life Insurance Company Limited, through its 68% shareholding in Max Life Insurance Company Limited.
On August 08, 2016 board approval was accorded to a draft ‘Composite Scheme of Amalgamation and Arrangement’ for amalgamating “the Company” with MFS; demerger of the insurance business from MFS and amalgamation into HDFC Standard Life Insurance Company Limited; merger of the remaining business of MFS into Max India Limited. Consequently, relevant regulatory approvals have been sought and are awaited.
I SignificantAccountingPolicies
Basis of preparation
The accompanying financial statements are prepared and presented under the historical cost convention, unless otherwise stated, and on accrual basis of accounting, in accordance with accounting principles generally accepted in India (Indian GAAP). The company has prepared the financial statements in compliance with the accounting standards notified under section 133 of the Companies Act 2013, read with relevant rules issued thereunder and other accounting principles generally accepted in India, to the extent considered relevant and appropriate for the purpose of financial reporting and are not inconsistent with the accounting principles as prescribed under the provisions of the Insurance Act, 1938 (amended by the Insurance Laws (Amendment) Act, 2015), Insurance Regulatory and Development Authority Act, 1999, Insurance Regulatory and Development Authority of India (Preparation of Financial Statements and Auditor’s Report of Insurance Companies) Regulations, 2002, (‘the Financial Statements Regulations’), the Master Circular on Preparation of Financial Statements and Filing of Returns of Life Insurance Business Ref No. IRDA/F&A/ Cir/232/12/2013 dated December 11, 2013, (‘the Master Circular’), the regulations framed thereunder and various orders/directions/circulars issued by the IRDAI and the practices prevailing within the insurance industry in India. Accounting policies have been consistently applied to the extent applicable and in the manner so required.
Use of estimates
The preparation of the financial statements is in conformity with the generally accepted accounting principles in India that require management to make estimates and assumptions that affect the reported amounts of assets and liabilities, disclosure of contingent liabilities as at the date of the financial statements, and the reported amounts of revenue and expenses during the year. The estimates and assumptions used in the accompanying financial statements are based upon management’s evaluation of the relevant facts and circumstances upto and as of the date of the financial statements. Actual results could differ from the estimates. Any revision to accounting estimates is recognised prospectively in current and future periods.
1) RevenueRecognition
Premium Income
Premium is recognised as income when due from policyholders. For linked business, premium income is recognised when the associated units are created. Premium on lapsed policies is recognised as income when such policies are reinstated. Top-up premiums are recognised as single premium.
Incomefromlinkedpolicies
Income on linked policies including fund management charges, policy administration charges, surrender penalty charges,
Max Life Insurance Company Limited Registration No: 104; Date of Registration with IRDAI: November 15, 2000
AnnuAL RepoRt 2016-17 261
mortality charges, and other charges , wherever applicable are recovered from the linked fund and recognised when due in accordance with the terms and conditions mentioned in the policies.
Incomeearnedoninvestments
OtherthanLinkedBusiness
Interest income from investments is recognised on accrual basis. Amortization of premium/accretion of discount on debt securities including money market instruments is recognised over the maturity period on its intrinsic yield. Dividend income is recognised when the right to receive dividend is established. Realized gains/loss on debt securities is the difference between the sale consideration and the amortized cost computed on weighted average basis on the date of sale. Sale consideration for the purpose of realized gain/loss excludes interest accrued till transaction settlement date and is net of brokerage and statutory levies, if any.
In case of listed equity shares, mutual fund units, additional tier-1 bonds and alternate investment funds the profit/loss on actual sale of investment includes the accumulated changes in the fair value, previously recognised under “Fair Value Change Account” in the Balance Sheet. Unrealized gains/losses due to change in fair value of listed equity shares, mutual funds, additional tier-1 bonds and alternate investment funds units are credited / debited to the ‘Fair Value Change Account’. Income from alternative investment fund is recognised when a right to receive payment is established.
LinkedBusiness
Interest income from investments is recognised on an accrual basis. Amortization of premium/accretion of discount on debt securities with a residual maturity upto 182 days and money market instruments is recognised uniformly over the remaining maturity period. Dividend income is recognised on the ex-dividend date.
Realized gain/loss on securities is the difference between the sale consideration and the book value, which is computed on weighted average basis, on the date of sale. Sale consideration for the purpose of realized gain/loss excludes interest accrued till transaction settlement date and is net of brokerage and statutory levies, if any. Unrealized gains and losses are recognised in the respective fund’s Revenue Account.
Incomeearnedonloans
Interest income on loans is recognised on an accrual basis. Fees and charges also include policy reinstatement fees and loan processing fees which are recognised on receipt basis.
RentalIncomeonInvestmentProperty
Lease rentals on investment property is recognised on accrual basis and include only the realisable rent. Costs related to operating and maintenance of investment property are recognised as expense in the Revenue Account.
2) Reinsurance Premium
Reinsurance premium ceded is accounted for at the time of recognition of premium income in accordance with the treaty or in-principle arrangement with the reinsurer. Profit commission on reinsurance ceded is netted off against premium ceded on reinsurance.
3) AcquisitionCosts
Acquisition costs include expenses which are incurred to solicit and underwrite insurance contracts such as commission, medical fee, stamp duty, policy printing expenses, and other related expenses. These costs are expensed in the year in which they are incurred. Clawback of the commission paid, if any, is accounted for in the year in which it becomes recoverable.
4) BenefitsPaid
Benefits paid include policy benefit amount and the direct costs of settlement if any. Reinsurance recoverable thereon, if any, is accounted for in the same period as the related claim. Repudiated claims disputed before judicial authorities are provided for based on management judgment considering the facts and evidences available in respect of such claims.
Death and other claims are accounted for, when notified. Surrenders / withdrawal under non linked policies are accounted on the receipt of the consent from the policyholder. Surrenders / withdrawals under linked policies are accounted in the respective schemes when the associated units are cancelled. Surrenders, withdrawals and lapsation are disclosed net of charges recoverable. Amount payable on lapsed and discontinued policies are accounted for on expiry of lock in period.
Survival and maturity benefits are accounted for when due for payment to the policyholders.
Max Life Insurance Company Limited Registration No: 104; Date of Registration with IRDAI: November 15, 2000
AnnuAL RepoRt 2016-17262
Directors' ReportFinancial StatementsSchedules annexed to the forming part of the Financial Statements
All amounts in thousands of Indian Rupees, unless otherwise stated
5) Investments
Investments are made in accordance with the provision of the Insurance Act, 1938 and the Insurance Regulatory & Development Authority (Investment) Regulations, 2000 as amended and subsequent circulars/notifications issued by the IRDAI from time to time. Investments are recorded at cost on date of purchase, which includes brokerage and statutory levies, if any and excludes interest paid, if any, on purchase. Diminution in the value of investment (non-linked), other than temporary decline, is charged to Revenue Account/ Profit and loss account as applicable.
Classification
Investments intended to be held for a period less than twelve months or maturing within twelve months from the balance sheet date are classified as short term investments. All other investments are classified as long-term investments.
Valuation-Shareholder’sInvestmentsandNon-linkedPolicyholder’sInvestments
Debt securities, which include government securities and redeemable preference shares are considered as ‘held to maturity’ and measured at historical cost subject to amortization. The premium/discount, if any, on purchase of debt securities including money market instruments is recognised and amortized in the Revenue Account/Profit and Loss Account, as applicable, over the remaining period to maturity on the basis of their intrinsic yield.
Reverse repos are valued at cost. Fixed deposits are valued at cost till the date of maturity.
Listed shares, as at balance sheet date, are valued at fair value, being the last quoted closing price on National Stock Exchange (NSE) and in case the same is not available, then on the Bombay Stock Exchange Ltd (BSE). Unlisted equity shares (including awaiting listing) are stated at historical cost subject to diminution, if any, determined separately for each individual investment. Investments in Mutual fund units are valued at previous day’s net asset value of the respective funds.
Alternate Investment Funds are valued at Net Asset Value (NAV) if applicable or Historical Cost less diminution in value of Investments.
Additional Tier-1 bonds are valued on the basis of values generated by bond valuer based on matrix released by Credit Rating Information Services of India Limited (CRISIL) on daily basis.
Money market instruments like Commercial Papers, Certificate of Deposit, Treasury Bills (T-Bills) and Collaterised Borrowing and Lending Obligation (CBLO) are valued at historical cost, subject to amortisation of premium or accretion of discount over the period of maturity/holding on a Yield to maturity.
Land or building or part of a building or both held to earn rental income or capital appreciation or for both, if any, rather than for use in services or for administrative purposes is classified as real estate investment property and is valued at historical cost (including cost of improvements and other incidental costs) subject to revaluation on an annual basis. The change in the carrying amount of the investment property shall be taken to Revaluation Reserve. The depreciation charge shall be ignored for the valuation of Investment Property.
Rights are valued at fair value, being last quoted closing price on National Stock Exchange (NSE) and in case the same is not available, then on BSE. Unlisted rights are valued at a price computed as a difference between offer price and valuation price of the parent security.
Bonus entitlements are recognised as investments on the ‘ex- bonus date’.
Valuation-LinkedInvestments
Government securities are valued at the prices obtained from CRISIL Limited. Debt securities other than Government Securities are valued on the basis of values generated by bond valuer based on matrix released by the CRISIL Limited on daily basis.
Listed shares are valued at fair value, being the last quoted closing price on National Stock Exchange (NSE) and in case the same is not available, then on the BSE Ltd (BSE). Unlisted equity shares (including awaiting listing) are stated at historical cost subject to diminution, if any, determined separately for each individual investment. Mutual fund units are taken at the previous day’s net asset values.
Compulsory Convertible Debentures (CCD’s) are valued at fair value, being the last quoted closing price on National Stock Exchange (NSE) and in case the same is not available, then on the BSE Ltd(BSE).
Securities with call options are valued at the lower of the values as obtained by valuing the security to the final maturity date or to the call option date by using the benchmark rate based on the matrix released by CRISIL on daily basis. Securities with put options are valued at the higher of the value as obtained by valuing the security to the final maturity date or to the put option date by using the benchmark rate based on the matrix released by CRISIL on daily basis.

Max Life Insurance Company Limited Registration No: 104; Date of Registration with IRDAI: November 15, 2000
AnnuAL RepoRt 2016-17 263
Reverse repos are valued at cost. Fixed deposits are valued at cost till the date of maturity.
Money market and debt securities with a residual maturity upto 182 days are valued at amortised cost being the difference between the redemption value and historical cost/last valuation price, spread uniformly over the remaining maturity period of the instrument
Rights are valued at fair value, last quoted closing price on National Stock Exchange (NSE) and in case the same is not available, then on Bombay Stock Exchange (BSE). Unlisted rights are valued at a price computed as a difference between offer price and valuation price of the parent security
Bonus entitlements are recognised as investments on the ‘ex- bonus date’.
ValuationofDerivativeInstrument:-
Interest rate swaps are contractual agreements between two parties to exchange fixed rate and floating rate interest by means of periodic payments, calculated on a specified notional amount and defined interest rates. Interest payments are netted against each other, with the difference between the fixed and floating rate payments paid by one party.
For cash flow hedges, a forecast transaction that is the subject of the hedge must be highly probable and must present an exposure to variations in cash flows that could ultimately affect Revenue/Profit or loss.
At the inception of the transaction, the Company documents the relationship between the hedging instrument and the hedged item, as well as the risk management objective and the strategy for undertaking the hedge transaction. The Company also documents its assessment of whether the hedge is expected to be, and has been, highly effective in offsetting the risk in the hedged item, both at inception and on an ongoing basis.
Hedge effectiveness is the degree to which changes in cash flows of the hedged item that are attributable to a hedged risk are offset by changes in the cash flows of the hedging instrument. Hedge effectiveness is ascertained at the time of inception of the hedge and periodically thereafter. The portion of fair value gain/loss on the Interest Rate Derivative that is determined to be an effective hedge is recognised directly in appropriate equity account i.e. ‘Hedge Fluctuation Reserve’ which is included in ‘Credit/(Debit) Fair Value Change Account’ under Policyholders funds in the balance sheet. The ineffective portion of the change in fair value of such instruments is recognised in the Revenue Account in the period in which they arise. If the hedging relationship ceases to be effective or it becomes probable that the expected forecast transaction will no longer occur, hedge accounting is discontinued and accumulated gains or losses that were recognised directly in the Hedge Fluctuation Reserve are reclassified into Revenue Account.
All derivatives are initially recognised in the Balance sheet at their fair value, which usually represents their cost. They are subsequently re-measured at their fair value, with the method of recognising movements in this value depending on whether they are designated as hedging instruments and, if so, the nature of the item being hedged. Fair values are obtained from quoted market prices. All derivatives are carried as assets when the fair values are positive and as liabilities when the fair values are negative. The notional or contractual amounts associated with derivative financial instruments are not recorded as assets or liabilities on the statement of financial position as they do not represent the fair value of these transactions.
TransferofInvestments
Investments in debt securities are transferred from shareholders to policyholders at the lower of the market price and net amortized cost. Investments other than debt securities are transferred from shareholders to policyholders at lower of book value or market value. Transfers of investments between unit linked funds are effected at prevailing market price. No transfer of investments is carried out between different Policyholder’s funds.
ImpairmentofInvestments
The Company assesses at each Balance Sheet date, using internal and external sources, whether there is any indication that any investment may be impaired. In case of impairment, any loss is accounted for as an expense and disclosed under the head ‘Provision of diminution’ in the value of investment (net) in the Revenue/Profit and Loss Account. Any reversal of impairment loss, earlier recognised is accounted in Revenue/Profit and Loss Account.
6) FixedAssets-Property,Plant&Equipment,Intangibles,Depreciation/AmortisationandImpairment
Property, Plant & Equipment (PPE) (Tangible fixed asset) are stated at cost less accumulated depreciation. Cost includes acquisition, installation and all other costs directly attributable to bring the asset to its present location and working condition for its intended use. Any additions to the original PPE are depreciated over the remaining useful life of the original asset.
Intangible assets comprising software and software licenses are stated at cost less amortisation. Significant expenditure incurred on existing assets that increases the future economic benefits are capitalised and depreciated/amortised over the remaining useful life of original asset. Any expenditure for support and maintenance of the computer software is charged to the Revenue Account.

Max Life Insurance Company Limited Registration No: 104; Date of Registration with IRDAI: November 15, 2000
AnnuAL RepoRt 2016-17264
Directors' ReportFinancial StatementsSchedules annexed to the forming part of the Financial Statements
All amounts in thousands of Indian Rupees, unless otherwise stated
Assets individually costing upto rupees five thousand and not as part of a composite contract are fully depreciated in the month of acquisition. PPE at third party locations and not under direct physical control of the Company are fully depreciated over twelve months when it is available for use in the manner intended by management.
Cost of assets as at the Balance Sheet date not ready for its intended use as at such date are disclosed as capital work in progress. Advances given towards acquisition of PPE are disclosed in ‘Advance and other assets’ in Balance Sheet.
Gains or losses arising from de-recognition of PPE are measured as the difference between the net disposal proceeds and the carrying amount of the asset and are recognised in the Revenue Account when the asset is derecognized.
Depreciable amount for assets is the cost of an asset, or other amount substituted for cost, less its estimated residual value.
Depreciation on PPE has been provided on the straight-line method as per the useful life prescribed in Schedule II to the Companies Act, 2013 in respect of the following categories of assets
Assets EstimatedUsefullifeFurniture and Fixtures 10 yearsLaptop and Desktop 3 yearsOffice Equipment 5 years
Depreciation on PPE, in respect of the following categories of assets, has been provided on the straight-line method as per the useful life of the assets which has been assessed taking into account the nature of the asset, the estimated usage of the asset, the operating conditions of the asset, past history of replacement, etc.:
Assets EstimatedUsefullifeVehicles 5 yearsHandheld devices 1 yearIT equipment including servers and networks 4 years
Leasehold land is amortised over the renewable period of respective leases subject to a maximum of 10 years
Intangible assets are amortised over their estimated useful life on straight line method as follows:
Assets EstimatedUsefullifeSoftware (excluding Policy Administration System and Satellite systems) 4 yearsPolicy Administration & Satellite systems (Hardware and Software) 6 years
ImpairmentofPPE&IntangibleAsset
An asset is treated as impaired when the carrying value of the asset exceeds its recoverable value being higher of value in use and net selling price.
If at the balance sheet date there is an indication that a previously assessed impairment loss no longer exists, the recoverable amount is reassessed and the asset is reflected at the recoverable amount, subject to a maximum of depreciable historical cost. Such reversal is reflected in the Revenue/ Profit and Loss Account.
7) LiabilityforPolicies
The actuarial liability for policies in-force as at the valuation date is determined using appropriate methods and assumptions that conform to the regulations issued by the IRDAI and the Actuarial Practice Standards (APS) issued by the Institute of Actuaries of India (IAI). Specifically, the key principles considered for the valuation relate to the IRDA (Assets, Liabilities and Solvency Margin) Regulations, 2000 and the APS 1, APS 2 and APS 7 issued by the IAI.
The liability, valued on a policy by policy basis, is so calculated that together with future premium payments and investment income, the Company is able to meet all future claims (including bonus entitlements to policyholders, if applicable) and expenses, on the basis of actuarial estimates.
A brief description of the methodology used for valuing key categories of products is provided below:
1. The liability for individual non-linked business is valued using gross premium reserving methodology. For participating business, a reference is also made to the asset share of the policies as at the valuation date in order to appropriately allow for Policyholder’s reasonable expectations. The liability is floored to zero or the surrender value payable under the policies, if any.
2. The liability for individual (and group) unit linked business comprises of two parts – a unit reserve and a non-unit
Max Life Insurance Company Limited Registration No: 104; Date of Registration with IRDAI: November 15, 2000
AnnuAL RepoRt 2016-17 265
reserve. Unit reserve represents the value of units using the net asset value at the valuation date. Non-unit reserve is calculated using a discounted cashflow method and is similar to gross premium reserves.
3. The liability for group one year renewable term business is calculated using an unearned premium approach where the premium representing the unexpired policy term is held as a liability. For longer term group business, gross premium reserving methodology is used.
4. The liability for riders attached to a non-linked policy is calculated as higher of gross premium reserves and unearned premium reserves.
The liabilities above also allow (either explicitly or implicitly) for any cost of guarantees/options inherent in the products.
The regulations also require the insurers to hold certain additional reserves. The key additional reserves cover the following sources of liability:
1. Additional source of liability for policies which are lapsed as at the valuation date but represent a potential source of future liability if they revive within their revival period (generally termed as lapse revival reserves). The reserves are calculated using an assumption of revival probability, based on Company experience.
2. Additional source of liability for policies which may exercise their option of cancelling the policy within the free look period offered (generally termed as free look cancellation reserves). The reserves are calculated using an assumption of free look cancellation, based on Company experience.
3. Liability against policies for which the insured event has already occurred but the claim has not been reported to the Company (generally termed as Incurred but Not Reported reserves).
8) Employee’sBenefits
a) ShortTermEmployeeBenefits
All employees’ benefits payable within twelve months including salaries & bonuses are classified as short term employee benefits. Compensated absences and other benefits like insurance for employees are accounted on undiscounted basis during the accounting period in which the related services are rendered.
b) Post-EmploymentBenefits
Definedcontributionplans
The Company’s contributions towards Provident Fund, a defined contribution plan, which is administered through a trust, is at the rate as notified and charged to the Revenue Account.
Definedbenefitplans
The Company’s liability towards Gratuity, being defined benefit plans, is accounted for on the basis of independent actuarial valuations carried out as per ‘Projected Unit Credit Method’ at the balance sheet date. Actuarial gains / losses related thereof are recognised in the Revenue Account. The discount rate used for actuarial valuation is based on the yield of Government Securities. Actuarial gains or losses, if any, due to experience adjustment and the effects of changes in actuarial assumptions are accounted for in the Revenue Account or the Profit and Loss Account, as the case may be, in the period in which they arise.
c) OtherLongTermEmployeeBenefits
Other long term employee benefits includes accumulated long term compensated absences and long term incentive plans. Accumulated long term compensated absences are entitled to be carried forward for future encashment or availment, at the option of the employee subject to Company’s policies. Accumulated long term compensated absences are accounted for based on actuarial valuation determined using the projected unit credit method. Long term incentive plans are subject to fulfillment of criteria prescribed by the Company and is accounted for on the basis of independent actuarial valuations at the balance sheet date.
9) EmployeeStockOptionsPlans
The options are accounted for on an intrinsic value basis in accordance with the Guidance Note on Accounting for Employee Share based Payments, issued by the Institute of Chartered Accountants of India (ICAI). Intrinsic value of option, which is the difference between derived market price of the underlying stock and the exercise price on the grant date is amortised over the vesting period. The intrinsic value is being measured at each reporting date and at the date of settlement, with any changes in such value being recognised in Revenue Account/ Profit and Loss Account. Options that lapse are reversed by a credit to Revenue Account/ Profit and Loss Account equal to the amortised portion of the value of the lapsed options.
Max Life Insurance Company Limited Registration No: 104; Date of Registration with IRDAI: November 15, 2000
AnnuAL RepoRt 2016-17266
Directors' ReportFinancial StatementsSchedules annexed to the forming part of the Financial Statements
All amounts in thousands of Indian Rupees, unless otherwise stated
In a cash settled employee share based payment plan, the Company recognizes expense for the services received, as the employees render services over the vesting period.
10) SegmentalReporting
The Company operates in India in the following segments: Individual Life Participating business, Participating Pension business, Individual Life Non-participating business, Non-participating Annuity, Group business, Health, Linked Individual, Linked Pension, Linked Group and Shareholder’s Funds. Non-participating businesses include policies with committed cash flows, with no rights to the surplus in the business. Participating business include policies other than those of non-participating businesses. Investment of shareholder funds constitutes investible funds relating to Shareholders. Accordingly, the Company has provided primary segment information for these segments as per the Accounting Standard 17 on ‘Segment Reporting,’ read with the relevant IRDAI Regulations.
There are no reportable geographical segments, since all business operations of the company are given effect to in India and all policies are written in India only. The following basis has been used for allocation of assets, liabilities, revenues and expenses:
Assets, liabilities, revenues and expenses directly attributable and identifiable to the respective business segment are allocated on an actual basis. Other than the above assets, liabilities, revenues and expenses, are apportioned to the business segment by adopting one or more of the following bases, which is considered as appropriate by the management:
• Total number of policies in-force• First year premium• Subsequent year premium• Total premium• Weighted combination of sum assured, first year premium , renewal premium income and total number of policies in force• Sum assured and• First year commission
11) ContributiontoPolicyholder’sAccount(TechnicalAccount)
Contribution to Policyholder’s Account (Technical Account), if any, is made as decided by the Board of Directors.
12) Taxation
DirectTaxes
Income Tax expense comprises of current tax and deferred tax charge or credit, as applicable. Current income tax is measured at the amount expected to be paid to the tax authorities in accordance with the provisions of Section 44 of the Income Tax Act, 1961 read with Rules contained in the First Schedule and other relevant provisions of the Income Tax Act, 1961 as applicable to a company carrying on life insurance business.
Deferred income taxes reflect the impact of timing differences between taxable income and accounting income originating during the current year and reversal of timing differences for the earlier years. Deferred tax is measured using the tax rates and tax laws enacted or substantially enacted at the reporting date.
Deferred tax liabilities are recognised for all taxable timing differences. Deferred tax assets are recognised for timing differences only to the extent that there is reasonable certainty that sufficient future taxable income will be available against which such deferred tax assets can be realized.
The carrying amount of deferred tax assets and unrecognized deferred tax asset are reviewed at each reporting date. The Company writes up / down the carrying amount of deferred tax asset and recognizes the unrecognized deferred tax asset to the extent it becomes reasonably or virtually certain, as the case may be, that sufficient future taxable income will be available against which such deferred tax assets can be realized.
IndirectTaxes
The Company claims credit of service tax on input services, which is set off against tax on output services. As a matter of judgement, unutilized credits towards service tax on input services are carried forward under Advances & Other Assets wherever there is reasonable certainty of utilization.
13) OperatingLease
Leases where the lessor retains substantially all the risks and benefits of ownership over lease term are classified as operating leases. Operating lease rentals including escalations are recognised as an expense in the Revenue Account/Profit and Loss Account, as applicable, on a straight line basis over the period of the lease.

Max Life Insurance Company Limited Registration No: 104; Date of Registration with IRDAI: November 15, 2000
AnnuAL RepoRt 2016-17 267
14) Loans
Loans against policies are valued at the aggregate of book values (net of repayments) plus capitalized interest, subject to provision for impairment, if any.
15) ProvisionsandContingentLiabilities
The Company creates a provision when there is present obligation as a result of a past event that would probably result in an outflow of resources embodying economic benefits and a reliable estimate can be made of the amount of the obligation. A disclosure for a contingent liability is made when there is a possible obligation or a present obligation that arises from past events, that may, but probably will not, require an outflow of resources embodying economic benefits or a reliable estimate cannot be made. However, contingent assets are neither recognised nor disclosed.
16) EarningsPerShare
Basic earnings per share is calculated by dividing the net profit or loss for the period attributable to equity shareholders by the weighted average number of equity shares outstanding during the year. For the purpose of calculating diluted earnings per share, the net profit or loss for the year attributable to equity shareholders and the weighted average number of shares outstanding during the year are adjusted for the effects of all dilutive potential equity shares.
17) Fundsforfutureappropriations
Non-Linked:- Funds for future appropriations in non linked account represents funds, the allocation of which, either to participating policyholders or to shareholders, has not been determined at the balance sheet date. Transfers to and from the fund reflect the excess or deficit of income over expenses and appropriations in each accounting period arising in the Company’s policyholder fund.
Unit-Linked:- The FFA in the linked segment represents an amount that is estimated by the Appointed Actuary in respect of lapsed unit linked policies and is set aside in the Balance Sheet. This amount is required to be held within the policyholder fund till the time policyholder are eligible for revival of their policies and this amount is not made available for distribution to Shareholders until the expiry of the maximum revival period. After expiry of the revival period, the Company may appropriate FFA amount as a surplus on the Appointed Actuary’s recommendation.
18) Cashandcashequivalents
Cash and cash equivalents for the purpose of Receipts and Payments account includes cash in hand, bank balances, deposits with banks, other short-term highly liquid investments with original maturities of upto three months and which are subject to insignificant risk of change in value.
19) Foreignexchangetransactions
At the time of Initial recognition, foreign currency transactions are recorded in Indian Rupees at the rate of exchange prevailing on the date of the transaction. Exchange gain & losses are recognised in the period in which they arise, either in Revenue Account/ Profit & Loss Account, as the case may be.
II NOTES TO ACCOUNTS
1) ContingentLiabilities
Particulars As atMarch 31, 2017
As atMarch 31, 2016
Partly paid-up investment Claims, other than against policies, not acknowledged as debts by the Company
110,425 99,702
Underwriting commitments outstanding (in respect of shares and securities) Guarantees issued by or on behalf of the CompanyStatutory demands/ liabilities in dispute, not provided for (Refer Note a)* 4,373,294 5,178,550Reinsurance obligations to the extent not provided for in accounts Others (Refer Note b) 103,430 100,130Total 4,587,149 5,378,382
*Inclusive of Interest and penalty of Rs 1,339,374 and Rs 772,753 for March 31, 2017 and Rs 1,541,480 and Rs 1,773,332 for March 31, 2016 respectively.
Max Life Insurance Company Limited Registration No: 104; Date of Registration with IRDAI: November 15, 2000
AnnuAL RepoRt 2016-17268
Directors' ReportFinancial StatementsSchedules annexed to the forming part of the Financial Statements
All amounts in thousands of Indian Rupees, unless otherwise stated
Notes
a) A sum of Rs 1,867,035 has been demanded from the Company by the Income Tax authorities. The Company has contested the said orders at relevant appellate authority. Management believes that the Company’s grounds of appeal are well supported in law and no liability is expected to devolve in this regard.
Service Tax Authorities issued SCN cum demand notices vide SCN dated March 30, 2013, April 22, 2013 and April 16, 2014. Commissioner of Service tax confirmed demand for Rs 628,295 vide its order dated September 01, 2015 against SCN dated April16, 2014. Company has filed appeal before CESTAT.
b) Represents potential liability in respect of repudiated Policyholder’s claims Rs 103,430 (Mar 31, 2016 Rs.100,130).
2) Actuarial assumptions
The Company’s Appointed Actuary has determined valuation assumptions that conform to the relevant regulations issued by the IRDAI and the Actuarial Practice Standards issued by the Institute of Actuaries of India (IAI). Details of assumptions are given below:
• Interest rate
It is based upon the current and projected yields on the fund basis the projected yields on 10 year government bonds. A valuation rate of interest of 6.8% (March 31, 2016: 7.4%) for participating business and 7.1% (March 31, 2016: 7.5%) for non-participating, health business and riders has been used.
The valuation rate of interest rate was reduced by margin for adverse deviation (MAD) of 1.40% (March 31, 2016: 1.65%) for the participating business and 1.40% (March 31, 2016: 1.65%) for the major non-participating products.
For linked products, unit growth rate of 7.1% (March 31, 2016: 7.5%) has been used which was further reduced by MAD of 1.40% (March 31, 2016: 1.65%). For unit-linked products where there is a premium related bonus payable, the MAD for unit growth rate has been used as 2.10% (March 31, 2016: 2.35%).
• Mortality
Mortality assumptions for valuation purposes in general are set at levels above the current experience. The mortality assumptions are set as a percentage of the standard industry table (IALM 06-08) for assurance business. For annuity business, the standard table used is LIC Annuitants (1996-98).
These rates were further increased by MAD of 10% (March 31, 2016: 10%) for participating business and 20% (March 31, 2016: 20%) for the non-participating, unit linked and health business. For annuity business, a MAD of (10) % is used (March 31, 2016: (10) %).
• Morbidity
The IAI has recommended the CIBT93 study of UK for morbidity incident rates, due to lack of any published Indian experience.
Proportions of 100% (March 31, 2016: 95% to 300%) of these tables or reinsurance rates have been used which were further increased by MAD of 20% (March 31, 2016: 25%)
• Expenses
The maintenance expense assumptions are based on the current expense levels of the company. For prudence, assumptions do not allow for future expected savings in expenses. The assumptions were increased by MAD of 10% (March 31, 2016: 10%) for participating business and 10% (March 31, 2016: 10%) for non-participating, health and unit-linked business.
• Inflation
An assumption of 6.00% pa (March 31, 2016: 6.25% pa) for expense inflation has been used.
• Commission
It is based on the actual commission rates paid.
• Lapses
Lapse assumptions for valuation purposes in general are set at levels below the current experience. Further, MAD of 20% (March 31, 2016: 20%) for participating business, 50% (March 31, 2016: 50%) for non-participating and unit-linked business and 20% (March 31, 2016: 20%) for health business is applied.
Max Life Insurance Company Limited Registration No: 104; Date of Registration with IRDAI: November 15, 2000
AnnuAL RepoRt 2016-17 269
• Freelookcancellation
Provisions are made for the strain that may arise in the event of cancellation during the free look period. The free look cancellation assumption is 7% (March 31, 2016: 6.5%) for participating business, 4.0% (March 31, 2016: 3.0%) for non participating business and 7.5% (March 31, 2016: 7.0%) for the unit linked business. The assumptions were increased by MAD of 20% (March 31, 2016: 20.0%) for participating and non-participating business and 20% (March 31, 2016: 20.0%) for unit linked business.
• Futurebonuses
Provision is made for future bonuses based on expected bonus payouts consistent with the valuation assumptions and Policyholder’s reasonable expectations.
• LinkedLiabilities
Liabilities under unit linked policies comprise of a unit liability representing the fund value of in-force policies, the amount payable to discontinued policies; and, a non-unit liability for meeting future claims and expenses in excess of future charges. In respect of the fund value and the amount payable for the discontinued policies component, the question of assumptions does not arise and in respect of the non-unit liability the assumptions used are consistent with the comments above.
3) RestructuredAssets
The total of loan assets, standard assets, sub-standard assets and doubtful assets which are subject to restructuring is Rs Nil (March 31, 2016:Rs. Nil).
4) Encumbrances
The assets of the Company are free from all encumbrances, except for Fixed Deposits kept with bank amounting to Rs.2,419 (March 31, 2016:Rs.1,936).
5) Capitalandothercommitments
Particulars As at March 31, 2017 As at March 31,2016Estimated amount of contracts remaining to be executed on PPE (net of advances) 62,013 263,380Commitments made and outstanding for investments and loans - -Total 62,013 263,380
For commitments relating to lease arrangements, please refer note 12.
6) Taxation
The Company carries on the business of Life Insurance, therefore the provisions of section 44 and the first schedule of Income tax Act 1961, are applicable for computation of profit and gains of business. Accordingly, the Company has recorded a provision for tax of Rs. 1,082,900 (March 31, 2016: Rs 718,335).
7) Valueofunsettledcontractsrelatingtoinvestment
Value of contracts in relation to investments, for:
Particulars As at March 31, 2017 As at March 31, 2016Shareholders
FundPolicyholders
FundsTotal Shareholders
FundPolicyholders
FundsTotal
(a) Purchases where deliveries are pending*
219,141 2,618,757 2,837,898 18,842 2,209,363 2,228,205
(b) Sales where payments are overdue
- - - - - -
Total 219,141 2,618,757 2,837,898 18,842 2,209,363 2,228,205
* The above amount does not include the Primary market transaction where allotment is pending.

Max Life Insurance Company Limited Registration No: 104; Date of Registration with IRDAI: November 15, 2000
AnnuAL RepoRt 2016-17270
Directors' ReportFinancial StatementsSchedules annexed to the forming part of the Financial Statements
All amounts in thousands of Indian Rupees, unless otherwise stated
8) ManagerialRemuneration
Managerial remuneration details are as below:
Particulars 2016-17 2015 -16Salary and allowances 748,341 191,908Contribution to provident fund 1,593 1,448Value of perquisites 263 111Total 750,197 193,467
Notes:
(i) The above figures do not include provision for employee benefits, which are actuarially determined for the Company as a whole.
(ii) The remuneration of managerial personnel is in accordance with the requirements of Section 34A of the Insurance Act, 1938 as amended from time to time including amendment brought by Insurance Laws (Amendment) Act, 2015 . Amount of Rs 15,000 (March 31, 2016: Rs 15,000) has been charged to Policyholders Revenue Account and the balance, in excess, as required has been debited to Shareholder Account.
(iii) All perquisites, except amount received by the employees on cancellation/settlement of EPSP plan during the previous year, which has not been included above, in accordance with approved Employee Phantom Stock Plans, have been computed in accordance with Income Tax Act, 1961.
(iv) Remuneration to independent directors Rs 7,500 (March 31, 2016:Rs 10,500) is included under Schedule 3.
(v) As per Clause 9 of Corporate Governance Guidelines for Insurers in India 2016 total remuneration paid to Key Management Person is Rs 382,777 (excludes value of EPSP options granted and not exercised)
9) EmployeePhantomStockPlan
During the year ended March 31, 2013, the Company had issued Employee Phantom Stock Plan (EPOP) w.e.f. August 1, 2012.
During the year ended March 31, 2015, the Company had issued Employee Phantom Stock Plan (EPOP) w.e.f. July 01, 2014, September 25, 2014 and December 01, 2014. Further, during the year ended March 31, 2016, the Company issued Employee Phantom Stock Plan (EPOP) w.e.f. October 30th, 2015 and January 1st, 2016. Accordingly Rs 818,173 (March 31, 2016 :Rs 267,985) has been accrued as expense in the Revenue account/Profit & Loss account as applicable The details of the scheme are as under:
EPOP 2012 EPOP 2012 EPOP 2012 EPOP 2014 EPOP 2014 EPOP 2014Date of Grant 1-Aug-12 1-Jul-14 25-Sep-14 1-Dec-14 30-Oct-15 1-Jan-16No. of options outstanding (No. in ‘000) (31/3/2017)
10,259 - - 1,128 4,464 8,065
Exercise Price (Rs.) 29.97 29.97 29.97 43.3 43.3 53.64Graded Vesting Period1st Year 10% 10% 10% - - -2nd Year 20% 20% 20% - - 20%3rd Year 30% 30% 30% 50% 50% 30%4th Year 40% 40% 40% 50% 50% 50%Mode of Settlement Cash Cash Cash Cash Cash Cash
A summary of status of Company’s Employee Phantom Stock Option Plans is as given below:
Particulars As At March 31, 2017
As At March 31, 2016
Outstanding at the beginning of the year 34,681 23,969Add: Granted during the year - 14,585Less: Forfeited/lapsed during the year 2,896 2,428Exercised during the year 7,869 1,445Outstanding at the end of the year 23,916 34,681
Had the Company used the fair value of the options to value its Employee Phantom Stock Plan, the profit in profit and loss account (Shareholder’s Account) would have been lower by Rs. 84,244 (March 31, 2016: Rs 44,018) and basic earnings per share and diluted earnings per share would have been Rs. 3.40 (March 31, 2016: Rs 2.27) and Rs. 3.40 (March 31, 2016: Rs 2.27) respectively.
Max Life Insurance Company Limited Registration No: 104; Date of Registration with IRDAI: November 15, 2000
AnnuAL RepoRt 2016-17 271
The key assumptions used to estimate fair value of options are:
Particulars March 31, 2017 March 31, 2016Risk-free interest rate 6.44%-6.85% 7.13%-7.89%Expected life 1.25-4.67 Years 0.33-5.67 YearsExpected Volatility 36.82% 17.22%Expected dividend yield 1.22% 1.95%
10) PercentageofBusinesssector-wisea) Rural Sector
Particulars Policy Nos.2016-17 2015-16
Total number of policies 503,450 460,495Total number of Rural policies 109,130 94,241% of Rural policies to Total policies 21.68% 20.47%Prescribed Requirement 20.00% 20.00%
a) Social SectorParticulars Nooflivescovered
2016-17 2015-16Total number of lives 1,770,093 1,442,875Total number of Social lives 136,280 105,958% of Social lives to Total lives 7.70% 7.34%Prescribed Requirement (lives)* 95,147 55,000
* As per Insurance Regulatory and Development Authority of India (Obligations of Insurers to Rural and Social Sectors) Regulations, 2015 for financial year 2016-17, prescribed requirement for social lives is computed at 5% of total lives covered in the preceding financial year.
11) Percentageofrisk-retainedandrisk-reinsured
The extent of risk retained and reinsured is given below:Particulars Premium SumAssured
2016-17 2015-16 2016-17 2015-16Individual Business :Risk retained 99.33% 99.40% 63.36% 68.55%Risk reinsured 0.67% 0.60% 36.64% 31.35%Group Business :Risk retained 92.30% 91.85% 63.04% 64.43%Risk reinsured 7.70% 8.15% 36.96% 35.57%
12) Leases
The Company has leased office premises under various agreements with various expiry dates extending upto 10 years. Lease payments made under operating lease agreements have been fully recognised in the books of account. The lease rentals charged to Revenue Account is Rs 544,302 (March 31, 2016: Rs 538,993). The minimum future lease rentals payable under non-cancellable operating leases for specified duration in respect of such leases amount to the following:
Leaseobligationsfornon-cancelablelease 2016-17 2015-16Not later than 1 year 6,170 19,597Later than 1 year but not later than 5 years 1,909 8,466Later than 5 years - -
Max Life Insurance Company Limited Registration No: 104; Date of Registration with IRDAI: November 15, 2000
AnnuAL RepoRt 2016-17272
Directors' ReportFinancial StatementsSchedules annexed to the forming part of the Financial Statements
All amounts in thousands of Indian Rupees, unless otherwise stated
13) Detailsofnumberofclaimsintimated,disposedofandpendingwithdetailsofduration
Claims, which are settled and unpaid for more than 6 months as on balance sheet date amount to Rs 94,122 (March 31, 2016: Rs 74,906).
The claims settlement experience for the Company for FY 2016-17 has been as follows:S. No. ClaimsExperience Death Maturity Survival
BenefitAnnuities/
PensionSurrender Other
Benefits1 Claims O/S at the beginning of the period 4 8,698 - - 30 1 2 Claims reported during the period 14,493 55,248 20,787 1,752 252,508 137 3 Claims Settled during the period 14,246 63,887 20,760 1,752 252,538 134 4 Claims Repudiated during the period 220 - - - - 1 5 Claims Rejected 28 - 27 - - 3 6 Claims Written Back - - - - - - 7 Claims O/S at End of the period 3 59 - - - -
Less than 3months 3 23 - - - - 3 months to 6 months - 5 - - - - 6months to 1 year - 17 - - - -
1year and above - 14 - - - -
14) Interim/FinalDividend
The Board of Directors, in their meeting dated October 25, 2016, approved an interim dividend of Rs 0.73 per equity share for the half year ended September 30, 2016 (for the half year ended September 30, 2015: Rs 0.95 per equity share). This is in accordance with the provisions contained in section 123 of The Companies Act, 2013 read with the Companies (Declaration and Payment of Dividend) Rules, 2014 effective April 1, 2014, subsequently amended by the Companies (Declaration and Payment of Dividend) Amended Rules, 2014 effective June 12, 2014 (collectively referred to as the ‘ Dividend Rules’). Also, this was supported by a legal opinion obtained by the Company.
The Board has proposed a final dividend of Rs 0.64 (March 31, 2016: Rs 0.95) per equity share aggregating to Rs. 1,228,040 (March 31, 2016: Rs 1,822,872). The total appropriation due to dividend for the year ended March 31, 2017 Rs.3,163,930. (March 31, 2016: Rs 4,389,746) including dividend distribution tax of Rs. 535,156 (March 31, 2016: Rs 744,002).
The proposed final dividend is subject to approval by shareholders at the ensuing Annual General Meeting and has not been recorded as a liability as at March 31, 2017 in accordance with AS 4 - “Contingences and Events occurring after Balance Sheet Date” issued by Ministry of Corporate Affair dated March 30, 2016.
15) Contributionsfrom/toShareholder’sFundtoNonParticipatingPolicyholder’sFunds
The Company has transferred amount aggregating to Rs 2,398 (March 31, 2016: Rs 18,743) from the Shareholder’s Account (Profit &Loss Account) to the non participating business segments, in Policyholder’s Account (Revenue Account), to fund the deficit in respective segments.
As per the IRDA circular on ‘Recognition of surplus arising in non-participating funds as profit/loss in the Profit & Loss Account’ (IRDA/F&A/CIR/217/12/2010 dated December 27, 2010), a surplus of Rs 5,551,160 arising in the non-participating funds in the Revenue Account is transferred to the Profit & Loss Account for the year ended March 31, 2017 (March 31, 2016: Rs 3,351,180).
16) Distributionofsurplus
During the year out of the surplus allocated to participating policyholders one-ninth is transferred to shareholders the details are as under:Particulars 2016-2017 2015-2016
ParticipatingIndividualLife
ParticipatingIndividual
pension
Total ParticipatingIndividualLife
ParticipatingIndividual
pension
Total
Bonus to Policyholders (Refer Schedule 4) 7,943,722 13,255 7,956,977 5,977,035 14,063 5,991,098Interim Bonuses Paid (Refer Form A-RA) 6,920 - 6,920 3,697 - 3,697Special Bonus for Policyholders (Refer Form A-RA) - - - - (2,943) (2,943)Reversionary Bonus 125,639 - 125,639 133,616 - 133,616Dividend on Deposit 54,336 - 54,336 63,412 - 63,412Total 8,130,617 13,255 8,143,872 6,177,760 11,120 6,188,880TransfertoShareholder’sAccount(1/9th) 903,402 1,473 904,875 686,418 1,236 687,654
17) Policyholder’sBonus
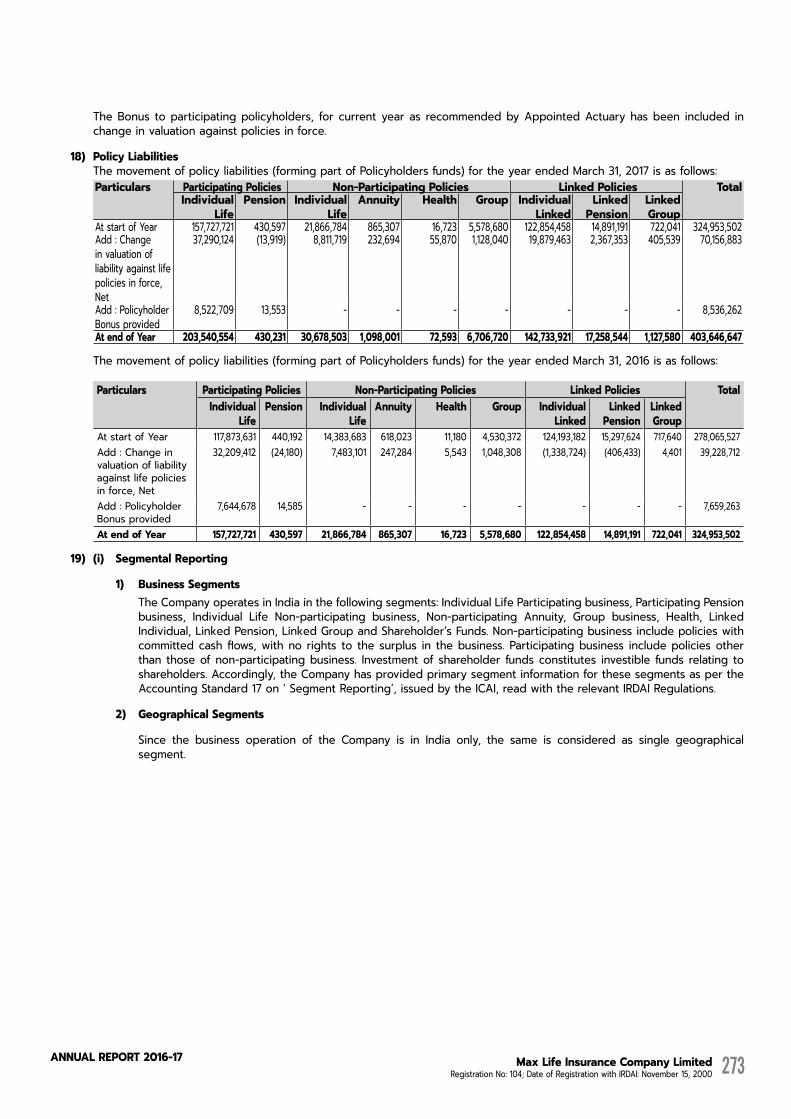
Max Life Insurance Company Limited Registration No: 104; Date of Registration with IRDAI: November 15, 2000
AnnuAL RepoRt 2016-17 273
The Bonus to participating policyholders, for current year as recommended by Appointed Actuary has been included in change in valuation against policies in force.
18) PolicyLiabilities The movement of policy liabilities (forming part of Policyholders funds) for the year ended March 31, 2017 is as follows:
Particulars ParticipatingPolicies Non-ParticipatingPolicies LinkedPolicies TotalIndividual
Life Pension Individual
Life Annuity Health Group Individual
LinkedLinkedPension
LinkedGroup
At start of Year 157,727,721 430,597 21,866,784 865,307 16,723 5,578,680 122,854,458 14,891,191 722,041 324,953,502Add : Change in valuation of liability against life policies in force, Net
37,290,124 (13,919) 8,811,719 232,694 55,870 1,128,040 19,879,463 2,367,353 405,539 70,156,883
Add : Policyholder Bonus provided
8,522,709 13,553 - - - - - - - 8,536,262
AtendofYear 203,540,554 430,231 30,678,503 1,098,001 72,593 6,706,720 142,733,921 17,258,544 1,127,580 403,646,647
The movement of policy liabilities (forming part of Policyholders funds) for the year ended March 31, 2016 is as follows:
Particulars ParticipatingPolicies Non-ParticipatingPolicies LinkedPolicies TotalIndividual
LifePension Individual
LifeAnnuity Health Group Individual
LinkedLinked
PensionLinkedGroup
At start of Year 117,873,631 440,192 14,383,683 618,023 11,180 4,530,372 124,193,182 15,297,624 717,640 278,065,527Add : Change in valuation of liability against life policies in force, Net
32,209,412 (24,180) 7,483,101 247,284 5,543 1,048,308 (1,338,724) (406,433) 4,401 39,228,712
Add : Policyholder Bonus provided
7,644,678 14,585 - - - - - - - 7,659,263
AtendofYear 157,727,721 430,597 21,866,784 865,307 16,723 5,578,680 122,854,458 14,891,191 722,041 324,953,502
19) (i) SegmentalReporting
1) BusinessSegments The Company operates in India in the following segments: Individual Life Participating business, Participating Pension
business, Individual Life Non-participating business, Non-participating Annuity, Group business, Health, Linked Individual, Linked Pension, Linked Group and Shareholder’s Funds. Non-participating business include policies with committed cash flows, with no rights to the surplus in the business. Participating business include policies other than those of non-participating business. Investment of shareholder funds constitutes investible funds relating to shareholders. Accordingly, the Company has provided primary segment information for these segments as per the Accounting Standard 17 on ‘ Segment Reporting’, issued by the ICAI, read with the relevant IRDAI Regulations.
2) GeographicalSegments
Since the business operation of the Company is in India only, the same is considered as single geographical segment.
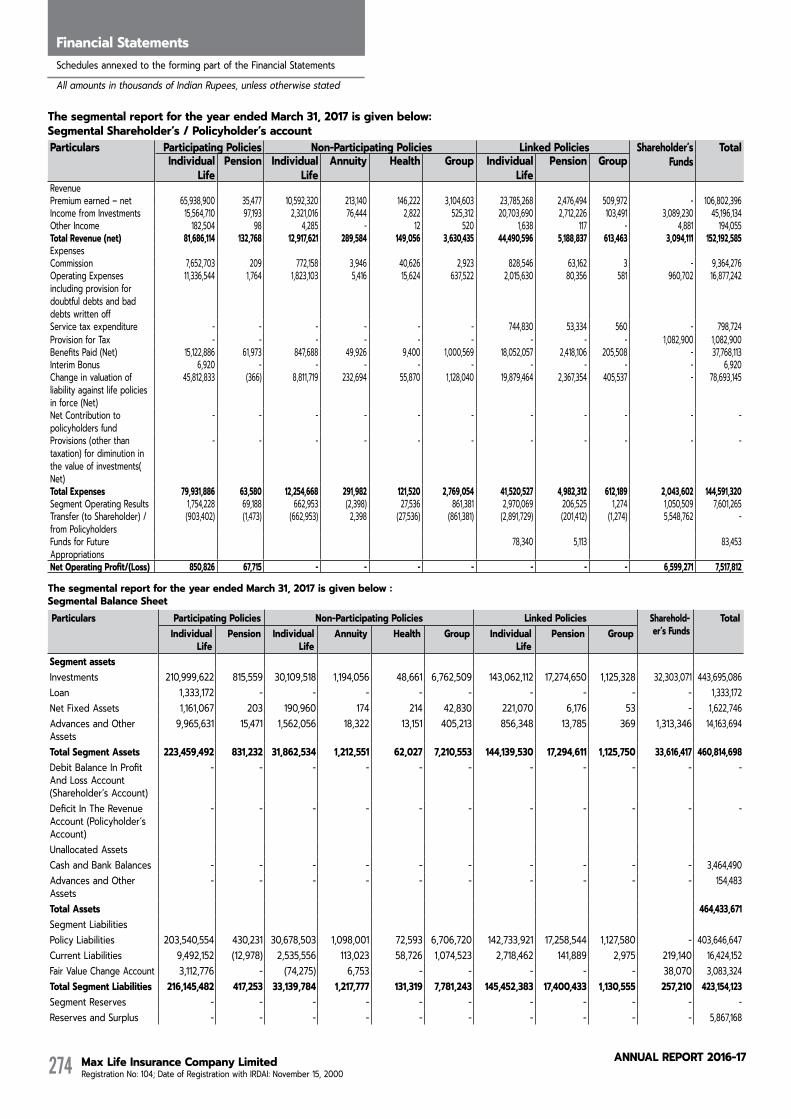
Max Life Insurance Company Limited Registration No: 104; Date of Registration with IRDAI: November 15, 2000
AnnuAL RepoRt 2016-17274
Directors' ReportFinancial StatementsSchedules annexed to the forming part of the Financial Statements
All amounts in thousands of Indian Rupees, unless otherwise stated
ThesegmentalreportfortheyearendedMarch31,2017isgivenbelow:SegmentalShareholder’s/Policyholder’saccountParticulars ParticipatingPolicies Non-ParticipatingPolicies LinkedPolicies Shareholder’s
Funds Total
IndividualLife
Pension IndividualLife
Annuity Health Group IndividualLife
Pension Group
RevenuePremium earned – net 65,938,900 35,477 10,592,320 213,140 146,222 3,104,603 23,785,268 2,476,494 509,972 - 106,802,396Income from Investments 15,564,710 97,193 2,321,016 76,444 2,822 525,312 20,703,690 2,712,226 103,491 3,089,230 45,196,134Other Income 182,504 98 4,285 - 12 520 1,638 117 - 4,881 194,055TotalRevenue(net) 81,686,114 132,768 12,917,621 289,584 149,056 3,630,435 44,490,596 5,188,837 613,463 3,094,111 152,192,585ExpensesCommission 7,652,703 209 772,158 3,946 40,626 2,923 828,546 63,162 3 - 9,364,276Operating Expenses including provision for doubtful debts and bad debts written off
11,336,544 1,764 1,823,103 5,416 15,624 637,522 2,015,630 80,356 581 960,702 16,877,242
Service tax expenditure - - - - - - 744,830 53,334 560 - 798,724Provision for Tax - - - - - - - - - 1,082,900 1,082,900Benefits Paid (Net) 15,122,886 61,973 847,688 49,926 9,400 1,000,569 18,052,057 2,418,106 205,508 - 37,768,113Interim Bonus 6,920 - - - - - - - - - 6,920Change in valuation of liability against life policies in force (Net)
45,812,833 (366) 8,811,719 232,694 55,870 1,128,040 19,879,464 2,367,354 405,537 - 78,693,145
Net Contribution to policyholders fund
- - - - - - - - - - -
Provisions (other than taxation) for diminution in the value of investments( Net)
- - - - - - - - - - -
TotalExpenses 79,931,886 63,580 12,254,668 291,982 121,520 2,769,054 41,520,527 4,982,312 612,189 2,043,602 144,591,320Segment Operating Results 1,754,228 69,188 662,953 (2,398) 27,536 861,381 2,970,069 206,525 1,274 1,050,509 7,601,265Transfer (to Shareholder) / from Policyholders
(903,402) (1,473) (662,953) 2,398 (27,536) (861,381) (2,891,729) (201,412) (1,274) 5,548,762 -
Funds for Future Appropriations
78,340 5,113 83,453
NetOperatingProfit/(Loss) 850,826 67,715 - - - - - - - 6,599,271 7,517,812
ThesegmentalreportfortheyearendedMarch31,2017isgivenbelow:SegmentalBalanceSheetParticulars ParticipatingPolicies Non-ParticipatingPolicies LinkedPolicies Sharehold-
er’sFundsTotal
IndividualLife
Pension IndividualLife
Annuity Health Group IndividualLife
Pension Group
SegmentassetsInvestments 210,999,622 815,559 30,109,518 1,194,056 48,661 6,762,509 143,062,112 17,274,650 1,125,328 32,303,071 443,695,086Loan 1,333,172 - - - - - - - - - 1,333,172Net Fixed Assets 1,161,067 203 190,960 174 214 42,830 221,070 6,176 53 - 1,622,746Advances and Other Assets
9,965,631 15,471 1,562,056 18,322 13,151 405,213 856,348 13,785 369 1,313,346 14,163,694
TotalSegmentAssets 223,459,492 831,232 31,862,534 1,212,551 62,027 7,210,553 144,139,530 17,294,611 1,125,750 33,616,417 460,814,698Debit Balance In Profit And Loss Account (Shareholder’s Account)
- - - - - - - - - - -
Deficit In The Revenue Account (Policyholder’s Account)
- - - - - - - - - - -
Unallocated AssetsCash and Bank Balances - - - - - - - - - - 3,464,490Advances and Other Assets
- - - - - - - - - - 154,483
Total Assets 464,433,671Segment LiabilitiesPolicy Liabilities 203,540,554 430,231 30,678,503 1,098,001 72,593 6,706,720 142,733,921 17,258,544 1,127,580 - 403,646,647Current Liabilities 9,492,152 (12,978) 2,535,556 113,023 58,726 1,074,523 2,718,462 141,889 2,975 219,140 16,424,152Fair Value Change Account 3,112,776 - (74,275) 6,753 - - - - - 38,070 3,083,324TotalSegmentLiabilities 216,145,482 417,253 33,139,784 1,217,777 131,319 7,781,243 145,452,383 17,400,433 1,130,555 257,210 423,154,123Segment Reserves - - - - - - - - - - -Reserves and Surplus - - - - - - - - - - 5,867,168
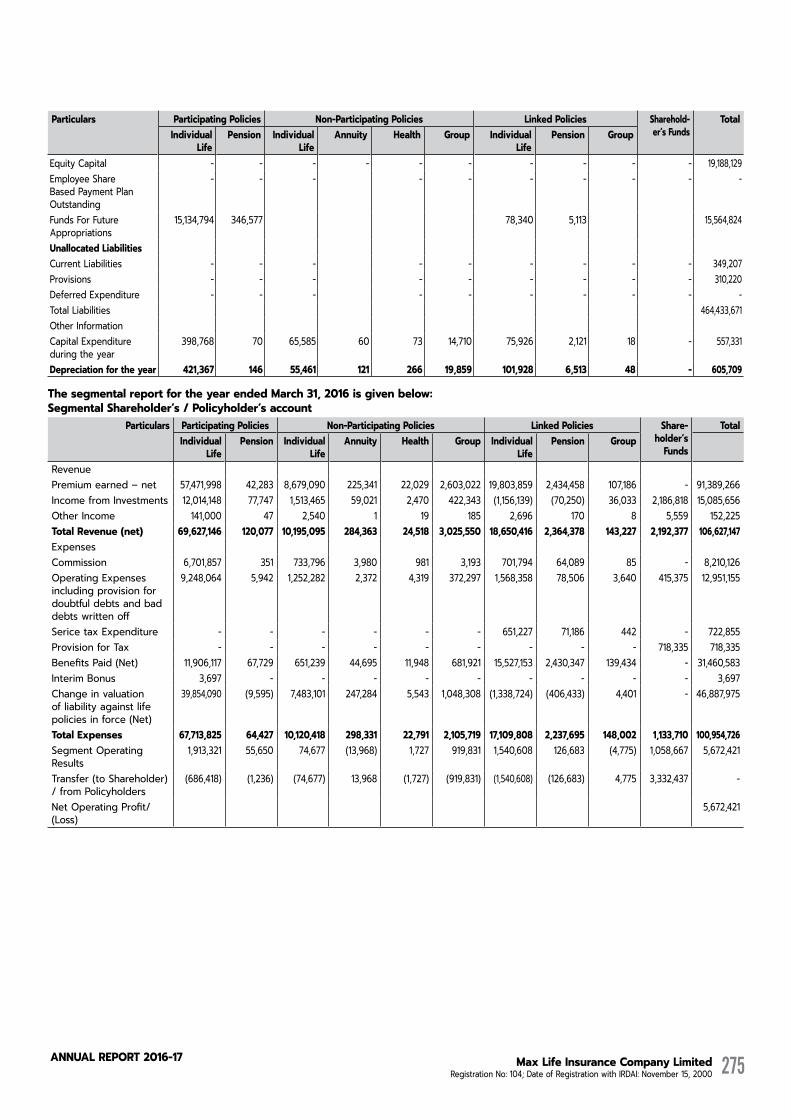
Max Life Insurance Company Limited Registration No: 104; Date of Registration with IRDAI: November 15, 2000
AnnuAL RepoRt 2016-17 275
Particulars ParticipatingPolicies Non-ParticipatingPolicies LinkedPolicies Sharehold-er’sFunds
TotalIndividual
LifePension Individual
LifeAnnuity Health Group Individual
LifePension Group
Equity Capital - - - - - - - - - - 19,188,129Employee Share Based Payment Plan Outstanding
- - - - - - - - - -
Funds For Future Appropriations
15,134,794 346,577 78,340 5,113 15,564,824
UnallocatedLiabilitiesCurrent Liabilities - - - - - - - - - 349,207Provisions - - - - - - - - - 310,220Deferred Expenditure - - - - - - - - - -Total Liabilities 464,433,671Other InformationCapital Expenditure during the year
398,768 70 65,585 60 73 14,710 75,926 2,121 18 - 557,331
Depreciation for the year 421,367 146 55,461 121 266 19,859 101,928 6,513 48 - 605,709
ThesegmentalreportfortheyearendedMarch31,2016isgivenbelow:SegmentalShareholder’s/Policyholder’saccount
Particulars ParticipatingPolicies Non-ParticipatingPolicies LinkedPolicies Share-holder’sFunds
TotalIndividual
LifePension Individual
LifeAnnuity Health Group Individual
LifePension Group
RevenuePremium earned – net 57,471,998 42,283 8,679,090 225,341 22,029 2,603,022 19,803,859 2,434,458 107,186 - 91,389,266Income from Investments 12,014,148 77,747 1,513,465 59,021 2,470 422,343 (1,156,139) (70,250) 36,033 2,186,818 15,085,656Other Income 141,000 47 2,540 1 19 185 2,696 170 8 5,559 152,225TotalRevenue(net) 69,627,146 120,077 10,195,095 284,363 24,518 3,025,550 18,650,416 2,364,378 143,227 2,192,377 106,627,147ExpensesCommission 6,701,857 351 733,796 3,980 981 3,193 701,794 64,089 85 - 8,210,126Operating Expenses including provision for doubtful debts and bad debts written off
9,248,064 5,942 1,252,282 2,372 4,319 372,297 1,568,358 78,506 3,640 415,375 12,951,155
Serice tax Expenditure - - - - - - 651,227 71,186 442 - 722,855Provision for Tax - - - - - - - - - 718,335 718,335Benefits Paid (Net) 11,906,117 67,729 651,239 44,695 11,948 681,921 15,527,153 2,430,347 139,434 - 31,460,583Interim Bonus 3,697 - - - - - - - - - 3,697Change in valuation of liability against life policies in force (Net)
39,854,090 (9,595) 7,483,101 247,284 5,543 1,048,308 (1,338,724) (406,433) 4,401 - 46,887,975
TotalExpenses 67,713,825 64,427 10,120,418 298,331 22,791 2,105,719 17,109,808 2,237,695 148,002 1,133,710 100,954,726Segment Operating Results
1,913,321 55,650 74,677 (13,968) 1,727 919,831 1,540,608 126,683 (4,775) 1,058,667 5,672,421
Transfer (to Shareholder) / from Policyholders
(686,418) (1,236) (74,677) 13,968 (1,727) (919,831) (1,540,608) (126,683) 4,775 3,332,437 -
Net Operating Profit/(Loss)
5,672,421

Max Life Insurance Company Limited Registration No: 104; Date of Registration with IRDAI: November 15, 2000
AnnuAL RepoRt 2016-17276
Directors' ReportFinancial StatementsSchedules annexed to the forming part of the Financial Statements
All amounts in thousands of Indian Rupees, unless otherwise stated
ThesegmentalreportfortheyearendedMarch31,2016isgivenbelow:SegmentalBalanceSheetParticulars Participating
PoliciesNon-ParticipatingPolicies LinkedPolicies Share-
holder’sFunds
Total
IndividualLife
Pension IndividualLife
Annuity Health Group IndividualLife
Pension Group
Investments 163,981,909 977,685 23,542,990 - 31,178 5,580,596 123,419,385 15,253,312 1,534,856 23,918,248 358,240,160Loan 763,949 - - - - - - - - - 763,949Net Fixed Assets 1,218,509 283 157,982 239 337 58,825 234,772 7,456 129 - 1,678,532Advances and Other Assets 7,684,739 15,034 1,040,610 654 15,376 282,410 1,863,267 205,422 20,372 1,010,381 12,138,265TotalSegmentAssets 173,649,106 993,003 24,741,582 893 46,893 5,921,831 125,517,424 15,466,190 1,555,357 24,928,629 372,820,906Debit Balance in Profit and Loss Account (Shareholder’s Account)
- - - - - - - - - -
Deficit in the Revenue Account (Policyholder’s Account)
- - - - - - - - - - -
Unallocated AssetsCash and Bank Balances - - - - - - - - - 3,326,300Advances and Other Assets - - - - - - - - - 163,732 Total Assets 376,310,939 Segment LiabilitiesPolicy Liabilities 157,727,721 430,597 21,866,784 865,307 16,723 5,578,680 122,854,458 14,891,191 722,041 - 324,953,502Current Liabilities 8,918,878 (12,312) 1,571,074 6,760 14,939 659,867 1,925,375 99,019 9,250 18,842 13,211,692Fair Value Change Account 87,780 - 11,956 838 - - - - - 96,709 197,283Total Segment Liabilities 166,734,379 418,285 23,449,814 872,905 31,662 6,238,547 124,779,833 14,990,210 731,291 115,551 338,362,477Segment Reserves - - - - - - - - - - - Reserves and Surplus - - - - - - - - - 953,786Equity Capital - - - - - - - - - 19,188,129 Funds For Future Appropriations
14,283,968 278,862 14,562,830
Unallocated LiabilitiesCurrent Liabilities - - - - - - - - - 438,013 Provisions - - - - - - - - - 2,805,705Deferred Expenditure - - - - - - - - - - TotalLiabilities 376,310,939 Other InformationCapital Expenditure during the year
787,150 183 102,055 154 218 38,000 151,662 4,816 83 - 1,084,323
Depreciation for the year 417,486 174 48,400 148 387 16,562 92,381 6,773 148 - 582,459Non-cash expenditure other than depreciationLiabilitiestoPolicyholders 39,854,090 (9,595) 7,483,101 247,284 5,543 1,048,308 (1,338,724) (406,433) 4,401 - 46,887,975
20)TheratiosasprescribedbyIRDAIaregivenbelow:Ratios 2016 – 2017 2015 – 2016
(a) New Business Premium Income Growth (segment wise)(Current Year New Business Premium as a % of Previous Year New Business Premium)Individual Life – Participating 122.91% 115.15%Pension – Participating 96.34% 95.16%Individual Life - Non Participating 114.62% 97.07%Individual Life – Annuity 94.59% 65.49%Health Insurance NC 171.43%Group 119.18% 125.04%Individual Linked 149.47% 109.90%Linked Pension 82.47% 94.36%Linked Group 475.72% 249.16%
(b) Net Retention Ratio 99.07% 99.16%(Net premium as a % of gross premium)

Max Life Insurance Company Limited Registration No: 104; Date of Registration with IRDAI: November 15, 2000
AnnuAL RepoRt 2016-17 277
Ratios 2016 – 2017 2015 – 2016(c) Ratio of Expenses of Management 23.45% 22.47%
(Expenses of Management as a % of Gross Premium) (Refer Note 1 below)(d) Commission Ratio 8.69% 8.91%
(Gross Commission as a % of Gross Premium)(e) Ratio of Policy holders' liabilities to Shareholder’s funds 1682.74% 1678.06%
(Policyholder’s Liability as a % of Shareholder’s Fund)(f) Growth rate of Shareholder’s Fund 23.99% -1.53%
(Increase/ (Decrease) in Shareholder’s Fund over previous year as a % of Shareholder’s Funds of Previous year) ( Refer Note 2 below)
(g) Ratio of Policyholder’s Surplus to Policyholder’s liability 1.55% 1.36%(Policyholder’s Surplus as a % of Policyholder’s Liability)(Refer Note 3 below)
(h) Change in net worth (over previous year) (In Rupees) 48,547 (3,139)(CY shareholder’s funds - PY shareholder’s funds)
(i) Profit after tax / Total Income 4.34% 4.12%(Refer Note 5 below)
(j) (Total Real Estate+Loans)/ Cash & Invested assets 0.35% 0.21%(k) Total Investments/(Capital + Surplus) ( Refer Note 4 below) 1776.18% 1782.37% (l) Total Affiliated Investments/(Capital + Surplus) NA NA
(m) Conservation RatioIndividual Life-Participating Policies 90.51% 87.17%Pension -Participating Policies 82.01% 90.35%Individual Life Non-Participating Policies 90.01% 89.95%Health Non-Participating Policies 84.62% 93.03%Individual Linked 83.55% 81.98%Linked Pension 83.52% 78.17%
(n) Persistency RatioBy Premium for 13th month 80% 79% for 25th month 70% 67% for 37th month 60% 58% for 49th Month 55% 56% for 61st month 53% 43%
By Count for 13th month 77% 74% for 25th month 67% 62% for 37th month 55% 52% for 49th Month 49% 49% for 61st month 46% 37%
(o) NPA Ratio NA NA(p) Yield on Investments
With realized gainsPolicyholder’sFunds:Non-Linked:Par 8.67% 8.74%Non-Par 9.07% 8.44%Sub-Total 8.74% 8.69%Linked:Non-Par 8.48% 5.80%Sub-Total 8.48% 5.80%Grand Total 8.65% 7.52%Shareholder’s Funds 14.53% 9.23%Without Realized Gains
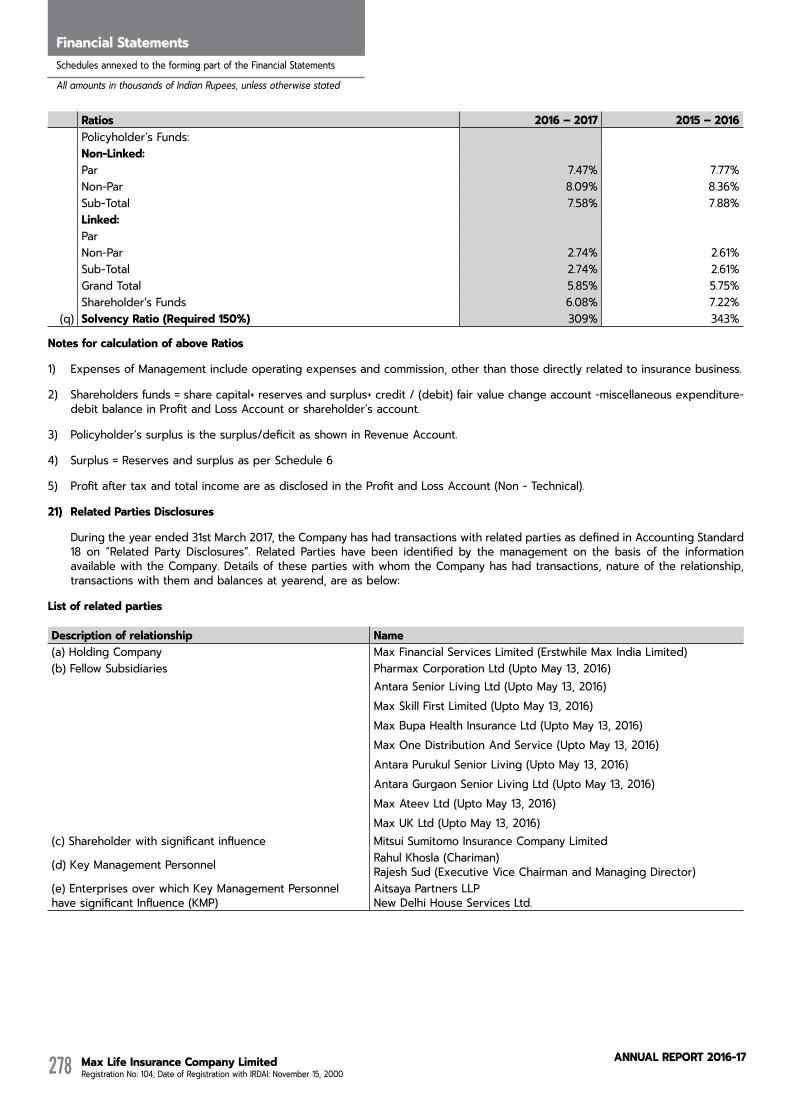
Max Life Insurance Company Limited Registration No: 104; Date of Registration with IRDAI: November 15, 2000
AnnuAL RepoRt 2016-17278
Directors' ReportFinancial StatementsSchedules annexed to the forming part of the Financial Statements
All amounts in thousands of Indian Rupees, unless otherwise stated
Ratios 2016 – 2017 2015 – 2016Policyholder’s Funds:Non-Linked:Par 7.47% 7.77%Non-Par 8.09% 8.36%Sub-Total 7.58% 7.88%Linked:ParNon-Par 2.74% 2.61%Sub-Total 2.74% 2.61%Grand Total 5.85% 5.75%Shareholder’s Funds 6.08% 7.22%
(q) SolvencyRatio(Required150%) 309% 343%
NotesforcalculationofaboveRatios
1) Expenses of Management include operating expenses and commission, other than those directly related to insurance business.
2) Shareholders funds = share capital+ reserves and surplus+ credit / (debit) fair value change account -miscellaneous expenditure-debit balance in Profit and Loss Account or shareholder’s account.
3) Policyholder’s surplus is the surplus/deficit as shown in Revenue Account.
4) Surplus = Reserves and surplus as per Schedule 6
5) Profit after tax and total income are as disclosed in the Profit and Loss Account (Non - Technical).
21) RelatedPartiesDisclosures
During the year ended 31st March 2017, the Company has had transactions with related parties as defined in Accounting Standard 18 on ”Related Party Disclosures”. Related Parties have been identified by the management on the basis of the information available with the Company. Details of these parties with whom the Company has had transactions, nature of the relationship, transactions with them and balances at yearend, are as below:
Listofrelatedparties
Description of relationship Name(a) Holding Company Max Financial Services Limited (Erstwhile Max India Limited)(b) Fellow Subsidiaries Pharmax Corporation Ltd (Upto May 13, 2016)
Antara Senior Living Ltd (Upto May 13, 2016)Max Skill First Limited (Upto May 13, 2016)Max Bupa Health Insurance Ltd (Upto May 13, 2016)Max One Distribution And Service (Upto May 13, 2016)Antara Purukul Senior Living (Upto May 13, 2016)Antara Gurgaon Senior Living Ltd (Upto May 13, 2016)Max Ateev Ltd (Upto May 13, 2016)Max UK Ltd (Upto May 13, 2016)
(c) Shareholder with significant influence Mitsui Sumitomo Insurance Company Limited
(d) Key Management Personnel Rahul Khosla (Chariman)Rajesh Sud (Executive Vice Chairman and Managing Director)
(e) Enterprises over which Key Management Personnel have significant Influence (KMP)
Aitsaya Partners LLPNew Delhi House Services Ltd.
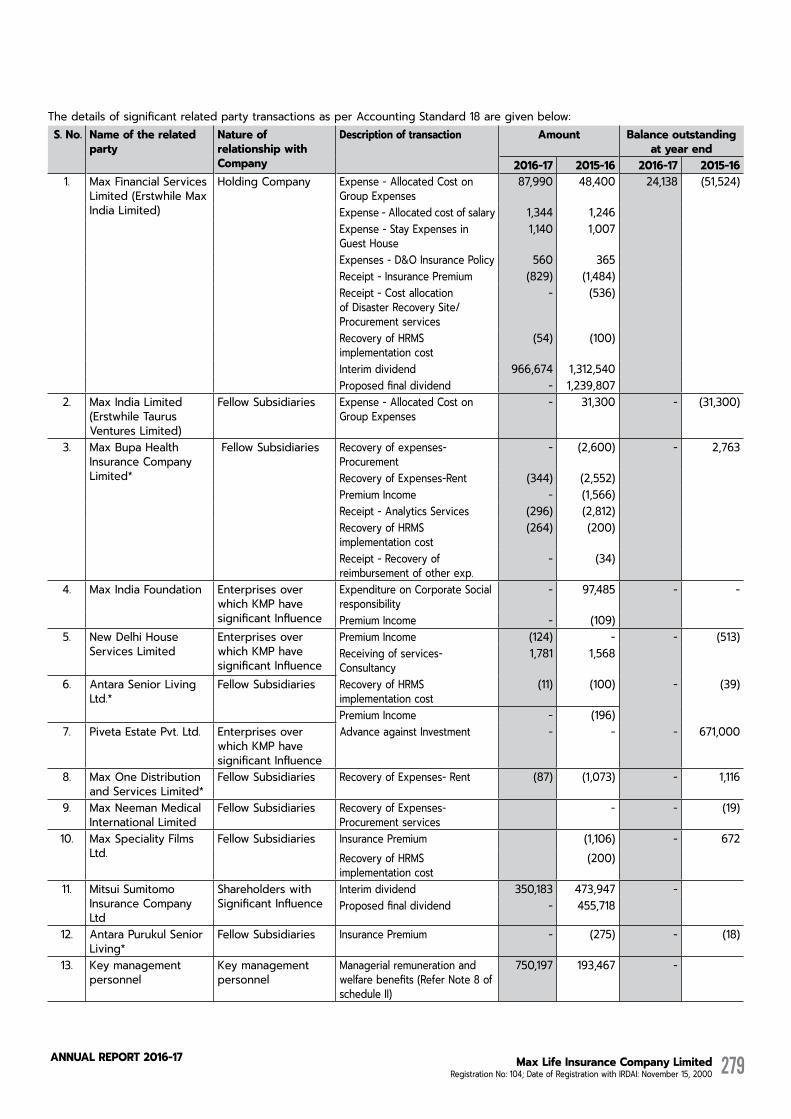
Max Life Insurance Company Limited Registration No: 104; Date of Registration with IRDAI: November 15, 2000
AnnuAL RepoRt 2016-17 279
The details of significant related party transactions as per Accounting Standard 18 are given below:S. No. Nameoftherelated
partyNature of relationship with Company
Description of transaction Amount Balanceoutstandingatyearend
2016-17 2015-16 2016-17 2015-161. Max Financial Services
Limited (Erstwhile Max India Limited)
Holding Company Expense - Allocated Cost on Group Expenses
87,990 48,400 24,138 (51,524)
Expense - Allocated cost of salary 1,344 1,246Expense - Stay Expenses in Guest House
1,140 1,007
Expenses - D&O Insurance Policy 560 365Receipt - Insurance Premium (829) (1,484)Receipt - Cost allocation of Disaster Recovery Site/Procurement services
- (536)
Recovery of HRMS implementation cost
(54) (100)
Interim dividend 966,674 1,312,540Proposed final dividend - 1,239,807
2. Max India Limited (Erstwhile Taurus Ventures Limited)
Fellow Subsidiaries Expense - Allocated Cost on Group Expenses
- 31,300 - (31,300)
3. Max Bupa Health Insurance Company Limited*
Fellow Subsidiaries Recovery of expenses- Procurement
- (2,600) - 2,763
Recovery of Expenses-Rent (344) (2,552) Premium Income - (1,566) Receipt - Analytics Services (296) (2,812)Recovery of HRMS implementation cost
(264) (200)
Receipt - Recovery of reimbursement of other exp.
- (34)
4. Max India Foundation Enterprises over which KMP have significant Influence
Expenditure on Corporate Social responsibility
- 97,485 - -
Premium Income - (109) 5. New Delhi House
Services LimitedEnterprises over which KMP have significant Influence
Premium Income (124) - - (513) Receiving of services- Consultancy
1,781 1,568
6. Antara Senior Living Ltd.*
Fellow Subsidiaries Recovery of HRMS implementation cost
(11) (100) - (39)
Premium Income - (196) 7. Piveta Estate Pvt. Ltd. Enterprises over
which KMP have significant Influence
Advance against Investment - - - 671,000
8. Max One Distribution and Services Limited*
Fellow Subsidiaries Recovery of Expenses- Rent (87) (1,073) - 1,116
9. Max Neeman Medical International Limited
Fellow Subsidiaries Recovery of Expenses- Procurement services
- - (19)
10. Max Speciality Films Ltd.
Fellow Subsidiaries Insurance Premium (1,106) - 672Recovery of HRMS implementation cost
(200)
11. Mitsui Sumitomo Insurance Company Ltd
Shareholders with Significant Influence
Interim dividend 350,183 473,947 -Proposed final dividend - 455,718
12. Antara Purukul Senior Living*
Fellow Subsidiaries Insurance Premium - (275) - (18)
13. Key management personnel
Key management personnel
Managerial remuneration andwelfare benefits (Refer Note 8 of schedule II)
750,197 193,467 -

Max Life Insurance Company Limited Registration No: 104; Date of Registration with IRDAI: November 15, 2000
AnnuAL RepoRt 2016-17280
Directors' ReportFinancial StatementsSchedules annexed to the forming part of the Financial Statements
All amounts in thousands of Indian Rupees, unless otherwise stated
S. No. Nameoftherelatedparty
Nature of relationship with Company
Description of transaction Amount Balanceoutstandingatyearend
2016-17 2015-16 2016-17 2015-1614. Max Skill First Limited* Fellow Subsidiaries Expenses - Training Services 34,981 317,188 - (27,081)
Receipt - Rental of office space (788) (6,133)Receipt - Asset transfer - (2,250)Receipt - IT support (47) (363)Receipt - Insurance Premium - (672)
*Partieswhererelationshipceasedtoexistduringtheperiod,havebeenshownatNilbalance.
22) SummaryofFinancialStatementsformingpartofNotestoAccounts(Rsin‘000)isgivenbelow:Particulars 2016-17 2015-16 2014-15 2013-14 2012-13Policyholder’sA/C
1 Gross Premium Income 1,078,040 921,616 817,162 727,854 663,870 2 Net Premium Income (Net of Re-insurance ceded) 1,068,024 913,893 810,515 721,181 657,030 3 Income from Investments (Net of losses) 421,069 128,988 410,574 216,216 129,936 4 Other Income (Miscellaneous Income) 1,892 1,467 1,458 1,773 1,017 5 Contribution from the Shareholder’s a/c 24 187 4,406 1,311 123 6 Total Income ( 2+3+4+5) 1,491,009 1,044,535 1,226,953 940,481 788,106 7 Commission 93,643 82,101 74,863 68,281 61,403 8 Brokerage - - - - - 9 Operating Expenses related to Insurance Business 167,153 132,586 130,457 126,668 123,256 10 Provision for Tax - Fringe Benefit Tax - - - - - 11 Total Expenses (7+8+9+10) 260,796 214,687 205,320 194,949 184,659 12 Payments to Policyholders (includes Bonus to
Policyholders)377,750 314,643 348,883 293,137 255,161
13 Increase in Actuarial Liability 786,931 468,880 611,392 390,897 279,644 14 Surplus/Deficit from Operations 65,532 46,325 61,358 61,498 68,642
SHAREHOLDER’S A/C15 Total Income under Shareholder’s Account 30,941 21,924 27,060 24,153 21,93816 Profit/(loss) before Tax 76,822 51,094 47,760 50,307 47,53917 Provision for Tax 10,829 7,183 6,335 6,716 5,194 18 Profit/ loss after tax 65,993 43,911 41,424 43,591 42,345 19 Interim and proposed final dividend (including
dividend distribution tax16,859 43,897 23,954 30,943 30,183
20 Transfer to Reserves - - (1,715) 2,186 2,11721 Profit/ loss carried to Balance Sheet 49,275 141 127 (16,470) (26,933)
MISCELLANEOUS22 Policyholder’s account:
Total Funds (Including Fund for Future Appropriation) 4,222,567 3,396,165 2,931,250 2,271,212 1,814,713Total Investments (Including Linked) 4,113,920 3,343,220 2,859,753 2,194,057 1,774,682 Yield on Investments (%) (Controlled Funds) 8.77% 8.64% 24.42% 3.90% 8.64%Yield on Investments (%) (Unit Linked Funds) 17.22% -1.34% -0.55% 12.67% 8.02%Shareholder’s account: Total Funds 250,934 202,386 205,525 202,633 188,152 Total Investments 323,031 239,182 262,269 277,509 271,105 Yield on Investments (%) 11.63% 9.12% 9.37% 5.38% 9.37%
23 Yield on Total Investments 11.94% 4.60% 8.40% 8.23% 8.40%24 Paid up Equity capital (including share premium and
reserves) 250,553 201,419 201,406 212,696 214,813
25 Weighted Average Number of Shares(in thousands) 1,918,813 1,918,813 1,936,821 1,944,691 1,944,691 26 Net Worth 250,934 202,386 205,525 202,633 188,152 27 Total Assets 4,644,337 3,763,391 3,273,209 2,473,845 2,002,86528 Earnings per share - Basic (Face Value : Rs 10 each) in Rs. 3.44 2.29 2.14 2.24 2.1829 Earnings per share - Diluted (Face Value : Rs 10 each) in Rs. 3.44 2.29 2.14 2.24 2.1830 Book Value per Share: Rs 10 Paid up 13.08 10.55 10.70 10.42 9.68

Max Life Insurance Company Limited Registration No: 104; Date of Registration with IRDAI: November 15, 2000
AnnuAL RepoRt 2016-17 281
23) Earningsperequityshare:Particulars 2016-17 2015-16
1 Net Profit/(Loss) as per Profit & Loss Account available for equity shareholders for both basic and diluted earnings per equity share of Rs 10
6,599,271 4,391,104
2 Weighted average number of equity shares for earnings per equity sharea) For basic earnings per equity share 1,918,812,856 1,918,812,856b) For diluted earnings per equity share 1,918,812,856 1,918,812,856Add: Weighted average outstanding employee stock options deemed to be issued for no consideration
- -
Weighted average number of equity shares for diluted earnings equity share 1,918,812,856 1,918,812,8563 Earning per equity share
a) Basic (in Rs.) 3.44 2.29b) Diluted (in Rs.) 3.44 2.29
24) EmployeeBenefits-DisclosuresasperAS15(Revised)i. DefinedContributionPlan
a. Employee State Insurance During the year, the Company has recognised the following amounts in the Revenue account / Profit and Loss Account:
Employee State Insurance 2016-17 2015-16Employers Contribution to Employee State Insurance 15,306 5,116
b. ProvidentFund
The Company contributes to the employee provident trust “Max India Limited Employees Provident Fund Trust” which is managed by the holding company and as per guidance note on AS–15, Employee Benefits (Revised) issued by the Accounting Standard Board (ASB), provident funds set up by employers, which requires interest shortfall to be met by the employer, needs to be treated as defined benefit plan.
The above mentioned contributions and shortfall, if any, is charged to Revenue Account / Profit and Loss Account.
The Company has carried out an independent actuarial valuation to measure the liability towards aforesaid interest shortfall. As per actuarial certificate there is Rs Nil (previous year: Rs Nil) shortfall in the earning of fund against statutorily required “interest rate guarantee” and accordingly, the liability on account of interest rate guarantee is Rs Nil (previous year: Rs Nil).
During the year, the Company has recognised the following amounts in the Revenue Account / Profit and Loss Account:
ProvidentFund 2016-17 2015-16Employers Contribution to Provident Fund 186,574 170,863
ii. DefinedBenefitPlans
The assumptions used in valuing the defined benefit obligations of interest rate guarantee are as follows:
Particulars 2016-17 2015-16Discount rate for the term of the Obligation 7.40% 7.50%Rate of return on plan assets 8.70% 8.70%Salary increase rate 7.50% 7.50%
a. Gratuity
This is a funded defined benefit plan under which the Company makes contributions to the Max Life Employees Group Gratuity Scheme. The scheme provides for a lump sum payment towards gratuity benefit as per the scheme rules, to an employee on his/her exit from employment either by way of resignation, retirement or death. The benefit accrues from the date of joining the employment but vests on completion of 5 years of continuous service. The completion of 5 years of service is not applicable in the case of death.
Defined benefit obligation is accounted for on the basis of independent actuarial valuations carried out as per ‘Projected Unit Credit Method’ at the balance sheet date. Actuarial gains / losses related thereof are expensed/recognized.
The following table sets out the status of the Gratuity Scheme:
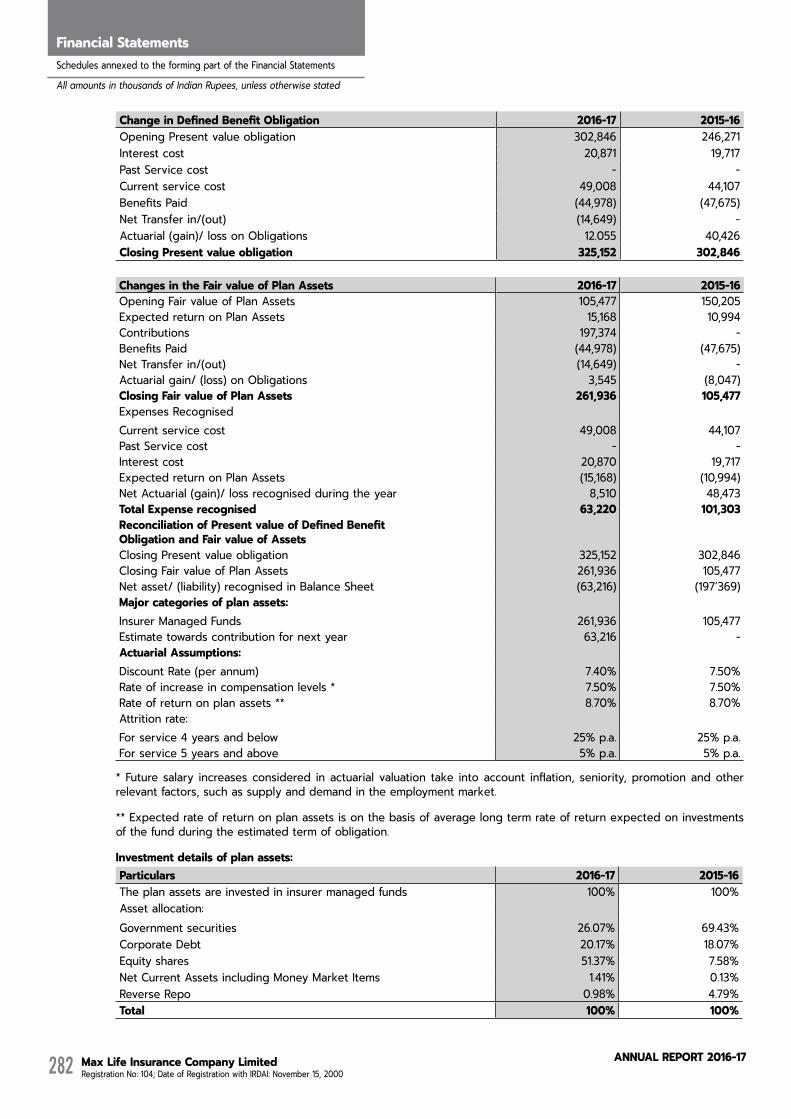
Max Life Insurance Company Limited Registration No: 104; Date of Registration with IRDAI: November 15, 2000
AnnuAL RepoRt 2016-17282
Directors' ReportFinancial StatementsSchedules annexed to the forming part of the Financial Statements
All amounts in thousands of Indian Rupees, unless otherwise stated
ChangeinDefinedBenefitObligation 2016-17 2015-16Opening Present value obligation 302,846 246,271Interest cost 20,871 19,717Past Service cost - -Current service cost 49,008 44,107Benefits Paid (44,978) (47,675)Net Transfer in/(out) (14,649) -Actuarial (gain)/ loss on Obligations 12.055 40,426ClosingPresentvalueobligation 325,152 302,846
ChangesintheFairvalueofPlanAssets 2016-17 2015-16Opening Fair value of Plan Assets 105,477 150,205Expected return on Plan Assets 15,168 10,994Contributions 197,374 -Benefits Paid (44,978) (47,675)Net Transfer in/(out) (14,649) -Actuarial gain/ (loss) on Obligations 3,545 (8,047)ClosingFairvalueofPlanAssets 261,936 105,477Expenses RecognisedCurrent service cost 49,008 44,107Past Service cost - -Interest cost 20,870 19,717Expected return on Plan Assets (15,168) (10,994)Net Actuarial (gain)/ loss recognised during the year 8,510 48,473TotalExpenserecognised 63,220 101,303ReconciliationofPresentvalueofDefinedBenefitObligationandFairvalueofAssetsClosing Present value obligation 325,152 302,846Closing Fair value of Plan Assets 261,936 105,477Net asset/ (liability) recognised in Balance Sheet (63,216) (197’369)Majorcategoriesofplanassets:Insurer Managed Funds 261,936 105,477Estimate towards contribution for next year 63,216 -Actuarial Assumptions:Discount Rate (per annum) 7.40% 7.50%Rate of increase in compensation levels * 7.50% 7.50%Rate of return on plan assets ** 8.70% 8.70%Attrition rate:For service 4 years and below 25% p.a. 25% p.a.For service 5 years and above 5% p.a. 5% p.a.
* Future salary increases considered in actuarial valuation take into account inflation, seniority, promotion and other relevant factors, such as supply and demand in the employment market.
** Expected rate of return on plan assets is on the basis of average long term rate of return expected on investments of the fund during the estimated term of obligation.
Investmentdetailsofplanassets:Particulars 2016-17 2015-16The plan assets are invested in insurer managed funds 100% 100%Asset allocation:Government securities 26.07% 69.43%Corporate Debt 20.17% 18.07%Equity shares 51.37% 7.58%Net Current Assets including Money Market Items 1.41% 0.13%Reverse Repo 0.98% 4.79%Total 100% 100%
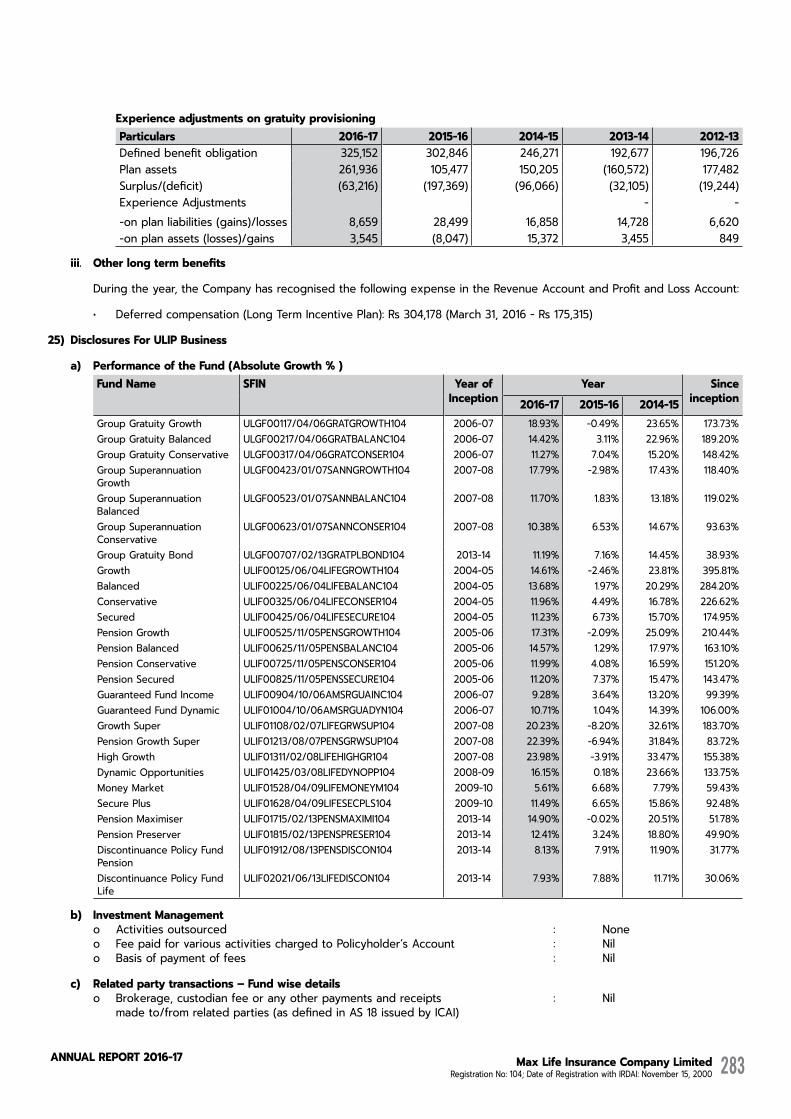
Max Life Insurance Company Limited Registration No: 104; Date of Registration with IRDAI: November 15, 2000
AnnuAL RepoRt 2016-17 283
ExperienceadjustmentsongratuityprovisioningParticulars 2016-17 2015-16 2014-15 2013-14 2012-13Defined benefit obligation 325,152 302,846 246,271 192,677 196,726 Plan assets 261,936 105,477 150,205 (160,572) 177,482 Surplus/(deficit) (63,216) (197,369) (96,066) (32,105) (19,244) Experience Adjustments - - -on plan liabilities (gains)/losses 8,659 28,499 16,858 14,728 6,620-on plan assets (losses)/gains 3,545 (8,047) 15,372 3,455 849
iii. Otherlongtermbenefits
During the year, the Company has recognised the following expense in the Revenue Account and Profit and Loss Account:
• Deferred compensation (Long Term Incentive Plan): Rs 304,178 (March 31, 2016 - Rs 175,315)
25) Disclosures For ULIP Business
a) PerformanceoftheFund(AbsoluteGrowth%)FundName SFIN Year of
InceptionYear Since
inception2016-17 2015-16 2014-15Group Gratuity Growth ULGF00117/04/06GRATGROWTH104 2006-07 18.93% -0.49% 23.65% 173.73%Group Gratuity Balanced ULGF00217/04/06GRATBALANC104 2006-07 14.42% 3.11% 22.96% 189.20%Group Gratuity Conservative ULGF00317/04/06GRATCONSER104 2006-07 11.27% 7.04% 15.20% 148.42%Group Superannuation Growth
ULGF00423/01/07SANNGROWTH104 2007-08 17.79% -2.98% 17.43% 118.40%
Group Superannuation Balanced
ULGF00523/01/07SANNBALANC104 2007-08 11.70% 1.83% 13.18% 119.02%
Group Superannuation Conservative
ULGF00623/01/07SANNCONSER104 2007-08 10.38% 6.53% 14.67% 93.63%
Group Gratuity Bond ULGF00707/02/13GRATPLBOND104 2013-14 11.19% 7.16% 14.45% 38.93%Growth ULIF00125/06/04LIFEGROWTH104 2004-05 14.61% -2.46% 23.81% 395.81%Balanced ULIF00225/06/04LIFEBALANC104 2004-05 13.68% 1.97% 20.29% 284.20%Conservative ULIF00325/06/04LIFECONSER104 2004-05 11.96% 4.49% 16.78% 226.62%Secured ULIF00425/06/04LIFESECURE104 2004-05 11.23% 6.73% 15.70% 174.95%Pension Growth ULIF00525/11/05PENSGROWTH104 2005-06 17.31% -2.09% 25.09% 210.44%Pension Balanced ULIF00625/11/05PENSBALANC104 2005-06 14.57% 1.29% 17.97% 163.10%Pension Conservative ULIF00725/11/05PENSCONSER104 2005-06 11.99% 4.08% 16.59% 151.20%Pension Secured ULIF00825/11/05PENSSECURE104 2005-06 11.20% 7.37% 15.47% 143.47%Guaranteed Fund Income ULIF00904/10/06AMSRGUAINC104 2006-07 9.28% 3.64% 13.20% 99.39%Guaranteed Fund Dynamic ULIF01004/10/06AMSRGUADYN104 2006-07 10.71% 1.04% 14.39% 106.00%Growth Super ULIF01108/02/07LIFEGRWSUP104 2007-08 20.23% -8.20% 32.61% 183.70%Pension Growth Super ULIF01213/08/07PENSGRWSUP104 2007-08 22.39% -6.94% 31.84% 83.72%High Growth ULIF01311/02/08LIFEHIGHGR104 2007-08 23.98% -3.91% 33.47% 155.38%Dynamic Opportunities ULIF01425/03/08LIFEDYNOPP104 2008-09 16.15% 0.18% 23.66% 133.75%Money Market ULIF01528/04/09LIFEMONEYM104 2009-10 5.61% 6.68% 7.79% 59.43%Secure Plus ULIF01628/04/09LIFESECPLS104 2009-10 11.49% 6.65% 15.86% 92.48%Pension Maximiser ULIF01715/02/13PENSMAXIMI104 2013-14 14.90% -0.02% 20.51% 51.78%Pension Preserver ULIF01815/02/13PENSPRESER104 2013-14 12.41% 3.24% 18.80% 49.90%Discontinuance Policy Fund Pension
ULIF01912/08/13PENSDISCON104 2013-14 8.13% 7.91% 11.90% 31.77%
Discontinuance Policy Fund Life
ULIF02021/06/13LIFEDISCON104 2013-14 7.93% 7.88% 11.71% 30.06%
b) InvestmentManagemento Activities outsourced : Noneo Fee paid for various activities charged to Policyholder’s Account : Nilo Basis of payment of fees : Nil
c) Relatedpartytransactions–Fundwisedetailso Brokerage, custodian fee or any other payments and receipts : Nil made to/from related parties (as defined in AS 18 issued by ICAI)
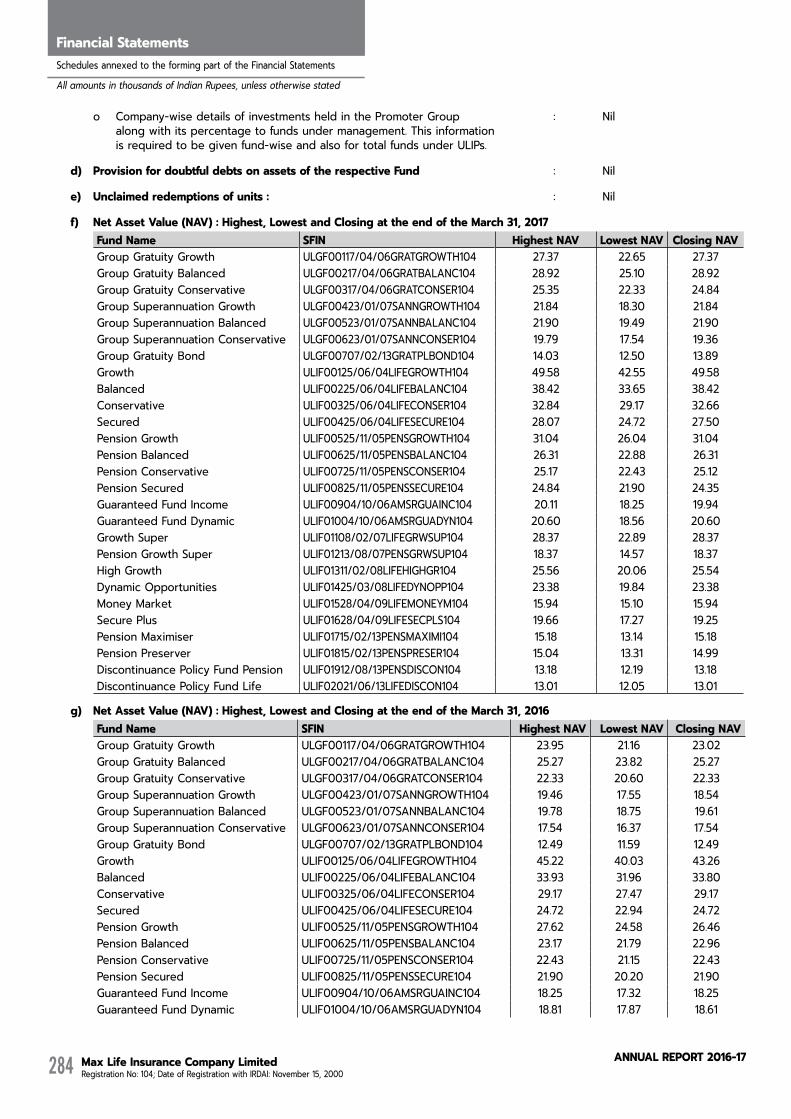
Max Life Insurance Company Limited Registration No: 104; Date of Registration with IRDAI: November 15, 2000
AnnuAL RepoRt 2016-17284
Directors' ReportFinancial StatementsSchedules annexed to the forming part of the Financial Statements
All amounts in thousands of Indian Rupees, unless otherwise stated
o Company-wise details of investments held in the Promoter Group : Nil along with its percentage to funds under management. This information
is required to be given fund-wise and also for total funds under ULIPs.
d) ProvisionfordoubtfuldebtsonassetsoftherespectiveFund : Nil
e) Unclaimedredemptionsofunits: : Nil
f) NetAssetValue(NAV):Highest,LowestandClosingattheendoftheMarch31,2017FundName SFIN HighestNAV Lowest NAV ClosingNAVGroup Gratuity Growth ULGF00117/04/06GRATGROWTH104 27.37 22.65 27.37Group Gratuity Balanced ULGF00217/04/06GRATBALANC104 28.92 25.10 28.92Group Gratuity Conservative ULGF00317/04/06GRATCONSER104 25.35 22.33 24.84Group Superannuation Growth ULGF00423/01/07SANNGROWTH104 21.84 18.30 21.84Group Superannuation Balanced ULGF00523/01/07SANNBALANC104 21.90 19.49 21.90Group Superannuation Conservative ULGF00623/01/07SANNCONSER104 19.79 17.54 19.36Group Gratuity Bond ULGF00707/02/13GRATPLBOND104 14.03 12.50 13.89Growth ULIF00125/06/04LIFEGROWTH104 49.58 42.55 49.58Balanced ULIF00225/06/04LIFEBALANC104 38.42 33.65 38.42Conservative ULIF00325/06/04LIFECONSER104 32.84 29.17 32.66Secured ULIF00425/06/04LIFESECURE104 28.07 24.72 27.50Pension Growth ULIF00525/11/05PENSGROWTH104 31.04 26.04 31.04Pension Balanced ULIF00625/11/05PENSBALANC104 26.31 22.88 26.31Pension Conservative ULIF00725/11/05PENSCONSER104 25.17 22.43 25.12Pension Secured ULIF00825/11/05PENSSECURE104 24.84 21.90 24.35Guaranteed Fund Income ULIF00904/10/06AMSRGUAINC104 20.11 18.25 19.94Guaranteed Fund Dynamic ULIF01004/10/06AMSRGUADYN104 20.60 18.56 20.60Growth Super ULIF01108/02/07LIFEGRWSUP104 28.37 22.89 28.37Pension Growth Super ULIF01213/08/07PENSGRWSUP104 18.37 14.57 18.37High Growth ULIF01311/02/08LIFEHIGHGR104 25.56 20.06 25.54Dynamic Opportunities ULIF01425/03/08LIFEDYNOPP104 23.38 19.84 23.38Money Market ULIF01528/04/09LIFEMONEYM104 15.94 15.10 15.94Secure Plus ULIF01628/04/09LIFESECPLS104 19.66 17.27 19.25Pension Maximiser ULIF01715/02/13PENSMAXIMI104 15.18 13.14 15.18Pension Preserver ULIF01815/02/13PENSPRESER104 15.04 13.31 14.99Discontinuance Policy Fund Pension ULIF01912/08/13PENSDISCON104 13.18 12.19 13.18Discontinuance Policy Fund Life ULIF02021/06/13LIFEDISCON104 13.01 12.05 13.01
g) NetAssetValue(NAV):Highest,LowestandClosingattheendoftheMarch31,2016FundName SFIN HighestNAV Lowest NAV ClosingNAVGroup Gratuity Growth ULGF00117/04/06GRATGROWTH104 23.95 21.16 23.02Group Gratuity Balanced ULGF00217/04/06GRATBALANC104 25.27 23.82 25.27Group Gratuity Conservative ULGF00317/04/06GRATCONSER104 22.33 20.60 22.33Group Superannuation Growth ULGF00423/01/07SANNGROWTH104 19.46 17.55 18.54Group Superannuation Balanced ULGF00523/01/07SANNBALANC104 19.78 18.75 19.61Group Superannuation Conservative ULGF00623/01/07SANNCONSER104 17.54 16.37 17.54Group Gratuity Bond ULGF00707/02/13GRATPLBOND104 12.49 11.59 12.49Growth ULIF00125/06/04LIFEGROWTH104 45.22 40.03 43.26Balanced ULIF00225/06/04LIFEBALANC104 33.93 31.96 33.80Conservative ULIF00325/06/04LIFECONSER104 29.17 27.47 29.17Secured ULIF00425/06/04LIFESECURE104 24.72 22.94 24.72Pension Growth ULIF00525/11/05PENSGROWTH104 27.62 24.58 26.46Pension Balanced ULIF00625/11/05PENSBALANC104 23.17 21.79 22.96Pension Conservative ULIF00725/11/05PENSCONSER104 22.43 21.15 22.43Pension Secured ULIF00825/11/05PENSSECURE104 21.90 20.20 21.90Guaranteed Fund Income ULIF00904/10/06AMSRGUAINC104 18.25 17.32 18.25Guaranteed Fund Dynamic ULIF01004/10/06AMSRGUADYN104 18.81 17.87 18.61

Max Life Insurance Company Limited Registration No: 104; Date of Registration with IRDAI: November 15, 2000
AnnuAL RepoRt 2016-17 285
FundName SFIN HighestNAV Lowest NAV ClosingNAVGrowth Super ULIF01108/02/07LIFEGRWSUP104 26.44 21.11 23.60Pension Growth Super ULIF01213/08/07PENSGRWSUP104 16.78 13.52 15.01High Growth ULIF01311/02/08LIFEHIGHGR104 22.13 18.46 20.60Dynamic Opportunities ULIF01425/03/08LIFEDYNOPP104 20.72 18.47 20.13Money Market ULIF01528/04/09LIFEMONEYM104 15.10 14.15 15.10Secure Plus ULIF01628/04/09LIFESECPLS104 17.26 16.00 17.26Pension Maximiser ULIF01715/02/13PENSMAXIMI104 13.48 12.55 13.21Pension Preserver ULIF01815/02/13PENSPRESER104 13.34 12.71 13.34Discontinuance Policy Fund Pension ULIF01912/08/13PENSDISCON104 12.19 11.23 12.19Discontinuance Policy Fund Life ULIF02021/06/13LIFEDISCON104 12.05 11.11 12.05
h) ExpensesChargedtoFund%:AnnualizedexpenseratiotoaveragedailyassetsoftheFundFundName SFIN Ratios as at
March 31, 2017Ratios as at
March 31, 2016Group Gratuity Growth ULGF00117/04/06GRATGROWTH104 0.57% 0.57%Group Gratuity Balanced ULGF00217/04/06GRATBALANC104 0.52% 0.51%Group Gratuity Conservative ULGF00317/04/06GRATCONSER104 0.46% 0.46%Group Superannuation Growth ULGF00423/01/07SANNGROWTH104 1.09% 1.08%Group Superannuation Balanced ULGF00523/01/07SANNBALANC104 0.98% 0.97%Group Superannuation Conservative ULGF00623/01/07SANNCONSER104 0.86% 0.85%Group Gratuity Bond ULGF00707/02/13GRATPLBOND104 0.46% 0.46%Growth ULIF00125/06/04LIFEGROWTH104 1.43% 1.42%Balanced ULIF00225/06/04LIFEBALANC104 1.26% 1.25%Conservative ULIF00325/06/04LIFECONSER104 1.03% 1.03%Secured ULIF00425/06/04LIFESECURE104 1.03% 1.03%Pension Growth ULIF00525/11/05PENSGROWTH104 1.44% 1.42%Pension Balanced ULIF00625/11/05PENSBALANC104 1.26% 1.25%Pension Conservative ULIF00725/11/05PENSCONSER104 1.03% 1.02%Pension Secured ULIF00825/11/05PENSSECURE104 1.03% 1.03%Guaranteed Fund Income ULIF00904/10/06AMSRGUAINC104 1.72% 1.71%Guaranteed Fund Dynamic ULIF01004/10/06AMSRGUADYN104 1.95% 1.94%Growth Super ULIF01108/02/07LIFEGRWSUP104 1.43% 1.42%Pension Growth Super ULIF01213/08/07PENSGRWSUP104 1.43% 1.42%High Growth ULIF01311/02/08LIFEHIGHGR104 1.44% 1.42%Dynamic Opportunities ULIF01425/03/08LIFEDYNOPP104 1.44% 1.42%Money Market ULIF01528/04/09LIFEMONEYM104 1.03% 1.03%Secure Plus ULIF01628/04/09LIFESECPLS104 1.03% 1.02%Pension Maximiser ULIF01715/02/13PENSMAXIMI104 1.90% 1.88%Pension Preserver ULIF01815/02/13PENSPRESER104 1.67% 1.65%Discontinuance Policy Fund Pension ULIF01912/08/13PENSDISCON104 0.57% 0.57%Discontinuance Policy Fund Life ULIF02021/06/13LIFEDISCON104 0.57% 0.57%
i) Ratioofgrossincome(includingunrealizedgains)toaveragedailynetassetsFundName SFIN Ratios as at
March 31, 2017Ratios as at
March 31, 2016Group Gratuity Growth ULGF00117/04/06GRATGROWTH104 13.48% -0.44%Group Gratuity Balanced ULGF00217/04/06GRATBALANC104 13.95% 3.64%Group Gratuity Conservative ULGF00317/04/06GRATCONSER104 10.99% 7.39%Group Superannuation Growth ULGF00423/01/07SANNGROWTH104 17.47% -1.95%Group Superannuation Balanced ULGF00523/01/07SANNBALANC104 11.98% 2.79%Group Superannuation Conservative ULGF00623/01/07SANNCONSER104 10.57% 6.81%Group Gratuity Bond ULGF00707/02/13GRATPLBOND104 10.19% 6.94%Growth ULIF00125/06/04LIFEGROWTH104 15.09% -1.14%Balanced ULIF00225/06/04LIFEBALANC104 13.84% 3.41%Conservative ULIF00325/06/04LIFECONSER104 12.04% 5.57%

Max Life Insurance Company Limited Registration No: 104; Date of Registration with IRDAI: November 15, 2000
AnnuAL RepoRt 2016-17286
Directors' ReportFinancial StatementsSchedules annexed to the forming part of the Financial Statements
All amounts in thousands of Indian Rupees, unless otherwise stated
FundName SFIN Ratios as at March 31, 2017
Ratios as at March 31, 2016
Secured ULIF00425/06/04LIFESECURE104 11.38% 7.67%Pension Growth ULIF00525/11/05PENSGROWTH104 17.43% -0.81%Pension Balanced ULIF00625/11/05PENSBALANC104 14.83% 2.48%Pension Conservative ULIF00725/11/05PENSCONSER104 12.31% 5.18%Pension Secured ULIF00825/11/05PENSSECURE104 11.45% 8.11%Guaranteed Fund Income ULIF00904/10/06AMSRGUAINC104 10.58% 5.36%Guaranteed Fund Dynamic ULIF01004/10/06AMSRGUADYN104 12.06% 2.97%Growth Super ULIF01108/02/07LIFEGRWSUP104 20.12% -7.16%Pension Growth Super ULIF01213/08/07PENSGRWSUP104 21.78% -5.85%High Growth ULIF01311/02/08LIFEHIGHGR104 23.02% -2.70%Dynamic Opportunities ULIF01425/03/08LIFEDYNOPP104 16.41% 1.57%Money Market ULIF01528/04/09LIFEMONEYM104 6.50% 7.50%Secure Plus ULIF01628/04/09LIFESECPLS104 11.74% 7.92%Pension Maximiser ULIF01715/02/13PENSMAXIMI104 15.30% 2.30%Pension Preserver ULIF01815/02/13PENSPRESER104 12.83% 5.25%Discontinuance Policy Fund Pension ULIF01912/08/13PENSDISCON104 7.99% 9.01%Discontinuance Policy Fund Life ULIF02021/06/13LIFEDISCON104 7.84% 9.74%
j) Fund-wisedisclosureofappreciationand/or(depreciation)invalueofinvestmentssegregatedclass-wiseFundName SFIN Bonds Equity Government
SecuritiesMutual Funds
Money Market
Total
Group Gratuity Growth ULGF00117/04/06GRATGROWTH104 382 11,905 322 - - 12,609Group Gratuity Balanced ULGF00217/04/06GRATBALANC104 3,586 9,032 1,405 - - 14,023Group Gratuity Conservative ULGF00317/04/06GRATCONSER104 6,936 - 4,752 - - 11,688Group Superannuation Growth
ULGF00423/01/07SANNGROWTH104 1 24 1 - - 26
Group Superannuation Balanced
ULGF00523/01/07SANNBALANC104 1 4 1 - - 6
Group Superannuation Conservative
ULGF00623/01/07SANNCONSER104 182 - 218 - - 400
Group Gratuity Bond ULGF00707/02/13GRATPLBOND104 15 - 139 - - 154Growth ULIF00125/06/04LIFEGROWTH104 531,693 5,625,936 132,009 - - 6,289,638Balanced ULIF00225/06/04LIFEBALANC104 210,262 1,295,703 64,060 - - 1,570,025Conservative ULIF00325/06/04LIFECONSER104 13,134 30,603 3,947 - - 47,684Secured ULIF00425/06/04LIFESECURE104 72,495 - 16,097 - - 88,592Pension Growth ULIF00525/11/05PENSGROWTH104 40,963 1,068,164 9,074 - - 1,118,201Pension Balanced ULIF00625/11/05PENSBALANC104 20,156 181,486 1,951 - - 203,593Pension Conservative ULIF00725/11/05PENSCONSER104 1,644 2,818 112 - - 4,574Pension Secured ULIF00825/11/05PENSSECURE104 11,723 - 2,105 - - 13,828Guaranteed Fund Income ULIF00904/10/06AMSRGUAINC104 272 69 89 - - 430Guaranteed Fund Dynamic ULIF01004/10/06AMSRGUADYN104 483 1,407 165 - - 2,055Growth Super ULIF01108/02/07LIFEGRWSUP104 (264) 5,600,089 - 305,529 - 5,905,354Pension Growth Super ULIF01213/08/07PENSGRWSUP104 - 1,159,198 - 10,791 - 1,169,989High Growth ULIF01311/02/08LIFEHIGHGR104 - 109,460 - - - 109,460Dynamic Opportunities ULIF01425/03/08LIFEDYNOPP104 60,770 1,062,318 24,112 - - 1,147,200Money Market ULIF01528/04/09LIFEMONEYM104 - - - - - -Secure Plus ULIF01628/04/09LIFESECPLS104 20,713 - 2,823 - - 23,536Pension Maximiser ULIF01715/02/13PENSMAXIMI104 4,770 120,110 8,136 - - 133,016Pension Preserver ULIF01815/02/13PENSPRESER104 9,017 55,914 15,702 - - 80,633Discontinuance Policy Fund Pension
ULIF01912/08/13PENSDISCON104 - - 3,337 - - 3,337
Discontinuance Policy Fund Life
ULIF02021/06/13LIFEDISCON104 - - 28,042 - - 28,042
Total 1,008,934 16,334,240 318,599 316,320 - 17,978,093
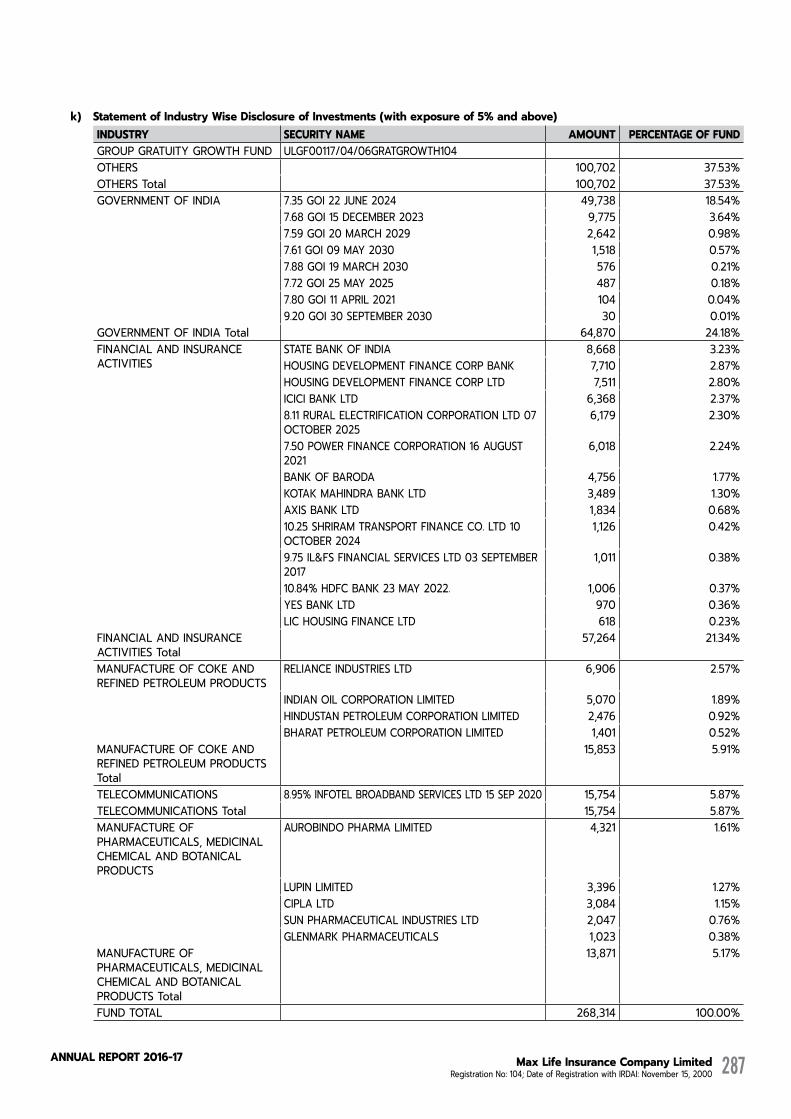
Max Life Insurance Company Limited Registration No: 104; Date of Registration with IRDAI: November 15, 2000
AnnuAL RepoRt 2016-17 287
k) StatementofIndustryWiseDisclosureofInvestments(withexposureof5%andabove)INDUSTRY SECURITY NAME AMOUNT PERCENTAGE OF FUNDGROUP GRATUITY GROWTH FUND ULGF00117/04/06GRATGROWTH104 OTHERS 100,702 37.53%OTHERS Total 100,702 37.53%GOVERNMENT OF INDIA 7.35 GOI 22 JUNE 2024 49,738 18.54% 7.68 GOI 15 DECEMBER 2023 9,775 3.64% 7.59 GOI 20 MARCH 2029 2,642 0.98% 7.61 GOI 09 MAY 2030 1,518 0.57% 7.88 GOI 19 MARCH 2030 576 0.21% 7.72 GOI 25 MAY 2025 487 0.18% 7.80 GOI 11 APRIL 2021 104 0.04% 9.20 GOI 30 SEPTEMBER 2030 30 0.01%GOVERNMENT OF INDIA Total 64,870 24.18%FINANCIAL AND INSURANCE ACTIVITIES
STATE BANK OF INDIA 8,668 3.23%HOUSING DEVELOPMENT FINANCE CORP BANK 7,710 2.87%HOUSING DEVELOPMENT FINANCE CORP LTD 7,511 2.80%ICICI BANK LTD 6,368 2.37%8.11 RURAL ELECTRIFICATION CORPORATION LTD 07 OCTOBER 2025
6,179 2.30%
7.50 POWER FINANCE CORPORATION 16 AUGUST 2021
6,018 2.24%
BANK OF BARODA 4,756 1.77%KOTAK MAHINDRA BANK LTD 3,489 1.30%AXIS BANK LTD 1,834 0.68%10.25 SHRIRAM TRANSPORT FINANCE CO. LTD 10 OCTOBER 2024
1,126 0.42%
9.75 IL&FS FINANCIAL SERVICES LTD 03 SEPTEMBER 2017
1,011 0.38%
10.84% HDFC BANK 23 MAY 2022. 1,006 0.37% YES BANK LTD 970 0.36% LIC HOUSING FINANCE LTD 618 0.23%FINANCIAL AND INSURANCE ACTIVITIES Total
57,264 21.34%
MANUFACTURE OF COKE AND REFINED PETROLEUM PRODUCTS
RELIANCE INDUSTRIES LTD 6,906 2.57%
INDIAN OIL CORPORATION LIMITED 5,070 1.89% HINDUSTAN PETROLEUM CORPORATION LIMITED 2,476 0.92% BHARAT PETROLEUM CORPORATION LIMITED 1,401 0.52%MANUFACTURE OF COKE AND REFINED PETROLEUM PRODUCTS Total
15,853 5.91%
TELECOMMUNICATIONS 8.95% INFOTEL BROADBAND SERVICES LTD 15 SEP 2020 15,754 5.87%TELECOMMUNICATIONS Total 15,754 5.87%MANUFACTURE OF PHARMACEUTICALS, MEDICINAL CHEMICAL AND BOTANICAL PRODUCTS
AUROBINDO PHARMA LIMITED 4,321 1.61%
LUPIN LIMITED 3,396 1.27% CIPLA LTD 3,084 1.15% SUN PHARMACEUTICAL INDUSTRIES LTD 2,047 0.76% GLENMARK PHARMACEUTICALS 1,023 0.38%MANUFACTURE OF PHARMACEUTICALS, MEDICINAL CHEMICAL AND BOTANICAL PRODUCTS Total
13,871 5.17%
FUND TOTAL 268,314 100.00%
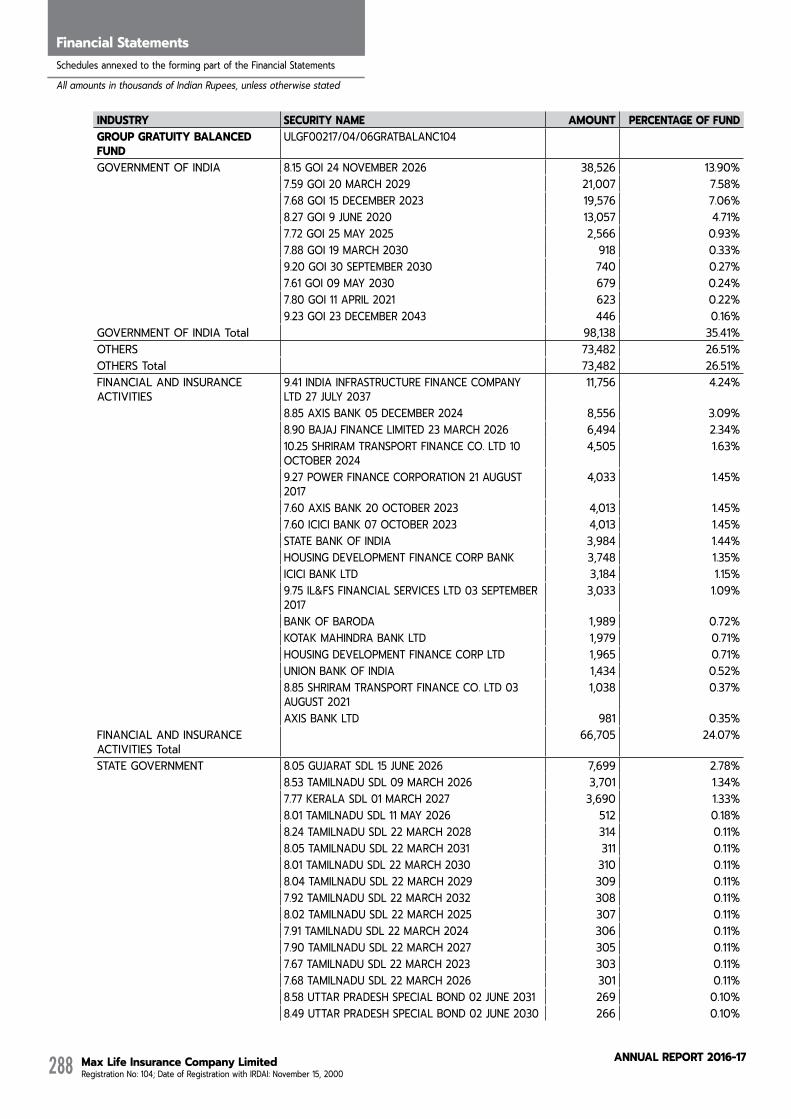
Max Life Insurance Company Limited Registration No: 104; Date of Registration with IRDAI: November 15, 2000
AnnuAL RepoRt 2016-17288
Directors' ReportFinancial StatementsSchedules annexed to the forming part of the Financial Statements
All amounts in thousands of Indian Rupees, unless otherwise stated
INDUSTRY SECURITY NAME AMOUNT PERCENTAGE OF FUNDGROUP GRATUITY BALANCED FUND
ULGF00217/04/06GRATBALANC104
GOVERNMENT OF INDIA 8.15 GOI 24 NOVEMBER 2026 38,526 13.90% 7.59 GOI 20 MARCH 2029 21,007 7.58% 7.68 GOI 15 DECEMBER 2023 19,576 7.06% 8.27 GOI 9 JUNE 2020 13,057 4.71% 7.72 GOI 25 MAY 2025 2,566 0.93% 7.88 GOI 19 MARCH 2030 918 0.33% 9.20 GOI 30 SEPTEMBER 2030 740 0.27% 7.61 GOI 09 MAY 2030 679 0.24% 7.80 GOI 11 APRIL 2021 623 0.22% 9.23 GOI 23 DECEMBER 2043 446 0.16%GOVERNMENT OF INDIA Total 98,138 35.41%OTHERS 73,482 26.51%OTHERS Total 73,482 26.51%FINANCIAL AND INSURANCE ACTIVITIES
9.41 INDIA INFRASTRUCTURE FINANCE COMPANY LTD 27 JULY 2037
11,756 4.24%
8.85 AXIS BANK 05 DECEMBER 2024 8,556 3.09% 8.90 BAJAJ FINANCE LIMITED 23 MARCH 2026 6,494 2.34% 10.25 SHRIRAM TRANSPORT FINANCE CO. LTD 10
OCTOBER 20244,505 1.63%
9.27 POWER FINANCE CORPORATION 21 AUGUST 2017
4,033 1.45%
7.60 AXIS BANK 20 OCTOBER 2023 4,013 1.45% 7.60 ICICI BANK 07 OCTOBER 2023 4,013 1.45% STATE BANK OF INDIA 3,984 1.44% HOUSING DEVELOPMENT FINANCE CORP BANK 3,748 1.35% ICICI BANK LTD 3,184 1.15% 9.75 IL&FS FINANCIAL SERVICES LTD 03 SEPTEMBER
20173,033 1.09%
BANK OF BARODA 1,989 0.72% KOTAK MAHINDRA BANK LTD 1,979 0.71% HOUSING DEVELOPMENT FINANCE CORP LTD 1,965 0.71% UNION BANK OF INDIA 1,434 0.52% 8.85 SHRIRAM TRANSPORT FINANCE CO. LTD 03
AUGUST 20211,038 0.37%
AXIS BANK LTD 981 0.35%FINANCIAL AND INSURANCE ACTIVITIES Total
66,705 24.07%
STATE GOVERNMENT 8.05 GUJARAT SDL 15 JUNE 2026 7,699 2.78% 8.53 TAMILNADU SDL 09 MARCH 2026 3,701 1.34% 7.77 KERALA SDL 01 MARCH 2027 3,690 1.33% 8.01 TAMILNADU SDL 11 MAY 2026 512 0.18% 8.24 TAMILNADU SDL 22 MARCH 2028 314 0.11% 8.05 TAMILNADU SDL 22 MARCH 2031 311 0.11% 8.01 TAMILNADU SDL 22 MARCH 2030 310 0.11% 8.04 TAMILNADU SDL 22 MARCH 2029 309 0.11% 7.92 TAMILNADU SDL 22 MARCH 2032 308 0.11% 8.02 TAMILNADU SDL 22 MARCH 2025 307 0.11% 7.91 TAMILNADU SDL 22 MARCH 2024 306 0.11% 7.90 TAMILNADU SDL 22 MARCH 2027 305 0.11% 7.67 TAMILNADU SDL 22 MARCH 2023 303 0.11% 7.68 TAMILNADU SDL 22 MARCH 2026 301 0.11% 8.58 UTTAR PRADESH SPECIAL BOND 02 JUNE 2031 269 0.10% 8.49 UTTAR PRADESH SPECIAL BOND 02 JUNE 2030 266 0.10%
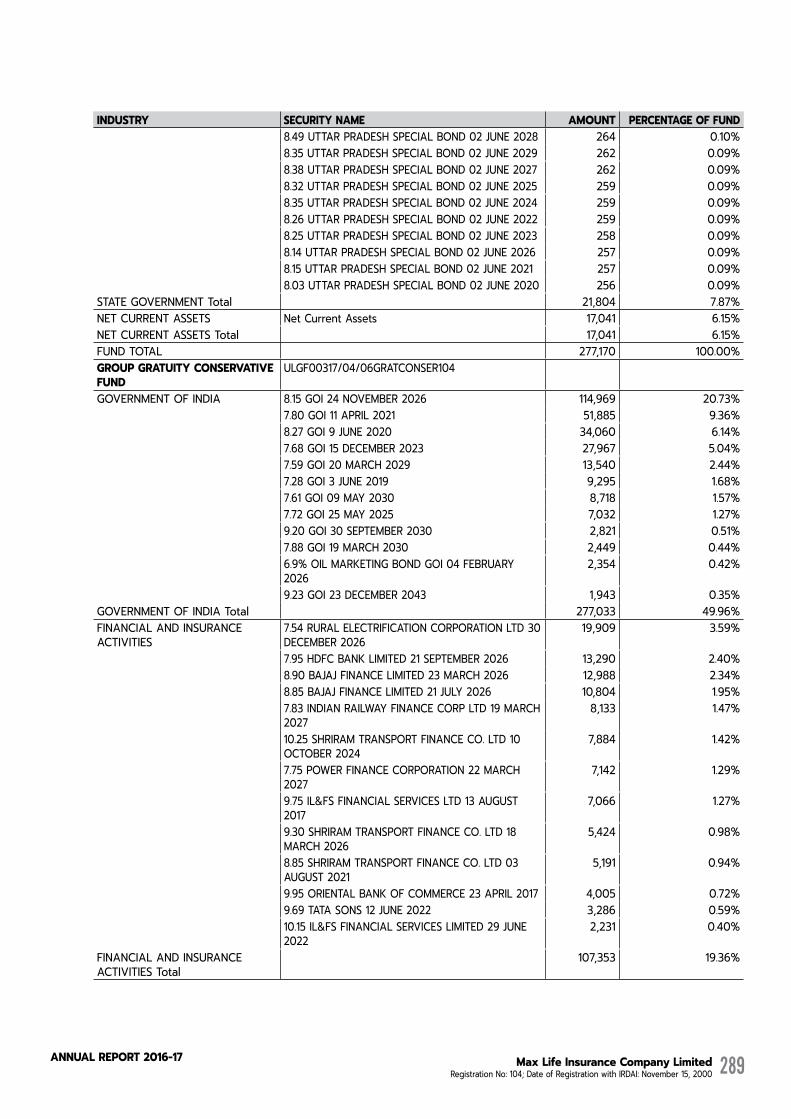
Max Life Insurance Company Limited Registration No: 104; Date of Registration with IRDAI: November 15, 2000
AnnuAL RepoRt 2016-17 289
INDUSTRY SECURITY NAME AMOUNT PERCENTAGE OF FUND 8.49 UTTAR PRADESH SPECIAL BOND 02 JUNE 2028 264 0.10% 8.35 UTTAR PRADESH SPECIAL BOND 02 JUNE 2029 262 0.09% 8.38 UTTAR PRADESH SPECIAL BOND 02 JUNE 2027 262 0.09% 8.32 UTTAR PRADESH SPECIAL BOND 02 JUNE 2025 259 0.09% 8.35 UTTAR PRADESH SPECIAL BOND 02 JUNE 2024 259 0.09% 8.26 UTTAR PRADESH SPECIAL BOND 02 JUNE 2022 259 0.09% 8.25 UTTAR PRADESH SPECIAL BOND 02 JUNE 2023 258 0.09% 8.14 UTTAR PRADESH SPECIAL BOND 02 JUNE 2026 257 0.09% 8.15 UTTAR PRADESH SPECIAL BOND 02 JUNE 2021 257 0.09% 8.03 UTTAR PRADESH SPECIAL BOND 02 JUNE 2020 256 0.09%STATE GOVERNMENT Total 21,804 7.87%NET CURRENT ASSETS Net Current Assets 17,041 6.15%NET CURRENT ASSETS Total 17,041 6.15%FUND TOTAL 277,170 100.00%GROUP GRATUITY CONSERVATIVE FUND
ULGF00317/04/06GRATCONSER104
GOVERNMENT OF INDIA 8.15 GOI 24 NOVEMBER 2026 114,969 20.73% 7.80 GOI 11 APRIL 2021 51,885 9.36% 8.27 GOI 9 JUNE 2020 34,060 6.14% 7.68 GOI 15 DECEMBER 2023 27,967 5.04% 7.59 GOI 20 MARCH 2029 13,540 2.44% 7.28 GOI 3 JUNE 2019 9,295 1.68% 7.61 GOI 09 MAY 2030 8,718 1.57% 7.72 GOI 25 MAY 2025 7,032 1.27% 9.20 GOI 30 SEPTEMBER 2030 2,821 0.51% 7.88 GOI 19 MARCH 2030 2,449 0.44% 6.9% OIL MARKETING BOND GOI 04 FEBRUARY
20262,354 0.42%
9.23 GOI 23 DECEMBER 2043 1,943 0.35%GOVERNMENT OF INDIA Total 277,033 49.96%FINANCIAL AND INSURANCE ACTIVITIES
7.54 RURAL ELECTRIFICATION CORPORATION LTD 30 DECEMBER 2026
19,909 3.59%
7.95 HDFC BANK LIMITED 21 SEPTEMBER 2026 13,290 2.40% 8.90 BAJAJ FINANCE LIMITED 23 MARCH 2026 12,988 2.34% 8.85 BAJAJ FINANCE LIMITED 21 JULY 2026 10,804 1.95% 7.83 INDIAN RAILWAY FINANCE CORP LTD 19 MARCH
20278,133 1.47%
10.25 SHRIRAM TRANSPORT FINANCE CO. LTD 10 OCTOBER 2024
7,884 1.42%
7.75 POWER FINANCE CORPORATION 22 MARCH 2027
7,142 1.29%
9.75 IL&FS FINANCIAL SERVICES LTD 13 AUGUST 2017
7,066 1.27%
9.30 SHRIRAM TRANSPORT FINANCE CO. LTD 18 MARCH 2026
5,424 0.98%
8.85 SHRIRAM TRANSPORT FINANCE CO. LTD 03 AUGUST 2021
5,191 0.94%
9.95 ORIENTAL BANK OF COMMERCE 23 APRIL 2017 4,005 0.72% 9.69 TATA SONS 12 JUNE 2022 3,286 0.59% 10.15 IL&FS FINANCIAL SERVICES LIMITED 29 JUNE
20222,231 0.40%
FINANCIAL AND INSURANCE ACTIVITIES Total
107,353 19.36%
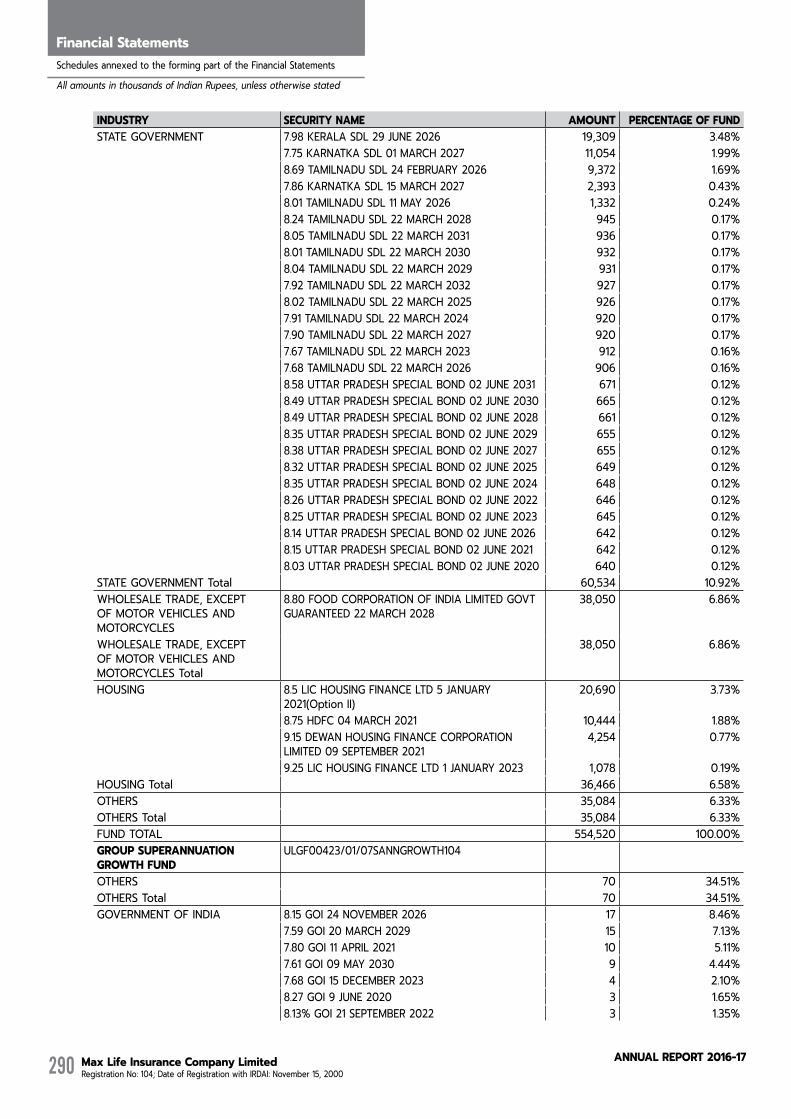
Max Life Insurance Company Limited Registration No: 104; Date of Registration with IRDAI: November 15, 2000
AnnuAL RepoRt 2016-17290
Directors' ReportFinancial StatementsSchedules annexed to the forming part of the Financial Statements
All amounts in thousands of Indian Rupees, unless otherwise stated
INDUSTRY SECURITY NAME AMOUNT PERCENTAGE OF FUNDSTATE GOVERNMENT 7.98 KERALA SDL 29 JUNE 2026 19,309 3.48% 7.75 KARNATKA SDL 01 MARCH 2027 11,054 1.99% 8.69 TAMILNADU SDL 24 FEBRUARY 2026 9,372 1.69% 7.86 KARNATKA SDL 15 MARCH 2027 2,393 0.43% 8.01 TAMILNADU SDL 11 MAY 2026 1,332 0.24% 8.24 TAMILNADU SDL 22 MARCH 2028 945 0.17% 8.05 TAMILNADU SDL 22 MARCH 2031 936 0.17% 8.01 TAMILNADU SDL 22 MARCH 2030 932 0.17% 8.04 TAMILNADU SDL 22 MARCH 2029 931 0.17% 7.92 TAMILNADU SDL 22 MARCH 2032 927 0.17% 8.02 TAMILNADU SDL 22 MARCH 2025 926 0.17% 7.91 TAMILNADU SDL 22 MARCH 2024 920 0.17% 7.90 TAMILNADU SDL 22 MARCH 2027 920 0.17% 7.67 TAMILNADU SDL 22 MARCH 2023 912 0.16% 7.68 TAMILNADU SDL 22 MARCH 2026 906 0.16% 8.58 UTTAR PRADESH SPECIAL BOND 02 JUNE 2031 671 0.12% 8.49 UTTAR PRADESH SPECIAL BOND 02 JUNE 2030 665 0.12% 8.49 UTTAR PRADESH SPECIAL BOND 02 JUNE 2028 661 0.12% 8.35 UTTAR PRADESH SPECIAL BOND 02 JUNE 2029 655 0.12% 8.38 UTTAR PRADESH SPECIAL BOND 02 JUNE 2027 655 0.12% 8.32 UTTAR PRADESH SPECIAL BOND 02 JUNE 2025 649 0.12% 8.35 UTTAR PRADESH SPECIAL BOND 02 JUNE 2024 648 0.12% 8.26 UTTAR PRADESH SPECIAL BOND 02 JUNE 2022 646 0.12% 8.25 UTTAR PRADESH SPECIAL BOND 02 JUNE 2023 645 0.12% 8.14 UTTAR PRADESH SPECIAL BOND 02 JUNE 2026 642 0.12% 8.15 UTTAR PRADESH SPECIAL BOND 02 JUNE 2021 642 0.12% 8.03 UTTAR PRADESH SPECIAL BOND 02 JUNE 2020 640 0.12%STATE GOVERNMENT Total 60,534 10.92%WHOLESALE TRADE, EXCEPT OF MOTOR VEHICLES AND MOTORCYCLES
8.80 FOOD CORPORATION OF INDIA LIMITED GOVT GUARANTEED 22 MARCH 2028
38,050 6.86%
WHOLESALE TRADE, EXCEPT OF MOTOR VEHICLES AND MOTORCYCLES Total
38,050 6.86%
HOUSING 8.5 LIC HOUSING FINANCE LTD 5 JANUARY 2021(Option II)
20,690 3.73%
8.75 HDFC 04 MARCH 2021 10,444 1.88% 9.15 DEWAN HOUSING FINANCE CORPORATION
LIMITED 09 SEPTEMBER 20214,254 0.77%
9.25 LIC HOUSING FINANCE LTD 1 JANUARY 2023 1,078 0.19%HOUSING Total 36,466 6.58%OTHERS 35,084 6.33%OTHERS Total 35,084 6.33%FUND TOTAL 554,520 100.00%GROUP SUPERANNUATION GROWTH FUND
ULGF00423/01/07SANNGROWTH104
OTHERS 70 34.51%OTHERS Total 70 34.51%GOVERNMENT OF INDIA 8.15 GOI 24 NOVEMBER 2026 17 8.46% 7.59 GOI 20 MARCH 2029 15 7.13% 7.80 GOI 11 APRIL 2021 10 5.11% 7.61 GOI 09 MAY 2030 9 4.44% 7.68 GOI 15 DECEMBER 2023 4 2.10% 8.27 GOI 9 JUNE 2020 3 1.65% 8.13% GOI 21 SEPTEMBER 2022 3 1.35%
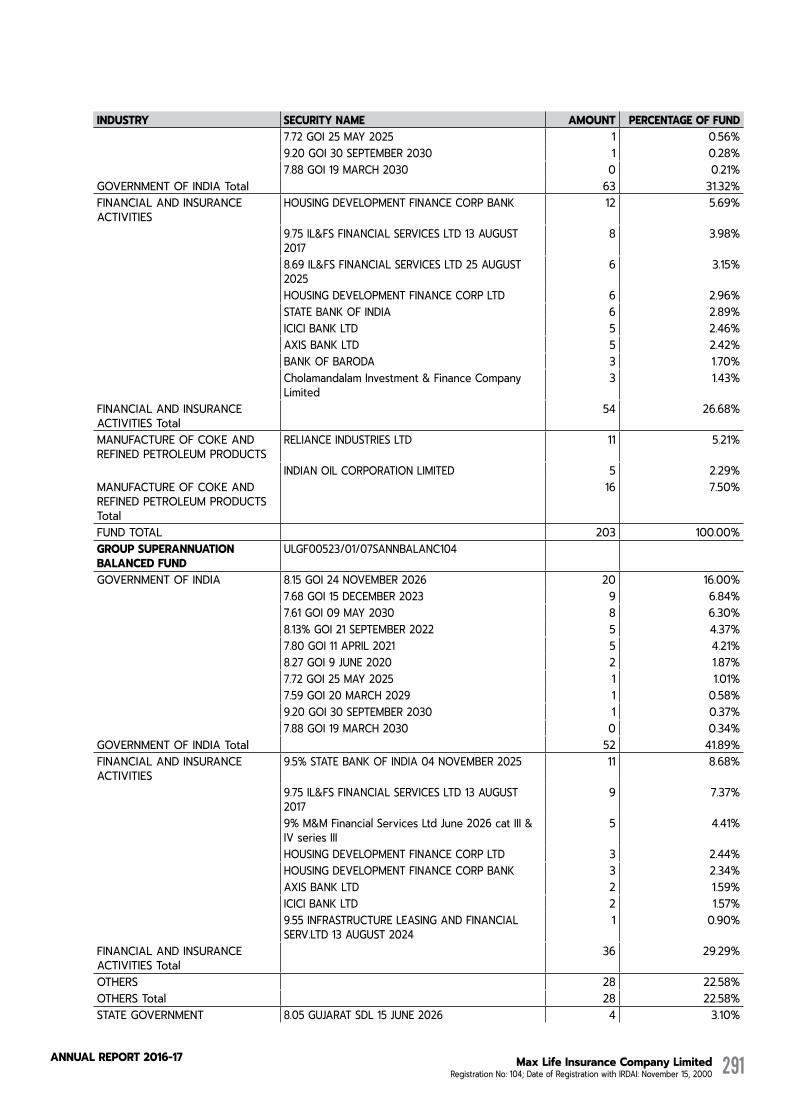
Max Life Insurance Company Limited Registration No: 104; Date of Registration with IRDAI: November 15, 2000
AnnuAL RepoRt 2016-17 291
INDUSTRY SECURITY NAME AMOUNT PERCENTAGE OF FUND 7.72 GOI 25 MAY 2025 1 0.56% 9.20 GOI 30 SEPTEMBER 2030 1 0.28% 7.88 GOI 19 MARCH 2030 0 0.21%GOVERNMENT OF INDIA Total 63 31.32%FINANCIAL AND INSURANCE ACTIVITIES
HOUSING DEVELOPMENT FINANCE CORP BANK 12 5.69%
9.75 IL&FS FINANCIAL SERVICES LTD 13 AUGUST 2017
8 3.98%
8.69 IL&FS FINANCIAL SERVICES LTD 25 AUGUST 2025
6 3.15%
HOUSING DEVELOPMENT FINANCE CORP LTD 6 2.96% STATE BANK OF INDIA 6 2.89% ICICI BANK LTD 5 2.46% AXIS BANK LTD 5 2.42% BANK OF BARODA 3 1.70% Cholamandalam Investment & Finance Company
Limited3 1.43%
FINANCIAL AND INSURANCE ACTIVITIES Total
54 26.68%
MANUFACTURE OF COKE AND REFINED PETROLEUM PRODUCTS
RELIANCE INDUSTRIES LTD 11 5.21%
INDIAN OIL CORPORATION LIMITED 5 2.29%MANUFACTURE OF COKE AND REFINED PETROLEUM PRODUCTS Total
16 7.50%
FUND TOTAL 203 100.00%GROUP SUPERANNUATION BALANCED FUND
ULGF00523/01/07SANNBALANC104
GOVERNMENT OF INDIA 8.15 GOI 24 NOVEMBER 2026 20 16.00% 7.68 GOI 15 DECEMBER 2023 9 6.84% 7.61 GOI 09 MAY 2030 8 6.30% 8.13% GOI 21 SEPTEMBER 2022 5 4.37% 7.80 GOI 11 APRIL 2021 5 4.21% 8.27 GOI 9 JUNE 2020 2 1.87% 7.72 GOI 25 MAY 2025 1 1.01% 7.59 GOI 20 MARCH 2029 1 0.58% 9.20 GOI 30 SEPTEMBER 2030 1 0.37% 7.88 GOI 19 MARCH 2030 0 0.34%GOVERNMENT OF INDIA Total 52 41.89%FINANCIAL AND INSURANCE ACTIVITIES
9.5% STATE BANK OF INDIA 04 NOVEMBER 2025 11 8.68%
9.75 IL&FS FINANCIAL SERVICES LTD 13 AUGUST 2017
9 7.37%
9% M&M Financial Services Ltd June 2026 cat III & IV series III
5 4.41%
HOUSING DEVELOPMENT FINANCE CORP LTD 3 2.44% HOUSING DEVELOPMENT FINANCE CORP BANK 3 2.34% AXIS BANK LTD 2 1.59% ICICI BANK LTD 2 1.57% 9.55 INFRASTRUCTURE LEASING AND FINANCIAL
SERV.LTD 13 AUGUST 20241 0.90%
FINANCIAL AND INSURANCE ACTIVITIES Total
36 29.29%
OTHERS 28 22.58%OTHERS Total 28 22.58%STATE GOVERNMENT 8.05 GUJARAT SDL 15 JUNE 2026 4 3.10%
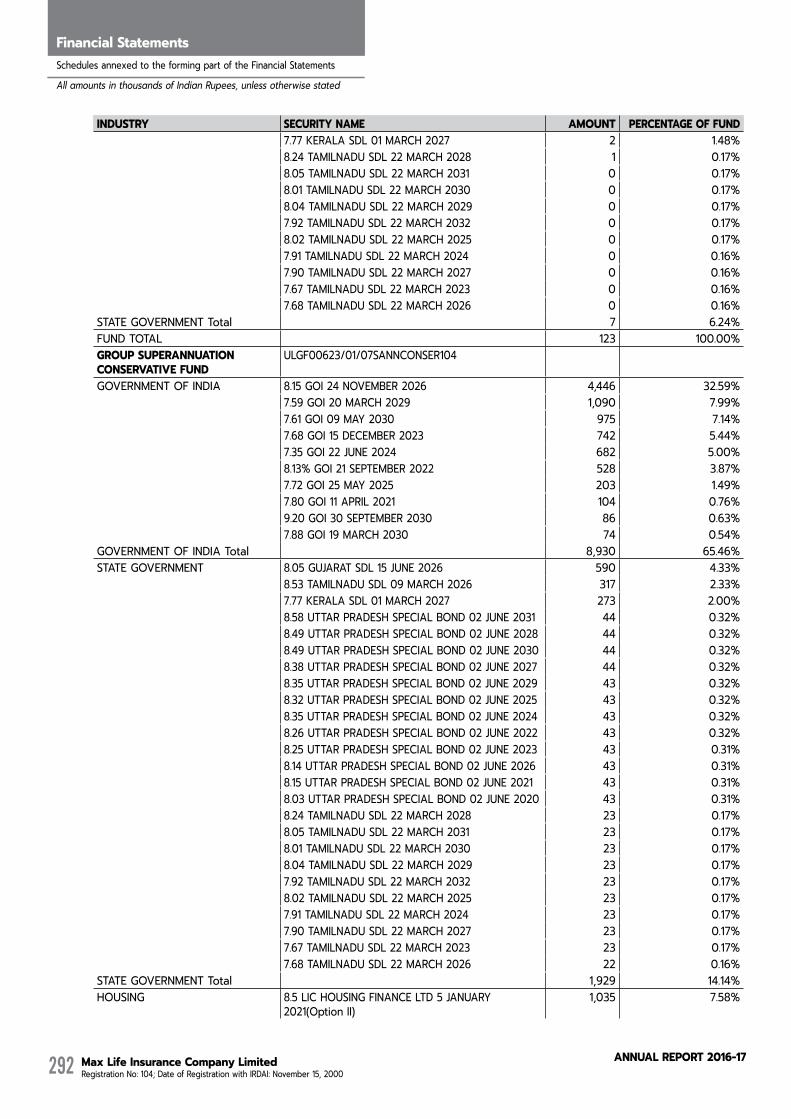
Max Life Insurance Company Limited Registration No: 104; Date of Registration with IRDAI: November 15, 2000
AnnuAL RepoRt 2016-17292
Directors' ReportFinancial StatementsSchedules annexed to the forming part of the Financial Statements
All amounts in thousands of Indian Rupees, unless otherwise stated
INDUSTRY SECURITY NAME AMOUNT PERCENTAGE OF FUND 7.77 KERALA SDL 01 MARCH 2027 2 1.48% 8.24 TAMILNADU SDL 22 MARCH 2028 1 0.17% 8.05 TAMILNADU SDL 22 MARCH 2031 0 0.17% 8.01 TAMILNADU SDL 22 MARCH 2030 0 0.17% 8.04 TAMILNADU SDL 22 MARCH 2029 0 0.17% 7.92 TAMILNADU SDL 22 MARCH 2032 0 0.17% 8.02 TAMILNADU SDL 22 MARCH 2025 0 0.17% 7.91 TAMILNADU SDL 22 MARCH 2024 0 0.16% 7.90 TAMILNADU SDL 22 MARCH 2027 0 0.16% 7.67 TAMILNADU SDL 22 MARCH 2023 0 0.16% 7.68 TAMILNADU SDL 22 MARCH 2026 0 0.16%STATE GOVERNMENT Total 7 6.24%FUND TOTAL 123 100.00%GROUP SUPERANNUATION CONSERVATIVE FUND
ULGF00623/01/07SANNCONSER104
GOVERNMENT OF INDIA 8.15 GOI 24 NOVEMBER 2026 4,446 32.59% 7.59 GOI 20 MARCH 2029 1,090 7.99% 7.61 GOI 09 MAY 2030 975 7.14% 7.68 GOI 15 DECEMBER 2023 742 5.44% 7.35 GOI 22 JUNE 2024 682 5.00% 8.13% GOI 21 SEPTEMBER 2022 528 3.87% 7.72 GOI 25 MAY 2025 203 1.49% 7.80 GOI 11 APRIL 2021 104 0.76% 9.20 GOI 30 SEPTEMBER 2030 86 0.63% 7.88 GOI 19 MARCH 2030 74 0.54%GOVERNMENT OF INDIA Total 8,930 65.46%STATE GOVERNMENT 8.05 GUJARAT SDL 15 JUNE 2026 590 4.33% 8.53 TAMILNADU SDL 09 MARCH 2026 317 2.33% 7.77 KERALA SDL 01 MARCH 2027 273 2.00% 8.58 UTTAR PRADESH SPECIAL BOND 02 JUNE 2031 44 0.32% 8.49 UTTAR PRADESH SPECIAL BOND 02 JUNE 2028 44 0.32% 8.49 UTTAR PRADESH SPECIAL BOND 02 JUNE 2030 44 0.32% 8.38 UTTAR PRADESH SPECIAL BOND 02 JUNE 2027 44 0.32% 8.35 UTTAR PRADESH SPECIAL BOND 02 JUNE 2029 43 0.32% 8.32 UTTAR PRADESH SPECIAL BOND 02 JUNE 2025 43 0.32% 8.35 UTTAR PRADESH SPECIAL BOND 02 JUNE 2024 43 0.32% 8.26 UTTAR PRADESH SPECIAL BOND 02 JUNE 2022 43 0.32% 8.25 UTTAR PRADESH SPECIAL BOND 02 JUNE 2023 43 0.31% 8.14 UTTAR PRADESH SPECIAL BOND 02 JUNE 2026 43 0.31% 8.15 UTTAR PRADESH SPECIAL BOND 02 JUNE 2021 43 0.31% 8.03 UTTAR PRADESH SPECIAL BOND 02 JUNE 2020 43 0.31% 8.24 TAMILNADU SDL 22 MARCH 2028 23 0.17% 8.05 TAMILNADU SDL 22 MARCH 2031 23 0.17% 8.01 TAMILNADU SDL 22 MARCH 2030 23 0.17% 8.04 TAMILNADU SDL 22 MARCH 2029 23 0.17% 7.92 TAMILNADU SDL 22 MARCH 2032 23 0.17% 8.02 TAMILNADU SDL 22 MARCH 2025 23 0.17% 7.91 TAMILNADU SDL 22 MARCH 2024 23 0.17% 7.90 TAMILNADU SDL 22 MARCH 2027 23 0.17% 7.67 TAMILNADU SDL 22 MARCH 2023 23 0.17% 7.68 TAMILNADU SDL 22 MARCH 2026 22 0.16%STATE GOVERNMENT Total 1,929 14.14%HOUSING 8.5 LIC HOUSING FINANCE LTD 5 JANUARY
2021(Option II)1,035 7.58%
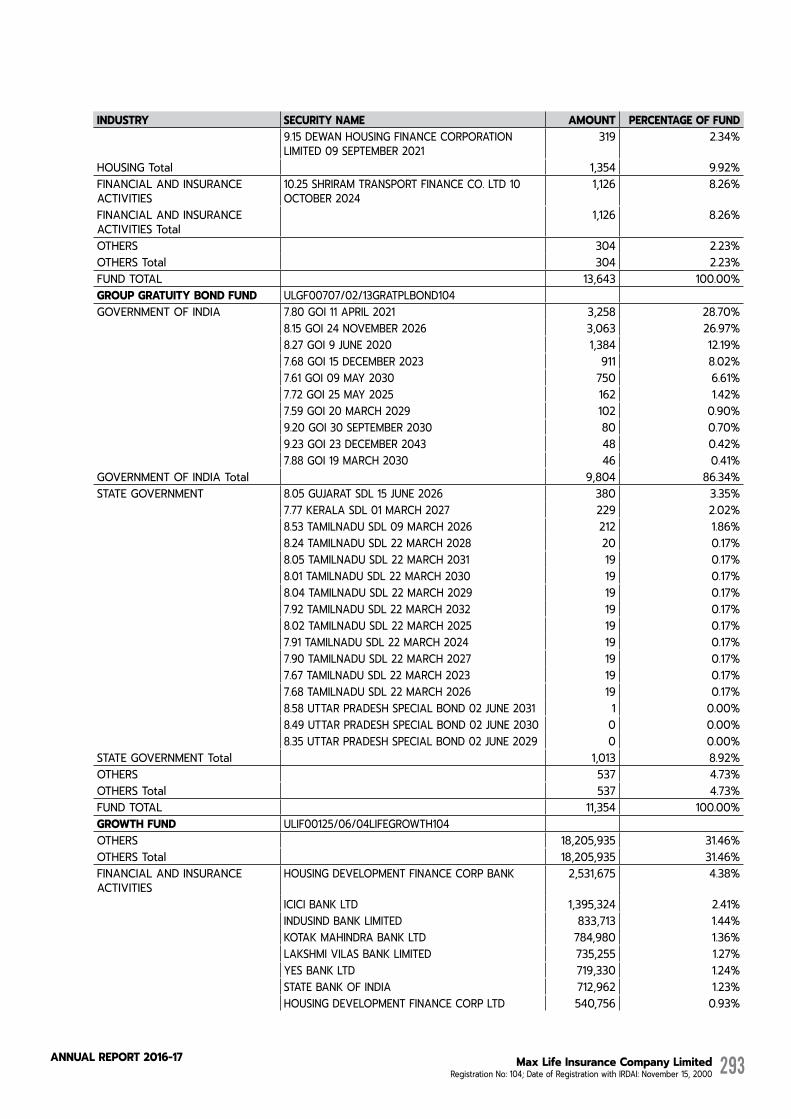
Max Life Insurance Company Limited Registration No: 104; Date of Registration with IRDAI: November 15, 2000
AnnuAL RepoRt 2016-17 293
INDUSTRY SECURITY NAME AMOUNT PERCENTAGE OF FUND 9.15 DEWAN HOUSING FINANCE CORPORATION
LIMITED 09 SEPTEMBER 2021319 2.34%
HOUSING Total 1,354 9.92%FINANCIAL AND INSURANCE ACTIVITIES
10.25 SHRIRAM TRANSPORT FINANCE CO. LTD 10 OCTOBER 2024
1,126 8.26%
FINANCIAL AND INSURANCE ACTIVITIES Total
1,126 8.26%
OTHERS 304 2.23%OTHERS Total 304 2.23%FUND TOTAL 13,643 100.00%GROUP GRATUITY BOND FUND ULGF00707/02/13GRATPLBOND104 GOVERNMENT OF INDIA 7.80 GOI 11 APRIL 2021 3,258 28.70% 8.15 GOI 24 NOVEMBER 2026 3,063 26.97% 8.27 GOI 9 JUNE 2020 1,384 12.19% 7.68 GOI 15 DECEMBER 2023 911 8.02% 7.61 GOI 09 MAY 2030 750 6.61% 7.72 GOI 25 MAY 2025 162 1.42% 7.59 GOI 20 MARCH 2029 102 0.90% 9.20 GOI 30 SEPTEMBER 2030 80 0.70% 9.23 GOI 23 DECEMBER 2043 48 0.42% 7.88 GOI 19 MARCH 2030 46 0.41%GOVERNMENT OF INDIA Total 9,804 86.34%STATE GOVERNMENT 8.05 GUJARAT SDL 15 JUNE 2026 380 3.35% 7.77 KERALA SDL 01 MARCH 2027 229 2.02% 8.53 TAMILNADU SDL 09 MARCH 2026 212 1.86% 8.24 TAMILNADU SDL 22 MARCH 2028 20 0.17% 8.05 TAMILNADU SDL 22 MARCH 2031 19 0.17% 8.01 TAMILNADU SDL 22 MARCH 2030 19 0.17% 8.04 TAMILNADU SDL 22 MARCH 2029 19 0.17% 7.92 TAMILNADU SDL 22 MARCH 2032 19 0.17% 8.02 TAMILNADU SDL 22 MARCH 2025 19 0.17% 7.91 TAMILNADU SDL 22 MARCH 2024 19 0.17% 7.90 TAMILNADU SDL 22 MARCH 2027 19 0.17% 7.67 TAMILNADU SDL 22 MARCH 2023 19 0.17% 7.68 TAMILNADU SDL 22 MARCH 2026 19 0.17% 8.58 UTTAR PRADESH SPECIAL BOND 02 JUNE 2031 1 0.00% 8.49 UTTAR PRADESH SPECIAL BOND 02 JUNE 2030 0 0.00% 8.35 UTTAR PRADESH SPECIAL BOND 02 JUNE 2029 0 0.00%STATE GOVERNMENT Total 1,013 8.92%OTHERS 537 4.73%OTHERS Total 537 4.73%FUND TOTAL 11,354 100.00%GROWTH FUND ULIF00125/06/04LIFEGROWTH104 OTHERS 18,205,935 31.46%OTHERS Total 18,205,935 31.46%FINANCIAL AND INSURANCE ACTIVITIES
HOUSING DEVELOPMENT FINANCE CORP BANK 2,531,675 4.38%
ICICI BANK LTD 1,395,324 2.41% INDUSIND BANK LIMITED 833,713 1.44% KOTAK MAHINDRA BANK LTD 784,980 1.36% LAKSHMI VILAS BANK LIMITED 735,255 1.27% YES BANK LTD 719,330 1.24% STATE BANK OF INDIA 712,962 1.23% HOUSING DEVELOPMENT FINANCE CORP LTD 540,756 0.93%

Max Life Insurance Company Limited Registration No: 104; Date of Registration with IRDAI: November 15, 2000
AnnuAL RepoRt 2016-17294
Directors' ReportFinancial StatementsSchedules annexed to the forming part of the Financial Statements
All amounts in thousands of Indian Rupees, unless otherwise stated
INDUSTRY SECURITY NAME AMOUNT PERCENTAGE OF FUND 9.15 SHRIRAM TRANSPORT FINANCE CO. LTD 13APRIL
2021524,218 0.91%
7.95 HDFC BANK LIMITED 21 SEPTEMBER 2026 359,858 0.62% 8.90 BAJAJ FINANCE LIMITED 23 MARCH 2026 337,698 0.58% 9.30 SHRIRAM TRANSPORT FINANCE CO. LTD 18
MARCH 2026292,900 0.51%
9.67 TATA SONS LIMITED 13 SEPTEMBER 2022 273,536 0.47% 9.55 INFRASTRUCTURE LEASING AND FINANCIAL
SERV.LTD 13 AUGUST 2024226,295 0.39%
8.51 INDIA INFRADEBT LIMITED 05 MAY 2026 213,707 0.37% 9.15 YES BANK LIMITED 30 JUNE 2025 160,591 0.28% 10.00 SHRIRAM TRANSPORT FINANCE CO. LTD 13
NOVEMBER 2024155,908 0.27%
10.84% HDFC BANK 23 MAY 2022. 154,900 0.27% 8.60 SUNDARAM FINANCE LTD 12 APRIL 2019 153,355 0.27% 8.85 SHRIRAM TRANSPORT FINANCE CO. LTD 03
AUGUST 2021122,505 0.21%
8.30% RURAL ELECTRIFICATION CORPORATION LTD 10 APRIL 2025
109,209 0.19%
12.4296% JANALAKSHMI FINANCIAL SERVICES PVT LTD (STEP UP & COMPOUNDING)
101,907 0.18%
7.52 RURAL ELECTRIFICATION CORPORATION LTD 07 NOVEMBER 2026
99,393 0.17%
NABARD CD 05 JANUARY 2018 95,336 0.16% 9.5% CANARA BANK FD 28 APRIL 2019 95,000 0.16% 7.75 POWER FINANCE CORPORATION 22 MARCH
202779,582 0.14%
10.40% PNB SR1 31 DECMBER PERPATUAL BOND 68,586 0.12% 9.41 INDIA INFRASTRUCTURE FINANCE COMPANY
LTD 27 JULY 203763,481 0.11%
NABARD CD 20 FEBRUARY 2018 60,374 0.10% 7.83 INDIAN RAILWAY FINANCE CORP LTD 19 MARCH
202757,947 0.10%
8.69 IL&FS FINANCIAL SERVICES LTD 25 AUGUST 2025
53,220 0.09%
10.75 ASPIRE HOME FINANCE CORPORATION LIMITED 08 JUNE 2020
53,125 0.09%
7.54 RURAL ELECTRIFICATION CORPORATION LTD 30 DECEMBER 2026
50,768 0.09%
7.50 POWER FINANCE CORPORATION 17 SEPTEMBER 2020
50,365 0.09%
7.54 NABARD 29 MARCH 2032 50,059 0.09% 9.95% AXIS BANK 28 MARCH 2019 45,163 0.08% 9.69 TATA SONS 12 JUNE 2022 33,958 0.06% 9.25 INFRASTRUCTURE DEV FINANCE CORP LTD 13
SEPTEMBER 201912,322 0.02%
8.90 POWER FINANCE CORPORATION LIMITED 18 MARCH 2023
9,579 0.02%
10.30 % YES BANK NCD 25 JULY 2021 6,537 0.01% 9.61 POWER FINANCE CORP LTD 29 JUNE 2021 6,465 0.01% 9.20 IDBI BANK LIMITED PERPETUAL 31 DECEMBER
20995,931 0.01%
8.11 RURAL ELECTRIFICATION CORPORATION LTD 07 OCTOBER 2025
4,120 0.01%
7.50 POWER FINANCE CORPORATION 16 AUGUST 2021
4,012 0.01%
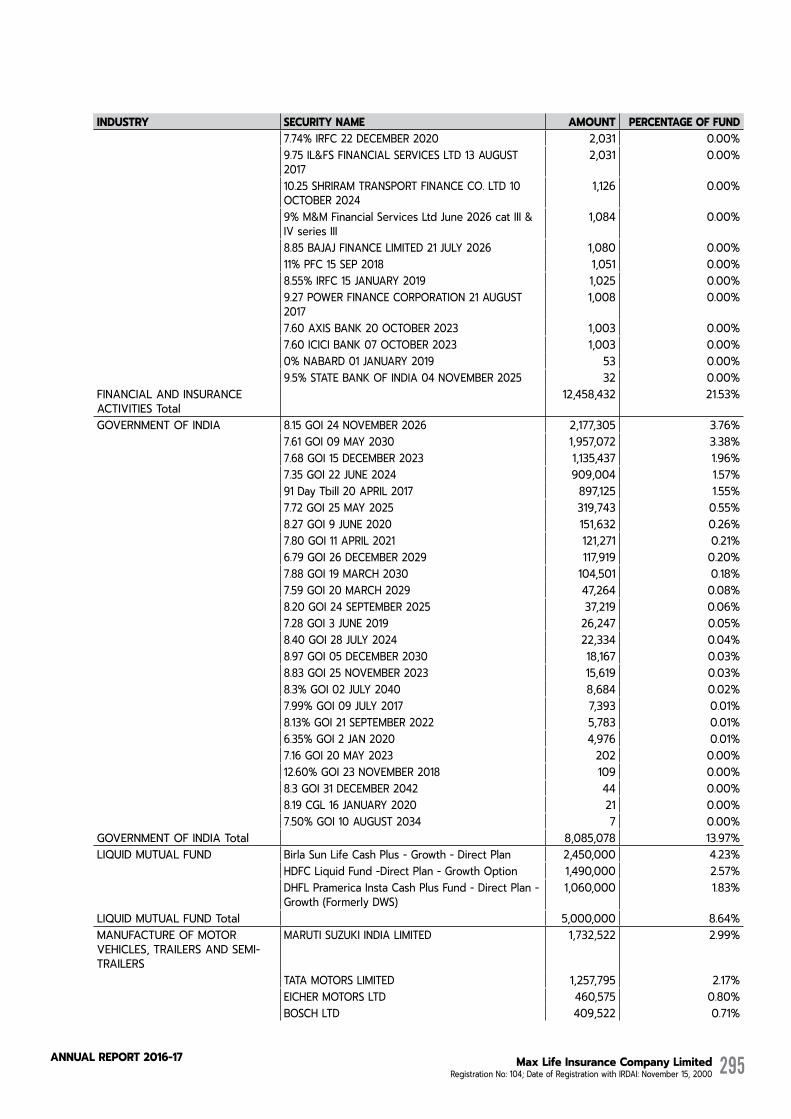
Max Life Insurance Company Limited Registration No: 104; Date of Registration with IRDAI: November 15, 2000
AnnuAL RepoRt 2016-17 295
INDUSTRY SECURITY NAME AMOUNT PERCENTAGE OF FUND 7.74% IRFC 22 DECEMBER 2020 2,031 0.00% 9.75 IL&FS FINANCIAL SERVICES LTD 13 AUGUST
20172,031 0.00%
10.25 SHRIRAM TRANSPORT FINANCE CO. LTD 10 OCTOBER 2024
1,126 0.00%
9% M&M Financial Services Ltd June 2026 cat III & IV series III
1,084 0.00%
8.85 BAJAJ FINANCE LIMITED 21 JULY 2026 1,080 0.00% 11% PFC 15 SEP 2018 1,051 0.00% 8.55% IRFC 15 JANUARY 2019 1,025 0.00% 9.27 POWER FINANCE CORPORATION 21 AUGUST
20171,008 0.00%
7.60 AXIS BANK 20 OCTOBER 2023 1,003 0.00% 7.60 ICICI BANK 07 OCTOBER 2023 1,003 0.00% 0% NABARD 01 JANUARY 2019 53 0.00% 9.5% STATE BANK OF INDIA 04 NOVEMBER 2025 32 0.00%FINANCIAL AND INSURANCE ACTIVITIES Total
12,458,432 21.53%
GOVERNMENT OF INDIA 8.15 GOI 24 NOVEMBER 2026 2,177,305 3.76% 7.61 GOI 09 MAY 2030 1,957,072 3.38% 7.68 GOI 15 DECEMBER 2023 1,135,437 1.96% 7.35 GOI 22 JUNE 2024 909,004 1.57% 91 Day Tbill 20 APRIL 2017 897,125 1.55% 7.72 GOI 25 MAY 2025 319,743 0.55% 8.27 GOI 9 JUNE 2020 151,632 0.26% 7.80 GOI 11 APRIL 2021 121,271 0.21% 6.79 GOI 26 DECEMBER 2029 117,919 0.20% 7.88 GOI 19 MARCH 2030 104,501 0.18% 7.59 GOI 20 MARCH 2029 47,264 0.08% 8.20 GOI 24 SEPTEMBER 2025 37,219 0.06% 7.28 GOI 3 JUNE 2019 26,247 0.05% 8.40 GOI 28 JULY 2024 22,334 0.04% 8.97 GOI 05 DECEMBER 2030 18,167 0.03% 8.83 GOI 25 NOVEMBER 2023 15,619 0.03% 8.3% GOI 02 JULY 2040 8,684 0.02% 7.99% GOI 09 JULY 2017 7,393 0.01% 8.13% GOI 21 SEPTEMBER 2022 5,783 0.01% 6.35% GOI 2 JAN 2020 4,976 0.01% 7.16 GOI 20 MAY 2023 202 0.00% 12.60% GOI 23 NOVEMBER 2018 109 0.00% 8.3 GOI 31 DECEMBER 2042 44 0.00% 8.19 CGL 16 JANUARY 2020 21 0.00% 7.50% GOI 10 AUGUST 2034 7 0.00%GOVERNMENT OF INDIA Total 8,085,078 13.97%LIQUID MUTUAL FUND Birla Sun Life Cash Plus - Growth - Direct Plan 2,450,000 4.23% HDFC Liquid Fund -Direct Plan - Growth Option 1,490,000 2.57% DHFL Pramerica Insta Cash Plus Fund - Direct Plan -
Growth (Formerly DWS)1,060,000 1.83%
LIQUID MUTUAL FUND Total 5,000,000 8.64%MANUFACTURE OF MOTOR VEHICLES, TRAILERS AND SEMI-TRAILERS
MARUTI SUZUKI INDIA LIMITED 1,732,522 2.99%
TATA MOTORS LIMITED 1,257,795 2.17% EICHER MOTORS LTD 460,575 0.80% BOSCH LTD 409,522 0.71%

Max Life Insurance Company Limited Registration No: 104; Date of Registration with IRDAI: November 15, 2000
AnnuAL RepoRt 2016-17296
Directors' ReportFinancial StatementsSchedules annexed to the forming part of the Financial Statements
All amounts in thousands of Indian Rupees, unless otherwise stated
INDUSTRY SECURITY NAME AMOUNT PERCENTAGE OF FUND MOTHERSON SUMI SYSTEMS LIMITED 305,431 0.53%MANUFACTURE OF MOTOR VEHICLES, TRAILERS AND SEMI-TRAILERS Total
4,165,845 7.20%
HOUSING 8.50 LIC HOUSING FINANCE LTD 29 AUGUST 2025 473,897 0.82% 8.75 HDFC 04 MARCH 2021 386,420 0.67% 8.55 LIC HOUSING FINANCE LTD 14 AUGUST 2025 263,988 0.46% 8.5 LIC HOUSING FINANCE LTD 5 JANUARY
2021(Option II)262,767 0.45%
8.45% HOUSING DEVELOPMENT FINANCE CORPORATION 18 MAY 2026
221,261 0.38%
9.45 HDFC 21 AUGUST 2019 213,654 0.37% 9% INDIABULLS HOUSING FINANCE LTD 8th
February 2021 - OPTION I 210,339 0.36%
9.51 LIC HOUSING FINANCE LTD 24 JULY 2019 209,566 0.36% 9.3 LIC HOUSING FINANCE LTD 14 SEPTEMBER 2022 161,609 0.28% 8.65 HDFC 18 SEPTEMBER 2020 156,222 0.27% 9.43 LIC HOUSING FINANCE LTD 10 FEBRUARY 2022 146,895 0.25% QE FINANCE (TIER II) 24 APRIL 2019 116,343 0.20% 9.90 LIC HOUSING FINANCE LTD 11 NOVEMBER 2021 109,402 0.19% 9.15 DEWAN HOUSING FINANCE CORPORATION
LIMITED 09 SEPTEMBER 2021106,348 0.18%
10.10% HDFC 13 SEPTEMBER 2017 86,073 0.15% 9.25 DEWAN HOUSING FINANCE CORPORATION
LIMITED 08 SEPTEMBER 202379,206 0.14%
8.95% LIC HOUSING FINANCE 15 SEPTEMBER 2020 56,715 0.10% 9.34 HDFC 28 AUGUST 2024 54,725 0.09% 9.40 HDFC 26 AUGUST 2019 52,319 0.09% 9.5% HDFC 10 DEC 2017 50,855 0.09% 8.98% HDFC 26 NOV 2020 36,805 0.06% 8.9% HDFC 18 AUGUST 2020 36,675 0.06% 9.80% LIC HOUSING FINANCE 22 OCTOBER 2017 27,411 0.05% 11.15% HDFC 06 AUGUST 2018 24,126 0.04% 8.52 LIC HOUSING FINANCE LTD 3 MARCH 2025 10,525 0.02% 9.25 LIC HOUSING FINANCE LTD 1 JANUARY 2023 3,234 0.01%HOUSING Total 3,557,380 6.15%STATE GOVERNMENT 7.98 KERALA SDL 29 JUNE 2026 944,633 1.63% 7.75 KARNATKA SDL 01 MARCH 2027 461,862 0.80% 8.49 TAMILNADU SDL 10 FEBRUARY 2026 263,627 0.46% 7.77 KERALA SDL 01 MARCH 2027 144,094 0.25% 7.86 KARNATKA SDL 15 MARCH 2027 112,915 0.20% 8.53 KERALA SDL 09 MARCH 2026 105,545 0.18% 8.53 TAMILNADU SDL 09 MARCH 2026 84,493 0.15% 8.01 TAMILNADU SDL 11 MAY 2026 65,055 0.11% 8.18 HARYANA SPL BOND 15 JUNE 2022 51,541 0.09% 8.18 HARYANA SPL BOND 15 JUNE 2023 51,466 0.09% 8.58 UTTAR PRADESH SPECIAL BOND 02 JUNE 2031 41,312 0.07% 8.49 UTTAR PRADESH SPECIAL BOND 02 JUNE 2030 40,975 0.07% 8.49 UTTAR PRADESH SPECIAL BOND 02 JUNE 2028 40,692 0.07% 8.35 UTTAR PRADESH SPECIAL BOND 02 JUNE 2029 40,352 0.07% 8.38 UTTAR PRADESH SPECIAL BOND 02 JUNE 2027 40,349 0.07% 8.32 UTTAR PRADESH SPECIAL BOND 02 JUNE 2025 39,954 0.07% 8.35 UTTAR PRADESH SPECIAL BOND 02 JUNE 2024 39,933 0.07% 8.26 UTTAR PRADESH SPECIAL BOND 02 JUNE 2022 39,810 0.07% 8.25 UTTAR PRADESH SPECIAL BOND 02 JUNE 2023 39,764 0.07%
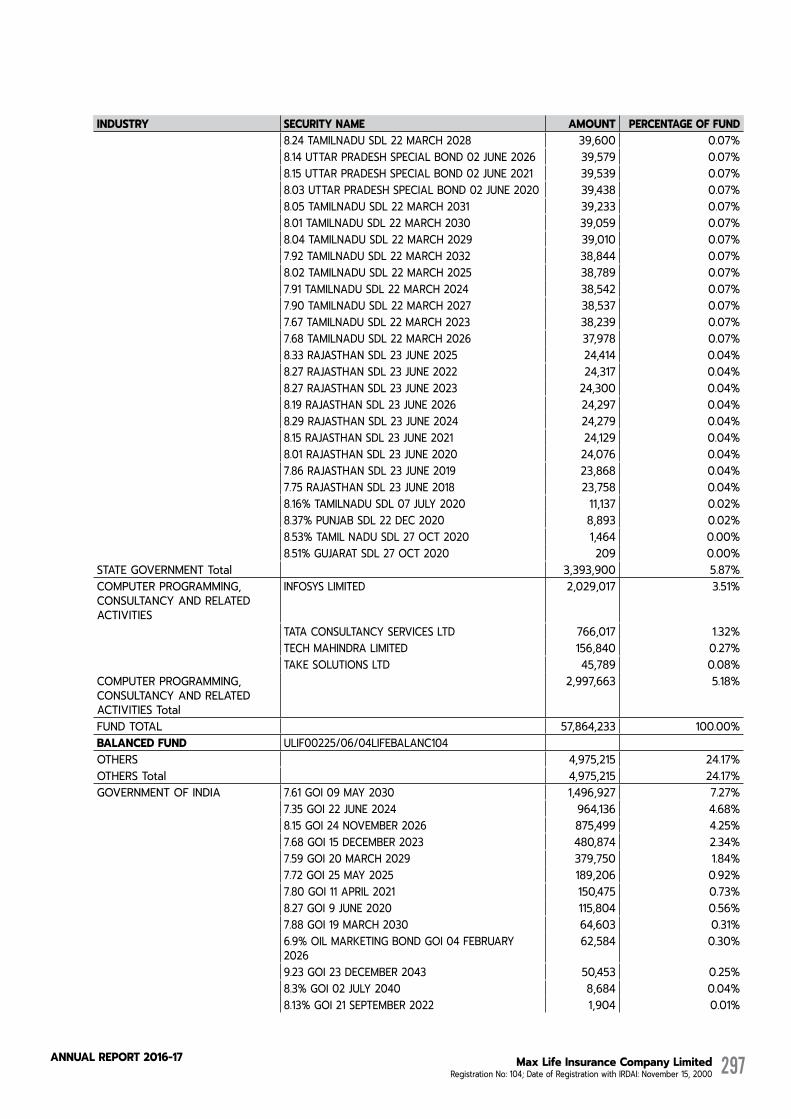
Max Life Insurance Company Limited Registration No: 104; Date of Registration with IRDAI: November 15, 2000
AnnuAL RepoRt 2016-17 297
INDUSTRY SECURITY NAME AMOUNT PERCENTAGE OF FUND 8.24 TAMILNADU SDL 22 MARCH 2028 39,600 0.07% 8.14 UTTAR PRADESH SPECIAL BOND 02 JUNE 2026 39,579 0.07% 8.15 UTTAR PRADESH SPECIAL BOND 02 JUNE 2021 39,539 0.07% 8.03 UTTAR PRADESH SPECIAL BOND 02 JUNE 2020 39,438 0.07% 8.05 TAMILNADU SDL 22 MARCH 2031 39,233 0.07% 8.01 TAMILNADU SDL 22 MARCH 2030 39,059 0.07% 8.04 TAMILNADU SDL 22 MARCH 2029 39,010 0.07% 7.92 TAMILNADU SDL 22 MARCH 2032 38,844 0.07% 8.02 TAMILNADU SDL 22 MARCH 2025 38,789 0.07% 7.91 TAMILNADU SDL 22 MARCH 2024 38,542 0.07% 7.90 TAMILNADU SDL 22 MARCH 2027 38,537 0.07% 7.67 TAMILNADU SDL 22 MARCH 2023 38,239 0.07% 7.68 TAMILNADU SDL 22 MARCH 2026 37,978 0.07% 8.33 RAJASTHAN SDL 23 JUNE 2025 24,414 0.04% 8.27 RAJASTHAN SDL 23 JUNE 2022 24,317 0.04% 8.27 RAJASTHAN SDL 23 JUNE 2023 24,300 0.04% 8.19 RAJASTHAN SDL 23 JUNE 2026 24,297 0.04% 8.29 RAJASTHAN SDL 23 JUNE 2024 24,279 0.04% 8.15 RAJASTHAN SDL 23 JUNE 2021 24,129 0.04% 8.01 RAJASTHAN SDL 23 JUNE 2020 24,076 0.04% 7.86 RAJASTHAN SDL 23 JUNE 2019 23,868 0.04% 7.75 RAJASTHAN SDL 23 JUNE 2018 23,758 0.04% 8.16% TAMILNADU SDL 07 JULY 2020 11,137 0.02% 8.37% PUNJAB SDL 22 DEC 2020 8,893 0.02% 8.53% TAMIL NADU SDL 27 OCT 2020 1,464 0.00% 8.51% GUJARAT SDL 27 OCT 2020 209 0.00%STATE GOVERNMENT Total 3,393,900 5.87%COMPUTER PROGRAMMING, CONSULTANCY AND RELATED ACTIVITIES
INFOSYS LIMITED 2,029,017 3.51%
TATA CONSULTANCY SERVICES LTD 766,017 1.32% TECH MAHINDRA LIMITED 156,840 0.27% TAKE SOLUTIONS LTD 45,789 0.08%COMPUTER PROGRAMMING, CONSULTANCY AND RELATED ACTIVITIES Total
2,997,663 5.18%
FUND TOTAL 57,864,233 100.00%BALANCED FUND ULIF00225/06/04LIFEBALANC104 OTHERS 4,975,215 24.17%OTHERS Total 4,975,215 24.17%GOVERNMENT OF INDIA 7.61 GOI 09 MAY 2030 1,496,927 7.27% 7.35 GOI 22 JUNE 2024 964,136 4.68% 8.15 GOI 24 NOVEMBER 2026 875,499 4.25% 7.68 GOI 15 DECEMBER 2023 480,874 2.34% 7.59 GOI 20 MARCH 2029 379,750 1.84% 7.72 GOI 25 MAY 2025 189,206 0.92% 7.80 GOI 11 APRIL 2021 150,475 0.73% 8.27 GOI 9 JUNE 2020 115,804 0.56% 7.88 GOI 19 MARCH 2030 64,603 0.31% 6.9% OIL MARKETING BOND GOI 04 FEBRUARY
202662,584 0.30%
9.23 GOI 23 DECEMBER 2043 50,453 0.25% 8.3% GOI 02 JULY 2040 8,684 0.04% 8.13% GOI 21 SEPTEMBER 2022 1,904 0.01%
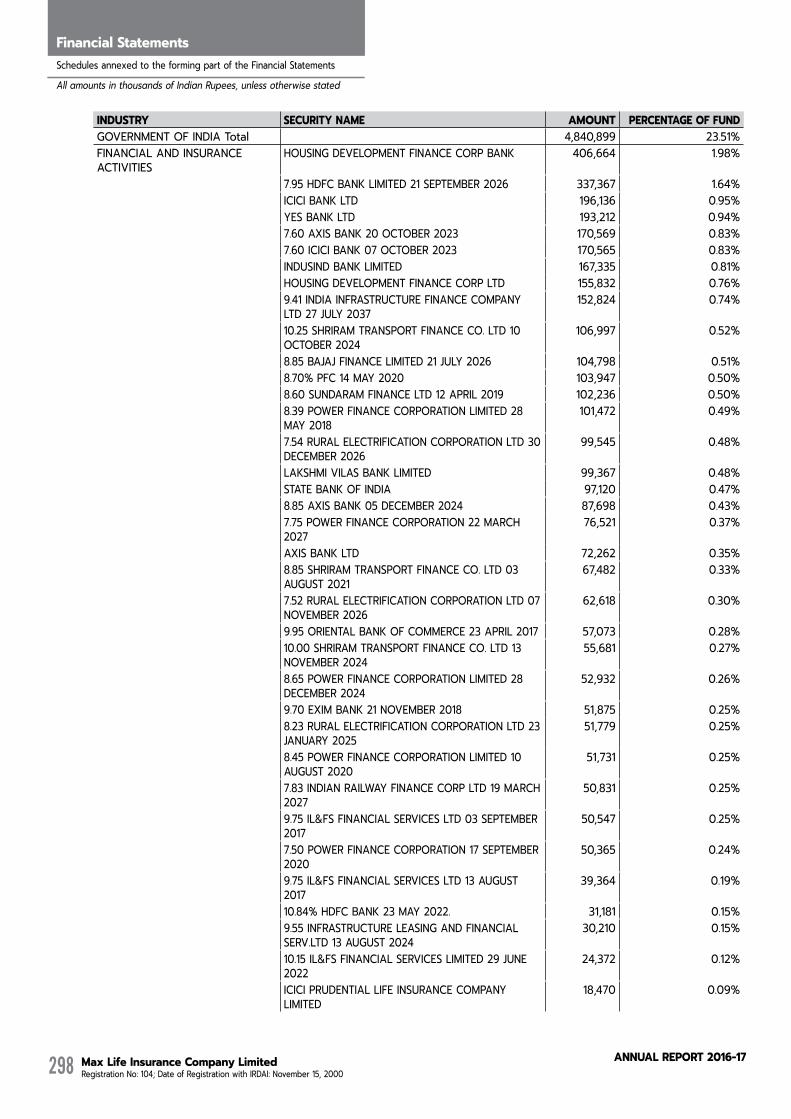
Max Life Insurance Company Limited Registration No: 104; Date of Registration with IRDAI: November 15, 2000
AnnuAL RepoRt 2016-17298
Directors' ReportFinancial StatementsSchedules annexed to the forming part of the Financial Statements
All amounts in thousands of Indian Rupees, unless otherwise stated
INDUSTRY SECURITY NAME AMOUNT PERCENTAGE OF FUNDGOVERNMENT OF INDIA Total 4,840,899 23.51%FINANCIAL AND INSURANCE ACTIVITIES
HOUSING DEVELOPMENT FINANCE CORP BANK 406,664 1.98%
7.95 HDFC BANK LIMITED 21 SEPTEMBER 2026 337,367 1.64% ICICI BANK LTD 196,136 0.95% YES BANK LTD 193,212 0.94% 7.60 AXIS BANK 20 OCTOBER 2023 170,569 0.83% 7.60 ICICI BANK 07 OCTOBER 2023 170,565 0.83% INDUSIND BANK LIMITED 167,335 0.81% HOUSING DEVELOPMENT FINANCE CORP LTD 155,832 0.76% 9.41 INDIA INFRASTRUCTURE FINANCE COMPANY
LTD 27 JULY 2037152,824 0.74%
10.25 SHRIRAM TRANSPORT FINANCE CO. LTD 10 OCTOBER 2024
106,997 0.52%
8.85 BAJAJ FINANCE LIMITED 21 JULY 2026 104,798 0.51% 8.70% PFC 14 MAY 2020 103,947 0.50% 8.60 SUNDARAM FINANCE LTD 12 APRIL 2019 102,236 0.50% 8.39 POWER FINANCE CORPORATION LIMITED 28
MAY 2018101,472 0.49%
7.54 RURAL ELECTRIFICATION CORPORATION LTD 30 DECEMBER 2026
99,545 0.48%
LAKSHMI VILAS BANK LIMITED 99,367 0.48% STATE BANK OF INDIA 97,120 0.47% 8.85 AXIS BANK 05 DECEMBER 2024 87,698 0.43% 7.75 POWER FINANCE CORPORATION 22 MARCH
202776,521 0.37%
AXIS BANK LTD 72,262 0.35% 8.85 SHRIRAM TRANSPORT FINANCE CO. LTD 03
AUGUST 202167,482 0.33%
7.52 RURAL ELECTRIFICATION CORPORATION LTD 07 NOVEMBER 2026
62,618 0.30%
9.95 ORIENTAL BANK OF COMMERCE 23 APRIL 2017 57,073 0.28% 10.00 SHRIRAM TRANSPORT FINANCE CO. LTD 13
NOVEMBER 202455,681 0.27%
8.65 POWER FINANCE CORPORATION LIMITED 28 DECEMBER 2024
52,932 0.26%
9.70 EXIM BANK 21 NOVEMBER 2018 51,875 0.25% 8.23 RURAL ELECTRIFICATION CORPORATION LTD 23
JANUARY 202551,779 0.25%
8.45 POWER FINANCE CORPORATION LIMITED 10 AUGUST 2020
51,731 0.25%
7.83 INDIAN RAILWAY FINANCE CORP LTD 19 MARCH 2027
50,831 0.25%
9.75 IL&FS FINANCIAL SERVICES LTD 03 SEPTEMBER 2017
50,547 0.25%
7.50 POWER FINANCE CORPORATION 17 SEPTEMBER 2020
50,365 0.24%
9.75 IL&FS FINANCIAL SERVICES LTD 13 AUGUST 2017
39,364 0.19%
10.84% HDFC BANK 23 MAY 2022. 31,181 0.15% 9.55 INFRASTRUCTURE LEASING AND FINANCIAL
SERV.LTD 13 AUGUST 202430,210 0.15%
10.15 IL&FS FINANCIAL SERVICES LIMITED 29 JUNE 2022
24,372 0.12%
ICICI PRUDENTIAL LIFE INSURANCE COMPANY LIMITED
18,470 0.09%
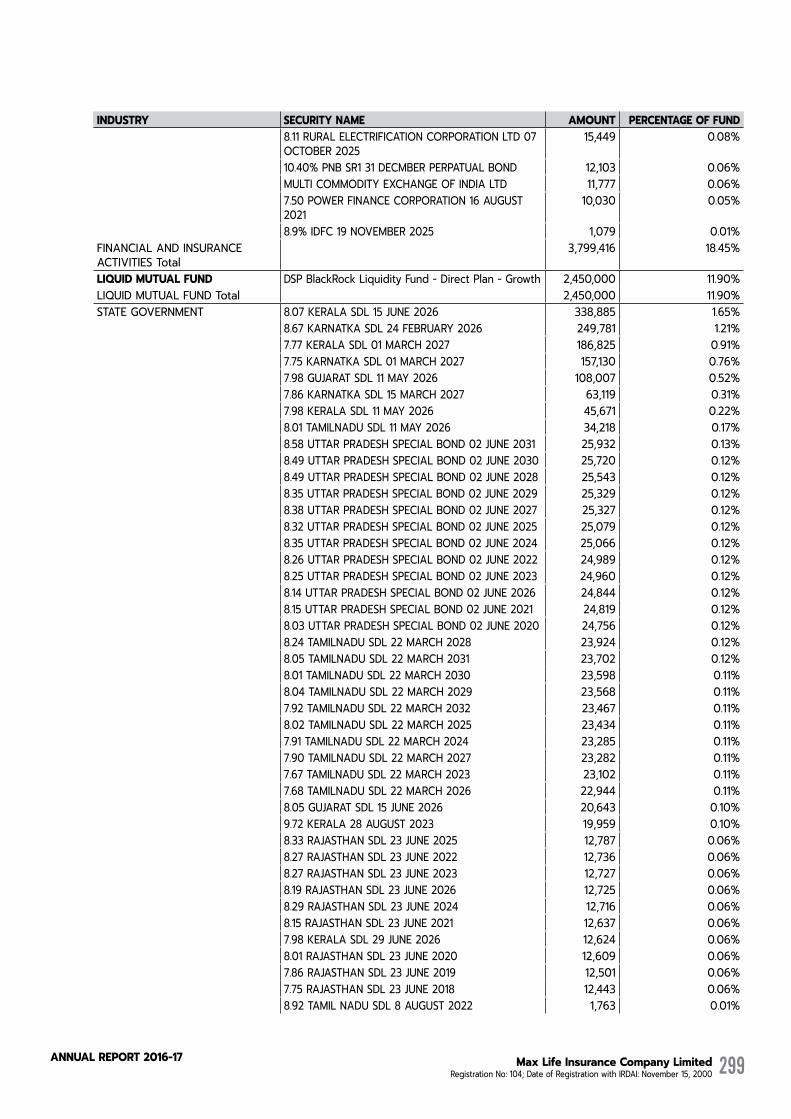
Max Life Insurance Company Limited Registration No: 104; Date of Registration with IRDAI: November 15, 2000
AnnuAL RepoRt 2016-17 299
INDUSTRY SECURITY NAME AMOUNT PERCENTAGE OF FUND 8.11 RURAL ELECTRIFICATION CORPORATION LTD 07
OCTOBER 202515,449 0.08%
10.40% PNB SR1 31 DECMBER PERPATUAL BOND 12,103 0.06% MULTI COMMODITY EXCHANGE OF INDIA LTD 11,777 0.06% 7.50 POWER FINANCE CORPORATION 16 AUGUST
202110,030 0.05%
8.9% IDFC 19 NOVEMBER 2025 1,079 0.01%FINANCIAL AND INSURANCE ACTIVITIES Total
3,799,416 18.45%
LIQUID MUTUAL FUND DSP BlackRock Liquidity Fund - Direct Plan - Growth 2,450,000 11.90%LIQUID MUTUAL FUND Total 2,450,000 11.90%STATE GOVERNMENT 8.07 KERALA SDL 15 JUNE 2026 338,885 1.65% 8.67 KARNATKA SDL 24 FEBRUARY 2026 249,781 1.21% 7.77 KERALA SDL 01 MARCH 2027 186,825 0.91% 7.75 KARNATKA SDL 01 MARCH 2027 157,130 0.76% 7.98 GUJARAT SDL 11 MAY 2026 108,007 0.52% 7.86 KARNATKA SDL 15 MARCH 2027 63,119 0.31% 7.98 KERALA SDL 11 MAY 2026 45,671 0.22% 8.01 TAMILNADU SDL 11 MAY 2026 34,218 0.17% 8.58 UTTAR PRADESH SPECIAL BOND 02 JUNE 2031 25,932 0.13% 8.49 UTTAR PRADESH SPECIAL BOND 02 JUNE 2030 25,720 0.12% 8.49 UTTAR PRADESH SPECIAL BOND 02 JUNE 2028 25,543 0.12% 8.35 UTTAR PRADESH SPECIAL BOND 02 JUNE 2029 25,329 0.12% 8.38 UTTAR PRADESH SPECIAL BOND 02 JUNE 2027 25,327 0.12% 8.32 UTTAR PRADESH SPECIAL BOND 02 JUNE 2025 25,079 0.12% 8.35 UTTAR PRADESH SPECIAL BOND 02 JUNE 2024 25,066 0.12% 8.26 UTTAR PRADESH SPECIAL BOND 02 JUNE 2022 24,989 0.12% 8.25 UTTAR PRADESH SPECIAL BOND 02 JUNE 2023 24,960 0.12% 8.14 UTTAR PRADESH SPECIAL BOND 02 JUNE 2026 24,844 0.12% 8.15 UTTAR PRADESH SPECIAL BOND 02 JUNE 2021 24,819 0.12% 8.03 UTTAR PRADESH SPECIAL BOND 02 JUNE 2020 24,756 0.12% 8.24 TAMILNADU SDL 22 MARCH 2028 23,924 0.12% 8.05 TAMILNADU SDL 22 MARCH 2031 23,702 0.12% 8.01 TAMILNADU SDL 22 MARCH 2030 23,598 0.11% 8.04 TAMILNADU SDL 22 MARCH 2029 23,568 0.11% 7.92 TAMILNADU SDL 22 MARCH 2032 23,467 0.11% 8.02 TAMILNADU SDL 22 MARCH 2025 23,434 0.11% 7.91 TAMILNADU SDL 22 MARCH 2024 23,285 0.11% 7.90 TAMILNADU SDL 22 MARCH 2027 23,282 0.11% 7.67 TAMILNADU SDL 22 MARCH 2023 23,102 0.11% 7.68 TAMILNADU SDL 22 MARCH 2026 22,944 0.11% 8.05 GUJARAT SDL 15 JUNE 2026 20,643 0.10% 9.72 KERALA 28 AUGUST 2023 19,959 0.10% 8.33 RAJASTHAN SDL 23 JUNE 2025 12,787 0.06% 8.27 RAJASTHAN SDL 23 JUNE 2022 12,736 0.06% 8.27 RAJASTHAN SDL 23 JUNE 2023 12,727 0.06% 8.19 RAJASTHAN SDL 23 JUNE 2026 12,725 0.06% 8.29 RAJASTHAN SDL 23 JUNE 2024 12,716 0.06% 8.15 RAJASTHAN SDL 23 JUNE 2021 12,637 0.06% 7.98 KERALA SDL 29 JUNE 2026 12,624 0.06% 8.01 RAJASTHAN SDL 23 JUNE 2020 12,609 0.06% 7.86 RAJASTHAN SDL 23 JUNE 2019 12,501 0.06% 7.75 RAJASTHAN SDL 23 JUNE 2018 12,443 0.06% 8.92 TAMIL NADU SDL 8 AUGUST 2022 1,763 0.01%

Max Life Insurance Company Limited Registration No: 104; Date of Registration with IRDAI: November 15, 2000
AnnuAL RepoRt 2016-17300
Directors' ReportFinancial StatementsSchedules annexed to the forming part of the Financial Statements
All amounts in thousands of Indian Rupees, unless otherwise stated
INDUSTRY SECURITY NAME AMOUNT PERCENTAGE OF FUND 8.75 TAMILNADU SDL 22 Feb 2022 349 0.00% 8.69 KARNATAKA SDL 08 FEBRUARY 2022 53 0.00%STATE GOVERNMENT Total 1,889,578 9.18%ELECTRICITY, GAS, STEAM AND AIR CONDITIONING SUPPLY
9.3 POWER GRID CORPORATION (TAXABLE) SR- XLVI 4 SEPTEMBER 2024
142,020 0.69%
POWER GRID CORPORATION OF INDIA LTD 102,181 0.50% 9.1 EAST NORTH INTERCONNECTION COMPANY
LIMITED 31 MARCH 202380,559 0.39%
9.1 EAST NORTH INTERCONNECTION COMPANY LIMITED 28 JUNE 2024
64,971 0.32%
8.13 NUCLEAR POWER CORPORATION OF INDIA LIMITED 28 MARCH 2029
63,139 0.31%
8.13 NUCLEAR POWER CORPORATION OF INDIA LIMITED 28 MARCH 2028
62,966 0.31%
8.13 NUCLEAR POWER CORPORATION OF INDIA LIMITED 28 MARCH 2027
62,776 0.30%
9.30 POWER GRID CORPORATION 28 JUNE 2024 54,713 0.27% 8.10 NTPC LTD 27 MAY 2021 54,267 0.26% 8.85 POWER GRID CORPORATION OF INDIA LIMITED
19 OCTOBER 202553,756 0.26%
8.40 NUCLEAR POWER CORPORATION OF INDIA LIMITED 28 NOVEMBER 2026
53,189 0.26%
GAIL (INDIA) LIMITED 52,773 0.26% 8.40 POWER GRID CORPORATION 27 MAY 2027 52,741 0.26% 8.14 NUCLEAR POWER CORPORATION OF INDIA
LIMITED 25 MARCH 202852,507 0.26%
8.13 NUCLEAR POWER CORPORATION OF INDIA LIMITED 28 MARCH 2030
52,460 0.25%
8.85 EAST NORTH INTERCONNECTION COMPANY LIMITED 30 SEPTEMBER 2020
52,391 0.25%
8.14 NUCLEAR POWER CORPORATION OF INDIA LIMITED 25 MARCH 2027
52,355 0.25%
8.14 NUCLEAR POWER CORPORATION OF INDIA LIMITED 25 MARCH 2026
52,189 0.25%
9.30 POWER GRID CORPORATION 28 JUNE 2019 52,128 0.25% INDRAPRASTHA GAS LIMITED 50,748 0.25% 8.13 NUCLEAR POWER CORPORATION OF INDIA
LIMITED 28 MARCH 203145,209 0.22%
TATA POWER LIMITED 40,483 0.20% PETRONET LNG LIMITED 40,315 0.20% 8.40 POWER GRID CORPORATION 27 MAY 2024 10,450 0.05%ELECTRICITY, GAS, STEAM AND AIR CONDITIONING SUPPLY Total
1,401,286 6.81%
HOUSING 8.5 LIC HOUSING FINANCE LTD 5 JANUARY 2021(Option II)
206,903 1.00%
9.15 DEWAN HOUSING FINANCE CORPORATION LIMITED 09 SEPTEMBER 2021
160,883 0.78%
8.49 HDFC 27 APRIL 2020 155,018 0.75% 8.45% HOUSING DEVELOPMENT FINANCE
CORPORATION 18 MAY 2026105,363 0.51%
8.52 LIC HOUSING FINANCE LTD 3 MARCH 2025 105,248 0.51% 9% INDIABULLS HOUSING FINANCE LTD 8th
February 2021 - OPTION I 105,170 0.51%
9.45 HDFC 21 AUGUST 2019 84,833 0.41% 9.24 HDFC 24 JUNE 2024 54,551 0.26% 8.75 HDFC 04 MARCH 2021 52,219 0.25%
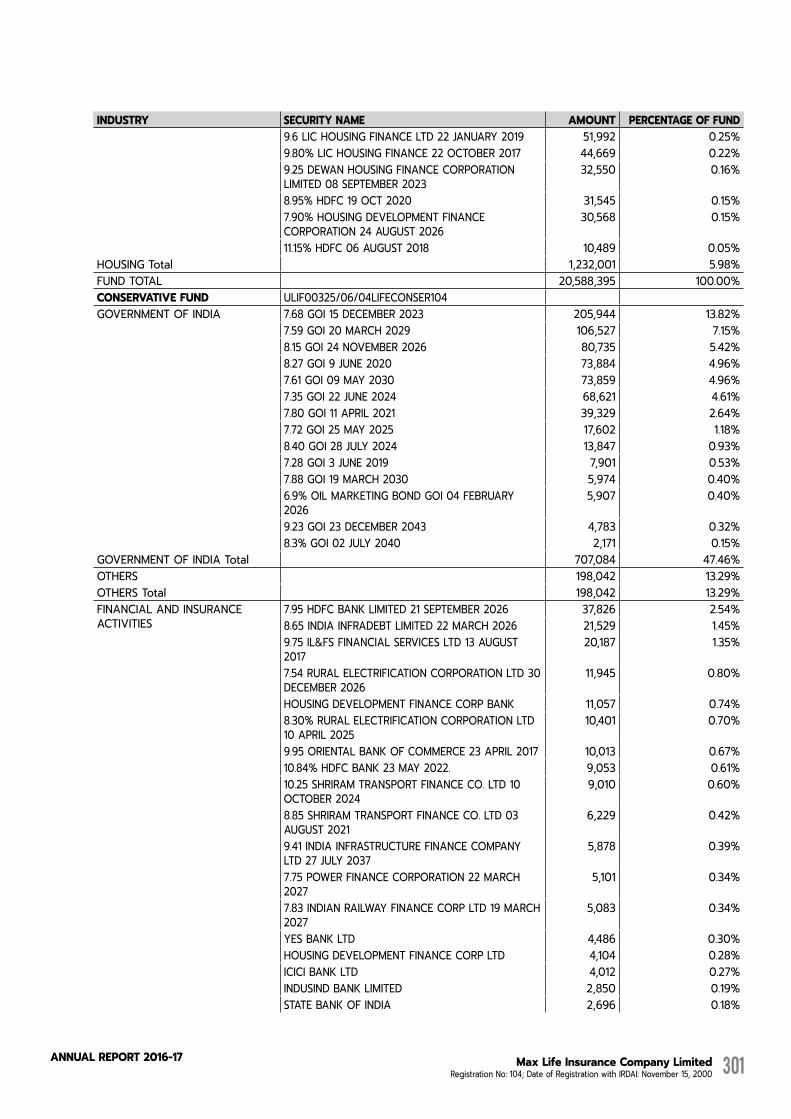
Max Life Insurance Company Limited Registration No: 104; Date of Registration with IRDAI: November 15, 2000
AnnuAL RepoRt 2016-17 301
INDUSTRY SECURITY NAME AMOUNT PERCENTAGE OF FUND 9.6 LIC HOUSING FINANCE LTD 22 JANUARY 2019 51,992 0.25% 9.80% LIC HOUSING FINANCE 22 OCTOBER 2017 44,669 0.22% 9.25 DEWAN HOUSING FINANCE CORPORATION
LIMITED 08 SEPTEMBER 202332,550 0.16%
8.95% HDFC 19 OCT 2020 31,545 0.15% 7.90% HOUSING DEVELOPMENT FINANCE
CORPORATION 24 AUGUST 202630,568 0.15%
11.15% HDFC 06 AUGUST 2018 10,489 0.05%HOUSING Total 1,232,001 5.98%FUND TOTAL 20,588,395 100.00%CONSERVATIVE FUND ULIF00325/06/04LIFECONSER104 GOVERNMENT OF INDIA 7.68 GOI 15 DECEMBER 2023 205,944 13.82% 7.59 GOI 20 MARCH 2029 106,527 7.15% 8.15 GOI 24 NOVEMBER 2026 80,735 5.42% 8.27 GOI 9 JUNE 2020 73,884 4.96% 7.61 GOI 09 MAY 2030 73,859 4.96% 7.35 GOI 22 JUNE 2024 68,621 4.61% 7.80 GOI 11 APRIL 2021 39,329 2.64% 7.72 GOI 25 MAY 2025 17,602 1.18% 8.40 GOI 28 JULY 2024 13,847 0.93% 7.28 GOI 3 JUNE 2019 7,901 0.53% 7.88 GOI 19 MARCH 2030 5,974 0.40% 6.9% OIL MARKETING BOND GOI 04 FEBRUARY
20265,907 0.40%
9.23 GOI 23 DECEMBER 2043 4,783 0.32% 8.3% GOI 02 JULY 2040 2,171 0.15%GOVERNMENT OF INDIA Total 707,084 47.46%OTHERS 198,042 13.29%OTHERS Total 198,042 13.29%FINANCIAL AND INSURANCE ACTIVITIES
7.95 HDFC BANK LIMITED 21 SEPTEMBER 2026 37,826 2.54%8.65 INDIA INFRADEBT LIMITED 22 MARCH 2026 21,529 1.45%9.75 IL&FS FINANCIAL SERVICES LTD 13 AUGUST 2017
20,187 1.35%
7.54 RURAL ELECTRIFICATION CORPORATION LTD 30 DECEMBER 2026
11,945 0.80%
HOUSING DEVELOPMENT FINANCE CORP BANK 11,057 0.74%8.30% RURAL ELECTRIFICATION CORPORATION LTD 10 APRIL 2025
10,401 0.70%
9.95 ORIENTAL BANK OF COMMERCE 23 APRIL 2017 10,013 0.67%10.84% HDFC BANK 23 MAY 2022. 9,053 0.61%
10.25 SHRIRAM TRANSPORT FINANCE CO. LTD 10 OCTOBER 2024
9,010 0.60%
8.85 SHRIRAM TRANSPORT FINANCE CO. LTD 03 AUGUST 2021
6,229 0.42%
9.41 INDIA INFRASTRUCTURE FINANCE COMPANY LTD 27 JULY 2037
5,878 0.39%
7.75 POWER FINANCE CORPORATION 22 MARCH 2027
5,101 0.34%
7.83 INDIAN RAILWAY FINANCE CORP LTD 19 MARCH 2027
5,083 0.34%
YES BANK LTD 4,486 0.30% HOUSING DEVELOPMENT FINANCE CORP LTD 4,104 0.28% ICICI BANK LTD 4,012 0.27% INDUSIND BANK LIMITED 2,850 0.19% STATE BANK OF INDIA 2,696 0.18%
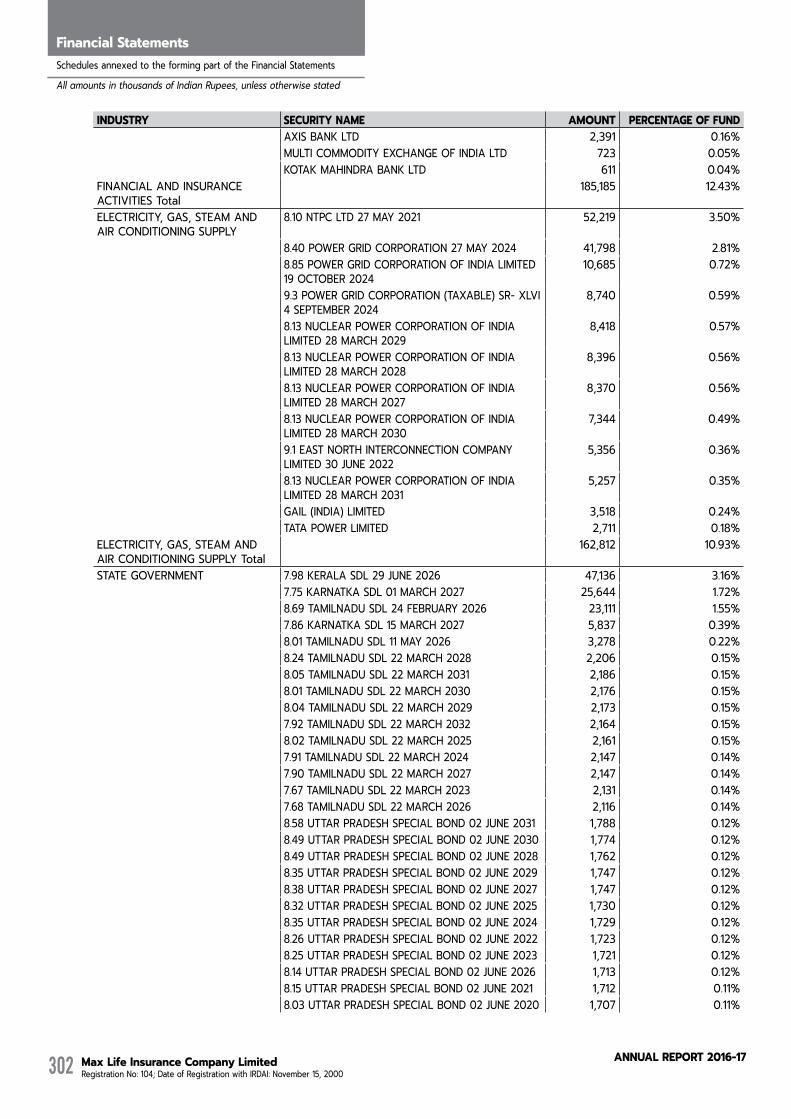
Max Life Insurance Company Limited Registration No: 104; Date of Registration with IRDAI: November 15, 2000
AnnuAL RepoRt 2016-17302
Directors' ReportFinancial StatementsSchedules annexed to the forming part of the Financial Statements
All amounts in thousands of Indian Rupees, unless otherwise stated
INDUSTRY SECURITY NAME AMOUNT PERCENTAGE OF FUND AXIS BANK LTD 2,391 0.16% MULTI COMMODITY EXCHANGE OF INDIA LTD 723 0.05% KOTAK MAHINDRA BANK LTD 611 0.04%FINANCIAL AND INSURANCE ACTIVITIES Total
185,185 12.43%
ELECTRICITY, GAS, STEAM AND AIR CONDITIONING SUPPLY
8.10 NTPC LTD 27 MAY 2021 52,219 3.50%
8.40 POWER GRID CORPORATION 27 MAY 2024 41,798 2.81% 8.85 POWER GRID CORPORATION OF INDIA LIMITED
19 OCTOBER 202410,685 0.72%
9.3 POWER GRID CORPORATION (TAXABLE) SR- XLVI 4 SEPTEMBER 2024
8,740 0.59%
8.13 NUCLEAR POWER CORPORATION OF INDIA LIMITED 28 MARCH 2029
8,418 0.57%
8.13 NUCLEAR POWER CORPORATION OF INDIA LIMITED 28 MARCH 2028
8,396 0.56%
8.13 NUCLEAR POWER CORPORATION OF INDIA LIMITED 28 MARCH 2027
8,370 0.56%
8.13 NUCLEAR POWER CORPORATION OF INDIA LIMITED 28 MARCH 2030
7,344 0.49%
9.1 EAST NORTH INTERCONNECTION COMPANY LIMITED 30 JUNE 2022
5,356 0.36%
8.13 NUCLEAR POWER CORPORATION OF INDIA LIMITED 28 MARCH 2031
5,257 0.35%
GAIL (INDIA) LIMITED 3,518 0.24% TATA POWER LIMITED 2,711 0.18%ELECTRICITY, GAS, STEAM AND AIR CONDITIONING SUPPLY Total
162,812 10.93%
STATE GOVERNMENT 7.98 KERALA SDL 29 JUNE 2026 47,136 3.16% 7.75 KARNATKA SDL 01 MARCH 2027 25,644 1.72% 8.69 TAMILNADU SDL 24 FEBRUARY 2026 23,111 1.55% 7.86 KARNATKA SDL 15 MARCH 2027 5,837 0.39% 8.01 TAMILNADU SDL 11 MAY 2026 3,278 0.22% 8.24 TAMILNADU SDL 22 MARCH 2028 2,206 0.15% 8.05 TAMILNADU SDL 22 MARCH 2031 2,186 0.15% 8.01 TAMILNADU SDL 22 MARCH 2030 2,176 0.15% 8.04 TAMILNADU SDL 22 MARCH 2029 2,173 0.15% 7.92 TAMILNADU SDL 22 MARCH 2032 2,164 0.15% 8.02 TAMILNADU SDL 22 MARCH 2025 2,161 0.15% 7.91 TAMILNADU SDL 22 MARCH 2024 2,147 0.14% 7.90 TAMILNADU SDL 22 MARCH 2027 2,147 0.14% 7.67 TAMILNADU SDL 22 MARCH 2023 2,131 0.14% 7.68 TAMILNADU SDL 22 MARCH 2026 2,116 0.14% 8.58 UTTAR PRADESH SPECIAL BOND 02 JUNE 2031 1,788 0.12% 8.49 UTTAR PRADESH SPECIAL BOND 02 JUNE 2030 1,774 0.12% 8.49 UTTAR PRADESH SPECIAL BOND 02 JUNE 2028 1,762 0.12% 8.35 UTTAR PRADESH SPECIAL BOND 02 JUNE 2029 1,747 0.12% 8.38 UTTAR PRADESH SPECIAL BOND 02 JUNE 2027 1,747 0.12% 8.32 UTTAR PRADESH SPECIAL BOND 02 JUNE 2025 1,730 0.12% 8.35 UTTAR PRADESH SPECIAL BOND 02 JUNE 2024 1,729 0.12% 8.26 UTTAR PRADESH SPECIAL BOND 02 JUNE 2022 1,723 0.12% 8.25 UTTAR PRADESH SPECIAL BOND 02 JUNE 2023 1,721 0.12% 8.14 UTTAR PRADESH SPECIAL BOND 02 JUNE 2026 1,713 0.12% 8.15 UTTAR PRADESH SPECIAL BOND 02 JUNE 2021 1,712 0.11% 8.03 UTTAR PRADESH SPECIAL BOND 02 JUNE 2020 1,707 0.11%
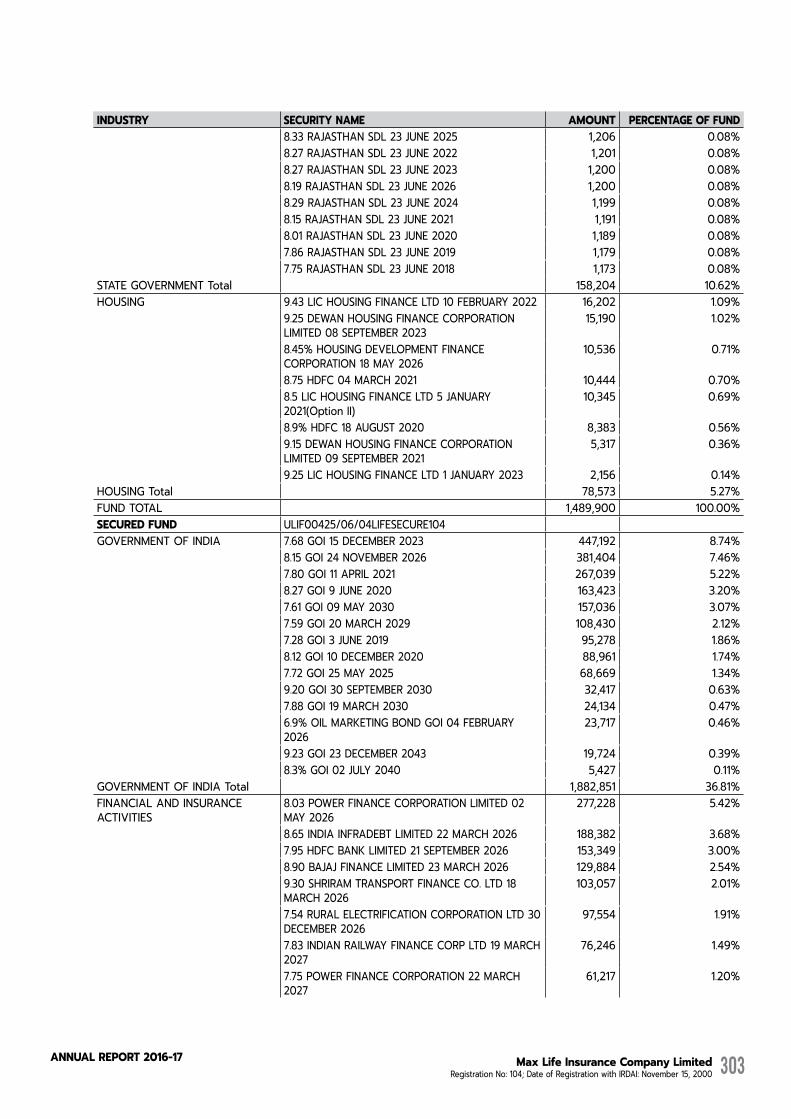
Max Life Insurance Company Limited Registration No: 104; Date of Registration with IRDAI: November 15, 2000
AnnuAL RepoRt 2016-17 303
INDUSTRY SECURITY NAME AMOUNT PERCENTAGE OF FUND 8.33 RAJASTHAN SDL 23 JUNE 2025 1,206 0.08% 8.27 RAJASTHAN SDL 23 JUNE 2022 1,201 0.08% 8.27 RAJASTHAN SDL 23 JUNE 2023 1,200 0.08% 8.19 RAJASTHAN SDL 23 JUNE 2026 1,200 0.08% 8.29 RAJASTHAN SDL 23 JUNE 2024 1,199 0.08% 8.15 RAJASTHAN SDL 23 JUNE 2021 1,191 0.08% 8.01 RAJASTHAN SDL 23 JUNE 2020 1,189 0.08% 7.86 RAJASTHAN SDL 23 JUNE 2019 1,179 0.08% 7.75 RAJASTHAN SDL 23 JUNE 2018 1,173 0.08%STATE GOVERNMENT Total 158,204 10.62%HOUSING 9.43 LIC HOUSING FINANCE LTD 10 FEBRUARY 2022 16,202 1.09% 9.25 DEWAN HOUSING FINANCE CORPORATION
LIMITED 08 SEPTEMBER 202315,190 1.02%
8.45% HOUSING DEVELOPMENT FINANCE CORPORATION 18 MAY 2026
10,536 0.71%
8.75 HDFC 04 MARCH 2021 10,444 0.70% 8.5 LIC HOUSING FINANCE LTD 5 JANUARY
2021(Option II)10,345 0.69%
8.9% HDFC 18 AUGUST 2020 8,383 0.56% 9.15 DEWAN HOUSING FINANCE CORPORATION
LIMITED 09 SEPTEMBER 20215,317 0.36%
9.25 LIC HOUSING FINANCE LTD 1 JANUARY 2023 2,156 0.14%HOUSING Total 78,573 5.27%FUND TOTAL 1,489,900 100.00%SECURED FUND ULIF00425/06/04LIFESECURE104 GOVERNMENT OF INDIA 7.68 GOI 15 DECEMBER 2023 447,192 8.74% 8.15 GOI 24 NOVEMBER 2026 381,404 7.46% 7.80 GOI 11 APRIL 2021 267,039 5.22% 8.27 GOI 9 JUNE 2020 163,423 3.20% 7.61 GOI 09 MAY 2030 157,036 3.07% 7.59 GOI 20 MARCH 2029 108,430 2.12% 7.28 GOI 3 JUNE 2019 95,278 1.86% 8.12 GOI 10 DECEMBER 2020 88,961 1.74% 7.72 GOI 25 MAY 2025 68,669 1.34% 9.20 GOI 30 SEPTEMBER 2030 32,417 0.63% 7.88 GOI 19 MARCH 2030 24,134 0.47% 6.9% OIL MARKETING BOND GOI 04 FEBRUARY
202623,717 0.46%
9.23 GOI 23 DECEMBER 2043 19,724 0.39% 8.3% GOI 02 JULY 2040 5,427 0.11%GOVERNMENT OF INDIA Total 1,882,851 36.81%FINANCIAL AND INSURANCE ACTIVITIES
8.03 POWER FINANCE CORPORATION LIMITED 02 MAY 2026
277,228 5.42%
8.65 INDIA INFRADEBT LIMITED 22 MARCH 2026 188,382 3.68% 7.95 HDFC BANK LIMITED 21 SEPTEMBER 2026 153,349 3.00% 8.90 BAJAJ FINANCE LIMITED 23 MARCH 2026 129,884 2.54% 9.30 SHRIRAM TRANSPORT FINANCE CO. LTD 18
MARCH 2026103,057 2.01%
7.54 RURAL ELECTRIFICATION CORPORATION LTD 30 DECEMBER 2026
97,554 1.91%
7.83 INDIAN RAILWAY FINANCE CORP LTD 19 MARCH 2027
76,246 1.49%
7.75 POWER FINANCE CORPORATION 22 MARCH 2027
61,217 1.20%
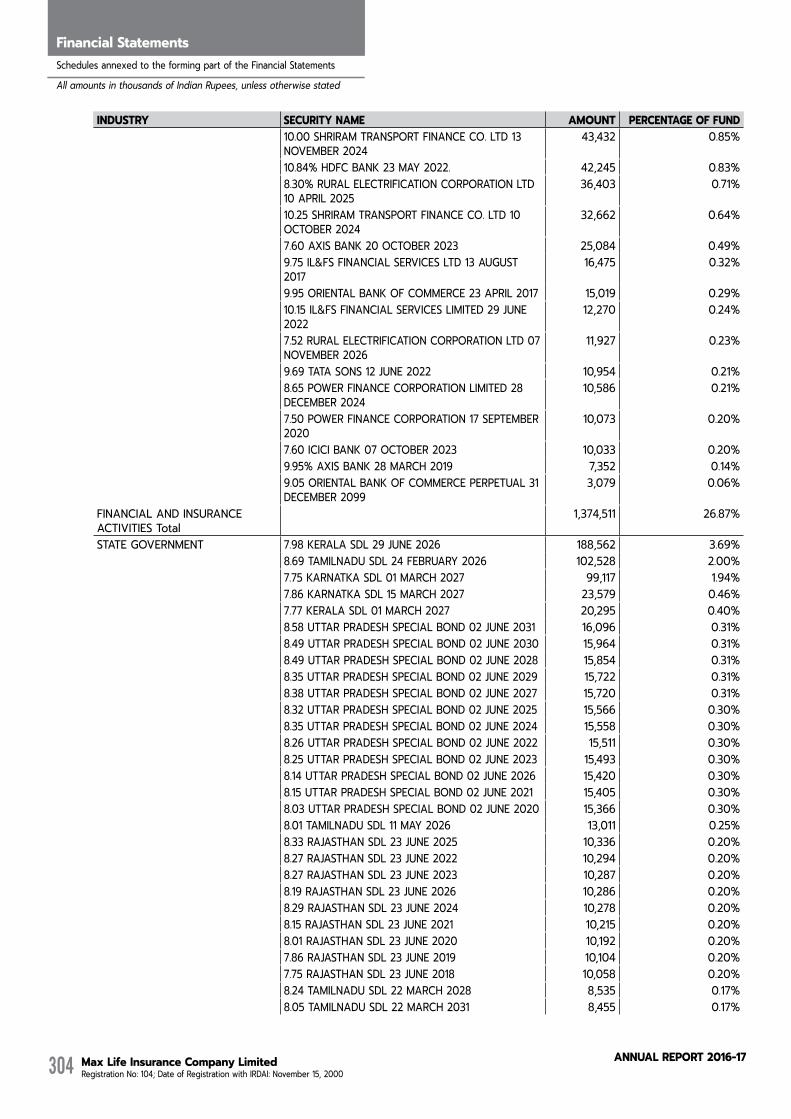
Max Life Insurance Company Limited Registration No: 104; Date of Registration with IRDAI: November 15, 2000
AnnuAL RepoRt 2016-17304
Directors' ReportFinancial StatementsSchedules annexed to the forming part of the Financial Statements
All amounts in thousands of Indian Rupees, unless otherwise stated
INDUSTRY SECURITY NAME AMOUNT PERCENTAGE OF FUND 10.00 SHRIRAM TRANSPORT FINANCE CO. LTD 13
NOVEMBER 202443,432 0.85%
10.84% HDFC BANK 23 MAY 2022. 42,245 0.83% 8.30% RURAL ELECTRIFICATION CORPORATION LTD
10 APRIL 202536,403 0.71%
10.25 SHRIRAM TRANSPORT FINANCE CO. LTD 10 OCTOBER 2024
32,662 0.64%
7.60 AXIS BANK 20 OCTOBER 2023 25,084 0.49% 9.75 IL&FS FINANCIAL SERVICES LTD 13 AUGUST
201716,475 0.32%
9.95 ORIENTAL BANK OF COMMERCE 23 APRIL 2017 15,019 0.29% 10.15 IL&FS FINANCIAL SERVICES LIMITED 29 JUNE
202212,270 0.24%
7.52 RURAL ELECTRIFICATION CORPORATION LTD 07 NOVEMBER 2026
11,927 0.23%
9.69 TATA SONS 12 JUNE 2022 10,954 0.21% 8.65 POWER FINANCE CORPORATION LIMITED 28
DECEMBER 202410,586 0.21%
7.50 POWER FINANCE CORPORATION 17 SEPTEMBER 2020
10,073 0.20%
7.60 ICICI BANK 07 OCTOBER 2023 10,033 0.20% 9.95% AXIS BANK 28 MARCH 2019 7,352 0.14% 9.05 ORIENTAL BANK OF COMMERCE PERPETUAL 31
DECEMBER 20993,079 0.06%
FINANCIAL AND INSURANCE ACTIVITIES Total
1,374,511 26.87%
STATE GOVERNMENT 7.98 KERALA SDL 29 JUNE 2026 188,562 3.69% 8.69 TAMILNADU SDL 24 FEBRUARY 2026 102,528 2.00% 7.75 KARNATKA SDL 01 MARCH 2027 99,117 1.94% 7.86 KARNATKA SDL 15 MARCH 2027 23,579 0.46% 7.77 KERALA SDL 01 MARCH 2027 20,295 0.40% 8.58 UTTAR PRADESH SPECIAL BOND 02 JUNE 2031 16,096 0.31% 8.49 UTTAR PRADESH SPECIAL BOND 02 JUNE 2030 15,964 0.31% 8.49 UTTAR PRADESH SPECIAL BOND 02 JUNE 2028 15,854 0.31% 8.35 UTTAR PRADESH SPECIAL BOND 02 JUNE 2029 15,722 0.31% 8.38 UTTAR PRADESH SPECIAL BOND 02 JUNE 2027 15,720 0.31% 8.32 UTTAR PRADESH SPECIAL BOND 02 JUNE 2025 15,566 0.30% 8.35 UTTAR PRADESH SPECIAL BOND 02 JUNE 2024 15,558 0.30% 8.26 UTTAR PRADESH SPECIAL BOND 02 JUNE 2022 15,511 0.30% 8.25 UTTAR PRADESH SPECIAL BOND 02 JUNE 2023 15,493 0.30% 8.14 UTTAR PRADESH SPECIAL BOND 02 JUNE 2026 15,420 0.30% 8.15 UTTAR PRADESH SPECIAL BOND 02 JUNE 2021 15,405 0.30% 8.03 UTTAR PRADESH SPECIAL BOND 02 JUNE 2020 15,366 0.30% 8.01 TAMILNADU SDL 11 MAY 2026 13,011 0.25% 8.33 RAJASTHAN SDL 23 JUNE 2025 10,336 0.20% 8.27 RAJASTHAN SDL 23 JUNE 2022 10,294 0.20% 8.27 RAJASTHAN SDL 23 JUNE 2023 10,287 0.20% 8.19 RAJASTHAN SDL 23 JUNE 2026 10,286 0.20% 8.29 RAJASTHAN SDL 23 JUNE 2024 10,278 0.20% 8.15 RAJASTHAN SDL 23 JUNE 2021 10,215 0.20% 8.01 RAJASTHAN SDL 23 JUNE 2020 10,192 0.20% 7.86 RAJASTHAN SDL 23 JUNE 2019 10,104 0.20% 7.75 RAJASTHAN SDL 23 JUNE 2018 10,058 0.20% 8.24 TAMILNADU SDL 22 MARCH 2028 8,535 0.17% 8.05 TAMILNADU SDL 22 MARCH 2031 8,455 0.17%
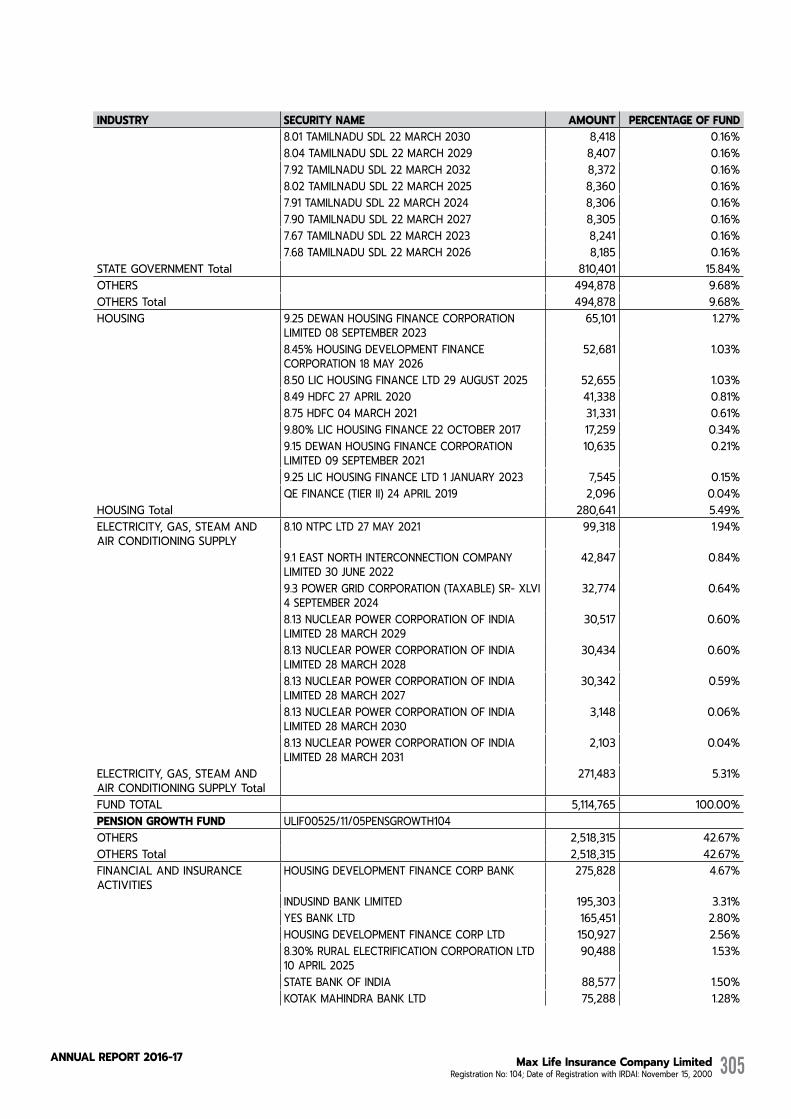
Max Life Insurance Company Limited Registration No: 104; Date of Registration with IRDAI: November 15, 2000
AnnuAL RepoRt 2016-17 305
INDUSTRY SECURITY NAME AMOUNT PERCENTAGE OF FUND 8.01 TAMILNADU SDL 22 MARCH 2030 8,418 0.16% 8.04 TAMILNADU SDL 22 MARCH 2029 8,407 0.16% 7.92 TAMILNADU SDL 22 MARCH 2032 8,372 0.16% 8.02 TAMILNADU SDL 22 MARCH 2025 8,360 0.16% 7.91 TAMILNADU SDL 22 MARCH 2024 8,306 0.16% 7.90 TAMILNADU SDL 22 MARCH 2027 8,305 0.16% 7.67 TAMILNADU SDL 22 MARCH 2023 8,241 0.16% 7.68 TAMILNADU SDL 22 MARCH 2026 8,185 0.16%STATE GOVERNMENT Total 810,401 15.84%OTHERS 494,878 9.68%OTHERS Total 494,878 9.68%HOUSING 9.25 DEWAN HOUSING FINANCE CORPORATION
LIMITED 08 SEPTEMBER 202365,101 1.27%
8.45% HOUSING DEVELOPMENT FINANCE CORPORATION 18 MAY 2026
52,681 1.03%
8.50 LIC HOUSING FINANCE LTD 29 AUGUST 2025 52,655 1.03% 8.49 HDFC 27 APRIL 2020 41,338 0.81% 8.75 HDFC 04 MARCH 2021 31,331 0.61% 9.80% LIC HOUSING FINANCE 22 OCTOBER 2017 17,259 0.34% 9.15 DEWAN HOUSING FINANCE CORPORATION
LIMITED 09 SEPTEMBER 202110,635 0.21%
9.25 LIC HOUSING FINANCE LTD 1 JANUARY 2023 7,545 0.15% QE FINANCE (TIER II) 24 APRIL 2019 2,096 0.04%HOUSING Total 280,641 5.49%ELECTRICITY, GAS, STEAM AND AIR CONDITIONING SUPPLY
8.10 NTPC LTD 27 MAY 2021 99,318 1.94%
9.1 EAST NORTH INTERCONNECTION COMPANY LIMITED 30 JUNE 2022
42,847 0.84%
9.3 POWER GRID CORPORATION (TAXABLE) SR- XLVI 4 SEPTEMBER 2024
32,774 0.64%
8.13 NUCLEAR POWER CORPORATION OF INDIA LIMITED 28 MARCH 2029
30,517 0.60%
8.13 NUCLEAR POWER CORPORATION OF INDIA LIMITED 28 MARCH 2028
30,434 0.60%
8.13 NUCLEAR POWER CORPORATION OF INDIA LIMITED 28 MARCH 2027
30,342 0.59%
8.13 NUCLEAR POWER CORPORATION OF INDIA LIMITED 28 MARCH 2030
3,148 0.06%
8.13 NUCLEAR POWER CORPORATION OF INDIA LIMITED 28 MARCH 2031
2,103 0.04%
ELECTRICITY, GAS, STEAM AND AIR CONDITIONING SUPPLY Total
271,483 5.31%
FUND TOTAL 5,114,765 100.00%PENSION GROWTH FUND ULIF00525/11/05PENSGROWTH104 OTHERS 2,518,315 42.67%OTHERS Total 2,518,315 42.67%FINANCIAL AND INSURANCE ACTIVITIES
HOUSING DEVELOPMENT FINANCE CORP BANK 275,828 4.67%
INDUSIND BANK LIMITED 195,303 3.31% YES BANK LTD 165,451 2.80% HOUSING DEVELOPMENT FINANCE CORP LTD 150,927 2.56% 8.30% RURAL ELECTRIFICATION CORPORATION LTD
10 APRIL 202590,488 1.53%
STATE BANK OF INDIA 88,577 1.50% KOTAK MAHINDRA BANK LTD 75,288 1.28%
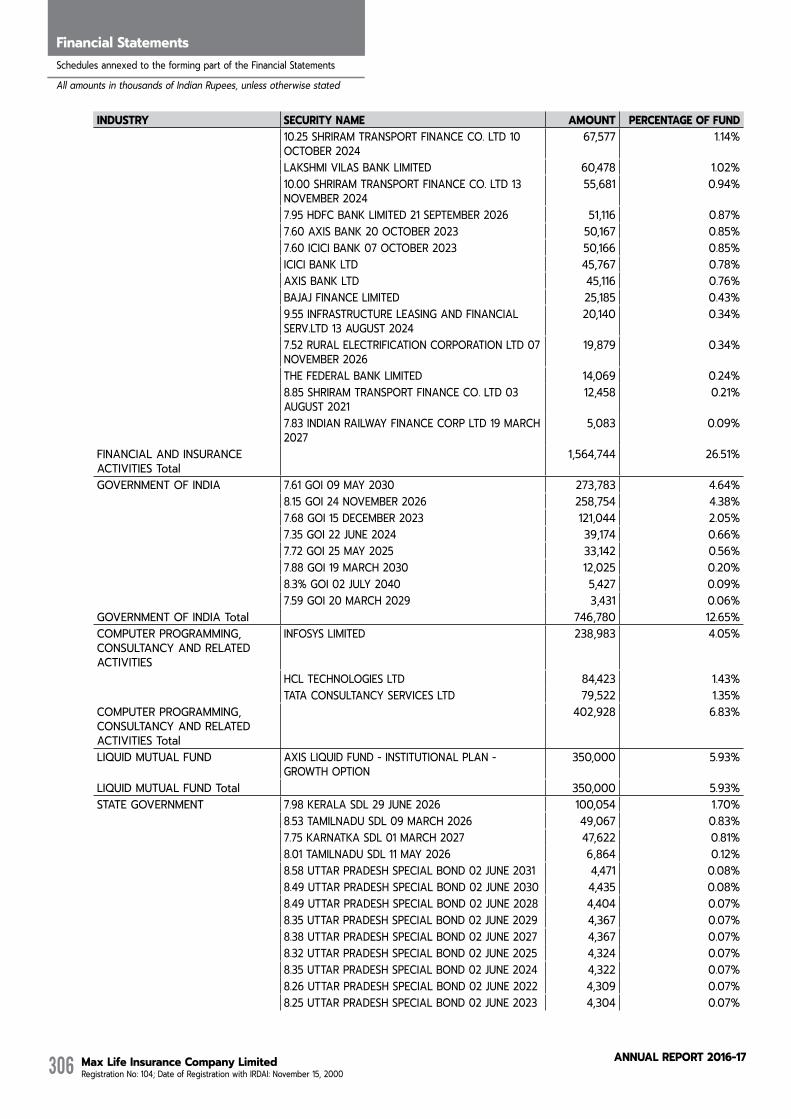
Max Life Insurance Company Limited Registration No: 104; Date of Registration with IRDAI: November 15, 2000
AnnuAL RepoRt 2016-17306
Directors' ReportFinancial StatementsSchedules annexed to the forming part of the Financial Statements
All amounts in thousands of Indian Rupees, unless otherwise stated
INDUSTRY SECURITY NAME AMOUNT PERCENTAGE OF FUND 10.25 SHRIRAM TRANSPORT FINANCE CO. LTD 10
OCTOBER 202467,577 1.14%
LAKSHMI VILAS BANK LIMITED 60,478 1.02% 10.00 SHRIRAM TRANSPORT FINANCE CO. LTD 13
NOVEMBER 202455,681 0.94%
7.95 HDFC BANK LIMITED 21 SEPTEMBER 2026 51,116 0.87% 7.60 AXIS BANK 20 OCTOBER 2023 50,167 0.85% 7.60 ICICI BANK 07 OCTOBER 2023 50,166 0.85% ICICI BANK LTD 45,767 0.78% AXIS BANK LTD 45,116 0.76% BAJAJ FINANCE LIMITED 25,185 0.43% 9.55 INFRASTRUCTURE LEASING AND FINANCIAL
SERV.LTD 13 AUGUST 202420,140 0.34%
7.52 RURAL ELECTRIFICATION CORPORATION LTD 07 NOVEMBER 2026
19,879 0.34%
THE FEDERAL BANK LIMITED 14,069 0.24% 8.85 SHRIRAM TRANSPORT FINANCE CO. LTD 03
AUGUST 202112,458 0.21%
7.83 INDIAN RAILWAY FINANCE CORP LTD 19 MARCH 2027
5,083 0.09%
FINANCIAL AND INSURANCE ACTIVITIES Total
1,564,744 26.51%
GOVERNMENT OF INDIA 7.61 GOI 09 MAY 2030 273,783 4.64% 8.15 GOI 24 NOVEMBER 2026 258,754 4.38% 7.68 GOI 15 DECEMBER 2023 121,044 2.05% 7.35 GOI 22 JUNE 2024 39,174 0.66% 7.72 GOI 25 MAY 2025 33,142 0.56% 7.88 GOI 19 MARCH 2030 12,025 0.20% 8.3% GOI 02 JULY 2040 5,427 0.09% 7.59 GOI 20 MARCH 2029 3,431 0.06%GOVERNMENT OF INDIA Total 746,780 12.65%COMPUTER PROGRAMMING, CONSULTANCY AND RELATED ACTIVITIES
INFOSYS LIMITED 238,983 4.05%
HCL TECHNOLOGIES LTD 84,423 1.43% TATA CONSULTANCY SERVICES LTD 79,522 1.35%COMPUTER PROGRAMMING, CONSULTANCY AND RELATED ACTIVITIES Total
402,928 6.83%
LIQUID MUTUAL FUND AXIS LIQUID FUND - INSTITUTIONAL PLAN - GROWTH OPTION
350,000 5.93%
LIQUID MUTUAL FUND Total 350,000 5.93%STATE GOVERNMENT 7.98 KERALA SDL 29 JUNE 2026 100,054 1.70% 8.53 TAMILNADU SDL 09 MARCH 2026 49,067 0.83% 7.75 KARNATKA SDL 01 MARCH 2027 47,622 0.81% 8.01 TAMILNADU SDL 11 MAY 2026 6,864 0.12% 8.58 UTTAR PRADESH SPECIAL BOND 02 JUNE 2031 4,471 0.08% 8.49 UTTAR PRADESH SPECIAL BOND 02 JUNE 2030 4,435 0.08% 8.49 UTTAR PRADESH SPECIAL BOND 02 JUNE 2028 4,404 0.07% 8.35 UTTAR PRADESH SPECIAL BOND 02 JUNE 2029 4,367 0.07% 8.38 UTTAR PRADESH SPECIAL BOND 02 JUNE 2027 4,367 0.07% 8.32 UTTAR PRADESH SPECIAL BOND 02 JUNE 2025 4,324 0.07% 8.35 UTTAR PRADESH SPECIAL BOND 02 JUNE 2024 4,322 0.07% 8.26 UTTAR PRADESH SPECIAL BOND 02 JUNE 2022 4,309 0.07% 8.25 UTTAR PRADESH SPECIAL BOND 02 JUNE 2023 4,304 0.07%
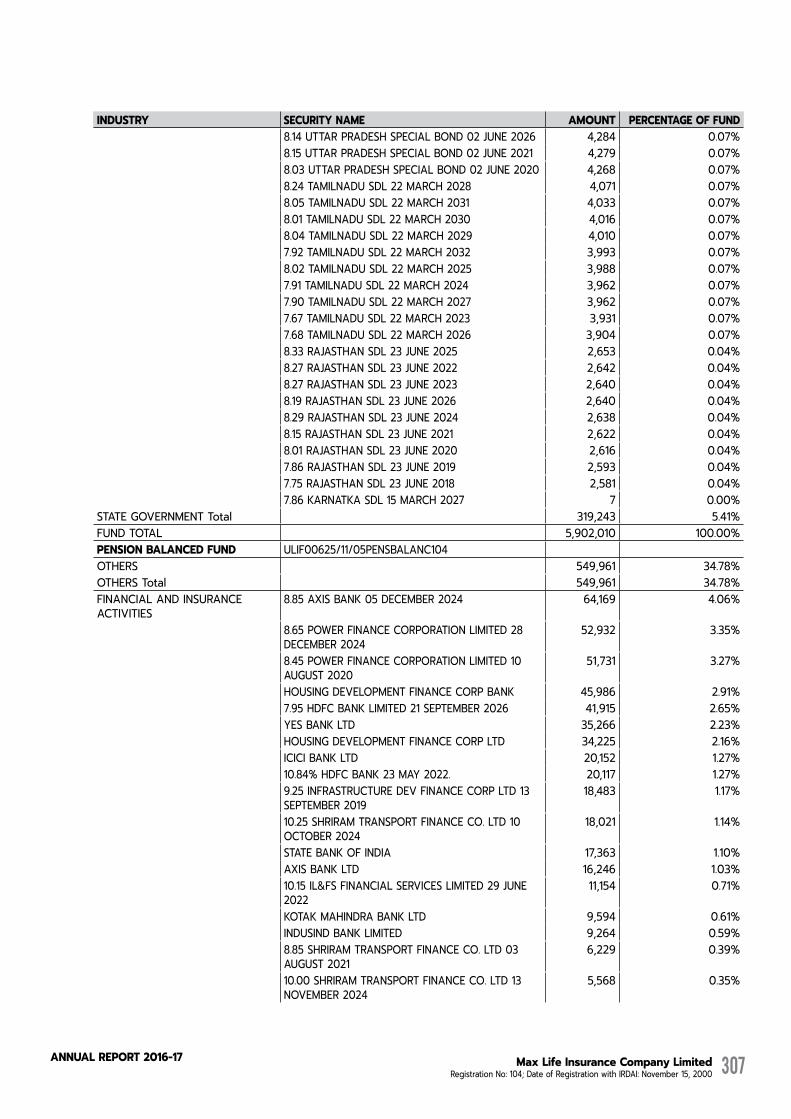
Max Life Insurance Company Limited Registration No: 104; Date of Registration with IRDAI: November 15, 2000
AnnuAL RepoRt 2016-17 307
INDUSTRY SECURITY NAME AMOUNT PERCENTAGE OF FUND 8.14 UTTAR PRADESH SPECIAL BOND 02 JUNE 2026 4,284 0.07% 8.15 UTTAR PRADESH SPECIAL BOND 02 JUNE 2021 4,279 0.07% 8.03 UTTAR PRADESH SPECIAL BOND 02 JUNE 2020 4,268 0.07% 8.24 TAMILNADU SDL 22 MARCH 2028 4,071 0.07% 8.05 TAMILNADU SDL 22 MARCH 2031 4,033 0.07% 8.01 TAMILNADU SDL 22 MARCH 2030 4,016 0.07% 8.04 TAMILNADU SDL 22 MARCH 2029 4,010 0.07% 7.92 TAMILNADU SDL 22 MARCH 2032 3,993 0.07% 8.02 TAMILNADU SDL 22 MARCH 2025 3,988 0.07% 7.91 TAMILNADU SDL 22 MARCH 2024 3,962 0.07% 7.90 TAMILNADU SDL 22 MARCH 2027 3,962 0.07% 7.67 TAMILNADU SDL 22 MARCH 2023 3,931 0.07% 7.68 TAMILNADU SDL 22 MARCH 2026 3,904 0.07% 8.33 RAJASTHAN SDL 23 JUNE 2025 2,653 0.04% 8.27 RAJASTHAN SDL 23 JUNE 2022 2,642 0.04% 8.27 RAJASTHAN SDL 23 JUNE 2023 2,640 0.04% 8.19 RAJASTHAN SDL 23 JUNE 2026 2,640 0.04% 8.29 RAJASTHAN SDL 23 JUNE 2024 2,638 0.04% 8.15 RAJASTHAN SDL 23 JUNE 2021 2,622 0.04% 8.01 RAJASTHAN SDL 23 JUNE 2020 2,616 0.04% 7.86 RAJASTHAN SDL 23 JUNE 2019 2,593 0.04% 7.75 RAJASTHAN SDL 23 JUNE 2018 2,581 0.04% 7.86 KARNATKA SDL 15 MARCH 2027 7 0.00%STATE GOVERNMENT Total 319,243 5.41%FUND TOTAL 5,902,010 100.00%PENSION BALANCED FUND ULIF00625/11/05PENSBALANC104 OTHERS 549,961 34.78%OTHERS Total 549,961 34.78%FINANCIAL AND INSURANCE ACTIVITIES
8.85 AXIS BANK 05 DECEMBER 2024 64,169 4.06%
8.65 POWER FINANCE CORPORATION LIMITED 28 DECEMBER 2024
52,932 3.35%
8.45 POWER FINANCE CORPORATION LIMITED 10 AUGUST 2020
51,731 3.27%
HOUSING DEVELOPMENT FINANCE CORP BANK 45,986 2.91% 7.95 HDFC BANK LIMITED 21 SEPTEMBER 2026 41,915 2.65% YES BANK LTD 35,266 2.23% HOUSING DEVELOPMENT FINANCE CORP LTD 34,225 2.16% ICICI BANK LTD 20,152 1.27% 10.84% HDFC BANK 23 MAY 2022. 20,117 1.27% 9.25 INFRASTRUCTURE DEV FINANCE CORP LTD 13
SEPTEMBER 201918,483 1.17%
10.25 SHRIRAM TRANSPORT FINANCE CO. LTD 10 OCTOBER 2024
18,021 1.14%
STATE BANK OF INDIA 17,363 1.10% AXIS BANK LTD 16,246 1.03% 10.15 IL&FS FINANCIAL SERVICES LIMITED 29 JUNE
202211,154 0.71%
KOTAK MAHINDRA BANK LTD 9,594 0.61% INDUSIND BANK LIMITED 9,264 0.59% 8.85 SHRIRAM TRANSPORT FINANCE CO. LTD 03
AUGUST 20216,229 0.39%
10.00 SHRIRAM TRANSPORT FINANCE CO. LTD 13 NOVEMBER 2024
5,568 0.35%

Max Life Insurance Company Limited Registration No: 104; Date of Registration with IRDAI: November 15, 2000
AnnuAL RepoRt 2016-17308
Directors' ReportFinancial StatementsSchedules annexed to the forming part of the Financial Statements
All amounts in thousands of Indian Rupees, unless otherwise stated
INDUSTRY SECURITY NAME AMOUNT PERCENTAGE OF FUND 7.83 INDIAN RAILWAY FINANCE CORP LTD 19 MARCH
20275,083 0.32%
9.75 IL&FS FINANCIAL SERVICES LTD 03 SEPTEMBER 2017
5,055 0.32%
IDFC LIMITED 1,433 0.09% 7.52 RURAL ELECTRIFICATION CORPORATION LTD 07
NOVEMBER 2026994 0.06%
FINANCIAL AND INSURANCE ACTIVITIES Total
490,980 31.05%
GOVERNMENT OF INDIA 7.61 GOI 09 MAY 2030 148,046 9.36% 7.35 GOI 22 JUNE 2024 125,685 7.95% 7.59 GOI 20 MARCH 2029 35,847 2.27% 7.68 GOI 15 DECEMBER 2023 32,811 2.07% 7.80 GOI 11 APRIL 2021 12,452 0.79% 7.88 GOI 19 MARCH 2030 5,714 0.36% 6.9% OIL MARKETING BOND GOI 04 FEBRUARY
20265,354 0.34%
7.72 GOI 25 MAY 2025 5,117 0.32% 9.23 GOI 23 DECEMBER 2043 4,397 0.28% 8.27 GOI 9 JUNE 2020 3,144 0.20% 8.3% GOI 02 JULY 2040 2,171 0.14%GOVERNMENT OF INDIA Total 380,738 24.08%STATE GOVERNMENT 7.98 KERALA SDL 11 MAY 2026 47,005 2.97% 7.77 KERALA SDL 01 MARCH 2027 22,335 1.41% 8.67 KARNATKA SDL 24 FEBRUARY 2026 16,965 1.07% 8.53 TAMILNADU SDL 09 MARCH 2026 6,028 0.38% 7.86 KARNATKA SDL 15 MARCH 2027 5,583 0.35% 8.01 TAMILNADU SDL 11 MAY 2026 3,278 0.21% 8.58 UTTAR PRADESH SPECIAL BOND 02 JUNE 2031 2,683 0.17% 8.49 UTTAR PRADESH SPECIAL BOND 02 JUNE 2030 2,661 0.17% 8.49 UTTAR PRADESH SPECIAL BOND 02 JUNE 2028 2,642 0.17% 8.35 UTTAR PRADESH SPECIAL BOND 02 JUNE 2029 2,620 0.17% 8.38 UTTAR PRADESH SPECIAL BOND 02 JUNE 2027 2,620 0.17% 8.32 UTTAR PRADESH SPECIAL BOND 02 JUNE 2025 2,594 0.16% 8.35 UTTAR PRADESH SPECIAL BOND 02 JUNE 2024 2,593 0.16% 8.26 UTTAR PRADESH SPECIAL BOND 02 JUNE 2022 2,585 0.16% 8.25 UTTAR PRADESH SPECIAL BOND 02 JUNE 2023 2,582 0.16% 8.14 UTTAR PRADESH SPECIAL BOND 02 JUNE 2026 2,570 0.16% 8.15 UTTAR PRADESH SPECIAL BOND 02 JUNE 2021 2,568 0.16% 8.03 UTTAR PRADESH SPECIAL BOND 02 JUNE 2020 2,561 0.16% 8.24 TAMILNADU SDL 22 MARCH 2028 1,902 0.12% 8.05 TAMILNADU SDL 22 MARCH 2031 1,885 0.12% 8.01 TAMILNADU SDL 22 MARCH 2030 1,876 0.12% 8.04 TAMILNADU SDL 22 MARCH 2029 1,874 0.12% 7.92 TAMILNADU SDL 22 MARCH 2032 1,866 0.12% 8.02 TAMILNADU SDL 22 MARCH 2025 1,863 0.12% 7.91 TAMILNADU SDL 22 MARCH 2024 1,851 0.12% 7.90 TAMILNADU SDL 22 MARCH 2027 1,851 0.12% 7.67 TAMILNADU SDL 22 MARCH 2023 1,837 0.12% 7.68 TAMILNADU SDL 22 MARCH 2026 1,824 0.12% 8.33 RAJASTHAN SDL 23 JUNE 2025 962 0.06% 8.27 RAJASTHAN SDL 23 JUNE 2022 959 0.06% 8.27 RAJASTHAN SDL 23 JUNE 2023 958 0.06% 8.19 RAJASTHAN SDL 23 JUNE 2026 958 0.06%

Max Life Insurance Company Limited Registration No: 104; Date of Registration with IRDAI: November 15, 2000
AnnuAL RepoRt 2016-17 309
INDUSTRY SECURITY NAME AMOUNT PERCENTAGE OF FUND 8.29 RAJASTHAN SDL 23 JUNE 2024 957 0.06% 8.15 RAJASTHAN SDL 23 JUNE 2021 951 0.06% 8.01 RAJASTHAN SDL 23 JUNE 2020 949 0.06% 7.86 RAJASTHAN SDL 23 JUNE 2019 941 0.06% 7.75 RAJASTHAN SDL 23 JUNE 2018 937 0.06%STATE GOVERNMENT Total 159,674 10.10%FUND TOTAL 1,581,353 100.00%PENSION CONSERVATIVE FUND ULIF00725/11/05PENSCONSER104 GOVERNMENT OF INDIA 7.68 GOI 15 DECEMBER 2023 17,519 14.76% 7.61 GOI 09 MAY 2030 12,108 10.20% 8.15 GOI 24 NOVEMBER 2026 9,611 8.10% 7.80 GOI 11 APRIL 2021 4,670 3.93% 7.72 GOI 25 MAY 2025 1,575 1.33% 7.28 GOI 3 JUNE 2019 1,198 1.01% 7.88 GOI 19 MARCH 2030 585 0.49% 9.23 GOI 23 DECEMBER 2043 224 0.19% 7.59 GOI 20 MARCH 2029 135 0.11%GOVERNMENT OF INDIA Total 47,625 40.12%FINANCIAL AND INSURANCE ACTIVITIES
8.35 IDFC BANK LTD 10 MAY 2018 3,044 2.56%
9.95 ORIENTAL BANK OF COMMERCE 23 APRIL 2017 3,004 2.53% 10.25 SHRIRAM TRANSPORT FINANCE CO. LTD 10
OCTOBER 20242,253 1.90%
8.85 BAJAJ FINANCE LIMITED 21 JULY 2026 2,161 1.82% 9.75 IL&FS FINANCIAL SERVICES LTD 13 AUGUST
20172,120 1.79%
10.00 SHRIRAM TRANSPORT FINANCE CO. LTD 13 NOVEMBER 2024
1,114 0.94%
9.69 TATA SONS 12 JUNE 2022 1,095 0.92% 8.85 SHRIRAM TRANSPORT FINANCE CO. LTD 03
AUGUST 20211,038 0.87%
10.84% HDFC BANK 23 MAY 2022. 1,006 0.85% HOUSING DEVELOPMENT FINANCE CORP BANK 906 0.76% HOUSING DEVELOPMENT FINANCE CORP LTD 811 0.68% 10.15 IL&FS FINANCIAL SERVICES LIMITED 29 JUNE
2022725 0.61%
ICICI BANK LTD 693 0.58% STATE BANK OF INDIA 648 0.55% AXIS BANK LTD 355 0.30%FINANCIAL AND INSURANCE ACTIVITIES Total
20,973 17.67%
STATE GOVERNMENT 8.05 GUJARAT SDL 15 JUNE 2026 4,789 4.03% 8.53 TAMILNADU SDL 09 MARCH 2026 2,326 1.96% 7.77 KERALA SDL 01 MARCH 2027 2,157 1.82% 8.01 TAMILNADU SDL 11 MAY 2026 307 0.26% 8.58 UTTAR PRADESH SPECIAL BOND 02 JUNE 2031 268 0.23% 8.49 UTTAR PRADESH SPECIAL BOND 02 JUNE 2030 266 0.22% 8.49 UTTAR PRADESH SPECIAL BOND 02 JUNE 2028 264 0.22% 8.35 UTTAR PRADESH SPECIAL BOND 02 JUNE 2029 262 0.22% 8.38 UTTAR PRADESH SPECIAL BOND 02 JUNE 2027 262 0.22% 8.32 UTTAR PRADESH SPECIAL BOND 02 JUNE 2025 260 0.22% 8.35 UTTAR PRADESH SPECIAL BOND 02 JUNE 2024 259 0.22% 8.26 UTTAR PRADESH SPECIAL BOND 02 JUNE 2022 259 0.22% 8.25 UTTAR PRADESH SPECIAL BOND 02 JUNE 2023 258 0.22% 8.14 UTTAR PRADESH SPECIAL BOND 02 JUNE 2026 257 0.22%
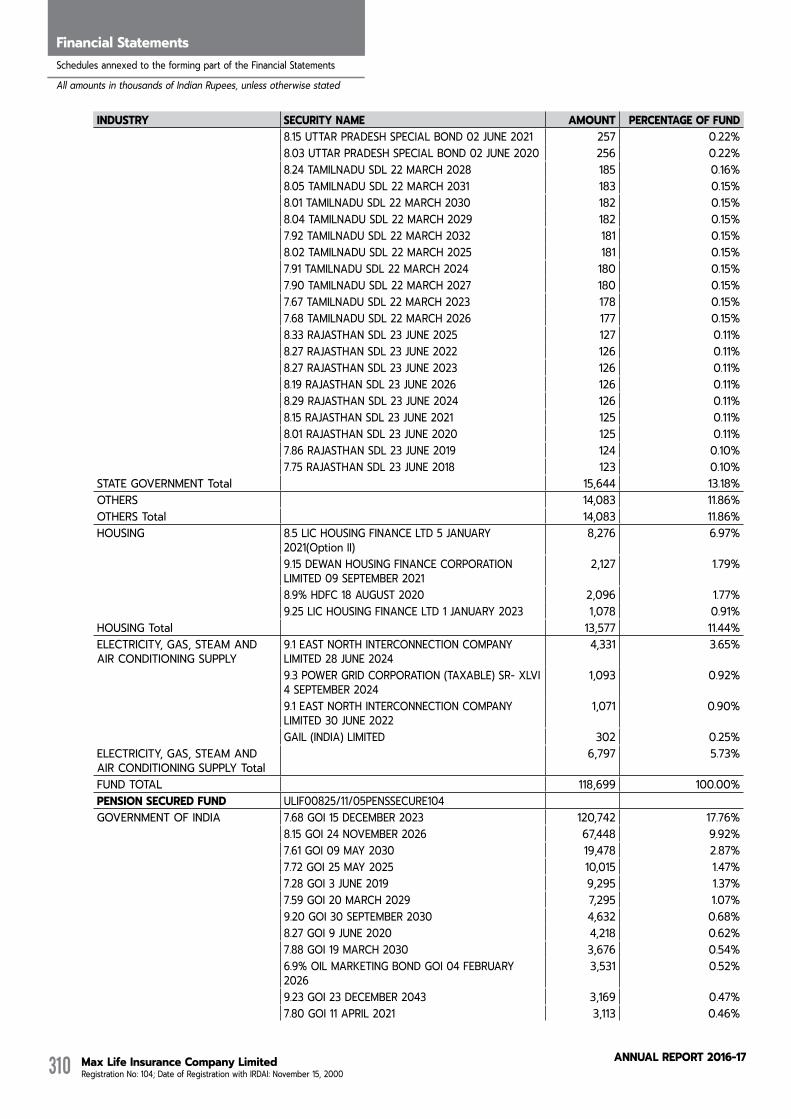
Max Life Insurance Company Limited Registration No: 104; Date of Registration with IRDAI: November 15, 2000
AnnuAL RepoRt 2016-17310
Directors' ReportFinancial StatementsSchedules annexed to the forming part of the Financial Statements
All amounts in thousands of Indian Rupees, unless otherwise stated
INDUSTRY SECURITY NAME AMOUNT PERCENTAGE OF FUND 8.15 UTTAR PRADESH SPECIAL BOND 02 JUNE 2021 257 0.22% 8.03 UTTAR PRADESH SPECIAL BOND 02 JUNE 2020 256 0.22% 8.24 TAMILNADU SDL 22 MARCH 2028 185 0.16% 8.05 TAMILNADU SDL 22 MARCH 2031 183 0.15% 8.01 TAMILNADU SDL 22 MARCH 2030 182 0.15% 8.04 TAMILNADU SDL 22 MARCH 2029 182 0.15% 7.92 TAMILNADU SDL 22 MARCH 2032 181 0.15% 8.02 TAMILNADU SDL 22 MARCH 2025 181 0.15% 7.91 TAMILNADU SDL 22 MARCH 2024 180 0.15% 7.90 TAMILNADU SDL 22 MARCH 2027 180 0.15% 7.67 TAMILNADU SDL 22 MARCH 2023 178 0.15% 7.68 TAMILNADU SDL 22 MARCH 2026 177 0.15% 8.33 RAJASTHAN SDL 23 JUNE 2025 127 0.11% 8.27 RAJASTHAN SDL 23 JUNE 2022 126 0.11% 8.27 RAJASTHAN SDL 23 JUNE 2023 126 0.11% 8.19 RAJASTHAN SDL 23 JUNE 2026 126 0.11% 8.29 RAJASTHAN SDL 23 JUNE 2024 126 0.11% 8.15 RAJASTHAN SDL 23 JUNE 2021 125 0.11% 8.01 RAJASTHAN SDL 23 JUNE 2020 125 0.11% 7.86 RAJASTHAN SDL 23 JUNE 2019 124 0.10% 7.75 RAJASTHAN SDL 23 JUNE 2018 123 0.10%STATE GOVERNMENT Total 15,644 13.18%OTHERS 14,083 11.86%OTHERS Total 14,083 11.86%HOUSING 8.5 LIC HOUSING FINANCE LTD 5 JANUARY
2021(Option II)8,276 6.97%
9.15 DEWAN HOUSING FINANCE CORPORATION LIMITED 09 SEPTEMBER 2021
2,127 1.79%
8.9% HDFC 18 AUGUST 2020 2,096 1.77% 9.25 LIC HOUSING FINANCE LTD 1 JANUARY 2023 1,078 0.91%HOUSING Total 13,577 11.44%ELECTRICITY, GAS, STEAM AND AIR CONDITIONING SUPPLY
9.1 EAST NORTH INTERCONNECTION COMPANY LIMITED 28 JUNE 2024
4,331 3.65%
9.3 POWER GRID CORPORATION (TAXABLE) SR- XLVI 4 SEPTEMBER 2024
1,093 0.92%
9.1 EAST NORTH INTERCONNECTION COMPANY LIMITED 30 JUNE 2022
1,071 0.90%
GAIL (INDIA) LIMITED 302 0.25%ELECTRICITY, GAS, STEAM AND AIR CONDITIONING SUPPLY Total
6,797 5.73%
FUND TOTAL 118,699 100.00%PENSION SECURED FUND ULIF00825/11/05PENSSECURE104 GOVERNMENT OF INDIA 7.68 GOI 15 DECEMBER 2023 120,742 17.76% 8.15 GOI 24 NOVEMBER 2026 67,448 9.92% 7.61 GOI 09 MAY 2030 19,478 2.87% 7.72 GOI 25 MAY 2025 10,015 1.47% 7.28 GOI 3 JUNE 2019 9,295 1.37% 7.59 GOI 20 MARCH 2029 7,295 1.07% 9.20 GOI 30 SEPTEMBER 2030 4,632 0.68% 8.27 GOI 9 JUNE 2020 4,218 0.62% 7.88 GOI 19 MARCH 2030 3,676 0.54% 6.9% OIL MARKETING BOND GOI 04 FEBRUARY
20263,531 0.52%
9.23 GOI 23 DECEMBER 2043 3,169 0.47% 7.80 GOI 11 APRIL 2021 3,113 0.46%
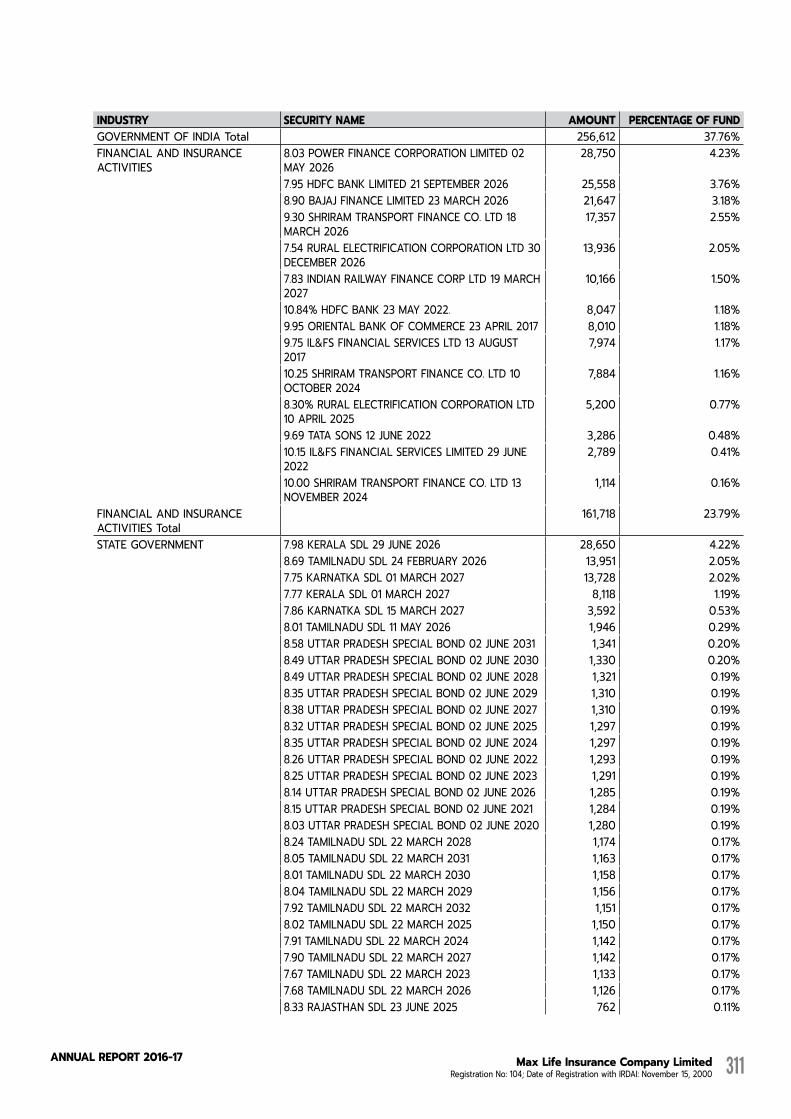
Max Life Insurance Company Limited Registration No: 104; Date of Registration with IRDAI: November 15, 2000
AnnuAL RepoRt 2016-17 311
INDUSTRY SECURITY NAME AMOUNT PERCENTAGE OF FUNDGOVERNMENT OF INDIA Total 256,612 37.76%FINANCIAL AND INSURANCE ACTIVITIES
8.03 POWER FINANCE CORPORATION LIMITED 02 MAY 2026
28,750 4.23%
7.95 HDFC BANK LIMITED 21 SEPTEMBER 2026 25,558 3.76% 8.90 BAJAJ FINANCE LIMITED 23 MARCH 2026 21,647 3.18% 9.30 SHRIRAM TRANSPORT FINANCE CO. LTD 18
MARCH 202617,357 2.55%
7.54 RURAL ELECTRIFICATION CORPORATION LTD 30 DECEMBER 2026
13,936 2.05%
7.83 INDIAN RAILWAY FINANCE CORP LTD 19 MARCH 2027
10,166 1.50%
10.84% HDFC BANK 23 MAY 2022. 8,047 1.18% 9.95 ORIENTAL BANK OF COMMERCE 23 APRIL 2017 8,010 1.18% 9.75 IL&FS FINANCIAL SERVICES LTD 13 AUGUST
20177,974 1.17%
10.25 SHRIRAM TRANSPORT FINANCE CO. LTD 10 OCTOBER 2024
7,884 1.16%
8.30% RURAL ELECTRIFICATION CORPORATION LTD 10 APRIL 2025
5,200 0.77%
9.69 TATA SONS 12 JUNE 2022 3,286 0.48% 10.15 IL&FS FINANCIAL SERVICES LIMITED 29 JUNE
20222,789 0.41%
10.00 SHRIRAM TRANSPORT FINANCE CO. LTD 13 NOVEMBER 2024
1,114 0.16%
FINANCIAL AND INSURANCE ACTIVITIES Total
161,718 23.79%
STATE GOVERNMENT 7.98 KERALA SDL 29 JUNE 2026 28,650 4.22% 8.69 TAMILNADU SDL 24 FEBRUARY 2026 13,951 2.05% 7.75 KARNATKA SDL 01 MARCH 2027 13,728 2.02% 7.77 KERALA SDL 01 MARCH 2027 8,118 1.19% 7.86 KARNATKA SDL 15 MARCH 2027 3,592 0.53% 8.01 TAMILNADU SDL 11 MAY 2026 1,946 0.29% 8.58 UTTAR PRADESH SPECIAL BOND 02 JUNE 2031 1,341 0.20% 8.49 UTTAR PRADESH SPECIAL BOND 02 JUNE 2030 1,330 0.20% 8.49 UTTAR PRADESH SPECIAL BOND 02 JUNE 2028 1,321 0.19% 8.35 UTTAR PRADESH SPECIAL BOND 02 JUNE 2029 1,310 0.19% 8.38 UTTAR PRADESH SPECIAL BOND 02 JUNE 2027 1,310 0.19% 8.32 UTTAR PRADESH SPECIAL BOND 02 JUNE 2025 1,297 0.19% 8.35 UTTAR PRADESH SPECIAL BOND 02 JUNE 2024 1,297 0.19% 8.26 UTTAR PRADESH SPECIAL BOND 02 JUNE 2022 1,293 0.19% 8.25 UTTAR PRADESH SPECIAL BOND 02 JUNE 2023 1,291 0.19% 8.14 UTTAR PRADESH SPECIAL BOND 02 JUNE 2026 1,285 0.19% 8.15 UTTAR PRADESH SPECIAL BOND 02 JUNE 2021 1,284 0.19% 8.03 UTTAR PRADESH SPECIAL BOND 02 JUNE 2020 1,280 0.19% 8.24 TAMILNADU SDL 22 MARCH 2028 1,174 0.17% 8.05 TAMILNADU SDL 22 MARCH 2031 1,163 0.17% 8.01 TAMILNADU SDL 22 MARCH 2030 1,158 0.17% 8.04 TAMILNADU SDL 22 MARCH 2029 1,156 0.17% 7.92 TAMILNADU SDL 22 MARCH 2032 1,151 0.17% 8.02 TAMILNADU SDL 22 MARCH 2025 1,150 0.17% 7.91 TAMILNADU SDL 22 MARCH 2024 1,142 0.17% 7.90 TAMILNADU SDL 22 MARCH 2027 1,142 0.17% 7.67 TAMILNADU SDL 22 MARCH 2023 1,133 0.17% 7.68 TAMILNADU SDL 22 MARCH 2026 1,126 0.17% 8.33 RAJASTHAN SDL 23 JUNE 2025 762 0.11%

Max Life Insurance Company Limited Registration No: 104; Date of Registration with IRDAI: November 15, 2000
AnnuAL RepoRt 2016-17312
Directors' ReportFinancial StatementsSchedules annexed to the forming part of the Financial Statements
All amounts in thousands of Indian Rupees, unless otherwise stated
INDUSTRY SECURITY NAME AMOUNT PERCENTAGE OF FUND 8.27 RAJASTHAN SDL 23 JUNE 2022 759 0.11% 8.27 RAJASTHAN SDL 23 JUNE 2023 758 0.11% 8.19 RAJASTHAN SDL 23 JUNE 2026 758 0.11% 8.29 RAJASTHAN SDL 23 JUNE 2024 758 0.11% 8.15 RAJASTHAN SDL 23 JUNE 2021 753 0.11% 8.01 RAJASTHAN SDL 23 JUNE 2020 751 0.11% 7.86 RAJASTHAN SDL 23 JUNE 2019 745 0.11% 7.75 RAJASTHAN SDL 23 JUNE 2018 741 0.11%STATE GOVERNMENT Total 103,904 15.29%HOUSING 8.49 HDFC 27 APRIL 2020 15,502 2.28% 9.25 DEWAN HOUSING FINANCE CORPORATION
LIMITED 08 SEPTEMBER 202310,850 1.60%
8.45% HOUSING DEVELOPMENT FINANCE CORPORATION 18 MAY 2026
10,537 1.55%
8.75 HDFC 04 MARCH 2021 10,444 1.54% 9.25 LIC HOUSING FINANCE LTD 1 JANUARY 2023 9,701 1.43% 9.15 DEWAN HOUSING FINANCE CORPORATION
LIMITED 09 SEPTEMBER 20215,317 0.78%
HOUSING Total 62,351 9.17%OTHERS 54,941 8.08%OTHERS Total 54,941 8.08%ELECTRICITY, GAS, STEAM AND AIR CONDITIONING SUPPLY
8.13 NUCLEAR POWER CORPORATION OF INDIA LIMITED 28 MARCH 2029
8,418 1.24%
8.13 NUCLEAR POWER CORPORATION OF INDIA LIMITED 28 MARCH 2028
8,396 1.24%
8.13 NUCLEAR POWER CORPORATION OF INDIA LIMITED 28 MARCH 2027
8,370 1.23%
9.1 EAST NORTH INTERCONNECTION COMPANY LIMITED 30 JUNE 2022
6,427 0.95%
9.3 POWER GRID CORPORATION (TAXABLE) SR- XLVI 4 SEPTEMBER 2024
5,462 0.80%
8.10 NTPC LTD 27 MAY 2021 3,072 0.45%ELECTRICITY, GAS, STEAM AND AIR CONDITIONING SUPPLY Total
40,145 5.91%
FUND TOTAL 679,671 100.00%GUARANTEED FUND INCOME FUND
ULIF00904/10/06AMSRGUAINC104
GOVERNMENT OF INDIA 8.27 GOI 9 JUNE 2020 1,760 15.23% 7.61 GOI 09 MAY 2030 1,593 13.79% 7.68 GOI 15 DECEMBER 2023 1,538 13.31% 7.35 GOI 22 JUNE 2024 969 8.39% 7.80 GOI 11 APRIL 2021 947 8.20% 8.13% GOI 21 SEPTEMBER 2022 460 3.98% 8.40 GOI 28 JULY 2024 241 2.09% 7.59 GOI 20 MARCH 2029 119 1.03% 7.88 GOI 19 MARCH 2030 60 0.52% 7.72 GOI 25 MAY 2025 53 0.46%GOVERNMENT OF INDIA Total 7,740 67.01%FINANCIAL AND INSURANCE ACTIVITIES
0% NABARD 01 JANUARY 2019 833 7.21%
9.75 IL&FS FINANCIAL SERVICES LTD 13 AUGUST 2017
454 3.93%
9.5% STATE BANK OF INDIA 04 NOVEMBER 2025 396 3.43% HOUSING DEVELOPMENT FINANCE CORP LTD 51 0.44% STATE BANK OF INDIA 45 0.39%
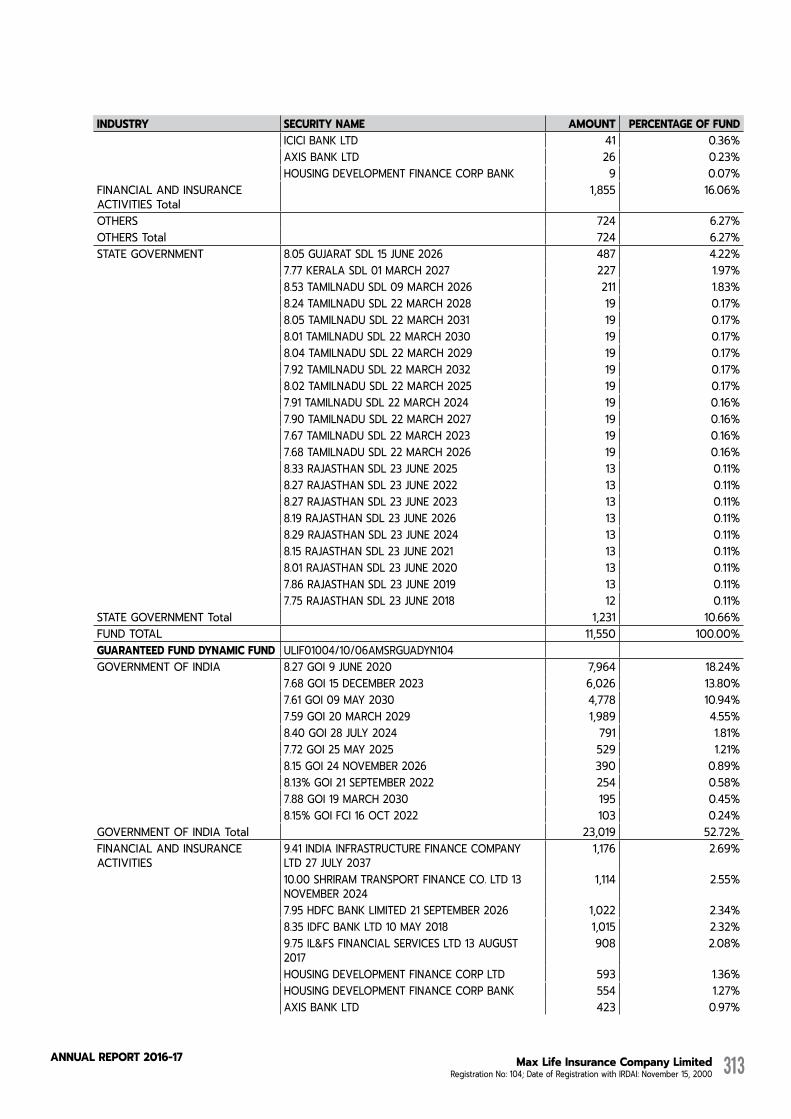
Max Life Insurance Company Limited Registration No: 104; Date of Registration with IRDAI: November 15, 2000
AnnuAL RepoRt 2016-17 313
INDUSTRY SECURITY NAME AMOUNT PERCENTAGE OF FUND ICICI BANK LTD 41 0.36% AXIS BANK LTD 26 0.23% HOUSING DEVELOPMENT FINANCE CORP BANK 9 0.07%FINANCIAL AND INSURANCE ACTIVITIES Total
1,855 16.06%
OTHERS 724 6.27%OTHERS Total 724 6.27%STATE GOVERNMENT 8.05 GUJARAT SDL 15 JUNE 2026 487 4.22% 7.77 KERALA SDL 01 MARCH 2027 227 1.97% 8.53 TAMILNADU SDL 09 MARCH 2026 211 1.83% 8.24 TAMILNADU SDL 22 MARCH 2028 19 0.17% 8.05 TAMILNADU SDL 22 MARCH 2031 19 0.17% 8.01 TAMILNADU SDL 22 MARCH 2030 19 0.17% 8.04 TAMILNADU SDL 22 MARCH 2029 19 0.17% 7.92 TAMILNADU SDL 22 MARCH 2032 19 0.17% 8.02 TAMILNADU SDL 22 MARCH 2025 19 0.17% 7.91 TAMILNADU SDL 22 MARCH 2024 19 0.16% 7.90 TAMILNADU SDL 22 MARCH 2027 19 0.16% 7.67 TAMILNADU SDL 22 MARCH 2023 19 0.16% 7.68 TAMILNADU SDL 22 MARCH 2026 19 0.16% 8.33 RAJASTHAN SDL 23 JUNE 2025 13 0.11% 8.27 RAJASTHAN SDL 23 JUNE 2022 13 0.11% 8.27 RAJASTHAN SDL 23 JUNE 2023 13 0.11% 8.19 RAJASTHAN SDL 23 JUNE 2026 13 0.11% 8.29 RAJASTHAN SDL 23 JUNE 2024 13 0.11% 8.15 RAJASTHAN SDL 23 JUNE 2021 13 0.11% 8.01 RAJASTHAN SDL 23 JUNE 2020 13 0.11% 7.86 RAJASTHAN SDL 23 JUNE 2019 13 0.11% 7.75 RAJASTHAN SDL 23 JUNE 2018 12 0.11%STATE GOVERNMENT Total 1,231 10.66%FUND TOTAL 11,550 100.00%GUARANTEED FUND DYNAMIC FUND ULIF01004/10/06AMSRGUADYN104 GOVERNMENT OF INDIA 8.27 GOI 9 JUNE 2020 7,964 18.24% 7.68 GOI 15 DECEMBER 2023 6,026 13.80% 7.61 GOI 09 MAY 2030 4,778 10.94% 7.59 GOI 20 MARCH 2029 1,989 4.55% 8.40 GOI 28 JULY 2024 791 1.81% 7.72 GOI 25 MAY 2025 529 1.21% 8.15 GOI 24 NOVEMBER 2026 390 0.89% 8.13% GOI 21 SEPTEMBER 2022 254 0.58% 7.88 GOI 19 MARCH 2030 195 0.45% 8.15% GOI FCI 16 OCT 2022 103 0.24%GOVERNMENT OF INDIA Total 23,019 52.72%FINANCIAL AND INSURANCE ACTIVITIES
9.41 INDIA INFRASTRUCTURE FINANCE COMPANY LTD 27 JULY 2037
1,176 2.69%
10.00 SHRIRAM TRANSPORT FINANCE CO. LTD 13 NOVEMBER 2024
1,114 2.55%
7.95 HDFC BANK LIMITED 21 SEPTEMBER 2026 1,022 2.34% 8.35 IDFC BANK LTD 10 MAY 2018 1,015 2.32% 9.75 IL&FS FINANCIAL SERVICES LTD 13 AUGUST
2017908 2.08%
HOUSING DEVELOPMENT FINANCE CORP LTD 593 1.36% HOUSING DEVELOPMENT FINANCE CORP BANK 554 1.27% AXIS BANK LTD 423 0.97%

Max Life Insurance Company Limited Registration No: 104; Date of Registration with IRDAI: November 15, 2000
AnnuAL RepoRt 2016-17314
Directors' ReportFinancial StatementsSchedules annexed to the forming part of the Financial Statements
All amounts in thousands of Indian Rupees, unless otherwise stated
INDUSTRY SECURITY NAME AMOUNT PERCENTAGE OF FUND STATE BANK OF INDIA 401 0.92% ICICI BANK LTD 395 0.90%FINANCIAL AND INSURANCE ACTIVITIES Total
7,601 17.41%
OTHERS 5,591 12.80%OTHERS Total 5,591 12.80%STATE GOVERNMENT 8.05 GUJARAT SDL 15 JUNE 2026 1,610 3.69% 7.77 KERALA SDL 01 MARCH 2027 752 1.72% 8.53 TAMILNADU SDL 09 MARCH 2026 740 1.70% 8.01 TAMILNADU SDL 11 MAY 2026 102 0.23% 8.24 TAMILNADU SDL 22 MARCH 2028 64 0.15% 8.05 TAMILNADU SDL 22 MARCH 2031 63 0.14% 8.01 TAMILNADU SDL 22 MARCH 2030 63 0.14% 8.04 TAMILNADU SDL 22 MARCH 2029 63 0.14% 7.92 TAMILNADU SDL 22 MARCH 2032 63 0.14% 8.02 TAMILNADU SDL 22 MARCH 2025 63 0.14% 7.91 TAMILNADU SDL 22 MARCH 2024 62 0.14% 7.90 TAMILNADU SDL 22 MARCH 2027 62 0.14% 7.67 TAMILNADU SDL 22 MARCH 2023 62 0.14% 7.68 TAMILNADU SDL 22 MARCH 2026 61 0.14% 8.33 RAJASTHAN SDL 23 JUNE 2025 42 0.10% 8.27 RAJASTHAN SDL 23 JUNE 2022 42 0.10% 8.27 RAJASTHAN SDL 23 JUNE 2023 42 0.10% 8.19 RAJASTHAN SDL 23 JUNE 2026 41 0.10% 8.29 RAJASTHAN SDL 23 JUNE 2024 41 0.10% 8.15 RAJASTHAN SDL 23 JUNE 2021 41 0.09% 8.01 RAJASTHAN SDL 23 JUNE 2020 41 0.09% 7.86 RAJASTHAN SDL 23 JUNE 2019 41 0.09% 7.75 RAJASTHAN SDL 23 JUNE 2018 41 0.09%STATE GOVERNMENT Total 4,202 9.62%ELECTRICITY, GAS, STEAM AND AIR CONDITIONING SUPPLY
9.1 EAST NORTH INTERCONNECTION COMPANY LIMITED 28 JUNE 2024
3,249 7.44%
ELECTRICITY, GAS, STEAM AND AIR CONDITIONING SUPPLY Total
3,249 7.44%
FUND TOTAL 43,662 100.00%GROWTH SUPER FUND ULIF01108/02/07LIFEGRWSUP104 OTHERS 9,167,685 24.69%OTHERS Total 9,167,685 24.69%FINANCIAL AND INSURANCE ACTIVITIES
HOUSING DEVELOPMENT FINANCE CORP BANK 2,656,541 7.16%
ICICI BANK LTD 1,185,598 3.19% HOUSING DEVELOPMENT FINANCE CORP LTD 967,352 2.61% KOTAK MAHINDRA BANK LTD 665,582 1.79% YES BANK LTD 649,677 1.75% INDUSIND BANK LIMITED 615,856 1.66% STATE BANK OF INDIA 462,090 1.24% AXIS BANK LTD 339,217 0.91% BAJAJ FINSERV LTD 245,904 0.66% Cholamandalam Investment & Finance Company
Limited154,408 0.42%
9.5% STATE BANK OF INDIA 04 NOVEMBER 2025 139 0.00%FINANCIAL AND INSURANCE ACTIVITIES Total
7,942,364 21.39%
LIQUID MUTUAL FUND IDFC CF-Plan C-Growth 2,300,000 6.19%
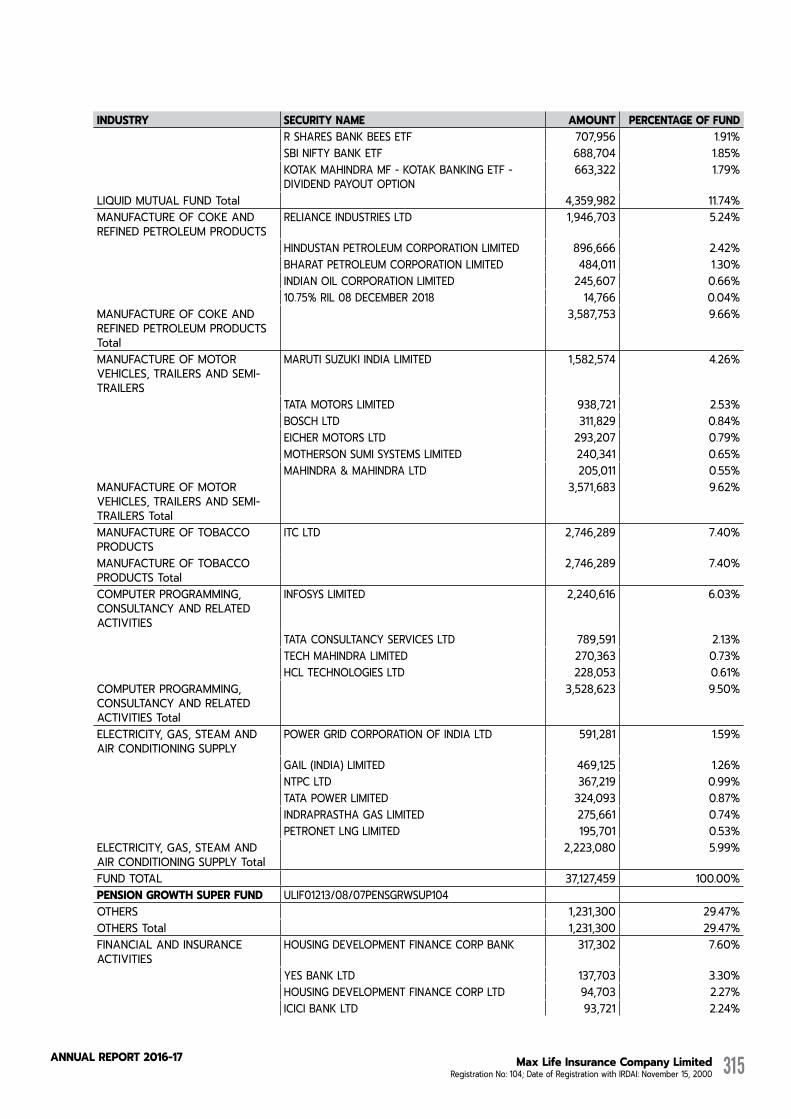
Max Life Insurance Company Limited Registration No: 104; Date of Registration with IRDAI: November 15, 2000
AnnuAL RepoRt 2016-17 315
INDUSTRY SECURITY NAME AMOUNT PERCENTAGE OF FUND R SHARES BANK BEES ETF 707,956 1.91% SBI NIFTY BANK ETF 688,704 1.85% KOTAK MAHINDRA MF - KOTAK BANKING ETF -
DIVIDEND PAYOUT OPTION663,322 1.79%
LIQUID MUTUAL FUND Total 4,359,982 11.74%MANUFACTURE OF COKE AND REFINED PETROLEUM PRODUCTS
RELIANCE INDUSTRIES LTD 1,946,703 5.24%
HINDUSTAN PETROLEUM CORPORATION LIMITED 896,666 2.42% BHARAT PETROLEUM CORPORATION LIMITED 484,011 1.30% INDIAN OIL CORPORATION LIMITED 245,607 0.66% 10.75% RIL 08 DECEMBER 2018 14,766 0.04%MANUFACTURE OF COKE AND REFINED PETROLEUM PRODUCTS Total
3,587,753 9.66%
MANUFACTURE OF MOTOR VEHICLES, TRAILERS AND SEMI-TRAILERS
MARUTI SUZUKI INDIA LIMITED 1,582,574 4.26%
TATA MOTORS LIMITED 938,721 2.53% BOSCH LTD 311,829 0.84% EICHER MOTORS LTD 293,207 0.79% MOTHERSON SUMI SYSTEMS LIMITED 240,341 0.65% MAHINDRA & MAHINDRA LTD 205,011 0.55%MANUFACTURE OF MOTOR VEHICLES, TRAILERS AND SEMI-TRAILERS Total
3,571,683 9.62%
MANUFACTURE OF TOBACCO PRODUCTS
ITC LTD 2,746,289 7.40%
MANUFACTURE OF TOBACCO PRODUCTS Total
2,746,289 7.40%
COMPUTER PROGRAMMING, CONSULTANCY AND RELATED ACTIVITIES
INFOSYS LIMITED 2,240,616 6.03%
TATA CONSULTANCY SERVICES LTD 789,591 2.13% TECH MAHINDRA LIMITED 270,363 0.73% HCL TECHNOLOGIES LTD 228,053 0.61%COMPUTER PROGRAMMING, CONSULTANCY AND RELATED ACTIVITIES Total
3,528,623 9.50%
ELECTRICITY, GAS, STEAM AND AIR CONDITIONING SUPPLY
POWER GRID CORPORATION OF INDIA LTD 591,281 1.59%
GAIL (INDIA) LIMITED 469,125 1.26% NTPC LTD 367,219 0.99% TATA POWER LIMITED 324,093 0.87% INDRAPRASTHA GAS LIMITED 275,661 0.74% PETRONET LNG LIMITED 195,701 0.53%ELECTRICITY, GAS, STEAM AND AIR CONDITIONING SUPPLY Total
2,223,080 5.99%
FUND TOTAL 37,127,459 100.00%PENSION GROWTH SUPER FUND ULIF01213/08/07PENSGRWSUP104 OTHERS 1,231,300 29.47%OTHERS Total 1,231,300 29.47%FINANCIAL AND INSURANCE ACTIVITIES
HOUSING DEVELOPMENT FINANCE CORP BANK 317,302 7.60%
YES BANK LTD 137,703 3.30% HOUSING DEVELOPMENT FINANCE CORP LTD 94,703 2.27% ICICI BANK LTD 93,721 2.24%
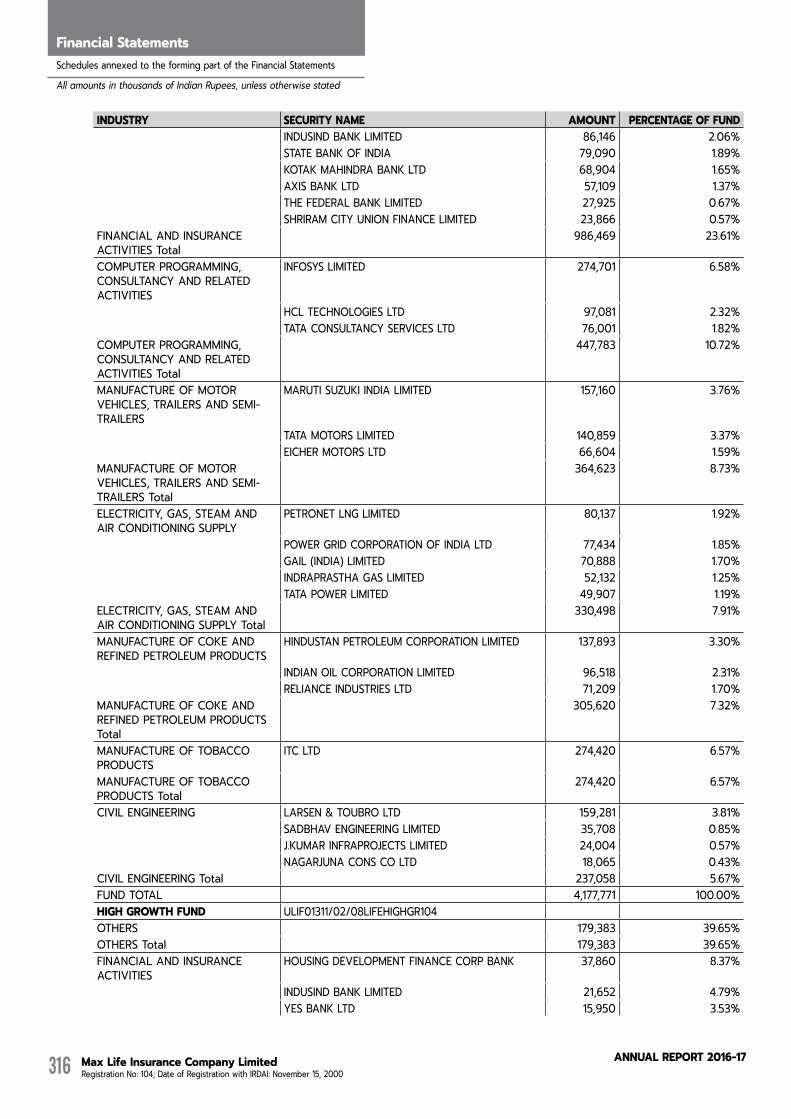
Max Life Insurance Company Limited Registration No: 104; Date of Registration with IRDAI: November 15, 2000
AnnuAL RepoRt 2016-17316
Directors' ReportFinancial StatementsSchedules annexed to the forming part of the Financial Statements
All amounts in thousands of Indian Rupees, unless otherwise stated
INDUSTRY SECURITY NAME AMOUNT PERCENTAGE OF FUND INDUSIND BANK LIMITED 86,146 2.06% STATE BANK OF INDIA 79,090 1.89% KOTAK MAHINDRA BANK LTD 68,904 1.65% AXIS BANK LTD 57,109 1.37% THE FEDERAL BANK LIMITED 27,925 0.67% SHRIRAM CITY UNION FINANCE LIMITED 23,866 0.57%FINANCIAL AND INSURANCE ACTIVITIES Total
986,469 23.61%
COMPUTER PROGRAMMING, CONSULTANCY AND RELATED ACTIVITIES
INFOSYS LIMITED 274,701 6.58%
HCL TECHNOLOGIES LTD 97,081 2.32% TATA CONSULTANCY SERVICES LTD 76,001 1.82%COMPUTER PROGRAMMING, CONSULTANCY AND RELATED ACTIVITIES Total
447,783 10.72%
MANUFACTURE OF MOTOR VEHICLES, TRAILERS AND SEMI-TRAILERS
MARUTI SUZUKI INDIA LIMITED 157,160 3.76%
TATA MOTORS LIMITED 140,859 3.37% EICHER MOTORS LTD 66,604 1.59%MANUFACTURE OF MOTOR VEHICLES, TRAILERS AND SEMI-TRAILERS Total
364,623 8.73%
ELECTRICITY, GAS, STEAM AND AIR CONDITIONING SUPPLY
PETRONET LNG LIMITED 80,137 1.92%
POWER GRID CORPORATION OF INDIA LTD 77,434 1.85% GAIL (INDIA) LIMITED 70,888 1.70% INDRAPRASTHA GAS LIMITED 52,132 1.25% TATA POWER LIMITED 49,907 1.19%ELECTRICITY, GAS, STEAM AND AIR CONDITIONING SUPPLY Total
330,498 7.91%
MANUFACTURE OF COKE AND REFINED PETROLEUM PRODUCTS
HINDUSTAN PETROLEUM CORPORATION LIMITED 137,893 3.30%
INDIAN OIL CORPORATION LIMITED 96,518 2.31% RELIANCE INDUSTRIES LTD 71,209 1.70%MANUFACTURE OF COKE AND REFINED PETROLEUM PRODUCTS Total
305,620 7.32%
MANUFACTURE OF TOBACCO PRODUCTS
ITC LTD 274,420 6.57%
MANUFACTURE OF TOBACCO PRODUCTS Total
274,420 6.57%
CIVIL ENGINEERING LARSEN & TOUBRO LTD 159,281 3.81% SADBHAV ENGINEERING LIMITED 35,708 0.85% J.KUMAR INFRAPROJECTS LIMITED 24,004 0.57% NAGARJUNA CONS CO LTD 18,065 0.43%CIVIL ENGINEERING Total 237,058 5.67%FUND TOTAL 4,177,771 100.00%HIGH GROWTH FUND ULIF01311/02/08LIFEHIGHGR104 OTHERS 179,383 39.65%OTHERS Total 179,383 39.65%FINANCIAL AND INSURANCE ACTIVITIES
HOUSING DEVELOPMENT FINANCE CORP BANK 37,860 8.37%
INDUSIND BANK LIMITED 21,652 4.79% YES BANK LTD 15,950 3.53%
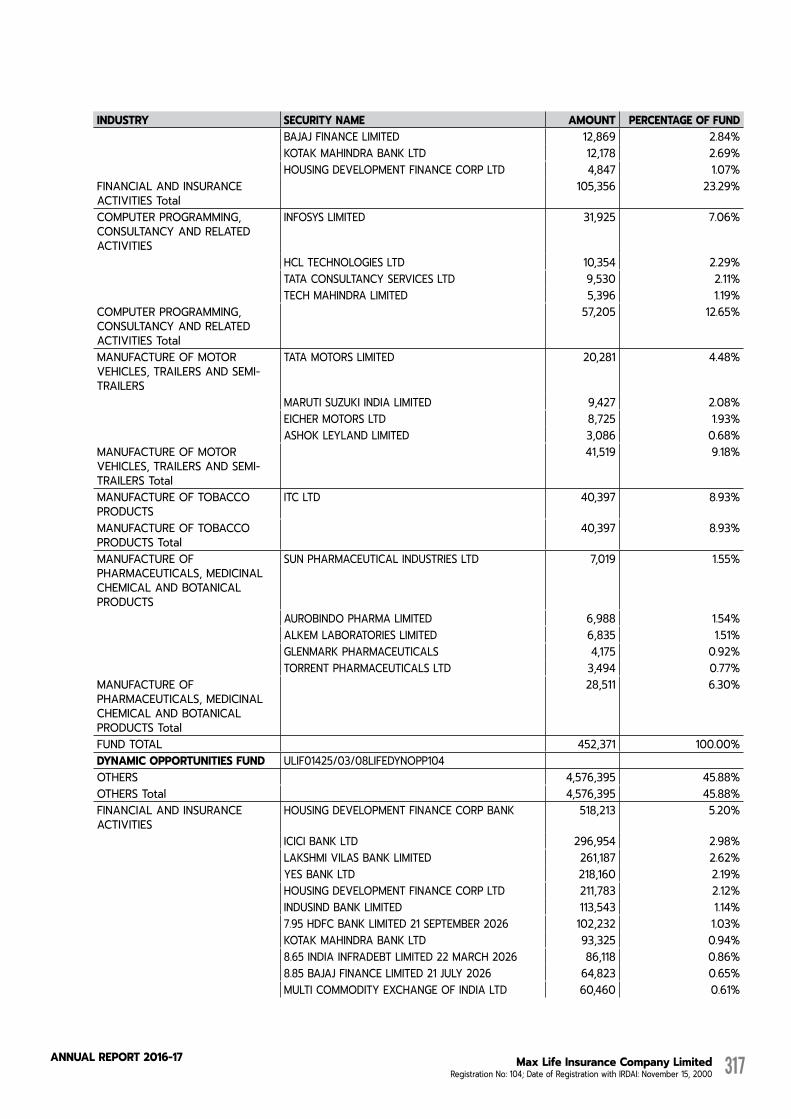
Max Life Insurance Company Limited Registration No: 104; Date of Registration with IRDAI: November 15, 2000
AnnuAL RepoRt 2016-17 317
INDUSTRY SECURITY NAME AMOUNT PERCENTAGE OF FUND BAJAJ FINANCE LIMITED 12,869 2.84% KOTAK MAHINDRA BANK LTD 12,178 2.69% HOUSING DEVELOPMENT FINANCE CORP LTD 4,847 1.07%FINANCIAL AND INSURANCE ACTIVITIES Total
105,356 23.29%
COMPUTER PROGRAMMING, CONSULTANCY AND RELATED ACTIVITIES
INFOSYS LIMITED 31,925 7.06%
HCL TECHNOLOGIES LTD 10,354 2.29% TATA CONSULTANCY SERVICES LTD 9,530 2.11% TECH MAHINDRA LIMITED 5,396 1.19%COMPUTER PROGRAMMING, CONSULTANCY AND RELATED ACTIVITIES Total
57,205 12.65%
MANUFACTURE OF MOTOR VEHICLES, TRAILERS AND SEMI-TRAILERS
TATA MOTORS LIMITED 20,281 4.48%
MARUTI SUZUKI INDIA LIMITED 9,427 2.08% EICHER MOTORS LTD 8,725 1.93% ASHOK LEYLAND LIMITED 3,086 0.68%MANUFACTURE OF MOTOR VEHICLES, TRAILERS AND SEMI-TRAILERS Total
41,519 9.18%
MANUFACTURE OF TOBACCO PRODUCTS
ITC LTD 40,397 8.93%
MANUFACTURE OF TOBACCO PRODUCTS Total
40,397 8.93%
MANUFACTURE OF PHARMACEUTICALS, MEDICINAL CHEMICAL AND BOTANICAL PRODUCTS
SUN PHARMACEUTICAL INDUSTRIES LTD 7,019 1.55%
AUROBINDO PHARMA LIMITED 6,988 1.54% ALKEM LABORATORIES LIMITED 6,835 1.51% GLENMARK PHARMACEUTICALS 4,175 0.92% TORRENT PHARMACEUTICALS LTD 3,494 0.77%MANUFACTURE OF PHARMACEUTICALS, MEDICINAL CHEMICAL AND BOTANICAL PRODUCTS Total
28,511 6.30%
FUND TOTAL 452,371 100.00%DYNAMIC OPPORTUNITIES FUND ULIF01425/03/08LIFEDYNOPP104 OTHERS 4,576,395 45.88%OTHERS Total 4,576,395 45.88%FINANCIAL AND INSURANCE ACTIVITIES
HOUSING DEVELOPMENT FINANCE CORP BANK 518,213 5.20%
ICICI BANK LTD 296,954 2.98% LAKSHMI VILAS BANK LIMITED 261,187 2.62% YES BANK LTD 218,160 2.19% HOUSING DEVELOPMENT FINANCE CORP LTD 211,783 2.12% INDUSIND BANK LIMITED 113,543 1.14% 7.95 HDFC BANK LIMITED 21 SEPTEMBER 2026 102,232 1.03% KOTAK MAHINDRA BANK LTD 93,325 0.94% 8.65 INDIA INFRADEBT LIMITED 22 MARCH 2026 86,118 0.86% 8.85 BAJAJ FINANCE LIMITED 21 JULY 2026 64,823 0.65% MULTI COMMODITY EXCHANGE OF INDIA LTD 60,460 0.61%

Max Life Insurance Company Limited Registration No: 104; Date of Registration with IRDAI: November 15, 2000
AnnuAL RepoRt 2016-17318
Directors' ReportFinancial StatementsSchedules annexed to the forming part of the Financial Statements
All amounts in thousands of Indian Rupees, unless otherwise stated
INDUSTRY SECURITY NAME AMOUNT PERCENTAGE OF FUND 8.19 POWER FINANCE CORPORATION LIMITED 14
JUNE 202351,590 0.52%
9.75 IL&FS FINANCIAL SERVICES LTD 03 SEPTEMBER 2017
41,448 0.42%
9.27 POWER FINANCE CORPORATION 21 AUGUST 2017
41,334 0.41%
7.50 POWER FINANCE CORPORATION 17 SEPTEMBER 2020
40,292 0.40%
9.25 INFRASTRUCTURE DEV FINANCE CORP LTD 13 SEPTEMBER 2019
30,806 0.31%
SHRIRAM CITY UNION FINANCE LIMITED 26,582 0.27% 8.85 SHRIRAM TRANSPORT FINANCE CO. LTD 03
AUGUST 202125,954 0.26%
7.52 RURAL ELECTRIFICATION CORPORATION LTD 07 NOVEMBER 2026
23,854 0.24%
8.11 RURAL ELECTRIFICATION CORPORATION LTD 07 OCTOBER 2025
15,449 0.15%
10.84% HDFC BANK 23 MAY 2022. 15,088 0.15% Cholamandalam Investment & Finance Company
Limited12,725 0.13%
7.50 POWER FINANCE CORPORATION 16 AUGUST 2021
10,030 0.10%
7.83 INDIAN RAILWAY FINANCE CORP LTD 19 MARCH 2027
5,083 0.05%
ICICI PRUDENTIAL LIFE INSURANCE COMPANY LIMITED
4,614 0.05%
AXIS BANK LTD 53 0.00%FINANCIAL AND INSURANCE ACTIVITIES Total
2,371,700 23.78%
GOVERNMENT OF INDIA 8.15 GOI 24 NOVEMBER 2026 654,157 6.56% 7.61 GOI 09 MAY 2030 464,285 4.66% 7.68 GOI 15 DECEMBER 2023 405,584 4.07% 7.72 GOI 25 MAY 2025 69,885 0.70% 6.9% OIL MARKETING BOND GOI 04 FEBRUARY
202623,514 0.24%
9.23 GOI 23 DECEMBER 2043 19,282 0.19% 7.88 GOI 19 MARCH 2030 17,501 0.18% 7.59 GOI 20 MARCH 2029 7,085 0.07% 8.3% GOI 02 JULY 2040 6,513 0.07% 9.20 GOI 30 SEPTEMBER 2030 5,808 0.06%GOVERNMENT OF INDIA Total 1,673,614 16.78%COMPUTER PROGRAMMING, CONSULTANCY AND RELATED ACTIVITIES
INFOSYS LIMITED 365,029 3.66%
TATA CONSULTANCY SERVICES LTD 151,394 1.52% HCL TECHNOLOGIES LTD 66,109 0.66% TECH MAHINDRA LIMITED 54,180 0.54% WIPRO LTD 54,149 0.54%COMPUTER PROGRAMMING, CONSULTANCY AND RELATED ACTIVITIES Total
690,861 6.93%
STATE GOVERNMENT 8.53 TAMILNADU SDL 09 MARCH 2026 101,413 1.02% 7.77 KERALA SDL 01 MARCH 2027 100,453 1.01% 7.98 KERALA SDL 29 JUNE 2026 81,120 0.81% 8.05 GUJARAT SDL 15 JUNE 2026 66,091 0.66% 7.98 KERALA SDL 11 MAY 2026 61,048 0.61%

Max Life Insurance Company Limited Registration No: 104; Date of Registration with IRDAI: November 15, 2000
AnnuAL RepoRt 2016-17 319
INDUSTRY SECURITY NAME AMOUNT PERCENTAGE OF FUND 7.86 KARNATKA SDL 15 MARCH 2027 20,424 0.20% 8.01 TAMILNADU SDL 11 MAY 2026 14,240 0.14% 8.24 TAMILNADU SDL 22 MARCH 2028 8,577 0.09% 8.05 TAMILNADU SDL 22 MARCH 2031 8,498 0.09% 8.01 TAMILNADU SDL 22 MARCH 2030 8,460 0.08% 8.04 TAMILNADU SDL 22 MARCH 2029 8,449 0.08% 7.92 TAMILNADU SDL 22 MARCH 2032 8,413 0.08% 8.02 TAMILNADU SDL 22 MARCH 2025 8,401 0.08% 7.91 TAMILNADU SDL 22 MARCH 2024 8,348 0.08% 7.90 TAMILNADU SDL 22 MARCH 2027 8,347 0.08% 7.67 TAMILNADU SDL 22 MARCH 2023 8,282 0.08% 7.68 TAMILNADU SDL 22 MARCH 2026 8,226 0.08% 8.58 UTTAR PRADESH SPECIAL BOND 02 JUNE 2031 7,154 0.07% 8.49 UTTAR PRADESH SPECIAL BOND 02 JUNE 2030 7,095 0.07% 8.49 UTTAR PRADESH SPECIAL BOND 02 JUNE 2028 7,046 0.07% 8.35 UTTAR PRADESH SPECIAL BOND 02 JUNE 2029 6,987 0.07% 8.38 UTTAR PRADESH SPECIAL BOND 02 JUNE 2027 6,987 0.07% 8.32 UTTAR PRADESH SPECIAL BOND 02 JUNE 2025 6,918 0.07% 8.35 UTTAR PRADESH SPECIAL BOND 02 JUNE 2024 6,915 0.07% 8.26 UTTAR PRADESH SPECIAL BOND 02 JUNE 2022 6,894 0.07% 8.25 UTTAR PRADESH SPECIAL BOND 02 JUNE 2023 6,886 0.07% 8.14 UTTAR PRADESH SPECIAL BOND 02 JUNE 2026 6,854 0.07% 8.15 UTTAR PRADESH SPECIAL BOND 02 JUNE 2021 6,847 0.07% 8.03 UTTAR PRADESH SPECIAL BOND 02 JUNE 2020 6,829 0.07% 8.33 RAJASTHAN SDL 23 JUNE 2025 5,498 0.06% 8.27 RAJASTHAN SDL 23 JUNE 2022 5,476 0.05% 8.27 RAJASTHAN SDL 23 JUNE 2023 5,472 0.05% 8.19 RAJASTHAN SDL 23 JUNE 2026 5,471 0.05% 8.29 RAJASTHAN SDL 23 JUNE 2024 5,467 0.05% 8.15 RAJASTHAN SDL 23 JUNE 2021 5,433 0.05% 8.01 RAJASTHAN SDL 23 JUNE 2020 5,421 0.05% 7.86 RAJASTHAN SDL 23 JUNE 2019 5,375 0.05% 7.75 RAJASTHAN SDL 23 JUNE 2018 5,350 0.05%STATE GOVERNMENT Total 661,165 6.63%FUND TOTAL 9,973,735 100.00%MONEY MARKET FUND ULIF01528/04/09LIFEMONEYM104 GOVERNMENT OF INDIA 91 Day Tbill 04 MAY 2017 248,631 80.96% 91 Day Tbill 20 APRIL 2017 49,840 16.23% 7.59 GOI 20 MARCH 2029 8,120 2.64%GOVERNMENT OF INDIA Total 306,591 99.84%OTHERS 494 0.16%OTHERS Total 494 0.16%FUND TOTAL 307,085 100.00%SECURE PLUS FUND ULIF01628/04/09LIFESECPLS104 GOVERNMENT OF INDIA 7.68 GOI 15 DECEMBER 2023 298,755 19.80% 8.15 GOI 24 NOVEMBER 2026 89,509 5.93% 8.27 GOI 9 JUNE 2020 76,504 5.07% 7.80 GOI 11 APRIL 2021 63,092 4.18% 7.59 GOI 20 MARCH 2029 57,977 3.84% 7.35 GOI 22 JUNE 2024 45,174 2.99% 7.28 GOI 3 JUNE 2019 28,816 1.91% 7.61 GOI 09 MAY 2030 24,631 1.63% 7.72 GOI 25 MAY 2025 16,483 1.09% 8.12 GOI 10 DECEMBER 2020 15,699 1.04%

Max Life Insurance Company Limited Registration No: 104; Date of Registration with IRDAI: November 15, 2000
AnnuAL RepoRt 2016-17320
Directors' ReportFinancial StatementsSchedules annexed to the forming part of the Financial Statements
All amounts in thousands of Indian Rupees, unless otherwise stated
INDUSTRY SECURITY NAME AMOUNT PERCENTAGE OF FUND 9.20 GOI 30 SEPTEMBER 2030 11,123 0.74% 7.88 GOI 19 MARCH 2030 5,690 0.38% 6.9% OIL MARKETING BOND GOI 04 FEBRUARY
20265,605 0.37%
9.23 GOI 23 DECEMBER 2043 4,670 0.31% 8.13% GOI 21 SEPTEMBER 2022 32 0.00%GOVERNMENT OF INDIA Total 743,760 49.29%FINANCIAL AND INSURANCE ACTIVITIES
8.65 INDIA INFRADEBT LIMITED 22 MARCH 2026 59,206 3.92%
8.65 POWER FINANCE CORPORATION LIMITED 28 DECEMBER 2024
42,345 2.81%
7.95 HDFC BANK LIMITED 21 SEPTEMBER 2026 36,804 2.44% 8.90 BAJAJ FINANCE LIMITED 23 MARCH 2026 32,471 2.15% 7.75 POWER FINANCE CORPORATION 22 MARCH
202725,507 1.69%
7.83 INDIAN RAILWAY FINANCE CORP LTD 19 MARCH 2027
20,332 1.35%
9.30 SHRIRAM TRANSPORT FINANCE CO. LTD 18 MARCH 2026
15,187 1.01%
7.60 ICICI BANK 07 OCTOBER 2023 15,050 1.00% 10.25 SHRIRAM TRANSPORT FINANCE CO. LTD 10
OCTOBER 202411,263 0.75%
10.00 SHRIRAM TRANSPORT FINANCE CO. LTD 13 NOVEMBER 2024
11,136 0.74%
7.54 RURAL ELECTRIFICATION CORPORATION LTD 30 DECEMBER 2026
4,977 0.33%
9.75 IL&FS FINANCIAL SERVICES LTD 13 AUGUST 2017
4,340 0.29%
9.95 ORIENTAL BANK OF COMMERCE 23 APRIL 2017 3,004 0.20% 10.15 IL&FS FINANCIAL SERVICES LIMITED 29 JUNE
20222,231 0.15%
9.69 TATA SONS 12 JUNE 2022 2,191 0.15% 8.03 POWER FINANCE CORPORATION LIMITED 02
MAY 20262,054 0.14%
FINANCIAL AND INSURANCE ACTIVITIES Total
288,098 19.09%
STATE GOVERNMENT 7.98 KERALA SDL 29 JUNE 2026 44,353 2.94% 7.75 KARNATKA SDL 01 MARCH 2027 24,902 1.65% 8.69 TAMILNADU SDL 24 FEBRUARY 2026 22,046 1.46% 7.77 KERALA SDL 01 MARCH 2027 15,221 1.01% 7.86 KARNATKA SDL 15 MARCH 2027 5,559 0.37% 8.01 TAMILNADU SDL 11 MAY 2026 3,073 0.20% 8.24 TAMILNADU SDL 22 MARCH 2028 2,167 0.14% 8.05 TAMILNADU SDL 22 MARCH 2031 2,147 0.14% 8.58 UTTAR PRADESH SPECIAL BOND 02 JUNE 2031 2,146 0.14% 8.01 TAMILNADU SDL 22 MARCH 2030 2,138 0.14% 8.04 TAMILNADU SDL 22 MARCH 2029 2,135 0.14% 8.49 UTTAR PRADESH SPECIAL BOND 02 JUNE 2030 2,129 0.14% 7.92 TAMILNADU SDL 22 MARCH 2032 2,126 0.14% 8.02 TAMILNADU SDL 22 MARCH 2025 2,123 0.14% 8.49 UTTAR PRADESH SPECIAL BOND 02 JUNE 2028 2,114 0.14% 7.91 TAMILNADU SDL 22 MARCH 2024 2,109 0.14% 7.90 TAMILNADU SDL 22 MARCH 2027 2,109 0.14% 8.35 UTTAR PRADESH SPECIAL BOND 02 JUNE 2029 2,096 0.14% 8.38 UTTAR PRADESH SPECIAL BOND 02 JUNE 2027 2,096 0.14%
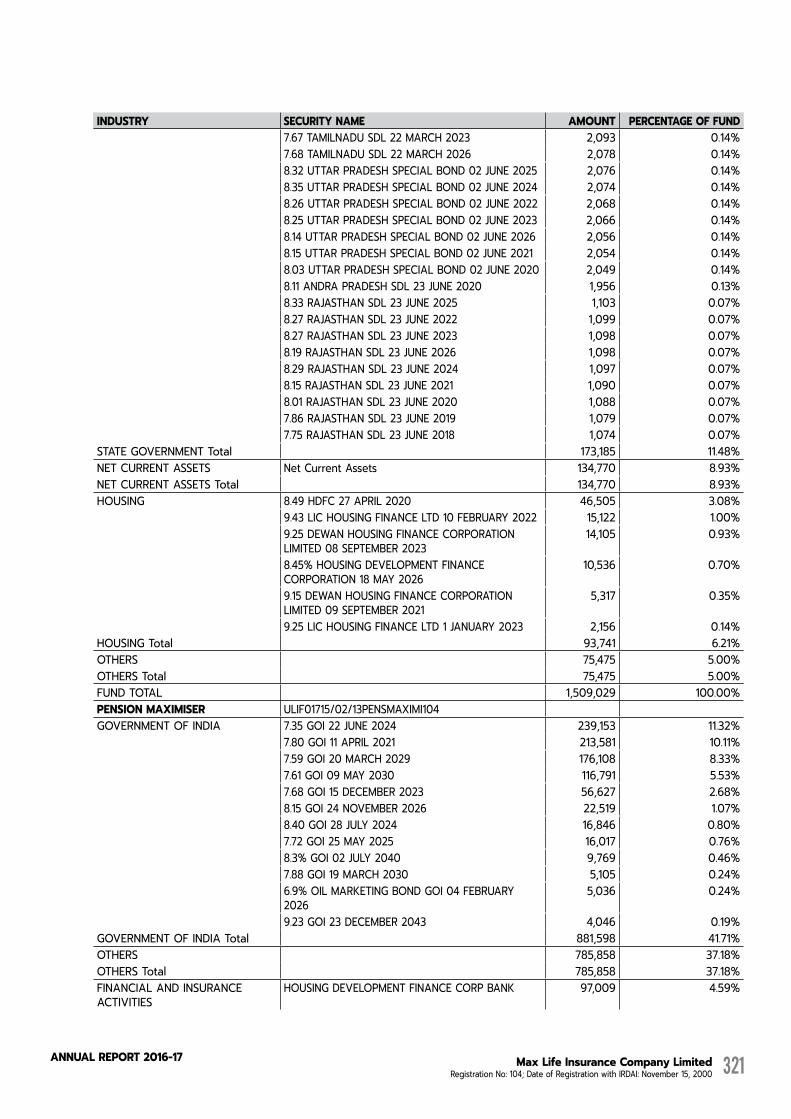
Max Life Insurance Company Limited Registration No: 104; Date of Registration with IRDAI: November 15, 2000
AnnuAL RepoRt 2016-17 321
INDUSTRY SECURITY NAME AMOUNT PERCENTAGE OF FUND 7.67 TAMILNADU SDL 22 MARCH 2023 2,093 0.14% 7.68 TAMILNADU SDL 22 MARCH 2026 2,078 0.14% 8.32 UTTAR PRADESH SPECIAL BOND 02 JUNE 2025 2,076 0.14% 8.35 UTTAR PRADESH SPECIAL BOND 02 JUNE 2024 2,074 0.14% 8.26 UTTAR PRADESH SPECIAL BOND 02 JUNE 2022 2,068 0.14% 8.25 UTTAR PRADESH SPECIAL BOND 02 JUNE 2023 2,066 0.14% 8.14 UTTAR PRADESH SPECIAL BOND 02 JUNE 2026 2,056 0.14% 8.15 UTTAR PRADESH SPECIAL BOND 02 JUNE 2021 2,054 0.14% 8.03 UTTAR PRADESH SPECIAL BOND 02 JUNE 2020 2,049 0.14% 8.11 ANDRA PRADESH SDL 23 JUNE 2020 1,956 0.13% 8.33 RAJASTHAN SDL 23 JUNE 2025 1,103 0.07% 8.27 RAJASTHAN SDL 23 JUNE 2022 1,099 0.07% 8.27 RAJASTHAN SDL 23 JUNE 2023 1,098 0.07% 8.19 RAJASTHAN SDL 23 JUNE 2026 1,098 0.07% 8.29 RAJASTHAN SDL 23 JUNE 2024 1,097 0.07% 8.15 RAJASTHAN SDL 23 JUNE 2021 1,090 0.07% 8.01 RAJASTHAN SDL 23 JUNE 2020 1,088 0.07% 7.86 RAJASTHAN SDL 23 JUNE 2019 1,079 0.07% 7.75 RAJASTHAN SDL 23 JUNE 2018 1,074 0.07%STATE GOVERNMENT Total 173,185 11.48%NET CURRENT ASSETS Net Current Assets 134,770 8.93%NET CURRENT ASSETS Total 134,770 8.93%HOUSING 8.49 HDFC 27 APRIL 2020 46,505 3.08% 9.43 LIC HOUSING FINANCE LTD 10 FEBRUARY 2022 15,122 1.00% 9.25 DEWAN HOUSING FINANCE CORPORATION
LIMITED 08 SEPTEMBER 202314,105 0.93%
8.45% HOUSING DEVELOPMENT FINANCE CORPORATION 18 MAY 2026
10,536 0.70%
9.15 DEWAN HOUSING FINANCE CORPORATION LIMITED 09 SEPTEMBER 2021
5,317 0.35%
9.25 LIC HOUSING FINANCE LTD 1 JANUARY 2023 2,156 0.14%HOUSING Total 93,741 6.21%OTHERS 75,475 5.00%OTHERS Total 75,475 5.00%FUND TOTAL 1,509,029 100.00%PENSION MAXIMISER ULIF01715/02/13PENSMAXIMI104 GOVERNMENT OF INDIA 7.35 GOI 22 JUNE 2024 239,153 11.32% 7.80 GOI 11 APRIL 2021 213,581 10.11% 7.59 GOI 20 MARCH 2029 176,108 8.33% 7.61 GOI 09 MAY 2030 116,791 5.53% 7.68 GOI 15 DECEMBER 2023 56,627 2.68% 8.15 GOI 24 NOVEMBER 2026 22,519 1.07% 8.40 GOI 28 JULY 2024 16,846 0.80% 7.72 GOI 25 MAY 2025 16,017 0.76% 8.3% GOI 02 JULY 2040 9,769 0.46% 7.88 GOI 19 MARCH 2030 5,105 0.24% 6.9% OIL MARKETING BOND GOI 04 FEBRUARY
20265,036 0.24%
9.23 GOI 23 DECEMBER 2043 4,046 0.19%GOVERNMENT OF INDIA Total 881,598 41.71%OTHERS 785,858 37.18%OTHERS Total 785,858 37.18%FINANCIAL AND INSURANCE ACTIVITIES
HOUSING DEVELOPMENT FINANCE CORP BANK 97,009 4.59%

Max Life Insurance Company Limited Registration No: 104; Date of Registration with IRDAI: November 15, 2000
AnnuAL RepoRt 2016-17322
Directors' ReportFinancial StatementsSchedules annexed to the forming part of the Financial Statements
All amounts in thousands of Indian Rupees, unless otherwise stated
INDUSTRY SECURITY NAME AMOUNT PERCENTAGE OF FUND 7.95 HDFC BANK LIMITED 21 SEPTEMBER 2026 40,893 1.93% YES BANK LTD 25,664 1.21% STATE BANK OF INDIA 22,749 1.08% 7.52 RURAL ELECTRIFICATION CORPORATION LTD 07
NOVEMBER 202619,879 0.94%
ICICI BANK LTD 17,461 0.83% INDUSIND BANK LIMITED 14,545 0.69% 9.75% RURAL ELECTRIFICATION CORPORATION
LIMITED 11 NOVEMBER 202110,883 0.51%
UNION BANK OF INDIA 10,827 0.51% 8.11 RURAL ELECTRIFICATION CORPORATION LTD 07
OCTOBER 202510,299 0.49%
7.50 POWER FINANCE CORPORATION 16 AUGUST 2021
10,030 0.47%
KOTAK MAHINDRA BANK LTD 9,476 0.45% HOUSING DEVELOPMENT FINANCE CORP LTD 9,453 0.45% 8.85 SHRIRAM TRANSPORT FINANCE CO. LTD 03
AUGUST 20215,191 0.25%
7.83 INDIAN RAILWAY FINANCE CORP LTD 19 MARCH 2027
5,083 0.24%
IDFC LIMITED 2,506 0.12% 10.25 SHRIRAM TRANSPORT FINANCE CO. LTD 10
OCTOBER 20242,252 0.11%
SHRIRAM CITY UNION FINANCE LIMITED 781 0.04% AXIS BANK LTD 467 0.02%FINANCIAL AND INSURANCE ACTIVITIES Total
315,448 14.93%
STATE GOVERNMENT 7.98 KERALA SDL 29 JUNE 2026 36,724 1.74% 7.75 KARNATKA SDL 01 MARCH 2027 23,979 1.13% 8.69 TAMILNADU SDL 24 FEBRUARY 2026 18,637 0.88% 7.86 KARNATKA SDL 15 MARCH 2027 4,988 0.24% 8.01 TAMILNADU SDL 11 MAY 2026 2,561 0.12% 8.24 TAMILNADU SDL 22 MARCH 2028 2,073 0.10% 8.05 TAMILNADU SDL 22 MARCH 2031 2,053 0.10% 8.01 TAMILNADU SDL 22 MARCH 2030 2,044 0.10% 8.04 TAMILNADU SDL 22 MARCH 2029 2,042 0.10% 7.92 TAMILNADU SDL 22 MARCH 2032 2,033 0.10% 8.02 TAMILNADU SDL 22 MARCH 2025 2,030 0.10% 7.91 TAMILNADU SDL 22 MARCH 2024 2,017 0.10% 7.90 TAMILNADU SDL 22 MARCH 2027 2,017 0.10% 7.67 TAMILNADU SDL 22 MARCH 2023 2,001 0.09% 7.68 TAMILNADU SDL 22 MARCH 2026 1,988 0.09% 8.58 UTTAR PRADESH SPECIAL BOND 02 JUNE 2031 1,341 0.06% 8.49 UTTAR PRADESH SPECIAL BOND 02 JUNE 2030 1,330 0.06% 8.49 UTTAR PRADESH SPECIAL BOND 02 JUNE 2028 1,321 0.06% 8.35 UTTAR PRADESH SPECIAL BOND 02 JUNE 2029 1,310 0.06% 8.38 UTTAR PRADESH SPECIAL BOND 02 JUNE 2027 1,310 0.06% 8.32 UTTAR PRADESH SPECIAL BOND 02 JUNE 2025 1,297 0.06% 8.35 UTTAR PRADESH SPECIAL BOND 02 JUNE 2024 1,297 0.06% 8.26 UTTAR PRADESH SPECIAL BOND 02 JUNE 2022 1,293 0.06% 8.25 UTTAR PRADESH SPECIAL BOND 02 JUNE 2023 1,291 0.06% 8.14 UTTAR PRADESH SPECIAL BOND 02 JUNE 2026 1,285 0.06% 8.15 UTTAR PRADESH SPECIAL BOND 02 JUNE 2021 1,284 0.06% 8.03 UTTAR PRADESH SPECIAL BOND 02 JUNE 2020 1,280 0.06% 8.33 RAJASTHAN SDL 23 JUNE 2025 863 0.04%

Max Life Insurance Company Limited Registration No: 104; Date of Registration with IRDAI: November 15, 2000
AnnuAL RepoRt 2016-17 323
INDUSTRY SECURITY NAME AMOUNT PERCENTAGE OF FUND 8.27 RAJASTHAN SDL 23 JUNE 2022 859 0.04% 8.27 RAJASTHAN SDL 23 JUNE 2023 859 0.04% 8.19 RAJASTHAN SDL 23 JUNE 2026 859 0.04% 8.29 RAJASTHAN SDL 23 JUNE 2024 858 0.04% 8.15 RAJASTHAN SDL 23 JUNE 2021 853 0.04% 8.01 RAJASTHAN SDL 23 JUNE 2020 851 0.04% 7.86 RAJASTHAN SDL 23 JUNE 2019 843 0.04% 7.75 RAJASTHAN SDL 23 JUNE 2018 840 0.04%STATE GOVERNMENT Total 130,511 6.18%FUND TOTAL 2,113,415 100.00%PENSION PRESERVER ULIF01815/02/13PENSPRESER104 GOVERNMENT OF INDIA 7.80 GOI 11 APRIL 2021 306,018 15.12% 7.68 GOI 15 DECEMBER 2023 265,377 13.11% 7.35 GOI 22 JUNE 2024 248,885 12.30% 7.61 GOI 09 MAY 2030 123,032 6.08% 8.15 GOI 24 NOVEMBER 2026 95,105 4.70% 7.59 GOI 20 MARCH 2029 77,814 3.85% 7.72 GOI 25 MAY 2025 22,488 1.11% 7.88 GOI 19 MARCH 2030 7,425 0.37% 6.9% OIL MARKETING BOND GOI 04 FEBRUARY
20267,388 0.37%
9.23 GOI 23 DECEMBER 2043 6,015 0.30% 8.3% GOI 02 JULY 2040 5,427 0.27%GOVERNMENT OF INDIA Total 1,164,974 57.57%OTHERS 426,174 21.06%OTHERS Total 426,174 21.06%FINANCIAL AND INSURANCE ACTIVITIES 7.95 HDFC BANK LIMITED 21 SEPTEMBER 2026 76,674 3.79% 8.85 BAJAJ FINANCE LIMITED 21 JULY 2026 32,412 1.60% HOUSING DEVELOPMENT FINANCE CORP BANK 20,109 0.99% YES BANK LTD 16,368 0.81% STATE BANK OF INDIA 11,458 0.57% INDUSIND BANK LIMITED 10,399 0.51% 7.50 POWER FINANCE CORPORATION 16 AUGUST
202110,030 0.50%
7.52 RURAL ELECTRIFICATION CORPORATION LTD 07 NOVEMBER 2026
9,939 0.49%
8.30% RURAL ELECTRIFICATION CORPORATION LTD 10 APRIL 2025
8,321 0.41%
10.25 SHRIRAM TRANSPORT FINANCE CO. LTD 10 OCTOBER 2024
7,884 0.39%
AXIS BANK LTD 7,321 0.36% LIC HOUSING FINANCE LTD 7,191 0.36% 8.85 SHRIRAM TRANSPORT FINANCE CO. LTD 03
AUGUST 20216,229 0.31%
7.83 INDIAN RAILWAY FINANCE CORP LTD 19 MARCH 2027
5,083 0.25%
HOUSING DEVELOPMENT FINANCE CORP LTD 4,784 0.24% 10.00 SHRIRAM TRANSPORT FINANCE CO. LTD 13
NOVEMBER 20243,341 0.17%
ICICI BANK LTD 3,011 0.15% SHRIRAM CITY UNION FINANCE LIMITED 1,935 0.10% KOTAK MAHINDRA BANK LTD 1,181 0.06% IDFC BANK LIMITED 925 0.05% IDFC LIMITED 851 0.04%
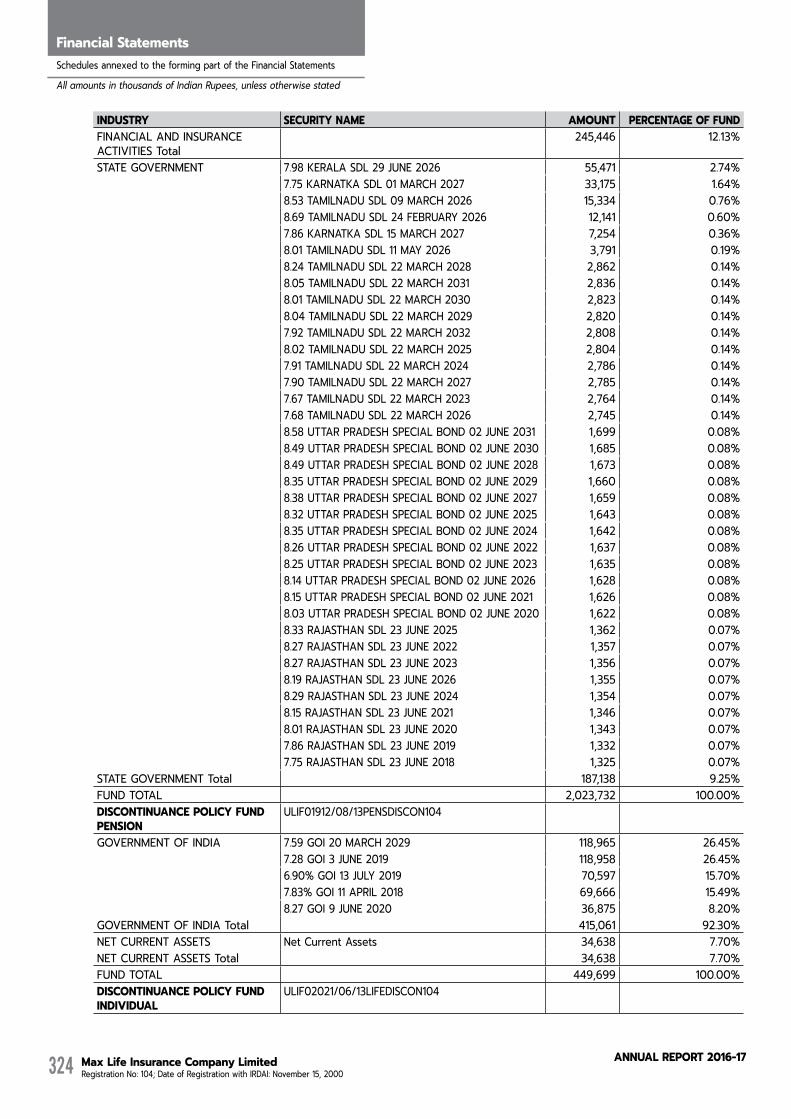
Max Life Insurance Company Limited Registration No: 104; Date of Registration with IRDAI: November 15, 2000
AnnuAL RepoRt 2016-17324
Directors' ReportFinancial StatementsSchedules annexed to the forming part of the Financial Statements
All amounts in thousands of Indian Rupees, unless otherwise stated
INDUSTRY SECURITY NAME AMOUNT PERCENTAGE OF FUNDFINANCIAL AND INSURANCE ACTIVITIES Total
245,446 12.13%
STATE GOVERNMENT 7.98 KERALA SDL 29 JUNE 2026 55,471 2.74% 7.75 KARNATKA SDL 01 MARCH 2027 33,175 1.64% 8.53 TAMILNADU SDL 09 MARCH 2026 15,334 0.76% 8.69 TAMILNADU SDL 24 FEBRUARY 2026 12,141 0.60% 7.86 KARNATKA SDL 15 MARCH 2027 7,254 0.36% 8.01 TAMILNADU SDL 11 MAY 2026 3,791 0.19% 8.24 TAMILNADU SDL 22 MARCH 2028 2,862 0.14% 8.05 TAMILNADU SDL 22 MARCH 2031 2,836 0.14% 8.01 TAMILNADU SDL 22 MARCH 2030 2,823 0.14% 8.04 TAMILNADU SDL 22 MARCH 2029 2,820 0.14% 7.92 TAMILNADU SDL 22 MARCH 2032 2,808 0.14% 8.02 TAMILNADU SDL 22 MARCH 2025 2,804 0.14% 7.91 TAMILNADU SDL 22 MARCH 2024 2,786 0.14% 7.90 TAMILNADU SDL 22 MARCH 2027 2,785 0.14% 7.67 TAMILNADU SDL 22 MARCH 2023 2,764 0.14% 7.68 TAMILNADU SDL 22 MARCH 2026 2,745 0.14% 8.58 UTTAR PRADESH SPECIAL BOND 02 JUNE 2031 1,699 0.08% 8.49 UTTAR PRADESH SPECIAL BOND 02 JUNE 2030 1,685 0.08% 8.49 UTTAR PRADESH SPECIAL BOND 02 JUNE 2028 1,673 0.08% 8.35 UTTAR PRADESH SPECIAL BOND 02 JUNE 2029 1,660 0.08% 8.38 UTTAR PRADESH SPECIAL BOND 02 JUNE 2027 1,659 0.08% 8.32 UTTAR PRADESH SPECIAL BOND 02 JUNE 2025 1,643 0.08% 8.35 UTTAR PRADESH SPECIAL BOND 02 JUNE 2024 1,642 0.08% 8.26 UTTAR PRADESH SPECIAL BOND 02 JUNE 2022 1,637 0.08% 8.25 UTTAR PRADESH SPECIAL BOND 02 JUNE 2023 1,635 0.08% 8.14 UTTAR PRADESH SPECIAL BOND 02 JUNE 2026 1,628 0.08% 8.15 UTTAR PRADESH SPECIAL BOND 02 JUNE 2021 1,626 0.08% 8.03 UTTAR PRADESH SPECIAL BOND 02 JUNE 2020 1,622 0.08% 8.33 RAJASTHAN SDL 23 JUNE 2025 1,362 0.07% 8.27 RAJASTHAN SDL 23 JUNE 2022 1,357 0.07% 8.27 RAJASTHAN SDL 23 JUNE 2023 1,356 0.07% 8.19 RAJASTHAN SDL 23 JUNE 2026 1,355 0.07% 8.29 RAJASTHAN SDL 23 JUNE 2024 1,354 0.07% 8.15 RAJASTHAN SDL 23 JUNE 2021 1,346 0.07% 8.01 RAJASTHAN SDL 23 JUNE 2020 1,343 0.07% 7.86 RAJASTHAN SDL 23 JUNE 2019 1,332 0.07% 7.75 RAJASTHAN SDL 23 JUNE 2018 1,325 0.07%STATE GOVERNMENT Total 187,138 9.25%FUND TOTAL 2,023,732 100.00%DISCONTINUANCE POLICY FUND PENSION
ULIF01912/08/13PENSDISCON104
GOVERNMENT OF INDIA 7.59 GOI 20 MARCH 2029 118,965 26.45% 7.28 GOI 3 JUNE 2019 118,958 26.45% 6.90% GOI 13 JULY 2019 70,597 15.70% 7.83% GOI 11 APRIL 2018 69,666 15.49% 8.27 GOI 9 JUNE 2020 36,875 8.20%GOVERNMENT OF INDIA Total 415,061 92.30%NET CURRENT ASSETS Net Current Assets 34,638 7.70%NET CURRENT ASSETS Total 34,638 7.70%FUND TOTAL 449,699 100.00%DISCONTINUANCE POLICY FUND INDIVIDUAL
ULIF02021/06/13LIFEDISCON104
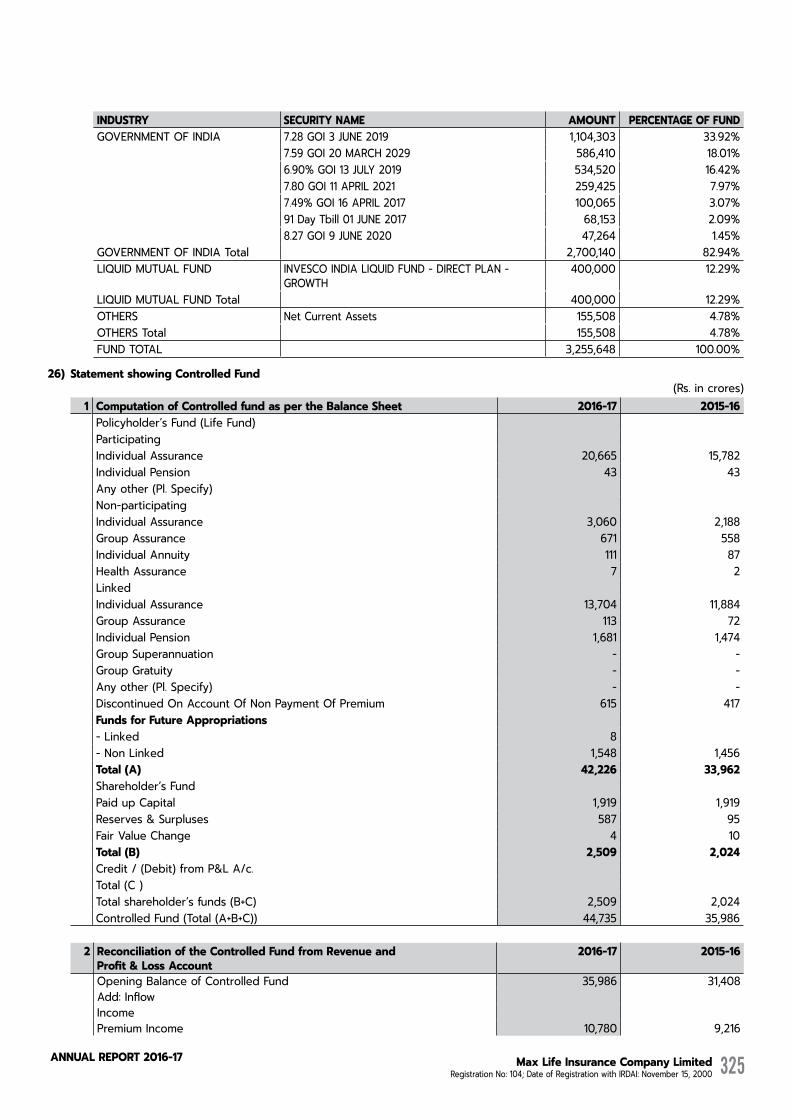
Max Life Insurance Company Limited Registration No: 104; Date of Registration with IRDAI: November 15, 2000
AnnuAL RepoRt 2016-17 325
INDUSTRY SECURITY NAME AMOUNT PERCENTAGE OF FUNDGOVERNMENT OF INDIA 7.28 GOI 3 JUNE 2019 1,104,303 33.92% 7.59 GOI 20 MARCH 2029 586,410 18.01% 6.90% GOI 13 JULY 2019 534,520 16.42% 7.80 GOI 11 APRIL 2021 259,425 7.97% 7.49% GOI 16 APRIL 2017 100,065 3.07% 91 Day Tbill 01 JUNE 2017 68,153 2.09% 8.27 GOI 9 JUNE 2020 47,264 1.45%GOVERNMENT OF INDIA Total 2,700,140 82.94%LIQUID MUTUAL FUND INVESCO INDIA LIQUID FUND - DIRECT PLAN -
GROWTH400,000 12.29%
LIQUID MUTUAL FUND Total 400,000 12.29%OTHERS Net Current Assets 155,508 4.78%OTHERS Total 155,508 4.78%FUND TOTAL 3,255,648 100.00%
26) StatementshowingControlledFund(Rs. in crores)
1 ComputationofControlledfundaspertheBalanceSheet 2016-17 2015-16Policyholder’s Fund (Life Fund)ParticipatingIndividual Assurance 20,665 15,782 Individual Pension 43 43Any other (Pl. Specify)Non-participatingIndividual Assurance 3,060 2,188Group Assurance 671 558Individual Annuity 111 87Health Assurance 7 2LinkedIndividual Assurance 13,704 11,884Group Assurance 113 72Individual Pension 1,681 1,474Group Superannuation - -Group Gratuity - -Any other (Pl. Specify) - -Discontinued On Account Of Non Payment Of Premium 615 417FundsforFutureAppropriations- Linked 8- Non Linked 1,548 1,456Total (A) 42,226 33,962 Shareholder’s FundPaid up Capital 1,919 1,919Reserves & Surpluses 587 95Fair Value Change 4 10Total (B) 2,509 2,024Credit / (Debit) from P&L A/c.Total (C )Total shareholder’s funds (B+C) 2,509 2,024Controlled Fund (Total (A+B+C)) 44,735 35,986
2 ReconciliationoftheControlledFundfromRevenueandProfit&LossAccount
2016-17 2015-16
Opening Balance of Controlled Fund 35,986 31,408Add: InflowIncomePremium Income 10,780 9,216

Max Life Insurance Company Limited Registration No: 104; Date of Registration with IRDAI: November 15, 2000
AnnuAL RepoRt 2016-17326
Directors' ReportFinancial StatementsSchedules annexed to the forming part of the Financial Statements
All amounts in thousands of Indian Rupees, unless otherwise stated
2 ReconciliationoftheControlledFundfromRevenueandProfit&LossAccount
2016-17 2015-16
Less: Reinsurance ceded 100 77Net Premium 10,680 9,139Investment Income 4,211 1,290Other Income 19 15Funds transferred from Shareholder’s Accounts 0 2Total Income 14,910 10,445Less: Outgo (i) Benefits paid (Net) 3,777 3,146(ii) Interim Bonus Paid 1 -(iii) Change in Valuation of Liability 7,869 4,689 (iv) Commission 936 821(v) Operating Expenses 1,672 1,326Total Outgo 14,255 9,982 Surplus of the Policyholder’s Fund 655 463 Less: transferred to Shareholder’s Account 555 335Net Flow in Policyholder’s account 100 128 Add: Net income in Shareholder’s Fund 660 439 Net In Flow / Outflow 760 567Add: change in valuation Liabilities 7,869 4,689 Add: Increase in Paid up Capital - -Add:Increase in share premium - -Closing Balance of Controlled Fund 44,615 36,664 -Policyholder Dividend - --Shareholder Dividend (169) (439)-ESOP - --Fair Value Change 289 (240)-Reserves & Surplus - --Misc Expenditure - -Total 44,735 35,986As Per Balance Sheet 44,735 35,986
(Rs. in crores)3 ReconciliationwithShareholder’sandPolicyholder’sFund 2016-17 2015-16
Policyholder’s Funds3.1 Policyholder’s Funds - Traditional-PAR and NON-PAR
Opening Balance of the Policyholder’s Fund 20,114 15,332Add: Surplus of the Revenue Account 92 128Add: change in valuation Liabilities 5,604 4,863-Policyholder Dividend - -- Fair Value Change 294 (208)Total 26,104 20,114As per Balance Sheet 26,104 20,114
3.2 Policyholder’s Funds - Linked Opening Balance of the Policyholder’s Fund 13,847 14,021Add: Surplus of the Revenue Account 8 -Add: change in valuation Liabilities 2,265 (174)Total 16,120 13,847As per Balance Sheet 16,120 13,847Shareholder’s Funds Opening Balance of Shareholder’s Fund 2,024 2,055Add: net income of Shareholder’s account (P&L) 660 439Add: Infusion of Capital - -Add: Increase in Share Premium - -Closing Balance of the Shareholder’s fund 2,684 2,494-Shareholder Dividend (169) (439)-FV Change (6) (32)As per Balance Sheet 2,509 2,024

Max Life Insurance Company Limited Registration No: 104; Date of Registration with IRDAI: November 15, 2000
AnnuAL RepoRt 2016-17 327
27) TheadditionaldisclosuresonexpensespursuanttotheIRDAICircular067/IRDA/F&A/CIR/MAR-08datedMarch28,2008havebeendetailedhereinbelow:Heads 2016-17 2015-16Outsourcing Expenses 1,259,933 827,045Business Development 1,324 4Marketing Support 2,681 18
28) AdditionalinformationonRemuneration:
Information under section 197(12) of the Companies Act, 2013 read with Companies (Appointment And Remuneration Of Managerial Personal Rules) 2014, as amended, are annexed in the Director’s Report.
29) TheMicro,SmallandMediumEnterprisesDevelopmentAct,2006:
Under the Micro Small and Medium Enterprises Development Act 2006 certain disclosures are required to be made relating to Micro Small and Medium Enterprises. Based on the confirmation received from the suppliers there are no dues payable to vendors covered by the Micro, Small and Medium Enterprises Development Act, 2006, as at March 31, 2017.
30)Comparatives
Previous year figures have been regrouped where necessary to conform to current year’s classification. The details of regroupings/ reclassifications done in previous year figures are as follows:
S. No. Regroupedto Regroupedfrom Amount Reason1 Service tax deposits in
Schedule 12 Service tax unutilised credit in Schedule 12
57,957 Service tax deposit reclassified from Service tax unutilised credit to show appropriate presentation.
2 Payable to Policyholders in Schedule 13
Unclaimed amount-Policyholders in Schedule 13
764,962 Payable to policyholder reclassified from Unclaimed amount-policyholder as per IRDA unclaimed guideline to show fair presentation.
3 Deposit, Advances & Staff Loans
Service tax paid 57,957 Service tax deposit reclassified from Service tax unutilised credit to show appropriate presentation.
31) DisclosuresonpenaltiesformingpartofFinancialStatementsundercircularNo.005/IRDAI/F&A/CIR/MAY-09
FortheyearendedMarch31,2017(Rs. in ‘000)
Authority Non-Compliance/ Violation Penalty Awarded
Penalty Paid
Penalty Waived/Reduced
Insurance Regulatory and Development Authority
1. Adjustment of balance premium without consent of policyholder. (Violation of Sec 64VB of Insurance Act 1938).
2. Insurance Brokers were remunerated in excess of prescribed limit. (Violation of Regulation 19)
500
500
500
500
Nil
Nil
Service Tax Authorities Income Tax Authorities Any other Tax Authorities Enforcement Directorate/ Adjudicating Authority/ Tribunal or any Authority under FEMA Registrar of Companies/ NCLT/CLB/ Department of Corporate Affairs or any Authority under Companies Act, 1956 Penalty awarded by any Court/ Tribunal for any matter including claim settlement but excluding compensation Securities and Exchange Board of India Competition Commission of India Any other Central/State/Local Government / Statutory Authority
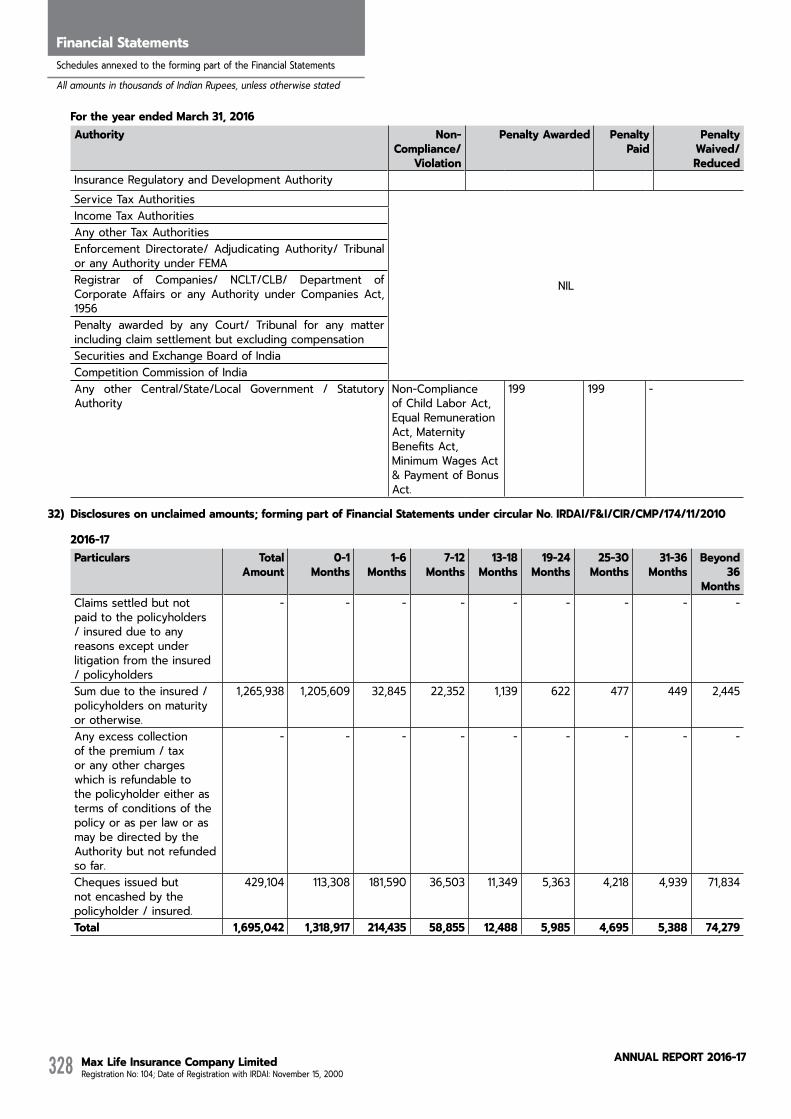
Max Life Insurance Company Limited Registration No: 104; Date of Registration with IRDAI: November 15, 2000
AnnuAL RepoRt 2016-17328
Directors' ReportFinancial StatementsSchedules annexed to the forming part of the Financial Statements
All amounts in thousands of Indian Rupees, unless otherwise stated
FortheyearendedMarch31,2016Authority Non-
Compliance/ Violation
PenaltyAwarded Penalty Paid
Penalty Waived/Reduced
Insurance Regulatory and Development Authority Service Tax Authorities
NIL
Income Tax Authorities Any other Tax Authorities Enforcement Directorate/ Adjudicating Authority/ Tribunal or any Authority under FEMA Registrar of Companies/ NCLT/CLB/ Department of Corporate Affairs or any Authority under Companies Act, 1956 Penalty awarded by any Court/ Tribunal for any matter including claim settlement but excluding compensation Securities and Exchange Board of India Competition Commission of India Any other Central/State/Local Government / Statutory Authority
Non-Compliance of Child Labor Act, Equal Remuneration Act, Maternity Benefits Act, Minimum Wages Act & Payment of Bonus Act.
199 199 -
32) Disclosuresonunclaimedamounts;formingpartofFinancialStatementsundercircularNo.IRDAI/F&I/CIR/CMP/174/11/2010
2016-17Particulars Total
Amount0-1
Months1-6
Months7-12
Months13-18
Months19-24
Months25-30
Months31-36
MonthsBeyond
36Months
Claims settled but not paid to the policyholders / insured due to any reasons except under litigation from the insured / policyholders
- - - - - - - - -
Sum due to the insured / policyholders on maturity or otherwise.
1,265,938 1,205,609 32,845 22,352 1,139 622 477 449 2,445
Any excess collection of the premium / tax or any other charges which is refundable to the policyholder either as terms of conditions of the policy or as per law or as may be directed by the Authority but not refunded so far.
- - - - - - - - -
Cheques issued but not encashed by the policyholder / insured.
429,104 113,308 181,590 36,503 11,349 5,363 4,218 4,939 71,834
Total 1,695,042 1,318,917 214,435 58,855 12,488 5,985 4,695 5,388 74,279

Max Life Insurance Company Limited Registration No: 104; Date of Registration with IRDAI: November 15, 2000
AnnuAL RepoRt 2016-17 329
2015-16Particulars Total
Amount0-1
Months1-6
Months7-12
Months13-18
Months19-24
Months25-30
Months31-36
MonthsBeyond
36 Months
Claims settled but not paid to the policyholders / insured due to any reasons except under litigation from the insured / policyholders
- - - - - - - - -
Sum due to the insured / policyholders on maturity or otherwise.
1,466,214 1,093,452 180,897 73,763 56,486 5,333 15,704 3,377 37,200
Any excess collection of the premium / tax or any other charges which is refundable to the policyholder either as terms of conditions of the policy or as per law or as may be directed by the Authority but not refunded so far.
- - - - - - - - -
Cheques issued but not encashed by the policyholder / insured.
667,558 62,627 140,985 76,936 24,221 26,862 52,749 79,876 203,300
Total 2,133,771 1,156,080 321,882 150,699 80,708 32,195 68,454 83,254 240,500
DetailsofUnclaimedamountsandInvestmentIncomeParticulars 2016-17 2015-16Opening Balance 1,368,860 1,495,382Add: Amount transferred to unclaimed amount 963,617 1,228,361Add: Cheques issued out of the unclaimed amount but not encashed by the policyholders (To be included only when the cheques are stale) 565,423 619,608Add: Investment Income 70,478 -Less: Amount paid during the year 2,469,547 1,974,491Closing Balance of Unclaimed Amount 498,831 1,368,860
33) DisclosuresformingpartofFinancialStatementsasrequiredunderIRDAI(TreatmentofDiscontinuedLinkedInsurancePolicies)regulations,2010
a) MovementinfundsfordiscontinuedpoliciesParticulars 2016-17 2015-16
Fund for Discontinues Policies Opening Balance of Funds for discontinued policies 4,165,784 2,375,041Add: Fund of policies discontinued during the year 4,446,158 2,760,632Less: Fund of policies revived during the year 2,818,456 1,213,879Add: Net Income/ Gains on investment of the fund 370,920 248,993 Less: Fund Management Charges levied 14,751 3,946Less: Amount refunded to policyholders during the year 3,047 1,056 Closing balance of fund for discontinued policies 6,146,607 4,165,785
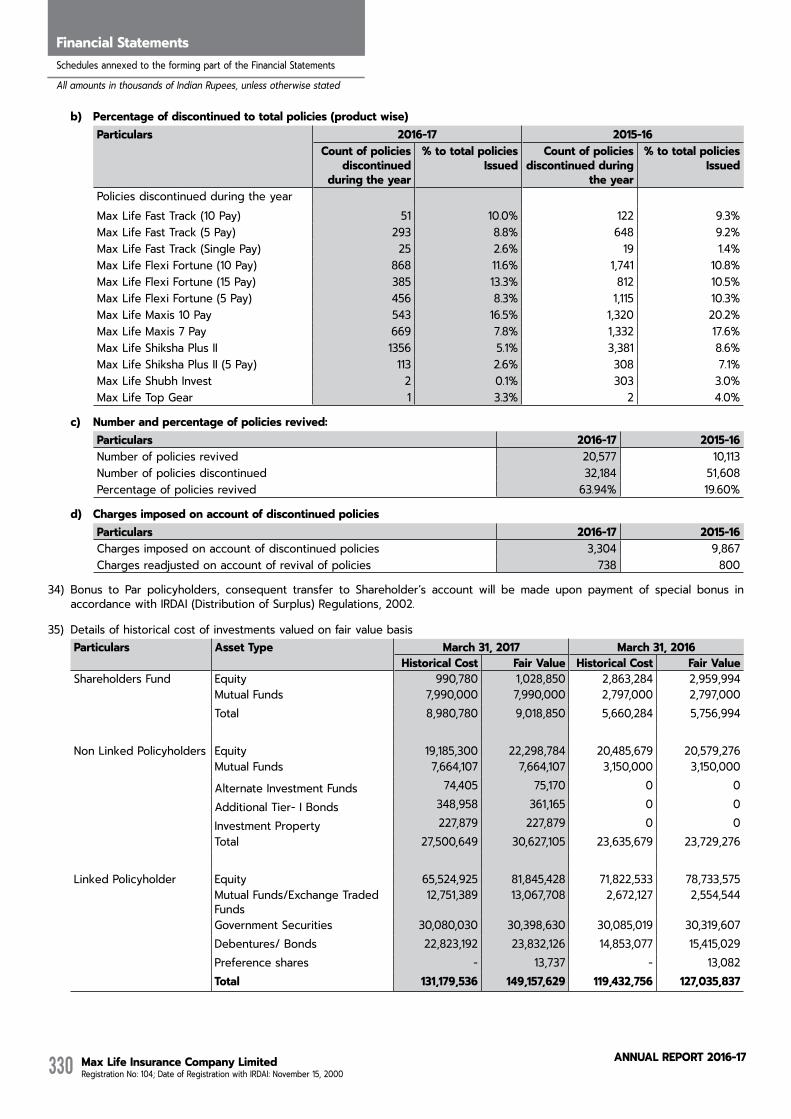
Max Life Insurance Company Limited Registration No: 104; Date of Registration with IRDAI: November 15, 2000
AnnuAL RepoRt 2016-17330
Directors' ReportFinancial StatementsSchedules annexed to the forming part of the Financial Statements
All amounts in thousands of Indian Rupees, unless otherwise stated
b) Percentageofdiscontinuedtototalpolicies(productwise)Particulars 2016-17 2015-16
Count of policies discontinued
duringtheyear
% to total policiesIssued
Count of policies discontinuedduring
the year
% to total policiesIssued
Policies discontinued during the yearMax Life Fast Track (10 Pay) 51 10.0% 122 9.3%Max Life Fast Track (5 Pay) 293 8.8% 648 9.2%Max Life Fast Track (Single Pay) 25 2.6% 19 1.4%Max Life Flexi Fortune (10 Pay) 868 11.6% 1,741 10.8%Max Life Flexi Fortune (15 Pay) 385 13.3% 812 10.5%Max Life Flexi Fortune (5 Pay) 456 8.3% 1,115 10.3%Max Life Maxis 10 Pay 543 16.5% 1,320 20.2%Max Life Maxis 7 Pay 669 7.8% 1,332 17.6%Max Life Shiksha Plus II 1356 5.1% 3,381 8.6%Max Life Shiksha Plus II (5 Pay) 113 2.6% 308 7.1%Max Life Shubh Invest 2 0.1% 303 3.0%Max Life Top Gear 1 3.3% 2 4.0%
c) Numberandpercentageofpoliciesrevived:Particulars 2016-17 2015-16Number of policies revived 20,577 10,113Number of policies discontinued 32,184 51,608Percentage of policies revived 63.94% 19.60%
d) ChargesimposedonaccountofdiscontinuedpoliciesParticulars 2016-17 2015-16Charges imposed on account of discontinued policies 3,304 9,867Charges readjusted on account of revival of policies 738 800
34) Bonus to Par policyholders, consequent transfer to Shareholder’s account will be made upon payment of special bonus in accordance with IRDAI (Distribution of Surplus) Regulations, 2002.
35) Details of historical cost of investments valued on fair value basisParticulars Asset Type March 31, 2017 March 31, 2016
Historical Cost Fair Value Historical Cost Fair ValueShareholders Fund Equity 990,780 1,028,850 2,863,284 2,959,994
Mutual Funds 7,990,000 7,990,000 2,797,000 2,797,000Total 8,980,780 9,018,850 5,660,284 5,756,994
Non Linked Policyholders Equity 19,185,300 22,298,784 20,485,679 20,579,276Mutual Funds 7,664,107 7,664,107 3,150,000 3,150,000
Alternate Investment Funds 74,405 75,170 0 0
Additional Tier- I Bonds 348,958 361,165 0 0
Investment Property 227,879 227,879 0 0Total 27,500,649 30,627,105 23,635,679 23,729,276
Linked Policyholder Equity 65,524,925 81,845,428 71,822,533 78,733,575Mutual Funds/Exchange Traded Funds
12,751,389 13,067,708 2,672,127 2,554,544
Government Securities 30,080,030 30,398,630 30,085,019 30,319,607Debentures/ Bonds 22,823,192 23,832,126 14,853,077 15,415,029Preference shares - 13,737 - 13,082Total 131,179,536 149,157,629 119,432,756 127,035,837
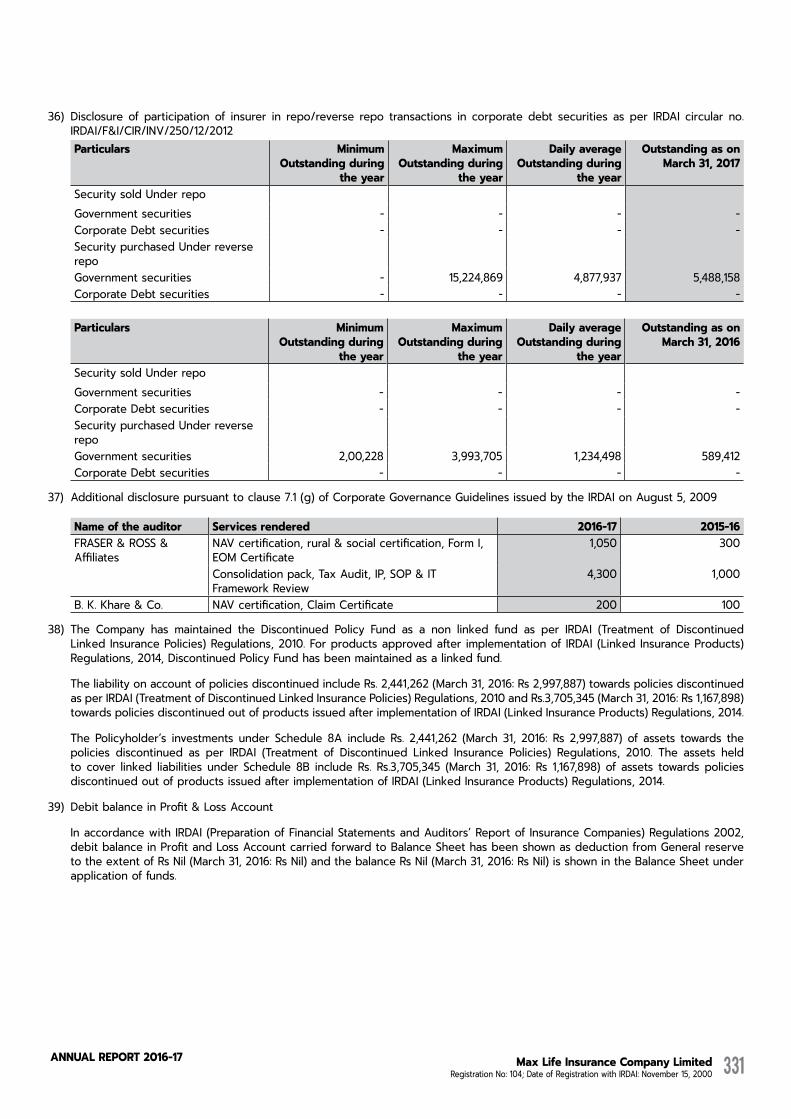
Max Life Insurance Company Limited Registration No: 104; Date of Registration with IRDAI: November 15, 2000
AnnuAL RepoRt 2016-17 331
36) Disclosure of participation of insurer in repo/reverse repo transactions in corporate debt securities as per IRDAI circular no. IRDAI/F&I/CIR/INV/250/12/2012Particulars Minimum
Outstandingduringthe year
MaximumOutstandingduring
the year
DailyaverageOutstandingduring
the year
OutstandingasonMarch 31, 2017
Security sold Under repoGovernment securities - - - -Corporate Debt securities - - - -Security purchased Under reverse repoGovernment securities - 15,224,869 4,877,937 5,488,158Corporate Debt securities - - - -
Particulars Minimum Outstandingduring
the year
MaximumOutstandingduring
the year
DailyaverageOutstandingduring
the year
OutstandingasonMarch 31, 2016
Security sold Under repoGovernment securities - - - -Corporate Debt securities - - - -Security purchased Under reverse repoGovernment securities 2,00,228 3,993,705 1,234,498 589,412Corporate Debt securities - - - -
37) Additional disclosure pursuant to clause 7.1 (g) of Corporate Governance Guidelines issued by the IRDAI on August 5, 2009
Nameoftheauditor Servicesrendered 2016-17 2015-16FRASER & ROSS & Affiliates
NAV certification, rural & social certification, Form I, EOM Certificate
1,050 300
Consolidation pack, Tax Audit, IP, SOP & IT Framework Review
4,300 1,000
B. K. Khare & Co. NAV certification, Claim Certificate 200 100
38) The Company has maintained the Discontinued Policy Fund as a non linked fund as per IRDAI (Treatment of Discontinued Linked Insurance Policies) Regulations, 2010. For products approved after implementation of IRDAI (Linked Insurance Products) Regulations, 2014, Discontinued Policy Fund has been maintained as a linked fund.
The liability on account of policies discontinued include Rs. 2,441,262 (March 31, 2016: Rs 2,997,887) towards policies discontinued as per IRDAI (Treatment of Discontinued Linked Insurance Policies) Regulations, 2010 and Rs.3,705,345 (March 31, 2016: Rs 1,167,898) towards policies discontinued out of products issued after implementation of IRDAI (Linked Insurance Products) Regulations, 2014.
The Policyholder’s investments under Schedule 8A include Rs. 2,441,262 (March 31, 2016: Rs 2,997,887) of assets towards the policies discontinued as per IRDAI (Treatment of Discontinued Linked Insurance Policies) Regulations, 2010. The assets held to cover linked liabilities under Schedule 8B include Rs. Rs.3,705,345 (March 31, 2016: Rs 1,167,898) of assets towards policies discontinued out of products issued after implementation of IRDAI (Linked Insurance Products) Regulations, 2014.
39) Debit balance in Profit & Loss Account
In accordance with IRDAI (Preparation of Financial Statements and Auditors’ Report of Insurance Companies) Regulations 2002, debit balance in Profit and Loss Account carried forward to Balance Sheet has been shown as deduction from General reserve to the extent of Rs Nil (March 31, 2016: Rs Nil) and the balance Rs Nil (March 31, 2016: Rs Nil) is shown in the Balance Sheet under application of funds.
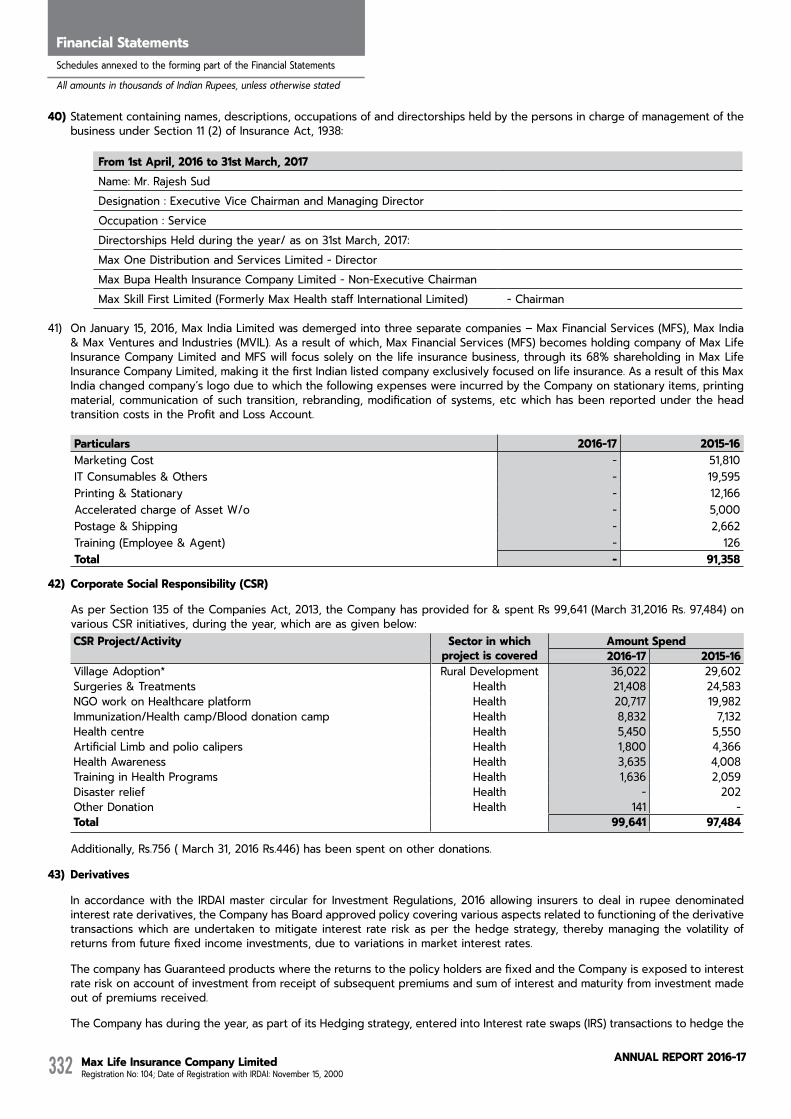
Max Life Insurance Company Limited Registration No: 104; Date of Registration with IRDAI: November 15, 2000
AnnuAL RepoRt 2016-17332
Directors' ReportFinancial StatementsSchedules annexed to the forming part of the Financial Statements
All amounts in thousands of Indian Rupees, unless otherwise stated
40) Statement containing names, descriptions, occupations of and directorships held by the persons in charge of management of the business under Section 11 (2) of Insurance Act, 1938:
From 1st April, 2016 to 31st March, 2017Name: Mr. Rajesh SudDesignation : Executive Vice Chairman and Managing DirectorOccupation : ServiceDirectorships Held during the year/ as on 31st March, 2017:Max One Distribution and Services Limited - DirectorMax Bupa Health Insurance Company Limited - Non-Executive ChairmanMax Skill First Limited (Formerly Max Health staff International Limited) - Chairman
41) On January 15, 2016, Max India Limited was demerged into three separate companies – Max Financial Services (MFS), Max India
& Max Ventures and Industries (MVIL). As a result of which, Max Financial Services (MFS) becomes holding company of Max Life Insurance Company Limited and MFS will focus solely on the life insurance business, through its 68% shareholding in Max Life Insurance Company Limited, making it the first Indian listed company exclusively focused on life insurance. As a result of this Max India changed company’s logo due to which the following expenses were incurred by the Company on stationary items, printing material, communication of such transition, rebranding, modification of systems, etc which has been reported under the head transition costs in the Profit and Loss Account.
Particulars 2016-17 2015-16Marketing Cost - 51,810 IT Consumables & Others - 19,595 Printing & Stationary - 12,166 Accelerated charge of Asset W/o - 5,000 Postage & Shipping - 2,662 Training (Employee & Agent) - 126 Total - 91,358
42) CorporateSocialResponsibility(CSR)
As per Section 135 of the Companies Act, 2013, the Company has provided for & spent Rs 99,641 (March 31,2016 Rs. 97,484) on various CSR initiatives, during the year, which are as given below:CSRProject/Activity Sector in which
projectiscoveredAmountSpend2016-17 2015-16
Village Adoption* Rural Development 36,022 29,602Surgeries & Treatments Health 21,408 24,583NGO work on Healthcare platform Health 20,717 19,982Immunization/Health camp/Blood donation camp Health 8,832 7,132Health centre Health 5,450 5,550Artificial Limb and polio calipers Health 1,800 4,366Health Awareness Health 3,635 4,008Training in Health Programs Health 1,636 2,059Disaster relief Health - 202Other Donation Health 141 -Total 99,641 97,484
Additionally, Rs.756 ( March 31, 2016 Rs.446) has been spent on other donations.
43) Derivatives
In accordance with the IRDAI master circular for Investment Regulations, 2016 allowing insurers to deal in rupee denominated interest rate derivatives, the Company has Board approved policy covering various aspects related to functioning of the derivative transactions which are undertaken to mitigate interest rate risk as per the hedge strategy, thereby managing the volatility of returns from future fixed income investments, due to variations in market interest rates.
The company has Guaranteed products where the returns to the policy holders are fixed and the Company is exposed to interest rate risk on account of investment from receipt of subsequent premiums and sum of interest and maturity from investment made out of premiums received.
The Company has during the year, as part of its Hedging strategy, entered into Interest rate swaps (IRS) transactions to hedge the
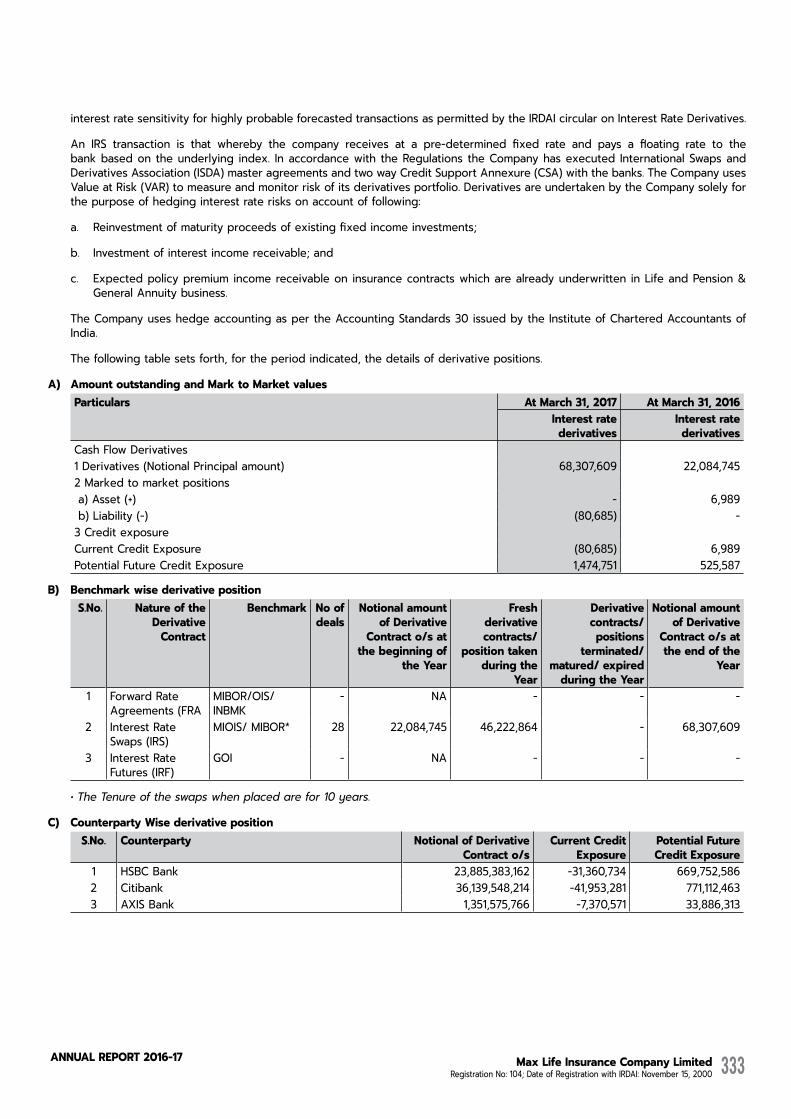
Max Life Insurance Company Limited Registration No: 104; Date of Registration with IRDAI: November 15, 2000
AnnuAL RepoRt 2016-17 333
interest rate sensitivity for highly probable forecasted transactions as permitted by the IRDAI circular on Interest Rate Derivatives.
An IRS transaction is that whereby the company receives at a pre-determined fixed rate and pays a floating rate to the bank based on the underlying index. In accordance with the Regulations the Company has executed International Swaps and Derivatives Association (ISDA) master agreements and two way Credit Support Annexure (CSA) with the banks. The Company uses Value at Risk (VAR) to measure and monitor risk of its derivatives portfolio. Derivatives are undertaken by the Company solely for the purpose of hedging interest rate risks on account of following:
a. Reinvestment of maturity proceeds of existing fixed income investments;
b. Investment of interest income receivable; and
c. Expected policy premium income receivable on insurance contracts which are already underwritten in Life and Pension & General Annuity business.
The Company uses hedge accounting as per the Accounting Standards 30 issued by the Institute of Chartered Accountants of India.
The following table sets forth, for the period indicated, the details of derivative positions.
A) AmountoutstandingandMarktoMarketvaluesParticulars At March 31, 2017 At March 31, 2016
Interest rate derivatives
Interest rate derivatives
Cash Flow Derivatives 1 Derivatives (Notional Principal amount) 68,307,609 22,084,7452 Marked to market positions a) Asset (+) - 6,989 b) Liability (-) (80,685) -3 Credit exposure Current Credit Exposure (80,685) 6,989Potential Future Credit Exposure 1,474,751 525,587
B) BenchmarkwisederivativepositionS.No. Nature of the
DerivativeContract
Benchmark No ofdeals
Notional amount ofDerivative
Contract o/s at thebeginningof
the Year
Fresh derivativecontracts/
positiontakenduringthe
Year
Derivativecontracts/ positions
terminated/matured/expiredduringtheYear
Notional amount ofDerivative
Contract o/s at theendofthe
Year
1 Forward Rate Agreements (FRA
MIBOR/OIS/INBMK
- NA - - -
2 Interest Rate Swaps (IRS)
MIOIS/ MIBOR* 28 22,084,745 46,222,864 - 68,307,609
3 Interest Rate Futures (IRF)
GOI - NA - - -
• The Tenure of the swaps when placed are for 10 years.
C) CounterpartyWisederivativepositionS.No. Counterparty NotionalofDerivative
Contract o/sCurrentCredit
ExposurePotential Future CreditExposure
1 HSBC Bank 23,885,383,162 -31,360,734 669,752,5862 Citibank 36,139,548,214 -41,953,281 771,112,4633 AXIS Bank 1,351,575,766 -7,370,571 33,886,313
Max Life Insurance Company Limited Registration No: 104; Date of Registration with IRDAI: November 15, 2000
AnnuAL RepoRt 2016-17334
Directors' ReportFinancial StatementsSchedules annexed to the forming part of the Financial Statements
All amounts in thousands of Indian Rupees, unless otherwise stated
44) PendingLitigation
The Company’s pending litigations comprise of claims against the Company primarily by the customers and proceedings pending with Tax authorities. The Company has reviewed all its pending litigations and proceedings and has adequately provided for where provisions are required and disclosed the contingent liabilities where applicable, in its financial statements. The Company does not expect the outcome of these proceedings to have a material adverse effect on its financial statement at March 31, 2017. Refer note I. for details on contingent liabilities. In respect of litigations, where the management assessment of a financial outflow is probable, the Company has made a provision of Rs. 299,913 at March 31, 2017. (March 31, 2016: Rs 275,908).
45) LongTermcontract
The Company has a process whereby periodically all long term contracts are assessed for material foreseeable losses. At the year end, the Company has reviewed and ensured that adequate provision as required under any law / accounting standards for material foreseeable losses on such long term contracts including derivative contracts, if any has been made in the financial statements
For insurance contracts, actuarial valuation of liabilities for policies in force is calculated by the reliance has been placed on the Appointed Actuary of the Company. The Appointed Actuary has confirmed that the assumptions used in valuation of liabilities for policies in force are in accordance with the guidelines and norms issued by the Insurance Regulatory and Development Authority of India (“IRDAI”) and the Institute of Actuaries of India in concurrence with the IRDA.
46) The disclosure requirement as envisaged in Notification G.S.R 308(E) dated 30th March 2017 is not applicable to the Company.
SignaturestoSchedules1to16
In terms of our report attached For and on behalf of the Board of Directors of Max Life Insurance Company Limited
For Fraser&Ross For B.K.Khare&Co. Rahul Khosla K Narasimha Murthy RajeshSudChartered Accountants Chartered Accountants Chairman Independent Director Executive Vice Chairman & ICAI Firm Registration No. 000829S ICAI Firm Registration No. 105102W DIN: 03597562 DIN: 00023046 Managing Director
DIN: 02395182
S. Ganesh PadminiKhareKaicker Marielle Theron HideakiNomura Prashant Tripathy Partner Partner Director Director Chief Financial Officer Membership No. 204108 Membership No. 044784 DIN: 02667356 DIN: 05304525 PAN: ABTPT2026P
Place : Bangalore Place : Mumbai Jose John AnuragChauhanDate : May 19, 2017 Date : May 19, 2017 Appointed Actuary Company Secretary
Membership No. A16169Place : New DelhiDate : May 19, 2017
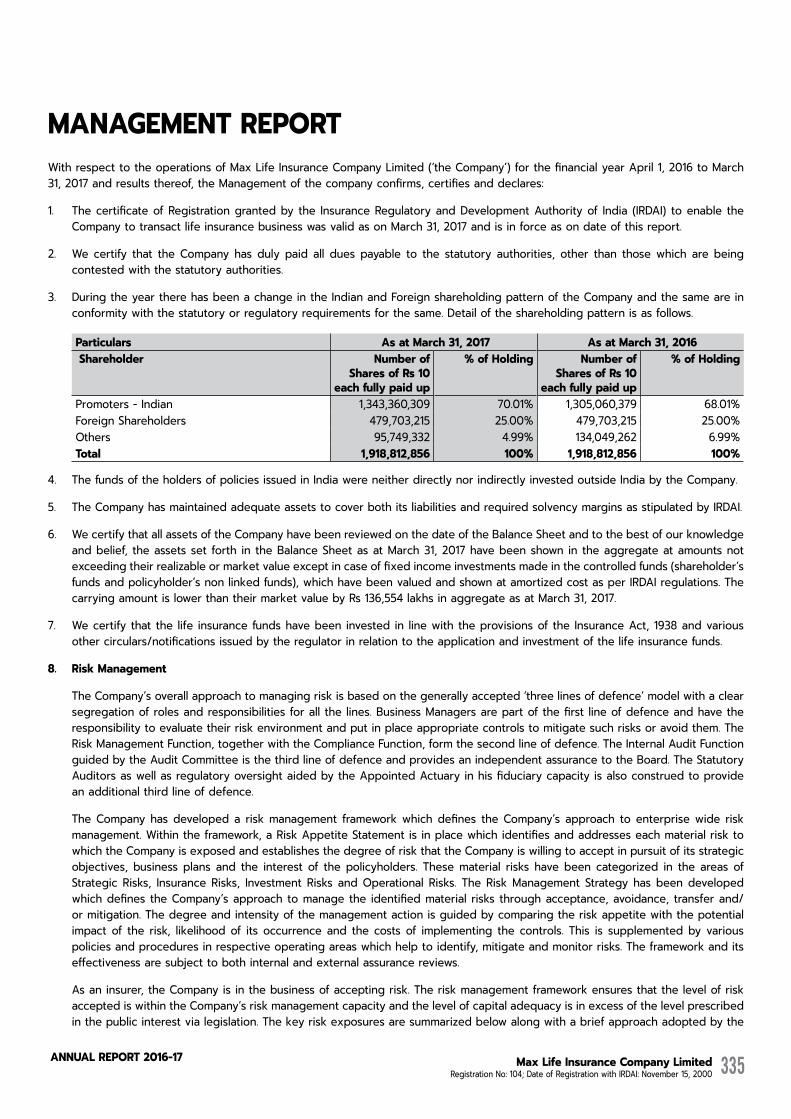
Max Life Insurance Company Limited Registration No: 104; Date of Registration with IRDAI: November 15, 2000
AnnuAL RepoRt 2016-17 335
MANAGEMENT REPORTWith respect to the operations of Max Life Insurance Company Limited (‘the Company’) for the financial year April 1, 2016 to March 31, 2017 and results thereof, the Management of the company confirms, certifies and declares:
1. The certificate of Registration granted by the Insurance Regulatory and Development Authority of India (IRDAI) to enable the Company to transact life insurance business was valid as on March 31, 2017 and is in force as on date of this report.
2. We certify that the Company has duly paid all dues payable to the statutory authorities, other than those which are being contested with the statutory authorities.
3. During the year there has been a change in the Indian and Foreign shareholding pattern of the Company and the same are in conformity with the statutory or regulatory requirements for the same. Detail of the shareholding pattern is as follows.
Particulars As at March 31, 2017 As at March 31, 2016Shareholder Numberof
Shares of Rs 10 eachfullypaidup
%ofHolding NumberofShares of Rs 10
eachfullypaidup
%ofHolding
Promoters - Indian 1,343,360,309 70.01% 1,305,060,379 68.01%Foreign Shareholders 479,703,215 25.00% 479,703,215 25.00%Others 95,749,332 4.99% 134,049,262 6.99%Total 1,918,812,856 100% 1,918,812,856 100%
4. The funds of the holders of policies issued in India were neither directly nor indirectly invested outside India by the Company.
5. The Company has maintained adequate assets to cover both its liabilities and required solvency margins as stipulated by IRDAI.
6. We certify that all assets of the Company have been reviewed on the date of the Balance Sheet and to the best of our knowledge and belief, the assets set forth in the Balance Sheet as at March 31, 2017 have been shown in the aggregate at amounts not exceeding their realizable or market value except in case of fixed income investments made in the controlled funds (shareholder’s funds and policyholder’s non linked funds), which have been valued and shown at amortized cost as per IRDAI regulations. The carrying amount is lower than their market value by Rs 136,554 lakhs in aggregate as at March 31, 2017.
7. We certify that the life insurance funds have been invested in line with the provisions of the Insurance Act, 1938 and various other circulars/notifications issued by the regulator in relation to the application and investment of the life insurance funds.
8. RiskManagement
The Company’s overall approach to managing risk is based on the generally accepted ‘three lines of defence’ model with a clear segregation of roles and responsibilities for all the lines. Business Managers are part of the first line of defence and have the responsibility to evaluate their risk environment and put in place appropriate controls to mitigate such risks or avoid them. The Risk Management Function, together with the Compliance Function, form the second line of defence. The Internal Audit Function guided by the Audit Committee is the third line of defence and provides an independent assurance to the Board. The Statutory Auditors as well as regulatory oversight aided by the Appointed Actuary in his fiduciary capacity is also construed to provide an additional third line of defence.
The Company has developed a risk management framework which defines the Company’s approach to enterprise wide risk management. Within the framework, a Risk Appetite Statement is in place which identifies and addresses each material risk to which the Company is exposed and establishes the degree of risk that the Company is willing to accept in pursuit of its strategic objectives, business plans and the interest of the policyholders. These material risks have been categorized in the areas of Strategic Risks, Insurance Risks, Investment Risks and Operational Risks. The Risk Management Strategy has been developed which defines the Company’s approach to manage the identified material risks through acceptance, avoidance, transfer and/or mitigation. The degree and intensity of the management action is guided by comparing the risk appetite with the potential impact of the risk, likelihood of its occurrence and the costs of implementing the controls. This is supplemented by various policies and procedures in respective operating areas which help to identify, mitigate and monitor risks. The framework and its effectiveness are subject to both internal and external assurance reviews.
As an insurer, the Company is in the business of accepting risk. The risk management framework ensures that the level of risk accepted is within the Company’s risk management capacity and the level of capital adequacy is in excess of the level prescribed in the public interest via legislation. The key risk exposures are summarized below along with a brief approach adopted by the

Max Life Insurance Company Limited Registration No: 104; Date of Registration with IRDAI: November 15, 2000
AnnuAL RepoRt 2016-17336
Directors' ReportFinancial Statements
Company to manage those risks.
1. StrategicRisks
The Company accepts these risks inherent with the key business decisions and plans in areas of product strategies, distribution models, regulatory and legislative changes. The Company’s planning process includes forward looking scenario analysis and stress testing to assess the potential impact of the strategic choices being made including impact on policyholder security. The Company initiates full scale strategic reviews whenever it perceives that prevailing strategies may become misaligned with the operating environment and a recalibration with the changing environment is required.
2. InsuranceRisks
The Company accepts various insurance risks as a core reason for its existence, including mortality and discontinuity. The Company manages mortality risks by use of sound underwriting norms defined in the Underwriting Policy & manuals and leverages technology to deploy business intelligence in decision making. The Company transfers mortality risks above certain threshold to reinsurers based on its annual Reinsurance Program. The Company has in put in place appropriate controls in the sales process and practices to encourage need based selling and product suitability for its customers. Products are also assessed for fairness against predetermined benchmarks and the Policyholder Protection Committee reviews borderline cases.
The Company also accepts risks inherent in pricing of insurance products with long term financial obligations. A Product Steering Committee governs a defined process and structure for development of products covering all stages of product development including pricing as well as approvals. The Company follows a ‘Treat Customer Fairly’ policy, principles and considerations of which are tested at the time of pricing of products.
3. InvestmentRisks
The Company manages a substantial level of assets in support of its obligations to policyholders and shareholders and is exposed to investment risks of Credit, Market, Liquidity and increasing complexities like derivatives and alternate investment funds. In addition, the make-up of investment portfolios may not conform with the characteristics of the liabilities such investments are intended to support, leading to ALM risks. For effective management of such risks, a structured approach is in place comprising of active oversight by Investment Committee and Risk, Ethics and Asset Liability Committee with detailed management through a Working Investment Committee and an ALM Group, besides regular checks by the concurrent auditor
under the regulatory framework. This is complemented by external reviews as needed to ensure that the Company’s processes are aligned to contemporary best practices. The ALM policy defines the constraints on Investment Policy arising from the nature of the liabilities that invested assets support. The Investment Policy defines in appropriate detail the specific limits on various forms of investment arising from Regulations, the ALM Policy and the Company’s specific investment related risk appetites on various forms of investment. The Company has a well defined disclosure policy in accordance with which it discloses details of portfolios of both non-linked and linked business on its website at monthly and quarterly intervals.
4. OperationalRisks
The Company is exposed to various areas of operational risks, including mis-selling, technology, business continuance, information security, fraud, business processes, outsourcing, and compliance. These are mitigated by regular review and monitoring of operating, reporting processes and procedures. A range of policies and procedures to manage these risks is in place including Business Continuity Management, Information Security, Outsourcing, Anti-Fraud, Anti-Corruption and Anti-Bribery, and Anti-Money Laundering Policies together with a Business Code of Conduct. The first line of defence, through the departmental self assessments, identifies all potential areas of inherent as well as residual risks along with the mitigation actions. The progress against these is monitored closely by respective functions, and is followed up by monitoring and reviews by the second and the third lines of defence.
5. OtherEmergingRisks
Operating models continue to evolve based on contemporary technologies, changing stakeholder preferences as well as regulatory requirements. The pace of these changes, together with the impact of innovative business models and emerging technologies, create additional risk exposures for the Company. The Company is also conscious of potential risks driven by changes in the geopolitical environment. The Company scans its operating environment continuously and its risk capabilities and controls are augmented accordingly. The emerging risks are monitored and reported to the Risk, Ethics and ALM Committee on a quarterly basis along with the potential implication and management’s identified action plan to manage these risks early.
9. The Company has not sold any policies outside India during the year. The Company is operating in India only and has no exposure to any other country risk.
10. Average claim settlement time for last five years along with ageing of outstanding claims as at balance sheet date is disclosed below.
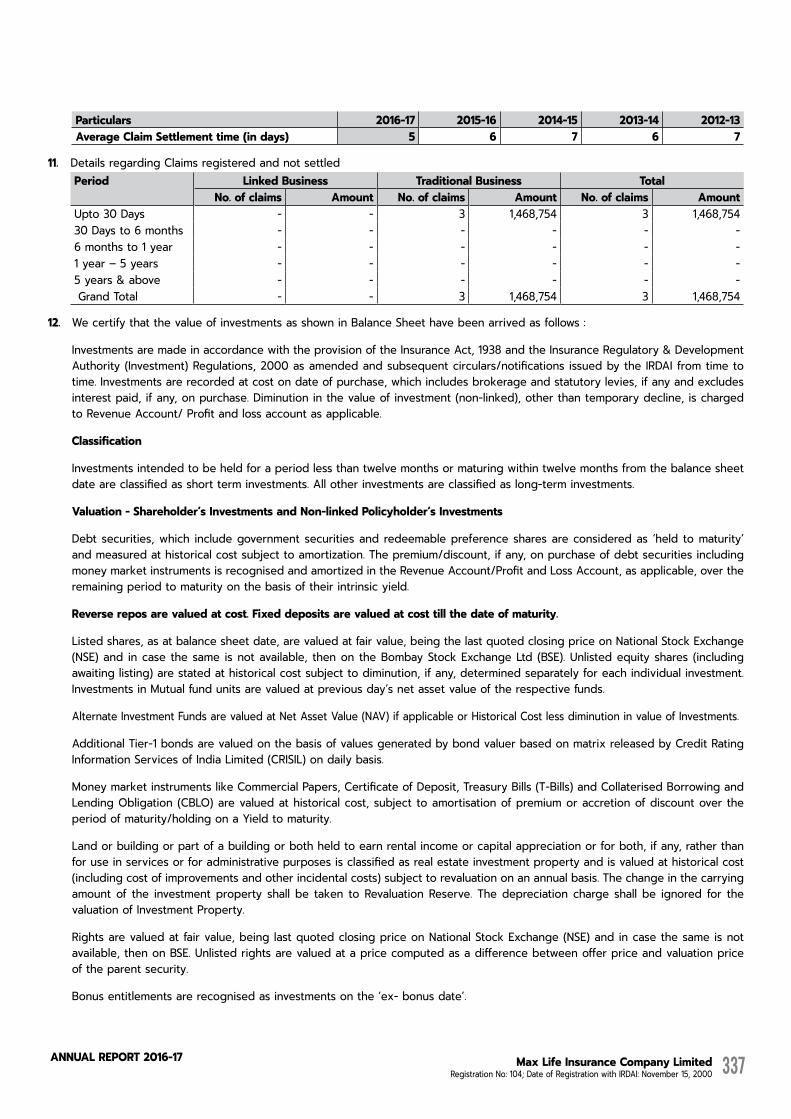
Max Life Insurance Company Limited Registration No: 104; Date of Registration with IRDAI: November 15, 2000
AnnuAL RepoRt 2016-17 337
Particulars 2016-17 2015-16 2014-15 2013-14 2012-13AverageClaimSettlementtime(indays) 5 6 7 6 7
11. Details regarding Claims registered and not settledPeriod LinkedBusiness TraditionalBusiness Total
No. of claims Amount No. of claims Amount No. of claims AmountUpto 30 Days - - 3 1,468,754 3 1,468,75430 Days to 6 months - - - - - -6 months to 1 year - - - - - -1 year – 5 years - - - - - -5 years & above - - - - - - Grand Total - - 3 1,468,754 3 1,468,754
12. We certify that the value of investments as shown in Balance Sheet have been arrived as follows :
Investments are made in accordance with the provision of the Insurance Act, 1938 and the Insurance Regulatory & Development Authority (Investment) Regulations, 2000 as amended and subsequent circulars/notifications issued by the IRDAI from time to time. Investments are recorded at cost on date of purchase, which includes brokerage and statutory levies, if any and excludes interest paid, if any, on purchase. Diminution in the value of investment (non-linked), other than temporary decline, is charged to Revenue Account/ Profit and loss account as applicable.
Classification
Investments intended to be held for a period less than twelve months or maturing within twelve months from the balance sheet date are classified as short term investments. All other investments are classified as long-term investments.
Valuation-Shareholder’sInvestmentsandNon-linkedPolicyholder’sInvestments
Debt securities, which include government securities and redeemable preference shares are considered as ‘held to maturity’ and measured at historical cost subject to amortization. The premium/discount, if any, on purchase of debt securities including money market instruments is recognised and amortized in the Revenue Account/Profit and Loss Account, as applicable, over the remaining period to maturity on the basis of their intrinsic yield.
Reversereposarevaluedatcost.Fixeddepositsarevaluedatcosttillthedateofmaturity.
Listed shares, as at balance sheet date, are valued at fair value, being the last quoted closing price on National Stock Exchange (NSE) and in case the same is not available, then on the Bombay Stock Exchange Ltd (BSE). Unlisted equity shares (including awaiting listing) are stated at historical cost subject to diminution, if any, determined separately for each individual investment. Investments in Mutual fund units are valued at previous day’s net asset value of the respective funds.
Alternate Investment Funds are valued at Net Asset Value (NAV) if applicable or Historical Cost less diminution in value of Investments.
Additional Tier-1 bonds are valued on the basis of values generated by bond valuer based on matrix released by Credit Rating Information Services of India Limited (CRISIL) on daily basis.
Money market instruments like Commercial Papers, Certificate of Deposit, Treasury Bills (T-Bills) and Collaterised Borrowing and Lending Obligation (CBLO) are valued at historical cost, subject to amortisation of premium or accretion of discount over the period of maturity/holding on a Yield to maturity.
Land or building or part of a building or both held to earn rental income or capital appreciation or for both, if any, rather than for use in services or for administrative purposes is classified as real estate investment property and is valued at historical cost (including cost of improvements and other incidental costs) subject to revaluation on an annual basis. The change in the carrying amount of the investment property shall be taken to Revaluation Reserve. The depreciation charge shall be ignored for the valuation of Investment Property.
Rights are valued at fair value, being last quoted closing price on National Stock Exchange (NSE) and in case the same is not available, then on BSE. Unlisted rights are valued at a price computed as a difference between offer price and valuation price of the parent security.
Bonus entitlements are recognised as investments on the ‘ex- bonus date’.
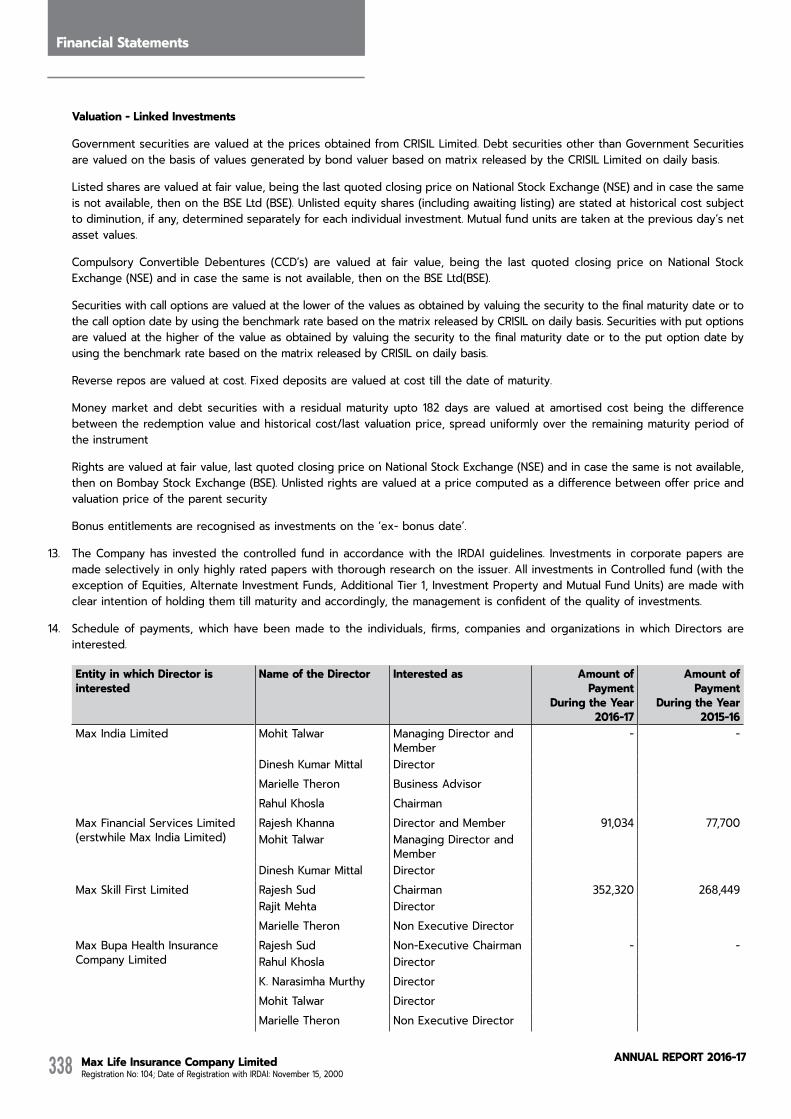
Max Life Insurance Company Limited Registration No: 104; Date of Registration with IRDAI: November 15, 2000
AnnuAL RepoRt 2016-17338
Directors' ReportFinancial Statements
Valuation-LinkedInvestments
Government securities are valued at the prices obtained from CRISIL Limited. Debt securities other than Government Securities are valued on the basis of values generated by bond valuer based on matrix released by the CRISIL Limited on daily basis.
Listed shares are valued at fair value, being the last quoted closing price on National Stock Exchange (NSE) and in case the same is not available, then on the BSE Ltd (BSE). Unlisted equity shares (including awaiting listing) are stated at historical cost subject to diminution, if any, determined separately for each individual investment. Mutual fund units are taken at the previous day’s net asset values.
Compulsory Convertible Debentures (CCD’s) are valued at fair value, being the last quoted closing price on National Stock Exchange (NSE) and in case the same is not available, then on the BSE Ltd(BSE).
Securities with call options are valued at the lower of the values as obtained by valuing the security to the final maturity date or to the call option date by using the benchmark rate based on the matrix released by CRISIL on daily basis. Securities with put options are valued at the higher of the value as obtained by valuing the security to the final maturity date or to the put option date by using the benchmark rate based on the matrix released by CRISIL on daily basis.
Reverse repos are valued at cost. Fixed deposits are valued at cost till the date of maturity.
Money market and debt securities with a residual maturity upto 182 days are valued at amortised cost being the difference between the redemption value and historical cost/last valuation price, spread uniformly over the remaining maturity period of the instrument
Rights are valued at fair value, last quoted closing price on National Stock Exchange (NSE) and in case the same is not available, then on Bombay Stock Exchange (BSE). Unlisted rights are valued at a price computed as a difference between offer price and valuation price of the parent security
Bonus entitlements are recognised as investments on the ‘ex- bonus date’.
13. The Company has invested the controlled fund in accordance with the IRDAI guidelines. Investments in corporate papers are made selectively in only highly rated papers with thorough research on the issuer. All investments in Controlled fund (with the exception of Equities, Alternate Investment Funds, Additional Tier 1, Investment Property and Mutual Fund Units) are made with clear intention of holding them till maturity and accordingly, the management is confident of the quality of investments.
14. Schedule of payments, which have been made to the individuals, firms, companies and organizations in which Directors are interested.
Entity in which Director is interested
Name of the Director Interestedas Amount of Payment
DuringtheYear2016-17
Amount of Payment
DuringtheYear2015-16
Max India Limited Mohit Talwar Managing Director and Member
- -
Dinesh Kumar Mittal DirectorMarielle Theron Business AdvisorRahul Khosla Chairman
Max Financial Services Limited (erstwhile Max India Limited)
Rajesh Khanna Director and Member 91,034 77,700Mohit Talwar Managing Director and
MemberDinesh Kumar Mittal Director
Max Skill First Limited Rajesh Sud Chairman 352,320 268,449Rajit Mehta DirectorMarielle Theron Non Executive Director
Max Bupa Health Insurance Company Limited
Rajesh Sud Non-Executive Chairman - -Rahul Khosla Director K. Narasimha Murthy DirectorMohit Talwar DirectorMarielle Theron Non Executive Director
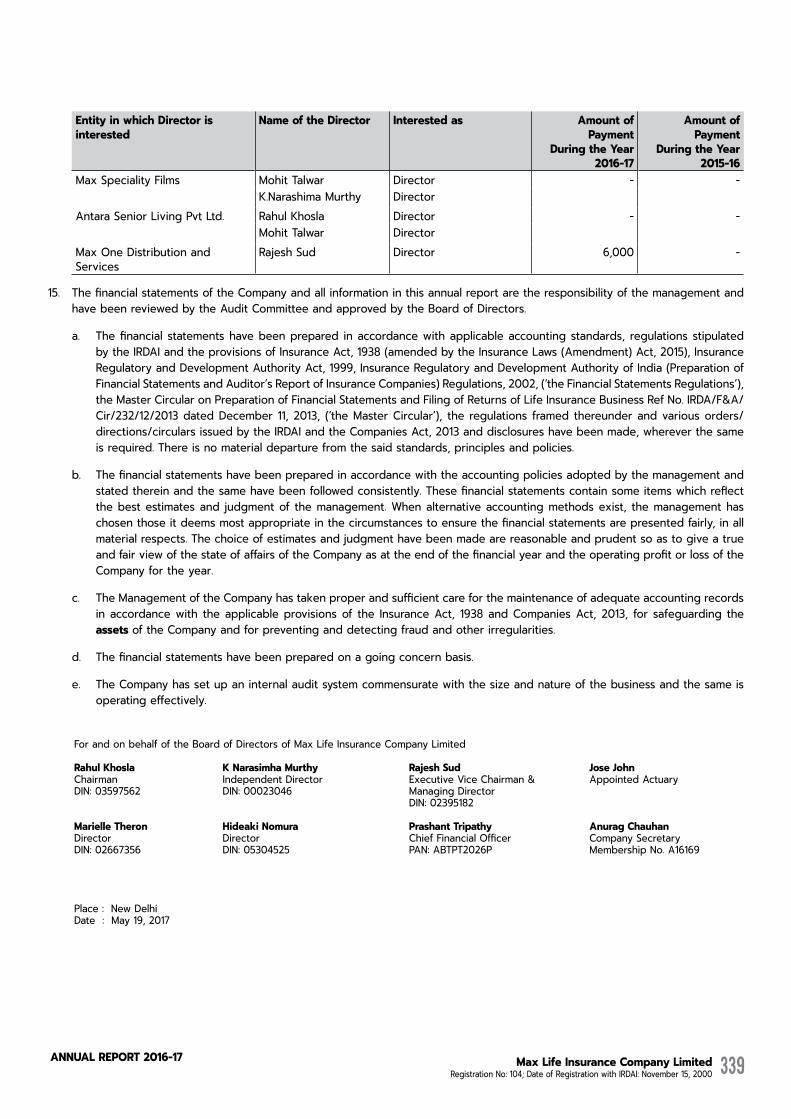
Max Life Insurance Company Limited Registration No: 104; Date of Registration with IRDAI: November 15, 2000
AnnuAL RepoRt 2016-17 339
Entity in which Director is interested
Name of the Director Interestedas Amount of Payment
DuringtheYear2016-17
Amount of Payment
DuringtheYear2015-16
Max Speciality Films Mohit Talwar Director - -K.Narashima Murthy Director
Antara Senior Living Pvt Ltd. Rahul Khosla Director - -Mohit Talwar Director
Max One Distribution and Services
Rajesh Sud Director 6,000 -
15. The financial statements of the Company and all information in this annual report are the responsibility of the management and have been reviewed by the Audit Committee and approved by the Board of Directors.
a. The financial statements have been prepared in accordance with applicable accounting standards, regulations stipulated by the IRDAI and the provisions of Insurance Act, 1938 (amended by the Insurance Laws (Amendment) Act, 2015), Insurance Regulatory and Development Authority Act, 1999, Insurance Regulatory and Development Authority of India (Preparation of Financial Statements and Auditor’s Report of Insurance Companies) Regulations, 2002, (‘the Financial Statements Regulations’), the Master Circular on Preparation of Financial Statements and Filing of Returns of Life Insurance Business Ref No. IRDA/F&A/ Cir/232/12/2013 dated December 11, 2013, (‘the Master Circular’), the regulations framed thereunder and various orders/directions/circulars issued by the IRDAI and the Companies Act, 2013 and disclosures have been made, wherever the same is required. There is no material departure from the said standards, principles and policies.
b. The financial statements have been prepared in accordance with the accounting policies adopted by the management and stated therein and the same have been followed consistently. These financial statements contain some items which reflect the best estimates and judgment of the management. When alternative accounting methods exist, the management has chosen those it deems most appropriate in the circumstances to ensure the financial statements are presented fairly, in all material respects. The choice of estimates and judgment have been made are reasonable and prudent so as to give a true and fair view of the state of affairs of the Company as at the end of the financial year and the operating profit or loss of the Company for the year.
c. The Management of the Company has taken proper and sufficient care for the maintenance of adequate accounting records in accordance with the applicable provisions of the Insurance Act, 1938 and Companies Act, 2013, for safeguarding the assets of the Company and for preventing and detecting fraud and other irregularities.
d. The financial statements have been prepared on a going concern basis.
e. The Company has set up an internal audit system commensurate with the size and nature of the business and the same is operating effectively.
For and on behalf of the Board of Directors of Max Life Insurance Company Limited
Rahul Khosla K Narasimha Murthy RajeshSud Jose JohnChairman Independent Director Executive Vice Chairman & Appointed ActuaryDIN: 03597562 DIN: 00023046 Managing Director
DIN: 02395182
Marielle Theron HideakiNomura Prashant Tripathy AnuragChauhanDirector Director Chief Financial Officer Company SecretaryDIN: 02667356 DIN: 05304525 PAN: ABTPT2026P Membership No. A16169
Place : New DelhiDate : May 19, 2017


100
MAX FINANCIAL SERVICES LIMITED (FORMERLY MAX INDIA LIMITED) MAX HOUSE, OKHLA NEW DELHI – 110020 | T: +91 11 4259 8000WWW.MAXFINANCIALSERVICES.COM
/themaxgroup /maxgroup /company/3187772