Embed Size (px)
Citation preview

1Ecosystem Health and Sustainability www.ecohealthsustain.org
Optical water quality and human perceptions of rivers: an ethnohydrology study
Amie O. West,1,4 Justin M. Nolan,2 and J. Thad Scott3
1Environmental Dynamics Program, University of Arkansas, GEAR 216, Fayetteville, Arkansas 72701 USA2Department of Anthropology, University of Arkansas, Old Main 330, Fayetteville, Arkansas 72701 USA
3Department of Crop, Soil, and Environmental Science, University of Arkansas, 115 Plant Science Building, Fayetteville, Arkansas 72701 USA
Abstract. Rivers are revered worldwide for their ecologic, scenic, and recreational value. The capacity to communicate effectively among human groups with vested interest in rivers hinges on understanding the nature of human perceptions of water quality and the extent to which they vary intraculturally. Recognizing the intersection between measured water quality and the characteristics of rivers that influence human perceptions facilitates potential for better communication across disciplines and among stakeholders. We conducted interviews and a pile- sort task with water quality experts and nonexperts. Our analysis suggested human evaluation of water quality is guided by culturally constructed criteria, regardless of respondent expertise, experience, or demographics. Cluster analysis results implied that measured physical and chemical parameters of rivers were directly related to the visible attributes used in human judgments. We suggest that, regardless of variability among individual stakeholders, observable characteristics may be the foundation for a common understanding of water quality in rivers.
Key words: environmental cognition; environmental perceptions; ethnohydrology; interdisciplinary research; Ozark Highlands; resource management; river recreation; water quality.
Citation: West, A. O., J. M. Nolan, and J. T. Scott. 2016. Optical water quality and human perceptions of rivers: an ethnohydrology study. Ecosystem Health and Sustainability 2(8):e01230. doi:10.1002/ehs2.1230
Introduction
The ability to integrate cultural values into water resource management is increasingly important as climate and landscape change become more salient and polarized in public opinion. Stakeholder engagement in water re-sources management is as important as application of scientific knowledge (Wheater and Gober 2015), and pre-senting water quality assessments in terms of impacts to human activities and values will make them more mean-ingful to the public (Keeler et al. 2012). For example, the U.S. Environmental Protection Agency (U.S. EPA) have encouraged states to develop numeric nutrient criteria, and have advocated science to achieve this goal (e.g., U.S. EPA 2010). While it is acknowledged that changes in water characteristics caused by excessive nutrients can compromise recreational use (U.S. EPA 2000), the U.S. EPA has not yet included methods that evaluate human values or perceptions in criteria development strategies. Human perceptions of water quality (WQ) should be evaluated so that citizen values are justly considered in the protection of water bodies.
Optical water quality (OWQ) refers to the suitability of a waterbody, as defined by its optical properties, to support biodiversity and/or human welfare (Kirk 1988). Physical, chemical, and biological assessments can quan-tify WQ in the biosphere in terms of concentrations of sediments, nutrients, and pollutants, and their effects on aquatic systems. But, water quality in regard to the human environment is a more complicated subject—cultural, spiritual, and aesthetic values are much more difficult to quantify. Recent studies in both the hydro-logic and the social sciences have broadened the concept of ecosystem services to help quantify the social value of water quality in the environment (e.g., Keeler et al. 2015, Nelson et al. 2015, Castro et al. 2016). Still, research projects integrating the two sciences are somewhat rare (Egan et al. 2009, Brauman 2015). Despite myriad sug-gestions to use holistic approaches to environmental management (Falkenmark 1977, NRC 2004, Lall 2014), ecology and the human environment are still often con-sidered separately because of the difficulty of relating quantitative data to human values.
Early work connecting quantitative values of OWQ with human perceptions related mean Secchi depth and total phosphorus in lakes in Minnesota and Vermont to recreational impairment (Heiskary and Walker 1988,
Manuscript received 5 April 2016; revised 16 May 2016; accepted 19 May 2016. 4 E-mail: [email protected]

2
WEST ET AL. An ethnohydrology study
Volume 2(8) v Article e01230Ecosystem Health and Sustainability
Smeltzer and Heiskary 1990). Researchers in New Zealand linked measured water clarity and color to judged recreational suitability in rivers (Smith et al. 1991, 1995, Smith and Davies- Colley 1992). More recently, Egan et al. (2009) determined reduced water clarity and increased total phosphorus concentrations to be directly related to a decrease in recreational trips to Iowa lakes. Suplee et al. (2009) quantitatively linked benthic algae biomass in Montana streams to recreational desirability. Keeler et al. (2015) found that Minnesota and Iowa lakes that had greater average water clarity received more fre-quent recreational visitation. Smith et al. (2015) exam-ined WQ measurements alongside visual assessments of recreational ability in streams of New York State and proposed thresholds for total phosphorus, total nitrogen, suspended chlorophyll a, and turbidity that would main-tain desirability. Our study sought to expand on these by examining the cognitive structures that inform human judgments of aquatic environments. Pile sorting is a structured interviewing method that offers respondents a set of cards, images, or items which they are instructed to organize into groups that go together, without provid-ing suggestions or examples (Weller 2015). The pile- sort exercise was designed to elicit and explore the dimen-sions guiding variability in cultural domain perceptions (Trotter et al. 2015), rather than individual preferences, decisions, or behaviors.
Culture is the set of learned behavior patterns and shared values and beliefs of a social group (Goodenough 1981), and environmental perceptions can be a prod-uct of a shared cultural framework (Cottet et al. 2013). Perceptions of WQ are also influenced by the individual senses of the observer with respect to all of the com-plexities of his or her own prior experiences and asso-ciations (Coughlin 1976). The study of ethnohydrology has developed, from its inception by William Back (1981), to describe the culturally constituted knowledge of water (Gartin et al. 2010). Ethnohydrology studies have examined an array of issues, ranging from urban residents’ views of water management (Gartin et al. 2010) to the imaginings of long- term changes of water in the environment by school- aged children (Vins et al. 2014); from the cultural understanding of connections between water quality and disease (Brewis et al. 2013) to perceived injustices of institutions responsible for water distribution (Wutich et al. 2013). A mental model is a functional cognitive structure that allows indi-viduals to understand and make decisions regarding their environment (Jones et al. 2011, Lynam and Brown 2012). External information is processed through an evolving individual mental model, elicitation of which may strengthen conservation planning and implemen-tation (Biggs et al. 2011). Ethnohydrology studies can help examine cultural paradigms and may allow for the development of a common mental model of human dimensions of water that will enhance communica-tion among stakeholders, scientists, and policymakers
(West et al. 2016). To represent the full significance of water in our environment, we must recognize percep-tual, emotional, spiritual, and aesthetic ideals (Burmil et al. 1999). The complete understanding of water envi-ronments required to inform sustainability science can only be achieved by integration of the hydrologic and social sciences (Braden et al. 2009, Orlove and Caton 2010, Linton 2014). As such, river monitoring and man-agement can be strengthened by incorporating both ecological and human values (Harmsworth et al. 2011).
This study aimed to contribute to an integrative understanding of human perceptions and OWQ in riv-ers by investigating two hypotheses: (1) Wide agreement exists among stakeholders in judgments of similarity when observing aquatic conditions; and (2) judgments of similarity will be related to measurable water qual-ity attributes because the effects of chemical and physi-cal variability are often directly visible. The overarching objective of this study was to demonstrate the associa-tions between scientific environmental indicators and human perceptions of rivers, using rivers of the south-western Ozarks as a case study.
Materials and Methods
Study area: Southwestern Ozarks, USA
Five rivers in the southwestern Ozarks of Arkansas, USA, were chosen for their regional popularity as recreational destinations. Four of the five rivers in this study are held under special designations by the States of Arkansas and Oklahoma: The Buffalo, Kings, and Mulberry rivers are designated extraordinary resource waters by the State of Arkansas; the Buffalo and Mulberry rivers are also natural and scenic waterways by the State of Arkansas; the Illinois River is designated ecologically sensitive by the State of Arkansas and also as a scenic river by the State of Oklahoma. The Illinois River has reaches listed as impaired for aesthetics by phosphorus, and for primary contact rec-reation by pathogen indicators (OK DEQ 2014). The fifth river, War Eagle Creek, is simply designated as a primary contact recreation waterway. The five rivers in this study are characteristic of the region’s riffle- pool morphology, with bedrock, rubble, and gravel dominating the stre-ambeds (Adamski et al. 1995).
The chosen rivers represent a range of land use char-acteristics (Table 1), flow patterns, and chemistry. All five rivers originate in the sandstone, shale, and silt-stone of the Boston Mountain (BM) ecoregion. Four of the rivers then cut deeply through the limestone and dolomite of the Ozark Highlands (OH) ecoregion, pro-viding a narrow, but critical range of WQ variability for the region. Streams of the BM ecoregion generally have exceptional water quality, with low nutrient and min-eral concentrations, whereas karst geology and increas-ing human alteration contribute to higher alkalinity, dissolved solids, and nutrient concentrations in the OH

3
WEST ET AL. An ethnohydrology study
Volume 2(8) v Article e01230Ecosystem Health and Sustainability
ecoregion (Adamski et al. 1995, Woods et al. 2004). The sampling location on each river was chosen to coincide with the following U.S. Geological Survey gaging sta-tions to allow us to continuously monitor flow condi-tions via WaterWatch (waterwatch.usgs.gov): Buffalo River near St. Joe, AR; Illinois River south of Siloam Springs, AR; Kings River near Berryville, AR; Mulberry River near Mulberry, AR; and War Eagle Creek near Hindsville, AR.
Data collection
Site visits were initiated by precipitation events that induced flows favorable for kayak and canoe recreation during spring and early summer of 2014 (April through June). Data were collected at intervals ranging from sev-eral times per day to approximately once every 2–5 d as flow receded, based on observation of the river’s response to precipitation. Black disk visibility (BDV) was recorded as the average of three visual distance measurements with a horizontal black disk device (Davies- Colley 1988). This method is similar to the Secchi disk, but uses an inverted periscope and an all- black target to measure visual clarity under water. Because the measurement is made horizontally under water, BDV is useful in shallow rivers and is directly related to the inherent optical prop-erties of the water (Davies- Colley 1988, Steel and Neuhauser 2002, Zaneveld and Pegau 2003). At each visit, we photographed underwater conditions at wrist depth to capture both the water background and the sub-strate. We collected three liters of water at each sampling occasion in acid- washed bottles and immediately stored them on ice and transported them to the laboratory at the University of Arkansas in Fayetteville, AR. Water sam-ples were kept at ~4°C and processed within 48 h. We used a 7200 Trilogy fluorometer (Turner Designs, San Jose, CA, USA) fitted with a turbidity module, and cali-brated with a blank sample of deionized water and AMCO Clear turbidity standards (GFS Chemicals, Powell, OH, USA) of 10 and 100 NTU. We recorded the average turbidity of three rapidly consecutive measure-ments on each sample. Total suspended solids (TSS) were measured according to standard methods (APHA 2005) using Whatman GF/F 47- mm glass fiber filters. We also filtered water samples through Whatman GF/F 25- mm glass fiber filters for analysis of suspended
chlorophyll a (chl- a) and particulate phosphorus (PP) concentrations. Filters were kept frozen until analysis. We used the Trilogy™ fluorometer to measure chl- a, via the acid digestion method, following overnight extraction with acetone. We also used the Trilogy™ fluorometer, fit-ted with an absorbance module, to measure PP using the 1% persulfate digestion and ascorbic acid colorimetric method (APHA 2005). Prior to statistical analysis, we log10- transformed concentration values because water quality data typically exhibit lognormal distribution (Hirsch et al. 1991).
We chose 26 photographs independently of WQ meas-urements, including one photograph that was “staged”; that is, the substrate was stirred up intentionally (WQ parameters for this photograph were not included in sta-tistical analyses). The final set of photographs was settled upon so as to be fully representative of the visual range of OWQ conditions throughout the sampling period without being too overwhelming for respondents. After the photographs were chosen, we noted two occasions where we selected two photographs from the same sam-pling event (Fig. 1). Because our inspection judged the images to have noticeable visible differences, we elected to keep the duplicates to allow us to consider what effect the photography might introduce. We matched tiles of the Munsell Color charts for plant tissue (Munsell Color 1977) to each photograph to give numeric values to the dominant Munsell hue (color), Munsell value (light-ness), and Munsell chroma (saturation) of the image. We assigned a brief written survey and pile- sort task with the 26 photographs to 167 respondents (151 completed pile- sorts) at four different locations: 38 respondents at the Arkansas Water Resources Center annual confer-ence 2014 (AWRC), 59 at the Arkansas Chapter of the American Fisheries Society annual meeting 2015 (AAFS), 39 at the 2015 Jungle Boater Race at Mulberry River (RACE), and 31 respondents in front of a local grocery/department store (SHOP). Each respondent was asked to sort the images “by whatever criteria you deem mean-ingful.” This wording was specified in such a way as not to suggest respondents sort by preference or any other proposed criteria.
The written survey was administered prior to the pile- sort task to ensure that each respondent was equally aware of the topic when they approached the pile- sort, and included the following questions:
Table 1. Catchment characteristics.†
Site Gage # Stream order Area (km2) % Urban % Forest % Pasture Ecoregion
Buffalo R. 07056000 5 2147 3.2 83.2 11.2 BM, OHIllinois R. 07195430 6 1489 16.4 28.5 52.8 OHKings R. 07050500 5 1365 4.1 67.5 25.8 OHMulberry R. 07252000 5 966 3.2 90.7 4.7 BMWar Eagle Cr. 07049000 4 681 4.6 58.0 35.0 OH
Note: BM, Boston Mountains; OH, Ozark Highlands.†Land use from U.S. Geological Survey (2011), and level III ecoregion from Woods et al. (2004).
4
WEST ET AL. An ethnohydrology study
Volume 2(8) v Article e01230Ecosystem Health and Sustainability
1. Education Level: High School, Some College, Asso-ciate Degree/Professional Certification, Bachelor’s Degree, Advanced Degree
2. How knowledgeable are you about water quality in rivers? 1 (Very little knowledge)–7 (Expert)
3. How experienced are you with recreation on rivers (kayaking, canoeing, fishing, etc.)? 1 (Very little expe-rience)–7 (Expert)
4. How important to you is water quality in rivers? 1 (Not important)–7 (Very important)
5. How important to you is water clarity in rivers? 1 (Not important)–7 (Very important)
For comparisons presented in this report, we separated respondents into two subgroups for each of the first three questions.
Statistical analyses
A nonmetric multidimensional scaling (NMDS) proce-dure was carried out in Anthropac (Borgatti 1996) to gen-erate a two- dimensional proximity (dissimilarity) matrix (Weller and Romney 1988) of the photographs from the entire set of respondents’ pile- sorts. We repeated the pro-cedure for 14 subgroups of respondents as defined by survey responses. Upon confirmation of an acceptable stress value in two dimensions (less than 0.313 for 26 items; Sturrock and Rocha 2000), we used the NMDS coordinates in further analyses. The NMDS coordinates of 25 photographs (staged photograph removed) and the corresponding WQ measurements for each photograph were used to perform a property fitting analysis (PROFIT) in UCINET 6 (Borgatti et al. 2002). PROFIT is a multiple linear regression technique wherein a vector represent-ing a dependent variable, in this case a WQ parameter, is fitted to the independent X- and Y- coordinates of the photographs in the NMDS (Kruskal and Wish 1978). The regressed vector runs through the origin and is an indi-cator of the direction of increasing value of the WQ parameter with respect to the locations of photographs on the NMDS. PROFIT analysis allowed us to test the hypothesis that a given WQ variable was an underlying dimension in pile sorting.
We derived distance matrices from the NMDS coordi-nates and performed agglomerative hierarchical cluster analyses with the complete set of pile- sorts and those of the subgroups using the average- link in R (R Core Team 2015) to identify which photographs tended to exist together within the NMDS. Because of the multitude of indices for determining the optimal number of clusters, we selected two methods that use different calculation procedures, the Duda and Hart index (Duda and Hart 1973) and the gap index (Tibshirani et al. 2001). The Duda and Hart index is an iterative local optimization method that uses the sum of squared errors within clusters, sample size, and the number of dimensions to calculate a critical value which is
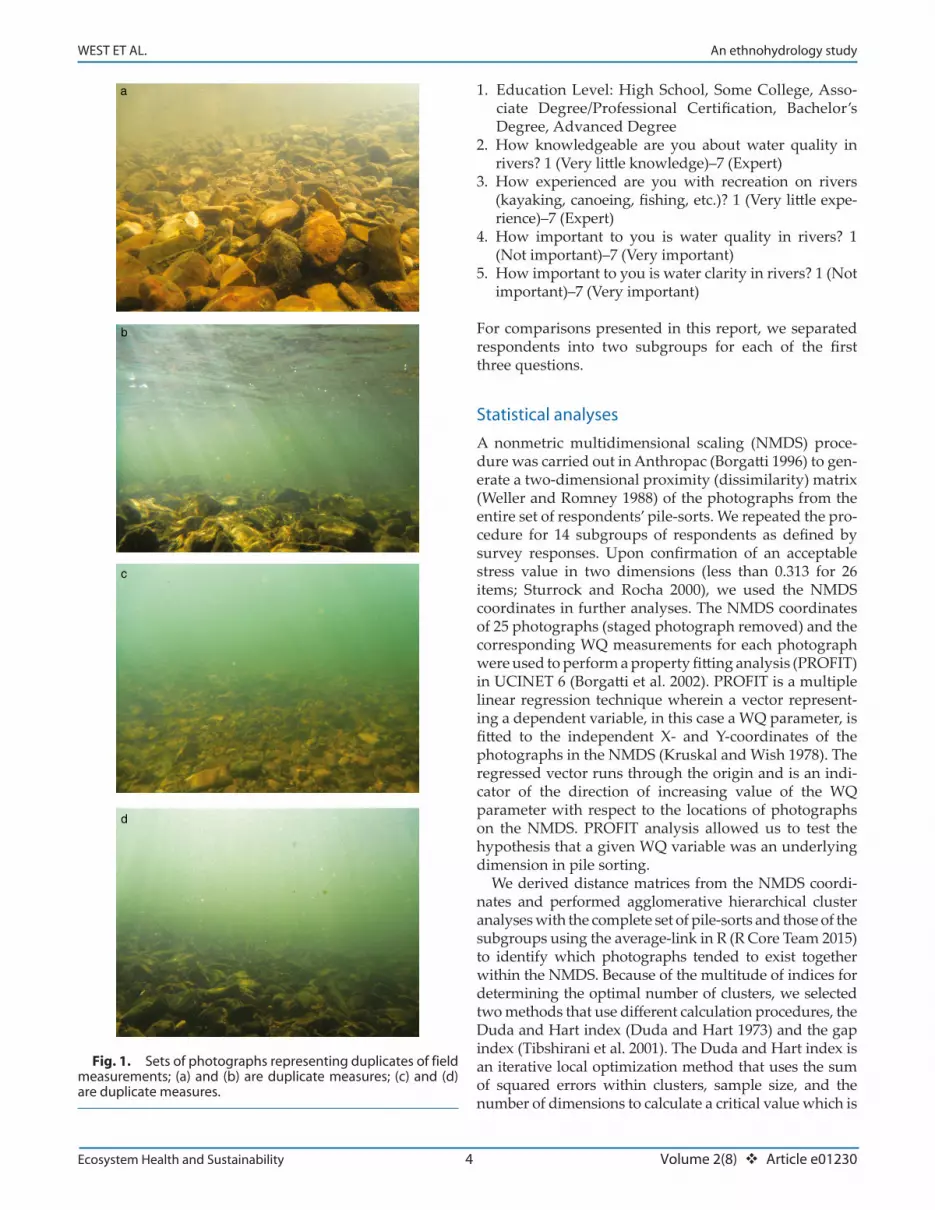
Fig. 1. Sets of photographs representing duplicates of field measurements; (a) and (b) are duplicate measures; (c) and (d) are duplicate measures.
a
b
c
d

5
WEST ET AL. An ethnohydrology study
Volume 2(8) v Article e01230Ecosystem Health and Sustainability
compared to a standard score, and has been shown to per-form reliably with relatively small sample sizes (Milligan and Cooper 1985). The gap index is a global optimization procedure that determines the most likely number of clus-ters by comparing the dispersion against the null distri-bution (Tibshirani et al. 2001). We calculated both indices using the NbClust package for R (Charrad et al. 2014). We further investigated each WQ variable among the clusters with one- way analysis of variance (ANOVA) for each WQ variable. If ANOVA results were significant at the 95% confidence level, we followed with pairwise t- tests among the clusters using the Bonferroni P- value correction. We also visually assessed NMDS plots of respondents by demographics and survey responses.
Results
Respondent demographics
We recruited 167 total respondents, for which 151 com-pleted pile- sorts were used. Sixteen were thrown out due to documentation error. General demographics of the 151 respondents are shown in Table 2. Regardless of our solicitation of responses outside the university in an attempt to represent a greater range of education levels, it seemed that individuals with a bachelor’s degree or higher were both more common at our solicitation events and more willing to participate in the survey. Fifty per-cent of respondents at the two nonacademic events (BOAT and SHOP) held a bachelor’s degree or higher. Thus, the range of education levels was probably not representative of the general population.
Multidimensional scaling and property fitting analysis
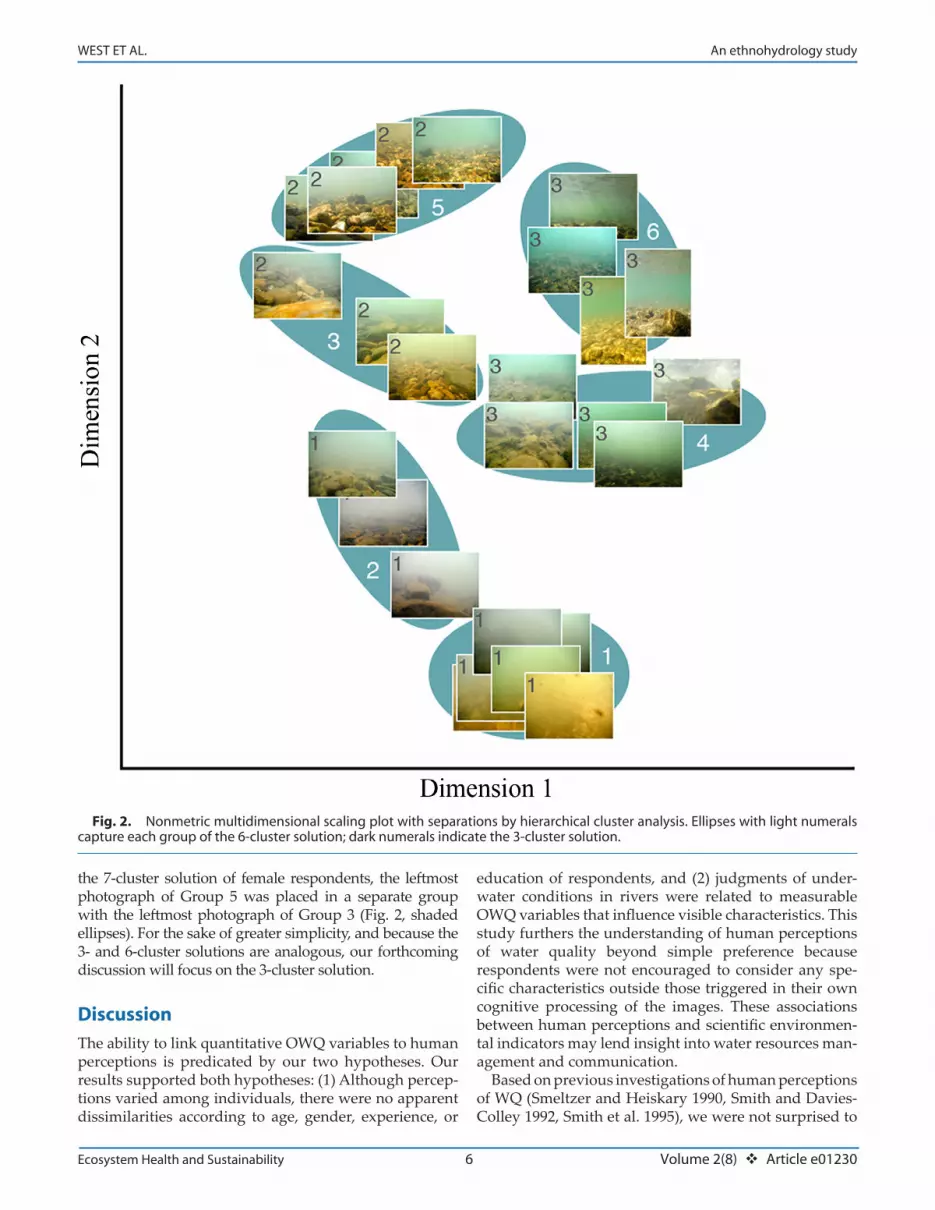
The NMDS plot with an acceptable stress value of 0.121 (Fig. 2) illustrates the overall solution to the pile- sort. Photographs frequently placed into the same pile are closer together, and those rarely piled together are farther apart in the NMDS plot. Property fitting analysis allowed us to
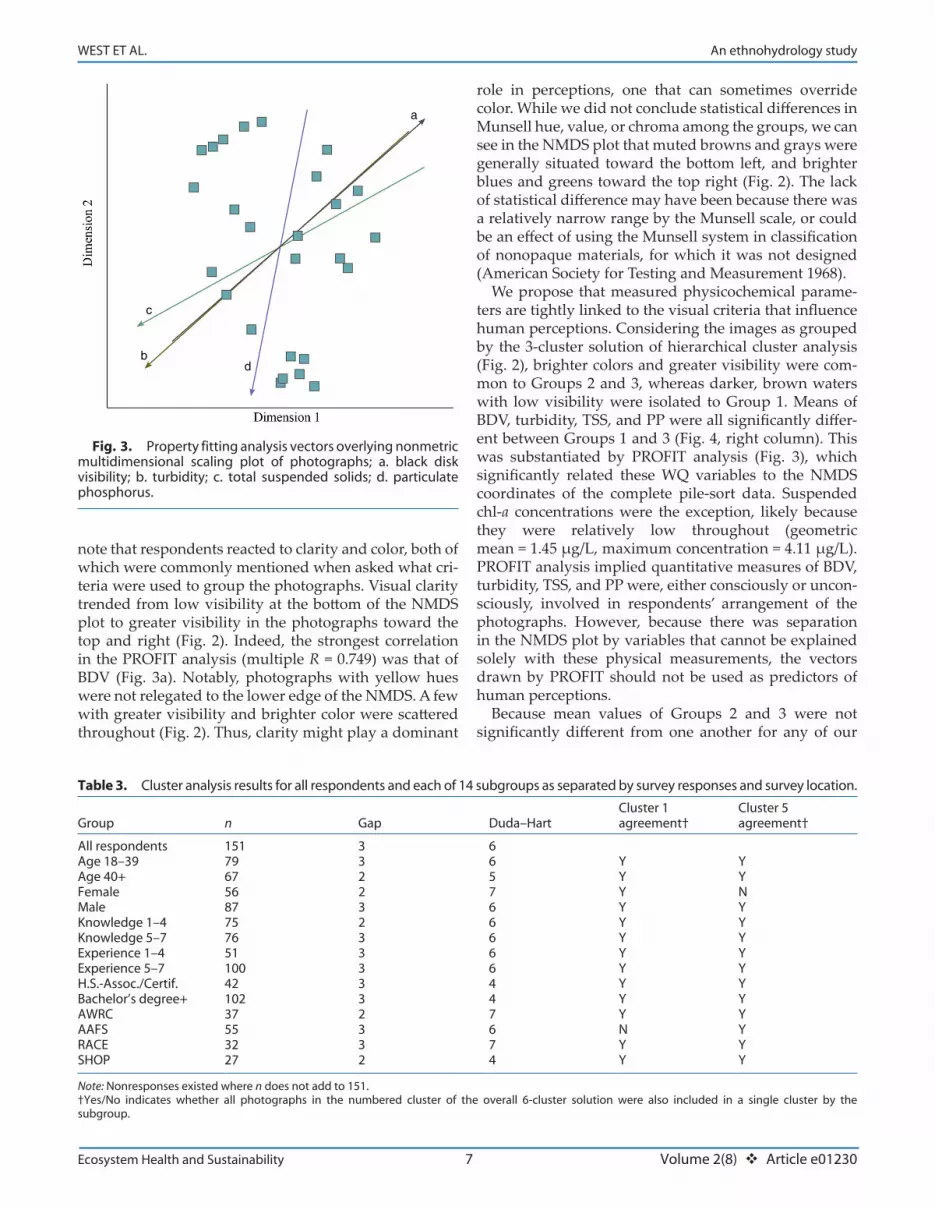
investigate the relationship between our measured WQ variables and the coordinates of the NMDS plot. PROFIT resulted in significant relationships among NMDS coordi-nates and WQ variables (P ≤ 0.001) for BDV, turbidity, TSS, and PP, with multiple R values of 0.749, 0.707, 0.667, and 0.673, respectively. The PROFIT vectors show the general direction of increasing value for each WQ variable (Fig. 3). Turbidity and TSS generally increased from top right to bottom left, and inversely for BDV. The PROFIT regression vector for PP correlated closely with the vertical axis (Fig. 3d). Suspended chl- a was not significantly related to the NMDS coordinates in PROFIT analysis.
Hierarchical cluster analysis
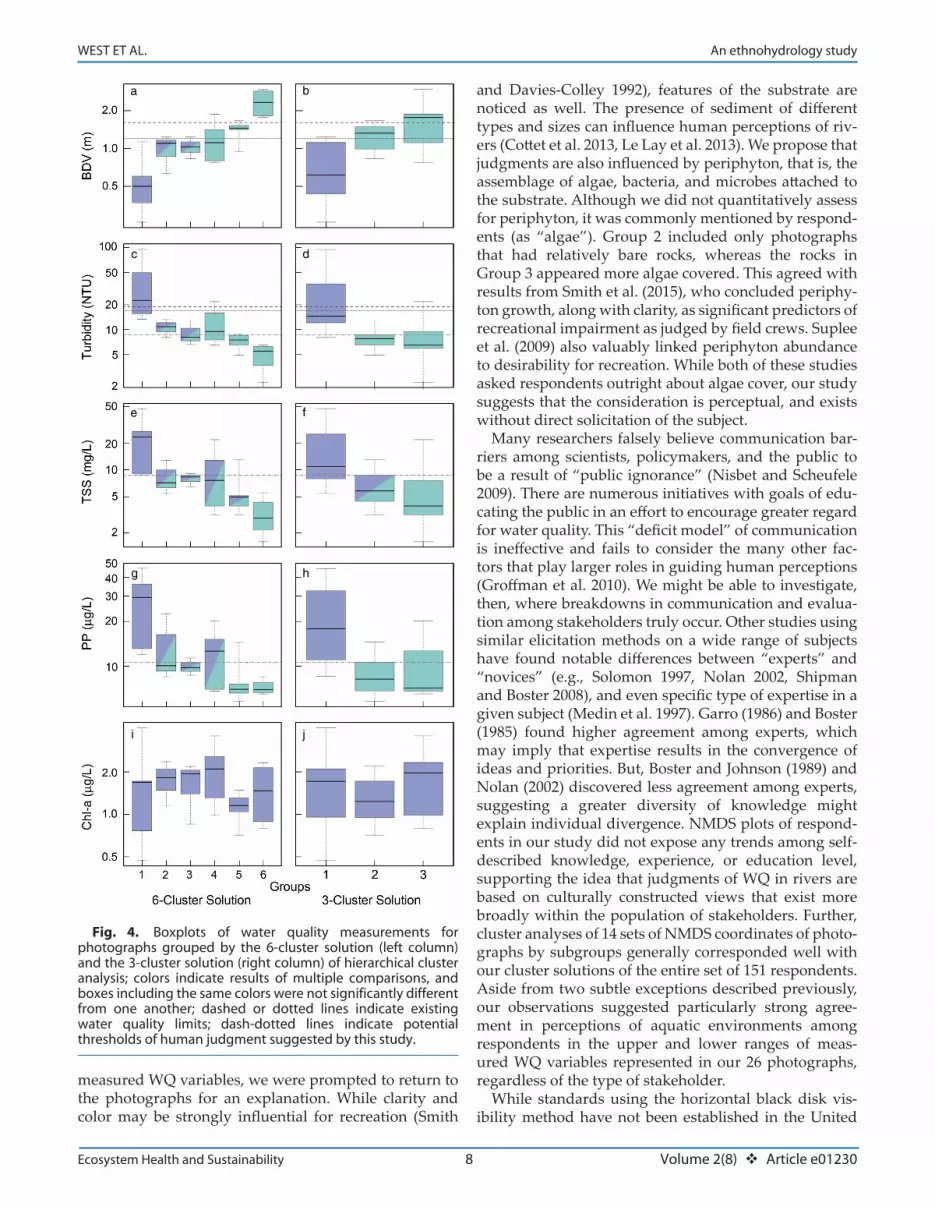
Hierarchical cluster analysis allowed us to identify groupings within the NMDS solution. The Duda and Hart index suggested a 6- cluster solution (Fig. 2, indi-cated by shaded ellipses); the gap index indicated three clusters were optimal (Fig. 2, indicated by dark numer-als). Investigation of WQ measurements among the groups by ANOVA returned significant differences (P < 0.05) for TSS, turbidity, BDV, and PP for both the 3- and the 6- cluster solutions. Munsell hue, value, and chroma, and concentrations of suspended chl- a were not significantly different among the groups. In the 6- cluster solution, multiple comparisons showed Groups 1 and 6 were significantly different (P < 0.05) from one another for every measured water quality variable except chl- a (Fig. 4, left column). Groups 2 and 3 were intermediate for BDV and turbidity. Groups 2 through 5 were interme-diate for TSS. Groups 2 through 4 were intermediate for PP. For the 3- cluster solutions, multiple comparisons confirmed Groups 1 and 3 were significantly different (P < 0.05) from one another for every measured water quality variable except suspended chl- a (Fig. 4, right col-umn). Group 2 was an intermediate between Groups 1 and 3 for TSS. Group 1 was significantly different from both Groups 2 and 3 for BDV, turbidity, and PP.
Upon separating the pile- sorts by survey responses and solicitation venue, and generating NMDS plots of pho-tographs, subgroup cluster analysis results were similar to those of the entire data set. We were unable to identify patterns in NMDS plots of respondents by subgroups. All NMDS plots were within acceptable stress limits for rep-resentation in two dimensions. Differences among groups existed in the optimal number of clusters determined by the Gap and Duda and Hart indices (Table 3). However, within the number of optimal clusters indicated by the Duda and Hart index for the 14 subgroups (Table 2, left column), the six photographs of Group 1 of the 6- cluster solution (Fig. 2, bottom) remained together in all but one subgroup. A pho-tograph dominated by a cloudy bright orange with no obvious suspended particulates was isolated into its own cluster in the 6- cluster solution for AAFS respondents. Similarly, the five photographs of Group 5 (Fig. 2, top left) remained within a single cluster in all but one subgroup. In
Table 2. Summary of respondent demographics.
Demographic n
High school 7Some college 26Associate degree/professional certification 9Bachelor’s degree 42Advanced degree 60Age 18–24 28Age 25–34 36Age 35–44 36Age 45–54 17Age 55+ 29Female 56Male 87
Note: Nonresponses existed where n does not add to 151.
6
WEST ET AL. An ethnohydrology study
Volume 2(8) v Article e01230Ecosystem Health and Sustainability
the 7- cluster solution of female respondents, the leftmost photograph of Group 5 was placed in a separate group with the leftmost photograph of Group 3 (Fig. 2, shaded ellipses). For the sake of greater simplicity, and because the 3- and 6- cluster solutions are analogous, our forthcoming discussion will focus on the 3- cluster solution.
Discussion
The ability to link quantitative OWQ variables to human perceptions is predicated by our two hypotheses. Our results supported both hypotheses: (1) Although percep-tions varied among individuals, there were no apparent dissimilarities according to age, gender, experience, or
education of respondents, and (2) judgments of under-water conditions in rivers were related to measurable OWQ variables that influence visible characteristics. This study furthers the understanding of human perceptions of water quality beyond simple preference because respondents were not encouraged to consider any spe-cific characteristics outside those triggered in their own cognitive processing of the images. These associations between human perceptions and scientific environmen-tal indicators may lend insight into water resources man-agement and communication.
Based on previous investigations of human perceptions of WQ (Smeltzer and Heiskary 1990, Smith and Davies- Colley 1992, Smith et al. 1995), we were not surprised to
Fig. 2. Nonmetric multidimensional scaling plot with separations by hierarchical cluster analysis. Ellipses with light numerals capture each group of the 6- cluster solution; dark numerals indicate the 3- cluster solution.
7
WEST ET AL. An ethnohydrology study
Volume 2(8) v Article e01230Ecosystem Health and Sustainability
note that respondents reacted to clarity and color, both of which were commonly mentioned when asked what cri-teria were used to group the photographs. Visual clarity trended from low visibility at the bottom of the NMDS plot to greater visibility in the photographs toward the top and right (Fig. 2). Indeed, the strongest correlation in the PROFIT analysis (multiple R = 0.749) was that of BDV (Fig. 3a). Notably, photographs with yellow hues were not relegated to the lower edge of the NMDS. A few with greater visibility and brighter color were scattered throughout (Fig. 2). Thus, clarity might play a dominant
role in perceptions, one that can sometimes override color. While we did not conclude statistical differences in Munsell hue, value, or chroma among the groups, we can see in the NMDS plot that muted browns and grays were generally situated toward the bottom left, and brighter blues and greens toward the top right (Fig. 2). The lack of statistical difference may have been because there was a relatively narrow range by the Munsell scale, or could be an effect of using the Munsell system in classification of nonopaque materials, for which it was not designed (American Society for Testing and Measurement 1968).
We propose that measured physicochemical parame-ters are tightly linked to the visual criteria that influence human perceptions. Considering the images as grouped by the 3- cluster solution of hierarchical cluster analysis (Fig. 2), brighter colors and greater visibility were com-mon to Groups 2 and 3, whereas darker, brown waters with low visibility were isolated to Group 1. Means of BDV, turbidity, TSS, and PP were all significantly differ-ent between Groups 1 and 3 (Fig. 4, right column). This was substantiated by PROFIT analysis (Fig. 3), which significantly related these WQ variables to the NMDS coordinates of the complete pile- sort data. Suspended chl- a concentrations were the exception, likely because they were relatively low throughout (geometric mean = 1.45 μg/L, maximum concentration = 4.11 μg/L). PROFIT analysis implied quantitative measures of BDV, turbidity, TSS, and PP were, either consciously or uncon-sciously, involved in respondents’ arrangement of the photographs. However, because there was separation in the NMDS plot by variables that cannot be explained solely with these physical measurements, the vectors drawn by PROFIT should not be used as predictors of human perceptions.
Because mean values of Groups 2 and 3 were not significantly different from one another for any of our
Fig. 3. Property fitting analysis vectors overlying nonmetric multidimensional scaling plot of photographs; a. black disk visibility; b. turbidity; c. total suspended solids; d. particulate phosphorus.
a
b
c
d
Table 3. Cluster analysis results for all respondents and each of 14 subgroups as separated by survey responses and survey location.
Group n Gap Duda–HartCluster 1 agreement†
Cluster 5 agreement†
All respondents 151 3 6Age 18–39 79 3 6 Y YAge 40+ 67 2 5 Y YFemale 56 2 7 Y NMale 87 3 6 Y YKnowledge 1–4 75 2 6 Y YKnowledge 5–7 76 3 6 Y YExperience 1–4 51 3 6 Y YExperience 5–7 100 3 6 Y YH.S.- Assoc./Certif. 42 3 4 Y YBachelor’s degree+ 102 3 4 Y YAWRC 37 2 7 Y YAAFS 55 3 6 N YRACE 32 3 7 Y YSHOP 27 2 4 Y Y
Note: Nonresponses existed where n does not add to 151.†Yes/No indicates whether all photographs in the numbered cluster of the overall 6- cluster solution were also included in a single cluster by the subgroup.
8
WEST ET AL. An ethnohydrology study
Volume 2(8) v Article e01230Ecosystem Health and Sustainability
measured WQ variables, we were prompted to return to the photographs for an explanation. While clarity and color may be strongly influential for recreation (Smith
and Davies- Colley 1992), features of the substrate are noticed as well. The presence of sediment of different types and sizes can influence human perceptions of riv-ers (Cottet et al. 2013, Le Lay et al. 2013). We propose that judgments are also influenced by periphyton, that is, the assemblage of algae, bacteria, and microbes attached to the substrate. Although we did not quantitatively assess for periphyton, it was commonly mentioned by respond-ents (as “algae”). Group 2 included only photographs that had relatively bare rocks, whereas the rocks in Group 3 appeared more algae covered. This agreed with results from Smith et al. (2015), who concluded periphy-ton growth, along with clarity, as significant predictors of recreational impairment as judged by field crews. Suplee et al. (2009) also valuably linked periphyton abundance to desirability for recreation. While both of these studies asked respondents outright about algae cover, our study suggests that the consideration is perceptual, and exists without direct solicitation of the subject.
Many researchers falsely believe communication bar-riers among scientists, policymakers, and the public to be a result of “public ignorance” (Nisbet and Scheufele 2009). There are numerous initiatives with goals of edu-cating the public in an effort to encourage greater regard for water quality. This “deficit model” of communication is ineffective and fails to consider the many other fac-tors that play larger roles in guiding human perceptions (Groffman et al. 2010). We might be able to investigate, then, where breakdowns in communication and evalua-tion among stakeholders truly occur. Other studies using similar elicitation methods on a wide range of subjects have found notable differences between “experts” and “novices” (e.g., Solomon 1997, Nolan 2002, Shipman and Boster 2008), and even specific type of expertise in a given subject (Medin et al. 1997). Garro (1986) and Boster (1985) found higher agreement among experts, which may imply that expertise results in the convergence of ideas and priorities. But, Boster and Johnson (1989) and Nolan (2002) discovered less agreement among experts, suggesting a greater diversity of knowledge might explain individual divergence. NMDS plots of respond-ents in our study did not expose any trends among self- described knowledge, experience, or education level, supporting the idea that judgments of WQ in rivers are based on culturally constructed views that exist more broadly within the population of stakeholders. Further, cluster analyses of 14 sets of NMDS coordinates of photo-graphs by subgroups generally corresponded well with our cluster solutions of the entire set of 151 respondents. Aside from two subtle exceptions described previously, our observations suggested particularly strong agree-ment in perceptions of aquatic environments among respondents in the upper and lower ranges of meas-ured WQ variables represented in our 26 photographs, regardless of the type of stakeholder.
While standards using the horizontal black disk vis-ibility method have not been established in the United
Fig. 4. Boxplots of water quality measurements for photographs grouped by the 6-cluster solution (left column) and the 3-cluster solution (right column) of hierarchical cluster analysis; colors indicate results of multiple comparisons, and boxes including the same colors were not significantly different from one another; dashed or dotted lines indicate existing water quality limits; dash- dotted lines indicate potential thresholds of human judgment suggested by this study.
a b
c d
g h
i j
e f
9
WEST ET AL. An ethnohydrology study
Volume 2(8) v Article e01230Ecosystem Health and Sustainability
States, the New Zealand Ministry for the Environment has published guidelines stating that BDV should exceed 1.6 m (Fig. 4a,b, dashed line) in waters managed for contact recreation (Ministry for the Environment 1994). Smith et al. (1995) found that 75% of recreational users rated BDV values of 1.2 m or greater as “suitable” or bet-ter for bathing (Fig. 4a,b, dotted line). The upper quar-tile of BDV in Group 1 in the 3- cluster solution, which may represent conditions judged as less desirable, was just below that (1.12 m). Although we did not seek pref-erence, per se, our study of WQ judgments is compara-ble to recreational users’ rating of suitability for bathing found by Smith et al. (1995). The Arkansas Pollution Control and Ecology Commission (2011) have developed turbidity standards of 17 and 19 NTU for all flows in riv-ers in the Ozark Highlands and Boston Mountains ecore-gions, respectively (Fig. 4c,d, dotted and dashed lines; Considering these standards alongside the 3- cluster solution of our study, the upper quartiles of turbidity measurements for photographs in Groups 2 and 3 were well below both thresholds. The median of Group 1 (14.6 NTU) was also below these standards. This suggests human perceptions of OWQ may not wholly agree with existing limits set to maintain ecological integrity. While Smith et al. (2015) proposed a turbidity value of 4.0 NTU as a threshold for avoiding substantial impacts to recre-ation in wadeable New York streams, our analysis may allow for a less conservative value for larger recreational rivers of the Ozarks. Because Group 2 of the 3- cluster solution included the images that most respondents agreed upon as belonging together, and generally repre-sented a mid- range in WQ that was still distinctly sepa-rate from the tight grouping of Group 1, we may be able to extend our cluster analysis and multiple comparison results to suggest turbidity, TSS, and/or PP thresholds for human judgments using the upper quartiles of Group 2 (Fig. 4, dash- dotted lines). This would infer a turbidity limit of 8.6 NTU, a TSS limit of 8.5 mg/L, and a PP limit of 10.2 μg/L.
We acknowledge that photography may not necessarily be the best representation of the true observable conditions under water. Our best attempts were made to minimize variation; however, automatic camera operations may somewhat misrepresent the relative conditions by correct-ing the exposure for instantaneous underwater lighting. We did consider this when choosing photographs and have two sampling occasions that were represented twice in the pile- sort images (Fig. 1). In the first set of duplicates (Fig. 1a,b), the primary difference is the camera angle, which affected the dominant color of the image and the ability to discern details of the substrate. The two were placed in different groups by cluster analysis of the NMDS coordinates, Groups 2 and 3, respectively. The other set of duplicates (Fig. 1c,d) have more subtle differences. While they are nearly identical in color, one image shows rays of light and the surface of the water (Fig. 1c). They were both placed into Group 3 by cluster analysis. Even with
the potential weaknesses, photographs may be the most practical method for assessing responses of groups while controlling for a multitude of outside influences that may affect perceptions, such as odor, flow, litter, and landscape (West et al. 2016).
Conclusions
We sought to examine human perceptions of WQ in riv-ers using photographs of the aquatic environment to elicit and examine mental models of stakeholders. Our results imply that individuals may deploy similar cogni-tive processes to discern differences among images of aquatic conditions in rivers, and these judgments can be linked to commonly measured OWQ variables. We sug-gest some important physical and chemical parameters of WQ may be communicated meaningfully across groups in terms of how they relate to visible attributes. This ethnohydrology study moves toward linking a range of quantitative WQ parameters to culturally con-structed user perceptions that can inform resource man-agement. The consensus among individuals here may mean we have come one step closer to understanding the differences—or lack thereof—in perceptions among groups of stakeholders in water resources.
Acknowledgments
This work was generously supported in part by the U.S. Geological Survey 104B Program and the Arkansas Water Resources Center (project #2014AR351B), and by a research grant awarded by The Geological Society of America. We sincerely appreciate the cooperation of the Arkansas Chapter of the American Fisheries Society, Arkansas Water Resources Center, Turner Bend Outfitter, and the Fayetteville Walmart Supercenter. We thank D. Chen, D. Dillon, D. Hall, A. Rodman, S. Speir, and B. Winston for valuable field assistance and insights.
Literature CitedAdamski, J. C., J. C. Petersen, D. A. Freiwald, and J. V. Davis.
1995. Environmental and hydrological setting of the Ozark Plateaus study unit, Arkansas, Kansas, Missouri, and Oklahoma: Water Resources Investigation Report 94-4022.
American Society for Testing and Measurement. 1968. ASTM D1535: standard method of specifying color by the Munsell system. American Society for Testing and Measurement, Washington, D.C., USA.
APHA. 2005. Standard methods for the examination of water and wastewater. Twenty-first edition. American Public Health Association, American Water Works, Washington, D.C., USA.
Back, W. 1981. Hydromythology and ethnohydrology in the new world. Water Resources Research 17:257–287.
Biggs, D., N. Abel, A. T. Knight, A. Leitch, A. Langston, and N. C. Ban. 2011. The implementation crisis in conservation planning: could “mental models” help? Conservation Letters 4:169–183.
Borgatti, S. 1996. ANTHROPAC 4 methods guide. Analytic Technologies, Natick, Massachusetts, USA.
10
WEST ET AL. An ethnohydrology study
Volume 2(8) v Article e01230Ecosystem Health and Sustainability
Borgatti, S., M. Everett, and L. Freeman. 2002. Ucinet for win-dows: software for social network analysis. Analytic Technologies, Harvard, Massachusetts, USA.
Boster, J. 1985. Requiem for the omniscient informant: there’s life in the old girl yet. Pages 177–197 in J. Dougherty, editor. Directions in cognitive anthropology. University of Illinois Press, Urbana, Illinois, USA.
Boster, J., and J. C. Johnson. 1989. Form or function: a com-parison of expert and novice judgments of similarity among fish. American Anthropologist 91:866–889.
Braden, J. B., et al. 2009. Social science in a water observing system. Water Resources Research 45:W11301.
Brauman, K. 2015. Hydrologic ecosystem services: linking eco-hydrologic processes to human well- being in water research and watershed management. Wiley Interdisciplinary Reviews: Water 2:345–358.
Brewis, A. A., M. Gartin, A. Wutich, and A. Young. 2013. Global convergence in ethnotheories of water and disease. Global Public Health 8:13–36.
Burmil, S., T. C. Daniel, and J. D. Hetherington. 1999. Human values and perceptions of water in arid landscapes. Landscape and Urban Planning 44:99–109.
Castro, A. J., C. C. Vaughn, J. P. Julian, and M. García-Llorente. 2016. Social demand for ecosystem services and implications for watershed management. JAWRA Journal of the American Water Resources Association 52:209–221.
Charrad, M., N. Ghazzali, V. Boiteau, and A. Niknafs. 2014. NbClust: an R package for determining the relevant number of clusters in a data set. Journal of Statistical Software 61:1–36.
Cottet, M., H. Piégay, and G. Bornette. 2013. Does human per-ception of wetland aesthetics and healthiness relate to eco-logical functioning? Journal of Environmental Management 128:1012–1022.
Coughlin, R. 1976. The perception and valuation of water quality: a review of research method and findings. Page 310 in K. Craik, and E. Zube, editors. Perceiving environmental quality: research and applications. Plenum Press, New York, New York, USA.
Davies-Colley, R. J. 1988. Measuring water clarity with a black disk. Limnology and Oceanography 33:616–623.
Duda, R., and P. Hart. 1973. Pattern classification and scene analysis. John Wiley & Sons, New York, New York, USA.
Egan, K. J., J. A. Herriges, C. L. Kling, and J. A. Downing. 2009. Valuing water quality as a function of water quality measures. American Journal of Agricultural Economics 91:106–123.
Falkenmark, M. 1977. Water and mankind – a complex system of mutual interaction. Ambio 6:3–9.
Garro, L. 1986. Intracultural variation in folk medical knowledge: a comparison between curers and noncurers. American Anthropologist 88:351–370.
Gartin, M., B. Crona, A. Wutich, and P. Westerhoff. 2010. Urban ethnohydrology: cultural knowledge of water quality and water management in a desert city. Ecology and Society 15:36.
Goodenough, W. 1981. Culture, language, and society. Second edition. Benjamin/Cummings, Menlo Park, California, USA.
Groffman, P. M., C. Stylinski, M. C. Nisbet, C. M. Duarte, R. Jordan, A. Burgin, M. A. Previtali, and J. Coloso. 2010. Restarting the conversation: challenges at the interface between ecology and society. Frontiers in Ecology and the Environment 8:284–291.
Harmsworth, G., R. Young, D. Walker, J. Clapcott, and T. James. 2011. Linkages between cultural and scientific indicators of river and stream health. New Zealand Journal of Marine and Freshwater Research 45:423–436.
Heiskary, S. A., and W. W. Walker. 1988. Developing phosphorus criteria for Minnesota lakes. Lake and Reservoir Management 4:1–9.
Hirsch, R. M., R. B. Alexander, and R. A. Smith. 1991. Selection of methods for the detection and estimation of trends in water quality. Water Resources Research 27:803–813.
Jones, N. A., H. Ross, T. Lynam, P. Perez, and A. Leitch. 2011. Mental models: an interdisciplinary synthesis of theory and methods. Ecology and Society 16:46.
Keeler, B., S. Polasky, K. Brauman, K. A. Johnson, J. C. Finlay, A. O’Neill, K. Kovacs, and B. Dalzell. 2012. Linking water quality and well- being for improved assessment and valu-ation of ecosystem services. Proceedings of the National Academy of Sciences 109:18619–18624.
Keeler, B., S. A. Wood, S. Polasky, C. Kling, C. T. Filstrup, and J. A. Downing. 2015. Recreational demand for clean water: evidence from geotagged photographs by visitors to lakes. Frontiers in Ecology and the Environment 13:76–81.
Kirk, J. T. O. 1988. Optical water quality- what does it mean and how should we measure it? Journal- Water Pollution Control Federation 60:194–197.
Kruskal, J. B., and M. Wish. 1978. Multidimensional scaling Sage University Papers Series. Quantitative application in the social sciences; No. 07-011. Sage, Newbury Park, California, USA.
Lall, U. 2014. Debates – the future of hydrological sciences: a (common) path forward? One water. One world. Many climes. Many souls. Water Resources Research 50:5335–5341.
Le Lay, Y. F., H. Piégay, and A. Rivière-Honegger. 2013. Perception of braided river landscapes: implications for public partici-pation and sustainable management. Journal of Environmental Management 119:1–12.
Linton, J. 2014. Modern water and its discontents: a history of hydrosocial renewal. Wiley Interdisciplinary Reviews: Water 1:111–120.
Lynam, T., and K. Brown. 2012. Mental models in human–envi-ronment interactions: theory, policy implications, and meth-odological explorations. Ecology and Society 17:24.
Medin, D. L., E. B. Lynch, J. D. Coley, and S. Atran. 1997. Categorization and reasoning among tree experts: do all roads lead to Rome? Cognitive Psychology 32:49–96.
Milligan, G., and M. Cooper. 1985. An examination of procedures for determining the number of clusters in a data set. Psychometrika 50:159–179.
Munsell Color. 1977. Munsell Color charts for plant tissues. Second edition. Munsell Color, Baltimore, Maryland, USA.
Nelson, N. M., J. B. Loomis, P. M. Jakus, M. J. Kealy, N. von Stackelburg, and J. Ostermiller. 2015. Linking ecological data and economics to estimate the total economic value of improving water quality by reducing nutrients. Ecological Economics 118:1–9.
Nisbet, M. C., and D. A. Scheufele. 2009. What’s next for science communication? Promising directions and lingering distrac-tions. American Journal of Botany 96:1767–1778.
Nolan, J. M. 2002. Wild plant classification in little dixie: var-iation in a regional culture. Journal of Ecological Anthropology 6:68–80.
NRC. 2004. Confronting the nation’s water problems: the role of research. National Academies Press, Washington, D.C., USA.
OK DEQ. 2014. Water Quality in Oklahoma: 2014 Integrated Report.Orlove, B., and S. C. Caton. 2010. Water sustainability: anthro-
pological approaches and prospects. Annual Review of Anthropology 39:401–415.
R Core Team. 2015. R: a language and environment for statistical computing. R Foundation for Statistical Computing, Vienna, Austria.
11
WEST ET AL. An ethnohydrology study
Volume 2(8) v Article e01230Ecosystem Health and Sustainability
Shipman, A. C. S., and J. Boster. 2008. Recall, similarity judg-ment, and identification of trees: a comparison of experts and novices. Ethos 36:171–193.
Smeltzer, E., and S. A. Heiskary. 1990. Analysis and applications of lake user survey data. Lake and Reservoir Management 6:109–118.
Smith, D. G., and R. J. Davies-Colley. 1992. Perception of water clarity and colour in terms of suitability for recreational use. Journal of Environmental Management 36:225–235.
Smith, D. G., A. Cragg, and G. Croker. 1991. Water clarity criteria for bathing waters based on user perception. Journal of Environmental Management 33:285–299.
Smith, D. G., G. F. Croker, and K. A. Y. McFarlane. 1995. Human perception of water appearance 1. Clarity and colour for bathing and aesthetics. New Zealand Journal of Marine and Freshwater Research 29:29–43.
Smith, A. J., B. T. Duffy, and M. A. Novak. 2015. Observer rating of recreational use in wadeable streams of New York State, USA: implications for nutrient criteria development. Water Research 69:195–209.
Solomon, G. E. A. 1997. Conceptual change and wine expertise. Journal of the Learning Sciences 6:41–60.
Steel, E. A., and S. Neuhauser. 2002. Comparison of methods for measuring visual water clarity. Journal of the North American Benthological Society 21:326–335.
Sturrock, K., and J. Rocha. 2000. A multidimensional scaling stress evaluation table. Field Methods 12:49–60.
Suplee, M. W., V. Watson, M. Teply, and H. McKee. 2009. How green is too green? Public opinion of what constitutes unde-sirable algae levels in streams. Journal of the American Water Resources Association 45:123–140.
Tibshirani, R., G. Walther, and T. Hastie. 2001. Estimating the number of clusters in a data set via the gap statistic. Journal of the Royal Statistical Society: Series B (Statistical Methodology) 63:411–423.
Trotter, R. I., J. Schensul, and K. Kostick. 2015. Theories and methods in applied anthropology. Pages 661–693 in H. Bernard, and C. Gravlee, editors. Handbook of methods in cultural anthropology. Second edition. Rowman & Littlefield, Lanham, Maryland, USA.
US EPA. 2000. Nutrient criteria technical guidance manual rivers and streams. EPA-822-B-00-002. US EPA, Washington, D.C., USA.
US EPA. 2010. Using stressor-response relationships to derive numeric nutrient criteria. EPA-820-S-10-001. US EPA, Washington, D.C., USA.
US Geological Survey. 2011. GAGES II: Geospatial Attributes of Gages for Evaluating Streamflow summary report.
Vins, H., A. Wutich, A. Brewis, M. Beresford, A. Ruth, and C. Roberts. 2014. Children’s perceived water futures in the United States southwest. Human Organization 73:235–246.
Weller, S. 2015. Structured interviewing and questionnaire con-struction. Pages 343–390 in H. Bernard, and C. Gravlee, editors. Handbook of methods in cultural anthropology. Second edition. Rowman & Littlefield, Lanham, Maryland, USA.
Weller, S. C., and A. K. Romney. 1988. Systematic data collec-tion. Sage, Newbury Park, California, USA.
West, A. O., J. M. Nolan, and J. T. Scott. 2016. Optical water quality and human perceptions: a synthesis. Wiley Interdisciplinary Reviews: Water 3:167–180.
Wheater, H., and P. Gober. 2015. Water security and the science agenda. Water Resources Research 51:5406–5424.
Woods, A. J., T. L. Foti, S. S. Chapman, J. M. Omernik, J. A. Wise, E. O. Murray, W. L. Prior, J. B. J. Pagan, J. A. Comstock, and M. Radford. 2004. Ecoregions of Arkansas (color poster with map, descriptive text, summary tables, and photographs). U.S. Geological Survey, Reston, Virginia, USA.
Wutich, A., A. Brewis, A. M. York, and R. Stotts. 2013. Rules, norms, and injustice: a cross- cultural study of perceptions of justice in water institutions. Society & Natural Resources 26:795–809.
Zaneveld, J. R., and W. Pegau. 2003. Robust underwater visibility parameter. Optics Express 11:2997–3009.
Copyright: © 2016 West et al. This is an open access article under the terms of the Creative Commons Attribution License, which permits use, distribution and reproduction in any medium, provided the original work is properly cited.


