Embed Size (px)
Citation preview

OPERATION REDWING
Project 2.63Characterization of Fallout
Pacific Proving Grounds
May-July 1956
Headquarters Field CommandDefense Atomic Support Agency
9 ndia
March
NOTICE
Base, Albuquerque, New Mexico
15, 1961
This isan extraciremainsclassifiedas of thisdate.
of WT-1317, whichSECRET/RESTRICTED DATA
Extractversionpreparedfor:
Director
DEFENSE NUCLEAR AGENCY
Washington, D.C. 20305
1 JUNE 1982
WT-1317 (EX)EXTRACTED VERSION
410881
Approved for public release;distribution unlimited.

uNCLASSIFIEDSECURITY CLASSIFICATION OF THIS pAGE (~~n D=j- Em(-dj
.
\
4
7
#
II
7
It
1:
14
tg
2C
o9Foctsm
-
REPORT DOCUMENTATION PAGEREAD INSTRUCTIONS
BEFORE COMPLETING FORMREPoRT HUUDER 2. GOVT ACCESSION NO. 3. Recipients CATALOG MuMEER
WT-1317 (EX)
1.TITLE (rnd SubtMi@ 5. TYPE OF REPORT h PERIOO COVERED
Operation REDWING - Project 2.63,Characterization of Fallout
4. PERFORMING ORG. REPORT NuH8ER
WT-1317 (EX)‘.AUTHOR(-) . . CONTRACT ORGRAMT MUUmCrV@
T. Triffet, Project OfficerP. D. LaRiviere
).PERFORMING oRGANIZATION NAt4E ANO AOOUESS 10. PROGRAM ELEuENT.PROJCCT. TASKbREA k WtiRK UNIT NuMBERS
US Naval Radiological Defense LaboratorySan Francisco, California
1.COMTROLLINGOFFICE NAME ANO AODRESS 12. REPORT OATE
Headquarters, Field Command March 15, 1961Defense Atomic Support Agency !1.NI.IMSEROF PAGES
Sandia Base, Albuquerque, New Mexico14. MONITORING AG’ENCY NAME k AOORESS(i/d,l/errnf I?om Controllh# O/lIc.) IS. SECURITY CLASS. (0/ fhlo foPorfJ
UNCLASSIFIED1S., DECLASSIFICATION/OOWNGRAOIMG
SCHEOULE
S. OtSTRIBUTION STATEMENT (Of this R9P0?tj
Approved for public release; unlimited distribution.
7. 01ST R18UTION STATEMENT (o( ?h~ ●b.tra. t ●fr,-dfn 8tock 20. {/ dfff.r-f horn R-port)
0. SUPPLEMENTARY NOTES
This report has had the classified information removed and has been republishedin unclassified form for public release. This work was performed by Kaman Tempounder contract DNAO01-79-C-0455 with the close cooperation of the ClassificationManagement Division of the Defense Nuclear Agency.
B.KCY wOROS (C~tinu9 of! revwrne ●ld. iin.c.aa~ rnd Id.nflly by block numb.rl
Operation REDWINGFalloutSurface Radiation
o. ASsTRAcT (Crnt#... rnw.r.r.. .J*l/n.c...~rndlfffybyyby bl-k n-b-) The general objective was tO
)btain data sufficient to characterize the fallout, interpret the aerial and oceano-graphic survey results, and check fallout-model theory for Shots Cherokee, Zuni,‘lathead, Navajo, and Tewa during Operation REDWING. Detailed measurements of fall-Jut buildup were planned. Measurements of radiation characteristics and physical,:hemical, and radiochemical properties of individual solid and slurry particles and:otal cloud and fallout samples were also planned, along with determinations of the;urface densities of activity and environmental components in the fallout at eachfiajorstation.
-----DD ,;::;3 1473 EDITION 06 1 Nov4SlSofJSOLETE
UNCLASSIFIEDSECURITY CLASSIFICATION OF THIS pAGE (*- D-~En~-o@

FOREWORD
This report has had classified material removed in order tomake the information available on an unclassified, openpublication basis, to any interested parties. This effort todeclassify this report has been accomplished specifically tosupport the Department of Defense Nuclear Test Personnel Review(NTPR) Program. The objective is to facilitate studies of thelow levels of radiation received by some individuals during theatmospheric nuclear test program by making as much informationas possible available to all interested parties.
The material which has been deleted is all currentlyclassified as Restricted Data or Formerly Restricted Data underthe provision of the Atomic Energy Act of 1954, (as amended) oris National Security Information.
This report has been reproduced directly from availablecopies of the original material. The locations from whichmaterial has been deleted is generally obvious by the spacingsand “holes” in the text. Thus the context of the materialdeleted is identified to assist the reader in the determinationof whether the deleted information is germane to his study.
It is the belief of the individuals who have participatedin preparing this report by deleting the classified materialand of the Defense Nuclear Agency that the report accuratelyportrays the contents of the original and that the deletedmaterial is of little or no significance to studies into theamounts or types of radiation received by any individualsduring the atmospheric nuclear test program.

ABSTRACTThe general objective was to obtain data sufficient to characterize the fallout, interpret theaer id and oceanographic survey results, and check fallout-model theory for Shots Cherokee,Zuni, Flathead, Navajo, and Tewa during Operation Redwing. Detailed measurementsof fwo~tbuildup were planned. Measurements of the radiation characteristics and physical, chemical,and radiochemical properties of individual solid and slurry particles and total cloud and falloutsamples were also planned, along with determinations of the surface densities of activity andenvironmental components in the fallout at each major station.
Standardized instruments and instrument arrays were used at a varietj of stations whichincluded three ships, two barges, three rafts, thirteen to seventeen deep-anchored skiffs, andfour islands at Bikini Atoll. Total and incremental fallout collectors and gamma time-intensityrecorders were featured in the field instrumentation. Special laboratory facilities for early-
time studies were established aboard one ship. A number of buried trays with related survey
markers were located in a cleared area at one of the island stations. Instrument failures werefew, and a large amount of data was obtained.
This report summarizes the times and rates of arrival, times of peak and cessation, mass-arrival rates, particle-size variation with time, ocean-penetration rates, solid- and slurry-particle characteristics, activity and fraction of device deposited per unit area, surface densi-ties of chemical components, radionuclide compositions with corrections for fractionation andinduced activities, and photon and air- ionization decay rates. A number of pertinent correla-tions are also presented: predicted and observed fallout patterns are compared, sampling biasis analyzed, gross-product decay is discussed in relation to the t- ‘-2 rule, fraction-of-devicecalculations based on chemical and radiochemical analyses are given, the relationship of film-dosimeter dose to gamma time-intensity integral is considered, a comparison is made betweeneffects computed from radiochemistry and gamma spectrometry, air-sampling measurementsare interpreted, and the fallout effects are studied in relation to variations in the ratio of fissionyield to total yield.
Some of the more-important general conclusions are summarized below:The air burst of Shot Cherokee produced no fallout of military significance.Fallout-pattern locations and times of arrival were adequately predicted by model theory.Activity-arrival-rate curves for water- surface and land- surface shots were similar, and
were well correlated in time with local-field ionization rates.Particle- size distributions from land- surface shots varied continuously with time at each
station, with the concentration and average size appearing to peak near time-of-peak radiationrate; the diameters of barge- shot fwout droplets, on the other hand, remained remarkablyconstant in diameter at the ship stations.
Gross physical and chemical characteristics of the solid fallout particles proved much thesame as those for Shot Mike dwing Operation Ivy ad Shot Bravo during Operation Castle. New
information was obtained, however, relating the radiochemical and physical characteristics of
individtil particles. Activity was found to vw roughly as the square of the diameter for irreg-ular particles, ad as some power greater than the cube of the diameter for spheroi~ particles.
Fallout from barge shots consisted of slurry droplets, which were composed of water, seasalts, and radioactive solid particles. The latter were spherical, generally less than 1 micronin diameter, and consisted mainly of oxides of calcium and iron. At the ship locations, thesolid particles contained most of the activity associated with the slurry droplets; close in, how-ever, most of the activity was in soluble form.
Bulk rate of penetration of f~lout in the ocean was, under several restrictions, similar forboth solid and slurry particles. Estimates are !@wn of the amount of activity which may have
5

been lost below the thermocline for the fast-settling fraction of solid-particle fallout.Fractionation of radionuclides from Shot Zuni was severe while that from Shot Tewa was
moderate; Shots Flathead and Navajo were nearly unfractiomted. Tables are provided, incor-porating fractionation corrections where necessary, which a~ow the ready calculation of infinite-field ionization rates, and the contribution of individual induced activities to the total ionizationrate.
Best estimates are given of the amount of activity deposited per unit area at all samplingstations. Estimates of accuracy are included for the major stations.

This report presents the finaLresu.lts of one Oftheprojects participating in the military-effectprograms of Operation Redwing. Overall in.formatiori about this and the other military-effectprojects can be obtained from WT– 1344, the “Summary Report of the Commander, Task Unit3.” This technical summary includes: (1) tables listing each detonation with its yield, type,environment, meteorological conditions, etc. ; (2)maPS showing shot locations; (3) discussionsof results by programs; (4) summaries of objectives, procedures, results, etc., for aLl projects;and (5) a listing of project reports for the miiitary-effect programs.
Wherever possible,
PREFACEcontributions made by others have been specifically referenced in the body
of this report and are not repeated here. The purpose of this section is to express appreciationfor the many important contributions that could not be referenced.
Suggestions fundamental to the success of the project were made during the early planningstages by C. F. Miller, E. R. Tompkins, and L. B. Werner. During the first part of the operation,L. B. Werner also organized and dtrected the analysis of samples at U.S. Naval RadiologicalDefense Laboratory (NRDL). Sample analysis at NRDL during the latter part of the operationwas directed by P. E. Zigman, who designed and did much to set up the sample distribution cen-ter at Eniwetok Proving Ground (EPG) while he was in the field. C. M. Callahan was responsiblefor a large share of the counting measurements at NRDL and also contributed to the chemicalanalyses.
The coordination of shipboard construction requirements by J. D. Sartor during the prelimi-nary phase, the assembly and c hec~out of field-laboratory instrumentation by M. J. Nuckollsand S. K. Ichiki, and the scientific staff services of E. H. Covey through the field phase wereinvaluable. fmportant services were also rendered by F. Kirkpatrick, who followed the process-ing of all samples at NRDL and typed many of the tables for the reports, V. Vandivert, who pro-vided continuous st~f assis~nce, and M. Wiener, who helped with the ftil assembly of, thisreport.
Various NRDL support organizations performed outstanding services for the project. Someof the most no@ble of these were: the preparation of &l.I report illustrations by members of the
Technical Wormation Division, the final design and construction of the majority of project in-Strurnents by personnel from the Engtieering Division, the packing and &ansshipment of allproject ge~ by representatives of the Logistics Support Division, and the handling of all rad-safe procedures by members of the Health Physics Division. In this connection, the illustrationwork of 1. ~yashi, the photographic work of M. Brooks, and the rad-safe work of W. J. Neall
were particularly noteworthy.The project is also indebted to the Planning Department (Design Division), and the Electronics
Shop (67) of the San Francisco Naval Shipyard, for the final design and construction of the shipand barge platforms and instrument-control systems; and to U. S. Naval MobUe Construction
Battalion 5, port Hueneme, California, for supplying a number of field persomel.The names of the persons who manned the field phase are listed below. Without the skills
7

and exceptional effort devoted to the project by these persons, the analyses and results presentedin this report could not have been achieved:
Deputy Project Officer (Bikini): E. C. Evans III.Deputy Project Off icer (Ship): W. W. Perkins.Director of Water Sampling: S. Baum.Assistant Director of Laboratory Operations: N. H. Farlow.Program 2 Control Center: E. A. Schuert (fallout prediction), P. E. Zigman, and W. J.
Armstrong.Eniwetok Operations: M. L. Jackson, V. Vandivert, E. H. Covey, A. R. Beckman, SN T. J.
Cook, CD2 W. A. Morris, SWl M. A. Bell, and SN I. W. Duma.Laboratory Operations: C. E. Adams, M. J. Nuckolls, B. Chow, S. C. Foti, W. E. Shelberg,
D. F. Coven, C. Ray, L. B. Werner, W. Williamson, Jr., M. H. Rowell, CAPT B. F. Bennett,S. Rainey,CDR T. E. Shea, Jr., and CDR F. W. Chambers.
Bikini Operations: J. Wagner, C. B. Moyer, R. W. Voss, CWO F. B. Rinehart, S’WCN W. T.Veal, SN B. L. Fugate, axxi CE3 K J. Neil. Barge Team: L. E. Egeberg (captain), T. E. Sivley,E. L. AIvarez, ET3 R. R. Kaste, CMG1 J. O. Wilson, SW2 W. L. Williamson, A. L. Berto, E. A.Pelosi, J. R. Eason, K. M. Wong, and R. E. Blatner. Raft Team: H. K Chan (Captiin), F. A.Rhoads, SWCA W. L. Hampton, and SWCN H. A.-Hunter. Skiff Team: LTJG D. S. Tanner (cap-tain), M. J. Lipanovic& L. D. Miller, DM2 D. R. Dugas, and ET3 W. A. Smith.
Ship Operations: YAG-40 Team: E. E. BoeteL ET1 T. Wolf, ET3 J. K. LaCost, J. D.O’Connor and J. Mackin (water sampling), and CAPT G. G. Molumphy. YAG- 39 Team: M. M.Bigger (captatn), W. L. Morrison, ET1 W. F. Fuller, ET3 R. L. Johnson, and E. R. Tompkins(water sampling). LST-611 Team: F. A. French (captain), ENS H. B. Curtis, ET2 F. E. Hooley,and ET3 R. J. Wesp.
Rad-Safe Operations: J. E. Law, Jr., E. J. Leahy, R. A. Sulit, A. L. Smith, F. A. Devlin, B.G. Lindberg, G. E. BackmaG L. V. Barker, G. D. Brown, L. A. Carter, C. K. Irwin, P. E. Brown,F. Modjeski, and G. R. Patterson.

CONHIKS‘~~~CT.-.--------.--- ----------------------- -------------- 5
FOREWORD ------------ --------------------- ‘- ---------------- 7
PREFACE --------------- ---------------------- ‘----- ---------- 7
CHAPTER1 INTRODUCTION ------------ ----------------------- ‘--- 15
1.1 Objectives ------------ -------------------- ---------------- 151.2 Background ------------- ---------------------- ------------ 151.3 Theory ---------------- ------------------------ ‘--------- 16
1.3.1 General Requirements -- ------------------ ---------------- 161.3.2 Data Requirements ------- -------------------- ------------ 161.3.3 Special Problems and Solutions -------------------- ---------- 171.3.4 Radionuclide Composition and Radiation Characteristics-- ------------ 171.3.5 Sampling Baas ---------- -------------------- ------------ 171.3.6 OverallApproach --------- ------------------------------- la
CHAPTER2 PROCEDURE ------------ ---------------------- ‘------ 19
2.1 Shot participation --------- -------------------- --------------2.2 Jn.strumentation ---------- -------------------- --------------
2.2.1 Major Sampling Array ------ ---------------------- --------2.2.2 Minor Sampling Array ------ ------------------------- -----
2.2.3 Speci.al Sampling Faculties- -- ------------------------------2.2.4 Laboratory Facilities ----------- --------------------- -----
2.3 Station Locations -------- -------------------- ---------------2.3.1 Barges, Rafts, Islands, and fildff s-------------- --------------2.3.2 Ships ------------------- --------------------- --------
2.4 Operations ----------- ---------------------- --------------2.4.1 Logistic ---------------- ---------------------- --------2.4.2 Technical --------------- --------------------- ---------
191919202122
242424252526
CHAPTER3 wsuLTs ---------------- ----------------------- ----,42
3.I Dat,a presentation -------- -------------------- --------------- 423.2 Bufldup Characteristics ----- -------------------- -------------- 42
3.2.1 Rate Of Arrival --------- -------------------- ------------ 423.2.2 Times ofA.rrival, Peak Activity, and Cessation ---------- --------- 443.2.3 Mass-Arrival Rate ------- -------------------- ------------ 453.2.4 Particle-Size Variation---- -------------------- ------------ ~~3.2.5 Ocean Penetration ------- -------------------------------- 47
3.3 Physic~, Chemical, and Radiochemical Characteristics- ---------------- 493.3.1 Solid Particles ---------- -------------------- ----------- 493.3.2 Slurry Particles -------------------- -------------------- 533.3.3 Activity and FractionofDevice ------------------------------ 553.3.4 Chemical Composition ~d Surface Density --------------- -- --’---- 56
3.4 Radionuclide Composition and Radiation Characteristics ----------------- 56
3.4.1 Approach ---------------- ------------------------ ----- 56
9

3.4.2 Activities and Decay Schemes ------------------------------- 57
3.4.3 Instrument Response and Air-Ionization Factors ------------------- 57
3.4.4 Observed Radionuclide Composition -------------------- ------- 583.4.5 Fission-Product- Fractionation Corrections -------------------- -- 583.4.6 Results and Discussion ------ ---------------------- -------- 59
CtiPTER4 DISCUSSION ---------------- ------------------------ - 113
4.1 Shot Cherokee ------------- ---------------------- ---------- 1134.2 Data Reliability -------------- ------------------------ ‘----- 1144.3 Correlations -------------- ---------------------- ---------- 114
4.3.1 Fallout Predictions -------- ---------------------- -------- 1144.3.2 Sampling Bias ------------ ---------------------- -------- 1154.3.3 Gross Product Decay --------- ----------------------- ‘---- 1204.3.4 Fraction of Device by Chemistry and Radiochemistry - --------------- 1214.3.5 Total Dose by Dosimeter and Time-Intensity Recorder- -------------- 1214.3.6 Radiochemistry-Spectrometry Comparison- -------------------- -- 1224.3.7 Air Sampling ------------- ---------------------- ‘------- 1224.3.8 Relation of Yield Ratio to Contamination Index -------------------- 123
CHAPTER 5 CONCLUSIONS AND RECOMMENDATIONS -------------------- 15CI
5.1 Conclusions -------------- ---------------------- ----------- 1505.1.1 Operational ---------------- ----------------------- ‘---- 15°5.1.2 Technical ---------------- ----------------------- ‘----- 151
5.2 Recommendations ----------- ----------------------- --------- 154
REFERENCES -------------- ------------------------ ‘ ----------- 157
APPENDIXA INSTRUMENTATION ----------- ------------------------ 162
A.1 Collector Identification ------- ---------------------- ---------- 162A.2 Detector Data ------------- ------------------------ ‘------- 162
A.2.1 End-Window Counter ------- ---------------------- -------- 162A.2.2 Beta Counter ------------ ---------------------- ‘------- 162A.2.3 4-n Ionization Chamber ----------------------------------- 162A.2.4 Well Counter ------------ ---------------------- ‘------- 163A.2.5 20-Channel Analyzer ------- ---------------------- -------- 163A.2.6 Doghouse Counter --------- ---------------------- -------- 163A.2.7 Dip Counter --------------- ----------------------- ----- 164A.2.8 Single-Channel Analyzer ----- ---------------------- -------- 164A.2.9 Gamma Time-Intensity Recorder- ---------------------- ------ 164
APPENDXXB MEASUREMENTS ----- ”------ ------------------------- - 169
B.1 Buildup Data -------------- ----------------------- --------- 169B.2 Physical, Chemical, and Radiological Data ------------------------- 207B.3 Correlations Data ---------- ----------------------- --------- 269B.4 Unseduced Data ------------ ------------------------ ‘------- 279
FIGURES
‘2.1 Aerial view ofmajor sampling array- ---------------------- ‘------ 332.2 Plan andelevation ofmajor sampling array ------------------------- 342.3 Ship and barge stations ------ ----------------------- ‘ --------- 352.4 Functional view of gamma time--intensity recorder (TIR)- ---------------- 362.5 Functional view of incremental collector (IC) ------------------------ 36
10

2.6 Function~ view of open-closetoal collector (OCC) -------------------- 372.7 Minor sampling array -------- ------------------------ -------- 37
2.8 Location maPMdpl~drawtig of Site How ---------------------- ---- 382.9 Counter geometries ---------------------- ------------------- 39
2.10 Station locations intheatoll mea- ----------------------- -------- 402.11 Shiplocations attimes ofpe* activity- ------------------------ --- 413.1 Rates of arrival at major stations, Shot Flathead- -------------------- - 763.2 Rates of arrival at major stations, Shot Navajo -------------------- --- 7?3.3 Rates ofarrival at major stations, Shot Zuni ------------------------ 783.4 Rates ofarrival at major stations, Shot Tewa ------------------------ 79
3.5 Calculated mass-arrivti rate, Shots Zuni and Tewa -------------------- 803,6 Particle-size variation at ship stations, Shot Zuni - -------------------- 813.7 Particle-size variation at barge and island stations, Shot Zuni- ------------ 823.8 Particle-size variation at ship stations, Shot Tewa -------------------- 833.9 Particle- size variation at barge and island stations, Shot Tewa ------------ 843.10 Ocean activity profiles, Shots Navajo and Tewa -------------------- -- 853.11 Volubility ofsolid falloutparticles- ---------------------- -------- 863.12 Gamma-energy spectra of sea-water-soluble activity ------------------ 873.13 Typical solid falloutparticles -- ----------------------- ‘-------- 883,14 Angular falloutparticle, Shot Zuni ----------------- -------------- 893.15 High magnification of part of an angular fallout particle, Shot Z~i --------- 903.16 Spheroidal fallout particle, Shot Zuni ----------------- ------------ 913.17 Angular fallout particle, Shot Tewa ---------------- -------------- 92
3.18 Spheroidal falloutpa-rticle, Shot Tewa ---------------------------- 933.19 Thin section and radioautograph of spherical fallou’ particle, Shot Inca ------ 943.20 Energy-dependent activity ratios for altered and unaltered
particles, Shot Zuni --------------- ---------------------- 953.21 Atoms of Np2X, BaitO, and Sra* versus atoms of MOS9for altered
and unaltered particles, Shot Zuni ---------------- ------------ 963.22 particle group median activity versus mean size, Shot Zuni- ------------- 973.23 p~ticle group median activity versus mean sfze, Shot Tewa ------------- 983.24 Relation of particle weight to activity, Shot Tewa -------------------- - 993.25 Relation of particle density to activity, Shot Zuni -------------------- - 1003.26 Gamma decay of altered and unaltered particles, Shot Zuni -------------- 1013.27 Gmma spectra of altered and unaltered particles, Shot Zuni ------------- 1023.28 Photomicrograph of slurry-particle reaction area and insoluble solids- ------ 1033.29 Electronmicrograph of slurry-particle insoluble solids ----------------- 1033.30 NaCl mass versus activity per square foot, Shot Flathead --------------- 1043.31 ~ioautograph of ~urry-particle trace and reaction area --------------- 1043.32 ~dionuclide fractionation of xenon, krypton, and antimony
products, Shot Zuni --------------- ---------------------- 1!53.33 R-v~ue relationships for several compositions, Shot Zuni- -------------- 1063.34 Photon-decay rate by doghouse counter, Shot Flathead ----------------- 1073.35 photon-decay rate by doghouse counter, Shot Navajo- ------------------ 1083.36 Photon-decay rate by doghouse counter, Shot Zuni -------------------- 1093.37 Photon-decay rate by doghouse counter, Shot Tewa- ------------------- 1103.38 Beta-decay rates, Shots Flathead and Navajo- -------------------- --- 1113.39 Computed ionization-decay rates, Shots Flathead, Navajo,
Zuni, and Tewa ----------- ~ --------------------- ‘------ 1124.1 Approximate station locations and predicted fallout pattern, Shot Cherokee ---- 1354.2 Survey-meter measurement of rate of arrival on Y’AG 40, Shot Cherokee- ----- 1364.3 Incremental collector measurement of rate of arrival on YAG 40,
Shot Cherokee ----------- --------------------- --------- 137
11

4.4
4.5
4.6
4.74.84.94.104.114.12
4.13
4.144.15A.1A.2A.3A.4B.1B.2B.3B.4B.5B.6
B.7B.8B.9B.10B.11B.12B.13
B.14B.15B.16
(,
1
1
Gamma-energy spectra of slurry particles, Shot Cherokee - -- -- -- --- - ---- 138Photon decay of slurry particles, Shot Cherokee -------------------- -- 139
Predicted and observed fallout pattern, Shot Flathead- ------------------ 140Predicted and observed fallout pattern, Shot Navajo -------------------- 141Predicted and observed fallout pattern, Shot Zuni -------------------- - 142Predicted and observed fallout pattern, Shot Tewa -------------------- - 143
Close and distant particle collections, Shot Zuni -------------------- 144Cloud model for fallout prediction ------------------------ ------- 145Comparison of incremental-collector, particle-stze frequency
distributions, Shots Zuniand Tewa --------- ------------------ 146Comparison of incremental-collector, mass-arrival rates and
variation with particle size, Shots Zuni and Tewa ------- -------- --- 147
Comparative particle- size v=iation with time, YAG 39, Shot Tewa- -------- 148IUustrative gamma-ray spectra- ---------------------- ---------- 149
Collector designations --------------------------------------- 165Shadowing interference in horizontal plane for TIR -------------------- 166Maximum shadowing interference in vertical plane for TIR --------------- 167Minimum shadowing interference in vertical plane for TIR --------------- 168Ocean-penetration rates, Shots Flathead, Navajo, and Tewa -------------- 206Gamma decays of solid fallout particles, Shot Zuni -------------------- 263Gamma spectra of solid fallout particles, Shot Zuni- ------------------- 264Gamma spectra of solid fallout particles, Shot Zuni- ------------------- 265Reiation of inscribed to projected particle diameter- ------------------- 266Computed gamma- ionization rate above a uniformly contaminated .
smooth infinite plane ------- -------------------- ---------- 267Gamma-ionization-decay rate, Site How --------------------------- 268Surface-monitoring-device record, YAG 39, Shot Zuni- ----------------- 29?Surface-monitoring-device record, YAG 39, Shot Flathead --------------- 300
Surface-monitoring-device record, YAG 40, Shot Flathead -------------- 301Surface-monitoring-device record, YAG 39, Shot Navajo ------------ = -- 302Surface-monitoring-device record, YAG 40, Shot Navajo --------------- 303Surface-monitoring-device record, YAG 40, Shot Tewa ---------------- 304Normalized dip-counter-decay curves ----------------------- ----- 305Gamma spectra of slurry-particle insoluble solids, Shot Flathead --------- 306Gamma spectra of slurry-particle reaction area, Shot Flathead ----------- 307
TABLES
2.12.22.32.43.13.23.33.43.53.63.7
3.83.9
Shot Data ---------------- ------------------------- ------- 28Station Instrumentation ----- ---------------------- ------------ 29Station Locations inthe Atoll Area ----------------------- -------- 30Ship Locations at Times of Peak Activity ------------------------ --- 31Times of Arrival, Peak Activity, and Cessation at Major Stations ---------- 61.Times of Arrival at Major and Minor Stations in the Atoll &ea ------------ 61Penetration Rates Derived from Equivalent - Depth Determinations ---------- 62Depths at Which Penetration Ceased from Equivalent-Depth Determinations ---- 62Maximum Penetration Rates Observed- ----------------------- ----- 62Exponent Values for Probe Decay Measurements -------------------- -- 62X-Ray Diffraction Analyses and Specific Activities of Individual
Particles, Shoti Zuni -------------- --------------------- -- 63Distribution of Particle Densities, Shot Zuni- -------------------- ---- 63Radiochemical Properties of Altered and Unaltered Particles, Shot Zuni ------ 64
3.10 Activity Ratios for Particles from Shots Zuni and Tewa- ---------------- 64
. 12

3.Il Distribution of Activity of YAG 40 Tewa Particles with Size and Type ------- 643.12 Physical, Chemical, and Radiological Properties of Slurry Particles ------- 65
3.13 Compounds Identified in Slurry -P~ticle Insoluble Solids ---------------- 65
3.14 Radioc hemic~ properties of Slurry p=ticles, YAG 40, Shot Flathead- ------ 653.15 Fissions ~d Fraction of Device (Mog~ per Unit Area- ----------------- 663.16 Surface Density of Fallout Components in Terms of Original Composition- ---- 673.17 Radiochemical Fission-Product R-Values- -------------------- ----- 67
3.18 Radiochemicd Acti.nide Product/Fission Ratios of Fallout andStandard Cloud Samples ------ ---------------------- ------- 68
3.19 Radiochemicd Product/Fission Ratios of Cloud Samples andSelected Fallout Samples ------ ---------------------- ------ 68
3.20 Estimated Product/Fission Ratios by Gamma Spectrometry -------------- 693.21 Theoretical Corrections to Reference Fission-Product Composition,
Shot Zuni --------------- ---------------------- ------- 693.22 Computed Ionization Rate 3 Feet Above a Uniformly Contaminated Plane ----- 70
4.1 Activity Per Unit Area for Skiff Stations, Shot Cherokee ----------------- 1244.2 Evaluation of Measurement and Data Reliability- -------------------- -. 1244.3 Comparison of Predicted and Observed Times of Arrival and Maximum
Particle-Size Variation with Time- ---------------------- ----- 1264.4 Relative Bias of Standard-Platform Collections -------------------- --- 1274.5 Comparison of How Island Collections --------------------- -------- 1284.6 Surface Density of Activity Deposited on the Ocean- -------------------- 1284.7 Dip-Counter Conversion Factors- ---------------------- ---------- 1294.8 Fraction of Device per Square Foot- ----------------------- ------- 1304.9 Gamma Dosage by ESL Film Dosimeter and Integrated TIR Measurements- ---- 1314.10 Percent of Film Dosimeter Reading Recorded by TIR ------------------ 1324.11 Comparison of Theoretical Doghouse Activity of Standard-Cloud Samples
by Gamma Spectrometry and Radiochemistry - ------ ------ ------ 132
4.12 comparison of Activities Per Unit Area Collected by the High Volume
Fi.lter and Other Sampling Instruments- ---------------------- -- 1334.13 Normalized Ionization Rate (SC), Contamination Index, and Yield Ratio ------ 134B.1 Observed Ionlzation~te, T~---------------------------------- 170
B.2 ~crementi CoUector Data---- ---------------------- ---------- 176B.3 Measured ~te of particle Deposition, Shots Zuni and Tewa -------------- 198B.4 C~c~ated ~te of Mass Deposition, Shots Zuni and Tewa- --------------- 200B.5 Measured ~te of particle Deposition, Supplementary Data,
Shots Zuniand Tewa --------- ----------------------- ----- 202B.6 C~c~ated ~te of Mass Deposition, Supplementary Data,
Shots Zuniand Tewa -------- ---------------------- ------- 204B.7 Counting and ~diochemic~ Results for Individual Particles,
Shots Zunimd Ten ------------------------------------- 2°8B.8 Weight, Activi&, and Fission Values for Sized Fractions from
Whim ~ple YFNB29ZU---------- ; ---------------------- 209B.9 Frequencies and Activity Characteristics of Particle Size ad
Particle Type Groups, Shots Zuniand Tewa --------- ------------ 21°B.1O survey of shot Tewa Reagent Fums for Slurry Particle Traces ----------- 213B.11 Tot~Activi& and Mass of~urry FMout -------------------------- 214B. 12 Gamma Activity and Fission Content of WC and AOCi Collectors /
by Mog9 Analysis ----------- ----------------------- ----- 215B. 13 Observed Doghouse Gam~ Activity- Fission Content Relationship --------- 217B.14 Dip-counter Activity ad Fission content of AOC2 Collectors- ------------ 218B.15 ~p probe ~d Doghouse-counter Correlation with Fission Content --------- 220
13

B.16 Elemental Analysis of Device Environment ------- ------------------ 221B.17 Principal Components of Device Complex -------- ------------------ 221B.18 Component Analysis of Failout Samples ----------------------- ---- 222B.19 Air-Ionization Rates of Induced Products for 104 Fissions/Ft2,
Product/Fission Ratio of Unity (SC)-- ------------------------- 232
B. 20 Absolute Photon Intensities in Millions of Photons per Secondper Line for Each Sample ----- ----------------------- ----- 235
B.21 Gamma-Ray Properties of Cloud and Faliout Samples Based onGamma-Ray Spectrometry (NRB)-- ------------------------- - 237
B.22 Computed Doghouse Decay Rates of Fallout and Cloud Samples- ----------- 240B.23 Observed Doghouse Decay Rates of Fallout and Cloud Samples ------------ 251B.24 Computed Beta-Decay Rates---- ----------------------- -------- 254B.25 Observed Beta-Decay Rates---- ----------------------- -------- 257B.26 4-7r Gamma Ionization Chamber Measurements -------------------- -- 258B.27 Gamma Activity and Mean Fission Content of How F Buried Collectors ------ 260B.28 How Island Surveys, Station F --------------- ------------------ 261B.29 Sample Calculations of Particle Trajectories -------------------- --- 270B. 30 Radiochemical Analysis of Surface Sea Water and YAG 39
~cay-T@smples-------- ---------------------- ------- .277
B.31 RainfaU-Coilection Results ~- --------------------- ------------ 278B.32 Activities of Water Samples ---- ---------------------- --------- 280B.33 Integrated Activities from Probe Profile Measurements (S10) ------------ 289B.34 Individual Solid-Particle Data, Shots Zuni and Tewa- ------------------ 290B.35 Individual Slurry-Particle Data, Shots Flathead and Navajo -------------- 294B.36 High Volume Filter Sample Activities ---------------------------- 296B.37 Observed Wind Velocities Above the Standard Platforms ---------------- 297
14

Chopfer /
m’/?oDucT/oN
I.1 , OBJECTIVES
The general objective was to collect and corkelate the data needed to characterize the fallout,interpret the observed surface-radiation contours, and check the models used to make predic-
tions, for Shots Cherokee, Zuni, Flathead, Navajo, and Tewa durtig Operation Redw~g.
Ths specific objectives of the project were: (1) to determine the time of arrival, rate of
arrivai, and cessation of faUout, as weil as the variation in particle-size distribution and gamma-radiation field intensity with time, at several points close to and distant from ground zero; (2)to collect undisturbed samples of fallout from appropriate land- and water-surface detonationsfor the purpose of describing certain physical properties of the particles and droplets, includ-ing their shape, size, density and associated radioactivity; measuring the activity and massdeposited per unit area; establishing the chemicai and radiochemical composition of the falloutmateriai; and determining the sizes of particles and droplets arriving at given times at severalimportant points in the fa.ilout area; (3) to make early-time studies of selected particles andSamples in order to establish their radioactive-decay rates and gamma-energy spectra; (4) tOmeasure the rate of penetration of activity in the ocean during faliout, the variation of activitYwith depth during and @er ftiout, and the variation of the gamma-radiation field with time aShort distance above the water surface; and (5) to obtain supplementary radiation-contour dataat short and intermed~te distances from ground zero by total-fallout collections and time-of-arrival measurements.
It was not an objective of the project to obtain data sufficient for the determination of com-
Plete fallout contours. Instead, emphasis was placed on: (1) complete and controlled documen-tation of the faUout event at certa~ key points throughout the pattern, also intended to serve asCOrre~tion po~ts with the surveys of other projects; (2) precise measurements of time-dependent phenomem, which could be utilized to establish which of the conflicting assumptions
of various f~out prediction theories were correct; (3) analysis of the fallout material for theprimary purpose of obtain~g a better understanding of the con~minant produced by water-surface
detonations; and (4) gross documentation of the fallout at a large number of points in and near the@goon.
1.2 BACI.fGRO~
A few collections of f~lout from tower shots were made in open pans during Operation Green-house (Reference 1). More extensive measurements were made for the surface and underground‘~ts Of Operation Jangle (Reference ?). Specialized collectors were designed to sample incre-men~y with time ad to exclude efi~eous material by s~pl~g ofly during the fdlOUt perbd.
fie studies during Operation Jangle indicated that fallout couid be of military importance in a-‘eas beyond the zones of severe blast and thermal damage (Reference 3).
Ming operation Ivy, a limited effort was made to determine the important fdbut areas for
a device of megaton yield (Reference 4). Because of operational difficulties, no information on

fallout in the downwind direction was obtained. Contours were established in the upwind and
crosswind directions by collections on rtit sations located in the lagoon.Elaborate plans to measure the fallout in all directions around the shot point were made for
Operation Castle (Reference 5). These plans involved the use of collectors mounted on free-
floating buoys placed in four concentric circles around the shot point shor~y before detonation.Raft stations were also used in the lagoon nd land stations were located on a number of the il3-lands. Because of poor predictability of detonation times and operational difficulties caused byhigh seas, only fragmentary data was obtained from these stations.
The measurement of activity levels on several neighboring atolls that were unexpectedly con-taminated by debris from Shot 1 of Operation Castle provided the most useful data concerning
the magnitude of the fallout areas from multimegaton weapons (Reference 6). Later ~ the op-eration, aerial and oceanographic surveys of the ocean areas were conducted and water sampleswere collected (References 7 and 8). These measurements, made with crude equipment con-structed tn the forward are% were used to calculate approximate fallout contours. The aerial-survey data and the activity levels of the water samples served to check the contours derivedfrom the oceanographic survey for Shot 5. No oceanographic survey was made on Shot 6; how-ever, the contours for this shot were constructed from aerial- survey and water- sample &ta.
In spite of the uncertainty of the contours calculated for these shots, the possibility of deter-mining the relative concentration of radioactivity in the ocean following a water-surface detona-tion was demonstrated. During Operation Wigwam (Reference 9), the aerial and oceanographicsurvey methods were again successfully tested.
Durtng Operation Castle, the question arose of just how efficiently the fallout was sampledby the instruments used on that and previous operations. Studies were made at Operation Tea-pot (Reference 10) to estimate this efficiency for vm-ious types of collectors located at differentheights above the ground. The results demonstrated the difficulties of obtaining reliable samplesand defined certain factors affecting collector efficiency. These factors were then applied in thedesign of the collectors and stations for Operation Redwing.
1.3 THEORY
1.3.1 General Requirements. Estimates of the area contaminated by Shot 1 during OperationCastle indicated that several thousand sqwe miles had received significant levels of fallout (Ref -erences 5, 11 and 12), but these estimates were based on very-meager data. It was consideredessential, tkrefore, to achieve adequate documentation during Operation Redwing. Participation
in a joint program designed to obtain the necessary data (Reference 13) was one of the responsi-bilities of this project.
The program included aerial and oceanographic surveys, as well as lagoon and island sur-veys, whose mission was to make surface-radiation readings over large areas and collectsurface-water samples (References 14, 15 and 16). Such readings and samples cannot be useddirectly, however, to provide a description of the contaminated material or radiation-contourvalues. Corrections must be made for the characteristics of the radiation and the settling anddissolving of the fallout in the ocean. It was these corrections which were of primary interestto this project. .
1.3.2 Data Requirements. Regardless of whether deposition occurs on a land or water sur-face, much the same basic information is required for fallout characterization, contour con-struction, and model evaluation, specifically: (1) fallout buiidup data, including time of arrival,rate of arrival, time af cessation, and puticle - size variation with time; (2) fallout compositiondata, including the physical characteristics, chemical components, fission conten~ and radio-nuclide composition of representative particles and samples; (3) fallout radiation data, includingphoton emission rate and ionizing power as a function of time; and (4) total fallout data, includingthe number of fissions and amount of mass deposited per unit area, as well as the total gamma-ionization dose delivered to some late time.
16

‘-1. 1.3.3 Special Problems and Solutions. Models can be checked most readily by means of
~out.buildup data, because this depends only on the aerodynamic properties of the particles,~~ initial distribution in the cloud, and intervening meteorological conditions. The construc-
Uon of land-equivalent radiation contours, on the other hand, requires characterization of the
Composition and radiations of the fallout in addition to ~ormat ion on the total amount deposited.
1.3.4 Radionuclide Composition and Radiation Characteristics. In the present case, for ex-
: ample, exploratory attempts to resolve beta-decay curves into major components failed, because‘ at the latest times measured, the gross activity was generally still not decaying in accordanceAwith the computed fission-product disintegration rate. It was known that, at certain times, in-
duced activities in the actinides alone could upset the decay constant attributed to fission prod-ucts, and that the salting agents present in some of the devices could be expected to influenceihe gross decay rate to a greater or lesser extent depending on the amounts, half lives, and‘decay schemes of the activated products. The extent to which the properties of the actual fissionproducts resembled those of thermally fissioned U*S and fast fission of Uza was not known, norwere the effects of radionuckie fractionation. In order to estiblish the photon-emission char-
acteristics of the source, a reliable method of calculating the gamma-ray properties of a definedquantity and distribution of nuclear-detonation products had to be developed. Without such infor-mation, measurements of gamma-ionization rate and sample activity, made at a variety of times,“couLd not be compared, nor the results applied in biological-hazard studies.
Fission-product, induced-product, and fractionation corrections can be made on the basis ofradiochemical analyses of samples for important nuclides. This leads to an average radionuclide
composition from which the emission rate and energy distribution of gamma photons can be com-@ed for various times. A photon-decay curve can then be prepared for any counter with knownresponse ctiacteristics Md, ~ c~cdati,ng ionization rates at the same times, a correspondingionization-decay c~ve. These curves cm in turn & compared with experimental curves to checkthe basic composition ~d used to reduce counter and survey-meter readings.
1.3.5 Sampling Bias. Because the presence of the collection system itself usually distortsthe 10C~ air stream, correctio~ for sample b~s ~e ~SO required before the totti ftiout de-
posited at a point may be determined. To make such corrections, the sampling arrays at allstations must be geometries.l,ly i&nt~c~, S0 tit their collections may be compared when cor-rected for w~ velocity, ad ~ in&pen&nt -d absolute meas~e of t~ tom fwout deposited
~ one or more of the stations must be obtained. The latter is often dtfficult, ff not impossible,to do ad for this reason it is desirable to express radiologic~ effects, such as dose rate, bl
terms of a reference fission density. Insertion of the best estimate of the actual fission densitythen leads to the com~ted inf~ite-p~ne ioni~tion rate for that C2L%S.
h principle, on the deck of a ship large enough to sim~te ~ infinite pwe, the same falhlt-
rtiiation measurements can be made as on a land mass. in actual fact, however, there are im-POrbt difference: ~ additio~l deposition b~s exists because of the distortion of the airflow
$rowd the ship; the collecting surfaces on the ship are less retentive than a land plane, and~~ geometric configuration is different; a partial washdown must be used if the ship is =Med,and this requires headway into the swface wind ~ order to ~in~~ position and avoid SU1’lpk
contiminatlon tn the unwashed area. For these reasons, the bias problem is even more severeakard ship than on land.
The preced~g considerations were applied ~ the development of the present experiment ~d~ be reflected ~ t~ treatment of the ~~. ~ ~jor sampl~g s~tions were constructed
‘i~e and included an instrument for measuring wind velocity. The buried-tray array surround-b the major s~tion on Site HOW WaS ~tended to provide one calibration point, and it was hoped-t another co~d & derived from the ~ter- sampl~g measurements. w the ZM.lySiS whichfOUows, fractiomtion corrections w~ be -de ad radiological q~ntities expressed in termS
of 1C14fissions wherever possible. Relative-bias corrections will be included for each major‘~tion, and an attempt wi~ also be made to assess absolute bias for these stations.
17

1,3.6 Overall Approach. It should be emphasized that, at the time this project was conceived,the need for controlled and correlated sets of fallout data for megaton bursts was critical. Be-
cause of the lack of experimental criteria, theoretical concepts could be neither proved nor dis-proved, and progress was blocked by disagreements over fundamental parameters. The distri-bution of particle sizes and radioactivity within the source cloud, the meteorological factorswhich determined the behavior of the particles falling through the atmosphere, the relationshipof activity to particle size , and the decay and spectral characteristics of the fallout radiations:all were in doubt. Even the physical and chemical nature of the particulate from water-surfacebursts was problematical, and all exist ing model theory was based on land-surface detonations.Corrections necessitated by collection bias and radionuclide fractionation were considered re-finements.
The objectives stated in Section 1.1 were formulated primarily to provide such sets of data.However, the need to generalize the results so that they could be ~.pplied to other combinationsof detonation conditions was also recognized, and it was felt that studies relating to basic radio-logical variables should receive particular emphasis. Only when it becomes possible to solvenew situations by inserting the proper values of such detonation parameters as the yield of thedevice and the composition of environmental materials tn generalized mathematical relation-ships wffl it become possible to truly predict fallout and combat its effects.
18

Chopfef 2
Pl?ocmm
2.1 SHOT PARTICIPATION
This project participated inis given in Table 2.1.
2.2 INSTRUMENTATION
Shots Cherokee, Zuni, Flathead, Navajo and Tewa. Shot data
The instrumentation featured standardized arrays of sampling instruments located at a vari-ety of stations and similar sets of counting equipment located in several different laboratories.Barge, raft, island, skiff, and ship stations were used, and ail instruments were designed todocument fallout from air, land, or water bursts.
The standardized arrays were of two general types: major and minor. The overall purposeof both was to establish a basis for relative measurements. Major arrays were located on the
ships, barges, and Site How; minor arrays were located on the rafts, skiffs, and Sites How,
George, WiIliam, and Charlie. All major array collectors ae identified by letter and numberin Section A. 1, Appendix A.
Special sampling facilities were provided on two ships and Site HOW.The instrument arrays located at each station are listed in Table 2.2.
2.2.1 Major Sampling Array. The plafforms which supported the major arrays were 15 or20 feet in diameter and 3 feet 8 inches deep. Horizontal windshields were used to create uni-form airflow conditions over the surfaces of the collecting instruments (Figures 2.1 and 2.2).
All platiorms were mounted on towers or king posts of ships to elevate them into the free airstream (Figure 2.3).
Each array included one gamma time- intensity recorder (TIR), one to three incrementalcollectors (IC), four open-close total coUectors (Kc), two always-open total collectors, Type
1 (AOC1), one recording anemometer (R4), and one trigger-control unit (Mark I or Mark II).The TIR, an autorecyclic gamma ionization dosimeter , is shovni dissembled in Figure 2.4.
R consisted of sever~ simi~r units each of which contiined an ionization chamber, an integrat-tig range capacitor, associated electrometer and recyclic relay circuitry, and a power ampli-
fier, fed to a 20-pen Esterline-Angus operational recorder. Information was stored as a linePulse on a moving paper tape, each line corresponding to the basic unit of absorbed radiationfor that c~mel. w operation, the ~te~ating capacitor ~ par~el with the ionization chamber
was charged negatively. M a radiation field, the voltage across this capacitor became morePositive with ionization until a point was reached where the electrometer circuit was no longer
nonconducting. The resultant current flow tripped the power amplifier which energized a re-cYcling relay, actuated the recorder, and recharged the chamber to its original voltage. Ap-proximately ‘~ inch of polyethylene was used to exclude beta rays, such that increments of gammaionization dose from 1 mr to 10 r were recorded with respect to time. Dose rate could then beob~i.ned from the spacing of increments, and total dose from the number of increments. Thisblstrument provided data on the time of arrival, rate of arrival, peak and ceSSatiOn Of falIOUt,
and decay of the radiation field.The IC, shown with the side covers removed in Figure 2.5, contained 55 to 60 trays with
sensitive collecting surfaces 3.2 inch in diameter. The trays were carried to exposure pos[tionbY a FQir of interconnected gravity-spring-operated vertical elevators. Each tray was exposed
19

at the top of the ascending el@vator for M WA ‘iCrement ‘f ‘ime> ‘Uytig ‘rem 2 ‘0 15 ‘tiutes
for different instruments; after exposure it was pushed horizontally across to the descending
elevator by means of a pneumatic piStOn. For land- surface shots, grease-coated cellulose ace-
tate disks were’ used as collecting sUrfa@S; for water-surface shots these were interspersed
with diNcs carrying chloride-sensitive f ilms. This instrument also furnished data on the time
of arrival, rate of arrival, peak and cessation of fallout and, tn addition, provided samples formeasurements of single-particle properties, Particle- size distribution, and radtation charac -teristics.
The OCC, shown with the toP cover removed @ F@re 2.6, contained a square aluminumtray about 2 ticbes deep and 2.60 square feet in area. Each tray was lined with a thin sheet of
polyethylene to facilitate sample removal and fffled with a fiberglass honeycomb insert to im-prove coUection and retention efficiency Wtthout htndering subsequent analyses. The collectorwas equipped with a sliding lid, to prevent samples from betng altered by environmental condi-tions before or after collection, and designed in such a way that the top of the collecting traywas raised about ‘~ inch above the top of the instrument when the lid was opened. Upon recovery,each tray was sealed with a separate a.lumtim cover *4 inch thick which was left in place unttl
the ttme of laboratory analysis. The samples collected by thts instrument were used for chemi-
cal and radiochemical measurements of tdal fallout and for determinations of activity depositedper unit area.
The AOCI was an OCC tray assembly which was continuously exposed from the time of place-ment until recovery. It was provided as a backup for the OCC, and tb samples were intendedto serve * same purposes.
ThS RA -S a stock instrument (AN/UMQ-5J3, mlo8/uMQ-0 =w$ble of record@ -dspeed and direction as a function of time.
The Mark I and II trigger-control units were central panels designed to control the operationof the instruments in the major sampling array. The Mark I utilized ship power and providedfor msnual control of OCC’S and automatic control of IC’S. The Mark II had its own power andwas completely automatic. A manually operated direct-circuit trigger was used for the shipinstallations and a combination of radio, ligh~ pressure and radiation triggers was used on thebarges and Site How.
In addition to the instruments described above, an experimental high-volume filter unit (HVF),or incremental air sampler, was located on each of the ship platforms. It consisted of eightheads, each with a separate closure, and a single blower. The heads contained dimethyltere-plmlate (DMT) filters, 3 inches in diameter, and were oriented vertically upward. Air wasdrawn through them at the rate of about 10 cubic feet per minute as they were opened sequen-tially through the control unit. The instrument was designed to obtain gross aerosol samplestuder conditions of low concentration and permit the recove~ of particles without alterationresulting from sublimation of the DMT.
SStS of instruments consisting of one incremental and one total-fallout collector belonging toProject 2.65 and one gamma dose recorder belonging to Project 2.2 were also placed on the shipplatforms and either on or near the barge and Site How platforms. These were provided to makeeventual crQss-correlation d data possible.
2.2.2 Minor Sampling Array. The minor array (Figure 2.7) was mounted in two ways. Onthe skiffs, a telescoping mast and the space within the skiff were used for the instruments. Onthe rafts and islands, a portable structure served both as a tower and shield against blast andthermal effects. However, all arrays included the same instruments: one time-of-arrival de-tector (TOAD), one film-pack dosimeter (ESL), and one always-open total collector, Type 2(AOC~. I
The TOAD consisted of an ion~ation-c~~r radiation trigger and an 8-day chronometric
clock started by the trigger. With this instrument, the time of arrival was determined by sub-tracting the clock reading from the tow period elapsed between detonation ~d the time whenthe instrument was read.
The E= =$ a @dard Evans Sigt@ ~oratory film pack used to estimate the gross gam-
20

~ Imization dose.~ AOCZ consisted of a 7-inch-diameter funnel, a ‘~-inch-diameter tube, and a 2-gallon
tie, SU of polyethylene , with a thim layer of fiberglass honeycomb in the mouth of the funnel.
c~ected samples were used to determine the activity deposited per unit area.
2.2.3 Special Sampling Facilities. The YAG 40 carried a shielded laboratory (Figure 2.3),which could commence studies shortly after the arrival of the fallout. This laboratory was in-
dependently served by the specm incremental collector (SIC) and an Esterline-bgus recorderwhfch continuously recorded the radiation field measured by TIR’s located on the king-post plat -
form and main deck.The SIC consisted of two modified IC’S, located side by side and capable of being operated
independentLy. Upon completion of whatever sampling period was destred, trays from eitherinstrument could be lowered directLy into the laboratory by means of an enclosed elevator. Boththe tiys and their collecting surfaces were identical to those employed in the unmodified IC’s.The samples were used first for early-time studies, which featured work on single particlesad gamma decay and measurements of energy spectra. Later, tlw samples were used for de-tailed physical, chemical, and radiochemical analyses.
Both the YAG 39 and YAG 40 carried water-sampling equipment (Figure 2.3). The YAG 39was equipped with a penetration probe, a decay tank with probe, a surface-monitoring device,and surface-sampling equipment. The YAG 40 was similarly equipped except that it had no de-cay tank with probe.
The penetration probe (SIO- P), which was furnished by Project 2.62a, contained a multipleGM tube sensing element and a depth gage. It was supported on an outrigger projecting about25 feet over the side of the ship at the bow and was raised and lowered by a winch operated from
the secondary control room. Its output was automatically recorded on an X-Y recorder locatedin the same room. The t.nst.rument was used during and after fallout to obtain successive verti-IXUprofiles of apparent mil.ltioentgens per hour versus depth.
The tank containing the decay probe (s’fO-D) was located on the main deck of the YAG 39 and~, in effect, a large always-open tota,l collector with a wtmishield similar to that on the stand-ard platform secured to its upper edge. It was approximately 6 feet in diameter and 674 feetdeep. The probe was identical to the S10- P described above. Except in the case of Shot Zuni,the sea water with which it was f~ed afresh before each event, was treated with nitric acid toretard plate out of the radioactivity and st~red continuously by a rotor located at the bottomof the U
The surface-monitoring device (NYC)- M), which was provided by Project 2.64, contained a
~stic phosphor and photomultiplier sensing element. The instrument was mounted in a fixedposition at tie e~ of the ~w out=igger ad its output WIS recorcfed automatically on an Esterline-&l&us recorder located ~ th~ secondary control room of the ship. ~blg fdlOUt, it WaS prO-
tected by a polyethylene bag. This was later removed while the device was operating. ThePUrpo!3e of the device WM to estimate the contribution of surface contamination to the total read-
%. The instrument was essentially unshielded, exhibiting a nonuniform 4-n response. It wasbltended to measure the c~g~g ~mma. rad~tion field close above the surface of the ocean for
Purposes of correlation with readings of similar instruments carried by the survey aircrsft.The surface- sampling equipment consisted of a 5-gailon polyethylene bucket with a hand line
and a number of */z-gallon polyethylene bottles. This equipment was used to collect water sam-Ples after the cessation of fa.llOut.
A supplementary sampling fac@y was established on Site How near the tower of the majorsampl~ array (Figure 2.8). E consisted of twelve AOC!I’S without lt.ners or inserts (AOCt -B),eah with ~ adjacent Swvey s~e, 3 feet high The trays were fffled with earth and buried bl
such a way that their collecting surfaces were flush with the ground. Every location markedwith a stake -s monitored ~th a ~nd survey meter at a~l,lt 1-&y intervals for 5 or 6 &yS
after each event. Samples from the trays were used in assessing the collection bias of the majorsampling ~raY by provid~g ~ absolute “due of the number of fissions deposited per unit area.
21

The survey-meter readings were used to estabiish the gamma-ionization decay above a surface
approximating a uniformly contaminated infinite plane.
2.2.4 Laboratory Facilities. Samples were measured and analyzed in the shielded laboratory
aboard the YAG 40, the field laboratory at Site Elmer and the U. S. Naval Radiological DefenseLaboratory (NRDL). The laboratories in the forward area were equipped primarily for makingearly-time measurements of sample radioactivity,. all other measurements and analyses beingperformed at NR.DL. Instruments used in determining the radiation characteristics of samplesare discussed briefly below and shown in Figure 2.9; pertinent details are given in Section A.2,Appendix A. Other special laboratory equipment used during the course of sample studies con-sisted of an emission spectrometer, X-ray diffraction apparatus, electron microscope, ion-exchange columns, polarograp~ flame photometer, and Galvanek-Morrison fluorimet er.
The YAG 40 laboratory was used primarily to make early-gamma and beta-activity measure-ments of fallout samples from the SIC trays. AU trays were counted in an end-window gammacounter as soon as they were removed from the elevator; decay curves obtained from a few ofthese served for corrections to a common time. Certain trays were examined under a wide-field stereomicroscope, and selected particles were sized and removed with a hypodermic needlethrust through a cork. Other trays were rinsed with acid and the resulting stock solutions usedas correlation and decay samples in the end-window counter, a beta proportional counter, a 4-rgamma ionization chamber and a gamma well counter. Each particle removed was stored on itsneedle tn a small glass vial and counted in the well counter. Occasional particles too active forthis counter were assayed in a special holder in the end-window counter, and a few were dis-solved and treated as stock solutions. Gamma-ray pulse-height spectra were obtained from aselection of the described samples using a 20-channel gamma analyzer. Sturdy-energy calibra-tion and reference-counting standards were prepared at NRDL and used continuously with eachinstrument throughout the operation.
The end-window counter (Figure 2.9A) consisted of a scintillation detection unit mounted inthe top portion of a cylindrical lead shield 11/2 inch thick, and connected to a preamplifier, am-plifier ad scaler unit (Section A.2). The detection unit contained a 1~2-inch-diameter-by -72-
inch-thick NaI(Tl) crystal fitted to a photomultiplier tube. A ‘~-inch-thick aluminum beta ab-sorber was located between the crystal and the counting chamber, and a movable-shelf arrange-ment was utilized to achieve known geometries.
The beta counter (Figure 2.9B) was of the proportional, continuous-flow type consisting of agas-filled chamber with an aluminum window mounted in a 172-inch-thick cylindrical lead shield(Section A.2). A mixture of 90-percent argon and 10-percent CQ was used. The detection unitwas mounted in the top ~rt of the shield with a 1-inch circular section of the chamber windowexposed toward the sample, and connected through a preamplifier and amplifier to a conventional
scaler. A movable-shelf arrangement similar to the one described for the end-window counterwas used in the counting chamber. Samples were mounted on a thin plastic film stretched acrossan opening in an aluminum frame.
The 4-T gamma ionization chamber (GIC) consisted of a large, cylindrical steel chamber witha plastic-lined steel thimble extending into it from the top (Figure 2.9 C). The thimble was sur-rounded by a tungsten-wire collecting grid which acted as the negative electrode, while the cham-ber itself served as the positive electrode. This assembly was shielded with approximately 4inches of lead and connected externally to variable resistors and a vibrating reed electrometer,which was coupled in turn to a Brown recorder (section A.2). Measurements were recorded inmillivolts, together with corresponding resistance dati from the selection of one of four possiblescales, and reported in milliamperes of ionization current. Samples were placed in lusteroidtubes and lowered into the thimble for measurement.
The gamma well counter (Figure 2.9D) consisted of a scintillation detection unit with ahollowed-out crystal, mounted in a cyiindric~ lead shield 114 inches thick, and connected througha preamplifier to a scaler system (Section A.2). The detection unit contained a 1!/4-inch-diameter-by-2-inch-thick NaI(Tl) cryst~, with a ~,-inch-diameter -by- 1~’-inch weU, joined to a phototube.Samples were lowered into the we~ through a circ~ar opening in the top of the shield.
22
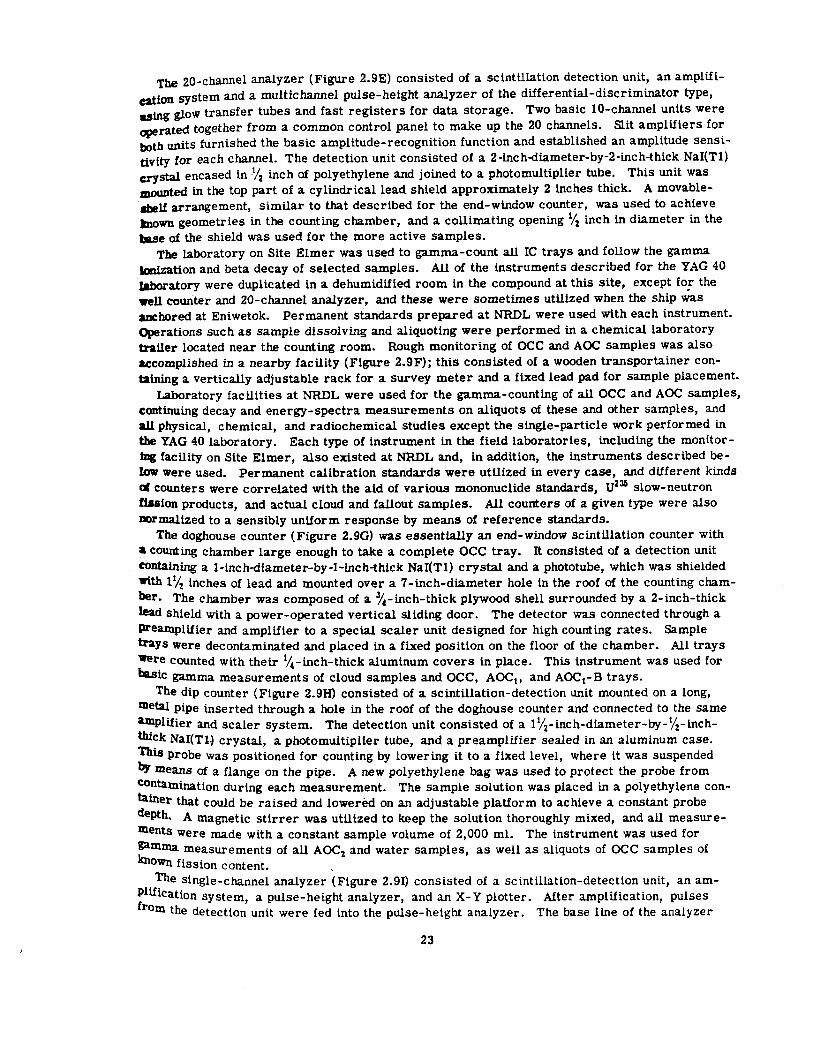
The 20.channel analyzer (Figure 2.9E) consisted of a scintillation detection unit, an amplifi-
~ion system and a multichannel pulse-height analyzer of the differential-discriminator type,
~hg @ow transfer tubes and fast registers for data storage. Two basic 10-chamel units were
~nted together from a common control panel to make up the 20 channels. Slit amplifiers for~th tits furnished the basic amplitude-recognition function and established an amplitude sensi-
tivity for each channel. The detection unit consisted of a 2-inch-diameter-by-2 -inch-thick NaI(Tl)
~stal encased in 1/2 inch of polyethylene and joined to a photomultiplier tube. This unit was~mted in the top part of a cylindrical lead shield approximately 2 inches thick. A movable-~lf arrangement, similar to that described for the end-window counter, was used to achieve~OWU geometries in the counting chamber, and a collimating opening 1/’ inch in diameter in the
lmse of the shield WM used for the more active samples.The laboratory on Site Elmer was used to gamma-count all IC trays and follow the gamma
ionization and bea decay of selected samples. AU of the instruments described for the YAG 40
@oratory were duplicated in a dehumidified room in the compound at this site, except fo~ the
well counter and 20-channel analyzer, and these were sometimes utilized when the ship wasanchored at Eniwetok. Permanent standards prepared at NRDL were used with each instrument.Operations such as sample dissolving and aliquoting were performed in a chemical laboratorytiiIer located near the counting room. Rough monitoring of OCC and AOC samples was also
accomplished in a nearby facility (Figure 2.9 F); this consisted of a wooden transportainer con-taining a vertically adjustable rack for a survey meter and a fixed lead pad for sample placement.
Laboratory facilities at NRDL were used for the gamma-countfng of all OCC and AOC samples,continuing decay and energy-spectra measurements on aliquots of these and other samples, andall physical, chemical, and radiochemical studies except the single-particle work performed inb YAG 40 laboratory. Each type of instrument in the field laboratories, including the monitor-tug facility on Site Elmer, also existed at WL and, in addition, the instruments described be-
- were used. Permanent calibration standards were uttlized in every case, and different kindsd counters were correlated tith the aid of various mononuclide standards, U*U slow-neutronfkion products, ad ac~l cloud and fallout samples. All counters of a given type were alsoIX3mnalized to a sensibly uniform response by mems of reference standards.
The doghouse counter ( Fi~re 2.9G) wss essentially ZII end-window scintillation counter with
? Counting chamber large enough to take a complete OCC tiay. It consisted of a detection unitCOU@~ing a l.inch+iamete~by .l-~ch+hick NaI(Tl) crys~ ~d a phototube, which WZS shielded
~th 11/2 inches of lead and mounted over a ?-inch-dtameter hole in the roof of the counting cham-k. The c~mber was composed of a ~4- inch-thick plpmod shell surrounded by a 2-inch-thickM shield with a power-operated vertical sliding door. The detector was comected through aWe=plifier and amplifier to a special scaler unit designed for high counting rates. Sample~Ys were decontaminated and placed in a fixed position on the floor of the chamber. All trays~re counted with their ‘/4-inch-thick aluminum covers in place. This instrument was used for
‘ic gamma measurements of cloud samples and OCC, AOC,, and AOCt- B trays.The dip counter (Figure 2.9H) consisted of a scintillation-detection unit mounted on a long,
‘em PiPe inserted through a hole in the roof of the doghouse counter and connected to the same~Phfier and scaler system. The detection unit consisted of a 1~z- inch-diameter-by- ~z- inch-‘Ck NaI(TQ crystal, a photomultiplter tube, and a preamplifier sealed in an aluminum case.‘is Probe was positioned for counting by lowering it to a fixed level, where it was suspendedh means of a flange on the pipe. A new polyethylene bag was used to protect the probe from‘n~mi~tion dur~ each measurement. The sample solution was placed in a polyethylene con-‘tier tit could be raised and lowered on an adjustable plaffor m to achieve a constant probe‘epth. A magnetic stirrer was uttltzed to keep the solution thoroughly mixed, and ail measure-ments were made with a constant sample volume of 2,000 ml. The instrument was used for‘mm measurements of all AOCz and water samplesJQIO~ fission content.
, as well as aliquots of OCC samples of
‘e single-channel analyzer (Figure 2.91) consisted of a scintillation-detection unit, an am-‘lMicatiOn System a pulse-height analyzer, and an X-Y plotter. After amplification, PUISeS
‘rorn the detection’ unit were fed into the pulse-height analyzer. The base line of the analyzer
23

was swept slowly across the puise spectrum and the output simultaneously fed into a count-ratemeter. Count rate was recorded on the Y-axis of the plotter, and the analyzer base-line pOsi-
tion on the X-axis, giving a record reducible to gamma intensity versus energy. The detection
unit consisted of a 4- inch- diameter-by-4-inch-thick NaI(Tl) crystal, optically coupled to aphotomultiplier tube and housed in a lead shield 2YZinch thick on the sides and bottom. A 6-tnch-thick lead plug with a ‘~-inch-diameter collimating opening was located on top, with thecollimator directed toward the center of the crystal. The sample was placed in a glass vialand suspended tn a fixed position a short distance above the collimator. All quantitative gain--energy- spectra measurements of cloud and fallout samples were made with this instrument.
Relative spectral data was aiso obtained at later times with a single-channel analyzer. Thisinstrument utilized a detection unit with a 3-tnch-diameter -by-3- inch-thick uncollimated NaI(Tl)crystal. Reproducible geometries were neither required nor obtained; energy calibration wasaccomplished with convenient known standards.
2.3 STATION LOCATIONS
2.3.1 Barges, Rafts, Islands, and Skiffs. The approximate locations of all project stationsin the atoi.i area are shown for each shot tn Figure 2.10; more exact locations are tabulated inTable 2.3. The Rafts 1, 2, and 3, the island stations on Sites George and How, and the SkiffSDD, EE, ~ LL, and TT remained in the same locations during the entire operation. Otherstations changed posit ion at least once and sometimes for each shot. These changes are indi-cated on the map by the letters for the shots during which the given position applies; the table,however, gives the exact locations. All stations were secured and protected from fallout durbigShot Ikkota in which this project did not participate.
The choice of locations for the barges was conditioned by the availability of cleared anchoringsites, the necessity of avoiding serious blast damage, and the fact that the YFNB 29 carried twomajor sampling arrays while the YFNB 13 carried only one. Within these limitations they werearranged to sample the heaviest faliout predicted for the lagoon area ad yet guard against late
changes in wind direction. In generai, the YFNB 29 was located near Site How for all shots ex-cept Tewa, wkn it was anchored off Site Bravo. The YFNB 13 was located near Site Charliefor all shots except Cherokee and Tewa, when it was positioned near Site How. Because bothbarges were observed to oscillate slowly almost completely around their points of anchorage,an uncertainty of *200 yards must be asswiated with the locations given in Table 2.3.
The raft positions were chosen for much the same reasons as for the barge positions, butalso to improve the spacing of data points in the lagoon. An uncertainty of * 150 yards shouldbe associated with these anchorage coordinates.
The island stations, except for Site How, were selected on the basis of predicted heavy fall-out. It was for this reason that the minor sampling array (M) located at Site William for ShotsCherokee, Zuni, and Fiathead was moved to Site Charlie for Shots Navajo and Tewa. Site Howwas selected to be in a region of moderate f~lout so that survey and recovery teams could enter
at early times. A detailed layout of the installation on Site How is shown in Figure 2.8.Because th skiffs were deep anchored and could not be easiiy moved (Reference 15), their
locations were originally selected to provide rougMy uniform coverage of the most probable
fallout sector. With the exception of Stations WW, 2Ut, and YY-assembled from componentsrecovered from other stations and placed late in the operation —their positions were not delib-erately changed. Instead, the different locations shown in Figure 2.10 reflect the fact that theskiffs sometimes moved their acho~ges ~d sometimes broke loose entirely and were tempo-
rarily 10sL Loran fixes were taken during arming and recovery, before and after each shot.The locations given in Table 2.3 were derived from the fixes and represent the best estimate ofthe positions of the skiffs during ftiout, for ~ average deviation cd * 1,000 ~ds in each coor-dinate.
24
2.3.2 Ships. The approximate locations of the three project ships at the times when they ex-perienced peak ionization rates during each shot are presented in Figure 2.11. Table 2.4 gives

these locations more Precisely and also lists a number of other successive positions occupiedby each ship between the times of arrival and cessation of fallout.
From the tabulated data, the approximate courses of the ships during their sampling intervalsmay be reconstructed. The given coordinates represent Loran fixes, however, and cannot beconsidered accurate to better than ● 500 yards. Further, the ships did not always proceed from
one point to another with constant velocity, and an uncertainty of + 1,000 yards should be appliedto any intermediate position calculated by assuming uniform motion in a straight line betweenpoints.
The ships were directed to the initial positions listed in Table 2.4 by messages from the Pro-
IPJII 2 control center (see S@ion 2.4. O; but once fallout began to srrive, each ship performeda fixed maneuver which led to the remaining positions. This maneuver, which for Shots Chero-kee and Zuni consisted of moving into the surface wind at the minimum speed (< 3 knots) neces-sary to maintain headway, was a compromise between several requirements: the desirabilityof remaining in the same location with respect to the surface of the earth during the fallout-collection period, and yet avoiding nonuniform sampling conditions; the importance of preventingsample contamination by washdown water —particularly on the forward part of the YAG 40 wherethe SIC was located; and the necessity of keeping the oceanographic probe (SIO- P) away from theship. It was found, however, that the ships tended to depart too far from their initial locationswhen surface winds were light; and this maneuver was modified for tk remaining shots to includea figure eight with its long axis (< 2 nautical miles) normal to the wind, should a distance of 10nautical miles be exceeded.
The YAG 40 and LST 611 ordinarily left theti sampling sites soon after the cessation of faU-out and returned to Eniwetok by the shortest route. The YAG 39, on the other hand, after beingrelieved long enough to unload samples at Bikini to the vessel, Horizon (Scripps Institution ofOceanography), remained in position for an additional day to conduct water-sampling operationsbefore returning to Eniwetok.
2.4 OPERATIONS
2.4.1 Logistic. Overall project operations were divided into several parts with one or more 2teams ~ a separate director assigned to each. Both between shots smd during the critical D-3to D+ 3 period, the teams functioned as the basic organizational units. In general, instrument
maintenance was accomplished during the interim periods, instrument arming between D-3 andD-1, and sample recovery and processing from D-day to D+ 3.
Control-center operations took place in the Program 2 Control Center aboard the commandship, USS Estes. This team, which consisted of three persons headed by the project officer,constructed pro~ble f~lout patterns hsed on meteorological information obtained from TaskForce 7 ad made successive corrections to the patterns as later information became available.The te~ also directed the movements of the project ships and performed the calculations re-qUi.red to reduce ~d interpret early &ta communicated from them. .
Ship operations featured the use of the YAG 40, YAG 39, and LST 611 as sampling stations.These ships were positioned in the predicted fa.lltit zone before the arrival of fallout and re-UIXned thers until after its cessation. Each ship was manned by a minimum crew and carriedOne project te~ of thee or four members who readied the major array instruments, operated
@m dur~ f~out, ~d recovered m packed the collected samples for unloading at the sample-dhtribution cen~r on Site Elmer. Water sampltig, however, was accomplished by separate twO-
- teams aboard the YAG’s, and early-sample measurements were performed by a team “of sixPersons in the YAG 40 laboratory.
Bikini operations included the maintenance, arming, and recovery of samples from all proj ~
ect stations in the atoll area. Because every station had to operate automatically during falloutad samples ~d to be recovered at relatively early times, three teams of four or five men each
were required. The barge team was responsible for the major samplfng arrays on the YFNB 13,~B 29, and Site How, as well as for the special sampling facility located on the latter. Thertit team was responsible for the m~or sampling ~rays on the r~ts ad atofl isl~ds, ~d the
25

skiff team for those on the skiffs, all of which were anchored outside of the lagoon. The samples
collected by these teams were returned to the sample-recovery center on Site Nan and processedthere for shipment to the sample-distribution center on Site Elmer.
Laboratory operations were conducted on the YAG 40 and on Site Elmer. One six-man teamworked on the YAG 40 during fallout, m=dcing the measurements of the SIC tray samples describedin Section 2.2.3, while a second three-man team remained on Site Elmer to make the measure-ments of the lC trays as soon as they arrived. Decay measurements and other studies begun on
the ship were sometimes continued by the same persons on Site Elmer and later at NRDL.
Eniwetok operations consisted of the administrative activities of the project headquartersoffice located there, and the sample-processing activities of the sample-distribution center.All samples collected by ship, laboratory, and Bikini operations were recorded, decontaminated,monitored, packed, and placed on one of two early flights to NRDL by the four-man team assignedto this center.
Thus, all samples were collected either atmard the project ships or by one of the Bikini sta-tions; all, however, were routed through the sample-distribution center on Site Elmer beforebeing ‘shipped to NRDL. Charts removed from recorders and records of field-instrument read-
ings were also processed through the center. Only SIC and IC trays were used for field-
laboratory measurements, all others being counted and analyzed at NRDL.
2.4.2 Technical. Fallout information was required in three broad categories: buildup char-acteristics, including all time-dependent data associated with fallout arrival; physical, chemical,and radiochemical characteristics, including both single particles and total samples; and radio-nuclide composition and radiation characteristics, including fract ionat ion and gamma ionization
decay. The operational procedures discussed in the preceding paragraphs, as well as the in-strumentation described in Section 2.2, were designed around these requirements.
The rate of fallout arrival and most other buildup characteristics were determined from TKRrecords and measurements of IC and SIC trays. Consequently, this information was obtained atall major-sampling-array locations and several additional places aboard the project ships. Timeof arrival, however, was determined at all stations; wherever major arrays were located, it wasderived from the TIR’s and IC’ S, while the TOAD’s supplied it for the minor arrays. The wayin which particle-size distributions changed with time was determined by sizing and counting ICtray collections, and mass-arrival rates were calculated from the same data. Ocean-penetrationrates were derived from the probe (SIO-P) measurements made on the YAG 39 and YAG 40.Periodic TIR readings from the ships and selected SIC tray data were also reported to the con-trol center during each shot and used for preliminary fallout analyses.
The majority of single-particle studies were performed on particles collected by the SIC onthe YAG 40, although particles from IC and OCC trays, as well as two unscheduled samples
from the YFNB 29, were also used. The sizes and gamma activities of all particles were meas-ured, diameter being defined and used as an index of size for solid ptiticles and NaCl content
for slurry particles. Solid particles were also classified as to type and used for a number ofspecial studies, including decay md ~mma-energy-spectra measurements and radiochemical
analyses.The total%mount of fallout, and all other properties requiring a total collection, were deter-
mined from OCC and AOC samples. As indicated in Section 2.2.4, all OCC and AOCI trays, aswell as all AOC.Z boffles after the ~ter~ in the funnel Wd tube had been washed into them witha dilute acid, were shipped directly to NRDL and gamma-counted. Following this, OCC traysamples from each station were removed md analyzed for their chemical and radiochemicalcompositions, so that the surface densities of Vaious fallout components and the total amountof activity deposited per unit area could be calculated.
Aliquots were withdrawn from the OCC - sample solutions at NRDL and measured in the 4-Tionization chamber along with ~iquots of Aocz ~d sea-water samples in order to relate thedifferent kinds of gamma measurements. Other aliquots and undissolved fractions of the origi-ti sample were used for gamma spectra md beti- and gamma-decay measurements, with gam-~ decay being followed both on crys~ Couters ad ti the 4-u ionization chamber. Samples
, 26

collected on selected trays from the SIC were also dissolved in the YAG 40 laboratory and ali-quots of the resulting solution used for simiiar purposes. Information obtained in these ways,When combined with radiochemical results, provided a basis for establishing an average radio-
nuclide composition from which air-ionization rates could be calculated.Measurement of the actuai air-ionization rate above a simulated infinite plane was made on
Site How. In addition to the record obtained by the TIR, periodic ionization-rate readings were
made with a hand survey meter held 3 feet above the ground at each of the buried-tray (AOC1-B)locations. The number of fissions collected in these trays served both to caiibrate the collec-
tions made by the major array on the tower and to establish experimental vaiues of the ratio ofroentgens per hour to fissions per square foot. Fission concentrations in a number of surface-water samples collected from the YAG 39 and YAG 40 were also determined for use in conjunc -tion with the average depth of penetration, to arrive at an independent estimate of the totalamount of failout deposited at these locations.
It was intended to calibrate one of the oceanographic probes (S10- D) directly by recording itsresponse to the total fallout deposited in the tank aboard the YAG 39, and subsequently measur-ing the activities of water samples from the tank. Because it malfunctioned, the probe couidnot be calibrated in this way, but the samples were taken and fission concentrations estimatedfor each shot. Records were also obtained from the surface-monitoring devices (NYO-M) on theYAG 39 and YAG 40. These records could not be reduced to ocean-survey readings, however,because the instruments tended to accumulate surface contamination and lacked directionalshielding.
27

Yffi 40YAG 40-AYM 40-B 1Yffi 39YM 39-c 1L6T 611MT 611-D 1
Y?NE 13-E 1HOWLmd-F 1Y?NB 29-o 1YYNB 26-E 1
==&LWiubm Orc&rue-M
EaftPEaftBBaits
af3AAsIff BBu ccU DD.SrMEEw F?affoo-NHiwfffcxSkiffLL9kiffMblan PPSkufmlwm26mm’SkJ. ffw-wSdfxwwWfcxxaIff YY
.
1
3
3
1111
1
4!2 1 11
4 2 1 13
42 1 1
42 1 142 1 14 2 1 14 a
11
1
111
11111111111111111111
1
1
1
1111
11
1
111
11111111111111111111
1 11
1 1 1
12
11
1
111
1111111,1111111111111
29

T~LE 2.3 STATION LOCATIONS IN THE ATOLL AREA
ShotCherokee shotZurd ShotFlathead ShotNavajo ShotTewa
stationNorth Latitude North Latitude North L::itude North Latitude North Latitude
and & and and and
Eat Longitude East Longitude East Longitu& East Longitude E&WLor@tude
deg mln &g min deg min deg min &g mln
YFNB 13 (E)
YFNB 29 (G,H)
HowIsLvd (F) ●
How Island (K) ●
George Islaml (L) ●
William Xsland (M) ●
Charlie I&ind (M) ●
Raft-1 (P)
RaIt-2 (R)
Raft-3 (S)
Skiff-AA
Sktfl-BB
skiff-cc
Sldff-DD
Skiff-EE
9dff-FF
Sklf@3G
Skiff-HH
Skiff-ia(
Skiff-LL
Skiff-MM
sldff-PP
H-RR
SkM-ss
Skiff-’I-r
Skiff-ou
Sldfc-w
skiff-w
9ciff-xx
skiif-YY
11 35.3165 31.211 37.5
16S 27.0
148J20N167.360E148,450N167Z1OE168,530N131450E109,030N079340E
——
1116S11
16511
16512
164
1218512
16512
16512
165
1216611
16512
16512
165
1216511
16411
16511
165
1116511
16611
16511
165
——————
35.127.634.622.235.417.206.147.0
11.610.011.323.011.540.011.357.3
02.415.557..913.801.322.902.040.0
02.058.052.858.452.022.851.040.0
50.058.050.815.042.547.521.719.5
——————
11 40.0165 17.211 37.s
165 27.0
148,320N167,360E148,450N167210E168,530N131,250E109,030N079,540E
——
1116511
16511
16512
144
1216512
16512
16512
165
1216611
16512
16512
165
1215511
154——11
165
1116511
16611
16511
165
——————
35.127.634.622.235.417.206.147.0
11.610.011.323.0u .540.011.357.3
02.415.557.813.601.322.902.040.0
02.058.052.658.4——51.040.0
50.056.050.815.042.547.521.719.5
——————
11 40.0165 17.211 37.5
165 27.0
148,320N167,360E148,450N167310E168,530N131,250C109,030N079,540E
1116511
16511
16512
164
1216512
16512
16512
165
1216611
16512
16512
165
1216511
16411
165u
165
1116511
16611
165——
—
————
35.127.634.622.23s.417.206.147.0
11.610.010.717.611.540.011.357.3
03.514.257.613.802.021.602.040.0
02.058.052.850.450.523.953-335.2
51.158.050.61s.042.547.5——
——————
11 39.1165 16.211 36.2
165 29.8
148,320N167,360E14S,450N167,210E168,530N131,250E
——
172,150N081,160E
1116511
16511
16S12
164
1216512
16512
16512
165
12166——12
16512
165
1216511
16411
16511
165
—
11166————
——————
35.127.634.622.235.417.205.444.9
11.507.511.820.911.540.011.357.3
02.415.5——
02.021.602.040.0
02.056.052.756.052.022.852.339.7
——
50.615.0————
——————
11 37.5165 27.011 37.4
165 14.2
148,320N167,360E148,450Ni67,210E166,530N131,250E
——
172,150N061,150E
1116S11
16511
16512
164
1216512
16512
16512
165
1216612
16512
16512
16S
1216511
16411
16511
165
——
11166————
1116511
16411
164
35.127.634.622.235.417.205.444.9
11.507.511.820.911.540.011.357.3
02.415.501.110.202.021.602.040.0
02.058.052.756.052.022.652.339.7
——
50.815.0————
43.211.s4?..255.154.036.4
“ Holmes and Namer coordinates.
30


32

33

/
COLLECTING SURFACEFOR ALL INSTRUMENTS
/
---- —--- —--- -4
Zofto forsit~swons15 ft O for barge #nd Howhndstotions i
II
SPACE RESERVEO FOROTHER INSTRUMENTS
ALWAYS OPEN TOTALCOLLECTOR (AOCI)
OPEN CLOSE TOTALCOLLECTOR (OCC)
CONTROL UNIT
INCREMENTALCOLLECTOR (IC)
HIGH VOLUMEFILTER UNIT
Centerline
of ship
SPACE RESERVEO FOROTHER INSTRUMENTS
TIME INTENSITYRECORDERDETECTOR HEAO
SPACE RESERVEO FOROTHER INSTRUMENTS
Figure 2.2 Plan and elevation of major sampling array.
34

YAG 39 ~ 40
1TELEVISION CAMERA>
DROGUE RACK(YAG 40 ONLY)
I
I
2.62 AN02,64 PROBE ‘ANO MONITOR RECOROERSANO WINCH CONTROL PANEL ANO RECOROER
cONTROLS FOR SHIELDED LABORATORYsTANARO PLATFORM (YAG400NLY)
PLA#VIEW
CONTROL PANEL FOR SPECIALINCREMENTAL COLLECTOR
ENOWINOOWGAMMA COUNTER
MICROSCOPE
wELLGAMMACOUNTER
20CHANNEL ANALYZER ANO ACCESSORIES E$=??!FBETA COUNTER
41r ION CHAMEER AND ACCESSORIES
yLEADsHfELD
ELEVATOR FROM SIC
CASTLE FOR SAMPLE STORAGE
LST 611MAJORSAMPLING
GAMMA TIME-INTENSITY ARRAY\
CONTROL PANEL ANO’RECORDERS FORSTANDARO PLATFORM
YFNB13~29.
/
MAJOR SAMPLING MAJOR SAMPLING
ARRAY(YFNS 290NLY)
ANEMOMETER
II
Figure 2.3 Ship and barge stations.
35

7.i
*i
Figure 2.5 Functional view of incremental collector (IC).
36

Figure 2.6 Functional view of open-close total collector (C)CC).
7m D PaYElwm-ENcFUMIKLAMO19CXCEL[MC, I
u \ %XYCTMYUMCBOTTLE(hOC,I
sulr~ STATIONS~OUNO~l~MCO*901TLt M$C OOARO
MI.7C114VLCMCrumlm (hoc. 1
Figure 2.7 Minor sampling array.
37

z
a
w
u
o
30x
aoz
. .,
. ...,. . .
OOG’L91 3
z
o
0
a
a
-1
. .1
.:.. . 000’L91 3
o0N
mui-az
0=00-0
0
Oz*UJ
b x
0:c
c0zdv3
,

..
—,, .+
@ END W,NOOW cOUNTER
@ WELL COUNTER
,.,<.,
~,.,.
““ @OOGHO”SE COUNTER
,.
@ SETA COUNTER
!,
“,, ,,,,m!.,
@ 20 CHANNEL ANALYZER
-V*. s--au. 1
%
,,. _,. r-c.
-m !.-.”1”l .
/ ‘“-
,.... {/-”,-
I ,/
&-.,.“” -,4.!””. , ____ _.
--—.---:,<:: ,,,.. !.. .-
. . . . !<,! ..,.
,. % >’. , /::———— ,.,. — ..__
@ DIP COUNTER
@) 4W ION CHAMEER
“’’””””w.....it “,!M, -., *,,,..s..cms,
.--.,
-T-
1..,,,
I-( m.. ,
.,*i,!. r-c.!
.,,
@ MONITORINGFACILITY
Omw,ws Rre ad m Seole
—,!.+
~~
@) SINGLE CHANNEL ANALYZER (NRSI
Figure 2.9 Counter geometries.
39

●.Q
_m—
.
.-
.
I
: .:”+...
:m.
.w:..*.
●.
..—- —-----
:.::.
.●✎
●.m.
I
40
—z—
>.>●u.
.

13”—
4d—
au..
.
“:44r_
‘i. .,,
20’_
40’ 164” 20’ I
, LST-61120’ — c
14’
&, LS~-611
—
2d— 746-39
c
,YAG-40 _c
1LSTT-6M ~
—N
LST;611 $~ YA43-40
.
+ Ls~-611
. 40
, YA:-39
+ YA;- 40
, YAI -40
, YA$-39
i YA~-39
OIKINI OR ESCHHOLTZ ATOLL
Figure 2.11 Ship locations at times of peak activity.
41

Chapter 3
RKSULLS3.1 DATA PRESENTATION
The data has been reduced and appears in comprehensive tables (Appendix B) that summarizecertain kinds of information for all shots and stations. The text itself contains only derived re-sults.
In general, the details of calculations, such as those involved in reducing gross gamma spec-tra to absolute photon intensities or in arriving at R-values, have not been included. Instead,original data and final results are given, together with explanations of how the latter were ob-tained and with references to reports containing detailed calculations.
Results for the water- surface Shots Flathead and Navajo, and the land-surface and near-land-surface Shots Zuni and Tewa, are presented in four categories: fallout-buildup characteristics(Section 3.2); physical, chemical, and radiochemical characteristics of the contaminated mater-ial (Section 3.3); its radionuclide composition and radiation characteristics (Section 3.4); andcorrelations of results (Section 4.3). Appendix B contains all reduced data for these shots sep-arated into three types: that pertaining to the buildup phase (Section B.1); information on phy-sical, chemical, and radiological properties (Section B.2); and data used for correlation studies(Section B.3).
Measurements and results for Shot Cherokee, an air burst during which very little falloutoccurred, are summarized in Section 4.1.
Unreduced data are presented in Section B.4.Each of the composite plots of TIR readings and XCtray activities presented in the section on
buildup characteristics may be thought of as constituting a general description of the surfaceradiological event which occurred at that station. Ln this sense the information needed to corn-.plete the picture is provided by the remainder of the section on particle-size variation with timeand mass-arrival rate, as well as by the following sections on the activity deposited per unitarea, the particulate properties of the contaminated material, its chemical and radiochemicalcomposition, and the nature of its beta- and gamma-ray emissions. Penetration rates and ac-tivity prof~es in the ocean extend the description to subsurface conditions at the YAG locations.The radiological event that took place at any major station may be reconstructed in as muchdetail as desired by using Figures 3.1 through 3.4 as a guide and referring to the samples fromthat station for the results of interest. Each sample is identified by station, collector, and shotin all tables and figures of results, and the alphabetical and numerical designations assigned toall major array collectors are summarized in Figure Al.
Throughout the treatment which follows, emphasis has been placed on the use of quantitiessuch as fissions per gram and Rgg values, whose variations show fundamental differences infallout properties. In addition, radiation characteristics have been expressed in terms of unitfissions wherever possible. As a result, bias effects are separated, certain conclusions aremade evident, and a number of correlations become possible. Some of the latter are presentedin Sections 3.3, 3.4, and 4.3.
3.2 BUILDUP CHARACTERISTICS
3.2.1 Rate of Arrival. Reduced and corrected records of the ionization rates measured byone TIR and the sample activities determined from one IC at each major array station are plot-ted against time since detonation (TSD) in Figures 3.1 through 3.4 for Shots Flathead, Navajo,
42

Zmi, ~d Tewa. Numerical values are tabulated in Tables B. 1 and B.2. Because the records
~ the TfR’S and the deck (D-TIR) are plotted for the YAG’s, the measurements made by the
T@s in the standard platform (P-TIR) have been included in Appendix B. The records of thel~s with shorter collection intervals have been omitted, because they show only the greater
~iability in the fine structure of the other curves and do not cover the entire fallout period.
TIR readings kve been adjusted in accordance with the calibration factors applying to the
four ionization Chfiers present in each instrument, and corrected to account for saturationloss over all ranges. (The adjustments were made in accordance with a private communicationfrom H. Rimert, NRDL, and based upon CoGo gamma rays incident on an unobstructed chamber,
normal to its axis. ) Recorder speeds have also been checked and the time applying to eachre@ng verified. In those cases where saturation occurred in the highest range, readings have
Men estimated on the basis of the best information available and the curves dotted in on thefigures.
E is pointed out that these curves give only approximate air-ionization rates. Because of“tie varying energy-response characteristics of each ionization chamber, and internal shielding
effects resulting from the construction of the instrument, TZR response was nonuniform withrespect both to photon energy and direction, as indicated in Figures A.2 through A.4. The over-alI estimated effect was to give readings as much as 20 percent lower than would have been re-corded by an ideal instrument. (Measurements were made on the YAG 39 and YAG 40 during
all four shots with a Cutie Pie or TIB hand survey meter held on top of an operating TIR. Then’s indicated, on the average, 0.85 +25 percent of the survey meter readings, which them-
selves indicate only about 75 percent of the true dose rate 3 feet above a uniformly distributed
plane source (Reference 17). Total doses calculated from TfR curves and measured by film-pack dosimeters (ESL) at the same locations are compared in Section 4.3.5. )
Detailed corrections are virtually impossible to perform, requiring source strength andSPSCtral composition as functions of direction and time, combined with the energy-directionalresponse c~acteristics of each chamber. It is also pointed out that these sources of error“= inherent to some degree b every real cietector and are commonly given no consideration
~bkoever. Even with an ideal instrument, the measured dose rates could not be compared~ theoretic~ land-equiv~ent dose rates because of irregularities in the distribution of the~ce ~ter~ ~d shielding effects associated with surface conditions. However, a qualitativeSt@ of the perfor~nce c~racteristics of ship, b~ge, ~d is~nd TIR’s indicated thd W per-
formed in a reamer similar for the average numbers of fissions deposited and identical radio-~clide compositions.
The exposure ~terv~ assoc~ted with each IC tray IIZS been carefully checked. In those
-es where the time required to count all of the trays from a single instrument was unduly long,activities have been expressed at a common time of H +12 hours. Background and coincidencel~s corrections have also been made.
The time interval during which each tray was exposed is of particular importance, not only~ause its midpoint fixes the mean time of coUection, but also because all tray activities inc~ts Per minute (counts/rein) have been normalized by dividing by this interval, yielding counts
-~r minute per minute of exposure (counts/min2). Such a procedure was necessary, because~ectiorr interv~s of.several dtfferent lengths were used. The resulting quantity is m activity-‘iv~ rate, and each figure shows how this quantity varied over the successive collection inter-~s at the reference time, or time when the trays were counted. If it can be established that
‘s is Proportional to activity, these same curves can be used to study mass-arrival rate with‘ie (section 3.2.3 Shots Flathead and Navajo); if, on theother hand, the relationship of massb ‘tiVitY is unkno’wn they may be used for comparison with curves of mass-arrival rate con-‘~ted by some othe’r means (Section 3.2.3, Shots Zuni and Tewa).
~% while each point on a TIR curve expresses the approximate gamma ionization rate pro-‘Ca at tbt time by all sources of activity, the corresponding time point on the IC curve givesti ‘ecaY-corrected relative rate at which activity was arriving. Both complementary kinds of‘or~tion are needed for an accurate description of the radiological event that took pbce at a‘Ven station and Ue plotted together for this reason—Qther way.
not because they are comparable in any
43

The activities of the IC trays have not been adjusted for sampling bias, although some un-
doubtedly exists, primarily because its quantitative effects are unknown. Relative rates maystill be derived if it is assumed that all trays are biased alike, which appears reasonable forthose cases in which wind speed and direction were nearly constant during the sampling period(Section 4.3.2). More extensive analysis would be required to eliminate uncertainties in the re-maining cases.
It should also be mentioned that IC trays with alternating greased-disk and reagent-film col-lecting surfaces were intentionally used in all of the collectors for Shots Flathead and Navajo— with no detectable difference in efficiency for the resulting fallout drops— and of necessityfor Shot Tewa. The late move of Shot Tewa to shallow water produced essentially solid particlefallout, for which the efficiency of the reagent film as a collector was markedly low. Thus, onlythe greased-disk results have been plotted for the YAG 40 in Figure 3.4, although it was neces-sary to plot both types for some of the other stations. Trays containing reagent-ftlm disks, allof which were assigned numbers between 2994 and 3933, may be distinguished by reference toTable B.2. A few trays, designated by the prefix P, also contained polyethylene disks to facil-
itate sample recovery.
3.2.2 Times of Arrival. Peak Activitv. and Cessation. The times at which fallout first ar-. .rived, reached its peak, and ceased at each major array station are summarized for all shotsin Table 3.1. Peak ionization rates are also listed for convenient reference. Time of arrivaldetector (TOAD) results, covertng all minor array stations and providing additional values forthe major stations in the atoll area, are tabulated in Table 3.2.
The values given in Table 3.1 were derived from Figures 3.1 through 3.4, and the associatednumerical values in Tables B. 1 and B.2, by establishing certain criterta which could be appliedthroughout. These are stated in the table heading; while not the only ones possible, they werefelt to be the most reasonable tn view of the available data.
Arrival times (t# were determined by inspection of both TIR and IC records, the resultingvalues being commensurate with both. Because the arrival characteristics varied, arrivalcould not be defined in some simple way, such as “1 mr/hr above background.” The final val-ues, therefore, were chosen as sensible-arrival times, treating each cue individually. Itshould be mentioned that, within the resolvtng power of the instruments used, no time cliff er -ence existed between the onset of material coIlect ions on the IC trays and the toe of the TIR
buildup curve. The IC’s on the ships were manually operated and generally were not triggereduntil the arrival of fallout was indicated by the TIR or a survey meter, thus precluding any ar-rival determination by IC; those at the unmanned stations, however, triggered automatically atshot time, or shorUy thereafter, and could be used. The SIC on the YAG 40 also provided usa-ble dam ordinarily yielding an earlier arrival time than IC B-7 on the same ship. In order toconserve trays, however, the number exposed before fallout arrival was kept small, resultingin a larger time uncertainty within the exposure interval of the first active tray.
Once defined, times of peak activity (t~ could be taken directly from the TIR curves. Be-cause peaks were sometimes broad and flat, however, it was felt to be desirable to show alsothe time interval during which the ionization rate was within 10 percent of the peak value. Ex-amination of these data indicated that tp -2 ta ; this point is discussed and additional data arepresented in Reference 18.
Cessation time (tc) is even more difficult to define than arrival time. In almost every case,for example, fallout was still being deposited at a very low rate on the YAG 40 when the ship
depsrted station. Nevertheless, an extrapolated cessation time which was too late would givean erroneous impression, because 90 or 95 percent of the fallout was down hours earlier. Forthis reason, IC-tray activities measured at a common time were cumulated and the time atwhich 95 percent of the fallout had been deposited read off. A typical curve rises abruptly,rounds over, and approaches the tot~ amount of fmout asymptotically. Extrapolated c essationtimes were estimated primarily from the direct IC pl@s (Figures 3.1 thrOugh 3.4), supplemented
by the cumulative plots, and the T~ records replotted On log-log paper. It must be emphasized
44

~ tIW cessation times reported are closely related to the sensitivity of the measuring systems
~ed and the ftiOut levels observed.N values for time of arrival given in Table 3.2 were determined from TOAD measurements.
They were obtained by subtracting the time intervaI measured by the instrument clock, which~t,ed when fallout arrived, from the total period elapsed between detonation and the time when
the instrument was read.
Because the TOAD’S were developed for use by the project and could not be proof-tested indance, certain operational problems were encountered in their use; these are reflected byFootnotes $, 11and t in Table 3.2. Only Footnote ~ indicates that no information was obtained
by the units; however, Footnotes 5 and Y are used to qualify questionable values. Because theTOAD’S from the b=ge and island major stations were used elsewhere after Shot Flathead, Foot-aote ● primarily expresses the operational difficulties involved in servicing the skiffs and keep-ing them in place.
The fact that a station operated properly and yet detected no faLlout is indicated in both tables‘~ Footnote ~ . In the case of the major stations, this means that the TIR record showed nomeasurable increase and all of the IC trays counted at the normal background rate. For theminor stations, however, it means that the rate of arrival never exceeded 20 mr/hr per halflmr, because the radiation trigger contained in the TOAD was set for this value.
3.2.3 Mass-Arrival Rate. A measure of the rate at which mass was deposited at each ofthe major siations during Shots Zuni and Tewa is plotted in Figure 3.5 from data contained inTable B.4; additional data are contained in Table B.6. Corresponding mass-arrival rates forf%mts Flathead and Navajo may be obtained, where available, by multiplying each of the IC-trayactivities (count/minz) in Figures 3.1 and 3.2 by the factor, micrograms per square feet perhour per counts per minute per minute, [@(ft?-hr-count/min2)]. For the YAG 40, YAG 39,@ LST 611, the factor is 0.0524 for Shot Flathead and 0.7rl for Shot Navajo. For the YFNB29, the factor is ().343 for shot Flathead. For the YFNB 13 and HOW-F, the factor is 3.69 for
Shot Navajo.The former values of mass-arrival rate, micrograms per square foot per hour [pg/(ft?/hr) ],
were c~culated from the particle-s~e distribution studies in Reference 19, discussed in morede~fl in section 3.2.4, The nuder of solid p~ticles h each size increment deposited per
square foot per hour was converted to mass by assuming the particles to be spheres wtth a den-siq of 2.36 gm/cm3. Despite the fact that a few slurry particles might have been present (Sec-~n 3.3.1), these values were then summed, over all size iricrements, to obtain the total mass-arrival rate for each tray, or as a function of time since detonation (TSD). These results maynot be typical for the geographic locations from which the samples were taken, because of col-lector bias (Section 4.3.2).
&cause this res~t will be affected by any discrepancy between the number of particles of
a certain size, which would have passed through an equal area in free space had the tray notbeen present, ~d the nuder ~ti=tely collected by the tray and counted, both sampling bias
(seCtion 4-3.2) and cout~ error (section 3.2.4) are reflected in the curves of Figure 3.5. For
~s reason they, like the curves of Section 3.2.1, are intended to provide only relative-rate in-‘~mtion aqd should not be integrated to obtain total- maSS values , even over the limited periods‘~n it would be possible to do so. The total amount of mass (mg/ft2) deposited at each major~tion, determined from ~~mic~ a~ysis of WC coUections, is given ~ Table 3.16.
The constats ~ be used for the water-s~face shots follow from the slurry-particle sodium
c~oride analyses in Reference 31 and were derived on the basis of experimentally determined‘dues relating well-counter gamti activity to sodium chloride weight in the deposited fallout.
‘hese values and the methods by which they were obtained are presented in Section 3.3.2. Thebtors were calculated from the ratio of counts per minute per minute (count/min2) for the IC-
- by area to counts per minute per gram [(counts/min)/gm] of NaCl from Table 3.12. The gramsOf NaCl were converted to grams & f~lout, with water ~cluded, in the ratio of 1/2.2; and the
~m~ well counts from the table were expressed as end-window gamma counts by use Of the
‘tio 1/62. An average value of specific activity for each shot was used for the ship stations,
45

while a v~ue more nearly applicable for material deposited from 1 to 3 hours after detonation
was used for the barge and island stations.It is to be noted that the insoluble solids of the slurry particles (Section 3.3.2) were not in-
cluded in the conversion of grams Of NaCl to grams of fallout. Even though highly active, theyconstituted less than 2 to 4 percent of the total mass and were neglected in view of measurementerrors up to +5 percent for sodium chloride, + 15 percent for specific activity, and *25 percent
for water content.
3.2.4 Particle- Size Variation. The way in which the distribution of solid-particle sizes
varied over the fallout buildup period at each of the major stations during Shots Zuni and Tewais shown in Figures 3.6 through 3.9. The data from which the plots were derived are tabulated
in Table B.3, and similar data for a number of intermediate collection intervals are listed inTable B.5. AU of the slurry particles collected over a single time interval at a particular lo-
cation during Shots Flathead and Navajo tended to fall in one narrow size range; representativevalues are included in Table 3.12.
The information contained in Tables B. 3 through B.6 and plotted in the figures representsthe results of studies described in detail in Reference 19. All IC trays were inserted in a fixed
setup employing an 8-by-10-inch-view camera and photographed with a magnification of 2., soonafter being returned to NRDL. Backlighting and low-contrast film were used to achieve maxi-mum ~rticle visibility. A transparent grid of 16 equal rectangular areas was then superim-posed on the negative and each area, enlarged five times, printed on 8-by-10-inch paper at acombined linear magnification of 10.
Since time-consuming manual methods had to be used in sizing and counting the photographedparticles, three things were done to keep the total number as small as possible, consistent withgood statistical practice and the degree of definition required. (1) The total number of traysavailable from each collector was reduced by selecting a representative number spaced at moreor less equal intervals over the fallout-buildup period. Reference was made to the TKR and ICcurves (Figures 3.1 to 3.4) during the selection process, and additional trays were included intime intervals where sharp changes were indicated. (2) Instead of counting the particles in allareas of heavily loaded trays, a diagonal line was drawn from the most dense to the least denseedge and only those areas selected which were intersected by the line. (3) No particles smallerthan 50 microns in diameter were counted, this being arbitrarily established as the size defin-ing the lower limit of significant local fallout. (The lower limit was determined from a falloutmodel, using particle size as a basic input parameter (Section 4.3.1). Particles down to -20microns in diameter will be present, although the majority of particles between 20 and 50 mi-crons will be deposited at greater distances than those considered. )
Actual sizing and counting of the particles on the selected ten times enlargements was ac-complished by the use of a series of gages consisting of four sets of black circular spots of thesame magnification, graduated in equal-diameter increments of 5, 10, 30, and 100 microns.These were printed on a sheet of clear plastic so that the largest spot which could be completely
inscribed in a given particle area could be determined by superimposition. Thus, all of the par-ticle sizes listed refer to the diameter of the maximum circle which could be inscribed in the
projected area of the particle. A preliminary test established that more-consistent results couldbe achieved using this parameter than the projected diameter, or diameter of the circle equal tothe projected area of the particle.
A number of problems arose in connection with the counting procedure: touching particleswere difficult to distinguish from single aggregates; particles which were small, thin, translu-
cent, or out of focus were diffictit to see against the background; particles falling on area bor-
derlines could not be accurately sized and often had to be eliminated; some elongated particles,for which the inscribed-circle methti was of questionable validity, were observed; a strongtendency existed to overlook particles smaller than shut 60 microns, because of the graininessof the print and natural human error. Most of these problems were alleviated, however, by hav-ing each print prwessed in advance by a SpeC ia~y trained editor. Ml particles to be counted
were first marked by the editor, then sized by the counter.
46

Once the basic data, consisting of the number of particles in each arbitrary size interval~tween 50 and 2,600 microns, were obtained for the selected trays, they were normalized to
a l-micron interval and smoothed, to compensate in part for sample sparsity, by successive~plications of a standard smoothing function on a digital computer. These, with appropriate~it conversions, are the results listed in Tables B.3 and B.5: the numbers of particles, within
a l-micron interval centered at the indicated sizes, collected per hour for each square foot of
surface.
Figures 3.6 through 3.9 show how the concentration of each particle size varied over thebuildup period by providing, in effect, successive frequency distributions on time-line sections.
The curves representing the 92.5- and 195-micron particles have been emphasized to bring outoverall trends and make the figures easier to use. Measures of central tendency have beenavoided, because the largest particles which make the most-significant contribution to the ac -
tivity are not significantly represented in the calculation of the mean particle size, while thesmall particles which make the greatest contribution in the calculation of the mean particle sizeare most subject to errors from counting and background dust deposits. It should also be re-
membered that sampling bias is present and probably assumes its greatest importance for thesmall particles.
Plots of pure background collections for the ship and barge stations resemble the plot of theYAG 39 data for Shot Zuni, but without the marked peaks in the small particles or the intrusionsof the large particles from below, both of which are characteristic of fallout arrival. This isnot necessarily true for the How land station, however, where such features may result fromdisturbances of the surface dust ~ the series of peaks at about 4 hours during Shot Zuni, for ex-ample, appears to be the result of too close an approach by a survey helicopter.
3.2.5 Ocean Penetration. Figure 3.10 shows the general penetration behavior of fallout ac -tivity in the Ocem for Shot Navajo, a water-surface shot, and Sht Tewa, resembling a land-
Surface shot. These simplified curves show a number of successive activity profiles measuredduring and after the fallout period with the oceanographic probe (S10- P) aboard the YAG 39 anddemonstrate the changing and variable nature of the basic phenomena. The best estimates ofthe rate at which the main body of activity penetrated at the YAG 39 and YAG 40 locations during
shots Flathead, Navajo, and Tewa are summarized in Table 3.3, and the depths at which thispenetration was observed to cease are listed in Table 3.4. The data from which the results were
obtained are presented in graphical form in Figure B. 1; reduced-activity profiles similar to thoseskwn in Figure 3.10 were used in the preparation of the plots. Estimates of the maximum pene-tration rates observed for Shots Zuni, Navaj O, anti Tewa appear in Table 3.5.
The values tab~ated in Reference 20 represent the res~t of a systematic study of measuredProfiles for features indicative of penetration rate. Various shape characteristics, such as thedepth of the first increase in activitY level above norm~ background and the depth of the junctureOf the ~oss body of activity with the thin body of activity below, were considered; but none was
found to be applicable in every case.The concept of equiv~ent depth was devised so that: (1) all the profile data (i. e. , all the
Cuves giving activity Concentration as a function of Cfepth) could be used, ami (2) the results of
‘he project 2.63 water-sampling effort could be related to other Program 2 studies, in which‘he determination of activity per unit volume of water near the surface (surface concentration)
‘as a prime measurement. The equivalent depth is defined as the factor which must be appliedto the swface concentration to give the total activity per unit water surface area as represented
% the measured profile. Because the equivalent depth may be determined by dividing the pla-‘~etered area of any profile by the appropriate surface concentration, it is relatively independ-ent of profile shape and activity level and, in addition, can utilize any measure of surface con-centration which can be adjusted to the time when the profile was taken and expressed in thesame units of activity measurement. Obviously, if the appropriate equivalent depth can be de-termined it may be applied to any measurement of the surface concentration to produce an es-‘imate of ’the activity per unit area when no other data are available.
The penetration rates in Table 3.3 were obtained by plotting all equivalent-depth points avail-
47
able for each ship and shot (Figure B“l)) dividing the dz~ into appropriate interv~s on the b~isof the plots, and calculating the slopes of the least-squares lines for these intervals. The max-imum depths of penetration listed in Table 3.4 were derived from the same plots by establishing
that the slopes did not differ signific~tly from zero outside of the selected intervals. Erraticbehavior or faihare of the probes on both ships during Shot Zuni and on the YAG 40 during ShotFlathead prevented the taking of data which could be used for equivalent-depth determinations.
It did prove possible in the former case, however, to trace the motion of the deepest tip of the
activity profile from the YAG 39 measurements; and this is reported, with corresponding valuesfrom the other events, as a maximum Penetration rate in Table 3.5.
E is important to emphasize that the values given in Tables 3.3 and 3.4, while indicating re-markably uniform penetration behavior for the different kinds of events, refer only to the grossbody of the fallout activity as it gradually settles to the thermocline. When the deposited mate-rial consists largely of solid paticles, as for Shots Zuni and Tewa, it appears that some fastpenetration may occur. The rates listed for these shots in Table 3.5 were derived from a fast-
traveling component which may have disappeared below the thermocline, leaving the activity
profile open at the bottom (Figure 3.10). On the other hand, no such penetration was observed
for shot Flathead and was questionable in the case of Shot Navajo. This subject is discussedfurther in Section 4.3.2, and estimates of the amount of activity disappearing below the thermo-cline are presented.
It is also important to note that the linear penetration rates given in Table 3.3 apply only fromabout the time of peak onward and after the fallout has penetrated to a depth of from 10 to 20 me-ters. h-regular effects at shallower depths, like the scatter of data points in the vicinity of thethermocline, no doubt reflect the influence both of dtif erenc es in fallout composition and uncon-trollable oceanographic variables. The ships did move during sampling and may have enc oun-
tered nonuniform conditions resulting from such localized disturbances as thermal gradients,turbulent regions, and surface currents.
In addition to penetration behavior, decay and volubility effects are present in the changingactivity profiles of Figure 3.10. The results of the measurements made by the decay probe(sIO-D) suspended in the tank filled with ocean water aboard the YAG 39 are summarized inTable 3.6. Corresponding values from Reference 15 are included for comparison; although sim-ilar instrumentation was used, these values were derived from measurements made over slightlydifferent time intervals in contaminated water taken from the ocean some time after fallouthad ceased.
TWO experiments were performed to study the volubility of the activity associated with solidfallout particles and give some indication of the way in which activity measurements made withenergy-dependent instruments might be affected. Several attempts were also made to make di-rect measurements of the gamma-energy spectra of water samples, but only in one case (Sample
YAG 39-T-IC-D, Table B.X)) was there enough activity present in the aliquot.
The results of the experiments are summarized in Figures 3.11 and 3.12. Two samples ofparticles from Shot Tewa, giving 4-7r ionization chamber readings of 208 X 10-s and 674 x 10-8ma respectively, were removed from a single (XX tray (YAG 39-C-34 TE) and subjected tomeasurements designed to indicate the volubility rates of various radionuclides in relation tothe overall Volubility rate of the activity in ocean water.
The first sample (Method I) was placed on top of a glass-wool plug in a short glass tube. A
piece of rubber tubing connected the top of this tube to the bottom of a 10-ml microburet filledwith sea water. The sea water was passed over the particles at a constant rate, and equivolumefractions were collected at specified time intervals. In 23 seconds, 3 ml passed over the parti-cles, corresponding to a settling rate of 34 cm/min — approximately the rate at which a particleof average diameter in the sample (115 microns) would have seffled. The activity of each fract-ion was measured with the well counter soon after collection and, when these measurementswere combined with the toti sample activity, the curntiative percent of the activity dissolved
was computed (Figure 3.11). Gmma-energy spectra were also measured on fractions corre-sponding roughly to the beginning (10 seconds), middle (160 seconds) and end (360 seconds) ofthe run (Figure 3.12). The time of the run was D+ 5 days.
48

on D+ 4 thesecondsample (Method IO was placed in a vessel containing 75 mi of sea water.After stirring for a certain time interval, the solution was centrifuged and a 50-A aliquot re-
moved from the supernate. This procedure was repeated several times over a 48-hour period,
~th the activity of each fraction being measured shortly after separation and used to compute
the cum~ative Percent of the to= activity in solution (Figure 3.11). The gamma spectrum of~ solution stirred for 48 hours was also measured for comparison with the spectra obtained
by Method I (Figure 3.12).As indicated in Figure 3.11, more than 1 percent of the total activity went into solution in less
than 10 seconds, followed by at least an additional 19 percent before equilibrium was achieved.This was accompanied by large spectral changes
(Figure 3.12); nearly all of the I ,
, indicating marked radionuclide fractionation’31 for example, appears to have been dissolved in 360 seconds.
The dip-counter activities of all water samples taken by Projects 2.63 and 2.62a are tabulatedin Table B.32. Ocean background corrections have not been attempted but may be estimated foreach shot at the YAG 39 and YAG 40 locations from the activities of the background samplescollected just prior to the arrival of fallout. AU other corrections have been made, however,
iucluding those required by the dilution of the designated 1,100-ml depth samples to the standard2,000-ml counting volume. Normalized dip-counter decay curves for each event (Figure B.14),and the records of the surface-monitoring devices (NYO-M, Figures B.8 through B. 13) are alsofncluded in Section B.4.
3.3 PHYSICAL, CHEMICAL, AND RADIOCHEMICAL CHARACTERISTICS
3.3.1 Solid Particles. All of the active fallout collected during Shot Zuni, and nearly allcollected du.r~g Shot Tewa, consisted of solid particles which closely resembled those fromshot M during Operation Ivy and Shot 1 during Operation Castle (References 21 and 22). Alter-nate trays containing greased disks for solid-particle collection and reagent films for slurry-Micle collection were used in the IC’S during Shot Tewa. Microscopic examination of thelatter revealed an insignificant number of slurry particles; these results are summarized inTable B. 10. No slurry p~ticles were Observect in the Zuni fallout, although a small number
may have been deposited.AS illustrated M Figure 3.13, the particles varied from unchanged irregular grains of coral
- to completely alter~ spheroid~ particles or flaky agglomerates, and in a number of cases&luded dense black spheres (Reference 19). Each of these types is covered in the discussionOf physic~, chemic~, radiochemic~, and radiation characteristics which follows. Basic datafOr ab~t 100 pmticles from each shot, selected at random from among those removed from the
81C trays ~ the YAG 40 ~~ratory, are included in Table B.34.
Physical and Chemical Characteristics. A number of irregular and spheroidal-titles coUected on the Y~B 29 cluing Shots Zuni and Tewa were thin-sectioned and studied-er a petrographic microscope (Reference 23); some from Shot Zuni were aho subjected to
~-ray diffraction analysis (Table 3.7). Typical thin sections of both types of particles are pre-‘ented in Figures 3.14, 3.15 and 3.16 for Shot Zuni and Figures 3.17 and 3.18 for Shot Tewa.~though the ~rticles shOwn ~ the figures were taken from samples of close-in fallout, those
co~ected 40 rn~es or more from the shot point by the SIC on the YAG 40 were observed to bea~kr, except for being smaller in size.
Both methods of ~ysis showed the ~eat majority of irregular particles to consist of fine-
~~ed calcium hydroxide, Ca(OH)z, with a thin surface layer of calcium carbonate, CaCO~(Mgure 3.17). A few, however, @d surface layers of caJcium hydroxide with central cores Of~hanged cord (CaC@, ad ~ even s~~er number were composed entirely of unchanged
cord (Figure 3.14). It is Hkely that the chemically changed particles were formed by decar-‘nation of the original calcium carbonate to calcium oxide followed by hydration to calcium%’*oxide and subsequent reaction with c~ in the atmosphere to form a thin C~t Of calcium
C-bonate. Particles of this kind were angular in appearance and unusually white in color (Fig-‘e 3.13, A and G).
hhny of tie ~re~ puticles from Shot Zuni were Observed to carry small highly active
49

spherical particles 1 to 25 microns in diameter on their surfaces (Figures 3.13G and 3.15).
Shot Tewa particles were almost entirely free from spherical particles of this kind, althougha few with diameters less than 1 micron were discovered when some of the irregular Particleswere powdered and examined with an electron microscope. A few larger isolated sphericalparticles were also found in the Zuni fallout (Figures 3.13, B and H). Such particles varied incolor from orange-red for the smallest sizes to opaque black for the largest sizes.
While these particles were too small to be subjected to petrographic or X-ray diffractionanalysis, it was possible to analyze a number of larger particles collected during Shot Incawhich appeared to be otherwise identical (Figure 3.19). The Inca particles were composedprimarily of Fe304 and calcium iron oxide (2 CaO. Fe20J but contained smaller amounts ofFe20a and CaO. Some were pure iron oxide but the majority contained talc ium oxide in free
form or as calcium iron oxide (Reference 24).Most of the spheroidal particles consisted of coarse- grained talc ium hydroxide with a thin
surface layer of calcium carbonate (Figure 3.16). Nearly all contained at least a few grains ofcalcium oxide, however, and some were found to be composed largely of this material (Figure3,18) — 5 to ’75 percent by volume. Although melted, particles of this kind probably underwentmuch the same chemical changes as the irregular particles, the print ipal cliff erence being thatthey were incompletely hydrated. They varied in appearance from irregular to almost perfectspheres and in color from white to pale yellow (Figure 3.13, C, H, and IQ. Many had central
cavities, as shown in Figure 3.16 and were in some cases open on one side.Because of their delicacy, the agglomerated particles could not be thin-sectioned and had to
be crushed for petrographic and X-ray diffraction analysis. They were found to be composedprimarily of calcium hydroxide and some calcium carbonate. It has been observed t~t simtirparticles are formed by the expansion of calcium oxide pellets placed in distilled water, and thatthe other kinds of fallout particles sometimes change into such aggregates if exposed to air forseveral weeks. The particles were flaky in appearance, with typical agglomerated structures,and a transparent white in color (Figure 3.13, D, I, and J); as verified by examination of ICtrays in the YAG 40 laboratory immediately after collection, they were deposited in the formsshown.
The densities of 71 yellow spheroidal particles, 44 white spheroidal particles, and 7 irregularparticles from Shot Zuni were determined (Reference 25) using a density gradient tube and abromoform-bromobenzene mixture with a range from 2.0 to 2.8 gm/cm3. These results, show-ing a clustering of densities at 2.3 and 2.7 gm/cm3, are summarized in Table 3.8. The yellowspheres axe shown to be slightly more dense than the white , and chemical spot tests made foriron gave relatively high intensities for the former with respect to the latter. No density deter-minations were made for agglomerated particles, but one black spherical particle (Table 3.7)was weighed and calculated to have a density of 3.4 gm/cm3.
The subject of size distribution has been covered separately in Section 3.2.4, and all infor-mation on particle sizes is included in that section.
Radio chemical Characteristics. Approximately 30 irregular, spheroidal and ag-glomerated particles from Shot Zuni were subjected to individual radiochemical analysis (Ref-erence 26), and the activities of about 30 more were assayed in such a way that certain of theirradiochernical properties could be inferred. A number of particles of the same type were alsocombined in several cases so that larger amounts of activity would be available. These dataare tabulated in Tables B.7 and B.8.
8s Mogg, Baito- Lzlto and Np2Sg were made. (All classifiedRadiochemical measurements of Sr ,information such as the product/fission ratio for Np238, whit h could not be included in Reference26, and the limited amount of data obtained for Shots Tewa and Flathead were received in theform of a private communication from the authors of Reference 26. ) For the most part, con-ventional methods of analysis (References 27 and 28) were used, although the amounts of NP2Wand Mogg (actually Tcgg m ) were determined in part from photopeak areas measured on the single-chamel gamma analyzer (Section 2.2 and Reference 29). The total number of fissions in eachsample was calculated from the number of atoms of Mog9 present, and radiochemical res~tswere e~ressed as R-values using Mogg as a reference. (R-values, being defined as the ratio
50

~ the observed amount of a given nuclide to the amount expected from thermal neutron fission~ Uzx, relative to some reference nuclide , combine the effects of fractionation and variations
@ fission yield and contain a number of experimental uncertainties. Values between 0.5 and 1.5c~ot be considered significantly different from 1.0. ) Selected particles were also weighed sotit the number of fissions per gram could be computed.
Radioactivity measurements were made in the gamma well counter (WC) and the 4-r gammaionization chamber (GIC), both of which are described in Section 2.2. Because the efficiency ofw former decreased with increasing photon energy, while the efficiency of the latter increased,
samples were often assayed in both instruments and the ratio of the two measurements (countsper minute per 104 fissions to milliamperes per 104 fissions) used as an indication of differencesin radionuclide composition.
It will be observed that the particles in Table B.7 have been classified according to color andshape. For purposes of comparing radiochemical properties, spheroidal and agglomerated par-ticles have been grouped together and designated as “altered particles,” while irregular parti-cles have been designed “unaltered particles.” The latter should not be interpreted literally,
“d course; it will be evident from the foregoing section that the majority of irregular particleshave undergone some degree of chemical change. Particles were classified as altered if they
exhibited the obvious physical changes of spheroidal or agglomerated particles under the opticalmicroscope.
Radiochemical results for all altered and unaltered particles from Shot Zuni are summarizedIn Table 3.9, and activity ratios of the particles from this shot and Shot Tewa are compared inTable 3.10. The differences in radiochemical composition suggested in the tables are empha-sized in Figure 3.20, which shows how the energy-dependent ratios (counts per minute per ldfissions, m~iamperes per 104 fissions and counts per minute per milliamperes) varied withtime, and in Figure 3.21, wherein the data used for computing the R-values and product/fission
(P/f) ratios (number of atoms of induced product formed per fission) in Tables B.7 and B.8 arePresented graphically by plotting the numbers of atoms of each nuclide in a sample versus theIIUmber of atoms of M09S. Data obtained from calibration runs with neutron- irradiated Uzx arephtted in the former for comparison; and the standard cloud sample dab for NP239, as we~ astise derived from the esti~ted device fission yields for Ba140 and Sr89, are included in thehtter.
~ is interesting to note that these results not oAy establish that marked differences existbetween the two types of particles, but also show the ~tered particles to be depleted in both=i40-LZi40 am @g, whUe the u~tered particles are enriched in ~i40- u140 and PerhaPs sligMIYdSpleted ~ @~. The altered particles are ~so seen to be about a factor of 100 higher than the
~tered in terms of fissions per gram. When these R-values are compared with those obtainedfrom gross f~lout samples (Tables 3.17 and 3.21), it is further found t~t the values for altered
~ticles resemble those for samples from the lagoon area, while the ValueS fOr the unaltered
_iCles resemble those from cloud SampleS.“ Activit Y I?elationship S. All of the particles whose gamma activities and physical~perties were measured in the YAG 40 laboratory (Table B.34), as we~ as .9 Weral hundred
‘iitioti particles from the incremental collectors on the other ships and barges, were studied~stematic~ly (Reference 30) ~ an attempt to determine whether the activities of the particles
‘re functio”~lly related to their size.~d in Figures 3.22 and 3.23.
These data are listed in Table B.9 and the results arePossible relationships between particle activity, weight, and
‘Uity were also considered (Reference 25), using a separate group of approximately 135 Wr-‘les collected on the YFNB 29 during Shots Zuni and Tewa and the YAG 39 during Shot Tewa‘y; Figures 3.24 and 3.25 show the results.‘- AS ~plied by t~ differences ~ rad{~hemi~~ composition discussed in the preceding SeCtiOn,
‘k@ differences exist in the gamma-radiation characteristics of the different types of parti-~es. Compared with the variations in decay rate anck energy spectrum observed for different‘icles collected at about the same time on the YAG 40 (Figures B.2, B. 3 and B.4), altered‘icles show large changes relative to unaltered particles. Figures 3.26 and 3.27 from Ref -‘ence 26 illustrate this point. The former, arbitrarily normalized at 1,000 hours, shows how
51

well-counter decay rates for the two tYPe6 of particles deviate on both sides of the interval from200 to 1,200 hours, and how the same curves fafl to coincide, as they shotid for equivtient radio.
nuclide compositions, when plotted in terms ~ 10’ fissions. The latter shows the regions in
which the primary radionuclide deficiencies exist.
The previous considerations suggest tkt Particles should be grouped according to type for
the study of activity-size relationships.
Figures 3.22 and 3.23 show the res~ts of a study tide in this way (Table B.9). A large num-ber of the particles for which size and activity data were obtained in the YAG 40 laboratory dur-
ing Shots Zuni and Tewa were first grouped according to size (16 groups, about 32 microns wide,from 11 to 528 microns), then subdivided accord~g to type (irre@r or an@ar, spheroi~ orspherical, and agglomerated) within each size group. The distribution of activities in each Sizegroup and subgroup was considered ~d it wzs found that, while no regular distribution was ap-
parent for the size group, the subgroup tended toward normal distribution. Median activitieswere utilized for both, but maximum and minimum values for the overall size group were in-cluded in Table B. 9 to show the relative spread. It WW be observed that activity range and
median activity both increase with size.Simtlar results for groups of particles removed from IC trays exposed aboard the YAG 39,
LST 611, YFNB 13, and YFNB 29 during Shot Tewa are also included in Table B.9. These havenot been plotted or used in the derivation of the final relationships, because the particles wereremoved from the trays and well- count ed between 300 and 600 hours after the shot, and manywere so near background that their activities were questionable. (This should not be interpretedto mean that the faLlout contained a significant number of inactive particles. Nearly 100 percentof the particles observed in the YAG 40 laboratory during Shots Zuni and Tewa were active. )
In the ftgures, the median activity of each size group from the two sets of YAG 40 data hasbeen plotted against the mean diameter of the group for the particles as a whole and several ofthe ~ticle type subgroups. Regression lines have been constructed, using a modified least-
squares method wtth median activities weighted by tioup frequencies, and 95-percent-confidencebands are shown in every case. Agglomerated particles from Shot Zuni and spheroidal particletafrom Shot Tewa have not been treated because of the sparsity of the data.
It should also be noted that different measures of diameter have been utilized in the two cases.The particles from both shots were sized under a low-power microscope using eyepiece microm-eter disks; a series of sizing circles was used during Shot Zuni, leading to the diameter of theequiv~ent projected ~ea Da, while a linear scale was used for Shot Tewa, giving simply the
maximum particle diameter Dm. The first method was selected because it could be appliedunder the working conditions in the YAG 40 laboratory and easily related to the method describedin Section 3.2.4 (Figure B.5); the second method was adopted so that more particles could be proc-essed and an upper limit established for size in the development of activity-size relationships.
The equations for the regression lines are gtven in the figures and summarized as follows:2“4, shot Tew& A = Dml-8 ,all particles, Shot Zuni, A = Da “ irregular particles, Shot Zuni, A
‘“2, Shot Tewa, A = Dm=& 1“’; spheroidal particles, Shot Zuni, A = DaS-T; and agglomeratedparticles, Shot Tewa, A = Dm2-’ .
(Wogous relationships for Tewa particles from the ~ 29 were derived on the basis ofmuch more limited data in Reference 25, using maximum diameter as the measure of size. (....These are llsted below; error not attributable to the linear regression was estimated at aboutZOOpercent for the first two cases ti 400 percent for the last: all particles, A a Dm2”01 ; ir-regular particles, A = Dm ‘-’2 ; and spheroidal particles, A = Dm3”3’. )
It may be observed that the activity of the irregular particles varies approximately as the
square of the diameter. This is in good agreement with the findtngs in Reference 23; the radio-autographs in Figures 3.14 ~d 3.17 show the activity to be concentrated largely on the surfaces
of the irre~ particles. The activity of the spheroidal particles, however, appears to varyas the third or fourth power of the diameter, which co~d mea either that it is a true functionof particle volume or &t it diffused into the molten particle in a region of higher activity con-centration in the cloud. The thin- section radioautographs suggest the latter to be true, showingthe activity to be distributed throughout the volume in some cases (Figure 3.16) but confined to
52

@ surface in others (Figure 3.18). It may also be seen that the overall variation of activity
~~ size is controlled by the irregular particles, which appear to predomim+te numerically in
@ fallout (Table B.9), rather than by the spheroidal particles. Table 3.11 illustrates how the
~tivity in each size group was divided among the three particle types.No correlation of particle activity with density was possible (Figure 3.25) but a rough rela-
@nship with weight was derived for a group of Tewa particles from the YFNB 29 on the basis
of Figure 3.24: A = @“T, where W refers to the weight in micrograms and nonregressionerror is estimated at -140 percent (Reference 25). (An additional study was performed atNRDL, using 57 particles from the same source and a more stable microbalance. The result-~ relation was: A a @“’7. ) This res~t is consistent with the diameter functions, because
& = W2fi. Th e relative activities of the white and yellow spheroidal particles referred to ear-
ner were ako compared and the latter were found to be slightly more active than the former.
3.3.2 Slurry Particles. All of the fallout collected during Shots Flathead and Navajo consist-ed of slurry particles whose inert components were water, sea salts, and a small amount ofinsoluble solids. (Although IC and SIC trays containing greased disks were interspersed amongthose containing reagent films for shots, no isolated solid particles that were active were ob-served. ) Lamge crystals disp~aying the characteristic cubic shape of sodium chloride were oc-
casionally observed in suspension. The physical and chemical, radiochemica.1, and radiation
characteristics of these particles are discussed below. Table B. 35 contains representative sets
of data, including data on particles collected on the YAG 40 and at several other stations duringeach shot.“ Physical and Chemical Characteristics. Slurry particles have been studiedextensively and are discussed in detail in Reference 31. The results of preliminary studies ofthe insoluble solids contained in such particles are given in Reference 32. Figure 3.28 is aPhotomicrograph of a typical deposited slurry droplet, after reaction with the chloride-sensitive
reagent film surface. The chloride-reaction area appears as a white disk, while the trace or@)ression of the imphg~g drop is egg shaped and encloses the insoluble solids. The concen-bic rings are thought to be a Liese@ng phenomenon. An electronmicrograph of a portion of theSolids is shown ~ Fi~e 3.29, Wustrattig the typical dense agglomeration of small spheres
922dirregular particIes.The physic~ properties of the droplets were esmlished in part by microscopic examination
b2 & YAG 41) laboratory soon titer their ~riv~, ~d ti p- by subsequent measurements and
“c~ctitions. For example, the dimensions of the droplets that appeared on the greased trayswOvided a rapid appro~i~tion Of drop d~meter, but the sphere diameters reported in Table
3.12 Were calculated from the amount of chloride (reported as NaCl equivalent) and H20 meas-med later from the reagent films. It will be noted that particle size decreased very slowly withtie; and that for any given time period, size distribution need not be considered, because stand--d deviations are small. Average densities for the slurry particles; calculated from their di-mensions and the masses of NaCl and HZO present, are also given in Table 3.12.
~. the basis of tie &~ ~ T~le 3.12, and a c~ibration method for solids volume thSt in-
‘O1ved the collection on reagent film of simulated slurry droplets containing aluminum oxide~ensions-’of appropriate diameter at known concentrations, it was estimated that the particles
‘ere about 80 percent NaCl, 18 percent HZO, and 2 percent insoluble solids by volume. The‘tier Were generally amber in color and appeared under high magnification (Figure 3.29) to be%@omerates composed of ~re~r ~d spheric~ solids ranging in size from about 15 microns
~ less than C).lmicron in diameter. The greatest number of these solids were spherical andless tk 1 micron in diameter, although a few were observed in the size range from 15 to 60microm.
Chemical properties were determined by chloride reagent film, X-ray diffraction, and elec-‘ion diffraction techniques. (The gross chemistry of slurry drops is of course implicit in the‘yses of the OCC collections from Shots Flathead and Navajo (Table B.18); no attempt has‘en -de to determine the extent of correlation. ) The first featured the use of a gelatin filmConbinbg colloidal red silver bichromate, with which the soluble halides deposited on the film
53

react when dissolved in saturated, hot water vapor. The area of the reaction disk produced,
easily measured with a microscope, is proportional to the amount of NaCl present (Reference
33). The values of NaCl mass listed in Table 3.12 were obtained by this method; the values of
HZO mass were obtained by constructing a calibration curve relating the volume of water in theparticle at the time of impact to the area of its initial impression, usually well defined by theinsoluble solids trace (Figure 3.28). Because the water content of slurry fallout varies withatmospheric conditions at the time of deposition , mass is expressed in terms of the amount of
NaCl present; the weight of water may be estimated by multiplying the NaCl mass by 1.2, theaverage observed factor.
Conventional X-ray diffraction methods were used for qualitative analysis of the insolublesolids, stripped from the reagent film by means of an acrylic spray coating, and they werefound to consist of calcium iron oxide (2 CaO” Fe20~, oxides of calcium and iron, and various
other compounds (Table 3.13). Some of these were also observed by electron diffraction.
Radio chemical Characteristics. Thirteen of the most-active slurry particles
removed from the SIC trays in the YAG 40 laboratory during Shot Flathead were combined (Ref-erence 26), and analyzed radiochemically in much the same way as the solid particles describedearlier in Section 3.3.1. The sample was assayed in the gamma well counter (WC) and the 4-~
gamma ionization chamber (GIC), then a~yzed for MOgg, Bai40-Lai40, Sr8s, and NP23U; tomfissions, activity ratios, R-values and the product/fission ratio were computed as before. Theresults are presented in Table 3.14.
It may be seen that the product/fission ratio and R99(89) value are compzwable with the valuesobtained for gross fallout samples (Tables 3.17, 3.18, and 3.21), and that the overall radionuclidecomposition resembles that of the unaltered solid particles. Slight depletion of both Ba140-La’40
and Sr8g is indicated.Activity Relationships. Since the mass of sl~ry-particle fallout was expressed in
terms OLNaCl mass, it was decided to attempt to express activity relationships in the sameterms. This was accomplished in two steps. First, the H+ 12-hours well-counter activities
measured on the IC trays from the majority of the stations listed in Table 3.12 were summedto arrive at the total amounts of activity deposited per unit area (counts per minute per squarefoot). These values were then divided by the average specific activity calculated for each sta-tion (counts per minute per microgram NaCl) to obtain the total amount of NaCl mass depositedper unit area (micrograms NaCl per square foot). Results for Shot Flathead are plotted in Fig-ure 3.30, and numerical values for both shots are tabulated in Table B. 11; the Navajo resultswere not plotted because of insufficient data. (Figure 3.30 and Table B. 11 have been correctedfor recently discovered errors in the tray activity summations reported in Reference 31. )
While this curve may be used to estimate the amount of activity associated with a givenamount of slurry-fallout mass in outlying areas, it must be remembered that the curve is basedon average specific activity. It should also be noted that the unusually high values of NaCl massobtained for the YFNB 29 during Shot Flathead have not been plotted. A corresponding y highvalue for the YFIW3 13 during Shot Navajo appears in the table. These were felt to reflect dif-ferences in composition which are not yet well understood.
A preliminary effort was aho made to determine the way in which the activity of slurry par-ticles was divided between the soluble and insoluble phases. As illustrated in Figure 3.31,radioautographs of cMofide reaction areas on reagent films from all of the Flathead collectionsand a few of the Navajo shipboard collections indicated that the majority of the activity was as-soc iated with the “kmoluble solids. This result was apparently confirmed when it was found that84 percent of the total activity was removable by physical stripping of the insoluble solids; how-ever, more careful later studies (private communication from N. H. Farlow, NRDL) designedto establish the amount of activity in solids that could not be stripped from the film, and theamount of dissolved activity in gelatin removed with the strip coating, decreased this value to65 percent. It must be noted that the stripp~g process was applied to a Flathead sample fromthe YAG 40 only, and that solubiiity experiments on (3CC collections from other 10Cati021S atshot Navajo (Reference 32) indicated the partition of soluble-insoluble activity IIHY W-Y withcollector location or time of arrival. The latter experiments, performed in duplicate, yielded
54

average insoluble percentages of 93 and 14 for the YAG 39 (two aliquots) and the YFNB 13 re -~ctively.
while such properties of barge shot fallout as the slurry nature of the droplets, diameters,
densities, and individu~ activities ~ve been adequately measured, it is evident t~t more ex-tensive experimentation is required to provide the details of composition of the solids, theircontribution to the weight of the droplets, and the distribution of activity within the contents ofthe droplets.
3.3.3 Activity and Fraction of Device. An estimate of the total amount of activity deposited
at every major and minor station during each shot is listed in Table 3.15. Values are expressedboth as fissions per square foot and fraction of device per square foot for convenience. In thecase of the major stations the weighted mean and standard deviation of measurements made onthe four OCC’S and two AOC1’S on the standard platform ae given, while the values tabulatedfor the minor stations represent single measurements of AOC2 collections. Basic data for bothcases are included in Tables B. 12 and B. 14. (Tray activities were found to pass through a max-imum and minimum separated by about 180 degrees when plotted against angular displacementfrom a reference direction; ten values at 20-degree intervals between the maximum and mini-mum were used to compute the mean and standard deviation (Section 4.3.2 ).)
The number of fissions in one OCC tray from each major station and one standard cloud sam-ple was determined by radiochemical analysis for Mo ‘g after every shot (Reference 34). Because
these same trays and samples had previously been counted in the doghouse counter (Section 2.2),the ratio of doghouse counts per minute at 100 hours could then be calculated for each shot andlocation, as shown in Table B. 13, and used to determine the number of fissions in the remaining
OCC trays (fissions per 2.60 ftz, Table B.12). Final fissions per square foot values were con-verted to fraction of device per squ~e foot by me~s of the fission yields contained in Table 2.1
~ use of the conversion factor 1.45 x 10²s fissions/Mt (f ission). (Slight discrepancy ies may be‘9 because only interim yields were avail-found to exist in fraction of device values based on MO ,
able at the time of calculation. )A.liquots from some of the same (XC trays analyzed radiochemica.lly for Mogg were also
measured on the dip counter. Since the number of fissions in the aliquots could be calculated~ the f~lout from Shots Flathead ~d Navajo was relatively unfractiowted, the total numberd fissions ~ each Aocz from these shots could be computed directly from their dip-countertiivities us~g a constint ratio of fissions per dip counts per minute at 100 hours. Table B.141
@ves the results.8hot Zuni, and to a lesser efient shot TeW, falout was severely fractionated, however, and
U ~s necessary first to convert dip-counter activities to doghouse-counter activities, so that@ more-extensive relationships between the latter and the fissions in the sample could be util-‘ed. With the aliquot measurements referred to above, an average value of the ratio of dog-‘iSe activity per dip-counter activity was computed (Table B. 15), and this used to convert all‘~ counts per minute at 100 hours to doghouse counts per minute at 100 hours (Table B. 1411).‘% most appropriate value of fissions per doghouse counts per minute at 100 hours was then‘lected for each minor station, on the basis of its location and the time of fallout arrival, and
“b tom number of fissions calculated for the collector area, 0.244 ft2. Final fission per square‘w v~ues were arrived at by normalizing to 1 ftz, and fraction of device per square foot was
; ‘mPuted from the total number of device fissions as before.~~’ -y of the results presented in this report are expressed in terms of ld fissions. For“~=mple, all gamma- and beta-decay curves in Section 3,4 (Figures 3.34 to 3.38) are plotted in:aib of counts per second per 104 fissions, and the final ionization rates as a function of time‘m ‘ach shot (Figure 3 39) are given in terms of roentgens per hour per 104 fissions per square‘-- Thus the estima~es in Table 3.15 are all that is required to calculate the radiation inten-aties whic~ would have been observed at each station under ideal conditions any time after thecessation Of f~lout. It should be noted, however, that the effects of sampling bias have not been‘*tielY eliminated from the tabulated values and, consequently, will be reflected in any quantity‘etermined by means of them. Even though the use of weighted-mean collector values for the
55

major stationB constitutes m adjustment for relativ@ p~tform bias, the question rema~s aS tO
What percent of the total number of fissions per unit area, which would have been deposited in
the absence of the collector, were actually collected by it. This question is considered in detail
in Section 4.3.2.
3.3.4 Chemical Composition and Surface Density. The total mass of the fallout collected per
unit area at each of the major stations is summarized for all four shots in Table 3.16. Results
are further divided into the amounts of coral and sea water making up the totals, on the assump-tion that all other components in the device complex contributed negligible mass. These valueswere obtained by conventional quantitative chemical analysis of one or more of the OCC traycollections from each station for calcium, sodium, chlorine, potassium, and magnesium (Ref-erences 35 through 38); in addition analyses were made for iron, copper and uranium (privatecommunication from C. M. Callahan and J. R. Lai, NRDL). The basic dhemical results are pre-sented in Tables B. 16 and B.18. (Analyses were also attempted for aluminum and lead; possiblybecause of background screening, however, they were quite erratic and have not been included.)
The chemical analysis was somewhat complicated by the presence in the collections of a rela-tively large amount of debris from the fiberglass honeycomb (or hexcell) inserts, which had tobe cut to collector depth and continued to span even after several removals of the excess mate-rial. It was necessary, therefore, to subtract the weight of the fiberglass present in the samplesin order to arrive at their gross weights (Table B. 18X). The weight of the fiberglass was deter-mined in each case by dissolving the sample in hydrochloric acid to release the carbonate, ff.l-tering the resultant solution, and weighing the insoluble residue. In addition, the soluble portionof the resin binder was analyzed for the elements listed above and subtracted out as hexcell con-tribution to arrive at the gross amounts shown (References 39 and 40). A,liquots of the solutionwere then used for the subsequent analyses.
It was also necessary to subtract the amount of mass accumulated as normal background.These values were obtained by weighing and ana.lyzt.ng samples from a number of OCC trayswhich were known to have collected no fallout, although exposed during the fallout period. Manyof the trays from Shot Cherokee, as well as a number of inactive trays from other shots, wereused; and separate mean weights with standard deviations were computed for each of the elementsunder ocean and land collection conditions (Tables B. 16 and B. 18).
After the net amount of each element due to fallout was determined, the amounts of original
coral and sea water given in Table 3.16 could be readily computed with the aid of the sourcecompositions shown in Table B.16. In most cases, coral was determined by calcium; however,where the sea water/coral ratio was high, as for the barge shots, the sea water contribution o
Lthe observed calcium was accounted for by successive approximation. Departure from zero ofthe residual weights of the coral and sea water components shown in Table B. 18 reflect comb ederrors in analyses and compositions. It should be noted that all A values given in these datarepresent only the standard deviation of the background collections, as propagated through the
successive subtractions. In the case of Shot Zuni, two OCC trays from each platiorm wereanalyzed several months apart, with considerable variation resulting. It is not known whethercollection bias, aging, or inherent analytical variability is chiefly responsible for these dis-crepancies;-
The principal components of the device and its immediate surroundings, exclusive of themturally occurring coral and sea water, are listed in Table B. 17. The quantities of iron, copperand uranium in the net fallout are shown in Table B. 181 to have come almost entirely from this
source. Certain aliquots from the OCC trays used for radiochemical analysis were also ana-lyzed independently for these three elements (Table B. 1811). These data, when combined withthe tabulated device complex information, allow computation of fraction of device; the calcula-tions have been carried out in Section 4.3.4 for uranium and iron and compared with those basedon Mogs.
3.4 RADIONUCLIDE COMPOSITIC)N AIWI WDIATION CHARACTERISTICS
3.4.1 Approach. If the identity, decay scheme, and disintegration rate of every nuclide in
56

z sample are know% then ~1 emitted particle or photon properties of the mixture C- be COm-puted. U, in addition, calibrated radiation detectors are available, then the effects of the sam-ple emissions in those instruments may also be computed and compared with experiment. Fi-
~ly, air-ionization or dose rates may be derived for this mixture under specified geometrical
conditions and concentrations.III the calculations to follow, quantity of sample is expressed in time-invariant fissions, i.e.,
the number of device fissions responsible for the gross activity observed; diagnostically, thequantity is based on radiochemically assayed Mogg and a fission yield of 6.1 percent. This nuclide,
therefore, becomes the fission indicator for any device and any fallout or cloud sample. Thecomputation for slow-neutron fission of U2X, as given in Reference 41, is taken as the reference
fission model; hence, any Rgg(x) values in the samples differing from unity, aside from experi-mental uncertainty, represent the combined effects of fission kind and fractionation, and neces-
sitate modification of the reference model if it is to be used as a basis for computing radiationproperties of other fission-product compositions. (An R-value may be defined as the ratio of
the amount of nuclide x observed to the amount expected for a given number of reference fissions.The notation Rgg(x) means the R-value of mass number x referred to mass number 99. )
Two laboratory instruments are considered: the doghouse counter employing a l-inch-diameter-by- 1-inch-thick NaI(Tl) crystal detector, and the continuous-flow proportional betacounter (Section 2.2). The first was selected because the decay rates of many intact OCC col-lections d all cloud samples were measured in this instrument; the second, because of thedesirability of checking calculated decay rates independent of gamma-ray decay schemes. A.l-tIm@ decay data were obtained on the 4-n gamma ionization chamber, response curves (Ref-erence 42) were not included in the calculations. However, the calculations made in this sectionare genertiy consistent with the data presented in Reference 42. The data obtained are listedin Table B.26.
3.4.2 Activities and Decay Schemes. The activities or disintegration rates of fission prod-‘- for 1(Y fissio~ were wen from Reference 41; the disintegration rates are used where a-ioactive disintegration is any spontaneous cknge in a nuclide. Other kinds of activities are
=ified, e.g., beta activity. (See Section 3.4.4. ) Those of induced products of interest wereCOmputed for 104 fissions and a product/fission ratio of 1, t~t is, for ld i.nitti atoms (Ref cr-
.-e 43).Prepublication res~ts of a study of the most- tiportint remaining nuclear constants — the
decay schemes of these nuclides —are contained in References 42 and 44. The proposed*heroes, which provide gamma and X-ray photon energies and frequencies per disintegration,~ude all fission products Imown up to as early as -45 minutes
~cts required.
, as well as most of the induced
All of the following calculations are, therefore, limited to the starting timementioned and are ~bitra.rily terminated at 301 days.
““ 3.4.3 Instrument Response and Air-Ionization Factors. A theoretical response curve for the!.~use counter, based on a few cal~rat~ nuclides, led to the expected counts/disintegration
id -h fission and induced product as a function of time, for a point-source geometry and 104tmsions or initial atoms (Reference 43). The condensed decay schemes of the remaining induced
- ‘lides were also included. To save time, the photons emitted from each nuclide were sorted~tio ~ardized energy increments, 21 of equal logarithmic width comprising the scale from “m ‘v to 3.25 Mev. The response was actually computed for the average energy of each incre-
~>m% which in gener~ led to errors no greater than -10 percent.YR’ c~ting rates expected in the beta counter were obtained from application of the physical-~~~etry factor ~ the theoretical tow-beta and pos itrOn activity of @ sample. With a re-t ~me curve essent@UY flat to beta E= over a reasonably wide range of ener~ies> it was not‘*’*es~Y to derive the response to each nuclide and sum for the total. Because the samples
‘re ‘ssentidly weightless point sources, supported and covered by 0.80 mg/cm2 of pliofilm,~r~ and absorption corrections were not made to the observed count rates; nor Were
%-ray contributions subtracted out. Because many of the detailed corrections are self-
57

canceling, it is assumed the results are correct to within - 2(I percent. The geometries (or
count s/beta) for Shelves 1 through 5 are given in Section A. 2.Air - ionization rates 3 feet above an infinite uniformly Contaminatedplane,here~terreferred
to as standard conditions (SC), are based on the curve shown in Figure B.6, which was originallyobtained in another form in Reference 7. The particular form shown here, differing mainly in
choice of parameters and units, has been published in Reference 45. Points computed ~ Ref-erence 46 and values extracted from Reference 47 are also shown for comparison. The lattervalues are low, because air scattering is neglected.
The ionization rate (SC) produced by each fission-product nuclide as a function of time forId reference fissions/ft2 (Reference 17), was computed on a line-by-line basis; the inducedproducts appear in Table B. 19 for 104 fissions/ft2 and a product/fission ratio of 1, with linesgrouped as described for the doghouse-counter-response calculations.
The foregoing sections provide all of the background information necessary to obtain the ob-j ectives listed in the first paragraph of Section 3.4.1, with the exception of the actual radionuclidecomposition of the samples. The following sections deal with the available data and methods used
to approximate the complete composition.
3.4.4 Observed Radionuclide Composition. IWdiochemicai R-values of fission products aregiven in Table 3.17 and observed actinide product/fission ratios appear in Table 3.18, the twotables summarizing most of the radiochemistry done by the Nuclear and Physical Chemistry,
and Analytical and Standards Branches, NRDL (Reference 34).
The radiochemical results in Reference 34 are expressed as device fractions, using fission
yields estimated for the particular device types. These have been converted to R-values by use
of the equation:
FODE(X) FYE(x)R~ (x) = F0D(99) “ FY@(x)
99” FO~(x) and FYE(x) are respec -Where Rig (x) is the R-value of nuclide x relative to Mo ,tively the device fraction and estimated yield of nuclide x reported in Reference 34, FY9(x) is
‘the thermal yield of nuclide x, and FOD(99) is the device fraction by Mogg. The thermal yieldsused in making this correction were taken from ORNL 1793 and are as follows: Zrgs, 6.4 per-cent. Teln, 4.4 percent; Srflg, 4.8 percent; Srw, 5.9 percent; Csi37, 5.9 percent; and Ceiu, 6.1pert’ent. The yield of Mogg was taken as 6.1 percent in all cases. The R-values for all cloud-sample nuclides were obtained in that form directly from the authors of Reference 34.
Published radiochemical procedures were followed (References 48 through 54), except formodifications of the strontium procedure, and consisted of two Fe(OH) ~ and BaCrOd scavengesand one extra Sr(NO~2 precipitation with the final mounting as SrCOt. Table 3.19 lists princi-pally product/f ission ratios of induced activities other than actinides for cloud samples; sources
are referenced in the table footnotes.Supplementary inforntion on product/fission ratios in fallout and cloud samples was ob-
tained from gamma-ray spectrometry (Tables B.20 and B.21) and appears in Table 3.20.
3.4.5 Fission- Product- Fractiomtion Corrections. Inspection of Tables 3.17 through 3.20,as well as the various doghouse-counter z,nd ion-cbmber decay curves, led to the conclusionthat the radionuclide compositions of Shots Flathead and Navajo could be treated as essentiallyunfractionated. It also appeared that Shots Zu.ni and Tewa, whose radionuclide compositionsseemed to vary continuously from lagoon to cloud, ad probably within the cloud, might be COV-
ered by two compositions: one for the close-in lagoon area, and one for the more-distant shipand cloud samples. The various compositions are presented as developed, starting with the
simplest. The general method and supporting data are given, followed by the results.Shots Flathead and Navajo. Where fission products are not fractionated, that is,
where the observed R99(x) values are reasonably close to 1 (possible large R-values among low-yield valley and right-wing mass numbers are ignored), gross fission-product properties may
58

~readily extracted from the sources cited. Induced product contributions may be added in
~r diminishing the tabular values (product/fission = 1) by the proper ratio. After the result-~ ~omputed doghouse-counter decay rate is compared with experiment, the ionization rate (SC)
my be computed for the same composition. Beta activities may also be computed for this com-
position — making allowance for those disintegrations that produce no beta particles. The Navajo
~om~sition wzs computed in this manner, as were the rest of the compositions, once fractiona-
t~n corrections had been made., Shot Zuni. A number of empirical corrections were made to the computations for un-
~tionated fission products in an effort to explain the decay characteristics of the residual~~tions. from this slmt. The lagoon-area composition was developed first, averaging avail-~e lagoon area R-values. As shown in Figure 3.32, R-values of nuclides which, in part atl-, are decay products of antimony are plotted against the half life of the antimony precursor,
_dng t_hefission-product decay chains tabulated in Reference 56. (Some justification for the
1 .. .71fthe “
) ,-—
assumptions are made that, after -45 minutes, the R-values of all members of a given-chain
are identical, and related to the half life of the antimony precursor, then Figure 3.32 may beased to estimate R-values of other chains containing antimony precursors with different halfMes. The R-value so obtained for each chain is then used as a correction factor on the activity(Reference 41) of each nuclide in that chain, or more directly, on the computed doghouse activ-ity or ionization (SC) contribution (Table 3.21). The partial decay products of two other frac-
mnating precursors, xenon and krypton, are also shown in Figure 3.32, and are similarlyemployed. These deficiencies led to corrections in some 22 chains, embrac @ 54 nuclidestit contributed to the activities under consideration at some time during the period of interest.ThE R-value of 1131WXJ taken as 0.03; a locally measured b.t otherwise unreported 11371131ratiod 5.4 yields an 1133R-value of 0.16.
Although the ~rtic~ate cloud composition might have been developed similarly, uSirlg adffferent set of curves ~sed on cloud R-v~ueg, it was noticed tit a fair relation existed be-
~*n cloud and lagoon nuclide R-values as shown in Figure 3.33. Here Rgg(x) cloud/Rgg(x) lagoon~ Plotted versus Rg9(x) ki~oon average. The previously determined lagoon chain R-values were*n simply multiplied by the indicated ratio to obtain the corresponding cloud R-values. The_ lines ~icate the trends for two other locations, YAG 39 and YAG 40, although these were
~ Pursued because of time limitations. It is assumed that the cloud and lagoon compositions‘present extremes, with all others intermediate. No beta activities were computed for thisshot.
shot Tewa. Two simplifying approximations were made. First, the cloud and outer sta-b average R-values were judged sufficiently close to 1 to permit use of unfractionated fission-Cts. second, because the lagoon-area fission-product composition for shot Tewa appeared
ti b the same as for its Zuni counterpart except in mass 140, the Zuni and Tewa lagoon fission‘cts were therefore judged to be identical, except that the Ba140-La140 contribution was in-~ed by a factor of 3 for the latter.., The induced. products were ~ded @ us~g pr@uct/fissiOn ratios approprhte to the k3CatiOn
‘rever POssible; however, the sparsity of ratio data for fallout samples dictated the use of
“’~ values for most Of the minor induced activities...-.~ ‘ 3.4.6 Res~ts and Discussion. Table B.22 is a compilation of the computed doghouse count-‘h ‘a@s for the compositions described; these data and some observed decay rates are shownk ‘@res 3.34 through 337 AU experimental doghouse-counter data is listed in Table B.23.‘e B.24 similarly sum”~izes the Flathead and Navajo computed beta-counting rates; they‘e cOmPared with experiment in Figure 3.38, and the experimental data are given in Table~2S” Results of the gamma-ionization or dose rate (SC) calculations for a surface concentra-% ‘f 10” fissions/ft2 are presented in Table 3.22 and plotted in Figure 3.39. It should be em-‘ksked tkt these computed results are intended to be absolute for a specified composition
59
and number of fissions as determined by MOeg content, and no arbitrary normalization has been
employed to match theory and experiment. Thus, the curves in Figure 3.39, for instance, rep.
resent the best available estimates of the SC dose rate produced by Id fissions/ft* of the VariOu
mixtures. The Mogg cmtent of each of the samples represented is identic~, namely the numbercorresponding to 104 fissions at a yield of 6.1 percent. The curves are displaced vertically
from one another solely because of the fractiomtion of the other fission products with respectto Mogg, and the contributions of variOUs kinds and amounts of induced products.
E may be seen that the computed and observed doghouse-counter decay rates are tn fairlygood agreement over the time Period for which data could be obtained. The beta-decay curvesfor Shots Flathead and Navajo, initiated on the YAG 40, suggest that the computed gamma andionization curves, for those events at least, are reasonably correct as early as 10 to 15 hoursafter detonation.
The ionization results may not be checked directly against experiment; it was primarily forthis reason that the other effects of the proposed compositions were computed for laboratoryinstruments. H reasonable agreement can be obtained for dtiferent types of laboratory detector~then the inference is that discrepancies between computed and measured ionization rates in the”field are due to factors other than source composition and ground-surface fission concentration.
The cleared area surrounding wtion F at HOW Island (Figure 2.8) offers the closest approxi-mation to the standard conditions for which the calculations were made, and Shot Zuni was theonly event from which sufficient fallout was obtained at this station to warrant making a com-parison. With the calculated dose rates based on the average buried-tray value of 2.08 ● 0.22x 10¹⁴ fissions/f# (Table B.27) and the measured rates from Table B.28, (plotted in Figure B.7),
the observed/calculated ratio varies from 0.45 at 11.2 hours to 0.66 from 100 to 200 hours, faU-ing to an average of 0.56 between 370 and 1,000 hours. Although detailed reconciliation of theoryand experiment is beyond the scope of this report, some of the factors operating to lower the ra-tio from an ideal value of unity were: (1) the cleared area was actually somewhat less than in-finite in exten~ averaging -120 feet in radius, with the bulldozed sand and brush rtngtng thearea in a horseshoe-shaped embankment some 7 feet high; (2) the plane was not mathematicallysmooth; and (3) the survey instruments used indicate less than the true ionization rate, i. e., theintegrated response factor, including an operator, is lower than that obtained for Coco in the cal-ibrating direction.
It is estimated that, for average energies from 0.15 Mev to 1.2 Mev, a cleared radius of 120feet provides from -0.80 to -0.’70 of an infinite field (Reference 46). The Cutie Pie surveymeter response, similar to the TIB between 100 kev and 1 Mev, averages about 0.85 (Reference17). These two factors alone, then, could depress the observed/calculated ratio to -0.64.
60

•2
● ☛☛☛☛☞✍☞✍
+
**+*-*+$
1’ -11
w;*++ I!-l
I
I
I
II
II
II
I..
● ☞☛✍✎

TABLE 3.3 PENETRATION RATES DERIVED FROM EQUIVALENT-DEPTH DETERMINATIONS
Number. Limits
shotTime Studied
Station RateFrom TO
95 petof Points Confidence
TSD, hr w’hr dbr
Flathead YAG 39 10 8.3 12.8 3.0 2.5
Navajo YAG 39 10 7.4 18.6 2.G 0.2Navajo YAG 40 4 10.0 13.0 4.0 2.1
Tewa YAG 39 26 5.1 14.8 3.0 0.7
Tewa YAG 40 5 5.2 8.1 4.0 2.9
TABLE 3.4 DEPTHS AT WHICH PENETRATTON CEASED FROM EQUIVALENT-DEPTH DETERMJ.NATIONS
Number Time Stud.fed● Limits Estimated
shot Station Deptiof Points From To
95 pet TbermoclineConfMence Depth●
TSD, hr meters meters meters
Navajo YAG 39 13 30.9 40.1 62 15 40 to 60
Tewa YAG 39 17 15.3 20.5 49 10 40 tn 60
31.8 34.8
● See Reference 15.
TABLE 3.5 MAXfMUM PENETRATION RATES OBSERVED
Number Tirm Studied* Limits
Sflot station Rate 95 petof Potnte From To
ConfidenceTSD, hr uv’hr m~r
Zuni YAG 39 3 15.2 16.8 - 30 .
9 17.8 29.8 2.4 0.9Navajo YAG 39 5 3.1 5.2 23.0 9.8
Tewa YAG 39 2 3.8 4.1 - 300 —
TABLE 3.6 EXPONENT VALUES FORPROBE DECAY MEASUREMENTS
The tabulated numbers are values of n in the ex-pression: A = & (t/~)n , where A indicates the
activity at a reference time, t, aod AOthe activiwti tbe time of observation, ~.
shotExponent Values
Project 2.63 Project 2.62a
Zuni 0.90 1.13Flaihead 0.90 1.05Navajo 1.39 1.39Tewa * I .34
● Instrument malfunctioned.
62
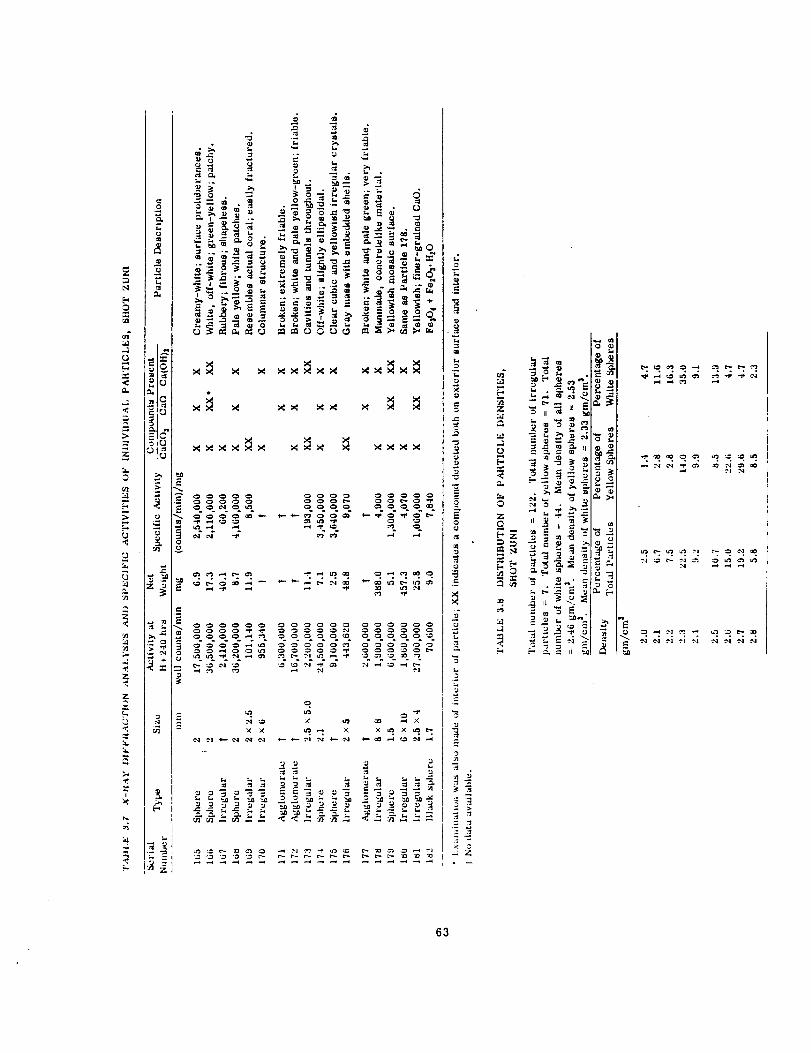
o
:
i
I
0
r
1
I
X3 x x X*5X* Xxzxz
Jixxxxxxzz
XXX*3X Xfix 2 X*X*
63

TABLS 3.9 HADIOCHEMIC& PROPERTIES OF ALTERSD AND UNALTERED PARTICLSS,SHOT ZUNI
Altered Particles Unaltered Particles
Quantity Time Number of valueNumber of
Samples SamplesValim
TSD. br
fis.9iona/gm(x lo~) —
fiss130E/gm(x lo~) ●—
——
—(counts/min)/lo4fieeiona 71(counts/mln)/104fissions 105
(cmmt41/min)/lo’ fissions 239(cOunte/mfn)/lo’fissions 632
Ma/lo’ fissions (x 10- 1’) 71ma/104ffssione (X10- 17) 105
ma/104fissiom (X10- ‘r) 239ma/104fissions (X10- ‘T) 481
(counts/min)/ma(x 10U) 71
(cotuds/min)/ma (x 10U) 105
(camt8/min)/ma (x 10”) 239
614
—.
4312
4312
54
10
3.8 * 3.1 9 0.090 * 0.12
42 i 2.7 24 0.033 ● 0.035
——0.34 ● 0.060.35* 0.080.0540.013
30*524*73.41.7
11*114*316*2
4‘711
4711
4136
—— .——0.s3 ● 0.19
1.1 * 0.4
0.12
0.024
59 .+24109● 31205.1
9.3 * 2.08.6 * 1.56.2 ● 1.3
* Calculatedfrom activity ratios on the basis of particles analyzedfor total flssiona.
TABLS 3.10 ACTIVITY RATIOS FOR PARTICLES FROM SHOTS ZUNI AND TEWA
SM Zuni ShotTewaActivityRatio Altered Particles Unaltered Particles All ParticIes
Value Time value Time Valw? TimeTSD, hr TSD, hr TSD, hr
(cOunts/min)/ma(x 10U) 14. ● 3. 105 8.6 * 1S 105 11. ● 6. 9616. + 2. 239 8.2 ● 1.3 239
(counte/mm)/104fissions 0.35 + 0.08 105 1.1 ● 0.4 105 0.36 * 0.12 970.054 239 0.12 239 0.18 * 0.02 172
ma/l& fissions (x 10-17) 24. * ‘1. 105 109. * 31. 105 37. * 15. 97
3.4 239 20. 239
TABLS 3.11 DISTRIBUTION OF ACTIVITY OF YM3 40 TEWAPARTXCLES WITH SIZE AND TYPE
Percent of
Size Group CompositePercent of Size Group Activity
Total ActivityIrregular Spheroidal Agglomerated
microns
16to 33 <0.1 23.4 76.6 0.034 to 66 2.2 ‘ 86.1 5.0 6.967to 99 6.0 46.4 37.5 16.0
100to 132 11.6 66.6 6.7 24.6133to 165 18.2 43.4 5.7 50.91G6to 198 16.9 49.3 1.9 48.6
199to 231 6.1 56.0 0.0 41.9232to 264 9.9 14.7 0.0 65.3265to 297 7.0 14.6 0.1 65.3298to 330 11.5 18.5 0.0 81.4331to 363 0.7 — — 100.0
364to 396 1.7 0.0 2.2 97.7397to 429 — — — —
430to 4G2 0.6 23.6 76.2 0.0463to 495 — — — —
496to 528 3.4 100.0 0.0 0.0
, 64

TABLE 3.12 PHYSICAL, CHEMfCAL, AND RADIOLCCICAL PROPERTIES OF SLURRY PARTICLESn
.+ll indicated errors are stand~d deviations of the mean.r
Time of , Number ofAverage Avercge
Average Density
Arrival station ParticlesAverage Diameter ● Average Specific Activity
NaCl MaSS H20 MMS+ Standard
fntervd Measured Deviation+ Standard Deviation + Stcndard Deviation
T!iD, br Pg I@ gin/cm’ microns x 10’0(counte/min)/gmt
Shot Flathead:
Ito3 YFNB 297t09 YAG 39 and.
LST 611llto12 YAG 4015to 18 Y& 40
0.06 0.08 1.28 * 0.1 57*6 43*8t4 to 10
50 to 52103t04
67 to 76
5t0209 to 14
144tmlo5t023
11 to 15332865
13 to 14
133 to 182
0.621.200.69
1.29 * 0.011.35 * 0.051.34 * 0.08
112 * 2 282 * 20
129 * 16 285 * 160121* 6 265 ● 90
0.420.940.50
282* 30$Tc4aIs 1.30 * 0.01
Shot Navajo:
1.38 * 0.041.50 * 0.011.41 * 0.041.45 * 0.041.31 ● 0.02
272 k 14229 * 24166 * 6142 & 22110* 5
4+0.6116*314*29*3
11*2
lto3 YFNB 133t05 YAG 395t06 L9T 6117t09 YAG 409L1O YAG 40
7.777.621.611.250.44
7.944.491.831.0’90.60
16+426~21T29f23f56*7
10to 11 YAG 40lltn12 YAG 4012to13 YAG 4013to14 YAG 4014to 15 YAG 401Sto 18 YAG 40
0.660.300.310.170.100.06
0.500.440.310.270.180.32
1.43 + 0.031.32 + 0.011.37 * 0.011.28 ● 0.021.30 * 0.031.15 * 0.02
111 * 494*496*286i775+284i4
Tobds 1.35 * 0.01 21+35
● Diameter of spherical slurry droplet at time of arrival.t Photon count in weU counter at H+12.~ Not included in calculation of totaLSBased on summation of hxtividual-psrticle epecific activities.
f Calculated mfue based on tc4al tray count, number of pakticlee per tray, and averNaCI mws yr p~cle; n~ kc[uded in calculation of tctd.
TABLE 3.14 RADIOCHEMfCAL PROPERTIES OF SLURRYPMUITCLES, YAG 40, SHOT FLATHEAD
TABLE 3.13 COMPOUNDS identified IN SLURRY-
PARTICLE INSOLUBLE SOLIDSAm.dysis of the combined p~iclee led to the following data:Description, essentially NaCl; WC, 0.872 x 10⁶counts/rein;time of WC, 156 TSD, hre; G~C, 36 x lo-’i ma; time OfGIC.196,TSD. hrs; fiesions, 6.83 x 101O;Bal’oSr8g! NP23Spr~~ct/fissiOn rtiio, 0.41; ~tivlty
ratios at 196 TSD, hrs, 9.9 x 10” (counts/min)/ma, 0.13(counts/min)/10’ fissiona, mv.f13.0 x LO- “ ma/104fissions.
FfeId Number Wc Time of WC
X 108counts/rein TSD, hrS
AU compounds were i&ntified by X-ray diffraction except Fe203Wd NaCa(S[04), which wcre identified by eIectron diffraction;
2&0. Fe2C), W- also observed in one sample by electron diffrw-QOU. The presence of Cu in the Navajo sample WaS established& X-ray diffraction. I indicates definite identification and PI
Possible i&ntiffcUiOn.
compound Shot Flathead Shot Navajo
zc~. Fe20, IGC% 1 IFe@, IFe@, 1 ICSSOL.2H20 INat] 1 INaca(sioi) PISt% PI~. Fe203 PI
2660-1 0.0668 1892682-2 0.116 1902334-1 0.0730 1902677-1 0.0449 1932333-L 0.131 180?682-1 0.0607 1892331-1 0.249 189
2333-2 0.064 1912334-4 0.146 1902333-3 0.0487 1902332-1 0.0295 1902681-3 0.235 190‘2681-1 0.141 190
65

+4+4++++
67
.

!-, -. .,
11 !
.
.
/
- ,,.. -. -.- ”--—.* ,.- .“ . ..”.. -.!
1 k .2
,1, , 1
. .
.
UII 1 1 U!ll , 1 11111I 1 1 b,lll! I I
i k(./.- w-
I i
i ;. .---
@i
,

~,... —..-- .---N .- ..,--
●t *
?t
1
. ./ ?
I
{
*4
/ I
, If
/ ?
k’”,.,.,---,.- -
.
<.,.,.-,!.. 7—-. —. .-., .r.-
, b +
,.. ----
;- - ---
,-.-... m.--—. . . ... ”.,..-
“a
7“I
8a’t3
mC6
77

. .-----
I—
,-.,.,-” - y.. 0,- “. .;-- ...!
I:
4*‘, ,
!- - ..-
4 ././. !
.“. m -- --—, . ,,-.. ..,. .”,
1 i -9Z?> 1“’’” l’” T 1
I
*,., ., - -1-.
,-,-. “
... .,-... -, -,-1”- —,. . ,.- . . . . . . . .
-,:,
---+
% I 1. .
L’! i,,,,,,, l,,,,, , 1,-b k } .!
,-,., ,,” -,- = 7-<.,l... -.. r-
78

.,.,.!
;. ,--, .)-e ------- “------
-,-,>,---- l-l”- “-. ..y..l * I.- .“ ..!. !,- “..
:i ;
] ~r,,1 Q >
Bf’”
,1, !,,l’~! , %I
l“’”I
,.,.,.,.-... —,.- n. -----~ -9 >
n,,
~:’’’”-a
I
1 Jc
1z
II
i● :
:
*
.
!m, ,1.,,, , 1b h“
,-7 .! ,.n .e,.-
,.,.,,,” - !,,,- “
!., .! ,,” ---
79
:./.! ,,.. .m,.,,.o
!.,., .
---- -, —.. -—,--- ..-,. -
?;
. . I
ii

\
\
\
4
\
\
T
6 7 81S0 {M)
n
12 13 14 15 16
I I ITli WA
● Y&L 40 lM~C UU2TAL COUII_ D-7 “.3 WMB IS mawbwru couxcron E-57* WOWISLANDlwcREM2W16LCoufcron F-64o VFW*2s lNcREMtMTu CouEclon M-m8 VAG39 ,MCREMCM7ALCOLLECTORC-20A LST611INCR2MEMT6LCCUXCTM D-4 I
o 1 2 3 4 5 6 7 B 9
TSO [ 14R}
Figure 3.5 Calculated mass-arrival rate,
80
10 11 12 13 14 15 16
Shots Zuni and Tewa.

11 I I I I I.,
[ VAz
7s0 ( FIR]
-
!11111Zunl-mem
1 I k+’’”’NY’’i--i---J’+’7l“m’”J’ ,}, ‘\/,\’\ ‘
/$ 1’, ~ \/’ \P \ 233* 1325p
!s Ir !8 Is 29 Z1 22 23 24 25 m z? 29 29
Tso (Hnl
Figure 3.6 Particle-size variation at ship stations, Shot Zuni.
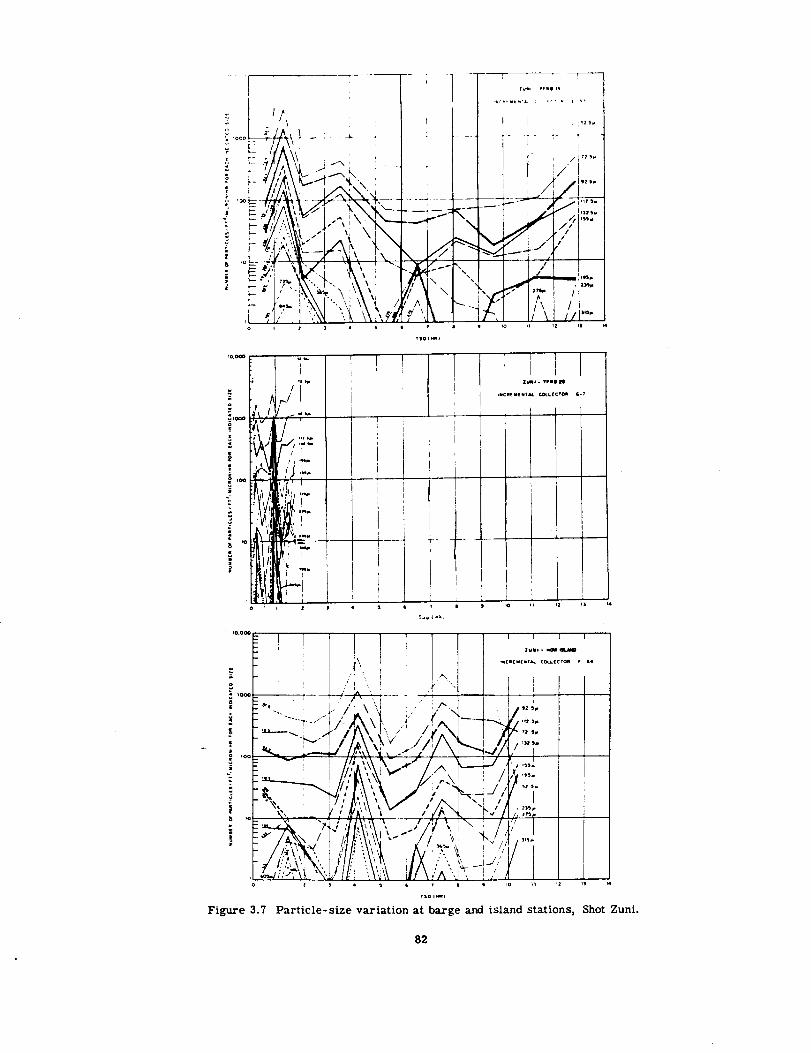
‘T--T-- TT=.:Tl
,-11, IJi I 11 I II ! I 1/[ 1
r,. ,.-,
‘0”’’7!1-1!11I
.,..~ il ‘~ In! . Wmm n
:$“,., ●C*,* c0LLccm9 C.7
; 1,. , I I I
1l!! I
I i I I I I I I
0,323. 3.7** *“’2’=’”!>.,””.
r,. ,8-)
Figure 3.7 Particle- size variation at barge and island stations, Shot Zuni.
82

Elll1 I I I ,! I I I
Iill rr... uo.o I.-”r. c.!., -0, ,[,,9. , ,
—
—
—
—
—
—
—
—
—●
.
—
—
I I I I ITCW. . UV91
4.,., ”,... UU1CW9 0.41
!,O (-,
Figure 3.8 Particle- size variation at ship stations, Shot Tewa.

,, n !,
Figure 3.9 Particle- size variation at barge and island stations, Shot Tewa.
84

a
10
10
10
:.0
.
.
.
., M
:
s *O..
IO
w
w
,00
I
o
Figure 3.10 Ocean activity profiles, Shots Navajo and Tewa.
85

u-l
0
(1N33 M3d) NOllnlOS NI A11A113V
86

Figure 3.13 Typical solid fallout particles.

------- .—..__ ___ ___
\
w
.
.’.,..
I
—. -—.— .——— --- ----- . .. . .-.-—--L -* ---------- .4.- -d. 1
Figure 3.14 Angular fallout particle,.
a. Ordinary light. b. Crossed nicols.
Shot Zuni.c. Radioautograph.
89

.1
i . .+
I 450p
Figure 3.15 High magnification of partof an angular fallout particle, Shot Zuni.
90

Figure 3.16 Spheroidal fallout particle, Shot Zuni..a. Ordinary light. b. Crossed nicols. c. Radioautograph.
91

Figure 3.17 A.ngular fallout particle, Shot Tewa.a. Ordinary light. b. Crossed nicols. c. Radioautograph.
92

Figure 3.18a. Ordinary
Spheroidal fallout particle, Shot Tewa.light. b. Crossed nicols. c. Radioautograph.
93

....~-— ...- .
94

.
-00 0
e
0 4 Q
8.*
.
1[11 I I I
4
.

““nX==
@. I:
IA I I I 11111 1 I I 1 11
“’IT
F Wmbus b?m -1*qrew f,Dmm~-
~ I*.* d*fim tho 95%mnfld,rlm band
d I { I I 111! I I I I Ill)
ala 1+
E I
Figure 3.22 Particle group median activity versus mean size, Shot Zuni.
.
97

E IALL P..T,CLCS lCOMPOSITCI
,.z.o.t~I
L I
!10I I I I I 11111 I I I II
IQ ,.l
Figure 3.23
.
t I
t iLL
L/)
/,
:
//
/s
/I
i,1 — .-—ITEwA-YAG 40
r
I0 I I I ‘1 !11 I I I IL
. ,@
group median
iId
10 I I I I 1111 I I I 1 IL-
~m ,.2
versus mean size, Shot Tewa.

~0
00
0/
‘f
/40
I I I 1111
m
0’0
/0
/● /
/0
/0
●
●
EACH POIIVT REPRESENTSONE PARTICLE
I I 111111 I I I 11111
10’ 102 loawEIGHT ( MICROGRAMS )
Figure 3.24 Relation of particle weight to activity, Shot Tewa.
99

1.9 2.0 2.1 2.2 23 2.4 2.5 2.6 2.7 2.8 2.9
DENSITY (GM/CM3)
Figure 3.25 Relation of particle density to activity, Shot Zuni.

4.
1111!1
Jlllll I
k ●OI
w3 113M
z.
Jlllll
JII!ll 111111 .●0
( w/3 113A ) A11A112W
101
1

-.
.
103

o 0 00 0 0?- @ w-l
\
\
I
>
+x
1-a
.->i=
ng
a
00 0 0 0 00 0 0 0* m N
14 0s(SWVW)OU31W) 120N SSVW 1V101

L
,~-z
,(f 3.
1.0
ZUNI(Precursors,nporenthesi$)
AVERAGE LAGOON AREA COMPOSITION
@32
10-1
F
I .i
10-5 I I I 1111 I I I 1111 I I I 11111
,0-1 10 10,02
I I II,03
HALF-LIFE OF PreCUrSOrS (s EcO~MINl
%we 3.32 Radionuclide fractionation of xenon, krypton, md antimony products, Shot Zuni.
105

103
,02
zo0c)a-1
x
Dna
10
1
t-
‘-
ZUNI
A STANDARD CLOUD
● YAG 39
■ YAG 40
,()-2 ,0-1
LAGOON AVERAGE R99 (X)
Figure 3.33 R-value relationships for several compositions,
1.0
Shot Zuni.
106

-310
-410
10-5
10=
107
\
F IAVERAGE FALLOUT COMPOSITION
r- ( COMPUTEO )
t-
L.wl
-1
1. ..
I0°r L—+**+I0-9 1 l-.Luul-LLulul
1 10 102 103 104—
FLATHEADOOGHOUSE l=x I- No I CRYSTAL
Q STANDARD CLOUD
❑ YFNB 13 E-55
+ LST 611 D- 53
AGE (HR)
Figure 3.34 Photon-decay rate by doghouse counter, Shot Flathead.
‘

>
ba
163_
I 04 _
105 _\
AVERAGE FALLOUT COMPOSITION /
( COMPUTED )
10% _\
i=
IO”L-LLLUW10-’ 1
I.lllu10
I
AGE (HR)
NAVAJO
DOGHOUSE l=X1” NaI CRYSTAL
0 STANDARD CLOUD
o YFNB 13 E-60
A YAG 39 C-22
102
LLu..u
\
-1-l_uu103 104
Figure 3.35 Photon-decay rate by doghouse counter, Shot Navajo.

w
-310
ZUNI
\ DOGHOUSE l“x 1“ No I CRYSTAL
104 _
0 STANDARD CLOUD
a YAG39 C-23
o YFNB 13 E-55
● HOW F 0-5t-
.=‘1 l\’QIn=’1 I \ 1>
FAVERAGE \Y _CLOUO COMPOSITION
LAGOON AREA COMPOSITION ~0 (COMPUTEO )
( COMPUTEO )
10-7
10-8
10-9 L 1111111 I 111111.
II
I
I
\
0
\
■
●
■
10-’ I 10 102 103 104
AGE( HR)
Figure 3.36 Photon-decay rate by doghouse counter, Shot Zuni.
109

10-3
AVERAGE CLOUD AND OUTER FALLOUT AREA
— cOMpOs’T’ON > ‘cOMpuTED ) ITEWA
lti4
10-5
10-6
F
1J DOGHOUSE l“xl” NaI CRYSTAL
o STANDARD CLOUD
T YAG 40 B-17
~ YAG 39 C-35
0 LSD 611 D-53
● HOW F-63
❑ YFNB 29 H-79
AVERAGE IJGOON AREA COMPOSITION ‘
-?
-710
r
“8+
ITED )
.-.
10-9 1}0-’ 1 10 102 103
?8&
L,A
@-
104
AGE (HR)
Figure 3.37 Photon-decay rate by doghouse counter, Shot Tewa.
110

I
10-’
10-2
10-3
10-’
—————— \— FLATHEAD AND NAVAJO
— CONTINUOUS FLOW
\PROPORTIONAL DETECTOR
I● YAG 40 A-1. 3473/8 FL SHEW 1
0 YAG 40 A-1, P-373303~ *sHE~ 3
,{FLATHEAD SHELF 1
( COMPUTED I
\ \ . I.
‘ \\“.
\“.
NAVAJO SHELF 3.
( COMPUTED )
I 0-5 rt
10 LJ_LIJJ10-’
I
10
‘$●....0
<
102
AGE (HR)
I03
sb ●.
‘%%0
%90
000
0
0c
104
Figure 3.38 Beta-decay rates, Shots Flathead and Navajo.
111

E...
1“-’*
~uzo1=a
10”
&
10-’2Ft-
L16’4 -
10-’ 1
\
+
“\\\.....\
““.:.\ \......
.,,, %...>,..“..>,“+.
“..\,““.x
‘..>,“-+,
“%,
—
—
— ZUNI
— ZUNI
CLOUD
UGOON —
—TEWA CLOUD
— TEWA LAGOON
-— NAVAJO
— FLATH EAD —
11111I 02
AGE (HR )
I 03
111104
Figure 3.39 Computed ionization-decay rates, Shots Flathead, Navajo, Zuni, and Tewa.
112

Chopter 4
Dlscusslol
4.1 SHOT CHEROKEE
Because the residual radiation level from Shot Cherokee was too low to be of any militarysignificance, the results were omitted from Chapter 3. However, this should not be interpreted
to mean that no fallout occurred; the evidence is clear that very light fallout was deposited overa large portion of the predicted area.
Partly to obtain background data and provide a full-scale test of instrumentation and proced-ures, and partly to verify that the fallout was as light as anticipated, all stations were activatedfor the shot, and all exposed sampling trays were processed according to pian (Section 2.4).Small amounts of fallout were observed on the YAG 40 and YAG 39; the collectors removed fromSkiffS M, BB, CC, DD, GO, HH, MM, and W were slightly active; and low levels of activity
were also measured in two water samples collected by the S10 vessel DE 365. Results from m
other stations were negative.
The approximate position of each station during the collection interval is shown in Figure 4.1;
more exact locations for the skiffs and project ships are included in Tables 2.3 and 2.4. The
boundaries of the fallout pattern predicted by the methods described in Section 4.3.1 are ~SO
given in the figure, and it may be seen that nearly ail of the stations falling within the pattern
received some fallout. (Wiff pp and the LST 611 probably do not constitute exceptions, because
the former was overturned by the initial shock wave and the incremental collectors on the latterwere never triggered. )
On the YAG 40, an increase in normal background radiation was detected with a survey meterat about H + 6 hours, very close to the predicted time of f~out arrival. Although the ionizationrate never became high enough for significant TIR measurements, open-window survey meterreadfngs were conttiued until the level began to decrease. The results, plotted in Figure 4.2,show. a broad pe& of bout 0.25 mr/hr centered roughly on H + g hours. In addition, a few active
particles were coUected in two SIC and two IC trays during the same period; these results, ex-pressed in counts per minute per minute as before (Section 3.2.1), are given in Figure 4.3. Thespread ~ong the time axis reflects the fact that the SIC trays were exposed for longer intervals
than usual.Radioautographs of the tray reagent films showed that all of the activity on each one was ac-
COunted for by a s~@e p~ticle, which appeared in every case to be a typical slurry droplet of
the type described in Section 3.3.2. ficcessive gamma-energy spectra and the photon-decayrate of the most active tray (No. 729, -6,200 counts/rein at H +10 hours) were measured and
are presented in Figures 4.11and 4.5. The prominent peaks appearing at -100 and 220 kev in
the former appear to be due to Npzn.
A slight rise in background radiation was also detected with a hand survey meter on the YAG39. The open-w~dow level ~Creased from about 0.02 mr/hr at H +10 hours to ().15 mr/hr at
H+ 12 hours, before beginning to decltne. Only one IC tray was found to be active (No. 56* 9,2(Jo co~ts/min at H +10 hours), and this was the control tray exposed on top of the collector
for 20 hours from 1300 on D-day to 0900 on D+ 1. Although about 25 small spots appeared onthe reagent film, they were arranged in a way that suggested the breakup of one larger slurry~rticle on impact; as on the “YAG 40 trays, only NaCl crystals were visible under low-poweroPtics in the active regions.
Plots of the gamma-energy spectrum and decay for this sample are included in Figures 4.4and 4.5; the similarities of form [n both cases suggest a minimum of radionuclide fractionation.
113
By means of the Flathead conversion factor [ -1.0 x 10G fissions;(dip counts!min at 100 hours)],
the dip-counter results for the AOC’S from the skiffs have been converted 10 fissions per square
foot in Table 4.1, so that they may be compared With the values for the other shots (Table 3-15)-
The dip-counter activities of all water samples, including those for the DE 365, are Summarized
in Table B.32.
4.2 DATA RELIABILITY
The range and diversity of the measurements required for a project of this size virtually
precludes the possibility of making general statements of accuracy which are applicable in allcases. .Xevertheless, an attempt has been made in Table 4.2 to provide a qualitative evaluationof the accuracy of the various types of project measurements. Quantitative statements of accu-racy, and sometimes precision, are given and referenced where available. No attempt has beenmade, however, to summarize the errors listed in the tables of results in the text; and certain
small errors, such as those in station locations in the lagoon area and instrument exposure andrecovery times, have been neglected.
Although the remaining estimates are based primarily on experience and judgment, commentshave been included in most cases containing the principal factors contributing to the uncertainty.The following classification system is employed, giving both a quality rating and, where appli-cable, a probable accuracy range:
Class Quality Accuracy Range
A Excellent * O to 10 percent
B Good + 10 to 25 percent
c Fair x 25 to 50 percent
D Poor * ? 50 percent
N No information available
4.3 CORRELATIONS
4.3.1 Fallout Predictions. As a part of operations irt the Program 2 Control Center (Section2.4), successive predictions were made of the location of the boundaries and hot line of the fall-
out patt@rn for each shot. (The hot line is defined in Reference 67 as that Iinear path throughthe fallout area along which the highest levels of activity occur relative to the levels in adjacent
areas. The measured hot line in the figures was estimated from the observed contours, andthe boundary established at the lowest isodose-rate line which was well delineated. ) The finalpredictions are shown superimposed on the interim fallout patterns from Reference 13 it? Fig-ures 4.6 through 4.9. Allowance has been made for time ~ariation of the winds during ShotsFlathead and Navajo, and for time and space variation during Shots Zuni and Tewa. Predictedand observed times of fallout arrival at most of the major stations, as well as the maximumparticle sizes predicted and observed at times of arrival, peak, and cessation, are alSO com-
pared in Table 4.3. The marked differences in particle collections from close and distant s~-tions are illustrated in Fi=gure 4.10. In the majority of cases, agreement is close enough to
justify the assumptions used in making the predictions; in the remaining cases, the differencesare suggestive of the way in which these assumptions should be altered.
The fallout-forecasting method is described in detail in Reference 67. This method beginswith a verticti-line source above the shot point, and assumes that ~ particle sizes exist at z:alti~udes: the arrival points of particles of several different sizes (75, 100, 200, and 350 ~-i:
in diameter in this case), originating at the centers of success i~’e 5,000-foot altitude inc~:-~-~are ~hen plotted on the surface. The measured winds are used to arrive at single VeCt Gr~ ~ ~-
resentative of the winds in each layer, and these vectors are applied to the particle for [h: -:’ :iod of time required for it to fall through the layer. The required times are c~lc’ula~ed fr~~
114

~ations for particle terminal velocity, of the form described by Da.Uavalle. Such equations
consider the variables of particle density, air density, particle diameter, air viscosity, and
constants incorporating the effects of gravity and particle shape. (Modified versions of the
~igi.nd Dal.lavalle equations are presented in Reference 67; data on the Marshall Islands atmos-
phere required to evaluate air density and air viscosity are also given in this reference. ) The
~t two steps are simplified, however, by the use of a plotting template, so designed that vec-
tors laid off in the wind direction, to the wind speed, automatically include terminal velocity
adjustments (Reference 68).
Size lines result from comecting the surface-arrival points for particles of the same stzefrom increasing increments of altitude; height lines are generated by connecting the arrival
points of particles of different sizes from the same altitudes. These two types of lines form a
network from which the arrival times of particles of various sizes and the perimeter of the fall-
at pattern may be estimated, once the arrival points representing the line source have been
expanded to include the entire cloud diameter. This last step requires the use of a specific
cloud model. The model that was used in arriving at the results of Figures 4.6 through 4.9 andTable 4.3 is shown in Figure 4.11. Particles larger than 1,000 microns in diameter were re-
stricted to the stem radius, or inner 10 percent of the cloud radius, while those from 500 to1,000 microns in diameter were limited to the inner 50 percent of the cloud radius; all particlesizes were assumed to be concentrated primarily in the lower third of the cloud and upper third
d the stem.
The dimensions shown in the figures were derived from empirical curves available in thefield, relating cloud height and diameter to device yield (Reference 67). Actual photographicmeasurements of the clouds from Reference 69 were used wherever possible, however, forsubsequent calculations leading to results tabulated in Table 4.3.
The location of the hot line follows directly from the assumed cloud model, being determinectby the height lines from the lower third of the cloud, successively corrected for time and, some-times, space variation of the winds. Time variation was applied tn the field fn all cases, butspace v~~tion later ad o~y in cases of gross disagreement. The procedure generally followedwas to apply the variation of the winds iii the case of the 75- and 100-micron particles and use
shot-time winds for the heavier pmticles. Wind data obtained from balloon runs at 3-hour inter-vals by the Task Force were used both to establish the initial shot-time wi.ndS and make the
correctio~ for time and space variation. The calculations for Shot Zuni are summarized forillustrative purposes in Table B. 29.
It is of particular interest to note that it was necessary to consider both time and space var-
tition of the winds for Shots Zuni and Tewa in order to bring the forecast patterns into general~eement with the measured patterns. Vertical air motions were considered for Shot Zuni butfound to have little effect on the overall result. It is also of interest to observe that the agree-ment achieved was nearly as good for Shots Flathead and Navajo with no allowance for space
‘artition as for Shots Zuni and Tewa with this factor included, in spite of the fact that the falloutfrom the former consisted of slurry rather than solid particles below the freezing level (W?CtiOM
3.3.1 ad 3.3.2), Whether this difference can be attributed to the grOSS differences in the @tUre
@ the ftimt. is not known.
4.3.2 Sampling Bias. When a solid object such as a collecting tray is placed in a uniformah stream, the streamlines in its immediate vicinity become distorted, and small particlesfalling into the region will be accelerated and displaced. As a result, a nonrepresentative orbhsed sample may be collected. Although the tray will collect a few particles that otherwisew~d not ~ve ken deposited, the geometry is such t~t a l~ger number that would hitVe fallen
bough the area occupied by the tray will actually fall elsewhere. In an extreme case of small,%ht particles and high wind velocity, practically all of the particles could be deposited else-where, because the number deposited elsewhere generally increases with increasing wind veloc -‘~ and decreasing particle size and density.
This effect ~s long been recognized in rainfti sampling, ~d some experimental collectorsbe been equipped with a thin horizon~ windshield designed to minimize strea~ine distortion
115

(Reference 72). The sampling of solid fallout particles presents even more severe problems,however, because the particles may also blow out of the tray after being collected, producing
an additional deficit in the sample.
III addition, samples collected in identical collectors located relatively close together in a
fixed array have been found to vary with the position of the collector in the array and its height
above the ground (References 10 and 72). It follows from such studies that both duplication and
replication of sampling are necessary to obtain significant results.Consideration was given to each of these problems in the design of the sampling stations. &s
attempt was made to minimize and standardize streamline distortion by placing horizontal wtnd.shields around all major array plafforms and keeptng their geometries constant. (The flowcharacteristics of the standard platform were studied both by small-scale wtnd-tunnel tests and ‘measurements made on the mounted platform prior to the operation (Reference 73). It was ‘found that a recirculator flow, resulting tn updrafts on the upwind side and downdrafts on the
downwind side, developed inside the platform with increasing wind velocity, leading to approxi-
mately the same streamline distortion in every case. ) Similar windshields were used for the
SIC on the YAG 40 and the decay probe tank on the YAG 39, and fumels were selected for the .minor array collectors partly for the same reason.
Honeycomb inserts, which created dead-air ce~s to prevent 10SS of ~ter~, were used hall OCC and A(X collectors. This choice represented a compromise between the conflictingdemands for high collection efficiency, ease of sample removal, and freedom from adulterantsin subsequent chemical and radiochemical analyses.
Retentive grease surfaces, used in the IC trays designed for solid-particle sampling, facili-
tated single-particle removal.
All total collectors were duplicated In a standard arrangement for the major arrays; andthese arrays, like the minor arrays, were distributed throughout the fallout =ea and utilized ‘for all shots to provide adequate replication.
At the most, such precautions make it possible to relate collections made by the same kindof sampling arrays; they do not insure absolute, unbiased collections. In effect, this meansthat, while all measurements made by major arrays may constitute one self-consistent set, andthose made by minor arrays another, it is not certain what portion of the total deposited falloutthese sets represent. As explained earlier (Section 3.1), this is one reason why radiologicalproperties have been expressed on a unit basis wherever possible. Efforts to interpret platform
collections include a discussion and treatment of the relative bias observed within the platiorms,
as well as comparisons of the resulting plafform values with buried-tray and minor array col-
lections on How lslsnd, water sampling and YAG 39 tank collections, and a series of postopera-
tion rainfall measurements made at IURDL.
Relative Platform Bias. The amount of fallout collected by the OCC and AOC1 col-
lectors in the upwind part of the standard platform was lower than that collected in the downwindportion. It was demonstrated in Reference 74 that these amounts usually varied symmetricallyaround the plaff orm with respect to wind direction, and that the direction established by the lineconnect ing the interpolated maximum and minimum collections (observed bias direction) coin-
cided withtie wind direction. A relative wind varying with time during fallout was treated byvectorial summation, with the magnitude of each dtiectioti vector proportio~ to the. amoimtof fallout occurring in that time. (Variations in the relative wind were caused principally byship maneuvers, or by oscillation of the anchored barges under the influence of wind ad CU-rent; directions va.rytig within * 15 degrees were considered constit.) The resulting collectionpattern with respect to the weighted wind res~~t (computed bias direction) was similar to thatfor a single wind, although the ratio of the ~imum to the minimum co~ection (bias ratio) waS
usually nearer unity, and the bias direction correspondingly less certain.The variability ‘h relative-wind dtiection ~d fwout rate, which could under certain condi-
tions produce a uniform collection around the plafform, may be expressed as a bias fraction(defined in Reference 74 as the magnitude of the resultant vector mentioned above divided bythe arithmetic sum of the individual vector magnitudes). In effect, this fraction represents ameasure of the degree of single-wind deposition purity, because the bias fraction in such a case
116

~d be 1; on the other hand, the resultant vector would vanish for a wind that rotated uniformly~o~ the platform an integral number of times during uniform fallout, and the fraction would
,beo.Where necessarY, the mean value of the four OCC and two Aocl collectors was chosen as
representative for a Platform; but when a curve of fallout amount versus angular displacement
from the b~s direction co~d be constructed using these collections, the mean v~ue of the curve
was obtained from 10 equispaced values between O and 180 degrees. The latter applied to all@dforms except the LST 611 and the YFNB’s, probably indicating disturbances of the air stream
“incident on the pla~orm by the geometry of the carrier vessel. These platiorms, however, weremounted quite low; while the YAG plaff orms were high enough and so placed as to virtually guar-
anteeundisturbedincidence for all winds forward of the beam.‘ Pertinent results are summarized in Table 4.4. Fallout amounts per collector are given .asdoghouse-counter activities at 100 hours, convertible to fissions by the factors given in TableB.13; the mean values so converted appear in Table 3.15. Wind velocities are listed in Table
-B.3’l; as in the summary table, the directions given are true for How Island and relative to thebow of the vessel for all other major stations.
“ No attempt was made to account quantitatively for the values of the bias ratio observed, evenfor a single-wind system; undoubtedly, the relative amount deposited in the various parts of thepiatform depends on some function of the wind velocity and particle terminal velocity. As indi-cated earlier, the airflow pattern induced by the platform itself appeared to be reproducible fora given wind speed, and symmetrical about a vertical plane parallel with the wind direction.Accordingly, for a given set of conditions, collections made on the plafform by different instru-ments with similar intrinsic efficiencies W vary only with location relative to the wind dtrec -tion. Further experimentation is required to determine how the collections are related to a trug
ground value for different combinations of particle characteristics and wind speeds.A limited study of standard-platform bias based on incremental collector measurements was
~SO made,. using the data discussed in Section 3.2.4 (Reference 19). These results are present-ed in Figures 4.12, 4.13, ad 4.14. The first compwes particle-size frequency distributions
d collections made at the same time by different collectors located at the same station; studiesfor the YAG 39 and YAG 40 during Shots Zuni and Tewa are included. The second compares the
“M relative mass collected as a function of time, and the variation of relative mass with par-Ucle size, for different collectors located at the same station; as above, YAG 39 and YAG 40cOUections during Shots Zuni and Tewa were used. The last presents curves of the same typegiven in Section 3.2.4 for the two IC’S located on the upwind side of the YAG 39 platiorm; these-Y be compared with the curves in Figure 3.8 which were derived from the IC on the downwindside.
The results show that, except at late times, the overall features of collections made by dif-ferent instruments at a given station correspond reasonably well, but that appreciable differences
b ugnitude may exist for a particular time or particle size. In the case of collections made‘n a single plafform (YAG 39), the differences are in general agreement with the bias curves‘~cussed above; and these differences appear to be less than those between collections made
‘~ the deck and in the standard platiorm (A-1 and B-7, YAG 40). It is to be noted that incre-mental-collector comparisons constitute a particularly severe test of bias differences because~ the small size (- 0.0558 ft2).of the collecting tray.
How Island Collections. One of the primary purposes of the Site How station wash determine the overall collection efficiency of the total collectors mounted in the standard
~pktform. An area was cleared on the northern end of the island, Plaff orm F with its support-h tOWer was moved from the YFNB 13 to the center of this area, and 12 AOC1 trays were filled~th 10cal soi.I and buried in a geometrical array around the tower with their collecting surfaces‘lush With the ground (Figure 2.8). After every shot, the buried trays were returned to NRDL
W counted in the same manner as the OCC trays from the platform.~ is assumed that the collections of these buried trays represent a near-ideal experimental
*Preach to determining the amount of fallout actually deposited on the ground. (Some differ-ences, believed minor, were present in OCC and AOC1-B doghouse-counter geometries. Very
$
117

little differential effect is to be expected from a lamina of activity on top of the 2 inches of swversus activity distributed on the honeycomb insert and bottom of the tray. The more serious
possibility of the active particles sifting down through the inert sand appears not to have occur.red, because the survey-meter ratios of AOC1-B’S to OCC’S taken at Site Nan, Site Elmer, andNRDL did not change significantly with time. )
In Table 4.5, weighted-mean platform values, obtained as described above, are converted tofissions per square foot and compared to the average buried-tray deposit taken from Table B.27.It may be seen that, within the uncertainty of the measurements, the weighted-mean platformvalues are in good agreement with the ground results. It must be recalled, however, that s~e
winds prevailed at How Island for all shots, and tlmt the observed bias ratios were low (< 2).The AOC2 collections at Station K (Table 3.15) are also included in Table 4.5 for comparison.
They appear to be consistently slightly lower than the other determinations, with the exceptionof the much lower value for Shot Navajo. The latter may be due to recovery loss and countingerror resulting from the light fallout experienced at the station during this shot. Because only
one collector was present in each minor sampling array, bias studies of the kind conducted for
the major arrays were not possible. As mentioned earlier, however, an attempt was made to
minimize bias in the design of the collector and, insofar as POS sible, to keep geometries al Lke.
Although it was necessary to reinforce their mounting against blast and thermal damage on the
rafts and islands (Figure 2.7), identical collectors were used for all minor arrays.Shipboard Collections and Sea Water Sampling. The plafform collections
of the YAG 39 and YAG 40 may be compared with the water-sampling results reported in Refer-ence 20, decay-tank data from the YAG 39, and in some cases with the water-sampling resultsfrom the S10 vessel Horizon (Reference 15). Strictly speaking, however, shtpboard collectionsstxxdd not be compared with post-fallout ocean surveys, because , in general, the fallout to which
the ship is exposed while attempting to maintain geographic position is not that experienced by
the element of ocean in which the ship happens to be at cessation.The analysis of an OCC collection for total fission content is straightforward, although the
amount collected may be biased; the ocean surface, on the other hand, presents an ideal collec-tor but difficult analytical problems. For example, background activities from previous shotsmust be known with time, position, and depth; radionuclide f ractionat ion, with depth, resultingfrom leaching in sea water should be known; and the decay rates for all kinds of samples andinstruments used are required. Fallout material which is fractionated differently from point-to-point in the fallout field before entry into the ocean presents an added complication.
Table 4.6 summarizes the results of the several sampling and analytical methods used. Theocean values from Reference 20 were calculated as the product of the equivalent depth of pene-tration (Section 3.2.5) at the ship and the surface concentration of activity (Method I). The latterwas determined in every case by averaging the dip-count values of appropriate surface sampleslisted in Table B.32 and converting to equivalent fissions per cubic foot. When penetrationdepths could not be taken from the plots of equivalent depth given in Figure B. 1, however, theyhad to be estimated by some other means. Thus, the values for both ships during Shot Zuniwere assumed to be the same as that for the YAG 39 during shot Tewa; the value for the YAG 39during Shc& Flathead was estimated by extrapolating the equivalent depth curve, while that forthe YAG 40 was taken from the same cwve; and the v~ues for the YAG 40 during Shots Navajoand Tewa were est im.ated from what profile data was available.
The conversion factor for each shot (fissions/( dip counts/rein at 200 hours) for a standardcounting volume of 2 liters) was obtained ~ Method I from the response of the dip counter to a
known quS.ntitY Of fissions. Although direct dip counts of OCC aliquots of known fission contentbecame available at a later date (Table B. 15), it was necess~y at the time to derive these v~ues
frOm diquOtS of OCC and water samples measured in a common detector, usually the well count-er. The values for the decay w listed under Method I in Table 4.6 were also obtained from
dip counts of tank samples, similarly converted to fissions per cubic foot. Dip-counter responsewas decay-corrected to 20(J hours by m.e~s of the norm~ued cmves shown in Figure B.14.
Another estimate of activity in the ocean was made (private communication from R. Caputi,NRDL), Wiing the approach of planimeter~g the tot~ ~eas of a number of probe prof~es meaS-
118

ured at late times in the region of YAG 39 operations during Shots Navajo and Tewa (Method II).(The probe profiles were provided, with background contamination subtracted out and converted
from microamP@res to apparent milliroentgens per hour by F. Jennings, Project 2.62a, S10.Measurements were made from the SIO vessel Horizon. ) The integrated areas were convertedto fissions per square foot by applying a factor expressing probe response in fissions per cubicfoot. This factor was derived from the ratio at 200 hours of surface probe readings and surface~le dip counts from the same station, after the latter had been expressed in terms of fissionsusing the direct dip counter-OCC fission content data mentioned atmve. These results are also
listed in Table 4.6.
The set of values for the YAG 39 decay tank labeled Method HI in the same table is based ondfrect radiochemical analyses of tank (and ocem surface) samples for Mogg (Table B. 30). Theresults of Methods I and If were obtained before these data became available and, accordingly,were accomplished without Imowledge of the actual abundance distribution of molybdenum withdepth in sea water.
Table 4.7 is a summary of the dip-to-fission conversion factors indicated by the results inTable B.30; those used in Methods I and II are included for comparison. It is noteworthy that,for the YAG 39, the ocean surface is always enriched in molybdenum, a result which is in agree-ment with the particle dissolution measurements described earlier (Figures 3.11 and 3.12); inthis experiment Mog9, Np23a, and probably 1131were shown to begin leaching out preferentially
within 10 seconds. The tank value for Shot Zuni, where the aliquot was withdrawn before acidi-fying or stirring, shows an enrichment factor of -3.5 r;!ative to the OCC; acidification and stir-ring at Shot Tewa eliminated the effect. The slurry fallout from Shots Flathead and Navajo,however, shows only a slight tendency to behave in this way.
Finally, Table 4.6 abo lists the representative platform values obtained earlier, as well asti maximum values read from the platform-collection curves for the cases where depositionoccurred under essentially single-wind conditions (Table 4.4). These values are included as a
result of postoperation rainfall measurements made at NRDL (Table B.31). (Alt bough the data
have not received complete statistical analysis, the ratio of the maximum collection of rainfall
by a OCC on the LST 611 platform to the average collection of a ground array of OCC trays isindicated to be 0.969 + 0.327 for a variety of wind velocities (Reference 75). )
It may be seen by examination of Table 4.6 that the most serious discrepancies between ocean~ shipbcrard collections arise in two cases: the YAG 39 during Shot Zuni, where the ocean/WC (maximum) ratio of -2 may be attributed entirely to the fission/dip conversions employed— assuming the OCC value is the correct average to use for a depth profile; and the YAG 39bing shot Navajo, where the a ea/OCC rat io is -10, but the tank radiochemical value and& Horuon proffie v~ue ~most agree within their respective limits. While the OCC value
~pears low in this muitiwind situation, the difference between the YAG 39 and Horizon profiles-y be the background correction made by S10.
Tn the final analysis, the best and most complete data were obtained at the YAG 39 and Hori-
zon Stations during Shot Tewa. Here, preshot ocean surface backgrounds were negligibly small;equipment performed satisfactorily for the most part; the two vessels ran probe profiles in sightof each ot~r; ~ the Hortion obtained depth samples at about the same time. The YAG 39 did
‘* move excessively during fallout, and the water mass of interest was marked and folIowed by~ogue buoys. In addition to the values reported in Table 4.6, the value 1.82 x 101s fissions/ft2~S ob~ined for the depth.sample prof~e, using the dip-to-fission factor indicated in Table 4.7.
(kcau~ of the vaiationS in the fission conversion factor with the fractionation eychibited from
~ple to sample, a comparison was made of the integral value of the dip counts (dip countsl
‘~)/2 liters) feet from the depth-sample profile with the OCC YAG 39-C-21 catch expressed
ti simik units. The ratio ocean integral/OCC-C- 21 = 1.08 was obtained. )E may be seen t~t au v~ues for this shot and ~ea agree remarkably well, in spite of the
‘~t that Method I measurements extend effectively down to the thermoclme, some of the Methodu Profiles to 500 meters, and the depth sample cast to 168 meters. If the maximum OCC catch‘s tden as the total fallout, then it must be concluded that essentially no activity was lost to‘ePths greater than those indicated. Although the breakup of friable particles and dissolution
119

of surface-particle activiry might provide an explanation, contrary evidence exists in the rapid
initial settling rates observed in some profiles, the solid nature of many particles from which
only -20 percent of the activity is leachable in 48 hours, and the behavior of Zuni fallout in the
YAG 39 decay tank. Relative concentrations of 34, 56, and 100 were observed for samples taken
from the latter under tranquil, stirred, and stirred-plus-acidified conditions. (Based on thisinformation and the early Shot Tewa profiles of Figure 3.1O, the amount lost is estimated atabout 50 percent at the YAG 39 locations in Reference 20. ) If on the other hand it is assumedthat a certain amount of activity was lost to greater depths, then the curious coincidence thatthis was nearly equal to the deficit of the maximum OCC collection must be accepted.
It is unlikely t M any appreciable amount of activity was lost beIow the stirred layer follow-ing Shots Flathead and ?Qavajo. NO active solids other than the solids of the slurry particles,which existed almost completely in sizes too small to have settled below the observed depth inthe time available, were collected during these shots (Section 3.3.2).
In view of these considerations and the relative reliability of the data (Section 4.2), it is rec-ommended that the maximum platform collections (Table B.12) be utilized as the best estimateof the total amount of activity deposited per unit area. An error of about *50 percent shouldbe associated with each value, however, to allow for the uncertainties discussed above. Althoughstrictly speaking, this procedure is applicable only in those cases where single-wind depositionprevailed, it appears from Table 4.6 that comparable accuracy may be achieved for cases ofmultiwind deposition by retaining the same percent error and doubling the mean platform value.
4.3.3 Gross Product Decay. The results presented in Section 3.4.6 allow computation ofseveraI other radiological properties of fission products, among them the gross decay exponent.Some discussion is wuranted because of the common practice of applying a t-’”2 decay functionto any kind of shot, at any time, for any instrument.
This exponeng popularized by Reference 58, is apparently based on a theoretical approxima-tion to the beta-decay rate of fission products made in 1947 (Reference 59), and some experi-mental gamma energy-emission rates cited in the same reference. Although these early theo-retical results are remarkably good when restricted to the fission-product properties and timesfor which they were intended, they have been superseded (References 41, 60, 61, and 62); and,except for simple planning and estimating, the more -exac: results of the latter works shouldbe used.
If fractionation occurs among the fission products, they can no longer be considered a stand-ard entity with a fixed set of time-dependent properties; a fractionated mixture has its own setof properties which may vary over a wide range from that for normal fission products.
Another source of variation is induced activities which, contrary to Section 9.19 of Referent?47, can significantly alter lmth the basic fission-rmoduct-decav curve shaue and gross propertymagnitudes per fission. ~
.-- The induced products contributed 63 percent of the to”ti dose 7:x
in the Bikini Lagoon area 110 hours after Shot Zuni; and 65 percent of the dose rate from Shot
Navajo products at an age of 301 days was due to induced products, mainly MnM and Ta182. .~- ‘though many examples could be found where induced activities are of little concern, the a Pri~
assumption that they are of negligible importance is unsound.
Because the gross disintegration rate per fission of fission products may vary from shot toshot for the reason mentioned above, it is apparent that gamma-ray properties will dSO vil.r~, Iand the measurement of any of these with an instrument whose response varies with photon en-er=~ further complicates matters.
Although inspection of any of the decay curves presented may show an approximate t-l. zaverage decay rate when the time period is judiciously chosen, it is evident that the ~loPe ‘scontinuously changing, and more important, thit the absolute values of the functions, e. :..photons per second per fission or roentg-ens per hour per fissions per square foot, Va:y c52-siderably with sample composition.
AS an example of the errors which may be introduced by indiscriminate US2 of the t-i”~ ‘“
120

tion or by assuming that all effects decay alike, consider the lagoon-area ionization curve forShot Tewa (Figure 3.39) which indicates that the l-hour dose rate may be obtained by multiply-
ing the 24-hour value by 61.3. A t-’. z correction yields titead a factor of 45.4 (-26 percent
error), and if the doghouse-decay curve is assumed proportional to the ionization-decay curve,
a factor of 28.3 (– 54 percent) results. To correct any effect to another time it is important,
therefore, to use a theoretical or observed decay rate for that particular effect.
4.3.4 Fraction of Device by Chemistry and RadioChemistry. The size of any sample maY beexpressed as some fraction of device. In principle, any device component whose initial weightis known may serve as a fraction indicator; and in the absence of fractiomtion and analytical er-
rors, all indicators would yield the same fraction for a given sample. In practice, however,only one or two of the largest inert components will yield enough material in the usual falloutsample to allow reliable measurements. These measurements also require accurate knowledgeof the amount and variability of background material present, and fractionation must not be in-troduced in the recovery of the sample from its collector.
The net amounts of several elements collected have been given in Section 3.4.4, with an as-sessment of backgrounds and components of corti and sea water. The residuals of other ele-
ments are considered to be due to the device, and may therefore be converted to fraction ofdevice (using Table B. 17) and compared directly with results obtained from Meg’. This hasbeen done for iron and uranium, with the results shown in Table 4.8. Fractions by copperproved inexplicably high (factors of 100 to 1,000 or more), as did a few unreported analysesfor lead; these results have been omitted. The iron and uranium values for the largest samplesare seen to compare fairly well with Mogg, while the smaller samples ted to yieki erratic andunreliable results.
4.3.5 Total Dose by Dosimeter and Time-Intensity Recorder. Standard fUrn-pack dosimeters,prepared and distributed in the field by the U.S. Army Signal Engineering Laboratories, Project2.1, were paced af each major and minor sampling array for all siwts. Following sample re-covery, the film packs were returned to this project for processing and interpretation as describ-ed in Reference 76; the results appear in Table 4.9.
The geometries to which the dosimeters were exposed were always complicated and, in afew instances, varied between shots. In the case of the ship arrays, they were located on topof the TLR dome in the standard platform. On How-F and YFNB 29, Shot Zuni, they were tapedto an OCCJ support -2 feet above the deck cd the platform before the recovery procedure becamee~lishe~ ~ other major array film packs were taped to the RA mast or ladder stanchion-2.5 feet above the rim of the platform to facilitate their recovery under high-dose-rate condi-
tions. Minor array dosimeters were located on the exterior sukface of the shielding cone -4.5feet a~ve the base ti the case of the rafts and islands, and -5 feet above the deck on the masts
of all skiffs except sk~fs BB ~d DD where they were located -10 feet above the deck on the~st for shot Zui; su&iequentiy the masts were shortened for operational reasons.
Where possible, the dose recorded by the film pack is compared with the integrated TIR
readings (Table B. 1) for the period between the time of fallout arrival at the station and thetime when the fflm pack WS recovered; the restits ze shown in ‘I’able 4.9. n hZS already been
bldlcated (section 3.4.6) t~t the T~ records only a portion of the total dose in a given radiation
field because of its construction features and response characteristics. This is borne out byTable 4.10, which summarizes the percen~ges of the film dose represented in each case by the
TUt dose.It is interesting to .@serve that for the ships, where the geometry was essentially constant,
this percentage remains much the same for all shots except Navajo, where it is consistently10w. The same appe~s to be gener~y true for the barge platforms, although the resdts are
much more difficult to evaluate. A possible explanation may lie in the energy-response curvesof the TIR and film dosimeter, because Navajo fallout at early times contained MnSe and Na2’‘both of which emit hard gamma rays— while these were of little importance or absent in theother shots.
121

4.3.6 Radiochemistry - Spectrometry Comparison. Calibrated spectrometer measurements
on sampies of known fission content allow expected counting rates to be computed for the samp-
les in any gamma counter for which the response is simply related to the gross photon frequency
and energy. Accordingly, the counting rate of the doghouse counter was computed for the staM-ard-cloud samples by application of the calibration curve (Reference 43) to the sPectral lines
.and frequencies reported in Reference 57 and reproduced in Table B.20. These results are
compared with observations in Table 4.11, as well as with those obtained previously usingradiochemical- input information with the same calibration curve. Cloud samples were chosen,because the same physical sample was counted both in the spectrometer and doghouse counter,thereby avoiding uncertainties h composition or fission content introduced by aliquoting or otherhandling processes.
Several of the spectrometers used by the project were uncalibrated, that is, the relation be-tween the absolute number of source photons emitted per unit time at energy E and the result%pulse-height spectrum was unknown. A comparison method of analysis was applied in these
cases, requiring the uea of a semi-isolated reference photopeti whose nuclide source wasknown, toward the high-energy end of the spectrum. From this the number of photons per sec.
ends per fissions per area can be computed. The area of the photopeak ascribed to the induced
product, when roughly corrected by assuming efficiency to be inversely proportional to energy,
yields photons per seconds per fissions. The latter quantity leads serially, via the decay scheme,
to disintegration rate per fission at the time of measurement
3
to atoms at zero time per
fission, which is the desired product/fission ratio. They ine at 0.76 Mev provides a
satisfactory reference from -30 days to 2 years, but the gross spectra are usually not simple
enough to permit use of this procedure until an age of - ‘/2 year has been reached.A few tracings of the recorded spectra appear in Figure 4.15, showing the peaks ascribed to
the nuclides of Table 3.20. Wherever possible, spectra at dtfferent ages were examined to in-.sure proper half-life behavior, as in the M@ illustration. The Zuni cloud-sample spectrum at226 days also showed the 1.7-Mev ltne of Sb’24, though not reproduced in the figure. This line
was barely detectable in the How Island spectrum, shown for comparison, and the 0.60-Mev
line of Sb124 could not be detected at all.Average energies, photon-decay rates and other gamma-ray properties have been computed
from the reduced spectral data in Table B.20 and appear in Table B.21.
4.3.7 Air Sampling. As mentioned earlier, a prototype instrument known as the high volumefilter (HVF) was proof-tested during the operation on the ship-array platforms. This instrumentwhose intended function was incremental aerosol sampling, is described in Section 2.2. All unitswere oriented fore and aftin the bow region of the plafform between the two lC’s shown in FigureA. 1. The sampling heads opened vertically upward, with the plane of the filter horizontal, andthe airflow rate was 10 ft~min over a filter area of 0.0670 ft2, producing a face velocity of 1.7mph.
The instruments were manually operated according to a fixed routtne from the secondary
control room of the “ship; the first filter was opened when fallout was detected and left open untilthe TIR reading on the deck reached -1 r/hr; the second through the seventh filters were ex-
posed for ~2-hour intervals, and the last filter was kept open until it was evident that the fallout
rate had reached a very low level. This plan was intended to provide a sequence of relative airconcentration measurements during the fallout period, although when 1 r/hr was not reached
Oniy one filter was exposed. Theoretically, removal of the dimethylterephalate filter materialby sublimation will allow recovery of an unaltered, concentrated sample; in practice however,
the sublimation process is so slow that it was not attempted for this operation.
After the sampling heads had been returned to ~L, the filter material containing the activ-
ity was removed as completely as possible md measured iII the 4-n ionization chamber; these
data are summarized in Table B. SC. It may be seen that the indicated arrival c ha.racteristics
generally correspond with those shown in Figures 3.1 to 3.4.A comparative study was ~SCI made for some shots of the total number of fissions per square
foot coilected by HVF’S, lC’S, ad C)CC’S located on the same platform. Ionization-chamber
122

activities were converted to fissions by means of aliquots from OCC YAG 39-c-21, shots Flat-bead md Navajo, and YAG 40-B-6, Shot Zuni, which had been analyzed for Mogg. E may beseen in Table 4.12 t~t, with one exception, the HVF collected about the same or less activitythan the other two instruments. In view of the horizontal aspect of the filter and the low airflow
rate us~, there is Littie question that the majority of the activity the HVF collected was due tofallout. The results obtained should not, therefore, be interpreted as an independent aerosol ‘
hazard.—.
123

TABLE 4.I Acmy PER UNIT MEA FoR
SKIFF STATIONS , SHOT CHEROKEE
No fallout waa collected on tbe skiffs omitted fromthe table.
“ Station Dip counte/min at H + hrApproximatefissions/#
M 3,094 196.6 2.5 x @
BB 3,0s4 196.6 2.5 x lo~
cc 4,459 150.3 2.8 x lo~
DD 9,886 214.2 8.7 X 10*
GG 5,720 196.2 4.6 X 10UNH 858 196.1 6.9 X 10°
MM 8,783 214.0 7.7 x lo~w 452 432.0 8.o X 10’
TABLE 4.2 EVALUATION OF MEASUREME~ AND DATA RELIABILITY
L Field Meaeure~nW and Ikpoaitlon Properties
clam Maaaurement Inetrunmnt ComnmWa
AAA-C
A-C
A-D
A
A-C
D
B-D
c
ccNB
cND
D
D
c
D
Station Iocdonj Sbt~
Station locatlon, ektffaTfme of arrhd
Ttma of arrival
T&m d arrtval ‘
Time of peak ionlaatlon rateTfma of peak fallout arrival rata
Tirm of COSSatiOO
Time of ceeeafdon
Ionization rat8, in situ
Apparentionisation rab, fn cxxmnAppent ionir.atlonrate, in tankbniaetion rate, above ma surfaceIonization rate, in situ
Total doeaTotal doaa‘Weight of fallout/araa
Fraction d &vlca/area (Fe, U)
Ortginal corel-aea-waterConatituena
Fiesiona and fraction ofdevtce/area (Men)
Fissione/area
l-m
Ic
ToAD
TrFfxc
TIR
xc
TM
SIO-P
SRI-DNY*M
TIB, Ctie Pie
TxftESL ~m pack
Occ
Occ
Occ
Occ
SK)-P , dip
● 500 to 1,000 yarda.* 1,000yarda.Arbitrary selection of oigniflcant increaae
above backgmxudUncertainty in first tray aigntficantly above
background; arrival unceti within tinminterval tray exposed.
Uncertain for initially low ratas of fieldiocreaae; malfunction on skiffs; clock-
readtng Wftculties.—
Unca~ for protracted fallout duration endsharp deposition rata paake.
Dapenda on tmowledge of decay rata ofmeidual material.
Rata plot for protracted fallout and falloutwith eharp kpositlon-rata paakn may con-
tinua to end of expoeure period; cumulathacttvlty slope approaches 1.
Poor directionakmer~ reaponee (AppendixA.2); variatioaa in calibration; poor inter-chambar agreena?mt.
Celibratlon vartabla, mchenlcat Mftculties.Ca.llbratlon vartebla, electrical difficulties.’H@ self-contadnatl on obaarved.Calibration for pofnt mnurcein callbratton
dflwction; lwadfnga -20 percent low aboveexten&d aauoa.
see above: Ionization rata, TDt.Aseumed ● 20 percent.Biea uncertainty (section 4.3.2); V-iSbfu&
of background CO& CtiOM ; - bdow: Ele-mentaf compoeitloo, fallout.
Biaa uncartalnty(section 4.3.2); uncertaln~of indicator ebundmce tn device surrooml-@; eee below: Elemental compoaitlo%fallout.
Variatiooa in aMl, reef, ad lagoon bottomcomposition; aae below: Elemental COqO-
eition, fallout.Biaa uncertainty (Section 4.3.2); device ftaekm
yield uncertainty.Uwertaintiee in dlp to fission conversion
factor, ocean background, fractionationof rtionucIidae, motion of we@r; aee above:Apparent iordzation rate, in ocean.
f
124

TABLE 42 CONTINUED
IL Mmrdoxy Actiti& Meaeuremanta.
cl- hfeasumnwtt sample Comm3nta—.A
A-c
A
A
B
A
B
D
A
Gamma activity, dogbouee
Gamma activity,dip
Gemma activity, end-windowGamma ectlvity, well
Gamma acUvity, 4-r ion chember
Mon aeaay, radocknicdR&iioclmmical R-values,
product/5sion rattoe3pectronmtry R-values,
prnduct/fieaion ratloaRelative decay rates, all
Inetrumente
OCC, AOCi ,AOCi-B
AOCZ diquOfd,tank, sea wakr
IC trayaIndividual ptUti-
clea, allquote
of moat .mmpleeAliquote of moat
samples
oCC, cloudOcc, cloud
Occ, cloud, [c
Au required
Precision bettar than* 5 prcent, except forend portion of &cay curves.
Aliquoting uncertainty wtth occasional presenceof solide in hif@ specific-activity sample.
Precision better than* 5 percent.Precision for single particles *3 percent (Ref-
erence 26).
Borneskill required in operation; precision●5 to 20 percent at twice background (Ref-erence 26).
Accuracy *10 percent (Reference 24).Accurecy of nuclicb determination *20 to 25
percent (Reference 34).Factor of 2 or 3; misidentification poaaible.
With few exceptions, necees~ decay correc-tions made from observed decay ratee ofappropriate samples in counters desired.
m. LabLuatory Physical and Chemical Meaeuremente
Claee Meaeuremmt Bample Comxmnte
A
BD
A
A
c
D
B-c
cblori& content, slurry dropsWater volwm, slurry dropekkmtffiCiltim, COmpOlmdO and
elemente d slurry solideBofAdparttcle wwights
Bolid particle deneitles
EfementaI conqwsition, fallout
Identification, compound8 ad
elemen@ of slurry soflde
Parttcle dae-fre~ency
diatributione, conoentrationaend relative w9ighte vereustlnm
XC reagent ftlmXCreagent filmIc reagent Glme.
OcCXCtraye, OCC,
Unacbedlded
XC tray-, OCC,
unscheduledOcc
IC reagent film,Occ
XC traye
Accuracy * 5 percent (Reference 31).Accuracy *25 percent (IWemooe 31).Poaeible mtaidentlftcation; small amiples,
amaJ1number d samples.Accurecy ad precision *5 pg. ledtng to *1
percent or bettar on moat perttcles (Refer-eme 26).
Precieion bett8r than +5 percent.
Large deviatbne in composition from dupllcatetraye; recovery loee, end poaeible freotiona-Uon, -40 mg; hcmeycombinterference.
Possible rniaidentlftcation; smaU namplee;ezrAU number of eamplea.
Dlfflcukiee in recognition of diecm* particles,treatment of flaiw or aggregated parttclea;
uncefiain application of &flned dlemeter toterminal-veiooity equatiooa; tray background
and photographic maolutton in smaller sixa
rW*.
lV. Nation cbarec@rietlcs Data
Claee Item Commente
A-C G&una-ray decay acbemee &riount of decay ecbenm data available deperaienton
A-Bparticular aldlde. .
Ffasion-product-dtaintegration retee M *20 percent for time pericd considered (Refer-ence 41).
N co-d r/hr at 3 R above Inf.hdk phmephoton/ttnm/area
Error aemmed small compared to errors In falloutconcentration, radfonuollde composition, ad decay
vereue photonenergyecbeme data.
B A&olute callbretion, bta oountam Pereonaf communication from J. Meckln, NRDL.B Abeolute calibration, doghouse counter Uncertainty in disintegration rata of calibrating nu-
cU&Js; dependenceon garoma-ray decay schemes.
125
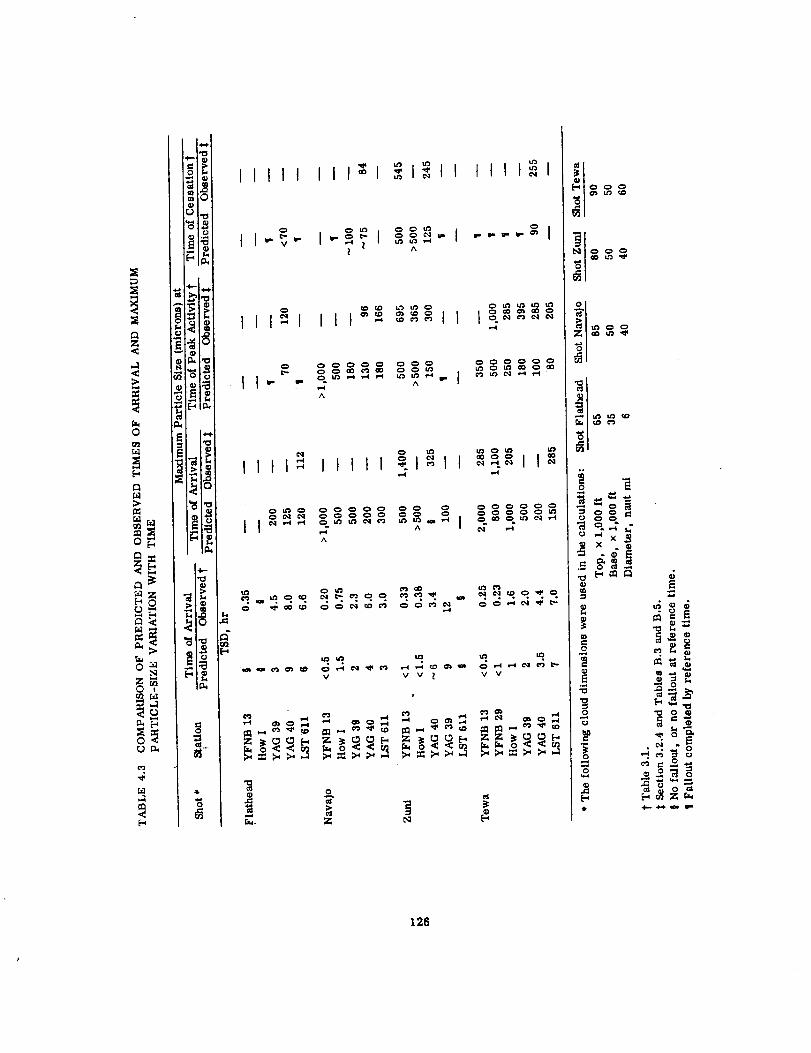
,
00000 000Ooalmm Oouaqln$-td I-l Inua l-w
A IdA
11111:-.1:11
00000000000-O(oo-ln @adc-i- -1
..

●
☞
●
●
●
☛
co o*-Um
-. ---’-- -0000 0000dr-ld !-1 SAl+l-ld
!i.1A
uAN
nA !+
wE-J
J
u-x.
127
t

In
4ka
g!
Xxxx 11:1:11:11-H + +1
.
-a 3:“o?-l d
x x
11111 :11~1+( -H
128

kl4
x
I
>4
(
mb-o
I
I
I
I

1111111111111111111111 II
1111111111111111111111 II
1111111111111111111111 II

TABLE 4.10 PERCENT OF FILM DOSIMETER READINGRECORDED BY TIR
station shot Zunt Shot Flathead ShotNavajo Shot Tewa
pet pet pet pet
YAG 40-B 66 68 45 75
YAG 36-C 100 -100 46 97
ET 611-D ● 76 37 94
YFNB 13-E 41 t 19t 20 43
YFNB 29-G -100$ 49 12 51f
YFNB 29-H 97 32 42 89t
How F 35: ● 6 16
● NO fallout oocurred.t TIR maturated.$ Dosimeter location varied from ot&r shots.BIaatrumant malfunctiomd.
TABLE 4.11 COMPARISON OF THEORETICAL DOGHOUSE ACTIVITY OF STANDARD-CLOUD SAMPLES BY GAMMA SPECTROMETRY AND RADIOCHEMISTRY
Time of Observed Dog- Computed Activity and Errors
Spectral Run house Activtty Spectrometer Error Radi@hemtcal Error
H+hr counts/mtn counm/min @ counts/mtn m
Shot Zuni Standard Cloud, 9.84 x10 Uflssions
53 142,500 95,300 -33.1
117 70,000 47,450 -32.2
242 26,700 20,640 -22.7454 9,500 7,516 -20.97s0 3,700 3,7s0 + 2.43
1395 1,550 1,973 +27.3
Shot Flathead Standard Cloud, 2.79 X1O1’ fissione
86.5195262334435718
1,0311,558
171,000
72,000
45,000
30$00
19,300
8200
4,400
2,130
142,08051,49029,85022,76014,9206,7783,3412243
-16.S-28.5-33.7-25.4-22.7-17.3-22.5+5.31
Shot Navajo Standard Cloud, 3.46 XIOU fissione
51.5 34,000 27,470 -19.269 25,500 20,724 -18.7
141 11,000 9,432 -14.2191 7,000 7,411 + 5.87315 3,050 2,634 -7.08645 980 958 -2.24
Shot Tewa Standard Cloud, 4.71 xlOUfisaions
71.593.5
117165240334429579768
1,2691,511
442,000337,000262,000169,000
, 97,00054,00034,50020,20012,4005zoo3,850
244,930184,170157,880134,91074,78038,77025,20014,77010,8605,6604,550
-44.6-42.4-39.7-20.2-22.9-28.2-27.0-26.9-12.4+ 8.85
+ 18.2
163,54174,98129,10710,7454,5461,964
154,00866,96043,02229,12619,0647,9854,1522,076
31,35022,6309,7576#902,9271,038
429,600325,00D255,800161,00091,00052,28033,20019,64012,1504,9743,759
+ 14.8+ 7.11
+ 9.01+ 13.1+ 22.0
+28.0
-9.93
-7.00
-4.39
-4.49
-1.11-2.62-5.63-2,53
-7.79-11.3-11.3-10.1-4.03+5.92
-2.81-3.56-2.37-4.73-6.19-3.19-3.77-2.77-2.02-4.35-2.36
132

4(
‘am0“
,-(em“
x Xxxx
133

TABLE 4.13 NORMALIZED IONIZATION RATE (SC), CONTAMINATION INDEX, AND
YIELD RATIO
A number in parentheses Indicates the number of zeros between the decimal point and first
signlf ic ant figure.
Shotr/hr
&Zafissions /ftz
Hypothetical, 100 Pet
fission, unfractionatedfission products, noinduced activities
Zuni, lagoon-areacomposition
Zuni, cloud compoaitfon
FlatMad, averagecomposition
Navajo, averagecomposition
Tew& lagoon-areacomposition
1.12 hrs1.45 days9.82 day,
30.9 daya97.3 dayo
301days
1.12 hrs1.45 days9.82 days
30.9 days97.3 daya
301days
1.12 hrs1.45 days9.82 daya
30.9 days97.3 days
301 daya
1.12 hrs1.45 days9.82 days
30.9 days97.3 daya
301days
1.12 hrs1.45 days9.82 daya
30.9 days97.3 daya
301 days
1.12 hrs1.45 daya9.82 days
30.9 days97.3 days
301days
1.12 hrs1.45 days9.82 daya
30.9 days97.3 daya
301dayu
(12)6254
(14)6734
(15)6748
(15)1816
(16)3713
(17)5097
(12)S356
(14)4134
(15)3197
(16)9165
(16)4097
(17)7607
(12)7093
(13)1407
(14)1766
(15)4430
(16)8755
(16)1121
(12)5591
(14)6984
(15)7924
(15)1893
(18)3832
(17)5230
(12)6864
(14)8481 I
(15)7616/(15)2160\
(16)5933~(16)1477:
[12)3321[(14)3564~(15)3456(16)9158(16)2843(17)4206
.3’ewa, clout and outer (12)646ftiout composition (14)8913
(15)8870(15)1971(16)4019(17)6009
–—-8 Ratio of (r/hr)/(Mt(totaJ) /&) at t for device to (r/hr)/(Mt (totsJ)/ft$ at t for hypot&~&i~.
I
134


0m
0N
0 0“
(uH/MN) 31Vki NOIIVZ
136
0 u
c
NO I

OOUYorl ---
Q11
$w’‘N
“m
+
al
I
—Cil
31&inSOdX3 40 NIW M3d A11A113V AVU1
137

,03
102
10
1--1- Designation
l--u— YAG 40-A2--- YAG 39-C20
10
Sample Description Number Instrument
SIG TRAY 729 END WINDOWIC CONTROL TRAY 56 ENO WINOOW““i
Figure 4.5 Photon decay of slurry
102
(HR)
particles,
103

140

—
ZtI ,/I
i0z
—— —
I I I
““ .- ‘0.
141

a-l----
1-”~,..
4-““sL-
...
II
:+
.:
I1
~ I II Ilt
I I 1 t ,I
[I I
I I I ;1 IuJ— —8a-Jg!?dl- 1 I
I J!
0
,
142

1
3’
I
-. I-,
\\
..● �
., I . 1
/ I I ! \ u\ \ I .
/0- J----L” / h.
XCLJ./ i “!-. “T~’.i
I 1 I I I I,1
znnoi X- -I I L==l=nu
1—z— N /’
i~ ./ II o.
I I
143

b---,’,.’,
.. k
\
A HEAVYCOLLECTION
CLOSE IN15 MINUTE EXPOSURE
TRAY NO. 1204
YFNB 13, E-57ZUNI
---
-f
:.! . “1<..
. ..*”.;
>’.’.*
i.’. .
.>-’... .
/
iii$.* ,
● ..+:- ‘
A HEAVYCOLLECTION
FAR OUT15 MINUTE EXPOSURE
TRAY NO’411
YAG 40, B-7ZUNI
. ..-- . ..s”~’ ..<,;:.,.. , ,% :
l!’.*’.. -P’. ..-
~ 14,.
. . .
.’ - ●8,. .””.,* ‘w ‘
i.Y’ J . ‘e * -“.- ‘“ : :..:c \,
;.. . ...d.-,
9. “.●..-.’..,. .
.. . .
-.
i“” &s. . ... . .. ,,. . . . . .Z..r .
@14?9!9----,- ,*..!”
‘: ‘ @
*.
.-“,. ‘ A
Figure 4.10 Close and distant particle collections, Shot ZUni.
144

l-- AXIS OF SYMMETRY
~- OIAMETER ‘ {
[ ‘~
!, ... .. . .. . .. . ~“, .:,, :, ... ,.:.... ,’. ,..<..,,:..;:’:. .. ...!...,.,:;., ,,.,..$,...... . ,:. :.. ,,.,..,.. ‘. . . . . . .. . .., .:, -:,. ..:,.,.....,,..,,;...,,-+:,:.. , ::.’<,,., .... .:.’., ‘. ,,.,’.- ,., !.:.,., . ... ,; . ...,: ,....J$.,.::.”:..’}::..,, ..- .: J.: :... .. .. . <,’ :,... -. ,.,.:,.,., ..\.,,.,-.,, ,.,.-,.,,,,...... .,,, ,,.... . . . ... .. .,.... ! ., :.. :,,.)-,. ,.,. :,.. .’;....:.. .,. .. ,7. . . ........- r ,, -.~.,.., : ,, ,..,.. ~,. , .:,,:. >-.’..::’ ,.; ,,,.:,j.” ., ..-+>-.... ..‘.. .,> .+- ,, ;. .. .~..’.r.:,:“..., ... J-..:,.+.,. ,. ..,,,L ,.,.:,.:<:Tij ..... .?,:,.. . . .... . . ....... .;.,....., -,-,.,.;- Y:.......... ... . ... . .~...,.,. .... . . .. , ,..,.,,::+:.,-,:~.,.. .,<:....... ‘ ,.’..?~.....,,:.2.::,. .. *!-. ,, .... +..’-...,.f.,, ;,-,,:,.,<.,.,:... .,,:..... .... : ,...’,~. ..-,:..,..,.. ,.; -.: ,-...,: :<.,,..:.., (.. ;., . . !.
. . .. . . .. ‘, .’,.... ., .:-..
u . . .. .
.,-,-
TOP,.. .
.:. ” . ‘,... .:. ... ..... ----,.. .::
8A SE -“.. ~~ v:: i.:: STEM
. .
:. :.: .----- , ..:
:=,.i.,...- -’..
--: ;,’:;::* ;,:
f t .. ..I
ACTIVITY OISTRISUTION
SIZE FRACiONATION
Figure 4.11 Cloud model for fallout prediction.
145

f1 ! , 1 1 , @
[ I
1 /. ., , ! ,
Ill I Illlti s’ lll14f”l I I 111111! I I 11111I I I 111111! I I Ilrlllt I 1 0‘0
o0I 1 i =
:0
.........................
N+:;
:% o
,,1 1 ..... - g1 /
lull!!! 1 1!11111/” I -?!11111 I I 1111111 I I l!lll [11 I 1111111 I I 111[111 I I lou-l
uNG
a)Nm,-
1- ..1 I 1 I (II I 1-1
..-111!11 I ! 111[11 I I 11111 I I I 111111 I I 111111 I I I
no *O “o ‘o o y .2z o
0
MH NOM31t%zU fS31311$JVd 30 M3QWIl N
146

I I IO* I
I 111111I o
I I ● 0I I

,
—
#.-7-“, 1, .J”” (j \ \
+#..-..
b (( ‘\ -....... II
.\ \ f\
~~.i \
i ...I
>
> ‘\,..I I I \
I..<””’”””””””””)\ /“
-+-
ax
m:In
)-
—-----h
Ulllll I 11!1!1 I I 11!111 I I UU_LUJo0
0 0 0
00 00
n- ●
=3ZIS (13LV31(INI 143V3 M04 UH NOM31W +3 /S31311MVd 30 k13EllnN
148
4al
.?
Z
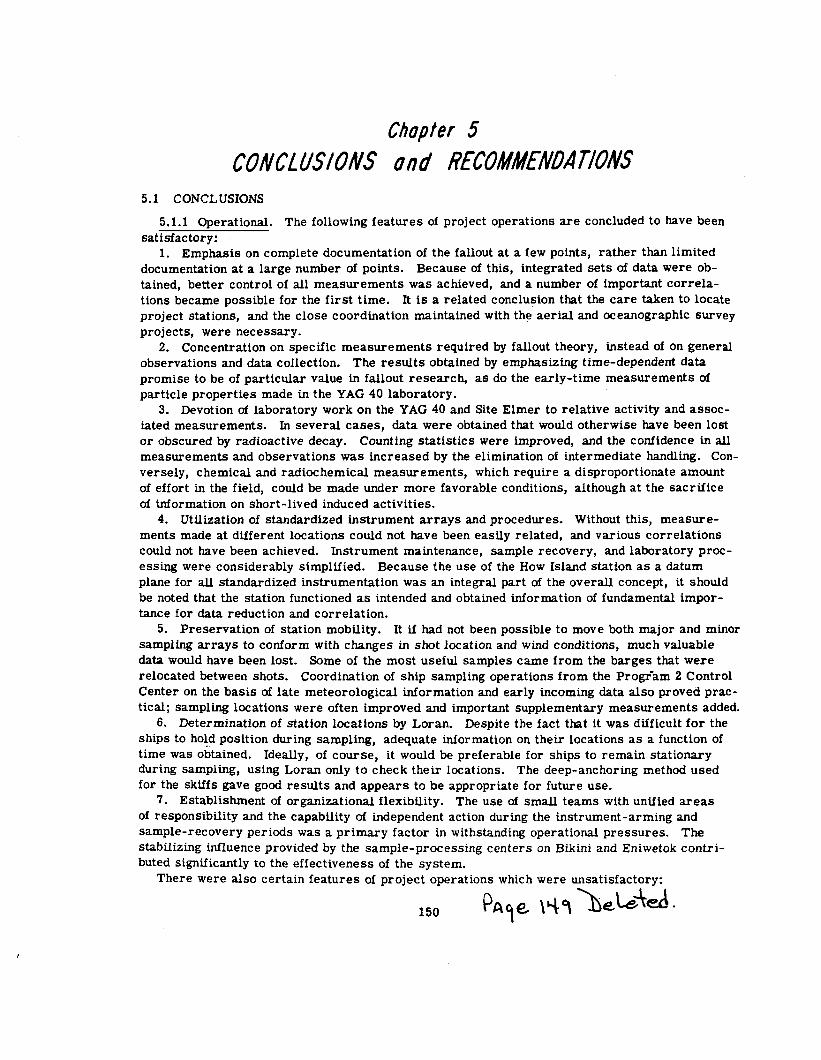
CONCLUSIONS5.1 CONCLUSIONS
Chptef 5
und RECOMMENDATIONS
5.1.1 Operational. The following features of project operations are concluded to Mve been
satisfactory:
1. Emphasis on complete documentation of the fallout at a few points, rather than limited
documentation at a large number of points. Because of this, integrated sets of data were ob-
tained, better control of all measurements was achieved, and a number of important correla-
tions became possible for the first time. It is a related conclusion that the care taken to locate
project stations, and the close coordination maintained with the aerial and oceanographic survey
projects, were necessary.
2. Concentration on specific measurements required by fallout theory, instead of on general
observations and data collection. The results obtained by emphasizing time-dependent data
promise to be of particular value in fallout research as do the early-time measurements of
particle properties made in the YAG 40 laboratory.
3. Devotion of laboratory work on the YAG 40 and Site Elmer to relative activity and assoc-
iated measurements. In several cases, data were obtained that would otherwise have been lost
or obscured by radioactive decay. Counting statistics were improved, and the confidence in all
measurements and observations was increased by the elimination of intermediate handling. Con-
versely, chemical and radiochemical measurements, which require a disproportionate amount
of effort in the field, could be made under more favorable conditions, although at the sacrifice
of information on short-lived induced activities.
4. Utilization of standardized instrument arrays and procedures. Without this, measure-ments made at different locations could not have been easily related, and various correlations
could not have been achieved. Instrument maintenance, sample recovery, and laboratory proc-essing were considerably simplified. Because the use of the How Island station as a datumplane for all standardized instrumentation was an integral part of the overall concept, it shouldbe noted that the station functioned as intended and obtained information of fundamental impor-
tance for data reduction and correlation.
5. Preservation of station mobility. It if had not been possible to move both major and minorsampling arrays to conform with changes in shot location and wind conditions, much valuable
data would have been lost. Some of the most useful samples came from the barges that were
relocated between shots. Coordination of ship sampling operations from the Progr-am 2 ControlCenter on the basis of late meteorological information and early incoming data also proved prac-tical; sampling locations were often improved and important supplementary measurements added.
6. Determination of station locations by Loran. Despite the fact tit it was difficult for theships to hold position during sampling, adequate infer mation on their locations as a function of.time was obtained. Ideally, of course , it would be preferable for ships to remain stationaryduring sampling, using Loran only to check their locations. The deep-anchoring method usedfor the skiffs gave good results and appears to be appropriate for future use.
7. Establishment of organizational flexibility. The use of small teams with unified areasof responsibility and the capability of independent action during the instrument-arming andsample-recovery periods was a primwy factor in withstanding operational pressures. Thestabilizing influence provided by the sample-processing centers on Bikini and Eniwetok contri-buted significantly to the effectiveness of the system.
There were alSO certain features of project operations which were unsatisfactory:

1. The large size of the project. If more-limited objectives had been adopted, and the meas -~ements to accomplish these objectives allotted to several smaller projects, the amount of field
administrative work and the length of time key personnel were required to spend in the fieldcould probably have been reduced. In future tests, the total number of shot participations should
be kept to the I’IIlniWrn compatible with specific data requirermmts.
2. The difficulty of maintaining adequate communications between the test site and NRDL.f)espite arrangements to expedite dispatches, frequent informal letters, and messages trans-
mitted by sample couriers, several cases occurred where important information was delayedin transit.
3. The use of instruments developed by other projects. Malfunctions were frequent in suchcases but were probably due partly to lack of complete familiarity with the design of the instru-ment. This is the principa4 reason why the water-sampling results are incomplete and of un-certain reliability.
4. The operational characteristics of certain project instruments. The time-of-arrival de-tectors (TOAD) were developed for the operation and had not been proof-tested in the field. Theytended to give good results when lccated on stable stations, such as barges or islands, and poorresults when located on stations like the skiffs. It seems probable that minor design modifica-tions would suffice to make this a dependable instrument. The honeycomb inserts used in theopen-close total collector (oCC) exhibited a tendency to wall and sho~d @ modified for futureuse. The sizes of the collecting areas of the always-open collector, Type 2 (AOC2), and incre-mental collector (IC) should be increased if possible. Complete redesign of the gamma time-intensity recorder (TKR) to improve its response characteristics, reduce its size, and make ita seif-contained unit was obviously required for future work and was initiated during the fieldphase.
5. The commitments of the project to supply eariy evaluations of field data. Because of the
nature of fallout studies, inferences drawn from unreduced data may be misleading. Despitethe urgency associated with studies of this kind, interim project reports should be confined topresenting the results of specific field measurements.
5.1.2 Technical. The general conclusions given below are grouped by subject and presentedfor the most part in the same order that the subjects are discussed in the preceding chapters.In a sense, the values tabulated and plotted in the text constitute the detailed conclusions, be-cause they represent the numerical results derived from the reduced data of the appendixes.For this reason, numerical values will be extracted from the text only if some generality isevident or to Ulustrate an observed range. Although the conclusions presented are not neces-sarily those of the authors whose works have been referenced in the text, interpretations are
Usually compatible.Buildup Characteristics.1. The time from fallout arrival to peak radiation rate was approximately equal to the time
of arriv~ for all stations and shots. Activity-arrival rate was roughly proportional to mass-
arrival rate for the solid-particle shots, Zuni and Tewa. A similar result was obtained for
outlying s~tions ciur ing Shot Flathead, although this proportionality did not hold for Shot Navajo
nor for the close- in collections from Shot Flathead.
2. The shape of the activity-arrival-rate curve was not markedly different for solid- andslurry-particle shots. In both types of events, the time from the onset of fallout to the timewhen the radiation rate peaked was usua~y much shorter t~n the time required for the remain-
der of the fallout to be deposited. There was some tendency for slurry fallout to be more pro-
tracted and less concentrated in a single major arriv~ wave; however, statistical fluctuations
due to low concentrations of particles and srnti collector areas were responsible for most of
the rapid changes observed after the time of peak. Where ftiout Concentrations were s~fic ien~Y
high, good time correlation was ord~nar~y obtained between peak rate of arrival and peak radi-
ation rate.
3. . Particle-size distributions varied cent i.nuously with time at each station during the solid-
particle shots, activity arrival waves being characterized by sharp increases in the concentra-
151

tion8 of the larger particles. Because of background dust and unavoidable debris on the trays,
correlation of the concentrations of smaller particles with radiological measurements was more
difficult. The concentrations of the smallest sizes remained almost constant with time. Par.title diameters gradually decreased with time at each station during the slurry-particle shots,though remaining remarkably constant at -100 to 200 microns on the ships during the entire
fallout period.4. h the vicinity of the ships, the gross body of fallout activity for the slurry-particle shots
penetrated to the thermocline from a depth of 10 to 20 meters at the rate of 3 to 4 m/hr. A con.
siderable fraction of the activity for the solid-particle shots penetrated to the thermoclhe atabout the same rate. This activity remained more or less uniformly distributed ahve the ther-mocline up to at least 2 days after the shot, and is presumed to have been in solution or assoc-iated with fine part icles present either at deposition or produced by the breakup of solid aggre-gates in sea water. An unknown amount of activity, perhaps as much as 50 percent of the total,penetrated at a higher rate and may have disappeared below the thermocline during the solid-particle shots. It is unlikely that any significant amount of activity was lost in this way duringthe slurry-particle shots.
5. Fractionation of Mog$, NP22S, and 1131occurred in the surface water layer following solid-
particle deposition; a continuous variation in composition with depth is indicated. Only slighttendencies in this direction were noted for slurry fallout.
Physical, Chemical, and Radiological Characteristics.1. The fallout from Shots Zuni and Tewa consisted almost entirely of solid particles similar
to those observed after the land-surface shots during Operations Ivy and Castle, consisting ofirregular, spheroidal, and agglomerated types varying in color from white to yellow and rang-ing in size from <20 microns to several millimeters in diameter. Most of the irregular Par-ticles consisted primarily of calcium hydroxide wtth a thin surface layer of calcium carb~tejalthough a few unchanged coral particles were present; while the spheroidal particles consistedof calcium oxide and hydroxide, often with the same surface layer of calcium carbonate. Theagglomerates were composed of calcium hydroxide with an outer layer of calcium carbonate.The particles almost certainly were formed by decarbonation of the origtnal coral to calciumoxide in the fireball, followed by complete hydration in the case of the irregular particles, andincomplete hydration in the case of the other particles; the surface layer, which may not havebeen formed by deposition time, resulted from reaction with Cq tn the atmosphere. The den-sities of the particles were grouped around 2.3 and 2.7 gm/cm3.
2. Radioactive black sphericaI particles, usually less than 1 micron in diameter, were ob-served in the fallout from Shot Zuni, but not. in the fallout from Shot Tewa. Nearly all suchparticles were attached to the surfaces of irregular particles. They consisted partially of CZI-
cium iron oxide and could have been formed by direct condensation in the fireball.
3. The radionuclide composition of the irregular particles varied from that of the spheroidaland agglomerated particles. The irregul~ particles tended to typify the cloud-sample and distant-fallout radiochemistry, while the spheroidal and agglomerated particles were more character-istic of the gross fallout near ground zero. The irregular particles tended to be enriched in
‘g” the spheroidal and agglomerated particles were depleted~~to- b~to”w slightiy depleted in Sr ,.in these nuclides but were much higher in specific activity. It should be recognized that thisclassification by types may be an oversimplification, and that a large sample of individual ~-ticles of all types might show a continuous variation of the properties described. The inferenceis strong, nevertheless, that the fractionation observed from point to point in the fallout field atShot Zuni was due to the relative abundance and activity contribution of some such particle typesat each location.
4. The activities of the irregul~ puticles v~ied roughly as their surface area or diametersquared, while those of the spheroidal p~ticles varied as some power higher than the third.Indications are that the latter were formed in a region of higher activity concentration in thecloud, with the activity diffusing into the interior while they were still in a molten state. Activ-ity was not related to particle density but v~ied with the weight of irregular particles in a man-ner consistent with a surface-area function.
152

5. The fallout from Shots Flathead and Navajo collected at the ship stations was made upentirely of slurry particles consisting of about 80 percent sodium chloride, 18 percent water,
and 2 percent insoluble solids composed primarily of oxides of calcium and iron. The individualinsoiubie solid particles were generally spherical and less than 1 micron in diameter, appearingto be the result of direct condensation in the fireball.
6. The radionuclide composition of individual slurry drops could not be assessed because ofinsufficient activity, but the results of combining a number of droplets were similar to thoseobtained from gross fallout collections. In general, much less fractionation of radionuclideswas evident in the slurry-particle shots than in the solid-particle shots. The amount of chloridein a slurry drop appetied to be proportional to the drop activity for the ship stations at Shot Flat-head; however, variability was experienced for Shot Navajo, and the relation failed for both shotsat close-in locations. Conflicting data was obtained on the contribution of the insoluble solids tothe total drop activity. While the slurry nature of the fallout and certain properties such as dropdiameters, densities, and concentrations have been adequately described, further experimenta-tion is required to establish the composition of the insoluble solids, and the partition of activityamong the components of the drop.
Radio nuclide Composition and Radiation Characteristics.1. The activities of products resulting from slow-neutron fission of UZS =e sufficiently
similar to those resulting from device fission to be quantitatively useful. It should alSO be notedthat the absolute calibration of gamma counters is feasible, permitting calculation of the count-per-disintegration ratio of any nuclide whose photon-decay scheme is known. “ For establishingthe quantity of a given nuclide in a complex mixture, radhchemistry is the method of choice; atthe present time, gamma- ray spectrometry appears less reliable, even for nuclides readilyidentifiable. In addition, gross spectra obtained with a calibrated spectrometer led to computedcounting rates for a laboratory gamma counter which were generally low.
2. Fractionation of radionuclides occurred in the fallout of all surface shots considered. Byseveral criteria, such as R-values and capture ratios, Shot Navajo was the least fractionated,with fractionation increasing in Shots Flathead, Tewa, and Zuni. For Shot Zuni, the fractiona-tion was so severe tht the ionization per fission of the standard cloud sample was -5 to 6 times
greater than for close-in fallout samples. Important nuclides usually deficient in the fallout were
members of the decay chains of antimony, xenon, and fcrypton, indicating that the latter products,
because of their volatfiities or rare-gas state, do not combine well with condensing or unaltered
carrier particles. Although empiric&1 methods have been employed to correct for fractionationti a given sample, and to relate the fractionation observed from sample to sample at Shot Zuni,the process is not well understood. As yet, no method is known for predicting the extent of frac -tionation to & expected for arbitrary yield and detonation conditions.
3. Tables of values are given for computing the infinite-field ionization rate for any point in,.—. the fallout field where the composition and fission density are known. The same tables permit
easy calculation of the contribution of any induced nuclide to the total ionization rate. Based onHOW Eland experience, rates S0 obtained are approximately twice as high as a survey meterW~d indicate. It is evident that unless fractionation effects, terrain factors, and instrument-response c~racteristics are quantitatively determined, accurate estimates of the fraction ofthe device in the local fallout cannot be obtained by summing observed dose-rate contours.
Correlations.1. The m~im’um fission densities observed during the various shots were, in fissions per
“ for Shot Zuni, 6 x 10square foot, approximately 4 x 10 ‘4 for Shot Flat-1s for Shot Tewa, 8 x 10head, 9 x 10¹³ for Shot Navajo, and 9 x 10¹⁰ for Shot Cherokee. The fallout whit h was deposited~ing Shot Cherokee arrived as slurry p~ticles similar to those produced by Shots Flatheadand Navajo ~~ appeared to be relatively u~ractionated with regard to radionuclide composition;
‘he total amount deposited was small, however, and of no military significance.
‘2. Reasonable agreement between the predicted and observed perimeters and central axes
Of the preliminary fallout patterns for Shots Zuni and Tewa was achieved by assuming the radio-active ~teri~ to be concentrated largely in the lower third of the cloud and upper third of the
‘tern, restricting particles larger than 1,000 and 500 microns in diameter to the inner 10 per-
153

cent and 50 percent of the cloud radius, respectively, and applying methods based on accepted
meteorological procedures. Modified particle fall-rate equations were used and corrections
were made for time and spatial variation of the winds. With the same assumptions, rough agree-ment was also achieved for Shots Flathead and Navajo by neglecting spatial variation of the winds,in spite of the gross differences in the character of the fallout. The reason for this agreement is
not well understood. Predicted fallout arrival times were often shorter by 10 to 25 percent than. the measured times, and the maximum particle sizes predicted at the times of arrival, peak,
and cessation were usually smaller by 10 to 50 percent than the measured sizes.3. The weighted mean values of the activity collected per unit area on the standard Platiorm
constitute a set of relative measurements, varying as a function of wind velocity and particleterminal velocity. The exact form of this function is not known; it appears, however, that theairflow characteristics of the plafform were sufficiently uniform over the range of wind veloc-ities encountered to make particle terminal velocity the controlling factor. The activity-per-unit-area measurements made on the samples from the skiffs may constitute a second set ofrelative values, and those made on samples from the raft and island minor arrays, a third set,closely related to the second.
4. The maximum plafform collections should be utilized as the best estimate of the totalamount of activity deposited per unit area. An error of about *50 percent should be associatedwith each value, however, to allow for measurement error, collection bias, and other uncer-tainties. Although this procedure is strictly applicable only in those cases where single-winddeposition prevailed, comparable accuracy may be achieved by doubling the mean platiorm W.lue
and retaining the same percent error.5. Decay of unfractionated fission products according to t-i ~2 is adequate for planning and
estimating purposes. Whenever fractionation exists or significant induced activities are present,however, an actual decay curve measured in a counter with knowm response characteristics, orcomputed for the specific radionuclide composition involved, should be used. Errors of 50 per-cent or more can easily result from misapplication of the t-’-2 rule in computations involvingradiological effects.
6. It is possible to determine fraction of device by iron or residual uranium with an accuracycomparable to a Mo ‘g determination, but the requirements for a large sample, low background,and detailed device information are severe. Ln general, fractions calculated from these elementstended to be high. Analysis of copper, aluminum, and lead produced very high results whichwere not reported. It is probable that backgrounds from all sources were principally responsi-ble, because the amounts of these elements expected from the Redwing devices were quite srnaU.
7. The time-intensity recorders consistently measured less gamma ionization dose than filmdosimeters located on the same plafforms. In those cases where the geometry remained nearlyconstant and comparisons could be made, this deficiency totaled -30 to 60 percent, in qualitativeagreement with the response characteristics of the instrument estimated by other methods.
8. Because nearly equal amounts of ftiout per unit area were collected over approximately
the same time interval by the incremental collector, high volume filter, and open-close collect-
ors on the ship platforms, it appears that air filtration through a medium exposed to directfallout at f.~ce velocities up to 1.’7 mph offers no substantial advantage over passive fallout sam-pling. It is apparent that under such conditions the collections are not proportional to the volumeof air filtered, and should not be interpreted as implying the existence of an independent aerosolhazard.
9. The contamination index, which provides a measure of the relative faUout ionization ratefor unit device yield per unit area, is approximately proportio~ to the ratio of fission yield to
total yield of the device.
5.2 RECOMMENDATIONS
It is believed that the preceding results empksize the desirability of making the following
additional measurements and analyses.
1. Time of fallout arrival, rate of arrival, time of pe~, and time of cessation should be
154

measured at a number of widely separated points for as many different sets of detonation con-
ditions as possible. Because these quantities represent the end result of a complex series of
interactions between device, particle, and meteorological parameters, additional relationships
between them would not oniy provide interim operational guides, but would aiso be useful asgeneral boundary conditions to be satisfied by model theory.
2. The particle-size distributions with time reported herein should be further assessed toremove the effects of background dust collections and applied to a more detailed study of pu-
ticle size-activity relationships. For future use, an instrument capable of rapidly sizing andcounting fallout particles in the diameter-size range from about 20 to 3,000 microns should bedeveloped. Severai promising instruments are available at the present time, and it is probable
that one of these could be adapted for the purpose. While appropriate collection and handlingtechniques would have to be developed as an integral part of the effort, it is likely that improvedaccuracy, better statistics, and large savings in manpower could be achieved.
3. Controlled measurements should be made of the amount of solid-particle activity whichpenetrates to depths greater than the therxnocline at rates higher than -3 to 4 m/hr. Support-ing measurements sufficient to define the particle size and activity distribution on arrival wouldbe necessary at each point of determination. Related to this, measurements should be made ofradionuclide fractionation with depth f or both solid and slurry particles; in generai, the volubilityrates and overail dispersion behavior of fallout materiai in ocean water should be studied further.
Underwater gamma detectors with improved performance characteristics and underwater particlecollectors should be developed as required. Underwater data are needed to make more-accurateestimates from measured contours of the total amount of activity deposited in the immediate vi-cinity of the Eniwetok Proving Ground.
4. A formation theory for slurry particles should be formulated. Separation pr~eduresshould be devised to determine the way in which the total activity and certain important radio-nuclides are partitioned according to physical-chemicai st-te. Microanalytical methods ofchemicai analysis applicable both to the soluble and insoluble phases of such particles are alsoneeded. The evidence is that the solids present represent one form of the fundamental radio-logical contaminant produced by nuclear detonations and axe for this reason deserving of theclosest study. The radiochemicai composition of the various types of solid particles from fali-out and cloud samples should also receive further anaiysis, because differences related to thehistory of the particles and the radiation fields produced by them appear to exist.
5. A fallout model appropriate for shots producing only slurry particles should be developed.At best, the fact that it proved possible to locate the fallout pattern for shots of this kind, usinga solid-particle model, is a fortuitous circumstance and should not obscure the fact that the pre-cipitation and deposition mechanisms are unknown. Considering the likelihood in modern war-fare of detonations occurring over appreciable depths of ocean water near operational areas,
such a model is no less important tk a rntiel for the land-surface case. It would aiso be de-
sirable to expand the solid-particle model applied during this operation to include the capability
of predicting radiation contours on the ~sis of conventional scaling principles or the particle
size-activity relationships given earlier..6. Theoretical and experimental studies of radionuclide fractionation with particle type and
spatti Coordinates should be continued. This is a matter of the first importance, for if the
systematic variations in composition suggested herein can be established, they will not only
rnalce possible more accurate calculation of the radiation fields to be expected, but may aiso
lead to a better understanding of the basic processes of fallout-particle formation and contami-nantion.
7. A series of experiments should be conducted to determine the true ionization rates andthose indicated by avatiable survey meters for a number of weli-known individual radionuclidesdeposited on various kinds of terrain. Although the absolute calibration of ail gamma countersand a good deal of logistic and analytical effort would be required, the resulting data would be
invaluable for comparison with theoretical results. Also in this connection, the proposed decayschemes of ail fission products and induced activities should be periodically revised and brought
up to date.
155

8. Some concept of fraction of device which is meaningful in terms of relative gamma-
radiation hazard should be formulated. The total ionization from all products of a given. devicecould, for example, be computed for a 4-z ionization chamber. Decay-corrected measurementin the chamber of any fallout sample, whether fractionated or not, would then give a quantityrepresenting a fraction of the total gamma-ray hazard. The definition of contamination index
should also be expanded to include the concept of contamination potential at any point in the fall-out area. In addition to the effects of the fission-to-total-yield ratio of the device on the result.ant radiation field, the final value should include the effects of the particle characteristics andchemical composition of the material as they affect chemical availability and decontamination.Ideally, the value should be derivable entirely from the parameters of the device and its envi- ,4
ronment, so that it could be incorporated in model theory and used as part of conventional pre-
diction procedures.
9. Additional bias studies of collecting instruments and instrument arrays should be per- \
formed. If possible, a total collector, an incremental collector, and a standard collector ~raY )should be developed whose bias characteristics as a function of wind velocity and particle ter- ‘minal velocity are completely known. This problem, which can be a source of serious error tifallout measurements, has never been satisfactorily solved. To do so will require full-scaletests of operational instruments using controlled airflow and particles of known shape, density,and size distribution. Collectors should be designed to present the largest collecting areaspossible, compatible with other requirements, in order to improve the reliability of subsequentanalyses.
10. More-detailed measurements of oceanographic and micro-meteorological variablesshould accompany any fukre attempt to make oceanographic or aerial surveys of fallout regions,if contour construction is to be attempted. It appears, in fact, that because of the difficulty ofinterpreting the results of such surveys, their use shouid be restricted to locating the falloutarea and defining its extent and generai features.
11. Based on the results presented in this report, and the final reports of other projects, acorrected set of fraction-of-device contours should be prepmed for the Redwing shots. Thesecontours may represent the best estimate of local fallout from megaton detonations available todate; however, more-accurate estimates could be made in the future by collecting and analyzingenough total-fallout samples of known bias to permit the construction of iso- amount contoursfor various important radionuclides.
156

1. C. E. Adams, F. R. Holden, and N. R. Wallace; “F~.out phenomenology”; Annex 6.4,
operation Greenhouse, WT - 4, August 1951; U.S. Nav~ Radiol&gicd Defense Laboratory, *nFrancisco 24, California; Confidential.
2. I. G. Poppoff and others; “Fall-Out Particle studies”; Project ~. 5a-2, OPeratiOn ‘an~e>
WT- 395 (in WT - 371), April 1952; u. S. Naval Radiological Defe,.se Laboratory, ~ Francisco
24, California; Secret Restricted Data..
3. R. K. Laurino and T.G. Poppoff; “Contamtition Patterns at operation J~gle”; ‘swL-399, 30 April 1953; U.S. Naval Radiological Defense Laboratory, = Fr~cisco 24> Cdtiornia;Unclassified.
4. W. B. Heidt, Jr. ad others; .’Na~e, ~tensity, ~d Distribution of Fd.1-@t from Mike
Shot”; Project 5.4a, Operation Ivy, WT-615, April 1g53; U.s. Nav31 Radiologic~ Defense Lab-
5. R. L. Stetson and others; “Distribution and Intens~ty of Fallout”; Project 2.Sa, OperationCastle, WT–915, January 1956; U.S. ~av~ ~diologic~ Defense Laboratory, - Francisco z%
California; Secret Restricted Da
6. Headquarters, Joint Task Force Seven, letter; Subject: “Radiological Surveys of SeveralMarshall Island Atolls ,“ 18 March 1954. ./
7. T. R. Folsom and L. B. Werner; “Distribution of ~dioactive Fallout by SurveY ~d AnalY-ses of Sea Water”; Project 2.7, Operation Castie, WT - 935, April 1959; Scripps hStitUtiOn OfOceanography, La JoHa, California, md U. S. pJav~ &diologicfl DefenSe Laboratory) San Fran-cisco 24, California; S&ret Restricted Data.
— .8- H. D. LeVine ad R T. Graveson; “%dioactive ~bris from Operation Castle Aerial Sur-
vey of Open Sea Following Yankee-Nectar”; NYO-4618.
9. M. B. Hawkins; “Determination of Radiological H~ard to personnel”; Project 2.4, Opera-tion Wigwam, WT - 1012, May 1957; u. s. Nav~ ~di~iogi~~ Defense Laboratory, San Francisco24, California; off ic iaf Use Only.
10. R. L. Stetson and others; “Distribution and ~tensity of Fallout from the UndergroundShot”; project ‘2.s.2, operation Teapot, WT_ 1154, ,March lg58; U. S. Naval Radiological DefenseLaimratory, San Francisco 24, California; Unclassified.
I 11. D. C. Borg ad others; “Radioactive F~l-out Hazards from Surface Bursts of Very High3Yield Nuclear Weapons”; AFSWP-50?, May 1954; Headquarters, Arn~ed Forces Special Weaponsproject, Washington 13, D. C. ; Secret Restricted Data.
12. “Fall-Out Symposium”; AFSWP-895, January 1955; Armed Forces SPeci~ WeaPonsproject, Washington 25, D. C. ; Secret Restricted Data.
13. V. A. J. VanLint and others; “Ftiout Studies During operation Redwing”; Program 2,operation Redwing, ITR- 1354, october 1956; Field Command, Armed Forces Special Weapons%OjeCt, ~dia ~se, ~buquerque, New ~le~ico; Secret Restricted Mta.
14. R. T. Graveson; “Fallout Location and Delineation by Acrid surveys”; Prolect 2.641@eration Redwing, ~R- 13] 8, February 195’7; u. s. AEC He~th and Safety Laboratory, NewYork, New York; Secret Restricted Dab.—
157

15. F.D. Jennings and others; “Fallout Studies by Oceanographic Methods”; Project 2.62a,operation Redwing, ITR - 1316, November 1956; University of California, Scripps institution 01
Oceanography, La Jolla, California; Secret Restricted Data.
16. M. Morgenthau and others; “Land Fallout Studies”; Project 2.65, Operation Redwing,
ZTR- 1319, December 1956; Radiological Division, Chemical Warfare Laboratories, Army
Chemical Center, Maryland; Secret Restricted Data.
17. C. F. Miller and P. Loeb; “The Ionization Rate and Photon Pulse Rate Decay of FissionProducts from Slow Neutron Fission of U235”; USNRDL-TR-247, August 1958; U. S. Nav~ Radiol-ogical Defense Laboratory, Ean Francisco 24, California; Unclassified.
18. P. D. LaRiviere; “The Relationship of Time of Peak Activity from Fallout to Time Of
Mrival”; USNRDL - TR- 137, February 1957; U. S. Naval Radiological Defense Laboratory, SanFrancisco 24, California; Unclassified.
= J. W. Hendricks; “Fallout Particle Size Measurements from Operation Redwing”;USNRDL-TR-264, July 1958; U. S. Naval Radiological Defense Laboratory, San Francisco 24,California; Confidential.
20. S. Baum; “Behavior of Fallout Activity in the Ocean”; NRDL Technical Report (in publi-cation); U. S. Naval Radiological Defense Laboratory, San Francisco 24, California; Secret.
21. C. E. Adams; “The Nature of Individual Radioactive Particles. II. Fallout Particlesfrom M-Shot, Operation Ivy”; uSNRDL-408, 1 July 1953; U. S. Naval Radiological Defense Lab-oratory, San Francisco 24, California; Confident ial.
22. C. E. Adams; “The Nature of Individual Radioactive Particles. IV. Fallout Particlesfrom th First Shot, Operation Castle”; USNRDL-TR-26, 17 January 1955; U.S. Naval Radio-logical Defense Laboratory, San Franc isco 24, California; Confidential.
I
23. C. E. Adams; “The Nature of Individual Radioactive Particles. V. Fallout Particlesfrom Shots Zuni and Tewa, Operation Redwing”; USNRDL-TR-133, 1 February 1957; U. S. NavalRadiological Defense Laboratory, San Franc isco 24, California; Confidential.
24. C. E. Adams and J. D. O’Connor; “The Nature of Individual Radioactive Particles. VI.Fallout Particles from a Tower Shot, Operation Redwing”; uSNRDL-TR-208, December 1957;U.S. Naval Radiological Defense Laboratory, San Francisco 24, California; Unclassified.
25. W. Williamson, Jr. ; “Investigation and Correlation of Some Physical Parameters ofFallout Material”; USNRDL-TR-152, 28 March 1957; U. S. Naval Radiological Defense Labora-tory, San Francisco 24, California; Unclassified.
26. J. Mackin and others; “Radiochemical Analysis of Individual Rad~oactive Fallout Parti-cles from a Land Surface Detonation”; USNRDL-TR- 386, September 1958; U.S. Naval Radio-logical Defense Laboratory, San Francisco 24, California; Unclassified.
27. C. D. Coryell and N. Sugarman; “Radioc heroical Studies: The Fission Products”; Book 3;McGraw-Hill, 1951.
28. %adiochemical Procedures in Use at the University of California Radiation Laboratory,Liver more”; UCRL-4377, 10 August 1954; University of California Radiation Laboratory, Liver-more, California.
29. L. D. McIsaac; “Determination of Np2U, “Total Fission s,” Mogg, and Ce14i in FissionProduct Mixtures by Gamma-Ray scintillation Spectrometry”; USNRDL-TR-72, 5 January 1956;U.S. Naval Radiological Defense Laboratory, San Franc isco 24, California; Unclassified.
158
30. H. K. Chan; “Activity- Size Relationship of Fallout Particles from Two Shots, OperationRedwing”; USNRDL-TR-314, February 1959; U.S. Naval Radiological Defense Laboratory, SanFrancisco 24, California; Unclassified.

31. N. H. Farlow and W. R. ScheH; “Physical, Chemical, and Radiologic~ Properties of
Slurry Particulate Fallout Collected During Operation Redwing”; USNRDL-TR- 170, 5 May 1957;U.S. Naval Radiological Defense Laboratory, San Franc isco 24, California; Unclassified.
32. W. R. Schell; “Physical Identification of Micron-Sized, Tnsoluble Fallout Particles CoI-Iected During Operation Redwing”; USNRDL-TR-364, 24 September 1959; U.S. Naval Radiolog-ical Defense Laboratory, San Francisco 24, California; Unclassified.
33. N. H. Farlow; “Quantitative Analysis of Chloride Ion in 10-G to 10-12 Gram Particles”;Analytical Chemistry; 29:883, 1957.
I .-L. R. Bunney and N. E. BaUou; “Bomb- Fraction Measurement Techniques”; USNRDL -
~
TR-176, September 1957; U.S. Naval Radiological Defense Laboratory, San Francisco 24, Cali-ornia; Secret Restricted Data.
35. M. Honma; “Flame Photometric Determination of Na, K Ca, Mg, and Sr in Seawater”;USNRDL-TR-62, September 1955; U.S. Naval Radiological Defense Laboratory, San Francisco24, California; Unclassified.
36. M. Honma; “Flame Photometric Determination of Na, ~ Ca, Mg, and Sr in Coral”;Unpublished data; U. S. Naval Radiological Defense Laboratory, San Francisco 24, Cal i.fornia.
37. F. D. Snell and C. T. Snell; “Calorimetric Methods of Analysis”; Vol. II Third Edition;D. Van Nostrand Co., New York; 1949.
38. A. P. Smith and F. S. Grimaldi; “The Fluorimetric Determination of Uranium in Non-saline and Saline Waters, Collected Papers on Methods of Analysis for Uranium and Thorium”;Geological Survey Bulletin 1006; U.S. Government Printing Office, Washington, D. C. ; 1954.
39. A. E. Greendale and M. Honma; “Glove Box and Associated Equipment for the RemovaIof Radioactive Fallout from Hexcell Collectors”; USNRDL-TR- 157, May 1957; U.S. Naval Radio-logical Defense Laboratory, San Franc isco 24, California; Unclassified. -
40. M. Honma and A. E. Greendale; ‘“Correction for Hexcell Background in Fallout Samples”;Unpublished data; U. S. Naval Radiological Defense Laboratory, San Francisco 24, California.
41. R. C. Belles and N. E. Ballou; “Calculated Activities and Abundances of Uzx FissionProducts”; uSNRDL-456, August 1956; U.S. Naval Radiological Defense Laboratory, San Fran-cisco 24, California; Unclassified.
42. C. F. Miller; “Response Curves for USNRDL 4-Pi Ionization Chamber”; USNRDL-TR-155, May 1957; U. S. Naval Radiological Defense Laboratory, San Francisco 24, California;Unclassified.
43. P. D. LaRiviere; “Response of Two Low-Geometry Scintillation Counters to Fission andOther Products”; USNRDL-TR-303, February 1959; U.S. Naval Radiological Defense Labora-tory, san.~r~cisco 24, California; Unclassified.
44. C. F. Miller; “Proposed Decay Schemes for Some Fission-Product and Other Radionu-clides”; USNRDL-TR-160, 17 May 1957; U. S. Naval Radiological Defense Laboratory, SanFrancisco 24, California; Unclassified.
—45. C. F. Miller; “Analysis of Fallout Data. Part III; The Correlation of Some Castle Fallout
Data from Shots 1, 2, and 3“; USNRDL-TR-222, May 1958; U.S. Naval Radiological Defense Lab-oratory, an Fr~cisco 24, California; Secret Restricted Data.
46. V. A. J. VanLint; “Gamma Rays from Plane and Volume Source Distributions”; Program2, Operation Redwing, ITR - 1345, September 1956; Weapons Effects Tests, Field Command,Armed Forces Special Weapons project, Sandia Base, Albuquerque, New Mexico; Confidential
Restricted Data.
159

47. “The Effects of Nuclear Weapons”; U.S. Atomic Energy Commission, Washington, D. c
June 1957; Unclassified.“~
48. L. E. Glendenin; “Determination of Strontium and Barium Activities in Fission”; NNEs
IV, 9, Paper 236, 1951.
49. D. N. Hume; “Determination of Zirconium Activity by the Barium Fluozirconate Method”.
NNES IV, 9, Paper 245, 1951.9
50. E. M. Scadden; “Improved Molybdenum Separation Procedure”; Nucleonics 15, 102, 1957.
51. L. E. Glendenin; “Improved Determination of Tellurium Activity in Fission”; NNES Iv,
9, Paper 274, 1951.
52. E. Mizzan; “ Phosphotungstate Precipitation Method of Analysis of Radioactive Cesium
in Solutions of Long-Lived Fission Products”; AECL Report PDB- 128, July 1954.
53. L. E. Glendenin and others; “Radiochemical Determination of Cerium in Fission”; Ana,L.
Chem. 27, 59, 1955.
54. L. Wish and M. Rowell; “Sequential Analysis of Tracer Amounts of Np, U, and PU in
Fission-Product Mixtures by Anion Exchange”; USNRDL-TR-117, 11 October 1956; U. S. Naval
Radiological Defense Laboratory, San Francisco 24, California; Unclassified.
Fission Products”; ORNL-1783, November
1955; Oak Ridge National Laboratory, Oak Ridge, Tennessee; Unclassified.+
lysis of Gamma Radiation from Fallout from Opera-tion Redwing”; USNRDL - TR- 146, 29 April 1957: U. S. Naval Radiological Defense Laboratory,San Francisco 24, California; Confidential Restricted Data. /
58. “The Effects of Atomic Weapons”; U. S. Atomic Energ Commission, Washington, D. C.,Revised September 1950; Unclassified.
59. K. Way and E. P. Wigner; “The Rate of Decay of Fission Products”; MDDC 1194, August
1947; Unclassified; also Phys. Rev. 73, 1318, 1948.
60. H. F. Hunter and N. E. Ballou; “Sim~tieous slow Neutron Fission of U2S Atoms. Indi-vidual Total Rates of Decay of the Fission Products”; USNRDL ADC-65, April 1949; U.S. NavalRadiological Defense Laboratory, San Francisco 24, California; Unclassified.
61. C. F. Miller; “Gamma Decay of Fission Products from the Slow-Neutron Fission of U2S”;USNRDL-TR- 187, 11 July 1957; U. S. Naval Radiological Defense Laboratory, San Francisco 24,California; Unclassified.
62. “Radiological Recovery of Fixed Milit~ Installations”; Navy, Bureau of Yards and
Docks, Na~Docks TPPL-13; Army Chemical Corps TM 3-225, interim revision, April 1958;Unclassified.
763. E. R. Tompkins and L. B. Werner; “Chemical, Pnii and Radiochemical Character-
istics of the Contaminant”; Project 2.6a, Operation Castle, WT-917, September 1955; U.S.Naval Radiological Defense Laboratory, San Francisc 024, California; Secret Restricted Data.
—64. H. V. Sverdrup, M. W. Johnson, and R. H. Fleming; “The Oceans, Their Physics, Chem-
istry, and General Biology”; Prentice- Hall, New York, 1942.
65. K. O. Emery, J. I. Tracey, Jr., and H. S. Ladd; “Geology of Bikini and Nearby Atolls.Bikini and Nearby Atolls: Part 1, Geolog#; Geological Survey Professional Paper 260-A, U.S.Government Printing Office, Washington, D. C. , 1954.
66. S. C. Foti; “Construction and Calibration of a Low Geometry Sc instillation Counter” ; Un-,
160 I

published data, U.S. Naval Radiological Defense Laboratory, San Franc isco 24, California.
67. E. A. Schuert; “A Fallout Forecasting Technique with Results Obtained at the Eniwetok
proving Ground”; USNRDL-TR- 139, 3 April f 957; U.S. Naval Radiological Defense Laboratory,
sa.n Francisco 24, California; Unclassified.
68. E. A. Schuert; “A Fallout Plotting Device”; USNRDL-TR-127, February 1957; U.S. NavalRadiological Defense Laboratory, San Francisco 24, California; Unclassified.
69. L. mISEeu, Jr. ; Cloud ph
L
otograpny”; P reject 9. la, Operation Redwing, ITR- 1343,
ch 1957; Edgerton, Germeshausen and Crier, Inc. ~ Boston, Massachusetts; Secret For- 1erly Restricted Data. \
Meteorological Report on Operation Redwing; Part I, “Meteorological Data,” Volumes1, 2, and 11 and Part II, “Meteorological Analyses,” Volumes 1, 2, and 3; Joint Task Force 7;
JT.FMC TP-1, 1956; Unclassified.
71. D. F. Rex; “Vertical Atmospheric Motions in the Equatorial Central Pacific’”; Joint Task
Force ?’ Meteorological Center, Pearl Harbor, T. H. ; Unclassified.
72. J. C. Kurtyka; “Precipitation Measurements Study”; State of Illinois Water Survey Divi-sion, Report of Investigation No. 20, 1953.
73. L. E. Egeberg and T. H. Shirasawa; “Standard Platform Sampling Bias Studies, Part I,
Preliminary Studies of Airflow”; USNRDL-TM-70, 25 Febrwy 1957; U.S. Naval RadiologicalDefense Laboratory, San Francisco 24, California; Unclassified.
74. H. K. Chan; “Analysis of Standard Platform Wind Bias to Fallout Collection at OperationRedwing”; USNRDL-TR- 363, September 1959; U.S. Naval Radiological Defense Laboratory, SanFrancisco 24, California; Unclassified.
75. W. W. Perkins and G. Pence; “Standard Plafform Sampling Bias Studies, Part ~ Rain-fall Bias Studie s“; USNRDL Technical Memorandum (in publication); U.S. Naval RadiologicalDefense Laboratory, San Franc isco 24, California; Unclassified.
76. P. Brown and others; “Gain sure versus Distance”; Project 2.1. Omratkm Red-. .wing, WT- 1310, 20 February 1960; U. S. Army Signal Engineering Laboratories, Fort Monmouth,New Jersey; Secret Restricted Data.
161

Appendix A .
/)YSTRUMEW2V70N,
A. 1 COLLECTOR IDENTIFICATION
Collector designations are shown in Figure Al.
A.2 DETECTOR DATA
A.2.1 End-Window Counter.
Crystal dimensions and type: li~-inch diameter
x 1A tich thick, Nal(Tl), HarshawPhotomultiplier tube ~: 6292 DuMont
Scaler types: Model 162 Nuclear Instrument Cor-poration, and Model 182 Nuclear-Chicago (in tandem)
Pb shield dfzmnsiona: 8~-inch outside diameterx 20 inches high x 11/2inches thick; additional 2-inchthickness in SW Elmer laboratory
Counting chamber dimensions: 5i/2-inch diameter
x 4 inches high
AI absorber thickness: ‘~ inch
Shelf distances from bottom of absorber:
Shelf Distance
cm
1 1.0
2 2.6
3 4.2
4 5.8
5 ‘7.4
Ratios to Shelf 5 (most commonly used) for cen-tered CSIST point source:
Shelf Ratio——
1 5.872 3.023 1.884 1.31 *
5 1.00
Minimum count rate requiring coincidence losscorrection: 1.! x 106 c ounts/min
Counting procedure: ordinarily 3- to l-minuteintervals for each sample
A-2.2 Beta Counter.
Gas proportions: 90 percent ~ 10 percent CC+Pb shield dimensions: 81~-inch outaide diameter
x 12 inches high x 11/2 inches thick; additional 2-inchthickness in Site Elms r laboratory
Counting chamber dimensions: 5i&inch diametarx 4 inches high
Al window thickness: 0.92 mg/cm2
Shelf geometries from bottom of window:
Shelf DistazcePhysical Geometry
.— Correctioncm
1 0.85 0.26282 1.50 0.15593 2.15 0.09584 3.75 0.03635 5.35 0.0177
Minimum count rate requiring coincidence loss cor-rection: 3.0 x 10S counts/rein
A2.3 4-7T Ionization Chamber (AAYtiW2il and StaZXI.arda Branch). (Two newer chambers of modified de-sign were also used. The response of these to 100 pg
of Ra = 700 x 10-g ma at 600 psi; therefore, all read-ings were normalized to the latter value. Use of pre-cision resistors (1 percent) eliminated scale correctionfactors. )
Gas type SZXIpressure: A -600 psiShield dimensions: Pb - 19-fnch outside diameter
x 22 inches high x 4 inches thick; additional l-footthickness of sandbags in Site Elmer laboratory
Counting chamber dimensions: n-inch diameter
x 14 inches high
Thimble dimensions: ls~-inch inside diameter x12 inches deep
Useful range: -217 x 10-11 ma (background) ta
200 x 10-8 ma
Correction factors to equivalent 109 scale:
Scale Factor——- ohms
~oll 0.936~olo 0.963109 1.000~oa 1.000
Response versus
Distance fromBottom of Tube
in
oto3. 3.5 to 5.5
sample (Ra) position:
RelativeResponse
gd
10099 to 92
Response to 100 pg Ra: 5.58 x 10⁻⁹ ma at -600 psi
Efficiency factors relative to CoGofor various nu-clides:
162

Nuclide Factor
~e14i
H&All’”@37
%M
co*
I&~a24
0.1860.2820.3550.6230.8841.0001.2051.312
A.2.4 Well Counter.Nuclear-Chicago Model DS-3Crystal dimensions and type: l’~-inch diameter
x z inches thick, NzI(T1)Well dimensions: ‘~-inch diameter x llA inches
&epPhotomultiplier tube type: 6292 DuMontScaler type: Model MPC-1 Berkeley, or Nuclear
fnatrument Corporation 162 with Nuclear-Chicago 182in tandem
Pb shield thickness: l% inches, with 3&inch diam-eter hole above crystal well; additional 2-inch thick-mss in YAG 40 laboratory
Counting rate versus sample volume in test tube(15 x 125 mm):
Sample RelativeVohlzm count Rataml pet
0.01 1001.81 99.2
3.9 (- well depth) 90.6
Efficiency for several nuclides:
Nuclids Efficiencycounts /dis
~ _—
p 0.42co~ 0.43~iJl 0.51
Minimum count rate requiring coincidence losscorrection: 1.0 x 10’ counts/rein
Counting procedure: minimum of 104 counts toQUintain a statistical error of -1.0 percent
A.2..3 2fJ-Chnnel Analyzer.
Crystal dIXEnSi031S aud type: 2-inch diameter x 2
~hes thick, NaI(Tl)Glow transfer tube types: GC-1OB and GC-1ODFast register type: SodecoVolt* gti (withdelay Mm pulse shaping): 1,000
Attenuation (with ladder a.ttanuator): 63 decibels in
l*ci&d etepsPb shield thicbss: -2 h2Ch4iS
Counting chanter dimensions: 8-inch diameter
x 31Ainches highshelf distances from bottom of detector:
Shelf Distancescm
1 2.072 4.763 5.254 6.84
Tray distance from bottom of detector when outsideof ‘&inch diameter collimator: 13.95 cm
233 ce141 H~03 , Na22Calibration standards: Ba , , *and CS’37
Calibration procedure: om per day and one follow-
ing each adjustment of amplifier or detector voltzgeCounting procedure: equal counting times for each
series on a given sample
&2.6 Doghouse Counter (Reference 43)Crystal dimensions and type: l-inch diameter x 1
inch thick, Nal(Tl), Harshaw aluminum absorber 1~-inch thick
Photomultiplier tube ~: 6292 DuMontScaler typ: Model 162 Nuclear instrument Cor-
poration, ad Mod?l 182 Nuclear-Chicago (in tandem)Pb shield dimensions (detector): 10-inch diameter
x 20 inches high x llA inches thickPb shield thicknese (counting chamber): 2 inchesCounting chamber dimensions: 20 x 24 x 34 inches
highSize of hole in roof of counting chamber for detec-
tor: 7-inch diameterDistance from bcttom of sample tray to bottom of
crystal: 36 inchesSample tray dimensions: 18 x 21 x 2 inches deepCounting efficiency for several point-source nu-
clides, centered in bottom of tray with ‘~-inch alu-minum cove r in place:
Nuclide counts/dis x 10-’
Naa 1.70
NaU 0.936
# 0.151*46 1.16
cow 1.02~95 0,506c8i37-Bai3Tm 0.548C=141 0.622~198 0.711
HI&03 0.842
Relative counter photon efficiency, computed fortotalaluminum thickness = % inch (3.43 @/cm*):
EmrgyMev
Efficiencypet
0.01 00,02 0.0034
0.03 3.24
0.05 33.3
0.07 48.7
0.10 57.8
0.1s 63.7
163

0.20
0.30
0.50
0.70
1.00
1.50
2.00
3.00
4.00
61.554.043.337.533.429.527.125,324.4
Minimum count rate requiring coincidence 10SS
correcticm: 1.0 x 10Scounts/reinCounting procedure: ordinarily 3- to l-minute
intervals for each sample; trays decontaminated andcounted with ‘/t-inch aluminum cover in place
A2.7 Dip Counter.Crystal dillleIWiOti and type: li~-inch diameter
x 1 inch thick, NaI(Tl)Photomultiplier tube type: 6292 DuMontScaler type: Same as doghouse counterShield thickness and counting chamber dimensions:
Same as doghouse counterSample volurm: 2,000 ml (constant geometry)Counting efficiency for several nuclides: (Private
communication from J. O’Connor, NRDL)
Nuclide
CeMl
HI&Os@6
@laT
NW
Sc’aC060
Na~
counts/dM x 10-2
1.20
1.72
1.28
0.916
0.870
1.76
1.56
1.29
Minimum count rate requiring coincidence losscorrection: 2 x 10⁶ counts/rein
Counting procedure: 2,000-ml samples at constantgeometry; counting intervals selected to maintain a
A2.8 Single-Channel Analyzer (Nuclear Radi~imBranch) (Reference 57) -
—,crystal dimensions and type: 4-inch ~-eter x q
inCheS thick, Naf(Tl)PhotomuMpIier tube type:6364 DuMontp~e-height analyzer type: Model 51O-SC Ato~
Inemlnm?uts
Pb shield thiclmss: 21/2inchesCollimator dimensions: ‘&fnch diameter x 6 k~~
long ;
Sample container type and size: glass VM, ‘&*diameter x 2% inches long
Diatame from bottom of S_Ple tO co~imtir o~w-–ing: 2 inches
Cabration standards: Na=, and H#03 -
JL2.9 Gamma Time-Intensity Recorder. The en-e~ and directional response characteristics of t&standard TfR detector, consisting of four ion cham-ters (4 k, Bm, and Cm) with a Protectiw dome,were determhd at NRDL. (Mea8ureIMn@ ti cal-culations were carried out by G. Hitchccck, T.sh.iraaaw~ and R. Caputi. )
A special jig permitted both horizontal ~ vertical
rotation abcut the center of the chamber under study.m-ectional response was measured and recorded con-
tinuously for 360 degrees in planes at 30-degreeincrements through the longitudinal axis of the Cmchamber. Relative response data was obtained byeffectively exposing the chamber to a cons-t ioniza-tion rate at six different energies-four X-ray ener-gies: 35 kev, 70 kev, 120 kev and 180 kev; and twosource energies: CSIST (1).663 hfeV) and Coa (1.2 hiOV).
The results for three mutually perpendicular planarresponses have been illustrated graphically to show:(1) shadowing interference ty other chambers in thehorizontal plane (Figure A2), (2) maximum shadowinginterference by otbr chambers in the vertical plsm(Figure A.3), and (3) minimum shadowimg interferenceby otkr chambers in the vertical pl~ (Figure &4).
statistic al error <1.0 percent
164

H76
G69E55
165

Ii
I
I
-—-180 KEV — 35 KEV
.—. —” 120 KEV .----- 1,2 MEV
.....000”=70 KEV –— 0.662 M EV
Figure .4.2 Shadowing interference in horizontal plane for TIR.
166

..—.” 180 KEV — 35 KEV
.—. —. 120 KEV ..---- 1.2 MEV
............ 70 KEV -– 0.662 MEV
Figure A3 Maximum shadoti~ interference in vertical pkne for TIR.
167
180—
..—..180 KEV — 35KEV
.—.—. 120 KEV ..---- 1.2 MEV
........... 70 KEV –—0.662 MEV
Figure A.4 Minimum shadowing interference in vertical plane for TIR.
168

Appendix %
IWASUR5W)VTS
B.1 BUILDUP DATA
169
TABLE B. 1 OBSERVED IONIZATION RATE, BY TIhlE-lNTENSITY RECORDER
Station md Shot Station and Shol Sbtion and Shot Station and Shot
yAG 40-B, No. 9 ZU
H+h~ mrfir
3.37
3.57
3.73
4.07
4.3’7
5.07
6.07
7.07
8.07
9.07
11.1
14.1
18.1
22.1
26. I
30.1
42.1
54.1
66.1
78.1
2.28
16.8
44.2
129
470
1,480
3,340
1,660
1,360
1,240
966
754
588
478
404
340
233
181
129
105
YAG 40, No. 13 (Deck) ZUH+hr rihr
3.53
3.63
3.70
3.77
3.85
3.97
4.05
4. 1?4.32
4.57
4.77
4; 95
5.08
5.25
5.40
5.57
5.73
5.90
6. O?
6.32 .
6.57
6.82
7.07
7.32
7.57
7.62
8.07
6.32
6.57
6.82
9.07
0.0165
0.0318
0.0386
0.0722
0.0847
0.128
0.165
0.249
0.480
0.9571.31
L 92
2.37
3. 2s
4.06
4.58
5.67
5.76
6.20
6.75
7.57
7.57
7.29
7.20
6.94
6.66
6.30
6.20
6.02
5.76
5.67
YAG 40, No. 13 (Deck) ZUH+hr r/hr
9. 3?
9.57
9.82
10.110.6
11.1
11.6
12.1
12.6
13.1
13.6
14.1
14.6
15.1
15.6
16.1
16.6
17.1
17.6
18.1
19.1
20.1
21.1
22.1
24.1
26.1
28.1
30.1
34.1
38.1
42.1
46.1
50.1
54.1
58.1
62.1
66.1
72.1
78.1
80.1
5.49
5.31
5.13
5.13
4.68
4.41
4.14
3.97
3.97
3.70
3.61
3.34
3.43
3.25
3.07
3.07
2.90
2.90
2.81
2.72
2.62
2.45
2.36
2.28
2.10
1.92
L 75
1.66
1.49
1.31
1.17
1.11
0.940
0.844
0.740
0.679
0.635
0.583
0.539
0.495
YAG 39-C, No. 9 ZUH+hr mr/hr
12.7 0.55913.1 0.706
13.6 0.765
14.1 0.926
15.1 1.47
16.1 2.96
17.1 4.29
t8. 1 6.54
19.1 8.36
20.1 9.42
21.1 10.2
22.1 10.2
23.1 10.8
YAG 39-C, No. 9 ZU YFNB 13-E, LUH+h~ mrl’hr H+rnln r/’hr
24.1
25.1
27.1
29.1
30.1
32.1
34.1
36.1
38.1
40.1
42.1
46.1
50.1
54.1
58.1
62.1
66.1
70.1
74.1
78 1
80.5
11.1
11.4
11.8
11.3
11.3
10.5
10.2
8.96
8.51
8.21
7.74
6.54
6.25
5.64
5.19
4.89
4.60
4.29
4.14
4.00
3.85
YAG 39, No. 13 (Deck) ZUH + hr mr/hr
13.0
14.0
15.0
16.0
17.0
18.0
19.0
20.0
21.0
24.0
25.0
29.0
30.0
31.0
32.2
42.0
48.0
49.0
50.0
52.0
66.0
68.0
69.0
70.0
72.0
3.24
4.86
6.66
13.1
17.2
25.4
31.8
34.2
34.9
37.4
37.6
36.3
36.2
34.6
33.5
26.3
21.8
20.8
19.9
19.8
15.8
15.4
14.9
14.6
14.2
20
21
22
23
24
27
28
29
55
180
195
210
300
420
600
1,015
1,495
1,975
3,415
0.0016
0.0070.0090.0160.0680.310.550.722.691.831.691.50.960.660.430.220.160,0780.041
How F, ZUH+m.in rh
23
24
26
27
2626+
30
32 .
33
34
41
46
49
54
59
62
64
66
70
74
60
87
97
106
112
120
130
151
200
400
0.0055
0.0086
0.013
0.051
0.092
0.37
0.47
0.66
0.58
0.73
0.67
1.09
1.61
2.13
257
2.67
2.87
2.74
2.57
274
2-61
2.57
2.46
2.48
2.39
2.17
2.00
1.70
1.17
0.54
170

TABLE B. I CONTINUED
s~tion and Shot Station and Shot Station and Shot Station and Shot
y~ 29-G ZUE+mm r/hr
10 0.0005
20 0.03
26 0.26
Z’1 0.54
28 0.83
29 0.99
31 1.32
33 3.10
35 4.0
36 4.94
43 9.21
49 9.84
94 7.05
124 5.64
139 4.7
184 3.06
274 2.”12
424 1.36
484 0.99
544 0.80
.574 0.78
649 0.70
799 #’q 0.551,624 0.31
2,524 0.193,424 0.15
YAG 40-B, ifO. 9 FL
n+hr mr/hr
6.00
6.00
9.00
10.0
11.0
12.0
15.0
16.0
1?. o
18.0
19.0
20.0
21.0
22.0
23.0
25.0
30.0
35.0
40.0
45.0
50.0
55.0
58.0
63.0
70.0
75.0
79.0
0.050
0.550
5.10
17.4
48.0
71.1
71.1
81.5
81.5
81.5
71.1
71.1
69.7
59.4
58.2
53.0
39:’0
35.2
30.0
27.6
16.2
14.9
13. ‘1
12.4
11.1
10.4
9.20
YAG 40, No. 13 (Deck) FL~+ hr mr/hr
6.00
8.00
8.57
9.00
9.57
10.0
11.0
12.0
13.0
14.0
15.0
16.0
17.0
18.0
19.0
20.0
21.0
22.0
23.0
24.0
30.0
35.0
40.0
45.0
50.0
55.0
58.0
63.0
70.0
75.0
79.0
0
1.93
6.18
17.4
3.%o
61.9
142
225
246
237
237
248
259
248
237
231
225
214
197
180
145
125
109
88.4
56.8
52.3
48.6
44.4
39.9
37.6
22.1
YAG 39-C, No. 9 FLIi+hr mr/hr
4.12 0.061
4.37 0.411
4.53 0.646
4.78 1.01
4.95 1.86
5.10 3.305.3a 6.19
5.66 6.23
6.05 10.7
6.27 12.3
6.52 15.4
6.72 19.4
7.02 21.9
7.28 21.9
7.50 23.7
7.75 26.1
6.02 28.6
8.28 29.9
8.57 29.9
8.77 32.3
9.19 32.9
9.60 31.7
YAG 39-C. No. 9 FL YAG 39, No. 13 (Deck) FLH+hr mr/hr H+hr mr/hr
10.1
10.5
11.0
11.6
12.1
12.6
13.1
13.6
14.1
15.1
16.0
17.0
18.0
19.0
20.0
21.0
22.0
23.0
24.0
26.0
28.0
30.0
32.0
34.0
36.0
38.0
40.0
45.0
50.0
55.0
60.0
64.9
70.1
75.0
80.0
32.335.533.437.236.034.633.432.331.029.227.326.124.923. ‘122.521.319.419.417. -716.314.613.412.411.611.010.49.808.716.555.775.044.684.334.153.50
YAG 39, No. 13 (Deck) FLH + hr mr/hr
4.62 3.34
5.23 21.8
5.57 42.9
6.57 45.6
7.07 76.4
7.57 87.8
6.5’7 121
9.00 121
10.0 121
11.0 141
12.0 131
13.0 121
15.0 102
18.0 63.0
22.0 69.0
26.0 55.0
30.0 46.5
36.0 39.2
42.0 33.747.0 28.248.0 21.854.0 15.466.0 10..!375.0 9.2776.0 6.3080.0 6.04
Ml’ 611-D, No. 1 FL
H+hr mr/’hr
6.57 0.14
7.32 0.67
7.57 22
7.90 15.3
6.40 32
6.73 57
6.90 76
9.07 99
9.23 86
9.40 83
9.57 80
10.1 76
10.9 71
12.1 65
13.1 60
14.1 55
15.6 48
17.6 44
19.6 3821.6 35
23.6 32
YFNB 13-E FLH+min r/hr
21 0.0016
24 0.005426 0.004830 0.030
32 0:S6
35 2.26
37 6.8277 21.8
137 11.5
257 5.5
377 2.5
437 1.9
491 1.6
557 1.5
617 1.2
617 1.4
f171

TABLE B.1 CONTINUED
Stat, on and Shot Station and Shot Station and Shot Station and Shot ~—
YFNB 29 H FLH+ min r/hr
35
36
38
40
42
44
45
51
53
54
56
58
77
91
100
175
250
470
630
850
1,100
1,500
1,600
0.004
0.0046
0.011
0.016
0.042
0.075
0.10
0.27
0.38
0.49
0.57
0.63
0.96
0.96
0.94
0.55
0.33
0.14
0.077
0.055
0.043
0.024
0.0198
YAG 40-B, No. 9 NAIi+hr mrhlr
5.07
6.02
6.23
6.36
6.62
6.87
6.96
7.09
‘I. 14
‘1.16
7.26
7.36
7.52
7.73
7.93
8.10
8.45
6.69
8.80
9.12
9.27
9.42
9.55
9.70
9.90
10.1
10.3
10.5
10.6
0.1460.1200.1750.2600.3700.5900.800L 441.30L 882.313.613.554.304.805.557,059.30
12.119.022.224.126.028.331.033.634.a36.742.5
YAG 40-B, No. 9 NAH+hr mr/hr
11.0
11.3
11.6
11.9
12.1
12.3
12.5
12.7
12.9
14.0
15.0
16.0
17.0
17.6
16.0
19.0
20.0
21.0
22.0
23.0
24.0
25.0
26.0
27.0
26.0
29.0
30.0
32.0
34.0
36.0
38.0
40.0
42.0
44.0
46.0
48.0
51.0
54.0
55.0
56.0
58.0
59.0
60.0
62.0
65.0
69.0
75.0
45.7
49.3
51.2
52.7
52.7
55.3
55.3
57.6
55.3
55.3
55.3
55.3
55.3
51.4
50.2 . .
48.8
46.3
25.9
21.0
18.4
17.7
16.6
16.2
14.3
13.9
13.1
12.5
11.6
10.6
10.3
9. so
9.20
9.40
9.10
6.20
7.70
7.40
6.05
6.55
6.30
6.18
5.55
5.49
5.30
4.93
4.68
4.18
YAG 40, No. 13 (Deck) NA
H+hr mr/hr
4.83 0.200
5.57 0.556
6.12 0.608
6.65 1.80
6.97 3.15
YAG 40, No. 13 (Deck) NAH+hr mr/hr
7.18
7.30
7.47
‘1. 63
7.80
7.95
8.10
6.33
6.46
8.62
8.75
8.85
9.02
9.27
9.47
9.67
9.96
10.3
10.6
11.0
11.3
11.6
12.0
12.2
12.3
12.5
12.7
13.0
13.5
14.0
15.0
15.9
16.9
16.0
18.9
20.0
20.2
20.4
21.0
22.0
23.0
24.0
25.0
26.0
27.0
28.0
29.0
30.0’
32.0
34.0
36.0
36.0
40.0
42.0
44.0
46.0
48.0
6.64
10.0
11.4
12.4
13.7
14.3
13.1
13.0
13.5
16.0
16.6
27.4
36.2
51.4
56.5
63.9
74.5
60.2
92.0
103
120
122
125
129
126
129
120
116
113
113
105
103
101
91.4
87.0
82.5
70.1
36.2
27.4
24.1
21.3
21.9
20.8
19. ‘1
17.0
16.4
15.4
14.9
14.3
13.4
12.9
12.0
11.7
11.1
10.6
10,2
9.58
YAG 40, No. 13 (Deck) NA
H+hr mr/hr
50.2 9.15
52.1 7.64
54.0 7.62
56.0 4.79
57.9 4.46
60.1 4.35
64.0 4.08
68. I 3..91
72.0 3.48
74.9 3.32
YAG 39-C, No. 9 NAH+br mr/’hr
1.972.22
2.38
2.47
2.55
2.65
3.00
3.90
3.50
3.70
3.67
4.18
4.42
4.62
4.85
5.17
5.33
5.46
5.6’7
5.85
6.02
6.37
6.57
6.77
7.16
7.40
7.63
8.10
8.37
8.62
9.18
9.48
9.78
10.2
10.5
10.9
11.3
11.6
12.1
12.6
13.0
14.1
0.1614.00
14.421.433.548.266.366.295.7
141207372431481465498525507516516512 “481471445422400386361347329304289267259246232222207203193164168
172

TAB~ B.1 CONTINUED
~tion and Shot Station and Shot Station and Shot Station and Shot
YAG W-C, NO. 9 NA YAG 39, No. 13 (Deck) NA
B+hr mr/hr H+hr mr/lm
la 2
16.0
17.0
la o
19.0
20.0
21.0
22.0
23.0
24.0
26.0
m. a
28.0
30.0
32.0
34.0
36.0
36.0
40.0
42.0
44.0
46.0.
4a. o
50.0
55.0
59.0
60.0
64.0
70.1
73.9
149
80.0
60.7
58. I
56.953.1
45.8
36.1
34.7
32.4
29.9
25.0
22.6
22.0
21.4
19.6
16.4
17.8
17.2
16.0
15.3
14.6
13.9
13.2
11.7
10.6
11.7
10.1
9.15
6.43
YAG 39, No. 13 (Deck) NA
H+& mr/hr
1.82
2.30
2.37
2.43
2.50
2.682.78
3.00
3.12
3.40
3.65
3.90
4.12
4.32
4.57
4.82
5.00
5.32
5.57
5.82
6.00
6.32
0.78
11.0
18. ‘7
36.1
73.3
110
101
143
177
221
310
558
900
1,240
1.070
900
900
1,010
1,130
1,130
1,490
1,240
6.5’7
6.82
7.00
‘7.32
7.57
‘1.82
6.32
8.82
9.32
9.82
10.3
10.6
11.6
12.0
12.6
13.0
13.6
14.1
14.6
15.0
15.6
15.7
16.0
16.6
17.0
1.9.0
19.0
20.0
21.0
22.0
23.0
24.0
25.0
26.0
27.0
28.0
30.0
32.0
34.0
36.0
38.0
40.0
42.0
44.0
47.0
50.0
53.0
56.0
59.0
84.0
66.0
74.0
1,130
900
773
726
671
624
603
557
502
468
434
412
376
344
332
305
288
277
266
243
221
132
110
108
106
96.7
92.1
68.9
76.7
69.1
65.8
63.6
61.3
59.1
53.6
51.4
48.1
44.8
42.8
41.0
39.3
37.5
35.6
34.5
31.6
29.1
25.4
23.6
23.6
21.6
20.8
18.1
LST 611-D, ?40.1 NA
H+hr rfir
2.2 0.00042
2.4 0.00045
2.7 0.00051
2.9 0.00087
3.1 0.0015
3.2 0.0029
3.4 0.0044
3.7 0.0085
3.8 0.013
4.0 0.015
4.1 0.017
4.4 9.010
4.6 0.008
4. r 0.011
4.80 0.01094.9 0.0124.97 0.0125.07 0.0165.6 0.0426.1 0.0437.1 0.034
10.1 0.02014.1 0.01216.1 0.008118.1 0.006724.1 0.004427.0 0.0039
YFNB 13-E NAH+min r/hr
10
18
27
29
38
46
58
72
91
116
121
136
219
301
406
631
1,006
1,066
1,306
1,546
1,666
1,786
1,906
2,026
2,146
2,266
2,626
3,106
3,468
0.0047
0.037
0.80
4.04
8.5
7.0
4.6
3.4
2.75
2.3
2.1
L 8
1.0
0.67
0.41
0.20
0.08
0.059
0.042
0.036
0.033
0.031
0.046
0.056
0.056
0.0410.032
0.02
0.015
How F NAIi+tin rbr
6 0.001033 0.001145 0.001948 0.005653 0.04854 0.06955 0.08359 0.1166 0.14576 0.13793 0.13
100 0.135110 0.14120 0.146125 0.146134 0.148140 0.150
Malfunction
YFNB 29-H, NAH+ fin r/hr
11
40
45
47
50
51
52
53
54
60
72
60
104
180
205
255
330
400
420
480
610
780
920
1,000
1,005
1,150
1,250
1,300
1,600
1,900
2,400
2,700
0.0011
0.0012
0.0026
0.0091
0.033
0.062
0.075
0.079
0.083
0.084
0.10
0.116
0.108
0.087
0.080
0.066
0.047
0.035
0.030
0.026
0.018
0.013
0.011
0.0078
0.0054
0.0050
0.0040
0.0034
0.0028
0.0023
0.0020
0.0014
173

TABLE B.1 CONTINUED
station and Shot StatIon and Shot Station and Shot StatIon and Shot
YAG 40-B. No. 9 TEH+hr r/hr
4.35
4.60
4.734.95
5.20
5.43
5.58
5.88
6.10
6.38
6.62
6.85
7.10
7.28
7.70
8.23
8.75
9.25
9.75
10.3
10.8
11.2
11< ‘1
12.2
12.8
13.2
13.8
14.2
14. ‘1
15.2
15.8
16.2
16.7
17.2
17.8
16.2
19.2
20.2
21.2
22.2
23.2
24.2
25.2
26.2
27.3
26.2
29.3
30.2
31.2
32.2
33.4
34.1
35.3
36.1
38.4
40.4
42.2
0.0017
0.0057
0.0134
0.127
0.598
1.08
1.33
1.76
1.66
1.90
1.98
2.13
2.23
2.24
2.21
2.03
1.94
2.09
1.89
1.85
1.79
1.80
1.56
1.60
1.57
1.48
1.40
1.35
1.32
1.25
1.21
1.15
L 13
1.09
1.05
1.01
0.992
0.927
0.881
0.832
0.784
0.770
0.702
0.670
0.608
“W.596
0.576
0.568
0.554
0.527
0.439
0.432
0.415
0.403
0.339
0.307
0. 29t?
YAG 40-B, No. 9 TEH+hr r/hr
44.2 0.262
46.2 0.207
48.2 0.193
50.2 0.191
52.2 0.17954.2 0.173
56.2 0.167
58.2 0.15960.2 0.152
62.2 0.139
64.2 0.133
66.2 0.129
68.2 0.127
70.2 0.126
72.2 0.118
75.2 0.113
YAG 40, No. 13 (Deck) TEH+hr r/h r
4.48
4.62
4.75
4.90
4.97
5.07
5.15
5.32
5.48
5.73
6.00
6.23
6.73
7.00
7.23
7.73
8.00
8.23
8.57
9.00
9.23
10.0
11.0
11.6
12.0
13.0
14.0
15.0
16.0
17.0
18.0
19.0
20.0
21.0
22.0
23.0
0.0040
0.0097
0.0252
0.111
0.233
0.793
1.20
2.41
3.52
5.08
6.31
6.76
7.22
7.22
7.43
6.65
6.19
5.97
5.97
6.54
6.65
6.65
6.65
6.65
6.54
5.64
5.42
4.29
3.97
3.64
3.52
3.29
3.18
3.08
2.96
2.86
YAG 40, No. 13 (Deck) TEH+hr r/hr
24, 0
25.0
26.0
26.6
27.0
28.0
29.0
30.0
31.0
32.0
33.0
34.0
35.0
36.0
37.0
38.0
39.0
40.0
41.0
42.0
43.0
44.0
45.0
46.0
48.0
50.0
52.0
54.0
55.0
57.0
59.0
61.0
63.0
65.0
68.0
72.0
75.0
2.74
2.64
2.52
2.08
1.47
1.42
1.42
1.36
1.35
1.30
1.25
1.22
1.19
1.14
1.06
0.730
0.660
0.588
0.572
0.566
0.512
0.478
0.470
0.260
0, 243
0.215
0.203
0.172
0.181
0.172
0.154
0.154
0.152
0.140
0.132
0.123
0.115
YAG 39-C, No. 9 TEH+tu r/hr
2.00 0.0017
2.20 0.0175
2.23 0.0306
2.28 0.0467
2.30 0.0591 ‘
2.33 0.0714
2.35 0.0837
2.37 0.109
2.70 0.514
2. 8S O. 728
2.97 0.906
3.05 1.08
3.13 1.29
3.20 1.41
3.27 1.60
YAG 39-C. No. 9 TEH+hr ~
3.32
3.3’7
3.42
3.45
3.50
3.53
3.57
3.62
3.63
3.67
3.70
3.73
3.85
3.93
3.95
4.00
4.03
4.10
4.13
4.15
4.20
4.22
4.25
4.28
4.30
4.31
4.32
4.35
4.42
4.47
4.52
4.58
4.62
4.73
5.07
5.15
5.23
6.15
7.15
8.15
9.15
10.2
11.2
12.2
13.2
14.2
15.2
16.2
17.2
18.1
19.2
20.2
21.1
22.1
24.2
26.2
28.2
1.70
1.88
2.05
2, 05
2.33
2.51
2.51
2.69
2.69
3.05
3.14
3.14
3.59
4.96
5.43
5.89
6.34
6.72
7.28
7.55
7.55
8.20
8.67
6.20
6.67
9.15
6.67
9.15
10.1
11.0
11.0
11.5
11.0
9.15
6.20
8.20
1.55
5.43
4.52
4.06
3.59
2.96
2.70
2.33
2.15
1.88
1.70
1.52
1.30
1.13
1.07
0.995
0.942
0.668
0.763
0.594
0.505
, 174

TABLE B.1 CONTINUED
Shtion and Shot Station and Shot Station ad Shot Station and Shot
YAG 39 C, No. 9 TE
H+hr r/hr
30.1
32.234.236.23s. 340.142.244.048.050.153.256.260.163.966.270.572.474.476.478.679.4
0.4650.4610.4120.3810.3760.3100.2920.2800.2430.2380.2150.1920.1710.1580.1510.1390.1360.131& 1230.1130.113
YAG 39, No. 13 (Deck) TEH+hr r/hr
1.30
2.10
2.23
L 32
2.25
2.38
2.57
2.73
3.00
3.23
3.32
3.57
4.00
4.07
4.32
4.57
5.00
5.57
6.00
6.57
7.00
1.57
8.57
9.00
9.57
10.0
10.6
11.0
12.0
13.0
14.0
15.0
16.0
17.0
18.0
0.00020.00620.04790.1380.1720.2630.6911.552.814.415.316.02
13.614.518.419.320.218. ‘116.915.514.513:-412.711.710.89.838.968.968.497,126.195.845.645.13
4.85
YAG 39, No. 13 peck) TEH+hr r/hr
20.021.022.023.024.025.028.027.028.029.130.131.032.133.134.035.036.037.136.139.040.041.042.042.945.04’7.249.051.053.055.057.059.061.063.164.966.067.069.0’71.073.075.077.079.080.2
L 86
3.61
3.52
3.52
3.07
2.98
2.90
2.36
2.28
2.19
2.10
2.10
1.92
1.84
L 75
L 49
1.44
1.36
L 37
1.09
1.04
1.00
0.972
0. 95s
O. 694
0.886
0. 82s
0.799
0.772
0.711
0. 6S9
0.642
0.616
0.564
0.555
0.529
0.516
0.499
& 48S
0.459
0.451
0.424
0.376
0.374
LST 611-D, IYo.1 TE
H+hr r/hr
7.18
7.23
7.73
8.23
8.65
8.95
9.28
9.51
9.18
10.0
10.26
10.48
0.002
0.0033
0.024
0.019
0.027
0.048
0.082
0.10
0.12
0.12
0.13
0.17
LST 611-D, No. 1 TE
H+hr r/hr
10.73 0.24
10.98 0.18
11.23 0.182
11.73 0.167
12.23 0.198
12.35 0.205
12.96 0.224
13.56 0.256
14.23 0.247
14.85 0.236
15.48 0.215
21.11 0.146
24.23 0.112
31.73 0.085
34.48 0.066
38.48 0.054
41J.46 0.051
YFNB 13-E TEH + min r/hr
18
26
30
32
35
36
37
40
43
46
50
61
71
81
91
101
111
114
118
118
123
177
204
309
429
909
1,269
1,500
2,109
3,069
3,309
3,549
3,789
4,029
4,509
0.00560.013
0.021
0.022
0.020
0.025
0.019
0.018
0.020
0.022
0.030
0.090
0.20
0.52
1.11
1.87
2.132.342.52.342.212.251.91.00.70.300.150.120.0760.0420.0160.0090.00850.00610.0072
How F TEH + min r/’hr
101 0.0069
107 0.016109 0.024112 0.032113 0.036115 0.041116 0.044117 0.051118 ~ O.060119 0.064128 0.101142 0.15149 0.19152 0.20173 0.22195 0.21221 0.19251 0.173341 0.11401 0.092599 0.061749 0.051899 0.042
1,289 0.0291,569 0.0241,889 0.021
YFNB 29-H TEH+min
1
3
14
16
20
22
24
25
26
28
34
38
44
49
490
670
730
850
920
970
1,300
2,000
3,000
3,200
r/hr
O.000560.000460.00160.0150.0470.300.600.600.902.03.87.4
10.013.29.97.16.96.35.95.33.51.91.140.72
17s
TABLE B.2 INCREMENTAL COLLECTOfl DATA
TrayExposure Began
(Mike Ttmc)Midpo]nt of Exposure
y Actlvltyy Act]wty
Number28 kkly 56
TSD per Unit Time
hr mm cOunts/m]n cOunts/’mln2
Designator: YAG 40-A-1 ZU
Counting Time: Corrected to H+12 hours
Nominal Exposure Interval: Variable
337,
330
331
332
333
334
335
336
324
325
326
327, 328
329
316, 319
320
321, 322
323
308
309
310
311
312
313
314
End of
run
0915 3.4
0930 3.7
0940 3.8
0950 4.1
1010 4.3
1020 4.5
1030 4.7
1040 4.8
1050 5.0
1100 5.2
1110 5.3
1120 5.7
1150 6.0
1200 6.3
1228 6.7
1250 ‘1.1
1313 7.4
1321 7.5
1336 7.8
1351 8.1
1410 8.4
1430 8.7
1450 9.1
1510 9.4
1530
Designator: YAG 40-B-7 ZU
Ccunting Time: H+55.1 to H+62.9 hours
Nominal Exposure Interval: 15 minutes
401 0916 3.5
402 0932.7 3.7
403 0947.4 4.0}
404 1002.1 4.2
405 1017.1 4.5
406 1031.8 4.7
407 1047 5.0
408 1102 5.2
409 1117.4 5.5
410 1132.6 5.7
411 1147.8 6.0
412 1203 6.3
413 1218.2 6.5
414 1233.4 6.7
415 1248.6 7.0
416 1303.8 7.2
417 1319 7.5
418 1334.2 7.8
419 1349.4 8.0
420 1404.6 8.3
36,330
307,800
298,900
1,392,000
2,378,000
2,149,000
1,219,000
1,808,000
4,023,000
4, 741,000
4,687,000
16,423,000
5,140,000
12,628,000
5,044,000
4,065,000
291,900
349,200
541,300
316,500
701,500
189,540
320,000
309,500
233,400349,300368,500
1,225,0002,089,0002,091,0002,626,0004.299,0004,146,0004,928,0003,916,0001,469,000
906,6001,074,0001,001,000
141,100110,20053,34026,83060,730
2,40030,80029,89069,600
237,800214,900121,900180,600402,300474,000466,700547,400514,000451,000229,300176, 70036,48023,28036,09016,66035,0709,480
16,00015,480
15,560
23,287
24,567
S1,667
139,267
139,400
175,067
286,600
276,400
32I3,533
261,067
97,933
60,573
71,600
66, 733
9,407
7,347
3,556
1,789
4, 049
176

TABLE B.? CONTINUED
TrsyExposure Began
Midpoint of Exposure(Mike Time) y Activity
y ActivityNumber
28 hhy 56TED per Unit Time
hr min countslnun counts /minZ
421 1419.8 8.5422 1435.0 8.8423 1450.2 9.042’4 1505.4 9.3425 1520.6 9.5426 1535.8 9.8427 1551.0 10.1428 1606.2 10.3429 1621.4 10.6430 1636.6 IO. 8431 16S1.8 11.0432 1707 11.3433 1722.2 11.6434 1737.4 11.8435 1752.6 12.1436 1807.8 12.3437 1823 12.6438 1638.2 12.a439 1853.4 13.1440 1908.6 13.3441 1923.8 13.6442 1939 13.9443 1954.2 14.1444 2009.4 14.4445 2024.6 14.6446 2039.8 14.8447 2055 15.1448 2110.2 15.4449 2125.4 15.6450 2140.1 16.1451 2212.6 —
Erxiof run End offauout
Designator: YAG 39-C-20 ZUCounting Time: H+66to H+ ’70hOUrS
Nominsl Exposure fnterval: 15 minutes
229 1805 12.3230 1820 12..5231 1835 12.8232 1850 13.0
233 1905 13.3234 1920 13.s235 1935 13.8236 1950 14.0237 2005 14.3238 2020 14.5239 2035 14.8240 2050 15.0241 2105 15.3242 2120 15.5243 2135 15.8244 2150 16.0245 2205 16.3246 2220 16.7247 2255 17.1248 2309.3 19.0249 0300 21.2250 0314.2 21.4251 0329.2 21.7252 0344.2 21.9253 0359.2 22.2254 0414.2 22.4255 0429.2 22.7
177
84,300
116,000
148,600
179,200
114,300
95,720
113,900
53,230
63,720
87,920
57,860. 63,490
42,370
32,260
32,390
18,430
14,260
15,610
15,790
10,150
20,150
16,950
17,210
12,960
12,150
12,460
12,280
4,462
10,600
111,600
719,900
1,929
1,690
4,440
1,414
8,880
2,540
452
1,093
1,389
2,412
1,663
3,552
6,532
12,660
10,670
6,076
7,651
14,880
14,190
131,900
18,400
9,236
2,767
2,647
5,074
8,143
7,990
5,620
7,733
9,907
11,946
7, 620
6,380
7,593
3,549
4,248
5,861
3,85’7
4,233
2,825
2,151
2,159
1,229
951
1,041
, 1,053
677
1,343
1,130
1,147
864
810
831
819
297
707
3,434
47.993
128
112
296
98
591
169
30
73
93
161
111
236
435
859
711
405
510
425
992
570
1,330
615
192
177
338
541
519

TABLE B. 2 CONTINUED
TrayExposure Began
Midpoint of Exposure(Mike Time) y Activity
y Activity
Number28 May 56
TSD per Unit Time
hr mln counts/mln counts/m1n2
256 0444.2 22.9
25 ‘1 0459.2 23.2
258 0514.2 23.4
259 0529.2 23.7
260 0544.2 23.9
261 0559.2 24.2
262 0614.2 24.4
263 0629.2 24. ‘1
264 0644.2 24.9
265 0659.2 25.2
266 0714.2 25.4
267 0729.2 25.7
268 0744.2 25.9
269 0759.2 26.2
270 0814.2 26.4
271 0629.2 26.7
272 0644.2 26.9
273 0659.2 27.2
274 0914.2 27.4
275 0929.2 27.7
276 0944.2 27.9
277 0959.2 28.2
278 1014.2 26.4
279 1029.2 28.7
280 1044.2 28.9
261 1059.2 29.2
282 1114.2 29.4
283 1129.2 29.7
264 1144.2 29.9
End of 1159.2
run
Designator: YFNB 13-E-57 ZU
Counting Time: H+39.3to H+42.8 hours
Nominal Exposure Interval: 15 minutes
1200 0556 0.1
1201 0611 0.4
1202 0626 0.6
1203 0641 0.9
1204 0656 1.1
1205 0711 1.4
1206 0726 1.6
1207 0741 1.9
1208 0756 2.1
1209 0811 2.4. 1210 0826 2.6
1211 0841 2.9
1212 0856 311213 0911 3.41214 0926 3.61215 0941 X91216 0956 4.11217 1011 4.41218 1026 4.61219 1041 4.9
1220 1056 5.11221 1111 5.4
1222 1126 5.6
1223 1141 5.9
1224 1156 6.1
6
24
36
54
r66
64
96
114
126
144
156
174
186
204
216234246264276294306324336354366
6,497
6,872
6,776
5,337
8,816
8,378
4,577
3,479
4,396
4.047
4,546
5,055
4,137
3,497
3,400
5,780
4,195
5,464
3,076
4,774
4,608
3,303
149,800
3,005
2,610
1,814
3,230
2,849
3,372
521752,200
2,726,0005,819,0007,034,0003,670,0002.752,0001,248,000
445,900173,700157,30039,8607,096
28,79019,3186,2115,363.4,4743,6991,2671,1131,0341,6292,1488,504
433
458
452
356
588
559
303
232
292
269
303
336
276
233
226
385
279
364
205
318
307
220
9,970
200
176
121
2.16
190
225
35
501,040
181,733
387,933
468,933
258,000
183,467
63,200
29,727
10,247
10,486
2,657
473
1,919
1,288
414
358
298
247
84
74
69109
145
567
178

TABLE B.2 CONTINUED
TrayExposure Began
Midpoint of Exposure(Mike T,me) y Activity
7 Activity
Number28 my 56
TSD per Unit Time
hr
1225 1211 6.41226 1226 6.61227 1241 6.91228 1256 7.11229 1311 7.41230 1326 7.61231 1341 7.91232 1356 8.11233 1411 8.41234 1426 8.61235 1441 8.91236 1456 9.11237 1511 9.41238 1526 9.61239 1541 9.9
1240 1556 10.11241 1611 10.41242 1626 10.61243 1641 10.91244 1656 11.11245 1711 11.41246 1726 11.61247 1741 11.91248 1756 12.112491250to 12531254 1941 13.6
Designator: How F-64 ZU
Counting Time: fi+20.2t0H +22.8 hours
Nominal Exposure Interval: 15 minutes
858
859
860
861
862
863
664
665
866
667
666
869
870
871
872
673
674
675
876
877 to 699
End of run
0556
0611
0626
0641
0656
0711
0726
0741
0756
0811
0826
0841
0856
0911
0926
0941
0956
1o11
1026
1641
0.1
0.4
0.6
0.9
1.1
1.4
1.6
1.9
2.1
2.4
2.8
2.9
3.1
3.4
3.6
3.9
4.1
4.4
4.6
10.7
mm counts/min counts/mint
384
396
414
426
444
456
474
466
504
516
534
546
564
576
594
606
624
636
654
666
684
696
714
726
828
6
24
36
54
66
84
96
114
126
144
156
174
186
204
216
234
246
264
276
800
850
1.036
536
1,249
586
5,734
21,079
12,420
566
1,818
12,490—
1,066
684
460
126
404
574
820
613
1,164
Background
Background
Background
Background
19
2,996
2,082,000
1,113,000
710,200
754,700
907,600
216,700
74,300
134,600
50
15
46
124
15
79
64
742
47
Background
Background
53
57
69
36
83
39
382
1,405
828
38
121
633—
71
46
32
8
27
38
55
41
78—
1
199
138,800
74,200
46,747
50,313
60,520
14,447
4,953
8,987
3
1
3
8
1
5
4
50
3
179

TABLE B. 2 CONTINUED
TrayExpasure Began
Midpoint of Exposure(Mike Time) y Activity
y Activity
Number28 Mliy 56
TSD per Unit Time
hr min counts/rein counts/minZ
Designator: YFNB 29-G-71 ZUCounting Time: fi+29.6 to H+ 35.4 hours
Nominal Exposure Interval: 2 minutes
1257
1258
1259
1260
1261
1262
1263
1264
1265
1266
1267
1268
1269
1270
1271
1272
1273
1274
1275
1276
1277
1278
1279
1280
1261
1282
1283
1284
1285
1286
1287
1288
1289
1290
1291
1292
1293
1294
1295
1296
1297.
1298
1299
1300
1301
1302
1303
1304
1305
1306
1307
1308
1309
I 310
1311
End of run
0558.2
0600
0602
0603.8
0605.6
060?. 3
0609.2
0611
0612.6
0615
0617
0616.8
0621
0622.7
0624.6
0626.4
0628.4
0630.3
0632.1
0634.1
0636.2
0638.3
0640.5
0642.7
0644.6
0646.8
0648. ‘1
0650.8
0652.8
0654.3
0656.5
0658.6
0700.8
0702.9
0705
0707
0709.1
0711.2
0713
071.5
0716.7
0716.5
0720.7
0722.4
0724.5
0726. ‘1
0728.8
0’730.8
0733
0735.1
0737
0739.1
0741.2
0743.3
0745.5
0747.2
3
5
7
9
10
12
14-
16
18
20
22
23
26
28
30
31
33
35
37
39
41
43
46
48
50
52
54
56
58
59
62
64.
66
68
70
72
74
76
78
80
82
83
65
87
90
92
94
96
98
100
102
104
106
108
110
274
1.059
34
-4
-2
-3
85
36
47
43
39
44
203
212
375
97,120
7,320
768,900
289,100
1,569,000
58,000
35,200
1,321,000
670,700
337,700
138,000
1,666,000
451,600
382,200
1,534,000
2,581,000
1,466,000
377,900
1,499,000
1,089,000
1,635,000
1,046,000
321,700
623,000
1,368,000
531,600
711,400
610,200
1,032,000
429,700
1,159,000
334,600
725,000
416,900
172,400
270,400
186,300
239,100
360,300
1,032,000
137
530
17
-2
-1
-2
42
19
24 .
22
20
22
102
206
172
46,560
3,660
384,450
144,500
784,500
29,000
1?, 600
660,500
335,350
168,650
69,000
833,000
225,800
191,100
767,000
1,290,500
733,000
168,950
749,500
544,500
817,500
524,000
160,850
311,500
693,000
265,800
355,700
305,100,
516,000
214,850
579,500
167,300
362,500
208,450
86,200
135,200
94,150
119,550
180,150
516,000
180

TABLE B.2 CONTINUED
T rsyE.qwsure Began
(Mike Time)Midpoint of Exposure
y Activi~y Activity
Number12-13 June 56
TSD per Unit Time
hr min counts/rein counts/min2
Designator: YAG 40-A-1 FL
Counting Time: Corrected to H +12 hours
Nomid- Exposure Interval: “-
3615
2690
3814
2689
3813
2688
3812
2687
3811
2686
3810
2685
3809
2684
3806
2683
3807
2682
3806
2681
3805
2680
3804
2679
3803
2678
3802
2677
3801
2876
3800
2675
3799
2674
3796
2673
3797
2669
3796
2671
End of
run
1145
I 300
1400
1430
15001530
1600
1630
1700
1730
1800
1830
1900
2000
2030
2100
2130
2200
2230
2300
2330
2400
0030
0100
0130
0200
0230
0300
0330
0400
0430
0500
0530
0600
0630
0700
0730
0800
0830
0850
0930
Variable
5.9
7.1
7.8
8.3
8.8
9.3
9.8
10.3
10.8
11.3
11.8
12.3
13.1
13.8
14.3
14.8
15.3
15.8
16.3
16.8
17.3
17.8
18.3
18.8
19.3
19.8
20.3
20.8
21.3
21.8
22.3
22.8
23.3
23.8
24.3
24.8
25.3
25.8
26.2
26.7
27.1
Designator: YAG 40-B-7 FL
Counting Tln.te: Corrected to H+ 12 hours
Nominal Exposure Interval: 15 minutes
12 June 56
2638 1235 6.3
3764 1250 6.5
2637 1305 6.8
3763 1320 7.0
2636 1335 7.3
3762 1350 7.5
2635 1405 7.8
3761 1420 8.0
434
405
15,453
393
15,370
22,130
76,380
24,670
114,400
52,230
45,700
4,495
192
175
22,170
13,470
55* 500
79,590
29,360
75,600
11,530
15,950
23,920
84
18,520
64
89
6,609
27,860
9,400
202,000
16,070
73
147
29
196
126
356
275
3,801
1,2131,301
714
414
392
3,347
146
1,526
5.8
6.8
515
13.1
512
738
2,546
622
3,813
1,741
1,523
150
3
6
739
449
1,850
2,653
979
2,520
384
532
797
3
617
2
3
220
929
313
6,733
537
z
5
1
6
4
11.9
13.7
95
84.8
86.7
47.8
27.6
26.1
223
9.7
102
181

TABLE B.2 CONTINUED
TrayExposure Began
Midpoint of Exposure(Mke Time} y Activity
y Activity
Number12 June 56
TSD ‘- per Unit Time
hr nun cOunts/ntin counts/min2
2634
3760
2633
3759
2632
3758
2631
3759
2630
3756
2629
3755
2828
3754
2627
3753
2626
3752
2626
3751
2624
3750
2623
3749
2622
3748
2621
3747
2620
3746
2619
3745
2618
3744
2617
3743
2616
3742
2615
3741
2614
3740
2613
3739
2612
3736
2611
End of
run
Designat&: YAG 39-C-20 FL
Counting Time: Corrected to H+ 12 hours
Nominal Exposure Interval: 15 minutes
2176 1050 4.53318 1104.6 4.82177 1119.6 5.03319 1134.6 5.32178 1149.6 5.53320 1205.5 5.82179 1220.8 6.0
1435
1450
1505
1520
1535
1550
1605
1620
1635
1650
170s
1720
1735
1750
1805
1820
1835
1s50
1905
1920
1936
1950
2005
2020
2035
2050
2105
2120
2135
2150
2205
2220
2234
2249
2304
2319
2334
2349
0004
0019
0034
0049
0104
0119
0133
0148
0203
0216
8.3
8.5
8.6
9.0
9.3
9.5
9.6
10.0
10.3
10.5
10.6
11.0
11.3
11.5
11.8
12.0
12.3
12.5
12.6
13.0
13.3
13.5
13.6
14.0
14.3
14.5
14.8
15.0
15.3
15.5
15.8
16.0
16.3
16.5
16.8
17.0
17.3
17.5
1?. 6
18.0
18.3
18.5
18.8
19.0
19.3
19.5
19.819.9
520
1,676
5,733
17,379
5,602
36,505
271
50,997
28,360163, 700
9,926
17, 720
11,990
3,799
8,997
45,806
210
32,833
7,223
960
293
804
290
717
41
807
118
22,609
4,565
193
176
17,653
326
2,627
1,360
1,877
283
8,805
374
21,188
7,158
625
644
675
1,948
843
1,974
34.7
125382
1,159373
2,43418.1
3,4001,692
10,910662
1,181799253600
3,05414
2,1894626419.553.619.347.8
353.87.9
1,52130412.911.7
1,17721.7
17590.6
12518.9
58724.9
1,41247741.742.945.0
13056.2
132
946 63.2
16,210 1,061
870 5s. o
65,930 4, 395
35,540 2,369
371,000 24,730
463 30.9
182
TABLE B.2 CONTINUED
TrayExposure Began
Midpoint of Exposure
Number(Mike Time) Y Activity Y Activity
12 June 56TSD per Unit Time
hr min countslmin counts/minZ
3321
2180
3322
2181
3323
2182
3324
2183
332S
2184
3326
2185
3327
2186
3328
2187
3329
2188
3330
21.99
3331
2190
3332
2191
3333
2192
3334
2i93
3335
2194
3336
2195
3337
2196
3338
2197
3339
2198 -
3340
2199
3341
2200
3342
2201
3343
2202
3344
2203
End of
run
1236.1
1251.2
1306.2
1321.5
1326.9
1352.2
1407.5
1422.9
1437.9
1452.9
1508.3
1523.5
1538.8
1554.1
1609.3
1624.4
1639.4
1654.7
1710.0
1725
1740
1755
1810.3
1825.5
1840.5
1855.8
1911.2
1926.2
1941.2
1956.5
2011.8
2027.1
2042.1
2057.3
2112.4
2127.4
2142.4
2157.4
2212.7
2228.0
2243
2258.3
2313.6
2328.8
2343.9
2358.9
0013.9
0028.9
0042.2
LST 611-D-50 FL
6.3
6.5
6.8
7.1
7.3
7.6
7.6
8.1
8.3
8.6
8.8
9.1
9.3
9.6
9.9
10.1
10.4
10.6
10.8
11.1
11.4
11.6
11.9
12.1
12.4
12.6
12.9
13.1
13.4
13.6
13.9
14.2
14.4
14.7
14.9
15.2
1s. 4
15.6
15.9
16.2
16.4
16.7
16.9
17.2
17.4
17.7
17.9
18.2
Designator:Counting Time: Corrected to H+12 hoursNominal Exposure [nterval: 15 minutes
2667 1327 7.2
3’792 1342.3 7.4
‘2666 1357.5 7.7
3791 1412.7 7.9
2665 1427.9 8.1
994
213
13,220
23
852
12,960
2,218
275
1,301
1,054
1,463
474
6,106
211
904
1,275
26,670
26,920
30,140
904
1,765
167
1,345
18,880
‘7, 738
298
484
172
19,360
616
782
1,120
2,243
12,925
1,567
506
653
578
1,535
249
887
619
1,250
536
495
308
1,125
460
426
1,079
28,757
622
16,747’
66.3
14.2
881
1
56.8
664
148
18.3
66.7
70.3
97.5
31.6
540
14.1
60.3
85
1,791
1,795
2,009
60.3
118
11.1
69.6
1,259
516
199
32.3
11.5
1,291
41.1
521
74.4
150
862
104
33.7
43.5
36.5
102
16.6
59.1
41.3
83.3
35.7
33.0
20.5
75.0
30.6
28.4
72
1,91541.5
1, ~5(j
183

TABLE B.2 CONTINUED
TrayExposure Began Midpoint of Exposure
Number(Mike Time) y Activity
Y Activity
12 June 56TSD per Unit Time
hr min counts/rein count8/min2
379026&43’78926633766266237672661376626603765265937642658378326573762265637s12655378026543779265337762652377726513776265037752649377426463773264737722S46377126453770264437692643376826423767264137662640End ofrun
1443.2
1458.4
1513.6
1528.8
1544
1559.2
1614.4
1629.6
1644.6
1700
1715.2
1730.4
1745.6
1800.8
1616
1631.2
1646.4
1901.6
1916.8
1932
1947.2
2002.6
2017.6
2033
2048.1
2103.3
2116.5
2133.7
2148.9
2204.1
2219.3
2234.5
2250
2305.2
2320.4
2435.6
25S0. 8
0006
0021.2
0036.4
0051.6
0106.6
0122
0137.2
01s2. 4
0207.6
0222.6
0238
0253.2
0308.4
0323.6
6.4
6.7
8.9
9.2
9.4
9.7
9.9
10.2
10.4
10. ‘1
10.9
11.2
11.4
11.7
12.0
12.2
12.5
12.7
13.0
13.2
13.5
13.7
14.0
14.2
14.5
14.8
15.0
15.3
15.5
15.6
16.0
16.3
16.5
16.6
17.0
17.3
17.5
17.8
18.1
18.3
18.5
18.8
19.1
19.3
19.6
19.8
20.1
20.3
20.6
20.6
1,691
69,250
31,126
6,348
765
216
348
477
396
472
743
218
1,088
83
1,922
640
1,239
63
626
425
425
432
2,482
93
11,269
194
966
697
536
161
402
663
1.481
140
402
536
187
1,219
1,189
375
1,658
4,037
1,735
519
409
1,209
1,112
2,184
988
583
126
4,620
2,070
422
52.4
14.4
23.2
31.8
26.5
31.5
49.5
14. s
72.5
5.5
128
56
82.6
4
41.7
28.9
26.3
29.8
165
6.2
751
12.9
64.3
46.5
36.7
10.7
26.8
44.2
98.7
9.3
26.8
35.7
12.5
81.3
- 79.3
25.0
110
269
116
34.6
27.3
80.6
74.1
145.0
65.9
36.9
184

TABLE B. 2 CONTINUED
Exposure BeganTray
(Mike Time)Midpoint of Exposure y Activity
Number TSDy Activity
12 June 56per Unit Time
hr mm counts/rein counts/min2
Designator: YFNB 29-H-78 FL
Counting Time: Corrected to H + 12 hours
Nominal Exposure Interval: 15 m)nutes
3067
1917
3068
1918
3069
1919
3070
1920
3071
to
1922
3073
1923
3074
1924
to
1926
3077
1927
3078
1928
3079
1929
3080
1930
3081
1931
to
1933
3084
1934
to
3091
End of
run
0626
0641
0656
071107~6
0741
0756
0811
0826 to 0841
ea. 15 min
0911
0926
0941
0956
1011 to 1026
e& 15 min
1111
1126
1141
1156
1211
1226
1241
1256
1311
1326
1341 to 1356
ea. 15 min
1441
1456
1511 to 1526
ea. 15 rnin
1826
1835
0.10.4
0.6
0.9
1.1
1.4
1.6
1.9
2.1
2.9
3.1
3.4
3.6
3.9
4.9
5.1
5.4
5.6
5.9
6.1
6.4
6.6
6.9
7.1
7.4
8.4
8.6
8.9
12.1
Designator: YAG 40-A-1 NA
Counting Time: Corrected to H + 12 hours
Nommal Exposure Interval: Variable
11-12 July 56
1863
3016
1864
3017
1865
3018
1866
3019
1867
3020
1868
3021
1869
3022
1670
070007450615090010031046111511451222131513451418144615151545
1.6
2.1
2.6
3.6
4.5
5.1
5.6
6.1
6.9
7.6
8.1
8.6
9.1
9:6
10.1
6
24
36
54
66
84
96
114
126
174
186
204
216
234
294
306
324
336
354
366
384
396
414
426
444
504
516
534
726
912
1,426
3,404
3,295
2,239,000
967,100
619,300
Background
Background
Backgro urrf
Backgraml1,003
4,297
5,459
Background
Background
Background
1,635
BackgroundBackgroumiBackgroundBackgrcwldBackgroundBackground
6,2483,719
BackgroundBackgroundBackground
6,312BackgroundBackground
Background
Background
Background
Backgrmd
BackgroundBackgroundBackgroundBackgroundBackground
12,29010,3606,036
30,35099,11089,02093,970
60.8
95.0
227
220
149,300
84,470
41,290
66.9
286
364
109
106—
76.3—
—416248
——
421—
—
———232
345
183
1,084
3,4182,967
3,132
185

TABLE B.2 CONTINUED
Exposure BeganTray
(Mike Time)Midpoint of Exposure y Activity
Number TSDy Activity
11-12 Ju1Y 56per Unit Time
hr mln cOunts/min counts/mln~
3023 1615 10.6
1871 1645 11.1
3024 1715 11.6
1872 1745 12.1
3025 1s15 12.6
1873 1845 13.1
3026 1915 13.6
1874 1946 14.1
3027 2015 14.6
1875 2045 14.9
3028 2100 15.3
1876 2130 15.8
3029 2206 16.4
1877 2230 16.8
3030 2302 17.3
1878 2330 17.8
3031 2400 18.3
1879 0031 “ 18.8
End of 0100 19.1
run
Designator: YAG 40-B-7 NA
Counting Time: Corrected to H +12 hours
Nominal Exposure Interval: 15 minutes
11 July 56
3290 0717 1.5
2148 0732.7 1.7
3291 0747,8 2.0
2149 0802.9 2.2
3292 0818 2.5
2150 0833.1 2.7
3293 0848.2 3.0
2151 0903.3 3.2
3294 0918.4 3.5
2152 0933.5 3.7
3295 0948.6 4.0
2153 1003.7 4.2
3296 1018.8 4.5
2154 1033.9 4.7
3297 1049.0 5.0
2155 1104.1 5.2
3298 1119.2 5.5
2156 1134.3 5.7
3299 1149,4 8.0.
2157 1204.5 6.2
3300 1219.6 6.5
2158 1234.7 6.7
3301 1249.8 7.0
2159 1304.9 7.2
3302 1320.0 7.5
2160 1335.1 7.7
3303 1350.2 6.0
2161 1405.3 8.2
3304 1420.4 8.52162 1435.5 8.7
3305 1450.6 9.0
2163 1505.7 9.2
3306 1520.8 9.5
72,090
27,380
50,380
50,340
48,960
28,440
40, 240
45,210
21,420
8,650
12,410
21,720
1S,680 .
1,795
803
1,142
1,403
65
431794625
018879
8040
5,97514
4762,967
218936
2,59028771
2,015147
1, 233228314
1,35012,56214,15012,11075,320
751355
35,170675
44,760
44,490
2,403
913
1,679
1,678
1,632
948
1,298
1,559
714
577
414
603
787
56
29
38
45
2
29
53
42
12
5
54
398
1
32
199
14
62
173
19
5
135
10
82
15
21
90
837
943
807
5,021
50
24
2,345
45
2,984
2,966
186

TABLE B.2 CONTINUED
TrayExposure Began
Midpoint of Exposure(Mike Time) y Activity Y Activity
Number11 July 56
TSD per Unit Time
hr mm counts/rein counts/mm2
2164
3307
2165
3308
2166
3309
2167
3310
2168
3311
2169
3312
2170
3313
2171
3314
2172
3315
2173
3316
2174
3317
2175
End of
1535.9
1551.0
1606.1
1621.2
1636.3
1651.4
1706.5
1721.6
1736.7
1751.8
1806.9
1822
1637.1
1852.5
1907.6
1922.7
1937.8
1952.9
2006
2023.1
2036.2
20s3. 3
2108.4
2123.5
9.7
10.0
10.2
10.5
10.7
11.0
11.2
11.5
11.7
12.0
12.2
12.5
12.7
13.1
13.3
13.6
13.8
14.1
14.3
14.6
14.8
15.1
15.3
15.5
run
Designator: YAG 39-C-20 NA
Counting Tim: Corrected to H+12 houre.Nominal ExFosur8 Intervsl: 15 minutes
1312
1313
1314
1315
1316
1317
1318
1319
1320
1321
1322
1323
1324
1325
1326
1327
1328
1329
1330
1331
1332
1333
1334
1335
1336
1337
1336
1339
1340
0800
0815
0630
0845
0900
0915
0930
0945
1000
1015
1030
104s
1100
1115
1130
114s
1200
1215
1230
124S
1300
1315
1330
1345
1400
1415
1430
1445
1500
2.2
2.4
2.7
2.9
3.2
3.4
3.7
3.9
4.2
4.4
4.7
4.9
5.2
5.4
5.7
5.9
6.2
6.4
6.7
6.9
7.2
7.4
7.7
7.9
8.2
8.4
8.7
8.9
9.2
6,659
36,910
223
51.410
7,156
5,568
2* 553
25,350
649
15, ’144
22,710
4,844
s, 514
24,940
\ 13, 990
2,190
17,990
2,633
11,540
824
11,081
1,067
19.981
105
118,320
21,020
44, 4ti
49,500
46
111,060
143,380
365,370
126,200
101,500
75,7’70
147,700
23,030
47,730
15* 450
89,620
0
6,623
172
2,386
6,483
164
1,896
43,180
4,945
3,97’9
85
72
444
2,461
15
3,427
’447
3,709
170
1,690
43
1,050
1.514
323
368
1,663
933
146
1,200
176
769
55
739
71
1,332
7
7,888
1,401
2,962
3,300
3
7,404
9,559
24,380
6,547
6,767
5,051
9,850
1,535
3,182
1,030
5,975—
455
11
159
432
11
126
288
330
262
6
5
187

TABLE B.2 CONTINUED
Exposure BeganTray Midpoint of Exposure y Activity
Number(Mike Time)
TSD‘y Actiwty
11 Jldy 56per Unit Time
hr mln counts/mln counta~mlnz
13411342134313441345134613471348134913501351135213531354135s135613571358135913601361136213631364136513661367End ofrun
Des@netor: JA3T611-D-41 NACounting Time: Corrected to H+12 hoursNominsl Exposure Interval: 12 minutes
2898 0904 3.21742 0916 3.42899 0927.8 3.61743 0939.7 3.82900 0951.6 4.01744 1003.7 4.22901 1015.5 4.41745 1027.7 4.62902 1040.0 4.81746 1052.2 5.02903 1104.0 5.21747 1116.1 5.42904 1127.9 5.61748 1139.8 5.82905 1151.‘1 6.01749 1203.6 6.22906 X215.4 6.41750 1227.3 6.62907 1239.2 6.61751 1251.0 7.02908 1302.8 7.21752 1314.7 7.42909 1326.6 7.61753 1338.5 7.82910 1350.3 8.0
1516
1531
1546
1601
1616
1630
1646
1701
1716
1731
1746
1801
1816
1831
1845
1901
1916
1931
1946
2001
2016
2031
2046
2101
2116
2131
2146
2201
9.4
9.7
9.9
10.210.4
10.7
10.9
11.2
11.4
11.7
11.9
12.2
12.4
12. ‘1
12.9
13.2
13.4
13.7
13.9
14.2
14.4
14.7
14.9
15.2
15.4
15.7
15.9
16.1
3,463
1, 2S9
147
3, 144
4,528
1,271
6,906
5,309
7,442
4,778
139
2,655
0
3,118
6,136
13,690
4,381
252
535
15,940
436
1,137
1,243
22,240
22,142
91,205
8,506
SW
185
BackgroundBsclqround
26122367
634406
3,82230,48015,0604,232
Background
8,637
B@
1,085
1,201
247
288
1,598
1,802
2,201
Background
453
2328610
21030285
460354496316
9177
2084099262921736
1,063297683
1,4831,4766,080
567
7816
——
22195.5
5334
3182,5401,255
353—
718—
901002124
133150183—
38
188

TABLE B.2 CONTINUED
TrayExposure Began
(Mike Time)Midpoint of Exposure y Activity
Number TSDy ACtlvlty
11 JUIV 56per Unit Time
hr mtn counts/rein counts /minZ
1754 1402.3 8.2
2911 1414.2 8.4
1755 1426.3 8.6
2912 1438.3 8.0
1756 1450.1 9.0
2913 1502.0 9.2
1757 1513.8 9.4
2914 1525.7 9.6
1758 1537.6 9.8
2915 1549.4 10.0
1759 1601.2 10.2
2916 1613.1 10.4
1760 1624.9 10.6
2917 1636.8 10.8
1761 1648.6 11.0
2918 1700.7 11.2
1762 171i. 7 11.4
2919 1724.5 11.6
1763 1736.5 11.8
2920 1748.4 12.0
1764 1800.2 12.2
2921 1812.2 12.4
1765 1824.1 12.6
2922 1835.8 12.8
1766 1847.8 13.0
2923 1859.6 13.2
1767 1911.5 13-4
2924 1923.3 13.6
1768 1935.2 13.8
2925 1947.2 to 1959 14.0
End of
run
Designator: YFNB 13-E-57 NA
Counting Time: Corrected to H + 12 hours
Nommal Exposure Interval: 15 minutes
2351 0556 0.1
3487 0611 0.4
2352 0626 0.63488 0641 0.92353 0656 1.13489 0711 1.423S4 0726. L 63490 0741 1.92355 0756 2.1
. .3491 0611 2.42356 ‘ 0826 2.63492 0841 2.92357 0856 3.13493 0911 3.42358 0926 3.63494 0941 3.92359 0956 4.13495 1o11 4.42360 1026 4.63496 1041 4.92361 1056 5.1
6243654668496
114126144156174186204216234246264276294306
189
417
323
579
222
163
97
129
1?’$
191
191
145
Background
211
111
199
288
122
222
159
69
214
203
145
277
127
672
567
940
123
284
56,590
1,743,300
918,500
931,600
194,600
146,400
100,000
57,400
69,600
82,110
10,580
10,300
1 595J
1,028
4,496
2,365
5,278
495
616
420
573
35
27
48
18
14
8
11
10
16
16
12—
18
9
17
24
10
18
13
6
18
17
12
23
11
48
47
76
10
24
3,773
116,200
61,230
62,100
12,970
9,760
6,666
3,827
4,640
5,473
705
687
106
69
300
156
352
33
41
26
38

TABLE B. 2 CONTINUED
TrayExposure Began
IiOdpwnt”of Exposure(Mike Tlmc) y Activity
y Actlvlty
Number11 July 56
TSD per Unit Time
hr mln countslmln countslminz
0550
0605
0620
0635
0650
0705
0720
0735
0750
0805
0820
083S
0850
0905
0920
0935
0950
1005
1020
1035
1050
1105
1120
1135
1150
1205
1220
1235
1250
3497 1111 5.4 324
2362 1126 5.6 336
3498 1141 5.9 354
2363 1156 6.1 366
3499 1211 6.4 364
2364 1226 6.6 396
3500 1241 6.9 414
2365 1256 7.1 426
3501 1311 7.4 444
2366 1326 7.6 456
3502 1341 7.9 474
2367 1356 8.1 486
3503 1411 8.4 509
2368 1426 8.6 516
3504 1441 8.9 534
End of 1456 10.0 600
run
Designator: HOW F-64 14A
Counting Time: Corrected to H+12 hoursNominal Exposure Interval: 15 minutes
354324103544241135452412354624133547241435482415354924163550241735512418355224193553242035542421
. 3555242235562423End ofrun
Designator: YFNB 29-H-78 NACounting Time: Corrected to H +12 hours
Nominal Exposure Interval: 15 minutes
914 — —
915 0556 0.1
916 0611 0.4917 0626 0.6
—0.75
1.0—————
2.5
2.8
3.0
3.3
3.5
3.8
4.0
4.3
4.5
4.8
5.0
5.3
5.5
5.8
6.0
6.3
6.5
6.8
———45
60
75
1
—135
150
188
180
198
210
228
240
258
270
288
300
316
330
348
360
376
390
408
62436
552
678
1,103
2,548
628
1,536
567
557
482
520
492
617
648
742
35. 000*
Backgrwmd
Backgmud
Backgroumf
127
24,410
Background
Backgro Und
Background
Background
Background
250
11,020
372
Background
573
2,450
Background
16.670
242
129
122
Background
133
Background
Backgrramd
Background602
5,739
37
58
74
170
55
102
38
37
32
35
33
41
43
49
2,333
—
—
—6.5
1,627.
———17
736
25—36
163—
1,111
16
9
8—
9—
—
—
40
363
Background —
Background —
892 59
740 49
190

T.lBLE B.2 CONTINUED
TrayExposure Began
Midpoint of Exposure
Number(Mike Time) y Activity
y ACtlvity
11 July 56TSD per Urut Time
hr mi n counts/rein countslminz
918 0641 0.9 54919 0656 1.1 66920 0711 1.4 84921 0726 1.6 96922 0741 1.9 114923 0756 2.1 126924 0811 2.4 144925 0826 2.6 156926 0841 ‘2.9 174927 0856 3.1 186928 0911 3.4 204929 0926 3.6 216930 0941 3.9 234931 0956 4.1 246932 1011to 1026 4.4 264to ea. 15 mln
.969 1926 13.6 816End of 1941 13.8 828
run
Designator: YAG 40-A-1 TE
Counting Time: Corrected to H + 12 hours
Nommal Exposure Interval: Variable
1650
2994
1839
P-2999
1842
30001856
P-2993183429861844
P-2991183829921837
P-2997183229881855
P-30051043299018S2
P-2989163630041841
P-2995184930021840
P-2987183530061848
P-3003
185130081833
End of run
0810
09511029104410551115114012001215123012471300131613311351141914491512152715471607162716521728180018321900193120002030210121302203223622472315
2316234623472413
2.74.44.95.15.35.76.16.46.66.97.17.47.67.98.38.89.39.69.9
10.210.510.911.412.012.513.013.514.014.51s. o15.516.016.516.917.217.5
17.718.018.2
78,010
179,514
Background
Background
Background
Background
Background
Background
26,850
8,913
703
Background
4,887
Background
BackgroundBackground
35
147,748
607,100
537,776
3,761.285
11,624,936
17,325,405
3,118,723
6, 376,846
5,266,514
‘1,439,262
1,608,283
5,194,303
3,440,155
10,462,893
2,885,754
11,137,524
778,442
5,835,239
767,586
3,709,095
2,940,929
2,911,091
1,123,353
1,859,306
482,186
354,591
43,616
43,530
5,831
1,356,448
4,611
833
4,888
1,287—
1,031—803
5,201
11.970
1,790
59447
—
326-—
———
—3,890
40,47048,890
168,060465,000866,300207,780425,100309,790572.300100,517346,300172,007373,70096,190
464,20051,760
291,60038,380
185,400117,63780,66335,10458,11017,22011,4401,5041,451
18846, 770
14025
44446
34—
26
191

TABLE B.2 CONTINUED
Tray Exposure BeganMidpoint of Exposure
Instrument(Mike Time) y Activity
y Actiwty
Number21 July 56
TSD per Unit Time
hr mm count8/min cOunts/m]n2
Designator: YAG-40-A-1, 2 TECountingTime: Corrected to H +12 hours
Nominal Exposure Interval: Variable
Greaue Trays onfy from each instrument
A-1
A-1
A-1
A-2
A-1
A-2
A-1
A-2
A-1
A-2
A-1
A-2
A-1
A-2
A-1
A-2
A-1
A-2
A-I
A-2
A-1A-2
A-1
A-2
A-1
A-2
A-1
A-1
A-1
Designator: YAG 40-B-7 TE
Counting Time: Corrected to H +12 hoursNominal Expomare Interval: 15 minutes
3094 1002
1945 1017
3095 1032
1946 1047
3096 1102
1947 1117
3097 1132
1948 1147
3098 1202
1949 1217
3099 12321950 1247
3100 1302
1951 1317
3101 1332
1952 1347
3102 1402
1850
1839
1842
2142
1856
2145
1834
2144
1844
2125
1838
2129
1837
2132
1832
2131
1855
2133
1843
2137
1852
2136
1836
2139
1841
2138
1849
1840
1835
0810 to 0951
1029 @ 1044
1055 to 1115
1115 ~ 1140
1140 to 1200
1200 to 1215
1215 @ 1230
1230 ~ 1247
1247 to 1300
1300 to 1316
1316 to 1331
1331 to 1351
1351 @1419
1419 to1449
1449 ~ 1512
1512 @ 1527
1527 to1547
1547 to 1607
1607 ~ 1627
1627 to 1652
1652 to 1728
1726 to 1800
1800 to 1632
1832 to 1900
1900 to 1931
1931 to 2000
2000 to 2030
2101 ~ 2130
2203 to 2236
2.7
4.9
5.3
5.7
6.1
6.4
6.6
6.9
7.1
7.4
7.6
7.9
8.3
8.8
9.3
9.6
9.9
10.2
10.5
10.9
11.4
12.0
12.5
13.0
13.5
14.0
14.5
15.5
16.5
4.4
4.6
4.9
5.1
5.4
5.6
5.9
6.1
6.4
6.6
6.9
7.1
7.4
7.6
7.9
8.1
6.4
‘-35
607,100
4,455,285
18,777,802
17,325,405
9,013,623
6,376,846
8,920,405
7,439,262
7,269,977
5,194,303
6,666,000
10,462,893
16,810,709
11,137,524
2,518,337
5,835,239
4,602, 232
3,709,095
4,649,959
2,911,091
5,283,346
1,859,306
633,986
354,591
66,707
43,530
1,356,448
833
790
13.193
83,782
1,526,080
481,080
3,543,120
747,536
3,064,320
528,960
2,190,320
908,048
3,155,520
946,960
2,745,120
53s, 040
1,551,920
843,600
0.315
40,470
405,020
1.252,000
866,300
600,921
425,100
524,700
572,300
449,400
346,300
333,300
373, 700
627,000
484, 200
167,900
291,800
230,110
185,400
186,000
60,863
165,100
58,110
22,640
11,440
2,300
1,451
46, 770
25
53
879
5,591
101,740
32,072
236,200
49,640
204,290
35,260
146,020
60,536
210,370
63,130
183,006
35,670
103,460
56,240
192

TABLE B.2 CONTINUED
T lllyExposure Begsn
Midpoint of Exposure(Mike Time) -f Activity
‘ y Activity.
Number21 July 56.
TSD per Unit Time
counts/min2hr min counts/rein
1953
3103
1954
3104
1955
3105
1956
3106
1957
3107
1958
3108
1959
3109
1960
3110
1961
3111
1962
3112
1963
3113
1964
3114
1965
3115
1966
3116
1967
X3117
1968
3118
1969
3119
1970
3120
1971
3121
1972
End of
run
Deeignstor: YAG 39-C-20 TECounU~T[me: H+36.4 to H+40.8 hours
Nominsl Expoaure Interval: 15 minutee
2813 0747 2.13933 0802 2.42812 0817 2.63932 0632 2.92811 0847 3.13931 0902 3.42810 0917 3.63930 0932 3.92809 0947 4.13929 1002 4.42808 1017 4.83928 1032 4.92807 1047 5.1
14171432144715021s1715321547160216171632164717021717173217471802181718321847190219171932194720022017203220472102211721322147220222172232224723022317233223470002
8.6
8.9
9.1
9.4
9.6
9.9
10.1
10.4
10.6
10.9
11.1
11.4
11.6
11.9
12.1
12.4
12.6
12.9
13.1
13.4
13.6
13.9
14.1
14.4
14.6
14.9
15.1
15.4
15.6
15.9
16.1
16.4
16.6
16.9
17.1
17.4
17.6
17.9
16.1
16.3
1,749,520
513, 760
3,302,960
826,880
1,744,960
568,480
1,130,880
607,544
669,864
298,224
922,792
216,272
322,086
36,328
140,448
112,875
322,088
56,118
88,524
31,692
35,902
4,985
14,029
18,057
32,132
5,563
37,240
19,912
44,323
2,553
7,174
1,398
56,513
10,396
54,476
19,456
43,502
668
322,513
63,740
143,380
1,132,000
1,146,000
4,362,000
2,458,000
8,359,000
4,675,000
18,570,000
9,457,000
19,780,000
1,074,000
1,868,000
116,630
34,250
220,200
55,130
116,300
37,690
75,390
40,500
44,660
19,680
61, S20
14,550
21,470
2,421
9,363
‘I, .525
21,470
3,741
5,901
2,112
2.393
332
935
1.203
2,142
370
2,462
1,327
2,954
170
478
93
3,767
693
3,631
1, 29?
2,900
44
21,510
4,249
9,.558
75,430
76,560
290,780
163,900
557,200
325,000
1,238,000
630,400 .
1,316,000
71,560124,800
193
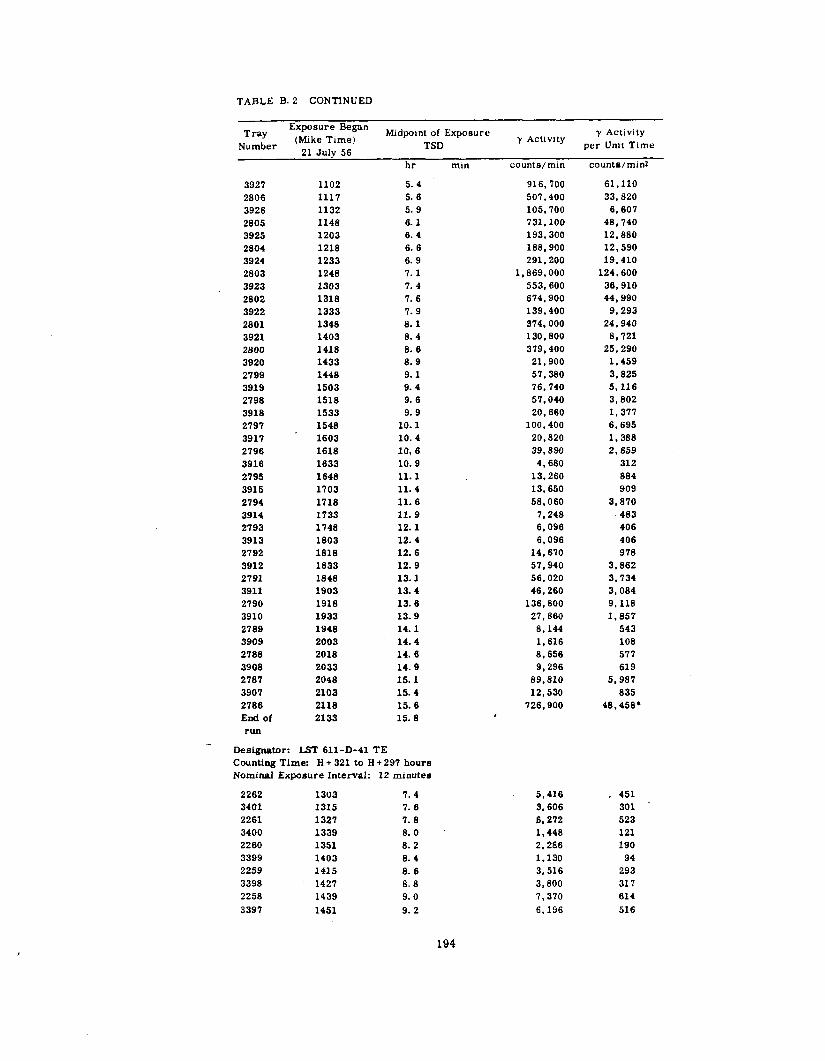
TABLE B.2 CONTINUED
Exposure BeganTray Midpcnnt of Exposure
(Mike Time)y Activity
Number TSDy Activity
21 July 56per Unit Time
hr mtn count8/min countalmmz
3927
2806
3926
280S
3925
2604
3924
2803
3923
2802
3922
2801
3921
2800
3920
2799
3919
2798
3918
2797
3917
2796
3916
2795
3915
2794
3914
2793
3913
2792
3912
2791
3911
2790
3910
2769
3909
2788
3908
2787
3907
2786
End of
run
Designator: LST 611-D-41 TE
Counting Time H+ 321 to H+297 hours
Nominal Exposure Interval: 12 minutes
2262 1303 7.4
3401 1315 7.6
2261 1327 ‘1. 8
3400 1339 6.02260 1351 8.23399 1403 8.42259 1415 8.63398 1427 8.82258 1439 9.0
3397 1451 9.2
1102
1117
1132
1148
1203
1218
1233
1248
1303
1318
1333
1348
1403
1416
1433
1446
1503
1516
1533
1548
1603
1618
1633
1648
1703
1718
1733
1748
1803
1816
1633
1848
1903
1916
1933
1946
2003
2018
2033
2048
2103
2118
2133
5.4
5.6
5.9
6.1
6.4
6.6
6.9
7.1
7.4
7.6
7.9
8.1
8.4
8.6
6.9
9.1
9.4
9.6
9.9
10.1
10.4
10, 6
10.9
11.1
11.4
11.6
11.9
12.1
12.4
12.6
12.9
13.1
13.4
13.6
13.9
14.1
14.4
14.6
14.9
15.1
15.4
15.6
15.8
916, 700
507,400
105,700
731,100
193,300
168,900
291,200
1,869,000
553,600
674,900
139,400
374,000
130,800
379,400
21,900
57,360
76,740
57,040
20,660
100,400
20,820
39,890
4,680
13,260
13,650
58,060
7,248
6,096
6,096
14,670
57,940
56,020
46,260
136,800
27,860
8,144
1,616
8,656
9,296
89,810
12,530
726,900,
61,110
33,820
6,607
48,740
12,860
12,590
19,410
124,600
36,910
44,990
9,293
24,940
8,721
25,290
1,459
3,825
5,116
3,802
1,377
6,695
1,368
2,659
312
884
909
3,870
463
406
406
978
3,862
3,734
3,084
9, 118
1,857
543
108
577
619
5,987
835
46,458”
5,416
3,606
6,272
1,446
2,286
1,130
3,516
3,800
7,370
6,196
451301
523
121
190
94
293
317
614
516
194

TABLE B.2 CONTINUED
TrayExposure Began
(Mike Time)Midpoint of Exposure
y Activityy Activity
Number21 July 56
TSD per Unit Time
hr mm cOunts/mln counts/min2
2257
3396
2256
3395
2255
3394
2254
3393
2253
3392
2252
3391
2251
3390
2250
3389
2249
3388
2248
3387
2247
3386
2246
3385
2245
3384
2244
3383
2243
3382
2242
3381
2241
to
2235
End of
run
Designator: YFNB 13-E-57 TE .
Counting Time: H+ 17.4 to H+ 17.8 hours
Nominal Exposure Interval: 15 minutes
1974 0546 7
3123 0601 22
1975 0616 37
3124 0631 52
1976 0646 67
3125 0707 82
1977 0716 97
3126 0731 112
End of 0746 120
run
1503
1515
1527
1539
1551
i603
1615
1627
1639
1651
1703
1715
1727
1739
1751
1803
1815
1827
1839
1851
1903
1915
1927
1939
1951
2003
2015
2027
2039
2051
2103
2115
2127 to 2139
ea. 12 min
2351
0003
9.4
9.6
9.8
10.0
10.2
10.4
10.6
10.8
11.0
11.2
11.4
11.6
11.8
12.0
12.2
12.4
12.6
12.8
13.0
13.2
13.4
13.6
13.8
14.0
14.2
14.4
14.6
14.8
15.0
15.2
15.4
15.6
15.8
18.2
18.3
11,6609,432
1S,9206,984
24,09011,69079,41020,3s036,0009,464
17,2607, 680
12,0002,978
10,3605,6649,9007,6268,192
10,58035,80012,6208,4882,4003,4683,4803,6482,1443,774
946406510214
Background
Background
20,608
22,530
291,600
2.351,000
1,603,000
1, 483,000
13,780,000
3,032,000
971
786
1,576
582
2,007
974
6,620
1,698
3,000
789
1,438
640
1,000
248
863
472
825
636
683
882
2,984
1,052
707
200
289
290
304
179
314
79
34
42
18—
—
1,375
1,472
19,420
156,700
106,800
98,900
917,500
200,000
195

TABLE B.2 CONTINUED
Exposure BeganTray Midpoint of Exposure
Number(khke Time) y Actlv!iy
y Activity
21 JUiY 56TSD per Umt Time
hr min count8/mkn cOunta/m1n2
De8ignatoC How-F-64 TE
Counting Time: H+lg.2ti H+20.4 hours
Nominal Exposure Interval: 15 minutes
2206 0s46 0.1 6
3347 0601 0.4’ 24
2207 0616 0.6
3346 0631 0.9
2208 0646 1.1
3349 0701 1.4
2209 0716 1.6
3350 0731 1.9
2210 0746 2.1
3351 0801 2.4
2211 0616 2.6
3352 0831 2.9
2212 0846 3.1
3353 0901 3.4
2213 0916 3.6
3354 0931 3.9
2214 0946 4.1
3355 1001 4.4
2215 1016 4.6
3356 1031 4.9
2216 1046 5.1
3357 1101 5.4
2217 1116 5.6
3366 1131 s. 9
2218 1146 6.1
3359 1201 6.4
2219 1216 6.6
3360 1231 6.9
2220 1246 7.1
3361 1301 7.4
2221 1316 7.6
3362 1331 7.9
2222 1346 8.1
End of 1357 8.2
run
Designator: YFNB-29-H-78 TE
Counting Time: H + 79.2 to H+81. 6 hours
Nominal Exposure Interval: 1S minutes
1371 0546 0.1
1372 0601 0.41373 0616 0.61374 0631 0.91375 0646 1.11376 0701 1.41377 0716 1.61378 0731 1.91379 0746 2.11380 0601 2.41381 0816 2.61382 0831 2.91363 0645.5 3.11384 0900 3.41385 0915 3.6
36
54
66
84
96
114
126
144
156
174
186
204
216
234
246
264
276
294
306
324
336
354
366
384
396
414
426
444
456
474
4S6
492
6
24
36
54
66
84
96
114
126
144
156
174
186
204
216
784
0
1,040
764
1,424
0
784
0
680
188,500
260,100
194,900
320,800
16
0
1,040
14,480
16
400
6s6
1,040
0
528
7,688
400
0
144
2,316 .
17,170
2.192
2,064
3,216
3,348
52
0
69
52
95
0
52
0
59
12,560
17,300
13,000
21,400
1
0
69
965
1
27
44
69
0
35
512
27
0
9
155
1,142
146
138
212
223
2,0169,184
2,379,0004,874,0007,905,0007,930,0009,919,0007.897,0006,577,0008,594,0002,962,0009,229,000
10,560,00015,715,0009,448,000
134
610
162,000
325,000
525,000
527,000
612,000 “
525,000
438,000
570,000
198,000
615,000
700,000
1,040,000
630,000
196

TABLE B. 2 CONTINUED.
Exposure BeganT ray
(Mike Time)Midpoint of Exposure
Numbery ACtivlty
y Activity
21 July 56TSD per Unit Time
1386
1387
1388
1389
1390
1391
1392
1393
1394
1395
1396
1397
1398
1399
1400
1401
1402
1403
1404
1405
1406
1407
1408
1409
1410
1411
1412
1413
1414
1415
1416
1417
1418
1419
1420
1421
1422
1423
1424
1425
End of
run
hr
0930 3.9
0945 4.1
1000 4.4
1015 4.6
1030 4.9
1045 5.1
1100 5.4
1115 5.6
1130 5. 9
1145 6.1
1200 6.4
1215 6.6
1230 6.9
1245 7.1
1300 7.4
1315 ‘1. 6
1330 7.9
1345 8.1
1400 8.4
1415 8.6
1430 8.9
1445 9.1
1500 9.4
1515 9.6
1530 9.9
1545 10.1
1600 10.4
1615 10.6
1630 10.9
1645 lL 1
1700 11.4
1715 11.6
1730 11.9
1745 12.1
1800 12.4
1815 12.6
1630 12.9
1845 13.1
1900 13.4
1915 13.6
1945 14.0
mm
234
246
264
276
294
306
324
336
354
366
384
396
414
426
444
456
474
466
504
516
534
546
564
576
594
606
624
636
654
666
684
696
714
726
744
756
774
786
804
616
840
countsl min counts/mtn2
6,331,0003,126,000
1,944,000
2,067,000
841, 900
370,600
311,200
56, 530
8, 740
1,316
15,650
2,340
2,852
4,900
17,840
46,680
8,464
2,596
5,924
23,300
35, 750
78,240
12,200
5,540
4,004
14,120
9,892
33,570
45,600
76,320
28,070
63,600
8,868
34,340
35,880
21,170
16,800
114, 9ho
131, 360
292,500°
422,000
209,000
129,000
138,000
56,100
24,600
20,800
3,900
560
87
1,040
150
190
326
1,160
3,120
565
173
400
1,550
2,300
5,200
800
370
266
920
655
2,200
3,000
5,000
1,670
5,550
590
2,300
2,360
1,410
1,120
7,600
8, 700
19,400
. ●Probably cross-contaminated in transport
197

.0
.~..rl“.-
. .00
“..
000-
--- --
“
0
:~
*
m.00
eO -
.2*-060
m*“Oc-
------
a.“0000. -..
n a
198

I
I
I
Ii
~
{
i“ z0
2 -0~
“ 00
--m,..
2 “--0
-~:“”
** O----.
. . ...** ..”
. .
.
.
0
*.00
. -.000
0.
..s00DJ
C-4-.
0. *
Ogo 0
-g~z “ ‘“ ““ 0-”
199

.

:
201

.0.
. .00 .
. . . = z .0 .-0
*00. 6 .
.0
.0
.0
-.”.
.-1”0-
. .0 O“--**O.i-r-- “!i
202

. .0 0
. .0 0
.0 . * - 1- .- O*
203

“. n -“:
--4s --
“. -. “.-.-. :
204

:.
“
%s
::“.
..-----. .“-
205

.
a0 ~ *
0
0 <
0
0m
IIII m
N
IIII 0
❑ N<1
<100
~oa 0
.11
0
0
0
m
0
(S M313W) Hld3Cl lN31VAln03/
206

B.2 PHYSICAL, CHEMICAL, AND
RADIOL(X21CAL DATA
207
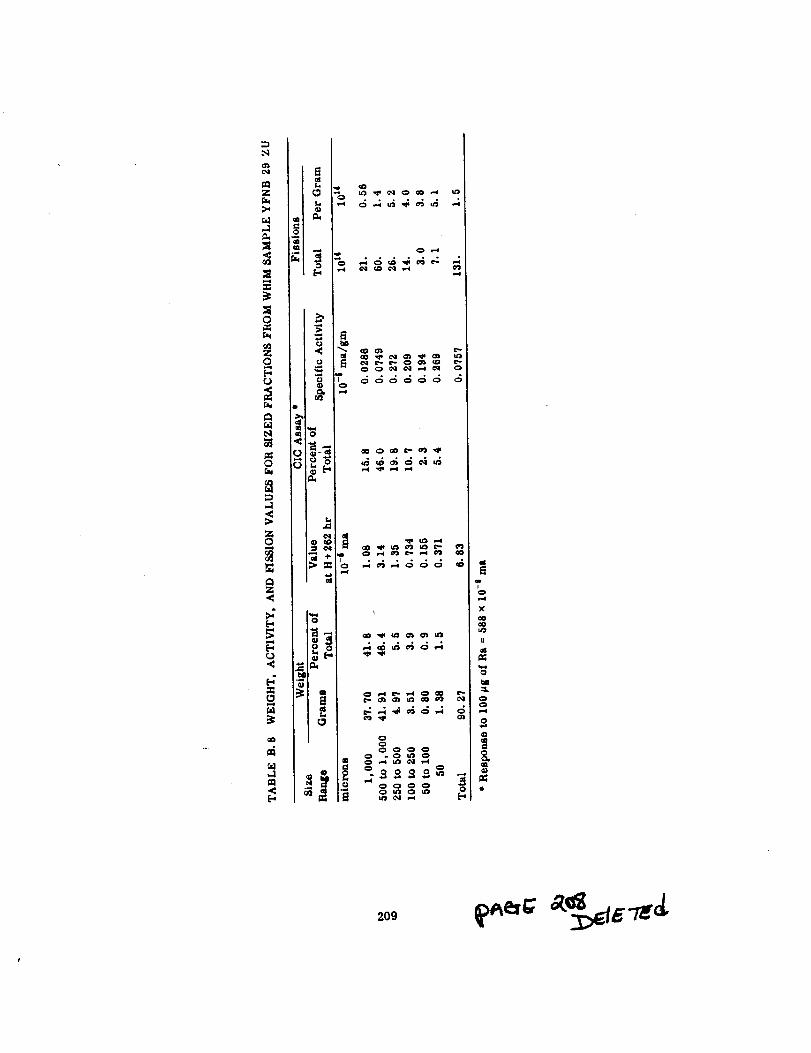
.
209

Ill:mm
101-
‘1
‘1
.00-
131!N-.
.-
INI*
ho *- d-
. .
nz<
0000
m
aiw
A❑
<t-
0000----:gg~-.-N
210f

d
I
I
I
I
I
I
I
I
I
I
I
Z+--=l”l I
I
I
I
I
I
I
I
I
I
I
x
m
, 211

0
3%:11°11110
‘5-00-0010 - s:
.d
212

TABLE B. 10 SURVEY OF SHOT TEWA REAGENT Ff LMS FOR SLURRY PARTICLE TRACES*
Station and Number of ReagentSerial Number of
Tray HavingNumber of Slurry Particles
Instrument Film Examined tSlurry Particles
Definite Doubtful
YAG 40-A-l 10 — o 0
YAG 40-A-2 7 3006 4
2988 2
YAG 40-B-7 28 — o 0
YAG 39-C-20 27 3930 53931 3
3927 13924 t
YAG 39-C-24 27 3721 2
3727 4
YAG 39-C-33 27 3828 $3829 $
UT 611-D-37 27 3211 1
3224 13231 1
LST 611-D-41 27 3394 1
3393 1
3401 1
LST 611-D-50 12 — o 0
YFNB 29-G-71 5 3433 -57s
YFNB 29-H-78 o — —
YFNB 13-E-57 5 — o 0
HOW F-64 17 — o 0
Totals 219 17 11 73
● Private communication from N. H. Farlow.f Every reagent film in each IC examined.I Covered with contaminated rain.9 Primarily splashes.
213

214

TABLE B. 12 GAMMA ACTIVITY AND FISSION CONTENT OF OCC AND AOCI COLLECTORS BY MO$SANALYSIS(AREA = 2.60 ftz)
The activities listed are for the unopened, covered collector On the floor of the doghouse counter. Fission valuesdetermined by radiochemlcal analysis are underlined, corresponding total fissions are corrected for recove2y
10SS. All other fission values are computed from the derived ratio fission/doghouse counts/rein at 100 hr (see
Table B.13). In most cases the observed ratio for a given platform is used for the other collectors on that plat-
form. For the YFNB 29, the ratio used is based on tbe average of the two independent Eseion values reported.
How F’ Flathead is computed from the average ratio obtained from all other Flathead platforms.
Shot Zuni Shot Flathead—----—----
CollectorDoghouse Recovered
TotalDoghouse Recovered
Activi~TotaI
DesignatorNumber of
FissionsActivity Number of
Fissionsat 100 hrs Fissions at 100 hrs Fissions
counts/rein
YAG 40-B- 4
-5
-6
-17
-18
-19
YAG 39-C-21
-22
-23
-34
-35
-36
LST 611-D-38
-39-40
-51-52-53
YFNB 13-E-54
-55
-56
-58
-59
-60
How F-61
-62
-63
-65
-66
-67
YFNB 29-G-68
-69
-70
-72
-73
-74
yFNB 29-H-75-76-77-79
-80
-81
standa~ cloud
433,600 ● —
4,538,900 —
‘1, 458’,800 1.27 x 10IS5,868,700 —
2,833,200 —
4,047,400 —
87,300 8.26 x 10¹²
35,560 —
35,560 —
34,400 —
64,180 —
132, 120 —
7.38 x 101*
7.73 x 101’1.27 X 10IS9.99 x 101’
4.82 x 10146.89 x 1014
8.26 x 10¹²
3.36 x 10¹²
3.36 x 10IZ
3.25 X 10¹²
6.07 X 10¹²
1.25 x 10¹³
NO FALLOUT;COLLECTORS NOT EXPOSED
2,805,200
3,305,8004,656,0001,780,900+
3,073,0004,004,200
2,081.0002,361,0002,877,000
2,229,0002,064,0001, 776,000
4,320,0004,419,600
5,881,7005,283,6004,054,000
4,884,800
5,732,2007,476,800
6,889,0007,476,8006, 180,8005,615,900
83,000
7.95 x 10”—————
5.01 x 101’—————
1.19 x 101s———
—
1.39 x 10’5—
———
—
7.95 x 10”9.37 x 10”1.32 x 10’C5.05 x 101’
8.71 x 101’1.13 x 10’$
5.01 x 10”5.68 x 101’
6.92 x 10145.37 x 101’4.97 x 101’
4.27 x 10¹⁴
1.19 x 10’s
1.20 x 101s
1.60 x 101s
1.44 x Iols
1.10 x 101S
1.33 x lol~t
1.54 x 10’6
2.03 x 10’6
2.42 x 10¹⁵
2.03 x lo’~
1.68 x 10’6
1.53 x 10’5
9.84 X 10¹²
counts/rein
421,500
84,480
35,200
34, 140
101,900
439,650
82,100
31,400
17,820
50,270
92,430
106,130
73,120
13,576
11,580*
21,840*
136,490
241, 150 ●
4,962,300
5,596,600
6,890,600
5,880,700
7, 364,000
4,978,800
666
1,107
1,443
603
604
620
219,800
266,900
303,550
272,450
233,760
230,400
316,600
271,700
302,880
298,560
309, 500
247,680
164,000
5.29 x 10¹³—
—
—
—
—
1.27 x 10¹³—
—
—
—
—
—
—
2.09 x 101*—
—
—
9.52 X 101’
—
—
—
—
—
—
—
—
—
—
—
3.47 x 10’J—
—
—
—
—
4.79 x 10’s—
—
—
—
—
—
7.56 X 101s
1.52 x 10*3
6.31 x 10IZ
6.12 x 10¹²
1.83 x 10¹³
7.89 x 10¹³
1.37 x lo’s
5.24 X 10¹²
2.97 x 10’2
8.39 x 10*2
1.54 x 10¹³
1.77 x 101’
1.74 x 10’3
3.22 x 10’2
2.75 x 10’*
5.19 x 10’*
3.24 x 10*S
5.73 x 10’3●
1.05 x 10’s
1.18 x 10’5
1.46 x 10¹⁵
1.24 x 10IS
1.56 X 101s
1.05 x 101s
1.26 x 10¹¹
2.10 x 10¹¹
2.74 x 10¹¹
1.14 x 1o11
1.15 x 10¹¹
1.16 X 10¹¹
3.81 x 101’
4.84 x 10¹³
5.50 x 10”
4.94 x 10*3
4.24 x 10¹³
4.17 x lo’~
5. gg x 1013
4.93 x 10”
5.49 x 10”
5.41 x 10’3
5.61 x 10¹³
4.49 x 10’$
2.79 x 101J
215

TABLE B.12 CONTINUED
Shot Navajo Shot Tewa
DoghouseCollector
Recovered Doghouse
Activity Number ofTotal Total
Designator FissionsActivity
Fissions tat 100 hrs Fissions at 100 hrs
YAG 40-B- 4-5-6-17-18
-19
YAG 39-C-21
-22
-23
-34
-35
-36
LST 611-D-38-39-40-51-52-53
YFNB 13-E-54-55-56-58-59-60
How F-61-62-63-65-66-67
YFNB 29-G-68-69-70-72-73
-74
YFNB 29-H-75-76-77-79-80-81
Standard Cloud
counts/rein
85,800
67,080
52,260
54,990
69,615
80,145
191,760
149,600
117,640
129,200
176, 700
205,360
16,860
18,130
9,016
8,722
17,836
19,600
727,600
476,000
804,640
806,070
‘{14, 000
675,240
16,110
18,820
16,980
18,440
15,890
15,130
8,330
9* 500
11,370
10,880
5,292 ●
10,090
13,130
7,546*
14,110
16,660
17,050
11,560
16,900
1.72 x 10i’—————
3.90 x lol~—————
3.03 x 10¹²—————
——
1.30 x 101’———
3.04 x 10¹²—————
——————
2.60 x 10¹²—
3.10 x 10**———
1.91 x 101J1.49 x 101’1.16 x 101s1.22 x 101J1.55 x 10’$1.78 x 10*3
4.48 x 10:s3.49 x lo’s2.75 x lo’s3.02 x 101J4.13 x 10”4.80 x 10:s
3.74 x 10’24.02 x 10122.00 x 10121.93 x 101*3.96 x 10124.35 x 10’2
1.46 x 10149.58 x 101;1.62 x 101’1.62 x 101’1.44 x 101’1.36 x 101’
3.62 x 10124.23 x 10124.26 x 10*24.14 x 10**3.57 x 10’*3.40 x 101*
2.06 x 10IZ2.35 x 101*2.81 x 10122.69 x 10121.31 x 10’*2.50 x 101Z
3.10 x 101*1.87 x 10123.65 x 101*4.12 x 10’24.22 x 10’22.86 x 101*
3.46 x 1012
counts/min
13,383,3004,504,7003,743,2004,956,6003,846,800
13,879,700
23,623,2005,754,7006,306,5006,192,2009,091,900
27,328,300
1,337,000810,900962,800
1,259,0001,336,5001,830,400
2,584,3003,616,3005,740,9004,180,4002,149,1002,447,800
255,940275,000331,570251,790214,470238,140
17,914,700#
32,654,40037,489,10018,895,70018,676,100
37,371,90046,094,00064,372,00061,366,40045,756,70037,853,100
315,000
1.95 x 10’C6.56 x 10145.45 x #’7.22 x 10”5.60 x 10142.02 x 10”
4.54 .x 10’S1.11 x 101’1.21 x 10$’1.19 x 101’1.75 x 10;’5.25 x 10i’
2.44 x 101’1.48 x 101’1.76 x 10”2.30 x 101’2.44 x 10;’3.34 x 101’
5.95 x 10”8.32 x 10*41.32 x 10IS9.62 x 10’44.95 x 10”5.63 x 10¹⁴
6.56 x 101s7.05 x 10’J8.5 X 1(.)13
6.45 X 10IS
5.50 x 10’J6.10 x 1011
3.61 x 101’.
6.26 x 101’7.18 x 101’3.62 x 10IS3.58 X 10*ST
6.79 x 10IC9.41 x 101$1.23 x 10:’1.18 x 10168.77 x 10IS7.25 x 1016
4.71 x 101’
Imperfect collection for quantity/area; hexcell and/or liner lost.Independent value by UCRL: 1.38 x 10iSAll recoveries >96 percenL No correction made.Absurd value excluded.Independent value by UCRL: 4.15 x 10IK
●
216

@i
I
I
I
i-iw
5
@i 4
I
w
U3m-#IA
m
217

.
.--n.=5== =: s..- --000000000 000H-I-44-11-IH ddl+++d
Xxxxxxx xxx xxxoN
4
-0-1
Xxix
G
Xxxxx
● ☞
..-*” -.q-
0000000004 Ad 4 d 44 l-l d
XxxlXxxxxxxxx xxxNW-’N+L-
tA16mi

“X’”x”xxxxxxxxlx Xxxlll xxx Xxxl
,219

-0 -0-0!+!44
::.0 0-o+!+-
xxx
. . .-0-0 “oM--4
xxx xx000neam
bn
mzh
. 220
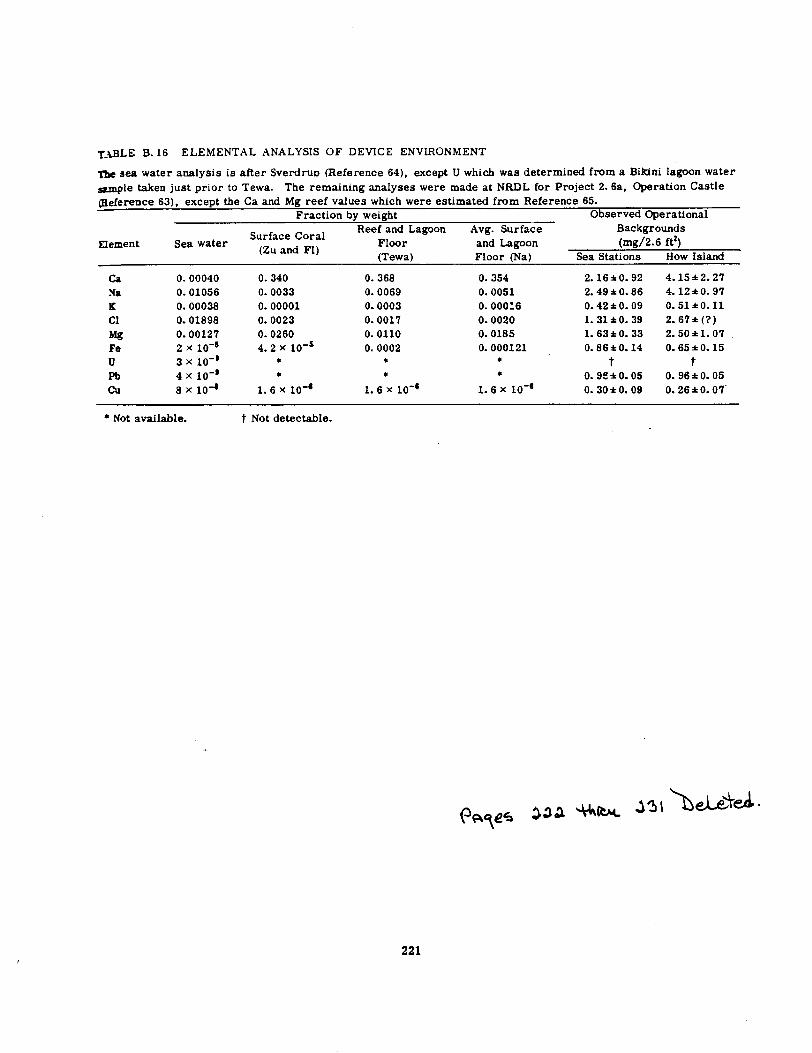
TABLE B. 16 ELEMENTAL ANALYSIS OF DEVICE ENVIRONMENT
~ sea water analysis is after Sverdruo (Reference 64), except U which was determined from a Bikini lagoon water
@le taken just prior to Tewa. The remdning analyses were made at NRDL for Project 2. 6a, Operation CastleReference 63). extent the Ca and Me reef values which were estimated fmm Reference 65.-___–.––, . ..-=
Fraction by weight Observed Operational
Surface CoralReef and Lagoon Avu. Surface Backgrounds
EIement Sea water (2u and Fl)Floor<m----- \
and Lagoon (mg~2.6 ftz)\Lewa) Floor &a) Sea Stations How Island
CaXaKc1
wFeu
PhCu
0.00040
0.01056
0.00038
0.01898
0.001272 x 10⁻⁸
3 x 10-04 x 10-0
8 x 10-
0.340
0.0033
0.00001
0.0023
0.02604.2 x 10-6
*
●
1.6 X 10⁻⁸
0.3680.00690.00030.00170.01100.0002
**
L 6 X 10⁻⁶
0.3540.00510. OOOZ60.00200.01850.000121
●
●
1.6 X 10-a
2.16*0.92
2. 49* 0.86
0.42 ● 0.09
1. 31* 0.39
1. 63* O. 33
0. 86*O. 14
t& 9$ ● 0.05
0. 30* 0.09
4. IS* 2.274. 12*O. 970. 51*O. 112.67*(?)2.50*1.070. 65+0. 15
t0.96 ● 0.050. 26*O. 07-
● Not available. t Not detectable.
.
221

—-- Omwo?(
1
UYl,o.-fmo.I-Jlno c-amN. mel-----..*NN. ...=----
L--W*WmmmmmUYlnlntnln-----w+dd -.4dti4-----
WmmmemaaeammU31ntnlnua-----.ddd.d4 . . . .-----
Wln m.-“---0
..===--00000. . . . .-----
.m mm-l-
. ..-.~fl=.-
--
00000. ...=----
.xmmmwOwua-n.m ml-m-----dNe4c4N-- ”-.-----
wlnL701--4 -..0. . . . .-----A+ ..-. ...=----
Wm.mmm. ..4...-4 +.------. . . . ..+ --------
.n~~~e
. . . .._----. .. +-4. ..44-----
mmwmm. .. A-..+ ..------4 ..-.-..==---
0d0301nN-!mmmlnm v-r------NLUNC+LN+..**---- -
.
‘ 232

M@loameaelcudl+*dd !-l!+-----0000044A -I-I-----
0
233-234

TABLE B. 21 GAMMA-RAY PROPERTIES OF CLOUD AND FALLOUT SAMPLES BASED ON GAMMA-RAYSPECTROMETRY (NRB)
Cloud samples arepartlculate collections insmail pieces of fiiter paper. .411fallout samples arealiquotsof OCC
sample solutions except those indicated as solid, which Ire dlquoted undissolved, by weight.
Averagemr/hr at 3 ft. (SC), for
sample Number of Nf fissions/ft2 TotalAge Energy
Photons/see
DesigmtiOn Fissions By Line By Error Photons 10C fissionE
E F Usirm E per sec— —hr
‘fpet x 106
Shot Cherokee
Standard cloud
sample
1
2
3
4
5
6
7
8
9
10
11
Shot Zuni
Standardcloudsample
1
2
3
4
5
8
7
8
9
How F-61
1
2
YAG 40-E4-19
2
3
4
5
6.
6’
7
8
9
10
HOW F-87
1234
YAG 40-B-61234
53
74
96
166
191
215
242
262.5
335
405.5
597.5
53
69
93
117
192
242
454
790
1,295
240
460
266
362
459
790
963
967
1,298
1,728.5
2,568.5
2,610
359
460.5
981
1,606
383
458
982
1,605
8.62 X 10’2
9.84 x 10¹²
1.00 x 101’
1
3.71 x 101’
(solid)
7.29 x 101’
(solid)
I
5.08 X 10¹³
I
kev
294
299
310337379391417446490509626
477413422433437485589624559
210247
419460508606731706710706711731
318385610646
444.76457.16656.58695.12
20.64
17.18
11.94
7.88
6.36
5.82
5.00
4.44
3.46
2.85
1.82
62.47
49.92
37.90
28.4516.7113.056.283.291.56
1.720.64
181.18110.18105.6251.0753.4649.2438.0928.4118.8514.50
10.668.314.383.54
12.929.434.493.47
237
21.15
17.66
12.15
8.36
6.87
6.24
5.40
4.81
3.81
3.10
1.98
67.36
52.89
39.64
30.12
17.78
14.03
8.84
3.52
1.65
1.73
0.65
193.33
119.14
113.95
54.87
56.63
51.89
40.91
30.05
19.60
16.02
11.38
8.73
4.53
3.64
13.79
10.07
4.76
3.60
2.47 11.62
2.79 9.65
1.78 6.53
6.09 4.04
8.02 2.917.22 2.598.00 2.108.33 1.75
10.12 1.268.77 0.998.79 0.52
7.83
5.95
4.59
5.67
6.40
7.51
8.92
6.99
6.45
0.58
1.56
6.71
8.13
7.89
7.44
5.93
5.38
7.40
5.773.98
10.46
6.755.053.422.82
6.736.796.013.75
22.98
20.82
15.28
11.316.624.711.900.930.48
1.340.43
74.9840.436.2914.8312.8712.219.587.074.603:65
5.823.691.200.93
5.053.581.20.86
1.317
1.094
0.740
0.456
0.330
0.294
0.238
0.198
0.143
0.112
0.059
2.335
2.116
1.553
1.149
0.673
0.479
0.193
0.095
0.049
0.134
0.043
0.202
0.109
0.098
0.040
0.035
0.033
0.026
0.019
0.012
0.010
0.080
0.051
0.016
0.013
0.10
0.070
0.024
0.017

TABLE B-21 CONTINUED
Averagemr/brat 3 ft. (SC), for
Sample Number ofAge Energy
Nf fissions/ftz TotaI Photons/sec
Designation Fissions EBy Line By Error” Photons —
E10’ f1St310n~
E Using ?? per sec
x 10’
Shot Flathead
Standard cloud
eample
2
3
4
5
6
7
8
9
YAG 39-C-36
1
2
YFNB 13-E-561234
YFNB 13-E-54
1
2
3
4
Shot Navajo
Staraiard cloud
eample
1
2
3
4
5
6
YFNB 13-E-54
1
3
4
5
YAG 39-C-36”-
1
2
YFNB 13-E-66
1
2
3
YAG 39-C-21
hr
96.5
195
262
334
435
718
1,0311,558
119.5
598
337722
1,032
1,538
357
720
1,034.5
1,538.5
51.5
69
141
191
315
645.5
197
311
360
551
216
260
237.5
359
551
309.5
Nf
2.79 x 101’
1
1.06 X 10*’*
(solid)
4.44 x 101’
(solid)
I3.81 X 10IJ
I
3.46 X 10¹²
2.40 x 10”(solid)
——
6.50 x 10IZ
I3.90 x lo*~
kev
335.88
402.04
489.13
535.96
573.61
661.49
708.63
676.61
306.28
532.06
515.7’4
659.93
681.15
699.09
3s9. 11
549.26
672.68
662.90
567.68
463.11
396.37
482.27
604.29
585.88
496.15
658.79
710.86
818.31
436.11
549.03
518.87
678.86
688.41
604.65
61.12
27.94
18.94
16.31
11.06
6.08
3.16
2.08
14.77
1.99
13.38
5.96
3.71
1.77
12.41
5.08
3.55
1.94
20.50
13.32
5.00
4.84
2.13
0.72
9.34
6.15
6.36
5.69
1.92
0.99
4.40
2.98
1.56
1.96
62.88
29.18
20.36
17.73
12.01
6.56
3.42
2.21
15.20
2.17
14.52
6.36
3.95
1.85
13.52
5.51
3.73
2.00
22.97
14.65
5.31
5.18
2.32
0.76
9.96
6.74
8.92
6.01
2.05
1.04
4.75
3.21
1.70
2.10
pet
2.68
4.44
7.50
8.39
8.59
7.89
6.23
6.25
2.91
9.05
8.52
7.05
6.47
4.52
8.94
6.46
5.07
3.09
12.05
9.98
6.70
7.02
8.92
8.33
6.63
7.24
6.70
5.62
6.77
5.05
7.95
7.’72
7, 59
7.14
30.4911.82
6.44
5.39
3.43
1.64
0.80
0.54
8.08
0.65
4, 58
1.60
0.96
0.44
5.66
1.64
0.92
0.50
6.62
4.94
2.18
1.75
0.63
0.22
3.27
2.19
2.09
1.24
0.76
0.31
1.49
0.78
0.41
0.57
1.093
0.4240.2310.1930.1230.0590.0290.019
0.7620.061
0.1030.0360.0220.010
0.1490.0430.0240.013
1.9131.4280.6300.5060.1820. 0s4
O.1360.0910.0870.052
——
0.2290.1200.063
0.146
238

TABLE B.21 CONTINUED
Averagemr/hr at 3 ft. (SC), for
Sample Number ofAge Energy
Nf fissions/ftz Total Photons/see
Designation FissionsE
By Line By Error Photons 10s fissionE r Using F per sec
Shot Tewa
Standard cloud
sample
1
2
3
4
5
6
7
8
9
10
11
YAG 39-C-36
1
2
3
4
5
YFNB 13-E-56
1
2
3
4
5
6
Y3-T-lC-D
YFNB 13-E-54
1
2
3
4
YAG 39-C-21
1
3’
4
5
6
hr
71.5
93.5
117.0
165.0
~ 240.5
333.5
429,.0
5’78.5
765.5
1.269.0
1,511.0
173.0
237.0
312.0
407.0
576.0
238
335
413
578
1,270
1,512
243
263
316
408.5
624.0
287
411
626
767
L, 271
7.
1,513
Nf
4.71 x 10”
1.77 x 10’J(solid)
I
3.40 x lol~(solid)
I—2.38 X 101s
I
1.82 x 101*
I
kev
401.33378.45377.50373.02460.73489.33.548.48629.64664.50646.8Q656.33
345.84355.39397.60416.92571.65
270.06295.5632’7.78434.03542.00563.09
360.31
306.39330.48373.45484.14
427.26465.32564.53605.21672.61669.95
127.1
94.25
75.64
62.27
44.21
24.86
18.47
12.70
10.404.944.13
16.7812.277.995.693.95
11.847.164.853.821.641.16
1.01
6.874.613.491.76
66.7240.6723.7017.339.757.83
131.64
97.60
79.29
65.71
47.38
27.01
20.16
13.83
11.18
5.21
4.33
17.41
12.81
8.42
6.04
4.22
IL. 24
7.46
5.07
4.00
1.67
1.17
1.06
7.21
4.85
3.71
1.90
73.34
43.65
25.53
18.66
10.16
8.08
pet
3.57
3.55
4.83
5.52
7.17
8.56
9.15
8.90
7.50
5.474.84
3.754.405.386.156.84
3.384.194.544.711.830.86
4.95
4.955.216.30
‘7.95
6.727.337.727.874.213.19
x 10’
53.42
42.00
34.21
28.69
16.75
8.99
6.00
3.62
2.78
1.33
1.09
6.2
5.67
3.45
2.36
1.21
7.38
4.11
2.52
1.50
0.50
0.34
0.48
3.83
2.32
1.62
0.64
27.96
15.28
7.40
5.07
2.51
2.00
1.134
0.892
0.726
0.609
0.356
0.191
0.127
0.077
0.059
0.028
0.023
0.463
0.332
0.195
0.133
0.068
0.217
0.121
0.074
0.044
0.015
0.010
0.161
0.100
0.068
0.027
0.154
0.084
0.041
0.028
0.014
0.011
239

C5wme a-+eJc4eJ@J@J
.- . —earannraNNC-ICJN.* --------mmmmm-----
ZZcz=m03ma2m---- -
0Ne4muJe4. Omwc5t5meJ@J-----L-c- r- Fl------
***amWmlnmmm~wmw-----mmoa o.+-----
--
meo~ooooom+-d-m-----0000-4+,-l -l-l,+-----
oo.acnmNeJ*d-mmmmm-----00000M4444-----
PWmotn4! -4*.+0ammam-----00000M!+d*d-----
eeaoloF-4C5*NPc-win*-----00000$-4 !-444.-(-----
.-4 +000eJel’NNeJmo+am aa-----00000$+*4-4.-----
!!3+000wmmuaomceeaww-----00000,-4T-lr-ld------
+.4+0000000W****-----00000=+4!4!4----
omm c-momamm*mmmm-----00000=d**ti----
.mmmmm
2’2%’?2-o V-o-ou
cs
N
0-cm
240

u
awFYuJOc-3 Ndn Pe3c-lm NN-----mm maw---- -
241

mP0
et-Fec-00000-d -d-l-----t-L-t-*t----- -
lavc-JmlnOoooad.!-l. oa-----l- l---m-----
0
,
oommmWc+-l+dmaammm-----000004-! !-4+!------
FWmoln+.!+ I-lo.mmmmm-----00000M.+ -H-l-----
ua 4000-se3mua0mmolmlml-----00000.4 H.+*--.--
~mc-wmL-wwwm-ldl.ddd-----mmmmm-----
mmmmcn+44HH-w *-$*-----00000.-I .-4.4*4-----..
s0
d
Ncoe!+mn
Inm@J L-o-r. dlnc-
.4@ic+4Gen
0-c

..c0

..
00000mmacnmNel’samml-----mmmmm-----
.s0
cQw o*-wmmdommmmm-----Wwwww-----
momma$-:-~~
-----Wwwww-----
0-ccm
244

..co.-
-~..0
245

— ——-oommmf-1-co to=VVmf--m-----moammm---- -
?4m.---Om-rr’acn-m L-w*-----00000.- +..-----
Wm’NwmUammvm.-l*+------t- t---------
vaal
-c
0-cm

C5mua-aea’ia’=m.Indm$+-----mmmo~---++
--
O-W**m@3e3d0eamm mea-----d,+!-ld !-1ddd+4-----
mmmmmmmmmmFJr Jc-Jmm-----+dr+dddd.+.+d-----
oooomw*-r-YmU31nmmm-----.++. Ad’+.-dd-+d-----
0,-1’mc-Juleeal+ o-1.-ldd!-+’m-----00004~!+!+!+d----
..c0
247

..s0
248

.Olnwaua m@Jua OaOminolm 0c4dmaVJmfnae *auaea@l----- -----rn’mwam ‘m fmwmm----- -----
CD WWWU3lnu-Juauak3e4eae4@4eJ-----00000,+. +.+.------
#..a0 UJW W-FM
mc.ammmInlalnuJua-----Adl+dd,+-I. +A. +-----
m
a
‘mw@Jwrnua@amlnoe4’NA-l M-----c-eee------
-#in NN-Fmneamwtnce*msa
+- N“m-e-P-d
249

I -----!-1 I
. .
..c0
u mlnoammL-lmelcawUalnln e-r-----00000dd 44-i-----
C-W*W
almmmm
‘2’2’22’2-o-ovum
*+4-+-V?
250

TABLE B. 23 OBSERVED DOGHOUSEDECAY RATES OF FALLOUT AND CLOUD SAMPLES
Fallout samples listed are total undisturbed OCC trays, counted with aluminum covers in place on the floor of the
counter, -36 inches from a 1 inch Naf(Tl) crystal. The standard cloud samples are essentially point sourcee of
filter paper in lusterold tubes, placed in a clean OCC tray, and similarly covered and counted. The extended
sources, or fallout samples, have been corrected to a point source equivalent by increasing the observed counting
rate by 7 percent (Reference 66). Their fission contents appear under Total Fissions in Table B. 12.Counting Time Observed Activity Counting Time Observed Activity
count e i secH+hr H+hr
counts/see104 fissions counts/rein
104 fiseions
192.2
383.1
598.3
771.5
1,538
97.6
191
383
771
1,538
1,970
2,403
counts/rein
YAG 39-C-23 ZU
14,930
4,647
2,073
1,416
509
YFNB 13-E-55 ZU
3, 51S, 106
1,415,754
411* 888
119,308
48,315
39,819
33,252
YFNB 13-E-56 ZU
70.3
95.7
191
383
771
1.539
76.8
95.6
190.9
383.1
771
1,539
1,971
2,422
166.3
383.1
743.6
1,534.7
70.4
167.6
384.3
742.8
1,534
2,544,603
1,909.529
769,170
223,180
63,691
26,463
How F-B-5 Zu
3,577,190
2,865,850
1,232,290
322,064
96,753
44,244
36,563
31,178
YAG 40-B-17 FL
19,4535,1381,620
495
YAG 39-C-22 FL
42.589
16, 2S1
4,150
1,220
390
7.93 x 10-~
2.46 X 10-’
1.13 x 10-’
7.51 x 10⁻⁸
2.71 x 10-’
6.69 X 10-’
2.69 X 10⁻¹
7.84 X 10+
2.27 X 10⁴
9.19 x 10-’
7. 5s x 10-’
6.33 X 10-’
8. 99x 10-76.74 X 10-7
2.72 X 10-’
7.68 x 10+
2.25 X 10⁴
9.34 x 10-’
9.68 x 10-’
7.76 X 10-’
3.34 x 10-’
8.72 X 10⁴
2.62 x 10+
1.20 x lo~
9.69 X 10-’
8.44 X 10-0
5.67 X 10-r
1.50 x 10-’
4.72 X 10-’
1.44 x 10+
1.45 x 10-’
s. 53 x 10-’
1.41 x 10-’
4.15 x lo-
1.33 x IO-Q
76.9
96.3
190.8
382.1
771.4
1,539
HOW F-B-12 ZU
2,945,620 9.97 x 10-’
2,242, 750 7. 59. X 10-’
930,350 3.15 x 10-’
266,730 9.03 x 10-’
78,557 2.66 x IO-J
35,970 1.22 x lo~
HOW F-63 ZU
76.7
95.6
191.0
382.2
771.4
1.539
52.1
70.8
94.2
123.3
170.2
189.6
237.6
285.9
406.4
525.6
770.6
1,538
220.0382.8742.6
1,534.9
94.7
167.8
384.1
1,535.5
3,935,480
3,015,’700
1,194,420
336,322
94,770
40,136
Z U Standard Cloud
144,652
113,562
87, 3i9
66,194
44,193
38,414
27,537
20,138
11,154
7,420
3,943
1,200
YFNB 13-E-58 FL
2,360,643
944,495
284,202
85,797
YFNB 29-H-79 FL
312,141
158,986
40,390
3,722
1.01 x 10-’
7.77 x 10⁻¹
3.06 X 10-r
6.67 X 10-$
2.44 x III-4
1.03 x 10-’
2.450 x IO-*
1.923 x 10+
1.478 x 10⁻⁶
1.104 x 10+
7.489 X 10⁻¹
6.504 X 10-T
4.664 x 10⁻¹
3.414 x 10-~
1.890 X 10⁻¹
1.260 X 10-’
6.676 x 10+
2.032 x 10A
3.39 x 10-’
1.36 X 10-’
4.09 x 10+
1.23 X 10-
1.03 x 10-~
5.24 X 10-’
1.33 x 10-f
1.23 X 10+
251

TABLE B. ?3 CONTINUED
Counting Time Observed Activity Counting Time Obsemed Activity
cOunts/6cc COunta/se~ -H.hr
104 fis.slonscountslmin
104fisaion~f++h~
69.9167.9
382.6
743.8
1,534.4
166.1
384.2
742.7
1,534.8
1,845.7
2,209
2,900
219.6
382.9
‘743. 4
1,535.4
2,209
2.900
counts/rein
YAG 39-C-23 FL
24,4079,460
2,344
706
225
LST 611-D-53 FL
149,251
35,315
10,828
3,098
2,409
1,960
1,363
YFNB 13-E-55 FL
2,235,884
665,062
270,865
81,183
52,372
36,557
YAG 39-C-22 NA
74.2
144.3
219.5
359.5
746.9
915.7
1,080.7
1,366.1
1,490.0
1,670.5
2.205.6
2,837.9
69.1
143.7
216.9
358.8
747.0
1,080.3
1,365.6
1,490.8
74.6
143.6
219.6
356.6
746.6
1,062.2
1,346.0
1,515.7
200,43492,19549,08221,2336,9835,4804,4133,4092,9592,4792,0591,577
YAG 39-C-23 NA
172,14473,65339,14116,7505,6113,4692,6222,462
LST 611-D-53 NA
28,098
12,919
7,899
2,892
974
581
465
396
1.4’7 x 10-45.69 x 10-’
1.41 x 10-’
4.25 x 10-’
1.35 x 10-*
4.65 X 10⁻⁷
1.10 x 10-~
3.37 X1O+
9.64 x 10⁻⁹
7.5 OX1O-’
6.10 x 10⁻⁹
4.24 X 10-’
3.36 X 10⁻⁷
1.31 x 10-’
4.09 x 10-’
1.19 x 10-’
7.92 x 10-s
5.52 X 10-s
1.02 x 10-’
4.71 x 10-’
2.51 x 10-’
1.06 x 10⁻⁷
3.57 x 10⁻¹
2.80 x 10-B
2.25 X 10-0
1.74 x 10-~
1.51 x 1O-B
1.27 X 10⁻¹
1.05 x 10-’
8.06 X 10-’
1.12X 10⁻⁹
4.79 x 10-’
2.54 x 10-’
1.08 X 10-’
3.64 x 10-0
2.25X 10-’
1.83x 10-0
1.59 x 10-’
1.15 x 10-’
5.30 x 10-’
3.24 X 10-r
1.19X 10-?
3.99 x 10-~
2.38 X 10-:
1.90 x 10-*
1.62 x 10⁻⁸
52.4
69.1
94.0
165.3
237.3
381.8
142.4
1,534
166.6
219.6
358.5
746.4
1,344.1
1,514.9
69.8
143.5
219.7
359.4
747.0
915.6
1,082.2
1,344.3
1,513.9
1,870.4
2,205.1
2,773.6
70.4
143.8
219.1
359.0
746.1
1,365
1,517
71.4
145.9
218.8
358.9
146.4
1,366.0
1,515.9
FL Standnrd Cloud
287,838
230,228
175,925
92,377
53,830
24,750
7,872
2,220
YAG 40-B-17 NA
26,016
18,249
7,642
2,649
1,281
1,107
YFNB 13-E-60 NA
999,232
429,456
232,011
102,949
36,000
27,495
22,014
16, 757
14,601
11,469
9, 718
7,277
HOW F-63 NA
26,717
12,278
6,454
2,880
924
“466
415
YFNB 29-H-79 NA
23,959
10,530
5, 730
2,702
1,050
561
516
1.72 X 1o-6
1.36 X lo-~
1.05 x 1(’JA
5.52 X 10⁻⁷
3.22 x 10⁻¹
1.48 X 1o-1
4.70 x 10+
1.33 x 1O-*
3.92 X 10⁻¹
2.67 x 10⁻¹
1.12 x 10-?
3.67 X 10-D
1,.87 X 10-S
1.62 x 10⁻¹
1.31 x 10-~
5.63 x 10⁻⁷
3.04 x 10⁻⁷
1.34 x 10-?
4.72 x 10-s
3.60 X 10-’
2.89 X 10-t
2.20 x 10⁻¹
1.91 x 10-a
1.50 x 1O-*
1. 27x10-S
9.54 x 10-’
1.20X 10-~
5.14 x 10-’
2.70 x 10-’
1.21 x 10-’
3.86 x 10-’
1.95 x 10-’
1.74 x 10⁻¹
1.04 x 10-’
4.56x 10⁻⁷
2.48 X 10-’
1.17X 10-’
4.54X 10-0
2.43 x 10-~
2.23x 10⁻⁶
252

TABLE B.23 CONTINUED
Counting Time Observed Activity Counting Time Observed Activity
H+hrcounts/see
cOunts/min104 fissions
YFNB 13-E-55 NA
countsiseccounts/rein
104 fissions
6,500 2.300 X 10⁻⁸
3,938 1.394 x 10⁻⁸
2,819 9.974 x 10⁻⁹
2,286 8.089 x 10⁻⁹
1,520 5.380 X 10-S
1,102.7
1,515.0
1,850.0
2,184.0
2.856.0
664,981
297,774
153,938
60,~74
20,954
14,486
11,729
11,087
YAG 40-B-17 TE
2,574,369
1,416,545
532,469
239,457
171,997
142,537
102,048
81,898
67,541
YAG 39-C-23 TE
1,665,239
630,800
266,401
218,954
163,349
117,404
93,.998
78,074
YAG 39-C-35 TE
2,404,826
888,580
398,518
318,530
237,960
172,678
138,005
113,942
88,350
72,540
53,454
HOW F-63 TE
259,09486,29929,21312,1159,6915,3934,3053,727
1,24 x lo-~
5.54 x 10⁻¹
2.86x 10⁻⁷
1,12 x 10-74.40 x 10-8
2.70 X 10⁻⁸
2.18 X 10⁻⁸
2.06 X 10⁻⁸
74.5144.4
219.0
358.7
746.8
1,081.9
1,365.81,516.0
NA Standard Cloud
35,258 1.696 X 10-’24.185 1.164x 10-~
10,784 5.194 x lo-r
5,724 2.757 X 10-12,438 1.174 x 10-’
736 3.543 x 10-’513 2.471 X 10-’
397 1.91OX 10-’339 1.632 X 10-’
49.871.9
142.9
218.6
357.6
814.01,083.0
1,342.0
1.512.0
6.35 X 10⁻⁷
3.49 x 10-‘
1.32 X 10⁻¹
5.91 x 10-a
4.25 X 10-0
3.52 X 10-0
2.52 X 10-S
2.02 x 10-’
1.67 X 10-0
166.2
240.6
407.8
674.6
766.7
910.8
1.125.61,299.7
1,494.7
LST 611-D-53 TE
956,332
519,659
199,818
87,570
70,485
52,294
38,524
30,370
24,662
19,289
16,056
11,593
5.11 x 10-’
2.7? x 10-’
1.07 x 10-T
4.67 X 10-8
X76X 10-8
2.79 X 10-s
2.06 x 10-C
1.62 X 10⁻⁸
1.33 x 10⁻⁸
1.03 x 10-~
8.57 X 10-$
6.19 x 10-*
166.1
240.5
408.3
674.9
766.8
911.0
1,108.6
1,318.9
1,514.b
1,850
2,184.0
2,855.0
2.45 X 10-’
9.30 x 10-~
3.92 X 10⁻¹
3.22 X 10⁻⁸
2.40 X 10⁻⁸
1.73 x 10-’
1.38 X 10-’
1.15 x 10⁻⁸
240.1
406.’2
675.9
766.7
910.8
1,126.4
1,300.6
1,493.4
YFNB 13-E-55 TE
2.45 X 10⁻⁷
9.05 x 10-14.06 X 10-03.24 X 10-82.42 X 10-11.76 X 10-11.41x 10-81.16 X 10-:9.00 x 10-S7.39x 10-s5.45 x 10-$
240.4
406.0
675.1
767.0
910.8
1,125.6
1,299.6
1,495.1
1,831.0
2,165.0
2,856.0
2,537,344
851,909
300,596
127,629
100,361
74,229
54,743
43,799
36,796
5.44 x 10-’
1.83 x 10⁻¹
6.44 X 10-t
2.73 x 10⁻⁸
2.15 x 10-Q
1.59 x 10⁻¹
1.17 x 10-’
9.39 x 10-$
7.s9 x 10-t
120.1
239.9
408.9
675.2
766.5
910.9
1,108.4
1,318.0
1,514.0
YFNB 13-E-60 TE
1,865,482
553,803
202,933
84,477
66,939
49,105
36,503
29,958
25,118
5.91 x 10-‘
1.75 Xlo-’
6.43 x 10-s
2.68 x 10-s
2.12 xlo-~
1.56 x 10-S
1.16 x10⁻⁴
9.49 x 10-D
7.96 x 10-s
119.9
242.4
408.4
675.0
766.9
910.7
1,108.5
1,318.0
1,514.0
5.44 x 10⁻¹
1.81 X 10-T
6.13 X 10-’
2.54 X 10⁻⁸
2.03 X 10-Q
1.13 x 10-$
9.03 x 10-$
7.82 X 10-e
120.2240.4407.6.675.2766.6
1,12s1,3181,514
.
TE Standard Cloud YFNB 29-H-79 TE
675,1
766.3
910.5
1,108.7
1,299.6
1,493.3
2,211,858 3.34 x 10-81,684,270 2.55 X 10-a1,149,807 1.74 x 10-$
886,099 1.34 x 10-1703,572 1.06 X 10-s
588,396 8.89 X 10-S
71.5 441.580
119.8 246,649
144.0 212,310
239.0 98,678
406.5 38,975
1.562 x 10⁻⁶
8.726 X lo-f
7.512 X 10⁻¹
3.492 X 10⁻⁷
1.379 x 1O-T909.8 9“202 3.256 X 10-S
253
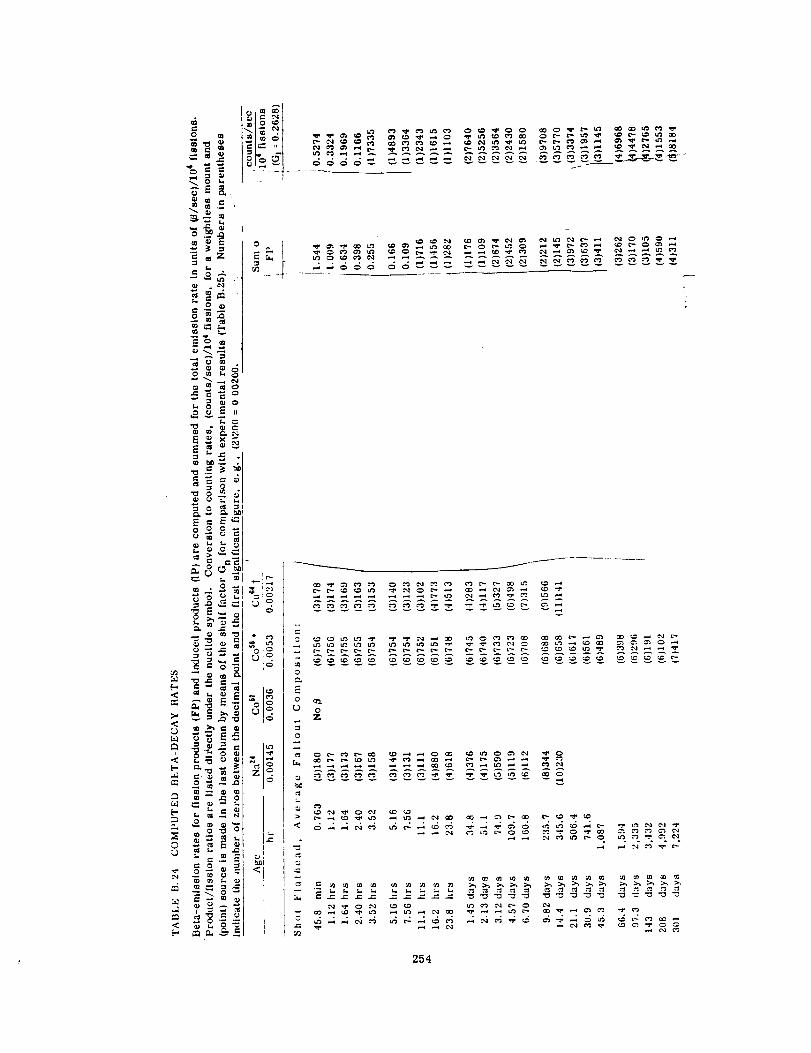
I
.~ —. . —
0.CDTm.--~.
4
.
254

no mm-swin-twoC5,-l ewe-----Cm@a-ru Yw-----
Ln-$-$mslPe t-c-eNca@Jc4e4-----Wcswcna-----
,-lo-mmc-~vsg-----Wwwww-----
-Fm.+o*wmmm-Uamlnlnul-----Inuatnlnua-----
..c0
Ou-JelA’w’--aWC-*---@em---

..
su-)
_...
dN
20++
!
256

TABLE B.25 OBSERVED BETA-DECAY RATES
Beta counting samples, supported and covered by 0.80 mg/cm2 Of P1iOfilm, Were PrePared ‘n ‘he
YAG40 from aiiquotsof SIC tray stock solution. Measurements Initmted there were usually ccm-
tinued On Site Elmer, md terminated at NRDL. When stock solution activity permitted, a portion
was shipped to NRDL as soon as possible, allowing simultaneous field and NRDLdecay measure-ments to be obtained. Nominally identical continuous-flow proportional detectors were installedat all three locstions, and small response differences were normalized W CSL31reference stand-ards. No scattering orabsorptlon corrections have been made to the observed counts.
Counter Counter
Location.*ge Activity Age
LocationActivity
counts/see counts t’sechr hr
10’ fissions 10’ fissions
Shot Flathead, sample 34?3/8, 3.09 xlosfissi On, shelf 1
YAG 40 16.4
19.5
21.7
24.0
27.9
31.1
34.1
36.6
41.1
45.0
49.8
Site Elmer 54.1
57.9
62.0
65.6
69.6
73.8
75.5
78.8
85.0
90.1
96.5
103.7
127.4 x 10⁻⁴ Site Elmer
109.3
99.42
89.42
80.0672.70
67.77
63.35
57.69
53.26
49.97
44.22
40.97
38.68
36.47
34.38
34.21
32.87
30.66
29.26
27.90
26.24
24.19
NRDL
x 10-4194.8
215
261
333
429
501
598
723
691
1,034
1,223
1,417
1,582
Shot Navajo, Sample P-3753 /8~2, 7.24 x10 Sfission, Shelf 3.
YAG 40 12.6215.58
18.24
20.33
23.76
26.90
29.78
34.51
38.0
47.9.
Site Elmer 67.8
74.6
87.0
89.9
99.0
7.426 x 10-s
5.801
4.933
4.386
3.701
3.276
2.950
2.495
2.262
1.748
1.157 x 10-’
1.027
8.640 X 10⁻⁴
8.262
7.363
112.3
123.8
130.9
136.6
153.4
161.5
175.0
194.2
224.1
247.8
NRDL 984
1,030
1,080
1,151
1,198
1,246
1,342
1,450
1,485
1,534
1,750
1,850
2,014
2,164
2,374
2.541
YAG 40 122.9 5.691 X 10⁻⁴ 2:666
150.0 4.446 2,834
&70.6 3.736 3,266
226.1 2.597 3,500
278.5 1.973 3,914
NRDL 478 1.011 x 10-44,320
574 7.937 x 10-’4,750
647 6.8765,330
693 6.4365,930
742 5.9046,580
814 5,3598,740
861 4.9666,230
.912 4.7338,640
257
22.63 x 10⁻⁴
20.07
18.66
17.84
15.33
14.69
13.02
11.49
9.412
6.339
11.49 x 10⁻⁴
10.18
7.718
5.389
3.566
2.875
2.226
1.692
1.226
0.9812
0.7773
0.5916
0.5194
4.196 x 10-f
3.906
3.731
3.223
3.269
3.126
2.620
2.647
2.477
2.373
2.040
1,883
1.710
1.535
1.425
1.293
1.252
1.077
9.346 X 10⁻⁶
8.678
7.413
6.308
5.617
4.8574.0053.752
3.453
3.039
2.440

TABLE B. 26 ~-n GAMMA Ionization Cf{AMBElf MEASUREMENTS
The fallout samples listed are all solutions of OCC sampies. Because three instruments ~ltbvarying responses were invoived in measurements durjng Operation Redwing, observed values
have been arbitrarily normalized linearly to a standard response of 700 x 10-$ ma for 100 kg
of radium.
ml
10
10
10
2
—
10
10
10
10
—
Sample
Shot and StaUonNumber of Fissions Age fun Current
Volume
hr m3/fissl On x 10-2’
Shot Zuni
YAG 40-B-6
How F-61 (1)
How F-61 (2)
How F-61 (3)
Standard cloud
Shot Flathead
YAG 39-C-21 (1)
YFNB 13-E-54 (1)
YFNB 13-E-54 (2)
YFNB 29-G68 (1)
Standard cloud .
5.08 X 101s 387
772
1,540
1.00 x 101’ 219
243
387
772
1,540
1.00 x lo’s 239
2.00 x 10’2 214
429
9.84 x 101* 52.4
190/
267
526
772
1,540
‘ 5,784
5.08 X 10¹¹ 220
244
266
388
746
1,539
3.81 x 10” 267
388
746
3.81 x 101’ 340
1.39 x 10’2 220
244
266
386
747
1,540
2.79 X 10¹³ 73.6
95.1
166
196
Shot Navajo
YAG 39-C-21 (1) 10 3.90 x 10’2
367
747
1,539
196
244
317
387
741
915
1,084
1,347
1,541
8.096
3.335
1.499
8.557
7.284
3.604
1.645
0.929
7.143
6.842
3.053
197.1
51.49
34.00
13.64
7.959
2.751
0.351
18.60
16.32
14.33
8.244
3.334
1.440
11.86
7.969
3.099
9.107
19.20
16.76
14.80
8.538
3.457
1.420
80.90
63.37
34.11
28.72
12.30
5.082
1+63
20.58
15.58
10.99
8.441
3.929
2.884
2.348
1.843
1.610
258

TABLE B.26 CONTINUED
SampleNumber of Fissions Age
Shot and Station VolumeIon Current
ml hr ma/fissions x 10-21
Shot Navajo
YAG 39-C-21 (2) 10 3.90X 10’*
YFNB 13-E-56 (1) 10 6.50 X 10¹²
YFNB 13-E-56 (2) 10
Standard cloud —
Shot Tewa
YAG 39-C-21 (1) 10
YAG 39-C-21 (2) 10
YFNB 13-E-54 (1) 10
YFNB 13-E-54 (2) 10
Standard cloud —
220
19624431’7387746915
1,0841,3471,540
6.50 X 10¹² 220
3.46 X 10¹² 52.575.6
148196381742915
1,0841,3441,5366,960
1.62 x 10¹⁴
1.82 x 10¹⁴
2.38 x 10¹³
2.38 x 10*3
4.71 x 10”
267
292
408
580675773916
1,1061,3001,5171,652
286
292408560675773916
1,1081,3001,517
262
77.0101.123172244408675773916
1,108
1,3001,5171,851
16.74
23.44
16.33
12.13
9.944
4.572
3.550
2.866
2.092
2.009
20.81
143.44
67.54
37.83
26.57
11.06
5.043
3.928
3.139
2.434
2.136
0.380
12.3610.925.9843.5892.9022.6321.9361.6801.2111.0560.906
11.00
6.345
3.692
2.134
1.730
1.458
1.187
0.964
0.727
0.653
7.566
88,74
69.07
56.67
39.83
24.18
12.15
5.9984.9043.769
2.726
2.076
1.664
1.201
259

TABLE B. 27 GAMMA ACTIVITY AND MEAN FISSION CONTENT OF HOW F BURfED COLLECTORS
(AREA = 2.60 FT2)
The activities summarized in this table have been corrected for contributions from shots other than theone designated. Flathead produced no activity in these collectors resolvable from the ZUni background.The conversion to fissions was made by means of the How Island factors shown in Table B.13.
Shot Cherokee ●
Collector —Shot Zuni Shot Navajo Shot Tewa
Dogh–. -.. louse Activity Doghouse Activityue.mgna~or
Doghouse Activity Doghouse Activityat 1O(Ihr at 100 hr at 100 hr at 100 hr
count simin count.simin countslmin counts/rein
F-B1-B2-B3-B4-B5-B6-B7 $-B8-B9-BIO-Bll 8-B12
7987
548596
2,560897
609630
174
240
1,056
2,154,0002,261,0002,022,0001,963,0002,737,000l,504,000t3,448,0002,295,0002,168,0002,463,0001,287,0002,189,000
20,809T14,145113,8701
9,088?19,44330,650 f26,454
7’,6888,163
18,5506,176f
17,654
262,800250,860203,380246,760206,940303,820329,970138,500t208,640200,450
39,370216,810
Mean and u : 537*192 2,250,200 ● 234,170 14,300*5,855 233,384 ● 35,150(35.8 pet) (10.41 pet) (40.94 pet) (15.06 pet)
Mean fissions/
coIlector 5.42 A0.57 X 1014 3.21 +1.32 x 10¹² 5.98*0.90 x 101s
Mean fissions/~2
2.08 A0.22 x 1014 1.24+0.51 x 10¹² 2.30k0.35 x 101s
● Values are pre-Redwing background activities.t Collector in estimated platform shadow; omitted from mean value.I Collector directly under platform; omitted from mean value.S Collector on sandbank slope; omitted from mean value.f Water leakage during recovery; omitted from mean value.
260


i II I I I Ill I I I II I I 1::;;;11++
4-
111
II
II
II
II
II
--
I I I I I I I I I I I I I I I 1:::::“Nlnm
.+*-

‘“’=
103
s ,
●.
L
●.O
“...
“..
“...
“..
“.“..
1
“,).(
“, .0
\
●.
●.
“.O“.
.I
.
“..
324-58 --
1
i
I
\
t
Designation Sample Description Number Instrument
YAG4$)-Al PART!CLE 325-30 WE~L -324-58
10 - 102 103TSD(HR)
w
A
104
Figure B.2 Gamma decays of solid fallout Particles, ~ot Zuni.

o
+
oIn
oIn*
o0*
oInF-)
o0m
ou-)t-u
~N
om
o0
0u)
o
v)zoav
zaw1-W
z~0
0w1-
0 0 0 0 0 00
0 00 In 0 In 0 u-l
F) m N N
(S NO M31W) M313k’IJV10 313M13 0391 M3SNl

267

t++tttt .:::~... - “’e”OrT’pe&N”m’r‘eigh’”beg=MONITORING “SHOW ISLAND (1 -12 AV)
TIR ~
CUTIE PIE--O‘l B-------#
25 FT
3FT3FT
1 10 10=
TIME SINCE ZUNI (HR)
Figure B.7 Gamma-ionization-decay rate, Sit-e How.
268

B.3 CORRELATIONS DATA
269

.
270

271

272

I

0
)
274

,-
‘gj
co~mggm (-mm2.. . ----

T~LE B.29 CONTINUED
ILI. SPACE VARIATION, TfME VARIATION, AND VERTICAL MOTIONS OF THE WIND FIELD
Corrected Remarke on CorrectIon EffectiveAltitude Time Time Cumulative Wind VerticalIncrement Through
VertlcafTime Velocity Motion for Fall- Wlnd
Through Motion Ing sped Velocity
10’ ft h,s hre hrs deg knots cm /eec deg knotsft pet
Shot Zum
Particle size, 75 microns
Orlgituting altltude, 60,000 feet
From
60 to 55 1.16 0.76
55 to 50 1.16 0.75
50 to 45 1.21 0.83
45 to 40 1.26 0.97
40 to 35 1.32 1.32
35 to 30 1.37 1.71
30 to 25 1.42 1.42
25 to 20 1.46 1.62
20 to 15 1.51 1.36
15 to 10 1.54 1.39
10 to 5 1.58 1.29
5t00 1.62 1.27
Shot ZUniPartjcle size, 100 ~cmn~Originating dtttude, 60,000 feet
From
60 to 55 0.64 0.49
551050 0.65 0.50 -
50 to 45 0.68 0.53
45 to 40 0.71 0.s9
40 to 3s 0.74 0.66
35 to 30 0.78 0.74
30 to 25 0.79 0.85
25 to 20 0.82 0.93
20 to 15 0.85 0.97
15 to 10 0.89 0.91
10 to 5 0.93 0.97
5t00 0.97 0.97
Shot Zuni
Pmticle size, 200 microns
Origi~ting altitude, 60.000 feet
From
60 to 55 0.21 0.19
55 to 50 0.22 0.20
50 to 45 0.24 0.22
45 to 40 0.26 0.24
40 to 35 0.28 0.27
35 to 30- 0.30 0.29
30 to 25 0.32 0.32
25 to 20 0.34 0.34
20 to15 0.36 0.36
15 to 10 0.38 0.40
10 to 5 0.40 0.40
Stoo 0.42 0.41
0.76
1.51
‘2.34
3.31
4.63
6.34
7.76
9.38
10.74
12.13
13.42
14.69
160
240
234
235
230
225
230
185
115
080
065
085
17
25
34
39
35
22
11
12
15
14
13
13
0.49 160 17
0.99 240 25
1.52 237 33
2.11 235 35
2.77 230 31
3.51 222 22
4.36 210 13
5.29 160 12
6.26 125 12
7.17 09s 15
8.14 090 16
9.11 090 18
0.19
0.39
0.61
0.85
1.12
1.41
1.73
2.07
2.43
2.83
3.23
3.64
160
240
235
230
225
205
180
145
120
100
090
090
17
25
33
36
32
20
15
12
11
16
20
20
-19.5
-20
–16.3
-10
●o
+6
*O
+3
-3
-3
-6
-7
-19.5
-18.5
-17.0
–12.0
-7
-3
+4
+6
+6
+1
+2
o
-20
-20
-18
-14
-8
-4
-1
●o
+1
+6
●o
-3
{50,000 53 4chart miy 54.6t
46.6+30 ~o
20 to
10 t11 h11 \22 427 \
160
240
234
235
230
225
230
185
115
080
085
065
11
16
23
30
35
27
11
13
13
13
11
10
{50,000 30 J 160 13
chart only 30 J 240 19
27 4 237 26
20 4 235 29
12 4 230 28
5J 222 21
7+ 210 14
12 t 160 14
12 ! 125 14
2f 095 15
4t 090 17
0 090 16
{50,000 10 4Chal-tnonly 11 I
10 i8.5b54
34lbolt5.5fo34
160
240
295
230
225
205
160
145
120
100
090
090—.—
1423
30
S2
s
19
1512
11
1720
19
276

.
Iw
:
a.+..+
277

I
0!-lo
++-++
278

B.4 UNREDUCED DATA
279

TABLE B.32 ACTIVfll ES OF WATER SAMPLES
Type NumberLoca tion CollectIon
Dip counts/2,000 mlNorth Limtude Eml bngltude Time
Dcg Ml n Deg M!n H.hr Net countslmm al H+hr
Shot Cherokee, YAG 40
Surface
Surface
Surface
SW Background
Sea Background
Sea Background
Shot Cherokee,
Surface
Surface
Surface
Sea Background
Sea Background
Sea Background
Tank
Tank
Tank
Tank Backgrwnd
Tank Background
Tank Background
Shot Cherokee,
Surface
Surface
Shot Cherokee,
Surface
Surface
Surface
Surface
Surface
Surface
Surface
Surface
Surface
Surface
Shot Cherokee,
Depth 15 m
Depth 30m
Depth4S m
DepLh60 m
Depth 75 m
Depth8S m
Depth 95 m
Depth 100 m
Depti 105 m
Depth 115 m
Surface
Surface
Surface
Surface
surface
Surface
Surface
Surface
Surface
Surface
6081
8082
6063
8078
8079
8080
YAG 39
8013
8014
8015
8010
8011
8012
8018
8019
8020
8007
8008
6009
DE 365
6173
6174
DE 534
8195
8196
6197
8198.
8199
6200
8201
6202
6203
8204
Horizon
8127
8128
8129
8130
6131
6132
6133
8134
813S
8136
8107
6108
6109
8110
8111
6112
8113
8114
8115
8116
12
12
12
12
12
12
13
13
13
13
13
13
13
13
13
13
13
13
14
14
12
12
12
11
11
11
11
11
11
11
13
13
13
13
13
13
13
13
13
13
1s
13
13
13
14
14
13
15
13
12
38
38
38
43
43
43
20
20
20
20
20
20
20
20
20
20
20
20
42
42
17
11
03
59
56
53
51
48..5
46
43
43.5
43.5
43.5
43.5
43.5
43.5
43.5
43.5
43.5
43.5
23
23
23
43.5
36
10. s
44.5
07.5
16
32
164
164
164
164
164
164
163
163
163
163
163
163
163
163
163
163
163
163
161
161
164
165
165
165
165
165
165
165
16S
165
164
164
164
164
164
164
164
164
164
164
163
163
163
164
164
164
165
165
165
165
23.5
23.5
23.5
39
3939
40
40
40
40
40
40
40
40
40
40
40
40
55.5
55.5
55
00
04
06.5
06
10
11
12
1515
05
05
05
05
05
0s
05
05
05
05
05
44
44
05
14
43
13
39
40
56
1 i’. 65
17.65
17.65
2.65
4.65
4.65
16.40
16.40
16.40
3.98
3.98
3.98
16.69
16.69
16.69
3.90
3.90
3.98
61.97
61.97
26.85
28.48
29.15
29.38
29.62
29.65
30.00
30.26
30.52
30.75
32. I5
32.15
322.15
32.15
32.15
32.15
32.15
32.15
32.15
32.15
46.98
27.15
27.15
31.90
61.15
16.15
68.09
55.40
72.15
76.15
66
66
54
s
o
6
2015
26
1
0
8
123
120
136
9
8
3
537
737
29
39
49
43
50
41
89
108
132
226
0
016
1
3
0
0
60
0
22
23
12
81
22
29
7
43
1’7
98.8
96.8
97.6
99.3
93.6
97.4
94.4
94.6
94.1
94.9
76.6
96.9
76.3
99.3
99.4
99.6
98.3
98.9
150.2
150.1
148.7
148.8
148.8
149.0
149.2
149.3
149.5
150.3
149.6
149.7
297.3
292.5
287.2
267.0
287.6
287.8
268.1
291.8
266.2
288.3
147.2
147.3
147.4
147.5
148.0
147.7
147.9
148.1
148.5
148.6
280

TABLE B.32 CONTINUED
TypeLocatmn COllechOn
,NumberXorth Latitude EJSLLongitude Time
Dip counts ;2,000 ml
Deg f+hn Deg Min H+hr ?let counts, mln at H + hr
Shot Zu n,, YAG 40
surface 8253
Surface 325.4
Surface S255
Surface Y258
Surface 8260
Surface !3259
Sea Background a25L
Sea Background g~52
Shot Zuni, YAG 39
Surface 8029
Surface 8030
Surface 8031
Sea Background 8023
Sea Backgrcu nd 9024
sea Background 8025
Sea Background 8026
Tank 8034
Tank 8035
Tank 8036
Tank Background 9027
Tank Background 8028
Shot Zunl. DE. 365
Surface 8301
Surface 8302
Surface 8303
Surface 8304
Surface 8305
Surface 8306
Surface 830?
Surface .9308
Surface 8309
Surface 8310
Surface 8313
Surface 8311
Surface 8314
Surface 8317
Surface 8312
Surface 8315
Surface 8316
Shot Zuni, DE 534
Surface 8261
Surface 826z
Surface 6263
Surface 8264
Surface 8265
.Surface 8266
Surface 8267
Surface 8268
Surface 8269
Surface 8270
Shot Zunl, Horizon
Depth 2,ooO 8117
Depth 1,500 8118
Depth 1,000 8119
Depth 750 8120
Depth 500 9121
Depth 250 0122
Depth 150 8123
Depth 125 8124
Depth 90 8125
Depth 110 S126
12
12
12
12
12
12
12
12
13
13
13
13
13
13
13
13
13
13
13
13
11
11
111?
12
13
13
12
12
12
12
12
12
12
12
12
12
11
11
11
11
12
12
13
13
13
12
13
13
13
13
13
13
13
13
13
13
25
25
25
22
2222
22
22
00
00
00
00
00
00
00
00
00
00
00
00
27
27
4s.1
10
13.8
37
3746.1
52.7
37.8
33
.43.9
33
39.7
3320
10.3
59
59
40.3
40.3
14.1
14.1
4646
47
’44
06.4
06.4
06.4
06.4
08.4
06..4
06.+
106.406.406.4
165
165
165
165
165
L65
165
165
16S
165
165
16S
165
165
165
16S
165
165
165
165
165
165
16S
165
165
163
163
166
165
16S
164
16S
164
163
165
164
164
16S
165
165
16S
164
164
164
164
163
16S
165
165
165
165
165
165
16S
L65
165
165
281
26
26
26
27
27
27
’49
49
11
11
11
00
00
00
00
13
13
13
00
00
08.2
08.2
06.2
27.8
S3
40.2
40.2
01.3
45.2
49.5
40
30.2
40
3609.4
59.3
50.8
04
04
35..2
35.229
29
33
3347
59
02
02
02
02
02
02
02
02
0202
16.08
16.08
16.08
17.08
11.06
17.06
3.42
3.42
26.08
26.08
26.06
5.58
5.58
5.58
5.58
26.4226.42
26.425.33
5.33
7.08
7.06
10.92
13.92
18.33
49.50
49.s0
31.25
67.08
69.0877.25
72.2S
77.25
86.83
74.56‘79.42
80.67
11.42
11.42
6.92
6.92
16.58
16.s8
56.S8
56.5861.5890.33
56.7558.75
56.75
58.7S
58.7S
58.75
58.75
S.6.75
58.7s58.75
193,.945
248,266
182,937
153,s10
139,734
136,300
173
5.997
4,949
5,250
5,82S
33
0
24
8
1s,0s7
21,732
16,192
17
9
313
14
3,870
21,109
3,311
2,469
2,710
11,160
4.96S
6,199
11,409
13,563
11,503
1,058
36,668
41,461
88s
18,660
17,341
229
318
13,474
12,S33
594
8,656
267
10,043
0
20
0
7
4
1s
13
31
22
27
72.2
72.5
72.6
149.8
149.9
1S0.1
72.1
72.1
147.8
147.9
147.9
123.0
147.3
149.4
149.6
146.0
148.2
148.3
147.5
147.6
240.2
240.3
240.4
240. S
240. S
240.6
241.5
241.6
241.7
242.0
242.3
242.3
242.3
242.4
242. S
242.6
242.6
213.8
214.1
214.3
214.6
214.8
215.0
21s.2
215.3
215.S
215.6
166.0
166.1
166.2
166.4
166.5
166.6
166.6
167.0
167. L
167.2

TABLE B.32 CONTINUED
TypeLocation Collect On
NumberNO rth Latttudc Emw Longitude Time
Dip cOunts/2,000 ml
Deg Mm Dcg Min H+hr Net counts/mm al H . hr
Depth 10 8137
Depth 25o 8146
Depth ’75 8138
Depth 30 8139
Depth 50 8140
Depth 90 8141
Depth 100 8142
Depth 125 8143
Dqrth 150 8144
Depth 200 8145
Depth 300 8147
Depth 350 8148
Depth 400 8149
Depth 450 8150
Depth 500 8151
Depth 70 8152
Depth 10 8153
Depth 50 8154
Depth 3,000 8315
Depth 2,500 8376
Surface 8363
Surface 8364
Surface 8365
Surface 8366
Surface 8367
Surface 8366
Surface 8377
Surface 6378
Surface 8379
Surface 8360
Surface 6388
Surface 6389
Surflce 0390
Surface 6391
Surface 6392
Shot Flathead, YAG 40
Surface 6092
Surface 8093
Surface 6097
SurfaM 8104
Surface 6103
Surface 6102
Surface S095
Surface 8094
Surface 6098
,- Surface 8099
Sea Backgrouml 8086
Sea Background 8089
Sea Background 8090
Sea Background 8091
Shot Flathead, YAG 39
Surface 8543
Surface 8645
Surface 8553
Surface 85S5
Surface 6544
Surface 85S4
13
13
13
13
13
13
13
13
13
13
13
13
13
1s
13
13
13
13
13
13
13
13
13
13
13
12
13
13
12
13
13
13
13
13
13
12
12
12
12
12
12
12
12
12
12
12
12
12
12
12
12
12
12
12
12
00
00
00
Go
00
00
00
00
00
00
00
00
00
00
00
06.4
06.4
06.4
08. s
06.4
00
00
0404.7
00
06.5
06.5
06.5
19
06
09
11.5
12.5
11
13
29
29
45.5
41
41
41
29
29
06
0645.5
29.8
19
19
0404
06
06
04
06
165
165
165
165
165
165
165
165
165
165
165
165
165
165
165
165
165
165
164
165
165
165
165
165
165
165
165
165
165
165
165
165
164
165
164
165
163
165166
166
166
165
165
165
165
166
165
165
165
165
165
165
165
165
165
12
12
12
12
12
12
12
12
12
12
12
12
12
12
12
02
02
0258
02
12
12
12.5
12.5
12
39
02
0217
04.5
56.5
55
56
55
52
45
45
01
05
05
05
45
45
26
28
01
22.2
20.520.5
2626
28
2626
28
32.58
32.58
32.58
32.58
32.58
32.58
32.5a
32.55
32.58
32.58
32.58
32.56
32.56
32.58
32.58
56.75
5s. 75
56.75
. 64.06
58.’75
32.58
32.56
37.06
41. s3
26.06
6.42
56. ?5
58.75
19.06
53.08
68.08
72.33
60.33
16.08
84.58
18.5
16.5
25.1
26.9
26.9
26.9
18.5
18.5
18.8
18.8
6.63
6.63
7.65
7.65
13.8
13.6
18.6
16.8
13.8
18.6
2.5 Bx 10:
27
2.31 XIOJ
3.35 flo*
2.42x IO$
1.62x 10²
1.60 x10²
40
25
0
93
35
53
71
73
1.64x 10$
I.64X1O’
1.53 X1O’
55
60
2.06 x10$
I.75X1O$
2.05 XI03
1.77X10³
2.S4 .X10:
93
l.llxlo~
1. O4X1OS
5.12x1O’
1.76x 10a
I.olxloa
9.9oxlo~
9.36x10²
1.06x 10s
9.85x101
12,332
9,286
6,166
3,670
7,681
4,856
7,9o6
7,6s4
19,401
24,122
6,087
7,266
7,944
1.953
12,690
8,442
7,491
3,744
9,2o5
3,006
167.3
167.2
167.4167.5
167.6
167.7
168.1
168.2
168.4
168.6
194.0194.2
194.3
194.5
194.6
194.6
195.0
195.1195.2
195.4
243.7
243.8
243.9
244.0
244.1
244.2
244.4
244.5
244.5
244.6
262.1
262.2
262.4
262.6
262.7
170.0
170.5170.3
170.2
170.3
170.4
170.4
170.6189.4
1.99.4
170.0
170.1
172.5
112.5
73.5
73.6
172.6
189.3
73.5
189.2
282

TABLE B.32 CONTINUED
Location CollectionType Number
North Lat,tude East Longitude TimeDip counts/2,000 ml
Deg Min Deg hti n H+ ht. Net counts/rein at H +hr
Sea Ba.ckgrm!nd
Sea Background
Sea B~ckgrcu nd
Sea Background
Tank
Tank
Tank
Tank
Tank
Tank
Tank Background
Tank Backgrcmmd
Shot Flathead,
Surface
Surface
Surface
Surface
Surface
Surface
Surface
Surface
Surface
Shot FIathead,
surface
Surface
Surface
Surface
Surface
Surface
Surface
Surface
Surface
Shot Flathead,
tkltpth 251
Depth 150
Depth 501
Depth 126
Depth 105
Depth 3s1
Depth 25
Depth 25
Dapth 350
Depth 50
Depth 25
Depth 50
Depth 501
Cepth 75
Dipth 351
Depth 91
Depth 75
Depth 91
Depth 106
Depth 126
Depth 151
Depth 251
Depth 150
Depth 500
Depth 75
Depth 50
Depth 105
Depth 90
Depth 2S
Depth 125
$539
S.540
3541
3542
S548
S550
3549
S558
3559
9560
8537
9538
DE 365
84008399
.9’4015394
8380
8397
8398
8393
839S
DE 534
8436
8435
6439
8440
6442
8443
8441
8437
8436
Horizon
8497
9496
6496
65oO
84S9
8495
6503
6504
8505
8506
8524
8S22
8520
6523
0519
8521
8514
6S13
8S15
8516
8517
8518
S501
8S02
85o1
65o9
8510
6512
6511
6S08
1’2
12
12
1212
12
12
12
12
12
12
12
13
13
13
11
12
13
13
11
12
11
11
11
11
11
12
11
11
11
12
12
12
12
12
12
12
12
12
12
12
12
12
12
12
12
12
12
12
12
12
12
12
12
12
12
12
12
12
12
01
01
05
0s04
04
04
06
08
08
01
01
17
17
47.8
30.5
44.0
10.3
21.2
30.5
30.0
36
36
51
53
45.1
42
45.1
52
52
29.5
29.5
29.5
29.529.5
29.S
09.3
07.2
09.2
07.2
22.5
22.5
07.2
22.507.2
22.5
07.2
0’7.2
07.2
07.2
07.2
07.209.2
09.2
09.2
09.2
09.2
09.2
09.2
09.2
16s
165
165
165
16S
165
165
165
165
165
165
165
165
165
164
164
165
166
165
164
165
185
165
165
164
165
163
16S
165
165
164
164
164
164
164
164
165
164
16S
164
164
164
164
1s4
164
164
164
164
164
164
164
164
16S
165
16S
165
165
16S
165’
165
283
L7
07
15
15
26
26
26
’26
20
28
07
07
05.3
05.3
21.5
53.8
31.2
09.1
38.9
53.8
14.2
11
11
20
56
03.8
29
03.8
23
19
34
34
34
34
34
34
31
50.5
31
SO.5
34
34
50.5
34
50.5
34
50.5
50.5
50.5
50. s
So. s
50.5
31
31
31
31
31
31
31
31
–0.66
-0.68
2.07
2.0-7
14.1
14.1
14.1
19.2
19.2
19.2
-0.93
-0.93
52.3
52.3
60.1
11.1
34.642.6
48.1
11.1
29.9
16.7
16.7
35.6
3s.1
47.8
51.1
47.8
19.1
31.7
75.1
75.1
7s.1
75.175.1
7s.1
29.6
53.1
29.6
53.1
75.1
75.1
53.1
75.1
53.1
75.1
53.153.1
5&1
53.1
53.1
53.1
29.6
29.6
29.6
29.6
29.6
29.6
29.6
29.6
12.5
637
438
424
209,567
91,374
113,379
30,555
30,537
41,859
556
572
2,605
2,169
2,7S4
1,173
6,145
2,165
1,846
1,326
6,649
4,891
4,972
19,491
11,651
10,761
1,017
10,025
22,535
15,277
5.49X lo~
7.00 x 10²
1.67x10²
1.25 xIOS
L27x102
4.76x 10²
3.54 x @
3.48x10X
3.27x102
4.O5X1O3
6. w X 102
3.62x10²
1.OIX1(?
1.13xlo~2.O2X1O2
3.91xllP
1.03xlo~
l.ozxlo~
951.16x10²
8.36x10²
1.96x10Z
2.56x1022.40X102
9.31x 10*
4.80X 102
8.56x101
L55xlo~
3.80x10²
1.47X11Y
71.9
72.2
72.3
72.4
73.7
73.9
73.8
189.6
189.6
189.7
72.5
72.6
214.8
214.9
215.0
215.1
215.7
215.8
215.9
215.9
216.0
194.3
194.3
194.4
194.5
194.5
194.6
194.7
194.6
194.9
190.6
190.9
191.2
191.5
191.6
191.9
192.5
193.4
193.5
193.6
196.3
196.5
196.6
213.5
213.6
213.7
213.9
214.0
214.1
214.3
214.3
214.6
217.5
217..9
217.7
239.9
240.0
240.2
240.4
240.5

TABLE B.32 CVNTINUED
Type NumberLuc!ation Collection
North Latltudc East Lungltude TI mcDIP countE./?, 000 ml
Deg M!n Deg Mln I+ - hr Net countst”mln at H + hr
Surface
Surface
Surface
Surface
Surface
Surface
Surface
Surface
Surface
Surface
Surface
Surface
Surface
Surface
Shot Navajo,
Surface
Surface
Surface
Scn Background
Saa Background
Sca Background
Shot Navaj O,
Surface
Surface
Surface
Surface
Surface
Surface
Surface
Surface
Surface
Surface
Surface
Surface
Surface
Surface
Surface
Surface
Surkce
Surface
Surface
Sca Background
Sea Background
Tank
Tank
Tank
Tank
Tank
Tank
Tank
Tank
.Tank
Tank
Tank
TankTankTank
TankTank
Tank Background
Tank Background
8485
8486
8487
8486
8477
8476
8481
6460
8482
8492
8493
6483
6484
8479
YAG 40
0276
8277
8278
8272
8273
8274
YAG 39
8580
8661
8582
8567
8565
8566
6580
8595
8596
8568
6601
86o2
6573
8567
8S69
8574
657S
8600
8594
0564
8563
6569
6570
6571
8563
6565
8s66
6579
6599
6591
6592
“6604
8593
S596
6605
65’77
8578
6561
8562
12
12
12
12
12
12
11
12
12
12
12
12
12
12
12
12
12
12
12
12
11
11
11
11
11
11
11
11
11
11
12
12
11
11
11
11
11
12
11
12
12
11
11
11
11
11
11
11
11
11
11
12
11
11
12
11
11
11
29
22..5
24
24
10
07
30
07
10.2
14
36.5
06
07.4
10
07
07
07
10.5
10.5
11
59.5
59.5
59.5
59
59
59
59.5
56
56
56
00
00
59.5
56
58
59.5
59.5
00
56
10
10
59
59
59
59.5
59.5
59.5
59.5
56
58
56
00
58
56
00
59.5
59.5
59
164
164
164
164
165
164
165
164
165
165
165
163
164
165
164
164
164
165
165
165
165
165
165
165
165
165
165
165165
165
165
165
165
165
165
165
165
165
165
165
165
165
165
165
165
165
165
165
165
165
i65
165
165
165
165
165
165
165
En route
284
00
34
32
32
31
52.3
11.3
51
31
27.2
23
52
46.6
31.3
57.5
57.5
57.5
03.5
03.5
05.
15.5
15.5
15.5
19
19
19
15.5
13
15.5
15
15
15
15.5
15
15
15.5
15.5
15
15.5
16
16
19
19
19
15.5
15.5
15.5
15.5
15.5
15
15
15
15
1s.5
15
15.5
15.5
19
70.1
98.9
80.1
00.1
29.6
50.6
17.6
46.1
16.6
101.6
100.6
42.6
56.8
29.6
16.9
16.9
16.9
1.3
1.3
1.8
16.2
18.2
16.2
10.3
10.3
10.3
16.2
35.9
35.9
32.4
39.9
39.9
17.6
32.4
32.4
17.6
17.6
39.9
39.5
0.9
0.9
10.6
10.6
10.6
16.3
16.3
16.3
17.6
36.0
32.5
32.5
40.0
32.5
36.0
40.0
17.6
17.6
1.0
1.0
1.92.102
4.12.102
4.25, 102
4.70.102
1.29 YIOJ
5.65 A 108
1.16x 10⁴
1.46x10⁴
4.12x10⁸
3.9 OX1O’
6.91.108
9.26.102
1.93.10’
1.6 YX103
15,196
15,615
15,623
2,136
2,161
399
61,925
60,637
79,545
109,820111,223
141,359
60,369
13,329
14,29116,006
12.324
12.432
27,677
17,509
16,594
39.429
24.722
11,726
14,714
328
224
411,687
423,655
458,030
448.969
467,724
451,791142,748
126,273
126,729
126,065
124,524129,962
109,514
104,539
122,019
116,574
3,009
3,084
190.1
190.3
190.5
190.6192.0
192.1
192.2
192.2
192.4
214.7
214.9
216.4
217.4
193.7
94.6
94.9
95.0
76.S76.6
94.7
75.5
75.775.6
75.9
95.5
95.5
95.6
191.0
191.5191.6
191.7
191.9192.0
195.9
196.0
196.0
196.1
196.2
190.9
95.3
95.2
76.0
76.0
76.1
76.2
76.2
76.3
196.4
192.2
196.3
196.5
196.5
196.6
217.8
217.6
217.9
218.0
35.0
95.1

TABLE B.32 CONTINUED
TypeLocation Collection
,NumberNorth Latitude East Longttude Time
Dip counts/2,000 ml
Deg F&n Deg Min H+hr Net counts/rein at H, h
Shot ~aV~JO,
Surface
Surface
Surface
Surface
Surface
Surface
Surface
Surface
Surface ~
Surface
Shot Nava Jo,
SurfaceSurface
Surface
SurLzce
Surface
Surface
Surface
Surface
Surface
Surface
Surface
Surface
Surface
Surface
Surface
Surface
Shot Navajo,
Depth 55
Depth 28
Depth 9
Depth 100
Depth 90
Depth 20
Depth 60
Depth 60
Depth 64
Depth 74
Depth 75
Depth 83
Depth 25
Depth 15
Depth SO
Depth 5
Depth 10
.. Depth 92
Depth 30
DePth 100
Depth 90
Dep~ 50
Depth 55
~pth 18
Surface
Surface
Surface
Surface
Surface
Surface
Surface
surface
Surface
SurfaceSurfaceSurface
DE 365
8047
8051
8048
Y0498242
8052
80538050
8054
8241
DE 534
8235
8236
823’7
8238
8239
8240
8444
8445
8446
8447
8448
8451
8452
8453
8454
8455
Horizon
S21O
8207
8205
8234
8231
8226
8222
.9230
8211
8212
8223
8213
8217
8216
8232
8215
8225
8214
8227
8224
8233
8220
8221
8206
8179
8156
8165
8191
8155
8190
8163
8164
8160
8162
8169
8168
11
12
11
11
11
12
12
1112
11
11
11
12
1111
12
12
11
11
12
12
12
12
11
12
12
12
12
12
11
11
11
11
11
12
12
11
12
11
11
11
11
11
12
11
11
11
11
11
12
12
11
11
12
11
12
11
11
11
1112
11
38.5
03
38.5
38
34.5
44.3
44.3
37.5
23.1
41
52
52
09
49.5
57
36
36
38
25
09
42
42.5
42.5
52.8
20
07
08.5
08.5
08.5
46.2
46.2
46.2
59.5
46.2
08.5
08.5
59.5
08.5
59.5
59.5
46.2
59.5
4&5
08.5
46.2
59.5
46.2
59.5
59.5
08.5
00.8
34.5
59.5
07
21.3
01
59.5
59.5
58.3
59.5
07
39
164
163
164
164
164
162
162164
164
165
165
165
165
164163
164
164
18-4
164164
163
164
164
184165
165
164
164
164
165
165
165
165
165
164
164
165164
165
165
165
165
165164
165
165
165
165
165
164
165
165
165
165
165
164
165
165
165165164
165
53.4
10.2
53.4
43.6
.44.1
40.0
40.0
37.5
41.4
11.5
41
41
12.2
45.9
55
54
54
53.2
26.5
14
33.4
19
19
37.6
20
2’1.5
53. ‘7
53.7
53.7
15.6
15.6
15.6
09
15.6
53.7
53.7
09
53.7
09
09
15.6
09
15.6
53.7
15.6
09
15.6
09
09
53.7
29.5
09
09
56.5
14
56.5
09
09
12.3
0956.5
03.8
1’4.0
36.6
14.0
15.3
– 34.4
43.0
43.0
18.5
75.0
–39.6
12.5
12.9
30.3
34.4
43.3
56.2
56.2
61.1
64.9
76.4
85.0
80.7
60.7
85.0
88.9
90.5
79.0
79.0
79.0
90.0
90.0
90.0
35.4
90.0
79.0
79.0
35.0
79.0
35.0
35.0
90.0
35.0
90.0
79.0
90.0
35.0
90.0
35.0
35.0
79.0
70.3
13.4
37.10
80.6
‘7.9
80.8
35.0
35.0
26.0
35.080.7
73.2
21,208
355
22.007
28,027
2,545
6,208
5,246
12,765
694
20,283
967
693
5,348
8,177
3,376
2,019
2.001
14.219
6,046
1,383
298
680
735
1,033
1,120
2,452
O.O9X1O4
0.145 .x lo~
2.49x 10⁴
2.49x 10⁴
2. S6X104
2.58x10⁴
2.29x 10⁴
2.29 X 10⁴
0
1.93X1134
2.09 x10⁴
0.016 X 10⁴
2.71 X 10⁴
2.53x 10⁴
1.98x 10⁴
2.58x10⁴
2.33x10⁴
5.13X10⁴
1.96x 10⁴
1.67 X 10⁴
1.96x10⁴
2.22X10⁴
2.18x 10⁴
2.o2x1o4
1.08xloa
1.42xI04
7.16x10a
7.ooxlf)z
8.OOX1OZ
8.11x10²
7.72x10²
7.26x10SI.osx10J7.34X11336.81x1021.52xI04
170.4
170.5
170.5
170.5
170.8
172.2172.3
213.7214.0
169.8
190.7215.0
214.2
214.9
214.8
215.8
214.8
216.4
190.0
190.3
190.4
191.0
190.0
215.8
214.9
215.0
170.6
170.7
170.9
170.1
171.0
171.0
191.6
215.0
“214.3
214.3
124.4
214.5
214.S
214.1
214.7
215.4
215.5
215.7216.0
216.0
216.1
216.2
216.4
216.5
171.1
189.9
190.1
190.1
190.2
190.5
L90.6190.7191.5’190.9191.7192.0
285

TABLE B.32 CONTINUED
Type NumberLucatlm COllcctlOn
North Ixitltudc East Lang!tude TtmeDip counts/2,000ml
Deg lWn Deg MIn H+hr Net countalm)n at H + hr
Surface
8urface
9u rface
Surface
Surface
Surface
Surface
Shot Tewa, YAG
Surfice
Surface
Surtke
Surface
Surface
Surface
Sea Background
Sca Background
Sca Background
Shot Tewa, YAG
Surface
Surface
Surface
Surface
Surface
Surface
Surface
Surface
Surface
Surface
Surface
Surtiwe
Surface
Surhce
Surface
Surface
Surface
Surface
Surface
sea Backgroulal
* BackgroundTankTankTankTank
TankTank
-TamkTankT*
TankTamkTankTarIJKTank
TankTamkBackground
Tank Background
Depth Background
Depth Background
8177
8187
8185
8186
8175
8176
8157
40
8284
8286
8285
82S5
8290
82S8
82s0
8201
S282
39
8325
8334
8335
8347
8341
8342
8329
8330
8337
8336
8331
8333
8339
6348
6343
8284
8326
8327
6245
8322
8321
8349
6350
8351
6410
8411
8412
8413
841S
8414
8416
8353
8354
8355
64o8
6409
8324
8323
8764
8763
11
11
11
11
11
11
11
12
12
12
12
12
12
12
12
12
12
12
12
12
12
12
12
12
12
12
12
12
12
12
12
12
12
12
46.2
47
43.2
46.5
46.2
46.2
47.2
07.4
07.4
06.0
“07.4
06.0
06.0
15
15
15
00.5
04
04
12
165
164
165
165
165
165
165
164
164
165
164
165
16S
164
164
164
165
165
165
165
At Eniwetok
09 16S
03 165
03 165
04 165
04 165
03 16S
04 165
04 165
12 165
09 165
07.4 164
00.5 165
00.5 165
12 165
En route
En route
En route
En route
En route
At Eniwetok
At Eniwetok
At Eniwetok
At Eniwetok
At Eniwetok
At Eniwetok
At Eniwetok
At Eniwetok
At Eni wetok
At Eniwetok
At Eniwetok
At Eniwetok
En route
En route
Bikini Lagoon
Bikini Lagoon
15.6
46,2
17.2
14
15.6
15.6
07.3
50. e
50.6
00.5
50.6
00.5
00.5
54.0
54.0
54.0
18
15
15
10. s
07
16
16
13.5
13.5
16
15
13.5
10.5
07
50.6
16
16
10.5
90.C
70.2
55.6
52.790.0
90.0
15.6
15.2
15.2
16.0
15.2
18.0
18.0
3.5
3.5
3.5
11.0
20.3
20.3
39.1
69.7
37.0
16.2
16.231.4
31.4
16.2
20.5
31.3
39.1
37.0
15.2
11.0
11.0
39.11.2
1.2
52.0
52.0
52.091.7
99.799.7
99.7
105.2
105.2
105.2
75.s
7s.5
75.5
61.7
61.11.6
1.6
-110.2-110.2
2.16x 10⁴ 215.0
1.38x1O’ 214.1
3.06x 10⁴ 215.0
7.66x10⁴ 216.2
2.09 .X104 216.2
2.16x1o’ t 216.3
3.41 x lot . 216.1
1.12xlo~1.208x 10⁶
1.239x10SI.112X1OJ
1.261x10t
I.188x10B
3,853
4,002
4,389
911,761
385.747
386,665
367,216
393,46S
404,010
450,532
432,405
333,775
339,126
370,653
3S5,06S
322.553
362,513
392,477
590,172
932,578
999,568
371,474
440
388
1.314x Klf
1.302 x10t
1.325 ~ 101
1.325 X 10f
1.292 XIOt
1.314X10⁷
1.292 x101
1.292 x 10⁷
1.32S x 107
1.302 X 10r
1.314 xlof
1.314 xlof
1.302 x 101
1.346x101
1.314X1137
5,S48
5,802
29,081
26,776
96.1
96.2
96.2
96.3
, 96.4
96.5
94.8
95.0
95.2
96.4
215.2
215.3
214.1
214.3
214.3
196.6
196.7
213.7
213.5
213.5
213.5
215.0
214.4
215.0
146.0
96.3
94.9
215.0
96.0
95.7
215.7
216.0
21s.4
218.1
216.3
216.4
216.5
21&5
216.5
216.6
216.7
216.6
218.8
216.0.
216.1
95.9
96.0
96.0
96. o
286

TABLE B.32 CONTINUED
Type NumberLOcatlcm Collection
North Latitude East Longitude TimeDip counts/2,000 ml
Deg hfin Deg Mm H+hr Net counts/rein atH + hr
Shot Tewa,
Surface
Surface
Surface
Surface
Surface
Surface
Surface
Surface
Surface
Surface
Surface
Surface
Surface
Surface
Surface
Surface
Surface
Surface
Surface
Shot Tewa,
Surface
Surface
Surface
Surface
Surface
Surface
Surface
Surface
Surface
Surface
Surface
Surface
Surface
Surface
Surface -
Surface
Surface
Shot Tewa,
Depth 70
Depth 20Depth 40
Depth 50
“Depth 60
Dapth 70
Depth 80
Depth 60
Depth 85
Depth 168
DE 365
8616
8618
8615
8627
8626
8625
8624
8623
6612
6610
8609
8614
8613
8619
6621
6611
8620
8622
8617
DE 534
6656
8664
8655
8652
8653
8651
8662
6661
8660
6659
6656
8657
8667
8666
8665
8663
8664
Horizon
6750
8734
8736
8737
8736
8739
6740
8749
87S1
8732
11
11
11
13
13
13
12
13
11
11
11
11
11
13
12
11
12
12
12
13
12
13
11
12
11
11
11
12
12
12
13
11
12
12
11
11
11
12
12
12
12
12
12
11
11
12
57
24.2
51.4
50.0
30.0
35. f!
31.2
00.8
36.0
31.5
31.5
51.4
43.7
08.7
40.5
35.7
40.5
14.2
02.5
46.8
57
41
46.5
21
46.5
58.2
32
07
32
49.5
46.8
40
20
49.9
56.2
41.2
53.2
30.5
30.5
30.5
30.5
30.5
30.5
53.2
53.2
11
164
165
163
162
162
163
163
164
154
165
165
163
165
164
164
164
164
165
165
164
166
165
165
165
165
154
164
164
164
164
164
162
162
162
164
163
165
164
164
164
1s4
164
164
165
165
165
.
32.8
24.0
43.6
41.0
41.0
30.0
49.5
05
07.2
06.2
06.2
43.6
05.7
51.2
53.9
40.0
53.9
01.5
13.8
46.6
07
48
33.7
41
33.7
54.5
00
29
42
42
46.8
33.3
43.4
55.5
54.5
10.6
14
57.1
57.1
57.1
57.1
57.1
57.1
14
14
10.5
42.2
51.4
36.2
104.7
104.7
99.0
93.0
85.3
25.o
14.0
14.0
36.2
33.4
62.7
69.4
18.7
69.4
74.4
45.7
41.9
25.3
34.7
12.6
17.7
12.6
74.2
65.1
59.3
54.7
52.1
41.9
le9.9
105.6
95.4
75.2
68,1
59.2
51.2
51.2
51.2
51.2
51.2
51.2
59.2
59.2
41.2
190,76.9
k 4,761
24,472
511
585
3,662
5,03?
7,303
76,103
7.302
6,648
25,502
5,577
10,095
142,860
149,040
145,527
333,796
379,187
626
6,o39
3,055
1,510
461
1,583
27,365
62,472
47,663
69,024
24,796
1,459
1,931
3,266
1,900
27,826
7,918
7. O4X1O4
1.54X 10J
7.64x10⁴
0.72x 10⁴
0.67 x10⁴
O.54X1O4
0.67x 10⁴
7.54X10⁴
6.53x 10⁴
1.03XI04
195.6
195.7
195i7
194.2
193.1
193.0
193.0
192.9
192.8
192.6
192.7
192.6
192.5
196.6
196.3
196.3
195.9
213.6
216.1
195.2
195.8
195.2
195.0
195.0
195.0
194.9
194..9
●
194.6
194.7
194.6
194.5
194.4
194.3
194.1
193.4
192.4
192.4
192.4
192.3
192.3
192.2
192.1
192.1
192.0
192.0
287

TABLE B.32 CONTINUED
.Locatlori CollectIonType Number
North Lat]tude East Longitude TimeDip counts/2.000 ml
Deg Min Deg Mm H+hr Net cOunta/mtn at H + hr
Depth 82 8730
~pth 125 8731
Depth 64 8729
Depth 10 8’733
fkptb 52 8728
Depth 38 8727
Depth 13 8724
Depth 9 8723
Depth 22 8725
Depth 30 8726
Depth 30 6135
Depth 100 8752
Depth 55 8748
Depth 50 8747
Depth 45 8746
Depth 40 8745
D8ptb 25 8744
Depth 10 8743
Depth 100 8742
Depth 90 8741
Surfkce 8718
Surface 8719
Surface S695
Surface 8697
Surface 8700
Surface 8706
Surface 6712
Surface 8722
Surface 8721
Surface 6714
Surisce 6699
surface 6693
surface 8694
Surface 8720
Surface 8717
Surface 8696
Surfice 8711
Surface 8705
Surtice 8707
Surface 8706
surface 8’/09
Surface 8?10
Surface 8713
● Pending further data reduction.
12
12
12
12
12
12
12
12
12
12
12
11
11
11
11
11
11
11
12
12
12
12
12
12
12
11
11
12
12
12
12
11
12
1.2
12
12
12
12
11
11
11
11
11
11
11
11
30.5
11
11
11
11
11
11
30+5
53.2
53.2
53.2
53.2
53.2
53.2
53.2
30.5
24.5
11
11
05
11
30.5
58.2
36
30.5
30.5
05.2
30.5
53.6
05
13.2
11
06.6
10.3
00
53.2
53.2
52.2
53.2
59
165
165
165
164
165
165
165
165
165
165
164
165
165
165
165
165
165
16S
164
164
165
165
165
164
1E4
164
164
164
164
164
165
165
165
165
165
165
164
165
165
165
165
164
10.5
10.5
10.5
51.1
10.5
10.5
10.5
10.5
10.5
10.5
57.1
14
14
14
14
14
14
14
57.1
57.1
10.5
10.5
16
10.5
51.1
57
07.2
57.1
57.1
36.2
57.1
26.2
16
06.7
10.5
12
11.2
52
15
15
15
15
20.5
41.2
41.2
41.2
51.2
41.2
41.2
41.2
41.2
41.2
41.2
51.2
59.2
59.2
59.2
59.2
59.2
59.2
59.2
51.2
51.2
41.2
41.2
21.7
41.2
51.9
77.7
25.0
51.9
51.9
92.2
51.9
18.4
21.7
46.4
41.2
31.0
81.2
71.9
59.0
59.0
59.0
59.0
85.2
3.21.104
0.75 x 10⁴
1.15 XIOI
1.61 xIOS
2. I2K1OJ
z.ooxlo~
1.92x10⁶
1.95 X1O$
I.92x10S
I.96x10S
1.53 X1OJ
4.08 x10⁴
2.07 x10b
2.07x 10⁸
1.66X10⁵
1.23 x10J
6.15 XI04
3.9OX1O4
O.5OX1O4
0.49XI04
4.20 x10C
4.06 x10⁶
3.33 X1OJ
4. IO X1O8
1.42 x10$
5.02X 10’
2.o3x 10C
1.35X lot
1.39X 10$
1.44X 10⁶
1.48 x10C
6.36x10⁴
3.38 x10C
4.21 x10t
4.14X lot
3.56x10J
5.67x10⁶
4.43X10⁴
3.53XI04
3.55 XI04
3.42x 10⁴
3.38x 10⁴
4.36x 10⁴
192.0
181.7
191.7
191.7
190.8
190.7
190.6
19o.6
190.5
190.5
190.4
190.3
180.3
190.3
1s0.1
190.0
190.0
190.0
190.0
189.9
215.1
21s.1
214.2
214.2
196.5
196.4
196.2
196.1
196.1
196.0
195.5
1%0
169.6
214.0
214.0
213.9
218.1
195.3
195.4
195.4
195.5
195.6
195.7
288

TABLE B. 33 INTEGRATED ACTIVITIES FROM PROBE PROFILE MEASUREMENTS 610)
Station
NumberH+hr North Latitude East Longitude Fissions/& ●
Deg Min Deg Min
Shot Tewa, Horizon
T-1 18.4 11
T-2 21.3 12
T-3 26.8 12
T4 30.0 12
T-5 40.2 12
T-5A 41.8 12
T-6 46.5 12
T-11 78.6 11
T-12 81.2 12
T-13 85.2 11
T-14 94.8 11
T-15 101.8 12
Mean of Stations
2t06snd12 -
Shot Navajo, Horizon
N-4 18.6 11N-4A 20.0 11N-5 21.2 11N-7 31.0 MN-8 34.3 11
Mean of Stations4t08
53.60506.906.6111313.258.210.3455905.3
5758.558.55959.5
165
165
165
165
165
165
165
164
165
164
164
164
165165165165165
26.2
16
13.2
12
10.51208.75711.22820.536.2
17.513130809
2.76* 0.23x 101’2.01* 0.17X10153.61+0.30 x 10163.47 k0.29x 10162.98+0.25x 10i62.11*0.18x 10i6 t2.90 A 0.24X10167.68 *0.64x10143.89 *0.33x10162. O5*O.17X1O’65.88* 0.50x10141.66* 0.14X 1015
%.00 * 0.77X 10!6
7.21 *0.80x 101s5.81 ● 0.64x 10IS5.95 ● 0.66x loi~Q86+0.65x101:5.07+ 0.56x 101S
5.98* 1.02x 101$
● Conversion factors (dIp counts/rein 2.29+0.24x 10⁶ (Tewa)
)app mr/hr :1.51 +0.36x 10⁶ (Navajo)
t Nanaen bottle sampling profile gave 1.82x 10¹⁶fissions/~ for this station.

TABLE B.34 INDIVIDUAL SOLID-PARTICLE DATA, SHOTS ZUNI AND TEWA
Pultlclc Mean Cullcetlon Particle
Typu Numbcl Time DiameterActivity
-H+hr microns Net counts/’mtn at H+ hr
Shot Zuni, YAG 40-A- I
Sphere
Sphere
Yellow sphere
Irregular
Irregular
Agglomerated
Agglomerated
Sphere
Sphere
Ye] low sphere
Yellow agglomerated
Irregular
Irregular
Irregular
Irregular
Sphere
Irregular
Irregular
Agglomerated
Irregular
Irregular
Yellow irregular
Irregular
Sphere
Irregular
Irregular
Irregular
Agglomerated
Agglomerated
Sphere
Sphere
Irregular
Sphere
Sphere
Sphere
Black sphere
Yellow sphere
Irregular
Sphere
Irregular
Agglomerated
Agglomerated
Agglomerated
Irregular
Irregular
Irregular
Agglomerated
Black irregular
Sphere
Irregular
Irregular
Agglomerated
Irregular
Irregular
331-7
322-17
327-59
327-15
325-64
327-21
327-66
331-2
335-6
335-7
335-1o
335-12
335-17
335-19
335-22
335-26
335-29
324-1
324-4
324-6
324-12
324-16
324-19
324-23
324-24
324-26
324-31
324-34
324-36
324-37
324-43
324-4a
324-51
324-53
324-54
324-55
325-56
325-57
325-60
325-63
325-67
325-71
325-75
325-79
325-83
325-85
325-90
325-93
325-97
325-99
322-93~2-13
324-57
352-2
3.84
7.17
5.58
5.5.9
5.17
5.58
5.17
3.84
4.67
4.67
4.67
4.67
4.67
4.67
4.67
4.67
4.67
4.67
5.005.00
5.005.005.005.005.005.00
5.005.005.005.005.00
5.005.005.005.005.00
5.175.175.175.175.17
5.175.175.175.175.17
5.175.175.17
5.177.177.175.005.17
290
200240143200240
260x 3601802207055
1206370
42x83220
8383X143
260120220
22022042
18018050
18012011060
120
24016614317042
8350
130240
180 to 260
1666563
380360
7010083
16626036020035
1,200,000607,000504,000432,000320,000
501,000439,000219,000
12932
77,6009,830
2444,940
152,000
22,60018,800
372,00031,800
114,000
235,000?32,140
9,030359,000104,00012,200
123,00030,90050,3009,180
86,400
27,800478,000417,000555,000
77
112,000719
456,000320,000167,000
123,0009,s30
17,700167,00025,900
8,8201,8706,960
28,000111,000549,00068,00011,400
12.012.012.012.012.0
12.012.012.012.012.0
12.012.012.012.012.0
12.012.012.012.012.0
12.012.012.012.012.012.0
12.012.012.012.012.0
12.012.012.012.012.0
12.012.012.012.012.0
12.012.012.012.012.0
12.012.012.0
12.012.012.012.012.0

TABLE B.34 CONTINUED
Particle Mean Collection Particle
Type Number Time DiameterActivity
- H+hr microns Net coonts/min at H + hr
Irregular
Sphere
Sphere
Irregular
Agglomerated
Irregular
Black sphere
Irregular
Irregular
irregular
Irregular
Irregular
Agglomerated
Sphere
Irregular
Irregular
Irregular
Irregular
Irregular
Irregula~
Sphere
Irregular
Sphere
Irregular
Irregular
Agglomerated
Agglomerated
Sphere
Irregular
Agglomerated[rregularIrregularIrregularSphere
IrregularYellow sphere
Sphere
Irregular
Irregular
Yellow irregular
325-5
325-7
325-14
325-16
325-20
325-23
325-26
325-27
325-31
325-25
325-39
325-41
325-43
325-51
325-54
325-55
322-18
327-21
327-2
327-5
327-8
327-12
32’7-17
327-20
327-26
327-28
327-31
327-33
327-37
327-43
327-45
327-47
327-52
327-55
327-58
327-59
327-63
322-4
322-26
311-11
Shot Tewa, YAG 40- A-1
Irreg’ulaT white 1S39-8
Irregular white 1842-3
Irregular white 1842-5
Fla@ white 1832-5
Spherical white . 1837-9
Irregular colorless 1832-1Irregular white 2131-10Flaky white 2145-15Irregular white 1839-2Irregular white 1839-5
Irregular white 1842-3
FIX white 1842-4
Irregular white 1842-5
Flaky white 2993-9
Irregular white 2993-11
5.17
5.17
5.17
5.17
5.17
5.17
5.17
5.17
5.17
5.17
5.17
5.17
5.17
5.17
.5.17
5.17
7.17
7.17
5.56
5.56
5.58
5.58
5.58
5.58
5.58
5.S8
5.58
5.56
5.58
5.56
5.56
5.58
5.56
5.56
5.56
5.58
5.58
7.17
7.17
8.42
5
5
5
9
8
9
10
6
5
5
5
5
6
6
6
65
166
166
120
120
100
45
120
265
240
83
120
220
100
110
100
240
120
90
180
120
155
130
240
380
380
166
60
200
166
60x120
220
120
83
83
143
200
240
166
180
165 X 330
231
231
198
132
99
132
528
165
231 X 330
231 ‘
264
231
196
165
1,660
106,00042,10072,50051,300
22,200317
22,900216,000
38,00017,800
114,000223.00019,900
657,00026,600
381,000653
39,600
178,000132,00090,00051,00063,900
141,000136,000126,00022,5003,930
116,00013,00080,30012,70050,700
8,200504,000123,00069,0003,750
126,000
3,2791,504,907
521,227476,363250,651
97,179122,480
2,46S,587241
1,268,762
1,504,9074,328,667
521,227243,712679,806
12.012.012.012.012.0
12.012.012.012.0
12.012.012.012.012.0
12.012.012.012.012.0
12.012.012.012.012.0
12.012.012.012.012.0
12.012.012.012.012.0
12.012.012.012.012.012.0
6.427.088.25
15.7515.67
15.6730.5833.675.335.92
7.087.176.25
10.3310.67
291

TABLE J?.3’t CONTINUED
Particle Mcm CollectIon Particle
TVPCA Ctivi ty
,Numbcr Time Diameter
-- H+hr microne Net counts/rein at H + hr
Flaky white
Spherical colorless
Irregular white
Flaky white
Irregular white
Flaky colorless
Irregular colorless
Flaky White
Flaky white
Flaky white
FIaky colorless
Flaky white
Flaky white
Irregular white
Flaky white
Spherical white
Irregular black
Irregular white
Irregular white
Irregular white
Irregular white
Irregular white
Irregular white
Flaky white
Spherical white
Irregular white
Spherical colorless
Irregular white
Flaky white
Irregular white
Colorless
Flaky white
Colorless
Flaky white
Spherical white
Flaky white
Irregular white
Flaky white
Irregular white
Irregular white
FIaky white
Irregular white
Fla@ white
Irregular white
Irregular white
Flaky white
Irregular white
Flaky white
Irregular white
Irregular white
1838-91838-111837-21837-51837-8
1837-111832-31832-51832-121832-15
1832-171832-211855-21855-81855-10
1842-71842-122145-102145-132144-3
2144-72144-101836-41836-81841-2
1849-11840-41840-61838-11838-7
1855-181855-201855-291843-21843-4
1843-101843-131843-161843-171852-2
1852-51852-111852-121852-142125-3
2125-92125-112125-132125-162129-4
8
8
8
8
8
8
9
9
9
9
9
9
10
1010
6
6
6
6
6
7
7
13
13
13
15
15
15
8
8
10
10
10
11
11
11
11
11
11
11
11
11
11
11
7
7
7
7
7
8
165x495
33
66
132
132
330
132
198
297
165
165
330
99
198
297
115
33
165
99
196
231
132
198
165
132
165
396
99
396
190
198
66
297
66
132
99
132
165
99
198
132
132
66
33
132
330
99
33
66
165
1,451,104
65,762
752,185
240,195
96.158
1,017,529
661,689
478,363
631,311
634,383
158,659
505,515
70,370
291,910
787,597
200,789
1,762
460,000
248,000
129,860
274,540
105,263
161,295
292,330
51,420
112,033
35,503
121,820
2,303,519
320.153
172
11,200
122
82,349
139,630
21,440
101,559
185,505
14,650
47,245
63,790
163,917
691
5,996
183,641
376,736
31,819
33,050
25,61545,217
22.92
14.67
21.33
16.17
20.00
21.0020.1715.7517.4217.58
16.0824.7541.6941.1841.33
8.588.83
33.5033.6537.58
34.0637.3337.5034.5836.91
38.7537.9237.9221.1719.83
25.3341.5427.0827.3340.56
40.0127.6740.1741.1341.00
39.9241.5828.1741.1740.00
39.5037.7538.6628.5639.83
292

TABLE B.34 CONTINUED
Particle Mean Collection Particle
Type Number Time DiameterActivity
-H+hr microns Net counts/rein at H + hr
Flaky colorless
Spherical white
Flaky white
Irregular white
trregldar white
Irregular white
Flaky white
Flaky white
Spherical white
Irregular white
Irregular white
Irregular white
Irregular white
Irreguiar white
Flaky white
Irregular whiteIrregular white
Irregular white
Irregular white
frreguiar white
Irregular whiteSpherical biack
Flaky white
Flaky white
Irregular white
Irregular white
White
Irregular white
Irregular white
FISJCVWhitS
Flstv whiteFlaky coloriess
Flaky whtte
Irregular white
Spherical white
2129-6
2129-9
2129-11
2129-17
2131-1
2131-3
2131-7
2131-9
2131-5
2131-8
2133-1
2133-4
2133-6
2133-11
2136-4
2136-7
2136-10
2136-14
2136-18
2139-2
2139-4
2136-2
2142-3
2142-7
2142-11
2142-15
2145-3
2145-7
2132-1
2132-2
2137-1
2137-4
2137-6
2137-10
1856-2
1856-3
1056-7
1634-3
1634-6
1634-10
1844-3
1844-4
1844-10
8
8
8
10
10
10
10
10
10
10
Flaky white
Irregular coloriesa
Flaky white
Irregular white
Irregular white.
Spherical white .
Irregular white
Spherical white
10
10
10
10
12
12
12
12
12
12
12
14
6
6
6
6
6
6
9
9
11
11
11
11
6
6
6
7
7
7
7
‘1
7
99
99
198
66
264
132
330
196
132
99
132
165
132
165
66
165
132
132
165
165
132
196
196
165
132
165
330
165
196
132
196
165
363
198
144
144
144
165
132
99
99,
264
165
49,295
125,583
296,737
13,090
596,410
242,473
1,366,339
363,425
181,177
169,257
125,271
253,241
210,497
189,999
21,679
409,519
272,559
171.285
190,020
228,567
214,060
0
755,093
346,200
276,823
203,303
680,070
562,400
4,538
1,232,123
902,179
1,024,960
1,017,891
644,789
171,555
130,923
’72
461,317
21,396
63$90
243,385
996,939
97,524
28.50
28.6’7
39.67
31.83
39.14
28.92
29.10
29.63
34.25
29.06
31.08
34.06
30.0029.5029.58
29.7529.6732.6731.7832.17
32.3532.6732.6337.1833.33
33.2533.1733.419.429.58
13.75 ,12.0822.6323.5823.17
24.3321.9224.0024.4214.25
21.5022.0822.25
293

TABLE B.35 INDI~UAL SLURRY-PARTICLE DATA, SHOTS FLATHEAD AND NAVAJO
Particle Mean Collection Particle ChlorideNumber Time Diameter Content
Activity
-H+hr microns grama Net counts/rein at H+ hr
Shot Flathead, YAG 40 -A-1
3812-3 ● 9.8 —
3812-6 9.8 —
Shot Flathead, YAG 40- B-7
3759-1 9.0 1713758-2 9.5 164
3757-1 10.0 1263756-3 10.5 253756-1 10.5 —
3754-2 11.5 123
3752-1 12.5 773745-1 16.0 1083741-1 18.0 —
Shot Flathead, YAG 39-C-33
2958-1 7.25 1342961-1 8.25 1603752-1 125 —
2979-1 17.25 72
Shot Flathead, LST 611-D-37
3538-1 7.5 1363537-1 7.58 1073536-2 7.75 1243535-2 8.00 1013534-2 8.12 108
3533-3 8.25 1113532-5 8.5 1093531-6 8.6 1033531-3 8.6 1043530-12 8.8 119
3530-7
3530-4
“ 3530-1
3529-6
3529-1
3525-1
3529-3
3529-2
3528-2
3528-1
8.8
8.8
8.8
9.00
9.00
9.6
9.00
9.00
9.1
9.1
122125
99114
98107
99102
98119
Shot Flathead, YFNB 29-H-78
3069-1 1.08 673069-2 1.08 —
3070-1 1.58 —
3070-2 1.58 —
3070-3 1.58 —
3070-5 1.58 553070-6 1.58 663070-7 1.56 —
3070-9 1.58 —
1.1 X10-C
2.10-’6.5x11)-1
1.6x11)-$
5.3xlo-f
7.5 X1 O-7
I.(lx 10-f
3.4 X1 O-4
2.7x10-T
l.lxlo-~
1.5x ll)-~1. OX1O-71.5 X1O-1
5.9xlo-f3.8x10-T
5.5xlo-f4X1 O-73.3 X1 O-!
ZBXIO-T
3. OX1O-T
2.2 X1 O-’
2.2 X1 O-’
Z.7XI()-1
L5xlo-f
3.9xlo-f
3.2x11)-7
4.4 X1 O-T
3.2x lo-f
4.7xlo-~
2.6x10-T
3.7 X1 O-V
2.2X lo-f
5.8x 10-T
1.5 X1 O-1
2.3x10⁻⁴
7.3 X1 O-6
5X1 O-T
3.6x10-S
4.5 X1O-8
Z6X10-8
8.2x10-DL8x10-T
294
1.85x1O’435,200
l.lxlo@
890,000577,500
2,200279,000
2.3x 10⁶
1.7X logl.lxlo~1.4xlo@
1.25x106623,000
L7x106
52’?,000
971,000942,000468,400
1.11 x 10’1.23x 10’
1.14X 10S336,000977,000
1.12X 10’66?,000
962,000944,000
1. O4X1O’313,000
l.l)xlo~
970,000945,000713,000578,000
1.2X10⁶
58,00039x lot24x 106
66,000
5,21515,70016,500
4,70060,500
13.2
14.0
12.0
12.0
12.0
12.0
12.0
12.0
12.0
12.0
12.0
12.0
12.0
12.0
12.0
12
12
12
12
12
12
12
12
12
12
12
12
12
12
12
12
12
12
12
12
12.0
12.0
12.0
12.0
12.0
12.0
12.0
12.0
12.0

TABLE B.35 CONTfNUED
Particle Mean Collection Particle Chloride
Number Time Diameter ContentActivity
-H+hr microns grams Net counts/rein at H + hr
Shot Navajo, YAG 40- A-1
1869-5 9 1651872-2 9 991874-1 14 13218764 16 —
1869-2 t 9 1491867-1 ‘7 —
1867-2 7 —
1867-5 7 1651869-1 T 9 1491869-9 9 1981869-9 t 9 198
Shot Navajo, YAG 40- B-7
3303-1 8 161
3303-2 8 126
3303-3 8 166
3303-4 8 128
3306-1 9 130
3306-2 9 112
330g-3 9 —3306-4 9 1213306-5 9 1343306-6 9 1213306-7 9 293308-1 10 143
3308-2 10 —
3308-3 10 1393308-9 10 1263308-5 10 1123308-6 10 1073308-7 10 112
3308-8 10 1003308-9 10 973308-10 10 1093308-11 10 111
Shot Navajo, YFNB 13-E-57
3489-3 1.4 2653488-5 1.4 3093490-1 4.9 2343480-s 1.9 326
2.5x10⁻⁶l.lxll)-~2.3x10-61.1 X1 O-69.6x10-T(3. J3X1O-7
6.8 X1 O-T
6. I3X1O-Y
1.1 X1 O-’
6. J3X1O-T
3.5xlo-~
1.6x10-C
1.(3x10-’
6.8x lo-r
1.1 X1 O-*(3.8x lo-r
5.8x10⁻⁷
&8x10-r
&8x113-T
3.13 XUJ-r
5.8x10-73.8x10-7
9.4x Io-~1.3 X1 O-$4.4 X1 O-.1.5X 10- ~
6.5x 10-C5.5 XI0-’3.6x10-’1.4 X1 O-J
286,73782,293
129,82132,397
369,29186,560
786,051562,080242,152599,190599,190
25,05917,891
4,4107,’?94
18,6432,992
6,0528,8389,682
11,4604,263
33,082
22,09832,46611,696
9,07611,084
5,562
2,720938
10,1926,068
560,000299,000199,000362,000
3491-1 294 279
34914 Z4 286
3491-6 2.4 230
3491-7 2.4 330
● Insoluble solids scraped from reagent-film reaction area 3812-6; IWnma-energy spectrafor both are given in Figures B.15 and B. 16.
t Dried slurry.
780,000151,000131,000281,000
10.614.214.716.910.0 “
7.68
7.758.169.84
12.412.4
152152152152147147
148148148148148148
148148149149149149
149149149149
12121212
12121212
295

TABLE B.36 HIGH VOLUME FILTER SAMPLE ACTIVITIES
Shot StationSampling Exposure Interval Ionization Chamber ●
Head Number From To Activity at H +hrH+hr H+hr x 1011 ma
Zuni YAG 39 C-25
YAG 40 B-8B-9B-10B-IIB-12B-13B-14B-15
Flathead YAG 39 C-25
YAG 40 B-8
LST 611 D-42
D-43
D-44
D-45
D-46
D-47
D-48
D-49
Navajo YAG 39 C-25
YAG 40 B-8
IAiT 611 D-42
Tewa YAG 39 C-25C-26C-27C.-28C-29C-30C-31C-32
YAG 40 B-8 IB-9B-10B-nB-12
.B-13
B-14
B-15
LST 611 D-42
12.2
7.83.44.85.35.86.36.87.3
4.4
6.1
7.07.68.2
10.912.214.115.618. b
2.1
1.2
3.2
2.02.73.23.74.24.75.25.7
4.35.66.26.77.2
7.78.28.7
7.3
31.1
16.34.85.35.86.36.87.37.8
23.7
26.4
7.68.2
10.912.214.115.618.625.6
15.9
19.1
15.4
2.73.23.74.24.75.25.78.4
5.66.26.77.2‘7.7
8.28.7
18.4
20.5
* Response to 100 #g of Ra = 700x 10-s ma.
T DMT spilled on recovery.
389
1,5434,440
10,27010,380
9,5402,8003,040
173
108 t
140
35814
35355
609
386
76
3201,2603,2308,980
14,8906,8905,2406,310
3,6904,7503,5302,9503,280
1,9302,920
10,590
7,280
458
458458458458458458458458
340
340
340340340340340340340340
244
244
244
412412412412412412412412
412412412412412
412412412
412
296

TABLE B.37 OBSERVED WIND VELOCITIES ABOVE THE STANDARD PLATFORMS
Relative wind direction is measured clockwise from the bow of all vesseIs, and indicates
thedirection from which the wind is blowing. ,NO recording anemometers were installed
on YFNB 13-E and YFNB 29-H; the LST 611 instrument malfunctioned.
Time ReIatlve Wind Velocity Tkme Relative Wind VelocltyH+hr Direction Speed H+hr Direction Speed
From To degrees knots Fmm To degrees knots
3.35
3.55
3.85
4.20
‘4.554.855.205.555.856.156.256.55
7.307.557.659.00
10.0011.0012.0013.0014.0015.0016.0017.00
6.05
6.60
7.00
7.057.508.359.209.309.509.70
10.0010.3010.4010.4510.9011.1011.2511.6011.6511.9012.4012.55
YAG 40 ZLf
3..55 125
3.!35 1304.20 130
4.55 130
4.85 130
5.20 135
5.55 135
5.85 135
6.15 1306.25 130 to 350’
6.55 350
6.85 355
YAG 40 FL
7.55 255
7.65 255 to 325*9.00 325
10.00 340
11.00 340
12.00
13.00
14.00
15.00
16.00
17.00
18.00
6.60
7.00
7.05
7.50
8.35
9.20
9.30
9.50
9.70
10.00
10.30
10.40
10.45
10.90
11.10
11.25
11.60
11.65
11.90
12.40
12.55
12.90
335
335
345
355
355
15
0
YAG 40 NA
350
35o to 235 t
235
235 to 135 ●
235 to 135 *
135 to 25t, :
25
25 to 275 *
275
275 to 25 t
25
25 to 315 ●
315
315 to 325 t
325
375 to 60 ●
60
60 to 45 *
45
45 to 90 t
90
90 to 85 ●
11
12
11
10
L3
10
11
10
14
17
19
21
13
18
15
15
15
15
17
17
17
17
15
16
16
18
13
16
11
16
1s
14
15
14
15
14
16
12
16
15
15
12
14
12
11
13
12.7
13.0
14.0
15.0
16.0
17.0
18.0
19.0
20.0
21.0
22.0
23.0
24.0
25.0
28.0
27.0
28.0
29.0
4.35
5.65
5.80
6.70
6.80
.9.30
8.45
10.30
10.60
12.25
12.60
13.30
13.35
2.20
2.35
2.50
2.60
2.70
2.80
2.90
3.10
3.30
4.10
4.30
5.00
5.20
6.10
6.30
13.0
14.0
15.0
16.0
17.0
18.0
19.0
20.0
21.0
22.0
23.0
24.0
25.0
26.0
27.0
28.0
29.0
30.0
5.65
5.80
6.70
6.80
8.30
8.45
10.30
10.60
12.25
12.60
13.30
13.35
15.25
2.35
2.50
2.60
2.70
2.80
2.90
3.10
3.30
4.10
4.30
5.00
5.20
6.10
6.30
7.00
YAG 39 ZU
10
0
0
355
340
335
340
3s0
o
350
0
355
355
5
25
30
25
15
YAG 39 FL
5
5to 85*
85
85 to 295 t
295
295 to 80 ●
80
SO to 290 t
290
290 to 75 ●
75
75 to 15 *
15
YAG 39 NA
265
265 to 25 ●
25
25 to 90*
90
9otJJ lot
10
10 to 295t
295
295 to 85*
85
85 to 305t305305 to 85 ●
85
19
1s
17
18
17
18
17
16
16
17
18
18
18
19
18
17
18
15
17
16
18
16
15
16
15
13
15
14
17
14
15
16
18
16
18
18
16
16
17
17
18
18
18
17
17
17
297
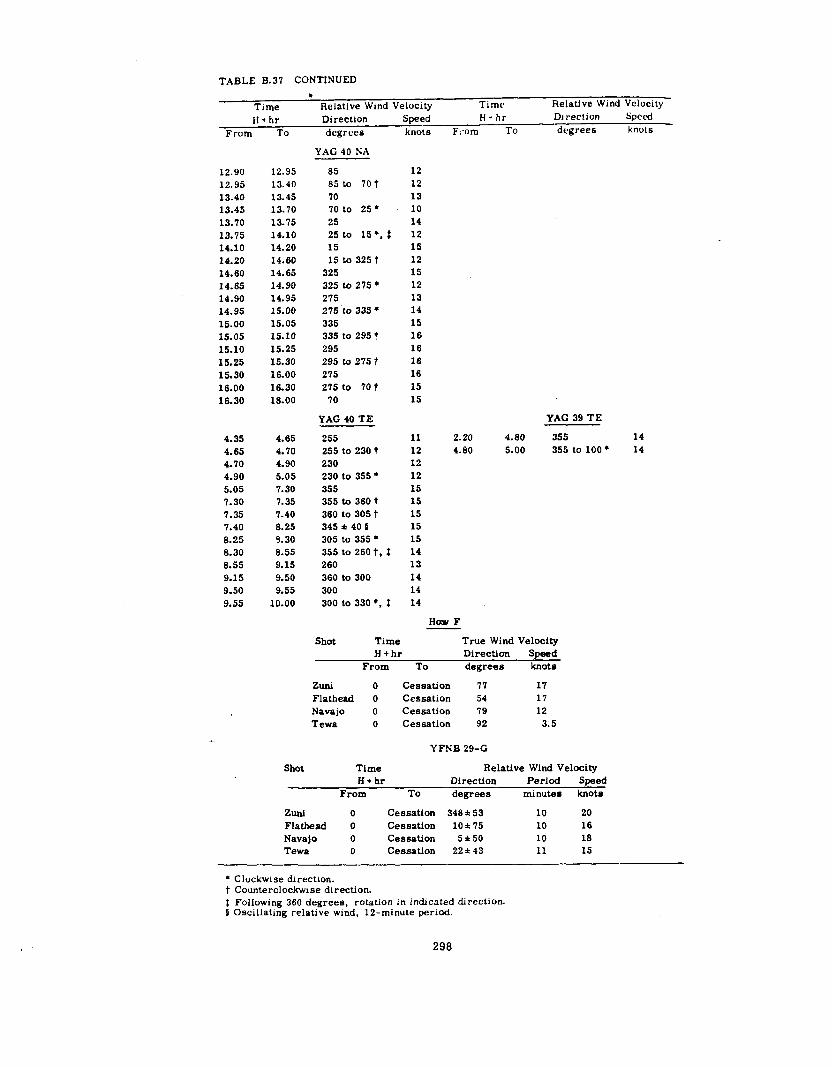
TABLE B.37 CONTINUED
b
Time Relative Wind Velocity Time Relative Wind Velocity
H+hr Direction Speed H+hr DI rection speed -
From TO degrees knots From TO degrees knots
12.90
12,95
13.40
13.45
13.70
13.75
14.10
14.20
14.60
14.65
14.90
14.95
15.00
15.05
15.10
15.25
15.30
16.00
16.30
4.35
4.65
4.70
4.90
5.05
7.30
7.35
7.40
6.25
8.30
6.55
9.15
9.50
9.55
12.95
13.40
13.45
13.70
13.75
14.10
14.20
14.60
14.65
14.90
14.95
15.00
15.05
15.10
15.25
I 5.30
16.00
16.30
16.00
4.65
4.70
4.90
5.05
7.30
7.35
7.40
6.25
9.30
8.55
9.15
9.50
9.55
10.00
YAG 40 NA
85
85 to 70 t
70
70 tO 25 ●
25
25 to 15*, $
15
15 to 325 t
325
325 to 275 *
275
275 to 335*
335
335 to 295 t
295
295 to 275 t
275
275 to 70 t
70
YAG 40 TE
255
255 to 230 t
230
230 to 355 ●
355
355 to 360 f
360 to 305 t
345 A 40 s
305 to 355 ●
355 to 260 t, t
260
360 to 300
300
300 to 330 ●, $
12
12
13
10
14
12
15
12
15
12
13
14
15
16
16
16
16
15
15
YAG 39 TE
11 2.20 4.80 355 14
12 4.80 5.00 355 to 100 ● 14
12
12
15
15
15
15
15
14
13
14
14
14
How F
Shot Time True Wind VelocityH+hr DirectIon Speed
From To degrees knots
Zuni o Cessation 77 17
Flathead O Cessation 54 17
Navajo o Cessation 79 12
Tewa o Cessation 92 3.5
YFNB 29-G
Shot Time Relative Wind Velocitv
H+hr Direction Period S~ed
From To degrees minutes knots
Zuni o Cessation 348 &53 10 20Flathead O Cessation 10*75 10 16Navajo o Cessation 5*5O 10 16Tewa o Cessation 22*43 11 15
● Clockwise direction.
t Counterclockwise direction.
I Following 36o degrees, rotation in indicated direction.S Oscillating relative wind, 12-minute period.
298

, ~3I
I Station Locotion Detector Type 8 Number
YAG 39 END OF SIO-P BOOM NYO-M
102 1
wt-
2z0i=<N
z~
10
I
8 1 ,B
I fv s
1
IIIm
f,~
11 LIMIT OF CALIBRATIONI I
o 10 - 20 30 40 I 50 60 70TIME SINCE DETONATION (HR)
Figure B.8 Surface-monitoring-device record, y= 39, mot Zuni.
299,

103
102
10 I Ia
> BAG REMOVED ~FROM DETECTOR 1T t
LIMIT OF CALIBRATIONI I
10 20 30 40 50 60 70
TIME SINCE DETONATION (HR)
Figure B.9 Surface-monitoring-device record, YAG 39, Shot Flathead.
300

103 I I 1 I I I
Station Location Detector Type ~ Number
YAG 40 END OF SIO-P BOOM NYO - M
r 1 1
ax\a
I
‘L- RAIN OBSERVED
b i
I
A\
II BAG REMOVED
@- ~ FROM DETECTOR
? I
FI
t
I
1
11
1
:1I●
It
1/’ I I
o 10 20 30 40 50 60 70
I ,LIMIT OF CALIBRATION \ I I
TIME SINCE DETONATION (HR)
Figure B.1O Surface-monitoring-device record, YAG 40, Shot Flat.head.
301

m uo 0 0
(NH/MW) 31VM NO IIVZINOI
302

u
a No 0 0
( MH/MM) 31VM NO IAVZINOI
am
oN
In
*
o
m
04
c1
i-
303

m0
—
0
(MH/UW)31VM NOIIVZINOI
304
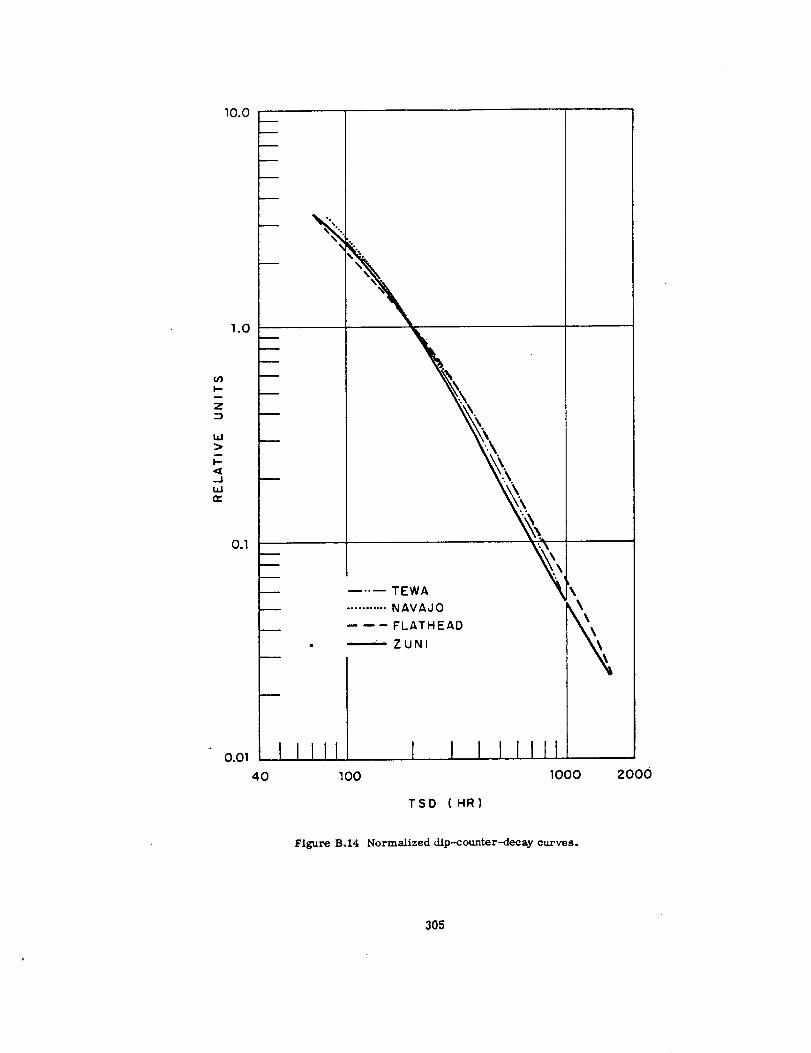
10.0
1.0
UY1-
;
3
u>
i=aAIA.1a
0.1
0.01
1- —--— TEWA
........... NAVAJO
- —- FLATHEAD
. —ZUNI
11111 I 11111
\\
\
\\\1
40 100 1000 2000
TSD (HR)
Figure B.14 Normalized dip-counter-decay curves.
305

(A3W) A9ki3N3
*W OQ W*.? ?.-
1
\
00

307-308


