Embed Size (px)
Citation preview
NUREG-0706Vol. III
Fir, I GenerimEnvironmenal IStatementon uranium mHllingProject M-25
Appendices G-V
September 1980,
Office of Nuclear MaterialSafety and SafeguardsU.S. Nuclear Regulatory Commission
U~pPCDuc.~ D tNATIONAL TECHNICAL
INFORMATION SERVICEU P|I$*kW IRC 0! "2NI1C1
Available from
Division~fUi.
GPO Sales ProgramTechnical Information and Document ControlS. Nuclear Regulatory Conwmmssion
Washington, D. C. 20555
Printed copy price: .
and
National TechnicalSpringfield,
Information ServiceVirginia 22161
NUREG-0706Vol. III
Rnaw GenericFEnv!irnmental Impact SI minunIton uranium millingProject M-25
Appendices G-V
September 1980
Office of Nuclear MaterialSafety and SafeguardsU.S. Nuclear Regulatory Commission

FOREWORD
Volume III contains Appeilces G-V, which support the
discussidns in Volume I. In some cases, the appendices expound
upon arguments developed in the .. document. In other cases,
supplementary material considered to be relevant, but not present
in Volume 1, is included. A third category-encompasses reprinting
of pertinent documents believed to be necessary for a comprehensive
presentation of the current situation, e.g., Public Lew 95-604.

iii
VOLUME ]I]
TABLE eF CONT.NTS
Page
CONTENTS ................ .......... ........... . ..............LIST OF FIGURES . . . . . .............................. .... ... . . ....... viiLIST OF TABLES ............................. ....... . . . . . . . . . . Vtii
APPENDIX G. CALCULATIONS FOR RADIOLOGICAL ASSESSMENTS ." . . . .......... G-1G-1. Source Term Estimation ......... . ................. . G-2
1. Ore Pad and Grinding . ... . . . . . . . .. ...... ...... G-21.1 Particulates. ......... ..................... ..... ........ ... G-21.2 Radon ........... ......... ... ..... ...... ..... . ....... . G-4
2. Yellowcake Dryir, and Packaging ...................... ...... ....... C-63. Tailings Pile
3.1 Particulates ...... ............... . ...... ...... .... .. G-73.2 Radon ........ .................... . . .......... ............ G-11
4. Radon from Dispersed Ore and Tailings ......... ........ ............ G-13G-2. Air Dispersion, Plume Depletion, and Radon Daughter Ingrowt#i. .... .......... G-16
l. Air Dispersion. . .................... G-16 "2. Plume Depletion ....... .................. . ................... G-203. Radon Daughter Ingrowth . ........ ............... ......... ...... G-20
G-3. Concentrations in Environmental Media .......... ..................... G-221. General Calculatlonal Procedures ........... ........... .. .... . QG'222. Ground Concentrations .".......................................... G-223. Total Air Concentrations .......... ......... .................. ... -254. Concentrations in Vegetation ............. ......................... G-265. Concentrations in Meat and Milk .......... ............... ....... .. 0276. Concentratinns at Different Times ............. ... .............. G-20
6.1 Concentrations during the Final Year of Actual Milling ..... ............ 6-28.6.2 Concentrations after the End of Actual Milling ....... ........... . . .6-286.3 Concentratiens for Environmental Dose Commitment Calculations ........ ...- 29
G-4. Concentrations of Radionuclides in the Air and on the Ground of theModel Region from.Operation of the Model Mill ..... ............... .. . G-30
G-5. Dose Calculations for Individuals .......... ........ . . ........ . .6'-431. Inhalation Doses .................................... . . G-43
1.1 Inhalation Dose Conversion Factors for Particulates. G............. -431.2 Inhalation Dose Conversion Factor for Radon Daughters ................. G-45
2.. External Doses .... ..................... ..................... G-463. Ingestion Doses.............. ..... .................... . G-474. Individual Dose Totals . . . . ........... . ....... ..... .. G-48
G-5. Dosp Calculations for the Regional Population ..... ..... ....... ....... G-511. Annual Population Dose Commitments ............................... . G-51
1.1 Populatlcn Inhalation Doses ............. .......................... G511.2 Population External Doses ..................................... G.5.1.3 Population Ingestion Doses ....... ................... ....... G-52
2. Annual Environmental Dose Commitaents .......... ..................... G-546-7. Health Effects from Irradiation .......... ......................... G-57
!. Background ............................................. .. . . C-572. :omatic Risk Estimators ........... ................. ............. G-57
2.1 Lung............. . . . .................................. G-582.2 Bone ............................ ........... 6-592.3 Leukemia. ..................... . ... ... . .... G-602.4 Whole Body.......................... .... .............. G-602.5 Other .................................... 6-612.6 Life Shortening ................ ............................. G-61
3. Genetic Risk Estimators .............. . . . ... ............... .... .G-62G-B Continental Radiological Impacts. . ...................... G-63G-9. Overview of Uranium Mill Research Activities ....... ................... G-69
1. Ore Pad and Grinding.. ............................ G-701.1 Particulates ............... ............................... G-701.2 Radon .................. ........... ................ ..... G-70
2. Yellowcake Drying and Fackaging ............ ........................ G-722.1- Radioactive Emissions ... .... . ................ G-722.2 Particle Size Distribution of Yellowcake Emissions . . . . . .... ...... 6-72.2.3 Solubility of Particulate Effluents ........................ . . G-722.4 Yellowcake Composition ......... ...... ...................... G-73
iv
CONTENTS (continued)
Page
3. Tailings ................... ......... G-743.1 Pa.ticulates ............... ............................... . . .. G-743 2 Radon ....... ............... .. . ........ ............. . . . G-763.3 Size and Activity Distribution of Sand from Uranium Kill Tailings Piles.. G-78
4. Food-Chain Contamination ............ ...................... ......... G-79
APPENDIX H. IMPACTS OF ALKALINE-LEACH HILL........... ................. H-1
APPENDIX I1 IMPACTS OF A LARGE-CAPACITY MILL .... ......... I-11. Introduction .-. . ..... ......... ......... 1.2. Environmental Effects ...... ....... ... ............. .... ..... ... I-13. Costs ................... ............ ........................... .. 1-2
APPENDIX J. INTERIM LAND CLEANUP CRITERIA FOR DECOMMISSIONING URANIUM MILL SITES . . . J-l
APPENDIX K. DETAILED COSTS OF MITIGATING ALTERNATIVES ...................... K-iK-I. Costs of Alternativesfor Controlling Airborne Wastes ......................... K-2
1. Alternatives to Control Dust from Ore Storage ........... ................. K-21.1 Water Spray ......... ............................ . .... K-21.2 Windbreak .... ........... ............................... K-21 3 Ore Warehouse ................ .......................... ...... . K... 2
2. Alternatives L-' Control Dust from Ore Handling, Crushing, andGrinding Jperations ....................... ....... ... ........... K-2
2.1 Orifice Dust Collector ............................................. K-22.2 Wet Impingement ................................................... . K-22.3 Lo%-Energy Venturi ............. .... ..... ................... . . K-32.4 Reverse Bag Filter ............................................... ..... K-32.5 Reverse Bag Filter Plsh, eiPA Filter. . ................... K-3
3. Alternatives to Cortrol Dist from Yellowcake Drying and Packaging ..... ....... K-34. Alternatives to Control Dust and Radon from the Tailings-Pile ..... ......... K-4
K-2. Costs of Alternative Special Tailings Control Processes ........ ............ K-51. Sands-Slimes Separation .................... ........................... K-b2. In Situ Dewatering ...................... ............................ K-S3. Fossil-Fueled Evaporators ............. ........................... ... K-54. Evaporation Pond .................. ............................... ... K-55. Horizontal Vacuum Belt Filter .......... .......... ................ .. K-56. Lime Neutralization ............................ . ................. K-57.a. Slimes Filtration (Disk Filter) T . ...... ........... K-67.b. Slimes Filtration (Bed Filter) ................ ....................... .K-68. Cement Fixation ........ ........................... .• ......... .. K-69. Asphalt Fixation ..................................... K-6
10. Barium Chloride Treatment .......... ....................... ... K6h1.I Ion Exchange ............... . . . . . . . . . . ... K-612. Nitric Acid Hill .............. ............................... K-6
K-3. Costs of Alternative Tailings Pond Liners ........ ................... ... K-8K-4. Costs of Alternati:e Hill Tailings Management Programs ."........... .... K-9
1. Base Case ......................... .................................. K-lO2. Alternative 1 . .................................................... K-133. Alternative 2 ................. ................................. .... K-134. Alternative 3 .... ............. ............................... K-185. Alternative 4 . ......................................... . K-186. Alternative 5 .................... ............................... . . . K-1l7. Alternative 6 ..... .............. ............ ................... K-208. Alternative 7 ........................................................ K-209. Alternative 8 ...................... ................................. K-22
10. Alternative 9 ................. .................................. ... K-22K-S. Costs of Alternative Methods of Transport of Tailings Slurry . . .. ....... K-25K-6. Costs of Alternative Coverings for Tailings Disposal Areas .... .......... ... K-26
1. Natural Covers .................... ............................... .... K-261.1 Radon Attenuation Properties .................................. ... -261.2 Availability and Unit Cost of Cover Material ...... ................ .... K-261.3 Variation of Tailings Area and Ore Grade ".K-261.4 Distribution of Sand and Slime Fractions .............. ....... K-291.5 Vegetstion and Riprap .... .... .. . . . . . ...... ........ ........ K-29
2. Syrnthetic Covers .................. ............................... ... K-3D
v
CONTENTS (continued)
Page
K-7. Costs of.Alternative Modes of MillDecommissioning . .* ............ K-311. Description of Actions Required to Implement Alternatives ...... ...... ..... K-312. Equipment and Building Decontamination .............. ..................... K-313. Removal of Building and Salvageable Equipment . . . .. ..... .............. . ...- 324. Aerial Decontamination ............................. ... ............... K-325., Miscellaneous ........ ........... ........... ... ..... .. ... . . . K-32
K-8. Cost Bases. . .................. . ..... K-34K-9. Disposal of ExistingTailings Piles .......... .............. ........ K`36
APPENDIX L. RANKINGS OF TAILINGS MANAGEMENT ALTERNATIVES. ..... ...... .......... L-1
APPENDIX M. REGIONAL POTENTIALS FOR SURFACE WATER CONTAMINATION FROM ANUNLINED TAILINGS POND ......... ................................ 1-1
APPENDIX N. RECLAMATION OF URANIUM MI.L AND TAILINGS DISPOSAL SITES ... ......... ... N-11. Introduction ............. ................. . ................ ..... N-12. Major Factors in the Design of-& Uranium Mill Tailings Reclamation Plan ..... ... N-1
2.1 Climate ................. ................ . .. N-12.2 Earth Cover M4aterials. ....... .......... ..... ......... N-12.3 Backfilling and Grading Procedures ........ ......... .................... N-42.4 Revegetation ........ ...................... ................. .... N-52.5 Maintenance ....... .............................. ................ N-5
APPENDIX 0. RADON EXHALATION FROM NATUR..L SOILS . .. . ............. .............. 0-1
APPENDIX P. CALCULATION OF THICKNESSES OF REQUIRED COVER MATERIALS ...... .......... P-11. General Considerations ....... ................................... P-12. Technical Discussion ............. .............. . . . P-i.
APPENDIX Q. URANIUM MILL TAILINGS RADIATION CONTROL ACT OF 1978 ..... . . .. . . .. Q-1
APPENDIX R. COSTS OF POST-OPERATIONAL SITE SURVEILLANCE ................. ....... R-11. Introduction ....................................... ....... R-12. Scenario I - Passive Monitoring ...... ....... ................. R-13. Scenario II - Inspection Plus Groundwater Monitoring ................ . ,. R-2
3.1 Inspection ...... ......... ......... ................................. R-23.2 Equipment . . . . . . . . . . . . . . . . . . . . . . . . . . . . . . . . . . .R-43.3 Scmple Analysis ....... .............. ........................ ....... R-4
4. Scenario III Passive Monitoring Plus Fencing ................... ... ...... R-55. Scenario IV -Limited Maintenance ............... ........................ R-56. Scenario V - Extensive Maintenance and Irrigation ........... ................ R-6
6.1 Maintenance of Vegetation .............. ........................... ... R-66.2 Groundwater Monitoring ............... ........................ ...... R-7
7. Summary .................... ..................................... ... R-7
APPENDIX S. SENSITIVITY ANALYSIS OF CUMULATIVE IMPACTS ........... ................ S-1
APPENDIX T. PROFILES OF OPERATING CONVENTIONAL U.S. URANIUM MILLS .............. .... T-11. Introduction and Summary ..... ............. . ....... ... .............. T-12. Profiles of Operating Uranium Mills ........ ... ....................... T-4
2.1 Canon City Mill, Cotter Corp ....... ....... .......................... T-42.2 Uravan Mill, Union Carbide Corp ................. ........... ......... T-42.3 L-Bar Mill, Sohio Petroleum Co./Reserve Oil & Minerals .... ............ T-52.4 Church Rock Mill, United Nuclear Corp ...... ......... .................... T-52.5 Bluewater Mill, Anaconda Co ....... . ...... .... ..................... 52.6 Ambrosia Lake Mill, Kert'-McGee Nuclear Corp ........... ................. T-62 7 Grants Mill, United Nuclear-Homestake ............. .................... T-62 8 Conquista Mill, Continental Oil/Pioneer Nuclear ........ ............... .T-72.9 Pa--a Maria Mill, Chevron Resources Co .......... .................... T-72.10 " " Mesa Mill, Energy Fuels Nuclear,. Inc ...... .................. .... T-72.11 0 ,l1l, Rio Algow Corp ................. ......................... T-82.12 w - , Atlas.Minerals Division of the Atlas Corp ..... ............... T-82.13 , Dawn Mining Co .................. ......................... T-92.14 Mill, Western Nuclear, Inc ................. .................... T-92.11. Pill, Federal fterican Partners. T1........... ........... T-)O2. !f, w1, PtIfT1ndIr Wines Corp ...... ....... ... .......... ..... ....- 10
vi
CONTENTS (continued)
2.17 Split Rock Mill, Western Nuclear, Inc ..........2.18 East Gas Hill- Mill, Union Carbide Corp .... .... ....2.19 Highland Mill, Exxon Corp. .............2.20 Bear Creek Mill, Rocky Mountain Energy Co ...........2.21 Shirley Basin M1i1, Pathfinder Mines Corp.......... ..2.22 Shirley Basin hill, Petrotoaics .......... ...... ....
3. Review of Uramiium Mill Tailings Management Programs InvolvingDisposal . . . . . . . . . . . . . ... . . . . . . . .... . .
Below-Grade
Page
... . . TollT-11
. . . . T-11. . . . T-12
T- 12. . . . T-12
T- 12
T-14
APPENDIX U. COST-BENEFIT CONSIDERATIONS FOR POST RECLAMATION RADON FLUX . ..........
1. Introduction ...... ....... .. .................... ....... . .....2. Basic Methodology . . . . . . . . . . . . . . . . . . . . . . . . . . .. . . . .3. Numerical Application . . . . . . . . . . . . ... . ... . . . . . . . .. . .
3.1 Parameter A, . .. . ................. . ... ......3.2 Parameter A2 . . . . .. .. .. . .. . . . . . . . . . . . . . . . .. . . . . . . . . .. .. .. . . . . . .3.3 Parameter A3 . . . . .. .. . .. .. .. .. . . . . . . . . . . . . . . . . . . . .. . . . . . . . . . . . . .3.4 Parameter A4 . . . . .. .. .. . .. .. .. .. . . . . . . . . . . . . . .. . . . . . . . . . . .. . . . . . .3.5 Parameter A5 . . . .. . . . . . . . . . . . . . . . .. . . . . . . . . . . . . . . . .. . . . . .3.6 Parameter T . . . . . . . . . . . . . . . . . . . . . . . . . . . ... . . .3.7 Results . . . . . . . . . . . . . . . . . . .. . . . . . . . . . . . . . . .
4. Summary and Conclusions . . . . . . . . . . . . . . . . . . . . . . . . . . . . .
APPENDIX V. RADIOLOGICAL EFFLUENT AND ENVIRNMENTA! MONITORING AT URANIUM MI LLS ....
U-I
U-IU-1U-3U- 3U-4U-4U-4U-4U-SU-5U-6
V".I
%V 1.
F I GuJ•[ S
G-). 1 Particle Size Distribution of Composite Uranium Ore Feed ". G-3G-1.2 S~ecific Activity of Radon as a Function of Particle Size of Composite,
Acid-Leached Tailings with a Near, Activity of 365 pCi Ra-Z26/g .. ....
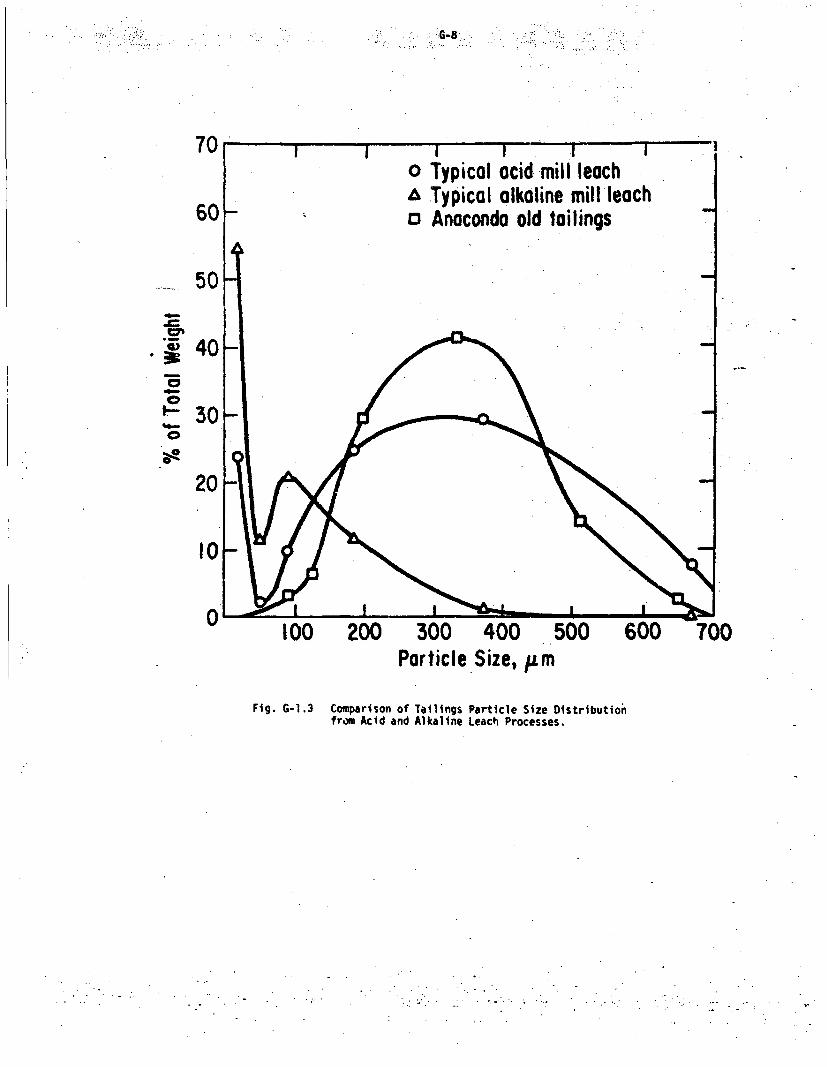
G-1.3 Comparison of Tailings Particle Size Distribution from Acidand Alkaline Leach Processes .......... ... ................ G-8
G-3.1 Schematic Diagram of Information Flow and Use for Dose Calculation3 . . G. . . G-24G-4.1 Computed Concentration of U-238 in the Air ....... ......... ........ .... G-31G-4.2 Computed Concentration of Th-230 in the Air G.. ... .- 31G-4.3 Computed Concentration of Ra-226 in the Air ..... .................... 6-32G-4.4 Computed Concentration of Pb-210 in the Air .............. .. . . . . ... G-32G-A.5 Computed Concentration of Po-210 in the Air . ................. G-33G-4.6 Computed Concentration of Rn-222 in the Air ....... . . . . . .-.. . G-33G-4.7 Computed Concentratlo., of U-238 Deposited on the Ground .G....... -34G-4.8 Computed Concentration of Th-230 Deposited on the Ground G-............. G34G-4.9 Computed Concentration of Ra-226 Deposited on the Ground .............. ......G-35G-4.10 Computed Concentration of Pb-2'3 Ueposited on the Ground." G:35G-4.11 Computed Concentration of Po-2iO Deposited on the Ground ............... G-36G-4.12 Working Level for Rn-222 Daughters .... ...... ........ .......... . . . -36G-4.13 Predicted U-238 Air Concentration Isopleths within 8 km of the Model Mill . . G-37G-4.'4 Predicted U-238 Air Concentration Isopleths within 80 km of the Model Mill G-38G-4.15 Predicted Ra-226 Air Concentration Isopleths within 8 km of the Model Mill G-39G-4.16 Predicted Ra-226 Air Concentration Isopleths within 80 km of the Model Mill G.-40G-4.17 Predicted Rn-212 Air Concentration Isopleths within 8 km of the Model Mill . -G-41G-4.18 Predicted Rn-222 Air Concentration Isopleths witnin 80 km of the.Model Mill ý. . G-42
K-4.1 Tailings Treatment Flow Sheet for Base Case an-. Alternatives 1 and 2 ........ K-12K-4.2 Schematic Diagram of Pit Treatment under Alternative 2 ........... ....... .. K-14K-4.3 Tailings Treatment Flow Sheet for Alternatives 3, 4. aid 5...... . .... ... .. K-19K-4.4 Tailings Treatment Flow Sheet for Alt.rnatives 6, 7, and 8 K.21K-4.5 Tailings Treatment Flow Sheet for Alternative 9 ... ......... ............. .. K-23K-6.1 Costs of Reducing Ra,.on-222 Exhalation Rate for Various Cover Types .... ....... K-28K-9.1 Recontouring and St;oilization of Existing Tailings Pile ............ . . K-37
T-1 Gas Hills - Below-Grade Tailings Disposal ....... ..... ................... T-20T-2 Union Carbide Gas Hills Uranium Facility A-9 PT ......... ................. T-20T-3 Sweetwater Plot Plan of Tailings Pits. ....... T-21T-4 Sweetwater Cross Sections ot Tailings Cell . ....... ............... T 21T-5 Energy Fuels - Six-Cell Tailings Disposal Syst, ., Ihite %esa Project . ..... T-221-6 Selection A-A 6-Cell Tailings Disposal System .'ear 9, týte mesa Projec. . T-22T-7 Staged Tailings Impoundment in an Active Open Pit 11 ,.e. Mtk ,or tianch Project . . T-23T-8 Mined Out Pit Burial. Dewatered Teilings, Morton Rar.-h ro!e ........ . T-23T-9 Mt. Taylor Project........ ........................ .......... T-24T-1O Gulf - Trench Cross Sections ...... ................... ...... T-24T-11 Pioneer - Tailings Impoundment Plan ......................... T-25T-12 Pioneer - Cross Section Through Impoundment. . ... ... ...... T-25

APPENDIX G. CALCULATIONS FOR RADIOLOGICAL ASSESSMENTS
Page
G-1. Source Term Estimation ...... ..... ............. . . ....... . . . . 6-2
G-2. Air Dispersion, Plume Depletion,. and Radon Daughter Ingrowth ... ............ G-16
G-!. Concentrations in Environmental Media. . ..... ............... G-22
G-4. Concentrations of Radionuclides in the Air and on the Ground if the Model RegionfromOperation of the Model Mill ...... ....... ... ..... ... ... ..... ....... G-30
G-5. Dose Calculations for Individuals.......... ...... .. ..... ......... G-43
G-6. Dose CalcLiation% for Regional Population ..... ..... .................... G-51
G-7. Health Effects from Irradiation ...... ........... .. . .. .. .......... G-57
G-F,. Continental Radioloqical Impacts. . ......... ... ..... ... ... ..... ... ..... G-63
G-9. Overview of Uranium Mill Research Activittes .......... ..... ........... G-69
G-1
APPENDIX G-1. WOURCE TERM ESTIMATION
A discussion and summary of calculations for the model mill emission source terms are presentedin the following subsections. By "source term" we mean simply the quantity of radioactivity (incuries, for example) released in a specified period of time. The calculated source terms aregiven in Table 5.5. In addition to these source terms, it ais - necessary to prnvide otherinput data which describe certain physical characteristics of the radioactive material such asparticle size and density. These parameters also are described in this section.
Thk sources of radioactive effluent that are included in this analysis of an operating uraniummill are the following: 1) the ore storage pad atid grinding operation; 2) yellowcake drying andpackaging; 3) tailings pile; and 4) radon from dispersed radium-bearing materials.
1. ORE PAD AND GRINDING
If one follows the sequence of processing steps through wh'ih the ore passes, the first source isa composite which includes storage on the ore pad and bins and the ore feed, crushing, and grind-ing operations. Each component releases particulates and radon gas.
1.1 ParticuAate=
At the mill the ore is segregated according to uranium, clay, and organic content and the v~riousgrades of ore are then blended to produce uniform feed for the mill. The quantity of ore stortdat the mill Jepends on the distance from the mine to the mill, anticipation of weather conditionsthat might limit mini:;g and transportation of the ore, management decisions to stockpile inanticipation of strikes, etc. For the model mill, storage sufficient fo. ten days of continuousmill operation is assumed.
When extracted from the mine, ores typically contain from 6 to 14% moisture. The moisture con-tert of the ore received at the mill is dependent on the duration of storage at the mine prior toshipment, the distance and means of transportation, and weather conditions. The average moisturecontent of the ore as it is received at the mill generally is not determined.
Windy and dry weather may dry the surface of ore stored at the mill and thereby increase theamount of fugitive dust that is released. The quantity of the airborne dust generated isdependent on the physical characteristics of the ore pad and its height relative to adjacentland', the physiography of the mill site, wind channeling, and wind shear velocity and profile.The frequency of winds in excess of 2 m/s (4.5 mph) is especially important. The rate of oretransport by wind may range from less than 10 g/hr-m to 10 kg/hr-m, while &he distance travelledwill depend on particle size and on wind profi e, velocity, and duration.' 6
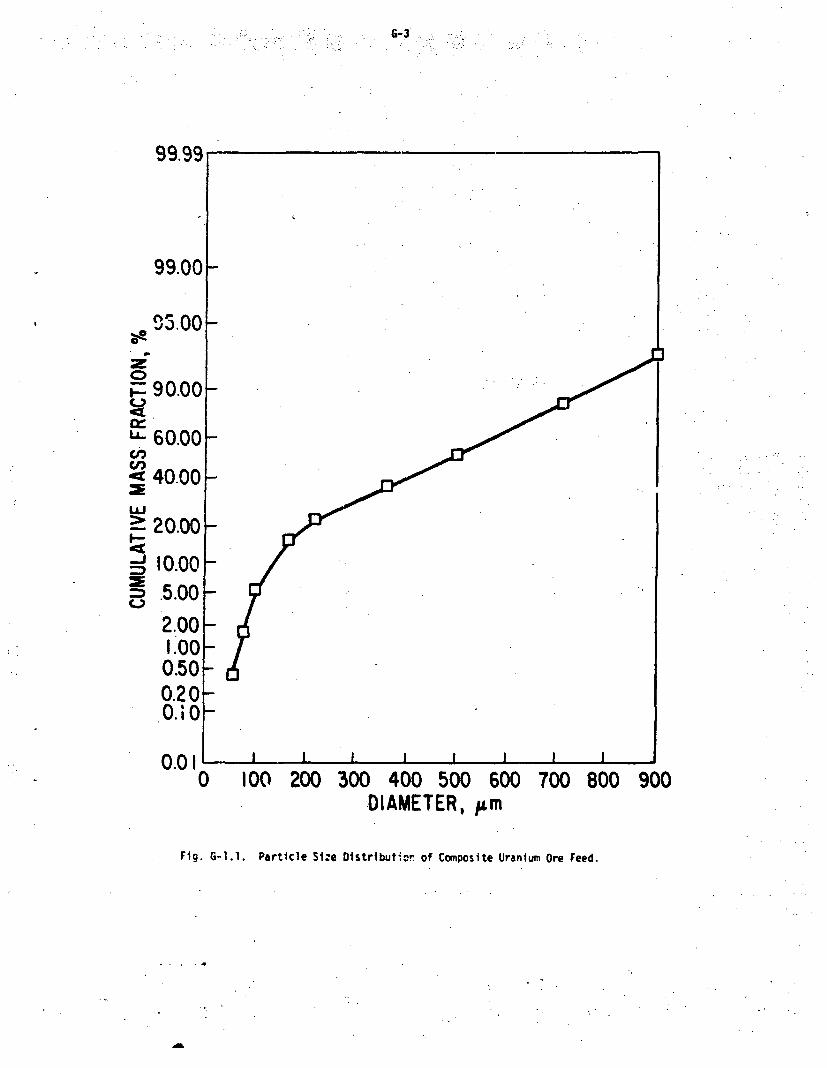
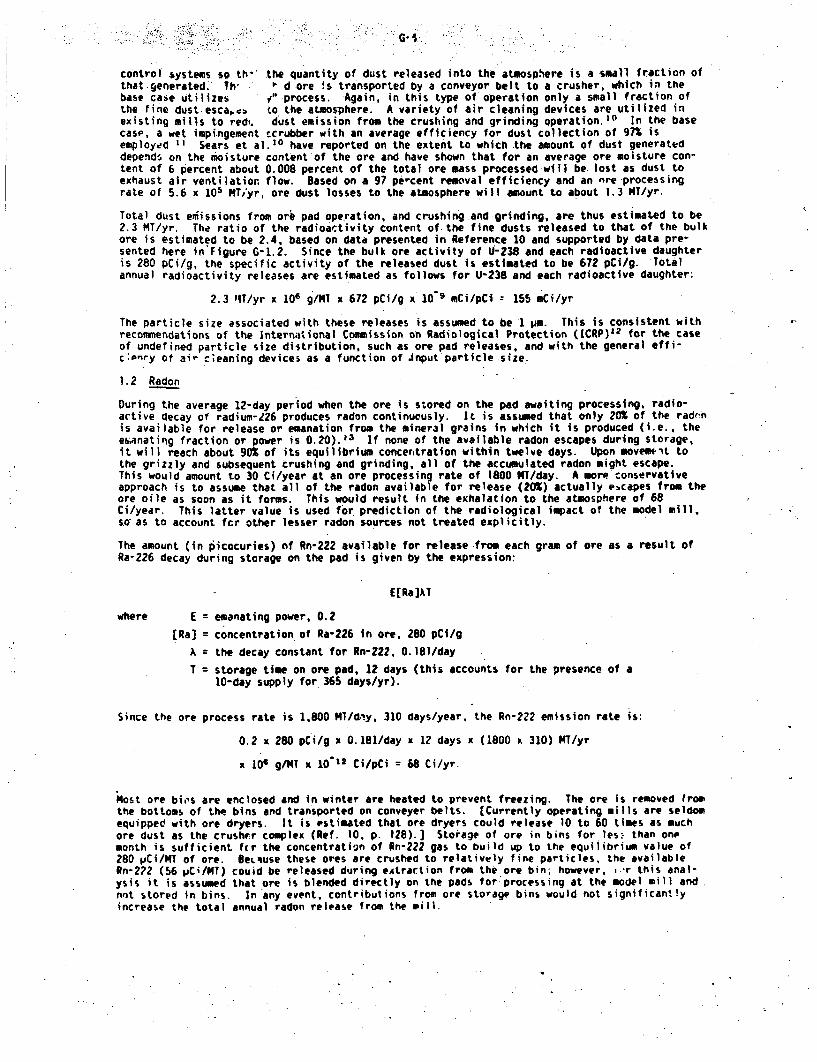
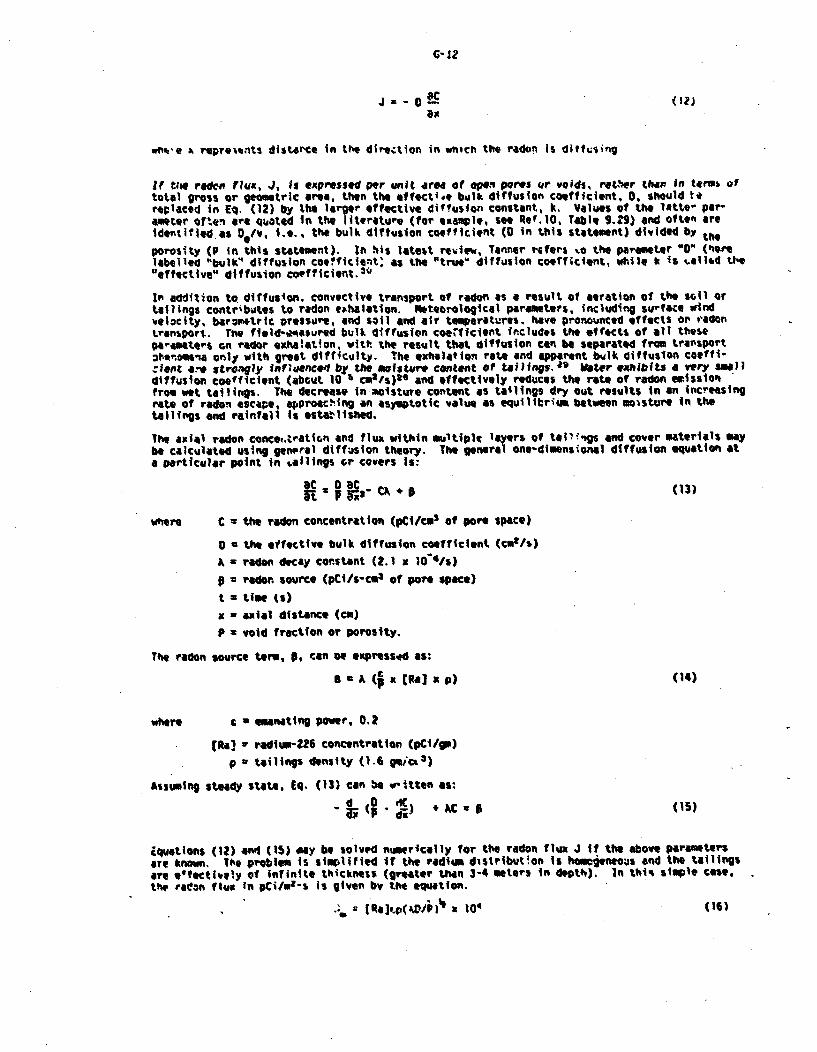
Estimation of the dust flux from the ore pad is further complicated by the action if ore trucksand machinery used to transport the ore to the crushing system. A study of fugitive dust pro-duction by surface. coal mining reports an emission factor of 0.06 grams of dust per kilogram ofmaterial handled by a front-end loading machine.? The combined actions of wind and machinery mayproduce an airborne flux in excess of u.l.g per kilogram of ore processed.8 With an ore processrate of 5.6 x 10⁵ IfT/yr (6.2 x 10s ST/yr) there is the potential for large quantities of ore tobecome airborne; however, much of it is of a particle si7e greater than 100 pm and therefore willbe transported only a short distance. Preliminary data, shown in Figure G-1.1, from measurementson a composite ore sample from one mine suggest that over 95% of the ore mass consists of non-suspendible particles greater than 100 pm in diameter. Below, in Section 3.1, it is estimatedthat the mass flux of suspendible particles leaving dry tailings surfaces is 3.7 MT/ha-yr. Forthe 0,5-ha ore pad, dusting at this rate would yield a total emission of about 1.9 NT/yr.Because of the reduced abundance of suspendible particle sizes, relative to tailings sands, andthe likelihood of greater surface moisture content, the dusting rate from the ore pad is esti-mated to be about 20 percent of that for exposed tailings surfaces, or about 0.7 MIT/ha-yr. Totaldust prodtction from all sources is assumed to be about three timo.- that produced by wind actionalone, or about 2 NT/ha-yr.9 Dust emission from the 0.5-ha ore pad is therefore esti'ated to beabout 1 MT/yr.
Transport of ore to the grizzly and crushing anO screening also are sources of dust. Some ofthese processes are carried out in buildings and the dust-loaded air is ventilated through
G-3
C-,
LA_
C6,
c.)
0.01L0 100 200 300 400 500 600 700 800 900
DIAMETER, .um
Fig. G-1.1. Particle Si:e Distributior of Composite Uranium Ore Feed.
11:ii 1 ...
control systems so th" the quantity of dust released into the atmosphere is a small fraction ofthat generated. Th' , d ore 4s transported by a conveyor belt to a crusher, which in thebase case utilizes ý'° process. Again, in this type of operation only a small fraction ofthe fine dust-escapc* to the atmosphere. A variety of air cleaning devices are utilized inexisting mills to red,. dust emission from the crushing and grinding operation.' 0 In the basecase, a wet impi-ngement ecrubber with an average efficiency for dust collection of 97% isemployed 11 Sears et al.10 have reported on the extent to which the amount of dust generateddepends on the moisture content of the ore and have shown that for an average ore moisture con-tent of 6 percent about 0.008 percent of the total ore mass processed will be lost as dust toexhaust air ventilation flow. Based on a 97 percent removal efficiency and an fre processingrate of 5.6 x 10⁵ MTyr. ore dust losses to the atmosphere will amount to about 1.3 MI/yr.
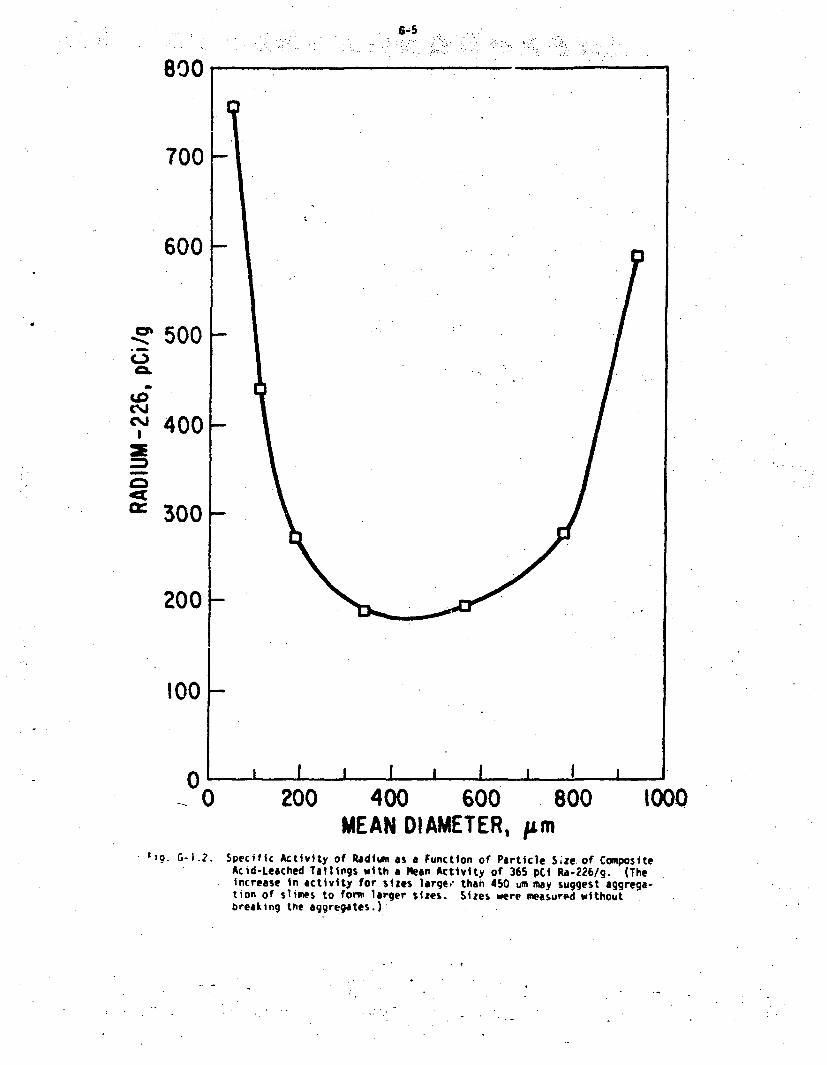
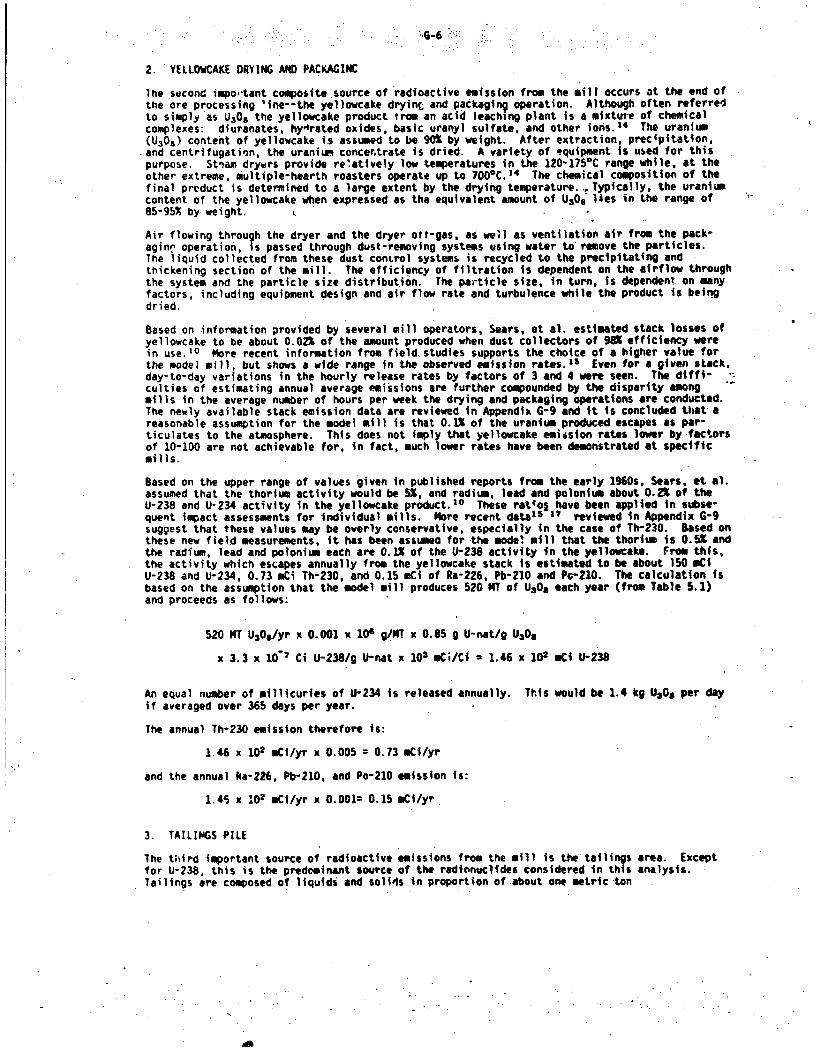
Total dust eiiissions from orn pad ope.ration, and crushing.and grinding, are thus estimated to be2.3 MT/yr. The ratio of the radioactivity content of the fine dusts released to that of the bulkore is estimated to be 2.4, based on data presented in Reference 10 and supported by data pre-sented here in'Figure G-1.2. Since the bulk ore activity of U-238 and each radioactive daughteris 280 pCi/g, the specific activity of the released dust is estimated to be 672 pCl/g. Totalannual radioactivity releases are estimated as follows for U-238 and each radioactive daughter:
2.3 1IT/yr x 106 g/M1 x 672 pCi/g x 10'9 mCi/pCi z 155 mCi/yr
The particle size associated with these releases is assumed to bel1 pm. This is consistent withrecommendations of the International Commission on Radiological Protection (ICRP)1 2 for the caseof undefined particle size distribution, such as ore pad releases, and with the general effi-cE;nry of air c~eaning devices as a function of input particle size..
1.2 Radon
During the average 12-day period when the ore is stored on the pad awaiting processing, radio-active decay of radium-226 produces radon continuously. It is assumed that only 20% of the radenis available for release or emanation from the mineral grains in which it is produced (i.e., theesanating fraction or power is 0.20).13 If none of the available radon escapes during storage,it will reach about 90% of its equilibrium concentration within twelve days. Upon moveme'It tothe grizzly and subsequent crushing and grinding, all of the accumulated radon might escape.This would amount to 30 Ci/year at an ore processing rate of 1800 MT/day. A more conservativeapproach is to assume that all of the radon available for release (20%) actually e.capes from theore oile as soon as it forms. This would result in the exhalation to the atmosphere of 68Ci/year. This latter value is used for prediction of the radiological impact of the model mill,so- as to account fcr other lesser radon sources not treated explicitly.
The amount (in picocuries) of Rn-222 available for release from each gram of ore as a result ofRa-226 decay during storage on the pad is given by the expression:
E[Ra]AY
where E = emanating power. 0.2
(Ra] = concentration of Ra-226 in ore, 280 pCi/g
A = the decay constant for Rn-22?, 0.181/day
T = storage time on ore pad, 1? days (this accounts for the presence of a10-day supply for 365 days/yr).
Since the ore process rate is 1,800 MI/d.y. 310 days/year, the Rn-222 emission rate is:
0.2 x 280 pCi/g x 0.181/day x 12 days x (1800 x 310) MT/yr
x 106 g/t4T x 10"12 Ci/pCi = 68 Ci/yr.
Most ore bi,,s are enclosed and in winter are heated to prevent freezing. The ore is removed fromthe bottoms of the bins and transported on conveyer belts. [Currently operating mills are seldomequipped with ore dryers. It is estimated that ore dryers could release 10 to 60 times as muchore dust as the crusher complex (Ref. 10, p. 128).] Storage of ore in bins for les- than onemonth is sufficient fcr the concentration of Rn-222 gas to build up to the equilibrium value of280 pCi/MT of ore. BeLquse these ores are crushed to relatively fine particles, the availableRn-2?2 (56 psC'/MT) couid be released during eAtraction from the ore bin; however. ,.-r this anal-ysis it is assumed that ore is blended directly on the pads for: processing at the model mill andnnt stored in bins. In any event, contributions from ore storage bins would not significantlyincrease the total annual radon release from the will.
6-5
800
700Hý
600H
C4%iCI
500
400
300
200
100 F-
I I I I I I I I00 I
200 400 600 4MEAN DIAMETER, pm
i00 1000
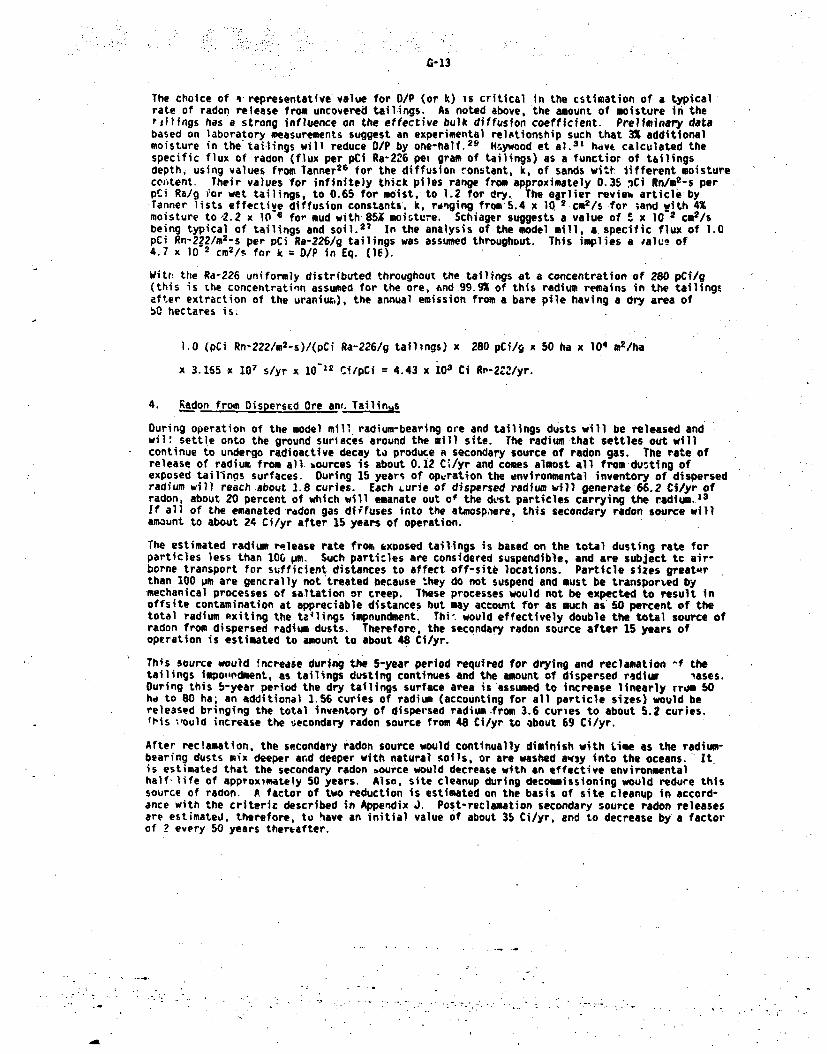
F19 . G-1.2. Specific Activity of Radium as a Function of Particle S ze. of CompositeAcid-Leached Tailings with a Rean Activity of 365 pCI Ra-226/g. (Theincrease in activity for sizes large.- than 450 um may suggest aggrega-tion of slimes to form larger sizes. Sizes were measurpd withoutbreaking the aggregates.)
2. YELLOWCAKE DRYING AND PACKAGINC
Mhe second impo,-tant composite source of radioactive emission from the mill occurs at the end ofthe ore processing 'ine--the yellowcake dryint and packaging operation. Although often referredto simply as U308 the yellowcake product trom an acid leaching plant is a mixture of chemicalcomplexes: diuranates, hydrated oxides, basic uranyl sulfate, and other ions.14 The uranium(U308) content of yellowcake is assumed to be 90% by weight. After extraction, precipitation,
.and centrifugation, the uraniuq concer,trate is dried. A variety of equipment Is used for thispurpose. Stnam dryers provide reatively low temperatures in the 120-175C range while, at theother extreme, multiple-hearth roasters operate up to 700*C.14 The chemical composition of thefinal product is determined to a large extent by the drying temperature. ,,Typically, the uraniumcontent of the yellowcake when expressed as the equivalent amount of UsO38 lies in the range of85-95% by. weight.
Air flowing through the dryer and the dryer ott-gas, aS well as ventilation air from the pack-agin' operation, is passed through dust-removing systems using water to remove the particles.The liquid collected from these dust control systems is recycled to the precipitating andthickening section of the mill. The efficiency of filtration is dependent on the airflow throughthe system and the particle size distribution. The particle size, in turn, is dependent on manyfactors, including equipment design and air flow rate and turbulence while the product is beingdried.
Based on information provided by several mill operators, Sears, et al. estimated stack losses ofyellowcake to be about 0.021 of the amount produced when dust collectors of 98% efficiency werein use. 10 More recent information from field. studies supports the choice of a higher value forthe model mill, but shows a wide range in the observed emission rates.'s Even for a given stack,day-to-day variations in the hourly release rates by factors of 3 and 4 were seen. The diffi-culties of estimating annual average emissions are further compounded by the disparity amongmills in the average number of hours per week the drying and packaging operations are conducted.The newly available stack emission data are reviewed in Appendix G-9 and it is concluded that areasonable assumption for the model mill is that 0.11 of the uranium produced escapes as par-ticulates to the atmosphere. This does not imply that yellowcake emission rates lower by fac*.orsof 10-100 are not achievable for, in fact, much lower rates have been demonstrated at specificmills.
Based on the upper range of values given in published reports from the early 1960s, Sears, et al.assumed that the thorium activity would be 51, and radium, lead and polonium about 0.2% of theU-238 and U-234 activity in the yellowcake product.1 0 These ratiol have been applied in subse-quent impact assessments for individual mills. More recent data's 17 reviewed In Appendix G-9suggest that these values may be overly conservative, especially in the case of Th-230. Based onthese new field measurements, it has been assumed for the model mill that the thorium is 0.5% andthe radium, lead and polonium each are 0.1% of the U-238 activity in the yellowcake. From this,the activity which escapes annually from the yellowcake stack is estimated to be about 150 mCiU-238 and U-234, 0.73 mCi Th-230, and 0.15 mCi of Ra-226, Pb-210 and Po-210. The calculation isbased on the assumption that the model mill produces 520 MT of U30a each year (from Table 5.1)and proceeds as follows:
520 MT U30./yr x 0.001 x 10⁶ g!MT x 0.85 g U-nat/g U309
x 3.3 x 10'7 Ci U-238/g U-nat x 103 m0C/Cl a 1.46 x 10² mCi U-238
An equal number of millicuries of U-234 is released annually. This would be 1.4 kg U30s per day
if averaged over 365 days per year.
The annual Th-230 emission therefore is:
1.46 x 10² mCi/yr x 0.005 = 0.73 mCi/yr
and the annual ka-Z26, Pb-210, and Po-210 emission is:
1.45 x 10² mCI/yr x 0.001= 0.15 mCI/yr
3. TAILINGS PILE
The third important source of radioactive emissions from the mill is the tailings area. Exceptfor U-238, this is the predominant source of the radionuclides considered in this analysis.Tailings are composed of liquids and solids in proportion of about one metric ton
• + ,• ~6-7. . .
of waste solution for each metric ton of solid tailings."4 1.t is assumed that during the leach-in;g process at the model mill, about 93% of the uranium is solubilized and 99% of tha solubitizedfracticn is extracted; the fraction not extracted is discharged with the tailings wvsie solutionbut is partiall-, recovered by recycling the solution. The overal; uranium recovery efficiency isassumed to be 93%. While these values are typical of cu,'rent practice, it should be noteJ thatsolubilization, extraction, and recycle recovery are processes whose effIciencies are determinedby factors specific for edch mill. For example, in order to increase daily product yield, areduced extraction efficiency (shorter leach duration) 4nd highe, rate of ore throughput may beadopted 14
The solid tailings contain more than 60% of the total long-lived radioactivity originally presentin the ore, including about 7% of t"e uranium, and-essentialiy all of the Th-230. Ra-226, Pb-210,and Po-210., The radioactivity content of slime solids is larger than that of the sand."9' 2 0
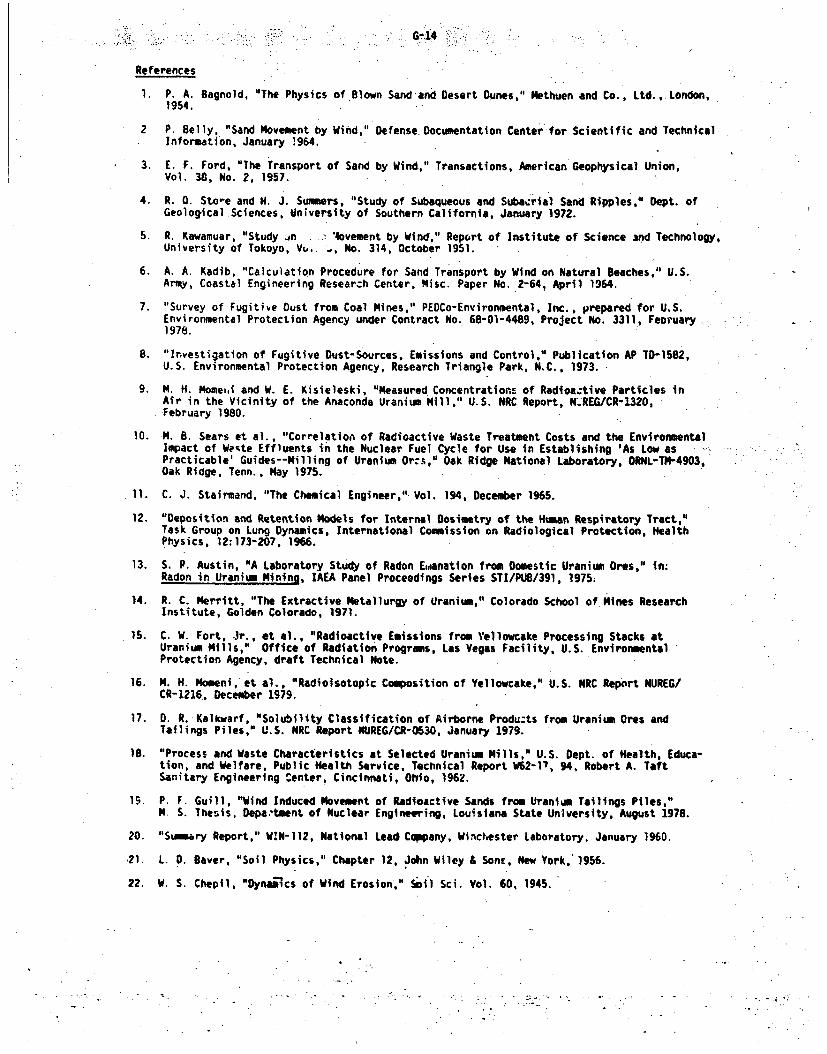
From the preliminary data presented in Figure G-1.2.19 the increase in specific activity forparticle sizes below 400 pm is clear. The amount of material in the slime fraction depends onthe mill process and ranges from 20% to 40. The relative amourcs of slipes and sands on thesurface of a tailings pile depends not only on the amount of c€ch fraction in the process was.estream., but also on the procedure used to distribute the.-tailings on the pile and the time theyhave been subject to weathering and erosion. This is evident from the data plotted in FigureG-1.3, which is based on the same recent field study as the data shown in Figure G-l.2. 1 Forthe radiological assessment described in Chapter 6, the dry area of the tailingb pond is con-sidered to be a source of airborne particulates and radon.
3.1 Particulates
The mechanism uf movement of tailings particles by wind is similar to the movement of soil and itOppendent on wind velocity, physical properties of the tailings and the nature of the tailingssurface.,' 2' Winl forces can generate three basic modes of particle movement: surface creep,saltation, and airborne suspension. Surface creep involves particles ranging in size from 500 to1000 Pm. These p+•rticles are rolled ilong the surface by the push ot strong winds and byexchange of mome.itum after impact with smaller particles insaltation. Saltation consists ofindividual particles jumping and lurching within a few centimeters of t.ie ground. Particles thatsaltate are. from 100 to 500 iw in size, depending on shape and density, And are quickly broughtback to the griund by the gravitational force. Particles smaller than IUO tim may have a velocityof fall lower than the upard velocity of the turbulent wind. Such particles are carried throughthe atmosphere for long periods and to great distances from their original location. The mech-anism by which fine particles are lifted off the ground is different from that of saltation. Ithas been observed that samples of soil composed only of fine dust particles may be extremelyresiktant to erosion by wind,22 but in mixtures witi, :o4rser grains these particles moved readily.It was concluded that suspension of fine dust in air may be primarily the result of movement ofgrains in saltation.
The particulate source term which represents the dust release from the dry tailings area of themodel mill is calculated following the method and procedures outlined below. 23
The wind velocity profile near the surface can be described by the general equation:'Uz = U'[2.5 In (z/Zo0)](1
where U1 shear velocity,
- where T is the surface shear stress and p the density of air
z = helgh' above surface, 1 meter
UZ = wind velocity at height z,
to= surface roughness height,
= height at which dz = 0, 0.01 meter.
When the wind above the surface exceeds a certain threshold velocity, particle saltatlon begins."he initiation of particle movement has been investigated by Bagnold, who expressed the thresholdvalue of the shear velocity, U•, as follows:'
U~t =A ;=p gd(2)
G-8
70
60
50
V•
0I,-0
40
30
20
10
0300 400 ,
Particle Size, /m
Fig. G-1.3 Comparison of Tailings Particle Size Distributionfrom Acid and Alkaline Leach Processes.
G-9
where o = density of dhe grain, 2.4 g/cm3 ,
p= density of air, 1.20 x 10⁻³ g/h; 3 (at 200"C),g = gravitat;onal constant, cm/s 2 ,
d = average diameter of the grain, 0.03 cm (300 pm),
A = dimensionless coefficient, the value of which in air for grains above 100 pm indiameter was found to be about 0.1.1
The influence of moisture in the sand on the threshold velocity for grain movement has beeninvestigated by Belly. 2 Based on his study, Equation 2 may be modified as follows:
= A~ (1.8 + 0.6.loglo W) (3)
where W is the water content expressed in percent by weight. In this analysis the moisturecontent of dry tailings is assumed to be 0.1%.
The rate of horizontal particle movement by the. saltation process, q, in mass per unit width andunit time was found by Bagnold to vary directly as the cube of the surface shear velocity,;
q = ChU* 3 (4)
where Ch is a constant dependent on the soil and surface conditions.
A modified relationship proposed by Lettan and reported by Gillette for the horizontal flux wasobserved for various soi. types under similar erosion conditions. 2 4 This modification of Equa-.tion 4 is given by:
q CU* 2 (U* - U*), and q 0 for U*<U (5)
where the shear velocities V* and U* have units of cm/s, the horizontal flux q has units ofg/cm-s, and C equals 10"6 g-s2/cm4.t
The wind pickup of fine particles (diameter, d<20 pm) from soil surface has been investigated byGillette. He found that the vertical flux, expressed in mass per unit area and unit time, V2 o,obeyed the empirical formula:
V2 0 Cv [UA/UtI (,)
where the coefficient of proportionality C is aboutl2 x 10"1°, and y is a constant dependent onthe fraction of fine particulates in the ssil.
Since vertical fluxes are always associcted with horizontal fluxes, an assumption was made thatfor wind-eroding surfaces, V20 is directly proportional to ¥. Travis derived the followingrelationship:2s
C1 t luI-'
where y is greater than three and increases as the aumber of suspendible particles per unit ma'sincreases.
A linear curve fitting by Travis of Gillette's experimental field data for y as a function o' theparticle mass percentage less than 20 pm in diameter, o, yielded the expression:
3 (8)
.G- 10
Since the vertical oust flux must 2pproach zero as the suspended particle mass. percentage, p,also approaches zero, Equation 7 was modified as foe ows:
•V20 /I q[Cv] rU-\13 iV29. ,. If,_-., (9)The constants C and Ch are approximately 2 x 10 "0 and l0'.respectively. 24
For particulate material of diameter, d, between 0 pm and 100 lrm, the total vertical flux for aradionuclide, i, in terms of radioactivity, Vi, is estimated using thkefollowing equation:
V =(10)
where 120 = specific activity of radionuclide "i" in tailings with a diameter lessthan 20m.
F20 = activity fraction of suspended particulates that are less than 20 pm indiameter.
The parameters used for estimation of particulate emission from the tailings are as follows:
Surface roughness height , z 0 = I cmDensity of tailings grains, a = 2.4 g/cm3
Average grain diameter, d = 300 pmPercent of tailinos mass that is smaller than 20 pm, p = 3.0
Specific activity of radionuclide i in tailings with particle size less than 20 gým indiameter, 120:
280 x 0.07 x 2.4 =.47.0.pCi/g (for U-238 and U-234)280 x 2.4 = 672 pCi/g (for Th-230, Ra-226, Pb-210, and Po-210)
Dry tailings water content, W = 0.1%Activity fraction of suspended particulates less than 20pm in diameter, F20 0.4.
The choice uf 0.4 as the value of F20 is somewhat irbltrary, but is consistent with data pre-sented in Reference 20 showing that about 80W of ..te activity of acid-leach tailings (as theyoccur on the ground, not suspended) is associated with particles less than 400 mesh (nominally38 pm) in size. It also is consistent with the assumed particle size distribution on which thecalculations of inhalation dose are based. As described in Appendix G-S, 30% of the radio-activity is assumed to be carried by tailings particles of 5 pm in diameter, while the remaining70% of the activity is associated with 35-pm particles.
The radioactivity of radionuclide "i" released from the tailings surface per year, E4 , is depend-ent on the wlad speeds, their frequencies of occurrence, and the total dry tailings ;ra:
Ei= f w Vi(w) (11)
where fw = frequency of wind speed w,
A = total dry tailings area, 50 ha,
VY(w) = vertical flux of radioactivity for radionuclide i and wind speed w.
For example, the vertical activity flux, V (a12260(0), produced by a wind speed of 10 mph measuredat 1 a above the tailings surface may be calculated by using the above equations as follows:
From Eq. (i), the shear velocity Is:
U, 10 h X 44. (C.1,)/O/ h 9 COs2.5 ln(100 cm/l cm)
-" ;• •° .:• : " • :.. .. ' •-• :•.: . :: i ...:•., : . • .".: - ,. ' . - .
From Eq. (3), the thresholdshear velocity necessary for saltation is:
0. 1- 120 . x 980 x 0.03 (1.8 0.6 log1o 0.1) = 29 cm/S.U~t 1.20 X 10"3
From Eq. (5), the saltation rate is:
q 106 x (39)2 (39 29) = 1.5 x 10 - /cm-s.
From Eq. (9), the vertical flux for particulates with size less than 20 Pm in diameter is:
V20 = 1.5 x 10⁻² 2 x 1 i 9 -11 4.3.x 10" g/c.-s,[29s l; j g
and from Eq. (10), the vertical activity flux for Ra-226 is:
VRa.226(0O) 4.3 x 10- o/cm2 -S.4 x 672 pCi/p 7.2 x 2 0-8 pCi/CM2-s.
The annual activity emissions from tailings, using the meteorological date given below inTable G-2.2, are calculated to be 8.7 mCi for U-238 and U-234 and 124 mCi for Th-230, Ra-226, -Pb-210, and Po-210. The mass flux of particles under 100 MIm in diameter from the tailings sur-face corresponding to this release of activity is 370 g/m2-year, or 185:MT/year from 50 ha.
3.2 Radon
The rate of radon exhalation, or flux, at the interface between a tailings pile and-the atmo-sphere is dependent on (I) the rate of generation of rador from the parent radium, (2) the con-centration of radon in the soil pore space, (3) diffusion through the pore spaces, and (4)transport phenomena.
The rate of radon generation is dependent on the concentration of radium [Ra] in the tailings,which is not constant through vertical and horizontal profiles because of variatioi.s in thequality of the ore processed through the years. Also, the differential settling of tailingsolids after discharge to the pond results in spatial fractionation, the larger tailing grainsbeing deposited closer to the point of discharge. Muc'i of the radium activity in the tailings isassociated with the finer grains which are washed to the lower areas and become buried at greaterdepth than the larger grains."'
The recoil energy of the radon ion after formation is about 0.1 91eV, and it has a track length ofabout 0.03 pm in the tailings solids and 60 pm in air. 2s The fraction of ridon ions that recoilinto pore space is dependent on the specific internal volume (ratio of internal pore surface tobulk volume) and tortuosity, i.e., average length of the flow path through the porous medium. Ifthe path length is small, the recoiling radorn will aeposit on other grains and will not escape.The fraction of the radon generated by Ra-226 decay that escapes from mineral grains is commonlycalled the emanating power (c). Values ranging from 0.01 to 0.91 have been reported for uraniumores. 13 The observed emanating power depends on many factors, such as the mineralogy, porosity,particle size diftribution, and thiisture content. As the ore is processed through the mill,changes occur which may influence tte emanating power of'the waste tailings. For "typical"tailings a value of approximately 0.2 has been given. 27 A series of measurements on dry, com-posite samples from the Vitro site yielded an emanating power of 0.20.21 More recently, 15samples from four different mining areas we-e found to range from 0.06 to 0.31, with an averageemanating power of 0.15.29 For this study an averaqe value of 0.20 has been assumed. Therefore,the quantity of radon generated per unit volume of tailings and available for exhalation isproportional to [Ra]cp where p is the bulk Oensity of the tailings. The concentration, C. ofradon (in picocurles/cw3 ) accumulated in thv pore space is given by [Ra]zp/P, where P is theporosity or void fraction, i.e., the fraction of the total volume that is not occupied by solidtailings particles (frequently identified by the symbol v in the literature). Values for poros-ity in the range of 30-40% have been reported.10
According to Fick's Law, the radon flux per unit area of tailings, J, is. related to both P andthe radon concentration per unit volume of void space, C, by msns of an effective diffusionconstant, k. The product klP is often called the effective bulk diffusion coefficient, 0.
G- 32
wi•t.e i repreivits distaMce in the direztion in wthch the radon is ditffsins
If tue raden flux, J, Is expressed per unit area of oWs pores ur voids, ret.-er than In terns oftotal gross or geometric area, then the effecti#e bulk diffusion coefficient, 0, should ter•placed in Eq. (12) by the larger effective diffusion constant, k, Values of tMe latteo par-
ameter oTf.en ale quoted in the literature (for example, see Re'. 10, Table 9.2&9) end often areideW'tifie4 as i.e., the bulk diftusion coefficient (0 in this statement) divided b) the
porosity (P In this sttement). In 'is latest review, Tanner Pifers %o the parameter "0" ( elabelled "bulk4 diffusion coefficien.t: as the Otrue" diffusion coefficient, while k is 46elled tI'e"effective" diffusion coefficient.Y'
In addition to diffusion, convective transport of ra•on as a result of aeration of the soil ortailings contributes to radon eihalation. Meteorological parameters, including surface windvelocity, baro.-tric pressure, end soil and air tesperatures. have pronounced effects o'r radontransport. The field-o.asured bulk diffusion coaeficient ircludes the effects of all theseParameters on r•dor exhalation, with 'the result that diffusion can be separated from transport2tter.m•ns. only with great difficu.lty. The exhalation rate and apparent bulk diffusion coeffi-:-ent #-# strongly influence4 by t•he moisture content of t)ailngs, 49 Water exhibits a very smlldiffusion coefficient (about 10 6 cmlls)RC and effectively reduces the rate of radon emissionfrom wet tailings. The decrease in moisture content s tailings dry out results in an increasingrate of redoq esc4pe, approaching an asymptotic value aS qui"itrium between moisture in thetailings and rainfall is estatelished.
The axial radon concei.tration and fluxi within multipi layers of taeil!gs and cover materials maybe calculated using general diffusion theory. The general one-dimensional diffusion wquation ata particular point in ,ailings or covers Is:
It P 17x (13)u" p •;r CA * pS(S
where C = the radon concentration (pCi/cm€ of pore space)
0 a the effective bulk diffusion coefficient (co t /s)A = radon decay corstant (2.1 x 1095)p radon source (pCi/s-cm1 of pore space)
t z time ts)x = axial distance (cm)P a void fraction or porosity.
The radon source term, P, can Oe expressd as:
Sa (A a (Raj x p) (14)
where C emanating power, 0.2
CRa] v radium-226 concentration (pCi/gP)p = tailings density (1.G g9mic*)
Assuming steady state, Eq. (13) can be w.itten as:
d * d AC (1S)
iquetions (12) an4 (15) ay be solved numerically for the radon flux J It the above parametersere known. To* problem is simplified if the radium distribution Is homoontoas and the tailingsare efectively of Infinite thickness (greater than 3-4 meters in depth). in thi% simple case,the raco" flux in pCi/- Is given by the equation.
".08 1 Q410PODA1111 a 104 (!1)
G-13
The choice of i representative value for 0/P (or k) is critical in the cstimation of a typicalrate of radon release from uncovered tailings. As noted above, the amount of moisture in therillings has a strong influence on the effective bulk diffusion coefficient. Preliminary databased on laboratory measurements suggest an experimental relationship such that 3% additionalmoisture in the tailings will reduce 0/P by one-half. 2
r Hsywood et al. 31 hdv& calculated thespecific flux of radon (flux per pCi Ra-226 pet gram of tailings) as a functior of tailingsdepth, using values from Tanner"6 for the diffusion ronstant, k, of sands witt• lifferent moisturecontent. Their values for infinitely thick piles range from approximately 0.35 'Ci Rn/m2-s perpCi Ra/g ior wet tailings, to 0.65 for moist, to 1.2 for dry. The egrlier review article byTanner lists effective diffusion constants. k, ranging from5.4 x IQ O.cm2/s for ;and gith 4%moisture to -2.2 x 10 I for mud with 85% moisture. Schiager suggests a value of 5 x 10 2 cm2/sbeing typical of tailings and soil.27 In the analysis of the model mill, a specific flux of 1.0pCi Rn-222/m2-s per pCi Ra-226/g tailings was assumed throughout. This implies a ialue of4.7 x 10 2 cm2/S for k = D/P in Eq. (11).
Witr: the Ra-226 uniformly distributed throughout the tailings at a concentration of 280 pCi/g(this is the concentration assumed for the ore, and 99.9% of this radium remains in the tailingsafter extraction of the uraniur,), the annual emission from a bare pile having a dry area ofbO hectares is.
1.0 (pCi Rn-222/m 2-s)/(pCi Ra-226/g tailings) x 280 pCi/g x 50 ha x 104 m2/ha
x 3.165 x 10⁷ s/yr x 10"12 Ci/pCi = 4.43 x i03 Ci Rn-2,,/yr.
4. Radon from DispersEd Ore an. Tailinms
During operation of the model mill radium-bearing ore and tailings dusts will be released andwil! settle onto the ground suriaces around the mill site. The radium that settles out willcontinue to undergo radioactive decay to produce a secondary source of radon gas. The rate ofrelease of radium from all %ources is about 0.12 C'/yr and comes almost all from dusting ofexposed tailings surfaces. During 15 years of operation the environmental inventory of dispersedradium will reach about 1.8 curies. Each Lurie of dispersed radium will generate 66.2 Ci/yr ofradon, about 20 percent of which will emanate out of the dust particles carrying the radium.13If all of the emanated radon gas diffuses into the atmospaere, this secondary radon source willamount to about 24 Ci/yr after 15 years of operation.
The estimated radium release rate from exposed tailings is based on the total dusting rate forparticles less than 100 pm. Such parti:les are considered suspendible, and are subject tc air-borne transport for sufficient distances to affect off-site locations. Particle sizes greatorthan 100 pm are gencrally not treated because they do not suspend and must be transpor%.ed bymechanical processes of saltation or creep. These processes would not be expected to result inoffsite contamination at appreciable distances but may account for as much as 50 percent of thetotal radium exiting the ta 4 lings impoundment. Thi* would effectively double the total source ofradon from dispersed radium dusts. Therefore, the secondary radon source after 15 years ofoptration is estimated to amount to about 48 Cil/yr.
This source would increase during the 5-year period required for drying and reclamation -f thetailings impo-ndment, as tailings dusting continues and the amount of dispersed radiuw lases.During this b-year period the dry tailings surface area is assumed to increase linearly rrum 50ho to 80 ha; an additional 1.56 curies of radium (accounting for all particle sizes) would bereleased bringing the total inventory of dispersed radium.from 3.6 curies to about 5.2 curies.rhis -'ould increase the s.econdary radon source from 48 Ci/yr to about 69 Ci/yr.
After reclamation, the secondary radon source would continually diminish with lime as the radium-bearing dusts mix deeper and deeper with natural soils, or are washed aw'y into the oceans. Itis estimated that the secondary radon &ource would decrease with an effective environmentalhalf, life of approximately 50 years. Also, site cleanup during decoomissioning would redure thissource of radon. A factor of two reduction is estimated on the basis of site cleanup in accord-ance with the criteria described in Appendix J. Post-reclamation secondary source radon releasesare estimated, therefore, to have an initial value of about 35 Ci/yr, and to decrease by a factorof ? every 50 years thertafter.
G-ý141
References
1. P. A. Bagnold, "The Physics of Blown Sand and Desert Dunes," Methuen and Co., Ltd., London,1954.
2 P. Belly, "Sand Movement by Wind," Defense Documentation Center for Scientific and TechnicalInformation, January !964.
3. E. F. Ford, "The Transport of Sand by Wind," Transactions, American Geophysical Union,Vol. 38, No. 2, 1957.
4. R. 0. Store and H. J. Summers, "Study of Subaqueous and Subacrial Sand Ripples," Dept. ofGeological Sciences, University of Southern California, January 1972.
5. R. Kawamuar, "Study *n . 3.. '4ovement by Wind," Report of Institute of Science and Technology,University of Tokoyo, Vu.. , No. 314, October 1951.
6. A. A. Kadib, "Calculation Procedure for Sand Transport by Wind on Natural Beaches," U.S.Army, Coastal Engineering Researzh Center, Misc. Paper No. 2-64, April 1964.
7. "Survey of Fugitive Oust from Coal Mines," PEOCo-Environmental, Inc., prepared for U.S.Environmental Protection Agency under Contract No. 68-01-4489, Project No. 3311, Feoruary :1978.
8. "Investigation of Fugitive Oust-Sources, Emissions and Control," Publication AP TD-1582,U.S. Environmental Protection Agency, Research Triangle Park, N.C., 1973.
9. M. H. Momei,i and W. E. Kisieleski, "Measured Concentrations of Radloaztive Particles inAir in the Vicinity of the Anaconda Uranium Mill," U.S. NRC Report, N'.REG/CR-1320,February 1980.
10. M. B. Sears et al., "Correlation of Radioactive Waste Treatment Costs and the EnvironmentalImpact of Weste Effluents in the Nuclear Fuel Cycle for Use in Establishing 'As Low asPracticable' Guides--Milling of Uranium Or:s," Oak Ridge National Laboratory, ORNL-TM-4903,Oak Ridge, Tenn., May 1975.
11. C. J. Stairmand, "The Chemical Engineer," Vol. 194, December 1965.
12. "Deposition and Retention Models for Internal Dosimetry of the Human Respiratory Tract,"Task Group on Lung Dynamics, International Commission on Radiological Protection, HealthPhysics, 12:173-207, 1966.
13. S. P. Austin, "A Laboratory Study of Radon Eanation from Domestic Uranium Ores," in:Radon in Uranium Mining, IAEA Panel Proceedings Series STI/PUB/391, 1975;
14. R. C. Merritt, "The Extractive Metallurgy of Uranium," Colorado School of Mines ResearchInstitute, Golden Colorado, 1971.
15. C. W. Fort, Jr., et al., "Radioactive Emissions from Vellowcake Processing Stacks atUranium Mills," Office of Radiation Programs, Las Vegas Facility, U.S. EnvironmentalProtection Agency, draft Technical Note.
16. M. H. Momeni, et al., "Radioisotopic Comqosition of Yellowcake," U.S. NRC Report NUREG/CR-1216, December 1979.
17. D. R. Kalkwarf, "Solubility Classification of Airborne Produ-ts from Uranium Ores andTailings Piles," U.S. NRC Report NIUREG/CR-0530, January 1979.
18. "Process and Waste Characteristics at Selected Uranium Mills," U.S. Dept. of Health, Educa-tion, and Welfare, Public Health Service, Technical Report W62-17, 94, Robert A. TaftSanitary Engineering Center, Cincinnati, Ohio, 1962.
19 P. F. Guill, "Wind Induced Movement of Radioactive Sands from Uranium Tailings Piles,"M. S. Thesis, Depa-tment of Nuclear Engineering, Louisiana State University, August 1978.
20. "Sutry Report," W!N-112, National Lead Cappany, Winchester Laboratory, January 1960.
.21. L. D. Bayer, "Soil Physics," Chapter 12, John Wiley & Son--, New York,' 1956.
22. W. S. Chepil, "Dynawlcs of Wind Erosion," S6,il Sci. Vol. 60, 1945.
G- 15
23. N. H. Momeni, Y. Yuan, and A. J. Zielen, "The Uranih. Dispersion and Dosimetry (UDAD)Code, U.S. NRC Report NUREG/CR-0553, May .979.
24. 0. A. Gillette, "On the Production of Soil Wind Erosion Aerosols Having the Potential forLong-Range Transport," Special Issue of Journal de Recherches Atmospheriques on the NiceSymposium on the Chesistry of Sea-Air Particulate Exchanoe Processes, Nice, France, October1973.
25. J. R. iravis, "A Model for Predicting the Redistribution of Particulate Contaminants fromSoil Surface," Atmosphere-Surface Exchange of Particulate andrGaseous Pollutants, CONF-"40921, ERDA Symposium Series No. 38, 1976.
26. A. 8. Tanner, "Radon Migration in the Ground: A Review," in: The Natural RadiationEnvironment, J. A. S. Afams, W. A. Lowder (editors), Universityrof Ch~icago Press, 1965.
27. K. J. Schiagar, "Analysis of Radiation Exposures on or Near Uranium Hill Tailing Piles,"Radiation Data Reports 15(7), 1974.
28. P. J. Macbeth et al., "Laboratory Research on Tailings Stabilization Methods and theirEffectiveness of Radiation Containment," Ford, Bacon, and Davis, Utah, inc., reportGJT-21, prepared for U.S. Dept. of Energy under contract No. E(05-1)-1658, April 1978.
29. V. C. Rogers, et ai.. "Characterization of Uranium Tailings Cover Materials for RadonFlux Reduction," U.S. NRC Report NUREG/CR-1081. March 1980.
30. A. 8. Tanner, "Radon Migration in the Ground: A Supplementary Review," 3rd InternationalSymposium on the Natural Radiation Environment, Houston, TX, 23-28 April 1978.
31.' F. F. Haywood et al., "Assessment of Radiological Impact of Inactive Uranium-Mill TailingsPile at Salt Lake City, Utah," Oak Ridge National Laboratory, Report No. ORNL/TM-5251,(tndated).
APPENDIX G-2. AIR OISPERSION, PLUME DEPLETION, AND RADON DAUGHTER INGROWTH
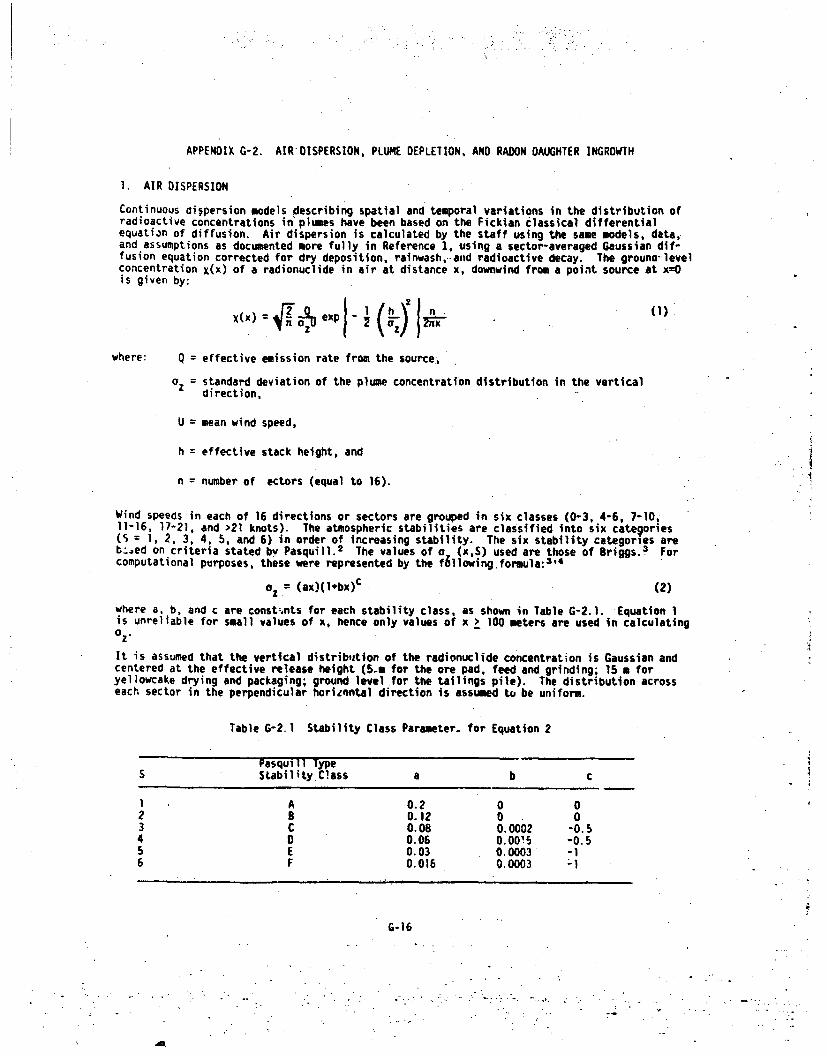
1. AIR DISPERSION
Continuous ai~persion models describing spatial and temporal variations in the distribution ofradioactive concentrations in' plumes have been based on the Fickian classical, differentialequation of diffusion. Air dispersion is calculated by the staff using the same models, data,and assumptions as documented more fully in Reference 1, using a sector-averaged Gaussian dif-fusion equation corrected for dry deposition, rainwash,-and radioactive decay. The grouno- levelconcentration X(x) of a radionuclide in air at distance x, downwind from a point source at x=Ois given by:
where: Q = effective emission rate from the source,
0z = standard deviation of the plume concentration distribution in the vertical
direction,
U mean wind speed,
h = effective stack height, and
n number of ectors (equal to 16).
Wind speeds in each of 16 directions or sectors are grouped in six classes (0-3, 4-6, 7-10,11-16, 17-21, and >21 knots). The atmospheric stabilities are classified into six categories(S = 1, 2, 3, 4, 5, and 6) in order of increasing stability. The six stability categories areb:.ed on criteria stated by Pasquill. 2 The values of a (x,S) used are those of Briggs. 3 Forcomputational purposes, these were represented by the fllowing.formula:3'4
oz = (ax)(lebx)c (2)
where a, b, and c are const-,nts for each stability class, as shown in Table G-2.1. Equation 1is unreliable for small values of x, hence only values of x > 100 meters are used in calculating
ozVIt is assumed that the vertical distribution of the radionuclide concentration is Gaussian andcentered at the effective release height (5-m for the ore pad, feed and grinding; 15 m foryellowcake drying and packaging; ground level for the tailings pile). The distribution acrosseach sector in the perpendicular horizontul direction is assumed to be uniform.
Table G-2.1 Stability Class Parameter- for Equation 2
Pasquill TypeS SLability Class a b c
1 A 0.2 0 02 8 0.12 0 03 C 0.08 0.0002 -0.54 D 0.06 0.00'5 -0.55 E 0.03 0.0003 -16 F 0.016 0.0003 1
G-16
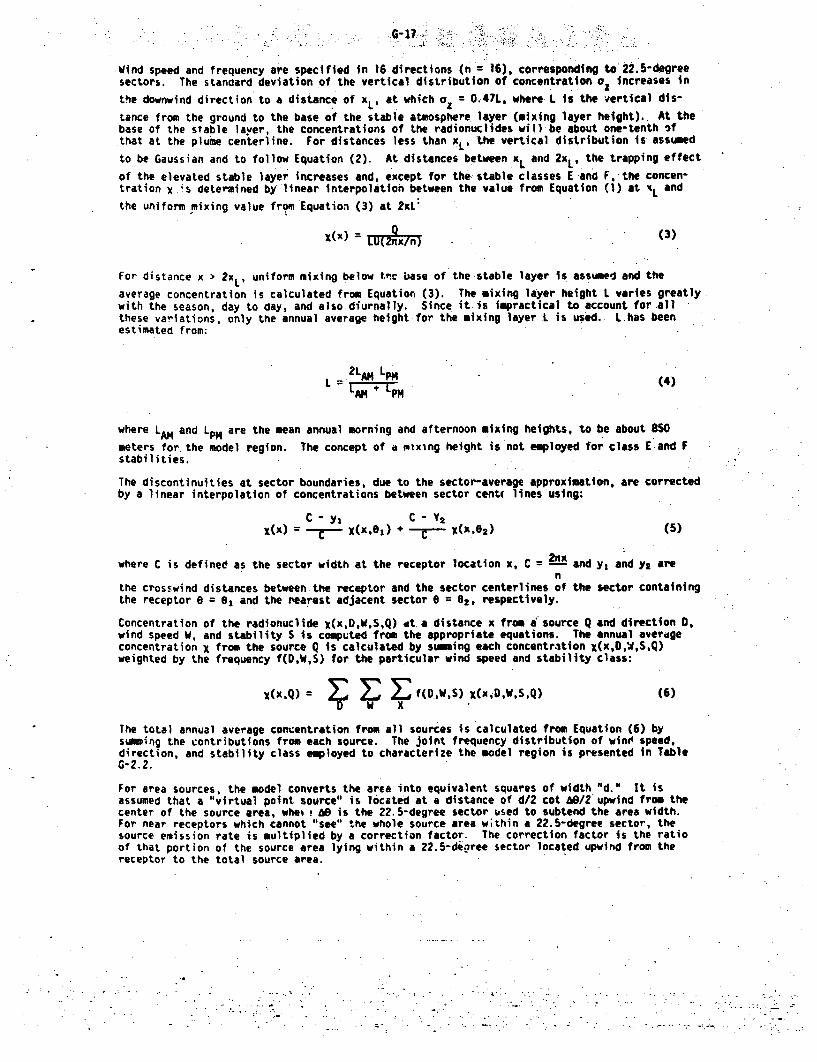
Wind speed and frequency are specified in 16 directions (n = 16), corresponding to 522.-degreesectors. The standard deviation of the vertical distribution of concentration oa increases in
the downwind direction to a distance of xL, at whi cho = 0.47L* where L is the vertical dis-
tance from the ground to the base of the stable atmosphere layer (mixing layer height). At thebase of the stable layer, the concentrations of the radionuclides will be about one-tenth ifthat at the plume centerline. For distances less than xL, 'the vertical distribution Is assumed
to be Gaussian and to follow Equation (2). At distances between xL and 2xL, the trapping effect
of the elevated stable layer increases and, except for the stable classes E and F, the concen-tration X .'s determined by linear interpolation between the value from Equation (1) at xL and
the uniform mixing value from Equation (3) at 2xL
X(x) . (3)
For distance x > 2 XL, uniform mixing below t.c base of the:stable layer is assumed and the
average concentration is calculated from Equation (3). The mixing layer height L varies greatlywith the season, day to day, and also diurnally. Since it is impractical to account for allthese variations, only the annual average height for the mixing layer L is used. L-has beenestimated from:
2LAM LpM
L 2 -PH (4)
where LAM and Lp are the mean annual morning and afternoon mixing heights, to be about 850
meters for the model region. The concept of a mixing height is not employed for class E and Fstabilities.
The discontinuities at sector boundaries, due to the sector-average approximation, are correctedby a linear interpolation of concentrations between sector cent( lines using:
C - yC C - Y2x(x) = x(x,e0) +-r (x,e 2 ) (5)
where C is defined as the sector width at the receptor location x, C =x- and y, and y2 aren
the crosswind distances between.the receptor and the sector centerlines of the sector containingthe receptor e = e1 and the rearest adjacent sector 0 = 02, respectively.
Concentration of the radionuclide X(x,DW,S,Q) dt a distance x from asource Q and direction 0,wind speed W, and stability S is computed from the appropriate equations. The annual averdgeconcentration X from the source Q is calculated by sIming each concentration x(x,D,b,S.Q)weighted by the frequency f(DW,S) for the particular wind speed and stability class:
x(x.Q) = ýJ Fa E f(D.W.S) x(xjD.W.S,Q) (6)
The total annual average conuentration from all sources is calculated from Equation (6) bysumming the contributions from each source. The joint frequency distribution of wine speed.direction, and stability class employed to characterize the model region is presented in TableG-2.2.
For area sources, the model converts the area into equivalent squares of width "d." It isassumed that a "virtual point source" is located at a distance of d/2 cot •/2'upwind from thecenter of the source area, wheb 69 is the 22.5-degree sector used to subtend the area width.For near receptors which cannot "see" the whole source area w;thin a 22.5-degree sector, thesource emission rate is multiplied by a correction factor. The correction factor is the ratioof that portion of the source area lying within a 22.5-deiree sector located upwind from thereceptor to the total source area.
. . . : .. . . .. . '. . . . . . - .. . ..
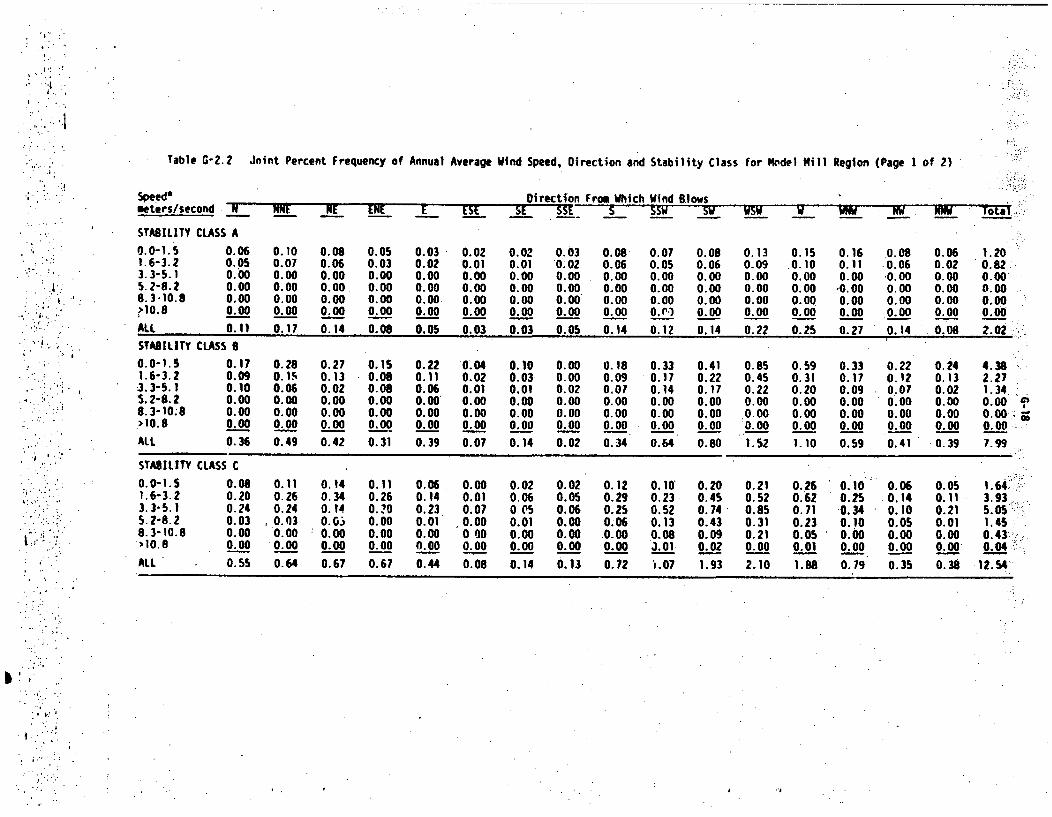
Table G-2.2 Joint Percent Frequency of Annual Average Wind Speed, Direction and Stability Class for Model Mill Region (Page I of 2)
I
Speed*seters/second N
STABILITY CLASS A0.0-1.5 0.061.6-3.2 0.053.3-5.1 0.005.2-8.2 0.008.3.10.8 0.00'10.8 0.00ALL 0.11
STABILITY CLASS 8
0.0-1.5 0.171.6-3.2 0.093.3-5.1 0.105.2-8.2 0.008.3-10.8 0.00>10.8 0.00
ALL 0.36
NN _ Nt
0.10 0.080.07 0.060.00 0.000.00 0.000.00 0.000.00 0.00
0.17 0.14
tNt E ESE SE
0.05 0.03 0.02 0.020.03 0.02 0.01 0.010.00 0.00 0.00 0.000.00 0.00 0.00 0.000.00 0.00 0.00 0.000.00 0.00 0.00 0.000.08 0.0o 0.03 0.03
SSE .., s SSW Si WSW_Direction From Which Wind Blows
0.03 0.08'0.02 0.060.00 0.000.00 0.000.00 0.000.00 0.00O.05 a. 14
0.07 0.08 0.130.05 0.06 0.090.00 0.00 0.000.00 0.00 0.000.00 0.00 0.00o.P.] 0.00 0.00
0.12 0.14 0.22
W WNW NW W Tot=a8
0.15 0.16 .0.08 0.06 1.200.10 0.11 .0.06 0.02 0.820.00 0.00 0.00 0.00 0.00
0.00 "0.00 0.00 0.00 0.000.00 0.00 0.00 0.00 0.000.00 0.00 o.00 0.00 0.00
0.25 0.27 0. 14 0.08 2.02 L
0.28 0.270.1le 0.130.06 0.020.00 0.000.00 0.000.00 0.000.49 0.42
0.15 0.22 0.04 0.100.08 0.11 0.02 0.030.08 0.06 0.01 0.010.00 0.00 0.00 0.000.00 0.00 0.00 0.000.00 0.00 0.00 0.000.31 0.39 0.07 0.14
0.00 0.180.00 0.090.02 0.070.00 0.000.00 0.000.00 0.00
0.02 0.34
0.33 0.41 0.850.17 0.22 0.450.14 0.17 0.220.00 0.00 0.000.00 0.00 0.0-00.00 0.00 ý0.00
0.64 0.80 1.52I I
STABILITY CLASS C
0.0-1.5 0.C1.6-3.2 0.23.3-5.1 0.25.2-8.2 0.C8.3-10.8 0.C'10.8 0.C
ALL O.!
0.59 0.33 0.22 0.24 4.380.31 0.17 0.12 0.13 2.270.20 0.09 0.07 0.02 1.34.0.00 0.00 0.00 0.00 0.000.00 0.00 0.00 0.00 0.00 -
0.00 0.00 0.00 0.00 0.00
1.10 0.59 0.41 0.39 7.99
0.26 0.10 0.06 0.05 1. 64'ýý.0.62 0.25 0.14 0.11 3.930.71 0.34 0.10 0.21 5.05,_
0.23 0.10 0.05 0.01 1.450.05 0.00 0.00 0.00 0.43;0.0o_1 0o.00 0.00 o0.00 0.04
1.88 0.79 0.35 0.38 12.54
18 0.11 0.14!0 0.26 0.344 0.24 0.143 0.03 0.6310 0.00 0.0010 0.00 0.00
55 0.64 0.67
0.11 0.06 0.00 0.020.26 0.14 0.01 0.060.?0 0.23 0.07 0 050.00 0.01 .0.00 0.010.00 0.00 0 g0 0.000.00 0.00 0.00 0.00
0.67 0.44 0.08 0.14
0.02 0.120.05 0.290.06 0.250.00 0.060.00 .0.000.00 0.000.13 0.72
0.10" 0.20 0.210.23 0.45 0.520.52 0.74 0.850.13 0.43 0.310.08 0.09 0.213.o01 0.02 0.00
It.07 1.93 2.10
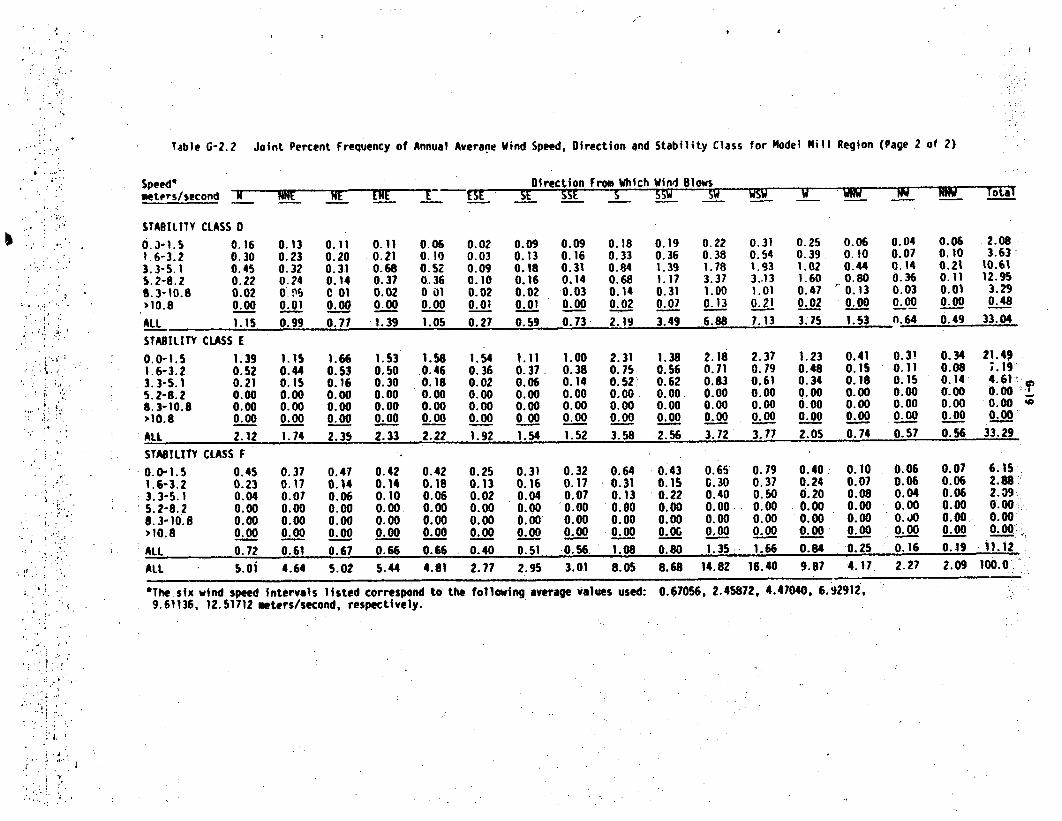
Table G-2.2 Joint Percent Frequency of Annual Averane Wind Speed, Direction and Stability Class for Model Mill Region (Page 2 of 2)
Speed*oeters/second
Direction From Which Win4 BlowsSE SSE S _ sw SW Wsw V WNN 14"t _t tLt t tt
STABILITY CLASS 0
0.3-1.51.6-3.23.3-5.15.2-8.28.3-10.8)'10.8
ALL
0.16 0.130.30 0.230.45 0.320.22 0.240.02 0. P0.00 0.01
1.15 0.99
0.110.200.3310.14C 010.000.77
0.11 0.06 0.020.21 0.10 0.030.68 0.52 0.090.37 0.36 0.100.02 0 01 0.020.00 0.00 0.011e39 .os 0-27
0.09 0.090.13 0.160.18 0.310.16 0.140.02 0.030.01 0.000.59 0.73
0.180.330.840.680.140.02
2.19
0.19 0.22 0.31 0.25 0.060.36 0.38 0.54 0.39 0.101.39 1.78 1.93 1.02 0.441.17 3.37 3.13 1.60 0.800.31 1.00 1.01 0.47 "0.130.07 0.13 0.21 0.02 0.00
3.49 6.88 7.13 3.75 1.53
NW Total
0.04 0.06 2.080.07 0.10 3.630.14 0.21 10.610.36 0.11 12.950.03 0.01 3.290.00 0.00 0.48
0.64 0.49 33.04
0.31 0.34 21.490.11 0.08 ;.190.15 0.14 4.61-•0.00 0.00 0.00 .0.00 0.00 0.000.00 0.00 0.000.57 0.56 33.29
STABILITY CLASS E
STABILITY CLASS E
0.0-1.51.6-3.23.3-5.15.2-8.28.3-10.8.10.8
S ALL
1.390.520.210.000.000.002.12
1.150.440.150.000.000.001.74
1.660.530.160.000.000.002.35
1.53 1.58 1.540.50 0.46 0.360.30 0.18 0.020.00 0.00 0.000.00 0.00 0.000.00 0.00 0.002.33 2.22 1.92
1.11 1.000.37. 0.380.06 0.140.00 0.000.00 0.000.00 0.001.54 1.52
2.310.750. 520.000.000.003.58
1.38 2.18 2.37 1.23 0.410.56 0.71 0.79 0.48 0.150.62 0.83 0.61 0.34 0.180.00 0.00 0.00 0.00 0.000.00 0.00 0.00 0.00 0.000.00 0.00 , 0.00 0.00 0.002.56 3.72 3.77 2.05 0.74
STABILITY CLASS F
0.0-1.51.6-3.23.3-5.15.2-8.28.3-10.8>10.8
0.450.230.040.000.000.00
0.370.170.070.000.000.00
0.410.140.060.000.000.00
0.42 0.42 0.250.14 0.18 0.130.10 0.06 0.020.00 0.00 0.000.00 0.00 0.000.00 0.00 0.00
0.31 0.320.16 0.170.04 0.070.00 '0.000.00 0.000.00 0.00
0.640.310.130.000.000.00
0.43 0.65 0.79 0.40 0.100.15 G.30 0.37 0.24 0.070.22 0.40 0.50 6.20 0.080.00 0.00 0.00 0.00 0.000.00 0.00 0.00 0.00 0.000.011 0.00, 0.00 10..00 0.00
0.06 0.07 6.15,0.06 0.06 2.88'0.04 0.06 2.W90.00 0.00 0.00:0.i0 0.00 0.000.00 0.00 0.00-1
ALL 0.72 0.61 0.61 0.66 0.66 - 0.40 0.51 0.56 1.08 0.80 1.35 1.66 0.84 0.25 0.16 0.19 - 11.12ALL 5.01 4.64 5.02 5.44 4.81 2.77 2.95 3.01 8.05 8.68 14.82 16.40 9.67 4.17. 2.27 2.09 100.0
*The six wind speed intervals listed correspond to the following average values used: 0.67056, 2.45872, 4.47040, 6.92912,9.61136, 12.51712 meters/second, respectively.
G-120
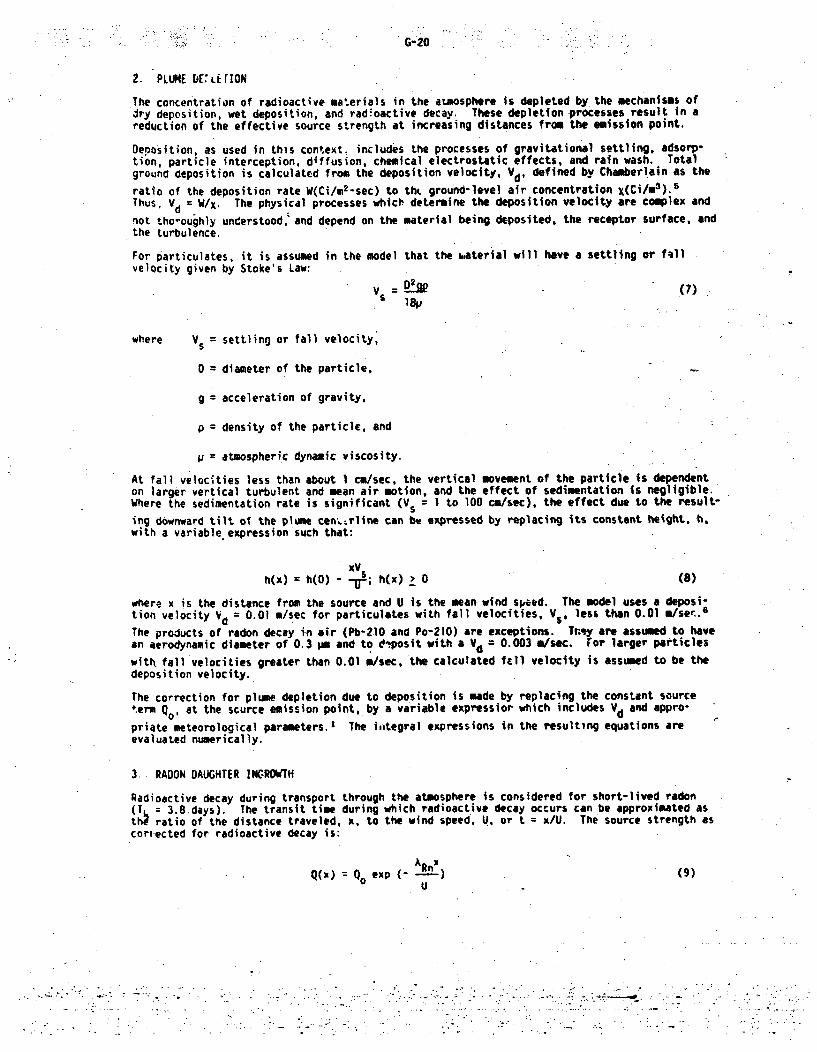
2. PLUME bEWLirmON
The concentration of radioactive maaerials in the atmosphere Is depleted by the mechanisms ofdry deposition, wet deposition, and radioactive decay. These depletion processes result in areduction of the effective source strength at increasing distances from the emission point.
Deposition, as used in this context. includes the processes of gravitational settling, adsorp-tion, particle interception, diffusion, chemical electrostatic effects, and rain wash. Totalground deposition is calculated from the deposition velocity, Vd, defined by Chamberlain as the
ratio of the deposition rate W(Ci/m 2 -sec) to tht ground-level air concentration x(Ci/m3).,Thus, Vd W/X. The physical processes which determine the deposition velocity are complex and
not tho-oughly understood,' and depend on the material being deposited, the receptor surface, andthe turbulence.
For particulates, it is assumed in the model that the katerial will have a settling or fal]velocity given by Stoke's Law:
Vs D_ (7)lapi
where Vs = settling or fall velocity,
0 diameter of the particle,
g = acceleration of gravity,
p density of the particle, and
p = atmospheric dynamic viscosity.
At fall velocities less than about I cm/sec, the vertical movement of the particle Is dependenton larger vertical turbulent and mean air motion, and the effect of sedimentation is negligible.Where the sedimentation rate is significant (Vs = I to 100 ca/sec), the effect due to the result-
ing downward tilt of the plume cen-...rline can bw expressed by replacing its constant height. h,with a variable expression such that:
xVh(x) = h(O) - T; h(x) 0 (8)
where x is the distance from the source and U is the mean wind spied. The model uses a deposi-tion velocity Vd = 0.01 i/sec for particulates with fall velocities, Vs, less than 0.01 8/see..
The products of radon decay in air (Pb-210 and Po-210) are exceptions. They are assumed to havean aerodynamic diameter of 0.3 pe and to dposit with a Vd = 0.003 m/sec. ror larger particles
with fall velocities greater than 0.01 i/sec, the calculated fall velocity is assumed to be thedeposition velocity.
The correction for plume depletion due to deposition is made by replacing the constant sourceterm Q0 1 at the scurce emission point, by a variable expressior which includes Vd and appro-
priate meteorological parameters.' The i,,tegral expressions in the resulting equations areevaluated numerically.
3. RADON DAUGHTER INGROVTH
Radioactive decay during transport through the atmosphere is considered for short-lived radon(T 3.8 days). The transit time during which radioactive decay occurs can be approximated asth4 ratio of the distance traveled, x, to the wind speed, U, or t x/U. The source strength ascori.ected for radioactive decay is:
Qo exp (---)(9)U
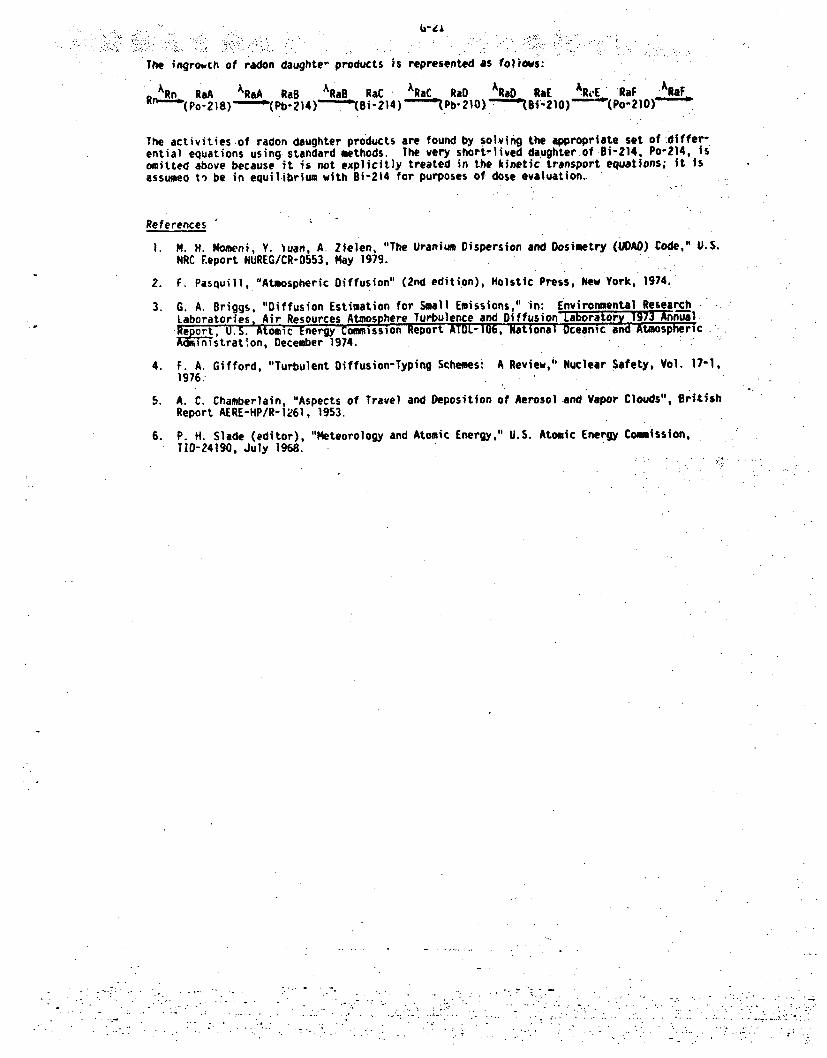
The ingrowth of radon daughte- products is represented as follows:
ARn RaA XRaA RaB ARaB RaC ARaC RaD ARaD RaE AReE RaF ARaFR, (Po- 218) - (Pb- 214)----(Bi-214)-- Pb-210) iZ•- 1O)----(Po-2lO)-
The activities .of radon daughter products are found by solving the appropriate set of differ-ential equations using standard methods. The very short-lived daughter of 91-214. Po-214, Isomitted above because it is not explicitly treated in the kinetic transport equations; it isassumeo to be in equilibrium with Bi-214 for purposes of dose evaluation..
References
1. M. H. Momeni, Y. Yuan, A. Zielen, "The Uranium Dispersion and Dos imetry (UDAD) Code," U.S.NRC Eeport NUREG/CR-0553, May 1979.
2. F. Pasquill, "Atmospheric Diffusion" (2nd edition), Holstic Press, New York, 1974.
3. G. A. Briggs, "Diffusion Estimation for Small Emissions," in: Environmental ResearchLaboratories, Air Resources Atmosphere Turbulence and Diffusion Laboratory 1973 An-Til.port, U.S. Atomic Energy Cofmnsslon Report ATOL-106, National Oceanic and AtmosphericAdiTh•stration, December 1974.
4. F. A. Gifford, "Turbulent Diffusion-Typing Schemes; A Review," Nuclear Safety, Vol. 17-1,1976.
5. A. C. Chamberlain, "Aspects of Travel and Deposition of Aerosol and Vapor Clouds", BritishReport AERE-HP/R-1261, 1953.
6. P. H. Slade (editor), "Meteorology and Atomic Energy," U.S. Atomic Energy Commission,TLD-24190, July 1968.
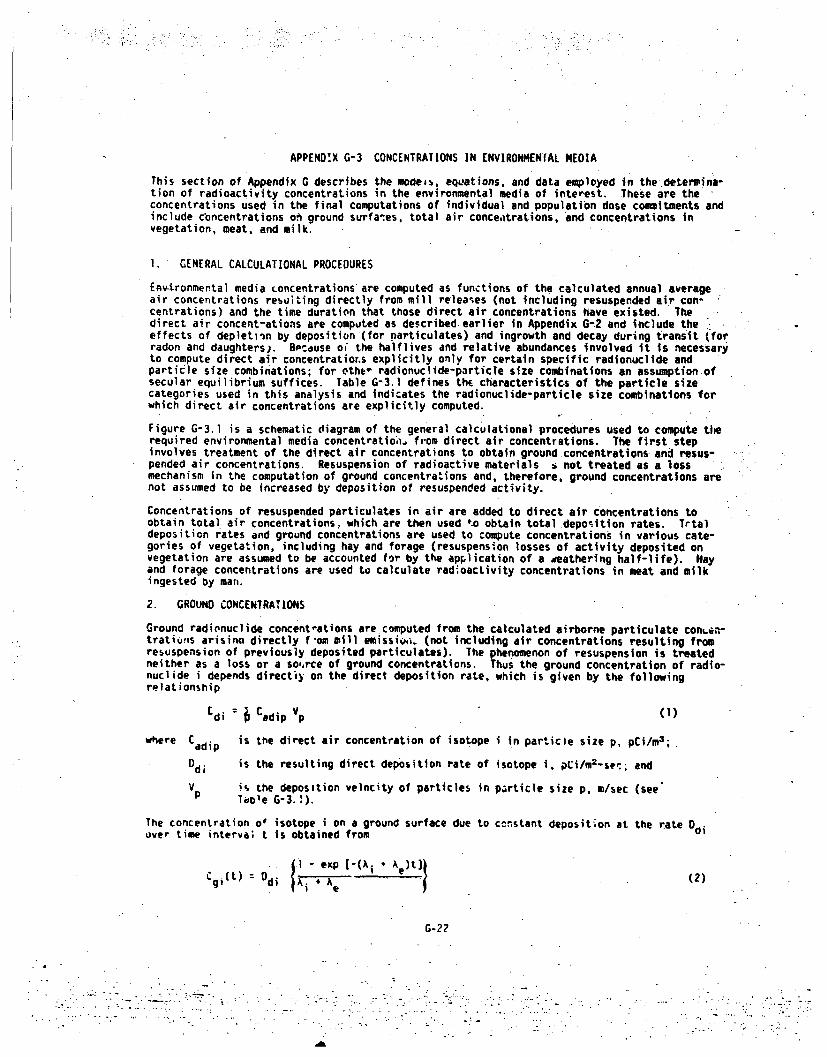
APPENDIX G-3 CONCENTRATIONS IN ENVIRONMENTAL MEDIA
This section of Appendix G describes the mode#,•, equations, and data employed in the determina-tion of radioactivity concentrations in the environmental media of interest. These are theConcentrations used in the final computations of individual and population dose commitments andinclude concentrations oh ground surfaies, total air conceatrations, and concentrations invegetation, meat, and milk.
1. GENERAL CALCULATIONAL PROCEDURES
Env4-.ronmental media Loncentratlons are computed as functions of the calculated annual averageair concentrations resuiting directly from mill releaies (not including resuspended air con-centrations) and the time duration that those direct air concentrations have existed. Thedirect air concent-ations are computed as described, earlier in Appendix G-2 and include theeffects of depletvan by deposition (for particulates) and ingrowth and decay during transit (forradon and daughters). Bpcause of the halflives and relative abundances involved it is necessaryto compute direct air concentratior.s explicitly only for certain specific radionuclide andparticle size combinations; for othek radionuclide-particle size combinations an assumption ofsecular equilibrium suffices. Table G-3.) defines thE characteristic's of the particle sizecategories used in this analysis and indicates the radionuclide-particle size combinations forwhich direct air concentrations are explicitly computed.
Figure G-3.1 is a schematic diagram of the general calculational procedures used to compute therequired environmental media concentratiomi. from direct air concentrations. The first stepinvolves treatment of the direct air concentrations to obtain ground.concentrations- and resus-pended air concentrations. Resuspension of radioactive materials * not treated as a lossmechanism in the computation of ground concentrations and, therefore, ground concentrations arenot assumed to be increased by deposition of resuspended activity.
Concentrations of resuspended particulates in air are added to direct air concentrations toobtain total air concentrations, which are then used to obtain total deposition rates. Trtaldeposition rates and ground concentrations are used to compute concentrations in various cate-gories of vegetation, including hay and forage (resuspension losses of activity deposited onvegetation are assumed to be accounted for by the application of a seathering half-life). Hayand forage concentrations are used to calculate radloacLivity concentrations in meat and milkingested by man.
2. GROUND CONCENTRATIONS
Ground radionuclide concentrations are computed from the calculated airborne particulate conLen-tratius arising directly f-om mill emissioi. (not including air concentrations resulting fromresuspension of previously deposited particulates). The phenomenon of resuspension is treatedneither as a loss or a so',rce of ground concentrations. Thus the ground concentration of radio-nuclide i depends directiy on the direct deposition rate, which is given by the followingrelationship
Cdi = Cadip VP (1)
where C adip is the direct air concentration of isotope i in particle size p, pCi/mr;
Odi is the resulting direct deposition rate of isotope J, pCi/m 2-sqV; and
V i% the deposition velocity of particles in particle size p, m/sec (see'P Tdole G-3.!).
The concentration o* isotope i on a ground surface due to ccnstant deposition at the rate Ddiover time interva; t is obtained from
• l-exp ['(Ai " e)tl}Cgi(t) D di {Ae • (2)
G-2?
-. , ~ ~.. * . . ,..
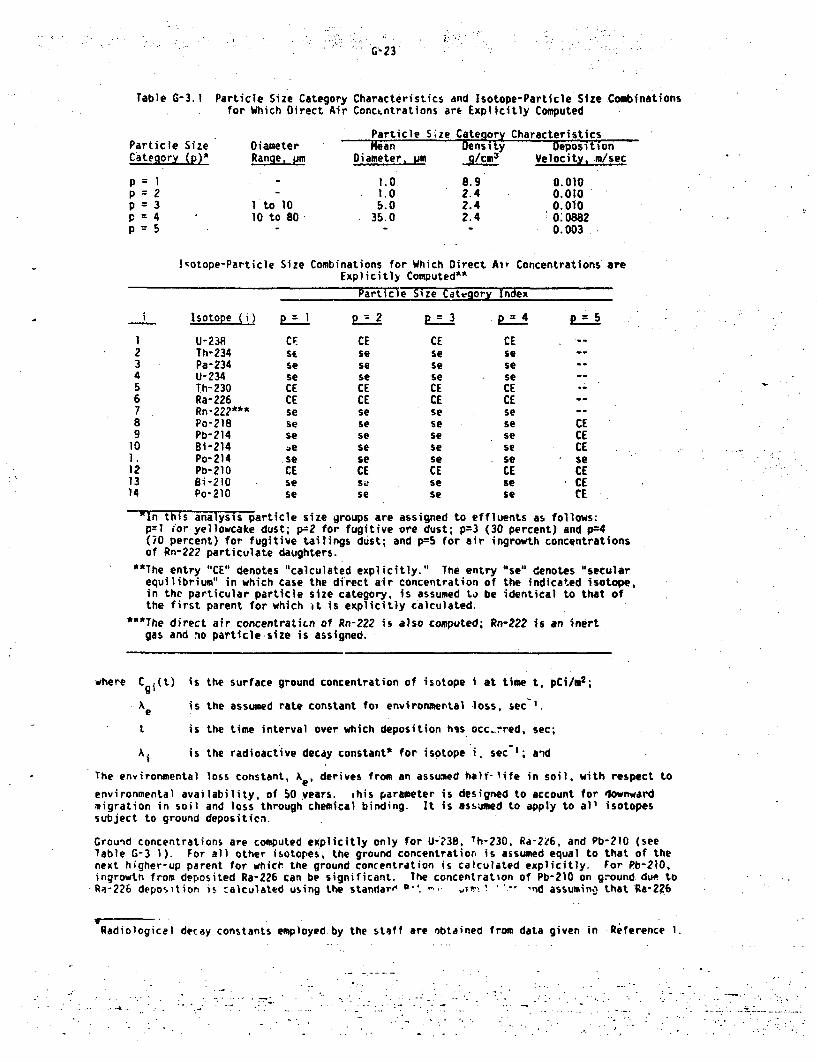
G-23
Table G-3.1 Particle Size Category Characteristics and Isotope-Particle Size Combinationsfor Which Direct Air Conctntrations are Explicitly Computed
Particle SizeCategory (p)
p=1p=p=3p=4p=5
DiameterRange, pm
1 to 1010 to 80
Particle Size CategoryMean Density
Diameter, ym g/_A
1.0.1.05.0
35.0
8.92.42.42.4
CharacteristicsDeposition
Velocity, m/sec
0.0100.0100.0100. 08820.003
Isotope-Particle Size Combinations for Which Direct Air Concentrations areExplicitly Computed**
Particle Size Category Index
Isotope (i) p = I p-2 p-- 3 p=4
123456789101.121314
U-238Th-234Pa-234U-234Th-230Ra-226Rn-222*"*Po-218Pb-214Bi-214Po-214Pb-210Bi-210Po-210
CF.sfseseCECEseseseae
seCEsese
CEseseseCECEseseseseseCESase
CEseseseCECEseseseseseCEsese
CEseseseCECEseseseseseCEsese
CECECEseCECECE
"In this analysis particle size groups are assigned to effluents as follows:p=l for yellowcake dust; p=2 for fugitive ore dust; p=3 (30 percent) and P=4(70 percent) for fugitive tailings dust; and p=5 for air ingrowth concentrationsof Rn-222 particulate daughters.
"xThe entry "CE" denotes "calculated explicitly." The entry "se" denotes "secularequilibrium" in which case the direct air concentration of the indicated isotope,in the particular particle size category, is assumed to be identical to that ofthe first parent for which -t is explicitly calculated.
'*The direct air concentraticon of Rn-222 is also computed; Rn-222 is an inertgas and no particle size is assigned.
where Cgi(t) is the surface ground concentration of isotope i at time t, pCi/M2 ;
Ae is the assumed rate constant foi environmental -loss, sece
t is the time interval over which deposition his occ..rred, sec;
Ai is the radioactive decay constant* for isotope i. sec 1; and
The environmental loss constant, he- derives from an assumed half-life in soil, with respect to
environmental availability, of 50 years. ghis parameter is designed to account for 4ownwardmigration in soil and loss through chemical binding. It is assumed to apply to all isotopessubject to ground deposition.
Ground concentrations are computed explicitly only for U-238, T h-230, Ra-2e6, and Pb-2l0 (seeTable G-3 1). For all other isotopes, the ground concentration is assumed equal to that of thenext higher-up parent for whict, the ground concentration is calculated explicitly. For Pb-210,ingrowth from deposited Ra-226 can be significant. The concentration of Pb-210 on ground due toRa-226 deposition is calculated using the standar 4
0" ý , ;Tr ' "nd assuming that Ra-226
Radiologicel decay constants employed by the staff are obtained from data given in Reference 1.
."4..".- .- .. -. ".. . -. -' .. . .:t-, -
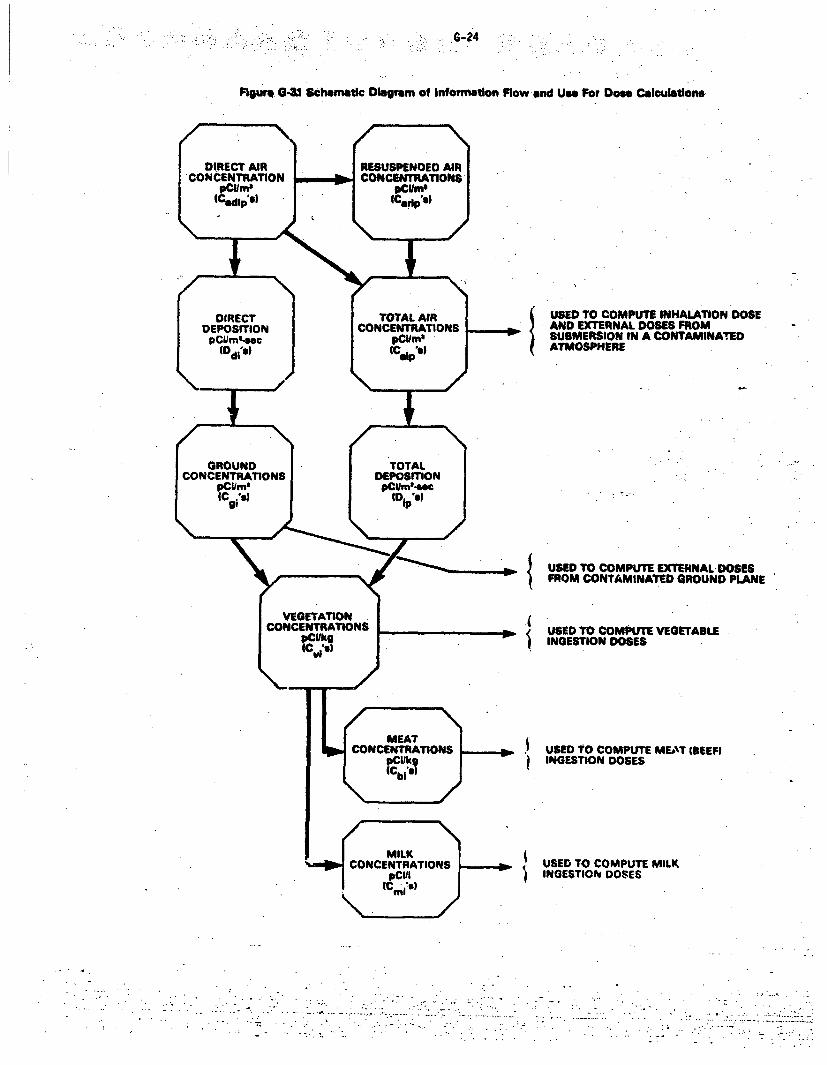
G-24
Figure G04 Schematic Diagram of InformatIon Flow and Use For Dose Calculations
) USED TO COMPUTE INHALATION DOSE
AND EXTERNAL DOSES FROMSUBMERSION IN A CONTAMINATEDATMOSPHERE
I(I
USED TO COMPUTE EXTERNAL-DOSESFROM CONTAMINATED GROUND PLANE
USED TO COMPUTE VEGETABLEINGESTION DOSES
USED TO COMPUTE ME.AT IBEEFIINGESTION DOSES
USED TO COMPUTE MILKINGESTION DOSES
.. ... . . . .
• o.. .. . ,
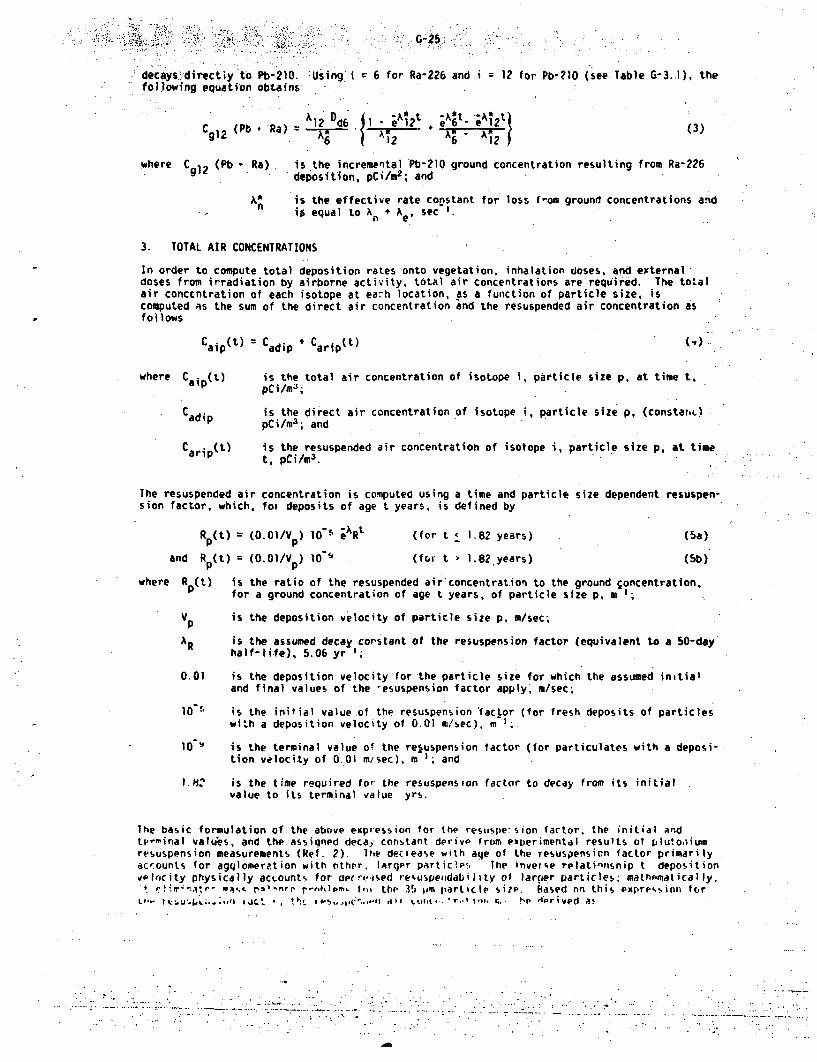
.decays directiy to Pb-210. using i 6 for Ra-226 and i 12 for Pb-?lO (see Table G-3.I), thefollowing equation obtains:
A. D -A~ .#\I% ..
1 (Pb12d6 J1 ""t e eA2 (3)
6g116 l2
where Cag 2 (Pb - Ra). is the incremental Pb-21O ground concentration resulting from Ra-226deposition, pCi/m 2 ; and
A• is the effective rate constant for loss f-om ground concentrations andif equal to An + Ael sec 1.
3. TOTAL AIR CONCENTRATIONS
In order to compute total deposition rates onto vegetation, inhalation doses, and externaldoses from irradiation by airborne activity, total air concentrations are required. The totalair conccntration of each isotope at earh location, as a function of particle size, iscomputed as the sum of the direct air concentration and the resuspended air concentration asfollows
Caip M Cadip + Carip(t)
where C aip(t) is the total air concentration of isotope i, particle size p, at time t,pCi/m 3 ;
is the direct air concentration of isotope i, particle size p, (constar,L)Cadip pCi/m 3 ; and
C arip(t) is the resuspended air concentration of isotope i, particle size p, at timet, pCi/M.3.
The resuspended air concentration is computed using a time and particle size dependent resuspen-sion factor, which, fow deposits of age t years, is defined by
Rp (t) = (O.01/V p) 10 eARt (for t < 1.82 years) (Sa)
and R p(t) = (O.01/V p) 10-9 (for t > 1,82.years) (5b)
where R (t) is the ratio of the resuspended air concentration to the ground goncentration,for a ground concentration of age t years, of particle size p, m 1;
Vp is the deposition velocity of particle size p, m/sec;
AR is the assumed decay corstant of the resuspension factor (equivalent to a 50-dayhalf-life), 5.06 yr 3;
0.01 is the deposition velocity for the particle size for which-the assumed initialand final values of the -esuspension factor apply, m/sec;
10-5 is the initial value.of the resuspension 'factor (for fresh deposits of particleswith a deposition velocity of 0.01 m/sec). m 1;
10 " is the terminal value of the resuspension factor (for particulates with a deposi-tion velocity of O.Ol m/sec), m 1; and
I.h2 is the time required fo, the resuspension factor to decay from its initialvalue to its terminal value yrs.
lhe basic formulation of the above expression for the restsle.sion factor, the initial andte-minal valties, and the assigned decay constant derivP from experimental results of plulooiumresuspension measurements (Ref. 2). lite dec.ease with aqe of the resuspensicn factor primarilyacrounts for agqlomeration with other, larger particIes! lhe inverse relatinnship t depositionvelocity physically acLounts for awre.-ised resuspeodability of larger particles; matnomatical ly.
S"mas, ml nrr r-111- f-l' the 35 liom particle sizp. based nn this expression for
1.c* !.ri '111 %.ta -. *r.ot-vo. r.. !.r •prived at
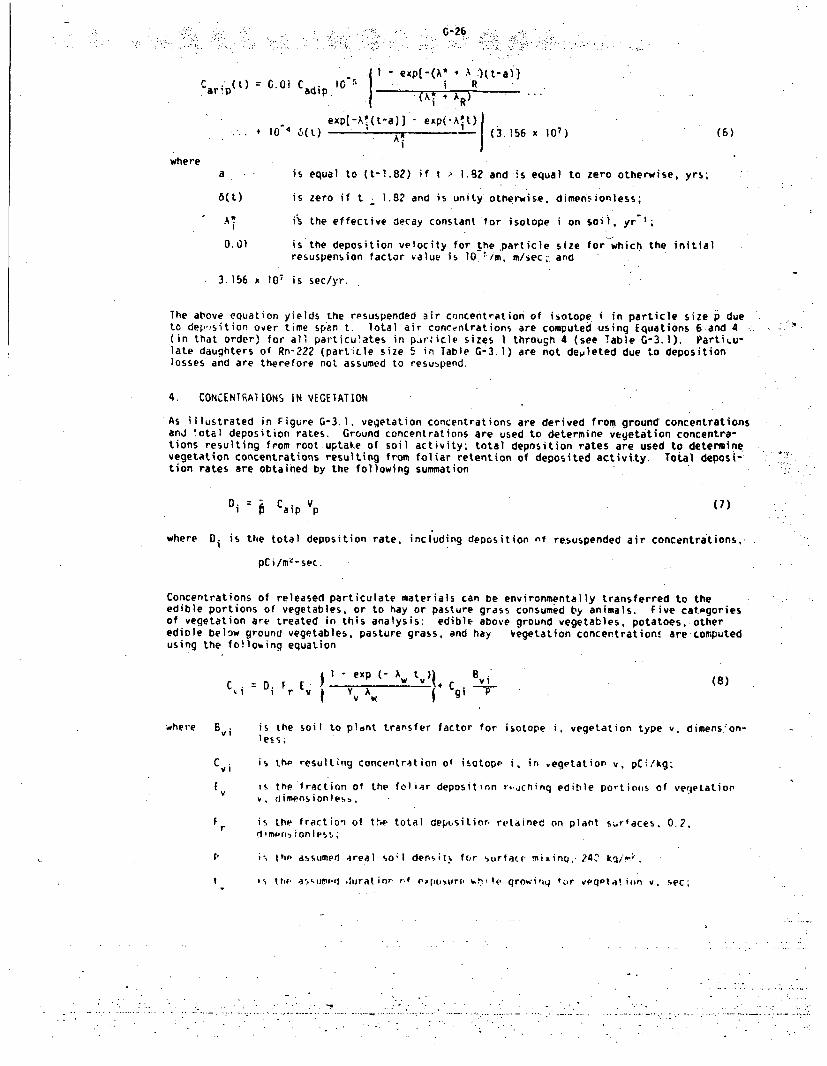
G -26
€.r~pt) =0.01Cadip,0"•li "exp[-(•;,*; 4) A :)(t-a))..
C (M C. 01 C 105 Rar, p adip I- P -(0i Aft)ta)
S exp[-A.(t-a)] - ep(.A(t)S *10"4 ý(t) " A0 (3.56 x 10) (6)
I
where
a is equal to (t-1.82) if t ? 1.82 and -s equal to zero otherwise, yrs;
6(t) is zero if t , 1.8? and is unity otherwise. dimensionless;
A!i'j the effective decay constant for isotope i on soil. yr 1;
0.01 is the deposition velocity for the .particle size for which the initialresuspension factor value is 10 i/m, m/sec;ý and
3.156 x 10⁷ is sec/yr.
The above equation yields the resuspended air concentration of isotope i in particle size p dueto dep.,sition over time span t. lotal air concentrations are computed using Equations.6.and 4(in that order) for all particulates in par'icle sizes 1 through 4 (see Table G-3.1). Partilu-late daughters of Rn-222 (particle size 5 in Table G-3.1) are not depleted due to depositionlosses and are therefore not assumed to resuspend.
4. CONCENTRAIHONS IN VEGEIATION
As illustrated in Figure G-3,1. vegetation concentrations are derived from ground concentrationsand total deposition rates. Ground concentrations are used to determine vegetation concentra-tions resulting from root.uptake of soil activity; total deposition rates are used to determinevegetation concentrations resulting from foliar retention of deposited activity. Total deposi-'tion rates are obtained by the following summation
Oi Caip Vp (7)
where Di is the total deposition rate, including deposition nf resuspended air concentrations,.
pCi/m"-sec.
Concentrations of released particulate materials can be environmentally transferred to theedible portions of vegetables, or to hay or pasture grass consumed by animals. five categoriesof vegetation are treated in this analysis: edible above ground vegetables, potatoes,.otheredible below ground vegetables, pasture grass, and hay Vegetation concentrations are computedusing the followinq equation
Fr v I - exp (- A, 8vi (8i r [V Yv A w gi P
where Bvi is the soil to plant transfer factor for isotope i, vegetation type v, dimens.ion-less;
Cvi is tho resulting concentration of isotopp i, ir, ,eqetation v, pCi,'kg.
IV i the fraction of the foliar depositinn r.'jchinq edible portiows of veqetationv v, riimensionlesý,
Fr is the fraction (if t'w total depbsitior retainec on plant s.jrfaces, 0.2,d imprý,ion less;
P i tIh assumerd areal so;il densit\ for surfact, mixinu,. 24, kj/?'
s th,. a3kljl,*1 ,lurat inr" ,f pl[ surn, lhl Ie qrowi,1q for v*qPtatit n v. sc;
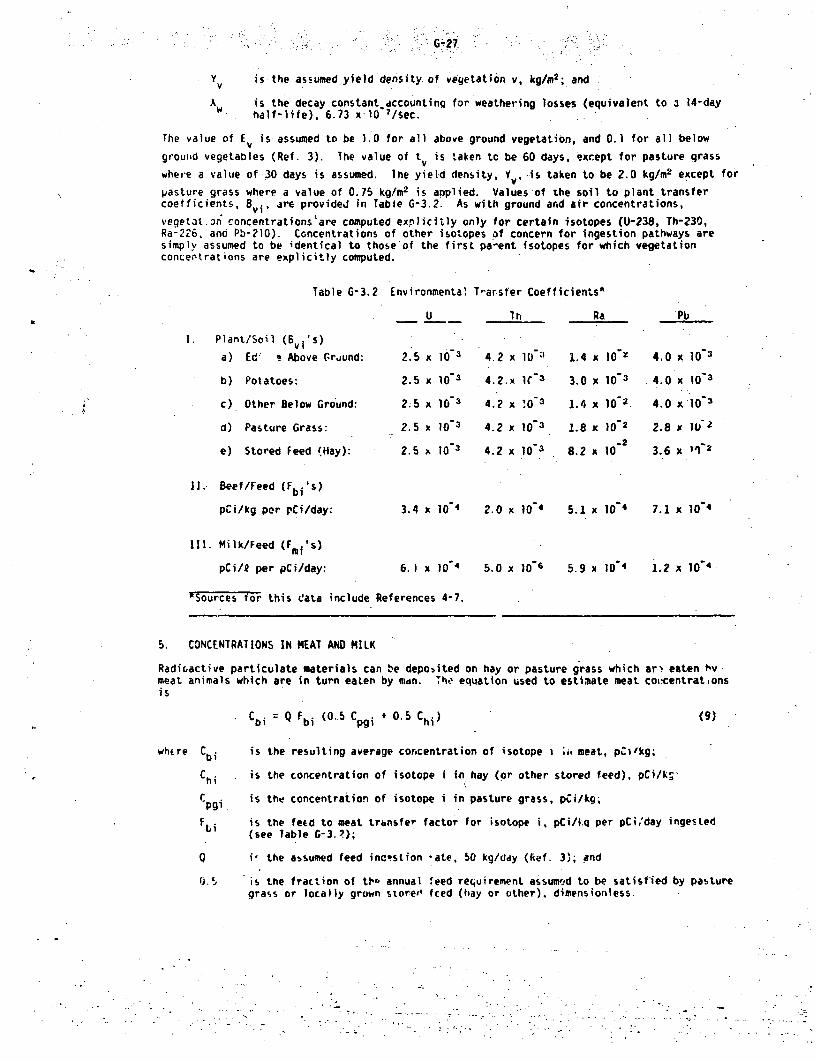
G;-Z7
Y is the assumedyield density of vegetation v, kg/M2 ; and
A is the decay constantdaccountinq for weathering losses (equivalent to a 14-dayw half-life), 6.73 x10 7O/Sec.
The value of E. is assumed to be 1.0 for all above ground vegetation, and 0.1 for all below
grould vegetables (Ref. 3). The value of t is taken tc be 60 days, except for pasture qrasswhere a value of 30 days is assumed. The yield density, Yv, is taken to be 2.0 kg/M2 except for
pasture grass where a value of 0.75 kg/M2 is applied. Values of the soil to plant transfercoefficients, Bvi, are provided in Table G-3.2. As with ground and air concentrations,
vegetat.on concentrations'are computed explicitly only for certain isotopes (U-238, Th-230,Ra-226, and Pb-210). Concentrations of other isotopes of concern for ingestion pathways aresimply assumed to be identical to those of the first pa-ent isotopes for which vegetationconcertrations are explicitly computed.
Table G-3.2 Environmental T-arsfer Coefficients*
U Th Ra Pb
I. P l a n t / S o i l ( 5v W S )0a) Ed' o Above Grjund: 2.5 x 10-a 4.2 x 10&; 1.4 x l10 4.0 x 10 "
b) Potatoes: 2.5 x 10"3 4.2.x 1473 3.0 x 10"3 4.0 x 10"3
c) Other Below Ground: 2M5 x 10 3 4.2 x !0 1.4 x 10² 4.0 x 10⁻³
d) Pasture Grass: 2.5 x 10"3 4.2 x 10³ 1.8 x 10"2 2.8 x 10⁻²
e) Stored Feed (Hay): 2.5 x 10"3 4.2 x 110" 3.6 x 11'2
I1. Beef/Feed (Fbi's)
pCi/kg per pCi/day: 3.4 x 10⁻⁴ 2.0 x 10⁴ 5.1 x 10- 7.1 x 10'4
111. Milk/Feed (F i's)
pCi/2 per pCi/day: 6.) x 10-4 5.0 x 10⁶ 5.9 x 10"4 1.2 x 10"4
'Sources for this data include References 4-7.
5. CONCENTRATIONS IN MEAT AND MILK
Radioactive particulate materials can be deposited on hay or pasture grass which arý eaten 1vmeat animals which are in turn eaten by mdn. Th.' equation used to estimate meat coivcentrationsis
Cbi = Q Fbi (0.5 Cpgi + 0.5 Chi) (9)
where Cbi is the resulting average concentration of isotope i ;i, meat, pCi/kg;
Chi is the concentration of isotope i in hay (or other stored feed), pCi/kr'
Cpgi. is the concentration of isotope i in pasture grass, pCi/kg.
fti is the feed to meat transfer factor for isotope i, pCi/L:q per pCi,'day ingested
(see Table G-3.ý);
Q i, the assumed feed incstion -ate, 50 kg/ddy (kef. 3); and
is the fraction of tU' annual feed requirement assume:,d to be satisfied by pasturegrass or locally grown store"i fced (hay or other), dimensionless.
G-28
lhe lactr 0,5. appears twice in Eq, 9i, abet'e. becaus.e it i4 assumed Lhat half the annual feedrequ",-•.*rt is satislfed hy pasture grass snd '•i!. oy lucally groan stc-eed feed. ihisreflects t.he following assumptions made for t'is analysis: the length of the grazing sea.onis & ,•nr..hs pL" year durihg which time the f.eo Nill consist of 100 percent pasture grass;
anc.. d.,'irg the remainder of the year tw)n p!asture gr.ass is unavailable. feed will consist of100 *erI;*ot locally grown vegetation. These assmpt'ors are aliu reflected in the followingvtation for milIk concentrations
Cmi Q Fi (0.5 C 0pgi 0.5 ChI) (10)
ittere Cmi is the average concentration ot isotope I in milk, pCi/f; and
Fmi !%i the feed to milk activ'i.y transfer factor for isotope I, pCi/A per pCi/dayingested (see Table G-3.2).
6, ,CO%1EN!IRA7TIONS AT DIFFERENT TIMES
The above equations for calculating enviromental meiia concentrations have been used to esti-mate ý..ncente'ations resulting at different times of the nwdel mill's life-cycle and from varyingsources. The following sub-sections address the specific methodo.ogies employed to satisfythese var)ing purposes.
6. 1 Cuncentratlons Ouring the Final Year of Actual Milling
The operational lifetime of the model mill Is assumed to be 15 years in duration. Averageco.ncentrations in environmental media during the l5th year of mill operation have been estimatedby assuming no initial concentrations (at t = 0) and by employing a value of 14.5 years for theparameter t appearing ir Equations 2, 3, 4, and 6. The resulting environmental media concentra-tions are those that would exist midway through the final year of actual milling and they areassumed to represent the average concentrations existing duripg that year.
In the case of multiple operating mills, a value of 14,5 years was %gain set for the parameter tin Equations 2. 3, d, and 6. however, the direct air concentrations entering into Equations I.4. and 6 were those resulting from all o0eratlng mills combined.
6.2 Concentrations After the End of Actual Milling
For the model mill only, average concentrations in environmental media for the 5th year fol-lowinrg the end of actual milling were calculateo. These concentrations were calculated as thesum ot those existing due to releases during the 15-year operational lifetime a.id due to post-milling tailings pile effluents. The average corncentrations during the Sth post-millinq yearwere estimated by calculating Concentrations existing 4.5 years after the end of millirl.
It order to obtain concentrations 4.5 years after the end of actual milling, due to releasesad,'inq the operational lifetime, a value of 15,0 years was used for the parameter t appearing inEquati.cis 2. 3. 4. and 6. Since direct air concentrations due to releases during operationva,•sn, the resulting environmental media concentrations due to those releases, 4.5 years afterthe ena of milling, arise only from residual ground and resuspended air concentrations. Resi-dual ground concentrations wert calculated by multiplying the end-of-milling values by thefactor
exp ((-0.693/50 years) a 4.5 years]
wlich represents the frartion remaining aftrr 4.5 years based on an assumed environmental nail-liWe of 50 years. Residual resuspended air concentrations were determined by
Ci (o.-.5) - 0.01 C 1 0" -le09 (-Ag! ( T d-0 . 5 ),..,
I - Vxp (-.'% 1 a
C is the direct air concentratiov, of Isotpe i. in p4rticlh' s i z e p,adrill resultin, from (and during) operational release,,. PCi/n";
CaI (Id-4. 5) is thp re'idual resuspendod sir conceatratini' of isotope i. inparticle e p. v. rrp.!ltinq from opepa tonal release-,. 0.S wvyrslariow tv tt•u eProd :1f th dryinq pgoriod (Id yprs), pri/or/,
G-29
1 is ".he length of tnw ±ir)-•ig pe.ied, 5 yrs;
is t** operailonal lifeime, 15 ýrs;
is the effective deca, coidtant for isotpe I an grouvl, yr' ;
is %t* deposition velocity •f Unae vrticle sze for which thetrminal value of the res,;spensio'r factor is I0 We W ./sec;
Ii(j , is , tomisr~Ai value of the le w I v.r, u1 f
3. )SxO Isa sec/yr.
Ii' rv s1,il v cii, and resus$erGed air corzentrations were then added to those calculated onti. basis r4 p.t•-mi'lling release rates, using t r 4.5 yeers in Equations 2. 3, 4, and 6, to-,2talr. t rcnd irto tesusoe:oe-d air caceatritio-s vxl5,ting 4.5 years after %Ie end of
in4i'.. Tot&" air concen Wo|ns, Wotet dQIj-.ion -ates, etc., were then calc-Alated itt tne
6.3 Tgs ~cns f~r Eir. rNwental_ Dose Coeefitmrse' Calcul ations
jr. t,". e' •. a-•rua' Dpopc'e1ton dose* th3%# been calculated babed e" si-mtens of i•',viduildgse di,. :,•rs d•e to a one-jear exposurt period %here the one-year exposure period is i•k'&
v the eitocr the 15t!ý y'ea- of actual millinU or the 5fl' year after milling ends. These calculi-•jor,• >-',e .v;,ae annual population dos* ccrmitmsets but are not useful for estimating the%otal ro3jlu'c.qitaj im~pcts Qf the model mill over the comined 20-yea. release period.
4r o1',;e .<, est•nate total annual impacts (from •hlich total icpacts over an exLended releasep.iO0O cen ý.e tjtimattd) the concePt of environvmntal dose copitiment is employed with a 100-
year inl.egriting pejod. in this app-o4CO' the impaJts of releases over a one-year period areesL-•aa•.:.qav suming all resulting population dose coomitmvnts over an exposure period of 100yer's tolo•Ormg release. These envirormnt.al dose copmitments have been calculated unPde the4ssj--;t;on "iat: population dose% resulting from a one-year exposure period, tW environner..alvedJ; Co"centrations resulting from Constant releases over 100 years, are equivalei-. tU. popu.4-tio" dos-.1 resulting fTrom a 100-year exposiro per-iod, to envlroWmental amedia concentrationsresulti,- f.om constant releases over one ,'cr.' On this basis the required environmental mediacorwestratio-.s are those averaW values over the period t = 100 years to t a 101 years. These
are calculated by settin% t to a valuw of 100.5 years In Equations 2, 3, 4, and 6.
It-l vall1diy of this assumtion, and the rationale for use of a 100-ye4r Integrating period,are az::rested in Appendix G-6.
ftilt, -1 r,.• R.
0. 0.C. kict¢er, "Noclea., Decay Data for Radionuclides Occurring in Routine Relea•es fromWaclear fuel C)cle Facilities". U.S. NRC Report ORKfML/MIREG/T1I'I2, August 1977.
z. Envrc.w,,-ta) Statement,. "Liquid Metal Fast Breider Reactor Program,2 Vol. 11, W_'.5ti-l535.
p.,G-30, 1974.
5. *1 F. Fitrche- avid W. L. Dotson (compilers). 44EPHNES - A 0' tal Com,,'tev Code for (sti-#tftn Reg.;onal RedlaO*"lci t.ffecti. frm the Nuclear FPwer nfdtdtry", Hlanfe•d .n.ineevl|lg!-'• ,v opIIt Laboratory, HIEDe t•M-71-6. Decew.-er 1971.
4. Y. C. N9. e! at , 'Predictiao of the "uigm CkaU.e to Man from the Fallout ot Nlu-lea-'Ge~it•, 1I4,nt.t.o.k for Estimatinq the Naimum I ternal Drse from Radlonuclidevi R-leavtI tuttr eia.pne-e.' USA[C Repart UCRK-50I6:s, Pa•t ;V, 196
S. R S B',ot', t el., "A Systems Analvsis 14ttcdvl*qy for Predicting Dose tu tRn from aPddlojc".iCvty Contamnited "ervestrial tnv,ro-ment." p, vceedingS• of the Third National
l.J .. n k(ni•-'Lology, Il}C Ileporl r4 l-r1(,:ii C, t tioqf. lenn , Dp..877-893, 19;4,
i~ R .1, 'ri% 'r f E Adi.cit:4, 44tvr~aI% Ciam -'so errestria. friwi-rtr-nt 0r Ar1`VM.!'a,~~~Prk , Ca "f~ t",-,,•ttvIA"1. %*,It 44.. 19:7
$I ,.'. , I -Il~.,n t , R. , 'as. .. '." ','c., ... t . o1 Gnat Cr isricqe 1.1,"a hr. a1 ,,4,I A01 f ý,,-', P ! ;..; 0,10 Siiqv, hAt Io'-al Lab!,r"
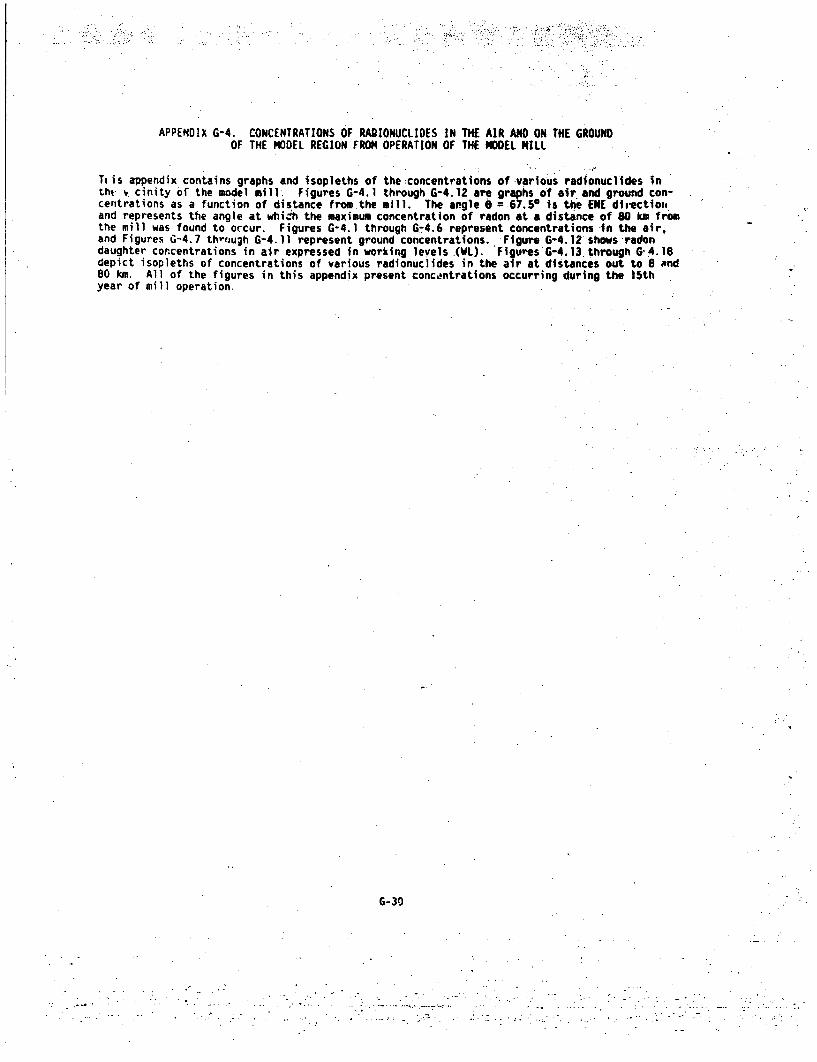
APPENDIX G-4, CONCENTRATIONS OF RA2IONUCLIDES IN THE AIR AND ON THE GROUNDOF THE MODEL REGION FROM OPERATION OF THE MODEL HILL
Tiis appendix contains graphs and isopleths of thetconcentrations of-various radionuclides intht. v cinity of the model mill. Figures G-4.1 through G-4.12 are graphs of air and ground con-cerntrations as a function of distance from the oil]. The anglese = 67.50 is the ENE directionand represents the angle at which the maximum concentration of radon at a distance of 80 km fromthe mill was found to occur. Figures G-4.1 through 674.6 represent concentrations in the air,and Figures G-4.7 through G-4.11 represent ground concentrations. Figure G-4.12 shows radondaughter concentrations in air expressed in working levels .(WL). Figures G-4.13 through G-4.18depict isopleths of concentrations of various radionuclides in the air at distances out to 8 ond80 km. All of the figures in this appendix present concentrations occurring during the 15thyear of mill operation.
G-30
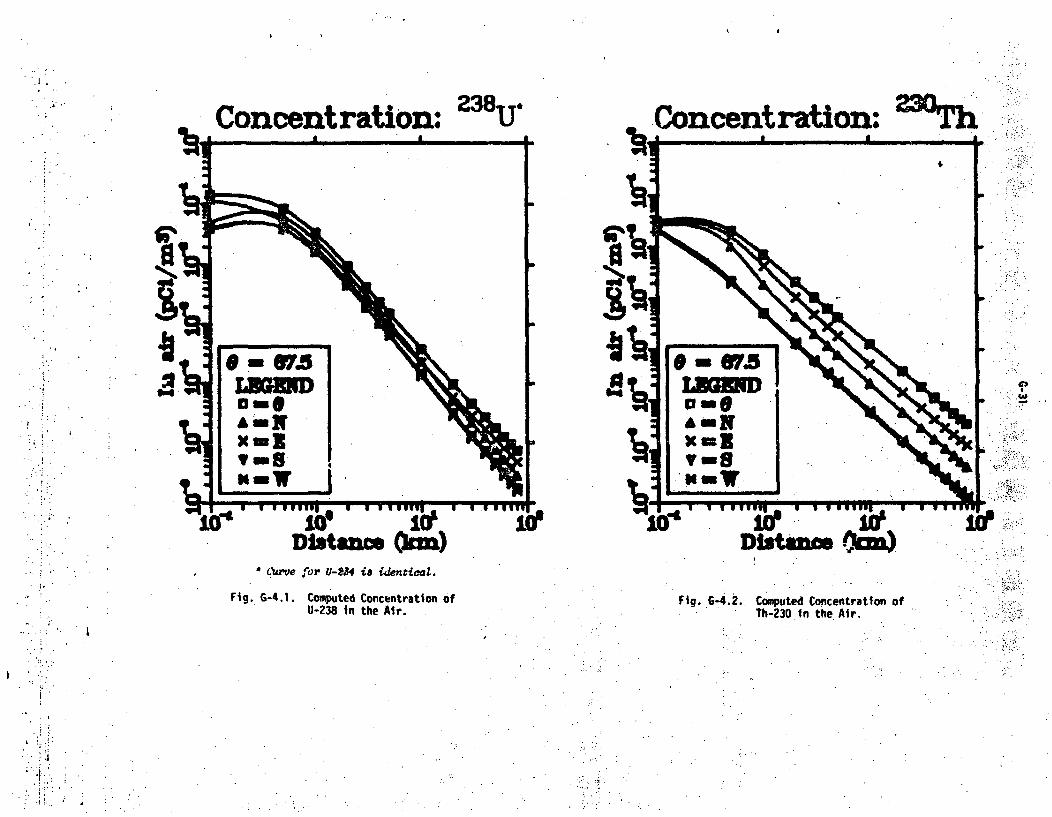
Concentration: 238U. Concentration: =M.T
A.W., -- I jfl, Lejo0teJ
* Cue for U-234 is icentical.
fig. G-4.1. Computed Concentration ofi.. U-238 in the Air. Fig. G-4.2. Computed Concentration ofTh-230 in the Air.
a
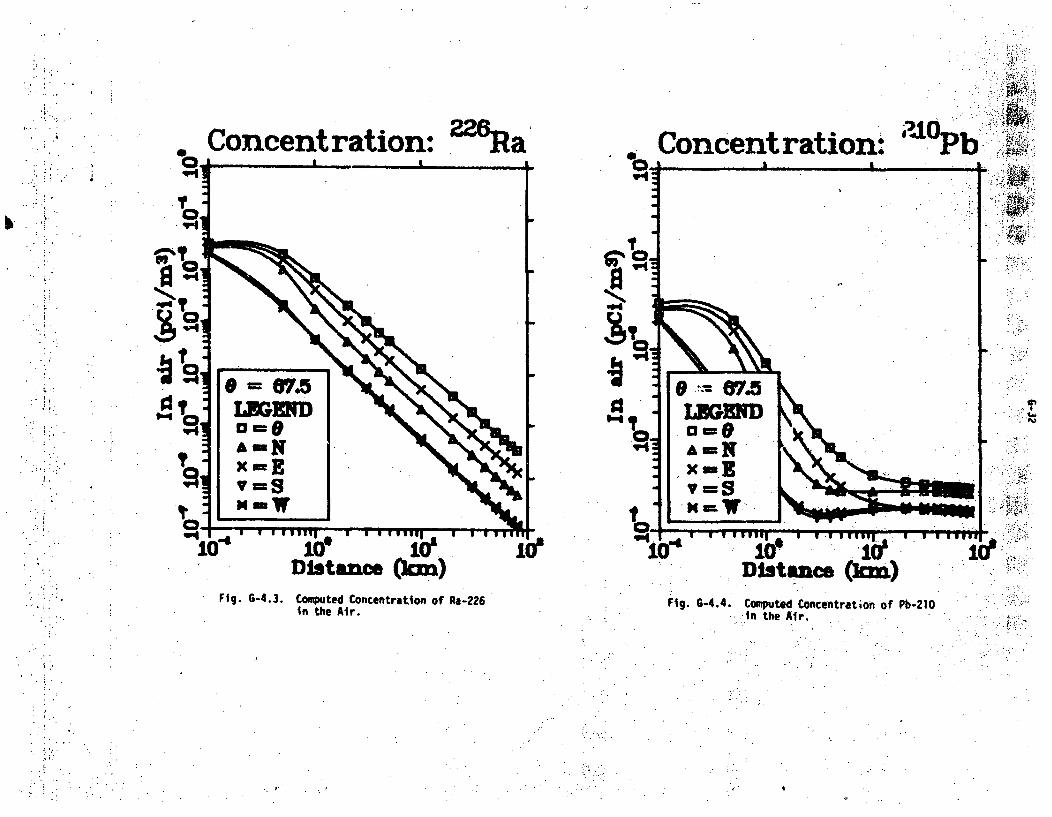
Concentration: 22SARRJt
ifto
Fig. G-4.3. Computed Concentration of Ra-226in the Air.
Fig. G-4.4. Computed Concentration of Pb-210An the Air.
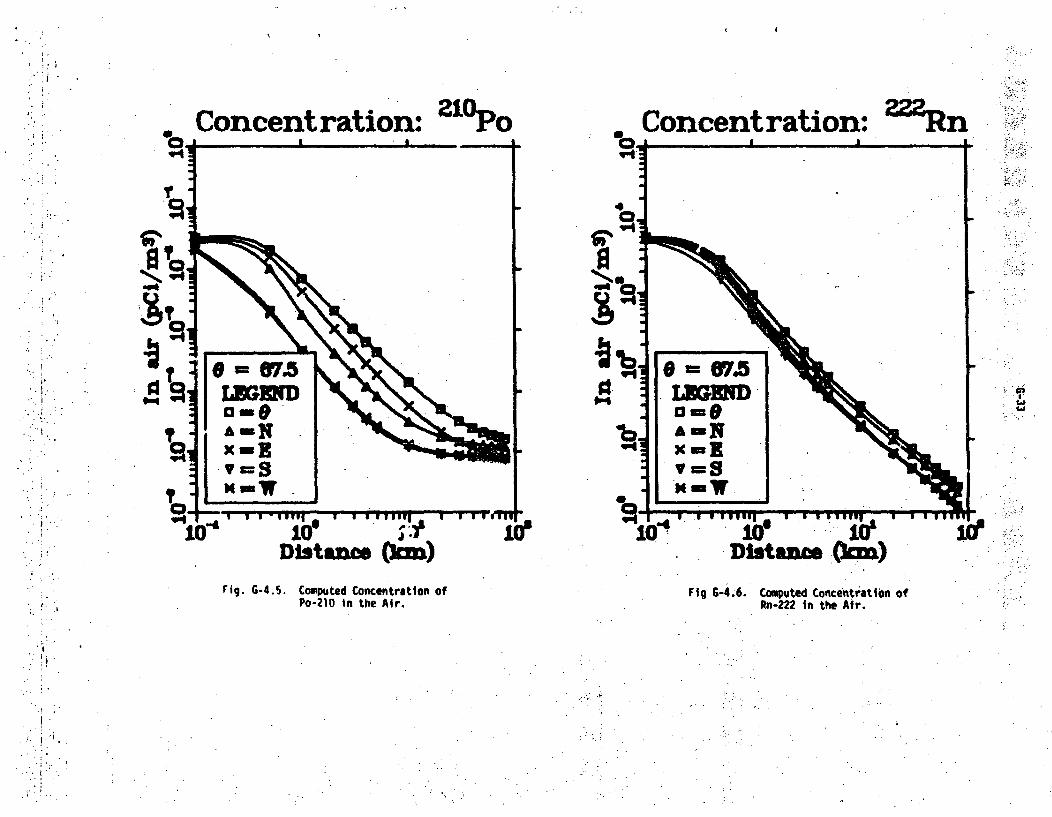
Concentration: °10 Po Concentration: 22Rn
.0.4I.)'9
Fig. G-4.5. Computed Concentration ofPo-210 in the Air.
Fig G-4.6. Computed ConcentratiOn ofRn-222 in the Air.
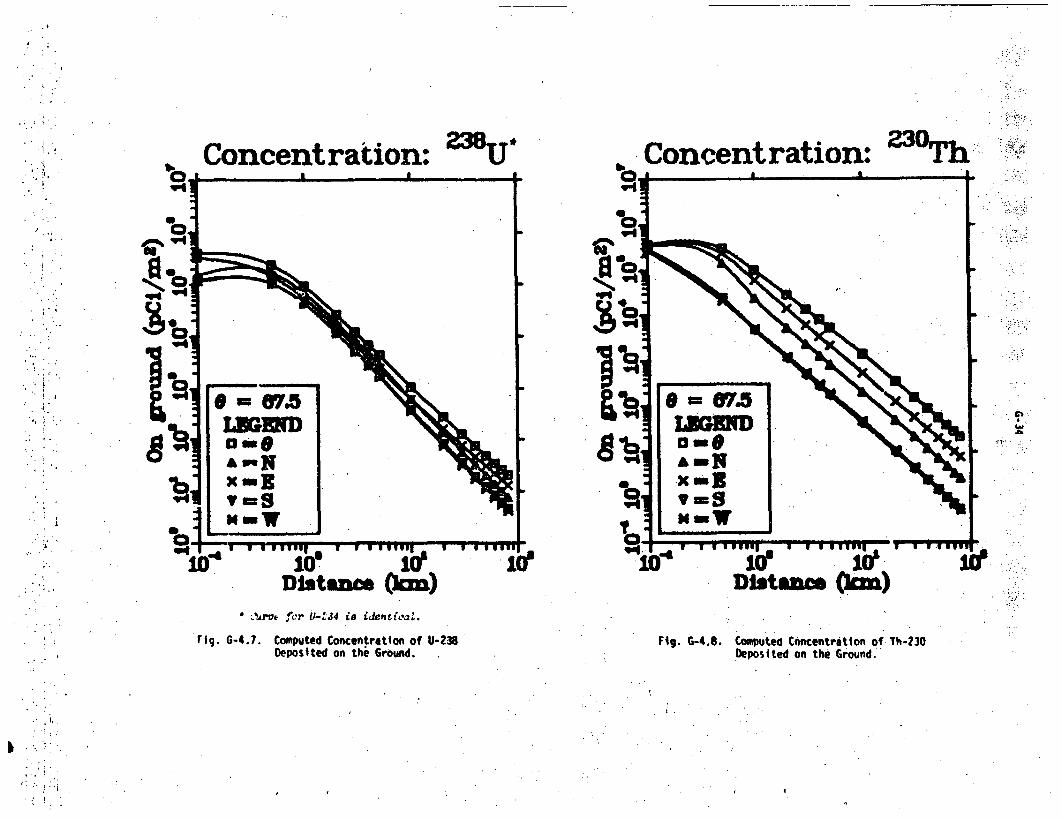
Concentration: MU 1* Concentration: 23OTh
/
4.•',
.1
Distance
I UiI5*
10'~m)
' I.A,& fer. U-LJ4 isa identcalz.
rig. G-4.7. Computed Concentration of U-238Deposited on the Ground.
Fig. G-4.8. Computeo Cncentrition of Th-230Deposited on the Ground.
I
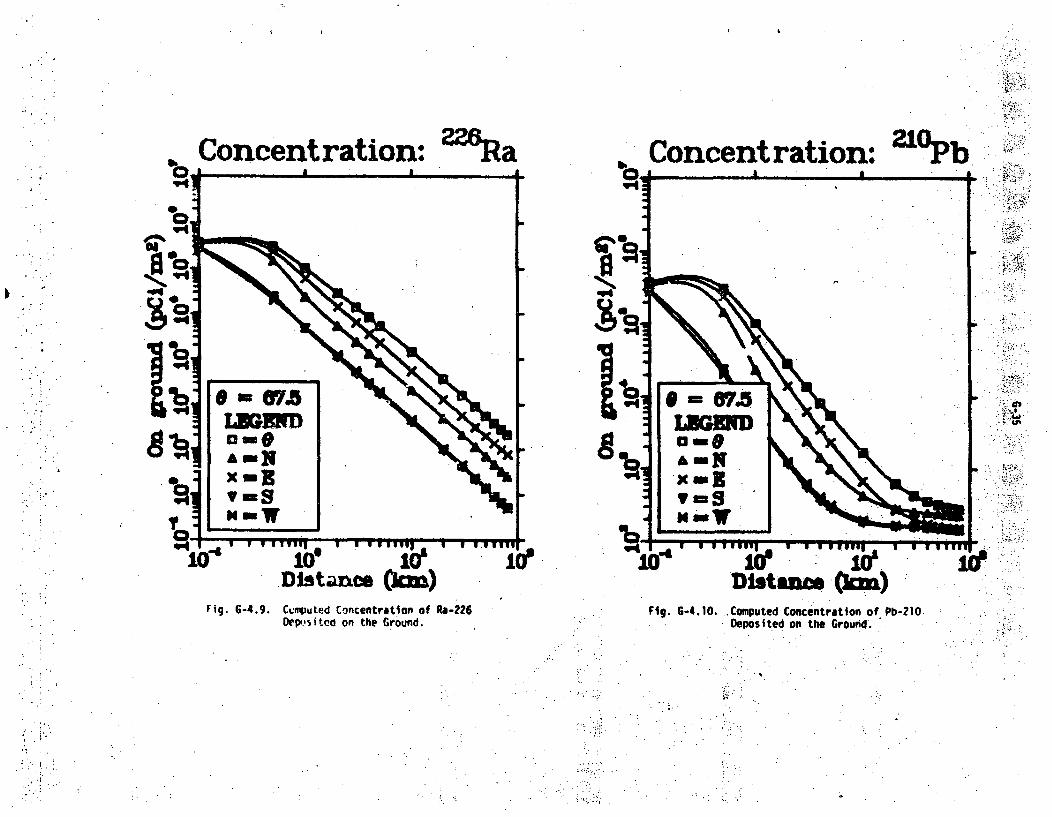
Concentration: ~26J~ a Concentration: 2'Pb
*~2~
7.,
* -Asr
A,'
0
U'
•6
I aWII,
loft(1CM) Diatmans (1m)
Fig. G-4.10. .Computed Concentration of Pb-210Deposited on the Ground.
Fig. G-4.9. Cemputed Concentration of Ra-226Depvsited on the Ground.
'qt
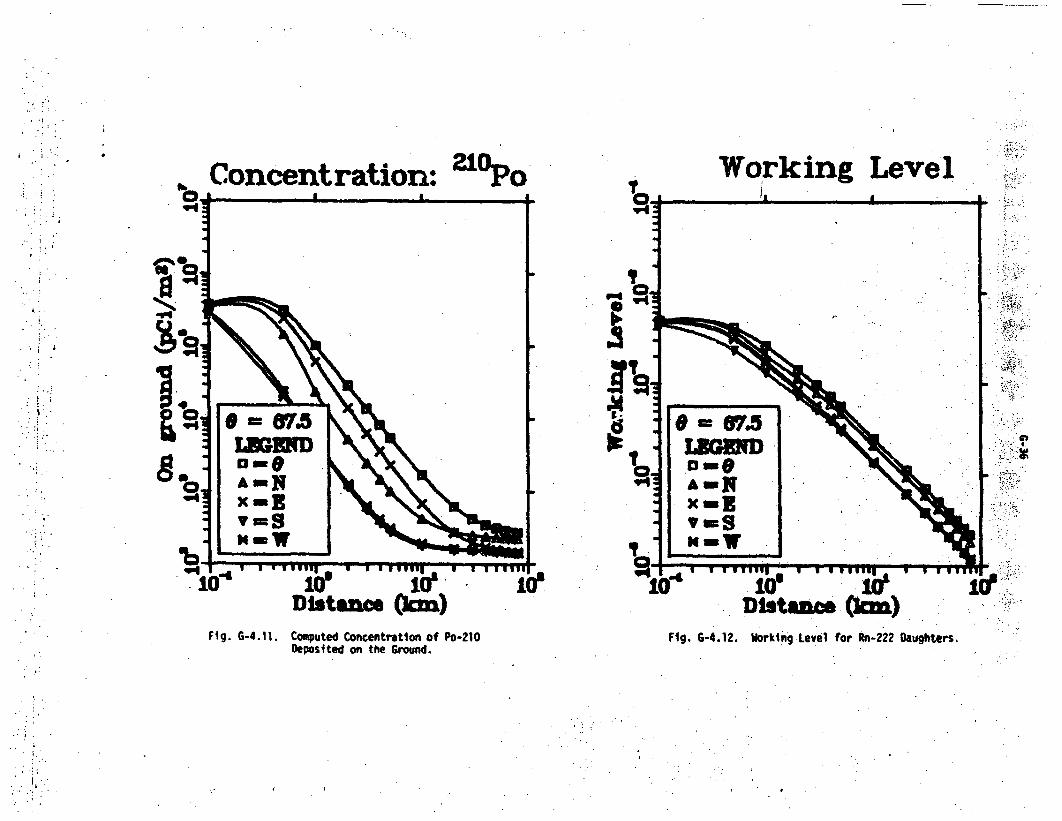
Concentration: 210po
0
Dist&"c
I W WIWI
lit(km)
-- U
10
Fig. GD-4.11. Computed Concentration of Po-210Deposited on the Ground.Fig. G-4.12. Working Level for Rn-222 Daughters.
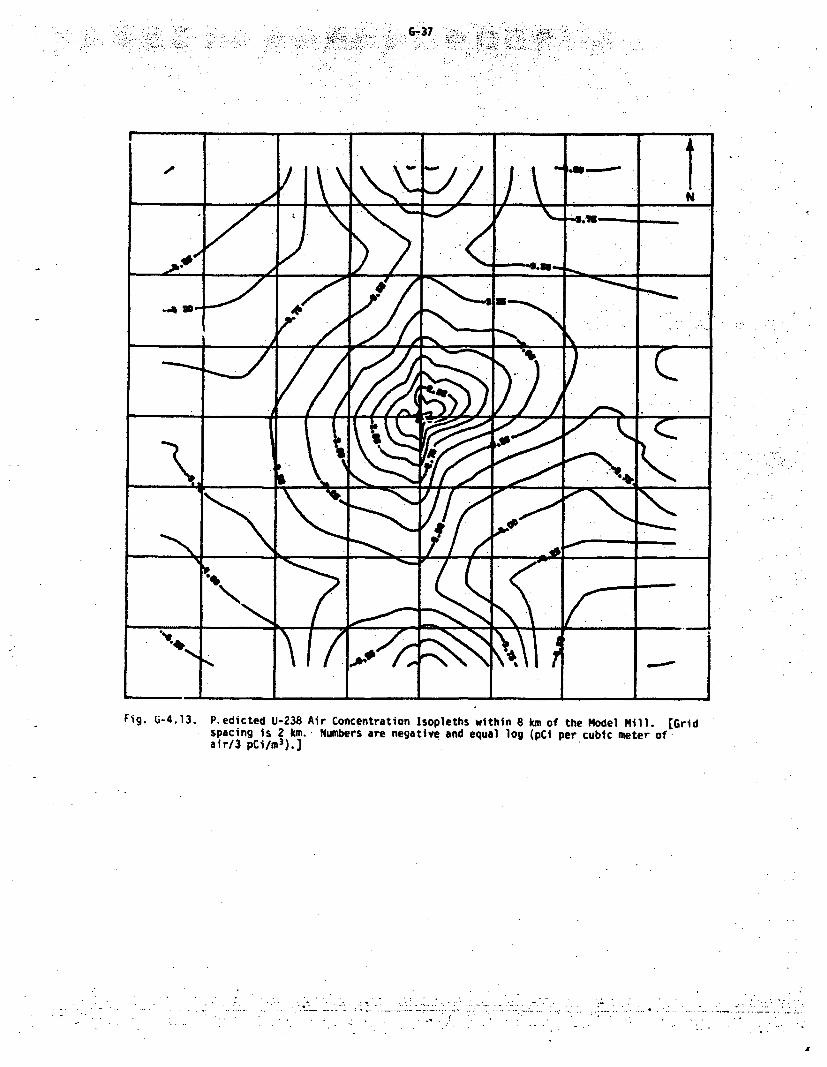
- .:G'-37. .. '~*;<
Fig. L(-4.13. P.edicted U-238 Air Concentration Isopleths within 8 km of the model Mill. [Gridspacing is 2 km. Numbers are negative and equal log (pCi per cubic meter of.air/3 pCi/OW).]
.. . . .
A
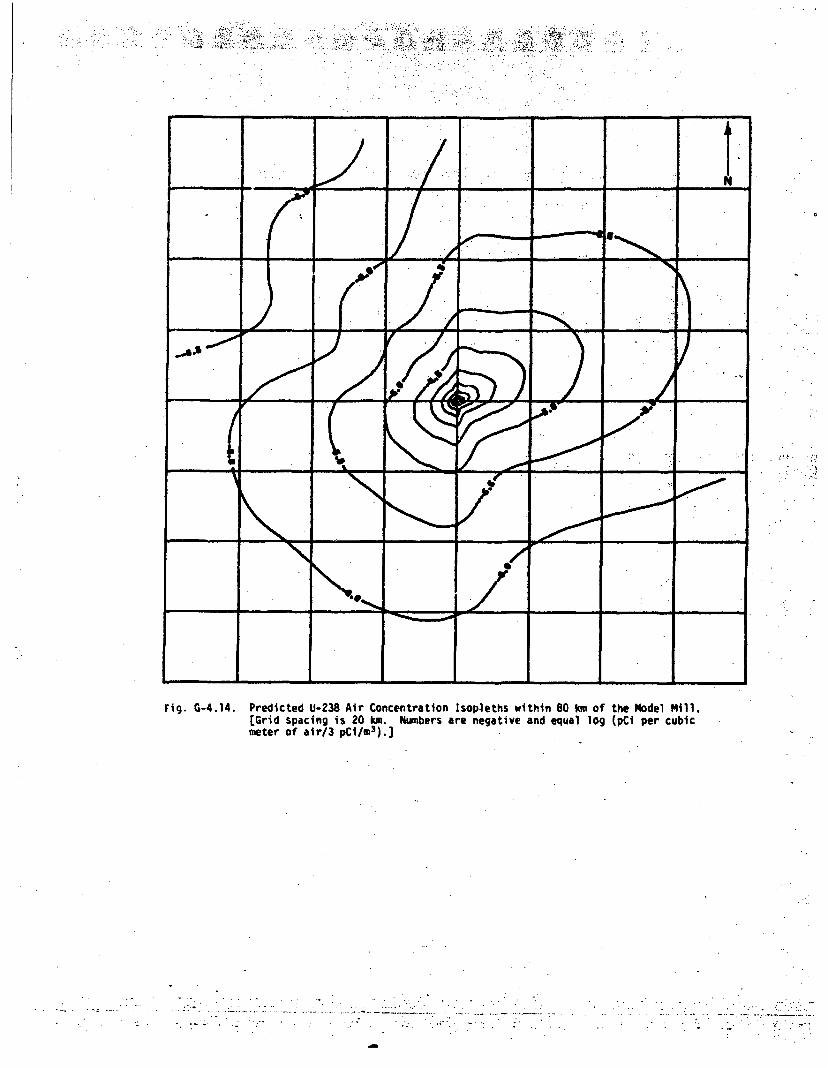
I -. C C.
. .~ *.
Fig. G-4.14. Predicted U-238 Air Concentration Isopleths within 80 km of the Model Mill.[Grid spacing is 20 km. Numbers are negative and equal log (pCi per cubicmeter of air/3 pCI/m 3 ).]
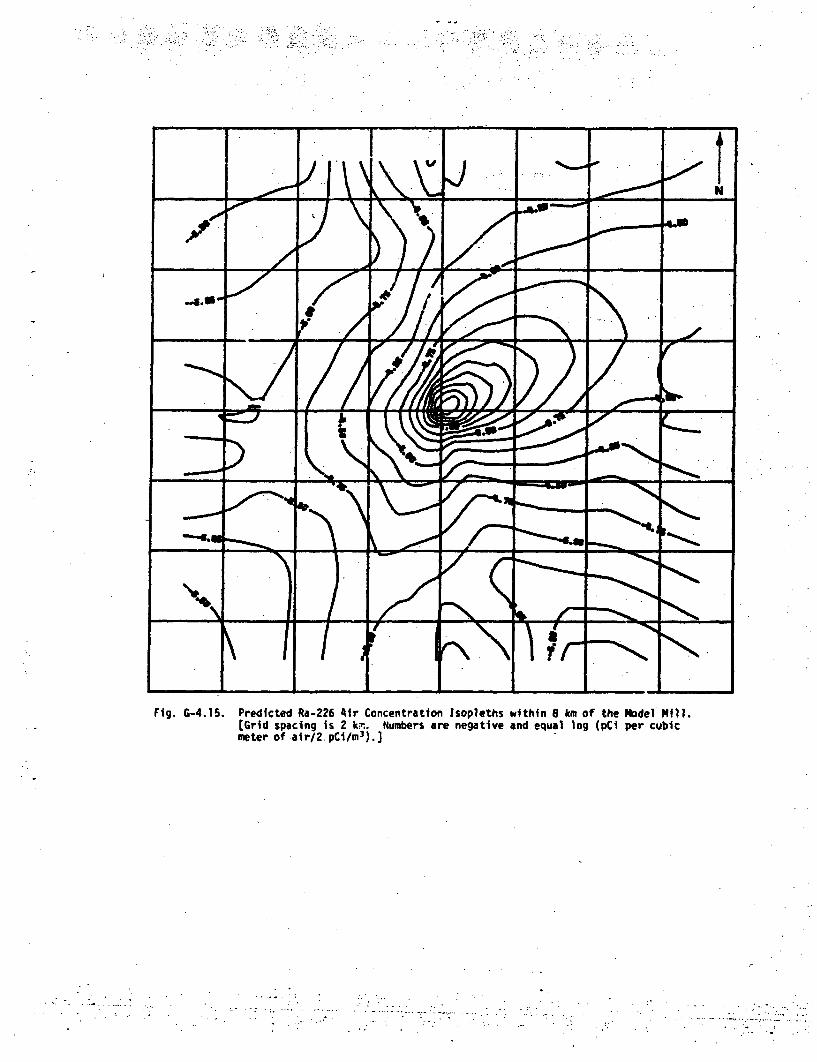
Fig. G-4.15. Predicted Ra-226 Air Concentration Isopleths within 8 km of the Model Mill.[Grid spacing is 2 ki. Numbers are negative and equal log (pCi per cubicmeter of air/2. pCi/M 3).]
.............................. .. ,...*. ..
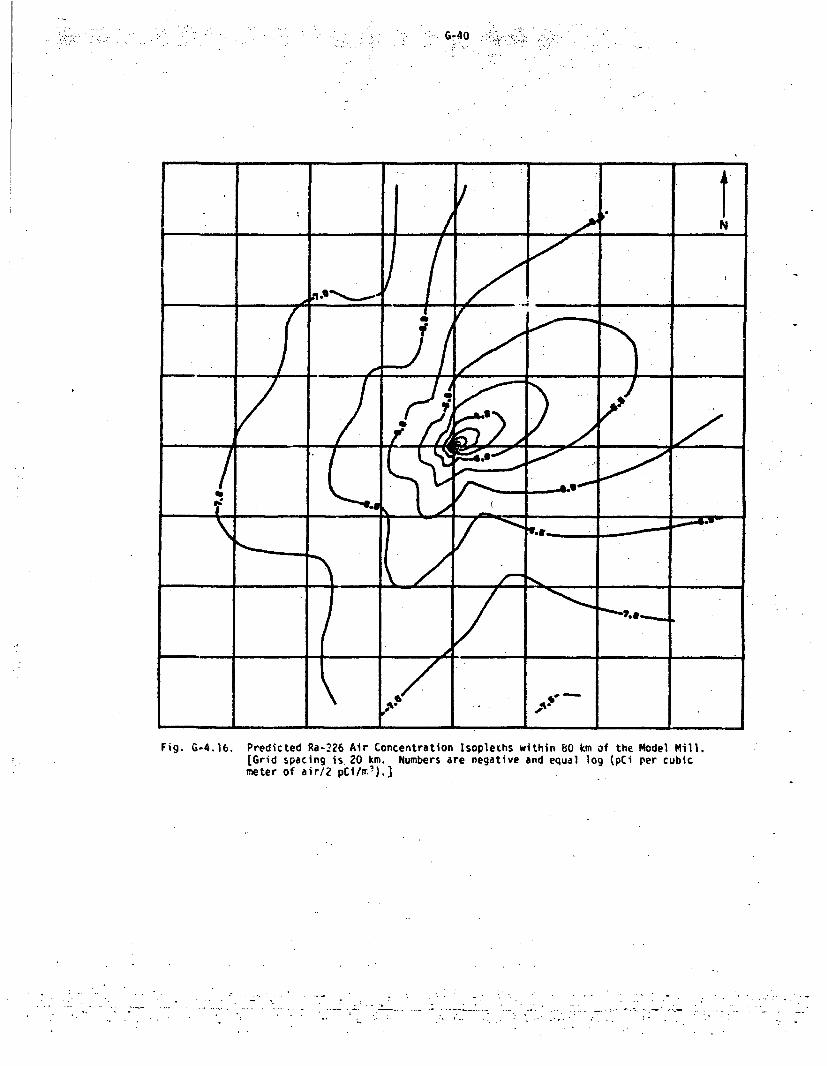
G-40
4
Fig. G-4.16. Predicted Ra-226 Air Concentration Isopleths within 80 km of the Model Mill.[Grid spacing is 20 km. Numbers are negative and equal log (pCi per cubicmeter of air/2 pCi/rE2 ).]
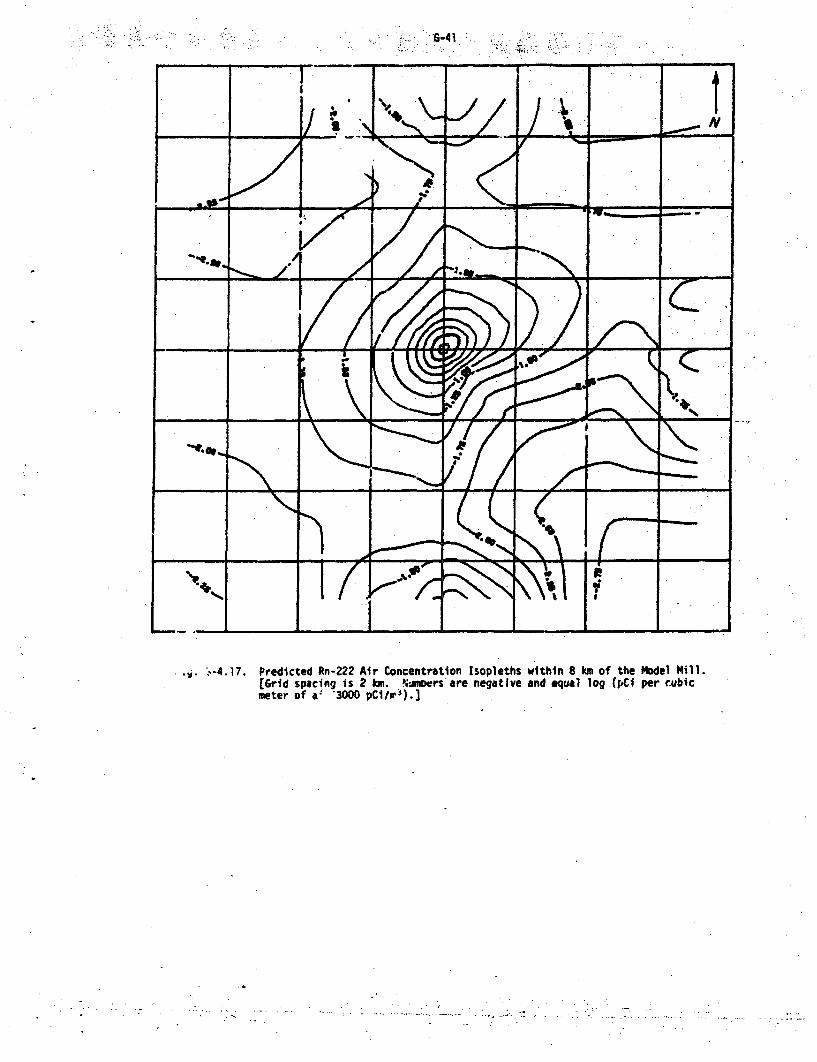
.G-41.
'.. ,-4.17. Predicted Rn-222 Air Concentration Isopleths within 8 km of the Model Mill.[Grid spacing is 2 km. '.umoers are negative and equal log (pCi per cubicmeter of a- '3000 pCi/r0).]
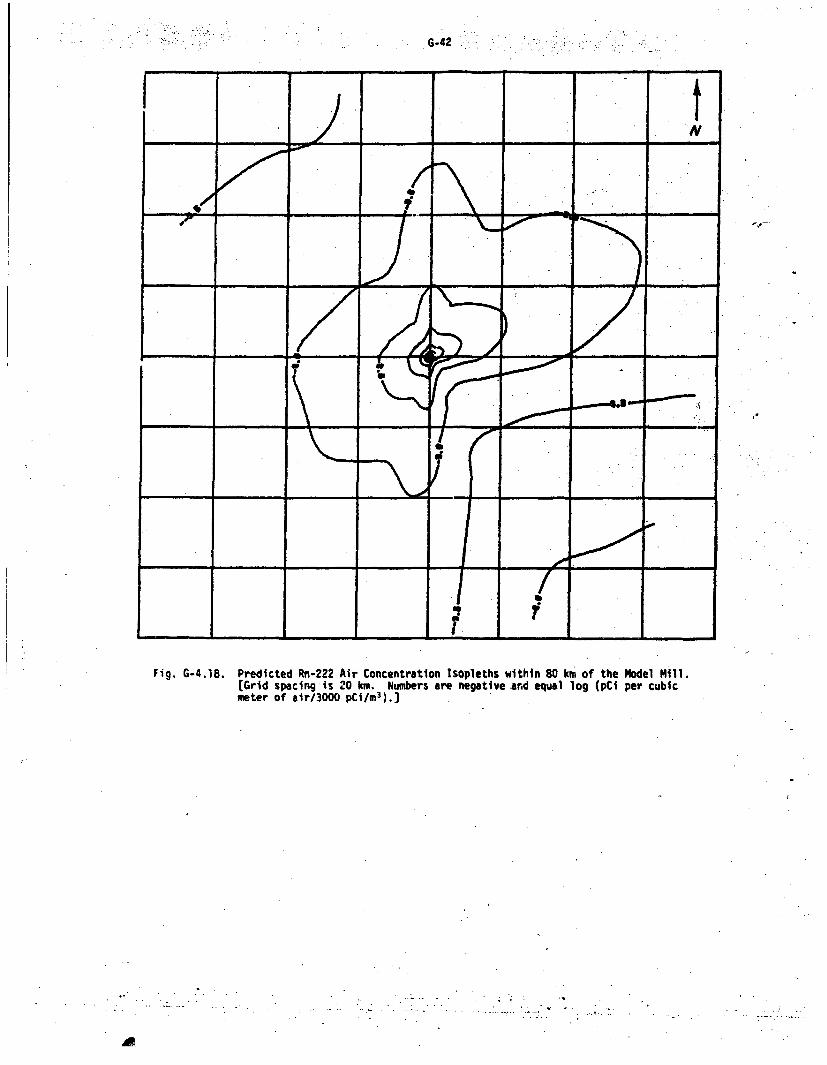
G-42
-7,--
ipi
Fig. G-4.18. Predicted Rn-222 Air Concentration Isopleths within 80 km of the Model Mill.[Grid spacing is 20 km. Numbers are negative Anrd equal log (pCi per cubicmeter of air/3000 pCi/r 3 ).]
Al
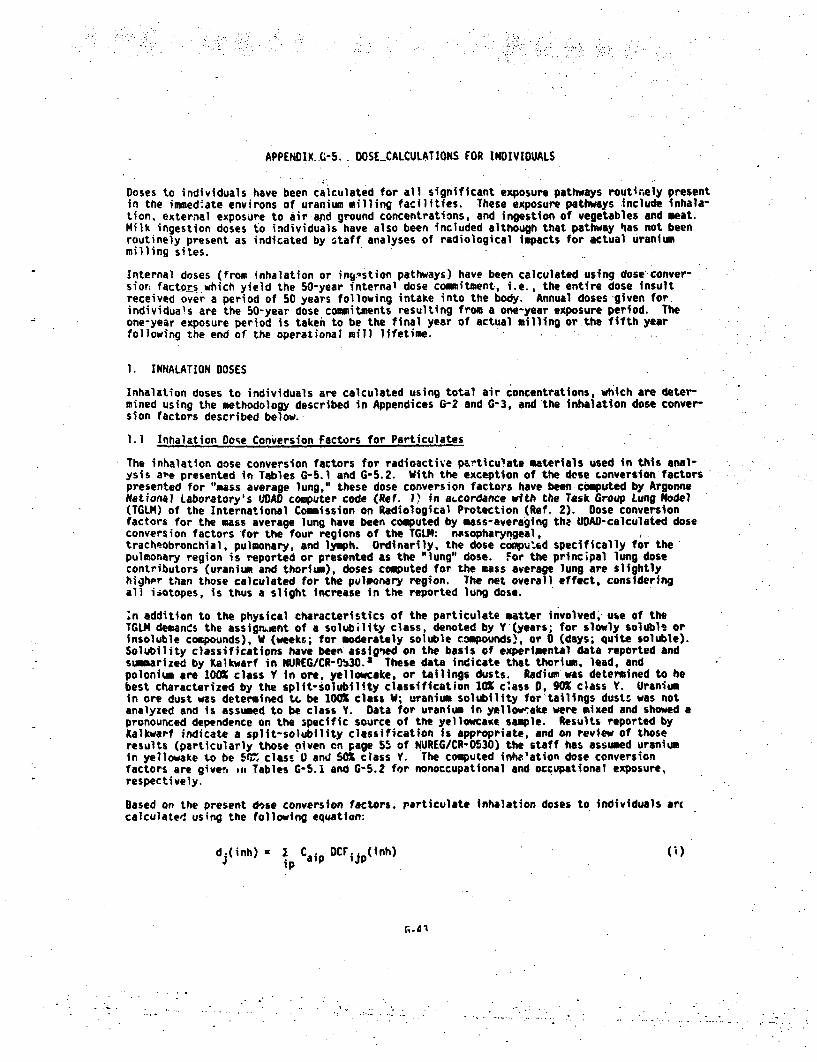
APPENDIX. G-5. .DOSECALCULATIONS FOR INDIVIDUALS
Doses to individuals have been calculated for all significant exposure pathways routinrely presentin the immediate environs of uranium milling facilities. These exposure pathways include inhala-tion, external exposure to air and ground concentrations, and ingestion of vegetables and meat.Milk ingestion doses to individuals have also been included although that pathway 'las not beenroutinely present as indicated by staff analyses of radiological impacts for actual uraniummilling sites.
Internal doses (from inhalation or ingestion pathways) have been calculated using dose conver-sion factors which yield the 50-year internal dose commitment, i.e., the entire dose insultreceived over a period of 50 years following intake into the body. Annual doses given forindividuals are the 50-year dose commitments resulting from a one-year exposure period. Theone-year exposure period is taken to be the final year of actual milling or the fifth yearfollowing the end of the operational mill lifetime.
I. INHALATION DOSES
Inhalation doses to individuals are calculated using total air concentrations, which are deter-mined using the methodology described in Appendices G-2 and G-3, and the inhalation dose conver-sion factors described below.
1.1 Inhalation Ooqe Conversion Factors for Particulates
The Inhalation aose conversion factors for radioactivep&rticu'ate materials used in this anal-ysis aye presented in Tables G-5.1 and G-5.2. With the exception of the dose conversion factorspresented for "*mass average lung," these dose conversion factors have been computed by ArgonneNational Laboratory's UDAD computer code (Ref. 1' in accordance with the Task Group Lung Model(TGLM) of the International Commission on Radiological Protection (Ref. 2). Dose conversionfactors for the mass average lung have been computed by mass-averaging the UDAD-calculated doseconversion factors for the four regions of the TGLN: nasopharyngeal,tracheobronchial, pulmonary, and lymph. Ordinarily, the dose compuled specifically for thepulmonary region is reported or presented as the "lung" dose. For the principal lung dosecontributors (uranium and thorium), doses computed for the mass average lung are slightlyhighpr than those calculated for the pulmonary region. The net overall effect, consideringall isotopes, is thus a slight increase in the reported lung dose.
:n addition to the physical characteristics of the particulate aatter involved, use of theTGL.M demands the assgnmient of a solubility class, denoted by Y1(years; for slowly solubli orinsoluble compounds), W (weeks; for moderately soluble compounds), or 0 (days; quite soluble).Solubility classifications have been assigwed on the basis of experimental data reported andsummarized by Kalkwarf in NUREG/CR-0b30.3 These data indicate that thorium, lead, andpolonium are 100 class Y in ore, yellowcake, or tailings dusts. Radium was determined to hebest characterized by the split-solubillty classification 101 class D, 90% class Y. Uraniumin ore dust was determined tc, be 100i class W; uranium solubility for'tailings dusts was notanalyzed and is assumed to be class Y. Data for uranium in yellow,7ake were mixed and showed apronounced dependence on the specific source of the yellowcaKe sample. Results reported byKalkwarf indicate a split-solubility classification is appropriate, and on review of thoseresults (particularly those piven on page 55 of NUREG/CR-0530) the staff has assumed uraniumin yellowake to be S50% class D and 50% class Y. The computed inha'ation dose conversionfactors are given on Tables G-5.1 and G-5.2 for nonoccupational and occupational exposure,respectively.
Based on the present dise conversion factors. particulate inhalation doses to individuals arccalculated using the following equation:
d.(inh) = I Caip OCF(ijp(nh) (I)ip
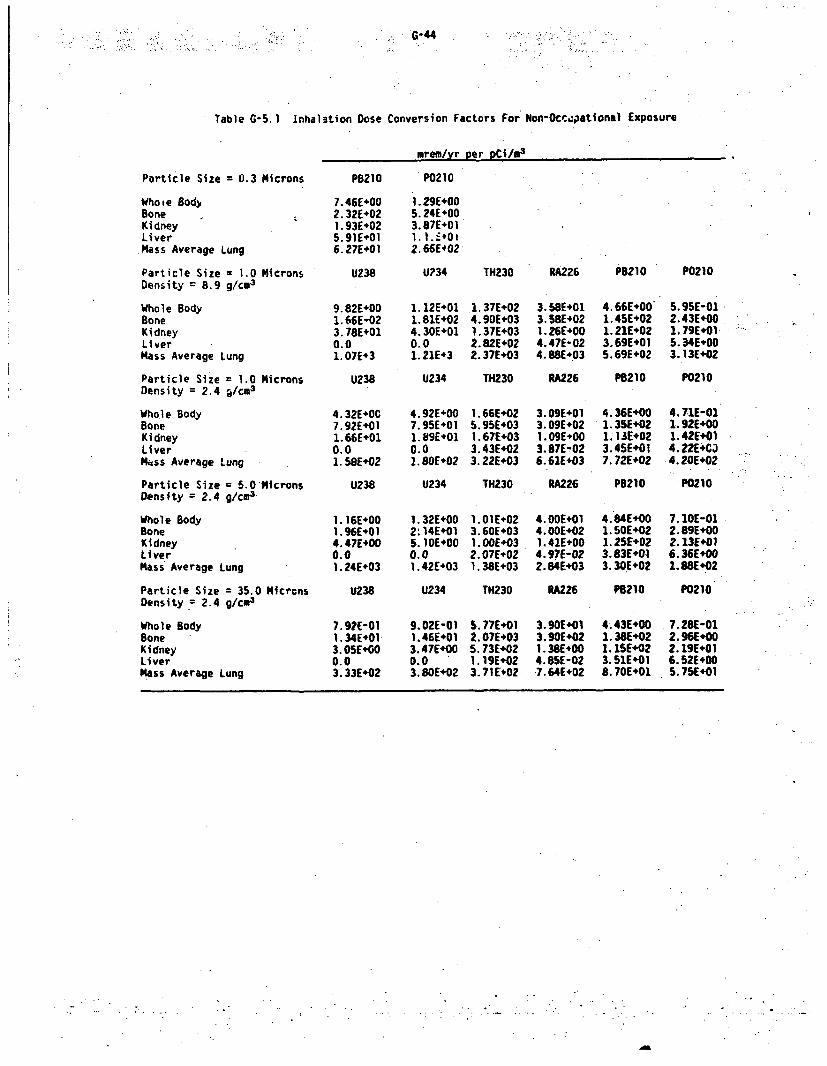
G-44
Table G-5.) Inhalation Dose Conversion Factors For Non-Ocr.cpational Exposure
mrem/yr per pCi/m 3
Particle Size = 0.3 Microns
Whote BodyBoneKidneyLiverMass Average Lung
Particle Size = 1.0 MicronsDensity = 8.9 g/cM3
Whole BodyBoneKidneyLiverMass Average Lung
Particle Size = 1.0 MicronsDensity = 2.4 g/cm
3
Whole BodyBoneKidneyLiverMass Average Lung
Particle Size = 5.0MicronsDensity = 2.4 g/cM3
Whole BodyBoneKidneyLiverMass Average Lung
Particle Size = 35.0 MicrcnsDensity 2.4 g/cM3
Whole BodyBoneKidneyLiverMass Average Lung
PB210
7.46E+002.32E+021.93E+025.91E+OI6.27E÷01
U238
9. 82E+001. 66E,023. 78E+010.01. 07E+3
U238
4. 32E+0C7.92E+011. 66E.010.01. 58E+02
U238
1.16E+001.96E*0l4.47E*000.01. 24E+03
U238
7.92E-01!. 34E+013. OSE000.03. 33E+02
'P0210
1. 29E+005.24E+003.87E+011. 1.1:012.66Ei02
U234
1. 12E+011. 81E+024.30E+010.01. 21E+3
TH230 RA226 P8210 P0210
1. 37E+024.90E+031.37E+032.,82E.022. 37E+03
3. 58E+013. 58E÷021. 26E+004.47E-024. 88Ee03
4.66E+00'1. 45E+021. 21E+023.69E+015.69E+02
5+95E-012.43E+001 79E+015.34E+003.13E+02
U234 TH230 RA226 P8210 P0210
4.92E+007.95E+011. 89E+010.01. 80E+02
1.66E+025. 95E+031. 67E÷033.43E+023. 22E+03
3. 09E+013.09E+021. 09E÷003.87E-026.61E+03
4.36E*001. 35E÷021. 13E*023.45E+017. 72E÷02
4.71E-011. 92E+001.42E+014.22E4CO4.20E÷02
U234 TH230 RA226 PB210 P0210
1. 32E+002.,14E4'015. 10E+000.01. 42E+03
l.01E.023. 60E+031. OOE.032. 07E+021. 38E+03
4. OOE+014. OOE+021.41E÷004.97E-022. 84E+03
4.84E+001. 50E+021. 25E+023.83E+013.30E+02
7.1IOE-012. 89E+002. 13E+016. 36EO001. 88E.02
U234 TH230 RA226 P8210 P0210
9. 02E-011.46E+013.47E÷000.03. 80E+02
5. 77E+012. 07E+035. 73E+021. 19E+023. 71 E'02
3.90E+013-90E+021. 38E+004.S5E-02.7. 64E+02
4.43E+001.38E÷021. 1SE+023.51E+018. 70E*01
7.28E-012.96E+002. 19E÷O 16.52E+005. 75E÷01
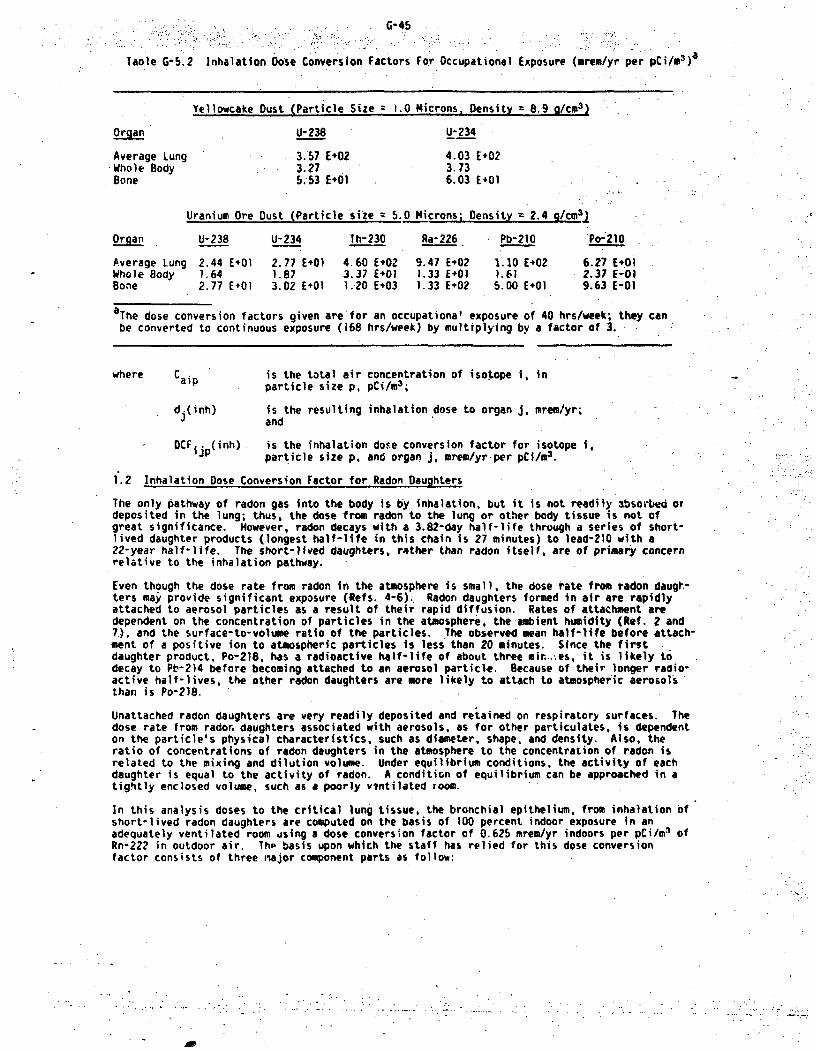
G-45
Taole G-5.2 Inhalation Dose Conversion Factors For Occupational Exposure (mrem/yr per pCi/m3)a
Yellowcake Dust (Particle Size 1.0 Microns, Density 8.9 g/cm3 )
OgnU-238 U-234
Average Lung 3.57 E+02 4.03 E+02Whole Body 3.27 3.73Bone 5.53 E.01 6.03 E*Ol
Uranium Ore Dust (Particle size 5.0 Microns; Density 2.4 Q/cm3)
Organ U-238 U-234 Th-230 Ra-2266 Pb-210 Po-210
Average Lung 2.44 E4O1 2.77 E+01 4.60 E+02 9.47 E*02 1.10 E+02 6.27 E+01Whole Body 1.64 1.87 3.37 E+O0 1.33 E£01 1.61 2.37 E-OlBone 2.77 E+01 3.02 E+01 1.20 E*03 1.33 E+02 5.00 E+01 9.63 E-01
aThe dose conversion factors given are for an occupational exposure of 40 hrs/week; they can
be converted to continuous exposure (168 hrs/week) by multiplying by a factor of 3.
where Ca. is the total air concentration of isotope i, inaip particle size p, pCi/M 3 ;
d.(inh) is the resulting inhalation dose to organ J, mrem/yr;and
CF " (inh) is the inhalation dose conversion factor for isotope i,ijlP particle size p. and organ j, mrem/yr per pCi/M 3 .
1.2 Inhalation Dose Conversion Factor for Radon Daughters
The only pathway of radon gas into the body is by inhalation, but it is not readily 3bsorbed oydeposited in the lung; thus, the dose from radon to the lung or other body tissue is not ofgreat significance. However, radon decays with a 3.82-day half-life through a series of short-lived daughter products (longest half-life in this chain is 27 minutes) to lead-210 with a22-year half-life. The short-lived daughters, r4ther than radon itself, are of primary concernrelative to the inhalation pathway.
Even though the dose rate from radon in the atmosphere is small, the dose rate from radon daugt-ters may provide significant exposure (Refs. 4-6).. Radon daughters formed in air are rapidlyattached to aerosol particles as a result of their rapid diffusion. Rates of attachment aredependent on the concentration of particles in the atmosphere, the ambient humidity (Ref. 2 and7.), and the surface-to-volume ratio of the particles. The observed mean half-life before attach-ment of a positive ion to atmospheric particles is less than 20 minutes. Since the firstdaughter product, Po-218, has a radioactive half-life of about three minr.z.es, it is likely todecay to Pb-214 before becoming attached to an aerosol particle. Because of their longer radio-active half-lives, the other radon daughters are more likely to attach to atmospheric aerosolsthan is Po-218.
Unattached radon daughters are very readily deposited and retained on respiratory surfaces. Thedose rate from rador daughters associated with aerosols, as for other particulates, is dependenton the particle's physical characteristics, such as diameter, shape, and density. Also, theratio of concentrations of radon daughters in the atmosphere to the concentration of radon isrelated to the mixing and dilution volume. Under equilibrium conditions, the activity of eachdaughter is equal to the activity of radon. A condition of equilibrium can be approached in atightly enclosed volume, such as a poorly vntilated room.
In this analysis doses to the critical lung tissue, the bronchial epithelium, from inhalation ofshort-lived radon daughters are computed on the basis of 100 percent indoor exposure in anadequately ventilated room ising a dose conversion factor of 0.625 mrem/yr indoors per pCi/m& ofRn-222 in outdoor air. Tho basis upon which the staff has relied for this dose conversionfactor consists of three major component parts as follow:
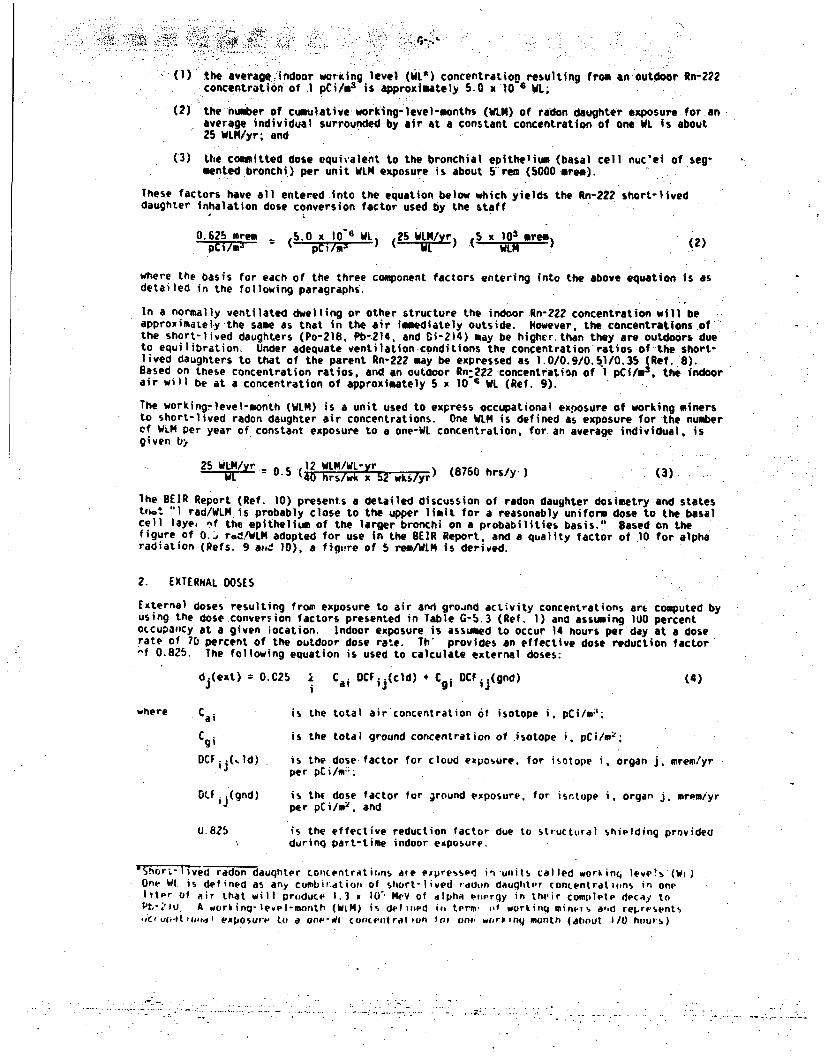
e(1) th average indoor working level (WL*) concentratiov resulting from an outdoor Rn-222'concentration of .1 pCi/n 3 .is approximately 5.0 x 10 6 WL;
(2) the number of cumulative working-level-months (WLN) of radon daughter exposure for anaverage individual surrounded by air at a constant concentration of one WL is about25 WLN/yr; and
(3) Lthe committed dose equivalent to the bronchial epithelium (basal cell nuc'ei of seg-mented bronchi) per unit WLM exposure is about 5 rem (5000 area).
These factors have all entered into the equation below which yields the: Rn-222 short-liveddaughter inhalation dose conversion factor used by the staff
0.625 mem 5.0 x 10O WL 25 WLM/yr ,5 x 103 are)
pCi/ma• = • p i/s w • WIN
where the basis for each of the three component factors entering into the above equation is asdetailed in the following paragraphs.
In a normally ventilated dwelling or other structure the indoor Rn'222 concentration will beapproximately the same as that in the air imdiately outside. However, the, concentrations ofthe short-lived daughters (Po-218, P11-214, and Ci-214) may be higher than they are outdoors dueto equilibration. Under adequate ventilation-conditions the concentration ratios of the short-lived daughters to that of the parent Rn-222 may be expressed as 1.0/0.9/0.51/0.35 (Ref. 8).Based on these concentration ratios, and an.outOoor Rn-222 concentration of 1 pCi/ur", the indoorair will be at a concentration of approximately 5 x 10 " WL (Ref. 9).
The working-level-month (WLM) is a unit used to express occupational exposure of working minersto short-lived radon daughter air concentrations. One WLM is defined as exposure for the numbercf WLM per year of constant exposure to a one-WL concentration, for an average individual, isgiven b>
25 WLM/yr 0 12 WLM/WL-yr (8760 hrs/y)W L = . 40 hrs/w k x b 2 w kS /y ) ( 7 0h/yy . " 3 )
The BEIR Report (Ref. 10) presents a detailed discussion of radon daughter dosimetry and statestviat "1 rad/WLM is probably close to the upper limit for a reasonably uniform dose to the basalcell laye, nf the epithelium of the larger bronchi on a probabilities basis." Based on thefigure of 0., r,./WLM adopted for use in the BEIR Report, and a quality factor of 10 for alpharadiation (Refs. 9 aii 10). a fiqasre of 5 rem/WIM is derived.
2. EXTERNAL DOSES
External doses resulting from exposure to air and ground activity concentrations art computed byusing the dose conversion factors presented in Table G-5.3 (Ret. 1) and assuming 100 percentoccupancy at a given iocation. Indoor exposure is assumed to occur 14 hours per day at a doserate of 70 percent of the outdoor dose rate. Th" provides an effective dose reduction factor"f 0.825. The following equation is used to calculate external doses:
d.(ext) 0.C25 I Cai DCF ij(cld) * C i DCrij(gnd) (4)
where . Ca is the total airconcentration of isotope i, pCi/m:;
C gi is-the total ground concentration of isotope i. pCi/m:;
DCFij(,ld) is the dose-factor for cloud exposure, for isotope i, organ j, mremyrper pCi/ma;
DLFij (gnd) is th( dose factor for ground exposure, for isotope i, organ j. mrm/yrper pCilmr; and
U0825 is the effective reduction factor due to structural shielding providedduring part-time indoor exposure.
"Shor~mved radon daughter concentrations ate expressetd in -units called workinc4 levels (WIOne WL is defined as any combiradtiOrn of Short-lived radon dauqhter (onLentratilfns in oneliter of air that will produce 1.3 x 10"' NeV of alpha oei.rgy in their complete decay toPt-4'iU. A working- levPl-month (WiN) i% deflnd iii term., of workinq minv., arnd represents,Cf ultit 141dI exposur' to a one-wil tcontcnt rat ?on o•o une, wor innq muntn (about I /0 hours)
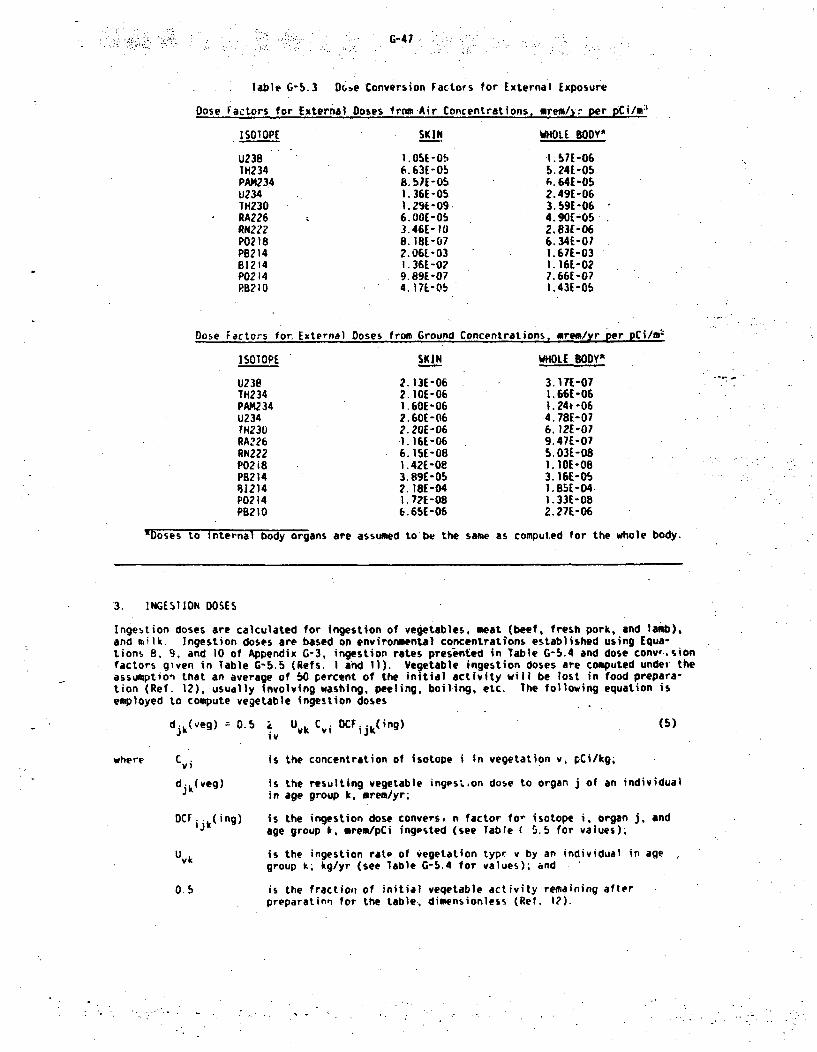
G-471 .:
table G-5.3 Do=e Conversion Factors for External Exposure
Dose Factors for External Doses from Air Concentrations, mrem/yr per pCi/m:'
ISOTOPE SKIN WHOLE BODY"
U238 1.05E-05 1.57E-06TH234 6.63E-05 5.24E-05PAM234 8.57[-05 A.641-05U234 1. 36E-05 2.49E-061H230 1.29E-09 3.59E-06RA226 6.00E-05 4.90E-05RN2Z2 3.46E-10 2.83E-06P0218 8.18E-07 6.34E-07PB214 2.06-E03 1.67E-03B1214 1.36E-02 1.16E-02P0214 9.89E-07 7.66E-07PB21O 4.17L-05 1.43[-05
Dose Factors for External Doses from Ground Concentrations, arem/yr per pCi/ml
ISOTOPE SKIN WHOLE BODY"
U238 2.13E-06 3.17E-07TH234 2.10E-06 1.66E-06PAM234 1.60E-06 .24t-06U234 2.60E-06 4.78E-07TH230 2.20E-06 6.12E-07RA226 1.16E-06 9.47E-07RN222 6.15E-08 5.03E-08P02i8 1.42E-De 1.10E-08PB214 3.89E-05 3.16E-0681214 2.18E-04 1.81E-04P0214 1.72E-08 1.33E-08PB210 6,65E-06 2.27E-06
RDoses to internal body organs are assumed to be the same as comput.ed for the whole body.
3. !NGES!ION DOSES
Ingestion doses are calculated for ingestion of vegetables, meat (beef, fresh pork, and lamb),and milk. Ingestion doses are based on environmental concentrations established using Equa-tions 8. 9, and 10 of Appendix G-3, ingestion rates presented in Table G-5.4 and dose conv'-,sionfactors given in Table G-5.5 (Refs. I and 11). Vegetable ingestion doses are computed under theassumption that an average of 60 percent of the initial activity will be lost in food prepara-tion (Ref. 12), usually involving washing, peeling, boiling, etc. The following equation isemployed to compute vegetable ingestion doses
djk(veg) = 0.5 Uvk Cvi DCF ijk(ing) (5)iv
where Cvi is the concentration of isotope i in vegetation v, pCi/kg;
djo(veg) is the resulting vegetable ingpst.on dose to organ j of an individualin age group k. mrem/yr;
OCfi.k(ing) is the ingestion dose convers. n factor fo" isotope i, organ j, andage group i, mrem/pCi ingested (see Table ( 5.5 for values);
Uvk is the ingestion rate of vegetation typr v by an individual in agegroup k; kg/yr (see Table G-5.4 for values); and
0.5 is the fractioet of initial veqetable activity remaining afterpreparatinn for the table, dimensionless (Ree. I?).
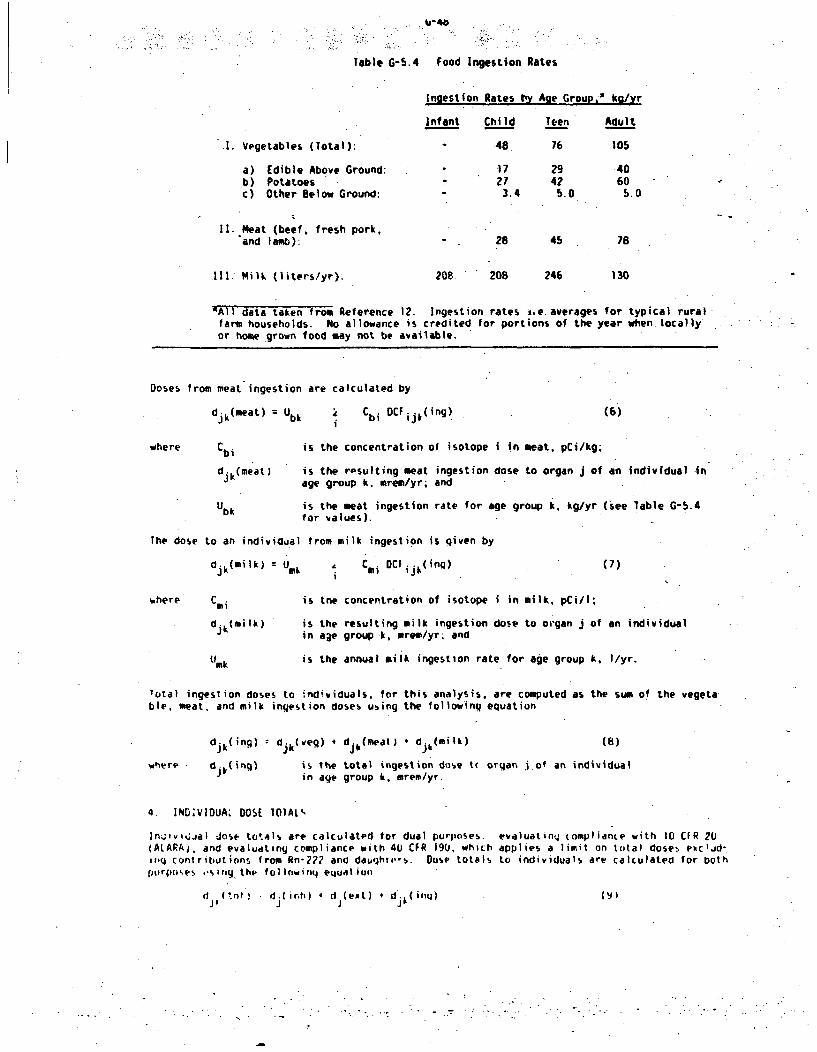
Table G-5.4 Food Ingestion Rates
.1. Vegetables (Total):
a) Edible Above Ground:b) Potatoesc) Other Below Ground:
11. Neat (beef, fresh pork,and lamb):
Ingestion Rates by
Infant Child
48
17* 27
3.4
Age Group.' kg/yr
Teen Adult
76 105
29 .404? 605.0 5.0
28 45 78
Ill. Milk (liters/yr): 208. 208 246 130
"All data taken from Reference 12• Ingestion rates .e averages for typical ruralfarm households. No allowance is credited for portions of the year when. locallyor home grown food may not be available.
Doses from meat ingestion are calculated by
djk(meat) = Ubk C bi DCFij (ing)i
(6)
where Cbi is the concentration of isotope i in meat. pCi/kg;
d jk(meat) is the rasulting meat ingestion dose to organ j of an individual inage group k. mrem/yr; and
Ubk is the meat ingestion rate for age group k, kg/yr (see Table G-5.4
for values).
The dose to an individual from milk ingestion is given by
djk(milk) = Umk Cmi DC ing) (7)tijk -
where Cmi
djk(milk)
is tne concentration of isotope i in milk, pCi/I:
is the resulting milk ingestion dose to organ j of an individualin age group k, mrem/yr. and
is the annual milk ingestion rate for age group k, I/yr.
Total ingestion doses to ind'viduals, for this analysis, are computed as the sum of the vegeta-ble, meat, and milk ingestion doses using the following equation
djk(ing) -djk(veg) * dj,(meat) * djk(milk) (8)
where djý (ing) is the total ingestion dose t( oryan j of an individualin age group k, mrem/yr.
4. IND;VIDUA. DOS IOIALIý
lnz.viWjal Jose totals are calculated for dual purposes. evaluatinq compliance with 10 CFR 20(ALARA), and evaludting compliance with 40 CFR 190, which applies a limit on total doses exclid-iq contrihtutions from Rn-272 arid daughti-s. Dose total% to individuals are calculated for bothpvrpoees ,slr rg.thp follrowirer equation
(dj (tnt • d. inh) * d j(ext) * djk(iql (9)
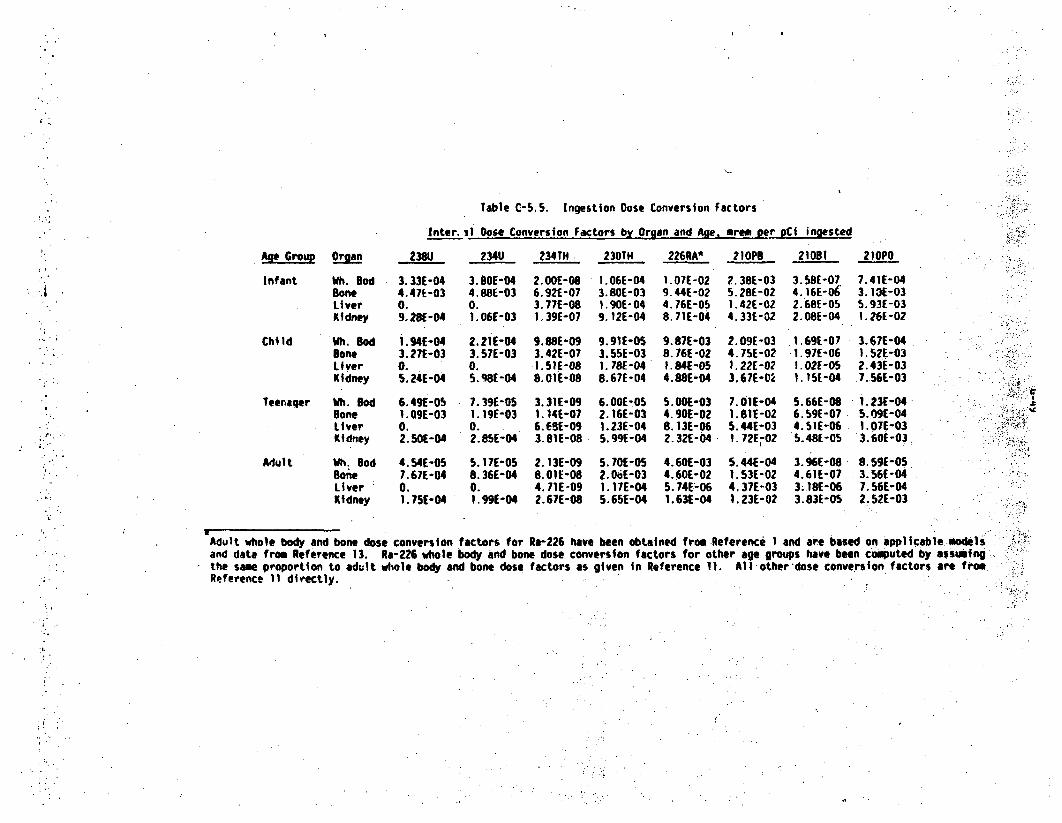
Table C-S.5. Ingestion Dose Conversion Factors
Inter. aD Dose Conversion Factors by Organ and Age, area per pCi ingested
ANe Group
Infant
Organ
MS. BodBoneLiverKidney
Child Wh. BodBoneLiverKidney
Teenaqer Wh. BodBoneLiverKidney
Adult Wh. SodBoneLiverKidney
238U
3. 33E-044. 47E-030.9. 28E-04
i.94E-043.27E-030.S.24E-04
6.49E-OS1.09E-030.2. SOE-04
4. 54E-OS7.67E-040.1.75E-04
234U
3.80E-044.88E-030.1.06E-03
2. 21E-043.57E-030.S. qeE-04
7. 39E-051. 19E-030.2. B5E-04
S.17E-OSB. 36E-040.1.99E-04
234TH
2. 00£-0O6.92E-073.77E-081,39E-07
9.88E-093.42E-07!.51£-088.01£-08
3.31E-091. 14E-076.69E-093.81E-08
2.13E-098. OlE-084.71E-092.67E-08
230TH
1.06E-043. OE-031. 90E- 049. 12E-04
9.91E-053.55E-031. 78E-048.67E-04
6. 00E-052. 16E-031.23E-045. 99E-04
5.70E-OS2.06E-031. 1IE-045.65E-04
226RA*
1.07E-029.44E-024.76E-058. 71E-04
9.87E-038. 76E-02I. 84E-054.88E-04
S. OOE-034.90E-028.13E-062.32E-04
4.60E-034.60E-02S. 74E-061.63E-04
21OPB
2. 38E-035. 28E-021. 42E-O24.33E-02
2.09[-034.75E-02i.22[-023.67E-02
7.0 1E-041.81E-025.44E-031.72E,-02
S. 44E-041.53E-024.37E-031.23E-02
21081
3.58E-074.16E-062.68E-052. 08E -04
1. 69E-071.97E-06I. 02E-051. 15E-04
5.66E-086.59E-074.5 1E-065.48E-05
3.96E-084.61E-073..l8E-063.83E-05
210PO
7.4)E-043. 0E-035.931-031.26E-02
3.67E-041.52E-032.43E-037. 56E-03
1. 23E-04S. 09E-041.071-033.60E-03.
8.59E-053. 56£-047.56E-042.52E-03
C
I .
Adult whole body and bone dose conversion factors for Ra-226 have been obtained from Reference I and are based on applicablemodels"i 4.and data from Reference 13. Ra-226 whole body and bone dose conversion factors for other age groups have been computed by assuming',.the same proportion to adult whole body and bone dose factors as given in Reference 11. All other dose conversion factors are from,Reference 11 directly.
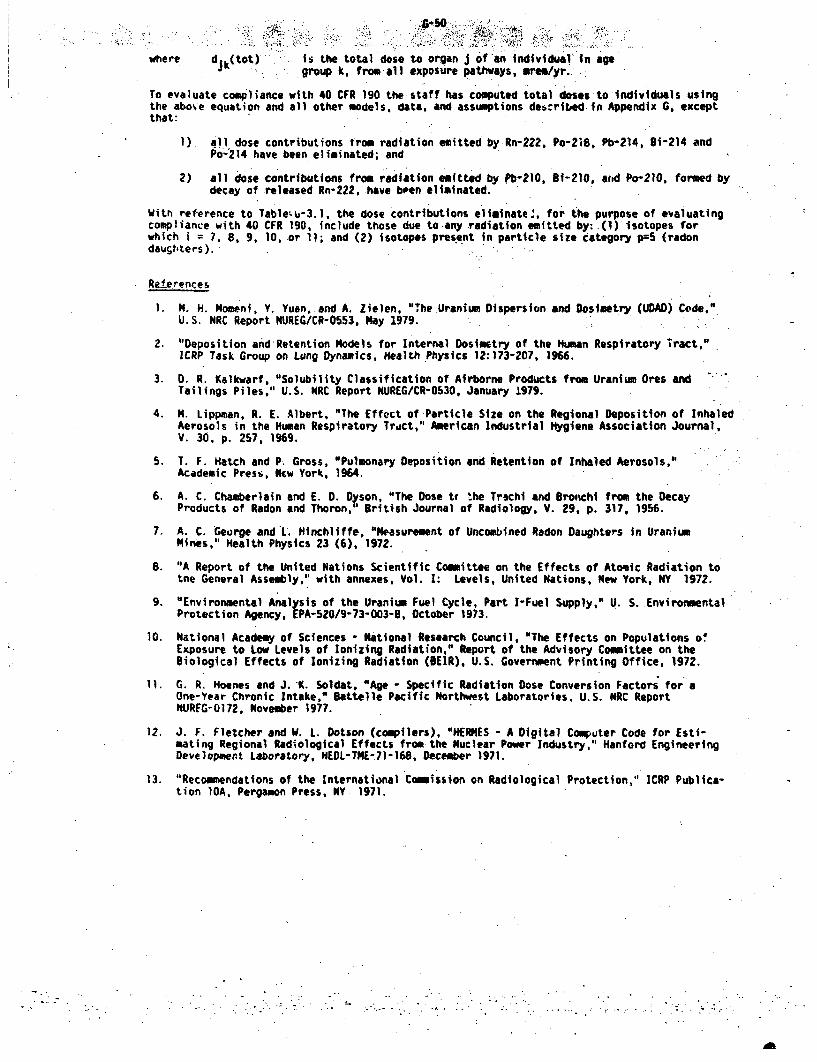
where djk(tot) is the total dose to-organ J ofan individual in agekgroup k, from all exposure pathways, ores/yr.
To evaluate compl iance with 40 CFR 190 the staff has computed total doses to individuals usingthe abo,e equation and all other models, data, and assumptions described in Appendix G, exceptthat:
1). al1 dose contributions from radiation emitted by Rn-222, Po-2i8, Pb-214, B-214 andPo-214 have been eliminated; and
2) all dose contributions from radiation emitted by Pb-210, B1-210, arid Po-210, formed bydecay of released Rn-222, have bpen eliminated.
With reference to Tableiu-3.1, the dose contributions eliminate., for the purpose of evaluatingcompliance with 40 CFR 190, include those due to any radiation emitted by: (1) isotopes forwhich i = 7, 8, 9, 10, or 11; and (2) isotopes present in particle size category p=5 (radondaughlters). .
Relfrences
I. 01. H. Moment, Y. Yuan, and A. Zhelen, "The.Uranium Dispersion and Dosimetry (UDAD) Code,"U.S. NRC Report NUREG/CR-0553, May 1979.
2. "Deposition and•Retention Models for Internal Dosiomtry of the Human Respiratory Tract,"ICRP Task Group on Lung Dynamics, Health Physics 12:173-207, 1966.
3. 0. R. Kalkwarf, "Solubility Classification of Airborne Products from Uranium Ores andTailings Piles," U.S. NRC Report NUREG/CR-0530, January 1979.
4. M. Lippman, R. E. Albert, "The Effect of Particle Size on the Regional Deposition of InhaledAerosols in the Human Respiratory Tract," American Industrial Hygiene Association Journal,V. 30, p. 257, 1969.
5. T. F. Hatch and P. Gross, "Pulmonary Deposition and Retention of Inhaled Aerosols,"Academic Press, New York, 1964.
6. A. C. Chamberlain and E. D. Dyson, "The Dose tt the Trachi and Bronchi from the DecayProducts of Radon and Thoron," British Journal of Radiology, V. 29, p. 317, 1956.
7. A. C. George and L. Hinchliffe, "Measurement of Uncombined Radon Daughters in Uraniummines," Health Physics 23 (6), 1972.
8. "A Report of the United Nations Scientific Committee on the Effects of Atomic Radiation totne General Assembly," with annexes, Vol. I: Levels, United Nations, New York, MY 1972.
9. "Environmental Analysis of the Uranium Fuel Cycle, Part I-Fuel Supply," U. S. EnvironmentalProtection Agency, EPA-520/9-73-003-8, October 1973.
10. National Academy of Sciences - National Research Council, "The Effects on Populations o!Exposure to Low Levels of Ionizing Radiation," Report of the Advisory Comittee on theBiological Effects of Ionizing Radiation (BEIR), U.S. Government Printing Office, 1972.
11. G. R. Hoenes and J. K. Soldat, "Age - Specific Radiation Dose Conversion Factors for-aOne-Year Chronic Intake," Battelle Pacific Northwest Laboratories. U.S. NRC ReportNUREG-0172, November 1977.
12. J. F. Fletcher and W. L. Dotson (compilers), "HERMES - A Digital Computer Code for Esti-mating Regional Radiological Effects from the Nuclear Power Industry," Hanford EngineeringDevelopmert Laboratory, HEDL-TRE-7)-168, December 1971.
13. "Recommendations of the International Comission on Radiological Protection," ICRP Publica-tion 10A, Pergamon Press, NY 1971.
........ .... .................. .
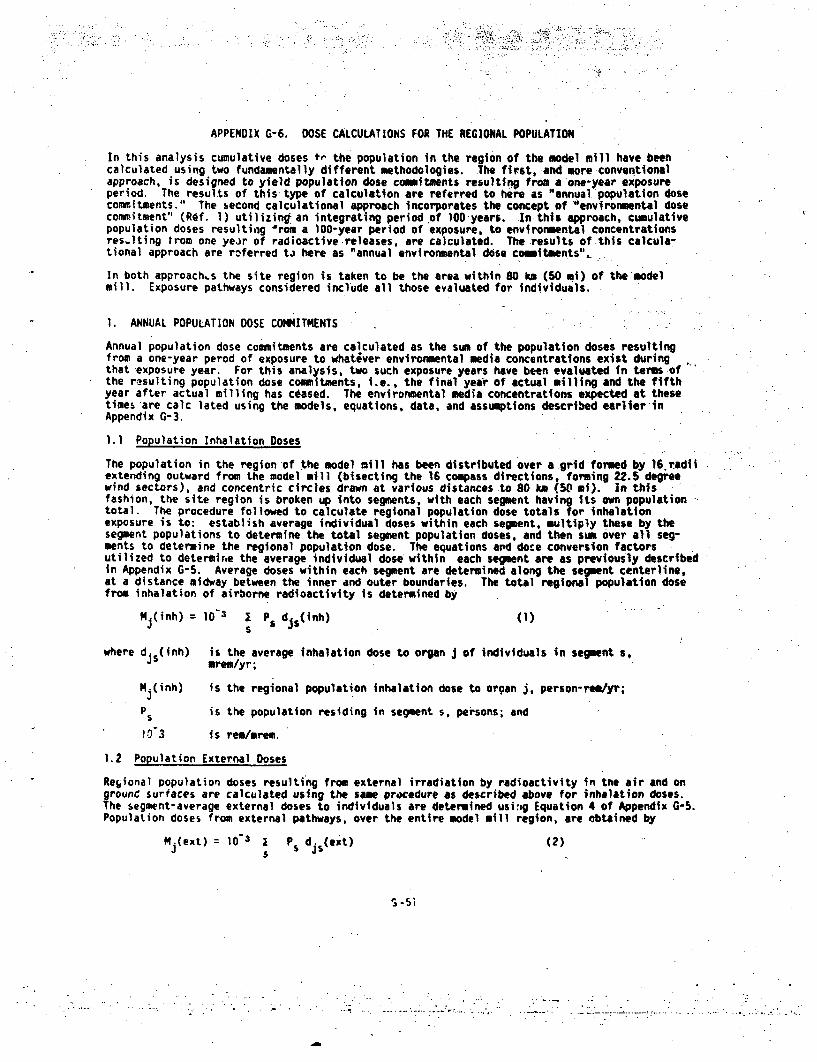
APPENDIX G-6. DOSE CALCULATIONS FOR THE REGIONAL POPULATION
In this analysis cumulative doses te the population in the region of the model mi11 have beencalculated using two fundamentally different methodologies. The first, and more conventionalapproach, is designed to yield population dose commitments resulting from a on-year exposureperiod. The results of this- type of calculation are referred to here as "annual population dosecommitments." The second calculatlonal approach incorporates the concept of "environmental dosecommwitment" (Ref. 1) utilizingt an Integrating period of 100 years. In this approach, cumulativepopulation doses resultig Irom a 100-year period of exposure, to environmental concentrationsres-lting trom one year of radioactive releases, are calculated. The results of this calcula-tional approach are referred to here as "annual environmental dose comitments",
In both approachs the site region is taken to be the area within 80 km (50 mt) of the modelmill. Exposure pathways considered include all those evaluated for individuals.
1. ANNUAL POPULATION DOSE COMMITNENTS
Annual population dose commitments are calculated as the sum of the population doses resultingfrom a one-year perod of exposure to whativer environmental media concentrations exist duringthat exposure year. For this analysis, two such exposure years have been evaluated in terms ofthe resulting population dose commitments, i.e., the final year of actual milling and the fifthyear after actual milling has ceased. The environmental media concentrations expected at thesetimes are calc lated using the models, equations, data, and assumptions described earlier inAppendix G-3.
1.1 Population Inhalation Doses
The population in the region of the model mill has been distributed over a grid formed by 16.jadilextending outward from the model mill (bisecting the 16 compass directions, forming 22.5 degreewind sectors), and concentric circles drawn at various distances to 80 km (50t m). In thisfashion, the site region is broken up into segments, with each segment having its own populationtotal. The procedure followed to calculate regional population dose totals for inhalationexposure is to: establish average individual doses within each segment, multiply these by thesegment populations to determine the total segment population doses, and then sum over all seg-ments to determine the regional population dose. The equations ard dote conversion factorsutilized to determine the average individual dose within each segment are as previously describedin Appendix G-5. Average doses within each segment are determined along the segment centerline,at a distance midway between the inner and outer boundaries. The total regional population dosefrom inhalation of airborne radioactivity is determined by
MN(inh) : 103 I Ps d js(inh) (1)S ,
where d js(inh) is the average inhalation dose to organ j of individuals in segment s,mrem/yr;
1.(inh) is the regional population inhalation dose to oroan J, person-rem/yr;
Ps is the population residing in segment s, persons; and
[0 3 is rem/mrem.
1.2 Population External Doses
Regional population doses resulti ng from external irradiation by radioactivity in the air and onground surfaces are calculated using the same procedure as described above for inhalation doses.The segment-average external doses to individuals are determined usi:sg Equation 4 of Appendix G-5.Population doses from external pathways, over the entire model mill region, are obtained by
MN(ext) = 10"3 I Ps d js(ext) (2)s
S-51
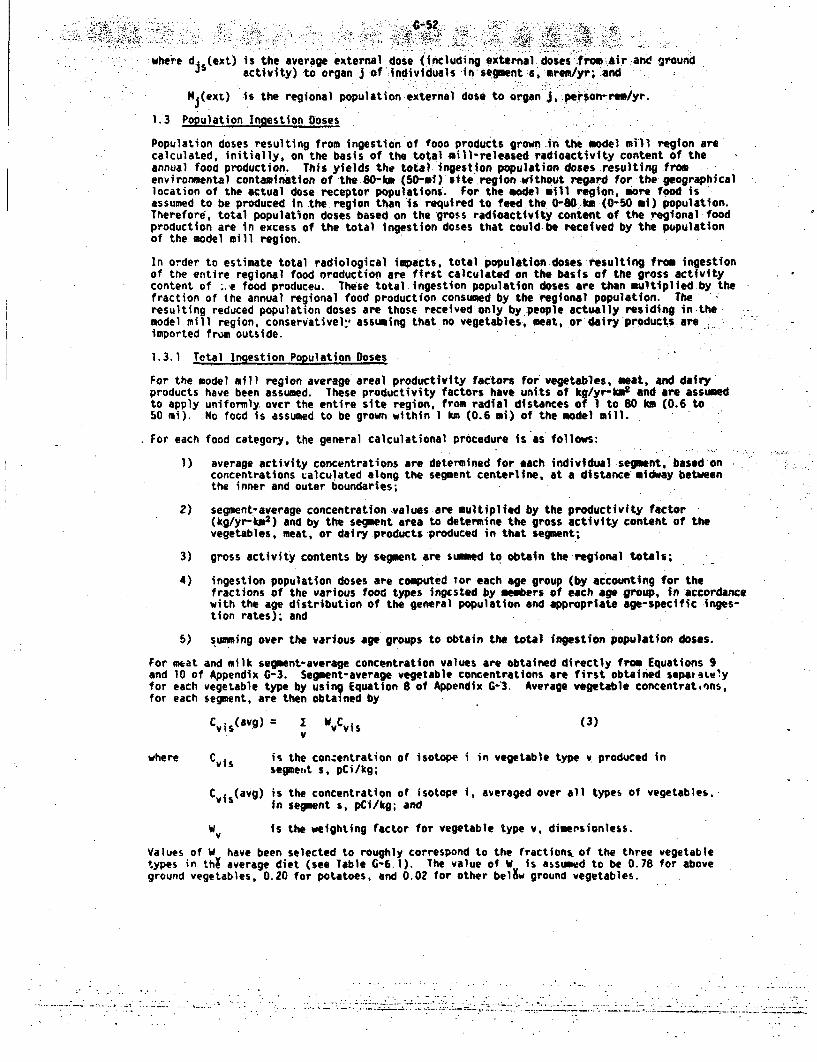
where d (ext) is the average external dose (including external doses :from*air and ground.s activity) to organ J of individuals insegment is rem/yr; and
R 4(ext) is the regional population external dose to organ J, person rem/yr.
1.3 Population Ingestion Doses
Population doses resulting from ingestion of fogo products grown..in the model mill region arecalculated, initially, on the basis of the total mill-released radioactivity content of theannual food production. This yields the total ingestion population doses resulting fromenvironmental contamination of the 80-km (50-mi) site region without regard for the geographicallocation of the actual dose receptor populations. For the model mill region, more food is 'assumed to be produced in the region than is required to feed the 0-80.km (0-50 mO ) population.Therefore, total population doses based on the gross radioactivity content of the regional foodproduction are in excess of the total ingestion doses that could.be received by the pupulationof the model mill region.
In order to estimate total radiological impacts, total population doses resulting from ingestionof the entire regional food oroduction are first calculated on the basis of the gross activitycontent of ..e food produceu. These total ingestion population doses are than multiplied-by thefraction of the annual regional food production consumed by the 'regional population. Theresulting reduced population doses are those received only by people actually residing in themodel mill region, conservativel, assuming that no vegetables., meat, or dairy products areimported from outside.
1.3.1 Total Ingestion Population Doses
For the model mill region average areal productivity factors for vegetables, meat, and dairyproducts have been assumed. These productivity factors have units of kg/yr-km2 and are assumedto apply uniformly, over the entire site region, from radial distances of I to 80 km (0.6 to50 mi). No food is assumed to be grown within 1 kmn (0.6 mi) of the model mill.
For each food category, the general calculational Procedure is as follows:
1) average activity concentrations are determined for each individual segment, based onconcentrations calculated along the segment centerline, at a distance midway betweenthe inner and outer boundaries;
2) segment-average concentration .values are multiplied by the productivity factor(kg/yr-km2) and by the segment area to determine the gross activity content of thevegetables, meat, or dairy products produced in that segment;
3) gross activity contents by segment are summed to obtain the-regional totals;
4) ingestion population doses are computed ?or each age group (by accounting for thefractions of the various food types ingested by members of each age group, in accordancewith the age distribution of the general population and appropriate age-specific inges-tion rates); and
5) sunning over the various age groups to obtain the total ingestion population doses.
For meat and milk segment-average concentration values are obtained directly from Equations 9and 10 of Appendix G-3. Segment-average vegetable concentrations are first obtained sepataLelyfor each vegetable type by using Equation 8 of Appendix G-3. Average vegetable concentratinns,for each segment, are then obtained by
Cvis(aVg) = WvCvis (3)v
where Cvis is the conzentration of isotope i in vegetable type v produced insegmeit s, pCi/kg;
Cvis(avg) is the concentration of. isotope i, averaged over all types of vegetables,.
in segment s, pCi/kg; and
W is the weighting factor for vegetable type v, dismensionless.
Values of W have been selected to roughly correspond to the fractions of the three vegetabletypes in thX average diet (see Table G-6.1). The value of W is assumed to be 0.78 for aboveground vegetables, 0.20 for potatoes, and 0.02 for other bel•w ground vegetables.
. . . . ...... ................ ......' ...-..-. . .. . . . . .
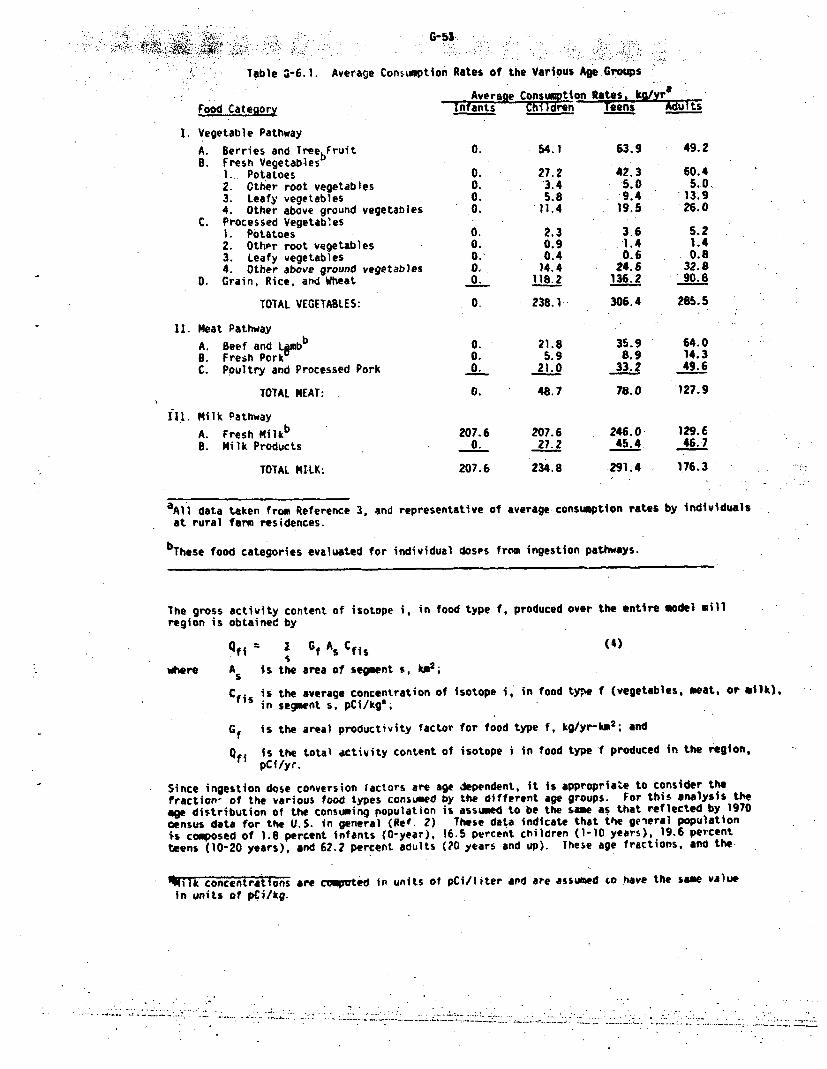
G-53
Table 3-6.1. Average Consumption Rates of the Various Age Groups
Average ConsumptionRates& ka/yrinfants Children Teens AdultsFood Category
1. Vegetable Pathway
A. Berries and Tree bFruitB. Fresh Vegetables
I... Potatoes2. Other root vegetables3. Leafy vegetables4. Other above ground vegetables
C. Processed VegetableS1. Potatoes2. Othor root vegetables3. Leafy vegetables4. Other above ground vegetables
D. Grain. Rice, and Wheat
TOTAL VEGETABLES:
0.
0.0.0.0.
0.0.0.-0.
54.1
27.23.45.8
11.4
2.30.90.4
14.4118.2
63.9
42.35.09.4
19.5
3.61.40.6
24.5136.2
49.2
60.45.0.
" 13.926.0
5.21.40.8
32.890.8
0. 238.1 306.4 285.5
11. Meat PathwayA.B.C.
Beef and LambbFresh PorkPoultry and Processed Pork
0.0.0.
0.TOTAL NEAT:
f1l. Milk Pathway
A. Fresh MilkbB. Milk Products
21.85.9
21.0
48.7
207.6
27.2
234.8
35.98.9
33.2
78.0
246.0
45.4
291.4
64.014.349.6
127.9
129.6
46.7
176.3
207.60.
207.6TOTAL MILK:
aAll data taken from Reference 3, and representative ofat rural farm residences.
average consumption rates by individuals
bThese food categories evaluated for individual doses from ingestion pathways.
The gross activity content of isotope I, in food type f, produced over the entire model millregion is obtained by
Qfj I Gf As Cfts
where As is the area of segment s, lukm;
(4)
Cfts is the average concentration of isotope i, in food type f (vegetables, meat, or milk),in segment s, pCi/kg*'
Gf is the areal productivity factor for food type f, kg/yr-kim2 ; and
Qfj is the total activity content of isotope i in food type f produced in the region,pCi/yr.
Since ingestion dose conversion factors are age dependent, it is appropriate to consider thefraction- of the various food types consumed by the different age groups. For this analysis theage distribution of the consuming population is assumed to be the same as that reflected by 1970census data for the U.S. in general (Ref. 2) These data indicate that the general population*s composed of 1.6 percent infants (0-year), 16.5 percent children (1-10 years), 19.6 percentteens (10-20 years), and 62.2 percent adults (20 years and up). These age fractions, and the
'%ilk concentrations are computed in units of pCI/liter and are assumed co have the same valuein units of pci/kg.
--- . . ... ..- , .,.
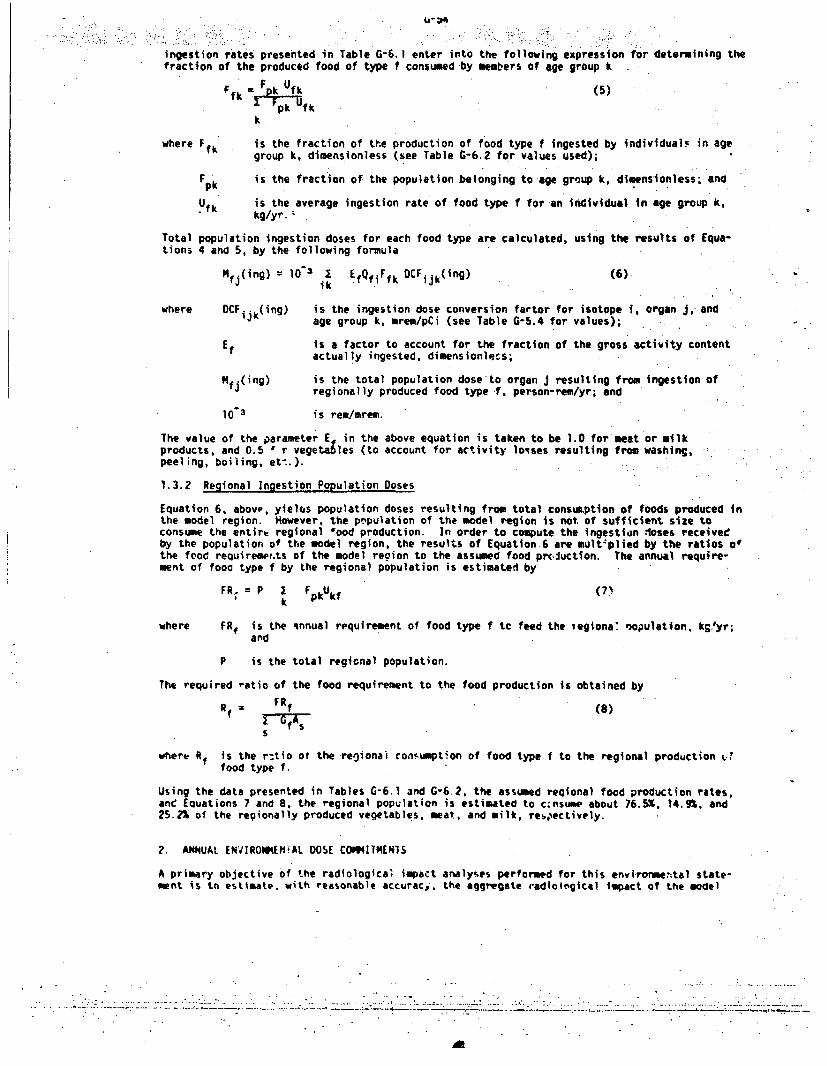
ingestion rates presented in Table G-6.1 enter into the following expression for determining the
fraction of the produced food of type f consumed by members of age group k
f = f (5)" I pk Ufkk
where Ffk is the fraction of the production of food type f ingested by individualF in agegroup k. dimensionless (see Table G-6.2 for values used);
Fpk is the fraction of the population belonging to age group k, dimensionless; and
Ufk is the average ingestion rate of food type f for an individual in age group k,kg/yr.ý
Total population ingestion doses for each food type are calculated, using the results of Equa-tions 4 and 5, by the following formula
Mfj3 (ng) lO"3 ' EfQfiFfk DCFijk('ng) (6)ik
where DCFi.k(ing) is the ingestion dose conversion factor for isotope i, organ J, andage group k, mrem/pCi (see Table G-5.4 for values);
Ef is a factor to account for the fraction of. the gross activity contentactually ingested, dimensionless;
Mfj(ing)j is the total population dose'to organ j resulting from ingestion of
regionally produced food type .f person-rem/yr; and
10 3 is rem/mrem.
The value of the parameter E in the above equation is taken to be 1.0 for meat or milkproducts, and 0.5 * r vegeta.:les (to account for activity losses resulting from washing,peelng, boiling, et-.).
1.3.2 Regional Ingestion Population Doses
Equation 6, above, yielas population doses resulting from total consumption of foods produced inthe model region. However, the po*pulation of the model region is not of sufficient size toconsume the entirt regional food production. In order to compute the ingestion doses receivedby the population of the model region, the results of Equation.6 are multiplied by the ratios o'the food requireaer.ts of the model region to the assumed food prc.uction. The annual require-ment of fooo type f by the regional population is estimated by
FR. = P 1 FpkUkf (7)k
where FRf is the innual requirement of food type f te feed the vegiona' nopulation, kg;.yr;
and
P is the total regional population.
The required -atio of the food requirement to the food production is obtained by
Rf FRf (8)I- = fA
s
where Rf is the r:tio or the reoionai consumption of food type f to the regional production c.1food type f.
Using the data presented in Tables G-6.1 and G-6.2, the assumed reqional food production rates,and Equations 7 and 8, the regional population is estimated to cnsume about 76.5%. 14.9%, and25.21 of the regionally produced vegetables, meat, and milk, resb.ectively.
2. ANNUAL ENVIROtWEMIAL DOSE CD917TENTS
A primary objective of the radiological impact analyses performed for this envi-rormental state-ment is tn estimate, with reasonable accuraci, the aggregate radioi-gical ilpact of the model
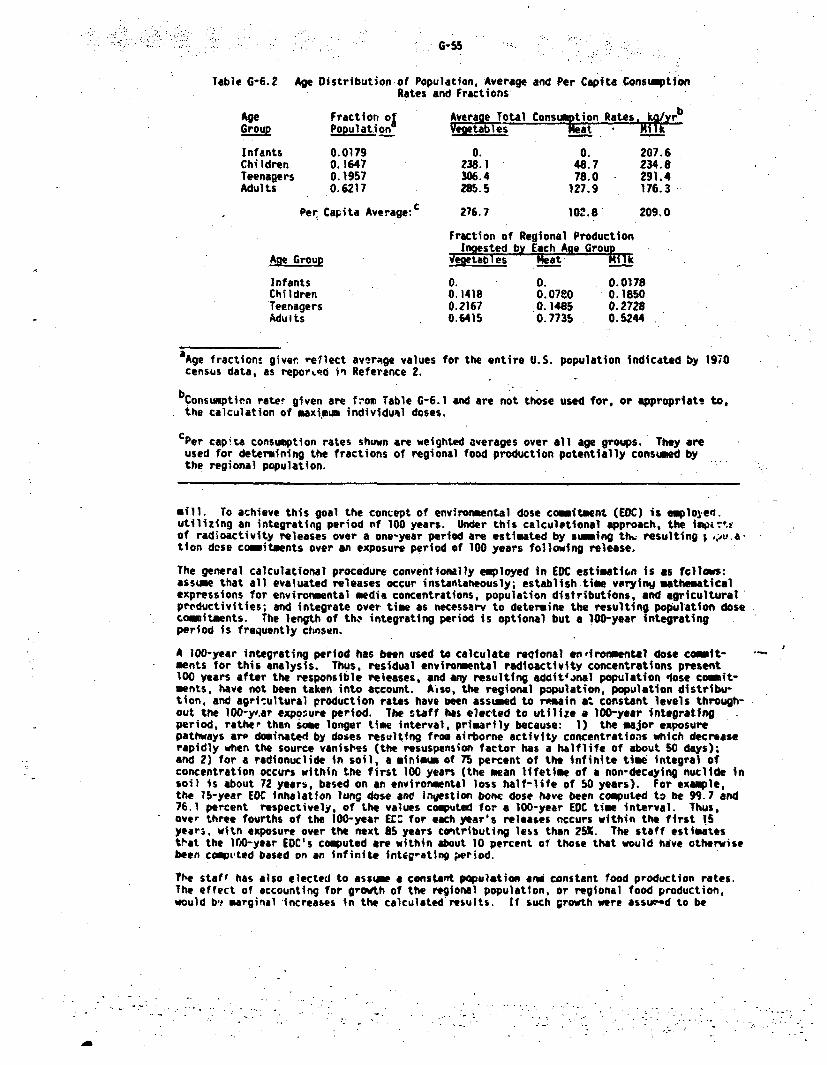
G-SS
Table G-6.2 Age Distribution of Population, Average and Per Capita ConsumtionRates and Fractions
Age Fraction ol Average Total Consumption Rates, ka/yrb
Group Population Vegetables Neat •.. k
Infants 0.0179 0. 0. 207.6Children 0.1647 238.1 48.7 234.8Teenagers 0.1957 306.4 78.0 291.4Adults 0.6217 285.5 127.9 176.3
Per Capita Average:c 276.7 102.8 209.0
Fraction of Regional ProductionIngested by Each Age Group
Age Group Vegetables 1 eat Milk
Infants 0. 0. 0.0178Children 0.1418 0.07o0 0.1850Teenagers 0.2167 0.1485 0.2728Adults 0.6415 0.7735 0.5244
aAge fractions givern reflect av.rnge values for the entire U.S. population indicated by 1970
census data, as reporL.d in Reference 2.
consumptien rate! given are from Table G-6.1 and are not those used for, or appropriate to,
the calculation of maximum individual doses.
Cper capita consumption rates shown are weighted averages over all age groups. They are
used for determining the fractions of regional food production potentially consumed bythe regional population.
mill. To achieve this goal the concept of environmental dose commitment (EDC) is emplojen.utilizing an integrating period of 100 years. Under this calculational approach, the imiuittof radioactivity releases over a one-year period are estimated by suming th,. resulting t ;oLo.a.tion dose commitments over an exposure period of 100 years following release.
The general calculational procedure conventionally employed in EDC estimation is as fllows:assume that all evaluated releases occur instantaneously; establish time varying mathematicalexpressions for environmental media concentrations, population distributions, and agriculturalprcductivities; and integrate over tim as necessarv to determine the resulting population dosecomitments. The length of th., integrating period is optional but a 100-year integratingperiod is frequently chosen.
A 100-year integrating period has been used to calculate reqional entironmental dose comit-ments for this analysis. Thus, residual environmental radioactivity concentrations present100 years after the responsible releases, and any resulting addit'inal population 4ose com•t-ments, have not been taken into account. Aeso, the regional population, population distribu-tion, and agricultural production rates have oeen assumed to remain a. constant levels through-out the l00-yf.ar exposure period. The staff has elected to utilize a 100-year integratingperiod, rather than some longer time interval, primarily because: 1) the major exposurepathways are dominated by doses resulting from airborne activity concentrations which decreaserapidly when the source vanishes (the resuspension factor has a halflife of about 50 days);and 2) for a radionuclide in soil, a minimum of 75 percent of the infinite time integral ofconcentration occurs within the first 100 years (the mean lifetime of a non-decaying nuclide insoil is about 72 years, based on an environmental loss half-life of 50 years). For example,the 15-year EDC inhalation lung dose and ingestion bone dose have been computed to be 9".7 and76.1 percent respectively, of the values computed for a 100-year EDC time interval. Thus,over three fourths of the 100-year ECC for each year's releases cccurs within the first ISyear3. with exposure over the next 85 years contributing less than 25%. The staff estimatesVhat the 100-year EDC's computed are within about 10 percent of those that would have otherwisebeen comptted based on an infinite Integrating period.
?he staff has also elected to assume a constant population and constant food production rates.The effect of accounting for growth of the regional population, or regional food production,would b,. marginal increases in the calculated'results. If such growth were assum'd to be
G-56
proportional to toe projected population of the U.S. as given in Appendix G-8, regional popula-tion and agricultural production would increase by only about 14 percent over a 15-year period,during which over 76 percent of the 100-year EDC would be delivered. The 100-year increase Inregional population, assuming constant relation to the U.S. population, would be about a third.The staff estimates the effect of accounting for such growth would be less than a 10 percentii.crease' in the reported results, and does not consider this variation to be significant inview of the relative uncertainty of other portions of this analysis, and the initial hypothe-.tical nature of the basic site parameters.
In order to calculate 100-year EDC's, based on constant agricultural and population data thevalue of the parameter t in Equations 2, 3, 4, and 6 is artificially set equal to 100.5 years.Thisyields invironmqntal media concentrations equivalent to averages over the period from 100to 101 years, resulting from constant release rates over the entire time. Exposure tn theseconcentrations for a one-year period is, Lnder the assumed conditions, numerically equivalentto exposure over the period from 0 to 101 years to environmental concentrations resulting fromreleases over the period from 0 to 1 year. To Illustrate this equality, consider that exposureover the period from 100 to 101 years, to envirrmental concentrations resulting from constantreleases over the entire time span, consists of exposure to concentrations resulting fromreleases during the discrete time intervals: t = 100 to 101 years (during the year of release);t = 99 to 100 years (average age of 1 year); t = 98 to 99 years (average age of 2 years); .......and t = 0 to 1 year (average age of 100 years). These component parts are identically the sameas those comprising the integral to 100 years following release, of exposures to environmentalmedia concentration. resulting from releases over a one-year period.
References
1. "Environmental Radiation Dose Commitment: An application to the Nuclear Power Industry",U.S. Environmental Protection Agency, EPA-520/4-73-002, 1974.
2. "Environmental Analysis of the Uranium Fuel Cycle, Part II - NuclearPower Reactors," :U.S.Environmental Protection Agency, EPA-520/9-73-003-C, November, 1973..
3. J. F. Fletcher and W. L. Dotson (compilers), "HERMES - A Digital Computer Code for Esti-mating Regional Radiological Eflects from the Nuclear Industry," Hanford EngineeringDevelopment Laboratory, HEOL-TNE-71-168, December 1971.
APPENDIX G-7. HEALTH EFFECTS FROM IRRADIATION
in this document, health effects which could be attributed to'radiation dose commitments associa-ted with uranium milling activity are estimated. These health effects are classified Into twogeneral types: somatic and genetic. The number of health effects is determined by multiplyingthe dose commitment by an appropriate risk estimator. In this appendix the risk estimators whichhave been used in the document .;are presented, and their derivation is discussed.
1. bACKGROUND
Health effects have been calculated in other NRC reports, such as WASH-1400 1 and GESNO.2 Inboth, da.ta were used, with a few changes, from the EIR Report as a basis for calculatinq a rangeof health effects. 3 Risks are given as either "absolute" or "relative." Rplative risk sdefined as "the ratio of the risk in those exposed to the risk to those not exposed (inc.;dencei- exposed populations to incidence in control populations)" (Ref. 3, p. 216). Absolute risk isdefined as the "product of assumed risk times the total population at risk, the numbers of casesthat will result from exposure of a given population" (Ref. 3, p. 213).
In the BEIR Report, health effects were calrulated for four basic cases: (1) an absolute risk,iodel %ith a 30-year plateau; (2) an absolu a risk model with a lifetime plateau; (3) a relativerisk model with a 30-year plateau; and (4) a relative risk model with a lifetime plateau. Sincethe mechanisms of radiation Larcinogenesis may be different for different organs, no one methodfor calculatino health effects from whole body exposure was endorsed in the BEIR Report.
Since the publication of the above reports, a National Academy of Sciences Ad Hoc Committee(NAS) has issued a report entitled "Health Effects of Alpha-Emitting Particles in the RespiratoryTract."4 This recent NAS report suggested two changes in the conclusions of the BEIR Report thatare important to this docuwent. First, it was stated that the absolute risk coefficient for lungmortalities should be increased from 1.3 to 2 mortalltIes/yr/l0 6 person-rem. This finding wasbased on new data on U. S. uranium miners exposed to radon. Second, it was stated that the rela-tive risk method of assessing radiological risks might be more appropriate for estimating lungcancer risks in.human populations. This finding was based in part on lung tumor mortality dataof beagles exposed to alpha irrudiation. it was indicated in a recent paper by Land and Normantk.- the relative risk approach is consistent with human data on lung cancer.s Since the majurityof health efiects associated with uranium milling were expected to be from inhalation of radon(an :lpha emitter), these findings were particularly significant for this document.
Although health effects from radiation have beer studied more thoroughly. than health effectsfrom many other carcinogenic age-ts. there are still many uncertainties in the estimation ofhealth effects from irradiation, as well as uncertainties -- sociated with other carcinogenicagents. These uncertainties are.in part due co the similarity 'f health effects from chronicirradiation to naturally occurring health effects. Typically, long latency periods and very lowprobabilities of octurrence make it difficult to detect any increase in cancers associated With.chronic exposure to low levels of radiation. The approach taken in developing risk estimatorsftr this document has been to place conservative bounds on health effects from the U.S. uraniummilling industry. It is expected that the assumptions and methods for computing health effectsfrorit irradiation will change as ,vxre data, such as the National Academy of Scienres BEIR I11Report, which is to be published In 1979, become available.
2. SOMATIC RISK ESTIMATORS
Somatic. risk estimators were ralculated for cancers of the lung and bone, leukemia, and for wholebody exposure. The risk estimators for all canoers except bone were calculated as the averageof the absolute and relative models. In deriving the different risk estimators, It was assumedthat under eq 'ilibrium conditions of continuous exposure, the number of deaths per lifetime per10 man-rem was equal to the number of deaths per year per 106 man-rem per year. A centralvalue anJ a range of risk est i mators for each type of cancer are given in Tablo G-7.1. r'nnseris-tive upper and lower bounds on risk estimators are also given. Assumptions and sources ot data*For each risk estimator are described below.
G-57
77................................
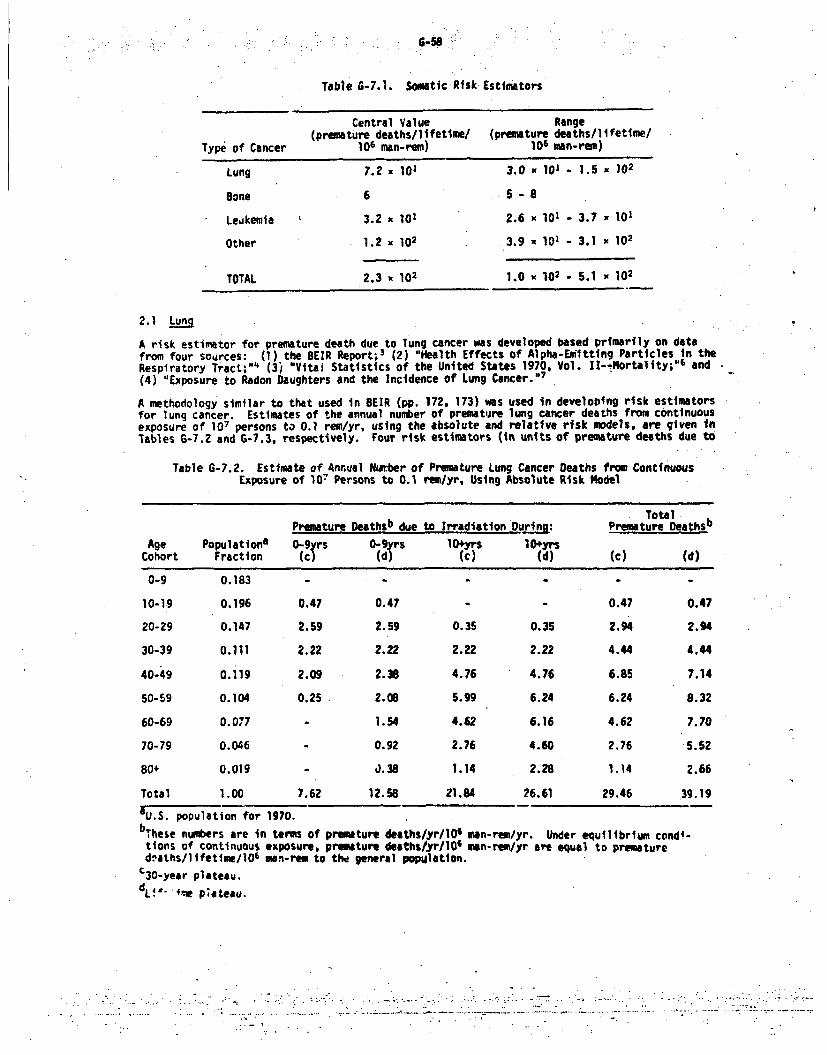
6-58
Table G-7.1. Somatic Risk Estimators
Central Value(premature deaths/lifetlme/
106 mn-rem)
Range(premature deaths/lifetime/
106 man-rem)Type of Cancer
Lung 7.2 x 101 3.0x 101 - 1.5 x 10².
Bone 6 5 -8
Leukemia 3.2 x 101 2.6 x 101 - 3.7 x 101
Other 1.2 x 10² 3.9 x 101 - 3.1 X 10²
TOTAL 2.3 x 10² 1.0 x 10² - 5.1 x 10²
2.1 Lung
A risk estimator for premature death due to lung cancer was developed based primarily on datafrom four sources: (1) the BEIR Report; 3 (2) "Health Effects of Alpha-Ebitting Particles in theRespiratory Tract;"4 (3) "Vital Statistics of the United States 1970, Vol. 1l--Mortality;"N6 and(4) "Exposure to Radon Daughters and the Incidence of Lung Cancer."'
A methodology similar to that used in BEIR (pp. 172, 173) was used in developing risk estimatorsfor lung cancer. Estimates of the annual number of premature lung cancer deaths from continuousexposure of 107 persons to 0.1 rem/yr, using the absolute and relative risk models, are given inTables G-7.2 and G-7.3. respectively. Four risk estimators (in units of premature deaths due to
Table G-7.2. Estimate of Annual Numrber of Premature Lung Cancer Deaths from ContinuousExposure of 107 Persons to 0.1 rm/yr, Using Absolute Risk Model
Total
Premature Deathsb due to Irradiation DurLng: Premature Deathsb
Age Populationa 0 9yrs 0-9 rs 106yrs 104yrsCohort Fraction (c) (c) (d)
0-9 0.183 - - -
10-19 0.196 0.47 0.47 - 0.47 0.47
20-29 0.147 2.59 2.59 0.35 0.35 2.94 2.94
30-39 0.111 2.22 2.22 2.22 2.22 4.44 4.44
40-49 0.119 2.09 2.38 4.76 4.76 6.85 7.14
50-59 0.104 0.25 2.08 5.99 6.24 6.24 8.32
60-69 0.077 - 1.54 4.62 6.16 4.62 7.70
70-79 0.046 0.92 2.76 4.60 2.76 5.52
80+ O.019 - 0.38 1.14 2.28 1.14 2.66
Total 1.00 7.62 12.58 21.84 26.61 29.46 39.19aU.S. population for 1970.
brhese numbers are in terms of premature deaths/yr/106 man-rem/yr. Under equilibrium condi-
tions of continuous exposure, premature deathslyr/106 mn-rem/yr are equal to prematured.naths/l1fetime/10 6 mei-reM to the general population.
C30-year plateau.
dL W- 'me p;ateau.
- . • .: , .;... .. -:.•.." -. ', . : ... " .2 .::: " :;:. .:. , .. _ •:..... •. : :+ . : . ;.-. ;: . . . -..-- . . : i+..:-. . . ... "."".." ..........-.. ...
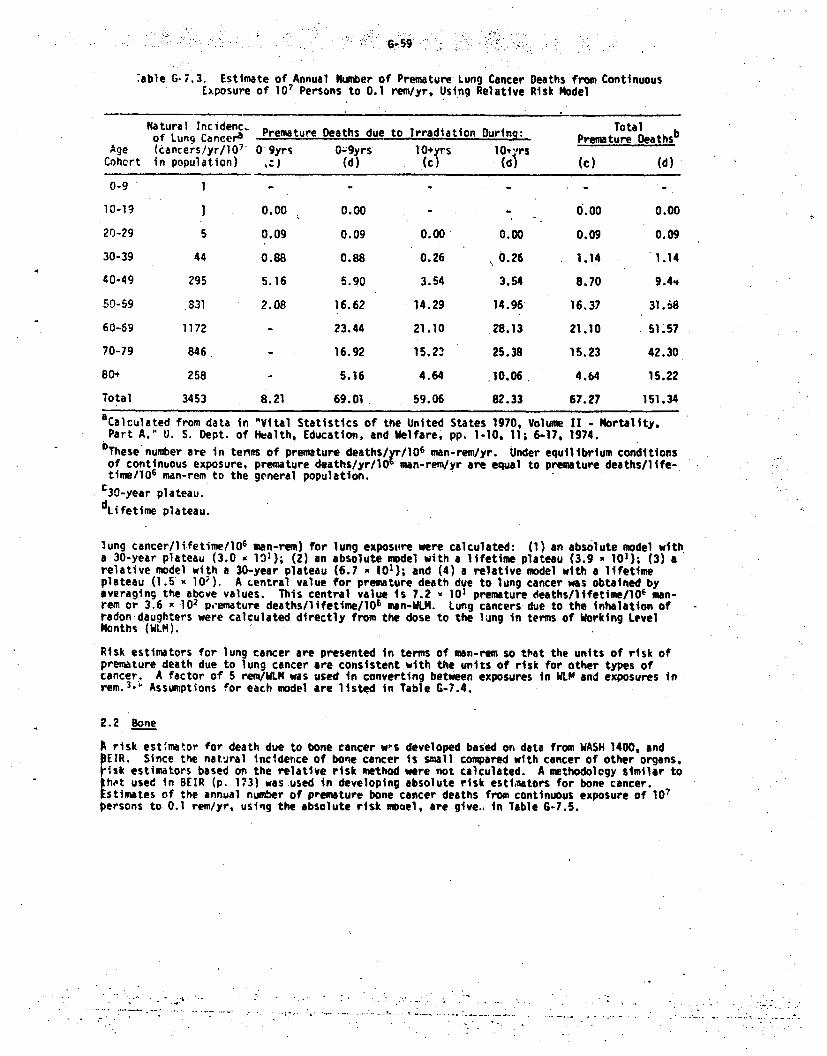
6-59
.able G-7.3. Estimate of Annual Number of Premature Lung Cancer Deaths from ContinuousExposure of 101 Persons to 0.1 rem/yr, Using Relative Risk Model
Natural lncidenc, Totalof Lung Cancera Premature Deaths due to Irradiation During:- Premature Deathsb
Age (cancers/yr/10 0g9yrs 0O9yrs l0+yrs 10',rsCohcrt in population) ,C) (d) (c) (d) (c) (d)
o-g - - - , - -
10-19 1 0.00 0.00 - - 0.00 0.00
20-29 5 0.09 0.09 0.00 0.00 0.09 0.09
30-39 44 0.88 0.88 0.26 0.26 1.14 1.14
40-49 295 5.16 5.90 3.54 3.54 8.70 9.4-
50-59 831 2.08 16.62 14.29 14.96 16.37 31.68
60-69 1172 - 23.44 21.10 28.13 21.10 51.57
70-79 846 r 16.92 15.23 25.38 15.23 42.30
80+ 258 - 5.16 4.64 10.06 4.64 15.22
Total 3453 8.21 69.01 59.06 82.33 67.27 151.34
acalculated from data in "Vital Statistics of the United States 1970, Volume I - Mortality,Part A," U. S. Dept. of Health, Education, and Welfare, pp. 1-10, 11; 6-17, 1974.
bThese'number are in terms of premature deaths/inr/10 6 man-rem/yr. Under equilibrium conditions
of continuous exposure, premature deaths/yr/10 man-rem/yr are equal to premature deaths/life-time/l06 man-rem to the general population.
C30-year plateau.
dLifetime plateau.
lung cancer/lifetime/10 6 man-rem) for lung exposure were calculated: (1) an absolute model witha 30-year plateau (3.0 x 13); (2) an absolute model with a lifetime plateau (3.9 x 101); (3) arelative model with a 30-year plateau (6.7 x 101); and (4) a relative model with a lifetimeplateau (1.5x 10²). A central value for premature death due to lung cancer was obtained byaveraging the above values. This central value Is 7.2 - 101 premature deaths/lifetime/0l man-rem or 3.6 x 10² p,'emature deaths/lifetime/lO man-WLM. Lung cancers due to the inhalation ofradon daughters were calculated directly from the dose to the lung in terms of Working LevelMonths (WLM).
Risk estimators for lung cancer are presented in terms of man-rem so tt'at the units of risk ofpremature death due to lung cancer are consistent with the units of risk for other types ofcancer. A factor of 5 rem/WLM was used in converting between exposures in WLP* and exposures inrem.3.' Assumptions for each model are listed in Table G-7.4.
R.2 Bone
risk est-nvator for death due to bone cancer ws developed based on data from WASH 1400, andEIR. Since the natural incidence of bone cancer is small compared with cancer of other organs,isk estimators based on the relative risk method were not calculated. A methodology similar to
I hot used in BEIR (p. 173) was used in developing absolute risk estimators for bone cancer.stimates of the annual number of premature bone cancer deaths from continuous exposure of 107
persons to 0.1 rem/yr. using the absolute risk mdel, are give.. in Table G-7.5.
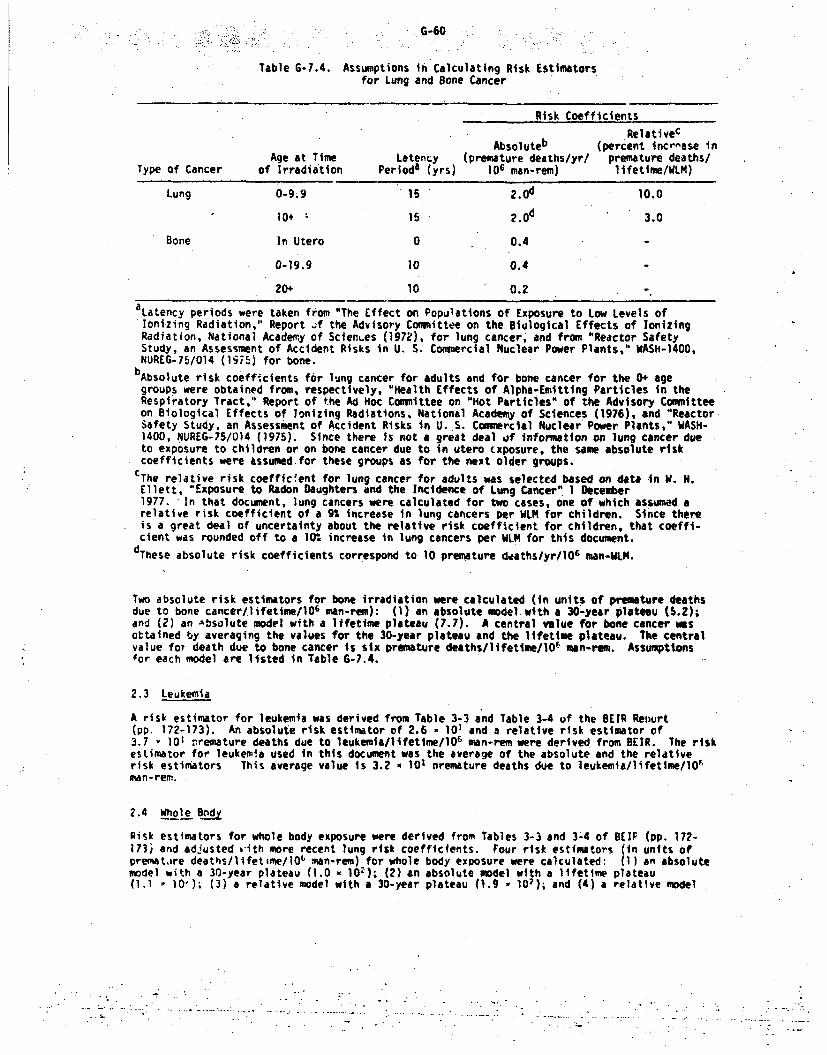
G-60
Table G-7.4. Assumptions in Calculating Risk Estimatorsfor Lung and Bone Cancer
Risk Coefficients
RelativecAbsoluteb (percent incr-ase in
Age at Time Latency (premature deaths/yr/ premature deaths/Type of Cancer of Irradiation Perioda (yrs) 106 man-rem) ltfetlme/WLM)
Lung 0-9.9 1s 2 .0 d 10.0
10+ 15 2 .0 d 3.0
Bone In Utero 0 0.4
0-19.9 10 0.4
20+ 10 0.2
aLatency periods were taken from "The Effect on Populations of Exposure to Low Levels of
Ionizing Radiation," Report ;f the Advisory Committee on the Biological Effects of IonizingRadiation, National Academy of Scieno.es (l972), for lung cancer, and from "Reactor SafetyStudy, an Assessment of Accident Risks in U. S. Coummercial Nuclear Power Plants," WASH-1400,NUREG-75/014 (1g75) for bone.
bAbsolute risk coefficients for lung cancer for adults and for bone cancer for the 0+ age
groups were obtained from, respectively, "Health Effects of Alpha-Emitting Particles in theRespiratory Tract," Report of the Ad Hoc Committee on "Hot Particles" of the Advisory Committeeon Biological Effects of Ionizing Radiations. National Academy of Sciences (1976), and "ReactorSafety Study, an Assessment of Accident Risks in U. S. Comnercial Nuclear Power Plants," WASH-1400, NUREG-75/014 (1975). Since there is not a great deal of information on lung cancer dueto exposure to children or on bone cancer due to in utero cxposure, the same absolute riskcoefficients were assumed for these groups as for the next older groups.
CThe relative risk coefficient for lung cancer for adults was selected based on data in W. H.
Ellett, "Exposure to Radon Daughters and the Incidence of Lung Cancer" I December1977. In that document, lung cancers were calculated for two cases, one of which assumed arelative risk coefficient of a 9% increase in lung cancers per WLM for children. Since thereis a great deal of uncertainty about the relative risk coefficient for children, that coeffi-cient was rounded off to a 10% increase in lung cancers per WLM for this document.
dThese absolute risk coefficients correspond to 10 premature deaths/yr/lO6 man-WLM.
Two absolute risk estimators for bone irradiation were calculated (in units of premature deathsdue to bone cancertlifetime/106 man-rem): (1) an absolute mdel with a 30-year plateau (S.2);and (2) an Absolute model with a lifetime plateau (7.7). A central value for bone cancer msottained by averaging the values for the 30-year plateau and the lifetime plateau. The centralvalue for death due to bone cancer is six premature deaths/lifetime/10. man-rem. Assumptionsfor each model are listed in Table G-7.4.
2.3 Leukemia
A risk estimator for leukemia was derived from Table 3-3 and Table 3-4 of the BEIR Repurt(pp. 172-173). An absolute risk estimator of 2.6 - 101 and a relative risk estimator of3.7 - 101 Premature deaths due to leukemia/lifetime/lO" man-rem were derived from BEIR. The riskestimator for leukemia used in this document was the average of the absolute and the relativerisk estimators This average value Is 3.2 x 101 oremAture deaths due to leukemia/lifettme/l0fman-rem.
2.4 Whole Body
Risk estimators for whole body exposure were derived from Tables 3-3 and 3-4 of BE]F (pp. 172-173) and adJusted v-ith more recent lung risk coefficients. Four risk estimators (in units ofpremat.are deaths/lifetime/106 man-rem) for whole body exposure were calculated: (1) an absolutemodel with a 30-year plateau (1.0 x 10.); (2) an absolute model with a lifetime plateau(1.1 10W); (3) a relative model with a 30-year plateau (1.9 10'); and (4) a relative model
--. 7
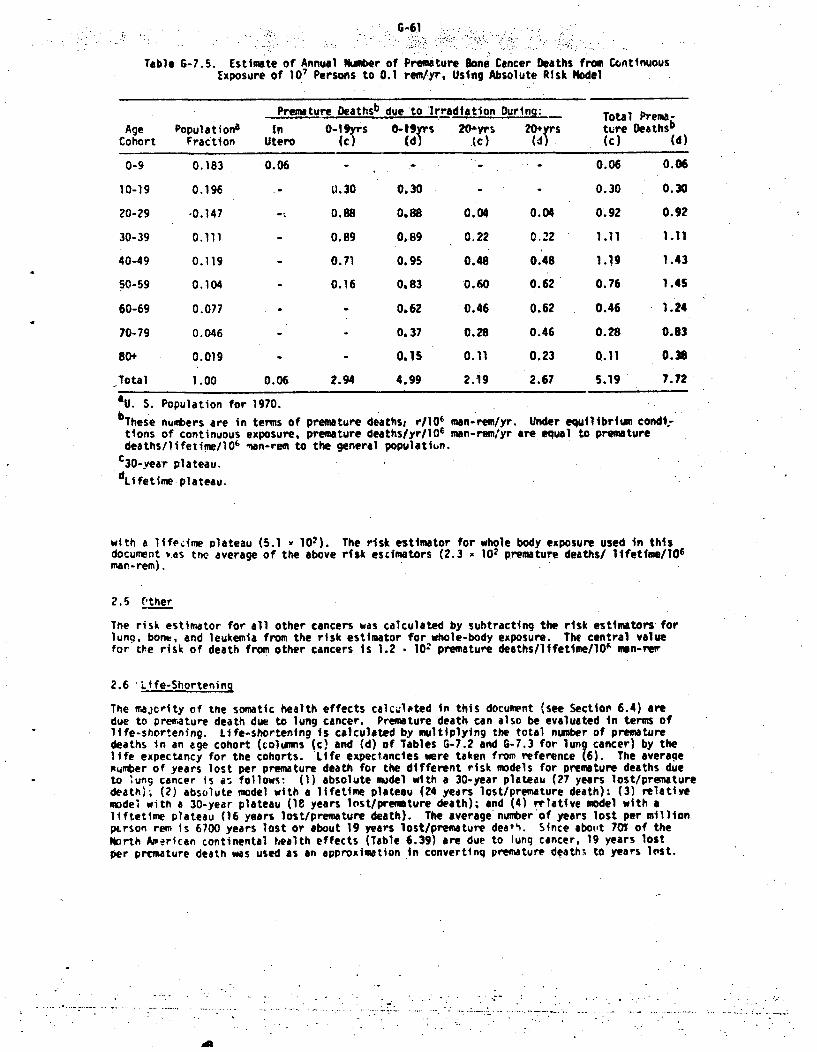
G-61
Table G-7.5. Estimate of Annual Number of Premature Bone Cancer Deaths from ContinuousExposure of 10" Persons to 0.1 rem/yr, Using Absolute Risk Model
Premature Deathsb due to Irradiation During: _ Total Prema-
Age Population' In 0-t9yrs 0-19 s 204yvs 20+yrs ture OeathsbCohort Fraction Utero (c) (d) Wc) (d) (c) (d)
0-9 0.183 0.06 - - - 0.06 0.06
10-19 0.19 - 0.30 0.30 - 0.30 0.30
20-29 -0.147 -• 0.88 0.88 0.04 0.04 0.92 0.92
30-39 0.111 - 0.89 0,89 0.22 0.22 1.11 1.11
40-49 0.119 - 0.71 0.95 0.48 0.48 1.19 1.43
50-59 O.104 " 0.16 0.83 0.60 0.62 0.76 1.45
60-69 0.077 - - 0.62 0.46 0.62 0.46 1.24
70-79 0.046 - - 0.37 0.28 0.46 0.28 0.83
80+ 0.019 - - 0.15 0.11 0.23 0.11 0.38
Total 1.00 0.06 2.94 4.99 2.19 2.67 5.19 7.72
aU. S. Population for 1970.
bThese numbers are in terms of premature deaths, r/1O0
tions of continuous exposure, premature deathsfyr/l0 6
deaths/lifetime/lO' man-rem to the general populatiun.c30-yeair plateau.
dLifetime plateau.
man-rem/yr. Under equilibrium condt;-man-rem/yr are equal to premature
with a lifezime plateau (5.1 - 102). The risk estimator for whole body exposure used in thisdocument v.as tnc- average of the above risk escimators (2.3 - 102 premature deaths/ lifetime/1O6man-rem).
2.5 (Pther
The risk estimator for all other cancers was calculated by subtracting the risk estimators forlung, bone, and leukemia from the risk estimator for whole-body exposure. The central valuefor the risk of death from other cancers is 1.2 • 102 premature deaths/1Ifetime/l V men-rev
2.6 'Life-Shortening
The majcrity of the somatic health effects calculited in this document (see Sectior 6.4) aredue to premature death due to lung cancer. Premature death can also be evaluated in terms oflife-shortening. Life-shortenfng is calculated by multiplying the total number of prematuredeaths in an age cohort (columns (c) and (d) of Tables G-7.2 and G-7.3 for lung cancer) by thelife expectancy for the cohorts. Life expectancies were taken from reference (6). The averagenumber of years lost per premature death for the different risk models for premature deaths dueto lung cancer is as follows: (1) absolute rodel with a 30-year plateau (27 years lost/prematuredeath); (2) absolute model with a lifetime plateau (24 years lost/premature death): (3) relativemodel with a 30-year plateau (18 years lost/premature death); and (4) relative model with aliftetime plateau (16 years lost/premature death). The average number'of years lost per millionptrson rem is 6700 years lost or about 19 years lost/premature deafh. Since abotit 707 of theNorth Aperican continental health effects (Table 6.39) are due to lunq cancer, 19 years lostper prcmature death was used as an approximation in convertinq premature death; to years lost.
7
642,
3. SENETIC RISK ESTIMATORS
Genetic risk estimators fcr this document were taket from GESNO. 2 The GESI4O qenetic riskestimators were based on the geometric mean of the ranqe of values given in Table 4 of BEIR(p. 57). The following genetic risk estimators were used: risk of specific genetic defects(158 accurrences/lifetime/lOW man-rem); risk of defects with comple' etiology (100 occurrences/lifetime/lObf man-rem); total genetic defect risk (25b uccurrencesilifetime/l(If' man-rem). Arange of uncertainty extends a factor of 3.16 above and below this for specific genetic defectsand a factor of 10 for defect: with compleA etiology.
References
1. "Reactor Safety Study, an Assessment of Accident Risks in U.S. Commercial Nuclear PowerPlants," U.S. Nuclear Regulatory Commission, WASH-1400, NUREG-75/014, 1975.
2. "Final Generic Environmental Statement on the Use of Recycle Plutonium in Mixed OxideFuel in Light Water Cooled Reactors," U.S. Nuclear Regulatory Commission, NUREG-00U2,August 1976.
3. "The Effect on Populations of Exposure to Low Levels of Ionizing Radiation," Report of theAdvisory Committee on the Biological Effects of Ionizing Radiation, National Academy ofSciences, 1972.
4. "Health Effects of Alpha-Emitting Particle. in the Respiratory Iract," Report of the AdHocComittee on "Hot Particles" of the Advisory Committee on the Biological Effects of Ionizing
.Radiations, National Academy of Sciences, 1976.
5. C. E. Land and J. E. Norman, "The Latent Periods of Radiogenic Cancers Occurr*ing AnonqJapanese A-Bomb Survivors," International Atomic Energy Agency Symposium on the LateBiological Effects of Ionizing Radiation, Vienna, Austria, 13-17 March 1978.
6. "Vital Statistics of the United States 1970, Volume II - Mortallty, Part A," U.S. Dept. ofHealth, Education and Welfare, pp. 1-10, 1-11, 6-17, 1974.
7. W. H. Ellett, "Exposure to Radon Daughters and the Tncidence of Lung Cancer," AmericanNuclear Society Meeting, December 1, 1977, San Francisco. California.
APPENDIX G-8. CONTINENTAL RADIOLOGICAL IMPACTS
G-63
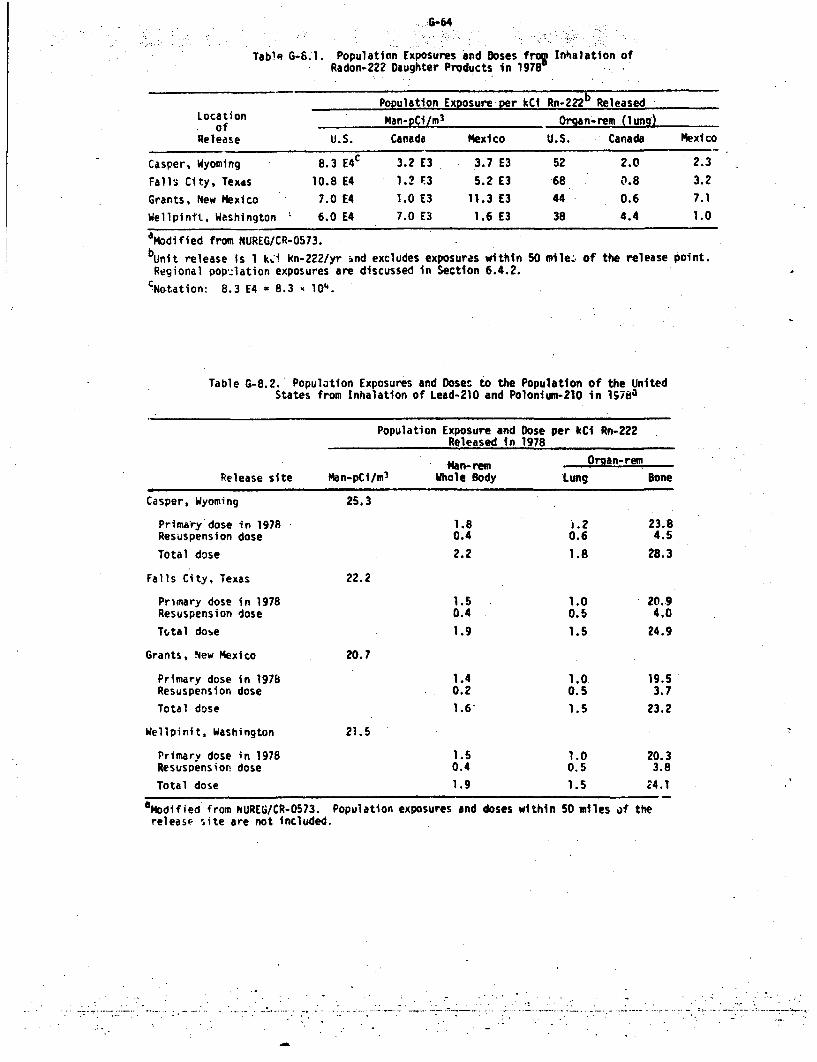
Table G-6.1. Population Exposures and Doses fr2W Inhalation ofRadon-222 Daughter Products in 1978
Population Exposure per kCiLocation Man-pCi/m3
o f "Release U.S. Canada Mexico
Casper, Wyoming 8.3 E4c 3.2 E3 3.7 E3Falls City, Texads 10.8 E4 1.2 F3 5.2 E3Grants, New Mexico 7.0 E4 1.0 E3 11.3 E3Wellpint., Washington 6.0 E4 7.0 E3 1.6 E3aModified from NUREG/CR-0573.bunit release Is I k. kn-222/yr 5nd excludes exposuras withinRegional pop-Aation exposures are discussed in Section 6.4.2.
CNetation: 8.3 E4 - 8.3 x 10⁴.
Rn-222b Released
Organ-.rem ( ung)U.S. Canada
52 2.0
68 0.8
44 0.6
38 4.4
Mexico
2.3
3.2
7.1
1.0
50 mile., of the release point.
Table G-8.2. Population Exposures and Doses to the Population of the UnitedStates from Inhalation of Lead-210 and Polonium-210 in 1 578a
Population Exposure and Dose per kCi Rn-222Released in 1978
Man- rem Organ-rem
Release site Man-pCi/m 3 Whole Body Lung Bone
Casper, Wyoming 25.3
Primary dose in 1978 1.8 1.2 23.8Resuspension dose 0.4 0.6 4.5
Total dose 2.2 1.8 28.3
Falls City, Texas 22.2
Primary dose in 1978 1.5 1.0 20.9Resuspension dose 0.4 0.5 4.0
Tvtal dose 1.9 1.5 24.9
Grants, New Mexico 20.7
Primary dose in 197b 1.4 1.0. 19.5Resuspension dose 0.2 0.5 3.7
Total dose 1.6' 1.5 23.2
Wellpinit, Washington 21.5
Primary dose in 1978 1.5 1.0 20.3Resuspension dose 0.4 0.5 3.8
Total dose 1.9 1.5 24.1
a odified from NUREG/CR-0573. Population exposures and doses within 50 miles of therelease site are not included.
7
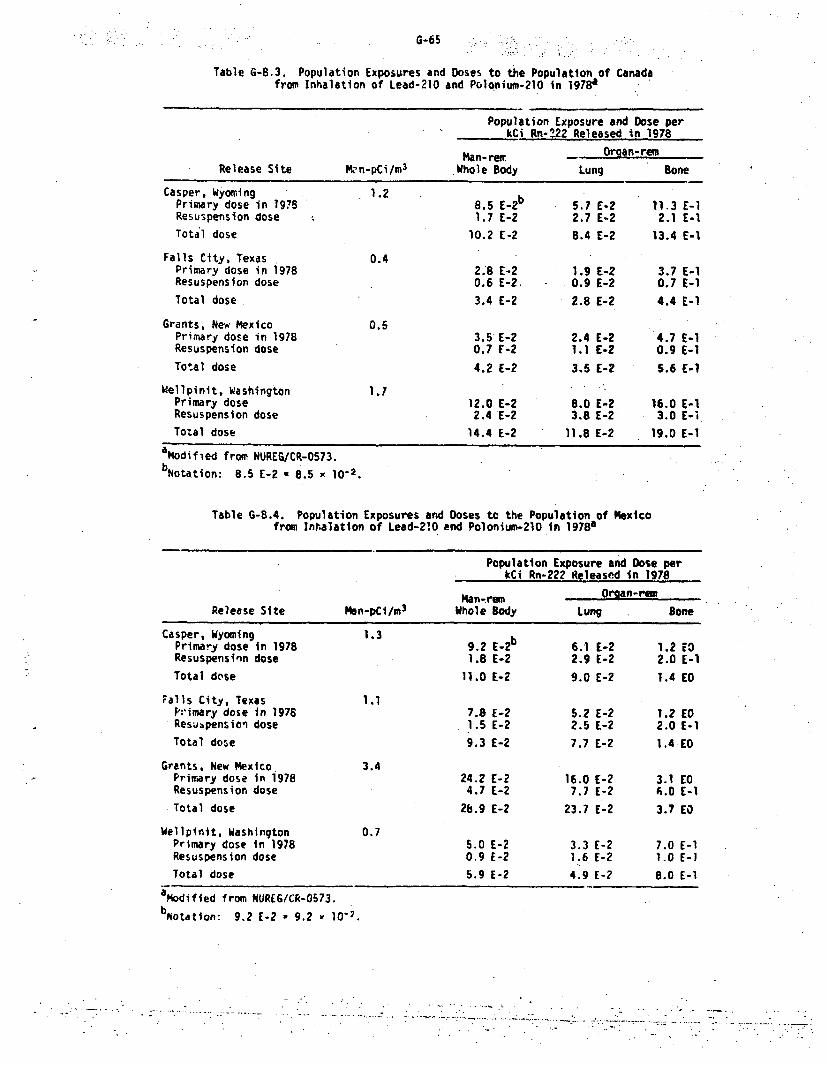
G-65
Table G-8.3. Population Exposures and Doses to the Population of Canadafrom Inhalation of Lead-210 and Polonium-210 in 1978a
Population Exposure and Dose perkCi Rn-222 Released in 1978
Release Site Kn-pCi/m 3 Man-rem.Whole Body
Organ-remLung Bone
Casper, WyomingPrimary dose in 1978Resuspension dose
Total dose
Falls City, TexasPrimary dose in 1978Resuspension dose
Total dose.
Grants, New MexicoPrimary dose in 1978Resuspension dose
Total dose
Wellpinit, WashingtonPrimary dose•Resuspension dose
Total dose
1.28.51.7
10.2
E-2bE-2
E -2
5.7 E-22.7 E-2
8.4 E-2
1.9 E-20.9 E-2
2.8 E-2
0.4
0.5
2.8 E-20.6 E-2.
3.4 E-2
3.5 E-20.7 F-2
4.2 E-2
12.0 E-22.4 E-2
14.4 E-2
11.3 E-12.1 E-1
13.4 E-1
3.7 E-10.7 E-1
4.4 E-1
4.7 E-10.9 E-I
5.6 E-1
16.0 E-13.0 E-i
19.0 E-1
2.41.1
3.5
E-2E-2
E-2
1.78.0 E-23.8 E-2
11.8 E-2aModified from NUREG/CR-0573.
bNotation: 8.5 E-2 a 8.5 x 10⁻².
Table G-8.4. Population Exposures and Doses tc the Population of Mexicofrom Inhalation of Lead-210 and Polonium-210 in 19 78 a
Population Exposure and Dose perkCi Rn-222 Released in 1978
Man-rein Oraan-renRelease Site Men-pCi/m 3 Whole Body Lung Bone
Casper, Wyoming 1.3Primary dose in 1978 9.2 E-2b 6.1 E-2 1.2 FOResuspenslnn dose 1.8 E-2 2.9 E-2 2.0 E-1Total dose 11.0 E-2 9.0 E-2 1.4 EO
Falls City, Texas 1.1Primary dose in 1978 7.8 E-2 5.2 E-2 1.2 EOResubpension dose 1.5 E-2 2.5 E-2 2.0 E-1
Total dose 9.3 E-2 7.7 E-2 1.41C0
Grants, New Mexico 3.4Primary dose in 1978 24.2 E-2 16.0 E-2 3.1 EOResuspension dose 4.7 E-2 7.7 E-2 6.0 E-ITotal dose 28.9 E-2 23.7 E-2 3.7 EO
Wellplnlt, Washington 0.7Primary dose in 1978 5.0 E-2 3.3 E-2 7.0 E-1Resuspension dose 0.9 E-2 1.6 E-2 1.0 E-I
Total dose 5.9 E-2 4.9 E-2 8.0 E-1
aModified from NUREG/CR-0573.
bNotatton: 9.2 E-2 - 9.2 x 10².
.... ............. ..........?. S-~.. .. ~
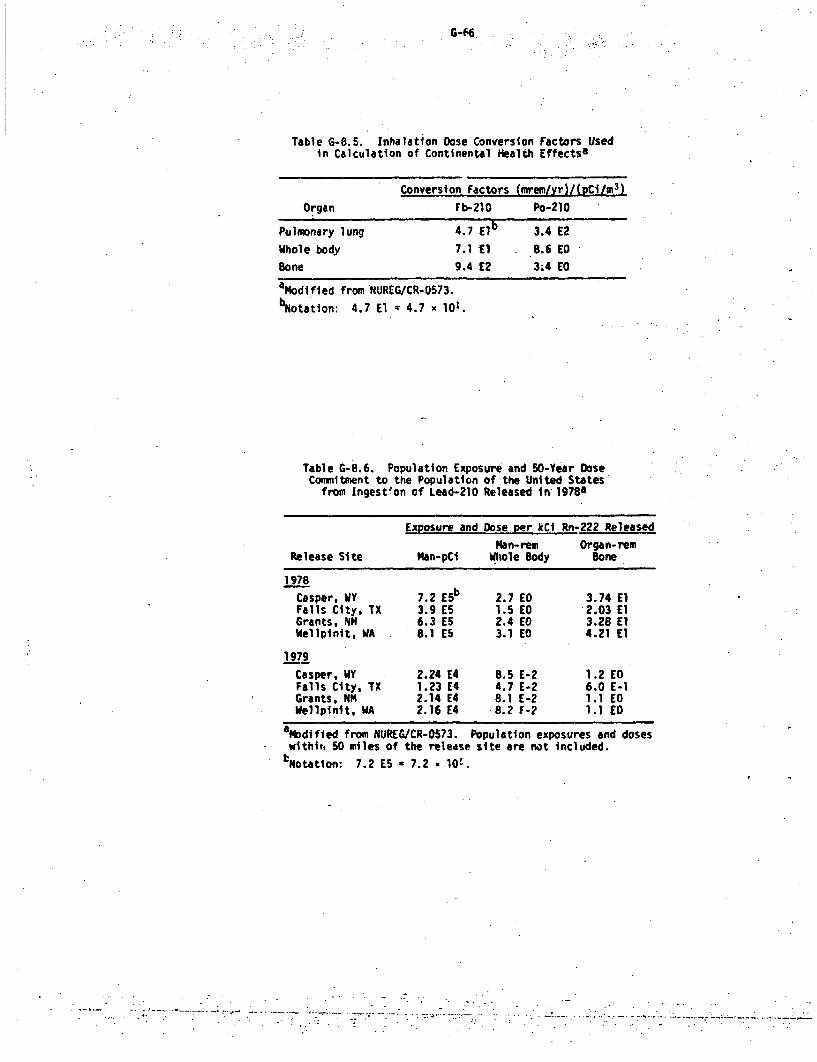
G-66
Table 6-8.5. Inhalation Dose Conversion Factors Usedin Calculation of Continental Health Effectsa
Conversion Factors (mrem/yr)/(pCi/m 3)
Fb-210 Po-210Organ
Pulmonary lung 4.7 Elb 3.4 E2
Whole body 7.1 El 8.6 EO
Bone 9.4 E2 3A4 EO
aodi fied from NUREG/CR-0573.
bNotation: 4.7 El - 4.7 x 101.
Table G-8.6. Population Exposure and 50-Year DoseCommitment to the Population of the United States
from Ingestion of Lead-210 Released in 1978a
Exposure and Dose per kCi Rn-222 Released
Man-rem Organ-remRelease Site Man-pCi Whole Body Bone
1978
Casper, WY 7.2 ESb 2.7 EO 3.74 ElFalls City, TX 3.9 ES 1.5 EO 2.03 ElGrants, NM 6.3 ES 2.4 EO 3.28 ElWellpinit, WA 8.1 E5 3.1 EO 4.21 El
1979
Casper, WY 2.24 E4 8.5 E-2 1.2 EOFalls City, TX 1.23 E4 4.7 E-2 6.0 E-1Grants, KM 2.14 E4 8.1 E-2 1.1 EOWellpinit, WA 2.16 E4 8.2 F-2 1.1 EO
afodified from NUREG/CR-0573. Population exposures and doseswithit, 50 miles of the release site are not included.
bNotation: 7.2 ES a 7.2 10.
..---.--.--..-.t~. -.----.-.-.- r---.--.-.-..-~.-.-.
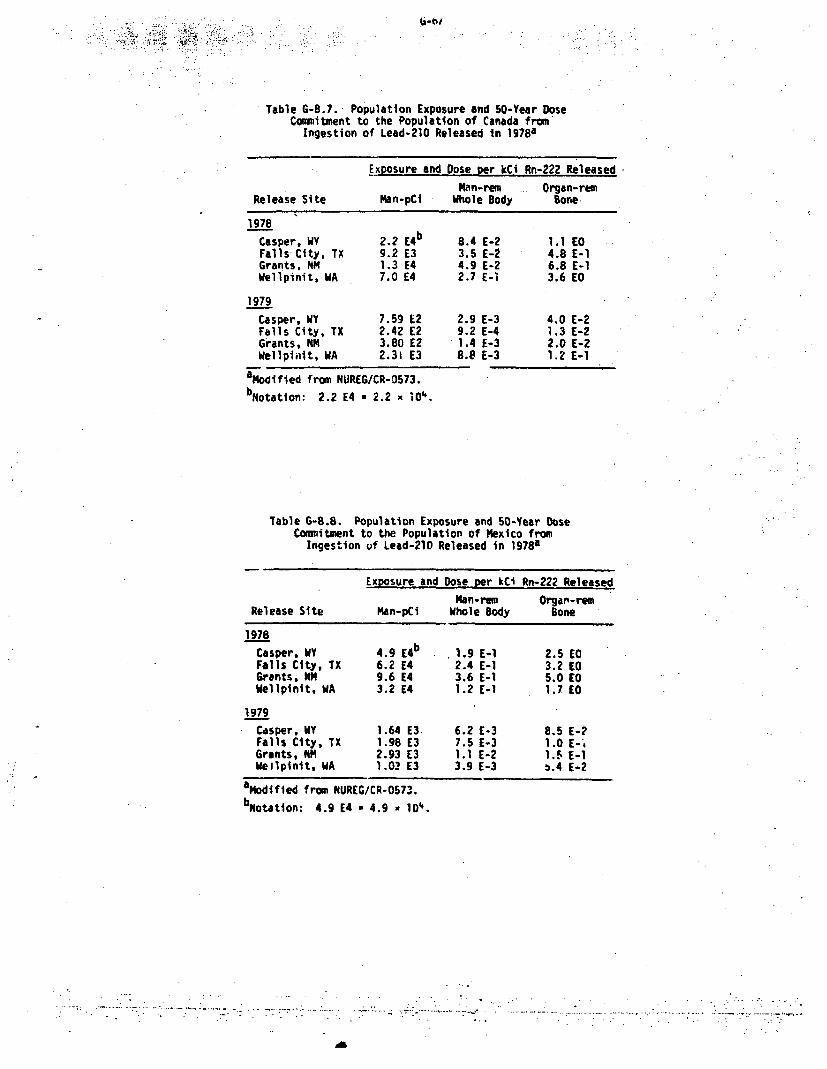
Table G-8.7. Population Exposure and 50-Year DoseCommiitment to the Population of Canada from
Ingestion of Lead-210 Released in 1978a
Exposure and Dose per kCi Rn-222 Released
Hen-rem Organ-remRelease Site Man-pCi Whole Body Bone
1978Casper, WY 2.2 E4b 8.4 E-2 1.1 EOFalls City, TX 9.2 E3 3.5 E-2 4.8 E-1Grants, NM 1.3 E4 4.9 E-2 6.8 E-1Wellpinit, WA 7.0 E4 2.7 E-i 3.6 EO
1979Casper, WY 7.59 E2 2.9 E-3 4.0 E-2Falls City, TX 2.42 E2 9.2 E-4 1.3 E-2Grants, HM 3.80 E2 1.4 E-3 2.0 E-2Wellplait, WA 2.31 E3 8.8 E-3 1.2 E-1
a Modified from NUREG/CR-0573.
bNotation: 2.2 E4 = 2.2 x 10⁴.
Table G-8.8. Population Exposure and 50-Year DoseCommitment to the Population of Mexico from
Ingestion uf Lead-210 Released in 19 78a
Exposure and Dose per kCi Rn-222 Released
Man-rem Organ-remRelease Site Man-pCi Whole Body Bone
1978Casper, WY 4.9 E4 b 1.9 E-1 2.5 EOFalls City, TX 6.2 E4 2.4 E-1 3.2 EOGrents, NH 9.6 E4 3.6 E-1 5.0 EOWellpinit. WA 3.2 E4 1.2 E-1 1.7 EO
1979Casper, WY 1.64 E3 6.2 E-3 8.5 E-?Falls City, TX 1.98 E3 7.5 E-3 1.0 E-,Grants, HM 2.93 E3 1.1 E-2 1.5 E-1Weilpinit, WA 1.02 E3 3.9 E-3 b.4 E-2
Nodified from NUREG/CR-0573.
bNotation: 4.9 E4 - 4.9 x 10⁴.
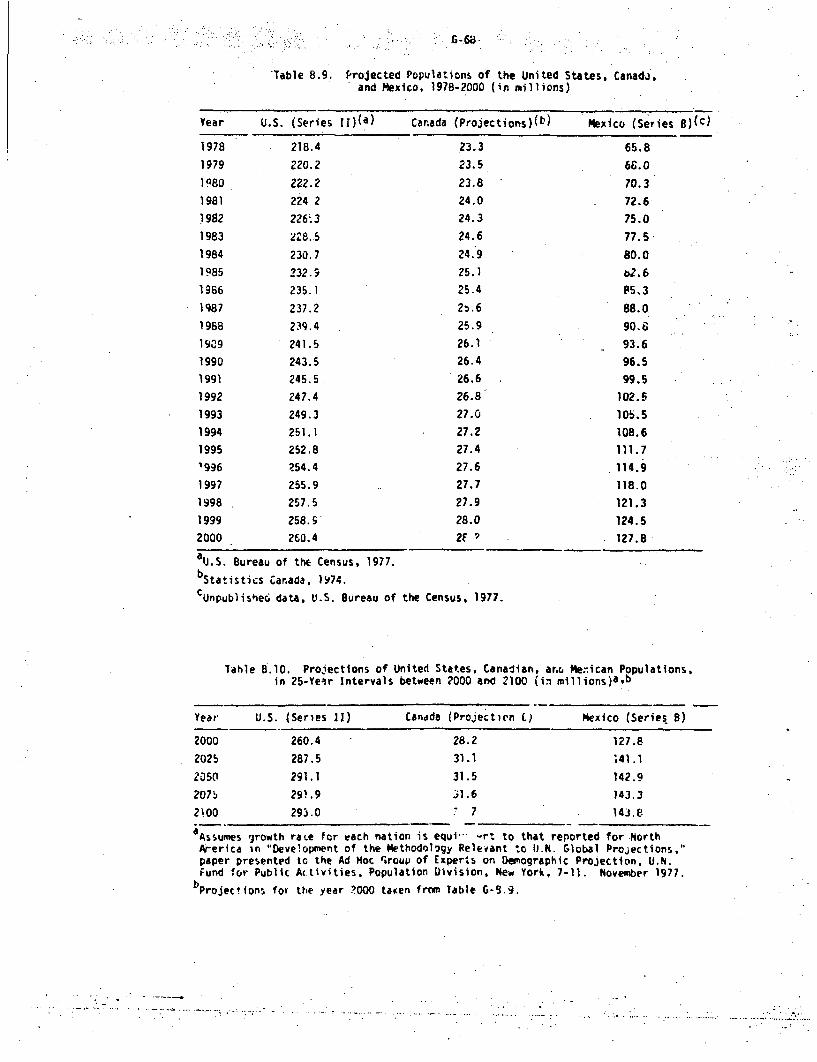
-648
Table 8.9. projected Populations of the United States, Canada,and Mexico, 1978-2000 (in millions)
Year U.S. (Series 10Z(a) Canada (Projections)(4) Mexico (Series B)(c)
1978
1979
1980
1981
1982
1983
1984
1985
1986
1987
1988
1989
1990
1991
1992
1993
1994
1995
1996
1997
1998
1999
2000
218.4
220.2
22?.?
224 2
226"3
228.5
230.7
232.9
235.1
237.2
239.4
241.5
243.5
245.5
247.4
249.3
251.1
252.8
254.4
255.9
257.5
258.9,
260.4
23.3
23.5
23.8
24.0
24.3
24.6
24.9
25.1
25.4
2!.6
25.9
26.1
26.4
26.6
26.8
27.0
27.2
27.4
27.6
27.7
27.9
28.02F
65.8
66.0
70.3
72.6
75.0
77.5
80.0
o2.6
88.0
90.6
93.6
96.5
99.5
102.5
105.5
108.6111.7
114.9
118.0
121.3
124.5
127.8
alJ.S. Bureau of the Census, 1977.bstatistics Carada, 1974.CUnpublishe6 data, U.S. Bureau of the Census, 1977.
lahle 8.10. Projections of United States, Canadian, arc, Metican Populations,in 25-Yeir Intervals between 2000 and 2100 (in millions)a.b
Year, U.S. (Series 11) Canada (Projection L) Mexico (Series B)
2000 260.4 28.2 127.8
2025 287.5 31.1 W41.1
2050 291.1 31.5 142.9
2075 29!.9 31.6 143.3
2)00 293.0 . 7 143.8
aAssumes growth raLe for vach nation is equl. -rt to that reported for North
Ar-erica in "Development of the Methodology Relevant to U.N. Global Projections,"paper presented to the Ad Hoc rroup of Experts on Demographic Projection, U.N.Fund for Public Activities, Population Division, New York, 7-11. November 1977.
bprojection. for the year ?000 taKen from Table G-9.9.
; " . . .. ii . ... . : i" 7'.
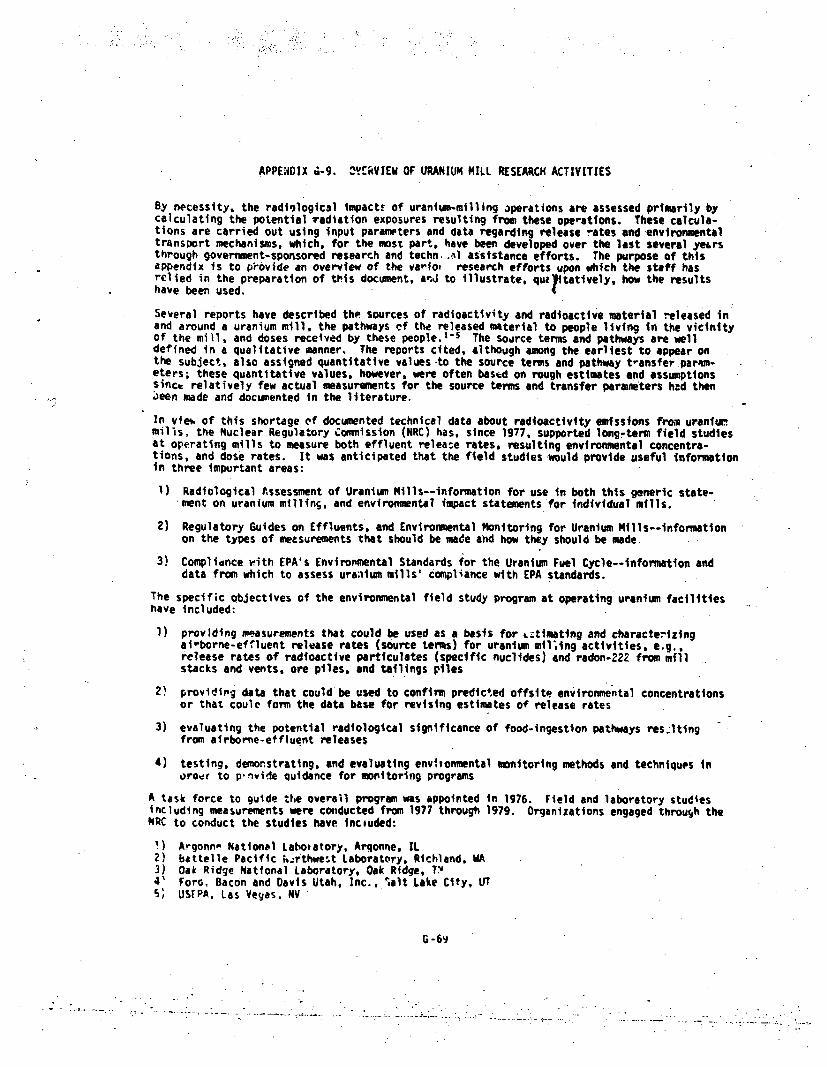
APPE3DIX Z-9. 2YERVIEW OF URANIUM HILL RESEARCH ACTIVITIES
By necessity, the radiological impacts of uranium-milling operations are assessed primarily bycalculating the potential %radiation exposures resulting from these operations. These calcula-tions are carried out using input parameters and data regarding release rates and environmentaltransport mechanisms, which, for the most part, have been developed over the last several yearsthrough government-sponsored research and techn. .,:l assistance efforts. The purpose of thisappendix is to pi-ovide an overview of the variol research efforts upon which the staff hasrelied in the preparation of this document, arA to illustrate, quteitatively, how the resultshave been used. 4
Several reports have described the sources of radioactivity and radioactive material released inand around a uranium mill, the pathways of the released material to people living in the vicinityof the mill, and doses received by these people. 1-5 The soarce terms and pathways are welldefined in a qualitative manner. The reports cited, although among the earliest to appear onthe subject, also assigned quantitative values -to the source terms and pathway t-ansfer param-eters; these quantitative values, however, were often based on rough estimates and assumptionssince relatively few actual measurements for the source terms and transfer parauiters had then;)een made and documented in the literature.
In vief of this shortage of documented technical data about radioactivity emissions from uraniue.mills, the Nuclear Regulatory Connission (NRC) has, since 1977, supported long-term field studiesat operating mills to measure both effluent release rates, resulting environmental concentra-tions, and dose rates. It was anticipated that the field studies would provide useful informationin three impurtant areas:
1) Radiological Assessment of Uranium Mills--information for use in both this generic state-ment on uranium millinS, and environmental impact statements for individual mills.
2) Regulatory Guides on Effluents, and Environmental Monitoring for Uranium Mills--Informationon the types of metsurements that should be made and how they should be made.
3) Compliance with EPA's Environmental Standards for the Uranium Fuel Cycle--information anddata from which to assess uraiium mills' compliance with EPA standards.
The specif;c objectives of the environmental field study program at operating uranium facilitieshave included:
1) providing measurements that could be used as a basis for L;tinating and characterizingaieborne-effluent release rates (source terms) for uranium mlling activities, e.g.,release rates of radioactive particulates (specific nuclides) and radon-222 from millstacks and vents, ore piles, and tailings piles
2) providing data that could be used to confirm predicted offstte environmental concentrationsor that coule form the data base for revising estimates of release rates
3) evaluating the potential radiological significance of food-ingestion pathways res-ltingfrom airborne-effluent releases
4) testing, demonstrating, and evaluating envivonmental monitoring methods and techniques inoroer to p'tvide quidance for monitoring programs
A task force to guide the overall program was appointed in 1976. Field and laboratory studiesincluding measurements were conducted from 1977 through 1979. Organizations engaged through theNRC to conduct the studies have inciuded:
1) Argonno Nationol Labotatory, Argonne, IL2) battelle Pacific hirthwest Laboratory, Richland, WA3) Oak Ridge National Laboratory, Oak Ridge, T•'4' Foro,. Bacon and Davis Utah, Inc., %alt Lake City, UTS; USFPA, Las Vegas, NV
G-69
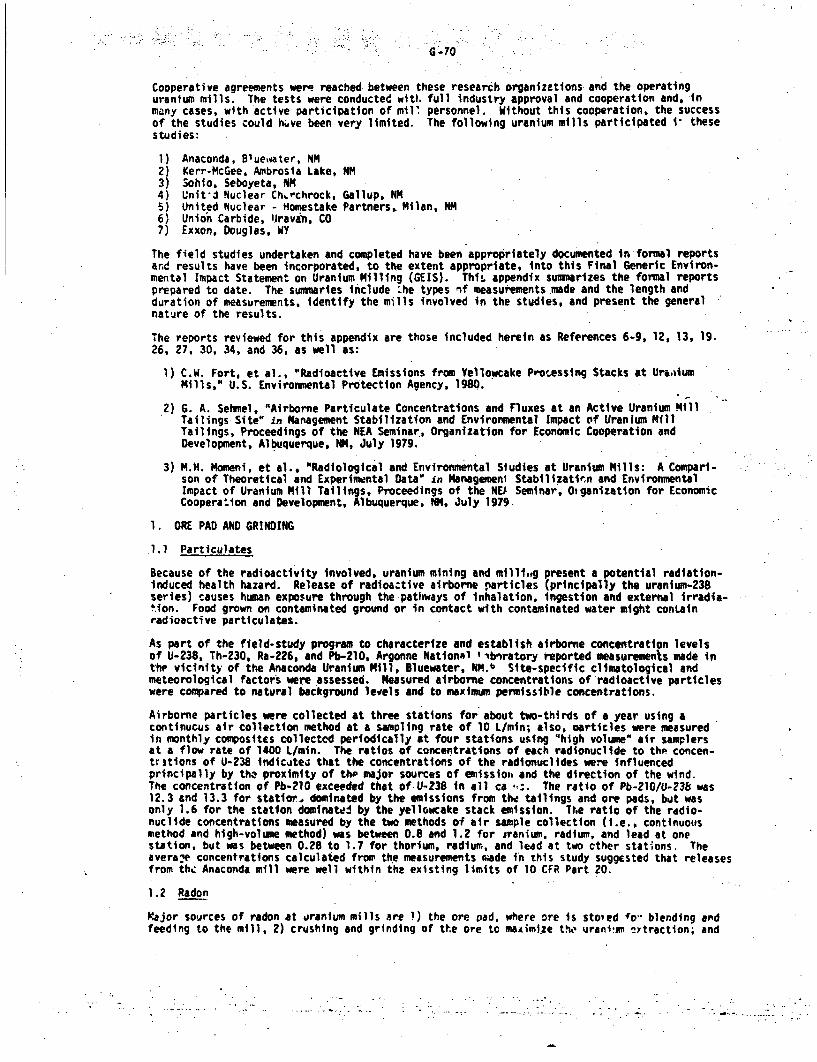
G -70
Cooperative agreements were reached between these research organizations and the operatinguranium mills. The tests were conducted witt. full industry approval and cooperation and, inmany cases, with active participation of mill personnel. Without this cooperation, the successof the studies could hive been very limited. The following uranium mills participated i" thesestudies:
1) Anaconda, Bluetvater, NM2) Kerr-McGee, Ambrosia Lake, NM3) Sohto, Seboyeta, NM4) Unit'd Nuclear Chirchrock, Gallup, NM5) United Nuclear - Homestake Partners, Milan, NM6) Union Carbide, I4ravan, CO7) Exxon, Douglas, WY
The field studies undertaken and completed have been appropriately documented in formal reportsand results have been incorporated, to the extent appropriate, into this Final Generic Environ-mental Impact Statement on Uranium Milling (GELS). This appendix sumnarizes the formal reportsprepared to date. The sumaaries include 'he types nf measurements made and the length andduration of measurements, identify the mills involved in the studies, and present the generalnature of the results.
The reports reviewed for this appendix are those included herein as References 6-9, 12, 13, 19.26, 27, 30, 34, and 36, as well as:
1) C.W. Fort, et al., "Radioactive Emissions from Yellowcake Processing Stacks at UraiumMills," U.S. Environmental Protection Agency, 1980.
2) G. A. Sehmel, "Airborne Particulate Concentrations and Fluxes at an Active Uranium MillTailings Site" in Management Stabilization and Environmental Impact of Uranium MillTailings, Proceedings of the NEA Seminar, Organization for Economic Cooperation andDevelopment, Albuquerque, NM, July 1979.
3) M.H. Momeni, et al., "Radiological and Environmental Studies at Uranium Mills: A Compari-son of Theoretical and Experimental Data" in Managemeni Stabilizatiln and EnvironmentalImpact of Uranium Mill Tailings, Proceedings of the NEt Seminar, Otiganization for EconomicCooperation and Development, Albuquerque, NM, July 1979.
1. ORE PAD AND GRINDING
.1.1 Particulates
Because of the radioactivity involved, uranium mining and milli,ig present a potential radiation-induced health hazard. Release of radloactive airborne particles (principally the uranium-238series) causes human exposure through the pathways of inhalation, ingestion and external irradia-tion. Food grown on contaminated ground or in contact with contaminated water might containradioactive particulates.
As part of the field-study program to characterize and establish airborne concentration levelsof U-238, Th-230, Ra-226, and Pb-210, Argonne National I -ibratory reported measurements made inthe vicinity of the Anaconda Uranium Mill, Bluewater, NM.b Site-specific climatological andmeteorological factors were assessed. Measured airborne concentrations of radioactive particleswere compared to natural background levels and to maximum permissible concentrations.
Airborne particles were collected at three stations for about two-thirds of a year using acontinucus air collection method at a sampling rate of 10 L/min; also, oarticles were measuredin monthly composites collected periodically at four stations using "high volume" air samplersat a flow rate of 1400 L/min. The ratios of concentrations of each radionuclide to thp concen-tritions of U-238 Indicatez that the concentrations of the radionuclides we-e influencedprincipally by the proximity of thp major sources of emissioto and the direction of the wind.The concentration of Pb-2lO exceeded that of U-238 in all ca *-:. The ratio of Pb-210/U-236 was12.3 and 13.3 for statior, dominated by the emissions from the tailings and ore pads, but wasonly 1.6 for the station dominatel by the yellowcake stack emission. The ratio of the radio-nuclide concentrations measured by the two methods of air sample collection (i.e.. continuousmethod and high-volume method) was between 0.8 and 1.2 for iranium, radium, and lead at onestation, but was between 0.28 to 1.7 for thorium, radium, and lead at two cther stations. Theaveray concentrations calculated from the measurements nade in this study suggested that releasesfrom the Anaconda mill were well within the existing limits of 10 CFR Part 20.
1.2 Radon
Major sources of radon at uranium mills are 1) the ore pad, where ore is stowed fo" blending andfeeding to the mill, 2) crushing and grinding of tt.e ore to maximi.ze the urantinm ý!Ytractton; and
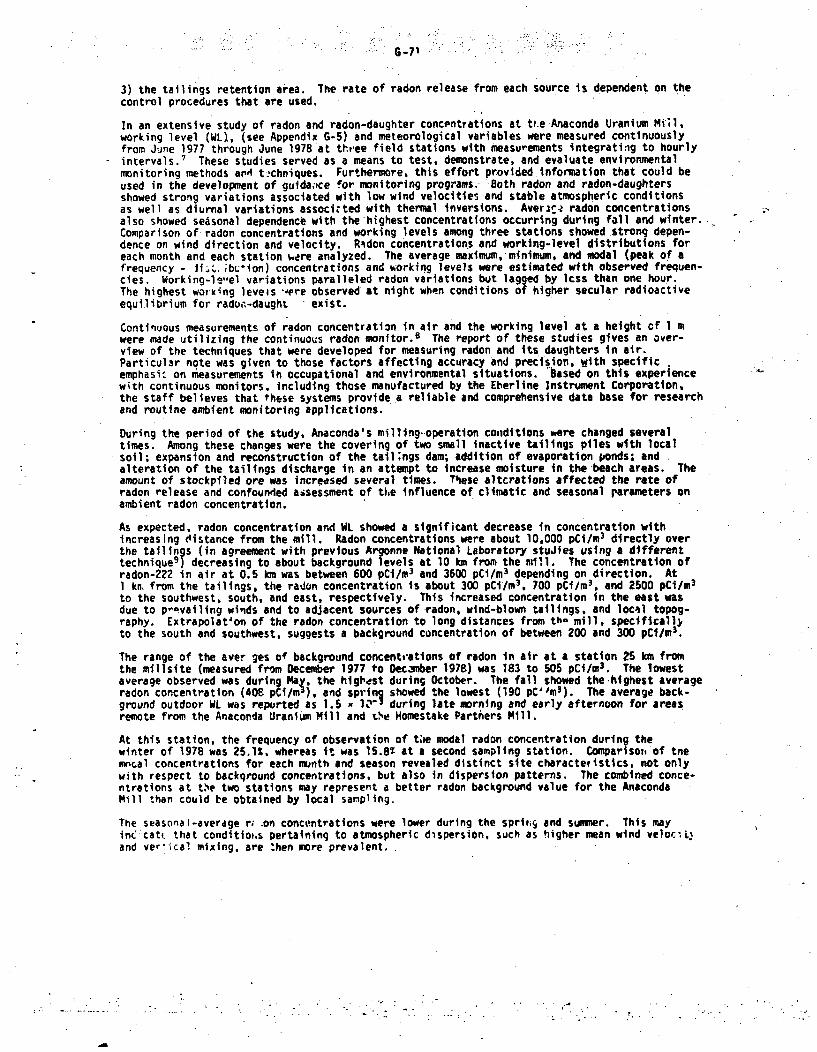
G-71
3) the tailings retention area. The rate of radon release from each source is dependent on thecontrol procedures that are used,
In an extensive study of radon and radon-daughter concpntratlons at tt.e Anaconda Uranium MillIworking level (WL)., (see Appendix G-5) and meteorological variables were measured continuouslyfrom June 1977 through June 1978'at three field stations with measurements integrating to hourlyintervals.' These studies served as a means to test, demonstrate, and evaluate environmentalmonitoring methods and týchniques. Furthermore, this effort provided information that could beused in the development of guida.,ce for monitoring programs. Both radon and radon-daughtersshowed strong variations associated with low wind velocities and stable atmospheric conditionsas well as diurnal variations associcted with thermal inversions. Aver:ae radon concentrationsalso showed seasonal dependence with the highest concentrations occurring during fall and winter..Comparison of radon concentrations and working levels among three stations showed strong depen-dence on wind direction and velocity. Ridon concentrations and working-level distributions foreach month and each station were analyzed. The average maximum,'minimum, and modal (peak of afrequency - 11-.. ;b;*ion) concentrations and working levels were estimated with observed frequen-cies. Working-l-,,el variations paralleled radon variations but lagged by lcss than one hour.The highest wovking levees '.-ere observed at night when conditions of higher secular radioactiveequilibrium for rador-daught exist.
Continuous measurements of radon concentration, in air and the working level at a height cf 1 mwere made utilizing the continuous radon monitor. 8 The report of these studies gives an over-view of the techniques that were developed for measuring radon and its daughters in air.Particular note was given to those factors affecting accuracy and precisior, with specificemphasie on measurements in occupational and environmental situations. Based on this experiencewith continuous monitors, including those manufactured by the Eberline Instrument Corporation,the staff believes that these systems provide a reliable and comprehensive data base for researchand routine ambient monitoring applications.
During the period of the study, Anaconda's milling-operation conditions were changed severaltimes. Among these changes were the covering of two small inactive tailings piles with localsoil; expansion and reconstruction of the tail;ngs dam; addition of evaporation ponds; andalteration of the tailings discharge in an attempt to increase moisture in the beach areas. Theamount of stockpiled ore was increased several times. These altcratlons affected the rate ofradon release and confounded assessment of the influence of climatic and seasonal parameters onambient radon concentration.
As expected, radon concentration and WL showed a significant decrease in concentration withincreasing distance from the mill. Radon concentrations were about 10,000 pCi/m 3 directly overthe tailings (in agreement with previous Argonne National Laboratory stuJies using a differenttechnique 9) decreasing to about background levels at 10 km from the mill. The concentration ofradon-222 in air at 0.5 km was between 600 pCi/M 3 and 3600 pCi/m 3 depending on direction. At1 kn, from the tailings, the radon concentration is about 300 pCi/m3. 700 pCi/m 3, and 2500 pCi/m 3
to the southwest, south, and east, respectively. This increased concentration in the east wasdue to p-pvailing winds and to adjacent sources of -radon, wind-blown tailings, and locail topog-raphy. Extrapolation of the radon concentration to long distances from tho mill, specificall3to the south and southwest, suggests a background concentration of between 200 and 300 pCi/m 3 .
The range of the aver ges of background concentrations of radon in air at a station 25 km fromthe millsite (measured from December 1977 to Decsmber 1978) was 183 to 505 pCi/m 3 . The lowestaverage observed was during May, the higtedst during October. The fall showed the-highest averageradon concentration (408 pCi/mi), and spring showed the lowest (190 pC'/m 3 ). The average back-ground outdoor WL was reported as 1.5 1Z."- during late morning and early afternoon for areasremote from the Anaconda Uranium Mill and the Homestake Partners Mill.
At this station, the frequency of observation of tVe modal radon concentration during thewinter of 1978 was 25.1%, whereas it was 15.8T at a second sampling station. Comparisov, of tnemecal concentrations for each month and season revealed distinct site charactetistics, not onlywith respect to backqround concentrations, but also in dispersion patterns. The combined conce-ntrations at tVe two stations may represent a better radon background value for the AnacondaMill than could be obtained by local sampling.
The seasonal-average r; .on concentrations were lower during the spritiý and summer. This mayin& catt that conditiot.s pertaining to atmospheric dispersion, such as higher mean wind velocrL.and vertical mixing, are then more prevalent.
G -72
2. YELLOWCAKE DRYING AND PACKAGING
2.1 Radioactive Emissions
An important composite :ource of radioactive emission from the mill occurs at the end of the oreprocessing line--the yellowcake drying and packaging operation. In view of the relative short-age of documented technical data about releases from the yellowcake stacks, the EPA's Office ofRadiation Programs-Las Vegas Facility (ORP-LV) has concentrated on measuring this source.
A series of tests on yellowcake drying and packagirg stacks was conducted at six mills fromApril 1977 to August 1978.1° Five of these mills employ the acid-leach process; United Nuclear-Homestake Partners (UNHP) uses an alkaline-leach Orocess. A general description of each milland the yellokcake exhaust afr cleanup system(s) in use at the time the tests were maJe areincluded in the study report. 1 0 The isokinetic sampling technique used for all stack tests wasthe •,dified EPA method 5 as defined in "Stendards of Performance for New Stationary Sources.",,
Six yellowcake grab samples, not associated with stack tests, were collected at four differentmills and the amount of uranium daughter radionuclides contained was determined. Coincidentally,the samples were also used to provide a cross-check of the analytical capabilities of three dif-ferent laboratories. There was generally good agreement among she laboratories (EPA, EberlineInstrument Company and LFE Corporation Environmental Analysis Laboratory) in the analyticalresults obtained for concentrations of radionuclides in the yellowcake samples (U-238, U-234,and U-235 and the daughter nuclides thorium-230, radium-226, lead-210, and polonium-210). Inthe majority of comparable cases, results are within the 2c :ounting error range.
The samp;ing and analytical results presented in tabular form in Reference 10 include individualstack test results and calculated uranium emission rates; emission rates for radionuclides otherthan uranium (i.e., thorium-230, radium-226, polonium-210, and lead-210); ratios of daughterradionuclides to U-238 parent for stack test samples; U3Oa drying, packaging, and emission rateparameters; variability of measured yellowcake emission rates; and daughter radionuclides inyellowcake as percent of U-238 parent; results of inter-laboratory cross-check results foruranium; and radionuclide concentrations in grab samples of yellowcake.
The study siowed that United Nuclear Church Rock (UNC) released an average of 0.1% of the U,0adried and packaged, Sohio released an average of 0.006% of the UO, dried and packaged, andUnion Carbide released an average of 0,09% of the U 0 dried and pickaged. The Union Carbideresult is identical to the release rate calculated 9yeArgonne National Laboratory in theirstudies of the radioisotopic composition of yellowcake.12
The Sears study showed that measured emission rates from a yellowcake'processing stack canroutinely vary by a factor of from two to five when tests are conducted without any controls onthe mill operating parameters. The EPA tests also-show that major anomalies (e.g., a rupturedfilter in the exhaust clean-up system) can caus- variations of as much as a factor of 20 in themeasured emission rate. It appears that the major rperational parameter that affects theemission rate is simply whether yellowcake is or is not being dried or packaged during thetesting period. An emission rate measurement representing only ope operating condition could biasestimates of the annual average source term considerebly.
2.2 Particle. Size Distribution of Yellowcake Emissions
A study of particle size distribution of yellowcake emissions from drying and pickaging stacksat uranium mills was conducted by the Office of Radiation Programs-Las Vegas Facility (ORP-LV)of the EPA."- Samples were collected from the dryer and packaging stacks at the United NuclearCorporation Uranium Mill neae Churchrock, NM, using an Andersen"' eight-stage vertical impactorfitted with an after-filter in combination with equipment as specified in EPA Method S as definedin "Standards of Performance for New Stationary Sources."Is This device collects particles in amanner compatible with determining the mass distributions as a function of aerodynamic diameter.Based on their studies, the authors concluded that the yellowcake particle emissions from theuranium mill packaging and dryer stacks can be .haracterized by mass median aerodynamic diametersof 1.62 and 1.19. um. If respirable particulate matter is defin.d as partic1ks with aerodynamicsizes s '.5 nm, then the packaging stack yields a respirable fraction of 69%, while that of thedryer is 9dt.
2.3 Solubillit. of Particulate Effluents
a basis for calcul.ting the radiation dose to a given organ following inhalttion of a radio-active aerosol is provided by the "Task Group Lung Model" (TGLM) as described in the report ofthe Task Group on Lung Dynamics for Committee 2 of the ICRP.11 This model describes the reten-tion of inhaled particulates in the luno and their subsequent redistribution to other bodytissues according to particle size and chemical compo.'tion. Currently recommesided values ofretention half-times and regional distribution fractior:s for these three classes are given in
|CRP Publication 19.1 Because of the relative paucity of data upon which to develop a moresophisticated model., chemical compounds have bten classified simply as class Y (thosf that arerethined In the lung for years), class W (retained for weeks), or class 0 (for days)."
The methodology used herein for estimating radiological impacts of uranium milling incorporatesthe TGLM classification of the long-lived radionuclidcs of interest. 17 Following the TGLMrecommendations, uranium and thorium were previously placed in class Y. while radium, lead, andpolonium were considered to be class W. Because the chemical and physical forms of these elementsin ore, tailings dust, and yellowcake were uncertain, these classifications were not consideredto be highly reliAble. Moreover, since the dose to a particular organ predicted to result fromI -iven inhalation exposure can change by a large factor depending on the pulmonal-y clearance
pa.ramiters (i.e., solubility classification), two solubility studies were undertaken .in order toprovide a firmer basis for applying the TGLM to the calculation of radiation doses from airbornemill effluents.
Both programs had as their objective the determination of maximum dissolution rates under condi-tions that approximated the physiological environment within the pulmonary lung. The firststudy was completed by the Inhalation Toxicology Research Laboratory (FRL) of the LovelaceInstitute. 20 Only yellowcake from the production lines of fnur different ,-l1: was examined.The dissolution rate was measured in a blood serum simulant and in 0.1 PA. K! For all samplesan. soluent, there appeared to be an easily dissolved fraction and a .'elatively insrl.blecomponent. The former was identified with the ammonium diuranate [(NH. 2. U20 7)] content of theyellC'XaKe and the latter 0tt0 the uranium octoxide (U300).
ITRL's measurements were subsequently confirmed by Battelle Pacific Northwest Laboratory .PNL)19which used yellowcake samples from the same four mills. Dissolution In simulated lung fluid wasmeasured in vitro by a batch technique that gave the highest rate mo.ing several mnethods thatwere tried. Samples of uranium diuranate and octoxide were also studied. As a result, U 0was given a Y classification in accord with the earlier recommendations of Steckel and Wleithand of Cooke and Holt. 22 The diuranate proved to have a dissolution half-time of less than aday, placing it in Class D, whereas the material studied by Cookr and Holt had been assigned toclass W. Since yellowcake usually contains significant, but varitble, fractions of diuranateand Octoxide, the finding of fast- and slow-dissolving components was not surprising. The ITRLand PNL data are in relatively good agreement although the more insoluble fraction of 3 of the4 samples was assigned to class W by PNL and class Y by ITRL. In retrospect, the PNL experi-mental technique vuld be expected to yield shorter half-times than the method of ITRL.
On the basis of these data, PNL recommended that yellowcake be assigned a mixed classificationof 60'. 0 - 40% be. If one considers the results of both studies relative tv the yellowcakedrying process in use at the four mills, it appears that the thermal history of the product isvery important. These data suggest that product frcm mills using steam dryers (maximum temper-atures in the range of 120 - 1806C) should be classified as more solublt then yellowcake thathas been processed through a high temperature roaster (600 - 8000 C), c •h a larger proportionconverted to octoxide.
2.4 Yellowcake Composit'on
The urarium content of yellowcake is conventionally expressed as octoxide although the output ofsome mills actually contains little uranium in this form. Other long-lived nuclides also arecarried through the process, but to a much smaller extent than uranium, and are present in theyellowcake. In order to make a complete assessmet.. of the radiological impact of yellowcakereleases to the atmosphere during drying and packaging it is necessary to know the concentrationof these other radioactive species. Several recent studies supported by the Pr, have providedadditional Information about the composition of yellowcake.
Merritt 23 reviewed much of the information available in reports from the early 1960s and statedthat the uranium product from acid-leach circuits generally cont'ined less than 0.1% of theradium and less than 5% of the thorium that were present in the ore. Thorium was reported to bevirtually insoluble in alkaline-leach circuits while radium dissolved to the extent of 1.5-3%and was mostly carried through into the yellowcake.
References 24 and 25 reported a significant range in the carryover of Th and Ra depending oi thepurification process being employed. The concentr'lion of thorium was given as 0.9% (ionexchange) to 5.3% (alkyl phosphoric extraction) of the ore content, and 0.02% to 0.22% for theradium. SeArs, et al,2 pointed out that solvent extraction with amine rather than alky, phos-phoric acid may reduce to less than-S% the imunt of thorium in the yellowcake. For theircost/benefit ana.ysis, the ORNL group conservatively chose values at the uppe.r end of the ranges,ramely a Th-230 content of 5% and a Ra-226 content of 0.21 of the U-238 activity in the yellow-cake produred by the arid-leach processes. These values were used in most, if not all, subseqi.!ntasses•srnts of the impacts from specific mills.
Recent measurements of yellowcake composition were made by groups from Argonne Nationdl Labora-tory, the EPA Office of Radiation Prcgrams (Lbs Vegas, NV) and Battelle Pacific NorthwestLaboratory. For the studies at Argonne,1 2 composite monthly yellowcake samples (from 2 to 13pe;. mill) were obtained from four different mills in New Mexico, Colorado, and Wyoming (all useda sulfuric a.Id leach). The range in average Th-230 activ.ty as a percent of the U-238 activityamong the mills was 0.08-0.4%t. For Ra-226, with allowance for two apparently anomalous valueso,-t of 13 samples from one mill, the range was from the detection limit up to O.Olt. The Pb-210values for the two mills from which data were available were O.01% and O.03%.
The EPA Office of Radiation Programs in i.as Vegas also measured yellowcake composition in samplesfrum five mills, two of which were included in the ANL study.-10 The results on samples fromacid-leach circuits (4 of the 5 mills) were consistent with the ANL findings. The range inaverage concentrations from these four mills, expressed as percent of the U-238 activity, wereas follows: Th-230. 0.10-0.70%; Ra-226, 0.0003-0.028%; Pb-210, 0.005-0.086%. The samples fromthe one alkaline-leach circuit included in this survey showed much higher concentrations of 2.3%for Th-230 and 0.5% for Ra-226. The result for thorium stands, in contrast to earlier reportsin the literature; ess.nLlally no Th reached the end product of alkaline processes.
As part of his solubility studies, Kalkwarf 19 also determined the composition of yellowcake inindividual samples from four mills, three of which used acid leaching. His results are similarin magnitude to the values quoted above, namely 0.086-0.88% for Th-230 and 0.009-0.048% for Ra-226. The sample from the one alkaline-leach mill confirmed the presence of Th-230 at a con-centration of about 3% and Ra-226 at about 1. of the U-238 activity. No values for Pb-210 werereported.
3. TAILINGS
3.1 Particulates
Battelle Pacific Northwest Laboratory studied the nature and behavior of uranium-mill tailingsparticles acted upon by wind stresses. 2 6 Field measurements were made at three uranium mills inthe Ambrosia Lake District of New Mexico, many of them at an alkaline carbonate-leach plant.Two other tailings "iles investigated were at plants employing the acid-leach process. Theinvestigation consisted of field and modeling studies de.igned to develop data and relationshipsbetween particle suspension, wind speed, and other important variables. Four major tasks com-prised the study.
3.1.1 Tailings 3article Characterization
Su'face and core samples (to a depth of 40 cm) were taken from selected areas of the tailingspiles; the concentrations of U-235, U-238, Fb-210, Ra-226, and Th-230 were determined as afunction of depth, and considerable variation was noted. For the alkaline-leach plant generally,daug'iter radionuclides of uranium were in radioactive equilibrium. Acid-leach tailings showedsome depletions of Th-230 due to solubility in the acidic slurry, which was confirmed by con-siderably higher levels in water samples. Particle size distributions and associated radio-activity concentrations showed much higher specific activity in the 7-20 um fraction than forlarger particles, but all size fractions contained significant radioactivity. A completespectrum of alements taken through x-ray fluorescence showed uranium, selenium, and molybdenumwell above ambient levels.
3.1.2 Tailings 'artiles In the Vicinity of the Plant
Soil samples taken from the surface (out to about 8 km from the tailings) and, in some cases,tror below showed the presence of tailings particles.- Isopleths showed a general patternsimilar to the pattern for prevailing winds. Radium-226 and lead-210 levels ranged from a fewhundred disintegrations per minute (dpm) per 3ram near the pile to background levels of a fewdpm Per grar at distances several kilor.aers from the pile. Estimates of radon release from,,)ntaminated soil indicated that the. dispersed radium contributed significant amounts of radonto the air. Association of radic oclides with particle size fractions was determined throughparticle size separations. The concentration of radioactivity in the soil showed that mixing inthe upper several centimeters had produced a roughly exponential decrease ;n activity withdepth. At distanres of several kilometers from the pile, surface and subsurface concentrationsrez.hed ambient levels. The effect of floodplain areas on soil-particle reclassification wasapparent In one transect north of the tailings pile sampled.
3.1.. Characterization of Airborne Particles and Measurement of Fluxes
Many field experiments were carried out Pt the alkaline-leach plant to chaý,acterize airborneparticle transport from the tailings pile as a function of wind speed, height and direction. Thesampling array provided samples from above the pile and at various downwind points when wind wa•blowing within a given sector and at different speeds. The expected general trend of very low
.G -75
upwind co,,centratic-is, increasing concentrations across the pile, and subsequent ret urn tobackground levels at distances of a few kilometers was found. Concentration changes as a functionof wind speed and height up to 15 m showed no consistent pattern, demonstrating the very complexnature of the suspension process. The distributions of rad'onuclides on airborne particlesconfirmed that the specific activity of the smaller sizefraction was greater thae, for largerparticles. Fluxes of prrticles could only oe roughly bracketed as a function of wind speedbecause of wind variations between samples taken from crosswind points in the vicinity of thetailings pile and further downwind. Apparent anomalous concentration variations with heightfrom the ground could not be reconciled with knowledge of wind character near the ground. Down-wind concentrations were referenced to guidance levels In 10 CFR 20 with the conclusion that Th-230 likely represents the radionuclide of most concern.' Elemental composition of airborneparticles was reasonably consistent with that reported for the tailings material with seleniumbeing present in considerably greater abundance than in local virgin soil. The great complexityof the system studied emphasized the considerable uncertainties in applying calculation.11 modelsto suspension, deposition, and transport.
3.1.4 Model Development
A transport and deposition model was developed and applied to the ,lkaline-leach tailings pile.Actual site meteorology was organized into joint frequency distributions of wind speed, direction,and stability fc- a seveinteen-month period. The model utilized deposition velocities of eachparticle size; thus calculations of net vertical fluxes to the gro,,nd as well as air concentra-tions at ground level ,-ere possible. The model was applied using an actual size distribution ofcomposited air orne particle samples from the alkaline-leach tailings pile. Resulting fluxes tothe ground at various distances were in reasonable agreement with relative surface concentrationsactually measured. The model has not yet been exercised using experimentally derived source-windspeed data. Additional work is recommended to compare the predictions of this and othermodels with the data available and to determine the sensitivity of the output (downwind airborneconcer.trations and deposition) to the source-term description.
3.1.S Conclusions
The results of Battelle's extensive studies and overall conclusions as related to each specifictask can be summarized as follows:
1) Tailings particle characterization
a) The alkaline carbonate-leach tailings, water-dispersed particulates from the top0.5 cm of the pile were characterized by about 40% of the Pb-210, U-238, Th-230,and Ra-226 being associated with particles % 7 0, (.11 um aerodynamic effectivediameter) and smaller in diameter. The mass of particles in this size range wasabout 9%. Particles collected directly from the slurry discharge point, thensize-fractionated in the liquid, were shown to have about 12% of the activematerial associated with the s 7 um range; these particles accounted for onlyabout 2.5% of the mass.
b) Concentrations of Ra-226, Th-230, and Pb-210 were of the order of 400 to 900dpm/g (- 2-4 - 10-4 uCi/g) for the bulk surface alkaline-leach tailings particles.The presence of approximately equal concentrations of these daughter products ofuranium showed them to be in equilibrium. Uranium-238 was -.10% or less of thedaughter products present. Core samples showed variation in radium activity pergram with depth but practically all results were within a factor of two of theaverage.
c) Surface samples of acid-leaching tailings selected to represent the very finematerial were found to be about 10 times wore radioactive per grant than thecoarse ma' rial samples.
d) Selenium was found in tne tailings at a level of about 200 ppm, or about 100times that in ambient soil. Molybdenum and uranium were also found in concen-trations higher than in background soil.
2) Taflings particles in the vicinity of the plant
Particles cor.tining uranium and daughter radionuclides are readily detected In soilsamples within several kilometers from both alkaline-leach and acid-leach tailingspiles. At one alkaline-leach plant 4t was estimated that dispersed Ra-226 in soilwill emit about 30% as much radon as is currently emitted from the tailings pileitself.
G -76
Surface layers of soil (' to 2 cm deep) contain much higher concentrations of radiumthan deeper layers of soil. At distances beyond about 6.4 km, the decrease with depthIs much less, but at these distances background concentrations are being approached.Soil particles classified by a wet sieving and sedimentation methods showed the radio-active material to be associated with all particle-size fractions, with a largefraction associated with soil particles less than 125 um in diameter. A clearly bi-modal distribution of fractions of Pb-210 associated with particle-size increments wasobserved with one mode centering on about 7 to 20 Pm and the other mode centering on
about 100 to 150 Pm.
Soil modification by river flood action was manifest in f jodplain regions. Theseregions showed unusually large fractions of particles in the 7-to 20-11m range.
The results clearly showed the long-term deposition of tailings particles In thevicinity ot the uranium mills. In principle,, these concentrations in soil could bereconciled with transport and deposition models.
3) Ch6racterization of airborne particles ani measurement of fluxes
The data on airborne solids concentrations in g/m 3 and airborne mass fluxes in g/(m2 -
day) show that tailings material is eroded by wind and removed from the pile. Erosionoccurs both from the tailings pile sides as well as the flat top surface. Concentra-tions and fluxes decrease with distance north of the pile and tend to be within thesame order of magnitude as backgound at 4000 m from the pile.
4) Model development
The development of a transport and deposition model provided a framework for predictionof ground ano air concentrations from a source of airborne particles. The model, whenapplied to particles whose size distribution was measured at the downwind rim of thetailings pile, gave relative ground deposition patterns similar to those found in thefield study. Clear-cut definition of size and radionuclide compositinn of particlesleaving the pile as a function of wind speed is needed to constructively exercise themodiel under many conditions. Although field studies have been made to obtain thenecessary detailed source-term information, an application of the model using thesefield data has not been made to date. Furthermore, the field data on airborne particleshas not disclosed Lonsistent relationships among the source term and other parameters. 26
3.2 Radon
Any assessment of the ijdiological Impact of radon from a uranium mill tailings pile requiresknowledge of its rate of release and the influence of various physical and meteorologicalparameters. A variety of approaches has been used to evaluate th. quantity o* radon relea.LI tothe atmosphere, both from specific sites aný from typical soil; Most involve collection andsubsequent analysis of radon or radon-daughters at or above the soil ;urface.
The objectives of the Battelle Pacific Northwest Laboratory studies were to develop and apply anabsolute method for determining radon emissions from uranium tailings. 2 7 Utilizing in situgamma-ray spectrometry techniques, Ra-226 and Rn-?22 (actually Pb-214) concentration gradientswere measured as a function of depth in tailings. This was accomplished by lowering a calibratedintrinsic germanium detector to discrete levels within a sealed and caseu test-well hole andaccumulating a gamma-ray spectrum with a multichannel analyzer. -Differences between the verticaldistributions of radium and radon were used to calculate a radon diffusion coefficient, thefraction of emanating radon and the flux of radon across the tailings-air interface. A dif-fusion model was developed that accounted for the nonuniform radium concentrations that occurwith depth in tailings piles.
From extensive field measurements at tailings piles the following averaged radon emanation power(a) and diffusion coefficients (cn'/sec) were determined for areas of differing moisture contentand compoiftion.
Alkaline Leach Acid Leach
a cm2 /se a cm2 /sec
Wet beach 0.3b 0.0010 0.20 0.0027Dry beach 0.43 0.0040 0.19 0.0037Berm 0.40 0.015 0.12 0.017
Higher rates .af diffusion occurred at the berms, which are comprised of the coarsest tailingsmaterial and are the driest portions of the tailings piles. Diffusion rates successivelydecreased in dry anc wet beach areas. Roughly 40C of the radnn produced in the more finelyground alkaline.lea,.h tailings was free to diffuse, compared to 20% in the acid-leach material.
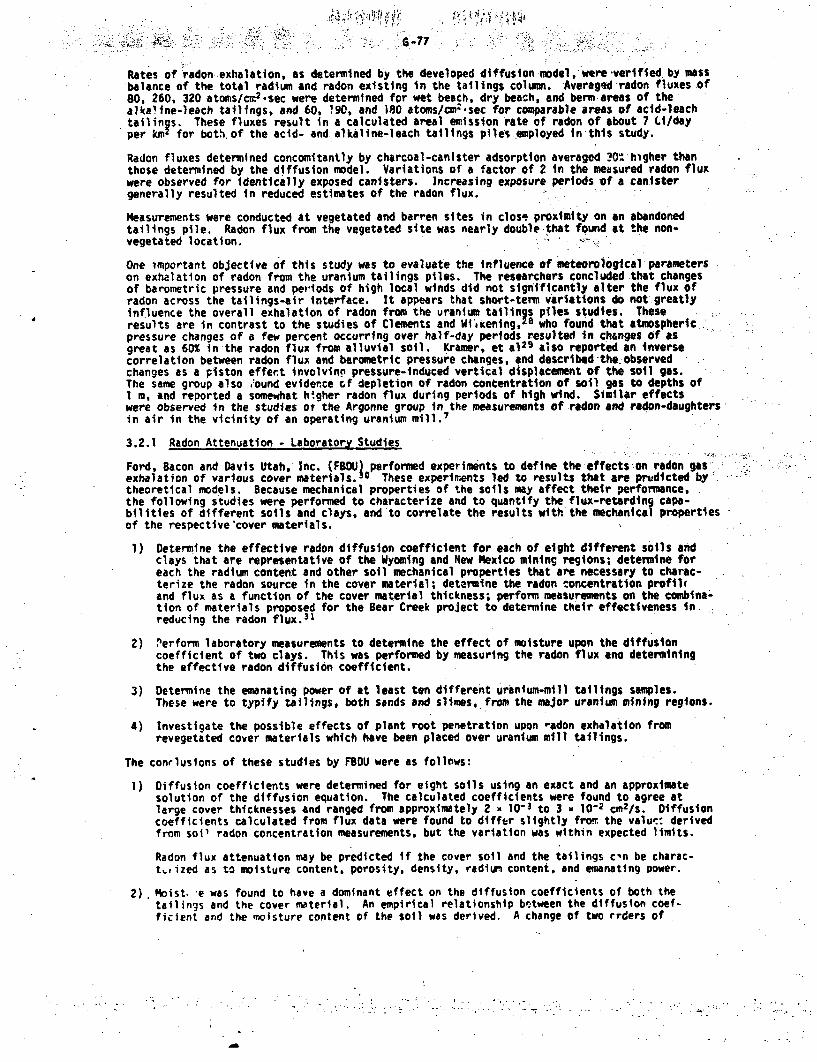
Rates of radon exhalation, as determined by the developed diffusion model, were.verified by massbalance of the total radium and radon existing in the tailings column. Averaged radon fluxes .of80, 260, 320 atoms/cr.i2 .sec were determined for wet beach, dry beach, and berm areas of thealkaline-leach tailings, and 60, !9o, and 180 atoms/cm2.sec for comparable areas of acid-leachtailings. These fluxes result in a calculated areal emission rate of radon of about 7 Li/dayper kmW for both of the acid- and alkaline-leach tailings piles employed in this study.
Radon fluxes determined concomitantly by charcoal-canister adsorption averaged 30: higher thanthose determined by the diffusion model. Variations of a factor of 2 in the measured radon fluxwere observed for Identically exposed canisters. Increasing exposure periods of a canistergenerally resulted in reduced estimates of the radon flux.
Measurements were conducted at vegetated and barren sites in close proximity on an abandonedtailings pile. Radon flux from the vegetated site was nearly double that found at the non-vegetated location. -
One important objective of this study was to evaluate the influence of meteorological parameterson exhalation of radon from the uranium tailings piles. The researchers concluded that changesof barometric pressure and periods of high local winds did not significantly alter the flux ofradon across the tailings-air interface. It appears that short-term variations do not greatlyinfluence the overall exhalation of radon from the uranium tailings piles studies. These .results are in contrast to the studies of Clements and Wfikening,28 who found that atmospheric.:pressure changes of a few percent occurring over half-day periods resulted in changes of asgreat as 60% in the radon flux from alluvial soil. Kramer, et al29 also reported an inversecorrelation between radon flux and barometric pressure changes, and described-the.observedchanges as a piston effect involvinn pressure-induced vertical displacement of the soil gas.The same group also ,:ound evidence cf depletion of radon contentration of soil gas to depths of1 m, and reported a somewhat higher radon flux during periods of high wind. Similar effects.were observed in the studies ot the Argonne group in the measurements of radon and radon-daughtersin air in the vicinity of an operating uranium mill.?
3.2.1 Radon Attenuation - Laboratory Studies
Ford, Bacon and Davis Utah, Inc. (FBDU) performed experiments to define the effects on radon gasexhalation of various cover materials. These experiments led to results that are prudicted by:theoretical models. Because mechanical properties of the soils may affect their performance.the following studies were performed to characterize and to quantify the flux-retarding capa-bilities of different soils and clays, and to correlate the results with the mechanical propertiesof the respective'cover materials.
1) Determine the effective radon diffusion coefficient for each of eight different soils andclays that are representative of the Wyoming and New Mexico mining regions; determine foreach the radium content and other soil mechanical properties that are necessary to charac-terize the radon source in the cover material; determine the radon concentration profilfand flux as a function of the cover material thickness; perform measurements on the combina-tion of materials proposed for the Bear Creek project to determine their effectiveness Inreducing the radon flux. 31
2) Perform laboratory measurements to determine the effect of moisture upon the diffusioncoefficient of two clays. This was performed by measuring the radon flux ana determiningthe effective radon diffusion coefficient.
3) Determine the emanating power of at least ten different uranium-mill tailings samples.These were to typify tailings, both sands and slimes, from the major uranium mining regions.
4) Investigate the possible effects of plant root penetration upon radon exhalation fromrevegetated cover materials which have been placed over uranium mill tailings.
The conclusions of these studies by FBDU were as follows:
1) Diffusion coefficients were determined for eight soils using an exact and an approximatesolution of the diffusion equation. The calculated coefficients were found to agree atlarge cover thicknesses and ranged from approximately 2 x 10⁻³ to 3 x 10⁻² cm2 /s. Diffusioncoefficients calculated from flux data were found to difftr slightly from the value.: derivedfrom soil radon concentration measurements, but the variation was within expected limits.
Radon flux attenuation may be predicted if the cover soil and the tailings cn be charac-t,, ized as to moisture content, porosity, density, radium content, and emanating power.
2). Moist. -e was found to have a dominant effect on the diffusion coefficients of both thetailings and the cover material. An empirical relationship brtween the diffusion coef-ficient and the moisture content of the soil was derived. A change of two rrders of
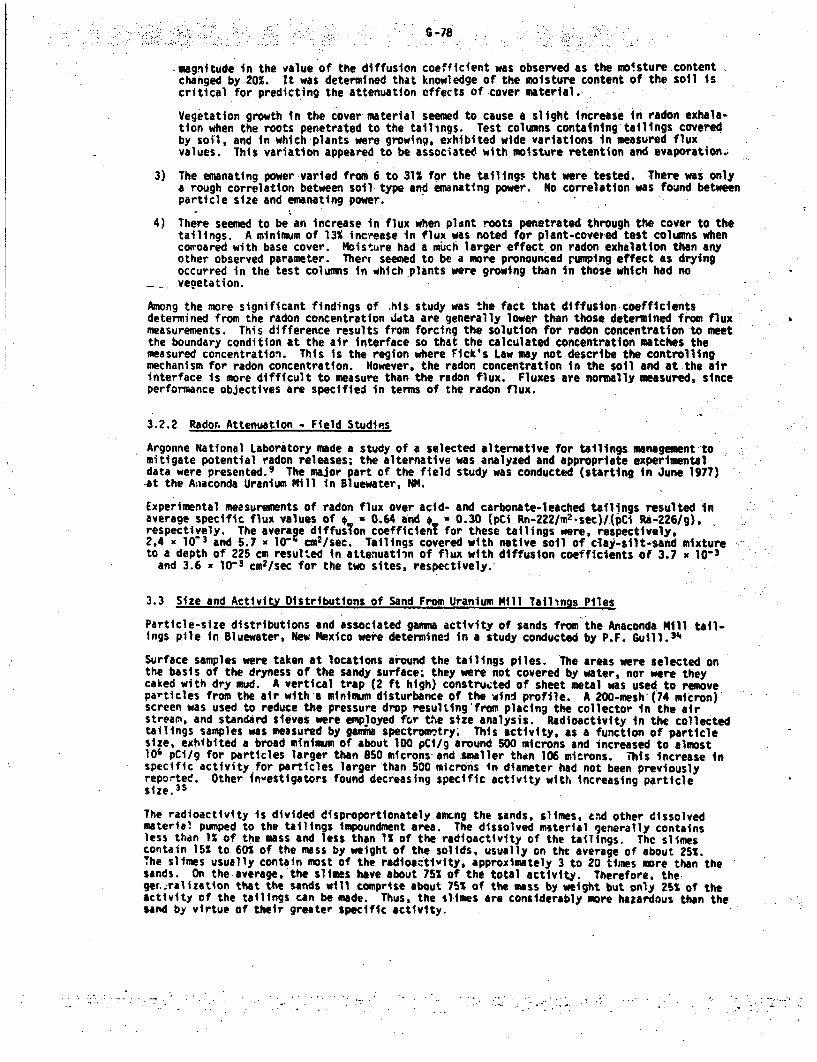
s-78
.magnitude in the value of the diffusion coefficient was observed as the mo.sture.contentchanged by 20%. It was determined that knowledge of the moisture content of the soil iscritical for predicting the attenuation effects of cover material.
Vegetation growth in the cover material seemed to cause a slight increase in radon exhala-tion when the roots penetrated to the tailings. Test columns containing tailings coveredby soil, and in which plants were growing, exhibited wide variations In measured fluxvalues. This variation appeared to be associated with moisture retention and evaporation.
3) The emanating power varied from 6 to 31% for the tailings that were tested. There was onlya rough correlation between soil type and emanating power. No correlation was found betweenparticle size and emanating power.
4) There seemed to be an increase in flux when pldnt roots penetrated through the cover to thetailings. A minimum of 13% increase in flux was noted for plant-covered test columns whencomoared with base cover. Moisture had a much larger effect on radon exhalation than anyother observed parameter. Therf seemed to be a more pronounced pumping effect as dryingoccurred in the test columns in which .plants were growing than in those which had novegetation.
Among the more significant findings of .his study was the fact that diffusion coefficientsdetermined from the radon concentration ddta are generally lower than those determined from fluxmeasurements. This difference results from forcing the solution for radon concentration to meetthe boundary condition at the air interface so that the calculated concentration matches themeasured concentration. This is the region where Fick's Law my not describe the controllingmechanism for radon concentration. However, the radon concentration in the soil and at the airinterface is more difficult to measure than the radon flux. Fluxes are normally measured, sinceperformance objectives are specified in terms of the radon flux.
3.2.2 Rador. Attenuation - Field Studies
Argonne National Laboratory made a study of a selected alternative for tailings management tomitigate potential radon releases; the alternative was analyzed and appropriate experimentaldata were presented. 9 The major part of the field study was conducted (starting in June 1977)*at the A;aaconda Uranium Hill in Bluewater, NM.
Experimental meesurements of radon flux over acid- and carbonate-leached tailings resulted inaverage specific flux values of * a 0.64 and # - 0.30 (pCi Rn-222m 2 .sec)/.(pCi PRa-226/g),respectively. The average diffusion coefficient for these tailings were, respectively,2,4 x 10"3 and 5.7 x 10⁻⁴ cm2/sec. Tailings covered with native soil of clay-silt-sand mixtureto a depth of 225 cm resulted in attenuatitn of flux with diffusion coefficients of 3.7 x 10⁻³
and 3.6 x 10⁻³ cm2 /sec for the two sites, respectively.-
3.3 Size and Activity Distributions of Sand From Uranium Mill Tailings Piles
Particle-size distributions and associated gamma activity of sands from the Anaconda Mill tail-ings pile in Bluewater, New Mexico were determined in a study conducted by P.F. Guill. 3
4
Surface samples were taken at locations around the tailings piles. The areas were selected onthe basis of the dryness of the sandy surface; they were not covered by water, nor were theycaked with dry mud. A vertical trap (2 ft high) constructed of sheet metal was used to removeparticles from the air with a minimum disturbance of the wind profile. A 200-mesh (74 micron)screen was used to reduce the pressure drop resulting'from placing the collector in the airstream, and standard sieves were employed fcor the size analysis. Radioactivity in the collectedtailings samples was measured by gamma spectro .try; This activity, as a function of particlesize, exhibited a broad minimum of about 100 pCi/g around 500 microns and increased to almost106 pCi/g for particles larger than 850 microns and smaller than 106 microns. This increase inspecific activity for particles larger than S00 microns in diameter had not been previouslyreported. Other investigators found decreasing specific activity with. increasing particlesize. 3
The radioactivity is divided disproportionately amcng the sands, slimes, cand other dissolvedmaterial pumped to the tailings impoundment area. The dissolved material generally containsless than 1% of the mass and less than 1% of the radioactivity of the tailings. The slimescontain 15% to 60% of the mass by weight of the solids, usually on the average of about 252.The slimes usually contain most of the radioactivity, approximately 3 to 20 times more than thesands. On the average, the slimes have about 75% of the total activity. Therefore, the.ger..;raltzation that the sands will comprise about 75% of the mass by weight but only 25% of theactivity of the tailings can be made. Thus, the l0imes are considerably more hazardous than thesand by virtue of their greater specific activity.
Th.- results further indicated that size differences exist between tailings from an alkaline-leachprocess and an acid-leach process, and that there is an age effect. TUe alkaline-talings dis-tribution is more narrow than that of the aci4-leach tailings; this is to oe expected because ofthe need for finer grinding of the feed ore for the alkaling process.
4. FOOD-CHAiN CONTAMINATIOP
A pilot study to assess and predict the potential radiological Impact of food ingestion pathwaysfor airborne effluents released from uranium milling operations,. focusing primarily on ingestionexposures associated with grazing animals and locally raised food crops or garden produce, wasunoertaken Dy Argonne National Laboratory in 1979.36 The study was designed to determine thelevels of-the long-lived ouclides in the uranium decay series--uranium, thorium-230, radium-226,and lead-210--that might enter the human food chain from milling operations. The levels ofhuran intake of these radionuclides from the food chain, water, and atmosphere were compared tothose in control areas distant from mines and mills.'
Rabbits, cattle, vegetables, and grass were collected on or near two uranium mill site.. Forcontrols, similar samples were obtained from areas 20 km or more from the mining and mIlloperations. For the onsite rabbits, the mean Ra-226 concentrations in muscle, lung, and kidneyof 5.5, 14, and 15 pCi/kg wet, respectively, were substantially higher than those In the tissuesof control animals (0.4, 1.5, and 0.2 pCi/kg). The levels in liver did not differ significantlybetween the groups. The concentrations in bone (femur and vertebra) were about 9000 and 350pCi/kg ash for the onsite and offstte animals, respectively. The levels of Pb-210 and Po-210did not differ significantly for a given tissue between the two groups, except that the'Po-210level in the kidney was greater in the onsite group.
For cattle the results were less complete, but the data indicated that the concentrations inmuscle, liver, and kidney do not. differ greatly between those grazed near the pile and thecontrols. The levels of Ra-226, and possibly of Pb-210, app.lved to be greater in the femur ofthe animals near the piles. Vegetables from a residential a in a mill site contal"nd sub-stantially greater concentrations of Ra-226 and Pb-2I than t. ,se reported for standard New YorkCit, diets.
Grass and cattle dung from land irrigated by wator €,cntaining 60 pCi/L i.a-226 from uranium mineshad concentrations of Ra-226 and Pb-210 that were about 50 and 8 times (respectively) greaterthan those in control samples.
It is estimated that doubling the normal concentrdtions.in meat and vegetables of uranium anddaughter products could increase the dose equivalent rates to the skeletons of persons consumingthesp foods by 30 mrem/yr or more.
Overall,the results showed that some contamination of the human food chain is likely. Thedegree of contamination ItS less than the above results might suggest because the sampling wasfrom locations where maximum contamination levels were expected and was not intended to yieldrepresentative or average values. In considering the actual exposure to che residents in thearea near the study site, one has to consider certain factors. The region under study had asmall population and limited agriculture. Only a small fraction of the homes (<5w) had gardens,and these probably supplied only a fraction of the yearly food for the familis involved. Itappears that with an admixture of foods from outside the region, contamination of the diet wouldprobably be small. Use of cattle that grazed near the mill as a food source would affect only afew families and, even in such cases, some of the meat consumed would probably come from distantsites.
References
1. H. Glauberman and A.J. Breslin, "Uranium Mill Tailings Study," Health and Safety Laboratory,U.S. AEC, New York Operations Office, HASL Technical Memorandum 64-14, July 31, 1964.
2. M.E. Sears, R.E. Blanco, R.C. Dahlman, G.S. Hill, A.D. Ryan, and J.P. Witherspoon, "Cor-relation of Radio~ctive Waste Treatment Costs and the Environmental Impact of Waste kffluent;in the Nuclear Fuel Cycle'tor Use in Establishing 'as Low as Practicable' Guides--14iliingof Uraiium Ores." ORNL-TH-4903, Vol. 1, May 1975.
3. "Environmental Analysis of the Uranium Fuel Cycle, Par* TV - Supplementary Analysis--1976,"USEPA. EPA 520/4-76-017, July 1976.
4. E. David Harvard (editor), "Workshop on Methods for Measuring Radiation in and AroundUranium Mills," Atomic Industrial Forum, Inc., August 1977.
.4-8
S. C.W. Sill, "Simultaneous Determination of U-238, U-234, Th-230, Ra-226, and Pb-210 inUranium Ores, Dusts, and -ill Tailings," Health Physics, Vol. 33, No. 5, November 1977.
6. M.H. Moment, et al, "Measured Concentrations of Radioactive Particles in Air in theVicinity of the Anaconda Uranium Mil'," Argonne National Laboratory, NUREG/CR-1320,ANL/ES-89, February 1980.
7. M.H. Momeni, et al, "Radon and Radon-Daughter Concentrations in Air in the Vicinity of the,Anaconda Uranium Mill," Argonne National Laboratory, NUREGiCR-113, ANL/ES-81, November 197^
8. M.N. Moment, et a1, "Systems for Continuous Measurement of Airborne Radon-222 Concentrationand Working Level," Argonne National Laboratory, NUREG/CR-1412, ANL/ES-88, April 1980.
9. M.H. Momeni, et al, "Radiological Impact of Uranium Tailings and Alternatives for TheirManagament," proceedings of the Health Physics Society 12th Mid-year Topical Symposium,"Low-Level Radioactive Waste Management," USEPA 520/3-79-002, February 1979.
10. "Radioactive Emissions from Yellowcake Proce•sing Stacks at Uranium Mills, USEPA, Office ofRadiation Programs-Las Vegas Facility, ORP/LV-79-3, 1980.
11. "Standards of Performance for New Stationary Sources--Revision to Reference Method 148,"USEPA, Federal Register, Vol. 42, No. 160. Thursday, August 18, 1977...
12. M.H. Momeni, et al, "Radioisotopic Composition of Yellowcake: An Esttmattm of StackRelease Rates," Argonne National Laboratory, NUREG/CR-1216, ANL/ES-84, December 1979.
13. C.W. Fort, et al, "Particle Size Distribution of Yellowcake Emissions at the UnitedNuclear-t'hurchrock Uranium Mill," ORP/LV- 30-1, January 1980.
14. Andersen 2000, Inc., "Operating Manual for Andersen 2000 Inc.: Mark I1 and Mark IIIParticle'Slzing Stack Samplers," Atlanta, GA, August 1977.
15. "Standards of Performance for New Stationary Sources," USEPA, Federal Register, Vol. 42,Mo. 160, August 18, 1977.
16. F.J. Miller, et al, "Size Considerations for Establishing a Standard for InhalableParticles," Journal of Air Pollution Control Association, Vol. 29. No. 6, pp. 610-0i5,June 1979.
17. P.E; Morrow, et al, "Deposition and Retention Models for Internal Dosimetry of the HumanRespiratory Tract," Health Physics, Vol. 12, pp. 173-207, February 1966.
18. "T4* Metabolism of Compounds of Plutonium and Other Actinides," ICRP Publication 19, 1972.
19. D.R. Kalkwarf, "Solubility Classification of Airborne Products from Uranium Ores andTailings Piles," Battelle Pacific Northwest Laboratory, NUREG/CR-0530, January 1979.
20. A.F. Edison and J.A. Mewhinney, "jrn Vitro Dissolution of Uranium Product Samples from FourUranium Mills," 1978.
21. L.M. Steckel and C.M. West, "Characterization of Y-12 Uranium Process Materials Correlatedwith In Vitro Exporience," Union Carbide Corporation, Oak Ridge Y-12 Plant, Y-1544A, 1966.
22. N. Cocke and F.B. Holt, "The Sclubility of Some Uranium Compounds in Simulated Lung Fluid."Health Physics, Vol. 27, pp. 69-77, July 1974.
23. R.C. Merritt, "The Extractive Metallurgy of Uranium," Colorado School of Mines ResearchInstitute, 197:.
24. "January 1960 Summary Report," National Lead Company, Winchester Laboratory, WIN-112,pp. 6-14 and 53-55, February 1960.
25. E.C. Tsivaglou and R.L. O'Connel, "Waste Guide for t~e Uranium Milling Industry," USPHS,RA Taft Sanitary Engineering Center, Technical Report W62-12, pp. 28-31, 1962.
26. L.C. Schwendiman, et al, "A Field and Modeling Study of Winrdblown Particles from aUranium Mill Tailinqs Pile," Battelle Pacific Northwest Laboratory, NURFG/CR-1407,PNL-3345, June 1980.
27. W.B. Silker and P.G. Heasler, "Diffusion and bxhalation of Radon from Uranium Tailings,"Battelle Pacific Northwest Laboratory, NUREG/'R-1138, PNL-3207, October 1979.
- . - . ., , ,...8 -
28. M.E. 'Clementts and M.H. Wilkening, "Atmospheric Pressure Effects on Rn-222 TransportAcross the Earth-Air Interface." J. Geo. Phys. Res. 79:5026-5029, 1974.
29. H.W. Kramer, et al., "Measurements of the Effects of Atmospheric Variables on Radon-222Flux and Soil Gas Concentrations," in The Natural Radiation Environment, (Chicago, IL:University of Chicago Press, 1964) pp. 191-215.
30. V.C. Rogers, et al, "Characterization of Uranium Tailings Cover Materials for Radon FluxReduction," Argonna National Laboratory and Ford, Bacon and Davis Utah, Inc., NUREG/CR-1081,March 1980.
31. "Enviro iental Statement Related to the Operation of the Bear Creek Project," RockyMountain Energy Company, NUREG/0129, January 1977.
32. M.H. Moment, et al. "Uranium Dispersion and Dosimetry Code, UWAD," Argonne NationalLaboratory, NUREG/CR-0553, ANL/tS-72, May 1979.
33. J.B. Martin. et al, "Generic Environmental Impact Statement on U.S. Uranium MillingIndustry," in Seminar on Management; Stabilization and Environmental Impact of UraniumMill Tailings, Nuclear Energy Agency (OECD), Albuquerque, NM, July 1979.
34. P.F. Guill, "Wind Induced Movwient of Radioactive Sands from Uranium Tailings Piles,"submitted to and accepted by the Graduate Faculty of the Louisiana State University andAgricultural and Mechenical College in partial fulfillment of the requirements for thedegree of Master of Science in the Department of Nuclear Engineering, August 1978.
35. Megumi, et al., "Ccncentration of Uranium Series Nuclides in Soil Particles .in Relationto Their Size," J. Geo. Phys. Re., Vol. 82, do. 2, 1977.
36. R.B. Holtzman, et al, "Contamination of the Human Food Chain by Uranium Mill TailingsPiles," Argonne National Laboratory, NUREG/CR-0758, ANL/ES-69, March 1979.

APPENDIX M. IMPACTS GF ALKALINE-LEAC4 HILL
The process of alkaline (cartionect laching is described in detail in Appendix B. Briefly, theore (ground'more finely thin for acid leachirg) is extracted with a mixed sodium carboiate-eodium bicarbonate solution. Heat and pressure may be used and air is usually used for oxidationof the uranium. The solids and liquids are separated -in counter-current filters or decantationtanks, and after wash'ng the solids are dficarded. The leacit liquid is treated with sodiumhyaroxide to precipitate uranium oxide which then is washed, filtered and dried for packaging.
In some cases, second stage precipitation is employed to reduce sodium concentration and toallow increased recycling of water. Sulfuric acid Is used to redissolve the uranium, which isthen precipitated with ammonia or peroxide.
The barren leach solution is recarbonated and recycled in the extraction process. After beingwashed, the solid tailings are slurried in a water stream (separate from other waste waters) andsent to the tailings pond. The extraction solution is continually reused. The volume of liqu.owastes from the alkaline mrill ranges from 0.3 to 0.8 ton pg., ton of ore, 1 compared to the modelmuil value of 1.0 ton with 0.3 ton being recycled.
The waste solution from the alkaline mill will have a pH of about 10 and total dissolved solidsof 12000 mg/L compared with pH? and 35000 mg/L in tk.e acid mill.' Host of the difference is ina lower sulfate level in the alkaline waste. Toxic anionic sWts of selenium, vanadium andarsenic will be much more soluble in the alkaline solution and~might cause serious grouddwatercontamination problems if the ores conta~n high concen.rations of these elements. In general,most pollutants will move more slowly or be less soluble in alkaline wastes than in acidicwastes. The uranium concentration in acid and alkaline solutions is about the same. Radumconcentration in alkaline solutions is from 4% to 20% of that in acid, and the thorium concen-tratio, is essentially negligible in alkaline solution. 1
The yellowcake from the alkaline process contains ?bout 1.8% of the radium originally in theore, compared with a content about 0.1% in yellow-ake from acid leachin:. As a cohsequencv morecare must be used ir, ventilation and dust control in handling alkaline yellowcake.
An alkaline mill is not properly an alternative to an acid mill; it is built when necessitatedby the properties of the uranitn ore to be processed. The cost of alkaline mills is difficultto estimate since none have been built lately; however. it is estimated that capital and operatingcosts would both be 3boUt 15% n 201 greater than for an average acid-leach mill.2 The costs ofpollution tailings control for the alkaline mill would be generally similar,' but would differin a few respects from those of the model mill. Since the yellowcake produced in an alkalinemill is more radioactive, a more expensive dust control device would be required to attain anaquivelent effluent radioactivity level.
Since tVe amount of wastewater, and usually the pollutant level of the alkal'ne water, is lowerthan in the acid mill, somewhat less stringert control might be possible. If, however, theanionic wastes (e.g., selenium) we-e present, a higher control level would be necessary. Asmaller surface area would be required for evaporation, and hence smaller but deeper tailingsareas could be used. The costs would depend on the height of the dam and could be greater forthe smaller area.3 The costs of liners or covers are not changed other then through changes inarea. The cheoical compositon of the tailings solution could determine the need for a givenliner and the associated cost.
H-I
H-2
Refe,'ences
1. M. B. Sears et el., "rorrelation of Redioactivp Waste Treatment Costs and the EnvironmentalImpact of Waste EUfluents in the Nuclear Fuel Cycle for Use in Establiihing as Low asPracttcable Guides--Milling of Uranium O'es," Oak Ridge National Laboratory, ORNL-TM-4903,May 1975.
2. "A-, Evalubtion of the Cnst Parameter for Hypothetical Uranium Milling Operations and OreTransportat:on Systems in the Western United States," Dames and Moore, prepared for ArgonneNational Laboratory, July 1977.
APPENDIX 1. IMPACTS OF A LARGE-CAPACITY MILL
I. !NTRODUCT ION
The ismiacts of a large uranium mill [7200 MT, (8000 ST) per day] and associated tailings dismosalarea~s) are considered and compared to those of four smaller mills [1800 MT (2000 ST) per day]sited in the same general location.
The potential advantages of a larger mill include confinement of the ervironmental impacts thatwo, Id be associated with the operation of four smaller milling facilities and their tailingsdisaosal systerns to a nruch smaller area. Capital, operating, and maintenance costs for a largerproduction center and tailings disposal operation should be less than the aggregate of those fora nijmb-r of scattered mills. With sources of potential problems localized, the expenses andeff-rts involved in instituting the necessary control measures (Secs. 8.2 and 8.3) also shouldbe reduced.
A disadvantage inherent in this option is the difficulty of finding an adequate mill locationand a tailings disposal area of suitable size and with the necessary characteristics for thecc.,tainment of a large volume of mill wastes. There would also be a concomitant increase in thecost of transporting ores from a number of distant mines to a common processing facility, aswell as the attendant adverse impacts resulting from an increase in vehicular traffic. Moreover,tý. c-,ntralized mil. might incur operational problems resulting from wide variations In physicalant cemical characteristics of ores coming from different mines (e.g., wide differences inmoisture content, grindabilirv, uranium and lime contents), a situation not usually encounteredat a mill with at, ore feed originating from one mine or a few mines in the same general ar',a andhavinq a fairly uniform and predictable quality.
Siting of uranium mills and associated facilities is influenced by land acquisition problems andby proximity to mines and to suitable tailings disposal sites (App. B), as well as by thecharacteristics and distribution of ore bodies.
Since the total quantities of discharges for a given output of uranium concentrate will beessentially equal, regardless of the size or number of mills involved, options which facilitatetransport of ore to the mill and of tailings from the mill, or which permit more effectivecontrol of environmental impacts, are discussed below. Costs affected by mil capacity areincluded.
2. ENVIRONMENTAL EFFECTS
If tallings disposal is excluded and if the processes and equipment use-* .,, the 7200-MT/eay(8;00 ST) mill are similar to those used in the smaller mills (except for number .r siz, ), theenvironmental irnpacts of the processes and equipment of the larger mill would be similar tothose described in Chapter 6 for the model mill, but greater in proportion to the increasedthroughput of the larger mill. Because of the larger mill's s-zp, and throughput, air-cleaningsystems and water usage could be mare efficient and the cverall environmental impacts (per tenprocessed) could be less than for four smaller mills. The proportional land area of the millalone would be reduced only slightly.
The radioloqical impact from the tailings to receptors at varying distances from the larqer millwill be increased by about a factor of four. However, the close-in receptors will experience anincrease of less than four times because the effluent component from the large tailings pond, anarea source, need not increase proportionately. If the depth of the tailings disposal pit isconstrained by geology o hydiology to the same depth as for the model mill, then the effluentcomponent would be the same for one large mill or four smaller ones. If, however, the depth ofthe pit is uncorstrained, the ratio of surface exposed to quantity of tailings contained can bedecreased. This could reduce surface emaiiation of radioactivity considerably. The radioloqicalimpact (in terms of oan-re") of a large disposal area to a receptor on its perimeter would beless than that for receptors on the perimeter of four smaller disposal area:.. Doses at thefence, trailer, and ranch. will be about four times greater than for the 1800 MT/day mill duringoperation. After mill shutdown, without reclamation, the tailings will dry out and become
1-1
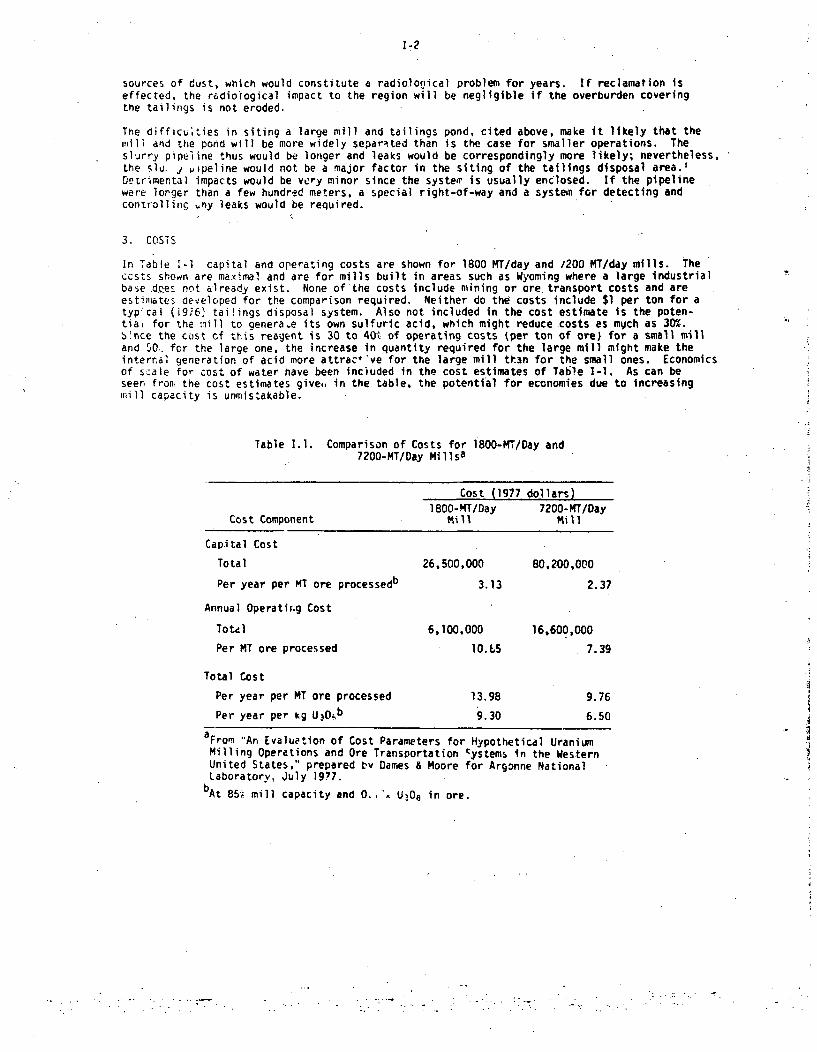
1-2
sources of dust, which would constitute a radiological problem for years. If reclamation iseffected, the radioiogical impact to the region will be negligible If the overburden coveringthe tailings is not eroded.
The difficulties in siting a large mill and tailings pond, cited above, make it likely that therill and the pond will be more widely separated than is the case for smaller operations. Theslurry pipeline thus would be longer and leaks would be correspondingly more likely; nevertheless,the slu. / pipeline would not be a major factor in the siting of the tailings disposal area.,Detrimental impacts would be very minor since the systeir is usually enclosed. If the pipelinewere lorger than a few hundred meters, a special right-of-way and a systen for detecting andcontroliing ,ny leaks would be required.
3. COSTS
In Table 1-1 capital and operating costs are shown for 1800 MT/day and /200 MT/day mills. Theccsts shown are maximal and are for mills built in areas such as Wyoming where a large industrialbase does not already exist. None of the costs include mining or ore transport costs and areestimates aeveloped for the comparison required. Neither do the costs include $1 per ton for atyp"cal (1926) tai!ings disposal system. Also not included in the cost estimate is the poten-tia, for the inill to generate its own sulfuric acid, which might reduce costs as mych as 30%.'!nce the cost of this reagent is 30 to 401 of operating costs ýper ton of ore) for a small milland 50:. for the large one, the increase in quantity required for the large mill might make theinternal generation of acid more attrac* ve for the large mill th3n for the small ones. Economicsof scale for cost of water have been included in the cost estimates of Table 1-1. As can beseen fron the cost estimates give., in the table, the potential for economies due to increasingmrill capacity is unmistakable.
Table 1.I. Comparison of Costs for 1800-MT/Day and7200-MT/Day Millsa
Cost (1977 dollars)1800-MT/Day 7200-MT/Day
Cost Component Mill Mill
Capital Cost
Total 26,500,000 80,200,000
Per year per MT ore processedb 3.13 2.37
Annual Operatir.g Cost
Tote] 6,100,000 16,600,000
Per MT ore processed lO.L5 7.39
Total Cost
Per year per MT ore processed 13.98 9.76
Per year per kg U30ýb 9.30 6.50
aFrom "An Evaluation of Cost Parameters for Hypotheticdl Uranium
Milling Operations and Ore Transportation cystems in the WesternUnited States," prepared by Dames & Moore for Argonne NationalLaboratory, July 19?7.
bAt 85A* mill capacity and 0..-• U30 in ore.
1-3
The tailinqs disposal cost for the large mill would be very similar to the combined disposalcosts for -our small mills. The scale of four is not really large enough to change the costsmarkedly and would only affect excavation costs. If the Pit were deep, and the mill more than amile from the pit, costs might actually increase slightly.
The staff is aware that the costs presentad in this appendix are now out of date. It is thestaff's opinion that the 'relationships of the costs are essentially unchanged so that theeconomies of scale are coriectly reflected. An approximate updating of the costs may be obtainedby oultiplying all cost figures 6y 1.25 to allow for inflation since 1977.
Reference
1. "Evaluation of Cost Parameters for Hypothetical Uranium Milli:tg Operations and Ore Trans--- tation Systems in Western United States, by Dames and Moore for Argonne National
La0cratory, July 1977.

APPENDIX J. EPA INTERIM CLEANUP STANDARDS FOR INACTIVE URANIUM PROCESSING SITES
in accordance with orovisions of the Ura.ium Mill Tailings Radiation Control Act of 1978
(UMTRCA, PL 95-604), the U.S. Environmental Protection Agency (EPA) has published interim
criteria for cleanup of open lands and structures at inactive uranium processing sites (as
designated under Title I of the UMTRCA). These interim criteria were published in the Federal
Register on April 22, 1980, and are reproduced below in full.
Although these criteria are effective only on an interim basis, and only for inactive sites, the
,i.C staff considers them to be the most carefully reasoned and generally applicable standards
now available for land cleanup and decommissioning of uranium mill sites. Therefore, the NRC
staff has temporarily adopted these criteria as representing NRC staff positions with respect to
land cleanup and deconmissioning of uranium mill sites.
If at some later time the EPA modifies these criteria, or proposes or adopts different criteria
more directly applicable for active uranium milling operations (as required by the UMTRCA), the
NRC staff intends to modify its staff position accordingly. Hewever, on an interim basis, the
criteria set forth below are those which the NRC staff would endorse and use as needed in indi-
vidual licensing proceedings.
J-l
is if
- -o2.
Federal Register Vol. 45, No. 79 /Tuesday*. April 22W..l) Rules and Regulationts
NVIROU4W.rTAL PAOMCTIroN
0CFR Part 192l~m 1'S4t.4
I Ceew*, ep c Stituerds for kntctvUrutium Pru* e g So"
A004r. E, Aronmental ProtectionAgency.AC7IO Interim standards.
MSiNWM: The Environmental ProtectionAgenry EPA) is issuing interimstandards for cleanup of open lands andbuildings contaminated with residualradioactive materials (mainly tailings)frm inactive uranium processing sites.The1r standards am also beingpublished simultaneously as proposedstandards upon which public commentil being solicited. (See ProposedCleanup Standards in the ProposedRules section of the Fedeal Rlgistw.r
EPA has developed these standardspursuant to Section 275(a) of the AtomicEnergy Act, as added by Section 2)l(s)of Pub. L a-. the Uranium MillTailingg Radiation Control Act of 1978Pub. L 9&404 requires the Departmentof EnergY (DOE) to conduct remedialactions fot designated inactive uraniumprocessing sites in accordance withstand&r-ds promulgated by EPA.Building and land contaminated withtailings pose a continuing threa topublic health. Some of these buildingshave been !ound to have radiation 'evelswhich are highly dangerous to anyoneexposed -o them for Iong times. Pub. L.95-04r.udes,. ndertaking remedialaction before EPA L,.s promulgatedstandards. 'Tere.oi .. we have decidedto promulgate interim. -tandards forcleanup of these open lands andbuildings, to permit DOE to takeredal acts under Pub. -L W404 toalleviate these problems.An18M Effective date: April 2.IS.M
Comment date: Comments should-bereceived on or before June 23. 1ISM.Amben: Comments should besubmitted to Docket No. A-79-ZL whichis located in the EnvironmentalPrnection Agency, Central DocketSection. Rrum 29WB, 401 M Street. SW..Washington. D.C. 240w0. The DraftEnvironmental lnract Statement rosyb, e;manined at the Central DocketaecJo.a. Shortly. after we proposedisposal standards for inactiveprocessing sitms, single copies nf theDraft EnV-rnmental Impact Statementmay be obtained by wilting to theaddress given below.,ao w PUMMIN mm ioWU OIWTACI'Dr. Stanley Uchtman, Criteria and
Standards Division (ANr.-400). Office ofRadiation iugrama, U.S. EnvironmentalProtection Agency. Iashington. D.C.20400: telephone nrmber 7W--g-O7.
WUM OAN SOMMATIOW PurMuatto Section 275(a) of the Atomic EnergyAct. as added by ctoc 2M(a) of Pub.L W4104, the Uranium MIU TaiingsRadiation Control Act of 1W9, DPA~hadeveloped standards for the cleanup ofopen lands and buildig cont#a tedwith uranium mill tal•ing from InacLzeprocessing sites. Pub. L 95-404 requiresthe Department of Energy to cOnductremedial actions for designs'. .tiveur m procsin sites in accordancewith stanards promulgated by W'A.(Section 104X((1) 42 U.S.C. Section715aj(1)). However, Pub. L 8-e04precludes undertaking remnedial actions
fore such standards are promulgated.Lands and buildings contaminated
with uranium mill taiings poet naka to.public health. The greatest haIkd fromtalings on open lands is Icreasedlevels of radon decay products inbuildings. Wb-n radon decay productsare inhaled, they Increas e tchance oflung cancer. Exposure to direct gammaradiation and car tamtinatlon of drinkingwater and food mpay also occur.
Tailings usually only pose significantrisk to people who are exposed for along time. However, some homes andother buildir~ps heve been found inwhich the radon decay productconcentration is quite dangerous. TIereare such buildings. for example, in SaltLakt City. and in Canousburm.Pannylvanla. Several buildings in SaltLake City am Immediately adjacent to atailings pile. or have tallings under.or arou d them. In some of thee indoorradon d&uy product concentrationsexceed the average occupational 'concentra on limit for uranium miners(0.3 WL).' included aiong there isa firestation in Salt Lake City. whenesubstantially elevated levels have beenmeasured even when mechanicalventiladon is used. In CanonsburS anndustriail park is now located on an
lnactlve processing site. Eight buildingleased to commercial tenants amlocated d_'ectly over heavilycontaminated land. Measuretmentsduring working hours show that allbuildings have substantially elevatedindoor redon decay productconcentrations, with the highest averagedaytime level being 0.4 WL. These levels
'A ua WiWs (WT. b my omlm~e.o d1mi.Sd d d dtmf b m hia da
ast -ill emil ab W elN0 i of 6pbo
my.oe s a astm e .a a tm dan oteIM"Wvetgo me *&..At m mo ma hui. r11meivt 0" n bw- S.us
ar dangerous and will contiuve. Toallow DOE to begi remsedlal actionunde Pub. L 9-.404 t XJleviste thesehazards, we have decidd to promulgatethese immediatelj efL.cuve interimcleanup standards.
Studies of indoor backgroundradioactivity in G:and Junction(Cohlmdo), New York State, and NewJesy show that at least 10 percent ofhousi with basements exceed theInteristandard's remedial ction levelof .015 WL. Because of this, we believeit would often be impossible to tmy toreduce levels for houses affected b.taIIn significantly below .A15 WL byreunoo the aUni•. 1Thus, it is unlikelytha thbal stadads will besmet at alevel sIgnificantly pore stringent thanthe Inter'i action level of 01 WI andremedial actions performed under theInterim standard will not have ii, beradone. Furthermore. although we havenot formally solicited public commentsan the interim standards, the NuclearRegulatory Commission and theDepatmenl of nergy have beencosulted. For theisemasons, we believeissuing immediately effective interimleanup standards is Justified.
A statement of the research. analysis.and other availablet information insupport of t interim standard iscontained in the preamble to theproposed standards publishedelsewhere in the Federal Register today.Additional background material may befound in the Draft Environmental lm'actStatersat being made available inDocket No. A-70-2. which is located atthe address givcu shove, and in otherinformation contained in that docket.We invite written comments on theseinterim standards, and they remainsubject to modification in response tosuch comments and to views expressedorally at public bearings (see below).
In addition to the procedures wefollowed prior to prculglgting theseinterim dleanup standard&, we areconductin the required public reviewprocess for promulgating finalstandards. in the Proposed Rules sectionof todays rederal Register, we arepropostin for comment the cleanupstandards for inactive uraniumprocessing sites. T'hey ar identical tothe interim ceahup standards which arebeing =de effective immediately.Furthermore, EPA intends to hold publicheariV on thes pruposed cleanupstandards and on proposed staxnardsfor the disposal of tailing from Inactivesites. The dipoeal standards. will beproposed for pubac comment soon. andthe Draft Environmental !mpectStatement for both proposed standardswill be made generally available at that
I
J-3
Federal ROAe / VOL 48. No. 71 / Tuesdby. April -.t. 1W. i.Ru'es ano Reguladoia 2.37
time. M -hefore, befk the, proposedcleanup and disposal esr.dalds becomefinal, members of the public will havethe opportunity to comment in writlar.and to pres•nt data. views, andarguments at a public heari.
Neabl-The costs and benefts of thee-cis m dicued in the raftllav-irkumtw impact Suta mL However
neither out tiebance of iterim cisnupstandards na tM remainder at o progrmto ,,et ramedial ecstio oetand for Pub. LWol -UM Prequire penof aan soonoalc
anel.as& undnet Exem-en e Order IUSS Weex~wwcý tbe coeat of the rsdial actianpro0Fa In ay cseD • ye7War tD be We thatihe t'W =bc critet,= ZPA ha, i"atbh-d(" M 90M May M 19M1) forrequiring an somoo analysis.
Detad; April 14. 1980,Demore hL Casde.Adminustratar.
Pat 192 is added to Tise 40 of theCode of Fedaral Regulations as follows
PARr 192-CVIRCAF~EffAj.PROU CTMow TANDA- O FORLWtAI4M .W1L TAILINGS
4 A--4"Pse-wdf
Cu"of OWS Lancde swe Wj§MW
No~ Pop. Brictive Winwdu-oilI miss a~a~
sac19•.0 Applicability.IMi1 Deftaltuon.1V.12 Standards.192.13 tffe:cv, date.
IuptC--•
Il". Ciitmt.h W exceptions.1S.=, Rsm*e actions for exucpttonal
WirtmstaLCO5.Tebe A llAeserved]Table B,
An~arly Sea 27& Atomc Energy Act of1954. (2 US-C. 2=j. as amended by theUranlium Mil Tallinp Radiaatn Cotrol Actof ISM. Pub. L 0-&04.
&AV. A-4MOMvSubpat 110An w.. 2tuid ordstor Camq' of Open LanuD mu
11:0 MpS -Rc Prom I•
I 19L" Applculty.This subpart applies to open lands
and bu•ldiun which are part of anyprocessing site designa ted by thedesetary of Earu uuder Pub. L 1011-O;4. Section I.= Section 101 of Pub. L1.-.4. states th&t proomalng idle"means-
(a) Any tse. Including the mill.m'.taIning residual radioective
mater.ials at which all or substantiallyall of the usr- um waes produced for sale
to any Federal agency prior to Prnruv 1,1t71 under a contract with any Peder1'agency. except in the case Of ( site at ornear Sick Rock. Colorado. unfesa-
(1) Such site was owned or controlled5 of Januar 1.1078. or is thereafterowned or controlled. by any Federalagency, or
(2) A license (issued by the (NuclearRegulator,, CommIJion or itspredecessor agency under the Atomic.Ehenll Act of I164 or b, a State aspermitted under section 74 of suca Act)for the production at such site of anyuranium or thorium product derivedfrom ores Is in effect on January 1, 197L.or is Issued or renewed after such date:and
•b} Any other real property orimprovement thereon which-
(1) s in thr vicnity of such site, and(a) Is determined by the Seoctary, in
consultation with the Commission, to becotamiated with residual radioactivemateals derived from such site.Any ownership or control of an area bya Federal agency which is acquiredpursuant to a cooperative agsementunder this title shall not be teated asownership or control by such agency forpurposes of paragrep•. (a)(1) of thissection. A licens for the production ofany uranium product from residualradioactive materais shaU not betreated "as License for production fromores within the meaning of paragraph(s)(2) of this section If such production Isin accordance with section 109(b).
.119M I Dsfiins.(a) Unless otherwise indicated in this
subpar, all terms hhall have the samemeaning as defined in Tlile I of theUranium Mill Tailings Radiation ControlAct of 197M.
(b) Remedial aoc•on mean any actionperformed under Section 108 of theUrnium Mill Tailings Radiation ControlAct of 1971
1O andmeans any surface orsusufce land which is not a disposalsite and Is not covered bye building.
(d) Wonkir Lmel (4) means saycombinatio of short-lived radlon decayproducts in one liter of air that willresult in the ultimataem ission of alphaprticles with a total energy of 130
on electron volts.(e) Doe equiwvent means aborbed
does multiplied by approprste factors tosqca t for differmacs in biologicaleffectiveness due to the type and energyot the radiation and other factors. Theunit of does equivalent is the *rsm."
(f) C'Me (Ci) meansthe amount ofradioactive ma•t• which produces 3billion nuclear tirnsformations peroecond. One pLtocurle (pCi) - 10- 11 CL
Remm•al sctx.-* rhal• • e c.wuLtdso es to p. 3vids reesonAble .sutancethat-
(a) TIe average c€en tu.tc. ofradium-225 attributable to residualradioactive material fom anydesignated processing site tn any.: -,athickness of soils or other materials or.open land within 1 foot of the surfsce., orin any-IS am thickness below I foot.shall not exceed A p0l/pt.
fbi The levels of raedoactivity in anyoccupied or colmpabie building shallnot exceed eithe of the values specifiedIn Table B because of residualradioactive mateda from anydesignated W eItsit.
(c) The cumnUlative etime radiationdoes %alhsot toany organ of thebod menimal,- otposed individualresulting from the presence of reolddualradioactive materials orbprdcmaterials h •allt amed the maimumdoese equivalent whlsh could ccnr fromradumt-rn and its decay products underparagraphs Is) and (b) of this section.
The standards of this subpart sall beeffe-tive April 22. IMW.
I lnll bu b Oo ie~epmm.Exction to the standards may be
jusNtble under any of the followingcdrcumstnce
(a) Public health or sfety would beunavoidably endangered in attemptingto meet one or more of tbe requirementsof Subpart A or Bepart B of this Part.
(b) The goal of eni talproLection would be better sered by notsatifbing cleanup requirements for openland. I 19 {2a) or the correspondingpart of i 12.•.1(). To Justify anexception A. these requirements thershould bea clearly unfavorableimbalance betwee the environmentalharm end the enviromental and healthbenefits which would-result fromImplementing the standard. Thelikelihood and extent of current andfuture human presence at th, ,te maybe considered in evaluatfi, ihrsebeneffis.
(c) The estimated costs of ren talactions to comply with the cleanuprequirements for buildings. I 312.1(b) orthe oojrrepondlnq part of I I9L.12(c). siun-.soonably hiLg relative to the
,w 41ts. Factors which may beo" isrsd in this lugmnt 'nclude the
nmod of occupancy. the radiation levelsin the most bfquently oo-iied areas.and the residual useful •i•tim of thebuilding. This criterton can only be used
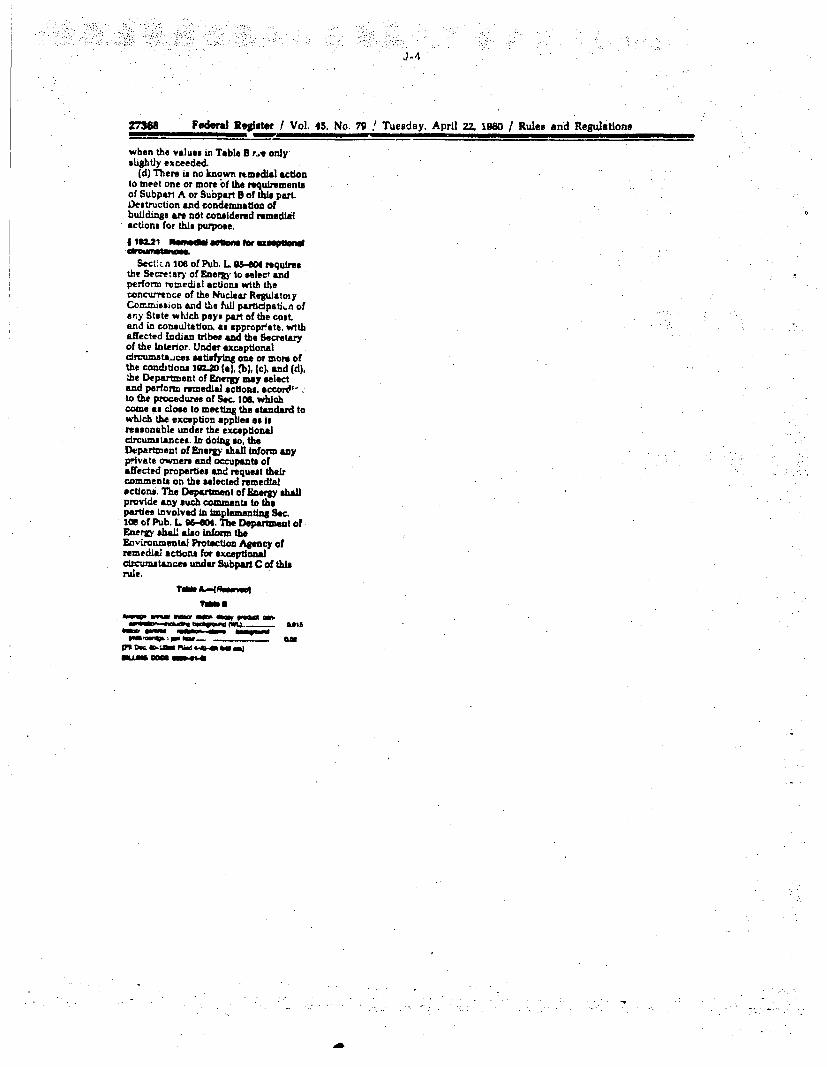
J-4
27368 Federal Reslster / Vol. 45, No. 79 n Tuesday. April 22.. 1980 / Rules and Regulations
when the values in Table B r.e onlyslightly exceeded.
(d) There is no known rmmedial actionto meet one or more of the requirementsof Subpart A or Subpart B of this part.Destruction and condemn-tion ofbuildings are not consldered remedialactions for this purpose.
* 192.21 Nee2• eeooee for tee,6eW
Sectr n 106 of Pub. L 95-.04 requiresthe Secretary of Energy to select andperform remedial actions with theconcurrence of the Nuclear RegulatoiyConrnission and the full paricipati, ofany State which pays part of the cost,and in consultation, as appropr'ate, withaffected Indian tribes and the Secretaryof the Interior. Under exceptional
rcummstasces atisfying one or more ofthe conditions 1ML (a). ,b), (c), and (d),the Department of Energ may selectand perform remedial actions, accord- .to the procedu'ee of Sec. 108, whichcome as close to mecting the standard towhich the exception applies eslsreasonable under the exceptionalcircumstances. In doing so. theDepartment of Energy shall Inform anyprivate owners and occupants ofaffected properties and request theircomments on the selected remedialoctions. The Department of Energy shallprovide any such commants to theparties involved in implementing Sec.loe of Pub. L 9&-804. The Department ofEnergy shail also inform theEnvironmental Protection Agency ofremedial actiomn for exceptionalcizrcunstancee under Subpart C of thisrule.
TOM Ao -,,t- To am
mat WU ~ eW aO
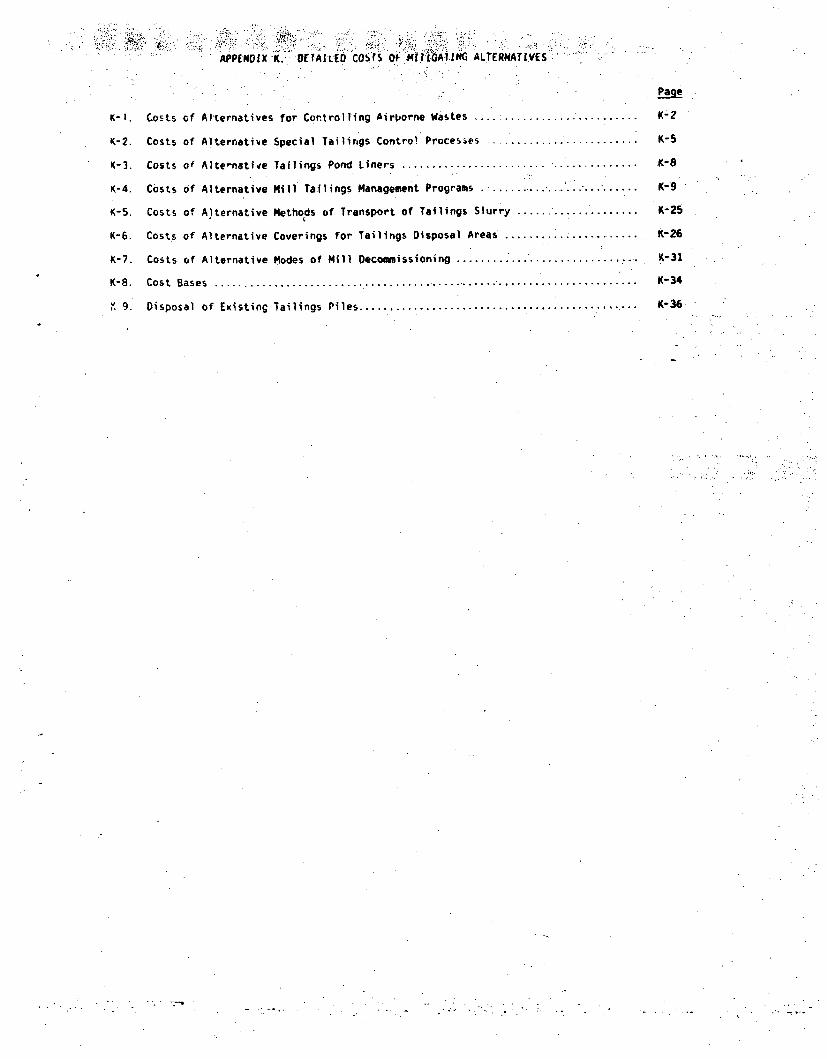
APPENDIX K. -DETAILED COVrS Of rflNýG ATERNATIVES
K-1. Costs cf Al-ternatives for Controlling Airtoorne Wastes .... .............. K-2
K-2. Costs of Alterrnative Special Tailinrgs Control Processes " . K-5
K-3. Costs of Alte-native Tailings Pond Liners ...................... .. .............. K-8
K-4. Costs of Alternative Mill Tailings Management Programs ........................ K-9
K-S. Costs of Alternative Methods of Transport of Tailings Slurry ................... K-25
K-6. Costs of Alternative Coverings for Tailings Disposal Areas ....................... K-26
K-7. Costs of Alternative Modes of Mill Decommissioning ............ ................... -31
K-8. Cost Bases ..................................... ....................... K-34
, 9. Disposal of Existing Tailings Piles ............................................ K-36
K-2
APPENDIX K-1. COSTS OF ALTERNATIVES FOR CONTROLLING AIRBORNE WASTES
During operations, uranium milling will produce a nimiber of 'airborne contaminants. In thisappendix the costs of alternative methods for control of dust from orestorage, ore handling andcrushing, yellowcake drying and pr'c'aging, and the tailings pond are considered. The methodsare described tn more detail in Chapter 8.
1. ALTERNATIVES TO CONTROL DUST FROM ORE STORAGE
1.1 Water jpray
One-half hectare would be used for ore storage, and for.this alternative it is assumed that taestorage pad would be sprinkled daily with about 3 mm of water.' It is assumed that a sprinklersystem similar to that used for general irrigation is set up. The capital costs can be scaleafrom the costs of larger systems using the scaling factor "X0.6., 'Based upon the costs of a70-ha--system in 1973, the 1980 costs of an ý-ha system woul.. be about.$9,000. Maintenance andoperation would be 105 per year, or $900. The cost nf water is taken as $0.13/0n,' and since4,500 me/year would be used, the cost wo.ld be .$600. Therefore, the total annual cost ofthesystem would be $2,100 and the total lifetime (lb-year) cost (capital and annual) would be$32,000.
1.2 Windbreak
For this alturnative, a 3.7-m high sheet metal or wooden fence would be erected on three sidesof the ½-ha ore storage pad, each side being 80 m long. The cost Is linearly scaled and escalatedfrom Reference 2 for a total cost of $17,000 for either type of fence.
1.3 Ore Warehouse
The cost of an ½-ha warehouse is estimated. .to be $3.6 million ($720/m2). A ventilation andscrubber system would be required, and costs for the system would probably be a substantialmultiple of those cited below for the various dust control alternatives.
2. ALTERNAI1VES TO CONTROL DUST FROM ORE HANDLING, CRUSHING, AND GRINDING OPERATIONS
Ore is crushed to reduce the large raw lumps to diameters of the order of 2.8 cm or less. Thisprocess can be carried out on relatively dry ores, and a substantial source term (Sec. 5.3.2)from dust and radon can arise. Similarly, the handling and movement of the crushed ores cangenerate dust and radon releases. G-inding of ores refers to the reduction of ore.particle sizefrom 2.5 cm t- about 28-mesh size in a rod or ball mill. This process is generally carried outwet at from 50% to 7r, solids. These processes are described in more detail in Appendix B.
This two-step process (crushing and grinding) can be replaced by a single-step process, wetsemi-autogenous grinding, which results in an equivalent product. A brief description of thisProcess is given in Section 8.2.
The incremental capital costs for dry operations are estimated as S95,000 and operating costs atabout $0.12/MT ore (12 increase). 3 In addition to basic equipment costs, a dust collectionsystem would be required for the dry crushing unit.
Costs are given below for dust collection equipment (described in Sec. 8.3.1) for handling,storage. and crushing facilities. Ihe costs, summarized in Table K-1.1, are for ores containingabout 61 water in an 1800 MT/day mill.
2.1 Orifice Dust Collector
Separate dual collector units for the ore bin and for the combined crusher and screen units a-eused in the base case. The crusher and screen unit has a capacity of 27,000 cfm and the binunit 270': cfm. Similar capacities are assumed for the other alternatives. Capital costs forthe crushinu u-it collector would be $90,000 and for the bin dust collector $23.000. Annualoperat!?.j ,. , "ncluding power, water, maintenance, and labor, would be $14,000. Lifetimecosts wG.., '. 0:.OO
2.2 Wet !or:
The dustoperat i nt4
•Jn and grinder would cost $27,700 ai.i $1l0,600,"respectively. Annual6 $16,800, and total lifetime cost $3"•,tOO.
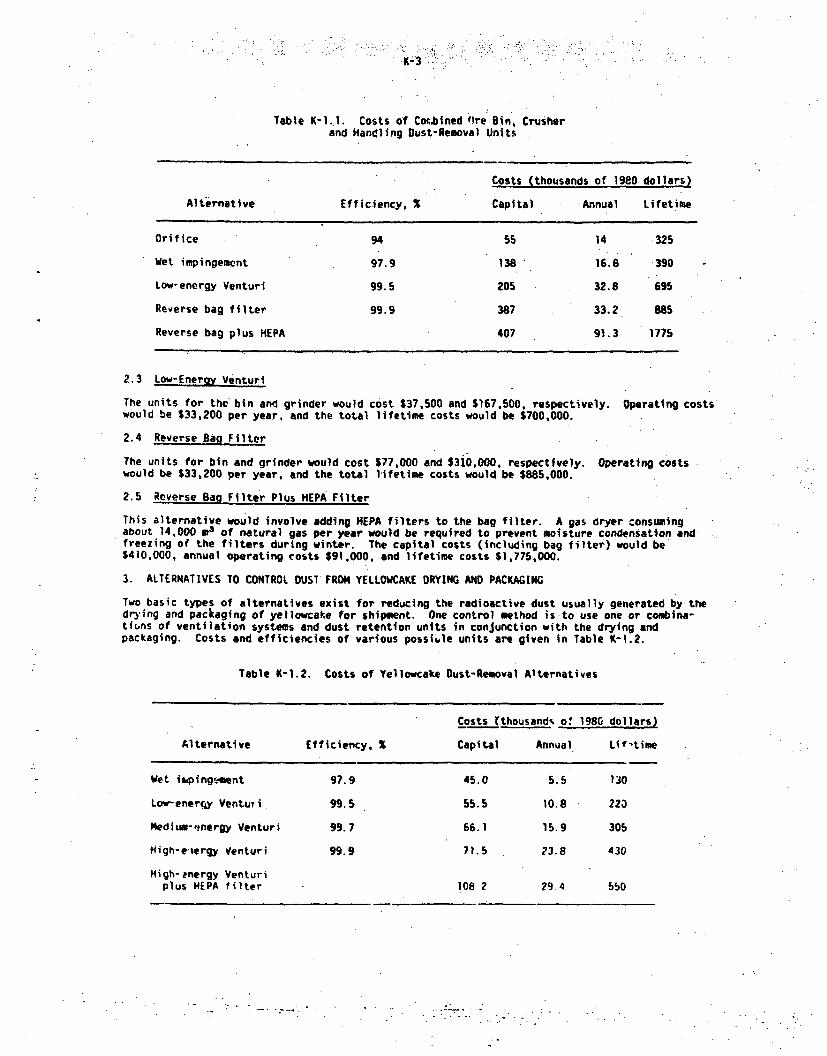
:K-;3
Table K-1.1. Costs of Cotbined Olre Bin, Crusherand Handling Dust-Removal Units
Costs (thousands of 1980 dollars)
Alternative Efficiency, % Capital Annual Lifetime
Orifice 94 55 14 325
Wet impingement 97.9 138 16.8 390
Low-energy Venturi 99.5 205 32.8 695
Reverse bag filter 99.9 387 33.2 885
Reverse bag plus HEPA 407 91.3 1775
2.3 Low-Energy Venturi
The units for the bin and grinder would cost $37,500 and $167,500, respectively. Operating costswould be $33,200 per year, and the total lifetime costs would be $700,000.
2.4 Reverse Bag Filter
The units for bin and grinder would cost $77,000 and $310,000, respectively. Operating costswould be $33,200 per year, and the total lifetime costs would be $885,000.
2.5 Reverse Bag Filter Plus HEPA Filter
This alternative would involve adding HEPA filters to the bag filter. A gas dryer consumingabout 14,000 ms of natural gas per year would be required to prevent moisture condensation andfreezing of the filters during winter. The capital costs (including bag filter) would be$410,000, annual operating costs $91,000, and lifetime costs $1,775,000.
3. ALTERNATIVES TO CONTROL DUST FROM YELLOWCAKE DRYING AND PACKAGING
Two basic types of alternatives exist for reducing the radioactive dust usually generated by thedrying and packaging of yellowcake for shipment. One control method is to use one or combina-tiuns of ventilation systems and dust retention units in conjunction with the drying andpackaging. Costs and efficiencies of various possible units are given in Table K-1.2.
Table K-1.2. Costs of Yellowcake Dust-Removal Alternatives
Costs Ithousand% o? 1980 dollars)
Alternative Efficiency, % Capital Annual Lif-time
Wet iwpingtment 97.9 45.0 5.5 130
Low-enerfgy VentuTi 99.5 55.5 10.8 223
Medium-,nergy Venturi 99.7 66.1 15.9 305
High-e-ergy Venturi 99.9 71.5 23.8 430
High-energy Venturiplus HEPA filter 108 2 29.4 550
The -costs have been. figured for 1700 m~iminutp units- The other method of dust reducti.on is toforego the drying step an(' ship tI.•. crude yelowc.a ke to the refining ill as a wet s.,rry orcake If this is done, drying ar. packaging of yeflowcake is unnecessary.. Pust wi'l no longerbe ge-ierated. and the yeliowcake suurce term becomes negligible. The yellowcake rf'ining milldoes. however, currently charge a premium of about $1.50/kg of U•O. (about 2 of t',e U3 0 price)fcr processing the alurry. 4 The excess cost would be balanced to a -large extent ty the reductioni,. eQuipment and operating costs for drying and for environmental controls.
The cost of installed drying and packaging equipment(including piping, instrumeitation, etc.)is estimated at $1.3 million, or about 15% of the total mill equipment cost of $e 6 million.'Prorating the mill's operating cost ($12/MT of tailings), the cost reduction is. "1.80/MT, orabout $1.]0/kg yellowcake. The capital cost. saving is about $0.02/kg yellowcake 'The maximumlifetime dust removal cost is $128,000 ($71,000 capital), equal to $0.06/biT tai-ings and $0.04/kgyellowcake. On this basis, the net cost to the mill oper•+or.of shipping yellnwcake as a slurryis $0.32/kg, about $290,000 annually anl $4.4 million lifetime.
A variation of the above procedure is the shipment of yellowcake as a "wet cale"; i.e. ,.theslurry would ne partially dried by filtering or centrifuging, and the'resulting moist form,Shipped to the conversion plant. An advantage of this option is that the wet take could beshipped in standard drums, whereas shipment of slurry would require a larger. thickýwalled..container. The savings of equipment and operating -osts would be those listed above, exceptthat acentrifuge. or equivalent apparatus, would still be required for preliminary drying. Thecost of the dewatering apparatus could be recovered from lower shipping costs.
4. ALTERNATIVES TO CONTROL DUST AND RADON kROM THE TAILINGS PILE
Oust from dry tailings can be minimized by keeping as large an area as possible under watev, bysprinkling with water, or by. various chemical sprays. Radon emissions can be minimized primarilyby maintaining a layer of liquid water over the tailings, ant; to A lesser extent by keeping thetailings saturated with water. Chemical sprays which cover the surface will have variableeffecciveness in controlling radon exhalation; inasmuch as they are applied as an interim dustcontrol measure during active use of the pile, such chemicals are expected to have little, ifany, effect on the emission of radon.
The costs uf keeping the tailings under water are affected by seepage, evaporation, and recyclingrates and by any unusual distribution of tailings or strengthenihg of the embankment. The costscf keeping the tailings under water would be a complex function of these variables, dependent onmi.ll operating conditions, and difficult to evaluate.
The costs of sprinkling the dry oeaches of the tailings pile wei'd be largely the costs ofoperating a water-sprinkling truck. About I ha per day would tit sprinkled withae.out 0.3 cm ofwater in eight hours. Water could be taken from the tailings p%,4; w;th negligible cost.
To estimate the cost of the sprinkling operation, the following lactcrs were considered. An18-NT ore truck traveling 360 km per day and having a useful li-e of tive years is-quoted ashaving total annual operating costs (including driver) of $66,000.1 The sprinkler truck isassumed to travel about 50 km per day and have a useful life o 1 t )•r-. The costs are takenas one-third of those for the ore truck for all items except ".h', driver, 1r, is assessed at fullcost. The estimated sprinkling cost is $35,000 per year and $57.'0: ii;'.19•e.
Chemical spraying is intended to stabilize surfaces againAt dust d',d t.rosion. V.rious syntheticand natural polymers have been used for the purpose. The I .it':i:t u.ualIT y tust be repeatedevery one to two years. Costs cited for treatment range froo $4•?," .o 3Ji,'.ia, with a value of$48GE being assumed here.
Refe e!:ee :
Dames and Moore, "An Evaluation of the Cost Parameters for Hjo,' ,.' Uranium MillifigOperaiions and Ore Transportation Systems in the Western Uniteo Statcb." Dame: and Moorereport prepared for Argonne Nationa.l Laboratory, July 1977.
2, P. B. Sears, et al.. "Correlation of Radioective Wa.te Treatment Costs ad the fnvironm-ntalImpact of Wase"TlTluent in the Nuclear Fuel Cycle for Use in Establishi'ig 'As Low asPd".titai' Guides--Mil1ing of Uranium Ores," Oak P`dge N.tional Laboratowv. ORNL-TN-4903,May 1975
3. N. S. Peters and K. 0. Timmerhaus, "Plant Design and [cnnomics for Chenical rnqineers," 2nd
edition, McGraw-Hill, 1968.
4. "Nuclear fuel," Vol. 3, No. I1, 21 August iq19.
it. K- •
ADPfNOk X ,. COSTS (.., - IVVE SPEC0AL TAILINGS CONTROL PROCESSES
ai .ujrL' cr 1.-ecial taili'.iqý .,?,t-ol procasses (desiilbed in Sec. 8.2) are considered.ppendix 'or, :t tese Drocessc5 are s;,iple, involving at few as one piece of macninery,
thers ir,*vnve ý.,mi 4,. ntworks of uacliir.: and pipes. Also, the.design and cnsts dependsDe.ifically or. the exact uurpouse cf the installation. -Most of the processca described
-w are Used nni| ,i t3:l'nqs disposl AlVternatives 7 and 8. The costs quoted are tailored tot%,use; nawever, tne values cited should give general ideas of costs for other installations.,,ocess numbers .,n the flow sheets in Ap.-e-ix K-4 (Figs. X-4.1, K'4.3, K-4.4, and.K-4.5) arekeyed %.c *hp ruml..rs given ii the pertinent oiscussion in thir section. Detailed descriptionsand engineering cost evaluotions of most of the mechanical r .4 cesses are ccntained In Reference 1.
I. SANOS-SLIMES SFFARATION
i Is -outd be separated from the slihes in two cyclone separators costing (installed. 1980)$66,00u.
? !ti SiTU DEWATERING
;or in situ de.ýalering of tailings, it is assumed that tho tailings pit bottom (about 42 haarva) wi'l be filled above the water tab e, lined with a clay or plastic liner, and a filterdra.ro system will be installed over the liner. The drain system consists of a network of 6-inch(15 cm), perforated, PVC pipes .laced at about 30 m intervals (with a total length of 17.100 mat $7.00'm) on the liner, and gravel fill (at $12/m3) would be used as filtep medium. Thethicknes: of the filter gravel will be about 0.3 m. Sumps, along with drainage pipes andelect.rical equipment, would be needed to drain any liquids collected by the system during opera-Lions. Teilings will be ueposited directly into the pit and drained liquids will be pumped to.he evaporatiosi pond. Based upon reviow of cost data on the above items, the installed costsfor the syste, (except liners) is estimated at about $680,000.
3. FOSSIL-FUELED EVAPORI1ORS
the c,pt4l costs of evaporators and assoc'a'ed equipment with an evaporation Cdpacity of4.6 ý 105 m3 of water per year are estimated as $1.7 million (1980 costs).' With a 10% thermalefficiency, 90,000 M. of c3al per year would be required, at a cost of $2.9 million.
4. EVAP3RATION POND
The 3vapo-atior pond is assumed to have an area of 40 ha (no creuit is given to direct evaporationfrom tallinns) and to require a 5--in-high dam; the bottom would be lined with hypalon. *The costsare es,.mated as $350,000 for site preparation, $315,000 for the dam, and $3.3 million for theliner. After 15 years of operation, about 30 cm of soluble salts would oe deposited on the pondbottom. It is postulated that these solids would be collected and disposed of in the tailingsiMpoundmant. The cost t0 restore the entire 40-ha evaporation pond area is estimated to beS.O,000. The total cost is thus $4,470,000. This cast applies to alternatives 3, 7, and 8,b;iore tailings are dewatered. If direct evaporation from tailings is taken into account (the.taff has estimated that about ine-third of the liquids will evaporate from the tailings area),then the evapcratlon pend will need to be only two-thirds 3s large (27 ha), and the cost isestimated as $2,880,000.
S. HORIZONTAL VACUU1% BELT FILTER
A horizontal v-,suum belt filter, .for use as an additional. taillngs treatment step prior todi: 1 ,osal, probably could be used to filte- and wash whole tailings or sands; however, the filtra-tior. of slimes aline probably would not be feasible. For the whole tailings from the modelmiil, it is estimated that a filter of 64 02 area, 2 at a cost of $465,000, would be required.Foir separated sands an 8 m2 filter costing $140,030 would be used. 2 ' 3
6 LIME NEISTRALIZATION
The slimes and liquid would be neutralized with lime. ;.etails of the equipimnL and costeitimates zre given in Rrference I. The costs are estimated to be $785,000, including lime-hatijling and mixing equipment, instrumer.tation, ancl auxiliary equipment. Each day 22 MT of lime.would be used at a cost of $32.40/MT delivered.'
7.a. SLIMES FILTRATION (disc filter)
The neutralized slime slurry would be treated in thickeners and filtered in vatuum disc flIters(200 r.) at i total cost of $1 35 million (1980. irstalled).,
. , . . . -
K-61'
7.b. SLIMES FILTRATION (bed filter)
For osen-air dewitering of taitngs (ty use of a dewatering filter bed), it is assumed that anarea sufficient.to-hold three years' production of slimes in a one-meter-deep layer (abuut80 ha) would bt necessary. After one year of dewatering, the tailings would be recovered forprocessing or disposal and the vacated portion of bed prepared for reuse. Small berms would beneeded Lo enclose the entire area and to form cells to separate fresh from dewatered tailings.Also, grading and drainage would have to be provided. Preparation costs are estimated at$56,000/ha. '7 Restoration costs at the end of operation are aiso expected to be about $5,000/hi.
8. rF)4ENT FI'ATION
Losts of equipment for cement fixation are also described in Reference 1. Materials-handlingand mixing equipment, instrumentation, and 4ssnciated apparatus would be required, at an estimatedcost of $1.40 million (1980). To provide a sufficient degree of resistance to leaching bygroundwater, a mixture ot one part cement to five parts slimes (dry basis) would be required, orlW MT of cement per day at $62/MT.
9. ASPHALT FIXATION
Costs of equipment for asphalt fixation are described in Reference 1. The capital costs wouldinclude materials-handling and mixing equipment, wiped film evaporators which combine mixing ofasphat with further drying of tailings, instrumentation, and associated equipment, for a totalcost of $5.15 million (1980). About 750 kg of asphalt -omuld be required per metric ton of dryslurry (420 INT/day) at a cost of $34.50/NT of asphalt. The equivalent of 50 HT of coal per day(cost, about $1600) would be required for evaporation of water from the asphalt mixture carriedout in the wiped film evaporator.
10. BARIUM CHLPRIDE TREATMENT
The costs of barium chloride (BaCd 2 ) treatment are largely those of the material plus the costs.of a series of lined settling ponds. The amount of P-12 added can range from 0.03 to 0.1 g/Lof tailings solution, 6 and about 1200 MT of tailine ilution (Ch. 5) must be treated. The costcf BaC 2 , including transportation, is about $500,•h. (1980) for a materials cost of $18 to $49per day. A total load requirement for 4u ha in three or tour plastic-lined settling ponds wouldcost bout $2.6 million. Restoration would add about $204,000 more to the Costs.
11. ION £XCHANGE
Although not considered in the alternative tailings disposal programs, the removal of radiumfrom tailings solution using ion exchange is a potentially viable process.9 To remove about99.5% of the radium from the tailings solution, about 1200 kg/day of barite (natural bariumsulfate) would L? required as a disposable ion-exchange bed. The cost would be about $250/day($95,000/ytir). The used barite would be relatively inert and could be disposed of in thetailings pile. Lime neutralization and filtration would be required pretreatment of the tailingssolution.
12. NITRIC ACID MILL
The capital and operating costs of a nitric acid mill may be istimated by using the costs given -in Reference 10 for a sulfuric acid mill and comparative costs for the two types of mills given'in Reference 1. For equipment, the costs are about $7.1 million for the sulfuric acid mill and$31.7 million for the nitric acid mill. Additional capital costs include those for building andsite develepment, utilities and connections, engineering costs, and conti. -ncies. These itemsadd $16.8 million to the costs of the sulfuric acid mill. The non-equipment items for the .nitric acid mill probably would not he proportional in cost, since a substantial fraction of theextra equipment costs are for similar items in stainless .*eel, rather than wood or mild steel;furthermore, a larqer plant area would be req.;ired for the equipment of tt' nitric acid plant.It, thtrefo, e, is assumed thaL the non-equipment co.ts for the nitric acid plant are aboutdouble those of thme 5ulfuric acid pla't, or about. $35 million.
Operating costs for the sulfuric acid mill (including reagents) are given as $R.40 to $9.84 pertrn of ore processed and for the model will are assumed to be $9.00 per ton.1° Total operatingcosts of $12.50 per ton are then obtained for tme nitric acid mill. Annual ooef'kting costs forth' mc-dl mill wuuld be $5.6 million, if sulfurc acid were use., and $7.7 million for the nitricac~d version. Lifetime (15 years) costs are $108 million ..nd $#89 million for sulfuric andnitric acid mills, resp,%ctively. Tailings disposal costs for the nitric acid mill are discussedin Section 10 of Appendix K-4. The costs of the two types of mills are 4u~marized i.i Table K-2.1.
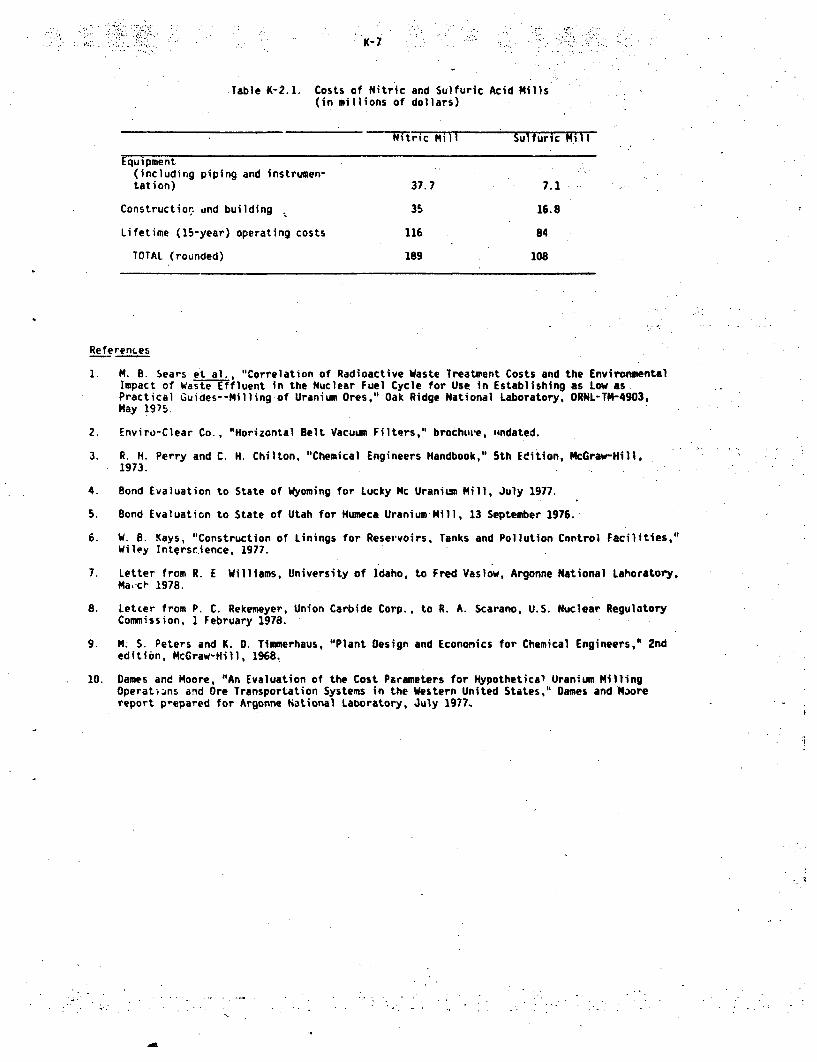
K-?
.Table K-2.1. Costs of Nitric and Sulfuric Acid Mills(in millions of dollars)
Nitric Mill Sulfuric MMil
Equipment.(including piping and instrumen-tation) 37.7 7.1
Construction und building 35 16.8
Lifetime (15-year) operating costs 116 84
TOTAL (rounded) 189 108
References
1. M. B. Sears et al., "Correlation of Radioactive Waste Treatment Costs and the EnvironmentalImpact of Wast-e-Effluent in the Nuclear Fuel Cycle for Use, in Establishing as Low as.Practical Guides--Milling of Uranium Ores," Oak Ridge National Laboratory, ORNL-TM-4903,May 1975.
2. Enviro-Clear Co., "Horizontal Belt Vacuum Filters," brochure, -andated.
3. R. H. Perry and C. H. Chilton, "Chemical Engineers Handbook," 5th Eeition, McGraw-Hill,1973.
4. Bond Evaluation to State of Wyoming for Lucky Mc Uranium Mill, July 1977.
5. Bond Evaluation to State of Utah for Humeca Uranium Mill, 13 September 1976.
6. W. B. Kays, "Construction of Linings for Reservoirs, Tanks and Pollution Control Facilities,"Wiley Intqrsc.ience, 1977.
7. Letter from R. E Williams, University of Idaho, to Fred Vaslow, Argonne National Lahoratory,Ma,-cf 1978.
8. Letcer from P. C. Rekemeyer, Union Carbide Corp., to R. A. Scarano, U.S. Nuclear RegulatoryCommission, 1 February 1978.
9. M. S. Peters and K. D. Timmerhaus, "Plant Design and Economics for Chemical Engineers," 2ndedition, McGraw-Hill, 1968.
10. Dames and Moore, "An Evaluation of the Cost Parameters for Hypothetical Uranium MillingOperatins and Ore Transportation Systems in the Western United States," Dames and Maorereport p-epared for Argonne National Laboratory, July 1977.
K-8
APPENDIX K-3. COSTS OF ALTERNATIVE TAILINGS POND LINERS
The first step beyond no surface treatment is the removal of topsoil and the compaction ofexpused surtace with heavy machinery. In estimating costs, the staff has assumed that 0.6 m oftopsoil are iinoved and stockpiled. The costs of removal and subsequent grading and compactionare taken as _.465/ 43 removed, or $0.33/m2 for 0.2m of topsoil removed.
For most installations of plastic or clay liners, the above treatment will have to be carriedout First aid these costs added to the liner costs, which for 0.75-mm polyester reinforcedhypalon ar. $6.9o/mf. Polyvinylchloride (PVC) can also be used in lower strength applicaticnsif it is protected from light and to some degree from oxygen. The corresponding total cost forPVC is about $4.90/m 2 . (See Appendix K-4 for a discussion of the various factors that influencethese coits. A list of the types of liners is given in Table 8.3 4Chapter 8.)
The :osts of clav depend greatly on the local availability of a suitable clay; e.g., a clayhaving a large proportion of montmorillonite. such as bentonite (see Supplement). Large depositsof bentonite and similar clays occur in Wyoming, South Dakota, Texas, Arizona, and Utah., in theuranium mining regions, and smaller deposits exist in all the Western states. In this discussionit is assumed that clay is available from an onsite borrow pit, and can be excavated, hauled,and emplaced as readily as overburden. Compaction of the clay liner is assumed to be done tomeet quality assurance and testing requirements more stringent than those for soils used ascover materials. The borrow pit is assumed to be resurfaced and revegetated. Total cost forinstallation of a 1-m thick clay liner is taken as $2.55/m2 (including $1.20/m3 for excavation,$1.25/1m 3 for controlled spreading and compacting, and $0.10/m 3 for restoration of borrow area).If clay must be transported from other sources, a cost of $0.27/n'-km must be added for transpor-tation costs,
The common costs of preparing a base for the liners are included in the area preparation costs;however, the requirements for a foundation for a synthetic liner can be stringent, and in somerare instances, preparati2'. costs may be comparable to liner costs.
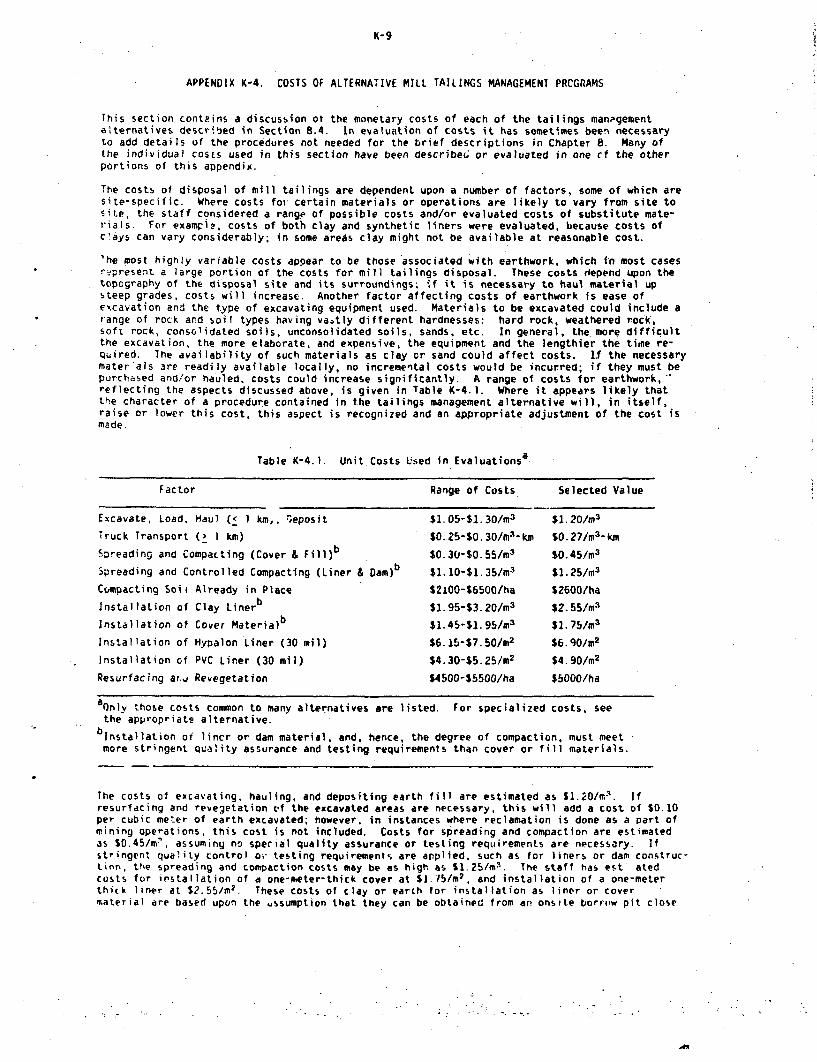
K-9
APPENDIX K-4. COSTS OF ALTERNATIVE MILL TAILINGS MANAGEMENT PRCGRAMS
This section contains a discussion of the monetary costs of each of the tailings managementalternatives described in Section 8.4. In evaluation of costs it has sometimes been necessaryto add details of the procedures not needed for the brief descriptions in Chapter 8. Many ofthe individual costs used in this section have been describe6 or evaluated in one cf the otherportions of this appendix.
The costs of disposal of mill tailings are dependent upon a number of factors, some of which aresite-specific. Where costs fov certain materials or operations are likely to vary from site tosite, the staff considered a range of possible costs and/or evaluated costs of substitute mate-rials. For exampi?, costs of both clay and synthetic liners were evaluated, because costs ofclays can vary considerably; in some areas clay might not be available at reasonable cost.
'he most highly variable costs appear to be those associated with earthwork, which In most casesrepresent a large portion of the costs for mill tailings disposal. These costs depend upon thetopography of the disposal site and its surroundings. if it is necessary to haul material upsteep grades, costs will increase. Another factor affecting costs of earthwork is ease ofexcavation and the type of excavating equipment used. Materials to be excavated could include arange of rock and soil types having vastly different hardnesses: hard rock, weathered rock.soft rock, consolidated soils, unconsolidated soils, sands, etc. In general, the. more difficultthe excavation, the more elaborate, and expensive, the equipment and the lengthier the tihe re-quired. The availability of such materials as clay or sand could affect costs. If the necessarymater'als 3re readily available locally, no incremental costs would be incurred; if they must bepurchased and/or hauled, costs could increase significantly; A range of costs for earthwork,"reflecting the aspects discussed above, is given in Table K-4.1. Where it appears likely thatthe character of a procedure contained in the tailings management alternative will, in itself,raise or lower this cost, this aspect is recognized and an appropriate adjustment of the cost ismade.
Table K-4.1. Unit Costs Used in Evaluationsa
Factor Range of Costs Selected Value
Excavate, Load, Haul ( I km,, -'jeposit $1.05-$1.30/m3 $1.20/M3
Truck Transport (> I km) $O..25-$O.30/m-'-km $0.27/m3-kmSpreading and Compacting (Cover & Fill)b 3$0.30-SO.55/m $0.45/r3
Spreading and Controlled Compacting (Liner & Dam)b $1.10-$1.35/M3 $1.25/m3
Cumpacting Soit Already in Place $2100-$6500/ha S2600/ha
Installation of Clay Linerb $1.95-$3.20/m3 $2.55/mr3
Installation of Cover Materialb $1.45-$.95/rm3 $1.75/1m
Installation of Hypalon Liner (30 mil) $6.15-$7.50/m2 $6.90/M 2
Installation of PVC Liner (30 mil) $4.30-$5.25/m2 $4.90/m2
Resurfacing ar.i Revegetation $4500-55500/ha $5000/ha
a niy those costs common to many alternatives are listed. For specialized costs, see
the appropriate alternative.bInstallation of lincr or dam material, and, hence, the degree of compaction, must meet
more stringent quality assurance and testing requirements than cover or fill materials.
The costs of excavating, hauling, and depositing earth fill are estimated as $1.20/m.%. Ifresurfacing and revegetation Uf the excavated areas are necessary, this will add a cost of $0.10per cubic meter of earth excavated; however, in instances where reclamation is done as a part ofmining operations, this cost is not included. Costs for spreading and compaction are estimatedas $0.45/m:, assuming no special quality assurance or testing requirements are necessary. Ifstringent quality control Oi testing requirement, are applied, such as for liners or dam construc-tinn, the spreading and compaction costs may be as high as $1.25/m3. The staff has est atedcosts for installation of a one-meter-thick cover at $1.75/m2 , and installation of a one-meterthick liner at $2.55/mz. These costs of clay or earth for installation as liner or covermaterial are based upon the ussumption that they can be obtained from an onsite borrow pit close
.0m
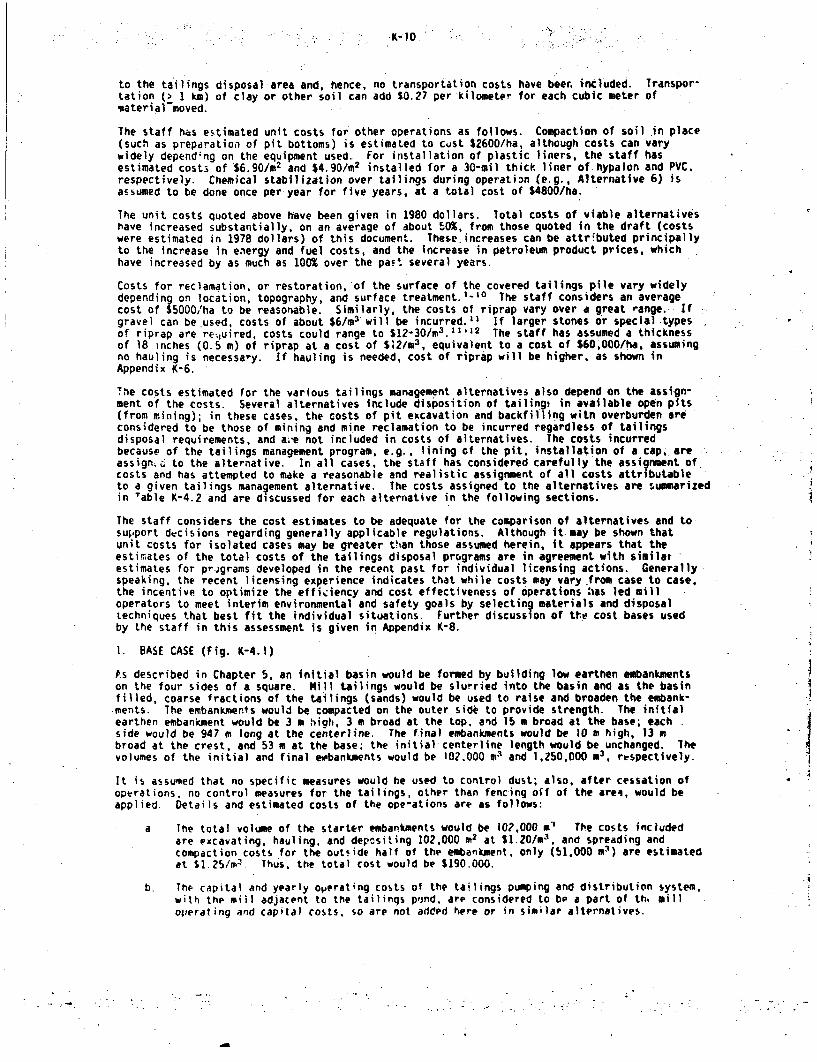
-K-10,
to the tailings disposal area and, hence, no transportation costs have beer. included. Transpor-tation (> 1 km) of clay or other soil can add $0.27 per kilometer for each cubic meter ofmaterial-moved.
The staff has estimated unit costs for other operations as follows. Compaction of soil in place(such as prepdration of pit bottoms) is estimated to cvst $2600/ha, although costs can varywidely depend~ng on the equipment used. For installation of plastic liners, the staff hasestimated costs of $6.90/m2 and $4.90/m2 installed for a 30-mil thick liner of hypalon and PVC.respectively. Chemical stabilization over tailings during operation (e.g., Alternative 6) isassumed to be done once per year for five years, at a total cost of $4800/ha.
The unit costs quoted above hNve been given in 1980 dollars. 7otal costs of viable alternativeshave increased substantially, on an average of about 50%, from those quoted in the draft (costswere estimated in 1978 dollars) of this document. These.increases can be attributed principallyto the increase in energy and fuel costs, and the increase in petroleum product prices, whichhave increased by as much as 100% over the past several years.
Costs for reclamation, or restoration, of the surface of the covered tailings pile vary widelydepending on location, topography, and surface treatment.'-I- The staff considers an averagecost of $5000/ha to be reasonable. Similarly, the costs of riprap vary over a great range. Ifgravel can be .used, costs of about $6/m3 will be incurred." if largerstones or special .typesof riprap are re.quired, costs could range to $12-30/m3 .I1'12 The staff has assumed a thicknessof 18 inches (0.5 m) of riprap at a cost of $;2/m 3 , equivalent to a cost of $60,000/ha, assumingno hauling is necessa-y. If hauling is needed, cost of riprap will be higher, as shown inAppendix K-6.
The costs estimated for the various tailings management alternatives also depend on the assign-ment of the costs. Several alternatives include disposition of tailingi in available open pits(from mining); in these cases, the costs of pit excavation and backfilling witf overburden areconsidered to be those of mining and mine reclamation to be incurred regardless of tailingsdisposal requirements, and ai-e not included in costs of alternatives. The costs incurredbecause of the tailings management program, e.g.. lining of the pit, installation of a cap,; areassign.- to the alternative. In all cases, the staff has considered carefully the assignment ofcosts and has attempted to make a reasonable and realistic assignment of all costs attributableto a given tailings management alternative. The costs assigned to the alternatives are summarizedin Table K-4.2 and are discussed for each alternative in the following sections.
The staff considers the cost estimates to be adequate for the comparison of alternatives and tosupport decisions regarding generally applicable regulations. Although it may be shown thatunit costs for isolated cases may be greater than those assumed herein, it appears that theestimates of the total costs of the tailings disposal programs are in agreement with similatestimates for pr.)grams developed in the recent past for individual licensing actions. Generallyspeaking, the recent licensing experience indicates that while costs may vary from case to case,the incentive to optimize the effiiency and cost effectiveness of operations has led milloperators to meet interim environmental and safety goals by selecting materials and disposaltechniques that best fit the individual situations. Further discussion of tte cost bases usedby the staff in this assessment is given in Appendix K-8.
1. BASE CASE (Fig. K-4.1)
As described in Chapter 5, an initial basin would be formed by building low earthen embankmentson the four sides of a square. Mill tailings would be slurried into the basin and as the basinfilled, coarse fractions of the tailings (sands) would be used to raise and broaden the embank-ments. The embankments would be compacted on the outer side to provide strength. The initialearthen embankment would be 3 m high, 3 m broad at the top, and 15 m broad at the base; eachside would be 947 m long at the centerline. The final embankments would be 10 m high, 13 mbroad at the crest, and 53 m at the base; the initial-centerline length would be unchanged. Thevolumes of the initial and final espbankments would be 102.000 m3 and 1,250,000 m3, respectively.
It is assumed that no specific measures would he used to control dust; also, after cessation ofoperations. no control measures for the tailings, other than fencing off of the arer, would beapplied. Details and estimated costs of the ope-ations are as follows:
a The total volume of the starter embankments would be 107,000 m" The costs includedare excavating, hauling, and depositing 102,000 M2 at S1.ZO/m 3 , and spreading andcompaction costs for the out'ide half of the embankment, only (51.000 i
3 ) are estimatedat $1.25/rn 2. Thus, the total cost would be $190,000.
b. The capital and yearly operating costs of the tailings pumping and distribution system,with the miHl adjacent to the tailings pomnd, are considered to be a part of th, milloperating and capital costs, so are not added here or in similar alternatives.
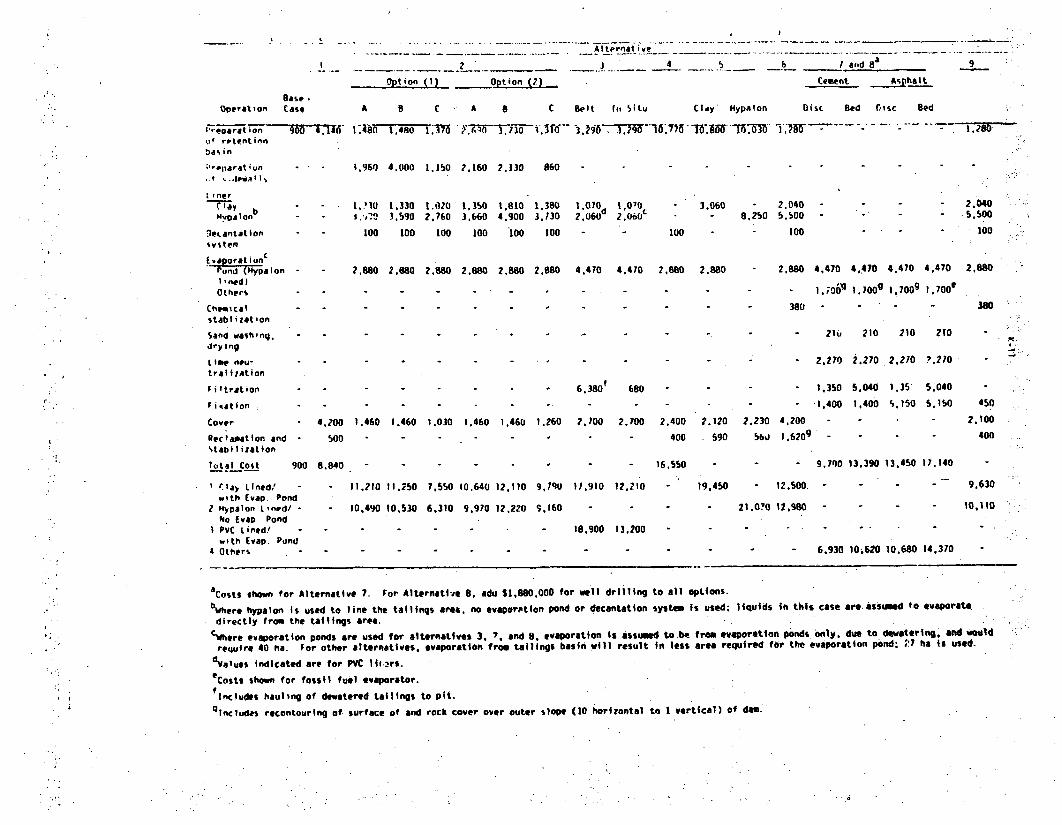
2 _ _ I - 4. -- 1 and a'88 9Option (1) Option (2) ,
easeOperation Case
Cement A phalt
Disc Bed rosc BedA B C A 8 C Belt It , Situ Clay Hypalon
v ý;parat ion 900 4,41 I:Abo 1.4110 ' -1h~ ~ o~ r) :i-- --- 1.280tit ,etentionba in
;oantat ion
t ined)
tab'.zton
ISeand vtionqsystnm
timeneu.
treal cae Ia
traitat ion
1.960 4.000 1.150 2.160 2.130 860
WL.'10 1.330 LoUO 1.350 1.810 1.380s.',i.. 3.590 2,760 3.660 4.900 3.130
100 t00 100 100 100 t00
2.880 2.880 2.880 2.880 2,880 2.880
1 070d2,060
1.0702.0 60C
100
3,060 - 2,0408,250 5,500
- 100
2.040- .5,500
100
4.470 4.410 2.880 2.880 2.880 4.470 4.470 4,470 4,470 2.880
- 1 ,; 06 g 1.7009 1,700g 1 .7 00 e
380 - 380
- 21i, 210 210 2TO
- 2.270 2.270 2.270 ?.270
6.380 680 . 1,350 5.040 1,35 5§040- - 1.400 1.400 5.150 5.150
2.230 4.200 - -
5bd 1.620g -
Cover
Reclamation and -%tabililation
Total Cost 901
t1 .a Lined!'with (yap. Pond
2 Hypalon Lined/ -No fvyP Pond
I PVC Lined/with Evap. Pond
4 Others
4.200 1.460 1.460 1.030 1.460 1.460 1.260
50o - - - -
3 8.840 - - - -
- 11.210 11.250 7.550 10.640 12.110 9,19U
. 10,40 10,530 6,310 9.970 12.220 9.160
2.100 2,100 2.400- 400
- 16.550
11.910 12.210
2.120590
4502.100
400
9,790 13.390 13.450 17,140
19,450 - 12,500. -
- 21,0'0 12.960 -
9.630
- - 10,110
- 18,900 13,200 -
- 6,930 10M620.10.680 14.370 -
aCosts shown for Alternative 7. For Alternative 8, adu $1,880.000 for well drilling to all options.bWhere hypalon is used to line the tailings area. no evaporption pond or decantation system is usedý liQuids in this case are Assumed to evaporatedirectly from the tailings area.
cWhere evaporation ponds are used for alternatives 3. 7, and 8, evaporation is assumed to bS from evaporation ponds only, due to dewatering. and wouldrequire 40 ha. For other alternatives, evaporation from tailings basin will result in less area required for the evaporation pond. ;'7 ha is used.
dvatueS indicated are for PVC lit.2rs.Costs shown for fossil fuel evaporator.
Ilncludes hauling of dewatered tailings to pit.qlncludes recontouring of surface of and rock cover over outer slope (10 horizontal to I vertical) of dam.
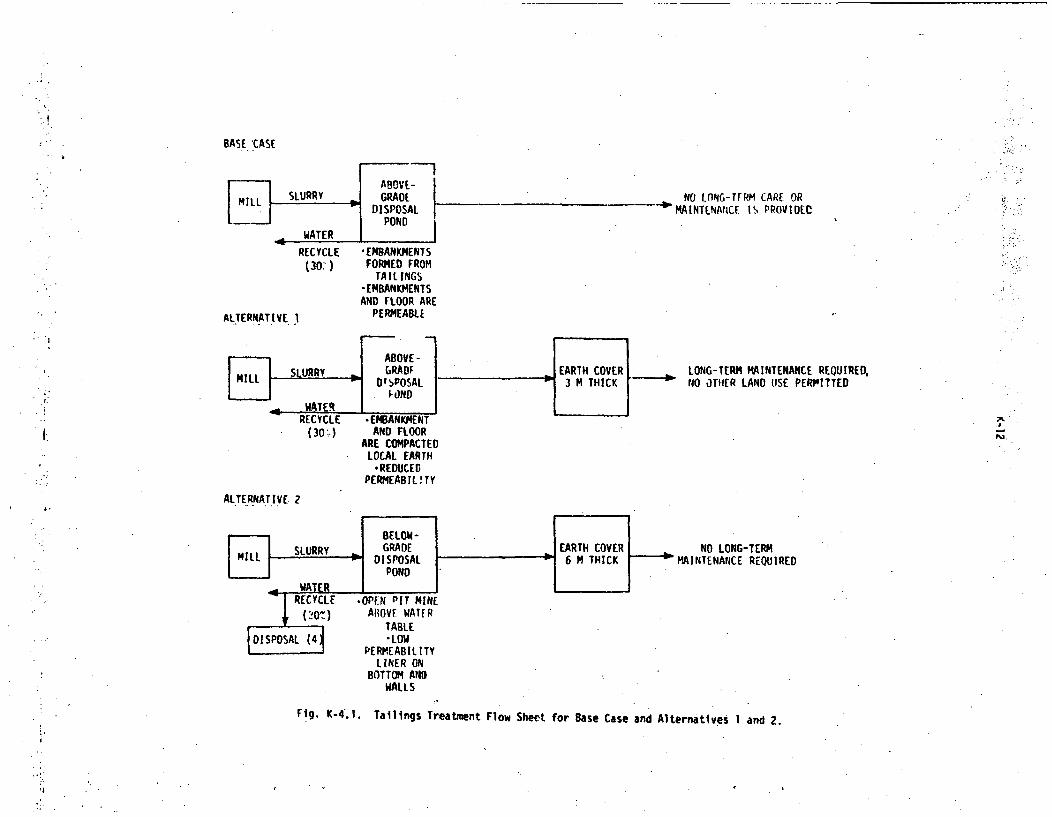
BASE 'CASE
'MILL SLURRY GRADE ___ ___________ NO tONqG-TFRM CARE OR[ DISPOSAL - pMAINTNAIICE I. PROVIDECPOND
WATER P:
RECYCLE EMBANKMENTS(30') FORMED FROM
TAILINGS-EMBANKMENTSAND FLOOR ARE
ALTERNATIVE I PERMEABLE
~AOVE -MILL.SLURRY am.• D RADI EARTH COVER LONG-TERM MAINTENANCE REQUIRED,
SDiPOSAL 3 M THICK -" NO dTBER LAND USE PERMITTED
I • WATER
RECYCLE -EMBANKMENT(30:.) AND FLOOR
ARE COMPACTEDLOCAL EARTH
*REDUCEDPERMEAB IL! TY
ALTERNATIVE, 2
~BELOW-GRADE EARTH COVER NO LONG-TERM
MILL SLURRY DISPOSAL 6 M THICK MAINTENANCE REQUIRED' ~POND "
• ..,, . WATER' •|RECYCLE -OPEN PIT MINE
S(•0•) ABOVE WATERTABLE
DISPOSAL (4 "LOWPERMEABILITY
Li•NER ONBOTTOM AND
WALLS
Fig. K-4.l. Tailings Treatment Flow Sheet for Base Case and Alternatives I and 2.
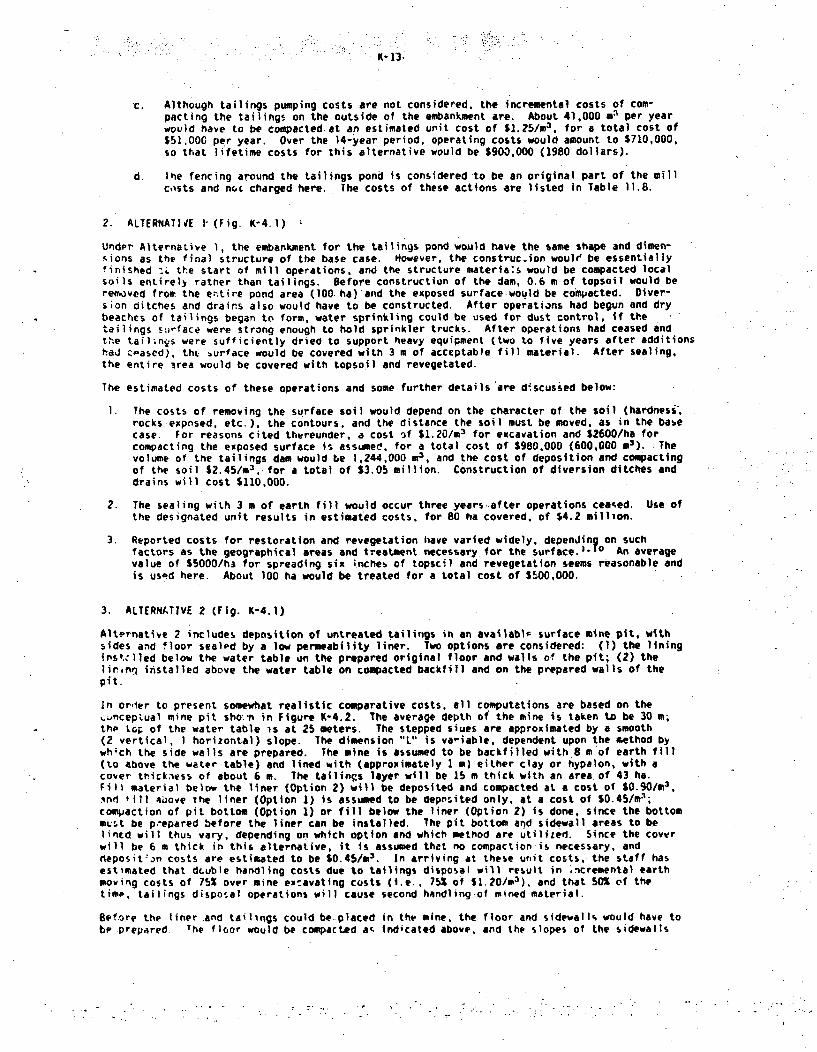
K-13-
c. Although tailings pumping costs are not considered, the incremental costs of com-pacting the tailings on the outside of the embankment are. About 41.000 m3 per yearwould have to be compacted at an estimated unit cost of $1.25/m3 , for a total cost of$51.000 per year. Over the 14-year period, operating costs would amount to $710,000,so that lifetime costs for this alternative would be $900,000 (1980 dollars).
d. ihe fencing around the tailings pond is considered to be an original part of the millcosts and noc charged here. The costs of these actions are listed in Table 11.8.
2. ALTERNATIVE 1- (Fig. K-4.1)
Under Alternative 1, the embankment for the tailings pond would have the same shape and dimen-0ions as the final structure of the base case. However, the construc.ion woule be essentiallyfinished -.ý the start of mill operations, and the structure materials would be compacted localsoils entirely rather than tailings. Before construction of the dam, 0.6 m of topsoil would bereo.aved froc the entire pond area (100 ha) and the exposed surface would be compacted. Diver-sion ditches and drains also would have to be constructed, After operations had begun and drybeaches of tailings began to form, water sprinkling could be used for dust control, if thetailings 5urface were strong enough to hold sprinkler trucks. After operations had ceased andthe tail;n.s were sufficiently dried to support heavy equipment (two to five years after additionshad Cpascd), tht. burface would be covered with 3 m of acceptable fill material. After sealing.the entire 3rea would be covered with topsoil and revegetated.
The estimated costs of these operations and some further details 'are d~scussed below:
I. The costs of removing the surface soil would depend on the character of the soil (hardnesi',rocks-exposed, etc.). the contours, and the distance the soil must be moved, as in the babecase. For reasons cited thereunder, a cost of $1.20/mn3 for excavation and $2600/ha forcompacting the exposed surface is assumed, for a total cost of $980,000 (600,000 m3). Thevolume of the tailings dam would be 1,244,000 m 3
, and the cost of deposition and compactingof the soil $2.45/m3 ,-for a total of $3.05 million. Construction of diversion ditches anddrains will cost $110,000.
2. The sealing with 3 m of earth fill would occur three years-after operations ceased. Use ofthe designated unit results in estimated costs, for 80 ha covered, of $4.2 million.
3. Reported costs for restoration and revegetation have varied widely, depending on suchfactors as the geographical areas and treatment necessary for the surface.'-'° An averagevalue of 35000/h3 for spreading six inches of topscil and revegetation seems reasonable andis usod here. About 100 ha would be treated for a total cost of $500,000.
3. ALTERNATIVE 2 (Fig. K-4.1)
Alternative 2 includes deposition of untreated tailings in an availablp surface mine pit, withsides and floor sealed by a low permeability liner. Two options are considered: (1) the lining4pstclled below the water table on the prepared original floor and walls of the pit; (2) thelirnn installed above the water table on compacted backfill and on the prepared walls of thepit.
In orler to present somewhat realistic comparative costs, all computations are based on the•unceptual mine pit sho.n in figure K-4.2. The average depth of the mine is taken tD be 30 m;thp top of the water table is at 25 meters. The stepped siues are approximated by a smooth(2 vertical, 1 horizontal) slope. The dimension "L" is va-iable, dependent upon the method bywh'ch the side walls are prepared. The mine is assumed to be backfilled with 8 m of earth fill(to above the water table) and lined with (approximately 1 m) either clay or hypalon, with acover thick.ess of about 6 m. The tallinrs layer will be 15 m thick with an area of 43 ha.Fill material below the liner (Option 2) will be deposited and compacted at a cost of $0.90/0 3 ,%nd 'ill aI4ove the liner (Option 1) is assumed to be deposited only, at a cost of $0.45/m 3 ;compaction of pit bottom (Option 1) or fill below the liner (Option 2) is done, since the bottomm...t be p.epared before the liner can be installed. The pit bottom and sidewall areas to belinrd will thus vary, depending on which option and which method are utilized. Since the coverwill be 6 m thick in this alternative, it is assumed that no compaction is necessary, anddepositlin costs are estimated to be $0.45/r 3 . In arriving at these unit costs,- the staff hasestimated that double handling costs due to tailings disposal will result in incremental earthmoving costs of 75% over mine ex:avating costs (i.e., 75% of $1.20/m3). and that 50% of thetime, tailings disposal operations will cause second handling-of mined material.
Before the liner and tailings could be-placed in the mine, the floor and sidewall% would have tobe prepared The floor would be compacted ag. Indicated above, and the slopes of the sidewalls
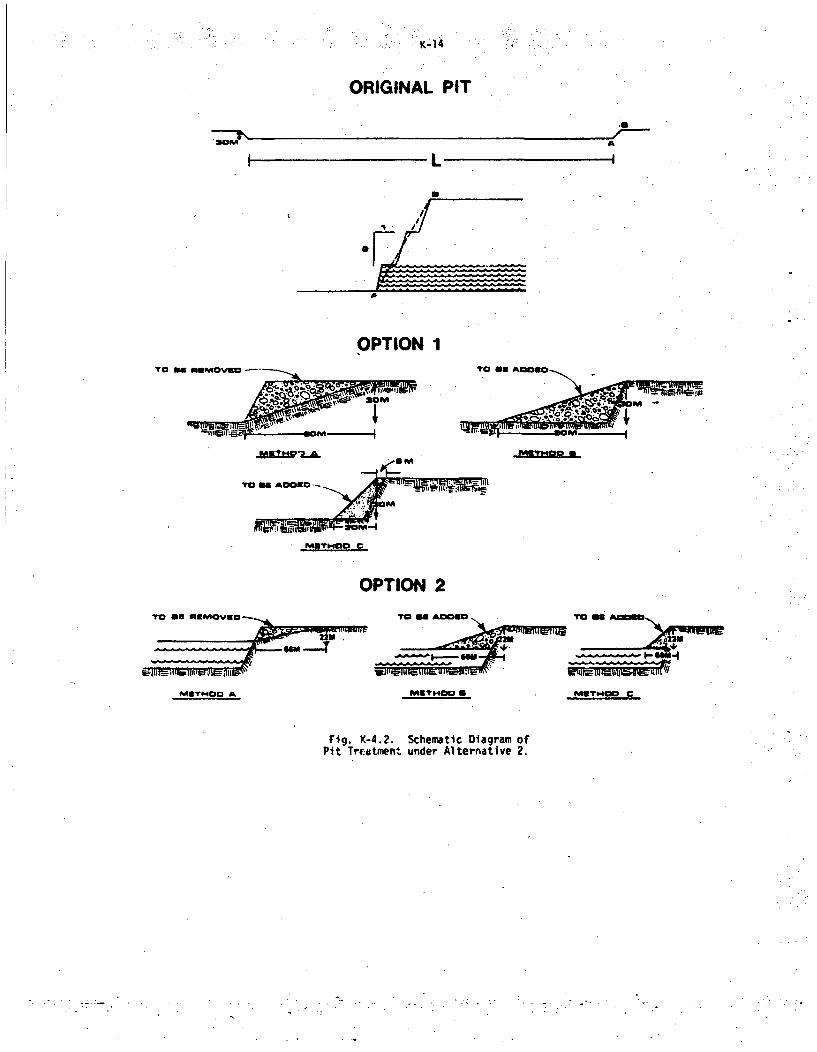
K.14
ORIGINAL PIT
2GM AA
I L
OPTION 1TO SE TO aE AODEO
AsUt"M a
To~~ MM0w
FART640 c
OPTION 2
20
MUTHOO A
aT nU ACCEC
MaTI4OC a MEIrMDOC c
Fig. K-4.2. Schematic Diagram ofPit Treatment under Alternative 2.
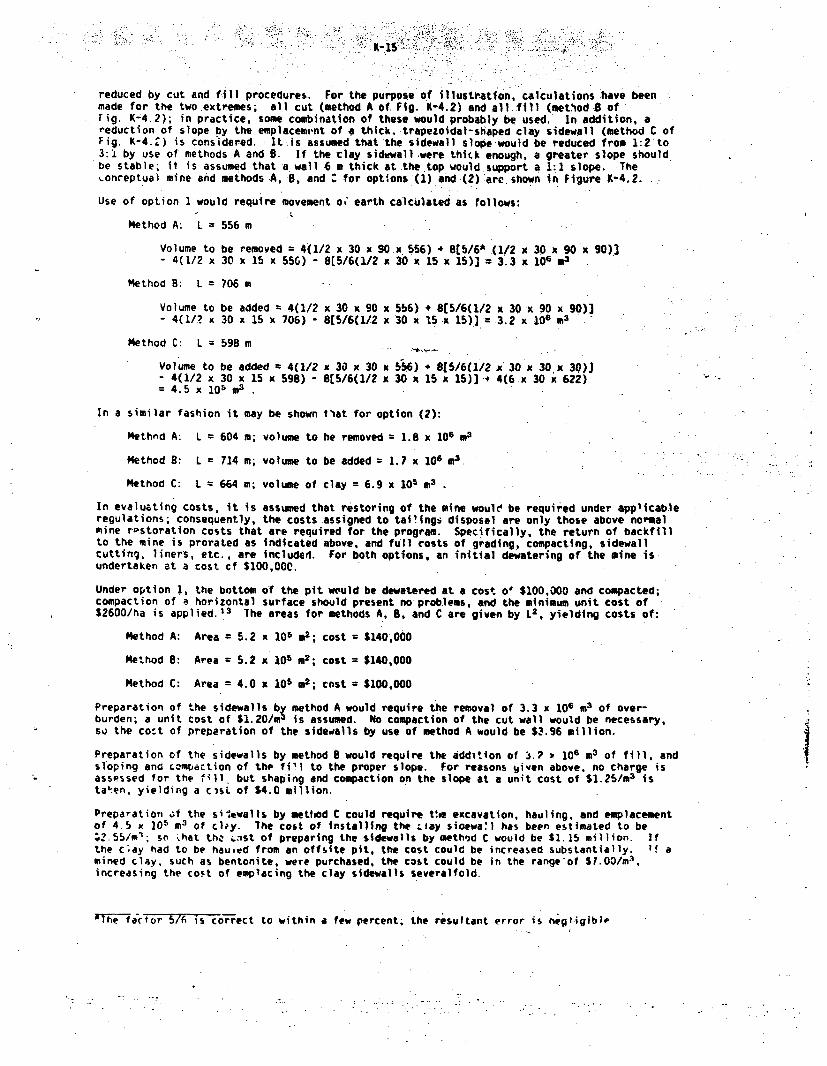
reduced by cut and fill procedures. For the purpose of illuStration, calculations have beenmade for the two extremes; all cut (method A of Fig. K-4.2) and all fill (method I ofrig. K-4.2); in practice, some combination of these would probably be used. In addition, areduction of slope by the emplacement of a thick. trapezoidal-shapea clay sidewall (method C ofFig. K-4.^) is considered. It s assumed that the sidewall slope would be reduced from 1:2 to3:1 by use of methods A and B. If the clay sidewall were thick enough, a greater slope shouldbe stable; it is assumed that a wall 6 m thick at the top. would.support a 1:1 slope. The.onreptual mine and methods A, 8, and : for options '(1) and.(2) are shown in Figure K-4.2.
Use of option 1 would require movement o, earth calculated as follows:
Method A: L = 556 m
Volume to be removed = 4(1/2 x 30 x 90.x 556) * 8(5/6* (1/2 x 30 x 90 x 90)]- 4(1/2 x 30 x 15 x 55G) - 8[5/6(1/2 x 30 x 15 x 15)] = 3.3 x 10⁶ m.
Method B: L = 706 m
Volume to be added 4(1/2 x 30 x 90 x 56) *8[5/6(1/2 x 30 x 90 x 90)]- 4(1/Z x 30 x 15 x 706) - 815/6(1/2 x 30 x 15 x 15)]) .3.2 x 106 m3
Method C: L = 598 m
Volume to be added 4(1/2 x 30 x 30 x 556) - 815/6(1/2 x 30 x 30.x 30)]4(1/2 x 30 x 15 x 598) - 8[5/6(1/2 x 30 x 15 x 15)]-* 4(6 x 30 x 622)4.5 x 10⁵ Mi
3
In a similar fashion it may be shown t1at for option (2):
Methnd A: L = 604 m; volume to he removed = 1.8 x 10⁶ m3
Method 8: L = 714 m; volume to be added = 1.7 x 10⁶ m•.
Method C: L = 664 m; volume of clay = 6.9 x 10S m3
In evaluating costs, it is assumed that restoring of the mine woule be required under applicab.leregulations; consequently, the costs assigned to taI'ings disposal are only those above normalmine restoration costs that are required for the program. Specifically, the return of backfillto the mine is prorated as indicated above, and full costs of grading, compacting, sidewallcutting, lIners, etc., are included. For both options, an initial dewatering of the mine isundertaken at a cost cf $100,000.
Under option 1, the bottom of the pit would be dewatered at a cost o' $100,000 and compacted;compaction of a horizontal surface should present no problems, and the minimum unit cost of$2600/ha is applied.1 3 The areas for methods A, 8, and C are given by L2 , yielding costs of:
Method A: Area = 5.2 x 10⁵ m2; cost = $140,000
Method B: Area = 5.2 x 10⁵ m2; cost = $140,000
Method C: Area = 4.0 x 10⁵ m2; cost = $100,000
Preparation of the sidewalls b method A would require the removal of 3.3 x 10⁶ m3 of over-burden; a unit cost of $1.20/MI is assumed. No compaction of the cut wall would be necessary,so the cot of preparation of the sidewalls by use of method A would be $2.96 million.
Preparation of the sidewalls by method B would require the addition of ý.. X 106 m3 of fill, andsloping and compaction of the fill to the proper slope. For reasons yiven above, no charge isassessed for the fill.. but shaping and compaction on the slope at a unit cost of $1.25/m3 istaken, yielding a cisL of $4.0 million.
Preparation cf the silewalls by method C could require tCe excavation, hauling, and emplacementof 4.5 x ]05 m3 of cl..y. The cost of installing the tlay sioewaTl has been estimated to be
2-.55/mi; so .hat thz ;st of preparing the sidewalls by meth'd C would be $1.15 million. If
the c;ay had to be haued from an offsite pit, the cost could be increased substantially. 1! amined clay, such as bentonite, were purchased, the cost could be in the range'of S7.0O/m1,increasing the cost of emplacing the clay sidewalls severalfold.
r'The factor 5/6 is correct to within a few percent; the resultant error is negligibl)'
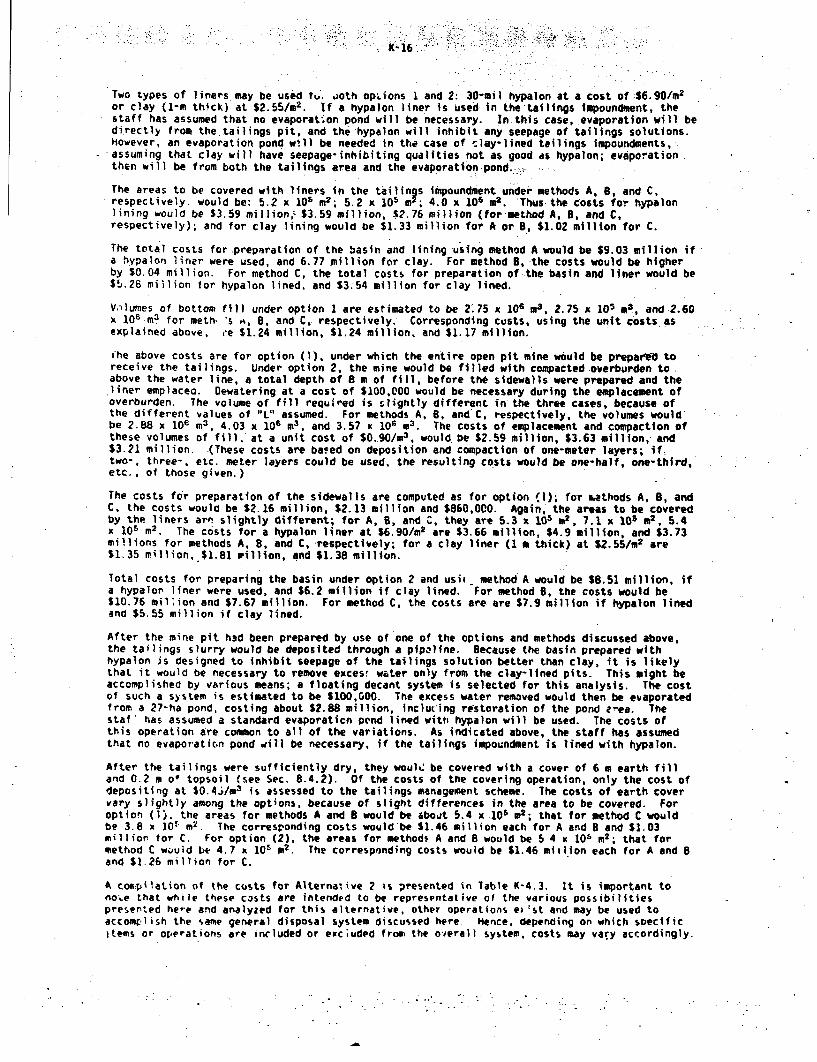
Ký-16.
Two types of liners may be used tu, uoth opkions I and 2: 30-mil hypalon at a cost of $6.90/m2
or clay (1-m thick) at $2.55/M2 . If a hypalon liner is used in the tailings impoundment, thestaff has assumed that no evaporat.on pond will be necessary. In this case, evaporation will bedirectly from the tailings pit, and the hypalon will inhibit any seepage of tailings solutions.However, an evaporation pond will be needed in the case of clay-lined tailings impoundments,
-assuming that clay will have seepage-inhibiting qualities not as good as hypalon; evaporationthen will be from both the tailings area and the evaporation ,pond..,.,,.
The areas to be covered with liners in the tailings impoundment under methods A, B, and C,respectively, would be: 5.2 x 10⁵ m2 ; 5.2 x 10⁵ m2; 4.0 x 10⁵ m2. Thus the costs for hypalonlining would be $3.59 million,ý $3.59 million, $2.76 million (for method A, 8, and C,respectively); and for clay lining would be $1.33 million for A or 8, $1.02 million for C.
The total costs for preparation of the basin and lining using method A would be $9.03 million if.a hypalon liner were used, and 6.77 million for clay. For method B. the costs would be higherby $0.04 million. For method C, the total costs for preparation of the basin and liner would be$5.28 million for hypalon lined, and $3:54 million for clay lined.V,1lumes of bottom fill under option 1 are estimated to be 2.75 x 10s a', 2.75 x l03 *a, and2.60
x 10 -mi for meth. "s A, B, and C, respectively. Corresponding custs, using the unit costs asexplained above, ,e $1.24 million, $1.24 million, and $1.17 million.
(he above costs are for option (1), under which the entire open pit mine would be prepayl toreceive the tailings. Under option 2, the mine would be filled with compacted overburden to.above the water line, a total depth of 8 m of fill, before the sidewalls were prepared and theliner emplaceo. Dewatering at a cost of $100,000 would be necessary during the emplacement ofoverburden. The volume of fill required is slightly different in the three cases, because ofthe different values of "L" assumed. For methods A, 8, and C, respectively, the volumes wouldbe 2.88 x 10⁶ m3 , 4.03 x 10f m3 , and 3.57 x 10i m3. The costs of emplacement and compaction ofthese volumes of fill. at a unit cost of $0.90/M3 , would. be $2.59 million, $3.63 million, and$3.21 million. .(These costs are based on deposition and compaction of one-meter layers; if,,two-, three-, etc. meter layers could be used, the resulting costs would be one-half, one-third,etc., of those given.)
The costs for preparation of the sidewalls are computed as for option (1); for ðods A, B, andC, the costs would be $2.16 million, $2.13 million and $860,000. Again, the areas to be coveredby the liners arn slightly different; for A, B, and C, they are 5.3 x 10s e 2 , 7.1 x 10⁵ m2 , 5.4x 10⁵ M2. The costs for a hypalon liner at $6.90/m2 are $3.66 million, $4.9 million, and $3.73millions for methods A, B, and C, respectively; for a clay liner (1 m thick) at $2.55/M2 are$1.35 million. $1.81 million, and $1.38 million.
Total costs for preparing the basin under option 2 and usi - method A would be $8.51 million, ifa hypalor liner were used, and $6.2 million if clay lined. For method B, the costs would be$10.76 mil'ion and $7.67 million. For method C, the costs are are $7.9 million if hypalon linedand $5.55 million if clay lined.
After the mine pit had been prepared by use of one of the options and methods discussed above,the tailings slurry would be deposited through a pipaline. Because the basin prepared withhypalon is designed to inhibit seepage of the tailings solution better than clay, it is likelythat it would be necessary to remove exces! water only from the clay-lined pits. This might beaccomplished by various means; a floating decant system is selected for this analysis. The costof such a system is estimated to be $100,000. The excess water removed would then be evaporatedfrom a 27-ha pond, costing about $2.88 million, lnclucing restoration of the pond erea. Thestaf.' has assumed a standard evaporaticn pond lined with hypalon will be used. The costs ofthis operation are common to all of the variations. As indicated above, the staff has assumedthat no evaporatic-n pond will be necessary, if the tailings impoundment is lined with hypalon.
After the tailings were sufficiently dry, they woul% be covered with a cover of 6 m earth filland 0.2 m of topsoil (see Sec. 8.4.2). Of the costs of the covering operation, only the cost ofdepositing at $0.4j/m3 is assessed to the tailings management scheme. The costs of earth covervary slightly among the options, because of slight differences in the area to be covered. Foroption (1). the areas for methods A and B would be &boat 5.4 x 10⁵ ma; that for method C wouldbe 3.8 x 10in m2 . The corresponding costs wouldbe $1.46 million each for A and B and $1.03million for C. For option (2), the areas for methods A and 8 would be 5 4 x 10⁵ m2 ; that formethod C wjuid be 4.7 x 10⁵ m2 . The corresponding costs would be $1.46 million each for A and Band $1.26 million for C.
A con~pilation of the custs for Alternative 2 is presented in Table K-4.3. It is important tono"e that while these casts are intended to be representative of the various possibilitiespresented here and analyzed for this alternative, other operations e) 'st and may be used toaccomplish the same general disposal system discussed here. Hence, depending on which specificitems or operations are included or excluded from the overall system, costs may vary accordingly.
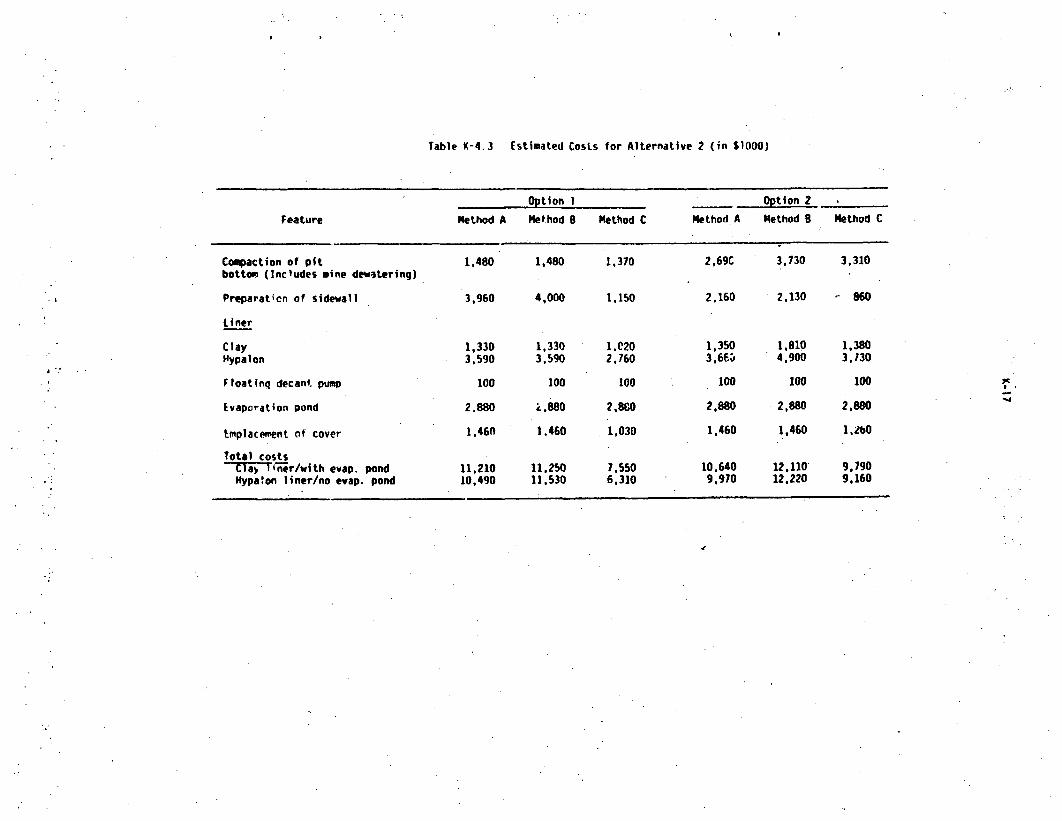
Table K-4.3 Estimated Costs for Alternative 2 (in $1000)
. I
Option 1 Option 2
Feature Method A Method 8 Method C Method. A Method 8 Method C
Compaction of pit 1.480 1.480 1,370 2,69C 3,730 3,310
bottom (Includes mine dewitering)
Preparatien of sidewall 3,960 4,000 1.150 2,160 2.130 860
Liner
Clay 1,330 1,330 1.020 1,350 1,810 1,380Hypalon 3.590 3,590 2,760 3,663 4,900 3,130
Floatinq decant pump 100 100 100 100 100 100
Evaporation pond 2.880 i.880 2.880 2,880 2,880 2,880
Emplacement of cover 1,460 1.460 1,030 1,460 1,460 1,2b0
Total costsTiVTlner/with evap. pond 11.210 11.250 7,550 10.640 12,110' 9,790
Hypa!on liner/no evap. pond 10,490 11.530 6,310 9,970 12,220 9,160
A".'
'C
-J
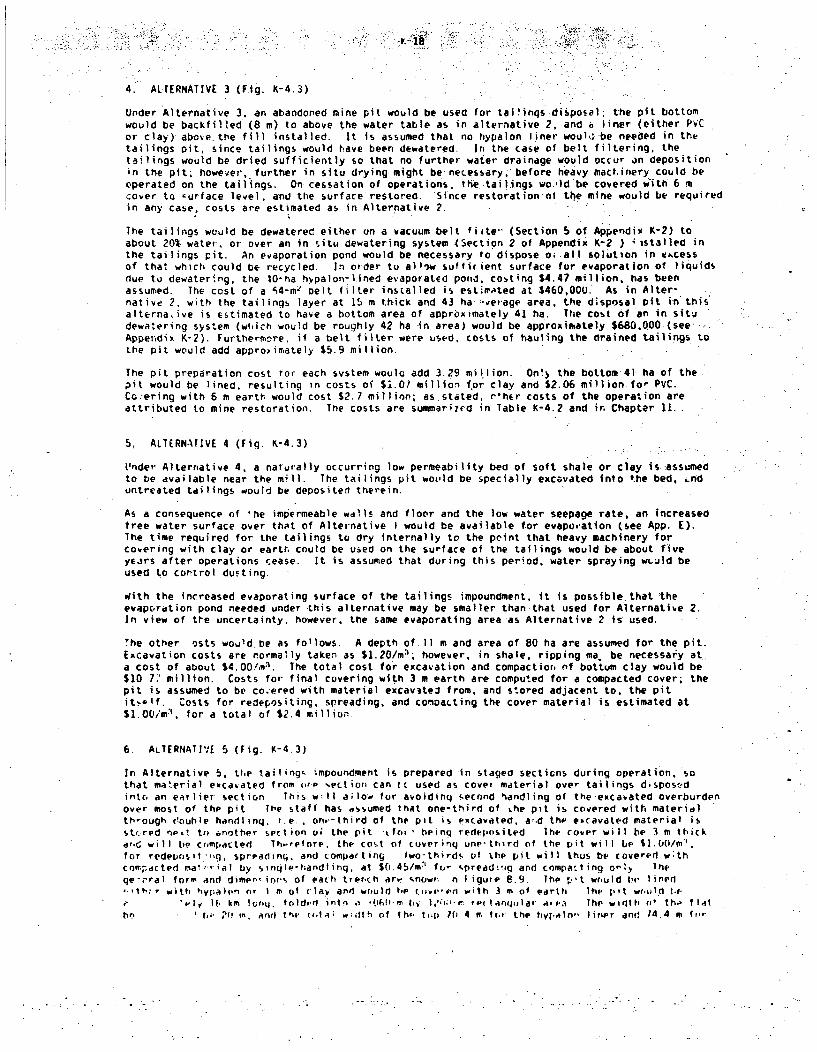
7.-
4. ALTERNATIVE 3 (Fig. K-4.3)
Under Alternative 3. an abandoned mine pit would be used for tai'inqs disposeal the pit bottomwould be backfilled (8 m) to above the water table as in alternative 2, and a liner (either PVCor clay) above. the fill installed. It is assumed that no hypalon liner wou1,-be needed in thetailings pit, since tailings would have been dewatered. In the case of belt filtering, thetailings would be dried sufficiently so that no further water drainage would occur an depositionin the pit; however, further in situ drying might be-necessary; before heavy. machinery 'could beoperated on the tailings. On. cessation of operations, the. tailings wo.,ld be covered with 6 ficover to -urface level, and the surface restored. Since restoration o0 the mine would be requiredin any case, costs are estimated as in Alternative 2.
The tailings would be dewaterec either on a vacuum belt fitte-" (Section 5 of Appendix K-2) toabout 20% water, or over an in situ dewatering system (Section 2 of Appendix K-2 ) 'istalled inthe tailings pit. An evaporation pond would be necessary to dispose o;.all solution in tcessof that which could be recycled. In order tu alliw sufficient surface for evaporation of liquidsdue to dewatering, the 4O-ha hvpalon-lined evaporated pond, costing $4.47 million, has beenassumed. The cost of a ;4-Wm oelt filter installed is estieated at $460,000. As in Alter-native 2. with the tailinqs layer at 1i m thick and 43 ha -verage area, the disposal pit tn thisalterna.ive is estimated to have a bottom area of approximately 41 ha. The cost of an in situdewatering system (which would be roughly 42 ha -in area) would be approximately $680,000 (see'Appen•dix K-2). Furthermore, if a belt filter were used, costs of hauling the drained tailings tothe pit would add approximately $5.9 million.The pit preparation cost ror each system wou1a add 3.29 million. On!) the bottom 41 ha of the.
pit would be lined, resulting in costs of $1.07 million for clay and $2.06 million foIi PVC.Co.'ering with 6 m earth would cost $2.7 million; as.stated, r'her costs of the operation areattributed to mine restoration. The costs are summarized in Table K-4.2 and in Chapter 1I..
5, ALTERNATIVE 4 (Fig. K-4.3)
Under Alternative 4, a naturally occurring low permeability bed of soft shale or clay is:assumedto be available near the mill. The tailings pit wotild be specially excavated Into the bed, .nduntreated tailings would be deposited therein.
As a consequence of he impermeable walls and floor and the low water seepage rate, an increasedtree water surface over that of Alternative I would be available for evaporation (see App. E).The time required for the tailings to dry internally to the point that heavy machinery forcovering with clay or earth could be used on the surface of the tailings would be about fiveyears after operations cease. It is assumed that during this period, water spraying wLuld beused to control dutting.
With the increased evaporating surface of the tailings impoundment. it is possible, that :theevaporation pond needed under -this alternative may be smaller than that used for Alternative 2.In view of tte uncertainty, however, the same evaporating area as Alternative 2 is* used.
The other osts woold be as follows. A depth of.11 m and area of 80 ha are assumed for the pit.Excavation costs are norma;ly taken as $1.20/m1; however, in shale, ripping ma be necessary at.a cost of about $4.00,OO. 3 . The total cost for excavation and compactior, of bottom clay would be$10 7.' million. Costs for final covering with 3 m earth are computed for a compacted cover; thepit is assumed to be co.ered with material excavateJ from, and stored adjacent to. the pitits If. Costs for redepositing, spreading, and comoacting the cover material is estimated at$1.O0/m 3 , for a total of S2.4 million
6. ALTERNATIVE 5 (Fig. K-4.3)
In Alternative 5, the tailings impoundment is prepared in staged secticns during operation, sothat material excavated from orP %ection can tc used as covet material over tailings disposfdintc. an earlier' section This w-ll ailow for avoidinq second handling of the-excavated overburdenover most of the pit The staff has assumed that one-third of Lhe pit is covered with materidlthrough clouhle handling, i.e., on.-third of the pit is excavated, a:.d the excavated material isist(red Oevt to another section oi the pit tfov, being redelpsited Ihe cover will be 3 m thicka,!c will be compacted Th.refnre. the cost of cuverinq one-third of the pit will be $I.(0/M'".for redeinsit ',,g, spread:n,. and comparting two-thirds of the pit will thus be covered w;thcompacted naf'• ,al by sintqlp-handtinq, at $0.45/m3 fo- %pread!isq and compatting only Theqe-nral form and dimepnior'• of eath troenh aria snowr n Iigurpe 8.9. Ihe f't wnuld be lined
, l.t;r with hiylij' irn or I m of (I dy and would top (,ive-en with 3 th of earth. lh, p •t w(,u.d I'# If, km tonq. folded intn ,o , rfll-m i,~ ol,'-' r (tantiolar a,.'a Ihe wildth ti' th' f lat
hn ' f. i•'l , and tvi" ((-lA" a dth of thc. ,i p 70 4 ff. fr the hyl.a In,, liner and 74.4 m ftor
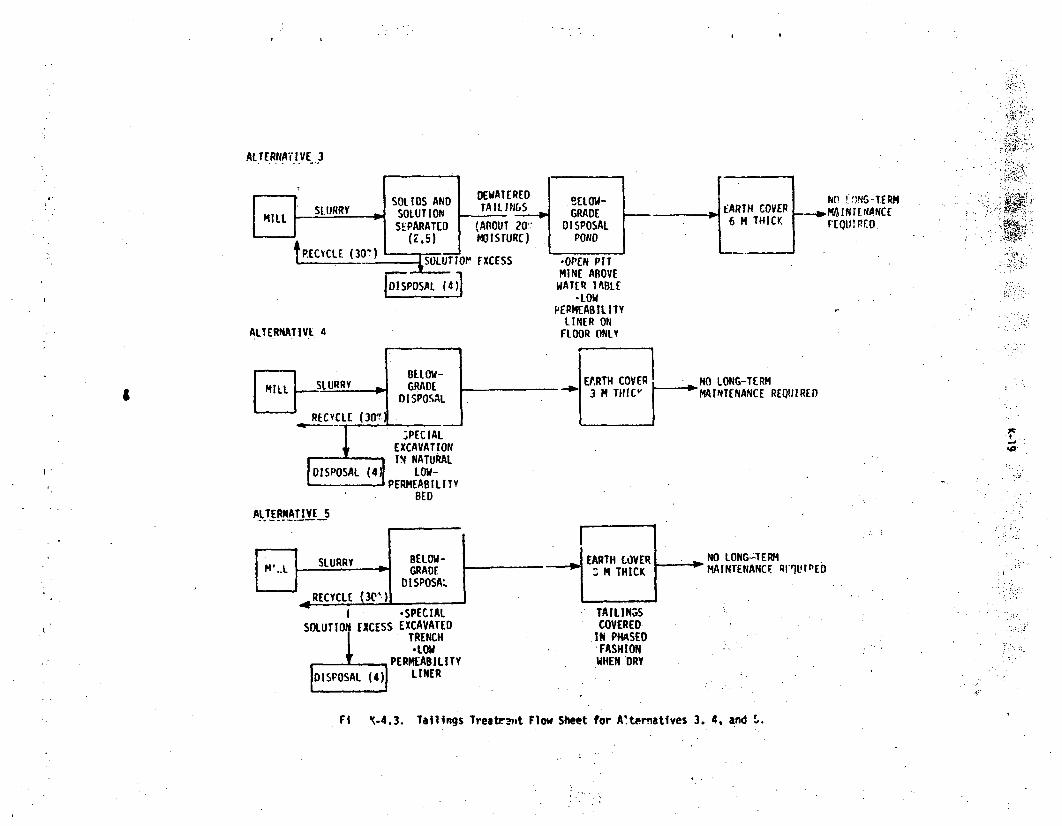
AL.TE.RNAT.IVE .3
NO I ''1G-TERM.N4INrL rANCEPEQu!RIo.
Q?-;-ý
MINE ABOVEWATER TABLE
.LOWPEPNEABILITY
LINER ONFLOOR ONLYALTERNATIVE 4
NO LONG-TERMMAINTENANCE REQUIREDA
;PECIALEXCAVATIONIN NATURAL
LOW-PERMEABILITY
BED
.4.
ALTERNATIVE•_5
NO LONG4TEmIMAINTENANCF RMI'UIDED
I -SPECIAL TAILINGSSOLUTION EXCESS EXCAVATED COVERED
TRENCH IN PHASEDI -LOW FASHION
PERMEABILITY WHEN DRY
DISPOSAL (4) LINER
Fi X-4.3. Tailings Treatmt Flow Sheet for A'temratives 3. 4, and L.
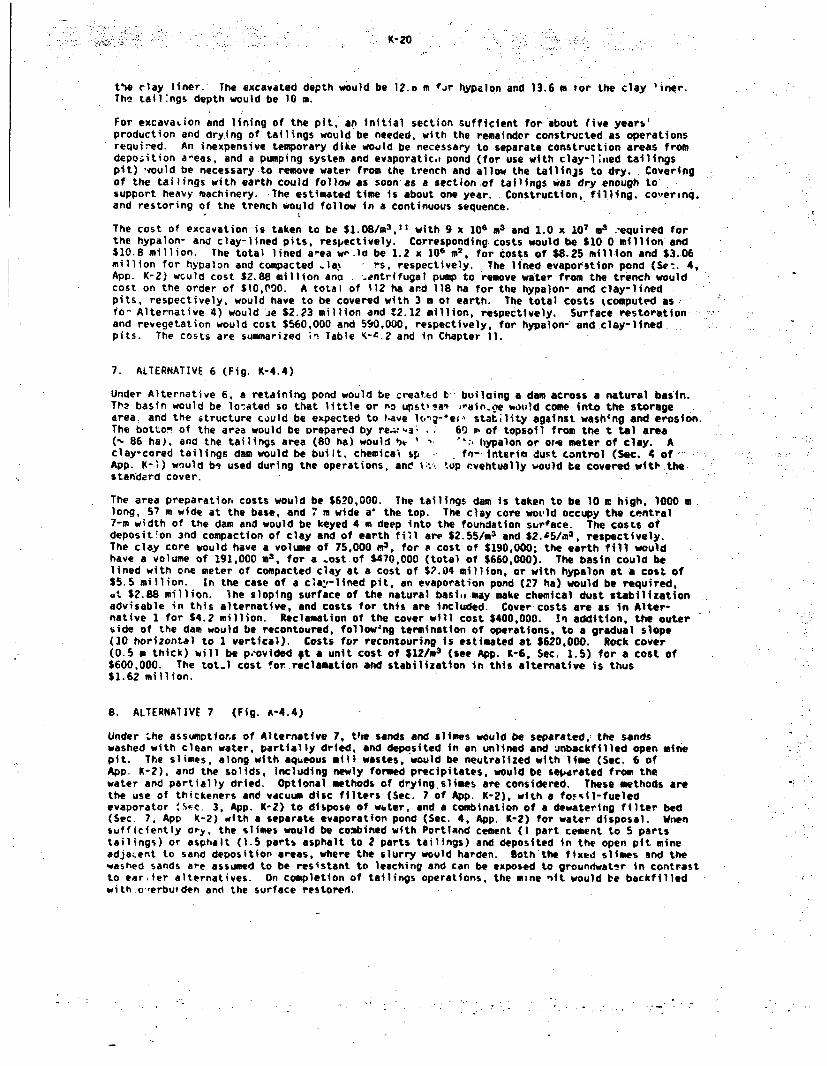
K- 20
tlie rlay liner. The excavated depth would be 12.o m fit hypelon and 13.6 a tor the clay liner.The tail:ngs depth would be 10 m.
For excavauion and lining of the pit, an initial section sufficient for about five years'production and dry.ing of tailings would be needed, with the remainder constructed as operationsrequired. An inexpensive temporary dike would be necessary to separate construction areas fromdeposition a-eas, and a pumping system and evaporatic.. pond (for use with clay-1 ned tailingspit) 'vould be necessary to remove water from. the trench and allow the tailinjs to dry. Coveringof the tailings with earth could follow as soon'as a section of tailings was dry enough tosupport heavy machinery. The estimated time is about one year. Construction, filling. coerinq.and restoring of the trench would follow in a continuous sequence.
The cost of excavation is taken to be $1.08/M33 ," with 9 x 10⁶ m3 and 1.0 x 10⁷ M3 .-equired forthe hypalon- and clay-lined pits, respectively. Corresponding. costs would be $10 0 million and$10.8 million. The total lined area w.lad be 1.2 X 10⁶ Mi. for costs of $8.25 million and $3.06million for hypalon and compacted Ila ' rs, respectively. The lined evaporation pond (Se7. 4,App. K-2) wculd cost SZ.88 million ano . -antrifugal pump to remove water from the trench wouldcost on the order of $l0,C00. A total of 112 ha and 118 ha for the hypalon- and clay-linedpits, respectively, would have to be covered with 3 m ot earth. The total costs (computed asfo- Alternative 4) would Je $2.23 million and ?2.12 million, respectively. Surface restorationand revegetation would cost $560,000 and 590,000, respectively, for hypalon- and clay-lined.;pits. The costs are summarized in Table K-4.2 and in Chapter 11.
7. ALTERNATIVE 6 (Fig. K-4.4)
Under Alternative 6, a retaining pond would be creatEd t, builaing a dam across a natural basin.Th? basin would be lo:ated so that little or no upst,?a' ,-sain.ne would come into the storagearea, and the structure could be expected to thave lng-*ei stat;lity against washing and erosion.The botton of the area would be Prepared by re.;:,,a# , 6' m of topsoil from the t tal area(% 86 ha). and the tailings area (80 ha) would Ie I * .' hypalon or or-e meter of clay. Aclay-cored tailings dam would be built, chemical sp . fo- interim dust control (Sec. 4 of,.App. K-i) would b- used during the operations, and '; tup evehtually would be covered witil.thestandard cover.
The area preparation costs would be $620,000. The tailings dam is taken to be 10 c high, 1000 mlong, 57 m wide at the base, and 7 m wide a' the top. The clay core wotld occupy the central7-m width of the dam and would be keyed 4 m deep into the foundation surface. The costs ofdeposit*on and compaction of clay and of earth fill are $2.55/m3 and $2.&5/# 3 , respectively.The clay core Would have a volume of 75,000 m3, for a cost of $190,000; the earth fill wouldhave a volume of 191,000 m3, for a .ost of $470,000 (total of $660,000). The basin could belined with one meter of compacted clay at a cost of $2.04 million, or with hypalon at a cost of$5.5 million. In the case of a c6a:-lined pit, an evaporation pond (27 ha) would be required,.t $2.88 million. lhe sloping surface of the natural basi,, may make chemical dust stabilizationadvisable in this alternative, and costs for this are included. Cover costs are as in Alter-native 1 for $4.2 million. Reclamation of the cover will cost $400,000. !n addition, the outerside of the dam would be recontoured, follow4ng termination of operations, to a gradual slope(10 horizontal to I vertical). Costs for recontouring is estimated at $620,000. Rock cover(0.5 m thick) will be p.-ovided qt a unit cost of $12/M 3 (see App. K-6, Sec. 1.5) for a cost of$600,000. The tot.- cost !or reclamation and stabilization in this alternative is thus$1.62 million.
8. ALTERNATIVE 7 (Fig. A-4.4)
Under Lhe assumptions of Alternative 7, tive sands and slimes would be separated,: the sandswashed with clean water, partially dried, and deposited in an unlined and inbackfllled open minepit. The slimes, along with aqueous mill wastes, would be neutralized with lime (Sec. 6 ofApp. K-2), and the solids, including newly formed precipitates, would be separated from thewater and partially dried, Optional methods of drying.slimes are considered. These methods arethe use of thickeners and vacuum disc filters (Sec. 7 of App. K-2), with a fossil-fueledevaporator 'So'., 3, App. K-2) to dispose of wbter, and a combination of a dewatering filter bed(Sec. 7, App K-2) with a separate evaporation pond (Sec. 4, App. K-2) for water disposal. Wnensufficiently dry, the slimes would be combined with Portland cement (I part cement to 5 partstailings) or asphalt (1.5 parts asphalt to 2 parts tailings) and deposited in the open pit mineadjacent to sand deposition areas, where the slurry would harden. Both'the fixed slimes and thewashed sands are assumed to be resistant to leaching and can be exposed to groundwater in contrastto ear ler alternatives. On completion of tailings operations, the mine nit would be backfllledwith.o-,erburden and the surface restored.
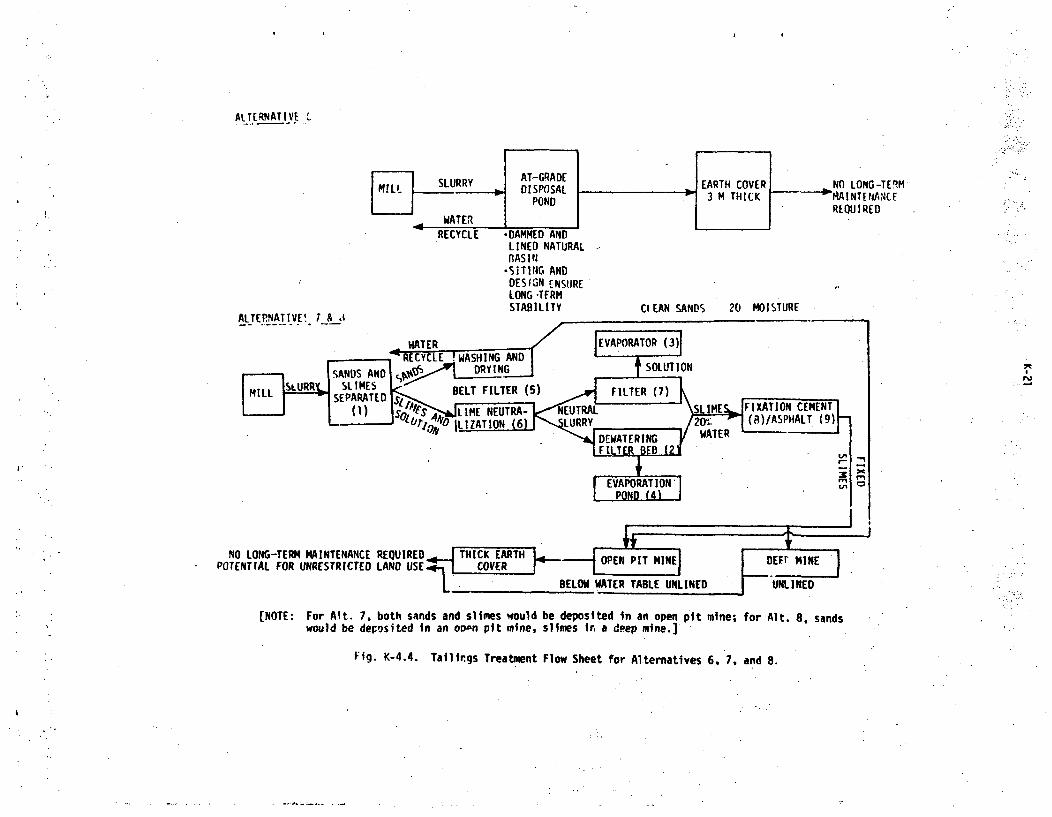
ALTERNATIVE t
LINED NATURAL -RAS I N
-SITI"G ANDDESIGN ENSURELONG-TFRMSTABILITY CLEAN SANDS 20 MOISTURE
ALTEP.NATIVEC 7 & J
NJ
[NOTE: For Alt. 7, both sands and slimes would be deposited in an open pit mine; for Alt. 8, sandswould be deposited in an opon pit mine, slimes in a dpep mine.]
Fig. K-4.4. Tailings Treatment Flow Sheet for Alternatives 6, 7. and 8.
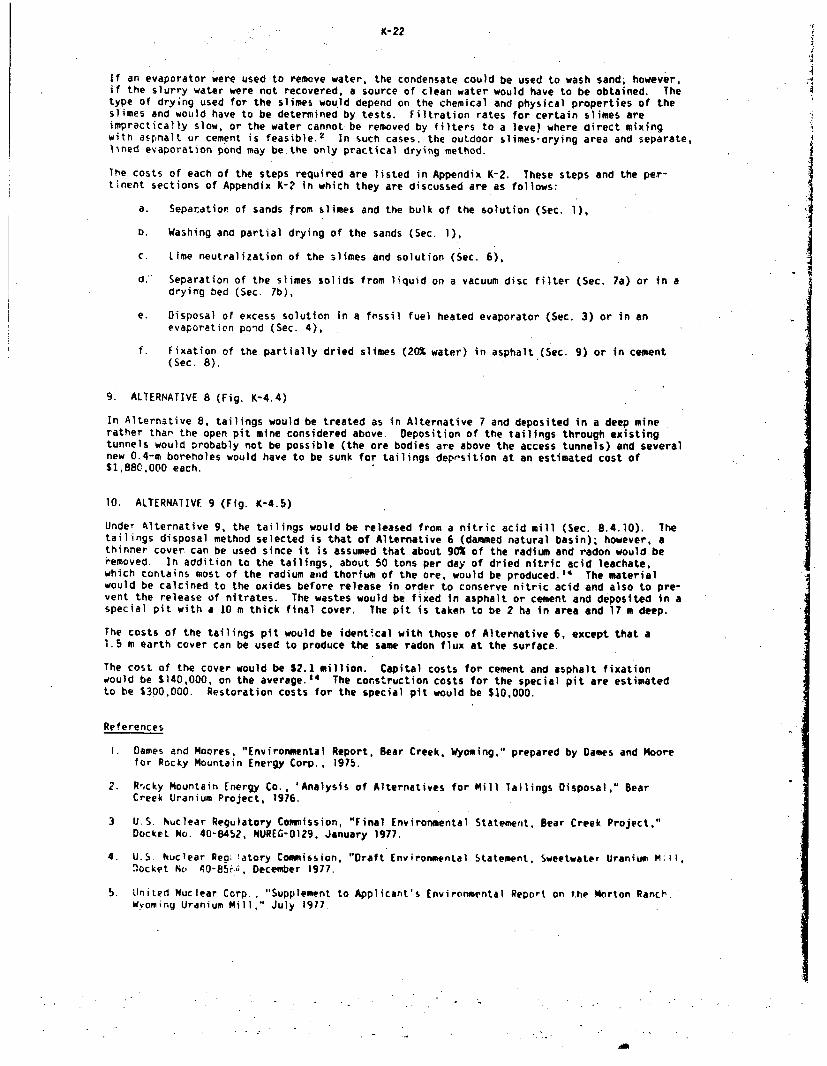
K-22
If an evaporator were used to remove water, the condensate could be used to wash sand; however,if the slurry water were not recovered, a source of clean water would have to be obtained. Thetype of drying used for the slimes would depend on the chemical and physical properties of theslimes and would have to be determined by tests. Filtration rates for certain slimes areimpractically slow, or the water cannot-be removed by filters to a leve) where direct mixingwith asphalt or cement is feasible. 2 In such cases, the outdoor slimes-crying area and separate,lined evaporation pond may be.the only practical drying method.
The costs of each of the steps required are listed in Appendix K-2. These steps and the per-tinent sections of Appendix K-2 in which they are discussed are as follows:
a. Separation of sands from slimes and the bulk of the solution (Sec. 1),
b. Washing and partial drying of the sands (Sec. 1),
C. Lime neutralization of the slimes and solution (Sec. 6),
d. Separation of the slimes solids from liquid on a vacuum disc filter (Sec. 7a) or in adrying bed (Sec. 7b),
e. Disposal of excess solution in a fnssi! fuel heated evaporator (Sec. 3) or in anevaporation poad (Sec. 4),
f. fixation of the partially dried slimes (20% water) in asphalt (Sec. 9) or in cement(Sec. 8).
9. ALTERNATIVE 8 (Fig. K-4.4)
In Alternative 8, tailings would be treated as in Alternative 7 and deposited in a deep minerather than the open pit mine considered above. Deposition of the tailings through existingtunnels would probably not be possible (the ore bodies are above the access tunnels) and severalnew 0.4-m boreholes would have to be sunk for tailings deppsition at an estimated cost of$1,88C,000 each.
10. ALTERNATIVE 9 (Fig. K-4.5)
Under Alternative 9, the tailings would be released from a nitric acid mill (Sec. 8.4.10). Thetailings disposal method selected is that of Alternative 6 (dammed natural basin); however, athinner cover, can be used since it is assumed that about 90% of the radium and radon would beremoved. In addition to the tailings, about 50 tons per day of dried nitric acid leachate,which contains most of the radium and thorium of the ore, would be produced.1 4 The materialwould be calcined to the oxides before release in order to conserve nitric acid and also to pre-vent the release of nitrates. The wastes would be fixed in asphalt or cement and deposited in aspecial pit with a 10 m thick final cover. The pit is taken to be 2 ha in area and 17 m deep.
The costs of the tailings pit would be identical with those of Alternative 6, except that a1.5 m earth cover can be used to produce the same radon flux at the surface.
The cost of the cover would be $2.1 million. Capital costs for cement and asphalt fixationwould be $140,000, on the average."4 The construction costs for the special pit are estimatedto be $300,000. Restoration costs for the special pit would be $10,000.
References
I. Dames and Moores. "Environmental Report, Bear Creek, Wyoming," prepared by Dames and Moorefor Rocky Mountain Energy Corp., 1975.
2. Rscky Mountain Energy Co., 'Analysis of Alternatives for Mill lailings Disposal," BearCreek Uranium Project, 1976.
3 U.S. Nuclear Regulatory Commission, "Final Environmental Statement, Bear Creek Project,"Docket No. 40-8452, NUREG-0129, January 1977.
4. U.S. Nuclear Rea; tatory Commission, "Draft Environmental Statement. Sweetwater Uranium M,1l,%ocket No 4 0-85,4, December 1977.
5. United Nuclear Corp., "Supplement to Applicant's Environmental Report on the Morton Ranct.Wyoming Uranium Mill." July 1917.
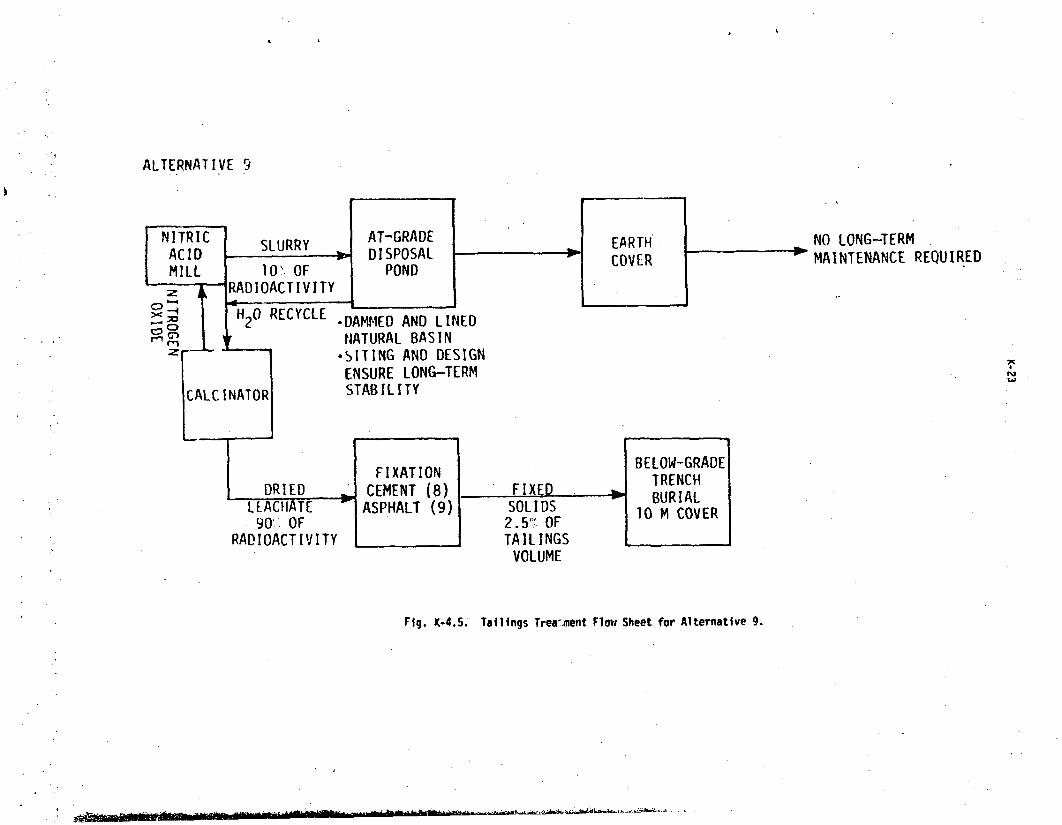
"'"I
ALTERNATIVE 9
NITRIC SLURRY AT-GRADE EARTH too NO LONG-TERMACID • DISPOSAL r I COVER r MAINTENANCE REQUIRED
PONU
-DAMMED AND LINEDNATURAL BASIN
-SITING AND DESIGNENSURE LONG-TERMSTABILITY
90'.. OFRADIOACTIVITY
FIXEDSOLIDS2.5'• OFTAILINGS
VOLUME
BELOW-GRADETRENCHBURIAL
10 M COVER
Fig. K-4.5. Tailings Trea'ment Flow Sheet for Alternative 9.
* .1- -24
6. Dames and Moore, "Supplement to the Source Material License Renewal Application. Analysisof Tailings Disposal Alternatives for Union Carbide Corporation, Gas Hills, Wyoming, UraniumHill," August 1977.
7. 0. Appolonia Consulting Engineers, Report 2, "Tailings Abandonment and Stabilization."p-epared by D'Appolonia Consulting Engineers, Inc., for Western Nuclear Corp., Split RockM.11, September 1977.
8. U.,. Environmental Protection Agency, "Environmental Analysis of the Uranium Fuel Cycle,Part IV. Supplementary Analysis, 1976," EPA 520/4-76-017, 1976.
9. Bond Evaluation to State of Wyoming for Lucky Mc Uranium Mill, July 1977.
10. Bond Evaluation to State of Utah for Humeca Uranium Hill, 13 September 1976.
11. R. 5. Means Co., Inc., "Building Construction Cost Data," Duxbury, MA, 1978.
12. Letter from E. Will, Dames and Moore. to R. Adrian, Atlas Minerals, "Riprap Design Study,"enc Iosore. 2 October 1978.
13. Dames and Moore, "An Evaluation of the Cost Parameters for Hypothetical Uranium MillingOperations and Ore Transportation Systems in the Western United States," Dames and Moorereport prepared for Argonne National Laboratory, July 1977.
14. .D. A. 3robst and W. P. Pratt, "United States Mineral Resources," U. S. Government PrintingOffice. 1973.
APPENOIX K-5 COSTS OF ALTERNATIVE METHODS OF-TRANSPORT OF TAILINGS SLURRY
In the discussion of tailings alternatives, it has been assumed that the disposal area would beclose to the mill, and the delivery costs could be charged to mill operations. Many of thealternatives would require special locations, which could make some extra tailings transportnecessary. For the model mill, an 18-cm pipeline would be required. Cost estimates (1980dollars, escalated from ref. 1) have been mde for-a 40-km-long pipeline, with lower unit costsfor longer distances.' The capital costs were $1.62 million, resulting In fixed charges of$275,000 per year. Operating costs were 2.24/MI-km (3.34/ST-mile), resulting in total costs(fixed charges = $1.24/MT-km (1.8¢/ST-mile)) of 3.44/MT-km (5.04/ST-mile). Truck transportcosts on a simil1r scale were 6.)6/MT-km (9.46/ST-mile).I Right-of-way costs are estimated as$1AO0/Ke ($2300/mile).' Assuming linearity of costs with distance, for the 1800 MT/day mill anda 16-km distance of the mill to the disposal site, then capital, annual and lifetime total costswould be $650,000, $370,000, and $6.2 million, respectively.
Reference
1. Dames and Moore. "An Evaluati-on of the Cost Parameters for Hypothetical Uranium MillingOperations and Ore Transportation Systems in the Western United States," Dames and Moorereport prepared for Argonne National Laboratory, July 1977.
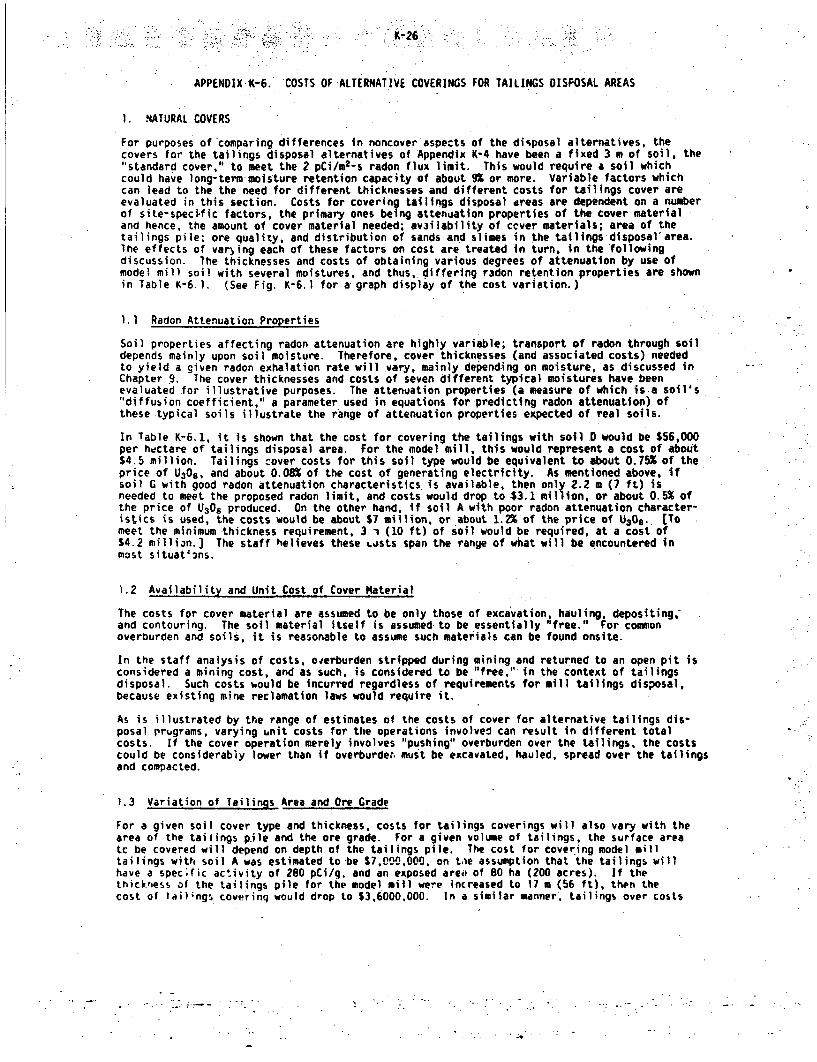
K"26
APPENDIX K-6. COSTS OF ALTERNATIVE COVERINGS FOR TAILINGS OISFOSAL AREAS
1. 4ATURAL COVERS
For purposes of comparing differences in noncover aspects of the disposal alternatives, thecovers for the tailings disposal alternatives of Appendix K-4 have been a fixed 3 m of soil, the"standard cover," to meet the 2 pCi/m 2-s radon flux limit. This would requireda soil whichcould have long-term moisture retention capacity of about 9% or more. Variable factors whichcan lead to the the need for different thicknesses and different costs for tailings cover areevaluated in this section. Costs for covering tailings disposal dreas are dependent on a numberof site-specific factors, the primary ones being attenuation properties of the cover materialand hence, the amount of cover material needed; availability of cever materials; area of thetailings pile; ore quality, and distribution of sands an'd slimes in the tailings disposal'area.The effects of varying each of these factors on cost are treated in turn, in the followingdiscussion. The thicknesses and costs of obtaining various degrees of attenuation by use ofmodel mill soil with several moistures, and thus, differing radon retention properties are shownin Table K-6.1. (See Fig. K-6.1 for a graph display of the cost variation.)
1.1 Radon Attenuation Properties
Soil properties affecting radon attenuation are highly variable; transport of radon through soildepends mainly upon soil moisture. Therefore. cover thicknesses (and associated costs) neededto yield a given radon exhalation rate will vary, mainly depending on moisture, as discussed inChapter 9. The cover thicknesses and costs of seven different typical moistures have beenevaluated for illustrative purposes. The attenuation properties (a measure of which is a soil's"diffusion coefficient," a parameter used in equations for predicting radon attenuation) ofthese typical soils illustrate the range of attenuation properties expected of real soils.
in Table K-6.1, it is shown that the cost for covering the tailings with soil D would be $56,000per hectare of tailings disposal area. For the model mill, this would represent a cost of about$4.5 million. Tailings cover costs for this soil type would be equivalent to about 0.75% of theprice of U309, and about O.08% of the cost of generating electricity. As mentioned above, ifsoil G with good radon attenuation characteristics is available, then only 2.2 m (7 ft) isneeded to meet the proposed radon limit, and costs would drop to $3.1 million, or about 0.5% ofthe price of U308 produced. On the other hand, if soil A with poor radon attenuation character-istics is used, the costs would be about $7 million, or about 1.2% of the price of U308. [Tomeet the minimum thickness requirement, 3 1 (10 ft) of soil would be required, at a cost of$4.2 million.] The staff helieves these oosts span the range of what will be encountered inmost situations.
i.2 Availability and Unit Cost of Cover Material
The costs for cover material are assumed to be only those of excavation, hauling, depositing,and contouring. The soil material itself is assumed to be essentially "free." For commonoverburden and soils, it is reasonable to assume such materials can be found onsite.
In the staff analysis of costs, o4erburden stripped during mining and returned to an open pit isconsidered a mining cost, and as such, is considered to be "free," in the context of tailingsdisposal. Such costs %ould be incurred regardless of requirements for mill tailings disposal,because existing mine reclamation laws would require it.
As is illustrated by the range of estimates of the costs of cover for alternative tailings dis-posal prugrams, varying unit costs for the operations involved can result in different totalcosts. If the cover operation merely involves "pushing" overburden over the tailings, the costscould be considerably lower than if overburden must be excavated, hauled, spread over the tailingsand compacted.
1.3 Variation of Tailings Area and Ore Grade
For a given soil cover type and thickness, costs for tailings coverings will also vary with thearea of the tailings pile and the ore grade. For a given volume of tailings, the surface areatc be covered will depend on depth of the tailings pile. The cost for covering model milltailings with soil A was estimated to be $7,000,000, on tOe assumption that the tailings willhave a spec;fic activity of 280 pCi/g. and an exposed areai of 80 ha (200 acres). If thethickness of the tailings pile for the model mill were increased to 17 m (56 ft), then thecost of tailings covering would drop to $3,6000,000. In a similar manner. tailings over costs
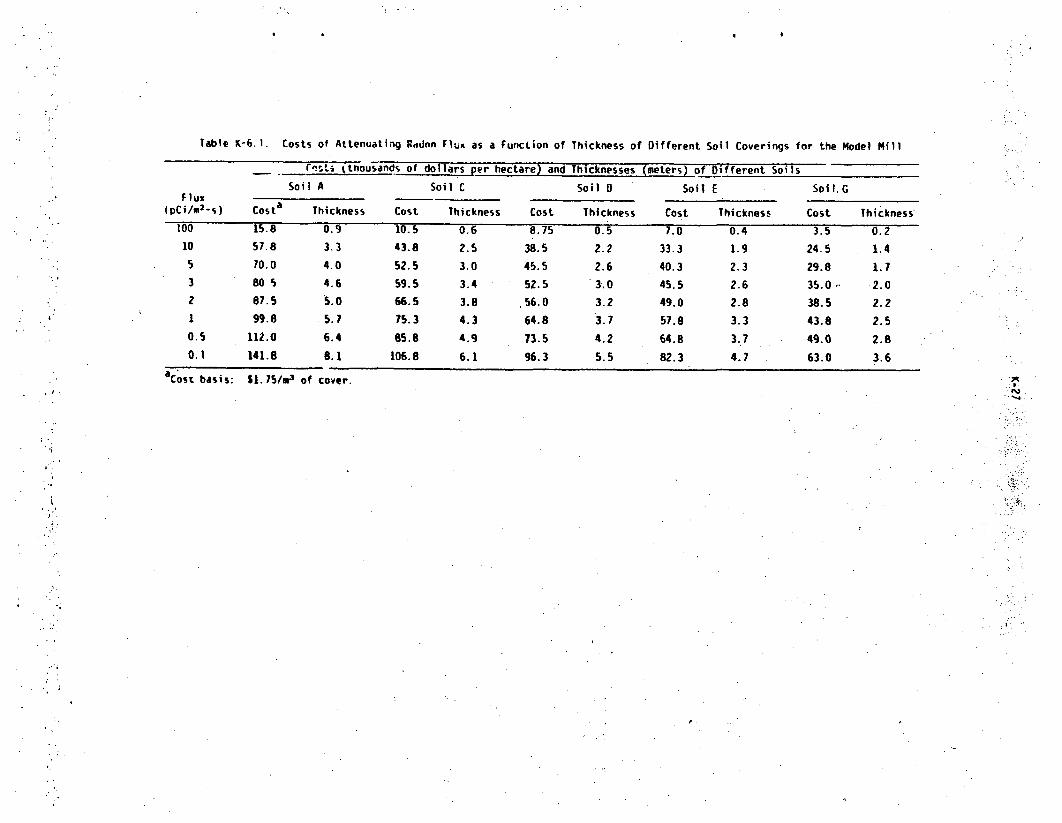
Table K-6.1. Costs of Attenuating Rddnn F'NA as a Function of Thickness of Different Soil Coverings for the Model Mill
rnsts (tnousands of dollars per hectare) and Thicknesses (meters) of Oifferent Soils
Soil AFlux
(pCU/m2 -s) Costa Thickness
Soil C
Cost Thickness
Soil D
Cost Thickness
Soil E
Cost Thickness
Soi1. G
Cost Thickness
LUU
10
5
3
2
1
57.8
70.0
80 5
87.5
99.8
U. J
3.3
4.0
4.6
5.0
5.7
I U. 543.8
52.5
59.5
66.5
75.3
85.8
106.8
.u.b2.5
3.0
3.4
3.8
4.3
4.9
6.1
8.75
38.5
45.5
52.5
56.0
64.8
73.5
96.3
0.5
2.2
2.6
3.0
3.2
3.7
4.2
5.5
7.0
33.3
40.3
45.5
49.0
57.8
64.8
82.3
0.4
1.9
2.3
2.6
2.8
3.3
3.7
4.7
3.5
24.5
29.8
35.0-,
38.5
43.8
49.0
63.0
0.2
1.4
1.7
2.0
2.2
2.5
2.8
3.6
0,5 112.0 6.4
0.1 141.8 8.1
acost basis: S1.75/m 3 of cover.S.rg
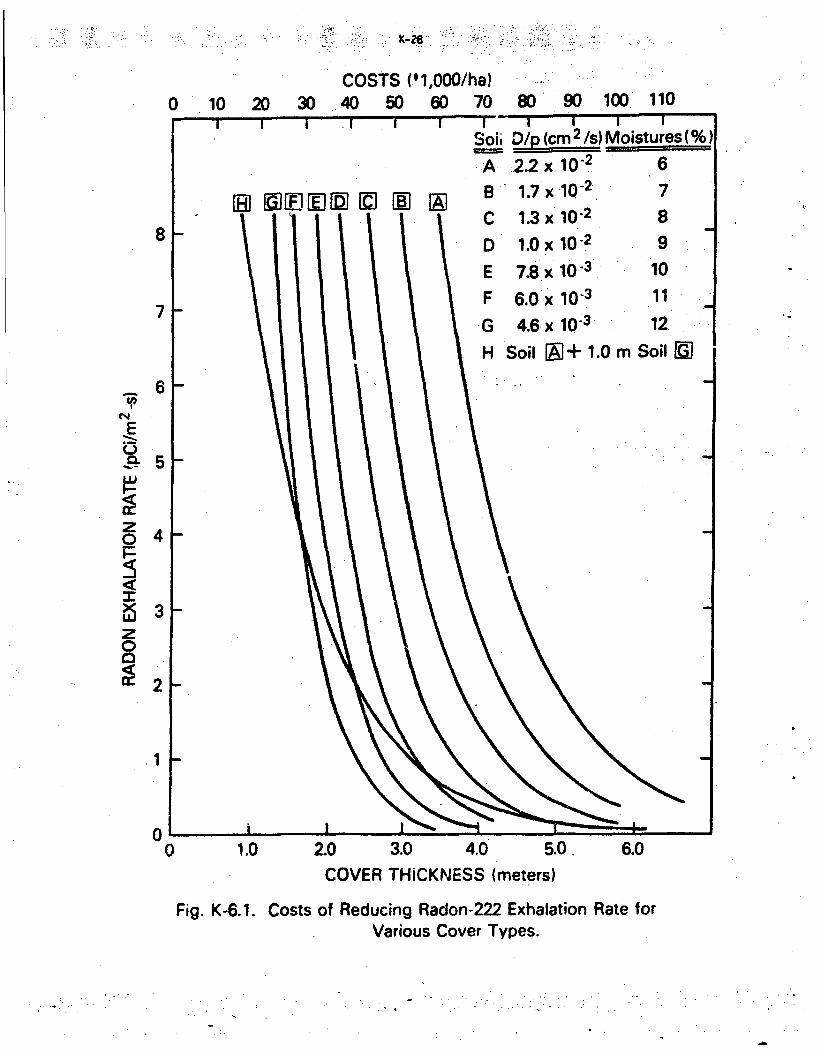
K-28
COSTS0 10 20 30 , 40 50
(' 1,000/ha).60 70. 80 90 100 110
8
7
C-)
0.
z0
6
5
4
3
2
1
00 1.0 2.0 3.0 4.0 5.0, 6.0
COVER THICKNESS (meters)
Fig. K-6.1. Costs of Reducing Radon-222 Exhalation Rate forVarious Cover Types.
for the model mill would approximately double, if the tailings pile thickness were halved to4.4 m (14 ft).
The effe, of ore grade is not so direct, since costs depend both on the thickness and area ofthe coy , wtK..n are affected differently bk the ore grade. An example should make the situationclear For t,'e model mill, an ore grade of 0.10% U is assumed, equivalent to a specific activityof 280 pCi/g, which; in turn, is assumed to be equivalent to a radon flux of 280 pCi/me-s. Theassurfied ore grado, with the assumed capacity of the mill, results in a production of an averageof 1.4MT/day (1.5 ST/day) of uranium, P:,d 1806 MT/day (1985 ST/day) of tailings. The mill'slifetime production of dried tailings, when spiead over the assumed area of 80 ha (200 acres),would have a depth of 8.73 m (29 ft,. If, instead, the ore grade were. assumed to be 0.05%(equivalent to a radon flux of 140 pCi/m 2 -s) and the uranium production were maintained at1.4 MT/day (1.5 ST/day) (so that the lifetime revenue is unchanged), the mill would then produce3600 MT/day (3960 ST/day) of tailings, equivalent to a lifetime production of 1.05 x 10⁷ m3
(13.13 x 10⁶ yd 3 ) of dried tailings. If this volume were'spread over 80 ha (ZOO acres), thedepth would be 13.1 m (42.9 ft). On the other hand, if thedepth.were maintained at 6.54 m(21.5 Vt), the area occupied would oe 160 ha (400 acres). In either case, the thickness of thecover of soil E required to reduce the radon flux at the surface to a given level, such as2 pCi/m 2 -s would be 2.4 m (7.9 ft) (see Fig. K-6.1). For the 80 ha (200 acre) area, the cost ofemplacing the cover would be $3.92 million; for the 160 ha (400 acre) area, $7.84 million.
These two situations represent the extremes; in practice an intermediate situation would exist.For purposes of illustration, it will be assumed that the increase (or decrease) in volume ofthe pile will be shared proportionately by increases in area and depth (i.e., AH/H = A/A, whereH is the height and A is the original area of the tailings). This assumption yields a depth of9.25 m (30.3 ft), an area of 113 ha (283 acres), and a cost of $4.75 .Illion for an ore grade of0.05% uranium. Other cases, computed in the same manner, are presented in Table 12.4.
1.4 Distribution of Sand and Slime Fractions
The manner in which the sand and slime fractions are distributed in the tailings pile willaffect the cover thicknesses needed and, therefore, the costs. If tailings are deposited insuch a fashion that slimes are layered below sands, as opposed to even distribution of these
r'artions, as might be the case in Alternative 5, the reduction of thickness required to reachtnr ?roposed limit using soil E rould be as much as about I m (3 ft), and associated cost savingsof about $1.4 ,nillion in application of cover material could be reali-ed.
1.5 Vegetation and Riprap
The covers are assumed to be restored by capping with "topsoil." which is seeded with nativegrasses, and watered until the vegetation is established. Quoted costs vary, and the staff haschosen an average value of $5000/ha. In some areas, such restoration may not be pussible,because sufficient vegetation cannot be established. In this event, stabilization by riprap maybe necessary. Again, quoted costs vary (see App. K-4), and the staff has chob.: a unit cost of$12/m 3 , on the basis that ordinary riprap available at the site would be adequate; assuming anaverage depth of 0.5 m, this is equivalent to $60,000/ha.
Costs for rock cover in several different areas near uranium mills were investigated. Generally,mvining costs for the rock are similar at all areas, where such rock Is available. Costs formining and grading of the rock ranged from $4.25 to $4.60 per ton, and areas around San Antonio.Texas, Rapid City, South Dakota, and Casper, Wyoming, were investigated. These cost. areapplicable to both coarse aggregate and medium aggregate. However, some quarries are not equippedto produce the coarse aggregate specified here, ds this is somewhat larger sized than'the maximumsize used for normal concrete aggrPgate.
Proximity of a source of rock, with respect to the uranium mill, will have a large influence onthe cost at covering tailings piles. Generally, costs for hauling rock are approximately $0.12per ton mile at present, with haul distances in the 20- to..40-mile range. Longer haul distanceswill slightly decrease the unit costs while shorter haul distances can greatly increase theton/mile costs for hauling.
At an average cost of $4.50 per ton for mining, crushing, and grading of coarse and mediumaggregate, and assuming a typical haul distance of 30 miles, the cost for rock at the si'te ofthe mode) mill would be approximately $8.10 per ton. Typically, in-place densitieL of thecoarse and medium aggregate will vange from 100 to 110 pounds pe" cubic foot, or 3.5OU to3.900 pounds ver cubic meter. Costs for installation (dumping, spreading, and rolittg) if therock on the tailings pile is estimated at $1.00 per cubic mete". 1h.rclore. total installedCosts Of the rock cover at the mill site is estimated at $16,00 per cubic meter (includinghauling), with a range of $;2-30/m:I.
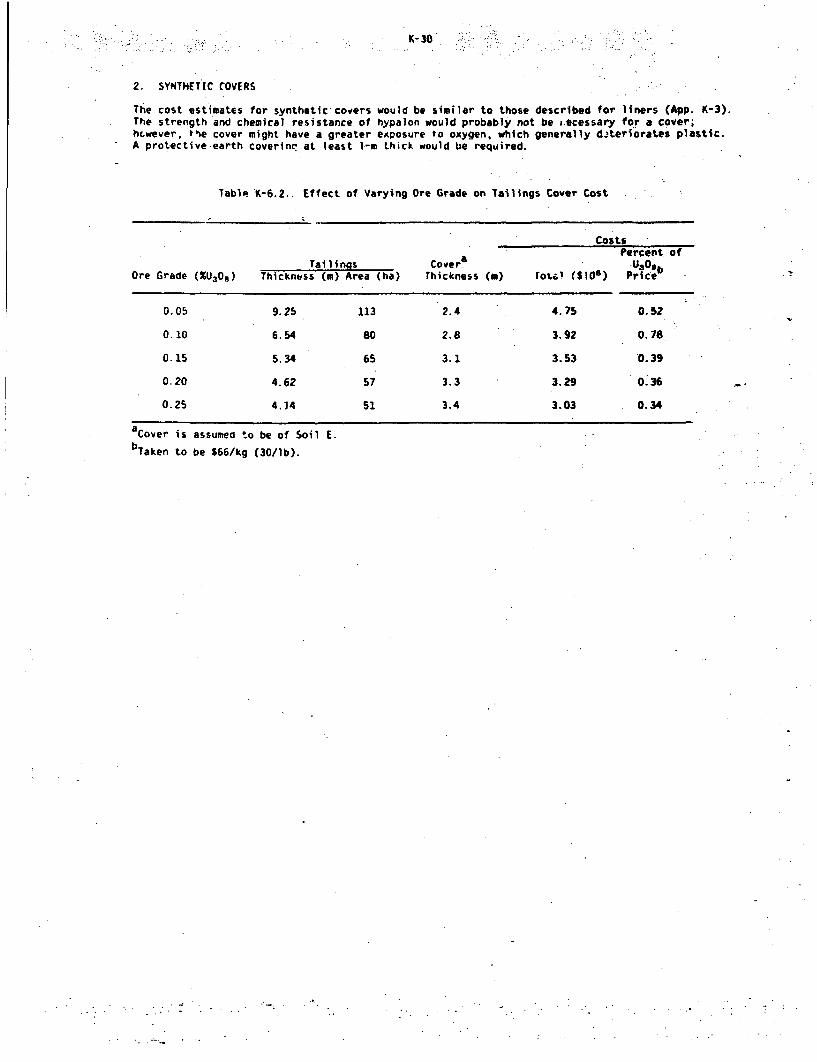
K- 30
2. SYNTHETIC COVERS
The cost estimates for synthetic covers would be similar to those described for liners (App. K-3).The strength and chemical resistance of hypalon would probably not be vecessary for a cover;hcwever, t'se cover might have a greater exposure to oxygen, which generally djteriorates plastic.A protective earth coverinq at least 1-m thick would be required.
Table K-6.2. Effect of Varying Ore Grade on Tailings Cover Cost
Costs
a rPercent ofCovers )UlO) PThickness (m) row• (sloe) Price"Ore Grade (%U 3 0O)
TailingsThickness (m) Area (ha)
0.05
0.10
0.15
0.20
0 .25
9.25
6.54
5.34
4.62
4.14
113
80
65
57
51
2.4
2.8
3.1
3.3
3.4
4.75
3.92
3.53
3.29
3.03
0.52
0.78
0. 39
0.36
0.34
aCover is assumed to be of Soil E.bTaken to be $66/kg (30/lb).
ýK-31
APPENDIX K-7. COSTS OF ALTERNATIVE MODES OF MILL DECOM4ISSIONING
Alternative modes of decommissioning are described in Section 8.5, and the environmental conse-quences of those actions were examined in Section 9.5. The monetary costs of the actions requiredto return the mill site (excluding the tailings area), the mill buildings, and any offsitecontarinated areas to conditions suitable for unrestricted general use are described in thissection. It. is assured that no tailings material would have been removed for use in offsiteconstruction and, therefore, that no decontamination of offsite buildings would be necessary.
The alternatives to be considered are: (1) the retention and use of some or all of the buildingsand equipment after decontamination, and (2) the complete removal of all buildings, foundations,and equipment, with the restoration of the site to its original state. The abandonment of themill and site wichout decontamination and with or without fencing and guards is not considered aviable alternative.
I. DESCRIPTION OF ACTIkj REQU.RED TO IMPLEMENT ALTERNATIVES
On cessAtian of mill operations, all salvageable equipment would be decontaminated to acceptablelevels of surface radioactivity (Table 9. 10). Nonsalvageable equipment would be removed fromthe buildings and buried in the tailings pile. Concrete floors, foundations, sumps, and subsur-face p'ping with unacceptably high levels of uranium and daughter nuclides would be broken up,removed, and buried in the tailings pile. Contaminated earth beneath removed foundations and,equipment wouid be excavated to the required depth and also taken to the tailings pile. Thebuilding would be decontaminated; any porous, contaminated material, such as concrete blockiwould be removed. For Option 1, equipment could be removed from the buildings as desired andthe buildings would then be available for general use. For Option 2. the buildings would beremoved and uncontaminated foundations broken up and used as fill or riprap on steep or erodibleslopes.
Areas outside the buildings and not covered with equipment would be treated identically in thetwo options. Heavily contaminated areas, such as ore pads and sludge or collection ponds, wouldbe excavated, generally to a depth of several feet. and the dirt removed to the tailings pile.The extensive onsite and offsite areas ligt.tly contaminated by dusts blown from the ore pad,mill, and tailings are expected to be excavated to a relatively shallow depth (4 to 6 inches),with contaminated dirt being taken to the tailings pond. Finally, all excavated areas would bebarkfilled, graded, topsoil add( J where necessary, and revegetated.
2. EQUIPMENT AND BUILDING DECONTAMINATION*
Generally, all metal-surfaced equipment can be decontaminated and reused. The types of equipmentsalvageable include crushers, grinders, rod mills, valves, pumps, steel tanks, and various otherspecial items. For decontamination, simple procedures, such as scrubbing with detergents andsandblasting, have generally been successful.
Soft-surfaced or porous materials (e.g., wood, fiberglass, plastic, concrete, concrete block, orrubber-surfaced equipment) generally cannot be decontaminated economically and must be removedand buried in the tailings area. Electric motors exposed to radioactive solutions usuallycannot be decontaminated. In some cases, high-quality lumber used for tank shells can be reusedin new uranium mills, but not otherwise.
Mill buildings of bolted, prefabricated steel construction, as assumed for the model mill, haverarely presented any decontamination problems. In some mills, however, large amounts of yellow-cake dust or of uranium daughter nuclides have accumulated in inaccessible areas, such as over:sadsupport members or rafters; such hazards must be guarded against during dismantling. In areas'where acid solutions are handled, uranium and its decay products have penetrated concretefoundations and the earth belnw to a depth of several feet. The contaminated foundations anddirt must be remaved regardless of whether the entire building is to be reused or removed. Inthe case of the model mill, it is assumed that extensive areas of concrete and dirt contaminationwould be present.
Although the decontamination of equipment and buildings is not generally hazarduus or difficult,protective equipment is required for workirg personnel. In addition, since unexpected hazardscan occur. competent health physics Personnel should be in close supervision* during cleaningand dismantling, and all applicable exposure limits must be met.
MHjch of the information in this section is based on comwunicatiors with representatives of.ndustly iind state and federal government agencies
. .. a.. .
The costs ascribed to the equipment and building decontamination pnase of de.ommissioning includethe dismantlement and burial of nonsalvageable equipment, decontamination of !.lvageable equip-ment and builditigs, and the removal of contaminated foundations and underlying dirt. No publishedbreakdown of individual costs are available, and the only estimates of total costs obtained werein terms of man-years expended. Reports or estimates for three different mills were 0.005,
.0.006, and 0.014 man-years per ton of mill capacity.' The value 0.006 is taken as a bestestimate, giving 12 man-years for the model mill. The necessary equipment and chemicals wouldbe available in the mill. On the basis of the areas of the Teaching and counter-currentdecontamination tanks, it is estimattl that 35,000 square feet of, concrete and underlying dirtwould be removed to a depth of six feet. Costs of removal ($1.20 per cubic yard) are includedin the total for deconta•ianation cited above.
3. REMOVAL OF BUILDING AND SALVAGEABLE EQUIPMENT
In several mills where production has ceased, the salvageable equipment has been sold or trans-ferred to new mills owned by the same company. Much of this equipment is of use in generalore-processing operations and consequently, markets should be available. For the model mill, itis assumed that the salvageable equipment would be removed without cost to the mill operator. Arough estimate is that the salvageatle equipment "ight be worth 10% to 20% rf the originalvalue; however, no credit is taken for such value, and it is assumed that thisyvalue would.offset the removal costs. The initial cost of the salvageable equipment is about one-third ofthe total cost for the model mill. 2
Estimated costs for building removcl (as in Alternative 2) ranged from $2.40 per square foot for*a remotely located, difficultly dissembled building, to a net value of $1.20 per square foot foran easily dissembled building with a nearby market. Industry sources generally have indicJtedthat buildings could be removed at no cost to the company, and this is assumed to be the casefor the model mill. 3 The foundations removed cou;d be used as uncontaminated fill or for theriprapping of steep slopes.
4. AREAL DECONTAMINATION
The decontamination and restoration of any area not covered by buildings or exterior mill equip-ment would be classed as "areal decontamination." Included would be heavily-contaminated area.,such as ore pads and sludge or storage ponds, as well as lightly contaminated areas wns-e settleddust from the ore, tailings pile, or mill was the contaminant. The costs would be those of.removing the layer of contaminated earth to a depth where concentrations of radioactivity areacceptable (Table 9.10), transporting thp contaminated earth to the tailings pond, and then re-storing and revegetating the area. Restoration woulO involve backfilling, regradin%, and addingtopsoil as necessary.
It is assumed that for the model mill, the ore pad would be the only heavily contaminated area.The pad would have an area of 8 ha (20 acres), and an excavation depth of three feet is assumed. 4
At a removal and burial cost of $1.20 per cubic yard, the total cost would be $120,000.
In the past. the area of light contamination, both onsite and offsite, has varied considerablyfrom mill to mill. A conservative estimate of this area for the average mill is about 300 acres,with a removal deoth of six inches.4 The cost of removal and restoration is taken as $1900 peracre for a total cost of $570,000.
5. MISCELLANEOUS
Continued maintenance costs are not estimated in this analysis. If the tailings pile were notsealed, decontamination would eventually be necessary again, since redeposition of radioactivedust from the pile would continue.
Engineering and contingency costs must also be aWed, in addition to the costs cited above fordecom•missioning. Based on a recent study,' engineering would be about 6% of the amounts givenabove, and contingency would be 15%. These costs must be added to the total. The costs, shownin Table K-7.i, are in 1980 dollars, and escalation must be added for future years, if tequired.
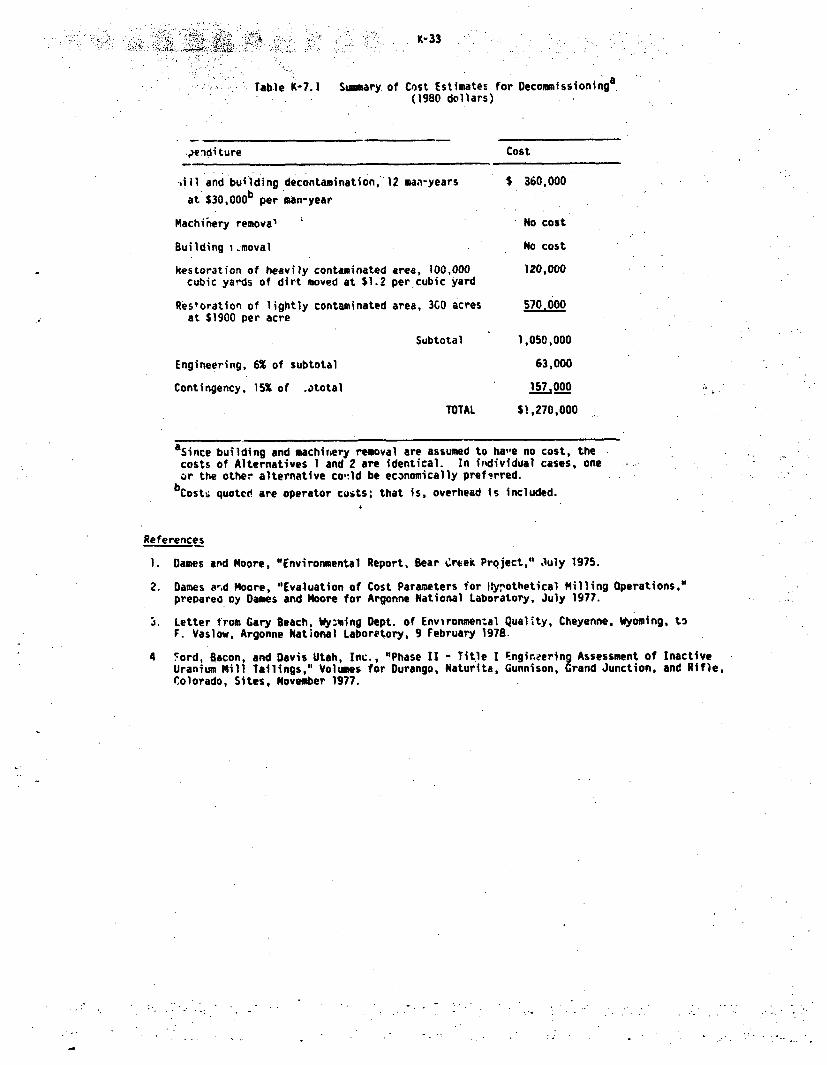
*~h~K-33
Table K-7.1 Sumary of Cost Estimates for Decomuissioning(1980 dollars)
•,)e-di ture
.ill and building decontamination, 12 man-years
at $30, 0 00 b per man-year
Machinery removal
Building i.moval
kestoration of heavily contaminated area, 100,000cubic yards of dirt moved at $1.2 per cubic yard
Restoration of lightly contaminated area, 3C0 acresat $1900 per acre
Subtotal
Cost
$ 360,000
No cost
No cost
120,000
Engineering, 6% of subtotal
Contingency, 15% of _atotal
1,050,000
63,000
157,000
$1,270,000TOTAL
aSince building and machin~ery removal are assumed to haie no cost, the
costs of Alternatives 1 and 2 are identical. In individual cases, oneor the other alternative cold be economically prefirred.
bcost% quoted are operator costs; that is, overhead is included.
References
1. Dames and Moore, "Environmental Report, Bear Creek Project," July 1975.
2. Dames a-.d Moore, "Evaluation of Cost Parameters for IIylothetical Milling Operations,"prepared oy Dames and Moore for Argonne National Laboratory, July 1977.
3. Letter from Gary Beach, Wy:.tng Dept. of Environmen.al Quality, Cheyenne, Wyoming, to
F. Vaslow, Argonne National Laboretory, 9 February 1978.
4 Ford, Bacon, and Davis Utah, Inc., "Phase 1I - Title I Engineering Assessment of InactiveUranium Mill Tailings," Volumes for Durango, Naturita, Gunnison, Grand Junction, and Rifle,Colorado, Sites, November 1977.
*- 34
APPENDIX K-8. COST BASES
Cc ts, as reported in this document, have been separated into the two major categories of capitalcosts and operation and maintenance costs. Although various systems can be utilized to delireatecomponents of each of-the categories, the following specific items have.been included, in derivingeach of the cost categories for the assessment.
Capital Cost Elements Considered:
Labor for constructionConstruction contractor's costs of owning and operating equipment for constructionMaterials for construction-Purcnased-equipment for installationConstruction contractor's general overhead and profitTaxes on construction equipment and materials (assessed'to construction contractor)Construction contractor's cost for bid bonds, performance bonds and insurance
Operating Cost Elements Considered:
Labor (including fringe benefits and supervision)ChemicalsFuelPower and nther purcahsed utility servicesTransportation of purchased materials
-Maintenance end replacement parts and materialsMaintenance and replacement labor
Cost estimates of this document do not include the elements listed below, principally becausethese elements can be quite variable. However, for general perspective, possible costs for eachelement have been estimated as percentages of the reported costs and are shown in parenthesesfor each element.
Capital Cost Elements Not Corside-ed:
Owner's costs for interest during construction (10 percent of construction costs - depends ontime required for construction Pnd interest rates applicable to funding capital)
Owners's costs for engineering (10 percent of construction costs)
Owner's legal and overhead costs for project administration (5 percent of construction costs)
Costs of land areas required for facilities and processes (no estimate - highly variable andsite specific)
Operating Cost Elements Not Considered:
Insurance (1 percent of construction costs per year)
Taxes on land aid facilities (2 percent of construction costs per year)
Environmental monitoring of operations and permitting (1 percent of operation and maintenancecosts per year)
These further cost items, if taken into consideration, may therefore add approximately 30% ormore to the costs quoted in th~s docicnt. Furthermore, no contingency.costs, which wouldnormally be about 15X to 20% of the quoted figures, have been Included.
for the purpose of uniformity and ".o facilitate comparisons, the staff has used unit costs forearthworv. operations which reflec# % ftracted costs (Appendix K-4). However, many mill operatorsalso are engaged in mining acti , and thus possess the equipment and expertise to performearthwork tasks. Hence, ccr 4ale savings, perhaps as much as 502 of the quoted figures.could be effected should werator perform his own eprthwork.
Also, it Is important to note that, because it is not possible in this generic study to do thekind of optimization of operations and costs that experience has shown can be and is done in realcases, the estimates of total costs in this document are considered to be conservatively on the
K- 35
high side. ror instance, by planningoperations to avoid expensive unit cost operations (seefor example, Appendix K-6, Section,1.2) or to avoid second handling, eperators have, in fact,achieved lower costs than those assumed in this document.
Costs given in this document are of the engineering type, estimated to be accurate within about±25%. In arriving at the cost estimates used for the assessment, the staff has investigatedcost information from various sources. Cost information developed during numerous mill licensingactions in the past, published cost indexes, special studies on costs developed in support ofthis document,"' 2 ano information supplied through consultation with mill operators, engineeringfirms, and construction contractors, have all been utilized by the staff in developing the costdata. A range of costs was determined from these sources for each of the unit cost items includedin the assessment, and average costs were used by tthe ;taff In making the assessment. Inaddition, the staff considered the possible variation; in costs due to location. Costs werederived for each of six uranium mining regiins: Colorado Plateau, Wyoming Basins, CoastalPlain, Colorado and Southern Rockies, Northern Rockies, and the Great Plains. Uniform costitems were then derived for the model mill based on weighted average costs; variation in costsfrom region to region are small.
References.
1. Dames and Moore, "An Evaluation of the Cost Parameters for Hypothetical Uranium MillingOperations and Ore Transporting Systems in the Western United States," report prepared forArgonne National Laboratory, July 1977.
2. Stanley Consultants, "Costs of Alternative Mill Tailings Management Programs," reportprepared for Argonne National Laboratory, (Update of Appendix K-4.) March 1980.
K- 36
APPENDIX K-9. DISPOSAL OF EXISTING TAILINGS PILES
The staff has investigated in the previous sections of this appendix the costs for tailingsdisposal alternatives at new tailings sites. The costs for disposing of existing tailings atoperating sites are discussed in this section.
Since .differinG amounts of tailings are currently being stored under various conditions at millsites, and it would be impractical to address all existing piles, the staff has assumed astandard reference tailings pile in developing costs for permanent disposal. The amount oftailings at an existing site are assumed to be equivalent to that generated by the model millestablished in this document. Although this quantity of tailings is less than that existing atmany mills, the staff has assessed costs for tailings disposal, using unit costs as .inAppendix K-4. Relative cost impacts for other amounts of tailings can, therefore, be estimatedby conside'ing costs for similar unit operations.
For tailings being stored at existing mills, the staff has developed costs for two cases of,permanent disposal alterna~ives: (1) recontouring and stabilizing existing piles in place.where site conditions would permit this, and (2) moving tailings to a new suitable location(assumed to be 10 km away from the existing site) where a pit is excavated for disposal. Case 1is illustrative of the least of what would be required to meet the requirements of regulationsbeing implemented. Where existing site conditions are clearly unacceptable from the point oflong-term stability, relocation will be nccessary, and Case 2 applies.
The original tailings pile is assumed to be bare, with a height of ,' m above grade and occupyingan area of approximi.tely 57 ha; the side slopes are taken to be 2 horizontal to I vertical. Aswith the base case, the embankments are assumed to be constructed with tailinjs, as has beenpracticed at some e.gisting mills. Under Case 1, the tailings pile will be recontoured In place;the tailings will be moved from the sides so that the resulting final slope will be 8 horizontalto 1 vertical. Any exzess tailings is redeposited on top of the pile. The entire tailings pilewill then be covered with a 3 to 5 a-thick soil cover, and the side slopes will be covered withan additional 0.5 P-thick rock cover for stabilization (Figure K-9.1).
The volume of tailings moved in Case 1 will be approximately 4.1 x 10⁵ g 3, and the total exposed
area of the recontoured pile will be roughly 7.2 x 10i mn2 (the total area occupied by therecontoured pile would be roughly 62 ha). The staff has estimated cbsts for installing covermaterial at $1.75/r 3 (App. K-4). Costs for moving tailings has been estimated to be $0.70/m03.Costs for rock cover are estimated to be S12/m3 (App. K-4). Costs are, therefore, $3 x 10⁵ forrecontouring, $3.8 million for a 3 a cover, and $1.9 million for rock cover. The total :osts tomove the tailings and provide a 3 i earthen cover, together with a 0.5 m rock cover over the'side slopes, will therefore be $6 million. If a 5 m-thick earthen cover is provided, totalcosts can be as t'igh as $8 million. If the top of the tailings pile is covered with a rockcover (0.15 i-thick), at $12/i 3, the cost of stabilization would increase by about $8 x 10s.The total cost- for recontouring and stabilization would, therefire, range between $6 million and$9 wllion under Case 1.
The above Cost considerations have been made with the assumption that all cover materials may beobtained from onsite areas. If rock cover materia' is not available onsite, then hauling rockfrom offsite sources would be necessary. To illustrate the cost impact of doing this, the staffhas estimated that the costs for installing rock cover, including hauling from an offsite source,would be done at a cost of about $20/i 3 (App. K-4). Similarly, If earthen material must behauled in from an offsite borrow pit, transportation costs can increase earthen cover installationcosts significantly. To illustrate the cost impact of doing this, the staff has assumed a hauldistance of 3.6 km (approximately 2 miles) in the case where earth must be obtained from anoffsite source. With a transportation unit cost of $O.27/ur3-ko (App. K-4), the transportationcosts for wiving earth to the site would be roughly $0.97,m/. The cost for installing earthencover in this case would therefore be about $2.72/irn.
In assessing the overall cover costs, however, the stafff considers that hauling to the siteboth of rock and earth would be unlikely; it is reasonable to expect that either rock or earthenmaterial, if not both, would be available onsite. Hence. the staff has estimated varying totalcosts for Case 1 based on these considerati 4 ns. If earthen raterial is available onsite, butrock cover material is ha,:led from an offsite source, total cost! for Case I can vary betwe. n$8 millon, for a 3 m-thick earthen cover and rock cover over the slopes of the tailings pileonly, and $13 million, for a S ir-thick earthen cover with rock cover over both the top and theslopes nf the tailings pile. If earthen material is not available onsite but rock cover materialis, tonal costs for Case I can vary between $7 million and $11 million, for si-llar covervariations as above. The entire range of costs, therefore, for Case 1, is from about $6 millionto $13 million.
Where recontouring, covering, and hardening of the tailings impoundment in place assumed forCasf I will not assure stability, then relocation will be nmcessary. and Case 2 applies This
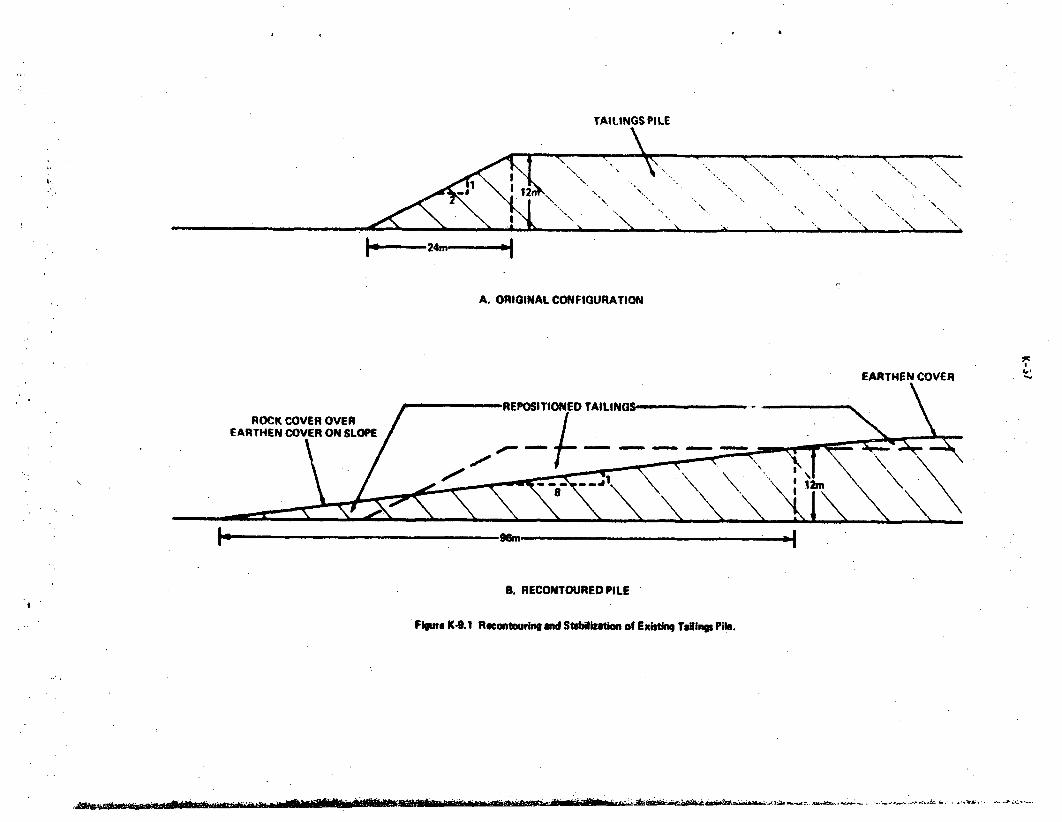
TAILINGS PILE
I.
A. ORIGINAL CONFIGURATION
EARTHEN COVER
I-4I
B. RECONTOUREDPILE
Figure K-9.1 Recontouring and Stabilimtion of Existing Tailings Pile.
A 38
situation might arise where tailings are located in the path of a major drainage, or are situatedwhere earthquake would most likely cause major disruption of the tailings pile. Under Case 2,the tailings are assumed to be totally removed, and roughly 1 m of sol beneath the tailingspile are assumpa to be cG,itamtnated and, therefore, need to be removed together with the tailingsas a part of site decontamination. The removed tailings and soil are assumed to be disposedinto an excavated pit 80 ha in area located 10 km from the original site. The pit is assumed tobe situated in a natural basin formed of a low permeability rock, so that the basin itself,rovides oart of the containment necessary to hold the tailings (similar to Alternative 6 ofApp. h'-4) A low-lying dam will be constructed on the lower side of the basin to provide theretaining structure. The material excavated from the pit is used partly as dam material andpartly as final covering over the tailings.
It is assumed that sufficient material will be excavated to provide a minimum of 4 m cover andmaterial for the low-lying dam. However, the amount of material used for dam construction isinsignificant, compared with the volume used for cover material, so that material and construc-tion costs for the dam would be negligible in this case. Hence, it is assumed that 4 m of earthwill be excavated from the 80 ha basin area, and that 4 m of cover will therefore be provided.The tailings deposited into the 80 ha pit will thus be approximately 8 m thick, and will besituated partly above grade. The dam •:ould be contoured to an outside slope of 8 horizontal to1 vertical, and the slope of the dam would be stabilized with a 0.5 m-thick rock cover.
In assessing the costs for transporting the tailings from the original site to the disposal pit,the staff has assumed that 20% of the tailings to be transported exist as slimes, and 80% existas sands. It would be necessary, therefore, to transport the 29% slimes portion of the tailingsby truck, while the remaining 80% sands portion could be moved less expensively, via pipeline,as a slurry. Since the tailings sands would be relatively dry (with an assumed moisture contentof about 10% by weight), it would be necessary to reslurry the sands before 'they can be pumpedthrough the pipelines. The staff has assumed that the tailings sands would be removed from theexisting pile, deposited into a holding tank, reslurried to approximatel) b01 water by weight,and then pumped to the disposal site. The slimes and contaminated soil would be removed, loadedinto trucks and transported to the pit for disposal. The staff has assumed the standard tailingspile as described above would need to be moved.
Based on the above assumptions, then, roughly 1.3 x 10⁶ 03 of tailings slimes and about 6 x 10s m3
of contaminated earth would be removed. The staff has estimated unit costs oT tailings removalat $0.70/m3 ,1 for a removal cost of $1.3 million. Unit costs fer transportation are as inAppendix K-4, at $0.27/m3 -kin, for a transportation cost of $5 million. The staff considers thedeposition costs of slimes and soil at the pit to be negliaitie. Total costs for moving theslimes and contaminated soil would therefore be about $F.3 million.
The tailings sands would have a volume of about 5.1 x 10⁶ m3 . Removal costs, with unit costsasindicated above, $0.70/0n, for sands would therefore be about $3.6-million. Capital costs for a10 km-long, 18 cm-diameter pipeline is estimated at about $7.0 x 10⁵ (from App. K-5; a scalingfactor of X°'6 has been used). Operating costs 'or pumping the slurry has been estimated at$0.022/MT-km (App. K-5). The volume of tailings sands estimated above by the staff would beequivalent to about 8.2 x 10⁶ MT. Since roughly 40% more water by weight would be added to thesands during the reslurry process, the resulting weight of tailings slurry to be pumped would beabout 11.5 x 10⁶ MT. Operating costs would therefore be about $2.5 million. The staff hasconsidered that costs for equipment and water for reslurrying are insignificant and has thereforenot included these costs. Total costs for moving the tailings sands would therefore be about$6.8 million.
The disposal basin would be prepared by first stripping 0.6 m of topsoil from an area of about80 ha; a 4 m-deep pit would then be excavated from the prepared basin. Excavation costs areestimated (App. K-4) at $1.20/i 3 . Costs for stripping topsoil are therefore about $6 x I13, andcosts for excavation of the pit would be about $S.9 million. No liners would be required. sincethe pit is in low permeability rock. Costs for preparation of the basin would therefore beabout $4.5 million.
Once the tailings have been deposited, the 80 ha area would be covered with about 4 m ofbackfilled overburden. Backfilling unit costs are estimated at $0.70/im3 ; tht cost for coveringwould therefore be about $2.3 million. Reclamation of the top of the covered pile, at $5000/ha(App. K-4), would cost about $4 x 10⁵. Providing a U.5 u-thick rock cover, at $12/W3 (App.K-4), over the recontoured slope would cost about $2 x 10i. Total costs for reclamation ar-dstabilization would therefore be about $2.9 millior.
Combining the above items, the total cost under Cast 2,. for relocating tailings to a new suitablelocation, would be about $20.5 million. This cost has been assessed for excavation of a 4 m-deeppit and providing a 4 i-thick cover. If a 6 i-deep pit were excavated and a 6 m-thick cover wereused, witt, the other factors held constant, the total cost would increase to about $23 5 million.If a 0.15 r-thick rock cover, at $12/0 3 , is applied to the top of the tailings impoundment,
K-' 9
stabilization costs would increase by about $1.1 million. Under Case 2, then, total costs wouldrange between $20 million and $25 million.
Reference
1. R. S. Means Co., Inc., "Building Construction Cost Data 1979," Duxbury, NA, 1978.

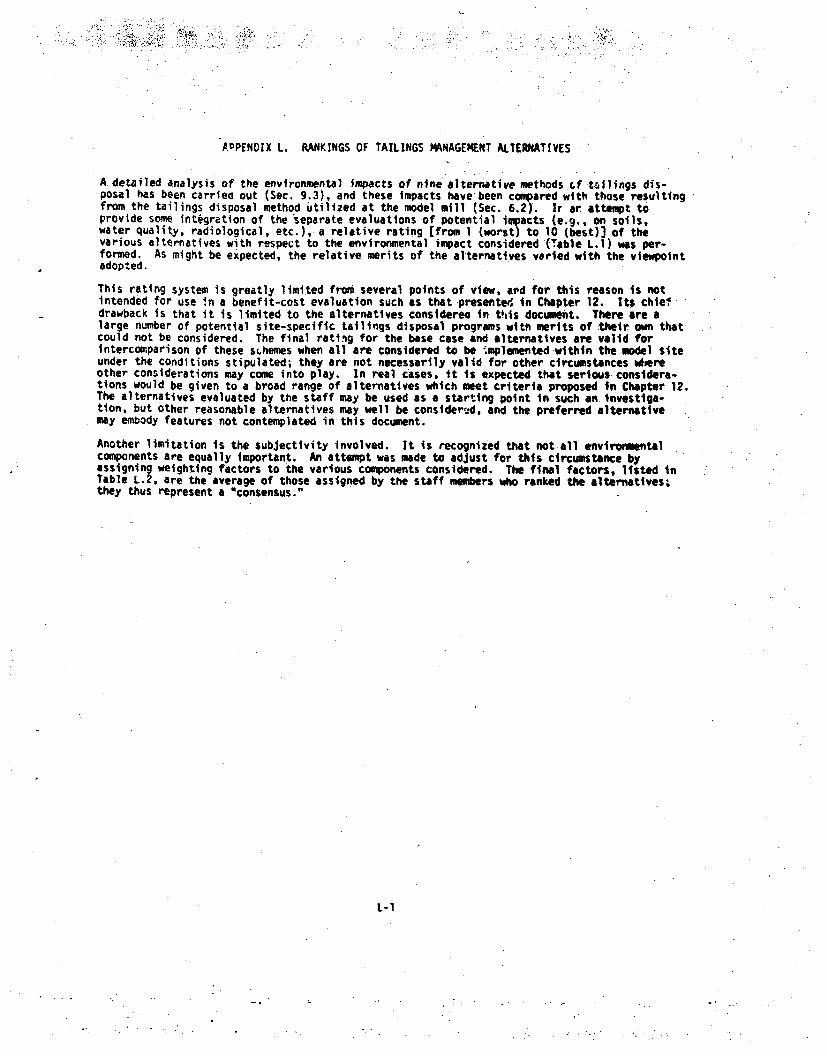
ADPENDIX L. RANKINGS OF TAILINGS MANAGEMENT ALTERNATIVES
A detailed analysis of the environmental impacts of nine alternative methods cf t.•ilings dis-posal has been carrieu out (Sec. 9.3), and these impacts have been compared with those resultingfrom the tailings disposal method utilized at the model mill (Sec. 6.2). Ir ar attempt toprovide some integration of the 'eparate evaluations of potential impacts (e.g., on soils,water quality, radiological, etc.), a relative rating [from 1 (worst) to 10 (best)] of thevarious alternatives with respect to the environmental impact considered (Table L.) was per-formed. As might be expected, the relative merits of the alternatives varied with the viewpointadopted.
This rating system is greatly limited from several points of view, ard for this reason is notintended for use in a benefit-cost evaluation such as that presentee in Chapter 12. Its chiendrawback is that it is limited to the alternatives considerea in tIds document. There are alarge number of potential site-specific tailings disposal programs with merits of their own thatcould not be considered. The final rating for the base case and alternatives are valid forintercomparison of these s0hemes when al1 are considered to be .mplemented within the model siteunder the conditions stipulated; they are not necessarily valid for other circumstances whereother considerations may come into play. In real cases, it is expected that serious considera-tions would be given to a broad range of alternatives which meet criteria proposed in Chapter 12.The alternatives evaluated by the staff may be used as a starting point in such an investiga-tion, but other reasonable alternatives may well be consider,.,d, and the preferred alternativemay embody features not contemplated in this document.
Another limitation is the subjectivity involved. It is recognized that not all environmentalcomponents are equally important. An attempt was made to adjust for this circumstance byassigning weighting factors to the various components considered. The final factors, listed inTable L.2, are the average of those assigned by the staff members who ranked the alternatives.they thus represent a "consensus."
L-1
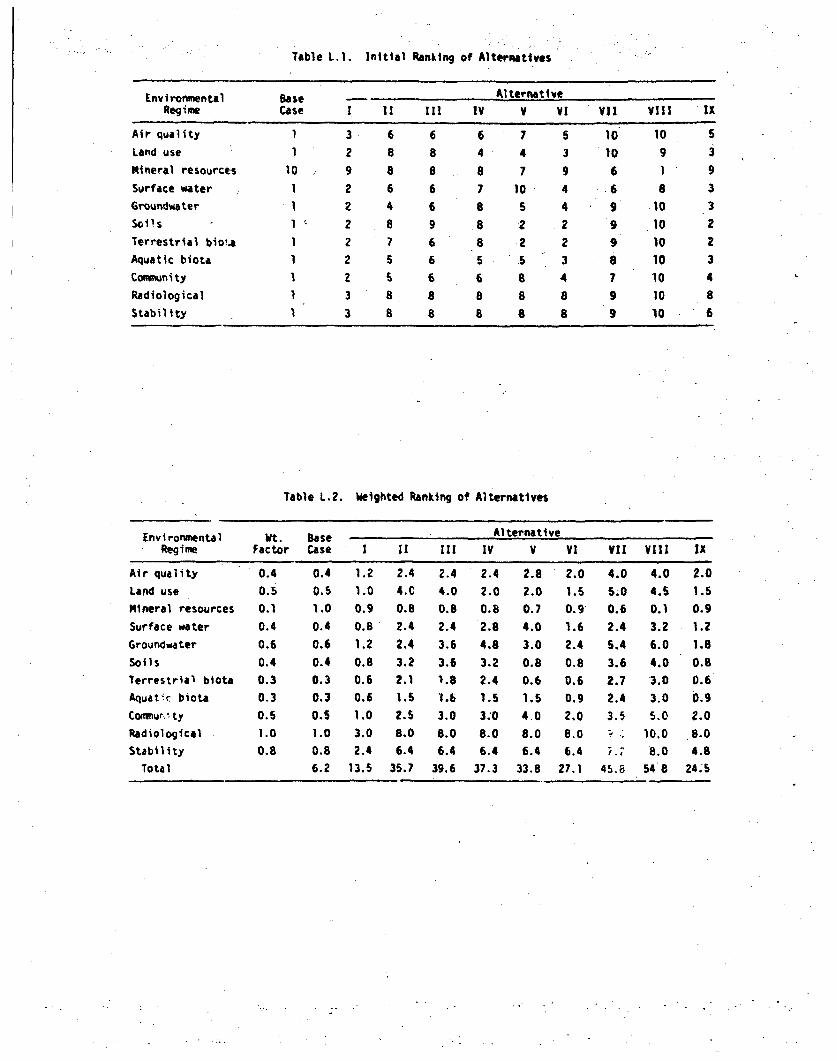
Table L,1. Initial Ranking of Alternatives
Environmental Base Alternative
Regime Case 1 11 111 IV V VI Vii Vill IX
Air quality 1 3 6 6 6 7 5 10 10 5
Land use 1 2 8 8 4 4 3 10 9 3
Mineral resourcts 10 9 8 8 8 7 9 6 1 9
Surface water 1 2 6 6 7 10 4 6 8 3
Groundwater 1 2 4 6 8 5 4 9 10 3
Sol~s 1 2 8 9 8 2 2 9 10 2
Terrestrial biol., 1 2 7 6 8 2 2 9 10 2
Aquatic biota 1 2 5 6 5 5 3 8 10 3
Communrity 1 z 5 6 6 8 4 7 10 4
Radiological 1 3 8 8 8 8 .8 9 10 8
Stability 1 3 8 8 a 8 8 9 10 6
Table L.2. Weighted Ranking of Alternatives
Environmental Wt. Base Alternative
Regime Factor Case I 11 11 IV V VI VII Vill IX
Air quality 0.4 0.4 1.2 2.4 2.4 2.4 2.8 2.0 4.0 4.0 2.0
Land use 0.5 0.5 1.0 4.C 4.0 2.0 2.0 1.5 S.0 4.5 1.5
Mineral resources 0.1 1.0 0.9 0.8 0.8 0.8 0.7 0.9 0.6 0.1 0.9
Surface water 0.4 0.4 0.8 2.4 2.4 2.8 4.0 1.6 2.4 3.2 1.2
Groundwater 0.6 0.6 1.2 2.4 3.6 4.8 3.0 2.4 5.4 6.0 1.8
Soils 0.4 0.4 0.8 3.2 3.6 3.2 0.8 0.8 3.6 4.0 0.8
Terrestrial biota 0.3 0.3 0.6 2.1 1.8 2.4 0.6 0.6 2.7 3.0 0.6
Aquat'c biota 0.3 0.3 0.6 1.5 1.b 1.5 1.5 0.9 2.4 3.0 0.9
Commnur~i ty 0.5 0.5 1.0 2.5 3.0 3:0 4.0 2.0 3.5 5.0 2.0
Radiological 1.0 1.0 3.0 8.0 8.0 8.0 8.0 8.0 . , 10.0 8.0
Stability 0.8 0.8 2.4 6.4 6.4 6.4 6.4 6.4 7 8.0 4.8
Total 6.2 13.5 35.7 39.6 37.3 33.8 27.1 45.8 54 8 24.5
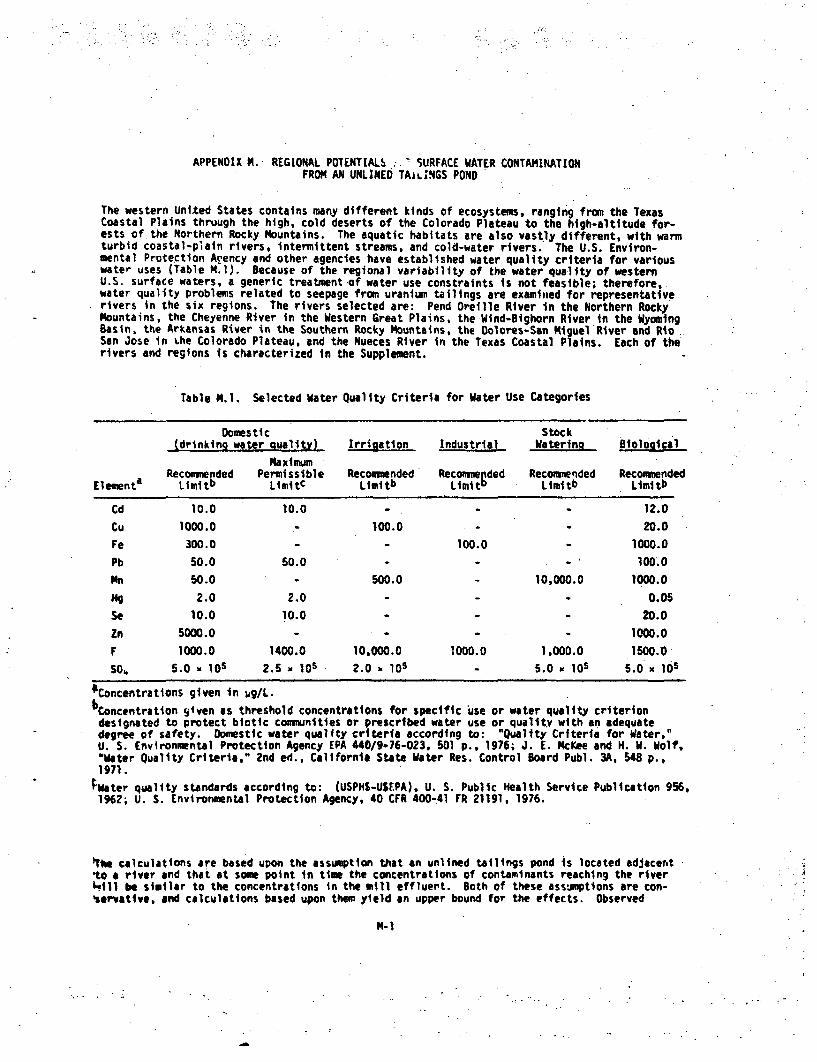
APPENDIX M. REGIONAL POTENTIALS. :. SURFACE WATER CONTAMINATIONFROM AN UNLINED TAILINGS POND
The western United States contains many different kinds of ecosystems, ranging from the TexasCoastal Plains thruugh the high, cold deserts of the Colorado Plateau to the high-altitude for-ests of the Northern Rocky Mountains. The aquatic habitats are also vastly different, with warmturbid coastal-plain rivers, intermittent streams, and cold-water rivers. The U.S. Environ-mental Protection Acency and other agencies have established water quality criteria for variouswater uses (Table M.1). Because of the regional variability of the water quality of westernU.S. surface waters, a generic treatment of water use constraints is not feasible; therefore,water quality problems related to seepage from uranium tailings are examined for representativerivers in the six regions. The rivers selected are: Pend Oreille River in the Northern RockyMountains, the Cheyenne River in the Western Great Plains, the Wind-Bighorn River in the WyomingBasin, the Arkansas River in the Southern Rocky Mountains, the Dolores-San Miguel River and RioSan Jose In Lhe Colorado Plateau, and the Nueces River in the Texas Coastal Plains. Each of therivers and regions is characterized in the Supplement.
Table N.l. Selected Water Quality Criteria for Water Use Categories
Domestic Stock(drinking water quality) Irrioation Industrial Watering Biological
maximumRecommended Permissible Recommended Recommeoded Recommended Recommended
Elementa Limitb Limitc Limitb Limit 0 Limitb Limitb
Cd 10.0 10.0 - - 12.0
Cu 1000.0 - 100.0 - 20.0
Fe 300.0 - - 100.0 - 1000.0
Pb 50.0 50.0 - - 100.0
1n 50.0 - 500.0 10,000.0 1000.0
Hg 2.0 2.0 - - 0.05
Se 10.0 10.0 * - 20.0
Zn 5000.0 - - - 1000.0
F 1000.0 1400.0 10,000.0 1000.0 1,000.0 1500.0so, 5.0 - 10S 2.5 - 10s 2.0 10S - 5.0 x 10⁵ 5.0 X 10S
OConcentrations given in ug/L.bconcentretion given as threshold concentrations for specific 'use or water quality criterion
designated to protect biotic communities or prescribed water use or quality with an adequatedegree of safety. Domestic water quality criteria according to: "Quality Criteria for Water,"U. S. Environmental Protection Agency EPA "0/9-76-023, 501 p.. 1976; J. E. McKee and H. W. Wolf,"Water Quality Criteria," 2nd ed., California State Water Res. Control Board Pub]. 3A, 548 p.,1971.
tWater quality standards according to: (USPHS-USEPA), U. S. Public Health Service Publication 956,1962; U. S. Environmental Protection Agency, 40 CFR 400-41 FR 21191, 1976.
tim calculations are based upon the assumption that an unlined tailings pond is located adjacent*to a river and that at some point in time the concentrations of contaminants reaching the river6u11 be similar to the concentrations in the mill effluent. Both of these assumptions are con-servative, and calculations based upon them yield an upper bound for the effects. Observed
N-!1
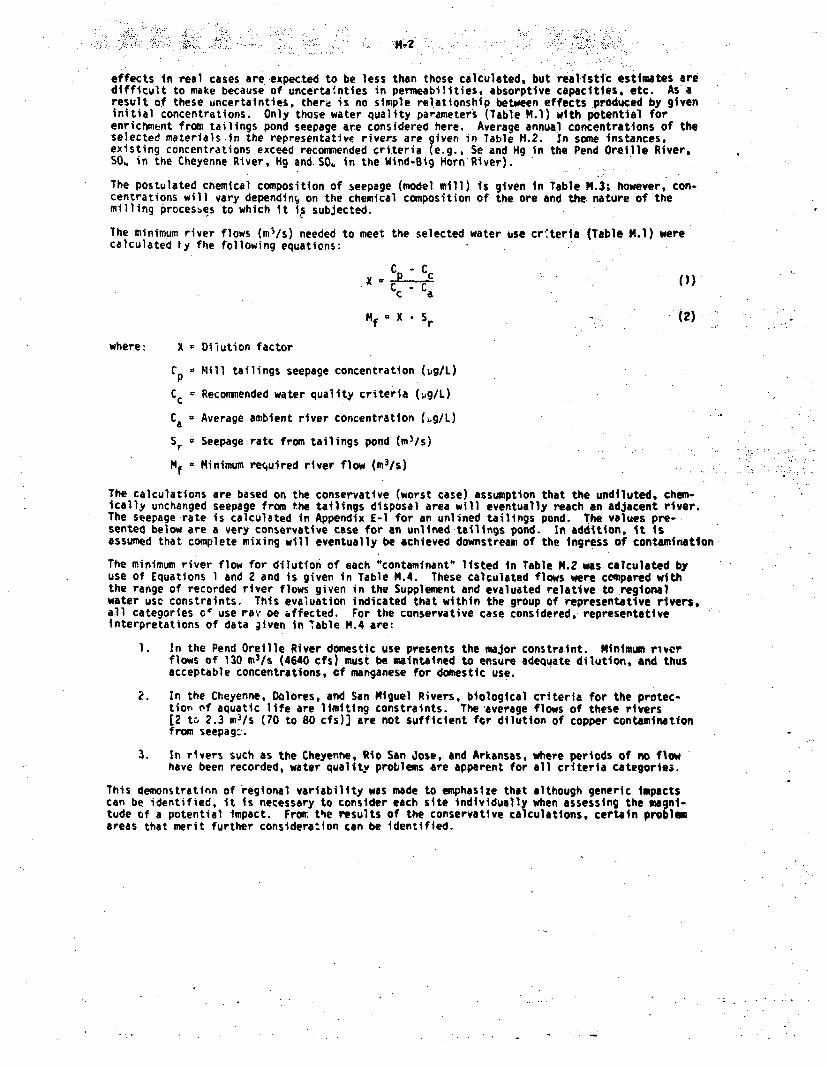
:94-
effects in real cases are expected to be less than those calculated. but realistic estimates aredifficult to make because of uncertainties in penneabillties, absorptive capacities, etc. As aresult of these uncertainties, there is no simple relationship between effects produced by giveninitial concentrations. Only those water quality parameters (Table M.1) with potential forenrichment from tailings pond seepage are considered here. Average annual concentrations of theselected materials in the representative rivers are given in Table M.2. in some instances,existing concentrations exceed recomnmended criteria (e.g., Se and Hg in the PendOreille River,SO, in the Cheyenne River, Hg and SO, in the Wind-Big Horn'River).
The postulated chemical composition of seepage (model mill) is given in Table M.3; however, con-centrations will vary dependin; on the chemical composition of the ore and the nature of themilling processes to which It 1s subjected.
The minimum river flows (mW/s) needed to meet the selected water use criteria (Table M.1) werecalculated ly fhe following equations:
X c p cCc -C a
Mr- x .sr -: (2)
where: X - Dilution factor
Cp a Mill tailings seepage concentration (ug/L)
cc a Recommended water quality criteria (ug/L)
Ca Average ambient river concentration (ig/L)
Sr Seepage ratE from tailings pond (m 3 /s)
M Minimum required river flow Wm/Is)
The calculations are based on the conservative (worst case) assumption that the undiluted, chem-ically unchanged seepage from the tailings disposal area will eventually reach an adjacent river.The seepage rate is calculated in Appendix E-1 for an unlined tailings pond. The values pre-sented below are a very conservative case for an unlined tailings pond. In addition, it isassumed that complete mixing will eventually be achieved downstream of the ingress of contamination
The minimum river flow for dilution of each "contaminant" listed in Table M.2 was calculated byuse of Equations 1 and 2 and is given in Table M.4. These calculated flows were compared withthe range of recorded river flows given in the Supplement and evaluated relative to regionalwater usc constraints. This evaluation indicated that within the group of representative rivers,all categories o' use ra. oe ffected. For the conservative case considered, representativeinterpretations of data given in Table M.4 are:
1. In the Pend Oreille River domestic use presents the major constraint. Minimum riverflows of 130 m3 /s (4640 cfs) must be maintained to ensure adequate dilution, and thusacceptable concentrations, of manganese for domestic use.
2. In the Cheyenne, Dolores, and San Miguel Rivers, biological criteria for the protec-tion. nf aquatic life are limiting constraints. The-average flows of these rivers[2 to 2.3 m3 /s (70 to 80 cfs)] are not sufficient for dilution of copper contaminationfrom seepag:.
3. In rivers such as the Cheyenne, Rio San Jose, and Arkansas, where periods of no flowhave been recorded, water quality problems are apparent for all criteria categories.
This demonstratlnn of regional variability was made to emphasize that although generic impactscan be identified, it is necessary to consider each site individually when assessing the magni-tude of a potential Impact. From. the results of the conservative calculations, certain problemareas that merit further consideration can be identified.
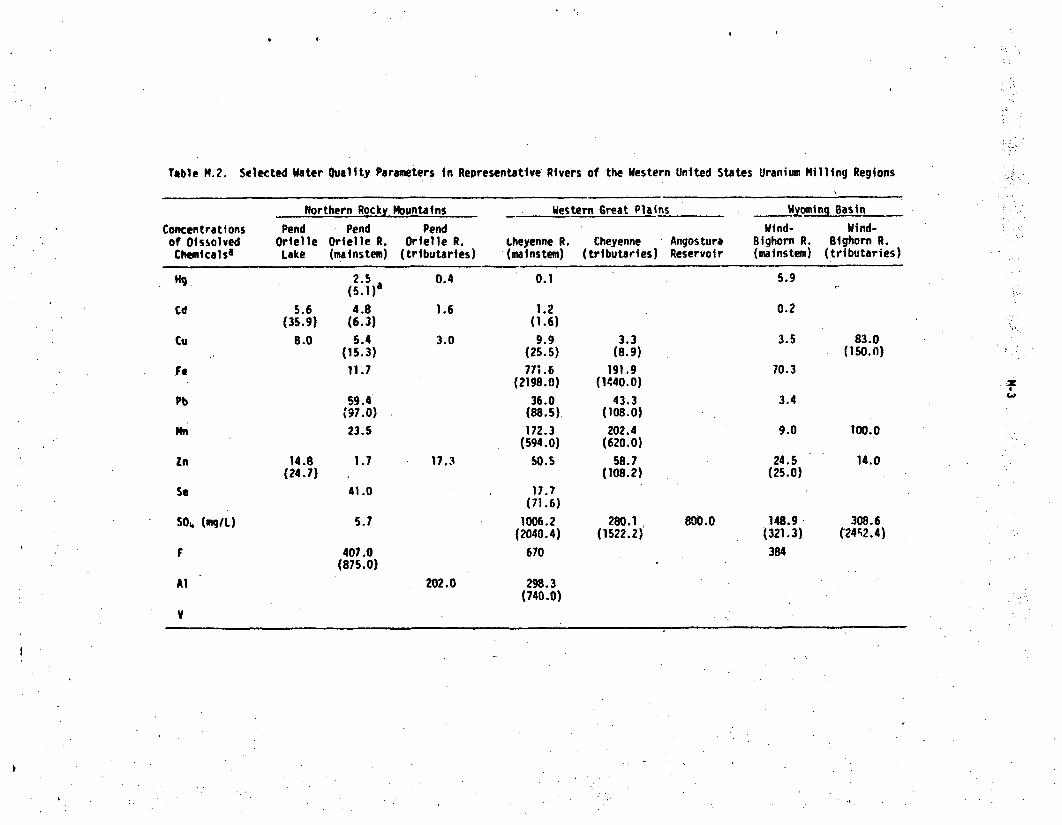
Table M.2. Selected Water Quality Parameters In Representative Rivers of the Western United States Uranium Milling Regions
Northern Rocky Mountains Western Great Plains Wyming BasinConcentrations Pend Pend Pend Wind- Wind-of Dissolved Orielle Orielle R. Ortelle R. Lheyenne R. Cheyenne Angostura Bighorn R. Bighorn R.Chemicalsa Lake (mainstem) (tributaries) (mainstem) (tributaries) Reservoir (mainstem) (tributaries)
lig 2.5 0.4 0.1 5.9(5.1I)a
Cd S.6 4.8 1.6 1.2 0.2(35.9) (6.3) (1.6)
Cu 8.0 5.4 3.0 9.9 3.3 3.5 83.0(15.3) (25.5) (8.9) (150.0)
Fe 11.7 771.6 191.9 70.3(2198.0) (1440.0)
Pb 59.4 36.0 43.3 3.4(97.0) (88.5) (108.0)
Mn 23.5 172.3 202.4 9.0 100.0(594.0) (620.0)
Zn 14.8 1.7 17.3 50.5 58.7. 24.5 14.0(24.7) (108.2) (25.0)
Se 41.0 17.7(71.6)
SO4 (mqL) 5.7 1006.2 280.1 800.0 148.9 308.6(2040.4) (1522.2) (321.3) (24;2.4)
F 407.0 670 384(875.0)
Al 202.0 298.3(740.0)
V
I,,
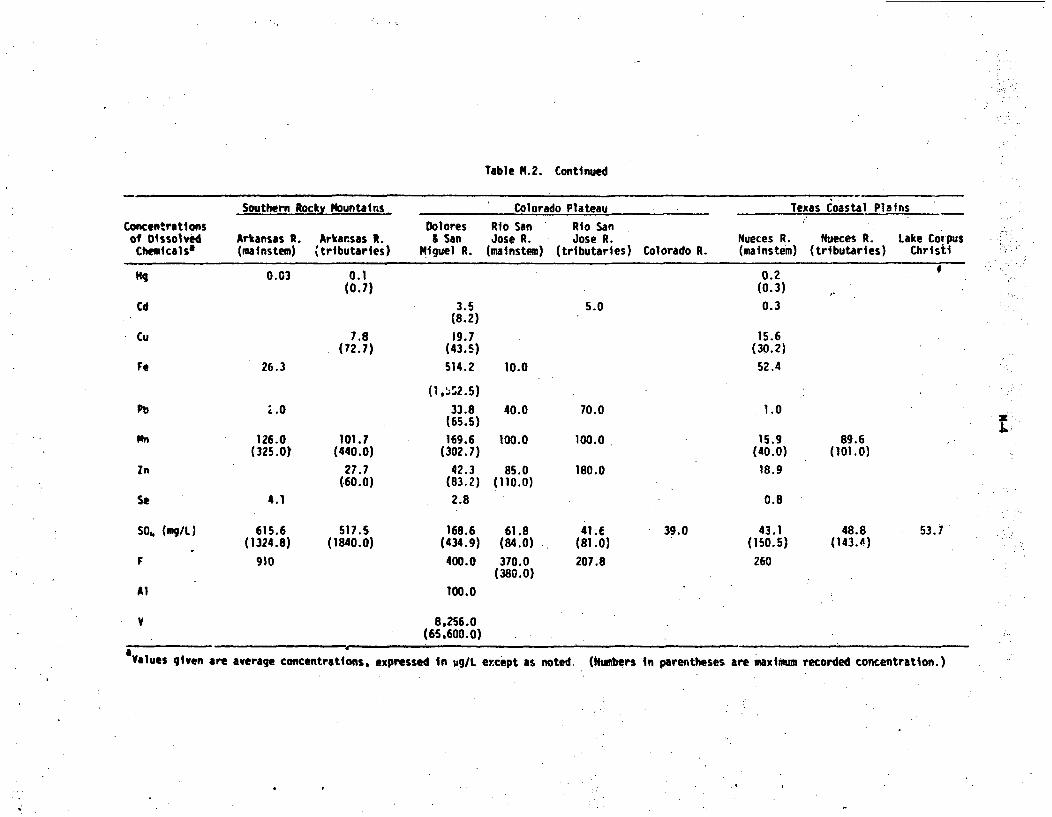
Table M.2. Continued
Southern Rocky Mountains Colorado Plateau Texas Coastal Plains
Concentrations Dolores Rio San Rio Sanof Dissolved Arkansas R. Arkansas R. & San Jose R. Jose R. Nueces R. Nueces R. Lake CorpusChemicalsa (mainstem) (tributaries) Miguel R. (mainstem) (tributaries) Colorado R. (mainstem) (tributaries) Christi
H9 0.03 0.1 0.2(0.7) (0.3)
Cd 3.5 5.0 0.3(8.2)
Cu 7.8 19.7 15.6(72.7) (43.5) (30.2)
Fe 26.3 514.2 10.0 52.4
(1, -2.5)
Pb i.0 33.8 40.0 70.0 1.0(65.5)
Mn 126.0 101.7 169.6 100.0 100.0 15.9 89.6(325.0) (440.0) (302.7) (40.0) (101.0)
Zn 27.7 42.3 85.0 180.0 18.9(60.0) (83.2) (110.0)
Se 4.1 2.8 0.8
S04 (mg/L) 615.6 517.5 168.6 61.8 41.f 39.0 43.1 48.8 53.Y(1324.8) (1840.0) (434.9) (84.0) (81.0) (150.5) (143.4)
F 910 400.0 370.0 207.8 260(380.0)
Al 100.0
V 8,256.0(65.600.0)
VaaValues given are average concentrations, expressed tn ug/L except as noted. (Num~bers in parentheses are maxinum recorded concentration.)
I
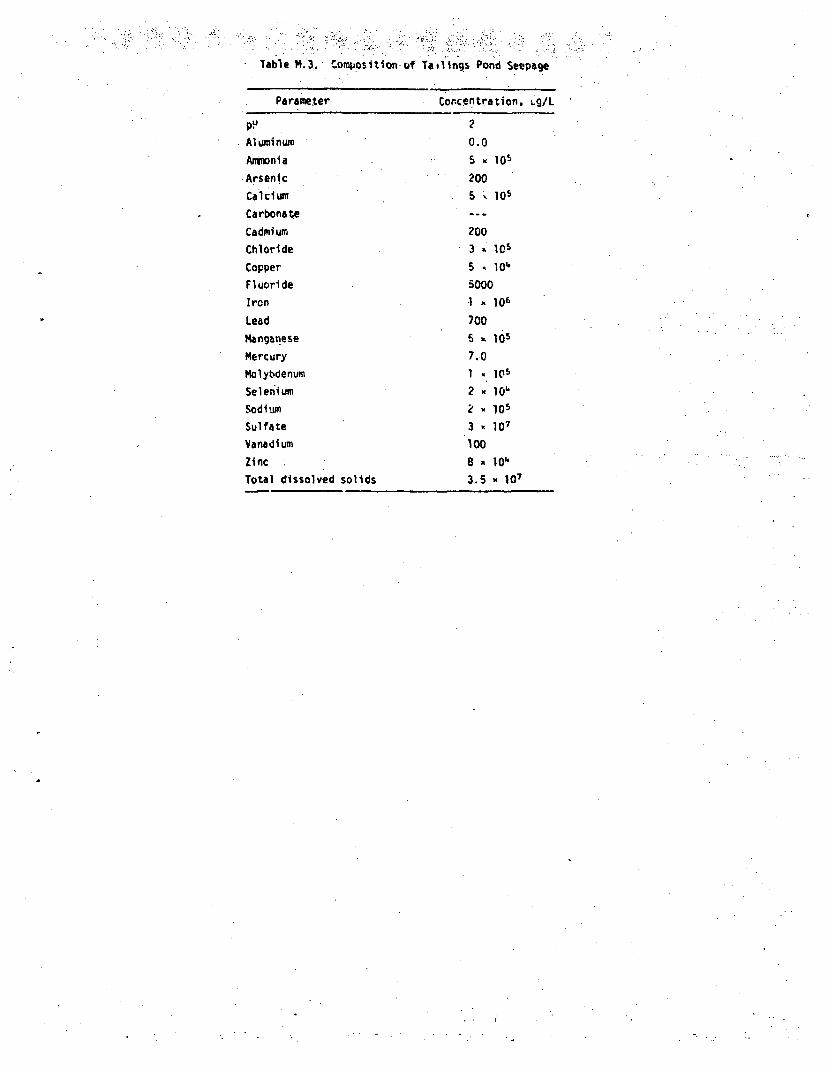
Table .3. Composition of Tailings Pond Seepage
Parame.er Concentration, Lg/L
pv 2
Aluminum 0.0
Ammonia 5 - 105
Arsenic 200
Calcium 5 1 105
Carbonate ---
Cadmium 200
Chloride 3 - 105
Copper 5 * 104
Fluoride 5000
Iron 1 - 106
Lead 700
Manganese 5 - 105
Mercury 7.0
Molybdenum 1 - C10
Selenium 2 10,
Sodium 2 105
Sulfate 3 * 107
Vanadium 100
Zinc 8 a 104
Total dissolved solids 3.5 - 107

Table M.4. F'low (ml/s) Required in Repre-entative Western Rivers to Dl1uta Seepage Contaminatjonfrom a-% Unlined Tailings Pond to Meet Water Quality Criterit for Various Uses
rend Oreille Rivera Che..enne Rivera
A 9 C D E F' A b -- 8 C 0 E F
Cd
Cu
Fe
Pb
"n
Hg
Se
Zn
F
so,
0.18
23.857.051.16
S7(-.U.o)c
(-6.63,0.550.020.41
0.25 0.25
0 .34 ,
24.20 -
(-5 .15 )c (-5. 15 )c
131.41
(-0.95) (-0.95)
(-4.50) (-4.50)
0.11
0.03 0.41
0.41 0.83
3.68 -
79.01
7.31 (-3.48)c
(-0. 0 1)c 0.03 0.01
1.04 - 0.41
0.12 0.15
34.55 0.35
30.59 -
0.75 3.43
4.19 (-28.60)
(-9.74) 0.24
60.61 (-18.10)
0.58 0.11
0.03 0.08
(-0.41) (-0.41)
0.15
1.5 -0. -- (-10.37) -.
1.43
0.24(-18.10)
0.03
(-0.28)
0.11
(-0.01)(-0.26)
- (-3.49)
0.01 0. LL
(-0.41)
Vind-Bighorn Rivera Arkansas Rivera
A B C 0 E F A S C 0 E F
Cd 0.11 0.14 0.14 - - - .; - . - -
Cu 21.10 0.34 - 3.60 . .... .
Fe 7.48 30.30 - - 234.49 7.14 25.46 - 94.59
Pb 0.50 1.04 1.04 - - 0.49 1 .OT 1.01
An 3.51 84.96 - 7.08 - (-3.48) 3.90 (-45.88) - 9.32 - (-3.48)
H9 (-0.08) (-0.12) (-0.12) - - - 24.36 0.24 0.24 - - -
Se - - 8.75 23.5§ 23.59 - -
Zn 0.56 0.11 - - -- -
F0.02 0.05 0.02 (-0.01) 0.05 0.05 0.04 0.31 0.01 (-0.01) 0.31 0.31SO#. (-0.21) (-0.21) (-0.17) (-0.17) - (-0.21) •-1.77) (-1.77) (-0.57) (-0.50) - (-1.77)
z*
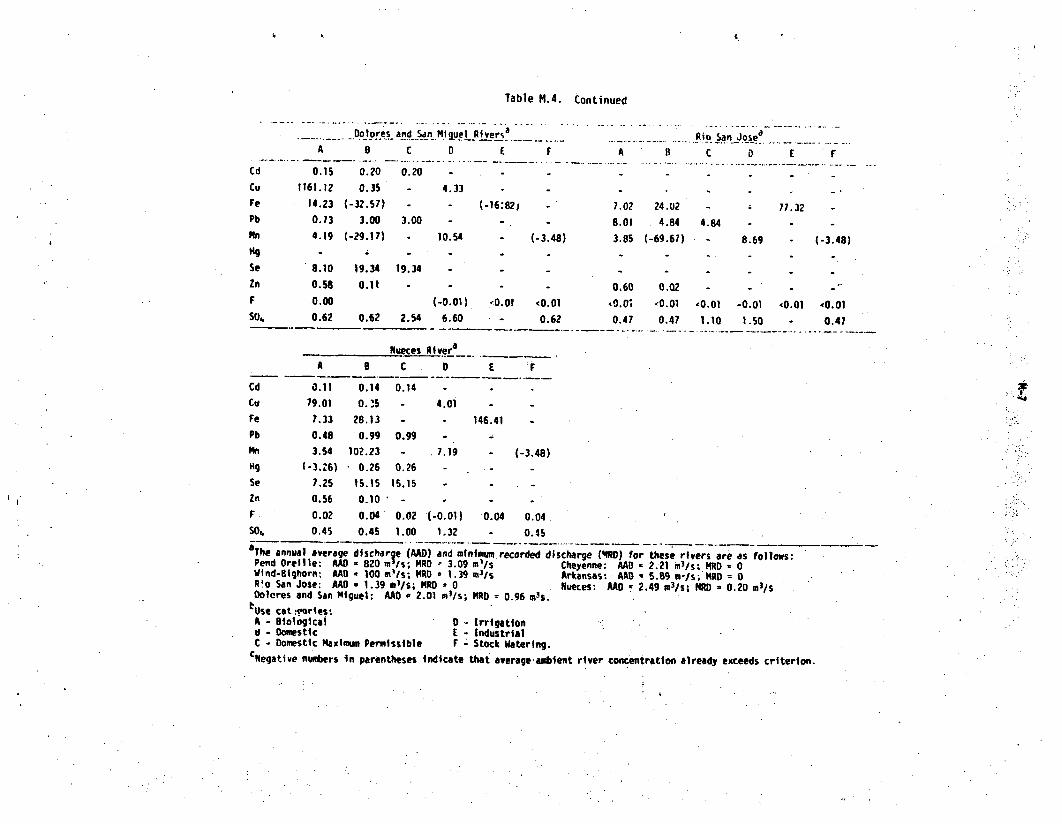
4.
Table 1.4. Continued
Cc
CuFe
PbMn
Dolores and San 14gueLRiversa' . . ...... . . .A C 0 E F A S
0.15 0.20 0.20
1161.12 0.35 - 4.33 -
14.23 (-3Z.57) - - (-16:82) - 7.02 24.02
0.73 3.00 3.00 - - 8.01 4.84
4.19 (-29.17) - 10.54 - (-3.48) 3.85 (-69.67
Rio San Josea
C 0 E F
4.84
77.32
1 8.69 (-3.48)
Se 8.10 19.34 19.34 - .
Zn 0.58 0.11 - - 0.60 0.02 .. "
F 0.00 (-0.01) .<o.0 <0.01 40,0 <0.01 '0.01 -0.01 (0.01 '0.01
s0o 0.62 0.62 2.54 5.60 . - 0.62 0.47 0.47 1.10 1.50 0.47
Nueces Rivera
A B C 0 E :F
Cd 0.11 0.14 0.14
Cu 79.01 0.5 - 4.0i
Fe 7.33 28.13 - -
Pb 0.48 0.99 0.99
Mn 3.54 102.23 - 7.19
H9 1-3.26) 0.26 0.26
Se 7.25 15.15 15.15
Zn 0.56 0.10 "
F. 0.02 0.04 0.02 (-0.01)
SO'. 0.45 0.45 1.00 1.32
X.
146.41
- (-3.48)
0.04 0.04
0.45
aThe annual average discharge (AAD) and minimum recorded discharge (4RD) for these rivers are as follows:Pend Oreille: AAD - 820 m3/s; MRO r 3.09 m'/s Cheyenne: AAD - 2.21 m3/s; MRD - 0Wind-81ghorn; AAD - 100 ml/si M D 1.39 m3lis Arkansas: -AAD 5.89 mIs; 14RD = 0R'o San Jose: AAD - 1.39 ml/s; RUD x 0 Nueces: AAD 2.49 m3Is; MRD 0.20 m3/sDolores and San Miguel: AAD a 2.01 ml/s; MRU-D 0.96 m3s.
bUse cat .. rtes:A - Biological 0 - Irrigationd - Domestic E - IndustrialC - Domestic Maximum Permissible F - Stock Watering.
CNegative numbers in parentheses Indicate that average-ambient river concentration already exceeds criterion.
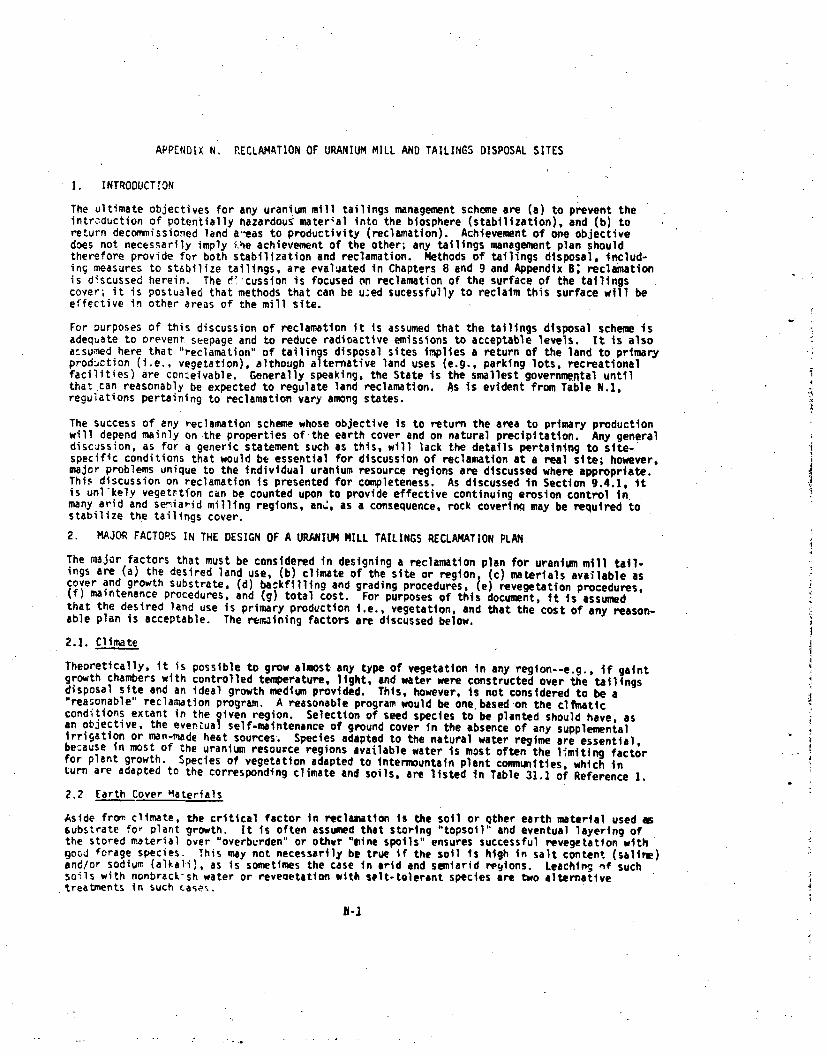
APPENDIX N. RECLAMATION OF URANIUM MILL AND TAILINGS DISPOSAL SITES
1. INTRODUCTION
The ultimate objectives for any uranium mill tailings management scheme are (a) to prevent theintroduction of potentially hazardoui mater'al into the biosphere (stabilization), and (b) toreturn decommissioned land a-eas to productivity (reclamation). Achievement of one objectivedoes not necessarily imply i0he achievement of the other; any tailings management plan shouldtherefore provide for both stabilization and reclamation. Methods of tailings disposal, includ-ing measures to stabilize tailings, are evaluated rin Chapters 8 and 9 and Appendix B; reclainationis discussed herein. The e.-cussion is focused on reclamation of the surface of the tailingscover; it is postualed that methods that can be uzed sucessfully to reclaim this surface will beeffective in other areas of the mill site.
For purposes of this discussion of reclamation it is assumed that the tailings disposal scheme isadequate to prevent seepage and to reduce radioactive emissions to acceptable levels. It is alsoatsumed here that "reclamation" of tailings disposal sites implies a return of the land to primaryproduction (i.e., vegetation), although alternative land uses (e.g., parking lots, recreationalfacilities) are conzeivable. Generally speaking, the State is the smallest governmen1tal untilthat can reasonably be expected to regulate land reclamation. As is evident from Table N.1,regulations pertaining to reclamation vary among states.
The success of any reclamation scheme whose objective is to return the area to primary productionwill depend mainly on the properties of-the earth cover and on natural precipitation. Any generaldiscussion, as for a generic statement such as this, will lack the details pertaining to site-specific conditions that would be essential for discussion of reclamation at a real site; however,major problems unique to the Individual uranium resource regions are discussed where appropriate.This discussion on reclamation is presented for completeness. As discussed in Section 9.4.1, itis un!'kely vegetrtton can be counted upon to provide effective continuing erosion control inmany arid and semiarid milling regions, aný, as a consequence, rock coverinq may be required tostabilize the tailings cover.
2. MAJOR FACTORS IN THE DESIGN OF A URANIUM MILL TAILINGS RECLAMATION PLAN
The major factors that must be considered in designing a reclamation plan for uranium mill tail-ings are (a) the desired land use, (b) climate of the site or region, (c) materials available ascover and growth substrate, (d) backfilling and grading procedures, (e) revegetation procedures,(f) maintenance procedures, and (g) total cost. For purposes of this document, it is assumedthat the desired land use is primary production i.e., vegetation, and that the cost of any reason-able plan is acceptable. The rewmining factors are discussed below.
2.1. Climate
Theoretically, It is possible to grow almost any type of vegetation in any region--e.g., if gaintgrowth chambers with controlled temperature, light, and water were constructed over the tailingsdisposal site and an ideal growth medium provided. This, however, Is not considered to be a"reasonable" reclamation program. A reasonable program would be one based on the clfimaticconditions extant in the given region. Selection of seed species to be planted should have, asan objective, the eventual self-maintenance of ground cover in the absence of any supplementalIrrigation or man-made heat sources-. Species adapted to the natural water regime are essential,be:ause in most of the uranium resource regions available water is most often the limiting factorfor plant growth. Species of vegetation adapted to Intermountain plant comunities, which inturn are adapted to the corresponding climate and soils, are listed in Table 31.1 of Reference 1.
2.2 Earth Cover Materials
Aside from. climate, the critical factor In reclamation is the soil or Qther earth material used as6ubstrate fo, plant growth. It Is often assumed that storing "topsoil" and eventual layering ofthe stored material over "overburden" or other "'ine spoils" ensures successful revegetation withgood forage species. This may not necessarily be true if the soil is high In salt content (sallne)and/or sodium (alkali), as is sometimes the case in arid and semiarid regions. Leachit, 'If suchSoils with nonbrack-sh water or reveaetation with selt-tolerant species are two alternativetreatments in such cases.
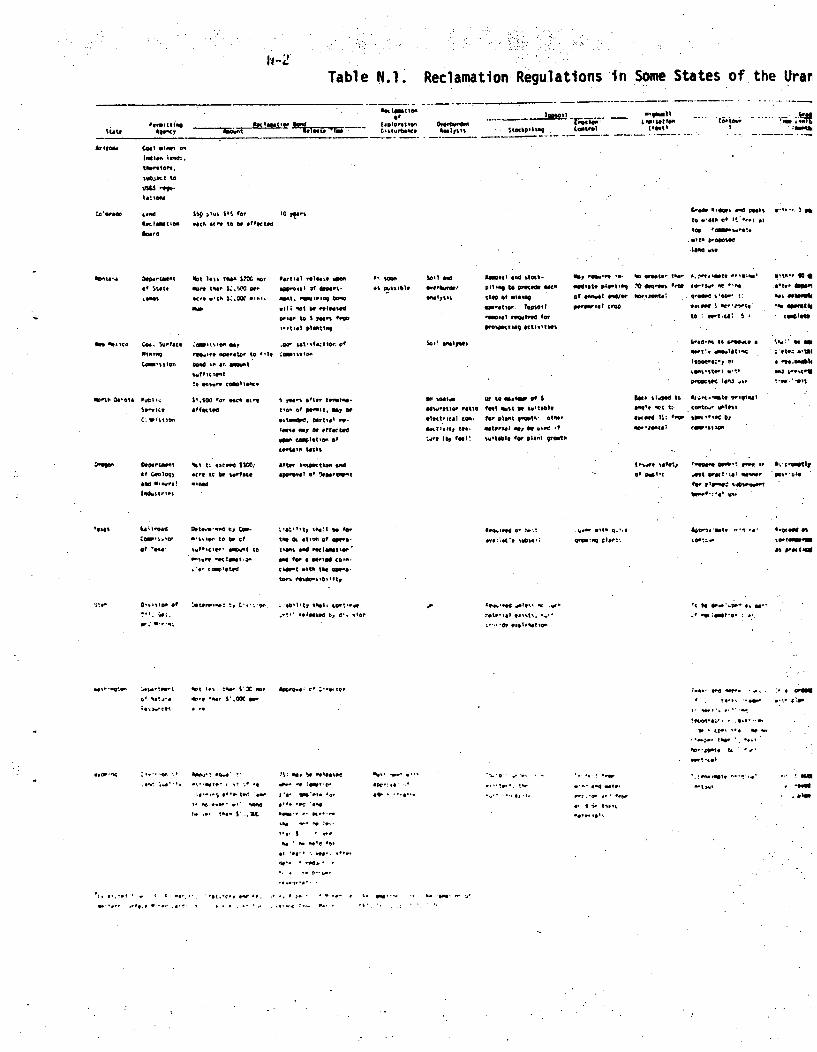
Table 4.1. Reclamation Regulations in Some States of the Urar
A,(lama Coal *efoe,
.1000 .4.Ijtf to .,
t • o1 -
loo..* ,.d
00100*0000
5darf
6%9 oSo.o $Is 0.' 10 M "00
"thdt0 to0 b0e *t0000100to.'0 000 0T0
W#t, i Oooot COO. 100000 01s%0 007 .- C t
0000000 00000* 00.000.to 10,O
Cadroson bo 00.0 a,. 00 mOsofico,00
10o00.0 lo.o.
Opp-W 90 am-%19-0
"we"o.l 9 6000.
.pr ooof oaeroo my t
*.t~. of 00.00 1 "0
0*0 00*101,00 ofOnto.. tests
0. said So0 09 I 000 o0a 10000.ad s"
*0fsbl t-.000, 011% tof om00 w-
000'4000 i"o 10.000 .
00.00.00 000.M9 00
#0000.00"t09010so00
O"Wato. attwiuoo
See, -8.0 00. 00 M,00000
aw*-At* p04Ot,09 1 090 deot ~w0f ~ I*0 000/00 000050000
900800001I00.0
*.ooo..to O0*000SO
00-0000 00 **00
000090 0'000 1:
0.0000 I
to o,0~t~101
I
h00000 ~
ifto. 0*001
00000060800
.9. 00000000* 60*0008
v~. ~
* 0000 0061
0 .00.000004
003 0.0800000
1080. .001
4-41M0.0 00 &no0..0
000000t- U10S.
O00000 leoz "Go b
awlewtol0 0 0olowW..8o0900
Malt 2001 001 0,
000 000000
C00 It 0 000
1.100 I.,dd .oco000
affected
000 oo.41j Ur to ftd*w of 6
44$oolo,W ooIIo feet #80100 00010000
elemt-Ical C00. for alsot 9000.- 000000
00000.0, to0.. M 11 det be7 0.000 09
wno (by 40! wtable0 for 010.1 g"Ad,
%&I t.0 001.00 IMCC 001o l"oo tle. 4"o0000 It o00 000061 01,000000 0. 'Oooug
00090
000000 safet) I*990 go O~ 009 00- % .#.I At' 11
ast %~00~00w0
016.0s W0000. t8..o , 07 1
of *w5 Oof'0W.0 odwW1 to
01010 00410*03
OW'0001 00t.!! 00 000
0me a, 0t000 of o..-
00001.01 for a o000'.400000, ." 1%o 910-4.
0009000 ~, 0 * M'00,
*00o.090 00 0.01 1.0 WI.0 Q.-.6
aPs a.*S€ NNI
.01.0 0'o0000 f
1000.
00 . 000 0..
.ww.~: tp Lo~ 00
OdOr 041 0.000,.
00 *00.0D000000
o0-*.O0 00 90Od
a- - ad V000wo
Oo do old".0 .. 0 0O . . *90.O 1 0'
St0., d
t-40.0~ .0. 0
-. 0.0 . 0000 s
*000'00 .. -. 0*.'! Oo.
.0.~ ~ 00. '0000* 0 ot 9 .0
I.0 *''*~ 100.? on
000010000'00 ~00
0.... *0...1.IL
.0 -. 00 000.0000
£0. W*000 *o.
0*** .00 *0000
00*~. 0*~
000. -. 10,0.
''0.0 .00.0
00. 0 000'f 000
0..
00...
'*.0000
0.'.'000. 10. 0.0.0000000.
00'. .. S..0.
*~ j ~0 01000
.
¶00 0 0 *~. , 009000 O0~ 000 0. 0 :0. 3. to SO .004* 00
-. 0.00.. 0 0.0......00..~ *0'<...
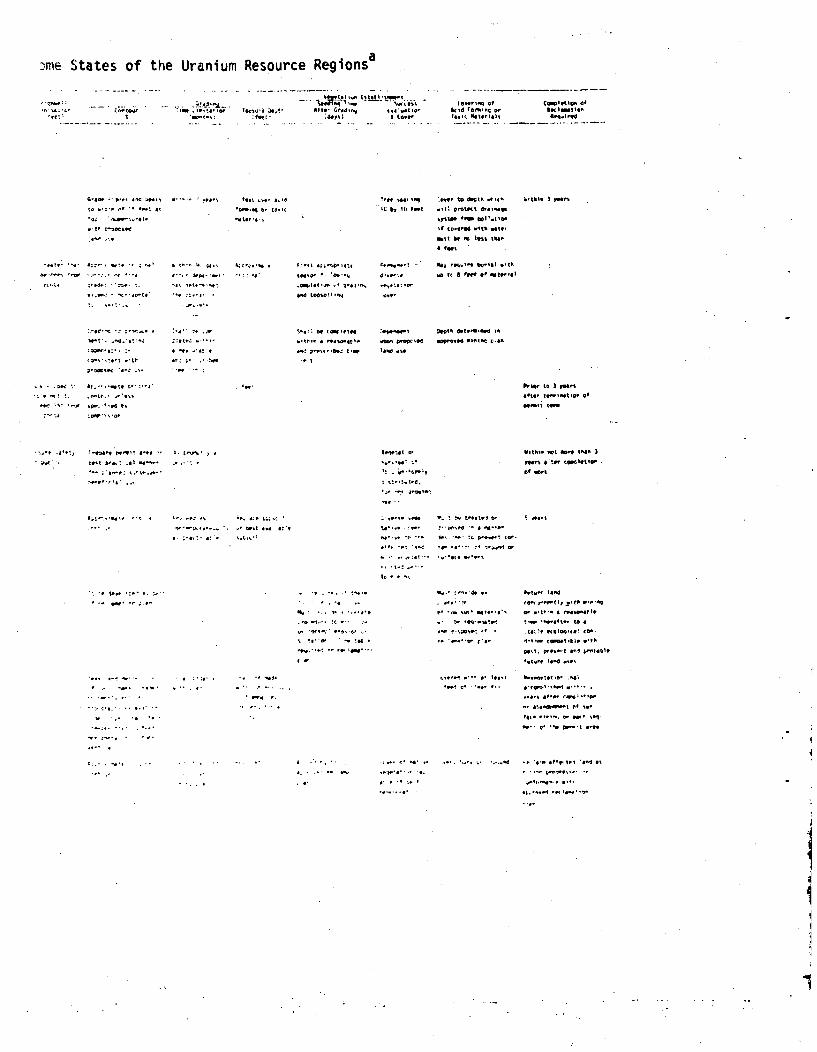
2me States of the Uranium Resource Regionsa
45. 't' Coftorie,.$A
0..t.. -- .....P' TWJ ,w"....
'-t-, :ff, ove,to--"040' of CSlpletioA of
Ald (o•,-95 or tIftlsittlc1orcw, til oim
C.o '9'ý f .. me 4o e.to4'.f 4~
Mlt be f wt toe I.Aft
o.ttks 3 "om
~f4te''4' £::'~ 0040 ' 4 '4~..f- '-Of <,'4X'-e
- i4"to 4' 044.-
4''.' 40*4'
"'9 44.
*094 "440
i's C' .
.m4 to*tor1'-4
S" f Ime ereet'~"A -- W.0t'
iW. P1.r."mec t-a
*oone-'r
isa;.
114 Ct'.- b,"CIl .'t0
me 048, e a ' feet 'a,
50~V' .. oc.Co;
f'4494 i'O '4'
W .Prot~.9 t
0o1e" Opt..'d 90eWpfc" -1" 90-6t.4
- t...~
9~.
*i"¶,'ooo ff"'? roe" 4. P'tfl' 4 4
- 404 9f5
4 '44 -'.00. ~' '.~t
,r.tr ',
* .4 0 ~ '4 ~e. *50 t~;4-;-'
9.;'..: 4, .4-4.4'
Wf'tf'At 4'
%i*. '99 C'
r'bo~9
'.0 ''Cot4f.
'a' '
of' 49 4 000
0t' '.9 :9*'
... *9*4
Pt,
prior to I pmrs
elter tle.r'et'tr om
Vitot. oft 0a ttr I
of eni
-14.
4'. -' --
% ' ' -
"'e40'.
-. 4 +-- to.•eto.I 0+"
ow,. -'.4 44 p'0.f0 499-
.'*e-,f -,'-sll.,'
0.' :'- ,o* e•..,
40 4,44040; -4 •- ,
.. 00
I.
4''t'
bopo toml~e41.1, t, 14
re'ect'to*-4. 'i9 -t 101,4'I or-
*it'e ,oW •4l0'
0 e,1.!o'4e t 0410-
944"'%++• O. 049' si04•w.-r- ".o• l ..
f'' 4' "01 00-- *'ft
*e' 1f9 to 'a-i 44
S . . ,.' 4' -' 9. .'m' . "-''9 C~'.."OC
S. .' '9 9'." '5~e"i'~.'~4'a. 4.
I

N-3
Soils of the arid and semiarid regions that do not have h."- concentrations of salt or alkalimay nevertheless be of low fertility because of low organic matter content (less than 1%), lownitrogen and plant-available phosphorus, and, as in certain areas of Wyoming, Texas, and SouthDakota, relatively high concentrations of selenium. Segregation and 'storage of soils appears toresult in a decreased productivity, most likely because of disruption of soil structure whichaffects aeration and water relationships, changes in the ecology of the soil microflora and fauna,which in turn can be expected to affect soil fertility.: A soil is a nonhpimoqeneous, multilayered,dynamic medium for plant growth and has developed during hundreds of years of interactions amongclimate, parent material, topography, and vegetation. The act of removing the surface layers("topsoil") destroys the integrity of the soil profile, and some would argue that such materialis no longer a soil. "Topsoil" (a term that is not found in the vocabulary of soil science) asdefined by mine operators, regulatory agencies, and other laymen, is variously the top 15 cm(6 inches ), plowdepth, loose material easily removed by scrapers, or surface material capable ofsupporting plant growth. The defi.nition Is not critical for purposes of reclamation, but canlead to ambiguity and erroneous interpretation of laboratory and field test results that havebeen developed for agricultural soils.
Most of the soils in arid and semiarid regions are relatively shallow; it is expected, therefore,that stockpiled 'topsoil" will be insufficient in quantity to provide adequate depth of coverabove tailings impoundments. Since it is undesirable to obtain "topsoil" from borrow areas(which would simply result in creating another area of disturbance), it is expected that mineoverburden and "spoil" will also be used as tailings cover and medium for plant growth. Suchmaterial has essentially no organic matter, poor structure, poor water-holding capacity, poorstability against erosion, poor aeration characteristics, and poor fertility in terms of nitrogenand plant-available phosphorus, in addition, the use of overburden that includes seleniferousshales, or that is high in molybdenum, boron, or vanadium, brings to the root zone material thatcan become toxic to plants or to herbivores. Chemical analysis of any material that is to beused as a medium for plant growth Is imperative, not only to determine the types and quantitiesof fertilizer and amendments needed, but also to determine any concentrations of potentiallytoxic elements. Chemical analysis should include determinations both of total and plant-available constitutents; elements that are not initially available for plant uptake may slowlybecome available with time through chemical and microbiological reactions in the material.
Soils of more humid regions tend to be deep and are relatively high in organic matter andfertility. Water availability will r"' usually be the limiting factor in revegetation In theseareas, but decreased fertility after "topsoil" storage, and disruption of soil structure, isexpected. Runoff and concomitant erosion are critical to these areas. Soils in these regionstend to be acid, and toxicities due to some trace metals may become -important if previouslyburied material is brought to the root zone.
Aside from adequate fertility, good soil structure is necessary for good plant growth becaise ofthe contribution of soil structure to the water regime, aeration, soil microfloral ecology, andresistance to wind and water erosion. Good soil structure can be developed only through theincorporation of organic matter in the presence of appropriate soil microorganisms that decom-pose organic material into large molecules that bind individual soil particles into stable aggre-gates. Man-made molecules (soil conditioners) that attempt to imitate the action of organicmatter in soil have been developed; initially, soil conditioners can enhance soil structure, butthe effects are not lasting and the conditioners are expensive for use in large areas such as ontailings disposal sites.
In surmary, whatever be the term applied to the earth material used as a medium for plant growthover tailings, the material should:
I. Be of sufficient depth to povide anchor for indigenous plant species to reducethe likelihood that roots will penetrate to the tail!ins body;
2. Provide macro- and micronutrients;
3. Contain no toxic concentrations of elemecnts such as Se, V. B, Mo, or As;
4. Have, if possible, a granular, water-stable aggregate structure. This condition willbe the most diffi-ult to meet over the short-term, since most overburden ,.wtcCAll candevelop into such structure only over a long period of weathering with annual incorpora-tion of organic matter. Howeve, it is a goal that should be approached as closely asreasonably possible.
An approximate range of chemical and physical properties of earth material (soil, overL;:jr~er., o,spoil) that can serve as criteria for evaljatina the plant arowth suitability of the material isgiven in Table N.2.
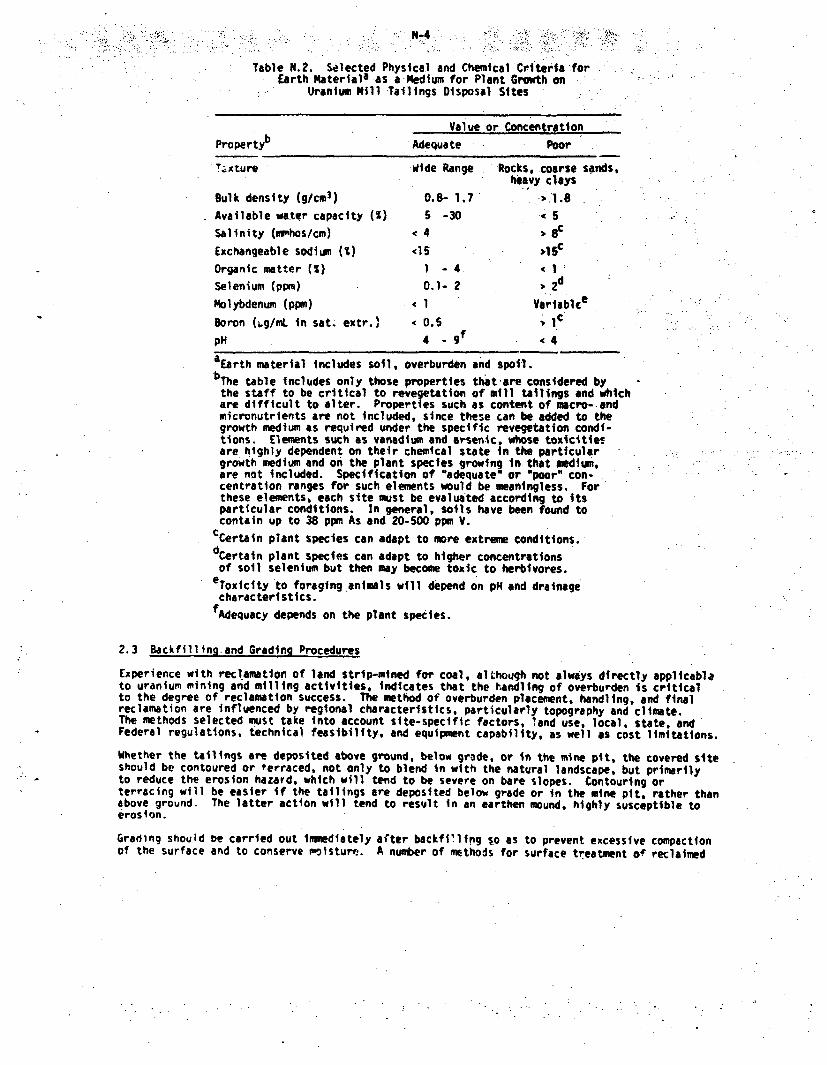
Table N.2. Selected Physical and Chemical Criteria forEarth Materiala as a Medium for Plant Growth on
Uranium Mill Tailings Disposal Sites
Value or Concentration
Propertyb Adequate Poor
Lixture Wide Range Rocks, coarse sands,heavy clays
Bulk density (g/cm3 ) 0.8- 1.7 .>1.8
Available watqr capacity (M) 5 -30 ' 5
Salinity (amhos/cm) ' 4 8
Exchangeable sodium (,) <15 , 15c
Organic matter (I) 1 - 4 ( 1
Selenium (ppm) 0.1- 2 2
Molybdenum (ppm) < 1 Variablce
Boron (i.g/mL in sat. extr.) < 0.5 1pH 4 - 9f 4
aEarth material includes soil, overburden and spoil.
bThe table includes only those properties that-are considered by
the staff to be critical to revegetation of mill tailings and whichare difficult to alter. Properties such as content of macro- andmicronutrients are not included, since these can be added to thegrowth medium as required under the specific revegetation condi-tions. Elements such as vanadium and arsenic, whose toxicitiesare highly dependent on their chemical state in the particular .growth medium and on the plant species growing in that medium,are not included. Specificattion of "adequate" or "poor" con-centration ranges for such elements would be meaningless. Forthese elements, each site must be evaluated according to itsparticular conditions. In general, soils have been found tocontain up to 38 ppm As and 20-500 ppm V.
CCertain plant species can adapt to more extreme conditions.
dcertain plant species can adapt to higher concentrations
of soil selenium but then may become toxic to herbivores.eToxicity to foraging animals will depend on pH and drainage
characteristics.
fAdequacy depends on the plant species.
2.3 Backfilling and Grading Procedures
Experience with reclamation of land strip-mined for coal, alLhough not always directly applicablato uranium mining and milling activities, indicates that the handling of overburden is criticalto the degree of reclamation success. The method of overburden placement, handling, and finalreclamation are influenced by regional characteristics, particularly topography and climate.The methods selected must take into account site-specific factors, land use, local, state, andFederal regulations, technical feasibility, and equipment capability, as well as cost limitations.
Whether the tailings are deposited above ground, below gr.ade, or in the mine pit, the covered siteshould be contoured or terraced, not only to blend in with the natural landscape, but primarilyto reduce the erosion hazard, which will tend to be severe on bare slopes. Contouring orterracing will be easier if the tailings are deposited below grade or in the mine pit, rather thanabove ground. The latter action will tend to result in an earthen mound, highly susceptible toerosion.
Grading should be carried out immediately after backfilling $o as to prevent excessive compactionof the surface and to conserve mnistur,2. A number of methods for surface treatment of reclaimed
areasýprior to'. seeding are .iffw muse including:3
1. Terracing--Terraces are constructed along the contours with a bulldozer and agriculturalharrow. Requires precision in structuring and is often used with a series of smallcheck dams and sediment ponds.
2. Furrow grading--A series of parallel furrows collect water and silt. As the ridges ofthe furrows weather, silt collects in the middle of the furro-. ,nd gradually fills it.This method has been successful on steep, ercsive, and toxic spnls in eastern andmidwestern states.
3. Gouging--Shallow depressions, about 35-40 cm (14-16 inches) wide, 15-20 cm (6-8 inches)deep, and 30-60 cm (1-2 ft) long, are scooped ,ut. This method has-been shown to effectsurface. water retentioq on gradual slopes and flat areas, and is used primarily inarid to semiarid climates.
4. Dozer basins--Elongated depressions, usually about I m (3 ft) deep and 8 m (25 ft)long, are constructed with an angled bulldozer blade. These basins trap and retainlarge amounts of surface runoff and have been effective in regions that experiencehigh intensity storms.
5. Deep chiseling--Consists of series of parallel slots, 15-20 cm (6-8 inches)deep.Curtails erosion from low intensity storms and is highly suited for broadcast seedinqof compacted spoils. -
2.4 Revegetation
In most cases, seeding and revegetation of prepared earth material is best accomplished in twophases--initially with quick-growing grasses and legumes, followed in a year or two withperennia, shrubs and low-qrowing woody species. The principal objective of the initial seedingis to establish a vegetative cover with proliferating root systems to reduce the hazard of erosionand to build up organic matter in the soil. During the first phase of the revegetation program.fertilizer, lime (if necessary), and clean mulches should be applied; at sites in arid regions itprobably is necessary to supplement natural precipitation until root systems are established..It is essential that the area be fenced to prevent grazing by livestock during this period.Experience with the reclamation of c3al rins spoils in the West and Southwest indicates thatperhaps the single most important determinnt of successful reclamation is restriction of grazing.Selection of the seed mixtures will depend on the availability of seed sources, in addition tothe factors of climate and soil discussed abc)ve; site-specific recommendations can be obtainedfrom the district Soil Conservation Servico ,'Ate land quality offices, and experience atreclaimed coal lands in the same region.
In general, seeding should be carried out before the period of maximum rainfall. Seedingequipment is usually an end-wheel press drill or rangeland drill. On slopes where the use ofsuch drills is not feasible, the seed can be broadcast and covered with earth by using a harrowor b, dragging a heavy chain. Fertilizer can be applied at the time of seeding, or soon after,either wet or dry. If wet (hydroseeding), the seed-fertilizer-water mixture should not bestored, since the salt solution can damage seed coats.
It is usual practice when seeding with legumes to inoculate the seeds with nitrogen-fixingbacteria before seeding; such a practice may be particularly important in seeding overburdenand mine spoils, which ordinarily are not expected to contain adequate numbers of these bacteria.
2.5 MaintenanceIt is expected that two to five years of Institutional maintenance will be necessary at reveqetatedtailings disposal sites before decommissioning. Maintenance will, in general, con.ist of:
Reseeding of bare areas in which the initial seeding was not successful;
Installation and repair of windbreaks, snow fences, water Jiversion ditches, and live-stock fences;
* Supplemental irrigation (if necessary), t.placement of mulches, and other erosioncontrol measures.
I Intruduction of perennial shrubs and woody species as the second phase of the reveqetationprocedure, 4f appropriate for the site and the region.
-~ 144
Re fe-e ces
I A. P. Plumomer, "Revegetation of Disturbed Intermountain Area Sites," in: Reclamation andUse of Disturbed Land in the Southwest, J. L. Thames (editor), The Universitty of Arizona
Fress, Tucson, 1977.
2. R. M. Miller, and R. E. Cameron, "Some Effects on Soil Microbiota of Topsoil StorageDuring Surface Mining," in: Fourth Syp Surface Mining and Reclamation, NCA/BCR CoalConference, Louisville, KY, 19-721Octobeir 1976.
3. "Economic Engineering Analysis of U.S. Surface Coal Mines and Effective Land Reclamation,"Skelly and Loy, Engineers-Consultarts, for U.S. Bureau of Mines, Contract Report S-241049,Washington, D.C., 1975.-
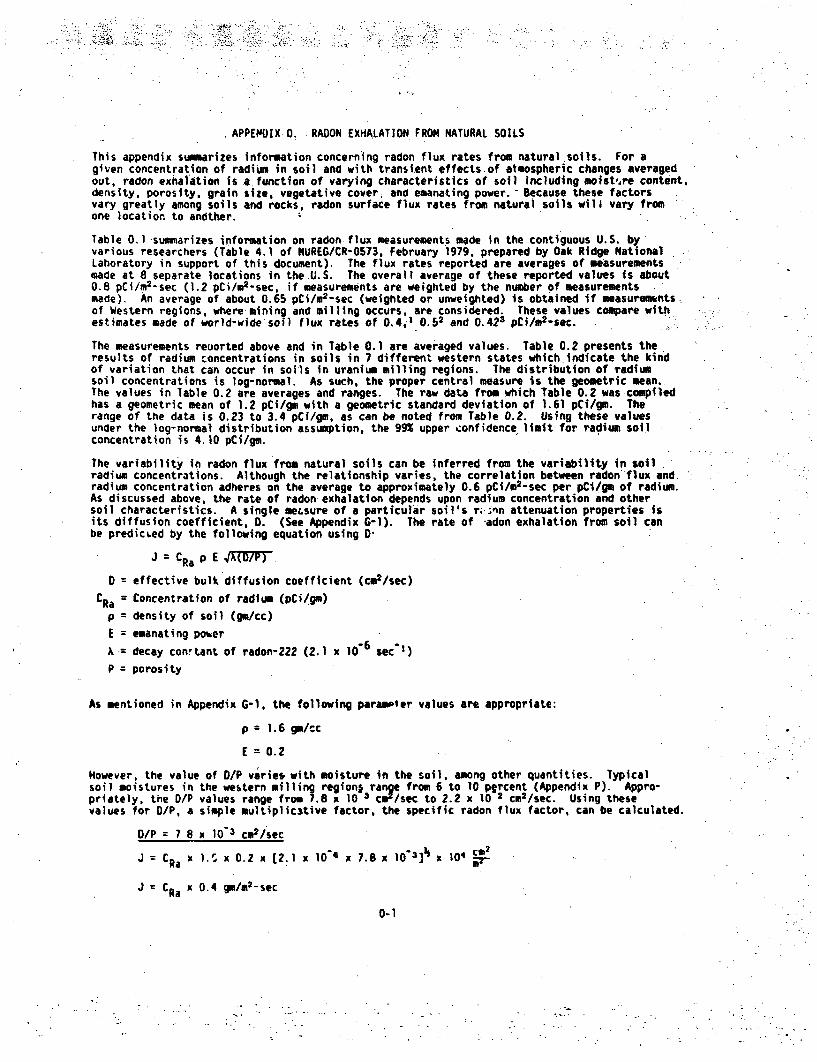
APPEPOIX 0. RADON EXHALATION FROM NATURAL SOILS
This appendix summarizes information concerning radon flux rates from natural soils. For agiven concentration of radium in soil and with transient effects of atmospheric changes averagedout, radon exhalation is a function of varying characteristics of soil including moist,,re content,density, porosity, grain size, vegetative cover, and emanating power. - Because these factorsvary greatly among soils and rocks, radon surface flux rates from natural soils will vary fromone location to andther.
Table 0.1 summarizes information on radon flux measurements made in the contiguous U.S. byvarious researchers (Table 4.1 of NUREG/CR-0573, February 1979, prepared by Oak Ridge NationalLaboratory in support of this document). The flux rates reported are averages of measurementsmade at 8 separate locations in the-U.S. The overall average of these reported values is about0.8 pCi/m 2 -sec (1.2 pCi/m 2 -sec, if measurements are weighted by the number of measurementsmade). An average of about 0.65 pCi/m 2 -sec (weighted or unweighted) is obtained if measurements.of Western regions, where mining and milling occurs, are considered. These values compare withestimates made of world-widelsoil flux rates of 0.4,1 0.52 and 0.423 pCi/m 2 -sec.
The measurements reoorted above and in Table 0.1 are averaged values. Table 0.2 presents theresults of radium concentrations in soils in 7 different western states which indicate the kindof variation that can occur in soils in uranium milling regions. The distribution of radiumsoil concentrations is log-normal. As such, the proper central measure is the geometric mean.The values in Table 0.2 are averages and ranges. The raw data from which Table 0.2 was compiledhas a geometric mean of 1.2 pCi/gm with a geometric standard deviation of 1.61 pCi/gm. Therange of the data is 0.23 to 3.4 pCi/gm, as can be noted from Table 0.2. Using these valuesunder the log-normal distribution assumption, the 99% upper confidence imit for radium soil
concentration is 4.10 pCi/gm.
The variability in radon flux from natural soils can be inferred from the variability in soilradium concentrations. Although the relationship varies, the correlation between radon flux andradium concentration adheres on the average to approximately 0.6 pCi/m2 -sec per pCi/gm of radium.As discussed above, the rate of radon exhalation depends upon radium concentration and othersoil characteristics. A single meLsure of a particular soil's r.-n attenuation properties isits diffusion coefficient, D. (See Appendix G-1). The rate of -adon exhalation from soil canbe predicted by the following equation using D-
J = CRO p E 4XP7•
D = effective bulk diffusion coefficient (cm2 /sec)CRa = Concentration of radium (pCi/gm)
p = density of soil (gm/cc)
E = emanating poaer
A = decay conrtant of radon-222 (2.1 x 10.6 sec"')
P = porosity
As mentioned in Appendix G-l, the following paramter values are appropriate:
p = 1.6 go/cc
E = 0.2
However, the value of D/P varies with moisture in the soil, among other quantities. Typicalsoil moistures in the western milling regionj range from 6 to 10 pIrcent (Appendix P). Appro-priately, the 0/P values range from 7.8 x 10 3 cV /sec to 2.2 x 10 2 cm2 /sec. Using thesevalues for O/P, a simple multiplic3tive factor, the specific radon flux factor, can be calculated.
D/P = 7 8 x 10"3 cm2 /sec
JC = x 1.1 x 0.2 x [2.1 x 10 3]x 7.8x 103] x 0O4 C
J = xra ' 0.4 gM/M 2 -sec
0-1
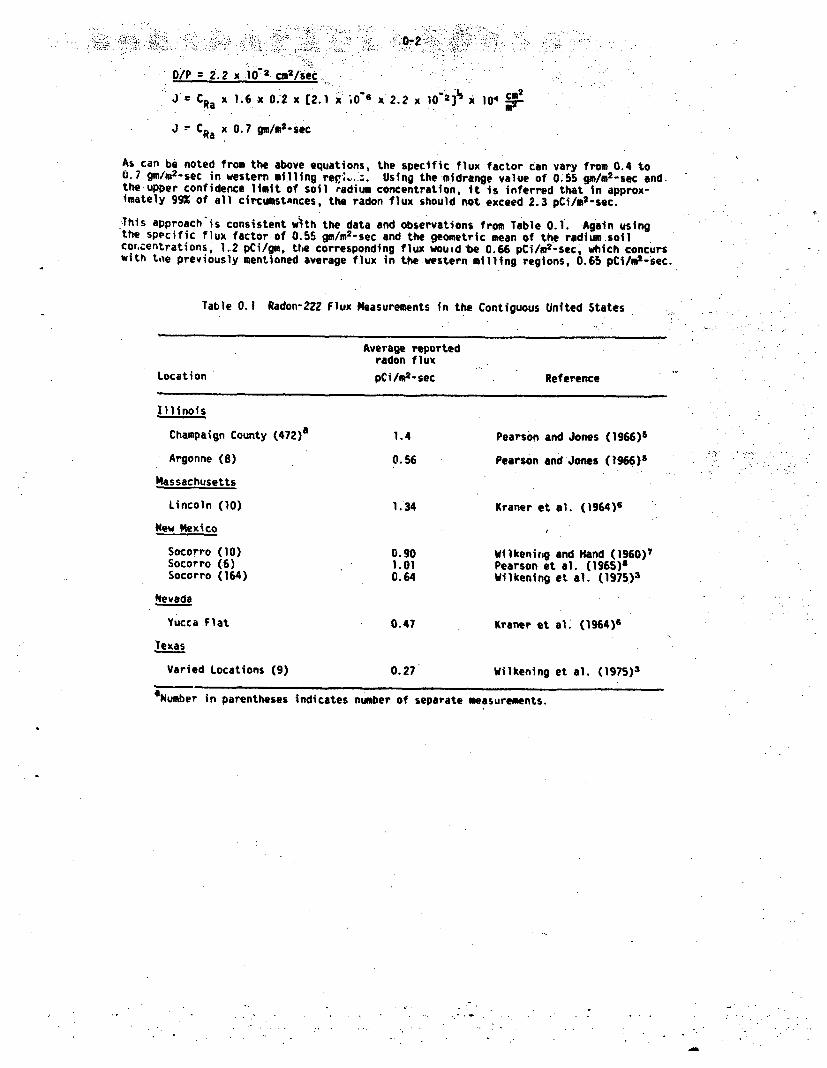
- ~~0-2~- *... -. '- A ... '.Si•! I I :
U/P 2.2 X 10² c.2/sec..
J = CRa x 1.6 x 0.2 x (2.1 x' 406 x 2.2 x 10" 2]x 10' cO
J CRa x 0.7 gu/mt -sec
As can be noted from the above equations, the specific flux factor can vary from 0.4 to0.7 9m/m 2 -sec in western milling rep;...;. Using the midrange value of 0.55 gm/m 2-sec andtheupper confidence limit of soil radium concentration, it is inferred that in approx-imately 992 of all circumstances, the radon flux should not exceed 2.3 pCi/m2-sec.
This approach'is consistent with the data and observations from Table 0.1. Again usingthe spocific flux factor of 0.55 gM/m 2-sec and the geometric mean of the radium soilcor.centrations, 1.2 pCi/gm, the corresponding flux wouid be 0.66 pCi/m2 -sec, which concurswith toe previously mentioned average flux in the western milling regions, 0.65 pCi/m'-sec.
Table 0. 1 Radon-222 Flux Measurements in the Contiguous United States
Average reportedradon flux
Location pCi/m2 -sec Reference
Illinois
Champaign County ( 4 72 )a 1.4 Pearson and Jones (1966)5
Argonne (8) 0.56 Pearson and Jones (1966)5
Massachusetts
Lincoln (10) 1.34 Kraner et al. (1964)6
New Mexico
Socorro (10) 0.90 Wilkeni•rg and Hand (1960)?Socorro (6) 1.01 Pearson et al. (1965)6Socorro (164) 0.64 Wilkening et al. (1975)3
Nevada
Yucca Flat 0.47 Kraner et al. (1964)6
Texas
Varied Locations (9) 0.27 Wilkening et al. (1975)3
aNumber in parentheses Indicates number of separate measurements.
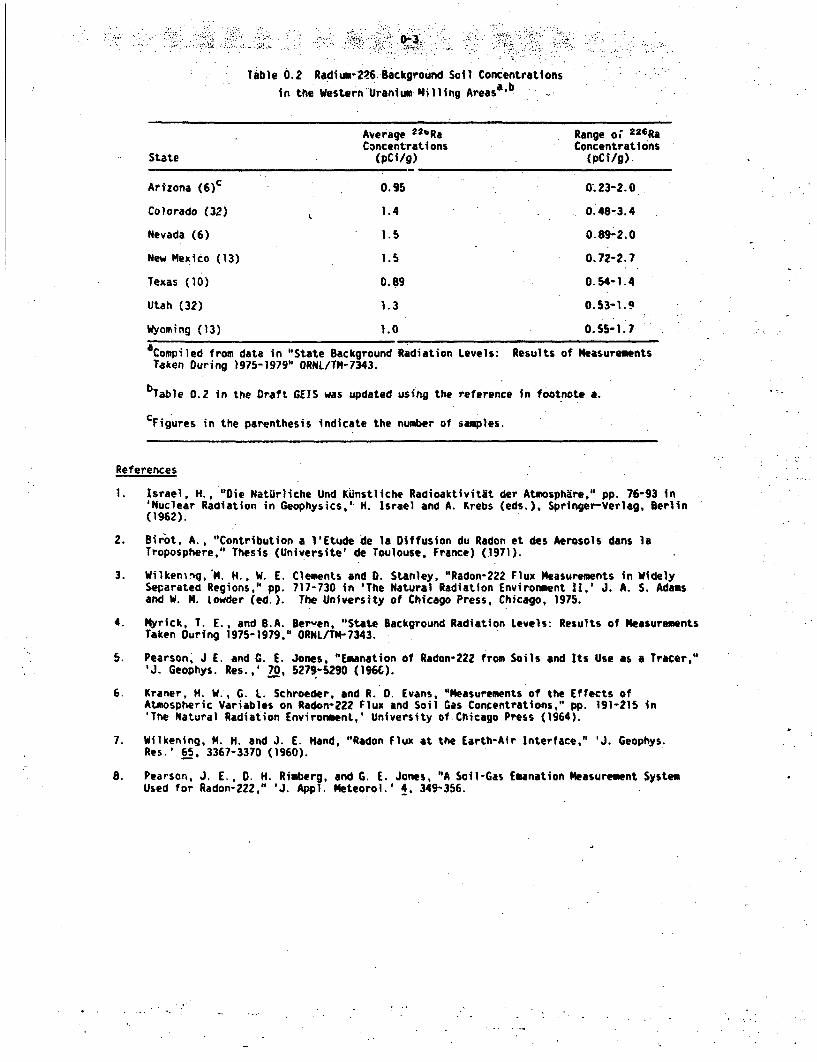
Table 0.2 Radius-276 Background Soil Concentrations
in the Western Uranium Milling Areas ab
Average C2 bRa Range oe 2 26RaConcentrations Concentrations
State (pCi/g) (pCi/g)
Arizona ( 6 )c 0.95 O0723-2.0
Colorado (32) 1.4 0.48-3.4
Nevada (6) 1.5 0.89-2.0
New Mexico (13) 1.5 0.72-2.7
Texas (10) 0.89 0.54-1.4
Utah (32) 1.3 0.53-1.9
Wyoming (13) 1.0 0.55-1.7.
aCompiled from data in "State Background Radiation Levels: Results of Measurements
Taken During 1975-1979" ORNL/TH-7343.
bTable 0.2 in the Draft GEIS was updated using the reference in footnote a.
CFigures in the parenthesis indicate the number of samples.
References
1. Israel, H., "Die NatUrliche Und Kunstliche Radioaktivitit der Atmosphire," pp. 76-93 in'Nuclear Radiation in Geophysics,' H. Israel and A. Krebs (eds.), Springer-Verlag, Berlin(1962).
2. Birot, A., "Contribution a 1'Etude de la Diffusion du Radon et des Aerosols dans laTroposphere," Thesis (Universite' de Toulouse, France) (1971).
3. Wilkening, 'M. H. , W. E. Clements and D. Stanley, "Radon-222 Flux Measurements in WidelySeparatea Regions," pp. 717-730 in 'The Natural Radiation Environment 1I,' J. A. S. Adamsand W. M. lowder (ed.). The University of Chicago Press, Chicago, 1975.
4. Myrick, T. E., and B.A. Berven, "State Background Radiation Levels: Results of MeasurementsTaken During 1975-1979," ORNL/TM-7343.
5. Pearson, J E. and G. E. Jones, "Emanation of Radon-222 from Soils and Its Use as a Tracer,"'J. Geophys. Res.,' 70, 5279-5290 (196C).
6. Kraner, H. W., G. L. Schroeder, and R. D. Evans, "Measurements of the Effects ofAtmospheric Variables on Radon-222 Flux and Soil Gas Concentrations," pp. 191-215 in'The Natural Radiation Environment,' University of Chicago Press (1964).
7. Wilkening, M. H. and J. E. Hand, "Radon flux at the Earth-Air Interface," 'J. Geophys.Res.' 65, 3367-3370 (1960).
8. Pearson, J. E. , . H. Rimberg, and G. E. Jones, "A Soil-Gas Emanation Measurement SystemUsed for Radon-222," 'J. Appl. Meteorol.' 4. 349-356.

APPENDIX P. CALCULATION OF 7HICKNESSES OF REQUIRED COVER MATERIALS
The calculation of the -thicknesses of cover materials required to attenuate radon flux to near-background levels is based upon diffusion theory. The effectiveness of a particular covermaterial in attenuating radon depends upon the material's ability to restrict the diffusior ufradon through it so that the radon gas decays to a solid daughter product before reaching thesurface. b
The next section of this appendix contains a discussion of general factors influencing radondiffusion through covers. The analytical model and example ralculations are given in section 2.It may be neglected with little loss of continuity in using the standard tables presented later.Section 3 contains the final equation used to calculate cover thicknesses presented in severaltables as a function of ore grade, tailings moisture and cover moisture.
1.0 GENERAL CONSIDERATIONS
The material properties used to determine rcdon attenuation are the effective bulk diffusioncoefficients (D) and porosities %P) of the cover material and of the tailings. Values of 0 maybe measured experimentally for a given material at its ambient moisture level and expecteddegree of compaction. Alternatively, D can be estimated solely from the moisture content andporosity of the material, because the large variation (four orders of magnitude) in 0 withmoisture content obscures the much smaller effects on the value of 0 from other soil properties'.Hence, the most important characteristic of cover soils is their ability to retain moisture.
Although soils contain widely varying proportions of the three particle size categories, sand(50-2,000pm), silt (2-50pm), and clay (2Qpm), they are generally referred to in terms of thepredominant particle size fraction,. i.e., clay soils contain greater than 40(,clay-sizedparticles. Because the small clay particles contain various proportions of clay minerals andchemicals, there is a great diversity of clays in nature; however, they all generally havepronounced absorption and adsorption of moisture. Because clays, particularly montmorlllonlte.,can retain significant amounts of moisture for extended periods of time, they are effective inattenuating radon; however, they must be protected from the surface effects of cracking anderosion. As an example of the water retention properties of clay, laboratory measurements ofindividual heavy clay types have measured hygroscopic water concentrations of 15 -to 20%. Thehygroscopic water is held as a very thin film and requires the application of greater th4n 30 to10.000 bars pressure2 .
A survey of available drilling log information from ten sites in the uranium milling regions inWyoming, Colorado, New Mexico and Utah yielded ambient moisture-concentrations of near-;urfaceclay soils ranging 9-12%, although a few isolated, undisturbed values exceeded 121. For ,on-claysoils the survey obtained moisture concentrations ranging from 6 to 10.
With the moisture concentration in the cover soils, 0 may be estimated from the followingempirical correlation of laboratory data':
D/P = 0.106 exp(-0.261 N), (1)
where N is the weight-percentage of soil moisture and D has units of cm2 /s. It is possible,using equation (1), to express radon attenuation also in terms of porosities and moistures ofthe tailings and cover. This correlation is based mainly upon a limited amount of laboratorydata, and it could possibly be modified slightly as additional data become available. The basicparameters chatacterizing the soils are the diffusion coefficient and the porosity. Thetquations given in Lhe next section are expressed in terms of 0 and P, but for convenienceequation (1) is used in select cases to give the moisture dependence explicitly. The convertedequationb may undergo slight modification as more research is conducted by the NRC and otherorganizations.
2.0 TECHNICAL DISCUSSION
Calculation of the thickness of cover materials required to attenuate radon flux to near-background levels is based upon the equation':
J, = Jo exp (-asx,) (2)
P-1
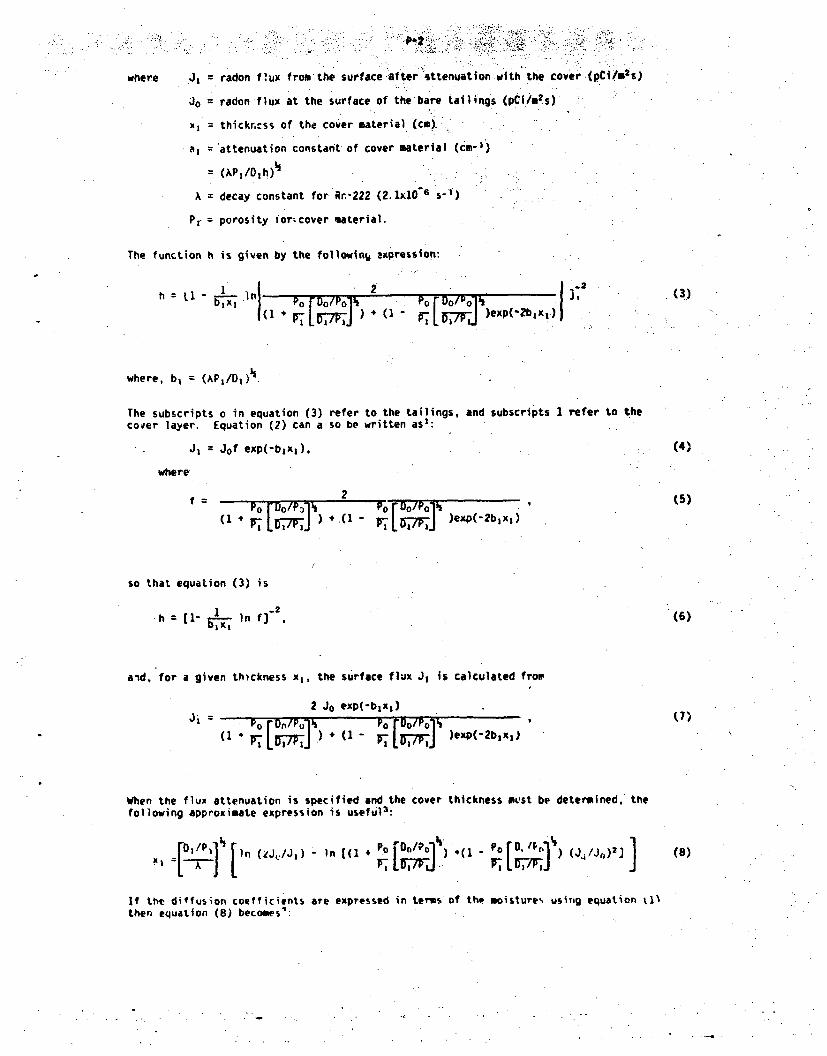
P-2 -
where ,J,
Jo
Pr
radon flux fromthe surface-after "ittenuation withthe cover .(pCi/m2 s)
radon flux at the surface of the bare tai ings (pCl/m2s)
thickncss of the cover material (cm).
attenuation constant:of cover material (cm-')
decay constant for Rr.-222 (2.1x10" 6 s)
porosity for-cover material.
The function h is given by the followin% xpression:
h(Ll o [D7 EJ)4 In P'Lr - )ePpo-zb,x 1 )hr b= P:D)
where, b, (AP,/DO".,
(3)
The subscripts o in equation (3)cover layer. Equation (2) can a
J, = Jof exp(-blx1 ),
refer to the tailings, and subscripts 1 refer to theso be written as':
where
po 2.o ) P DO/%1•(1 * , [-,7J -(1 " r, LI J )exp(-2b,xl)
(4)
(5)
so that equation (3) is
.h ( 1- 61 In "=2
aid, for a given th)ckness x,, the surface flux J, is calculated fror
2 Jo exp(-b l x,)J' - Pr on/P•u h. -r°/%l• SP-" , Lr,,3,J 0 Ft- L G, L7rJ )exp(-2bx,•
When the flux attenuation is specified and the cover thickness must be determined. thefollowing approximate expression is useful 3 :
SJIn (Z J,) - n [(1 , LI.(T, -PO [, '/F11 (Jý' /j,1)21
If the diffusion coefficients are expressed in terms of thp moistures usiuig equation 11•then equation (8) becomes':
(6)
(7)
(8)
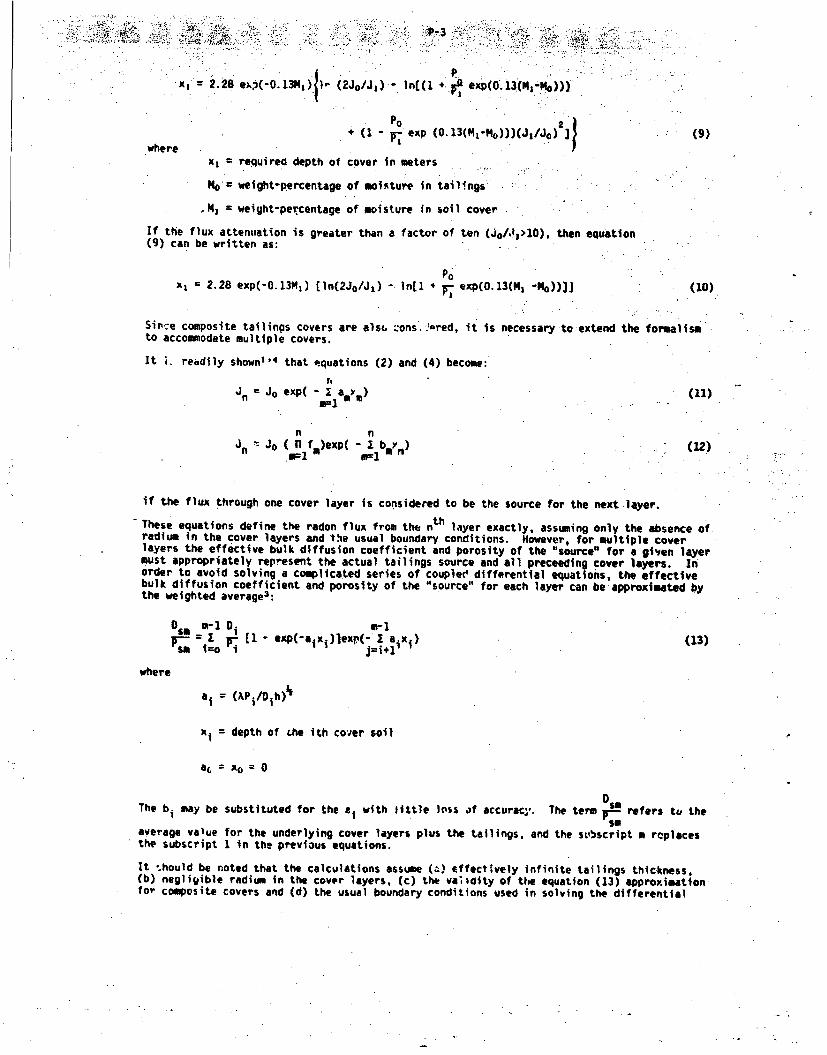
Po 2
=2.28 ; (1- /J1( exp (0.13(Mn-(e )))(J0/Jo).(9
wherex, required depth of cover in meters
No- weight-percentage of moisture in tailings
Al = weight-percentage of moisture in soil cover
If the flux attenuation is greater than a factor of ten (Jo/,)11>O), then equation(9) can be written as:
x, 2.28 exp(-O.13M,) [ln(2Jo/J 1 ) - ln[l 4 ]- exp(O.13(MI " 0))]J (10)
Sirce composite tailings covers are alsf, :ons,-Iared, it is necessary to:extend the formalismto accommodate multiple covers.
It i. readily shown t 14 that aquations (2) and (4) become:
in Jo exp( amym) (11)
n nin Jo n f,)exp( I bmYM) (12.)
if the flux through one cover layer is considered to be the source for the next .layer.
- These equations define the radon flux from the nth layer exactly, assuming only the absence of,radium in the cover layers and the usual boundary conditions. However, for multiple coverlayers the effective bulk diffusion coefficient and porosity of the "source" for a given layermust appropriately represent the actual tailings source and all preceeding cover layers. 1norder to avoid solving a complicated series of coupled differential equations, the effectivebulk diffusion coefficient and porosity of the "source" for each layer can be approximated bythe weighted average 3 :
Dsm =- I D( -3l=OP• [I - exp(-aix;)]~exp(- I aix;) (13)
s i j=ijo"I
where
ai = (XPt/Dth)1
xi = depth of the ith cover soil
ac = XO 0
The bi may be substituted for the al with tittle less of accurac;,. The term p.- refers tv the
average value for the underlying cover layers plus the tailings, and the subscript m replacesthe subscript 1 in the previous equations.
It thould be noted that the calculations assume (a) effectively infinite tailings thickness,(b) negligible radium in the cover layers, (c) the validity of the equation (13) approximation.for composite covers and (d) the usual boundary conditions used in solving the differential
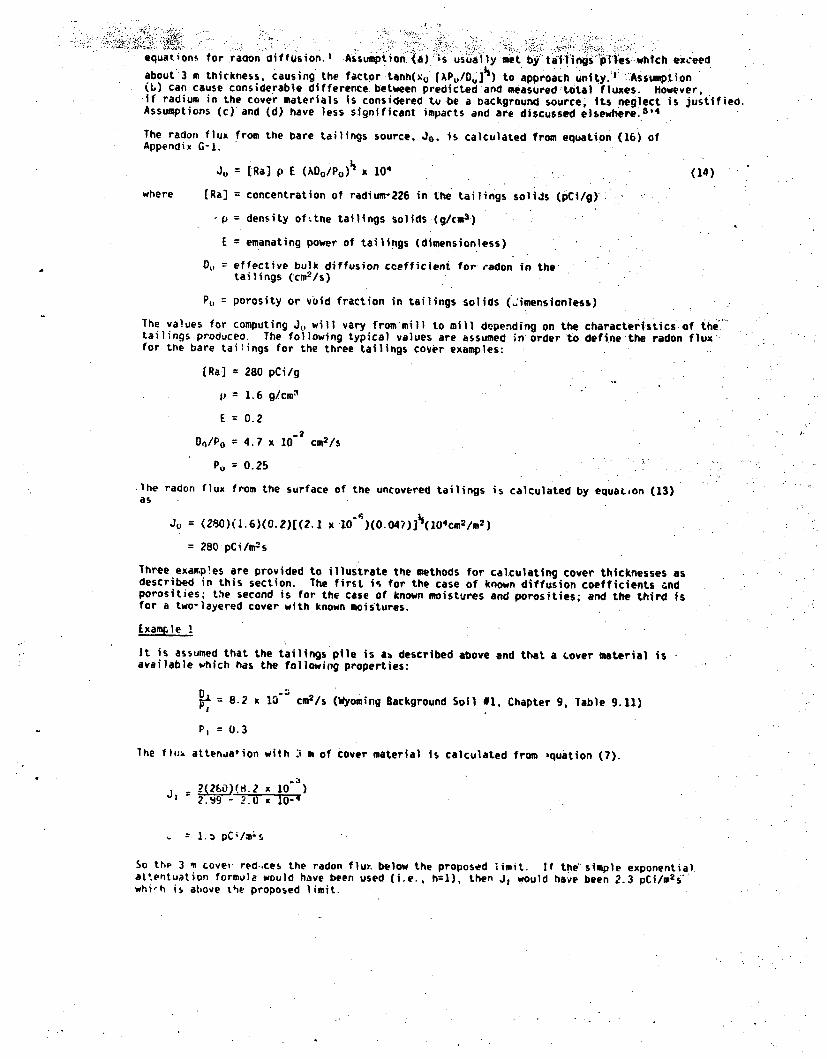
equations for radon aif fusion. I Assumption. (a) is usually met by" tafflings 'pies -which exceed.
about 3 m thickness. causing .the factor -tanh(xu (AP,/0U]½) to approah uni ty.*' 'Assuimption(b) can cause considerable difference between predicted and measured total fluxes. However,if radium in the cover materials is considered tu be a background source, its neglect is justified.Assumptions (c) and (d) have less significant impacts and are discussed elsewhere. 3' 4
The radon flux from the bare tailings source, Jo. is calculated from equation (16) ofAppendix G-1.
J, [Ra] p E (AO0 /Po)ý x 104 (14)
where [Ra] concentration of radium-226 in the tailings solijs (pCi/g)'
-p density of'tne tailings solids (g/cm3 )
E emanating power of tailings (dimensionless)
D, = effective bulk diffusion coefficient for radon in thetailings (Cm2/s)
P, = porosity or void fraction in tailings solids (..imensionless)
The values for computing JO will vary from mill to mill depending on the characteristics of the.tailings produceo. The following typical values are assumed in order to define the radon fluxfor the bare tai:ings for the three tailings cover examples:
[Ra] 280 pCi/g
p= 1.6 g/cml
E =0.2E=0.2
On/Po =4.7 x 10 cm2 /s
PO = 0.25
lhe radon flux from the surface of the uncovered tailings is calculated by equaton (13)as
Jo = (Z20)(1.6)(0.2)[((.1 x 10' )(O.047)]½(104cm2/m2)
= 280 pCi/m 2 s
Three exanp!es are provided to illustrate the methods for calculating cover thicknesses asdescribed in this section. The first is for the case of known diffusion coefficients andporosities; the second is for the case of known moistures and porosities; and the third isfor a two-layered cover with known moistures.
Example 2
It is assumed that the tailings pile is ab described above and that a Lover material isavailable which has the following properties:
8 x1 cm2 /s (Wyoming Background Soil 01, Chapter 9, Table 9.11)
P, = 0.3
The fluk attenuation with : m of cover material is calculated from squation (7).
J, ?Fo (.2x 10)2.49 - ?.0 x 10-q
- 1.s pCi/rn
So thp 3 m cove• red..ces the radon flux below the proposed Himit. If the' simple exponential,attentuation formula would have been used (i.e., h=1), then J, would have been 2.3 pCi/m2 s"whi'h is above the proposed limit.
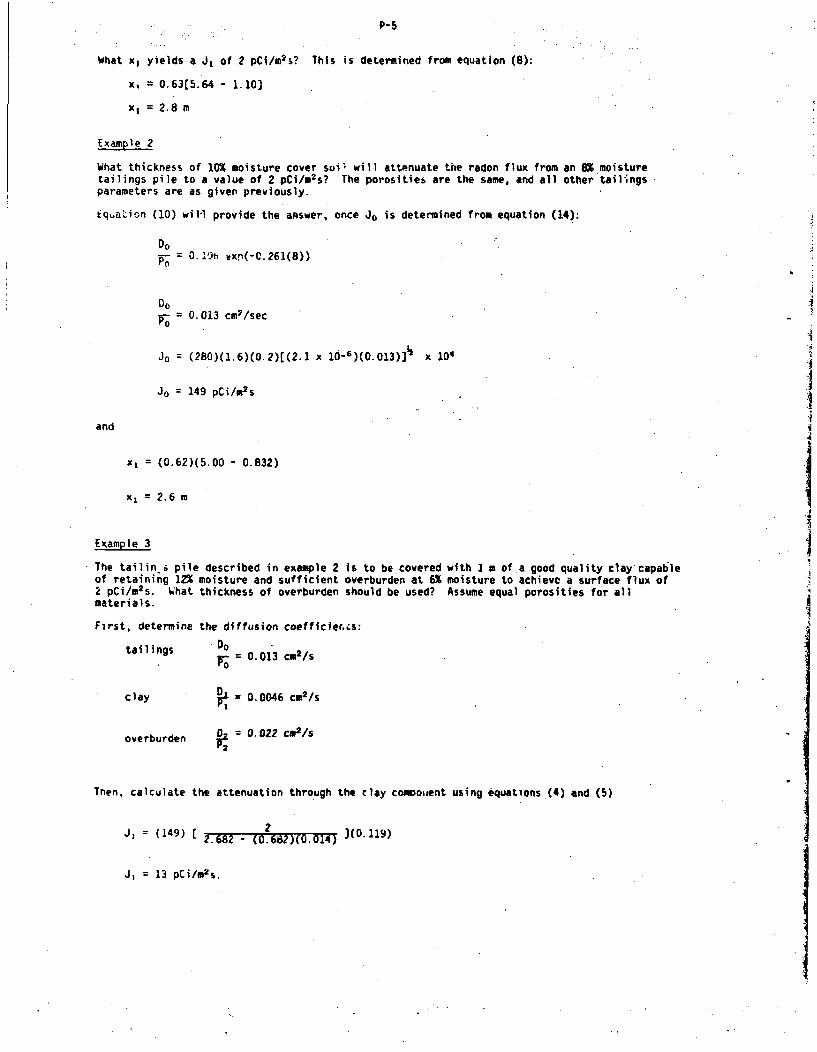
P-5
What x, yields a J, of 2 pCi/m 2 i? This is determined from equation (8):
x, = 0.63[5.64 - 1,10)
x,=2.8 m
Example 2
What thickness of 10% moisture cover suil will attenuate the radon flux from an 8 moisturetailings pile to a value of 2 pCi/m2 s? The porosities are the same, and all other tailingsparameters are as given previously.
iqua'hion (10) wil-1 provide the answer, once Jo is determined from equation (14):
Do
- 0.10 vxr(-C.261(8))
Do0.013 cm2 /sec
Jo = (280)(1.6)(0.2)[(2.1 x 16--)(0.013)]) x 104
Jo = 149 pCi/m 2 s
and
x, = (0.62)(5.00 - 0.832)
x,=2.6 m
Example 3
The tailin pile described in example 2 is to be covered with I m of a good quality clay capableof retaining 1Z2 moisture and sufficient overburden at 6% moisture to achieve a surface flux of2 pCi/m 2 s. What thickness of overburden should be used? Assume equal porosities for allmaterials.
First, determine the diffusion coefficier.;s:
tailings
clay
Do = . 2/0.013 cm2/s
DL = 0.0046 cm2 /sP,
overburden D = 0.022 cm2/s
Then, calculate the attenuation through the clay comvoisent using equations (4) and (5)
J = (149) 2 ](0.119)=(4) 2.682 - (0.682)(0.014)
J, = 13 pCi/m 2 s.
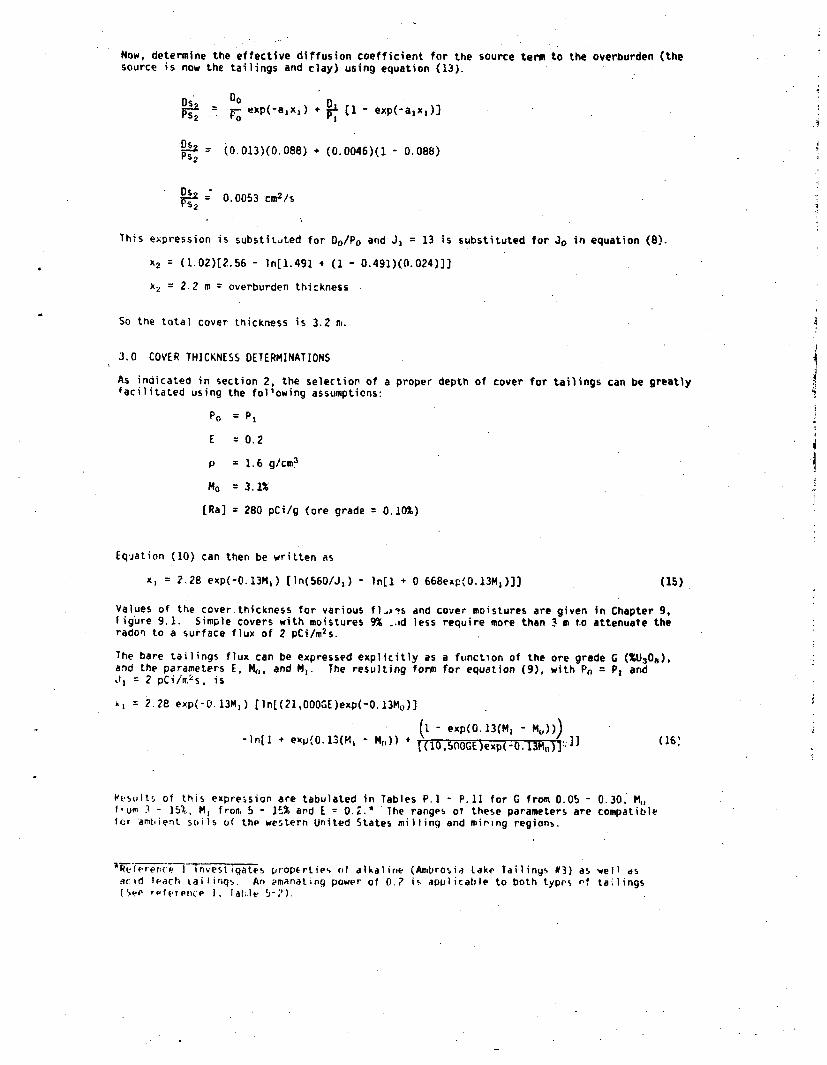
Now, determine the effective diffusion coefficient for the source term to the overburden (thesource is now the tailings and clay) using equation (13).
2 =Do
exp(-ajxj) + -.L (1 - exp(-azx1 ))
'" = (0.013)(0.088) + (0.0046)(1 - 0.088)Ps 2
"S 0.0053 cm2 /s
This expression is substitited for Oo/Po andJ 1 = 13 is substituted for Jo in equation (8).
x2 = (1.02)[2.56 - ln[1.491 + (1 - 0.491)(0.024)]]
x2 = 2.2 m = overburden thickness
So the total cover thickness is 3.2 ni.
3.0 COVER THICKNESS DETERMINATIONS
As indicated in section 2, the selection of a proper depth of cover for tailings can be greatlyfacilitated using the following assumptions:
PO = P1
E =0.2
p = 1.6 g/cm3
Mo = 3.1%
[Ra] = 280 pCi/g (ore grade 0.10%)
Eq-jation (10> can then be written as
x, 2.28 exp(-O.13M,) [ln(560/J,) - ln[1 + 0 668exp(O.13M1 )]] (1$)
Values of the cover thickness for various fl.•s and cover moistures are given in Chapter 9,figure 9.1. Simple covers with moistures 9% .. id less require more than 3 m t.o attenuate theradon to a surface flux of 2 pCi/m~s.
The bare tailings flux can be expressed explicitly as a function of the ore grade G (MU308 ),and the parameters E, M01, and NI. The resulting form for equation (9). with Pn = P1 and
2 pCi/rr2 s, is
2.28 exp(-O.13N1 ) [ln[(21,OOOGE)exp(-O.13ML)]
-In[( + expi(0.13(M1 - M(,)) + (IO- exp(O.13(M 1 - NM))) (16
Result, of this expreision are tabulated in Tables P.1 - P.11 for G from 0.05 - 0.30. MOf,um 3 - 151., M, fron, 5 - M and E = O.T.* The ranges of these parameters are compatiblefor ambient soils of the western United States milling and miring regions.
'Irerwen invest igates broperties (if alkaline (Anibrosia Lake Tailinys #3) as well d5
aicid liarh railingi. An emanating power of 0.? is apulicable to both types nf tailings(Se rpference 1. lah.le f--;')
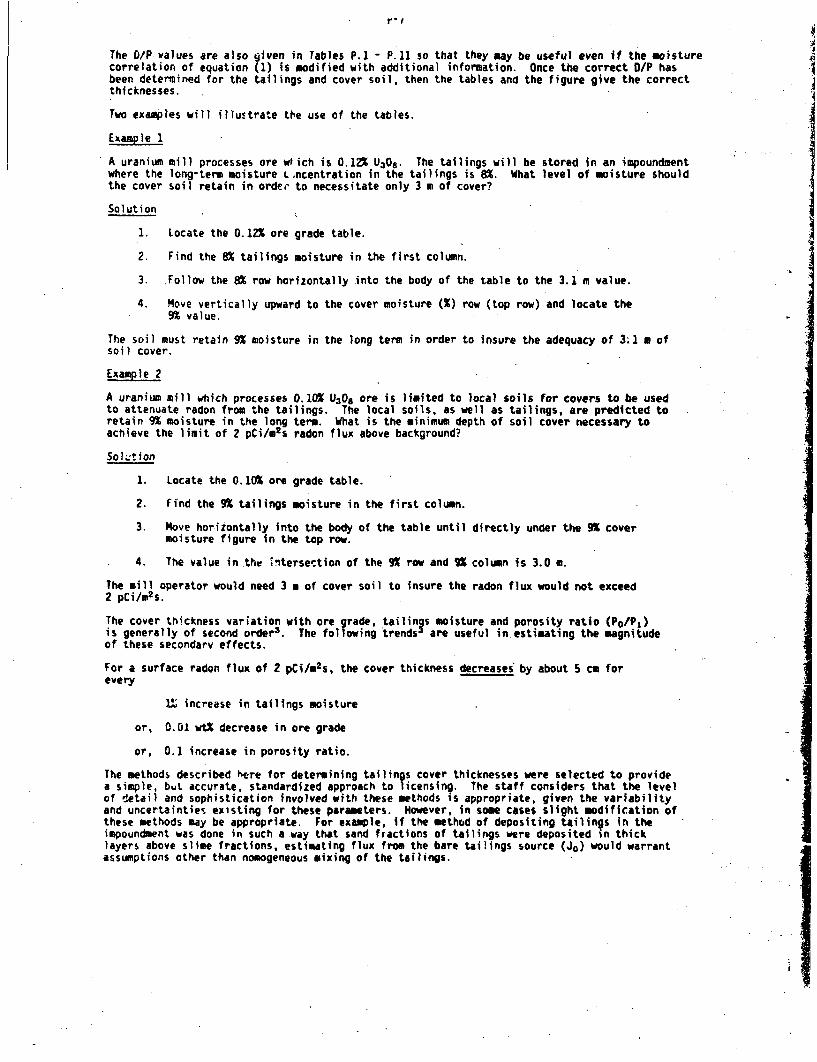
The D/P values are also 1 iven in Tables P.1 - P.11 so that they may be useful even itf the moisturecorrelation of equation (1) is modified with additional information. Once the correct U/P hasbeen determined for the tailings and cover soil, then the tables and the figure give the correctthicknesses.
Two examples will illustrate the use of the tables.
Example 1
A uranium mill processes ore wlich is 0.12% U3O8 . The tailings will be stored in an impoundmentwhere the long-term moisture ctncentration in the tailings is 8%. What level of moisture shouldthe cover soil retain in order to necessitate only 3 m of cover?
Solution
1. Locate the 0.12% ore grade table.
2. Find the 8% tailings moisture in the first column.
3. Follow the 8% row horizontally into the body of the table to the 3.1 m value.
4. Move vertically upward to the cover moisture (%) row (top row) and locate the9% value.
The soil must retain 9% moisture in the long term in order to insure the adequacy of 311 m of
soil cover,
Example 2
A uranium mill which processes 0.10% U30s ore is limited to local soils for covers to be usedto attenuate radon from the tailings. The local soils, as well as tailings, are predicted toretain 9% moisture in the long term. What is the minimum depth of soil cover necessary toachieve the limit of 2 pCi/m 2s radon flux above background?
So Ition
1. Locate the 0.10% ore grade table.
2. find the 9% tailings moisture in the first column.
3. Move horizontally into the body of the table until directly under the 9% covermoisture figure in the top row.
4. The value in .thL intersection of the 9% row and 9% column is 3.0 m.
The mill operator would need 3 m of cover soil to insure the radon flux would not exceed2 pCi/m2s.
The cover thickness variation with ore grade, tailings moisture and porosity ratio (Po/P 1 )is generally of second order 3 . The following trends3 are useful inestimating the magnitudeof these secondary effects.
For a surface radon flux of 2 pCi/m2 s, the cover thickness decreases by about 5 cm forevery
1; increase in tailings moisture
or, 0.01 wtX decrease in ore grade
or, 0.1 increase in porosity ratio.
The methods described here for determining tailings cover thicknesses were selected to providea simple, buL accurate, standardized approach to licensing. The staff considers that the levelof detail and sophistication involved with these methods is appropriate, given the variabilityand uncertainties existing for these parameters. However, in some cases slight modification ofthese methods may be appropriate. For example, if the method of depositing tailings in theimpoundment was done in such a way that sand fractions of tailings were deposited in thicklayers above slime fractions, estimating flux from the bare tailings source (Jo) would warrantassumptions other than nomogeneous mixing of the tailings.
i
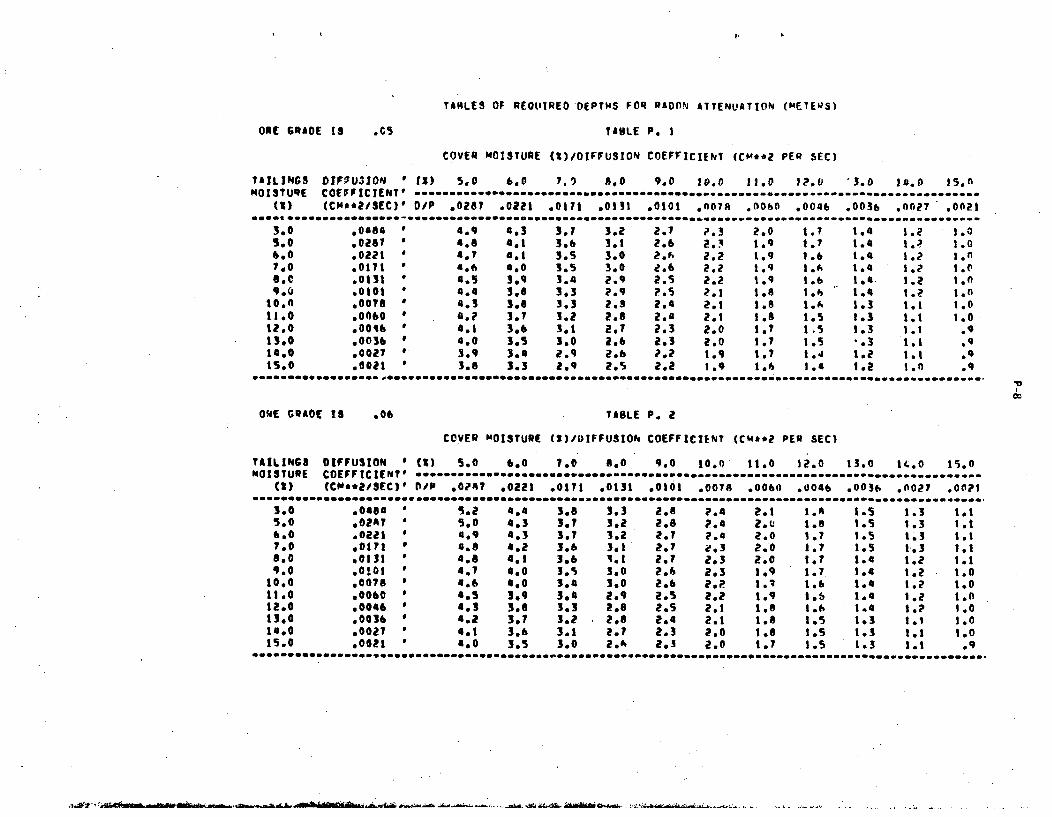
TARLES OF REOLITRED'OEPTHS FOR RADON ATTENUATION (METERS)
ORE GRADE IS .05 TABLE P, I
COVER MOISTURE (%)/DIFFUSION COEFFICIENT (CM*-2 PER SEC)
TAILINGS DIFPU310" 11) 5,0 6.0 7,) 8.0 9.0 3o.0 11.0 .o0 '3.0 14.0 15.ftM01TURE COE7FICIENTO ---- C-CoC -wC*---- m... --.--- ..... - ..... . f ........ A ........................
(M (CM*42/1SEC) 0/P *0287 .0221 .0111 .0131 .0101 .007A .0060 .0046 .0036 .0027 .00210S0-4, C .f e * s. b fe e . eS C e f. .. ..... . .. . . t 0. . . . . . . . . . ....... ... . .
3.0 *0084 * 4.9 4.3 3.7 3.2 2.7 P.3 2.0 1.7 1,4 1.2 1.05.0 .0267 ' 4.6 4.1 3,6 3.t 2.6 2.3 1.9 t1. 1.4 1.> 1.0b.o .0221 * 4.7 4.1 3.5 3.0 2.0 2.2 1.9 1.6 1.4 1.2 1.07,0 .0171 ' 4.6 4,0 3.S 3.0 2.6 2.2 1.9 l.6 1.4 1.? i.ea.C .0131 4 4.5 3.9 3.4 2.9 2.S 2.2 1.9 1.6 1.4. .2 1.09,4 ,0101 ' 4.4 3.8 3,3 2,9 ?s Z.1 . 1.8 1.6 1.4 1 .0 .0
10.0 .00T8 ' 4.3 3,8 3.3 2.3 2,4 2.1 1.8 1. 1.3 t,. 1.011.00 0060 4.? 3.7 3.2 2.8 2.4 2.1 1.8 1.5 i.3 1.t 1.012.0 .0046 * 4.1 3.6 3.1 2.7 2.3 2.0 1.? 1.5 1.3 1.1 .913.0 .0036 4,0 3.5 3.0 2,6 2.3 2.0 1.7 1.5 .3 111 .9140.0 .0027 3 3.9 3., 2.9 2.6 ?.2 1.9 1.7 1. 1.2 1.1 .41s.0 .0021 3.6 3.3 2,9 2.5 2.2 1.9 1.6 1.4 1.2 1.0 .9
--------------------------------------------.......C.....
OWE GRADE is .06 TASLE P. 2
COVER MOISTURE (M/)IFFUSION COEFFICIENT (CM&*2 PER SEC)
TAILINGS DIFFUSION * (2) 5.0 b.o 7,0 8.0 9.0 10.0 11.0 12.0 13.0 1 .0 15.0MOISTURE COEFFICIENT* . .-- ----- ***-* -..... - ........................................
(C) (Cm**.2/EC)l DIP .0•7 .0221 .01?1 .0131 .01o1 .0078 .0060 .0046 .003f .0027 .0p?100 ... wo..................b ...........- .0
3.0 ,0464 S e,2 4.4 3.8 3.3 2.e P.4 2.1 1.3 I.S 1.3 t1.5.0 .0247 * 5.0 4,3 3.7 3.2 2.6 P.4 2.t 10. 1.5 1.3 1.16.0 .0221 * 4.9 4.3 3.7 3.2 2.7 P.4 2.0 1.7 1.5 1.3 1.17.0 00171 4 4.8 4,2 3.6 3.2 2.7 e,3 2.0 1,7 1.5 1.3 1.18.0 .0131 * 4.8 4.1 3.6 l.1 2.7 2.3 2.0 1.7 1.4 1.2 t.19.0 .0!01 * 4.? 4,0 3.s 3,0 2.6 2,3 1,9 1.7 .1e 1.2 1.0
10,0 ,0076 * 4.6 4.0 3.4 3.0 2.6 2.2 1.4 1.6 1.4 1.? 1.011.0 .0060 4'5 3.9 3,4 2.9 2.5 2.2 109 1.5 1.4 1.2 I.s12.0 .0046 * 4.3 3.6 3.3 2.6 2.5 2.1 t.o 1,6 1.4 1.? 1.013.0 .0036 0 4.2 3,7 3.2 2.8 2.4 2.1 1.8 1.5 1.3 1.1 1.014.0 .002? a 4.1 3.6 3.1 2.7 2.3 2.0 1.8 1.S I.3 1.1 1.015.0 .0021 4.0 3o5 3.0 2.6 2.3 2.0 1.7 1.s 1.3 1.1 .9
CS ~ ~ ~ ~ ~ ~ .. o~ ....... .... v*S S CC C C C SCC S-C C C C55 5C C C C C C C - CC ...- - - - - -woo .. . . . . . .. . . . . . .. .
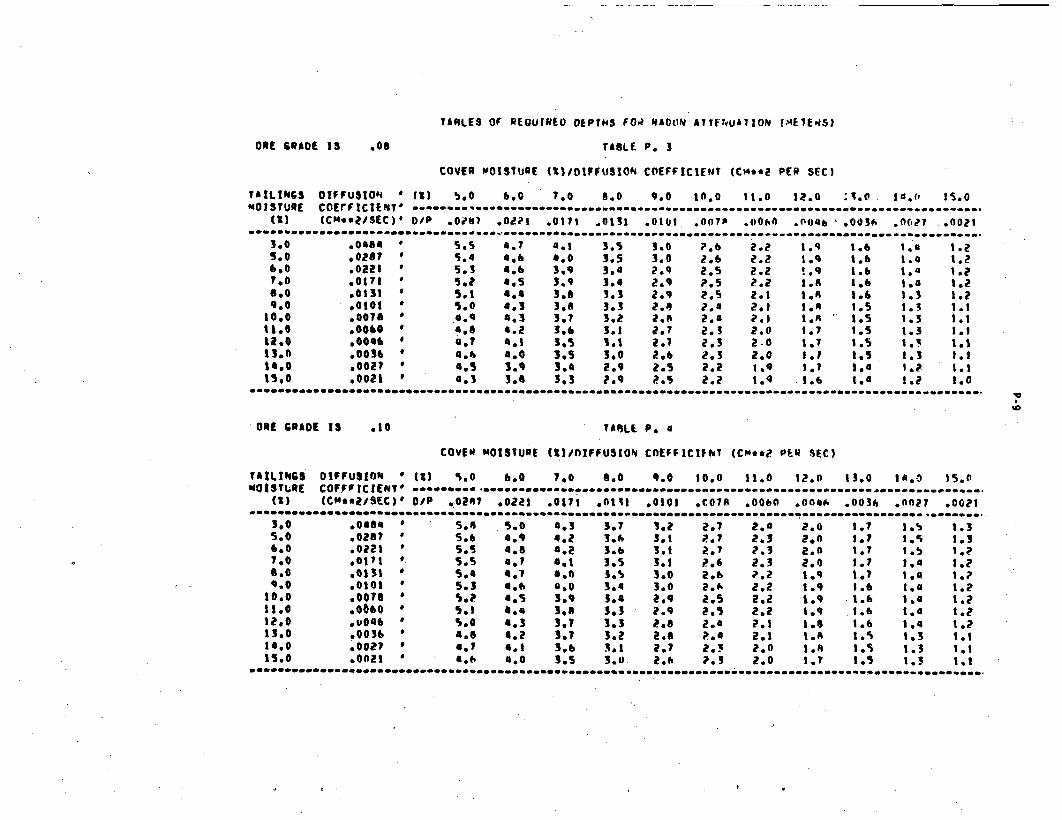
TARILES Or REQUIREO DEPTNS FOR RAON A1TFUNUATION (MEYES)
ORE GRADE IS loS TABLE P. 3
COVfR OIS1UAC (2)IODFFUSION. COEFFICIENT (C4*-2 PER SEC)
TAILINGS OIFFUSION ' (1) ( .0 6.0 7.0 9.0 9.0 10.0 11.0 12.0 :q.O 1.1,. 15.0MOISTURE COE!FICIE NTO --- o-o---o-o*- -o---o ......... -.................... ow ........................
(C) (CM.e0/SEC) DIP .008) .02! .0171 .0131 .0101 .007P .0060 .0046 ' .0036 O .Ot? .. 0021........ .....e...n-........................a. ...
3.0 .0880 * SOS 4.7 8.1 3.S 3.0 ?.6 2.2 1.9 .6 1.0 I.?5.0 .10I87 S.o 4,6 4.0 3.5 3.0 2.6 2.Z 1.9 1.6 l.a4 1.6,0 .0221 e 5.s 4.6 3,q 3,4 2.9 2.5 2.2 !,q 2.b 1.6 1.?7.0 .001 * So? a's 3,9 3. 2.9 P.5 2.2 I.R 1.6 164 1.26o0 .0131 * S| 4,4 3,6 3.3 2.9 2.s 2.1 |oR 1.6 1.3 1.29.0 0O0Ol * S.o 4.3 3,8 3.3 ?Ae 2. 2.l JA 1.s 1.3 1.110.0 ,0078 0 .. 4,3 307 3.2 2.8 2,0 2.1 t.A ,.s 1,3 1.1It', .0060 * 4,6 6.a 3,6 3.2 2o7 2,3 2.0 1.7 i's 1.3 1.112.0 ,0046 * 4,? 4,1 3's 1.1 .17 2.3 2.0 1.7 I.s i.+ 1113,0 .0036 4,k% 4.0 3.S 3.0 2.6 Z.3 2.0 1.? 1.S 1.3 111
14.0 .0021 * 4.5 3.9 3,4 ?.9 2.5 2.2 1.q I1 * ta 10? I.l15.0 .0021 0.3 3.6 3,3 ?69 a.s 2.2 l.q 1.6 t.o 1.? 1.0
............. a ..... e. 000.....................-----....--....
ORE GRADE IS ,10 TAOLE P. a
COVEO MOISTURE (5)/nIFFUSION COEFFICIthl (Cm**? PER SEC)
TAILINGS DIPFUSION (1) 50 6. o 7o0 6.0 q.o 10.0 1160 12.0 13,0 1A.0 IS.0mOiSTLRE COaFirICrIENT *. ---- -- *.. .................... .. ............ a--------------
(C) (CM**2iSEC)i 0/P .0287 .0@?| .0171 o0131 .0101 .C078 .0060 *0086 .003. .0111 .0021........ eae.. ~e~e --------... a.3,0 ,0468 * 5.8 5.0 0.3 3.1 1.2 2.7 2.' 2.0 1.7 14. 1.3
.O0 .0267 * 5.6 4.9 4.2 3.6 3.1 P.7 2.3 2.a 1.71 1. 1.36.0 .0221 * 5.5 s. e e.2 3.6 3.1 2.7 2.3 2.0 1.? 1.4 1.27,0 $017t * SS 4,7 01 3.5 *.1 P.6 2.3 2.0 I.? I, 1.26.0 .0131 * S,. 4,1 *,, 3.S 3.0 ?.6 P.2 1.q 1.? I. I.?q.o .0101 * 5.3 4.6 Goo 3.4 3.0 2.6 2.2 1.9 1.6 l.4 1.?10.0 ,009 S O.? 4'.5 3.9 .,a a.9 2.S 2.2 1.9 1.6 1.o 1.21110 ,0060 * 5.1 0.4 31 3.3 e.9 21.5 212 1.9 1.6 1.4 1.212,0 .u046 S 5.O 4.3 3.1 3.3 p.s 2.b ?A1 i.e 1.6 1.4 !,213.0 o0036 * 4o6 4.2 3.1 3.2 2.6 .0o 2.1 1.8 1.5 1,3 1.124.0 .0021 * 4.7 4.1 3.6 3.1 ?.1 20. 2.0 1.8 1.5 1.3 1.11S.0 .0021 a 4 . 8,0 3.S 3.0 2., ?.S 2.0 1,? 1.S 1.3 tot
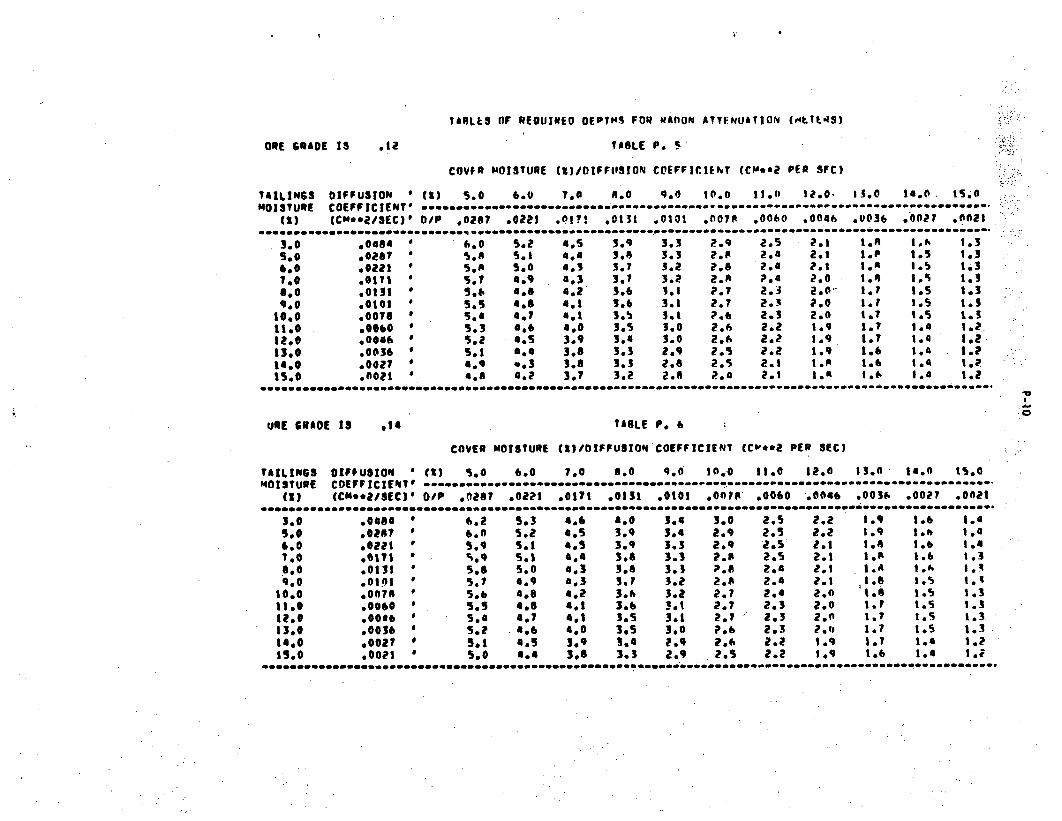
TARL&s OF REQUIRED DEPTHS FOR IEAnON A'TTENUATION (i4AttAIS)
OR[ GRADE IS .12 TABLE P. 5'
COVfR MOISTURE (2)/DIFFIOSION COEFFICIENT (Cm**2 PER SFC)
TAILINGS DIFFU31ON * (1) S50 600 7,0 RIO q.q 10.0 11.0 12.0. 13.0 16.0. 15.0MOISTURE COEFFICIENT" *e.. . o.......a0-0c...........
(1) (CM**2/SEC) 00P .026? .0221 .01?1 .0131 .0101 .001 .0060 .0046 .0036 ,002? .0021................ ...................... ........ S.. ..... .
3.0 o0484 0 6.0 S.2 4.S 309 3,3 2.9 2.S 20.1 1.5 1. 1.3SOo 002o7 a S*o S.1 4,4 3.6 3.3 2.5 2.4 201 toP 1.5 1.36.0 .0221 0 5.8 5.0 4.3 37so 3.2 ?08 2.4 2.1 'A, 1.5 143T1o .0171 * 5.? 4.9 4,3 3.7 3.2 2.A P,4 2.0 1.6 1,S 1.36.0 .0151 * 5o. 4,6 4o2 3.6 I.1 ?.7 2.3 2.0.1 .7.1 1.5 1.39.0 .010l SI 4,8 4.1 3.6 3.1 ?.7 20. 2.0 1. 1.5 1.3
10.0 0076 * 54 4. 4.1 3051 3.1 p.6 2.3 2.0 to? 145 1.11.0 .0060 * 5.3 4,6 4,0 3S 3.0 2,6 2.2 109 10? 1.4 1,21200 .0046 5 s.2 4's 3.9 3.4 3.0 2.0 2.2 1,9 1,7 14 I,2.13.0 00036 ' 5.1 4o4 3.6 3.3 2.9 2.5 2.2 1.9 106 14 1.?14.0 .0020 2 4.4 e.3 3.8 3.3 206 2.5 2.1 1,. lo 1,4 1.?15.0 *n00e * 4.8 4,2 3.? 3e2 2.6 P,4 2.1 .1 ,1 1 I I . 1.2
uRE GRAOE 18 t14 TABLE P. 6
COVER MOISTURE (%)/OIFFUSION COEFFICIENT (CV4*2 PER SECI
TAILINGS DIFFUSION * (2) 5o0 6.0 7,0 8.0 9.0 10.0 11.0 12*0 13.0 14.0 t1.0OISTURE COEFFICIENTO ... eoo.0.0 ............... we ....... ..... .....................
(I) (CC**2/SfC)# 0/P O8267 .022t .0171 .0131 t0101 .007# O0060 ,0046 ,0036 .0027 .0021
3.0 .0464 * 6.2 53 4,6 4.0 3.4 3.0 2.5 2.2 1.9 1.6 1.45.0 .026? * 6.0 5.2 4.S 3.9 3.4 2.9 2.5 2.2 1.9 I.e JIG6.0 .0221 5. So 5.1 4.5 3,9 3.3 209 2.5 2.1 104 l.b 1.41.0 .0171 6 6,9 5.1 S4, 3.6 3.3 2.8 2.S 2.1 1.o 1.6 1,36.0 .0131 So 5.6 5. 4,3 3,6 3.0 -.8 2,4 2.1 l.A 1.4 1.19.0 .0101 * 5.1 4.9 4.3 30? 3.2 2.5 2.4 2.1 1.6 t.5 1.q
10.0 60076 * 5.6 4.6 4,2 3.6 3e2 2.7 2.4 2.0 1.6 I.S 1.3I110 .0060 * 5,5 4,8 4,1 3,6 3.1 2.7 2o3 2.0 1.7 1.5 1.31.0 00046 * 5s4 407 4.1 3,5 3.1 2.7 - 2.5 2.0 1.7 1.5 1.313.0 .0036 * 5.2 4.6 4.0 3,5 3,0 ?.6 2.3 ?.(1 1.7 1.S 1.314,0 *002? * 5.1 4.5 3,9 3,4 2.q 2.4 2.2 1.q 1.7 1.4 1.?15.0 .0021 0 5.0 4,6 3,6 3.3 2.9 2.5 2.2 .g9 1.6 1.4 1.2
e.. ma- .......cvc.0 . . ..cc cc mcm c..m.cC ce c. ..
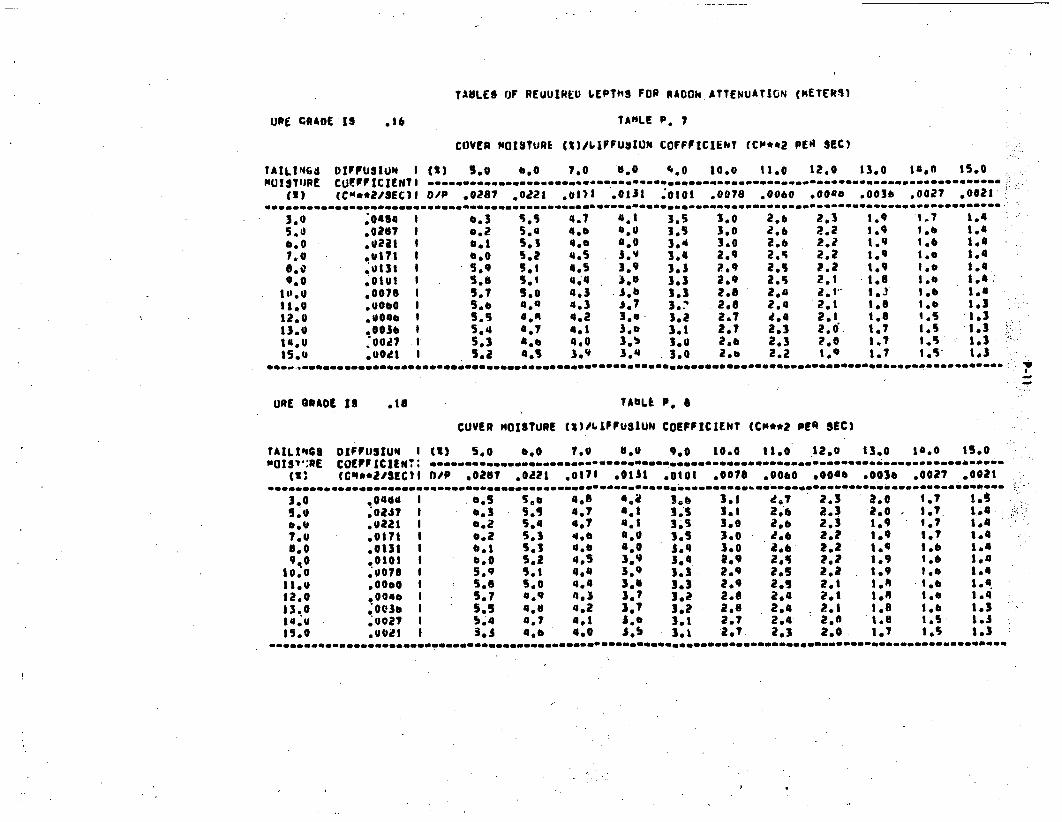
TABLES OF REOUIHRE LEPThS FOR RADON ATTENUATION (METER3)
ORE GRADE IS .16 TAKLE P. ?
cOvERn OISTURE (A)/LPFUSIOt COFFFICIEkY (C"**a2 PER ScC)
TAILINGd DIFFUSIOU I (2) S5o .0 0 70 6.0 '.0 10.0 11.0 12.0 13.0 18.o 15.0MUISTIiPR CUEFFICIENTI ......................... f ......... -e!.0
(2) (C;'Cl/oEC)l 0/P .0287 *0221 ,rl | .01 ,1 .0078 .0060 .004D .0036 .0027 .0021e.....e...*..enlele*. . ... e.. woo..... * ... "a-wa
3.0 O46e 043 1 ;a? 4.1 3.S 3.0 2.6 2.3 1,9 1.? 1.4S.d .0267 1 a.? So. 4o6 4.0 3.S 3.0 2.6 P.2 i.4 1o 1.40.0 .02a11 0.1 S,. ,o0 a,0 3,4 3.0 2.o 2.2 1.9 1.6 1.47Il voII 1 0.0 S.2 4.5 3.' 3.4 2.9 2.q 2.2 1.9 1.0 1,40.0 .0131 1 5.9 5.1 4.5 3.S 3.3 a.9 2.5 2.2 1.9 1.0 1.49.0 .0101 1 5.8 So 4,o4 Ao 3.3 2,9 2.5 2.1 1.6 1o0 1.4010 .0078 1 S17 5.0 4.3 .3,b 3.3 2.8 2. 21'" 1,3. 1.0 1.tlo .00o0 1 5.6 4,4 4.3 A,7 3,:% 2.8 2.4 2.1 1.6 1.0 10312.0 .004 1 S.s 4.4 4.2 3.e- 3.2 2.7 4.4 2.1 t.o 1.s -1.313.0 .0036 $ 5.4 T,7 4.1 3.& 3.1 2.7 2.3 2.6 1? 1.5 1.3 l14.0 :000? 1 S.3 4,o 4.0 3.j 3.0 2.0 2,3 2.0 1.7 1.15' 1.3tS.0 .00i I S.2 4,S 3*9 3,8 . 3.0 2.. 2.2 1,0 1.? I.5 1.3
ORE GRADE It .18
TAILINGSWOIS,3EN
DIFFUSIUO ICOEFFICIENT;CCM**213ECII
------------------- m i_
3.0S.0
7.08.09q0
10.011.012.013.014.019.0
o04S4.oJ7.v22110171,.0131.010110076.0000'0046..0036.00o7.Uoal
TAbLi P. 8
COVER MOISTURE ()*LIFFUSIU4N COEFFICIENT (Cm*,2 PER SEC)
Mt) 5.0 0.0 7.0 v .0 9.0 10.0 11,0 12.0 13.0 18.0 1s50
D/P 0281 .0221 .0171 .0131 .010t .'008 .0000 .00oo d 003 .0027 .0021
D0,5 Soa 4,68 4.i! 3.6 3.1 ? 2.3 2,0 1,7 1.4.03 S.9 4.7 4.1 3o,5 3.1 2.0 2.3 2.0 1.7. 1. 4
0.2 S,4 4,? 4.1 3,S 3.0 S .0 2.3 1.9 1.7 1.40.2 S.3 4,6 4.0 3,S 3.0 2.6 2.2 1.9 to7 1.40.1 S,3 4.0 4.0 S,4 3.0 '.. 2.2 1.4 1.0 1o40.0 S.2 4.5 3.9 3,4 2.9 2a5 2.2 1.9 1,6 1,85.9 5.1 4,4 3:9 3.3 2.9 2.S 2.2 1,9 t1, 1.45.6 S.o 4.4 3,6 3,3 2.9 2.5 2.1 1.8 1.. 1.4
. 7 4.9 4,3 3,7 3.2 2.8 2,4 2.1 1to to, 1,4SS 4.0 4,2 3,7 3,2 lo. 2,4 P,1 1.6 1,0 1.3S 4 4.7 4,1 3.0 3.1 2.? 2o4 2,6 1.6 .'s 1.35o3 4.6 4,0 Job 3.o 2.7 2,3 2,0 1.7 1, 1.3
e..O.*[email protected]****6.e*~@*in~@U Uin**O*UUU...*@**inem*OUeU**~**60~
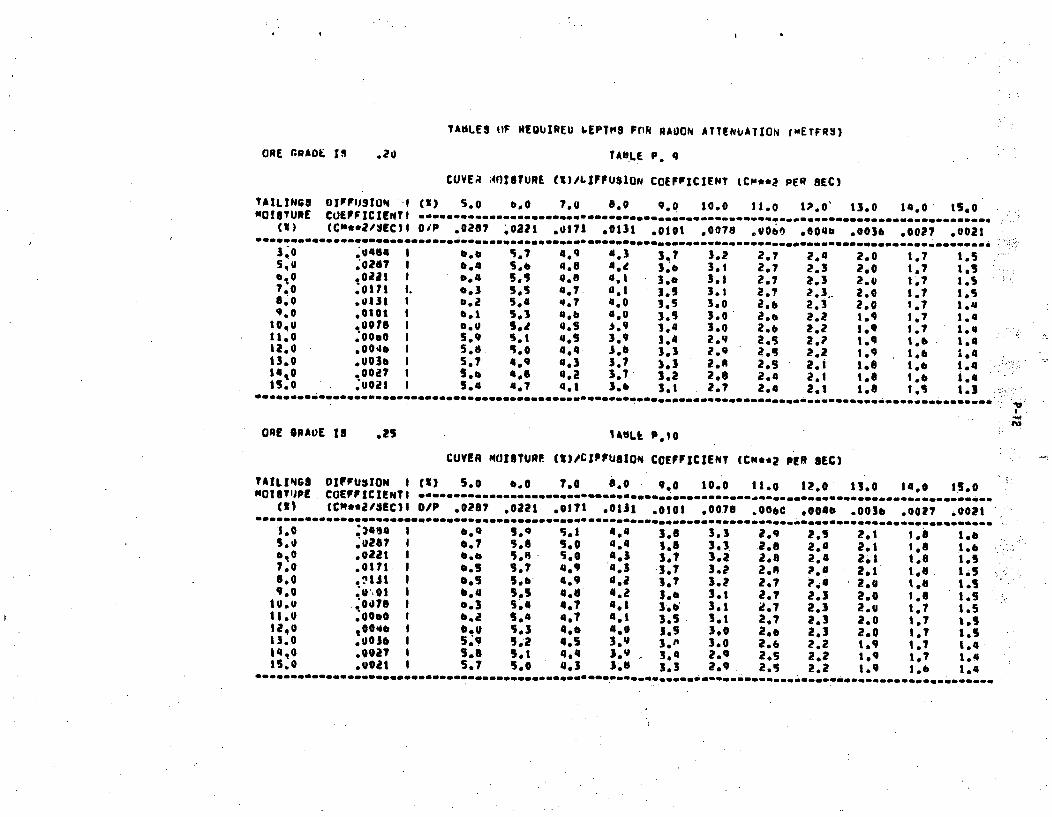
TAOLES OPF WEfQIREU f6EPTMS FOR RADON ATTENUATION (mETFRS)
ORE CRADE I .20 TAbLE P. q
CUVE•n ;4lITURE (M)LIFFU3ION COEFFICIENT tC"'e2 PER SEC)
TAILINGS DIFFUSION -I (2) S.0 0.0 7.0 8.0 9.0 10.0 11.0 17P0' 13.0 14.0 t1,OMOISTURE CUEPFICIENTI ........ .e .................. bfa.. ...............(I) (CC***/afC)g OiP .0267 '0221 .0171 . ,031 .0101 .0078 .U06 0040 .0036 .0027 .Q021**----..-.-.-*----.-.--..**.eM.......... .......... ........e................. .... a.....i!..
3.0 *0464 I 0.o v.? 419 4.3 3.7 3.2 2.7 2.4 2.0 7 1.5I'S~o .0267 I 6.4 S.6 4.8 4 .S 3,6 3.1 2.7 2.3 2.0 1.7 .S:
0 1.4 5.54 4.6 4.1 3.0 3.1 2.7 2.3 2. t l7 I.S7.0 .0171 I. 0.3 5,S 4,7 d.1 3*. 3.1 2.? 2.3. 2.0 1.7 1.S56.0 .0131 I 0.2 S,1 4.? 4.0 3.5 3.0 2.0 2.3 2.0 1.7 1.49.0 .0to1 1 6.1 5.3 4,0 4,0 3.5 3.0 2.6 2.2 1.9 1,7 1,4
10,0 ,0o76 I 0.0 S. 4.9 J.9 3,4 3.0 2.6 2.2 1,9 1.7 1.411.0 .00.0 1 S.9 S.1 4,5 3.9 3.4 2.9 2.S 2.? t.4 1.6 1.412.0 .0040 I 5.8. SIC 4,4 4 .6 3.3 2.9 2.5 2.2 1,q 1-6 -1,413.0 .O036 I 5.7 4.9 4,3 3.? 3,3 2o. 2.5 2l1 1.86 t6 1.414 0 .002? I S.1 4,6 4.2 3.7' 3.2 2.8 2*4 2.1 1I6 1.0 1.415.0 •.U002 I0 5.4 .7 4.1 3.6 3.1 02.? 2.4 2.1 1.6 1. 1.3S'l . "e0~e ** l *f .. fS•~l .f .fl.*.f
ORE GRAVE IS .JS 1ULE P*iO
CUVER MIJISTURE (E,#CZFPUSION COEFFICIENT (Cm*,2 pro SEC)
TAILINGS DIFFUSION 1 (1) S.0 le0 7.0 6.0 9.0 10.0 11.0 12.0 13.0 14.0 15.0O"O!TYIJPE. COEFFICIENTI .... -----
(2) (CNO**ItEC) DIP 0287 .0221 .0171 .0131 .0101 .00.78 *OOOC .0040 .0030 .0027 .0021
1.0 3464 1 Ole 9, • 5.1 4.4 3,6 3.3 2.9 2.5 2,1 1,8 1.6S.0 lo287 1 0.7 5.68 50 4.4 3.8 3.3 a.6 2.4 2.1 1.8 1.o60.0 .21e I 0.6 5.4 S. 4a' 3.7 3.2 2.8 2.4 24 1.08 1.s7.0 .0171 I 0.5 5.7 4.9 .3 3.,? 3.2 2.4 Pon 2.1 1e6 1. .6.0 0131 1 0.5 S. 4.9 4.2 3.? 3.2 2.? p.4 2.0 i,' 1. .9.0 .0%01I 0.4 SS 4.8 4.2 3,0 3.1 2.7 2.3 240 1.6 I.s
10.U t0078 I 8.3 5.4 4,7 lot 3,0 3,1 So7 2.3 2.0 t.? 1.S15.0 .0000 1 0.2 5.4 4.7 4.1 3.5. 3.t 2.? 2.3 2.0 1.7 1.512,0 t00o4 I boo SJ3 4,6 4,0 3.o 3.0 2,o 2.3 2.0 I.? .s513.0 .00306 S.9 5.2 4.5 3. 3.A 3.0 2.6 2.2 t.4 1.7 t,414 0 .4017 1 5.8 5.l 4,4 3, v 3,4 2.9 2.5 2.2 1.9 1,7 1041S.0 .Uoat 5.7 5.0 SIC 4,3 3.3 2.9 . 21. 2.2 1o9 1.0 1.4
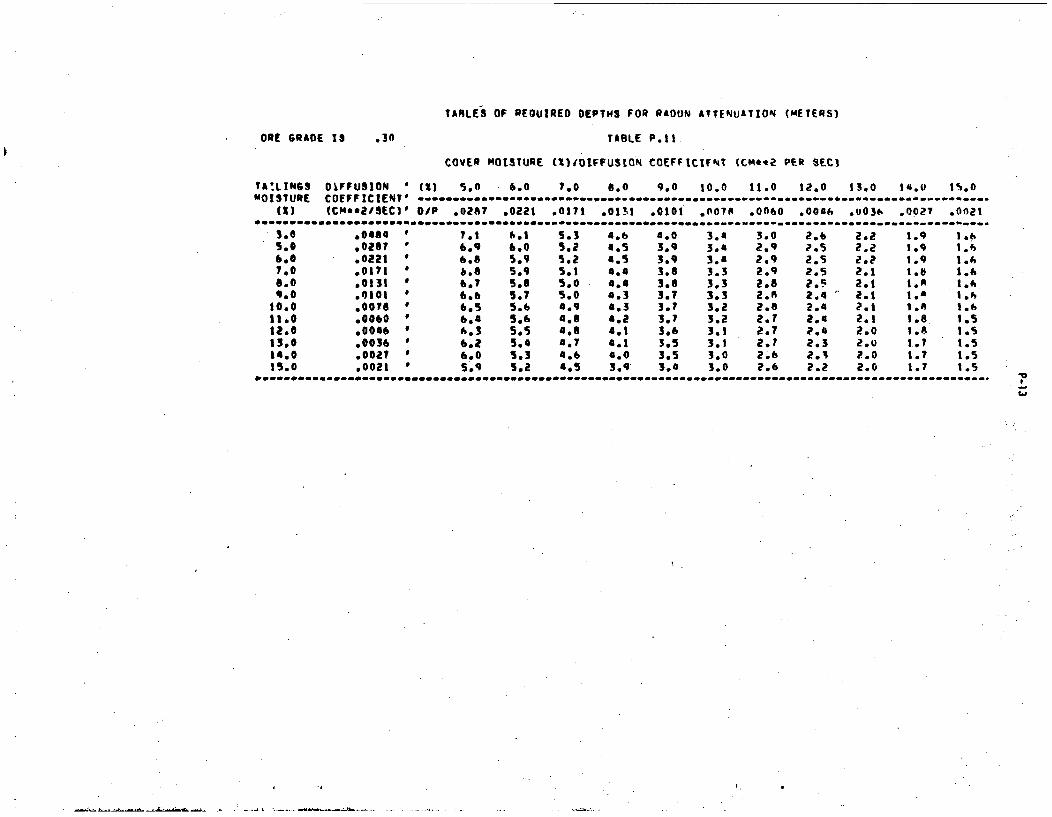
TARLES OF REOUIRED DEPTHS FOR RADON ATTENUATION (METERS)
ORE GRADE 13 .30 TABLE P.o1
COVER MOISTURE (1t1O1FFUStON COEFFtClvfT (CM6*2 PER SEC)
TAILINGS DIFFUSION * (2) 5.0 6.0 ?.0 6.0 9.0 10.0 11.0 12.0 13.0 14.0 15.0MOISTURE COEFFICIENT' .- - 0 .-.. -............ ................... .....................
(3) fCM**21SEC)' OP .0267 .0221 .0171 .011 .0101 *007p .0060 .0046 .I030, .0027 .0021
3,0 .0484 7,1 6.1 S.3 4.6 4.0 3.4 3.0 2.6 2.2 1.9 !.6S.0 .0267 * 6.9 6.0 5.2 4.5 3.9 3.4 2.9 P.5 2.2 1.9 ,.ý
6.0 .0221 6.8 5.9 5.2 4.5 3.9 3.4 2.9 2.5 Z.? 1.o 1.67.0 .0171 * 6.8 5.9 5.1 4.4 3.6 3.3 2.9 2.5 2.1 i.e 1.66.0 .0131 6.? 5.6 S.0 4.4 3.8 3.3 2.8 2.5 2.1 J*m 1.69.0 .0101 * 6.6 5.7 5.0 4.3 3.7 3.3 2.A 2.4 "" 2.1 1.0 1.6
tO.O .0078 6.5 5.6 4.9 4.3 3o? 3.2 2.8 2*4 2.1 J.o !.e11.0 .0060 * 6.4 5.6 4.6 4.2 3.7 3.2 2.T 2.4 2.1 1.8 1.51200 .0046* 6's3 5,5 4.6 4.1 3.6 3,1 2.7 p.4 2.0 1.8 I.s13.0 .0036 * 6.2 5.4 4.7 4.l 5.5 3.1 2.? 2.3 2,0 I.l 1.514.0 .0027 * 6,0 5.3 4.6 4.0 3.5 3.0 2.6 2.0 P.0 1.7 1.515.0 .0021 * 5 59 0.2 4.5 3.9 3.4 3.0 2.6 2.2 2.0 1.7 1.5
p.. ~ ~ ~ ~ ~ ----- w..aoac. .... c n.e ................... a .. aaaaaaaaaaaaaaaaaaaaaaaaaaaaa................ ---
4~n~na W..a -~
-P-14
References
1. V. C. Rogers, et. a&., "Characterizationof Uranium Tailings Cover Katerlals for RadonFlux Reduction" NUREG/CR-1081 (March, 1980)..
2. R. N. Yong and e. P Warkentin, Introduction to Soil Behavior, MacMillan, New York(1966).
3. V. C. Rogers and K. K. Nielson, "Determination of Radon Attenuation Through CoverMaterials," Unpublished.

APPENDIX Q. URANIUM HILL TAILINGS. RADIATION CONTROL ACT OF 1978
Q-1
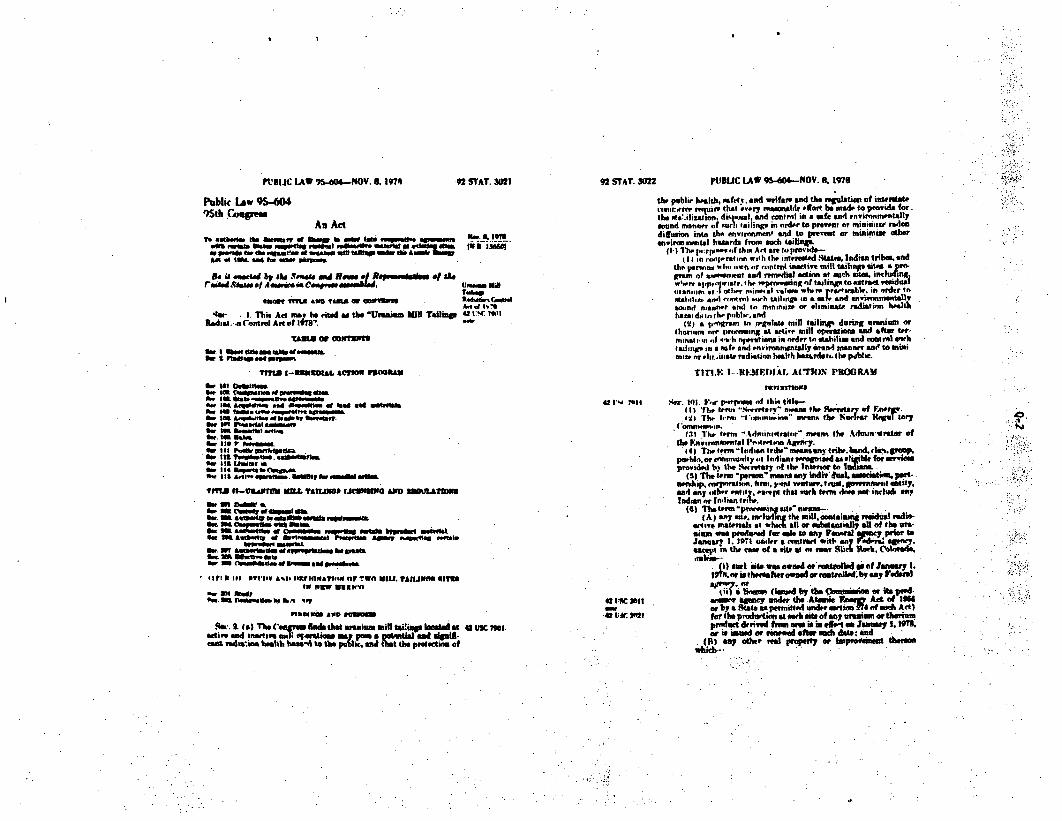
PDIJUC LAW 39S4f-l40V. S. 1914
Public LAW 95-604')Sth Gouges.
92 STAT. 3021
An ActT. SeihetmG Itoo Iesg of slowert ~ kno AP aq.e "P0f IS".S. 19
tol3o ndbndb Matria at @qsmi dia wise miiiueiii i01 Iot 013 t- mawU* 0
Ito if ~"~iad by the tauwit dad Roomeo ,I io ett.Js Rtus I A esn i Csramursm~a. Inisw mel
am. 1Ir.S &weTai orM Coorwe¶~s snrtw
4w - . This Ad way be cited N tOe 'Uranium M11 TaUIlP 42 VSC PK1111"jita. .o ontrol Act of 119231' -
TANAU OF OO11tifS141
Ow I obwoet 03 aawmpamb d'e.4" OieuM
Titl 1-11011901,61 ACTION 1`1103*3D
Sor tell Dow3133.G. to teweota or moie is.a- 046 Stoo11- IAA Loewdnik Mis Seroni of elab e watsvef
we. ==i01ho uI. gis0. lea~ a 2::=
Soc lea P14st - "m
a. Its T iWGiatbeIIJL~ ab~s
m a n-t'vemvuu ion. yOlwms ucmufb "seek&LIII
Z:i dwWe iL~ 3
be 4~Astbdm hew IPObed he OU
411'1111 11`111 VNisAIf iINC21iMATlIO OF TWO WILLi TAIUNII 111111111IN mawO maxifyi
lui-Num APO V.I
~m. ~a)The serm Sindsa eo canium, mill WSW locatsfiat 42 uSC mi.ad'. and Inactive moil olmatiomi mar= pum W&W Old dplfi-camt rad.viiaio hviel Is ba-d to the pa Aicad C the praedemi~ of
92 STAT. 3022 PIIBUC lAW 9S-604-MNOV. R. 1978
the publcw halti, sws.•. and welfare end the repletion of inteirtateimlW11rer r..Vrnff thai a;crT 90aot4111111 #101`4 be Mine to PMotid for.the ote.ilizaluon. dislxmal, and dntnrol in a afte nd environnmeatllyeound manno" if Rucli tailings in ordelr to priewot or minuintai, Maedifusion into th•, l nrinlrwimene and to preveet or mimin othermairomentasl hauwd fromn ulc tailingh .
(lI- 11w l:rju- o,,f this At aiw opoionido---(I I in rolwftinn with the intereotd .tates, Indian tbmed
te Slemo ,iUl. WA 'If h l1rlnltnt ine di.' Mill tainP sit dglum of wer-Poewni and iynH4WdiActeion at much amok inch .wwrr in 1 priral-r~ih. h eo proewasn tot tailinge to asired residualunansi or. at 'w .r "i . aal& voloha w to. rvjrs lahse. in o"der iostabilsaa And t .,,tnirn .twh tAilings an am sr and environmuentallyeoand mnea r aidl in minimie or elinminate radiation halhsaz, dd i.tlh pnulw.and
(2) a program to .wglati mill tlailingr duing uranium orthoruiM air' OanicOng at artive mill oprziom And after ter-ini.n ,| 4f.1-h n1awtilor" in order in "Lhilioe and rootral worh
tailinstsins it.e and onv.ainmentally amin nmannar an$ to i•nimaze nr alsi.ii~at radiai~on tssllih hau•.rdaeta lb. poblsc.
TiTi.x I-.-.;MX IlIA!. ATION PRW)GRAU
42i' Smg ~ . 1og. Yn prpnuimeeof qhititl*.-(I) "1n. t•n.. "N-rrde-r"- nam Sb PthNrwiwert of Foort.
71w I 1". l.-roi wo.wn miamn " men n th •we P lU " a • 1.rag
(13 ,ih lrte rm dminintralgr" imeons the Adumurnitair ofdieY~,,~unwnalI'meatmin Agrary.
i4l 13w term 'Indian tirbe" measi enva tub. band. clan. ioospIs-1in. or ennimunity g,, Indiant ivot-nissd aH aU foa oerrimprovided h)i %be Awitvirty of the Interimr to 1=
(5) Thu torm "pmnote" mnna any indiv* dua. eoeiat N pet.ssiirhip. corporal not. lierm, 'inl vnolurr. I uw. Cwrnimnet mtlity.
sui any in4hr env.itv. #aslat thai such ftrm lose no. includi anyIndian or ln'lientrA1•.
(A ) any en... in-lwadint the mill. containing iesiduaal radio-amrt. iatenials at whk-b all or suitaitally aH llof the ara-ui n ae p rod ised f or "I s to any Fi neswI a gl ey pror toJanuart I. 1971 under a contra witl. iey dImal seporn.warapt 11% the, Case of a site isat NIn ns. Slcb-h,. (4ootdo.
(i) s rt . W ai t 6o 9 0d W *Couitl l 111 e of .Ta1111 y I.l91or oi tlelhereafter ointsd or" ratrlld. by any VadW"aagfe"s. Or
(4l a Ijiuew (iomd by ties ofue its Poloupi42 t nC Wia etamay undea ehe Atlra Act of 15
- ~~~~or by a %tal at penmnistd under o uiAt,-4 VAC I21t 121 laea pmudoetiont sul its of ita marnim ortoeiu-n
prmdut drrivud froat nos is is aoleate Jensmy 1. 19M8or I is ad or Par afte smas do&: aa nd
(S) many othaer • a properlt or imp,04mo themeuhih"-
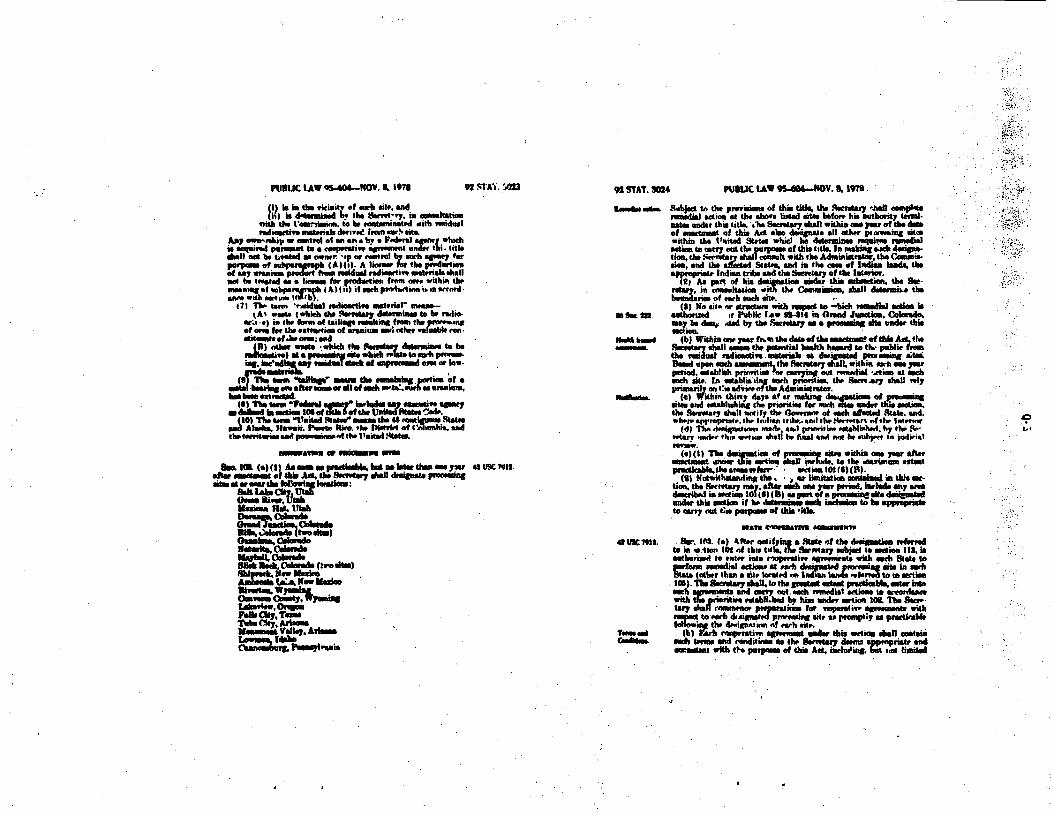
1-'
PUNKC LW 4S-640-M.OV. & 3978 92 .RTA'S. MO
11) islaI* tis :isi tV, of ear site, andit)is -unsimd 6the Serreat-ty. in - haststiaai
v~ 1w;t she t'mieslmn. to be tismntminated with rividuutMAWi@sto"y maeials deiea anu site-
AnPy owsf-rishp of eunOFA of an afta by 0 Fed..,)1 wheela gesThira psusast toa copeative W...,. =XLaiom,4111lad) no p ttwotsd M wvw 'ip or Ownttel bysadh agmene for
pevp f satps 4Ap Mb). A lawsfe the Pmdertsoaofan miUM p art fiuma ugridua radleertiv materials dolla hetreted SO a .... for yoadurtiot from rove within the
wusmug o vubglorsigjit I A) I itI) it seth im"wfvhem 6 in virard-Bitarewit Marlon 0 111 .
41, TU- term *v-AidWs tedimsrtive .at,,tlr mean*--aA% womme I whiti She Servetnay doet~rmnsae to be radio'.
NVLJ-e3 in b flip ftelaa ula from, the firme n~eof mor. for the estrartica, of uranium mel other ambeto cain.
(Iorthi woos1whidrht flrat 14*s~y&SLidrto beradleaie otUfII~ 0 t Mwhich voterProtiwlag,.. Iae'adiMY of, cp amd ame or low-
to m eU to *Wbnc um the ,iniflls~peeti of a
4 a1) oe fertm Thoia twoh II~w eamv uSammyoae hem. I Oa kaw tooau 7fwmri~sanOb
(0)i 'The #,eat "Unied qats7 e mosesesdo48MO~Ws Agmitit bped ;n mo -.U
am, 101. (a) (I As Ow S ptrohuhlm but ao ster duoam asew t 43 M 7912.ails, mosamems o" this do, SewMM doll draesigat pronga
wmat r *we*rh fat~awkslooocBakInto hkyjUta
Doesta C.,ad
51t mgbd Colmoed.(s.d.
8"a@* (Sty, s (twoohmNowee Vefley.Sm
91 STAT. 3114 PIJIUC LAW 9S-0 -4 0Ytt'. 1k 1971
ROND Sam- Sgbjaot to the proV'isii Of this titl the 204crotay 41413 eaemptvermi sation at the ahov, listed Shtea efore his omtbo.ity t,.ml.nate under this titLe. ,ll S•ctrs .doll within-omam yo of th doeof omnactnt of this Ad elm demilate all other pioainig m intwithin the tiitad Stites whiel he d4dehm ie esquirem, mdialadis, to awry out OiN purpom of this title. In manig asid dedspg-'
liog, the tw-irsr shall cooalt with the Admiistrator, the Comamao, and the sifed= Ss..• en• in the . rm nd ladsn isda theopF, .pr India tnbe and the Swerery of the ont•Arir.his ds mignshi ea •da sh mlmo~•tiom •-gemeoray, in otonsettata wito the Coamimmo, shutl dstmemiL theboundaries of tach sech site.
(S) wo &it* or grottes, with 5 - to "bid, medbis imias is.869 M~ authorized it Public Iow 03414 in Grad Jiagtiat. Colorado.
mmy be dmu AWd by the Secretary as a piemtmng ste undmr this
Nus •omd (bi Within am, ye•,, ft,ei the d"te of the eaaemni. of this Ad. 0*e- Seretoir dhll m ta e pa hial hamhh Imbsd to lb poitbic from
t e fnat rudiaodedi, materiels at designated viat swing iabaBsed upon msuh : m he flath afasy usiL, within In, eam ye-oed. -oiuslimt priewit .' e eatybnW out rendial -dAiem at iheb
m&el t. In aimbadilts merb porit•i i, thr swervaryShall relyprmh7on t* sdvieof the Admisniduiormrnd It) Witin thirty days of . r makiing d% 4 smm of
etao mad esthldihing the prioritme for at a " under 6= 2the Seirstary shall notify thw Goenwr of eah asiedS PSat. snd.whwto sp'mpnrsr slh' Indian rihe..anl tlh ipfriO .f the Inlteri,-
(? 1 si mnn made.wir a-- l pr• iie edahle't)( e. by th. 8-Mtary ndfr ibim wta w n hel he ir l and noe he oubje. t to udi'mal
(a) t0t des* pflta of atSiee ithin yarasortmoentunor tis esotion dWll irr ,:t the .na n 1ast,
(1e ) tfil-hdsad the. 'el r limitaties aintaladf in owu in60o. the frt" "nf.oft"a" a m year perid. lalade any Standenearl in section 0 (6) 1 A) SO Pas of a u aa desinatedunder this madih.. it hes isldemise. eam&ichiameudu to be @=tpee9o arty out 46, purpumeOf "hi 'it).
a wscm 791'. 301. Is) idle 4014 difying a Autoe of the daivimutio trefertoailni t11op It rof hitithe,t#hv Sereary subject to usdot'm$. is.'asthleriusi to "dter inas. dtope sivt aegiwairota with eSpar St ate to
Me) labo Set~ary sa t the guste an g Indiana eteo in etio
with tharlioritira eebilehad by himuandr wrioni 3(1 The Sear-lorydol com~to = iso 60 vrnia~tesi" an Sanets with~1 to Wted diAlgas im"o wst ras pamiwwir a pietmirafim
ng 4fhedeigation of Wal it ve.TaMG. e M 7X) a plp repatiw. agreement audtlr this mteraoo ll chat) atsnCAMM.. umdi tea. VA reniditas So the Isurrtai deeng aPpenpujts and
oeug M withte Iurp of this Ate, ineuhitiag, vu it limited
4.'
FURUC [A* 9S406-4IOV. 3, 1978 . " STAT. 300
6% a Haiskell do t6e so Of Fhderal mankams to am so"t w"ian ediyrel equired to amepleto the runedial notion ~alhd puaawamatto ouiom 1011.
(c) (1) fteept whet. the Stae% 6 re~uwd to 1 b116 1mmmdafte a provided in submelib. 4 a) = tum 61 ac peoej"MecWO nl
:ýmm with a State A a ratic ueloam1 shell Providethe tobtalin. am ftam pmtwribod bay othe Weritten smmm
(w) e" wrthe tK"-o anyi melind. sd w vbyyawto metmdi~e i(uedA) actondat sorb Uetmdsior fmI.lltoci it
moh his baire, motmeear, fall I ammmcarn leb
()b afthe Called S1lmh bomk. agans a hny bys
the Sw rat. an vbeaf otheinunthe Cb hlmmW m odr Aassigns
inrtotma her sikaed Isaprouniub have S Wetent tVAofety4 n tast nr agell.. Smmad the $,to PMvi.
rules Pvmlans .de thie Ae. Such raght of entry under thsemoionor Weinn..0 tau ant m am diea1ibed wn section 10 (4) f ) "h~ Wc-edmami on tom~imeuc of the eensdiaJ action, as dumsemaod by the'
,hail Ruh oldmer "a slthn m "b Odam ab Wed op pn,the mmari of the C(wboon wth dothe mmmd cand
M~ 7% owwmy ma in as -110o ouommt mined iatotkhi suimm Or mam I~ povide fur irmlmhueemea of the
miuml sof Mm dammimd by the cehe, an my mmmedu~l melha
Omyto a prieparty ower of regard at the timuleaich nuow-, indoanwin .-uth . Ed Only wit IepI to ems isourvmd by Each
Oee wner. No. .ih raluilarevmwu smy be wade wambo-J )ON ormdia cho. Wae ommaghtdpie to maamma of
AtheA. mad manle the application bors !Kelm-bmus amMWle by meac olwee within cam year &late anrumat 1iladr thismGIdim 00 nedinaIto 105 isppeOM by the Seciuary mnd the COO
of cthA with ~etto tam dite con,osId I tegi wit the Itam & -Ieoalhd §1 the
Administrator peroaln to feiolia 1173(s) of the Mattis FnrgyAc t oft9 oa~ IL nmi
ACminmu AM, SvMWft or eLAWN AeM A
Sao1L (a)Eadicapretialvesetumoet flwade mello .1(1 "il 41M 79I'04 he tm. womlisarnisdapprolatiatehy the -e-ear With
GOI-I no a nmiaimu. to sequine maydinlctpom
92 STAT. 3006 PUBLIC UW 9S-40(1.-NOV. t. 1973
Ias .t, aMdMf. whem eppoptlmu say .iare threul. Tv deter.mming whether to requirr the State i mms a deboArmted4 Procalesite owr Intered theren, curaleralon sheR be given lh pre ,vention
of windfeal pl ,-(b)(1) I (th SeeftW7 With the -mOSW ae of the CWmmaaNmiOn
. determiam that removal of rmidumal redim.tive mastrmal frme a proc.
, emO tiripprprieta, the C erativeen e nt d"I provrld1tW, ,h1tai =1 se q•-tend (Inlcift, whoen appropritmy
and silaaaitaunm of such uesidal rodlianiedir cuwials in ma s anldenviutonmentally mfsnd manner.
(2) Aequ•iatm by the Stabte dll nt he required wedu this sub.m..teon if a cite located an lend olarolted by ili-acertmay or madeavail"bl %7 the Serwtary of the btatior poUwwaat to mwtdaa 1%)9 )(9) ma aIeignstecl Iy the Sertrwith the. coneurfert" of the
mamtmao , 6W s•ch dimposifiteO mnd amSiliwiata.(e) No Stshtatell be required arder eutweiom (a) ny (b) to
sme1n may rmea proyertv or impromeanmt otaide the boundaries of-
(t) thot Vraton of the procming site Which is deeriued in)IA).mad
(2) hIM . and for diapudmiom of the imidul ead einotiv
(d) Ia the ee of w, ah MaJk•b wle dSaIR"WOWd Under this titleothar themea In'ise Wead. &M taeshl toe .hseteon as he aery. ad pUrMMsOt to rglaatiaS of the S•Me-.
sander that .o~hme~tmon, to s•mate that my perma who pourhes'p.oceesng ste after the realauval of radivea miale from,
zmi etc shel lb. uitjit•ed sto an uppeopi•ste mae pr SOr t 'p of the nature mad extent of residual rom•t.mitberumI d from she .,te. ia•iudil nomti of 'he dtme Vhm Euch acton
ltd~aoe to*k elmn, cand the ereiditio of mach mete after such maeio. tf theStat m the Owner of au si t.e ,lha Sate shll em notify mna prtop".tiveerelanthcribs.forecnta~ int If" atrt. option. or Itherarrange-
11111.1,11 muot to m olp ou== = sits. he S. t 7 •hadlhqel-ole, lio apprqpriate "the mand esgu ieftia to 16"tAwift atic n tak lwoa
lend reords of te "adudl radioativs materials whl wee locaedand~t~ mcieo teau and cuteart of ivaidaml
)(mtt mmiead mmd.- beoe XNu AW o tememmt with
aI Staute eader imela I aI proihdll perdeo i athein of mny Iandor ioteraeftherein meqoflkm by th tl In to sbmertiiu (6).the State, ar;ýa the eeur.of the Seautatay an the moanio6
permeneatly twain EahIne fan l l Iama Iis baea for&iInch lead. amd interests therein1 to mathoomrrmmtaJ
swaty within such State) for pewutm mIStII oW soely for p erk . u m tlo ia, eth r p ub li Sm e or
trilane, adA lands and interec to the Vaited I stem WmProvdedin sburion(f).
ff. =I s b~e sl ad mkeruela: (A) Mwthe th. .Aof aathe' NJeem and h Oonmih o.i& jgit may be gmi unader Sub-WWeral (A) oQrretained unde tMuhEMue (it) if Such isi
WSW for 'he d sanlic of enldumadloetie Materials.
PIUC LAW $4001.-NOV. 8. 1978 92 STAT. 3027
(2) NIa,.r alfaing for ask Ol lem ads mand minteret therein wbhica Om a parmnrgf ars, timh .ta dall ofer to ,I Such 'endsand lo.rede at th it air market value to the per•n ftrnm whom theqlat acquired them
if) i It PAch ac Gast lader 10 sihall provded that titleto--
% A) the seidual radioactive mnoriais aubject to the sq renwet.
(D) any lands and iatema therein which h•ve h- acquiredbthe Satat. under subsection (a) or 4b), for Ohn disposition
shall be transferred by the qiate to the Seremar wham tdo Secretarytwith do coneurropes of the Comnmissionl detetmiumthm at reeialeat... in completed tn arorecimice, with the reqluirement. imposed par.mant to "hi title. No pymat shall be ml in connection with thetrouaefs# of or-bh poopery from ands pritad for perpuOt ofthin Act other then payment.f MY u GItotiva end tegal Oincurred in cumying out subh tumf•r..
(u) , y of any trany sfe o the United 9tetesI .. Sethis ombeectios i by the Seretary or such Federalse a the Pdmdt may d• t.Newit.hinding any other
prof en of lawapt. GP mlotion of thi remedial actionantbnrimmd by thit title. ec pmeetr MAd minmea shall C'mm.tainAd Plroaton toe Fi liemied iyeC~mnmummo in tM& mannerGO will prtett the publie b0eeth, ofety, mnd the osvirnmaL Thecmbm may, PUMAt to M Ic ormm by rule oa order. rquirethe Secrreta rym other Federl 0886.y having -- ,dy of each pvop-erty and mneralo to nadmsahe such moniborin, mainteamnce. and
f mmmm nie. to peallct Publi hoWth and fety, andetoo eadtos ms th Clommisn doom nece y to crmply with theetamdard f action 2751a) of the -,tm e nerg Act of 1t54. The . V.
Secretary -r such other Federal ageny a. outborsid to carry outsaintenance. m,.ioriag amd ors,,genwy m0lamrem nder this Gmuoe.
ties, but shell take no Other action pruament to smeb lhegen, rule orolder with re-Ft to lack plroy and A ndeaale MnlM elpludysa .hor , ras after the dat. of m itm*w of this Ac. lit.United Staten thai not Itreder title to property ,, iltlet therein0curad •undor mbett tio to mype Omn State. oempt s pia.vidtn mumbsmtia (hM.
dea "ach (n 1 s)1Si log viad. permit. an tiubIon .)(l(A) hafprovide, fOwthe promipt sauis.
horsemant to tie Secretary from the pied of mch "ke. Surh Wmi.kurenmeot sheal e inm amnm ant equal to the letr of-
(1) that poatio of the fair maret value of thm lasector later.a thecm which bea t#h mamf t•to to such feir marketvale a the Tedennl sharm of the eeetm of aeuuition by the Stateto at -h [dV iatNow"nnet tierin = to tle tOtal of wecb
lthe totaglosoa paid by ther Secrtary -vit re &ct
The fair e ast ofla . ileah mc o iatmume "ul be determined Fs mAkaby ;we SecretaryU soof the dafa of the ale by the Ste. Aly jenounte dwrsn,.ved by the Ser•ea udar this 'ids sihll be dopmlad in theTreasry of the United tal•smieas neem reaipt.
92 STAT. 308 PUBIJC LAW 9S-&0-NOV. & 1978
(ht) Ito provision of any agreement under section 109 shell prfohibithe rr y of th ntrenor, wth the ooncrrunee of the Secra-"torySoot 9Enja~ry0and the@ Conunsimio, from disosin of many saub-.fe miIr right. by male or lma (I w dna with laws of thmUnited states applikbs to the *le, 1*--, or l" disposal of meahright.) which ale m ciated with land on which residual radiomb"material wa disposed and which are trpahe rd to the Unitedstates .m required mider tis -stion ithe e*retMary of the Interiortaksmuch gaion a$ the 0r-qm~ade daru dille=a .pnal .m to alhm. imaned by the Ckmaimnir to amm tat th kd radie-ti" matriel. will aft I di turbed by "ea of any activity Oermedon following such di uiitio If ay such mtoteri a distrbod byany aurboa•tvaty tha t. 7v of tit Intetrkw all 861 re prinoto thedimsltiosof•Lth mmsila, that tach materials will be meftud toam
afe antd onvircrA t"y rm Od coadtian ea determimnd by tha One-mimaloa and tk thr cram of esch reitoratien will be borne by theprre.r ac. sirunch ir-.in from the Secretary of the Interior or from
mtir- eo aonemevym
t4 V 7s0ns. Sec. 105. (0 -, nttifpay the Indeas tribe of th aepur~lulme to mit. i of ath titb •le the Secsietary in la~tis withthe See•"aur of dbo Interior, i eautLhorid to eftw atom eaopaOATiveegremast, subject to moction 1.111, with may Indian trite to farm
remedia on~aat adesignaited pana ielctdoach Indian tribe. fl Secretary hall. to the CA-dA cubit prin.tla enter Vt Mc aIVnmee and •rn• aut ach rmedil eatirAin aeeordalce with th* prioriti esmtalalished by him under motia 101.
lpeformin • any emned il a.ctinr under thisa motion and in carryin=tt Ray onotmnued manila or maintennc caqietling tedami
relo .tr niteiaa s. with any ad#teubjcttao'ert.egramont rader this oeiscia," doe ectawl
y qualified mebs of Indima tribes re nt in the vicinity of anylam mad sac ite. Farch such sgreemeat d"S ountain each terms end condition.dai, an the Secretary dem n appropriat mad cmisto at with the purpe.
of this Act. SOc term. and cdition shll requir the following:AIT l ndian tribe and any Ireom hold n irnterne tland sehll eecute a waiver (A) rslesain" the United States
of anhy llobilt o claim thereof by such tribe or persn concern-"ng suc= &Ih alction and (6I holdi the United Staes bat-.-.ho againt any claim writaig ut of the .iumnce of any suchemedial action.
(2) The@ rmedial action shal be selected! end performed ina remidne with saction 108 by the Secretary O tauch peteai ambe may deotwite.
(a) The •cretarry, the Commleson. and the Ad-niniestsato madtheir authorimad m. Pal .ntatievm Nhll have a permanent right of
of the Ipo a aet',moftItfu ttltje, to c1rry out much a uwrvtnet.modto enfioce any rules piec'bed under shim Act.
FAeh areement under "h sction shall take elect only upon c oaulrimo of the Cemmission with the terms and WaMd=iee of
(b) When the Secretary Vi the inno Pueac of the Counimiemdm.m removal of midmal radioeative matearlle teim a pmo..
Cr
.A~.'lat.Je.Lb.a..i-n-., -. - .~aeM..oshAtooli&... ... i..., -
PUBUC LAW 95-604--NOV. &. 1978 92 .TAT. 3029
is anit t asdeactbed in msbmcrtion (a) tobhe apppriate. he shellprotide. ciwrsi 0t with iaber appible provisiom lew. • site orst for the permenent disposition and itaNlization in a @of* andavrounseseilly road meior of such residual radioartiv materils.Such mat•shldiall e transferred tos •leStetary (without payment Tissu intherefor by the werrtar1) and permaantll retained sol manesin.l.I smase, oeftby the aristry ufere A onaditmoss es lishoed o a liosom iqs d lo w-m.by th CommIsimen. robljct to section t1-4f)(2) and (h).
AtCtUMNe OF tANDOM MIVWTAM
Sar. I(M. Where mn t, or" sjprPnese in order to rionelidate in 42 U9C tee.a Rste and onvironemsslly u masser the location of vesidualrediometive meterials which ae sm nmved frn p nmm s mte under
giopersive agreements under thi title, or whem otherwise ueasmorfur the permanent disposition sad stehbilistion of meah materiab inwhma nner
() the Sueritasy weay soont lend nod int n tsend for.eg purposeso by purhebess, donation. or undet any otheat authority
of law or(21 the Secretary of tL Intarilor my neab* avalable public
,ade adminiaterd byb him for serb pPeq e in etIOl Sam witho applictl prvimions of law.
PIore to equisitiae of lend mnder parerz (1) or (2) of this sub. Cauio.section in any Sktai. the Sereastay Ane I oemsult with the (lovremorof seuh Stt. No land@ wsy be acquired under euch pasepejih (I)
or is isay~sivn w i .'lem~is ll protming sitedeagstedeeL this title of (t) attive oaamium mill operation. unless the Sir.moany has obetiaid tEe eut of the Gorerno of such S•ate. No
snda eo•ronulled by saa Federal =gsov may be treefrrvd to theSece. "a 0 Carry out the porpu of thi Act without the e notof the chief edminitrative off.e of iebh gecy.
Soc. toy. (a) In the aso y of an diatbed itieforuwbi 4 N7917.as gp ' is Raeuted with soy Stats f no a-tion at suchrto tIhe Preretare dalsl pay 9 per cejium of the "nel too of such
umidil aectbn. including the dtual cos of aquirsinp ej s*it (odmy interes therein) or so? du"iion site (sad sny intervet thermin)tIuest to section l Othis titl,, and the S1tate shall pay the remain.deor of such emu• nov .Fe-ieal fe. The Sec•tary shell not paythe ambinistrative - incurred by any State to develop, IpNpe.sad eirr' am sy -oo emtie agreemnt useated with asuch ̀ tte
ander thi title. escape the ;pr eta share of the diniedrtiveMe"a scieted with the onquto ton of lande snd intere•s therei:.
ml7 uirdby .h Steme pement totbi title(b_) to th a of an., pruceing shte Ioatae rit Indian
lande. the SIM" shall pay the s=i t am of webh reediel acrt•
WASlAL SF510
Sac.. lO& 11) The Sert= or such permsentohe my designate 4s UsC 9itshl eet Perform la betlossat dsantd - shot
end disposal seant in accardaenos with the geneod =p =adreprescibed
92 STAT. 3030 PUBLUC LAW 9"sd0--NOV. &. 1978y. i0by the Ahdninuirtor purmutat to section 273 . of the Atostdi Energ
F., p S039 Act of 1954. The Stare shall partiilpats fully in the selection sod1pe"rfAiswe Of re-nilial action for which it. Cs•. Pad of the cod.Suh remedial action shall be selected nd erlra d with te coa-eurrence of the Comimion and in osmaultatiomn, so appropriate, withthe Indian tribe and time Secretary of the Interior.
(2) Thm Secretary shall emotechnology in performneingsuch rfedalsaction en will insure complianoe with the Inra stendards IIInulIted by the Administretor.under section .. 5 a. of the Atomic =nergAnt of 1954 and will samue the soft sod seovrimmeMally Roundatabilization of residual radioactive materials. consistent with exst-log law. No such rmedial action may be undertaken under t&is •ctionbe]." the proinulgetion by the Admitinixtrator of stuc standards,
(tsute Il) Prior to undertaking my remedial actin at a designated sitepuimuat to this title. the Soeray shll relAit pso of inter-an from private parties regarding the remilling of the mdoaZ rod*aetire materials at the site ned, upon recept of any e ofinterns, the Secretary shall evaluate mongot thinle te r minelcoentoration of the residual radioactive materials at iech designatedproesing sitc to determine whether, as a part of sny medial actionprogren. r of such minerals iq practicable. The Secretayt withthe cononon of the Coomimion. may permit the recovery o0 suchminaerls, under such terms and conditios ache may pnecri'e to 'ryout the purpoe of this title. No s revey shall be p iunless such eovery is conmsient with remedial actio. Ayp=r td by the Seeetary to reovet such mineral shall pay to the
-tary a share of the ret profits derived from such recovery, endetermin~ed by the Ikecetary. Roth share shal not eamned the totalaomount paid by th S.ecrtary for carrying out remedial action at e•undeignamed site. After payment of euch share to the United Stataaunder this eubrmftion. such person shall pay to the State in whichthe residual rsdioectise materials ae located a harea of the net prfu•tsderived from aurl. reovery, an determined by the Sereary". Theperon recein such mintrls shall beat all cost of each recovery.Any mpersunr •rying out mineral recovery activities under this pars-graph dsoll be required to obtain any nemmmcv 1;e under tieAtomic Ener"y Art of 19M4 or under State law an permitted under
42 UC 201t. ection 274 of such AdctEmu
ADAl
42 tSC 7919. Sec. too.. ?he Secrtry may pr.sce such Tales nsint. withthe prorof this Adt a he deems prpit puruant to title Vof the Dpa.oritmetof EUNeryOraiaonAt
1 VS$C 7M. Se. 110. (&)(1) Any peron who violatte s pvi of thistitl or asy cooperatviv ito pugsuant to thii tileor ay rule prn, erilh under this Act aIe g el mm dsignte pru-mi site, dispiition mite. or reedil actionm amh be sabjec to so
inmnent ~ %o a a~ civil :=al of not amor than ppooyeamb-f per day per violation. Soc asessment be made by order aflar"peeiods. •ecrit and an opportunity for a public heasting, pa ti to section
554 of titleS, United esta Code(2) Any nes against wbhm a poeaty In m id r thk me-
t6on may. within sty calender days after th date of the older of
....... ...... .1 - - ý!.";- -'.. - . , I .. .
PVRIUC lAW 9S4.6--0.vM IL.6 1978 92 STAT. 3031
the frewtay mamm a penalty, i t islat an action in the VisitedStats. enot -f appeals for the appropriate judaicial ceemti for juadicialrwve, on( eerh order in mvarridnwe with chapter I of itls IV. Vnilel*stmk Voela. The court shell have jurtalictm to toter a juinViont S ustWO a• meaffirtigs "odifyin. or ntting atd 1n 10~ orin 1a iste erar of larewimseathe ,viierlyt or the, o•trt mle .ad toir i•r he 2rrstyor eci tthratei over me, direct.
I any Person fia to Vey an .etaen•l of a civil Iszety afterIacotyev a Fetl Wne wiappealable order, the Moreretasy -&All
jIintatot nato omme h ao on c f h penalty in anypr-Pime. ,lianract curt of the United U... in ea action, tevaliditean apprn atem1e of such int a t rned or ordenr p shallem. be subject to mvi*w. Section 401(d) ofdte Department of -not 4ti pslmisuu Act "a no t apply with I ±psc to the funions of t 4y
(4) Nhor i, I palty ay he an awana the nmited • oran taeor pohtiral eheirmos of a Staite or any adleial ear employee
(5)~ ~ ~ ~ ~~po Nohndntmstnaelpe wnti Sarntsay from. amfort-tag any vine of this title or an, repaerative maremsnt" m anysuch rl .is victimsn or other -quiatelle 1ivewdy.
(b) = (a) do vat opply to any lien1e1i1a rqientwedor the Atomic Eseely Act of 1i6t Much licensieg mIqulinsmento 4e1;sc 11dshol be onfoeed by the Commiai a provided in voch Ac. el,.
IvlUm pa•amwavww
Sam fit. ia onlyin out dorelpovimm oa ths title. includig thse 42 MS 911*.designaution of agsatem, matlifthing, prioekiti for such site.,the el-tim of eial adle, and diW enete I of Couperative7~mnsn~the Secretary,. the AdJnimera'io. and the Conamimn•on
paitilitim nd.wheom appinopirinta. tdo -er-*oar hall pub~lic atwsi irs wiito mA mature en tis Stain
w et, eming sites end dioaal site ore 'urtmed.
sm I It (a jhe authority, of the Soctuary auoi rewlal USC 79nt.tL BI•~ti Aostato reinvili
Ath stuiesr title dabol tsimiatt an the date MV"n tor aftrthe date of pmulgailon b the A dniinramo of ene tandaappicablea lto much evrds enia tices suchm owteeminatimm date isapniflrslly etxteded Ity a Act of(C'npi enacted after the dlate ofesottnentof tie. Art..
(b The aameqen tut..Prim bedptobea to rnry out theperamm ofthi tile y iesSaristry.CT2.alntliffto, do, Come-
ma ea the gostary of the lnt*rior @hal en.t eced gmearimnmitao am a erablimbee d atnntil authaolsatln Aas for Uawl yearim7 and mach focal yr ithreafter aplml to the l36parment ofF.nvq.. Any .i mn ad for the pFor of this title JWlbe avlable util pd".
,4w-. Il itheU authority under thin title to enter into tontracts or a vq 791n.other obigiatloa requkirings the Vniteld R41111 to Mnab ulys r10Y Osy
92 STAT. 3182 PUBUC LAW 9S-dtt-NOV. & 1978
imetion and asspueapriathon Actia
a tiUl 7924 Set. 114. (a) Bleginning ain Janary 1, 19,0 a dauch yathwi atuntil January I. I• M. the Soe eoatry "ht sulait a evport to the Con-
Coifmp ajo We ther eretusof tirelteun 8e,.mquirad to he sakaft by theoroe, the (immnion. the •*ab ,t of be Interior, the Adminit"
trator. "ndota Statma an Indian Iftrime under this Art and! any amjenad-tm a to•teher lawe made by this Acs. FAch eport hoall-
(1) itlo& dau an the actual amnd mitraed cmi of use Ie.gam asstorisml by thi, thlo;
o descrbe theetent of paticipation by thea State and
(5) a"v$au this •efttit"v of tnradial akin. a dems da pipbises auiscismtd with the perforeo aft of Iench adion.;
(4) contain mach other iftinat;on en m a p h rtSeth rexport "ed ba ptaepcied sn commisltaeme w-t" thas Conmetteethe q -re'MY of the Interimr, and the Admiunistrator sand shall Omanther impartot wisewa, emmummta. ened tvosermendisimea if say. 71aCAMisaeiz shll sunsut to "e SWAVIAtay sad CýOna eri portionof ", ew reotender thara MAu adit in few"at to the sauthoritime ofthe(tisimoee und.aorta• 1 of this Ae
b ot latew then July t1, rt al pe979d e ragutmaItotiatarsu w"' hichs idenelle all sate. = ofate np& oreqrd
nd her taida m~oat (otr thn wade raiting f the pm-dota of etlectric metep) and ipecitae wicbih red"ra a EWAybjovindiefisa, over nick sates. The ropiayt shel tinclud thee= of
= sad o•• er daturst ir thn viinity of rie " that a•or may be contaminiatsd by each, materialism .d the
ariserii plamnnd or taken to tImova webi matereabm. Time retost shalldomrlsh to what smaner earch Wsat ma adimpsatey stabilmd andotliarwie contmlled to prevent rendo difumem fisma emeh sit intothIe e n cd othr environ limt IhfI my it% io " en
mehileie or controlled. the r ft sHl datebeihe ithe sectionspiano"dfoerMuh ate a"d the tien. frmoe; for terarimeinginc marcotmons.,
Impeaigthe reits ntrser Slits metimn, tim saoti "'ll aSoiddp licato f i ed i a u i2na for-ssinri .t ra . of the United
Cr. s States rap the table m••ttr of vobi eport. Sorh agndeislash~~~ onoatae wth he in the prepatecisonof aerni repor
ad furnmb e, inchfoenewtico ass awihinile to tha and ustatoay for
(r~elistr tan Janury1 IMA the Adesdimm.*eor, in ansatetine wi h o~vaý t hl lbsimi a~mn Wept tolheongeen ,gtm b~~~t~~~be ~ k tisla o sa ust.ealth, mifaty. sad enrmaiutal%asamedo 4f raniusnim , e e"astie wit.) reaimmdatieer ifany furaropassmmtodinimiAtbasmadt
(a) COpems.o 'th opr eorsareqited by this nctio, to be slmaifttedto the Om=grea desal. he ewrsofy submsitted to the Oesiodwas anInterior said Ineular Affair seed ob fountaint and Foeeig Camnessee
IL
.seieaa.ia ~ a. fre.L~Ja ~ ... ... ~' * .. ~.dui.r.
Mli' l,. LAW qI,,--lOV. . 197,I 92 STAT. NS
of the BM ,Jf RIrbmnsfie and the COMMit an nrg eMdNMtural Riaunoreef theo 9ee
1a) -Ae Cammsmon. in coperation with te hsectarvy. molmsta any rvlenst inftmetioe, otbor than tnmie rvc, end other
porea" * foreastice 4arwwit asemupWta f-a 'tmandantory, die-,-, msuony oevw a of law. abubd f. the conduct
of eac of the nmmmIl setions sauhorlaed by this title vae the sob.m p.e petputla me of those •lende radioactive ,taria is d&c.mmml eematimlly, w?• t ove pbUely ailalale comumuitly forImSO
Sle 1L to) mN ema h m he - Ie-dve__ r "i title with 4o UK" ;u.muon to any "i liealnd by the Ceatmimao m nder the Atonic
AerwtAt of 1904 ot by aSatao - peemittad under rtlone U4 of GtM20tiembp-rodct which id of N uralnium pdw ftom am ee(Other then ream amidwal ridloeaice m , a )SC m i
of eaofh 1 amm*•in•o et digneedhlhe mAlwy o clonut ai dy to detmidne thn•e Idlatlsel legal emehiltyo whih my person father then the United
ae or Indian tube) who owned or() -- e or Ieeetlle
aaehon w the Artm-reclemetimt at Other amedie actias wMt moped to snob Atc, Ie
inch udy, j, to the etant he deem itppiprieta dIn thep'tliaoe i1tervet. tabs mit ee•oi W1 gary owpro lnct of law in i 1 iJview urianismwee proid sed at vuchit"to to , ~ t bysue
h h fe•bpmutml'l prml imti lieb ilt.
TmIt 1I-uk~ f miL Tk waI s UC4 icS0wo AYDREGULATION DRIlFfIOWY
Sec. 901. Section lIt of the Atonaic Tzwrg Actof 1984josmeodedi a sc tw tito read so fullows:
'% the tenabyped ust atrilaP emee (I) my Iestlu -ometaW~ mrWa (exept woral erw material) Yaadd in o so madeeiliseoiwe 2=0by expenev to the Miedi"o itiniest to the presn of penloeing orWtlizingl v 1t outlas material, AMd (2) the talip or WNWproesd by iTs extrctIveton or conmtoato- of awinne.s orthem
frmy am aftI primarily fo its "am motaI oMuateo~
#"owve or am"a" W"
Sm UL OWw, e Citapre4of Go 0.tenit Zma. Afg of w I auxne
SUL 'bon Daorm" St.-cAny Boos me or amawu aftier the 0 eW u dat thk
abin n erami. U or -,tion ta Ofr y whoft sem& t 1 4 c UK2WIn the prmcI-, of saybyprod usmteriLuellne d inameile lie. Sll~.
a tUc mat
9-A STAT. 3054 PuDUC LAW 9Sa406-flov. L 1978
(I). dotll conatin meh termn end roaMitiomn t the Cammsimam dater-minei to be nuatry tasome that, prior to tmiuintiom of GO&
•1) the lioans". will C .%ply with deomamin•tion, doeWnmWimdnga end r•ctmataont wen•ardi pir lwd by the Cammimieofeor ste (A) at which unet Were pruesed primarily for thermosei maeterial comtent aind (n) at which euch byproduct maltriallediepeiftad.on
"(t+) ownerihip of any byproduct material. a dto ned in ew-4t s1C Sale. ties it . (2), whUich mtttd fui m sueeh 'lmuond ativity va
be trenfermed to (A) the utnited States or 4l) in the Sate inwhich each sttirly oscarritd sfuech 0ecto evereitmo the Optionunder suhection b1 (1) to aeois land und4ti the dinpeeal of
bpoutmateriell.Any lice... i% reat On the d40e of the enactment of this actim jaieither amisi chtrm d~ •n~d•~e on tel theeof af the,1,!. data of Ahina•.ion or amply with persloL (I) end 12)upon 0he termination of euch oer, wblcehider" ro names.
Ma -aee -b)(1)(AI) Ile CAmmi.ion Wul iqMire by role, el, gtlo., ororder that prior to the terminstion of any licess whh it Imms d starthe dat"ve data of this Olction, title to the kn&t including say iater-oft therein (other than U lanowed by the United Statn or, by a
swhich is wal for the diepant o enf anyvroduct matierial~•ndendby action 11 a. (Il). purvunat to auth jssdail le IneaUss
ferlld to-"() the Inited Stamor,
B ithe et in whieli, ech lead is los-stal. atthe opetio ofeatcheA d
lg8) (um the Comminmio deteemins prior to each formnimtiontIh transfer of title to sh ld and aMch byprodt uet.isl in rioa. -vey or dauleAl to protect t1w Publir hath. infety. or Welfare,6. to nainimise or eliminate dan+r to life or p etz. Such adae-miastion shall be mode in accordance wit section It of this AOt.Ilutwithiatndang any other protmasn of law or a" mach datiermies-tion. eriehur orety sani naateeuale abell be inairaalel pruetlvese- its by IhV4omam pusarnet, to faction =Z7) s acmain. as will potec the public halt. mstt. end Ons" eardamuot.
"(8) I f Iho•ni drtet imeby onldetirmof dl mrMamor salmurfe mluatia or both. of theland trW m I d to to UnitedSusa. or to a tate ea • dparnemeph (A) Rlot Onden. thepublic heaklh. eslaty. welfame or ownsam _ the Ce mopur_-met to nea rugulatimae sa it mAy pl•a•itbei ht pemit the m ofthe anrfemw or oubmertwoe uata-, or both, of seab al mi maimoeoma nt with the provliuime of ta metion. If the Commaimle
pe" achuit suc of haed, it doll pmad the pmat wI* tree-lrvlscUMwit the righ of BAAt refund with ,uiito each
veaof seh lnd."ý )If tm a far to th e U n ited S ta t, o f titl t0 " a" ' b
w1A m an Is reired Under %tin mie, the Bic-taOf Emegy or anY Vadees *Xrac aliqstad by th Fidm helfollowivg the Ceanmiukaile dwpatnnlnahon of eaieplisuamea udr mab."CUtM cm title " ad owiody oeec m yb b atearial sodbld transferred am ploydestin ilk subsection. Sash See-rotas or
Madeta aency "D maint•a s" material ead bad in mea mannermnwi protsat the publinc health and samty an the amvrmanst. Such
on
PUBUC LAW 9.--t-NOV. & 1978 92 STAT.•055 92 STAT. 3036 PURUC LAW 9SA06-141011- A, 1978
c mary w ay be trnanerred to another 0Am or instumentality ofe United , only "s A lof the Paid"L."(3) If t=for to a o! tite to each byproduct mteril is
rqured in eo-ovdm with thisheactime such Statll shll. followingShe t'ommiwn'e dateirminsmo of romplie'ce nder coectin d,
fme title and cudy of much byproduct material and land trace-fermd as provided in this bmction. .uh State shell maintain eachmaterinal and :sod in surh mmanneo 4 wiU protect the public helth,safot lind tle envionmmL.
"(41 In the c of amy amth iomem under a ome G, whic wee 42 Usc 3m.in effect om th effecive dato of this actiom. the OCmm mtym ire. before the lomaeiuin of wuh licens. each trameafr of ined
iateua thean 1• drribed in := (!) elthlaauh-aiim,) to d& tst or a Stat i whi-h m 4la locate4d.at the option uf muck Mtu. a may be neecesry to psulac the publichlmth. oltsi". and the anuironmuet from any el•et• inci d .with
sur~rp~octmatria Inasarcuinig the autharit:7of this Par,,hall tae into eoIdommed• tsh tatea of the
ewwoe, lsp of meul jand end iterests therein and the ability of thelikens to tom~fer tist end cealdy thervof to the Unitowd or
(6)The im tim to & e mme, ormby t"or odw.do~h tJ 8 rr7 • odin .W *#dad lMq or Stmike bevies Cos-odyf each property end Material to undertake sich mitoriutj.m •, and mene~ -y mstamtmenet as nsmau to Ioed th
=Ml healh u esfoty -il such other &din= an . he • im
swaneta, hIi ael ). en, +,ewo J sten.• parla to_ rmach• lo,isT louthm n d to n cu~t m MM' th ~ am mwtoOr•8mr ordl.wiham pei to each tmi tst•erol e sen o ehimhy
byh Cued gm b aofter ot f M t& n of - tis Aill he ntranfae )n titl otoawdor yroedn• t mftusi., mse defind
instm IaIa ().nloat#e or the1t0. c tadipumanttethin sub. atc W MaBOAionU 11all Ot reies. any llAma Of liability fur -5y tfedahut
orouo it daa Por to such trieaer.(Wr)Memriesa" inatyasenferrd to the Unta~ed &tan or a State
is nssewani with thes mabersio slall he tranefoinud withou teeso the I
T!%kWd State. or a ta 4sto ther then adminisrative and legal
+ remu urt ern , du n such i sasmfr). Sobi1 t to the previ.-k of ;: = 71011)'. thi bii.,ai the nITan Stat. ofra
State Shall et trANsfer Util. to MatWta Of PrpWatj "Waqud Wkidrchip mabmectima to an W4sn union smih trammfer a in thWne mom an-w as provided = t c to le) of the rewnmill Tailings
PadiAmie ContolActofaM.'(11) Th~e peoris of this subsection rspectng ermida of Mt)
n, o 7 so len d It. in t hle, a. of lnds bald In ta"by the. Utrmd Swas for say tin tibheo ccsids owned by muchAntile tllsi subject to a rairittiu egainst sleistiom impoand bythe Uitaed Steamm In "hea of each leob which an aimed for the die--a of byproduct m inidasdelned be sclemI I4 gle. .the Vessnlsshall be "Prequds to ~ae into ver ofh W smgmto Vfth Commoditieas may ha appropriate, to inie the Iimig-tervem aaitsmnc and mould-
tain of k* lads y th Vniedtalm"r- Pm terminaio.n enny Ioia to Whic thi 6i eppalims,
tie Commiom "lU dftravues whether &a not the hie bus o
=Imnbd ith al applicable standard aend requiemomnt under suh
ILmso li. (b) Mhe sction shall be effe, aIv three ymar sfter the enactmmt42 USC 2S13 ofth"sActa(w- ).The table of eontent* for chapter 8oE thoO Atomic one"y Act
of 19I4, I usdI by imntrim& the following new itm atq• theitem tolat to,,rtong 2:"sm. a Ows11blhp en -* •od of eortase 1• etor mtwlbtab l and b I
ae~rsoe 0 mrmlT+ wrIAtHI esinewoMs~
42 L 2i2. S • SOL SAetion i10 of the Atomic Enmtp Act of 18941 isamended by adding the following now sabction at the and tihlamr
"x. F#blush bty rule, nrdgulataen. or order. otter public a un, and4: ttic mi. in tmordea•n .l 'the requirements of action I1t of this Act euch
sandirabe nd instrutto, as the Cummimien ,ay dram *amar ccdatrnbl to mm,--"1I) that an edeli hn d, mnety, orr ther financial an1J o-
minet (-a determined by the Co•,noiuon) win he provided,bafot taination of amy Wmenm for byproduct materil as42 USC 2014 Mdn 'a In as II a. (2), bea hoIiest to pmnuit the oeoplatlio
of all totquirstoe a stakalisbi by the (`animisacs for the dealo,lamieation. -sommm c +ionnn md rerlsmation of tite. atlsailr," ne'* nt used in conjunction with byproduct ousr•t tm
'(2) that-'(A) in the rwof any emuh lit m e or renew• d sfter
the dat of toh ia-tmrs of ehis activttie. the nevl far longterm maintemnan and monitaring of msub sitels strucltaumAnd equipme after termination of math lim•tm will beminim d Wand. to the maximum extent precticable.eliminated. an
8(5) in the e• m of each Ii•f' e =0&sd Immaemrial (wbathehe efMc on tha data of the sneilmuet of th" satials cc Woodor renwed t hreafter 1.u the Ccanualm d•.aivn•i that anymsb long-term maiternmn amd mnicaitoring isI _eIY. the
lenebefore t-rinination of any limits for bypuuidrtmlatrial as defined in m4.how II #. (2), Vim make a,-ilablemuch boanding, eurety. or ier smanla Wm U ma as maybe necemary to aunet muh. long-tami amnsianon and
Such standards alinstructions promulgated by the Coinmion purstaet to this subset ion shall take into acoonent. as datermined by theCommuison. an to to avoid unnftn•7 duplication and exspenms ler-formants bond or other Financial ar.mageeueta which *r r tdhother Fedleral siltation or State sponrift and/ct other lcate aoe--ing bediss for such daomsmon detrantammlnation. and reclania.twm and long-rm :M.3a.aina. m ng nohinIn t"i psrarah Whel be construed to require that fleConimitiionaccept math d or rangmrinot if the Cnnmmemman d4terminue thatmachi hoond or a reaamnient art not aidequate to oMcaryot wabPava-graphic (I) and (2) tfthieNVActien.
42 USC 3I1. Sm M04. a) Section M,4 b. of dt Atom ic Enq Act of 1954 is.Ane by adding Is defined it actn 11 a. (i aftahei the wees
MAM"ek- a-
PU• IC LAW 95.04.-NOV. SI 1971 92 STAT. 3037
byrnk --a~t "W . ago (I I by v.oumtaaris ParsS) and (a) as paragraphs (5) epa-0 1 p a (m
mgiw& no rst phmtmi diatal Za)"() bu4odmct nututa rb me duffad in actnmI I 4L (2".(b) Semis'976 d. (U) of such Act s amenided by isemmg The fol. 4 U ,3.
lowng belore the word -compatible": "in anodae with the'= rr gntof alm tion a sad inall nther .rect".
T ) S1ai3 97d4 . of such Act in amended -- addi the WW. weatmam ag the eW theseof: 'As edin "hi Msum, the t-r heAv" ýasg A jaded" -,y am.&ndme.,. •t to uag-(a) SwoJaim914 joffmth ActIs- -
II byal brart~ag -etno. T• mnu"af ms-• - •.Uu du ug(* (1) em 54 pa ,~ •in emond d b dm ~ oo,M( addin ute nd before the Peuiod the M-ISingfer () 1State an wem.'nliem with ame or wiet. 'f the fequtem of t hs aItMi. I% e Oen.--a _afti tl wi •waI riesw . taeah agramasemi and fatetia taken by The St"matnada agree.~mam" To *er* cmnpliaanc with the Pro 0 n of thindmcam..
Wo~94 of -erb Adt is amended by ackding the following
in action I1 9. (2) of this Adt. or of any activity seclh ermalts tthe pradaetimeof byproduct vartariaso aso 41101111101 0der Am aglenuns nto psimma to muaetatf k, a SOat taflf require-
'(3I I emphaeo with the nequimem~ntd of suhecune b. of tee-teS 63 wte wmnu ownership of hYPodact nseriasl sud 'aNd).
SW(2) c nm wdih dsanderde which tsuhallb 6&adot II .thStat een ta. pruuertio of the public behkh, se o theseisenment fhum hanse misted with su iat n ulW-- whera euValeW. to the e~ntari eedcei. or "mosrningent than,atandarib adoptsd andanoened by theCoannands.forthe me" R~. Win uludn requiretmiOta and smadardsa prooulzaetd hitheq im s and the AdnaW.Mnmiatoro the inviuamantsProecio Aiteny puremat to mactor a.0ft san M7. mad iA% pý 3033.
TA") ion the eas of Wuroprldis paneducsa underStab law Which incude.-
*(i)641opsetpz ,after pahule notics, far wrIttencocauesse a pw heating, with a traamnsrpt
bdaW luetomtd is suth aderamisaatm and up-n The
"(5)is te ees o lasming puhiie ieas mprat -= for j rviewofte46
He henaring sad neeiaI ~iaJuea o h u"(C) auqia subat lionfwhc Ifa oao
as the humnee enwWrOnMMM rat allU WJII W&be available, to the public before tieom~iima of aymAITh proceedings) of the impact of math lien.- IcuinanY acthelima ZwAdoded puimat theet o enThe, en46 a
martwih analysis ehanl include-
92 MrAT. 3M PUBLIC LAW 9S-06-410-NOV. 8. 1978
"(i) an sawinent of the radiological and nontadi•-logical imnpa- to Tie public health of the artimiti•a t-hie mnductad puraofnt toWmch licnne;
1(iul an awnmient of any imila on a" y waterwaya c.tr•ondwater rvoutins from •c attivila;
"liii) eoutaeratiom of ahltnatienm. inludling alter-majtivie ai andl engineering inethbods. to the activifir- toLemotducted pnrantart to sorb l•ma; and
'iv) roraideratiom of the long-term'a pes. InTlu.ing devoouianaoring, dmcnamintim, e reclamationimpacts, an"ciato with activitie to be conducted pot-mA to srb licen including the nUsnament of any
byp" iNh anstekas dal. ned lf a6d iion 11 6e. M; and-(D "iit nvmajor coneaittctuo activity wit reapedtto mch Mterial " t o oemplying with the prvisons of
malupataph (C."If any Sta und uch Ot mtm any lap = 7 imyrequimfans for the payment of f to uh fa" the 1la ema.llon norltanii mau n eni monitoring of math maltrial, andif traunsfr to the UnitNI ItataM of each materal in requilra inaeelrdain. p ,inS ama with emelion 93 b.-of this A. meach agreeent doil br amem.by"the iomim t.on to provide that snch State -hlfl transfer to The
iltmed %Ctae uonam terinatiazon of the liaise ima to such licenseIt. tretl amount ealleted by Nth 9State Sumh herwesa fa I tchpurpose. If ,Wh paynments e reqruid, they "nawt be "iciwa Toinsure wmpliamv %itll The t4aridaq eaabhntlwd by the t'hmmiaiom
42 trc 2t. piuamuat to .ect 16m 1t a.of ms Act. ? -• t.. o . , h"ll bh required underpanmaph (5) to conducL prOedin, a cncerning any fIcem orr which would dupliw-t pr•ei condutW by theI 'inniaio."..
2 tMC M. (I) Section 174 e. of such Act is anreded byinerting the folIm,'..in# new smwitmac after paragraph ( 4 thervmef: Tie Conmmision sallalo retain authority umder any each agreemwen to make a dtemina.tis that all applikable standards and requi mPawt. havebahs metprinr to termination of a livew fr byproduct mWatrial. a0 4 Abed
4 UK 20t hin asetion 1t a. 12).".42 USJ 2W1 %1l Nothing in soy mi adwi made by Ifsle sMion dll preclude
oa.ty State toni eearcising any other authority me permitted wade, theAtomic PFAwWu Act of Wit4 reqiertung sa bproldu material. isd i ned W se II a. (it) of the AMraie -w -D Ad of 11044.42 umse~ =I h) (1) On or Inave• the due Three yersn afto do . eV f the a t
w- mint of This Act, nwt hes dlaa d t md by this tiale.any tatemaynerd, etho undmer State law ieqituVAT a, -ho, iM in m n It a. (1) of the
A Act of 1O54. in the mom manier, ed to the mum exhea, aspumatedhefam the Mactemai of this Ad.
(2) An imetrefuesat entered into with any Stat an permitted undersection, 2% 4 the Atomi Roaem4 Act of 1044 wit tweetw to hypeod.uct material s defoed in •ation II aL (2) of suf Ad., my beentsrted into at any Time after the data of the awea&..* of t Acthat no mach agreement may tae effoct before the dale three yams afterThe daft 61 the enacmen of this AMt
AD
PUMCIJ AW 9S-404--NOV. & 1979 92 STAT. 3039
OTf012¶M WO caWUMViURM m1PC 411111M ity OMf INAiTRL
Som 288. it) (Upm aof the Atomicle~are Act of 1954. i 4 UWC ItIemetidd by vidial the following ne wtionia at the rod thereof: a
8.w.#34 Actymanomoran(henusivi ftaecmmo (mAin Riven& 41 USC III&S01? MAiTMAL.-
"a. I'lle(.um ibashll insa, that the moeeanguaid ofanbjwti mteladdnd nuia lie. 121.bcsi -` astinvc 42 USC 3014
.(I theamspabums dgoinmagrpl to, iceal On, PAIMhealth and mistcy *ad the mvmsmem vi..a-
railgclhMoab amoiaed with the Weivstaumjaid wwt. thepm..-en tmmr f athbl 4m"te ia.~ i
by she Admoumaiam aaofthe, Ravtireemmatl. Ptaom Aemie @action 215. and Aos.
"a)j sawFntom Eumma q~mbt~l~ y h.mino. W"t the, 41senseam. althe isoma.whc at0 the MLMS ant pvdmiible a& het masps to
ovisamte apybleai to the P Ir rWed depaof dust heamadum latwie esmdated
m thSomud t V ,.DeslA~auedd 421E 48*bor he euiasgta autont indi " metiii. the Cormlecimr am
isibruto- ask pi.ph"*(I) by tek isguheim W Coder tepas porss, W 11
or ImiWmdmaved trnam Moicg under nation. inof doi Ant to aumiug ia.maaa. palsimie Writ and to OWE09 2111.~ with at ba, m mas it "aY dwem ory
I' -hewto t minsa~i. dAge to lift or proli.City. "An is monnection sub tho disposal of re of Maehbq T,&!* I l.eand
p) manati imsijeg sod ~inpcions end to moad" such
hAi vloaihe" sypmmcbaste the 1.had Sam. at a" O-d peelty.
U00, or = jdem., visag of the =iamia =in~tadtiu ogr di 81 "1be askjeolltoacaild Yaminy Aok r 31M
the sme WAM end is the moto j 60an s~oVitiaton a to a"m4 pmk, adW t JIM, 1340.1111 ilkhu "r th tie au F ~iab anj O tML
seathii&a the Cmmimainis ovda, any o aii im of "ii hA.(b) The A. .. of W.i "Mo1 the taicEaer Adt of OVWE2111.
flb., Ie eman" to rod an (Am".: 'No it.may tinmafer ormiveie in jucageta cegmaega munebiw, predat trendi-.
GRW ow. pamk h= uortmybipada mewsLe Baraims, S6. OWE213*
7t(M.V A tibi ...mtt for each 61110.r 6 ia .W by WM'tine the kfowling mew its= s~ew the been vioblatig to eaciim 88:
Si S06 (a) Cbsoe It of the Massie beauiy Act of 19K4InMmodedbln g flier ion 274 d ibfalewla es ai: OW i0Sa T. Kma"lwm &n KTMnMsuMy"9aMM Sum am UUMaiM 4 oWE sm
sum. Taxma.w-
92 STAT. 300 PUBLIC LAW 9S-604--NOV. & 1978
1e. ha ma me pfectica. bet act hWa than me yam Caire the dimof eaiuitent of this artim, the Admenuetor tof the Enari0.Manmail Prow'tan A ienc the ' itfeam mt.ied to in tis "Own menliii Aduaiava= ) rollbt. mai, nmatIde janiardo of ~aine.
alisin(incloluin gaw.Urds applicable to lluanme on&. mictamIL ft Uranium Will Taillaa Raduation (7cetea At& of a M)
ifor lbfts iftl o the obi Atlft ý OW ll the ridetoo
frownd . P 1104W and the h Wnasmam emudiaective mat• (mli aIen. is m4emia of thI , UirmiraKillTu flidaon SatlAct of tM) med iat io.die-"i out tailings .me ad de toy aim for moi matm-s
iib the dpeamtary of FAW . to jtie Iot ths Un.aius Mill Telling. INediatitl Ctad Act"of IOM3. Standiadsgo-Aaulged panosmat to thui lobuotm sel•% to Ohe mwametima siteiathroe , hli coensrtent. with to r , . tsm oft dolSiOWe"m
AnE tjC oth pAmI•dm amnem adM. Tile Adminiofar mal phitladelly t'im
me. bl ha tgma at 1 aci oppelih.bty'818 mat t te ~enlM iuad
stItmactainta oftis sectism, the Adaleimbtmi ame) by 1,sle.pcannukaf standards of oastel eppicaima for the pWeineii Of the
o 1ne = , uf&,ad the esviregaun froa ra ~dIm end asm-
mut. tisaiefe. dlb, utiasa o bp~s'Zo dl.ma •am
43 UMC364. c iwjoei. (2) of thWAce~teat t WhicherSeeaMp pi-dnMistily for their arm matierial acotent of which an said Is, thed" dimof sach byjmsdeet nimestuiel
colietios fr Ma in. .u f b. V.tetisen Of IIhuman bmelib atheonisninot cnistent with thestandards teqsutini maudie etilbu C of the Solid WoesDiqoma Act,as amnmded. which aem Iwimbit to meaWe~ Isut hPO Aau= 2Theat no pena. ed h Adminlrisa i pi gled cidir diAct or the Salid Wow wpd.) as, mammadid. inathimpes~speadmin tianefev. or dV~a of bY W Materiamlm. ua 04dendaoneian it 0, (2) Of this mayTh ?elsdlmllyin
mmii ayatad~e oelgati ptoadat to this bdm.Wtidian years after reachmeleof any andi iindavd. the Coaminear.
4v s a amttaeprmte toaj iamm aathrity idia meioii.24 b,(2).diall apply mach nammad deadend la the -os of any Boom. forb~$mict material ma d ine naion m .it a. (3) 7o 9y viu
ebl3 .the Admlft or 11pie"0 oII ul VtON%. 11n "in thd~e 7.-"IU~ie Seminr. emmrwite rem .amli. andoher
GPsmaNky .wvIabil tncatl H to uppIeft f matpmapmi v.5, ad Wa pivind of poblici racamuet of at Issiat dy daisfaa writlts cm.amena t'emsa and "an pportmity. sew math , - pewi ma"ela pthl mdlie oc.. for may ht, u pain" e ft, pea sil dafta,mu^wa. ad magemanta0 ae *Wit beemiata Ther shall hem6 thaiinipt
cmsnf ot any each Wavicag. The Adminisiet sal comakt withe Gin-Cimama and the Sp"Mau of EairAy bets., pisemlsotia. of amy such
0 n2 ".aMk"WNMn
ad
PUDULIC LAW 95.04.-NOV. 1 9"78 92 STAT. 3041
a.puim for review within sdiy deja after such Prainlloetiou in theUnitd Stata •court of apo.p.. for th Federl judicil circuit in whicheach patears r..eide or ban hie principel plaine of business. A oWp ofthe petition sha be forthwith tranlmitted hy th dlerk of court to theAd amiutrattr. The Admonutrar thnderup"o shal ch i in the crun thewritten roh.litea tLend freeanrirp of. the written or oral Iate-mopon which inch rule bmind u provided in sectilo 21 of tite*, Unied State CAode. T`he Cut 111101 ave joittlirtion to Ieviewthe rule in accordence with chapter 7 of title 3, United Statee Code S USC 701asia to grant eaptp-iate relief of provided In smu clip..tr. Thu
jadjmmit of the tour eflfii r , oL a ide u hotor m m pn. i.y rich rle hl so 0" to riu. i vi.the flupn,,•, (,and of the United 9018 upo= ariorar or eartilles-
taxs a provided in ection 124 of tide 21. United Stale Codes"(3s Any role vismanlg under this setion shal nwe take dfrt
alner then sixty relendar djay after ch promulgatio ."d. Imploetetlmatend nmfonmurt of the standards premulpate
pernent to euteeetion b. of this wetica haill be the resonibility ofth commion in the onoduet of its liensin ectivitie under this Act.Stairs azarrisingl authority putmat to euction 2T4 b. (2) oif thin Act 42 UK 2021."Ial implement and eaout" soci i etandae in mctodance with rob.,,a e ofoeuch edtlmAs. Nothing in thi Act applicable tobyprduct itn, d, n
isatioan II. (2) of thia Ad. shall•ale I e y • l - a uIsmsoottretor Inder the (in Air Adt of IM as emended, or tIe Foedarel 42 USC 7401Water Pollution CoD"l " amilanied.". MON..(b) The t" iof constimta for diaptser 19 of the Attests Eseig Act 23U t 0
is samded by ireerting the following new i s after, do the oi rlt- 'icgtomect42 27.4USC 3IS.Ike. 2111L. 8el amt .e"twneb b m am tiailw.
£rriintelo OF areeeeAaMo mc easte=
%L WT. Thne is hbeth, satlehs on be epprospried fori On
low 1 o the Necker iA&lacoty rJniedOn I a - e --- ' -Ato d for emk.ng frnta to Stat. which have t oam'"= a.t the C sm:. ander "doim 2T4 Of t" Atomic EneireAct of i9K4 to aid in the dvlgme fSaesgltt rwaider each soctlin which Inpeian -the poInimn ofth- 1
avmctunw Dma
,%r. 90e F400s motherwisejodd pin tin til the anmmmb 2 VmC 28t6mado by shot bumshal taks fed an the da of tshemomm of athe Act.
am go. Tone uDiscover ue commiemdieD 6ý0 . a mSCIa,dhe maiman axis" Practicabile. ism" aned eng udm e.junder amuiodejent made by this title w11th h1 . alucndipnmdttra under other euthoertite aotiained be the Atmio n ery ucAct of IPI 2KM
92 STAT. 3042 PUUBU LAW 9-6-NOV. . 1978
TITI.F Ill- STUDY ANDI) DESInATtO%* OF TWO MINTIT.I.AtNIS .tlTE. IN NEW MIEXICO
rrcor
aS USC 7941. SI 301. The tontueimion, in rormiolatiot with the Asttnowy lim-erl nild itho Attorney (leneral of the taft of New Meimcoiel wis-duct a s.utiy to determine the @itent end edewipcy of the authority ofthe ('ommieion end the State of New Meowco to tw•snive under theAtomic K.turgy Act of 1954 (as eimded by titl 11 of tiie Act) or
se usc t. t1ndter Sat. authority an permitted under eadion 274 of stch Ador under other provision of law, the ownets of the followit Sutiveuracnium mill save to undertake app ris" aidiosi to ulatendcon•rol all reeidual radioed ire inaterials at ech sites to protec publichealth, selety. and the etvirominent: the foaner Homutake-NewMexico I artnere eile near Milan. New Mexiro. an the Aniernda.
Roe"u to carbonatep e m tits eI nea r B1looawam. New lfexioss SuchCeni at" e@Mll ae ,ompletefand a r thereof "bmitfad to the Coln
rm end to th. - erntary within ron year oter eacment of thisAct, toget her with euch reatnimmeteati mu masay ie apiroi 9te flthe Commimon determines that mcli authority in no deqnsie tor"gtlate• a e ntral such materials at c itet in the inna pZZidedin th init generi of Cisixtiort, the conomloion ahall iucudin the report a statemnt of die neet for ichi determination. Nothingin this Art shall be co !,. :-. preovent or delay action by a Site anlertnutttd mnler a' .- .i74 of tI*e Atomi o er Ac of 19S4 orunder an ohe i to law or by the C oim s, to ralulafteach ivruluretv ntriote at such SAitM prior to ce41mplto
42 USC "a2. Sc. 30,, (a) W ithin ninety days fts the dame of hei rceipt of thereport and teconiteadausolste by the Commission underaection 3l. notwithstandtng the liitations ontained in ection1116) IX)nl.a inetion IlIS(&),if Je Coidodterminan acih study that subh titea ce t he reglated ai bnthe S .oratmmins in the mann decri•edl in • i fn
sthe Soecrietary may dedsiutbe cither or both of the mis refered to besection 301 a a proreang asite for pr m of tithe 1. Fol1wing rocdin ati. o n the %ecr 7ay -wter into -memo- agreemmts
-with New Max"ito perform remedlial action pMoreet to teO& titlcaoncening stiff the amid. radiotive mistenabils at scl the tumlt.teg erom oranumn produed for "die to a Pedetax iehr to
ind dio shill be tehbmtted byt te etar toghe wit i . ot hea 4 Of seirn ut ch noidie ado at the divolgo" site, tothe CeneitaC ntro and I~nana r9Aar and the Coammite onInterstate sad Foreign Canmmeto.t of the Knems of Bpeetcrendlit toth Committee an Ener" and Naturial fer. fteSae
(ýb) lI N4odesignation wider sloseetion 'a) dwhlleheelaghesolosiodiexpirat"t of ame huadrved and twety, onlnder &py (no includ-
ing any day in which either Hlow of Cotignoto in onot ini semiam
• '.. C
PUUJC LAW 9S4006&t4OV. S. IM7
bomasof an adjaoeftis of own then three coaledr doay tea .1ceraini or so odponniamot sinp do.) after receipt by such ('omeit,.Peof uch dosipsatiw
lei Zsep so thws "YP100t it gubmrtdas 1). acreooisal si..nodertail- withowmpelc'anj .i m0idmdthis utillshiall bo subjec to the proiwtuis ol itin I I aludting Ai
Approved Neseinbmr a.97&.
HOUSE AV". It 0314 vts I . as sel All ad ftOran& las'm md feap commra
Oft s. and"" =40 Vd. lie or'Oi I'-___ ,jeu eOM. 4.r- i i~U mOvs Ilk S ma oewe a Abea Moldes
92 STAT. 304 93 STAT. 796 PUBLC LAW 96-106-NOV 9. 1979
Public Law 96-106A 96th Congres
An ActCeT ae w. t o d 2s o no Uitd Stow Ccas. 0i.a Surfi,. yT? s um Aftotacif n~ Anal . WMM I.tiifpi
Sme. 22(•) Section 204h or the Uranium Mi6 Tailings Radiationits f , I. Control Act of 1318 is amended by adding at the andtiere(awmcm C follow nuewprragph:- -h
Urn "(3) o htwhatnding any other provision, of this ti"le where AState assumes or l assumed. punsuant to an agreement entered
* M 2 into under section 2V' b. of the Atomic f.neryW Act of 19K54 •uthorityo activity which results in the produclicon of byproduct
a DAL am. as defi k4 In setimn I I e. (2) ofsuch AMt the Commission4 USC M4. shall not. until the end of the thre.ys period beginning on the daot
of the enactment of this Act. habe "in ens outhorY over suChbyproduct material produced in an aectivity cove by such ageemot. unless the agreement is te tu s, pendd, or mended toprovide for rich Federal tienstn. If. at the end of such thfee-year
•miK aState has tot entered into such en anreemet wth mtpectto byproduct u~ierial, me deflned in sectieo 11 e. (2) of the Atomic
e Act of 1954. the Cocomibog shell hoe authority or suchmaterial.".
Section 4hx1)dof the Uranium Mll Taitinp RUdiatlM ContsetAct of 1978 is amended to mud ds followe:
%XIk) Duri the thraeear period beginning on the dsta of theenactment of this Act, notwithstanding any other .elsion OF thist/rio, an gta way exercis any authority undor Sio law inudad-Ing 8utoty Hexeis I pursuant to an apremre t entered into
a USC L pursuant to section 274 of the Atomic Energy Act of 1954) respectiga) broduct mat•s•' a det.ted in secUon 1 a. (2) or the Atmic
1U11 M Energy Actof 194..or I any acti•ity which results in tMe pfiouctiond USC SOIL of byproduct material as so desned. I the saume manner end to the
was, extent as pernutted befor the date of the ennc.mentof this Act.e that such State suthor ha be exercised In a.mantnrto the extent practicable. conmtent with the treu mentaofsection 274 o. of the Atomic Energ, Actof 1954 sa.dd bdascuon
Oftates. . 204MeM'" this Acti. TheCommision hll have th aut horitytoensure4208C3021, that such section 274 o-. is mpleented by any tou#th to the
estemt practicable durinhe t, ee-year parted beo.nnmnognihed.teof the enactment of this Act. othing in beet 8hll heonstrued to preclude the Conmmission or the Adma•nst•tr of tieEalvromnneoal protectrm Agency &rm taling such action undersc.. sction 275 of the Atomic Energy Act of 1954 as may be necsmay to
a t•icit inaplmeat title I ofthi Act.".
1-i
~' ,~
PUIUC LAW 96196-NOV. %.1"979 STAT. 800
fe) ?Mhe moter* of metlom 83a cof Ow Akomnu lase Act of im~t s.1064 is m dsaduto meeowfolow& "Any"kuiuewhikhisieffectom 4ZC2 III11the effeetive dota of this smion~ and w"Ics heutaeeouely lermi.natla withoult enewa sW rollywt puegrepM 41) ed (V po
(d) Secttle IMO of Oe Urlanm Mil Thmp Redatle. coubu/as -? FISIS bs umedd by adding after gmg*(iI the following 0.
pemoimles duinin the threeyear per Id bl alq tmt date ONdOwacetment of tis Act."
(e) Sect. MOMIKA of " th omml fA*in at of 'LOU Iaamended- 2lkl
011byrimilhlegal that folle~trammsndt..-dsOvthaugb'Ufl and kawftla In liet thereaWteMIlswbt
mWth*URetvds*
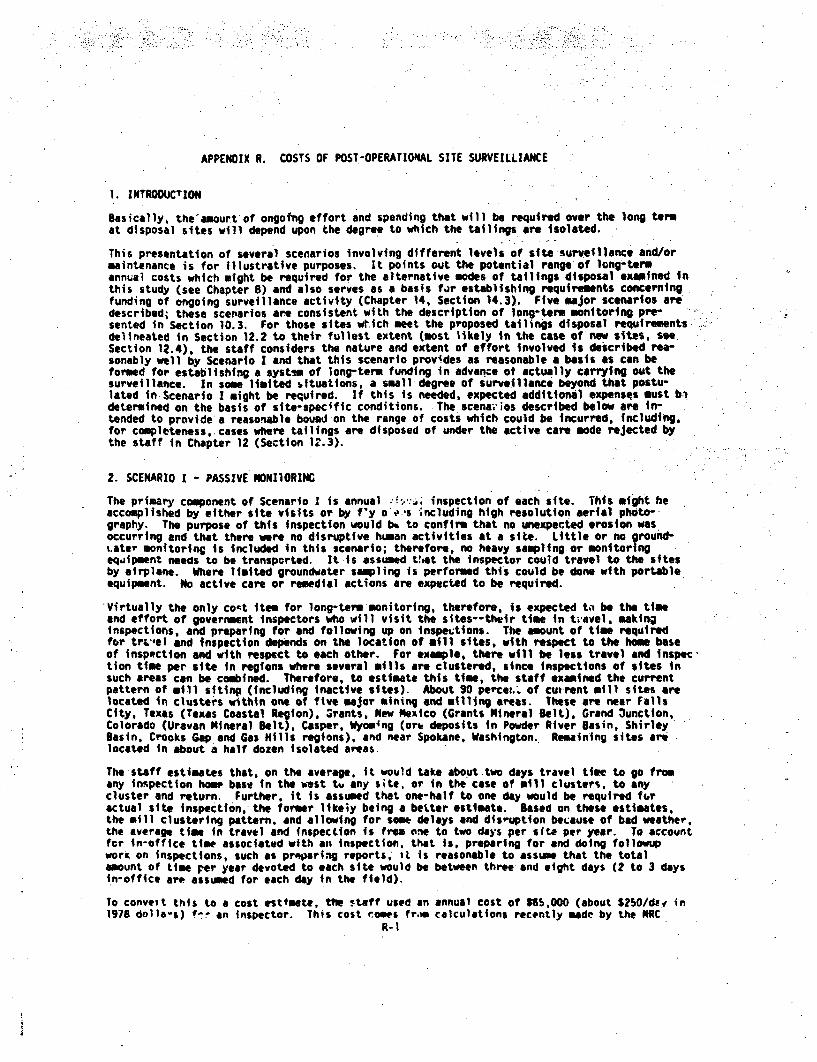
APPENDIX R. COSTS OF POST-OPERATIONAL SITE SURVEILLIANCE
1. INTRODUCTION
Basically, the'amourt of ongoing effort and spending that will be required over the long termat disposal sites will depend upon the degree to which the tailings are isolated.
This presentation of several scenarios involving different levels of site surveillance and/ormaintenance is for illustrative purposes. It points out the potential range of long-termannual costs which might be required for the alternative modes of tailings disposal examined inthis study (see Chapter 8) and also serves as a basis fir establishing requirements concerningfunding of ongoing surveillance activity (Chapter 14, Section 14.3). Five major scenarios aredescribed; these scenarios are consistent with the description of long-term monitoring pre-sented In Section 10.3. For those sites wtich meet the proposed tailings disposal requirementsdelineated in Section 12.2 to their fullest extent (most likely in the case of nwa sites, seeSection 12.4), the staff considers the nature and extent of effort involved is described rea-sonably well by Scenario I and that this scenario provides as reasonable a basis as can beformed for establishing a systsm of long-term funding in advance ot actually carrying out thesurveillance. In some limited bituations, a small degree of surveillance beyond that postu-lated in Scenario I might be required. If this is needed, expected additional expenses must b.'determined on the basis of site-specific conditions. The scenai-ios described below are in-tended to provide a reasonable boued on the range of costs which could be incurred, including,for completeness,.cases where tailings are disposed of under the active care mode rejected bythe staff in Chapter 12 (Section 12.3).
2. SCENARIO I PASSIVE NONIlORIMN
The primary component of Scenario I is annual ."'.d. inspection of each site. This might heaccomplished by either site visits or by f y o ÷s -including high resolution aerial photo-graphy. The purpose of this inspection would It to confirm that no unexpected erosion wasoccurring and that there were no disruptive human activities at a site. Little or no ground-%.ater monitoring is included in this scenario; therefore, no heavy sampling or monitoringeqaipment needs to be transported. It is assumed t:,at the inspector could travel to the sitesby airplane. Where limited groundwater sampling is performed this could be done with portableequipment. No active care or remedial actions are expected to be required.
Virtually the only coet item for long-term monitoring, therefore, is expected to be the timeand effort of goverment inspectors who will visit the sites--their time in ti.avel, makinginspections, and preparing for and following up on inspections. The amount of time requiredfor tr.',el and inspection depends on the location of mill sites, with respect to the home baseof inspection and with respect to each other. For example, there will be less travel and inspec-tion time per site in regions where several mills are clustered, since inspections of sites insuch areas can be combined. Therefore, to estimate this time, the staff examined the currentpattern of mill siting (including inactive sites). About 90 percer.t of cutrent mill sites arelocated in clusters within one of five major mining and milling areas. These are near FallsCity, Texas (Texas Coastal Region), Srants, New Mexico (Grants Mineral Belt), Grand 3unction,Colorado (Uravan Mineral Belt), Casper, Wyoming (ork deposits in Powder River Basin, ShirleyBasin, Crooks Gap and Gas Hills regions), and near Spokane, Washington. Remaining sites arelocated in about a half dozen isolated areas.
The staff estimates that, on the average, it would take about two days travel tire to go fromany inspection home base in the west tu any site, or in the case of mill clusters, to anycluster and return. Further, it is assumed that one-half to one day would be required furactual site inspection, the former likeiy being a better estimate. Based on these estimates,the mill clustering pattern, and allowing for sew delays and dis-uption because of bad weather.the average time in travel and inspection Is from one to two days per site per year. To accountfcr in-office time associated with as inspection, that is, preparing for and doing followupwork on inspections, such as proparing reports. it is reasonable to assume that the totalamount of time per year devoted to each site would be between three and eight days (2 to 3 daysin-office are assumed for each day in the field).
To conveit this to a cost estimate, tiwt staff used an annual cost of 165,000 (about $250/day in1978 dolla-s) f7 an inspector. This cost comes fr.m calculations recently made by the NRC
R-1
staff in connection with estabiisr)ng dicensing fees (42 FR 22149).) This *s the annual costfor one inspector in the NOC's Office of Inspection and Enforcemnt. It includes salary,personal benefits, administrative support, travel. management supervision and general overhead.The resulting estimate of costs pe, site is about $750 to $2,000. The cost estimates aresumearized as followb:
Lower bound:
I day (travel and inspection) * 2 days (office) 3 days3 days x $250 = $750
Upper bound:
2 days (travel and inspection) * 6 days (Gffice) z-8 days8 days & $250 = $2,Z00
Where limited grcundwater sampilig is conducted, analysis costs would be incurred. This wouldbe limited to analysis for selected chemical species wlich because of their mobility wouldeffectively provide an indicator of groundlater problems If they were to occur. Becausegroundwater movement is very slow in most cases (centimete-s per ysar), -onfirmatory samplingand analysis could be done on i relatively infrequent basis sucn as every 2-5 years dependingon site conditions. These analysis costs would be on the order of about $100-200. miscellane-ous equipment including cameras and portable groundwater sampling equipment would be nominal incost when amortized over a perlod of from 5 to 10.years and over all sites. According to therecent legislation on uranium mill tailings, as described in Chapter 13. NRC will have anoversight role in long-term monitoring of the sites. This will likely be an audit functionwith DOE (or the appropriate State agency if the State owns the site) having primary responsi-'bility for inspection. It is estimated that costs assbciatee with this effort would be about10% of those incurred by the inspecting egency. It is constrvatively estimated that costs forsuch analyses and miscellaneous equipment, as %,eli as 10 of tho total Inspection cost in orderto-take into account NRC oversight, would total no more thin about $500 per year. Therefore,. aconservative uppe- bound estimate of arnual coits for Sccnario I is about $2,500.
3. SCENARIO I1 - INSPECTION PLUS GROUNDWATER MOENTPRING
For Scenario II the primary component again is annual inspections; however, this scenarioincludes an increased level of grounowater monitoring. While the cost for the inspector's timeremains as the major element of the total surveillance costs under Scenario I1, equipment costs(Including a vehicle for transporting the monitoring equipment) and sample anelysis costs ii.-crease considerably. Establishment of a groundwater sampling program Involving frequentsampling is expected to be required, if at all, at only some sites where particular problems orconcPrns are identified du-Ing the preoperational and operational monitoring periods and duringthe compliance determination period. (See Section 14.J.)
While it is not expected that it be warranteo, an increased level of groundwater monitoring canbe postulated for all sites to provide a potential upper bound of site surveillance costs.This scenario assumes that monitoring wells at all sites would be chccked using dynamic asopposed to simple static (bailer lowered into monitorinq well) samples. More specifically,submersible pumps powered by gasoline generators mounted on four-wheel drive vehicles arepostulated for driving between sites to draw samples a.ncd perform visual inspections. It islikely that the frequency of this mock of inspection could be. reduced corsiterably by takingmost samples using portable bailing equipment (whictr could be carried by iwspectors flying tosites). The results of these static samples would be checked every several years by the moresophistilated dynamic sample taking procedu-es.
3. 1 Inspection
Again, tree amount of- time requi-ed for travel and inspection depends on the location of millsites, with reir!ct to the home base and with respect to each other. The location of millsites is assumed to fellow the pattern described under Scenario i. If it is assumed that GranýJunctior., Coloraoo is the insoector's home base, the distances to the four other mill clustersare as follow:
Grants, New Mexico %350 miles or 700 miles round trip-Casper. Wyoming -500 miles or 1,000 miles round tripSpokane. Wathington ],o00o miles or 2,000 miles round tripfalls City. Texas .1,500 miles or 3 AOO miles round trip
miles,
R- 3
For this s:enarioo, the situation 25-50 years into the future is covered; that is, after a largenumber of sites have been decommissioned. More specifically, it is assumed that there are 25decommissioned sites. This figure wa- somewhat arbitrarily selected. It is expected that onlya few sites will be decommissioned between now and the year 2000 Therefore, when this isadded to the number of currently inacti,,e sitei, the round figure of 25 sites seems reasonableto use for purposes of this analysis.
The location vi current peripheral sites Indicates that a good estimate of total mileage trav-eled per year for the 25 sites, figure which we have somewhat arbitrarily selected as alikely estimate of the total number of decommis-ioned sites by the year 2000, is double thisfigura or about 13,000 miles.' While this distance is assumed for this illustrative scenario,it is possible that sample taking and irtspectfon could be perform-d through regional DOE opera-tions, such as at the Richland/Hanford site, in which cace costs could be mome-ahat less.A more complete description of assumptions for trav:l PA inspection costs under Scenaric 11are:
Each site is inspected approximately once a year t4 the mobile inspectors unit.
Total time of travel assumed o cover the 25 or . sites13,000 miles z 350 mi/day = 47 daysThis is equivalvnt to about 1.5 days per site
Average time in inspection and sample taking at sites where ab~out 5 we'ls aresampled - 1 to 2 days.
* Ratio of in-office time to the time in travel and in field - Z:1 to 3:1.
Two persons would go to sites to do inspection and sampling. These would be seniorand junior technicians. ($30'000 to $20,000 for salary and o:erhead assumed respec-tively.) Supervision and office followup might be done by 3 project manager ($50,000for salary and overhead assumed) in conjunction with the two fie:d workers.
Based on these assumptions, costs for travel and Inspection compute as follows:
Lower bound:
2.5 days (travel and inspection) x 2 inspectors
2.5 x $125 ($30,000 per year)
+ 2.5 x $ 83 ($20,000 per year)
2.5 x $208 '4200 2.5 days x $200 = $500 $500
per diem = $35/day S x $35 = $175 $175
travel - $ .17/mile $ .17 x 13,00P miles $2,210 $100
$2,210 + 25 = $88 %$100
10 days (office) x $200 $2,000 $2 000fi77S/year or%$3,000/year
Upper bound:
3.5 days (travel and inspection) x 2 Inspectors
3.5 x $125
4 3.S x$S 83
3.5 x $208 '4200 3.5 days x $200 : $700 $700
per diem = $35/day 7 x $35 = $145 $245
travel $ .17/mile $ .17 x 13,000 miles $2,210 $100
$2,210 25 = 58e or .$100
21 day-, (office, x *200 = $4,200 $4 P00or %'5,000/year
R-4
3.2 Equipment
Equipment would include the following:
a. Capital Costs
2 submersible pumps (operating pump and spare). Capacity of 6.6 gpm @ 480 feet.Sized to permit very deep well sampling. Unit price - $335 $670
2 generators - (one for spare), 7 hp. units at $580 each. $1,160
4-wheel drive vehicle with A-frame sampler hoist and power winch. $12,000
Hose-500 ft. 1" hose 0 $1.50 lineal foot !750
Total costs for above $14,58
Monitoring'wells art assumed to be in place from operational monitoring period. Eachassumed to be replaced every 50 years, 5 at each site. 4-inch PVC and concrete-cased.well with padlocked manhole, $7,000 each2 5 x 7000 ÷ 50 years $700 at each site peryear.
b. Annual Capital Costs and Supplies
Assume equipment is amortized over 5 year
period - $ 30 = S2,ý16 %$3,000 $3,000
Maintenance costs and repair supplies. 10% capitalcosts assumed. $1,500
Supplies and miscellaneous sampling equipment suchas sample bottles, reagents, fuel for generator, etc.covered. (Sampling analysis costs below.) $4.000
Tt'W costs $8,500
c. Average Annual Capital Cost per Site
$8,500 + 25 = $340 %$350 $450
$700 per site for monitoring well replacement $700
4•1o000/11,
3.3 Sample Analysis
The specific kind of water sample analysis that must be performed will be a function of sitespecific concerns. During the periods of preoperational and operational mon;toring, selectedspecies such as sulfate ion may be identified as effective indicators of potential groundwaterproblems. Therefore, analysis procedures could be simplified to Isolate indicator elements.Assumptions that have been made with respect to sample analysis for this cost estimate are:
The kinds of analysis and 'osts outlined on the following table are assumed to boundthe situation.
Five samples are drawn at each site - two upstream arid three downstream.
On the average a fairly comprehensive analysis could be performed for approximately$750 - 1000 per site.
Therefore, the lower and upper bound cost estimates for Scenario 11 are:
Lowkr bound:
$3.000 (travel and inspection) * $1,000 (sampling equipment) +$1,000 (sample analysis) = $5,000
R-5
Upp. - -J:
$5,000 (..'vel and inspection) + $1,000 (sampling equipment) +$1,000 (..mple analysis) $7,000
COST OF WATER QUALITY ANALYSES 2
(1978 Dollars)
-Major Ie.jrganic Chemicals
Iron Carbonate PotassiumMagnesium Birarbonate pHChloride Sodium Electrical Conductivity
Group Rate: $53.50 to $107.00
Comprehensive Analysis
Uranium Lead Mercury Sulfate PotassiumVanadium iron Zinc Carbonate SilicaCopper Manganese Barium Bicarbonate Gross AlphaSelenium Chromium Fluoride Nitrate Gross BetaMolybderim Nickel Boron Ammonia Total Dissolved SolidsArsenic Cobalt Magnesium Sodium pHRadium 225 Cadmium Chloride Calcium Electrical Conductivity
Group Rate: $206.00 to $447.00
Gross Alpha Radium 226Gross Beta Uranium
Group Rate: $41.00 to $94.00
4. SCENARIO III- PASSIVE MOKITORING PLUS FFNCING
It may be determined at some sites that maintaining a fence around the tailings disposal areaprovides a necessary added measure of protection and isolation. For example, it can be postu-lated that a fence would be required to restrict grazing if grazing pressures are great orprevent other animal disturbance. In all probability fencing would only be necessary in rela-tively pnpulated areas or areas where grazing pressures warrant this.
In any evert, if it were determined that fencing was required at a certain site, it can beassumed th-t the initial cost of installing the fence would be included in the reclamationcosts. Hrwever, cnsts for repair and/or replacement of the fence should be covered in the costestimates for long-term surveillarze.
It is assumed that a very heavy duty fence would be installed (6 gage wire). The cost esti-mates on this type of fence range from $6.50 to $10.00 per lineal foot. For purposes of thiscost estimate $8.50/LF has been chosen as the average unit cost., Total costs would depend uponthe size of the disposal area. However, to illustrate these Costs the disposal area.is assumedto be approximately 1,000 meters (13,200 ft.) on each side. At $8.50/LF the cost of replacingthe entire fence would be $112,200. Assuming that the fence will last approximately 100 yearsand tsie cost of :eplacing the fence can be amortized over this period, the annual fencing costis $1,122 or approximately $1,000.
Therefore, if for illustrative purposes we add this cost for fencing to the upper bound costestimates for Scenarios I and II, the total costs for passive monitoring plus fencing are:
$2,500 (Scenario I inspection) + $1,000 (fencing) = $3,500$7,000 (Scenario II inspection, sampling & analys's) + $;,000 (fencing) $C,000
5. SCENARIO IV - LIMITED MAINTENANCE
Surveillance that ircludes some active care or maintenance is site specific and depends uponthe size and the configuration of the tailings disposal area. However. for the purpose of
developing a cost estimate for the various levels of site surveillance it is assumed that thetailings disposal area covers approximately 100 hectares. This limitedimaintanance scenariocorresponds with the nature of the active care mode of tailings disposal described ir. Chapter 8,where siting and design features do not eliminate the need for continuing maintenance.
The assumptions upon which Scenario 'V is based are:
Activities under the limited maintenance scenario include inspection, fencing,ýgroundwater monitoring, repair and revegetation of eroded areas.
Maintenance is limited to the equivalent of one hectare's worth of the tailingsdisposal area.
The cost for contracting to repair and revegetate the equivalent of one hectare isapproximately $2,500.3 This cost includes bringing in topsoil and reseeding as wellas limited renair of diversion channels. restabilizatlon of etba)kments and repair ofareas that "it erode excessively.
When this cost estimate for repair and revegetation of an area equivalent to one hectare isadded to the upper bouno ebtimates for inspection, groundwater monitorig and fencing, thetotal becomes:
$8,000 (inspection, groundwater monitoring and fencing) +$2,500 (limited ma'ntenance) = $10,500
It can be postulated that a particular portion of the tailings disposal area would be in needof more or less constant or repeated repair and/or maintenanre. In this situation a determina-tion coUld be made that it would be more Leneficial to providt, some sort of permanent fix suchas covering the area with rip rap. Assumptions for this situation are:
The equivalent of rip rapping would be necessary in order to repair one hectare'sworth of the disposai area.
The rip rap is laid about a half cater deep and costs $20/0.
Based on these assumptions, costs for rip rapping one hectare compute as follows:
$20 x 5,003 (M3) = $100,000
This kind of permanent fix would be equivalent in cost to about 12 years of annual maintenanceat the level assumed above in this scenario.
6. SCENARIO V - EXTENSIVE MAINTENANCE AND IRRIGATION
Scenario V involves extensive maintenance and revegetation, including irrigation of thetailings disposal aree and continued groundwater monitoring.
6.1 Maintenance of Vegetation
As with any scenario involving active care, the cost estimates for the maintenance systemdepend on the size of the tailings disposal area. Assumptitns are:
The ta:lings disposal area is assumed to be 100 hectares
Irrigation equipment, Including pump and miscellaneous valves and nozzles for a 100hectare aree, would cost approximately $107,000.4 (p. 137)
JrriOation equipment would need to be replaced approximately eve-v twenty years andeq. 'ment costs can be amortized over this period
St~stantial arnual operating costs are associated *ith Scenario V incliding costsfor:
- fertilizer $30/acre4 (p. 137) $7,500- power costs for irrigation pump' (p. 137) $1,858- maintenance labor and supplies = l10 of
irrigation equipment $10,700
7
operating labor ($25,000 salary,supervision included, xl/4 my) $6,250amortized equipment costs $5.350TOTAL or 2$32,000/site
-6.2 Groundwater Monitoring
Assumptions are:
Submersible pumps placed in five wells and replaced everv five years5 x $1,000 (pump, hose and installation charges) $5,000$5,000 ÷ 5 (years) = $1,000, -1000
Analysis costs =-$750 - $1,000 $1,000(see Scenario I) W site per year
7. SUM'ARY
Table R-1. Alternative Scenario Costs (Upper Bound Cost
Scenario I - Passive Monitoring
Inspection Costs - $2,000Miscellaneous Equipment and NRC Oversight - $500
Scenario II - Inspection Plus Groundwater Monitorinq.
Inspection Costs - $5,000Equipment - $1,000Sample • .lysis - $1,000
Scenario III - Passive Monitoring Plus Fencing
Inspection, Sampling and Asialysis (Scenario II) - $7,000Fencing - $1,000
Scenario IV - Limited Maintenance
Inspection, Groundwater Monitoring and Fencing - $8,000Repair and Revegetate 1 ha - $2,500Rip Rap (permanent fix) I ha - $100,000
Scenario V - Extensive Maintenance and Irrigation
Maintenance of Vegetation - $32,000Groundwater Monitoring - $2,000
Estimates)
$ 2,500
$ 7,000
$ 8,000
$10,500
$34,000
REFEkENCES
1. NUREG-O26a "Ctermination of Proposed License Fees for Fiscal Year 1977," 42 Fed.Reg. 22149 (1977).
2. NUREG/CR-0311, "Groundwater Elements of In Situ Leach• ining of tranium," Geragity &Miller. Inc. August 1978, p. 50.
3. Ch. 11 - Table 11.2
4. M. B. Sears et al., "Correla~ion of Radioactive Waste Treatment Costs and the Environ-mental Impacto--o-Waste Effluent in the Nuclear F,,el Cycle for .Use in Establishing as Lowas Practical Guides - Milling of Uranium Ores," Oak Ridge National Laboratory, Oak Ridge,Tennessee, ORNL-TM-4903, Vols. 1 and 2. May 1975.
APPENDIX S. SENSITIVITY ANALYSIS OF CUMULATIVE IMPACTS
Estimates of cumulative impacts (1979-2000) from uranium milling (Section 6.4, Section 9.3, andChapters 12 and 15) are sensitive to several key parameters. Parameters that are important inestimating cumulative impacts include: (I) nuclear power projectlens; (2) enrichment tailsissay policies;'(3) projectione of future ore grade; (4) depth of tailings piles; and (5) unitarea radon flux rates. Since there is uncertainty in all of the above parameters, there is anuncertainty in estimates of ctuulative impacts that depend, on these parameters. The purpose ofthis appendix is (1) to discuss the uncertainties in the above pArameters and estimate a rangefor them, and (2) to provide a range on the more significant cumulative impacts such as lardpermanently committed to tailings disposal and residual radon releases. In addition to uncer-tainty in source terms, there are uncertainties in transport estimates end health effects thatoccur as a result of radon releases. No attempt-is made to quantify uncertainties associated:with transport estimates. Ranges of uncertainty with regard'to health effect estimates, arediscussed in Appendix G.
Nuclear Power Projections
Land commitments and radon releases will generally Vary.-directly with the amount of nuclearpower generation. Nuclear power growth projections through the year 2000 are highly specula-tive. Projactions used in this document were taken from projections by the Department ofEnergy (DOE). hOE's most recent projections for nuclear capacity in the year 2000 extend froma low of 160 GWe to a high of 200 GWe.1 DOE's mid-ranUe projection is that used in this document(180 GWe). Consequently, the range on nuclear power in the year 2000 is taken to extend from160 to 200 GWe.
Cumulative UsOs requirements are approximately proportional to nuclear capacity estimates forthe year 2000. The rarge on cumulative U309 requirements thus extends from 500,000 to 630,000MT of U0a9. Cumulative impacts on land committed to tailings disposal, radon releases, anthealth effects are approximately proportional to the nuclear capacity estimates for the year2000. In addition to the uncertainties in nuclear power projections there is also en uncer-tainty in the estimate of the percentage of U3O8 that will be filled by conventional milling.This document has assumed that 77% of U30 -'equirements would be filled by conventional milling.The basis for this assumption is given in Chapter 3.
Enrichment Tails Assay
Enrichment tails assay depenos on )OE's vranium enrichment policies. (he enrichment tailsassay assumed in this dicument is 0.20 percent U-235.
Recently, DOE reduced the enrichment tails assay from 0.25 percent U-235 to 0.20 percentU-235.2 If a 0.25 percent tails assay were maintained until the year 2000, then cumulativeUOs0 requirements would be about 12 percent higher than those used in this document. DUE hasalso indicated that the tails assay might be increased to 0.25 perrent in the late 1980's.Consequently, the average enrichment tails assay is expected to remain in the range of 0.20percent to 0.25 percent.
Average Ore Grade
The average ore grad' used for all evaluations in this document is 0.10 percent. During 1979the average grade of ore processed in 21 operating conventional mills was about 0.12 percent,down about 15 percert from the previous year. 3 Although future ore grades are somewhat specula-tive, the graoe of ore that will be processed in the year 2000 has been predicted to be aboutO.fS percent, with ore from underground and open pit mines averaging about 0.10 and 0.06 percent,respectively. 4 The grade of 0.10 percent was thus selected to represent the -velage grade ofore proressed over the period 1979 through'theyear 2000. The range of thin lue, as used forthe calculation of cumulative industry impacts, is tiken to be from 0.08 per;ent to 0.12 percent.Ore &rade assumptions affect both the volume of tailings generated and the activity concentra-tion nf tailings. The tailings volume is inversely proportional to the ore grade. Tailingsactivity concentrations are directly proportional to the ore grade. If the depth of tailingsis held constant. then decreasing the ore grade results in increasing the land permanentlycom,.itted to tailings disposal. However. since the increase in tailings area is balanced by adecrease in activity concentration, there is no iot. inrrease in cumulative radon releases fromuncovered tail'ngs.
S-1
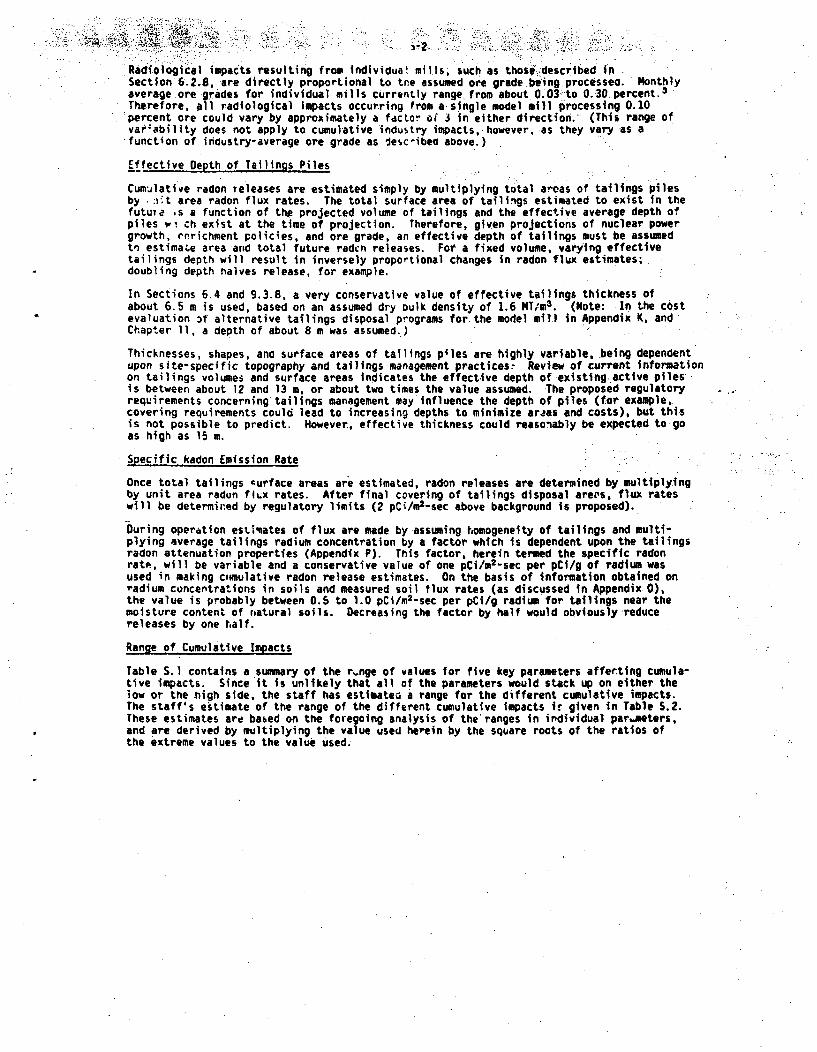
.. .. . . .. . . . . . . ... . ... ..
Radiological impacts resulting from individua! mills, such as those described inSection 6.2.8, are directly proportional to toe assumed ore grade being processea. Monthlyaverage ore grades for individual mills currently range from about 0.03•i.to 0.30 percent. 3
Therefore, alI radiological impacts occurring from a stngle model mill processing .0.10percent ore could vary by approximately a fdctor oi J in either direction.' (This range ofvaO;ability does not apply to cumulative industry impacts, however,. as they vary as afunction of industry-average ore grade as desc-ibeo above.)
Effective Depth of Tailings Piles
Cumulative radon re leases are estimated simply by multiplying total areas of tailings pilesby .:it area radon flux rates. The total surface area of tailings estimated to exist in thefuture ,s a function of the projected volume of tailings and the effective average depth ofpiles w i ch exist at the time of projection. therefore, given projections of nuclear powergrowth, enrichment policies, and ore grade, an effective depth of tailings must be assumedtel estimate area and total future radcn releases. For a fixed volume, varying effectivetailings depth will result in inversely proportional changes in radon flux estimates;doubling depth halves release, for example.
In Sections 6.4 and 9.3.8, a very conservative value of effective tailings thickness ofabout 6.5 m is used, based on an assumed dry bulk density of 1.6 MT/M 3 . (Note: In the costevaluation 3f alternative tailings disposal programs for. the model mill in Appendix K, andChapter 11, a depth of about 8 m was assumed.),
Thicknesses, shapes, ana surface areas of tailings piles are highly variable, being dependentupon site-specific topography and tailingsmanagement practicesr Review of current informationon tailings volumes and surface areas indicates the effective depth of existing, active pilesis between about 12 and 13 m, or about two times the value assumed. The proposed regulatory.requirements concerning'tailings management may influence the depth of piles (for example,.covering requirements could lead to increasing depths to minimize arias and costs), but thisis not possible to predict. However, effective thickness could reasonably be expected to goas high as 15 m.
Specific kadon. Emission Rate
Once total tailings eurface areas are estimated, radon releases are determined by multiplyingby unit area radun fltx rates. After final covering of tailings disposal areos, flux rateswill be determined by regulatory limits (2 pCi/m2-sec above background is proposed).
During operation estimates of flux are made by assuming homogeneity of tailings and multi-plying average tailings radium concentration by a factor which is dependent upon the tailingsradon attenuation properties (Appendix P). This factor, herein termed the specific radonrate, will be variable and a conservative value of one pCi/m2 -sec per pCi/g of radium wasused in making comulative radon release estimates. On the basis of information obtained onradium concentrations in soils and measured soil flux rates (as discussed in Appendix 0),the value is probably between 0.5 to 1.0 pCi/m 2-sec per pCi/g radium for tailings near themoisture content of natural soils. Decreasing the factor by half would obviously reducereleases by one half.
Range of Cumulative Impacts
Table S.1 contains a summary of the r.nge of values for five key parameters afferting cumula-tive impacts. Since it is unlikely that all of the parameters would stack up on either theiow or the high side, the staff has estinatei a range for the different cumulative impacts.The staff's estimate of the range of the different cumulative impacts if given in Table S.2.These estimates are baked on the foregoing analysis of the'ranges in individual paraeters,and are derived by multiplying the value used herein by the square roots of the ratios ofthe extreme values to the value used.
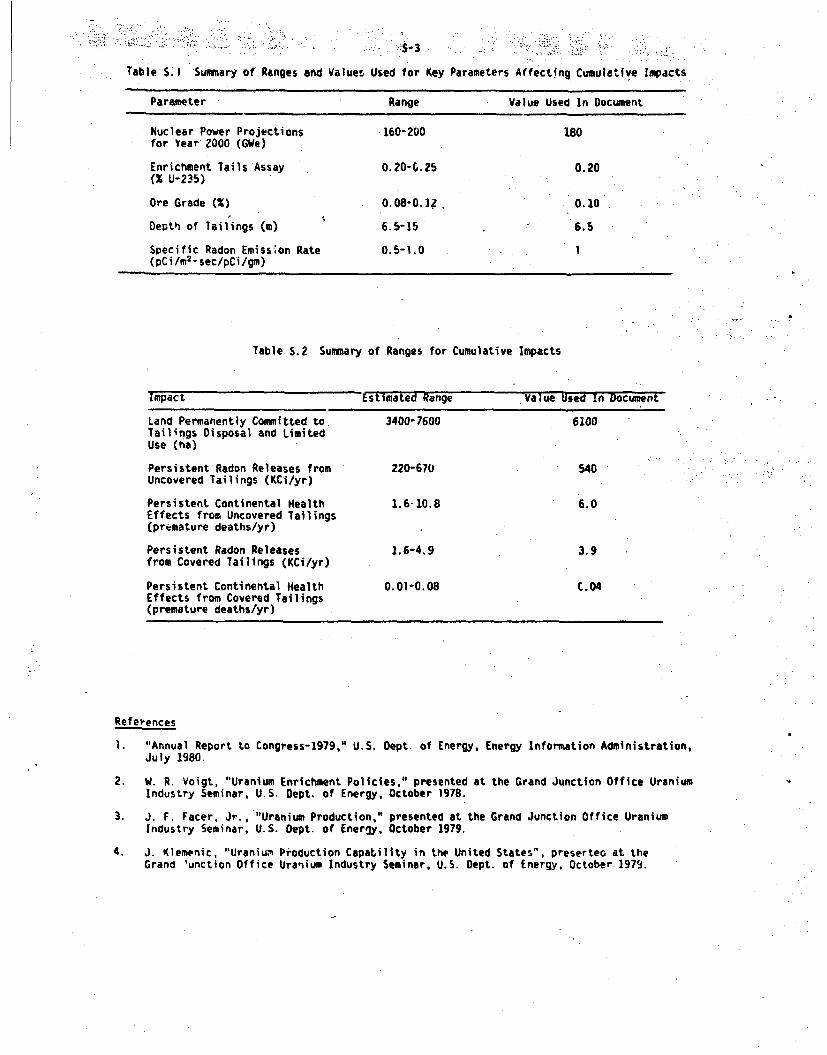
Table S.I Summary of Ranges and Valuer Used for Key Parameters Affecting Cumulative Impacts
Parameter Range Value Used In Document
Nuclear Power Projections ,160-200 180for Year 2000 (GWe)
Enrichment Tails Assay 0.20-0.25 0.20
(% U-235)
Ore Grade (0) 0.08-0.]? . 0.10
Depth of Tailings (M) 6.5-15 6.5
Specific Radon Emission Rate 0.5-1.0 1(PCi/m 2 -sec/pCi/gm)
Table S.2 Summary of Ranges for Cumulative Impacts
Impact
Land Permanently Committed toTailings Disposal and LimitedUse (ha)
Persistent Radon Releases fromUncovered Tailings (KCi/yr)
Persistent Continental HealthEffects from Uncovered Tailings(premature deaths/yr)
Persistent Radon Releasesfrom Covered Tailings (KCi/yr)
Persistent Continental HealthEffects from Covered Tailings(premature deaths/yr)
EstiSmatea Range
3400- 7600
220-670
1.6-10.8
1.6-4.9
0.01-0.08
value used In uocument
6100
540
6.0
3.9
C.04
References
1. "Annual Report to Congress-1979," U.S. Dept. of Energy, Energy Information Administration,July 1980.
2. W. R. Voigt, "Uranium Enrichment Policies," presented at the Grand Junction Office UraniumIndustry Seminar. U.S. Dept. of Energy, October 1978.
3. J. F. Facer. Jr. , "Uranium Production," presented at the Grand Junction Office UraniumIndustry Seminar, U.S. Dept. of Ener,3y, October 1979.
4. J. Klemenic, "Uranium Production Capability in the United States", preserteo at theGrand 'unction Office Uranium Industry Seminar. U.S. Dept. of Energy, October. 1979.

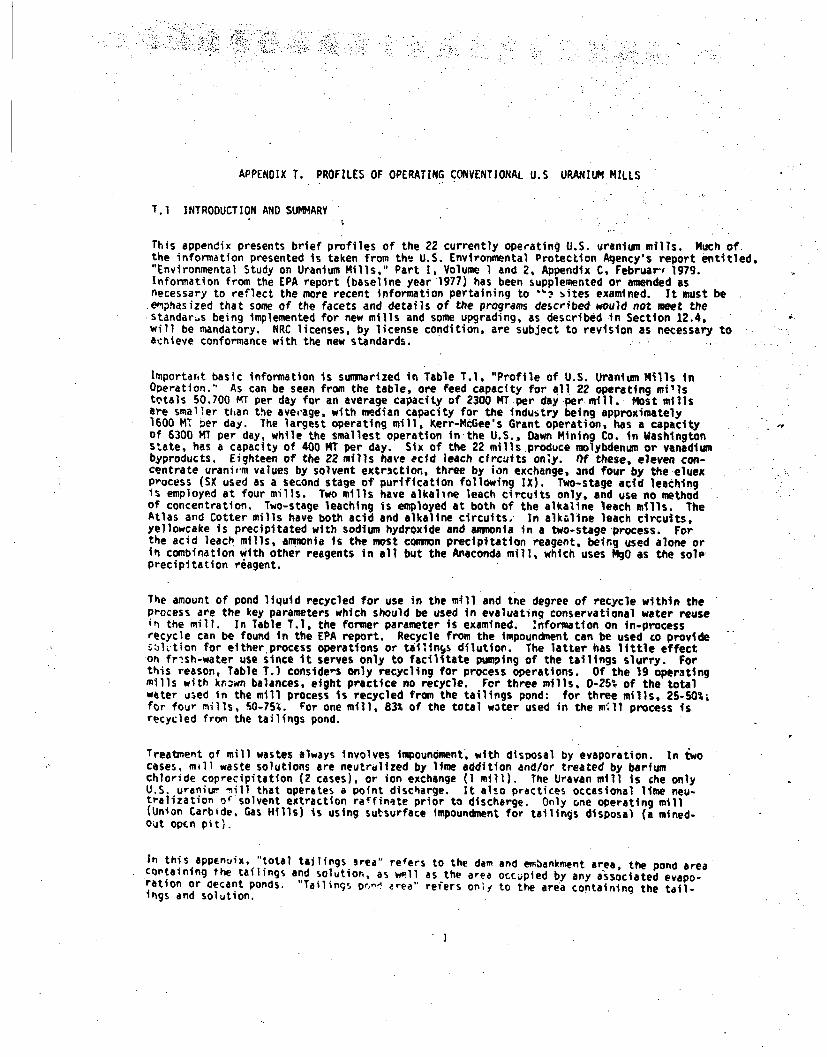
APPENDIXT. PROFILES OF OPERATING CONVENTIONAL U.S URANIUM MILLS
T.1 INTRODUCTION AND SUMM4ARY
This appendix presents brief profiles of the 22 currently operating U.S. uranium mills. Much ofthe information presented is taken from the U.S. Environmental Protection Agency's report entitled,"Environmental Study on Uranium Mills," Part I, Volume 1 and 2, Appendix C, Februar", 1979.Information from the EPA report (baseline year 1977) has been supplemented or amended asnecessary to reflect the more recent information pertaining to "? sites examined. It must be
,emphasized that some of the facets and details of the programs described would not meet thestandards being implemented for new mills and some upgrading, as described in Section 12.4,will be mandatory. NRC licenses, by license condition, are subject to revision as necessary toachieve conformance with the new standards.
Importarnt basic information is summarized in Table T.I, "Profile of U.S. Uranium Mills inOperation." As can be seen from the table, ore feed capacity for all 22 operating millstotals 50,700 MT per day for an average capacity of 2300 MT per day per mill. Most millsare smaller than the aver'age, with median capacity for the industry being approximately1600 MT ber day. The largest operating mill, Kerr-McGee's Grant operation, has a capacityof 6300 MT per day, while the smallest operation in the U.S., Dawn Mining Co. in Washingtonstate, has a capacity of 400 MT per day. Six of the 22 mills produce molybdenum or vanadiumbyproducts. Eighteen of the 22 mills have acid leach circuits only. Of these, eleven con-centrate urani'm values by solvent extraction, three by ion exchange, and four by the eluexProcess (SX used as a second stage of purification following IX). Two-stage acid leachingis employed at four mills. Two mills have alkaline leach circuits only, and use no methodof concentration. Two-stage leaching is employed at both of the alkaline leach mills. TheAtlas and Cotter mills have both acid and alkaline circuits. In alkaline leach circuits.yellowcake is precipitated with sodium hydroxide and ammonia in a two-stage process. Forthe acid leach mills, ammonia is the most comnon precipitation reagent, being used alone orin combination with other reagents in all but the Anaconda mill, which uses MgO as the soleprecipitation riagent.
The amount of pond liquid recycled for use in the mill and the degree of recycle within theprocess are the key parameters which should be used in evaluating conservational water reusein the mill. In Table T.1, the former parameter is examined. nformation on in-processrecycle can be found in the EPA report. Recycle from the impoundment can be used co provide•l,%tion for either process operations or tatiin~s dilutior. The latter has little effecton frish-water use since it serves only to facilitate pumping of the tailings slurry. Forthis reason, Table T.1 conside's only recycling for process operations. Of the 19 operatingmills with kr.nwn balances, eight practice no recycle. For three mills, 0-25t of the totalwater used in the mill process is recycled from the tailings pond: for three mills, 25-50%;for four mills, S0-75%. For one mill, 83% of the total water used in the mill process isrecycled from the tailings pond.
Treatment of mill wastes always involves impoundment, with disposal by evaporation. In twocases, mill waste solutions are neutrdlized by lime addition and/or treated by bariumchloride coprecipitation (2 cases), or ion exchange (I mill). The Uravan mill is che onlyU.S. uraniur nill that operates a point discharge. It also practices occasional lime neu-tralization of solvent extraction raffinate prior to discharge. Only one operating mill(Union Carbide, Gas Hills) is using sutsurface impoundment for tailings disposal (a mined-out opEn pit).
In this appenuix, "total tailings area" refers to the dam and embankment area, the pond areacontaining the tailings and solution, as well as the area occ.1pied by any associated evapo-ration or decant ponds. "Tailings' otr,.' earea" refers only to the area containing the tail-ings and solution.
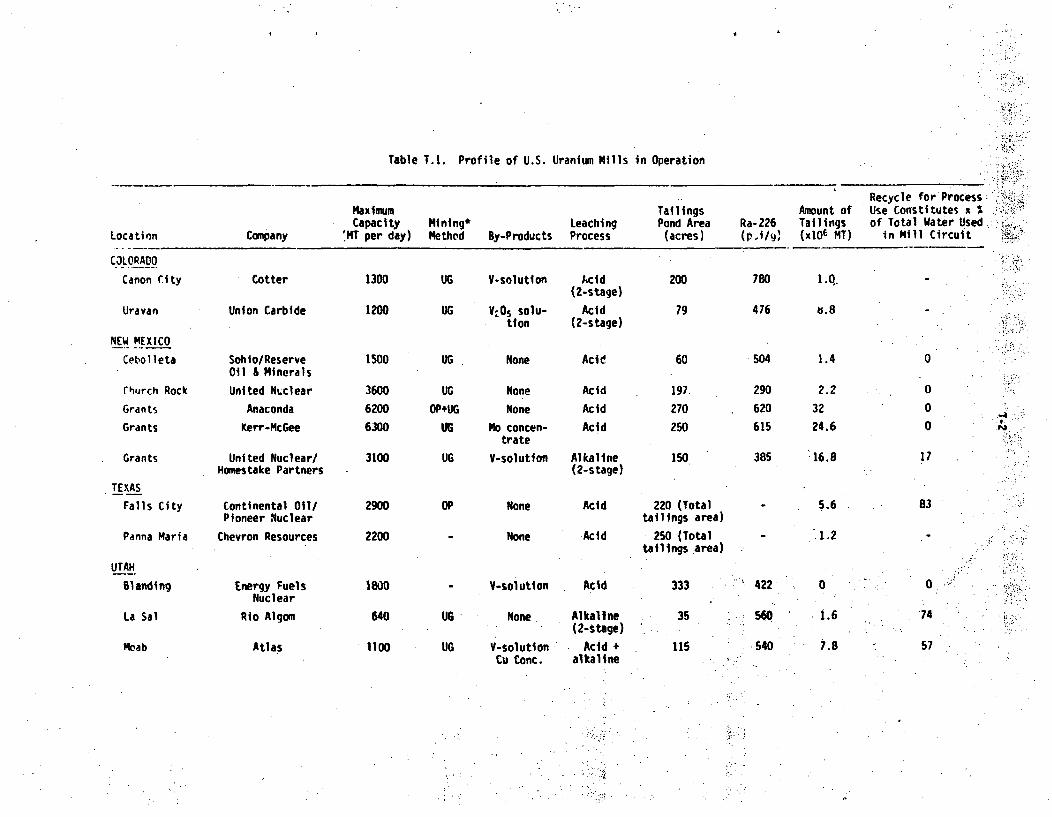
Table T.I. Profile of U.S. Uranium Hills in Operation
Recycle for Process,Amount of Use Constitutes x %
Ra-226 Tailings of Total Water Used...(p.t/) (x106 MT) in Mill Circuit
maximumCapacity
'MT per day)Mining*MethodLocation Company
LeachingBy-Products Process
TailingsPond Area(acres)
CXLORADO
Canon City
Uravan
NEW MEXICO
Cebolleta
rhurch Rock
Grants
Grants
Grants
TEXAS
Falls City
Panna Maria
UTAH
Blanding
La Sal
Moab
Cotter
Union Carbide
Sohlo/Reserve
Oil & Minerals
United NuclearAnaconda
Kerr-McGee
United Nuclear/Homestake Partners
Continental 0i1/Pioneer Nuclear
Chevron Resources
Energy FuelsNuclear
Rio Algom
Atlas
1300
1200
1500
360062006300
3100
2900
2200
1800
640
1100
Ut;
Ut;
Ut;
Ut;
OP.UGIRI
Ut;
V-solution
V:Os solu-tion
None
NoneNone
Mo concen-trate
V-solution
Acid(2-stage)
Acid(2-stage)
Acid
Acid
Acid
Acid
Alkaline(2-stage)
200
79
60
197.270250
150
780
476
504
290620615
385
1.0.
t1.8
OP None
- None
Acid 220 (Totaltailings area)
Acid 250 (Totaltailings area)
1.4
2.2
32
24.6
:16.8
5.6
.1.2
0
1.6
7.8
0
000
17
83
x-
UG
UG
V-solution
None
V-solutionCu Conc.
Acid
Alkaline(2-stage)
Acid +alkaline
333
35
l1S
422
560
.540
0
.74
57
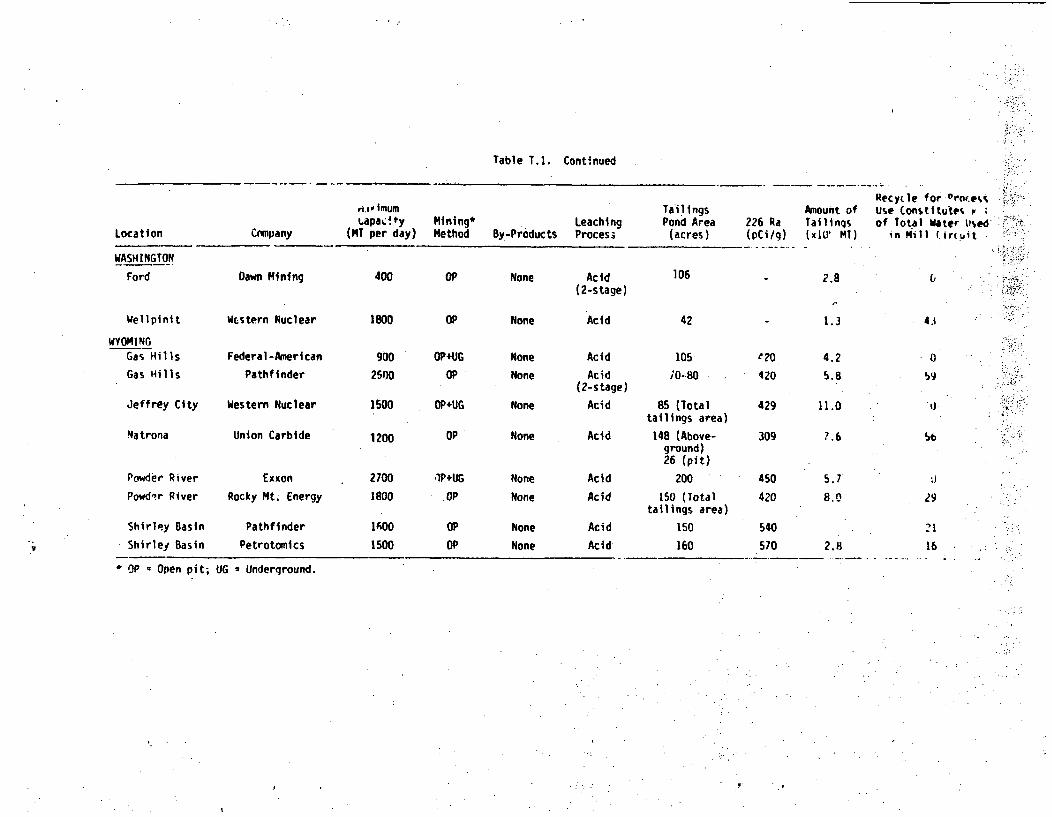
Table T.1. Continued
ri.l 01 mumLapaL•ty
(MT per day)Location Cnm
WASHINGTON
Ford Dawn
panyMining*Method
LeachingBy-Products Process
TailingsPond Area
(acres)
Recycle for OrnoeesAmount of Use Constitute% P :
Ra Tailinqs of Total Water Us~ed/9) (xiU' MI) in Mill (rIuit
226(pCi/
°._
Mining 400 OP None Acid(2-stage)
106
42
1.8
1.3
Li
Well pin t
WYOMINGGas Hills
Gas Hills
Jeffrey City
Natrona
Powder River
Powdir River
Shirley Basin
Shirley Basin
Wcstern Nuclear
Federal-American
Pathfinder
Western Nuclear
Union Carbide
Exxon
Rocky Mt. Energy
Pathfinder
Petrotomics
1800
9002500
1500
1200
2700
1800
10O0
1500
OP
OP+UG
OP
OP+UG
None
None
None
None
Acid
OP None
Acid
Acid(2-stage)
Acid
Acid
Acid
Acid
Acid
Acid
105
;O0.80
85 (Totaltailings area)
148 (Above-ground)26 (pit)
200
150 (Totaltailings area)
ISO
160
20. 4.2
420 5.8
429 11.0
309 2.6
4.3
069
't.
OIP+UG
OP
OPOP
None
None
NoneNone
450
420
540
570
5.7
8.0 29
21
16
* OP Open pit; hG = Underground.* OP z Open pit; UG = Underground.
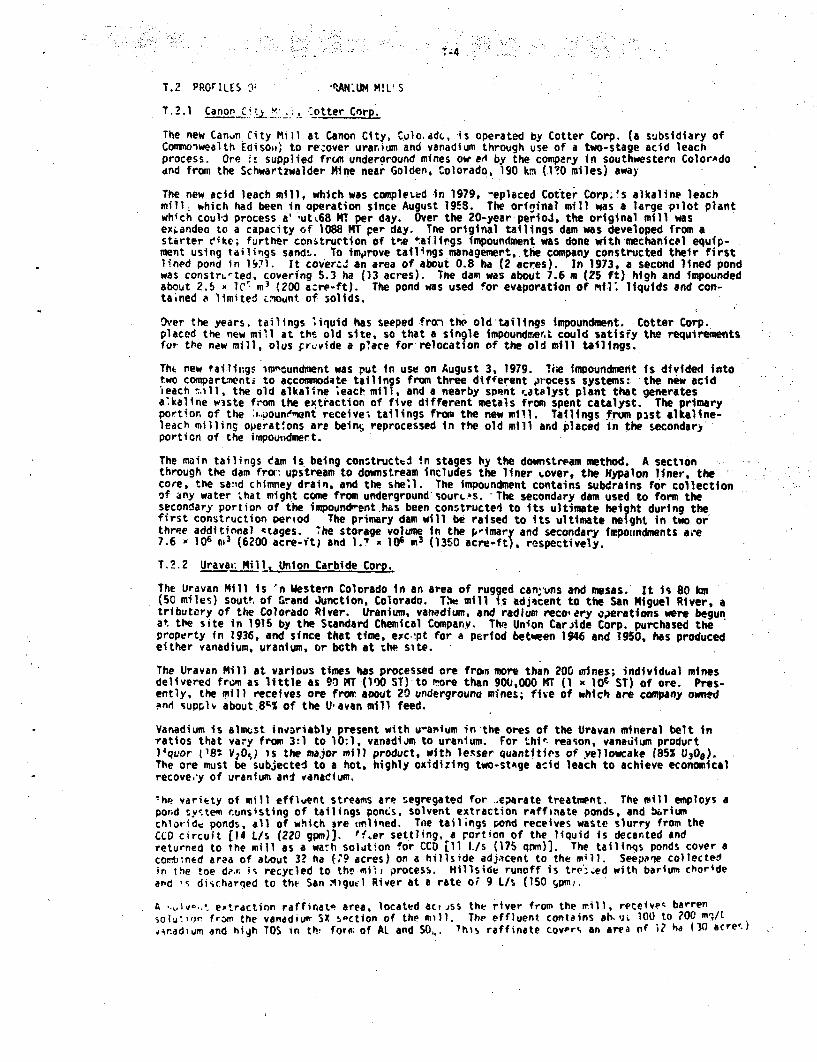
T-4.
T.2 PROFILES 0; 11AN'UM MILt S
T.2.1 Canon C't) •" ,, totter Core.
The new Canun City Mill at Canon City, Cvulo. ad., is operated by Cotter Corp. (a subsidiary ofCommonwealth Edisoi,) to recover uranium and vanadium through use of a two-stage acid leachprocess. Ore 1! supplied fruts underoround mines ow ed by the company in southwestern Color~dodnd from the Schwartzwalder Mine near Golden, Colorado, 190 km (l?0 miles) away
The new acid leach mill, which was completed in 1979, -eplaced Cotter Corp.'s alkaline leachmill, which had been in operation since August 19ES. The original mill was a large pilot plantwhich coul-d process a'"ut.68 MT per day. Over the 20-year perioJ, the original mill wasex~andeo to a capacity of 1088 MT per day. Tne original tailings dam was developed from astarter eike; further construction of to-* tai lirgs impoundment was done with mechanical equip-ment using tailings sands. To imparove tailings management,.the company constructed their firstlined pond in 1971. It coverzJ an area of about 0.8 ha (2 acres). In 1973, a second lined pondwas constructed, covering 5.3 ha (13 acres). The dam was about 7.6 m (25 ft) high and impoundedabout 2.5 x 1W m3 (ZOO azre-ft). The pond was used for evaporation of mil. liquids and con-tained a limited L.'ount of solids.
Over the years. tailings liquid has seeped fro• the old tailings impoundment. Cotter Corp.placed the new mill at the old site, so that a single impoundmernt could satisfy the requirementsfor the new mill, olus fruvide a place for relocation of the old mill tailings.
Tht new tailings imoundment was put in use on August 3, 1979. 1he impoundment is divided intotwo compartrnenti to accomnmodate tailings from three different process systems: the new acidieach m7all, the old alkaline .eact mill, and a nearby spent r.atelyst plant that generatesa~kaline wiste from the extraction of five different metals from spent catalyst. The primaryportion of the :,.,pounemeni receive; tailings from the new mill. Tailings from past alkaline-leach milling operations are beinc reprocessed in the old mill and placed in the secondar)portion of the impoutidmert.
The main tailings eam is being constructei In stages hy the downstream method. A section .through the dam fror, upstream to downstream includes the liner Lover, the Hypalon liner, thecore, the sand chimney drain, and the shell. The Impoundment contains subdralns for collectionof any water that might come from underground sour. -s. -The secondary dam used to form thesecondary portion of the impoundment.has been constructed to its ultimate hei ht during thefirst construction period The primary dam will be raised to its ultimate nelght in two orthree additional etages. "he storage volume in the j.imary and secondary impoundments av7.6 . 106 013 (6200 acre-ft) and 1. x 106 m3 (1350 acre-ft), respectively.
T.2.2 Urava,' Mill. Union Carbide Corp.
The Uravan Mill is 'n Western Colorado in an area of rugged can-'uns and mesas. It is 80 km(50 miles) sout- of Grand Junction, Colorado. Th'e mill is adjacent to the San Miguel River, atributary of the Colorado River. Uranium, vanadium, and radium recoery oerations were begunat the site in 1915 by the Standard Chemical Company. The Union Carjide Corp. purchased theproperty in 1936, and since that time, evc.'pt for a period between 1946 and 1950, has producedeither vanadium, uranium, or both at the site.
The Uravan Mill at various times has processed ore froen more than 200 mines; individual minesdelivered from as little as 9. HT (100 ST) to more than 90U,000 MT (1 x 10⁶ ST) of ore. Pres-ently, the mill receives ore frar aoout 20 undergrouno mines; five of which are company ownedýnd lsuprlý, about 8A% of the Uavan mill feed.
Vanadium is almust invariably present with u-anium in the ores of the Uravan mineral belt in-ratios that vary from 3:1 to 10:1, venadi.m to uranium. For thi, reason, vanadium produrt)"q,,or (18% V205) is the major mill product, with lesser quanities of yellowcake (85% U3O8).The ore must be subjected to a hot, highly oxidizing two-stAge acid leach to achieve economicalrecovery of uranium and vanadium.
1he variety of mill effluent streams are segregated for ..eparate treatment. The mill employs apond syýstem coinsisting of tailings ponts. solvent extraction raffinate ponds, and bariumchloride ponds, all of which ire unlined. Toe tailings rond receives waste slurry from theCCD circuit (14 L/s (220 gpm)]. 'fer settling, a portion of the liquid is decanted andreturned to the mill as a wa.h sol-iton for CCD i11 L./s (17S qrin)). The tailinqs ponds cover acortb:ned area of atout 32 ha (79 acres) on a hillside adjacent to the mill. Seepa'Ie collecte.in 1he toe dp.n is recycled to the milf process. Hillside runoff is tre':,ed with barium chorideand is discharqed to the San Migutel River at a rate of 9 L/s (150 Spmu.
A .Iv'..t eptractinn raffinata area, located act iss the river from the will, receives barrensolution from the vanadium SX !,ction of the mill. The effluent contains ah.,J• 100 to ?00 mi/tv-ýradium and high TDS in th. forn; of AL and SO,.. 7his raffinate covers an area nf 2? ha (30 acret)
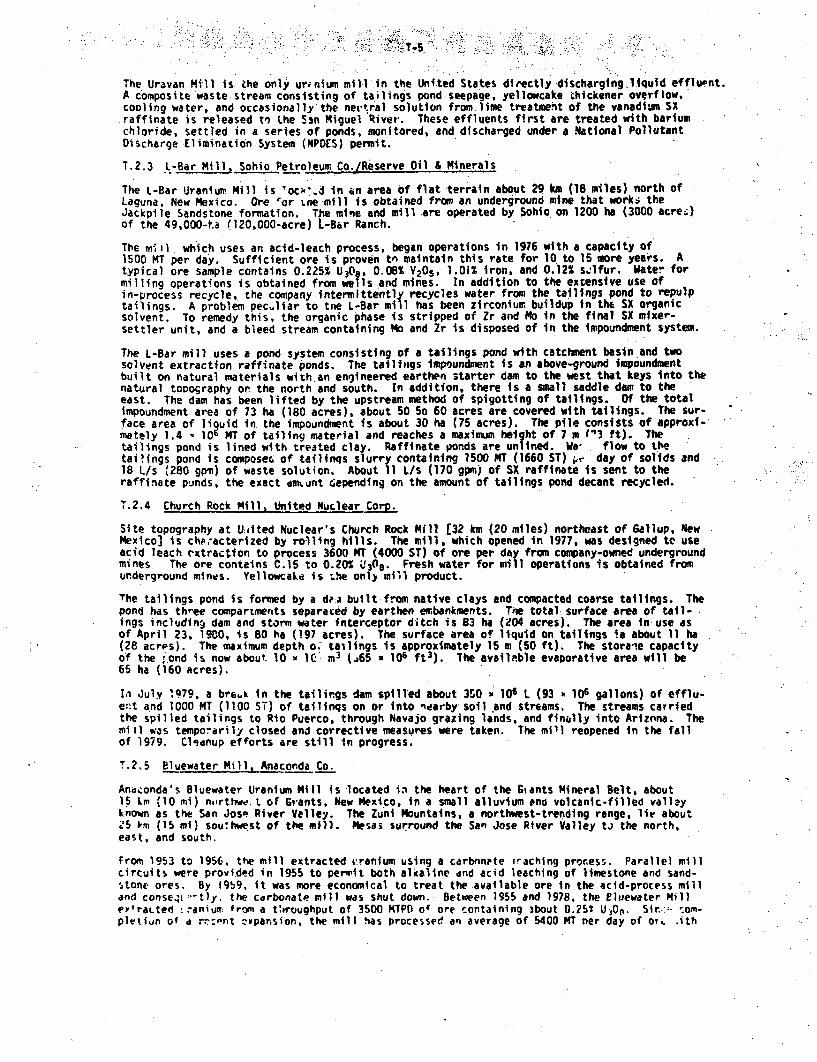
The Uravan Mill is the only ur;nium mill n the United States directly discharging.liquid effluent.A composite waste. stream consisting of tailings pond seepage, yellowcake thickener overflow,cooling water, and occasionally the nettral solution from. lime treatment of the vanadium SX
.raffinate is released ti the Sn Miguel River. These effluents first are treated with bariumchloride, settled in a series of ponds, monitored, and discharged under a National PollutantDischarge Elimination System (NPDES) permit.
T.2.3 L-Bar Mill, Sohio Petroleum Co./Reserve Oil & Minerals
The L-Bar Uranium Mill is 'oc•.d in &n area of flat terrain about 29 km (18 miles) north ofLaguna, New Mexico. Ore 'or tne mill is obtained from an underground mine that work: theJackpile Sandstone formation. The mine and mill are operated by Sohio on 1200 ha (3000 acreý)of the 49,000-t.a (120,000-acre) L-Bar Ranch.
The m';i I which uses an acid-leach process, began operations in 1976 with a capacity of1500 MT per day. Sufficient ore is proven tn maintain this rate for 10 to 15 more years. Atypical ore sample contains 0.225% U308 , 0.08% V205, 1.01% iron, and 0.12% s.lfur. Water formilling operations is obtained from wells and mines. In addition to the extensive use ofin-process recycle, the company intermittently recycles water from the tailings pond to repulptailings. A problem pec.liar to tne L-Bar mill has been zirconium buildup in the SX organicso lvent. To remedy this, the organic phase is stripped of Zr and No in the final SX mixer-settler unit, and a bleed stream containing Mo and Zr is disposed of in the impoundment system.
The L-Bar mill uses a pond system consisting of a tailings pond with catchment basin and twosolvent extraction raffinate ponds. The tailings impoundment is an above-ground impoundmentbuilt on natural materials with an engineered earthen starter dam to the west that keys into thenatural tooocraphy or the north and south. In addition, there is a small saddle dam to theeast. The dam has been lifted by the upstream method of spigotting of tailings. Of the totalimpoundment area of 73 ha (180 acres), about 50 So 60 acres are covered with tailings. The sur-face area of liquid in. the impoundment is about 30 ha (75 acres). The pile consists of approxi-mately 1.4 -05 MT of tailing material and reaches a maximum height of 7 m ('3 ft). Thetailings pond is lined with treated clay. Raffinate ponds are unlined. Wae flow to thetai!ings pond is composec, of tailinqs slurry containing 1500 MT (1660 ST) p÷ day of solids and18 L/s t280 gpm) of waste solution. About 11 L/s (170 gpm) of SX raffinate is sent to theraffinate punds, the exact am%.unt depending on the amount of tailings pond decant recycled.
1.2.4 Church Rock Mill, United Nuclear Corp.
Site topography at U:dited Nuclear's Church Rock Mill [32 km (20 miles) northeast of Gallup, NewMexico] is chlp-acterized by rolling hills. The mill, which opened in 1977, was designed to useacid leach extraction to process 3600 MT (4000 ST) of ore per day from company-owned undergroundmints The ore contains C.15 to 0.20% L'309. Fresh water for mill operations is obtained fromunderground mints. Yellowcake is ;he only mill product.
The tailings pond is formed by a dp.i bullt from native clays and compacted coarse tailings. Thepond has three compartments separaced by earthen embankments. The total surface area of tail-ings including• dam and storm water interceptor ditch is 83 ha (2O4 acres). The area in use asof April 23, 1900, is 80 ha (197 acres). The. surface area of liquid on talTings ia about 11 ha(28 acrps). The maximum depth o- tailings is approximately 15 m (50 ft). The stora'le capacityof the ;,ond is now about. 10 x IC- m3 (J65 x 106 ft 3 ). The available evaporative area will be65 ha (160 acres).
In July 1979, a bre.k in the tailings dam spilled about 350 106 1 (93 x 106 gallons) of efflu-en.t and 1000 MT (1100 ST) of tailinqs on or into nearby soil and streams. The streams carriedthe spilled tailings to Rio Puerco, through Navajo grazing lands, and finally into Ariznna. Themi l was temporarily closed and corrective measures were taken. The mill reopened in the fallof 1979. Cl.anup efforts are still in progress.
T.2.5 Bluewater Mill, Anaconda Co.
Ana,:onda's Bluewater Uranium Mill is located in the heart of the Giants Mineral Belt, about15 k~m (10 mi) nrthe,. L of Grants, New Mexico, in a small alluvium fnd volcanic-filled vallayknown as the San Jose River Valley. The Zuni Mountains, a northwest-trending range, lie about'5 1,m (15 mi) southwest of the mill. Mesas surround the San Jose River Valley tJ the north,east, and south.
From 1953 to 1956, the mill extracted uranium using a carbnnete irachlng process. Parallel millcircuits were provided in 1955 to permit both alkaline rnd acid leaching of limestone and sand-stone ores. By 19b9, it was more economical to treat the available ore in the acid-process milland conse.t :--tly, the carbonate mill was shut down. Between 1955 and 1978, the Eluewater MillePt raLted t-anium from a taroughput of 3500 MTPD of ore containing )bout 0.257 U)O(. Sir.::. :om-plexion of a r':-nt ziparsion, the mill has processed an average of 5400 MT ner day of or, .ith
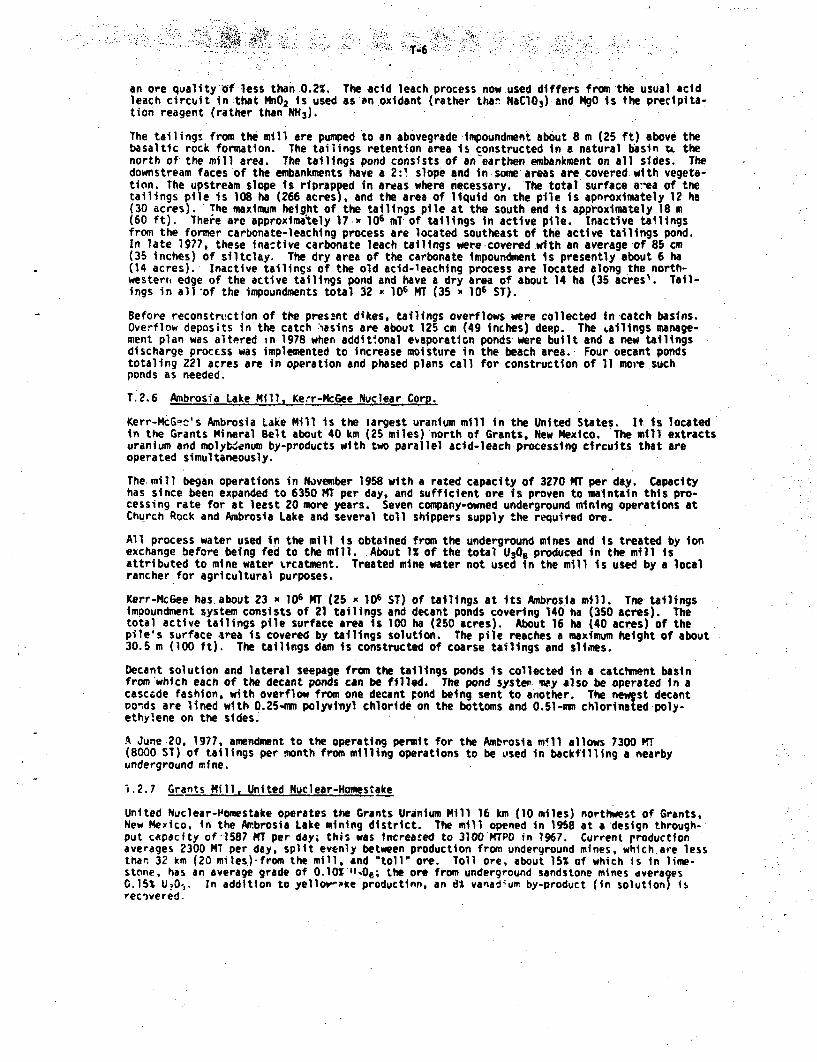
...... ii . .. . ..- - ~ !l !T.6.
an ore quality of less than 0.2%. The acid leach process now used differs from the usual acidleach circuit in that MnO 2 is used as en oxidant (rather than MaC10 3) and MgO is the precipita-tion reagent (rather than NH3 ).
The tallings from the mill are pumped to an abovegrade impoundment about 8 m (25 ft) above thebasaltic rock formation. The tailings retention area is constructed in a natural basin tu thenorth of the mill area. The tailings pond consists of an'earthen embankment on all sides. Thedownstream faces of the embankments have a 2:. slope and in some: areas are covered with vegeta-tion. The upstream slope is riprapped in areas where necessary. The total surface a:-ea of thetailings pile is 108 ha (266 acres), and the area of liquid on the pile is *pnroximately 12 ha(30 acres). 'The maximum height of the tailings pile at the south end is approximately 18 m(60 ft). Theie are approximately 17 x 106 mT of tailings in active pile. Inactive tailingsfrom the former carbonate-leaching process are located southeast of the active tailings pond.In late 1977, these ina:tive carbonate leach tailings were-covered with an average of 85 cm(35 inches) of siltclay. The dry area of the carbonate impoundment is presently about 6 ha(14 acres). Inactive tailings of the old acid-leaching process are located along the north-westerrt edge of the active tailings pond and have a dry area of about 14 ha (35 acres'. Tail-ings in all 'of the impoundments total 32 - 106 MT (35 u 106 ST).
Before reconstruction of the pres.nt d'kes, tailings overflows were collected in catch basins.Overflow deposits in the catch :)asins are about 125 cm (49 inches) deep. The "ailings manage-ment plan was altered in 1978 when addit.onal evaporation ponds were built and a new tailingsdischarge procEss was implemented to increase moisture in the beach area. Four oecant pondstotaling 221 acres are in operation and phased plans call for construction of 11 more suchponds as needed.
T.2.6 Ambrosia Lake Mill, Ker-McGee Nuclear Corp.
Kerr-McGoc's Ambrosia Lake Mill is the largest uranium mill in the United States. It is locatedin the Grants Mineral Belt about 40 km (25 miles) north of Grants. New Mexico. The mill extractsuranium and molyb.enum by-products with two parallel acid-leach processing circuits that areoperated simultaneously.
The. mill began operations in November 1958 with a rated capacity of 3270 MT per day. Capacityhas since been expanded to 6350 MT per day, and sufficient ore is proven to maintain this pro-cessing rate for at least 20 more years. Seven company-owned underground mining operations atChurch Rock and Ambrosia Lake and several toll shippers supply the required ore.
All process water used in the mill Is obtained from the underground mines and is treated by ionexchange before being fed to the mill. About 11 of the total Ug0s produced in the mill isattributed to mine water trcatment. Treated mine water not used in the mill is used by a localrancher for agricultural purposes.
Kerr-McGee has. about 23 - 106 MT (25 x 106 ST) of tailings at its Ambrosia mill. The tailingsimpoundment system consists of 21 tailings and decant ponds covering 140 ha (350 acres). Thetotal active tailings pile surface area is 100 ha (250 acres). About 16 ha (40 acres) of thepile's surface area is covered by tailings solution. The pile reaches a maximum height of about30.5 m (100 ft). The tailings dam is constructed of coarse tailings and slimes.
Decant solution and lateral seepage from the tailings ponds is collected in a catchinent basinfrom which each of the decant ponds can be filled. The pond systeel vay also be operated in acascade fashion, with overflow from one decant pond being sent to another. The ne%Vst decantponds are lined with 0.25-mm polyvi'nyl chloride on the bottoms and 0.51-mm chlorinated poly-ethylene on the sides.
A June 20, 1977, amendment to the operating permit for the Ambrosia mill allows 7300 MT(8000 ST) of tailings per month from milling operations to be used in backfilling a nearbyunderground mine.
1.2.7 Grants Mill, United Nuclear-Homestake
United Nuclear-Homestake operates the Grants Uranium Mill 16 km (10 miles) northwest of Grants,New Mexico, in the Ambrosia Lake mining district. The mill opened in 1958 at a 'design through-put capacity of-1587 MT per day; this was increased to 3100 MTPD in 1967. Current rroductfonaverages 2300 MT per day, split evenly between production from underground mines, which are lessthan 32 km (20 miles)-from the mill, and "toll" ore. Toll ore, about 15% of which is in lime-stone, has an average grade of 0.10Z 1l'Oe; the ore from underground sandstone mines averages0.15% U,01. In addition to yellow-ke productinn, an 81 vanadium by-product (in solution) isrec'overed.
T-7
On Februe'.- 8, 1977, a break in the mill tailings dam resulted in the entire tailings pondspilling into vacant land controlled by the mill operator. The spill covered an area of 10 to20 ha (25 to 50 acres) and was several centimeters deep..
The Grants Mill differs from other New K .- co Mills in two basic ways: (I) ore is leached withalkaline solution, 3nd (2) precipitation of yellowcake does not depend on first passing pregnantsolution through ion-exchange or solvent-extraction circuits. The mill practices both processrecycle and recycle for tailingr dilution. Because an alkaline leach process is employed, oreis finely ground to expose more uranium to the leach solution. As a consequence, fine tatlingsare produced. The tailings are discharged to an abovegrade impoundment covering a total area of105 ha (260 acres). The total active tailings pile surface area is 60 ha (150 acres) at thebase. ApproAimately 20 ha (50 acres) of the pile's surface area is covered by tailings solutionto a maximum depth of 0.46 m (1.5 fL). As of April, 1980, the-active pile consisted of approk.-mately 16.8 MT of taiiings material and reached a maximum height of 26.m (85 ft). UnitedNuclear-Homestakc. maintains 1.5 m (5 ft) of freeboard and 15"m (50.ft) of beach.
The subsoil is about 27 m (90 ft) thick with reasonably high permeability, which aggravatesproblems due to seepage from the tailings pond. The subsoil is underlain by a sandstone forma-tion and an aquifer is located under the ponds. Seepage from the pond is being controlled bythe use of downgradient collection wells to pump groundwater contaminated by pond seepage upfrom 12 to 18 m (40 to 60 ft) depths for return to the pond.
T.2.8 Conquista Mill, Continental Oil/Pioneer Nuclear
The Conquista Mill is located near Falls City, Texas, about 48 km (30 miles) southeast of SanAntonio. It is the only open-pit uranium mine-mill complex in the state. The project is ajovnt venture of Continental Oil (operator) and Pioneer Nuclear.
The mi'il has been in operation since ]972 and is exps.rted to continue through ]990, when orereserves will be depleted. The production includes about 540 MT per day of toll-processed orefrom Exxon Minerals' Felder open-pit mine in Live Oak County.
The mill recycles nearly 100, of the water sent to the main tailings pond--less the. amountevaporated and the amount entrained with the solid tailings. Tailings slurry and SX raffinatehleed are pumped to the tailings pond. A separate impoundment is provided for the compositestream of barren solution from. uranium precipitation and waste extract from the molybdemumscrubber in the solvent extraction circuit. These are solutions that cannot be recycled becausethey are contaminated with high levels of dissolved salts or metallic impurities. Provisionshave baen made to collect any pond seepage; however, since plant startup, no seepage has beendetecteJ. '.is is attributed to the underlying bentonitic clay and natural shale.
One .ide of the tailings pond has been keyed into the side of a hill. Dikes have been builtaround the other three sides of the impoundment. The embankment consists of clays and earthenmaterials. The mill operators expect to raise the dikes another 6 m (20 ft) in the near future.Currently, the tailings pond is half covered with water.
T.2.9 Pannr Maria Mill, Chevron Resources Co.
The Panna Maria Mill, located 160 km (160 miles) northwest of Corpus Christi, Texas, beganoperations in January 1979. The mill processes about 2700 MT per day of a mixture of low-,medium-, and high-grade sandy clay ore, averaging 0.07% U308.
Tailings are contained in an aboveground impoundment surrounded by dikes. The dikes have clayinteriors keyed onto a natural clay base. A dike partition separates the tailings pord into twocompartments, only one of which is currently in use for tailings storage.
T.2.10 Wh';te !lesa Mill, E..rgy Fuels Nuclear, Inc.
The White V.,sa Uranium M4ll is near the western edge of the Bland-ng Basin in southeastern Utah,about 8 km (5 miles) south of Blanding, Utah. The site is located on a nearly flat peninsulaplatform (White Mesa) tilted slightly to the south-southeast and surrounded on almost all sides.by drop canyons, washes, or valleys. The mill and associated tailings disposal ponds are onBlinding silt loam, a deep soil formed from windblown deposits of fine sands and silts.
The mill, oper3ted by Energy Fuels Nuclear, Inc., began operatiuns in July 1980. It is expectedto have an operating lifetime of 23 years. The site consists of 600 ha (1480 acres), 190 ha(480 acres) of whic will be used for milling, tailings disposal, and related'activities. Therewill be no onsite mining activities. Mines within 160 km (100 miles) of the company's ore-buying stations (in Blandinq and Hanksville) will supply the required ore. Energy Fuels Nuclearcontrols reserves of about 8600 MT (9500 S7) of U.O0. Principal urantium minero.s in the sedi-mentary host rock are urarinite and coffinite. Only uranium, vanadium, and copper are presentin sufficient quantities to warrant processing. At present, copper extraction is .neconomlc.
1T-B
The mill will utilize an acid-leach, solvent-extraction process to recover about 730 MT (800 ST)of U308 annually. Vanadium by-produ,.t recovery is expectedto yield 1500 HT (1600 ST) annually,containing less than 0.005! UO in the final vanadium product. The mill will use about
.5.9 - 105 M3 (480 acre-ft) of-water per year from the Navajo sandstone aquifer. No recycle ofponded water is planned.
Tailings will be produced at a rate of about 1800 MT (2000 ST) of solids per day and will bedischarged in a water slurry (pH 1.4-1.8; 50% solids) to a six-cell impoundment system (twocells for evaporation and four fortailings. disposal) that will cover 130 ha (330 acres). Thetailings system features simultaneous construction, operation, closure, and reclamation activ-ities. Each cell will have a (naximum area of 40 ha (100 acres). There could be two cellsdrying or undergoing reclamation while a third is being filled. This system is designed tostore 15 years' proouction tailings, and the total volume of tailings expected to be producedover the project lifetime will approach 7 x 10⁶ m3 (2 " 100 ft 3 ). The evaporation cells and onetailings cell will be lined with a multicomponent liner of synthetic material and clayey-silt;the remaining cells will be lined with a 0.6-m (2-ft) layer of comoacted clay.
T.2.11 Lisbon Mill, Rio Algom Corp.
The Lisbon mine-mill cumplex is located in a valley in a mountainous reglo., in Utah, about 48 km(30 miles) southeast of Moab. The mill has been in operation since 1971 and, based on projectedtonnage of reserves plus a contingency for unknown additional ore, Is expected to continueoperations for about four to Five years. beginning about D-cember 31, 1979. Ore is obtainedfrom underground mines located adjacent to the mill.
The Lisbon alkaline-leach mill has the lowest specific fresh-water use of any mill in the coun-try. In addition to in-process recycle, recycle from the tailings pond to the filtration stageis practiced. Uranium is recovered from pond water by ion exchange (37% efficient). Cross-country aeration (uxidation by flowing in one open trench) and barium chloride coprecipitatlonof mine water recovered from a depth of 823 al (2700 ft) are used to oxidize hydrosulfides andreduce radium concentrations to acceptable levels prior to discharge of the water to a localagricultural user.
The tailings retention area was constructed by crecting an earth-fill, clay-core dam across anat-rdl . Tne impoundment consists of tw- tailings ponds situated in a small west-trendingdrainage area of slightly more than a square mi . The ponds are designated as "upper" and"lower" tailings ponds. The upper pond lies directly upstream and east of the lower pond suchthat the rear of the lower pond is adjacent to thE mill site. Although both ponds are unlined,they are dug into natural clay to reduce wastewater seepage rates. In the spring, mine water ispumped to the lower tailings pond to extract uranium and sodium. Pond water is then decanted tothe upper pond, where it can be recycled to the mill.
At mill startup, tailings were deposited in, the lower tailings pond only. The upper pond wasbuilt in 1974 but not used until 1976. The lower pond has reached Its full storage capacity,and all tailings are being discharged into the upper pond. As of the end of 1979, about1.6 106 NT (1.8 * 106 ST) of ore had been processed at the mill, resulting in about1.1 : 106 m3 (940 acre-ft) of tailings contained in the two tailings ponds.
since there is only a small amot At of capacity rekmining in the storage area of the upper tail-irgs pond, Rio Algom has recently proposed raising the existing lower tailings embankment by7.6 m (25 ft). Such a raise would provide sufficient tailings storage for the next five yearsof mill operation.
T.2.12 Moab Milli Atlas Minerals Division of the Atlas Corp.
The Moab Mill is located in a mountainous area in Utah on the Colorado Ri,'er about 5 km (3 miles)northwest of the city ,f Moab. The mill processes ores from the Big Indian area and from sev-eral small private mines from other districts.
The mill has undergone sever:1 major process changes since operations began in November 1956.Primarily because of cuhanges in the ore, the original acid process was changed to an alkalineprocess utilizing the same resin-in-pulp equipment. In 1968. an acid-leaching and solvent-extraction process was added, with recovery of vanadium from the acid-leach circuit and copperfrom the alkaline lpach circuit. For many years, the mill wastes were discharged Into theColoraDo River, but this practice was stopped in 1977 and all liquid wastes now are impounded ina tailings pond. In addition, the alkaline-leach processing circuit has recently been alteredto redjce liquid effluents to the tailings pond.
The acid-leach circuit was designed to process 540 M. (600 ST) daily of vanadium-bearing oreswith at, a.:c-ae assay of 0.25; Ulf,, and l.52 V-0-. Recoveries of VO., and U308 are about 80Oand 9%,. respertivety. The modified alialine-ieach circuit was designed to process 540 MT
I
(600 ST) of high-l ime and copper-bearing Orcs daily, with an average assay of O.202 to 0.252U.O, and up to 1.01 copper. The circuit will recover UIOP and copper at about 941 and 80%efficiency, respectively. The mill has the capacity to process up to about 1080 Wt (1200 ST) ofore per day and to produce uo to 830 ITT (920 ST) of U108 , 2400 MT (2600 ST) of V>O,, and 50 MT(S5 ST) of copper annually, dep,,nding on ore grades processed.
The mill facilities inclu'e a system to treat river ,ater (to reduce hardness), raw wastewaters(to remove suspended and settleable solids), and decant water from the tailings pond (to removeradium by BaCl coprecipitation). The solids extracted by the water treatment system are storedin a number of small ponds within t~ie plant boundary. Liquid and solid effluents from the mill-;ng operation are impounded in toe tailings pond. The tailings impoundment is enclosed by fourembankmnent walls composed primarily of tailings. About 49 ha (120 acres) of the site arecovered with tailings to a depth of nearly 25 m (75 ft). The impoundment contains 6.4 1 106 MT(7 - 10' ST) of tailings, and about 3.6 10'- MT (4 -10 ST) of additional tailings are expectedto be produced through the r.maining mill lifetime. To accommodate the additional tailings,supplcmental tailings storage volume will .ieed to be provided.
T.2.lJ Ford Mill. Dawn Mininn Co..
The Ford Uranium Mill (450 MT per day) is operated by Dawn Mining Co. in the rolling hills ofeastern Washington State, about 40 lkm (25 miles) northwest of Spokane. Ore is obtaired from theMidnite open-pit mine, about 35 kom (22 miles) northwest of the mill. The ore reserves of theMidnight mine, expect"d to last about four or five years more, are on the Spokane IndianReservation.
Owned 51% by Newiiont Mining Corp. and 49, by Midnite Mines, Inc.', Dawn operated from 1957through 1964 under the AEC's concentrate purchase prograin. The mill was tamporarily shut d'fmin lq65 and then reopened in late 1969 after rehabilitation and reconditioning. To date, morethan 4.5 x 10f kg (10 - 106 pounds) of U30 has been recovered from about 2 x 10⁶ MT(2.2 - 106 ST) of ore averaging 0.2250, U308 .
The Ford Mill incorporates a two-stage agitation acid-leach of uranium from ore and a columion-exchange circuit consisting ot four pressurized cylinders, each containing a fixed bed ofanion exchange resins. Precipitation is carried out in two stages. In stage one, the pH israiscd with lime to precipitate iron, present in the ore as pyrite. Following separation of theiron precipitatc, uranium is precipitated from solution with ammonia in the second stage.: Wasterock and solutions are neutralized with lime and pumped to a single tailings pond.
There is no recycle of water from the impoundment. The company indicates that a considerableamount of silica is solubilized in the leaching process which, if allowed to build up in millsolutions, could decrease ion-exchange efficiency by displacing uranium loading sites on theresin. Therefore, recycle is not feasible at this operation.
The tailings pond is a conventional impoundment, roughly rectangular in shape. The pond isseparated into three compartments by natural-material embarkments. The pond is unlined, and itis estimated that most of the liquid coming into the tailings pond is lost through seepaqe. Thepond contains approximately 2.8 - SOr HT of tailings with 7C! solids. The tailinqs pond willbe filled during 1980 and a new disposal area is being developed for subgrade disposal of futuretai!ings. A pit will be excavated immediately to the south of the present tailings dam. Thesurface area of the pit will be 11 ha (28 acres). The structure will be 20 m (65 ft) deep andwill have a total volume of about 1.5 x 10⁴ m) (2 , 10' yd'), which is adequate for about 13years of mill production at the rate of 1.5 - 106 KT (1.7 % 10; ST) per year. The entire pitfloor and side slope surface will be lined with a reinforced 30-mil synthetic Hypalon liner.Elimination of sec.age from the tailings pond area by use of the new lined dispos3l facilitywill result in a solution disposal problem and Dawr. is considering several process w'ater manage-ment plans. It will be about three years before the solution buildup in the pond will becomecritical.
T.2.14 Sherwood Mill, Western Nuctyar. Inc.
The Sherwood Uranium Mill is operated by Western Nuclear. Inc.. in western Washinqton Stateabout 64, km (40 miles) northwest of Spokane, Washington. as part of the Sherwood Uranium Project.Westerr. Nuclear obtains low-grade ore *nr the mill from an open-pit mine nearhy at Wellpinit.The mill and mine art on land leased or the Spokane :,idian Reservation. The Sherwood depositsare aliout 6 km (4 miles) south of the deposits mined for Dawn Mining Co.'s Midnight operation.but the ores for the two operations are different in deposition. Western Nuclear began theShervood Project in 197L on established reserves of 7 - l0f MT (8- l0( ST) of 0.0891 U1O.The ore is emplaced in 23 , 106 ml (30 - 10r yd') of overburder, and waste. The mine opera'es ata cu;clff of 0.02: U,11, and the mill, which uses an acid-leach process, uper4tes at a cutoff of0.03i•. UO,.
T-10
Tailings slurry fromthe mill is neutralized by reat.tion with lime before it is pumped to thetailin.s pond. which has an area of 17 ha (42 acres). T7e pond is in a valley immediately southand east of the mill area. Thelupslope face of the tailings dam, as well as the settling areabehind the dam, is lined with Hypalon. The 40-mil liner on the dam face is further protectedwith a layer of coarse-settled solids. The tailings basin behind the dam is protected by diver-sion canals.
Solution is decanted from the tailings pond and either recycled to the process or treated withbarium chloride to remove Ra-Z26. The precipitate is deposited in a small flypalon-lined pond of372 m2 '4000 ft 2 ) south of the tailings pond. Decant from this small pond is evanorated in anunlined pond. Bench-scale tests on samples of neutralized effluent indicate that more than 90%of the Ra-226 is removed by treatment with RaCld. Maximum capacity of the BaC1 treatment sys-tem ic about 760 m3/day (140 gpm), which represents about 30% of the total 1i quid effluent tothe ponds. An additional 50% to 70% of the effluent can be recycled to the mill to decreasewater usage.
T.2.15 Gas Hills Mill, Federal American Partners
The Federal American Partner's (FAP) Gas Hills Mill-is in a hilly area of Wyo. ing, about 80 km.(50 miles) cast of Riverton. The mill began operating in October 1959 with an initial rated.capacity of 470 KT per day and is now licensed for 860 MT per day. Current plans call for theexpansion of the mill to about 2000 MT per day. The Eluex process is used at the mill, with ionexchange carried out in a resin-in-pulp circuit. The mill processes ores from surface and
underground mines operated by FAP in the Gas Hills area.. All of these ore reserves are leasedby the TVA. Current ore reserves are sufficient for about ten years of mill operation at theexpanded rate of 2000 KT pe.r day. The project life may be extended if additional ore reservesare ;ocated.
Mill tailings are being pumped to a conventional aboveground impoundment formed by a peripheralearth damr. Free liquid from the pond is pumped to a decant pond. The tailing, id is pro-Jected to reach its maximum capacity by late 1981. FAP is currently evaluating the feasibilityof disposing ot mill waste below grade in the Sagebrush-Tablestakes open-pit mine. The totalbelowgrade tailings area would be about 24 ha (60 acres) and would provide ten years of capacityfor mill tailings wastes. Currently, solution from the aboveground impoundment is not recycled;however, the disposal pit plan will allow for the decant of solutiuns back to the mill or intothe decant pond. This should decrease the freshwater usage at the mill.
T.,Z.16 Gas Hills mill. Pathfinder Mines Corp.
The Gas Hills Uranium. Mill (formerly the Luck Mc Mill) is operated by Pathfinder Mines Corp.(formerly Lucky Mc Corp.) In the Gas Hills region of Fremont, Wyoming, about 40 km (23 miles)northeast of Jeffrey City. This mill first began producing yellowcake in 1958 with a nominalore-processing capacity of 850 MT per day. Since then the capacity has been expanded to about2500 MT per day. The f.,ll uses a two-stage acid-leach.process and was the first in the UnitedStates to incorporate the moving bed ion-exchange technique originally developed in South Africa.It is also unique among U.S. uranium mills in using arion exchange for absorption of uranium fromthe feed solution.
Company-owned open-oit mining operations [1.5 to 3 km (1 to 2 'miles) from the mill] supply 95%of the ore processed. The remaining 5% is produced at two underground operations--the West GasHills mine and the East Gas Hills mine. The ore grade has averagedý0.261 U309 in pasf opera-tions and is expected to average 0.1% in the future. Although mines adjacent to the mill al ;ocuuld provide fresh water for ore process~ng, availability of hot [57*C (135*F)] well water atthe site makes it advantageous from a process standpoint to use well water in the mill and totreat mine water for discharge.
The tailings retention system consists of five tailings ponds encompassing 55 ha (135 acres).The pcnds are situated sequentially in a small natural ravine north-northwest of th-.e mill andare dug into an underlying shale formation. Clay core dams keyed into the shale provide pro-tection against lateral seepage. Only two of the five tailings ponds now contain tailings. Thetotal tailings area of these two ponds is 28 to 32 ha (70 to 80 acres). The average tailingsdepth, now 11 m (36 ft), is expected to increase to 33 m (110 ft) by the end of milling opera-tions (1996). The remaining three ponds are now used for solution evaporation.
In 1%3. a flooding incident occurred at the mill site in which 8.7 . 107 L (2.3 - 107 gallons)of impounded teilinyg solution was released to the environment. This incident prompted anenlargement of the tailings impoundment to its c'jrrent capacity. The existing system, with aminimum of 1.5 m (5 ft) of freeboard, is estimated to provide 8.7 - lO8 L (2.3 - 109 gallons)of emergency Storage.
- ~T-ll I
T.17 Split Rock Mill, Western Nuclear, Inc
The Split Rock Uranium Mil' iS part of Western Nuclear's operations In the Crook's Gap and GasHills Uranium Districts of Fremont County, Wyoming. The mill is 3.2 kin (2 miles) north ofJeffrey City, Wyoming, at the base of several foothills of the Granite Mountains. The firsturanium mill in Wyoming, the Split Rock mill beVan operations in 1957 with ore-processing.capacity of 360 MT per day. Major modifications and modernizatior.s in the process metallurgyhave increased the processing rate to 1540 MT per day. About half of the mili's daily produc-tion comes from open-pit mines in the Gas Hills district aad half from Western Nuclear's under-ground operations in, the Crook's Gap mining district. The ore grade has ranged from 0.15% to0.30. U308 Juring past operations and is expected to range from 0.051 to 0.15, in the future.Tailings nave been deposited inman area east to routheast of the plant since the beginning of
operations. On April 12, 1977, tailings slurry escaped from the Impoundment.as a result of abreach in the embankment at the northwestern corner of the pond.. About 10 m (33 ft) of theembarkment was breached, resulting in a release of about 7.5 x 1.06 L (2.0 i 10 •gallons) oftailings slurry.
For the estimated 20 remaining years oT mill operation,.a retention embankment will be incri-mentally constructed to a final elevation of 1964 m (6444 feet). The active tailings-disposalarea now occupies 34 ha (85 acres). It is estimated that in 20 years the area occupled by theactive and old tailings pond, dam, and embankment will have increased to a maximum of 93 ha .-:(230 acres).
T.7..18 East Gas Hills Mill, Union Carbide Corp.
The East Gas Hills Mill is part of the Union Carbide Uranium Project in the southeastern portionof the Wind River Basir, of Wyoming. The mill is about 95 km (60 miles) west of Casper, WyomIng,in an area of rolling hills interspersed with relatively flat areas.
The mill employs an acid leaching system (RIP-Eluex system) for recovery of uranium. Recycledso 'tion from the impoundment system is used to wash sands after sand-slime separation. Addi-tional pond decant solution is used for tailings dilution. The mill began operations in early1960 with a capacity of about 1300 MT per day; in January 1980, the capacity was increased to1250 MT per day. Open-pit operations at company-owned mines in East and West Gas Hills supplythe ore. Sufficient ore is proven to maintain the current milling rate for five to ten moreyear,. During the anticipated total active life of the project (1960-1986), about 12 x 106 1"(13 106 ST) of mill tailings will have been produzed. The retention capacity [7.6 - 106 MT
-4 14u' ST)) of the mill's original above-grade tailings impoundment has been reached, ands.,ce January 1980, tailings have been discharged to a depleted open-pit mine with a capacity of2.3 x 10' NT (2.5 - 10 ST). The pit has an area of 11 ha (26 acres), is clay-lined on thebottom, and has an in-pit dewatering system. The associated evaporation area consists of twoponds with a combined surface area of 9.7 ha (24 acres). A second mine pit will be availablefor tailings disposal in 1982. The maximum height of the embankment of the original abovegradetailings pond (and expansions) is about 14 m (45 ft). The original retention system has an areaof 60 ha (148 acres).Union Carbide also operates a heap leach facility in the mill area at its East Gas Hills site.The water [1.7 L/s (27 gpm))] used in the process is taken from the A-9 pit, and UsO9 Is recoveredfrom the high-grade leach liquor by a solvent extraction process. The organic phase is pumpedto Li existing mill circuit. Union Carbide expects to re .ver 140,000 kg (310,000 pounds) ofI308 frw' the low-.or=.i ore.
1.2.19 FHih'nd Mill, Exxon Corp.
Exxon's Highland mine and mitl comp~ex is in an area of rolling hills and stream valleys W km(60 miles) northeast of Casper, 0yoming, in the Powder River Basin. Exxon has be, n conductingmining and milling operations at t*,e Highland lo:ation since 1972. The uranium ore processed atthe mill is currently extracted frrom E)X I's surface mines and underground mine on the Highlandproperty. The mill also produces iranium c)ncentrate from iolutions and slurries containinguranium recovered from tailings sol.-tlons, and from a pilot in-situ leaching process operated atHighland.
The Highland mill processes an average of 2720 MT per day of ore, but has attained levels ashigh as 2950 MT per day in recent operations. This is 50% more than the originsl design capac-ity when the mill opened in 1972. The increase was achieved primarily through mill modifica-tions, such as changing electric motor horsepower ratings, altering process lines, and refine-,ments and additions to instrumentation. Because of a high degree of automation in the plant,five workers can control the entire mill, wni~h produces about 1800 MT (2000 ST) of yellowcakeper year.
Tailings are contained in a natural valley enclosed by an earthen clay-core dam. The tailingspond covers an area of 80 ha (200 acres). The tailings surface slopes from both the west and
east (embankment face) toward the pond. A small cutoff and pumpback system 210 m (700'ft)downstream of the embankment returns 3 L/s (50 gpm) of collected seepage to the pond.
T.2.20 Bear'Creek Hill, Rocky Mountain Energy Co.
The Bear Croek Mill is part of a uranium project that includes open-pit mining operations inConverse County, Wyoming, about 72 km (45 miles) northeast of Casper. The site Is in thesouthern portion of the Eastern Powder River Basin, between the Bighorn Mountains and the BlackHills. The site-is located within the Thunder Basin National Grassland, consisting cf inter-mingled Federal, state, and private land ownership.
Rocky Mountain Energy Co. dedicated its 9M10 MTPD Bear Creek complex on September 22, 1977.Production since has been increased to 1800 MT per day, a rate that will likely be maintaineduntil 1990. U,.Oe content of the ore ranges from less than 0.11 to 1.0%
The tailings impoundment is 300 m (1000 ft) west of the mill in a natural basin enclosed by anearth and rock dam. The dam will have a maximum height of 18 m (60 ft) and a length of 160 m(1500 it). Embanknent materials for the dam will come from borrow excavation of weakly cementedbedrock in mine pits.
The total a-ea of tailings retention is [61 ha (150 acres). The average depth of tailings willbe about 7 M (23 ft) by the end of 20 years of operation. The area is underlain by alluvium andlclaystone.
To improve stability, seepage through the tailings dam foundation will be controlled by exca-vating a cutoff trench to the top of the bedrock beneath the center of the dam and backfillingwith impervious material. An additional measure to contain seepage from the tailings pond isthe proposed construction of a 5-m (17 ft) (maximum height) dike about 240 m (800 ft) downstreamof the tailings dam. Extending upstream from the dike's center will be a bentonite-filledtrench reaching down to bedrock. Seepage collected in this trench will be pumped back to thetailings pond.
T.2.21 , Shirley Basin Mill, Pathfinder Mines Corp.
Pathfinder Mines Corp. (formerly Lucky Mc Uranium Corp.) operates the Shirley Basin Uranium Millin an area of plains and rolling hills about 72 km (45 miles) south of Casper, Wyoming.
Underground operations were used to mine the Shirley Basin property during the period-1960through 1963; solution mining maintained production from 1963 through 1970. The mill was com-pleted in 1971, and mining was converted to open-pit methods. The mill is a .. ogenous, with nopreliminary crushing. There are no conveyors in the plant. Static-bed resin columns extracturanium following acid leaching. The only recent change in mill equipment has been the instal-lation of a new yellowcake dryer and the addition of a cyclone wash that washes sands throughfive successive cyclones in series. This addition increased mill throughput from 1090 to16sU HT per day.
About 8.6 a 106 kg (19 a IV( pounds) of uranium concentrates will be produced over the 12-yearlifetime of the mill. A tailings pile covering about 93 ha (230 acres) and containing3.1 * 106 MT (3.5 i 106 ST) of tailings will be created. The impoundment system is unique inthat wastes are se~regated into two streams--a tailings slurry and overflow solution from yellow-cake washing thickners. The tailings slurry is pumped to a tailings pond, where seepage controlis provided by a compacted sandy clay blanket lining the pond bottom. There is no recycle fromthe tailings pond. Yellowcake thickener overflow is sent to a recycle pond, where it is mixed%ith cooling water and recycled to the grinding circuit. A collection ditch with a return pumpreturns about 0.6 L/s (10 gpm) of seepage to the impoundment system.
The present tailings pond covers about 61 ha ks50 acres). It requires only a single.-sidedretention dam. The fill material for the dam and for the keyway consists of sandy clay exca-vated from the open-pit mine.-
T.2.Z? Shirley Basin Mill, Petrotomics
Petrotomics' Shirley Basin Uranium Mill is located in a hilly area about 77 km (48 miles) southof Casper in the eastern Shirley Basin area of Wyoming. The mill beqan operations in 1962 atthe designed capacity of 480 MT per day; in 1967, new facilities were built to increase thecapacity to 910 WI per oay and to modify the solvent extraction circuit. Ir early 1975, GettyOil and Skelly Oil acquired Kerr-McGee Nuclear Corp's one-half interest in' Petrotomics. Themill was clo~ed from 1974 ontil 1977 for refurbishing and process improvements. The mill now isProcessinq ores from UJV (a joint venture of Getty and Skelly) and from the Jenkins Project ofUtility Fuels, Inc. UJV holds propertie,, in the Shirley Basin estimated to contain 6.4 - 10 91(7 - 10' ST) of uranium reserves. At the pre~ent average processing rate of 1500 MT per day,the expected ore life is about 20 years.
~: T-'13
The combined tailings slurry is pumped to a tailings area 140 m (450 ft) from the mill. Thearea was formed by damming a natural ravine with sand built up with mine overburden.. The tail-ings dam is situated near the head of a small tributary drainage to Sand Creek. The tailingsretention system currently consists of the main tailings pond [65 ha (160 acres)] and threecatchment basins and emergency dams which collect and return lateral seepage or overflow fromthe tailings area. The tailings pond was constructed with an underlying layer of clay to reduceseepaoe. The capacity of the tailings pond has been reached and Petrotomics has constructed anaddition -to the existing dam. The embaniment .addition-was constructed downstream.of the existinqembankment, incorporating the existing embankment in the upstream.toe of the larger embankment.
T.3 REVIEW OF URANIUM MILL TAILINGS MANAGEMENT PROGRAMS INVOLVING BELOW-GRADE DISPOSAL
Speech presented by:
Ross A. Scarano, ChiefUranium Recovery Licensing Branch
U.S. Nuclear Regulatory Commission
at the:
First International Conference onUranium Mine Waste Disposal,
Vancouver, B.C. Canada
May 19-21, 1980
RElVIEW OF URANIUM MILL TAILINGS MANAGEMENT PROGRAMSINVOLVING BELOW GRADE DISPOSAL
Ross A. Scarano, ChiefUranium Recovery Licensing BranchU. S. Nuclear Regulatory Comfss';A
It wasn't until late 1976 that the U. S..Nuclear Regulatory Commission
(NRC) set about to address the uranim tailings issue In earnest. It
-s decided that a generic environmental imact statement rela*•o to
* ranium milling operations would be prepared to support formal tailings
regulation. we recognized, however. that this not 4 tUsk that W4ld
take many years to caoplete and we could not take a 'bustness as usual'
lppra)ch to tailings managmnt aIn the interim; the issue was too sensitive.
To facilitate licensing during the interim period, to* NRc developed
guidelines In Pay 1177. for the .ndust y ir the form of the following
performence objectives for tailings monaqgrent:
Sitin and DesignI. Locate the tailings isolation area revete from people such that
population exposures would be reduced to the maximu extent reasonably
achievable.
Z. Locate the tailings Isolation area such that disruption ;,nd dispersion
by natural forces is eliminated or reduced- to te maximu extent
reasonably Achievable.
3. Design the Isolation area such that seepage of tonfr materials intothe groundamter system •.'ld be eliminated or reduced to the maxim
estent reasonably achievosle.During Operations
4. Eliminate the blow,,. Of tailings to unrestricted a-vat during
normal operating Conditions.
Post Reclamation
S. Reduce direct gas -waotlnn from the tmOundpnrt area to essentiolly
background.
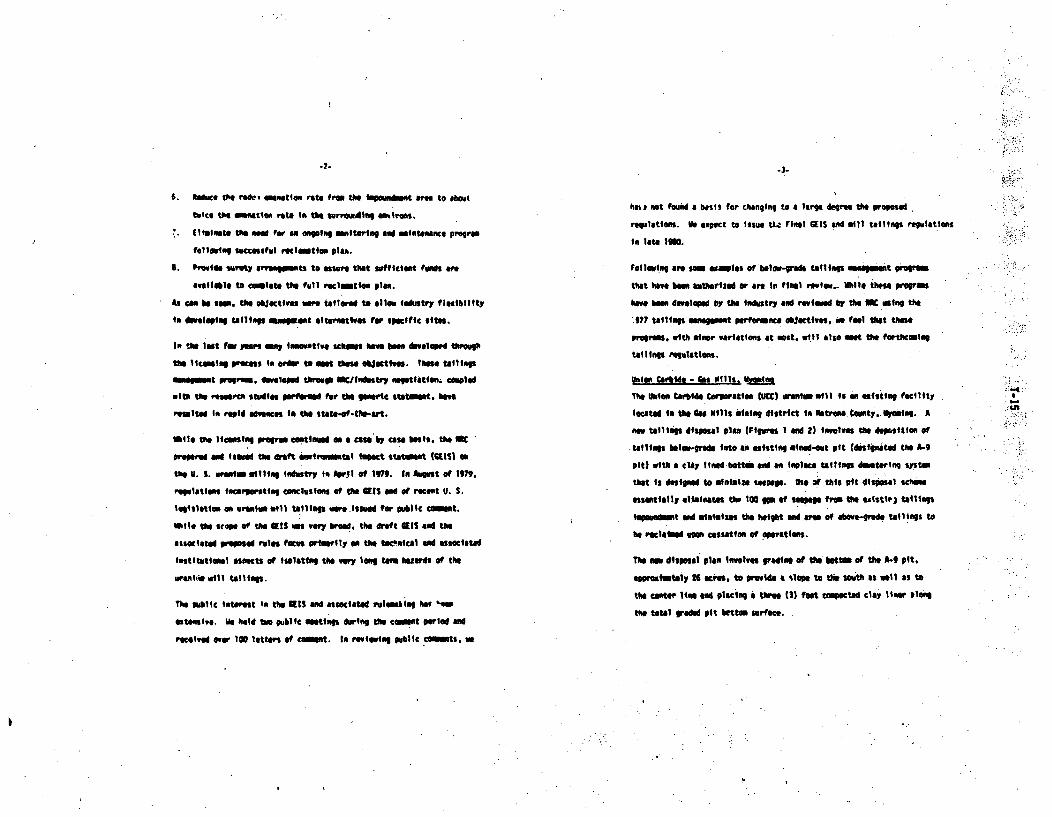
-2- -3-
5. ftduce Via rsd, anation rate from tie 11 mdouna t area to ibout
twice t•e mnettom rate In thme surmr ding mairaons.
• lisite the need for an isoping mnittoring end aintenance p•ogra
following successful rcliamtion plan.
S. Provid surety o 1n:11ts to asre that suffici4et funds ore
available to eolste thme full reclamtioon plan.
As cn be son. the objectives we tatlered to allow industry flexibility
tn volpinq tailltmmg moesuint alternatives for specifc sites.
In teg lost few Yom son inneovative scheme haoe base developed throuP
the Micemingie r 0 t order to smo meo" objectives. These tailings
manamnt Pgro m . developed through cOIndostry " iettstioe coupled
WitS the res•arch stdieas ONafi for the geONerC stotemt. hes
resulted Is r"id ed'eces the sto-0of-tairt.
*ibile the licmnsiog penren conttim d ma cat by case kIts. the fIK
ONeeme amid Ismed tie raft etmelymetal tImect statement OEMI a
the U. S. wrealo Willing Industry In April of 1979. In August of 1979.
gllIstioens ftoarpnratin conclustons of tie GEIS VA of recent U. S.
legistlttion an urentolv llW tallings e .issued for pumic commt.
mile aia scope of time UIS ws vy brad, the draft GItS and thie
assoctated Ppo•eid rais fou primarily ao the tloinical and assoctated
h"stitietiOel sects of tfileting the very long term hoazrds of the
urmwhfi will talings.
The Public Intaret In the SIRS own associated ruleneking has *n
extenstie. We held to public metitgs during the connt Perted and
received ever 100 letters of c¢nt. In reoWgq Public .matS. W
imas not foudid a basis for changing to a large degree t•e proposed .
requlations. IV expect to Issue tU.. Final GEIS and mill tallings regulations
tn lats 1990.
Following Iare sam eamples of below-grads tafllogs megeuwit
that Mwve benm uthorised or are in fil revwim... htll these P•rgras
have base developed by the Industry aid revioud by tme IMC usinl the
-.977 tafiltgs Management prformc objectives,. feel thet th•se
orf" . with minor variations at mot. will also met the fortheo1in
taillngs regulations.
union Carlide - Ws pill%. v~dm
The URION Carbide Cororation (MCCC) urenil mll is an elating facility
located io ths Goo Hills mining dfstrict in Matron. County., poning. A
no talllgs disposal plan (FIgVres I nd 2) Involves tie depsition or
.talings balm-grafd into an eisting slned-out pit (disipeitod tme A*-9
pit) with a &lay lined bottom and an Inglece tallingp dA toring Spstm
that is dastgoad to minimize -eueg. Use Vf this Pit disposal schmool
essentially eiminestes the 100 gpo of seepage from tM esistirj tailig•s
guneait and mianmiets the heightt end aro of above-grafe tailings to
be reclai up o• cessation of Operations.
The o" dispoal plan involves Vradin at e batten of ilathe A9 pit.
eppro&mM tely 26 acres, to Provide a 'tic" to Ie sob" as wall as to
the cMater line en peclng a teses (3) foot compacted clay linr *Ion
the total grad pit beetto surface.
-4i~ i'i
t.im
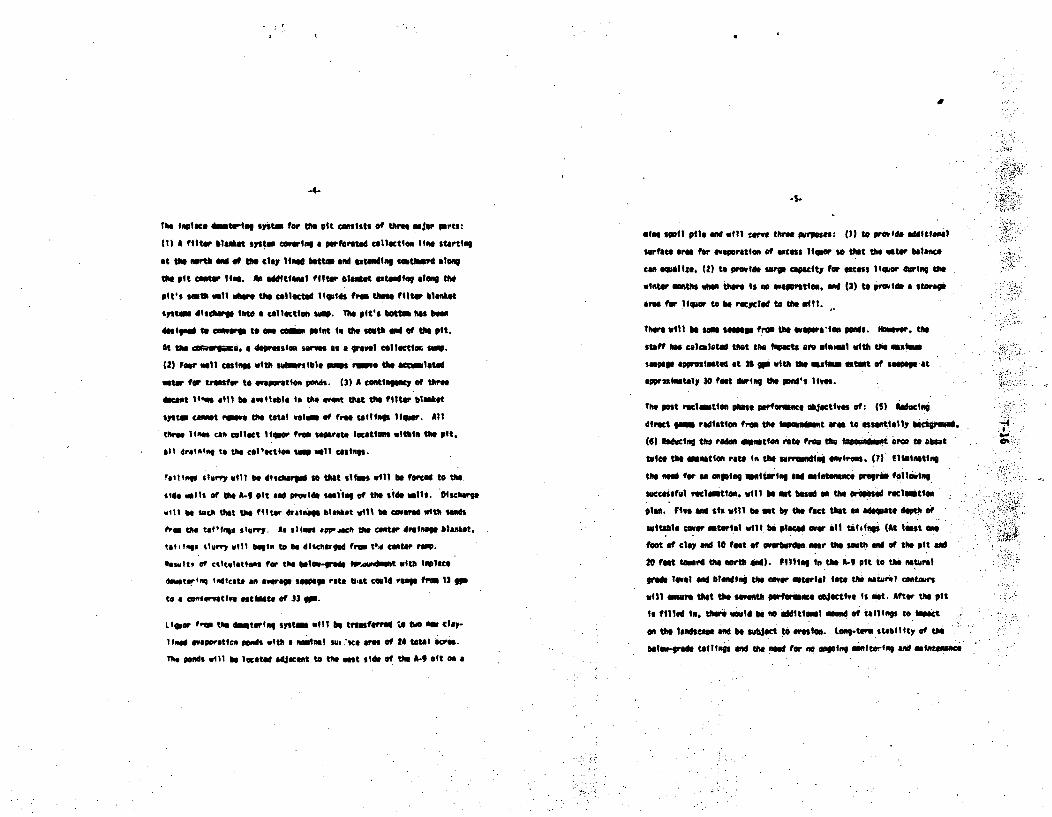
0
-4--S.
the iolace dmoteplg system for the pit consists of three major Prts:
(1) A filter blanket Vetter Covering a Iperforateld Collection lino Start'In
at tire t ai of as Clay limmd hatt= lid exteming setlhird samn
the pit center line. AN additional fil•te bla exteading along the
pit's sathi wall shore thme collected ligsids frim tLIse filter blanke
f im domlchag lwt a collection t . The pit's botm has bee
Igned to caeneg to me ce n paint in the south end of the pit.
At tae oCal' gm e dea "rusioa serves as a graen Cal lectifo sta .
(2) feer wall cUasin with "Uw nible pumps ove the accumleted
water for trotter to evaporation ponds. (3) A continlgpcy of thrwe
deant lI'e oil1 be available in tim event that tie filter blinket
sptem cat ret v tihe total volume of free tailings liquor. All
three lien can collect liquor i searote locations within tin pit.
all d4aining to the colloctloo ti sell c•st"i .
it •l'g slurry will be discharged so that elfmes will be tofted to the
aide e1l Is of as A-I pit ai provide seaing of the Side Walls. isharge
will be snch that the fitter draina btanket will te Covered With Seris
Pro the talfalps slurry. At slimse us•r¢ip the center drainage blanket.
tat.iIn, Slurry will begin to be dischmaged frto tk~e Centoer tip.
lesults of ciltlatties for the below-Irade IvAuowpd with InPlace
deowstr'q indicate ao avragte Seepage rate tiat could rang from 13 Ito
to a Coftheeitf e"twat* of 33 gO.
Liquor frip thA mtering Sltor will be traMnferred to am nel clay-
ined ovaaratice peopnd with a i•1iitl sum Pi*9 ir Of 24 total acres.
TWe pons Will be located adjacent to the West side Of the A-9 rot on a
rine spoil pile and will c-rve three purposes: (1) to provide additional
surtfce are tot evporrtlan af excess liquor so that the water balance
can emellsie. 12) to provide surge capacity tor excess liquor during the
winter months whea there is no evaporation, aid (3) to provide a storma
area fo r Igur to be recycled to the oIl.
There will be samosetpage from the evapora•le poMnS. fere . the
staff has calculated tac the l16at almos t with the tinaM
$enpsg swoaoiestod at 3S gpl with the allmo etret of e eat
itpW2xmtely 30 feet during the ponds lives.
the post reclaation phase perfoarnce objectives of: (S) ldducti
direct g radiation from the imodmet area to neus tially baclgirmid.
(61 Reducing the rod em anationi rote trom thm iOR,;set arm to about
twice the innatien rate in time sorprunding environs. (7) Eliminating
the need for an o""oing rneitringa ma nd emintmmnce prorn following
cestwfvl reclamation. will be met hsed an the prompod ral tion
plea. five• n Si Will be ft by th fect thet n adeqate depth of
suitable tower maternal will. be ploaced owe all taimings (At lust ONe
foot of clay amd 10 fet of oer nar the sooth and of the pit apid
20 fest ttmr4 the earth amd). Filling In the A-o pit. to the naturel
grad level aid blaendin the cover mateil ifte the nsaural contours
will fens that the seventh pemommncip objective Is pat. After the pit
Is tfiled In. there Would be no itiomna momd of tai•ling to ape .t
on the landse aON be subject to aoroste. ong-tern stability Of the
blelw-oraide tallings and time need tar no onging" monitorfIg amid mintemasc
-4
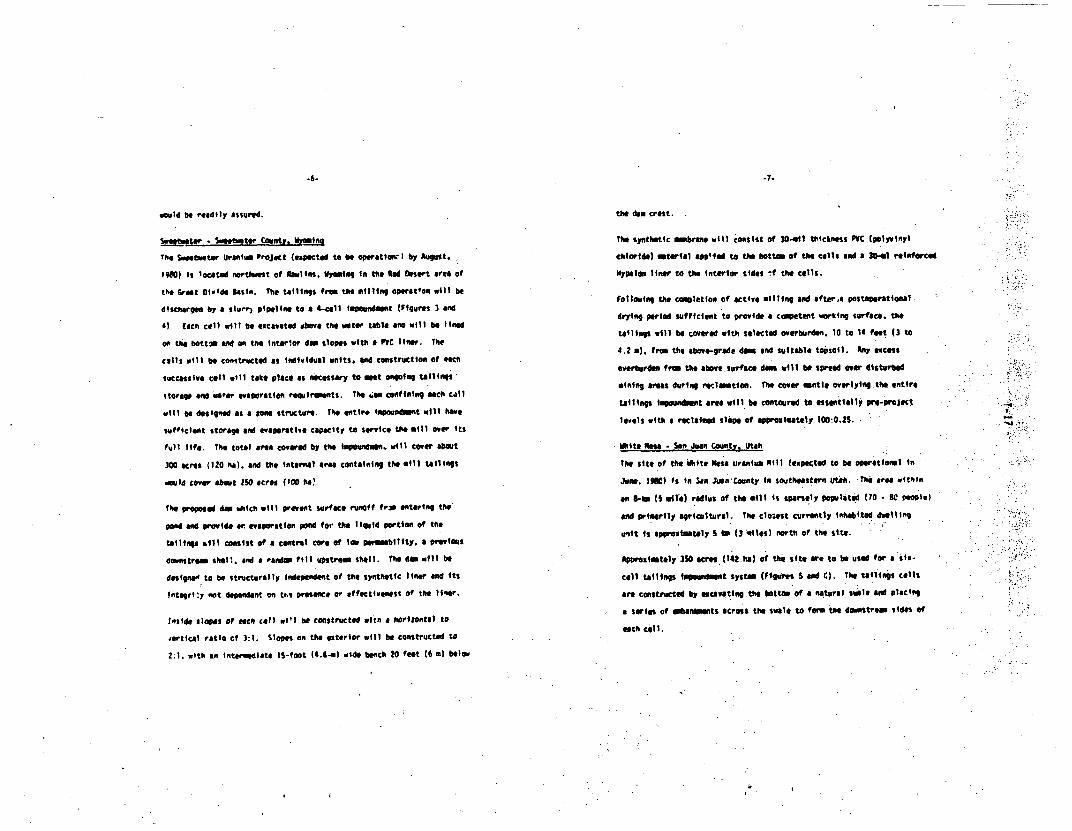
,6--7-
mould be readily assured. the dam crest.
Seatater . Sweetwater County,. lyomain
The Sweoteeter Uranium Project (expected to be operaticer I by August.
19M) is located nortimest of Rawlins. wyoyidg In t.he Red Desert aree of
the rreat Divide Basin. The tailings from the milling operation will be
discharged by a slurr) pipeline to a 4-Cell impoundment (Figures 3 and
6) Caen cell will be excavated above the water table one will be lined
on the bottlI &ad on tie Interior dam slopes with a PVC liner. tie
calls will be constructed as Individual units. and construction of eaci
successive cell will take place as necessary to met ofgoing taillings
storage aid meter evaporation reulrIomnts. The ;Am confining eCo call
will be designeld as a tone structure. The entire, ipoonnt will have
sufficlot storage and evaporative ca•aity to service the mill over Its
full life. The total area Covered by the isoovndn. will Cover about
300 acres (120 ba). and the Internal are containing the mill tailings
wid Cover about ISO acres (100 ha.'
The proposed dam whic will prevent surface runoff Iri entering the'
pond mnd rvile aer evaporation pond f0o- the liquid portion of the
tailings bill consist of a central wre of lo pem--bility, a previous
donstrems shell. and a raidae fill upstrce shell, the dam will be
dasign to be structurally Independent of the synthetic liner end Its
ivtegrlty not dependent on tit presence or effectiveness of the 1lnr.
milldf slpes Of eCh Cell will be constructed with a horimOntal to
,ortical ratio cf 3:1. Slopes on the exterior will be constructed to
2:1. with an Interldlate IS-foot (4.")mi wide bench 20 feet (6 ml below
The synthetic embrane will Consist of 30-d1 tOickness PVC .(Poyminyl
chloride) material app~led to the bottom of the cells end a 3D-l reinforced
Iypelon liner to the Interior sides f the cells.
Following tme conlletion of active milling and after A postoperational
drying Period sufficient to provide a copetent warking surface. the
tailings vill be covered with selected overburden. 10 to 14 feet (3 to
4.2 ). frI the 4bove-gred deam and suitable topsoil. Any excess
overburden fam the above surface dams will be spread over disturbed
mining areas during reclomotion. The cover mantle overlying .the entire
tailings Impoundnt area will be contoured to essentially pre-Project
levels with a reclaimed slope of appro•imatelY 100:0.25.
*Wit. 11sa . SAn Juan County, Utah
the site of the White mesa Uranium Hill (expected to be operational In
June. Ilo) is In Sin JulanCounty to southeastern Utah. The oe' wifthn
an 8-1e (S mil'e) radius of.the will Is sparsely populated (70 - SC People)
and prmaorily agriCultural. The closest currently Inhebitad dwelling
unit is appro•iately S is (3 *1les) north of the stte.
Aporoximatly 3S0 AcreM (142.ha) of the site are to be used for a Six-
cell tailings Impeumnd t system (Figures S and C). The tailings cells
are constructed by escavating the bottom of a natural seele and plecing
a sarie of aebenanoats across the swale to form the downstream sides of
each cell.
-~ 0
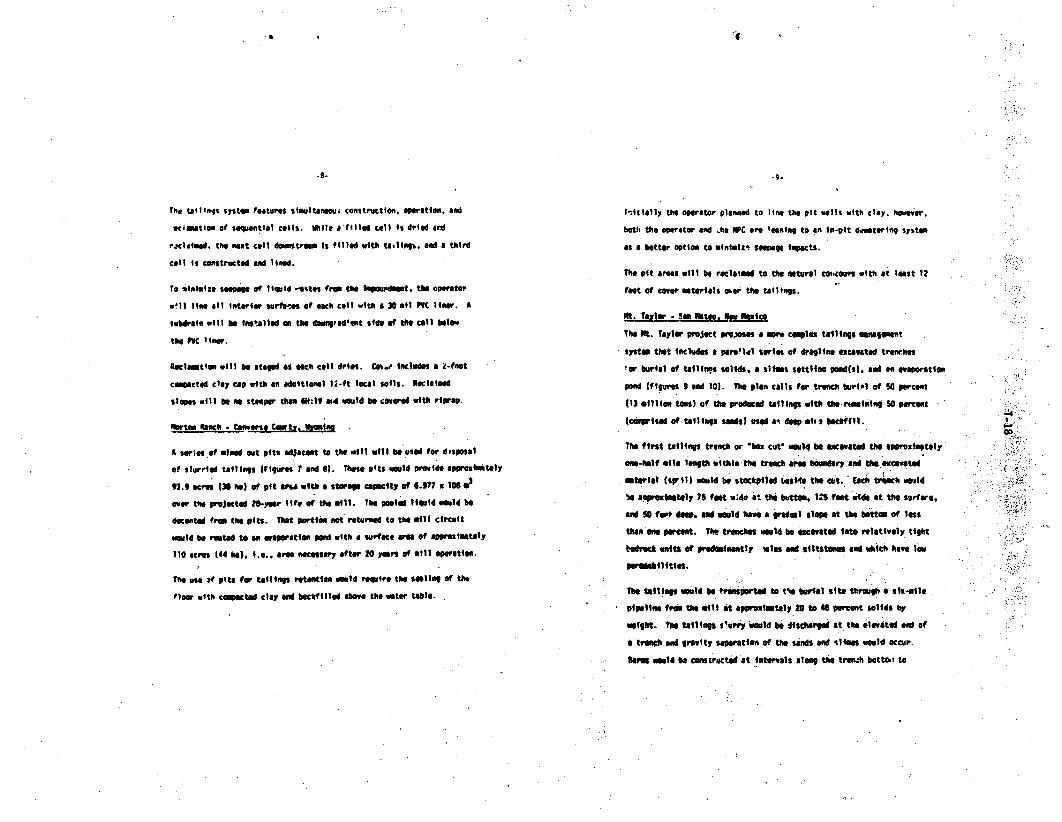
,it
-5- -9-
The taiings systm features $ismitanami construction. operation, and
eclation of sequential cells. Wille A'filled cell is dried am
ricisleed. the nest cell dotrem Is filed with W in•. and a third
cell Is constructed and lined.
To inftoze s66604 of liquid ,t'tes from the in rt. the operator
will liei all Interior surfacas of each cell with a 30 all PVC lIner. A
uledrain will be isalled an the doawnadint side of the cell below
the PVC liner.
Reclamtion will be stae as each cell debt. Ces Includes a Z-fnot
com cted clay cap with an afditlonel 12-ft local soils. Reclaimed
slopes will hboe steeper h 6nN:llV'id would be coveryed with r1prai.
artm Reanch - Coner-se Cowtvy, vlji
A savies of minem out pits adjacent to the wIl will be used for disposal
of slurried tailings (Figr 7 end 8). Uese oft$ wold Provide aprmt • ately
92.9 acres (1 he) of pit aVts with st•rage c•city of 6.9f" x 106
over the Projected 0y.ear life of the mill. The pfoled liquid would be
decanted fre the pits. That portion fot returned to the mill circuit
would he roeted to e aep•ratioln pond with a surface ae of aIpreul atfly
110 acres (44 he). I.e.. are necesary after 20 years of mill operation.
The use yf pits for tailings retention "auld require the Soaling of the
floor with c€oactad clay aid beci? illed above the water table.
Initielly the operator planned to line the pit walls with clay. hwesevr.
bot, the operator and •he iC are enning to an in-pit 4,atering system
as a better option to minlmlz. $*epage Ipoacts.
The pit areas will be reclaimed to the natural cobcours with at least 12
feet of cover materils 01r the tailings.
Mt. Titler - San Hatie, M polco
The Nt. Taylor project Ortososs a ware oalas tailings sieagment
syste that Includes a plrafl1l series of drag line icavted trenches
!or burial of taelli.s solids. a Illes settlini pond(s). and an evaporation
pond (figures 9 end 10). The plan calls for trendc burial of SO percent
(13 million tonsl of toe produced tailings with the-rimalin1g 50 percent
(c-eprised of tailings sands) used deep al0i bracfill.
The first tailings trenc1 or 'bo cut' Mul4 be cavtad the appromIately
one-half elli lengt within the bench am bo•ndary ad the eecevatad
material (sirll) would be stockpiled Lesiet the cut. Each trench wouldse pproxlnmtely 75 feat w;o ai* the buttom. I3 feet wide at the sarfare,
and SO fee deep. and Mold have a -adal sloPe at the hottom of less
then One porcent. The trenches wMuld be Scvated i Into relatively tight
,dreck euits of predninantly Isals and slltstoo rand dwich hive low
peemabllties.
The tailings Mould be trantnorted to 04a bIral site through a six-mile
pipeline from the mill at approshetoly 20 to 40 percent solids by
woight. The tallings $'rrl woid be discharged at the elevated end of
a tramph and gravity separation of the sands and 0fian would occur.
Seem wMld be constructid at- Intervals along the tre.h bettee to
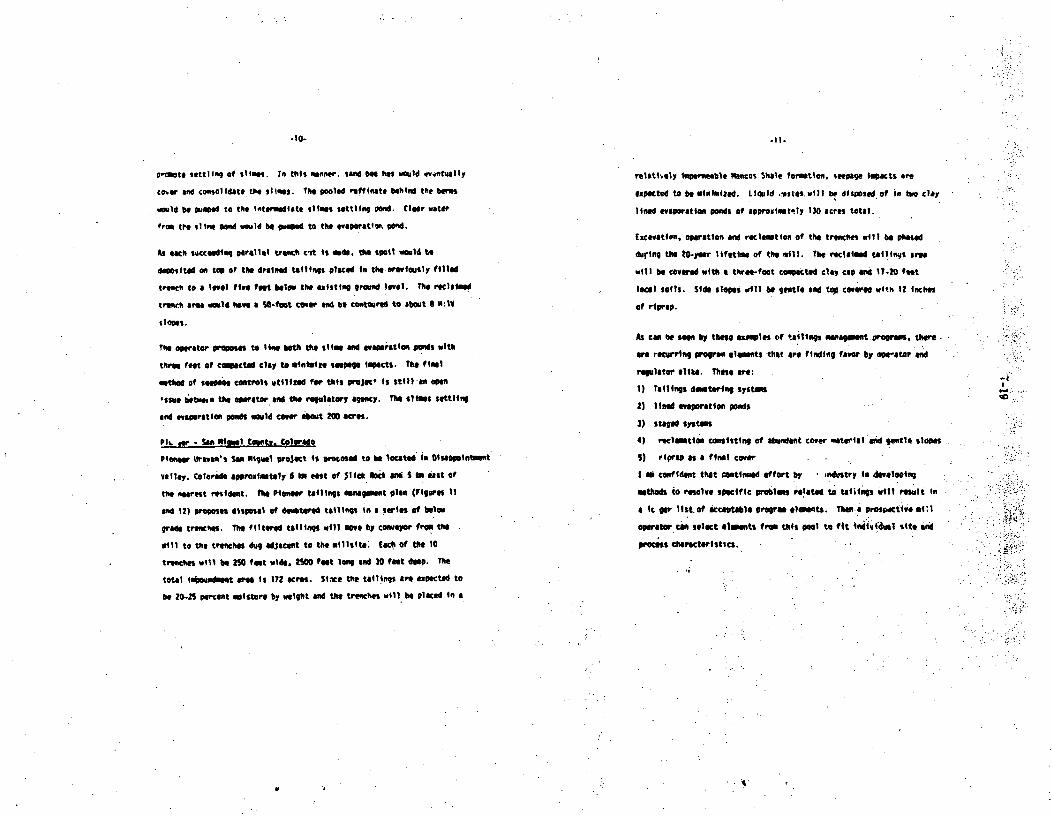
-0- -II-
prmte settling of site". in this Snner. sand be has wold eventually
cor and consolidate the slins. The Poled reffinate behind the bergs
would be puined to the Intermediate stins settling pond. Clear water
from the sling pOd OWwld be pumed to the evaporatift pOd.
As each succeeding parallel trench cat is mcde. the spoil would te
deosited on too of the drained tailings placed in the oreviously filled
trench to a level file feet below the existing roaund level. The reclaimed
tncrh area amd haeo a S"-fot cover and to contoured to about S N:IV
Sloaes.
The operator P oses to line bth the slime and evaporation Ponds with
three feet of cmacted clay to minimitt se Page Impacts. The final
mathad of seem04e controls utilited for this pfojec* Is still an Op
,ssue betwen the operator and the regulatory agency. The a1tloes settling
and evaoratiot ponds wMuld cover about 200 acres.
P. oer - San "glol Contir. Colorado
PMemo Uriavn's San liguel project Is prooased to be located in isppoitent
valley. CoTorado approxitely 6 in east of pick oeirt an S IN east Of
the nearest resident. the Pionee tailings manaoent plan (Figures 11
and i2) proposes disposal of dewtored tailing in a series of belm.
graft trenches. The filtered tailings will move by Conveyor from the .
mill to the trenches dug adjacent to the mIllsItsa tech of the 10
tren-hes will be 100 feet wide. 200 feet long and 30 feet deep. The
total i0•p•endi ar is 172 acres. St.ne the tailings are expectid to
be 20-25 percent ialsture by weight and the trenches wi1l be placed in a
reiatt.loy iro"reeble tancos Shale formation. seePige impacts are
expected to be ginimized. Liquid eastes, will be disposed of in two clay
lined evapration ponds of approsimatnly 130 acres total.
Excavation. operation and reclamation of the trenches will be phased
during the W-te- r lifetime of the mill. The reclaImed tallin;s area
will be covered with a three-foot compacted clay coo ami 17.20 feet
local soils. Side slope will be gentle and top covere with IZ inches
of riprap.
As can be se" by these exaples of tailings managmnt.programs there.
a#rec'urring program elaentS -that are finding favor by ope-ator and
regulator alike. These are:
1) Tailings dwterint systas
2) lined evaporation ponds
3) staged systaes
4) reclimtion consisting of abiundant cover material mad gentle slopes
S) riprp as a final cover
I oiconfident that continued ef fort by 1ndu strY IN developing
methods to resolve specific probles related to tailng will result in
a Ic por list of acceptable program elements. Th•ea porospdctive mEl
opeator caM select eh1nts from this pool to fit indiv"dual site and
process characteristics.
so
t0
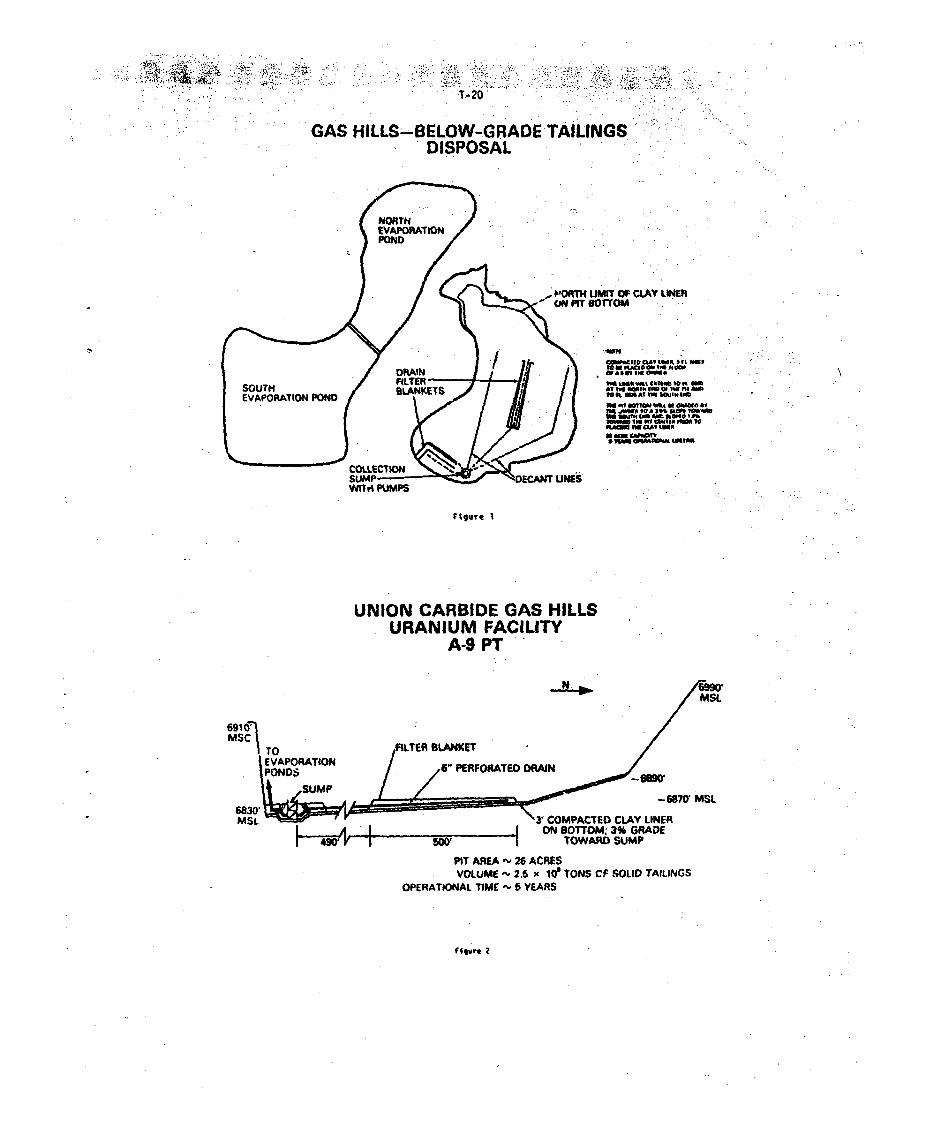
1,20.',~ p2,-
GAS HILLS-BELOW-GRADETAILINGSDISPOSAL
WTiI PUMPS
figurt I
UNION CARBIDE GAS HILLSURANIUM FACILITY
A-9 PT
MSL
FILTER BLANKET6" PERFORATED ODAN _saw
__ r.Jm"w'v U~
• II110 / V m•lL.
6830'MSL V COMPACTED CLAY LINER
ON BOTTOM: 3% GRADETOWARD SUMP
PIT AREA - 26 ACRESVOLUME ,- 2.5 x 100 TONS CF SOLID TAILINGS
OPERATIONAL TIME -' 5 YEARS
figv.r 2
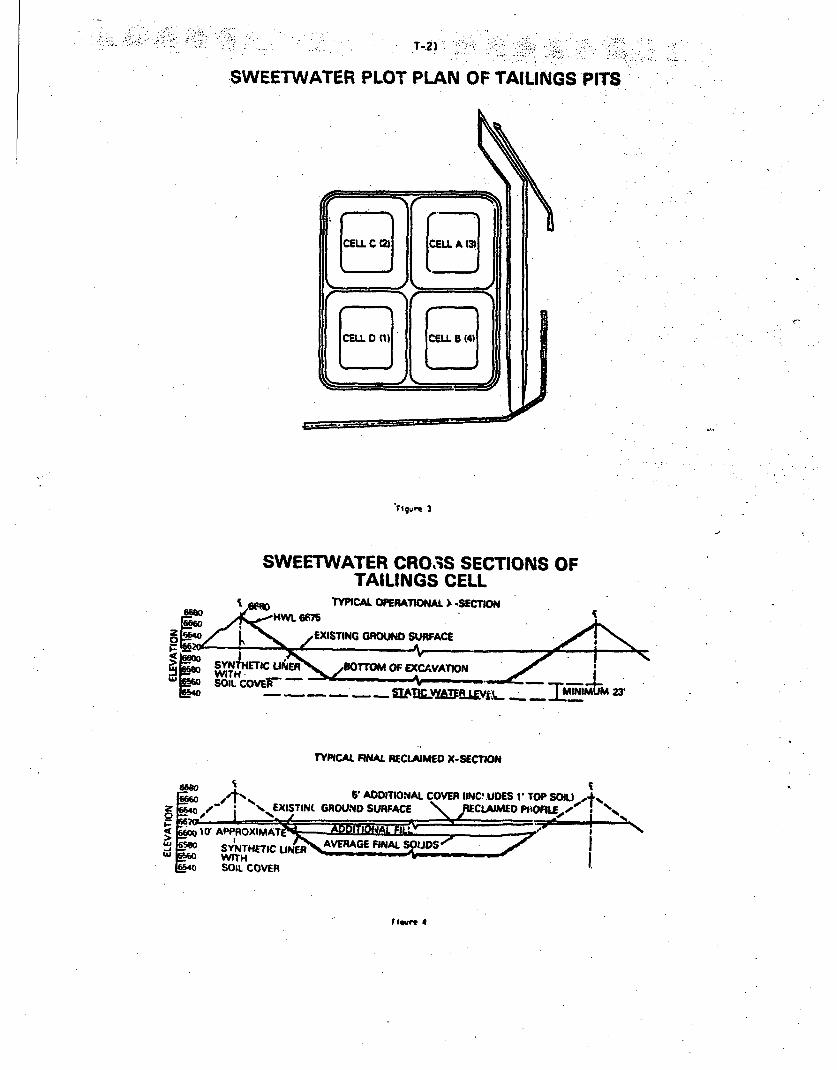
T-,.. 2. .
SWEETWATER PLOT PLAN OF TAILINGS PITS
:e-
" lgure 3
SWEETWATER CRO3S SECTIONS OFTAILINGS CELL
i W10TYPCAL OPERATIONAL A -SECTIONI
gz EXISTING GROUND SURFACE
i SYNIMIETIC UIIER .OTTOM OF EXCAVATION
S- -__ - I - - WA |
TYPICAL FINAL RECLAIMED X-SECTION
6w6 ,4., W ADDIoNAL COVER IC..UDES ' TOP SOIL)'t"Z .s.. EXISTINE GROUND SURFACE K ,RECLAIMED PKOFILUSE,, .
10 APPROXIMAT IL,Ij 6500 SYNTHETIC AVERAE FIN
tu WITH ..6540 SOIL COVER
Vrfovt 4
T-22
ENERGY FUELS-SIX-CELL TAILINGSDISPOSAL SYSTEM
CELL i -"ENLARGEMENT
CELL 5 SAFETYDIKE
WHITE IlESA PROJECTfigur* 5
SELECTION A-A6-CELL TAIUNG DISPOSAL SYSTEM
YEAR 9
cCtaLCLI
w~~~~aigr fiiCowo mI
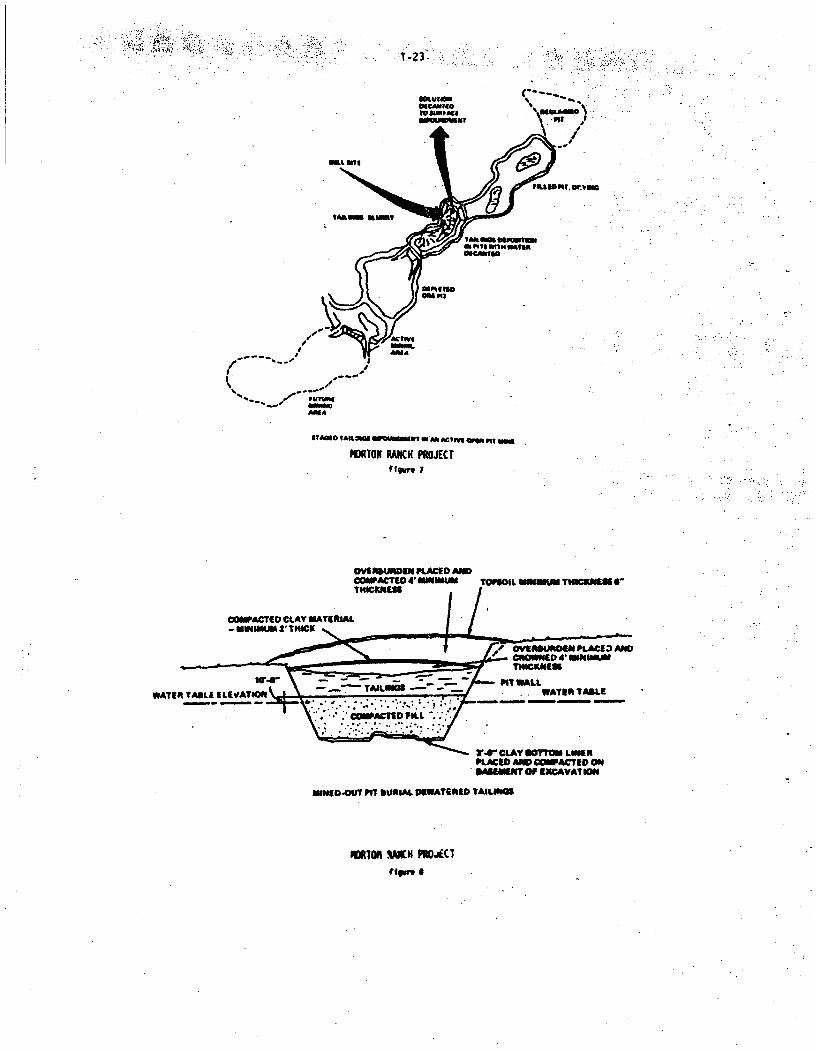
- 1v - I -~I.T .23
of~ttla "T. or.vmo
MKIflaOam PIT
mma
Purtun
-Af
SMO AK tSuM WOUNOW111 a af ̂ Clwi af plr &W
RORTON PANCH PROJCTf~waiv I
OVSIJN•DEN PLACED AND¢OWACTEO 4" MINIMUMTHICKNEM
CONPACTED CLAY MATERIAL-MSNiJM02THICK
ZOVEFAKNOMNPLACES AND-CRNOOW4(D4MAkMu
THICKNEU
PMY WALL. WATER TABLE
'4r CLAY 1OTTO1 LINERPLACED AND O•OACTED ONSAMIMET OF EXCAVATION
MINEDoUT PiT suRsAL ORWATSMED TAILING
mWToM %WMN MAU~
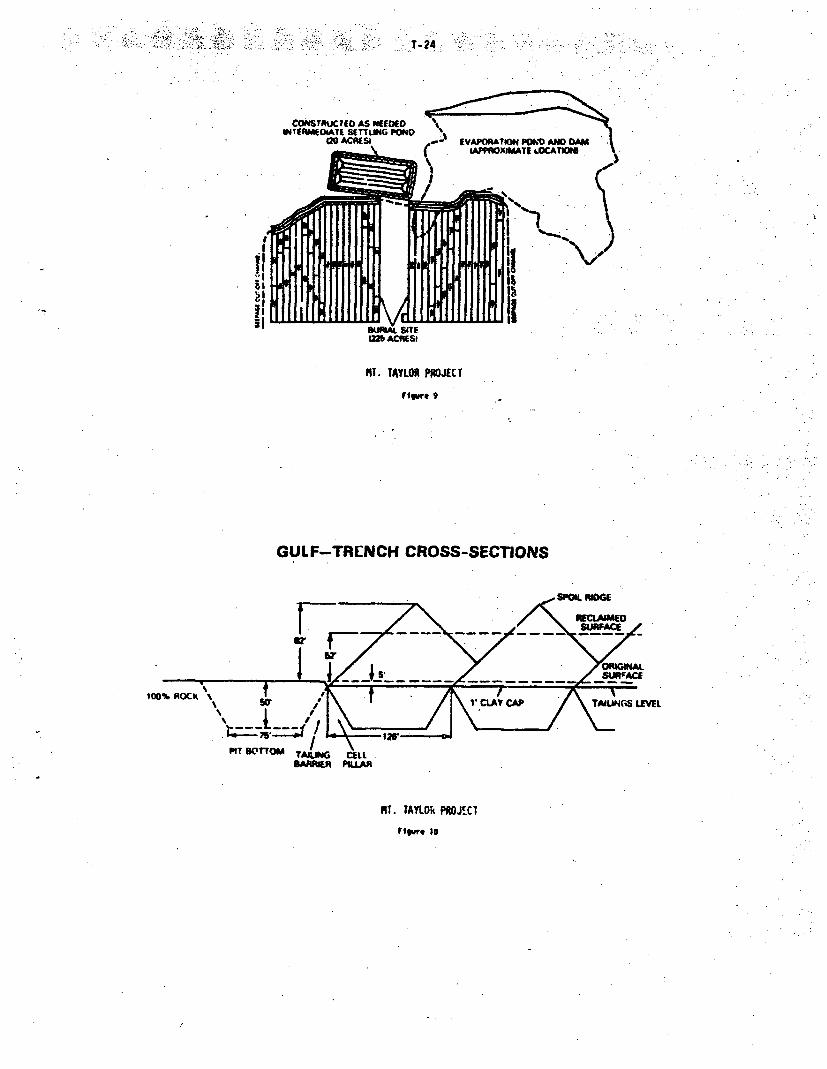
7- Z4
MT. TAYLOR PROJECT
Figure 9
GULF-TRENCH CROSS-SECTIONS
spo. mOGE
100% ROCK LEVtL
MI. TAYLOrk PROJI1CT
figure 10
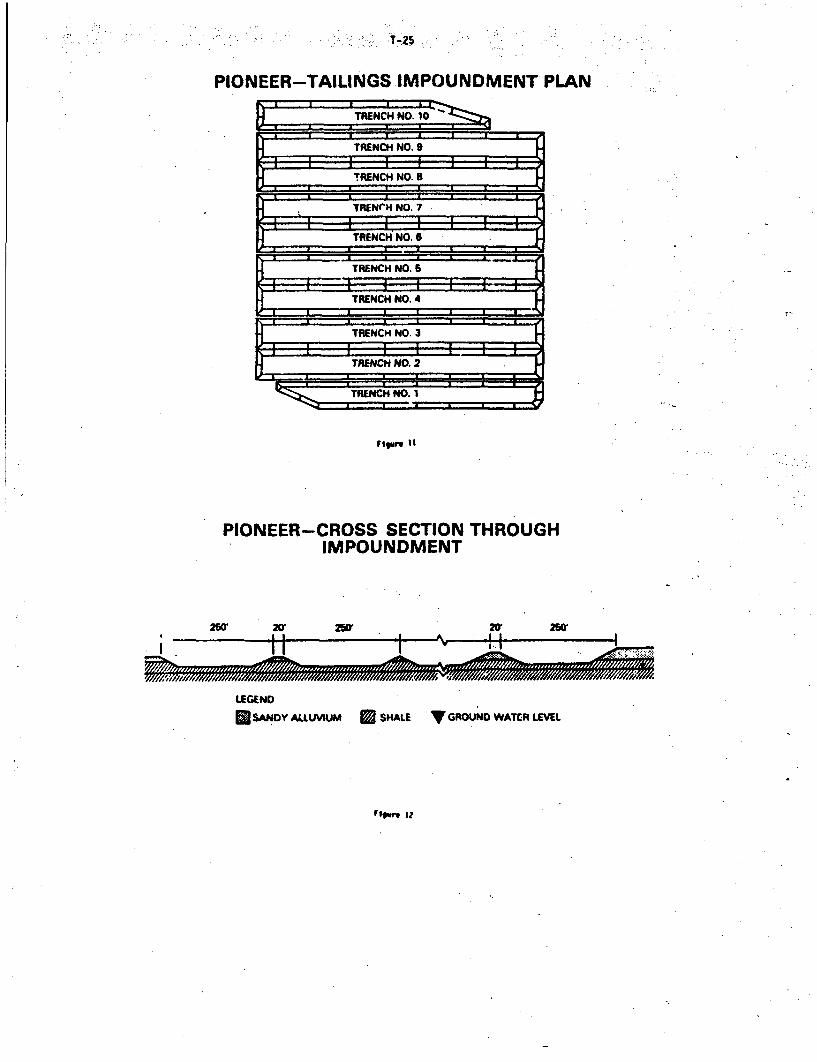
PIONEER-TAILINGS IMPOUNDMENT PLAN
TRENCH NO.91
TRENCH NO. 6TRENCH NO. 8
aTRENCH NO. 3
TR NCH".1
figulre 11
PIONEER-CROSS SECTION THROUGHIMPOUNDMENT
2W" 2" 2 2w" 250
LEGEND
* SANDY ALLUVIUM * SHALE Vr GROUND WATER LEVEL
FIrqgu Iz

I
APPENDIX U. COST-BENEFIT CONSIDERATIONS FOR POST-RECLAMATION RADON FLUX
1. INTRODUCTION
The staff has evaluated the matter of long-term tailings radon flux control in. terms of a widerange of public health and cost. factors. Alternative radon release limits have been evaluatedin terms of the following factors: costs for applying a final tailings cover under a full rangeof conditions such as will occur with varying ore grades, impoundment sizes and shapes, covermaterial types and so on; impacts on maximum exposed individuals -as they compare with existingradiation protection standards; total population exposures as they compare.with populationexposures from natural and technologically enhanced radon releases, both short and long term;and, radon fltxes that occur from natural soils. The speci c cost-benefit analysis of theradon control question is presented in Section 12.3.4.
In doing the cost-benefit analysis in Chapter 12, the staff considers it has conformed to theapplicable guiding principles for radiation protection are those established by the Interna-tional Commission on Radiation Protection (ICRP). These may be summarized as follows: 1
a. No practice shall be adopted unless its introduction produces a net positive benefit(justification of the practice).
b. The resulting dose equivalents to individuals shall not exceed the limits recommendedfor such doses under the appropriate circumstances (limitation of individual risk).
c. All exposures shall be kept "as low as reasonably achievable" (ALARA) taking intoaccount economic and social factors (optimization of radiation protection).
Application of the first principle involves making a judgment as to whether or not the par-ticular enterprise considered yields a net overall benefit. all things being considered, and Isthus far too broad to apply to the limited issue of post-reclamation radon control and is clearlybeyond the stated purpose and scope of this study (42 FR 13874). This study has not consideredthe question of whether there should be uranium milling or not. This is decided when reactorsare licensed. The second principle is indeed applicable, and is considered in Sections 12.3.4.3and 9.4.2 of the main document. In general, residual radon releases yield relatively smallindividual doses and are thus more limited by consideration of aggregate population risks.
The staff considers that in its cost-benefit evaluation of Chapter 12, it has established whatis ALARA as far as radon control and tailings containment is concerned. Another manner ofapplying the third principle might be to identify as the most appropriate control level thatlevel at which the costs of any further control exceed the incremental benefits that would bederived. This control level is theoretically determinable by employing an analytical techniquereferred to here as "optimization" although it is perhaps more widely known as cost-benefitbalancing. Radiation risks can usually be reduced to successively lower and lower residualleveli by. the application of additional controls. Iowever, as residual risks become smaller andsmaller the costs of further control, when expressed as a cost-benefit ratio (dollars spent perinit risk averted), become larger and larger. The process of optimization is used, to determinethat control level at which further control is no longer justified.
This optimum control level may also be equivalently defined as that level at which the aggregatesocietal "costs" of aFplied control and remaining risk are minimized, i.e.. total costs ofcontrol and residual risk are higthr for any different control level whether it be lesser orgreater than this optimum level.ZS Although optimization is an e.egant, simp'e and exactingconcept it can be extremely problematical in actual use. Severe difficulties can be encounteredin the process of attempting to precisely quantify and express in like units all involved costsand risks. Despite these difficulties, the staff exained the applicability of the optimizationconcept to the problem of long-term radon control. This appendix documents this examination,the results obtained, and the conclusions reached.
2. BASIC METHIODOLOGY
A complete cost-benefit optimization involves an analysis of the costs of providing protection(C p) and the residual impact to society or detriment which. wtv- valued as a cost, is denoted by
U-1
Cd. WithC and Cd both being expressed in like units, the combined costs of control an' resid-
ual detriment may then be denoted by :t where:
Ct Cp (1)
Cost-benefit optimization is achieved by that level of control which minimizes C 2.24 Thisapproach assures that total costs would be higher at any ocher level of control.t
Optimization involves analysis on an incremental or differential oasis to assos the cost-effectiveness of any further control as opposed to the overall cost-effectiveness of all appliedcontrol. Optimization thus reflects the cost-effectiveness of small adjustments albout someparticular level of controlý Mathematically, total costs as given by C in equation 1 areminimized when the first derivative has the value of zero. This condition is expressed by:
dCt dC ,dC =0(2)Vp Rd0
where F denotes the radon flux from the reclaimed tailings (pCi/m 2-sec).
In order to make use of equation 2, C and C must be expressed in closed form as continuousfunctions of F. Once this is accomplished the optimum flux (Fopt associated with the optimumcontrol level is determined simply by solving equation 2. It is the first step, rather than thelatter, wherein substantial problems arise. In order to avoid the many inherent difficultiesinvolved in a fully rigorous analysis, a somiwhat simplified calculational approach is adoptedand discussed below. Simplifying assumptions incluee assuming constant conditions of atmos-pheric dispersion, population density, surface radon flux, value of life, etc. Uncertaintiesand errors introduced via such assumptions are discussed later.
As assumed in Section 6.4 for a constant population at risk, the health detriment arising fromradon releases at a given surface flux may be expressed by:
0 = A3F (3)
where A, is a constant conversion factor, F is the surface flux, and 0 is the annual healthdetriment arising from continued radon releases (premature cancer deaths per-year). The unitsof A, are thus health effects per year per pCi/m 2-sec.
As shown in Chapter 11 and Appendix K, the costs of providing radon control, by installing anearthen cover of thickness x meters. may be expressed as:
Cp = A2 + A3x (4)
where C is the total dollar cost; A2 is the fixed dollar cost of final contouring, surfacestabilization by rock cover or self-sustaining vegetation, and other costs not proportional tocover thickness; and A3 is the dollar cost per meter thickness of applying earth cover.
As indicated in Appendix P, the relationship between cover thicknes~s and surface radon flux canbe approximated by:
F = Fo exp (-A/x) (5)
where A. is a function of the correction factor h, which-is in turn dependent on the cover thick-ness x. For simplicity, 4n average value of h is used here so that A4 will be a constant inde-pendent of x. Also, the assumption made in this analysis is that x will remain constant withtime--that is. it is assumed that there will be no erosion or aggradatlon at the site. Underthese assumptions, equation 5 may be solved for x and substituted into equation 4 to obtain
Cp L A2 * (A1/A4 ) In (Fa/F) (6)
Having expressed the costs of radon control in dollars and as a function of the residual flux F,it is now necessary to do the same for the health detriment C Equation 3 relates the innualhealtt detriment 0. in units of health effects per year, to t~e residual surface flux F. Thetotal health detriment D,. is obtained by integrating the annual health detriment D over time.for our purposes it may bi assumed for the p.'esent that D is a constant and does not vary withtime. Under this assumpticn, Dt is given by:
80 000 (7)Dt~troo DSI(7)
U-3
Where: 80,000 is the halfllfe of Th-230 in years;
4.5 x 1O9 is the halflife of.U-238 in years;
0.07 is the fraction of U-238'in feed ore which is pas:ed through with the tailings;and
0.693 is the natural log of .
Equation 7 includes integration of all radon releases over the full lifetime of the uranium andthorium progenitors. The radon released due to the initially present inventory of Ra-226 istemporarily disregarded due to its relative lnsigrifican:e. Equation 7 results in a value of Dwhich is 4.5 x 100 times the value of 0. The constant 4.5 x 100 represents the effective numbe4
of years over which health effects at the 'onstant annual rate D are integrated to arrive at thetotal health detriment D , and may thus t- modified to consider shorter time periods. The valueof C is obtained by multiplying 0 (health effects) by As; a constant representing the dollarvalug of a health effect. Substitition into equation 3 then yields:
Cd = 4.5 x 10⁸ A, AsF (8)
Equations 6 anci 8 may then be substituted into equation 2 and solved for F to obtainF Cut asgiven by:
Fopt = A3i(AAA 5s) (9)
where T is the effective number of years of annual health effects at the rate D which areincluded in the calculation. (The maximum value of T is given by equation 7 as 4.5 x 10⁸.) Tt-etheoretical optimum flux can thus be obtained by substituting appropriate numerical valucs forthe constants ,ewoted by A,, A3 , A4 , As, and T in equation 9. It should be noted that theparameter A2 , vhich reflects the costs of surface erosion protection, is no longer involved dueto the differentiation step involved (see equation 2). Although Fopt is apparently independent
of A2 , a constant surface flux--that is, constant x in equation (5)--could not in reality bemaintained without adequate surface erosion protection: As discussed more fully below, the costof such protection will normally be greater than costs of initial tailings cover, A3 , and willeven be much more significant in determining what the cover thickness, x, will be over the longterm. Although the ongoing value of x is actually more dependent on A2 than A3 . the vast uncer-tainty about the exact relationship between A2 and x make it impossible to explicitly includethis dependence in this analysis.
3. NUMERICAL APPLICATION
In order to determine the optimum radon flux control limit usiog equation 9 numerical valuesmust be assigned to the various involved constants. These ari defined as follows:
A, = the annual health effects resulting from radon releases at a constant surface
flux, health effects per year per pCi/m 2 -sec;
A3 = the cost of applying earth cover, dollars/metzer;
A4 = the constant a, appearing in equation 2 of Appendix P, m'1;
As = dollar cost per health effect; and
T = the effective number of years of annual health effects at the rate 0 which areweighed in the calculation.
Values for these parameters are discussed briefly below, on an inaividual basis. Aithough notinc rporatad in equation (9). the fixed cost parameter A2 is also discussed because of itsparamount importance in determining actual long-term tailings performance. Th? above valuesare each evaluated on the basit of 76 model mills, each with 80 ha (200 acres) of buriedtailings produced by processing 0.1% U304 ore. Health effects are based on the corttant popu-lation assumed to exist as of the year 2100 and inclLde both regional and continental com-ponents. Cost estimates for earth cover and health effects are based on currenL costs assumingfuture inflation or deflation would affect both equally. Uncertainties are ronsiovred in somedetail, but not in depth.
3.1 Parameter A,. Section 6.4 of this document. indicates that approximately 6 cancer he'altheffect; per year would result from a surface flux of 280 pCi/mW-sec, based on pcnolation Ai'stri-butions expected by the year 2100. This yield% a value of 0.021 effects/yr per p(i/m•-sec not
including genetic defects and al.o not including effects due to'exposure outside North America(an additional 25%).
Many subord'nate factors are involved in tnis parameter including atmospheric dispersion, popula-tion densities, -living-habits, biological factors, and health risk coefficients. The healthrisk coifficients utilized are those discussed in Appendix G-7 and are based on an assumedlinear, no-threshold dose-effect relationship. Although this assumption'may indeed be valid, oreven underestimate resulting health effects, presently available epidemiological data do notconclusively rule out thepossib lity of zero effects at the individual low doses and dose ratesinvolved here (conclusive evidence doec exist with respect to the induced occurrence of lungcancer at the higher radon doses and dose rates encountered in underground mines). Therefore,the ultimate lower bound for'the value of A, is take.i to be zero. For illustrative purpobes,downward variability by a factor of 10 is considered.
With respect to higher values, A, is dependent on assusedrpopulation densities which have con-siderable potential upward variation. Over the relatively recent past the population of theworld, and North America in particular., has increased dramatically. It Is possible to have muchlarger populations and population densities within the next several hundred years than arepresently projected for the year 2100. The projected population within 50 miles of currentmills even now ranges to a factor of 10 larger than that assumed to exist in the model region.Given these uncertainties, and uncertainties of other factors, the value of A, is considered tohave a nominal upper limit of 10 times the value derived from Section 6.4, or 0.21 healtheffects/yr per pCi/m 2-sec.
3.2 Parameter A2. The factor which will determine what the releases of radon will be over thelong term is not the initial thickness of radon attenuating cover placed over the tailings (thecost of which is A3 ). It will be a complex function of chiefly climatic and topographic site-specific conditions and of those siting and design features which are built into a disposalprogram to account for these conditions. The siting and design features include such things asplacing tailings below grade, flattening of slopes, minimizing of upstream drainage, providingcover erosisi protection, and so on. which are intended to isolate the tailings containment fromerosion and other disruptive processes. Parameter A2 , the cost for these factors, will varywidely from site to site (Section 12.3.3). Also, there is no practicable way .to correlate each ofthese steps with specific levels of long-termperformance. What will be the increase in con-tainment effectiveness over hundreds or thousands of years of providing slopes that are l0h:lvas opposed to 2N:lv? or of having rock cover over exposed slopes of embankment as opposed tovegetation alone? What will be the difference in tailings cover erosion over hundreds or .thousands of years, if there is an upstream drainage area of a square mile with a 1% grade'at asite as opossed to a few acres with a 5 percent grade? Or, if there is a tew more inches of netrainfall per year at one site than at another? These differences are significant in terms ofactual radon releases, but they are impossible to quantify.
The overriding importance of parameter A2 over parameter A. is reflected in the rejection of thetailings disposal mode (so-tilled Active Care Node) where a cover is pldced over the tailingsbut no measures are taken to prevent degradation of the tailings cover. This is stated as amajor conclusion of this statement in Section 12.3.3. Cost for protective measures (A2 ), asdescribed in 12.3.3 and line item 1 in Table 12.1, range from less then half cover costs tonearly four times more.
3.3 Pirameter A3 . As indicated by data presented in Appendix K, unit costs for applying earthcover are expected to be approximately $1.41 per meter of cover for the model mill and rangefrom abot $1.01 to $4.21, a factor of 3 higher. For 76 model mills the estimated cost would be$106M, ranging from about $761 to $320M. Greater variability is possible.
3.4 Parameter A4 . Consideration of the data presented in Appendix P yields an estimatedtypical value of about 1.3 with a range of from 0.8 to 3.0. The higher value corresponds tocover material with a much higher then average moisture content.
3.5 Parameter As. The monetary value of a human life is a highly Judgmental quantity. To mostpeople, even the idea o; establishing a dollar value for life is truly repugnant. Nevertheless,judgments as to the value of life are implicitly made on a continuing'basis in the course of,very day existence. For example, families may vacation by car rather than plane in order tosave money, despite the increased risk of fatal accident. Some indicAtion. of what society iswilling to spend .today to avert a health effect today can be obtained by examining wha! societyis spending to reduce risk from other I fe-threateninq hazards. This ranges widely, however,depending upon many complex societal factors anu percepti:,,s--anywhere from as little as $20,000to at least $10,000,000 per health effect saved and more has boen spent on hedl'.!" protpctionThis range includes expend!tures for such things as -edical screening and care, automobiletraffic sa'ety, airline safety. radioactive and isonu•'aiuactive-relatel missions and activities.
U-5
Expenditures for radioactivity-related ris:-s are routinely much greater than for other societalrisks. The estimated average value assumed here for As is $0.4N which is within the range citedabove.
3.6 Parameter T. This parameter is t-nc effective number of years of health effects occurringat the annual rate 0 which are weighed in the calculation of optimum flux. The ultimate upperlimit of the value of T is given by equation 7 as 4.5 x 10; it results almost entirely fromradon produced following decay of U-238 with a 4.5 billion year half-life. The radon producedfollowing decay of the 7% of the uranium in the ore passed through the mill as waste would notbecome a significant fraction of total radon releases for about 100,000 years, at which time itwould amount" to about 142 of total radon emissions. Therefore, if consideration of healtheffects occurring only within the first 100,00 years is desired, the U-238 component could besafely discarded with no great sacrifice in precision (especially given other largeruncertainties).
Over the first 4.5 billion year half life of U-238 gradually occurring processes could rea-sonably be expected to largely redistribute all materials now present in the earth's crust (thistime period exceeds the historical age of any known life form). Therefore, steps taken now toisolate tailings wastes would be wholly ln:onsequential, i.e., they would not affect total radonreleases to the oiosphere one way or another. During this time interval the radon released fromminable uranium resources would be independent of whether the uranium was mined or not. There-fore, no value can be assigned to earthen reclamation cover with respect to control of radonreleases from U-238 and impacts from such releases could not justifiably be debited against themilling operation as they would occur in any case. On this basis, a value of T selected withoutconsidering radon released due to U-238 in the tailings is appropriate.
With this change, the value of T given by equation 7 becomes about 115 thousand years (about 118thousand years including a radium component), or about 1.2 x lOs. To a much lesser extent, theconsiderations expressed above with respect to uranium also apply to thorium. However, radonreleases from buried tailings over the next 100,000 years or thereabouts should be somewhatcontrollable. Given that some uranium ore would become uncovered by natural erosional processesover this time ptriod, and therefore the impacts resulting from milling-related radon releaseswould have occurred anyway, an approximate value of 105 is taken as an appropriate reasonableupper limit of the value of T.
In the optimization process discussed so far, integrated costs have been compared to integratedbenefits (reductions in detriment). Another equally valid and feasible approach is to compareannual costs and benefits. Annualized costs may be conceptualized as the income or revenue peryear forfeited by committing a large capital investment to reclamation efforts. As indicated bythe data and discussion presented in Chapter .14, this annual lost revenue on committed capitalcan be approximated by assuming a 12 real intereE rate with the uncertainties discussed in thatchapter. In terms or equation 9, annualized costs equal to 1% of the value of A3 -(again,ignoring parameter A2 as a determinant of x and, hence, F) would replace the value of A3, andthe annualized residual detriment would be incorporated by assigning a value of unity to T.These changes would shift the analytical basis for the calculation of Fopt from comparison ofintegrated costs and benefits to comparison of annualized costs and benefits. As it turns out,this is numerically equivalent to calculating Fopt on the basis of integrated costs and benefitswhile 4ssigning a value of 100 to the parameter 7. Although real interest rates could varyupward by some degree, thus yielding a lower effective value of 7, a value of 100 for T is takento be a reasonable lower limit.
On the basis of the above discussion, the proper value of the parameter T is Indeter.inable butis taken to range from 100 to 100,000.
3.7 Results. A mathematical expression theoretically.yielding the optimum radon flux controllimitWa-s-been developed on the basis of first principles of radiation protection. This ex-pression, although based on a simplified calculational approach, involves several dependentvariables (parameters) whose proper values are clearly and largely uncertain. These parametershave been assigned values and/or ranges by available means, as summarized in Table U.1, in orderto allow the calculation of the theoretical optimum radon flux control limit.
The calculated radon flux control limits are oresented in Table U.7, as a function of the valueassigned for the integrating factor T, for both the central values and ranges of other par-ameters as presented in lable U.l. Central values of the optimum flux range from 97 to 0.097pCi/m2-sec., for values of T ranging from 100 to 100,000 years, respectively. The full range ofthe optimum flux, based on the ranges of parameter values as listed in Table U.), extends from"unlimited" to as low as 1.2 x 10 1, which is virtually zgro. The range of the optimum flux iswider yet if ultimate upper and lower bounds are considered.
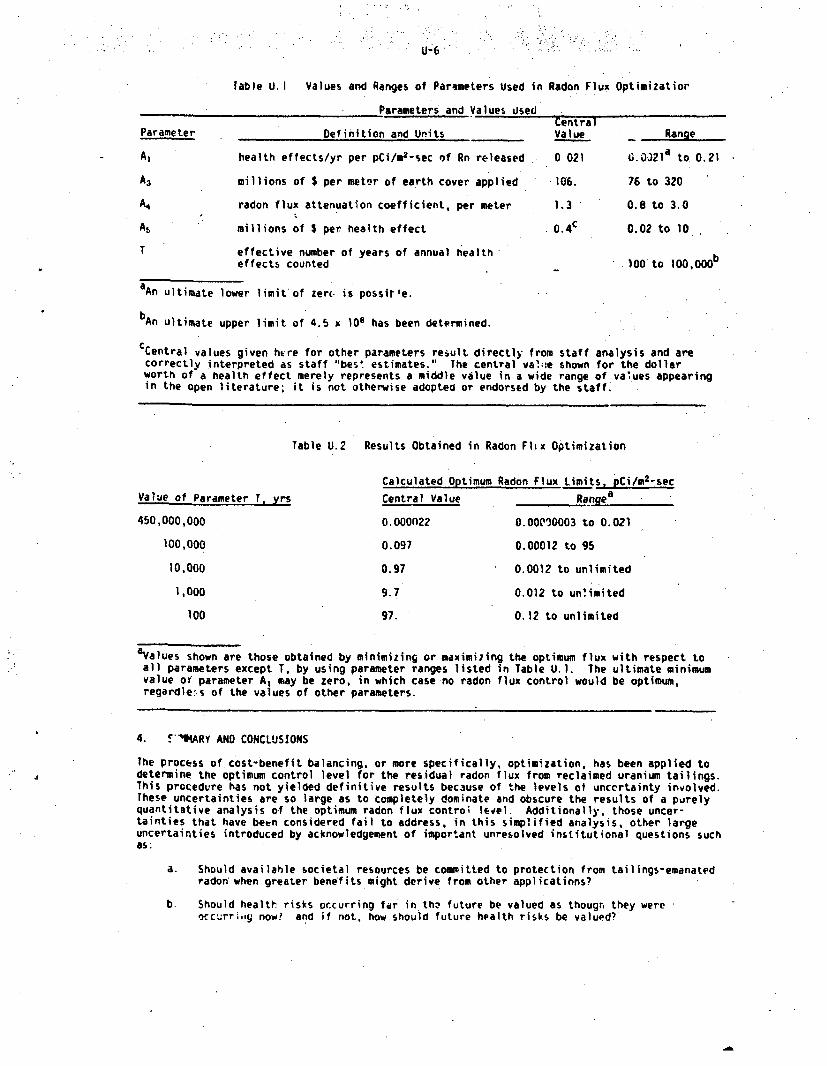
U-6
Table U.I Values and Ranges of Parameters Used in Radon Flux Optimizatior
Parameters and Values isedCentral
Parameter Definition and Units Value _ Range
A, health effects/yr per pCi/m 2 -sec of Rn released 0 021 O.0-21 a to 0.21
A3 millions of $ per meter of earth cover applied 106. 76 to 320
A4 radon flux attenuation coefficient, per meter 1.3 0.8 to 3.0
As millions of $ per health effect 0.4c 0.02 to 10
T effective number of years of annual health- beffects counted 100 to 100,000
aAn ultimate lower limit of zero. is possit'e.
bAn ultimate upper limit of 4.5 x 10⁸ has been determined.
CCentral values given here for other parameters result directly from staff analysis and are
correctly interpreted as staff "best estimates." The central val::e shown for the dollarworth of a health effect merely represents a middle value in a wide range of values appearingin the open literature; it is not otherwise adopted or endorsed by the staff.
Table U.2 Results Obtained in Radon Flix Optimization
Calculated Optimum Radon Flux Limits, pCi/m 2-sec
Value of Parameter T, yrs Central Value Rangea
450,000,000 0.000f22 0.0000003 to 0.021
100,000 0.097 0.00012 to 95
10,000 0.97 0.0012 to unlimited
1,000 9.7 0.012 to unlimited
100 97. 0.12 to unlimited
alValues shown are those obtained by minimizing or maximiuing the optimum flux with respect toall parameters except T, by using parameter ranges listed in Table U.I. The ultimate minimumvalue of parameter A, may be zero, in which case no radon flux control would be optimum,regardless of the values of other parameters.
4. F'IIARY AND CONCLUSIONS
The process of cost-benefit balancing, or more specifically, optimization, has been applied todetermine the optimum control level for the residual radon flux from reclaimed uranium tailings.This procedure has not yielded definitive results bec3use of the levels ot unccrtainty involved.These uncertainties are so large as to completely dominate and obscure the results of a purelyquantitative analysis of the optimum radon flux control level. Additionally, those uncer-tainties that have been considered fail to address, in this simplified analysis, other largeuncertainties introduced by acknowledgement of important unresolved institutional questions suchas:
a. Should available societal resources be committed to protection from tailings-emanatedradon when greater benefits might derive from other applicatinns?
b. Should health risks occurring far in thz future be valued as though they wereoccurr:.oy now? and if not, how should future health risks be valued?
"-7
it real)- worth reducing risks .;hi:h, on an individual basis, are Rt leastýP'wnlv ,&mall ani e.~c'n be 'aro.
' esnt generat'ons be ,e', * t,: ao hepteatn a Ihgacy of continuing undeserved*a• ition exposure? d
ThcF ;itrstions are, quite simply, beyond technic:? resoilution. Although pertinent and ippor-tan'. .• so involve emoti,'nal, politic.,, and e.en religious considerations that the appli-cation f'p..eiý. scienti.ic knoledge and analys~s it of no avail. Perspectives on how thesequesti,...a shou'o be iisered varie. widely among commentors on the draft GEIS. Many-stated thaitthe taiiinos isolation problem should be properly viewed as a short-term one when weighing the4mount of -&Jon control that shoule be required; for exa:4ple, 100 years was urged ar the periodc.,., which health effects should be integrated. Other romentors urged that the full period oftoxicity should be considt,-ed and, based on this and the large number of potential health effects,virtually no radon releases from the tailings shnul-• be allowed.
Notwithstar.ding the enormous subjectivity involved with these questions some might be.willing tomake judgment: about them and select values far the parameters described in Section 2 and 3that, for example, lie somewhere between the extremes. The optimization methovc'o2y would stillbreak down fr- the case of the uranium mill tailings disposal problem, however. This is largelydue to the i" .,sibility of correlating containment perfomance .nique'y with dl1 applicablecosts (that is, relating x to parameter A2 as discussed in Section 3.Z).
The uncertainty associated with containment r 'ormance 's vastly different from other radio-active environmental contrý.l or waste managem•eit cases where incremetal cost-benefit analysismight, fi, some cases, be reasonably relied upon. Tailings impoundments constitute large,diffuse and essentially permanent area sources as opposed to finite-term point sources which areamenable to mechanical emission control equipment. The hazards in the tailings are very lonrlived and the contaiment will need to be similarly durable. Therefore, there is very largeuncertainty as to the long-term isolation performance, unlike what would be the case when con-trolling a stack emission for a short period of eime. As opposed to being disposed of in deepgeological formations, tailings are being disposed of near-surface where conditions affectingperformance are much more rapidly changing with time.
Also as discussed previously, there is a strong interrelationship among ti.. various goals oftailings management. In some cases, there is competition among .- jectives. For example, inattempting to provide greater containment of radon and long-term stability by placing tailingsfurther below grade with increasingly thicker covers, tailings are being put closer to ground-watev formations making groundwater protection objectives more diffic.ilt to achieve. In othercases, working to achi~ve one ob .ctive also contributes toward attainment of another. Forexample, placing cover over a tailings pile not only reduces radon emissions and the associatedimpacts, but also provides some isolation from intrusion and reduces potential for tailingsmisuse. It is not possible to mronetize these interrelated factors so as to assure that thecost-benefit optimization is a realistic one.
References
1. International Commission on Radiological Protection, ICRP Publication 26, Annals of theICRP 1.3. 1977.
2. "Radiological Significance and Management of Tritium, Carbon-14, Kryptor,-65 and Iodine-129Arising from the Niclear Fuel Cycle," Nuclear Energy Agency Report SEN(80)1, 1980.
3. B. Fischoff, "The Art of Cost-Benefit Analysis," Defense Advanced Research Projects igencyreport PTR-1042-77-2, February 1977.
4. D. Newman, Engineering Econoir.ic Analysis, Engineering Press, 1980.
5. "Preliminary Guidance for Estimating Erosion on Areas Disturbed by Surface Minirg Activi-ties in the Interior Western United States." EPA report EPA-908/4-77-OO5, Jelly 1977.
6. B. t. Cohen, "Scciety's Valuation of Life Saving in Radiatio* Protection," Health Physizs,January 1980.

w
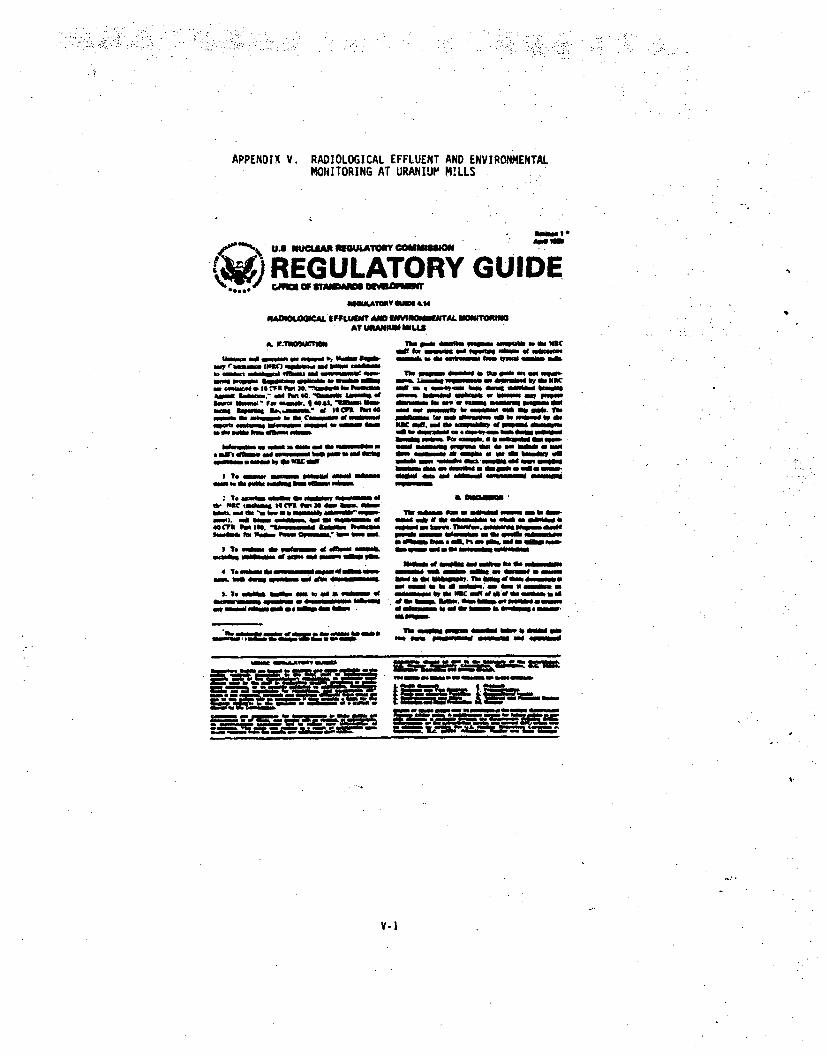
APPENDIX V. RADIOLOGICAL EFFLUENT AND ENVIRONMENTALMOINITORING AT URANIUP M!LLS
U.9 N"UCL-" DEAs COuSSSM
(,')REGULATORY GUIDEN•mOLOGC•A~S~. AuND sA NVURO•METAN . uATOue
AT UNUAM~ MLS
t. 0 t. mo U00domwTI
--u'.bua* 0m aqd~o aaamf e.soo-. 4c a0 toov ft" P3 P0. -,Adpuot Pum40a
Dw~ 400. -pa 40. Laoou unbsoSinWAMa 1 Gumeb. 140.65. "'MO uwmmo mEmft ON 40 l S hS540-pwf 0. -bow ft o C - of ohed
UPS --- 40 "4 e - ksolo gow muhem So0Mm WAW
on -u aa duf so am sotwwu m 0a mdil 410Puu wd -rv bus PW s d -NN
simuna bp 09 u oSCad
T.mwos obmO muado"mýa
40 Hca tar -a-- P' 0m mshimads to Nob P". o- woK b m inm no.
Iul To opem at ad sobo -mo4040db SON1116 P 4i won a" NNW a o
2be& om qpw awa saw .obem
To 60141 volo dw ad 40 fokw"4
wd iWomm"u w
ft & nuou GodI~ m apu wPmomlof
pmp a lxA 69 a ain m lywo of mo
-opsmmm W. le pin uind 67 as War
md ow bwwo 61 no" so obg. "I
USCPu W d 4N Pub ftineml 60 t00 201IM80610
bmff la we. doft a d -oot %Wmopooil" allf ad adobnk aws"oo
Tar ktwma km - inkm mai m0 dnON s 0t ftosdw Pu bso = Now" &
-mmkaWWOR. WAiNNUM PFNuddW..ft ft 0m.u adi &..*M
C ina km. tsa Ps w Poom , meas okmsme-Pammada u mol
Pup"& 41 adPf me obPu Pu **npnoswm" ma wok. ago w km a ao
aft a Pu oflpow.Th lba a0m dýG90 6110 10 VA d0 .km. am d= 0 daWA% W
-MNION Pu *. C Puc 400of4a Pu an u mo pINmat do %no Bom. am boom a "oo k a w40 Nowas" to Pu o kno b PuSUop u.
lb nfsp~ut4~t bdW 6 Wd WOn som psuouand onlasM polad i
arm
row--,mam
V-1
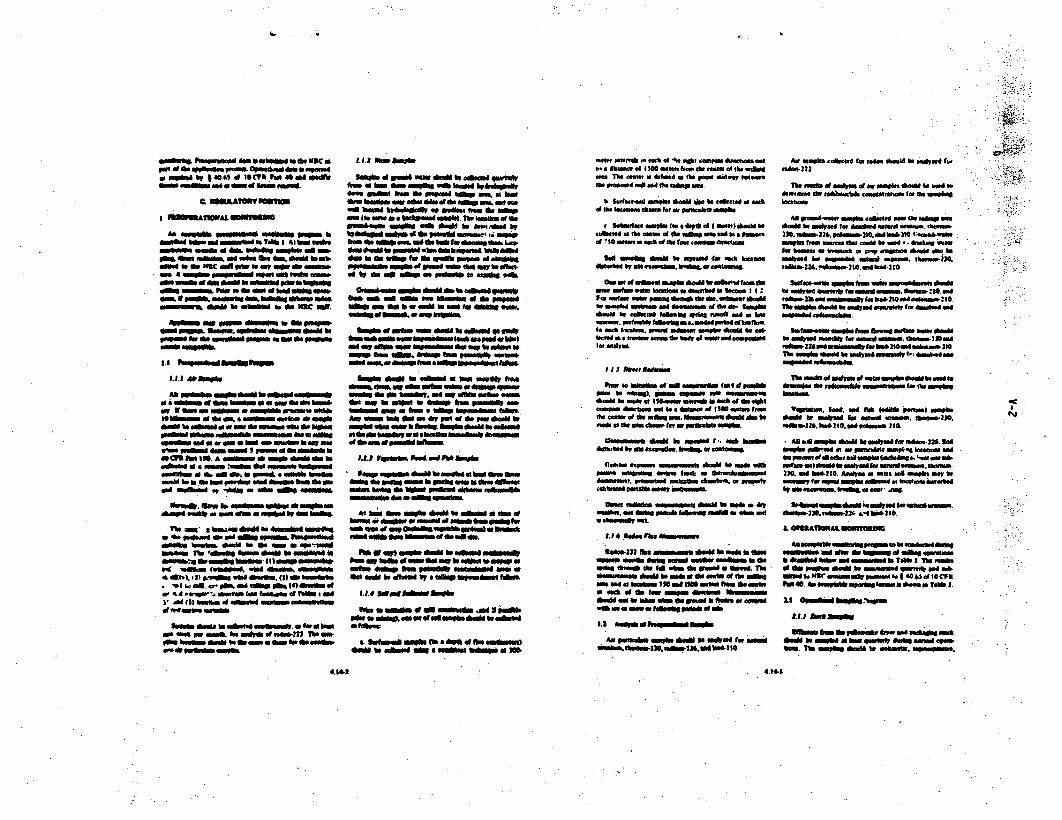
sor OF 00 waomp-aOo d dome is ,dm, powo by Ih~ IOCR 11 pa h aS am -A~
PSBPMmAt"ALUinO
am& "be=s mmd mdi Tab? I At um tuemammo numb e 4 Meldie .amoba NO ow.
-a am otma., ad "& h Oe Anu betdata.om Oas ww owC "WV " av a" as amm
wili Nenes rotoa agm o Sf~ IN -oim m
eM9ý to do smposa .eumNoso *5 gmmma
I'ef~moa smoftmi o NC
Af f-nv~k u.O th ogm om amm-1 em e~d 9m ba=- a am 9dn bow
-o ýo ,..m, aM a emae004 O4
aSM Vb temus i . moo dw to INN
4090ad 0 am a em - ones All NO
40 R IAWg fe. A -Mý OO emb do 10
omd" 09 omma ad* to VWiN. bb a
weato a an as em rooem swa adawbo, so do
Ifleel. U...tosos WNW wm maa lam
lb4w go" M woo em a nwu yO mb
a IS swoond mi - ad @ opo Powwmuadmepo ao e, ae be im, am a d",N
bofm % .- amea -mm am"t smeone ao
fe a"Me 4.mft.d"I Wdb&90Wemoa,-9 ISM. IaSOPot e " wd masge (9) do bwdof
or &4 ",pl, a .@ adb com toff of T m sE
- 4d .*o ambe uda cume feAf. a4 Teo a adadEiemsOApMali for~ modroo gemfgem A
own hemg dom beas C a saetd onsC awVoboovmmgus
I:SWm o ad NO ONIl ubw
fase a bum am saelt "Wa Imatd bvbA ho~son. -ehow tas 1 0 1 ado Mew muK Iawh*AN bmt mewa din at do biog ma. afd Mo-A baud - 0- a eet Insm as etm- ODamuam. bodind ansbk. 1%, kambe of fuwmn~wsmpf sib iemos a do" q*md bp
bm *a db am% maem Op a desaf &aM lA.am Odm be pwd siondob Uemad. web as"
awI mem~ fil as Nemd p- m ofgodmpmea soo ofd ~ M am am be ib.-
maw saw am & a sa e uudiU for madog *I
-wf ad t am& maw@ be eda m ommi
"am f.4 t-ko ob em I "ba D&p1SOU
oad a, ma ampe onomaa e omaadmm ah
amw am to a emeno bm p aaaa &
bugd emau a 6m& mi bwnma foanLANY Cý bwb mp asdr Part of the po o"tCata de abymeS a eb mm OMAN* dme
dI -qm Post we JI awm idm
daft am ewm a IN Plb~e ýim dkebeb
o* Pt amso emW "ame a" manmse"
boa, soew di - .4 em otemaba, .nk
Smt woo em" ae amo"aoOdm amei a~m Him a, a eomusaw as
Wa e wemA am swa of edwf =Aplma to m.d
emdi IN aftod of a SAMa bot a M~
mewt aimath a.e0 cub 'w *4a 00 cna deuccuasadeW.. dase f tOf 1ISIS Minus fham the main of the MAName The Cealle. adeind mt Fame pa. miaf toueaethe. pOPMA dI "an ad SheM onmi.
b lsrfawam am On Oe heM fil Indiced at wh
40 Selmfes me faro s~ mealkem
-1 !50 ealm . seeb at of fear taumin -dds.
toA mmfap dew ae Ipg Iff Sma bactimCdgsEd by I"oeumob"a. 0 .Cea'MOO
Ommew of mim ., mb-efmemm I ai-.00 Meado a deuaned in I -e-- I IFm ar Igs "M pun" eumat io. Iadeabemto g.#d Ca ad dauen.1 emO 111- 2&W#Melm ae aeonld tea.a qwhe "o Mtiee ad bu
1. mak, mkeeaa. mwwi maduua immetle Ogi be ass-biteWoetmumleel.aa b beyop "WO Igpdgm
I I j o *.eti dam
Plan, ac, bias.. of as eowgme (Ast d polo
*Gold be MoofI fewme *a"*i asc ime dousa
Aae beeemas" to s. aow~ ofae #no0 em howmfil ~MM of* .aw mtm . "@Neva" em m anb'sub ato one Chaseum., ht eme, rbok a..b.
MsgWMgf tmem ae mawmed 4." M& boefi
60"r"n _au Ammm Cd at embmm- mtawad exoue agga la am am A&adgo
imag I , &f psabe ae~ oa-m~a.'.pumo1.ae pmamolm lgawam s.bmo loul
t e i Pa t"bl am" , e e . a
aOOO,. OWg ON poic alisi foeg" aard mse ad
fadte.221 Neam woo Cdo e to waf in mO.Wm Ma.t Ciaf uMAd SNCW .eWAbM a110mat.. *.a a. *A #Ad em dis eod a Cue. INu
oft am &Iebý em0 af emO ao Ins o fANe ade bum MINN Waftpd It0 ineft atern .gud
emu an a ý orm eom pop" of me No n
"Sslmo Odoi m ao Mjpd INm muada
AN weaple c.110.04d for ad.d thad aw ad..d G.tae~222
Tbsqim, W1 of of am $bow 40em bad.,
Jecatmet.
AUSmd.a pa sefe Wii taimted - %e mo onemN be memleed lot'm No acas gamem Ibaiss. mUm.225. 4~u.I.ie 4"l .in.waamep"tw Mamnse do camd ae ad .. drah".. mfa MNN b a bleadgi a way gam SA.W @b be
alste Ega wded -asam.. tbenmis.
nomNapaa amm o sem v.5m mae- a"
lbtb eamma ai emmasee, far mded wadpo
I mV%-d raed.ba Mea abed ma.. %hm, I owa
aeemlama~ead.Ssada~ss.21
lb= for a" OMAN mow" a waremeama
&lb aibd maSE23 .4M6210.amd
6wn lUVdbad, mad souab I Table 2 "a e) be
-Aftad has. em. aierw wg "a."a0. SaOWN be oqu*.d atbl a 0 puadi a*&If owed adSm. "a lowe" mgA& bw o*Aw. a, .aman.
N
4.142I 4.l4-1
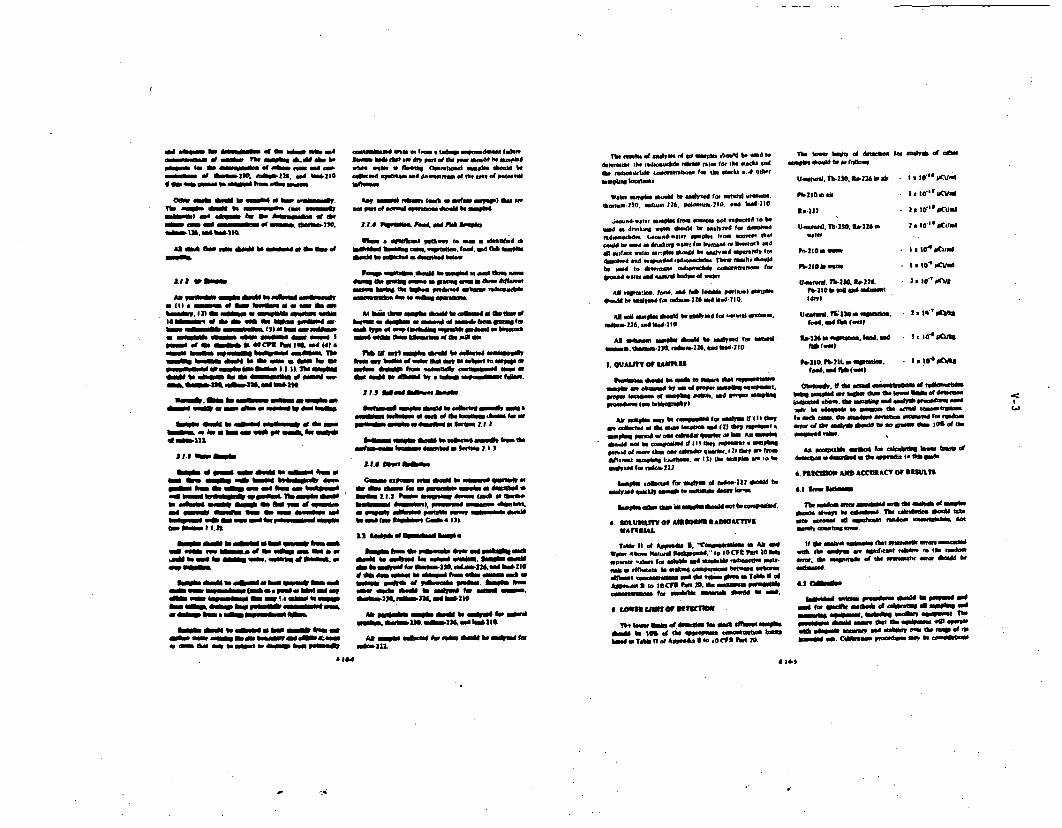
ad O&A n400%& St4 111 idno ft Mwom- too -0 *ootmo alwo lo d a
-.o of Oo.i3G. ftife234, ad hihd4IG
110 amif &a e -mgb tea -seibo) mead ý s 4. be.Woemm~o of st
As ayild 4..en AwA be sdb - be, 4.alt
%1oftm. .4 1 n eo a0 4.OW oreo %ai
pow oft 4.do 011 dCPSow #.10 ame 44?.a
-sw bom am" be do~ 4.a106wto a-MNM"1 as om *o 1.1.5k 110 ~fkm
lo abenix Noa4.4. ad00.4 -2
"WWI*. like INue=4. o m mo
Sao *ld be -mmm 4.dm a -s
Id Nio~lll
fimp aPn "M data Issembed hasowi w Smom saw b= beft easwodn Smm 4. "m am ad flm am bue.Sma
nd qwsmW 1 olomlo bui Go mu ad-m%No vll s ow mi anpopomod -mlo
to beoo 11.4me
'n s I" to .am" N. "M" -t4tes. W
dom a tom Sm (o a, 9 MOa lopMA fMisso wonmms sp( maw tO GaesImmamk& boom S..ob .4.ma*st
a tm.p boo tOi mowotl
@Eva am n i2a a -ý saw &a--opo sa memo. somosoo eSms"
ad* so am IN ow a kmm bas .m4.f
.mmnd WO s1- I0i . -rnso.- 44. 1004' mos a o C)NmIIal asset beaMw beso
ho.depEOS "wo 4 d oom... tf *10*5.9.10wita
oo pr .o d of aw-m prh ' -l be savsd
1. 1.4 rqu00m okowd. -ts Alb ta
-o bee -omo pomsy . ta. .44.10.94-ae be o~0.9-0 . uaibed Weis.
9-mw -moimna bemylo d a a".1am
Soam o.w~ Pas Sý toPia~ s ddfowstWOO ~llb"f4 lost baolPI.4..ad bO~MI .Soea.meMUSO6 4. WA. .pus
&I Imi sa NOON my loo be usbeud at 40 VAWOf5.100 a Isimor iNed -1 owmals bou #04
ad,. " 4ait #wood" 0 * ubk " a'a Itue~
no om oftmy myimma" m10 e as.1, .. im~
"a my ei..4 be"aeot oIt mye alp% to 20*myaN-% 4...P 600 - Ig ommymAIP OWamil ON" be ~d by or a np 44,.
#upon~ AM"e be 00%Md ymf mops
andemm 4.01a bedidod tandms Least 6 4..wIwsm smlin.a Somoedg todw - Ill
18.0~ Stalsift
amo , aa W401 bei be tod =am"envy aoatdi AN4. tern Is m P oMaspon a dCMW d10.4. 3..3 tam. Watwsmy 4ama too a anso
-olo eomom. - -wag dastsa osdive aftoo -. 1 I' ary -Amm daillbe god ton saom Ga0 4.13).
-um hum do e4. -y ad guS~wo~oi*ANbe WnIVW 4. alma -W. S *0.1O
of4 do memo (A 466d km .4 saw mb aisaga Newsl of yob e tmt. kmfthSo lof beo to II imusd &SMm.
ASi apukbe adumlAi beM Odyud be Mia tua22. 0k'3. 40 dSi
Too fwaft1. asyn.at .6t atmybe .11md to o.104,0dowosmw II..,9dioOW1b 06i Oman ftif IN0 41 O's adtwo ,os.daft~d 'aotav.1owOl to I"e morks .4' all..
*,ob gatpon Afw. be bo*104 to. 14.04000*..,.thoorn3l..s., 30 pt1l3. and ba4210
.0*54*50, 5. 4"04.--W~ mImp h "oct .0004 b,_ Wmd a dt0ogOkv 4.*"410 kuomlW .U *504. a.0d.'oeod-I" *,oepd** 4.15. Inha., so00*,t to
be, vad I,. blo-oo -&-uld, -aCrftwwe' t
0-MIt somilie. to-aOdo, 2 ad W-4- 1.*.11 a 4.1
LAMm atompla 4.010be0101 Is 0a - t ais"Mlasam
mdf.-"4 ad ps dat d- wayGI
La *Nooi..40. A'o b 2 a.4dvud o-2e10 t
9. QuA" M orIUnE
- a Mbmmyd by No of pma Novo u"WkOmt..pemy Oaabf MPbft 9000". Md I"0- oft""
paiolnetwooopeseyl
AN so. ffi be ca.o'o~m 4. inyes If ( 11 say
Le amotl.4 ao am moSametesad (3? anq 'maw, a4.h". 0-Sid owr am eabdqoI - a o AV eb
beaid"M b as~iftde tfldli?4. 05051*subw,.1 .~ 4. Come as06 quof . I I? ft.? So k"
ed.Owwwomy J.-'Aat. alIit tows yais *ON tobeo
unitraG tao d toaiyn t d. 23b2tb
awdyt aj sawos to amaiaS Asor t
beaw. moman usomi~dwo sao beua..poS*.d
1.51. Of.4 AoraM* S. "COO-Idd IN Am adWas. 4kmO MWe11 Sockp.ae." to IGCFSt Fort 304.'Post.e a..ow to II .15. 5.Aobhi .saO in-5105. st ttasm g Is.sw 5*1044.9Mm. Motion Obnoo
.1.1 tooamessm watrod ' 0. be tab1.4
APW.-e Now o0 CPU to too 30.4 minow =04
Ill ho im, Sob dobut wo"M10001bom. onesent a - o tol osf APPOOdA aSA be ~ .0(9 91 3
" M Oe h i m l I s, a t d lo . $ o . o ~ ~ i g e
9b.St.W.t0ui0 lt2 IN v. 10G^'MC
ob-Ioo3 * . 1G'6
1 Z1101
wFjb.341 r I to I.Gvi~d
ftiestGSTImddina 18dO~
1*236is ap.tiewas. fewIS. and 1b' 00t1110fooall) 1fol
food. .44 fooG -W
*01 S m. o ft " d w bemol o 4 . h efim be -1bo dem o.
move dqob be 4."w o0mmCA too mU....NVI. 6.0 ans.. I'm sdwd 40014.0 omut (a rnoset
As avistal .444.0 b 100100a llkO of 4u.0
damet a dm4.4o ab to Padut I dob vool
4. f10C1011 AMI ACCURACY OF WMM"L
-ts "o. 6,,-'' 1 kbf.dtdII
Ift I " am ly i n a S m indg o 4 .1 e5 0 t o m m o l d w
a~m. tho WO0S.0 so 0.4. alas IY .18 ~ hWMit
41. cmwdw
wes; (d 0 o ewd f aliorsams so0 be paemd adt
-mf Iy. am010 wmft' Owyna Two
POOi &BA mWAM .00 11- 1,.94 .40Isinm ". c4.ofloato , I a" fty beaogbw
to,
AN"6,a P&I
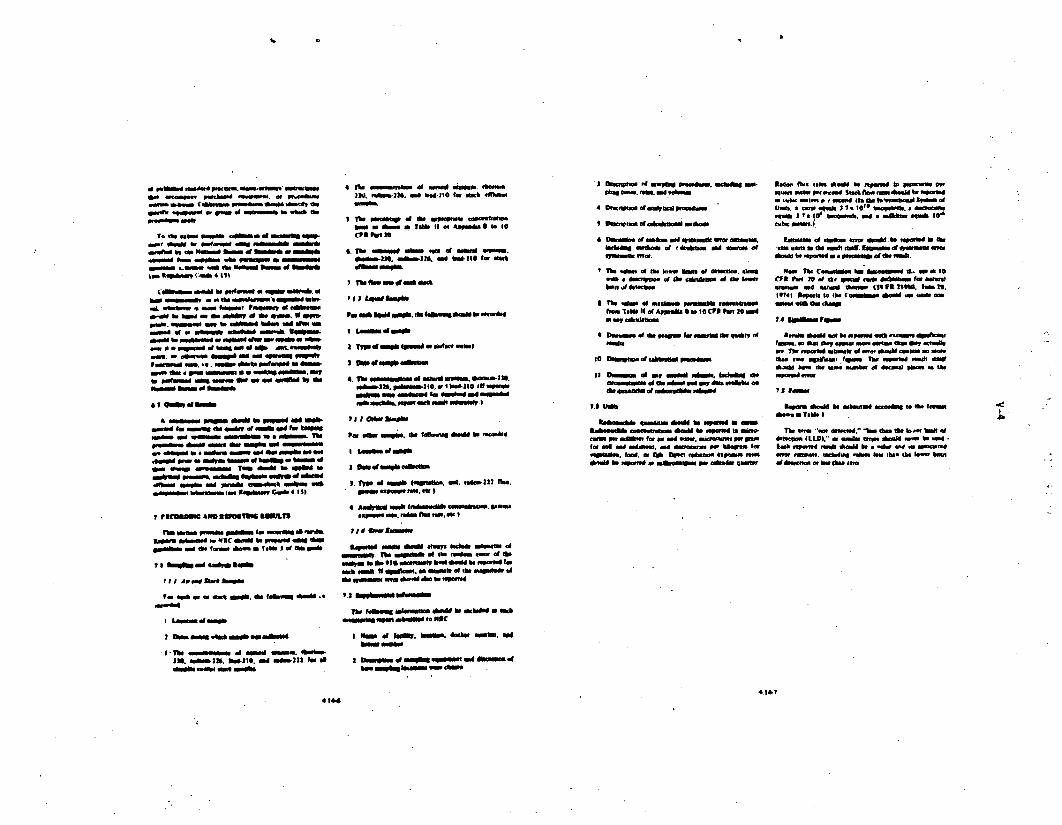
03 4.WI~d 1.0. peti..i skowtoft-new 4itmpo O3wedw 030Wmot. a 0.0440om
Me- - m& (40rov 304owd Siould A.40of.0030 atram & ow . movm0 . *0 m~e
-mowe "Oft
1. Who -a i sssm di0 of0 s.now ampwof 4 w0 hoePd - -W ndwwl - wo m
iosfe it go -ate omo soo ei.&owd hwe O-DO ed - s 0 inv~owe
-WP ýO ..inm .4. ONO OM 041 ="lin I.soleterp C vie III
~40 . so M 00 Boom" 03 so to. 9 030."Mo9. sameoo an 1. sated lodeft 4, am -ig-03ee .1 W430 wk9w* steme no-asm
-~ No ambevmil avalwa aft.-00wp"aim~ 0 8o GW..W Of O00 of 041. AM. OMMMMN
.04 - awrow doope ma .000 o 0443Va*~ 09tO .3009400 so4 3.4400-
-rf *04 -so wo e nw-to I wltwrm ow a" wilifte IV doNOO3O 9 Of MOAMP
411 Qup e mmA -om OPW &am b popplod ad9400l-oo to no"a tow-n o as i Feet boo
-09m w wom 00mow to a 10mo.
- ove bud . anm~ -MO s M oa 06 ON0dea "so0W b9m o at e03 a3~ %mmoO09 .0 Meo M0909N Vo *dom 0e -e Is
eflemgaesa 09 340* ainý*04 .40amoomems 3040emen, Is Isoamm G*de aII.)
r a5(00*m AM, off"?" 11111MR
Vi OM -. NOAM1 ""m f 0 Wine0.30900 Omee 3403, 142C anfi9d 414 W 09W of a
-mlde wa des #.meo dwre a TOO P of0 doa
1? 3otw a09 A42* te
?I I Ara" tereSao
Tot "A wr -0. staml. as 60009el dedbagadol
1Lamme of em
I49 gai .00$ ~ mem s split
31*0n sm~moef of moved wo. deolowIlk. .092m30. be3*30,o too 00442 3 toa
womn ooop da Moth
4li womentisteve o w0ftd -I* 000in3303. laft.226. 4" bo0210 fmtob .011M34.1
Ie TI -0. of4 as $04 Ac4m0. SO
CIFN PMt M.
G. lbk somom ON=. 0"a of d e*in.1J. nft126 a bld30-110 fee 03.
'I Lqo03&-J40
am 1 Ndi nsoce
4. Top evgomeo of mooned womm. Oione-*3 90.minral. 1M m.-310. w WO43423 off ugwoo
bOMM no *=*AMO 1 *309o04 MN-
woo angb0 u st. o "Mo0w 40044ho o..
I tons" .0mood
3.I por weli foso49341, 09. o001 2 2
Me0.
4 Awared 30* trob0o in44043. Swifts04900.04.to.o00, 30
0990493.04013.0 pod hoi ~ to03 tO
I0 oema 40 beot9. sea small" a"3044
.3003,0309 of "Mon 0INO
ba samlin hop.m w03 dChina 04 0
11qn 00a .43 pooe3,00003 vocldi am
4 oftfrmsof mistrust0*3
On omo *00.03. W0 "ouic ei nna
0.hokw 010,06. of ad mvwo of
T Tee oof as torv am" 09 doWtkm. 9340.40 4009300. "4of atdcollm, W3 atlow"4
tio. loom. 303f Appoe4 a, to OCIN Pon 20 owl
* *0oinoom tofo plawas tor asoot I0.0
11 flumu 03 m, rated sda. b0.3 40
06o0Mo9o 1 - Io~o~ o 003
a.00bomqm&. 404003&" be n93dw a090.tobee.400 towifevenm *04404409I0'to3-MO-
.30i 309, m 4*b oven codistio0 *so we004*ddhe ~mpod s 0 040.00990m jov .40 4w00
Rod" 0.0403tam.09 Stld be. noma d to Opoo
1.10..0 001 (3...4 eWmaftewilimmelioto. a ci .oul tM 3 1. 1010 boqooto. a sec030
.441 11140 loca 0.94. d09 oilb .403.4.4 le
030u obe 0 .oo 0. . 5g0 mpol 0640
Now. TU Ca.me"" Ion -000 it. go As30CPI Pot 200404c, moc 00on d04Oihow F ftaiwel
a".. 09 W -49*. (345 totIs40i. swi Is.
14. SWNI00 row"0
m4 Tot weaied abe4m oftie sbol movem003*0000
ismIo osio k.,e I'M03 4300T .ow~od 000.0
It4veri0il34el to atem0 .s.otoa to the f, -
Tim 000 "e00 doie4ted.- h.a *0 to- 3... a30
at" (I.I.M. ore awlsd mim . 044 mm to mod034000 to034 Aboohd A.W9 b0 .. 4 40 a0 404.,mit tomooo wisif "In o 40.h l-
4.146.4134
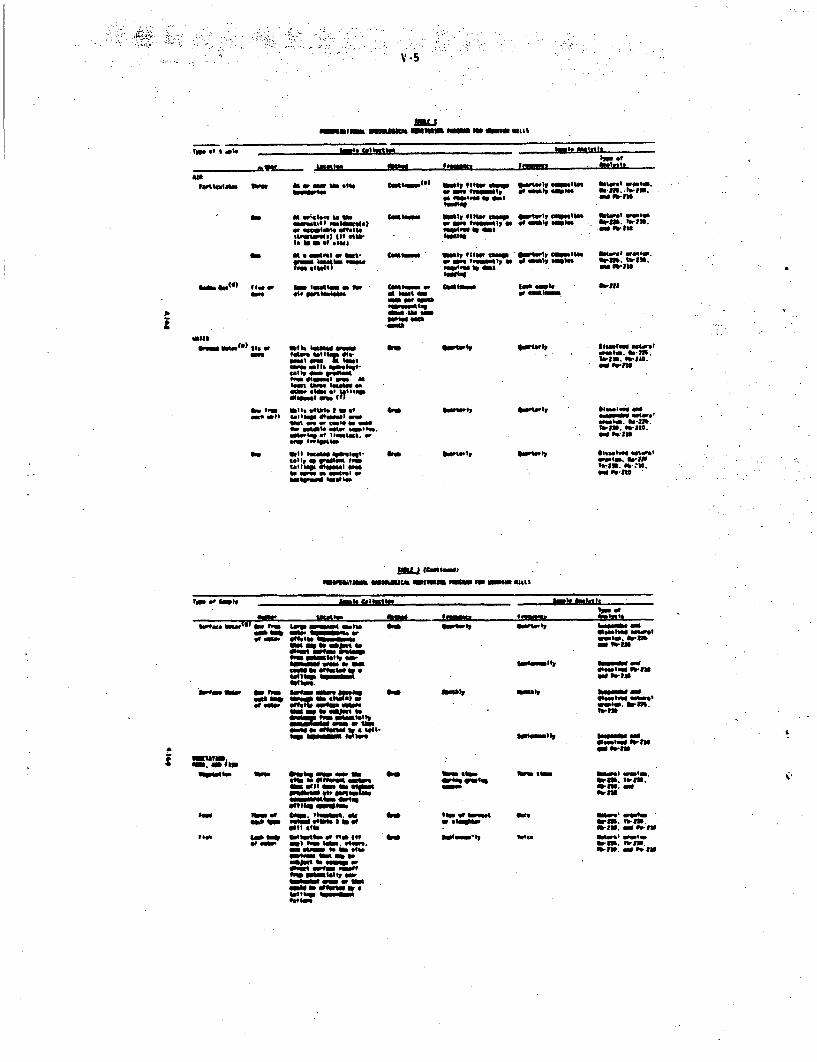
. V-S
fnmfmrn inommamMMMPm @ar ama. sull
typo fi l.01
w
bml. C.llmtlm
5-
WWII emuosiltwo of
AS w.mem Mtl an mebt boml. fit.h-
vee~ls' .ibeW Se Vale 011 v =-t.-t ce"stm Patera woo.'.,stBD tbs~s w , Mry as. m ebaisem. 11-226 ts-lu.
01acetal off.Is" 4" of5' 001 b-ie f:sulemrmesI (it low -wa
ow
'a mIM Inlol.gaas St. 0 d .. ems-te
is... ~ w "now£Imat
1-. W 1 am vn%%"a 1
wel ans Immote as40lwly me)"I~
Ctlmnemr U eNI st' tw 51 lses-. iStrew
4hme -
at emotame. Wselp"Nmfaq
~ as .mWae Sa
AMM
V minee
ValleGmw ow* Si v Sm. 4""W. Son 0011
em loel "Itelll.'~1 OM %"
"nttm to&~ to
of"* * Omilfetbs tMe' b
w* wl I sellauss OvmmI -AWl we - mid3 be egoo
U.eWlq £ loves ..ler." l- Nou
ow blit lot"" a'sklq- &asellpM, * yOl. "M
boa." Steatinte,
Se'etwoý15-. 4b-I.
sisau, wi-ts
wasow. se-liedes ft. toN
sselm Iowa,
.m~bb mMmal maul Feme.ue
'us et IMASON Me't'.
val @a 40 Owp -s~f swmo Stoag
onwe wool M a"elam ".n=
sanme p
srvSWseme tOees -~ to e
ago Wetiem #i
sits dffw wit-m
ow will f e
40HOaim m...*to" alle o
F40% goo e tem nsemi. of flb " P
ofmwM) "M WNW. ,m".Seusmmt SO no ofi
M eamiso memMe
emu up op"te orF."-%sw*m
ow mi %DP**a
i
to ies-Sttin b-kUL
soolsolsi
- imt,
-mIM
- mmlmlt W1b-i
WemO arm..
-mI -..tbo""i 6SeaIbt-lU
em es-tms
bmeel wel,.Irel. emm
ems-r. Is,-rn
wmlnJ som •-1
essas m~em'1-r8n. so 0-m.abrm. ewm .b-
be.mb-lb umldole asm
V
San W 6~e 4111Si "me-oo
sesww'I 1.0s
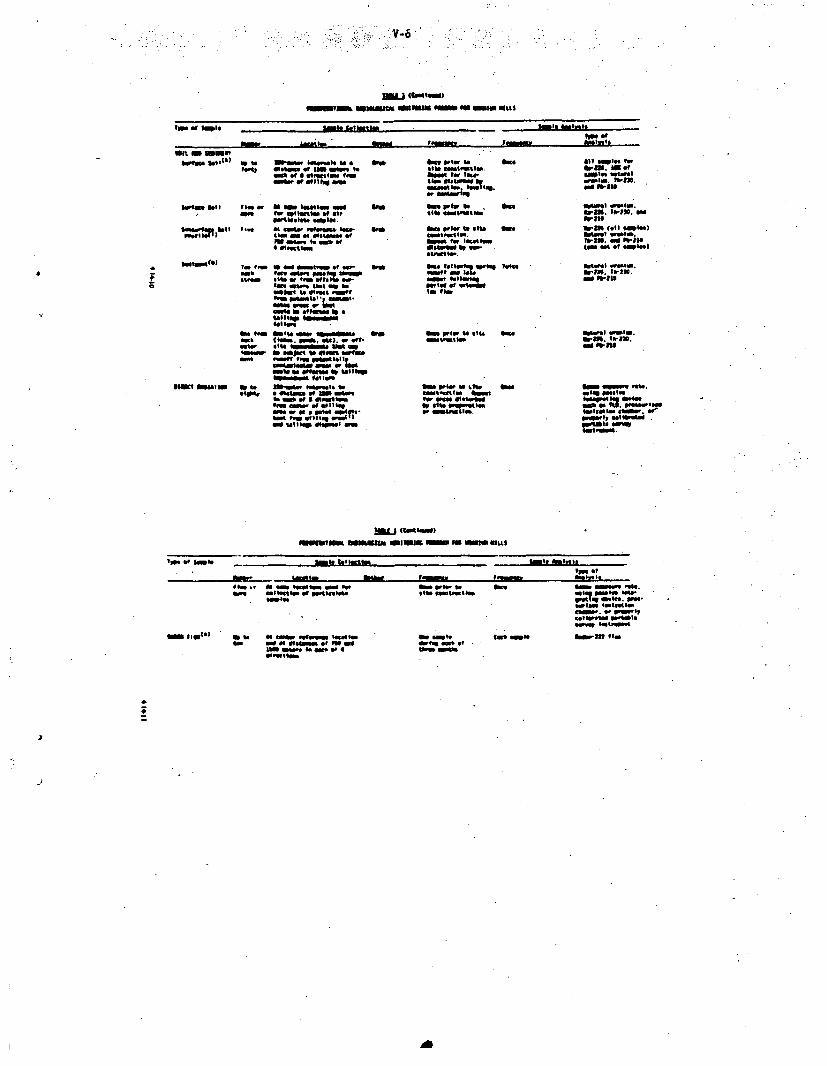
V-6
a" tm m)
Ina OFat mole sapl gimpint,
"it as emmrn
*Awee Sotl(a) 0 to 309.eaev loge-etel SoeeeWs OeW,~ of no alot so
sea ofa Otteroosta fto0~ 9 attt -VI"a
OF*
lute.~ ~ IS bittaso ft.wUw uat asp L~
lua~foo bi it. it - AWA ltofom ta. L
SOVISMOVes) tv a -4" o te f e , SIM
* ~ ~ ~ e mw an few to ~eq- b
ettm tt wo we amftomt amep nom ow a
am atmdoie mwee
Seitwem
be fat eta - 9w. Lt
tem a41 ofja no naoune1natt- 00 of0 at4
one is atat a r aetSmIte
oewl aSo wtiIStwolowt Us Im oftma saett
IBM orie. 1a oneGite amfie
"a" w ot'SIM in$"atbeaooawtib. mtatoo." mwif
beepolar to 014Site go"$emse
owe. prow eto bee a$so%-mttee
hime for Ivtepofleweof or Slow
otw%. ftIb
".Pt Md I:
41am prier to 11t4 $a
bee priew a #Jta ftCMM"IM be
9~w meý @ItOU~IV site O-ppmu-. inmteet
AlOwl" fore 9b-rn. MS ofetaps saloevt
wastes. WML.ol ft-RUl
meowet Westeb-tm. lie-lt. a
armU (all samples)
ic-ta. so 41441to " at 09 .tee)
motwet aesac.atm fjt-iol
ad~o WIN .
atopo; ft-RU
tstobs$ t..Po~NWIeWe-t OtgbW Se
MU ceao)IWMbwfe winSSSa 411111111111 011111i ON t IOU$
I"-e eq s t. -- 1 we .I&SMISS, iet. Auveet
L-Mlam St.amme eltetions of pwtortel. ta sat owtEwkefI I "tat
a.,
belie tet*.ltae.. p. p.~tpCola-plot W.teitOswap caumet
tao wet. ~-n, tie* o 0 e toum ee toetegoIS at tae Otwo. atessm.GM Io e#Same ofPa owe.
LIMt0e . *ob oewe" -64
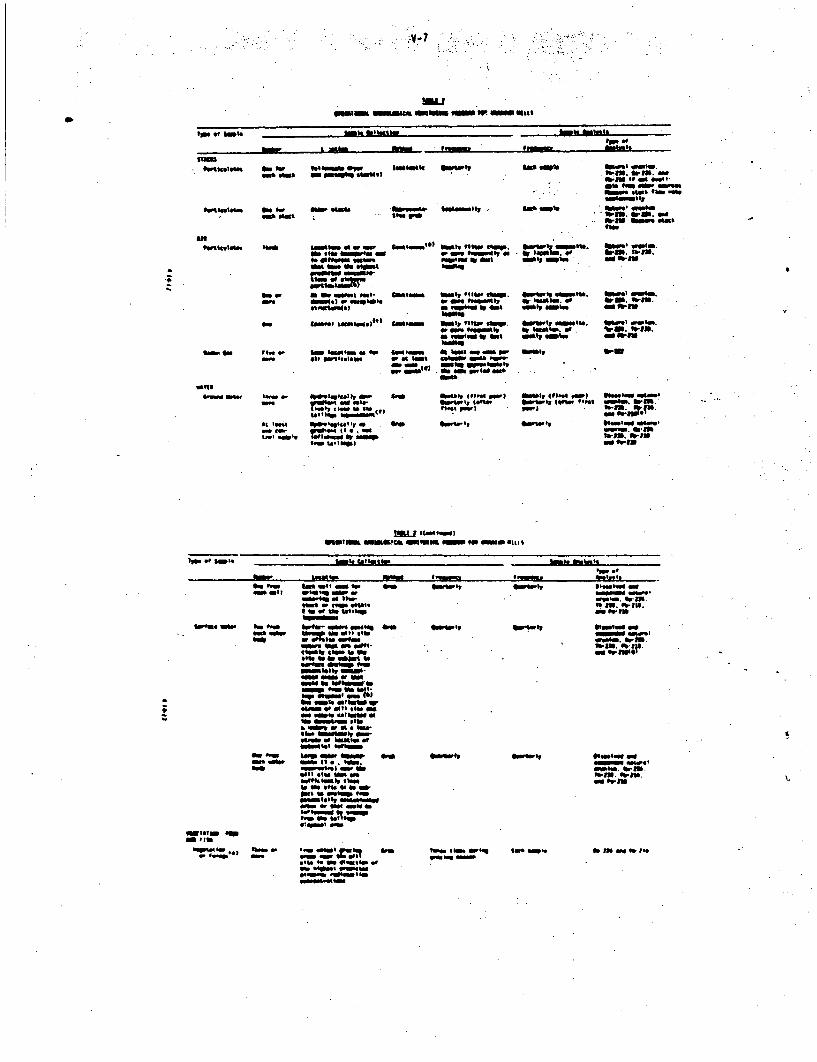
y- 7
OM M mMM MI~lo vIISW onyW
IjG*~ ofgfa uopl Ma albuw 8mu
'rna L1 20ie OPIION oiai ieý~i
on#o % kwass Ow meAuaits qim~tmer ~im 40 toos$ 4ial~
bil $moo imswa opsm .01481. or15. -96-816 of mefl Imi*Ole 9"a ~ MMWb&V *lel flow "as
91161. 0111. ad01101 manw* "astow
Gmitt 3wo ft. emem' sat"
'80..6904iP.
allfwtiaismi ,I&I team%" o -W catmiaeeeI Ltym flotw C~,p fiifufb S61140.
No offt lmo4ftam W am gym So ai.V .5 3Goa Inma Mile pfie."M t mu ad bRIPMaNM ma 93.t'. ma
so a a an cowt Plat- campas ftalt #tow cho. ea"W% gmite* i-i ineQa..m dopt) of m0111Oe on -el ori *aSual. of arm. bUs.
ot-orosoa .m~ IV *at moo meo in9 botUS
com" gmesamsVwbl flowse g"W 00 Itg smoe$0e 31314w, I
a10 Gs if am. Imilea $m, 40 O mi GO N. 4%I am WGot
uma
a-a. t. amotWooe~l MW*
I,-10:at to 040-MI iA oii ma
bIlosj (vs."t PWI mbmhlv 410-09 ifIl Olloai inom.
so taif o1 0 W1 j~i #-.a vaso. arm.'
Wetv. ft-IllWM1. WN
40 04re
"MJ 1liinfm'sIfta~tf M~McaIO mMaMM m ma Omdk1IS
Ipu at ompI* Lwi _l t.liaptos
mmu 01 "ImM ...e~ ~ Come plobi. 9 3age ~ o wie ifia9 -
111004114,mae Now Pls 9*-ksio=gimi tb fuw ofli
934
mw tam l lamf w 94"M ntA asl b
(mail (w "MSli 3 MGM
rnm 3l 461
"a efisms. saiateaUvlo W 4 a Ourbemma a am~o"ra
voomwo"$ 4w gosoft soe w 1014a
sSa li.l ta i L
11, E inm 1mome Gav am$*O
am-o IV 931mvp
m""m of-I'
Ideal 41miale
mallet, mae. ii *is~wl
vifon. ft-o.
aS *. IWIllb.-M 411410
93a1in-8
rti 953fi~lmaifoM W 4#
=".:uW mita eqOOlo" u el~mil ofto Vn lllo
135s too" go~o tar uspitIFNall one
So3w. M ans fit
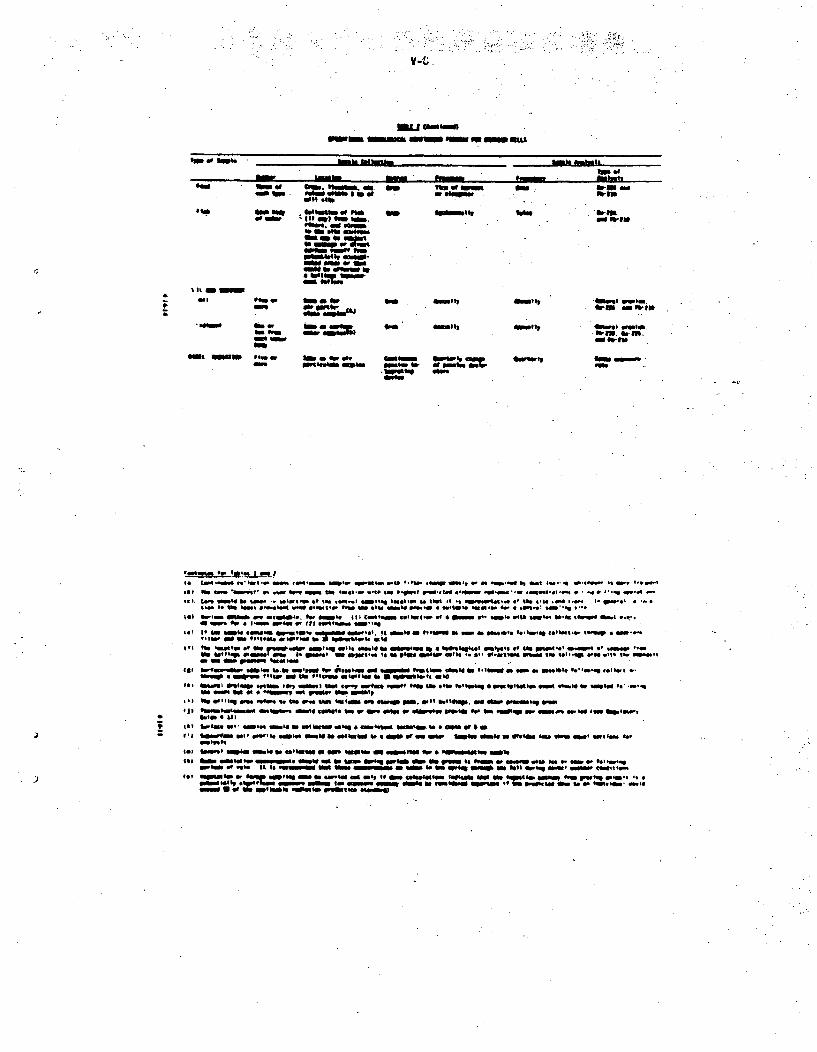
a MNAeM-WI IONM110 ml mo M mIw
PO of U11110
It 1 011114
0 it
Ise It
oi tw
o alsom= ib
11111O IMNII MOaW111al'
ems. maim
soft asho
aI ftll lowgo~ sia
MS.". -asmpo
aEm Ofto"411=, ~
- - wa=.0" W uem
OW OR Woviw o
"Mal Oso I$
A-m.alm.
11111 4br ad
*biem.wi
dongptq '41owet O IMe.ar so a e
i Us 0 OW be massp
isa mass,
wsmkobowm I.sa Zs Oaw-ta111110"S
I.co -C' t" .- 41alolaaa mias m" Wa ý" .'ma mm ass a mqpain6 41. . f .04.. ar.6.~ ...0, nos IMF 4Fm W "" gema "a .aeM.. n.5 'm *.-Iteamt O."ma aas' ga.-*n*'I 4 0 -- q gam-a,. 9- "WOO . la - s 5.w.~ 1" 1mm . ..
5 a ', at-s a Inftl5s s..s~. .4p lo. ga W-0. . .m. 2. ' 0
I-s I. af sam% "W~s. ON 94"si Olwl ~0 it.as . -. llmeao a two. *, 5'GW45 as
544 a-.- 0500 de 01as"00. 141, On*. 4 15 C-a-mo 46esrwo.1 6 so- la. "W.,all Woo. W-'s 46.Ofm' ss1.als Oa. OW . 5'a lwail -~ FsWlftaft Flom.,
"off* a s, atas in1astS. %".asst. s.1 a0 95am as lomf amnio. 4091.1- 1.sI, -. g . amo.'som " a 9smI.us.aen a W S *...m. a.
ta 0 80 1a~~ Ifa rwas& gmt.1 ail Imala 410 I~ ftU aa ains. mwes 41.1111,411o af 11at-1m Owe. a-mwII m'ow a. am pmsam 'a
is$ "~.a,"m
". so apsis OW' dim$."s Mo *oo falmat almst! in fImsalf asam a gassds* '.''in'is seminal 16. m.' 0 IItin .asato n go, aoso maossol " 'a40 at wetaP'msq.wsmmee m. ea5
6's 55etXsa 9N amam "ea tama Weam Mo -0w go"1 0ss'""m am moots 0_ ma olo
"a* 4 1.4 am allo "t"a "*. aaVast..m' an own -0m u, ems 11 asma "Mo 5 allo somoma iasm" nm mW
me) rfs ma' '.. a"Iss ala goem .s" a m W 0sl""a auasar a M~ W ma m "Now owasuý P-6tw l
f's odaa~i alls owl . oawl" ass a st losa ?A a 0046 eqo allow a as s~asn iae'a.m .ala'nst
tol eaf.' salm asm.ta!t wimasa as me NOW" an 0mm mmm~ 61111010Op a mfetw . asome "a a0 ass, aWm. assit ae vm*w toOmn s o"asom we e . ias f.-."i5
We. falls nw m iaý "*Mrs a .oa a wing If as allmmasa 1111~ as00oo at we frit's. o .as m t, 4 IM.'as't '
ame eq of low m. so issasa -W eal PWM. "llun
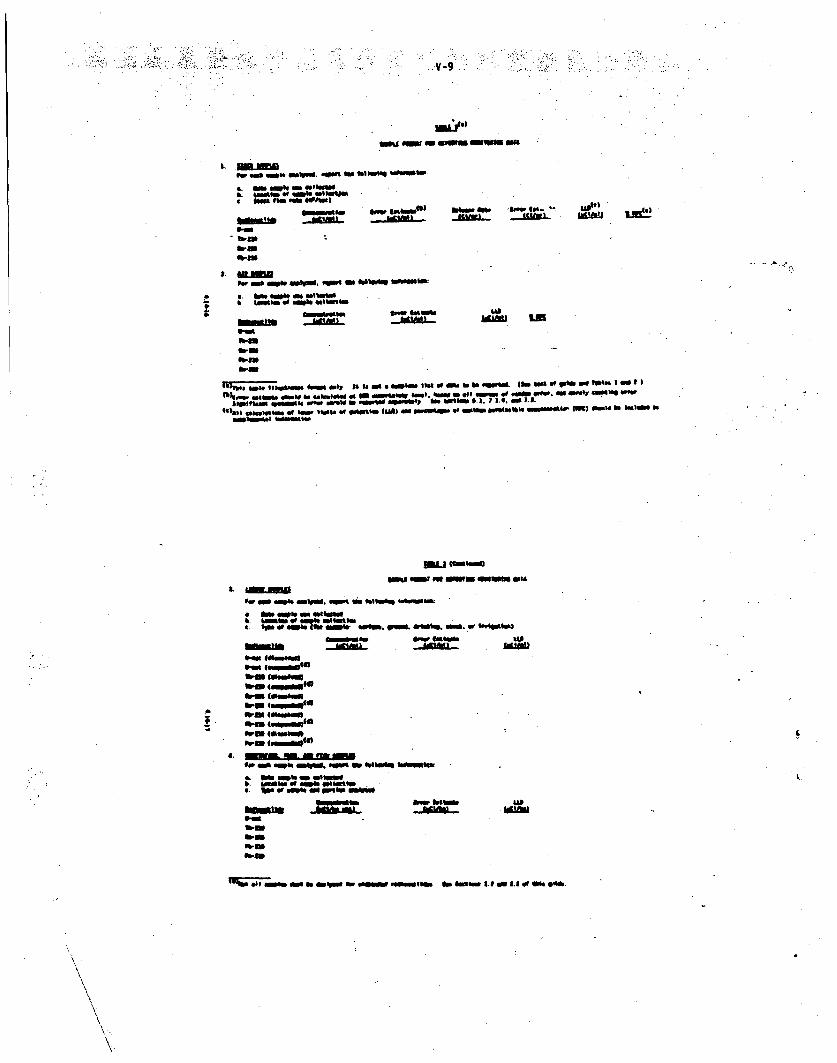
.1.V-9
amz aswig ma~i Omsu st.-
9om Sow 4ove inli. .1i INCAM USWi LIt.
a-rmbwm
SLI-
*uala 1p.06 Altud4 IN' S WOW-%* I-'- OO n m *11 "a'" o f OsmuWW'a "atl a-ssume WWWal 1Ekft of 4gbvies" f (LN 04 te "Um. oM ef w mm . eq~ hi em .enta (9)~ Millaw beW Rw a
&a womismi
a, low as am$ mfttuonbi IM flL04116M . Ff"aCoot emorS~i anew" t.
%f.o &CUMIt t~*.~ 4Wq .N ~~-040 dbkN Miwoo cmoswl
Pmomt Wrn ean'
b-rn faanwo
farn m*ouft400d. w fqf
Ib-rn 0mWASn
a. . iIi i
I
mm ~ S1b- t. MIMe 1.1 Wi EU V Si. *'ib.
N.
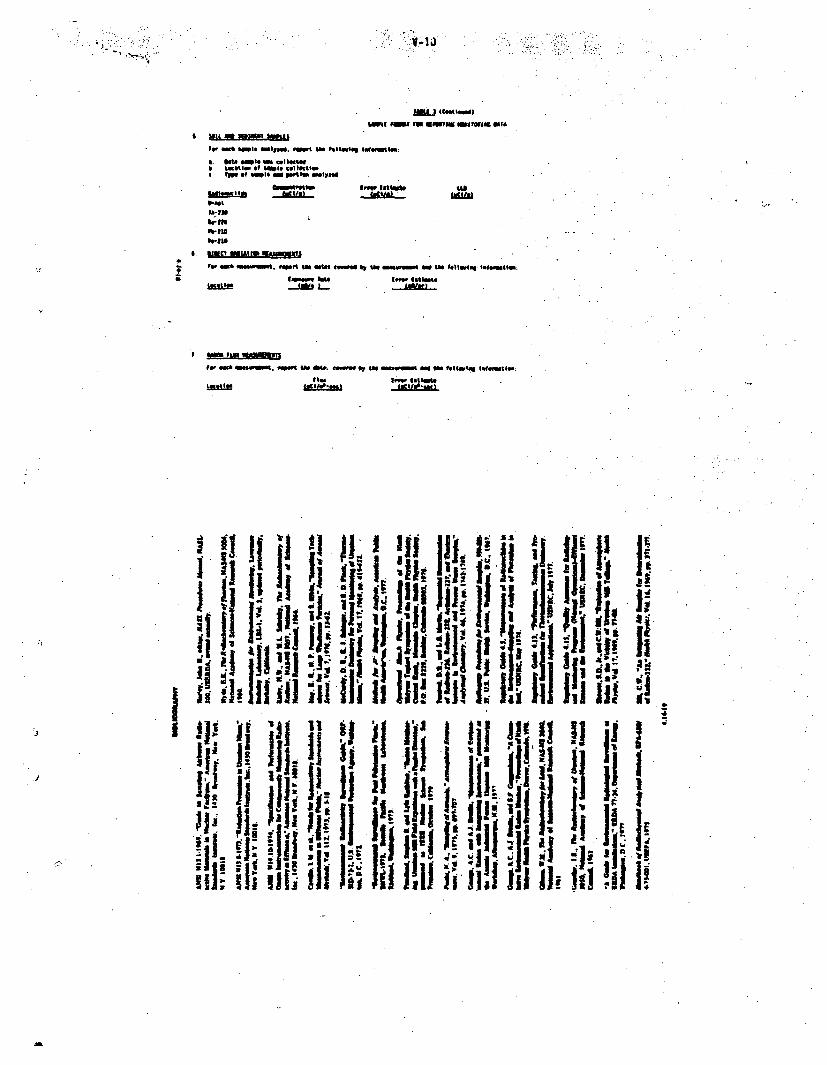
ma 0
s wit An mm3Y omJ
SPI Not onI C01146114111 I~ *~glC
k tMslas 0F sm"I, £liftts"
t ~ ~ u 1611141111110m~jheCCCCW I~uw ItI law
What ~
*~~~~ low"inruUut
li I sl. m Itt
3ii
IA. . V A.odlm O~,e mee Dmnoms of %-11. 0-:4JFlio. 21. to:16. aw ftbUO a 1'..... tb.. *os fi
i Tomato MM.. %-- Vol It. 101', ff 3014N4.
1161 1U w J 4. ex t: 1.110.. &.hma Osaw~mme..at LN.- 0 ValO. OM.. ad~. t* Doe.- Amfpt~y
0 .WVol 49. fll.~9 pp fol-
Ed. ('10 uptrmomaw .4 N- and tframohoodae 0 (%.. aw No Tubm by AVOW sbftmw"ee,2
A~oW~tb..m.Vol 19. felo 61844fl
So. C To.. " d. lmdlbftems- futnmrnmie. at AbleaMwe. 9..rbl ci 11h,.o M NO 4 -,Se. -0
Ied. A40pow csme.. Vol 4. 1014. pp I 115.3131
I& CO f.4W 2L U'lbma URmhwchwmd lbour...ft" of #.%Mae woi cho V..amuosm Ih.oms a floIo... I d a" w....tOM lmopflm jAftf Vol Seefryovl 41.19611.09 I61.241se
Ii. CrW. -somtwo sq sotI Soomhm4 beft~waaor
smar Mrsob okv Ib. tfaaat~n" of Sw.4m md mai
9'i.I.. A A Ndoltud. aud I t col. 'It o.phet" Cob-a- fbenolome.. .4 Atowm. U-4~oseina.e.- on~e. S,~.mg re JI-.P. 9.4 If.op. 317.340, 1971
Avemo t~ m a&, Ame. adm ec 1.um wwa Frope..Smod 'ed. J. "s..0. Aftom I.imbedu Fofts. Ift.
womm. wor. adi n sou. ;-vo ate a n- Deul.Atippa ao~daSie UmmewC MrI paeomON Iiodioo Sooner. 16.22. 11,11
LOWE L"? OF 0 IICTION
foo nlhpuow.ed dpale.l do .. t Lamt~etof owWe. ILLOISaAtoý d Ownd wisdom caoessretw of sodw,aimP amtong Mapid *41 bu5a ess P*bmb*' of binsdrucled. Keh .d 10 9% 1obea I tam. bb"h smapl
.,sed.Duul indam~ uei, 0 -d..oor d aWNWlw mouvat "wowem l. MA, do, MiLK to e-dvi, IV tiet w**v Ibe th nt..be kmgsa po1..
Pew po'b..i -fwmms wown t MIT
LLD 4662
.bme
LLD a -be mow bad of ddtoos Immeol:w. wafi~l.
%, 4, ""dada jena-o f wi
it1.~mtyeited~ON MCMil
l' l tu lb .. t o bsbs u
a t eto.Wn tI , cw ow.lw
I ob apsa md.. oes p,
IF ado faccmol uidnhsmeewl YOUd Cub
I basbn am~ to6.l
wood Gbm.W ad ow i lbO f ftMMe 9eo~kws
no ade wsus- w.o
Sim lb LLD ae sumIS.of asid mism. Ifmilbanal. iS6ftWMW VWi. moc. UMO IFFI Avfe. MVsomme a"I pe.dio Wnas am . a.4
A dw - i Oin doM pasmoufMesmwm
be- L- ... w00
Wýýoý,M Wow)" 1.. 4 I&A dM23I

NOTICE
THIS DOCUMENT HAS BEEN REPRODUCED
FROM THE BEST COPY FURNISHED US BY
THE SPONSORING AGENCY. ALTHOUGH IT
IS RECOGNIZED THAT CERTAIN PORTIONS
ARE ILLEGIBLE, IT IS BEING RELEASED
IN THE INTEREST OF MAKING AVAIL•ABLE
AS MUCH INFORMATION AS POSSIBLE.

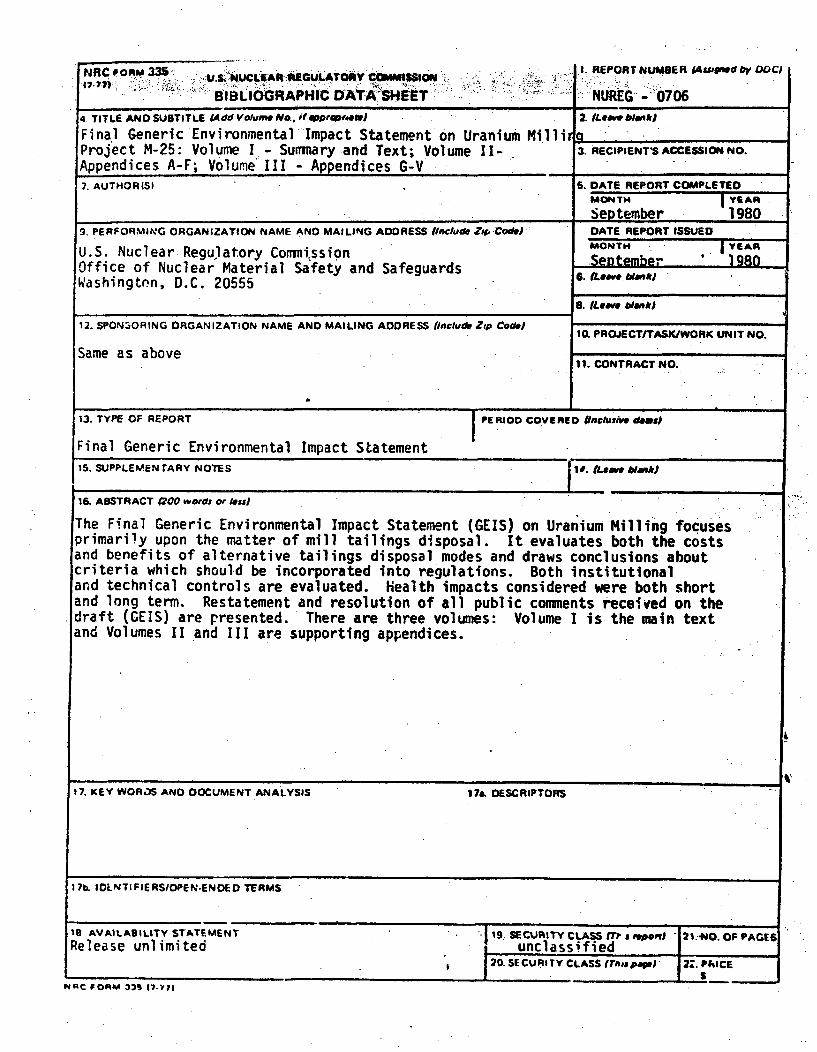
7NWUISA -811ULATORY COMMISSION:-
BIBLIOGRAPHIC DATASHEET
1. REPORT NUMBER (Ass~d by DOC)
NUREG6 -":0706
4 TITLE AND SUBTITLE lAdd VolumwNC, if N or•t. f " " 2. ILRea' bipok)
Fina'l Generic Environmental Impact Statement on Uranium MilligProject M-25: Volume I - Summary and Text; Volume II- 3.RECIPIENTSACCESSION NO.
Appendices A-F; Volume Ill - Appendices G-V7. AUTHOR(S) S. DATE REPORT COMPLETED
MOPITH YEAR
September 19809. PERFORMING ORGANIZATION NAME AND MAILING ADDRESS (iMclude Zsa. CodV DATE REPORT ISSUED
U.S. Nuclear Regulatory Commiission MONTH YEAR
Office of Nuclear Material Safety and Safeguards " r 1
Washingto'n, D.C. 20555 6.If____________
S. (Leve blak)
12. SPON3ORING ORGANIZATION NAME AND MAILING ADDRESS finclude Zip Code)10L PROJECTITASK/WORK UNIT NO.
Same as above11. CONTRACT NO.
13. TYPE OF REPORT PERIOD COVERED (Inclusive dews)
Final Generic Environmental Impact Statement15. SUPPLEMENrARY NOTES 17Ia. tLeave &/ank)
16. ABSTRACT 0200 words or lessi
The Final Generic Environmental Impact Statement (GEIS) on Uranium Milling focusesprimarily upon the matter of mill tailings disposal. It evaluates both the costsand benefits of alternative tailings disposal modes and draws conclusions aboutcriteria which should be incorporated into regulations. Both institutionaland technical controls are evaluated. Health impacts considered were both shortand long term. Restatement and resolution of all public conmnents received on thedraft (GELS) are presented. There are three volumes: Volume I is the main textand Volumes II and III are supporting appendices.
17. KEY WORL.IS AND DOCUMENT ANALYSIS 17a, DESCRIPTORS
17b. IDLNTIFIERSIOPEN.ENDED TERMS
16 AVAILABILITY STATEMENT - 19. SECURITY CLASS (TI iapet " 210.-'NO. OF PAGESRelease unlimited unclassified
20. SECURITY CLASS (Thea pdpj 2:. PU.ICE
0411C PO5PW 33 47-vil
49
-Printedon recycled
paper
Federal Recycling Program