Embed Size (px)
Citation preview

CHAPTER 8
ON THE RISKS OF TRANSPORTING DANGEROUS GOODS
Vedat Verter
I. Introduction
Hazardous materials (hazmats) pose a danger to the environment and to human health due to their toxic chemical ingredients. They include explosives, flammables, oxidizing materials, poisonous and infectious substances, radioactive materials, corrosive substances, and hazardous wastes. Most hazmats are not used at their point of production, and they are transported over considerable distances. For example, it is estimated that four billion tons of hazmats are transported annually across the U.S. highway, railroad, waterway and pipeline networks. Thus, according to the U.S. Department of Commerce (1994), roughly every fifth truck on U.S. highways is a hazmat truck. The public seems to be increasingly concerned with the unprecedented volume of dangerous goods movements. This is primarily because of the possibility of unintentional releases of toxic substances to the environment during transport
Traffic accidents are the main cause of hazmat release events which can lead to a variety of incidents, such as spill, frre, explosion, and/or toxic clouds. The possible consequences of these incidents include fatalities, injuries, damages to property, losses in property values, and environmental damages. Fortunately, the likelihood of such undesirable events is very small. For example, for a 90 tons rail-car carrying chlorine, Saccomanno et al. (1990) estimated an average rate of two fatalities and seven injuries per million kilometers of travel. Nevertheless, hazmat accidents do happen and in may cases have severe consequences, such as the 1979 train derailment in Mississagua, Ontario, where chlorine leaking from damaged tank cars forced the evacuation of 200,000 people. A spectacularly gruesome gasoline truck explosion in a tunnel in Afghanistan, claimed 2,700 lives in 1982.
Over the last decade, management of hazmats has received considerable attention from researchers. The recent survey of Erkut and Verter (1995b) indicates that establishment of potentially hazardous facilities, and routing of dangerous goods
R. E. Jorissen et al. (eds.), Quantified Societal Risk and Policy Making© Springer Science+Business Media New York 1998

74 Chapter 8
shipments are the problems that attracted the most attention. In general, there are a multiplicity of stakeholders in managing hazmats. For example, in selecting routes for hazmat shipments, carriers are usually concerned with their operational costs, whereas government agencies place more emphasis on the total societal risk imposed on the residents in their jurisdiction. Meanwhile, the local communities that incur more than their fair share of the societal risk, due to the routing choices of the carriers, might be pressing for more equity in the spatial distribution of risk. Evidently, hazmat management problems are multi-objective in nature, and the prescribed solutions could be effective to the extent that one can assess the societal risks associated with each alternative action plan.
In this chapter, we focus on the societal risks associated with hazmat transportation. Next Section describes a framework for the assessment of transport risks as well as a critique of a recent paper by Hundhausen (1996). Section 3 provides a comparison of the risks of hazmat transport in the U.S. , Canada and Germany, whereas Section 4 summarizes a recent risk assessment study in the province of Alberta.
II. Assessment of Hazmat Transport Risks
The most common measure of societal risk associated with a potentially hazardous activity is the expected undesirable consequence (Erkut and Verter, 1995b). That is, the risk associated with a hazmat shipment is usually defined as the probability of an undesirable incident during the trip, multiplied by its consequence. In the case of multiple shipments, the societal risk would naturally be the sum of the risks associated with individual shipments. Thus, the amount and type of the hazmat to be shipped. the probability of unintentional releases during transport, and the possible consequences of each incident constitute the major factors that detennine transport risk. The probability estimation task is complicated due to the fact that hazmat incidents are very rare events (i.e. , the probabilities are very small). Furthermore, the effect of a majority of the toxic materials on humans is not well-known. This makes it quite difficult to estimate the undesirable consequences of a hazmat incident in many cases. Therefore. assessment of the transport risks associated with hazmats is far from trivial.
Before moving on to the technicalities of risk assessment through the use of the expected consequence measure, it is important to note that there exist some criticism with regards to the appropriateness of this "traditional" model for hazmat logistics. The assumption of a risk-neutral public constitutes one of its weaknesses. Most people would prefer being exposed to a few incidents, each with a small hazard, rather than facing a catastrophe, even if rarely. This risk-averse attitude is not reflected by the expected consequence measure. The traditional definition of risk also presumes that a route can be used for shipments regardless of the past accidents on that path. However.

Vedat Verter 75
the shipments are likely to be re-routed in the case of a catastrophic incident. Nevertheless, we prefer using the traditional model for transport risk assessment on the grounds that it is very well-understood by most of the decision-makers concerned with hazmat logistics. We refer the interested reader to Erkut and Verter (1995b) for the alternative risk measures suggested in the academic literature.
The societal risk of a hazmat shipment can be estimated by aggregating the risks imposed on each resident along the route used for the trip. In general, a path between a pre-specified origin-destination pair would be composed of a set of road segments, each with different road characteristics. These features include; number of lanes, surface quality, traffic volume, and density of nearby population, and they constitute a key factor in determining the probability of a hazmat incident as well as its consequences. Thus, the risk imposed on a resident can be calculated as a sum of the risks due to the activity on each segment of the path. The resident's risk associated with a road segment, in turn, can be estimated as the probability of a hazmat incident multiplied by the probability that this individual will incur the undesirable consequence(s).
Apparently, it is next to impossible to make an accurate assessment of the transport risk associated with a hazmat shipment. Note that, however, in many hazmat logistics problems one needs to be able to compare the alternative action plans in terms of their risk, rather than estimating the absolute risk associated with each alternative. The following set of assumptions simplify the transport risk assessment task considerably, and the resulting estimates could still be useful in comparing alternative transport policies.
Assumption 1:
Assumption 2: Assumption 3: Assumption 4:
Each resident at a population center will incur the same risk due to the transportation activity, and hence population centers can be represented as points. Only one of the possible incident types during transport is considered. Only the most undesirable consequence of an incident is considered. The resident(s) at a location will incur the undesirable consequence, if the location is within a (pre-specified) threshold distance from the incident site.
The first assumption constitutes a crude approximation to the spatial distribution of population, which is used by almost all researchers in the area of transport risk assessment. To motivate the next two assumptions, we will use the example of a traffic accident involving a chlorine truck. According to the second assumption, it is sufficient to consider the release of a certain (most likely) percentage of the chlorine in the air. Clearly, all possible release scenarios need to be considered in assessing the absolute risk. The third assumption suggests that policy makers focus on mitigating the possibility of fatalities, and place much less emphasis on the other possible

76 Chapter 8
consequences of a chlorine release incident. Note that, this greatly simplifies the risk assessment process by reducing the required number of risk estimates, and by eliminating the technical difficulties regarding the aggregation of different types of consequences. Finally, assumption 4 eliminates the difficulties associated with estimating the likelihood of a population center incurring the undesirable consequence of interest. This is a very tedious task in many cases. For example, in the case of chlorine gas, one needs to estimate the probability of becoming a fatality, at a given population center, as a function of the toxic plume concentration at that location. The concentration level , however, depends on the distance to the accident site as well as the direction of wind and atmospheric stability at the time of the accident, which are highly random events.
On the basis of the above four assumptions, an individual 's risk associated with a road segment can be estimated as a product of the length of the portion of road segment for which he/she is within the threshold distance of the hazmat being shipped, and the incident probability. This "basic model" for hazmat transport risk assessment is used by many authors including Batta and Chiu (1988) and List and Mirchandani (1991). Erkut and Verter (1995a) observed that Assumption I is reasonable only when the route goes by small towns and villages. In the case of transporting dangerous goods across large population centers, however, assuming that all the residents would incur the possibility of being exposed to toxic substances might amount to a significant over-estimation of the transport risk. Thus, Erkut and Verter (1995a) provided an "extended model", which represents the population centers as two-dimensional objects (rather than points). They assumed that population distribution is uniform within the zones defined by census tracts. In the extended model, the risk incurred by each individual is inversely proportional to his/her distance to the road segment(s. The other three assumptions of the basic model, however, are retained. In implementing the above framework, it is crucial that the hazmat incident of concern, and its most undesirable consequence be clearly defined. Failure to identify the basic parameters of a risk assessment study would undermine its reliability in measuring the risks imposed on the public and environment. For example, Hundhausen (1996) presented an assessment of the risks associated with petroleum transportation in Germany. The undesirable event, in this study, was the release of petroleum during transport, and the undesirable consequence of concern was the loss of the material . Thus, the reported transport risks, in fact, represent the expected amount of petroleum lost during transport. Indeed, the economic risk of the petroleum carriers was assessed, rather than the societal risk due to the transportation activity.

Vedat Verter 77
Ill. International Comparisons of Transport Risks
In this section, we present transport risk figures from the U.S., Canada, and Germany, in an effort to provide the reader with an international comparison. It is important that the statistics quoted here are treated as representative figures, and not as benchmark estimates for each country. We elaborate on transport mode selection, and hazmat incident rates.
Transport mode selection is one of the wide range of decisions a carrier needs to make in transporting hazmats. Given the origin and destination of a shipment, and the type and amount of the material to be shipped, it is necessary to choose among alternative modes of transport, i.e., rail, road, or barge. This choice is important, since it implies the network that would be available for transport. Mode selection problems are usually dealt with in the context of risk assessment studies. For example, Hundhausen's ( 1996) estimates for petroleum transport in Germany are summarized in the following table.
Table 1: Risks of petroleum transport in Germany
Incident Rate Loss Risk %Major Major Inc. Rate (inc. I Mt-km) (t I inc.) (t I Mt-km) Incident (inc. / Mt-km)
Road 0,0117 2,3 0,0269 0,15 0,00176 Rail 0,0011 26,9 0,0296 0,14 0,00015 Water 0,0012 9,4 0,0113 0,31 0,00037
The transport risks depicted in Table 1 are estimated on the basis of the accidents that involved an unintentional release of petroleum during the period of 1987-1991. Incident rates represent the number of release accidents per kilometer shipment of a million ton of petroleum, whereas the average loss figures indicate the tons of material lost per incident. On the basis of the expected petroleum loss, waterways constitute the safest mode of transport. When one focuses on the major release events, rather than all petroleum releases, however, the resulting ranking of the transport modes may be different. Table 1 also reports the percentage of accidents that resulted in a release of more than 10,000 liters of petroleum in Germany. Note that rail transport has the least major incident rate, in this case, due to the high likelihood of major releases during maritime transport.
It is important to realize that, in general, accident rates depend on the characteristics of the transport network, and release probabilities depend on the material being shipped. Thus, the conclusions in Hundhausen ( 1996) are specific to the transport of petroleum through the German transport network(s), and may not be valid for other transportation

78 Chapter 8
activities. In order to elaborate on this point, Table 2 summarizes the risk estimates of Saccomanno et al. (1990) for the transportation of chlorine and LPG in the province of Ontario. Fatalities constitute the most undesirable consequence of LPG and chlorine incidents, and hence transport risk, in this case, represents the expected number of fatalities. The population density along the routes used for transport, in Ontario, is 1,000 people per square-kilometer.
Chlorine:
LPG:
Road Rail Road Rail
Table 2:Transport risks in Ontario
Vehicle Capacity (t) 27 90 18 63.5
Risk (fatalitieslt-km) 37.20 w-78.15 w-9
2.44 w-9
o.19 w-9
Evidently, road is the safer mode of transport for chlorine in Ontario. whereas railroads are safer for LPG shipments. Note that the container size is a key factor in determining the transport risk per vehicle.
Now, we tum to an international comparison of the road incident probabilities. Recently, Glickman and Sontag (1995) presented an analysis of the cost-risk trade-offs in routing hazmat shipments across the U.S. road network. In this study, they used a professional software package, PC*HazRoute, which contains digitized infonnation about 0.5 million miles of roads in the continental U.S. For each road segment, the length and the nearby population density are stored. The impact radius of an incident depends on the hazmat being shipped, whereas the accident and release probabilities vary by road type. The incident probabilities in PC*HazRoute are the average of the probabilities estimated for the states of California, Illinois, and Michigan. Here, we focus on the two-lane rural roads, as an example. According to Glickman and Sontag (1995), a vehicle traveling on this type of a road, in the U.S. , would be involved in 0.12 incidents per million kilometers.
Shortbread et al. (1994) conducted a comprehensive assessment of the transport risks associated with the hazardous waste shipments across the province of Alberta. This study was commissioned by Alberta Special Waste Management Corporation (ASWMC), in order to support their application to the provincial government for lifting of the ban on hazardous waste imports to Alberta. Shortbread et al. (1994) estimated that the incident probability on the two-lane rural roads of Alberta is 0.04 per million vehicle-kilometers, which is only a third of the U.S. average.
As depicted in Table 1, hazmat incident probability on the German road network is 0.012 per million ton-kilometers. Unfortunately, Hundhausen (1996) did not provide

Vedat Verter 79
any information about the variation of incident probabilities according to road type, and the vehicle capacities. In the U.S. , incident probability on the two-lane urban roads is five times that of the two-lane rural roads, whereas the same ratio is 2.5 in Alberta. Thus, without information on specific road types, a comparison of the German probability estimates with those of the U.S. and Canada would be unreliable.
IV. An Example: Transport of PCB Wastes across Alberta
Erkut and Verter (1995a) provided an assessment of the transport of wastes, contaminated with polychlorinated biphenyl (PCB), across the province of Alberta. Although PCB has no immediate toxic effects, there exists a consensus among scientists that long term exposure can cause cancer, and hence the federal government of Canada banned its use in 1977. Nevertheless, PCB had been widely used as a coolant in electrical transformers and other equipment, and thousands of tons of this toxic substance remain in storage at more than 3,000 sites across Canada. A fire at one of these sites, Saint-Basile, forced more than 3,500 residents from their homes for several weeks in 1988. This event attracted considerable public concern over the problem of properly disposing of PCB wastes. Due to their organic nature, these wastes need to be incinerated at high temperatures, and buried at specially constructed landfills.
ASWMC operates the only integrated hazardous waste treatment and disposal facility of Canada in Swan Hills, Alberta. ln February 1995, Alberta government approved ASWMC's request to import hazardous wastes from other Canadian provinces. Given that export of PCB to the U.S . is banned by the federal government in November 1995, ASWMC constitutes the only alternative to the local incinerators for safe disposal of PCB contaminated wastes. Shortreed et al. (1994) estimated that the PCB wastes to be imported from the eastern provinces amounts to an annual transport volume of 459 truck-loads. This implies considerable increases in the flow of hazardous wastes across Alberta, as well as the associated transport risks.
Transport Canada requires that all the residents within 0.8 kilometer of a PCB fire be evacuated. In this case, tl1e expected number of residents to be evacuated is an appropriate measure of the transport risk. The waste trucks coming from the east will travel 454 kilometers within Alberta on their way to Swan Hills. As shown in Figure I , "Route 3" passes through 19 population centers, including the cities of Lloydminster, Edmonton, and Spruce Grove. According to the 1991 census records, these cities have populations of 10,042, 616,741, and 12,884 respectively, and hence it is unrealistic to assume that a PCB fire would cause evacuation of their entire population. Thus, Erkut and Verter (1995a) assumed uniform population distributions in Lloydminster, Spruce

80 Chapter 8
Grove and the census tracts of Edmonton around Route 3, and implemented the extended model in assessing the transport risk.
As shown in Table 3, only 32,195 of the 616,741 people living in Edmonton are put at risk by the PCB waste shipments from eastern provinces. The other population centers on Route 3 are represented as points, which seems to be a reasonable assumption due to their small populations.
Length (km)
Route 3 454 Edmonton 17
Table 3: PCB transport risks in Alberta
Population ('91) Exposure
61 ,733 32,195
Risk truck (per truck)
0.006ll7 0.003820
Total risk (459 trucks)
2.8077 1.7533
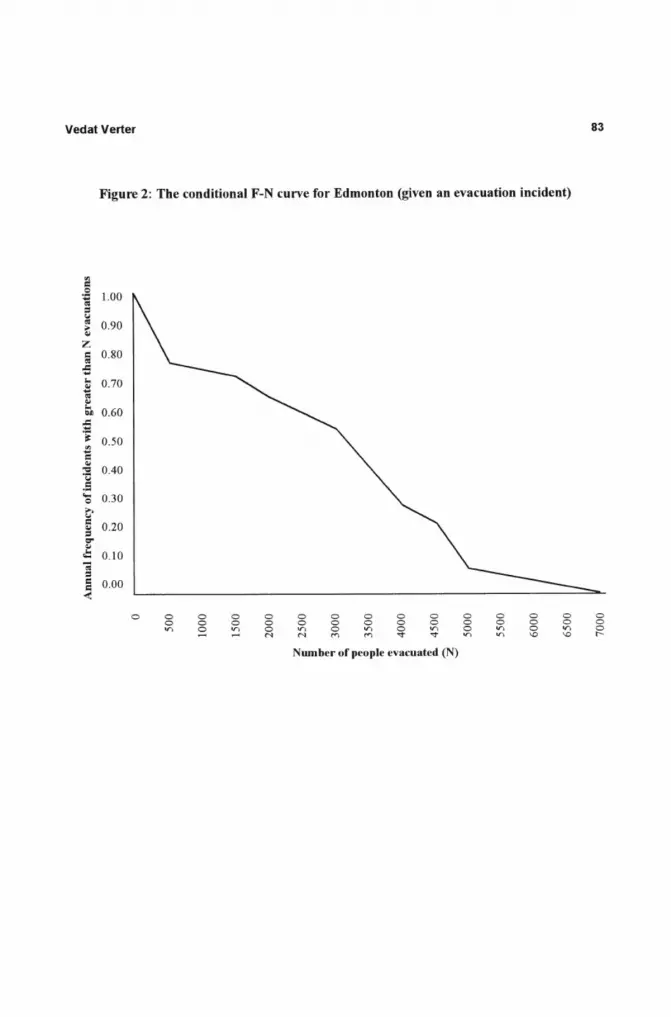
The overall transport risk associated with the PCB waste shipments on Route 3 amounts to 2.8 expected evacuations. Note that 62% of this risk is actually imposed on the residents of Edmonton. A risk profile of the PCB transport across Edmonton is presented in Figure 2, where the annual frequency is conditional to the occurrence of an evacuation incident in the city. Figure 2 shows that if an evacuation incident occurs in Edmonton, then there is an 80% probability that it will be necessary to evacuate more than 500 people. Note that, however, in the case of a catastrophic accident in Edmonton, as many as 6, 760 residents may have to be evacuated.
V. Concluding remarks
In this chapter, we described a framework for the assessment of hazmat transport risks, and presented comparisons of the transport risks in Germany, Canada, and the U.S. We also provided a brief account of a recent risk assessment study in the province of Alberta We conclude by re-iterating the following:
• Identification of the hazmat incident of concern, and its most undesirable consequence are crucial to risk assessment,
• Accident and release probabilities vary according to the characteristics of the transport network, and the hazmat to be shipped, and
• Consideration should be given to the spatial distribution of population in transporting dangerous goods through large cities.

Vedat Verter 81
Acknowledgment
This research has been partially supported by the Natural Sciences nf Engineering Research Coilllcil of Canada (OGP 183631).
References
Batta, R. and S.S. Chiu (1988), "Optimal Obnoxious Paths on a Network: Transportation of Hazardous Materials," Operations Research, 36, 1, pp. 84-92.
Erkut E. and V. Verter (1995a), "A Framework for Hazardous Materials Transport Risk Assessment," Risk Analysis, 15, 5, pp. 589-60 I.
Erkut E. and V. Verter (1995b), "Hazardous Materials Logistics", in Facility Location: A Survey of Applications and Methods, Z. Drezner (ed.), pp.467-506, Springer-Verlag, New York.
Glickman T.S. and M.A. Sontag (1995), "The Tradeoffs Associated with Rerouting Highway Shipments of Hazardous Materials to Minimize Risk," Risk Analysis, 15, pp. 61-67.
Hundhausen, G. (1996), Accident risk in complementary transport chains, presented at the Workshop on Societal Risk, Transport Safety, and Safety Policy, Utrecht, The Netherlands.
List, G. and P.B. Mirchandani (1991), "An Integrated Network/Planar Multiobjective Model for Routing and Siting of Hazardous Materials and Wastes," Transportation Science, 25, 2, pp. 146-156.
Saccomanno, F., J. Shortreed, M. Aerde, and J. Higgs (1990), Comparison of Risk Measures for the Transport of Dangerous Commodities by Truck and Rail. Transportation Research Record, Vol. 1245, pp. l-13.
Shortreed, J. , D. Belluz, F. Saccomanno, S. Nassar, L. Craig and G. Paoli (1994), Transportation Risk Assessment for the Alberta Special Waste Management System, Institute for Risk Research, University of Waterloo (Final Report).
U. S. Department of Commerce (1994), Truck Inventory and Use Survey, Bureau of the Census, Washington D.C.

82
Figure 1: The routes used for PCB transport in Alberta
r-----...,...-~ST TfAAIT S
PCB waste transport routes
AL.8ERTA
....._ - ... "9lwars
"' -L.......•.......J
Chapter 8
Vedat Verter 83
Figure 2: The conditional F-N curve for Edmonton (given an evacuation incident)
"'
~ 1.00
= ... "' 0.90 > .. z ; 0.80
-5 .. 0.70 .. ... "' ., ..
0.60 .. :; :s: :l
0.50
= ... "" 0.40 ·c .5 .... 0.30 = G' 5 0.20 = .... ..
.::: 0.10 -; = ~ 0.00
0 0 0 0 0 0 0 0 0 0 0 0 0 0 0 0 0 0 0 0 0 0 0 0 0 0 0 0 0 V) s V) 0 V) 0 V) 0 V) 0 V) 0 V) 0
N N "' "' ""'" ""'" V) V) 'D 'D t-
Number of people evacuated (N)