Embed Size (px)
Citation preview
HAL Id: tel-01356668https://tel.archives-ouvertes.fr/tel-01356668
Submitted on 26 Aug 2016
HAL is a multi-disciplinary open accessarchive for the deposit and dissemination of sci-entific research documents, whether they are pub-lished or not. The documents may come fromteaching and research institutions in France orabroad, or from public or private research centers.
L’archive ouverte pluridisciplinaire HAL, estdestinée au dépôt et à la diffusion de documentsscientifiques de niveau recherche, publiés ou non,émanant des établissements d’enseignement et derecherche français ou étrangers, des laboratoirespublics ou privés.
On-surface coupling reactions on calcium carbonateChiara Venturini
To cite this version:Chiara Venturini. On-surface coupling reactions on calcium carbonate. Other. Université PaulSabatier - Toulouse III, 2015. English. �NNT : 2015TOU30158�. �tel-01356668�
THÈSE
En vue de l'obtention du
DOCTORAT DE L’UNIVERSITÉ DE TOULOUSE
Délivré par l’Université Toulouse III – Paul Sabatier (UT3 Paul Sabatier) Discipline ou spécialité : Chimie moléculaire – CO 046
Présentée et soutenue par
Chiara VENTURINI
Le 25 Novembre 2015
On-surface coupling reactions on calcium carbonate
JURY
Dr. Evelina COLACINO Maître de conférences, Université de Montpellier Rapporteur Dr. Cédric BOISSIERE Chargé de Recherche, UPMC Collège de France Rapporteur Prof. Brigitte CAUSSAT Professeur, ENSIACET Toulouse Examinateur Dr. Hubert MUTIN Directeur de Recherche, ICG Montpellier Examinateur Prof. Marc VERELST Professeur, Université Paul Sabatier (Toulouse) Examinateur Dr. André GOURDON Directeur de Recherche, CEMES-CNRS, Toulouse Directeur de thèse
Ecole doctorale : Sciences de la Matière SDM Unité de recherche : CEMES-CNRS (UPR 8011)
Directeur de Thèse : Dr. André GOURDON

THÈSE
En vue de l'obtention du
DOCTORAT DE L’UNIVERSITÉ DE TOULOUSE
Délivré par l’Université Toulouse III – Paul Sabatier (UT3 Paul Sabatier) Discipline ou spécialité : Chimie moléculaire – CO 046
Présentée et soutenue par
Chiara VENTURINI
Le 25 Novembre 2015
On-surface coupling reactions on calcium carbonate
JURY
Dr. Evelina COLACINO Maître de Conférences, Université de Montpellier Rapporteur Dr. Cédric BOISSIERE Chargé de Recherche, UPMC Collège de France Rapporteur Prof. Brigitte CAUSSAT Professeur, ENSIACET, Toulouse Examinateur Dr. Hubert MUTIN Directeur de Recherche, ICG, Montpellier Examinateur Prof. Marc VERELST Professeur, Université Paul Sabatier, Toulouse Examinateur Dr. André GOURDON Directeur de Recherche, CEMES-CNRS, Toulouse Directeur de thèse
Ecole doctorale : Sciences de la Matière SDM Unité de recherche : CEMES-CNRS (UPR 8011)
Directeur de Thèse : Dr. André GOURDON


I
Acknowledgements
First and foremost I wish to express my sincere appreciation and gratitude to my
supervisor, Dr. André Gourdon, for supporting my study and research during these three
years, for his patience, motivation and knowledge. His guidance helped me in all the time of
research and writing of this thesis. I appreciate his contributions in terms of time, ideas, and
funding to make my Ph.D. experience productive and stimulating. I would also like to thank
the director of the laboratory, Dr. Alain Claverie, for providing me an excellent atmosphere
for doing research.
Besides my supervisor, I am also grateful to my thesis commission: Dr. Evelina
Colacino and Dr. Cédric Boissière for taking the time to deeply evaluate my work and Prof.
Brigitte Caussat, Dr. Hubert Mutin, Prof. Marc Verelst for their encouragement, insightful
comments and scientific discussion.
My sincere thank also goes to Prof. Angelika Kühnle and the entire research group at
the University of Mainz for kindly hosting me during my Ph.D. and especially to Robert
Lindner to reveal me all the secrets of the nc-AFM: vielen Dank!
I would also like to thank the entire group GNS, in particularly the chemists who have
contributed immensely to my personal and professional formation. A particular thank goes to
the other members of the laboratory that helped me during this thesis (especially David
Neumeyer and Dr. Nicolas Ratel-Ramond).
I wish to express my appreciation to all the common services of the University of
Toulouse Paul Sabatier and to the staff of different groups (Dr. Brigitte Guidetti, SPCMIB
and Prof. Catherine Amiens, LCC).
My sincere gratitude goes to my beloved family who always supported my work and
Vincent for his encouragement and help throughout the course of this thesis.
The financial support of ANR ICMADS is gratefully acknowledged.

III
Table of contents
General introduction ......................................................................................................... 1
References ........................................................................................................................... 2
1. Coupling reaction on surface in UHV conditions.............................................................5
1.1 State of art .................................................................................................................. 5
1.2 Coupling reactions on metal surface .......................................................................... 7
1.2.1 Ullmann reaction ................................................................................................... 7
1.2.2 Glaser-Hay reaction ............................................................................................. 11
1.2.3 Polycondensation reaction ................................................................................... 15
1.2.4 Summary of reactions on metal surfaces ............................................................. 17
1.2.5 Example of molecular devices obtained by couplingon metal surface ............... 18
1.3 Coupling reactions on insulating surfaces................................................................ 19
1.3.1 Coupling reaction on NaCl thin film ................................................................... 20
1.3.2 Coupling reaction on TiO2 .................................................................................. 20
1.3.3 Coupling reactions on calcite .............................................................................. 21
1.3.3.1 Photochemical activation on calcite ............................................................... 28
1.4 Limits ....................................................................................................................... 30
1.5 References ................................................................................................................ 31
2. Molecules designed for covalent coupling on calcite in UHV conditions.....................35
2.1 Conception of molecules .......................................................................................... 36
2.2 Molecules for homocoupling of ethynes .................................................................. 37
2.2.1 Introduction and objective ................................................................................... 37
2.2.2 Results and discussion ......................................................................................... 38
2.2.2.1 Retrosynthetic analysis ................................................................................... 38
2.2.2.2 Synthesis ......................................................................................................... 38
2.2.2.3 Deposition on CaCO3 surface ......................................................................... 40
2.2.3 Conclusion ........................................................................................................... 43
2.3 Molecules for photopolymerization ......................................................................... 43
2.3.1 Introduction and objective ................................................................................... 43
2.3.2 Results and discussion ......................................................................................... 45
2.3.2.1 Retrosynthetic analysis ................................................................................... 45
IV
2.3.2.2 Synthesis ......................................................................................................... 45
2.3.2.3 Characterization .............................................................................................. 48
2.3.2.4 Deposition on CaCO3 surface ......................................................................... 49
2.3.3 Conclusion ........................................................................................................... 50
2.4 Molecules for polycondensation .............................................................................. 50
2.4.1 Introduction and objective ................................................................................... 50
2.4.2 Results and discussion ......................................................................................... 55
2.4.2.1 Synthesis ......................................................................................................... 55
2.4.2.2 Characterization .............................................................................................. 58
2.4.3 Conclusion ........................................................................................................... 59
2.5 Molecules for Ullmann Coupling............................................................................. 60
2.5.1 Introduction and objective ................................................................................... 60
2.5.2 Results and discussion ......................................................................................... 60
2.5.2.1 Retrosynthetic analysis ................................................................................... 60
2.5.2.2 Synthesis ......................................................................................................... 61
2.5.2.3 Characterization .............................................................................................. 69
2.5.3 Conclusion ........................................................................................................... 73
2.6 General conclusion ................................................................................................... 73
2.7 References ................................................................................................................ 74
3. Preparation of CaCO3 particles for solid state reaction................................................77
3.1 Calcium carbonate .................................................................................................... 78
3.1.1 Calcium carbonate characteristics and properties ............................................... 78
3.1.2 Calcium carbonate formation .............................................................................. 80
3.1.3 Historical background ......................................................................................... 80
3.1.3.1 Calcium carbonate as construction material ................................................... 81
3.1.4 Modern uses and production ............................................................................... 82
3.2 Preparation methods of CaCO3 particles.................................................................. 83
3.3 Preparation of calcium carbonate microparticles ..................................................... 85
3.3.1 Specific surface for coupling reaction on CaCO3 particles ................................. 86
3.3.1.1 Results and discussion .................................................................................... 86
3.3.2 CaCO3 particles by grinding ................................................................................ 87
3.3.2.1 Results and discussion .................................................................................... 87
3.3.2.2 Conclusion on CaCO3 by grinding ................................................................. 89
3.3.3 CaCO3 particles via spray pyrolysis technique ................................................... 89
3.3.3.1 Results and discussion .................................................................................... 90
3.3.3.2 Conclusion on CaCO3 particles via spray pyrolysis technique .................... 110
V
3.3.4 General conclusion on preparation of CaCO3 particles for solid state reaction 110
3.4 References .............................................................................................................. 110
4. Coupling reaction on CaCO3 particles..........................................................................113
4.1 Reaction on solid surface by mechanochemistry ................................................... 114
4.1.1 Introduction and objective ................................................................................. 114
4.1.2 Experimental ..................................................................................................... 116
4.1.3 Results and discussion ....................................................................................... 119
4.1.4 Conclusions on reaction by mechanochemistry activation ............................... 120
4.2 Coupling reaction on solid surface by thermal activation ...................................... 121
4.2.1 Introduction and objective ................................................................................. 121
4.2.2 Experimental ..................................................................................................... 121
4.2.3 Results and discussion ....................................................................................... 121
4.2.4 Other reactions studied in this work .................................................................. 125
4.2.5 Conclusions on coupling reaction by thermal activation on CaCO3 microparticles.....................................................................................................129
4.3 General conclusion on coupling reactions on solid surface....................................129
4.4 References...............................................................................................................131
General conclusion ........................................................................................................ 133
References ....................................................................................................................... 135
Experimental part ..............................................................................................................137
Experimental part Chapter 2 ............................................................................................ 139
Generalities ...................................................................................................................... 139
Solvents and Reagents ................................................................................................ 139
Chromatographic supports .......................................................................................... 139
Analytical tools and devices ....................................................................................... 139
Synthesis .......................................................................................................................... 140
Experimental techniques .................................................................................................. 150
Experimental part Chapter 3 ............................................................................................ 151
Grinding of commercial calcium carbonate .................................................................... 151
Synthesis of particles via spray pyrolysis ........................................................................ 151
Characterization of calcium carbonate particles .............................................................. 151
Fourier-transform infrared spectroscopy (FTIR) ........................................................ 152
Thermogravimetry and differential thermal analysis (TG/DTA) ............................... 152
VI
X-ray powder diffraction (XRD) ................................................................................ 152
Scanning electron microscopy (SEM) ........................................................................ 152
Adsorption and BET ................................................................................................... 153
Laser granulometry (LG) ............................................................................................ 154
Transmission Electron Microscopy (TEM) ................................................................154
Experimental part Chapter 4 ............................................................................................ 155
Mechanochemistry experiments ...................................................................................... 155
Thermal experiments ....................................................................................................... 155
References ....................................................................................................................... 155
Annex....................................................................................................................................157
X-Ray structure of 3-ethynylbenzoic acid (11) ............................................................... 159
Résumé en français...........................................................................................................161
VII
List of abbreviations
ACC Amorphous Calcium Carbonate (nc)-AFM (non contact)-Atomic Force Microscopy amb. ambient anh. anhydrous approx. approximately aq. aqueous atm. atmosphere ARPES Angle-Resolved Photoemission Spectroscopy BET Brunauer–Emmett–Teller (theory) cal. calculated cat. catalyst conc. concentrated cyclohex. cyclohexane DOX doxorubicin eq. equivalent FFT Fast Fourier Transform FTIR Fourier Transform Infrared Spectroscopy GCC Ground Calcium Carbonate hex. hexane HRMS High Resolution Mass Spectroscopy LG Laser Granulometry MOFs Metal Organic Frameworks MOSFETs Metal-Oxide-Semiconductor Field-Effect Transistors MR Molecular Ratio NMR Nuclear Magnetic Resonance spectroscopy Pc Phthalocyanine PCC Precipitated Calcium Carbonate PDAs Polydiacetylenes PPC Poly Phthalocyanine Recryst. Recrystallization ref. Reference RT Room Temperature (25 °C) SEM Scanning Electron Microscopy SCOFs Surface Covalent Organic Frameworks SP Spray Pyrolysis SSA Specific Surface Area STM Scanning Tunneling Microscopy TBAF Tetra-n-butylammonium fluoride TEM Transmission Electron Microscopy TES Triethylsilane TG/DTA Thermogravimetry/Differential Thermal Analysis TLC Thin Layer Chromatography TMEDA N,N,N’,N’-tetramethylethylenediamine TMSA Trimethylsilylacetylene

VIII
TS Transition State UHV Ultra High Vacuum UV-Vis Ultraviolet-Visible Spectroscopy XPS X-ray Photoelectron Spectroscopy XRD X-Ray Diffraction
General introduction
1
General introduction
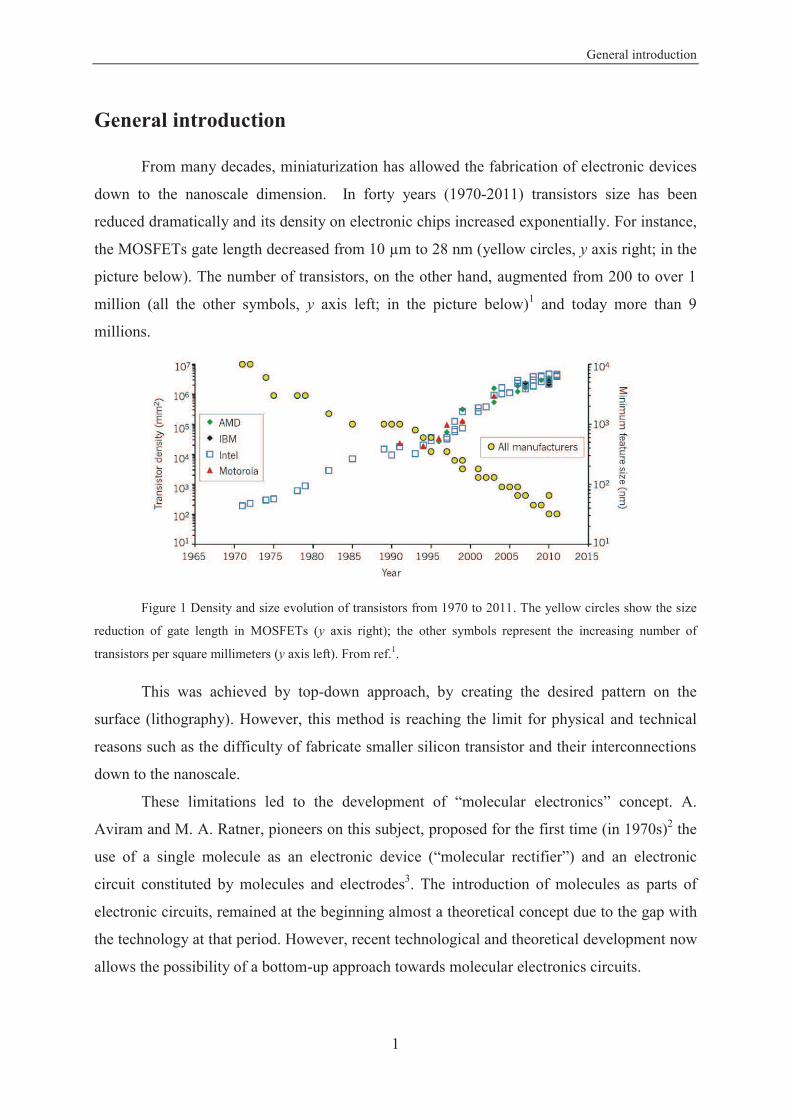
From many decades, miniaturization has allowed the fabrication of electronic devices
down to the nanoscale dimension. In forty years (1970-2011) transistors size has been
reduced dramatically and its density on electronic chips increased exponentially. For instance,
the MOSFETs gate length decreased from 10 m to 28 nm (yellow circles, y axis right; in the
picture below). The number of transistors, on the other hand, augmented from 200 to over 1
million (all the other symbols, y axis left; in the picture below)1 and today more than 9
millions.
Figure 1 Density and size evolution of transistors from 1970 to 2011. The yellow circles show the size
reduction of gate length in MOSFETs (y axis right); the other symbols represent the increasing number of
transistors per square millimeters (y axis left). From ref.1.
This was achieved by top-down approach, by creating the desired pattern on the
surface (lithography). However, this method is reaching the limit for physical and technical
reasons such as the difficulty of fabricate smaller silicon transistor and their interconnections
down to the nanoscale.
These limitations led to the development of “molecular electronics” concept. A.
Aviram and M. A. Ratner, pioneers on this subject, proposed for the first time (in 1970s)2 the
use of a single molecule as an electronic device (“molecular rectifier”) and an electronic
circuit constituted by molecules and electrodes3. The introduction of molecules as parts of
electronic circuits, remained at the beginning almost a theoretical concept due to the gap with
the technology at that period. However, recent technological and theoretical development now
allows the possibility of a bottom-up approach towards molecular electronics circuits.
General introduction
2
In order to obtain complex devices, one recent possibility is to use on-surface
synthesis by bottom-up approach: small precursor molecules are assembled on a very clean
(ideally insulating for electronic devices applications) surface by covalent coupling in order to
obtain complex structure.
Until now, the covalent coupling has been studied mainly on metallic surface, due to
several reasons, such as the technological instrument availability (scanning tunneling
microscope -STM- for instance), the strong van der Waals interaction between the precursor
molecules and metallic surface, and the catalyst role of the metal itself.
The objective of this thesis is inserted in this context: the exploration of the coupling
reactions on insulating surface of calcium carbonate. The first results of coupling (Ullmann
reaction) obtained on CaCO34–6 encouraged the choice of this material.
This work is presented in two parts: the first part is dedicated to the synthesis of
molecules for coupling reaction on insulating surface of CaCO3 in ultra high vacuum (UHV)
conditions. Then, in the second part of this work we extend this investigation to the
macroscale conditions (semi-preparative) by preparing CaCO3 microparticles and
investigating the coupling reaction of smaller molecules anchored on this substrate.
Chapter 1 is devoted to the state-of-art of the coupling reaction on surface in UHV
conditions, from the first results on metallic surface to insulating surfaces.
In chapter 2 we detail the synthesis of molecules for different type of reactions on
insulating surface of CaCO3 in UHV: homocoupling of ethynes, photopolymerization,
polycondensation and Ullmann coupling.
In chapter 3 we describe the preparation and characterization of CaCO3
microparticles via two different approaches: by grinding the commercial product and by spray
pyrolysis.
Finally chapter 4 is dedicated to the synthesis of molecules on CaCO3 microscale
particles.
General conclusions close the manuscript.
References
1. Ferain, I., Colinge, C. A. & Colinge, J.-P. Multigate transistors as the future of classical metal–oxide–semiconductor field-effect transistors. Nature 479, 310–316 (2011).
2. Does molecular electronics compute? Nat. Nanotechnol. 8, 377–377 (2013). 3. Aviram, A. & Ratner, M. A. Molecular rectifiers. Chem. Phys. Lett. 29, 277–283 (1974). 4. Kittelmann, M. et al. On-Surface Covalent Linking of Organic Building Blocks on a Bulk
Insulator. ACS Nano 5, 8420–8425 (2011).

General introduction
3
5. Kittelmann, M., Rahe, P., Gourdon, A. & Kühnle, A. Direct Visualization of Molecule Deprotonation on an Insulating Surface. ACS Nano 6, 7406–7411 (2012).
6. Kittelmann, M., Nimmrich, M., Lindner, R., Gourdon, A. & Kühnle, A. Sequential and Site-Specific On-Surface Synthesis on a Bulk Insulator. ACS Nano 7, 5614–5620 (2013).

Chapter 1: Coupling reactions on surface in UHV conditions
5
1 Coupling reactions on surface in UHV conditions
1.1 State of art ............................................................................................................. 5
1.2 Coupling reactions on metal surface ....................................................................... 7
1.2.1 Ullmann reaction ............................................................................................... 7
1.2.2 Glaser-Hay reaction ......................................................................................... 11
1.2.3 Polycondensation reaction ............................................................................... 15
1.2.4 Summary of reactions on metal surfaces .......................................................... 17
1.2.5 Example of molecular devices obtained by coupling on metal surface ............. 18
1.3 Coupling reactions on insulating surfaces ............................................................. 19
1.3.1 Coupling reaction on NaCl thin film ................................................................ 20
1.3.2 Coupling reaction on TiO2 ............................................................................... 20
1.3.3 Coupling reactions on calcite ........................................................................... 21
1.3.3.1 Photochemical activation on calcite ............................................................ 28
1.4 Limits .................................................................................................................. 30
1.5 References ........................................................................................................... 31
1.1 State of art
Self-assembly of molecules on surfaces in ultra high vacuum (UHV) conditions has
been widely investigated in the recent years. The structures are formed by reversible and weak
interactions (van der Waals, hydrogen bonds for instance). However those structures are
fragile, not stable outside UHV environment and the intermolecular charge transport is
precluded1–3. For this reason, one of the most recent challenges is the construction of devices
by bottom-up approach via covalent linking in UHV conditions.
Chapter 1: Coupling reactions on surface in UHV conditions
6
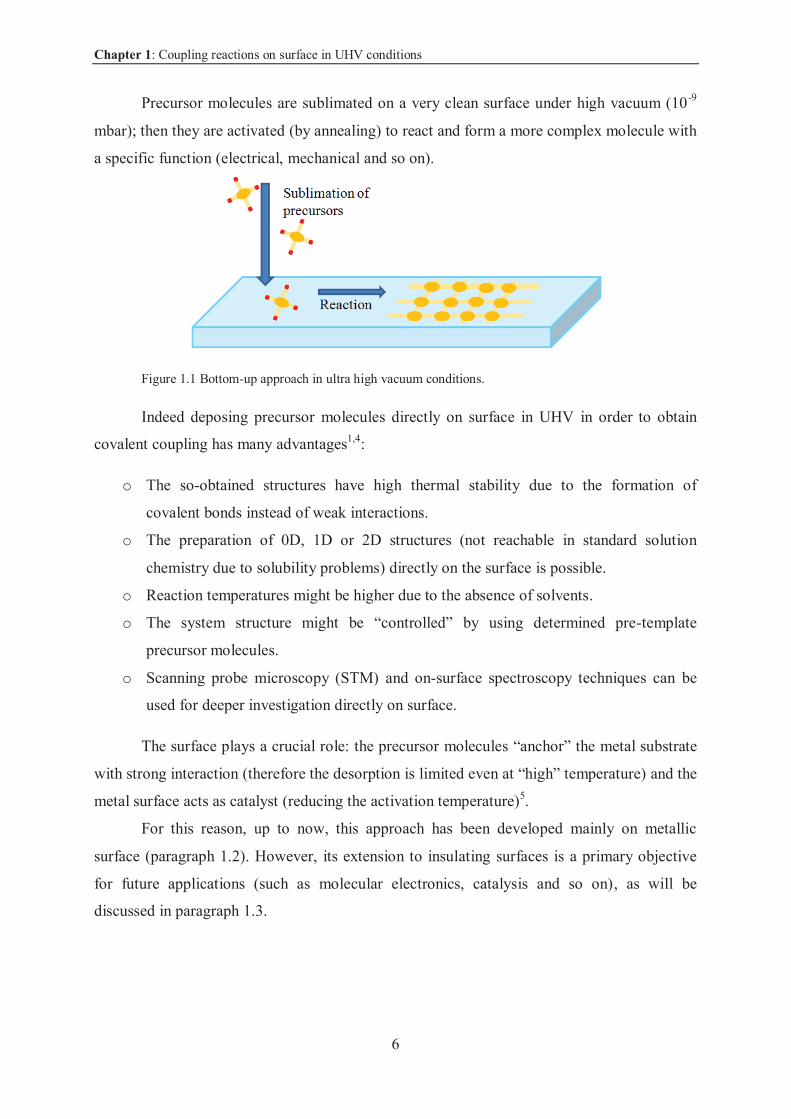
Precursor molecules are sublimated on a very clean surface under high vacuum (10 -9
mbar); then they are activated (by annealing) to react and form a more complex molecule with
a specific function (electrical, mechanical and so on).
Figure 1.1 Bottom-up approach in ultra high vacuum conditions.
Indeed deposing precursor molecules directly on surface in UHV in order to obtain
covalent coupling has many advantages1,4:
o The so-obtained structures have high thermal stability due to the formation of
covalent bonds instead of weak interactions.
o The preparation of 0D, 1D or 2D structures (not reachable in standard solution
chemistry due to solubility problems) directly on the surface is possible.
o Reaction temperatures might be higher due to the absence of solvents.
o The system structure might be “controlled” by using determined pre-template
precursor molecules.
o Scanning probe microscopy (STM) and on-surface spectroscopy techniques can be
used for deeper investigation directly on surface.
The surface plays a crucial role: the precursor molecules “anchor” the metal substrate
with strong interaction (therefore the desorption is limited even at “high” temperature) and the
metal surface acts as catalyst (reducing the activation temperature)5.
For this reason, up to now, this approach has been developed mainly on metallic
surface (paragraph 1.2). However, its extension to insulating surfaces is a primary objective
for future applications (such as molecular electronics, catalysis and so on), as will be
discussed in paragraph 1.3.
Chapter 1: Coupling reactions on surface in UHV conditions
7
1.2 Coupling reactions on metal surface
On-surface synthesis represents a very recent and active field of research. Since the
first studies in 2007 on metal surface, important progress have been done during the last
decades1,4,6. In this paragraph we will briefly recall the milestone papers of on-surface
coupling reaction in UHV on metal surfaces.
1.2.1 Ullmann reaction
One of the first and most studied reactions on metal surface in UHV is the Ullmann
coupling. The reaction is well known since early 20th century and involves the use of Cu
catalyst for the coupling of two aryl halides7.
Figure 1.2 Ullmann reaction.
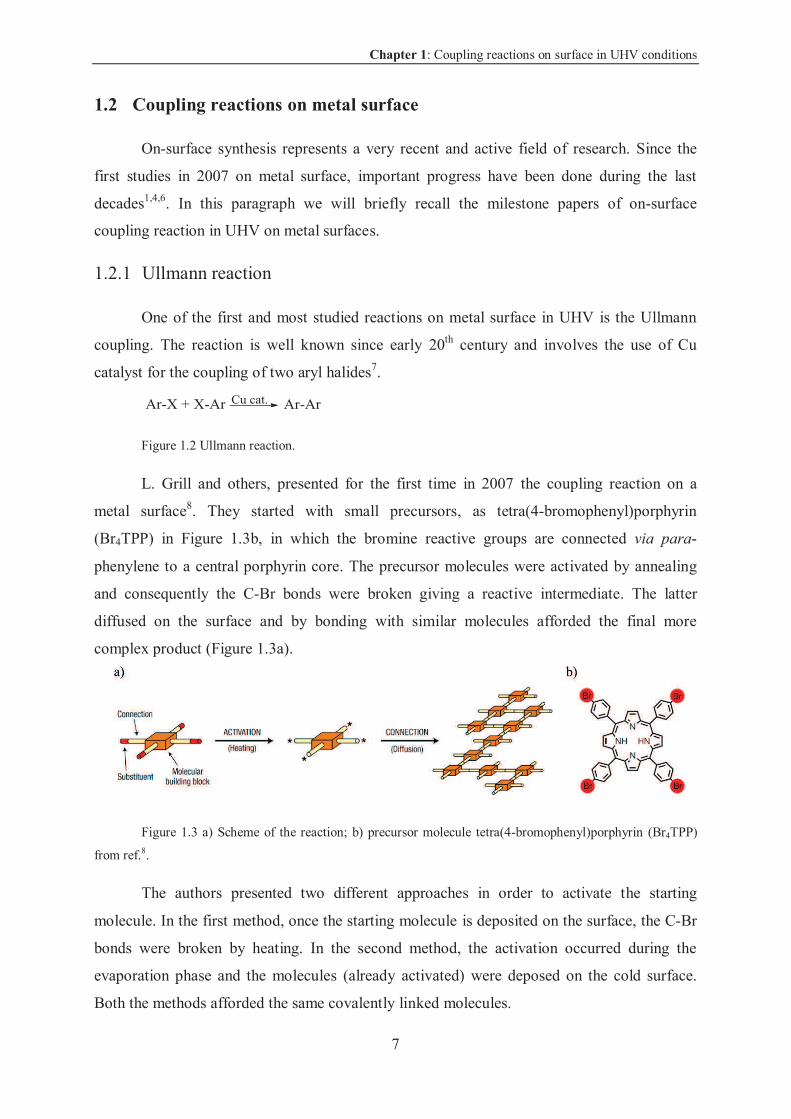
L. Grill and others, presented for the first time in 2007 the coupling reaction on a
metal surface8. They started with small precursors, as tetra(4-bromophenyl)porphyrin
(Br4TPP) in Figure 1.3b, in which the bromine reactive groups are connected via para-
phenylene to a central porphyrin core. The precursor molecules were activated by annealing
and consequently the C-Br bonds were broken giving a reactive intermediate. The latter
diffused on the surface and by bonding with similar molecules afforded the final more
complex product (Figure 1.3a).
Figure 1.3 a) Scheme of the reaction; b) precursor molecule tetra(4-bromophenyl)porphyrin (Br4TPP)
from ref.8.
The authors presented two different approaches in order to activate the starting
molecule. In the first method, once the starting molecule is deposited on the surface, the C-Br
bonds were broken by heating. In the second method, the activation occurred during the
evaporation phase and the molecules (already activated) were deposed on the cold surface.
Both the methods afforded the same covalently linked molecules.
Chapter 1: Coupling reactions on surface in UHV conditions
8
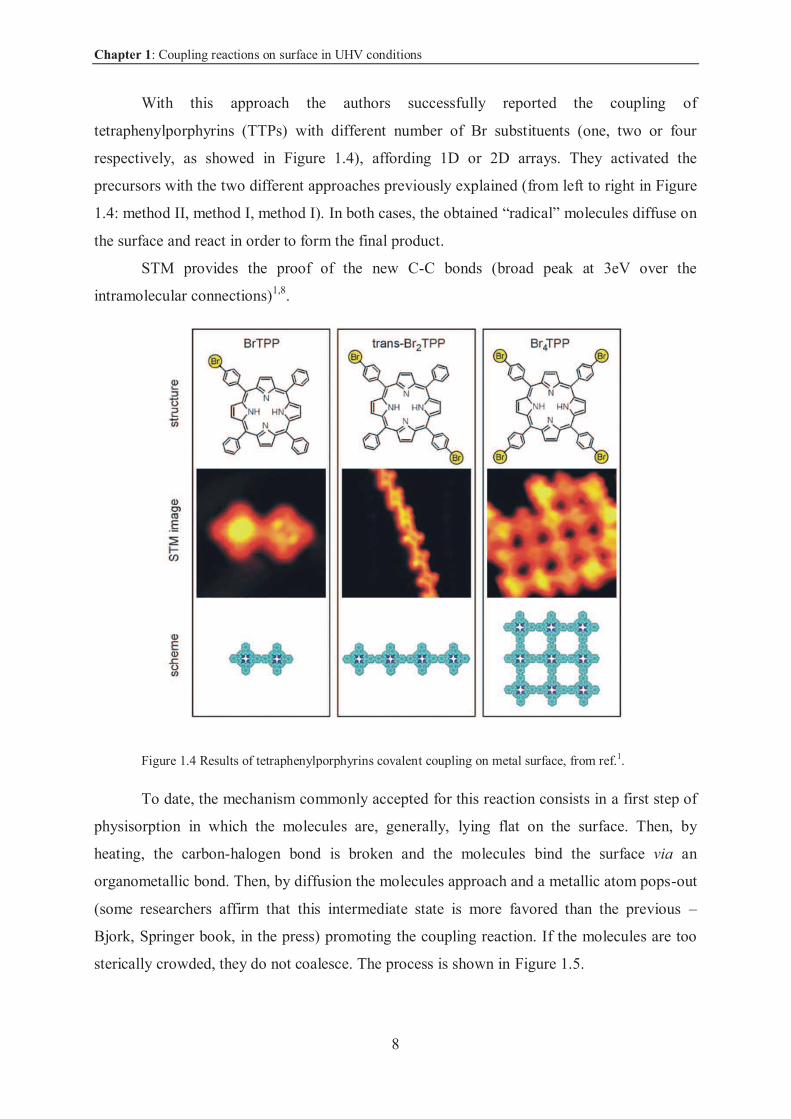
With this approach the authors successfully reported the coupling of
tetraphenylporphyrins (TTPs) with different number of Br substituents (one, two or four
respectively, as showed in Figure 1.4), affording 1D or 2D arrays. They activated the
precursors with the two different approaches previously explained (from left to right in Figure
1.4: method II, method I, method I). In both cases, the obtained “radical” molecules diffuse on
the surface and react in order to form the final product.
STM provides the proof of the new C-C bonds (broad peak at 3eV over the
intramolecular connections)1,8.
Figure 1.4 Results of tetraphenylporphyrins covalent coupling on metal surface, from ref.1.
To date, the mechanism commonly accepted for this reaction consists in a first step of
physisorption in which the molecules are, generally, lying flat on the surface. Then, by
heating, the carbon-halogen bond is broken and the molecules bind the surface via an
organometallic bond. Then, by diffusion the molecules approach and a metallic atom pops-out
(some researchers affirm that this intermediate state is more favored than the previous –
Bjork, Springer book, in the press) promoting the coupling reaction. If the molecules are too
sterically crowded, they do not coalesce. The process is shown in Figure 1.5.
Chapter 1: Coupling reactions on surface in UHV conditions
9
Figure 1.5 On-surface Ullmann coupling proposed mechanism.
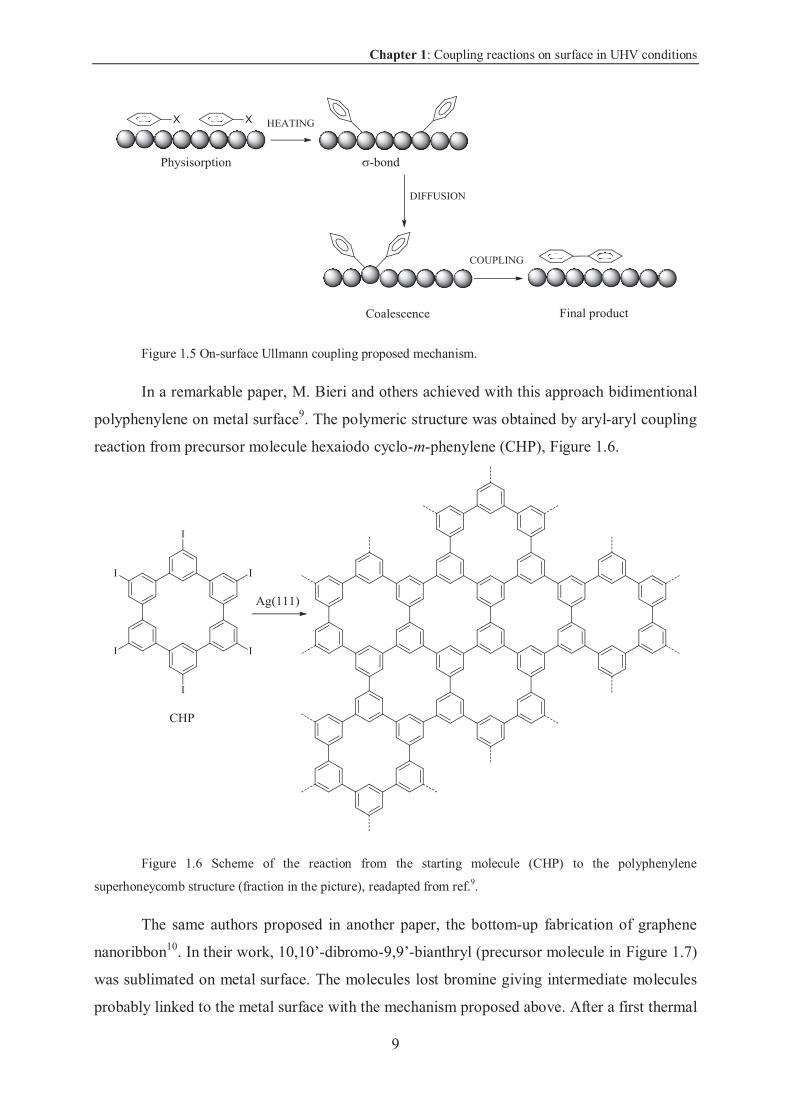
In a remarkable paper, M. Bieri and others achieved with this approach bidimentional
polyphenylene on metal surface9. The polymeric structure was obtained by aryl-aryl coupling
reaction from precursor molecule hexaiodo cyclo-m-phenylene (CHP), Figure 1.6.
Figure 1.6 Scheme of the reaction from the starting molecule (CHP) to the polyphenylene
superhoneycomb structure (fraction in the picture), readapted from ref.9.
The same authors proposed in another paper, the bottom-up fabrication of graphene
nanoribbon10. In their work, 10,10’-dibromo-9,9’-bianthryl (precursor molecule in Figure 1.7)
was sublimated on metal surface. The molecules lost bromine giving intermediate molecules
probably linked to the metal surface with the mechanism proposed above. After a first thermal
Chapter 1: Coupling reactions on surface in UHV conditions
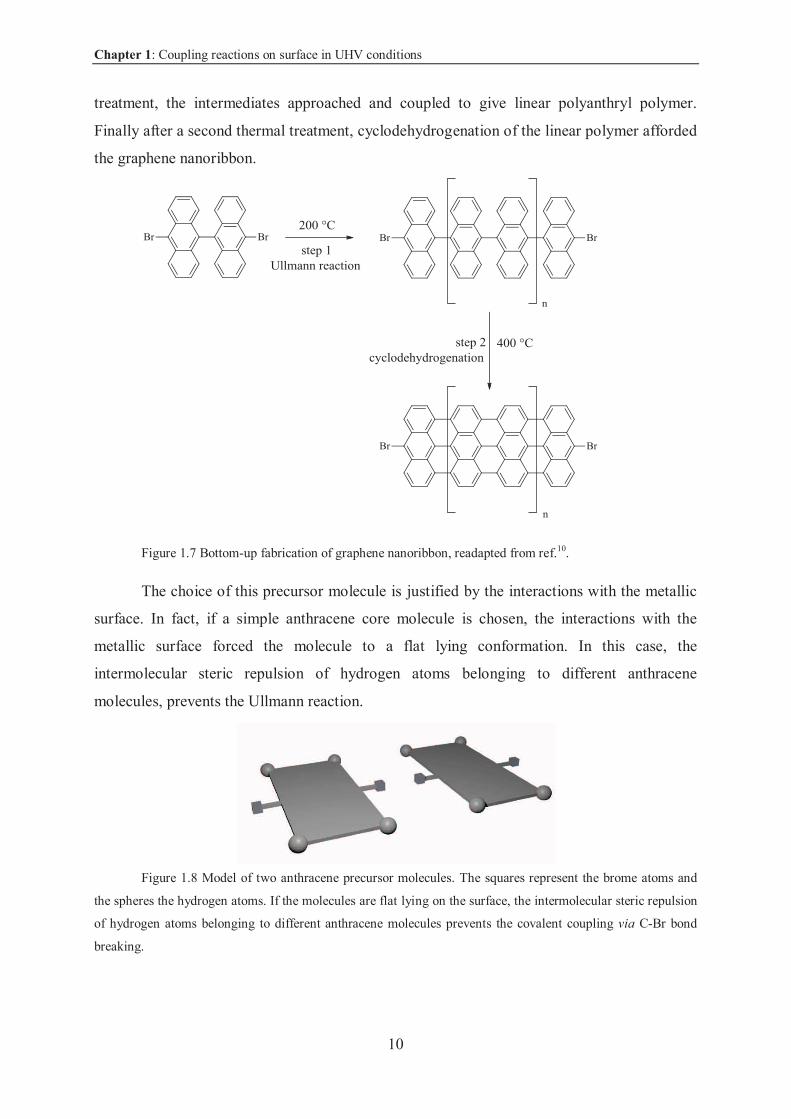
10
treatment, the intermediates approached and coupled to give linear polyanthryl polymer.
Finally after a second thermal treatment, cyclodehydrogenation of the linear polymer afforded
the graphene nanoribbon.
Figure 1.7 Bottom-up fabrication of graphene nanoribbon, readapted from ref.10.
The choice of this precursor molecule is justified by the interactions with the metallic
surface. In fact, if a simple anthracene core molecule is chosen, the interactions with the
metallic surface forced the molecule to a flat lying conformation. In this case, the
intermolecular steric repulsion of hydrogen atoms belonging to different anthracene
molecules, prevents the Ullmann reaction.
Figure 1.8 Model of two anthracene precursor molecules. The squares represent the brome atoms and
the spheres the hydrogen atoms. If the molecules are flat lying on the surface, the intermolecular steric repulsion
of hydrogen atoms belonging to different anthracene molecules prevents the covalent coupling via C-Br bond
breaking.
Chapter 1: Coupling reactions on surface in UHV conditions
11
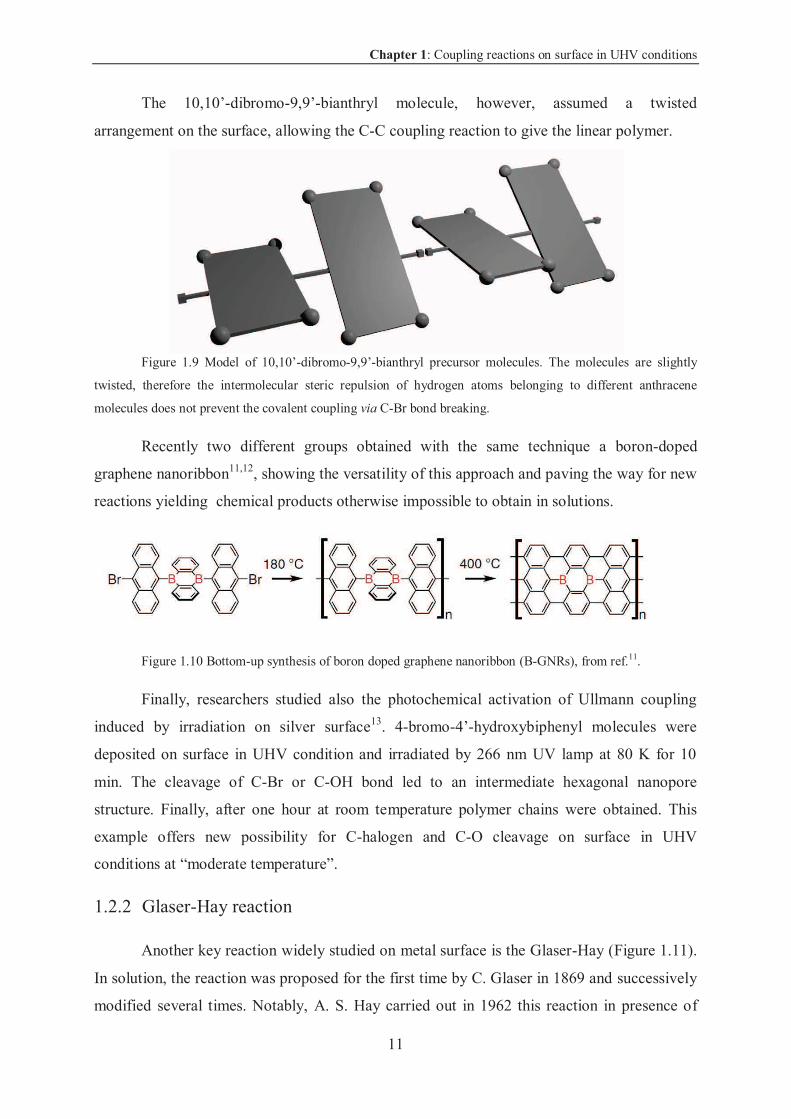
The 10,10’-dibromo-9,9’-bianthryl molecule, however, assumed a twisted
arrangement on the surface, allowing the C-C coupling reaction to give the linear polymer.
Figure 1.9 Model of 10,10’-dibromo-9,9’-bianthryl precursor molecules. The molecules are slightly
twisted, therefore the intermolecular steric repulsion of hydrogen atoms belonging to different anthracene
molecules does not prevent the covalent coupling via C-Br bond breaking.
Recently two different groups obtained with the same technique a boron-doped
graphene nanoribbon11,12, showing the versatility of this approach and paving the way for new
reactions yielding chemical products otherwise impossible to obtain in solutions.
Figure 1.10 Bottom-up synthesis of boron doped graphene nanoribbon (B-GNRs), from ref.11.
Finally, researchers studied also the photochemical activation of Ullmann coupling
induced by irradiation on silver surface13. 4-bromo-4’-hydroxybiphenyl molecules were
deposited on surface in UHV condition and irradiated by 266 nm UV lamp at 80 K for 10
min. The cleavage of C-Br or C-OH bond led to an intermediate hexagonal nanopore
structure. Finally, after one hour at room temperature polymer chains were obtained. This
example offers new possibility for C-halogen and C-O cleavage on surface in UHV
conditions at “moderate temperature”.
1.2.2 Glaser-Hay reaction
Another key reaction widely studied on metal surface is the Glaser-Hay (Figure 1.11).
In solution, the reaction was proposed for the first time by C. Glaser in 1869 and successively
modified several times. Notably, A. S. Hay carried out in 1962 this reaction in presence of
Chapter 1: Coupling reactions on surface in UHV conditions
12
catalytic amount of bidentate ligand N,N,N’,N’-tetramethylethylenediamine (TMEDA) (that
increases the solubility of the reactive species), copper (I) chloride in presence of oxygen14–16.
Figure 1.11 Glaser-Hay reaction.
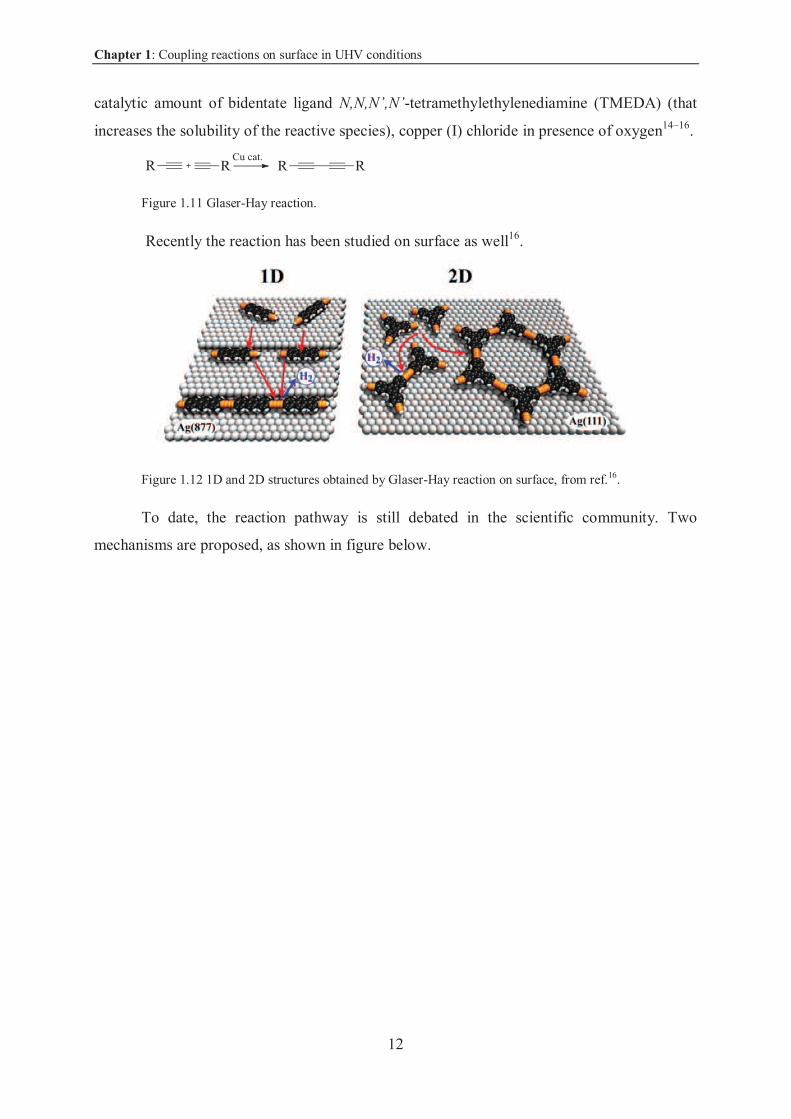
Recently the reaction has been studied on surface as well16.
Figure 1.12 1D and 2D structures obtained by Glaser-Hay reaction on surface, from ref.16.
To date, the reaction pathway is still debated in the scientific community. Two
mechanisms are proposed, as shown in figure below.
Chapter 1: Coupling reactions on surface in UHV conditions
13
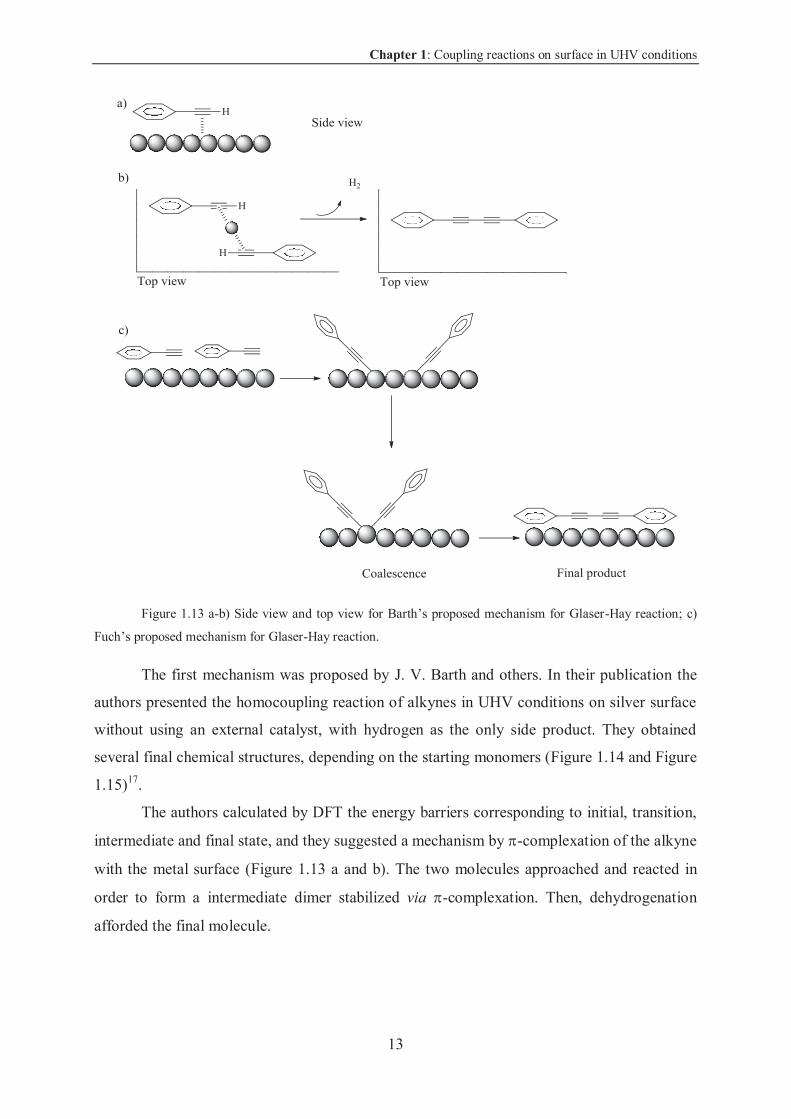
Figure 1.13 a-b) Side view and top view for Barth’s proposed mechanism for Glaser-Hay reaction; c)
Fuch’s proposed mechanism for Glaser-Hay reaction.
The first mechanism was proposed by J. V. Barth and others. In their publication the
authors presented the homocoupling reaction of alkynes in UHV conditions on silver surface
without using an external catalyst, with hydrogen as the only side product. They obtained
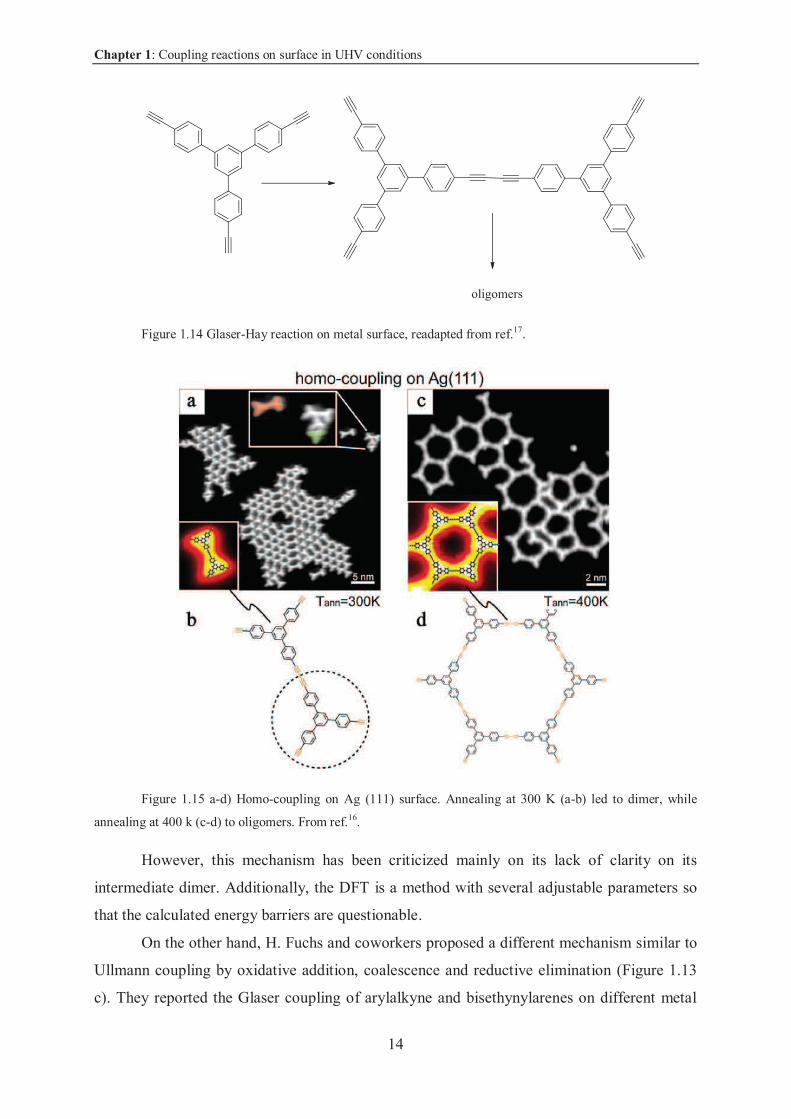
several final chemical structures, depending on the starting monomers (Figure 1.14 and Figure
1.15)17.
The authors calculated by DFT the energy barriers corresponding to initial, transition,
intermediate and final state, and they suggested a mechanism by -complexation of the alkyne
with the metal surface (Figure 1.13 a and b). The two molecules approached and reacted in
order to form a intermediate dimer stabilized via -complexation. Then, dehydrogenation
afforded the final molecule.
Chapter 1: Coupling reactions on surface in UHV conditions
14
Figure 1.14 Glaser-Hay reaction on metal surface, readapted from ref.17.
Figure 1.15 a-d) Homo-coupling on Ag (111) surface. Annealing at 300 K (a-b) led to dimer, while
annealing at 400 k (c-d) to oligomers. From ref.16.
However, this mechanism has been criticized mainly on its lack of clarity on its
intermediate dimer. Additionally, the DFT is a method with several adjustable parameters so
that the calculated energy barriers are questionable.
On the other hand, H. Fuchs and coworkers proposed a different mechanism similar to
Ullmann coupling by oxidative addition, coalescence and reductive elimination (Figure 1.13
c). They reported the Glaser coupling of arylalkyne and bisethynylarenes on different metal
Chapter 1: Coupling reactions on surface in UHV conditions
15
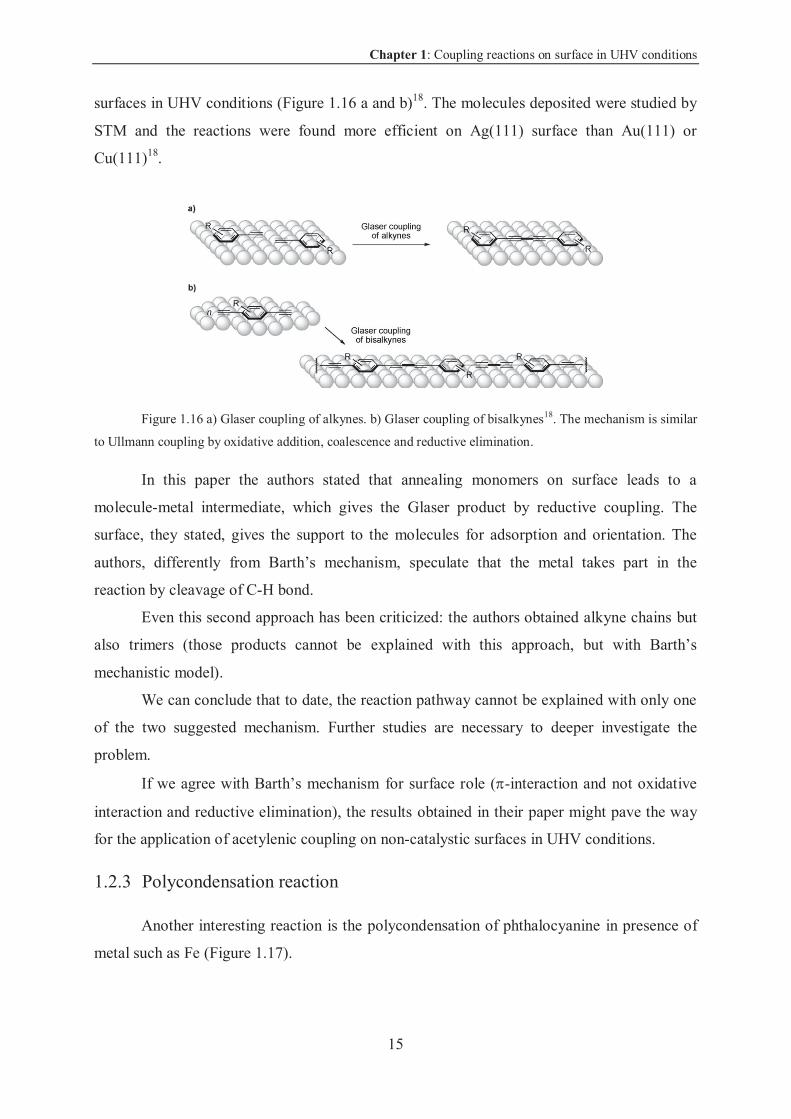
surfaces in UHV conditions (Figure 1.16 a and b)18. The molecules deposited were studied by
STM and the reactions were found more efficient on Ag(111) surface than Au(111) or
Cu(111)18.
Figure 1.16 a) Glaser coupling of alkynes. b) Glaser coupling of bisalkynes18. The mechanism is similar
to Ullmann coupling by oxidative addition, coalescence and reductive elimination.
In this paper the authors stated that annealing monomers on surface leads to a
molecule-metal intermediate, which gives the Glaser product by reductive coupling. The
surface, they stated, gives the support to the molecules for adsorption and orientation. The
authors, differently from Barth’s mechanism, speculate that the metal takes part in the
reaction by cleavage of C-H bond.
Even this second approach has been criticized: the authors obtained alkyne chains but
also trimers (those products cannot be explained with this approach, but with Barth’s
mechanistic model).
We can conclude that to date, the reaction pathway cannot be explained with only one
of the two suggested mechanism. Further studies are necessary to deeper investigate the
problem.
If we agree with Barth’s mechanism for surface role ( -interaction and not oxidative
interaction and reductive elimination), the results obtained in their paper might pave the way
for the application of acetylenic coupling on non-catalystic surfaces in UHV conditions.
1.2.3 Polycondensation reaction
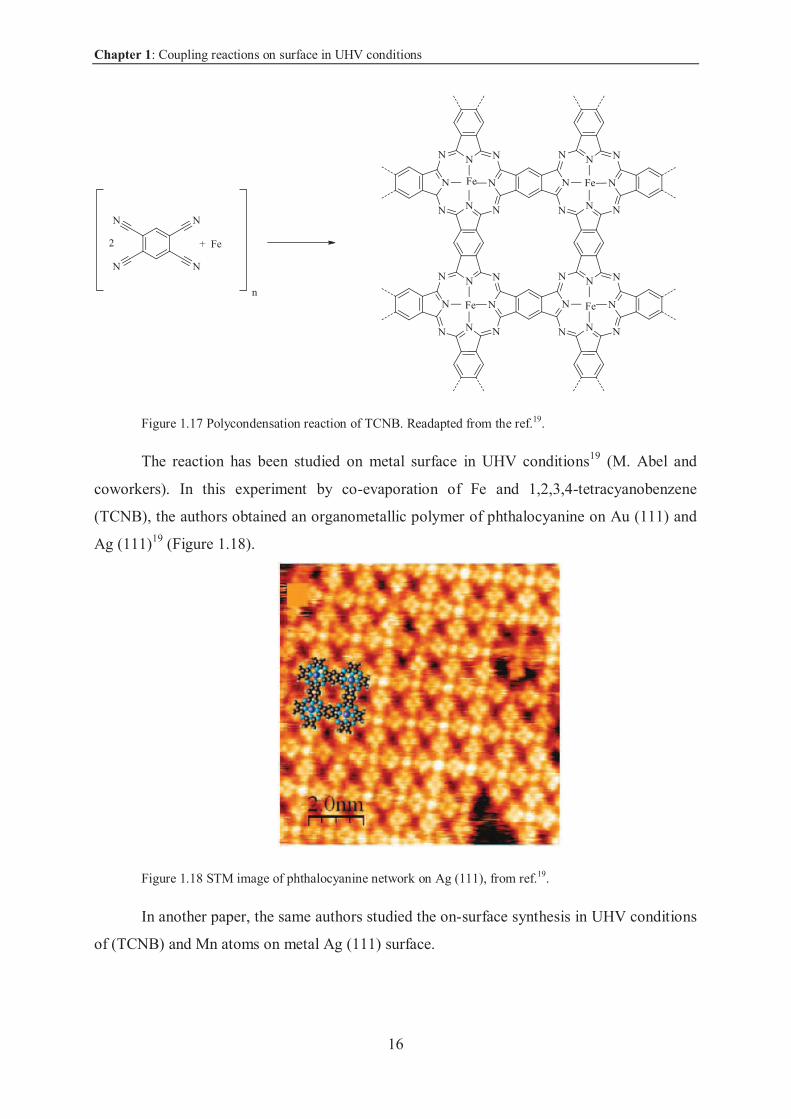
Another interesting reaction is the polycondensation of phthalocyanine in presence of
metal such as Fe (Figure 1.17).
Chapter 1: Coupling reactions on surface in UHV conditions
16
Figure 1.17 Polycondensation reaction of TCNB. Readapted from the ref.19.
The reaction has been studied on metal surface in UHV conditions19 (M. Abel and
coworkers). In this experiment by co-evaporation of Fe and 1,2,3,4-tetracyanobenzene
(TCNB), the authors obtained an organometallic polymer of phthalocyanine on Au (111) and
Ag (111)19 (Figure 1.18).
Figure 1.18 STM image of phthalocyanine network on Ag (111), from ref.19.
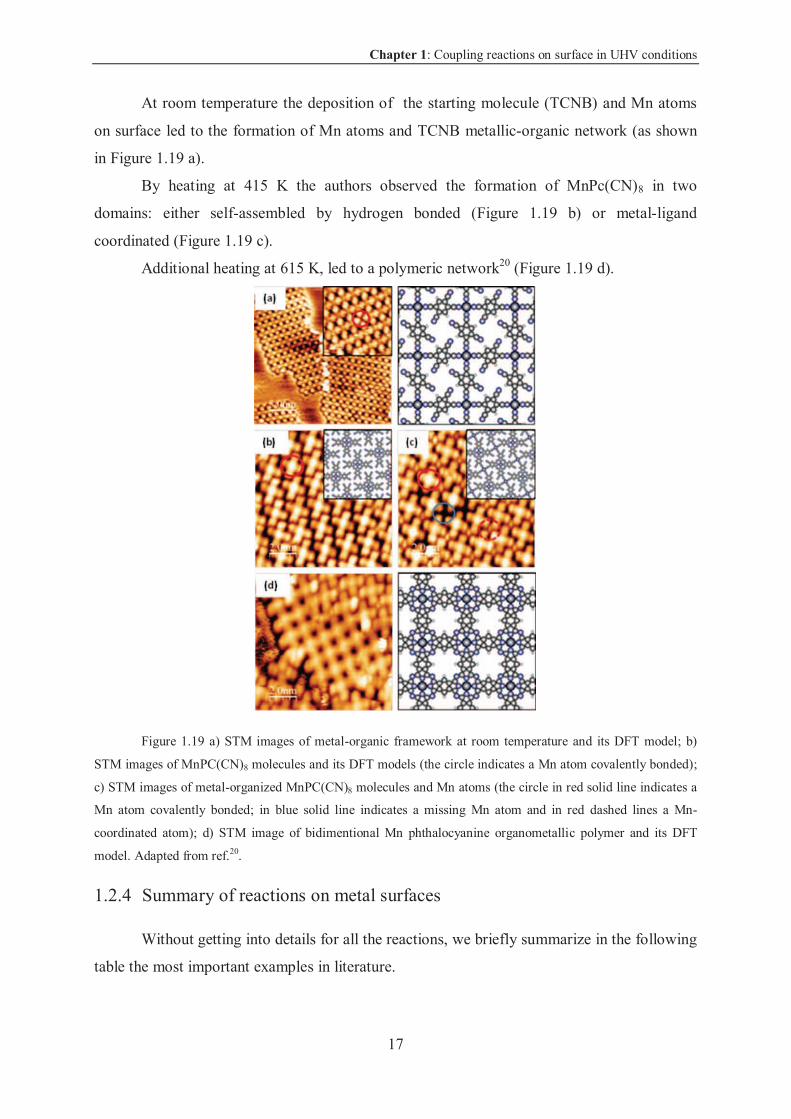
In another paper, the same authors studied the on-surface synthesis in UHV conditions
of (TCNB) and Mn atoms on metal Ag (111) surface.
Chapter 1: Coupling reactions on surface in UHV conditions
17
At room temperature the deposition of the starting molecule (TCNB) and Mn atoms
on surface led to the formation of Mn atoms and TCNB metallic-organic network (as shown
in Figure 1.19 a).
By heating at 415 K the authors observed the formation of MnPc(CN)8 in two
domains: either self-assembled by hydrogen bonded (Figure 1.19 b) or metal-ligand
coordinated (Figure 1.19 c).
Additional heating at 615 K, led to a polymeric network20 (Figure 1.19 d).
Figure 1.19 a) STM images of metal-organic framework at room temperature and its DFT model; b)
STM images of MnPC(CN)8 molecules and its DFT models (the circle indicates a Mn atom covalently bonded);
c) STM images of metal-organized MnPC(CN)8 molecules and Mn atoms (the circle in red solid line indicates a
Mn atom covalently bonded; in blue solid line indicates a missing Mn atom and in red dashed lines a Mn-
coordinated atom); d) STM image of bidimentional Mn phthalocyanine organometallic polymer and its DFT
model. Adapted from ref.20.
1.2.4 Summary of reactions on metal surfaces
Without getting into details for all the reactions, we briefly summarize in the following
table the most important examples in literature.
Chapter 1: Coupling reactions on surface in UHV conditions
18
Reaction name Substrate
Ullmann coupling Cu21, Ag22, Au8 and others
Glaser coupling Cu23, Ag17, Au18
Bergman cyclization Cu24, Ag25
Huisgen cycloaddition Cu26, Au27
Scholl reaction Cu28, Au10, Pt29, Ru30 and others
Ring-opening
polymerization
Cu31
Condensation reaction Cu32, Ag33, Au34
[2+2+2] cycloaddition Au35
[2+2] cycloaddition Au36
Table 1.1 Selection of on-surface reactions in UHV conditions, readapted from ref.6.
1.2.5 Example of molecular devices obtained by coupling on metal surface
The synthesis on metal surface in UHV allows carrying out experiments in ultra-clean
conditions on single molecule impossible to synthesize in solution. For instance L. Grill, C.
Joachim and others measured for the first time the conductance of a single molecule in
function of its length (2009)37.
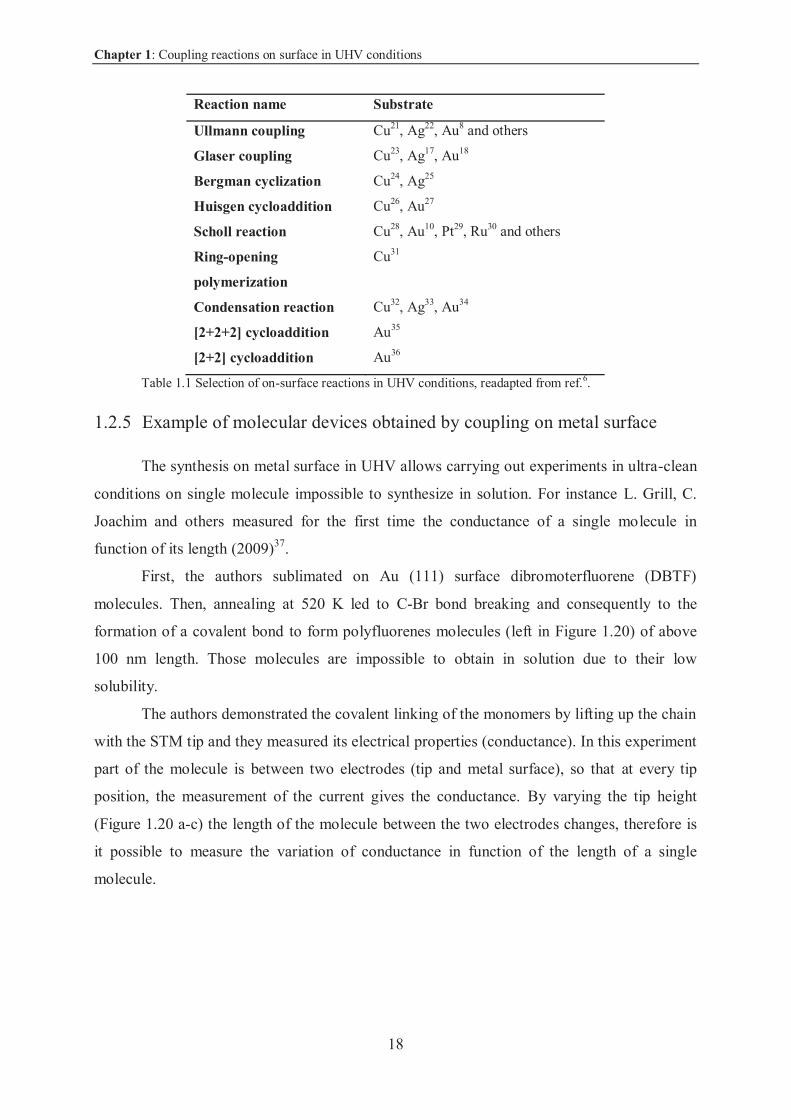
First, the authors sublimated on Au (111) surface dibromoterfluorene (DBTF)
molecules. Then, annealing at 520 K led to C-Br bond breaking and consequently to the
formation of a covalent bond to form polyfluorenes molecules (left in Figure 1.20) of above
100 nm length. Those molecules are impossible to obtain in solution due to their low
solubility.
The authors demonstrated the covalent linking of the monomers by lifting up the chain
with the STM tip and they measured its electrical properties (conductance). In this experiment
part of the molecule is between two electrodes (tip and metal surface), so that at every tip
position, the measurement of the current gives the conductance. By varying the tip height
(Figure 1.20 a-c) the length of the molecule between the two electrodes changes, therefore is
it possible to measure the variation of conductance in function of the length of a single
molecule.
Chapter 1: Coupling reactions on surface in UHV conditions
19
Figure 1.20 Left: synthesis of polyconjugated molecule on Au(111) surface; a-c) scheme of the lifting
by STM tip and conductance measured (d). From ref.4.
1.3 Coupling reactions on insulating surfaces
In this paragraph we present the recent state-of-art of coupling reactions focused on
insulating substrates. Up to now, coupling reactions on insulating surfaces remains less
investigated field. The main problem, in this case, is the weak molecule/surface interaction:
the molecules tent to desorb easily or to form 3D clusters. Additionally the surfaces do not
take part to the reaction (as catalyst) as the metal surfaces.
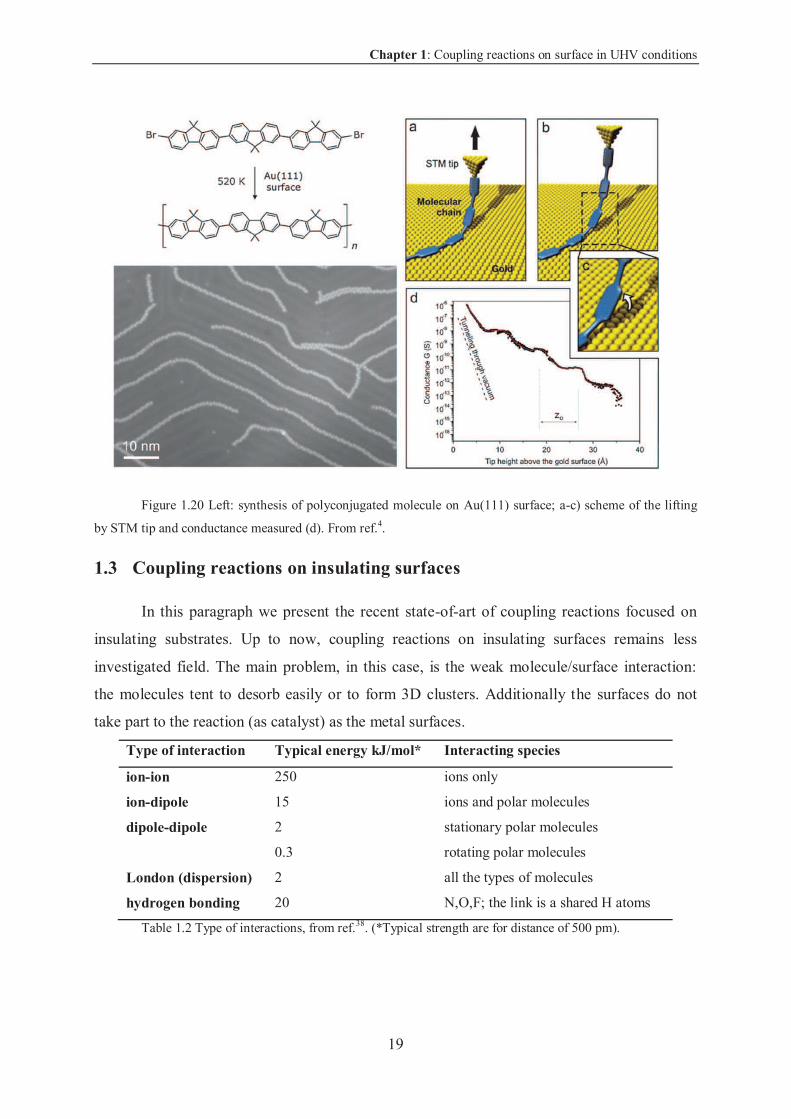
Type of interaction Typical energy kJ/mol* Interacting species
ion-ion 250 ions only
ion-dipole 15 ions and polar molecules
dipole-dipole 2 stationary polar molecules
0.3 rotating polar molecules
London (dispersion) 2 all the types of molecules
hydrogen bonding 20 N,O,F; the link is a shared H atoms
Table 1.2 Type of interactions, from ref.38. (*Typical strength are for distance of 500 pm).
Chapter 1: Coupling reactions on surface in UHV conditions
20
1.3.1 Coupling reaction on NaCl thin film
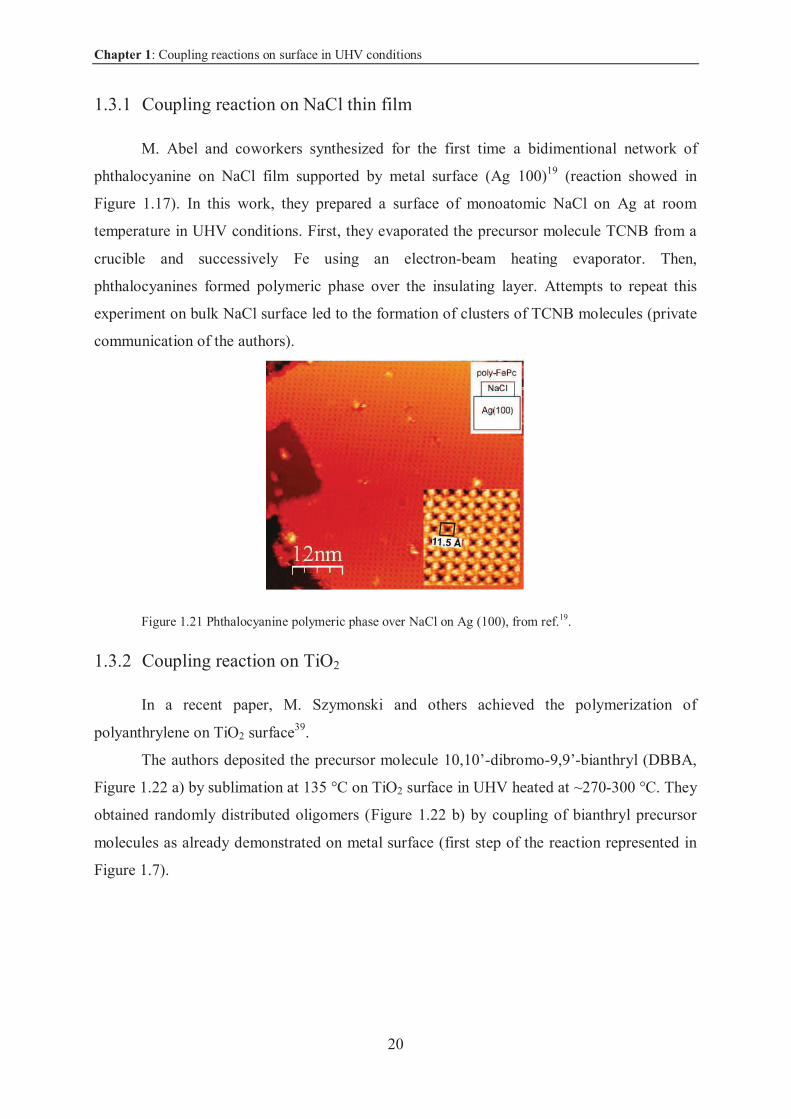
M. Abel and coworkers synthesized for the first time a bidimentional network of
phthalocyanine on NaCl film supported by metal surface (Ag 100)19 (reaction showed in
Figure 1.17). In this work, they prepared a surface of monoatomic NaCl on Ag at room
temperature in UHV conditions. First, they evaporated the precursor molecule TCNB from a
crucible and successively Fe using an electron-beam heating evaporator. Then,
phthalocyanines formed polymeric phase over the insulating layer. Attempts to repeat this
experiment on bulk NaCl surface led to the formation of clusters of TCNB molecules (private
communication of the authors).
Figure 1.21 Phthalocyanine polymeric phase over NaCl on Ag (100), from ref.19.
1.3.2 Coupling reaction on TiO2
In a recent paper, M. Szymonski and others achieved the polymerization of
polyanthrylene on TiO2 surface39.
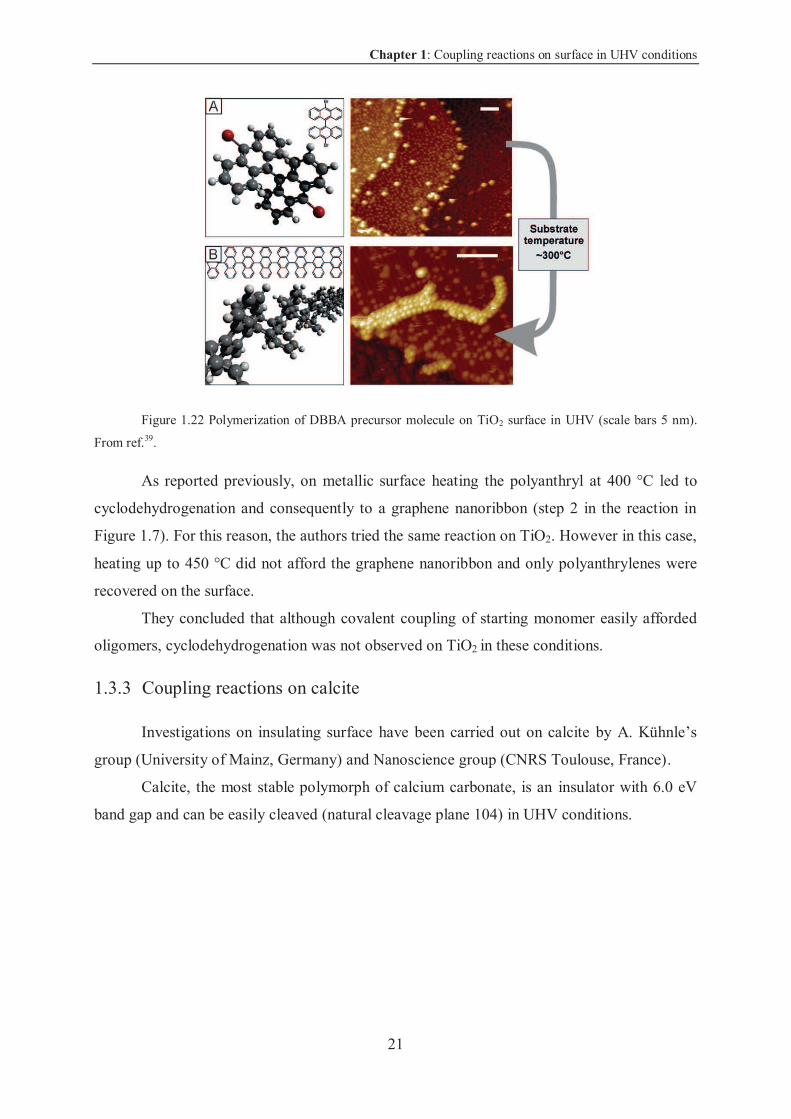
The authors deposited the precursor molecule 10,10’-dibromo-9,9’-bianthryl (DBBA,
Figure 1.22 a) by sublimation at 135 °C on TiO2 surface in UHV heated at ~270-300 °C. They
obtained randomly distributed oligomers (Figure 1.22 b) by coupling of bianthryl precursor
molecules as already demonstrated on metal surface (first step of the reaction represented in
Figure 1.7).
Chapter 1: Coupling reactions on surface in UHV conditions
21
Figure 1.22 Polymerization of DBBA precursor molecule on TiO2 surface in UHV (scale bars 5 nm).
From ref.39.
As reported previously, on metallic surface heating the polyanthryl at 400 °C led to
cyclodehydrogenation and consequently to a graphene nanoribbon (step 2 in the reaction in
Figure 1.7). For this reason, the authors tried the same reaction on TiO2. However in this case,
heating up to 450 °C did not afford the graphene nanoribbon and only polyanthrylenes were
recovered on the surface.
They concluded that although covalent coupling of starting monomer easily afforded
oligomers, cyclodehydrogenation was not observed on TiO2 in these conditions.
1.3.3 Coupling reactions on calcite
Investigations on insulating surface have been carried out on calcite by A. Kühnle’s
group (University of Mainz, Germany) and Nanoscience group (CNRS Toulouse, France).
Calcite, the most stable polymorph of calcium carbonate, is an insulator with 6.0 eV
band gap and can be easily cleaved (natural cleavage plane 104) in UHV conditions.
Chapter 1: Coupling reactions on surface in UHV conditions
22
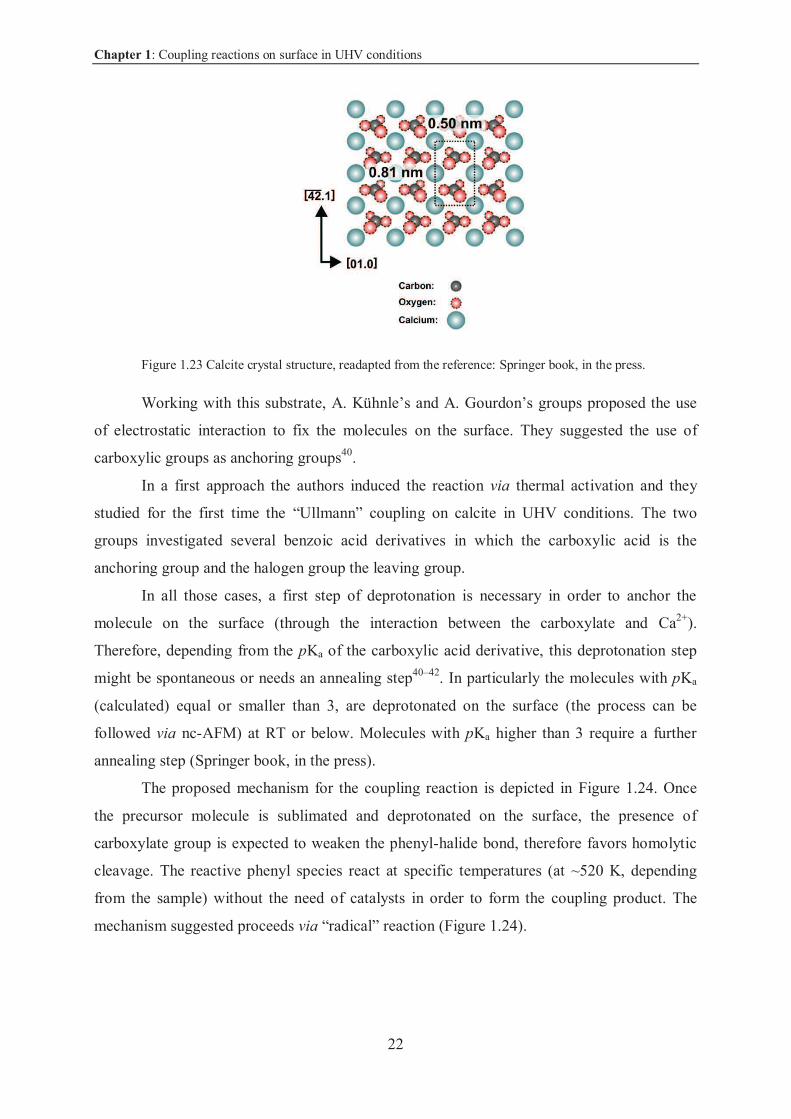
Figure 1.23 Calcite crystal structure, readapted from the reference: Springer book, in the press.
Working with this substrate, A. Kühnle’s and A. Gourdon’s groups proposed the use
of electrostatic interaction to fix the molecules on the surface. They suggested the use of
carboxylic groups as anchoring groups40.
In a first approach the authors induced the reaction via thermal activation and they
studied for the first time the “Ullmann” coupling on calcite in UHV conditions. The two
groups investigated several benzoic acid derivatives in which the carboxylic acid is the
anchoring group and the halogen group the leaving group.
In all those cases, a first step of deprotonation is necessary in order to anchor the
molecule on the surface (through the interaction between the carboxylate and Ca2+).
Therefore, depending from the pKa of the carboxylic acid derivative, this deprotonation step
might be spontaneous or needs an annealing step40–42. In particularly the molecules with pKa
(calculated) equal or smaller than 3, are deprotonated on the surface (the process can be
followed via nc-AFM) at RT or below. Molecules with pKa higher than 3 require a further
annealing step (Springer book, in the press).
The proposed mechanism for the coupling reaction is depicted in Figure 1.24. Once
the precursor molecule is sublimated and deprotonated on the surface, the presence of
carboxylate group is expected to weaken the phenyl-halide bond, therefore favors homolytic
cleavage. The reactive phenyl species react at specific temperatures (at ~520 K, depending
from the sample) without the need of catalysts in order to form the coupling product. The
mechanism suggested proceeds via “radical” reaction (Figure 1.24).
Chapter 1: Coupling reactions on surface in UHV conditions
23
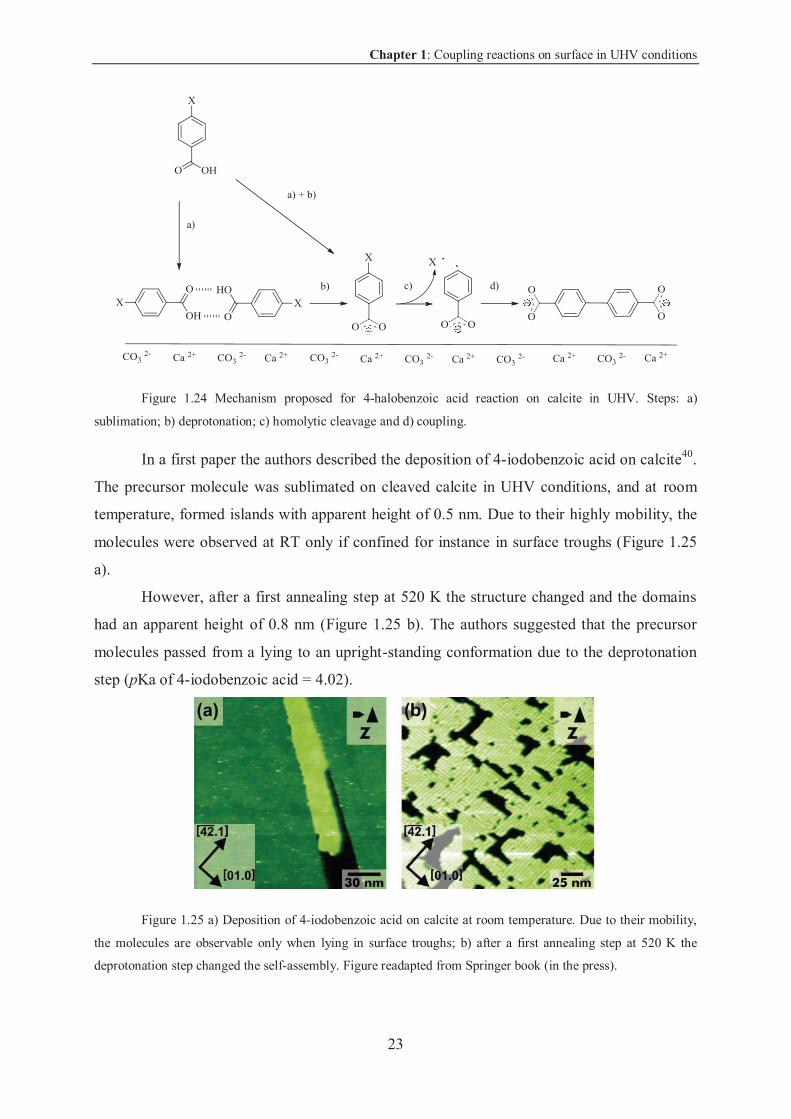
Figure 1.24 Mechanism proposed for 4-halobenzoic acid reaction on calcite in UHV. Steps: a)
sublimation; b) deprotonation; c) homolytic cleavage and d) coupling.
In a first paper the authors described the deposition of 4-iodobenzoic acid on calcite40.
The precursor molecule was sublimated on cleaved calcite in UHV conditions, and at room
temperature, formed islands with apparent height of 0.5 nm. Due to their highly mobility, the
molecules were observed at RT only if confined for instance in surface troughs (Figure 1.25
a).
However, after a first annealing step at 520 K the structure changed and the domains
had an apparent height of 0.8 nm (Figure 1.25 b). The authors suggested that the precursor
molecules passed from a lying to an upright-standing conformation due to the deprotonation
step (pKa of 4-iodobenzoic acid = 4.02).
Figure 1.25 a) Deposition of 4-iodobenzoic acid on calcite at room temperature. Due to their mobility,
the molecules are observable only when lying in surface troughs; b) after a first annealing step at 520 K the
deprotonation step changed the self-assembly. Figure readapted from Springer book (in the press).
Chapter 1: Coupling reactions on surface in UHV conditions
24
A second annealing step at 580 K revealed a different structure (rows) with apparent
high of 0.4 nm (Figure 1.26). The authors suggested that the second annealing afforded 4,4’-
biphenyldicarboxylic acid molecules on calcite.
This assignment was confirmed by the deposition of the dimer (biphenyl-4,4’-
dicarboxylic acid) directly on the surface40. The latter, once deposited, resulted in two
structures: side-by-side (same result obtained by the reaction of 4-iodobenzoic acid) and head-
to-tail type. In fact when biphenyl-4,4’-dicarboxylic acid is sublimated on the surface is not
deprotonated as 4-iodobenzoic, therefore it could form either hydrogen-bonded (head-to-tail)
or side-by-side structures Springer book (in the press).
Figure 1.26 a-b) 4,4’-biphenyldicarboxylic acid after annealing at 580 K (nc-AFM image and model).
Readapted from ref.40.
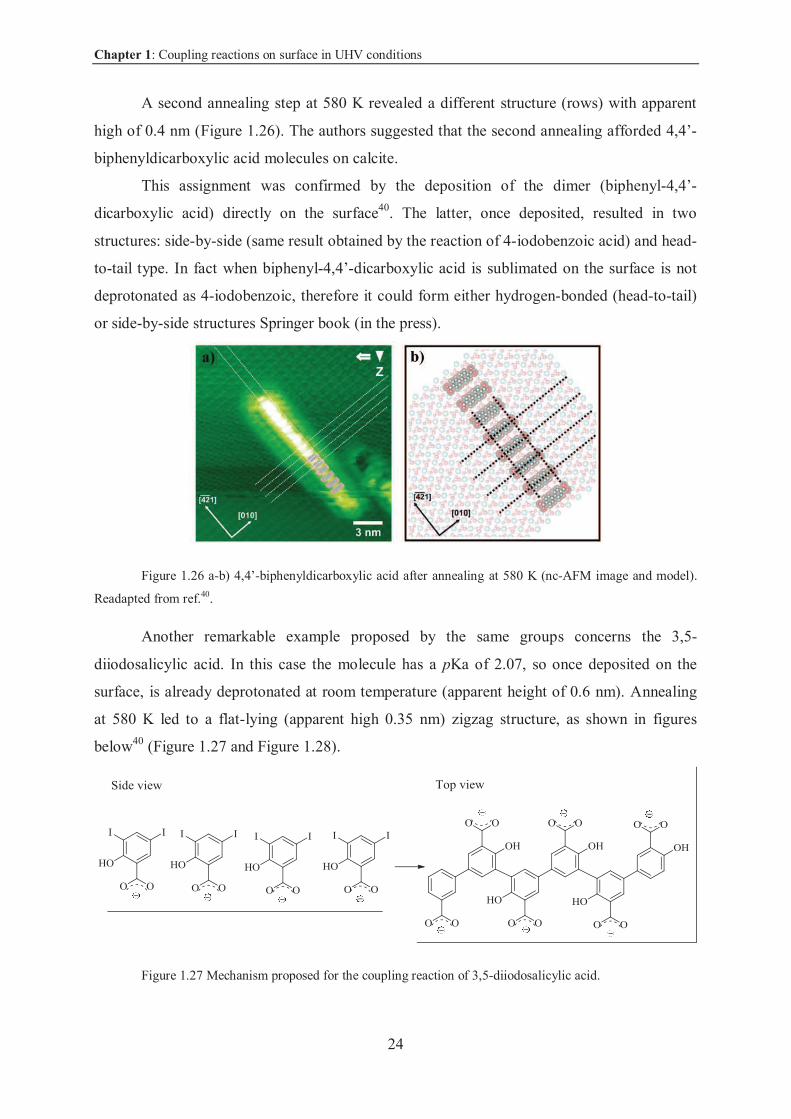
Another remarkable example proposed by the same groups concerns the 3,5-
diiodosalicylic acid. In this case the molecule has a pKa of 2.07, so once deposited on the
surface, is already deprotonated at room temperature (apparent height of 0.6 nm). Annealing
at 580 K led to a flat-lying (apparent high 0.35 nm) zigzag structure, as shown in figures
below40 (Figure 1.27 and Figure 1.28).
Figure 1.27 Mechanism proposed for the coupling reaction of 3,5-diiodosalicylic acid.
Chapter 1: Coupling reactions on surface in UHV conditions
25
Figure 1.28 a) Zigzag structure due to the covalent coupling of 3,5-diiodosalicylic acid after annealing
at 580 K; b) model of different observed structures obtained from this molecule, readapted from ref.40.
From those examples we deduce that the shape of the final coupling product could be
controlled by varying the position of the reactive halide groups6.
Depending of the phenyl-halide bond strength, the cleavage temperature expected to
increase in the order iodine, bromine, chlorine (bond energies: 268, 336 and 399 kJ/mol
respectively).
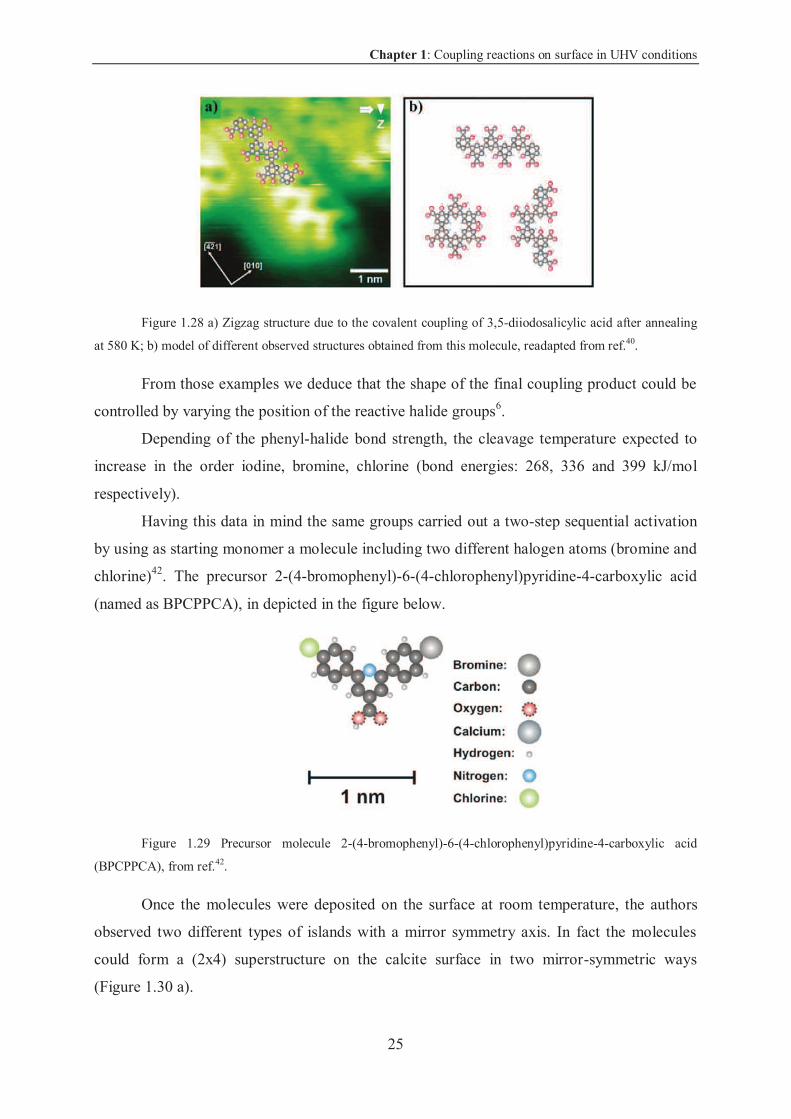
Having this data in mind the same groups carried out a two-step sequential activation
by using as starting monomer a molecule including two different halogen atoms (bromine and
chlorine)42. The precursor 2-(4-bromophenyl)-6-(4-chlorophenyl)pyridine-4-carboxylic acid
(named as BPCPPCA), in depicted in the figure below.
Figure 1.29 Precursor molecule 2-(4-bromophenyl)-6-(4-chlorophenyl)pyridine-4-carboxylic acid
(BPCPPCA), from ref.42.
Once the molecules were deposited on the surface at room temperature, the authors
observed two different types of islands with a mirror symmetry axis. In fact the molecules
could form a (2x4) superstructure on the calcite surface in two mirror-symmetric ways
(Figure 1.30 a).
Chapter 1: Coupling reactions on surface in UHV conditions
26
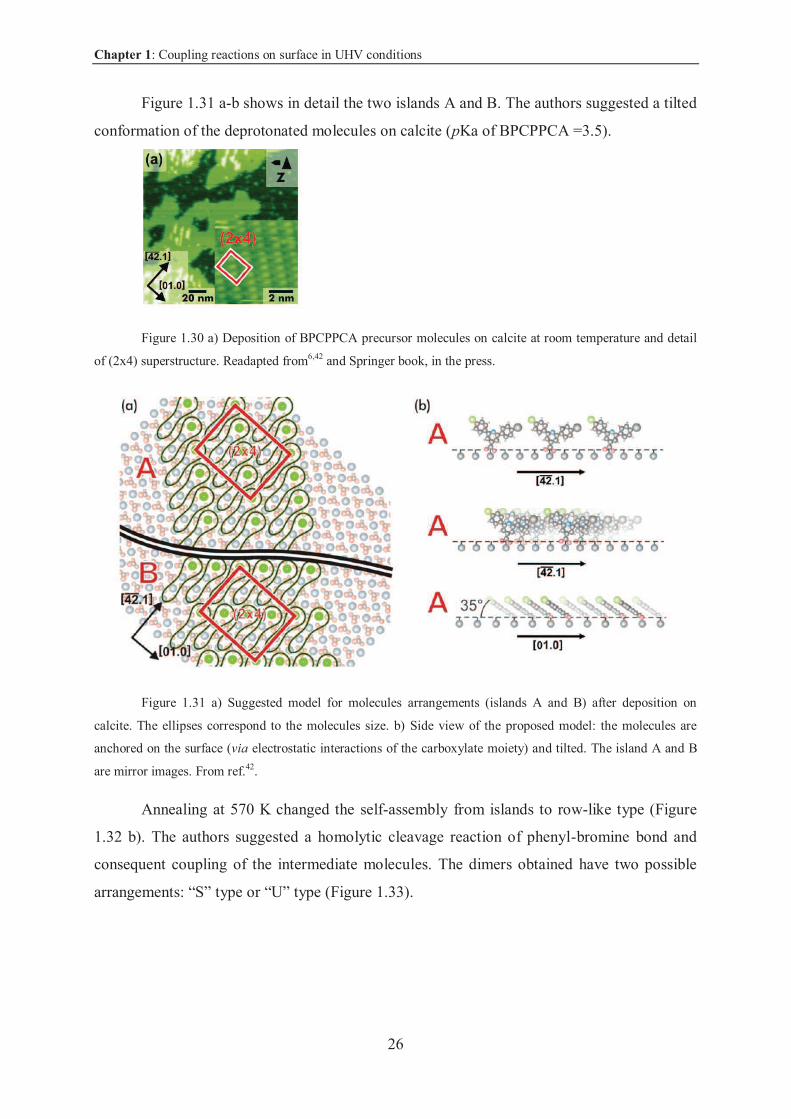
Figure 1.31 a-b shows in detail the two islands A and B. The authors suggested a tilted
conformation of the deprotonated molecules on calcite (pKa of BPCPPCA =3.5).
Figure 1.30 a) Deposition of BPCPPCA precursor molecules on calcite at room temperature and detail
of (2x4) superstructure. Readapted from6,42 and Springer book, in the press.
Figure 1.31 a) Suggested model for molecules arrangements (islands A and B) after deposition on
calcite. The ellipses correspond to the molecules size. b) Side view of the proposed model: the molecules are
anchored on the surface (via electrostatic interactions of the carboxylate moiety) and tilted. The island A and B
are mirror images. From ref.42.
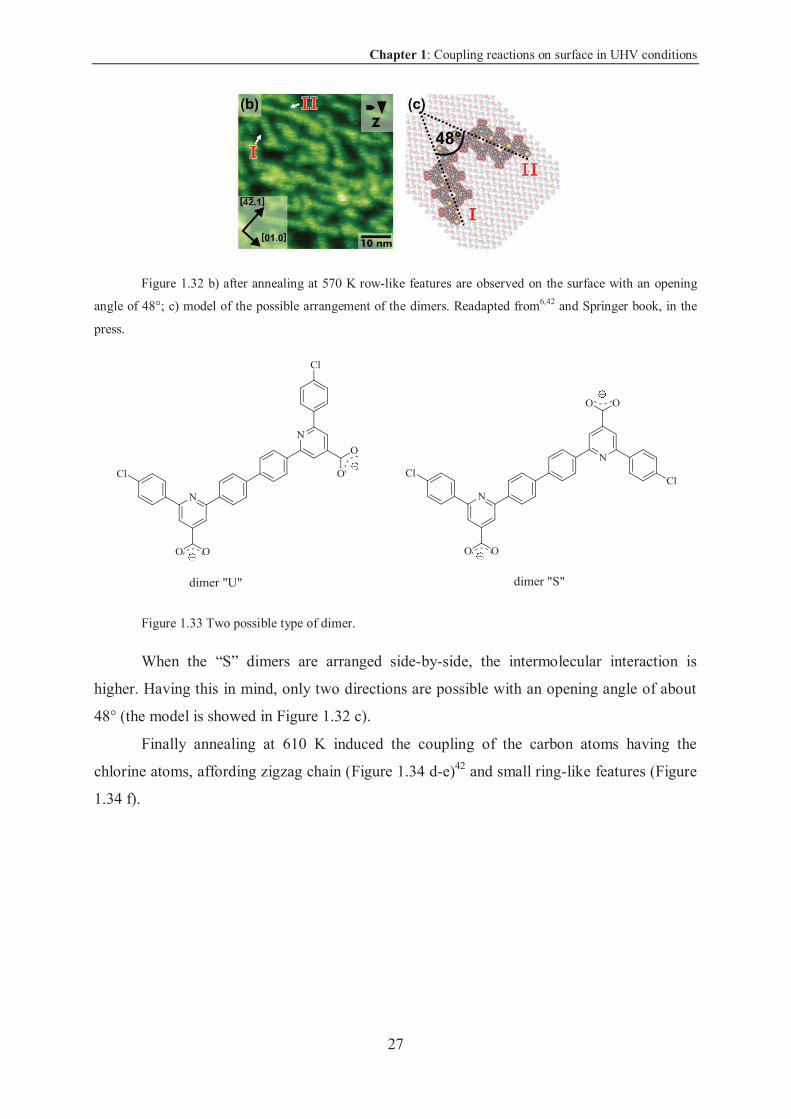
Annealing at 570 K changed the self-assembly from islands to row-like type (Figure
1.32 b). The authors suggested a homolytic cleavage reaction of phenyl-bromine bond and
consequent coupling of the intermediate molecules. The dimers obtained have two possible
arrangements: “S” type or “U” type (Figure 1.33).
Chapter 1: Coupling reactions on surface in UHV conditions
27
Figure 1.32 b) after annealing at 570 K row-like features are observed on the surface with an opening
angle of 48°; c) model of the possible arrangement of the dimers. Readapted from6,42 and Springer book, in the
press.
Figure 1.33 Two possible type of dimer.
When the “S” dimers are arranged side-by-side, the intermolecular interaction is
higher. Having this in mind, only two directions are possible with an opening angle of about
48° (the model is showed in Figure 1.32 c).
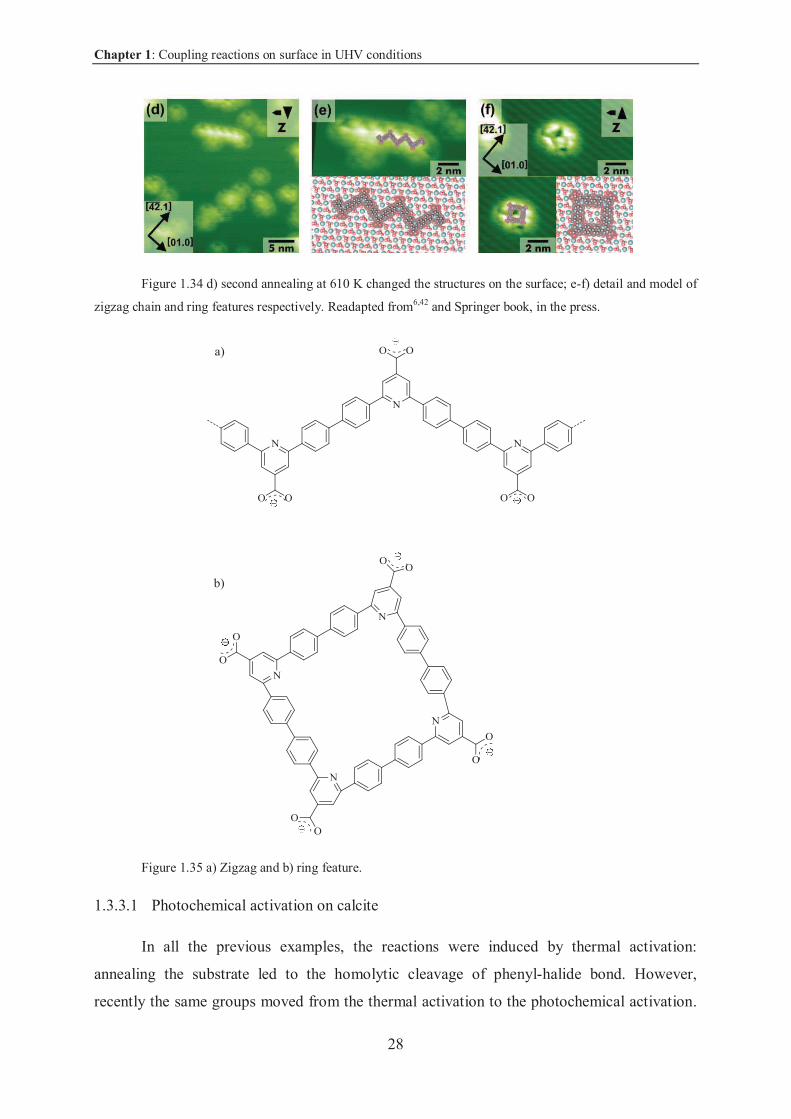
Finally annealing at 610 K induced the coupling of the carbon atoms having the
chlorine atoms, affording zigzag chain (Figure 1.34 d-e)42 and small ring-like features (Figure
1.34 f).
Chapter 1: Coupling reactions on surface in UHV conditions
28
Figure 1.34 d) second annealing at 610 K changed the structures on the surface; e-f) detail and model of
zigzag chain and ring features respectively. Readapted from6,42 and Springer book, in the press.
Figure 1.35 a) Zigzag and b) ring feature.
1.3.3.1 Photochemical activation on calcite
In all the previous examples, the reactions were induced by thermal activation:
annealing the substrate led to the homolytic cleavage of phenyl-halide bond. However,
recently the same groups moved from the thermal activation to the photochemical activation.
Chapter 1: Coupling reactions on surface in UHV conditions
29
The advantage in this case is that it does not require high temperature, therefore the
desorption of precursor molecules is limited.
As a first example, the authors selected C60 molecules, known to undergo to [2+2]
cycloaddition under irradiation.
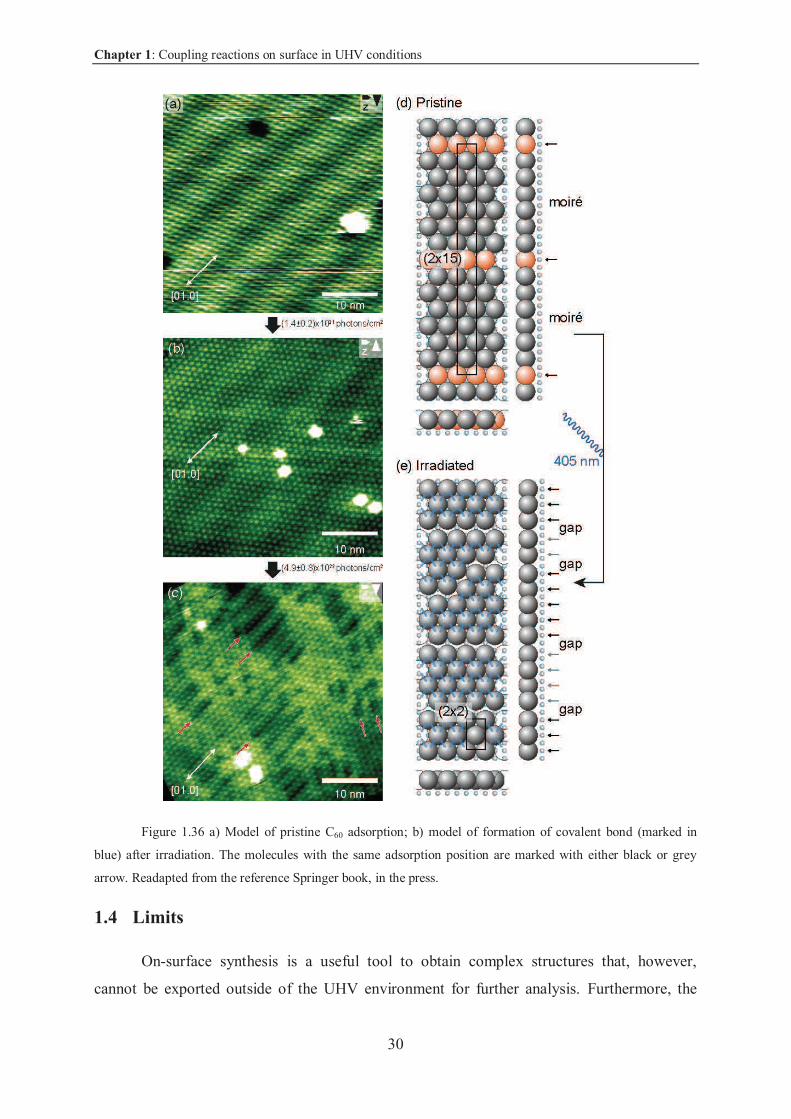
Once C60 molecules were deposited on calcite at room temperature, the authors
observed the formation of large islands (Figure 1.36 a). C60 molecules arranged via van der
Waals interactions. C60 diameters did not match with the substrate which led to the formation
of a moiré pattern. Only the molecules (in red) marked with the black arrows in Figure 1.36 d
matched perfectly with the correct site of adsorption on calcite substrate.
After irradiation (with a laser 405 nm), the assemblies started to degrade (Figure 1.36
b); successive irradiations drastically changed the features, and gaps (marked with arrows in
Figure 1.36 c) became then visible. The authors suggested that after successive irradiations,
the molecules were linked via covalent bond (shorter than van der Waals interaction), leading
to the formation of islands and irregularities as depicted in the model (Figure 1.36 e)43.
Chapter 1: Coupling reactions on surface in UHV conditions
30
Figure 1.36 a) Model of pristine C60 adsorption; b) model of formation of covalent bond (marked in
blue) after irradiation. The molecules with the same adsorption position are marked with either black or grey
arrow. Readapted from the reference Springer book, in the press.
1.4 Limits
On-surface synthesis is a useful tool to obtain complex structures that, however,
cannot be exported outside of the UHV environment for further analysis. Furthermore, the
Chapter 1: Coupling reactions on surface in UHV conditions
31
spectroscopic techniques accessible on metal surface (XPS, ARPES) are not compatible with
the insulating surfaces.
For these reasons we extended the investigation at macroscale level on particles in
order to easily recover the final product and characterize with routine analysis.
1.5 References
1. Gourdon, A. On-Surface Covalent Coupling in Ultrahigh Vacuum. Angew. Chem. Int. Ed. 47, 6950–6953 (2008).
2. Tait, S. L. Function Follows Form: Exploring Two-Dimensional Supramolecular Assembly at Surfaces. ACS Nano 2, 617–621 (2008).
3. Lafferentz, L. et al. Controlling on-surface polymerization by hierarchical and substrate-directed growth. Nat. Chem. 4, 215–220 (2012).
4. Franc, G. & Gourdon, A. Covalent networks through on-surface chemistry in ultra-high vacuum: state-of-the-art and recent developments. Phys. Chem. Chem. Phys. 13, 14283 (2011).
5. Björk, J. & Hanke, F. Towards Design Rules for Covalent Nanostructures on Metal Surfaces. Chem. – Eur. J. 20, 928–934 (2014).
6. Lindner, R. & Kühnle, A. On-Surface Reactions. ChemPhysChem 16, 1582–1592 (2015). 7. Sambiagio, C., Marsden, S. P., Blacker, A. J. & McGowan, P. C. Copper catalysed
Ullmann type chemistry: from mechanistic aspects to modern development. Chem. Soc.
Rev. 43, 3525 (2014). 8. Grill, L. et al. Nano-architectures by covalent assembly of molecular building blocks. Nat.
Nanotechnol. 2, 687–691 (2007). 9. Bieri, M. et al. Porous graphenes: two-dimensional polymer synthesis with atomic
precision. Chem. Commun. 6919 (2009). doi:10.1039/b915190g 10. Cai, J. et al. Atomically precise bottom-up fabrication of graphene nanoribbons.
Nature 466, 470–473 (2010). 11. Kawai, S. et al. Atomically controlled substitutional boron-doping of graphene
nanoribbons. Nat. Commun. 6, 8098 (2015). 12. Cloke, R. R. et al. Site-Specific Substitutional Boron Doping of Semiconducting
Armchair Graphene Nanoribbons. J. Am. Chem. Soc. 137, 8872–8875 (2015). 13. Shen, Q. et al. Self-assembled two-dimensional nanoporous molecular arrays and
photoinduced polymerization of 4-bromo-4 -hydroxybiphenyl on Ag(111). J. Chem. Phys. 142, 101902 (2015).
14. Siemsen, P., Livingston, R. C. & Diederich, F. Acetylenic Coupling: A Powerful Tool in Molecular Construction. Angew. Chem. Int. Ed. 39, 2632–2657 (2000).
15. Hay, A. S. Oxidative Coupling of Acetylenes. J. Org. Chem. 27, 3320–3321 (1962). 16. Klappenberger, F. et al. On-Surface Synthesis of Carbon-Based Scaffolds and
Nanomaterials Using Terminal Alkynes. Acc. Chem. Res. 48, 2140–2150 (2015). 17. Zhang, Y.-Q. et al. Homo-coupling of terminal alkynes on a noble metal surface. Nat.
Commun. 3, 1286 (2012). 18. Gao, H.-Y. et al. Glaser Coupling at Metal Surfaces. Angew. Chem. Int. Ed. 52, 4024–
4028 (2013). 19. Abel, M., Clair, S., Ourdjini, O., Mossoyan, M. & Porte, L. Single Layer of Polymeric
Fe-Phthalocyanine: An Organometallic Sheet on Metal and Thin Insulating Film. J. Am.
Chem. Soc. 133, 1203–1205 (2011).
Chapter 1: Coupling reactions on surface in UHV conditions
32
20. Koudia, M. & Abel, M. Step-by-step on-surface synthesis: from manganese phthalocyanines to their polymeric form. Chem. Commun. 50, 8565 (2014).
21. Hla, S.-W., Bartels, L., Meyer, G. & Rieder, K.-H. Inducing All Steps of a Chemical Reaction with the Scanning Tunneling Microscope Tip: Towards Single Molecule Engineering. Phys. Rev. Lett. 85, 2777–2780 (2000).
22. Gutzler, R. et al. Ullmann-type coupling of brominated tetrathienoanthracene on copper and silver. Nanoscale 6, 2660 (2014).
23. Eichhorn, J., Heckl, W. M. & Lackinger, M. On-surface polymerization of 1,4-diethynylbenzene on Cu(111). Chem. Commun. 49, 2900 (2013).
24. Sun, Q. et al. On-Surface Formation of One-Dimensional Polyphenylene through Bergman Cyclization. J. Am. Chem. Soc. 135, 8448–8451 (2013).
25. de Oteyza, D. G. et al. Direct Imaging of Covalent Bond Structure in Single-Molecule Chemical Reactions. Science 340, 1434–1437 (2013).
26. Bebensee, F. et al. On-Surface Azide–Alkyne Cycloaddition on Cu(111): Does It ‘Click’ in Ultrahigh Vacuum? J. Am. Chem. Soc. 135, 2136–2139 (2013).
27. Díaz Arado, O. et al. On-Surface Azide–Alkyne Cycloaddition on Au(111). ACS Nano 7, 8509–8515 (2013).
28. In’t Veld, M., Iavicoli, P., Haq, S., Amabilino, D. B. & Raval, R. Unique intermolecular reaction of simple porphyrins at a metal surface gives covalent nanostructures. Chem. Commun. 1536 (2008). doi:10.1039/b718865j
29. Otero, G. et al. Fullerenes from aromatic precursors by surface-catalysed cyclodehydrogenation. Nature 454, 865–868 (2008).
30. Rim, K. T. et al. Forming Aromatic Hemispheres on Transition-Metal Surfaces. Angew. Chem. Int. Ed. 46, 7891–7895 (2007).
31. Lin, Y.-P. et al. Self-Assembled Melamine Monolayer on Cu(111). J. Phys. Chem. C 117, 9895–9902 (2013).
32. Clair, S., Abel, M. & Porte, L. Growth of boronic acid based two-dimensional covalent networks on a metal surface under ultrahigh vacuum. Chem. Commun. 50, 9627 (2014).
33. Zwaneveld, N. A. A. et al. Organized Formation of 2D Extended Covalent Organic Frameworks at Surfaces. J. Am. Chem. Soc. 130, 6678–6679 (2008).
34. Weigelt, S. et al. Covalent Interlinking of an Aldehyde and an Amine on a Au(111) Surface in Ultrahigh Vacuum. Angew. Chem. Int. Ed. 46, 9227–9230 (2007).
35. Liu, J., Ruffieux, P., Feng, X., Müllen, K. & Fasel, R. Cyclotrimerization of arylalkynes on Au(111). Chem. Commun. 50, 11200 (2014).
36. Fesser, P. et al. Visualizing the Product of a Formal Cycloaddition of 7,7,8,8-Tetracyano-p-quinodimethane (TCNQ) to an Acetylene-Appended Porphyrin by Scanning Tunneling Microscopy on Au(111). Chem. - Eur. J. 17, 5246–5250 (2011).
37. Lafferentz, L. et al. Conductance of a Single Conjugated Polymer as a Continuous Function of Its Length. Science 323, 1193–1197 (2009).
38. Atkins, P. W. & Beran, J. A. General Chemistry. (Scientific Americans Books). 39. Kolmer, M. et al. Polymerization of Polyanthrylene on a Titanium Dioxide (011)-
(2×1) Surface. Angew. Chem. Int. Ed. 52, 10300–10303 (2013). 40. Kittelmann, M. et al. On-Surface Covalent Linking of Organic Building Blocks on a
Bulk Insulator. ACS Nano 5, 8420–8425 (2011). 41. Kittelmann, M., Rahe, P., Gourdon, A. & Kühnle, A. Direct Visualization of Molecule
Deprotonation on an Insulating Surface. ACS Nano 6, 7406–7411 (2012). 42. Kittelmann, M., Nimmrich, M., Lindner, R., Gourdon, A. & Kühnle, A. Sequential
and Site-Specific On-Surface Synthesis on a Bulk Insulator. ACS Nano 7, 5614–5620 (2013).
Chapter 1: Coupling reactions on surface in UHV conditions
33
43. Lindner, R. et al. Substrate Templating Guides the Photoinduced Reaction of C 60 on Calcite. Angew. Chem. Int. Ed. 53, 7952–7955 (2014).

Chapter 2: Molecules designed for covalent coupling on calcite in UHV conditions
35
2. Molecules designed for covalent coupling on calcite in UHV
conditions
2.1 Conception of molecules ............................................................................................ 36
2.2 Molecules for homocoupling of ethynes .................................................................... 37
2.2.1 Introduction and objective ..................................................................................... 37
2.2.2 Results and discussion ........................................................................................... 38
2.2.2.1 Retrosynthetic analysis ..................................................................................... 38
2.2.2.2 Synthesis ........................................................................................................... 38
2.2.2.3 Deposition on CaCO3 surface ........................................................................... 40
2.2.3 Conclusion ............................................................................................................. 43
2.3 Molecules for photopolymerization ........................................................................... 43
2.3.1 Introduction and objective ..................................................................................... 43
2.3.2 Results and discussion ........................................................................................... 45
2.3.2.1 Retrosynthetic analysis ..................................................................................... 45
2.3.2.2 Synthesis ........................................................................................................... 45
2.3.2.3 Characterization ................................................................................................ 48
2.3.2.4 Deposition on CaCO3 surface ........................................................................... 49
2.3.3 Conclusion ............................................................................................................. 50
2.4 Molecules for polycondensation ................................................................................ 50
2.4.1 Introduction and objective ..................................................................................... 50
2.4.2 Results and discussion ........................................................................................... 55
2.4.2.1 Synthesis ........................................................................................................... 55
2.4.2.2 Characterization ................................................................................................ 58
2.4.3 Conclusion ............................................................................................................. 59
Chapter 2: Molecules designed for covalent coupling on calcite in UHV conditions
36
2.5 Molecules for Ullmann Coupling .............................................................................. 60
2.5.1 Introduction and objective ..................................................................................... 60
2.5.2 Results and discussion ........................................................................................... 60
2.5.2.1 Retrosynthetic analysis ..................................................................................... 60
2.5.2.2 Synthesis ........................................................................................................... 61
2.5.2.3 Characterization ................................................................................................ 69
2.5.3 Conclusion ............................................................................................................. 73
2.6 General conclusion ..................................................................................................... 73
2.7 References .................................................................................................................. 74
In this chapter we present the synthesis of four families of molecules designed for
different reactions on CaCO3 surface: homocoupling of ethynes, photopolymerization,
polycondensation (phthalocyanine networks) and Ullmann reaction. The molecules were
synthesized by standard organic routes.
Then, the molecules will be deposited on calcite in UHV conditions. During the
redaction of this manuscript only the first two families were deposited. The others two
families will be studied soon. The work was done by Prof. A. K hnle’s group (R. Lindner, A.
Richter and others), University of Mainz, Germany.
2.1 Conception of molecules
As our molecules will be deposited on calcite in UHV conditions, we decided to adopt
the same strategy of carboxylic acid anchoring groups. The design of the target molecule
should take into account all the constraints due to the insulating material: the exigency of
anchoring groups (due to the low interaction molecule-substrate) and the technique used in
order to investigate the surface (nc-AFM). Therefore, the ideal molecule should have a central
core (ideally visible or recognizable with the nc-AFM), arms with the anchoring groups
(carboxylic acid) and some reactive groups.
Chapter 2: Molecules designed for covalent coupling on calcite in UHV conditions
37
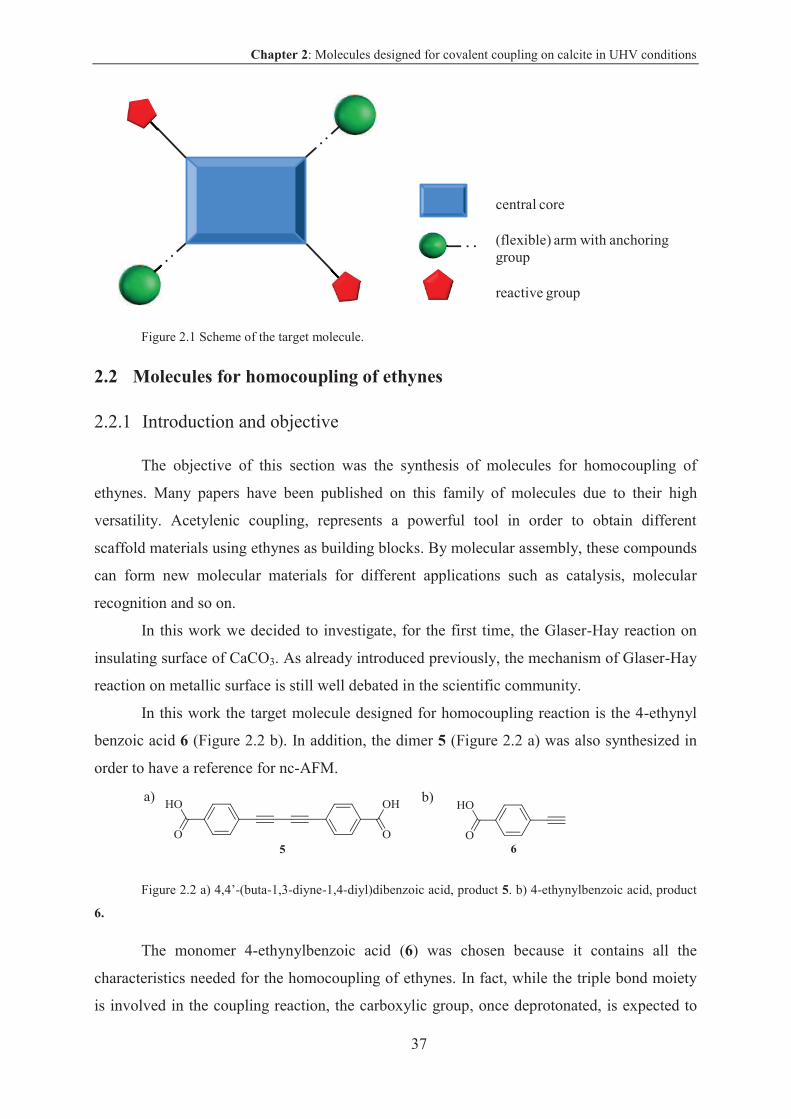
Figure 2.1 Scheme of the target molecule.
2.2 Molecules for homocoupling of ethynes
2.2.1 Introduction and objective
The objective of this section was the synthesis of molecules for homocoupling of
ethynes. Many papers have been published on this family of molecules due to their high
versatility. Acetylenic coupling, represents a powerful tool in order to obtain different
scaffold materials using ethynes as building blocks. By molecular assembly, these compounds
can form new molecular materials for different applications such as catalysis, molecular
recognition and so on.
In this work we decided to investigate, for the first time, the Glaser-Hay reaction on
insulating surface of CaCO3. As already introduced previously, the mechanism of Glaser-Hay
reaction on metallic surface is still well debated in the scientific community.
In this work the target molecule designed for homocoupling reaction is the 4-ethynyl
benzoic acid 6 (Figure 2.2 b). In addition, the dimer 5 (Figure 2.2 a) was also synthesized in
order to have a reference for nc-AFM.
Figure 2.2 a) 4,4’-(buta-1,3-diyne-1,4-diyl)dibenzoic acid, product 5. b) 4-ethynylbenzoic acid, product
6.
The monomer 4-ethynylbenzoic acid (6) was chosen because it contains all the
characteristics needed for the homocoupling of ethynes. In fact, while the triple bond moiety
is involved in the coupling reaction, the carboxylic group, once deprotonated, is expected to
central core
(flexible) arm with anchoring group
reactive group
Chapter 2: Molecules designed for covalent coupling on calcite in UHV conditions
38
bind strongly calcite. As already introduced previously the anchoring groups assure the
stability of the molecule on the surface. Once deposited, the monomer is expected to be
upright standing on calcite.
The dimer 4,4’-(buta-1,3-diyne-1,4-diyl)dibenzoic acid (5) was synthesized in order to
have a reference for the nc-AFM measurements. The homocoupling reaction product, the
dimer, is expected to be flat lying on the surface, due to the carboxylate groups pointing in
opposite directions.
This section describes the synthesis and the deposition of the molecules on CaCO3
surface and it will conclude with future perspectives.
2.2.2 Results and discussion
2.2.2.1 Retrosynthetic analysis
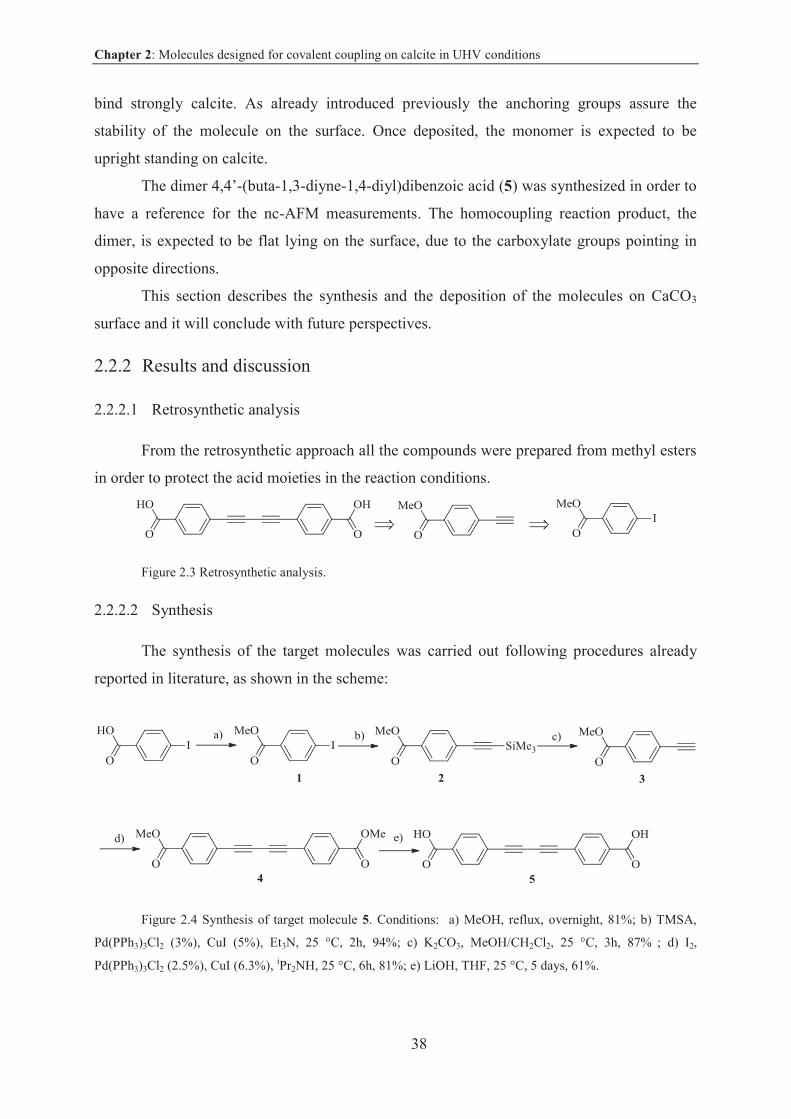
From the retrosynthetic approach all the compounds were prepared from methyl esters
in order to protect the acid moieties in the reaction conditions.
Figure 2.3 Retrosynthetic analysis.
2.2.2.2 Synthesis
The synthesis of the target molecules was carried out following procedures already
reported in literature, as shown in the scheme:
Figure 2.4 Synthesis of target molecule 5. Conditions: a) MeOH, reflux, overnight, 81%; b) TMSA,
Pd(PPh3)3Cl2 (3%), CuI (5%), Et3N, 25 °C, 2h, 94%; c) K2CO3, MeOH/CH2Cl2, 25 °C, 3h, 87% ; d) I2,
Pd(PPh3)3Cl2 (2.5%), CuI (6.3%), iPr2NH, 25 °C, 6h, 81%; e) LiOH, THF, 25 °C, 5 days, 61%.
Chapter 2: Molecules designed for covalent coupling on calcite in UHV conditions
39
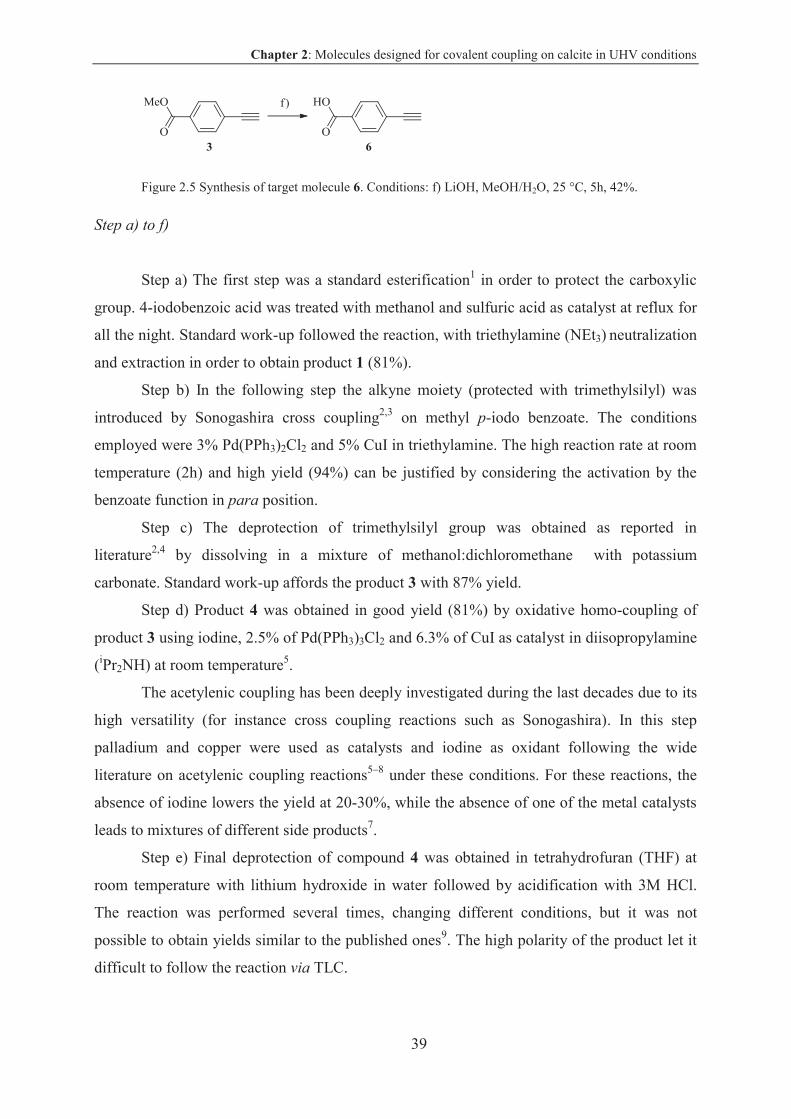
Figure 2.5 Synthesis of target molecule 6. Conditions: f) LiOH, MeOH/H2O, 25 °C, 5h, 42%.
Step a) to f)
Step a) The first step was a standard esterification1 in order to protect the carboxylic
group. 4-iodobenzoic acid was treated with methanol and sulfuric acid as catalyst at reflux for
all the night. Standard work-up followed the reaction, with triethylamine (NEt3) neutralization
and extraction in order to obtain product 1 (81%).
Step b) In the following step the alkyne moiety (protected with trimethylsilyl) was
introduced by Sonogashira cross coupling2,3 on methyl p-iodo benzoate. The conditions
employed were 3% Pd(PPh3)2Cl2 and 5% CuI in triethylamine. The high reaction rate at room
temperature (2h) and high yield (94%) can be justified by considering the activation by the
benzoate function in para position.
Step c) The deprotection of trimethylsilyl group was obtained as reported in
literature2,4 by dissolving in a mixture of methanol:dichloromethane with potassium
carbonate. Standard work-up affords the product 3 with 87% yield.
Step d) Product 4 was obtained in good yield (81%) by oxidative homo-coupling of
product 3 using iodine, 2.5% of Pd(PPh3)3Cl2 and 6.3% of CuI as catalyst in diisopropylamine
(iPr2NH) at room temperature5.
The acetylenic coupling has been deeply investigated during the last decades due to its
high versatility (for instance cross coupling reactions such as Sonogashira). In this step
palladium and copper were used as catalysts and iodine as oxidant following the wide
literature on acetylenic coupling reactions5–8 under these conditions. For these reactions, the
absence of iodine lowers the yield at 20-30%, while the absence of one of the metal catalysts
leads to mixtures of different side products7.
Step e) Final deprotection of compound 4 was obtained in tetrahydrofuran (THF) at
room temperature with lithium hydroxide in water followed by acidification with 3M HCl.
The reaction was performed several times, changing different conditions, but it was not
possible to obtain yields similar to the published ones9. The high polarity of the product let it
difficult to follow the reaction via TLC.
Chapter 2: Molecules designed for covalent coupling on calcite in UHV conditions
40
Entry Days Temperature Yield
Ref. lit. 9 3 RT 89%
1 2 RT 21%
2 3 RT 47%
3 5 RT 61%
4 3 35 °C 30 %
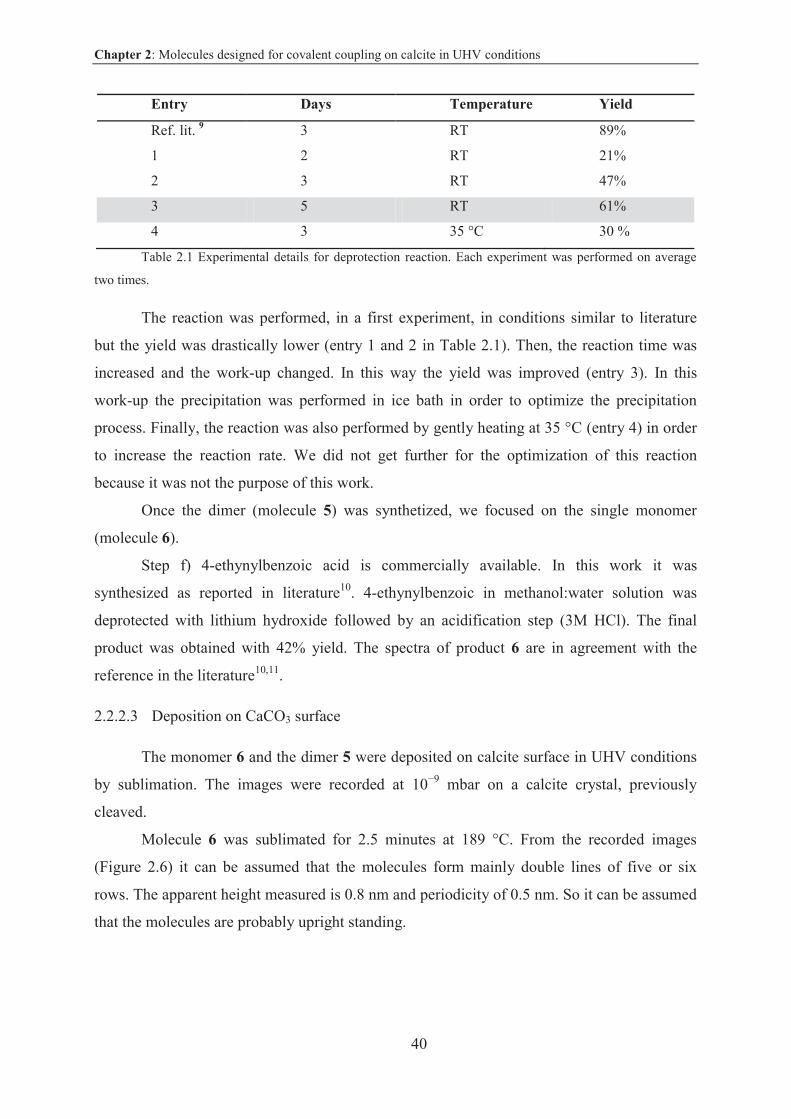
Table 2.1 Experimental details for deprotection reaction. Each experiment was performed on average
two times.
The reaction was performed, in a first experiment, in conditions similar to literature
but the yield was drastically lower (entry 1 and 2 in Table 2.1). Then, the reaction time was
increased and the work-up changed. In this way the yield was improved (entry 3). In this
work-up the precipitation was performed in ice bath in order to optimize the precipitation
process. Finally, the reaction was also performed by gently heating at 35 °C (entry 4) in order
to increase the reaction rate. We did not get further for the optimization of this reaction
because it was not the purpose of this work.
Once the dimer (molecule 5) was synthetized, we focused on the single monomer
(molecule 6).
Step f) 4-ethynylbenzoic acid is commercially available. In this work it was
synthesized as reported in literature10. 4-ethynylbenzoic in methanol:water solution was
deprotected with lithium hydroxide followed by an acidification step (3M HCl). The final
product was obtained with 42% yield. The spectra of product 6 are in agreement with the
reference in the literature10,11.
2.2.2.3 Deposition on CaCO3 surface
The monomer 6 and the dimer 5 were deposited on calcite surface in UHV conditions
by sublimation. The images were recorded at 10 9 mbar on a calcite crystal, previously
cleaved.
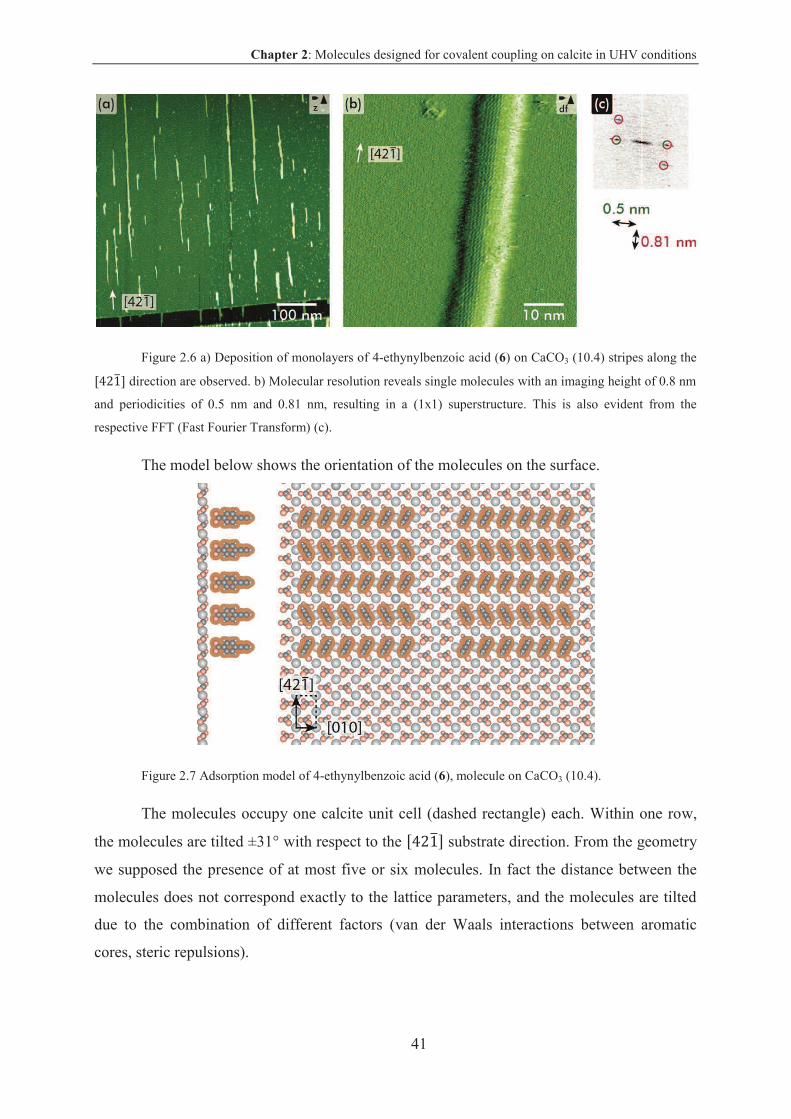
Molecule 6 was sublimated for 2.5 minutes at 189 °C. From the recorded images
(Figure 2.6) it can be assumed that the molecules form mainly double lines of five or six
rows. The apparent height measured is 0.8 nm and periodicity of 0.5 nm. So it can be assumed
that the molecules are probably upright standing.
Chapter 2: Molecules designed for covalent coupling on calcite in UHV conditions
41
Figure 2.6 a) Deposition of monolayers of 4-ethynylbenzoic acid (6) on CaCO3 (10.4) stripes along the
direction are observed. b) Molecular resolution reveals single molecules with an imaging height of 0.8 nm
and periodicities of 0.5 nm and 0.81 nm, resulting in a (1x1) superstructure. This is also evident from the
respective FFT (Fast Fourier Transform) (c).
The model below shows the orientation of the molecules on the surface.
Figure 2.7 Adsorption model of 4-ethynylbenzoic acid (6), molecule on CaCO3 (10.4).
The molecules occupy one calcite unit cell (dashed rectangle) each. Within one row,
the molecules are tilted ±31° with respect to the substrate direction. From the geometry
we supposed the presence of at most five or six molecules. In fact the distance between the
molecules does not correspond exactly to the lattice parameters, and the molecules are tilted
due to the combination of different factors (van der Waals interactions between aromatic
cores, steric repulsions).
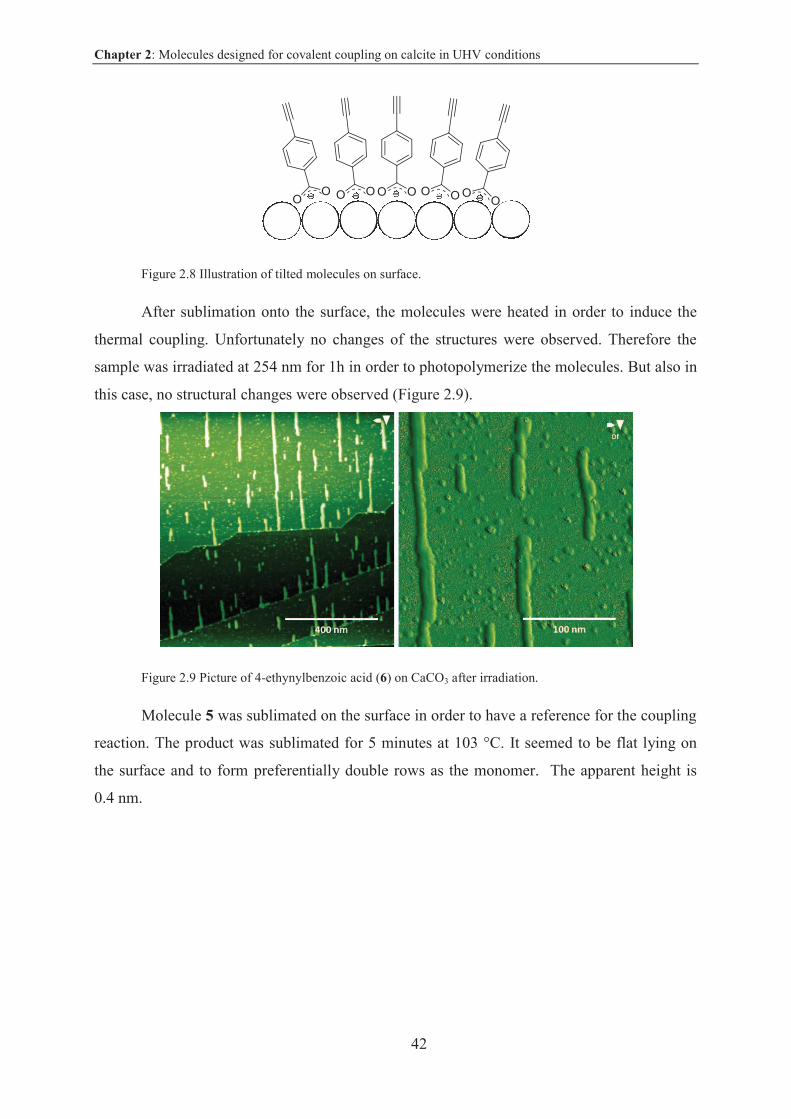
Chapter 2: Molecules designed for covalent coupling on calcite in UHV conditions
42
Figure 2.8 Illustration of tilted molecules on surface.
After sublimation onto the surface, the molecules were heated in order to induce the
thermal coupling. Unfortunately no changes of the structures were observed. Therefore the
sample was irradiated at 254 nm for 1h in order to photopolymerize the molecules. But also in
this case, no structural changes were observed (Figure 2.9).
Figure 2.9 Picture of 4-ethynylbenzoic acid (6) on CaCO3 after irradiation.
Molecule 5 was sublimated on the surface in order to have a reference for the coupling
reaction. The product was sublimated for 5 minutes at 103 °C. It seemed to be flat lying on
the surface and to form preferentially double rows as the monomer. The apparent height is
0.4 nm.
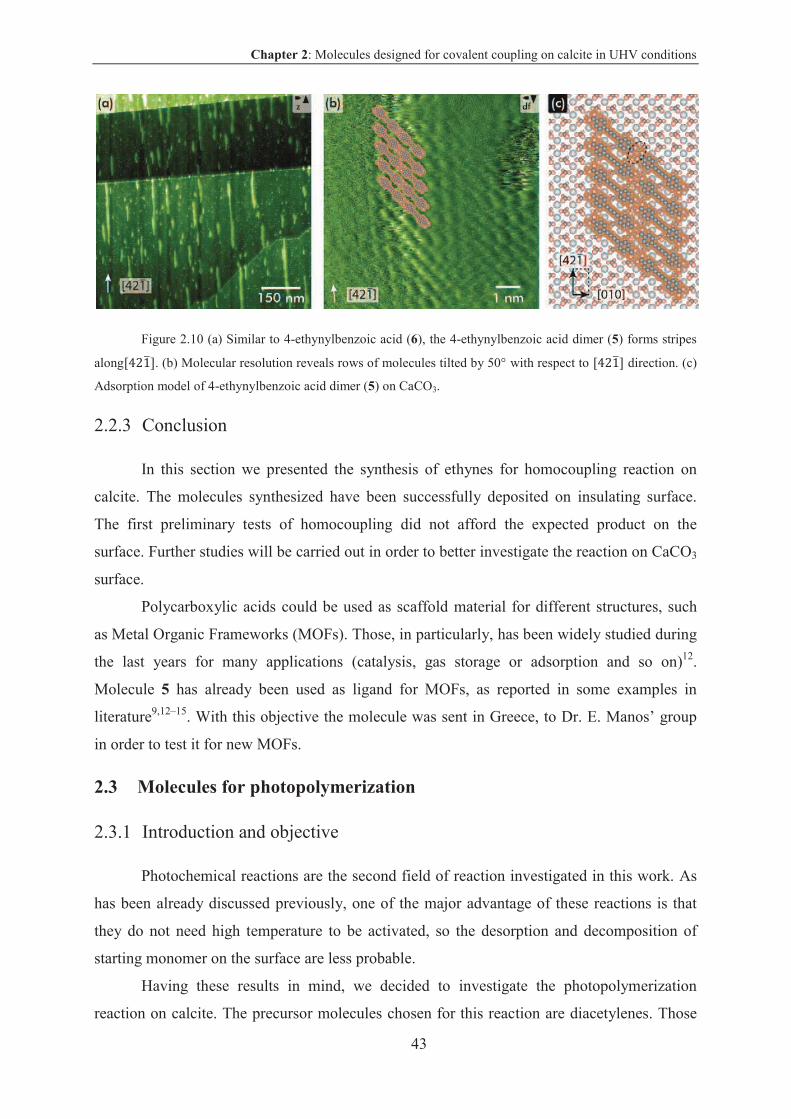
Chapter 2: Molecules designed for covalent coupling on calcite in UHV conditions
43
Figure 2.10 (a) Similar to 4-ethynylbenzoic acid (6), the 4-ethynylbenzoic acid dimer (5) forms stripes
along . (b) Molecular resolution reveals rows of molecules tilted by 50° with respect to direction. (c)
Adsorption model of 4-ethynylbenzoic acid dimer (5) on CaCO3.
2.2.3 Conclusion
In this section we presented the synthesis of ethynes for homocoupling reaction on
calcite. The molecules synthesized have been successfully deposited on insulating surface.
The first preliminary tests of homocoupling did not afford the expected product on the
surface. Further studies will be carried out in order to better investigate the reaction on CaCO3
surface.
Polycarboxylic acids could be used as scaffold material for different structures, such
as Metal Organic Frameworks (MOFs). Those, in particularly, has been widely studied during
the last years for many applications (catalysis, gas storage or adsorption and so on)12.
Molecule 5 has already been used as ligand for MOFs, as reported in some examples in
literature9,12–15. With this objective the molecule was sent in Greece, to Dr. E. Manos’ group
in order to test it for new MOFs.
2.3 Molecules for photopolymerization
2.3.1 Introduction and objective
Photochemical reactions are the second field of reaction investigated in this work. As
has been already discussed previously, one of the major advantage of these reactions is that
they do not need high temperature to be activated, so the desorption and decomposition of
starting monomer on the surface are less probable.
Having these results in mind, we decided to investigate the photopolymerization
reaction on calcite. The precursor molecules chosen for this reaction are diacetylenes. Those
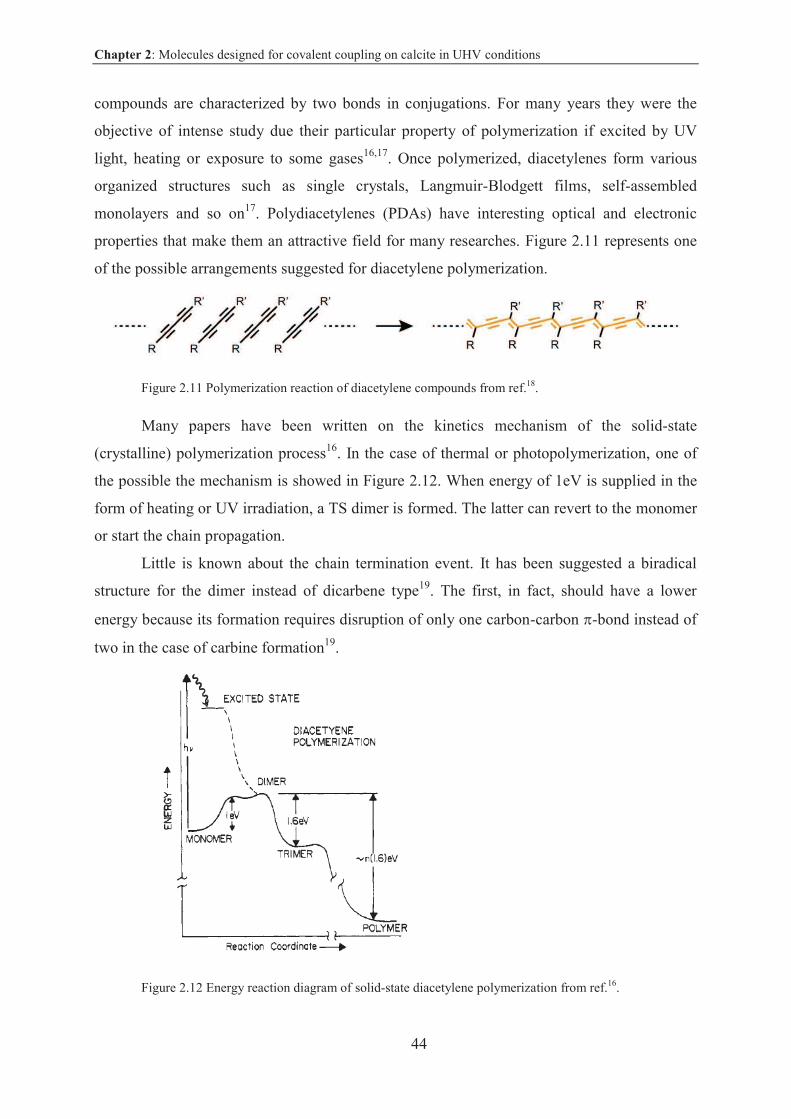
Chapter 2: Molecules designed for covalent coupling on calcite in UHV conditions
44
compounds are characterized by two bonds in conjugations. For many years they were the
objective of intense study due their particular property of polymerization if excited by UV
light, heating or exposure to some gases16,17. Once polymerized, diacetylenes form various
organized structures such as single crystals, Langmuir-Blodgett films, self-assembled
monolayers and so on17. Polydiacetylenes (PDAs) have interesting optical and electronic
properties that make them an attractive field for many researches. Figure 2.11 represents one
of the possible arrangements suggested for diacetylene polymerization.
Figure 2.11 Polymerization reaction of diacetylene compounds from ref.18.
Many papers have been written on the kinetics mechanism of the solid-state
(crystalline) polymerization process16. In the case of thermal or photopolymerization, one of
the possible the mechanism is showed in Figure 2.12. When energy of 1eV is supplied in the
form of heating or UV irradiation, a TS dimer is formed. The latter can revert to the monomer
or start the chain propagation.
Little is known about the chain termination event. It has been suggested a biradical
structure for the dimer instead of dicarbene type19. The first, in fact, should have a lower
energy because its formation requires disruption of only one carbon-carbon -bond instead of
two in the case of carbine formation19.
Figure 2.12 Energy reaction diagram of solid-state diacetylene polymerization from ref.16.
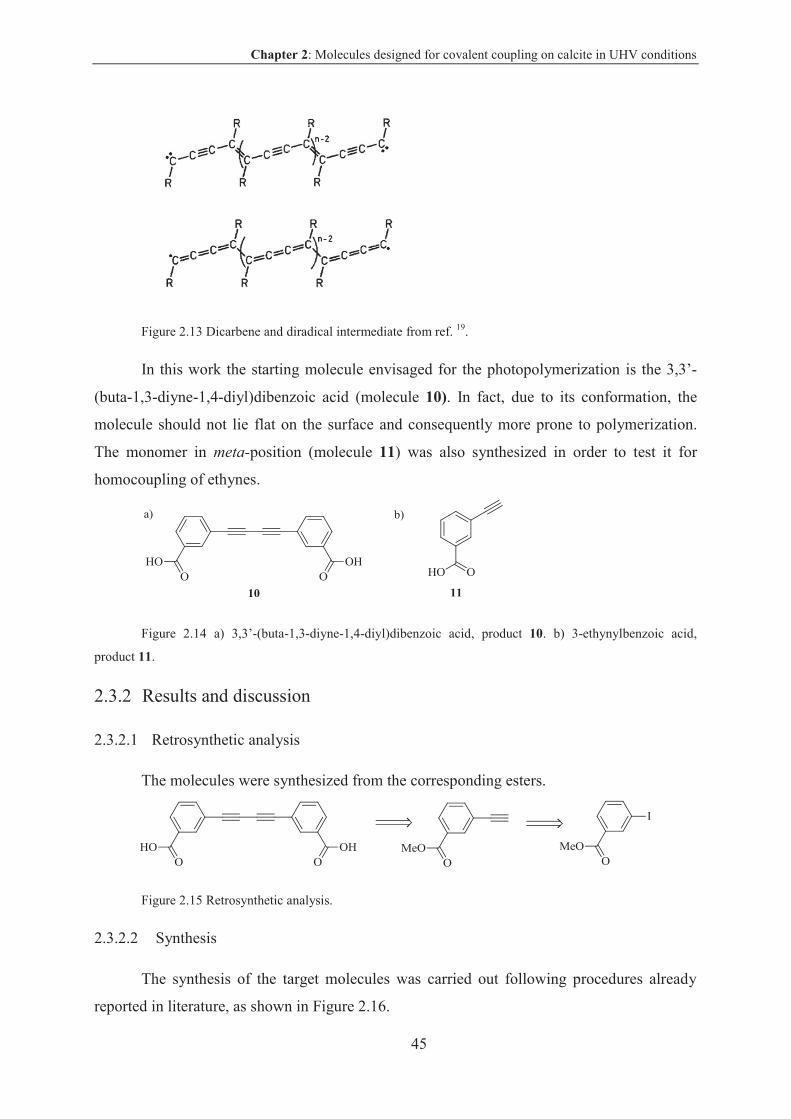
Chapter 2: Molecules designed for covalent coupling on calcite in UHV conditions
45
Figure 2.13 Dicarbene and diradical intermediate from ref. 19.
In this work the starting molecule envisaged for the photopolymerization is the 3,3’-
(buta-1,3-diyne-1,4-diyl)dibenzoic acid (molecule 10). In fact, due to its conformation, the
molecule should not lie flat on the surface and consequently more prone to polymerization.
The monomer in meta-position (molecule 11) was also synthesized in order to test it for
homocoupling of ethynes.
Figure 2.14 a) 3,3’-(buta-1,3-diyne-1,4-diyl)dibenzoic acid, product 10. b) 3-ethynylbenzoic acid,
product 11.
2.3.2 Results and discussion
2.3.2.1 Retrosynthetic analysis
The molecules were synthesized from the corresponding esters.
Figure 2.15 Retrosynthetic analysis.
2.3.2.2 Synthesis
The synthesis of the target molecules was carried out following procedures already
reported in literature, as shown in Figure 2.16.
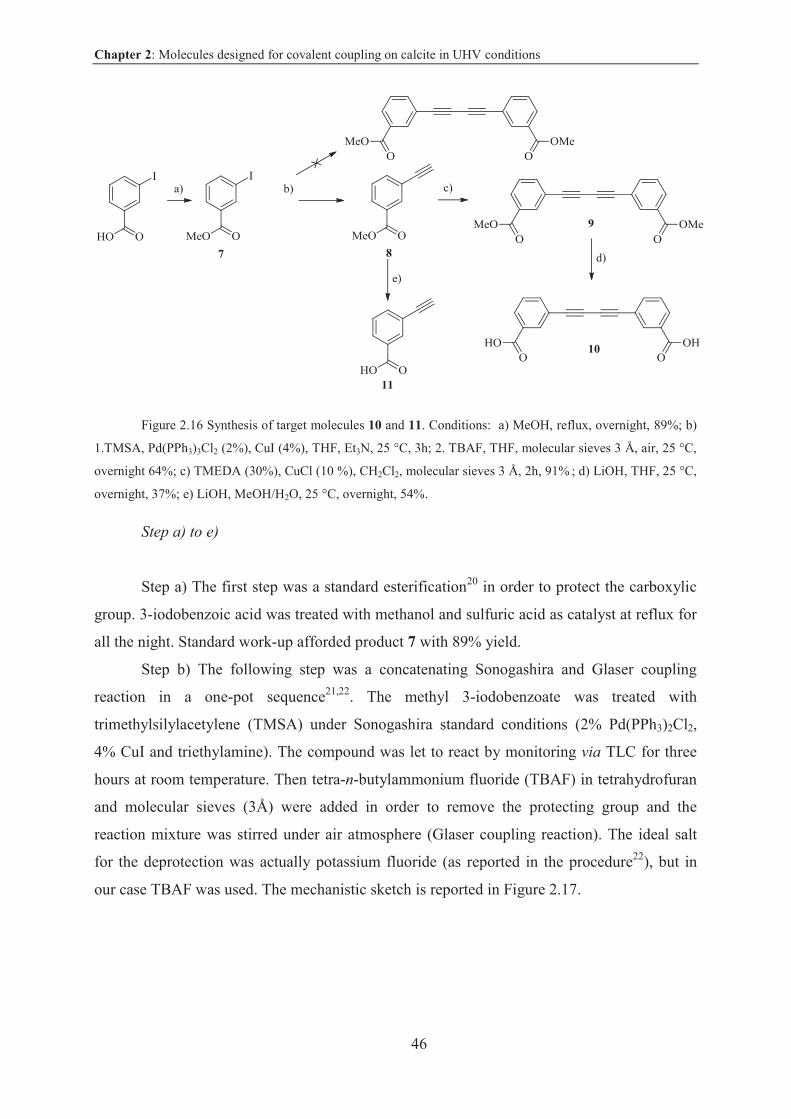
Chapter 2: Molecules designed for covalent coupling on calcite in UHV conditions
46
Figure 2.16 Synthesis of target molecules 10 and 11. Conditions: a) MeOH, reflux, overnight, 89%; b)
1.TMSA, Pd(PPh3)3Cl2 (2%), CuI (4%), THF, Et3N, 25 °C, 3h; 2. TBAF, THF, molecular sieves 3 Å, air, 25 °C,
overnight 64%; c) TMEDA (30%), CuCl (10 %), CH2Cl2, molecular sieves 3 Å, 2h, 91% ; d) LiOH, THF, 25 °C,
overnight, 37%; e) LiOH, MeOH/H2O, 25 °C, overnight, 54%.
Step a) to e)
Step a) The first step was a standard esterification20 in order to protect the carboxylic
group. 3-iodobenzoic acid was treated with methanol and sulfuric acid as catalyst at reflux for
all the night. Standard work-up afforded product 7 with 89% yield.
Step b) The following step was a concatenating Sonogashira and Glaser coupling
reaction in a one-pot sequence21,22. The methyl 3-iodobenzoate was treated with
trimethylsilylacetylene (TMSA) under Sonogashira standard conditions (2% Pd(PPh3)2Cl2,
4% CuI and triethylamine). The compound was let to react by monitoring via TLC for three
hours at room temperature. Then tetra-n-butylammonium fluoride (TBAF) in tetrahydrofuran
and molecular sieves (3Å) were added in order to remove the protecting group and the
reaction mixture was stirred under air atmosphere (Glaser coupling reaction). The ideal salt
for the deprotection was actually potassium fluoride (as reported in the procedure22), but in
our case TBAF was used. The mechanistic sketch is reported in Figure 2.17.
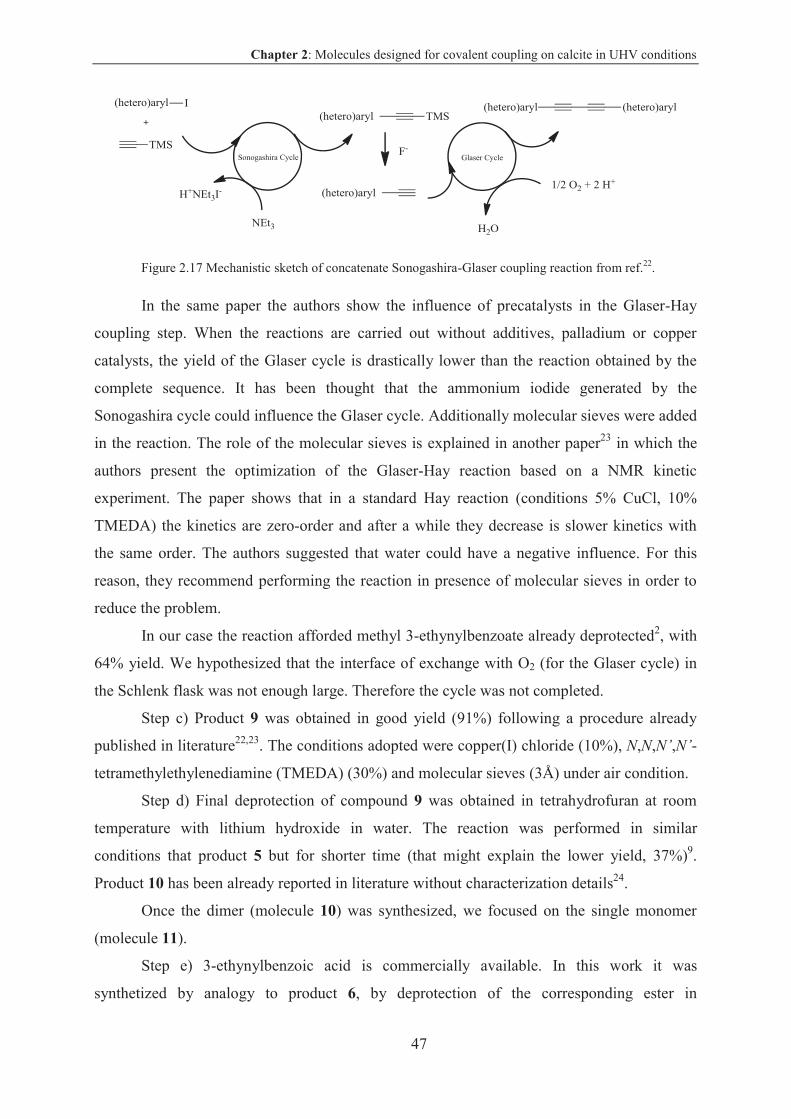
Chapter 2: Molecules designed for covalent coupling on calcite in UHV conditions
47
Figure 2.17 Mechanistic sketch of concatenate Sonogashira-Glaser coupling reaction from ref.22.
In the same paper the authors show the influence of precatalysts in the Glaser-Hay
coupling step. When the reactions are carried out without additives, palladium or copper
catalysts, the yield of the Glaser cycle is drastically lower than the reaction obtained by the
complete sequence. It has been thought that the ammonium iodide generated by the
Sonogashira cycle could influence the Glaser cycle. Additionally molecular sieves were added
in the reaction. The role of the molecular sieves is explained in another paper23 in which the
authors present the optimization of the Glaser-Hay reaction based on a NMR kinetic
experiment. The paper shows that in a standard Hay reaction (conditions 5% CuCl, 10%
TMEDA) the kinetics are zero-order and after a while they decrease is slower kinetics with
the same order. The authors suggested that water could have a negative influence. For this
reason, they recommend performing the reaction in presence of molecular sieves in order to
reduce the problem.
In our case the reaction afforded methyl 3-ethynylbenzoate already deprotected2, with
64% yield. We hypothesized that the interface of exchange with O2 (for the Glaser cycle) in
the Schlenk flask was not enough large. Therefore the cycle was not completed.
Step c) Product 9 was obtained in good yield (91%) following a procedure already
published in literature22,23. The conditions adopted were copper(I) chloride (10%), N,N,N’,N’-
tetramethylethylenediamine (TMEDA) (30%) and molecular sieves (3Å) under air condition.
Step d) Final deprotection of compound 9 was obtained in tetrahydrofuran at room
temperature with lithium hydroxide in water. The reaction was performed in similar
conditions that product 5 but for shorter time (that might explain the lower yield, 37%)9.
Product 10 has been already reported in literature without characterization details24.
Once the dimer (molecule 10) was synthesized, we focused on the single monomer
(molecule 11).
Step e) 3-ethynylbenzoic acid is commercially available. In this work it was
synthetized by analogy to product 6, by deprotection of the corresponding ester in
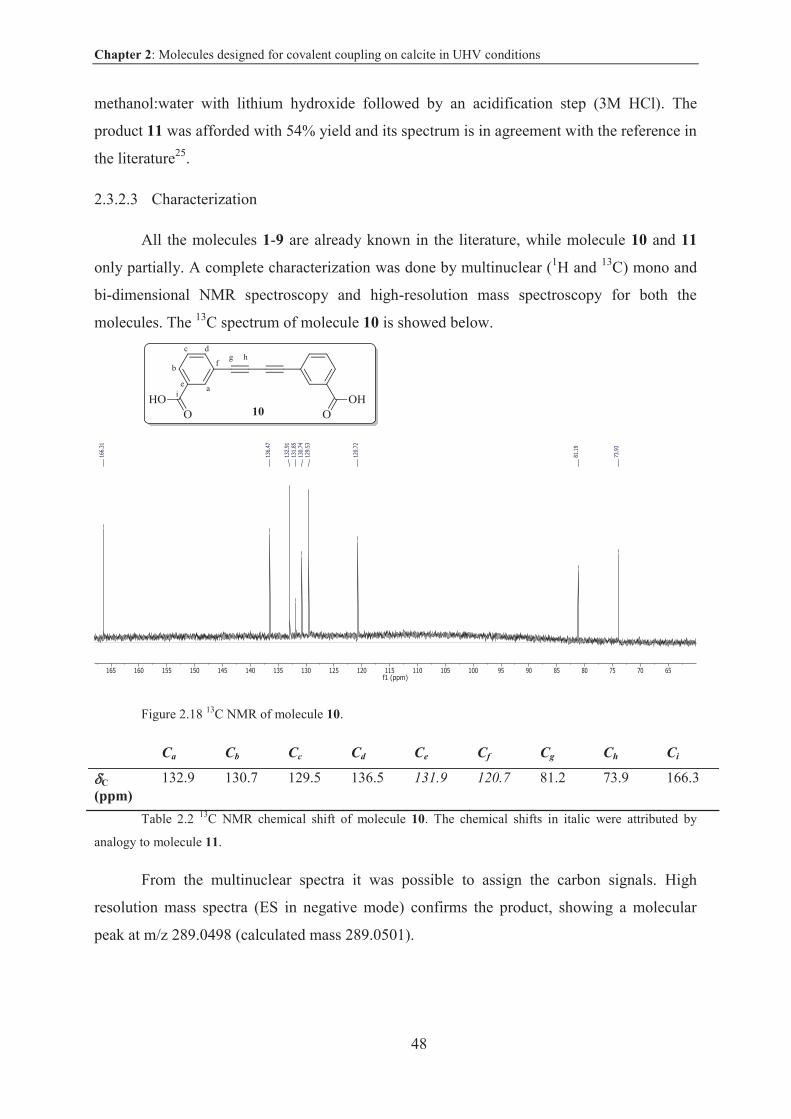
Chapter 2: Molecules designed for covalent coupling on calcite in UHV conditions
48
methanol:water with lithium hydroxide followed by an acidification step (3M HCl). The
product 11 was afforded with 54% yield and its spectrum is in agreement with the reference in
the literature25.
2.3.2.3 Characterization
All the molecules 1-9 are already known in the literature, while molecule 10 and 11
only partially. A complete characterization was done by multinuclear (1H and 13C) mono and
bi-dimensional NMR spectroscopy and high-resolution mass spectroscopy for both the
molecules. The 13C spectrum of molecule 10 is showed below.
Figure 2.18 13C NMR of molecule 10.
Ca Cb Cc Cd Ce Cf Cg Ch Ci
C
(ppm) 132.9 130.7 129.5 136.5 131.9 120.7 81.2 73.9 166.3
Table 2.2 13C NMR chemical shift of molecule 10. The chemical shifts in italic were attributed by
analogy to molecule 11.
From the multinuclear spectra it was possible to assign the carbon signals. High
resolution mass spectra (ES in negative mode) confirms the product, showing a molecular
peak at m/z 289.0498 (calculated mass 289.0501).
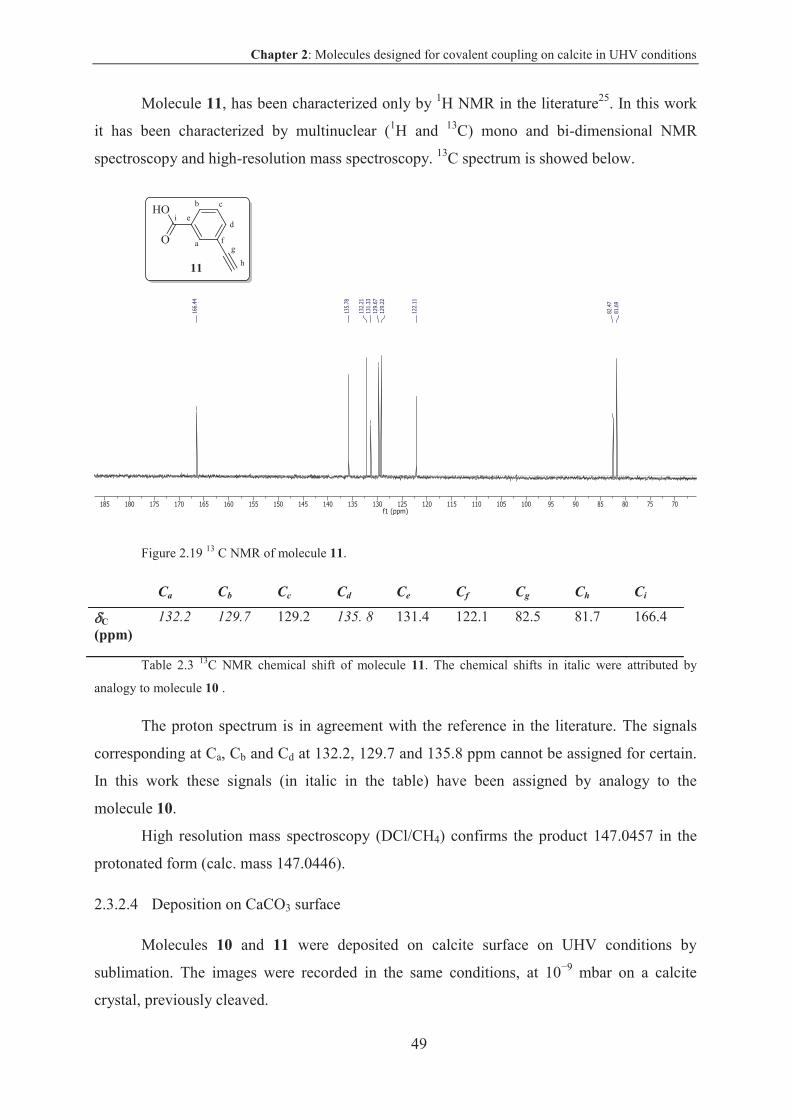
Chapter 2: Molecules designed for covalent coupling on calcite in UHV conditions
49
Molecule 11, has been characterized only by 1H NMR in the literature25. In this work
it has been characterized by multinuclear (1H and 13C) mono and bi-dimensional NMR
spectroscopy and high-resolution mass spectroscopy. 13C spectrum is showed below.
Figure 2.19 13 C NMR of molecule 11.
Ca Cb Cc Cd Ce Cf Cg Ch Ci
C
(ppm) 132.2 129.7 129.2 135. 8 131.4 122.1 82.5 81.7 166.4
Table 2.3 13C NMR chemical shift of molecule 11. The chemical shifts in italic were attributed by
analogy to molecule 10 .
The proton spectrum is in agreement with the reference in the literature. The signals
corresponding at Ca, Cb and Cd at 132.2, 129.7 and 135.8 ppm cannot be assigned for certain.
In this work these signals (in italic in the table) have been assigned by analogy to the
molecule 10.
High resolution mass spectroscopy (DCl/CH4) confirms the product 147.0457 in the
protonated form (calc. mass 147.0446).
2.3.2.4 Deposition on CaCO3 surface
Molecules 10 and 11 were deposited on calcite surface on UHV conditions by
sublimation. The images were recorded in the same conditions, at 10 9 mbar on a calcite
crystal, previously cleaved.
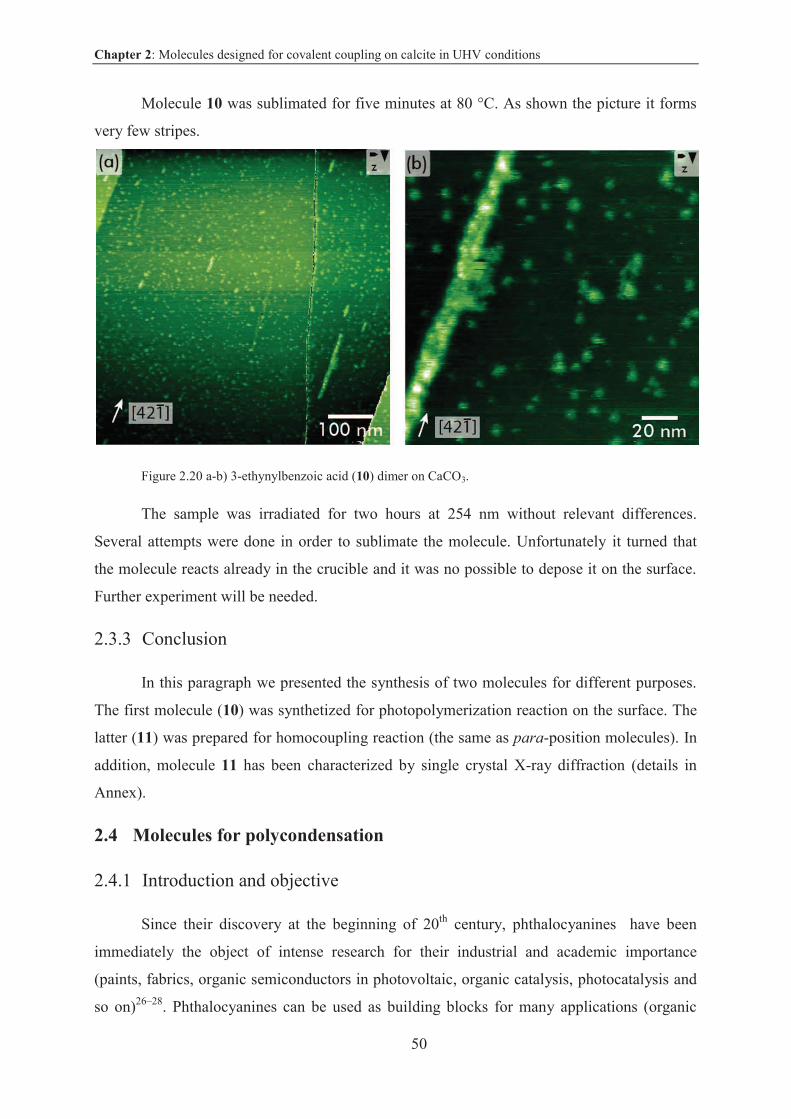
Chapter 2: Molecules designed for covalent coupling on calcite in UHV conditions
50
Molecule 10 was sublimated for five minutes at 80 °C. As shown the picture it forms
very few stripes.
Figure 2.20 a-b) 3-ethynylbenzoic acid (10) dimer on CaCO3.
The sample was irradiated for two hours at 254 nm without relevant differences.
Several attempts were done in order to sublimate the molecule. Unfortunately it turned that
the molecule reacts already in the crucible and it was no possible to depose it on the surface.
Further experiment will be needed.
2.3.3 Conclusion
In this paragraph we presented the synthesis of two molecules for different purposes.
The first molecule (10) was synthetized for photopolymerization reaction on the surface. The
latter (11) was prepared for homocoupling reaction (the same as para-position molecules). In
addition, molecule 11 has been characterized by single crystal X-ray diffraction (details in
Annex).
2.4 Molecules for polycondensation
2.4.1 Introduction and objective
Since their discovery at the beginning of 20th century, phthalocyanines have been
immediately the object of intense research for their industrial and academic importance
(paints, fabrics, organic semiconductors in photovoltaic, organic catalysis, photocatalysis and
so on)26–28. Phthalocyanines can be used as building blocks for many applications (organic
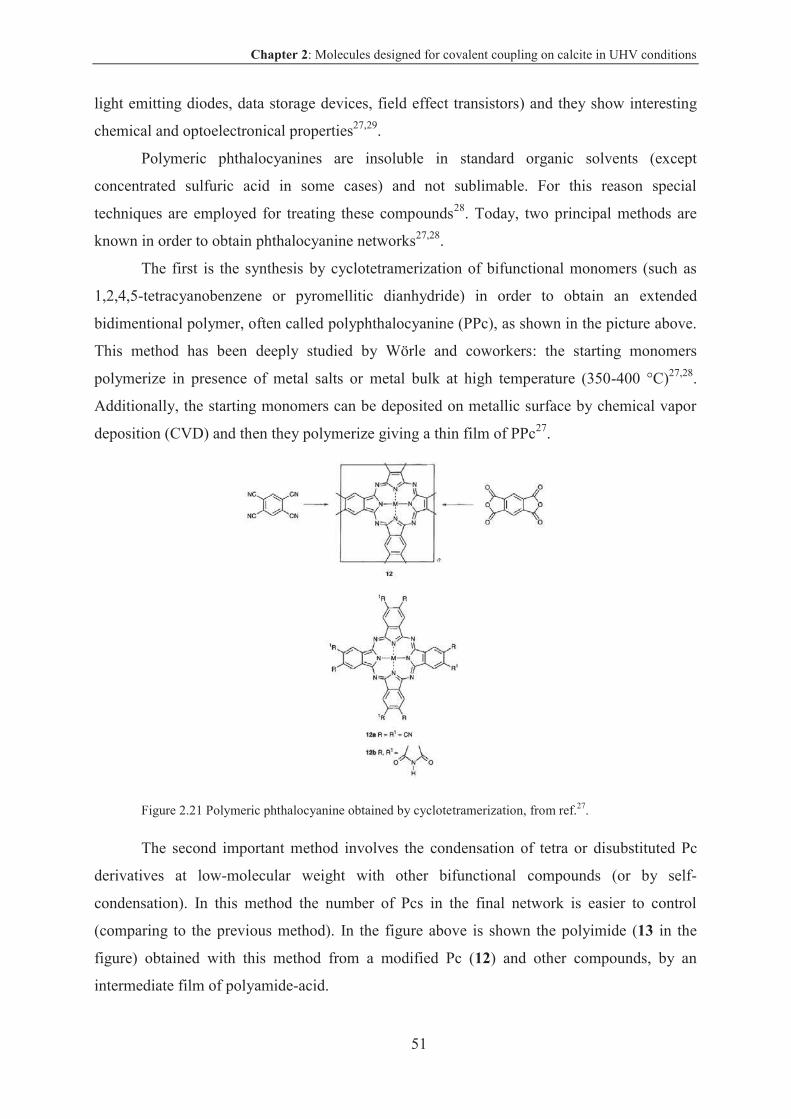
Chapter 2: Molecules designed for covalent coupling on calcite in UHV conditions
51
light emitting diodes, data storage devices, field effect transistors) and they show interesting
chemical and optoelectronical properties27,29.
Polymeric phthalocyanines are insoluble in standard organic solvents (except
concentrated sulfuric acid in some cases) and not sublimable. For this reason special
techniques are employed for treating these compounds28. Today, two principal methods are
known in order to obtain phthalocyanine networks27,28.
The first is the synthesis by cyclotetramerization of bifunctional monomers (such as
1,2,4,5-tetracyanobenzene or pyromellitic dianhydride) in order to obtain an extended
bidimentional polymer, often called polyphthalocyanine (PPc), as shown in the picture above.
This method has been deeply studied by Wörle and coworkers: the starting monomers
polymerize in presence of metal salts or metal bulk at high temperature (350-400 °C)27,28.
Additionally, the starting monomers can be deposited on metallic surface by chemical vapor
deposition (CVD) and then they polymerize giving a thin film of PPc27.
Figure 2.21 Polymeric phthalocyanine obtained by cyclotetramerization, from ref.27.
The second important method involves the condensation of tetra or disubstituted Pc
derivatives at low-molecular weight with other bifunctional compounds (or by self-
condensation). In this method the number of Pcs in the final network is easier to control
(comparing to the previous method). In the figure above is shown the polyimide (13 in the
figure) obtained with this method from a modified Pc (12) and other compounds, by an
intermediate film of polyamide-acid.
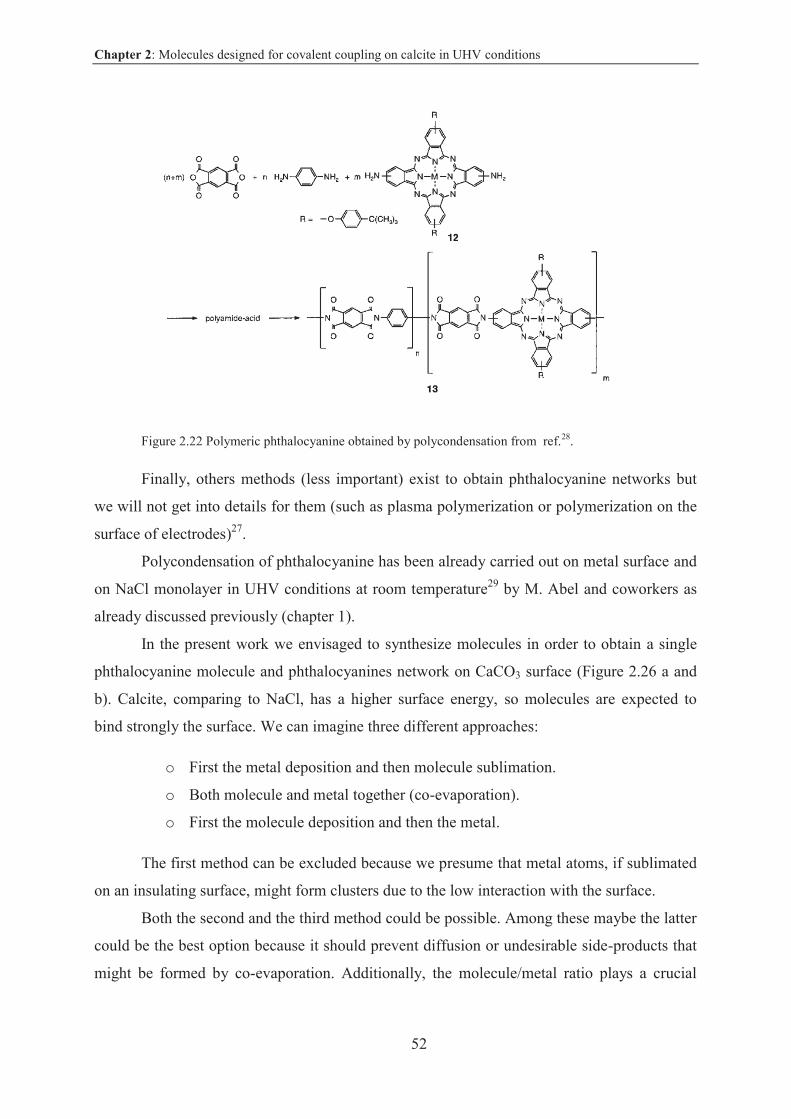
Chapter 2: Molecules designed for covalent coupling on calcite in UHV conditions
52
Figure 2.22 Polymeric phthalocyanine obtained by polycondensation from ref.28.
Finally, others methods (less important) exist to obtain phthalocyanine networks but
we will not get into details for them (such as plasma polymerization or polymerization on the
surface of electrodes)27.
Polycondensation of phthalocyanine has been already carried out on metal surface and
on NaCl monolayer in UHV conditions at room temperature29 by M. Abel and coworkers as
already discussed previously (chapter 1).
In the present work we envisaged to synthesize molecules in order to obtain a single
phthalocyanine molecule and phthalocyanines network on CaCO3 surface (Figure 2.26 a and
b). Calcite, comparing to NaCl, has a higher surface energy, so molecules are expected to
bind strongly the surface. We can imagine three different approaches:
o First the metal deposition and then molecule sublimation.
o Both molecule and metal together (co-evaporation).
o First the molecule deposition and then the metal.
The first method can be excluded because we presume that metal atoms, if sublimated
on an insulating surface, might form clusters due to the low interaction with the surface.
Both the second and the third method could be possible. Among these maybe the latter
could be the best option because it should prevent diffusion or undesirable side-products that
might be formed by co-evaporation. Additionally, the molecule/metal ratio plays a crucial
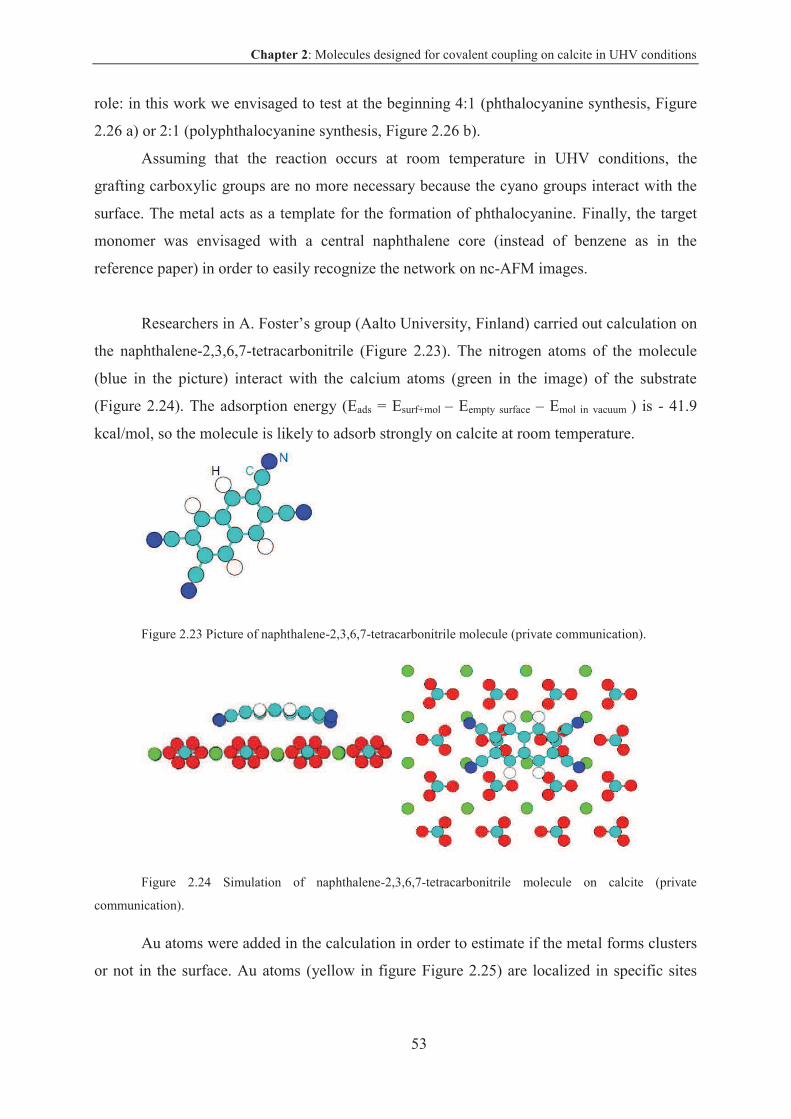
Chapter 2: Molecules designed for covalent coupling on calcite in UHV conditions
53
role: in this work we envisaged to test at the beginning 4:1 (phthalocyanine synthesis, Figure
2.26 a) or 2:1 (polyphthalocyanine synthesis, Figure 2.26 b).
Assuming that the reaction occurs at room temperature in UHV conditions, the
grafting carboxylic groups are no more necessary because the cyano groups interact with the
surface. The metal acts as a template for the formation of phthalocyanine. Finally, the target
monomer was envisaged with a central naphthalene core (instead of benzene as in the
reference paper) in order to easily recognize the network on nc-AFM images.
Researchers in A. Foster’s group (Aalto University, Finland) carried out calculation on
the naphthalene-2,3,6,7-tetracarbonitrile (Figure 2.23). The nitrogen atoms of the molecule
(blue in the picture) interact with the calcium atoms (green in the image) of the substrate
(Figure 2.24). The adsorption energy (Eads = Esurf+mol – Eempty surface – Emol in vacuum ) is - 41.9
kcal/mol, so the molecule is likely to adsorb strongly on calcite at room temperature.
Figure 2.23 Picture of naphthalene-2,3,6,7-tetracarbonitrile molecule (private communication).
Figure 2.24 Simulation of naphthalene-2,3,6,7-tetracarbonitrile molecule on calcite (private
communication).
Au atoms were added in the calculation in order to estimate if the metal forms clusters
or not in the surface. Au atoms (yellow in figure Figure 2.25) are localized in specific sites
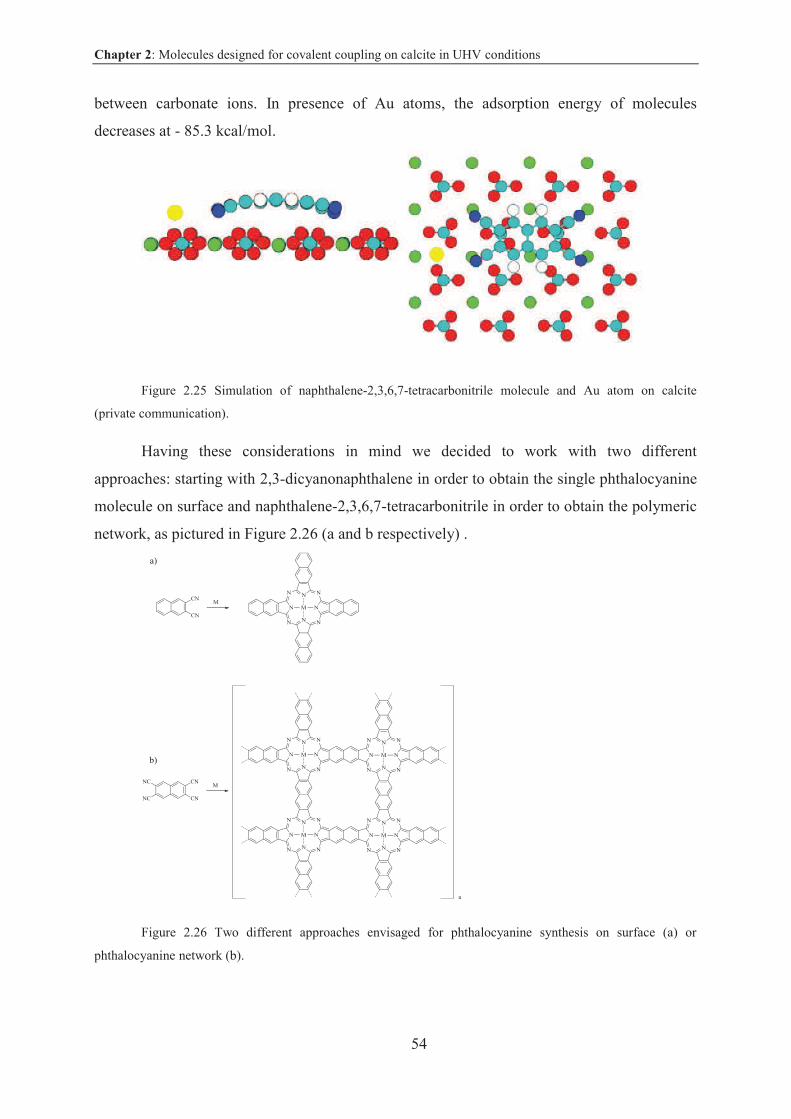
Chapter 2: Molecules designed for covalent coupling on calcite in UHV conditions
54
between carbonate ions. In presence of Au atoms, the adsorption energy of molecules
decreases at - 85.3 kcal/mol.
Figure 2.25 Simulation of naphthalene-2,3,6,7-tetracarbonitrile molecule and Au atom on calcite
(private communication).
Having these considerations in mind we decided to work with two different
approaches: starting with 2,3-dicyanonaphthalene in order to obtain the single phthalocyanine
molecule on surface and naphthalene-2,3,6,7-tetracarbonitrile in order to obtain the polymeric
network, as pictured in Figure 2.26 (a and b respectively) .
Figure 2.26 Two different approaches envisaged for phthalocyanine synthesis on surface (a) or
phthalocyanine network (b).
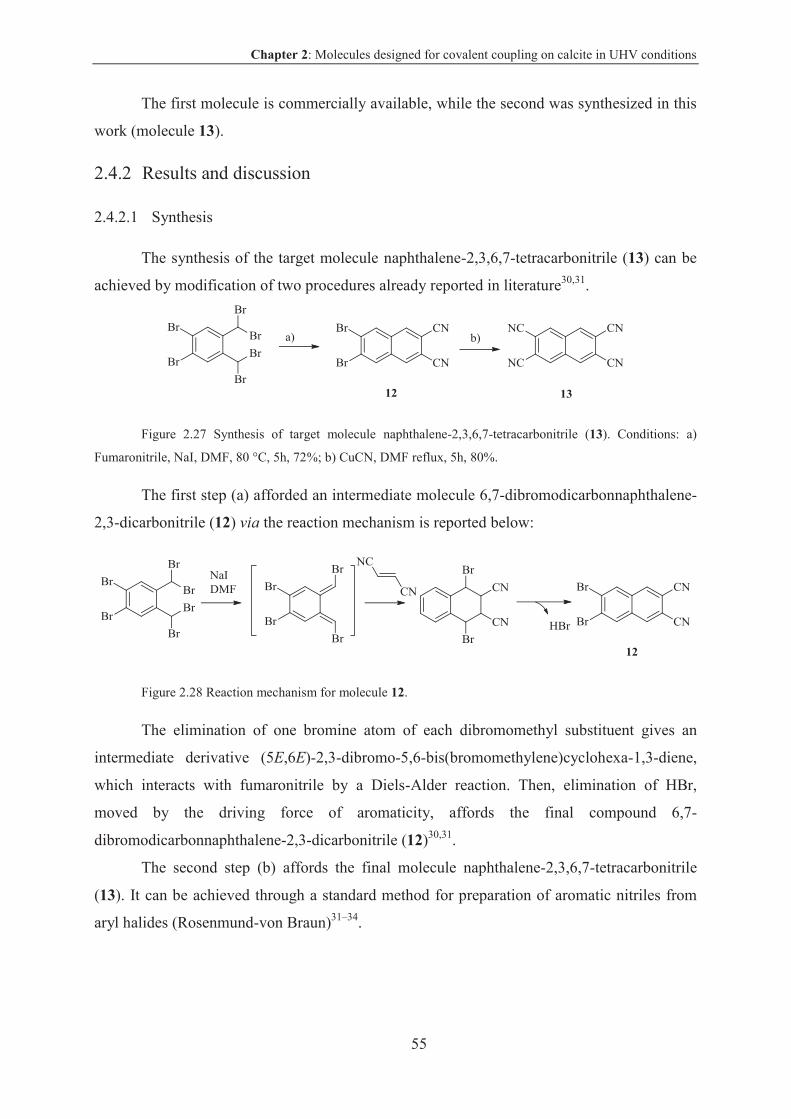
Chapter 2: Molecules designed for covalent coupling on calcite in UHV conditions
55
The first molecule is commercially available, while the second was synthesized in this
work (molecule 13).
2.4.2 Results and discussion
2.4.2.1 Synthesis
The synthesis of the target molecule naphthalene-2,3,6,7-tetracarbonitrile (13) can be
achieved by modification of two procedures already reported in literature30,31.
Figure 2.27 Synthesis of target molecule naphthalene-2,3,6,7-tetracarbonitrile (13). Conditions: a)
Fumaronitrile, NaI, DMF, 80 °C, 5h, 72%; b) CuCN, DMF reflux, 5h, 80%.
The first step (a) afforded an intermediate molecule 6,7-dibromodicarbonnaphthalene-
2,3-dicarbonitrile (12) via the reaction mechanism is reported below:
Figure 2.28 Reaction mechanism for molecule 12.
The elimination of one bromine atom of each dibromomethyl substituent gives an
intermediate derivative (5E,6E)-2,3-dibromo-5,6-bis(bromomethylene)cyclohexa-1,3-diene,
which interacts with fumaronitrile by a Diels-Alder reaction. Then, elimination of HBr,
moved by the driving force of aromaticity, affords the final compound 6,7-
dibromodicarbonnaphthalene-2,3-dicarbonitrile (12)30,31.
The second step (b) affords the final molecule naphthalene-2,3,6,7-tetracarbonitrile
(13). It can be achieved through a standard method for preparation of aromatic nitriles from
aryl halides (Rosenmund-von Braun)31–34.
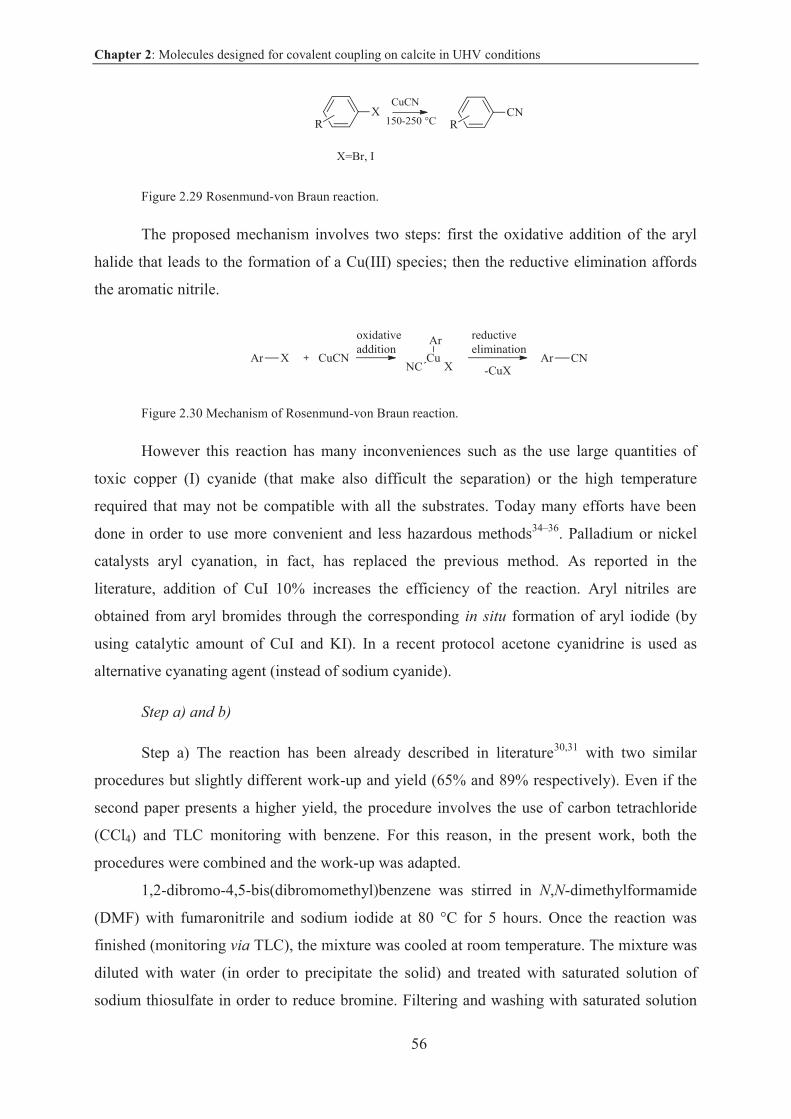
Chapter 2: Molecules designed for covalent coupling on calcite in UHV conditions
56
Figure 2.29 Rosenmund-von Braun reaction.
The proposed mechanism involves two steps: first the oxidative addition of the aryl
halide that leads to the formation of a Cu(III) species; then the reductive elimination affords
the aromatic nitrile.
Figure 2.30 Mechanism of Rosenmund-von Braun reaction.
However this reaction has many inconveniences such as the use large quantities of
toxic copper (I) cyanide (that make also difficult the separation) or the high temperature
required that may not be compatible with all the substrates. Today many efforts have been
done in order to use more convenient and less hazardous methods34–36. Palladium or nickel
catalysts aryl cyanation, in fact, has replaced the previous method. As reported in the
literature, addition of CuI 10% increases the efficiency of the reaction. Aryl nitriles are
obtained from aryl bromides through the corresponding in situ formation of aryl iodide (by
using catalytic amount of CuI and KI). In a recent protocol acetone cyanidrine is used as
alternative cyanating agent (instead of sodium cyanide).
Step a) and b)
Step a) The reaction has been already described in literature30,31 with two similar
procedures but slightly different work-up and yield (65% and 89% respectively). Even if the
second paper presents a higher yield, the procedure involves the use of carbon tetrachloride
(CCl4) and TLC monitoring with benzene. For this reason, in the present work, both the
procedures were combined and the work-up was adapted.
1,2-dibromo-4,5-bis(dibromomethyl)benzene was stirred in N,N-dimethylformamide
(DMF) with fumaronitrile and sodium iodide at 80 °C for 5 hours. Once the reaction was
finished (monitoring via TLC), the mixture was cooled at room temperature. The mixture was
diluted with water (in order to precipitate the solid) and treated with saturated solution of
sodium thiosulfate in order to reduce bromine. Filtering and washing with saturated solution
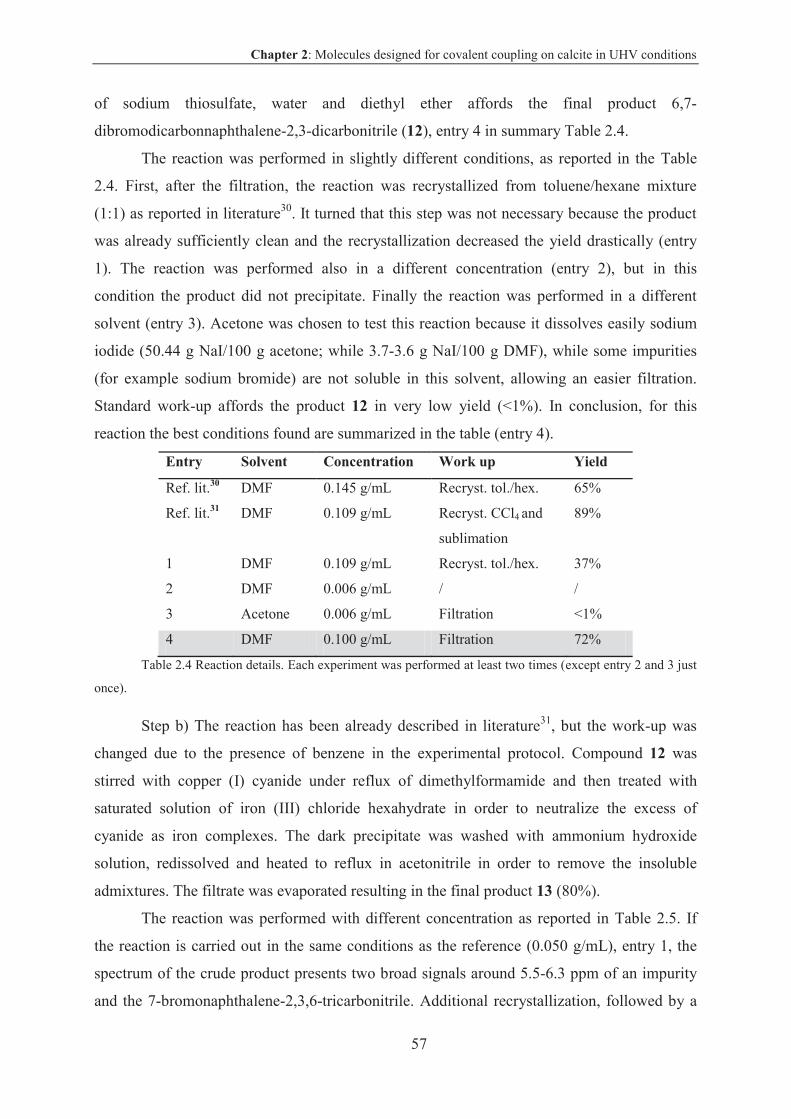
Chapter 2: Molecules designed for covalent coupling on calcite in UHV conditions
57
of sodium thiosulfate, water and diethyl ether affords the final product 6,7-
dibromodicarbonnaphthalene-2,3-dicarbonitrile (12), entry 4 in summary Table 2.4.
The reaction was performed in slightly different conditions, as reported in the Table
2.4. First, after the filtration, the reaction was recrystallized from toluene/hexane mixture
(1:1) as reported in literature30. It turned that this step was not necessary because the product
was already sufficiently clean and the recrystallization decreased the yield drastically (entry
1). The reaction was performed also in a different concentration (entry 2), but in this
condition the product did not precipitate. Finally the reaction was performed in a different
solvent (entry 3). Acetone was chosen to test this reaction because it dissolves easily sodium
iodide (50.44 g NaI/100 g acetone; while 3.7-3.6 g NaI/100 g DMF), while some impurities
(for example sodium bromide) are not soluble in this solvent, allowing an easier filtration.
Standard work-up affords the product 12 in very low yield (<1%). In conclusion, for this
reaction the best conditions found are summarized in the table (entry 4).
Entry Solvent Concentration Work up Yield
Ref. lit.30 DMF 0.145 g/mL Recryst. tol./hex. 65%
Ref. lit.31 DMF 0.109 g/mL Recryst. CCl4 and
sublimation
89%
1 DMF 0.109 g/mL Recryst. tol./hex. 37%
2 DMF 0.006 g/mL / /
3 Acetone 0.006 g/mL Filtration <1%
4 DMF 0.100 g/mL Filtration 72%
Table 2.4 Reaction details. Each experiment was performed at least two times (except entry 2 and 3 just
once).
Step b) The reaction has been already described in literature31, but the work-up was
changed due to the presence of benzene in the experimental protocol. Compound 12 was
stirred with copper (I) cyanide under reflux of dimethylformamide and then treated with
saturated solution of iron (III) chloride hexahydrate in order to neutralize the excess of
cyanide as iron complexes. The dark precipitate was washed with ammonium hydroxide
solution, redissolved and heated to reflux in acetonitrile in order to remove the insoluble
admixtures. The filtrate was evaporated resulting in the final product 13 (80%).
The reaction was performed with different concentration as reported in Table 2.5. If
the reaction is carried out in the same conditions as the reference (0.050 g/mL), entry 1, the
spectrum of the crude product presents two broad signals around 5.5-6.3 ppm of an impurity
and the 7-bromonaphthalene-2,3,6-tricarbonitrile. Additional recrystallization, followed by a
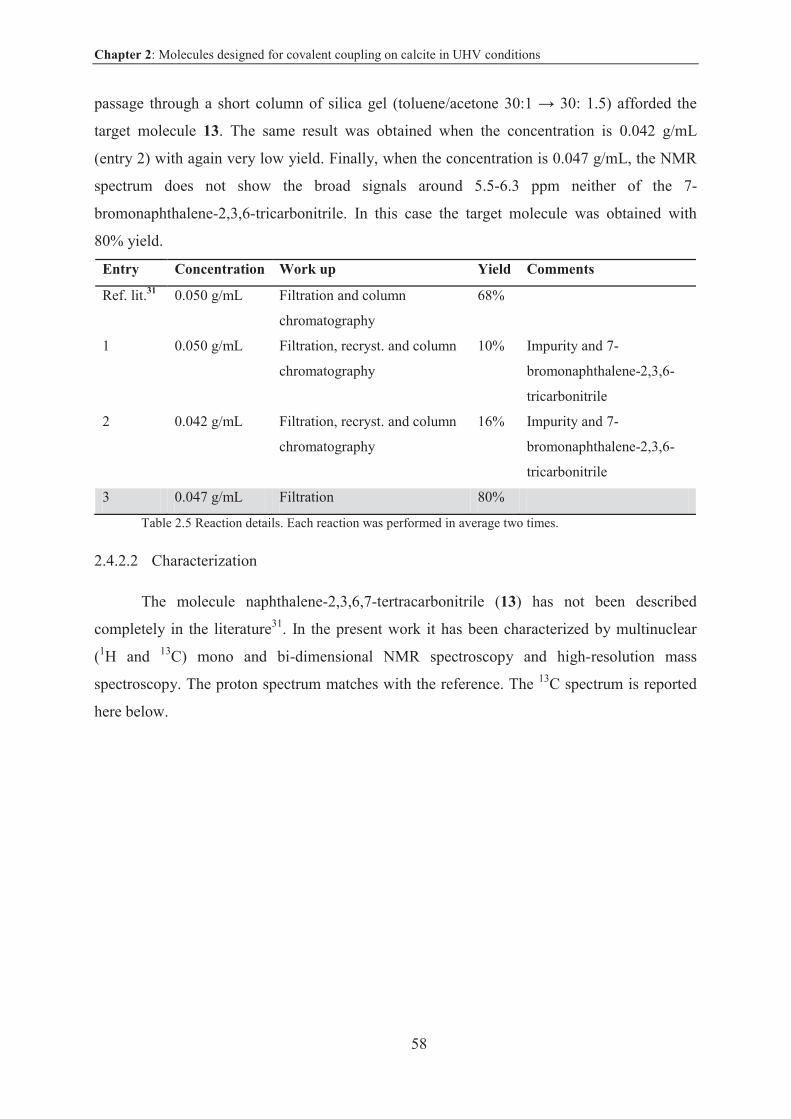
Chapter 2: Molecules designed for covalent coupling on calcite in UHV conditions
58
passage through a short column of silica gel (toluene/acetone 30:1 30: 1.5) afforded the
target molecule 13. The same result was obtained when the concentration is 0.042 g/mL
(entry 2) with again very low yield. Finally, when the concentration is 0.047 g/mL, the NMR
spectrum does not show the broad signals around 5.5-6.3 ppm neither of the 7-
bromonaphthalene-2,3,6-tricarbonitrile. In this case the target molecule was obtained with
80% yield.
Entry Concentration Work up Yield Comments
Ref. lit.31 0.050 g/mL Filtration and column
chromatography
68%
1 0.050 g/mL Filtration, recryst. and column
chromatography
10% Impurity and 7-
bromonaphthalene-2,3,6-
tricarbonitrile
2 0.042 g/mL Filtration, recryst. and column
chromatography
16% Impurity and 7-
bromonaphthalene-2,3,6-
tricarbonitrile
3 0.047 g/mL Filtration 80%
Table 2.5 Reaction details. Each reaction was performed in average two times.
2.4.2.2 Characterization
The molecule naphthalene-2,3,6,7-tertracarbonitrile (13) has not been described
completely in the literature31. In the present work it has been characterized by multinuclear
(1H and 13C) mono and bi-dimensional NMR spectroscopy and high-resolution mass
spectroscopy. The proton spectrum matches with the reference. The 13C spectrum is reported
here below.
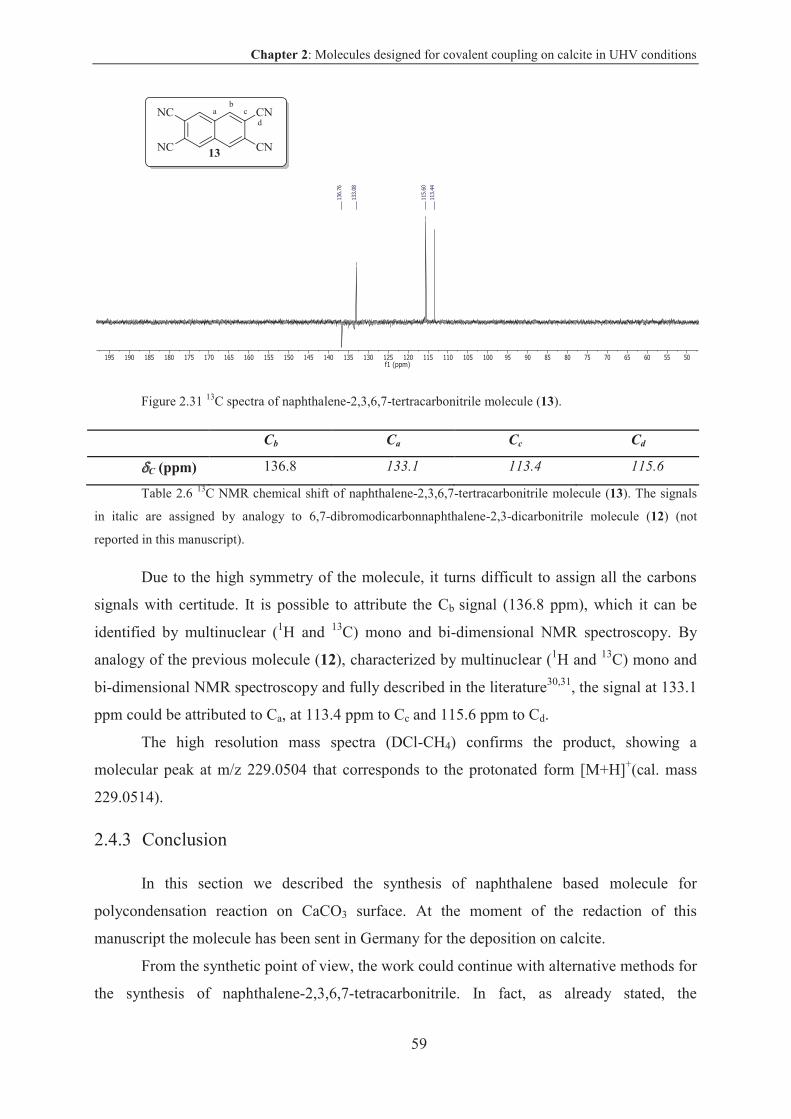
Chapter 2: Molecules designed for covalent coupling on calcite in UHV conditions
59
Figure 2.31 13C spectra of naphthalene-2,3,6,7-tertracarbonitrile molecule (13).
Cb Ca Cc Cd
C (ppm) 136.8 133.1 113.4 115.6
Table 2.6 13C NMR chemical shift of naphthalene-2,3,6,7-tertracarbonitrile molecule (13). The signals
in italic are assigned by analogy to 6,7-dibromodicarbonnaphthalene-2,3-dicarbonitrile molecule (12) (not
reported in this manuscript).
Due to the high symmetry of the molecule, it turns difficult to assign all the carbons
signals with certitude. It is possible to attribute the Cb signal (136.8 ppm), which it can be
identified by multinuclear (1H and 13C) mono and bi-dimensional NMR spectroscopy. By
analogy of the previous molecule (12), characterized by multinuclear (1H and 13C) mono and
bi-dimensional NMR spectroscopy and fully described in the literature30,31, the signal at 133.1
ppm could be attributed to Ca, at 113.4 ppm to Cc and 115.6 ppm to Cd.
The high resolution mass spectra (DCl-CH4) confirms the product, showing a
molecular peak at m/z 229.0504 that corresponds to the protonated form [M+H]+(cal. mass
229.0514).
2.4.3 Conclusion
In this section we described the synthesis of naphthalene based molecule for
polycondensation reaction on CaCO3 surface. At the moment of the redaction of this
manuscript the molecule has been sent in Germany for the deposition on calcite.
From the synthetic point of view, the work could continue with alternative methods for
the synthesis of naphthalene-2,3,6,7-tetracarbonitrile. In fact, as already stated, the
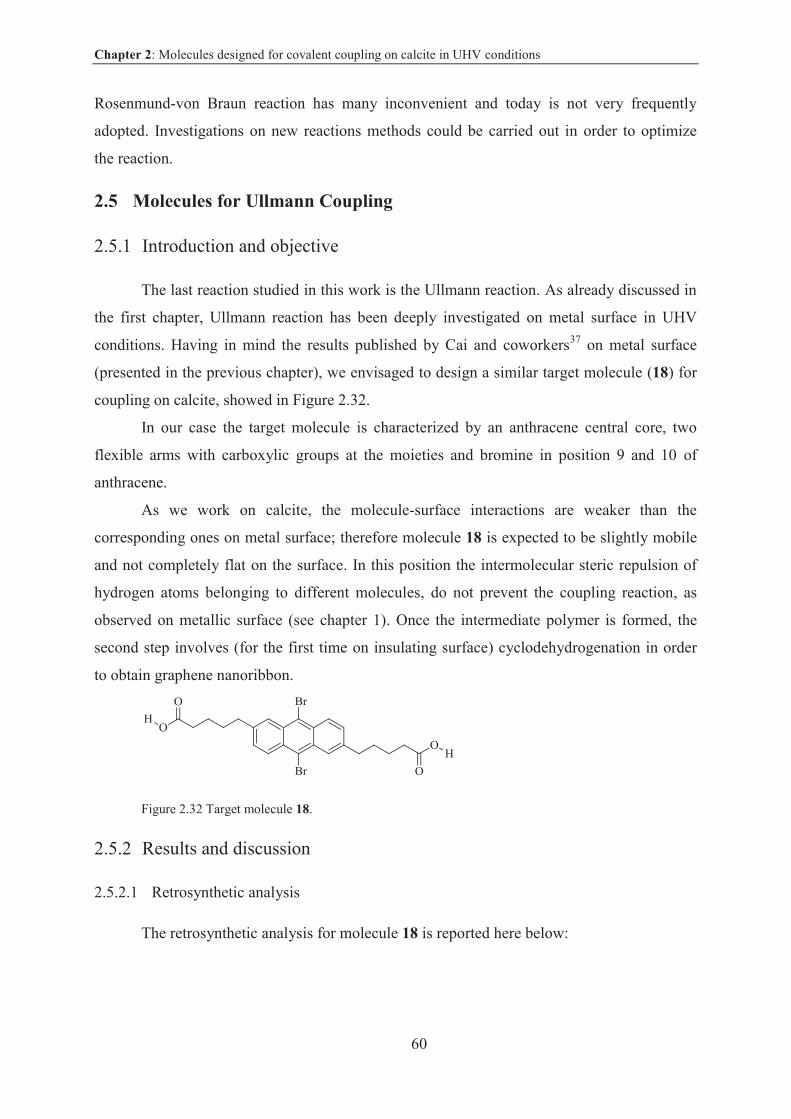
Chapter 2: Molecules designed for covalent coupling on calcite in UHV conditions
60
Rosenmund-von Braun reaction has many inconvenient and today is not very frequently
adopted. Investigations on new reactions methods could be carried out in order to optimize
the reaction.
2.5 Molecules for Ullmann Coupling
2.5.1 Introduction and objective
The last reaction studied in this work is the Ullmann reaction. As already discussed in
the first chapter, Ullmann reaction has been deeply investigated on metal surface in UHV
conditions. Having in mind the results published by Cai and coworkers37 on metal surface
(presented in the previous chapter), we envisaged to design a similar target molecule (18) for
coupling on calcite, showed in Figure 2.32.
In our case the target molecule is characterized by an anthracene central core, two
flexible arms with carboxylic groups at the moieties and bromine in position 9 and 10 of
anthracene.
As we work on calcite, the molecule-surface interactions are weaker than the
corresponding ones on metal surface; therefore molecule 18 is expected to be slightly mobile
and not completely flat on the surface. In this position the intermolecular steric repulsion of
hydrogen atoms belonging to different molecules, do not prevent the coupling reaction, as
observed on metallic surface (see chapter 1). Once the intermediate polymer is formed, the
second step involves (for the first time on insulating surface) cyclodehydrogenation in order
to obtain graphene nanoribbon.
Figure 2.32 Target molecule 18.
2.5.2 Results and discussion
2.5.2.1 Retrosynthetic analysis
The retrosynthetic analysis for molecule 18 is reported here below:
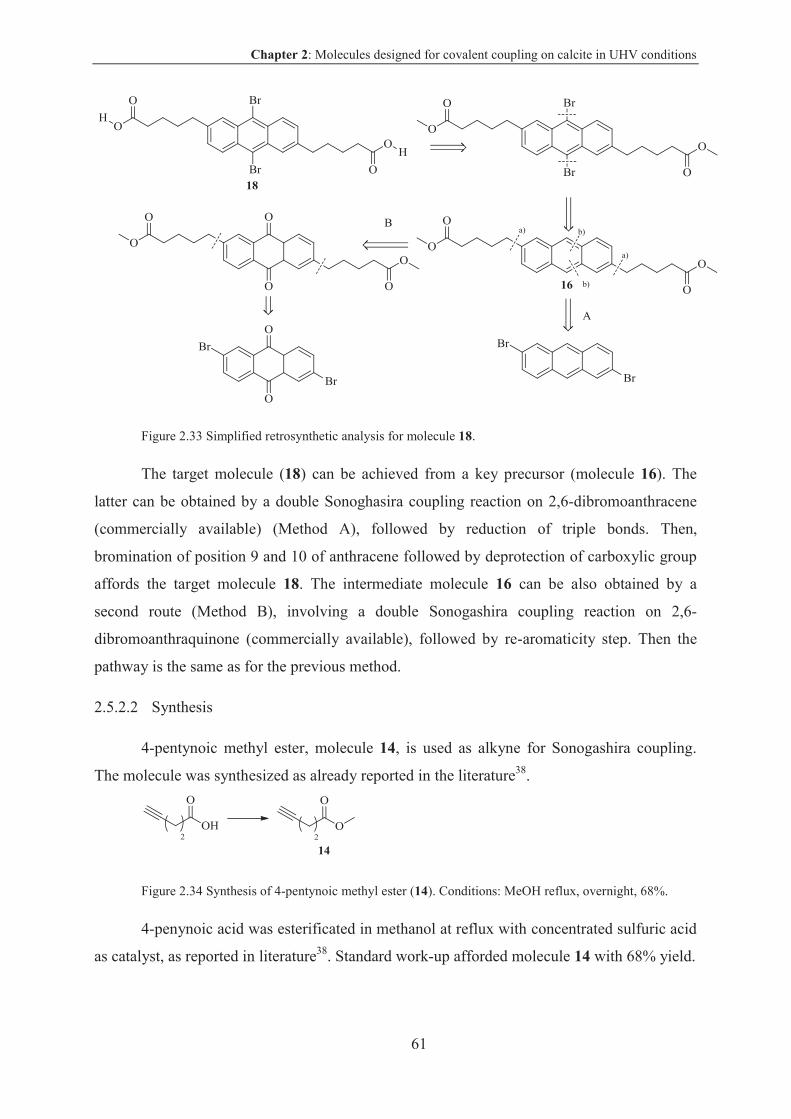
Chapter 2: Molecules designed for covalent coupling on calcite in UHV conditions
61
Figure 2.33 Simplified retrosynthetic analysis for molecule 18.
The target molecule (18) can be achieved from a key precursor (molecule 16). The
latter can be obtained by a double Sonoghasira coupling reaction on 2,6-dibromoanthracene
(commercially available) (Method A), followed by reduction of triple bonds. Then,
bromination of position 9 and 10 of anthracene followed by deprotection of carboxylic group
affords the target molecule 18. The intermediate molecule 16 can be also obtained by a
second route (Method B), involving a double Sonogashira coupling reaction on 2,6-
dibromoanthraquinone (commercially available), followed by re-aromaticity step. Then the
pathway is the same as for the previous method.
2.5.2.2 Synthesis
4-pentynoic methyl ester, molecule 14, is used as alkyne for Sonogashira coupling.
The molecule was synthesized as already reported in the literature38.
Figure 2.34 Synthesis of 4-pentynoic methyl ester (14). Conditions: MeOH reflux, overnight, 68%.
4-penynoic acid was esterificated in methanol at reflux with concentrated sulfuric acid
as catalyst, as reported in literature38. Standard work-up afforded molecule 14 with 68% yield.
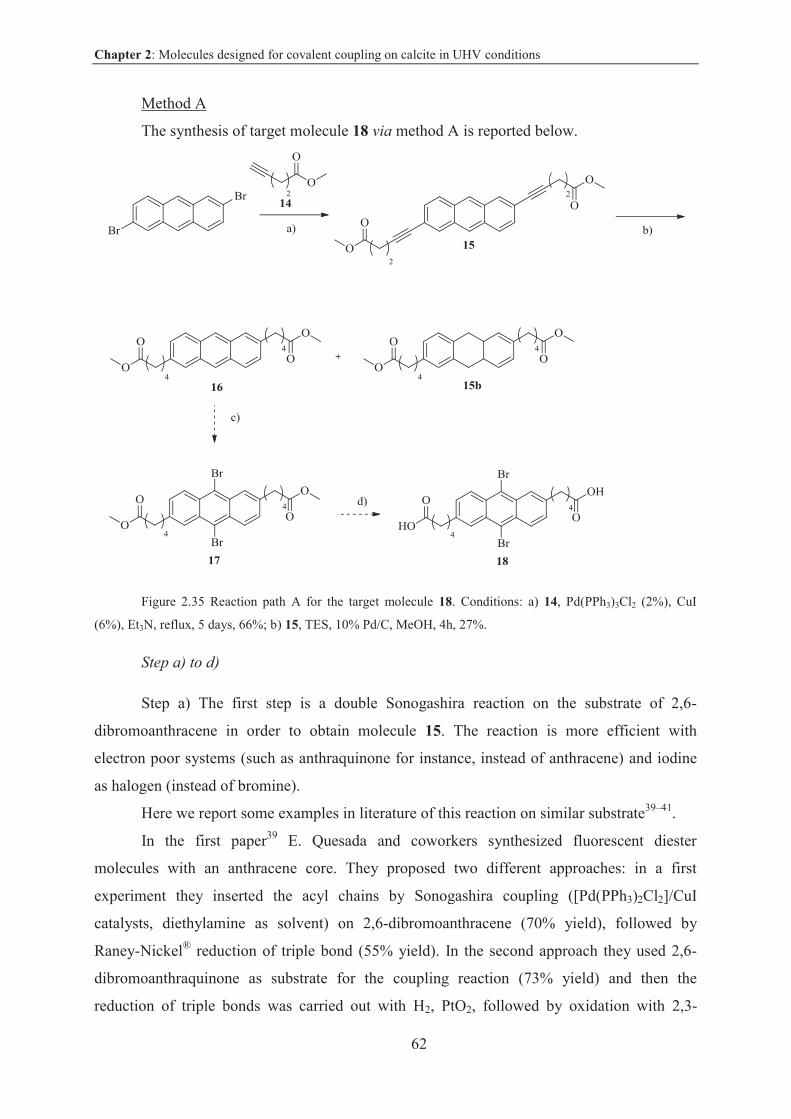
Chapter 2: Molecules designed for covalent coupling on calcite in UHV conditions
62
Method A
The synthesis of target molecule 18 via method A is reported below.
Figure 2.35 Reaction path A for the target molecule 18. Conditions: a) 14, Pd(PPh3)3Cl2 (2%), CuI
(6%), Et3N, reflux, 5 days, 66%; b) 15, TES, 10% Pd/C, MeOH, 4h, 27%.
Step a) to d)
Step a) The first step is a double Sonogashira reaction on the substrate of 2,6-
dibromoanthracene in order to obtain molecule 15. The reaction is more efficient with
electron poor systems (such as anthraquinone for instance, instead of anthracene) and iodine
as halogen (instead of bromine).
Here we report some examples in literature of this reaction on similar substrate39–41.
In the first paper39 E. Quesada and coworkers synthesized fluorescent diester
molecules with an anthracene core. They proposed two different approaches: in a first
experiment they inserted the acyl chains by Sonogashira coupling ([Pd(PPh3)2Cl2]/CuI
catalysts, diethylamine as solvent) on 2,6-dibromoanthracene (70% yield), followed by
Raney-Nickel® reduction of triple bond (55% yield). In the second approach they used 2,6-
dibromoanthraquinone as substrate for the coupling reaction (73% yield) and then the
reduction of triple bonds was carried out with H2, PtO2, followed by oxidation with 2,3-
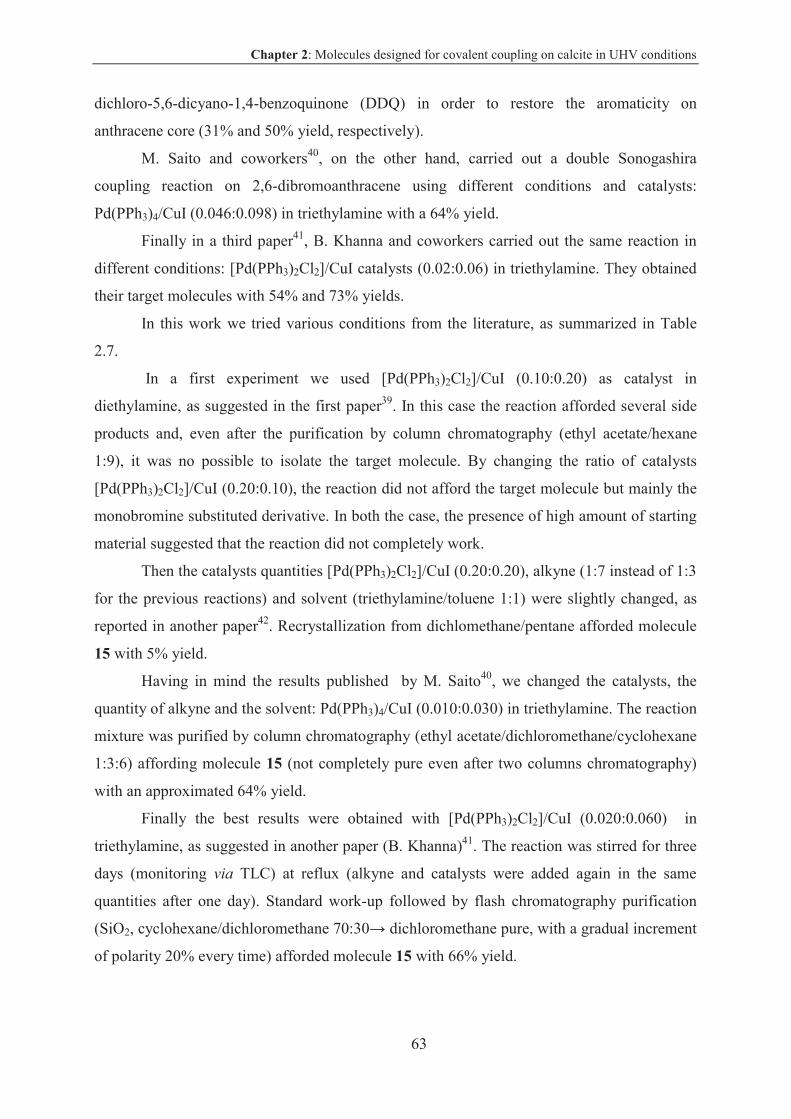
Chapter 2: Molecules designed for covalent coupling on calcite in UHV conditions
63
dichloro-5,6-dicyano-1,4-benzoquinone (DDQ) in order to restore the aromaticity on
anthracene core (31% and 50% yield, respectively).
M. Saito and coworkers40, on the other hand, carried out a double Sonogashira
coupling reaction on 2,6-dibromoanthracene using different conditions and catalysts:
Pd(PPh3)4/CuI (0.046:0.098) in triethylamine with a 64% yield.
Finally in a third paper41, B. Khanna and coworkers carried out the same reaction in
different conditions: [Pd(PPh3)2Cl2]/CuI catalysts (0.02:0.06) in triethylamine. They obtained
their target molecules with 54% and 73% yields.
In this work we tried various conditions from the literature, as summarized in Table
2.7.
In a first experiment we used [Pd(PPh3)2Cl2]/CuI (0.10:0.20) as catalyst in
diethylamine, as suggested in the first paper39. In this case the reaction afforded several side
products and, even after the purification by column chromatography (ethyl acetate/hexane
1:9), it was no possible to isolate the target molecule. By changing the ratio of catalysts
[Pd(PPh3)2Cl2]/CuI (0.20:0.10), the reaction did not afford the target molecule but mainly the
monobromine substituted derivative. In both the case, the presence of high amount of starting
material suggested that the reaction did not completely work.
Then the catalysts quantities [Pd(PPh3)2Cl2]/CuI (0.20:0.20), alkyne (1:7 instead of 1:3
for the previous reactions) and solvent (triethylamine/toluene 1:1) were slightly changed, as
reported in another paper42. Recrystallization from dichlomethane/pentane afforded molecule
15 with 5% yield.
Having in mind the results published by M. Saito40, we changed the catalysts, the
quantity of alkyne and the solvent: Pd(PPh3)4/CuI (0.010:0.030) in triethylamine. The reaction
mixture was purified by column chromatography (ethyl acetate/dichloromethane/cyclohexane
1:3:6) affording molecule 15 (not completely pure even after two columns chromatography)
with an approximated 64% yield.
Finally the best results were obtained with [Pd(PPh3)2Cl2]/CuI (0.020:0.060) in
triethylamine, as suggested in another paper (B. Khanna)41. The reaction was stirred for three
days (monitoring via TLC) at reflux (alkyne and catalysts were added again in the same
quantities after one day). Standard work-up followed by flash chromatography purification
(SiO2, cyclohexane/dichloromethane 70:30 dichloromethane pure, with a gradual increment
of polarity 20% every time) afforded molecule 15 with 66% yield.
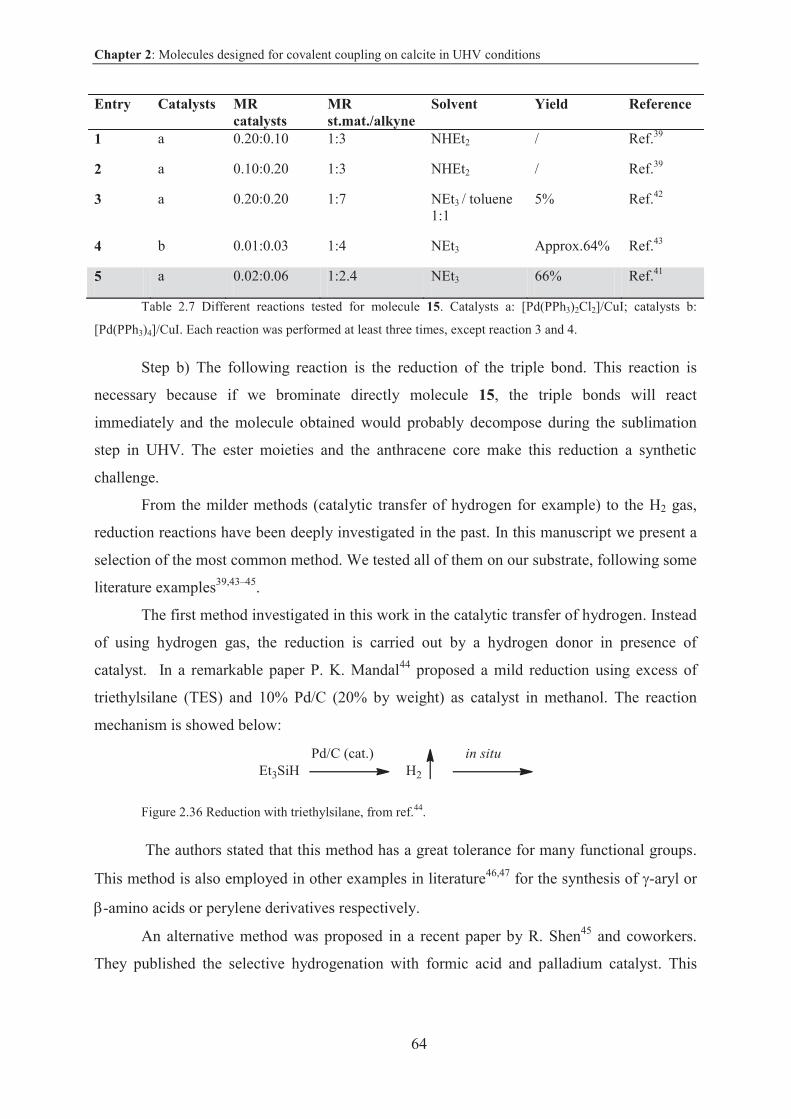
Chapter 2: Molecules designed for covalent coupling on calcite in UHV conditions
64
Entry Catalysts MRcatalysts
MRst.mat./alkyne
Solvent Yield Reference
1 a 0.20:0.10 1:3 NHEt2 / Ref.39
2 a 0.10:0.20 1:3 NHEt2 / Ref.39
3 a 0.20:0.20 1:7 NEt3 / toluene 1:1
5% Ref.42
4 b 0.01:0.03 1:4 NEt3 Approx.64% Ref.43
5 a 0.02:0.06 1:2.4 NEt3 66% Ref.41
Table 2.7 Different reactions tested for molecule 15. Catalysts a: [Pd(PPh3)2Cl2]/CuI; catalysts b:
[Pd(PPh3)4]/CuI. Each reaction was performed at least three times, except reaction 3 and 4.
Step b) The following reaction is the reduction of the triple bond. This reaction is
necessary because if we brominate directly molecule 15, the triple bonds will react
immediately and the molecule obtained would probably decompose during the sublimation
step in UHV. The ester moieties and the anthracene core make this reduction a synthetic
challenge.
From the milder methods (catalytic transfer of hydrogen for example) to the H2 gas,
reduction reactions have been deeply investigated in the past. In this manuscript we present a
selection of the most common method. We tested all of them on our substrate, following some
literature examples39,43–45.
The first method investigated in this work in the catalytic transfer of hydrogen. Instead
of using hydrogen gas, the reduction is carried out by a hydrogen donor in presence of
catalyst. In a remarkable paper P. K. Mandal44 proposed a mild reduction using excess of
triethylsilane (TES) and 10% Pd/C (20% by weight) as catalyst in methanol. The reaction
mechanism is showed below:
Figure 2.36 Reduction with triethylsilane, from ref.44.
The authors stated that this method has a great tolerance for many functional groups.
This method is also employed in other examples in literature46,47 for the synthesis of -aryl or
-amino acids or perylene derivatives respectively.
An alternative method was proposed in a recent paper by R. Shen45 and coworkers.
They published the selective hydrogenation with formic acid and palladium catalyst. This
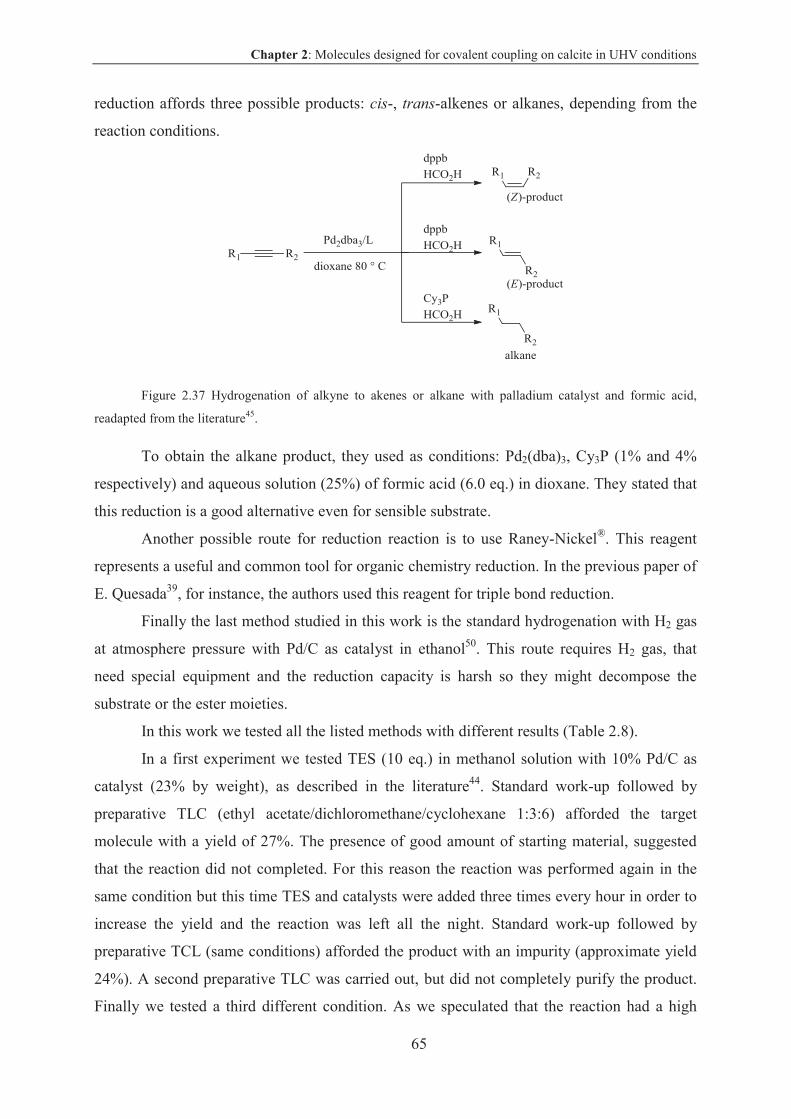
Chapter 2: Molecules designed for covalent coupling on calcite in UHV conditions
65
reduction affords three possible products: cis-, trans-alkenes or alkanes, depending from the
reaction conditions.
Figure 2.37 Hydrogenation of alkyne to akenes or alkane with palladium catalyst and formic acid,
readapted from the literature45.
To obtain the alkane product, they used as conditions: Pd2(dba)3, Cy3P (1% and 4%
respectively) and aqueous solution (25%) of formic acid (6.0 eq.) in dioxane. They stated that
this reduction is a good alternative even for sensible substrate.
Another possible route for reduction reaction is to use Raney-Nickel®. This reagent
represents a useful and common tool for organic chemistry reduction. In the previous paper of
E. Quesada39, for instance, the authors used this reagent for triple bond reduction.
Finally the last method studied in this work is the standard hydrogenation with H2 gas
at atmosphere pressure with Pd/C as catalyst in ethanol50. This route requires H2 gas, that
need special equipment and the reduction capacity is harsh so they might decompose the
substrate or the ester moieties.
In this work we tested all the listed methods with different results (Table 2.8).
In a first experiment we tested TES (10 eq.) in methanol solution with 10% Pd/C as
catalyst (23% by weight), as described in the literature44. Standard work-up followed by
preparative TLC (ethyl acetate/dichloromethane/cyclohexane 1:3:6) afforded the target
molecule with a yield of 27%. The presence of good amount of starting material, suggested
that the reaction did not completed. For this reason the reaction was performed again in the
same condition but this time TES and catalysts were added three times every hour in order to
increase the yield and the reaction was left all the night. Standard work-up followed by
preparative TCL (same conditions) afforded the product with an impurity (approximate yield
24%). A second preparative TLC was carried out, but did not completely purify the product.
Finally we tested a third different condition. As we speculated that the reaction had a high
Chapter 2: Molecules designed for covalent coupling on calcite in UHV conditions
66
kinetic rate, we decided to add TES diluted in methanol drop by drop in a dropping funnel
over 10 minutes. The reaction was let to react for 2 days (adding the catalyst and TES every
day). Standard work-up followed by preparative TLC (same conditions) afforded the target
molecule with a yield of 3%. We tried several times to reproduce the reaction again with the
first conditions, but we never achieved the results obtained before. In every case more than
50% of the starting material did not react. We suggested that the catalyst is poisoned
preventing the success of the reaction. We also obtained and characterized dihydroanthracene
derivative (molecule 15 b) as side product.
We decided to change the strategy using the conditions proposed in R. Shen’s paper45.
In this case, first we form the complex between the ligand Cy3P and Pd2(dba)3 (20% and 5%
respectively) in dioxane (the reaction color switches from dark red into dark orange), we
added molecule 15 and finally formic acid (aqueous solution at 25%, 6 eq.). The reaction
mixture was heated at 80 °C overnight. Standard work-up followed by preparative TLC (ethyl
acetate/dichlomethane/cyclohexane 1:4:5) afforded a degraded product that did not
correspond to the target molecule.
We also tested the Raney-Nickel® reaction in tetrahydrofurane for three hours
following the procedure already reported in the literature39. Standard work-up, followed by
purification afforded a degraded product that did not correspond to the target molecule.
Probably in both cases the reaction conditions (formic acid or Raney-Nickel®) were
too harsh and the anthracene derivative has been over reduced affording complex mixtures.
After a first purification the mixtures were not separated and we abandoned this route.
The other approach tested in this work is the in hydrogenation with H2 gas, as
suggested in the literature43. The reaction was conducted in ethanol with 10% Pd/C (0.28 eq.
of palladium) as catalyst in a presence of H2 gas at 0.4 bar. After four hours, the starting
material was still present so the reaction was left 48 hours under H2 atmosphere and rapid
stirring. Standard work-up followed by preparative TLC (ethyl acetate/cyclohexane 2:8)
afforded an unknown product. Characterization by NMR spectroscopy did not help in the
identification of the product; high resolution mass spectroscopy is in progress during the
redaction of the manuscript. The reaction was also carried out in similar conditions but for a
shorter time. The reaction was conducted in ethanol with 10% Pd/C (1.4 eq.) as catalyst in a
presence of H2 gas at ambient pressure. After 6 hours the starting materials was still present
but in smaller quantity. Standard work-up, followed by preparative TLC (ethyl
acetate/dichloromethane/cyclohexane 1:3:6) afforded the same product as in the previous case
(reduction with H2 gas at 0.4 bar) and starting material. Therefore we can deduce that when
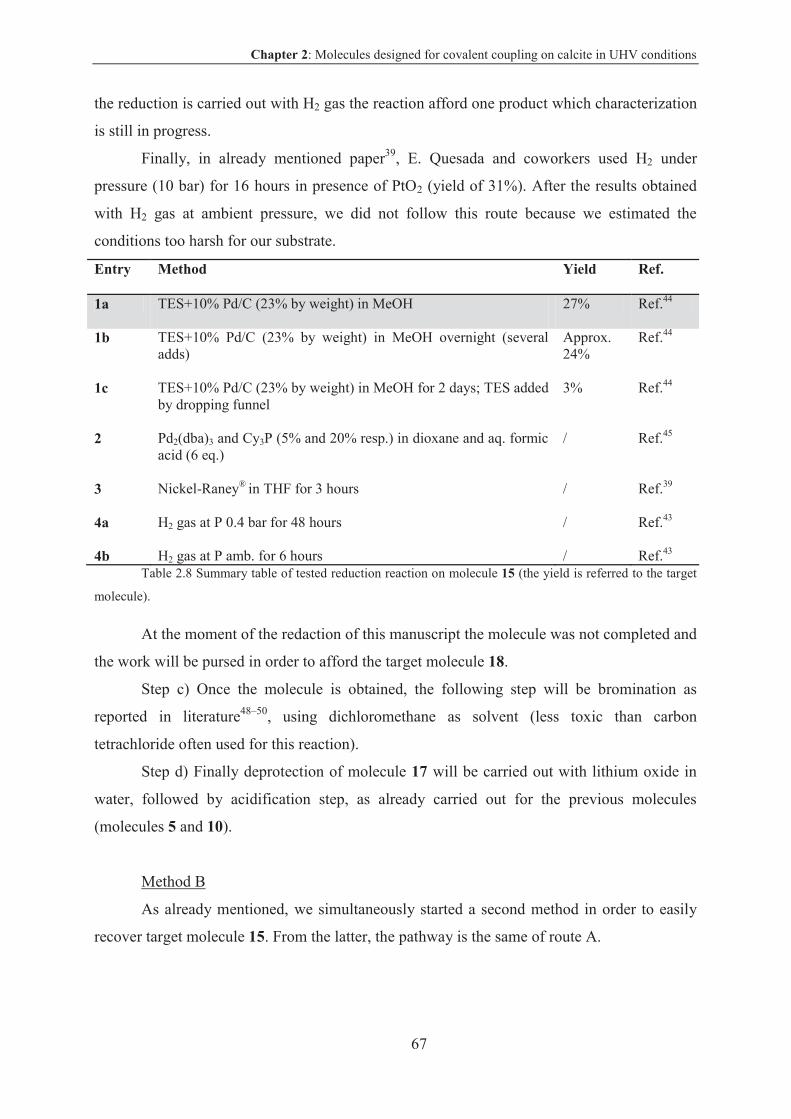
Chapter 2: Molecules designed for covalent coupling on calcite in UHV conditions
67
the reduction is carried out with H2 gas the reaction afford one product which characterization
is still in progress.
Finally, in already mentioned paper39, E. Quesada and coworkers used H2 under
pressure (10 bar) for 16 hours in presence of PtO2 (yield of 31%). After the results obtained
with H2 gas at ambient pressure, we did not follow this route because we estimated the
conditions too harsh for our substrate.
Entry Method Yield Ref.
1a TES+10% Pd/C (23% by weight) in MeOH
27% Ref.44
1b TES+10% Pd/C (23% by weight) in MeOH overnight (several adds)
Approx. 24%
Ref.44
1c TES+10% Pd/C (23% by weight) in MeOH for 2 days; TES added by dropping funnel
3% Ref.44
2 Pd2(dba)3 and Cy3P (5% and 20% resp.) in dioxane and aq. formic acid (6 eq.)
/ Ref.45
3 Nickel-Raney® in THF for 3 hours
/ Ref.39
4a H2 gas at P 0.4 bar for 48 hours
/ Ref.43
4b H2 gas at P amb. for 6 hours / Ref.43 Table 2.8 Summary table of tested reduction reaction on molecule 15 (the yield is referred to the target
molecule).
At the moment of the redaction of this manuscript the molecule was not completed and
the work will be pursed in order to afford the target molecule 18.
Step c) Once the molecule is obtained, the following step will be bromination as
reported in literature48–50, using dichloromethane as solvent (less toxic than carbon
tetrachloride often used for this reaction).
Step d) Finally deprotection of molecule 17 will be carried out with lithium oxide in
water, followed by acidification step, as already carried out for the previous molecules
(molecules 5 and 10).
Method B
As already mentioned, we simultaneously started a second method in order to easily
recover target molecule 15. From the latter, the pathway is the same of route A.
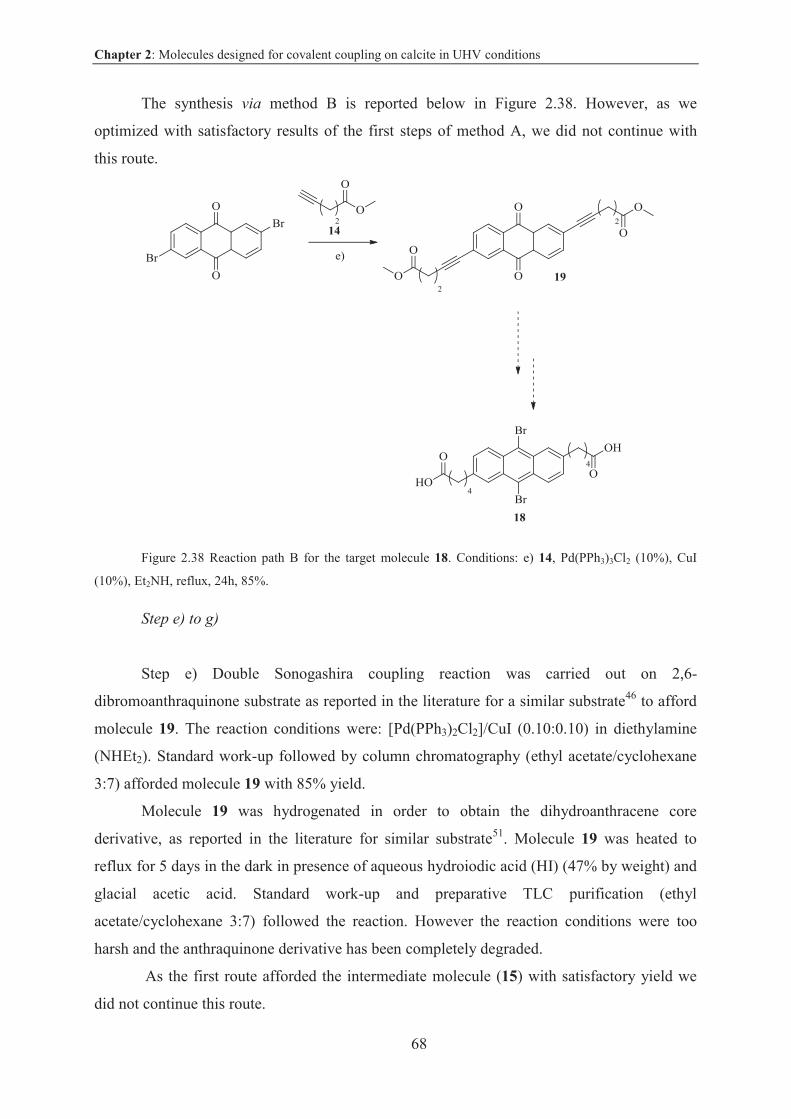
Chapter 2: Molecules designed for covalent coupling on calcite in UHV conditions
68
The synthesis via method B is reported below in Figure 2.38. However, as we
optimized with satisfactory results of the first steps of method A, we did not continue with
this route.
Figure 2.38 Reaction path B for the target molecule 18. Conditions: e) 14, Pd(PPh3)3Cl2 (10%), CuI
(10%), Et2NH, reflux, 24h, 85%.
Step e) to g)
Step e) Double Sonogashira coupling reaction was carried out on 2,6-
dibromoanthraquinone substrate as reported in the literature for a similar substrate46 to afford
molecule 19. The reaction conditions were: [Pd(PPh3)2Cl2]/CuI (0.10:0.10) in diethylamine
(NHEt2). Standard work-up followed by column chromatography (ethyl acetate/cyclohexane
3:7) afforded molecule 19 with 85% yield.
Molecule 19 was hydrogenated in order to obtain the dihydroanthracene core
derivative, as reported in the literature for similar substrate51. Molecule 19 was heated to
reflux for 5 days in the dark in presence of aqueous hydroiodic acid (HI) (47% by weight) and
glacial acetic acid. Standard work-up and preparative TLC purification (ethyl
acetate/cyclohexane 3:7) followed the reaction. However the reaction conditions were too
harsh and the anthraquinone derivative has been completely degraded.
As the first route afforded the intermediate molecule (15) with satisfactory yield we
did not continue this route.
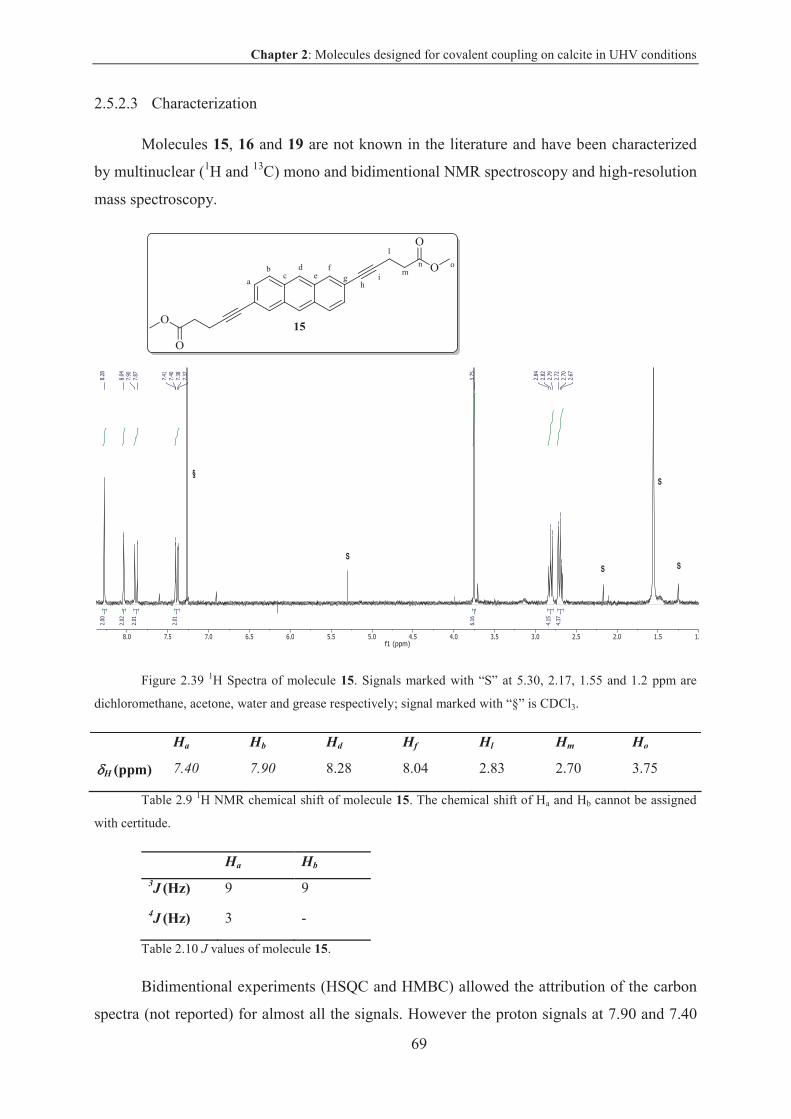
Chapter 2: Molecules designed for covalent coupling on calcite in UHV conditions
69
2.5.2.3 Characterization
Molecules 15, 16 and 19 are not known in the literature and have been characterized
by multinuclear (1H and 13C) mono and bidimentional NMR spectroscopy and high-resolution
mass spectroscopy.
Figure 2.39 1H Spectra of molecule 15. Signals marked with “S” at 5.30, 2.17, 1.55 and 1.2 ppm are
dichloromethane, acetone, water and grease respectively; signal marked with “§” is CDCl3.
Ha Hb Hd Hf Hl Hm Ho
H (ppm) 7.40 7.90 8.28 8.04 2.83 2.70 3.75
Table 2.9 1H NMR chemical shift of molecule 15. The chemical shift of Ha and Hb cannot be assigned
with certitude.
Ha Hb
3J (Hz) 9 9
4J (Hz) 3 -
Table 2.10 J values of molecule 15.
Bidimentional experiments (HSQC and HMBC) allowed the attribution of the carbon
spectra (not reported) for almost all the signals. However the proton signals at 7.90 and 7.40
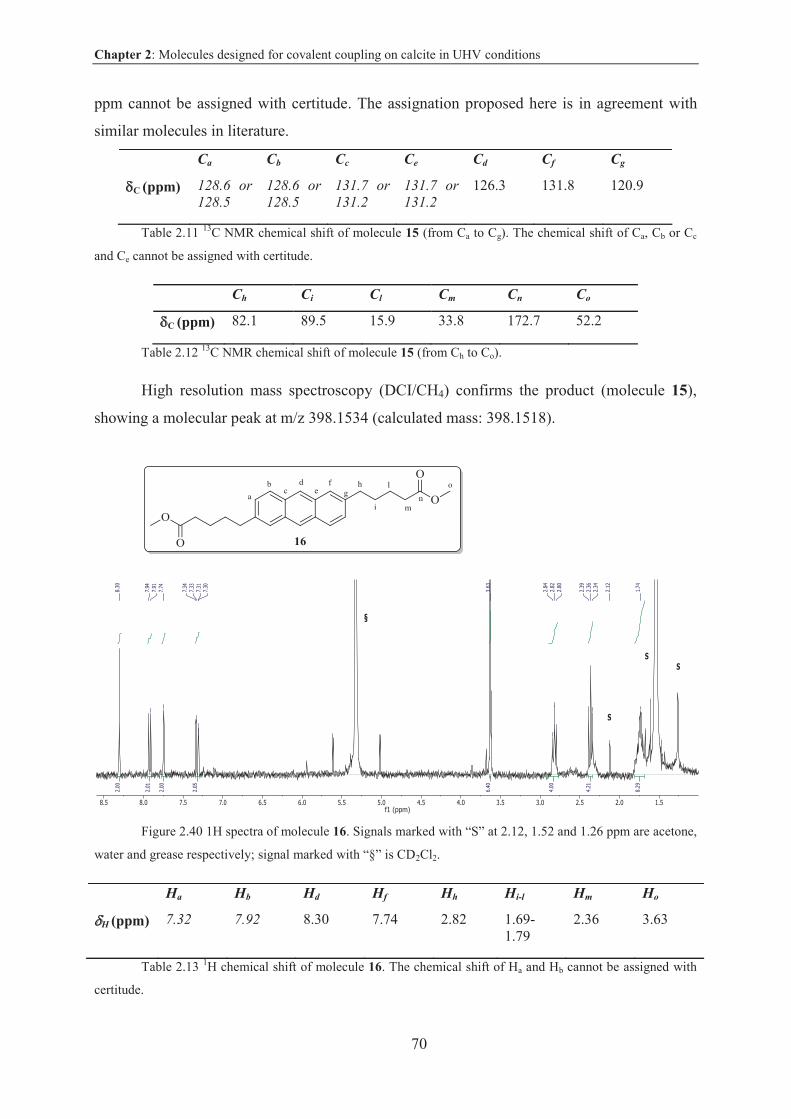
Chapter 2: Molecules designed for covalent coupling on calcite in UHV conditions
70
ppm cannot be assigned with certitude. The assignation proposed here is in agreement with
similar molecules in literature.
Ca Cb Cc Ce Cd Cf Cg
C (ppm) 128.6 or
128.5
128.6 or
128.5 131.7 or
131.2
131.7 or
131.2 126.3 131.8 120.9
Table 2.11 13C NMR chemical shift of molecule 15 (from Ca to Cg). The chemical shift of Ca, Cb or Cc
and Ce cannot be assigned with certitude.
Ch Ci Cl Cm Cn Co
C (ppm) 82.1 89.5 15.9 33.8 172.7 52.2
Table 2.12 13C NMR chemical shift of molecule 15 (from Ch to Co).
High resolution mass spectroscopy (DCI/CH4) confirms the product (molecule 15),
showing a molecular peak at m/z 398.1534 (calculated mass: 398.1518).
Figure 2.40 1H spectra of molecule 16. Signals marked with “S” at 2.12, 1.52 and 1.26 ppm are acetone,
water and grease respectively; signal marked with “§” is CD2Cl2.
Ha Hb Hd Hf Hh Hi-l Hm Ho
H (ppm) 7.32 7.92 8.30 7.74 2.82 1.69-1.79
2.36 3.63
Table 2.13 1H chemical shift of molecule 16. The chemical shift of Ha and Hb cannot be assigned with
certitude.
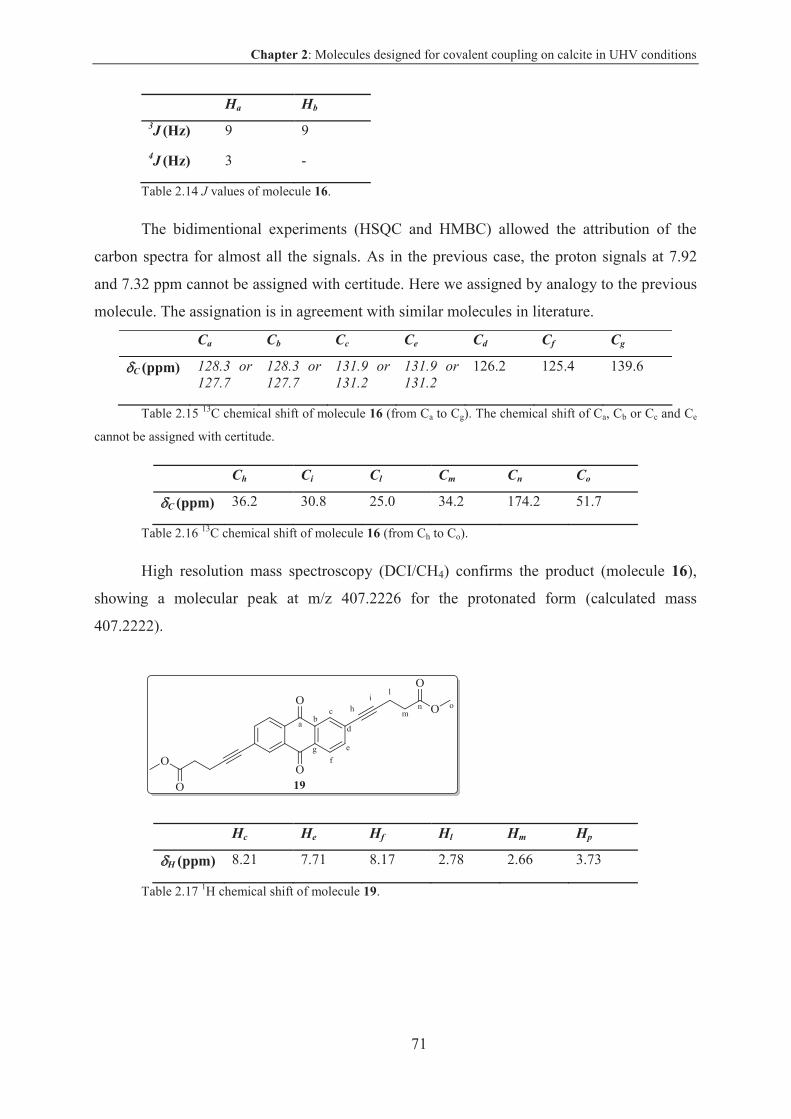
Chapter 2: Molecules designed for covalent coupling on calcite in UHV conditions
71
Ha Hb
3J (Hz) 9 9
4J (Hz) 3 -
Table 2.14 J values of molecule 16.
The bidimentional experiments (HSQC and HMBC) allowed the attribution of the
carbon spectra for almost all the signals. As in the previous case, the proton signals at 7.92
and 7.32 ppm cannot be assigned with certitude. Here we assigned by analogy to the previous
molecule. The assignation is in agreement with similar molecules in literature.
Ca Cb Cc Ce Cd Cf Cg
C (ppm) 128.3 or
127.7
128.3 or
127.7 131.9 or
131.2
131.9 or
131.2 126.2 125.4 139.6
Table 2.15 13C chemical shift of molecule 16 (from Ca to Cg). The chemical shift of Ca, Cb or Cc and Ce
cannot be assigned with certitude.
Ch Ci Cl Cm Cn Co
C (ppm) 36.2 30.8 25.0 34.2 174.2 51.7
Table 2.16 13C chemical shift of molecule 16 (from Ch to Co).
High resolution mass spectroscopy (DCI/CH4) confirms the product (molecule 16),
showing a molecular peak at m/z 407.2226 for the protonated form (calculated mass
407.2222).
Hc He Hf Hl Hm Hp
H (ppm) 8.21 7.71 8.17 2.78 2.66 3.73
Table 2.17 1H chemical shift of molecule 19.
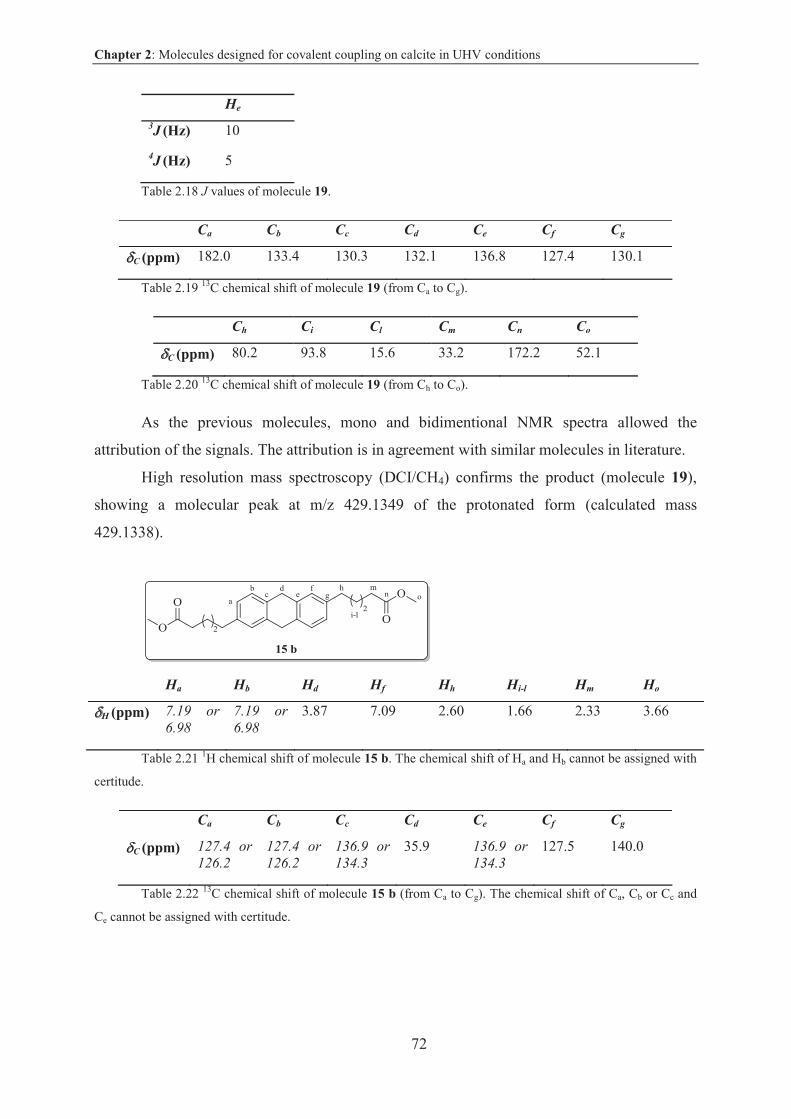
Chapter 2: Molecules designed for covalent coupling on calcite in UHV conditions
72
He
3J (Hz) 10
4J (Hz) 5
Table 2.18 J values of molecule 19.
Ca Cb Cc Cd Ce Cf Cg
C (ppm) 182.0 133.4 130.3 132.1 136.8 127.4 130.1
Table 2.19 13C chemical shift of molecule 19 (from Ca to Cg).
Ch Ci Cl Cm Cn Co
C (ppm) 80.2 93.8 15.6 33.2 172.2 52.1
Table 2.20 13C chemical shift of molecule 19 (from Ch to Co).
As the previous molecules, mono and bidimentional NMR spectra allowed the
attribution of the signals. The attribution is in agreement with similar molecules in literature.
High resolution mass spectroscopy (DCI/CH4) confirms the product (molecule 19),
showing a molecular peak at m/z 429.1349 of the protonated form (calculated mass
429.1338).
Ha Hb Hd Hf Hh Hi-l Hm Ho
H (ppm) 7.19 or
6.98
7.19 or
6.98 3.87 7.09 2.60 1.66 2.33 3.66
Table 2.21 1H chemical shift of molecule 15 b. The chemical shift of Ha and Hb cannot be assigned with
certitude.
Ca Cb Cc Cd Ce Cf Cg
C (ppm) 127.4 or
126.2
127.4 or
126.2
136.9 or
134.3
35.9 136.9 or
134.3 127.5 140.0
Table 2.22 13C chemical shift of molecule 15 b (from Ca to Cg). The chemical shift of Ca, Cb or Cc and
Ce cannot be assigned with certitude.
Chapter 2: Molecules designed for covalent coupling on calcite in UHV conditions
73
Ch Ci-l Cm Cn Co
C (ppm) 35.3 31.2 and 24.7
34.1 174.3 51.6
Table 2.23 13C chemical shift of molecule 15 b (from Ch to Co).
As we already mentioned, we obtained as side product of the reduction reaction of
molecule 15 (Figure 2.35, reaction b), the dihydroanthracene derivative (molecule 15 b). Even
if very instable due to its sensibility to air and light, we managed to characterize with mono
and bidimentional NMR spectra. As for the previous cases, some signals cannot be assigned
with certitude. The assignation is in agreement with similar molecules in the literature.
2.5.3 Conclusion
In this section we presented the synthesis of anthracene molecule in order to obtain the
graphene nanoribbon on calcite surface. With this purpose, first we synthesized an
intermediate molecule (molecule 15). This was obtained with satisfactory results by double
Sonogashira coupling reaction on anthracene core. We also investigated a second method
(method B) to obtain this key intermediate. Then, in order to reduce the triple bond we studied
different reduction reactions with several methods (triethylsilane, formic acid, Raney- Nickel®
and hydrogenation with H2 gas). A complete characterization (mono and bidimentional NMR
spectra and high resolution mass spectroscopy) was carried out on the molecules not already
described in the literature. Further studies will be carried on in order to optimize the reduction
and complete the final product (molecule 18) by bromination and deprotection steps.
2.6 General conclusion
In this chapter we presented the synthesis of four families of molecules for coupling
reactions on calcite in UHV conditions. Investigation of this new stimulating field of study
might pave the way for future applications in molecular electronics.
This exploratory work leads us to study four different types of reactions with
particular properties. First we synthesized molecules for homocoupling reactions on calcite
surface. Then, we focused on the synthesis of the analogous dimers for photopolymerization
reaction on surface. We continued the study with the synthesis of cyanonaphthalene
derivative for polycondensation reaction in order to obtain phthalocyanine network. Finally
we concluded the work with the study of anthracene derivative in order to reproduce the
Ullmann reaction on calcite. The molecules studied were synthetized with standard organic
Chapter 2: Molecules designed for covalent coupling on calcite in UHV conditions
74
routes and are being studied by nc-AFM by A. K hnle’s group in Germany. Characterization
by NMR and mass spectroscopy of the molecules completed the work. In addition to this,
some molecules were also used for MOFs.
2.7 References
1. Shao, M. & Zhao, Y. TTFAQ-cored D/A ensembles: synthesis, electronic properties, and redox responses to transition metal ions. Tetrahedron Lett. 51, 2892–2895 (2010).
2. Feng, Y.-S., Xie, C.-Q., Qiao, W.-L. & Xu, H.-J. Palladium-Catalyzed Trifluoroethylation of Terminal Alkynes with 1,1,1-Trifluoro-2-iodoethane. Org. Lett. 15, 936–939 (2013).
3. Niamnont, N., Siripornnoppakhun, W., Rashatasakhon, P. & Sukwattanasinitt, M. A Polyanionic Dendritic Fluorophore for Selective Detection of Hg2+ in Triton X-100 Aqueous Media. Org. Lett. 11, 2768–2771 (2009).
4. Zanotti, G. et al. Synthesis of a novel unsymmetrical Zn(II) phthalocyanine bearing a phenyl ethynyl moiety as sensitizer for dye-sensitized solar cells. Dalton Trans. 40, 38–40 (2010).
5. Fasina, T. M. et al. Synthesis, optical properties, crystal structures and phase behaviour of symmetric, conjugated ethynylarene-based rigid rods with terminal carboxylate groups. J.
Mater. Chem. 15, 690–697 (2005). 6. Siemsen, P., Livingston, R. C. & Diederich, F. Acetylenic Coupling: A Powerful Tool in
Molecular Construction. Angew. Chem. Int. Ed. 39, 2632–2657 (2000). 7. Liu, Q. & Burton, D. J. A facile synthesis of diynes. Tetrahedron Lett. 38, 4371–4374
(1997). 8. Hattori, T., Kijima, M. & Shirakawa, H. Oxidative polycondensation of acetylene by iodine
in the presence of a palladium-copper catalyst. Synth. Met. 84, 357–358 (1997). 9. Han, S. et al. A single-crystalline microporous coordination polymer with mixed parallel
and diagonal interpenetrating -Po networks. CrystEngComm 13, 4838–4840 (2011). 10. Bischoff, A., Subramanya, H., Sundaresan, K., Sammeta, S. & Vaka, A. Novel
Piperazine Derivatives as Inhibitors of Stearoyl-Coa Desaturase. (2008). at <WO2008157844 (A1)>
11. Jones, L. F. et al. Tuning magnetic properties using targeted structural distortion: New additions to a family of Mn6 single-molecule magnets. Inorganica Chim. Acta 361, 3420–
3426 (2008). 12. Meng, J.-P. et al. Metal–organic frameworks based on rigid ligands as separator
membranes in supercapacitor. Dalton Trans 44, 5407–5416 (2015). 13. Tranchemontagne, D. J. et al. Hydrogen Storage in New Metal–Organic Frameworks.
J. Phys. Chem. C 116, 13143–13151 (2012). 14. Britt, D., Tranchemontagne, D. & Yaghi, O. M. Metal-organic frameworks with high
capacity and selectivity for harmful gases. Proc. Natl. Acad. Sci. 105, 11623–11627 (2008).
15. Zheng, M.-X., Gao, X.-J., Zhang, C.-L., Qin, L. & Zheng, H.-G. Assembly of various degrees of interpenetration of Co-MOFs based on mononuclear or dinuclear cluster units: magnetic properties and gas adsorption. Dalton Trans 44, 4751–4758 (2015).
16. Prock, A., Shand, M. L. & Chance, R. R. Solid-state photopolymerization of diacetylenes. Macromolecules 15, 238–241 (1982).
17. Vinod, T. P., Chang, J. H., Kim, J. & Rhee, S. W. Self-Assembly and Photopolymerization of Diacetylene Molecules on Surface of Magnetite Nanoparticles. Bull. Korean Chem. Soc. 29, 799 – 804 (2008).
Chapter 2: Molecules designed for covalent coupling on calcite in UHV conditions
75
18. Okawa, Y., Akai-Kasaya, M., Kuwahara, Y., Mandal, S. K. & Aono, M. Controlled chain polymerisation and chemical soldering for single-molecule electronics. Nanoscale 4, 3013–3028 (2012).
19. Bässler, H. in Polydiacetylenes (ed. Cantow, H.-J.) 63, 1–48 (Springer-Verlag, 1984). 20. Offermann, D. A. et al. Synthesis and Incorporation into Cyclic Peptides of Tolan
Amino Acids and Their Hydrogenated Congeners: Construction of an Array of A–B-loop Mimetics of the C 3 Domain of Human IgE. J. Org. Chem. 77, 3197–3214 (2012).
21. Austin, W. B., Bilow, N., Kelleghan, W. J. & Lau, K. S. Y. Facile synthesis of ethynylated benzoic acid derivatives and aromatic compounds via ethynyltrimethylsilane. J. Org. Chem. 46, 2280–2286 (1981).
22. Merkul, E., Urselmann, D. & Müller, T. J. J. Consecutive One-Pot Sonogashira–
Glaser Coupling Sequence – Direct Preparation of Symmetrical Diynes by Sequential Pd/Cu Catalysis. Eur. J. Org. Chem. 2011, 238–242 (2011).
23. Vilhelmsen, M. H., Jensen, J., Tortzen, C. G. & Nielsen, M. B. The Glaser–Hay Reaction: Optimization and Scope Based on 13C NMR Kinetics Experiments. Eur. J. Org.
Chem. 2013, 701–711 (2013). 24. Matsubara, H. et al. Syntheses of Novel Fullerene Tweezers and Their Supramolecular
Inclusion Complex of C<SUB>60</SUB>. Chem. Lett. 27, 1099–1100 (1998). 25. Bleisch, T. J., Doti, R. A., Pfeifer, L. A. & Norman, B. H. Dihydropyrido Pyrimidine
Compounds as Autotaxin Inhibitors. (2014). at <WO2014168824 (A1)*> 26. Lever, A. B. P. et al. Recent studies in phthalocyanine chemistry. Pure Appl. Chem.
58, (1986). 27. McKeown, N. B. Phthalocyanine-containing polymers. J. Mater. Chem. 10, 1979–
1995 (2000). 28. Wöhrle, D. Phthalocyanines in Macromolecular Phases - Methods of Synthesis and
Properties of the Materials. Macromol. Rapid Commun. 22, 68–97 (2001). 29. Abel, M., Clair, S., Ourdjini, O., Mossoyan, M. & Porte, L. Single Layer of Polymeric
Fe-Phthalocyanine: An Organometallic Sheet on Metal and Thin Insulating Film. J. Am.
Chem. Soc. 133, 1203–1205 (2011). 30. Dini, D. et al. Nonlinear Transmission of a Tetrabrominated Naphthalocyaninato
Indium Chloride. J. Phys. Chem. B 110, 12230–12239 (2006). 31. Dubinina, T. V. et al. Synthesis and investigation of spectral and electrochemical
properties of alkyl-substituted planar binuclear phthalocyanine complexes sharing a common naphthalene ring. Inorganica Chim. Acta 363, 1869–1878 (2010).
32. Koelsch, C. F. & Whitney, A. G. THE ROSENMUND-von BRAUN NITRILE SYNTHESIS 1. J. Org. Chem. 06, 795–803 (1941).
33. Xu, W., Xu, Q. & Li, J. Sandmeyer cyanation of arenediazonium tetrafluoroborate using acetonitrile as a cyanide source. Org Chem Front 2, 231–235 (2015).
34. Zanon, J., Klapars, A. & Buchwald, S. L. Copper-Catalyzed Domino Halide Exchange-Cyanation of Aryl Bromides. J. Am. Chem. Soc. 125, 2890–2891 (2003).
35. Cristau, H.-J., Cellier, P. P., Spindler, J.-F. & Taillefer, M. Highly Efficient and Mild Copper-Catalyzed N- and C-Arylations with Aryl Bromides and Iodides. Chem. - Eur. J. 10, 5607–5622 (2004).
36. Cristau, H.-J., Ouali, A., Spindler, J.-F. & Taillefer, M. Mild and Efficient Copper-Catalyzed Cyanation of Aryl Iodides and Bromides. Chem. - Eur. J. 11, 2483–2492 (2005).
37. Cai, J. et al. Atomically precise bottom-up fabrication of graphene nanoribbons. Nature 466, 470–473 (2010).
38. Shimotahira, H., Fusazaki, S., Ikeda, I. & Ozoe, Y. A photoreactive probe that differentiates the binding sites of noncompetitive GABA receptor antagonists. Bioorg.
Med. Chem. Lett. 21, 1598–1600 (2011).
Chapter 2: Molecules designed for covalent coupling on calcite in UHV conditions
76
39. Quesada, E. et al. Synthesis and Fluorescence Properties of Novel Transmembrane Probes and Determination of Their Orientation within Vesicles. Helv. Chim. Acta 83, 2464–2476 (2000).
40. Saito, M., Nakano, Y. & Nakamura, H. Compound for organic thin-film transistor and organic thin-film transistor using the compound. (2013). at <http://www.google.com.ar/patents/US8513654>
41. Khanna, B., Parkin, S. R. & Revell, K. D. 2,6-Diarylethynylanthracenes: synthesis, morphology, and electro-optical properties. Tetrahedron Lett. 53, 6383–6387 (2012).
42. Kim, S.-O. et al. Organic semiconductor based on phenylethynyl end-capped anthracene. Thin Solid Films 519, 7998–8002 (2011).
43. Espacenet - Bibliographic data. at <http://worldwide.espacenet.com/publicationDetails/biblio?CC=WO&NR=2010096462A1&KC=A1&FT=D>
44. Mandal, P. K. & McMurray, J. S. Pd C-Induced Catalytic Transfer Hydrogenation with Triethylsilane. J. Org. Chem. 72, 6599–6601 (2007).
45. Shen, R. et al. Facile Regio- and Stereoselective Hydrometalation of Alkynes with a Combination of Carboxylic Acids and Group 10 Transition Metal Complexes: Selective Hydrogenation of Alkynes with Formic Acid. J. Am. Chem. Soc. 133, 17037–17044 (2011).
46. Seki, M. & Matsumoto, K. A novel approach to homochiral -amino acids. Tetrahedron Lett. 37, 3165–3168 (1996).
47. Handa, N. V., Mendoza, K. D. & Shirtcliff, L. D. Syntheses and Properties of 1,6 and 1,7 Perylene Diimides and Tetracarboxylic Dianhydrides. Org. Lett. 13, 4724–4727 (2011).
48. Cakmak, O., Erenler, R., Tutar, A. & Celik, N. Synthesis of New Anthracene Derivatives. J. Org. Chem. 71, 1795–1801 (2006).
49. Wang, J. et al. C-9 Fluorenyl Substituted Anthracenes: A Promising New Family of Blue Luminescent Materials. Org. Lett. 12, 3874–3877 (2010).
50. Lee, A. E., Grace, M. R., Meyer, A. G. & Tuck, K. L. Fluorescent Zn2+ chemosensors, functional in aqueous solution under environmentally relevant conditions. Tetrahedron Lett. 51, 1161–1165 (2010).
51. Athans, A. J., Briggs, J. B., Jia, W. & Miller, G. P. Hydrogen-protected acenes. J.
Mater. Chem. 17, 2636 (2007).
Chapter 3: Preparation of CaCO3 particles for solid state reaction
77
3. Preparation of CaCO3 particles for solid state reaction
3.1 Calcium carbonate ...................................................................................................... 78
3.1.1 Calcium carbonate characteristics and properties ................................................. 78
3.1.2 Calcium carbonate formation ................................................................................ 80
3.1.3 Historical background ........................................................................................... 80
3.1.3.1 Calcium carbonate as construction material ..................................................... 81
3.1.4 Modern uses and production ................................................................................. 82
3.2 Preparation methods of CaCO3 particles ................................................................... 83
3.3 Preparation of calcium carbonate microparticles ....................................................... 85
3.3.1 Specific surface for coupling reaction on CaCO3 particles ................................... 86
3.3.1.1 Results and discussion ...................................................................................... 86
3.3.2 CaCO3 particles by grinding .................................................................................. 87
3.3.2.1 Results and discussion ...................................................................................... 87
3.3.2.2 Conclusion on CaCO3 by grinding ................................................................... 89
3.3.3 CaCO3 particles via spray pyrolysis technique ..................................................... 89
3.3.3.1 Results and discussion ...................................................................................... 90
3.3.3.2 Conclusion on CaCO3 particles via spray pyrolysis technique ...................... 110
3.3.4 General conclusion on preparation of CaCO3 particles for solid state reaction .. 110
3.4 References ................................................................................................................ 110
In the second part of this work, we decided to extend the results obtained in UHV
conditions on macroscopic scale. Reactions directly on CaCO3 microparticles were
investigated in order to easily recover the final molecule by simply dissolution of the
substrate. This approach is technically impossible under UHV conditions. Once the target
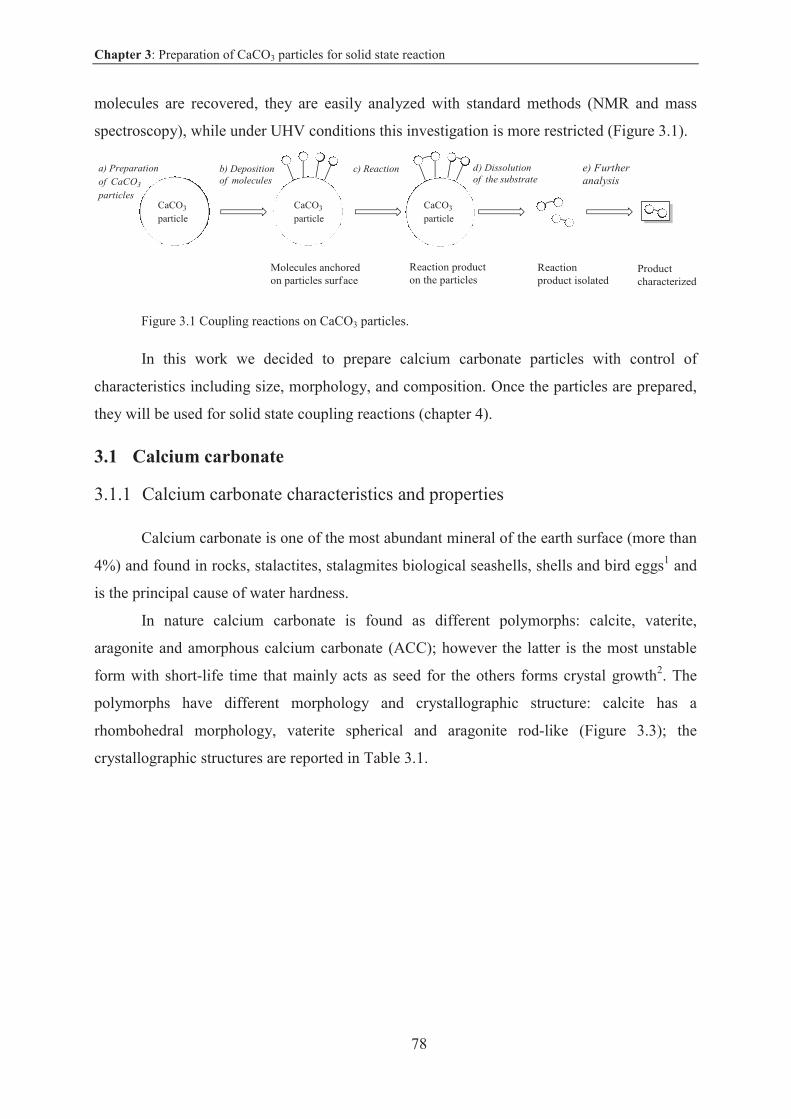
Chapter 3: Preparation of CaCO3 particles for solid state reaction
78
molecules are recovered, they are easily analyzed with standard methods (NMR and mass
spectroscopy), while under UHV conditions this investigation is more restricted (Figure 3.1).
Figure 3.1 Coupling reactions on CaCO3 particles.
In this work we decided to prepare calcium carbonate particles with control of
characteristics including size, morphology, and composition. Once the particles are prepared,
they will be used for solid state coupling reactions (chapter 4).
3.1 Calcium carbonate
3.1.1 Calcium carbonate characteristics and properties
Calcium carbonate is one of the most abundant mineral of the earth surface (more than
4%) and found in rocks, stalactites, stalagmites biological seashells, shells and bird eggs1 and
is the principal cause of water hardness.
In nature calcium carbonate is found as different polymorphs: calcite, vaterite,
aragonite and amorphous calcium carbonate (ACC); however the latter is the most unstable
form with short-life time that mainly acts as seed for the others forms crystal growth2. The
polymorphs have different morphology and crystallographic structure: calcite has a
rhombohedral morphology, vaterite spherical and aragonite rod-like (Figure 3.3); the
crystallographic structures are reported in Table 3.1.
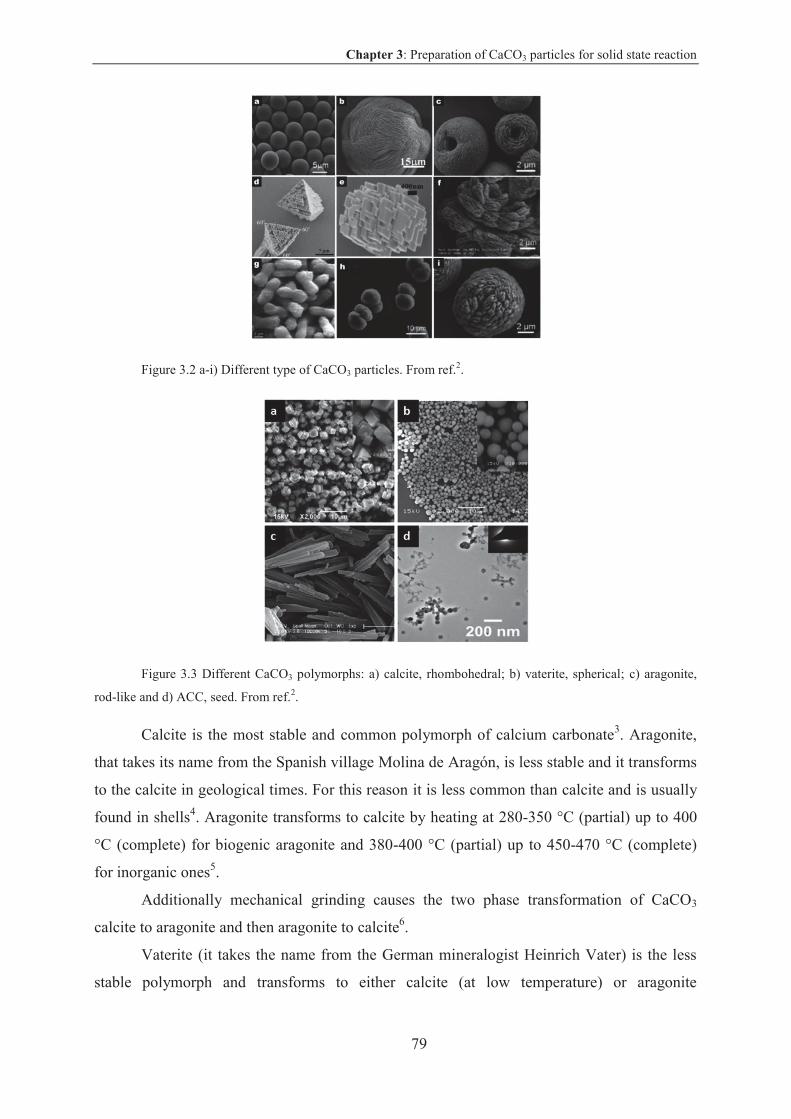
Chapter 3: Preparation of CaCO3 particles for solid state reaction
79
Figure 3.2 a-i) Different type of CaCO3 particles. From ref.2.
Figure 3.3 Different CaCO3 polymorphs: a) calcite, rhombohedral; b) vaterite, spherical; c) aragonite,
rod-like and d) ACC, seed. From ref.2.
Calcite is the most stable and common polymorph of calcium carbonate3. Aragonite,
that takes its name from the Spanish village Molina de Aragón, is less stable and it transforms
to the calcite in geological times. For this reason it is less common than calcite and is usually
found in shells4. Aragonite transforms to calcite by heating at 280-350 °C (partial) up to 400
°C (complete) for biogenic aragonite and 380-400 °C (partial) up to 450-470 °C (complete)
for inorganic ones5.
Additionally mechanical grinding causes the two phase transformation of CaCO3
calcite to aragonite and then aragonite to calcite6.
Vaterite (it takes the name from the German mineralogist Heinrich Vater) is the less
stable polymorph and transforms to either calcite (at low temperature) or aragonite
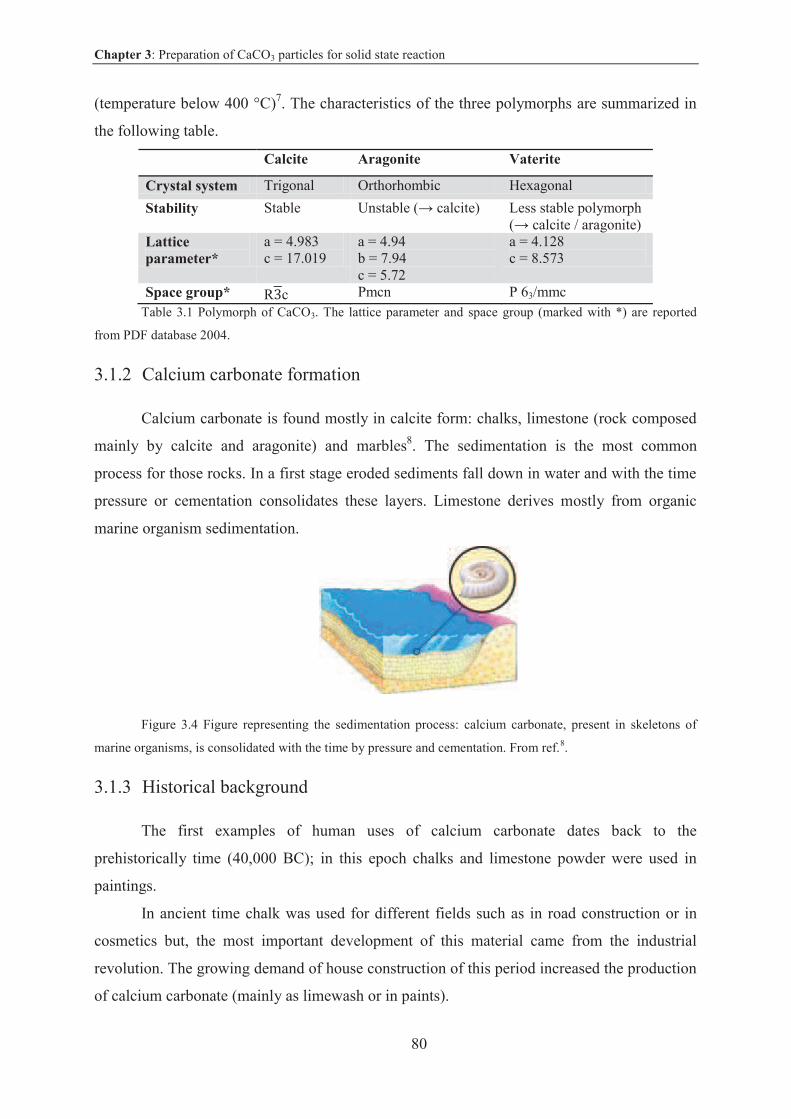
Chapter 3: Preparation of CaCO3 particles for solid state reaction
80
(temperature below 400 °C)7. The characteristics of the three polymorphs are summarized in
the following table.
Calcite Aragonite Vaterite
Crystal system Trigonal Orthorhombic Hexagonal
Stability Stable Unstable ( calcite) Less stable polymorph ( calcite / aragonite)
Lattice parameter*
a = 4.983 c = 17.019
a = 4.94 b = 7.94 c = 5.72
a = 4.128 c = 8.573
Space group* R c Pmcn P 63/mmc
Table 3.1 Polymorph of CaCO3. The lattice parameter and space group (marked with *) are reported
from PDF database 2004.
3.1.2 Calcium carbonate formation
Calcium carbonate is found mostly in calcite form: chalks, limestone (rock composed
mainly by calcite and aragonite) and marbles8. The sedimentation is the most common
process for those rocks. In a first stage eroded sediments fall down in water and with the time
pressure or cementation consolidates these layers. Limestone derives mostly from organic
marine organism sedimentation.
Figure 3.4 Figure representing the sedimentation process: calcium carbonate, present in skeletons of
marine organisms, is consolidated with the time by pressure and cementation. From ref.8.
3.1.3 Historical background
The first examples of human uses of calcium carbonate dates back to the
prehistorically time (40,000 BC); in this epoch chalks and limestone powder were used in
paintings.
In ancient time chalk was used for different fields such as in road construction or in
cosmetics but, the most important development of this material came from the industrial
revolution. The growing demand of house construction of this period increased the production
of calcium carbonate (mainly as limewash or in paints).
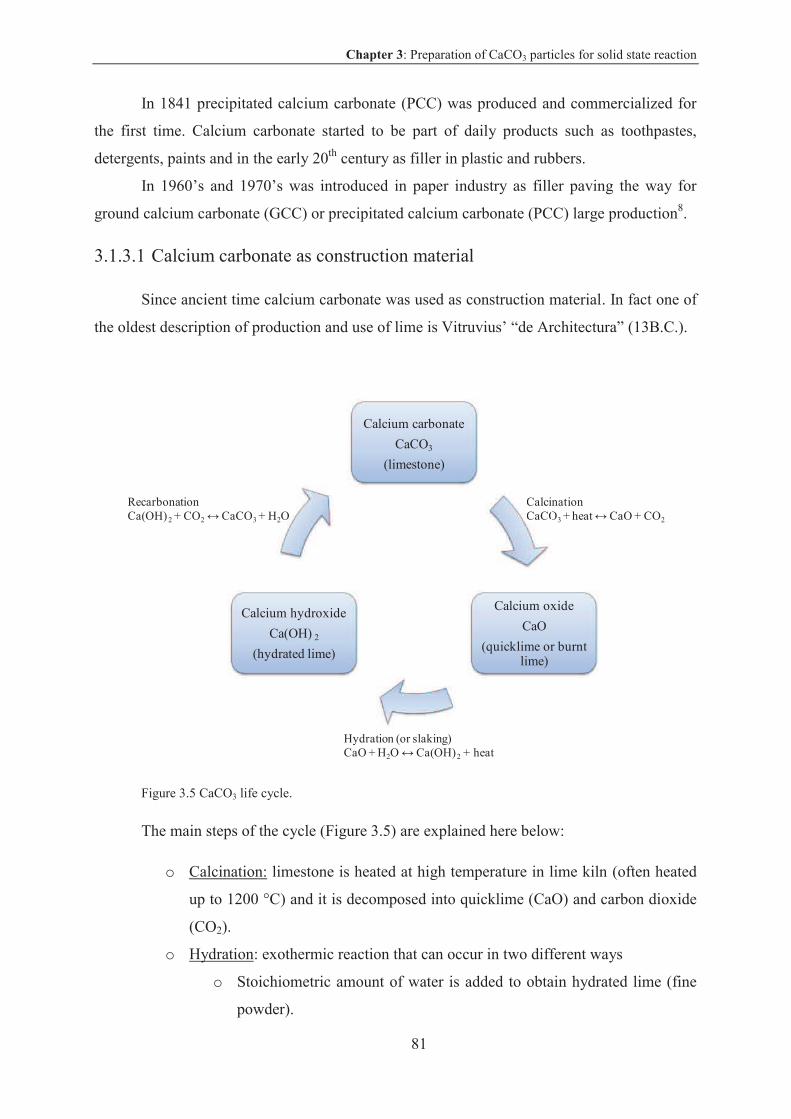
Chapter 3: Preparation of CaCO3 particles for solid state reaction
81
In 1841 precipitated calcium carbonate (PCC) was produced and commercialized for
the first time. Calcium carbonate started to be part of daily products such as toothpastes,
detergents, paints and in the early 20th century as filler in plastic and rubbers.
In 1960’s and 1970’s was introduced in paper industry as filler paving the way for
ground calcium carbonate (GCC) or precipitated calcium carbonate (PCC) large production8.
3.1.3.1 Calcium carbonate as construction material
Since ancient time calcium carbonate was used as construction material. In fact one of
the oldest description of production and use of lime is Vitruvius’ “de Architectura” (13B.C.).
Figure 3.5 CaCO3 life cycle.
The main steps of the cycle (Figure 3.5) are explained here below:
o Calcination: limestone is heated at high temperature in lime kiln (often heated
up to 1200 °C) and it is decomposed into quicklime (CaO) and carbon dioxide
(CO2).
o Hydration: exothermic reaction that can occur in two different ways
o Stoichiometric amount of water is added to obtain hydrated lime (fine
powder).
CalcinationCaCO3 + heat CaO + CO2
Calcium carbonate
CaCO3
(limestone)
Calcium oxide
CaO
(quicklime or burnt lime)
Calcium hydroxide
Ca(OH) 2
(hydrated lime)
CalciCaCO
Hydration (or slaking)CaO + H2O Ca(OH)2 + heat
RecarbonationCa(OH)2 + CO2 CaCO3 + H2O
Chapter 3: Preparation of CaCO3 particles for solid state reaction
82
o Excess of water (slaking process) to obtain hydroxide lime in slurry.
o Recarbonation: the last step of CaCO3 life cycle, hydrated lime adsorbs CO2
and reverts into CaCO3.
The last step is particularly important when lime mortar (constituted of hydrated lime,
sand and water) is used to paint the walls. Atmospheric CO2 converts calcium hydroxide into
calcium carbonate, hardening the building wall9.
3.1.4 Modern uses and production
Today calcium carbonate has a key role in industry and everyday life. Indeed, it is
used as filler in paints, coating and plastics2; in paper industry it is used for its brightness and
light scattering properties. Finally calcium carbonate can be used in health and personal care
or in the building field as itself (marble) as a constituent for cement.
Ground calcium carbonate (GCC) and precipitated calcium carbonate (PCC) are the
most common industrial methods. In the first one, calcium carbonate is extracted from natural
quarry, while in the other it is chemically synthesized from calcium oxide (obtained by
calcination process). CaO is then slaked with water to obtain calcium hydroxide; finally
CaCO3 precipitates by recarbonation with CO2. The uses of the two different methods are
summarized in the table below.
GCC PCC
Production Extraction Chemical Precipitation
Uses Filler: Filler: - Paper (mainly) - Cosmetic
- Plastic - Food/pharmaceuticals
- Paint - Plastic
- Adhesives - Paint/inks
- Paper
- Adhesives
Table 3.2 GCC in comparison to PCC methods: production and main uses.
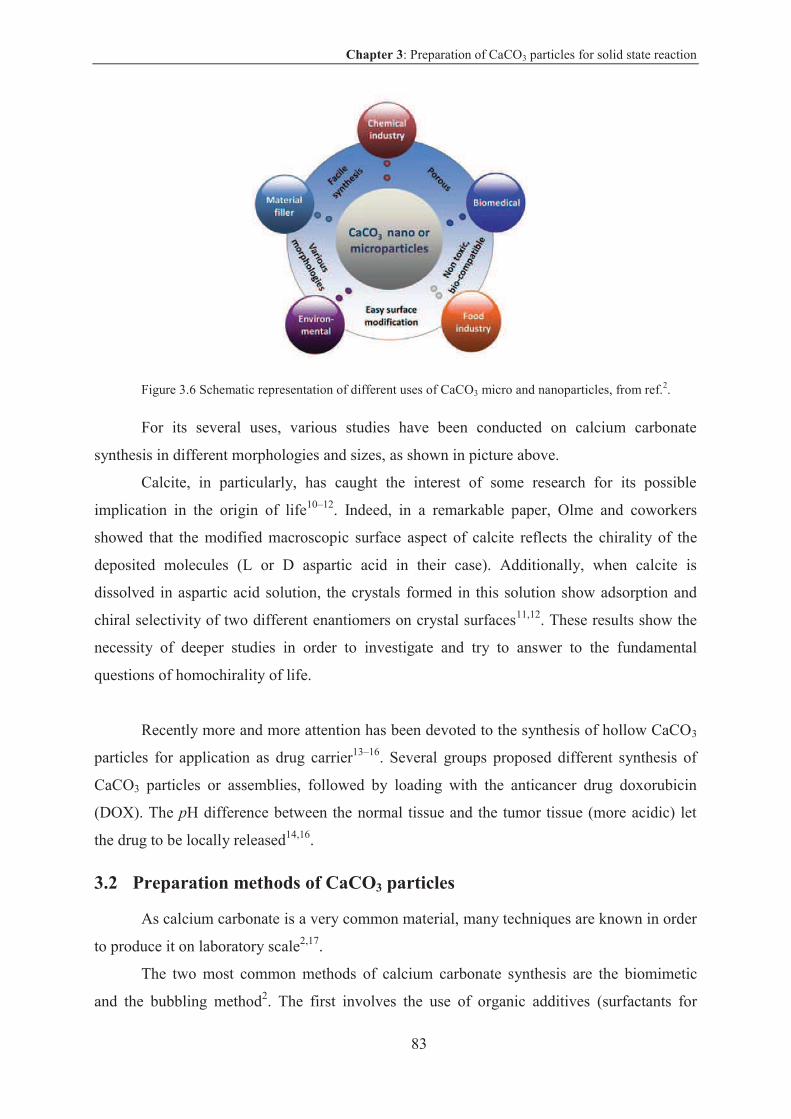
Chapter 3: Preparation of CaCO3 particles for solid state reaction
83
Figure 3.6 Schematic representation of different uses of CaCO3 micro and nanoparticles, from ref.2.
For its several uses, various studies have been conducted on calcium carbonate
synthesis in different morphologies and sizes, as shown in picture above.
Calcite, in particularly, has caught the interest of some research for its possible
implication in the origin of life10–12. Indeed, in a remarkable paper, Olme and coworkers
showed that the modified macroscopic surface aspect of calcite reflects the chirality of the
deposited molecules (L or D aspartic acid in their case). Additionally, when calcite is
dissolved in aspartic acid solution, the crystals formed in this solution show adsorption and
chiral selectivity of two different enantiomers on crystal surfaces11,12. These results show the
necessity of deeper studies in order to investigate and try to answer to the fundamental
questions of homochirality of life.
Recently more and more attention has been devoted to the synthesis of hollow CaCO3
particles for application as drug carrier13–16. Several groups proposed different synthesis of
CaCO3 particles or assemblies, followed by loading with the anticancer drug doxorubicin
(DOX). The pH difference between the normal tissue and the tumor tissue (more acidic) let
the drug to be locally released14,16.
3.2 Preparation methods of CaCO3 particles
As calcium carbonate is a very common material, many techniques are known in order
to produce it on laboratory scale2,17.
The two most common methods of calcium carbonate synthesis are the biomimetic
and the bubbling method2. The first involves the use of organic additives (surfactants for
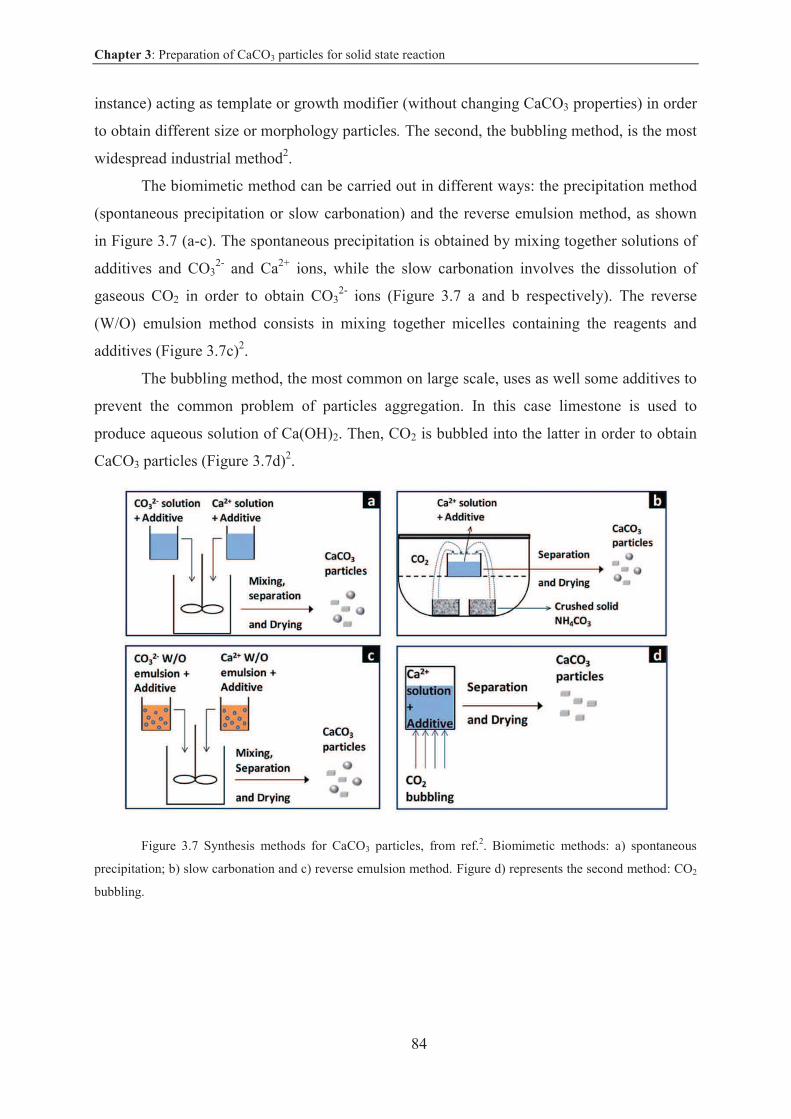
Chapter 3: Preparation of CaCO3 particles for solid state reaction
84
instance) acting as template or growth modifier (without changing CaCO3 properties) in order
to obtain different size or morphology particles. The second, the bubbling method, is the most
widespread industrial method2.
The biomimetic method can be carried out in different ways: the precipitation method
(spontaneous precipitation or slow carbonation) and the reverse emulsion method, as shown
in Figure 3.7 (a-c). The spontaneous precipitation is obtained by mixing together solutions of
additives and CO32- and Ca2+ ions, while the slow carbonation involves the dissolution of
gaseous CO2 in order to obtain CO32- ions (Figure 3.7 a and b respectively). The reverse
(W/O) emulsion method consists in mixing together micelles containing the reagents and
additives (Figure 3.7c)2.
The bubbling method, the most common on large scale, uses as well some additives to
prevent the common problem of particles aggregation. In this case limestone is used to
produce aqueous solution of Ca(OH)2. Then, CO2 is bubbled into the latter in order to obtain
CaCO3 particles (Figure 3.7d)2.
Figure 3.7 Synthesis methods for CaCO3 particles, from ref.2. Biomimetic methods: a) spontaneous
precipitation; b) slow carbonation and c) reverse emulsion method. Figure d) represents the second method: CO2
bubbling.
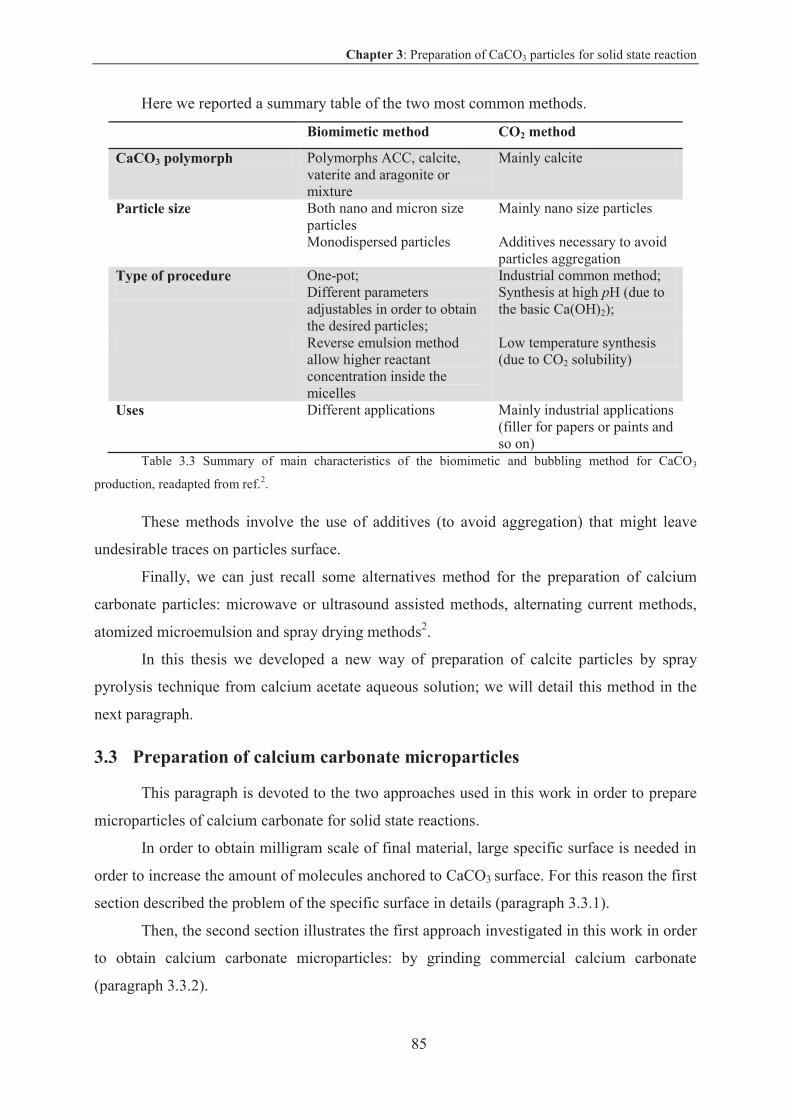
Chapter 3: Preparation of CaCO3 particles for solid state reaction
85
Here we reported a summary table of the two most common methods.
Biomimetic method CO2 method
CaCO3 polymorph Polymorphs ACC, calcite, vaterite and aragonite or mixture
Mainly calcite
Particle size Both nano and micron size particles
Mainly nano size particles
Monodispersed particles Additives necessary to avoid particles aggregation
Type of procedure One-pot; Industrial common method; Different parameters adjustables in order to obtain the desired particles;
Synthesis at high pH (due to the basic Ca(OH)2);
Reverse emulsion method allow higher reactant concentration inside the micelles
Low temperature synthesis (due to CO2 solubility)
Uses Different applications Mainly industrial applications (filler for papers or paints and so on)
Table 3.3 Summary of main characteristics of the biomimetic and bubbling method for CaCO3
production, readapted from ref.2.
These methods involve the use of additives (to avoid aggregation) that might leave
undesirable traces on particles surface.
Finally, we can just recall some alternatives method for the preparation of calcium
carbonate particles: microwave or ultrasound assisted methods, alternating current methods,
atomized microemulsion and spray drying methods2.
In this thesis we developed a new way of preparation of calcite particles by spray
pyrolysis technique from calcium acetate aqueous solution; we will detail this method in the
next paragraph.
3.3 Preparation of calcium carbonate microparticles
This paragraph is devoted to the two approaches used in this work in order to prepare
microparticles of calcium carbonate for solid state reactions.
In order to obtain milligram scale of final material, large specific surface is needed in
order to increase the amount of molecules anchored to CaCO3 surface. For this reason the first
section described the problem of the specific surface in details (paragraph 3.3.1).
Then, the second section illustrates the first approach investigated in this work in order
to obtain calcium carbonate microparticles: by grinding commercial calcium carbonate
(paragraph 3.3.2).
Chapter 3: Preparation of CaCO3 particles for solid state reaction
86
The third section deals with the synthesis and complete characterization of calcium
carbonate particles by spray pyrolysis technique (paragraph 3.3.3). The general conclusion
(paragraph 3.3.4) closes this part.
3.3.1 Specific surface for coupling reaction on CaCO3 particles
In this paragraph we present the estimation of the specific surface. First we evaluate
the specific surface area from scanning electron microscopy (SEM) photos of commercial
calcium carbonate, and then we estimate the specific surface area an ideal spherical or cubical
particle of CaCO3.
3.3.1.1 Results and discussion
3.3.1.1.1 Estimation of specific surface
Commercial CaCO3 (grade of purity 99.99%, Sigma-Aldrich) was analyzed by SEM
microscopy in order to evaluate the particles size (Figure 3.8). The product is formed by
aggregates of small cubes of 20 m of side. Having this result in mind, we estimate the
specific surface area (SSA) by simply considering a sphere of 10 m of radius or a cube of 20
m of side.
Vsphere= 4/3 r3 = 4.188 10-9 cm3 Vcube= a3 = 8 10-9 cm3
Volumetric mass density = 2.71 g/cm3
Weightsphere = 1.13 10-8 g Weightcube = 2.168 10-8 g
SSAsph. = 1.1 103 cm2/g = 0.1 m2/g SSAcube = 1.1 103 cm2/g = 0.1 m2/g
To sum up, the specific surface of considered CaCO3 leads to 0.1 m2/g.
By knowing the area occupied from one molecule (for instance 4-iodobenzoic acid
dimer) from the nc-AFM results (0.32 nm2), we can deduce from the SSA previously
calculated the quantity of final product (considering 100% yield): ~1.5 10-4 g.
As we will show later with the BET measurement, this is a very rough approximation
to a perfect spherical object with 100% of yield of the reaction.
From this result we conclude that the first step necessary for the coupling reaction is to
increase the specific surface. The following parts will introduce the two different approaches
used in this work to reach this objective.
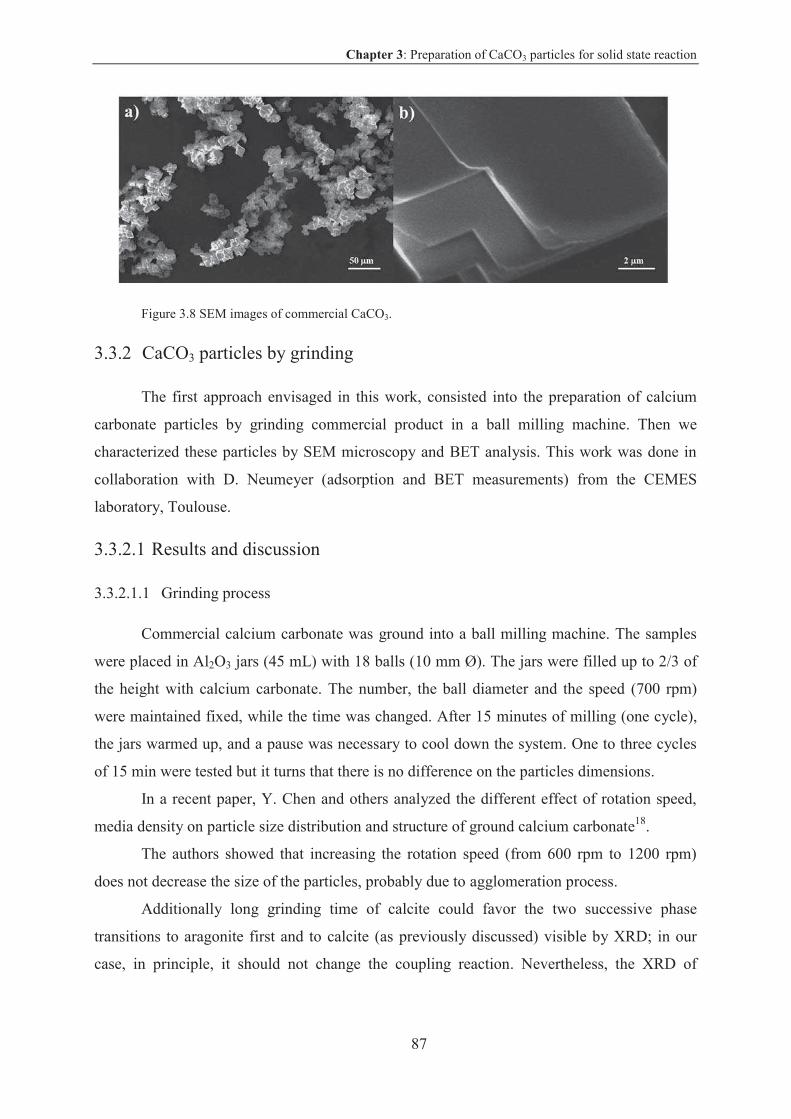
Chapter 3: Preparation of CaCO3 particles for solid state reaction
87
Figure 3.8 SEM images of commercial CaCO3.
3.3.2 CaCO3 particles by grinding
The first approach envisaged in this work, consisted into the preparation of calcium
carbonate particles by grinding commercial product in a ball milling machine. Then we
characterized these particles by SEM microscopy and BET analysis. This work was done in
collaboration with D. Neumeyer (adsorption and BET measurements) from the CEMES
laboratory, Toulouse.
3.3.2.1 Results and discussion
3.3.2.1.1 Grinding process
Commercial calcium carbonate was ground into a ball milling machine. The samples
were placed in Al2O3 jars (45 mL) with 18 balls (10 mm Ø). The jars were filled up to 2/3 of
the height with calcium carbonate. The number, the ball diameter and the speed (700 rpm)
were maintained fixed, while the time was changed. After 15 minutes of milling (one cycle),
the jars warmed up, and a pause was necessary to cool down the system. One to three cycles
of 15 min were tested but it turns that there is no difference on the particles dimensions.
In a recent paper, Y. Chen and others analyzed the different effect of rotation speed,
media density on particle size distribution and structure of ground calcium carbonate18.
The authors showed that increasing the rotation speed (from 600 rpm to 1200 rpm)
does not decrease the size of the particles, probably due to agglomeration process.
Additionally long grinding time of calcite could favor the two successive phase
transitions to aragonite first and to calcite (as previously discussed) visible by XRD; in our
case, in principle, it should not change the coupling reaction. Nevertheless, the XRD of
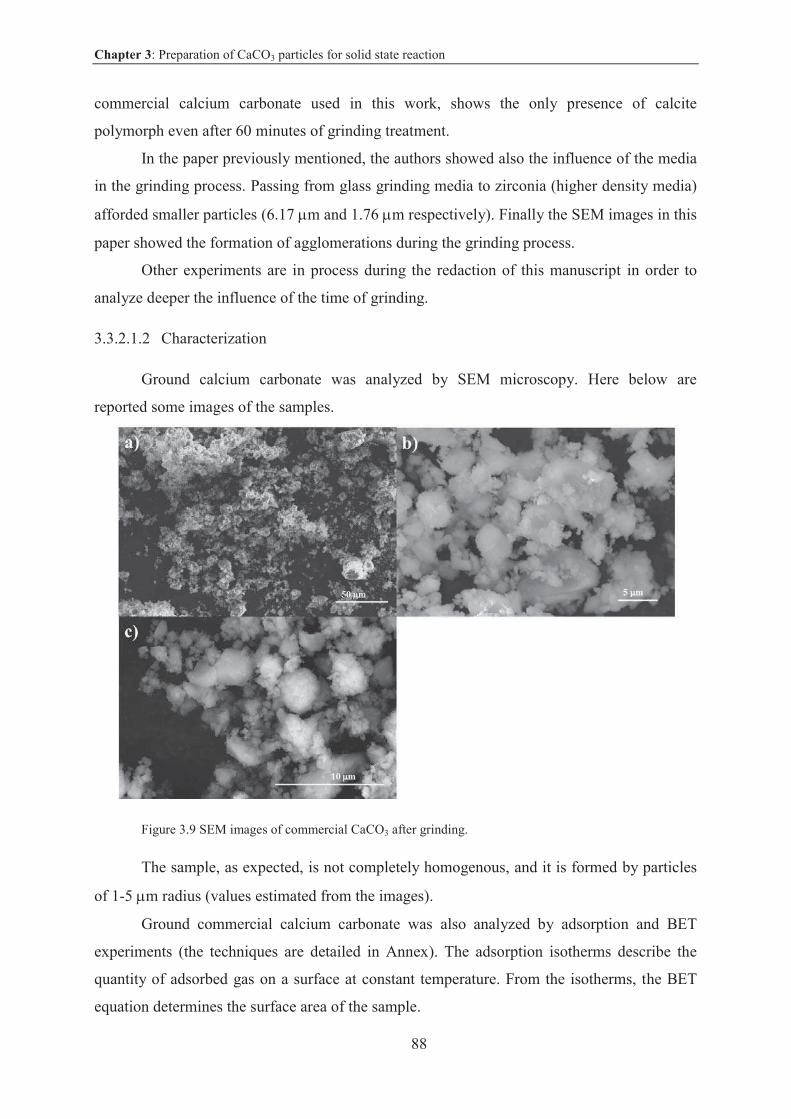
Chapter 3: Preparation of CaCO3 particles for solid state reaction
88
commercial calcium carbonate used in this work, shows the only presence of calcite
polymorph even after 60 minutes of grinding treatment.
In the paper previously mentioned, the authors showed also the influence of the media
in the grinding process. Passing from glass grinding media to zirconia (higher density media)
afforded smaller particles (6.17 m and 1.76 m respectively). Finally the SEM images in this
paper showed the formation of agglomerations during the grinding process.
Other experiments are in process during the redaction of this manuscript in order to
analyze deeper the influence of the time of grinding.
3.3.2.1.2 Characterization
Ground calcium carbonate was analyzed by SEM microscopy. Here below are
reported some images of the samples.
Figure 3.9 SEM images of commercial CaCO3 after grinding.
The sample, as expected, is not completely homogenous, and it is formed by particles
of 1-5 m radius (values estimated from the images).
Ground commercial calcium carbonate was also analyzed by adsorption and BET
experiments (the techniques are detailed in Annex). The adsorption isotherms describe the
quantity of adsorbed gas on a surface at constant temperature. From the isotherms, the BET
equation determines the surface area of the sample.
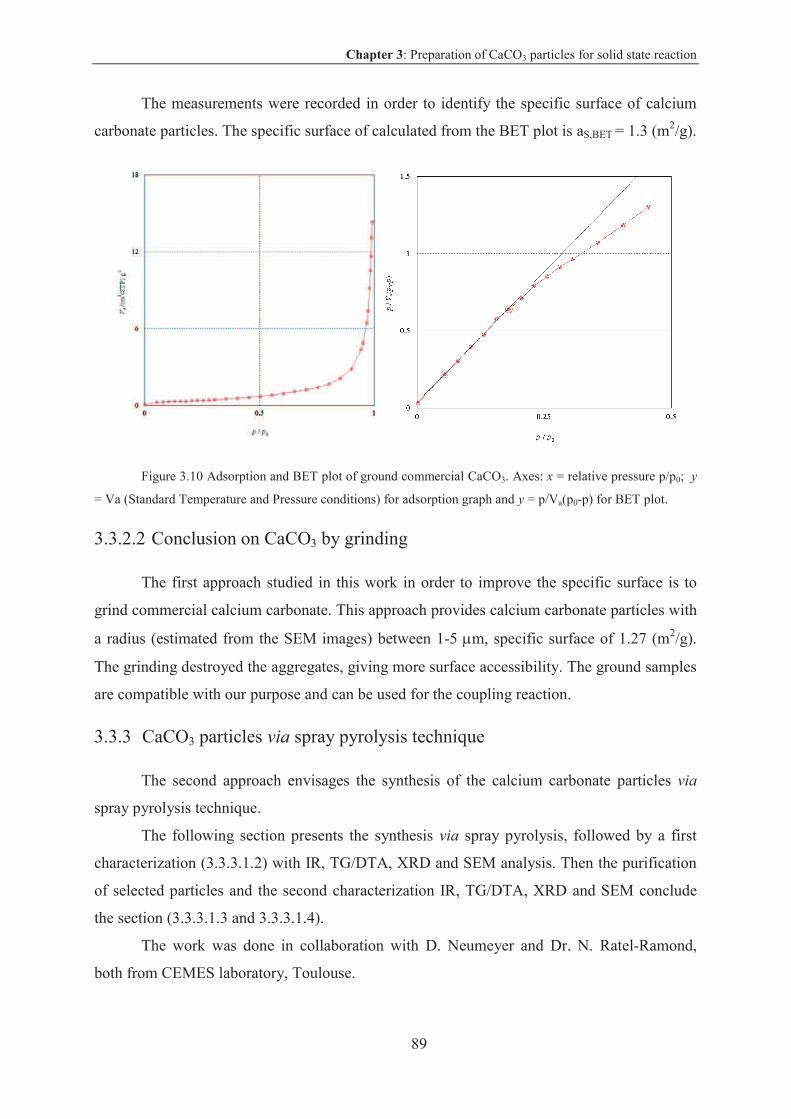
Chapter 3: Preparation of CaCO3 particles for solid state reaction
89
The measurements were recorded in order to identify the specific surface of calcium
carbonate particles. The specific surface of calculated from the BET plot is aS,BET = 1.3 (m2/g).
Figure 3.10 Adsorption and BET plot of ground commercial CaCO3. Axes: x = relative pressure p/p0; y
= Va (Standard Temperature and Pressure conditions) for adsorption graph and y = p/Va(p0-p) for BET plot.
3.3.2.2 Conclusion on CaCO3 by grinding
The first approach studied in this work in order to improve the specific surface is to
grind commercial calcium carbonate. This approach provides calcium carbonate particles with
a radius (estimated from the SEM images) between 1-5 m, specific surface of 1.27 (m2/g).
The grinding destroyed the aggregates, giving more surface accessibility. The ground samples
are compatible with our purpose and can be used for the coupling reaction.
3.3.3 CaCO3 particles via spray pyrolysis technique
The second approach envisages the synthesis of the calcium carbonate particles via
spray pyrolysis technique.
The following section presents the synthesis via spray pyrolysis, followed by a first
characterization (3.3.3.1.2) with IR, TG/DTA, XRD and SEM analysis. Then the purification
of selected particles and the second characterization IR, TG/DTA, XRD and SEM conclude
the section (3.3.3.1.3 and 3.3.3.1.4).
The work was done in collaboration with D. Neumeyer and Dr. N. Ratel-Ramond,
both from CEMES laboratory, Toulouse.
Chapter 3: Preparation of CaCO3 particles for solid state reaction
90
3.3.3.1 Results and discussion
3.3.3.1.1 Synthesis of CaCO3 particles
In this work we decided to use for the first time spray pyrolysis techniques for several
reasons: low-cost process17, simplicity19, absence of additives in this technique and its
availability in our laboratory.
The spray pyrolysis method has been widely studied and used to prepare numerous
types of dense or hollow particles, nanoparticles (for instance below 100 nm)20,
multicomponent materials17,19,21,22, thin films or fibers20,22.
Spray pyrolysis has been developed at industrial scale by a spin-off from our
laboratory named PYLOTE23.
Spray pyrolysis technique presents several advantages such as the high purity of the
final product, low-cost of the process and the possibility to obtain spherical micro and
submicron particles with different morphology24.
The principle of spray pyrolysis can be recalled here. A solution of an appropriate
starting material is atomized into small droplets; then, those are transported into a drying zone
by a carrier gas. Here the solvent is evaporated and the precursor precipitates. Finally the dry
precipitated particles are decomposed in a furnace at appropriate temperature and recovered
on a filter.
Many parameters can affect this process, leading to particles with different
morphology. The precursor solution (and the stoichiometry of the dissolved salts) determines
the composition of the final particles. The size of the atomized droplets and the starting
solution concentration can affect the average size and distribution of the final product. In
addition to the properties of the starting solution, the morphology of the final product is also
influenced by the carrier gas flow rate and the temperature17. The residence time of the
particle inside of the furnace is affected by the length of the furnace itself.
A variety of different particles can be obtained by modifying some parameters: for
instance if the evaporation rate of the solvent is low and the solubility of the product is high,
the particles obtained are dense (precipitation into the entire volume) and porous (due to the
evaporation of the gas). However, if the evaporation rate is high and the solubility low, the
precipitation occurs on the surface and the particles are hollow25.
A typical spray pyrolysis apparatus consists of (Figure 3.11):
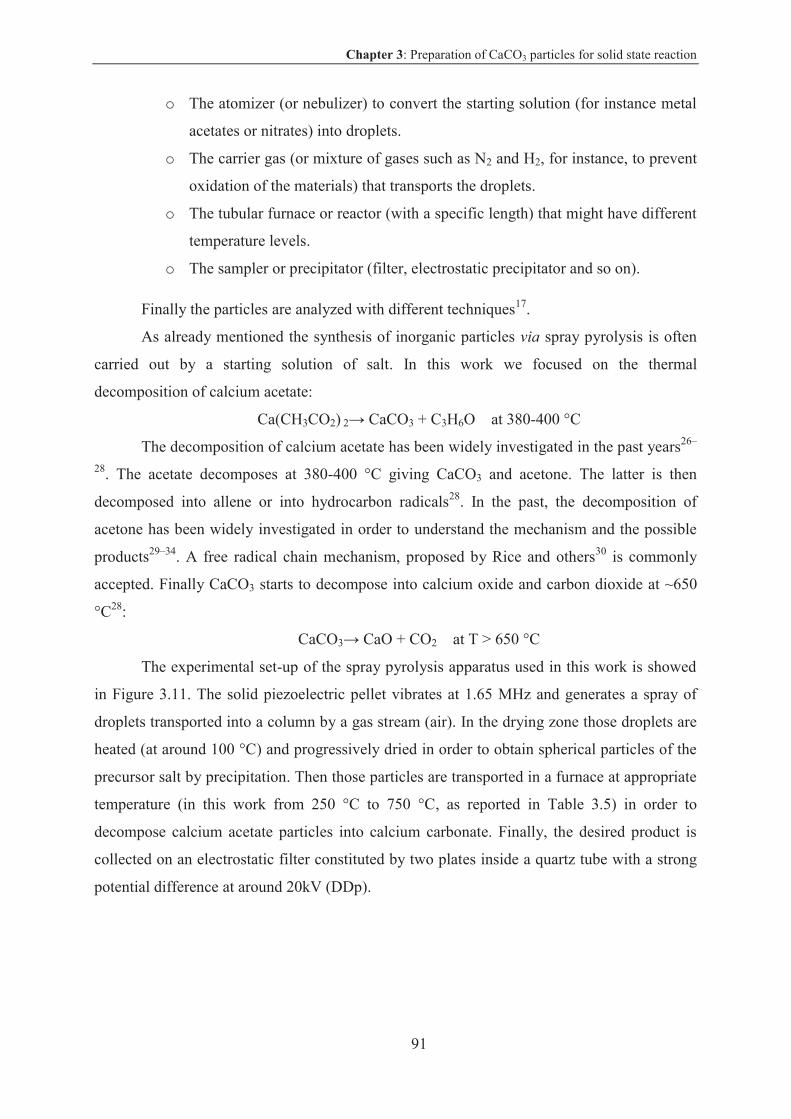
Chapter 3: Preparation of CaCO3 particles for solid state reaction
91
o The atomizer (or nebulizer) to convert the starting solution (for instance metal
acetates or nitrates) into droplets.
o The carrier gas (or mixture of gases such as N2 and H2, for instance, to prevent
oxidation of the materials) that transports the droplets.
o The tubular furnace or reactor (with a specific length) that might have different
temperature levels.
o The sampler or precipitator (filter, electrostatic precipitator and so on).
Finally the particles are analyzed with different techniques17.
As already mentioned the synthesis of inorganic particles via spray pyrolysis is often
carried out by a starting solution of salt. In this work we focused on the thermal
decomposition of calcium acetate:
Ca(CH3CO2) 2 CaCO3 + C3H6O at 380-400 °C
The decomposition of calcium acetate has been widely investigated in the past years26–
28. The acetate decomposes at 380-400 °C giving CaCO3 and acetone. The latter is then
decomposed into allene or into hydrocarbon radicals28. In the past, the decomposition of
acetone has been widely investigated in order to understand the mechanism and the possible
products29–34. A free radical chain mechanism, proposed by Rice and others30 is commonly
accepted. Finally CaCO3 starts to decompose into calcium oxide and carbon dioxide at ~650
°C28:
CaCO3 CaO + CO2 at T > 650 °C
The experimental set-up of the spray pyrolysis apparatus used in this work is showed
in Figure 3.11. The solid piezoelectric pellet vibrates at 1.65 MHz and generates a spray of
droplets transported into a column by a gas stream (air). In the drying zone those droplets are
heated (at around 100 °C) and progressively dried in order to obtain spherical particles of the
precursor salt by precipitation. Then those particles are transported in a furnace at appropriate
temperature (in this work from 250 °C to 750 °C, as reported in Table 3.5) in order to
decompose calcium acetate particles into calcium carbonate. Finally, the desired product is
collected on an electrostatic filter constituted by two plates inside a quartz tube with a strong
potential difference at around 20kV (DDp).
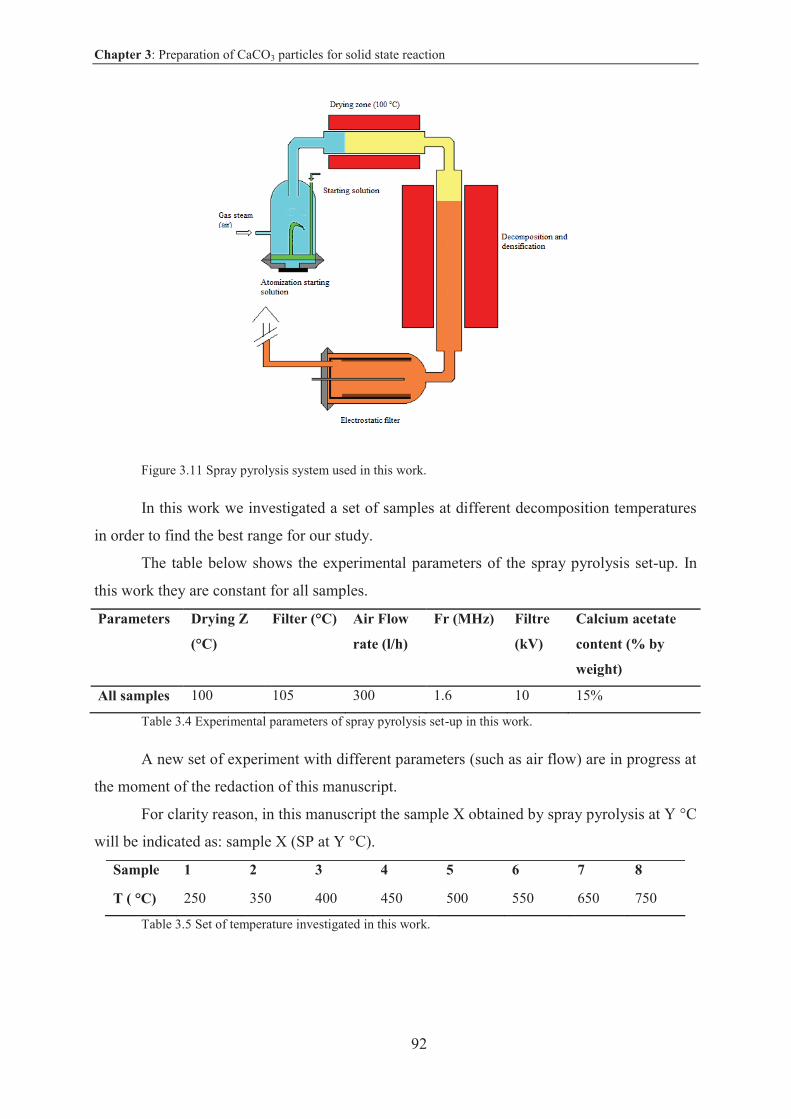
Chapter 3: Preparation of CaCO3 particles for solid state reaction
92
Figure 3.11 Spray pyrolysis system used in this work.
In this work we investigated a set of samples at different decomposition temperatures
in order to find the best range for our study.
The table below shows the experimental parameters of the spray pyrolysis set-up. In
this work they are constant for all samples.
Parameters Drying Z
(°C)
Filter (°C) Air Flow
rate (l/h)
Fr (MHz) Filtre
(kV)
Calcium acetate
content (% by
weight)
All samples 100 105 300 1.6 10 15%
Table 3.4 Experimental parameters of spray pyrolysis set-up in this work.
A new set of experiment with different parameters (such as air flow) are in progress at
the moment of the redaction of this manuscript.
For clarity reason, in this manuscript the sample X obtained by spray pyrolysis at Y °C
will be indicated as: sample X (SP at Y °C).
Sample 1 2 3 4 5 6 7 8
T ( °C) 250 350 400 450 500 550 650 750
Table 3.5 Set of temperature investigated in this work.
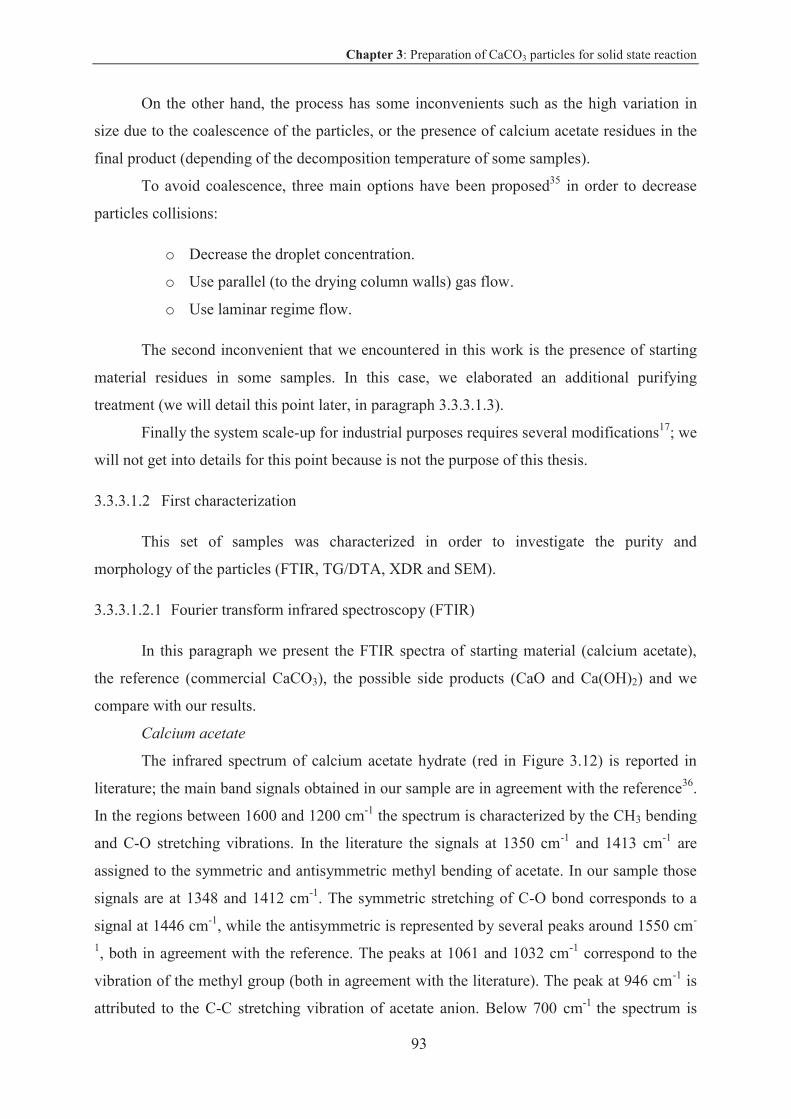
Chapter 3: Preparation of CaCO3 particles for solid state reaction
93
On the other hand, the process has some inconvenients such as the high variation in
size due to the coalescence of the particles, or the presence of calcium acetate residues in the
final product (depending of the decomposition temperature of some samples).
To avoid coalescence, three main options have been proposed35 in order to decrease
particles collisions:
o Decrease the droplet concentration.
o Use parallel (to the drying column walls) gas flow.
o Use laminar regime flow.
The second inconvenient that we encountered in this work is the presence of starting
material residues in some samples. In this case, we elaborated an additional purifying
treatment (we will detail this point later, in paragraph 3.3.3.1.3).
Finally the system scale-up for industrial purposes requires several modifications17; we
will not get into details for this point because is not the purpose of this thesis.
3.3.3.1.2 First characterization
This set of samples was characterized in order to investigate the purity and
morphology of the particles (FTIR, TG/DTA, XDR and SEM).
3.3.3.1.2.1 Fourier transform infrared spectroscopy (FTIR)
In this paragraph we present the FTIR spectra of starting material (calcium acetate),
the reference (commercial CaCO3), the possible side products (CaO and Ca(OH)2) and we
compare with our results.
Calcium acetate
The infrared spectrum of calcium acetate hydrate (red in Figure 3.12) is reported in
literature; the main band signals obtained in our sample are in agreement with the reference36.
In the regions between 1600 and 1200 cm-1 the spectrum is characterized by the CH3 bending
and C-O stretching vibrations. In the literature the signals at 1350 cm-1 and 1413 cm-1 are
assigned to the symmetric and antisymmetric methyl bending of acetate. In our sample those
signals are at 1348 and 1412 cm-1. The symmetric stretching of C-O bond corresponds to a
signal at 1446 cm-1, while the antisymmetric is represented by several peaks around 1550 cm-
1, both in agreement with the reference. The peaks at 1061 and 1032 cm-1 correspond to the
vibration of the methyl group (both in agreement with the literature). The peak at 946 cm-1 is
attributed to the C-C stretching vibration of acetate anion. Below 700 cm-1 the spectrum is
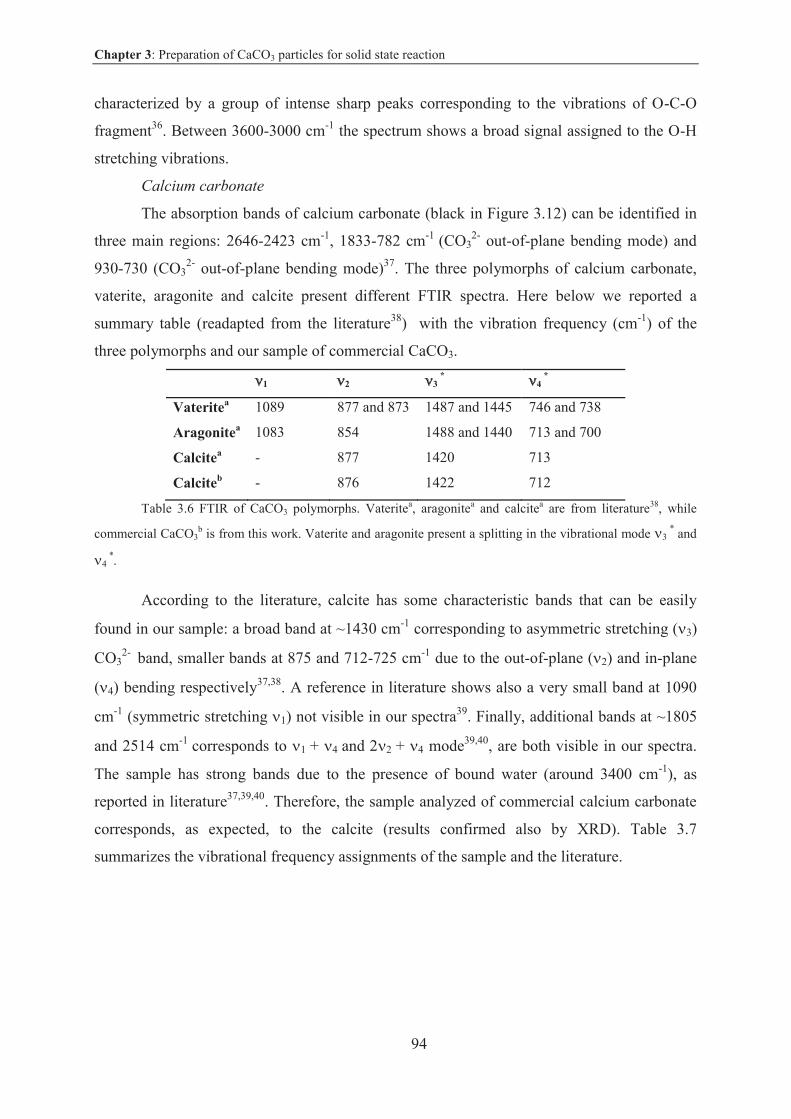
Chapter 3: Preparation of CaCO3 particles for solid state reaction
94
characterized by a group of intense sharp peaks corresponding to the vibrations of O-C-O
fragment36. Between 3600-3000 cm-1 the spectrum shows a broad signal assigned to the O-H
stretching vibrations.
Calcium carbonate
The absorption bands of calcium carbonate (black in Figure 3.12) can be identified in
three main regions: 2646-2423 cm-1, 1833-782 cm-1 (CO32- out-of-plane bending mode) and
930-730 (CO32- out-of-plane bending mode)37. The three polymorphs of calcium carbonate,
vaterite, aragonite and calcite present different FTIR spectra. Here below we reported a
summary table (readapted from the literature38) with the vibration frequency (cm-1) of the
three polymorphs and our sample of commercial CaCO3.
1 2 3*
4*
Vateritea 1089 877 and 873 1487 and 1445 746 and 738
Aragonitea 1083 854 1488 and 1440 713 and 700
Calcitea - 877 1420 713
Calciteb - 876 1422 712
Table 3.6 FTIR of CaCO3 polymorphs. Vateritea, aragonitea and calcitea are from literature38, while
commercial CaCO3b is from this work. Vaterite and aragonite present a splitting in the vibrational mode 3
* and
4 *.
According to the literature, calcite has some characteristic bands that can be easily
found in our sample: a broad band at ~1430 cm-1 corresponding to asymmetric stretching ( 3)
CO32-
band, smaller bands at 875 and 712-725 cm-1 due to the out-of-plane ( 2) and in-plane
( 4) bending respectively37,38. A reference in literature shows also a very small band at 1090
cm-1 (symmetric stretching 1) not visible in our spectra39. Finally, additional bands at ~1805
and 2514 cm-1 corresponds to 1 + 4 and 2 + 4 mode39,40, are both visible in our spectra.
The sample has strong bands due to the presence of bound water (around 3400 cm-1), as
reported in literature37,39,40. Therefore, the sample analyzed of commercial calcium carbonate
corresponds, as expected, to the calcite (results confirmed also by XRD). Table 3.7
summarizes the vibrational frequency assignments of the sample and the literature.
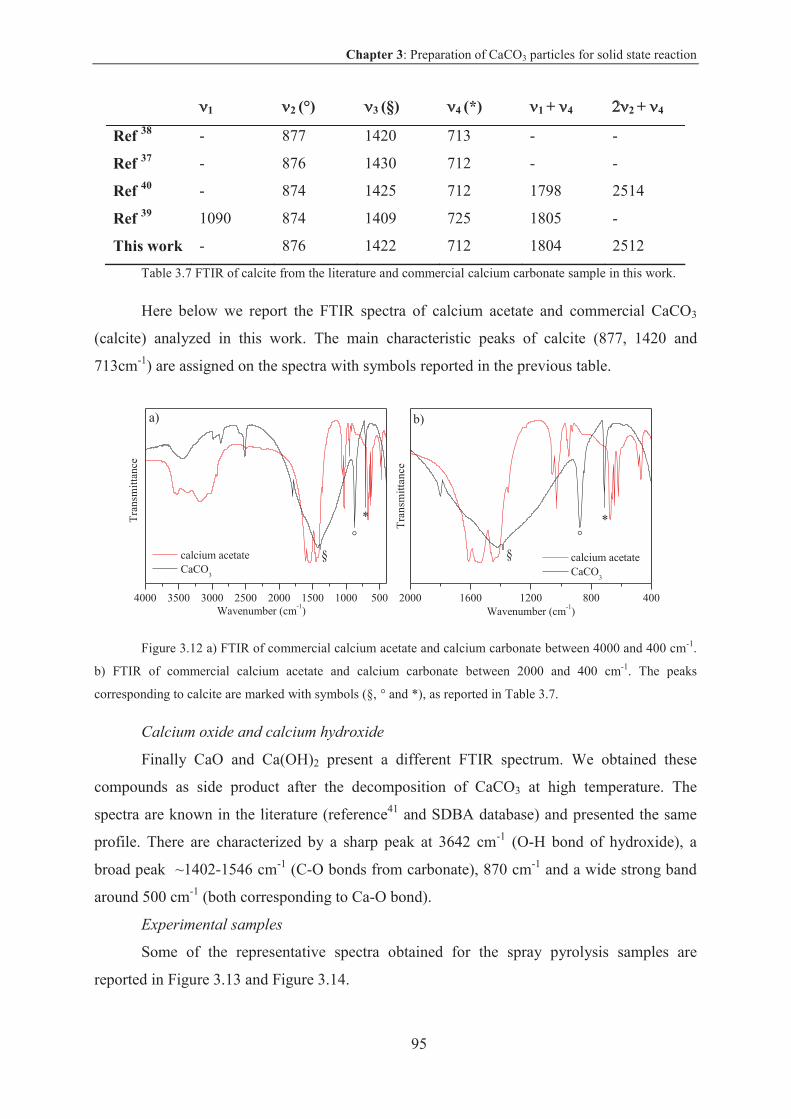
Chapter 3: Preparation of CaCO3 particles for solid state reaction
95
Table 3.7 FTIR of calcite from the literature and commercial calcium carbonate sample in this work.
Here below we report the FTIR spectra of calcium acetate and commercial CaCO3
(calcite) analyzed in this work. The main characteristic peaks of calcite (877, 1420 and
713cm-1) are assigned on the spectra with symbols reported in the previous table.
Figure 3.12 a) FTIR of commercial calcium acetate and calcium carbonate between 4000 and 400 cm-1.
b) FTIR of commercial calcium acetate and calcium carbonate between 2000 and 400 cm-1. The peaks
corresponding to calcite are marked with symbols (§, ° and *), as reported in Table 3.7.
Calcium oxide and calcium hydroxide
Finally CaO and Ca(OH)2 present a different FTIR spectrum. We obtained these
compounds as side product after the decomposition of CaCO3 at high temperature. The
spectra are known in the literature (reference41 and SDBA database) and presented the same
profile. There are characterized by a sharp peak at 3642 cm-1 (O-H bond of hydroxide), a
broad peak ~1402-1546 cm-1 (C-O bonds from carbonate), 870 cm-1 and a wide strong band
around 500 cm-1 (both corresponding to Ca-O bond).
Experimental samples
Some of the representative spectra obtained for the spray pyrolysis samples are
reported in Figure 3.13 and Figure 3.14.
4000 3500 3000 2500 2000 1500 1000 500 2000 1600 1200 800 400
*
§
Tra
nsm
itta
nce
Wavenumber (cm-1)
calcium acetate CaCO
3
§
*
°
a)
Tra
nsm
itta
nce
Wavenumber (cm-1)
calcium acetate CaCO
3
b)
°
1 2 (°) 3 (§) 4 (*) 1 + 4 2 + 4
Ref 38 - 877 1420 713 - -
Ref 37 - 876 1430 712 - -
Ref 40 - 874 1425 712 1798 2514
Ref 39 1090 874 1409 725 1805 -
This work - 876 1422 712 1804 2512
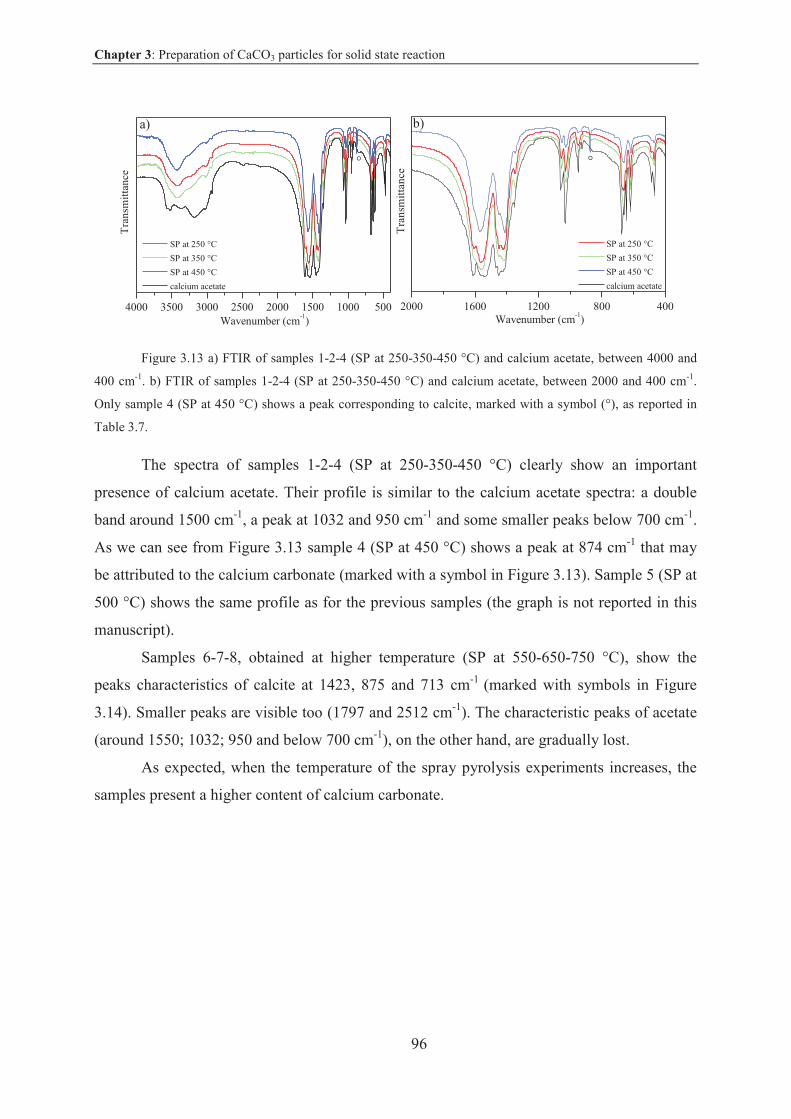
Chapter 3: Preparation of CaCO3 particles for solid state reaction
96
Figure 3.13 a) FTIR of samples 1-2-4 (SP at 250-350-450 °C) and calcium acetate, between 4000 and
400 cm-1. b) FTIR of samples 1-2-4 (SP at 250-350-450 °C) and calcium acetate, between 2000 and 400 cm-1.
Only sample 4 (SP at 450 °C) shows a peak corresponding to calcite, marked with a symbol (°), as reported in
Table 3.7.
The spectra of samples 1-2-4 (SP at 250-350-450 °C) clearly show an important
presence of calcium acetate. Their profile is similar to the calcium acetate spectra: a double
band around 1500 cm-1, a peak at 1032 and 950 cm-1 and some smaller peaks below 700 cm-1.
As we can see from Figure 3.13 sample 4 (SP at 450 °C) shows a peak at 874 cm-1 that may
be attributed to the calcium carbonate (marked with a symbol in Figure 3.13). Sample 5 (SP at
500 °C) shows the same profile as for the previous samples (the graph is not reported in this
manuscript).
Samples 6-7-8, obtained at higher temperature (SP at 550-650-750 °C), show the
peaks characteristics of calcite at 1423, 875 and 713 cm-1 (marked with symbols in Figure
3.14). Smaller peaks are visible too (1797 and 2512 cm-1). The characteristic peaks of acetate
(around 1550; 1032; 950 and below 700 cm-1), on the other hand, are gradually lost.
As expected, when the temperature of the spray pyrolysis experiments increases, the
samples present a higher content of calcium carbonate.
4000 3500 3000 2500 2000 1500 1000 500 2000 1600 1200 800 400
°
SP at 250 °C
SP at 350 °C
SP at 450 °C
calcium acetate
Wavenumber (cm-1)
SP at 250 °C
SP at 350 °C
SP at 450 °C
calcium acetate
T
rans
mit
tanc
e
°
a) b)
Wavenumber (cm-1)
Tra
nsm
itta
nce
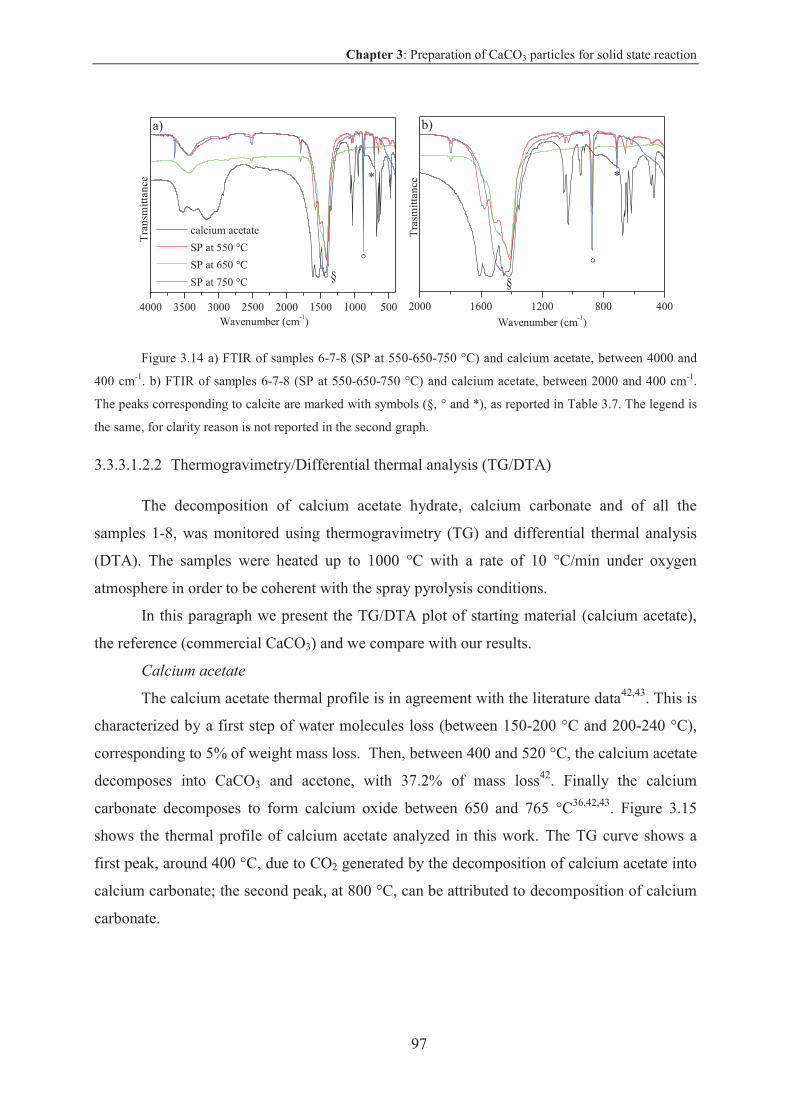
Chapter 3: Preparation of CaCO3 particles for solid state reaction
97
Figure 3.14 a) FTIR of samples 6-7-8 (SP at 550-650-750 °C) and calcium acetate, between 4000 and
400 cm-1. b) FTIR of samples 6-7-8 (SP at 550-650-750 °C) and calcium acetate, between 2000 and 400 cm-1.
The peaks corresponding to calcite are marked with symbols (§, ° and *), as reported in Table 3.7. The legend is
the same, for clarity reason is not reported in the second graph.
3.3.3.1.2.2 Thermogravimetry/Differential thermal analysis (TG/DTA)
The decomposition of calcium acetate hydrate, calcium carbonate and of all the
samples 1-8, was monitored using thermogravimetry (TG) and differential thermal analysis
(DTA). The samples were heated up to 1000 °C with a rate of 10 °C/min under oxygen
atmosphere in order to be coherent with the spray pyrolysis conditions.
In this paragraph we present the TG/DTA plot of starting material (calcium acetate),
the reference (commercial CaCO3) and we compare with our results.
Calcium acetate
The calcium acetate thermal profile is in agreement with the literature data42,43. This is
characterized by a first step of water molecules loss (between 150-200 °C and 200-240 °C),
corresponding to 5% of weight mass loss. Then, between 400 and 520 °C, the calcium acetate
decomposes into CaCO3 and acetone, with 37.2% of mass loss42. Finally the calcium
carbonate decomposes to form calcium oxide between 650 and 765 °C36,42,43. Figure 3.15
shows the thermal profile of calcium acetate analyzed in this work. The TG curve shows a
first peak, around 400 °C, due to CO2 generated by the decomposition of calcium acetate into
calcium carbonate; the second peak, at 800 °C, can be attributed to decomposition of calcium
carbonate.
4000 3500 3000 2500 2000 1500 1000 500 2000 1600 1200 800 400
°
§
calcium acetate
SP at 550 °C
SP at 650 °C
SP at 750 °C
Tra
nsm
itta
nce
Wavenumber (cm-1)
a) b)
§°
*
Tra
smit
tanc
e
Wavenumber (cm-1)
*
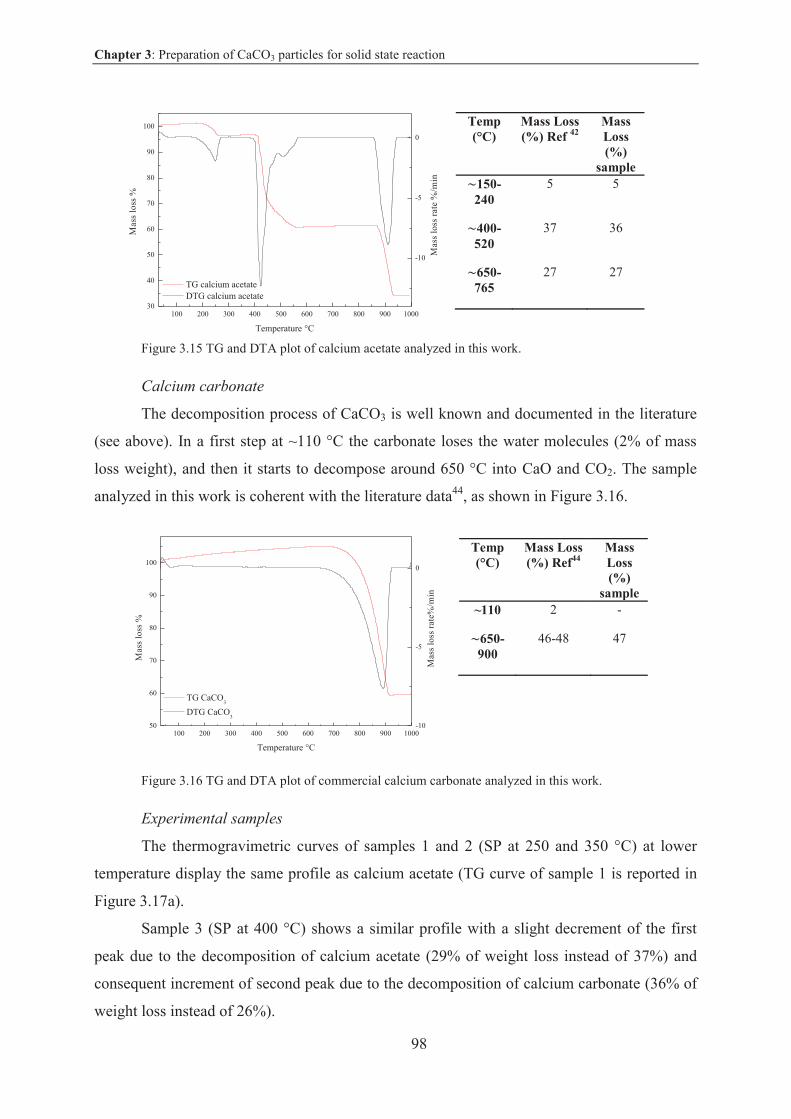
Chapter 3: Preparation of CaCO3 particles for solid state reaction
98
Figure 3.15 TG and DTA plot of calcium acetate analyzed in this work.
Calcium carbonate
The decomposition process of CaCO3 is well known and documented in the literature
(see above). In a first step at ~110 °C the carbonate loses the water molecules (2% of mass
loss weight), and then it starts to decompose around 650 °C into CaO and CO2. The sample
analyzed in this work is coherent with the literature data44, as shown in Figure 3.16.
Figure 3.16 TG and DTA plot of commercial calcium carbonate analyzed in this work.
Experimental samples
The thermogravimetric curves of samples 1 and 2 (SP at 250 and 350 °C) at lower
temperature display the same profile as calcium acetate (TG curve of sample 1 is reported in
Figure 3.17a).
Sample 3 (SP at 400 °C) shows a similar profile with a slight decrement of the first
peak due to the decomposition of calcium acetate (29% of weight loss instead of 37%) and
consequent increment of second peak due to the decomposition of calcium carbonate (36% of
weight loss instead of 26%).
Temp (°C)
Mass Loss (%) Ref 42
Mass Loss (%)
sample 150-240
5 5
400-520
37 36
650-765
27 27
Temp (°C)
Mass Loss (%) Ref44
Mass Loss (%)
sample ~110 2 -
650-900
46-48 47
100 200 300 400 500 600 700 800 900 100050
60
70
80
90
100
Mas
s lo
ss %
Temperature °C
TG CaCO3
DTG CaCO3
-10
-5
0
Mas
s lo
ss r
ate%
/min
100 200 300 400 500 600 700 800 900 100030
40
50
60
70
80
90
100
TG calcium acetate DTG calcium acetate
Mas
s lo
ss %
Temperature °C
-10
-5
0
Mas
s lo
ss r
ate
%/m
in
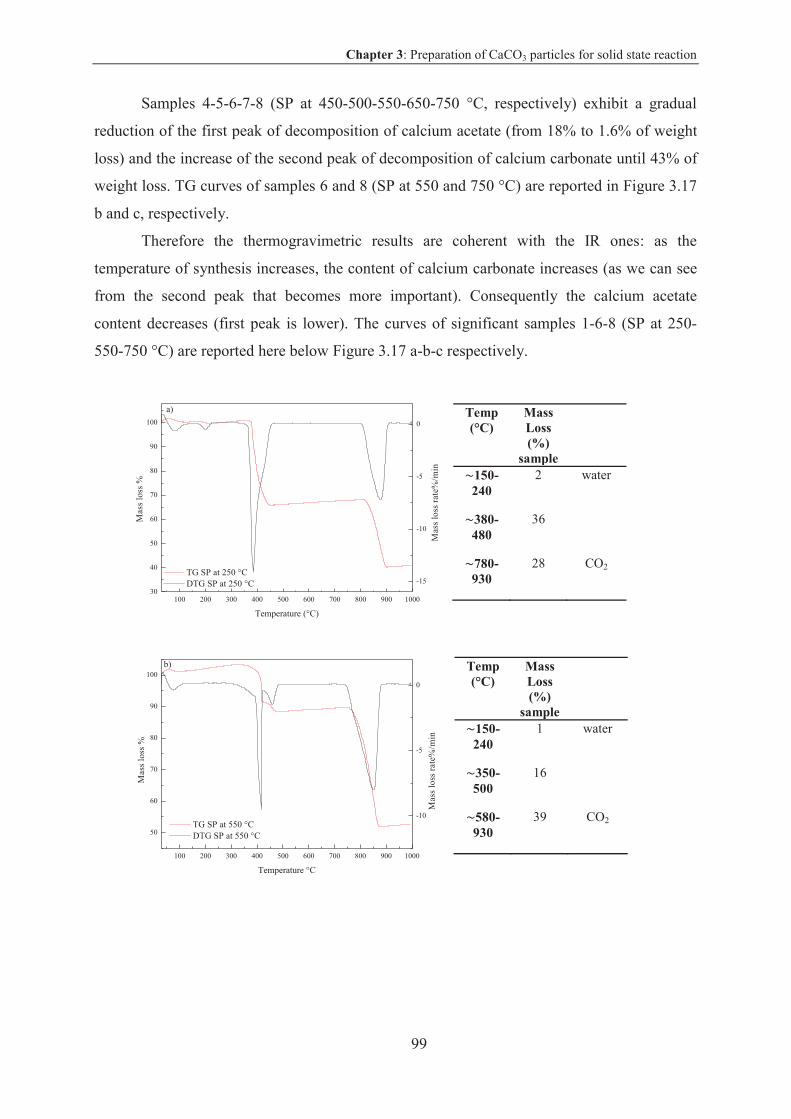
Chapter 3: Preparation of CaCO3 particles for solid state reaction
99
Samples 4-5-6-7-8 (SP at 450-500-550-650-750 °C, respectively) exhibit a gradual
reduction of the first peak of decomposition of calcium acetate (from 18% to 1.6% of weight
loss) and the increase of the second peak of decomposition of calcium carbonate until 43% of
weight loss. TG curves of samples 6 and 8 (SP at 550 and 750 °C) are reported in Figure 3.17
b and c, respectively.
Therefore the thermogravimetric results are coherent with the IR ones: as the
temperature of synthesis increases, the content of calcium carbonate increases (as we can see
from the second peak that becomes more important). Consequently the calcium acetate
content decreases (first peak is lower). The curves of significant samples 1-6-8 (SP at 250-
550-750 °C) are reported here below Figure 3.17 a-b-c respectively.
Temp (°C)
Mass Loss (%)
sample 150-240
2 water
380-480
36
780-930
28 CO2
Temp (°C)
Mass Loss (%)
sample 150-240
1 water
350-500
16
580-930
39 CO2
100 200 300 400 500 600 700 800 900 100030
40
50
60
70
80
90
100
TG SP at 250 °C DTG SP at 250 °C
Mas
s lo
ss %
Temperature (°C)
a)
-15
-10
-5
0
Mas
s lo
ss r
ate%
/min
100 200 300 400 500 600 700 800 900 1000
50
60
70
80
90
100
Mas
s lo
ss %
Temperature °C
TG SP at 550 °C DTG SP at 550 °C
-10
-5
0
Mas
s lo
ss r
ate%
/min
b)
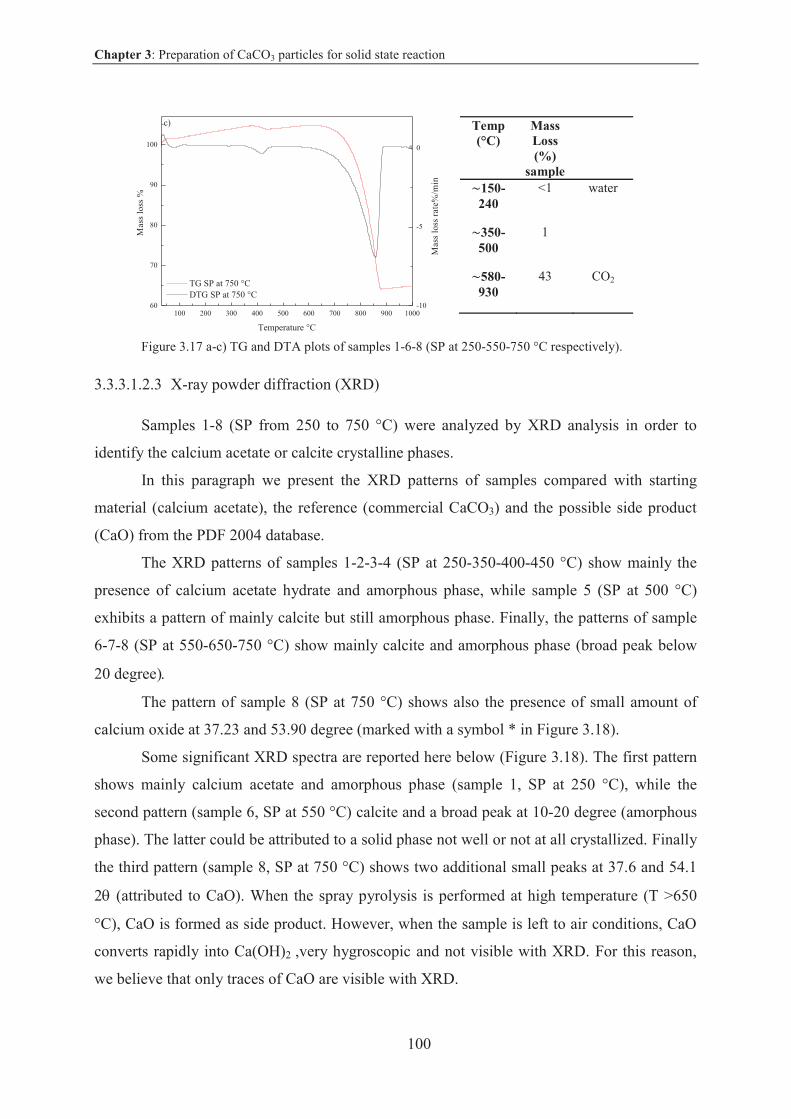
Chapter 3: Preparation of CaCO3 particles for solid state reaction
100
Figure 3.17 a-c) TG and DTA plots of samples 1-6-8 (SP at 250-550-750 °C respectively).
3.3.3.1.2.3 X-ray powder diffraction (XRD)
Samples 1-8 (SP from 250 to 750 °C) were analyzed by XRD analysis in order to
identify the calcium acetate or calcite crystalline phases.
In this paragraph we present the XRD patterns of samples compared with starting
material (calcium acetate), the reference (commercial CaCO3) and the possible side product
(CaO) from the PDF 2004 database.
The XRD patterns of samples 1-2-3-4 (SP at 250-350-400-450 °C) show mainly the
presence of calcium acetate hydrate and amorphous phase, while sample 5 (SP at 500 °C)
exhibits a pattern of mainly calcite but still amorphous phase. Finally, the patterns of sample
6-7-8 (SP at 550-650-750 °C) show mainly calcite and amorphous phase (broad peak below
20 degree)
The pattern of sample 8 (SP at 750 °C) shows also the presence of small amount of
calcium oxide at 37.23 and 53.90 degree (marked with a symbol * in Figure 3.18).
Some significant XRD spectra are reported here below (Figure 3.18). The first pattern
shows mainly calcium acetate and amorphous phase (sample 1, SP at 250 °C), while the
second pattern (sample 6, SP at 550 °C) calcite and a broad peak at 10-20 degree (amorphous
phase). The latter could be attributed to a solid phase not well or not at all crystallized. Finally
the third pattern (sample 8, SP at 750 °C) shows two additional small peaks at 37.6 and 54.1
2 (attributed to CaO). When the spray pyrolysis is performed at high temperature (T >650
°C), CaO is formed as side product. However, when the sample is left to air conditions, CaO
converts rapidly into Ca(OH)2 ,very hygroscopic and not visible with XRD. For this reason,
we believe that only traces of CaO are visible with XRD.
Temp (°C)
Mass Loss (%)
sample 150-240
<1 water
350-500
1
580-930
43 CO2
100 200 300 400 500 600 700 800 900 100060
70
80
90
100
TG SP at 750 °C DTG SP at 750 °C
Mas
s lo
ss %
Temperature °C
-10
-5
0
Mas
s lo
ss r
ate%
/min
c)
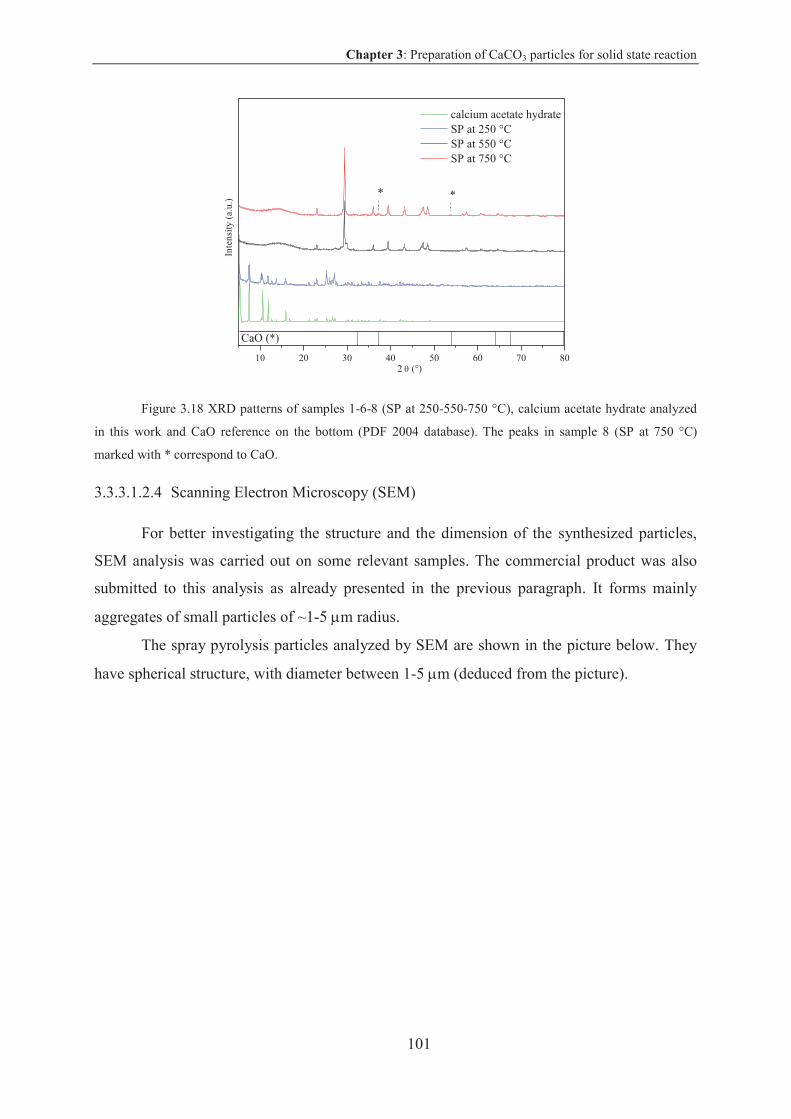
Chapter 3: Preparation of CaCO3 particles for solid state reaction
101
Figure 3.18 XRD patterns of samples 1-6-8 (SP at 250-550-750 °C), calcium acetate hydrate analyzed
in this work and CaO reference on the bottom (PDF 2004 database). The peaks in sample 8 (SP at 750 °C)
marked with * correspond to CaO.
3.3.3.1.2.4 Scanning Electron Microscopy (SEM)
For better investigating the structure and the dimension of the synthesized particles,
SEM analysis was carried out on some relevant samples. The commercial product was also
submitted to this analysis as already presented in the previous paragraph. It forms mainly
aggregates of small particles of ~1-5 m radius.
The spray pyrolysis particles analyzed by SEM are shown in the picture below. They
have spherical structure, with diameter between 1-5 m (deduced from the picture).
10 20 30 40 50 60 70 80
calcium acetate hydrate SP at 250 °C SP at 550 °C SP at 750 °C
*
Int
ensi
ty (
a.u.
)
2 (°)
CaO (*)
*
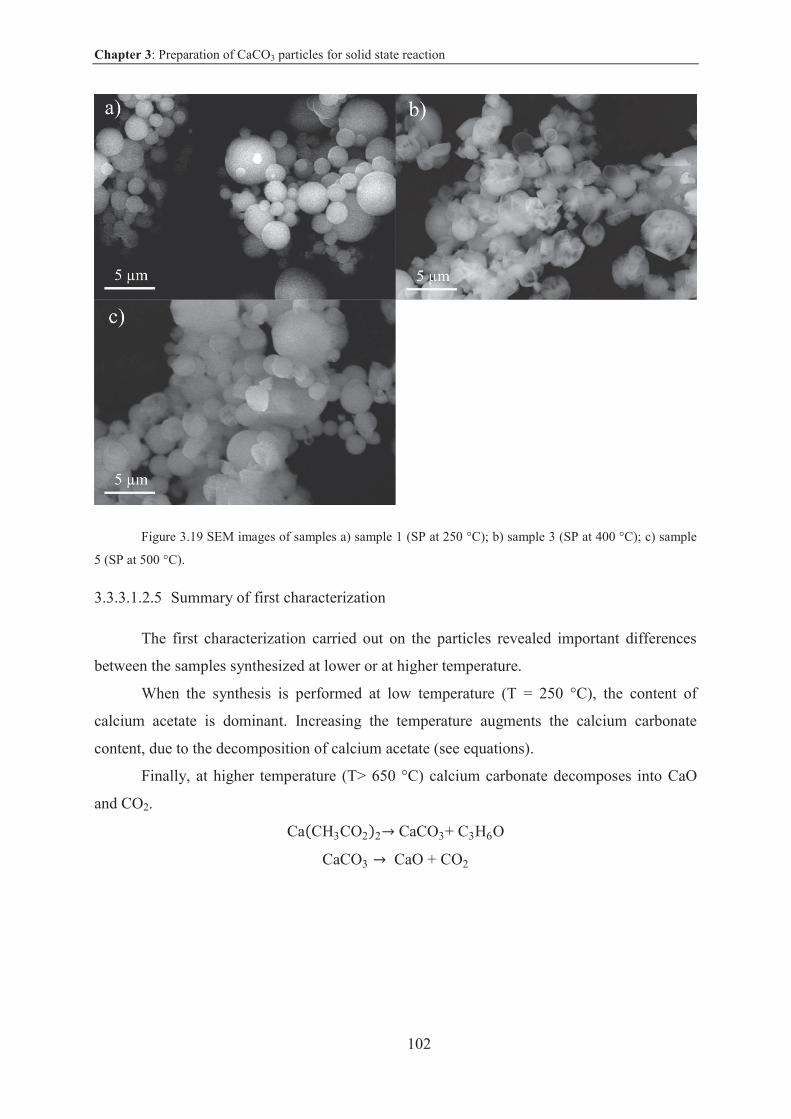
Chapter 3: Preparation of CaCO3 particles for solid state reaction
102
Figure 3.19 SEM images of samples a) sample 1 (SP at 250 °C); b) sample 3 (SP at 400 °C); c) sample
5 (SP at 500 °C).
3.3.3.1.2.5 Summary of first characterization
The first characterization carried out on the particles revealed important differences
between the samples synthesized at lower or at higher temperature.
When the synthesis is performed at low temperature (T = 250 °C), the content of
calcium acetate is dominant. Increasing the temperature augments the calcium carbonate
content, due to the decomposition of calcium acetate (see equations).
Finally, at higher temperature (T> 650 °C) calcium carbonate decomposes into CaO
and CO2.
Ca CH3CO2 2 CaCO3+ C3H6O
CaCO3 CaO + CO2
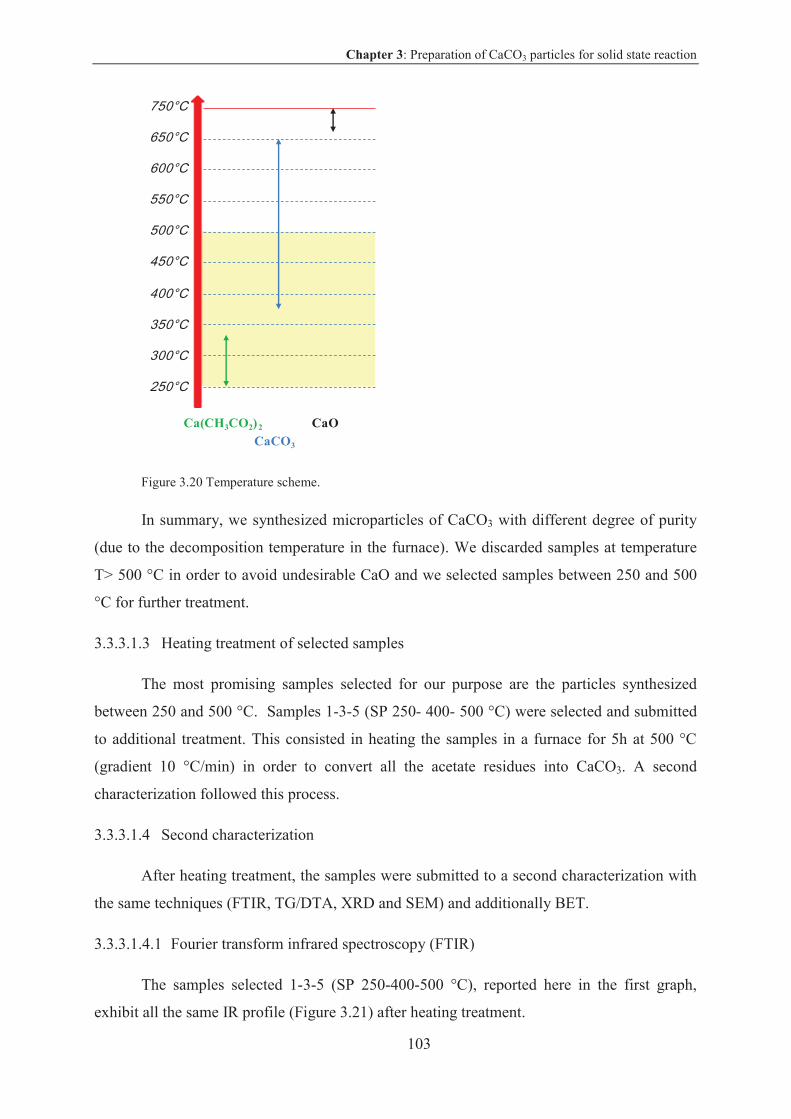
Chapter 3: Preparation of CaCO3 particles for solid state reaction
103
Figure 3.20 Temperature scheme.
In summary, we synthesized microparticles of CaCO3 with different degree of purity
(due to the decomposition temperature in the furnace). We discarded samples at temperature
T> 500 °C in order to avoid undesirable CaO and we selected samples between 250 and 500
°C for further treatment.
3.3.3.1.3 Heating treatment of selected samples
The most promising samples selected for our purpose are the particles synthesized
between 250 and 500 °C. Samples 1-3-5 (SP 250- 400- 500 °C) were selected and submitted
to additional treatment. This consisted in heating the samples in a furnace for 5h at 500 °C
(gradient 10 °C/min) in order to convert all the acetate residues into CaCO3. A second
characterization followed this process.
3.3.3.1.4 Second characterization
After heating treatment, the samples were submitted to a second characterization with
the same techniques (FTIR, TG/DTA, XRD and SEM) and additionally BET.
3.3.3.1.4.1 Fourier transform infrared spectroscopy (FTIR)
The samples selected 1-3-5 (SP 250-400-500 °C), reported here in the first graph,
exhibit all the same IR profile (Figure 3.21) after heating treatment.
Ca(CH3CO2)2
CaCO3
CaO
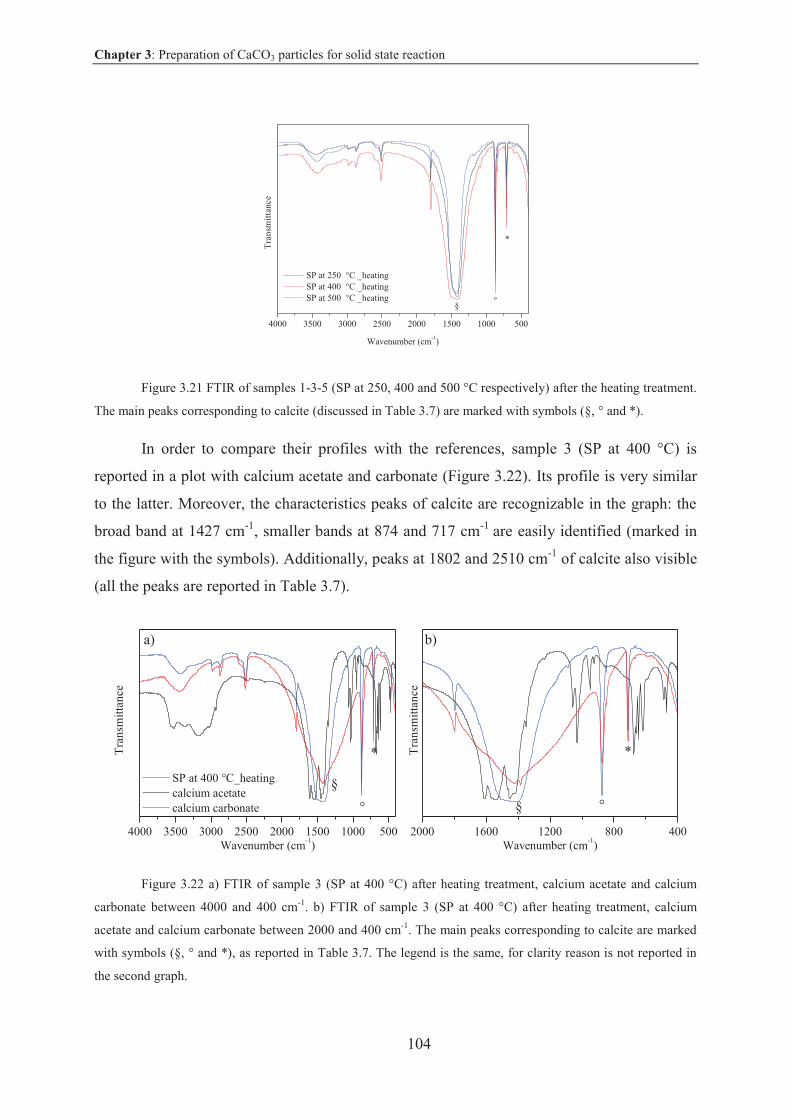
Chapter 3: Preparation of CaCO3 particles for solid state reaction
104
Figure 3.21 FTIR of samples 1-3-5 (SP at 250, 400 and 500 °C respectively) after the heating treatment.
The main peaks corresponding to calcite (discussed in Table 3.7) are marked with symbols (§, ° and *).
In order to compare their profiles with the references, sample 3 (SP at 400 °C) is
reported in a plot with calcium acetate and carbonate (Figure 3.22). Its profile is very similar
to the latter. Moreover, the characteristics peaks of calcite are recognizable in the graph: the
broad band at 1427 cm-1, smaller bands at 874 and 717 cm-1 are easily identified (marked in
the figure with the symbols). Additionally, peaks at 1802 and 2510 cm-1 of calcite also visible
(all the peaks are reported in Table 3.7).
Figure 3.22 a) FTIR of sample 3 (SP at 400 °C) after heating treatment, calcium acetate and calcium
carbonate between 4000 and 400 cm-1. b) FTIR of sample 3 (SP at 400 °C) after heating treatment, calcium
acetate and calcium carbonate between 2000 and 400 cm-1. The main peaks corresponding to calcite are marked
with symbols (§, ° and *), as reported in Table 3.7. The legend is the same, for clarity reason is not reported in
the second graph.
4000 3500 3000 2500 2000 1500 1000 500
Tra
nsm
itta
nce
Wavenumber (cm-1)
SP at 250 °C _heating SP at 400 °C _heating SP at 500 °C _heating
*
°§
4000 3500 3000 2500 2000 1500 1000 500 2000 1600 1200 800 400
SP at 400 °C_heating calcium acetate calcium carbonate
Tra
nsm
itta
nce
Wavenumber (cm-1)
a)
°
§
* Tra
nsm
itta
nce
Wavenumber (cm-1)
b)
°§
*
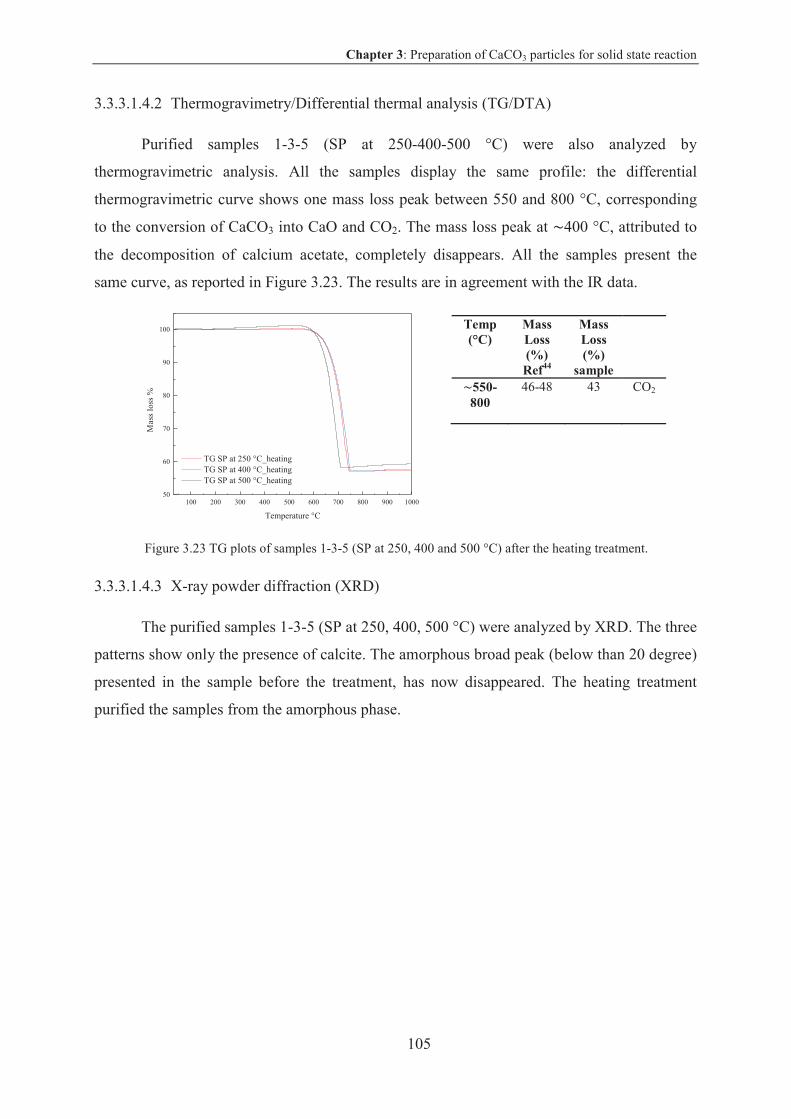
Chapter 3: Preparation of CaCO3 particles for solid state reaction
105
100 200 300 400 500 600 700 800 900 100050
60
70
80
90
100
TG SP at 250 °C_heating TG SP at 400 °C_heating TG SP at 500 °C_heating
Mas
s lo
ss %
Temperature °C
3.3.3.1.4.2 Thermogravimetry/Differential thermal analysis (TG/DTA)
Purified samples 1-3-5 (SP at 250-400-500 °C) were also analyzed by
thermogravimetric analysis. All the samples display the same profile: the differential
thermogravimetric curve shows one mass loss peak between 550 and 800 °C, corresponding
to the conversion of CaCO3 into CaO and CO2. The mass loss peak at 400 °C, attributed to
the decomposition of calcium acetate, completely disappears. All the samples present the
same curve, as reported in Figure 3.23. The results are in agreement with the IR data.
Figure 3.23 TG plots of samples 1-3-5 (SP at 250, 400 and 500 °C) after the heating treatment.
3.3.3.1.4.3 X-ray powder diffraction (XRD)
The purified samples 1-3-5 (SP at 250, 400, 500 °C) were analyzed by XRD. The three
patterns show only the presence of calcite. The amorphous broad peak (below than 20 degree)
presented in the sample before the treatment, has now disappeared. The heating treatment
purified the samples from the amorphous phase.
Temp (°C)
Mass Loss (%)Ref44
Mass Loss (%)
sample 550-800
46-48 43 CO2
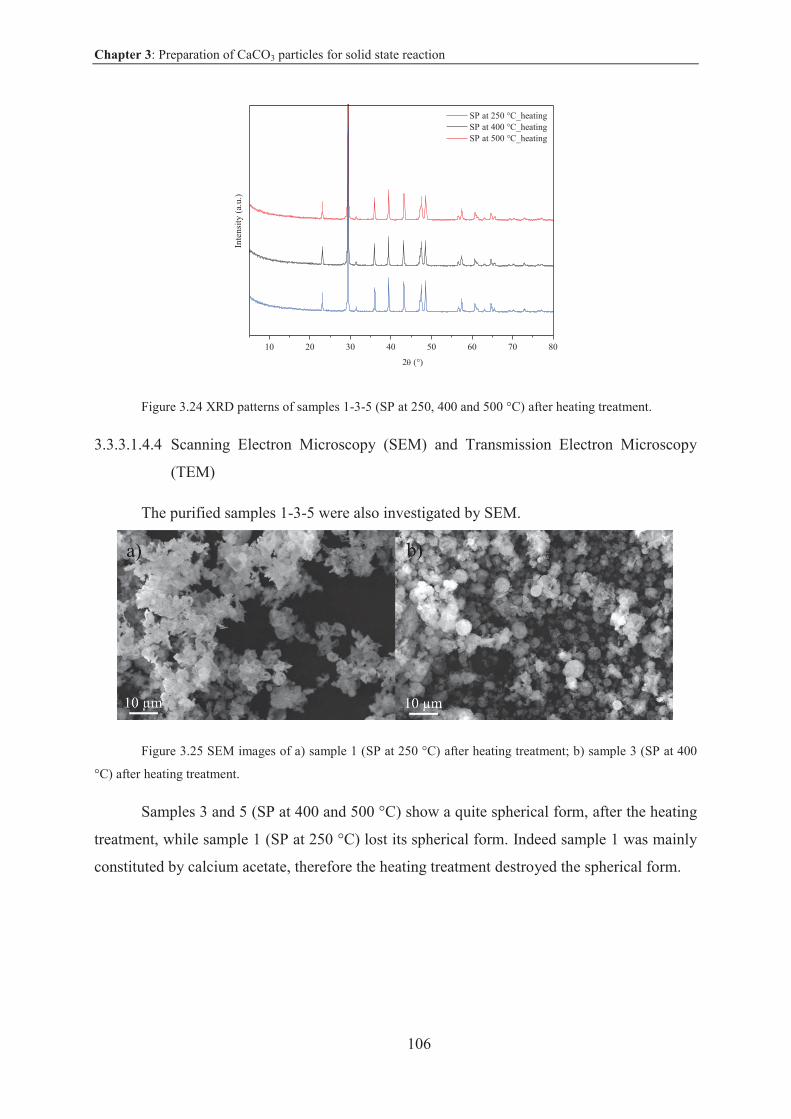
Chapter 3: Preparation of CaCO3 particles for solid state reaction
106
Figure 3.24 XRD patterns of samples 1-3-5 (SP at 250, 400 and 500 °C) after heating treatment.
3.3.3.1.4.4 Scanning Electron Microscopy (SEM) and Transmission Electron Microscopy
(TEM)
The purified samples 1-3-5 were also investigated by SEM.
Figure 3.25 SEM images of a) sample 1 (SP at 250 °C) after heating treatment; b) sample 3 (SP at 400
°C) after heating treatment.
Samples 3 and 5 (SP at 400 and 500 °C) show a quite spherical form, after the heating
treatment, while sample 1 (SP at 250 °C) lost its spherical form. Indeed sample 1 was mainly
constituted by calcium acetate, therefore the heating treatment destroyed the spherical form.
10 20 30 40 50 60 70 80
SP at 250 °C_heating SP at 400 °C_heating SP at 500 °C_heating
Inte
nsit
y (a
.u.)
2 (°)
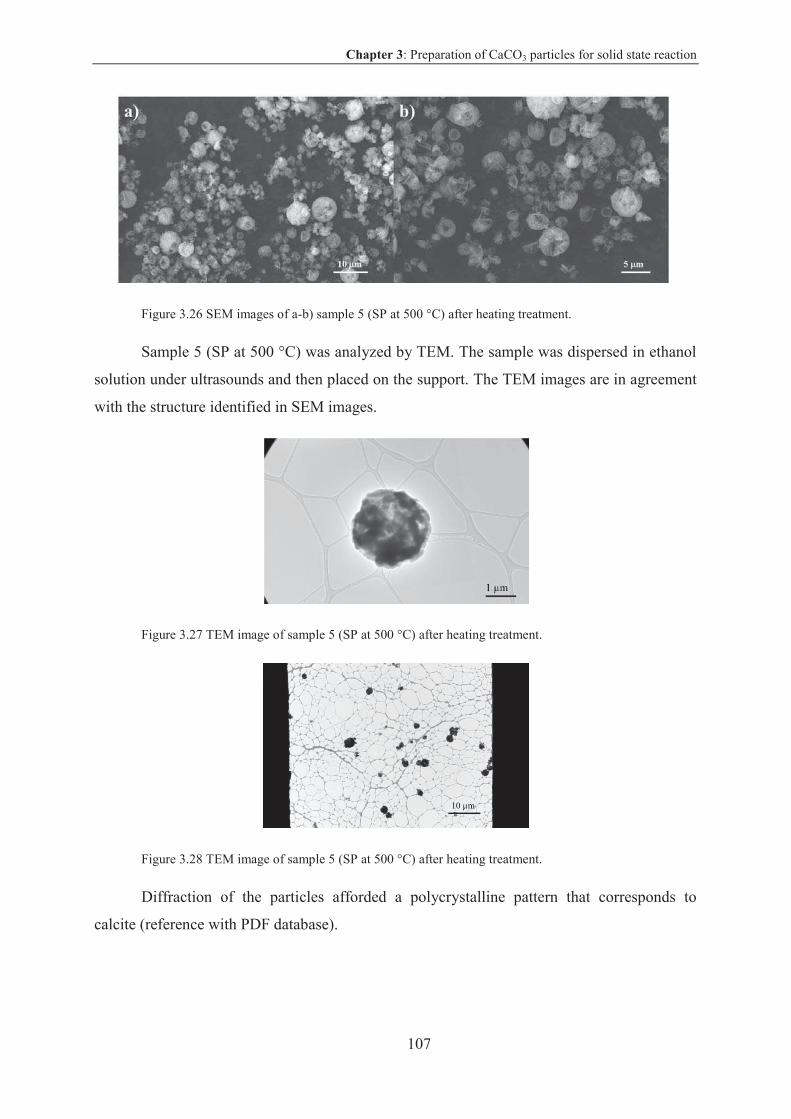
Chapter 3: Preparation of CaCO3 particles for solid state reaction
107
Figure 3.26 SEM images of a-b) sample 5 (SP at 500 °C) after heating treatment.
Sample 5 (SP at 500 °C) was analyzed by TEM. The sample was dispersed in ethanol
solution under ultrasounds and then placed on the support. The TEM images are in agreement
with the structure identified in SEM images.
Figure 3.27 TEM image of sample 5 (SP at 500 °C) after heating treatment.
Figure 3.28 TEM image of sample 5 (SP at 500 °C) after heating treatment.
Diffraction of the particles afforded a polycrystalline pattern that corresponds to
calcite (reference with PDF database).
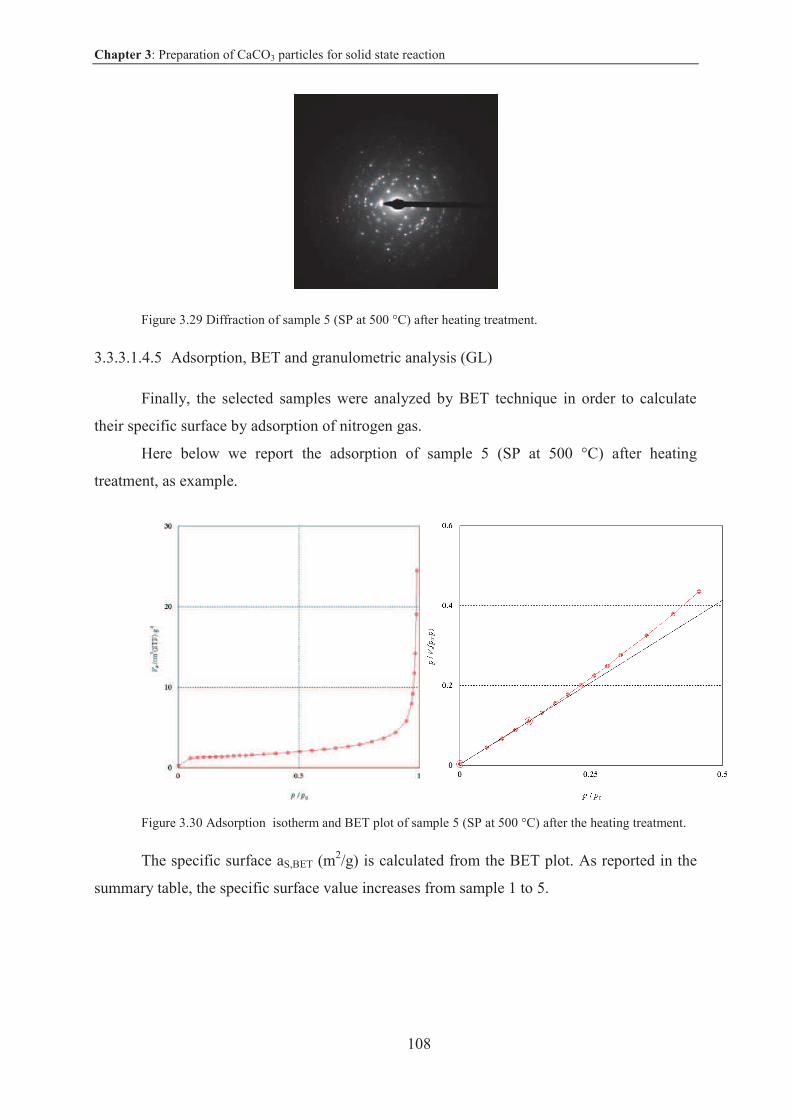
Chapter 3: Preparation of CaCO3 particles for solid state reaction
108
Figure 3.29 Diffraction of sample 5 (SP at 500 °C) after heating treatment.
3.3.3.1.4.5 Adsorption, BET and granulometric analysis (GL)
Finally, the selected samples were analyzed by BET technique in order to calculate
their specific surface by adsorption of nitrogen gas.
Here below we report the adsorption of sample 5 (SP at 500 °C) after heating
treatment, as example.
Figure 3.30 Adsorption isotherm and BET plot of sample 5 (SP at 500 °C) after the heating treatment.
The specific surface aS,BET (m2/g) is calculated from the BET plot. As reported in the
summary table, the specific surface value increases from sample 1 to 5.
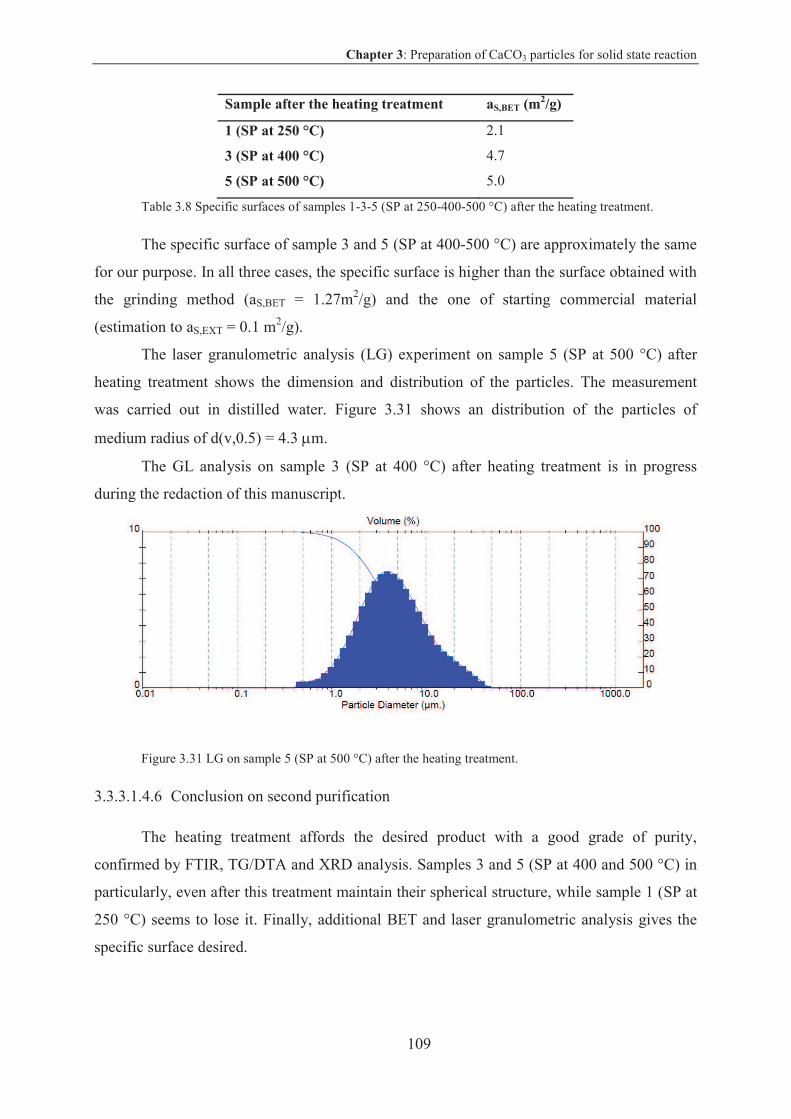
Chapter 3: Preparation of CaCO3 particles for solid state reaction
109
Sample after the heating treatment aS,BET (m2/g)
1 (SP at 250 °C) 2.1
3 (SP at 400 °C) 4.7
5 (SP at 500 °C) 5.0
Table 3.8 Specific surfaces of samples 1-3-5 (SP at 250-400-500 °C) after the heating treatment.
The specific surface of sample 3 and 5 (SP at 400-500 °C) are approximately the same
for our purpose. In all three cases, the specific surface is higher than the surface obtained with
the grinding method (aS,BET = 1.27m2/g) and the one of starting commercial material
(estimation to aS,EXT = 0.1 m2/g).
The laser granulometric analysis (LG) experiment on sample 5 (SP at 500 °C) after
heating treatment shows the dimension and distribution of the particles. The measurement
was carried out in distilled water. Figure 3.31 shows an distribution of the particles of
medium radius of d(v,0.5) = 4.3 m.
The GL analysis on sample 3 (SP at 400 °C) after heating treatment is in progress
during the redaction of this manuscript.
Figure 3.31 LG on sample 5 (SP at 500 °C) after the heating treatment.
3.3.3.1.4.6 Conclusion on second purification
The heating treatment affords the desired product with a good grade of purity,
confirmed by FTIR, TG/DTA and XRD analysis. Samples 3 and 5 (SP at 400 and 500 °C) in
particularly, even after this treatment maintain their spherical structure, while sample 1 (SP at
250 °C) seems to lose it. Finally, additional BET and laser granulometric analysis gives the
specific surface desired.
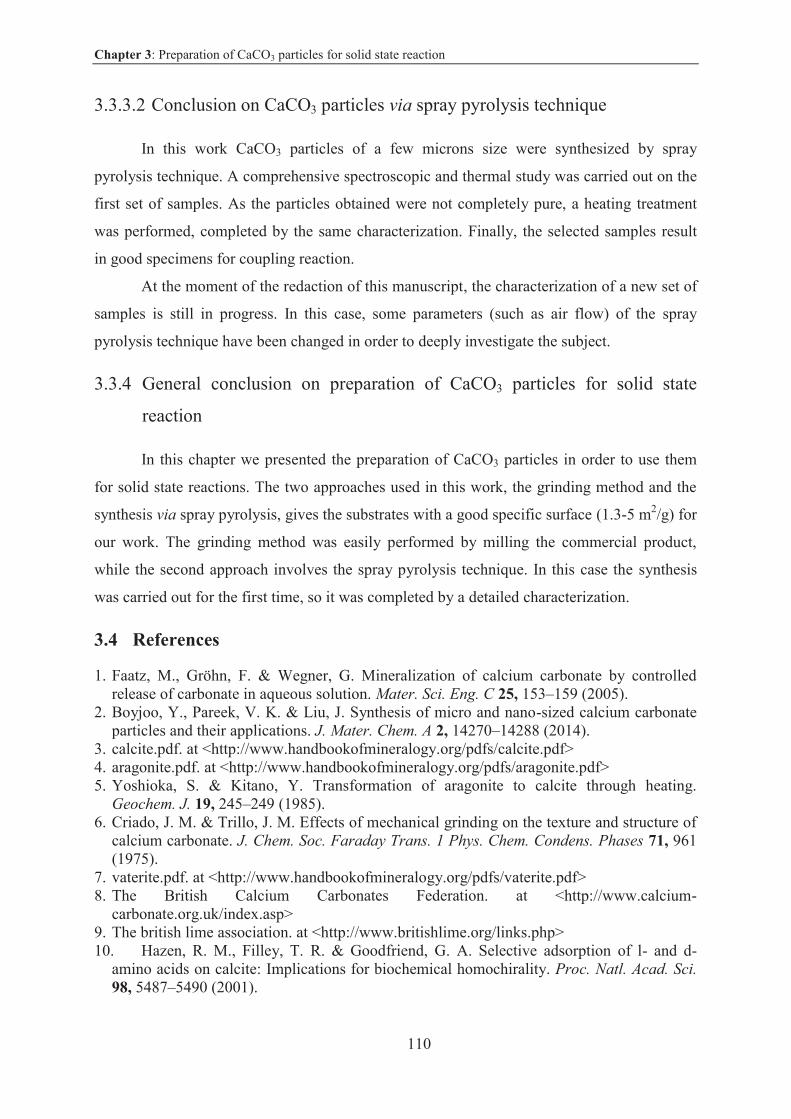
Chapter 3: Preparation of CaCO3 particles for solid state reaction
110
3.3.3.2 Conclusion on CaCO3 particles via spray pyrolysis technique
In this work CaCO3 particles of a few microns size were synthesized by spray
pyrolysis technique. A comprehensive spectroscopic and thermal study was carried out on the
first set of samples. As the particles obtained were not completely pure, a heating treatment
was performed, completed by the same characterization. Finally, the selected samples result
in good specimens for coupling reaction.
At the moment of the redaction of this manuscript, the characterization of a new set of
samples is still in progress. In this case, some parameters (such as air flow) of the spray
pyrolysis technique have been changed in order to deeply investigate the subject.
3.3.4 General conclusion on preparation of CaCO3 particles for solid state
reaction
In this chapter we presented the preparation of CaCO3 particles in order to use them
for solid state reactions. The two approaches used in this work, the grinding method and the
synthesis via spray pyrolysis, gives the substrates with a good specific surface (1.3-5 m2/g) for
our work. The grinding method was easily performed by milling the commercial product,
while the second approach involves the spray pyrolysis technique. In this case the synthesis
was carried out for the first time, so it was completed by a detailed characterization.
3.4 References
1. Faatz, M., Gröhn, F. & Wegner, G. Mineralization of calcium carbonate by controlled release of carbonate in aqueous solution. Mater. Sci. Eng. C 25, 153–159 (2005).
2. Boyjoo, Y., Pareek, V. K. & Liu, J. Synthesis of micro and nano-sized calcium carbonate particles and their applications. J. Mater. Chem. A 2, 14270–14288 (2014).
3. calcite.pdf. at <http://www.handbookofmineralogy.org/pdfs/calcite.pdf> 4. aragonite.pdf. at <http://www.handbookofmineralogy.org/pdfs/aragonite.pdf> 5. Yoshioka, S. & Kitano, Y. Transformation of aragonite to calcite through heating.
Geochem. J. 19, 245–249 (1985). 6. Criado, J. M. & Trillo, J. M. Effects of mechanical grinding on the texture and structure of
calcium carbonate. J. Chem. Soc. Faraday Trans. 1 Phys. Chem. Condens. Phases 71, 961 (1975).
7. vaterite.pdf. at <http://www.handbookofmineralogy.org/pdfs/vaterite.pdf> 8. The British Calcium Carbonates Federation. at <http://www.calcium-
carbonate.org.uk/index.asp> 9. The british lime association. at <http://www.britishlime.org/links.php> 10. Hazen, R. M., Filley, T. R. & Goodfriend, G. A. Selective adsorption of l- and d-
amino acids on calcite: Implications for biochemical homochirality. Proc. Natl. Acad. Sci. 98, 5487–5490 (2001).
Chapter 3: Preparation of CaCO3 particles for solid state reaction
111
11. Orme, C. A. et al. Formation of chiral morphologies through selective binding of amino acids to calcite surface steps. Nature 411, 775–779 (2001).
12. Addadi, L. & Weiner, S. Biomineralization: Crystals, asymmetry and life. Nature 411, 753–755 (2001).
13. Wei, W. et al. Preparation of Hierarchical Hollow CaCO 3 Particles and the Application as Anticancer Drug Carrier. J. Am. Chem. Soc. 130, 15808–15810 (2008).
14. Liu, L. et al. Biomineralization of Stable and Monodisperse Vaterite Microspheres Using Silk Nanoparticles. ACS Appl. Mater. Interfaces 7, 1735–1745 (2015).
15. Zhang, J. et al. Calcium Carbonate Nanoplate Assemblies with Directed High-Energy Facets: Additive-Free Synthesis, High Drug Loading, and Sustainable Releasing. ACS
Appl. Mater. Interfaces 7, 15686–15691 (2015). 16. Peng, C., Zhao, Q. & Gao, C. Sustained delivery of doxorubicin by porous CaCO3 and
chitosan/alginate multilayers-coated CaCO3 microparticles. Colloids Surf. Physicochem.
Eng. Asp. 353, 132–139 (2010). 17. Okuyama, K. & Wuled Lenggoro, I. Preparation of nanoparticles via spray route.
Chem. Eng. Sci. 58, 537–547 (2003). 18. Chen, Y., Lian, X., Li, Z., Zheng, S. & Wang, Z. Effects of rotation speed and media
density on particle size distribution and structure of ground calcium carbonate in a planetary ball mill. Adv. Powder Technol. 26, 505–510 (2015).
19. Caiut, J. M. A. et al. Elaboration of boehmite nano-powders by spray-pyrolysis. Powder Technol. 190, 95–98 (2009).
20. Messing, G. L., Zhang, S.-C. & Jayanthi, G. V. Ceramic Powder Synthesis by Spray Pyrolysis. J. Am. Ceram. Soc. 76, 2707–2726 (1993).
21. Joffin, N. et al. Phosphor powders elaborated by spray-pyrolysis: Characterizations and possible applications. Opt. Mater. 28, 597–601 (2006).
22. Patil, P. S. Versatility of chemical spray pyrolysis technique. Mater. Chem. Phys. 59, 185–198 (1999).
23. PYLOTE. at <http://www.pylote.fr/fr> 24. Joffin, N. Synthèse par pyrolyse d’aérosol et caractérisation de luminophores :
Y2O3:Eu3+ et An2SiO4:Mn2+ pour application dans les panneaux à plasma. (Toulouse, INPT, 2004). at <http://www.theses.fr/2004INPT012G>
25. Che, S., Sakurai, O., Shinozaki, K. & Mizutani, N. Particle structure control through intraparticle reactions by spray pyrolysis. J. Aerosol Sci. 29, 271–278 (1998).
26. Judd, M. D., Plunkett, B. A. & Pope, M. I. The thermal decomposition of calcium, sodium, silver and copper(II) acetates. J. Therm. Anal. 6, 555–563 (1974).
27. Wayne R. Pease, Robert L. Segall, Roger St. C. Smart & Peter S. Turner. Surface Reduction in Low-temperature Formation of Nickel Oxide from Different Nickel Salts. J.
Chem. Soc. Farady Trans. 1, 747–758 (1985). 28. Adánez, J., de Diego, L. F. & Garcõa-Labiano, F. Calcination of calcium acetate and
calcium magnesium acetate: effect of the reacting atmosphere. Fuel 78, 583–592 (1999). 29. Rice, F. O. & Vollrath, R. E. The thermal decomposition of acetone in the gaseous
state. Proc. Natl. Acad. Sci. U. S. A. 15, 702–705 (1929). 30. Rice, F. O., Rodowskas, E. L. & Lewis, W. R. The Thermal Decomposition of
Acetone. J. Am. Chem. Soc. 56, 2497–2498 (1934). 31. Winkler, C. A. & Hinshelwood, C. N. The Thermal Decomposition of Acetone
Vapour. Proc. R. Soc. Lond. Ser. Math. Phys. Sci. 149, 340–354 (1935). 32. Allen, A. O. The Thermal Decomposition of Acetone. J. Am. Chem. Soc. 58, 1052–
1053 (1936). 33. Davoud, J. G. & Hinshelwood, C. N. Thermal Decomposition of Acetone. Nature 144,
909–910 (1939).
Chapter 3: Preparation of CaCO3 particles for solid state reaction
112
34. Smith, J. R. E., Phil, D. & Hinshelwood, C. N. The Thermal Decomposition of Acetone. Proc. R. Soc. Lond. Math. Phys. Eng. Sci. 183, 33–37 (1944).
35. Alavi, S. et al. Spray Pyrolysis synthesis of submicronic particles. Possibilities and limits. 30A, 417–424 (2002).
36. Musumeci, A. W., Frost, R. L. & Waclawik, E. R. A spectroscopic study of the mineral paceite (calcium acetate). Spectrochim. Acta. A. Mol. Biomol. Spectrosc. 67, 649–
661 (2007). 37. Legodi, M. A., de Waal, D., Potgieter, J. H. & Potgieter, S. S. Rapid determination of
CaCO3 in mixtures utilising FT—IR spectroscopy. Miner. Eng. 14, 1107–1111 (2001). 38. Andersen, F. A. et al. Infrared Spectra of Amorphous and Crystalline Calcium
Carbonate. Acta Chem. Scand. 45, 1018–1024 (1991). 39. Diego Rodriguez-Blanco, J., Shaw, S. & G. Benning, L. The kinetics and mechanisms
of amorphous calcium carbonate (ACC) crystallization to calcite , via vaterite. Nanoscale 3, 265–271 (2011).
40. Gunasekaran, S. & Anbalagan, G. Spectroscopic study of phase transitions in natural calcite mineral. Spectrochim. Acta. A. Mol. Biomol. Spectrosc. 69, 1246–1251 (2008).
41. Guan, W. et al. A Novel Synthesis Method of Porous Calcium Silicate Hydrate Based on the Calcium Oxide/Polyethylene Glycol Composites. J. Nanomater. 2013, 1–7 (2013).
42. Bilton, M., Brown, A. P. & Milne, S. J. Investigating the optimum conditions for the formation of calcium oxide, used for CO 2 sequestration, by thermal decomposition of calcium acetate. J. Phys. Conf. Ser. 371, 012075 (2012).
43. Niu, S., Han, K., Lu, C. & Sun, R. Thermogravimetric analysis of the relationship among calcium magnesium acetate, calcium acetate and magnesium acetate. Appl. Energy 87, 2237–2242 (2010).
44. Babou-Kammoe, R., Hamoudi, S., Larachi, F. & Belkacemi, K. Synthesis of CaCO3 nanoparticles by controlled precipitation of saturated carbonate and calcium nitrate aqueous solutions. Can. J. Chem. Eng. 90, 26–33 (2012).
Chapter 4: Coupling reaction on CaCO3 particles
113
4. Coupling reaction on CaCO3 particles
4.1 Reaction on solid surface by mechanochemistry ............................................ 114
4.1.1 Introduction and objective .......................................................................... 114
4.1.2 Experimental .............................................................................................. 116
4.1.3 Results and discussion ................................................................................ 119
4.1.4 Conclusions on reaction by mechanochemistry activation ........................ 120
4.2 Coupling reaction on solid surface by thermal activation ............................... 121
4.2.1 Introduction and objective .......................................................................... 121
4.2.2 Experimental .............................................................................................. 121
4.2.3 Results and discussion ................................................................................ 121
4.2.4 Other reactions studied in this work ........................................................... 125
4.2.5 Conclusions on coupling reaction by thermal activation on CaCO3
microparticles ............................................................................................. 129
4.3 General conclusion on coupling reactions on solid surface ............................ 129
4.4 References ....................................................................................................... 131
In the previous chapter we prepared CaCO3 microparticles with correct specific
surface for our purpose (Figure 4.1 a).
In this chapter we will describe the deposition of molecules on those particles (Figure
4.1 b), the reaction activation on the surface (Figure 4.1 c), and the work-up in order to isolate
the product (Figure 4.1 d-e).
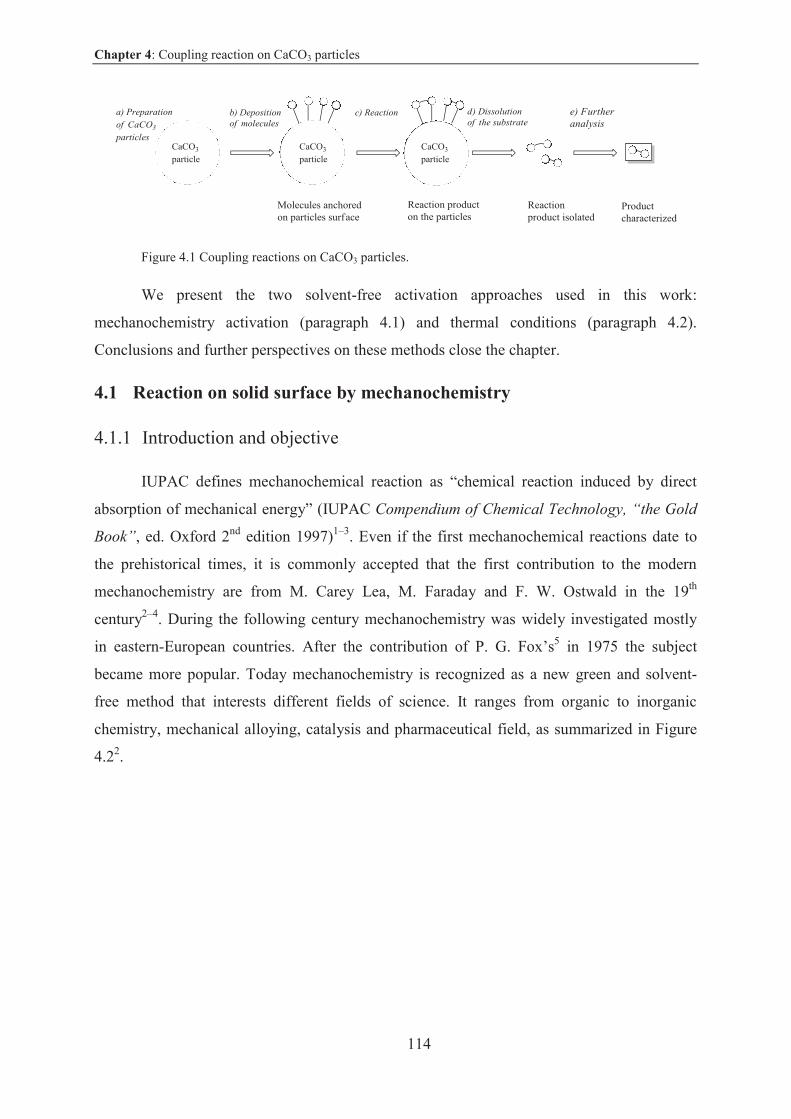
Chapter 4: Coupling reaction on CaCO3 particles
114
Figure 4.1 Coupling reactions on CaCO3 particles.
We present the two solvent-free activation approaches used in this work:
mechanochemistry activation (paragraph 4.1) and thermal conditions (paragraph 4.2).
Conclusions and further perspectives on these methods close the chapter.
4.1 Reaction on solid surface by mechanochemistry
4.1.1 Introduction and objective
IUPAC defines mechanochemical reaction as “chemical reaction induced by direct
absorption of mechanical energy” (IUPAC Compendium of Chemical Technology, “the Gold
Book”, ed. Oxford 2nd edition 1997)1–3. Even if the first mechanochemical reactions date to
the prehistorical times, it is commonly accepted that the first contribution to the modern
mechanochemistry are from M. Carey Lea, M. Faraday and F. W. Ostwald in the 19th
century2–4. During the following century mechanochemistry was widely investigated mostly
in eastern-European countries. After the contribution of P. G. Fox’s5 in 1975 the subject
became more popular. Today mechanochemistry is recognized as a new green and solvent-
free method that interests different fields of science. It ranges from organic to inorganic
chemistry, mechanical alloying, catalysis and pharmaceutical field, as summarized in Figure
4.22.
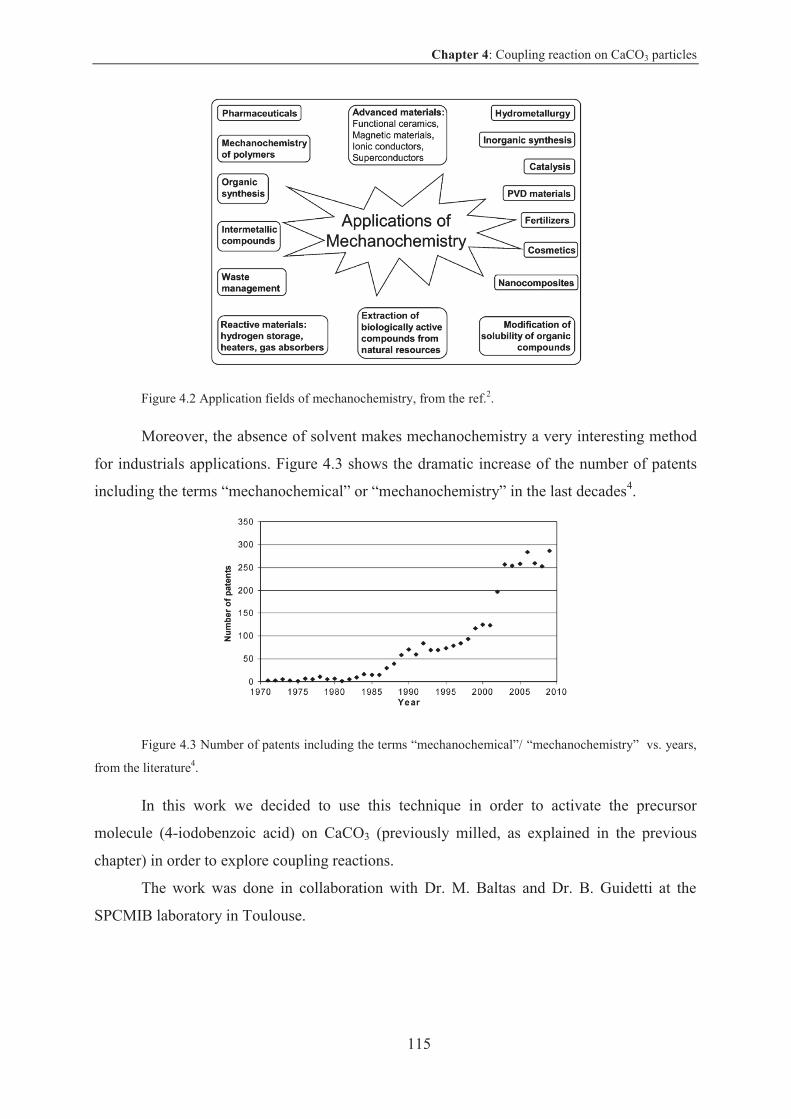
Chapter 4: Coupling reaction on CaCO3 particles
115
Figure 4.2 Application fields of mechanochemistry, from the ref.2.
Moreover, the absence of solvent makes mechanochemistry a very interesting method
for industrials applications. Figure 4.3 shows the dramatic increase of the number of patents
including the terms “mechanochemical” or “mechanochemistry” in the last decades4.
Figure 4.3 Number of patents including the terms “mechanochemical”/ “mechanochemistry” vs. years,
from the literature4.
In this work we decided to use this technique in order to activate the precursor
molecule (4-iodobenzoic acid) on CaCO3 (previously milled, as explained in the previous
chapter) in order to explore coupling reactions.
The work was done in collaboration with Dr. M. Baltas and Dr. B. Guidetti at the
SPCMIB laboratory in Toulouse.
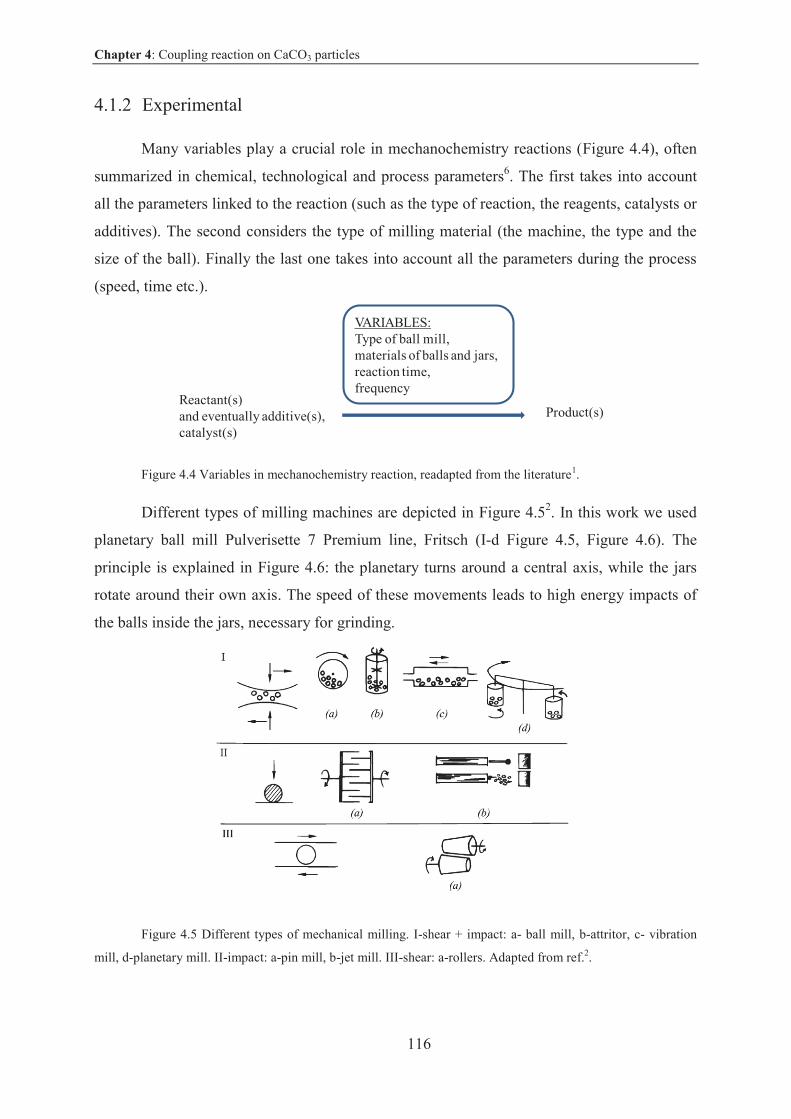
Chapter 4: Coupling reaction on CaCO3 particles
116
4.1.2 Experimental
Many variables play a crucial role in mechanochemistry reactions (Figure 4.4), often
summarized in chemical, technological and process parameters6. The first takes into account
all the parameters linked to the reaction (such as the type of reaction, the reagents, catalysts or
additives). The second considers the type of milling material (the machine, the type and the
size of the ball). Finally the last one takes into account all the parameters during the process
(speed, time etc.).
Figure 4.4 Variables in mechanochemistry reaction, readapted from the literature1.
Different types of milling machines are depicted in Figure 4.52. In this work we used
planetary ball mill Pulverisette 7 Premium line, Fritsch (I-d Figure 4.5, Figure 4.6). The
principle is explained in Figure 4.6: the planetary turns around a central axis, while the jars
rotate around their own axis. The speed of these movements leads to high energy impacts of
the balls inside the jars, necessary for grinding.
Figure 4.5 Different types of mechanical milling. I-shear + impact: a- ball mill, b-attritor, c- vibration
mill, d-planetary mill. II-impact: a-pin mill, b-jet mill. III-shear: a-rollers. Adapted from ref.2.
Reactant(s)and eventually additive(s), catalyst(s)
Product(s)
VARIABLES:Type of ball mill,materials of balls and jars,reaction time,frequency
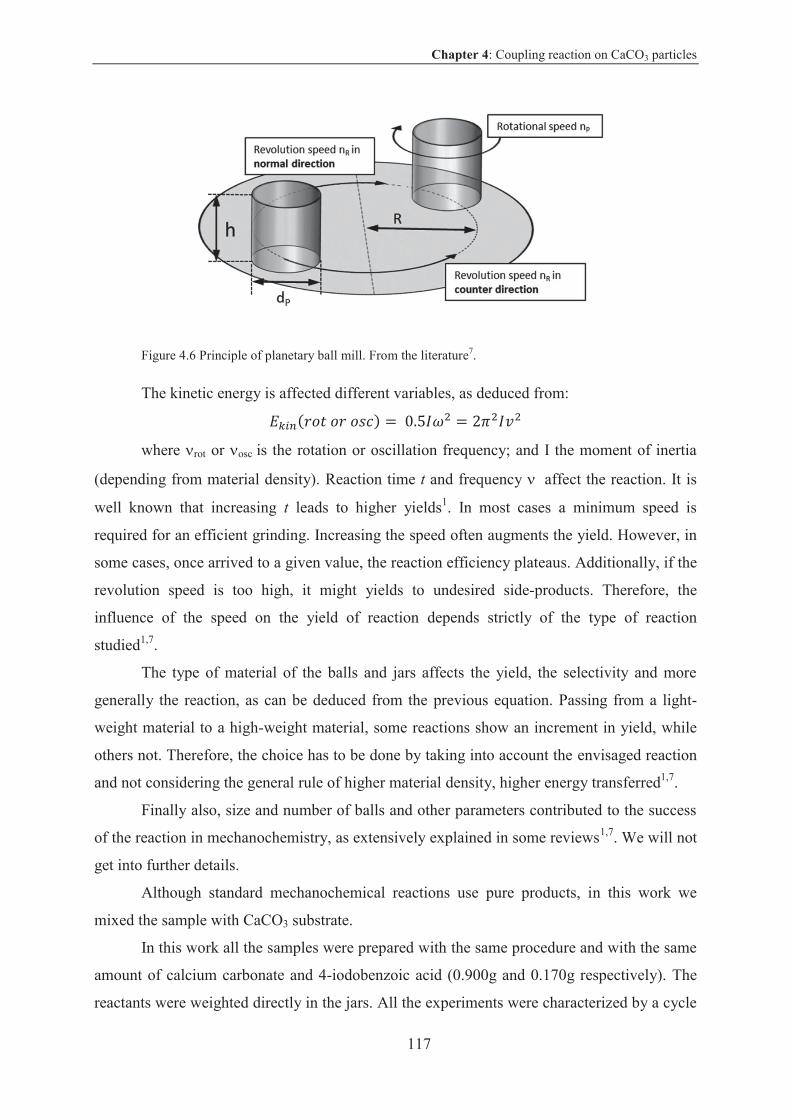
Chapter 4: Coupling reaction on CaCO3 particles
117
Figure 4.6 Principle of planetary ball mill. From the literature7.
The kinetic energy is affected different variables, as deduced from:
where rot or osc is the rotation or oscillation frequency; and I the moment of inertia
(depending from material density). Reaction time t and frequency affect the reaction. It is
well known that increasing t leads to higher yields1. In most cases a minimum speed is
required for an efficient grinding. Increasing the speed often augments the yield. However, in
some cases, once arrived to a given value, the reaction efficiency plateaus. Additionally, if the
revolution speed is too high, it might yields to undesired side-products. Therefore, the
influence of the speed on the yield of reaction depends strictly of the type of reaction
studied1,7.
The type of material of the balls and jars affects the yield, the selectivity and more
generally the reaction, as can be deduced from the previous equation. Passing from a light-
weight material to a high-weight material, some reactions show an increment in yield, while
others not. Therefore, the choice has to be done by taking into account the envisaged reaction
and not considering the general rule of higher material density, higher energy transferred1,7.
Finally also, size and number of balls and other parameters contributed to the success
of the reaction in mechanochemistry, as extensively explained in some reviews1,7. We will not
get into further details.
Although standard mechanochemical reactions use pure products, in this work we
mixed the sample with CaCO3 substrate.
In this work all the samples were prepared with the same procedure and with the same
amount of calcium carbonate and 4-iodobenzoic acid (0.900g and 0.170g respectively). The
reactants were weighted directly in the jars. All the experiments were characterized by a cycle
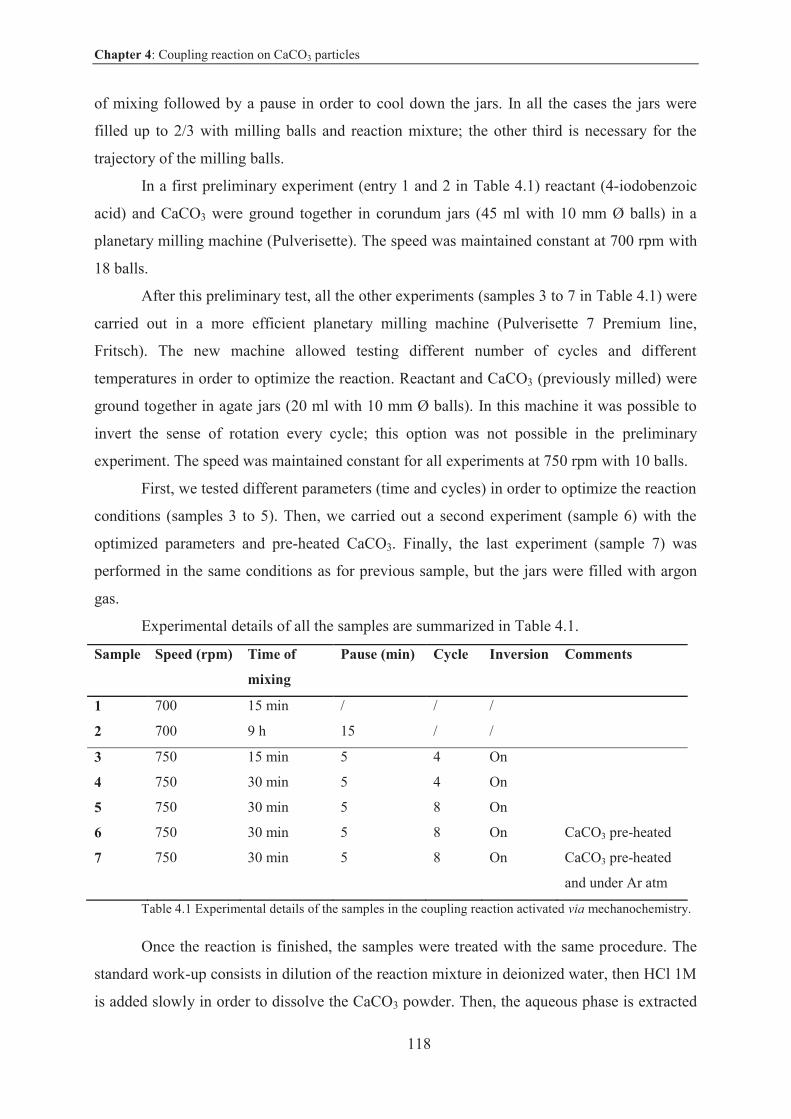
Chapter 4: Coupling reaction on CaCO3 particles
118
of mixing followed by a pause in order to cool down the jars. In all the cases the jars were
filled up to 2/3 with milling balls and reaction mixture; the other third is necessary for the
trajectory of the milling balls.
In a first preliminary experiment (entry 1 and 2 in Table 4.1) reactant (4-iodobenzoic
acid) and CaCO3 were ground together in corundum jars (45 ml with 10 mm Ø balls) in a
planetary milling machine (Pulverisette). The speed was maintained constant at 700 rpm with
18 balls.
After this preliminary test, all the other experiments (samples 3 to 7 in Table 4.1) were
carried out in a more efficient planetary milling machine (Pulverisette 7 Premium line,
Fritsch). The new machine allowed testing different number of cycles and different
temperatures in order to optimize the reaction. Reactant and CaCO3 (previously milled) were
ground together in agate jars (20 ml with 10 mm Ø balls). In this machine it was possible to
invert the sense of rotation every cycle; this option was not possible in the preliminary
experiment. The speed was maintained constant for all experiments at 750 rpm with 10 balls.
First, we tested different parameters (time and cycles) in order to optimize the reaction
conditions (samples 3 to 5). Then, we carried out a second experiment (sample 6) with the
optimized parameters and pre-heated CaCO3. Finally, the last experiment (sample 7) was
performed in the same conditions as for previous sample, but the jars were filled with argon
gas.
Experimental details of all the samples are summarized in Table 4.1.
Sample Speed (rpm) Time of
mixing
Pause (min) Cycle Inversion Comments
1 700 15 min / / /
2 700 9 h 15 / /
3 750 15 min 5 4 On
4 750 30 min 5 4 On
5 750 30 min 5 8 On
6 750 30 min 5 8 On CaCO3 pre-heated
7 750 30 min 5 8 On CaCO3 pre-heated
and under Ar atm
Table 4.1 Experimental details of the samples in the coupling reaction activated via mechanochemistry.
Once the reaction is finished, the samples were treated with the same procedure. The
standard work-up consists in dilution of the reaction mixture in deionized water, then HCl 1M
is added slowly in order to dissolve the CaCO3 powder. Then, the aqueous phase is extracted
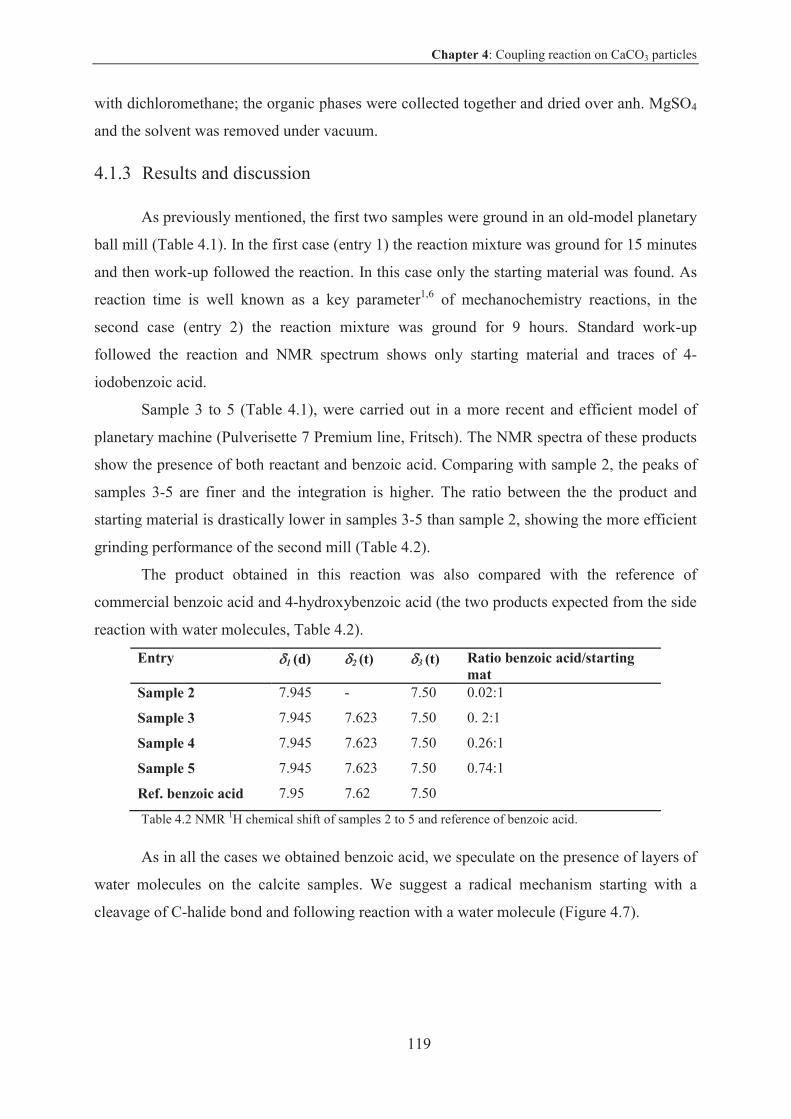
Chapter 4: Coupling reaction on CaCO3 particles
119
with dichloromethane; the organic phases were collected together and dried over anh. MgSO4
and the solvent was removed under vacuum.
4.1.3 Results and discussion
As previously mentioned, the first two samples were ground in an old-model planetary
ball mill (Table 4.1). In the first case (entry 1) the reaction mixture was ground for 15 minutes
and then work-up followed the reaction. In this case only the starting material was found. As
reaction time is well known as a key parameter1,6 of mechanochemistry reactions, in the
second case (entry 2) the reaction mixture was ground for 9 hours. Standard work-up
followed the reaction and NMR spectrum shows only starting material and traces of 4-
iodobenzoic acid.
Sample 3 to 5 (Table 4.1), were carried out in a more recent and efficient model of
planetary machine (Pulverisette 7 Premium line, Fritsch). The NMR spectra of these products
show the presence of both reactant and benzoic acid. Comparing with sample 2, the peaks of
samples 3-5 are finer and the integration is higher. The ratio between the the product and
starting material is drastically lower in samples 3-5 than sample 2, showing the more efficient
grinding performance of the second mill (Table 4.2).
The product obtained in this reaction was also compared with the reference of
commercial benzoic acid and 4-hydroxybenzoic acid (the two products expected from the side
reaction with water molecules, Table 4.2).
Entry 1 (d) 2 (t) 3 (t) Ratio benzoic acid/starting mat
Sample 2 7.945 - 7.50 0.02:1
Sample 3 7.945 7.623 7.50 0. 2:1
Sample 4 7.945 7.623 7.50 0.26:1
Sample 5 7.945 7.623 7.50 0.74:1
Ref. benzoic acid 7.95 7.62 7.50
Table 4.2 NMR 1H chemical shift of samples 2 to 5 and reference of benzoic acid.
As in all the cases we obtained benzoic acid, we speculate on the presence of layers of
water molecules on the calcite samples. We suggest a radical mechanism starting with a
cleavage of C-halide bond and following reaction with a water molecule (Figure 4.7).
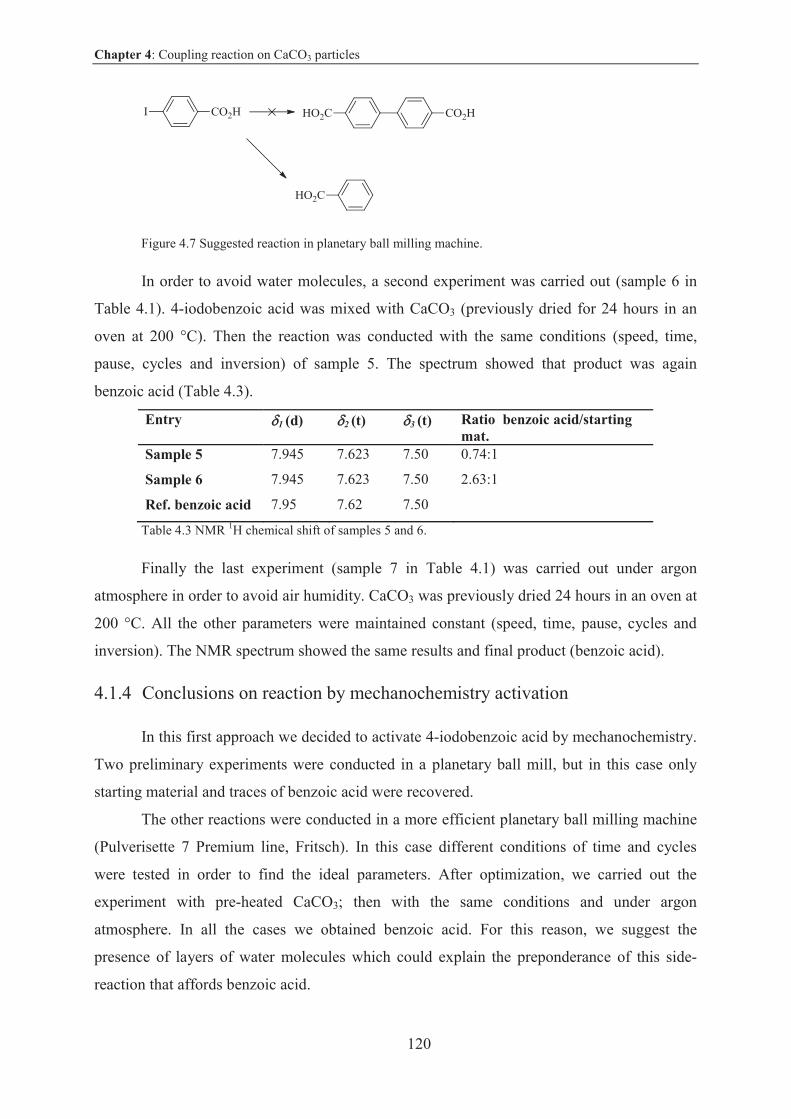
Chapter 4: Coupling reaction on CaCO3 particles
120
Figure 4.7 Suggested reaction in planetary ball milling machine.
In order to avoid water molecules, a second experiment was carried out (sample 6 in
Table 4.1). 4-iodobenzoic acid was mixed with CaCO3 (previously dried for 24 hours in an
oven at 200 °C). Then the reaction was conducted with the same conditions (speed, time,
pause, cycles and inversion) of sample 5. The spectrum showed that product was again
benzoic acid (Table 4.3).
Entry 1 (d) 2 (t) 3 (t) Ratio benzoic acid/starting mat.
Sample 5 7.945 7.623 7.50 0.74:1
Sample 6 7.945 7.623 7.50 2.63:1
Ref. benzoic acid 7.95 7.62 7.50
Table 4.3 NMR 1H chemical shift of samples 5 and 6.
Finally the last experiment (sample 7 in Table 4.1) was carried out under argon
atmosphere in order to avoid air humidity. CaCO3 was previously dried 24 hours in an oven at
200 °C. All the other parameters were maintained constant (speed, time, pause, cycles and
inversion). The NMR spectrum showed the same results and final product (benzoic acid).
4.1.4 Conclusions on reaction by mechanochemistry activation
In this first approach we decided to activate 4-iodobenzoic acid by mechanochemistry.
Two preliminary experiments were conducted in a planetary ball mill, but in this case only
starting material and traces of benzoic acid were recovered.
The other reactions were conducted in a more efficient planetary ball milling machine
(Pulverisette 7 Premium line, Fritsch). In this case different conditions of time and cycles
were tested in order to find the ideal parameters. After optimization, we carried out the
experiment with pre-heated CaCO3; then with the same conditions and under argon
atmosphere. In all the cases we obtained benzoic acid. For this reason, we suggest the
presence of layers of water molecules which could explain the preponderance of this side-
reaction that affords benzoic acid.
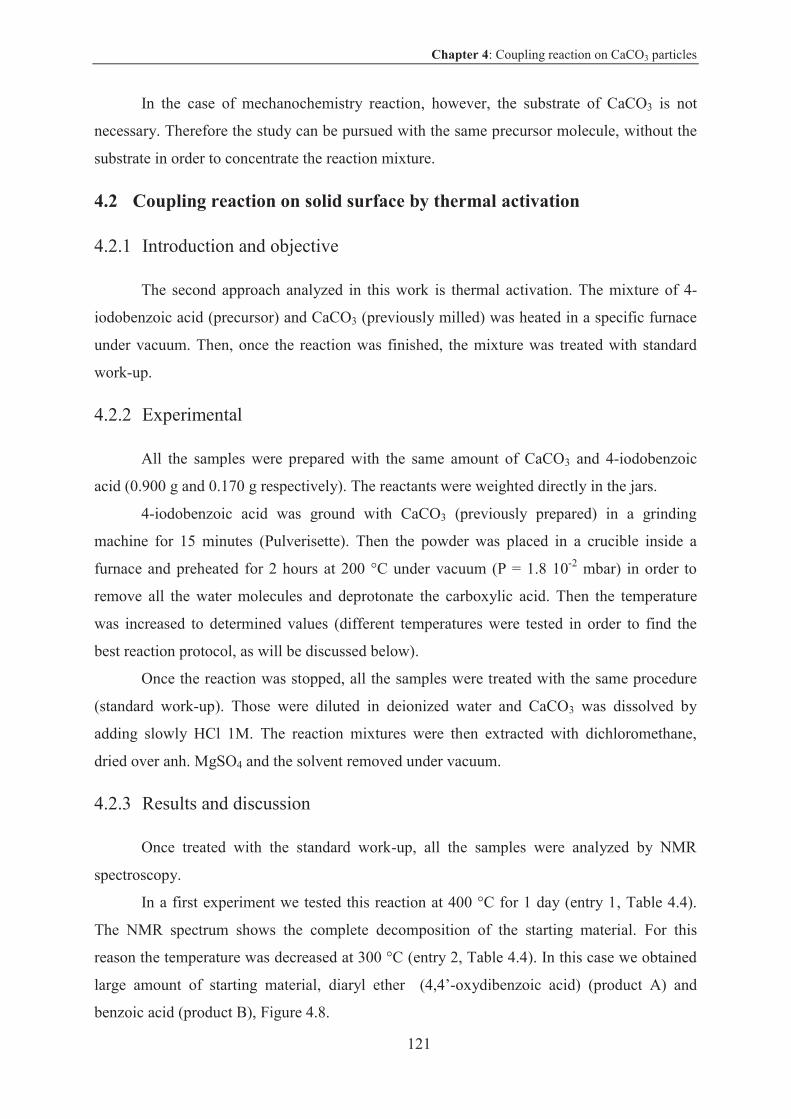
Chapter 4: Coupling reaction on CaCO3 particles
121
In the case of mechanochemistry reaction, however, the substrate of CaCO3 is not
necessary. Therefore the study can be pursued with the same precursor molecule, without the
substrate in order to concentrate the reaction mixture.
4.2 Coupling reaction on solid surface by thermal activation
4.2.1 Introduction and objective
The second approach analyzed in this work is thermal activation. The mixture of 4-
iodobenzoic acid (precursor) and CaCO3 (previously milled) was heated in a specific furnace
under vacuum. Then, once the reaction was finished, the mixture was treated with standard
work-up.
4.2.2 Experimental
All the samples were prepared with the same amount of CaCO3 and 4-iodobenzoic
acid (0.900 g and 0.170 g respectively). The reactants were weighted directly in the jars.
4-iodobenzoic acid was ground with CaCO3 (previously prepared) in a grinding
machine for 15 minutes (Pulverisette). Then the powder was placed in a crucible inside a
furnace and preheated for 2 hours at 200 °C under vacuum (P = 1.8 10-2 mbar) in order to
remove all the water molecules and deprotonate the carboxylic acid. Then the temperature
was increased to determined values (different temperatures were tested in order to find the
best reaction protocol, as will be discussed below).
Once the reaction was stopped, all the samples were treated with the same procedure
(standard work-up). Those were diluted in deionized water and CaCO3 was dissolved by
adding slowly HCl 1M. The reaction mixtures were then extracted with dichloromethane,
dried over anh. MgSO4 and the solvent removed under vacuum.
4.2.3 Results and discussion
Once treated with the standard work-up, all the samples were analyzed by NMR
spectroscopy.
In a first experiment we tested this reaction at 400 °C for 1 day (entry 1, Table 4.4).
The NMR spectrum shows the complete decomposition of the starting material. For this
reason the temperature was decreased at 300 °C (entry 2, Table 4.4). In this case we obtained
large amount of starting material, diaryl ether (4,4’-oxydibenzoic acid) (product A) and
benzoic acid (product B), Figure 4.8.
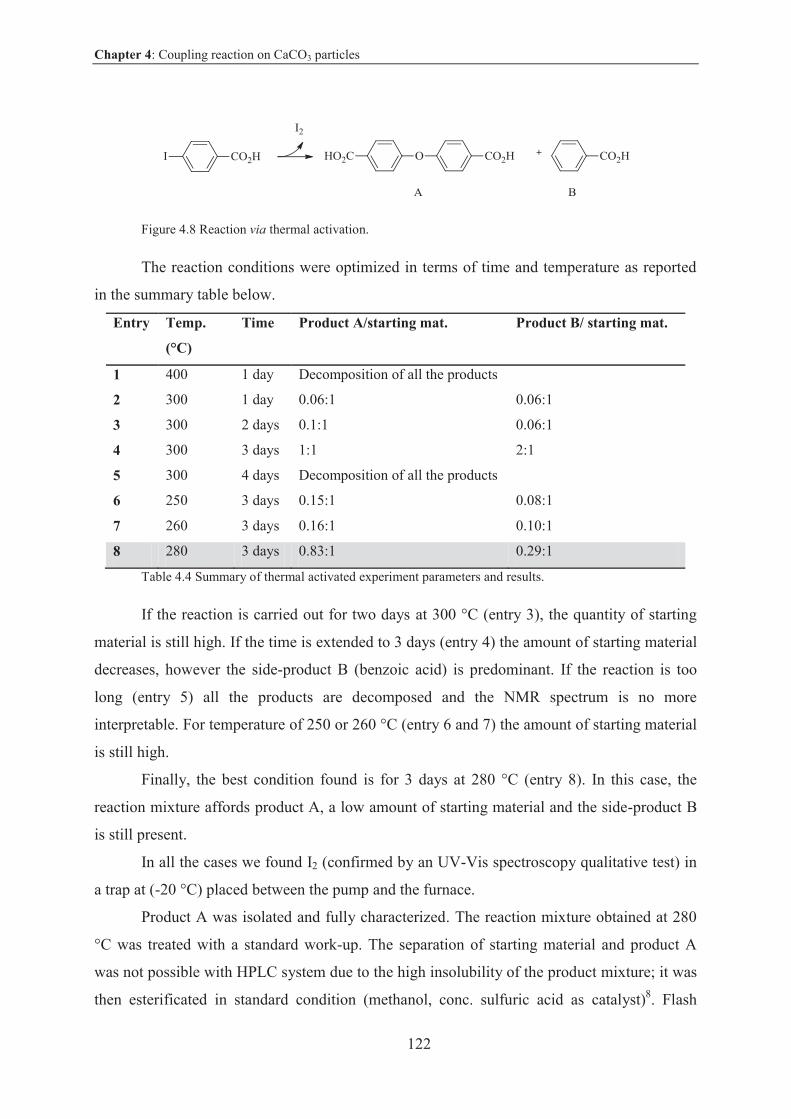
Chapter 4: Coupling reaction on CaCO3 particles
122
Figure 4.8 Reaction via thermal activation.
The reaction conditions were optimized in terms of time and temperature as reported
in the summary table below.
Entry Temp.
(°C)
Time Product A/starting mat. Product B/ starting mat.
1 400 1 day Decomposition of all the products
2 300 1 day 0.06:1 0.06:1
3 300 2 days 0.1:1 0.06:1
4 300 3 days 1:1 2:1
5 300 4 days Decomposition of all the products
6 250 3 days 0.15:1 0.08:1
7 260 3 days 0.16:1 0.10:1
8 280 3 days 0.83:1 0.29:1
Table 4.4 Summary of thermal activated experiment parameters and results.
If the reaction is carried out for two days at 300 °C (entry 3), the quantity of starting
material is still high. If the time is extended to 3 days (entry 4) the amount of starting material
decreases, however the side-product B (benzoic acid) is predominant. If the reaction is too
long (entry 5) all the products are decomposed and the NMR spectrum is no more
interpretable. For temperature of 250 or 260 °C (entry 6 and 7) the amount of starting material
is still high.
Finally, the best condition found is for 3 days at 280 °C (entry 8). In this case, the
reaction mixture affords product A, a low amount of starting material and the side-product B
is still present.
In all the cases we found I2 (confirmed by an UV-Vis spectroscopy qualitative test) in
a trap at (-20 °C) placed between the pump and the furnace.
Product A was isolated and fully characterized. The reaction mixture obtained at 280
°C was treated with a standard work-up. The separation of starting material and product A
was not possible with HPLC system due to the high insolubility of the product mixture; it was
then esterificated in standard condition (methanol, conc. sulfuric acid as catalyst)8. Flash
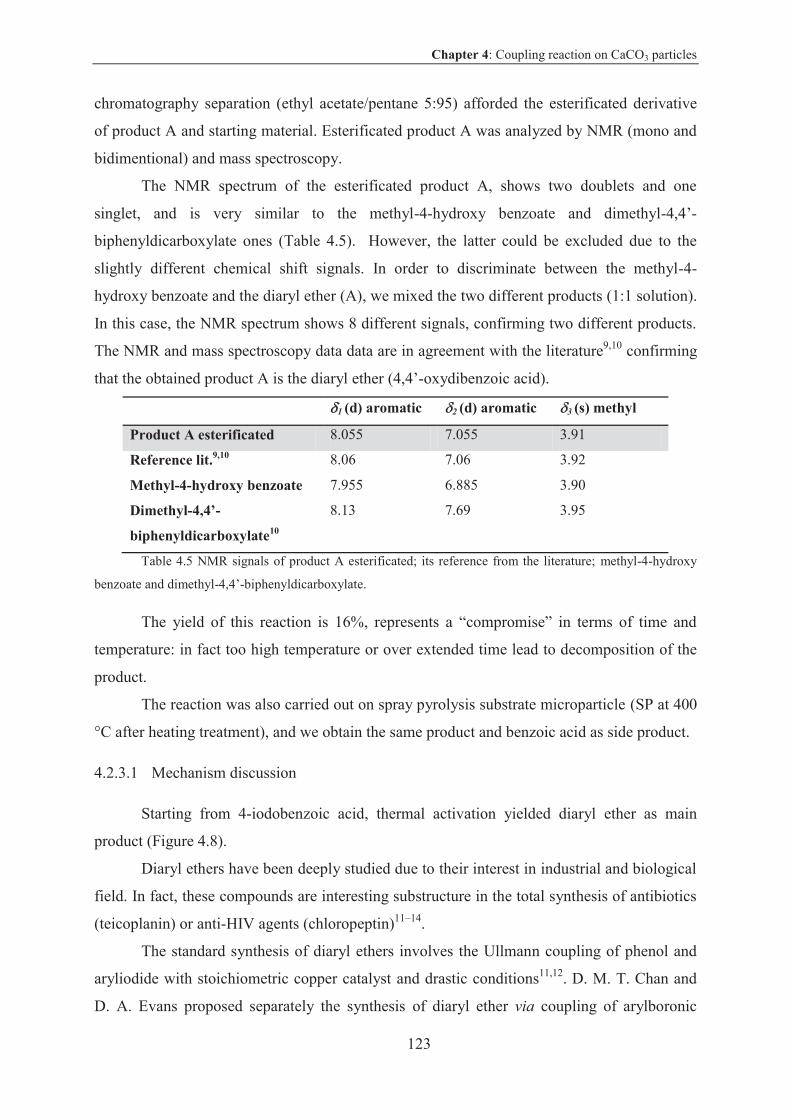
Chapter 4: Coupling reaction on CaCO3 particles
123
chromatography separation (ethyl acetate/pentane 5:95) afforded the esterificated derivative
of product A and starting material. Esterificated product A was analyzed by NMR (mono and
bidimentional) and mass spectroscopy.
The NMR spectrum of the esterificated product A, shows two doublets and one
singlet, and is very similar to the methyl-4-hydroxy benzoate and dimethyl-4,4’-
biphenyldicarboxylate ones (Table 4.5). However, the latter could be excluded due to the
slightly different chemical shift signals. In order to discriminate between the methyl-4-
hydroxy benzoate and the diaryl ether (A), we mixed the two different products (1:1 solution).
In this case, the NMR spectrum shows 8 different signals, confirming two different products.
The NMR and mass spectroscopy data data are in agreement with the literature9,10 confirming
that the obtained product A is the diaryl ether (4,4’-oxydibenzoic acid).
1 (d) aromatic 2 (d) aromatic 3 (s) methyl
Product A esterificated 8.055 7.055 3.91
Reference lit.9,10 8.06 7.06 3.92
Methyl-4-hydroxy benzoate 7.955 6.885 3.90
Dimethyl-4,4’-
biphenyldicarboxylate10
8.13 7.69 3.95
Table 4.5 NMR signals of product A esterificated; its reference from the literature; methyl-4-hydroxy
benzoate and dimethyl-4,4’-biphenyldicarboxylate.
The yield of this reaction is 16%, represents a “compromise” in terms of time and
temperature: in fact too high temperature or over extended time lead to decomposition of the
product.
The reaction was also carried out on spray pyrolysis substrate microparticle (SP at 400
°C after heating treatment), and we obtain the same product and benzoic acid as side product.
4.2.3.1 Mechanism discussion
Starting from 4-iodobenzoic acid, thermal activation yielded diaryl ether as main
product (Figure 4.8).
Diaryl ethers have been deeply studied due to their interest in industrial and biological
field. In fact, these compounds are interesting substructure in the total synthesis of antibiotics
(teicoplanin) or anti-HIV agents (chloropeptin)11–14.
The standard synthesis of diaryl ethers involves the Ullmann coupling of phenol and
aryliodide with stoichiometric copper catalyst and drastic conditions11,12. D. M. T. Chan and
D. A. Evans proposed separately the synthesis of diaryl ether via coupling of arylboronic
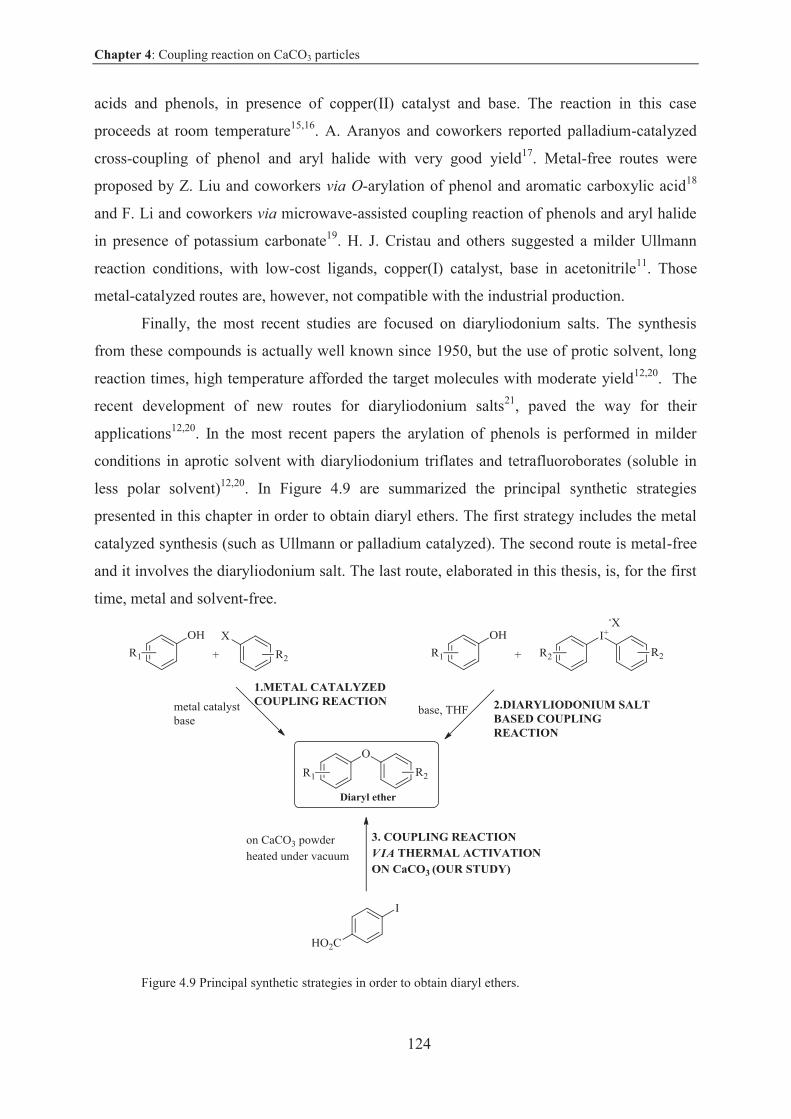
Chapter 4: Coupling reaction on CaCO3 particles
124
acids and phenols, in presence of copper(II) catalyst and base. The reaction in this case
proceeds at room temperature15,16. A. Aranyos and coworkers reported palladium-catalyzed
cross-coupling of phenol and aryl halide with very good yield17. Metal-free routes were
proposed by Z. Liu and coworkers via O-arylation of phenol and aromatic carboxylic acid18
and F. Li and coworkers via microwave-assisted coupling reaction of phenols and aryl halide
in presence of potassium carbonate19. H. J. Cristau and others suggested a milder Ullmann
reaction conditions, with low-cost ligands, copper(I) catalyst, base in acetonitrile11. Those
metal-catalyzed routes are, however, not compatible with the industrial production.
Finally, the most recent studies are focused on diaryliodonium salts. The synthesis
from these compounds is actually well known since 1950, but the use of protic solvent, long
reaction times, high temperature afforded the target molecules with moderate yield12,20. The
recent development of new routes for diaryliodonium salts21, paved the way for their
applications12,20. In the most recent papers the arylation of phenols is performed in milder
conditions in aprotic solvent with diaryliodonium triflates and tetrafluoroborates (soluble in
less polar solvent)12,20. In Figure 4.9 are summarized the principal synthetic strategies
presented in this chapter in order to obtain diaryl ethers. The first strategy includes the metal
catalyzed synthesis (such as Ullmann or palladium catalyzed). The second route is metal-free
and it involves the diaryliodonium salt. The last route, elaborated in this thesis, is, for the first
time, metal and solvent-free.
Figure 4.9 Principal synthetic strategies in order to obtain diaryl ethers.
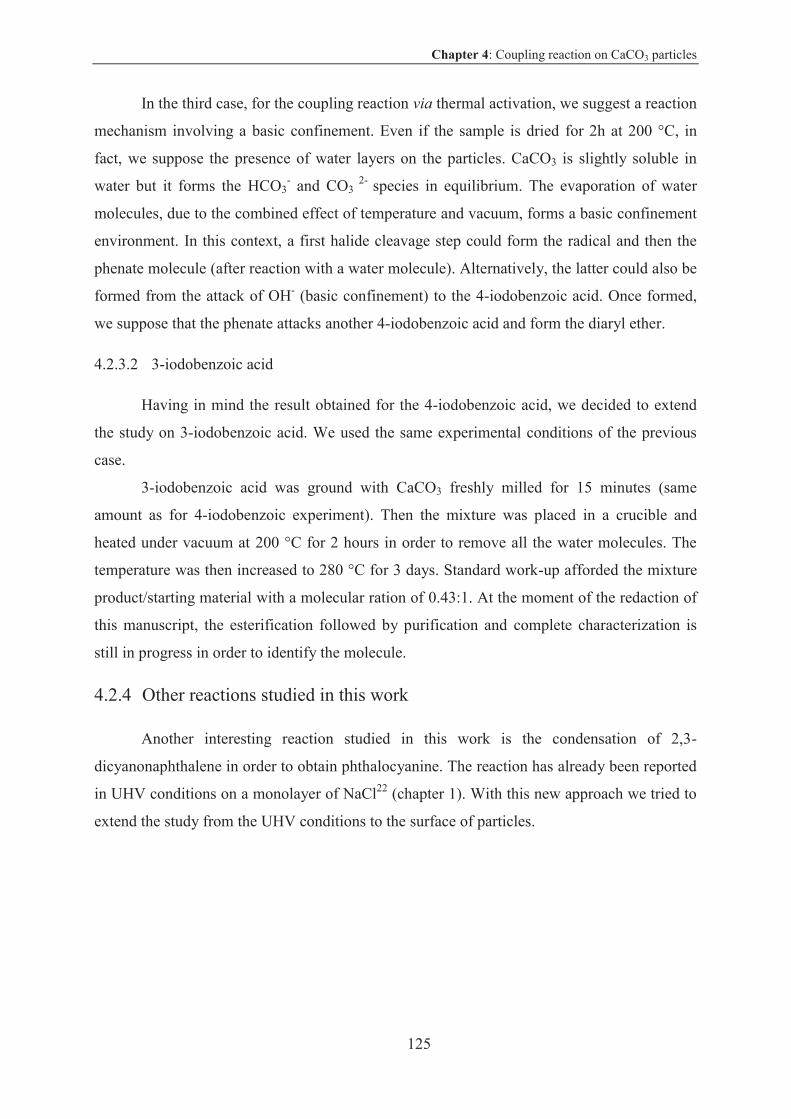
Chapter 4: Coupling reaction on CaCO3 particles
125
In the third case, for the coupling reaction via thermal activation, we suggest a reaction
mechanism involving a basic confinement. Even if the sample is dried for 2h at 200 °C, in
fact, we suppose the presence of water layers on the particles. CaCO3 is slightly soluble in
water but it forms the HCO3- and CO3
2- species in equilibrium. The evaporation of water
molecules, due to the combined effect of temperature and vacuum, forms a basic confinement
environment. In this context, a first halide cleavage step could form the radical and then the
phenate molecule (after reaction with a water molecule). Alternatively, the latter could also be
formed from the attack of OH- (basic confinement) to the 4-iodobenzoic acid. Once formed,
we suppose that the phenate attacks another 4-iodobenzoic acid and form the diaryl ether.
4.2.3.2 3-iodobenzoic acid
Having in mind the result obtained for the 4-iodobenzoic acid, we decided to extend
the study on 3-iodobenzoic acid. We used the same experimental conditions of the previous
case.
3-iodobenzoic acid was ground with CaCO3 freshly milled for 15 minutes (same
amount as for 4-iodobenzoic experiment). Then the mixture was placed in a crucible and
heated under vacuum at 200 °C for 2 hours in order to remove all the water molecules. The
temperature was then increased to 280 °C for 3 days. Standard work-up afforded the mixture
product/starting material with a molecular ration of 0.43:1. At the moment of the redaction of
this manuscript, the esterification followed by purification and complete characterization is
still in progress in order to identify the molecule.
4.2.4 Other reactions studied in this work
Another interesting reaction studied in this work is the condensation of 2,3-
dicyanonaphthalene in order to obtain phthalocyanine. The reaction has already been reported
in UHV conditions on a monolayer of NaCl22 (chapter 1). With this new approach we tried to
extend the study from the UHV conditions to the surface of particles.
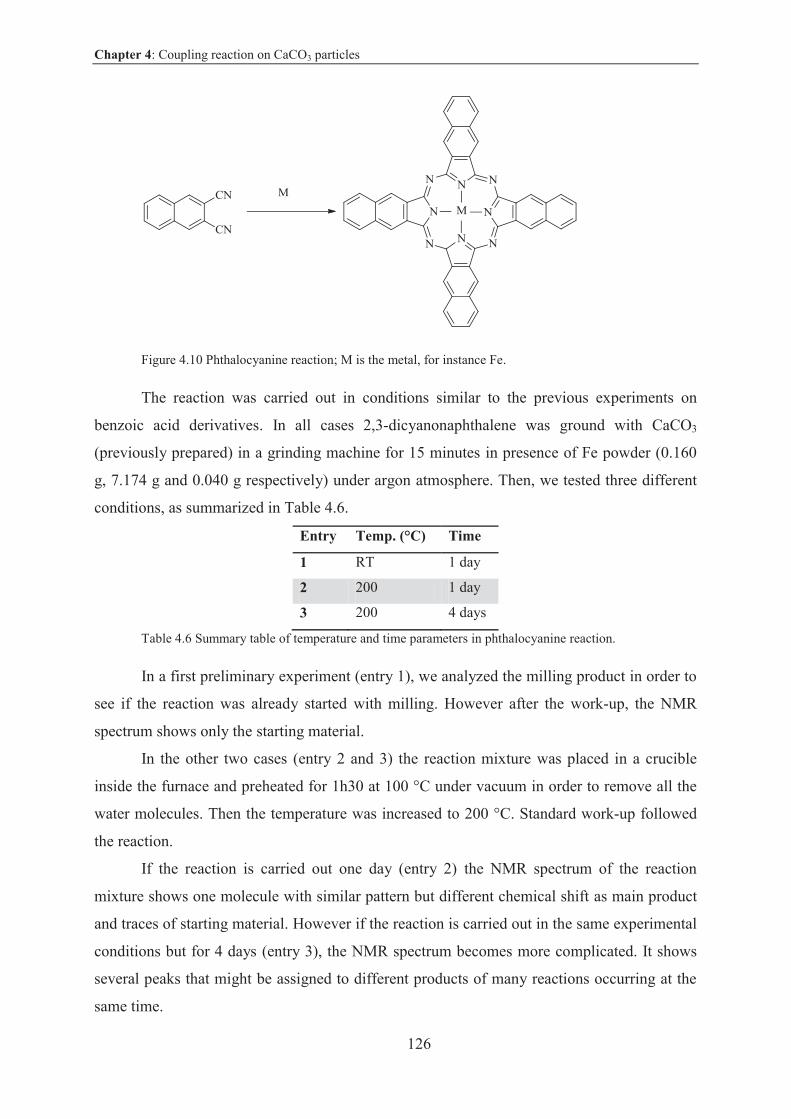
Chapter 4: Coupling reaction on CaCO3 particles
126
Figure 4.10 Phthalocyanine reaction; M is the metal, for instance Fe.
The reaction was carried out in conditions similar to the previous experiments on
benzoic acid derivatives. In all cases 2,3-dicyanonaphthalene was ground with CaCO3
(previously prepared) in a grinding machine for 15 minutes in presence of Fe powder (0.160
g, 7.174 g and 0.040 g respectively) under argon atmosphere. Then, we tested three different
conditions, as summarized in Table 4.6.
Entry Temp. (°C) Time
1 RT 1 day
2 200 1 day
3 200 4 days
Table 4.6 Summary table of temperature and time parameters in phthalocyanine reaction.
In a first preliminary experiment (entry 1), we analyzed the milling product in order to
see if the reaction was already started with milling. However after the work-up, the NMR
spectrum shows only the starting material.
In the other two cases (entry 2 and 3) the reaction mixture was placed in a crucible
inside the furnace and preheated for 1h30 at 100 °C under vacuum in order to remove all the
water molecules. Then the temperature was increased to 200 °C. Standard work-up followed
the reaction.
If the reaction is carried out one day (entry 2) the NMR spectrum of the reaction
mixture shows one molecule with similar pattern but different chemical shift as main product
and traces of starting material. However if the reaction is carried out in the same experimental
conditions but for 4 days (entry 3), the NMR spectrum becomes more complicated. It shows
several peaks that might be assigned to different products of many reactions occurring at the
same time.
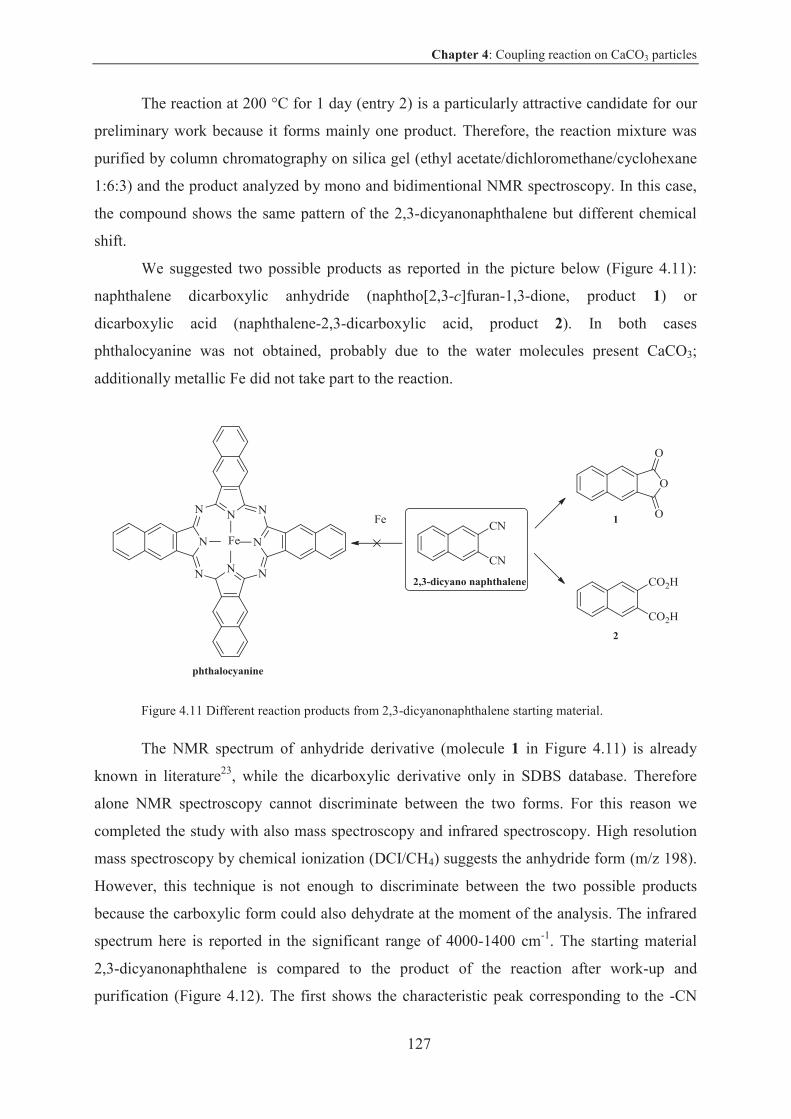
Chapter 4: Coupling reaction on CaCO3 particles
127
The reaction at 200 °C for 1 day (entry 2) is a particularly attractive candidate for our
preliminary work because it forms mainly one product. Therefore, the reaction mixture was
purified by column chromatography on silica gel (ethyl acetate/dichloromethane/cyclohexane
1:6:3) and the product analyzed by mono and bidimentional NMR spectroscopy. In this case,
the compound shows the same pattern of the 2,3-dicyanonaphthalene but different chemical
shift.
We suggested two possible products as reported in the picture below (Figure 4.11):
naphthalene dicarboxylic anhydride (naphtho[2,3-c]furan-1,3-dione, product 1) or
dicarboxylic acid (naphthalene-2,3-dicarboxylic acid, product 2). In both cases
phthalocyanine was not obtained, probably due to the water molecules present CaCO3;
additionally metallic Fe did not take part to the reaction.
Figure 4.11 Different reaction products from 2,3-dicyanonaphthalene starting material.
The NMR spectrum of anhydride derivative (molecule 1 in Figure 4.11) is already
known in literature23, while the dicarboxylic derivative only in SDBS database. Therefore
alone NMR spectroscopy cannot discriminate between the two forms. For this reason we
completed the study with also mass spectroscopy and infrared spectroscopy. High resolution
mass spectroscopy by chemical ionization (DCI/CH4) suggests the anhydride form (m/z 198).
However, this technique is not enough to discriminate between the two possible products
because the carboxylic form could also dehydrate at the moment of the analysis. The infrared
spectrum here is reported in the significant range of 4000-1400 cm-1. The starting material
2,3-dicyanonaphthalene is compared to the product of the reaction after work-up and
purification (Figure 4.12). The first shows the characteristic peak corresponding to the -CN
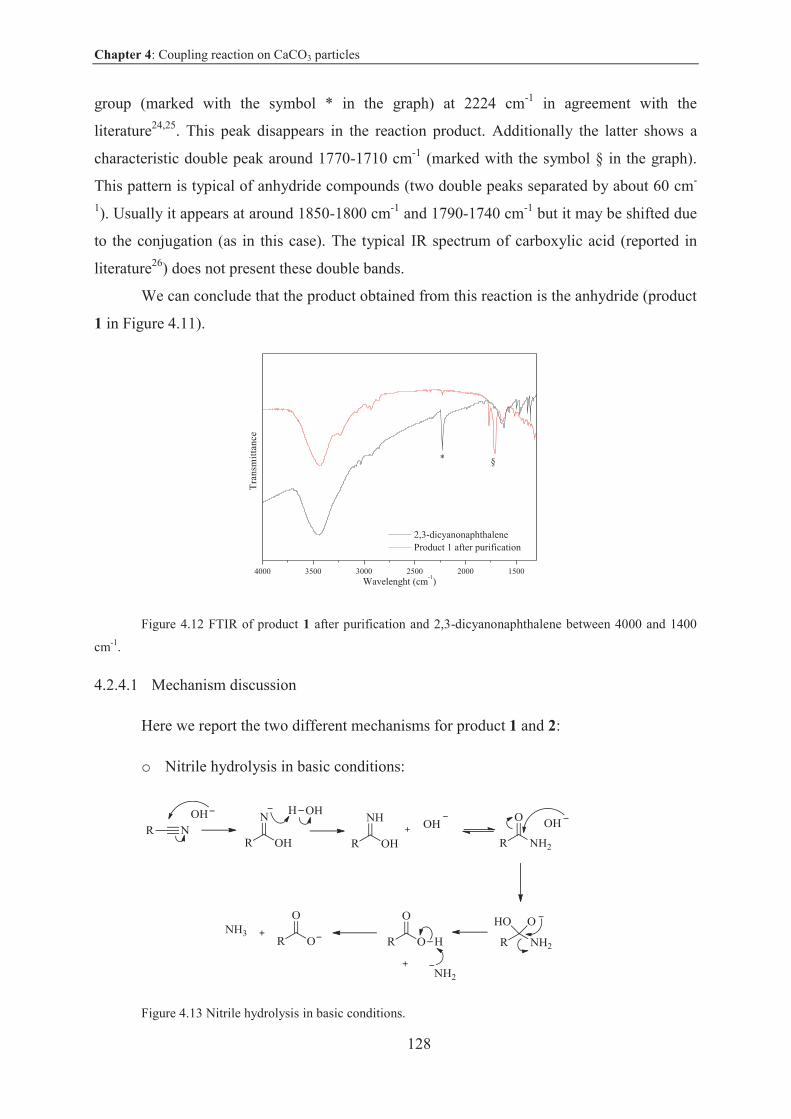
Chapter 4: Coupling reaction on CaCO3 particles
128
group (marked with the symbol * in the graph) at 2224 cm-1 in agreement with the
literature24,25. This peak disappears in the reaction product. Additionally the latter shows a
characteristic double peak around 1770-1710 cm-1 (marked with the symbol § in the graph).
This pattern is typical of anhydride compounds (two double peaks separated by about 60 cm-
1). Usually it appears at around 1850-1800 cm-1 and 1790-1740 cm-1 but it may be shifted due
to the conjugation (as in this case). The typical IR spectrum of carboxylic acid (reported in
literature26) does not present these double bands.
We can conclude that the product obtained from this reaction is the anhydride (product
1 in Figure 4.11).
Figure 4.12 FTIR of product 1 after purification and 2,3-dicyanonaphthalene between 4000 and 1400
cm-1.
4.2.4.1 Mechanism discussion
Here we report the two different mechanisms for product 1 and 2:
o Nitrile hydrolysis in basic conditions:
Figure 4.13 Nitrile hydrolysis in basic conditions.
150020002500300035004000
2,3-dicyanonaphthalene Product 1 after purification
Tra
nsm
itta
nce
Wavelenght (cm-1)
* §
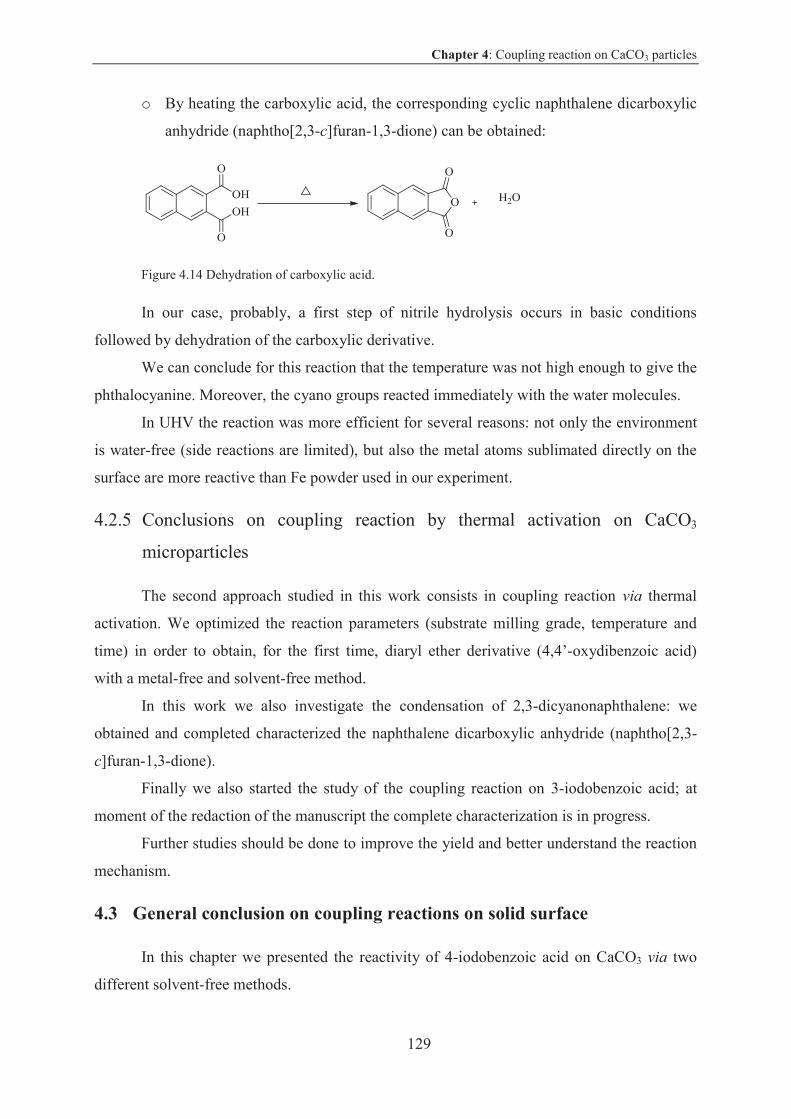
Chapter 4: Coupling reaction on CaCO3 particles
129
o By heating the carboxylic acid, the corresponding cyclic naphthalene dicarboxylic
anhydride (naphtho[2,3-c]furan-1,3-dione) can be obtained:
Figure 4.14 Dehydration of carboxylic acid.
In our case, probably, a first step of nitrile hydrolysis occurs in basic conditions
followed by dehydration of the carboxylic derivative.
We can conclude for this reaction that the temperature was not high enough to give the
phthalocyanine. Moreover, the cyano groups reacted immediately with the water molecules.
In UHV the reaction was more efficient for several reasons: not only the environment
is water-free (side reactions are limited), but also the metal atoms sublimated directly on the
surface are more reactive than Fe powder used in our experiment.
4.2.5 Conclusions on coupling reaction by thermal activation on CaCO3
microparticles
The second approach studied in this work consists in coupling reaction via thermal
activation. We optimized the reaction parameters (substrate milling grade, temperature and
time) in order to obtain, for the first time, diaryl ether derivative (4,4’-oxydibenzoic acid)
with a metal-free and solvent-free method.
In this work we also investigate the condensation of 2,3-dicyanonaphthalene: we
obtained and completed characterized the naphthalene dicarboxylic anhydride (naphtho[2,3-
c]furan-1,3-dione).
Finally we also started the study of the coupling reaction on 3-iodobenzoic acid; at
moment of the redaction of the manuscript the complete characterization is in progress.
Further studies should be done to improve the yield and better understand the reaction
mechanism.
4.3 General conclusion on coupling reactions on solid surface
In this chapter we presented the reactivity of 4-iodobenzoic acid on CaCO3 via two
different solvent-free methods.
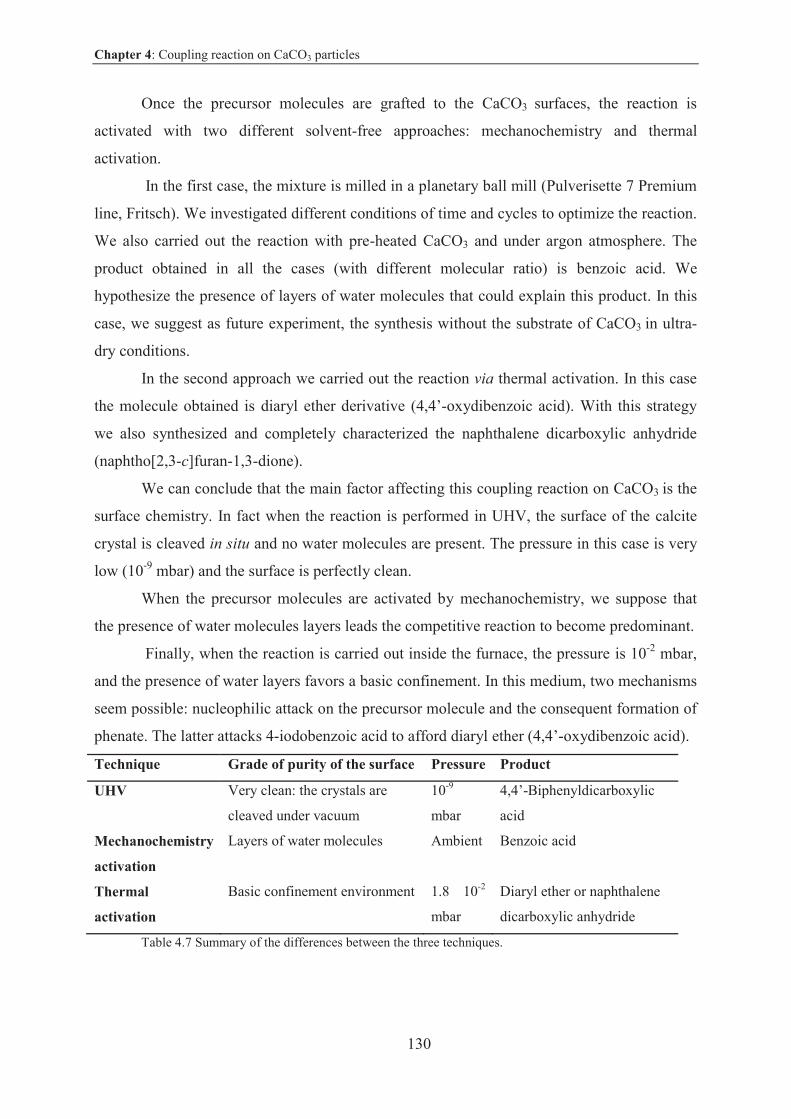
Chapter 4: Coupling reaction on CaCO3 particles
130
Once the precursor molecules are grafted to the CaCO3 surfaces, the reaction is
activated with two different solvent-free approaches: mechanochemistry and thermal
activation.
In the first case, the mixture is milled in a planetary ball mill (Pulverisette 7 Premium
line, Fritsch). We investigated different conditions of time and cycles to optimize the reaction.
We also carried out the reaction with pre-heated CaCO3 and under argon atmosphere. The
product obtained in all the cases (with different molecular ratio) is benzoic acid. We
hypothesize the presence of layers of water molecules that could explain this product. In this
case, we suggest as future experiment, the synthesis without the substrate of CaCO3 in ultra-
dry conditions.
In the second approach we carried out the reaction via thermal activation. In this case
the molecule obtained is diaryl ether derivative (4,4’-oxydibenzoic acid). With this strategy
we also synthesized and completely characterized the naphthalene dicarboxylic anhydride
(naphtho[2,3-c]furan-1,3-dione).
We can conclude that the main factor affecting this coupling reaction on CaCO3 is the
surface chemistry. In fact when the reaction is performed in UHV, the surface of the calcite
crystal is cleaved in situ and no water molecules are present. The pressure in this case is very
low (10-9 mbar) and the surface is perfectly clean.
When the precursor molecules are activated by mechanochemistry, we suppose that
the presence of water molecules layers leads the competitive reaction to become predominant.
Finally, when the reaction is carried out inside the furnace, the pressure is 10-2 mbar,
and the presence of water layers favors a basic confinement. In this medium, two mechanisms
seem possible: nucleophilic attack on the precursor molecule and the consequent formation of
phenate. The latter attacks 4-iodobenzoic acid to afford diaryl ether (4,4’-oxydibenzoic acid).
Technique Grade of purity of the surface Pressure Product
UHV Very clean: the crystals are
cleaved under vacuum
10-9
mbar
4,4’-Biphenyldicarboxylic
acid
Mechanochemistry
activation
Layers of water molecules Ambient Benzoic acid
Thermal
activation
Basic confinement environment 1.8 10-2
mbar
Diaryl ether or naphthalene
dicarboxylic anhydride
Table 4.7 Summary of the differences between the three techniques.
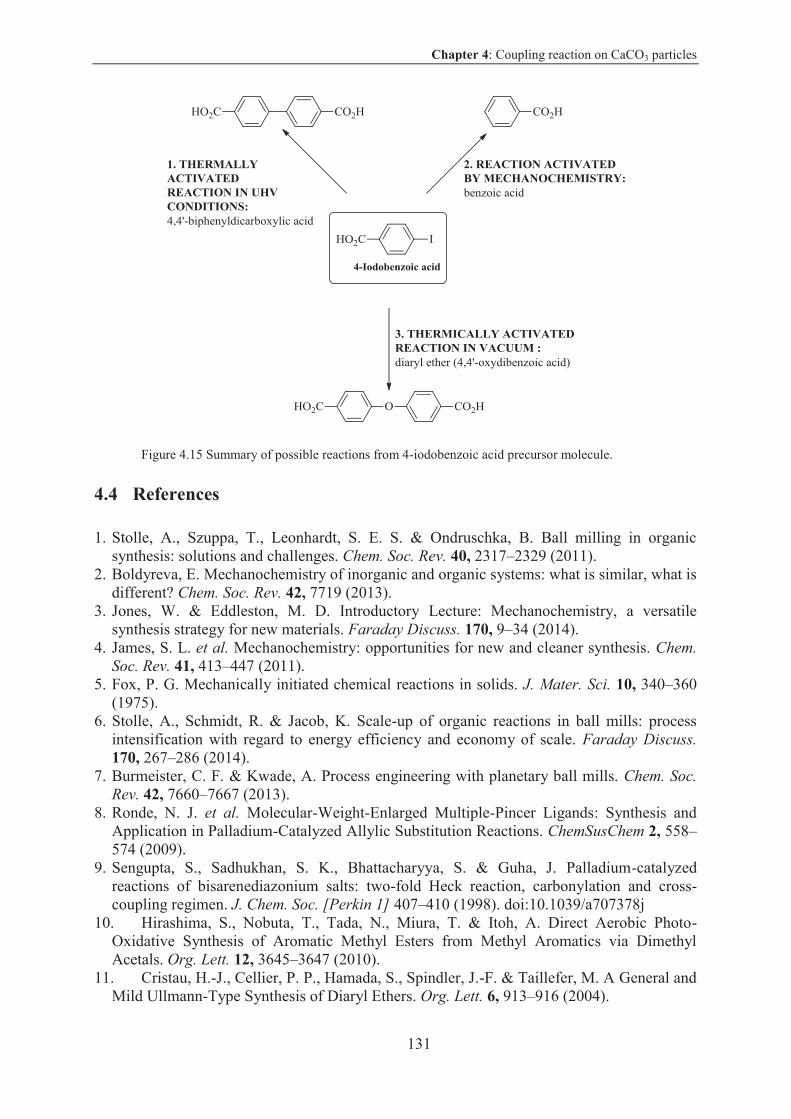
Chapter 4: Coupling reaction on CaCO3 particles
131
Figure 4.15 Summary of possible reactions from 4-iodobenzoic acid precursor molecule.
4.4 References
1. Stolle, A., Szuppa, T., Leonhardt, S. E. S. & Ondruschka, B. Ball milling in organic synthesis: solutions and challenges. Chem. Soc. Rev. 40, 2317–2329 (2011).
2. Boldyreva, E. Mechanochemistry of inorganic and organic systems: what is similar, what is different? Chem. Soc. Rev. 42, 7719 (2013).
3. Jones, W. & Eddleston, M. D. Introductory Lecture: Mechanochemistry, a versatile synthesis strategy for new materials. Faraday Discuss. 170, 9–34 (2014).
4. James, S. L. et al. Mechanochemistry: opportunities for new and cleaner synthesis. Chem.
Soc. Rev. 41, 413–447 (2011). 5. Fox, P. G. Mechanically initiated chemical reactions in solids. J. Mater. Sci. 10, 340–360
(1975). 6. Stolle, A., Schmidt, R. & Jacob, K. Scale-up of organic reactions in ball mills: process
intensification with regard to energy efficiency and economy of scale. Faraday Discuss. 170, 267–286 (2014).
7. Burmeister, C. F. & Kwade, A. Process engineering with planetary ball mills. Chem. Soc.
Rev. 42, 7660–7667 (2013). 8. Ronde, N. J. et al. Molecular-Weight-Enlarged Multiple-Pincer Ligands: Synthesis and
Application in Palladium-Catalyzed Allylic Substitution Reactions. ChemSusChem 2, 558–
574 (2009). 9. Sengupta, S., Sadhukhan, S. K., Bhattacharyya, S. & Guha, J. Palladium-catalyzed
reactions of bisarenediazonium salts: two-fold Heck reaction, carbonylation and cross-coupling regimen. J. Chem. Soc. [Perkin 1] 407–410 (1998). doi:10.1039/a707378j
10. Hirashima, S., Nobuta, T., Tada, N., Miura, T. & Itoh, A. Direct Aerobic Photo-Oxidative Synthesis of Aromatic Methyl Esters from Methyl Aromatics via Dimethyl Acetals. Org. Lett. 12, 3645–3647 (2010).
11. Cristau, H.-J., Cellier, P. P., Hamada, S., Spindler, J.-F. & Taillefer, M. A General and Mild Ullmann-Type Synthesis of Diaryl Ethers. Org. Lett. 6, 913–916 (2004).
Chapter 4: Coupling reaction on CaCO3 particles
132
12. Jalalian, N., Ishikawa, E. E., Silva, L. F. & Olofsson, B. Room Temperature, Metal-Free Synthesis of Diaryl Ethers with Use of Diaryliodonium Salts. Org. Lett. 13, 1552–
1555 (2011). 13. Deng, H. et al. Total Synthesis of Anti-HIV Agent Chloropeptin I. J. Am. Chem. Soc.
125, 9032–9034 (2003). 14. Evans, D. A., Katz, J. L., Peterson, G. S. & Hintermann, T. Total Synthesis of
Teicoplanin Aglycon. J. Am. Chem. Soc. 123, 12411–12413 (2001). 15. Chan, D. M. ., Monaco, K. L., Wang, R.-P. & Winters, M. P. New N- and O-arylations
with phenylboronic acids and cupric acetate. Tetrahedron Lett. 39, 2933–2936 (1998). 16. Evans, D. A., Katz, J. L. & West, T. R. Synthesis of diaryl ethers through the copper-
promoted arylation of phenols with arylboronic acids. An expedient synthesis of thyroxine. Tetrahedron Lett. 39, 2937–2940 (1998).
17. Aranyos, A. et al. Novel Electron-Rich Bulky Phosphine Ligands Facilitate the Palladium-Catalyzed Preparation of Diaryl Ethers. J. Am. Chem. Soc. 121, 4369–4378 (1999).
18. Liu, Z. & Larock, R. C. Facile O -Arylation of Phenols and Carboxylic Acids. Org.
Lett. 6, 99–102 (2004). 19. Li, F., Wang, Q., Ding, Z. & Tao, F. Microwave-Assisted Synthesis of Diaryl Ethers
without Catalyst. Org. Lett. 5, 2169–2171 (2003). 20. Jalalian, N., Petersen, T. B. & Olofsson, B. Metal-Free Arylation of Oxygen
Nucleophiles with Diaryliodonium Salts. Chem. - Eur. J. 18, 14140–14149 (2012). 21. Merritt, E. & Olofsson, B. Diaryliodonium Salts: A Journey from Obscurity to Fame.
Angew. Chem. Int. Ed. 48, 9052–9070 (2009). 22. Abel, M., Clair, S., Ourdjini, O., Mossoyan, M. & Porte, L. Single Layer of Polymeric
Fe-Phthalocyanine: An Organometallic Sheet on Metal and Thin Insulating Film. J. Am.
Chem. Soc. 133, 1203–1205 (2011). 23. Nishina, Y., Kida, T. & Ureshino, T. Facile Sc(OTf) 3-Catalyzed Generation and
Successive Aromatization of Isobenzofuran from o -Dicarbonylbenzenes. Org. Lett. 13, 3960–3963 (2011).
24. Lin, C.-H., Lin, K.-H., Pal, B. & Tsou, L.-D. Iterative synthesis of acenesvia homo-elongation. Chem Commun 803–805 (2009). doi:10.1039/B814840F
25. Akai, N., Kudoh, S. & Nakata, M. Matrix-isolation infrared spectrum and optimized structure of 2,3-dicyanonaphthalene in the T1 state. Chem. Phys. Lett. 392, 480–485 (2004).
26. Rz czy ska, Z., Kula, A., Sienkiewicz-Gromiuk, J. & Szybiak, A. Synthesis, spectroscopic and thermal studies of 2,3-naphthalenedicarboxylates of rare earth elements. J. Therm. Anal. Calorim. 103, 275–281 (2011).
General conclusion
133
General conclusion
The objective of this thesis was to explore covalent coupling on insulating surface of
calcium carbonate. For this reason, we first synthesized a series of molecules to be deposited
on calcium carbonate in Ultra High Vacuum (UHV) conditions, in order to study various
types of reactions: homocoupling of ethynes, photopolymerization, polycondensation and
Ullmann reaction.
The molecules comprised a carboxylic acid anchoring group (in order to prevent the
formation of clusters or desorption from the surface) and a reactive groups.
Then we also synthesized 2,3-dicyanonaphthalene and naphthalene-2,3,6,7-
tetracarbonitrile compounds in order to investigate the polycondensation on calcite in UHV in
presence of metal atoms (Fe or Au) to yield the phthalocyanines or polyphthalocyanines.
Those molecules are currently been studied on calcite surface in UHV conditions in
Prof. A. Kühnle’s group, University of Mainz, Germany.
In the second part of this work we extended for the first time this investigation from
the surface in UHV to microparticles surfaces. First, we prepared calcium carbonate
microparticles by grinding or by spray pyrolysis (a new method of preparation of these
particles) that were fully characterized with different techniques: FTIR, TG/DTG, XRD, SEM
and BET. Then, the precursor molecules were deposited on the surface of those particles and
the reactions were activated with two different solvent-free methods:
o By grinding in a planetary milling machine (mechanochemical activation).
o By heating the samples in a furnace under vacuum (thermal activation).
Then, the microparticles of CaCO3 were dissolved in weak acids allowing the
extraction of the reaction products and their characterization by NMR and mass spectroscopy.
As a prototype reaction, we studied the coupling of 4-iodobenzoic acid which has been
shown to give 4,4’-biphenyldicarboxylic acid in UHV.
In the first case (mechanochemical activation) we obtained benzoic acid as the main
product, while in the second case (thermal activation) diaryl ether derivative. In both cases the
formation of reaction products was interpreted as the presence of water layers.
General conclusion
134
Perspective works
The short term work envisages completing the deposition and the study of the
synthesized molecules on calcite in UHV (ethynes, dimers and naphthalene derivatives).
In particularly the naphthalene-2,3,6,7-tetracarbonitrile compound will be deposited in
presence of different metals (such as Mn instead of Fe, that in a previous case on metal
surface allows a diminution of activation temperature1).
For the reactions on calcium carbonate microparticles, it will be possible to synthesize
similar molecules such as polyether derivatives.
For long term work, we envisage to heat the calcium carbonate at high temperature
under vacuum (for instance at 10-6 mbar) for several hours in order to remove water
molecules, then the substrate could be transferred in a glove box to perform the reactions in a
water-free environment. The work should be completed with a specific study on water layers
on calcium carbonate.
Additionally, we propose to investigate different types of reactions under vacuum. The
precursor molecules should have an anchoring group to fix the insulating surface and reactive
groups to perform the reaction, possibly without catalyst.
Possible candidates for this objective are the diboronic acids. With these molecules
two reactions could be studied: dehydration in order to obtain polymeric structures or
esterification.
The reaction envisaged on calcium carbonate microparticles should take into account
two main problems that could prevent the result:
o The presence of a layer of water molecules.
o The polymeric structures might be sensible to the water acid work-up used in
the previous cases.
To conclude, calcium carbonate represents an appealing material for future
applications in UHV conditions, due to its properties and high surface energy (compared to
NaCl or other insulating systems). The explorative work conducted in this thesis paved the
way for future studies.
On the other hand, as demonstrated in this work, microparticles of this material can be
easily prepared and used as substrate for on-surface reactions. The easy work-up allows
General conclusion
135
recovering different products. In this context, calcium carbonate offers new possibility as
substrate for solvent-free reactions.
References
1. Koudia, M. & Abel, M. Step-by-step on-surface synthesis: from manganese phthalocyanines to their polymeric form. Chem. Commun. 50, 8565 (2014).

EXPERIMENTAL PART

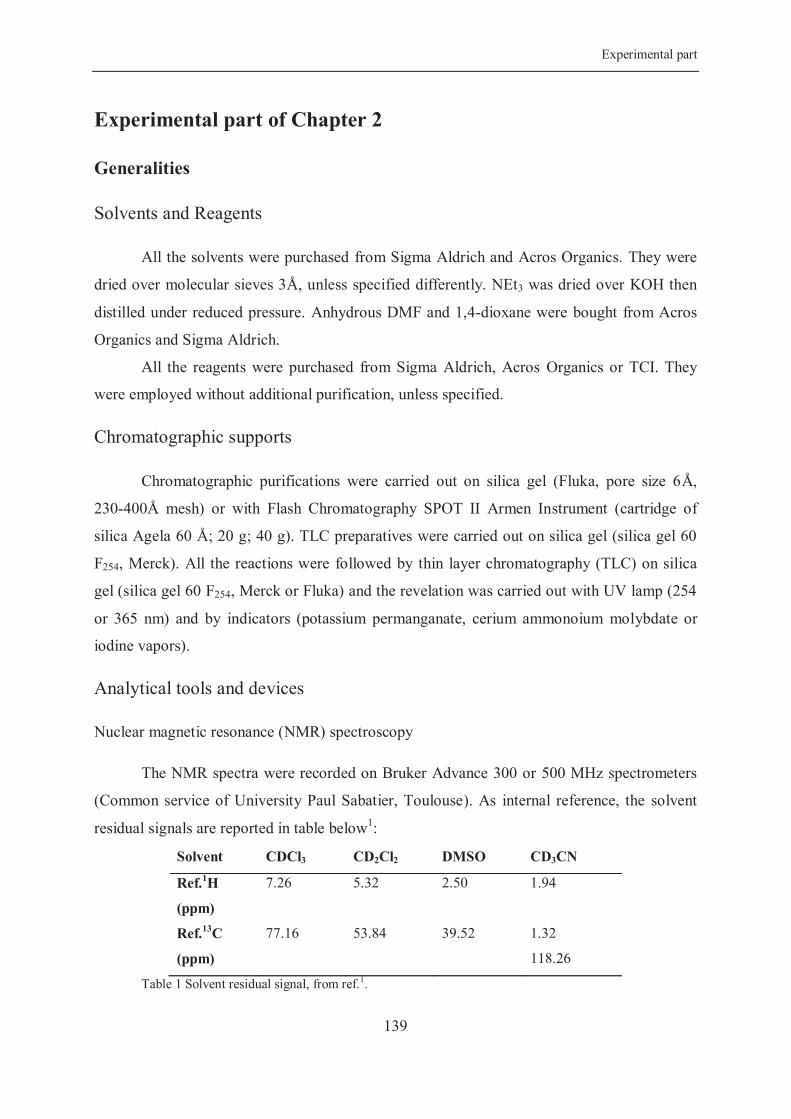
Experimental part
139
Experimental part of Chapter 2
Generalities
Solvents and Reagents
All the solvents were purchased from Sigma Aldrich and Acros Organics. They were
dried over molecular sieves 3Å, unless specified differently. NEt3 was dried over KOH then
distilled under reduced pressure. Anhydrous DMF and 1,4-dioxane were bought from Acros
Organics and Sigma Aldrich.
All the reagents were purchased from Sigma Aldrich, Acros Organics or TCI. They
were employed without additional purification, unless specified.
Chromatographic supports
Chromatographic purifications were carried out on silica gel (Fluka, pore size 6Å,
230-400Å mesh) or with Flash Chromatography SPOT II Armen Instrument (cartridge of
silica Agela 60 Å; 20 g; 40 g). TLC preparatives were carried out on silica gel (silica gel 60
F254, Merck). All the reactions were followed by thin layer chromatography (TLC) on silica
gel (silica gel 60 F254, Merck or Fluka) and the revelation was carried out with UV lamp (254
or 365 nm) and by indicators (potassium permanganate, cerium ammonoium molybdate or
iodine vapors).
Analytical tools and devices
Nuclear magnetic resonance (NMR) spectroscopy
The NMR spectra were recorded on Bruker Advance 300 or 500 MHz spectrometers
(Common service of University Paul Sabatier, Toulouse). As internal reference, the solvent
residual signals are reported in table below1:
Solvent CDCl3 CD2Cl2 DMSO CD3CN
Ref.1H
(ppm)
7.26 5.32 2.50 1.94
Ref.13C
(ppm)
77.16 53.84 39.52 1.32
118.26
Table 1 Solvent residual signal, from ref.1.
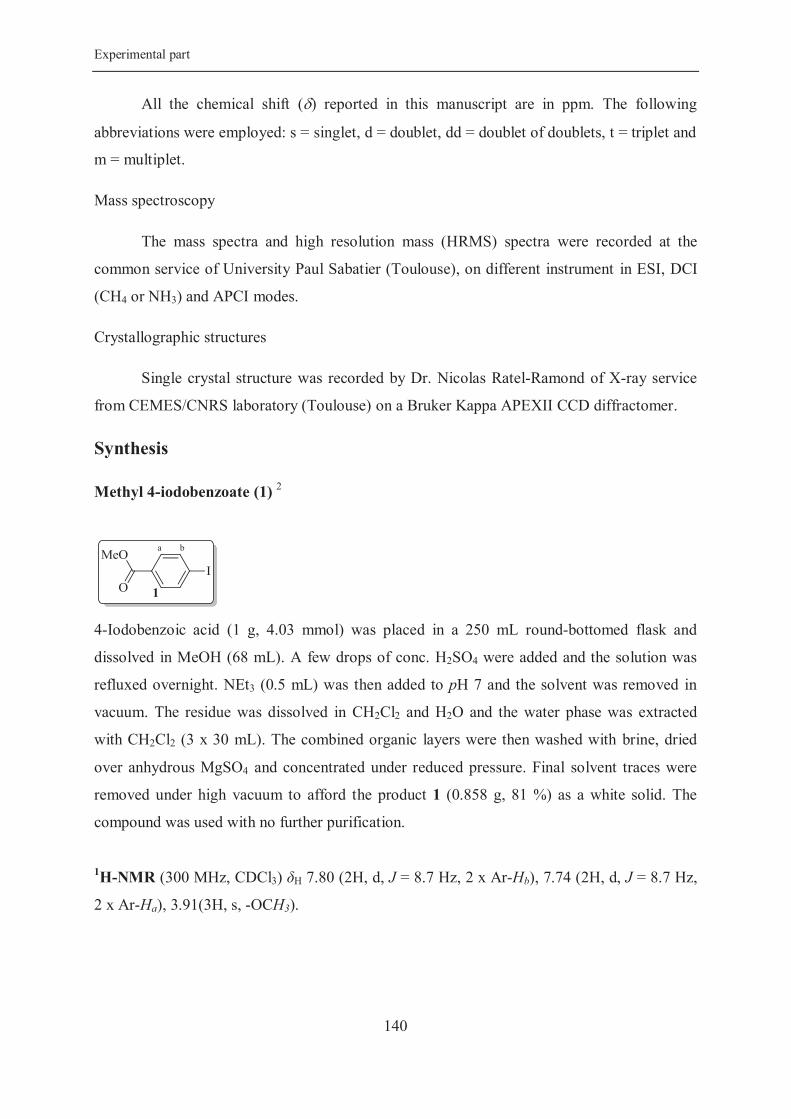
Experimental part
140
All the chemical shift ( ) reported in this manuscript are in ppm. The following
abbreviations were employed: s = singlet, d = doublet, dd = doublet of doublets, t = triplet and
m = multiplet.
Mass spectroscopy
The mass spectra and high resolution mass (HRMS) spectra were recorded at the
common service of University Paul Sabatier (Toulouse), on different instrument in ESI, DCI
(CH4 or NH3) and APCI modes.
Crystallographic structures
Single crystal structure was recorded by Dr. Nicolas Ratel-Ramond of X-ray service
from CEMES/CNRS laboratory (Toulouse) on a Bruker Kappa APEXII CCD diffractomer.
Synthesis
Methyl 4-iodobenzoate (1) 2
4-Iodobenzoic acid (1 g, 4.03 mmol) was placed in a 250 mL round-bottomed flask and
dissolved in MeOH (68 mL). A few drops of conc. H2SO4 were added and the solution was
refluxed overnight. NEt3 (0.5 mL) was then added to pH 7 and the solvent was removed in
vacuum. The residue was dissolved in CH2Cl2 and H2O and the water phase was extracted
with CH2Cl2 (3 x 30 mL). The combined organic layers were then washed with brine, dried
over anhydrous MgSO4 and concentrated under reduced pressure. Final solvent traces were
removed under high vacuum to afford the product 1 (0.858 g, 81 %) as a white solid. The
compound was used with no further purification.
1H-NMR (300 MHz, CDCl3) H 7.80 (2H, d, J = 8.7 Hz, 2 x Ar-Hb), 7.74 (2H, d, J = 8.7 Hz,
2 x Ar-Ha), 3.91(3H, s, -OCH3).
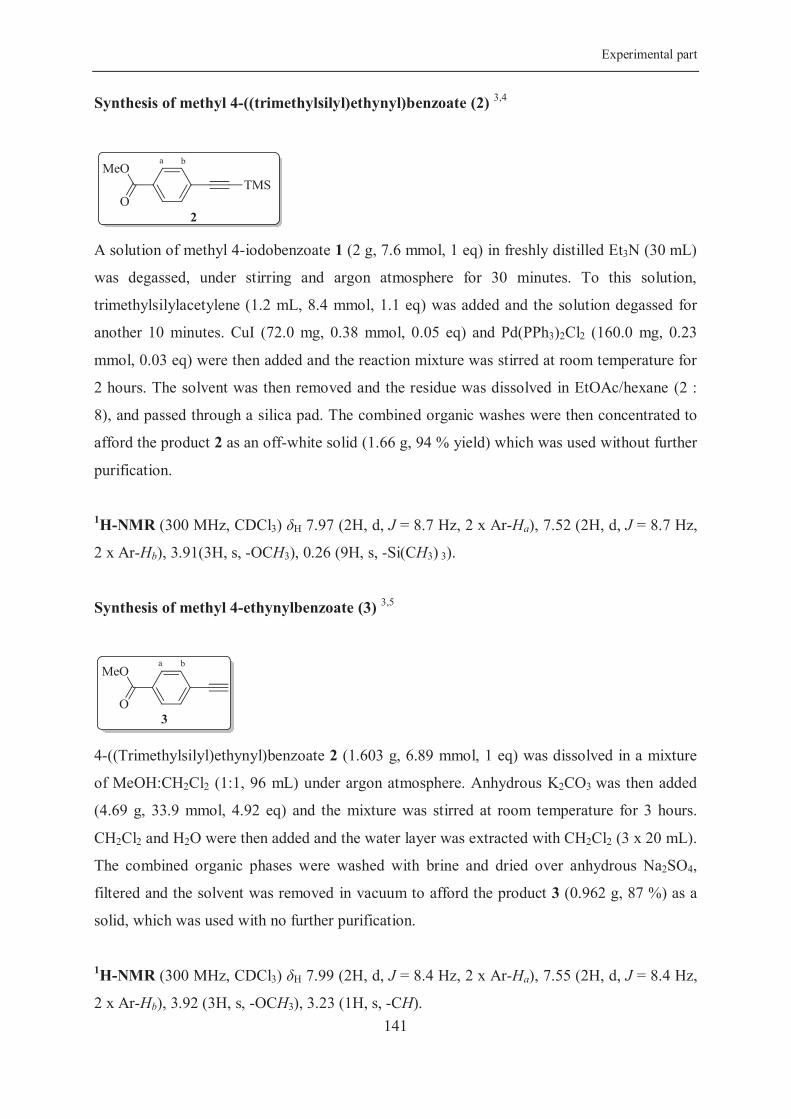
Experimental part
141
Synthesis of methyl 4-((trimethylsilyl)ethynyl)benzoate (2) 3,4
A solution of methyl 4-iodobenzoate 1 (2 g, 7.6 mmol, 1 eq) in freshly distilled Et3N (30 mL)
was degassed, under stirring and argon atmosphere for 30 minutes. To this solution,
trimethylsilylacetylene (1.2 mL, 8.4 mmol, 1.1 eq) was added and the solution degassed for
another 10 minutes. CuI (72.0 mg, 0.38 mmol, 0.05 eq) and Pd(PPh3)2Cl2 (160.0 mg, 0.23
mmol, 0.03 eq) were then added and the reaction mixture was stirred at room temperature for
2 hours. The solvent was then removed and the residue was dissolved in EtOAc/hexane (2 :
8), and passed through a silica pad. The combined organic washes were then concentrated to
afford the product 2 as an off-white solid (1.66 g, 94 % yield) which was used without further
purification.
1H-NMR (300 MHz, CDCl3) H 7.97 (2H, d, J = 8.7 Hz, 2 x Ar-Ha), 7.52 (2H, d, J = 8.7 Hz,
2 x Ar-Hb), 3.91(3H, s, -OCH3), 0.26 (9H, s, -Si(CH3) 3).
Synthesis of methyl 4-ethynylbenzoate (3) 3,5
4-((Trimethylsilyl)ethynyl)benzoate 2 (1.603 g, 6.89 mmol, 1 eq) was dissolved in a mixture
of MeOH:CH2Cl2 (1:1, 96 mL) under argon atmosphere. Anhydrous K2CO3 was then added
(4.69 g, 33.9 mmol, 4.92 eq) and the mixture was stirred at room temperature for 3 hours.
CH2Cl2 and H2O were then added and the water layer was extracted with CH2Cl2 (3 x 20 mL).
The combined organic phases were washed with brine and dried over anhydrous Na2SO4,
filtered and the solvent was removed in vacuum to afford the product 3 (0.962 g, 87 %) as a
solid, which was used with no further purification.
1H-NMR (300 MHz, CDCl3) H 7.99 (2H, d, J = 8.4 Hz, 2 x Ar-Ha), 7.55 (2H, d, J = 8.4 Hz,
2 x Ar-Hb), 3.92 (3H, s, -OCH3), 3.23 (1H, s, -CH).
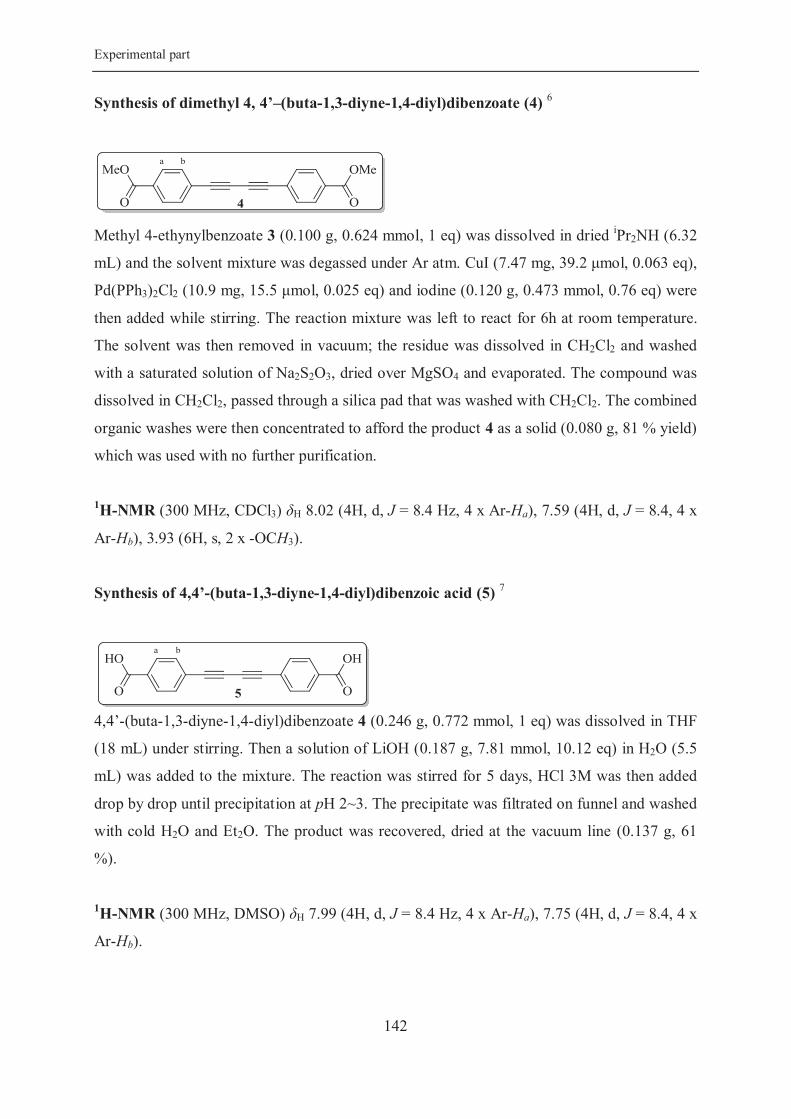
Experimental part
142
Synthesis of dimethyl 4, 4’–(buta-1,3-diyne-1,4-diyl)dibenzoate (4) 6
Methyl 4-ethynylbenzoate 3 (0.100 g, 0.624 mmol, 1 eq) was dissolved in dried iPr2NH (6.32
mL) and the solvent mixture was degassed under Ar atm. CuI (7.47 mg, 39.2 mol, 0.063 eq),
Pd(PPh3)2Cl2 (10.9 mg, 15.5 mol, 0.025 eq) and iodine (0.120 g, 0.473 mmol, 0.76 eq) were
then added while stirring. The reaction mixture was left to react for 6h at room temperature.
The solvent was then removed in vacuum; the residue was dissolved in CH2Cl2 and washed
with a saturated solution of Na2S2O3, dried over MgSO4 and evaporated. The compound was
dissolved in CH2Cl2, passed through a silica pad that was washed with CH2Cl2. The combined
organic washes were then concentrated to afford the product 4 as a solid (0.080 g, 81 % yield)
which was used with no further purification.
1H-NMR (300 MHz, CDCl3) H 8.02 (4H, d, J = 8.4 Hz, 4 x Ar-Ha), 7.59 (4H, d, J = 8.4, 4 x
Ar-Hb), 3.93 (6H, s, 2 x -OCH3).
Synthesis of 4,4’-(buta-1,3-diyne-1,4-diyl)dibenzoic acid (5) 7
4,4’-(buta-1,3-diyne-1,4-diyl)dibenzoate 4 (0.246 g, 0.772 mmol, 1 eq) was dissolved in THF
(18 mL) under stirring. Then a solution of LiOH (0.187 g, 7.81 mmol, 10.12 eq) in H2O (5.5
mL) was added to the mixture. The reaction was stirred for 5 days, HCl 3M was then added
drop by drop until precipitation at pH 2~3. The precipitate was filtrated on funnel and washed
with cold H2O and Et2O. The product was recovered, dried at the vacuum line (0.137 g, 61
%).
1H-NMR (300 MHz, DMSO) H 7.99 (4H, d, J = 8.4 Hz, 4 x Ar-Ha), 7.75 (4H, d, J = 8.4, 4 x
Ar-Hb).
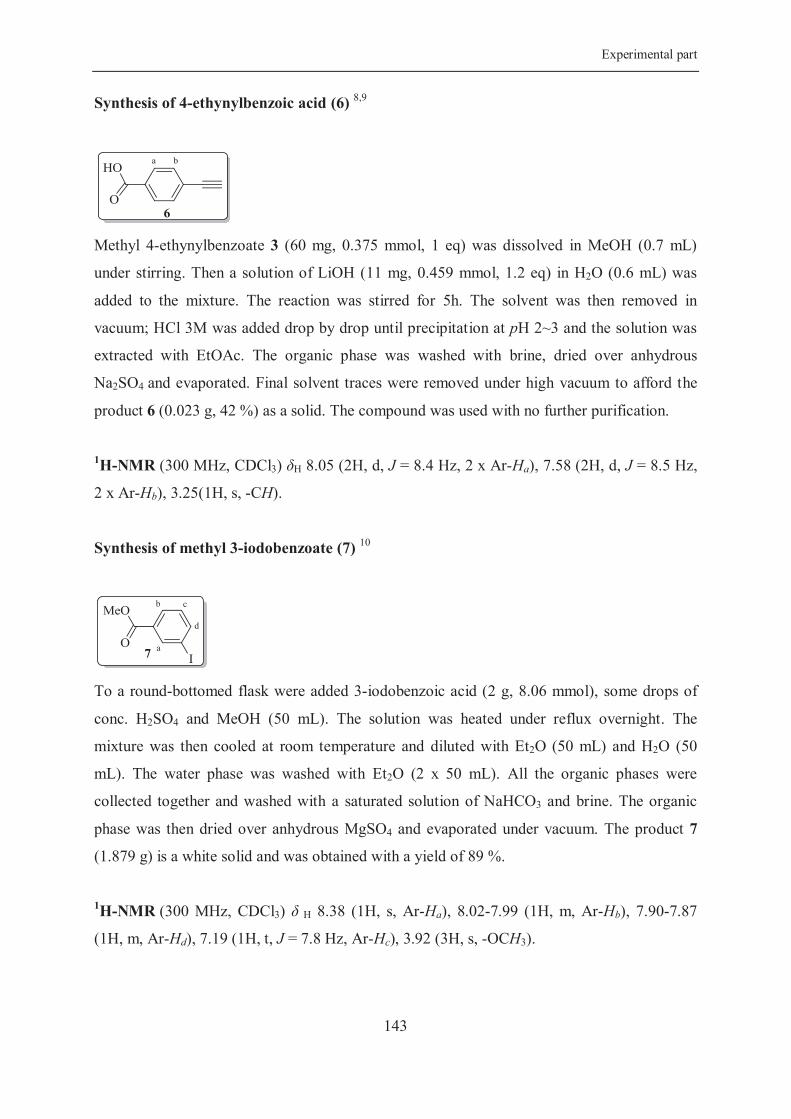
Experimental part
143
Synthesis of 4-ethynylbenzoic acid (6) 8,9
Methyl 4-ethynylbenzoate 3 (60 mg, 0.375 mmol, 1 eq) was dissolved in MeOH (0.7 mL)
under stirring. Then a solution of LiOH (11 mg, 0.459 mmol, 1.2 eq) in H2O (0.6 mL) was
added to the mixture. The reaction was stirred for 5h. The solvent was then removed in
vacuum; HCl 3M was added drop by drop until precipitation at pH 2~3 and the solution was
extracted with EtOAc. The organic phase was washed with brine, dried over anhydrous
Na2SO4 and evaporated. Final solvent traces were removed under high vacuum to afford the
product 6 (0.023 g, 42 %) as a solid. The compound was used with no further purification.
1H-NMR (300 MHz, CDCl3) H 8.05 (2H, d, J = 8.4 Hz, 2 x Ar-Ha), 7.58 (2H, d, J = 8.5 Hz,
2 x Ar-Hb), 3.25(1H, s, -CH).
Synthesis of methyl 3-iodobenzoate (7) 10
To a round-bottomed flask were added 3-iodobenzoic acid (2 g, 8.06 mmol), some drops of
conc. H2SO4 and MeOH (50 mL). The solution was heated under reflux overnight. The
mixture was then cooled at room temperature and diluted with Et2O (50 mL) and H2O (50
mL). The water phase was washed with Et2O (2 x 50 mL). All the organic phases were
collected together and washed with a saturated solution of NaHCO3 and brine. The organic
phase was then dried over anhydrous MgSO4 and evaporated under vacuum. The product 7
(1.879 g) is a white solid and was obtained with a yield of 89 %.
1H-NMR (300 MHz, CDCl3) H 8.38 (1H, s, Ar-Ha), 8.02-7.99 (1H, m, Ar-Hb), 7.90-7.87
(1H, m, Ar-Hd), 7.19 (1H, t, J = 7.8 Hz, Ar-Hc), 3.92 (3H, s, -OCH3).
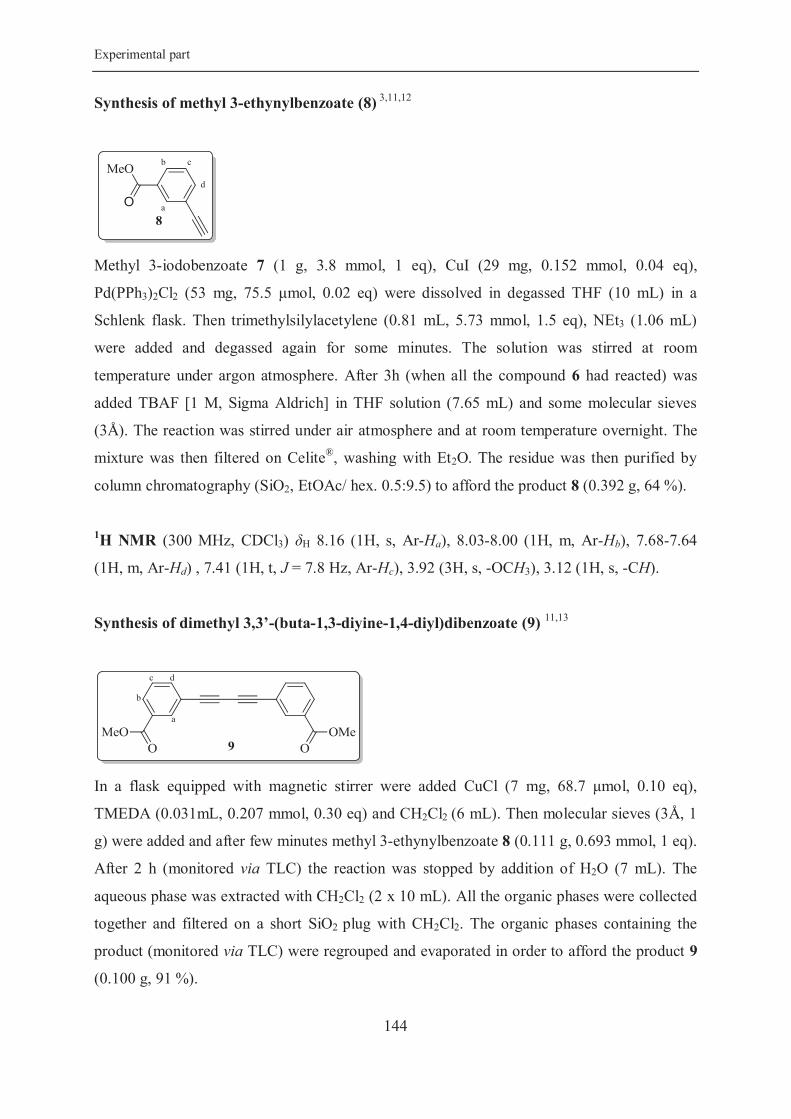
Experimental part
144
Synthesis of methyl 3-ethynylbenzoate (8) 3,11,12
Methyl 3-iodobenzoate 7 (1 g, 3.8 mmol, 1 eq), CuI (29 mg, 0.152 mmol, 0.04 eq),
Pd(PPh3)2Cl2 (53 mg, 75.5 mol, 0.02 eq) were dissolved in degassed THF (10 mL) in a
Schlenk flask. Then trimethylsilylacetylene (0.81 mL, 5.73 mmol, 1.5 eq), NEt3 (1.06 mL)
were added and degassed again for some minutes. The solution was stirred at room
temperature under argon atmosphere. After 3h (when all the compound 6 had reacted) was
added TBAF [1 M, Sigma Aldrich] in THF solution (7.65 mL) and some molecular sieves
(3Å). The reaction was stirred under air atmosphere and at room temperature overnight. The
mixture was then filtered on Celite®, washing with Et2O. The residue was then purified by
column chromatography (SiO2, EtOAc/ hex. 0.5:9.5) to afford the product 8 (0.392 g, 64 %).
1H NMR (300 MHz, CDCl3) H 8.16 (1H, s, Ar-Ha), 8.03-8.00 (1H, m, Ar-Hb), 7.68-7.64
(1H, m, Ar-Hd) , 7.41 (1H, t, J = 7.8 Hz, Ar-Hc), 3.92 (3H, s, -OCH3), 3.12 (1H, s, -CH).
Synthesis of dimethyl 3,3’-(buta-1,3-diyine-1,4-diyl)dibenzoate (9) 11,13
In a flask equipped with magnetic stirrer were added CuCl (7 mg, 68.7 mol, 0.10 eq),
TMEDA (0.031mL, 0.207 mmol, 0.30 eq) and CH2Cl2 (6 mL). Then molecular sieves (3Å, 1
g) were added and after few minutes methyl 3-ethynylbenzoate 8 (0.111 g, 0.693 mmol, 1 eq).
After 2 h (monitored via TLC) the reaction was stopped by addition of H2O (7 mL). The
aqueous phase was extracted with CH2Cl2 (2 x 10 mL). All the organic phases were collected
together and filtered on a short SiO2 plug with CH2Cl2. The organic phases containing the
product (monitored via TLC) were regrouped and evaporated in order to afford the product 9
(0.100 g, 91 %).
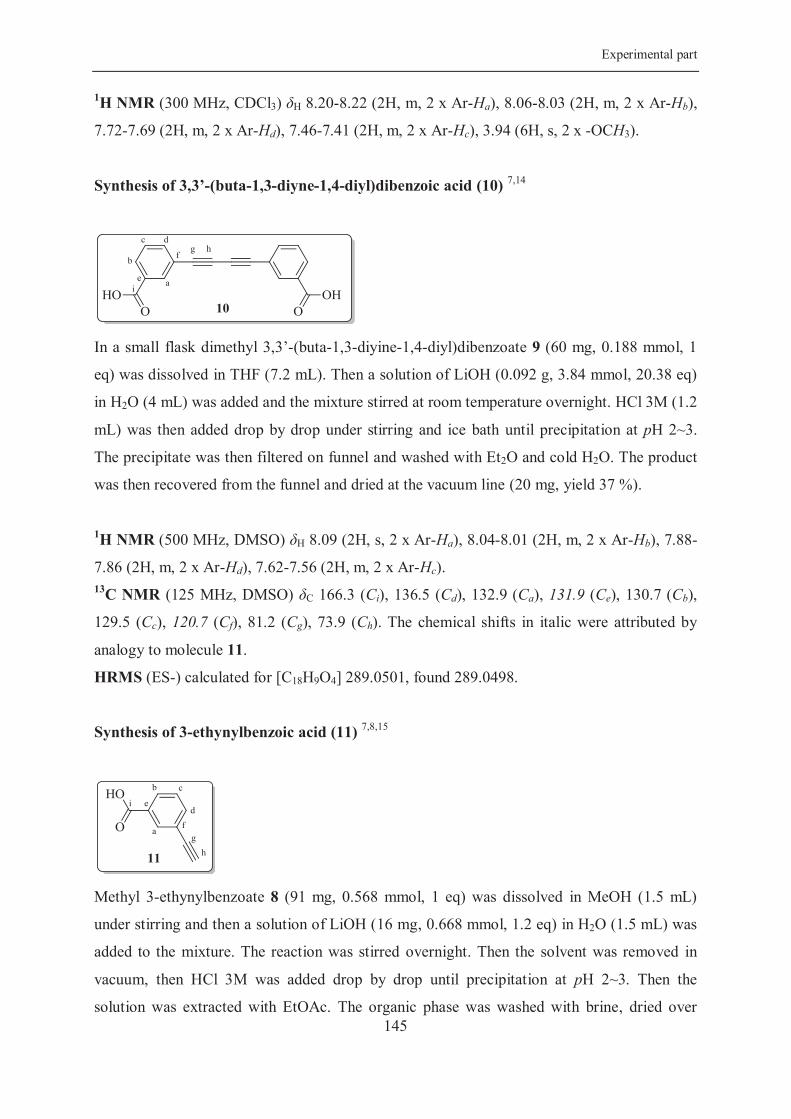
Experimental part
145
1H NMR (300 MHz, CDCl3) H 8.20-8.22 (2H, m, 2 x Ar-Ha), 8.06-8.03 (2H, m, 2 x Ar-Hb),
7.72-7.69 (2H, m, 2 x Ar-Hd), 7.46-7.41 (2H, m, 2 x Ar-Hc), 3.94 (6H, s, 2 x -OCH3).
Synthesis of 3,3’-(buta-1,3-diyne-1,4-diyl)dibenzoic acid (10) 7,14
In a small flask dimethyl 3,3’-(buta-1,3-diyine-1,4-diyl)dibenzoate 9 (60 mg, 0.188 mmol, 1
eq) was dissolved in THF (7.2 mL). Then a solution of LiOH (0.092 g, 3.84 mmol, 20.38 eq)
in H2O (4 mL) was added and the mixture stirred at room temperature overnight. HCl 3M (1.2
mL) was then added drop by drop under stirring and ice bath until precipitation at pH 2~3.
The precipitate was then filtered on funnel and washed with Et2O and cold H2O. The product
was then recovered from the funnel and dried at the vacuum line (20 mg, yield 37 %).
1H NMR (500 MHz, DMSO) H 8.09 (2H, s, 2 x Ar-Ha), 8.04-8.01 (2H, m, 2 x Ar-Hb), 7.88-
7.86 (2H, m, 2 x Ar-Hd), 7.62-7.56 (2H, m, 2 x Ar-Hc). 13C NMR (125 MHz, DMSO) C 166.3 (Ci), 136.5 (Cd), 132.9 (Ca), 131.9 (Ce), 130.7 (Cb),
129.5 (Cc), 120.7 (Cf), 81.2 (Cg), 73.9 (Ch). The chemical shifts in italic were attributed by
analogy to molecule 11.
HRMS (ES-) calculated for [C18H9O4] 289.0501, found 289.0498.
Synthesis of 3-ethynylbenzoic acid (11) 7,8,15
Methyl 3-ethynylbenzoate 8 (91 mg, 0.568 mmol, 1 eq) was dissolved in MeOH (1.5 mL)
under stirring and then a solution of LiOH (16 mg, 0.668 mmol, 1.2 eq) in H2O (1.5 mL) was
added to the mixture. The reaction was stirred overnight. Then the solvent was removed in
vacuum, then HCl 3M was added drop by drop until precipitation at pH 2~3. Then the
solution was extracted with EtOAc. The organic phase was washed with brine, dried over
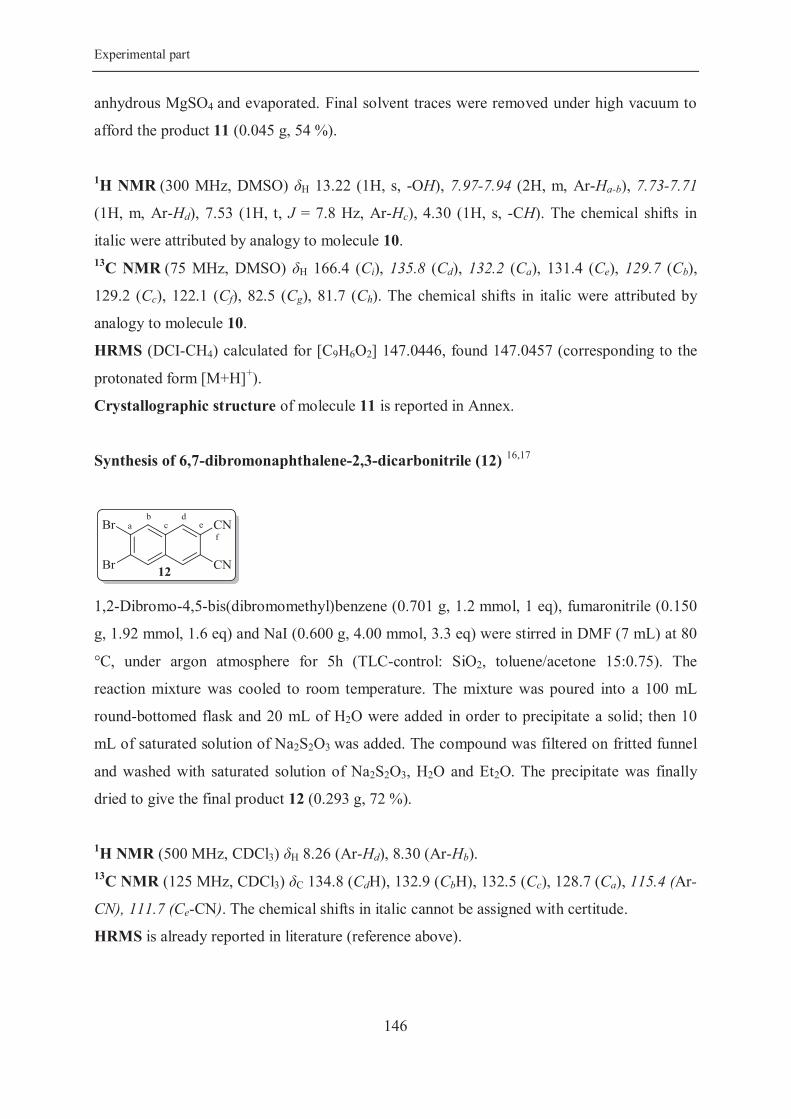
Experimental part
146
anhydrous MgSO4 and evaporated. Final solvent traces were removed under high vacuum to
afford the product 11 (0.045 g, 54 %).
1H NMR (300 MHz, DMSO) H 13.22 (1H, s, -OH), 7.97-7.94 (2H, m, Ar-Ha-b), 7.73-7.71
(1H, m, Ar-Hd), 7.53 (1H, t, J = 7.8 Hz, Ar-Hc), 4.30 (1H, s, -CH). The chemical shifts in
italic were attributed by analogy to molecule 10. 13C NMR (75 MHz, DMSO) H 166.4 (Ci), 135.8 (Cd), 132.2 (Ca), 131.4 (Ce), 129.7 (Cb),
129.2 (Cc), 122.1 (Cf), 82.5 (Cg), 81.7 (Ch). The chemical shifts in italic were attributed by
analogy to molecule 10.
HRMS (DCI-CH4) calculated for [C9H6O2] 147.0446, found 147.0457 (corresponding to the
protonated form [M+H]+).
Crystallographic structure of molecule 11 is reported in Annex.
Synthesis of 6,7-dibromonaphthalene-2,3-dicarbonitrile (12) 16,17
1,2-Dibromo-4,5-bis(dibromomethyl)benzene (0.701 g, 1.2 mmol, 1 eq), fumaronitrile (0.150
g, 1.92 mmol, 1.6 eq) and NaI (0.600 g, 4.00 mmol, 3.3 eq) were stirred in DMF (7 mL) at 80
°C, under argon atmosphere for 5h (TLC-control: SiO2, toluene/acetone 15:0.75). The
reaction mixture was cooled to room temperature. The mixture was poured into a 100 mL
round-bottomed flask and 20 mL of H2O were added in order to precipitate a solid; then 10
mL of saturated solution of Na2S2O3 was added. The compound was filtered on fritted funnel
and washed with saturated solution of Na2S2O3, H2O and Et2O. The precipitate was finally
dried to give the final product 12 (0.293 g, 72 %).
1H NMR (500 MHz, CDCl3) H 8.26 (Ar-Hd), 8.30 (Ar-Hb). 13C NMR (125 MHz, CDCl3) C 134.8 (CdH), 132.9 (CbH), 132.5 (Cc), 128.7 (Ca), 115.4 (Ar-
CN), 111.7 (Ce-CN). The chemical shifts in italic cannot be assigned with certitude.
HRMS is already reported in literature (reference above).
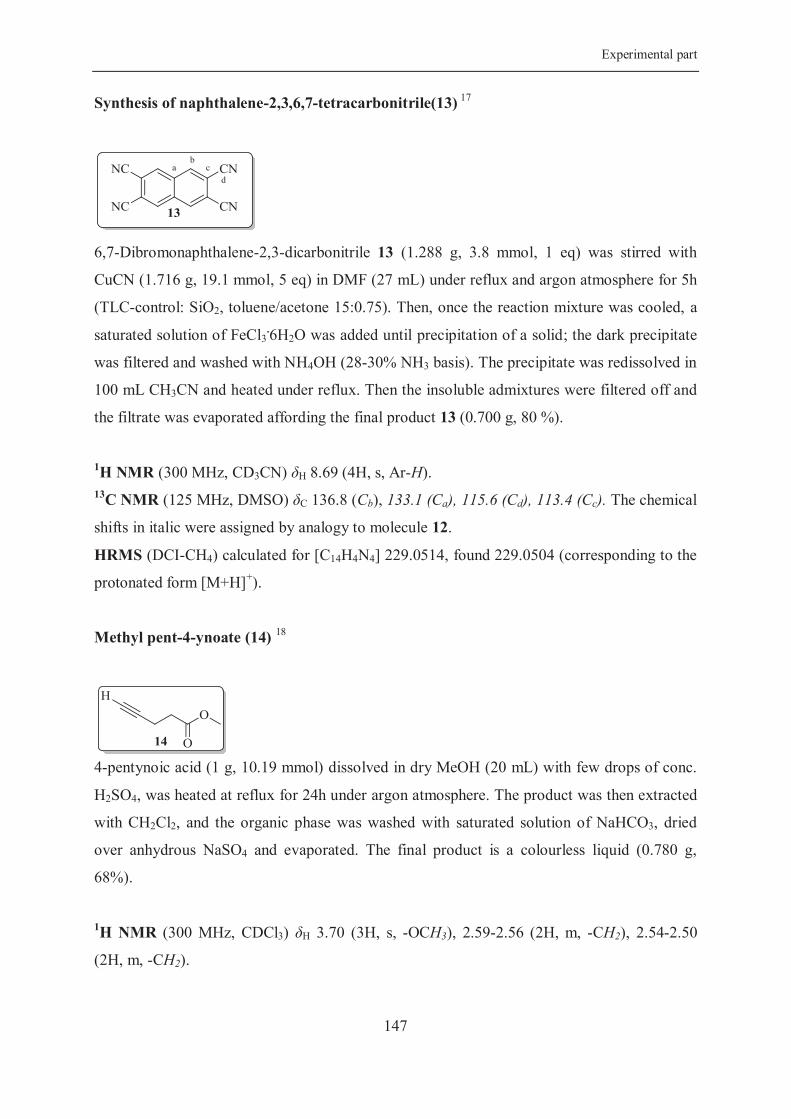
Experimental part
147
Synthesis of naphthalene-2,3,6,7-tetracarbonitrile(13) 17
6,7-Dibromonaphthalene-2,3-dicarbonitrile 13 (1.288 g, 3.8 mmol, 1 eq) was stirred with
CuCN (1.716 g, 19.1 mmol, 5 eq) in DMF (27 mL) under reflux and argon atmosphere for 5h
(TLC-control: SiO2, toluene/acetone 15:0.75). Then, once the reaction mixture was cooled, a
saturated solution of FeCl3.6H2O was added until precipitation of a solid; the dark precipitate
was filtered and washed with NH4OH (28-30% NH3 basis). The precipitate was redissolved in
100 mL CH3CN and heated under reflux. Then the insoluble admixtures were filtered off and
the filtrate was evaporated affording the final product 13 (0.700 g, 80 %).
1H NMR (300 MHz, CD3CN) H 8.69 (4H, s, Ar-H). 13C NMR (125 MHz, DMSO) C 136.8 (Cb), 133.1 (Ca), 115.6 (Cd), 113.4 (Cc). The chemical
shifts in italic were assigned by analogy to molecule 12.
HRMS (DCI-CH4) calculated for [C14H4N4] 229.0514, found 229.0504 (corresponding to the
protonated form [M+H]+).
Methyl pent-4-ynoate (14) 18
4-pentynoic acid (1 g, 10.19 mmol) dissolved in dry MeOH (20 mL) with few drops of conc.
H2SO4, was heated at reflux for 24h under argon atmosphere. The product was then extracted
with CH2Cl2, and the organic phase was washed with saturated solution of NaHCO3, dried
over anhydrous NaSO4 and evaporated. The final product is a colourless liquid (0.780 g,
68%).
1H NMR (300 MHz, CDCl3) H 3.70 (3H, s, -OCH3), 2.59-2.56 (2H, m, -CH2), 2.54-2.50
(2H, m, -CH2).
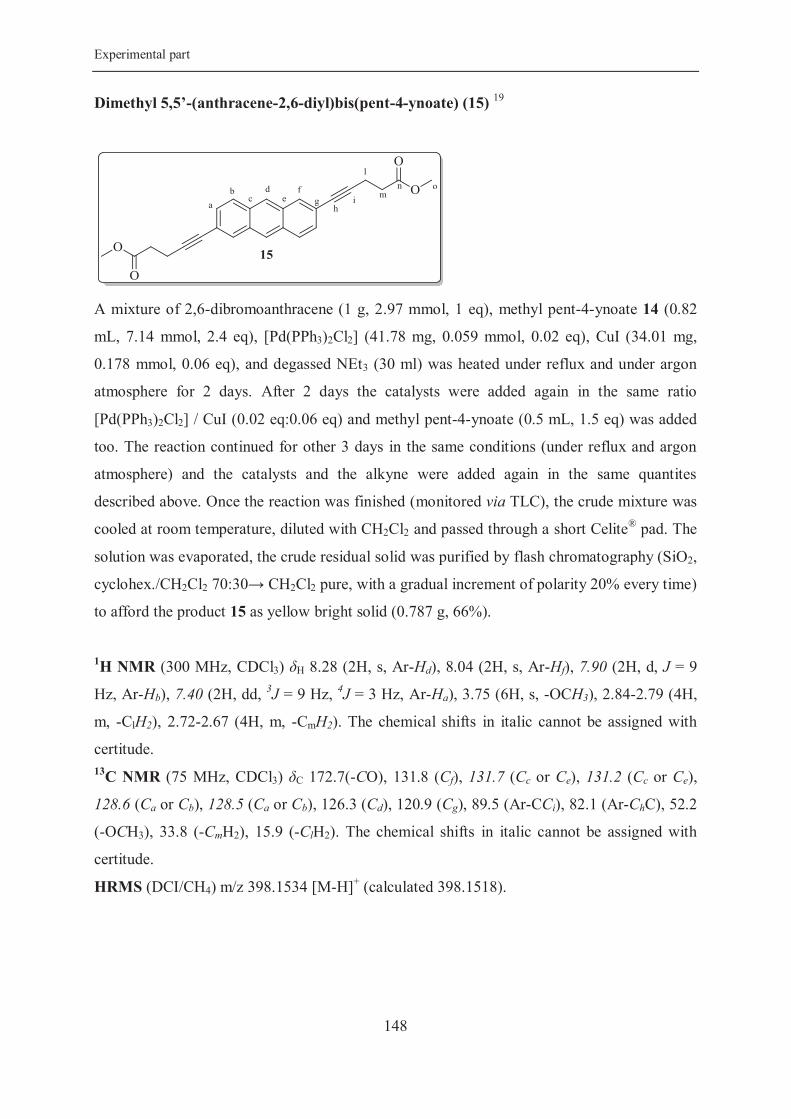
Experimental part
148
Dimethyl 5,5’-(anthracene-2,6-diyl)bis(pent-4-ynoate) (15) 19
A mixture of 2,6-dibromoanthracene (1 g, 2.97 mmol, 1 eq), methyl pent-4-ynoate 14 (0.82
mL, 7.14 mmol, 2.4 eq), [Pd(PPh3)2Cl2] (41.78 mg, 0.059 mmol, 0.02 eq), CuI (34.01 mg,
0.178 mmol, 0.06 eq), and degassed NEt3 (30 ml) was heated under reflux and under argon
atmosphere for 2 days. After 2 days the catalysts were added again in the same ratio
[Pd(PPh3)2Cl2] / CuI (0.02 eq:0.06 eq) and methyl pent-4-ynoate (0.5 mL, 1.5 eq) was added
too. The reaction continued for other 3 days in the same conditions (under reflux and argon
atmosphere) and the catalysts and the alkyne were added again in the same quantites
described above. Once the reaction was finished (monitored via TLC), the crude mixture was
cooled at room temperature, diluted with CH2Cl2 and passed through a short Celite® pad. The
solution was evaporated, the crude residual solid was purified by flash chromatography (SiO2,
cyclohex./CH2Cl2 70:30 CH2Cl2 pure, with a gradual increment of polarity 20% every time)
to afford the product 15 as yellow bright solid (0.787 g, 66%).
1H NMR (300 MHz, CDCl3) H 8.28 (2H, s, Ar-Hd), 8.04 (2H, s, Ar-Hf), 7.90 (2H, d, J = 9
Hz, Ar-Hb), 7.40 (2H, dd, 3J = 9 Hz, 4
J = 3 Hz, Ar-Ha), 3.75 (6H, s, -OCH3), 2.84-2.79 (4H,
m, -ClH2), 2.72-2.67 (4H, m, -CmH2). The chemical shifts in italic cannot be assigned with
certitude. 13C NMR (75 MHz, CDCl3) C 172.7(-CO), 131.8 (Cf), 131.7 (Cc or Ce), 131.2 (Cc or Ce),
128.6 (Ca or Cb), 128.5 (Ca or Cb), 126.3 (Cd), 120.9 (Cg), 89.5 (Ar-CCi), 82.1 (Ar-ChC), 52.2
(-OCH3), 33.8 (-CmH2), 15.9 (-ClH2). The chemical shifts in italic cannot be assigned with
certitude.
HRMS (DCI/CH4) m/z 398.1534 [M-H]+ (calculated 398.1518).
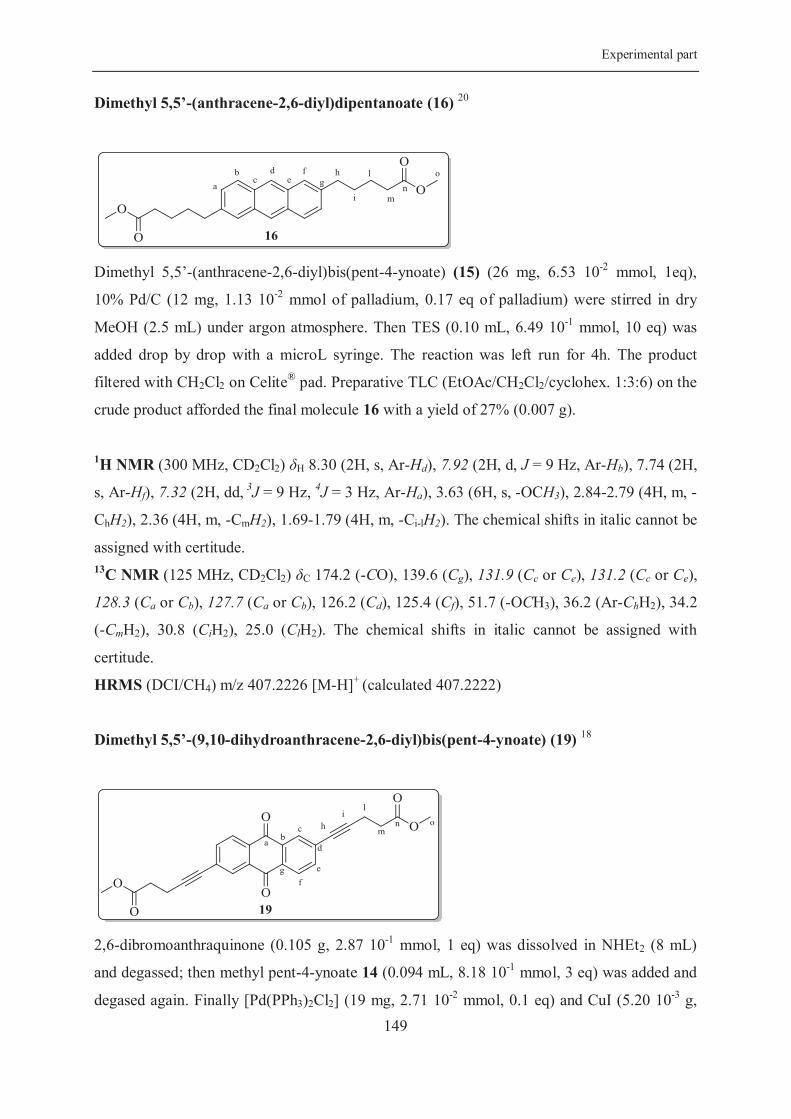
Experimental part
149
Dimethyl 5,5’-(anthracene-2,6-diyl)dipentanoate (16) 20
Dimethyl 5,5’-(anthracene-2,6-diyl)bis(pent-4-ynoate) (15) (26 mg, 6.53 10-2 mmol, 1eq),
10% Pd/C (12 mg, 1.13 10-2 mmol of palladium, 0.17 eq of palladium) were stirred in dry
MeOH (2.5 mL) under argon atmosphere. Then TES (0.10 mL, 6.49 10-1 mmol, 10 eq) was
added drop by drop with a microL syringe. The reaction was left run for 4h. The product
filtered with CH2Cl2 on Celite® pad. Preparative TLC (EtOAc/CH2Cl2/cyclohex. 1:3:6) on the
crude product afforded the final molecule 16 with a yield of 27% (0.007 g).
1H NMR (300 MHz, CD2Cl2) H 8.30 (2H, s, Ar-Hd), 7.92 (2H, d, J = 9 Hz, Ar-Hb), 7.74 (2H,
s, Ar-Hf), 7.32 (2H, dd, 3J = 9 Hz, 4J = 3 Hz, Ar-Ha), 3.63 (6H, s, -OCH3), 2.84-2.79 (4H, m, -
ChH2), 2.36 (4H, m, -CmH2), 1.69-1.79 (4H, m, -Ci-lH2). The chemical shifts in italic cannot be
assigned with certitude. 13C NMR (125 MHz, CD2Cl2) C 174.2 (-CO), 139.6 (Cg), 131.9 (Cc or Ce), 131.2 (Cc or Ce),
128.3 (Ca or Cb), 127.7 (Ca or Cb), 126.2 (Cd), 125.4 (Cf), 51.7 (-OCH3), 36.2 (Ar-ChH2), 34.2
(-CmH2), 30.8 (CiH2), 25.0 (ClH2). The chemical shifts in italic cannot be assigned with
certitude.
HRMS (DCI/CH4) m/z 407.2226 [M-H]+ (calculated 407.2222)
Dimethyl 5,5’-(9,10-dihydroanthracene-2,6-diyl)bis(pent-4-ynoate) (19) 18
2,6-dibromoanthraquinone (0.105 g, 2.87 10-1 mmol, 1 eq) was dissolved in NHEt2 (8 mL)
and degassed; then methyl pent-4-ynoate 14 (0.094 mL, 8.18 10-1 mmol, 3 eq) was added and
degased again. Finally [Pd(PPh3)2Cl2] (19 mg, 2.71 10-2 mmol, 0.1 eq) and CuI (5.20 10-3 g,
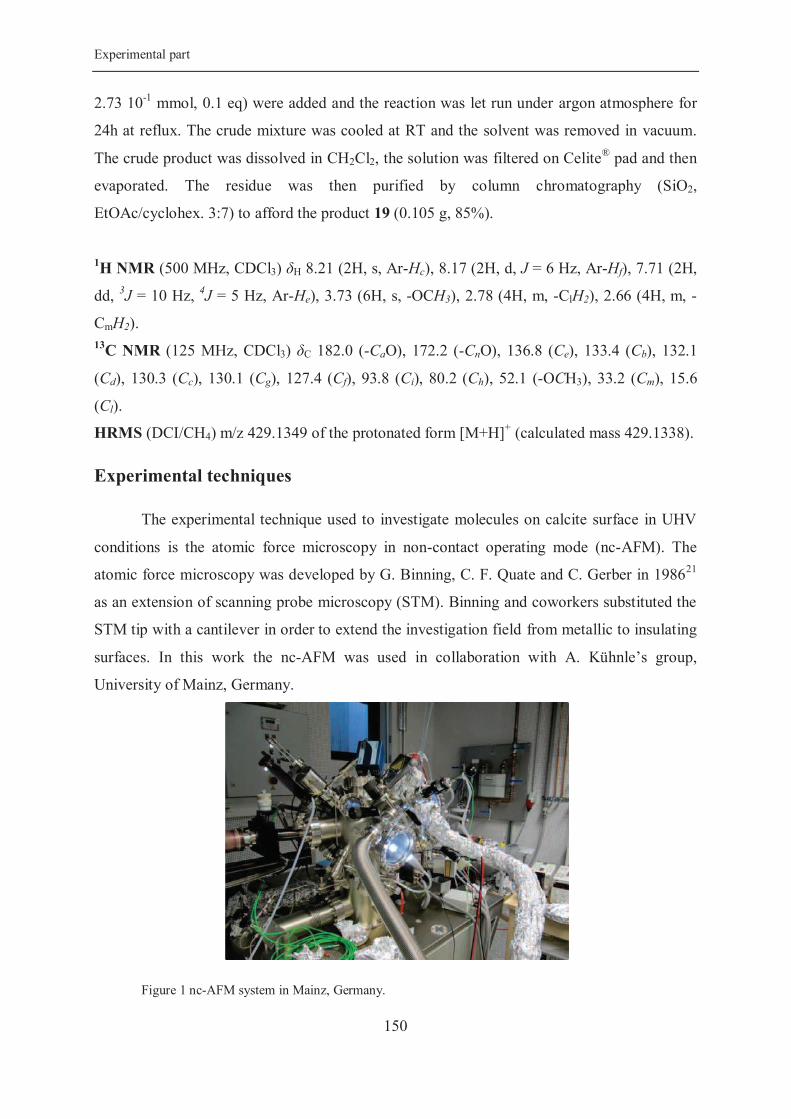
Experimental part
150
2.73 10-1 mmol, 0.1 eq) were added and the reaction was let run under argon atmosphere for
24h at reflux. The crude mixture was cooled at RT and the solvent was removed in vacuum.
The crude product was dissolved in CH2Cl2, the solution was filtered on Celite® pad and then
evaporated. The residue was then purified by column chromatography (SiO2,
EtOAc/cyclohex. 3:7) to afford the product 19 (0.105 g, 85%).
1H NMR (500 MHz, CDCl3) H 8.21 (2H, s, Ar-Hc), 8.17 (2H, d, J = 6 Hz, Ar-Hf), 7.71 (2H,
dd, 3J = 10 Hz, 4
J = 5 Hz, Ar-He), 3.73 (6H, s, -OCH3), 2.78 (4H, m, -ClH2), 2.66 (4H, m, -
CmH2). 13C NMR (125 MHz, CDCl3) C 182.0 (-CaO), 172.2 (-CnO), 136.8 (Ce), 133.4 (Cb), 132.1
(Cd), 130.3 (Cc), 130.1 (Cg), 127.4 (Cf), 93.8 (Ci), 80.2 (Ch), 52.1 (-OCH3), 33.2 (Cm), 15.6
(Cl).
HRMS (DCI/CH4) m/z 429.1349 of the protonated form [M+H]+ (calculated mass 429.1338).
Experimental techniques
The experimental technique used to investigate molecules on calcite surface in UHV
conditions is the atomic force microscopy in non-contact operating mode (nc-AFM). The
atomic force microscopy was developed by G. Binning, C. F. Quate and C. Gerber in 198621
as an extension of scanning probe microscopy (STM). Binning and coworkers substituted the
STM tip with a cantilever in order to extend the investigation field from metallic to insulating
surfaces. In this work the nc-AFM was used in collaboration with A. Kühnle’s group,
University of Mainz, Germany.
Figure 1 nc-AFM system in Mainz, Germany.
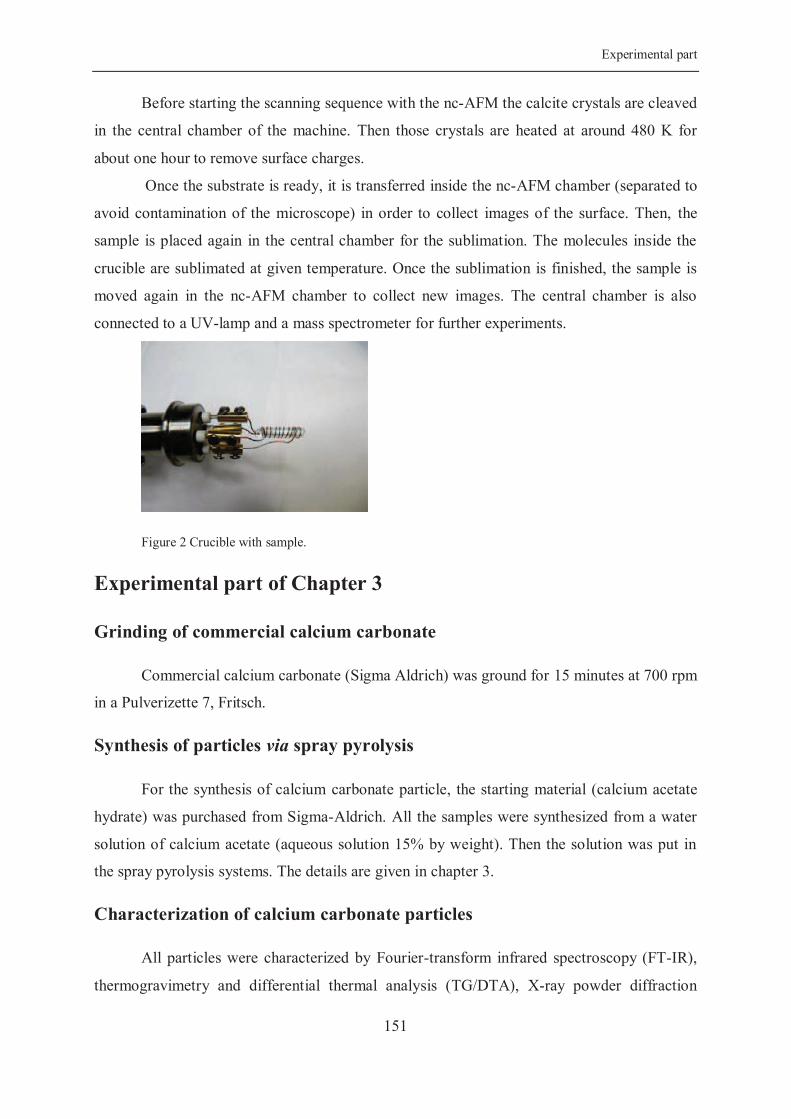
Experimental part
151
Before starting the scanning sequence with the nc-AFM the calcite crystals are cleaved
in the central chamber of the machine. Then those crystals are heated at around 480 K for
about one hour to remove surface charges.
Once the substrate is ready, it is transferred inside the nc-AFM chamber (separated to
avoid contamination of the microscope) in order to collect images of the surface. Then, the
sample is placed again in the central chamber for the sublimation. The molecules inside the
crucible are sublimated at given temperature. Once the sublimation is finished, the sample is
moved again in the nc-AFM chamber to collect new images. The central chamber is also
connected to a UV-lamp and a mass spectrometer for further experiments.
Figure 2 Crucible with sample.
Experimental part of Chapter 3
Grinding of commercial calcium carbonate
Commercial calcium carbonate (Sigma Aldrich) was ground for 15 minutes at 700 rpm
in a Pulverizette 7, Fritsch.
Synthesis of particles via spray pyrolysis
For the synthesis of calcium carbonate particle, the starting material (calcium acetate
hydrate) was purchased from Sigma-Aldrich. All the samples were synthesized from a water
solution of calcium acetate (aqueous solution 15% by weight). Then the solution was put in
the spray pyrolysis systems. The details are given in chapter 3.
Characterization of calcium carbonate particles
All particles were characterized by Fourier-transform infrared spectroscopy (FT-IR),
thermogravimetry and differential thermal analysis (TG/DTA), X-ray powder diffraction
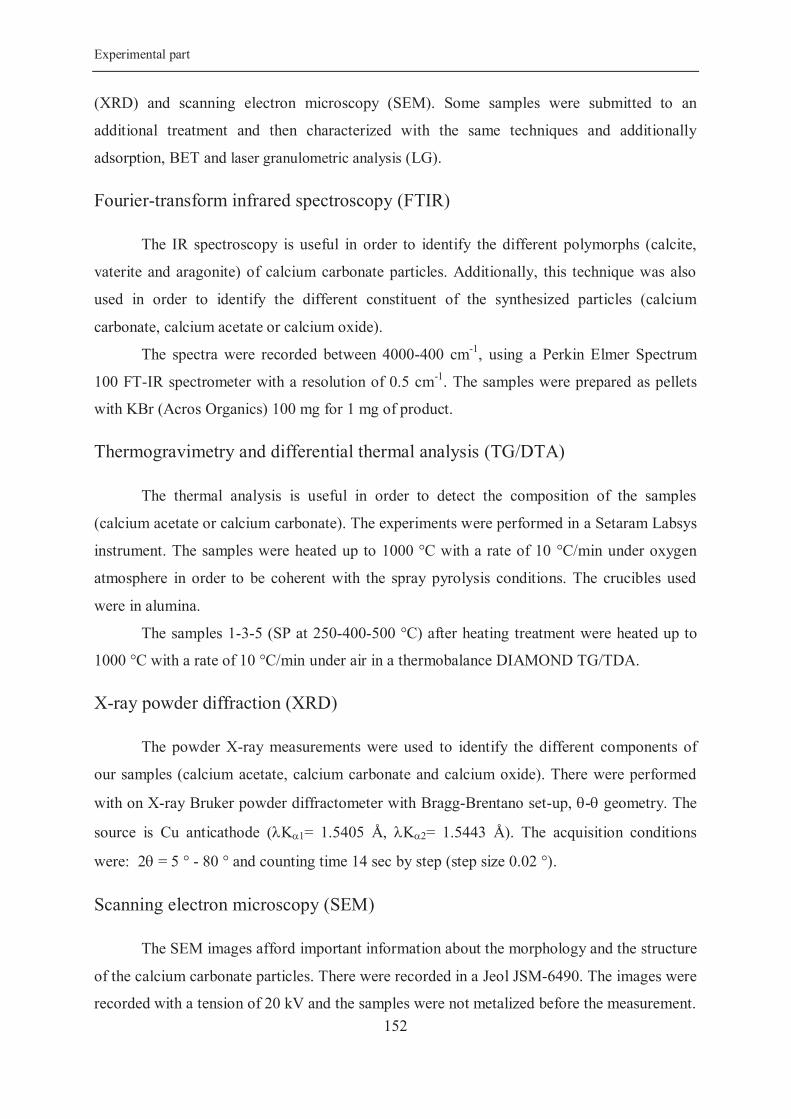
Experimental part
152
(XRD) and scanning electron microscopy (SEM). Some samples were submitted to an
additional treatment and then characterized with the same techniques and additionally
adsorption, BET and laser granulometric analysis (LG).
Fourier-transform infrared spectroscopy (FTIR)
The IR spectroscopy is useful in order to identify the different polymorphs (calcite,
vaterite and aragonite) of calcium carbonate particles. Additionally, this technique was also
used in order to identify the different constituent of the synthesized particles (calcium
carbonate, calcium acetate or calcium oxide).
The spectra were recorded between 4000-400 cm-1, using a Perkin Elmer Spectrum
100 FT-IR spectrometer with a resolution of 0.5 cm-1. The samples were prepared as pellets
with KBr (Acros Organics) 100 mg for 1 mg of product.
Thermogravimetry and differential thermal analysis (TG/DTA)
The thermal analysis is useful in order to detect the composition of the samples
(calcium acetate or calcium carbonate). The experiments were performed in a Setaram Labsys
instrument. The samples were heated up to 1000 °C with a rate of 10 °C/min under oxygen
atmosphere in order to be coherent with the spray pyrolysis conditions. The crucibles used
were in alumina.
The samples 1-3-5 (SP at 250-400-500 °C) after heating treatment were heated up to
1000 °C with a rate of 10 °C/min under air in a thermobalance DIAMOND TG/TDA.
X-ray powder diffraction (XRD)
The powder X-ray measurements were used to identify the different components of
our samples (calcium acetate, calcium carbonate and calcium oxide). There were performed
with on X-ray Bruker powder diffractometer with Bragg-Brentano set-up, - geometry. The
source is Cu anticathode ( K 1= 1.5405 Å, K 2= 1.5443 Å). The acquisition conditions
were: 2 = 5 ° - 80 ° and counting time 14 sec by step (step size 0.02 °).
Scanning electron microscopy (SEM)
The SEM images afford important information about the morphology and the structure
of the calcium carbonate particles. There were recorded in a Jeol JSM-6490. The images were
recorded with a tension of 20 kV and the samples were not metalized before the measurement.
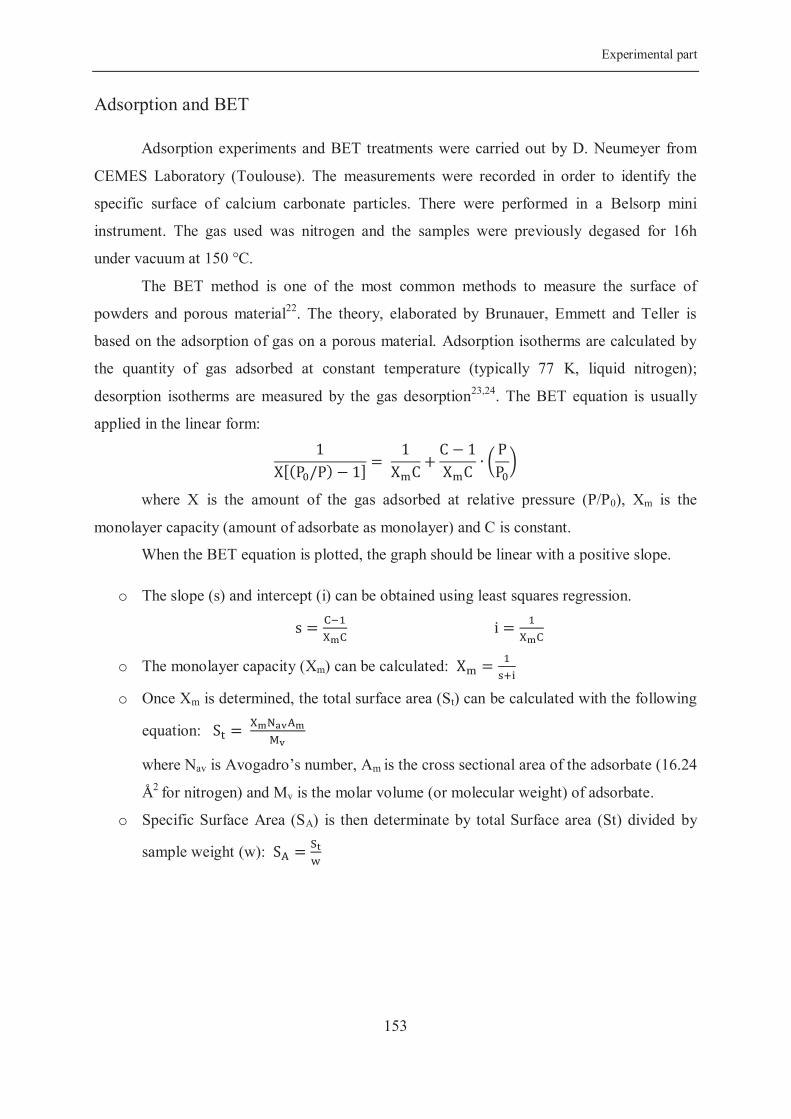
Experimental part
153
Adsorption and BET
Adsorption experiments and BET treatments were carried out by D. Neumeyer from
CEMES Laboratory (Toulouse). The measurements were recorded in order to identify the
specific surface of calcium carbonate particles. There were performed in a Belsorp mini
instrument. The gas used was nitrogen and the samples were previously degased for 16h
under vacuum at 150 °C.
The BET method is one of the most common methods to measure the surface of
powders and porous material22. The theory, elaborated by Brunauer, Emmett and Teller is
based on the adsorption of gas on a porous material. Adsorption isotherms are calculated by
the quantity of gas adsorbed at constant temperature (typically 77 K, liquid nitrogen);
desorption isotherms are measured by the gas desorption23,24. The BET equation is usually
applied in the linear form:
where X is the amount of the gas adsorbed at relative pressure (P/P0), Xm is the
monolayer capacity (amount of adsorbate as monolayer) and C is constant.
When the BET equation is plotted, the graph should be linear with a positive slope.
o The slope (s) and intercept (i) can be obtained using least squares regression.
o The monolayer capacity (Xm) can be calculated:
o Once Xm is determined, the total surface area (St) can be calculated with the following
equation:
where Nav is Avogadro’s number, Am is the cross sectional area of the adsorbate (16.24
Å2 for nitrogen) and Mv is the molar volume (or molecular weight) of adsorbate.
o Specific Surface Area (SA) is then determinate by total Surface area (St) divided by
sample weight (w):
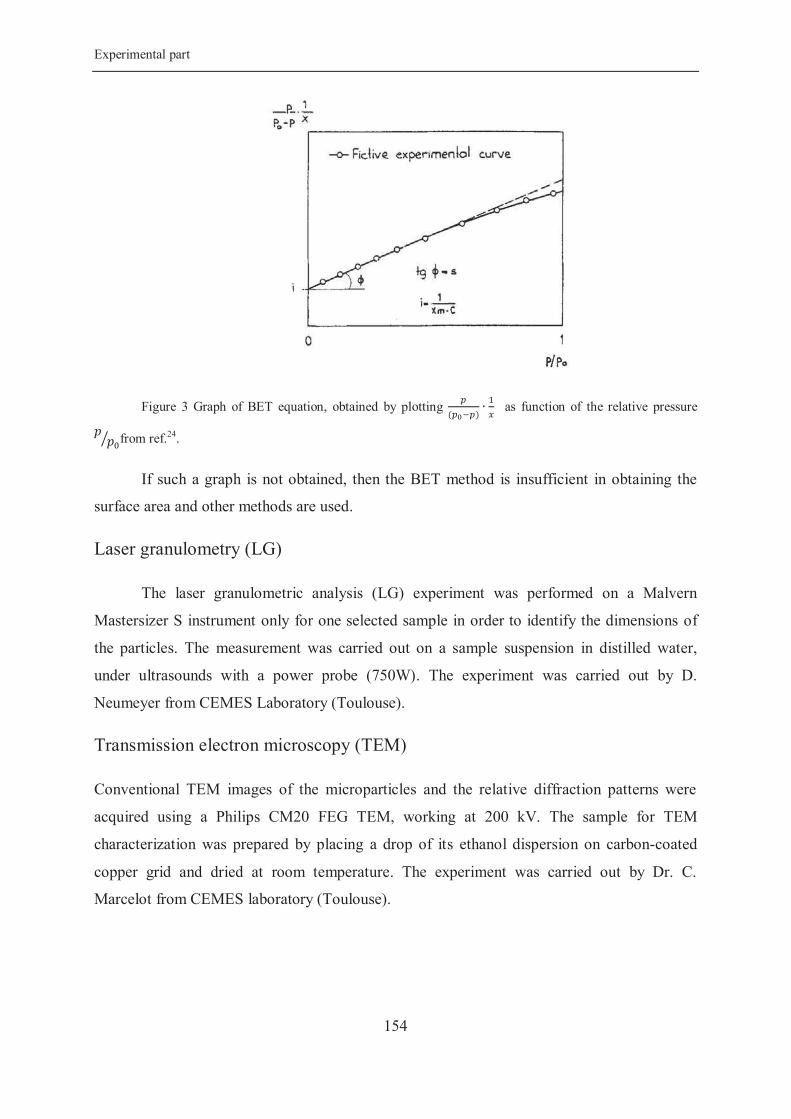
Experimental part
154
Figure 3 Graph of BET equation, obtained by plotting as function of the relative pressure
from ref.24.
If such a graph is not obtained, then the BET method is insufficient in obtaining the
surface area and other methods are used.
Laser granulometry (LG)
The laser granulometric analysis (LG) experiment was performed on a Malvern
Mastersizer S instrument only for one selected sample in order to identify the dimensions of
the particles. The measurement was carried out on a sample suspension in distilled water,
under ultrasounds with a power probe (750W). The experiment was carried out by D.
Neumeyer from CEMES Laboratory (Toulouse).
Transmission electron microscopy (TEM)
Conventional TEM images of the microparticles and the relative diffraction patterns were
acquired using a Philips CM20 FEG TEM, working at 200 kV. The sample for TEM
characterization was prepared by placing a drop of its ethanol dispersion on carbon-coated
copper grid and dried at room temperature. The experiment was carried out by Dr. C.
Marcelot from CEMES laboratory (Toulouse).
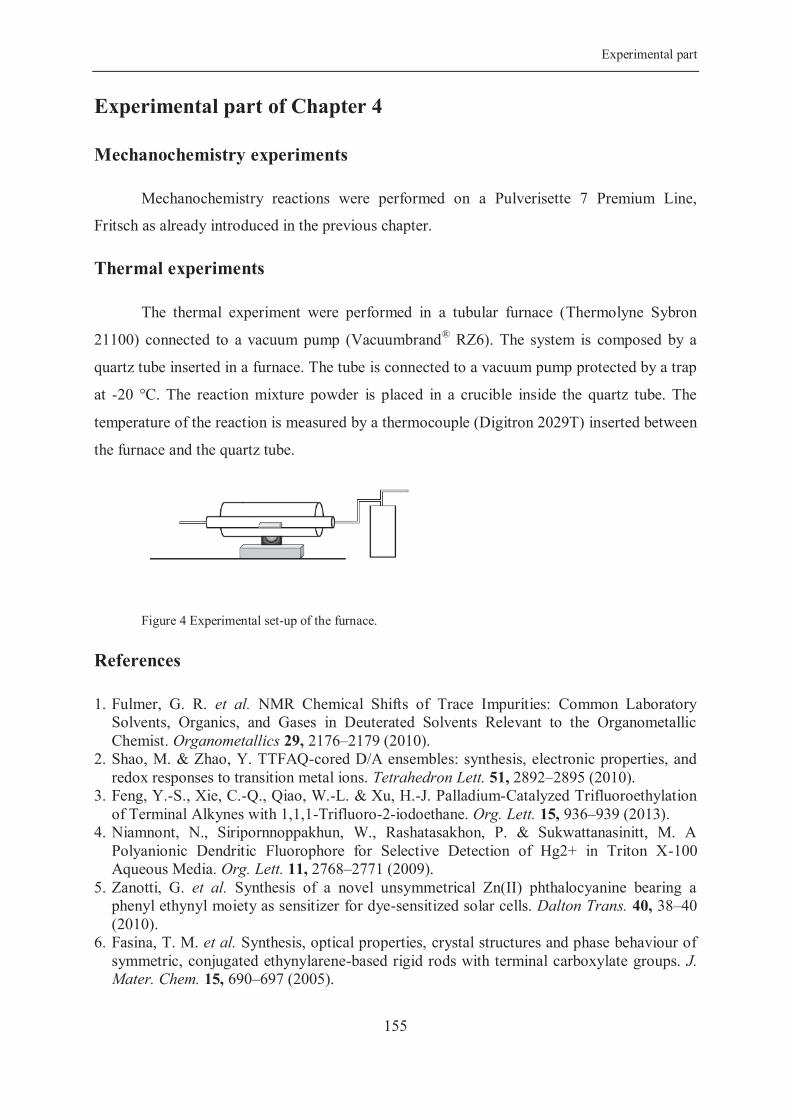
Experimental part
155
Experimental part of Chapter 4
Mechanochemistry experiments
Mechanochemistry reactions were performed on a Pulverisette 7 Premium Line,
Fritsch as already introduced in the previous chapter.
Thermal experiments
The thermal experiment were performed in a tubular furnace (Thermolyne Sybron
21100) connected to a vacuum pump (Vacuumbrand® RZ6). The system is composed by a
quartz tube inserted in a furnace. The tube is connected to a vacuum pump protected by a trap
at -20 °C. The reaction mixture powder is placed in a crucible inside the quartz tube. The
temperature of the reaction is measured by a thermocouple (Digitron 2029T) inserted between
the furnace and the quartz tube.
Figure 4 Experimental set-up of the furnace.
References
1. Fulmer, G. R. et al. NMR Chemical Shifts of Trace Impurities: Common Laboratory Solvents, Organics, and Gases in Deuterated Solvents Relevant to the Organometallic Chemist. Organometallics 29, 2176–2179 (2010).
2. Shao, M. & Zhao, Y. TTFAQ-cored D/A ensembles: synthesis, electronic properties, and redox responses to transition metal ions. Tetrahedron Lett. 51, 2892–2895 (2010).
3. Feng, Y.-S., Xie, C.-Q., Qiao, W.-L. & Xu, H.-J. Palladium-Catalyzed Trifluoroethylation of Terminal Alkynes with 1,1,1-Trifluoro-2-iodoethane. Org. Lett. 15, 936–939 (2013).
4. Niamnont, N., Siripornnoppakhun, W., Rashatasakhon, P. & Sukwattanasinitt, M. A Polyanionic Dendritic Fluorophore for Selective Detection of Hg2+ in Triton X-100 Aqueous Media. Org. Lett. 11, 2768–2771 (2009).
5. Zanotti, G. et al. Synthesis of a novel unsymmetrical Zn(II) phthalocyanine bearing a phenyl ethynyl moiety as sensitizer for dye-sensitized solar cells. Dalton Trans. 40, 38–40 (2010).
6. Fasina, T. M. et al. Synthesis, optical properties, crystal structures and phase behaviour of symmetric, conjugated ethynylarene-based rigid rods with terminal carboxylate groups. J.
Mater. Chem. 15, 690–697 (2005).
Experimental part
156
7. Han, S. et al. A single-crystalline microporous coordination polymer with mixed parallel and diagonal interpenetrating -Po networks. CrystEngComm 13, 4838–4840 (2011).
8. Bischoff, A., Subramanya, H., Sundaresan, K., Sammeta, S. & Vaka, A. Novel Piperazine Derivatives as Inhibitors of Stearoyl-Coa Desaturase. (2008). at <WO2008157844 (A1)>
9. Jones, L. F. et al. Tuning magnetic properties using targeted structural distortion: New additions to a family of Mn6 single-molecule magnets. Inorganica Chim. Acta 361, 3420–
3426 (2008). 10. Offermann, D. A. et al. Synthesis and Incorporation into Cyclic Peptides of Tolan
Amino Acids and Their Hydrogenated Congeners: Construction of an Array of A–B-loop Mimetics of the C 3 Domain of Human IgE. J. Org. Chem. 77, 3197–3214 (2012).
11. Merkul, E., Urselmann, D. & Müller, T. J. J. Consecutive One-Pot Sonogashira–
Glaser Coupling Sequence – Direct Preparation of Symmetrical Diynes by Sequential Pd/Cu Catalysis. Eur. J. Org. Chem. 2011, 238–242 (2011).
12. Austin, W. B., Bilow, N., Kelleghan, W. J. & Lau, K. S. Y. Facile synthesis of ethynylated benzoic acid derivatives and aromatic compounds via ethynyltrimethylsilane. J. Org. Chem. 46, 2280–2286 (1981).
13. Vilhelmsen, M. H., Jensen, J., Tortzen, C. G. & Nielsen, M. B. The Glaser-Hay Reaction: Optimization and Scope Based on 13C NMR Kinetics Experiments: The Glaser-Hay Reaction. Eur. J. Org. Chem. 2013, 701–711 (2013).
14. Matsubara, H. et al. Syntheses of Novel Fullerene Tweezers and Their Supramolecular Inclusion Complex of C60. Chem. Lett. 1099–1100 (1998).
15. Bleisch, T. J., Doti, R. A., Pfeifer, L. A. & Norman, B. H. Dihydropyrido Pyrimidine Compounds as Autotaxin Inhibitors. (2014). at <WO2014168824 (A1)*>
16. Dini, D. et al. Nonlinear Transmission of a Tetrabrominated Naphthalocyaninato Indium Chloride. J. Phys. Chem. B 110, 12230–12239 (2006).
17. Dubinina, T. V. et al. Synthesis and investigation of spectral and electrochemical properties of alkyl-substituted planar binuclear phthalocyanine complexes sharing a common naphthalene ring. Inorganica Chim. Acta 363, 1869–1878 (2010).
18. Shimotahira, H., Fusazaki, S., Ikeda, I. & Ozoe, Y. A photoreactive probe that differentiates the binding sites of noncompetitive GABA receptor antagonists. Bioorg.
Med. Chem. Lett. 21, 1598–1600 (2011). 19. Khanna, B., Parkin, S. R. & Revell, K. D. 2,6-Diarylethynylanthracenes: synthesis,
morphology, and electro-optical properties. Tetrahedron Lett. 53, 6383–6387 (2012). 20. Mandal, P. K. & McMurray, J. S. Pd C-Induced Catalytic Transfer Hydrogenation
with Triethylsilane. J. Org. Chem. 72, 6599–6601 (2007). 21. Binnig, G. & Quate, C. F. Atomic Force Microscope. Phys. Rev. Lett. 56, 930–933
(1986). 22. International Union of Pure and Applied Chemistry. Reporting physisorption data for
gas/solid systems with Special Reference to the Determination of Surface Area and Porosity. Pure Appl Chem 57, pp. 603—619, 1985. (1985).
23. Brunauer, S., Deming, L. S., Deming, W. E. & Teller, E. On a Theory of the van der Waals Adsorption of Gases. J. Am. Chem. Soc. 62, 1723–1732 (1940).
24. Fagerlund, G. Determination of specific surface by the BET method. Matér. Constr. 6, 239–245 (1973).

ANNEX

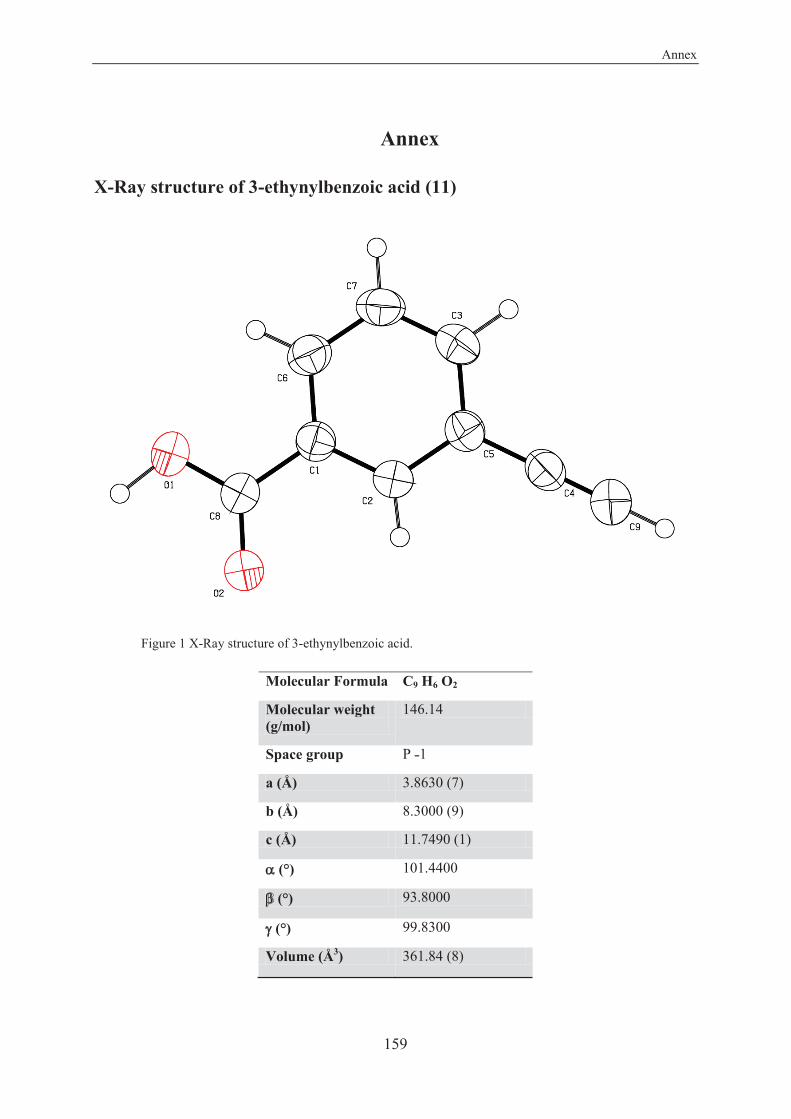
Annex
159
Annex
X-Ray structure of 3-ethynylbenzoic acid (11)
Figure 1 X-Ray structure of 3-ethynylbenzoic acid.
Molecular Formula C9 H6 O2
Molecular weight (g/mol)
146.14
Space group P 1
a (Å) 3.8630 (7)
b (Å) 8.3000 (9)
c (Å) 11.7490 (1)
(°) 101.4400
(°) 93.8000
(°) 99.8300
Volume (Å3) 361.84 (8)
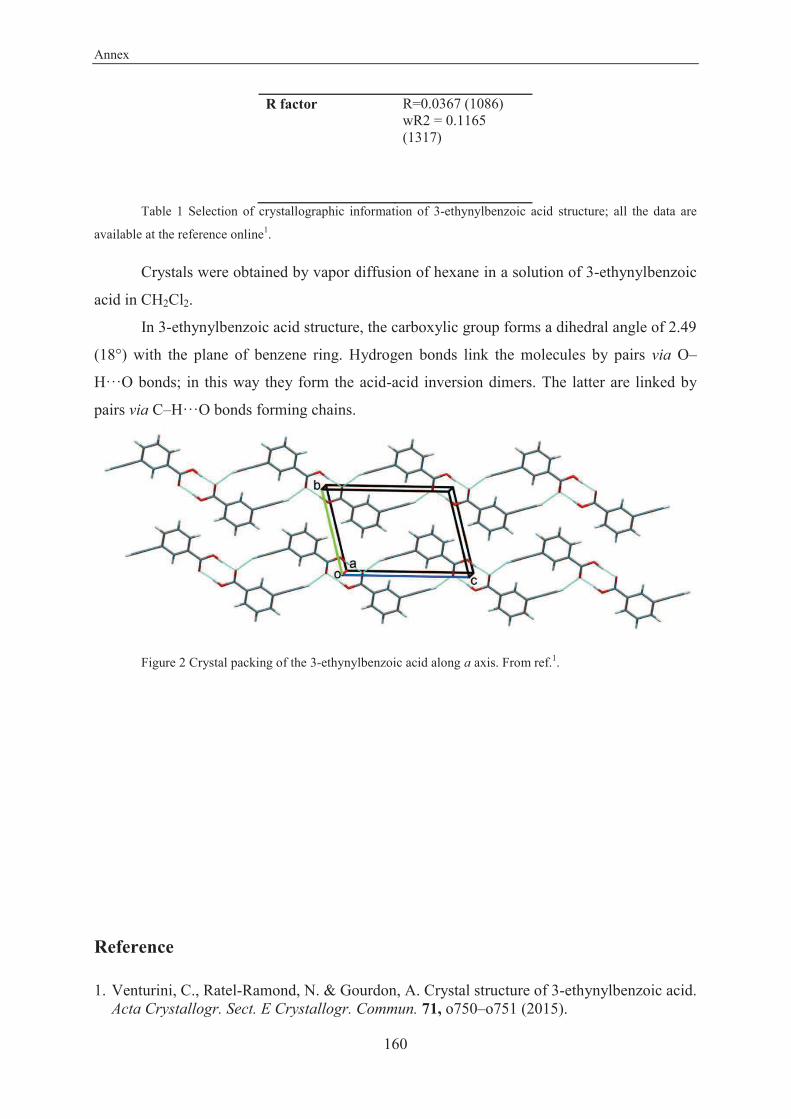
Annex
160
R factor R=0.0367 (1086) wR2 = 0.1165 (1317)
Table 1 Selection of crystallographic information of 3-ethynylbenzoic acid structure; all the data are
available at the reference online1.
Crystals were obtained by vapor diffusion of hexane in a solution of 3-ethynylbenzoic
acid in CH2Cl2.
In 3-ethynylbenzoic acid structure, the carboxylic group forms a dihedral angle of 2.49
(18°) with the plane of benzene ring. Hydrogen bonds link the molecules by pairs via O–
H···O bonds; in this way they form the acid-acid inversion dimers. The latter are linked by
pairs via C–H···O bonds forming chains.
Figure 2 Crystal packing of the 3-ethynylbenzoic acid along a axis. From ref.1.
Reference
1. Venturini, C., Ratel-Ramond, N. & Gourdon, A. Crystal structure of 3-ethynylbenzoic acid. Acta Crystallogr. Sect. E Crystallogr. Commun. 71, o750–o751 (2015).
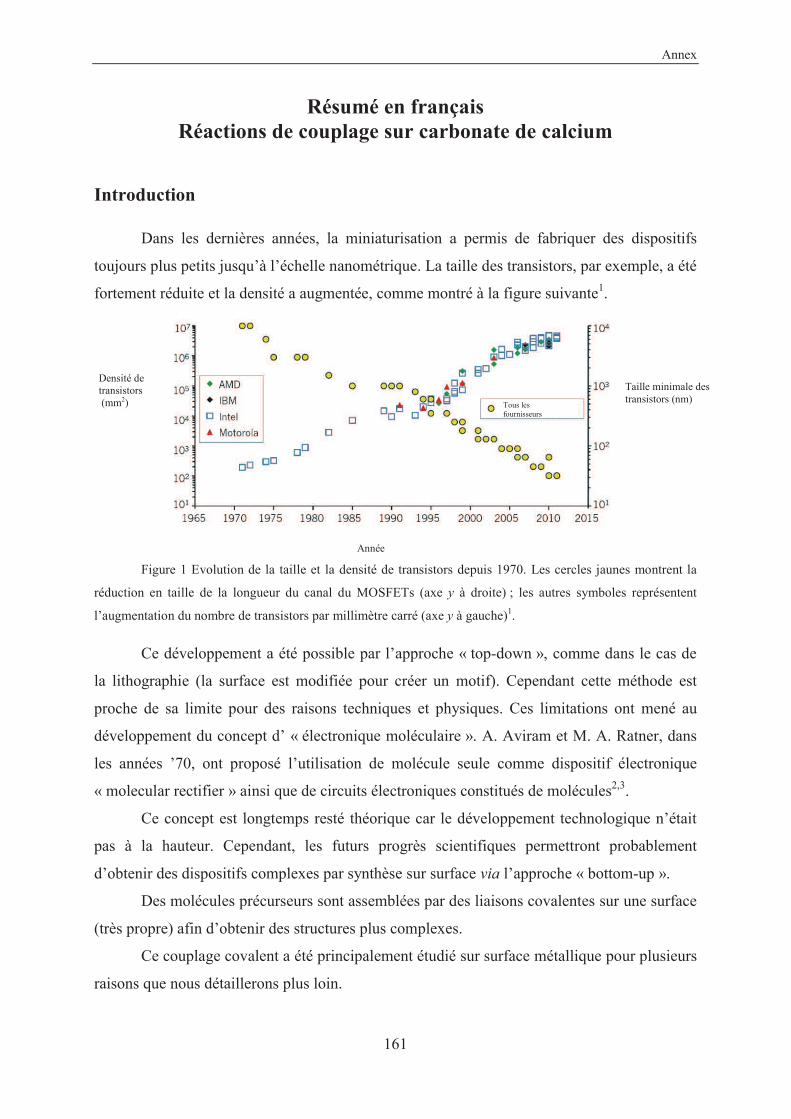
Annex
161
Résumé en français Réactions de couplage sur carbonate de calcium
Introduction
Dans les dernières années, la miniaturisation a permis de fabriquer des dispositifs
toujours plus petits jusqu’à l’échelle nanométrique. La taille des transistors, par exemple, a été
fortement réduite et la densité a augmentée, comme montré à la figure suivante1.
Figure 1 Evolution de la taille et la densité de transistors depuis 1970. Les cercles jaunes montrent la
réduction en taille de la longueur du canal du MOSFETs (axe y à droite) ; les autres symboles représentent
l’augmentation du nombre de transistors par millimètre carré (axe y à gauche)1.
Ce développement a été possible par l’approche « top-down », comme dans le cas de
la lithographie (la surface est modifiée pour créer un motif). Cependant cette méthode est
proche de sa limite pour des raisons techniques et physiques. Ces limitations ont mené au
développement du concept d’ « électronique moléculaire ». A. Aviram et M. A. Ratner, dans
les années ’70, ont proposé l’utilisation de molécule seule comme dispositif électronique
« molecular rectifier » ainsi que de circuits électroniques constitués de molécules2,3.
Ce concept est longtemps resté théorique car le développement technologique n’était
pas à la hauteur. Cependant, les futurs progrès scientifiques permettront probablement
d’obtenir des dispositifs complexes par synthèse sur surface via l’approche « bottom-up ».
Des molécules précurseurs sont assemblées par des liaisons covalentes sur une surface
(très propre) afin d’obtenir des structures plus complexes.
Ce couplage covalent a été principalement étudié sur surface métallique pour plusieurs
raisons que nous détaillerons plus loin.
Densité de transistors (mm2)
Année
Taille minimale des transistors (nm)
Tous les fournisseurs
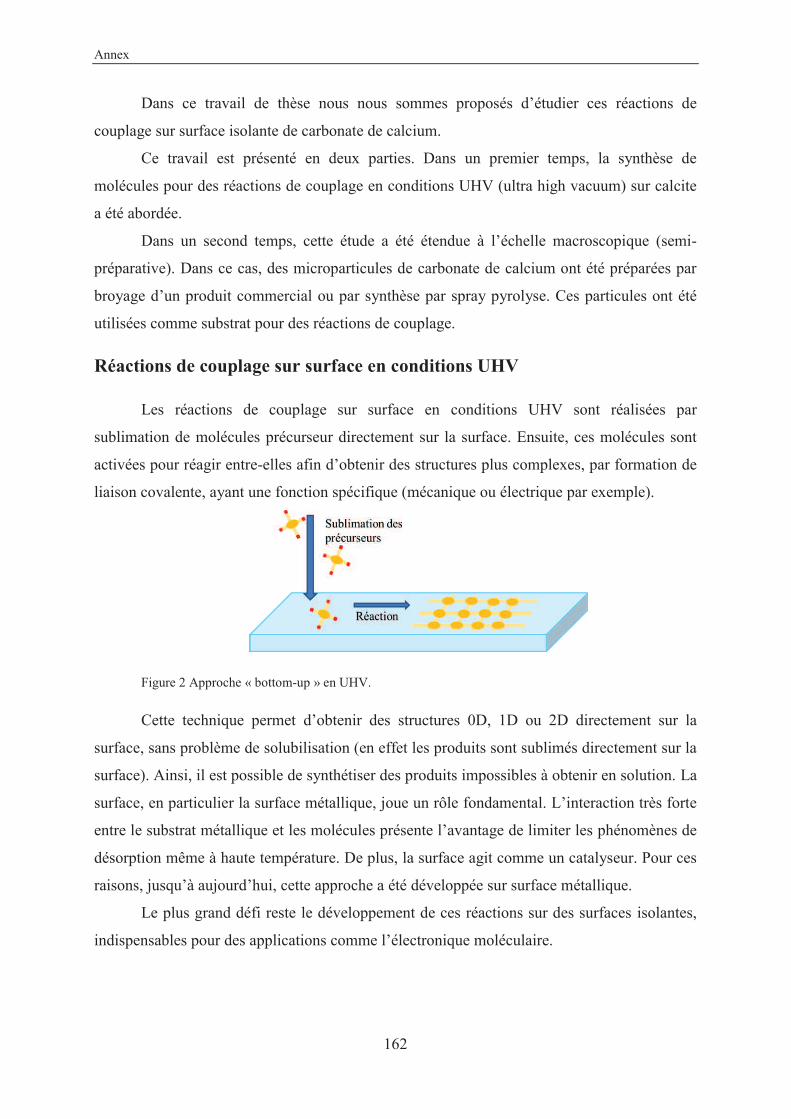
Annex
162
Dans ce travail de thèse nous nous sommes proposés d’étudier ces réactions de
couplage sur surface isolante de carbonate de calcium.
Ce travail est présenté en deux parties. Dans un premier temps, la synthèse de
molécules pour des réactions de couplage en conditions UHV (ultra high vacuum) sur calcite
a été abordée.
Dans un second temps, cette étude a été étendue à l’échelle macroscopique (semi-
préparative). Dans ce cas, des microparticules de carbonate de calcium ont été préparées par
broyage d’un produit commercial ou par synthèse par spray pyrolyse. Ces particules ont été
utilisées comme substrat pour des réactions de couplage.
Réactions de couplage sur surface en conditions UHV
Les réactions de couplage sur surface en conditions UHV sont réalisées par
sublimation de molécules précurseur directement sur la surface. Ensuite, ces molécules sont
activées pour réagir entre-elles afin d’obtenir des structures plus complexes, par formation de
liaison covalente, ayant une fonction spécifique (mécanique ou électrique par exemple).
Figure 2 Approche « bottom-up » en UHV.
Cette technique permet d’obtenir des structures 0D, 1D ou 2D directement sur la
surface, sans problème de solubilisation (en effet les produits sont sublimés directement sur la
surface). Ainsi, il est possible de synthétiser des produits impossibles à obtenir en solution. La
surface, en particulier la surface métallique, joue un rôle fondamental. L’interaction très forte
entre le substrat métallique et les molécules présente l’avantage de limiter les phénomènes de
désorption même à haute température. De plus, la surface agit comme un catalyseur. Pour ces
raisons, jusqu’à aujourd’hui, cette approche a été développée sur surface métallique.
Le plus grand défi reste le développement de ces réactions sur des surfaces isolantes,
indispensables pour des applications comme l’électronique moléculaire.
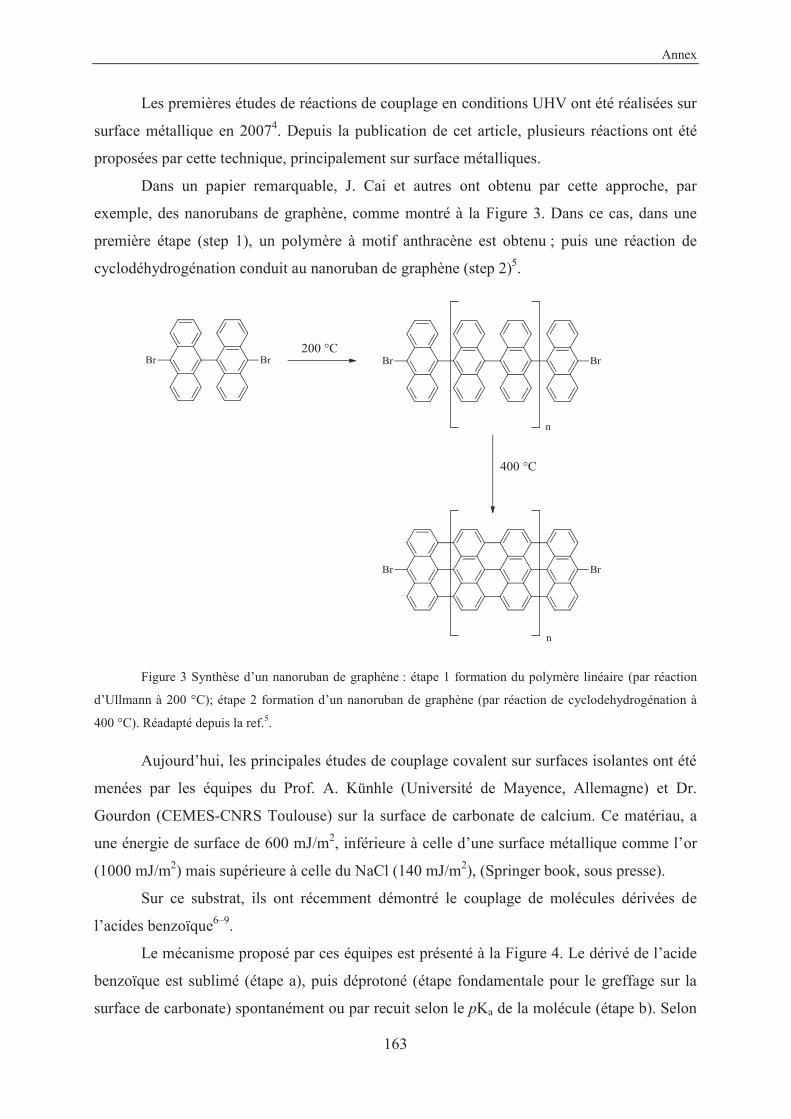
Annex
163
Les premières études de réactions de couplage en conditions UHV ont été réalisées sur
surface métallique en 20074. Depuis la publication de cet article, plusieurs réactions ont été
proposées par cette technique, principalement sur surface métalliques.
Dans un papier remarquable, J. Cai et autres ont obtenu par cette approche, par
exemple, des nanorubans de graphène, comme montré à la Figure 3. Dans ce cas, dans une
première étape (step 1), un polymère à motif anthracène est obtenu ; puis une réaction de
cyclodéhydrogénation conduit au nanoruban de graphène (step 2)5.
Figure 3 Synthèse d’un nanoruban de graphène : étape 1 formation du polymère linéaire (par réaction
d’Ullmann à 200 °C); étape 2 formation d’un nanoruban de graphène (par réaction de cyclodehydrogénation à
400 °C). Réadapté depuis la ref.5.
Aujourd’hui, les principales études de couplage covalent sur surfaces isolantes ont été
menées par les équipes du Prof. A. Künhle (Université de Mayence, Allemagne) et Dr.
Gourdon (CEMES-CNRS Toulouse) sur la surface de carbonate de calcium. Ce matériau, a
une énergie de surface de 600 mJ/m2, inférieure à celle d’une surface métallique comme l’or
(1000 mJ/m2) mais supérieure à celle du NaCl (140 mJ/m2), (Springer book, sous presse).
Sur ce substrat, ils ont récemment démontré le couplage de molécules dérivées de
l’acides benzoïque6–9.
Le mécanisme proposé par ces équipes est présenté à la Figure 4. Le dérivé de l’acide
benzoïque est sublimé (étape a), puis déprotoné (étape fondamentale pour le greffage sur la
surface de carbonate) spontanément ou par recuit selon le pKa de la molécule (étape b). Selon
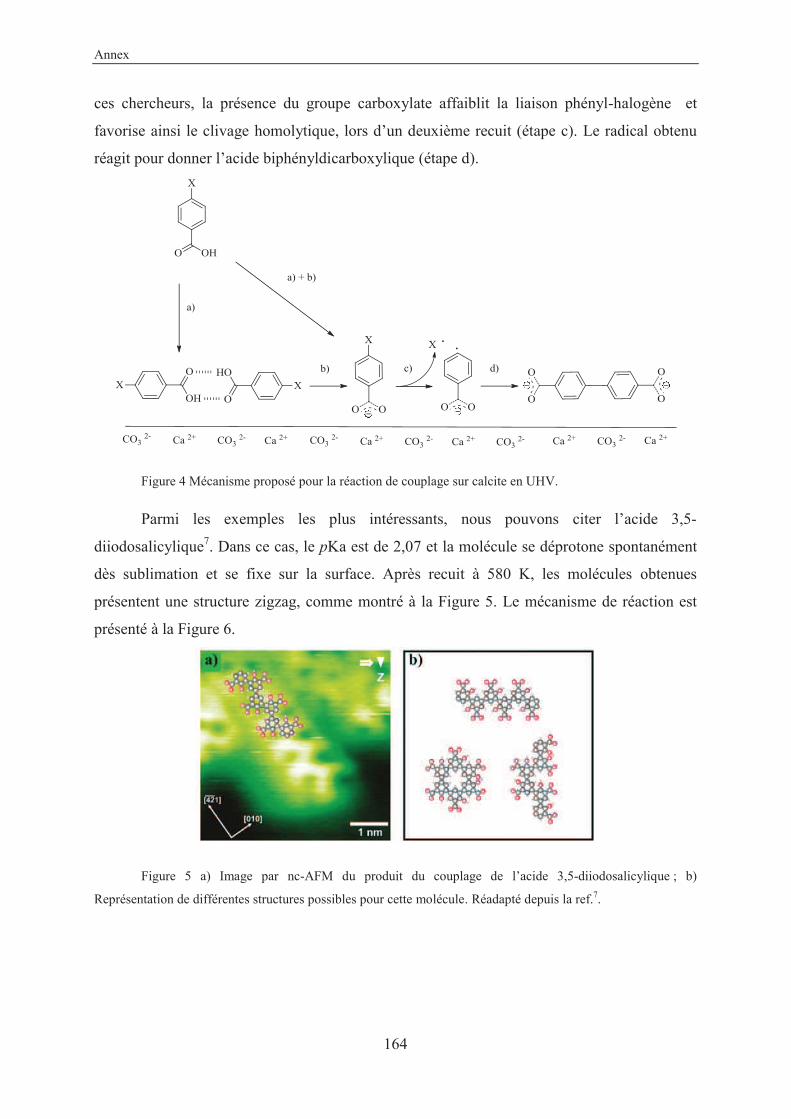
Annex
164
ces chercheurs, la présence du groupe carboxylate affaiblit la liaison phényl-halogène et
favorise ainsi le clivage homolytique, lors d’un deuxième recuit (étape c). Le radical obtenu
réagit pour donner l’acide biphényldicarboxylique (étape d).
Figure 4 Mécanisme proposé pour la réaction de couplage sur calcite en UHV.
Parmi les exemples les plus intéressants, nous pouvons citer l’acide 3,5-
diiodosalicylique7. Dans ce cas, le pKa est de 2,07 et la molécule se déprotone spontanément
dès sublimation et se fixe sur la surface. Après recuit à 580 K, les molécules obtenues
présentent une structure zigzag, comme montré à la Figure 5. Le mécanisme de réaction est
présenté à la Figure 6.
Figure 5 a) Image par nc-AFM du produit du couplage de l’acide 3,5-diiodosalicylique ; b)
Représentation de différentes structures possibles pour cette molécule. Réadapté depuis la ref.7.
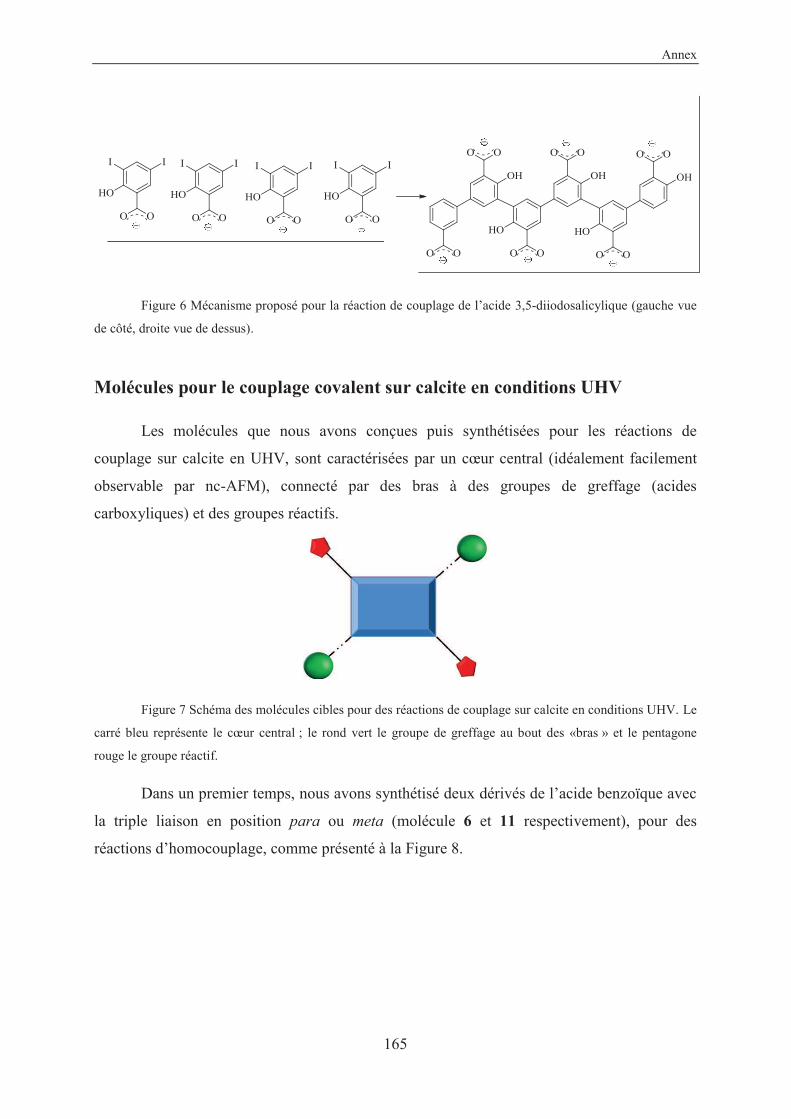
Annex
165
Figure 6 Mécanisme proposé pour la réaction de couplage de l’acide 3,5-diiodosalicylique (gauche vue
de côté, droite vue de dessus).
Molécules pour le couplage covalent sur calcite en conditions UHV
Les molécules que nous avons conçues puis synthétisées pour les réactions de
couplage sur calcite en UHV, sont caractérisées par un cœur central (idéalement facilement
observable par nc-AFM), connecté par des bras à des groupes de greffage (acides
carboxyliques) et des groupes réactifs.
Figure 7 Schéma des molécules cibles pour des réactions de couplage sur calcite en conditions UHV. Le
carré bleu représente le cœur central ; le rond vert le groupe de greffage au bout des «bras » et le pentagone
rouge le groupe réactif.
Dans un premier temps, nous avons synthétisé deux dérivés de l’acide benzoïque avec
la triple liaison en position para ou meta (molécule 6 et 11 respectivement), pour des
réactions d’homocouplage, comme présenté à la Figure 8.
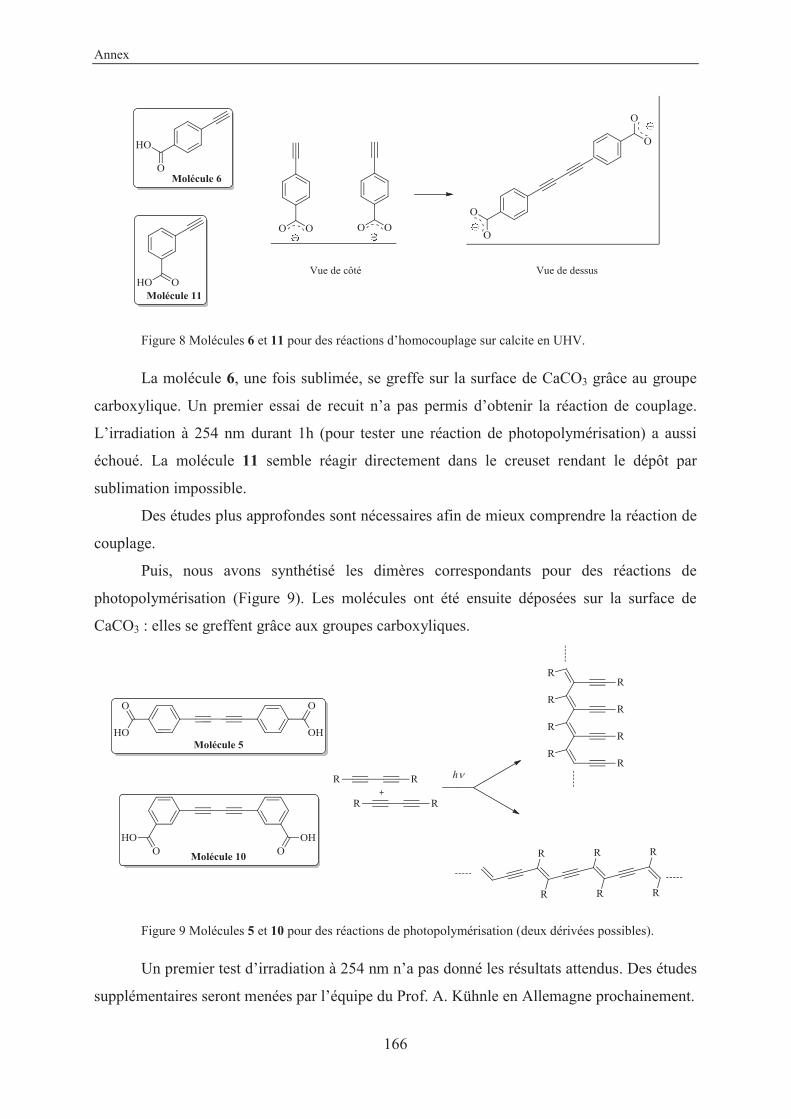
Annex
166
Figure 8 Molécules 6 et 11 pour des réactions d’homocouplage sur calcite en UHV.
La molécule 6, une fois sublimée, se greffe sur la surface de CaCO3 grâce au groupe
carboxylique. Un premier essai de recuit n’a pas permis d’obtenir la réaction de couplage.
L’irradiation à 254 nm durant 1h (pour tester une réaction de photopolymérisation) a aussi
échoué. La molécule 11 semble réagir directement dans le creuset rendant le dépôt par
sublimation impossible.
Des études plus approfondes sont nécessaires afin de mieux comprendre la réaction de
couplage.
Puis, nous avons synthétisé les dimères correspondants pour des réactions de
photopolymérisation (Figure 9). Les molécules ont été ensuite déposées sur la surface de
CaCO3 : elles se greffent grâce aux groupes carboxyliques.
Figure 9 Molécules 5 et 10 pour des réactions de photopolymérisation (deux dérivées possibles).
Un premier test d’irradiation à 254 nm n’a pas donné les résultats attendus. Des études
supplémentaires seront menées par l’équipe du Prof. A. Kühnle en Allemagne prochainement.
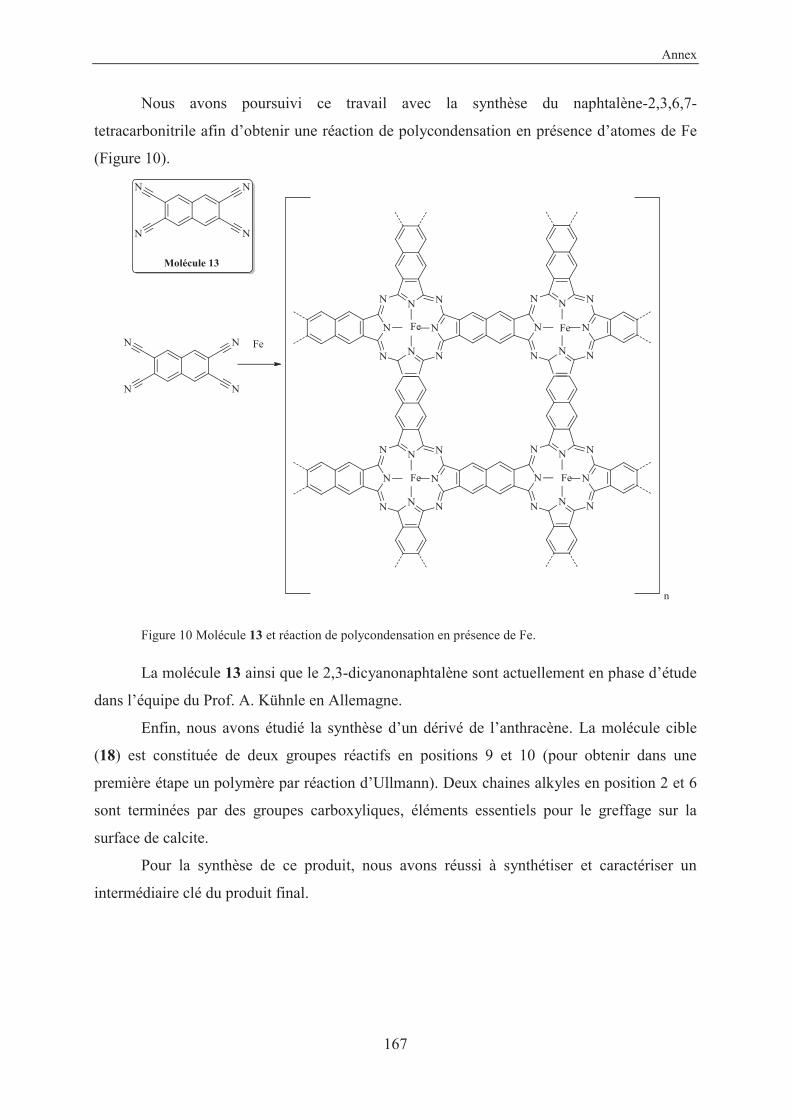
Annex
167
Nous avons poursuivi ce travail avec la synthèse du naphtalène-2,3,6,7-
tetracarbonitrile afin d’obtenir une réaction de polycondensation en présence d’atomes de Fe
(Figure 10).
Figure 10 Molécule 13 et réaction de polycondensation en présence de Fe.
La molécule 13 ainsi que le 2,3-dicyanonaphtalène sont actuellement en phase d’étude
dans l’équipe du Prof. A. Kühnle en Allemagne.
Enfin, nous avons étudié la synthèse d’un dérivé de l’anthracène. La molécule cible
(18) est constituée de deux groupes réactifs en positions 9 et 10 (pour obtenir dans une
première étape un polymère par réaction d’Ullmann). Deux chaines alkyles en position 2 et 6
sont terminées par des groupes carboxyliques, éléments essentiels pour le greffage sur la
surface de calcite.
Pour la synthèse de ce produit, nous avons réussi à synthétiser et caractériser un
intermédiaire clé du produit final.
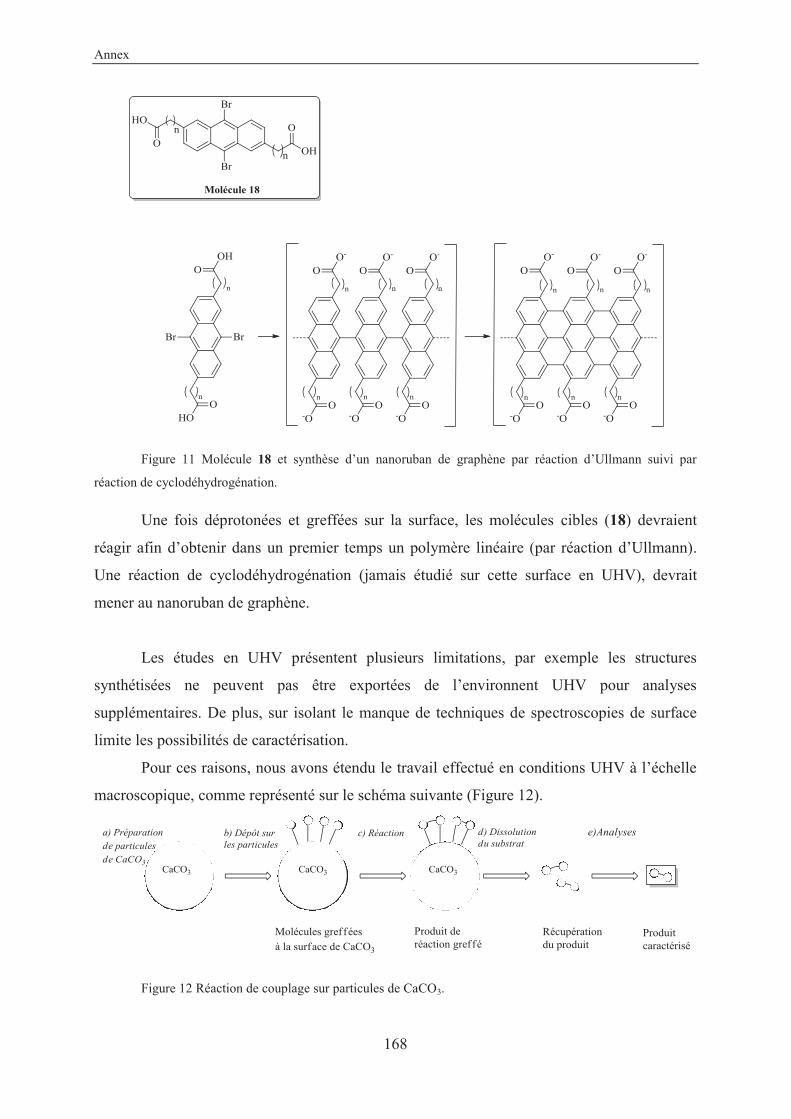
Annex
168
Figure 11 Molécule 18 et synthèse d’un nanoruban de graphène par réaction d’Ullmann suivi par
réaction de cyclodéhydrogénation.
Une fois déprotonées et greffées sur la surface, les molécules cibles (18) devraient
réagir afin d’obtenir dans un premier temps un polymère linéaire (par réaction d’Ullmann).
Une réaction de cyclodéhydrogénation (jamais étudié sur cette surface en UHV), devrait
mener au nanoruban de graphène.
Les études en UHV présentent plusieurs limitations, par exemple les structures
synthétisées ne peuvent pas être exportées de l’environnent UHV pour analyses
supplémentaires. De plus, sur isolant le manque de techniques de spectroscopies de surface
limite les possibilités de caractérisation.
Pour ces raisons, nous avons étendu le travail effectué en conditions UHV à l’échelle
macroscopique, comme représenté sur le schéma suivante (Figure 12).
Figure 12 Réaction de couplage sur particules de CaCO3.
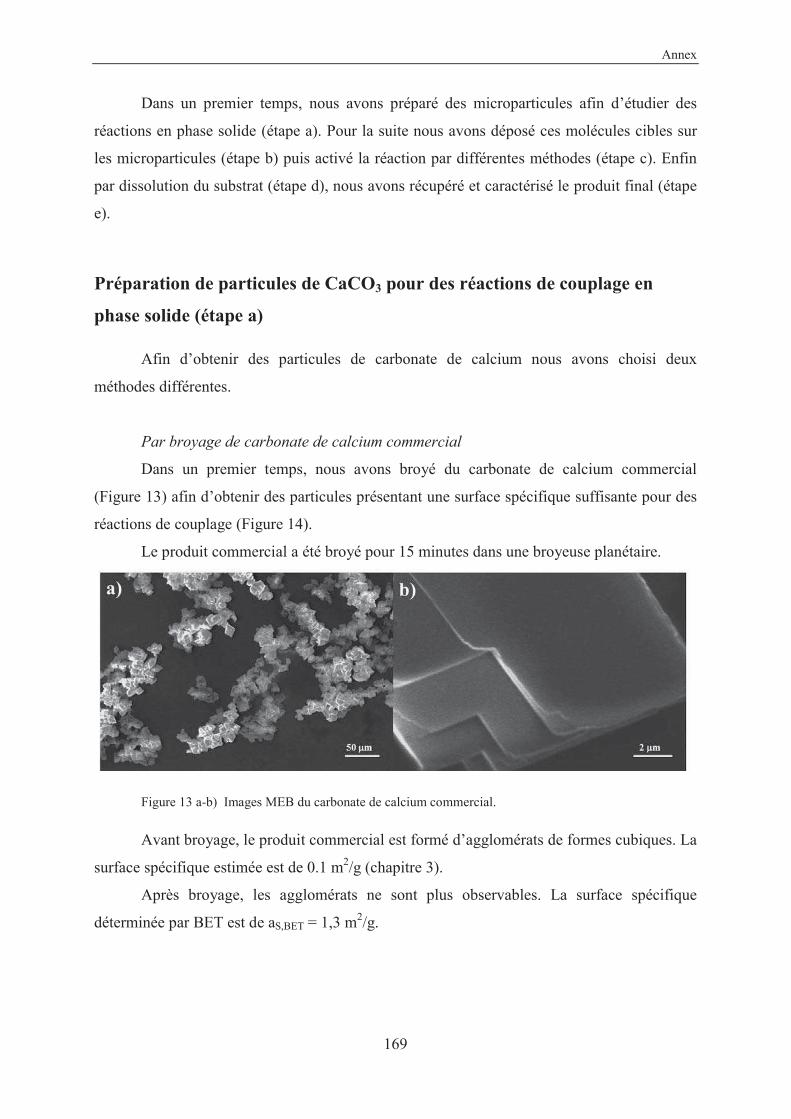
Annex
169
Dans un premier temps, nous avons préparé des microparticules afin d’étudier des
réactions en phase solide (étape a). Pour la suite nous avons déposé ces molécules cibles sur
les microparticules (étape b) puis activé la réaction par différentes méthodes (étape c). Enfin
par dissolution du substrat (étape d), nous avons récupéré et caractérisé le produit final (étape
e).
Préparation de particules de CaCO3 pour des réactions de couplage en
phase solide (étape a)
Afin d’obtenir des particules de carbonate de calcium nous avons choisi deux
méthodes différentes.
Par broyage de carbonate de calcium commercial
Dans un premier temps, nous avons broyé du carbonate de calcium commercial
(Figure 13) afin d’obtenir des particules présentant une surface spécifique suffisante pour des
réactions de couplage (Figure 14).
Le produit commercial a été broyé pour 15 minutes dans une broyeuse planétaire.
Figure 13 a-b) Images MEB du carbonate de calcium commercial.
Avant broyage, le produit commercial est formé d’agglomérats de formes cubiques. La
surface spécifique estimée est de 0.1 m2/g (chapitre 3).
Après broyage, les agglomérats ne sont plus observables. La surface spécifique
déterminée par BET est de aS,BET = 1,3 m2/g.
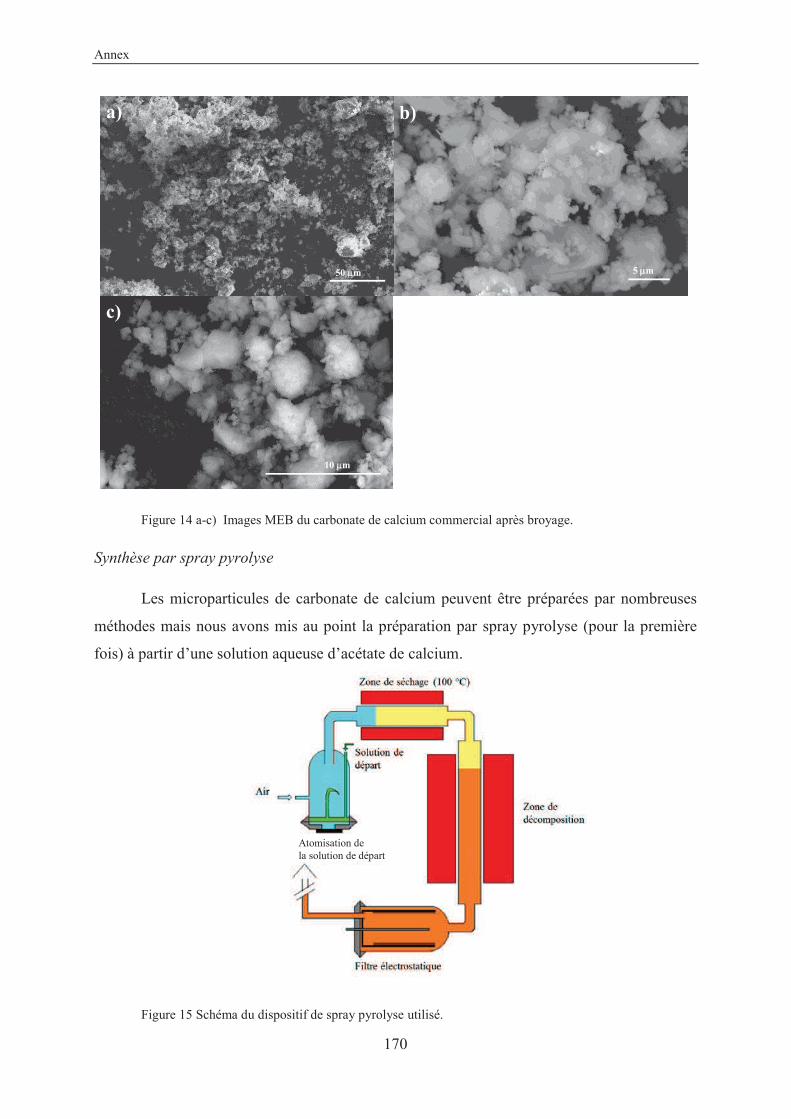
Annex
170
Figure 14 a-c) Images MEB du carbonate de calcium commercial après broyage.
Synthèse par spray pyrolyse
Les microparticules de carbonate de calcium peuvent être préparées par nombreuses
méthodes mais nous avons mis au point la préparation par spray pyrolyse (pour la première
fois) à partir d’une solution aqueuse d’acétate de calcium.
Figure 15 Schéma du dispositif de spray pyrolyse utilisé.
5 m50 m
10 m
a) b)
c)
Atomisation de la solution de départ
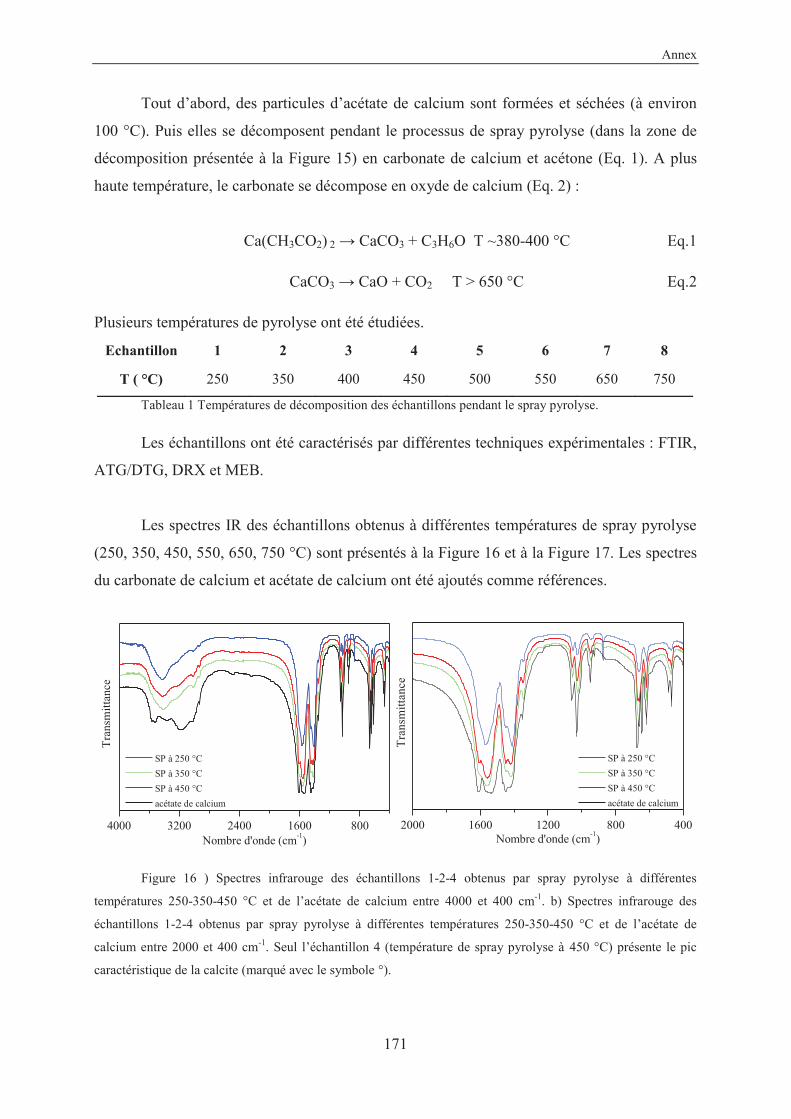
Annex
171
Tout d’abord, des particules d’acétate de calcium sont formées et séchées (à environ
100 °C). Puis elles se décomposent pendant le processus de spray pyrolyse (dans la zone de
décomposition présentée à la Figure 15) en carbonate de calcium et acétone (Eq. 1). A plus
haute température, le carbonate se décompose en oxyde de calcium (Eq. 2) :
Ca(CH3CO2) 2 CaCO3 + C3H6O T ~380-400 °C Eq.1
CaCO3 CaO + CO2 T > 650 °C Eq.2
Plusieurs températures de pyrolyse ont été étudiées.
Echantillon 1 2 3 4 5 6 7 8
T ( °C) 250 350 400 450 500 550 650 750
Tableau 1 Températures de décomposition des échantillons pendant le spray pyrolyse.
Les échantillons ont été caractérisés par différentes techniques expérimentales : FTIR,
ATG/DTG, DRX et MEB.
Les spectres IR des échantillons obtenus à différentes températures de spray pyrolyse
(250, 350, 450, 550, 650, 750 °C) sont présentés à la Figure 16 et à la Figure 17. Les spectres
du carbonate de calcium et acétate de calcium ont été ajoutés comme références.
Figure 16 ) Spectres infrarouge des échantillons 1-2-4 obtenus par spray pyrolyse à différentes
températures 250-350-450 °C et de l’acétate de calcium entre 4000 et 400 cm-1. b) Spectres infrarouge des
échantillons 1-2-4 obtenus par spray pyrolyse à différentes températures 250-350-450 °C et de l’acétate de
calcium entre 2000 et 400 cm-1. Seul l’échantillon 4 (température de spray pyrolyse à 450 °C) présente le pic
caractéristique de la calcite (marqué avec le symbole °).
4000 3200 2400 1600 800 2000 1600 1200 800 400
SP à 250 °C
SP à 350 °C
SP à 450 °C
acétate de calcium
Nombre d'onde (cm-1)
SP à 250 °C
SP à 350 °C
SP à 450 °C
acétate de calcium
T
rans
mit
tanc
e
Nombre d'onde (cm-1)
Tra
nsm
itta
nce
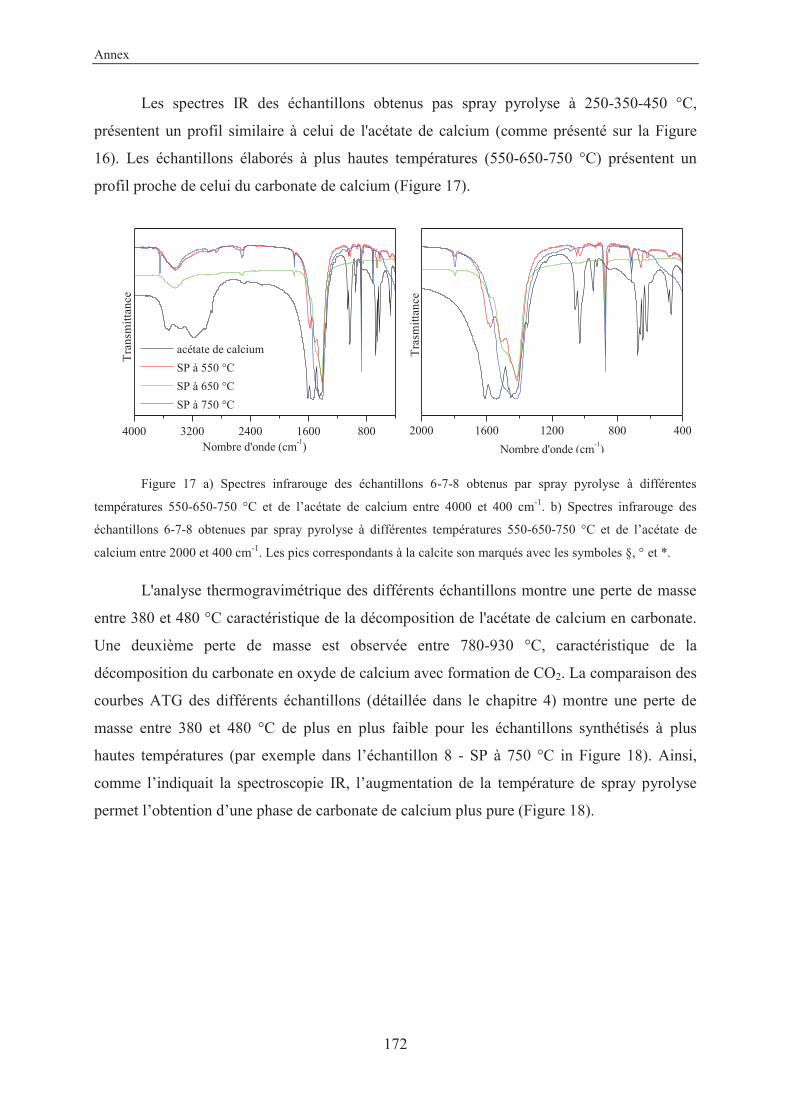
Annex
172
Les spectres IR des échantillons obtenus pas spray pyrolyse à 250-350-450 °C,
présentent un profil similaire à celui de l'acétate de calcium (comme présenté sur la Figure
16). Les échantillons élaborés à plus hautes températures (550-650-750 °C) présentent un
profil proche de celui du carbonate de calcium (Figure 17).
Figure 17 a) Spectres infrarouge des échantillons 6-7-8 obtenus par spray pyrolyse à différentes
températures 550-650-750 °C et de l’acétate de calcium entre 4000 et 400 cm-1. b) Spectres infrarouge des
échantillons 6-7-8 obtenues par spray pyrolyse à différentes températures 550-650-750 °C et de l’acétate de
calcium entre 2000 et 400 cm-1. Les pics correspondants à la calcite son marqués avec les symboles §, ° et *.
L'analyse thermogravimétrique des différents échantillons montre une perte de masse
entre 380 et 480 °C caractéristique de la décomposition de l'acétate de calcium en carbonate.
Une deuxième perte de masse est observée entre 780-930 °C, caractéristique de la
décomposition du carbonate en oxyde de calcium avec formation de CO2. La comparaison des
courbes ATG des différents échantillons (détaillée dans le chapitre 4) montre une perte de
masse entre 380 et 480 °C de plus en plus faible pour les échantillons synthétisés à plus
hautes températures (par exemple dans l’échantillon 8 - SP à 750 °C in Figure 18). Ainsi,
comme l’indiquait la spectroscopie IR, l’augmentation de la température de spray pyrolyse
permet l’obtention d’une phase de carbonate de calcium plus pure (Figure 18).
4000 3200 2400 1600 800 2000 1600 1200 800 400
acétate de calcium
SP à 550 °C
SP à 650 °C
SP à 750 °C
Tra
nsm
itta
nce
Nombre d'onde (cm-1)
Tra
smit
tanc
e
Nombre d'onde (cm-1)
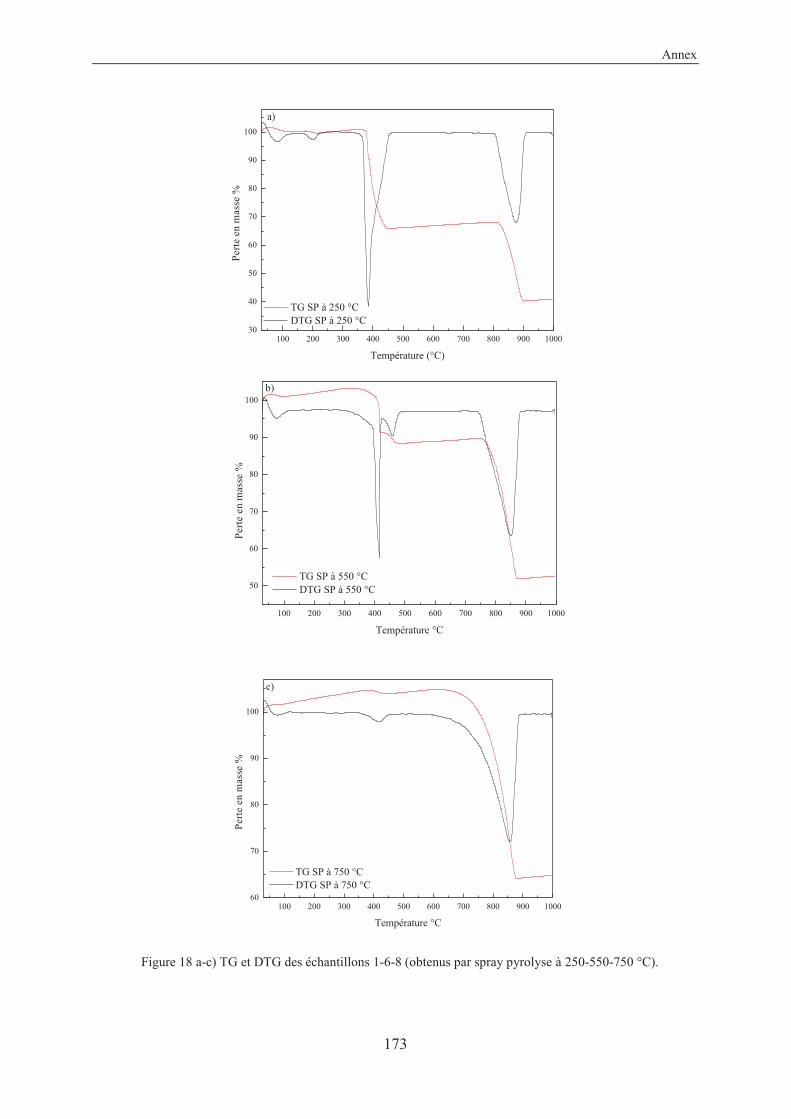
Annex
173
Figure 18 a-c) TG et DTG des échantillons 1-6-8 (obtenus par spray pyrolyse à 250-550-750 °C).
100 200 300 400 500 600 700 800 900 100030
40
50
60
70
80
90
100
TG SP à 250 °C DTG SP à 250 °C
Per
te e
n m
asse
%
Température (°C)
a)
100 200 300 400 500 600 700 800 900 1000
50
60
70
80
90
100
Per
te e
n m
asse
%
Température °C
TG SP à 550 °C DTG SP à 550 °C
b)
100 200 300 400 500 600 700 800 900 100060
70
80
90
100
TG SP à 750 °C DTG SP à 750 °C
Per
te e
n m
asse
%
Température °C
c)
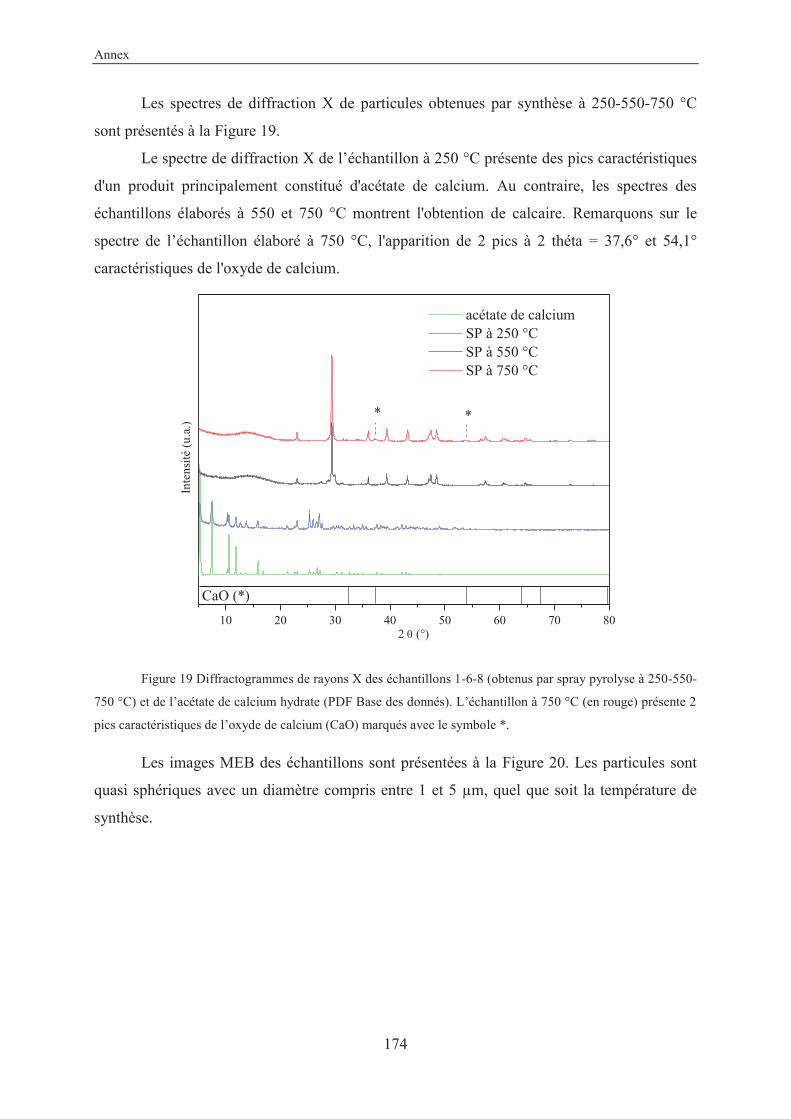
Annex
174
Les spectres de diffraction X de particules obtenues par synthèse à 250-550-750 °C
sont présentés à la Figure 19.
Le spectre de diffraction X de l’échantillon à 250 °C présente des pics caractéristiques
d'un produit principalement constitué d'acétate de calcium. Au contraire, les spectres des
échantillons élaborés à 550 et 750 °C montrent l'obtention de calcaire. Remarquons sur le
spectre de l’échantillon élaboré à 750 °C, l'apparition de 2 pics à 2 théta = 37,6° et 54,1°
caractéristiques de l'oxyde de calcium.
Figure 19 Diffractogrammes de rayons X des échantillons 1-6-8 (obtenus par spray pyrolyse à 250-550-
750 °C) et de l’acétate de calcium hydrate (PDF Base des donnés). L’échantillon à 750 °C (en rouge) présente 2
pics caractéristiques de l’oxyde de calcium (CaO) marqués avec le symbole *.
Les images MEB des échantillons sont présentées à la Figure 20. Les particules sont
quasi sphériques avec un diamètre compris entre 1 et 5 m, quel que soit la température de
synthèse.
10 20 30 40 50 60 70 80
acétate de calcium SP à 250 °C SP à 550 °C SP à 750 °C
*
Inte
nsit
é (u
.a.)
2 (°)
CaO (*)
*
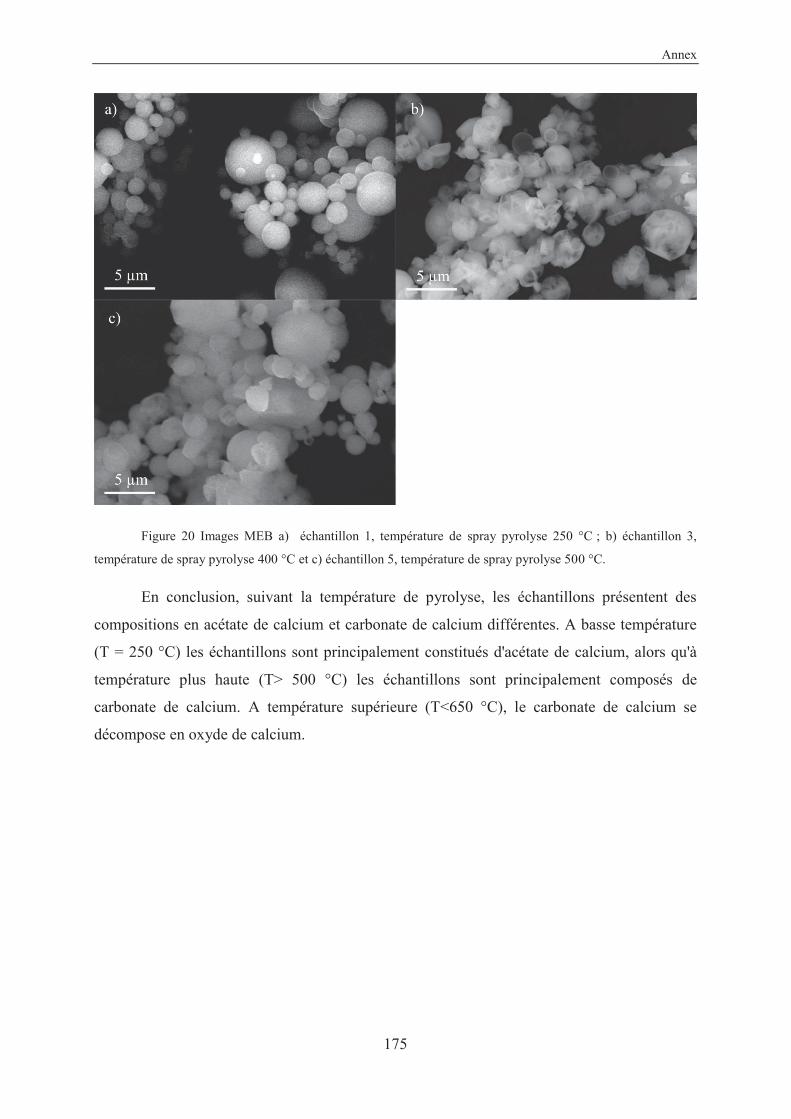
Annex
175
Figure 20 Images MEB a) échantillon 1, température de spray pyrolyse 250 °C ; b) échantillon 3,
température de spray pyrolyse 400 °C et c) échantillon 5, température de spray pyrolyse 500 °C.
En conclusion, suivant la température de pyrolyse, les échantillons présentent des
compositions en acétate de calcium et carbonate de calcium différentes. A basse température
(T = 250 °C) les échantillons sont principalement constitués d'acétate de calcium, alors qu'à
température plus haute (T> 500 °C) les échantillons sont principalement composés de
carbonate de calcium. A température supérieure (T<650 °C), le carbonate de calcium se
décompose en oxyde de calcium.
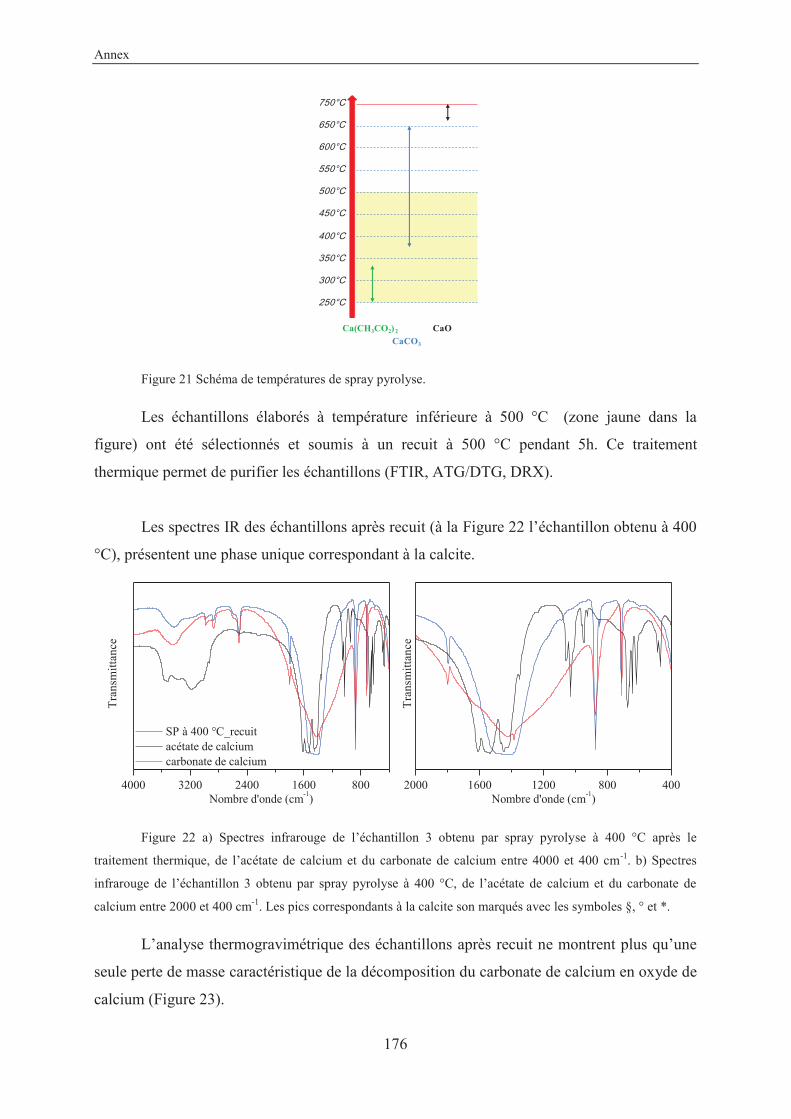
Annex
176
Figure 21 Schéma de températures de spray pyrolyse.
Les échantillons élaborés à température inférieure à 500 °C (zone jaune dans la
figure) ont été sélectionnés et soumis à un recuit à 500 °C pendant 5h. Ce traitement
thermique permet de purifier les échantillons (FTIR, ATG/DTG, DRX).
Les spectres IR des échantillons après recuit (à la Figure 22 l’échantillon obtenu à 400
°C), présentent une phase unique correspondant à la calcite.
Figure 22 a) Spectres infrarouge de l’échantillon 3 obtenu par spray pyrolyse à 400 °C après le
traitement thermique, de l’acétate de calcium et du carbonate de calcium entre 4000 et 400 cm-1. b) Spectres
infrarouge de l’échantillon 3 obtenu par spray pyrolyse à 400 °C, de l’acétate de calcium et du carbonate de
calcium entre 2000 et 400 cm-1. Les pics correspondants à la calcite son marqués avec les symboles §, ° et *.
L’analyse thermogravimétrique des échantillons après recuit ne montrent plus qu’une
seule perte de masse caractéristique de la décomposition du carbonate de calcium en oxyde de
calcium (Figure 23).
Ca(CH3CO2)2
CaCO3
CaO
4000 3200 2400 1600 800 2000 1600 1200 800 400
SP à 400 °C_recuit acétate de calcium carbonate de calcium
Tra
nsm
itta
nce
Nombre d'onde (cm-1)
Tra
nsm
itta
nce
Nombre d'onde (cm-1)
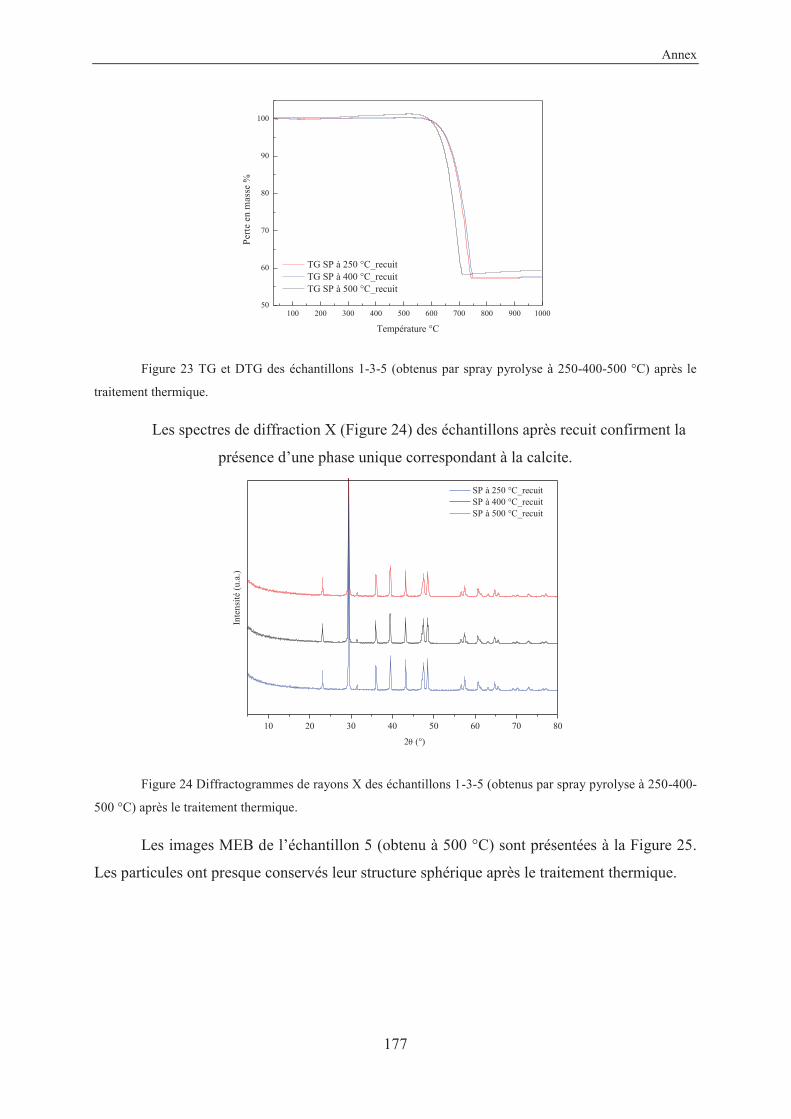
Annex
177
Figure 23 TG et DTG des échantillons 1-3-5 (obtenus par spray pyrolyse à 250-400-500 °C) après le
traitement thermique.
Les spectres de diffraction X (Figure 24) des échantillons après recuit confirment la
présence d’une phase unique correspondant à la calcite.
Figure 24 Diffractogrammes de rayons X des échantillons 1-3-5 (obtenus par spray pyrolyse à 250-400-
500 °C) après le traitement thermique.
Les images MEB de l’échantillon 5 (obtenu à 500 °C) sont présentées à la Figure 25.
Les particules ont presque conservés leur structure sphérique après le traitement thermique.
100 200 300 400 500 600 700 800 900 100050
60
70
80
90
100
TG SP à 250 °C_recuit TG SP à 400 °C_recuit TG SP à 500 °C_recuit
Per
te e
n m
asse
%
Température °C
10 20 30 40 50 60 70 80
SP à 250 °C_recuit SP à 400 °C_recuit SP à 500 °C_recuit
Inte
nsit
é (u
.a.)
2 (°)
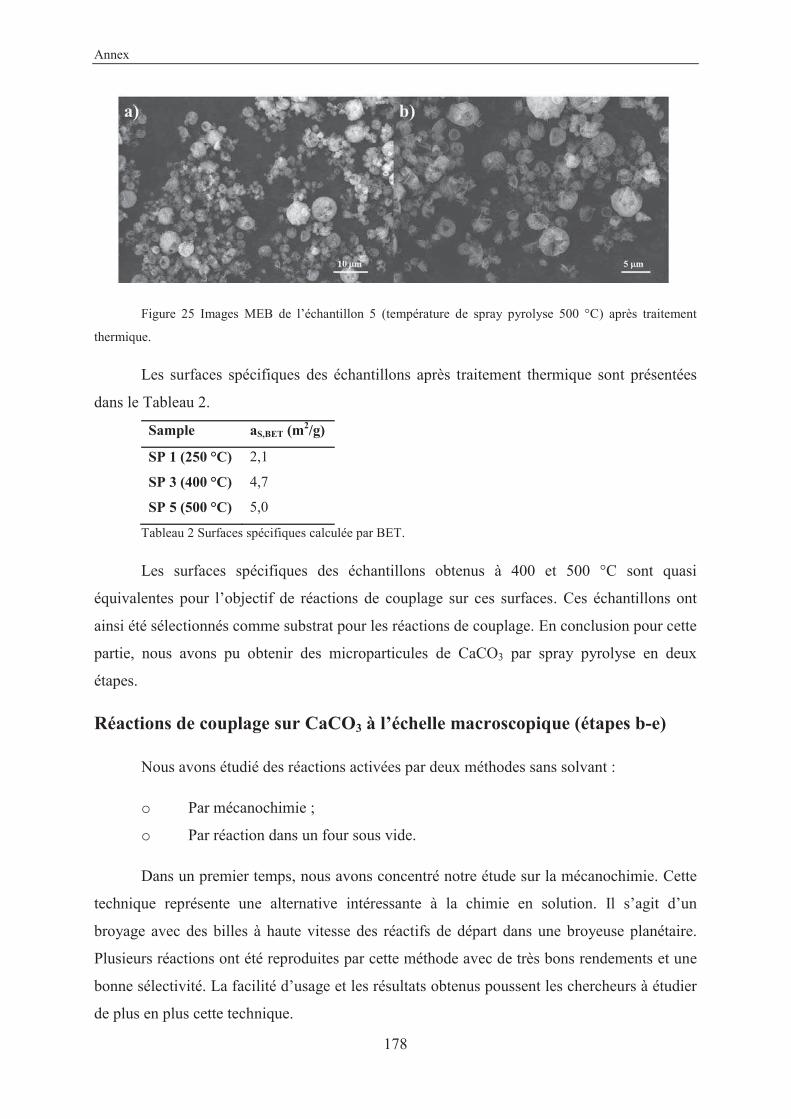
Annex
178
Figure 25 Images MEB de l’échantillon 5 (température de spray pyrolyse 500 °C) après traitement
thermique.
Les surfaces spécifiques des échantillons après traitement thermique sont présentées
dans le Tableau 2.
Sample aS,BET (m2/g)
SP 1 (250 °C) 2,1
SP 3 (400 °C) 4,7
SP 5 (500 °C) 5,0
Tableau 2 Surfaces spécifiques calculée par BET.
Les surfaces spécifiques des échantillons obtenus à 400 et 500 °C sont quasi
équivalentes pour l’objectif de réactions de couplage sur ces surfaces. Ces échantillons ont
ainsi été sélectionnés comme substrat pour les réactions de couplage. En conclusion pour cette
partie, nous avons pu obtenir des microparticules de CaCO3 par spray pyrolyse en deux
étapes.
Réactions de couplage sur CaCO3 à l’échelle macroscopique (étapes b-e)
Nous avons étudié des réactions activées par deux méthodes sans solvant :
o Par mécanochimie ;
o Par réaction dans un four sous vide.
Dans un premier temps, nous avons concentré notre étude sur la mécanochimie. Cette
technique représente une alternative intéressante à la chimie en solution. Il s’agit d’un
broyage avec des billes à haute vitesse des réactifs de départ dans une broyeuse planétaire.
Plusieurs réactions ont été reproduites par cette méthode avec de très bons rendements et une
bonne sélectivité. La facilité d’usage et les résultats obtenus poussent les chercheurs à étudier
de plus en plus cette technique.
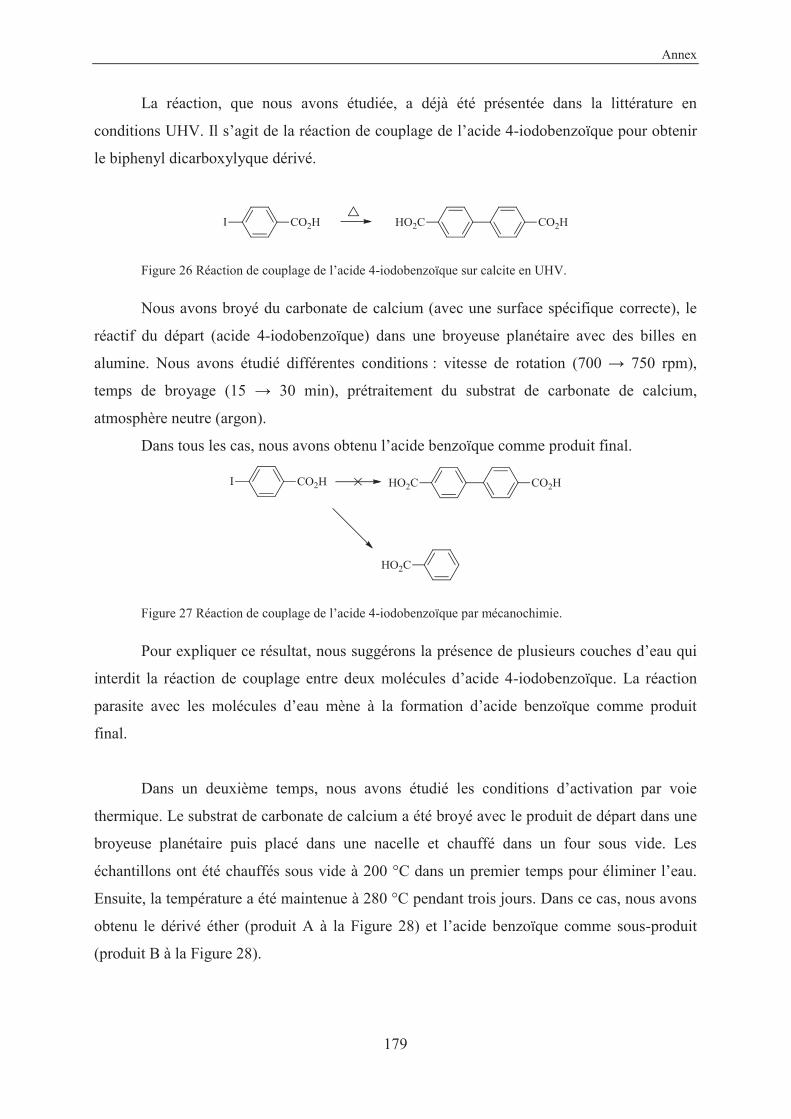
Annex
179
La réaction, que nous avons étudiée, a déjà été présentée dans la littérature en
conditions UHV. Il s’agit de la réaction de couplage de l’acide 4-iodobenzoïque pour obtenir
le biphenyl dicarboxylyque dérivé.
Figure 26 Réaction de couplage de l’acide 4-iodobenzoïque sur calcite en UHV.
Nous avons broyé du carbonate de calcium (avec une surface spécifique correcte), le
réactif du départ (acide 4-iodobenzoïque) dans une broyeuse planétaire avec des billes en
alumine. Nous avons étudié différentes conditions : vitesse de rotation (700 750 rpm),
temps de broyage (15 30 min), prétraitement du substrat de carbonate de calcium,
atmosphère neutre (argon).
Dans tous les cas, nous avons obtenu l’acide benzoïque comme produit final.
Figure 27 Réaction de couplage de l’acide 4-iodobenzoïque par mécanochimie.
Pour expliquer ce résultat, nous suggérons la présence de plusieurs couches d’eau qui
interdit la réaction de couplage entre deux molécules d’acide 4-iodobenzoïque. La réaction
parasite avec les molécules d’eau mène à la formation d’acide benzoïque comme produit
final.
Dans un deuxième temps, nous avons étudié les conditions d’activation par voie
thermique. Le substrat de carbonate de calcium a été broyé avec le produit de départ dans une
broyeuse planétaire puis placé dans une nacelle et chauffé dans un four sous vide. Les
échantillons ont été chauffés sous vide à 200 °C dans un premier temps pour éliminer l’eau.
Ensuite, la température a été maintenue à 280 °C pendant trois jours. Dans ce cas, nous avons
obtenu le dérivé éther (produit A à la Figure 28) et l’acide benzoïque comme sous-produit
(produit B à la Figure 28).
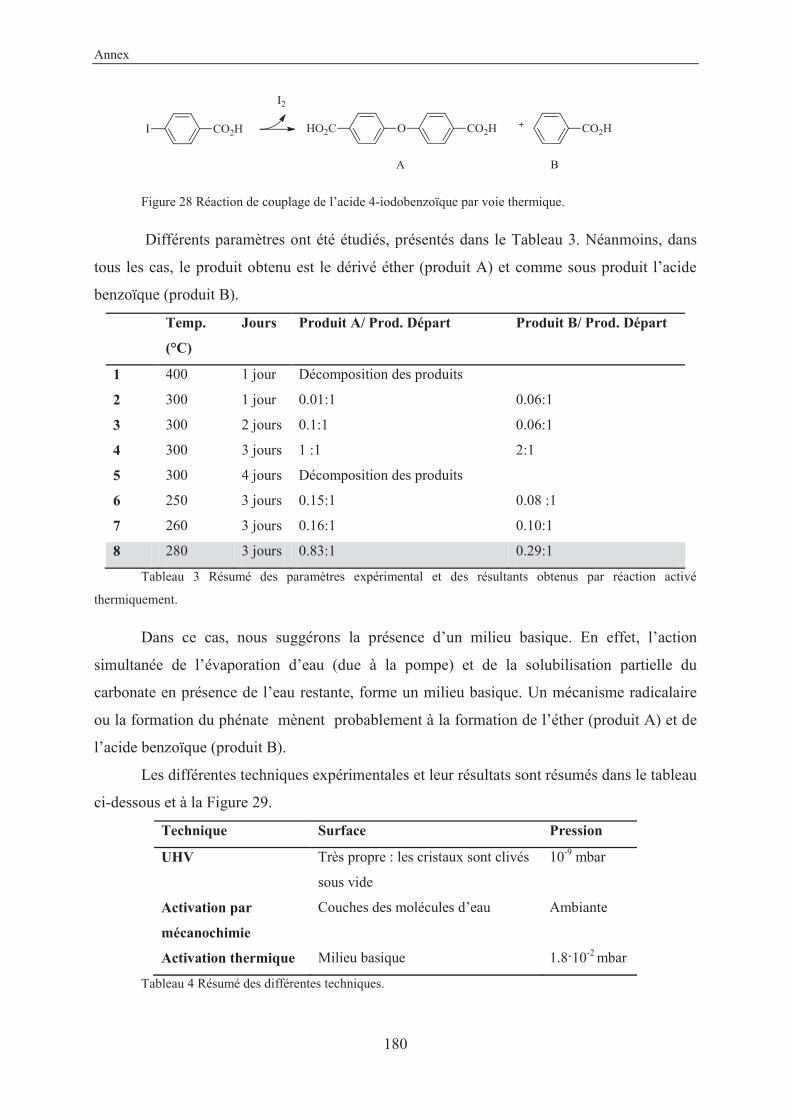
Annex
180
Figure 28 Réaction de couplage de l’acide 4-iodobenzoïque par voie thermique.
Différents paramètres ont été étudiés, présentés dans le Tableau 3. Néanmoins, dans
tous les cas, le produit obtenu est le dérivé éther (produit A) et comme sous produit l’acide
benzoïque (produit B).
Temp.
(°C)
Jours Produit A/ Prod. Départ Produit B/ Prod. Départ
1 400 1 jour Décomposition des produits
2 300 1 jour 0.01:1 0.06:1
3 300 2 jours 0.1:1 0.06:1
4 300 3 jours 1 :1 2:1
5 300 4 jours Décomposition des produits
6 250 3 jours 0.15:1 0.08 :1
7 260 3 jours 0.16:1 0.10:1
8 280 3 jours 0.83:1 0.29:1
Tableau 3 Résumé des paramètres expérimental et des résultants obtenus par réaction activé
thermiquement.
Dans ce cas, nous suggérons la présence d’un milieu basique. En effet, l’action
simultanée de l’évaporation d’eau (due à la pompe) et de la solubilisation partielle du
carbonate en présence de l’eau restante, forme un milieu basique. Un mécanisme radicalaire
ou la formation du phénate mènent probablement à la formation de l’éther (produit A) et de
l’acide benzoïque (produit B).
Les différentes techniques expérimentales et leur résultats sont résumés dans le tableau
ci-dessous et à la Figure 29.
Technique Surface Pression
UHV Très propre : les cristaux sont clivés
sous vide
10-9 mbar
Activation par
mécanochimie
Couches des molécules d’eau Ambiante
Activation thermique Milieu basique 1.8 10-2 mbar
Tableau 4 Résumé des différentes techniques.
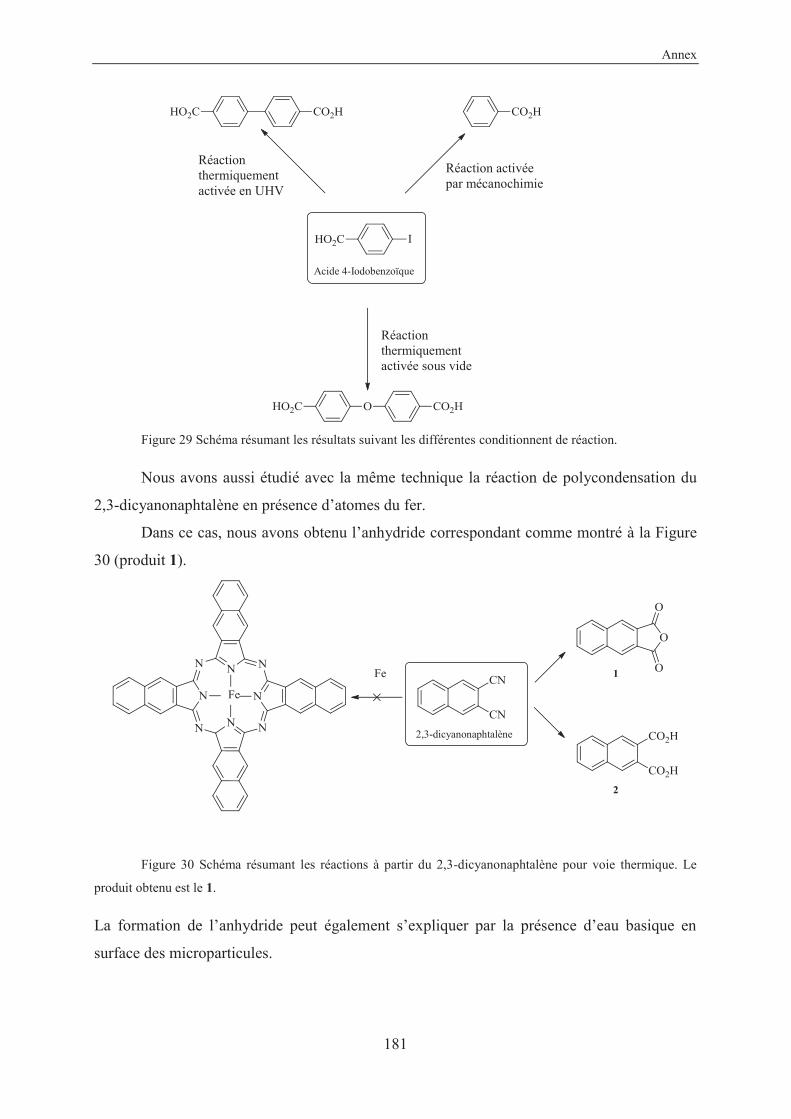
Annex
181
Figure 29 Schéma résumant les résultats suivant les différentes conditionnent de réaction.
Nous avons aussi étudié avec la même technique la réaction de polycondensation du
2,3-dicyanonaphtalène en présence d’atomes du fer.
Dans ce cas, nous avons obtenu l’anhydride correspondant comme montré à la Figure
30 (produit 1).
Figure 30 Schéma résumant les réactions à partir du 2,3-dicyanonaphtalène pour voie thermique. Le
produit obtenu est le 1.
La formation de l’anhydride peut également s’expliquer par la présence d’eau basique en
surface des microparticules.
Réaction thermiquement activée en UHV
Réaction activée par mécanochimie
Acide 4-Iodobenzoïque
Réaction thermiquement activée sous vide
2,3-dicyanonaphtalène
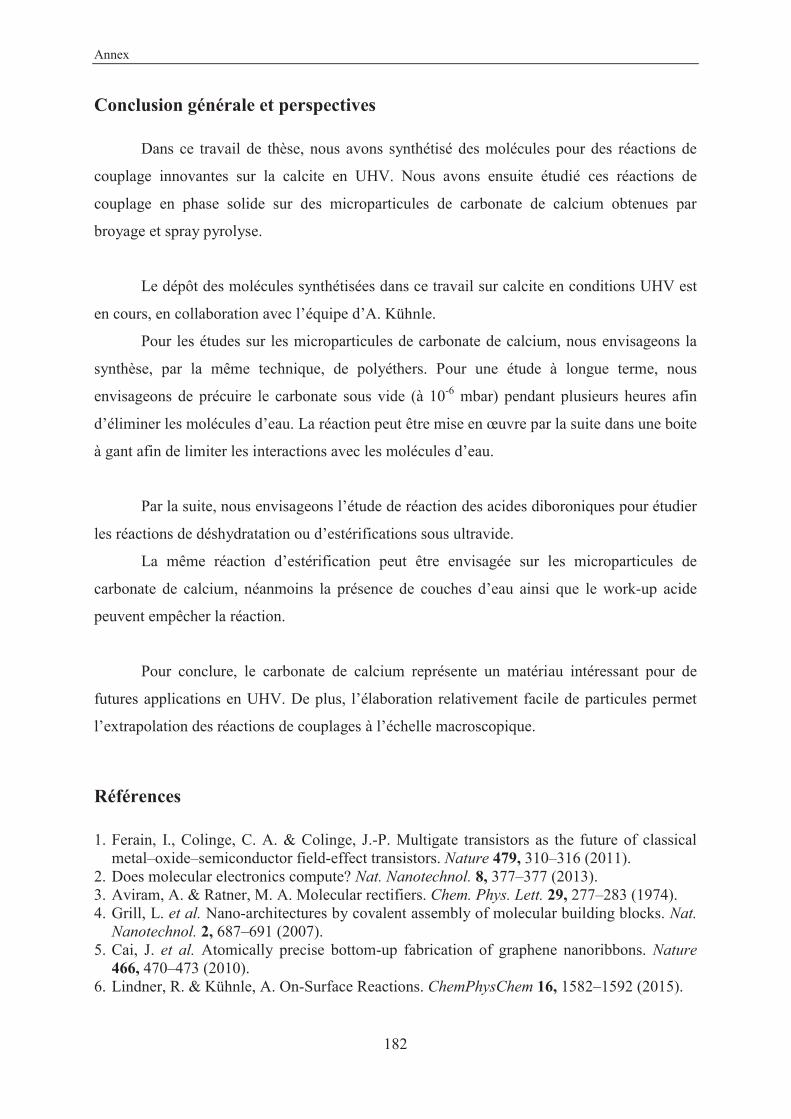
Annex
182
Conclusion générale et perspectives
Dans ce travail de thèse, nous avons synthétisé des molécules pour des réactions de
couplage innovantes sur la calcite en UHV. Nous avons ensuite étudié ces réactions de
couplage en phase solide sur des microparticules de carbonate de calcium obtenues par
broyage et spray pyrolyse.
Le dépôt des molécules synthétisées dans ce travail sur calcite en conditions UHV est
en cours, en collaboration avec l’équipe d’A. Kühnle.
Pour les études sur les microparticules de carbonate de calcium, nous envisageons la
synthèse, par la même technique, de polyéthers. Pour une étude à longue terme, nous
envisageons de précuire le carbonate sous vide (à 10-6 mbar) pendant plusieurs heures afin
d’éliminer les molécules d’eau. La réaction peut être mise en œuvre par la suite dans une boite
à gant afin de limiter les interactions avec les molécules d’eau.
Par la suite, nous envisageons l’étude de réaction des acides diboroniques pour étudier
les réactions de déshydratation ou d’estérifications sous ultravide.
La même réaction d’estérification peut être envisagée sur les microparticules de
carbonate de calcium, néanmoins la présence de couches d’eau ainsi que le work-up acide
peuvent empêcher la réaction.
Pour conclure, le carbonate de calcium représente un matériau intéressant pour de
futures applications en UHV. De plus, l’élaboration relativement facile de particules permet
l’extrapolation des réactions de couplages à l’échelle macroscopique.
Références
1. Ferain, I., Colinge, C. A. & Colinge, J.-P. Multigate transistors as the future of classical metal–oxide–semiconductor field-effect transistors. Nature 479, 310–316 (2011).
2. Does molecular electronics compute? Nat. Nanotechnol. 8, 377–377 (2013). 3. Aviram, A. & Ratner, M. A. Molecular rectifiers. Chem. Phys. Lett. 29, 277–283 (1974). 4. Grill, L. et al. Nano-architectures by covalent assembly of molecular building blocks. Nat.
Nanotechnol. 2, 687–691 (2007). 5. Cai, J. et al. Atomically precise bottom-up fabrication of graphene nanoribbons. Nature
466, 470–473 (2010). 6. Lindner, R. & Kühnle, A. On-Surface Reactions. ChemPhysChem 16, 1582–1592 (2015).
Annex
183
7. Kittelmann, M. et al. On-Surface Covalent Linking of Organic Building Blocks on a Bulk Insulator. ACS Nano 5, 8420–8425 (2011).
8. Kittelmann, M., Rahe, P., Gourdon, A. & Kühnle, A. Direct Visualization of Molecule Deprotonation on an Insulating Surface. ACS Nano 6, 7406–7411 (2012).
9. Kittelmann, M., Nimmrich, M., Lindner, R., Gourdon, A. & Kühnle, A. Sequential and Site-Specific On-Surface Synthesis on a Bulk Insulator. ACS Nano 7, 5614–5620 (2013).

Université de Toulouse Thèse d’Université, spécialité Chimie Moléculaire
Soutenue le 25 novembre 2015
Chiara VENTURINI
On-surface coupling reactions on calcium carbonate
Covalent coupling on metallic surfaces in UHV (Ultra High Vacuum) conditions is a new method for preparing molecular structures otherwise impossible to achieve in solution (graphene nanoribbons, 2D polymers for instance). The major challenge is now to extend these reactions from metallic to insulating surfaces, for future applications as, for instance, in molecular electronics. In particular, the coupling reaction of benzoic acid derivatives, grafted on calcite via carboxylic groups, has been demonstrated for the first time in UHV conditions. In the first part of this work, we synthesized precursor molecules for specific reactions (homocoupling of ethynes, photopolymerization, polycondensation and Ullmann reaction) on calcium carbonate in UHV conditions. In the second part of this work we extended this investigation up to the macroscale level (semi-preparative) by grafting molecules on calcium carbonate microparticles, followed by reaction activation and finally by dissolution of the substrate in order to recover the coupling products. The calcium carbonate microparticles were prepared by grinding commercial product or by spray pyrolysis and were fully characterized by FTIR, TG/DTG, XRD, SEM and BET techniques. Then, after grafting of organic reactant, the reactions were activated with two different solvent-free methods: by grinding in a planetary milling machine or by heating the samples in a furnace under vacuum. Whereas in UHV conditions, 4-iodobenzoic acid affords biphenyldicarboxylic acid, mechanochemical condition gives benzoic acid and thermal activation the dibenzoic acid ether. Keywords: calcium carbonate, coupling reactions, spray pyrolysis, solvent-free reactions, ball milling, surface chemistry
Réactions de couplage sur calcium carbonate
Le couplage covalent sur surface métallique en UHV (Ultra High Vacuum) est une technique émergente permettant de synthétiser des structures moléculaires impossibles à obtenir par la chimie en solution (nanorubans de graphène, polymères 2D par exemple). Aujourd’hui, le plus grand défi
reste le développement de ces réactions sur des surfaces isolantes pour différentes applications comme, par exemple, l’électronique moléculaire. En particulier, le couplage de dérivés d’acides benzoïques, greffés sur les surfaces de carbonate de calcium en UHV par des groupes carboxyliques, a été démontré récemment pour la première fois. Lors de ces travaux, nous avons dans un premier temps synthétisé des molécules précurseurs de réactions de couplage (homo-couplage d’éthyne, photopolymérisation, polycondensation et réaction d’Ullmann) sur des surfaces
de carbonate de calcium en UHV. Par la suite, nous avons mené cette étude à l’échelle
macroscopique (semi-préparatoire), par greffage de molécules sur des microparticules de carbonate de calcium, puis activation de la réaction, et enfin dissolution du substrat afin d’extraire le produit
final. Les microparticules ont été obtenues par broyage de produit commercial ainsi que par spray pyrolyse et complètement caractérisées par FTIR, ATG/DTG, DRX, MEB et BET. Les réactions de couplage ont été activées par deux méthodes sans solvant: par broyage dans une broyeuse planétaire ou par traitement thermique sous vide. Alors qu’en UHV le couplage de l’acide 4-iodobenzoïque donne l’acide biphenyldicarboxylique, en mécanochimie nous avons obtenu l’acide benzoïque et
par activation thermique l’éther dibenzoïque. Mots clés: carbonate de calcium, réactions de couplage, spray pyrolyse, réactions sans solvant, mécanochimie, chimie de surface
Centre d’élaboration de matériaux et d’études structurales – CNRS UPS 8011
29 Rue Jeanne Marvig, BP 94347, 31055 Toulouse Cedex 4


