Embed Size (px)
Citation preview

Aalborg Universitet
On Optimum Safety Levels of Breakwaters
Burcharth, Hans Falk; Sørensen, John Dalsgaard
Published in:Proceedings of the 31st PIANC Congress
Publication date:2006
Document VersionPublisher's PDF, also known as Version of record
Link to publication from Aalborg University
Citation for published version (APA):Burcharth, H. F., & Sørensen, J. D. (2006). On Optimum Safety Levels of Breakwaters. In Proceedings of the31st PIANC Congress: Estoril, Portugal, May 2006. (Vol. 2, pp. 634-648). New York: Curran Associates, Inc.
General rightsCopyright and moral rights for the publications made accessible in the public portal are retained by the authors and/or other copyright ownersand it is a condition of accessing publications that users recognise and abide by the legal requirements associated with these rights.
? Users may download and print one copy of any publication from the public portal for the purpose of private study or research. ? You may not further distribute the material or use it for any profit-making activity or commercial gain ? You may freely distribute the URL identifying the publication in the public portal ?
Take down policyIf you believe that this document breaches copyright please contact us at [email protected] providing details, and we will remove access tothe work immediately and investigate your claim.
Downloaded from vbn.aau.dk on: June 28, 2016
1
ON OPTIMUM SAFETY LEVELS OF BREAKWATERS
Hans F. Burcharth, Aalborg University, Denmark, [email protected] John Dalsgaard Sorensen, Aalborg University, Denmark, [email protected]
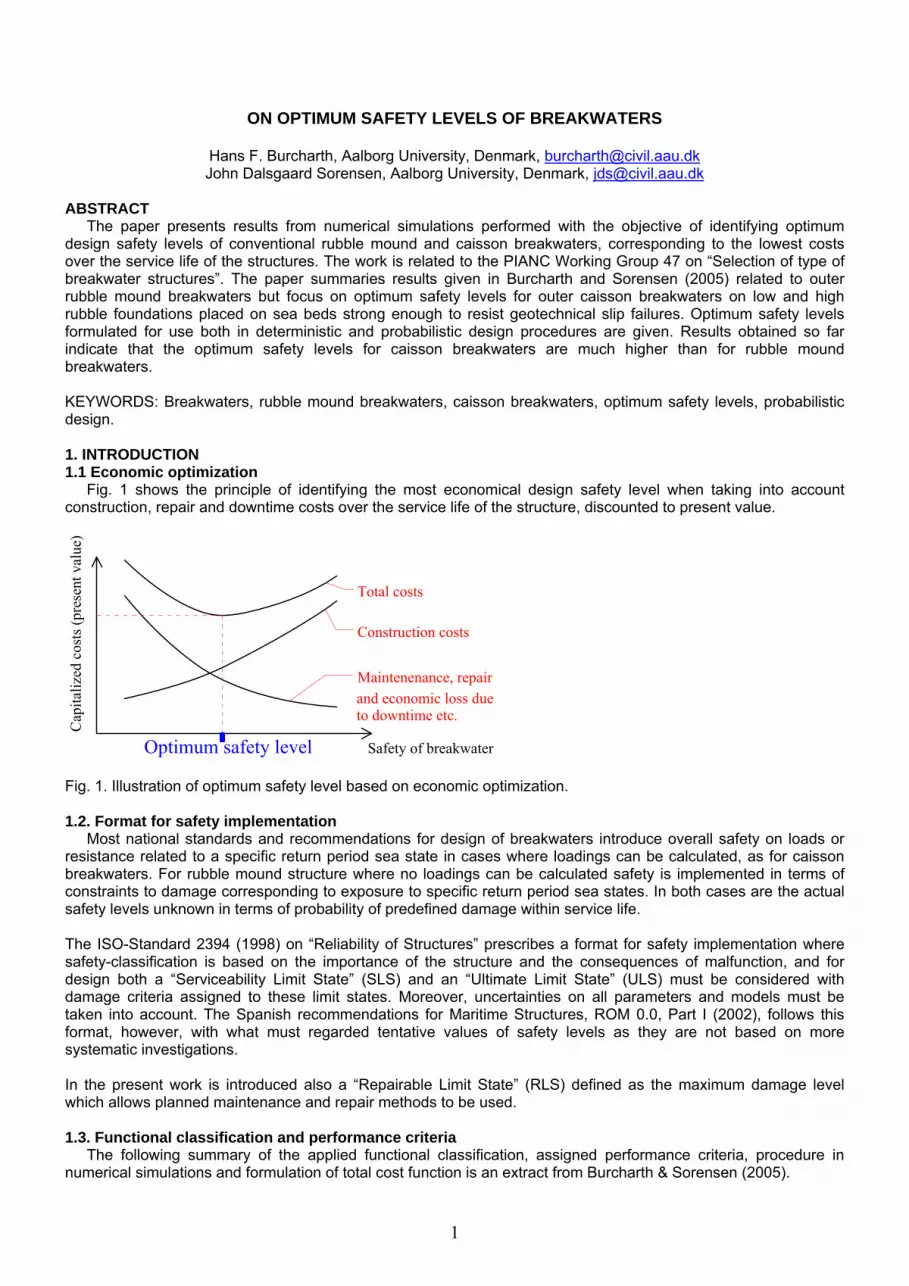
ABSTRACT The paper presents results from numerical simulations performed with the objective of identifying optimum design safety levels of conventional rubble mound and caisson breakwaters, corresponding to the lowest costs over the service life of the structures. The work is related to the PIANC Working Group 47 on “Selection of type of breakwater structures”. The paper summaries results given in Burcharth and Sorensen (2005) related to outer rubble mound breakwaters but focus on optimum safety levels for outer caisson breakwaters on low and high rubble foundations placed on sea beds strong enough to resist geotechnical slip failures. Optimum safety levels formulated for use both in deterministic and probabilistic design procedures are given. Results obtained so far indicate that the optimum safety levels for caisson breakwaters are much higher than for rubble mound breakwaters. KEYWORDS: Breakwaters, rubble mound breakwaters, caisson breakwaters, optimum safety levels, probabilistic design. 1. INTRODUCTION 1.1 Economic optimization Fig. 1 shows the principle of identifying the most economical design safety level when taking into account construction, repair and downtime costs over the service life of the structure, discounted to present value.
Fig. 1. Illustration of optimum safety level based on economic optimization. 1.2. Format for safety implementation Most national standards and recommendations for design of breakwaters introduce overall safety on loads or resistance related to a specific return period sea state in cases where loadings can be calculated, as for caisson breakwaters. For rubble mound structure where no loadings can be calculated safety is implemented in terms of constraints to damage corresponding to exposure to specific return period sea states. In both cases are the actual safety levels unknown in terms of probability of predefined damage within service life. The ISO-Standard 2394 (1998) on “Reliability of Structures” prescribes a format for safety implementation where safety-classification is based on the importance of the structure and the consequences of malfunction, and for design both a “Serviceability Limit State” (SLS) and an “Ultimate Limit State” (ULS) must be considered with damage criteria assigned to these limit states. Moreover, uncertainties on all parameters and models must be taken into account. The Spanish recommendations for Maritime Structures, ROM 0.0, Part I (2002), follows this format, however, with what must regarded tentative values of safety levels as they are not based on more systematic investigations. In the present work is introduced also a “Repairable Limit State” (RLS) defined as the maximum damage level which allows planned maintenance and repair methods to be used. 1.3. Functional classification and performance criteria The following summary of the applied functional classification, assigned performance criteria, procedure in numerical simulations and formulation of total cost function is an extract from Burcharth & Sorensen (2005).
Safety of breakwater
Maintenenance, repair
Construction costs
Total costs
Cap
italiz
ed c
osts
(pre
sent
val
ue)
and economic loss dueto downtime etc.
Optimum safety level

2
So far only outer breakwaters with no berths just behind or near the breakwater have been analysed. Fig. 2 shows this functional class and the applied tentatively defined limit state performance criteria. TSH , is the transmitted significant wave height corresponding to return period equal to design life time T. D is the relative number of displaced armour units. Functional classification
Outer breakwaters
Tentative performance criteria
Wave transmission SLS: HS,T = 0.5 – 1.8 m Damage to main armour SLS: D = 5 %, RLS: D = 15 % ULS: D = 30 % Sliding distance of caissons SLS: 0.2 m, ULS: 2 m
Fig. 2. Functional classification: Outer breakwaters and related limit state performance criteria. Fig. 3. shows another functional class where moorings are arranged just behind the breakwater and performance criteria therefore are more restrictive. q is the average overtopping discharge in m3/s per metre of breakwater. Functional classification
Rear side moorings
Tentative performance criteria
Wave overtopping SLS: q = 10-5 - 10-4 m3/ms ULS: q = 10-3 - 10-2 m3/ms Damage to main armour SLS: D = 5 %, RLS: D = 15 % ULS: D = 30 % Sliding distance of caissons SLS: 0.0 m, ULS: 0.5 m
Fig. 3. Example of functional class with restrictive limit state performance criteria. 1.4. Cost function The optimal design is determined from the following optimization problem where the total expected costs during the design lifetime TL are minimized:
where T return period used for deterministic design TL design life time CI(T) initial costs (building costs) with design based on return period T CR1(T) cost of repair for minor damage with design based on return period T PR1(t) probability of minor damage in year t with design based on return period T CR2(T) cost of repair for major damage
Inner basins
Outer basinJetties
{ }( )
(1) ),()(),()(),()()()( min ∑+
+++==
LT
t tFFRRRRIT r
tTPTCtTPTCtTPTCTCTC1 1
12211

3
PR2(t) probability of major damage in year t with design based on return period T CF(T) cost of failure including downtime costs PF(t) probability of failure in year t with design based on return period T r real rate of interest No benefits and costs related to loss of life are included. The breakwater is designed corresponding to a design wave height with return period T. The reliability level corresponding to the optimal return period T from (1) is then the optimal reliability level. 1.5. Wave statistics The applied long-term wave statistics are based on fitting of 3-parameter Weibull distributions to field data from Follonica (Adriatic Sea), Bilbao (Bay of Biscaya) and Sines (Atlantic Ocean). Storms are assumed to be modelled by a Poisson process with occurrence rate corresponding to the average number of storms per year. Characteristics of these wave climates are indicated in Table 1 which provides the deepwater significant wave heights corresponding to 100 years and 400 years return periods. More details are given in PIANC (1992). Table 1. Example of return period significant wave heights in deep water of applied long-term wave climates.
Location y
osH 100, y
osH 400,
Follonica 5.64 m 6.20 m
Bilbao 8.76 m 9.38 m
Sines 13.2 m 14.2 m
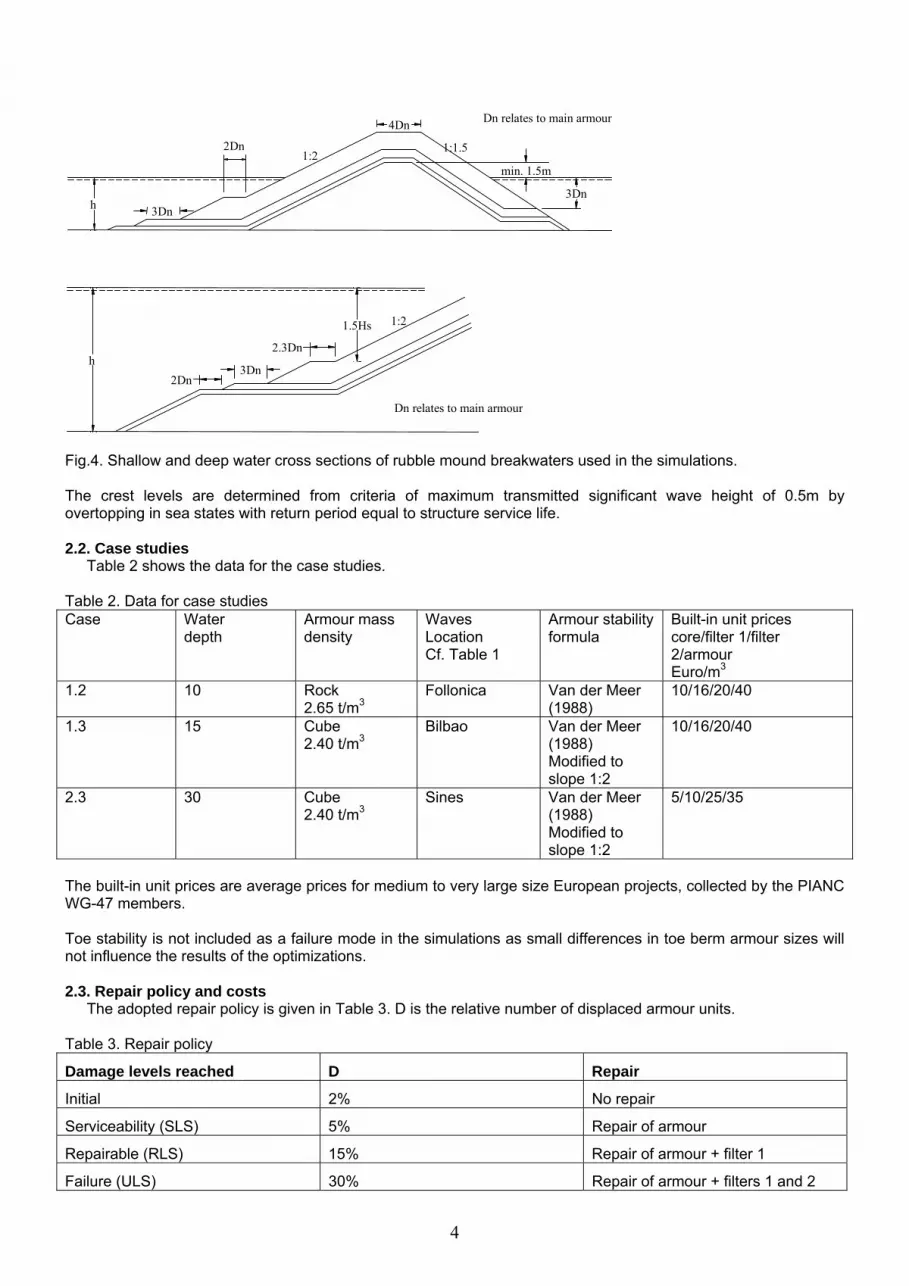
1.6. Downtime costs In case of failure of the breakwater, waves might penetrate into the harbour and cause stop of some port operations, for example loading/unloading of container vessels. The affected parties are the vessel owner/charter, the stevedoring company, the port authority, and the related service industries. For a large container vessel berth out of action the total direct loss could be in the order of 200,000 Euro per day. Assuming 90 days stop in the period of breakwater repair, the total costs would be 18,000,000 Euro. This amount is used in the simulation as a possible upper limit for downtime costs related to a breakwater length of 1km. Downtime costs related to bulk terminals would be significantly lower. 1.7. Procedure in simulations The optimization problem (1) is solved by a numerical procedure using Monte Carlo simulation in which a very large number of structures are exposed to realistic life time wave histories. The structure geometries are determined by conventional deterministic design for a selected range of water depths and long-term wave statistics applying design waves corresponding to different return periods as described above. Damages as they occur are identified and accumulated, and repairs are performed in accordance with defined repair policy. The related costs of repairs are calculated. Failures (large damages), which introduce downtime costs due to stop of port operations are identified and related downtime costs are calculated. Further, the construction cost of each breakwater is calculated. All costs are added to obtain the total lifetime cost. Among each type of structure and environmental conditions is identified the structure with the lowest life time costs, and for this structure is extracted the related probabilities of reaching SLS, RLS and ULS in the structure life time. These values then represent the optimum design safety levels. The simulations comprise the influence on the optimum safety level of interest rate (inflation included), structure service life and downtime costs. 2. RUBBLE MOUND BREAKWATERS 2.1. Cross Sections The following is an extract of some of the results given in Burcharth and Sorensen (2005) related to outer rubble mound breakwaters with concrete cube and rock armour with cross sections as shown in Fig. 4. Dn = (armour unit volume)1/3. Hs is the significant wave height used in the design
4
4Dn
3Dn
min. 1.5m
h 3Dn
1:2 1:1.52Dn Dn relates to main armour
2Dn
1.5Hs 1:2
Dn relates to main armour
h 2.3Dn
3Dn
Fig.4. Shallow and deep water cross sections of rubble mound breakwaters used in the simulations. The crest levels are determined from criteria of maximum transmitted significant wave height of 0.5m by overtopping in sea states with return period equal to structure service life. 2.2. Case studies Table 2 shows the data for the case studies. Table 2. Data for case studies Case Water
depth Armour mass density
Waves Location Cf. Table 1
Armour stability formula
Built-in unit prices core/filter 1/filter 2/armour Euro/m3
1.2 10 Rock 2.65 t/m3
Follonica Van der Meer (1988)
10/16/20/40
1.3 15 Cube 2.40 t/m3
Bilbao Van der Meer (1988) Modified to slope 1:2
10/16/20/40
2.3 30 Cube 2.40 t/m3
Sines Van der Meer (1988) Modified to slope 1:2
5/10/25/35
The built-in unit prices are average prices for medium to very large size European projects, collected by the PIANC WG-47 members. Toe stability is not included as a failure mode in the simulations as small differences in toe berm armour sizes will not influence the results of the optimizations. 2.3. Repair policy and costs The adopted repair policy is given in Table 3. D is the relative number of displaced armour units. Table 3. Repair policy
Damage levels reached D Repair
Initial 2% No repair
Serviceability (SLS) 5% Repair of armour
Repairable (RLS) 15% Repair of armour + filter 1
Failure (ULS) 30% Repair of armour + filters 1 and 2

5
For repair the built-in unit prices are increased by 50% compared to prices for initial construction given in Table 2. Moreover, mobilization and demobilization costs are included as 30% of the initial armour layer construction costs. The downtime costs of 18,000,000 EURO apply when RLS occur. 2.4. Damage accumulation model Each storm is set to 1,000 waves. Damages occur and are accumulated only when the damage levels S=1 and Nod=0.002 for 1000 waves are exceeded. S and Nod are damage parameters used in the Van der Meer armour stability formulae. Damage accumulation takes place only when the next storm has a higher Hs-value than the preceding value. The relative decrease in damage with the number of waves inherent in the stability formulae (Van der Meer, 1988a, 1988b) is taken care of by keeping track of the number of waves which contributes to damage. 2.5. Example of results Table 4 and Fig. 5 show the outcome of some of the optimization simulations for cases 1.3 and 2.3. Table 4. Case 1.3. Optimum safety levels for concrete cube armoured outer breakwater. 50 years service lifetime. 15 m water depth. Damage accumulation included. (Burcharth and Sorensen, 2005).
Optimum data for deterministic design
Optimum limit state average number of events within service lifetime
Real Interest Rate (%)
Optimized design return period, T (years)
HsT
(m)
Optimum armour unit mass W (t)
Free- board Rc (m)
SLS
RLS
ULS
Construction costs for 1 km length (1,000 EURO)
Total lifetime costs for 1 km length (1,000 EURO)
2 400 6.20 12.5 6.3 1.11 0.008 0.001 17,494 19,268
5 200 5.92 10.9 6.0 1.84 0.015 0.003 16,763 18,318
8 100 5.64 9.5 5.8 2.98 0.031 0.008 16,038 17,625
2 400 6.20 12.5 6.3 1.11 0.008 0.002 17,494 19,391
5 200 5.92 10.9 6.0 1.82 0.015 0.004 16,763 18,453
8 100 5.64 9.5 5.8 2.98 0.031 0.008 16,038 17,821
15000
20000
25000
30000
35000
40000
45000
0 2 4 6 8 10 12 14 16
Design armour weight in ton
Tota
l cos
ts in
1,0
00 E
uro
2%5%8%
Fig. 5. Case 1.3. Total costs in 50 years lifetime as function of real interest rate and armour unit mass used in deterministic design. Damage accumulation included. (Burcharth and Sorensen, 2005).

6
Table 4 and Fig. 5 are valid for simulations with and without the downtime cost as no significant difference was found. Table 5. Case 2.3. Optimum safety levels for concrete cube armoured outer breakwater. 30 m water depth. 50 years lifetime. Damage accumulation included. Downtime costs 18 million EURO for damage D > 15%. (Burcharth and Sorensen, 2005).
Optimum data for deterministic design
Optimum limit state average number of events within structure lifetime
Lifetime (years)
Real Interest Rate
(%) Optimized design return period, T (years)
HsT
(m)
Optimumarmour unit mass W
(t)
Free- boardRc (m)
SLS
RLS
ULS
Construction costs for 1 km length (1,000 EURO)
Total Lifetime costs for 1 km length (1,000 EURO)
2 1000 14.7 168 14.8 1.21 0.008 0.001 76,907 86,971
50 5 400 14.2 150 14.8 1.84 0.016 0.003 73,722 81,875
8 100 13.2 122 14.8 3.39 0.052 0.012 68,635 78,095
50000
70000
90000
110000
130000
150000
170000
190000
210000
25 50 75 100 125 150 175
Design armour weight in ton
Tota
l cos
ts in
1,0
00 E
uro
50 year - 2%50 year - 5%50 year - 8%100 year - 2%100 year - 5%100 year - 8%
Fig. 6. Case 2.3. Total costs in 50 years lifetime as function of real interest rate and armour unit mass used in deterministic design. Damage accumulation and downtime costs included. (Burcharth and Sorensen, 2005). 2.6. Conclusions related to outer rubble mound breakwaters
• All simulations show very flat minima of total costs as function of armour unit mass. Thus it is less important to identify the exact optimum failure probability because the lifetime costs are practically independent of the design safety level within a fairly wide range. This is because the larger capital costs of a safer structure are almost balanced by smaller repair costs. As a consequence it is generally preferable to choose a conservative design in order to reduce the political and financial inconveniences related to repairs.
• The results show that optimum safety levels are higher than the safety levels inherent in conventional
deterministic designs, especially in the case of depth limited wave height conditions and/or low interest rates. • Further, the results show that for the investigated type of breakwater the critical design limit state
corresponds to Serviceability Limit State (SLS) defined by moderate damage to the armour layer. Designing for SLS and performing repair when the SLS-damage is reached, imply that the probability of very severe damage or failure is almost negligible, and so will be the related cost of repair and downtime costs. This is typical for structures with ductile damage development.

7
• The identified optimum safety levels correspond to exceedence of the SLS-moderate damage level in average once to twice within a service life of 50 years, given the yearly interest rates is 2-5 %. For higher interest rates the optimum number of exceedences will increase corresponding to less safe structures.
• The simulations show that for optimum designs the lifetime costs and the optimum safety levels decrease
rather significantly with increasing interest rates! Thus it is more economic to design for more frequent repairs in case of high interest rates. This however might be practically and politically unacceptable.
• The ratio of optimum design failure probability to service lifetime is almost constant for each design limit
state. This means that if for SLS the optimum number of exceedences of the SLS-damage level is one within a service life of 50 years, then it will be roughly two within a service life of 100 years.
• Downtime costs within realistic ranges seem to have only marginal influence on the optimum safety level.
• Damage accumulation has to be considered in the design of armour layers having a significant influence on
the optimum safety level.
• The obtained results indicate that optimum safety levels for rubble mound breakwaters belonging to functional classes with more restrictive performance criteria than outer breakwaters, cf. Fig. 3, will be almost the same as for outer breakwaters. This is because of the marginal influence of downtime costs.
3. CAISSON BREAKWATER 3.1.Cross sections Fig. 7 shows the cross sections dealt with in the simulations. The ratio between the draft of the caisson, h’ and the water depth h is varied in order to identify the most economical height of the rubble foundation. In accordance with Japanese recommendations given by OCDI (2002) for outer breakwaters is chosen a freeboard of
,. LTsc Hh ⋅= 60 where TL is the design life time.
Fig. 7. Cross sections of outer caisson breakwaters on bedding layer (top) and high mound foundation (bottom).
trtf
dh
hc
bf B br
h'
1:1.5 1:1.5

8
3.2. Failure modes So far only conditions with sea bed materials strong enough to resist slip failures have been analysed. The studied failure modes are shown in Fig. 8. For the slip failure the angle Ф giving the lowest resistance has been identified.
b/2 b/2
Resultant force
Sliding of caisson
Slip failure plane
θ
Fig. 8. Failure modes included in the optimization. Toe berm stability has not been included because the extra cost of making the berm armour very safe is too small to have significant influence on the optimization. 3.3. Repair policy and limit state performances. Two methods of repair/stabilization are considered as shown in Fig. 9.
1:1.5 1:1
Armour blocks Rock rubble mound
bf
2m
h' 2h'3
h'
Fig. 9. Armour blocks in front of caisson and rubble mound behind caisson as means of repair. The used limit state performances and related method of repair are given in table 6. Table 6. Limit state performances and repair. Limit states Failures Repair
SLS
Sliding distance 0.2 m No
RLS
Sliding distance 0.5 m Armour blocks in front or mound behind
ULS Sliding distance 2.0 m
Slip failure
Both
Both, doubled unit price 3.4. Bulk unit prices Table 7 provides the average built-in bulk unit prices collected by the Working Group members. The Japanese prices are used in the present analyses.

9
Table 7. Average built-in bulk unit prices in Euro/m3.
Structure part Europe Japan
Caisson 90 150
Armour layers 150 235
Foundation core 25 37
Armour blocks in front for repair 150 200
Mound behind for repair 25 50
3.5. Stability calculations Wave loads on caissons are determined by the formula by (Goda 2000). It is assumed that large impulsive forces are avoided by imposing the conditions that the sea bed is more gentle than 1:50, and ≥hd / 0.6, see Fig. 7. Deterministic design The caisson width B in the deterministic design is determined by applying the design wave height
TLsodesign HH ⋅= 81. for non-depth limited conditions. LT
soH is the deep water significant wave height corresponding to return period TL, i.e. the service life time of the structure. As wave length is applied the one corresponding to local water depth h given a deep water wave steepness of so=0.04. For depth limited conditions is used max. Hdesign=0.8 h. The design equation for B reads
⎥⎦⎤
⎢⎣⎡ −⋅+−
⋅=
uccwc
H
pghghf
FSB
21 ')( ρρρ
(2)
Where FH is the horizontal wave load corresponding to Hdesign, calculated by the Goda formula. S = 1.2 is a safety factor f = 0.6 is the friction coefficient of the base plate ρc = 2150 kg/m3, bulk mass density of caisson ρw = 1025 kg/m3, mass density of water ρu = wave induced uplift pressure at base plate front edge calculated by the Goda formula. Tilting of the caisson around the heel applying a safety factor of S = 2.5 is included in the deterministic determination of B, but was never critical. The average normal stress σ over the effective foundation width b, see Fig. 8, is calculated in order to get a simple measure for the foundation loading. Reliability calculations In the probabilistic calculation of the performances of the deterministic designs are used the actual time series of Rayleigh distributed wave heights obtained from sample simulations in accordance with the long-term statistics, see Table 1 and PIANC (1992), including uncertainties on the distribution parameters. In order to avoid unrealistic wave heights was used double truncated Weibull distributions (Tae-Min Kim, 2004). The number of waves in each storm is set to 1,000. A limit for the maximum wave height of 0.8 times the local water depth h is used. Wave loads were determined from the Goda formula without safety factor, corrected for bias and including uncertainty (assuming truncated Normal-distribution) as follows:

10
200900 . ,. 1.4, 0.5 force, HorizontalFH
FH ==<<μσ
μFHHF
(3)
300800 . ,. ,1.4 0.5 force, Uplift ==<<FU
FUFHUF
μσ
μ
The friction factor f is modelled by a double truncated normal distribution with mean value ,./ ,. f 1060 == ff μσμ and cut-off limits 0.7 < f < 1.4. In the slip failure calculations are used the reduced effective friction angle dϕ based on normal distributed friction angle φ with
4 eq. cf. 10%, COV and with angle dilation ddistribute normal a and 10%, COV and ==== oo 2538 ψϕ μψμ
ψϕψϕϕ sin sin-1
cos sin tan =d (4)
For the equations related to the slip failure see Sorensen and Burcharth (2000). The sliding distance SD of the caisson should in principle be determined from the dynamic equation of motion assuming a model for the time history of the loading by each wave. In order to save computation time is used the diagrams shown in Fig. 10. The ordinate is the ratio of the actual horizontal wave force HF of a single wave to the wave force limit ,HF which just causes the caisson to slide calculated from eq. (2) with S = 1.

11
type 3
y = 0,0327Ln(x) + 1,2064
1
1,05
1,1
1,15
1,2
1,25
1,3
0 0,2 0,4 0,6 0,8 1 1,2 1,4
SD (m), sliding distance
F_H
/ F_
H,li
mit
type 5
y = 0,079Ln(x) + 1,4861
11,11,21,31,41,51,61,71,81,9
0 1 2 3 4 5 6 7
SD (m), sliding distance
F_H
/ F_
H,li
mit
Fig. 10. Diagrams for the estimation of caisson sliding distance. The data points in Fig. 10 was provided by Tae-Min Kim (2005), based on his earlier calculations for a caisson (type 3) in water depth h = 16 m, of dimensions 5) (type caisson a and m, 11.5 x .3 25 x 5 x x ' 13=dBxhxh c in water depth h = 24 m, dimensions of m 12.5 x 26.8 x 5 x 14 x x h x ' c =dBh In accordance with OCDI (2002), the following factors in the Goda formula for the reduction of the wave loads in case of repair with armour blocks in front of the caisson is used:
606080
670213001
31 ../ for .
/ 0.3 for / .../ for .
max
maxmax
max
<⎪⎩
⎪⎨
⎧
≥
≤−
<
==
hHhHhH
hHλλ (5)

12
02 =λ The resistance to sliding Rm provided by the mound behind the caisson is calculated in accordance with OCDI (2002) and with mound dimensions as shown in Fig. 11.
V s, Volume of sliding part
Rm
θ
Fig. 11. Illustration of resistance of mound to sliding.
)( tan ' ϕθγ +⋅= sm VR (6) where Vs is the volume of the sliding part of the mound mound of weightunit submerged N/m 9810 ' 3=γ
material mound of friction of angle ,o38=ϕ . min. to related identified be to ,horizontal withangle plane slip the is mRθ 3.6. Case studies Table 8 gives an overview of the studied cases. A deep water wave steepness of 0.04 and an interest rate of 5% p.a. are used in all cases. No downtime costs are included. Table 8. Case studies. Caissons on hard bottom.
Wave climate Case Water depth, h (m)
Structure lifetime TL (years) Location LT
sH (m
Sliding equation type cf. Fig. 10
RLS repair
F1a 15 100 Follonica 5.64 3 Armour blocks in front F1b - - - - - Mound behind B1a 25 100 Bilbao 8.76 5 Armour blocks in front B1b - - - - - Mound behind S1a 40 100 Sines 13.2 5 Armour blocks in front S1b - - - - - Mound behind S2 100 Follonica 5.64 5 Mound behind The simulations show that there is hardly any difference in optimum safety levels whether initial repairs are made with armour blocks in front of the caisson or a mound behind the caisson. In the following are only shown cases with repair made by armour blocks in the front. Table 9 and Fig. 12 show the results of Case F1a.

13
Table 9. Case F1a. Optimum safety levels for outer caisson breakwater in 15 m water depth. 100 years service lifetime.
50000
55000
60000
65000
70000
75000
80000
85000
90000
95000
100000
10 100 1000 10000design return period, years
Life
time
cost
s, E
uro/
m
h'/h=0.70h'/h=0.77h'/h=0.83h'/h=0.90h'/h=0.97
Fig. 12. Case F1a. Dependence of lifetime costs on relative height of caisson rubble mound foundation and on return period applied in deterministic design.
Caisson breakwater optimization Initial repair with blocks in front
Case: F1a
Seabed : Hard
Unit prices: Japanese
Interest rate: , 5 % p.a.
Downtime costs: 0 €
Structure lifetime TL = 100 years, Water depth h = 15 m, Wave steepness so = 0.04
Waves: Follonica , =LTsH 5.64 m, =hH LT
s / 0.38 , Freeboard == LTsc Hh 60. 3.38 m
Friction factor f = 0.6 , Friction angle φ = 38o , Dilation angle ψ = 25o
Data for deterministic design
Ssliding = 1.2, Stilting = 2.5
Failure probability in structure lifetime corresponding to minimum lifetime costs
Costs
Caisson draft, h’
Toe level, d below SWL
Return period
Hs Caisson width, B
Effective width, b
Aver. normal stress, σ
SLS RLS ULS Slip failure Construction
Lifetime
(m) (-m) (years) (m) (m) (m) (KN/m2) (€/m) (€/m)
10.5 9.0 1000 6.56 20.9 12 258 0.035 0.031 0.019 0.094 64157 68739
11.5 10.0 1000 6.56 19.9 11 290 0.011 0.011 0.004 0.047 61701 63954
12.5 11.0 50 5.36 16.3 9 320 0.053 0.045 0.034 0.090 52781 58972
13.5 12.0 50 5.36 16.4 9 339 0.030 0.024 0.013 0.035 52876 55141
14.5 13.0 25 5.07 15.9 9 360 0.039 0.035 0.027 0.007 51104 53162
14
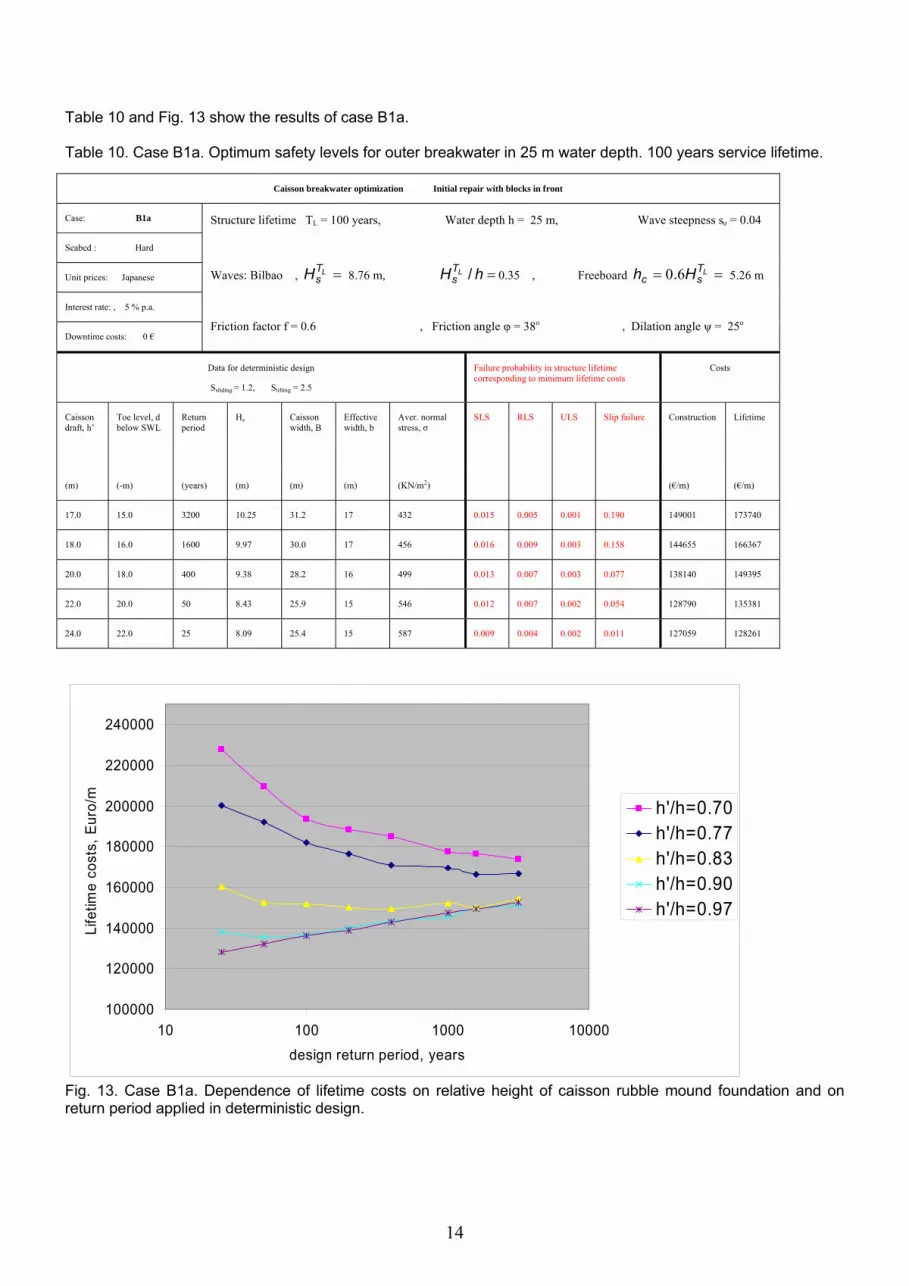
Table 10 and Fig. 13 show the results of case B1a. Table 10. Case B1a. Optimum safety levels for outer breakwater in 25 m water depth. 100 years service lifetime.
100000
120000
140000
160000
180000
200000
220000
240000
10 100 1000 10000design return period, years
Life
time
cost
s, E
uro/
m
h'/h=0.70h'/h=0.77h'/h=0.83h'/h=0.90h'/h=0.97
Fig. 13. Case B1a. Dependence of lifetime costs on relative height of caisson rubble mound foundation and on return period applied in deterministic design.
Caisson breakwater optimization Initial repair with blocks in front
Case: B1a
Seabed : Hard
Unit prices: Japanese
Interest rate: , 5 % p.a.
Downtime costs: 0 €
Structure lifetime TL = 100 years, Water depth h = 25 m, Wave steepness so = 0.04
Waves: Bilbao , =LTsH 8.76 m, =hH LT
s / 0.35 , Freeboard == LTsc Hh 60. 5.26 m
Friction factor f = 0.6 , Friction angle φ = 38o , Dilation angle ψ = 25o
Data for deterministic design
Ssliding = 1.2, Stilting = 2.5
Failure probability in structure lifetime corresponding to minimum lifetime costs
Costs
Caisson draft, h’
Toe level, d below SWL
Return period
Hs Caisson width, B
Effective width, b
Aver. normal stress, σ
SLS RLS ULS Slip failure Construction
Lifetime
(m) (-m) (years) (m) (m) (m) (KN/m2) (€/m) (€/m)
17.0 15.0 3200 10.25 31.2 17 432 0.015 0.005 0.001 0.190 149001 173740
18.0 16.0 1600 9.97 30.0 17 456 0.016 0.009 0.003 0.158 144655 166367
20.0 18.0 400 9.38 28.2 16 499 0.013 0.007 0.003 0.077 138140 149395
22.0 20.0 50 8.43 25.9 15 546 0.012 0.007 0.002 0.054 128790 135381
24.0 22.0 25 8.09 25.4 15 587 0.009 0.004 0.002 0.011 127059 128261

15
3.7. Preliminary conclusions related to outer caisson breakwaters on hard bottom. For the investigated hard bottom cases where slip failures in the sea bed do not occur, the most economical designs, seen over the structure lifetime, are caissons placed on a bedding layer although the construction costs are almost independent on the relative height of the rubble foundation. From the two cases it is seen that the optimum safety level in terms of optimum return period in deterministic design is much higher for caissons on a high mound than for a caisson on bedding layer. This is because of the higher probability of a geotechnical slip failure in case of high mounds. It is also seen that the optimum limit state failure probabilities to be applied in probabilistic designs are significantly higher for the structure in 25 m water depth than for the structure in 15 m water depth. Roughly speaking, the SLS and RLS optimum failure probabilities within 100 years service lifetime are approximately 3 % in case of 15 m water depth and approximately 1 % in case of 25 m water depth. Compared to the SLS optimum failure probabilities for outer rubble mound structures, the caisson values are two orders of magnitude smaller. This shows the fundamental difference in failure sensitivity between a rubble structure and a monolithic structure. 4. ACKNOWLEDGEMENTS The PIANC WG 47 members are acknowledged for their contributions through discussions on the subject. Dr. Tae-Min Kim is acknowledged for his submission of data on caisson sliding. REFERENCES Sorensen, J.D. and Burcharth, H.F. (2000). “Reliability analysis of geotechnical failure modes for vertical wall breakwaters”. Computer and Geotechnics 26, pp 225-245, 2000. Burcharth, H.F. and Sorensen, J.D. (2005). “Optimum safety levels for rubble mound breakwaters”. Proc. Int. Conference on Coastlines, Structures and Breakwaters 2005. Institution of Civil Engineers, London, U.K. pp 483-495, 2005. Goda, Y. (2000). “Random seas and design of maritime structures”. Advanced Series on Ocean Engineering, Vol. 15, World Scientific. ISO 2394 (1998). “General principles on reliability for structures.” International Standard. OCDI (2002). “Technical standards and commentaries for port and harbour facilities in Japan”. The Overseas Coastal Area Development Institute of Japan. PIANC (1992). “Analysis of rubble mound breakwaters”. Report of Working Group 12 pf PTC II. Supplement to PIANC Bulletin No 78/79. PIANC General Secretariat, Brussels. ISBN 2-87223-047-5, 1992. ROM 0.0, Part 1 (2002). “Recommendations for maritime structures”, Ministerio de Fomento, Puertos del Estado, Spain. Tae-Min Kim (2004). “New estimation of caisson sliding distance for improvement of breakwater reliability design”. Ph.D. thesis, Kyoto University, Japan. Tae-Min Kim (2005). Personal communication. Van der Meer, J.W. (1988a) “Rock slopes and gravel beaches under wave attack”. Delft University of Technology, The Netherlands, 1988. Van der Meer, J.W. (1988b) “Stability of cubes, Tetrapods and Accropodes”. Proc. Breakwater ’88, Eastborne, Thomas Telford, U.K., 1988.


