Embed Size (px)
Citation preview
On-Farm Assessment of Soil Quality in California’s Central Valley
Susan S. Andrews,* Jeffrey P. Mitchell, Roberto Mancinelli, Douglas L. Karlen, Timothy K. Hartz,William R. Horwath, G. Stuart Pettygrove, Kate M. Scow, and Daniel S. Munk
ABSTRACT Program, 1990; Mitchell et al., 1999). Mitchell et al.(1999) also reported a perceived decline in soil qualityThe high-value, large-scale crop production systems in the Sanamong producers. As a result of these concerns, manyJoaquin Valley (SJV) of California typically entail intensive tillage
and large fertilizer and water inputs but few C additions to the soil. SJV producers have begun to question the long-termSuch practices often contribute to a decline in soil quality. Our objec- sustainability of their intensively managed agriculturaltive for this participatory study was to examine the effects of supple- systems.mental C management practices (SCMPs) on various soil quality To help farmers in the SJV evaluate the soil qualityindicators. To increase farmer participation, we conducted the study effects of alternative soil management practices, the Weston farms using a variety of SCMPs, including cover crops, compost and Side On-Farm Demonstration Project (WSD) was con-manure amendments, and several different crop rotations common
ducted from 1995 to 1998. This participatory researchto the region. The SCMPs significantly changed a number of soiland extension program originally included 11 large-scaleproperties, including soil organic matter (SOM); total Kjeldahl N;SJV row-crop producers, University of California Coop-microbial biomass C and N; exchangeable K; Olsen P; and extractableerative Extension researchers, USDA Natural ResourcesFe, Mn, and Zn. A comparison including previously established, adja-
cent organic, conventional, and transitional fields in addition to the Conservation Service (NRCS) conservationists, USDA-treatment fields at one farm revealed significant differences in 16 of ARS scientists, and private-sector consultants.18 soil quality indicators. A soil quality index computed for this farm Developing science-based guidelines to quantify im-scored the established organic system significantly higher than the pacts of routinely used organic inputs in this region wasconventional system. Our results suggest that significant changes in identified as an important priority among the project’sseveral soil quality indicators occur with a variety of SCMPs. This is farmer participants (Mitchell and Goodell, 1996). Aespecially noteworthy considering the intensive tillage, irrigation, and
brief, written survey of 15 participants, conducted dur-hot, semiarid environment of the SJV, California, where increases ining a routine project meeting, invited input about theirSOM and related soil properties are generally not expected in a 3-yrinterest in an indexing tool to evaluate soil quality (sensustudy.Andrews and Carroll, 2001; Karlen et al., 1998). Four-teen of the respondents indicated that a soil qualityassessment tool would be useful to compare manage-Western Fresno County in the San Joaquin Valleyment alternatives (one blank response) (S.S. Andrews,(SJV) of California is one of the world’s mostJ.P. Mitchell, and D.L. Karlen, unpublished data, 1999).productive agricultural regions. Farmers in this areaBased on that level of participatory support, our projectproduce more than one-third of the county’s annual $3objectives were to (i) facilitate information exchangebillion agricultural output, making it the highest reve-among farmers, consultants, and researchers regardingnue-producing county in the USA (California Dep. ofthese soil management practices; (ii) monitor and evalu-Food and Agric., 1997). Dominant crop rotations in-ate on-farm, side-by-side comparisons of various SCMPs;clude annual crops (Mitchell et al., 1999) such as pro-and (iii) demonstrate the use of a soil quality indexcessing tomato (Lycopersicon esculentum L.), cotton(SQI) for the region.(Gossypium hirsutum L.), onion (Allium cepa L.), garlic
(A. sativum L.), cantaloupe (Cucumis melo L. var. reticu-latus Naud.), wheat (Triticum aestivum L.), sugarbeet MATERIALS AND METHODS(Beta vulgaris L.), and lettuce (Lactuca sativa L.).
Site DescriptionsThe intense production practices used in this regionSide-by-side comparisons of conventional and organic-include frequent and intensive tillage, irrigation, and
based production systems were established on 11 farms inextensive use of fertilizers and pesticides but few addi-autumn 1995. The farms were located in the western SJVtions of organic amendments to the soil (Mitchell et al.,between Mendota and Huron, CA. At the beginning of the1999). These intensive practices have raised concernsproject, we randomly designated adjacent fields at each farmabout resource management and water consumption asto receive either conventional or alternative treatments. Thewell as environmental concerns such as fugitive dust, fields varied in size but generally ranged from 30 to 60 ha
ground water quality, and food safety (SJV Drainage
Abbreviations: BD, bulk density; CEC, cation exchange capacity;S.S. Andrews and D.L. Karlen, USDA-ARS, Natl. Soil Tilth Lab.,EC, electrical conductivity; MBN, microbial biomass nitrogen; MDS,Ames, IA 50011; J.P. Mitchell and T.K. Hartz, Dep. of Vegetableminimum data set; NRCS, Natural Resources Conservation Service;Crops and Weed Sci., and W.R. Horwath, G.S. Pettygrove, and K.M.PC, principal component; PCA, principal component analysis; PMN,Scow, Dep. of Soils and Biogeochem., Univ. of California, Davis, CApotentially mineralizable nitrogen; SAFS, Sustainable Agriculture95616; R. Mancinelli, Dep. of Crop Prod., Univ. of Tuscia, 01100,Farming Systems (Project); SAR, sodium adsorption ratio; SCMPs,Viterbo, Italy; and D.S. Munk, Univ. of California Coop. Ext., 1720supplemental carbon management practices; SJV, San Joaquin Valley;S. Maple Ave., Fresno, CA 93702. Received 22 May 2000. *Corre-SOM, soil organic matter; SQI, soil quality index; TKN, total Kjeldahlsponding author ([email protected]).nitrogen; WSA, water-stable aggregates; WSD, West Side On-FarmDemonstration Project; x-K, exchangeable potassium.Published in Agron. J. 94:12–23 (2002).
12
ANDREWS ET AL.: ON-FARM SOIL QUALITY ASSESSMENT IN CALIFORNIA 13
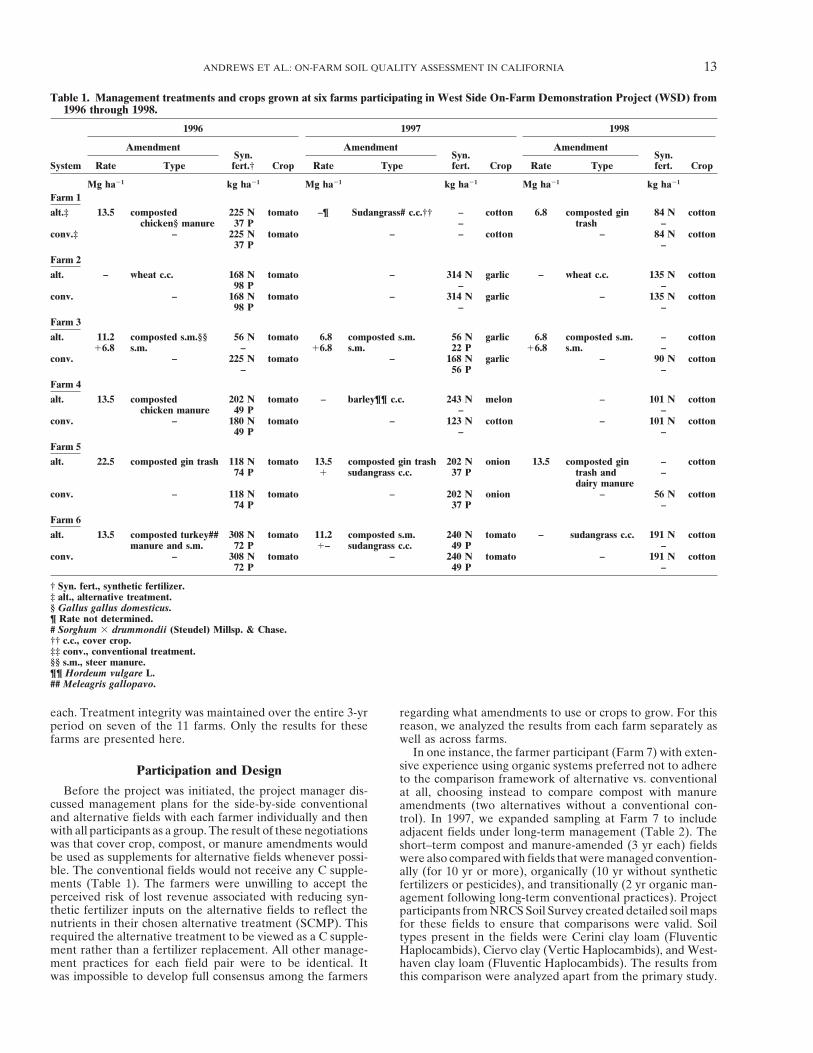
Table 1. Management treatments and crops grown at six farms participating in West Side On-Farm Demonstration Project (WSD) from1996 through 1998.
1996 1997 1998
Amendment Amendment AmendmentSyn. Syn. Syn.
System Rate Type fert.† Crop Rate Type fert. Crop Rate Type fert. Crop
Mg ha�1 kg ha�1 Mg ha�1 kg ha�1 Mg ha�1 kg ha�1
Farm 1alt.‡ 13.5 composted 225 N tomato –¶ Sudangrass# c.c.†† – cotton 6.8 composted gin 84 N cotton
chicken§ manure 37 P – trash –conv.‡ – 225 N tomato – – cotton – 84 N cotton
37 P –Farm 2alt. – wheat c.c. 168 N tomato – 314 N garlic – wheat c.c. 135 N cotton
98 P – –conv. – 168 N tomato – 314 N garlic – 135 N cotton
98 P – –Farm 3alt. 11.2 composted s.m.§§ 56 N tomato 6.8 composted s.m. 56 N garlic 6.8 composted s.m. – cotton
�6.8 s.m. – �6.8 s.m. 22 P �6.8 s.m. –conv. – 225 N tomato – 168 N garlic – 90 N cotton
– 56 P –Farm 4alt. 13.5 composted 202 N tomato – barley¶¶ c.c. 243 N melon – 101 N cotton
chicken manure 49 P – –conv. – 180 N tomato – 123 N cotton – 101 N cotton
49 P – –Farm 5alt. 22.5 composted gin trash 118 N tomato 13.5 composted gin trash 202 N onion 13.5 composted gin – cotton
74 P � sudangrass c.c. 37 P trash and –dairy manure
conv. – 118 N tomato – 202 N onion – 56 N cotton74 P 37 P –
Farm 6alt. 13.5 composted turkey## 308 N tomato 11.2 composted s.m. 240 N tomato – sudangrass c.c. 191 N cotton
manure and s.m. 72 P �– sudangrass c.c. 49 P –conv. – 308 N tomato – 240 N tomato – 191 N cotton
72 P 49 P –
† Syn. fert., synthetic fertilizer.‡ alt., alternative treatment.§ Gallus gallus domesticus.¶ Rate not determined.# Sorghum � drummondii (Steudel) Millsp. & Chase.†† c.c., cover crop.‡‡ conv., conventional treatment.§§ s.m., steer manure.¶¶ Hordeum vulgare L.## Meleagris gallopavo.
each. Treatment integrity was maintained over the entire 3-yr regarding what amendments to use or crops to grow. For thisreason, we analyzed the results from each farm separately asperiod on seven of the 11 farms. Only the results for these
farms are presented here. well as across farms.In one instance, the farmer participant (Farm 7) with exten-
sive experience using organic systems preferred not to adhereParticipation and Designto the comparison framework of alternative vs. conventional
Before the project was initiated, the project manager dis- at all, choosing instead to compare compost with manurecussed management plans for the side-by-side conventional amendments (two alternatives without a conventional con-and alternative fields with each farmer individually and then trol). In 1997, we expanded sampling at Farm 7 to includewith all participants as a group. The result of these negotiations adjacent fields under long-term management (Table 2). Thewas that cover crop, compost, or manure amendments would short–term compost and manure-amended (3 yr each) fieldsbe used as supplements for alternative fields whenever possi- were also compared with fields that were managed convention-ble. The conventional fields would not receive any C supple- ally (for 10 yr or more), organically (10 yr without syntheticments (Table 1). The farmers were unwilling to accept the fertilizers or pesticides), and transitionally (2 yr organic man-perceived risk of lost revenue associated with reducing syn- agement following long-term conventional practices). Projectthetic fertilizer inputs on the alternative fields to reflect the participants from NRCS Soil Survey created detailed soil mapsnutrients in their chosen alternative treatment (SCMP). This for these fields to ensure that comparisons were valid. Soilrequired the alternative treatment to be viewed as a C supple- types present in the fields were Cerini clay loam (Fluventicment rather than a fertilizer replacement. All other manage- Haplocambids), Ciervo clay (Vertic Haplocambids), and West-ment practices for each field pair were to be identical. It haven clay loam (Fluventic Haplocambids). The results from
this comparison were analyzed apart from the primary study.was impossible to develop full consensus among the farmers

14 AGRONOMY JOURNAL, VOL. 94, JANUARY–FEBRUARY 2002
Table 2. Management treatments and crops grown at Farm 7 of the West Side On-Farm Demonstration Project (WSD) from 1996through 1998.
1996 1997 1998
Amendment Amendment AmendmentSyn. Syn. Syn.
System Rate Type fert.† Crop Rate Type fert. Crop Rate Type fert. Crop
Mg ha�1 kg ha�1 Mg ha�1 kg ha�1 Mg ha�1 kg ha�1
manure 11.2 poultry manure – tomato 11.2 poultry manure – melons 11.2 poultry manure – tomato– – –
compost 11.2 composted – tomato 11.2 composted – melons 11.2 composted – tomatopoultry manure – poultry manure – poultry manure –
organic 11.2 poultry manure – broccoli‡ 11.2 poultry manure – spinach§ 11.2 poultry manure – tomato– – –
trans.¶ – 168 N cotton 11.2 poultry manure 202 N tomato – 326 N garlic– 72 P 127 P
conv.# – 112 N string bean†† – 168 N cotton – 393 N onion34 P – 127 P
† Syn. fert., synthetic fertilizer.‡ Brassica oleracea L.§ Spinacia oleracea L.¶ trans., field in second year of transition from conventional to organic management.# conv., conventionally managed field (no organic amendments).†† Phaseolus vulgaris L.
After completing sampling and analyses, we summarized extraction followed by emission spectrometry. Cation exchangecapacity (CEC) was determined by the Ba saturation–Ca re-and discussed the data with participating farmers to obtain
their views and perceptions. These data summaries were sub- placement method of Janitzky (1986). Zinc, Fe, and Mn weredetermined using the DTPA (diethylenetriaminepentaaceticsequently presented and discussed with other farmers, advi-
sors, and researchers. acid) micronutrient extraction method developed by Lindsayand Norvell (1978). Sodium adsorption ratio (SAR) was calcu-lated from saturated paste extracts of Na�, Ca2�, and Mg2�
Soil Sampling, Processing, and Analysisin milliequivalents per liter (U.S. Salinity Lab. Staff, 1954).
Six composite soil samples were taken each spring and Electrical conductivity (Rhoades, 1982) and pH of water-satu-autumn from alternative and conventional fields. [For brevity, rated pastes (U.S. Salinity Lab. Staff, 1954) were measuredwe report the results from the beginning and ending sampling using conductivity and pH meters, respectively. Soil aggregatedates (spring 1995 and fall 1998) only. Electrical conductivity stability was measured on 1- to 2-mm-diam. aggregates using(EC) was the only soil quality indicator that appeared to be the slow-wetting, wet-sieve procedure of Kemper and Ro-affected by sampling time.] Each sample consisted of 8 to 12 senau (1986).bulked cores taken to a depth of 15 cm. The sampling protocol Soil biological properties were analyzed using field-moistconsisted of locating one of six fixed, central reference points samples from 1998. Potentially mineralizable N (PMN) wasusing field measurements or global positioning system coordi- defined as NO3–N that accumulated in 35-g (dry weight) soilnates and then collecting soil cores in an X pattern within a samples during a 4-wk incubation at �30 kPa soil water poten-15-m radius of that point. In fields that were bedded before tial before and after a 4-wk aerobic incubation (Bundy andsampling, cores were collected from the furrow, shoulder, and Meisinger, 1994). For microbial biomass determinations, 20-gcenter part of beds. In fields that had recently been disked or soil samples were used in the chloroform-incubation methodleveled, cores were collected randomly at each sampling site described by Horwath et al. (1996). Microbial biomass Nwithout regard to surface topography. Large pieces of raw (MBN) was determined for these samples using a Kn � 0.58organic material were removed from the soil surface before conversion factor (Horwath and Paul, 1994).collecting the samples. After collection, the samples were re-frigerated until passed through a (13- by 13-mm mesh size) Statistical Analysessieve and then prepared for analysis.
We compared the alternative and conventional treatmentWell-mixed, air-dried samples were analyzed for chemicalmeans for Farms 1 through 6 combined. The data for theseand physical properties at the University of California’s Divi-farms are reported on a gravimetric basis because BD wassion of Agriculture and Natural Resource Analytical Labora-determined only in 1998. We looked for differences betweentory. Soil texture was determined for baseline soils in 1995 bytreatments on each sampling date and across the two datesthe hydrometer method (Gee and Bauder, 1986). Soil bulkusing the nonparametric Wilcoxon rank sum (c2 ) test on JMPdensity (BD) was estimated by the core method (Blake andv. 3 software for Windows (SAS Inst., Cary, NC).1 This nonpar-Hartge, 1986). Soil organic matter (SOM) was determinedametric test finds differences less often than its parametricusing the modified Walkley–Black method of Nelson and Som-counterpart, the t-test (Ott, 1988). Therefore, we believe themers (1982). Total Kjeldahl nitrogen (TKN) was determinedrank sum test may be more applicable than the t-test to on-using the standard digestion of Issac and Johnson (1976). Soilfarm studies, where scientific rigor and control over inputsNO3–N was extracted with KCl (Keeney and Nelson, 1982).are more difficult to obtain than in plot studies, because it isExtracts were analyzed for NO3–N via Cd reduction by a mod-less likely to have false positive conclusions (Type I errors).ified Griess–Ilsovay method using a diffusion-conductivity an-
The expanded data set collected from Farm 7 in 1998,alyzer (Carlson, 1978). Soluble P (Olsen P) was determinedby sodium bicarbonate (NaHCO3 ) extraction and subsequentcolorimetric analysis (Olsen et al., 1954). Exchangeable K (x-K) 1 Reference to trade names and companies is made for information(Knudson et al., 1982) and exchangeable Ca (Lanyon and purposes only and does not imply endorsement by the USDA or
University of California.Heald, 1982) were determined using an ammonium acetate

ANDREWS ET AL.: ON-FARM SOIL QUALITY ASSESSMENT IN CALIFORNIA 15
tions using Stella Research v. 5.1.1 software (High Perfor-including five management systems (manure, compost, or-mance Syst., Hanover, NH). Every observation of the MDSganic, transitional, and conventional), was evaluated for vari-indicators was transformed for all five treatments using nonlin-ables expressed volumetrically using a one-way analysis ofear scoring functions where the y-axis ranged from 0 to 1variance (ANOVA) and Student’s t comparison of means atand the x-axis represented a site-dependent expected range� � 0.05. We transformed data from this farm, as necessary, to(Andrews et al., 2001; Karlen et al., 1998; Karlen and Stott,meet statistical assumptions of normality and equal variances.1994). A score of 1 was given when an indicator value repre-sented high function, i.e., if the indicator was nonlimiting to
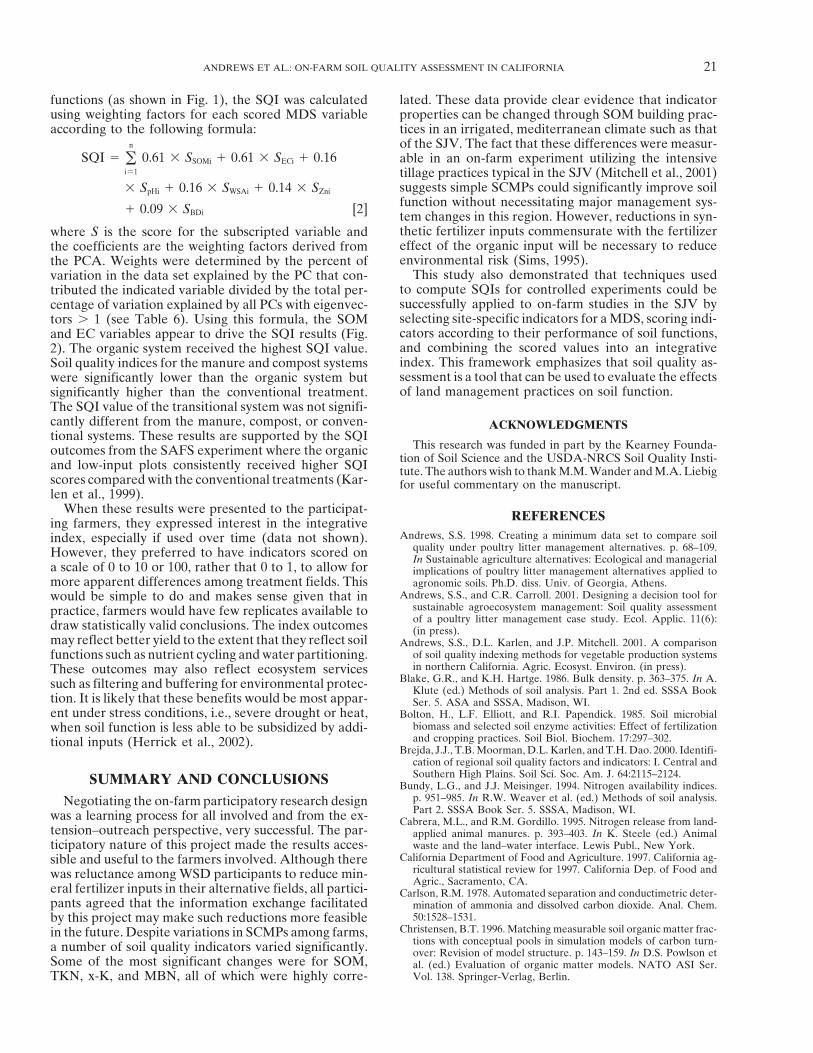
Soil Quality Index Demonstration related soil functions and processes such as nutrient cycling,water partitioning, supporting biodiversity, filtering and buff-We constructed a SQI for the 1998 soils data from Farmering, or structural stability. Scoring functions are used widely7, using techniques that performed well for a smaller-scaleunder various guises in economics as utility functions (Nor-experiment of vegetable production systems in California’sgaard, 1994), multiobjective decision making as decision func-Central Valley (Karlen et al., 1999), to determine if the methodtions (Yakowitz et al., 1993), and systems engineering as awas sufficiently robust for on-farm applications. Because inno- tool for modeling (Wymore, 1993). Andrews et al. (2001)vative farmers routinely experiment with alternative manage- found that nonlinear scoring of indicators was more represen-ment practices, often for only one season before making a tative of system function than linearly scored indicators over
decision to adopt, we evaluated a comparative assessment a large range of indicator values measured in northern Cali-technique that does not have to be repeated as part of a time fornia.series. The three main steps of this technique are to (i) select The expected range for the indicators (x-axis range) wasa minimum data set (MDS) of indicators that best represent determined based on observed values in this study and litera-soil function, (ii) score the MDS indicators based on their ture values for similar soils and climate (when available). Theperformance of soil functions, and (iii) integrate the indicator shape of the decision function—typically some variation of ascores into a comparative index of soil quality. normal distribution, an upper asymptote, or a lower asymp-
To select a representative MDS (Doran and Parkin, 1994) tote—was determined by consensus of the researchers in-for the alternative systems, we first performed standardized volved and literature values quantifying the relationships be-principal component analysis (PCA) of all untransformed data tween indicators and soil functions (Fig. 1). For example, wethat showed statistically significant differences between man- used upper asymptotes or more is better functions for soilagement systems using ANOVA or Student’s t (as described organic matter (SOM) and water-stable aggregates (WSA)above). Principal components (PCs) for a data set are defined based on their roles in soil fertility, water partitioning, andas linear combinations of the variables that account for maxi-mum variance within the set by describing vectors of closestfit to the n observations in p-dimensional space, subject tobeing orthogonal to one another. There are many documentedstrategies for using PCA or closely related factor analyses toselect a subset from a large data set (e.g., Andrews and Carroll,2001; Brejda et al., 2000). The strategy described here is similarto that described by Dunteman (1989). We assume that PCsreceiving high values best represent system attributes. There-fore, we examined only the PCs with eigenvalues �1 (Brejdaet al., 2000).
For a particular PC, each variable received a weight orfactor loading that represents its contribution to the PC. Weretained only the highly weighted variables from each PC forthe MDS. We defined highly weighted as that within 10% ofthe highest factor loading (using absolute values). When morethan one variable was retained within a PC, we calculatedtheir linear correlations to determine whether the variablescould be considered redundant and, therefore, eliminatedfrom the MDS (Andrews, 1998). If the highly weighted vari-ables were not correlated (assumed to be a correlation coeffi-cient of �0.60), then each was considered important and wasretained in the MDS. Among well-correlated variables withina PC, the variable with the highest sum of correlation coeffi-cients (absolute values) was chosen for the MDS (Andrewsand Carroll, 2001; Karlen et al., 1999).
As a check of how well the MDS represented the manage-ment system goals, we performed multiple regressions usingthe final MDS indicators as independent variables and mea-sures representing management goals as dependent variables(Andrews and Carroll, 2001; Karlen et al., 1999). The availablemanagement goal variables were: yield (proportion of mea-sured yield/county average to account for different crops),gross revenues (including price premiums for organic produce) Fig. 1. The scoring functions used to transform the measured indicator(Fresno Dep. of Agric., 1998), and SAR (to represent sodicity values into performance-based scores for the soil quality indexconcerns in this region). (SQI) where the y-axis represents soil quality value (or perfor-
After determining the MDS indicators, we scored each of mance of soil function) and the x-axis is the site-dependent expectedrange for each indicator.the MDS variables based on their performance of soil func-
16 AGRONOMY JOURNAL, VOL. 94, JANUARY–FEBRUARY 2002
structural stability (Tiessen et al., 1994; Soil Survey Staff, As information regarding changes in soil fertility be-1998). We used a lower asymptote or less is better function came available for each alternative field, one WSD par-for BD due to the inhibitory effect of high BD on root growth ticipant specifically requested guidelines from the man-and soil porosity (Soil Survey Staff, 1998). Variations of mid- agement team about how he could refine his mineralpoint optimum curves were used for soil pH (Whittaker, 1959), fertilizer program for 1999. This attitudinal change isEC (Tanji, 1990), and Zn (Maynard, 1997) based on crop sen-
a very favorable outcome for a participatory project.sitivity levels and nutrient availability.Further, synthetic fertilizer reductions will be necessaryOnce transformed, the MDS variables for each observationto make organic amendments an environmentally safewere weighted using the PCA results. Each PC explained aoption (Sims, 1995) for the SJV and other areas.certain amount (%) of the variation in the total data set.
This percentage, divided by the total percentage of variation There are no data to quantify current annual useexplained by all PCs with eigenvectors �1, provided the SCMPs in the West Side region of the SJV, but weweighting factor for variables chosen under a given PC. We estimate that they are not used on more than 5% ofthen summed the weighted MDS variable scores for each the row-crop land. In contrast, seven of the original 11observation in the following formula: participating farmers (64%) maintained their on-farm
comparisons between conventional and alternative soilSQI � �
n
i�1
Wi � Si [1] management practices for the entire 3 yr.There were several different reasons why the project’s
where W is the PC weighting factor and S is the indicator primary goal of utilizing SCMPs was not maintainedscore. We compared the calculated SQI treatment means using on four of the original farms. In one case, financialANOVA and Student’s t at � � 0.10. We assumed that higher considerations precluded purchase of the additional in-index scores meant better soil quality or greater performance
puts. At two sites, a farm-wide decision was made toof soil functions.rotate the fields that received organic inputs; thus, theorganic amendments were applied to other, nonprojectfields in the second and/or third years. Finally, one farmRESULTS AND DISCUSSIONwas sold during the course of the project, and the newParticipationlandowner was unable or unwilling to maintain the in-
Despite numerous coordination efforts, SCMPs eval- tegrity of the side-by-side comparisons. The results fromuated on participating farms varied considerably in type, the remaining seven farms are presented below.amount, and chemical composition (Tables 1 and 2).Compost or manure was applied to alternative fields 14 Soil Analyses on Farms 1 through 6times, late summer or winter cover crops were grown
We report soil indicator results for samples takenas green manure six times, and combinations of coverwhen the project began in fall 1995 and in spring 1998crops plus compost or manure were used twice duringfor the six farms that maintained consistent alternativethe project’s 30-mo history (Hartz, 2000). Crop rotationand conventional treatments over the study period (Ta-among farms also differed. Such differences among ex-ble 3). Several additional soil quality indicators wereperimental treatments would be intolerable in mecha-added during the course of the study and are reportednistic research programs where control over experimen-for the ending date only (Table 4). Fourteen of 18 indi-tal design is rarely in question. However, these on-farmcators exhibited significant differences between treat-studies were initiated to demonstrate that SOM buildingments, sampling dates, or both.practices could be implemented in the SJV without in-
All indicators (except Mn) had significantly differentterfering with current cropping practices and to providebaseline values between treatment fields at one or morepreliminary soil test data that would help quantify thefarms. The number of significantly different indicatorsimpact of those SOM building practices.
Interviews with farmer participants revealed that they ranged from eight (of the 11 indicators sampled in 1995)at Farm 4 to one at Farm 6. Textural differences providewere considering these soil amendments primarily as
means of adding C to the soil to improve soil quality one explanation: Soil textures at Farms 1 through 5varied slightly between adjacent fields but were mostlyrather than as fertilizer replacements. Reluctance to
reduce fertilizer application rates in alternative-treat- clays, clay loams, or loams. Soil textures for alternativeand conventional fields at Farm 6 were classified asment fields stemmed primarily from concerns about
yield reductions. Farmers also emphasized that build- sandy loam or loamy sand (data not shown). Anothersuspected reason for baseline differences in 1995 wasing soil fertility with organic materials generally takes
longer than the 3-yr duration of this study. Their knowl- that sampling may have occurred after soil amendmenttreatments were applied to some farms. Exact dates ofedge with respect to SOM and total organic C is sup-
ported by the scientific literature, e.g., Christensen amendment applications with respect to soil samplingwere not recorded. This is another example of the diffi-(1996). However, their concept fails for plant-available
N, P, K, and micronutrients; many studies have shown culties of working on farm where farmers’ schedules donot always coincide with those of researchers. To dealthe short-term fertilizer effects of organic amendments,
e.g., Yadvinder-Singh et al. (1992) for green manures, with this potential bias, we performed statistical analyseson the percent difference between treatments for eachStephenson et al. (1990) and Cabrera and Gordillo
(1995) for animal wastes, and Gagnon and Simard indicator in each year, similar to the technique em-ployed by Karlen and Colvin (1992) to compare farming(1999) for composts.
ANDREWS ET AL.: ON-FARM SOIL QUALITY ASSESSMENT IN CALIFORNIA 17
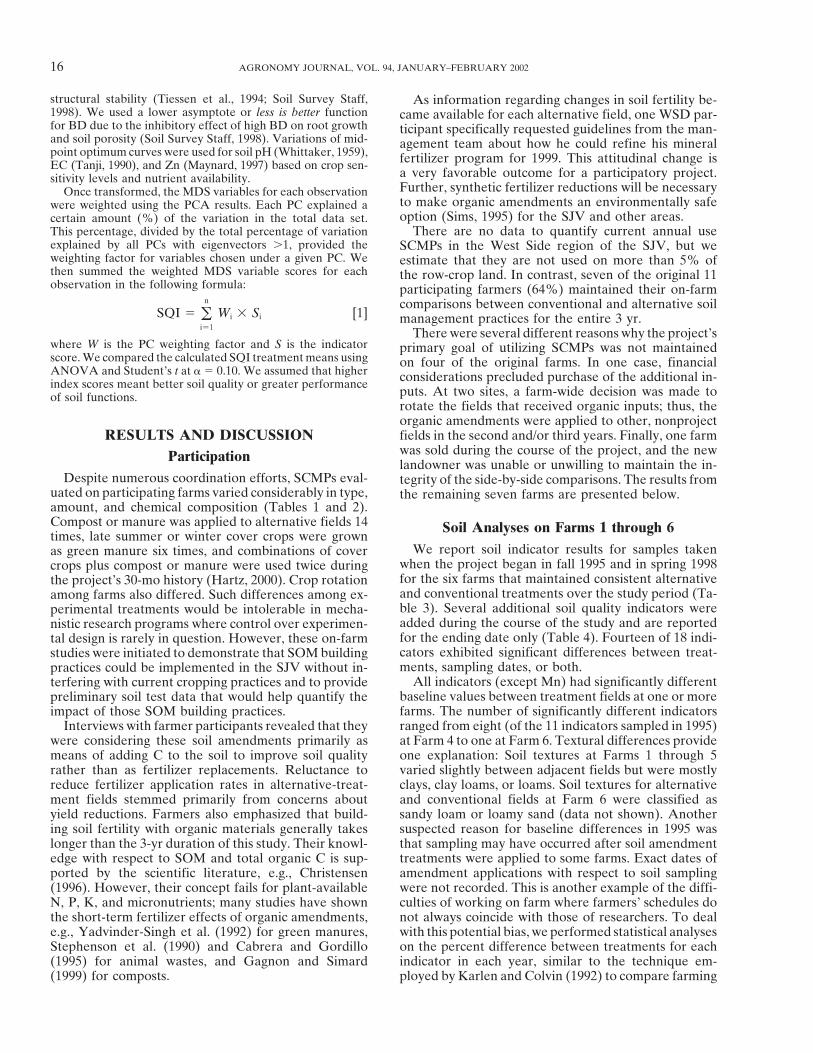
Table 3. Selected soil quality indicators sampled to a 15-cm depth at six San Joaquin Valley (SJV) farms in 1995 and 1998: soil organicmatter (SOM); total Kjeldahl N (TKN); soil pH; electrical conductivity (EC); sodium adsorption ratio (SAR); cation exchange capacity(CEC); exchangeable K (x-K); water-stable aggregates (WSA); and extractable Fe, Mn, and Zn.
SOM TKN pH EC SAR CEC x-K WSA Fe Mn Zn
System 1995 1998† 1995 1998† 1995 1998† 1995 1998† 1995 1998† 1995 1998† 1995 1998† 1995 1998† 1995 1998† 1995 1998† 1995 1998†
g kg�1 �log H� dS m�1 cmol kg�1 mg kg�1 % g kg�1
Farm 1
Alt.‡ 11.0 12.4* 0.81 0.74 7.8 7.7** 2.2 1.1** 3.2 2.5 32.9 31.4** 492 663** 88.8 89.4 11.4 11.0 19 17 1.5 3.4#Conv.§ 10.8 11.6** 0.72 0.64* 7.8 7.7* 2.7 1.2** 3.7 2.9** 34.6 33.3* 502 601** 91.1 89.0 10.2 8.4 18 11* 1.8 1.8
¶ * * * * # * * * * # * #
Farm 2
Alt. 12.0 9.6# 0.86 0.73* 7.6 7.6 1.9 0.8# 1.5 1.5 31.8 31.5 504 475 86.7 91.0* 8.7 6.6* 18 13 3.3 1.8#Conv. 10.8 7.3# 0.80 0.62# 7.7 7.8 1.3 0.5# 1.8 1.8 30.3 29.3* 446 384# 83.4 87.7 8.8 5.6# 13 9# 2.0 1.4#
¶ * # # * # * # # # # # # * # ** **
Farm 3
Alt. 10.7 11.1 0.81 1.29# 8.0 7.7# 1.0 1.5** 1.8 3.5# 31.8 30.7 523 579 84.2 88.0* 9.3 7.2* 18 12** 1.2 2.3*Conv. 10.8 8.7# 0.82 1.02# 8.0 7.8# 1.3 1.3 2.2 3.5# 30.9 31.6 528 436# 84.9 90.6** 10.2 6.5** 20 11# 1.2 1.9*
¶ # # ** * * # *
Farm 4
Alt. 10.0 8.8** 0.82 0.75* 7.6 7.8 5.4 1.2# 4.3 2.1** 25.9 20.9# 477 442 73.4 79.8* 10.8 n.d.n/a†† 17 n.d.n/a 1.4 n.d.n/a
Conv. 8.3 8.6 0.67 0.66 7.7 7.9# 1.6 0.8# 2.4 1.4# 21.8 18.0** 383 410 60.3 72.1# 15.3 n.d.n/a 21 n.d.n/a 1.0 n.d.n/a
¶ *** ** # # ** * # * # * * #
Farm 5
Alt. 10.1 12.2* 0.70 0.79* 7.7 7.7 4.6 2.7# 6.9 5.5 33.3 31.8* 584 612 88.3 89.9 9.7 11.0 12 12 1.7 4.6#Conv. 8.1 9.0# 0.61 0.61 7.7 7.7 2.6 1.8* 2.7 3.5* 29.5 28.7 414 462 88.0 87.5 12.9 6.8# 14 11# 1.7 3.2#
¶ # # * # # * # * # # # # * ** # *
Farm 6
Alt. 6.4 5.7 0.48 0.69# 7.9 7.8# 0.8 0.4# 1.3 0.8# 13.3 13.3 297 260 65.2 60.7 7.2 6.0* 11 10 1.8 2.7#Conv. 6.3 3.5# 0.45 0.38 7.9 7.8 1.0 0.4# 1.5 0.8# 13.0 9.9# 277 169** 64.5 67.8 6.8 5.2 13 10* 1.8 1.5
¶ # # * # * * ** #
Means of Farms 1–6
Alt. 10.0 9.9 0.74 0.83 7.8 7.7* 2.6 1.5# 3.2 2.7 28.2 26.5 479 500 81.1 83.1* 9.5 8.3* 16 13** 1.9 2.9#Conv. 9.2 8.0 0.68 0.70 7.8 7.8 1.7 1.0# 2.4 2.2 26.7 25.1 425 399 78.7 82.8 11.1 6.4# 16 11# 1.6 2.3**
¶ * # * # * ** # * # # **
* Significant at the 0.05 level.** Significant at the 0.01 level.† Significance of �2 comparisons between years (1995 vs. 1998).‡ Alt., alternative treatment using supplemental C management practices.§ Conv., conventional treatment (no C supplement).¶ Significance of �2 comparisons between management practices (alt. vs. conv.) within one year.# Significant at the 0.005 level.†† n.d., not determined; n/a, test not applicable.
systems. While the baseline differences are a concern, while others showed decreases or no change in theseindicators. One likely reason for these inconsistent tem-if sampling did occur after initial treatment applications,
it would only serve to minimize treatment effects when poral responses is the differing quality of the amend-ments used at the six farms (i.e., differences in C/N oranalyzed over time, leading to more conservative con-
clusions. lignin/N ratio of the amendment itself).Another factor in the SOM and TKN responses maySoil organic matter was higher in soils from alterna-
tive fields than from conventional fields at four of six be the high number and intensity of tillage operationsperformed in both alternative and conventional treat-farms in 1998 (Table 3). Similarly, TKN was significantly
higher in soils from alternative fields than in soils from ments. Tillage has long been known to deplete SOM(Reicosky et al., 1995). A written survey including eightconventional fields in five of six farms. However, several
farms also had significant treatment differences in 1995, participating farmers conducted during a routine prog-ress report meeting revealed that an average of moreincluding Farm 5 where we suspect treatments were
applied before collection of baseline samples. The alter- than six tillage operations are performed each year (S.S.Andrews, J.P. Mitchell, and D.L. Karlen, unpublishednative field soils had an average of 8% more SOM and
TKN than conventionally managed soils in 1995 but data, 1999). Evidence for a tillage effect is found in thedownward trend in mean soil C/N ratio {calculated as16% more SOM and 19% more TKN in 1998 (P �
0.001 for each). These on-farm changes in SOM are [(SOM � 0.8)/TKN]} for all fields on Farms 1 through6. The ratio was significantly lower in 1998 (9.9:1) thanconsistent with those reported by Clark et al. (1998) for
both organic and low-input cropping systems in Califor- in 1995 (10.8:1) (P � 0.009). Mean soil C/N ratio fromalternative and conventional fields followed this trendnia’s Sacramento Valley.
Although differences between treatments within each separately but with less statistical significance (P � 0.08for alternative and P � 0.05 for conventional). Con-year were significant, the temporal changes in SOM and
TKN were less consistent: Some farms showed increases versely, the mean percentage of WSA increased over
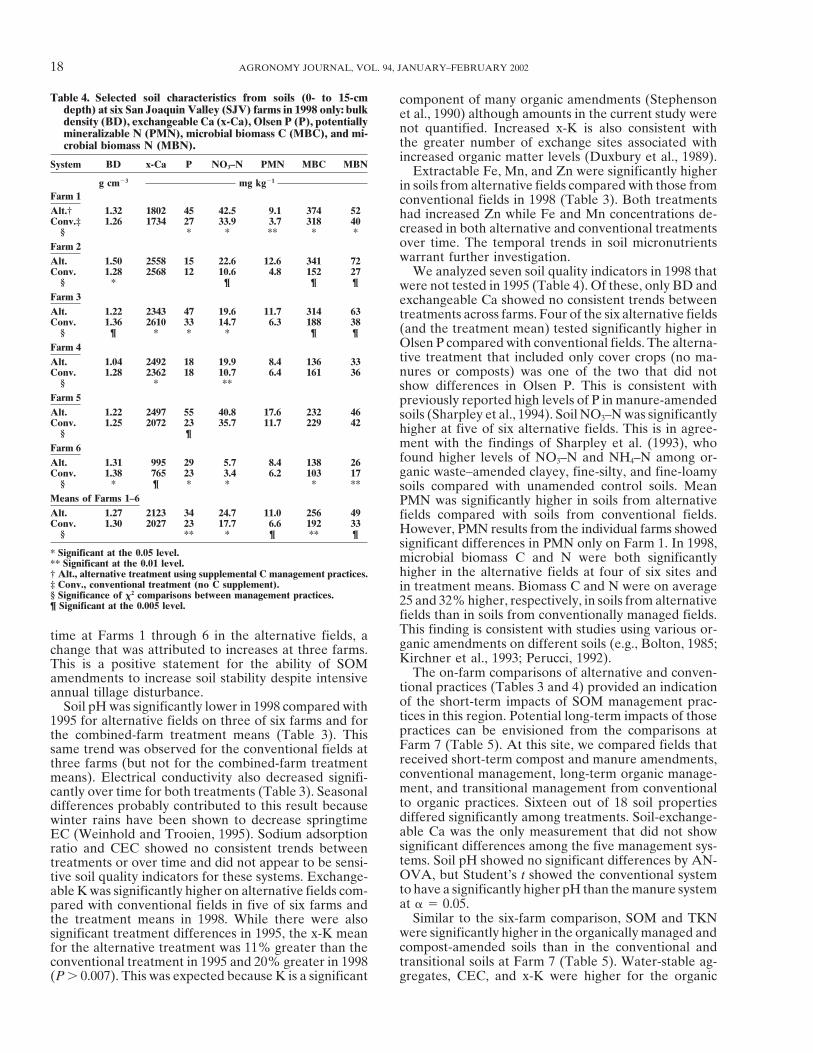
18 AGRONOMY JOURNAL, VOL. 94, JANUARY–FEBRUARY 2002
Table 4. Selected soil characteristics from soils (0- to 15-cm component of many organic amendments (Stephensondepth) at six San Joaquin Valley (SJV) farms in 1998 only: bulk et al., 1990) although amounts in the current study weredensity (BD), exchangeable Ca (x-Ca), Olsen P (P), potentially not quantified. Increased x-K is also consistent withmineralizable N (PMN), microbial biomass C (MBC), and mi-
the greater number of exchange sites associated withcrobial biomass N (MBN).increased organic matter levels (Duxbury et al., 1989).
System BD x-Ca P NO3–N PMN MBC MBN Extractable Fe, Mn, and Zn were significantly higherg cm�3 mg kg�1 in soils from alternative fields compared with those from
Farm 1 conventional fields in 1998 (Table 3). Both treatmentsAlt.† 1.32 1802 45 42.5 9.1 374 52 had increased Zn while Fe and Mn concentrations de-Conv.‡ 1.26 1734 27 33.9 3.7 318 40
creased in both alternative and conventional treatments§ * * ** * *over time. The temporal trends in soil micronutrientsFarm 2warrant further investigation.Alt. 1.50 2558 15 22.6 12.6 341 72
Conv. 1.28 2568 12 10.6 4.8 152 27 We analyzed seven soil quality indicators in 1998 that§ * ¶ ¶ ¶ were not tested in 1995 (Table 4). Of these, only BD and
Farm 3 exchangeable Ca showed no consistent trends betweenAlt. 1.22 2343 47 19.6 11.7 314 63 treatments across farms. Four of the six alternative fieldsConv. 1.36 2610 33 14.7 6.3 188 38 (and the treatment mean) tested significantly higher in§ ¶ * * * ¶ ¶
Olsen P compared with conventional fields. The alterna-Farm 4tive treatment that included only cover crops (no ma-Alt. 1.04 2492 18 19.9 8.4 136 33nures or composts) was one of the two that did notConv. 1.28 2362 18 10.7 6.4 161 36
§ * ** show differences in Olsen P. This is consistent withFarm 5 previously reported high levels of P in manure-amendedAlt. 1.22 2497 55 40.8 17.6 232 46 soils (Sharpley et al., 1994). Soil NO3–N was significantlyConv. 1.25 2072 23 35.7 11.7 229 42 higher at five of six alternative fields. This is in agree-§ ¶
ment with the findings of Sharpley et al. (1993), whoFarm 6found higher levels of NO3–N and NH4–N among or-Alt. 1.31 995 29 5.7 8.4 138 26ganic waste–amended clayey, fine-silty, and fine-loamyConv. 1.38 765 23 3.4 6.2 103 17
§ * ¶ * * * ** soils compared with unamended control soils. MeanMeans of Farms 1–6 PMN was significantly higher in soils from alternativeAlt. 1.27 2123 34 24.7 11.0 256 49 fields compared with soils from conventional fields.Conv. 1.30 2027 23 17.7 6.6 192 33 However, PMN results from the individual farms showed§ ** * ¶ ** ¶
significant differences in PMN only on Farm 1. In 1998,* Significant at the 0.05 level. microbial biomass C and N were both significantly** Significant at the 0.01 level.
higher in the alternative fields at four of six sites and† Alt., alternative treatment using supplemental C management practices.‡ Conv., conventional treatment (no C supplement). in treatment means. Biomass C and N were on average§ Significance of �2 comparisons between management practices. 25 and 32% higher, respectively, in soils from alternative¶ Significant at the 0.005 level.
fields than in soils from conventionally managed fields.This finding is consistent with studies using various or-time at Farms 1 through 6 in the alternative fields, aganic amendments on different soils (e.g., Bolton, 1985;change that was attributed to increases at three farms.Kirchner et al., 1993; Perucci, 1992).This is a positive statement for the ability of SOM
The on-farm comparisons of alternative and conven-amendments to increase soil stability despite intensivetional practices (Tables 3 and 4) provided an indicationannual tillage disturbance.of the short-term impacts of SOM management prac-Soil pH was significantly lower in 1998 compared withtices in this region. Potential long-term impacts of those1995 for alternative fields on three of six farms and forpractices can be envisioned from the comparisons atthe combined-farm treatment means (Table 3). ThisFarm 7 (Table 5). At this site, we compared fields thatsame trend was observed for the conventional fields atreceived short-term compost and manure amendments,three farms (but not for the combined-farm treatmentconventional management, long-term organic manage-means). Electrical conductivity also decreased signifi-ment, and transitional management from conventionalcantly over time for both treatments (Table 3). Seasonalto organic practices. Sixteen out of 18 soil propertiesdifferences probably contributed to this result becausediffered significantly among treatments. Soil-exchange-winter rains have been shown to decrease springtimeable Ca was the only measurement that did not showEC (Weinhold and Trooien, 1995). Sodium adsorptionsignificant differences among the five management sys-ratio and CEC showed no consistent trends betweentems. Soil pH showed no significant differences by AN-treatments or over time and did not appear to be sensi-OVA, but Student’s t showed the conventional systemtive soil quality indicators for these systems. Exchange-to have a significantly higher pH than the manure systemable K was significantly higher on alternative fields com-at � � 0.05.pared with conventional fields in five of six farms and
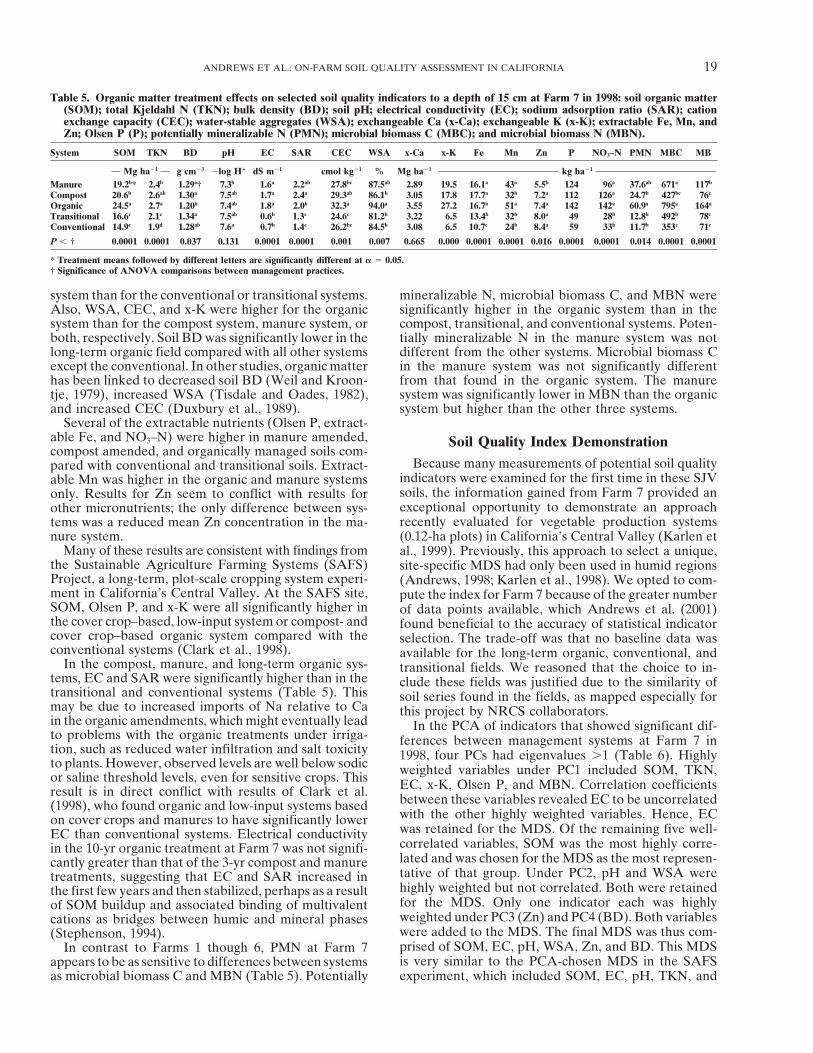
Similar to the six-farm comparison, SOM and TKNthe treatment means in 1998. While there were alsowere significantly higher in the organically managed andsignificant treatment differences in 1995, the x-K meancompost-amended soils than in the conventional andfor the alternative treatment was 11% greater than thetransitional soils at Farm 7 (Table 5). Water-stable ag-conventional treatment in 1995 and 20% greater in 1998
(P � 0.007). This was expected because K is a significant gregates, CEC, and x-K were higher for the organic
ANDREWS ET AL.: ON-FARM SOIL QUALITY ASSESSMENT IN CALIFORNIA 19
Table 5. Organic matter treatment effects on selected soil quality indicators to a depth of 15 cm at Farm 7 in 1998: soil organic matter(SOM); total Kjeldahl N (TKN); bulk density (BD); soil pH; electrical conductivity (EC); sodium adsorption ratio (SAR); cationexchange capacity (CEC); water-stable aggregates (WSA); exchangeable Ca (x-Ca); exchangeable K (x-K); extractable Fe, Mn, andZn; Olsen P (P); potentially mineralizable N (PMN); microbial biomass C (MBC); and microbial biomass N (MBN).
System SOM TKN BD pH EC SAR CEC WSA x-Ca x-K Fe Mn Zn P NO3–N PMN MBC MB
Mg ha�1 g cm�3 �log H� dS m�1 cmol kg�1 % Mg ha�1 kg ha�1
Manure 19.2b* 2.4b 1.29a† 7.3b 1.6a 2.2ab 27.8bc 87.5ab 2.89 19.5 16.1a 43a 5.5b 124 96a 37.6ab 671a 117b
Compost 20.6b 2.6ab 1.30a 7.5ab 1.7a 2.4a 29.3ab 86.1b 3.05 17.8 17.7a 32b 7.2a 112 126a 24.7b 427bc 76c
Organic 24.5a 2.7a 1.20b 7.4ab 1.8a 2.0b 32.3a 94.0a 3.55 27.2 16.7a 51a 7.4a 142 142a 60.9a 795a 164a
Transitional 16.6c 2.1c 1.34a 7.5ab 0.6b 1.3c 24.6c 81.2b 3.22 6.5 13.4b 32b 8.0a 49 28b 12.8b 492b 78c
Conventional 14.9c 1.9d 1.28ab 7.6a 0.7b 1.4c 26.2bc 84.5b 3.08 6.5 10.7c 24b 8.4a 59 33b 11.7b 353c 71c
P � † 0.0001 0.0001 0.037 0.131 0.0001 0.0001 0.001 0.007 0.665 0.000 0.0001 0.0001 0.016 0.0001 0.0001 0.014 0.0001 0.0001
* Treatment means followed by different letters are significantly different at � � 0.05.† Significance of ANOVA comparisons between management practices.
system than for the conventional or transitional systems. mineralizable N, microbial biomass C, and MBN weresignificantly higher in the organic system than in theAlso, WSA, CEC, and x-K were higher for the organic
system than for the compost system, manure system, or compost, transitional, and conventional systems. Poten-tially mineralizable N in the manure system was notboth, respectively. Soil BD was significantly lower in the
long-term organic field compared with all other systems different from the other systems. Microbial biomass Cin the manure system was not significantly differentexcept the conventional. In other studies, organic matter
has been linked to decreased soil BD (Weil and Kroon- from that found in the organic system. The manuresystem was significantly lower in MBN than the organictje, 1979), increased WSA (Tisdale and Oades, 1982),
and increased CEC (Duxbury et al., 1989). system but higher than the other three systems.Several of the extractable nutrients (Olsen P, extract-
able Fe, and NO3–N) were higher in manure amended, Soil Quality Index Demonstrationcompost amended, and organically managed soils com-
Because many measurements of potential soil qualitypared with conventional and transitional soils. Extract-indicators were examined for the first time in these SJVable Mn was higher in the organic and manure systemssoils, the information gained from Farm 7 provided anonly. Results for Zn seem to conflict with results forexceptional opportunity to demonstrate an approachother micronutrients; the only difference between sys-recently evaluated for vegetable production systemstems was a reduced mean Zn concentration in the ma-
nure system. (0.12-ha plots) in California’s Central Valley (Karlen etMany of these results are consistent with findings from al., 1999). Previously, this approach to select a unique,
the Sustainable Agriculture Farming Systems (SAFS) site-specific MDS had only been used in humid regionsProject, a long-term, plot-scale cropping system experi- (Andrews, 1998; Karlen et al., 1998). We opted to com-ment in California’s Central Valley. At the SAFS site, pute the index for Farm 7 because of the greater numberSOM, Olsen P, and x-K were all significantly higher in of data points available, which Andrews et al. (2001)the cover crop–based, low-input system or compost- and found beneficial to the accuracy of statistical indicatorcover crop–based organic system compared with the selection. The trade-off was that no baseline data wasconventional systems (Clark et al., 1998). available for the long-term organic, conventional, and
In the compost, manure, and long-term organic sys- transitional fields. We reasoned that the choice to in-tems, EC and SAR were significantly higher than in the clude these fields was justified due to the similarity oftransitional and conventional systems (Table 5). This soil series found in the fields, as mapped especially formay be due to increased imports of Na relative to Ca this project by NRCS collaborators.in the organic amendments, which might eventually lead In the PCA of indicators that showed significant dif-to problems with the organic treatments under irriga- ferences between management systems at Farm 7 intion, such as reduced water infiltration and salt toxicity 1998, four PCs had eigenvalues �1 (Table 6). Highlyto plants. However, observed levels are well below sodic weighted variables under PC1 included SOM, TKN,or saline threshold levels, even for sensitive crops. This EC, x-K, Olsen P, and MBN. Correlation coefficientsresult is in direct conflict with results of Clark et al.
between these variables revealed EC to be uncorrelated(1998), who found organic and low-input systems basedwith the other highly weighted variables. Hence, ECon cover crops and manures to have significantly lowerwas retained for the MDS. Of the remaining five well-EC than conventional systems. Electrical conductivitycorrelated variables, SOM was the most highly corre-in the 10-yr organic treatment at Farm 7 was not signifi-lated and was chosen for the MDS as the most represen-cantly greater than that of the 3-yr compost and manuretative of that group. Under PC2, pH and WSA weretreatments, suggesting that EC and SAR increased inhighly weighted but not correlated. Both were retainedthe first few years and then stabilized, perhaps as a resultfor the MDS. Only one indicator each was highlyof SOM buildup and associated binding of multivalentweighted under PC3 (Zn) and PC4 (BD). Both variablescations as bridges between humic and mineral phaseswere added to the MDS. The final MDS was thus com-(Stephenson, 1994).prised of SOM, EC, pH, WSA, Zn, and BD. This MDSIn contrast to Farms 1 though 6, PMN at Farm 7is very similar to the PCA-chosen MDS in the SAFSappears to be as sensitive to differences between systems
as microbial biomass C and MBN (Table 5). Potentially experiment, which included SOM, EC, pH, TKN, and

20 AGRONOMY JOURNAL, VOL. 94, JANUARY–FEBRUARY 2002
Table 7. Variables used as measures of management goals to testTable 6. Results of principal component analysis (PCA) of se-lected soil quality indicators from the five management systems the efficacy of the minimum data set (MDS) at Farm 7: gross
revenues (REV), yield as a proportion of county averageat West Side Demonstration (WSD) Farm 7 in 1998.(YLD), and sodium adsorption ration (SAR).
PCs† PC1 PC2 PC3 PC4 PC5System REV† YLD† SAR
Eigenvalue: 8.60‡ 2.22 1.93 1.24 0.80Percent: 50.60 13.06 11.35 7.30 4.70 $ ha�1
Cumulative percent: 50.60 63.67 75.02 82.32 87.01 Manure 2295 0.86 2.2a*Eigenvectors:§ Compost 2648 0.99 2.4ab
SOM, kg ha�1 0.295¶ �0.033 0.265 0.134 �0.187 Organic 2380 0.89 2.0b
TKN, kg ha�1 0.288# �0.133 0.154 0.322 �0.095 Transitional 1807 1.11 1.3c
BD, g cm�3 �0.127 �0.315 0.209 0.563 0.302 Conventional 1564 1.08 1.4c
pH, �log H� �0.104 0.522 0.094 0.253 0.119 P � ‡ 0.0001 0.0001 0.0001EC, dS m�1 0.282 �0.085 �0.280 �0.013 0.287
* Treatment means followed by different letters are significantly differentSAR 0.222 �0.102 �0.351 0.373 0.227at � 0.05.CEC, cmol kg�1 0.216 0.452 �0.004 0.164 �0.205
† Means comparison tests are not applicable because values are singleWSA, % 0.197 0.486 0.008 0.079 0.130 observances for each treatment.x-K, kg ha�1 0.303 �0.010 0.260 0.046 �0.123 ‡ Significance of nonparametric �2 comparisons between managementFe, kg ha�1 0.238 �0.147 �0.208 0.250 �0.554 practices.Mn, kg ha�1 0.277 �0.191 0.009 �0.362 �0.086Zn, kg ha�1 �0.093 �0.254 0.441 �0.025 �0.002
We used management goal data (Table 7) in a valida-Olsen P, kg ha�1 0.288 �0.119 �0.080 0.115 0.081tion check of the MDS representation of the system.NO3–N, kg ha�1 0.245 �0.048 �0.334 �0.220 �0.013
PMN, kg ha�1 0.265 �0.024 0.019 �0.132 0.553 Multiple regressions of the MDS indicators as indepen-MBC, kg ha�1 0.256 0.028 0.331 �0.146 0.053 dent variables and management goal data as iterativeMBN, kg ha�1 0.275 0.103 0.344 �0.171 0.118 dependent variables yielded coefficients of determina-
† PC, principal component. tion (r 2 ) of 0.81 for proportional yield, 0.84 for gross‡ Eigenvalues in italic correspond to the PCs examined for the index. revenues, and 0.77 for SAR. This suggests that the MDS§ SOM, soil organic matter; TKN, total Kjeldahl N; BD, bulk density;
is responsive to several management goals in this system.EC, electrical conductivity; SAR, sodium adsorption ratio; CEC, cationexchange capacity; WSA, water-stable aggregates; x-K, exchangeable K; In a more controlled environment (i.e., plot studies vs.PMN, potentially mineralizable N; MBC, microbial biomass C; MBN, on-farm trials), we would also include regressions againstmicrobial biomass N.
¶ Underlined factor loadings correspond to the indicators included in measures of environmental goals such as erosion andthe MDS. leaching. Nevertheless, these results are consistent with# Factor loadings in italic are considered highly weighted.
results from this technique in northern California (Kar-len et al., 1999) and in Georgia (Andrews, 1998; An-exchangeable Mg and Ca (Karlen et al., 1999). We sug-
gest that this similar composition of MDS’s is important, drews and Carroll, 2001) where greater numbers of man-agement goal variables were measured.considering there were differences in soil type, scale,
inputs, and analyses performed for the two studies. After the indicators were transformed using scoring
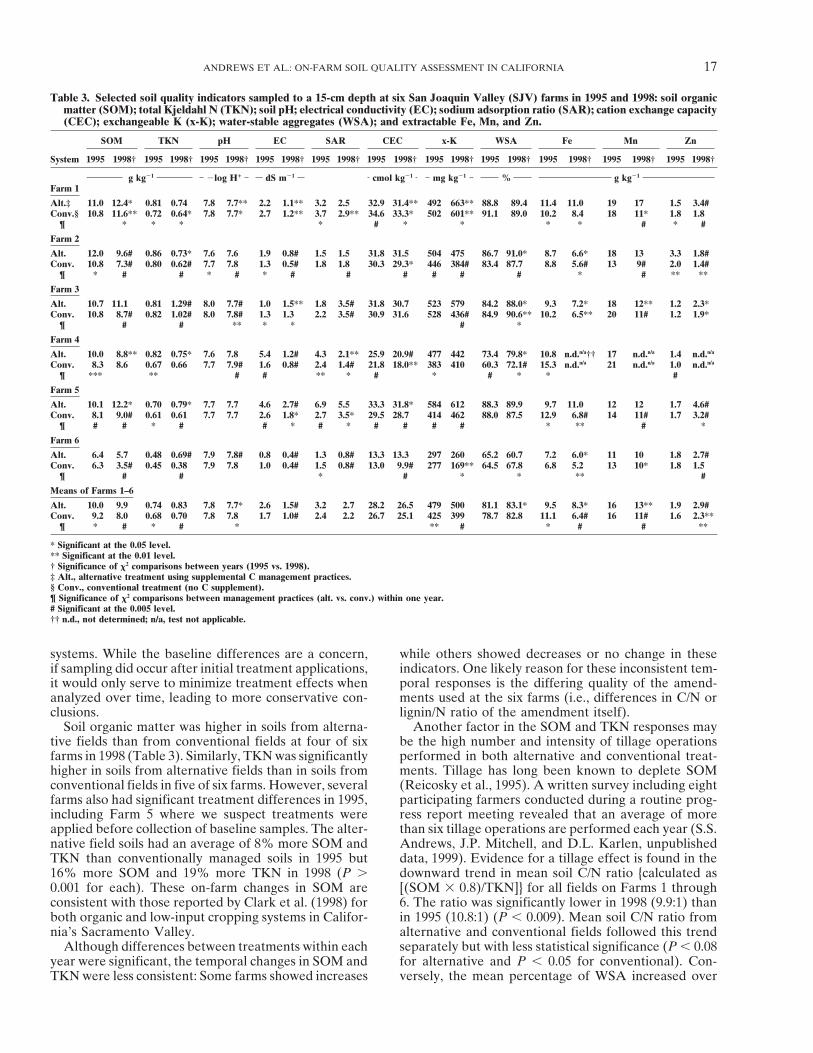
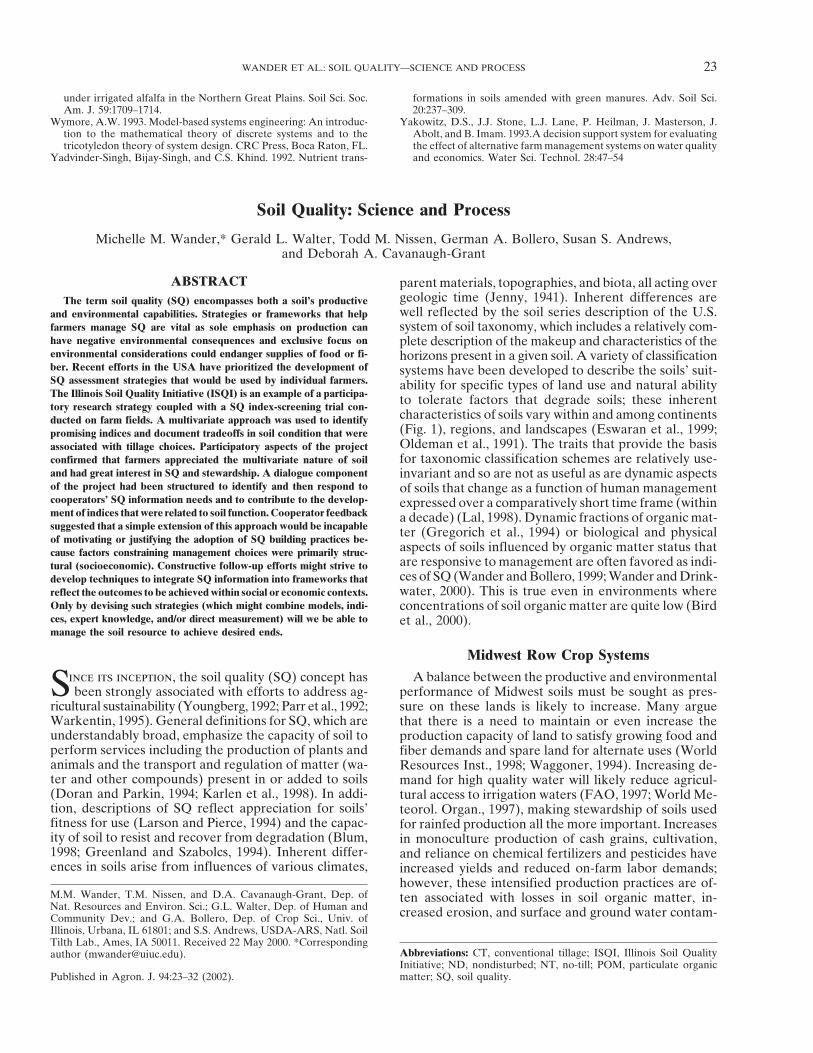
Fig. 2. Soil quality index (SQI) results for management comparisons at Farm 7 in 1998. Stacked bars show the component (scored and weighted)indicator means added to derive the overall index values. Error bars denote standard deviation of overall index values. Significant differencesbetween treatments are denoted by different letters at � � 0.10. BD, bulk density; WSA, water-stable aggregates; EC, electrical conductivity;SOM, soil organic matter.
ANDREWS ET AL.: ON-FARM SOIL QUALITY ASSESSMENT IN CALIFORNIA 21
functions (as shown in Fig. 1), the SQI was calculated lated. These data provide clear evidence that indicatorproperties can be changed through SOM building prac-using weighting factors for each scored MDS variable
according to the following formula: tices in an irrigated, mediterranean climate such as thatof the SJV. The fact that these differences were measur-
SQI � �n
i�1
0.61 � SSOMi � 0.61 � SECi � 0.16 able in an on-farm experiment utilizing the intensivetillage practices typical in the SJV (Mitchell et al., 2001)suggests simple SCMPs could significantly improve soil� SpHi � 0.16 � SWSAi � 0.14 � SZni
function without necessitating major management sys-� 0.09 � SBDi [2] tem changes in this region. However, reductions in syn-
thetic fertilizer inputs commensurate with the fertilizerwhere S is the score for the subscripted variable andeffect of the organic input will be necessary to reducethe coefficients are the weighting factors derived fromenvironmental risk (Sims, 1995).the PCA. Weights were determined by the percent of
This study also demonstrated that techniques usedvariation in the data set explained by the PC that con-to compute SQIs for controlled experiments could betributed the indicated variable divided by the total per-successfully applied to on-farm studies in the SJV bycentage of variation explained by all PCs with eigenvec-selecting site-specific indicators for a MDS, scoring indi-tors � 1 (see Table 6). Using this formula, the SOMcators according to their performance of soil functions,and EC variables appear to drive the SQI results (Fig.and combining the scored values into an integrative2). The organic system received the highest SQI value.index. This framework emphasizes that soil quality as-Soil quality indices for the manure and compost systemssessment is a tool that can be used to evaluate the effectswere significantly lower than the organic system butof land management practices on soil function.significantly higher than the conventional treatment.
The SQI value of the transitional system was not signifi-cantly different from the manure, compost, or conven- ACKNOWLEDGMENTStional systems. These results are supported by the SQI
This research was funded in part by the Kearney Founda-outcomes from the SAFS experiment where the organiction of Soil Science and the USDA-NRCS Soil Quality Insti-and low-input plots consistently received higher SQI tute. The authors wish to thank M.M. Wander and M.A. Liebig
scores compared with the conventional treatments (Kar- for useful commentary on the manuscript.len et al., 1999).
When these results were presented to the participat- REFERENCESing farmers, they expressed interest in the integrativeAndrews, S.S. 1998. Creating a minimum data set to compare soilindex, especially if used over time (data not shown).
quality under poultry litter management alternatives. p. 68–109.However, they preferred to have indicators scored on In Sustainable agriculture alternatives: Ecological and manageriala scale of 0 to 10 or 100, rather that 0 to 1, to allow for implications of poultry litter management alternatives applied tomore apparent differences among treatment fields. This agronomic soils. Ph.D. diss. Univ. of Georgia, Athens.
Andrews, S.S., and C.R. Carroll. 2001. Designing a decision tool forwould be simple to do and makes sense given that insustainable agroecosystem management: Soil quality assessmentpractice, farmers would have few replicates available toof a poultry litter management case study. Ecol. Applic. 11(6):draw statistically valid conclusions. The index outcomes (in press).
may reflect better yield to the extent that they reflect soil Andrews, S.S., D.L. Karlen, and J.P. Mitchell. 2001. A comparisonof soil quality indexing methods for vegetable production systemsfunctions such as nutrient cycling and water partitioning.in northern California. Agric. Ecosyst. Environ. (in press).These outcomes may also reflect ecosystem services
Blake, G.R., and K.H. Hartge. 1986. Bulk density. p. 363–375. In A.such as filtering and buffering for environmental protec- Klute (ed.) Methods of soil analysis. Part 1. 2nd ed. SSSA Booktion. It is likely that these benefits would be most appar- Ser. 5. ASA and SSSA, Madison, WI.ent under stress conditions, i.e., severe drought or heat, Bolton, H., L.F. Elliott, and R.I. Papendick. 1985. Soil microbial
biomass and selected soil enzyme activities: Effect of fertilizationwhen soil function is less able to be subsidized by addi-and cropping practices. Soil Biol. Biochem. 17:297–302.tional inputs (Herrick et al., 2002).
Brejda, J.J., T.B. Moorman, D.L. Karlen, and T.H. Dao. 2000. Identifi-cation of regional soil quality factors and indicators: I. Central andSouthern High Plains. Soil Sci. Soc. Am. J. 64:2115–2124.SUMMARY AND CONCLUSIONS Bundy, L.G., and J.J. Meisinger. 1994. Nitrogen availability indices.p. 951–985. In R.W. Weaver et al. (ed.) Methods of soil analysis.Negotiating the on-farm participatory research designPart 2. SSSA Book Ser. 5. SSSA, Madison, WI.was a learning process for all involved and from the ex- Cabrera, M.L., and R.M. Gordillo. 1995. Nitrogen release from land-
tension–outreach perspective, very successful. The par- applied animal manures. p. 393–403. In K. Steele (ed.) Animalwaste and the land–water interface. Lewis Publ., New York.ticipatory nature of this project made the results acces-
California Department of Food and Agriculture. 1997. California ag-sible and useful to the farmers involved. Although therericultural statistical review for 1997. California Dep. of Food andwas reluctance among WSD participants to reduce min-Agric., Sacramento, CA.
eral fertilizer inputs in their alternative fields, all partici- Carlson, R.M. 1978. Automated separation and conductimetric deter-pants agreed that the information exchange facilitated mination of ammonia and dissolved carbon dioxide. Anal. Chem.
50:1528–1531.by this project may make such reductions more feasibleChristensen, B.T. 1996. Matching measurable soil organic matter frac-in the future. Despite variations in SCMPs among farms,
tions with conceptual pools in simulation models of carbon turn-a number of soil quality indicators varied significantly. over: Revision of model structure. p. 143–159. In D.S. Powlson etSome of the most significant changes were for SOM, al. (ed.) Evaluation of organic matter models. NATO ASI Ser.
Vol. 138. Springer-Verlag, Berlin.TKN, x-K, and MBN, all of which were highly corre-

22 AGRONOMY JOURNAL, VOL. 94, JANUARY–FEBRUARY 2002
Clark, S., W.R. Horwath, C. Shennan, and K.M. Scow. 1998. Changes Mitchell, J.P., and P.B. Goodell. 1996. Extending biologically inte-grated farming systems within the San Joaquin Valley’s West Side.in soil chemical properties resulting from organic and low-input
farming practices. Agron. J. 90:662–671. 1996 Annu. Rep. to the Sustainable Agric. Res. and Educ. Progr.Biol. Integrated Farming Syst. Progr. Div. of Agric. and Nat. Re-Doran, J.W., and T.B. Parkin. 1994. Defining and assessing soil quality.
p. 3–21. In J.W. Doran et al. (ed.) Defining soil quality for a sus- sources, Univ. of California, Davis.Mitchell, J.P., T.K. Hartz, G.S. Pettygrove, D.S. Munk, D. May, F.tainable environment. SSSA Spec. Publ. 35. ASA and SSSA, Madi-
son, WI. Menezes, J. Diener, and T. O’Neill. 1999. Organic matter recyclingvaries with crops grown. Calif. Agric. 53:37–40.Dunteman, G.H. 1989. Principal components analysis. Sage Publ.,
London. Mitchell, J.P., W.T. Lanini, S.R. Temple, P.N. Brostrom, E.V. Herrero,E.M. Miyao, T.S. Prather, and K.J. Hembree. 2001. Reduced-distur-Duxbury, J.M., M.S. Smith, J.W. Doran, C. Jordan, L. Szott, and E.
Vance. 1989. Soil organic matter as a source and sink of plant bance agroecosystems in California. In Proc. Int. Congr. for Eco-syst. Health, Sacramento, CA. 15–20 Aug. 1999. Ecology Action,nutrients. p. 33–67. In D.C. Coleman et al. (ed.) Dynamics of soil
organic matter in tropical ecosystems. NifTAL Project, Hono- Willits, CA (in press).Nelson, D.W., and L.E. Sommers. 1982. Total carbon, organic carbonlulu, HI.
Fresno Department of Agriculture. 1998. Agricultural crop and live- and organic matter. p. 539–579. In A.L. Page et al. (ed.) Methods ofsoil analysis. Part 2. 2nd ed. SSSA Book Ser. 5. SSSA, Madison, WI.stock report. Fresno Dep. of Agric., Fresno, CA.
Gagnon, B., and R.R. Simard. 1999. Nitrogen and phosphorus release Norgaard, R.B. 1994. Ecology, politics, and economics: Finding thecommon ground for decision making in conservation. p. 439–465.from on-farm and industrial composts. Can. J. Soil Sci. 79:481–489.
Gee, G.W., and J.W. Bauder. 1986. Particle size analysis. p. 383–411. In G.K. Meffe and C.R. Carroll (ed.) Principles of conservationbiology. Sinauer Assoc., Sunderland, MA.In A. Klute (ed.) Methods of soil analysis. Part 1. 2nd ed. SSSA
Book Ser. 5. ASA and SSSA, Madison, WI. Olsen, S.R., C.V. Cole, F.S. Watanabe, and L.A. Dean. 1954. Estima-tion of available phosphorous in soils by extraction with sodiumHartz, T.K., J.P. Mitchell, and C. Giannini. 2000. Nitrogen and carbon
mineralization dynamics of manures and composts. HortScience 35: bicarbonate. USDA Circ. 939. USDA, Washington, DC.Ott, L. 1988. An introduction to statistical methods. 3rd ed. PWS-209–212.
Herrick, J.E., J.R. Brown, A. Tugel, P.L. Shaver, and K.M. Havstad. Kent Publ. Co., Boston, MA.Perucci, P. 1992. Enzyme activity and microbial biomass in a field2002. Application of soil quality to monitoring and management:
Paradigms from rangeland ecology. Agron. J. 94:3–11 (this issue). amended with municipal refuse. Biol. Fertil. Soils 14:54–60.Reicosky, D.C., W.D. Kemper, G.W. Langdale, C.L. Douglas, Jr.,Horwath, W.R., and E.A. Paul. 1994. Microbial biomass. p. 753–773.
In R.W. Weaver et al. (ed.) Biochemical and microbiological prop- and P.E. Rasmussen. 1995. Soil organic matter changes resultingfrom tillage and biomass production. J. Soil Water Conserv. 50:253–erties of soil. Part 2. SSSA Book Ser. 5. SSSA, Madison, WI.
Horwath, W.R., E.A. Paul, D. Harris, J. Norton, L. Jagger, and K.A. 261.Rhoades, J.D. 1982. Soluble salts. p. 635–655. In A.L. Page et al. (ed.)Horton. 1996. Defining a realistic control for the chloroform fumi-
gation–incubation method using microscopic counting and 14C- Methods of soil analysis. Part 2. 2nd ed. SSSA Book Ser. 5. SSSA,Madison, WI.labeled substrates. Can. J. Soil Sci. 76:459–467.
Issac, R.A., and W.C. Johnson. 1976. Determination of total nitrogen San Joaquin Valley Drainage Program. 1990. A management planfor agricultural subsurface drainage and related problems on thein plant tissue using a block digestor. J. Assoc. Off. Anal. Chem.
59:98–100. Westside San Joaquin Valley. Final Report of the San JoaquinValley Drainage Program. U.S. Dep. of Interior and CaliforniaJanitzky, P. 1986. Cation exchange capacity. In M.J. Singer and P.
Janitzky (ed.) Field and laboratory procedures used in a soil chro- Resources Agency, Sacramento, CA.Sharpley, A.N., S.C. Chapra, R. Wedepohl, J.T. Sims, T.C. Daniel,nosequence study. U.S. Geol. Survey Bull. 1648. U.S. Gov. Print.
Office, Washington, DC. and K.R. Reddy. 1994. Managing agricultural phosphorus for pro-tection of surface waters: Issues and options. J. Environ. Qual.Karlen, D.L., S.S. Andrews, and J.P. Mitchell. 1999. A soil quality
index for vegetable production. p. 219. In 1999 Agron. abstr. ASA, 23:437–451.Sharpley, A.N., S.J. Smith, and W.R. Bain. 1993. Nitrogen and phos-Madison, WI.
Karlen, D.L., and T.S. Colvin. 1992. Alternative farming system effects phorus fate from long-term poultry litter applications to Oklahomasoils. Soil Sci. Soc. Am. J. 57:1131–1137.on profile nitrogen concentrations on two Iowa farms. Soil Sci.
Soc. Am. J. 56:1249–1256. Sims, J.T. 1995. Characteristics of animal wastes and waste-amendedsoils: An overview of the agricultural and environmental issues. p.Karlen, D.L., J.C. Gardner, and M.J. Rosek. 1998. A soil quality
framework for evaluating the impact of CRP. J. Prod. Agric. 11: 1–13. In K. Steele (ed.) Animal waste and the land–water interface.Lewis Publ., New York.56–60.
Karlen, D.L., and D.E. Stott. 1994. A framework for evaluating physi- Soil Survey Staff. 1998. A rapidly executable point protocol for partialsoil quality evaluation. USDA-NRCS Nat. Soil Survey Cent., Lin-cal and chemical indicators of soil quality. p. 53–72. In J.W. Doran
et al. (ed.) Defining soil quality for a sustainable environment. coln, NE.Stephenson, A.H., T.A. McCaskey, and B.G. Ruffin. 1990. A survey ofSSSA Spec. Publ. 35. ASA and SSSA, Madison, WI.
Keeney, D.R., and D.W. Nelson. 1982. Nitrogen—inorganic forms. broiler litter composition and potential value as a nutrient resource.Biol. Wastes 34:1–9.p. 643–698. In A.L. Page et al. (ed.) Methods of soil analysis. Part
2. 2nd ed. SSSA Book Ser. 5. SSSA, Madison, WI. Stephenson, F.J. 1994. Humis chemistry. John Wiley & Sons, NewYork.Kemper, W.D., and R.L. Rosenau. 1986. Aggregate stability and size
distribution. p. 425–442. In C.A. Black (ed.) Methods of soil analy- Tanji, K.K. 1990. Agricultural salinity assessment and management.Manual 71. Am. Soc. Civil Eng., New York.sis. Part 1. 2nd ed. SSSA Book Ser. 5. ASA and SSSA, Madison, WI.
Kirchner, M.J., A.G. Wollum II, and L.D. King. 1993. Soil microbial Tiessen, H., E. Cuevas, and P. Chacon. 1994. The role of organicmatter in sustaining soil fertility. Nature (London) 371:783–785.populations and activities in reduced chemical input agroecosys-
tems. Soil Sci. Soc. Am. J. 57:1289–1295. Tisdale, J.M., and J.M. Oades. 1982. Organic matter and water-stableaggregates in soils. J. Soil Sci. 33:141–163.Knudsen, D., G.A. Peterson, and P.F. Pratt. 1982. Lithium, sodium
and potassium. p. 225–246. In A.L. Page et al. (ed.) Methods of U.S. Salinity Laboratory Staff. 1954. Diagnosis and improvement ofsaline and alkali soils. In L.A. Richards (ed.) USDA Handb. 60.soil analysis. Part 2. 2nd ed. SSSA Book Ser. 5. SSSA, Madison, WI.
Lanyon, L.E., and W.R. Heald. 1982. Magnesium, calcium, strontium USDA, Washington, DC.Weil, R.R., and W. Kroontje. 1979. Physical condition of a Davidsonand barium. p. 247–262. In A.L. Page et al. (ed.) Methods of soil
analysis. Part 2. 2nd ed. SSSA Book Ser. 5. SSSA, Madison, WI. clay loam after five years of heavy poultry manure applications.J. Environ. Qual. 8:387–392.Lindsay, W.L., and W.A. Norvell. 1978. Development of a DTPA
soil test for zinc, iron manganese and copper. Soil Sci. Soc. Am. Whittaker, C.W., M.S. Anderson, and R.F. Reitemeier. 1959. Limingsoils: An aid to better farming. USDA Farmers Bull. 2124. U.S.J. 42:421–428.
Maynard, D.N. 1997. Knott’s handbook for vegetable production. 4th Gov. Print. Office, Washington, DC.Wienhold, B.J., and T.P. Trooien. 1995. Salintiy and sodicity changesed. John Wiley & Sons, New York.
WANDER ET AL.: SOIL QUALITY—SCIENCE AND PROCESS 23
under irrigated alfalfa in the Northern Great Plains. Soil Sci. Soc. formations in soils amended with green manures. Adv. Soil Sci.20:237–309.Am. J. 59:1709–1714.
Wymore, A.W. 1993. Model-based systems engineering: An introduc- Yakowitz, D.S., J.J. Stone, L.J. Lane, P. Heilman, J. Masterson, J.Abolt, and B. Imam. 1993.A decision support system for evaluatingtion to the mathematical theory of discrete systems and to the
tricotyledon theory of system design. CRC Press, Boca Raton, FL. the effect of alternative farm management systems on water qualityand economics. Water Sci. Technol. 28:47–54Yadvinder-Singh, Bijay-Singh, and C.S. Khind. 1992. Nutrient trans-
Soil Quality: Science and Process
Michelle M. Wander,* Gerald L. Walter, Todd M. Nissen, German A. Bollero, Susan S. Andrews,and Deborah A. Cavanaugh-Grant
ABSTRACT parent materials, topographies, and biota, all acting overgeologic time (Jenny, 1941). Inherent differences areThe term soil quality (SQ) encompasses both a soil’s productivewell reflected by the soil series description of the U.S.and environmental capabilities. Strategies or frameworks that help
farmers manage SQ are vital as sole emphasis on production can system of soil taxonomy, which includes a relatively com-have negative environmental consequences and exclusive focus on plete description of the makeup and characteristics of theenvironmental considerations could endanger supplies of food or fi- horizons present in a given soil. A variety of classificationber. Recent efforts in the USA have prioritized the development of systems have been developed to describe the soils’ suit-SQ assessment strategies that would be used by individual farmers. ability for specific types of land use and natural abilityThe Illinois Soil Quality Initiative (ISQI) is an example of a participa- to tolerate factors that degrade soils; these inherenttory research strategy coupled with a SQ index-screening trial con-
characteristics of soils vary within and among continentsducted on farm fields. A multivariate approach was used to identify(Fig. 1), regions, and landscapes (Eswaran et al., 1999;promising indices and document tradeoffs in soil condition that wereOldeman et al., 1991). The traits that provide the basisassociated with tillage choices. Participatory aspects of the projectfor taxonomic classification schemes are relatively use-confirmed that farmers appreciated the multivariate nature of soil
and had great interest in SQ and stewardship. A dialogue component invariant and so are not as useful as are dynamic aspectsof the project had been structured to identify and then respond to of soils that change as a function of human managementcooperators’ SQ information needs and to contribute to the develop- expressed over a comparatively short time frame (withinment of indices that were related to soil function. Cooperator feedback a decade) (Lal, 1998). Dynamic fractions of organic mat-suggested that a simple extension of this approach would be incapable ter (Gregorich et al., 1994) or biological and physicalof motivating or justifying the adoption of SQ building practices be-
aspects of soils influenced by organic matter status thatcause factors constraining management choices were primarily struc-are responsive to management are often favored as indi-tural (socioeconomic). Constructive follow-up efforts might strive toces of SQ (Wander and Bollero, 1999; Wander and Drink-develop techniques to integrate SQ information into frameworks thatwater, 2000). This is true even in environments wherereflect the outcomes to be achieved within social or economic contexts.
Only by devising such strategies (which might combine models, indi- concentrations of soil organic matter are quite low (Birdces, expert knowledge, and/or direct measurement) will we be able to et al., 2000).manage the soil resource to achieve desired ends.
Midwest Row Crop SystemsA balance between the productive and environmentalSince its inception, the soil quality (SQ) concept has
been strongly associated with efforts to address ag- performance of Midwest soils must be sought as pres-ricultural sustainability (Youngberg, 1992; Parr et al., 1992; sure on these lands is likely to increase. Many argueWarkentin, 1995). General definitions for SQ, which are that there is a need to maintain or even increase theunderstandably broad, emphasize the capacity of soil to production capacity of land to satisfy growing food andperform services including the production of plants and fiber demands and spare land for alternate uses (Worldanimals and the transport and regulation of matter (wa- Resources Inst., 1998; Waggoner, 1994). Increasing de-ter and other compounds) present in or added to soils mand for high quality water will likely reduce agricul-(Doran and Parkin, 1994; Karlen et al., 1998). In addi- tural access to irrigation waters (FAO, 1997; World Me-tion, descriptions of SQ reflect appreciation for soils’ teorol. Organ., 1997), making stewardship of soils usedfitness for use (Larson and Pierce, 1994) and the capac- for rainfed production all the more important. Increasesity of soil to resist and recover from degradation (Blum, in monoculture production of cash grains, cultivation,1998; Greenland and Szabolcs, 1994). Inherent differ- and reliance on chemical fertilizers and pesticides haveences in soils arise from influences of various climates, increased yields and reduced on-farm labor demands;
however, these intensified production practices are of-M.M. Wander, T.M. Nissen, and D.A. Cavanaugh-Grant, Dep. of ten associated with losses in soil organic matter, in-Nat. Resources and Environ. Sci.; G.L. Walter, Dep. of Human and creased erosion, and surface and ground water contam-Community Dev.; and G.A. Bollero, Dep. of Crop Sci., Univ. ofIllinois, Urbana, IL 61801; and S.S. Andrews, USDA-ARS, Natl. SoilTilth Lab., Ames, IA 50011. Received 22 May 2000. *Corresponding
Abbreviations: CT, conventional tillage; ISQI, Illinois Soil Qualityauthor ([email protected]).Initiative; ND, nondisturbed; NT, no-till; POM, particulate organicmatter; SQ, soil quality.Published in Agron. J. 94:23–32 (2002).


