Embed Size (px)
Citation preview

JOURNAL O1• GEOPHYSICAL RESEARCH, SPACE PHYSICS VOL. 75. No. 19, JULY 1, 1970
OGO 5 Observations of Electrostatic Turbulence in Bow Shock Magnetic Structures
l•. W. ]FREDRICKS, G. M. CROOK, C. F. KENNEL, 2 I. M. GREEN, AND F. L. SCARF
Space Sciences Laboratory, TR W Systems Group Redondo Beach, California 90278
P. J. COLEMAN AND C. T. RUSSELL
Institute o/ Geophysics and Planetary Physics University o• California, Los Angeles, California 90024
We present magnetic field, VLF electric field, and directed positive ion flux measurements made during passage of OGO 5 through many bow shock structures both inbound and out- bound on March 12, 1968. These shocks were chosen because the period March 11-13, 1968, was one of a reasonably quiet solar wind. The data are correlated on time scales •_144 msec and show that electrostatic wave turbulence is generated in the shock front by diamagnetic currents flowing on scale lengths •c/,•p-, the electron inertial length. This electrostatic tur- bulence builds to high levels near or in the regions of large jumps in ]B] and then decays rapidly downstream. A jump in I BI and the scattering or randomization of protons are observed to occur only a•ter a strong level of electrostatic turbulence is achieved; this leads to the conclusion that the electrostatic turbulence is a major contributor to the shock dis- sipative process. This turbulence is best explained as the ion acoustic or Buneman mode due to two-stream instability. One very thick shock structure is displayed which contains many very large amplitude and nearly reversible magnetic field pulsations.
INTRODUCTION
In this paper we present some field and particle data acquired by experiments aboard the OGO 5 spacecraft during traversals of bow shock structures on both inbound and outbound orbital
segments on March 12, 1968. The highly eccentric orbit, the high data rate telemetry, and the unique combination of particle and field experiments aboard OGO 5 make possible an examination of the bow shock on scales so
short that wave-particle interactions and their influence on structural details of the shock may be examined directly. The mean free path for particle collisions is about 1 AU in the solar wind near the earth; the plasma Debye length kz• = (KT•/4•rNe")"" and the electron and proton inertial lengths c/w•- and c/w• + are, respectively, a few tens of meters, several kilometers, and
x Institute of Geophysics and Planetary Physics Publication 813.
2 Permanent address' Department of Physics, University of California, Los Angeles, California 90024.
Copyright (• 1970 by the American Geophysical Union.
several tens to about a hundred kilometers. Of
these three plasma lengths, only kD presents difficulty in its resolution when using the high data rates of OGO 5. Since wave-particle interactions on the scale lengths kD and replace ordinary particle-particle collisions in the so-called 'collisionless' plasma shock, it is clear that the OGO 5 observations are important to the understanding of dissipation and disper- sion properties of the earth's bow shock, and indeed may allow extrapolation to a whole class of high /S, high Alfv•n-Mach number shocks.
The inclusion of the first VLF electric field
experiment on OGO 5 leads to acquisition of a new type of data in the bow shock region: measurement of fluctuating electric fields due to plasma oscillations. Such oscillations, arising from current-driven instabilities in the hydro- magnetic shock structure, have long been post- ulated as a dissipation mechanism to replace ordinary particle collisions [Sagdeer, 1965; Sagdeer and Galeev, 1966; Kellogg, 1964; Tidman, 1967a, b; Fredricks eta/., 1968; Fredricks and Coleman, 1969; Krall and Book, 1969], As shown
3751
3752 FREDRICKS ET AL.
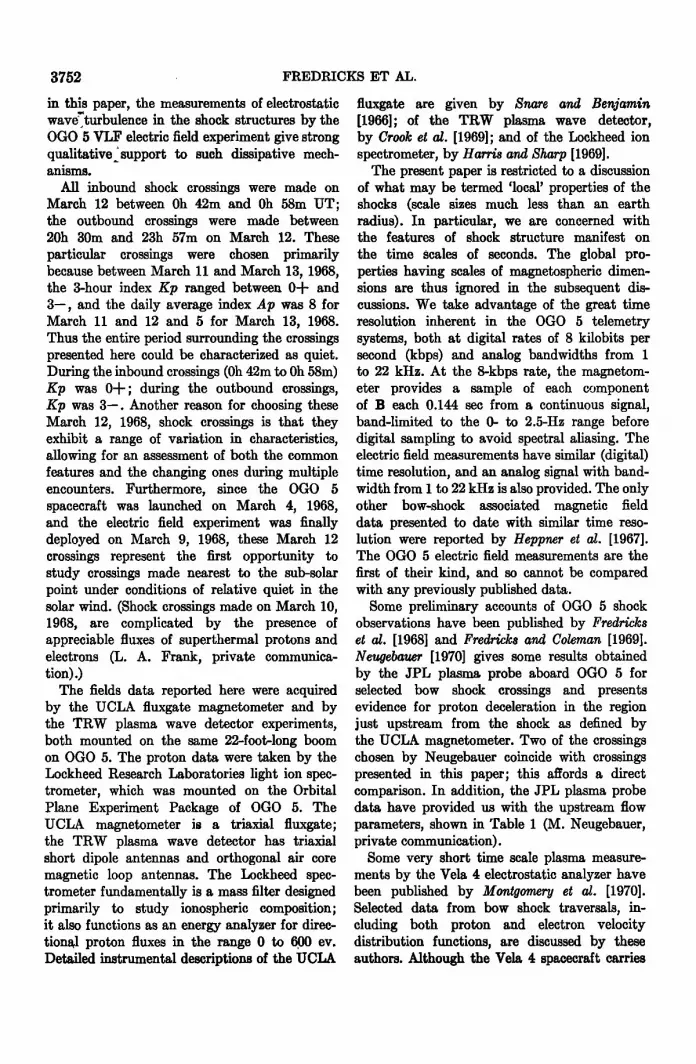
in this paper, the measurements of electrostatic wave•i•turbulence in the shock structures by the OGO 5 VLF electric field experiment give strong qualitative'•Support to such dissipative mech- anisms.
All inbound shock crossings were made on March 12 between Oh 42m and Oh 58m UT; the outbound crossings were made between 20h 30m and 23h 57m on March 12. These
particular crossings were chosen primarily because between March 11 and March 13, 1968, the 3-hour index Kp ranged between 0-• and 3--, and the daily average index A p was 8 for March 11 and 12 and 5 for March 13, 1968. Thus the entire period surrounding the crossings presented here could be characterized as quiet. During the inbound crossings (Oh 42m to Oh 58m) Kp was 0-•; during the outbound crossings, Kp was 3--. Another reason for choosing these March 12, 1968, shock crossings is that they exhibit a range of variation in characteristics, allowing for an assessment of both the common features and the changing ones during multiple encounters. Furthermore, since the OGO 5 spacecraft was launched on March 4, 1968, and the electric field experiment was finally deployed on March 9, 1968, these March 12 crossings represent the first opportunity to study crossings made nearest to the sub-solar point under conditions of relative quiet in the solar wind. (Shock crossings made on March 10, 1968, are complicated by the presence of appreciable fluxes of superthermal protons and electrons (L. A. Frank, private communica- tion) .)
The fields data reported here were acquired by the UCLA fluxgate magnetometer and by the TRW plasma wave detector experiments, both mounted on the same 22-foot-long boom on OGO 5. The proton data were taken by the Lockheed Research Laboratories light ion spec- trometer, which was mounted on the Orbital Plane Experiment Package of OGO 5. The UCLA magnetometer is a triaxial fluxgate; the TRW plasma wave detector has triaxial short dipole antennas and orthogonal air core magnetic loop antennas. The Lockheed spec- trometer fundamentally is a mass filter designed primarily to study ionospheric composition; it also functions as an energy analyzer for direc- tional proton fluxes in the range 0 to 6.00 ev. Detailed instrumental descriptions of the UCLA
fluxgate are given by Snare and Benjamin [1966]; of the TRW plasma wave detector, by Crook et al. [1969]; and of the Lockheed ion spectrometer, by Harris and Sharp [1969].
The present paper is restricted to a discussion of what may be termed 'local' properties of the shocks (scale sizes much less than an earth radius). In particular, we are concerned with the features of shock structure manifest on
the time 'scales of seconds. The global pro- perties having scales of magnetospheric dimen- sions are thus ignored in the subsequent dis- cussions. We take advantage of the great time resolution inherent in the OGO 5 telemetry systems, both at digital rates of 8 kilobits per second (kbps) and analog bandwidths from 1 to 22 kHz. At the 8-kbps rate, the magnetom- eter provides a sample of each component of B each 0.144 sec from a continuous signal, band-limited to the 0- to 2.5-Hz range before digital sampling to avoid spectral aliasing. The electric field measurements have similar (digital) time resolution, and an analog signal with band- width from I to 22 kHz is also provided. The only other bow-shock associated magnetic field data presented to date with similar time reso- lution were reported by Heppner et al. [1967]. The OGO 5 electric field measurements are the
first of their kind, and so cannot be compared with any previously published data.
Some preliminary accounts of OGO 5 shock observations have been published by Fredricks et al. [1968] and Fredricks and Coleman [1969]. Neugebauer [1970] gives some results obtained by the JPL plasma probe aboard OGO 5 for selected bow shock crossings and presents evidence for proton deceleration in the region just upstream from the shock as defined by the U CLA magnetometer. Two of the crossings chosen by Neugebauer coincide with crossings presented in this paper; this affords a direct comparison. In addition, the JPL plasma probe data have provided us with the upstream flow parameters, shown in Table I (M. Neugebauer, private communication).
Some very short time scale plasma measure- ments by the Vela 4 electrostatic analyzer have been published by Montgomery et al. [1970]. Selected data from bow shock traversals, in- cluding both proton and electron velocity distribution functions, are discussed by these authors. Although the Vela 4 spacecraft carries

BOW SHOCK ELECTROSTATIC TURBULENCE
TABLE 1. Upstream Plasma and Orbital Parameters Times are universal time.
3753
0h42m 0h48m 0h52m 20h43m 22h39m 22h45m 22h48m 23h57m
RSAT, Rz 14.7 14.6 14.6 17.1 18.5 18.6 18.6 19.4 sA T, deg 27 27 27 49 48 48 48 48 SA T, deg 335 335 335 298 301 301 301 303 SAT, km sec -• 1.9 1.9 1.9 1.5 1.3 1.3 1.3 1.2
•., deg --44 -44 -44 34 31 31 31 29 •., deg 133 133 133 326 329 330 330 332 Uo, km sec -' 378 387 390 350 382 347 348 350 n+, cm -8 9.5 10.0 10.9 10 12.1 14.8 15.1 10 1og,o T•,, øK 4.5 4.8 4.7 4.5 4.5 4.7 4.7 ? [B[, • 7.2 6.5 7 3.5 9 8 5 8.6
no field experiments with which these excellent particle data might have been correlated, we feel that the Vela 4 measurements are easily reconciled with the field and particle measure- ments from OGO 5 presented here. We concur in the initial speculations of Montgomery et al. on the relationship of their Vela 4 data to pre- viously published descriptions of OGO 5 shock structures [Fredricks et al., 1968; Fredricks and Coleman, 1969].
OBSERVATION S
In Figure I we show the pertinent segments of OGO 5 orbits 3 and 4, on which traversals of the shock structures occur. The inbound
portion of orbit 3 between Oh 42m 30s and approximately Oh 53m UT on March 12, 1968, contains crossings shown on Figures 2 to 5. The outbound segment of orbit 4 between 20h 42m and 23h 56m UT on March 12, 1968, contains the shock structures shown in Figures 6 to 10. Similarities and differences can be found in all
these shock structures, which we shall discuss in some detail.
Figure 2 shows three shock crossings; the first is comparatively gradual and the second and third are quite sharp. The upstream par- ameters (before Oh 42m UT) are given in Tables I and 2. The central panel of Figure 2 shows the total magnetic field measured by the UCLA triaxial fluxgate magnetometer. The top panel in Figure 2 shows a dynamic spectrum (f-t diagram) formed from the 0.5- to 5-kHz portion of the TRW electric dipole signal on the special- purpose analog channel. (Mixed with this electric field signal at the lower frequency end, •1 kHz, are a few signals from the GSFC
rubidium vapor magnetometer. These can easily be identified by direct comparison in time with the fluxgate wave form on the central panel.) The bottom panel in Figure 2 shows the directed positive ion flux J+ measured by the Lockheed ion spectrometer in the proton energy range 0-600 ev. During this period the sun-satellite- spectrometer angle was approximately 61 ø . This geometrical consideration is important to the interpretation of flux data. The gaps in the J+ data in Figure 2 et seq. are due to alternate switching between a low-sensitivity mode (gaps) and a high-sensitivity (data as shown) mode of operation. Thus, the blank periods have no physical significance. Since the data shown in Figures 2 and 3 demonstrate the wide structural variability of the bow shock on time scales of tens of seconds, we shall now describe in some detail the salient features of
the crossings they contain. At Oh 42m 28s the fluxgate magnetometer
began to sense compressional fluctuations of gently increasing magnitude, which lasted until about Oh 43m 05s. This magnetic structure contains periods •-•1 sec or less, with AB/B generally less than but comparable to unity near the end of the interval. The interesting property of this precursor region (•-•37 sec long) is the variation of [B[ between a minimum value, which is approximately equal to that of the upstream field [B0[ before Oh 42m 28s, and the gradually increasing maxima, which peak near 1.5 times IBo[. These variations in lB[ are accompanied by bursts of electric field fluctua- tions as shown by the dynamic spectrum in the top panel. The electric field bursts correlate quite well with 'individual gradients (slopes)

3754 FREDRICKS ET AL.
Rho
I i ' I
• Shocks
15
IO o
15 10 5
• Xse
is observed in association with this ev•ent; strong broad-band electric fields are indicated by the f-t plot. Large amplitude variations in IBI follow this until about Oh 43m 35s, when a rapid transition to a region similar to that around Oh 42m 30s is observed. Another rapid increase of IBI occurs between Oh 43m 50s and Oh 43m 53s, where the field changes from •10 to •40 y. Note the narrowly confined, strong burst of broad-band electric fluctuations near Oh 43m 51s.
The record shown in Figure 3 begins about 30
sec after that of Figure 2 ends. This whole region is characterized by large amplitude com- pressions and rotations of B, measurable fluxes J+, and small electric field noise levels. At Oh 45m 54s, a sharply defined transition from
Fig. 1. Geometry of March 12, 1968, shock this 'downstream' region occurs, and from encounters. Here Rho -- (Y,e • • Zse•) TM and X,• Oh 46m until near Oh 52m 30s, the spacecraft are geocentric cylindrical solar ecliptic coordi- was again in the solar wind. nates in units of earth radii. Universal time is shown (in hours)at points along the orbit. Any definition of 'the shock front' on the
basis of the data in Figures 2 and 3 is ambiguous. One would tentatively define a shock near
in the IBI fluctuations. We also note that the Oh 43m 07s, another at Oh 43m 38s, a third at ion flux J+ is •104 cm-'- sec -• in this initial Oh 43m 51s, and a final one at Oh 45m 54s. The field structure, which indicates little proton last three are sharply defined by all three instru- heating and no large angle deflection of the ments, whereas the first contains a long pre- plasma flow. In all discussions of the changes cursor structure in the electric and magnetic in ion spectrometer fluxes, we shall use the fields data. We shall offer possible interpreta- 'heating' and 'scattering' somewhat loosely. tions of Figures 2 and 3 in our discussion section. The quantitativeseparation of flux enhancements Figure 4 shows data for a shock structure at shock encounters into randomization or initially discussed in preliminary papers by bulk deflection of ion flow will not be made. On Fredricks et al. [1968] and Fredricks and Coleman the basis of aerodynamic calculations for the [1969]. This shock also was recently discussed bow shock, however, the magnetosheath bulk by Neugebauer [1970], who noted a net decelera- flow should be deflected away from the accept- tion of protons without significant heating or ance cone of the ion spectrometer. Thus, direction change in the region between Oh 52m enhanced fluxes recorded by the spectrometer 10s and Oh 52m 31s. The proton flow energy are explicitly assumed here to be the result changed from about 794 to 560 ev in this time of at least strong ion scattering, if not full thermalization. The word 'heating,' as used in TABLE 2. Direction Cosines of TheoreticalShock this paper, does not imply that thermal equili- Normals brium is achieved, but rather it is used to mean that a large disturbance of the initial (solar Time GSM GSE wind) ion distribution function manifests itself
Oh 42m .930, -.351, .107 .930, -.235, .281 as enhanced fluxes into the ion spectrometer Oh 48m .931, -.350, .107 .931, -.234, .281 and that these ion flux changes, furthermore, Oh 52m .931, -.348, .108 .931, -.232, .280 represent a sizable fraction of the entropy 20h43m .728,-.644, .234 .728,-.416, .545 increase associated with the bow shock structure. 22h 39m .744, -.635, .208 .744, -.404, .532
22h 45m .745, -.634, .208 .745, -.403, .532 At Oh 43m 05s a rapid, large swing in IBI 22h 48m .745, -.634, .207 .745, -.403, .531
from •8 to •25 '• occurs in about 3 sec. A 23h 57m .754, -.623, .208 .754, -.398, .532 jump in J+ of about two orders of magnitude

BOW SHOCK ELECTROSTATIC TURBULENCE 3755

3756 FREDRICKS ET AL.
Broadband
Electric Field
5o0 '
f (khz) I).5
Iel
40
30
20
1
' I ! ii
108[ '
2sec ,02_ , ' ! ' " I
O h 45 ITI O0 S 45 m 30 s 46m00 s Fig. 3. Electric field, m•gnetic field, •nd directed ion flux correlation in •nother shock
structure encountered inbound on M•rch 12, 1968.
interval. The center panel of Figure 4 contains the output of the 1.3 q- 0.0925-kItz filter channel from the TRW electric dipole experiment. The broad-band fit diagram for this shock has been published elsewhere [Fredricks et al., 1968]. We simply note here that this shock is quite sharp and is well defined, with upstream and downstream regions well separated by the abrupt gradient in [B[ at Oh 52m 32s. The flux measure- ment J+ shows the rapidity of the proton scat. tering near Oh 52m 32s.
Figure 5 shows a shock crossing made several
minutes downstream from the 'clean' shock of Figure 4. This double crossing exhibits many of the same features seen in the initial crossing of Figure 2. We note the appearance of 0.5- to 1.5-sec period compressions in the almost symmetrical dish-like portion of the magnetic profile between Oh 56m 30s and Oh 57m 40s. Note, however, that the spacecraft remained in a definite 'precursor' region during the entire time interval between shock crossings as defined by J..
We will now examine the outbound crossings

BOW SHOCK ELECTROSTATIC TURBULENCE 3757
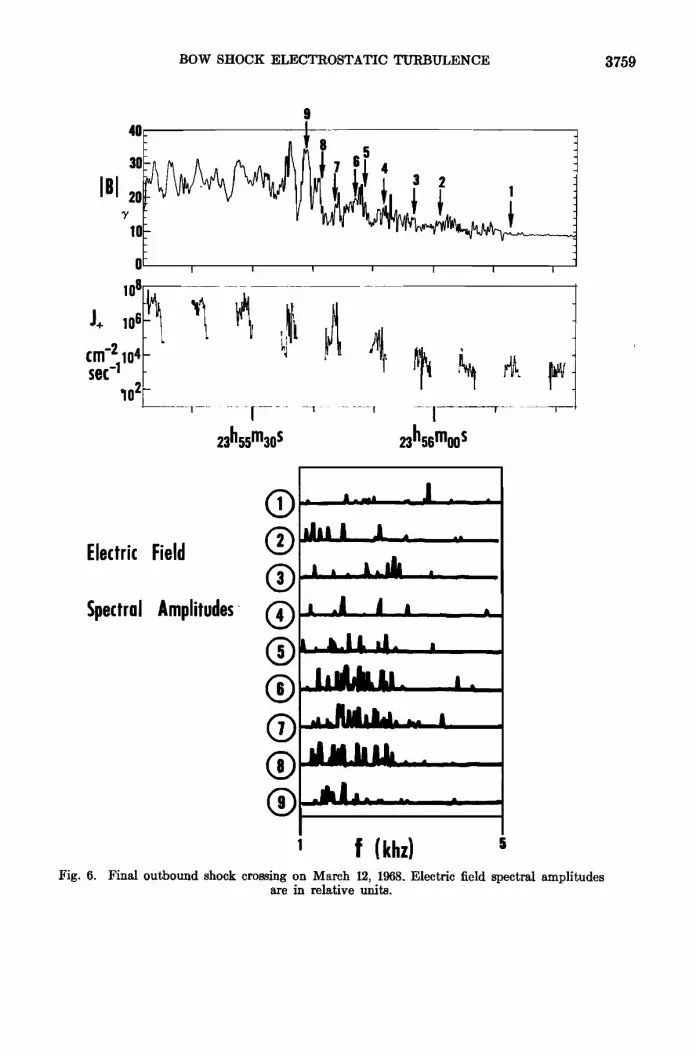
on March 12, 1968 (in reverse order). The final crossing on this day is shown in Figure 6. The upper two panels contain the total field and directed ion flux J+. The bottom panel shows the spectral amplitude of the electric field versus frequency at selected points (indi- cated by the arrows on the upper panel) in the magnetic structure of the shock. These spectra are obtained from the 1- to 22-kHz broad-band analog signal from one axis of the TRW electric dipole sensor; this signal is pro- cessed by a fast wave analyzer, which forms the 1- to 5-kHz frequency sweep shown in Figure 6 in 50 msec. We shall defer the discussion of
absolute spectral amplitudes in displays such as Figure 6 et seq. to a later paper on the more detailed plasma physics of bow shock structures In the present paper we shall discuss only the relative spectral amplitudes, and suffice it to say that these electric fields correspond in order of magnitude to spectral densities of 10 -8 to 10 -• volt m -• Hz -•/• rms (see, e.g., Figure 4, central panel).
A striking feature of this structure is a gradual, largely reversible magnetic 'precursor' region between 23h 56m 12s and about 23h 55m 48s
(points marked I and 5 in Figure 6). The term 'reversible' is here used in the sense that undergoes an appreciable excursion followed by a decrease to nearly the upstream field level, under the assumption that this decrease is
40
10_4• -•--
k cm. 2 sec'11o 2 , , 4o'S
oh52m2o s ohsmooS Fig. 4. An example of a sharp well-defined bow
shock encountered inbound on March 12, 1968.
not due to a field annihilation process. The fluctuating electric fields exhibit a weak spectrum in this region, and an increase of less than one order of magnitude is apparent in directed ion flux Or.. In the regions between points 5 and 9, however, we note a broader spectrum of electric fluctuations, along with gradual enhancement of J.. Throughout this region, the fluctuations in [B[ are similar to those in Figure 2 subsequent to Oh 42m 28s. These fluctuations have periods between the band limit of the magnetometer (0.4 sec) and •1 sec, and their near reversibility suggests that this is a region in which mag- netic and flow kinetic energies are being ex- changed without significant proton heating. To the left of point 8 in Figure 6, the field oscillations become irreversible, because of what appears to be an abrupt proton heating between 23h 55m 50s and 23h 55m 40s, a view consistent with the Or+ enhancement downstream of point 7. Note that this apparent heating occurs predominantly in a region where the electric field spectral distribution (traces 6, 7, and 8) has broadened significantly. (We shall expand on this observation in the discussion section.)
The spacecraft remained in the magnetosheath between 23h 55m 30s (on Figure 6) and about 22h 48m 45s (on Figure 7). The crossing shown in Figure 7 is clearly a sharper one than that in Figure 6. The profile of [B[ on the uppermost panel, while exhibiting the Nl-sec oscillations, has a mean field variation much more akin to
the shock shown on Figure 4 than to that shown in Figure 6. We have plotted the 1.3-kHz filter channel amplitude for the TRW electric dipole sensor in the central panel of Figure 7. Note that the amplitude profile of this electric field measurement peaks in the middle of the main gradient in [B[, and its skirts follow the decreases in the slope of [B[ on either side. This would suggest that the electric field fluctuations are stimulated by the diamagnetic current setting up the magnetic field profile, as previously postulated [Fredricks et al., 1968; Fredricks and Coleman, 1969] for the shock of Figure 4. The directed flux J+ jumps rapidly by more than two orders of magnitude at this large gradient in the presence of the electric field fiuctuations• this indicates a rapid thermalization process. At this time, the Lockheed ion spectrometer was pointing about 24 ø away from the satellite sun line.

3758 FREDRICKS ET AL.
40
•30 I 10
0
IBI
108 t J+ 106• cm-• _1o4• '•
sec'11o2• ohsm3 s oh7moS oh7m:; s oh58moo s
Fig. 5. An incomplete diffuse shock crossing during inbound passage on March 12, 1968.
Another relatively sharp crossing is shown in Figure 8 at about 22h 44m 02s. This shock and its associated proton deceleration phenome- non has been discussed by Neugebauer [1970]. Again we note a precursor region (between points marked I and 4 on the upper panel in Figure 8) containing small amplitude compressions of IBI with periods between the magnetometer band limit (at 0.4 sec) and N1 sec. The relative spectral amplitude distributions of electric field fluctuations in the band i to 5 kHz are
shown in the right panel of Figure 8, for the points in the MHD structure indicated by the arrows on the panel containing [B[. According to Neugebauer [1970], the proton stream gave up about 140 ev of its initial bulk energy (N610 ev) between points 1 and 4, and in the vicinity of point 4 the proton energy spectrum began to show broadening and fast fluctuations. Wc note that all electric field spectra contain signi- ticant energy when integrated over the whole band. However, we caution the reader that these spectra are obtained over a 50-msec time interval, and thus we must look at not only individual spectral traces such as those in Figure 8, but also at the spectral content of traces q-50 msec, q-100 msec, ..., on either side of the trace shown in order to gain a true insight into the total amount of electric field fluctuation
energy in specific parts of any shock structure. This type of analysis is in progress, and results will be reported in a subsequent paper.
A structure more similar to that of Figure 6 is shown in Figure 9. This crossing was made only about 3.5 min from that of Figure 8, and the undisplayed data between 22h 40m 40s and 22h 43m 55s indicate residence of the satellite
in a magnetosheath plasma. A proton decelera- tion in the region between points I and 6, similar to those in other shocks published by Neugebauer [1970], is again observed (Neuge- bauer, private communication). We note that the spectral amplitude distributions on the right-hand panel of Figure 9 show buildup of spectral content with very energetic broad-band spectra appearing at points 4, 5, and 6. Note also that the electric field fluctuation spectrum weakens significantly, even though IBI continues to exhibit large slopes and fluctuation amplitudes (at points 7 and 8) downstream from the large step in IBI near 22h 40m 32s. The entire profile of IBI in Figure 9 shows periods from about 0.5 to about 2 sec. The enhancement of the
directed flux J+ appears much more gradual than the enhancement in the shock structures
of Figures 7 and 8. The final structure we shall present is shown
in Figure 10. It was encountered about 2 hours earlier than that in Figure 9. The portion of the structure shown in Figure 10 does not have the properties usually associated with a true MHD shock, but rather resembles a long train of solirons, or nearly reversible nonlinear mag- netic pulses swinging between approximately
BOW SHOCK ELECTROSTATIC TURBULENCE 3759
9 40 ....
30 7 • 4 Iel?2o , , •
O I I I I I i
108--
J+ 106
cn1-2104 sec -1
,io 2
23 h55 m30s 23h 56 moo s
Electric Field
Spectral Amplitudes •
I f (khz) 5 l•ig. 6. Final outbound shock crossing on March 12, 1968. Electric field spectral amplitudes
are in relative units.

3760 FREDRICKS ET AL.
3O
10'3 v/m J+ 11)6 f
• SO S I •z I• #m30s •zh4emoos Fig. 7. A shock encountered during outbound
passage on March 12, 1968. Note shape of electric field oscillations at 1.3 kHz, and its correlation with shape of magnetic field profile [BI.
the upstream field value and a very large ampli- tude. In the presence of a significant conversion of proton flow energy into random (thermal) energy, such returns of large amplitude field excursions back to the upstream field level are possible only if field annihilation occurs. Because of the very large amplitudes of these MHD pulses, it is possible that combinations of large flow direction changes and interchange of flow and magnetic field energies could lead to the enhanced fluxes measured by the Lock- heed ion spectrometer (J+ panel in Figure 10) in the absence of significant proton thermali- zation. These fluxes could result from the rapid sweeping of a narrow thermal distribution of protons across the upper end (600 to 400 ev) of the spectrometer passband as the lB I field absorbs energy from, or restores energy to, the bulk motion in a manner consistent with the
fluid conservation laws (such as Bernoulli's law for plasma flow). However, the data them- selves give no means for discriminating between field annihilation or solitoh interpretations.
The relative spectral amplitudes of electric fluctuations at selected points in the MHD
40-rib ...........
IBI? 3o 20 i ,3 , 2 1
oi lO 6
J,
-2 1o4 cm -1
sec 1o 2
22h44moo s 1o S 2o S t f (khz) Fig. 8. A sl•ock encountered during outbound passage on March 12, 1968.

BOW SHOCK ELECTROSTATIC TURBULENCE 3761

3762 FREDRICKS ET AL.

BOW SHOCK ELECTROSTATIC TURBULENCE 3763
structure show significant content primarily when large slopes in IBI are encountered. Note the weakness of spectra 1, 2, 3, 5, 6, 10, and 11; spectra 4, 7, 8, and 9, which are much stronger, are associated with large apparent gradients in
An irreversible phenomenon gradually develops well downstream from the point corresponding to the left-hand edge of Figure 10. The process is so gradual that it is not practical to plot the available data on a scale suitable for pub- lication that would also retain any great degree of detail in the fields structure. Therefore, we have sacrificed some of the time resolution in
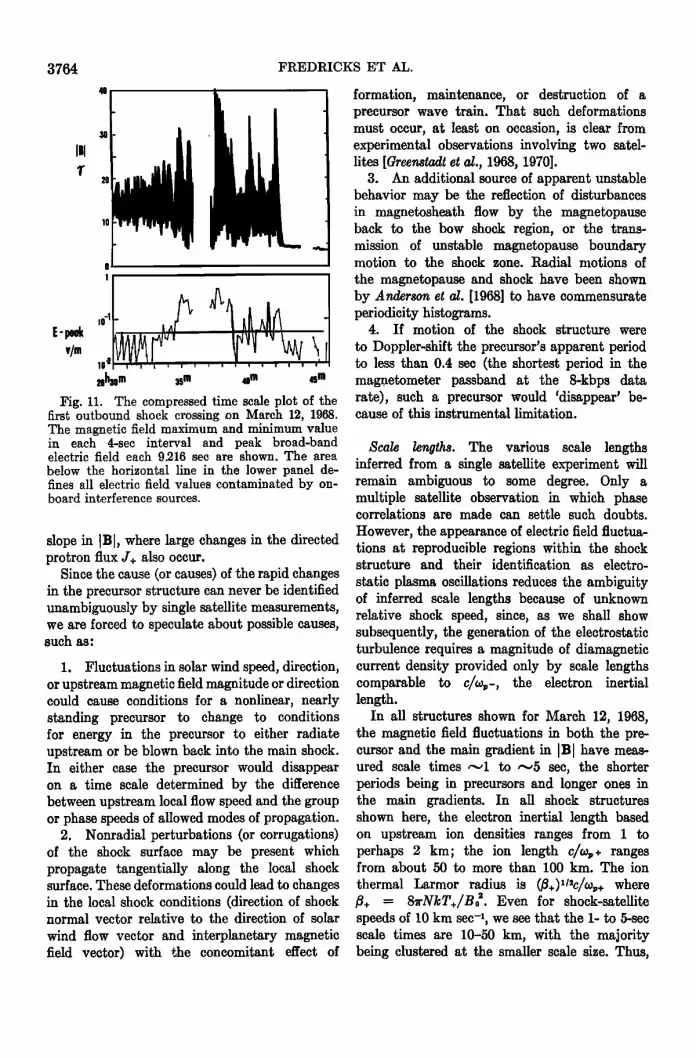
the plot shown in Figure 11. The upper panel of Figure 11 shows the max-
imum and minimum values of [B I on each 4-sec interval between 20h 30m and 20h 46m. The
lower panel shows the peak electric field measured each 9.216 sec. by a sample-and-hold circuit examining the 0.2- to 70-kHz wave form from the TRW electric dipoles. The gradual formation of a shock is evident from the envelope of the minima of IBI, which shows a distinct upward trend at about 20h 36m. We note also that the
peak electric field values exceed their minimum significance level only between 20h 42m 30s and about 20h 35m, an indication that this broad region contains an extended dissipation mech- anism necessary to finally bring about the irreversible behavior of lB[ seen to the left of 20h 36m.
DISCUSSION
Motion and stability of shock structures. Both order and disparity are evident in the shock structures shown in Figures 2-11. We have examples of structures whose main features, such as the jump in [B[, the proton randomi- zation, and the electric field fluctuations, are sharply defined on time scales of 1 to less than 10 sec. We also have examples of structures with 'precursors' of durations on the scale of tens of seconds, with a largely reversible com- pressional oscillation of period ranging from about 0.4 to about 2 sec, accompanied by electric field fluctuation spectra that begin weakly and strengthen with depth into the structure.
As a matter of fact, we observe such an extended shock structure on the first penetration of the shock region on March 12, 1968, at about
Oh 42m 28s (Figure 2); this structure is followed by a quite sharp exit into an upstream region at about Oh 43m 35s and a similar very sharp reentry at about Oh 43m 53s, that is, two sharp shock structures separated by only 18 sec. The gradient (slope A[B[/At) in [B[ for these two crossings is of the order of 2 to 3 sec, which at the spacecraft speed corresponds to a scale length of 3 to 5 km, if a stationary shock structure is assumed. A third example of such a structure is shown in Figure 3 at •0h 45m 53s, and in Figure 4 at Oh 52m 32s. However, the double crossing in Figure 5 between Oh 56m 30s and Oh 57m 35s has the long 'precursor' characteristic of the first crossing in Figure 2.
It is clear that, if the differences in the struc- tural features (sharp or diffuse) of these inbound shock crossings were due entirely to the state of radial motion of the shock structure relative
to the spacecraft, the broad or extended pre- cursor-type of structure would be seen when the shock speed is low, whereas sharp transi- tions would be expected at the large shock speeds. By any reasonable model of radial motion, such as the harmonic oscillator [Holzer et al., 1966] or a variation on it [Heppner et al., 1967], one would expect the lowest shock speeds to occur near the turning (or end) points. One must assume, however, that, if the shock surface were undergoing such simple radial excursions as an integral structural entity, the turning point for the two sharp crossings in Figure 2 would lie between Oh 43m 35s and Oh 43m 53s.
That is, the shock speed would become zero somewhere in this range. To compress the structure between Oh 42m 28s and Oh 43m 08s
into that of the sharp gradients near either Oh 43m 35s or Oh 43m 53s requires a shock speed enhancement of a factor of about 20, which would have had to occur over a time interval
of perhaps 10 sec from a 'rest' condition between these latter two times.
Rather than accept the possibility that we are observing a shock structure, integrity of which is preserved over scales of tens of seconds, that suffers large radial accelerations in this time scale, we argue that the data from the inbound crossings presented in Figures 2-5 strongly suggest an unstable structure on a scale of tens of seconds. This 'unstable' nqmen- clature refers to the presence or absence of the precursor waves upstream from the main large
3764
E-peak v/m
•oh•o m •m 4o m 4,qm
Fig. 11. The compressed time scale plot of the first outbound shock crossing on March 12, 1968. The magnetic field maximum and minimum value in each 4-see interval and peak broad-band electric field each 9.216 sec are shown. The area below the horizontal line in the lower panel de- fines all electric field values contaminated by on- board interference sources.
slope in ]B], where large changes in the directed protron flux J+ also occur.
Since the cause (or causes) of the rapid changes in the precursor structure can never be identified unambiguously by single satellite measurements, we are forced to speculate about possible causes, such as:
1. Fluctuations in solar wind speed, direction, or upstream magnetic field magnitude or direction could cause conditions for a nonlinear, nearly standing precursor to change to conditions for energy in the precursor to either radiate upstream or be blown back into the main shock. In either case the precursor would disappear on a time scale determined by the difference between upstream local flow speed and the group or phase speeds of allowed modes of propagation.
2. Nonradial perturbations (or corrugations) of the shock surface may be present which propagate tangentially along the local shock surface. These deformations could lead to changes in the local shock conditions (direction of shock normal vector relative to the direction of solar
wind flow vector and interplanetary magnetic field vector) with the concomitant effect of
FREDRICKS ET AL.
formation, maintenance, or destruction of a precursor wave train. That such deformations must occur, at least on occasion, is clear from experimental observations involving two satel- lites [Greenstadt et al., 1968, 1970]..
3. An additional source of apparent unstable behavior may be the reflection of disturbances in magnetosheath flow by the magnetopause back to the bow shock region, or the trans- mission of unstable magnetopause boundary motion to the shock zone. Radial motions of
the magnetopause and shock have been shown by Anderson et al. [1968] to have commensurate periodicity histograms.
4. If motion of the shock structure were
to Doppler-shift the precursor's apparent period to less than 0.4 sec (the shortest period in the magnetometer passband at the 8-kbps data rate), such a precursor would 'disappear' be- cause of this instrumental limitation.
Scale lengths. The various scale lengths inferred from a single satellite experiment will remain ambiguous to some degree. Only a multiple satellite observation in which phase correlations are made can settle such doubts.
However, the appearance of electric field fluctua- tions at reproducible regions within the shock structure and their identification as electro-
static plasma oscillations reduces the ambiguity of inferred scale lengths because of unknown relative shock speed, since, as we shall show subsequently, the generation of the electrostatic turbulence requires a magnitude of diamagnetic current density provided only by scale lengths comparable to c/a•,-, the electron inertial length.
In all structures shown for March 12, 1968, the magnetic field fluctuations in both the pre- cursor and the main gradient in I BI have meas- ured scale times •1 to •5 sec, the shorter periods being in precursors and longer ones in the main gradients. In all shock structures shown here, the electron inertial length based on upstream ion densities ranges from i to perhaps 2 kin; the ion length claY+ ranges from about 50 to more than 100 km. The ion
thermal Larmor radius is (]3+)•l'c/a•,,, where •+ = 8•-NkT+/B•. Even for shock-satellite speeds of 10 km sec% we see that the 1- to 5-see scale times are 10-50 km, with the majority being clustered at the smaller scale size. Thus,

BOW SHOCK ELECTROSTATIC TURBULENCE 3765
we argue that the most likely scale lengths for the precursor oscillations (standing wavelengths) are a few electron inertial lengths c/•o•-. This is also the most likely scale length for the large gradients in IBI after which some degree of irreversibility (in I BI and J+) ensues.
The most powerful argument for the scale length c/•o•- is the presence of bursts of electric field fluctuations in the regions of steep slopes of IBI [Fredricks et al., 1968; Fredricks and Cole- man, 1969]. We note that in the precursor fluctuations, where AIB I is several gammas, the current density will be determined approxi- mately by (see, e.g., Fredricks [1969])
where U• is diamagnetic drift speed due to electrons. I• A• ,• c/o•-, then for N = 10 cm -•, T_ = 10•øK, and T+ = 5 X 10•øK we have •,-• 6•r X 10 • sec% and thus
Uola+ • 10.(A {BI)
where a+ = (2kT+/M+) •' N 3 X 106 cm sec-' is the mean thermal proton speed and A]B I is in gammas. At T_/T+ = 2, the threshold for ion acoustic wave generation occurs at a drift speed about 27 times the proton thermal speed (see, e.g., Figure 1 of Fredricks [1969]), and one would expect instability for /XlB I • 2.7 •,. As T_/T+ increases, the critical drift speed decreases rapidly so that smaller fluctuations /XiB i • 1 •, on scale lengths of c/•o,,_ would generate electrostatic plasma wave turbulence. Since the turbulence as observed has these features, we conclude that the hypothesis of scale lengths of c/•o•_ corresponding to magnetic field struc- tures of durations • 1 sec receives strong support. If the scale length Az N c/o¾+ had been used in the foregoing calculation, Uo would be (m_/m+)V•. -- 1/43 times the above value, and thus would be well below the threshold
for instability for the observed values of AIB I. Electric field fluctuations. The observed elec-
trostatic turbulence has the following properties:
1. It is associated in time with the regions of steep slope in [B[, which suggests a current- driven instability. However, this does not rule out the possible presence of ion-ion beam instabilities in these regions of large I BI grad- ients.
2. It ranges in frequency from below the filter centered on 5(}0 Hz up to •3 kHz, and, wherever overlapping frequency coverage of magnetic fluctuations is available, they are observed to be less than our threshold level
of 5 m• rms. This suggests that it is an elec- trostatic wave phenomenon.
3. The electrostatic turbulence exhibits
gradually increasing strength, as inferred from relative energy density <E•>/8z' estimates, with increasing depth into the magnetic field pre- cursor structure, when this structure is present. Its spectral content begins as a few isolated narrow-band spikes in the initial portion of the precursor and becomes a denser set of such spikes as the precursor is traversed, until, at a point very near the large gradient in IBI and jump in J+, its spectrum tends to broaden to the extent that the individual frequency spikes begin to merge into a continuum. When this 'saturation' occurs, we estimate <EO/8z'n•T. < 10-'.
4. In structures without a precursor or with a negligible precursor the electrostatic turbulence builds rapidly in the main gradient of IBI with broad spectral content up to >•3 kHz.
5. In all structures presented here, the flux J+ and the magnetic field IBI jump irreversibly only after the occurrence of a layer of strong electrostatic turbulence. This suggests that the dominant dissipation process in these bow shock structures may be the effective collisions due to wave-particle interactions in this tur- bulent layer leading to proton heating. Electron heating very probably occurs before this in the regions of much weaker electrostatic tur- bulence [Montgomery et al., 1970].
6. The strength of the electrostatic fluctua- tions decays rapidly after the proton heating (as inferred from the J+ enhancements) down- stream from the large gradient in IBI, even though very large slopes in [B[ persist. From this behavior we infer that the rapid proton ran- domization has quenched the plasma instability responsible for the electrostatic wave turbulence in the shock front, and diamagnetic drift cur- rents in the downstream magnetosheath become less than or equal to the threshold value for marginally stable electrostatic waves.
Some of these observed properties have plausible explanations that are based on minimal

3766
plasma physics arguments. For example, the spectral characteristics described under items 2 and 3 above suggest that the initial weak instabilities excite single modes, but, as the source strength (diamagnetic drift current) increases, a nonlinear mode mixing and spectral broadening with saturation of intensity occur. Such nonlinear spectra should peak at rest frame frequencies near co•+ and at wavelengths of the order of a few Debye lengths kD = (kT/4•rNe•) TM. (See, e.g., the monograph by Kadomtsev [1965] on plasma turbulence, with special attention to ch. IV, no. 2.)
If one assumes that/z = (kkD) <• i for these waves, the convectively Doppler-shifted fre- quency (as measured in the satellite frame) is given by
comax' -----COO q- k' Uo
= + Uo/X) 0 ( where 0 is the angle between k and Uo and coo is the wave frequency in a fluid rest frame. For density N • 10 era-a, temperatures T+ /5 X 10•øK, T_ • 2T+, and wind speed Uo 850 km see -t, we have an observed frequency
fmax t -- fo q- (8 X 10a)/z cos O I-Iz (2) The rest frame frequency fo may be f•+ (ion acoustic instability), (M_/M+)•taf•- = 0.08f•- (Buneman instability), or the Krall and Book [1060] drift wave instability, wherefo• (f, The three rest frame frequencies for these possible modes are'
fo = f•+ •--- 650 Hz (ion acoustic instability) fo = 0.08 f•_ •--- 2.2 kHz (Buneman's instability) fo • (f,+f•-)•/• • 15 Hz (Drift-wave instability)
It is apparent that a range of values of the param- eter/z cos 0 from •0.1 to •1.0, when combined with any one of the rest frame frequencies fo given above, can easily explain the range of Doppler-shifted frequencies observed by the OGO 5 plasma wave detector.
The electrostatic modes excited by the dia- magnetic currents in the bow shock structure have not been precisely identified. It seems clear from the evidence at hand however, that these waves must be driven by a two-stream instability. Since we have no knowledge of the shape of the local electron velocity distribution on the basis of any OGO 5 particles experiment, we must speculate that conditions for two-stream in- stabilities exist, since waves in the observed
FREDRICKS ET AL.
frequency band correspond to Doppler-shifted rest frame frequencies expected for either the ion acoustic wave [Fried and Gould, 1961] predicted for this region [Scarf et al., 1965; Fredricks and Scarf, 1965], or the Buneman [1958] instability. These two instabilities are basically the same, being derived from the electrostatic wave dis- persion relation under different excitation condi- tions. The Buneman instability is expected when the (diamagnetic, in this case) drift speed is very large in comparison to electron thermal speed, and its rest frame frequency is co N (M_/M+)•/3co,,_ = 0.08co•-. Because of the observed range of frequencies •3 kHz (whereas co•-/2•r • 30 kHz for all shocks discussed in the present paper), we feel that either the ion acoustic wave or the Buneman wave is involved
in the electrostatic wave turbulence in these
shocks, and that we cannot distinguish between them in our data. On the other hand, the drift- wave instability of Krall and Book [1969] seems a less likely candidate, since their calculation is restricted to gradient lengths much greater than c/co,•-, the scale length observed by the OG0 5 experiments.
Su•Amr
We have presented, described, and discussed electric field, magnetic field, and directional ion flux data acquired by instruments aboard OGO 5 during passage through bow shock structures on March 12, 1968. Briefly stated, our main obser- vations can be summarized as follows:
1. The MHD scale lengths for both precursor wavelengths and the initial large jumps in total field IBI are best fitted by a few electron inertial lengths c/co•,-, not by ion lengths such as c/co•,+ or the proton gyroradius.
2. Unstable (irreproducible) MI-ID precursor profiles were observed on time scales of tens of seconds.
3. Pre-shock structures consisting of many very large (3 • <• [B[ •< 30 •), and ..nearly reversible pulse-like magnetic variations were observed in one shock front. These structures
are both compressional and rotational; they suggest the possible existence of nonlinear soliton solutions even in this high f] large Alfv•n-Mach number flow, although one cannot rule out the possibility that field • annihilation effects were responsible. •

BOW SHOCK ELECTROSTATIC TURBULENCE 3767
4. Electros•tic waves in the range from below 0.56 up to more than 3 kHz are observed at reproducible places in the MHD shock structure. These regions correlate with those of
..large observed slope in [B[, where large dia- magnetic (drift) currents are expected.
5. These electrostatic waves increase in
intensity with depth into the MHD structure, apparently saturating in the vicinity of the point at which the [B[ variations become irreversible.
6. The dominant randomization of protons (as indicated by the enhancement of the flux J+ of 0-to 600-ev protons) appears to correlate in every case with the region in which the electrostatic wave turbulence becomes saturated.
7. The strong electrostatic oscillations decay rapidly in the region downstream, where irrevers- ibility in [B[ variations and enhanced proton temperatures develop.
8. Doppler shifts due to the convective term k- U0, where Ikl-• k•) -• and IU01 is approximately solar wind speed, can easily explain the spreading of rest frame frequenciesNw, + or (M_/M+)I/3w,- over the observed 0- to •3- kHz band.
Acknowledgments. It is a pleasure to acknowl- edge the cooperation of several fellow experi- menters on OGO 5. In particular, we are deeply indebted to Drs. G. W. Sharp, K. K. Harris, and S. L. Ossakow of Lockheed Research Labora- tories for permission to display the ion flux data in the present paper, and for discussions of their significance. We also wish to thank Dr. Marcia Neugebauer of the Jet Propulsion Laboratory for the plasma data in upstream regions, and for several discussions of these shock crossings. Ex- tensive discussions of the relationship between these OGO 5 observations and the particles data from Vela 4 with Dr. M.D. Montgomery of Los A!amos Scientific Laboratory were most helpful, as were discussions with Dr. F. V. Coroniti of U.C.L•. about some of the theoretical interpre- tations.
This work was supported by the National Aero- nautics and Space Administration's OGO Project Office at Goddard Space Flight Center under contracts •NAS5-9278 (TRW) and NAS 5-9098 (UCLA).
The Editor wishes to thank Dr. M.D. Mont-
gomery and Dr. D. A. Tidman for their assistance in evaluating this paper.
I•EFERENCES
Anderson, K. A., J. H. Binsack, and D. H. Fair- field, Hydromagnetic disturbances of 3- to 15- minute period on the magnetopause and their
relation to bow shock spikes, J. Geophys. Res., 73, 2371, 1968.
Buneman, 0., Instability, turbulence, and con- ductivity in current-carrying plasma, Phys. Rev. Lett., 1, 8, 1958.
Crook, G. M., F. L. Scarf, R. W. Fredricks, I. M. Green, and P. Lukas, The OGO 5 plasma wave detector: Instrumentation and in-flight opera- tion, IEEE Trans. Geosci. Electron., GE-7, 120, 1969.
Fredricks, R. W., Electrostatic heating of solar wind ions beyond 0.1 AU, J. Geophys. Res., 74, 2919, 1969.
Fredricks, R. W., and P. J. Coleman, Jr., Obser- vations of the microstructure of the earth's bow
shock, in Proceedings o• International Confer- ence on Plasma Instabilities in Astrophysics, Gordon and Breach, New York, 1969.
Fredricks, R. W., C. F. Kennel, F. L. Scarf, G. M. Crook, and I. M. Green, Detection of electric field turbulence in the earth's bow shock, Phys. Rev. Lett., 21, 1761, 1968.
Fredricks, R. W., and F. L. Scarf, Effects of solar- wind composition on the threshold for plasma instability in the transition region, J. Geophys. Res., 70, 4765, 1965.
Fried, B. D., and R. W. Gould, Longitudinal ion oscillations in a hot plasma, Phys. Fluids, 4, 139, 1961.
Greenstadt, E. W., I. M. Green, and D. S. Col- burn, Earth's bow shock: Elapsed-time obser- vations by two closely spaced satellites, Science, 162, 898, 1968.
Greenstadt, E. W., I. M. Green, G. T. Inouye, D. S. Colburn, J. H. Binsack, and E. F. Lyon, Dual satellite observations of bow shock macro- structure, Cosmic Electrodynamics, vol. 1, no. 1, in press, 1970.
Harris, K. K., and G. W. Sharp, OGO 5 ion spectrometer, IEEE Trans. Geosci. Electron., GE-7, 93, 1969.
tteppner, J.P., M. Sugiura, T. L. Skillman, B. G. Ledley, and M. Campbell, OGO A magnetic field observations, J. Geophys. Res., 72, 5417, 1957.
Holzer, R. E., M. G. McLeod, and E. J. Smith, Preliminary results from the OGO I search coil magnetometer: Boundary positions and mag- netic noise spectrum, J. Geophys. Res., 71, 1481, 1966.
Kadomtsev, B. B., Plasma Turbulence, Academic Press, New York, 1965.
Kellogg, P. J., Shock waves in interplanetary plasma, Univ. Minn. Tech. Rep. CR-69, Feb. 1964. (Also Proceedings o• International Con- •erence on Cosmic Rays, Jaipur, India, 1963.)
Krall, N. A., and D. L. Book, Ion sound instabil- ity in a collisionless shock wave, Phys. Fluids, 12, 347, 1969.
Montgomery, M.D., J. R. Asbridge, and S. J. Bame, Vela 4 plasma observations near the earth's bow shock, J. Geophys. Res., 75, 1217, 1970.

3768 FREDRICKS ET AL.
Neugebauer, M., Initial deceleration •f solar-wind positive ions in the earth's bow shock, J. Geo- phys. Res., 75, 717, 1970.
Sagdeer, R. Z., On Ohm's law in unstable plasmas, in Annual Symposium on Applied Mathematics, Courant Institute, New York University, 1965.
Sagdeer, R. Z., and A. A. Galeev, Lectures on the nonlinear theory of plasma, IC/66/64, Inter- national Centre for Theoretical Physics, Trieste, 1966.
Scarf, F. L., W. Bernstein, and R. W. Fredricks, Electron acceleratœon and plasma instabilities in
the transition region, J. Geophys. Res., 70, 9, 1965.
Snare, R. C., and C. R. Benjamin, Magnetic field instrument for the OGO-E spacecraft, IEEE Trans. Nucl. Sci., NS-15(6), 1966.
Tidman, D. A., Turbulent shock waves in plasmas, Phys. Fluids, 10, 547, 1967a.
Tidman, D. A., The earth's bow shock wave, J. Geophys. Res., 7•, 1799, 1967b.
(Received December 29, 1969; revised March 17, 1970.)