Embed Size (px)
Citation preview

O and Pb isotopic analyses of uranium minerals by ion microprobe
and U–Pb ages from the Cigar Lake deposit
Mostafa Fayek a,*, T. Mark Harrison a, Rodney C. Ewing b,1,Marty Grove a, Chris D. Coath a
aDepartment of Earth and Space Science, University of California, Los Angeles, CA 90095-1567, USAbDepartment of Nuclear Engineering and Radiological Sciences, The University of Michigan, 2958A Cooley Building,
2355 Bonisteel Boulevard, Ann Arbor, MI 48109-2104, USA
Received 30 May 2001; accepted 22 October 2001
Abstract
We apply a rapid and accurate in situ technique to make U–Pb isotopic measurements of complexly intergrown uranium
minerals and oxygen isotopic analyes of uraninite from the unconformity-type Cigar Lake uranium deposit. Secondary uranium
minerals intergrown with uraninite, such as coffinite, USiO4�nH2O and calciouranoite, CaU2O7�5H2O, were identified by high-
resolution transmission electron microscopy (HRTEM). In situ U–Pb results from three stages of uraninite and coffinite define
well-correlated arrays on concordia with upper intercepts of 1461F 47, 1176F 9, and 876F 14 Ma (F 1r). These ages are
interpreted as the minimum ages of mineralization correlate with the timing of clay mineral alteration (f 1477 Ma) associated
with these unconformity-type uranium deposits, the ages of magnetization events at 1600–1450 and 900 Ma from the
Athabasca Basin, and the Grenvillian Orogeny at f 1100 Ma. In situ U–Pb isotopic analyses of uraninite and coffinite can
document the Pb*/U heterogeneities that occur on the scale of 15–30 Am, thus providing relatively accurate information
regarding the timing of fluid interactions associated with the evolution of these deposits. The high spatial resolution and
precision of the ion microprobe allow us to measure d18O values of 20–100 Am unaltered portions of uraninites from Cigar
Lake. The range of d18O values (� 33.9 to � 20.4x) are among the lowest reported for unconformity-type deposits,
confirming that conventional fluorination analyses of material sampled at the mm-scale are insufficient to avoid contamination
from isotopically heavier coffinite and calciouranoite. D 2002 Elsevier Science B.V. All rights reserved.
Keywords: Uraninite; SIMS; U–Pb; Oxygen; Isotopes; Cigar Lake
1. Introduction
Uranium deposits have been used as ‘‘natural ana-
logues’’ in order to understand the mechanism and
extent of migration of uranium and other radionuclides
from a spent fuel repository because uraninite, UO2 + x
(the most common U4 + -bearing mineral, found in
most uranium deposits) and UO2 (the major constituent
0009-2541/02/$ - see front matter D 2002 Elsevier Science B.V. All rights reserved.
PII: S0009 -2541 (01 )00401 -6
* Corresponding author. Current address: 306 Geology Bldg.,
Department of Geological Sciences, University of Tennessee,
Knoxville, TN 37996, USA. Tel.: +1-865-576-4839; fax: +1-865-
576-8559.
E-mail addresses: [email protected] (M. Fayek),
[email protected] (R.C. Ewing).1 Tel.: +1-313-647-8529.
www.elsevier.com/locate/chemgeo
Chemical Geology 185 (2002) 205–225

of spent fuel) are chemically and structurally similar
(Finch and Ewing, 1992; Janeczek et al., 1996). How-
ever, the extent and processes of alteration of uraninite
in these deposits are, in general, poorly understood.
Uraninite varies widely in composition from UO2.07
to UO2.25 (Grandstaff, 1976; Dyck, 1978; Smith, 1984;
Burns et al., 1996). Although the uraninite structure
can accommodate some degree of oxidation, in highly
oxidizing-aqueous environments, uraninite is unstable
and susceptible to alteration and oxidation, commonly
altering to hydrated uranyl phases. Corrosion experi-
ments on synthetic UO2 (Bruno et al., 1991; Wronkie-
wicz et al., 1992; Bruno et al., 1995), UO2 fuel
(Johnson et al., 1982; Johnson and Werme, 1994) and
natural uraninite (Fayek et al., 1997a) have shown that
uraninite and synthetic UO2 in the presence of an
oxidizing fluid readily alter to hydrated uranyl-oxides
and hydrated uranyl-silicates which include curite,
schoepite, becquerelite, and soddyite, which are similar
to uranyl minerals associated with natural uraninite.
The Cigar Lake unconformity-type uranium
deposit, located near the eastern rim of the Athabasca
Basin in Saskatchewan (Fig. 1), has recently been the
focus of an international program to study uranium
deposits as natural analogues for subsurface spent
nuclear fuel repositories (Cramer, 1995; Smellie and
Karlsson, 1996). The Cigar Lake deposit was selected
as a natural analogue because it is well preserved
without evident, significant radionuclide migration to
the surface during the past 10000 years (Goodwin et
al., 1988; Cramer, 1995). In addition, the uranium ore
is surrounded by natural barriers, including a clay zone
and several hundred meters of sandstone host rock,
which are similar in many respects to the conceptual
disposal proposed for the disposal of spent nuclear fuel
in Canada (Cramer, 1995). Therefore, the Cigar Lake
deposit is considered to be important because many of
its features are analogous to the barrier systems which
are proposed for nuclear waste repositories.
Although many aspects of this deposit have been
documented in detail (e.g. Cramer, 1995; Smellie and
Cramer, 1994), establishing the timing of initial ura-
nium emplacement and subsequent alteration history
have been challenging and incompletely realized
goals. For example, it is very unusual to obtain
concordant U–Pb data from uraninite and the degree
Fig. 1. Map showing the extent of the Athabasca Basin, location of the uranium deposits and major lithostructural domains in the crystalline
basement of Saskatchewan (modified from Hoeve and Sibbald, 1978). Abbreviations: MD=Mudjatik Domain; WD=Wollaston Domain;
PLD=Peter Lake Domain; RD=Rottenstone Domain; and WL=Wollaston Lake; R =River; L=Lake.
M. Fayek et al. / Chemical Geology 185 (2002) 205–225206

of discordance is often much greater than 5% leading
to uncertainty in the interpretation of the U–Pb values
(e.g., Cumming and Krstic, 1992).
The wide range of ages associated with multiple
mineralizing episodes from the Cigar Lake deposit
(Cummings and Krstic, 1992; Fayek et al., 1997a)
underscores both the mobility of U and Pb* during
subsequent alteration events and the limitations of the
analytical methods. In addition, uraninites from the
Cigar Lake deposit have a wide range of d18O values
(� 28.5x to � 3.8x; Fayek et al., 1997a). The
light d18O values are likely the result of post deposi-
tional recrystallization of the uraninite by meteoric
waters having d18O values f� 20x(Kotzer and
Kyser, 1993; Fayek and Kyser, 1997; Fayek et al.,
1997a), where as the heavy d18O values may be due to
the inclusion of fine intergrowths of coffinite and clay
minerals that could not be separated during the micro-
drilling of the uraninite for oxygen isotopic analyses
by the fluorination technique. Therefore, precise, high
spatial resolution U–Pb and O isotopic measurements
of minerals with complex chemistry such as uraninite
would greatly aid in unraveling the complex fluid
histories associated with certain uranium deposits.
The purpose of this study is to characterize the
secondary, actinide-bearing phases that formed during
the alteration of uraninite and utilize the ion microp-
robe to characterise the oxygen isotopic composition
of uraninite and determine the age of uranium miner-
als from the Cigar Lake deposit. These techniques
combine the advantages of conventional U–Pb dating
(i.e., use of concordia) and in situ analysis, and there-
fore are suited for the study of chemically complex
uranium-oxides associated with unconformity-type
uranium deposits.
2. Background
2.1. In situ isotopic analyses by SIMS
Secondary ionization mass spectrometry (SIMS) or
the ion microprobe is a technique that was developed
to provide in situ measurement of isotopic ratios with
a spatial resolution on the scale of a few micrometers.
SIMS analyses uses a focused beam of primary ions (a
few micrometers in diameter) to bombard a solid
sample surface in order to obtain a localized analysis.
The bombardment or ‘‘sputtering’’ removes atoms
from the polished surface of the specimen. Some of
these atoms are ionized during the process and can be
focused and accelerated as a ‘‘secondary’’ beam
through a slit and into a mass spectrometer (Reed,
1989). For stable isotopic (i.e. negative ion) measure-
ments, the selected area is sputtered with a 10-keV
Cs + primary beam which generates a secondary
negative ion beam of the desired element (e.g. O, N,
C, S) whereas for U and Pb measurements, a 10-keV
O� primary beam is used which generates a secon-
dary positive ion beam of the desired element (e.g. U,
Pb, Th, etc.).
During the measurement process, an intrinsic
mass-dependent bias is introduced and is referred to
as instrumental mass fractionation (IMF). A variety of
processes combines to produce the observed IMF.
These include secondary atom extraction (sputtering)
and ionization (Sigmund, 1969; Shroeer et al., 1973;
Williams, 1979; Yu and Lang, 1986), secondary ion
transmission (Shimizu and Hart, 1982), and detection
(Valley and Graham, 1991; Lyon et al., 1994). The
greatest contributors to the IMF are sputtering and
ionization which depend most strongly upon sample
characteristics (i.e., chemical composition). This is
referred to as compositionally dependent fractiona-
tions or ‘‘matrix effects’’ (e.g., Valley et al., 1997).
Therefore, in ion microprobe analysis, IMF is cor-
rected for by comparing measurements of a chemi-
cally and isotopically homogenous mineral standard
that is compositionally similar to the unknown. Ion
microprobe results from the standard are compared to
its accepted isotopic composition in order to compute
a correction factor that is applied to the unknowns
measured during the same analysis session (e.g.,
Leshin et al., 1998).
3. Analytical techniques
3.1. Standard material selection and grain mount
preparation
Candidate material, synthetic UO2, to be used as a
uraninite standard was crushed, sieved to the < 350
mesh (5–10 Am) size fraction and sample purity was
assessed by X-ray diffraction. For ionmicroprobe grain
mounts, 500 Am to f 1 mm-sized crystals of synthetic
M. Fayek et al. / Chemical Geology 185 (2002) 205–225 207

Table 1
Ion and electron microprobe data from the Cigar Lake deposit
Sample Spot Mineral d18O 207Pb/ Error 208Pb/ Error 207Pb/206Pb Electron microprobe dataa
No. (x) 206Pb % (1r) 206Pb % (1r) Age (Ma)UO2 PbO SiO2 CaO
W 83C 1 uran � 23.1 0.08444 0.16 0.000239 3.4 1303F 3 80.2 12.8 0.21 1.04
2 uran � 25.5 0.08436 0.15 0.000228 2.2 1301F 3 78.8 14.1 0.05 0.69
3 uran � 23.9 0.08555 0.15 0.000167 3.6 1328F 3 79.4 14.9 0.02 0.75
4 uran � 25.2 0.08514 0.16 0.000090 3.8 1319F 3 80.4 14.2 0.06 0.85
5 uran � 25.5 0.08506 0.13 0.000076 3.7 1317F 3 81.0 14.1 0.06 0.75
6 uran � 24.8 0.08568 0.15 0.000079 4.1 1331F 3 80.0 13.9 0.11 0.79
7 uran � 25.6 0.08590 0.14 0.000064 3.7 1336F 3 79.8 14.1 0.01 0.76
8 uran � 25.3 0.08552 0.13 0.000088 3.6 1327F 3 79.3 13.8 0.10 0.75
9 uran � 24.7 0.08577 0.55 0.000305 1.7 1333F 10 80.6 14.9 0.06 0.77
10 uran � 28.0 0.08534 0.13 0.000075 5.0 1323F 2 79.3 13.8 0.06 0.79
11 uran � 27.3 0.08514 0.16 0.000087 4.8 1319F 3 80.5 14.3 0.04 0.72
12 uran � 25.9 0.08543 0.14 0.000242 2.1 1325F 3 79.5 13.8 0.09 0.77
13 uran � 22.9 0.08382 0.18 0.000142 3.5 1288F 4 80.4 13.4 0.10 0.84
14 uran � 25.0 0.08389 0.15 0.000120 3.4 1290F 3 79.5 13.2 0.08 0.86
15 uran � 23.4 0.08400 0.14 0.000092 4.4 1293F 3 79.7 12.8 0.13 0.91
CS615A1 1 uran � 33.9 0.08220 0.24 0.000249 3.6 1250F 9 78.3 12.4 0.22 1.09
2 uran � 29.2 0.08169 0.26 0.000588 2.6 1238F 13 80.1 12.4 0.29 1.05
3 uran � 30.5 0.08397 0.20 0.000196 5.6 1292F 8 77.3 14.1 0.04 0.85
4 uran � 32.5 0.08245 0.22 0.000256 3.4 1256F 9 78.9 13.0 0.15 0.90
5 uran � 27.9 0.08124 0.22 0.000148 4.7 1227F 8 81.8 11.8 0.07 0.89
6 uran � 29.7 0.08246 0.26 0.000158 6.1 1256F 16 78.8 11.8 0.23 1.13
7 uran � 33.7 0.08302 0.21 0.000100 5.2 1270F 8 78.7 14.0 0.03 1.08
8 uran � 30.1 0.07929 0.24 0.000301 3.3 1179F 8 79.9 11.8 0.48 1.43
9 coff N.A 0.06585 0.59 0.004573 2.0 802 83.4 1.1 3.62 1.68
10 Ca–U N.A 0.05129 0.84 0.001485 15.3 254 82.1 1.3 3.34 2.34
CS615B 1 uran � 20.4 0.07845 0.28 0.000975 2.4 1158F 5 78.2 12.6 0.23 1.13
2 uran � 23.0 0.07944 0.27 0.000197 5.1 1183F 5 80.0 12.0 0.19 1.24
3 uran � 24.1 0.07807 0.26 0.000152 7.3 1149F 5 79.4 12.2 0.20 1.11
4 uran � 26.7 0.07938 0.26 0.000177 5.4 1182F 5 79.0 12.8 0.17 0.99
5 uran � 24.9 0.07942 0.26 0.000128 6.3 1183F 5 79.0 12.7 0.18 1.12
6 uran � 26.4 0.07874 0.35 0.000186 5.9 1166F 7 79.9 11.8 0.23 1.14
7 uran � 24.8 0.07964 0.33 0.000165 5.6 1188F 7 80.2 12.8 0.17 0.95
8 uran � 25.7 0.07945 0.35 0.000310 4.4 1183F 7 80.3 11.6 0.29 1.32
CS449 1 uran � 23.8 0.08173 0.28 0.000401 3.8 1239F 5 81.2 11.7 0.24 1.22
2 uran � 27.0 0.07976 0.25 0.000053 9.3 1191F 5 80.1 11.7 0.17 1.17
3 uran � 23.1 0.08104 0.24 0.000056 8.7 1222F 5 80.1 12.6 0.18 1.26
4 uran � 26.7 0.08105 0.27 0.000234 4.8 1223F 5 80.2 11.2 0.37 1.43
5 uran � 28.9 0.07839 0.26 0.000048 10.0 1157F 5 78.8 13.1 0.16 1.19
6 uran � 24.2 0.07771 0.25 0.000068 8.0 1140F 5 82.3 8.6 0.22 2.27
7 uran � 23.8 0.08293 0.23 0.000090 6.7 1268F 4 79.4 11.7 0.27 1.13
8 uran � 27.3 0.07932 0.26 0.000102 7.0 1180F 5 79.6 14.3 0.16 0.99
9 coff N.A 0.07692 0.58 0.003918 3.0 1119F 10 82.8 1.6 3.23 2.32
10 coff N.A 0.07649 0.65 0.004692 5.2 1108F 10 81.5 1.9 2.63 2.70
11 coff N.A 0.07550 0.46 0.003864 2.2 1082F 9 81.5 1.7 2.87 2.32
CS235m 1 uran � 20.6 0.06879 0.34 0.000637 3.2 893F 7 81.2 9.2 0.39 1.77
2 uran � 23.2 0.06850 0.33 0.000477 3.9 884F 7 80.2 9.6 0.28 1.76
3 uran � 23.8 0.06795 0.36 0.002083 2.0 867F 7 82.5 8.7 0.49 1.79
M. Fayek et al. / Chemical Geology 185 (2002) 205–225208

U Pb 206Pb 207Pb 208Pb 235U 238U 207Pb/ Error 206Pb/ Error q(x,y)(%) (%) 235U (%) 238U (%)
70.7 11.9 11.0 0.93 0.00262 0.509 70.2 1.818 1.8 0.156 1.8 0.997
69.5 13.1 12.1 1.02 0.00275 0.5001 69.0 2.041 1.7 0.175 1.7 0.996
70.0 13.8 12.7 1.09 0.00212 0.504 69.5 2.157 1.6 0.183 1.6 0.996
70.8 13.2 12.1 1.03 0.00109 0.5098 70.3 2.029 1.7 0.173 1.7 0.996
71.4 13.1 12.1 1.03 0.00092 0.514 70.9 1.998 1.7 0.170 1.7 0.997
70.5 12.9 11.9 1.02 0.00093 0.508 70.0 2.010 1.7 0.170 1.7 0.997
70.3 13.1 12.1 1.04 0.00077 0.506 69.8 2.051 1.7 0.173 1.7 0.997
69.9 12.8 11.8 1.01 0.00104 0.503 69.4 2.000 1.7 0.170 1.7 0.998
71.0 13.8 12.7 1.09 0.00389 0.511 70.5 2.136 1.7 0.181 1.6 0.954
69.9 12.8 11.8 1.01 0.00089 0.503 69.4 2.005 1.7 0.170 1.7 0.998
70.9 13.3 12.3 1.04 0.00107 0.510 70.4 2.046 1.7 0.174 1.7 0.996
70.1 12.8 11.8 1.01 0.00285 0.505 69.6 1.997 1.7 0.170 1.7 0.997
70.8 12.5 11.5 0.96 0.00164 0.510 70.3 1.891 1.8 0.164 1.8 0.995
70.1 12.2 11.3 0.95 0.00136 0.504 69.6 1.876 1.8 0.162 1.8 0.997
70.2 11.9 11.0 0.92 0.00101 0.505 69.7 1.824 1.8 0.157 1.8 0.997
69.0 11.5 10.6 0.87 0.00264 0.497 68.5 1.752 1.9 0.155 1.9 0.993
70.6 11.6 10.7 0.87 0.00628 0.508 70.1 1.713 1.9 0.152 1.9 0.992
68.1 13.1 12.1 1.01 0.00237 0.491 67.6 2.068 1.7 0.179 1.7 0.994
69.5 12.1 11.1 0.92 0.00286 0.501 69.0 1.837 1.8 0.161 1.8 0.994
72.1 10.9 10.1 0.82 0.00150 0.519 71.6 1.580 2.0 0.141 2.0 0.995
69.4 11.0 10.1 0.83 0.00160 0.500 68.9 1.661 2.0 0.147 2.0 0.993
69.3 12.9 12.0 0.99 0.00120 0.499 68.8 1.984 2.0 0.174 2.0 0.993
70.4 10.9 10.1 0.80 0.00300 0.507 69.9 1.583 2.0 0.145 2.0 0.993
73.4 1.0 1.0 0.06 0.00436 0.529 72.9 0.119 19.6 0.013 19.6 1.000
72.4 1.2 1.2 0.06 0.00172 0.521 71.9 0.114 16.4 0.016 16.4 0.999
68.9 11.7 10.8 0.85 0.01054 0.496 68.4 1.712 1.9 0.158 1.9 0.991
70.5 11.1 10.3 0.82 0.00203 0.507 70.0 1.617 1.9 0.148 1.9 0.992
70.0 11.4 10.5 0.82 0.00160 0.504 69.5 1.632 1.9 0.152 1.9 0.992
69.6 11.8 11.0 0.87 0.00194 0.501 69.1 1.739 1.9 0.159 1.8 0.991
69.6 11.8 10.9 0.87 0.00140 0.501 69.1 1.733 1.9 0.158 1.8 0.991
70.4 10.9 10.1 0.80 0.00188 0.507 69.9 1.573 2.0 0.145 2.0 0.987
70.7 11.9 11.0 0.88 0.00181 0.509 70.2 1.722 1.9 0.157 1.8 0.986
70.8 10.8 10.0 0.79 0.00308 0.510 70.3 1.553 2.0 0.142 2.0 0.987
71.6 10.8 10.0 0.82 0.00401 0.515 71.1 1.585 2.0 0.141 2.0 0.992
70.6 10.9 10.1 0.80 0.00053 0.508 70.1 1.581 2.0 0.144 2.0 0.993
70.6 11.7 10.8 0.87 0.00061 0.508 70.1 1.720 1.9 0.154 1.9 0.993
70.7 10.4 9.6 0.78 0.00226 0.509 70.2 1.534 2.1 0.137 2.0 0.992
69.4 12.1 11.3 0.88 0.00054 0.500 68.9 1.766 1.8 0.163 1.8 0.991
72.5 8.0 7.4 0.58 0.00051 0.522 72.0 1.107 2.6 0.103 2.6 0.996
70.0 10.9 10.0 0.83 0.00090 0.504 69.5 1.651 2.0 0.144 2.0 0.994
70.2 13.2 12.3 0.97 0.00130 0.505 69.7 1.924 1.7 0.176 1.7 0.990
73.0 1.5 1.4 0.11 0.00544 0.525 72.4 0.203 13.3 0.019 13.3 0.999
71.8 1.8 1.6 0.13 0.00768 0.517 71.3 0.242 11.3 0.023 11.3 0.999
71.8 1.6 1.4 0.11 0.00556 0.517 71.3 0.210 12.9 0.020 12.9 0.999
71.5 8.6 8.0 0.55 0.00511 0.515 71.0 1.071 2.5 0.113 2.4 0.992
70.6 8.9 8.4 0.57 0.00399 0.509 70.1 1.126 2.4 0.119 2.3 0.991
72.7 8.0 7.5 0.51 0.01563 0.523 72.2 0.974 2.6 0.104 2.6 0.992
(continued on next page)
M. Fayek et al. / Chemical Geology 185 (2002) 205–225 209

UO2 were selected and arranged in clusters on double-
sticky tape within a 25 mm-diameter brass mold.
Buehler ‘‘Epoxide’’ epoxy resin was then poured in
and allowed to harden overnight. The hardened epoxy
mounts were separated from the brass moulds and
polished using 600–2400 grit SiC sandpaper and, then,
successively, 3 to 0.1 Am diamond polishing com-
pounds. The mounts were then washed with a dilute
soap solution, and rinsed in deionized water. The
mounts were carbon coated and the individual grains
examined for homogeneity by transmitted light micro-
scopy, back scattered electron (BSE) imaging, and
quantitative electron microprobe analysis.
Sections of core (25 mm in diameter) from the
Cigar Lake unconformity-type uranium deposit,
northern Saskatchewan, were similarly prepared for
ion and electron microprobe analysis. Chemical com-
positions of the uraninite (Table 1) were determined
by wavelength dispersive spectroscopy using an auto-
mated CAMECA 50 X-ray microanalyzer operated at
15 keV, a beam diameter of 10 Am, and counting
times of 40 s per element. Synthetic UO2 and minerals
(grossular garnet for Si and Ca and galena for Pb)
were used as standards. Detection limits of the ele-
ments (Table 1) were on the order of 0.1 wt.%. The
program PAP was used to reduce the data for the
various elements. Oxygen contents of uraninite were
calculated by stochiometery assuming an ideal com-
position of UO2. The mounts were placed in steel
sample holders where surface conductivity was
approximately 5–10 V/cm. The entire assembly was
then placed in the ion microprobe sample lock and
held at high vacuum for a minimum of 8 h prior to the
start of analysis.
3.2. HRTEM analyses of uranium oxide minerals
Samples for HRTEM were prepared by slicingf 100 Am-thick portions of the probe mounts and
selecting 3 mm-diameter chips from these sections.
The chips were then polished on both sides using a lap
grinder to an approximate thickness of 20–30 Am and
then mounted onto a TEM sample copper disk. The
samples were treated for 8–16 h in a rapid-etching
ion-milling apparatus (6 keV, 2.5 mA, 15j–20jinclination) until perforated. The samples were then
usually treated for 15–20 min at a 6j–10j inclination
to clean the surface. Some samples were crushed and
powdered, and the powders placed on carbon grids.
Prepared samples were then examined using a JEOL
JEM-2010 high-resolution transmission electron
microscope (HRTEM). This instrument has analytical
capabilities and a point-to-point resolution of 1.9 A.
3.3. Conventional stable isotope analyses of the UO2
standards
The oxygen isotopic composition of a synthetic
uraninite crystal (UO2.1) was isotopically character-
ized by conventional methods to calibrate it for poten-
tial use as an ion microprobe standard. Oxygen was
liberated from multiple fractions of finely powdered
Sample Spot Mineral d18O 207Pb/ Error 208Pb/ Error 207Pb/206Pb Electron microprobe dataa
No. (x) 206Pb % (1r) 206Pb % (1r) Age (Ma)UO2 PbO SiO2 CaO
CS235m 4 uran � 22.0 0.06865 0.37 0.000736 3.5 888F 8 81.7 8.2 0.51 1.97
5 uran � 24.8 0.06849 0.33 0.000522 4.2 884F 7 78.2 12.2 0.17 1.65
6 uran � 23.7 0.06680 0.39 0.000990 3.1 831F 8 82.6 8.8 0.29 1.83
7 uran � 27.0 0.06801 0.31 0.000724 3.1 869F 6 75.8 15.4 0.07 1.36
8 uran � 25.0 0.07929 0.26 0.000235 4.9 1179F 5 78.9 11.4 0.49 1.54
9 uran � 23.4 0.08709 0.22 0.000123 5.6 1362F 4 75.0 15.2 0.07 1.24
10 uran � 26.4 0.06837 0.38 0.000529 5.1 880F 8 80.5 8.9 0.44 1.73
11 uran � 32.3 0.06766 0.35 0.000496 3.9 858F 7 77.9 13.6 0.21 1.05
12 uran � 23.3 0.06933 0.39 0.001034 4.2 909F 8 82.7 5.7 0.82 2.14
13 uran � 26.1 0.06757 0.37 0.000763 3.5 856F 8 80.2 9.7 0.35 1.75
Spot locations for sample CS615A1 and CS235 m are shown in Figs. 6 and 7, respectively. Pb–Pb and U–Pb data for samples W83C and
CS615A1 are from Fayek et al. (2000a). Abbreviations: uran = uraninite; coff = coffinite; Ca–U= calciouranoite; N.A= not available.a All electron microprobe data are reported in units of wt.%. Uncertainty in measuring the Pb and U concentrations is F 0.1 wt.% (100
ppm).
Table 1 (continued )
M. Fayek et al. / Chemical Geology 185 (2002) 205–225210

( < 350 Am) material derived from a single UO2 crystal
by using the BrF5 technique of Clayton and Mayeda
(1963). Oxygen isotopic compositions are reported in
units of xrelative to Vienna Standard Mean Ocean
Water (V-SMOW). Replicate analyses for d18O are
reproducible to F 0.1x, and the d18O value of NIST-
28 quartz is 9.6x. The oxygen yield for UO2 was
3.8F 0.3. Multiple measurements (5) gave a d18O
value of 8.1F 0.3x.
3.4. Ion microprobe oxygen isotopic analyses of
synthetic UO2 and uraninite
Isotopic analyses of the UO2 standard and the
unknown, uraninite, were made at UCLA with the
CAMECA IMS 1270 ion microprobe (de Chambost et
al., 1991) in multi-collection mode, by sputtering with
a f 10 Am� 20 Am, 0.5-nA primary beam of Cs +
ions with impact energy f 20 keV. This beam creates
a crater depth of approximately 500 nm. Low energy
(0 to 30 eV) negative secondary ions were analyzed.
A mass resolving power (M/DM) of f 2000 (full
width at 10% full height) was sufficient to eliminate
isobaric hydride interferences and generate flat peak
tops f 0.020 amu wide for oxygen isotopes.
The recent development of the multicollector detec-
tion system for the CAMECA IMS 1270 SIMS has
permitted routine high-resolution (f 10 Am scale)
high precision (sub per mil) in situ O isotopic analyses
of geological materials (Fayek et al., 2001). The
multicollector consists of five motorized, computer-
controlled, movable collector units. Each unit can be
configured to contain either an electron multiplier
(EM) or Faraday cup (FC) with a slit assembly.
Secondary ion intensities are high enough to permit
the detection of both major and minor isotopes of
oxygen by Faraday cups (FC). Faraday cup precision
is on the order of 10� 4 A. A primary beam current off 2.7 nA produced a f 2� 109 counts/s for 16O
and f 6� 106 for 18O. The FC signals were meas-
ured by electrometers housed in a temperature-con-
trolled vacuum chamber (f 10 � 3 Torr) with
feedback resistor of 109 V. Typically, drift in the FC
detection system over a 12-h period was f 0.2 fA, or
approximately 1xof the 18O � signal, and corrected
for by making several FC background measurements
during each day of analysis. Measurements comprised
25 cycles, each cycle consisting of a 10-s measure-
ment. Internal precision of F 0.3xunder these con-
ditions was routinely obtained for analyses of < 5 min
duration.
Fig. 2 shows ion microprobe oxygen isotopic
analyses of different spots of the UO2 standard made
over a several-analyses session. The solid line in the
plot represents the reference isotopic value determined
by conventional methods, whereas the dashed lines
represent the standard deviation calculated from the
ion microprobe data. The data show some additional
scatter beyond the internal precision; however, there is
no trend within a single population with a standard
deviation of 0.5x (Fig. 2). This value may be taken
as representative of the overall point-to-point repro-
U Pb 206Pb 207Pb 208Pb 235U 238U 207Pb/ Error 206Pb/ Error q(x,y)(%) (%) 235U (%) 238U (%)
72.0 7.6 7.1 0.49 0.00526 0.518 71.5 0.947 2.7 0.100 2.7 0.992
68.9 11.4 10.6 0.73 0.00555 0.496 68.4 1.466 1.9 0.155 1.9 0.987
72.7 8.1 7.6 0.51 0.00754 0.524 72.2 0.972 2.6 0.106 2.6 0.990
66.8 14.3 13.4 0.91 0.00970 0.481 66.3 1.894 1.6 0.202 1.6 0.984
69.5 10.6 9.8 0.78 0.00231 0.500 69.0 1.554 2.0 0.142 2.0 0.993
66.1 14.1 13.0 1.13 0.00159 0.476 65.6 2.369 1.6 0.197 1.6 0.992
70.9 8.2 7.7 0.53 0.00408 0.511 70.4 1.033 2.6 0.110 2.5 0.990
68.6 12.6 11.8 0.80 0.00587 0.494 68.1 1.621 1.8 0.174 1.7 0.983
72.8 5.3 5.0 0.35 0.00515 0.524 72.3 0.659 3.8 0.069 3.8 0.995
70.6 9.0 8.4 0.57 0.00642 0.509 70.1 1.118 2.4 0.120 2.3 0.989
M. Fayek et al. / Chemical Geology 185 (2002) 205–225 211

ducibility of the method. Although the typical spot-to-
spot reproducibility of fF 0.5xis not as precise as
that obtained by conventional analyses, the amount of
material consumed during ion microprobe analysis is
generally about 105 times less providing us with a
very high spatial resolution.
The oxygen isotopic composition of uranium min-
erals (i.e., coffinite and Ca-rich uranyl oxides) other
than uraninite could not be measured by ion microp-
robe because a chemically and isotopically suitable
standard was not available.
3.5. Data presentation and IMF correction
All oxygen isotopic data are presented using stand-
ard d-notation relative to the appropriate standards,
Vienna Standard Mean Ocean Water (V-SMOW) for18O/16O and Vienna Peedee Belemnite (V-PDB) for13C/12C. The equation for calculating d values in units
of per mil (x) is:
dsample ¼ ðRsample � RstdÞ=Rstd � 103 ð1Þ
where Rsample and Rstd are the absolute ratios in
sample and standard, respectively. dbias, which is the
isotope mass fractionation that occurs during SIMS
analysis, was calculated in the same manner as dsample,
using Eq. (1).
3.6. Ion microprobe Pb isotopic analyses of uranium
oxides
The analytical protocol for uranium mineral U–Pb
measurements using the CAMECA ims 1270 is sim-
ilar to that used by Fayek et al. (2000a). A f 1-nA
primary ion beam of O� was focused to a 15� 30
Am spot. The following species were detected sequen-
tially by switching the magnetic field: 203.5 (back-
ground), 204Pb + , 206Pb + , 207Pb + , and 208Pb + . High
resolution mass scans indicate that isobaric interfer-
ences were fully resolved. A typical analysis lastedf 10 min comprising of 25 analysis cycles. Common
Pb (204Pb + ) was not detected. Lead isotopic analyses
of uranium oxide minerals by ion probe were made
during separate analytical sessions on the same spots
that were analyzed for their oxygen isotopic compo-
sition. Oxygen isotopic analyses preceded the analy-
ses of Pb isotopes so that O� primary beam used to
obtain Pb isotopic data would not contaminate the
analysis area. Instrumental mass fractionation due to
matrix effects does not occur for the isotopes of lead
in minerals (i.e., zircon, uraninite, etc.), therefore, a
Fig. 2. External reproducibility of oxygen isotope analyses measured over a several analytical sessions for synthetic UO2. Shown are mass-
fractionation corrected d18OSMOW values with 1r error bars. Solid lines represent the accepted value based on conventional analyses. Data from
Table 2.
M. Fayek et al. / Chemical Geology 185 (2002) 205–225212

standard was not required and obtaining the Pb iso-
topic composition of all the uranium-bearing minerals
such as, uraninite, coffinite, and Ca-rich uranyl oxide
was possible.
3.7. Calculation of U/Pb ratios
The Pb isotope ratios determined by ion microprobe
and the concentration of Pbmeasured by electron probe
from the same spot were combined to calculate the
concentrations of 206Pb and 207Pb. Using the present-
day 238U/235U ratio of 137.88 and the U concentration
measured by electron probe, the amounts of 238U and235Uwere calculated. The concentrations of 238U, 235U,206Pb, and 207Pb were then used to calculate206Pb/238U, and 207Pb/235U for each spot. This method
avoids the need for a concordant uraninite or coffinite
ion microprobe standard with homogenous U/Pb ratios
because only the Pb isotopes are measured by ion
microprobe, which exhibit negligible instrumental
fractionation during sputtering (Meddaugh, 1983; Zet-
terstrom et al., submitted for publication).
3.8. Error calculation.
The uncertainties in the 206Pb/238U and 207Pb/235U
ratios, rx and ry, respectively, and the covariance,
rxy, were calculated by propagating the uncertainties
in measuring Pb isotopic ratios by ion probe and the
uncertainties in measuring the Pb and U concentra-
tions by electron probe (Table 1). The largest source
of error in this method is in the determination of U
and Pb concentrations by electron microprobe. Con-
cordia intersections were calculated using the program
ISOPLOT (Ludwig, 1993). Uncertainties in the ages
are 1r in every case. Detailed error calculations
equations used in calculating the isotopic ratios are
presented in Fayek et al. (2000a).
4. Petrographic relations and mineral paragenesis
4.1. Uraninite
Uraninite at Cigar Lake occurs as black to dark
grey masses with a metallic to sub-metallic luster.
Uraninite is highly fractured, with sulfides, arsenides,
clay, and rust-colored carbonate minerals (mainly
calcite) infilling fractures. X-ray diffraction revealed
uraninite, coffinite, galena, chalcopyrite, and pyrite as
the most abundant minerals in the clay-free fraction of
the ore (Janeczek and Ewing, 1994).
As with other uranium deposits in the Athabasca
Basin, three main stages of ore formation were
observed in thin section and by BSE. These are: stage
1 (U1), 2 (U2), and 3 uraninite (U3). All stages of
uranium ore are variably altered to Ca–Si-rich,
hydrous uranium minerals and coffinite. Stage 1, 2
and 3 uraninites occur as masses, uraninite cubes, and
pseudo-cubes, ranging in size from 0.1 to 0.5 cm.
Stage 1 and 2 uraninites occur as nodular masses that
range in size up to 5 cm across. Nodules are com-
posed of many botryoids that exhibit radial textures in
thin section as a result of uniformly distributed radial
shrinkage cracks. Spaces between botryoids of stage 1
uraninite are filled with clay minerals, Ni–Cu arsen-
ides and Ni–Co sulf-arsenides (Reyx and Ruhlmann,
1993). However, Cu–Fe-sulfides are commonly asso-
ciated with stage 3 uraninite (Bruneton, 1987; Reyx
and Ruhlmann, 1993).
Stage 1 uraninite is characterized by high PbO
contents (13.10 to 14.54 wt.%) and low SiO2 and CaO
contents ( < 1 wt.%); whereas, stage 2 uranium min-
erals are characterized by intermediate PbO contents
(7.78 to 11.64 wt.%) and intermediate SiO2 and CaO
contents (1–3.5 wt.%), and stage 3 uraninite has low
to moderate PbO contents (0.24 to 6.33 wt.%) and
variable SiO2 and CaO contents (Fayek et al., 1997a).
However, all three stages of uraninite have high
uranium contents (77.52 to 84.37 wt.%).
Stage 1 and 2 uraninites have similar X-ray pow-
der-diffraction patterns which are consistent with UO2
(Fayek et al., 2000b). Selected area diffraction and
lattice images obtained using HRTEM of the least
altered stage 1 and 2 uraninites show that these
uraninite samples are well crystallized and essentially
defect-free (Fig. 3a; Fayek et al., 2000b). The energy-
dispersion spectroscopy (EDS) of these well-crystal-
lized uraninite samples indicates that they have rela-
tively high Pb contents but low Si and Ca contents
(Fig. 3b; Fayek et al., 2000b). A more detailed
description of the uranium ore can be found in Fayek
et al. (1997a).
HRTEM analyses of stage 3 uraninite have identi-
fied patches of uraninite (f 500 Am) and coffinite
being replaced by a Ca-rich uranyl-oxide hydrate
M. Fayek et al. / Chemical Geology 185 (2002) 205–225 213

mineral (Fig. 4a). Selected area diffraction patterns
obtained by HRTEM show that this Ca-rich uranyl-
oxide hydrate mineral is crystalline (Fig. 4b) and
calculated d-spacings from selected area diffraction
patterns indicate a unit cell that is distinctly different
from that of uraninite, with the most intense diffraction
peaks most closely matching those of calciouranoite
(CaU2O7�5H2O) heated to 900 jC (see below; Table
2). However, the structure of calciouranoite is not
known. In areas where the uraninite is partially altered
to calciouranoite, lattice images (Fig. 4c) show a
‘‘comb’’-like texture that is probably the result of a
volume change that occurs during the alteration proc-
ess. Similar textures occur when biotite alters to chlo-
Fig. 3. (a) Selected area electron diffraction pattern of stage 1 uraninite (sample CS615A1); (b) energy dispersive spectrum (EDS) of stage 1
uraninite (sample CS615A1). The Cu is from the Cu grid.
M. Fayek et al. / Chemical Geology 185 (2002) 205–225214

rite (Baronnet, 1992; Veblen, 1992). Uraninite-free
regions are characterized by high Ca contents and
relatively low to moderate Si and Pb contents (Fig. 4d).
4.2. Coffinite
Coffinite, in hand specimen, occurs as grey-black
microveinlets. In thin section, coffinite occurs as
colliform bands along uraninite grains and botryoids
and as feathery crystalline dark grey masses in carbo-
nate veins. Replacement of uraninite and by coffinite
was pervasive along fractures and uraninite-sulfide
contacts. Fine-grained coffinite often contains relics of
uraninite (Fig. 5a) and is intimately intergrown with
clays. Coffinite is characterized by low PbO contents
(0 to 2.08 wt.%), moderate but variable CaO (0.42 to
4.94 wt.%) and occasionally low SiO2 contents (9.00
to 18.41 wt.%; Fayek et al., 1997a).
Selected-area diffraction patterns of coffinite often
show streaking (Fig. 5b) and concentric diffraction
rings (Fayek et al., 2000b). High-resolution images
reveal uraninite sub-grains (Fig. 5c), edge dislocations,
low-angle grain boundaries, ‘‘bent’’ lattice fringes, and
interstitial regions (Fig. 5c) that are characterized by
relatively high Si and Ca contents (Fig. 5d) and
variable Pb contents. Similar features are observed in
Fig. 4. (a) Bright field image of calciouranoite (CaU) with relict uraninite (Ur); (b) selected-area diffraction pattern showing the crystalline
nature of calciouranoite; (c) high-resolution transmission electron (HRTEM) image showing relic uraninite (Ur) and calciouranoite (CaU), and
the ‘‘comb’’ texture (white box) associated with volume change during the alteration of uraninite to calciouranoite; (d) energy dispersive
spectrum (EDS) of calciouranoite (Sample CS235 m). The Cu is from the Cu grid.
M. Fayek et al. / Chemical Geology 185 (2002) 205–225 215

samples from Oklo, Gabon and are interpreted to be
the result of radiation damage, despite the relatively
rapid annealing of radiation-induced defects in urani-
nite (Casas et al., 1998).
The close association of sulfides, such as chalco-
pyrite, with coffinite suggests that coffinite formed
under reducing conditions ( fO2 < 10� 40) (Janeczek
and Ewing, 1992). Coffinite is stable relative to
uraninite at intermediate dissolved silica levels
(f 10� 4 to 10� 3 mol/l; (Langmuir, 1978)). In fluids
permeating through the sandstone, the dissolved silica
concentrations reach 5.1�10� 4 mol/l (Janeczek and
Ewing, 1992). Therefore, it is not surprising that
extensive coffinitization occurs at Cigar Lake. How-
ever, the P–Tconditions for coffinite formation are not
well defined (Janeczek and Ewing, 1992). The thermal
stability of coffinite has been reported to range bet-
ween 25 jC and 1000 jC (Hoekstra and Fuchs, 1956;
Hemingway, 1982).
4.3. Ca-uranyl-oxide hydrate minerals
In hand specimen, uranyl-oxide hydrate minerals
are yellow to orange in color and occur as micro-
veinlets that cut across uraninite. In thin section,
uranyl minerals are closely associated with coffinite
and occur as homogenous colliform bands along the
edges of uraninite grains or as microveinlets that cut
across the common uranium ore minerals (Fayek et al.,
1997a). These minerals are characterized by low UO2
contents (63.1 to 82.50 wt.%), variable PbO contents
( < 0.1 to 12.17 wt.%), and intermediate to low SiO2
and CaO contents (0.18 to 6.49 wt.%). However,
there is no correlation between UO2 and PbO contents
Table 2
Interplanar spacing for uraninite, coffinite and calciouranoite from the Cigar Lake unconformity-type uranium deposit
Uraninite Coffinite Calciouranoite
(JCDPS #20-1344)a (CS 615 220) (JCPDS #11-420) (CS 235L 113) (Rogova et al., 1974a)b (CS 235 L 113)
d(A) Int. hkl d(A)c hkl d(A) Int. hkl d(A) hkl d(A) Int. d(A)
3.140 100 111 3.11 111 4.640 95 101 4.76 101 5.741 40
2.721 45 200 2.73 200 3.480 100 200 3.54 200 3.367 60
1.924 50 220 1.94 220 2.789 45 211 3.206 90 3.23
1.641 50 311 2.636 95 112 2.720 60 2.79
1.803 70 312 2.460 40
1.974 90
1.880 50
1.850 50
1.776 50
1.685 40
1.684 90 1.62
1.600 40
1.563 40
1.452 40
1.394 40 1.40
1.349 50
1.286 40
1.176 40
1.152 40
1.142 40
1.117 70
1.064 60 1.06
1.044 70
1.006 60
0.996 60
a JCPDS-ICDD copyright (c) 1990.b hkl values are unavailable because unit cell is not known.c d-spacing of most intense peaks ( > 40%) from electron diffraction patterns.
M. Fayek et al. / Chemical Geology 185 (2002) 205–225216

of uranyl oxide hydrate-uraninite alteration minerals
(Fayek et al., 1997a).
The uranyl minerals could not be identified based
on the X-ray powder-diffraction pattern because they
are fine grained ( < 15 nm). However, HRTEM anal-
yses of stage 3 uraninite and calculated d-spacings
from selected area diffraction patterns indicate that the
Ca-rich uranyl mineral is likely calciouranoite (Fig. 4;
Table 2).
Calciouranoite was first described by Rogova et al.
(1974a) as a higher hydrate of metacalciouranoite
(Rogova et al., 1974b). Calciouranoite occurs gener-
ally as a brownish-orange poorly crystalline coating
that must be heated to produce a powder X-ray
diffraction pattern and can be represented ideally by
the formula CaU2O7�5H2O. Electron microprobe anal-
yses by Rogova et al. (1974a) show that calcioura-
noite has moderate UO2 contents (68.02 to 71.78
wt.%), low PbO contents (1.18 to 2.68 wt.%), and
low to moderate SiO2 (0.32 to 4.00 wt.%) and CaO
contents (5.86 to 6.77 wt.%), which are similar in
composition to the calciouranoite from Cigar Lake
(Fayek et al., 1997a). However, the calciouranoite
from Cigar Lake has higher PbO contents because it
replaces a Proterozoic uraninite (f 1500 Ma), which
has a high PbO content relative to that of the upper
Fig. 5. (a) Bright-field image of coffinite (Cof) with relict uraninite (Ur); (b) selected area diffraction pattern showing two phases: uraninite and
coffinite; (c) high-resolution transmission electron (HRTEM) image showing bent lattice fringes and polycrystalline microtexture. Subgrains are
uraninite (Ur) with interstitial coffinite zones (Cof); (d) energy dispersive spectrum (EDS) of coffinite rich zones (Sample CS235 m). The Cu is
from the Cu grid.
M. Fayek et al. / Chemical Geology 185 (2002) 205–225 217

Jurassic to lower Cretaceous uraninite that was
studied by Rogova et al. (1974a,b).
Published studies on the dissolution, oxidation, and
secondary phase formation during the interaction
between uraninite and UO2- and silica-saturated oxi-
dizing fluids have shown that shortly after the onset of
uraninite or UO2 dissolution, uranyl-oxide hydrates
(e.g. becquerelite and curite) precipitate followed by
uranyl-silicate minerals such as soddyite and urano-
phane and eventually uranyl alkali silicates (Finch and
Ewing, 1992; Fayek et al., 1997b). Therefore, the
close association between coffinite and calciouranoite
and moderate Si contents of calciouranoite suggests
that in the presence of oxidizing fluids coffinite may
alter to higher oxide hydrate phases.
5. Oxygen isotope systematics
Previously reported d18O values of stage 1, 2 and 3
uraninites from Cigar Lake (� 28.5 to � 3.8x;
Fayek et al., 1997a), which were obtained by micro-
drilling thick sections and analysing the powders by
the fluorination technique, show a wide range of
values with generally increasing d18O values with
increasing SiO2 and CaO contents and with each
subsequent stage of uraninite. However, it was not
clear whether the increase in d18O values with
increasing SiO2 and CaO contents was the result of
uraninite precipitating from subsequent fluids with
higher SiO2 and CaO contents or incorporation of Si-
and Ca-rich minerals, such as clays, coffinite, and Ca-
uranyl-oxide hydrates, during the micro-drilling pro-
cedure. The high spatial resolution of the in situ
oxygen isotopic measurements by ion microprobe
(15� 30 Am) has allowed us to analyse relatively
unaltered regions of uraninite, devoid of alteration
minerals, within a single thin section. Figs. 6 and 7
show back-scattered electron images of stage 1, 2 and
3 uraninites, respectively, and the spots analysed by
electron and ion microprobe. Ion microprobe d18Omeasurements obtained from 20 to 100 Am areas of
stage 1, 2 and 3 uraninites indicate that portions of the
uraninite inferred petrologically to be relatively unal-
tered have a range of d18O values from � 33.9 to
� 20.5x(Fig. 8a). These values are among the
lowest reported from unconformity-type uranium
deposits from the Athabasca Basin. The exceptionally
low and narrow range of d18O values obtained by ion
microprobe relative to the analyses obtained by
micro-drilling and conventional fluorination analyses
confirms that even mm-scale sampling is insufficient
to avoid veins of isotopically heavier, Ca–U oxide
hydrates and coffinite. Electron microprobe analyses
of the same spots analyzed by ion microprobe show
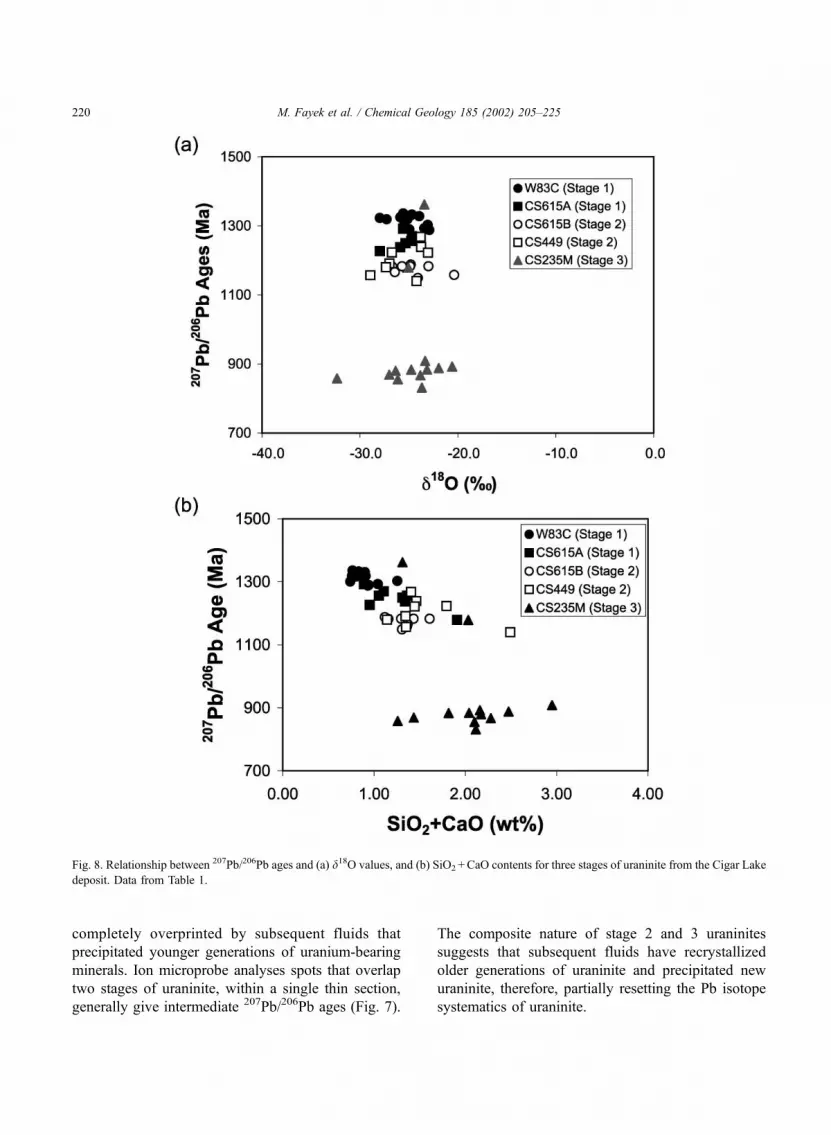
that stage 2 and 3 uraninites have slightly higher SiO2
and CaO content relative to stage 1 uraninite (Fig.
8b); however, this slight increase in SiO2 and CaO
content has had little effect on the d18O values of the
uraninites.
Isotopic andmicrothermometric studies on clay, and
silicate minerals in textural equilibrium with uraninite
Fig. 6. Back-scattered electron image of stage 1 uraninite from Cigar Lake (CS615A1). Coffinite (Cof) and calciouranoite (CaU) alteration
appears as dark gray while uraninite (U1) and galena (Gal) is light gray. Labeled spots indicate analyses points for U–Pb and O isotopic
measurements.
M. Fayek et al. / Chemical Geology 185 (2002) 205–225218

from the Cigar Lake and other unconformity-type
uranium deposits from the Athabasca Basin indicate
that the dominant fluids involved in the formation of
unconformity-type uranium deposits were saline fluids
having d18O values of approximately 4F 4xand
temperatures of 175F 25 jC (e.g., Kotzer and Kyser,
1995). Using these results, in conjunction with theo-
retical and experimental uraninite-water fractionation
factors (Hattori and Halas, 1982; Zheng, 1995; Fayek
and Kyser, 2000), uraninite should have d18O values
near � 10x. However, at temperatures of 200 jC, thed18O values of the uraninite indicate that they should
have been in equilibrium with fluids with d18O values
near � 20x. The fractionation between uraninite
and water at temperatures f 100–200 jC is f 11x(Fayek and Kyser, 2000), and so the anomalously low
d18O values of all three stages of uraninite are likely
due to recrystallization of uraninite by late meteoric
waters, which in the Athabasca area have d18O values
of approximately � 20 to � 16x(Kotzer and Kyser,
1995), resulting in only minor disturbances to their
chemical composition and texture, and limited acti-
nide migration. This implies that these fluids were
relatively reducing because uranium mineral chemis-
try and solubility is largely a function of fO2 and
uraninite is stable only under very reducing conditions
( fO2 < 10� 25; Cramer, 1995). Therefore, in situ oxy-
gen isotopic analyses of uraninite not only can provide
information regarding the fluid history of this deposit,
but can also provide the base-line context for the
interpretation of U mobilization during repository
relevant time periods.
6. Pb–Pb and U–Pb isotope systematics
The 207Pb/206Pb ages of uraninite, coffinite and Ca-
rich uranyl oxide minerals range from 254 to 1362
Ma. Samples of stage 1 uraninite tend to have homo-
genous 207Pb/206Pb ages, on the scale of the thin
section, ranging from 1362 to 1222 Ma, whereas stage
2 and 3 uraninites predominantly have 207Pb/206Pb
ages ranging from 1191 to 1140 Ma and 909 to 802
Ma, respectively. These ages are similar to those
previously reported for uraninite from the Athabasca
basin (e.g., Cumming and Krstic, 1992; Kotzer and
Kyser, 1993; Fayek and Kyser, 1997). However,
samples of stage 2 and 3 uraninites are generally less
uniform in terms of their Pb isotopic composition,
containing regions that give 207Pb/206Pb ages that are
consistent with all three stages of uraninite (Fig. 8a).
For example, 207Pb/206Pb ages from brighter regions
observed in BSE images of stage 2 and 3 uraninites
generally give ages that are consistent with stage 1
uraninite (Fig. 8a). These regions are interpreted to be
remnant grains of stage 1 uraninite that were not
Fig. 7. Back-scattered electron image of (a) stage 2 uraninite
(CS615B1). Coffinite (Cof) alteration appears as dark gray while
uraninite (U2) is light gray. Also shown are two oval-shaped craters
(very light gray) that mark spots that were analyzed by ion and
electron microprobe; (b) stage 3 uraninite (CS235 m). Uraninite
(U3) has a mottled texture where bright patches represent remnant
stage 1 uraninite that was not completely recrystallized. Also shown
are two oval-shaped craters (very light gray) that mark spots that
were analyzed by ion and electron microprobe.
M. Fayek et al. / Chemical Geology 185 (2002) 205–225 219
completely overprinted by subsequent fluids that
precipitated younger generations of uranium-bearing
minerals. Ion microprobe analyses spots that overlap
two stages of uraninite, within a single thin section,
generally give intermediate 207Pb/206Pb ages (Fig. 7).
The composite nature of stage 2 and 3 uraninites
suggests that subsequent fluids have recrystallized
older generations of uraninite and precipitated new
uraninite, therefore, partially resetting the Pb isotope
systematics of uraninite.
Fig. 8. Relationship between 207Pb/206Pb ages and (a) d18O values, and (b) SiO2 +CaO contents for three stages of uraninite from the Cigar Lake
deposit. Data from Table 1.
M. Fayek et al. / Chemical Geology 185 (2002) 205–225220
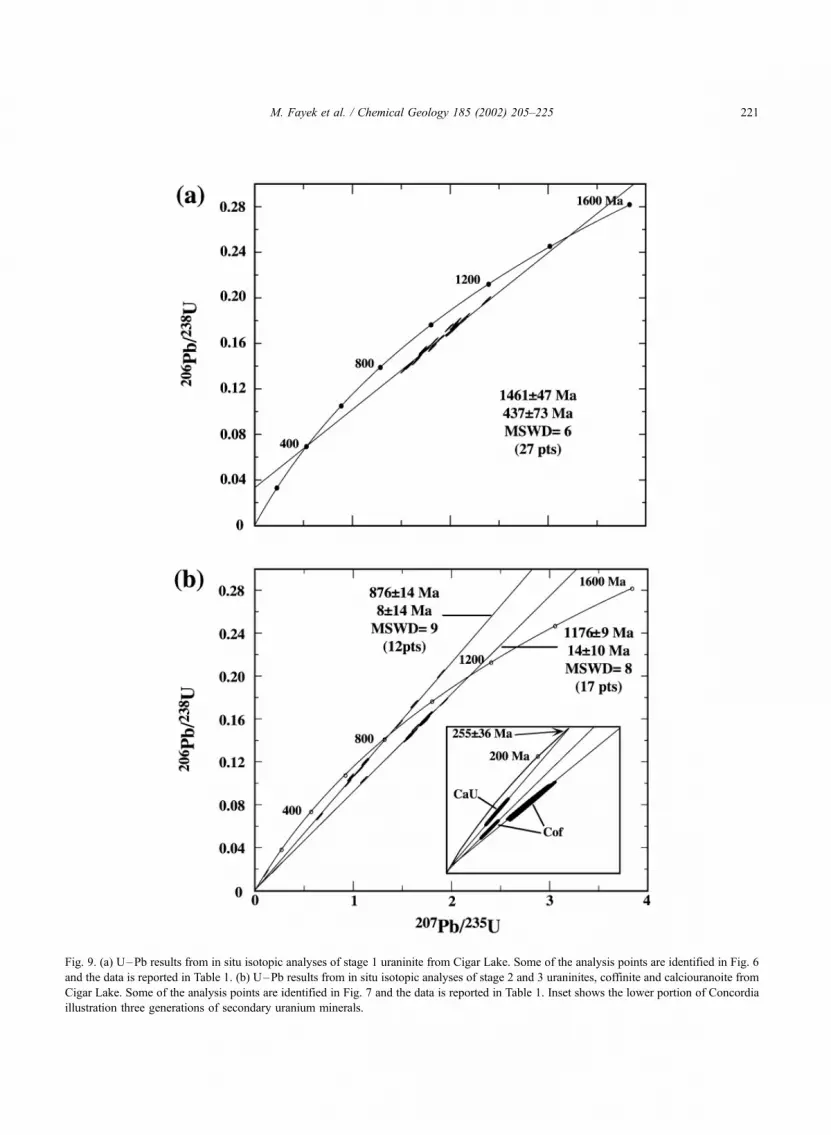
Fig. 9. (a) U–Pb results from in situ isotopic analyses of stage 1 uraninite from Cigar Lake. Some of the analysis points are identified in Fig. 6
and the data is reported in Table 1. (b) U–Pb results from in situ isotopic analyses of stage 2 and 3 uraninites, coffinite and calciouranoite from
Cigar Lake. Some of the analysis points are identified in Fig. 7 and the data is reported in Table 1. Inset shows the lower portion of Concordia
illustration three generations of secondary uranium minerals.
M. Fayek et al. / Chemical Geology 185 (2002) 205–225 221

Si- and Ca-rich uranium minerals, such as coffinite
and cacliouranoite, are associated with each stage of
uraninite. Coffinite has 207Pb/206Pb ages of 1119–
1082 and 802 Ma, whereas calciouranoite gives an
age of 245 Ma. These ages suggest that there were
several generations of Si- and Ca-rich alteration
minerals, precipitating from Si- and Ca-rich fluids.
The 207Pb/206Pb ages from coffinite are similar to the207Pb/206Pb ages from stage 2 and 3 uraninites sug-
gesting that these Si- and Ca-rich fluids were involved
in the precipitation of stage 2 and 3 uraninites, which
also tend to have higher Si and Ca contents relative to
stage 1 uraninite (Fig. 8b).
Fig. 9a shows a concordia plot of the U–Pb data
from stage 1 uraninite. When all 27 points are re-
gressed together, an upper intercept of 1461F 47 Ma
and lower intercept of 437F 73 Ma is obtained with
an MSWD of 6. The age obtained from the regression
of all the points is interpreted to represent the mini-
mum age of mineralization, which corresponds with
the Rb–Sr age of clay mineral alteration (f 1477
Ma) associated with the unconformity-type uranium
deposits (Kotzer and Kyser, 1995) and the age of one
of the magnetization events (B-type magnetization,
1600–1450 Ma) from the Athabasca basin (Kotzer et
al., 1992).
Fig. 9b shows a concordia plot of the U–Pb data
from stage 2 and 3 uraninites, coffinite, and calciour-
anoite. Regression of the points, including two gen-
erations of coffinite, give upper intercepts of 1176F 9
and 876F 14 Ma, and lower intercept of 14F 10 and
8F 14 Ma, respectively. The ages obtained from the
regression are also interpreted to represent the mini-
mum age of mineralization. These ages correspond
with the age of the Grenvillian Orgeny (f 1100 Ma;
Mallard and Rogers, 1997), which occurred to the
southeast of the Athabasca Basin, and the age of one
of the magnetization events (C-type magnetization,f 900 Ma) from the Athabasca basin (Kotzer et al.,
1992), which is likely due to fluids that migrated
during the break up of Rhodinia (i.e., separation of
North America from Australia at f 900 Ma) (Young,
1992; Li et al., 1996).
Lead diffusion in uraninite is a rapid process with
diffusion rates of three to six orders of magnitude
faster than in silicates such as zircon (Yershov, 1974;
Janeczek and Ewing, 1995). Therefore, the lower
intercepts (e.g., 437F 73 Ma) likely do not reflect a
Pb resetting event, but result from continuous Pb
diffusion (Tilton, 1960). This continuous Pb diffusion
model is plausible because the temperature remained
relatively constant (below 200 jC) throughout the
history of these deposits (Kotzer and Kyser, 1995).
Several of the points from stage 3 uraninite plot
above concordia. These data are from samples that
contain fine intergrowths of calciouranoite and gen-
erally have low uranium contents (Table 1). The
presence of a uranyl oxide hydrate mineral, such as
calciouranoite, indicates that uraninite has been
hydrated and partially oxidized in the presence of a
fluid. The low UO2 contents are likely the result of the
increased solubility of oxidized uranium and the
preferential leaching of U6 + from uraninite. The age
of the calciouranoite does not correspond with the
uraninite or coffinite ages and is interpreted to be the
result of late fluids that altered uraninite and coffinite.
In contrast, the concordia plot of data from Cigar
Lake obtained by micro-drilling and conventional wet
chemical techniques (Cumming and Krstic, 1992)
shows a great deal of scatter. In their study, Cumming
and Krstic (1992) were unable to avoid micrometer
intergrowths of galena and coffinite. Therefore, the in
situ U–Pb data analyses may be indicating the timing
and nature of the recrystallizing event, which prior to
the in situ analyses was obscured by the wide varia-
bility in the data obtained by micro-drilling and
conventional isotopic analyses.
7. Conclusions
(1) We used a technique that utilizes both the
electron and ion microprobe to obtain rapid and
precise in situ U–Pb isotopic analyses of uranium
minerals. The advantages of this technique over con-
ventional methods and previous ion microprobe tech-
niques are: (1) mineral separation and chemical
digestion are not required, (2) a uranium mineral
standard with homogenous Pb*/U is not required,
and (3) minor alteration phase, such as coffinite, and
calciouranoite with a complex chemistry can be rou-
tinely analyzed for their U–Pb isotopic composition.
(2) A concordia plot of U–Pb data, obtained by this
technique, from three stages of uraninite and coffinite
from the Cigar Lake uranium deposit are discordant
with upper intercepts of 1461F 47, 1176F 9, and
M. Fayek et al. / Chemical Geology 185 (2002) 205–225222

876F 14 Ma. These ages correspond with the age of
the clay mineral alteration associated with unconform-
ity-type uranium deposits, ages of magnetization
events from the Athabasca basin, and the Grenvillian
Orogeny.
(3) Ion microprobe analysis by ion microprobe in
multi-collection mode permits rapid (i.e. time per
analyses < 5 min), precise (F 0.5x) in situ oxygen
isotopic analysis of uraninite. The oxygen isotopic
analyses of uraninite represent the first in situ stable
isotopic measurements of uranium oxides.
(4) In situ oxygen isotopic analyses of discreet 20–
100 Am size regions of uraninite, from the Cigar Lake
Deposit, that appear to be free of alteration have the
lowest d18O values (� 33.9 to � 20.4x) ever re-
ported for unconformity-type uranium deposits. These
results suggest that uraninite likely interacted with
fluids with d18O values of ca. � 18x, (i.e. similar
in composition to recent meteoric waters) resulting in
only minor disturbances to their chemical composition
and texture, and limited actinide migration.
(5) The in situ technique, when applied to other
deposits, can potentially help constrain the chrono-
logical and fluid evolution of unconformity-type ura-
nium deposits. Chemical and isotopic characterizing
of natural phases such as uraninite, coffinite, and
calciouranoite provides an approach to confronting
the long-term behavior of radioactive waste (i.e. UO2
in spent fuel) in specific geologic environments.
Determining the corrosion and behavior of radioactive
waste by using natural analogue phases provides
fundamental data that are significant to performance
assessments of the waste over extended time periods.
Acknowledgements
This study was supported by a grant from the U.S.
Department of Energy. We thank Dr. T.K. Kyser for
providing the UO2 standard and the facilities for
conventional isotopic analyses. Kerry Klassen and
Aliona Valyashko expertly provided technical assis-
tance. We also thank Drs. Frank Kyte and Kevin
McKeegan for their expert technical assistance. The
UCLA ion microprobe laboratory is partially sup-
ported by a grant from the National Science
Foundation Instrumentation and Facilities program.
The manuscript greatly benefited from the construc-
tive comments of Prof. Roberta Rudnick and the two
referees who reviewed this manuscript.
References
Baronnet, A., 1992. Polytypism and stacking disorder. In: Buseck,
P.R. (Ed.), Minerals and Reactions at the Atomic Scale: Trans-
mission Electron Microscopy. Rev. Mineral., vol. 27. Minera-
logical Society of America, Chelsea, MI, pp. 231–289.
Bruneton, P., 1987. Geology of the Cigar Lake uranium deposit
(Saskatchewan, Canada). In: Gilboy, C.F., Vigrass, L.W.
(Eds.), Economic Minerals of Saskatchewan. Sask. Geol. Soc.
Spec. Publ., vol. 8, pp. 99–119.
Bruno, J., Casas, I., Puigdomenech, I., 1991. The kinetics of UO2
under reducing conditions and the influence of an oxidized sur-
face layer (UO2 + x): application of a continuous flow-through
reactor. Geochim. Cosmochim. Acta 55, 647–658.
Bruno, J., DePablo, J., Duro, L., Figuerola, E., 1995. Experimental
study and modeling of the U(VI)–FE(OH)(3) surface precipita-
tion coprecipitation equilibria. Geochim. Cosmochim. Acta 59,
4113–4123.
Burns, P.C., Miller, M.L., Ewing, R.C., 1996. U6 + minerals and
inorganic phases: a comparison and hierarchy of crystal struc-
tures. Can. Mineral. 34, 845–880.
Casas, I., de Pablo, J., Gimenez, I., Torrero, M.E., Bruno, J., Cera,
E., Finch, R.J., Ewing, R.C., 1998. The role of pe, pH, and
carbonate on the solubility of UO2 and uraninite under nomi-
nally reducing conditions. Geochim. Cosmochim. Acta 62,
2223–2231.
Clayton, R., Mayeda, T.K., 1963. The use of bromine pentafluoride
in the extraction of oxygen from oxides and silicates for isotopic
analysis. Geochim. Cosmochim. Acta 27, 43–52.
Cramer, J.J., 1995. The Cigar Lake uranium deposit: analogue in-
formation for Canada’s nuclear fuel waste disposal concept.
AECL Rep. 11204, 32 pp.
Cumming, G.L., Krstic, D., 1992. The age of unconformity-related
uranium mineralization in the Athabasca Basin, northern Sas-
katchewan. Can. J. Earth Sci. 29, 1623–1639.
de Chambost, E., Hillion, F., Rasser, B., Migeon, H.N., 1991. The
CAMECA ims 1270: a description of the secondary ion optical
system. In: Benninghoven, H. (Ed.), SIMS VIII Proceedings.
Wiley, New York, pp. 207–210.
Dyck, W., 1978. The mobility and concentration of uranium and its
decay products in temperate surficial environments. In: Kimber-
ley, M.M. (Ed.), Short Course in Uranium Deposits: Their Min-
eralogy and Origin. Mineral. Assoc. Can., vol. 3, pp. 57–92.
Fayek, M., Kyser, T.K., 1997. Characterization of multiple fluid
events and Rare-Earth-Element mobility associated with forma-
tion of unconformity-type uranium deposits in the Athabasca
Basin, Saskatchewan. Can. Min. 35, 627–658.
Fayek, M., Kyser, T.K., 2000. Low temperature oxygen isotopic
fractionation in the uraninite–UO2–CO2–H2O system. Geo-
chim. Cosmochim. Acta 64, 2185–2197.
Fayek, M., Janeczek, J., Ewing, P.C., 1997a. Mineral chemistry and
oxygen isotopic analyses of uraninite, pitchblende and uranium
M. Fayek et al. / Chemical Geology 185 (2002) 205–225 223

alteration minerals from the Cigar Lake deposit, Saskatchewan,
Canada. Appl. Geochem. 12, 549–565.
Fayek, M., Kyser, T.K., Ewing, R.C., Miller, M.L., 1997b. Uranin-
ite–water interaction in an oxidizing environment. Mater. Res.
Soc. Symp. Proc. 465, 1201–1208.
Fayek, M., Harrison, T.M., Grove, M., Coath, C.D., 2000a. A rapid
in situ method for determining the ages of uranium oxide min-
erals. Int. Geol. Rev. 42, 163–171.
Fayek, M., Burns, P.C., Guo, Y.-X., Ewing, R.C., 2000b. Micro-
structures associated with uraninite alteration. J. Nucl. Mater.
277, 204–210.
Fayek, M., Harrison, T.M., Grove, M., Coath, C.D., Ewing, R.C.,
2001. In situ stable isotopic analyses of multiple generations of
cementation associated with a petroleum reservoir, North Coles
Levee, San Joaquin Basin, California. J. Sediment. Res. 71,
444–485.
Finch, R.J., Ewing, R.C., 1992. Corrosion of uraninite under oxi-
dizing conditions. J. Nucl. Mater. 190, 133–156.
Goodwin, B.W., Cramer, J.J., McConnel, D.B., 1988. The role of
natural analogues in performance assessment. IAEA Technical
Report Series: Appendix B, pp. 37–45.
Grandstaff, D.E., 1976. A kinetic study of the dissolution of ura-
ninite. Econ. Geol. 71, 1493–1506.
Hattori, K., Halas, S., 1982. Calculation of oxygen isotope fractio-
nation between uranium dioxide, uranium trioxide and water.
Geochim. Cosmochim. Acta 46, 1863–1868.
Hemingway, B.S., 1982. Thermodynamic properties of selected ura-
nium compounds and aqueous species at 298.15 K and 1 bar
and at higher temperatures—preliminary models for the origin
of coffinite deposits. U.S.G.S. Open-file Rep, pp. 82–619.
Hoekstra, H.R., Fuchs, L.H., 1956. Synthesis of coffinite–USiO4.
Science 123, 105.
Hoeve, J., Sibbald, T.I.I., 1978. On the genesis of Rabbit Lake and
other unconformity-type uranium deposits in northern Saskatch-
ewan, Canada. Econ. Geol. 73, 1450–1473.
Janeczek, J., Ewing, R.C., 1992. Corrosion and alteration of uranin-
ite under reducing conditions. J. Nucl. Mater. 490, 157–173.
Janeczek, J., Ewing, R.C. 1994. Uraninite from Cigar Lake: drill
cores 220 and FH-18. AECL report, 1085, pp. 93–103.
Janeczek, J., Ewing, R.C., 1995. Mechanisms of lead release from
uraninite in natural fission reactors in Gabon. Geochim. Cosmo-
chim. Acta 59, 1917–1931.
Janeczek, J., Ewing, R.C., Oversby, V.M., Werme, L.O., 1996. Ur-
aninite and UO2 in spent nuclear fuel: a comparison. J. Nucl.
Mater. 238, 21–130.
Johnson, L.H., Werme, L.O., 1994. Materials characteristics and
dissolution behavior of spent nuclear fuel. Mater. Res. Soc.
Symp., 24–27.
Johnson, L.H., Shoesmith, D.W., Lunansky, G.E., Baily, M.G.,
Tremaine, P.R., 1982. Mechanisms of leaching and dissolution
of UO2 fuel. J. Nucl. Technol. 56, 238–253.
Kotzer, T.G., Kyser, T.K., 1993. O, U and Pb isotopic and chemical
variations in uraninite: implications for determining the tempo-
ral and fluid history of ancient terrains. Am. Mineral. 78, 1262–
1274.
Kotzer, T.G., Kyser, T.K., 1995. Petrogenesis of the Proterozoic
Athabasca Basin, northern Saskatchewan, Canada, and its rela-
tion to diagenesis, hydrothermal uranium mineralization and
paleohydrogeology. Chem. Geol. 120, 45–89.
Kotzer, T.G., Kyser, T.K., Irving, E., 1992. Paleomagnetism and the
evolution of the fluids in the Proterozoic Athabasca Basin,
northern Saskatchewan, Canada. Can. J. Earth Sci. 29, 1474–
1491.
Langmuir, D., 1978. Uranium solution–mineral equilibria at low
temperatures with application to sedimentary ore deposits. Geo-
chim. Cosmochim. Acta 42, 547–569.
Leshin, L.A., McKeegan, K.D., Carpenter, P.K., Harvey, R.P., 1998.
Oxygen isotopic constraints on the genesis of carbonates from
martian meteorite ALH84001. Geochim. Cosmochim. Acta 62,
3–13.
Li, Z.X., Zhang, L., Powel, C.McA., 1996. Positions of the East
Asian cratons in the Neoproterozoic supercontinent Rodinia.
Aust. J. Earth Sci. 43, 593–604.
Ludwig, K.R., 1993. ISOPLOT. A plotting and regression program
for radiogenic-isotope data. USGS, Open File Rep., 91–445,
pp. 1–42.
Lyon, I.C., Saxton, J.M., Turner, G., 1994. Isotopic fractionation in
secondary ionization mass spectrometry. Rapid Commun. Mass
Spectrom. 8, 837–843.
Mallard, L.D., Rogers, J.J., 1997. Relationship of Avalonian and
Cadomian terranes to Grenville and Pan-African events. J. Geo-
dyn. 23, 197–221.
Meddaugh, W.S., 1983. Age and origin of uraninite in the Elliot
Lake, Ontario uranium ores. Unpublished Ph.D. diss., Harvard
University.
Reed, S.J.B., 1989. Ion microprobe analysis—a review of geolog-
ical applications. Min. Mag. 53, 3–24.
Reyx, J., Ruhlmann, F., 1993. Etude metallographie des differentes
associations minerales et caracterisation chimique des mineraux
uraniferes du gisement de Cigar Lake (Saskatchewan, Canada).
Can. J. Earth Sci. 30, 705–719.
Rogova, V.P., Belova, L.N., Kiziyarov, G.N., Kuznetsova, N.N.,
1974a. Calciouranoite, a new hydroxide of uranium. Int. Geol.
Rev. 16, 1255–1256.
Rogova, V.P., Belova, L.N., Kiziyarov, G.N., Kuznetsova, N.N.,
1974b. Bauranoite and metacalciouranoite, new minerals of
the hydrous uranium oxide group. Int. Geol. Rev. 16, 214–219.
Shimizu, N., Hart, S.R., 1982. Applications of the ion microprobe to
geochemistry and cosmochemistry. Annu. Rev. Earth Planet.
Sci. 10, 483–526.
Shroeer, J.M., Rhodin, T.N., Bradley, R.C., 1973. A quantum-me-
chanical model for the ionization and excitation of atoms during
sputtering. Surf. Sci. 34, 571–580.
Sigmund, P., 1969. Theory of sputtering: I. Sputtering yield of
amorphous and polycrystalline targets. Phys. Rev. 184, 383–
416.
Smellie, J., Cramer, J.J., 1994. Final report of the AECL/SKB Cigar
Lake analog study: AECL Report, 10851, pp. 28–50.
Smellie, J., Karlsson, F., 1996. A reappraisal of some Cigar Lake
issues of importance to performance assessment. SKB Tech.
Rep. (TR 96-08), Stockholm.
Smith, D.K., 1984. Uranium mineralogy. Uranium Geochemistry,
Mineralogy, Geology, Exploration and Resources. The Institu-
tion of Mining and Metallurgy, London, England, pp. 43–88.
M. Fayek et al. / Chemical Geology 185 (2002) 205–225224

Tilton, G.R., 1960. Volume diffusion as a mechanism for discordant
lead ages. J. Geophys. Res. 65, 2933–2945.
Valley, J.W., Graham, C.M., 1991. Ion microprobe analysis of oxy-
gen isotope ratios in granulite facies magnetites: diffusive ex-
change as a guide to cooling history. Contrib. Miner. Petrol. 109,
38–52.
Valley, J.W., Graham, C.M., Hart, B., Eiler, J.M., Kinny, P.D.,
1997. Ion microprobe analysis of oxygen, carbon, and hydro-
gen isotope ratios. In: McKibben, M.A., Shanks, W.C. (Eds.),
Applications of Microanalytical Techniques to Understanding
Mineralizing Processes. Soc. Econ. Geol. Rev., vol. 7, pp.
73–98.
Veblen, D.R., 1992. Electron microscopy applied to nonstoichiom-
etry, polytypism, and replacement reaction minerals. In: Buseck,
P.R. (Ed.), Minerals and Reactions at the Atomic Scale: Trans-
mission Electron Microscopy. Rev. Mineral., vol. 27. Minera-
logical Society of America, Chelsea, MI, pp. 181–223.
Williams, P., 1979. The sputtering process and sputtered ion emis-
sion. Surf. Sci. 90, 588–643.
Wronkiewicz, D.J., Bates, J.K., Gerding, T.J., Veleckis, E., Tani,
B.S., 1992. Uranium release and secondary phase formation
during unsaturated testing of UO2 at 90 jC. J. Nucl. Mater.
190, 107–127.
Yershov, V.M., 1974. A method of examining the diffusion param-
eters of lead in uranium minerals. Geokhimiya 10, 1565–1568.
Young, G.M., 1992. Late Proterozoic stratigraphy and the Canada–
Australia connection. Geology 20, 215–218.
Yu, M.L., Lang, N., 1986. Mechanisms of atomic ion emission
during sputtering. Nucl. Instrum. Methods B14, 403–413.
Zheng, Y., 1995. Isotope fractionation in uranium oxides. Nucl. Sci.
Technol. 6, 193–197.
Zetterstrom, L., Fayek, M., Sunde, T., Schoberg, H., 2001. U and Pb
isotope calibration of uraninite and galena standards for SIMS.
Standards News Letter submitted for publication.
M. Fayek et al. / Chemical Geology 185 (2002) 205–225 225


![Sometimes a Cigar [Magazine] is More Than Just a Cigar [Magazine]: Pro-Smoking Arguments in Cigar Aficionado, 1992-2000](https://img.dokumen.tips/doc/110x75/6347e126031992cdcf01c086/sometimes-a-cigar-magazine-is-more-than-just-a-cigar-magazine-pro-smoking-arguments.jpg)


