Embed Size (px)
Citation preview

Springer is collaborating with JSTOR to digitize, preserve and extend access to Advances in Archaeological Method and Theory.
http://www.jstor.org
Nutritional Inference from Paleopathology Author(s): Rebecca Huss-Ashmore, Alan H. Goodman and George J. Armelagos Source: Advances in Archaeological Method and Theory, Vol. 5 (1982), pp. 395-474Published by: SpringerStable URL: http://www.jstor.org/stable/20210060Accessed: 08-07-2015 17:48 UTC
Your use of the JSTOR archive indicates your acceptance of the Terms & Conditions of Use, available at http://www.jstor.org/page/ info/about/policies/terms.jsp
JSTOR is a not-for-profit service that helps scholars, researchers, and students discover, use, and build upon a wide range of content in a trusted digital archive. We use information technology and tools to increase productivity and facilitate new forms of scholarship. For more information about JSTOR, please contact [email protected].
This content downloaded from 192.101.188.25 on Wed, 08 Jul 2015 17:48:38 UTCAll use subject to JSTOR Terms and Conditions
Nutritional Inference
from Paleopathology
REBECCA HUSS-ASHMORE, ALAN H. GOODMAN, and GEORGE J. ARMELAGOS
INTRODUCTION
Recent interest in paleonutrition has led to a proliferation of methods for
the reconstruction of prehistoric diet. Although the technology of food pro
curement is a traditional archaeological concern, the role of food in changing
human systems has only begun to be explored. Chief among the problems to
be investigated is the nature and success of human adaptation. Adaptation, as
defined here, is not simply the maintenance of homeostasis, but a dynamic in
teraction between human populations and the environment (including other
human groups) (Thomas 1975). Because food procurement and consumption
systems form a direct interface for humans with their habitat, these systems
are critical components of the human adaptive complex. It is the purpose of
this review to show how patterns of skeletal growth and pathology can be used
to investigate changing patterns of human interaction with the nutritional
environment.
Much of the effort in paleonutrition research has been directed toward the
identification of dietary items. This has been approached through a variety of
techniques for environmental reconstruction. Primary concerns have been
the reconstruction of the resource spectrum that was available (Grayson 1974;
La Marche 1974), and attempts to isolate the portion of that spectrum that
was actually eaten (Kaplan and Maina 1977). Toward these ends, increasingly
sophisticated refinements of floral, faunal, and fecal analysis have been
395
ADVANCES IN ARCHAEOLOGICAL METHOD AND THEORY, VOL. 5 Copyright - 1982 by Academic Press, Inc.
All rights of reproduction in any form reserved. ISBN 0-12-003105-1
This content downloaded from 192.101.188.25 on Wed, 08 Jul 2015 17:48:38 UTCAll use subject to JSTOR Terms and Conditions

396 REBECCA HUSS-ASHMORE, ALAN H. GOODMAN, AND GEORGE J. ARMELAGOS
devised. Such research forms an essential basis for testing questions about ecological relationships. Unfortunately, most studies of dietary composition have remained descriptive documentation of the resources used. (For an in teresting exception, see Kaplan 1973.) Processual questions, such as the role
of nutritional status in subsistence change, have rarely been adequately ad
dressed. One recent approach to such questions has been the use of models from
microeconomics and ecology to predict resource use and subsistence change. The simplest such models are essentially cost-benefit analyses for particular strategies of resource capture. This approach has been applied to the foraging
behavior of hunter-gatherers (Winterhalder 1977) and to the adoption of
agriculture (Cohen 1977a,b; Earle 1980). More sophisticated models of op
timal foraging behavior have attempted to consider strategies for all essential
resources simultaneously (Keene 1979, 1982; Reidhead 1980). Such models have the potential for expanding subsistence studies beyond mere description by predicting adaptive behavior for particular environments.
In general, these theoretical models are heuristic devices of greater or lesser
realism, and are valuable for their ability to generate hypotheses about
human-environment interaction. Their utility for solving specific problems is dependent on their testability. We would advocate the use of human skeletal
populations as a source of data for testing dietary hypotheses. Although
traditional archaeological methods have detailed with increasing accuracy the nature of human adaptations, the success of those adaptations can best be
judged by their effect on the health and nutritional status of the population in
question. In light of its potential contribution, human skeletal material is an
underutilized resource for studies of paleonutrition (Wing and Brown 1980). The history of skeletal studies, as well as the generalized nature of stress
responses in bone is a major reason for this neglect. Although bone has tradi
tionally been thought to reflect environmental conditions only tangentially, new approaches to skeletal biology provide the methods to overcome such drawbacks. Pathological conditions in prehistoric skeletons reflect distur bances of growth and repair in bone, and can therefore be used to infer the en
vironmental stressors that caused them. Stress is defined here as the physiological disruption of an organism
resulting from environmental perturbation. The degree of physiological disruption is a function of both the severity of environmental stressors and the
adequacy of host response. In keeping with our view that pathology and
growth disruptions are "general" indicators of stress, a model developed by
Goodman is utilized (Figure 9.1). Although stress cannot be directly ob served in archaeological populations, the impact of that stress on the skeletal
system can be determined. Past nutritional deficiencies may therefore be in
This content downloaded from 192.101.188.25 on Wed, 08 Jul 2015 17:48:38 UTCAll use subject to JSTOR Terms and Conditions

NUTRITIONAL INFERENCE FROM PALEOPATHOLOGY 397
ENVIRONMENTAL __CULTURAL |_ HOST _ PHYSIOLOGICAL _ IMPACT OF CONSTRAINTS BUFFERING RESISTANCE DISRUPTION STRESS
SYSTEM . (STRESS) A. STRESSORS A. GROWTH DISRUPTION B. LIMITING . Altered Growth Curves
RESOURCES i Tronsverse Arrest brnes ii Dental Growth Disruptions B. DAMPENED FERTILITY
AND FECUNDITY l C. DISEASE
D. DEATM
Figure 9.1. An ecological model of general stress. (From Armelagos et al. 1980.)
ferred from the pattern and severity of involvement within the skeleton and from the distribution of involvement within the population.
The realization that the skeletal pathologies of archaeological populations could aid in interpreting adaptation stimulated research in this area. Skeletal biologists have realized that patterns of growth and development, changes in morphology, and alterations in the morbidity-mortality profile of a group can be used to analyze its success in adjusting to its environment. Angel (1954), for example, used a number of features, such as stature and patterns
of disease, to interpret the impact of changes in ecology on biological and cultural processes. These studies have given considerable time depth to our understanding of trends in human adaptation. Our purpose is to suggest methods for studying nutritional deficiencies in skeletal populations and to see how these techniques can advance our knowledge of nutritional factors in human adaptation. Our investigation of methods in paleonutritional research has two objectives: first, to help in delimiting the historical and geographical distribution of nutritional deficiencies in archaeological populations, and second, to understand the biocultural processes involved in the nutritional adaptation of prehistoric populations.
In the following sections, we briefly outline the processes of growth and repair in bone that are subject to environmental influence, and review the ef fects of nutrient deficiencies on those processes. We then examine how the' results of nutrient deficiency, that is, pathologies and growth disturbances, can be used to identify malnutrition in archaeological populations. Individual stress markers are described and their utility is discussed.
GROWTH AND REMODELING IN NORMAL AND MALNOURISHED BONE
Normal Process
The traditional interest of paleopathology has been the recognition and diagnosis of disease from past human populations. Because bone is more fre quently preserved than are other tissues, a wide range of skeletal pathologies
This content downloaded from 192.101.188.25 on Wed, 08 Jul 2015 17:48:38 UTCAll use subject to JSTOR Terms and Conditions
398 REBECCA HUSS-ASHMORE, ALAN H. GOODMAN, AND GEORGE J. ARMELAGOS
have been catalogued. Meaningful interpretation of these phenomena and their use in cultural reconstruction depends on an understanding of the nor
mal processes of skeletal growth and repair. Environmental factors may then be seen as influencing this process, either favorably, through diet, exercise, and the like, or unfavorably, through deficiency or other insults.
At the macroscopic level, the skeleton can be seen as an organ system in
constant communication and cooperation with other systems. The primary functions of this system are support and locomotion, storage and regulation
of minerals (and thus the ion concentration or acidity of body fluids), protec
tion of the brain and spinal cord, and the production of red blood cells. This is
a very diverse set of functions for a single system, and indicates the degree to
which total body functioning is dependent on the maintenance of a functional
skeletal system. The fact that other systems such as fat, muscle, and
epithelium are affected relatively early in malnutrition, and that gross skeletal changes occur relatively late, indicates an adaptive response on the part of the
organism. An organism that sacrificed its skeletal system to mild malnutrition would, at the very least, find itself hampered in its food quest.
At the histological level, McLean and Urist (1968:3) have defined bone as
"a highly specialized form of connective tissue, composed of interconnected cells in an intercellular substance and forming the skeleton or framework of
the bodies of most vertebrates. " To this general definition, it should be added
that bone functions as a support for other organs and shares with other con
nective tissue a matrix of collagen (i.e., protein fibers embedded in a ground
substance high in mucopolysaccharides). The hardness of bone is attributable to crystalline salts, chiefly composed of calcium, phosphate, carbonate, and citrate, deposited within the organic matrix. Specialized cells mediate the deposition and withdrawal of this mineral component. The actions of these
cells are essential to the growth, maintenance, and repair of bone, and give
bone its dynamic quality as a living tissue.
Bone changes constantly throughout the life cycle and is most subject to en
vironmental influence during periods of rapid development and growth. In sults during the embryonic period, when the first calcified tissues are formed, have the potential to radically alter the course of development. Insults during later fetal development are less severe, and the primary effect of undernutri
tion at this point appears to be retarded growth (Thomson and Hytten 1977).
Growth in the skeleton is primarily determined by the interaction of two
processes-the laying down of bone by osteoblastic cells and the selective
removal of bone by osteoclasts. The balance between these two processes
determines the rate at which growth proceeds. Internal remodeling and repair
of bone are likewise dependent on site-specific removal of bone and its
replacement by new skeletal tissue. These elemental processes are altered by the lack (or occasionally the excess) of nutrients. For example, insufficient
This content downloaded from 192.101.188.25 on Wed, 08 Jul 2015 17:48:38 UTCAll use subject to JSTOR Terms and Conditions
NUTRITIONAL INFERENCE FROM PALEOPATHOLOGY 399
protein retards the formation of new bone matrix, whereas disturbances of
calcium metabolism alter the mineralization of that matrix. Both may result
in a relative deficiency of bone.
The dynamic interplay between osteoblastic and osteoclastic action con tinues throughout life and results in the configuration seen in the skeletons of
archaeological populations. Interpretation of this record is complicated by the generalized character of bone response. Because bone responds to stress less dramatically than other systems, minor illness or mild nutritional defi ciencies may be expected to have little lasting effect. Conversely, when gross
deficiencies of bone are discovered, they may indicate a response to a stress so
severe or so prolonged as to have exhausted the response potential of other
systems. Since the exact severity of environmental stressors is not always detectable,
so also the nature of the disturbance may be difficult to elucidate. Many
disturbances, by acting on the same process, may produce similar results, and
the identification of a single causative agent may not be possible. This is par
ticularly true in the case of nutritional deficiencies, in which the synergistic ef
fect of multiple deficiencies, or of interaction with infectious disease, is fre quently a complicating factor. It should become apparent from the following
sections that the definitive diagnosis of a single dietary deficiency in a skeletal
population is at best a hazardous undertaking.
Effects of Deficiency on Bone
Experimental studies of bone pathology in malnutrition have produced a
voluminous literature, much of it inconclusive or contradictory. The am biguous nature of the results in many of these studies reflects the difficulty of
isolating specific effects for specific deficiencies. For example, stunting of growth and failure to gain weight are reported for most deficiency states. This
may not mean, however, that the nutrient being investigated is solely responsi ble. Many animals subjected to nutritional imbalance are reluctant to eat, and
thus suffer to an unknown degree from protein or energy deficit as well. A
lack of protein can in turn materially affect the transport and utilization of
vitamin A and calcium, further deranging the physiology of the organism. The level of a nutrient provided in the diet is thus not necessarily the same as
the level physiologically available. Not surprisingly, single nutrient deficien
cies are rarely encountered outside the laboratory setting.
Single deficiency diseases are also relatively rare in human populations.
Some, such as scurvy among sailors, or rickets in northern industrial city dwellers, are directly traceable to specific environmental conditions. Beri
beri, on the other hand, is primarily a technologically induced condition.
Resulting from a lack of thiamine in polished-rice diets, it appears not to have
This content downloaded from 192.101.188.25 on Wed, 08 Jul 2015 17:48:38 UTCAll use subject to JSTOR Terms and Conditions
400 REBECCA HUSS-ASHMORE, ALAN H. GOODMAN, AND GEORGE J. ARMELAGOS
been a problem before the introduction of highly efficient mechanized milling (McLaren 1976). Where rice is parboiled before milling, or fortified with vitamins, thiamine deficiency is once again a relatively rare disease. The distribution of pellagra is likewise limited. Occurring sporadically in the southern United States and southern Africa, it reached epidemic proportions in the early twentieth century (Goldberger et al. 1920; Roe 1973). Linked to a
maize diet, it was shown to result from the abnormally low content in that grain of both available niacin and its amino acid precursor, tryptophan. Although outbreaks of pellagra ("disease of the mealies") continue to be reported in southern Africa; other populations for whom maize is a staple ap pear to have avoided the disease. Katz et al. (1974) have argued that the wide spread New World practice of treating maize with lime (or other alkaline substances) enhances the nutritional quality of the grain. This is based on the
work of Bressani et al. (1958), who found that heating and alkaline treatment
significantly reduced the imbalance of amino acids in maize, making the limited tryptophan more effective. More recent experiments by Gontzea, et al. (1962) and Gontzea and Sutescu (1968) indicate that lime treatment in creases the dystrophic effects of all-maize diets. These authors, along with
Kaplan (1973), feel that prevention of pellagra and growth disorders requires the supplementation of maize with other sources of amino acids and B vitamins.
Even in clear-cut cases of deficiency disease, however, it is doubtful that only a single nutrient is lacking. An actual diet so restricted as to cause frank vitamin deficiency may be limited in protein, energy, or minerals as well. As in animal studies, the degree of interaction of multiple nutritional factors is dif ficult to assess.
Insofar as specific effects of nutrients can be identified in bone, they reflect the portions of the growth and repair process mediated by that element. Stewart (1975) has phrased this graphically, expanding on Mellanby's (1950)
metaphor, which likened the skeleton to the walls of a citadel and osteoblasts to building operatives. Protein and energy, he notes,
are essential for providing building materials and energy, and vitamin C ensures that the
materials are used to provide a calcifiable matrix. Vitamin D controls calcification, in
sisting that all matrix deposited is mineralized even if older structures have to be destroyed
to provide the inorganic salts. The continuing reshaping of bone necessary to ensure con
formity with the final plan is directed by vitamin A, which exercises an overall control over
the sites of activity of the osteoblasts and osteoclasts. Enzymes can be regarded as tools,
and hormones as managers stimulating building, maintenance, and, where necessary, the
destruction of the main structure (Stewart 1975:56).
It might be added here that enzymes and hormones, the so-called tools and
managers, are themselves proteins, and are therefore influenced by dietary protein.
This content downloaded from 192.101.188.25 on Wed, 08 Jul 2015 17:48:38 UTCAll use subject to JSTOR Terms and Conditions
NUTRITIONAL INFERENCE FROM PALEOPATHOLOGY 401
Protein-Energy Deficiencies
The effects of protein and energy deficits on the skeletal system appear to be
broadly systemic and generalized. A condition of protein-energy malnutri tion is therefore very difficult (perhaps impossible) to diagnose definitively, solely on the basis of skeletal pathology. Numerous experimental animal studies have shown the chief effect of underfeeding to be a slowing or even a
cessation of growth. In the extended investigations conducted by McCance and his colleagues (Dickerson and McCance 1961; McCance 1960; McCance et al. 1962; McCance et al. 1961; Pratt and McCance 1958, 1960, 1964) on
underfed piglets and cockerels, it was shown that the earlier the nutritional
deficiency was introduced, the more severe and irreversible was the stunting. If stress is not experienced until after weaning, normal growth can be in
duced by refeeding. However, rats underfed from birth remained stunted, even when later allowed unlimited access to food (McCance and Widdowson
1962). Examination of the bones of underfed animals showed several factors
involved in growth failure. First, growth in length of long bones was greatly
slowed. The cartilage growth plates at the ends of the long bones were
unusually thin, and their cellular activity was disturbed. Remodeling activity
increased in this area, with the amount of bone removed by osteoclasts ex
ceeding the amount formed by osteoblasts. Growth in the width of long bones
was likewise slowed, and the new bone formed was characterized by relatively
thin protein fibers and small mineral crystals. In response to the generalized
stress of dietary insufficiency, only a minimal amount of new bone was
formed in order to maintain growth. At the same time, older bone was more
rapidly removed, especially in the interior of the cortex of the long bones. This
resulted in an increase in the diameter of the marrow cavity, and a concomi
tant thinning of the cortex (see Figure 9.2).
The dimensions and chemistry of the long bones in severe undernutrition
have been well summarized by Dickerson and McCance (1961). Compared to
well-fed age-mates, the humeri of piglets and the femora of cockerels were
noticeably short and thin. The ratio of length to width, however, remained the
same. The weight-length ratio of these bones was low in undernourished
animals, reflecting the greatly reduced cortex. There was no evidence of a lack
of calcium or phosphorus in the- experimental animals; in fact the total
amounts of mineral were similar to age-mate controls. The ratio of calcium to
nitrogen was high in undernourished animals. Both of these findings reflect
the lowered protein content of the bones, and therefore a relative hyper
calcification of the cortex. Radiographically, this hypercalcification was seen
as an increase in densely mineralized bands or "cement lines" surrounding
resorption spaces, and as radiopaque transverse lines in the metaphyses, or
growing ends, of the long bones. These hypermineralized bands were abnor
mal in that the matrix contained no collagen fibers.
This content downloaded from 192.101.188.25 on Wed, 08 Jul 2015 17:48:38 UTCAll use subject to JSTOR Terms and Conditions

402 REBECCA HUSS-ASHMORE, ALAN H. GOODMAN, AND GEORGE J. ARMELAGOS
Linea Aspera
Periosteumrn
\ Cavity
Endosteum ~ Cortex
Figure 9.2. Cross section of a typical long bone.
Although the long bones have been most intensively studied in undernutri
tion, they are not the only portion of the skeleton affected. Growth of the
skull is retarded, and bones of the skull vault are thin (Garn et al. 1966).
Growth of the mandible is relatively more retarded than that of the teeth,
leading to crowding of teeth and impaction of unerupted teeth within the bone
(McCance et al. 1961). It may be noted here that most abnormalities of bone
structure and chemistry are eventually reversible if refeeding occurs during the growth period of the animal. Teeth, however, differ from bones in this
regard; abnormalities of tooth structure resulting from undernutrition re main in spite of rehabilitation.
Many of the effects of underfeeding may be seen as not only a lack of
energy, but also a physiological deficiency of protein. When the diet is
restricted in calories, protein may be burned to provide necessary energy. Platt et al. (1961) have estimated that a 30-407o reduction in the amount of
food consumed results in a 60% decrease in the protein value of the diet.
Theoretically, therefore, even a high-protein diet could result in effective pro tein deficiency if fed in such small amounts that energy needs were not met.
When high-calorie, low-protein diets have been fed to laboratory animals,
the resultant bone pathologies resemble those in simple undernutrition, but are generally more severe. Frandsen et al. (1954) showed that protein
deficient rats had severely retarded long-bone lengths, narrow epiphyseal
growth plates, and fewer sites of actual bone formation. In rats fed a diet that
was totally protein free, growth and ossification finally ceased, and the
growth plate was sealed off with a thin layer of bone. The severity of these
changes was undoubtedly influenced by the fact that these animals, although
allowed unlimited amounts of protein-free food, refused to eat more than
This content downloaded from 192.101.188.25 on Wed, 08 Jul 2015 17:48:38 UTCAll use subject to JSTOR Terms and Conditions

NUTRITIONAL INFERENCE FROM PALEOPATHOLOGY 403
minimal amounts, and were therefore energy deficient as well. Pigs main
tained on low-protein diets have shown skeletal changes similar to those in
rats (Platt and Stewart 1962). Radiographically, the distal portion of the
radius was rarified and contained numerous transverse "growth-arrest" lines. This osteoporotic appearance was considered to be a result of reduced
matrix formation, and an imbalance in the activity of osteoblasts and
osteoclasts. Skulls and vertebrae were also small and osteoporotic, with
vertebral canals that were disproportionately large for their total cross sec tions. Protein-deficient dogs and monkeys showed similar changes (Jha et al. 1968).
Although rats on diets low in both protein and calcium lost mineral from
their bones, simply supplementing the diet with calcium did not produce remineralization (El-Maraghi et al. 1965). However, the addition of protein to the diet resulted in significant increases in bone deposition, accompanied by greater osteoblastic and lesser osteoclastic action.
Taken together, these animal experiments indicate that bone changes in protein-energy deficiency are the result of decreased formation and increased destruction of bone matrix. The imbalance between the two processes can be
viewed as part of the total adaptive response pattern of the body. In the face of
protein and energy deficiencies, endogenous supplies can be liberated for use in maintaining growth and function. When deficiencies become severe or pro longed, even growth may be sacrificed. Thus the protein spared in nutrient
deficiency osteoporosis is theoretically made available for the maintenance of
body systems, including bone. Studies of living human populations show analogous skeletal changes in
protein-energy malnutrition. Most notable of these are the reduction in stature and in total amount of bone. Children on diets low in energy, essential
amino acids, or total protein, display disturbed growth patterns and a marked
thinning of cortical bone (Garn 1966). In severe undernutrition, bone loss
becomes systemic, involving skull, vertebrae, long bones of the limbs, and
even the extremities. An increased number of Harris lines, or lines of growth
arrest, are frequently seen. Poor mineralization is reflected in the large trabeculae and spongy appearance of the growing ends of bones. Ossification
of secondary centers (epiphyses, wrist, ankle, etc.) appears to be delayed.
Garn et al. (1966) have suggested a development sequence for the skeletal
changes in undernutrition. First, as energy intake decreases, growth re
quirements are increasingly ill met. Both longitudinal and transverse growth is slowed, whereas Harris lines become more frequent. Second, with con
tinued caloric deficit, even the slowed rate of overall growth cannot be main
tained. Although growth in length and width slowly continues, the amount of
new bone added is insufficient, resulting in thinner bone cortices. Finally, as
the child enters negative nitrogen balance and soft tissues become wasted,
This content downloaded from 192.101.188.25 on Wed, 08 Jul 2015 17:48:38 UTCAll use subject to JSTOR Terms and Conditions

404 REBECCA HUSS-ASHMORE, ALAN H. GOODMAN, AND GEORGE J. ARMELAGOS
bone growth becomes even more economical. Not only is there a failure to add
sufficient bone to maintain cortical volume, but existing bone may be "bor
rowed" to maintain growth and remodeling. The resulting volume of com
pact bone may be only half that expected for a given age.
Vitamin Deficiencies
Deficiencies of vitamins A, C, and D have been demonstrated to affect
growth and development of bone. Probably the most visible and thoroughly
studied of these for human populations has been vitamin D. In historic times
at least, rickets has been one of the most important bone diseases of children
in temperate climates. As early as 1660, rickets was attributed to damp climate
and poor food (Stewart 1975). Although the curative effects of sunshine and
cod-liver oil were known by the nineteenth century, the role of vitamin D was
discovered only in the twentieth century through a series of laboratory ex
periments. The clinical picture of vitamin D deficiency is well known. Viewed
radiographically, the shafts of the long bones show a generalized rarefaction, with frequent deformities, such as bowing or twisting. Bones undergoing rapid growth are likely to be most severely affected. Trabecular patterns
become blurred, and calcification at the growth plates becomes irregular. In
addition to the deformities of the bone shaft, there are dramatic changes in the
metaphyses. Remodeling of the funnel-shaped region of the metaphyses is
disturbed, and a thick mass of uncalcified tissue develops. This overgrowth of
matrix gives the ends of rachitic bones a swollen appearance, with a deeply
cupped articular surface. As a result, rachitic subjects appear to have large
knobby joints. Ribs are affected as well since long bones result in swelling at
the costochondral junction. This "beading" of the ribs has been called the
"rachitic rosary," and is a classic feature of the disease.
Vitamin D deficiency in adults results in osteomalacia, or softening of
bone, with radiographic changes similar to those in rickets. In addition,
adults may show symmetrical rarified transverse lines, or pseudofractures
(Milkman 1930). If deficiency begins in adulthood, metaphyseal changes are
not normally seen. Histologically, both rickets and osteomalacia result from a failure of the
osteoid matrix to calcify normally. Engfeldt and Hjertquist (1961) have
reviewed the literature on the microscopic appearance of rachitic bone. The
primary feature in both children and adults is the excess of uncalcified matrix.
In children, islands of unremodeled cartilage may be seen in the bone
trabeculae, surrounded by unmineralized osteoid. In adults, the Haversian
system is poorly developed, with few osteons. Broad bands of subperiosteal
osteoid remain uncalcified and unremodeled. The bowing deformities of
This content downloaded from 192.101.188.25 on Wed, 08 Jul 2015 17:48:38 UTCAll use subject to JSTOR Terms and Conditions
NUTRITIONAL INFERENCE FROM PALEOPATHOLOGY 405
rickets can be directly attributed to the effects of compression on this un
mineralized bone. Bowing of long bones is also sometimes seen in vitamin C deficiency, or
scurvy. Cortices of long bones become thin and radiolucent. In contrast to
vitamin D deficiency, however, the osteoporosis of scurvy results from a reduced formation of calcifiable bone matrix. Fractures are common, due to the weakened cancellous bone in the metaphyseal area. Calcified spurs may be
seen at the metaphyseal-diaphyseal junction, as remnants of old fracture
callus. Subperiosteal hemorrhage is also a prominent feature of scurvy, and
with periodic recurrence, may lead to a thickening of the bone shaft. Blood
pooled beneath the periosteum may calcify during bouts of healing, eventu
ally leading to a buildup of bone on the outer surface. This may occur on the
superior surface of the orbits as well as in the long bones, resulting in a pitted
appearance (Steinbock 1976). Although significant bone changes are known to accompany experimental
vitamin A deficiency, these probably have little relevance for human skeletal populations. Under normal conditions, humans store large amounts of
vitamin A in the liver, and can synthesize it readily from dietary precursors.
When severe deficiencies of vitamin A occur in modern populations, they ap
pear to result from diets greatly restricted in variety as well as in amount.
Symptoms in such populations primarily involve epithelial tissue, although
neural changes have been suggested (Barnicot and Datta 1972; Rodahl 1966).
The involvement of bone in human hypovitaminosis A remains speculative.
Bony changes demonstrated for rats (Wolbach 1947) and dogs (Mellanby 1938) are the result of disturbances in site and activity of osteoblasts and
osteoclasts. In general, a deficiency of vitamin A promotes excessive
osteoclastic activity on bone surfaces next to the marrow cavity, and excess
osteoblastic activity on nonmarrow surfaces. This results in an enlargement
of the marrow cavity and an increase in the total width of the bone; length of
bones is not affected. Increases in diameter are most noticeable in the skull
vault, mandible, long bones, and neural arches of the vertebrae.
Inorganic Nutrients
Calcium and phosphorus are undoubtedly the most important mineral
elements for the growth and maintenance of the skeletal system. Bone serves
as the primary mineral bank for the living organism, accumulating reserves
during growth, and releasing them during periods of low intake or increased
expenditure. The adult human skeleton may contain 1200 g or more of
calcium and 500 g of phosphorus, as well as citrate, carbonate, sodium,
magnesium, and traces of other elements (Stewart 1975). Deficiencies of these
nutrients at the cellular level may be the result of impaired absorption or
This content downloaded from 192.101.188.25 on Wed, 08 Jul 2015 17:48:38 UTCAll use subject to JSTOR Terms and Conditions
406 REBECCA HUSS-ASHMORE, ALAN H. GOODMAN, AND GEORGE J. ARMELAGOS
transport, as well as simple dietary insufficiency. Conversely, when intakes are low, transport may be enhanced such that serum calcium-phosphorus ratios are maintained (Winter et al. 1972). It should be emphasized that the ratios of available minerals are more important for skeletal maintenance than are absolute amounts.
Experimental feeding of diets low in calcium has generally been reported to produce osteoporosis, characterized by the development of normal bone in reduced amounts (Parsons and Hampton 1969). Growth may be slowed, and turnover rates increased. El-Maraghi et al. (1965) report increased
osteoclasis, low ash values, and numerous intercortical resorption spaces for
animals on low-calcium diets. Ratio of new bone to old bone also increased and was reflected in the decreased mineralization seen.
A variety of dietary and environmental conditions can interact with
calcium intake to affect bone formation and mineralization. For example, protein-energy deficiency, vitamin D deficiency, and disuse can all exacer bate the effects of low calcium intake. Among the Eskimo, low levels of vitamin D and dietary calcium may interact to produce behavioral and
skeletal changes. Compression fractures of the vertebrae are common in
Eskimo populations, and age-related osteoporosis begins early in both sexes (Mazess and Mather 1974). It has been suggested that, in late winter, dwin
dling food supplies and lack of vitamin D may critically reduce available calcium, resulting in symptoms of arctic hysteria (Foulks 1973; Katz and Foulks 1969).
By contrast, high lactose diets have been shown to increase the efficiency of calcium utilization (Lengeman and Comar 1961), and an adequate supply of calcium reduces the amount of vitamin D necessary for bone mineralization.
An ability to digest lactose would therefore appear advantageous in areas of low solar radiation, where vitamin D production may be limited. The use of fresh milk and a low incidence of lactose intolerance should therefore be
theoretically advantageous for populations at high latitudes. Calcium intake can also affect the utilization of phosphorus. Rickets has
been induced experimentally in rats not only by deficiencies of vitamin D, but also by low phosphorus intakes, or by a calcium-phosphorus imbalance. The appearance of osteomalacia or rickets can be induced in rats by the addition of extra calcium to their diet (Stewart 1975). With a calcium-phosphorus ratio of 4, or 5:1, calcium combines with phosphorus to render it metabolically unavailable. The resulting bone is characterized by excessive osteoid forma tion, and poor mineralization.
Debate over the effect of dietary phytic acid on phosphorus utilization con
tinues. The rachitogenic effect of many cereal-based diets has been noted, and attributed to high levels of phytate. Phytate is known to bind minerals, in
cluding phosphorus, and much of the phytate phosphorus ingested has been
This content downloaded from 192.101.188.25 on Wed, 08 Jul 2015 17:48:38 UTCAll use subject to JSTOR Terms and Conditions

NUTRITIONAL INFERENCE FROM PALEOPATHOLOGY 407
shown to be excreted intact (McCance and Widdowson 1935, 1942). This in dicates that the full phosphorus content of the diet was not organically available. Cooking, however, can reduce the amount of phytate found in raw vegetable products, as does phytase, an enzyme occurring naturally in phytate-containing plants. The action of phytase is enhanced by acidity and heat (up to 70?C) (Gontzea and Sutescu 1968). Thus, prolonged yeast action and baking can reduce phytate content of whole wheat bread by 40Wo. Furthermore, there is evidence that humans can adapt to the ingestion of phytate and can release a significant portion of the bound dietary minerals. Because human digestive juices do not appear to contain phytase, it has been hypothesized that this is accomplished through the action of microorganisms in the intestine (Gontzea and Sutescu 1968).
Phytate has also been shown to lower the absorption of calcium, iron, zinc, and magnesium. This does not appear to adversely affect skeletal mineraliza tion in individuals with access to a varied diet and sufficient vitamin D.
However, in populations relying largely on unleavened whole-meal bread as a
dietary staple, mineral deficiencies may occasionally become pronounced (Berlyne et al. 1973; Wills et al. 1972). In areas of the Middle East where ab normally high phytate diets have been combined with geophagy (ingestion of large amounts of clay), a distinctive syndrome of zinc-deficiency dwarfism has been reported (Halsted et al. 1972; Prasad et al. 1961; Ronaghy and
Halsted 1975). Manganese, copper, and iron have also been experimentally manipulated
such that bone growth was disturbed. With the exception of iron (discussed in
the following), it is doubtful that these experimental conditions are significant for human populations. Even marginal human diets generally contain enough of these elements to prevent frank deficiency.
NUTRITIONAL DEFICIENCIES IN ARCHAEOLOGICAL POPULATIONS
As can be seen from the previous section, the assessment of nutritional status is extremely complex and difficult, even for living populations.
Although anthropometric measures have been useful for comparison of in
dividuals and sample populations to growth standards, there are difficulties
in assessing nutritional deficiency in these groups. Stature, for example, has
been used as one indication of nutritional status. Other indexes that consider
weight to height ratios have also been used. The anthropologist studying nutritional deficiencies in living populations has the advantage of examining soft tissues such as fat and muscle, which are more sensitive to nutritional
changes. Even with the advantage of examining soft tissues, it is often dif
This content downloaded from 192.101.188.25 on Wed, 08 Jul 2015 17:48:38 UTCAll use subject to JSTOR Terms and Conditions
408 REBECCA HUSS-ASHMORE, ALAN H. GOODMAN, AND GEORGE J. ARMELAGOS
ficult to select appropriate indicators of nutritional status, particularly when deficiencies are subclinical.
The skeletal biologist working with archaeological populations does not have the advantage of using most of the indicators available for living popula tions. There are, however, advantages to the use of archaeological skeletons in dietary reconstruction. Archaeological samples can provide large series of complete skeletons. Consequently, the physical anthropologist can examine the total skeleton to determine the effects of nutrition on the various bones of an individual. This will reflect the systemic effects of stress. In addition, skeletal biologists may have the total population at their disposal. One of the
problems with much growth research, particularly in cases of malnutrition, is that most of the attention is focused on the survivors. Those who are most
severely involved (i.e., those that die) are examined either superficially or not at all.
Specific Deficiencies Identified in Archaeological Samples
Steinbock (1976:322) reemphasizes the difficulty in ascertaining specific nutritional deficiencies from archaeological skeletal material. He states, "it should be emphasized that malnutrition is rarely selective for only one vital
component. Malnutrition (including malabsorption and excessive loss of nutrients) is almost always multiple, resulting in deficiency of several or many nutrients to varying degrees." In addition, many of the nutritional deficien cies leave no skeletal changes. Beri-beri (thiamine deficiency), for example, is not detectable in bone, and humans with severe vitamin A depletion usually die of other causes before skeletal lesions become evident. Pellagra (niacin deficiency) is of considerable interest because it is found where maize is a
staple crop. Despite the prevalence of maize horticulture in many areas of the New World, there is presently no evidence of skeletal involvement from
pellagra. A variety of explanations can be advanced to account for this lack of
evidence. Experimentally induced niacin deficiency in other animals has pro duced little information on the skeletal processes affected. Thus, effects may be so slight as to have escaped detection by normal analytic procedures.
Vitamin D and vitamin C deficiencies are also difficult to detect in archaeo
logical bone. There is, however, some skeletal evidence from archaeological
samples for vitamin D deficiency. Virchow (1872) argued that many features of the Neanderthal skull were due to deficiency of vitamin D, and Pruner-Bey (1868) ascribed lateral flattening of Cro-Magnon tibiae to the same cause.
Wells (1975) notes that neither of these diagnoses could be sustained. Reports of vitamin D deficiency have been found in archaeological Danish popula tions (Furst 1920; Nielsen 191 1). M6ller-Christensen (1958) has a frequency
This content downloaded from 192.101.188.25 on Wed, 08 Jul 2015 17:48:38 UTCAll use subject to JSTOR Terms and Conditions

NUTRITIONAL INFERENCE FROM PALEOPATHOLOGY 409
of about 1 % in a Danish monastery cemetery (N = 800) (Aebelholt) that was
in use from 1250 to 1550 (Wells 1975:753). Gejvall (1960) found only one case
in a sample of 364 individuals in the cemetery at Westerhus, Sweden. Accord
ing to Wells, there is considerable controversy about the Precolumbian occur rence of vitamin D deficiency in the Americas. Although there are some
reports from the earlier part of this century, there has been little evidence from more recent investigations in which the analysis is more systematic.
Wells believes that there is a positive correlation between rickets and ur
banization in postmedieval, industrial Europe. In fact, historic sites in England show significant increases of the disease. Wells notes that almost a
quarter of the 50 burials from Norwich show classic examples of rickets
(1975:755), with individuals displaying severe bowing of the femora and tibiae.
There are similar problems with the analysis of scurvy (vitamin C defi
ciency) in prehistory. The most important diagnostic features are related to
changes in soft tissue. Swollen, spongy, and infected gums and subcutaneous
hemorrhages are some of the important diagnostic features of scurvy. Since these features are often difficult to diagnose in bone, obtaining archaeologi
cal evidence for this condition is likely to be problematic. Even with the prob
lems of diagnosis, M6ller-Christensen (1958) reports 78 cases of scurvy in 800 Aebelholt individuals, whereas Gejvall found only one case (N = 364) in the
medieval Swedish cemetery at Westerhus (Gejvall 1960). Wells (1975:757) found about 7 cases (7%) in Anglo-Saxon burials from Anglia.
Steinbock (1976:254) is optimistic about the possibility of improving the diagnosis of scurvy in skeletal remains. The subperiosteal hemorrhages pro
duced by the disease provide one of the most important diagnostic features.
The ossification or calcification of these hematomas provides the archaeolog
ical evidence for vitamin C deficiency. Even when these subperiosteal hemor
rhages are resorbed, the increased osteoclastic activity weakens the cancellous
bone in the metaphyses. Steinbock reports that, on the basis of these
diagnostic features, Saul (1972, 1973) found 27% of the 63 adult ancient
Mayas to have ossified periosteal lesions, which he diagnosed as probable
cases of scurvy. Saul speculates that this evidence of famine and disease may
provide an explanation for the collapse of Maya civilization. More substantial
evidence would be required, however, before such a conclusion concerning
the Maya collapse would be warranted.
Although vitamin deficiencies have been reported from the archaeological
record, the diagnostic problems of protein and energy malnutrition have been
thought intractable. A typical comment is made by Wells: "No indubitable
examples of kwashiorkor are known from ancient burial grounds and it is
unlikely that any will be recognized unless some wholly unexpected method of
identification can be devised" (1975:758). It is true that traditional methods
This content downloaded from 192.101.188.25 on Wed, 08 Jul 2015 17:48:38 UTCAll use subject to JSTOR Terms and Conditions
410 REBECCA HUSS-ASHMORE, ALAN H. GOODMAN, AND GEORGE J. ARMELAGOS
have not proved successful in identifying protein-energy deficiency. However, the methodology that now offers promise in identifying pro tein-energy deficiency does not rely on new techniques, but on a systematic application of techniques that have been available for years.
The search for specific diagnostic skeletal markers of malnutrition has been unsuccessful since skeletal responses to nutritional stress are generalized and systemic. The systemic nature of these responses, however, can be used to in terpret the nature of the stressors involved. Rather than searching for single diagnostic criteria, bone growth patterns, remodeling, infection, repair, and aging for an entire skeletal population can be examined. The occurrence of stress markers at different parts of the life cycle can also be examined and then compared to the mortality schedule of the group. Finally, information de rived from direct examination of the skeletal remains can then be combined
with environmental data to produce a more realistic picture of the nutritional status of the populations under study.
The following section outlines skeletal markers that have been used as in dicators of nutritionally induced stress. Reconstruction of past dietary status requires the examination of many such markers for both subgroups at risk and the entire skeletal population.
Measures of Nutritional Stress in Bone
Long-bone Growth Curves
Although a variety of methods exist for determining nutritional status in
children, the most widely used single measure is growth. Not only is growth sensitive to nutritional disturbance, but it is relatively easy to assess. Since growth in the skeletal system accounts for over 98Wo of an individual's total height, it is appropriate to view growth disturbances caused by malnutrition as disturbances of the skeletal system process. Growth in length of long bones reflects overall statural increase, and can therefore be used as a proxy
measure. Lengths of long bones have been plotted against age for a variety of modern
and prehistoric populations. Comparison of the resulting curves (or formulas derived from them) can be used to indicate differences in timing or amount of growth of long bones in several modern populations, and Maresh (1955) has constructed growth curves from data on well-nourished American children. These form a standard against which growth in skeletal populations can be measured.
The construction of reliable growth curves from skeletal material requires the use of a large and well-preserved subadult population, and the use of den
This content downloaded from 192.101.188.25 on Wed, 08 Jul 2015 17:48:38 UTCAll use subject to JSTOR Terms and Conditions
NUTRITIONAL INFERENCE FROM PALEOPATHOLOGY 411
tal age as an approximation of chronological age. Armelagos et al. (1972) have compiled such data for tibia, fibula, femur, radius, ulna, humerus, and clavicle from prehistoric Sudanese Nubia. Johnston (1962), Merchant and Ubelaker (1977), and Ubelaker (1978) have compiled growth curves from North American data. The growth curves for prehistoric populations may dif fer from the theoretical modern curves in two basic ways. First, the shape of the two curves may be similar, but the prehistoric population may display
delayed growth (slower overall growth, later adolescent growth spurt, or later achievement of adult stature). Second, the shape of the curves may differ, in dicating discrepancies in the growth pattern.
Delays in growth and maturation have been recognized in modern popula tions. Frisancho and Garn (1970) and Frisancho et al. (1970) believe that these delays are an adaptive response to chronic low nutrient availability. Thomas has shown that the delayed maturation evidenced in a highland Quechua
population significantly reduces the population's energy (1973). Delayed growth, small adult size, and reduced sexual dimorphism all reduce nutrient requirements and may be a complex of adaptations to low nutrient availabil ity (Thomas 1973).
Delayed growth curves have also been commonly observed in prehistoric populations. Using cross-sectional data from three prehistoric Sudanese Nu bian populations, Armelagos et al. (1972) found a suggestion of retarded growth. Rapid increase in length occurred during the first two years, and again during the early teen years. Although it is difficult to isolate an adoles cent growth spurt from cross-sectional data, these findings suggest that max
imal growth may have been later than for modern populations. The finding that epiphyseal fusion is not complete in all individuals by the twenty-fifth year is further evidence of delayed maturation in this group.
Lallo (1973) presents a very similar growth pattern for the Dickson Mounds
populations from the Illinois River Valley. The greatest postinfant increase in
long-bone length occurs after the fifteenth year. Long-bones for individuals who died between the ages of 25 and 35 are significantly longer than those who died between the ages of 20 and 25. It therefore appears that growth often con
tinued well into the third decade. Thus, the growth curves of preindustrial populations seem to differ from those of well-nourished modern populations in that there is a regular demonstration of delayed maturation in the former.
These differences may be due at least in part to long-term mild or moderate undernutrition and may be seen as an "adaptive" response to low nutrient
availability. In contrast to growth delays, differences in the actual shape of growth
curves between populations have received little attention. Where they are
found, such differences probably reflect more severe and more acute distur
This content downloaded from 192.101.188.25 on Wed, 08 Jul 2015 17:48:38 UTCAll use subject to JSTOR Terms and Conditions

412 REBECCA HUSS-ASHMORE, ALAN H. GOODMAN, AND GEORGE J. ARMELAGOS
bances. According to Tanner (1977), the theoretical pattern of growth derived from modern populations follows a smooth curve of the form
Y = a + b(x) + c log(x)
When Bickerton (1979) plotted long-bone length against dental age for Dickson Mounds juveniles (0-7 years), all long bones showed a slight but
perceptive slowing of growth around 2-5 years. When these data were fitted to a polynomial regression, it was found that the third-degree polynomial gave a
significantly better fit than the second-degree polynomial (Goodman 1980). This indicates a fundamentally different growth pattern, accounted for by the
early-childhood deceleration. Observations of the Sudanese Nubian growth curves (Armelagos et al.
1972) and those from Indian Knoll, Kentucky (Johnston 1962, 1968) also reveal a similar slowing of growth around the ages of 2-6 years. Because
weaning traditionally occurs at this age and is frequently accompanied by in
fection and refusal to eat, we hypothesize that this growth pattern reflects acute nutritional stress. Such stress should be most obvious in areas where suitable weaning foods are absent or low in protein.
A comparison with the growth curves for pre-nineteenth century Eskimo and Aleut bears out this contention (Y'Edynak 1976). These populations show no cessation of growth before the sixth year. Between 6 and 8 years, there is a marked growth retardation in females, which is later compensated by a preadolescent growth spurt of greater magnitude than that found in
males. This pattern may reflect late weaning and a high-protein diet. It sug gests, however, that females may have different patterns of activity or diet, particularly beyond 6 years of age.
Adult Stature
Despite the long tradition of anthropometry in physical anthropology, the relationship between adult stature and nutritional stress remains unclear. Small adult stature is frequently associated with chronic low nutrient availability, and it has been proposed that under such circumstances small body size may be an energy-efficient response (Thomas 1973). Determining the relationship between short-term nutrient stresses during the growth phase and later-attained adult stature is more problematic. Although growth is reduced when food intake is inadequate, refeeding has been shown to produce "catch-up growth" in both experimental animals and malnourished children (Himes 1978). This growth spurt can offset most, if not all, growth retarda tion resulting from short-term periods of undernutrition. Timing and degree
of malnutrition are important; however, milder insults of short duration, or those occurring later in the growth period, are more adequately compensated by "catch-up growth."
This content downloaded from 192.101.188.25 on Wed, 08 Jul 2015 17:48:38 UTCAll use subject to JSTOR Terms and Conditions
NUTRITIONAL INFERENCE FROM PALEOPATHOLOGY 413
Because there is such a strong genetic component to adult stature, re
searchers are understandably wary about attributing height differences be tween populations to environmental factors. One area in which comparison
of mean height between skeletal populations has occurred is in the analysis of
secular trends in height within countries and defined geographical regions (Acheson and Fowler 1964; Craig 1963). Reasons given for secular increases in adult stature include decreases in childhood-infancy disease, exogamy produced hybrid vigor, less exposure to environmental stressors, and elimina tion of nutritional deficiencies (Dubos 1965:77-79). Of these factors, im provement in nutritional status is perhaps most frequently cited, and is generally thought to be the most important.
Differences in adult stature may be attributed to differential nutritionally induced stress only if reasonable control is given to genetic factors and other obvious environmental factors (high altitude, temperature, cultural factors, etc.). (See Haas and Harrison 1977 for a review of such factors.) This control
is not often possible, but could be approached by the study of a single archae
ological population that has undergone a change in subsistence patterns.
Other confounding factors, such as loss of the most highly stressed subadults
through mortality, and the variable effects of catch-up growth, make adult
stature a relatively insensitive indicator of juvenile nutritionally induced
stress. Adult stature, therefore, should be used with other indicators as a col
laborative measure of stress.
Sexual Dimorphism and Other Measures of Adult Shape
Measures of adult shape, such as the degree of sexual dimorphism within a
population, have similar problems as indicators of juvenile nutrient stress as
do measures of adult stature. Shape measures may be largely genetic and are
affected by a variety of environmental factors. However, Stini (1969, 1972,
1975) believes that certain shape differences between populations are at least
partly the result of differences in nutrient availability. In attempting to docu
ment the effect of nutritional availability on sexual dimorphism, he has con
cluded that males are more adversely affected by undernutrition than
females. This results from hormonal factors in females that help to maintain a
more consistent growth pattern. It follows that in times of food scarcity,
males will be smaller and dimorphism will decrease. For modern populations, at least, there appears to be strong association between nutrient availability
and sexual dimorphism.
Lallo (1973) has tested this proposed relationship for the Dickson Mounds
populations, from the Illinois River Valley. This population underwent a
rapid change in diet. During a period of 400 years, they experienced a shift
from hunting and gathering to a form of intensified agriculture. Using
femoral and pelvic indicators of sexual dimorphism, Lallo was unable to
This content downloaded from 192.101.188.25 on Wed, 08 Jul 2015 17:48:38 UTCAll use subject to JSTOR Terms and Conditions

414 REBECCA HUSS-ASHMORE, ALAN H. GOODMAN, AND GEORGE J. ARMELAGOS
show a significant difference in the degree of sexual dimorphism among the
three Dickson skeletal populations. These results do not invalidate Stini's hypotheses. Rather, it may reflect difficulty in demonstrating changes in
dimorphism in an archaeological population undergoing rapid changes in
diet. Other macroscopic measures of adult skeletal size and shape (humeral
femoral index, long-bone width-long-bone length, etc.) have similar limita tions as diagnostic features. Greater control is needed to increase the validity
of these measures; and even then, they are not likely to be the most sensitive in
dicators of nutritionally induced stress. They can, however, be employed in a
multifactorial approach in which measures of greater and lesser sensitivity are
combined to produce a pattern of skeletal involvement. Some of the more sen
sitive indicators of stress are discussed in the following sections.
Porotic Hyperostosis
Porotic hyperostosis, along with osteoporosis, is one of the best-studied stress markers available for studying archaeological populations. Although it
is often difficult to uncover indisputable evidence of nutritional deficiency in skeletal material, recent evidence suggests that porotic hyperostosis may result from iron-deficiency anemia. In conditions of anemia, red cell produc tion is increased, with a concomitant expansion of the marrow cavities of the
thin bones of the skeleton. The skull in particular becomes thickened, as a
result of significant expansion of the diploe. As the marrow spaces expand,
the outer layer of bone becomes very thin, often exposing the trabecular bone
of the diploe. The thickened bone and the porous, sievelike appearance are the
most distinctive characteristics of the condition. The cranial bones most com
monly involved are the superior portion of the orbits, the forehead portion of
the frontal bone, and the parietal above the temporal line (Figure 9.3).
Moseley (1963) and Steinbock (1976:213-252) have discussed the problems of differential diagnosis in porotic hyperostosis. They note that most of the
anemias show skeletal manifestations, but that the pattern and extent of in
volvement can usually distinguish between nutritional anemias and those caused by hereditary factors (Table 9.1). In general, the skeletal changes in
nutritional anemias are less severe.
Earlier studies have emphasized hereditary anemias as the primary cause of
porotic hyperostosis. Sickle-cell anemia or thalassemia has been the most fre
quent diagnosis of the condition. Eng (1958) was one of the first researchers to
report that skeletal changes resembling hereditary anemias resulted from iron-deficiency anemia. Moseley (1965) further argued that the Precolumbian cases of porotic hyperostosis are the result of iron-deficiency anemia. In an
important study of porotic hyperostosis, Hengen (1971) explained the
This content downloaded from 192.101.188.25 on Wed, 08 Jul 2015 17:48:38 UTCAll use subject to JSTOR Terms and Conditions

NUTRITIONAL INFERENCE FROM PALEOPATHOLOGY 415
LJ_ c m
Figure 9.3. Porotic hyperostosis (cribra orbitalia) of the orbital surface.
etiology of the condition in prehistoric populations, and isolated the various
geographical and cultural factors associated with the condition. He argued
that poor hygienic practices and parasitic involvement were responsible for iron-deficiency anemias, which resulted in porotic hyperostosis.
Another explanation advanced is that of M6ller-Christensen (1953) who
notes that in a group of 190 skulls from a leper cemetery at Naestved, Den
mark, 45% of the adults and 837o of the children showed evidence of porotic
hyperostosis of the orbits. Although M6ller-Christensen argues that leprosy is the possible cause of the lesion, he does not specify how leprosy could have
resulted in the lesion and does not attempt to link the infection with nutrition.
Although porotic hyperostosis is not by itself diagnostic of a specific anemia, it is a useful tool for investigating nutritional stress in an archaeologi
This content downloaded from 192.101.188.25 on Wed, 08 Jul 2015 17:48:38 UTCAll use subject to JSTOR Terms and Conditions

416 REBECCA HUSS-ASHMORE, ALAN H. GOODMAN, AND GEORGE J. ARMELAGOS
TABLE 9.1
Partial List of Conditions That May Result in Porotic Hyprostosis of the Craniuma
Congenital hemolytic anemias
A. Thalassemias 1. Thalassemia major (Mediterranean disease, Cooley's anemia, erythroblastic anemia) 2. Thalassemia intermedia-severe heterozygous
3. Thalassemia minor-mild heterozygous
B. Sickle-cell disease
1. Sickle-cell anemia (Hemoglobin S-homozygous)
2. Hemoglobin C-homozygous 3. Hemoglobin E-homozygous
4. Hemoglobin S-C
5. Hemoglobin S-thalassemia
6. Other less common abnormal hemoglobins C. Hereditary nonspherocytic hemolytic anemia
1. Glucose-6-phosphate dehydrogenase deficiency 2. Pyruvate kinase deficiency 3. Probably other deficiencies
D. Hereditary spherocytosis (spherocytic anemia, congenital hemolytic jaundice) E. Hereditary elliptocytosis (rare)
Iron-deficiency anemia
Cyanotic congenital heart disease (rare)
Polycythemia vera in childhood (rare)
a From Mensforth et al. (1978). Adapted from Moseley (1965).
cal population. The use of such an indicator for nutritional inference should
be undertaken within the context of an ecological analysis of a group's total
adaptation. The distribution and severity of the lesion, the occurrence with
respect to age and sex, and the reconstruction of the group's subsistence pat tern should facilitate identification of nutritional anemias.
Using a paleoepidemiological approach, Carlson et al. (1974) undertook an
analysis of porotic hyperostosis in a population from Sudanese Nubia.
Carlson and his coworkers noted a high frequency of porotic hyperostosis (21 %o), which was restricted to the superior border of the orbit. The frequency
among children aged 0-6 was 32To, significantly higher than in the population as a whole. The relatively mild involvement (affecting only the superior border of the orbits) and the age distribution argue against a serious
hereditary anemia as the cause. The reliance on cereal grains such as millet and
wheat, which are poor sources of iron, stress induced by weaning practices, and the probable high incidence of parasitic infection, suggest iron-deficiency anemia as the most likely cause of porotic hyperostosis in the Nubian case.
El-Najjar and coworkers (1976) reached similar conclusions in their
analysis of porotic hyperostosis in prehistoric Native American groups of the
Southwest. The reliance on maize (another cereal grain poor in iron) was
believed to predispose these groups to nutritional anemias. Carlson et al.
(1974) and El-Najjar et al. (1976) argue that iron-deficiency anemia results
This content downloaded from 192.101.188.25 on Wed, 08 Jul 2015 17:48:38 UTCAll use subject to JSTOR Terms and Conditions

NUTRITIONAL INFERENCE FROM PALEOPATHOLOGY 417
from a diet low in iron, foods that inhibit the bioavailability of iron, infec
tious conditions that reduce the absorption of iron, and weanling diarrhea.
Thus, the interpretation of porotic hyperostosis requires an ecological perspective, both a reconstruction of the subsistence pattern of the archaeo logical population and a detailed paleoepidemiological analysis of the pathological conditions found.
Lallo et al. (1977) provided such an analysis for the Dickson Mounds
population. The frequency of porotic hyperostosis increased as the sub sistence pattern changed; as the population increased its reliance on
agriculture, the frequency of porotic hyperostosis nearly quadrupled (from 13.6 to 51.5 %, see Table 9.2). The increased reliance on maize may have in
creased the potential for iron-deficiency anemia. Maize is not only low in iron,
but also contains phytates that can inhibit the absorption of iron. The major
impact of the nutritional deficiency appears to have been on infants and
children (Table 9.3). By using more refined age categories, Lallo and
coworkers were able to determine the age of onset and the peak frequencies
for nutritional anemias. Infants during their first year and children between
the ages of 2 and 5 were shown to be at greatest risk. This is consistent with
dietary patterns of modern populations, in which iron supplementation is recommended beyond the age of 6 months.
In addition, Lallo et al. were able to establish an association between the
occurrence of porotic hyperostosis and infection. Infection was measured by the extent of periosteal reaction in the long bones. These researchers
demonstrated that a synergistic relationship existed between porotic hyperostosis and periosteal reaction (Table 9.4). Individuals in this sample with both porotic hyperostosis and periosteal infection usually displayed a more severe manifestation of each condition. For example, if an individual
displayed only porotic hyperostosis, it would likely be restricted to the orbit.
However, if there was evidence of periosteal reaction, porotic hyperostosis was usually found to be more severe and more extensive (i.e., not restricted to
the orbits, but involving the frontal and parietals as well). Similarly, in
TABLE 9.2
Porotic Hyperostosis in the Dickson Mounds Populationa
Porotic N hyperostosis %
Late Woodland 44 6 13.6
Mississippian-acculturated Late Woodland 93 29 31.2
Middle Mississippian 101 52 51.5
a Modified from Lallo etal. (1977:476, Table 1).
This content downloaded from 192.101.188.25 on Wed, 08 Jul 2015 17:48:38 UTCAll use subject to JSTOR Terms and Conditions

418 REBECCA HUSS-ASHMORE, ALAN H. GOODMAN, AND GEORGE J. ARMELAGOS
TABLE 9.3
Age Specific Frequency of Porotic Hyperostosis for the Combined Samples from Dickson Moundsa
Porotic hyperostosis
Age N N %
0-.9 79 16 20.3
1-1.9 45 13 28.9
2-4.9 43 20 46.5 5-9.9 45 28 62.2
10-14.9 26 10 38.5
Total 238 87 36.6
a Modified from Lallo et al. (1977:478, Table 2).
dividuals with porotic hyperostosis and evidence of reactive periosteal bone display a greater infectious involvement. The severity of the periosteal reac
tion was greater, and there were more bones showing evidence of infectious reaction (Figure 9.4). The mechanism of the synergistic reaction of nutrition and infection has been established in contemporary populations. Iron
deficiency anemia can inhibit the body's immunological ability to ward off in
fections. Conversely, infections can reduce the ability of the digestive system to absorb the nutrients necessary for survival.
Although the study by Lallo and his coworkers has clarified the relation ship of porotic hyperostosis to both subsistence change and to infection, it has one major methodological drawback. This study did not distinguish between
healed and nonhealed periosteal or porotic hyperostotic lesions. Analysis of healed and nonhealed lesions can provide the basis for evaluating the age of onset for nutritional anemias and for determining the impact on survival of those with the condition. For example, a finding in which 29%7o of second-year
TABLE 9.4
Frequency of Infectious Lesions (Periostitis and Osteomyelitis) and Porotic Hyperostosisa
Postcranial Porotic infectious Porotic hyperostosis and
lesions hyperostosis infectious lesions
Dickson population N N % N % N %
Late Woodland 44 9 20.5 6 13.6 3 6.5
Mississippian-acculturated Late Woodland 93 45 48.4 29 31.2 20 21.5
Middle Mississippian 101 74 73.3 52 51.5 41 40.6
Total 238 128 53.8 87 36.5 64 26.9
a Modified from Lallo et al. (1977:479).
This content downloaded from 192.101.188.25 on Wed, 08 Jul 2015 17:48:38 UTCAll use subject to JSTOR Terms and Conditions

NUTRITIONAL INFERENCE FROM PALEOPATHOLOGY 419
Figure 9.4. Periosteal reaction involving the long-bone shatt.
mortalities showed porotic hyperostosis with evidence of healing would in dicate that the condition occurred at an earlier age and the individuals sur
vived the earlier episode of stress. We would assume that those who show no
indication of healing experienced a more recent episode of nutritional stress. A more thorough analysis of porotic hyperostosis has been undertaken by
Mensforth et al. (1978), using more refined age categories and distinguishing between remodeled and unremodeled lesions. Similar assessments were made of the periosteal reaction in long bones. The analysis of porotic hyperostosis
and periosteal reactions in the same population provides the means for
establishing the relationship between anemia and infection with respect to age of onset, duration, and decline of these conditions. The study was undertaken on a Late Woodland ossuary sample from the Libben site (Ottawa County,
Ohio) composed of 1327 articulated skeletons, 452 of which were infants and
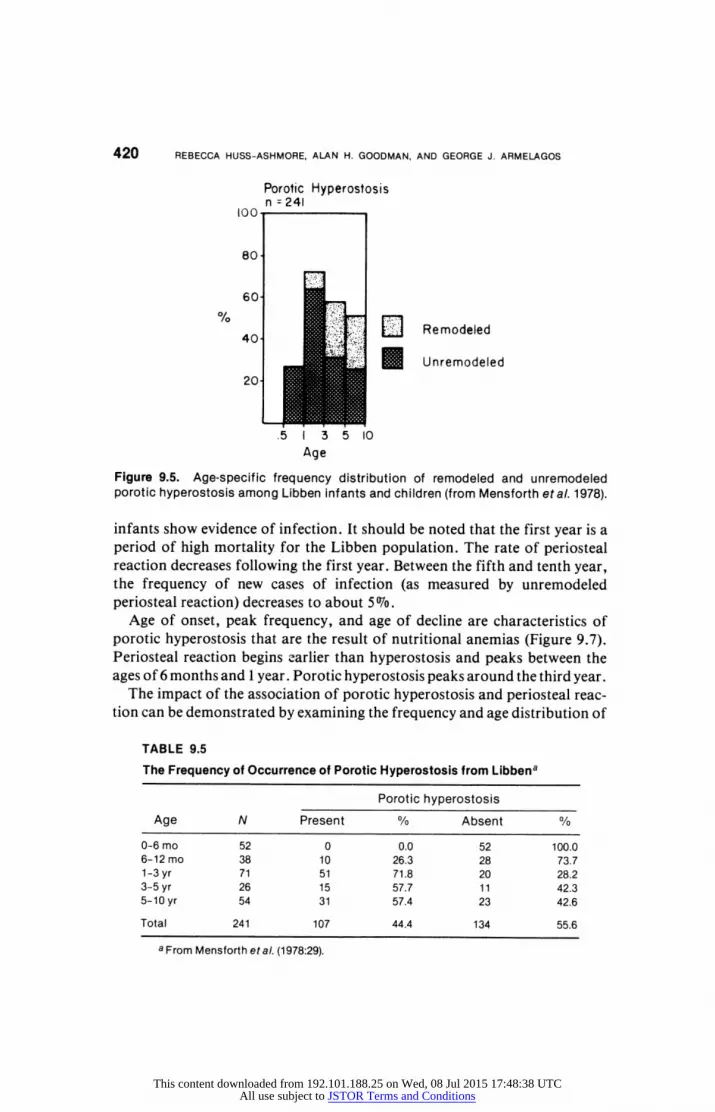
children. The distribution of unremodeled porotic hyperostosis (Figure 9.5, Tables
9.5 and 9.6) indicates that the lesion does not occur before the age of 6 months
and occurs at a low frequency between the sixth and twelfth months. There is,
however, a dramatic rise in incidence between the first and third year, with a
frequency of about of 607o . From the third to the tenth year there is a leveling
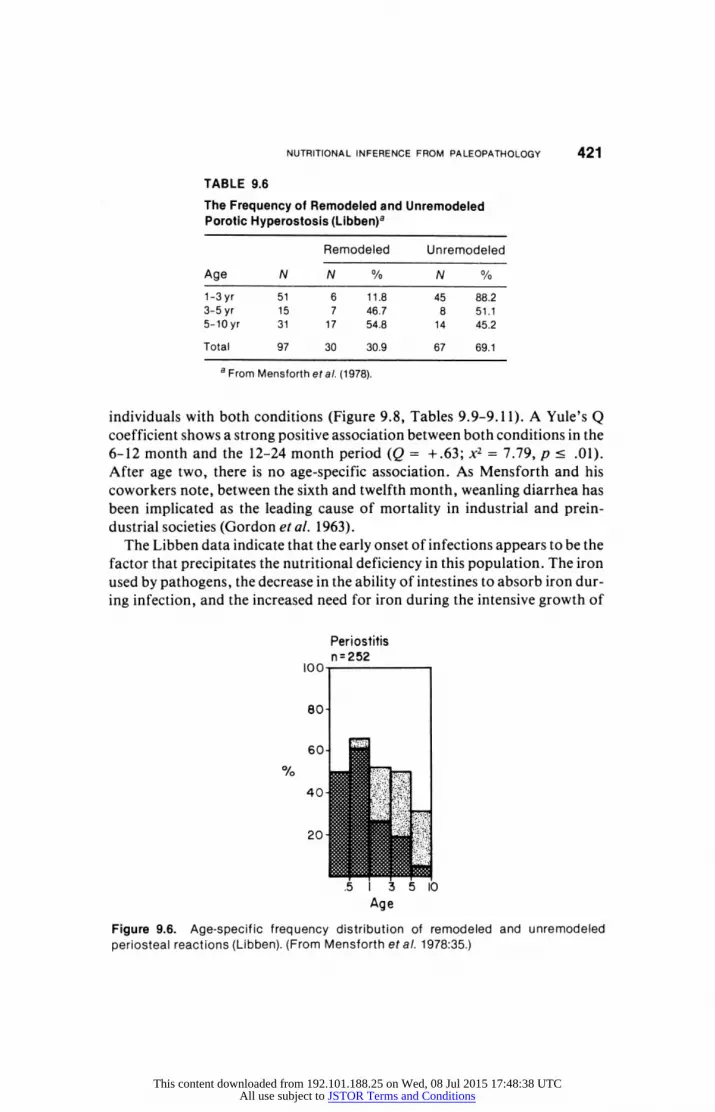
off in frequency to about 207o. The highest frequency for periosteal reaction
occurs during the first year (Figure 9.6, Tables 9.7 and 9.8), in which half the
This content downloaded from 192.101.188.25 on Wed, 08 Jul 2015 17:48:38 UTCAll use subject to JSTOR Terms and Conditions
420 REBECCA HUSS-ASHMORE, ALAN H. GOODMAN, AND GEORGE J. ARMELAGOS
Porotic Hyperostosis n =241
100
80
Remodeled 40
Unremodeled
20 li
Age
Figure 9.5. Age-specific frequency distribution of remodeled and unremodeled porotic hyperostosis among Libben infants and children (from Mensforth etal. 1978).
infants show evidence of infection. It should be noted that the first year is a period of high mortality for the Libben population. The rate of periosteal reaction decreases following the first year. Between the fifth and tenth year, the frequency of new cases of infection (as measured by unremodeled periosteal reaction) decreases to about 5' o.
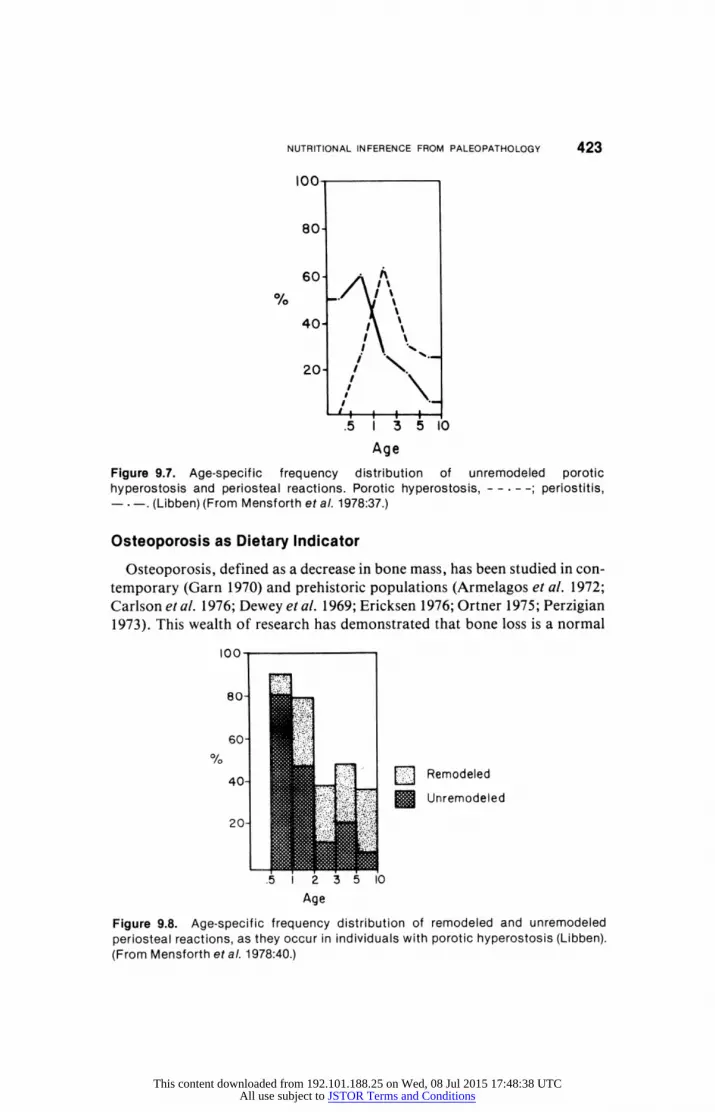
Age of onset, peak frequency, and age of decline are characteristics of porotic hyperostosis that are the result of nutritional anemias (Figure 9.7). Periosteal reaction begins earlier than hyperostosis and peaks between the ages of 6 months and 1 year. Porotic hyperostosis peaks around the third year.
The impact of the association of porotic hyperostosis and periosteal reac tion can be demonstrated by examining the frequency and age distribution of
TABLE 9.5
The Frequency of Occurrence of Porotic Hyperostosis from Libbena
Porotic hyperostosis
Age N Present % Absent %
0-6 mo 52 0 0.0 52 100.0 6-12 mo 38 10 26.3 28 73.7 1-3 yr 71 51 71.8 20 28.2 3-5 yr 26 15 57.7 1 1 42.3 5-10 yr 54 31 57.4 23 42.6
Total 241 107 44.4 134 55.6
a From Mensforth eta/. (1978:29).
This content downloaded from 192.101.188.25 on Wed, 08 Jul 2015 17:48:38 UTCAll use subject to JSTOR Terms and Conditions
NUTRITIONAL INFERENCE FROM PALEOPATHOLOGY 421
TABLE 9.6
The Frequency of Remodeled and Unremodeled Porotic Hyperostosis (Libben)a
Remodeled Unremodeled
Age N N % N %
1-3 yr 51 6 11.8 45 88.2
3-5 yr 15 7 46.7 8 51.1
5-10 yr 31 17 54.8 14 45.2
Total 97 30 30.9 67 69.1
a From Mensforth etal. (1978).
individuals with both conditions (Figure 9.8, Tables 9.9-9.11). A Yule's Q
coefficient shows a strong positive association between both conditions in the
6-12 month and the 12-24 month period (Q = +.63; x2 = 7.79, p < .01).
After age two, there is no age-specific association. As Mensforth and his
coworkers note, between the sixth and twelfth month, weanling diarrhea has
been implicated as the leading cause of mortality in industrial and prein
dustrial societies (Gordon et al. 1963).
The Libben data indicate that the early onset of infections appears to be the
factor that precipitates the nutritional deficiency in this population. The iron
used by pathogens, the decrease in the ability of intestines to absorb iron dur
ing infection, and the increased need for iron during the intensive growth of
Periostitis n=252
100
an
60- i
40 l
5 I 3 5 10
Age
Figure 9.6. Age-specific frequency distribution of remodeled and unremodeled periosteal reactions (Libben). (From Mensforth et al. 1978:35.)
This content downloaded from 192.101.188.25 on Wed, 08 Jul 2015 17:48:38 UTCAll use subject to JSTOR Terms and Conditions

422 REBECCA HUSS-ASHMORE, ALAN H. GOODMAN, AND GEORGE J. ARMELAGOS
TABLE 9.7
The Frequency of Occurrence of Periosteal Reactions from Libbena
Periosteal Reactions
Age N Present % Absent %
0-6 mo 52 26 50.0 26 50.0 6-12 mo 38 25 65.8 13 34.2 1-3 yr 67 35 52.2 32 47.8 3-5 yr 26 13 50.0 13 50.0 5-10 yr 69 21 30.4 48 69.6
Total 252 120 47.6 132 52.4
a From Mensforth et al. (1978:34).
the first 2 years of life are probably the most critical elements in the develop ment of anemia in the Libben population.
The archaeological reconstruction of Libben suggests that diet is not the
major factor in the etiology of porotic hyperostosis at this site. The available
protein appears to have been adequate. The synergistic response of microbial
infection, malabsorption due to weanling diarrhea, and nutrient depletion
that occurs with rapid growth are the more likely causes of porotic
hyperostosis in the Libben population. In summary, we agree with Mensforth et al. (1978:47) in their conclusion
that the partitioning of skeletal populations into broad age categories may
obscure the pathophysiological factors contributing to porotic hyperostosis. Further, they convincingly argue that the physical qualities (remodeled and
unremodeled) of porotic hyperostosis and periosteal reactions provide a
method for estimating the impact of nutritional and infectious disease stressors on morbidity and mortality in prehistoric populations. Paleoepi demiological analysis of this sort, in conjunction with a thorough analysis of
subsistence pattern, may provide a means for understanding the role of diet and disease in archaeological populations.
TABLE 9.8
The Frequency of Remodeled and Unremodeled Periosteal Reactions from Libbena
Remodeled Unremodeled
Age N N % N %
6-12 mo 25 2 8.0 23 92.0
1-3 yr 35 18 51.4 17 48.6
3-S yr 13 8 61.5 5 38.5
5-10 yr 21 17 81.0 4 19.0
Total 94 45 47.9 49 52.1
a From Mensforth etal. (1978).
This content downloaded from 192.101.188.25 on Wed, 08 Jul 2015 17:48:38 UTCAll use subject to JSTOR Terms and Conditions
NUTRITIONAL INFERENCE FROM PALEOPATHOLOGY 423
100
80
60
40
! \' 20
.5 1 3 5 lo
Age
Figure 9.7. Age-specific frequency distribution of unremodeled porotic hyperostosis and periosteal reactions. Porotic hyperostosis, ; periostitis,
- . -. (Libben) (From Mensforth et al. 1978:37.)
Osteoporosis as Dietary Indicator
Osteoporosis, defined as a decrease in bone mass, has been studied in con
temporary (Garn 1970) and prehistoric populations (Armelagos et al. 1972;
Carlson et al. 1976; Dewey et al. 1969; Ericksen 1976; Ortner 1975; Perzigian
1973). This wealth of research has demonstrated that bone loss is a normal
100 -
0/0
fl Remodeled
Unremodeled
Age
Figure 9.8. Age-specific frequency distribution of remodeled and unremodeled periosteal reactions, as they occur in individuals with porotic hyperostosis (Libben). (From Mensforth et al. 1978:40.)
This content downloaded from 192.101.188.25 on Wed, 08 Jul 2015 17:48:38 UTCAll use subject to JSTOR Terms and Conditions

424 REBECCA HUSS-ASHMORE, ALAN H. GOODMAN, AND GEORGE J. ARMELAGOS
TABLE 9.9
The Frequency of Occurrence of Individuals with Both Porotic Hyperostosis and Periosteal Reactions (Libben)a
Porotic Hyperostosis and Periosteal Reactions
Age N Present % Absent %
0-6mo 0 0 0.0 0 0.0 6-12 mo 10 9 90.0 1 10.0
1-2 yr 24 19 79.2 5 20.8
2-3 yr 27 10 37.0 17 63.0
3-5 yr 15 7 46.7 8 53.3 5-10yr 31 11 35.5 20 64.5
Total 107 56 52.3 51 47.7
a From Mensforth et al. (1978).
feature of the aging process. In addition, however, there havr oeen attempts
to relate bone loss to differences in subsistence patterns. Perzigian (1973) specifically tested the hypothesis that change in diet may affect the rate at
which osteoporosis develops. Although he found an increase in the size of medullary cavity (a common measure of osteoporosis) in agriculturalists as compared to hunter-gatherers, he did not believe this to be nutritionally related. Rather, he reasoned that agricultural populations have a more ade
quate nutritional intake, and, therefore, the increase in osteoporosis could not be explained on the basis of diet. Apparently, Perzigian accepted the
assumption that agriculturalists are better fed. However, since there is
historical and archaeological evidence that nutritional deficiencies increase in populations involved in intensive agriculture (Cook 1976; Cook and Buikstra 1979) this assumption may not be warranted.
Recently, Huss-Ashmore (1978) and Martin and Armelagos (1979) have in
TABLE 9.10
The Frequency of Remodeled and Unremodeled Periosteal Reactions in Individuals with Porotic Hyperostosis (Libben)a
Remodeled Unremodeled
Age N N % N %
6-12mo 9 1 11.1 8 88.9
1-2 yr 19 8 42.1 11 57.9
2-3 yr 10 7 70.0 3 30.0
3-5 yr 7 4 57.1 3 42.9
5-10 yr 11 9 81.8 2 18.2
Total 56 29 51.8 27 48.2
a From Mensforth et al. (1978).
This content downloaded from 192.101.188.25 on Wed, 08 Jul 2015 17:48:38 UTCAll use subject to JSTOR Terms and Conditions

NUTRITIONAL INFERENCE FROM PALEOPATHOLOGY 425
TABLE 9.11
Values for the Association of Porotic Hyperostosis with Periosteal Reactions (Libben)a
Age x2 Yule's Q
6-12 mo 1.73 +.54 1-2yr 6.62b +.75 2-3 yr .04 -.07 3-5 yr .16 +.15 5-10 yr 1.64 +.36
6 mo-2 yr 7.79b +.63 0 mo-10 yr 4.11b +.29
a From Mensforth et al. (1978).
bStatistical Significance at 0.01.
vestigated the nutritional basis for premature osteoporosis in juveniles and young adults. Garn et al. (1966) have demonstrated that there is a reduction in compact bone thickness and bone mineral in modern children with pro tein-energy malnutrition. Measurement of radiographs of the second
metacarpal showed a marked decrease in cortical thickness in undernourished children. Huss-Ashmore has suggested that the decrease in cortical bone noted in prehistoric Nubian juveniles may be evidence of protein-energy malnutrition in that group. Previous studies of long-bone growth in Nubian children (Armelagos et al. 1972; Mahler 1968) have showed some evidence of irregularities in growth at the earlier ages (1-5 years). However, the small sam ple sizes involved precluded a conclusive statement about the retardation of growth in this sample.
In an attempt to integrate bone growth with patterns of remodeling, Huss
Ashmore analyzed microradiographs of femoral cross section from 75 prehistoric Nubian juveniles, aged from birth to 14 years. She hypothesized that although the retardation of long-bone growth may indicate nutritional stress, decrease in cortical thickness may be a more powerful measure of
dietary deficiencies. For the Nubian sample, long-bone growth (femoral length plotted against dental age) could be characterized by a generalized
growth curve (Figure 9.9), with growth proceeding rapidly for the first 2
years, and slowing somewhat thereafter. The development of midshaft width
(Figure 9.10) and a cross-sectional area (Figure 9.11) of the femur demonstrate a similar trend. Taken together, these figures suggest a relatively normal maintenance of growth in length and width of long bones. However, a
comparison of cortical thickness with total midshaft diameter indicates some
striking discrepancies (Figure 9.10). Cortical thickness not only fails to in
crease, but actually decreases after age 10. The impact of this aspect of growth failure may be seen by examining changes in percent cortical area, a more ac
This content downloaded from 192.101.188.25 on Wed, 08 Jul 2015 17:48:38 UTCAll use subject to JSTOR Terms and Conditions
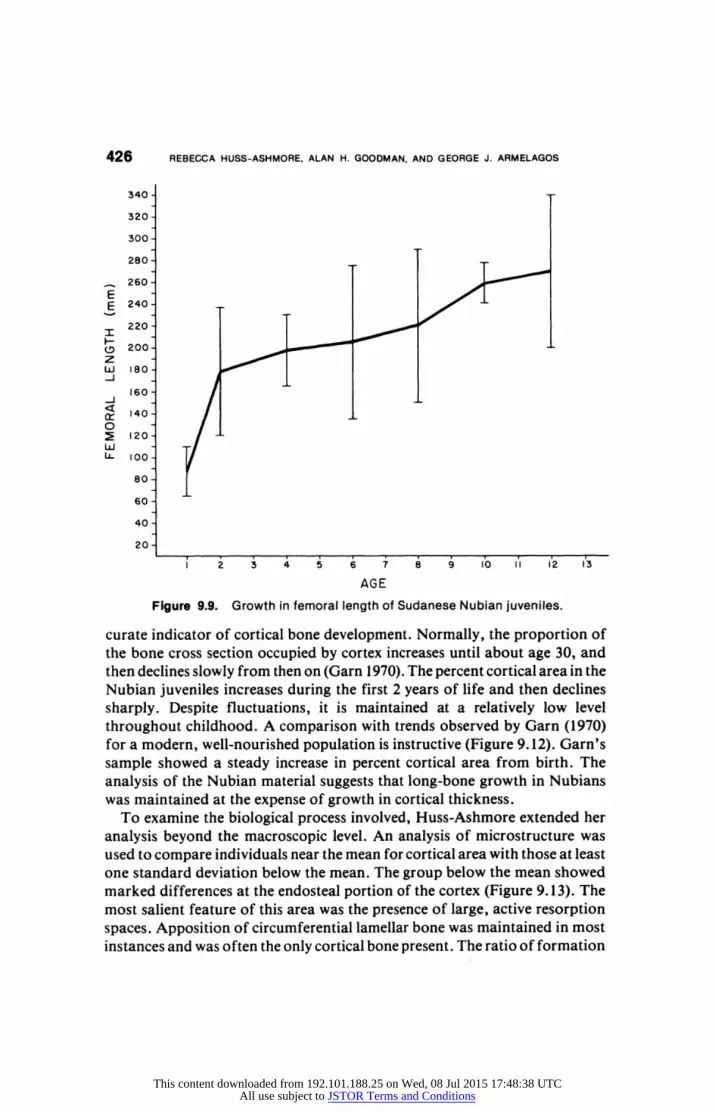
426 REBECCA HUSS-ASHMORE, ALAN H. GOODMAN, AND GEORGE J. ARMELAGOS
340
320
300
280
260
E E 240
220
200 z LUJ 180
160
< i40
2 120 LUJ
80
60
40
20
I 2 3 4 5 6o7 8 9 l0 II 12 13
AGE
Figure 9.9. Growth in femoral length of Sudanese Nubian juveniles.
curate indicator of cortical bone development. Normally, the proportion of
the bone cross section occupied by cortex increases until about age 30, and
then declines slowly from then on (Garn 1970). The percent cortical area in the
Nubian juveniles increases during the first 2 years of life and then declines
sharply. Despite fluctuations, it is maintained at a relatively low level
throughout childhood. A comparison with trends observed by Garn (1970) for a modern, well-nourished population is instructive (Figure 9.12). Garn's
sample showed a steady increase in percent cortical area from birth. The
analysis of the Nubian material suggests that long-bone growth in Nubians
was maintained at the expense of growth in cortical thickness.
To examine the biological process involved, Huss-Ashmore extended her analysis beyond the macroscopic level. An analysis of microstructure was
used to compare individuals near the mean for cortical area with those at least
one standard deviation below the mean. The group below the mean showed
marked differences at the endosteal portion of the cortex (Figure 9.13). The
most salient feature of this area was the presence of large, active resorption
spaces. Apposition of circumferential lamellar bone was maintained in most
instances and was often the only cortical bone present. The ratio of formation
This content downloaded from 192.101.188.25 on Wed, 08 Jul 2015 17:48:38 UTCAll use subject to JSTOR Terms and Conditions
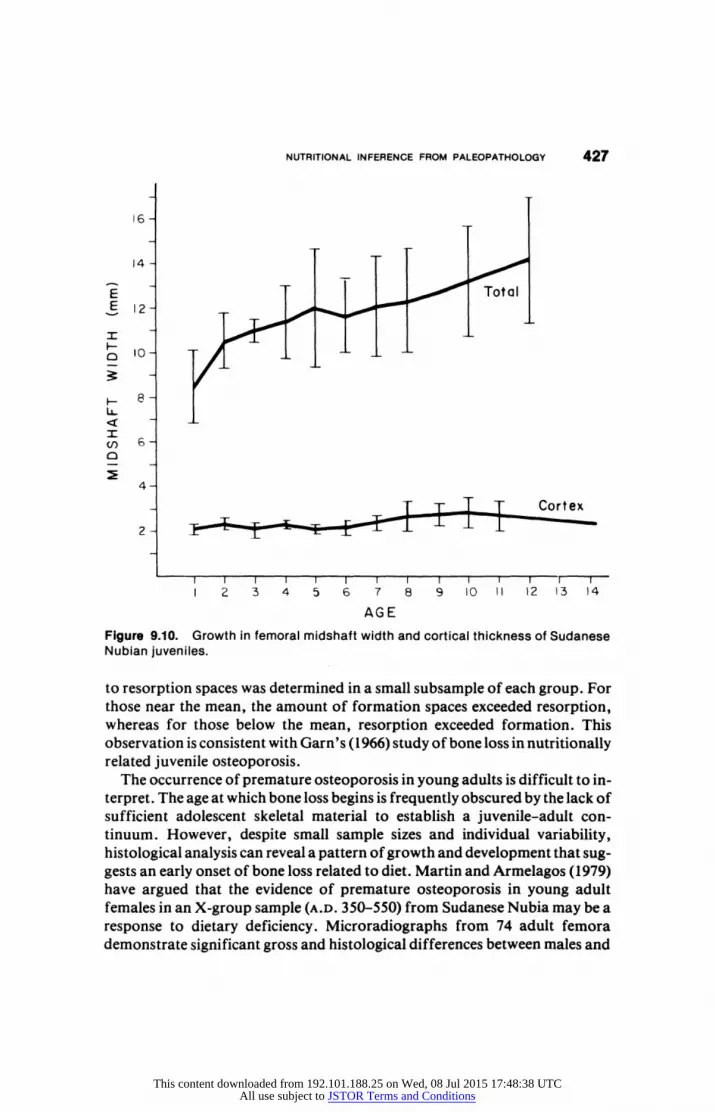
NUTRITIONAL INFERENCE FROM PALEOPATHOLOGY 427
16 -
14
E 12 -
H. t o - _
LL.
U) 6
4
T 1 F ~~cort ex 2
1 2 3 4 5 6 7 8 9 10 11 12 13 14
AGE
Figure 9.10. Growth in femoral midshaft width and cortical thickness of Sudanese Nubian juveniles.
to resorption spaces was determined in a small subsample of each group. For
those near the mean, the amount of formation spaces exceeded resorption, whereas for those below the mean, resorption exceeded formation. This observation is consistent with Garn's (1966) study of bone loss in nutritionally
related juvenile osteoporosis. The occurrence of premature osteoporosis in young adults is difficult to in
terpret. The age at which bone loss begins is frequently obscured by the lack of
sufficient adolescent skeletal material to establish a juvenile-adult con
tinuum. However, despite small sample sizes and individual variability,
histological analysis can reveal a pattern of growth and development that sug
gests an early onset of bone loss related to diet. Martin and Armelagos (1979)
have argued that the evidence of premature osteoporosis in young adult
females in an X-group sample (A.D. 350-550) from Sudanese Nubia may be a
response to dietary deficiency. Microradiographs from 74 adult femora demonstrate significant gross and histological differences between males and
This content downloaded from 192.101.188.25 on Wed, 08 Jul 2015 17:48:38 UTCAll use subject to JSTOR Terms and Conditions

428 REBECCA HUSS-ASHMORE, ALAN H. GOODMAN, AND GEORGE J. ARMELAGOS
In0 cmZ
.40 -2.5
1 2.0 4.30
0 1.5
*.20
U,~~~~~~~~~~~~~~~~~~J Age1.0 U,
0
.10
0.5
1 2 3 4 5 6 7 8 9 10 11 12 13 14
Age
Figure 9.11. Growth in the cross-sectional area of the femur of Sudanese Nubian juveniles.
females in osteoporotic bone loss (Figure 9.14). Quantification of the ratio between osteoblastic deposition and osteoclastic resorption provides a poten tial means for distinguishing normal from pathological development and for understanding the processes underlying macroscopic change.
Rates of remodeling can be calculated by quantifying the frequency of resorption spaces and forming osteons. Resorption spaces can be identified by rough, high-density edges with Howship's lacunae, whereas forming os teons are characterized by low density and relatively large Haversian canals (Figure 9.15).
The morphometric analysis of the 20-29-year-old Nubian females indicates an increase in resorption and a decrease in rate of mineralization. The de creased mineralization is reflected in the increased number of forming, low density osteons (Figure 9.16).
Analysis of the rates of resorption and formation should differentiate changes in the endosteal region of the cortex. The ratio of periosteal forma tion to periosteal resorption is approximately 2:1. Although there are no significant differences in male and female resorption rates, females in the 20-29 age class show an increase in the number of forming osteons. The en dosteal surface, however, shows the most interesting differences in rates of formation and resorption. The females in the 20-29 year age group display in creased resorption, indicating extremely active remodeling (Figure 9.17).
This content downloaded from 192.101.188.25 on Wed, 08 Jul 2015 17:48:38 UTCAll use subject to JSTOR Terms and Conditions

NUTRITIONAL INFERENCE FROM PALEOPATHOLOGY 429
100
90
80 - Normals
o~~~~~~~~~~~~~~~~m
70
60 -J uin
CL~~~~~~~~~~~~~~~~~~
QK 50 -A
0
40
z uiJ 30
0 cr ILL 20
10
I I I I I I I I l I I I l I 1 2 3 4 5 6 7 8 9 l0 I I 1 2 13 14
A G E
Figure 9.12. Increase in percent cortical area of Sudanese Nubian juveniles as com
pared to the trend observed for modern American juveniles (Garn 1970).
The pattern of bone loss suggests that young adult females may be more
stressed than males. That such stress occurs during the peak reproductive
period suggests the possibility of nutritional involvement. Although bone is deposited during pregnancy, it is resorbed during prolonged lactation (Garn
1970). Females who are lactating can be deprived of 300 mg of calcium and
500- 1000 kcal per day. Multiparous females are especially at risk, since their
reserves of calcium and energy are likely to become depleted, with resultant
bone loss. Premature osteoporosis in infants and children in this same
population supports the contention that the demineralization of bone in
young adult females is related to diet.
Although the results of these two studies are suggestive, their conclusions
must be tested on other populations. Stout (1976) has estimated bone turn
over rates for two Illinois Woodland populations undergoing dietary change.
His results indicate an increase in bone turnover with the shift from hunting
and gathering to maize horticulture. He has suggested that this physiological
This content downloaded from 192.101.188.25 on Wed, 08 Jul 2015 17:48:38 UTCAll use subject to JSTOR Terms and Conditions

430 REBECCA HUSS-ASHMORE, ALAN H. GOODMAN, AND GEORGE J. ARMELAGOS
Figure 9.13. Photomicroradiographs of femoral cross sections: (a) well-maintained cortex in a normal young individual, and (b)the cortex of an osteoporotic juvenile. Note the large resorption holes and deficient mineralization (dark areas) in the osteoporotic individual.
This content downloaded from 192.101.188.25 on Wed, 08 Jul 2015 17:48:38 UTCAll use subject to JSTOR Terms and Conditions

NUTRITIONAL INFERENCE FROM PALEOPATHOLOGY 431
This content downloaded from 192.101.188.25 on Wed, 08 Jul 2015 17:48:38 UTCAll use subject to JSTOR Terms and Conditions

432 REBECCA HUSS-ASHMORE, ALAN H. GOODMAN, AND GEORGE J. ARMELAGOS
LU90_
80 _
ox 70 _ ---'7 70
I
z 60 -
C.) UJ
50
AGE 20-29 30-39 40-49 50+
ax SD .882 .770 .602 .529 N 15 10 4 3
SD .893 .545 .724 .941 N 22 9 3 4
Figure 9.14. Relationship between percentage of cortical area of bone and age in Nubian adults. (From Martin and Armelagos 1979:574.)
change is the result of secondary hyperparathyroidism, due to calcium defi ciency with a high-maize diet. If applied to a series of archaeological popula tions, such morphometric analysis promises to be a useful tool in uncovering nutritional stress.
Osteophytosis
Osteophytosis, or the development of numerous exostoses, has been shown to result from the ingestion of particular dietary toxins (Stewart 1975). The
most common of these are fluorine and the lathyrogens. Although moderate ingestion of fluorine has been credited with reducing osteoporosis, ingestion
of large amounts (200-1000 ppm) can interfere with bone formation (Weatherell and Weidmann 1959). Osteoblastic activity is stimulated by high fluorine intake, with a consequent formation of excess osteoid and cartilage.
Because fluorine interferes with calcium absorption, the osteoid formed may be poorly mineralized, and a condition of "pseudorickets" may occur. Serum calcium is maintained by resorption of bone from endosteal surfaces, with a
consequent reduction in bone mass. Conversely, bone is laid down at points of muscle attachment. Such bone is rough and whitened, consisting of coarsely woven trabeculae that are not remodeled to normal cortical bone.
Lathyrogens, derivatives of a group of leguminous plants (Lathyrus), may also produce an overgrowth of bone at the points of muscle attachment. These exostoses are accompanied by pitting of the surface of the bone, produced by
This content downloaded from 192.101.188.25 on Wed, 08 Jul 2015 17:48:38 UTCAll use subject to JSTOR Terms and Conditions
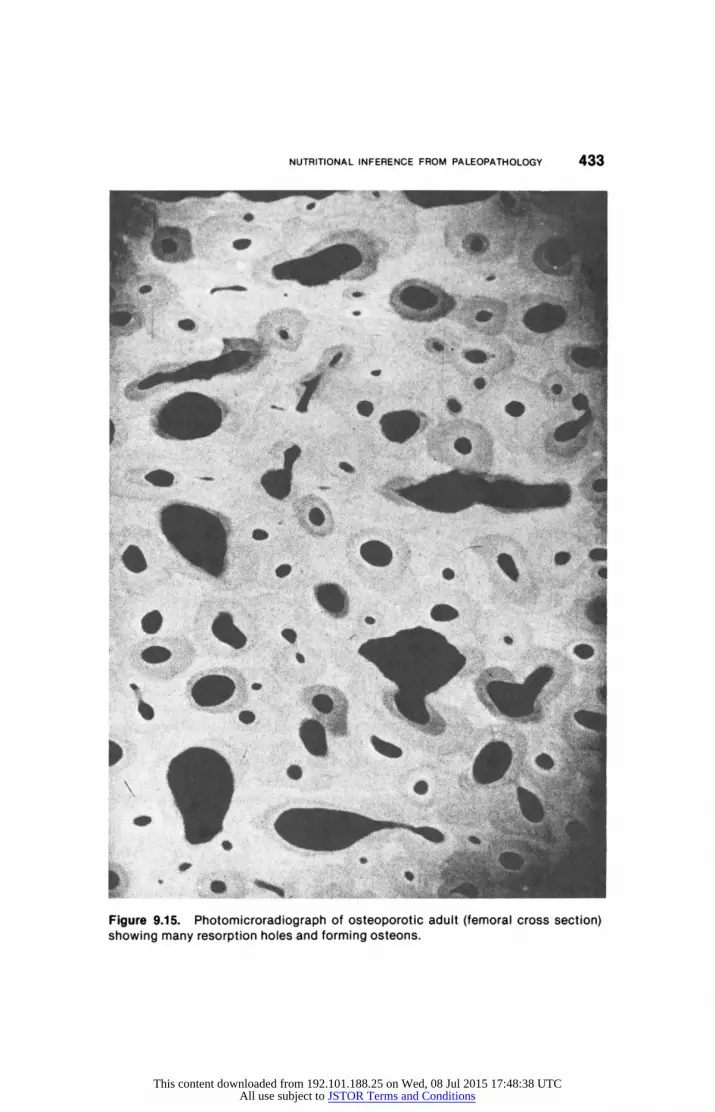
NUTRITIONAL INFERENCE FROM PALEOPATHOLOGY 433
!-,~~~~~~~~~~~~~i ' *
0%,~4
i t tI.. '. S ij.'<4.n
Figure 9.15. Photomicroradiograph of osteoporotic adult (femoral cross section) showing many resorption holes and forming osteons.
This content downloaded from 192.101.188.25 on Wed, 08 Jul 2015 17:48:38 UTCAll use subject to JSTOR Terms and Conditions

434 REBECCA HUSS-ASHMORE, ALAN H. GOODMAN, AND GEORGE J. ARMELAGOS
8
7 Q * / Forming |- < '/ " ~~~~~~~~Osteons
6
z L5
Resorption
< 3 x ~~~~~~~~~~~~Spaces
AGE 20-29 30-39 40-49 50+
O"N 15 10 4 3
Q N 22 9 3 4
Figure 9.16. Average frequencies per microscopic field of resorption spaces and forming osteons for males and females from Sudanese Nubia (Martin and Armelagos 1979:574).
subperiosteal hemorrhages. It appears that the ingestion of a lathyrogen-rich
diet interferes with collagen metabolism, and that such interference is more
severe for young, growing animals than for adults (Geiger et al. 1933).
Two cautionary considerations should be introduced here. First, both
fluoridosis and osteolathyrism are rare conditions in humans and unlikely to be prominent in skeletal populations. Second, other conditions, both hereditary and inflammatory, can produce an overgrowth of bone at the
points of muscle attachment. A diagnosis of dietary osteophytosis should
therefore be considered only when accompanied by overwhelming evidence from environmental sources.
Harris Lines
Although the existence of transverse lines in the growing ends of long bones
has long been reported, their significance is still a subject of debate. These
lines are commonly referred to as Harris lines, after one of the early research
ers to extensively study their occurrence (Harris 1926, 1931, 1933) (Figure
9.18). The mechanisms of their formation are fairly well documented (Park
1964; Steinbock 1976), but their precise cause is still obscure. The interpreta
This content downloaded from 192.101.188.25 on Wed, 08 Jul 2015 17:48:38 UTCAll use subject to JSTOR Terms and Conditions

NUTRITIONAL INFERENCE FROM PALEOPATHOLOGY 435
4.* _4.5 45 -
4.0 F tntFormt ? 40 40
35 35t 35
so IX 3.0 -= I -0 _ d -z u
d2.5 d' ~25 - 25 crEndosteot Formnation
tx 2o ix 2.0 ix20 d
Endosteal Resorption 15 Pertosteot Resorption l 5 I 5
1o0 d' 1.0 t I.o
.s (a) (b) (c) .5 . . * L * L I.5 5
20-29 30-39 40-49 50+ 20-29 30-39 40-49 50+ 20-29 30-39 40-49 50+ AGE AGE AGE
Figure 9.17. (a) Average frequencies of forming osteons and resorption spaces at the periosteum. Though periosteal resorption remains relatively constant, formation shows variability. (b) and (c) Average frequencies of forming osteons and resorption spaces at the endosteum. Endosteal formation shows slight variation. Endosteal resorption increases dramatically for Sudanese Nubian females aged 20-29 years. (From Martin and Armelagos 1979:575.)
tion of Harris lines in an archaeological population should therefore be ap proached with caution, and nutritional stress should be inferred only when there is supporting evidence from other skeletal indicators.
The controversy over Harris lines extends even to their nomenclature. Since Harris was neither the discoverer of the phenomenon nor the first to explore its cause, other researchers have objected to the use of his name (Garn et al. 1968) to describe the phenomenon. Other labels that are generally considered to be synonymous with Harris lines include "transverse trabeculae," "transverse lines," "radiopaque transverse lines," "bone scars," and "lines of arrested growth." Garn et al. (1968) are critical of these labels because the phenomena described are neither precisely due to arresting of growth, ex clusively transverse, nor invariably linelike. Garn et al. prefer the use of the
general label "lines and bands of increased density" (1968), a somewhat cumbersome phrase. We will continue here to use the term Harris lines, or simply lines, as a convenient short designation. However, the reader should be aware of the synonyms in other studies, and their explicit or implicit dif ferences in meaning.
The most precise analysis of Harris lines is by densitometric analysis, in volving the observation of adjacent longitudinal areas of bone for differences in density. However, Harris lines are more practically observable radiographically as lines or bands of increased radiopacity that can occur in
all cartilaginous bone. In round bones (carpals, tarsals, etc.) these lines
This content downloaded from 192.101.188.25 on Wed, 08 Jul 2015 17:48:38 UTCAll use subject to JSTOR Terms and Conditions

.: : . ... ...
Fiue9.8 ari iesi h dsa fmro aNtveA eianjvnlefo tePeloproda lckMs.2Nmes5r o
idn ifia-o.
This content downloaded from 192.101.188.25 on Wed, 08 Jul 2015 17:48:38 UTCAll use subject to JSTOR Terms and Conditions
NUTRITIONAL INFERENCE FROM PALEOPATHOLOGY 437
follow the topographic contours of the development of that bone. In long bones, the lines are transverse, or nearly so.
Few have studied the frequency distribution of these lines throughout the skeleton. Two researchers that have reported on such findings are in close agreement regarding the relative frequencies of Harris lines in different bones. According to Park, "arrest lines were most common at the anterior rib end, next at the upper and lower tibia ends with the lower end of the femur rating not far behind. The upper femur exhibited them less constantly. The lower radius followed next" (1964:830). Whereas Garn et al. find that "they are far more common in the distal part of the tibia than on any other bone or on any other part of the tibia. Next in order of frequency, they may appear on (1) the proximal tibia, (2) the distal femur, (3) the distal radius and (4) the
metacarpals" (1968:61). Thus, the precise relative frequencies of occurrence of Harris lines on dif
ferent bones and bone ends need further refinement. It is generally agreed that Harris lines are most frequent in long bones and that the best bones to
study are probably the tibia, femur, and radius. Because of the relatively high frequency of lines in these bones and their well-defined aging sequences, these bones are most frequently selected for examination of Harris lines.
Variation in lines is also evident, even within the same bone. Lines may be variable in thickness and in density. The relationship of line thickness and density and their cause is unclear. A tentative hypothesis is that thickness is a function of growth velocity and the length of the growth disruption. Density
may be a function of the severity or the completeness of the growth disrup tion. However, the causes of line thickness and density have not yet been
definitely investigated. Lines are not always transverse and may be oblique (Garn et al. 1968).
Often these lines do not transverse the bone in its entirety. The cause of
oblique lines is not thought to differ from that of transverse lines. Their
obliqueness is likely a function of the age dynamics of bone growth and remodeling (Garn et al. 1968).
Park (1964) and Garn et al. (1968) attribute Harris-line formation to
episodes of growth disruption in which cartilage cell division slows or stops while mineralization is allowed to continue. The structure of the bones formed is abnormal, and may be resistant to osteoclastic removal. Therefore,
when growth resumes, the long-bone cartilaginous plates move longitudi nally, leaving rings of increased mineralization, density, and radiopacity behind. It should be added that these lines are not simply growth-arrest lines, but may more accurately be thought of as recovery lines (Park 1964).
The mechanisms of Harris-line formpation in bone are similar to those of
hypoplastic lines in dental enamel. Harris lines also seem to resemble enamel
hypoplasias in that they are caused by a wide variety of environmental insults
This content downloaded from 192.101.188.25 on Wed, 08 Jul 2015 17:48:38 UTCAll use subject to JSTOR Terms and Conditions

438 REBECCA HUSS-ASHMORE, ALAN H. GOODMAN, AND GEORGE J. ARMELAGOS
or stresses. Measles, scarlet fever, infantile paralysis, pneumonia, starvation, vitamin A, C, and D deficiencies, protein-energy malnutrition, kwashior kor, and mechanical restriction have all been associated with the occurrence
of Harris lines (see Park 1964 for a more extensive review).
Cartilagenous bone growth disruptions seem to be a "logical response" of
the organism in the face of nutritional insufficiency and environmental insults of a less than chronic nature. Park states that "when nutritional disturbances
in the young animal become so severe that nutrient material is inadequate to
go around, in the economy of nature the bones are sacrificed.... In the crisis
the bones simply cease to grown and, when the crisis is over, proceed to carry
on again" (1964:815). Acheson suggests that "evidently the child in an
adverse environment, instead of using his available amino acids for skeletal
growth, is mobilizing them and redirecting them so that he can best deal with
the stress to which he is adapting" (1960:87).
Two studies have attempted to associate the occurrence of Harris lines with
that of enamel hypoplasias. The results of these two studies are contradictory.
McHenry and Schulz (1976) did not find a significant association in a group of
prehistoric Californians. Using a different statistical technique and a mixed archaeological population (North America), Clarke (1978) did find a signifi
cant positive association between Harris lines and hypoplasias. Further research on the relationship of Harris lines and hypoplasias must be under
taken to resolve this discrepancy. As indicators of stress, hypoplasias and Harris lines have some important
differences. First, Harris lines are generally more common and may be
observed over a greater span of years (birth to 18) than hypoplasias (usually
from birth to around 6 years). However, even controlling for this difference,
McHenry and Schulz (1976) found Harris lines to be about 10 times as com
mon. These results suggest that Harris lines are formed by insults that are not
as severe or long lasting as those which cause enamel hypoplasias.
Second, bone is a more variable and viable substance in terms of growth
and remodeling than enamel. The timing of enamel development is under
stronger genetic control than that of bone (Garn et al. 1965), and the age of
Harris-line occurrence must be estimated with less precision. Clarke (1978)
presents a methodology for estimating within one year the time in life at which
Harris lines develop (Table 9.12). His well-developed methodology is a con
servative estimation of the precise timing of the occurrence of lines in an ar
chaeological population. Third, because of the remodeling process, many previously formed Harris
lines are resorbed. Garn et al. (1968) have studied this problem extensively.
Their major findings suggest that (a) the resorptive process has nearly equal
effect on all portions of the bone, and (b) the thicker and denser lines will tend
This content downloaded from 192.101.188.25 on Wed, 08 Jul 2015 17:48:38 UTCAll use subject to JSTOR Terms and Conditions

NUTRITIONAL INFERENCE FROM PALEOPATHOLOGY 439
TABLE 9.12
Chronology of Harris-Line Developmenta
Female Male
Percent per Accumulated Percent per Accumulated Age yr percent yr percent
0 .193 .429 .178 .423 1 .125 .346 .119 .347 2 .087 .292 .074 .296 3 .066 .255 .059 .265 4 .057 .227 .050 .240 5 .052 .202 .044 .219 6 .049 .180 .052 .200 7 .052 .159 .042 .178 8 .054 .137 .045 .160 9 .057 .114 .059 .141
10 .047 .089 .045 .120 11 .043 .069 .040 .101 12 .033 .051 .037 .084 13 .027 .037 .052 .068 14 .019 .025 .034 .046 15 .014 .017 .037 .032 16 .025 .011 .038 .016
a Modified from S. Clarke (1978).
to persist longer. We would expect lines that are thicker and formed later to persist.
Anthropologists have attempted to associate Harris lines with (a) gender, (b) adult stature, (c) longevity, and (d) culture. The relationship between
Harris lines and gender is not conclusive. McHenry (1968) and Nickens (1975) did not find significant differences in the frequency of Harris lines by gender for groups of prehistoric California and Mesa Verde Native Americans, respectively. Woodall (1 968) (Casas Grandes population) reports that females had more lines than males. Wells finds fewer Harris lines in Anglo-Saxon
males. He interprets this as a reflection of the protected position of males within Anglo-Saxon societies, affording them better care and nutrition (1961:528). However, Goodman and Clark (1981) found that males in their
Dickson sample have more Harris lines than females. At present, it is not
possible to specify the precise interaction of gender and cultural factors in the
etiology of Harris lines.
The associations found between Harris lines and adult stature are also in
consistent. Blanco et al. (1974) found an inverse relationship between Harris
lines and stature in Guatemalan children, and Perzigian (1977) implies that there is an inverse association between Harris lines and attained adult stature in the Indian Knoll populations. However, Goodman and Clark (1981) found
This content downloaded from 192.101.188.25 on Wed, 08 Jul 2015 17:48:38 UTCAll use subject to JSTOR Terms and Conditions
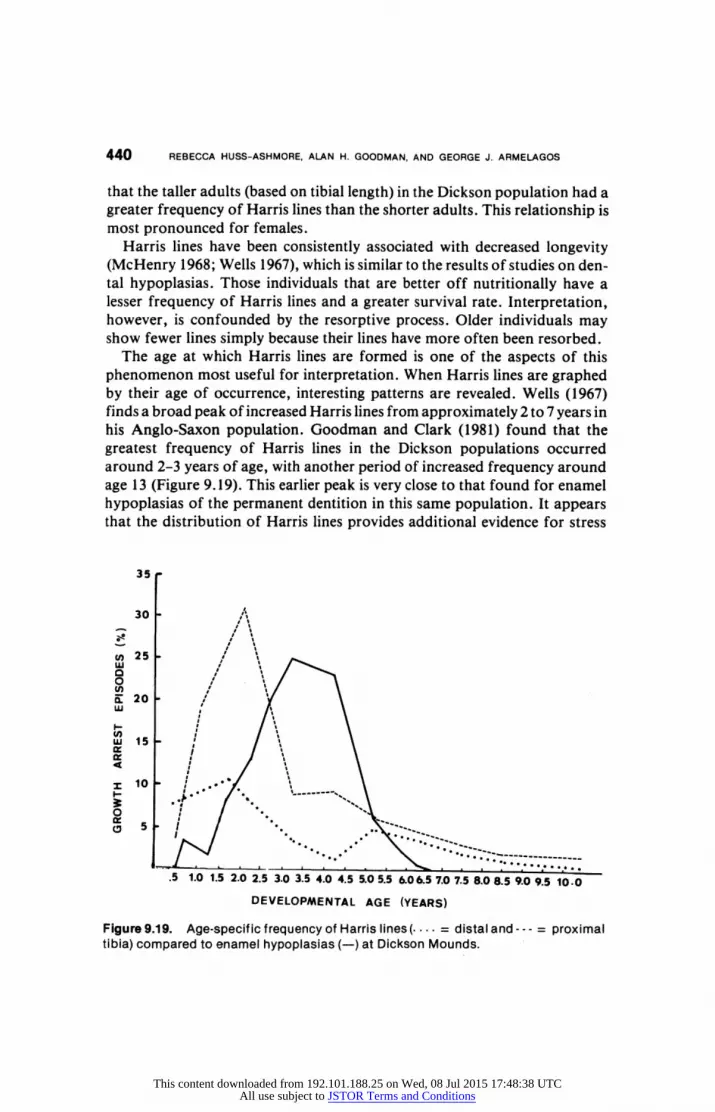
440 REBECCA HUSS-ASHMORE, ALAN H. GOODMAN, AND GEORGE J. ARMELAGOS
that the taller adults (based on tibial length) in the Dickson population had a greater frequency of Harris lines than the shorter adults. This relationship is most pronounced for females.
Harris lines have been consistently associated with decreased longevity (McHenry 1968; Wells 1967), which is similar to the results of studies on den tal hypoplasias. Those individuals that are better off nutritionally have a
lesser frequency of Harris lines and a greater survival rate. Interpretation, however, is confounded by the resorptive process. Older individuals may show fewer lines simply because their lines have more often been resorbed.
The age at which Harris lines are formed is one of the aspects of this phenomenon most useful for interpretation. When Harris lines are graphed by their age of occurrence, interesting patterns are revealed. Wells (1967) finds a broad peak of increased Harris lines from approximately 2 to 7 years in
his Anglo-Saxon population. Goodman and Clark (1981) found that the
greatest frequency of Harris lines in the Dickson populations occurred around 2-3 years of age, with another period of increased frequency around
age 13 (Figure 9.19). This earlier peak is very close to that found for enamel hypoplasias of the permanent dentition in this same population. It appears that the distribution of Harris lines provides additional evidence for stress
35
30 'A,
c25/
0/ E 20~~I
wi 15
10
0 o5 I
.5 1.0 1.5 2.0 2.5 3.0 3.5 4.0 4.5 5.0 5.5 &06.5
7.0 7.5 8.0 8.5 9.0 9.5 10.0
DEVELOPMENTAL AGE (YEARS)
Figure 9.19. Age-specific frequency of Harris lines (.... = distal and --- = proximal tibia) compared to enamel hypoplasias (-) at Dickson Mounds.
This content downloaded from 192.101.188.25 on Wed, 08 Jul 2015 17:48:38 UTCAll use subject to JSTOR Terms and Conditions

NUTRITIONAL INFERENCE FROM PALEOPATHOLOGY 441
during weaning in this population. In summary, Harris lines should be con sidered an indicator of generalized stress during the growth stage. Many fac tors may produce stresses that are capable of causing Harris lines. Such stresses need not be particularly severe or prolonged. Thus nutrition, alone or in concert with other environmental disturbances, may be reflected in the for
mation of such lines.
Measures of Nutritional Stress in Teeth
The measurement and analysis of teeth have traditionally received a great deal of attention in studies of paleoanthropology. This disproportionate em phasis has resulted primarily from the fact that teeth are extraordinarily hard. They therefore remain for recovery and analysis when other tissues, including bone, are destroyed. The dental conditions most frequently studied for their relationship to diet are dental caries and dental attrition. Both conditions have been widely researched, and an extensive literature on each exists. Both
conditions have been shown to relate to diet, but are not in themselves in dicative of nutritional status. Caries, for example, is generally known to be positively correlated with dietary carbohydrate intake and dental attrition (Burns 1979; Leigh 1925; Turner 1979); but is negatively associated with
malnutrition. The present discussion will emphasize those less well-known dental features that have empirically been shown to be systemically related to stress markers in bone: developmental enamel defects, asymmetrical denti tion, and crowding and malocclusion of teeth.
Enamet Hypoplasia
Enamel hypoplasia is one of three developmental defects of the dentition that have been proposed as markers of nutritional stress in both modern and prehistoric populations. Along with enamel hypocalcification and defective dentin, enamel hypoplasia is a highly useful marker of physiological stress.
Because enamel 'hypoplasia yields a well-preserved, relatively permanent record of growth disturbance, examination of them is a promising technique for dietary investigation. Enamel hypoplasia is usually defined as a deficiency in enamel thickness resulting from a cessation of ameloblast (enamel forming) activity (Figure 9.20) (Sarnat and Schour 1941). Other terms such as "con genital defects of the enamel" (Zsygmondy 1893), and "chronologic enamel
aplasia" (Sarnat and Schour 1941) have been used in reference to the same
phenomenon. Occasionally, the descriptive terms "ring" and "linear" are
utilized, as in neonatal rings, tooth rings, and linear enamel hypoplasia. However, the term enamel hypoplasia is now widely recognized and will be used here as a generic name for disturbances in enamel development due to
ameloblast activity.
This content downloaded from 192.101.188.25 on Wed, 08 Jul 2015 17:48:38 UTCAll use subject to JSTOR Terms and Conditions

442 REBECCA HUSS-ASHMORE, ALAN H. GOODMAN, AND GEORGE J. ARMELAGOS
Figure 9.20. Enamel hypoplasia of the maxillary incisors and canine in a Native American individual from the Pueblo period at Black Mesa.
Enamel hypoplasias may be studied either by direct observation of the sur
face or by microscopic observation of enamel thin sections. Rose (1973) has
presented a detailed account of the appearance, method of analysis, and util
ity of microscopic examination of enamel hypoplasias and other developmen tal defects. Microscopic examination is a sensitive indicator of stress, in that
"pathological" phenomena that are not macroscopically evident can be ex
amined and described. Macroscopic examination sacrifices some resolution for a savings in time, equipment, and the integrity of the tooth. The choice of
which technique to use should be based on the relative importance of these
factors for the specific project at hand (see Rose et al. 1978).
Enamel hypoplasia often occurs in concert with enamel hypocalcification,
the other class of enamel developmental defects. Although these two
developmental defects may be caused by similar environmental insults, they
occur through different developmental mechanisms. Enamel is calcified in two stages. The first stage, matrix formation, accounts for approximately
30% of the calcified salts. Enamel hypoplasia is a result of a disturbance dur
ing matrix formation and is evidenced by the reduced thickness of the enamel.
The second stage is maturation, during which enamel calcification is com
pleted. If the enamel organ is disrupted during this stage, the resulting enamel
This content downloaded from 192.101.188.25 on Wed, 08 Jul 2015 17:48:38 UTCAll use subject to JSTOR Terms and Conditions
NUTRITIONAL INFERENCE FROM PALEOPATHOLOGY 443
will be of normal thickness but the calcified salt content will be reduced. This hypocalcification will be obvious by the opaque appearance of the enamel.
Although hypocalcification is easily discerned, it seems to be a less common phenomenon in the permanent dentition. It therefore requires a large popula tion for meaningful analysis. Since hypocalcification is more frequently seen in the deciduous dentition, it is a useful indicator of prenatal stress. Cook and
Buikstra (1979) have examined enamel hypoplasia, hypocalcification, and hypoplasia-related caries in the deciduous dentition of a Middle and Late
Woodland skeletal series from Illinois. The high frequency of such defects was associated with skeletal evidence of anemia and infection, and high
weaning-age mortality. This constellation of disturbances suggests the pres ence of nutritional deficiencies in Illinois Woodland populations.
Defects in dentin development are often similar in cause to enamel hypoplasia, and can be seen as an additional measure of general stress in the growing individual (Molnar and Ward 1975). Some of the dentin defects that have been identified are incremental lines of Von Ebner, contour lines of Owen, interglobular dentin, scattered cacospherite, or hypocalcified dentin. These can be studied in conjunction with defects of enamel to produce a more complete picture of stress.
Enamel hypoplasia may be the result of a wide variety of environmental stresses (Giro 1947; Kreshover 1960; Massler et al. 1941; Sarnat and Schour 1941; Schour and Massler 1945; Rose 1973; Vila 1949). Kreshover sum
marizes his review:
ample clinical and experimental evidence exists to suggest that developmental tooth defects are generally non-specific in nature and can be related to a wide range of systemic distur
bances, and any of which, depending upon their severity and the degree of tissue response,
might result in defective enamel and dentin (1960:166).
In addition to their high validity as stress indicators, hypoplasias have other
advantages. First, teeth are the most commonly found skeletal remains. Sec
ond, hypoplasias are unaffected by later life events and have a "memory" of earlier metabolic events; defects can also be related to future events such as
morbidity. Third, the developmental timing of the defective enamel, and therefore of the stressful event, can be located, thus allowing for the forma tion of a chronological graph of the developmental timing of stressful events.
The growing dental structure, particularly the enamel and dentin yield accurate, prompt and permanent records of both normal fluctuation and pathologic accentuations of
mineral and general metabolism. Fortunately, these records are easily read by virtue of the
orderly and rhythmic growth of these tissues in their daily, ringlike succession.
In enamel hypoplasia the history of systemic disturbances is indelibly recorded by a
cessation of ameloblast activity. A lack of enamel formation is noted in the particular por
tion of each tooth that is developing during the disease period (Sarnat and Schour
1941:1989).
This content downloaded from 192.101.188.25 on Wed, 08 Jul 2015 17:48:38 UTCAll use subject to JSTOR Terms and Conditions
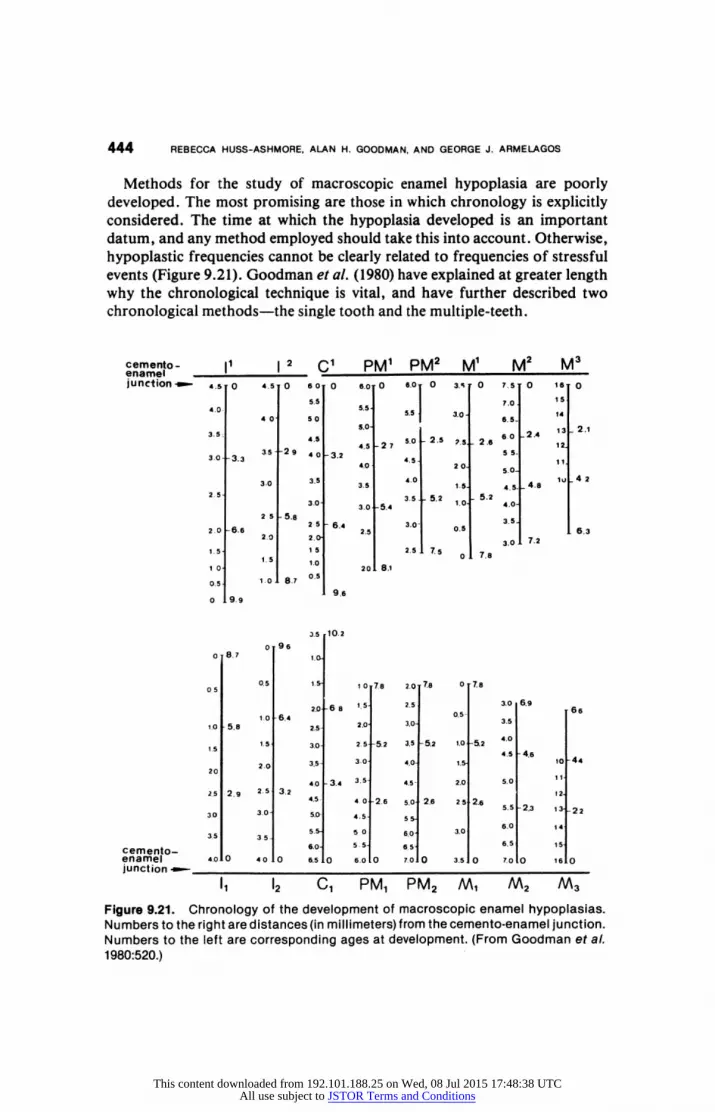
444 REBECCA HUSS-ASHMORE, ALAN H. GOODMAN, AND GEORGE J. ARMELAGOS
Methods for the study of macroscopic enamel hypoplasia are poorly
developed. The most promising are those in which chronology is explicitly considered. The time at which the hypoplasia developed is an important datum, and any method employed should take this into account. Otherwise, hypoplastic frequencies cannot be clearly related to frequencies of stressful events (Figure 9.21). Goodman et al. (1980) have explained at greater length
why the chronological technique is vital, and have further described two chronological methods-the single tooth and the multiple-teeth.
cemento- 1 1 2 C1 PM' pM2 MI M2 M3 enamnel iju n ct ion 405 0 4.5 0 60 0 6.0 0 6.0 0 3.S 0 7.5 0 16 0
0.5 7.0 195
4.0- S.5 S.5
3.0 14 4 0 5 0 16.5.. 5.0 13 2.1
3.5' 4O.S 2 .5 3 27 5.0 2.5 2.6 . 8
2.4
cemento-~~~~~~~~~3S 294 4; s 027 i 5 -
3.0 - 3.3 32 . 4,0 2 0- ~~~~~5.0
3.0 3.5 4.5 4.0 13.5 4.S 4.6 lu 4 2
2.5- 3.5 5.2 5.2 3.0 3.0 5C4 1.0 t 4.0o
25S 5.8 3.5 2.0 -6.6
2 5 6.4 3.0- 0.5 6.3 20 0
6.6 2.5 20 2. ~~~~~~~~~~~~~~~~~~~3.0 7.2
1.5. 1 5 2.5 7 0 7.8
1 0 201 8.1
0.5 1.0 8.7 0.5
0 9.tst 9
). 5 1 0.2
0 996 0 8.7 1
05 0.5 1. 10 7es 2.0 78 0 7.8
2.0--6 a 1.5 2.5 3.0 6.9
1.0 -6.4 0.5-6 1.0 562.5- 2.0 3.035
15 15- 3.0- 2.5 -52 3.5 -5.2 1.0 -5.2 40
1.5 ~~~~~~~~~~~~~~~~~4.5 4.6
2.0 3.5- 3.0- 4.0- 1. 10 -44 20
4.0 3.4 3.5
4.5- 2.0 5.0 1
2.5 2.9 2.5 3.212 4.5- 4.0- 2.6 5.0o 2.6 2 5 2.6 5 23 13--2 2
3.0 3.0 5D. 4.5 5. .53 2
35 ~~~~~~~~~5 5 0 6.0 3.0 6.0 1 4
cemento- ~~~~ ~~~~ ~~ ~ ~~~6.0 5 5- 6.5 6.5 15S enamel 4.00 4 00. 6.5 0 6.0 .0 7.00 3.5 0 7.0 0 16 0 junction mw-__ _ _ _ _ _ _ _ _ _ _ _ _ _ _ __ _ _ _ _ _ _ _ _ _ _ _ _ _ _ _
I 1 2 C, PM1 PM2 M1A A2 A3
Figure 9.21. Chronology of the development of macroscopic enamel hypoplasias. Numbers to the right are distances (in millimeters) from the cemento-enamel junction. Numbers to the left are corresponding ages at development. (From Goodman et al.
1980:520.)
This content downloaded from 192.101.188.25 on Wed, 08 Jul 2015 17:48:38 UTCAll use subject to JSTOR Terms and Conditions

NUTRITIONAL INFERENCE FROM PALEOPATHOLOGY 445
The single-tooth technique utilizes only one tooth type for analysis. The tooth of choice is usually the mandibular canine (for examples, see Schulz and
McHenry 1975). This tooth is selected because of its relatively long
developmental time span and its relatively high sensitivity to environmental stress. Although this technique is very accurate and replicable, it cannot distinguish hypoplasias due either to nonsystemic environmental stress (e.g., those due to local trauma) or congenitally caused hypoplasias. Therefore, the
technique loses some validity as a measure of general systemic stress.
The multiple-teeth technique examines all teeth present for the occurrence of hypoplasias. This technique offers a longer record of development, is able
to distinguish nonsystemic defects and extends the sample size. However, these techniques are more complex, and may therefore lose replicability (Goodman et al. 1980; Swirdstedt 1966).
The overriding difficulty in this type of analysis is that it is not clearly
known which teeth are most sensitive to environmental stress. Our data show
that relative sensitivities change with developmental age. More precisely, for the Dickson populations the incisors, and specifically the central maxillary in cisors, appear to be the teeth most likely to exhibit an enamel hypoplasia if the
defect occurs before 3 years of age. If the hypoplasia occurs between 3 and 7
years of age, the canines are most likely to be affected. We have therefore sug
gested a "best teeth" technique, which combines the uses of canines and in
cisors. For the Dickson populations, 95 % of the chronological growth disrup
tions are recorded in either the incisors or the canines. That is, the addition of
premolars and molars adds only 5% more growth disruption episodes. It is
therefore suggested that a multiple-teeth technique could be shortened to eliminate the postcanine teeth. We suggest the use of two of the canines and
two of the incisors, with preference for the maxillary central incisors.
Although there have been few studies of the frequency and chronology of
enamel hypoplasia in a population, a few types of inference are possible.
These will be discussed with reference to (a) seasonality, (b) sex, (c) class,
(d) culture, (e) longevity, and (f) age at hypoplasia formation.
Swardstedt (1966) has devised a method of analyzing for seasonal occur
rence of enamel hypoplasia by examining the chronological spacing of
hypoplasias in individuals with greater than one occurrence of enamel
hypoplasia. However, he did not find any support for a seasonal effect when
his method was tested on an archaeological population from Westerhus (A.D.
1025-1375). Goodman et al. (1980) examined those individuals in the Dickson
sample who had more than one hypoplasia. They found that the frequency of
hypoplasias separated by a year was greater than that of hypoplasias
separated by half a year (Table 9.13). They attribute these results to an annual
cycle of stress.
Infante and Gillespie (1974) did not find a significant sex difference in fre
quencies of hypoplasias in a group of modern rural Guatemalan school
This content downloaded from 192.101.188.25 on Wed, 08 Jul 2015 17:48:38 UTCAll use subject to JSTOR Terms and Conditions
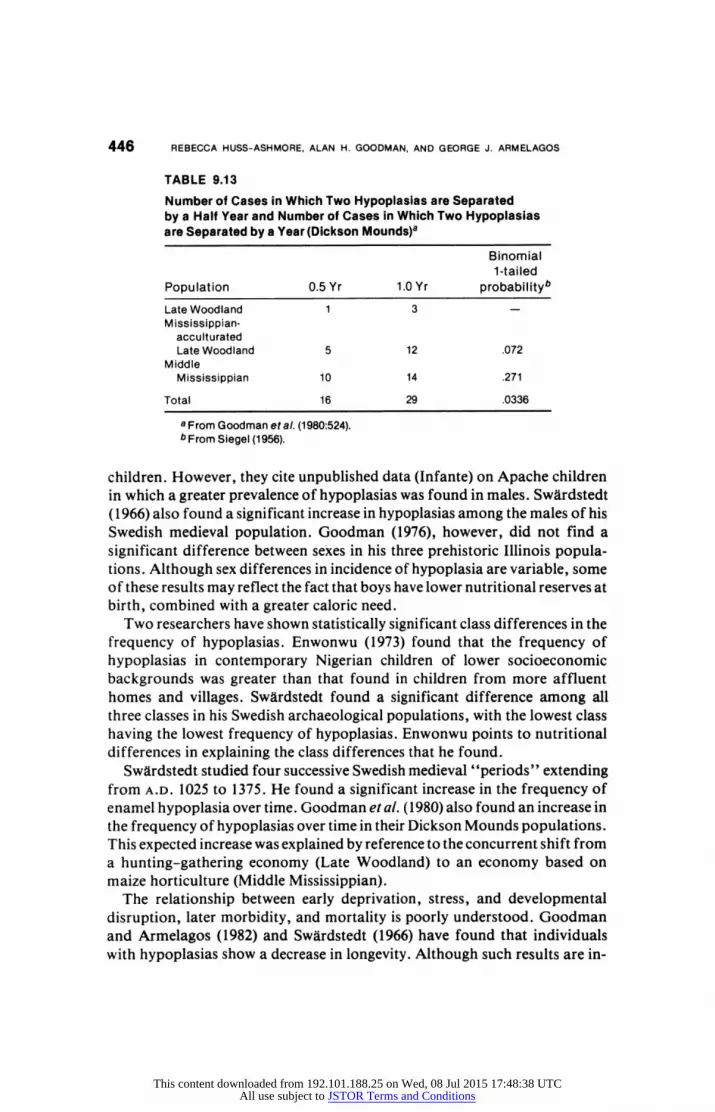
446 REBECCA HUSS-ASHMORE, ALAN H. GOODMAN, AND GEORGE J. ARMELAGOS
TABLE 9.13
Number of Cases in Which Two Hypoplasias are Separated by a Half Year and Number of Cases in Which Two Hypoplasias are Separated by a Year (Dickson Mounds)a
Binomial 1-tailed
Population 0.5 Yr 1.0 Yr probabilityb
Late Woodland 1 3 -
Mississippian
acculturated
Late Woodland 5 12 .072
Middle
Mississippian 10 14 .271
Total 16 29 .0336
a From Goodman et al. (1980:524).
b From Siegel (1956).
children. However, they cite unpublished data (Infante) on Apache children
in which a greater prevalence of hypoplasias was found in males. Swardstedt
(1966) also found a significant increase in hypoplasias among the males of his
Swedish medieval population. Goodman (1976), however, did not find a significant difference between sexes in his three prehistoric Illinois popula tions. Although sex differences in incidence of hypoplasia are variable, some
of these results may reflect the fact that boys have lower nutritional reserves at
birth, combined with a greater caloric need.
Two researchers have shown statistically significant class differences in the frequency of hypoplasias. Enwonwu (1973) found that the frequency of hypoplasias in contemporary Nigerian children of lower socioeconomic backgrounds was greater than that found in children from more affluent
homes and villages. Swardstedt found a significant difference among all
three classes in his Swedish archaeological populations, with the lowest class
having the lowest frequency of hypoplasias. Enwonwu points to nutritional differences in explaining the class differences that he found.
Swardstedt studied four successive Swedish medieval "periods" extending
from A.D. 1025 to 1375. He found a significant increase in the frequency of
enamel hypoplasia over time. Goodman et al. (1980) also found an increase in
the frequency of hypoplasias over time in their Dickson Mounds populations.
This expected increase was explained by reference to the concurrent shift from
a hunting-gathering economy (Late Woodland) to an economy based on
maize horticulture (Middle Mississippian). The relationship between early deprivation, stress, and developmental
disruption, later morbidity, and mortality is poorly understood. Goodman
and Armelagos (1982) and Swardstedt (1966) have found that individuals
with hypoplasias show a decrease in longevity. Although such results are in
This content downloaded from 192.101.188.25 on Wed, 08 Jul 2015 17:48:38 UTCAll use subject to JSTOR Terms and Conditions

NUTRITIONAL INFERENCE FROM PALEOPATHOLOGY 447
triguing, it is not known how universal this pattern is or why it occurs. It is
possible that the same individuals in a population are constantly being ex
posed to stress, which results in hypoplasias during childhood and early mor
tality as adults. Alternatively, those individuals with hypoplasias may be
"damaged" and therefore more susceptible to future stress. As with Harris lines, the chronology of hypoplasia occurrence is a useful
analytical procedure. Sarnat and Schour (1941:1992) have published a chronological graph for a group of Chicagoans that has come to be accepted
as a modern standard. Their graph shows 32 of all hypoplasias occurring
before the first year, and that over 90%Vo occur before the second year. This
graph is assumed to reflect the pattern of stress and susceptibility in a modern
population, and is the only such graph of which the authors are presently
aware. All three known graphs of enamel hypoplasias chronology in archaeologi
cal populations differ greatly from Sarnat and Schour's. Graphs for the
Swedish medieval and prehistoric Illinois populations (Figure 9.22) show
strong central tendencies around 2.5-3.0 years of age (Goodman and
Armelagos, 1980; Swardstedt 1966). A graph of incidence among prehistoric
70 - Chicago - Modern
60
I \
s40 ,
30
E ! 20 - Westerhus
so L y S California Prehistoric
10 - ,** Dickson Mounds
,. . :j . l I | I 1 _ I I ib**b~~~~~~~~~U.. - *
.5 1.0 1.5 2.0 2.5 3.0 3.5 4.0 4.5 50 5.5 6.0 6.5 7.0
Age ( Years)
Figure 9.22. Chronology of enamel hypoplasias. (From Goodman and Armelagos
1980.)
This content downloaded from 192.101.188.25 on Wed, 08 Jul 2015 17:48:38 UTCAll use subject to JSTOR Terms and Conditions
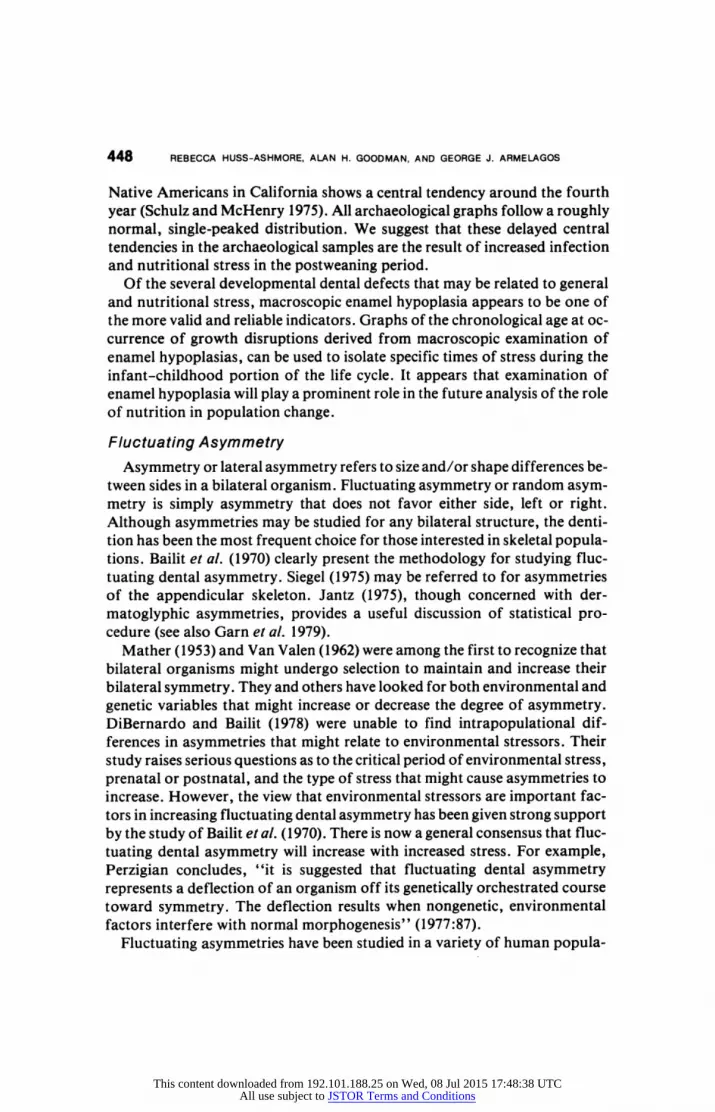
448 REBECCA HUSS-ASHMORE, ALAN H. GOODMAN, AND GEORGE J. ARMELAGOS
Native Americans in California shows a central tendency around the fourth
year (Schulz and McHenry 1975). All archaeological graphs follow a roughly
normal, single-peaked distribution. We suggest that these delayed central tendencies in the archaeological samples are the result of increased infection and nutritional stress in the postweaning period.
Of the several developmental dental defects that may be related to general
and nutritional stress, macroscopic enamel hypoplasia appears to be one of
the more valid and reliable indicators. Graphs of the chronological age at oc
currence of growth disruptions derived from macroscopic examination of enamel hypoplasias, can be used to isolate specific times of stress during the
infant-childhood portion of the life cycle. It appears that examination of
enamel hypoplasia will play a prominent role in the future analysis of the role
of nutrition in population change.
Fluctuating Asymmetry
Asymmetry or lateral asymmetry refers to size and/or shape differences be
tween sides in a bilateral organism. Fluctuating asymmetry or random asym
metry is simply asymmetry that does not favor either side, left or right.
Although asymmetries may be studied for any bilateral structure, the denti tion has been the most frequent choice for those interested in skeletal popula tions. Bailit et al. (1970) clearly present the methodology for studying fluc
tuating dental asymmetry. Siegel (1975) may be referred to for asymmetries of the appendicular skeleton. Jantz (1975), though concerned with der matoglyphic asymmetries, provides a useful discussion of statistical pro cedure (see also Garn et al. 1979).
Mather (1953) and Van Valen (1962) were among the first to recognize that
bilateral organisms might undergo selection to maintain and increase their
bilateral symmetry. They and others have looked for both environmental and
genetic variables that might increase or decrease the degree of asymmetry.
DiBernardo and Bailit (1978) were unable to find intrapopulational dif
ferences in asymmetries that might relate to environmental stressors. Their
study raises serious questions as to the critical period of environmental stress,
prenatal or postnatal, and the type of stress that might cause asymmetries to
increase. However, the view that environmental stressors are important fac
tors in increasing fluctuating dental asymmetry has been given strong support
by the study of Bailit et al. (1970). There is now a general consensus that fluc
tuating dental asymmetry will increase with increased stress. For example,
Perzigian concludes, "it is suggested that fluctuating dental asymmetry
represents a deflection of an organism off its genetically orchestrated course toward symmetry. The deflection results when nongenetic, environmental factors interfere with normal morphogenesis" (1977:87).
Fluctuating asymmetries have been studied in a variety of human popula
This content downloaded from 192.101.188.25 on Wed, 08 Jul 2015 17:48:38 UTCAll use subject to JSTOR Terms and Conditions
NUTRITIONAL INFERENCE FROM PALEOPATHOLOGY 449
tions. There is no consensus as to whether males or females show greater
asymmetry. Niswander and Chung (1965) found that Japanese females were
more dentally asymmetric than Japanese males. However, this result was not
duplicated by DiBernardo (1973) for Japanese children, nor in any of Per
zigian's samples (the Indian Knoll hunter-gatherers, the Campbell-Larson agriculturalists, and the Hamann-Todd population).
DiBernardo found an association between decreased socioeconomic status and increased asymmetry (1973). Suarez (1974) found greater asymmetry in a
Neanderthal population than in a modern Ohio population. Doyle and
Johnston (1977) showed that their Eskimo and Pueblo samples were also
more asymmetric than Suarez's modern sample. Bailit et al. (1970) found
asymmetry to be greatest among Tristanites, the Nasoi, the Kwaio, and
residents of modern Boston, in that order. Perzigian (1977) found greater asymmetry in his Indian Knoll skeletal sample than in his Campbell-Larson or
Hamann-Todd populations. He interprets these last results to mean that populations under greater environmental stress will demonstrate a greater
level of asymmetry. Bailit et al. likewise state, "asymmetry in the dentition is
related to the general level of health and nutrition in each population"
(1970:636).
Malocclusion and Crowding of Teeth
Because dental development is less severely affected by environmental stresses than the bone in which it is located (Garn et al. 1965), the crowding of
teeth may be an indicator of general and/or specific nutritional stress (Wid
dowson and McCance 1964). In a series of experiments on undernourished
piglets, tooth development was shown to be only slightly retarded. However, the alveolar bone in which the teeth were located was noticeably stunted. This
resulted in too little room for the developing teeth, with concomitant crowding and impaction of the molars (Trowell et al. 1954). We therefore
suggest that the appearance of such a pattern in archaeological populations
may indicate acute or severe nutritionally based stress.
Malocclusion has also been attributed to poor diet (Howe 1924), but much
of the evidence for this has been taken from animal experiments. In
malnourished children, the primary difference noted is a slightly subnormal
angle of the maxillary incisors (Parker et al. 1952). Children with
kwashiorkor show little evidence of undue malocclusion (Trowell et al. 1954).
Because there is a large genetic component to crowding and malocclusion, these measures should not be assumed to reflect nutritional status unless there
is supporting evidence. To our knowledge, neither has been systematically employed in investigating archaeological populations. When used with other
indicators of growth disruption, dental crowding and impaction could con
firm a diagnosis of dietary involvement.
This content downloaded from 192.101.188.25 on Wed, 08 Jul 2015 17:48:38 UTCAll use subject to JSTOR Terms and Conditions

450 REBECCA HUSS-ASHMORE, ALAN H. GOODMAN, AND GEORGE J. ARMELAGOS
Bone Collagen Analysis as an Indicator of Nutritional Deficiencies
Preliminary work has suggested that the analysis of collagen recovered
from the human skeletal system provides a method for assessing diet and
dietary deficiencies. Collagen is a stable protein with a long half-life. Since
collagen is synthesized in stages, its composition reflects diet during the
various phases of individual development. It is possible to analyze collagen synthesized during the various development phases. This is accomplished by
the serial extraction of collagen formed during various stages of the life cycle.
For example, collagen synthesized just prior to death can be extracted from
archaeological bone by dilute saline solution, whereas other substances can be
used to extract collagen fractions developed earlier in life. The two types of
collagen analysis that now show promise for dietary reconstruction are the
analysis of trace elements and the examination of stable carbon isotopes.
Elemental Analysis
Chemical analysis of major, minor, and trace elements can provide an im
portant technique for assessing paleonutrition. Elemental analysis has fo
cused on those trace minerals that can play an important role in nutrition
(Maugh 1973; Ulmer 1977). Studies of trace minerals have attempted to deter
mine the impact of toxic levels or deficiency states. Gilbert (1977) and Wing
and Brown (1980) have provided general discussions on the potential of trace
mineral analysis for paleonutrition. The incorporation of trace minerals into
bones and teeth has been examined in a number of prehistoric populations
(Boaz and Hampel 1978; Brown 1973, 1974; Gilbert 1975; Schoeniger 1979a,
1979b; Stedt 1979; Szpunar et al. 1978).
The analysis of trace elements related to diet is complicated by a number of
factors. For example, there are often in vivo interactions between elements
that can affect their distribution; post-mortem changes resulting from organic and inorganic exchanges will alter the concentration of trace elements
(Hassan 1975; Hassan and Ortner 1977). The development of techniques to
extract secondary carbonates should help to resolve these problems.
Although there have been a large number of elements tested, most studies
have focused on variation in zinc, copper, manganese, magnesium, and stron
tium. These studies suggest that zinc and copper would increase in popula
tions with a high dietary meat intake, whereas manganese, magnesium, and
strontium would be higher in populations in which vegetables comprise a
greater proportion of the diet. Gilbert (1975) analyzed five trace minerals (zinc, copper, strontium,
maganese, and magnesium) in 75 individuals from the Dickson Mound population in Illinois. This population was experiencing a rapid shift in sub
This content downloaded from 192.101.188.25 on Wed, 08 Jul 2015 17:48:38 UTCAll use subject to JSTOR Terms and Conditions

NUTRITIONAL INFERENCE FROM PALEOPATHOLOGY 451
sistence from hunting-gathering (Late Woodland) to intensive maize agriculture (Middle Mississippian). Zinc concentrations did discriminate be tween the populations in the predicted fashion. Since zinc is related to protein
consumption, the decrease in zinc levels would be expected in the maize
reliant Middle Mississippian population. Gilbert also found that zinc levels were related to the occurrence of pathology in some of the groups. For exam
ple, among the Late Woodland populations there was a negative correlation
between zinc concentration and the occurrence of pathology. Bahou (1975) expanded on this aspect of the study and found relationships between trace
elements and other pathologies. The analysis of strontium has also been used to discriminate between meat
and plant eaters. Although strontium and calcium react chemically in a
similar fashion, most animals actively discriminate against strontium through renal excretion. Plants, however, accumulate strontium in their leaves and stems. Even though animals excrete strontium, the accumulation of stron tium in bone may give clues to diet. Toots and Voorhies (1965) applied stron
tium analysis to discriminate herbivores and carnivores in paleontological samples. They found that herbivore skeletons had the highest concentration
of strontium, whereas carnivores had the lowest concentration.
Brown (1973, 1974) has pioneered the use of strontium analysis as a dietary
indicator. Using strontium-calcium ratios, she was able to assess the relative
importance of meat and vegetables in the diet (herbivorous humans have a
strontium-calcium ratio of 1:2000, whereas in carnivorous humans, the ratio
is 1:4800). In addition she was able to assess differential access to meat by
subgroups in the population. The impact of status differences on access to
meat could thus be determined.
Schoeniger (1979a,b) used atomic-absorption spectrometry (AAS) and neutron-activation analysis to assess diet in prehistoric populations from Chalcatzingo, Mexico. Individuals with highest status had the lowest mean
bone-strontium levels (more meat in the diet), whereas burials without grave
goods had the highest mean bone-strontium levels.
The application of strontium analysis is not without its problems. Boaz and
Hampel (1978) were not able to distinguish differences in strontium concen
tration in paleolithic samples that were heavily mineralized. However, Fuchs
(1978) and Schoeniger (1978) suggest that there are methods for evaluating the
impact of contamination. Fuchs (1978) argues that chemical separation can
be used to distinguish, identify, and isolate fractions of bone mineral most
representative of dietary strontium levels. Furthermore, by monitoring aluminum levels (aluminum is not incorporated into living bone, but is incor
porated in interred bone), the presence of contamination can be determined
(Szpunar et al. 1978).
Stedt (1979) used inductively coupled plasma-atomic emission spec
This content downloaded from 192.101.188.25 on Wed, 08 Jul 2015 17:48:38 UTCAll use subject to JSTOR Terms and Conditions
452 REBECCA HUSS-ASHMORE, ALAN H. GOODMAN, AND GEORGE J. ARMELAGOS
trometry (ICP-AES) to analyze trace-element differences between Fremont (N = 50) and Anasasi (N = 50) skeletal samples, which she believed might
result from differences in diet. Stedt measured 13 elements (sodium, potassium, lithium, phosphorus, calcium, manganese, barium, aluminum, iron, magnesium, copper, zinc, and lead) but found no conclusive evidence of
trace-element differences that could be related to diet.
Stedt believes that factors affecting her results include the variability of
trace elements in separate bones of the body (Gilbert 1975), variation in trace
elements in different fractions of the same bone (Kuhn 1979), physiological
state prior to death (Stedt 1979:89), and diagenic effects of soil and fossiliza
tion process. In addition, the use of samples from a large number of sites may
have increased the variability found. Although Gilbert (1977:94-96) has stated that AAS provided the best ap
proach to trace-element analysis, recent advances in instrumentation of
ICP-AES has altered this situation. The ICP-AES provides multielement channels (up to 40 elements), and greater precision, accuracy, and sensitivity.
It thus has a greater potential than arc emission spectroscopy (AES), AAS, or
neutron-activation analysis (see Fassel 1978). The use of multielemental analysis would be difficult without methods for
systematically analyzing the variation in concentration of various elements. Nonparametric recognition techniques have been developed, such as
ARTHUR (see Harper et al. 1977), that can help to analyze such complex
data. ARTHUR has the capacity to include other variables, such as pathology
and archaeological information, that might be useful.
R. Barnes, in the Department of Chemistry at the University of Massachu
setts, is presently using ICP-AES to test elemental variation in prehistoric Nubian bones. He will be collaborating with R. G. Brown to examine the con
centration of 32 elements in the total bone sample, as well as the serial collagen
fraction (dilute salt, guanidine hydrochloride, acetic acid, and gelatine frac tions) extracted for stable-isotope analysis. This approach may help to clarify
some of the confusion that centers around trace-element analysis and its use in
reconstructing diets of prehistoric populations.
Stable Carbon Isotope Analysis
It is now possible to assess principal dietary components through the use of
stable carbon isotopes. The ratio of the two stable carbon isotopes-'2C and
'IC-in animal tissue reflects the diet of the organism. Plant groups, because
of differences in types of metabolism during photosynthesis, have different
modal values for the ratio of stable carbon isotopes. (The following discus
sion is based on information supplied by Bumsted [1980] and personal com
munication.) Nearly 99% of the earth's carbon is composed of the stable isotope 12C
whereas a little over 1 Wo is composed of "3C. The carbon content of a plant
This content downloaded from 192.101.188.25 on Wed, 08 Jul 2015 17:48:38 UTCAll use subject to JSTOR Terms and Conditions

NUTRITIONAL INFERENCE FROM PALEOPATHOLOGY 453
reflects the 613C value of its immediate carbon source, either atmospheric car bon dioxide or the aquatic bicarbonate or carbon dioxide pools. The 613C value is the ratio of 13C to '2C compared to a standard, and is always negative
and expressed in thousandths (e.g., - 38/oo) (see Lerman 1975 for a more
detailed discussion). Carbon in plants is metabolized through three major pathways: C3 (Calvin), C4 (Hatch-Slack), and Crassulacean acid metabolism (CAM). During photosynthesis, plants will preferentially take up '2C over I3C. Although 6I3C values for plants may range from 0 to - 38%oo, naturally
occurring ratios are highly predictable, reflecting the metabolic pathway of the plant. C4 (Hatch-Slack) plants take up more 13C than do C3 plants and will
therefore have a higher (less negative) 13C/'2C ratio. The modal value for C4 plants is - 12%o, whereas for C3 plants, the mode is - 280/oo. CAM plants,
with the ability to use both C3 and C4 pathways, are intermediate in value.
Exact values depend on growth conditions.
The application of stable-carbon-isotope analysis to paleonutrition is based on controlled animal studies. This research has demonstrated that as
carbon is passed along the food chain, the carbon composition of animals continues to reflect the relative isotopic composition of their diet (Bender et
al., 1981; DeNiro 1977; DeNiro and Epstein, 1978a,b). The plants that comprise the diet of animals will have distinct 13C values.
Maize, a tropical New World cultigen, is a C4 plant. On the other hand, the native flora of North American temperate environments is composed of
primarily C3 varieties. Therefore, a shift from indigenous gathered plants (C3) to cultivated plants such as maize (C4) will result in a shift in dietary isotopic values. Since '3C/'2C ratios do not change after the death of an organism, ar
chaeological remains can be used to assess diet. Food refuse, soil humus, or
skeletal remains are potential sources of carbon for dietary reconstruction.
Interest in carbon isotopes has focused on their use in interpreting '4C dates
and in environmental reconstruction. Bender (1968) and Stuiver (1978) have
used 613C analysis to correct radiocarbon dates. There have also been a
number of attempts to apply stable isotope analysis to environmental
reconstruction (DeNiro and Epstein 1978b; Lerman and Troughton 1975; Mazany 1978; Teeri and Stowe 1976; Tieszen et al. 1979).
There have been only nine stable carbon isotope studies published that are
explicitly relevant to anthropology (Bender et al., 1981; Brothwell and
Burleigh 1977; Burleigh and Brothwell 1978; Craig and Craig 1972; DeNiro
and Epstein 1978a; Herz and Wenner 1978; MacNeish 1978; van der Merwe
and Vogel 1978; Vogel and van der Merwe 1977). Of these studies, six consider
the problem of dietary reconstruction.*
Using a small sample of rib (seven individuals) from four sites in New York
*These six studies are Bender et al. (1981), Burleigh and Brothwell (1978), DeNiro and Ep
stein (1978a), MacNeish (1978), van der Merwe and Vogel (1978), Vogel and van der Merwe
(1977).
This content downloaded from 192.101.188.25 on Wed, 08 Jul 2015 17:48:38 UTCAll use subject to JSTOR Terms and Conditions

454 REBECCA HUSS-ASHMORE, ALAN H. GOODMAN, AND GEORGE J. ARMELAGOS
state, Vogel and van der Merwe (1977) found a shift in the 61IC values of hunt ing-gathering populations and horticulturalists. The average 613C value for hunter-gatherers was - 19.730,oo, whereas the horticulturalists averaged - 14.43%o/. Vogel and van der Merwe suggest that these stable isotope values indicate that maize comprised 40'70 of the diet of horticulturalists. Further, they argue that the shift to intensive cultivation occurred within 200 years of its introduction.
Van der Merwe and Vogel (1978) undertook a larger study (52 individuals) of 10 midwestern sites dated from 300 B.C. to A.D. 1300. Premaize sites gave average values of -21.4 -fi .78%/oo, whereas maize-site samples averaged - 1.8 - 1 .3%/oo. Females from these sites appeared to have less maize in their
diet than males (64-75 %o). Further, Bender etal. (1981) have examined a sam
ple of 46 individuals from archaic Hopewell, and Mississippian sites in the Midwest. Their study indicates that maize was of little importance in the
Hopewell diet. Carbon-isotope analysis of human skeletal material from the Viru Valley
shows an increase in the use of maize in a diet that relied extensively on
seafood (DeNiro and Epstein 1978a). Interestingly, the isotopic analysis of human remains reveals that maize was introduced at least 200 years before there is archaeological evidence for its use. Another Peruvian study has used the isotopic analysis of nonhuman remains to assess maize cultivation. From
analysis of the hair of 10 Peruvian dogs, Burleigh and Brothwell (1978) were
able to show that maize contributed 20-60% of the animals' diet. MacNeish (1978) has used stable isotopes to reconstruct energy flows of
prehistoric sites from the Tehuacan Valley of Mexico. The 613C values were
used to determine the proportions of maize and animal protein in the diet of 75 individuals. This information, combined with archaeological reconstruc tion of diet, was used to estimate the production and use of energy.
These five studies indicate that stable-isotope analysis can be of use in
reconstructing the diet of prehistoric populations. However, the actual deter mination of proportion of maize in diets is still controversial, and methods for this should be tested further. Although previous studies have dealt with the
question of the importance of maize in the diet, there is a potential for using stable carbon isotopes to determine nutritional deficiencies in archaeological groups. For example, we may now be able to test the relationship of intensity of maize use to the increase in nutritional and infectious lesions in a skeletal population.
The effective use of stable carbon isotopes in paleonutritional research re
quires information on variation of 613C values within a population and the im
pact of variation on the health of individuals in the group. Preliminary studies by Vogel, van der Merwe, and their colleagues indicate that there are sex dif ferences with respect to the use of maize. The effects of these dietary dif
This content downloaded from 192.101.188.25 on Wed, 08 Jul 2015 17:48:38 UTCAll use subject to JSTOR Terms and Conditions

NUTRITIONAL INFERENCE FROM PALEOPATHOLOGY 455
ferences remain to be studied. Bumsted, Armelagos, and R. G. Brown (Uni versity of Massachusetts) are collaborating with Lerman (University of Arizona) on a stable-carbon isotope study of a large synchronic sample and a
diachronic sample (from Sudanese Nubia), both of which exhibit excellent preservation of the biological remains (mummified skin, hair, etc.). These studies should provide information on the range of variation in these isotopes
among individuals and between segments of the population (sex and age
groups). The simultaneous analysis of stable carbon isotopes and specific nutritional diseases should clarify many questions about the effects on nutri tional health of increased reliance on maize and other cereal grains.
Demographic Variables as Indicators of Nutritional Stress
Specific demographic variables, in conjunction with archaeological and
skeletal indicators of nutritional stress, may be used to measure the impact of
nutritional deficiencies on population. Nutrition has frequently been im plicated in demographic change. However, without corroborative evidence from archaeology and skeletal biology, such change is difficult to interpret.
Buikstra (1977) and Cook (1976) have provided a model for the analysis of
demographic and dietary change. Their analysis considers multiple measures
of stress in skeletal systems in conjunction with tightly controlled archaeolog
ical assessment of shifts in subsistence. In such controlled situations, it may be
possible to measure the impact of nutritionally caused stress. If there is good
archaeological and skeletal evidence of nutritional deficiency, the impact on
mortality may be measured.
Mortality is a sensitive indicator of demographic change (Weiss 1973, 1975,
1976). Since the death of an individual is the ultimate example of maladapta
tion, it can be used to measure how well human groups adjust to their environ
ment. The effect of mortality on the age structure of a population provides a
key to understanding the impact of stress on that population.
The specific causes of death are extremely difficult to interpret in skeletal
populations. In a few cases, severe trauma can be diagnosed as the cause of
death. This information is not always necessary, however, since the pattern of
mortality provides information for assessing various stressors. Although
gross measures of mortality (i.e., percent of adults versus percent of children)
have been used for demographic analysis, a more systematic analysis of mor
tality using life tables is desirable (Swedlund and Armelagos 1969, 1976;
Weiss 1973). The life table is an effective method for assessing mortality dif
ferences between groups and changes within groups (Ascadi and Nemeskeri
1970; Moore et al. 1975; Palkovich 1978; Swedlund and Armelagos 1969;
Weiss 1973). For example, increases in age-specific mortality can be a clue to
the existence of a specific stressor. Cook (1976), using United Nations life
This content downloaded from 192.101.188.25 on Wed, 08 Jul 2015 17:48:38 UTCAll use subject to JSTOR Terms and Conditions

456 REBECCA HUSS-ASHMORE, ALAN H. GOODMAN, AND GEORGE J. ARMELAGOS
tables for a prehistoric Illinois population, demonstrated that mortality data could be used to infer nutritional stress. Using Cook's method, Buikstra (1977) showed that mortality increased in the age groups predicted to be relatively more malnourished. Mortality in these age groups also increased
with the intensification of agriculture from Middle to Late Woodland, and was associated with an increase in skeletal pathologies.
The relationship between pathology and mortality provides a potentially interesting vehicle for the study of nutritional stress. The physiological condi tion underlying pathology (even if it is not the immediate cause of death) can have an impact on mortality. In the Dickson Mounds population, Armelagos et al. (1980) and Bickerton (1979) have constructed life tables for the segments of the population aged 0-10 years, and computed life expectancies for the total sample, those with porotic hyperostosis, and those with periosteal in volvement. Life expectancy data indicate that individuals with periosteal reactions experienced severe mortality. Individuals in whom periosteal reac tion was present at birth could be expected to live 0.8 year. The sample with
3L
>- 2
II..
>~~~~ 2 _: 4 ** 6\ 9
C.:): *AG E
-j, X
* I . * '., I I @ - 1 2 3 4 5 6 7 S 9 SO
AGE ( YEARS )
Figure 9.23. Life expectancy for the Dickson Mounds population for those dying within the first 10years. Individuals with infection, - - -, orporotic hyperostosis, * -,
showed reduced life expectancy as compared to the total population,
This content downloaded from 192.101.188.25 on Wed, 08 Jul 2015 17:48:38 UTCAll use subject to JSTOR Terms and Conditions
NUTRITIONAL INFERENCE FROM PALEOPATHOLOGY 457
porotic hyperostosis also showed increased mortality when compared with the total sample. Between the ages of 6 months and 2.5 years, individuals with
porotic hyperostosis had a life expectancy between 0.26 and 0.67 years less
than those individuals without porotic hyperostosis (see Figure 9.23). After age 4, a difference in life expectancy is about 13 years.
In one of the most innovative analyses of the impact of underlying morbid
ity on mortality, Palkovich (1978, 1979) modified Preston's (1972, 1974, 1976) "dimensions of mortality" and applied it to an archaeological popula tion. She found a significant association (p < .02) of pathology with mortal
ity in several age classes. Porotic hyperostosis of the cranium and orbit, en
docranial lesions, and general porosity were statistically related to increased death rates between the ages of I and 4.9 years, implying that poor nutrition is
a predisposing factor for mortality in this group.
These few studies indicate the potential utility of demography for studying paleonutrition. The continued development of sophisticated demographic methods should provide more accurate measures of the effect of nutritional deficiency on the pattern of mortality. Imaginative use of these methods may
then afford us insights into the evolutionary impact of malnutrition on
human populations.
CONCLUSIONS
Our purpose in this chapter has been first, to outline the types of skeletal
and population changes that accompany malnutrition, and second, to in
dicate pathologies and anomalies of skeletal growth that can be used to infer
nutritional stress. A summary of these indicators is provided in Table 9.14.
Obviously, not all stress markers are of equal utility, and we have attempted to point out limitations. The greatest drawback to the use of skeletal popula
tions in nutritional studies is the generalized nature of their response to
stressors. Growth is an excellent example of this. Severe deficiency of almost
any nutrient will result in less than optimal growth. However, this same result
can be produced by disease, malabsorption, altitude, genetic factors, or even
social and physiological deprivation. Disturbances of growth are therefore
measures of general stress, as are the results of growth-stature and sexual
dimorphism. Used singly, such measures mean very little. Used together, they can indicate the presence of long-term mild or moderate stress. Growth curves
and mortality schedules can additionally provide information on the timing and severity of stress.
Nutritional interpretation of skeletal pathologies depends on the use of
more specific indicators. Harris lines, though sensitive measures of acute
stress, need not be nutritionally caused. Enamel hypoplasias, porotic
This content downloaded from 192.101.188.25 on Wed, 08 Jul 2015 17:48:38 UTCAll use subject to JSTOR Terms and Conditions
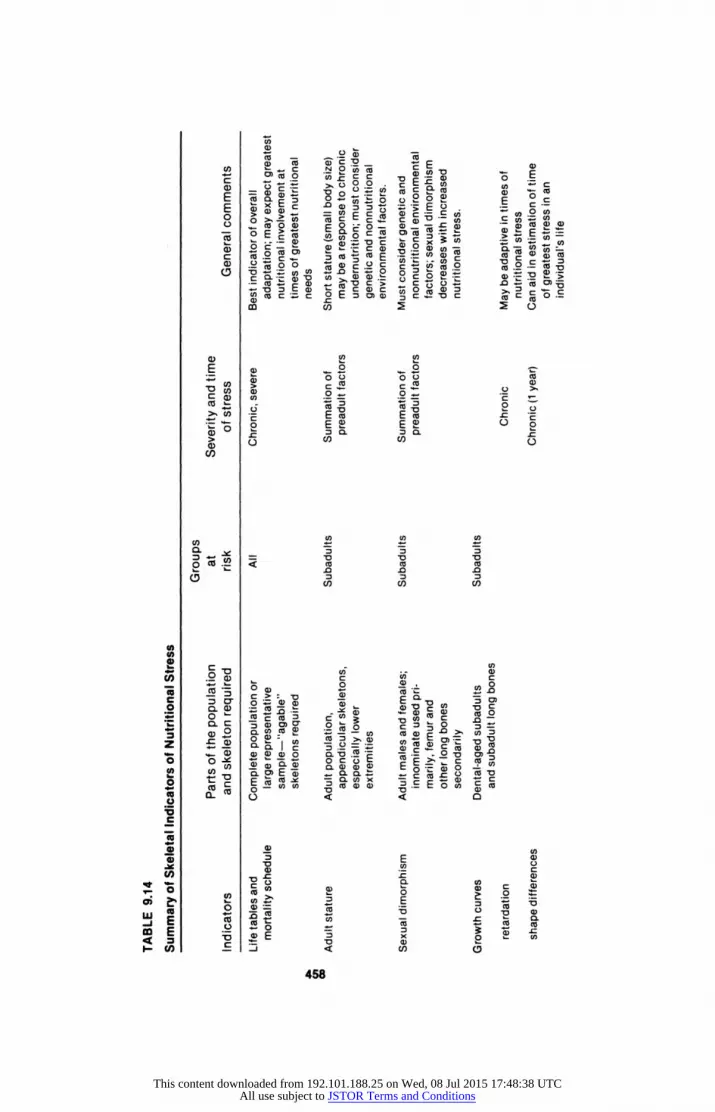
co 0 0
0 E ClD -C =
0~
0 E0:C 0 = :? 3 -C0 .- ~ cI E )C )( c n Co
. > E c 0 ,- 2 0o m o Ec C ( c o 0a) .~~ 0 0 - ~ _ .
co ~~~~~~~~~c E
0 U)~~~~~~~~ C E ~~~~~( D C2 1 0 X0U 0 00) a 00 ) 0L
c o 0)
o o Eo Eo -c
-C -c~~~~~ .l0 t: 0 >ID r > ' o c
U) U) U
00 0 0
0~~~~~~
U) 0 0 l 0 C co _
0 0, ?5 ~~~~~
0C 0 E E > U).2o0 cn
o O~~~~~~~ 0~~CD E _o co)
C, 0:
0 co 0Sc 0 _ U,3
Cl) 0~~~~~~~~U U) C0
c U)~~~~~
~0 -1 - 0 0
cti E> "C - 0
I-U .E Vr0 0 0 Ea Co C M :3) C!
CL 7 a)0) T 458:
This content downloaded from 192.101.188.25 on Wed, 08 Jul 2015 17:48:38 UTCAll use subject to JSTOR Terms and Conditions
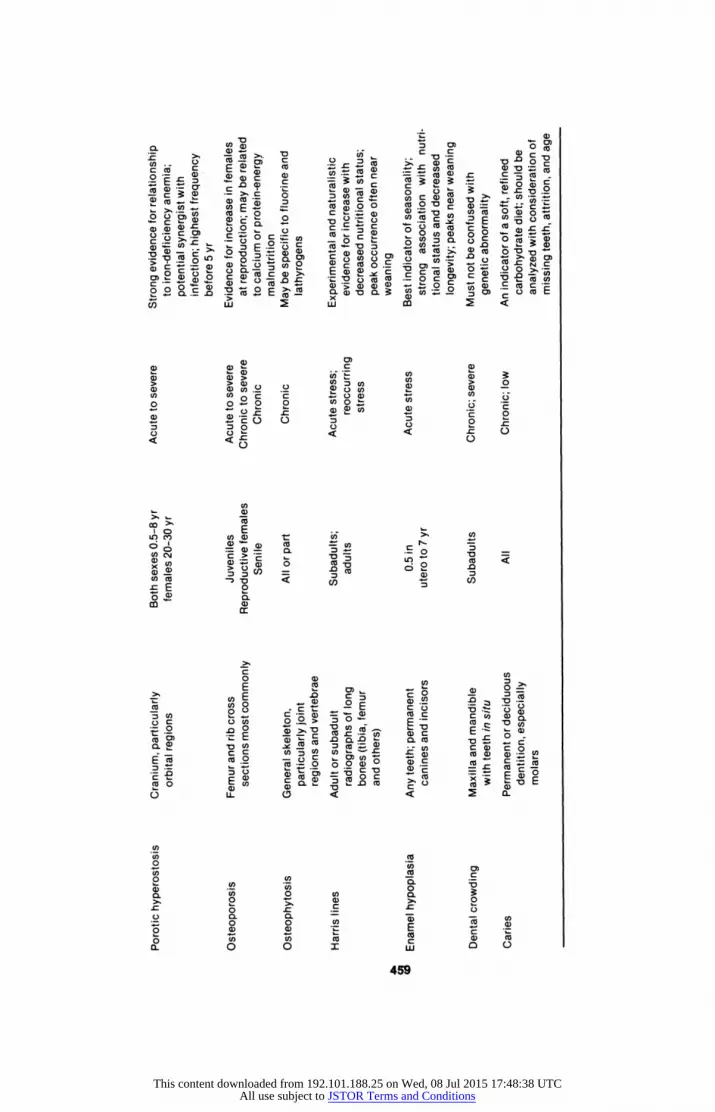
_ Cflq~~U 0Cu0
CCu~~~~ C E0'- Cu V.2~~~~~~~ C co, ~ C -) C (D C cot
CD) ~ C 0 ~ . Cu) CIOC 0~~~~~~~~c 1)cu a)
E c 0~v~. DC, 0E CD
M 0 crC 0 D Cuc 0uC 0C
VCD0i 0 lo 0 _
a C CD a~0 C cuO -a > 0-. Zu.~
a) a) - L
o o.-~~~o 0- 0 >D~ C ID 04 C C o rC c 0
C ,.
a) c m -0 C 20
-CA 0 o a 0- -0E2 0L 0
0 `D0E
a)C
'0 E~~~~~~~~~"0 )c LC)C~~) CDa) t
U,
o 0 0~a 0 u
a)~~~~( > 0,, 0
co a)
C:) E~~ VI) m U) 0 a) C
CD0 O -0 72E a 0 'a
U) C'4 > c Ul) ~ ~ C) C (1) U) '4-a) Cu) ).CC
x > 4) 0 a) Cu c > 0 .
o U~ ~ ~~-0 < <
E 0~~CD0
0~~~~~~~C 0D
o C E (D 0~~~~
C
o CD CD ~~~~~~"Dcu a) cu
o : cn7 0 I e 0 0 - .0
- 0 r- L. 45C
This content downloaded from 192.101.188.25 on Wed, 08 Jul 2015 17:48:38 UTCAll use subject to JSTOR Terms and Conditions

460 REBECCA HUSS-ASHMORE, ALAN H. GOODMAN, AND GEORGE J. ARMELAGOS
hyperostosis, and premature osteoporosis are probably the most valid in dicators of nutritional involvement, but even they are not meaningful when used alone, or on single individuals.
Skeletal pathologies are most useful for archaeological reconstruction when a series of general and specific measures are analyzed for an entire
skeletal population. In this way, both chronic and acute stress can be recog
nized, and the severity of each assessed. Meaningful statements about nutri tional status depend on the demonstration of patterns of disturbance in the processes of bone growth and repair. They depend even more on the
demonstration that such patterns are distributed differentially by age and sex within and between populations. We therefore advocate the simultaneous consideration of all measures available to produce a complete picture of
populational stress response. Few such thorough studies have been under taken to date, but the Libben site, analyzed by Mensforth et al. (1978) and
others, may serve as an example of an integrated ecological and populational
approach. It should be noted that the most useful indicators of nutritional status are
those applicable to the juvenile portion of a population. This reflects the fact that growing bone is most easily imprinted by nutritional disturbances, and that children are at greatest risk of malnutrition. The adult organism is buf
fered from mild malnutrition by its greater nutrient stores and more highly
developed metabolic controls. When signs of nutritional involvement, such as premature osteoporosis, are seen in adults, they undoubtedly reflect severe conditions.
The future productivity of paleonutritional studies will require cooperation not only between anthropological subdisciplines, but between anthropology and a variety of other disciplines. Skeletal analysis, in particular, is increas
ingly oriented toward the techniques of chemistry and microbiology. Elemen tal analysis and the determination of 13C/12C ratios in bone, though only
briefly reviewed here, are likely to be important in future studies. Such tech
niques are not in themselves radically new, but their application to archaeo
logical material is an interesting and promising development. It should be borne in mind, however, that the most sophisticated
methodologies and the most precise techniques are only as good as the ques
tions that are asked of them. The formulation of evolutionary questions is
thus the first step to the productive study of paleoecological relationships. It is
not enough simply to demonstrate change. Rather, it is in the causes and con
sequences of change that we are interested. Traditional methods of dietary reconstruction have documented change in diet. Skeletal studies have demonstrated change in patterns of human growth and pathology. It is now
necessary to integrate these two aspects of our inquiry so that causal questions can be addressed.
The serious study of adaptation and dietary change will require informa
tion outside the traditional realms of archaeology and paleopathology. For
This content downloaded from 192.101.188.25 on Wed, 08 Jul 2015 17:48:38 UTCAll use subject to JSTOR Terms and Conditions

NUTRITIONAL INFERENCE FROM PALEOPATHOLOGY 461
example, we still do not know whether childhood malnutrition, or even life long undernutrition, reduces biological fitness. This question is central to any discussion of nutritional adaptation and evolution and could be addressed in living populations. This is only one of the possible areas in which nutritionists and anthropologists could profitably cooperate, and students of paleonutri tion should encourage such interaction.
The previous discussion has not attempted to cover all possible skeletal traits that have ever been assigned nutritional significance. Rather, we have outlined an approach to skeletal studies that may serve to integrate them into a larger bioarchaeological framework. By concentrating on the concepts of process and pattern, we have attempted to link environmental influences to
markers in bone. Disturbances in process may thus be used to evaluate the suc cess with which a population has adjusted to its nutritional environment.
ACKNOWLEDGMENTS
The analysis of the Nubian skeletal material was supported by grants GS7, GS286, and GS557 from the National Science Foundation. Subsequent analysis of histology of bone was supported by the National Institute of Health research grant NIH-1-ROI-02771-01. The analysis of
tetracycline was partially funded by the University of Massachusetts biomedical research and support grant RR07048. We also thank Debra L. Martin, John Curry, M. Pamela Bumsted, and Jeanette Goodman for their helpful comments on a draft of the manuscript.
REFERENCES
Acheson, R. M. 1960 Effect of nutrition and disease on human growth. In Human growth, edited by
J. M. Tanner. New York: Pergamon Press. Pp. 73-92.
Acheson, R. M., and G. B. Fowler
1964 Sex, socio-economic status and secular increase in stature. British Journal of Preventive Social Medicine 18:25-34.
Angel, J. L.
1954 Human biology, health and history in Greece. Yearbook of the American Philosophical Society, pp. 168-172, 266-270.
Armelagos, G. J., J. H. Mielke, K. H. Owen, D. P. Van Gerven, J. R. Dewey, and P. E. Mahler
1972 Bone growth and development in prehistoric populations from Sudanese Nubia. Journal of Human Evolution 1:89-119.
Armelagos, G. J., A. Goodman, and S. Bickerton
1980 Determining nutritional and infectious disease stress in prehistoric populations (Abstract). American Journal of Physical Anthropology 52:201.
Ascadi, G. Y., and J. Nemeskeri
1970 History of human lifespan and mortality. Budapest: Akademiai Kaido.
Bahou, W. F.
1975 The relationships of particular trace elements to various bone pathologies in the
Dickson Mounds skeletal population. Unpublished Senior Honors thesis, Depart
ment of Anthropology, University of Massachusetts, Amherst.
This content downloaded from 192.101.188.25 on Wed, 08 Jul 2015 17:48:38 UTCAll use subject to JSTOR Terms and Conditions

462 REBECCA HUSS-ASHMORE, ALAN H. GOODMAN, AND GEORGE J. ARMELAGOS
Bailit, H. L. P., P. L. Workman, J. K. Niswander, and C. J. MacClean
1970 Dental asymmetry as an indicator of genetic and environmental stress in human
populations. Human Biology 42:626-638. Barnicot, N. A., and S. P. Datta
1972 Vitamin A and bone. In The biochemistry andphysiology of bone (Vol. 2), edited by G. Bourne. New York: Academic Press. Pp. 197-229.
Bender, M. 1968 Mass spectrometric studies of carbon 13 variations in corn and other grasses.
Radiocarbon 10:468-472. Bender, M., D. Baerreis, and R. Steventon
1981 Further light on carbon isotopes and Hopewell agriculture. American Antiquity, 46:346-353.
Berlyne, G. M., J. Ben Ari, E. Nord, and R. Shainkin
1973 Bedouin osteomalacia due to calcium deprivation caused by high phytic acid con tent of unleavened bread. American Journal of Clinical Nutrition 29:910-911.
Bickerton, S. 1979 Porotic hyperostosis in a prehistoric Amerindian population from Dickson
Mound. Paper presented to the Northeastern Anthropological Association, Hen niker, New Hampshire.
Blanco, R. A., R. M. Acheson, C. Canosa, and J. N. Salomon
1974 Height, weight, and lines of arrested growth in young Guatemalan children. American Journal of Physical Anthropology 40:39-48.
Boaz, N. T., and J. Hampel
1978 Strontium content of fossil tooth enamel and diet in early hominids. Journal of Paleontology 52:928-933.
Bressani, R., R. Paz y Paz, and N. S. Scrimshaw
1958 Corn nutrient losses. Chemical changes in corn during preparation of tortillas. Journal of Agriculture and Food Chemistry 6:770-773.
Brothwell, D., and R. Burleigh 1977 On sinking Otavalo man. Journal of Archaeological Science 4:291-294.
Brown, A. B.
1973 Bone strontium as a dietary indicator in human skeletal populations. Unpublished Ph.D. dissertation, Department of Anthropology, University of Michigan, Ann Arbor.
1974 Bone strontium as a dietary indicator in human skeletal populations. Contribu tions to Geology 13:85-87.
Buikstra, J. E. 1977 Biocultural dimensions of archeological study: a regional perspective. In
Biochemical adaptation in prehistoric America, edited by R. L. Blakely. Athens, Georgia: University of Georgia Press. Pp. 67-84.
Bumsted, M. P. 1980 The potential of stable carbon isotopes in bioarcheological anthropology. In
Biocultural adaptation-comprehensive approaches to skeletal analyses, edited by D. L. Martin and M. P. Bumsted. Department of Anthropology Research
Reports. University of Massachusetts, Amherst, in press. Burleigh, R., and D. Brothwell
1978 Studies on Amerindian dogs. I. Carbon isotopes in the diet of domestic dogs from early Peru and Ecuador. Journal of Archeological Science 5:355-362.
Burns, P. E.
1979 Log-linear analysis of dental caries occurrence in four skeletal series. American
Journal of Physical Anthropology 51:637-648.
This content downloaded from 192.101.188.25 on Wed, 08 Jul 2015 17:48:38 UTCAll use subject to JSTOR Terms and Conditions
NUTRITIONAL INFERENCE FROM PALEOPATHOLOGY 463
Carlson, D. S., G. J. Armelagos, and D. P. Van Gerven
1974 Factors influencing the etiology of cribra orbitalia in prehistoric Nubia. Journal of Human Evolution 3:405-410.
1976 Patterns of age-related cortical bone loss (osteoporosis) within the femoral diaphysis. Human Biology 48:295-315.
Clarke, S. K. 1978 Markers of metabolic insult: the association of radiopaque transverse lines,
enamel hypoplasias and enamel histopathologies in a prehistoric human skeletal
sample. Unpublished Ph.D. dissertion, Department of Anthropology, University of Colorado, Boulder.
Cohen, M. N. 1977a The food crisis in prehistory: overpopulation and the origins of agriculture. New
Haven, Connecticut: Yale University Press. 1977b Population pressure and the origins of agriculture: an archaeological example
from Peru. In Origins of agriculture, edited by C. Reed. The Hague: Mouton Press. Pp. 135-177.
Cook, D. C. 1976 Pathologic stress and disease processes in Illinois woodland populations: An
epidemiological approach. Unpublished Ph.D. dissertation, Department of An thropology, University of Chicago, Chicago.
Cook, D. C., and J. E. Buikstra
1979 Health and differential survival in prehistoric populations: prenatal dental defects. American Journal of Physical Anthropology 51:649-664.
Craig, H., and V. Craig
1972 Greek marbles: determination of provenance by isotopic analysis. Science 176: 401-403.
Craig, J. 1963 The heights of Glasgow boys: secular and social influences. Human Biology
35:524-539. DeNiro, M. J.
1977 I. Carbon isotope distribution in food chains, II. Method of carbon isotope frac tionation associated with lipid synthesis. Unpublished Ph.D. dissertation, Depart
ment of Anthropology, California Institute of Technology. DeNiro, M. J., and S. Epstein
1978a Dietary analysis from l3C/'2C ratios of carbonate and collagen fractions of bone. U.S. Geological Survey Open File Report 78-701:90-9 1.
1 978b Influence of diet on the distribution of carbon isotopes in animals. Geochimica et Cosmochemica Acta 42:495-506.
Dewey, J. R., G. J. Armelagos, and M. H. Bartley
1969 Femoral cortical involution in three archaeological populations. Human Biology 41:13-28.
Di Bernardo, R. 1973 Prenatal stress, developmental noise, and postnatal risk. Unpublished Ph.D.
dissertation, Department of Anthropology, City University of New York. Univer
sity Microfilms, Ann Arbor. Di Bernardo, R. and H. L. Bailit
1978 Stress and dental asymmetry in a population of Japanese children. American Jour
nal of Physical Anthropology 48:89-94. Dickerson, J. W. T., and R. A. McCance
1961 Severe undernutrition in growing and adult animals: 8. The dimensions and
chemistry of the long bones. British Journal of Nutrition 15:567-576.
This content downloaded from 192.101.188.25 on Wed, 08 Jul 2015 17:48:38 UTCAll use subject to JSTOR Terms and Conditions

464 REBECCA HUSS-ASHMORE, ALAN H. GOODMAN, AND GEORGE J. ARMELAGOS
Doyle, W., and 0. Johnston
1977 On the meaning of increased fluctuating dental asymmetry: A cross-populational study. American Journal of Physical Anthropology 46:127-134.
Dubos, R. 1965 Man Adapting. New Haven, Connecticut: Yale University Press.
Earle, T. 1980 A model of subsistence change. In Modeling change in prehistoric subsistence
economies, edited by T. K. Earle and A. L. Christensen. New York: Academic
Press. Pp. 1-29. El-Maraghi, N. R. A., B. S. Platt, and R. J. C. Stewart
1965 The effect of the interaction of dietary protein and calcium on the growth and
maintenance of the bones of young adult and aged rats. British Journal of Nutri
tion 19:491-509. El-Najjar, M. Y., D. J. Ryan, C. G. Turner III, and B. Lozoff
1976 The etiology of porotic hyperostosis among the prehistoric Anasazi Indians of southwestern United States. American Journal of Physical Anthropology 44:477 488.
Eng, L. L.
1958 Chronic iron deficiency anemia with long bone changes resembling Cooley's anemia. Acta Haematologica 19:263-268.
Engfeldt, B., and S. 0. Hjertquist 1961 Vitamin D deficiency and bone and tooth structure. World Review of Nutrition
and Dietetics 2:187-208. Enwonwu, C. D.
1973 Influence of socio-economic conditions on dental development in Nigerian children. Archives of Oral Biology 18:95-107.
Ericksen, M. R. 1976 Cortical bone loss with age in three native American populations. American Jour
nal of Physical Anthropology 45:443-452. Fassel, V. A.
1978 Quantitative elemental analysis by plasma emission spectroscopy. Science 202: 183-191.
Foulks, E. F. 1973 The arctic hysterias of the North Alaskan Eskimo. Anthropological Studies No.
10. American Anthropological Association, Washington, D.C. Frandsen, A. M., M. M. Nelson, E. Sulon, H. Becks, and H. M. Evans
1954 The effects of various levels of dietary protein on skeletal growth and enchondral ossification in young rats. Anatomical Record 119:247-261.
Frisancho, A. R., and S. M. Garn
1970 Childhood retardation resulting in reduction of adult body size due to lesser adolescent skeletal delay. American Journal of Physical Anthropology 33:325 336.
Frisancho, A. R., S. M. Garn, and W. Ascoli
1970 Population differences in skeletal maturation and its relationship to growth in body size (Abstract). American Journal of Physical Anthropology 33:130.
Fuchs, A. 1978 Strontium/calcium ratios in bone: An assessment of their use in paleodietary
research. MASCA Journal, pp. 10-11. University of Pennsylvania, Philadelphia. Furst, C. M.
1920 Ndrde de Doda Vittna. Stockholm: Svenska Teknolog i Forlag.
This content downloaded from 192.101.188.25 on Wed, 08 Jul 2015 17:48:38 UTCAll use subject to JSTOR Terms and Conditions

NUTRITIONAL INFERENCE FROM PALEOPATHOLOGY 465
Garn, S. M.
1970 The earlier gain and later loss of cortical bone in nutritional perspective. Spring field: Charles C. Thomas.
Garn, S. M., P. E. Cole, and B. H. Smith
1979 The effect of sample size on crown size asymmetry. Journal of Dental Research 58:2012.
Garn, S. M., A. R. Lewis, and R. S. Kerewsky
1965 Genetic, nutritional, and maturational correlates of dental development. Journal of Dental Research 44:228-242.
Garn, S. M., C. G. Rohmann, and M. A. Guzman
1966 Malnutrition and skeletal development in the preschool child. In Preschool child malnutrition, pp. 43-62. National Academy of Sciences, National Research Coun cil, Washington, D.C.
Garn, S. M., F. N. Silverman, K. P. Hertzog, and C. G. Rohman
1968 Lines and bands of increased density: their implication to growth and develop ment. Medical Radiography and Photography 44:58-89.
Geiger, B. J., H. Steenbock, and H. T. Parsons 1933 Lathyrism in the rat. Journal of Nutrition 6:427-442.
Gejvall, N. G. 1960 Westerhus. Ohlssons, Lund.
Gilbert, R. 1975 Trace element analyses of three skeletal Amerindian populations at Dickson
Mounds. Unpublished Ph.D. dissertation, Department of Anthropology, Univer sity of Massachusetts, Amherst.
1977 Applications of trace element research to problems in archaeology. In Biocultural adaptation in prehistoric America, edited by R. L. Blakely. Athens: University of Georgia Press. Pp. 85-100.
Giro, C. M.
1947 Enamel hypoplasia in human teeth: an examination of its causes. Journal of the American Dental Association 34:310-317.
Goldberger, J., G. A. Wheeler, and E. Sydenstricker 1920 A study on the relation of diet to pellagra incidence in seven textile-mill com
munities of South Carolina in 1916. Public Health Reports 35:648-713. Gontzea, I., and P. Sutescu
1968 Natural antinutritive substances in foodstuffs and forages. Basel: Karger. Gontzea, I., P. Sutescu, V. Cosma, and D. Cocora
1962 Cercetari asuptra posibilitatilor de contracarare a efectului distrofiant al prom bului (Parts 1-3). Igenia 11:281-302.
Goodman, A. 1980 Polynomial regressions of dental age with long bone length for Dickson Mounds
subadults. Unpublished ms., Department of Anthropology, University of Massachusetts, Amherst.
1976 Enamel hypoplasia as an indicator of stress in three skeletal populations from Il
linois (Abstract). American Journal of Physical Anthropology 44:181. Goodman, A., and G. J. Armelagos
1980 The chronology of enamel hypoplastic growth disruptions in prehistoric, historic, and modern populations (Abstract). American Journal of Physical Anthropology
52:232. 1982 Childhood growth disruption and decreased adult longevity in a prehistoric Il
linois population. Submitted to Science.
This content downloaded from 192.101.188.25 on Wed, 08 Jul 2015 17:48:38 UTCAll use subject to JSTOR Terms and Conditions

466 REBECCA HUSS-ASHMORE, ALAN H. GOODMAN, AND GEORGE J. ARMELAGOS
Goodman, A., G. J. Armelagos, and J. Rose
1980 Enamel hypoplasias as indicators of stress in three prehistoric populations from Il linois. Human Biology, 52:515-528.
Goodman, A., and G. R. Clark
1981 Harris lines as indicators of stress in prehistoric Illinois populations. In Biocultural adaptations comprehensive approaches to skeletal analysis. Research Report No. 20, pp. 35-46. Department of Anthropology, University of Massachusetts, Amherst.
Gordon, J. D., I. D. Chitkara, and J. B. Wyon
1963 Weanling diarrhea. American Journal of Medical Science 245:345-377. Grayson, D. K.
1974 The Riverhaven #2 vertebrate fauna: comments on faunal analysis and on aspects
of the subsistence potential of prehistoric New York. Man in the Northeast 8:23 39.
Haas, J., and G. C. Harrison
1977 Nutritional anthropology and biological adaptation. Annual Review of Anthro pology 6:69-101. Annual Review, Palo Alto.
Halsted, J. A. et al.
1972 Zinc deficiency in man: the Shiraz experiments. American Journal of Medicine
53:277. Harper, A. M., D. L. Duewer, B. R. Kowalski, and J. Fasching
1977 ARTHUR and experimental data analysis: the heuristic use of a polyalgorithm.
In Chemometrics: theory and application, edited by B. R. Kowalski. Washington, D.C.: American Chemical Society. Pp. 14-52.
Harris, H. A.
1926 The growth of the long bones in childhood, with special reference to certain boney
striations of the metaphysis and to the role of the vitamins. Archives of Internal
Medicine 38:785-806. 1931 Lines of arrested growth in the long bones in childhood: correlation of histological
and radiographic appearances in clinical and experimental conditions. British
Journal of Radiology 4:561-588, 622-640. 1933 Bone growth in health and disease: the biologicalprinciples underlying the clinical,
radiological and histological diagnosis of perversions of growth and disease in the skeleton. London: Oxford University Press.
Hassan, A. A.
1975 Geochemical and mineralogical studies of bone material and their implications for radiocarbon dating. Unpublished Ph.D. dessertation, Department of Geology, Southern Methodist University.
Hassan, A. A., and D. Ortner
1977 Inclusions in bone material as a source of error in radiocarbon dating. Archae
ometry 19:131-135. Hengen, 0. P.
1971 Cribra orbitalia: Pathogenesis and probable etiology. Homo 22:57-75. Herz, N., and D. Wenner
1978 Assembly of Greek marble inscriptions by isotopic methods. Science 199:1070 1072.
Howe, P. R.
1924 Some experimental effects of deficient diets on monkeys. Journal of theAmerican Dental Association 11: 1 161-1165.
This content downloaded from 192.101.188.25 on Wed, 08 Jul 2015 17:48:38 UTCAll use subject to JSTOR Terms and Conditions
NUTRITIONAL INFERENCE FROM PALEOPATHOLOGY 467
Huss-Ashmore, R. 1978 Nutritional determination in a Nubian skeletal population (Abstract). American
Journal of Physical Anthropology 48:407. Infante, P., and G. M. Gillespie
1974 Enamel hypoplasia in Apache Indian children. Ecology of Food and Nutrition 2:155-156.
Jantz, R. L.
1975 Population variation in asymmetry and diversity from finger to finger for digital ridge-counts. American Journal of Physical Anthropology 42:215-224.
Jha, G. T., M. G. Deo, and V. Ramalingaswami
1968 Bone growth and protein deficiency. American Journal of Pathology 53:1111 1121.
Johnston, F. E. 1962 Growth of the long bones of infants and young children at Indian Knoll. American
Journal of Physical Anthropology 20:249-254. 1968 Growth of the skeleton in earlier peoples. In The skeletal biology of earlier human
populations, edited by D. R. Brothwell. New York: Pergamon Press. Pp. 57-66. Johnston, F. E., H. Wainer, D. Thissen, and R. B. MacVean
1976 Hereditary and environmental determinants of growth in height in a longitudinal sample of children and youth of Guatemalan and European ancestry. American
Journal of Physical Anthropology 44:469-476. Kaplan, L.
1973 Ethnobotanical and nutritional factors in the domestication of American beans. In Man and hisfoods, edited by C. E. Smith, Jr., pp. 75-86. University: University
of Alabama Press. Pp. 75-86.
Kaplan, L., and S. L. Maina
1977 Archeological botany of the Apple Creek site, Illinois. Journal of Seed Technology 2:40-53.
Katz, S., and E. Foulks
1969 Mineral metabolism and behavior abnormalities of calcium homeostasis. American Journal of Physical Anthropology 32:299-304.
Katz, S., M. L. Hediger, and L. S. Valleroy
1974 The anthropological and nutritional significance of traditional maize processing techniques in the New World. Science 184:765-773.
Keene, A. 1979 Economic optimization models and the study of hunter-gatherer subsistence
systems. In Transformations: mathematical approaches to culture change, edited by C. Renfrew and K. Cooke. New York: Academic Press. Pp. 369-404.
1982 Optimal foraging in a non-marginal environment: A model of prehistoric sub
sistence strategies in Michigan. In Hunter-gatherer foraging strategies:
Ethnographic and archeological analyses, edited by B. Winterhalder and A.
Smith. Chicago: University of Chicago Press, in press.
Kreshover, S. 1960 Metabolic disturbances in tooth formation. Annals of the New York Academy of
Sciences 85:161-167. Kuhn, J. K.
1979 Trace and minor elemental analyses of Sicilian skeletons by X-ray fluorescence.
Paper presented to the American Association of Physical Anthropologists, San
Francisco.
This content downloaded from 192.101.188.25 on Wed, 08 Jul 2015 17:48:38 UTCAll use subject to JSTOR Terms and Conditions
468 REBECCA HUSS-ASHMORE, ALAN H. GOODMAN, AND GEORGE J. ARMELAGOS
Lallo, J. 1973 The skeletal biology of three prehistoric American Indian populations from
Dickson Mound. Unpublished Ph.D. dissertation, Department of Anthropology, University of Massachusetts, Amherst.
Lallo, J., G. J. Armelagos, and R. P. Mensforth
1977 The role of diet, disease, and physiology in the origin of porotic hyperostosis. Human Biology 49:471-483.
La Marche, V. C., Jr.
1974 Paleoclimatic inferences from long tree-ring records. Science 183:1043-1048. Leigh, R. W.
1925 Dental pathology of Indian tribes of varied environmental and food conditions. American Journal of Physical Anthropology 8:179-199.
Lengeman, F. W., and C. L. Comar
1961 Distribution of absorbed strontium-85 and calcium-45 as influenced by lactose. American Journal of Physiology 200:1051-1054.
Lerman, J. C.
1975 How to interpret variations in the carbon isotope ratio of plants: biologic and en vironmental effects. In Environmental and biological control of photosynthesis, edited by R. Marcell. The Hague: W. Junk. Pp. 323-335.
Lerman, J. C., and J. H. Troughton 1975 Carbon isotope discrimination by photosynthesis: implications for bio- and geo
sciences. In Proceedings of the Second International Conference on Stable Isotopes, edited by E. R. Klein and P. D. Klein, pp. 630-644. United States Energy
Research Development Agency, Argonne, Illinois. MacNeish, R.
1978 Energy and culture in ancient Tehuacan. In manuscript. Mahler, P. E.
1968 Growth of the Long Bones in a Prehistoric Populationfrom Sudanese Nubia. Un published M.A. thesis, Department of Anthropology, University of Utah.
Maresh, M. M.
1955 Linear growth of long bones of extremities from infancy through adolescence. American Journal of Diseases of Children 89:725-742.
Martin, D. L., and G. J. Armelagos
1979 Morphometrics of compact bone: an example from Sudanese Nubia. American Journal of Physical Anthropology 51:571-578.
Massler, M., I. Schour, and H. G. Poncher
1941 Developmental pattern of the child as reflected in the calcification pattern of the teeth. American Journal of Diseases of Children 62:33-67.
Mather, K. 1953 Genetical control of stability in development. Heredity 7:397-436.
Maugh, T. 1973 Trace elements: a growing appreciation of their effects on man. Science 181:253
254. Mazany, T.
1978 Isotope dendroclimatology: natural stable carbon isotope analysis of tree rings from an archeological site. Paper presented to the Fourth International Con
ference on Geochronology, Cosmochronology, and Isotope Geology, Snowmass at-Aspen, Colorado.
Mazess, R., and W. E. Mather
1974 Bone mineral content of northern Alaskan Eskimos. American Journal of Clinical Nutrition 7:916-925.
This content downloaded from 192.101.188.25 on Wed, 08 Jul 2015 17:48:38 UTCAll use subject to JSTOR Terms and Conditions
NUTRITIONAL INFERENCE FROM PALEOPATHOLOGY 469
McCance, R. A. 1960 Severe undernutrition in growing and adult animals. 1. production and general ef
fects. British Journal of Nutrition 14:59-73. McCance, R. A., J. W. T. Dickerson, G. Bell, and 0. Dunbar
1962 Severe undernutrition in growing and adult animals. 9. The effect of undernutri tion and its relief on the mechanical properties of bone. British Journal of Nutri
tion 16:1-12. McCance, R. A., E. H. R. Ford, and W. A. B. Brown
1961 Severe undernutrition in growing and adult animals. 7. Development of the skull, jaws and teeth in pigs. British Journal of Nutrition 15:213-224.
McCance, R. A., and E. M. Widdowson
1935 Phytin in human nutrition. Biochemical Journal 29:2694-2699. 1942 Mineral metabolism of healthy adults on white and brown bread dietaries. Journal
of Physiology 101:44-85. 1962 Nutrition and growth. Proceedings of the Royal Society of Britain 156:326
337. McHenry, H.
1968 Transverse lines in long bones in prehistoric California Indians. American Journal of Physical Anthropology 29:1-17.
McHenry, H. M., and P. Schulz
1976 The association between Harris lines and enamel hypoplasia in prehistoric Califor nia Indians. American Journal of Physical Anthropology 44:507-512.
McLaren, D. S. 1976 Nutrition and its disorders (second ed.). Edinburgh: Churchill Livingstone.
McLean, F. C., and M. R. Urist
1968 Bone. Fundamentals of the physiology of skeletal tissue. Chicago: University of Chicago Press.
Mellanby, E. 1938 The experimental production of deafness in young animals by diet. Journal of
Physiology 94:380-398. 1950 A Story of Nutritional Research. Baltimore: Williams and Wilkins.
Mensforth, R. P., C. 0. Lovejoy, J. W. Lallo, and G. J. Armelagos
1978 The role of constitutional factors, diet, and infectious disease in the etiology of porotic hyperostosis and periosteal reactions in prehistoric infants and children.
Medical Anthropology 2:1-59. Merchant, V. L., and D. H. Ubelaker
1977 Skeletal growth of the protohistoric Arikara. American Journal of Physical An thropology 46:61-72.
Milkman, L. A. 1930 Pseudofractures (hunger osteopathy, late rickets, osteomalacia). American Jour
nal of Roentgenology 24:29-37. Miller-Christensen, V.
1953 Ten lepers from Naestved in Denmark. Copenhagen: Danish Science Press. 1958 Bogen om Aebelholt Kloster. Kobenhaven: Dansk Videnskabs Foring.
Molnar, S., and S. C. Ward
1975 Mineral metabolism and microstructural defects in primate teeth. American Jour
nal of Physical Anthropology 43:3-17. Moore, J., A. Swedlund, and G. J. Armelagos
1975 The use of life tables in paleodemography. In Population studies in archeology and
biological anthropology: A symposium, edited by A. Swedlund, pp. 57-70.
American Antiquity Memoir No. 30.
This content downloaded from 192.101.188.25 on Wed, 08 Jul 2015 17:48:38 UTCAll use subject to JSTOR Terms and Conditions
470 REBECCA HUSS-ASHMORE, ALAN H. GOODMAN, AND GEORGE J. ARMELAGOS
Moseley, J. E. 1963 Bone changes in hematologic disorders. New York: Grune and Stratton. 1965 The paleopathologic riddle of symmetrical osteoporosis. American Journal of
Roentgenology 95:135-143. Nickens, P.
1975 Paleoepidemiology of Mesa Verde Anasazi population: lines of increased density. Unpublished ms., Department of Anthropology, University of Colorado, Boulder.
Nielsen, H. A. 1911 Ydenligeve bidragtil stenalder folkets. AnthropologiAarb. Nord. Oldk. Hist. (3rd
Series) 1:81-205. Niswander, J. D., and C. S. Chung
1965 The effects of inbreeding on tooth size in Japanese children. American Journal of Human Genetics 17:390-398.
Ortner, D. J. 1975 Aging effects on osteon remodeling. Calcified Tissue Research 18:27-36.
Palkovich, A. 1978 A model of the dimensions of mortality and its application to paleodemography.
Unpublished Ph.D. dissertation, Department of Anthropology, Northwestern University.
1979 Mortality patterns in paleodemography: exploring the cause structure of mortal ity. Paper presented to the American Anthropological Association, Cincinnati.
Park, E. A.
1964 The imprinting of nutritional disturbances on the growing bone. Pediatrics 33 (supplement): 815-862.
Parker, G. S., S. Dreizen, and T. D. Spies
1952 A cephalometric study of children presenting clinical signs of malnutrition. Angle Orthodontics 22:125-136.
Parson, V., and C. Hampton 1969 Phosphate deficiency and collagen metabolism. In Nutritional aspects of the
development of bone and connective tissue, edited by J. C. Somogyi and E.
Kodicek. Basel: Karger. Pp. 46-57. Perzigian, A. J.
1973 Osteoporotic bone loss in two prehistoric Indian populations. American Journal of Physical Anthropology 39:87-96.
1977 Fluctuating dental asymmetry: variation among skeletal populations. American Journal of Physical Anthropology 47:81-88.
Platt, B. S., P. S. Miller, and P. R. Payne
1961 Protein value of human foods. In Recent advances in clinical nutrition, edited by J. F. Brock. London: Churchill. Pp. 351-374.
Platt, B. S., and R. J. C. Stewart
1962 Transverse trabeculae and osteoporosis in bones in experimental protein-calorie deficiency. British Journal of Nutrition 16:483.
Prasad, A. S., J. A. Halsted, and M. Nadimi
1961 Syndrome of iron-deficiency anemia, hepatosplenomegaly, hypogonadism, dwarfism and geophagia. American Journal of Medicine 31:532.
Pratt, C. W. M., and R. A. McCance
1958 Histological changes occurring in the long bones of chickens dwarfed by pro longed undernutrition. Journal of Anatomy 92:655-658.
1960 Severe undernutrition in growing and adult animals. 2. changes in the long bones
This content downloaded from 192.101.188.25 on Wed, 08 Jul 2015 17:48:38 UTCAll use subject to JSTOR Terms and Conditions

NUTRITIONAL INFERENCE FROM PALEOPATHOLOGY 471
of growing cockerels held at fixed weights by undernutrition. British Journal of Nutrition 14:75-84.
1964 Severe undernutrition in growing and adult animals. British Journal of Nutrition 18:393-408.
Preston, S. 1972 Influence of cause of death structure on age-patterns of mortality. In Population
dynamics, edited by T. N. E. Greville. New York: Academic Press. 1974 Demographic and social consequences of various causes of death in the United
States. Social Biology 21:144-162. 1976 Mortality patterns in nationalpopulations. New York: Academic Press.
Pruner-Bey, M. 1868 An account of the human bones found in the cave of Cro-Magnon in Dordogne:
VII. In Reliquiae acquitanicae, being contributions to the archaeology and paleontology of Perigord, edited by E. Lartet and H. Cristy. Paris and Coaden: Bailliere.
Reidhead, V. 1980 The economics of subsistence change: a test of an optimization model. In Model
ing change in prehistoric economics, edited by T. K. Earle and A. L. Christensen. New York: Academic Press. Pp. 141-186.
Rodahl, K. 1966 Bone development. In Human development, edited by F. Falkner. Philadelphia:
Saunders. Pp. 503-509. Roe, D.
1973 A plague of corn: the social history of pellagra. Ithaca: Cornell University Press. Ronaghy, H. A., and J. A. Halsted
1975 Zinc deficiency occurring in females: report of two cases. American Journal of Clinical Nutrition 28:831-836.
Rose, J. C.
1973 Analysis of dental micro-defects of prehistoric populations from Illinois. Un published Ph.D. dissertation, Department of Anthropology, University of
Massachusetts, Amherst. Rose, J. C., G. J. Armelagos, and J. Lallo
1978 Histological enamel indicator of childhood stress in prehistoric skeletal samples.
American Journal of Physical Anthropology 49:511-516. Sarnat, B. G., and I. Schour
1941 Enamel hypoplasia (chronological enamel hypoplasia) in relation to systemic
disease: a chronologic, morphologic, and etiologic classification. Journal of the
American Dental Association 28:1989-2000.
Saul, F.
1972 The human skeletal remains from Altar de Sacrificios. Papers of the Pea
body Museum of Archeology and Ethnology No. 63. Harvard University, Cam
bridge. 1973 Disease in the Maya area: the Pre-Columbian evidence. In The classic Maya col
lapse, edited by T. P. Culbert. Albuquerque: University of New Mexico Press.
Schoeniger, M. J. 1978 Bone strontium and diet: methods and some possible sources of error. American
Journal of Physical Anthropology 48:435. 1979a Dietary reconstruction at Chalcatzingo, a formative period site in Morelos, Mex
ico. Museum of Anthropology, University of Michigan, Technological Reports
No. 9.
This content downloaded from 192.101.188.25 on Wed, 08 Jul 2015 17:48:38 UTCAll use subject to JSTOR Terms and Conditions

472 REBECCA HUSS-ASHMORE, ALAN H. GOODMAN, AND GEORGE J. ARMELAGOS
1979b Diet and status at Chalcatzingo: some empirical and technical aspects of strontium analysis. American Journal of Physical Anthropology 51:295-3 10.
Schour, I., and M. Massler
1945 The effects of dietary deficiencies upon the oral structures (Parts I-III). Journal of the American Dental Association 32:714-727, 871-879, 1022-1030.
Schulz, P. D., and H. M. McHenry
1975 The distribution of enamel hypoplasia in prehistoric California Indians. Journal of Dental Research 54:913-920.
Siegal, M. I. 1975 Stress and fluctuating limb asymmetry in various aspects of rodents. Growth
39:363-369. Stedt, P. G.
1979 Trace element analysis of two prehistoric populations: the Fremont and the Anasazi. Unpublished Ph.D. dissertation, Department of Anthropology, San Diego State University.
Steinbock, R. T. 1976 Paleopathological diagnosis and interpretation: bone diseases in ancient human
populations. Springfield, Illinois: Charles C. Thomas. Stewart, R. J. C.
1975 Bone pathology in experimental malnutrition. World Review of Nutrition and Dietetics 21:1-74.
Stini, W. A. 1969 Nutritional stress and growth: sex differences in adaptive response. American
Journal of Physical Anthropology 31:417-426. 1972 Reduced sexual dimorphism in upper arm muscle circumference associated with
protein-deficient diet in a South American population. American Journal of Physical Anthropology 36:341-352.
1975 Adaptive strategies of populations under nutritional stress. In Biosocial interac tions in population adaptation, edited by E. S. Watt, F. E. Johnston, and G. W.
Lasker. The Hague: Mouton. Pp. 19-41.
Stout, S. D. 1976 Histomorphometric analysis of archeological bone. Unpublished Ph.D. disserta
tion, Department of Anthropology, Washington University, St. Louis. Stuiver, M.
1978 Carbon-14 dating: a comparison of beta and ion counting. Science 202:881-883. Suarez, B. K.
1974 Neanderthal dental asymmetry as the probable mutation effect. American Journal of Physical Anthropology 41:411-416.
Swardstedt, T. 1966 Odontological aspects of a medievalpopulation in the province of Jtmtland/Mid
Sweden. Stockholm: Tiden-Barnangen Tryckerien. Swedlund, A. C., and G. J. Armelagos
1969 Une recherche en paleo-demographie: la Nubie Soudanaise. Annales-Economies Societies-Civilizations 6:1287-1298.
1976 Demographic anthropology. Wm. C. Brown, Dubuque. Szpunar, C., J. B. Lambert, and J. E. Buikstra
1978 Analysis of excavated bone by atomic absorption. American Journal of Physical Anthropology 48:199-202.
Tanner, J. M.
1977 Human growth and constitution. In Human biology, edited by G. H. Harrison, et
al., (second ed.). New York: Oxford University Press. Pp. 301-385.
This content downloaded from 192.101.188.25 on Wed, 08 Jul 2015 17:48:38 UTCAll use subject to JSTOR Terms and Conditions
NUTRITIONAL INFERENCE FROM PALEOPATHOLOGY 473
Teeri, J. A., and L. G. Stowe
1976 Climatic patterns and the distribution of C4 grasses in North America. Oecologia (Berl.) 23:1-12.
Thomas, R. B.
1973 Human adaptation to a high Andean energy flow system. Occasional Papers in Anthropology No. 6. Pennsylvania State University, University Park.
1975 The ecology of work. In Physiological anthropology, edited by A. Damon. New York: Oxford University Press. Pp. 59-79.
Thomson, A. M., and F. E. Hytten
1977 Physiological basis of nutritional needs during pregnancy and lactation. In Nutri tional impacts on women throughout life with emphasis on reproduction, edited
by K. S. Moghissi and T. N. Evans. Hagerstown, Maryland: Harper. Pp. 10-22.
Tieszen, L., D. Hein, S. Quortrup, J. Troughton, and S. Imbamba 1979 Use of 13C values to determine vegetation selectivity in East African herbivores.
Oecologia 37:351-359. Toots, H., and M. R. Voorhies
1965 Strontium in fossil bones and the reconstruction of food chains. Science 149:854 855.
Trowell, H. C., J. N. P. Davies, and R. F. A. Dean
1954 Kwashiorkor. London: Arnold. Turner, Christy G.
1979 Dental anthropological indications of agriculture among the Jomon people of cen tral Japan. American Journal of Physical Anthropology 51:619-636.
Ubelaker, D. H. 1978 Human skeletal remains: excavation, analysis and interpretation. Chicago:
Aldine. Ulmer, D. D.
1977 Trace elements. New England Journal of Medicine 297:318-321. Van der Merwe, N., and J. C. Vogel
1978 13C content of human collagen as a measure of prehistoric diet in Woodland North
America. Nature 276:815-816. Van Valen, L.
1962 A study of fluctuating asymmetry. Evolution 16:125-142. Vila, F.
1949 A review of the literature on enamel hypoplasia. Journal of the Phillippine Dental Association 2(5):5-21.
Virchow, R. 1872 Untersuchung des Neandertal schadels. Zeitschrift fuir Ethnologie 4:157.
Vogel, J. C., and N. van der Merwe
1977 Isotopic evidence for early maize cultivation in New York State. American Antiq uity 42:238-242.
Weatherell, J. A., and S. M. Weidmann
1959 The skeletal changes of chronic experimental fluorosis. Journal of Pathology and Bacteriology 78:243-255.
Weiss, K. 1973 Demographic models for anthropology. American Antiquity Memoir No. 27.
1975 Demographic disturbance and the use of life tables in anthropology. In Population
studies in archeology and biological anthropology: a symposium, edited by A. Swedlund, pp. 46-56. American Antiquity Memoir No. 30.
1976 Demographic theory and anthropological inference. Annual Review of An
thropology 5:351-381.
This content downloaded from 192.101.188.25 on Wed, 08 Jul 2015 17:48:38 UTCAll use subject to JSTOR Terms and Conditions

474 REBECCA HUSS-ASHMORE, ALAN H. GOODMAN, AND GEORGE J. ARMELAGOS
Wells, C. 1961 A new approach to ancient disease. Discovery 22:526-531. 1967 A new approach to paleopathology: Harris lines. In Disease in antiquity, edited by
D. R. Brothwell and A. T. Sandison. Springfield, Illinois: Charles C. Thomas. Pp. 390-404.
1975 Prehistoric and historic changes in nutritional diseases and associated conditions. Progress in Food and Nutritional Sciences 1(2):729-779.
Widdowson, E. M. and R. A. McCance
1964 Effects of nutrition and disease on growth. British Dental Journal 117:326-330. Wing, E. S., and A. B. Brown
1980 Paleonutrition. Method and theory inprehistoricfood ways. New York: Academic Press.
Winter, M., E. Morava, T. Horvath, G. Simon, and J. Sos
1972 Some findings on the mechanism of adaptation of the intestine to calcium defi
ciency. British Journal of Nutrition 28:10-111. Winterhalder, B. P.
1977 Foraging strategy adaptations of the boreal forest Cree: an evaluation of theory and models from evolutionary ecology. Unpublished Ph.D. dissertation, Depart ment of Anthropology, Cornell University.
Wolbach, J. B. 1947 Vitamin A deficiency and excess in relation to skeletal growth. Journal of Bone
and Joint Surgery 29:171. Woodall, J.
1968 Growth arrest lines in long bones of the Casas Grandes population. PlainsAnthro
pologist 13:152-160. Y'Edynak, G.
1976 Long bone growth in Western Eskimo and Aleut skeletons. American Journal of Physical Anthropology 45:569-574.
Zsygmondy, 0. 1894 Beitrage zur Kenntnis der Entstehungsurache der hypoplastischen Emaildefecte.
Transactions of the World's Columbian Dental Congress 1:48-67.
This content downloaded from 192.101.188.25 on Wed, 08 Jul 2015 17:48:38 UTCAll use subject to JSTOR Terms and Conditions