Embed Size (px)
Citation preview

Numerical modelling of droplet impingement
This article has been downloaded from IOPscience. Please scroll down to see the full text article.
2005 J. Phys. D: Appl. Phys. 38 3664
(http://iopscience.iop.org/0022-3727/38/19/015)
Download details:
IP Address: 152.78.128.150
The article was downloaded on 06/02/2011 at 06:27
Please note that terms and conditions apply.
View the table of contents for this issue, or go to the journal homepage for more
Home Search Collections Journals About Contact us My IOPscience

INSTITUTE OF PHYSICS PUBLISHING JOURNAL OF PHYSICS D: APPLIED PHYSICS
J. Phys. D: Appl. Phys. 38 (2005) 3664–3673 doi:10.1088/0022-3727/38/19/015
Numerical modelling of dropletimpingementS Kamnis and S Gu1
School of Engineering and Applied Science, Aston University, Aston Triangle,Birmingham B4 7ET, UK
E-mail: [email protected]
Received 6 May 2005, in final form 1 August 2005Published 16 September 2005Online at stacks.iop.org/JPhysD/38/3664
AbstractPowder particles are projected from a thermal spray gun towards substratesto generate protective coatings. A clear understanding of the dynamicimpingement when droplets make contact with substrates is critical forcontrolling and optimizing the thermal spray process. A dropletimpingement model is developed to simulate the transient flow dynamicsduring impact, spreading and solidification. The volume of fluid surfacetracking technique is employed within a fixed Eulerian structured mesh. Thenumerical model is validated with experimental data from tin dropletmeasurements. The results prove that thermal contact resistance is the keyelement in characterizing the substrate surface roughness for impingementmodelling. It is found that spreading, solidification and air entrapment areclosely related to surface roughness.
Nomenclature
General symbolsA porosity coefficientcp specific heat capacityC porosity constantEc Eckert numberFvol surface tension source termg gravity vectorh sensible heatH total heat�H latent heatk thermal conductivityCµ coefficient for turbulent viscosityL latent heat of freezingn̂ω unit vector normal to the wallp pressureq heat fluxR substrate surface roughnessSh enthalpy source termSy moment source termt timet̂ω unit vector tangential to the wallT temperature
1 Author to whom any correspondence should be addressed.
u velocityU0 droplet impact velocity
Greek symbolsα coefficient in numerical schemeβ liquid fractionη small constant to avoid division by zeroθω contact angleλ porosityµ dynamic viscosityρ densityσ surface tensionτ Marangoni stressϕ volume fraction
Subscriptsi, j, l coordinate indicesliquid liquid materialref reference pointsolid solid materialw wall
Mathematical operators∂ partial differential operator∇ del operator� difference between two quantities of a variable→ vector form of variable
0022-3727/05/193664+10$30.00 © 2005 IOP Publishing Ltd Printed in the UK 3664

Numerical modelling of droplet impingement
1. Introduction
In the process of thermal spray, powder particles are injectedinto a spraying gun where they are melted, accelerated andprojected onto substrates to form protective coating to enhancethe performance of substrates. The large number of processparameters, in which the physical properties of coating aresensitive to, leads to expensive and time consuming trial anderror optimization of thermal spray process. Better controlof the process requires a fundamental understanding of thethermal-physics within and outside the gun. To date, progresshas been made to study gas/particle dynamics within sprayingguns and external free jet region; however, there is still alack of clear understanding of the impingement process wheredynamic flow and heat transfer occur during the impact,spreading and solidification of molten droplets. Numericalmodelling has become an important tool for process controland optimization in many engineering applications. A well-developed model can provide insight into the underlyingphysics of the process by overcoming the technical constraintsimposed by experiments.
Through the years much effort has been made todevelop droplet impingement models. The early work byHarlow and Shannon [1] oversimplifies the impingementprocess, neglecting both viscous and surface tension effectsin their modelling. Later phase change is introduced inthe impingement models [2–4] by considering an order ofmagnitude balance between inertial, viscous and surfacetension. More recent numerical models [5–8] incorporate bothMAC and volume of fluid (VOF) methods [9] in order to closelyrepresent the detailed physics.
Despite the advance in developing numerical methods, theaccuracy of existing droplet impingement models is severelylimited by many assumptions being made. For example,the models developed by Bennet and Poulikakos [10] and
Solid Steel Region initially at 298 K
Substrate
Phase 1 & 2 Fluid Region
Axis of Symmetry
Refined Mesh
Chamber walls
Figure 1. Computational domain for the impingement model.
Kang et al [11] assume that solidification starts only afterdroplet spreading is finished. Simultaneous spreading andsolidification are incorporated into the splash models [12, 13];however, the thermal contact resistance at the liquid–solidinterface in those models is neglected and liquid–solidcontact angle is given an arbitrary constant value, whichcould bring a certain degree of error into the model as theresearch by Pasandideh-Fard et al [14] demonstrates thatthe value of contact angle could significantly influence theaccuracy of model predictions. Finite element methods areused by Waldvogel and Poulikakos [15] to solve dropletimpingement; however the capillary forces at the liquid–solid angle are not included in their model. More recentlySivakumar and Nishiyama [16] have presented a splash modelwith improvement on the governing equations with modifiedinitial conditions, but this model is applicable only to fastsolidification due to the assumption that solidification occurswithin a time during the beginning of the impact process.Latest research includes a 3D model developed by GhafouriAzar et al [17] who used experiment-based input parametersto simulate the impact of droplets on the tip of a pin projectingfrom a flat surface. Nevertheless the accuracy of the 3D modelis affected by the following factors: the shrinkage effect causedby the density discrepancy between liquid and solid materialsis not considered; no-slip wall is employed instead of usingmore realistic boundary condition and the possibility of airentrapment between splat and substrate is ignored.
The study aims to develop a 2D numerical model that isable to accurately simulate the droplet impingement process.Detailed data of thermal–physical properties are incorporatedinto the material model instead of using constant values,e.g. different thermal conductivity and density for liquidand solid, latent heat of freezing. Most assumptions thatcould affect prediction in existing droplet impingement modelsare replaced with close-to-reality algorithms, e.g. Marangoni
3665

S Kamnis and S Gu
Table 1. Initial conditions and properties of tin and stainless steelused in the simulation.
Impinging droplet Tin (Sn)Substrate Stainless steelDroplet diameter 2.2 mmDroplet initial temperature 519 KSubstrate initial temperature 298 KImpinging velocity 4 m s−1
Solidus temperature (Tsolid) 504 KLiquidus temperature (Tliquid) 506 KThermal conductivity liquid tin 33.6 W (m K)−1
Thermal conductivity solid tin 62.2 W (m K)−1
Thermal conductivity steel 14.9 W (m K)−1
Density steel 7900 kg m−3
Density liquid tin 6980 kg m−3
Density solid tin 7200 Kg m−3
Droplet surface tension 0.566 N m−1
Specific heat droplet 244 J (kg K)−1
Specific heat steel 477 J (kg K)−1
Latent heat of solidification 585 00 J kg−1
Table 2. Contact angle variation during impact.
Contact angle θ (˚) Time (ms)
140 1–3120 3–6
60 6–8
stress boundary for substrate surface boundary where the shearstress is solved as a function of temperature, an additionalheat transfer resistance in the governing equation to solveair entrapment and, as a result, detailed physics could berevealed and many limitations for impingement modelling willbe eliminated. It needs to be pointed out that the geometricconstraint for a 2D model prohibits a correct prediction of thenumber of fingers formed around a droplet, which can onlybe solved with more computationally expensive 3D models.The current 2D modelling will pave the way for such a studyand the numerical methods will be further extended to a3D impingement model using the Rayleigh–Taylor instabilitytheory to calculate the formation of fingers.
2. Numerical model
The droplet impingement model is solved with thecomputational domain shown in figure 1. Only half of thedomain is actually computed with a symmetric boundaryin the middle and a very fine grid is used for the regionswhere impact, spreading and solidification occur. Thenumerical method used in this study is a segregated solutionalgorithm [18] with a control volume based technique. Thepressure and velocity are coupled with semi-implicit methodfor pressure linked equations (SIMPLE) algorithm [19, 20]which uses a guess-and-correct procedure for the calculationof pressure on the staggered grid arrangement. The quadraticupwind interpolation (QUICK) scheme [21] is used for thediscretization of the model equations. As a higher orderscheme, the QUICK method can minimize false diffusionerrors at the cost of computational stability.
The droplet impingement model is developed andvalidated with the experimental measurement of tin
Table 3. Thermal contact resistance variation with surfaceroughness.
Substrate roughness Thermal contact resistance × 10−6
(µm) (m2 K W−1)
0.06 1.80.07 2.50.56 3.13.45 5.7
droplets [22]. Material properties being used in this modelare listed in table 1. The numerical model works onthe basis of two-dimensional, axi-symmetric, incompressiblelaminar fluid. On impingement, heat transfer is dominatedby convection and conduction; therefore, radiation from thedroplet surface to the surroundings is negligible.
2.1. Flow modelling
Numerical models of droplet impingement are solved by theNavier–Stokes and energy equations, coupled with the VOFsurface tracking technique on a fixed Eulerian structured mesh.In the VOF model, a single set of momentum equations isshared by the fluids, and the volume fraction of each of thefluids in each computational cell is tracked throughout thedomain. In this method, the volume fraction of the 1st fluid inthe cell is denoted as ϕ: ϕ = 0 for an empty cell; ϕ = 1for a full cell and 0 < ϕ < 1 when a cell contains theinterface between the 1st and 2nd fluids. The following singlemomentum equation is solved throughout the domain:
∂
∂t(ρ �u)+∇·(ρ �u�u) = −∇p+∇·[µ(∇�u + ∇�uT )]+ρ �g+Fvol+Sy
(1)Equation (1) is dependent on the volume fractions of phasesthrough the properties ρ and µ. The velocity differencesbetween the two phases in this model are not pronouncedso the shared-field approximation can be safely used withoutadversely affecting velocity computations near the interface.The face fluxes for the VOF model are calculated usingthe geometric reconstruction scheme available in FLUENT.The interface between fluids is solved by a piecewise-linearapproach. The continuum surface force (CSF) proposed byBrackbill et al [23] is used for the surface tension model.The additional surface tension model for the VOF calculationresults in a source term in equation (1) and is expressed as avolume force as follows:
Fvol = σij
ρki∇αi
(1/2)(ρi + ρj ). (2)
The mathematical equation of the contact angle is based onthe study of Brackbill et al [23] in which the curvature of thesurface near the substrate wall surface is adjusted according todynamics boundary conditions. The contact angle at the wall isgiven as θω, and the surface normal to the cell next to the wall is
n̂ = n̂ω cos θω + t̂ω sin θω. (3)
The values of the liquid–solid contact angle during spreadingand recoiling of droplets are taken from the data produced byAziz and Chandra [24] as listed in table 2. The set of con-tact angles are universally applied to all surface roughness in
3666

Numerical modelling of droplet impingement
Figure 2. Comparison between simulation and photographic images taken from [21] at surface roughness is 0.06 µm.
the current study, and later results show excellent agreementbetween the predictions and experimental results. Accuratecharacterization of the substrate surface requires three inputparameters, namely liquid–solid contact angles, thermal con-tact resistance and Marangoni convention. Given the universalvariation of the contact angle and Marangoni stress boundarybeing applied to the contact surface, it is possible to specify
the surface roughness using thermal contact resistance inthis study.
The momentum equation (1) is in a general format forthe numerical solution of the fluid flow and solidification.A definition of the source term that is used to modify themomentum equation in a mushy zone (a region in which theliquid fraction lies between 0 and 1) is required; as the porosity
3667

S Kamnis and S Gu
Figure 3. Variation of spread factor at different substrate surface roughness.
decreases the velocity also decreases to zero when the mushbecomes completely solid as represented by
Sy = −Au. (4)
The form of A is derived from the Darcy law:
A = −C(1 − λ)2
λ3 + η. (5)
The value of C depends on the morphology of the porousmedia and measures the amplitude of the damping; a highervalue C corresponds to a rapid deceleration to zero velocity onsolidification. In the current model C is given a constant valueof 150 000 that gives accurate prediction in comparison withexperiments.
2.2. Solidification and heat transfer modelling
An enthalpy porosity technique [25–27] is used for modellingthe solidification process. In this technique, a variable namedliquid fraction is calculated instead of tracking the meltinterface explicitly. The liquid fraction indicates the volumefraction of the cell in liquid form and is associated with eachcell in the domain. The liquid fraction is computed at eachiteration based on an enthalpy balance. The mushy zone ismodelled as a pseudo porous medium in which the porositydecreases from 1 to 0 as the material solidifies.
The enthalpy of the material is computed as the sum ofthe sensible enthalpy, h, and the latent heat, �H , as follows:
H = h + �H, (6)
where
h = href +∫ T
Tref
cp dT . (7)
The liquid fraction, β, is defined as
β = 0 if T < Tsolid,
β = 1 if T > Tliquid,
β = T − Tsolid
Tliquid − Tsolidif Tsolid < T < Tliquid.
(8)
The latent heat content is written in terms of the latent heat offreezing, L:
�H = βL. (9)
Heat transfer in the droplet is modelled by solving the energyequation. Due to high temperature difference between thedroplet and substrate and the relative low droplet velocity(Eckert number: Ec = U 2
0 /Cp�T ≈ 3 × 10⁻⁴), viscousdissipation is negligible and not included in the current model.The energy equation is written as
∂
∂t(ρH) + ∇ · (ρ �uH) = ∇ · (k∇T ) + Sh. (10)
The source term appearing on the right-hand side is equal to:
Sh = ∂ρ�H
∂t+ ∇(ρu�H). (11)
In isothermal cases, due to the step change of �H along withzero velocity at the solid–liquid interface the convective partof this source term takes the value of zero. In a mushy regioncase this source term must be included. The temperature issolved from the energy equation (10) and the liquid fractionequation (8). Powder particles with 100% purity are rarelyused in real engineering environment. For a wider application,the phase change in the solidification model is implementedwithin a temperature spectrum instead of giving a singlemelting point.
Heat transfer within the substrate is solved as conductionalone, and the governing equation is
ρwcpw∂Tw
∂t= �∇ · (kw �∇Tw). (12)
The model considers the presence of an air gap between thesubstrate wall surfaces and the solidified material, using anadditional heat transfer resistance between walls and cellswith the liquid fraction less than 1. This contact resistanceis included by modifying the conductivity of the fluid near thewall. Thus, the wall heat flux is written as
q = T − Tw
(1/k) + R(1 − β). (13)
3668
Numerical modelling of droplet impingement
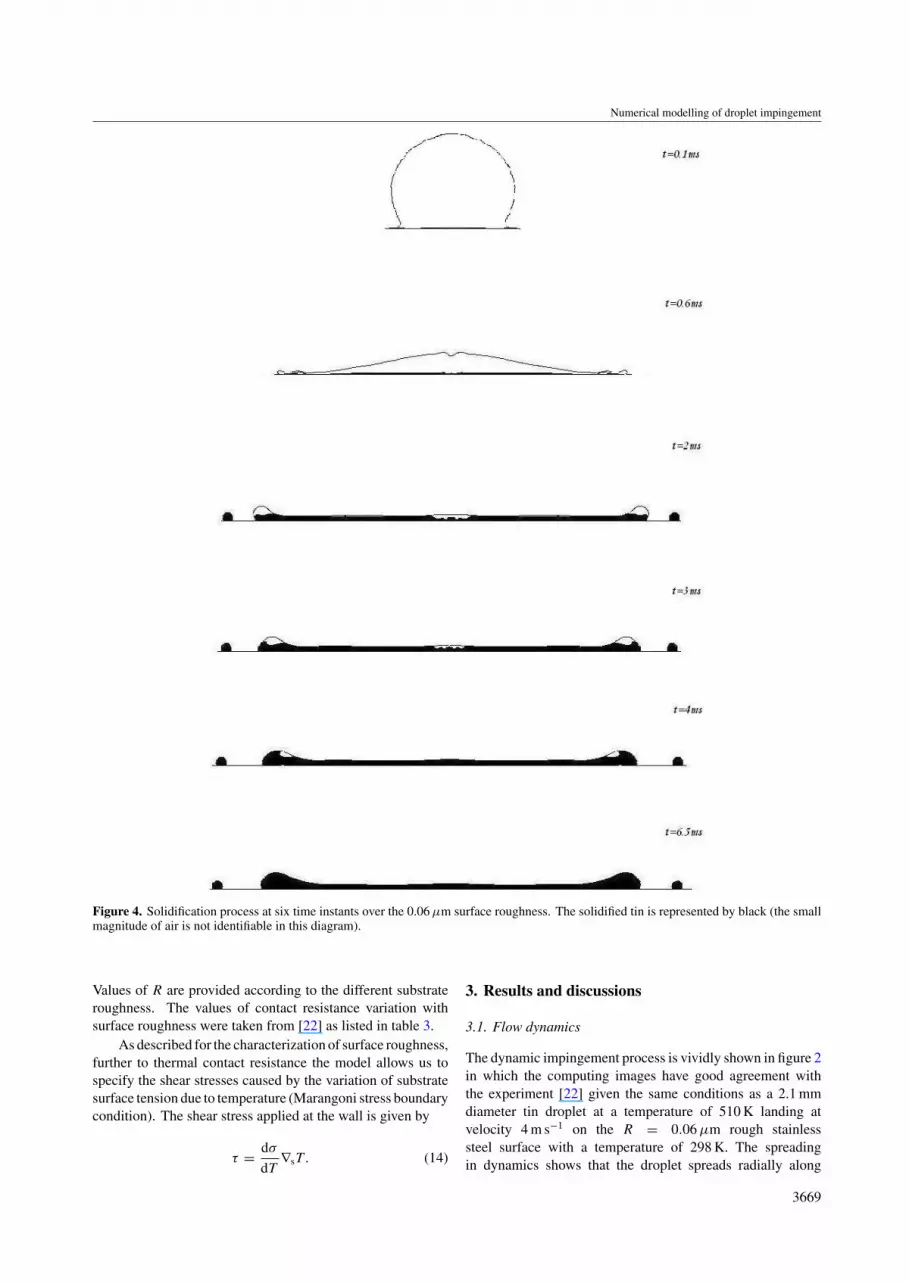
Figure 4. Solidification process at six time instants over the 0.06 µm surface roughness. The solidified tin is represented by black (the smallmagnitude of air is not identifiable in this diagram).
Values of R are provided according to the different substrateroughness. The values of contact resistance variation withsurface roughness were taken from [22] as listed in table 3.
As described for the characterization of surface roughness,further to thermal contact resistance the model allows us tospecify the shear stresses caused by the variation of substratesurface tension due to temperature (Marangoni stress boundarycondition). The shear stress applied at the wall is given by
τ = dσ
dT∇sT . (14)
3. Results and discussions
3.1. Flow dynamics
The dynamic impingement process is vividly shown in figure 2in which the computing images have good agreement withthe experiment [22] given the same conditions as a 2.1 mmdiameter tin droplet at a temperature of 510 K landing atvelocity 4 m s−1 on the R = 0.06 µm rough stainlesssteel surface with a temperature of 298 K. The spreadingin dynamics shows that the droplet spreads radially along
3669

S Kamnis and S Gu
Figure 5. Pressure contours at three time instants inside the droplet landing at 0.06 µm surface roughness.
the substrate surface after the impact; the break-off fromedges is initiated at approximately 0.6 ms, gets detachedfrom the edges at 0.9 ms and forms satellite droplets. Thedroplet reaches its maximum spread at 1.8 ms as quantitativelyillustrated in figure 3, and then surface tension pulls theedges of the droplet inwards and the spreading stabilizes from3.4 ms when the droplet mainly solidifies. The solidification atdifferent time frames is shown in figure 4. Thin solidificationlayers are developed at the centre and edges of the droplet rightafter the impact at 0.1 ms; the solidification layers progressto the most contact surface as the droplets spreads at 0.6 ms;the solidification rapidly takes over the droplet by 2.0 ms;only a fraction of liquid remains within the internal edgesof the droplet at 4.0 ms when the droplet spreading becomesstabilized, and full solidification arrives at 6.5 ms.
The flow patterns during impingement are shown bypressure contour and velocity vector results in figures 5 and 6,respectively. On impact the high impact velocity generates ahigh pressure region under the droplet; shortly after the impactat 0.55 ms the high pressure at the centre of the droplet forcesthe liquid to flow over the contact surface while the surfacetension is comparatively small; the maximum flow velocity isachieved at the edge where all the momentum is transferredto the radial direction, and the cross-section area is small.The velocity at the edge is found to be 6 m s−1, 2 m s−1 higherthan the impact velocity. As the spreading and solidificationdevelop, the flow slows down and the surface tension becomessignificant, which gives rise to the high pressure regions atthe edges and eventually redirects the flow back towards the
centre as clearly shown in the 2.2 ms time frame plot in figure 6.The flow rests mostly at 4.4 ms as a result of solidification, anda small fraction of backflow with a velocity less than 0.5 m s−1
is found in the remaining liquid at the edges.
3.2. Surface roughness
In this study, the surface roughness is evaluated by thethermal contact resistance as demonstrated in table 2. Thetemperature history at the impact point in figure 7 indicatesthat the temperature dependence on surface roughness or,more precisely, high temperature profile is achieved at lowthermal contact resistance on smooth surface. However, thedroplet spreading is affected differently. The results in figure 3show that the spread rate of the droplet is dependent on thesurface roughness. At a substrate temperature of 298 K, thedroplet spreads much wider before recoiling with a significantincrease of surface roughness from R = 0.07 to 3.45 µmwhile a slight increase of surface roughness from R = 0.07to 0.56 µm gives only a marginal effect. The computingresults confirm the experimental observation [22] that thesubstrate surface roughness influences the spreading processthrough solidification, i.e. the smooth surface has low thermalresistance that allows rapid solidification which prevents thedroplet from spreading further; the rough surface increasesthermal contact resistance that slows down solidificationprocess and allows the droplet to spread in a greater extent.Further examination of figure 3 shows that recoiling issubstantially affected by the surface roughness: the droplet
3670

Numerical modelling of droplet impingement
Figure 6. Velocity vectors at three time instants inside the droplet landing at the 0.06 µm surface roughness.
Figure 7. Substrate surface temperatures at point of impact fordifferent roughness.
recoils marginally at R = 0.06 and 0.07 µm roughness,more pronounced at R = 0.56 µm and significantly atR = 3.5 µm.
3.3. Air entrapment
It is anticipated that air could be trapped between droplet andsubstrate during the impingement, and as a matter of fact, airinvolvement reduces heat transfer rate between the droplet andsubstrate. The presence of air can be easily identified in thedensity plots where the density of tin is thousand times largerthan that of air. The dynamic evolution of density distributionover the substrate surface is shown in figure 8. Air is trappedin the centre of the droplet on impact and that remains the onlyair entrapment region at the early stage of spreading. As thespreading progresses at 0.55 ms, three identifiable air regionsare presented within the droplet: zone 1 is in the centre, zone 2
is about 0.002 mm radial distance from the centre and zone 3 islocated near the edge. As the droplet continues to spread andsolidification becomes significant, by 2.2 ms, zone 1 movesoutwards, zone 2 remains mostly unchanged, zone 3 movessubstantially outwards and is replaced by two separate zones:a small adjacent air zone 3a is formed within the droplet and abig air gap zone 3b separates the main droplet and satellitedroplets. As the droplet recoils at 4.4 ms, zone 1 movesinwards, zone 2 is steady and zone 3b expands as a result of themain droplet edge recoiling inwards. A possible explanationfor the generation of air entrapment during the spreading is thatthe edge of the droplet solidifies more quickly than the mainbody of the droplet; the liquid flows over the solidified edge,and air is trapped consequently. Therefore, the air entrapmentis closely linked to solidification. The previous results alreadydemonstrate that spreading and solidification are associatedwith surface roughness. A comparison of density profileat different surface roughness in figure 8 shows that the airzone 2 disappears and zone 3b remains within the main dropletinstead of separating the main and satellite droplets at highsurface roughness R = 0.56 and 3.45 µm, which is consistentwith experimental and previous findings that high thermalcontact resistance at rough surface slows down solidificationand suppresses splashing.
4. Conclusions
A numerical model has been developed to investigate theimpingement of tin droplets on a flat stainless steel plate. Thefollowing conclusions can be drawn:
• The thermal contact resistance can be used effectively tocharacterize surface roughness, and the numerical resultsdemonstrate excellent agreement with the experimentaldata.
• The solidification of droplets is significantly affectedby the thermal contact resistance/substrate surface
3671

S Kamnis and S Gu
(a) (b)
(c) (d)
(e) (f)
(g)
Figure 8. Density profiles along the contact surface. Density distributions on 0.06 µm surface roughness at (a) 0.1 ms, (b) 0.3 ms,(c) 0.55 ms, (d ) 2.2 ms, (e) 4.4 ms. ( f ) Density distribution on 0.56 µm surface roughness at 4.4 ms. (g) Density distribution on 3.5 µmsurface roughness at 4.4 ms.
roughness. On smooth surfaces where contact resistanceis low and heat is transferred rapidly from the droplet tosubstrate, droplet solidifies quickly, which prompts thebreak-up and formation of satellite droplets.
• Air is trapped in the droplet during the impingement. Theair entrapment during spreading is dependent on substratesurface roughness, i.e. less air is trapped at high thermalcontact resistance on rough surface.
3672

Numerical modelling of droplet impingement
References
[1] Harlow F H and Shannon J P 1967 The splash of a liquiddroplet J. Appl. Phys. 38 3855–66
[2] Jones H 1971 Cooling, freezing and substrate impact ofdroplets formed by rotary atomization J. Phys. D: Appl.Phys. 4 1657–60
[3] Madejski J 1976 Solidification of droplets on a cold surfaceInt. J. Heat Mass Transfer 19 1009–13
[4] Madejski J 1983 Droplets on impact with a solid surface Int. J.Heat Mass Transfer 26 1095–8
[5] Trapaga G and Szekely J 1991 Mathematical modeling of theisothermal impingement of liquid droplets in sprayprocesses Metall. Trans. B 22 901–14
[6] Tsurutani K, Yao M, Senda J and Fujimoto H 1990 Numericalanalysis of the deformation process of a droplet impingingupon a wall JSME Int. J. (Ser. 2) 33 555–61
[7] Watanabe T, Kuribayashi I, Honda T and Kanzawa A 1992Deformation and solidification of droplet on a coldsubstrate Chem. Eng. Sci. 47 3059–65
[8] Pasandideh-Ford M and Mostaghimi J 1994 Deformation andsolidification of molten particles on a substrate in thermalspraying Proc. 7th National Thermal Spray Conf. (Boston,MA, 1994) ed C C Berndt and S Sampath, pp 405–15
[9] Welch J E, Harlow F H, Shannon J P and Daly B J 1966 TheMAC method Technical Report LA-3425 LANL
[10] Bennet T and Poulikakos D 1994 Heat transfer aspects of splatsolidification: modelling and experiment J. Mater. Sci. 292025–39
[11] Kang B, Zhao Z and Poulikakos D 1994 Solidification ofliquid metal droplets impacting sequentially on a solidsurface ASME J. Heat Transfer 116 436–45
[12] Liu H, Lavernia E J and Rangel R 1993 Numerical simulationof substrate impact and freezing of droplets in plasma sprayprocess J. Phys. D: Appl. Phys. 26 1900–8
[13] Trapaga G, Matthys E F, Valencia J J and Szekely J 1992 Fluidflow, heat transfer and solidification of molten metaldroplets impinging on substrates: comparison of numericaland experimental results Metall. Trans. B 23 701–18
[14] Pasandideh-Fard M, Qiao Y M, Chandra S and Mustaghimi J1996 Capillary effects during droplet impact on a solidsurface Phys. Fluids 8 650–9
[15] Waldvogel J M and Poulikakos D 1997 Solidificationphenomena in picoliter size solder droplet deposition
on a composite substrate Int. J. Heat Mass Transfer 40295–309
[16] Sivakumar D and Nishiyama H 2004 Spreading andsolidification of a molten metal droplet impinging on aheated surface Int. J. Heat Mass Transfer 47 4469–78
[17] Ghafouri Azar R, Yang Z, Chandra S and Mostafhimi J 2005Impact of molten metal droplets on the tip of a pinprojecting from a flat surface Int. J. Heat Fluid Flow26 334–47
[18] Van Doormal J P, Raithby G D and McDonald B H 1987 Thesegregated approach to predicting viscous compressiblefluid flows ASME J. Turbomachinery 109 268–77
[19] Peric M 1990 Analysis of pressure-velocity coupling onnon-orthogonal grids Numer. Heat Transfer Part B:Fundamentals 17 63–82
[20] Raithby G D and Schneider G E 1979 Numerical solution ofproblems in compressible fluid flow: treatment of thevelocity-pressure coupling Numer. Heat Transfer 2417–40
[21] Leonard B P 1995 Order of accuracy of QUICK and relatedconvection-diffusion schemes Appl. Math. Modell. 19640–53
[22] Shakeri S and Chandra S 2002 Splashing of molten tindroplets on a rough steel surface Int. J. Heat Mass Transfer45 4561–75
[23] Brackbill J U, Kothe D B and Zemach C 1992 A continuummethod for modeling surface tension J. Comput. Phys.100 335–54
[24] Aziz S D and Chandra S 2000 Impact, recoil and splashing ofmolten metal droplets Int. J. Heat Mass Transfer 432841–57
[25] Voller V R 1987 Modeling solidification processes TechnicalReport in Mathematical Modeling of Metals ProcessingOperations Conf. (Palm Desert, CA: AmericanMetallurgical Society)
[26] Voller V R, Brent A D and Reid K J 1987 A Computationalmodeling framework for the analysis of metallurgicalsolidication process and phenomena Technical Report inConf. for Solidification Processing (Ranmoor House,Sheffield)
[27] Voller V R and Prakash C 1987 A fixed-grid numericalmodeling methodology for convection-diffusion mushyregion phase-change problems Int. J. Heat Mass Transfer30 1709–20
3673


