Embed Size (px)
Citation preview

Nuclear Repulsion Enables D
Current Biology 23, 1999–2010, October 21, 2013 ª2013 Elsevier Ltd All rights reserved http://dx.doi.org/10.1016/j.cub.2013.07.076
Articleivision
Autonomy in a Single Cytoplasm
Cori A. Anderson,1 Umut Eser,2 Therese Korndorf,1
Mark E. Borsuk,3 Jan M. Skotheim,4 and Amy S. Gladfelter1,*1Department of Biological Sciences, Dartmouth College,Hanover, NH 03755, USA2Department of Applied Physics, Stanford University,Stanford, CA 94305, USA3Thayer School of Engineering, Dartmouth College, Hanover,NH 03755, USA4Department of Biology, Stanford University, Stanford,CA 94305, USA
Summary
Background: Current models of cell-cycle control, based onclassic studies of fused cells, predict that nuclei in a sharedcytoplasm respond to the sameCDK activities to undergo syn-chronous cycling. However, synchrony is rarely observed innaturally occurring syncytia, such as the multinucleate fungusAshbya gossypii. In this system, nuclei divide asynchronously,raising the question of how nuclear timing differences aremaintained despite sharing a common milieu.Results: We observe that neighboring nuclei are highly vari-able in division-cycle duration and that neighbors repel oneanother to space apart and demarcate their own cytoplasmicterritories. The size of these territories increases as a nucleusapproaches mitosis and can influence cycling rates. Thisnonrandom nuclear spacing is regulated by microtubulesand is required for nuclear asynchrony, as nuclei that tran-siently come in very close proximity will partially synchronize.Sister nuclei born of the samemitosis are generally not persis-tent neighbors over their lifetimes yet remarkably retain similardivision cycle times. This indicates that nuclei carry a memoryof their birth state that influences their division timing and sup-ports that nuclei subdivide a common cytosol into functionallydistinct yet mobile compartments.Conclusions: These findings support that nuclei use cyto-plasmic microtubules to establish ‘‘cells within cells.’’ Individ-ual compartments appear to push against one another tocompete for cytoplasmic territory and insulate the divisioncycle. This provides a mechanism by which syncytial nucleican spatially organize cell-cycle signaling and suggests sizecontrol can act in a system without physical boundaries.
Introduction
Classic cell-fusion experiments by Rao and Johnson from the1970s showed that when HeLa cells in different phases ofthe cell cycle were fused together to form multinucleatecells, their nuclei rapidly synchronized [1–5]. Similarly, earlyDrosophila syncytial embryos orchestrate highly synchro-nous nuclear division cycles [6]. These findings indicatethat nuclear division can be coordinated through sharing acommon cytoplasm, likely by exposure to similar levels ofkey regulators.
*Correspondence: [email protected]
Although sharing a common cytoplasm can result in syn-chronous nuclear division cycles, it is by no means certain.After HeLa cell fusion, nuclear asynchrony may arise in subse-quent mitoses [7]. When amultinucleated myotubule re-entersthe cell cycle, its nuclei do so asynchronously [8]. Similarly,many filamentous fungi display asynchronous division ofnuclei in one cell [9]. Therefore, synchronization due to sharedcytoplasmic signals can be spatially restricted. Although ex-amples of asynchronous nuclear division within a commoncytoplasm have been documented, the mechanisms of asyn-chrony in syncytia are not well understood. Asynchronypresumably requires timing variability within the nuclear divi-sion cycle in addition to a mechanism, such as compartmen-talization of the cytoplasm, which would prevent adjacentnuclei from experiencing similar concentrations of regulatorymolecules.There are numerous known molecular sources of cell-cycle
timing variability, including stochastic differences in geneexpression and size control [10]. InSaccharomyces cerevisiae,stochastic expression of cell-cycle regulators generatescell-to-cell variability in division timing within a population[11, 12]. In addition, differences in cell size at birth influencethe duration of G1 prior to the point of commitment to celldivision [11, 13–17]. Smaller cells delay cell-cycle progressionrelative to larger cells, which results in timing variability withinthe population. In a multinucleate context, it is unknownwhether nuclei sense and respond to a local volume of cyto-plasm or somehow more globally coordinate nuclear divisionwith cell growth.Progression through the phases of the cell cycle is driven by
the cyclin/CDK biochemical oscillator regulated by periodiccyclin accumulation and degradation [18–20]. In a syncytialcontext in which nuclei cycle asynchronously, many out-of-sync biochemical oscillators coexist and fail to entrain oneanother. This requires either that the activity of the oscillators(e.g., the capacity to phosphorylate substrates) is completelyrestricted to nuclei, perhaps due to a cytoplasmic CKI, and/or that there are barriers to diffusion of CDK activity. Suchbarriers would allow each nucleus to have its own segmentof cytoplasm driving only its local oscillator. It is unclearwhat the cell biological basis would be of such cytoplasmicbarriers, yet the phenomenon of asynchrony likely requiressome insulation of nuclei from signaling molecules diffusingfrom neighboring regions.To examine the mechanisms of asynchrony, we observe
nuclear division timing and spatial distributions in the multinu-cleate fungusAshbya gossypii. NeighboringAshbya nuclei canbe in different cell-cycle stages, and their nuclear divisioncycle times can vary widely [21]. Asynchrony in Ashbyaemerges early in G1 and is under genetic control, as mutantcells lacking central components of the G1/S regulatorypathway become more synchronous in their division cycles[22]. Components of this pathway control transcription, whichis of interest given that transcripts are translated and shared inthe common cytoplasm. The importance of this transcriptionalregulatory pathway for asynchrony supports the hypothesisthat there may be restricted sharing of newly made proteinsbetween neighboring nuclei. Here, we employ live-cell imaging

Figure 1. Mitosis in A. gossypii Is Not Restricted in Space or Time
(A) Observed division times in A. gossypii cells, mean = 1186 38 min (n = 92
division times, seven independent time-lapse movies).
(B) Plot of mitosis locations throughout the cell. Each mitosis is indicated as
an ‘‘x.’’ The color of the ‘‘x’’ corresponds to the time point of mitosis. This
mitosis map shows most nuclei divide in the central parental hypha rather
than in the lateral side branches. Some of this bias is from the fact that
the parent hypha has been in existence for longer time than the side
branches, and so by chance more mitoses would occur in that region of
the cell.
(C) Movie still images of dividing nuclei in a germinating spore. After the first
nuclear division, sister nuclei cycle asynchronously, 15 min apart (asterisks
indicate the first sister mitosis, and arrowheads indicate the second sister
mitosis).
See also Figures S1 and S4 and Movies S1, S2, S3, and S4.
Current Biology Vol 23 No 202000
and statistical approaches to investigate how Ashbya nucleifunctionally insulate themselves to produce variable nucleardivision cycle times within a common cytoplasm.
Results
Nuclei Divide throughout Time and SpaceThe positions and divisions of all nuclei in single Ashbya cellswere tracked through time using time-lapse imaging of cellsexpressing histone H4-GFP (HHF1-GFP) to visualize nuclei
(Movies S1, S2, and S3 available online). Nuclear coordinateswere imported into MATLAB to analyze the timing patternsand spatial relationships of individual nuclei (Movies S1, S2,and S3). The mean and SD of nuclear division time were118 and 38 min, respectively (n = 92 division times from sevenindependent time-lapse movies), consistent with previousobservations (Figure 1A) [21]. Mitoses occur at all locationsthroughout the cell and are not restricted to a single region,such as a tip (Figure 1B), indicating that there are not stableor persistent sites that consistently favor or disallow nucleardivision. Additionally, nuclei that divide around the sametime point in the movie are not generally found to be neareach other in the cell, indicating that there are not transient,local bursts of mitotic activity (Figures 1B and S1; n = 95 mito-ses in three independent movies). Nuclear autonomous divi-sion occurs regardless of the size of the cell. In fact, eventhe very first nuclear divisions after germination are asynchro-nous (Figure 1C and Movie S4; n = 25 mitoses in five indepen-dentmovies). These data indicate that nuclear autonomy is nota consequence of the gradual accumulation of timing differ-ences among many nuclei as cells age and become large.Thus, regardless of overall cell size, nuclei are highly variableand asynchronous in division timing even when sharing thesame cytosol.
Nuclei Are Nonrandomly Spaced Due to Microtubule-Dependent Fluctuations
How might nuclei establish functionally autonomous zones ina common cytoplasm? Notably, we see regular spacingbetween neighboring nuclei that is significantly different fromwhatwould be expected if theywere randomly positioned (Fig-ures 2A and 2B; observed mean = 4.36 2.1 mm, p < 0.001, Kol-mogorov-Smirnov [K-S] test and F test). This prompted us toask how nonrandom spacing is achieved and to look at hownuclei move relative to their neighbors. First, we examinednuclear positions in a variety of mutants lacking microtubulemotors or having perturbed microtubule length [23–25]. Themajority of these mutants show nuclei that are closer together,while cells lacking Ase1, a microtubule-associated protein(MAP), and the kinesin Kip2 both show larger distancesbetween neighboring nuclei (Figure 2C and Table 1). Impor-tantly, the nuclear spacing in all mutant strains except Kip2is more variable compared to the wild-type (WT; Table 1).This increased variability is associated with nuclear spacingthat is significantly more random for all mutants except Kip2as compared to the notably nonrandom spacing observed inthe WT (Figures 2D, 2E, and S2). Thus, regulation of the micro-tubule cytoskeleton is critical for nonrandom nuclear spacing.Next, we looked at how neighboring nuclei move relative to
one another to examine how nonrandom spacing is achieved.To do this, we measured the difference in the distancesbetween a nucleus and its two nearest neighbors (‘‘neighboroffset’’) and plotted the offsets through time (Figures 3A and3B). In WT cells, the distances between individual nuclei andtheir neighbors typically fluctuate around a mean value; how-ever, these fluctuations are eliminated when microtubuledynamics are impaired with nocodazole (Figure 3C, left). Tofurther assess how neighboring nuclei change positionsthrough time, we plotted the neighbor offset at each time pointagainst the change in neighbor offset at the subsequent timepoint (Figure 3C, middle and right). InWT cells, we see that off-sets change substantially each time point, as indicated byspread of points around zero. In contrast, in the absence ofmicrotubules, nuclei no longer fluctuate in position relative to

Figure 2. Nonrandom Nuclear Spacing Requires
Microtubule Regulation
(A) Image of an A. gossypii cell expressing H4-
GFP. Cell outline is false colored red.
(B) Cumulative distribution plot of observed dis-
tances between nuclei (black line) compared to
randomized simulations of nuclear spacing (p <
0.001). The gray dashed line represents the
simulated median, and the gray shaded area
represents the outer bounds of 100 random sim-
ulations.
(C) Cumulative distribution plot of observed dis-
tances between nuclei inmutants that lackmicro-
tubule motors or have perturbed microtubule
length.
(D) Cumulative distribution plot of observed dis-
tances between nuclei compared to a simulation
of randomized nuclear spacing for both the WT
and prom180-DYN1.
(E) Percent difference of observed nuclear
spacing from random spacing. Bar heights corre-
spond the mean of comparisons against 100
random simulations and error bars represent
the 2.5th and 97.5th percentiles of these compar-
isons. Values near 100% indicate more constant
spacing, while values near 0% indicate spacing
that is closer to random.
See also Figures S2 and S5, Table S1, andMovies
S1, S2, S3, and S4.
Nuclear Division Autonomy in One Cell2001
their neighbors. In cells with depolymerized microtubules, theoffsets cluster at a nonzero point, indicative of aberrantspacing, and, importantly, there is little change in the offsetfrom time point to time point such that the points are oftenhighly clustered (Figure 3C, middle and right).
We next assessed the time scale of the fluctuations charac-teristic of WT cells. Autocorrelation analysis of nuclear offsetover time reveals that nuclei are repelling one another on atime scale of w2.2 min (Figure 3D). The autocorrelation func-tion fits well to an exponential decay. This is consistent withan Ornstein-Uhlenbeck model for Brownian motion subjectto a restoring force in a highly dampedmedia [26]. Thus, nucleiuse microtubule-based motion to repel their neighbors to pro-duce a nonrandom spatial distribution.
Nuclei Control and Can React to Local SpacingWe hypothesize that repulsive forces between nuclei helpthem to subdivide the cytoplasm into ‘‘territories’’ or zonesof influence. How then is regular nuclear spacing maintained
while the cytoplasm expands due tocell growth? Importantly, all expansionis happening at hyphal tips, so mostnuclei are tens to hundreds of microme-ters away from the actual site wherecell size is increasing, yet they maintainconsistent spacing at all locations.We hypothesized that nuclear dy-namics may also promote the distribu-tion of spacing in a cell with asymmetricgrowth and that each nucleus couldlocally control the amount of space itaccrues. In this model, the sizes of indi-vidual nuclear territories may change,analogous to how a uninucleate cellgrows through its cell cycle.
By tracking how neighbor spacing changes over the divisioncycle, we found that an increase in local spacing occurs grad-ually in anticipation of mitosis (Figure 4A; r = 0.91). This growthin territory size is characteristic of most of the population, asterritory size versus time yields r > 0.5 in 59% of nuclei(Figures S3A and S3B). Nuclei are also significantly fartherfrom their neighbors prior to mitosis than throughout theremainder of the cell cycle (Figure 4B; p < 0.001, K-S test).Importantly, because all cell growth is restricted to the hyphaltip, the increase in local cytoplasm size prior to mitosis is dueto repositioning of nuclei and not local intercalary growth.Furthermore, because nuclei can bypass one another andmigrate far from their birth location in the cell (Figure S3C),the local decrease in nuclear spacing that must occur foreach mitosis is quite transient and not creating an artifactualincrease in space throughout the entire cell cycle. This linkbetween the division cycle and territory size increase furthersupports that spacing is controlled at the level of the individualnucleus.

Table 1. Summary Statistics for Internuclear Distances
Strain
Mean
(mm)
SD
(mm)
CV
(%)
SE of
CV (%)
CV Difference
from the WT
(%)
Index of
Dispersion n
WT (AG523) 5.32 2.27 43.34 1.17 2 0.98 684
prom180-
DYN1
(AG521)
3.88 3.10 79.88 2.75 184 2.47 422
prom130-
DYN1
(AG522)
3.72 3.62 97.23 2.77 224 3.52 614
bik1D
(AG541)
3.71 3.07 82.62 2.42 191 2.53 583
ase1D
(AG545)
6.42 3.32 51.63 2.10 119 1.71 303
kip2D
(AG552)
6.22 2.61 42.02 1.26 97 1.10 557
nud1D
(AG559)
4.17 2.79 66.78 2.32 154 1.86 414
stu2D
(AG560)
2.88 2.00 69.28 2.39 160 1.38 420
spc72D
(AG561)
3.33 2.29 68.66 2.35 158 1.57 427
cnm67D
(AG565)
5.89 6.03 102.36 4.11 236 6.17 310
Current Biology Vol 23 No 202002
In most uninucleate cells, cell size is inversely proportionalto cycle time, so we next asked whether division timing isaffected by the amount of space a nucleus inhabits at birth.However, nuclear spacing in the early period of the cycleonly very weakly correlates with overall division cycle length(Figure S3D; r = 20.19). Additionally, nuclear spacing immedi-ately preceding mitosis has a modest correlation with divisiontiming (Figure S3E; r = 0.28). Therefore, the amount of space anucleus is born into and ultimately possesses seems to onlymodestly influence overall division timing. As an additionalmethod to investigate how territory size may be linked to divi-sion time, we artificially increased the local spacing aroundnuclei using nocodazole, which arrests the nuclear cycle whilestill allowing normal cell growth (Figures 4C and 4D). Uponrelease from the arrest, nuclei re-enter the division cycle, andcell growth continues at hyphal tips at normal rates (data notshown). Remarkably, we see that nuclei swiftly recover tonear-WT spacing even while the cells continue to grow duringthe release period (Figures 4C and 4D). Therefore, the nuclearcycle must speed up in response to the increased amount ofcytoplasm per nucleus to restore the original spacing. Thisargues that the division cycle is able to respond to alterationsin the amount of cytoplasm per nucleus, but this reaction is notreadily detectable unless spacing is substantially perturbed.
Nonrandom Nuclear Spacing Is Required for DivisionAsynchrony
The data thus far are consistent with the model that nuclearmovement generates nonrandom spacing and that this func-tions to maintain a constant balance of nuclei to cytoplasm.We hypothesized that controlled spacing may provide insula-tion between neighboring nuclei to promote autonomousnuclear division. To investigate whether spacing influencesthe degree of asynchrony, we took advantage of a subpopula-tion of nuclei that undergo ‘‘bypassing’’ events in which theychange places with one of their neighbors (Figure 5A). Suchencounters require nuclei to pass <0.25 mm from one anotherand thus would represent the greatest opportunity for inter-mingling of cell-cycle regulators. We asked whether nuclei
that came close together like this were subsequently synchro-nized such that they would tend to divide at the same timepoint of the movie. In fact, we see that nuclei that undertakea bypassing event are significantly more likely to divide at asimilar moment in time than nuclei from the same data setsthat are paired randomly irrespective of spacing (Figure 5B).Whereas persistent nuclear neighbors, defined as those thatspend at least 30 min between 2 and 5 mm of each other yetdo not bypass (Figure 5A), are more similar to the random dis-tribution (Figure 5B; ANOVA, p < 0.05; median Dtprandom =49 min; median Dtp2–5 mm = 41 min; Dtp0.25 mm = 30 min). Thissuggests that nuclear spacing is important to insulate nucleifrom their neighbors and to allow for nuclear cycle timingautonomy.If controlled nuclear spacing insulates nuclei, we predict that
randomly spaced nuclei would divide more synchronouslythan theWT. Indeed, we see a significant increase in local syn-chrony in cells with randomized and closer nuclear spacingdue to diminished dynein expression (Figure 5C, Table 2, andMovies S5, S6, and S7). Mitoses are more likely to be adjacentto one another even though the overall proportion of dividingnuclei of this mutant strain is not substantially different fromthe WT (Table 2). In these cells, multiple neighboring nucleiare seen to divide at the same time and we observe ‘‘runs’’of mitoses within a few time points (Figure 5C). Immunofluo-rescence quantification shows that there are frequent runs ofnuclei in the same cell-cycle phase, with lengths of up to 12synchronized nuclei in a row. This is in contrast to WT cells,which have fewer runs of synchronized nuclei and a frequencyof such runs that is consistent with what is expected by chance(Figure 5D). These data suggest that nonrandom nuclearspacing is a key component of asynchronous nuclear division.
Sister Nuclei Inherit Nuclear Division TimingNuclear spacing functions to promote autonomy in nuclei, yetthere is still a large amount of variation in timing across theoverall population (Figure 1A). We next sought to addresswhether the source of timing variability is stochastic or sys-tematic in nature. If there is some heritable or systematicsource of timing variation, it should reveal itself as a timingrelationship within lineages of related nuclei. Alternatively, iftiming is purely stochastic, then related nuclei will have no rela-tionship in their timing. Statistical analysis of division timingdifferences within and between nuclear lineages can be usedto identify the existence of inherited sources of division timingvariability (Figure 6A).We examined division timing in 32 pairs of sister nuclei, born
of one mitosis, from seven movies (Figure 6B and Movies S1,S2, and S3). To examine sister timing relationships, wecompared the difference in nuclear-division-cycle durationsof sister nuclei to a distribution of randomly selected pairs ofnuclei. The mean difference between sister nuclear-cycledurations was only 23 6 22 min compared to 41 6 37 minfor the randomized control, indicating a significant degreeof inherited variation, as sisters were more similar in timingthan expected by chance (Figure 6B and Table 3; p < 0.05,two-sample t test and K-S test). As an alternative method,we used a nonparametric rank-based statistical test to deter-mine how sisters are related in division times and find aclear positive association (Table 3; ZR = 2.83, p < 0.01). Thisalso indicates that sister division times are more similarto one another than compared to the entire population of divi-sion times. Although statistically similar, sisters still havedifferent absolute times, indicating that they are not perfectly
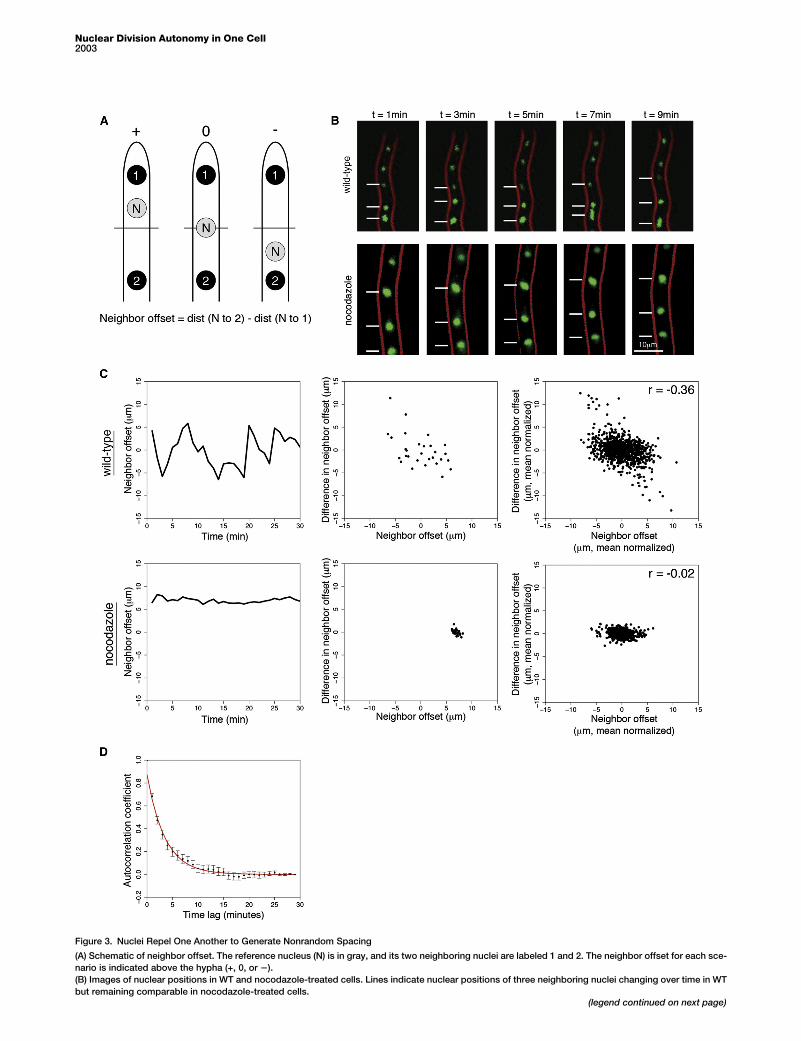
Figure 3. Nuclei Repel One Another to Generate Nonrandom Spacing
(A) Schematic of neighbor offset. The reference nucleus (N) is in gray, and its two neighboring nuclei are labeled 1 and 2. The neighbor offset for each sce-
nario is indicated above the hypha (+, 0, or 2).
(B) Images of nuclear positions in WT and nocodazole-treated cells. Lines indicate nuclear positions of three neighboring nuclei changing over time in WT
but remaining comparable in nocodazole-treated cells.(legend continued on next page)
Nuclear Division Autonomy in One Cell2003

Current Biology Vol 23 No 202004
synchronized but rather are more similar to one another intiming than are other unrelated nuclei. These data supportthat a proportion of timing variability arises from a trait thatis inherited by sister nuclei at mitosis and differs among thepopulation of mitotic nuclei.
To assess whether the timing association between sistersdecays as they travel far apart, we examined how far sisternuclei move away from one another after mitosis. We foundthat most sisters traveled away from one another, with greaterthan 53% of sister pairs at least 10 mm (approximately two tothree nuclei) apart 75 min after their birth (Figure 6C). Addition-ally, sisters that travel far apart are related in timing compa-rably to sisters that stay in close proximity, indicating thatthe sister timing relationship is not strongly related to howclose together they are in their next cycle, at least on the scaleof tens of microns (t test, time difference of sister pairs <10 mmcompared to sisters >10 mm apart, p < 0.18). Thus, inheritedsimilarity in division timing is retained even when sisters arephysically far apart. This inherited timing similarity is an espe-cially robust timing determinant because it is detectable inspite of the fact that sisters undergo several bypassing eventswith nuclei of other lineages that would presumably diminishtheir association in timing (Figure 5B). This suggests thatnuclei inherit regulators of division and the fact that timingis carried across distances supports the model that eachnucleus creates functionally insulated territories within aseemingly continuous cytoplasm.
Discussion
Asynchrony in division timing is a universal property ofcultured cells and can be observed even among cyclingnuclei in a common cytoplasm of certain syncytia. Variationand autonomy in division timing may protect against externalstress, e.g., by limiting the number of nuclei during the sensi-tive state of DNA replication. Additionally, they may serve tomaintain a consistent nuclear-to-cytoplasmic ratio. There-fore, there are likely to be active mechanisms that promoteasynchrony in multinucleate contexts. We analyzed nuclearasynchrony in Ashbya by considering two different divisioncycle timing relationships: (1) nuclei that are neighbors and(2) sister nuclei that are born of one mitosis and then movefar apart from one another. We hypothesized that nucleimay generate independent compartments of cytosol thatfoster division autonomy. Consistent with this idea, we foundthat nuclei in the Ashbya syncytium are nonrandomly distrib-uted and actively repel neighbors to generate nuclear terri-tories or ‘‘cells within cells.’’ Cytoplasmic territories respondto the local nuclear division cycle and are likely to be a mech-anism by which nuclear density is coordinated with overallcell growth. Thus, active nuclear positioning promotesnuclear autonomy and asynchronous division of neighboringnuclei.
Nuclear spacing is critical in many organisms for diversecellular functions and cellular organization [27]. We haveevidence that nuclei actively control their spacing relative toneighbors inAshbya using nuclear repulsion andmicrotubules(Figures 2 and 3). Previous work in Ashbya has shown that
(C) Nuclear offset time series forWT cells and nocodazole-treated cells. Left plo
terplot of neighbor offset versus difference in neighbor offset for a single nucleu
offset for all tracked nuclei.
(D) Autocorrelation functions of nuclear offsets in WT cells and an exponential
traces; error bars represent the SEM.
nuclei utilize the microtubule cytoskeleton to fluctuate andbypass within the common cytoplasm [23, 25, 28, 29]. In addi-tion, small data sets have shown neighboring nuclei movingclose to one another and then rapidly moving apart and beingcarried by cytoplasmic flow [30]. Our analyses of large popula-tions of dynamic nuclei support these findings and indicatethat individual nuclei create territories by controlling localcytoplasmic spacing. We observe that nuclear positions fluc-tuate about a mean position and that nuclei are pushed backto the mean on a time scale of w2.2 min by a microtubule-dependent mechanism (Figure 3). Similar nuclear fluctuations,which begin after nuclear fusion in meiosis in S. pombe, arecontrolled by dynein motors. The asymmetric loading ofdynein and the dynamic redistribution of dynein on microtu-bules due to load forces facilitate these oscillatory move-ments. These horsetail oscillations occur with an w10 minperiod and span a 10 mm distance, which is a relatively similartime and length scale as we see in Ashbya [31]. We speculatethat spatially variable regulation of dynein localization andactivity in Ashbya is likely to be the basis of nuclear repulsionand nonrandom nuclear positioning.The observation that local nuclear spacing increases with
progression through the nuclear-division cycle suggests thatthe nuclear-division cycle is in fact able to act on cytoplasmictargets to regulate local nuclear crowding. Local nuclear-divi-sion-cycle regulation of microtubule-associated proteins ormotors may function to alter local nuclear spacing as nucleiprogress through their cycle. Overlapping microtubulesemanating from neighboring nuclei may be responsible fornuclear repulsion [28]. Short cytoplasmic microtubules arethought to generate forces that may be resisted by some othercomponent of the cytosol that perhaps changes stiffness withthe cell cycle and allows for MT motors to work [23, 29, 32].Interestingly, there is evidence that aster-aster interactionzones, such as those seen in the early divisions of large cellssuch as zebrafish and Xenopus embryos, are also spacedapart depending on when in the cell cycle the asters meet.This spacing is speculated to be based on dynein activityfrom molecules anchored on the cytosol [33, 34]. Regulationof motor activity may enhance the pushing apart of neigh-boring nuclei in preparation for mitosis in Ashbya, and severalmotors examined in our study have consensus CDK phos-phorylation sites. The identity of the cytosolic substratesreacting to this regulation in Ashbya and how this regulationwould be spatially restricted to a zone of single nucleusrequires further investigation.There is mounting evidence for cytoplasmic organization
withinmany syncytia. Crosses ofNeurospora crassa ‘‘banana’’mutants generate one large multinucleate ascospore with agenetically mixed population of nuclei. When banana mutantcrosses involve one parent strain expressing GFP, thosenuclei that encode GFP have increased GFP localizationcompared to nuclei from the parent without the fluorescentlabel encoded, even though the nuclei reside in a commoncytoplasm. This pattern is accentuated after several mitoticdivisions, resulting in a gradient of GFP intensity from oneend of the spore to the other, a distance of approximately100 mm [35]. Nuclear-based cytoplasmic organization has
ts: neighbor offset through time for an individual nucleus. Middle plots: scat-
s. Right plots:mean normalized neighbor offset versus difference in neighbor
fit (red). Points represent mean autocorrelation function over all WT nuclear

Figure 4. Local Nuclear Spacing Is Related to Cell-Cycle Progression
(A) Scatterplot of local nuclear spacing through time for an individual nucleus (r = 0.91).
(B) Cumulative distribution plots of all nuclear spacing (excluding time points immediately after mitoses) and spacing immediately before a mitosis event.
(C) Still images of nuclear spacing at t = 0 hr and t = 4 hr after nocodazole treatment release. Cells were treated with either dimethyl sulfoxide (DMSO) or
10 mg/ml nocodazole for 4 hr before release.
(D) Cumulative distribution plot of internuclear distances at t = 0 hr and t = 4 hr after release. Cells were treated with either DMSO or 10 mg/ml nocodazole for
4 hr before release. t = 0 hr postrelease: control median = 2.9 mm, nocodazole median = 6.9 mm. t = 4 hr postrelease: control median = 3.2 mm, nocodazole
median = 4.4 mm.
See also Movies S1, S2, S3, and S4.
Nuclear Division Autonomy in One Cell2005

Figure 5. Nuclear Spacing and Division Timing Synchrony
(A) Schematic of nuclear relationships. Bypassing nuclei are defined as those that come within 0.25 mm of each other. Neighboring nuclei are defines as
those who spend >30 min within 2 to 5 mm of each other. The difference between the time point of division for each nuclear relationship is indicated as
D time point of mitosis.
(B) Box plot of D time point of mitosis for all tracked nuclei and observed divisions. A randomized D time point was calculated based on observed mitosis
times. ANOVA, p < 0.05.
(C) Movie still images of nuclei in prom130-DYN1 cells. Synchronously dividing nuclei are indicated with an asterisk (*). In cells 1 and 2, neighboring nuclei
divide at the exact same time, while a run of several nuclei in cell 3 divide within a 10 min time span.
(D) Stacked bar plot of synchronous runs of nuclei based on immunofluorescence analysis of cell-cycle stages. Black bars indicate those runs that contain
only two nuclei, and bars in white represent those runs with three or more nuclei. A chance proportion of expected runs was calculated and plotted to
compare with the observed synchrony in both the WT and prom130-DYN1. See also Figure S3, Table S1, and Movies S1, S2, S3, S4, S5, S6, and S7.
Current Biology Vol 23 No 202006
also been observed in the Drosophila syncytial embryo thatcontains thousands of nuclei in one cytoplasm and, prior tocellularization, endomembranes (endoplasmic reticulum andGolgi) are organized to create functionally distinct units aroundindividual nuclei [36–38]. These examples, when combined
with this study, support that nuclei can insulate themselveswithin a common cytoplasm.The notion that individual nuclei in a syncytium may be in
conflict or competition, which we observe as the repulsion ofnuclear neighbors from one another, is well documented on
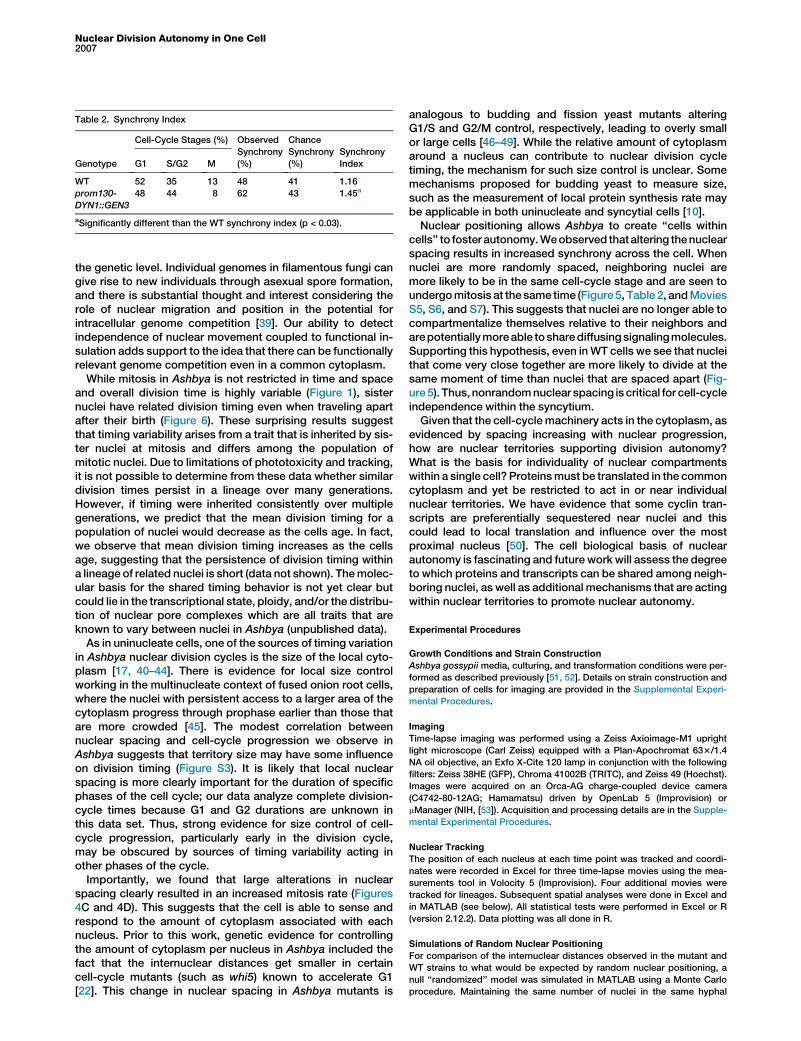
Table 2. Synchrony Index
Genotype
Cell-Cycle Stages (%) Observed
Synchrony
(%)
Chance
Synchrony
(%)
Synchrony
IndexG1 S/G2 M
WT 52 35 13 48 41 1.16
prom130-
DYN1::GEN3
48 44 8 62 43 1.45a
aSignificantly different than the WT synchrony index (p < 0.03).
Nuclear Division Autonomy in One Cell2007
the genetic level. Individual genomes in filamentous fungi cangive rise to new individuals through asexual spore formation,and there is substantial thought and interest considering therole of nuclear migration and position in the potential forintracellular genome competition [39]. Our ability to detectindependence of nuclear movement coupled to functional in-sulation adds support to the idea that there can be functionallyrelevant genome competition even in a common cytoplasm.
While mitosis in Ashbya is not restricted in time and spaceand overall division time is highly variable (Figure 1), sisternuclei have related division timing even when traveling apartafter their birth (Figure 6). These surprising results suggestthat timing variability arises from a trait that is inherited by sis-ter nuclei at mitosis and differs among the population ofmitotic nuclei. Due to limitations of phototoxicity and tracking,it is not possible to determine from these data whether similardivision times persist in a lineage over many generations.However, if timing were inherited consistently over multiplegenerations, we predict that the mean division timing for apopulation of nuclei would decrease as the cells age. In fact,we observe that mean division timing increases as the cellsage, suggesting that the persistence of division timing withina lineage of related nuclei is short (data not shown). Themolec-ular basis for the shared timing behavior is not yet clear butcould lie in the transcriptional state, ploidy, and/or the distribu-tion of nuclear pore complexes which are all traits that areknown to vary between nuclei in Ashbya (unpublished data).
As in uninucleate cells, one of the sources of timing variationin Ashbya nuclear division cycles is the size of the local cyto-plasm [17, 40–44]. There is evidence for local size controlworking in the multinucleate context of fused onion root cells,where the nuclei with persistent access to a larger area of thecytoplasm progress through prophase earlier than those thatare more crowded [45]. The modest correlation betweennuclear spacing and cell-cycle progression we observe inAshbya suggests that territory size may have some influenceon division timing (Figure S3). It is likely that local nuclearspacing is more clearly important for the duration of specificphases of the cell cycle; our data analyze complete division-cycle times because G1 and G2 durations are unknown inthis data set. Thus, strong evidence for size control of cell-cycle progression, particularly early in the division cycle,may be obscured by sources of timing variability acting inother phases of the cycle.
Importantly, we found that large alterations in nuclearspacing clearly resulted in an increased mitosis rate (Figures4C and 4D). This suggests that the cell is able to sense andrespond to the amount of cytoplasm associated with eachnucleus. Prior to this work, genetic evidence for controllingthe amount of cytoplasm per nucleus in Ashbya included thefact that the internuclear distances get smaller in certaincell-cycle mutants (such as whi5) known to accelerate G1[22]. This change in nuclear spacing in Ashbya mutants is
analogous to budding and fission yeast mutants alteringG1/S and G2/M control, respectively, leading to overly smallor large cells [46–49]. While the relative amount of cytoplasmaround a nucleus can contribute to nuclear division cycletiming, the mechanism for such size control is unclear. Somemechanisms proposed for budding yeast to measure size,such as the measurement of local protein synthesis rate maybe applicable in both uninucleate and syncytial cells [10].Nuclear positioning allows Ashbya to create ‘‘cells within
cells’’ to foster autonomy.Weobserved thataltering thenuclearspacing results in increased synchrony across the cell. Whennuclei are more randomly spaced, neighboring nuclei aremore likely to be in the same cell-cycle stage and are seen toundergomitosis at the same time (Figure5, Table 2, andMoviesS5, S6, and S7). This suggests that nuclei are no longer able tocompartmentalize themselves relative to their neighbors andarepotentiallymoreable tosharediffusingsignalingmolecules.Supporting this hypothesis, even inWT cells we see that nucleithat come very close together are more likely to divide at thesame moment of time than nuclei that are spaced apart (Fig-ure5). Thus,nonrandomnuclear spacing is critical for cell-cycleindependence within the syncytium.Given that the cell-cycle machinery acts in the cytoplasm, as
evidenced by spacing increasing with nuclear progression,how are nuclear territories supporting division autonomy?What is the basis for individuality of nuclear compartmentswithin a single cell? Proteinsmust be translated in the commoncytoplasm and yet be restricted to act in or near individualnuclear territories. We have evidence that some cyclin tran-scripts are preferentially sequestered near nuclei and thiscould lead to local translation and influence over the mostproximal nucleus [50]. The cell biological basis of nuclearautonomy is fascinating and future work will assess the degreeto which proteins and transcripts can be shared among neigh-boring nuclei, as well as additional mechanisms that are actingwithin nuclear territories to promote nuclear autonomy.
Experimental Procedures
Growth Conditions and Strain Construction
Ashbya gossypii media, culturing, and transformation conditions were per-
formed as described previously [51, 52]. Details on strain construction and
preparation of cells for imaging are provided in the Supplemental Experi-
mental Procedures.
Imaging
Time-lapse imaging was performed using a Zeiss Axioimage-M1 upright
light microscope (Carl Zeiss) equipped with a Plan-Apochromat 633/1.4
NA oil objective, an Exfo X-Cite 120 lamp in conjunction with the following
filters: Zeiss 38HE (GFP), Chroma 41002B (TRITC), and Zeiss 49 (Hoechst).
Images were acquired on an Orca-AG charge-coupled device camera
(C4742-80-12AG; Hamamatsu) driven by OpenLab 5 (Improvision) or
mManager (NIH, [53]). Acquisition and processing details are in the Supple-
mental Experimental Procedures.
Nuclear Tracking
The position of each nucleus at each time point was tracked and coordi-
nates were recorded in Excel for three time-lapse movies using the mea-
surements tool in Volocity 5 (Improvision). Four additional movies were
tracked for lineages. Subsequent spatial analyses were done in Excel and
in MATLAB (see below). All statistical tests were performed in Excel or R
(version 2.12.2). Data plotting was all done in R.
Simulations of Random Nuclear Positioning
For comparison of the internuclear distances observed in the mutant and
WT strains to what would be expected by random nuclear positioning, a
null ‘‘randomized’’ model was simulated in MATLAB using a Monte Carlo
procedure. Maintaining the same number of nuclei in the same hyphal
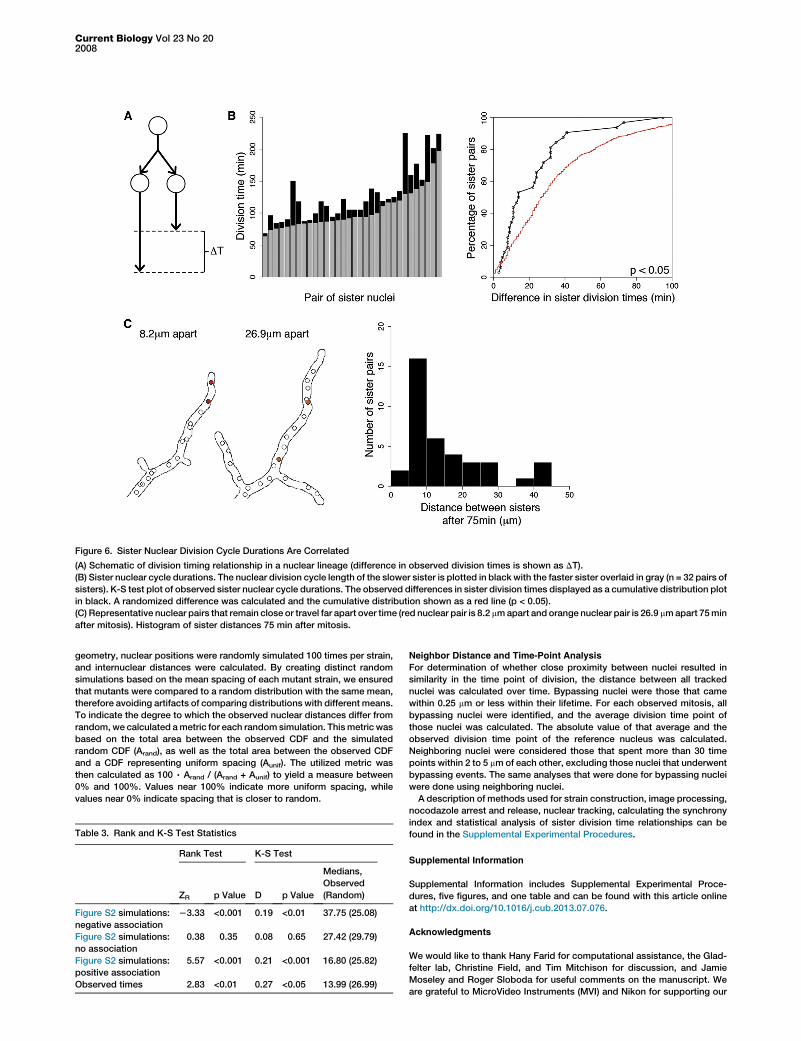
Figure 6. Sister Nuclear Division Cycle Durations Are Correlated
(A) Schematic of division timing relationship in a nuclear lineage (difference in observed division times is shown as DT).
(B) Sister nuclear cycle durations. The nuclear division cycle length of the slower sister is plotted in black with the faster sister overlaid in gray (n = 32 pairs of
sisters). K-S test plot of observed sister nuclear cycle durations. The observed differences in sister division times displayed as a cumulative distribution plot
in black. A randomized difference was calculated and the cumulative distribution shown as a red line (p < 0.05).
(C) Representative nuclear pairs that remain close or travel far apart over time (red nuclear pair is 8.2 mmapart and orange nuclear pair is 26.9 mmapart 75min
after mitosis). Histogram of sister distances 75 min after mitosis.
Current Biology Vol 23 No 202008
geometry, nuclear positions were randomly simulated 100 times per strain,
and internuclear distances were calculated. By creating distinct random
simulations based on the mean spacing of each mutant strain, we ensured
that mutants were compared to a random distribution with the same mean,
therefore avoiding artifacts of comparing distributions with different means.
To indicate the degree to which the observed nuclear distances differ from
random, we calculated ametric for each randomsimulation. Thismetric was
based on the total area between the observed CDF and the simulated
random CDF (Arand), as well as the total area between the observed CDF
and a CDF representing uniform spacing (Aunif). The utilized metric was
then calculated as 100 , Arand / (Arand + Aunif) to yield a measure between
0% and 100%. Values near 100% indicate more uniform spacing, while
values near 0% indicate spacing that is closer to random.
Table 3. Rank and K-S Test Statistics
Rank Test K-S Test
ZR p Value D p Value
Medians,
Observed
(Random)
Figure S2 simulations:
negative association
23.33 <0.001 0.19 <0.01 37.75 (25.08)
Figure S2 simulations:
no association
0.38 0.35 0.08 0.65 27.42 (29.79)
Figure S2 simulations:
positive association
5.57 <0.001 0.21 <0.001 16.80 (25.82)
Observed times 2.83 <0.01 0.27 <0.05 13.99 (26.99)
Neighbor Distance and Time-Point Analysis
For determination of whether close proximity between nuclei resulted in
similarity in the time point of division, the distance between all tracked
nuclei was calculated over time. Bypassing nuclei were those that came
within 0.25 mm or less within their lifetime. For each observed mitosis, all
bypassing nuclei were identified, and the average division time point of
those nuclei was calculated. The absolute value of that average and the
observed division time point of the reference nucleus was calculated.
Neighboring nuclei were considered those that spent more than 30 time
points within 2 to 5 mm of each other, excluding those nuclei that underwent
bypassing events. The same analyses that were done for bypassing nuclei
were done using neighboring nuclei.
A description of methods used for strain construction, image processing,
nocodazole arrest and release, nuclear tracking, calculating the synchrony
index and statistical analysis of sister division time relationships can be
found in the Supplemental Experimental Procedures.
Supplemental Information
Supplemental Information includes Supplemental Experimental Proce-
dures, five figures, and one table and can be found with this article online
at http://dx.doi.org/10.1016/j.cub.2013.07.076.
Acknowledgments
We would like to thank Hany Farid for computational assistance, the Glad-
felter lab, Christine Field, and Tim Mitchison for discussion, and Jamie
Moseley and Roger Sloboda for useful comments on the manuscript. We
are grateful to MicroVideo Instruments (MVI) and Nikon for supporting our

Nuclear Division Autonomy in One Cell2009
instrument needs at MBL in Woods Hole, MA. This work was supported by
NIH R01-GM081506 (A.S.G.), Lemann and Colwin fellowships (A.S.G.)
from the Marine Biological Laboratory in Woods Hole, NIH award
T32GM008704 (C.A.A.), NIH RO1-GM092925 (J.S.), and the Burroughs Well-
come Fund (J.S.).
Received: January 28, 2013
Revised: May 31, 2013
Accepted: July 23, 2013
Published: October 3, 2013
References
1. Rao, P.N., and Johnson, R.T. (1972). Premature chromosome conden-
sation: a mechanism for the elimination of chromosomes in virus-fused
cells. J. Cell Sci. 10, 495–513.
2. Johnson, R.T., and Rao, P.N. (1971). Nucleo-cytoplasmic interactions in
the acheivement of nuclear synchrony in DNA synthesis and mitosis in
multinucleate cells. Biol. Rev. Camb. Philos. Soc. 46, 97–155.
3. Rao, P.N., and Johnson, R.T. (1971). Mammalian cell fusion. IV.
Regulation of chromosome formation from interphase nuclei by various
chemical compounds. J. Cell. Physiol. 78, 217–223.
4. Johnson, R.T., and Rao, P.N. (1970). Mammalian cell fusion: induction of
premature chromosome condensation in interphase nuclei. Nature 226,
717–722.
5. Johnson, R.T., Rao, P.N., and Hughes, H.D. (1970). Mammalian cell
fusion. 3. A HeLa cell inducer of premature chromosome condensation
active in cells from a variety of animal species. J. Cell. Physiol. 76,
151–157.
6. Foe, V.E., and Alberts, B.M. (1983). Studies of nuclear and cytoplasmic
behaviour during the five mitotic cycles that precede gastrulation in
Drosophila embryogenesis. J. Cell Sci. 61, 31–70.
7. Westerveld, A., and Freeke, M.A. (1971). Cell cycle of multinucleate cells
after cell fusion. Exp. Cell Res. 65, 140–144.
8. Cardoso, M.C., Leonhardt, H., and Nadal-Ginard, B. (1993). Reversal of
terminal differentiation and control of DNA replication: cyclin A and
Cdk2 specifically localize at subnuclear sites of DNA replication. Cell
74, 979–992.
9. Gladfelter, A.S. (2006). Nuclear anarchy: asynchronous mitosis in multi-
nucleated fungal hyphae. Curr. Opin. Microbiol. 9, 547–552.
10. Turner, J.J., Ewald, J.C., and Skotheim, J.M. (2012). Cell size control in
yeast. Curr. Biol. 22, R350–R359.
11. Di Talia, S., Skotheim, J.M., Bean, J.M., Siggia, E.D., and Cross, F.R.
(2007). The effects of molecular noise and size control on variability in
the budding yeast cell cycle. Nature 448, 947–951.
12. Bean, J.M., Siggia, E.D., andCross, F.R. (2006). Coherence and timing of
cell cycle start examined at single-cell resolution. Mol. Cell 21, 3–14.
13. Doncic, A., Falleur-Fettig, M., and Skotheim, J.M. (2011). Distinct
interactions select and maintain a specific cell fate. Mol. Cell 43,
528–539.
14. Nash, R.S., Tokiwa, G., Anand, S., Erickson, K., and Futcher, A.B. (1988).
The WHI1+ gene of Saccharomyces cerevisiae tethers cell division to
cell size and is a cyclin homolog. EMBO J. 7, 4335–4346.
15. Wheals, A.E. (1982). Size control models of Saccharomyces cerevisiae
cell proliferation. Mol. Cell. Biol. 2, 361–368.
16. Lord, P.G., andWheals, A.E. (1981). Variability in individual cell cycles of
Saccharomyces cerevisiae. J. Cell Sci. 50, 361–376.
17. Johnston, G.C., Pringle, J.R., and Hartwell, L.H. (1977). Coordination of
growth with cell division in the yeast Saccharomyces cerevisiae. Exp.
Cell Res. 105, 79–98.
18. Murray, A.W., and Kirschner, M.W. (1989). Cyclin synthesis drives the
early embryonic cell cycle. Nature 339, 275–280.
19. Murray, A.W., Solomon, M.J., and Kirschner, M.W. (1989). The role of
cyclin synthesis and degradation in the control of maturation promoting
factor activity. Nature 339, 280–286.
20. Bloom, J., and Cross, F.R. (2007). Multiple levels of cyclin specificity in
cell-cycle control. Nat. Rev. Mol. Cell Biol. 8, 149–160.
21. Gladfelter, A.S., Hungerbuehler, A.K., and Philippsen, P. (2006).
Asynchronous nuclear division cycles in multinucleated cells. J. Cell
Biol. 172, 347–362.
22. Nair, D.R., D’Ausilio, C.A., Occhipinti, P., Borsuk, M.E., and Gladfelter,
A.S. (2010). A conserved G1 regulatory circuit promotes asynchronous
behavior of nuclei sharing a common cytoplasm. Cell Cycle 9, 3771–
3779.
23. Lang, C., Grava, S., Finlayson, M., Trimble, R., Philippsen, P., and
Jaspersen, S.L. (2010). Structural mutants of the spindle pole body
cause distinct alteration of cytoplasmic microtubules and nuclear
dynamics in multinucleated hyphae. Mol. Biol. Cell 21, 753–766.
24. Grava, S., Keller, M., Voegeli, S., Seger, S., Lang, C., and Philippsen, P.
(2011). Clustering of nuclei in multinucleated hyphae is prevented by
dynein-driven bidirectional nuclear movements andmicrotubule growth
control in Ashbya gossypii. Eukaryot. Cell 10, 902–915.
25. Grava, S., and Philippsen, P. (2010). Dynamics of multiple nuclei in
Ashbya gossypii hyphae depend on the control of cytoplasmic microtu-
bules length by Bik1, Kip2, Kip3, and not on a capture/shrinkage mech-
anism. Mol. Biol. Cell 21, 3680–3692.
26. Gardiner, C.W. (1985). Handbook of Stochastic Methods for Physics,
Chemistry, and the Natural Sciences (Berlin: Springer-Verlag).
27. Gundersen, G.G., and Worman, H.J. (2013). Nuclear positioning. Cell
152, 1376–1389.
28. Gibeaux, R., Lang, C., Politi, A.Z., Jaspersen, S.L., Philippsen, P., and
Antony, C. (2012). Electron tomography of the microtubule cytoskeleton
in multinucleated hyphae of Ashbya gossypii. J. Cell Sci. 125, 5830–
5839.
29. Lang, C., Grava, S., van den Hoorn, T., Trimble, R., Philippsen, P., and
Jaspersen, S.L. (2010). Mobility, microtubule nucleation and structure
of microtubule-organizing centers in multinucleated hyphae of Ashbya
gossypii. Mol. Biol. Cell 21, 18–28.
30. Alberti-Segui, C., Dietrich, F.S., Altmann-Johl, R., Hoepfner, D., and
Philippsen, P. (2001). Cytoplasmic dynein is required to oppose the
force that moves nuclei towards the hyphal tip in the filamentous asco-
mycete Ashbya gossypii. J. Cell Sci. 114, 975–986.
31. Vogel, S.K., Pavin, N., Maghelli, N., Julicher, F., and Toli�c-Nurrelykke,
I.M. (2009). Self-organization of dynein motors generates meiotic
nuclear oscillations. PLoS Biol. 7, e1000087.
32. Field, C.M., Wuhr, M., Anderson, G.A., Kueh, H.Y., Strickland, D., and
Mitchison, T.J. (2011). Actin behavior in bulk cytoplasm is cell cycle
regulated in early vertebrate embryos. J. Cell Sci. 124, 2086–2095.
33. Mitchison, T., Wuhr, M., Nguyen, P., Ishihara, K., Groen, A., and Field,
C.M. (2012). Growth, interaction, and positioning of microtubule asters
in extremely large vertebrate embryo cells. Cytoskeleton (Hoboken)
69, 738–750.
34. Wuhr, M., Tan, E.S., Parker, S.K., Detrich, H.W., 3rd, and Mitchison, T.J.
(2010). Amodel for cleavage plane determination in early amphibian and
fish embryos. Curr. Biol. 20, 2040–2045.
35. Freitag, M., Hickey, P.C., Raju, N.B., Selker, E.U., and Read, N.D. (2004).
GFP as a tool to analyze the organization, dynamics and function of
nuclei and microtubules in Neurospora crassa. Fungal Genet. Biol. 41,
897–910.
36. Frescas, D., Mavrakis, M., Lorenz, H., Delotto, R., and Lippincott-
Schwartz, J. (2006). The secretory membrane system in the
Drosophila syncytial blastoderm embryo exists as functionally compart-
mentalized units around individual nuclei. J. Cell Biol. 173, 219–230.
37. Mavrakis, M., Rikhy, R., and Lippincott-Schwartz, J. (2009). Cells within
a cell: Insights into cellular architecture and polarization from the orga-
nization of the early fly embryo. Commun. Integr. Biol. 2, 313–314.
38. Mavrakis, M., Rikhy, R., and Lippincott-Schwartz, J. (2009). Plasma
membrane polarity and compartmentalization are established before
cellularization in the fly embryo. Dev. Cell 16, 93–104.
39. Gladfelter, A.S., and Berman, J. (2009). Dancing genomes: fungal
nuclear positioning. Nat. Rev. Microbiol. 7, 875–886.
40. Fantes, P., and Nurse, P. (1977). Control of cell size at division in fission
yeast by a growth-modulated size control over nuclear division. Exp.
Cell Res. 107, 377–386.
41. Fantes, P.A. (1977). Control of cell size and cycle time in
Schizosaccharomyces pombe. J. Cell Sci. 24, 51–67.
42. Fantes, P.A. (1981). Division timing: controls, models and mechanisms.
In The Cell Cycle, P.C.L. John, ed. (New York: Cambridge University
Press).
43. Fantes, P.A. (1981). Cell cycle controls in fission yeast: a genetic anal-
ysis. In The Cell Cycle, P.C.L. John, ed. (New York: Cambridge
University Press).
44. Nurse, P., and Thuriaux, P. (1977). Controls over the timing of DNA repli-
cation during the cell cycle of fission yeast. Exp. Cell Res. 107, 365–375.
45. Gimenez-Martin, G., Lopez-Saez, J.F., Moreno, P., and Gonzalez-
Fernandez, A. (1968). On the triggering of mitosis and the division cycle
of polynucleate cells. Chromosoma 25, 282–296.
Current Biology Vol 23 No 202010
46. Thuriaux, P., Nurse, P., and Carter, B. (1978). Mutants altered in the con-
trol co-ordinating cell division with cell growth in the fission yeast
Schizosaccharomyces pombe. Mol. Gen. Genet. 161, 215–220.
47. Russell, P., and Nurse, P. (1986). cdc25+ functions as an inducer in the
mitotic control of fission yeast. Cell 45, 145–153.
48. Nash, R.S., Volpe, T., and Futcher, B. (2001). Isolation and characteriza-
tion of WHI3, a size-control gene of Saccharomyces cerevisiae.
Genetics 157, 1469–1480.
49. Surana, U., Robitsch, H., Price, C., Schuster, T., Fitch, I., Futcher, A.B.,
and Nasmyth, K. (1991). The role of CDC28 and cyclins during mitosis in
the budding yeast S. cerevisiae. Cell 65, 145–161.
50. Lee, C., Zhang, H., Baker, A.E., Occhipinti, P., Borsuk, M.E., and
Gladfelter, A.S. (2013). Protein aggregation behavior regulates cyclin
transcript localization and cell-cycle control. Dev. Cell 25, 572–584.
51. Wendland, J., Ayad-Durieux, Y., Knechtle, P., Rebischung, C., and
Philippsen, P. (2000). PCR-based gene targeting in the filamentous fun-
gus Ashbya gossypii. Gene 242, 381–391.
52. Ayad-Durieux, Y., Knechtle, P., Goff, S., Dietrich, F.S., and Philippsen, P.
(2000). A PAK-like protein kinase is required for maturation of young
hyphae and septation in the filamentous ascomycete Ashbya gossypii.
J. Cell Sci. 113, 4563–4575.
53. Edelstein, A., Amodaj, N., Hoover, K., Vale, R., and Stuurman, N. (2001).
Computer Control of Microscopes using mManager (Hoboken: John
Wiley & Sons, Inc.).


