Embed Size (px)
Citation preview

DOCUMENT RESUME
ED 204 208 SO 013 424
TITLE contractor Report: Museum Program Survey, 1979.INSTITUTION National Center for Education Statistics (DREW),
Washington, D.C.REPORT NO NM-81-204PUB DATE Mar 81CONTRACT 300-79-0668NOTE 326p.: Not available from EDRS in paper copy due to
poor reproducibility of tables throughout originaldocument. Some pages may not reproduce clearly fromEDPS in microfiche due +o broken print type oftables.
EDPS PPIC? MF01 Plus Postage. PC Not Available from EDRS.DESrPIPTOPS Educational Improvement: Facility Planning: Facility
Requirements: Facility Utiliza+ioa Research:Financial Support: *Museums: National Surveys:Professional Personnel: Program Effectiveness:Questionnaires: Statistical Surveys: Tables (Data(
ABSTRACTA sample of 1,373 museums was selected to represent
the total sample of 4,408 nonprofit museums in the 50 states and theDistrict of Columbia. Museums in the sample were surveyed in 1979 bymeans of a survey questionnaire and informal interviews to providedata in five areas--finance, program, facilities, personnel, andmuseum priorities. For the purposes of the survey, a museum wasdefined as an institution organized on a peraanent basis foressentially educational or aesthetic purposes that utilizes a staff,owns or uses tangible oblects, and cares for these objects andexhibits them to the public on a regular basis. Highlights fromsurvey findings include that approximately one -half of all nonprofitmuseums were primarily history museums, one-fifth were sciencemuseums, and an additional 14% were art museums. Findings also showthat museums were fairly uniformly spread throughout the country:slightly over one-half of all museums had a membership program:almost half of museum operating income was earned and an estimated14% of total operating income came from the Federal government:approximately two-thirds of all'institutions had library facilities:slightly over one-half of all institutions had facilities for thephysically handicapped: and approximately two-thirds of all museumshad increasing educational roles, although the percentage ofpersonnel devoted to educational responsibilities has remainedsubstantially unchanged (approximately 9%) in recent years. As apriority, education ranked first, followed by exhibits, conservation,and research, respectively. The document concludes with a copy of thesurvey questionnaire and tables of data. (DUI
************************************************************************ Peproductions supplied by EDRS are the best that can be made ** from the original document. ************************************************************************
rml'-'"let1)1111
I
! 'ft-
BEST COPY AM
co Contractor Report.,N,.._..i.CD Museum Program Survey, 1979r.icmw
...
A
eo
0 National Center for
Ain
Education Statistics
U S DEPARTMENT OF HEALTH,EDUCATION &WELFARENATIONAL INSTITUTE OF
EDUCATION
'...s 00CurOC NT HAS BEEN REPRO.0 r CO ExACTor AS RemvcD FROMr.f Pt R SON OR ORGANIZATION ORIGIN.
A. yr, . PO.NTS Of- VIEW OR OPINSONS'..*FO OD NOT NECESSARILY REPRE',ENT of F ( ,AL NATIONAL INSTITUTE OF.0. r A I.ON POso ION OR POLICY
NIuseum Program Survey. 1979
Lewis C. Price, Ph DLisa DiRoccoJanice D. Lewis
Macro Systems. Inc
NOES Project OfficerHelen Eckard
March 1981
Prepared for the National Center forEducation Statistics under contract0E-300-79-0668 with the U.S. Department ofEducation. Contractors undertaking suchprojects are encouraged to express freelytheir professional judgment. This report,therefore, does not necessarily representpositions on policies of the Qoverreentand no official endorsement should beinferred. This report is released asreceived from the Contractor.
NOES 81 204
aft
ACKNOWLEDGMENTS
Many people contributed generously to the design and implementation of thesurvey. In particular, special thanks are due to Ms. Helen Eckard, the NCESProject Officer, for her support. and guidance throughout the project, and toMr. Abe Frankel and Mr. Fred Fisher, both from NCES, for their assistance inselecting the sample and processing the data.
Thanks are due to the respondents from the sample museums and relatedinstitutions included in this study. Without their cooperation and effort toprovide the required information, successful completion of the study would nothave been possible.
Finally, appreciation is due to th41 following Macro Systems staff and con-sultants for their contributions to the study: Mr. Doug Hickman, statisticalprogramming; Mr. Dhirendra Ghosh, sampling statistics; Ms. Nancy Csider, surveyoperations; Ms. Eddie Hyder, Ms. Linda McLaughlin, Ms. Debbie Candelora and Ms.Jackie Thompson, report preparation.
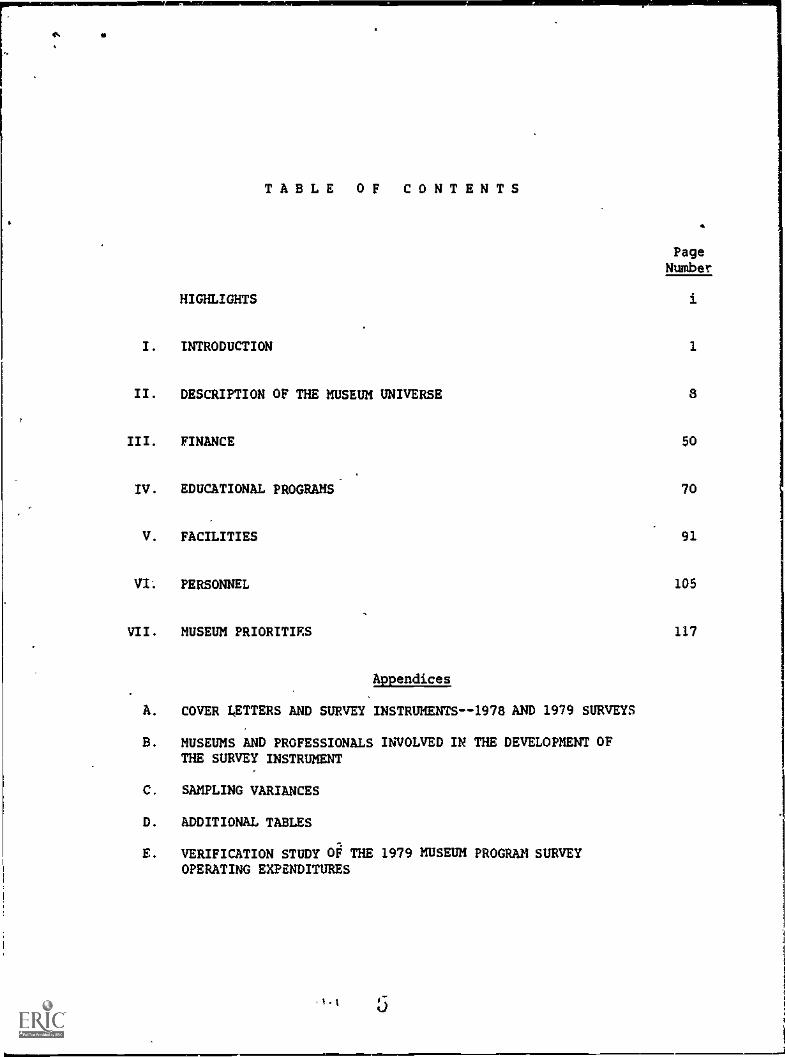
TABLE OF CONTENTS
PageNumber
HIGHLIGHTS
I. INTRODUCTION 1
II. DESCRIPTION OF THE MUSEUM UNIVERSE 8
III. FINANCE 50
IV. EDUCATIONAL PROGRAMS 70
V. FACILITIES
VI. PERSONNEL
VII. MUSEUM PRIORITIES
Appendices
A. COVER UTTERS AND SURVEY INSTRUMENTS - -1978 AND 1979 SURVEYS
B. MUSEUMS AND PROFESSIONALS INVOLVED IN THE DEVELOPMENT OFTHE SURVEY INSTRUMENT
C. SAMPLING VARIANCES
D. ADDITIONAL TABLES
E. VERIFICATION STUDY OF THE 1979 MUSEUM PROGRAM SURVEYOPERATING EXPENDITURES
91
105
117
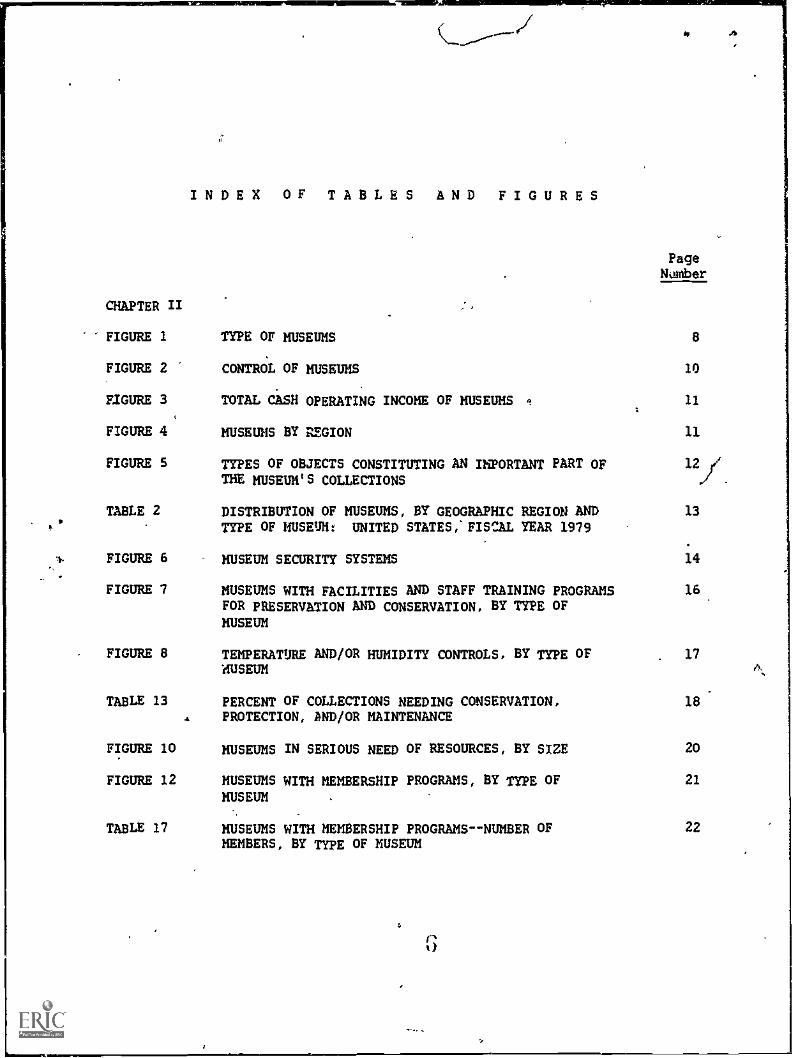
INDEX OF TABLES AND FIGURES
CHAPTER II
FIGURE 1 TYPE OF MUSEUMS
PageNumber
8
FIGURE 2 CONTROL OF MUSEUMS 10
FIGURE 3 TOTAL CASH OPERATING INCOME OF MUSEUMS 1 11
FIGURE 4 MUSEUMS BY REGION 11
FIGURE S 12)/TYPES OF OBJECTS CONSTITUTING AN I)PORTANT PART OFTHE MUSEUM'S COLLECTIONS
TABLE 2 DISTRIBUTION OF MUSEUMS, BY GEOGRAPHIC REGION AND 13
TYPE OF MUSEUM: UNITED STATES, FISCAL YEAR 1979
FIGURE 6 MUSEUM SECURITY SYSTEMS 14
FIGURE 7 MUSEUMS WITH FACILITIES AND STAFF TRAINING PROGRAMS 16
FOR PRESERVATION AND CONSERVATION, BY TYPE OFMUSEUM
FIGURE 8 TEMPERATURE AND/OR HUMIDITY CONTROLS, BY TYPE OF . 171USEUM
TABLE 13 PERCENT OF COLLECTIONS NEEDING CONSERVATION, 184 PROTECTION, AND/OR MAINTENANCE
FIGURE 10 MUSEUMS IN SERIOUS NEED OF RESOURCES, BY SIZE 20
FIGURE 12 MUSEUMS WITH MEMBERSHIP PROGRAMS, BY TYPE OF 21
MUSEUM
TABLE 17 MUSEUMS WITH MEMBERSHIP PROGRAMS--NUMBER OF 22
MEMBERS, BY TYPE OF MUSEUM

INDEX OF TABLES AND FIGURES(continued)
Page
Number
TABLE 18 MEDIAN ANNUAL MEMBERSHIP FEES, BY TYPE OF MUSEUM 22
TABLE 19 MEDIAN ANNUAL MEMBERSHIP FEES, BY SIZE OF MUSEUM 23
TABLE 22' MEDIAN ADMISSION FEES, BY TYPE OF MUSEUM 24
FIGURE 14 TOTAL MUSEUM ATTENDANCE BY YEAR: UNITED STATES, 251979
FIGURE 15 SOURCES OF OPERATING INCOME, BY TYPE OF MUSEUM 26
FIGURE 16 PERCENT OF TOTAL MUSEUM EXPENDITURES SPENT IN 27EACH AREA OF OPERATION
TABLE 26 oTOTAL ACQUISITION EXPENDITURES, BY TYPE 28
TABLE 1 TYPE OF MUSEUM, BY TOTAL OPERATING INCOME OF 29MUSEUM
TABLE 3 FREQUENCIES OF OBJECTS IN COLLECTION - ART, 30
BY TYPE OF MUSEUM AND TYPE OF OBJECTS IN-COLLECTION: UNITED STATES, FISCAL YEAR 1979
TABLE 4
TABLE 5
TABLE 6
FREQUENCIES OF OBJECTS IN COLLECTION - HISTORY,BY TYPE OF MUSEUM AND TYPE OF OBJECTS INCOLLECTION: UNITED STATES, FISCAL YEAR 1979
FREQUENCIES OF OBJECTS IN COLLECTION - SCIENCE,BY TYPE OF MUSEUM AND TYPE OF OBJECTS INCOLLECTION: UNITED STATES; FISCAL YEAR 1979
FREQUENCIES OF OBJECTS IN COLLECTION -S?ECIALIZED, BY TYPE'OF MUSEUM AND OBJECTS INCOLLECTION: UNITED STATES, FISCAL YEAR 1979
30
31
32
TABLE 7 MUSEUMS WITH FIRE AND BURGLAR ALARMS, BY TYPE 33
TABLE 8 MUSEUMS EMPLOYING SECURITY GUARDS, BY TYPE 34
7
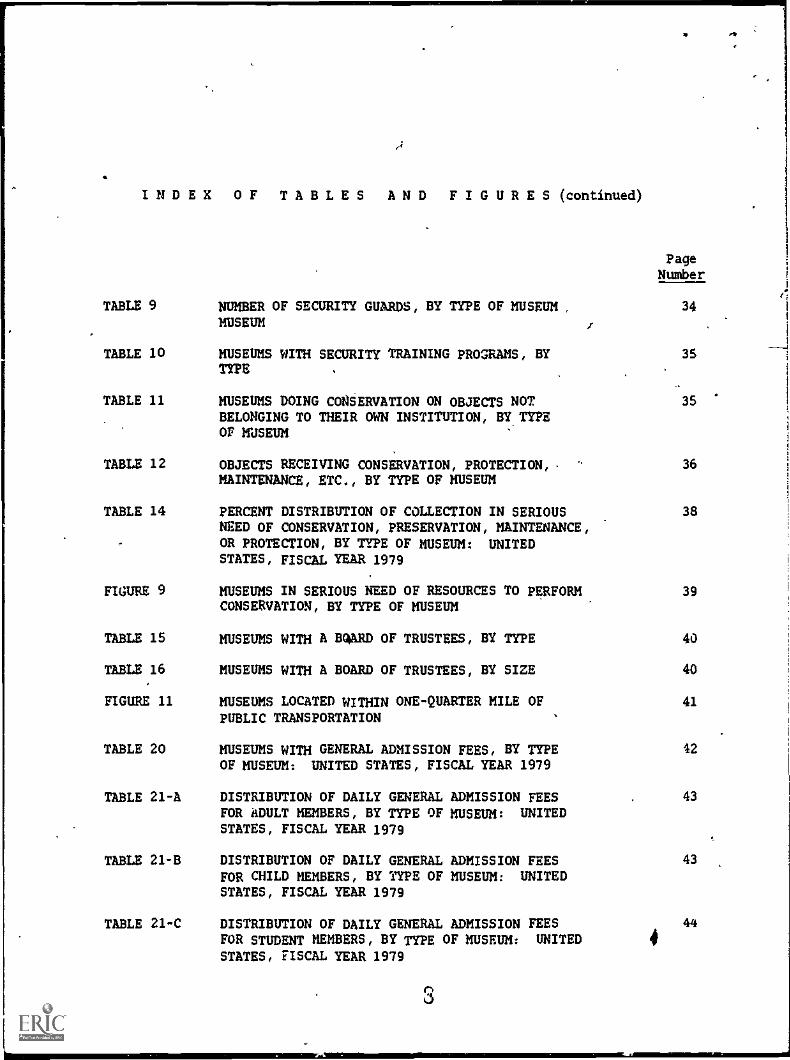
INDEX OF TABLES AND FIGURES (continued)
PageNumber
TABLE 9 NUMBER OF SECURITY GUARDS, BY TYPE OF MUSEUM, 34
MUSEUM
TABLE 10 MUSEUMS WITH SECURITY TRAINING PROGRAMS, BY 35TYPE
TABLE 11 MUSEUMS DOING CONSERVATION ON OBJECTS NOT 35BELONGING TO THEIR OWN INSTITUTION, BY TYPEOF MUSEUM
TABLE 12 OBJECTS RECEIVING CONSERVATION, PROTECTION,- Pb 36
MAINTENANCE, ETC., BY TYPE OF MUSEUM
TABLE 14
FIGURE 9
PERCENT DISTRIBUTION OF COLLECTION IN SERIOUSNEED OF CONSERVATION, PRESERVATION, MAINTENANCE,OR PROTECTION, BY TYPE OF MUSEUM: UNITEDSTATES, FISCAL YEAR 1979
MUSEUMS IN SERIOUS NEED OF RESOURCES TO PERFORMCONSERVATION, BY TYPE OF MUSEUM
38
39
TABLE 15 MUSEUMS WITH A B4ARD OF TRUSTEES, BY TYPE 40
TABLE 16 MUSEUMS WITH A BOARD OF TRUSTEES, BY SIZE 40
FIGURE 11 MUSEUMS LOCATED WITHIN ONE-QUARTER MILE OF 41
PUBLIC TRANSPORTATION
TABLE 20 MUSEUMS WITH GENERAL ADMISSION FEES, BY TYPE 42
OF MUSEUM: UNITED STATES, FISCAL YEAR 1979
TABLE 21-A DISTRIBUTION OF DAILY GENERAL ADMISSION FEES 43
FOR ADULT MEMBERS, BY TYPE OF MUSEUM: UNITEDSTATES, FISCAL YEAR 1979
TABLE 21-B DISTRIBUTION OF DAILY GENERAL ADMISSION FEES 43
FOR CHILD MEMBERS, BY TYPE OF MUSEUM: UNITEDSTATES, FISCAL YEAR 1979
TABLE 21-C DISTRIBUTION OF DAILY GENERAL ADMISSION FEES 44
FOR STUDENT MEMBERS, BY TYPE OF MUSEUM: UNITED 4STATES, FISCAL YEAR 1979
S

INDEX OF TABLES AND FIGURES (continued}
TABLE 21-D
TABLE 21-E
TABLE 21-F
FIGURE 13
TABLE 23
TABLE 24
TABLE 25 k
CHAPTER III
TABLE 31
TABLE 32
FIGURE 17
.40
DISTRIBUTION OF DAILY GENERAL ADMISSION FEESFOR SENIOR CITIZEN MEMBERS, BY TYPE OF MUSEUM:UNITED STATES:FISCAL YEAR 1979
DISTRIBUTION OF DAILY GENERALFOR GROUP MEMBERS, BY TYPE OFSTATES, FISCAL YEAR 1979
DISTRIBUTION OF DAILY GENERALFOR OTHER MEMBERS, BY TYPE OFSTATES, FISCAL YEAR 1979
ADMISSION FEESMUSEUM: UNITED
ADMISSION.FEESMUSEUM: UNITED
MUSEUMS CHARGING ADMISSION FEES, BY SIZE OFMUSEUM
TOTAL OPERATING INCOME, B2 TYPE OF MUSEUM ANDSOURCE OF OPERATING INCOME: UNITED STATES,FISCAL YEAR 1974'
SOURCE OF EARNED INCOME, BY TYPE OF MUSEUM:UNITED STATES, FISCAL YEAR 1979
DISTRIBUTION OF OPERATING EXPENDITURES ACROSSPROGRAM AREAS, BY TYPE OF MUSEUM: UNITEDSTATES, FISCAL YEAR 1979
AVERAGE ANNUAL ATTENDANCE, 1975-1979, BY TYPE OFMUSEUM: UNITED STATES, FISCAL YEAR 1979
PERCENTAGES OF TOTAL CASH OPERATING INCOME FROMFOUNDATIONS, CORPORATIONS, AND OTHER NON-GOVERNMENTSOURCES
10,*
TOTAL FEDERAL SUPPORT FROM SPECIFIC SOURCES
FIGURE 18 MUSEUMS WHICH EXPERIENCED A GAIN, LOSS OR BROKEEVEN, BY TYPE
tivti 3
PageNumber
44
45
45
46
47
48
49
52
52
53
55

TABLE 35
INDEX OF TABLES AND FIGURES(continued)
RATIO OF CAPITAL EXPENDITURES TO OPERATINGEXPENDITURES, BY TYPE OF MUSEUM: UNITED STATES,FISCAL YEAR 1979
PageNumber
56
TABLE 36 MEAN STAFF BY TYPE, BY NET INCOME 59
FIGURE 19 MUSEUMS UNABLE TO ABSORB THE IMPACT OF INFLATION 61WITHOUT REDUCING THE LEVEL OF OPERATIONS, BY TYPE
TABLE 27 ACCURATE ATTENDANCE MEASUREMENT METHOD, BY TYPE 62
9OF MUSEUM: UNITED STATES, FISCAL YEAR 1979
TABLE 28 ATTENDANCE RANGES,-BY YEAR (1975 THROUGH 1979) 63
TABLE 29 ANNUAL ATTEMANCE: 1979, BY TYPE OF MUSEUM: - 64
UNITED STATES, FISCAL YEAR 1979
TABLE 30 TOTAL ANNUAL ATTENDANCE, 1975-1979, BY TYPE OFMUSEUM: UNITED STATES: FISCAL YEAR 1979
TABLE 33 TOTAL CASH OPERATING INCOME FROM FEDERALGOVERNMENT SOURCES, BY TYPE
TABLE 34 MUSEUMS WITH ENDOWMENT FUNDS, BY TYPE OF MUSEUM:UNITED STATES, FISCAL YEAR 1979
TABLE 37 MUSEUMS WITH FACILITIES FOR CONSERVATION ANDPRESERVATION, BY TYPE AND NET INCOME
TABLE 38 PERCENT OF COLLECTIONS NEEDING UPKEEP
TABLE 39 IMPACT OF INFLATION, BY GEOGRAPHIC REGION:UNITED STATES, FISCAL YEAR 1979
64
65
66
67
67
68
TABLE 40 AREAS OF ACTIVITY REDUCED BY MUSEUMS UNABLE TO 69
ABSORB THE IMPACT OF INFLATION, BY TYPE
10

sr
INDEX OF TABLES AND FIGURES(continued)
CHAPTER IV
TABLE 42
FIGURE 20
FIGURE 21
FIGURE 22
FIGURE 23
FIGURE 24
FIGURE 25
FIGURE 26
FIGURE 27
FIGURE 28
TABLE 41
TABLE 43-A
TABLE 43-B
TRENDS IN EDUCATIONAL ROLES, BY SIZE O TOTAL'OPERATINt, EXPENDITURE: UNITED STATES,.FISCAL YEAR1979
EDUCATIONAL ROLE OF MUSEUMS, BY GEOGRAPHIC REGION
DISTRIBUTION OF SELECTED TYPES OF MUSEUMS OFFERINGFINE ARTS PROGRAMS, BY TYPE OF PARTICIPANT
DISTRiBUiION OF INSTITUTIOWOFFERING SPECIFICPROGRAMS, BY TYPE OF MUSEUM.
MUSEUMS OFFERING SPECIAL PROGRAMSGROUPS: UNITED STATES, 1979
MUSEUMS OFFERINGMINORITY GROUPS:
MUSEUMS OFFERINGMUSEUM
SPECIAL PROGRAMSUNITED STATES,
TEACHER TRAINING
FOR SPECIFIC
tit
FOR, SPECIFIC
1979
, BY TYPE OF
MUSEUMS PROVIDING PROGRAMS FOR ACADEMIC CREDIT, BYTYPE
MUSEUMS LOANING EXHIBITIONS, BY TYPE
MUSEUMS ASSESSING THE EFFECTIVENESS OF EXHIBITIONS,BY TYPE
TRENDS IN EDUCATIONAL ROLES,' BY TYPE OF MUSEUM:UNITED STATES, FISCAL YEAR 1979
GENERAL EDUCATIONAL PROGRAMS OFFERED--TOURS,BY TYPE OF MUSEUM AND PARTICIPANTS: UNITEDSTATES, FISCAL YEAR 1979
GENERAL EDUCATIONAL PROGRAMS OFFERED--DEMONSTRATIONS, 85
BY TYPE OF MUSEUM AND PARTICIPANTS: UN""7.n STATES,
FISCAL YgARI979
PageNumber
71
72
74
75
75 .1.
78
80.
"81
82
83
84
84

INDEX OF TABLES AND.FIGURES(continued)
TABLE 43-C
TABLE -43 -D
TABLE 43-E
TABLE 43-F
TABLE 43-6
7,1)TABLE 43 -H
TABLi 44
-TABLE 45
(
`TABLE 46
CHAPTER V
FIGURE 29
GENERAL EDUCATIONAL PROGRAMS OFFERED--SPECIALLECTURES, BY TYPE OF MUSEUM AND PARTICIPANTS,\UNITED STATES, FISCAL YEAR 1979
GENERAL EDUCATIONAL PROGRAMS OFFERED--CLASSES,WORKSHOPS, SEMINARS, BY TYPE OF MUSEUM ANDPARTICIPANTS: UNITED STATES, FISCAL YEAR 1979
GENERAL EDUCATIONAL PROGRAMS' OFFERED-- PERFORMINGAnspeoGnms, BY TY# OF muspi AND PARTICIPANTS:UNITED STATES, FISCAL YEAR 1979
GENERAL EDUCATIONAL PROGRAMS OFFERED--FILMSANDATHER MEDIA PRowmq, BY TYPE OF MUSEUM ANDPARTICIPANTS: UN/TgD STATES, FISCAL YEAR 1979
GENERAL EDUCATIONAL'PggRAMS OFFERED -- OUTREACHPROD BY. TYPEl'OF MUSEUM AND PARTICIPANTS:UNI D STATES, FISCAL YEAR 1979
GENERAL EDUCATIO4AL PROGRAMS OFFERED--OTHERPROGRAMS, BY TYPg OF MUSEUM AND PARTICIPANTS:UNITED STATES, FISCALYEAR 1979
AUDIENCES FOR MUSEUNS OFFERING SPECIFIC PROGRAMS,BY TYPE OF MUSEUM: UNITEP STATES, FISCAL YEAR1979 . , I
PROGRAMS DESIGNED FOO S CIFIC ETHNIC GROUPS,BY TYPE OF MUSEUM: UNI. ED STATES, FISCAL YEAR1979
PROGRAMS DESIGNED FOR SPECIFIC ETHNIC GROUPS,'BY GEOGRAPHIC REGION: UNITED STATES, FISCALYEAR 1979
MUSIUMS FACILITIES OWNED AND/OR OPERATED BY ANZNTITY OTHER THAN THE GOVERNING AUTHORITY
2A.
PageNumber
85
86
87
87
8R
88
89
90
90
91

INDEX OF TABLES AND FIGURES(continued)
PageNumber
FIGURE 30 DISTRIBUTION OF MUSEUMS BY NUMBER OF BOOK TITLES 94
FIGURE 31 MUSEUMS WITH FACILITIES FOR THE HANDICAPPED, BY 95TYPE
FIGURE 32 MUSEUMS BY raCENT OF FACILITY ACCESSIBLE TO THE 96MOBILITY IMPAIRED
TABLE 47 DISTRIBUTION OF MUSEUMS OWNED AND/OR OPERATED 98BY AN ENTITY OTHER THAN THE GOVERNING AUTHORITY,BY TYPE
TABLE 48 FACILITIES AVAILABLE FOR PUBLIC USE AND METHOD 99OF OPERATION, BY TYPE OF MUSEUM: UNITED STATES,FISCAL YEAR 1979
TABLE 49 TYPE OF LIBRARY, BY TYPE OF MUSEUM: UNITEDSTATES, FISCAL YEAR 1979
TABLE SO NUMBER OF BOOKS FOR MUSEUMS WITH LIBRARIES,BY TYPE Of MUSEUM: UNITED STATES, FISCALYEAR 1979
TABLE 51 NUMBER OF PERIODICAL SUBSCRIPTIONS FOR MUSEUMSWITH LIBRARIES, BY TYPE OF MUSEUM: UNITEDSTATES, FISCAL YEAR 1979
TABLE 52 PERCENT OF DISTRIBUTION OF EXHIBITION SPACEUTILIZED, BY TYPE OF MUSEUM: UNITED STATES,FISCAL YEAR 1979
TABLE 53 PERCENT OF DISTRIBUTION OF STORAGE SPACEUPLIZED, BY TYPE OF MUSEUM: UNITED STATES,FISCAL YEAR 1979
CHAPTER VI
100
101
102
103
104
FIGURE 33 DISTRIBUTION OF REGULAR FULL -TIME PERSONNEL, BY 105
AREA OF RESPONSIBILITY
FIGURE 34 --'11NIVARIATE DISTRIBUTIONS OF SALARY RANGES FOR 108MUSEUM STAFF FOR ALL MUSEUMS: UNITED STATES, 1979

INDEX OF TABLES AND FIGURES (continued}
TABLE 54
TABLE 55-A
-
DISTRIBUTION OF REGULAR FULL-TIME STAFF ACROSSAREAS OF RESPONSIBILITY, BY TYPE OF MUSEUM:UNITED STATES, FISCAL YEAR 1979
SALARY DISTRIBUTION OF FULL-TIME CURATORIALSTAFF, BY SALARY RANGE AND TYPE OF MUSEUM:UNITED STATES, FISCAL YEAR 1979,
TABLE 55-B SALARY DISTRIBUTION OF FULL-TIME EXHIBITS STAFF,BY SALARY RANGE AND TYPE OF MUSEUM: UNITEDSTATES, FISCAL YEAR 1979
TABLE 55-C SALARY DISTRIBUTION OF FULL-TIME CONSERVATIONSTAFF, BY SALARY RANGE AND TYPE OF MUSEUM:UNITED STATES, FISCAL YEAR 1979
TABLE 55-D SALARY DISTRIBUTION OF FULL-TIME EDUCATIONSTAFF, BY SALARY RANGE AND TYPE OF MUSEUM:UNITED STATES, FISCAL YEAR 1979
TABLE 55-E SALARY DISTRIBUTION OF FULL-TIME DEVELOPMENTSTAFF, BY SALARY RANGE AND TYPE OF MUSEUM:UNITED STATES, FISCAL YEAR 1979
TABLE 55-F SALARY DISTRIBUTION OF FULL-TIME MEMBERSHIPSTAFF, BY SALARY RANGE AND TYPE 07 MUSEUM:UNITED STATES, FISCAL YEAR 1979
TABLE 55-G SALARY DISTRIBUTION OF FULL-TIME PUBLICINFORMATION STAFF, BY SALARY RANGE AND TYPE OFMUSEUM: UN/TED.STATES, FISCAL YEAR 1979
TABLE 55-H SALARY DISTRIBUTION OF FULL-TIME LIBRARY STAFF,BY SALARY RANGE AND TYPE OF MUSEUM: UNITEDSTATES, FISCAL YEAR 1979
TABLE 55-I SALARY DISTRIBUTION OF FULL-TIME GENERALISTSTAFF, BY SALARY RANGE AND TYPE OF MUSEUM:UNITED STATES, FISCAL YEAR 1979
1.0
PageNumber
109
110
110
111
111
112
112
113
113
114

INDEX OF TABLES AND FIGURES(continued)
TABLE 55-J SALARY DISTRIBUTION OF FULL-TIME GENERALADMINISTRATION STAFF, BY SALARY RANGE AND TYPEOF MUSEUM: UNITED STATES, FISCAL YEAR 1979
TABLE 55-K SALARY DISTRIBUTION OF FULL-TIME SECURITY STAFF,BY SALARY RANGE AND TYPE OF MUSEUM: F4ATEDSTATES, FISCAL YEAR 1979
TABLE 55-L SALARY DISTRIBUTION OF FULL -TIME BUILDING ANDMAINTENANCE STAFF, BY SALARY RANGE AND TYPE OFMUSEUM: UNITED STATES, FISCAL YEAR 1979
TABLE 55-M SALARY DISTRIBUTION OF FULL-TIME OTHER STAFF, BYSALARY RANGE AND TYPE OF MUSEUM: UNITFDSTATES, FISCAL YEAR 1979
TABLE 55-N SALARY DISTRIBUTION OF FULL-TIME TOTAL STAFF,BY SALARY RANGE AND TYPE OF MUSEUM: UNITEDSTATES, FISCAL YEAR 1979
CHAPTER VII
PageNumber
114
115
115
116
116
TABLE 56 HIGHEST PRIORITY OF MUSEUM ACTIVITIES, BY TYPE 118OF MUSEUM
4?)
TABLE 57-A ELUCATION PRIORITY OF MUSEUM ACTIVITIES, BY TYPE 119OF HOjEUM: UNITED STATES, FISCAL YEAR 1979
TABLE 57-B EXHIBITION PRIORITY OF MUSEUM ACTIVITIES, BY 119TYPE OF MUSEUM: UNITED STATES, FISCAL YEAR 1979
TABLE 57-C CONSERVATION PRIORITY OF MUSEUM ACTIVITIES, BY 120
TYPE OF MUSEUM: UNITED STATES, FISCAL YEAR 1979
TABLE 57-D RESEARCH PRIORITY OF MUSEUM ACTIVITIES, BY TYPE 120OF MUSEUM: UNITED STATES, FISCAL YEAR 1979
TABLE 57-E OTHER PRIORITIES OF MUSEUM ACTIVITIES, BY TYPE 121
OF MUSEUM: UNITED STATES, FISCAL YEAR 1979

HIGHLIGHTS
Characteristics Of The 1979 Nonprofit Museum Universe
In 1979, approximately one-half of all nonprofit museums were primarilyhistory museums, one-fifth were science museums, and an additional 14 per-cent were art museums. General museums, specialized museums, parks andvisitor centerb, and children's museums made up the balance.
Oven' one-half of all nonprofit museums were controlled or governed by aprivate, nonprofit organization, and an additional one-third were con-trolled by government agencies.
Museums were fairly uniformly spread throughout the country.
Slightly over one-half of all museums had a membership program, and themajority of these programs enrolled fewer than 500 members.
Total museum attendance rose by approximately 50 million visitors (16 per-cent) from 1975 to 1919. and total 1979 attendance was approximately 350million visitors.
I'..nances
Approximately one-third of all funds were expended on building and mainte-nance activities.
Almost half (42 percent) of museum operating income was earned.
Less than one-fourth of total operating income came from contributions andgrants from non-government sources, i.e., foundations, corporations, indi-vidual contributions, and other sources.
An estimated 14 percent of total operating income came from the Federalgovernment, with deg es of Federal support ranging on the average fromless than 5 percent or specialized museums to almost one-half of themuseum's total operating income for parks and visitor centers.
An indicator of the financial status of museums was obtained by subtractingtotal operating income from total operating expenditures; results showedthat 53 percent of all museums broke even, 11 percent suffered a net loss,and 36 percent showed a net gain in 1979.
Those museums that had a riot loss had a greater median number of membersand also had higher membership fees than those institutions that had a netgain or broke even.
., i 1`-La)

The mean number of staff of museums experiencing a net loss was approxi-mately twice that of those experiencing a uet gain.
Approximately one-third of all museums were unable to absorb the impact ofinflation without reducing the level of 1979 operations below that of thepreceding year.
Educational Programs
Approximately two-thirds of all museums had increasing educational roles,whereas only 2 percent had decreasing educational roles.
Museums offered a wide variety of general educational activities; over one-half of all museums offered tours, demonstrations, special lectures, andfilms and other media programs for one or more types of participants.
Approximately two-thirds of the total museums offered some type of specificprogram in fiscal year 1979.
Less than one out of ten museums offered programs specifically designed toserve various ethnic audiences.
Facilities
Only about one-fifth of all museums had facilities owned and/or operated byan entity other than the governing institution.
Approximately two-thirds of all institutions had library facilities. Mostof these had between 1 and 5,000 distinct book titles in their library.
Slightly over one-half of all institutions had facilities for the physi-cally handicapped.
Personnel
An estimated two-fifths of the regular full-time museum personnel spent amajority of their time in either general administration or building andmaintenance.
The percentage of personnel devoted to educational responsibilities hasremained substantially unchanged (approximately 9 percent) in recent years.
Priorities
As a priority, education ranked first, followed by exhibits, conservation,and research, respectively.
ii

I. INTRODUCTION
1. BACKGROUND AND PROCEDURE
Today's museums are facing a variety of problems that are common to manypublic service organizations: inflation and rising operating costs, increasingdemands for services, decreasing private support, and increasing security needs.In response to many of these problems, Congress enacted the Museums Services Acton October 8, 1976, which established the Institute of Museum Services (IN§)within what was then the Department of Health, Education, and Welfare:LIThe purpose of INS, as mandated by Congress, is:
to encourage and assist museums im their educational role inconjunction with formal systems of elementary, secondary andpostsecondary education and with programs of non-formal educationfor all age groups; to assist museums in modernizing their meth-ods and facilities so that they may be better able to conserveour cultural, historic, and scientific heritage; and to ease thefinancial burden borne by museums as a result of their increas-ing use by the public. (20 U.S.C. 916-968)
To achieve these purposes, IMS is authorized to award grants to museums forsuch activities as:
Developing and maintaining professionally trained and experiencedstaff
Meeting administrative costs associated with preservation, ehi-bition, and education
Cooperating with other museums to develop traveling exhibitions,meeting transportation costs, and identifying and locating col-lections available for loan
Conserving artifacts and art objects
Developing and carrying out special programs for certain seg-ments of the public, such as programs for urban neighborhoods,rural areas, Indian reservations, and penal and other Stateinstitutions
IMS later became part of the Department of Education.

IMS funding is guided by the policy directions of the National Museum Ser-vices Board. In ordec to develop general policies concerning the powers,duties, and authorities vested in IMS, the National Museum Services Board musthave current information concerning the programs and needs of museums.
Initially, the National Museum Services Board and IMS had little currentand comprehensive data on the situation in the museum field.3/ Therefore, theyrequested the National Center for Education Statistics (NCES) to conduct a com-prehensive survey of all institutions in the nation that met the definition of amuseum in 1978.1/ The purpose of the 1978 survey was to assemble, for the firsttime, a comprehensive database of the complete museum universe in the UnitedStates and to provide a descriptive analysis of a few key characteristics ofmuseums. The data.collected included: an updated name and adckess, identifica-tion of key manage tent, current telephone number, control of institution, typeof institution, year chartered, number of employees, weeks open per year, annualattendance, and current operating expenditures during the reporting year (totaland museum function only). Appendix A contains a copy of the 1978 universe sur-vey form. The 1978 universe survey provided the sampling frame for conductingan in-depth sample survey of the 1979 museum universe discussed in this report.
A sample of 1,373 nonprofit museums in 50 States'and the District of Colum-bia was taken from the universe of 4,5801 nonprofit museums. For the purposesof this survey, a museum was defined as an institution organized on a permanentbasis for essentially educational or aesthetic purposes and that utilizes astaff; owns or uses tangible objects, whether animate or inanimate; cares forthese Objects; and exhibits them to the public on a regular basis. Museumdirectors were requested to complete a detailed mail survey form concerningtheir institutions (see Appendix A for cover letter and form). A response rateof 94 percent was achieved. Twenty-one sampled museums were determined to benot yet open to the public, three were permanently closed, and five did not meetthe definition of a museum. These last three categories were estimated to com-prise approximately 172 museums in the 1978 universe. Thus, approximately 4,408
1/ The first and only comprehensive survey of all types of museums in theUnited States, which was conducted by the National Endowment for the Arts andreported in Museums USA 1974, was based on data from only 728 institutions forFY 1971-72. Since then, no surveys have gathered similar informatiLn from sucha wide variety of institutions.
2/ A museum is defined as "an institution organized on a permanent basis foressentially educational or aesthetic purposes, which, utilizing a staff, owns oruses tangible objects, whether animate or inanimate, cares for these objects andexhibits them to the public on a regular basis."
4/- In the course of the survey, 49 iuplicate institutions (i.e., same museumwith different names, addresses, etc., or group of museums owned and/or oper-ated by an umbrella agency) were identified in the universe and the originaluniverse size of 4,629 was appropriately adjusted (4,580).
-2-
(4,580 - 172) nonprofit museums were estimated to be onen to the public in 1979.The survey data from the sampled respondents analyzed in this report wereweighted so as to represent these museums.
2.4
ISSUES ADDRESSED
The survey analyses Address five key issue aspects of museums: financial,program, facilities, personnel, and museum priorities. Many of these issueswere identified or crystallized in a formative evaluation of the 3979 surveyinstrument carried out prior to the conduct of the survey.V Informal inter-views were carried out with a number of museum directors in late spring of 1979to discuss issues and information needs facing museums.
(1) Financial Concerns (Chapter III)
Museums appear to be facing financial difficulties as the result of avariety of forces. Inflation has led to rising operating costs and hascaused increased difficulty in obtaining private support. Increasingdemand for museum services has resulted in greater security needs and,thus, enhanced capital requirements. The increasing demand has alsocreated the context for increasing dependence on Federal, funds, but thissupport has also brought with it the costs associated with compliance withFederal regulations. One current example of the costs associated withFederal support is the cost.of complying with regulations concerning pro-visions for handicapped persons, as outlined in Section 504 of the Reha-bilitation Act of 1973.
Several outcomes are associated with the financial difficulties ofmuseums, but of greatest concern is potential reduction in museum services.This service reduction may result directly from financial problems, or itmay be related to a decrease in staff with specialized training. To over-come financial problems, institutions may respond by hiring more staff withbusiness management skills and fewer staff with museum skills. Or theinstitutions may increase user fees, which can, in turn, lead to a reduc-tion in the accessibility of services to certain population groups.
The following questions relating to financial concerns of museums in1979 are addressed in this study:
What was the demand for museum services?
What was the level of private support of museums?
What was the level of Federal support?
5/Russ-Eft, Darlene. Formative Evaluation of the 1979 Museum Survey Form,
Statistical Analysis Group in Education - American Institutes for Research, PaloAlto, California, 1979.

How many museums experienced severe financial" problems in 1979?
Hew did museums experiencing financial difficulty differ fromother museums regarding their user programs and fees, types andnumbers of staff, and conservation needs?
Were museums able to absorb the impact of inflation on cost ofsalaries, wages, goods, and services without reducing the levelof current operations below the prior year's level?
(2) Educational Programs (Chapter IV)
Traditionally, museums have been concerned with collecting, preserv-ing, and exhibiting our heritage and culture. Partly as a result of Fed-eral support for educational programs in museums and the widening audiencefor museums' services, the major focus of museum activities is shiftingtoward educational experiences for the public. Some museum administratorsworry about the changing emphasis; they are concerned that the collection,preservation, and research activities may be neglected. This is especiallytrue if museums are facing financial difficulties and must make criticaldecisions about the direction of their activities.
On the other side, there are those who believe that the educationalpotential of museums has yet to be discovered and fully utilized. Thesepeople feel that few museums, let alone Congress and the voting public,realize the variety of educational programs that could be provided. Also,although some museums may have educational concerns, few studies of theeffectiveness of museum programs from an educational standpoint have beenundertaken.
The following specific questions relating to educational programs ofmuseums in 1979 are addressed inAhis study:
Were museums increasing their educational activities? 'What andhow many activities?
What kinds of educational programs were they offering, and whowere the audiences?
Were sources of information on the effectiveness of museum-basededucational programs being developed?
(3) Facilities (Chapter V)
There may be a discrepancy between museums' activity priorities andiho £dcilities available to them. These discrepancies may signal the needfor additional support (e.g., through the INS grant program). Thus, thefollowing questions are addressed relative to museum facilities in 1979:
2'-4-
ti
Who owned the facilities?
What kinds of facilitiesuse?
How much of the availablelized by museums?
(4) Personnel (Chapter VI)
were available in museums for public
exhibition and storage space was uti-
As discussed above, changes are occurring in the role and activitiesof museums, and such changes may be reflected in the composition of thestaff. For example, as education becomes of increasing concern to museums,the numbers of staff assigned to educational responsibilities will prob-ably increase. With financial problems of more concern, institutions maybe able to increase their educational staff only by reducing the staffassigned to conservation, curatorial, registration, and research activi-ties. At the same time, the financial and security problems encounteredby museums have resulted in increasing demands for staff with skills fordealing with these problems.
The low salary levels of museum personnel relative to comparable occu-pations pose a serious threat that museums will not be able to find andretain well-educated and qualified personnel. This roblem arises at atime when there is a felt need to improve the quality of museum staffs.One aspect of this concern can be seen in the increasing emphasis to setprofessional standards and to establish procedures for museum accreditationby the American Association of Museums.
Specific questions addressed regarding museum personnel in 1979include:
Were the numbers of personnel with educational responsibilitiesincreasing while those with curatorial, conservation, andresearch emphasis were decreasing?
Did Museum workers receive relatively low wages compared to per-sons working in similar positions in other fields?
(5) Museum Priorities(Chapter VII)
Finally, this study addresses the nation's museums' priorities in 1979as they relate to the following activities:
EducationExhibitionConservation/preservationResearchOther
-5-
st

3. USEFULNESS TO OTHER NATIONAL ORGANIZATIONS
In addition to providing the National Museum Board and IMS with informationabout the museum field that can be used in making policy and program decisions,the survey provides data useful to the Nat" nal ndowment for the Arts, theNational Endowment for the Humanities, and t ational Science Foundation inplanning their funding programs for museum activities. The survey results alsoprovide useful comparative information to local museum directors for planningand developing their programs.
4. SURVEY METHODOLOGY
A number of museum professionals were involved in the design of the surveyinstrument (see Appendix 8). The survey form was critiqued by various groups ofmuseum directors through regional meetings sponsored by NCES. Additionally, aformative evaluation of the survey form 15.1 was conducted, resulting in finalrevisions to content of the questions, axd the survey contractor adapted theformat to direct machine coding. An assessment of the survey items resultingfrom the 1979 experience is provided under a separate cover.1/
The sample was drawn by the NCES using the 1978 museum universe survey asthe sampling frame. Because IMS was interested in national estimates pertainingto nonprofit museums eligible for the INS grant program, all for-profit museumswere deleted from the universe file prior to drawing the sample. The remainingmuseums were stratified by type, control, size (as defined by 1978 operatingexpenditures), and geographic region. A stratified random sample was drawnselecting large museums with certainty. The details of the sample selection andsurvey procedures are described under a separate cover.V
The survey instrument was mailed to museum directors on December 12, 1979.Nonrespondent follow-ups included a reminder letter, telephone follow-up, secondsurvey ,mailout, followed by a final telephone' follow-up. A 94 percent responserate w e achieved. All surveys went through extensive manual and machine editchecks to detect and correct logic and consistency errors. All errors in thedata submissions were resolved with the museum directors by telephone; an aver-age of three calls per museum resulted. Noncritical data items still missingfollowing a reasonable number of follow-up attempts were imputed based onresponses of peer museums. Each sampled respondent was appropriately weightedto represent the 1978 universe of nonprofit museums.
Presentation Of Survey Data
The various tables and graphical representations in this report representthe estimated 4,408 nonprofit museums. as of 1978 that were, in fact, open to the
6/Ibid.
1/ 1979 Museum Program Survey: Project Methodology and Evaluation Report,Macro Systems, Inc., November, 1980.
11/ Ibid.
-6-

public in 1979. The reader is cautioned to determine the specific base for per-cent computation (shown as 100 percent) in each table examined in order to avoidmisinterpretation of the data.
Data are most frequently analyzed by museum type (i.e., art, children's,general, history, parks and visitor centers, science, and specialized) as
reported by the museum directors in the 1978 universe survey. Type was definedas that "which most nearly describes your institution's primary activity."Where appropriate, data are also analyzed by region (i.e., North Atlantic, GreatLakes/Plains, Southeast, West/Southwest), size (based on operating expendituresfor the fiscal year ending prior to January 1, 1980),2/ and governing authority(i.e., private/nonprofit organization, municipal government, county government,State government, Federal government, private elementary/secondary school, pri-vate college/university, publi. c school district, public college/university,church/denominational group, industrial or commercial corporation, private indi-
v.i.dual, other). Governing authority was defined as the agency that owns thecollections and assets of the institution but not necessarily its facilities.
Selected samplin4variances are presented in Appendix C.
S. OTHER RESULTS OF THE STUDY
More information is available from the study data than is published here.There are numerous other data presentations that may be useful to selectedaudiences. Qualified investigators and recognized institutions seeking avail-able information may obtain a computer tape and detailed. documentation by writ-ing or calling:
Data Systems BranchNational Center for Education Statistics400 Maryland Avenue, S.W.Washington, D.C. 20202
Attn: Ms. Charlene HoffmanPresidential Building, Suite 205
(301) 436-7900
9/Operating expenditures includes all direct expenditures that are an integral
part of the institution's operation. Excluded are inkind goods and services,overhead and maintenance provided by another or parent organization, and CETAand other paid personnel that logy not be part of the institution's direct expen-ditures but are integral to operation.
-7-

IL. DESCRIPTION OF THE MUSEUM UNIVERSE
O
1. CHARACTERISTICS AND DISTRIBUTION OF MUSEUMS
A total of 4,408 nonprofit museums and related institutions are repre-sented by this survey. They can be described by examining their distribution by(1) type, (2) control, (3) size, and (4) geographic region, which are the fourmain characteristics used in this study.
(1) Type Of Museum
One -half of the museums were classified by their directors as pri-marily history museums in the 1978 universe survey. Approximately 18 per-cent were classified as science museums and 14 percent were classified as
PERCENT
50
45
40
35
30
25
20
15
10
5
t4
A*-1
6
FIGURE 1-- -Type of Museums
N04,408
1/There are an estimated 156 for-profit museums in the United States.
-8-qr.
2,

art museums. The remaining 18 percent were classified as general (9 percent), specialized (4 percent), parks ar.. visitor centers (4 percent), archildren's museums (1 percent).
(2) Control (Governing Authority)
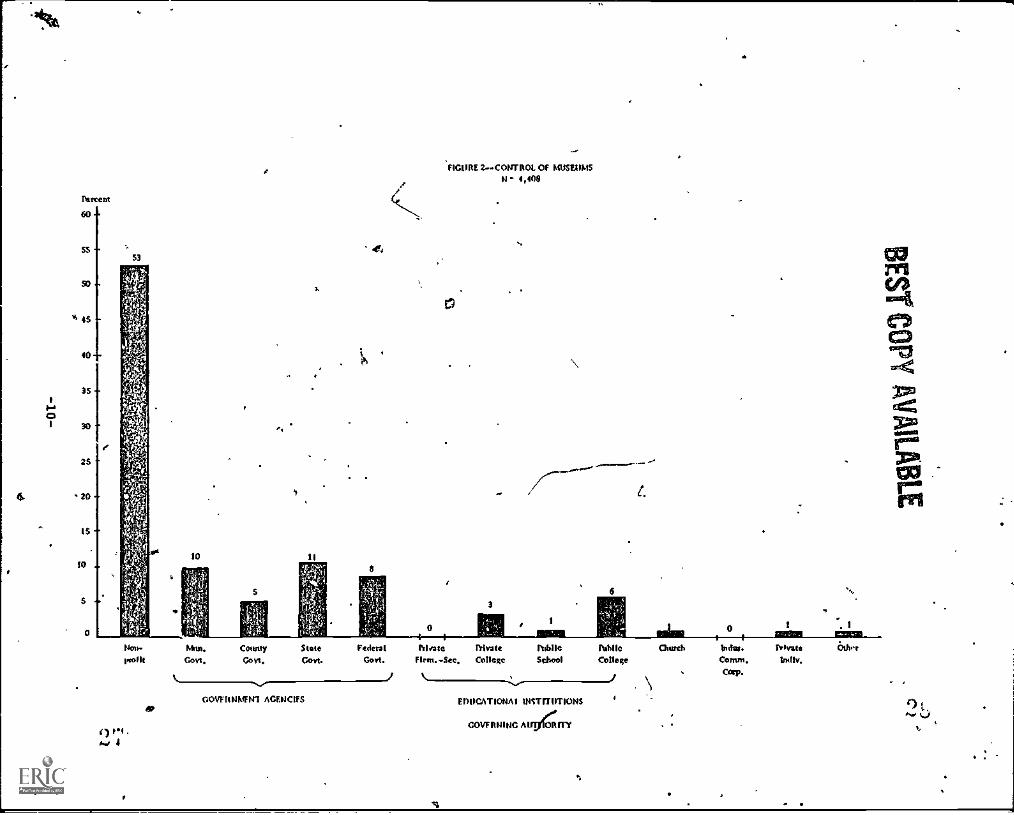
The governing authority was defined as the agency that owns the co]lections and assets of the institution but not necessarily its facilitiesOver one-half (an estimated 53 percent)" of all museurs were governed bynonprofit private institution (see Figure 2). Government agencies rank(second highest, operating approximately one-third of all nonprofit museum:Of the institutions operated by government agencies, .State governmenioperated the greatest number (33 percent) and county governments the fewer(15 percent).
Educational institutions operated an estimated 11 percent of the museums. Of these, the majority (91 percent) were run by public or privaicolleges and the remaining 9 percent were run by private elemehtansecondary schools" or plablic schools._ The remaining museums were operateby religious groups, companies, private individuals, or others.
(3) Size
Size of museum was defined by the.total operating income for the fircal year ending prior to January 1, 1980. Income includes total Wengrant monies and contributions from State and local governments, found(tions, corporations, and individuals; combined with all net earned incom(The largest percent of museums (an estimated 37 percent) were in the indorrange of $1° to $25,000 (see Figure 3). The second most common incorrange was $;5,001. to $50,000 (15 percent of all museums). Slightly ov(one-tenth of the nation's nonprofit museums were estimated to have incom(exceeding $400,000, whereas 1 percent had no income. For example, a fami:might Jive in a hiktvic house or, own a historic dwelling on their proserty, maintain it as a hobby, and allow visitors, including school group:to tour it without charge. *
For each type ,of museum, with the exception of art museums, it wfound that operating' income was most frequently in toe $1 to 25,000 ran((see Table 1, end. of chapter). Thk largest group of art museums (20 petcent) were estimated to have operating income in the highest range (ov($400,000) for the 1979 fiscal year.
History museums appeared to havecent reported income under $50,000exceeding $400,000. Most other typestial percentage in the highest rangecent), art museums (20 percent), genetized museums (12 percent).
the lowest financial support; 65 petand only 5 percent reported incotof museums reported a fairly substatof income: science museums (22 petal museums (13 percent), and specie:
There may be fewer avenues of outside support for which history muse(are eligible. An examination of history museum programs for patron suppoilater in this report may indicate areas that could be developed by histo'museums.
55
50 4.
4S -
40
1-I
8
35
30
'I
25
4 20
IS
10 -
5
0
S3
Mon-
roe, It
10 II
8
FIGURE 4..CONTROL OF 1.1115E11M5N 4,408
Mitst.
Govt.Cottstty
Govt.StateGovt.
GOVF1t1114N1 ACENCIFS
FederalGovt.
3
1.
aF,
0 MI 0 1 1
MIME iligilli 13111311I I 1 1
rtleato TrIvate h4/114 PAM Chard, lndot. Prorate alb"'Wm.-See, ConoRc School College Cotroll. Int*.
Caen.
E111ICATIONA1 INSTITUTIONS
GOVERNING A119411-Y

Percent
40
35
30
20..
n-
to-
s-
BEST COPY AVAILABLE
15
FIGURE 3- .TOTAL CASH OPERATING INCOMEOF MUSEUMS
N 4,408
11
25,001. 93,001. 75,001. 200,120:. 200,001 3004171- 400,00130,000 75,000 100,000 2E0,000 300,000 400,000 4 P1
TOTAL CASHOPERATING TNCOME
(4) Region
The greatest number of museums (31 percent) were found in the NorthAtlantic States and the fewest (18 percent) in the Southeast (see Figure4). Almost the same number of museums were estimated to be in the GreatLakes/Plains States as in the' Westgouthwest (26 and 25 percent,
respect5vely).
Percent
31
FIGURE 4-- MUSEUMS SY REGIONN 4,408
North Greet Wu Wert andAtlantic .; and Rehm Southwest
REGION
vtt 23
-PY AVAILABLE
A closer examination of the types of museums found in various partsof the country revealed some regional differences. As would be expected,history museums predominated in each of the four regions (see Table 2).The largest percent of both history museums (37 percent) and art museums(35 percent) were found in the North Atlantic States. In the Great Lakes/
Plains States, Southeast, and West/Southwest, there were more sciencemuseums than art museums (21 percent and 13 percent, respectively); thelargest number of science, museums (32 percent) were found in the Westand Southwest. Although parks and visitor centers were the fifth mostcommonly found type of museum in the West/Southwest and Southeast(7 percent), they comprised, only one to two percent of the museums in theother regions. The difference might be explained by the large acreagesavailable for park facilities in the Western United States, in contrastto the highly industrialized character of the North Atlantic States andseverity of the winters in the Great Lakes and Plains States.
2, TYPES OF COLLECTIONS
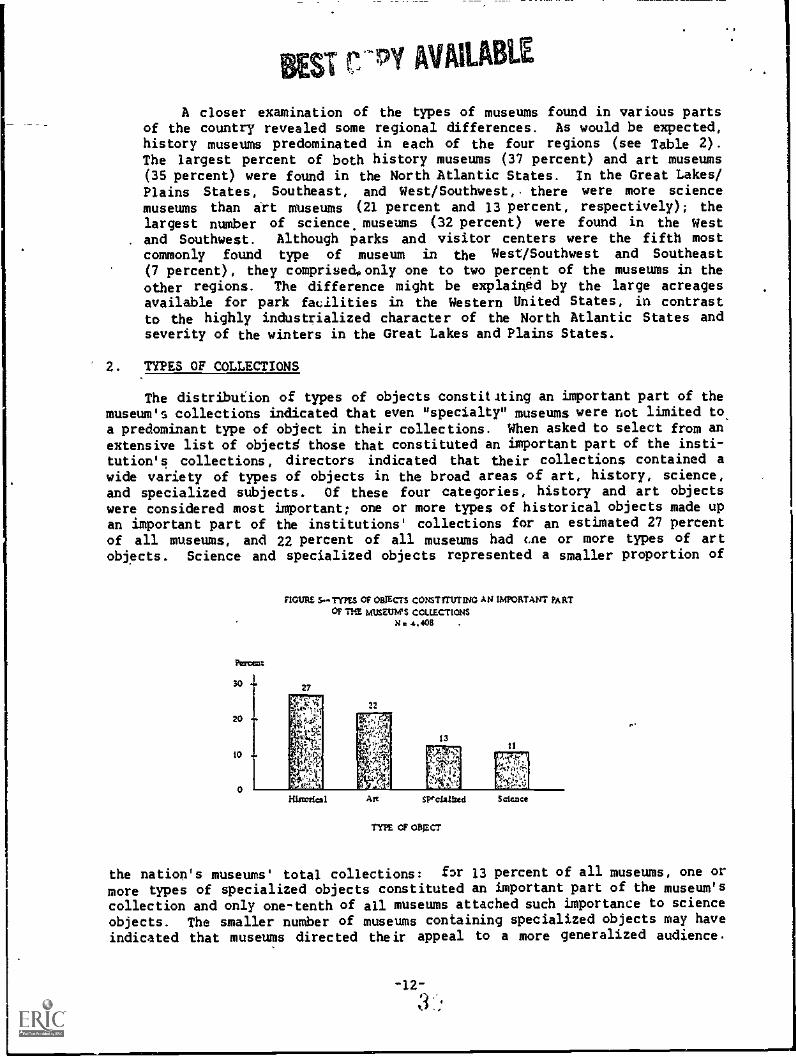
The distribution of types of objects constituting an important part of themuseum's collections indicated that even "specialty" museums were not limited toa predominant type of object in their collections. When asked to select from anextensive list of objects' those that constituted an important part of the insti-tution's collections, directors indicated that their collections contained awide variety of types of objects in the broad areas of art, history, science,and specialized subjects. Of these four categories, history and art objectswere considered most important; one or more types of historical objects made upan important part of the institutions' collections for an estimated 27 percentof all museums, and 22 percent of all museums had cne or more types of artobjects. Science and specialized objects represented a smaller proportion of
nonts....ralsoromolcomilmwommowavnboaOF ME MUSEUM'S COLLECTIONS
144.402 .
27
22
1311
Historical Art SPeatilted
TYPE OF OBJECT
Science
the nation's museums' total collections: for 13 percent of all museums, one or
more types of specialized objects constituted an important part of the museum's
collection and only one-tenth of all museums attached such importance to scienceobjects. The smaller number of museums containing specialized objects may haveindicated that museums directed their appeal to a more generalized audience.
-12-

3
DOLE 2.41ISTRIOUTION OF MUSEUMS, BY GEOGRAPHIC REGION AND TYPE OF NUMMI UNITED STATES. FISCAL YEAR 1979
TYPE OF NOSEON 10TAL
GEOGRAPHIC REGION
NORTH ATLANTIC GREAT LAKES ANDPLAINS
SOUTHEAST NW AND lOUIHNEST,
ALL TYPES 4.400 1.373 1.129 779 1.127PERCENT 100.0 31.1 25.6 17.7 25.6ART 609 216 140 309 145PERCENT 100,4 35.4 22,9 17,9 23,8CNILNRENIS SI 22 10 7 13PERCENT 100.0 42.5 19.0 12.8 25.7GENERAL 382 78 109 70 126PERCEN1 140.0 24.3 28.5 tea 31,9HISTORY 2.204 S09 $62 340 405
PERCENT 100,0 36.7 25.5 15.8 24,0PARKS ANDVISITOR CENTERS 165 16 25 56 69
PFRCENT 100.0 9,4 15.2 33.9 41,5SCIENCE 800 169 217 157 257PERCENT 100.0 21.1 27,2 19,6 32.1
SPECIALTIES 197 64 66 34 33PERCENT 190.0 3P,7 33,6 17.1 16.5
Ca i
mmul
CIOCI)

BEST r."'PY AVAILABLE
Tables 3 through 6 (end of charter) display each of the specialized objectsby type of museum. On the survey form, there were a total of 47 possible art,science, history, and specialized objects; one or more could be selected by themuseum director as constituting an important part of the museum's collections.Of significance was the tendency of history museums to contain a wide variety ofart, history, science; and specialized objects. For 39 of.those objects, atleast 35 percent and, at most, 79 percent of all.museums identifying the objectas an important part of the museum's collections represented history museums.
An estimated 65 percent of all museums had a complete up-to-date inventoryof their collections. More than half of the museums in each type of museummaintained an up-to-date inventory. A.rt museums had the highest percentage (86percent) and history museums had the lowest (57 percent), which may be due to
- the wider variety of the latter's collections.
3. SECURITY.
it was estimated that slightly over half of all museums (52 percent) had afire alarm system (see Figure 6), and approximately the same number (55 percent)had a burglar alarm system. About three-quarters of the fire or burglar alarmsystems were connected to the local authorities.
Perms
60
SO
40
40
20
10
0
FIGURE 6-441.1SEUM SECURITY SYSTEMS
N . 4,408
SS
41
2S
Type of Security
COsteeet46 to Authorities
butitutioas Hairlogsrise Alarms IWO, Ale=
knottyOulu*
rat OF SECURITY 1,7711.1Z.o
SecurityTraits*Rooms

Art museums most frequently had fire and burglar alarm systems (73 percentof all art museums had a fire alarm system; 83 percent had a burglar alarm);(see Table 7, end of chapter). Parks and visitor centers used such alarms leastfrequently, but, this may be explained by the fact that many outdoor museums andnature centers, for which traditidnal security measures may be inappropriate,are included in this category. One wouexpect to find a lower percentage ofalarm systems at these museums.
rlOverall, slightly more than one-quarter (28 percent) of all museumsemployed security guards (see Table 8, end of chapter), but over half of all artmuseums (62 percent) employed security guards. Of those museums that did employsecurity guards, the number of guards employed ranged from one to over 51.1VMost museums (84 percent) do not have a security training program (see Table 10,end of chapter).
4. CONSERVATION AND PROTECTION
Although museums relied on several means to preserve and maintain objectsor to protect their live exhibits, most (57 percent) did not have their ownfacilities for the preservation, conservation and protection of their exhibits(see Figure 7). Science museums had the highest percentage of institutions withtheir own facilities (66 percent); the majority (57 percent) of specializedmuseums also had their own facilities. Many museum directors indicated that,although they did not have their own facilities, they .maintained cooperativearrangements with other museums in their geographic area Specialized museumsoften did not have access to such arrangements and tended to remain more iso-lated, probably because of the unique nature of,their collections.
Of those museums that maintained facilities for protection and conservationof exhibits (43 percent), close to one-half (47 percent) supported staff train-ing programs on the care of museum objects in conjunction with universities,other museums, and/or other organizations. Parks and visitor centers had thehighest percentage of institutions (32 percent) that provided staff training forconservation (71 percent of all parks and visitor centers with facilities),whereas art museums had the smallest percentage--only la percent (40 percent ofall art museums with facilities).
In order to assess the extent to which museums were involved in cooperativeconservation activities, museum directors were asked if their staff did conser-vation work on objects not belonging to their own institution. An estimated12 percent of all museums did work on objects not belonging to their own insti-tution. Science museums most frequently (38 percent) did conservation work onobjects not belonging to their collection, followed by history museums (28 per-cent) (see Table 11, end of chapter.)
2/The very high numbers of security guards found at art and :science museums
may be partially due to the difficulty some university-based museums had sepa-rating general university guards from museum guards only (see Table 9, end ofchapter).
-15-

. %
BEST Mir AVAILABLE
MORE 7-- MUSEUMS wrrx PAGIUTES Ate STAPP TNAINING PROGRAMS FOR PRISMATIC,'AND CONSERVATION, BY TYPE OF M'JSFUM
N 4,40$
Concerning the types of objects receiving the most conservation, protec-tion, and maintenance, it was found that the greatest attention was given toworks on paper (23 percent), furniture (22 percent). photographs (22 percent),books (18 percent), textiles (17 percent), and paintings (17 percent). Artmuseums most frequently performed conservation activities on paintings (37 per-cent), followed by works on paper and Sculpture (see Table 12, end of chapter).Comparing art museums to other museum types revealed that art museums were morelikely to do conservation activities on sculpture objects.
Among children's museums, conservation was most frequently performed on'counted zoological objects (24 percent), followed by ethnographical objects (22percent).
Approximately one-third of general museums' preserved photographs, althoughthey undertook conservation efforts on a wide variety of objects. The secondmost mentioned category of objects receiving conservation by general museumstaff was furniture (31 percent).
-16-
AP
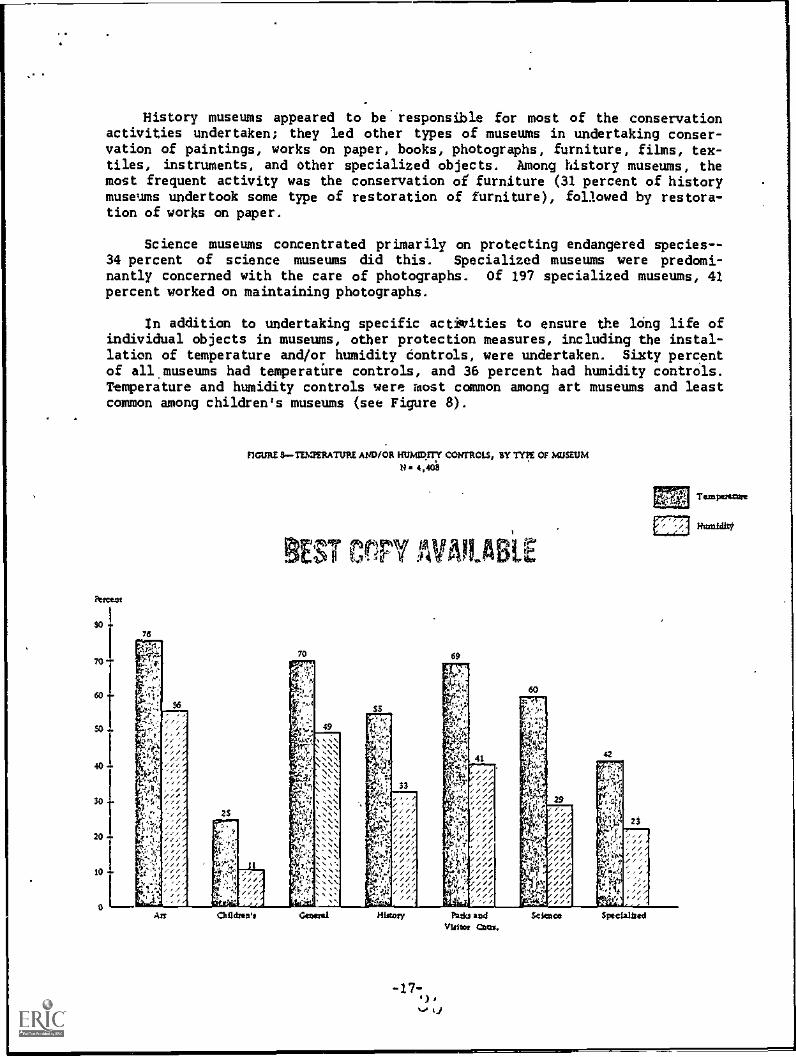
History museums appeared to beresponsible for most of the conservationactivities undertaken; they led other types of museums in undertaking conser-vation of paintings, works on paper, books, photographs, furniture, films, tex-tiles, instruments, and other specialized objects. Among history museums, themost frequent activity was the conservation of furniture (31 percent of historymuseums undertook some type of restoration of furniture), followed by restora-tion of works on paper.
Science museums concentrated primarily on protecting endangered species- -34 percent of science museums did this. Specialized museums were predomi-nantly concerned with the care of photographs. Of 197 specialized museums, 41percent worked on maintaining photographs.
In addition to undertaking specific activities to ensure the long life ofindividual objects in museums, other protection measures, including the instal-lation of temperature and/or humidity controls, were undertaken. Sixty percentof all museums had temperatUre controls, and 36 percent had humidity controls.Temperature and humidity controls were most common among art museums and leastcommon among children's museums (see Figure 8).
SO241
70
60
so..
40
30
20
10
2$
FIGURE 11.TWERATURE AND/OR HUMPITY CONTROLS, by TYTE OF MUSEUM104,401
Art Chadtvet
BEST AVRABil
70
S3
33
64
mar?
42
PatIcs apd Seiestee Specla1hedV1sitot Cow.
Tempe:maw
11stailditf

Si CITY AVAILABLE
Museum direCtors were asked to estimate the proportion of their collectionsthat was in serious need of conservation, preservation, maintenance or protec-tion. Eighty-two percent of the responses were fairly evenly distributedbetween 0 and 49 percent; 18 percent of all museums indicated that "greater than49 percent" of their collections needed conservation, protection, and/or main-tenance (see Table 13).
Table 13.-Percent Of Collections Needing conservation,Protectson, And/Or Maintenance
Percent ofCollections
NeedingConservacsan Total Percent
All Museums 4.408 /00.0
None 817 12.0
Less Than St 699 16.0
St - 14 842 19.0
- 24t 817 18.0
25% 49 745 17.0
Greater Than 49 787 18.0
Children's and specialized maseums indicated the greatest need for conser-vation (median of 31 percent and 22 percent of collections, respectively). (See
Table 14, end of chapter.) On the other hand, parks and visitor centersappeared to have the least need (median of 3.9 percent of collections).
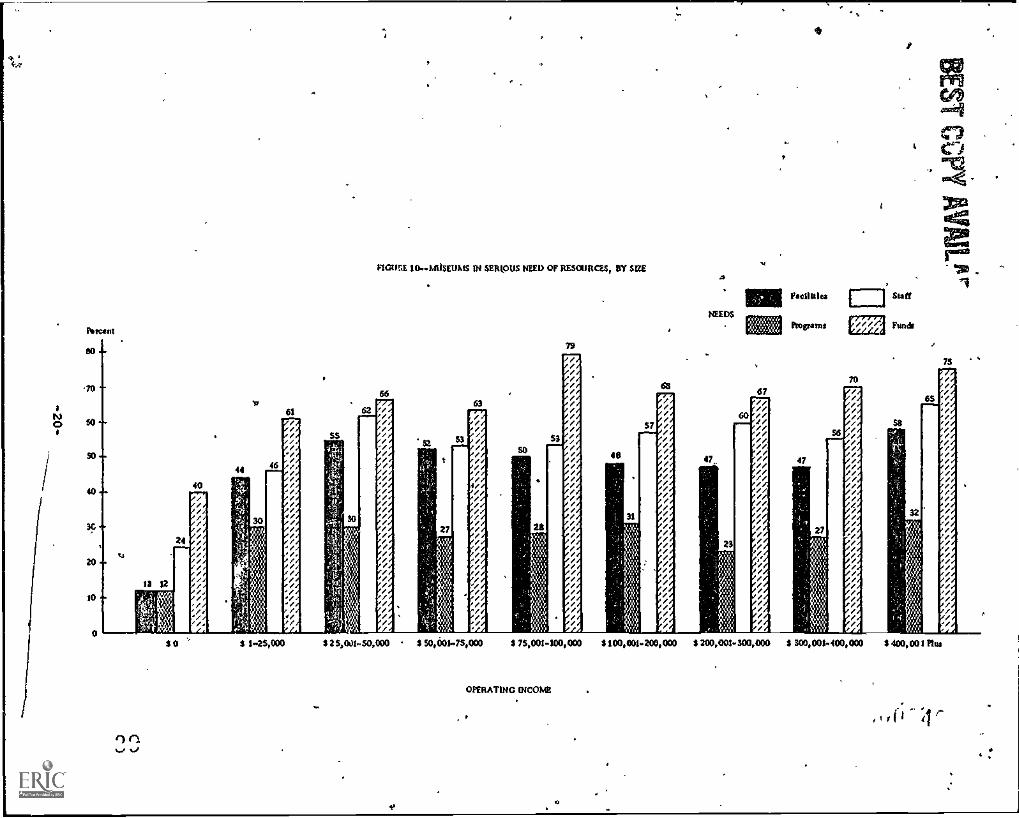
Museums were asked whether resources were needed for facilities, programs,staff, and/or funds for maintaining collections. Out of the four areas, themost serious estimated need was for funds, and the least was for programs.
Resources Needed In Collections:
Resource
Percent. Of
All Museums
Funds 66%
Staff 54%Facilities 49%
Programs 30%
It appeared that, although most museums either had a conservation program inplace or had access to one, many did not have the necessary funds to purchasematerials, tools, etc., to implement conservation activities.
934
-18-
It
The relative need across these four areas was surprisingly uniform acrossmuseum types (see Figure 9, end of chapter). Children's and specialized museumsexpressed the greatest overall need.
A look at the needed resources across museums of varying sizes revealedthat larger museums tended to express somewhat greater needs for resources (seeFigure 10).
These findings substantiate the concern expressed by museum professionalsthat museum priorities are shifting away from conservation and research activi-ties.
5. BOA D OF TRUSTEES
It was estimated that more than three-fourths of all museums (78 percent)had a Board of Trustees,with direct responsibility for the Institution's pol-icy; almost all children's museums had a Board of Trustees (98 percent). Incontrast, it was estimtied that parks and visitor Centers had the lowest per-centage of institution with a Board of Trustees (35 percent) (see Table 15,end of chapter). L.aseums with zero income were unlikely to have a Board ofTrustees (26 percent) (see Table 16, end of chapter).
6. ACCESSIBILITY
,One measure of the accessibility of an institution is its proximity to somemeans of public transportation. Sixty percent of all museums were locatedwithin one-quarter mile of public transportation. Art museums were most likelyto be olose" to public transportation--80 percent were within one-quarter mile(see Figure 11, end of chapter). Next most accessible were children's museums(two-thirds within one-quarter mile Of public transportation). Parks and visi-tor enters were least likely to be close to public transportation (only 9 per-cent w;thin one quarter mile of public transportation).
Other measures of accessibilityums become inaccessible to those whobecome members; however, museums aretain the institution. Membership andto the museum and its programs.
are membership and admission fees. Muse-cannot afford to Oy the admission fee oroften forced to charge such fees to main -admission fees also demonstrate commitment
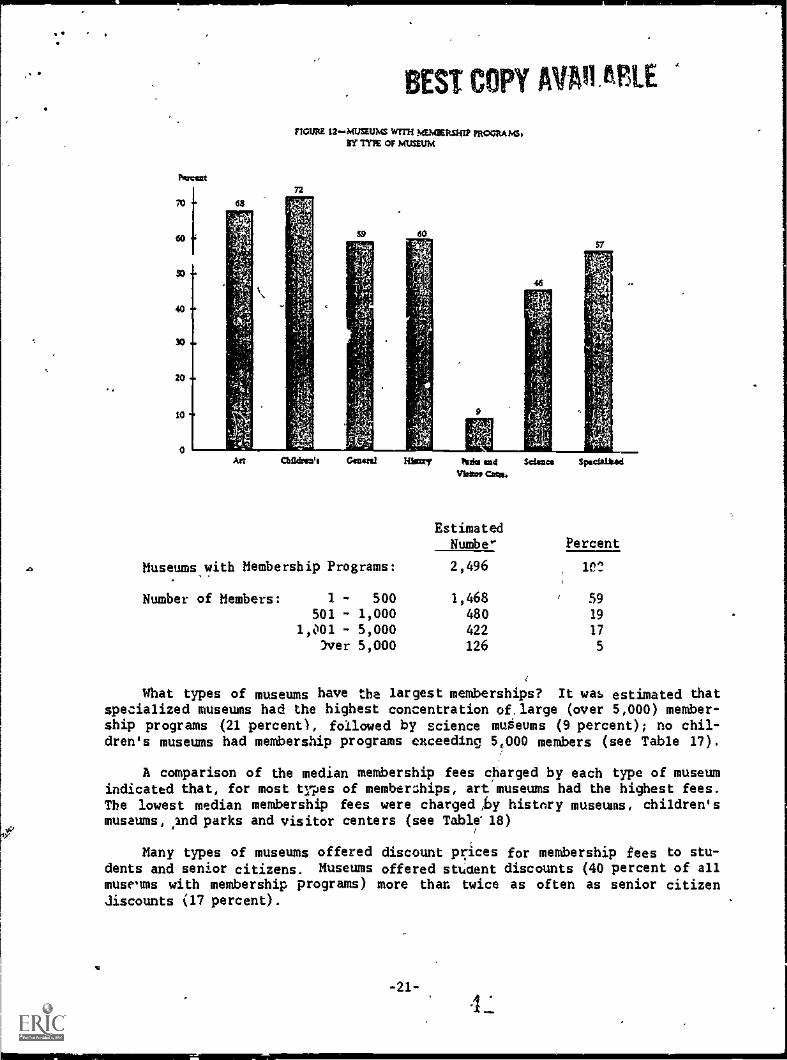
It was estimated that over one-half of all museums (57 percent) had a mem-bership program. Children's and art museums were most likely to have membershipprograms (72 and 68 percent, respectively) and parks and visitor centers leastlikely (9 percent) (see Figure 12).
Number Of Members. Most museums (59 percent) with membership programs had500 members or fewer; very few exceeded 5,000.
-19-
Or,
STM
k' Wail'.O9aI
fil
20 N,,,,,
......................J
YV,..\\\SX\\11N.
g-\ \ \ \ 'CC -`
,.-,.-,: CCe
46%
g\\\\\\\\\\\\\\\\\
X\\\r
N
0 ZZ'=ZZZ=M=
NA_NN_±..NNx xx........)ANA,,,N1NA
N
NN,.-\\k\NN\N\k,\\NN'.NN\\NXXNNX\XN,1
a\\\\\\\\\\\\\\\\
NNNNNX,,\ ,,,,,, N,,NN,kTNIAN\,,N,,NNV
N\\\
,,1\,,, ,,,,,,
\\\\\\\\\\\\\\\
8O8..8aN
OINNNNNN
,,,,.N.,,s,,,,I,\%,,
)
0
I1
sw
I--
dS
gg
-20-
00
0P4cc
0
4
LA
SO
40
30
20
10
68
BEST COPY AVM ITI1
FIGURE 12-MUSEUMS WITH MEMBERSHIP PROGRAMS/BY TYPE or MUSEUM
60
Cbildgen's Gonad Hl ty !s age Selena SpedalladUnite, Citn.
EstimatedNumbe- Percent
Museums with Membership Programs: 2,496 1e2
Number of Members: 1 - 500 1,468 59
501 1,000 480 19
1,001 - 5,000 422 17
Yver 5,000 126 5
What types of museums have the largest memberships? It was estimated thatspecialized museums had the highest concentration of.large (over 5,000) member-ship programs (21 percents, followed by science museums (9 percent); no chil-dren's museums had membership programs exceeding 5,000 members (see Table 17).
A comparison of the median membership fees charged by each type of museumindicated that, for most types of memberships, art museums had the highest fees.The lowest median membership fees were charged ,by history museums, children'smuseums, mil parks and visitor centers (see Table' 18)
Many types of museums offered discount prices for membership fees to stu-dents and senior citizens. Museums offered student discounts (40 percent of allmuseums with membership programs) more than twice as often as senior citizen,Discounts (17 percent).
-21-
4
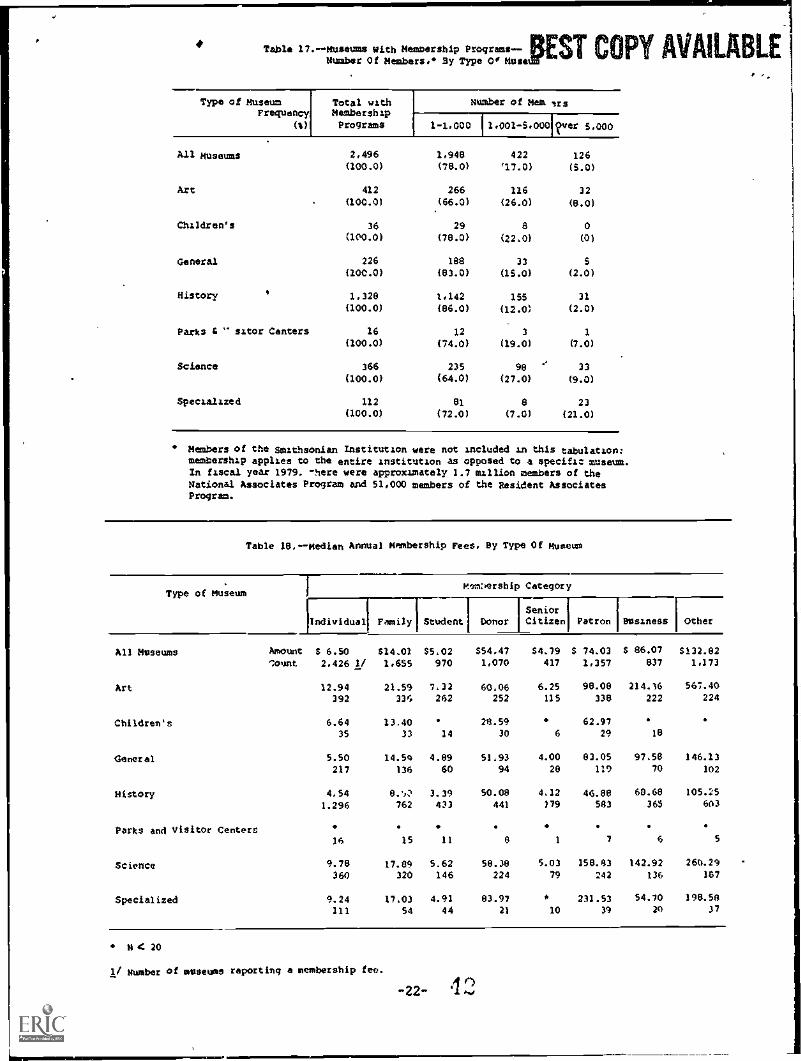
Table 17.--Humber Of
itM eembers.* rship
Sy Typegram04.-...PEST COPY AVAILABLEseums Wh Memb Pros
Type of MuseumFrequency
(5)
Total withMembershipPrograms
Number of Mak Irs
1-1.000 I 1.001-5,0001iiver 5.000
All museums
Art
Children's
General
History
2.496(100.0)
412
(100.0)
36
(100.0)
226(100.0)
41.328(100.0)
1.948(78.0)
266(66.0)
29(78.0)
188
(83.0)
1,142
(86.0)
422'17.0)
116(26.0)
8
(22.0)
33
(15.0)
155
(12.0)
126
(5.0)
32
(8.0)
0(0)
5
(2.0)
31
(2.0)
Parks t " sitar Canters 16 12 3 1
(100.0) (74.0) (19.0) (7.0)
Science 366 235 98 33(100.0) (64.0) (27.0) (9.0)
Specialized 112 81 8 23(100.0) (72.0) (7.0) (21.0)
Members of the Smithsonian Institution were not included in this tabulation:memberShip applies to the entire institution as opposed to a speafl: museum.In fiscal year 1979, -here were approximately 1.7 million members of theNational Associates Program and 51,000 members of the Resident AssociatesProgram.
Table 18,--Median Annual Membership Fees. By Type Of Museum
Type of MuseumMem:bership Category
Individual Family1
I Senior
Student Donor Citizen Patron Business Other
Al! Museums hmount S 6.50 $14.01 $5.02 $54.47 $4.79 S 74.03 S 86.07 $132.82count 2,426 1/ 1,655 970 1,070 417 1,357 837 1,173
Art 12.94 21.59 7.32 60.06 6.25 98.08 214.16 567.40
392 336 262 252 115 338 222 224
Children's 6.64 13.40 28.59 62.9735 33 14 30 6 29 18
General 5.50 14.54 4.89 51.93 4.00 83.05 97.50 146.13217 136 60 94 28 119 70 102
History 4,54 0..,,Z4 3.39 50.08 4.12 46.88 60.68 105,25
1.296 762 433 441 179 583 365 603
Parks and Visitor Centers16 15 11 1 7 6 5
Science 9.78 17.89 5.62 58.38 5.03 158.63 142.92 260.29
360 320 146 224 79 242 136 187
Specialized 9.24 17.03 4.91 83.97 231.53 54.70 190.58
111 54 44 21 10 39 20 37
11 4 20
1/ Number of museums reporting a membership fee.
4-22- I.)
,

BEST V2PY AVAILIABLE
Size of museum and inedian''ffiembership fee were positively correlated: thelarger the museum, the higher the median fee. For all types of memberships, thehighest membership fees were charged by museums that earned over $400,000, andthe lowest fees were charged by those with income of $1 to $25,000 (see Table19).
Table 19.--Median Annual Membership Pee, Sy Size Of Museum
Museum Size $(Operating Incomel
Membership TO*
Individual Family Student DonorSeniorCitizen Patron Business Other
All museums 1/ Amount $ 6.50 $14.01 $5.02 $54.47 $4.79 $ 74.03 $ 86.07 $132.82
Count 2,426 2/ 1,655 970 1,070 41 1,357 037 1,173
$1-25,000 3.43 4.96 1.74 26.26 2.70 34.15 34.98 90.61
874 436 183 200 59 331 111 285
$25,0001-50,000 5.94 9.48 3.29 50.49 3.21 45.22 72.79 98.93
534 204 107 139 78 158 138 196
550,001-75,000 0.64 15.20 5.08 57.42 77.11 54.99 258.98156 116 82 89 10 101 74 80
$75,001-100,000 7.74 15.47 5.09 69.32 7.40 92.07 86.19 210.06
226 174 140 97 72 160 107 126
$100.001-200.000 10.44 19.12 5.43 53.35 3.79 99.81 81.69 198.06
250 224 134 155 46 170 116 147
$200,001-300.000 10.90 21.08 6.05 76.64 7.36 97.35 246.70 423.09
120 99 63 84 36 81 71 61
$300,001-400,000 10.64 18.97 6.31 56.06 5.59 92.37 237.66 263.60111 93 59 60 34 82 41 72
$400.001-Plus 14.04 22.80 8.84 81.55 7.77 315.53 313.76 520.89
355 310 202 230 84 274 179 207
-N4 20
1/ Smithsonian institution membership tees were not included in this tabulation, membership applies to theentire institution as opposed to a specific museum. Annual membership in the National Asavul4tea Programwas $14.0u, membership in the Resident Associate Program was 621.00 per single membership, $2(,,00 perdouble, and $36.00 per family.
2/ Number of museums reporting a membership tee.
(1) Admission Fees
Although it was estimated that over one-half of all museums had mem-bership programs in 1979, fewer tl'.411 one-third (32 percent) charge generaladmission fees. Specialized museums were most likely to charge admissionfees (62 percent); parks and visitor centers and art museums were leastlikely to do so (15 and 16 percent, respectively; see Table 20, end ofchapter). For those museums charging admission fees, most fees were fixedas opposed to suggested.
There was a wide range of types of admission fees: member and non-member, adult, children, student, senior citizen, group rates, and othertypes. Museums rarely charged admission fees to members (see Tables 21-A
"Au

through 21-F, end of chapter); over 90 percent of museums with admissionfees admitted members for free.
Table 22 presents median admission fees for each type of museum.Comparing this table to Table 18 revealed that, although art museums hadthe highest annual membership fees, they had relatively low median admis-sion fees.
Table 22.--Nedien Admission Pees, By Type Of Museum
Type of Museum
AmountCount
Admission Categories
MemberAdult
NonmembeAdult 1 Child Student
SeniorCitizen Group Other
All museums 0 $0.93 $0.32 $0.41 $0.64 $0.74 $0.32939 1/ 1,346 1,226 774 S7S 675 338
Art 0 0.88 0.26 0.39 0.43 0.34 0.3672 97 87 65 52 45 25
Children's 0 0.94
21 21 15 9 9 14
General 0 3.88 0.29 0.40 0.26 0.87 0.441 69 94 87 74 32 44 27
History 0 0.85 0.26 0.34 0.54 0.83 0.36457 721 665 385 277 313 136
Parks and 0 1.43
Piss= Centers 11 22 18 12 20 12 10
Science 0 1.19 0.44 0.57 0.74 0.63 0.3S226 212 240 161 136 160 119
SPecialized 0 2.12 0.44 0.74 0.89 0.16 0.3184 120 114 69 60 87 16
14 20
1/ Number of museums reporting an admission fee.
There was a positive relationship between size of museum and likeli-hood of charging admission fees; the larger the museum, the more likely itwas to charge an admisson fee (see Figure 13, end of chapter).
ts:
(2) Attendance
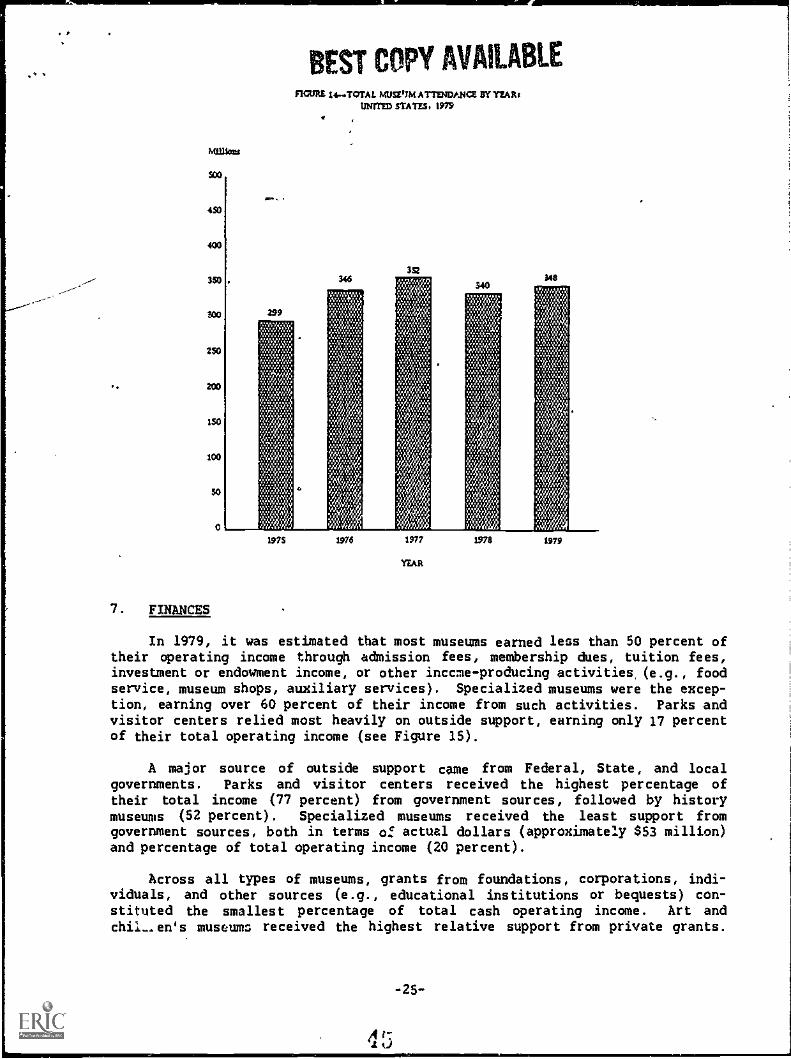
Total museum attendance has risen approximately 50 million (16 per-cent) since 1975. The largest increase in attendance (47 million) occurredbetween 1975 and 1976, which, according to museum directors, can be attrib-uted to special bicentennial events and displays. Although attendancepeaked in 1977 and dropped 3 percent in 1978, it appeared to be on theupsurge again in 1979 (see Figure 14). A more detailed breakdown andanalysis of attendance will be provided in Chapter 3.
-24-
&Mow
9:b3
450
400
350 .
250
200
150
100
30
0
7. FINANCES
BEST COPY AVAILABLEFIGURE 14 TOTAL MUSEUM ATTENDANCE BY Y2Altt
UN11ED STATES, ton
MO+
348
1975 1476 1977
YEAR
1978 1979
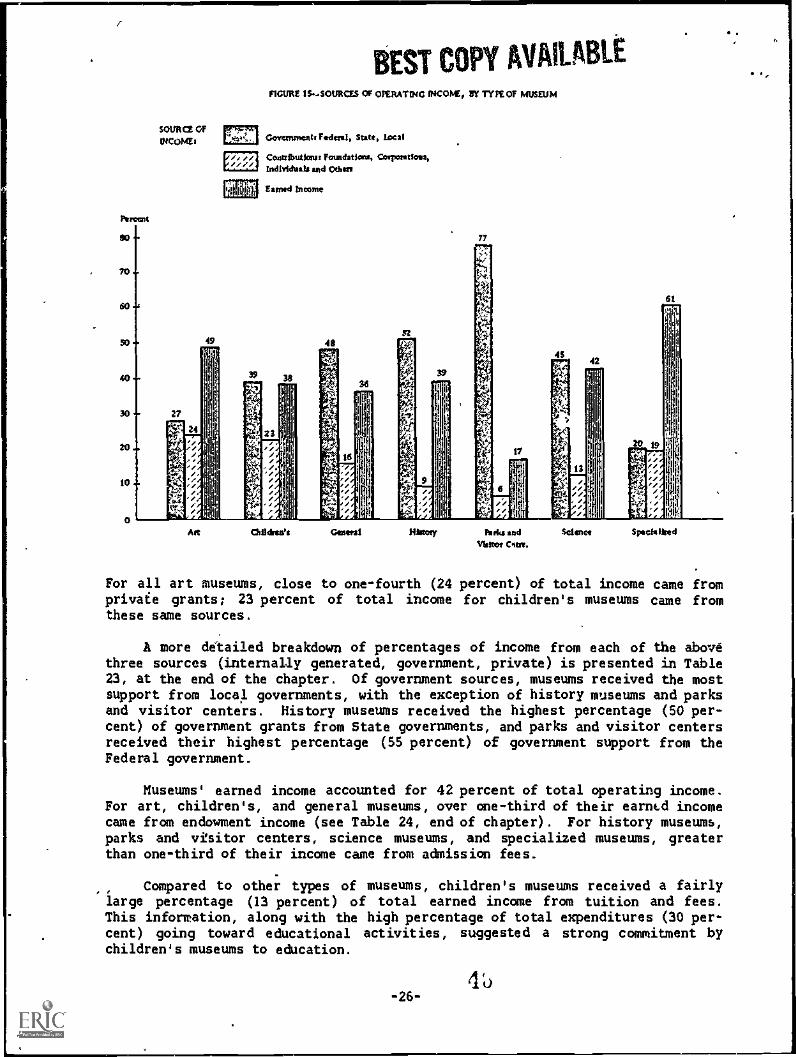
In 1979, it was estimated that most museums earned leas than 50 percent oftheir operating income through admission fees, membership dues, tuition fees,investment or endowment income, or other inccme-producing activities, (e.g., foodservice, museum shops, auxiliary services). Specialized museums were the excep-tion, earning over 60 percent of their income from such activities. Parks andvisitor centers relied most heavily on outside support, earning only 17 percentof their total operating income (see Figure 15).
A major source of outside support came from Federal, State, and localgovernments. Parks and visitor centers received the highest percentage oftheir total income (77 percent) from government sources, followed by historymuseums (52 percent). Specialized museums received the least support fromgovernment sources, both in terms 0: actual dollars (approximately S53 million)and percentage of total operating income (20 percent).
Across all types of museums, grants from foundations, corporations, indi-viduals, and other sources (e.g., educational institutions or bequests) con-stituted the smallest percentage of total cash operating income. Art and
museum received the highest relative support from private grants.
-25-
r
SOURCE OF
ISCOMEI
BEST COPY AVAILABLEFIGURE issouRas or OPERATING INCOW, NY TYPE OF MUSEUM
Govarimentt Fdaal, Stasi kcal
Contributkeos Foundations, Corpnetkea,to4Prideals and Odom
Famed bleorne
Peaccat
SO
70
60 .6
50
40
30
20
10
0
27
48
"1:11
;
Aft
16
9
77
17
1
6 14
;;111
24
,,Am Chilthesit Gwent Hamm Parks sod
illskor CAW.
4542
13
61
Selma Specialised
For all art museums, close to one-fourth (24 percent) of total income came fromprivate grants; 23 percent of total income for children's museums came fromthese same sources.
A more ddtailed breakdown of percentages of income from each of the abovethree sources (internally generated, government, private) is presented in Table23, at the end of the chapter. Of government sources, museums received the mostsupport from local governments, with the exception of history museums and parksand visitor centers. History museums received the highest percentage (50 per-cent) of government grants from State governments, and parks and visitor centersreceived their highest percentage (55 percent) of government support from theFederal government.
Museums' earned income accounted for 42 percent of total operating income.For art, children's, and general museums, over one-third of their earncd incomecame from endowment income (see Table 24, end of chapter). For history museums,parks and visitor centers, science museums, and specialized museums, greaterthan one-third of their income came from admission fees.
Compared to other types of museums, children's museums received a fairlylarge percentage (13 percent) of total earned income from tuition and fees.This information, along with the high percentage of total expenditures (30 per-cent) going toward educational activities, suggested a strong commitment bychildren's museums to education.
-26-

20
Museum directors were asked to estimate the percentages of their totaloperating expenditures that were spent in various areas of the museum's opera-tion. For all museums, it was estimated that the greatest amount was used ingeneral administrative activities (20 percent) and building and maintenance(19 percent); the least was spent in paid advertising (Figure 16). Educationalactivities constituted 11 percent of all operating expenditures.
IS
10
S w.
0
13
FIGURE 16...dutoy.NT Of TOTAL MUSEUM EXnrcorruitEd
EACII AREA OF OPERATION
ST CPPY AMPABLE
11
20 19
Ctmtodal Welts Comer- Edw. IhreloP MotIlter- Publicratios tattoo meet sidp
hidfuhm
maim
Security General Idid./;Ankh- Maim.traits
Other
Across types of museums, art museums used the highest percentage of theiroperating expenditures (23 percent) on general administration, whereas chil-dren's museums used close to one-third (30 percent) of their total operatingexpenditures on educational activities (Table 25, end of chapter). Generalmuseums spent the highest percentage (18 percent) on curatorial activities.Parks and visitor centers used the largest percent (38 percent) of theirresources for building and maintenance activities.
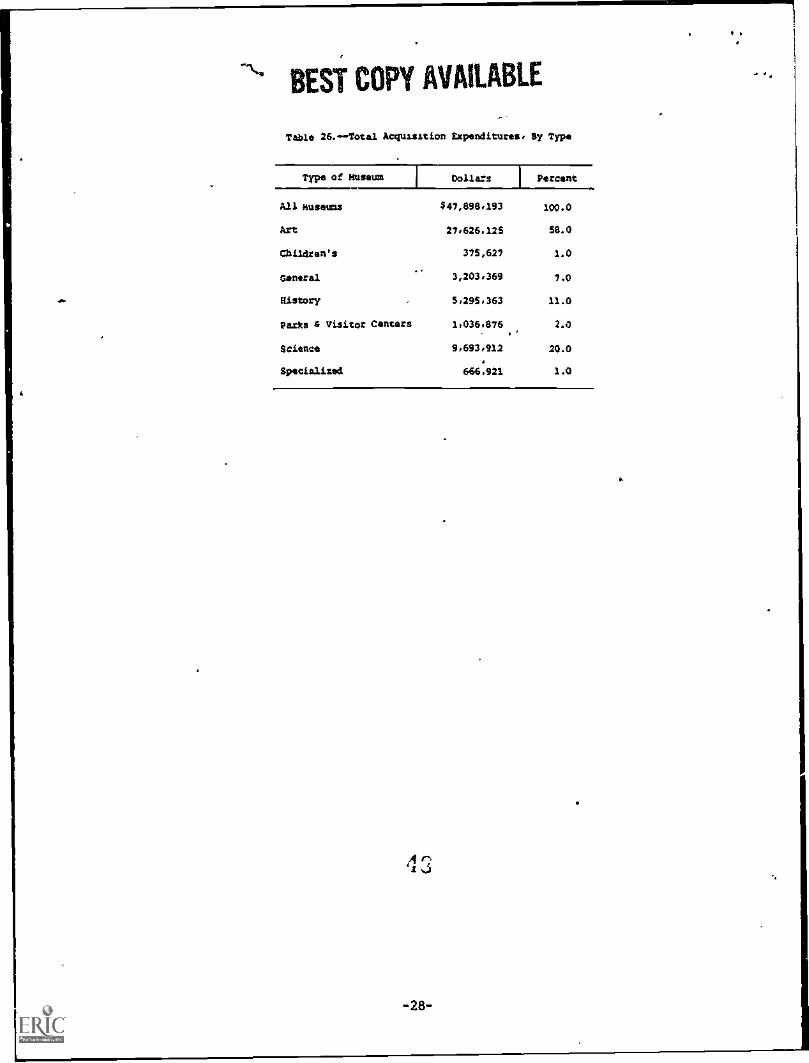
Expenditure data also provided an indication of the priorities that museumsset for their activities. Acquisition expenditures by a museum, which indicatea desire and an ability to improve the museum's collections, accounted for closeto $50 million. The majority of those expenditures (58 percent) were by artmuseums (see Table 26). Following art museums in terms of acquisition dollarsexpended were science museums (20 percent). It was further estimated that chil-dren's and specialized museums spent the least on acquisition expenditures (onepercent each).
1
BEST COPY AVAILABLE
4.
Table 26.--Total Acquisition Expenditures, Sy Type
Type of Museum Dollars1
Percent
All museums
hrt
Children's
General
History
Parks 4 visitor Centers
Science
Specialised
547,696,193
27,626.125
375,627
3,203,369
5,295,363
1,036,676
9,693,912
666.921
100.0
56.0
1.0
7.0
11.0
2.0
20.0
1.0

Table 1. --Type Of Museum, By Total Operating Income Of Museum
TypeCount
(Row %)
Total Operating Income
Totals$0 $1 -
$25,000$25,001-$50,000
$50,001-$75,000
$ 75,001-$100,000
200,001-5100,001 $
lk$200,000 300,000
$300,001-1
$400,000$400,001 -
Plus
All Museums 4,408 46 1,616 671 306 _47 533 219 178 492(100.0) (1.0) (37.0) (15.0) (7.0) (8.()) (12.0) (5.0) (4.0) (11.0)
Art 609 0 78 103 55 58 111 4, 52 35 119(100.0) (0) (13.0) (17.0) (9.0) (9.0) (18.0) (8.0) (6.0) (20.0)
Children's 51 0 18 5 11 0 6 5 1 6
(100.0) (0) (34.0) (10.0) (21.0) (0) (11.0) (10.0) (2.0) (12.0)
General 382 3 174 40 23 21 43 21 7 50
(100.0) (1.0) (45.0) (10.0) (6.0) (6.0) (11.0) (6.0) (2.0) (13.0)
History 2,204 42 1,004 389 125 172 227 74 65 106(100.0) (2.0) (45.0) (18.0) (6.0) (8.0) (10.0) (3.0) (3.0) (5.0)
Parks & 165 0 43 22 25 18 24 18 2 15
Visitor Centers (100.0) (0) (26.0) (13.0) (15.0) (11.0) (14.0) (11.0) (1.0) (9.0)
Science 800 0 206 86 57 66 109 43 60' 174(100.0) (0) (26,0) (11.0) (7.0) (8.0) (14.0) (5.0) (7.0) (22.0)
Socialized 197 1 95 27 11 13 14 5 8 23
(100.0) (0) (48.0) (14.0) (6.0) (6.0) (7.0) (3.0) (4.0) (12.0)
4 5r2

TABLE 3.FREDUENC:28 OF UBJEETA IN COLLECTION ART. BY TYPE OF MUSEUM AND TYPE OF OBJECTS IN COLLECTION4UNITED4STATES. FISCAL YEAR 1979
,eb
ARI ONACTS 1H1/.1.
N 4,400
TYPE OF HUSEUK4
A14 CHILDREN'S GEREHAL 111811111Y
PARKS ANDVISITORCENTERS
SCIENLE SPECIALIZED
ARTS AND CRAFTS 9(I 1S6 26 130 435 36PERCENT OF Nusiu45 20.5 25.6 SS.2 , 34.1 19,8 21.5DEEo0441yE ARTS 1.151 210 11 350 669 22PERCENT op' NoSEUNS 26:1 34.4 21,0 39.3 30.4 13,0FINE ANIS 1,530 554 5 201 598 36PERCENI OF 44SEuRS 34./ 90.6 10.0 52.5 27.1 81.5FOLK KOT 1.425 151 29 140 593 Z1PERCENT oF 448FoRS 23.3 24.7 54,9 36.6 26.9 12.7PNUTOGNAPHY 1.522 239 7 197 784 53PERCENT OF 4u6EumS 34.5 39.2 12.9 51.4 35.6 31.8HENN. ARTMES1614-4 116 9 0 14 60 6
PERCENT OF NoSEuRS . 3.1 1.5 .0 3.7 2.7 3.3UTnER AR/ 313 49 3 27 153 11
PERCENT uF ROSt1148 7.1 8.1 5.1 7.0 6,9 6.4
65 33
10.0 16.8
5436
6 .4
,4)8 18.1
97 42
12.1 21.477 15
9.6 7.b162 00
20.3 40.930 16
3.7 9.1SI 20
6,4 10.1
TABLE 4.FREOUENCIES OF 00JECT8 IN COLLECTION .s NTSTURY. BY TYPE OF MUSEUM AND TYPE OF 00JEET8 IN COLLECTIONSUNITED STATES. FISCAL YEAR 1979
rilsfOky ;WELTS 11JIAL
N 4,40B
TYPE OF RuS2UN
ANT EuILDRENIs GENERAL HISTORYPARKS ANDVISITORCENTERS
ISCIENCE
raiC4
cit)
Xsit .
re"31:0
r2-9PtCIALIZED Fri .
HISTORICNMSE/BoILDIN49 1,642 56 14 222 1.326 6/ 103 92
PERCENT OF NusEoNs 42,7 9.5 27.9 58.2 60.2 40.3 12.9 46.7RISTURIC SIMS 1.243 10 3 96 689 80 53 64PERCENT OF NOSEUN8 07.3 2.9 5.9 25,0 40,4 48,5 6./ 34,5RISIDHY 2.145 54 25 245 1.518 79 136 69PERCENT OF musEuns 48.7 8.4 40.8 64.2 68,9 47.6 17.4 45.0HIsTORIC iNiPs 220 9 4 17 173 12 S I
PERCENT or RuSEUNS 5.4 1.4 7.2 4.5 7.9 7.0 .6 .6NIL1TART 743 10 3 92 532 49 29 28PERCENT of muffortS 16.9 1.6 6.1 Z4.0 24.1 29.7 3.6 14,3OTHER NISlUoy 996 24 3 79 b86 39 59 55PERCENT Or oU9EUN0 21.5 4.6 5.1 20.7 31,1 23.6 7,4 27,9
VA,
LP

TABLE 5..-FREOUENCIE8 Of OBJECTS IN COLLECTION SCIENCE 8Y TYPE Of MUSEUM AND TYPE Of OBJECT. IN COLLECTION!UNITED STATES. FISCAL YEAR 1979
TICILNCE ONACTS ToTALH -.4,406
TYPE OF NUSEUN
ANT cHILukEN1S GIOLNAL iftimovPARKS ANDVISITORCENTERS
AfNONAUTICS.ASTRONOMY, SPACt..
PERCEN1 1W lustumsLIVE ANTRALPERCENT Dr NUSEUNSPNE0ENVED ANIrAlPERCENt OF rolsEuHSANINNOPULOICAL, ,
ElHNOLoGICAL, '
INDIANPERCENT OF NuSEUNSARCNEoLOOICAL .....PERCENT OF NNStUNS4EOLOGICAL. NINERAL,
PALEuNTOLONICALPERCENT oF NOSEuNS
...)INDUSTRIAL
tAPENCENT OF Noftums .' NEPIC01, DEHIAt,
NEALIN.PHARNACOLOKICAL
- PERCENT 1W +MONSNATURAL HiSToRY AN N
NATURAL SCIENCE."PERCEJ 1)F Nu5EoN3 .
06 AbRICULTUNE,PLANTS,
BOTANICAL.JNTICOLT4BAL
PERCENT oF NoSEuNSGENERAL SCUNCtPERCENT OF NUSEUNSPHYSICAL SCIENCE AND
MATHEMATICSPERCENT OF MUSEUMSTECNNULOayPERCENT oF No$EONSM EN SCIENCEPERCENT IN. lIuSEJPS 6
i
2295.24149.4503
11.4
1,15326.206419.6
75817.2441
10.o
439!'9.4
70316.0
70115.91503.4
1092.526o5.9la.3
.
6.9
S.7
152.4
487.950
8.1
203.2
o
.9
0
.0
17
2.7
10
2.94
66
7
1,1
3
.90
.4
7
13.116
31,022
43.9
SI...****676'.6
Ibt19.0
2242,8
b
10.0
7
13.3
41,
00.8
4
7.1II
20.0
3
5.95
9642
2.9
201'
7.433
06794
2$.b
17746,312733.3
15540.656
14,8
7920.8
11028.7
. 0923.3
369.5
174.33366
0
.9
o
582,6281,31466,b
57025.941215.7
26612.127512.5
2:54.8
:677.6
2159,832
1,4
371.790
4610
.0
.
2
1.216
9,441
24.8
40.01 6271.3
58
3:1
0
40
659.439.43
7444;1
6.1
1
.613
7.62
1.2
1)
SCIENCE 8PELIALIUD
128 1
11:364
.57
314b,112
21.8
,
230 32 ''',00128.7 16.3
24.3 5,2 CA194 10 rig
227 10
mot
525.1 C1240
286.: eV20.3
119 178.7 XX
N414.9
284 2035.5 10.2 r-293 9 CV
40 rilma3b.7
4.7 2.04 fr
41 4
S.1 2.168 48
8.6
1.1
24.49
F. 3
ti

1
TABLE o.-Foeoutmcies OF (INJECTS IN COLLECTION SPECIALIZED, BY TYPE OF MUSEUM AND TYPE OF OBJECTS IN COLLECTIONIUNITED STATES. FISCAL YEAR 1979
-SPECIALIZED OuJE1,I3 T0TAL14 4.400
ANTIUUFS 2.111PERCENT Of HUSEUtiS 47.4ANCHIIECTuRAL 078PERC,N1 of SOMAS 19.9Au01041SuAL AND MN 650PERCENT Uf noSEutis 16,6LOCUS 42PERCENT Of NUSEURS ..... 1.0CONmuNicATIoNs . 319PENDENT 01 mosEOPS ..... 7.2CUSTUnt 1.300PERCENT Uf NoSE11M3 29.7pun .. 38PERCENT OF mUSEuRS .9FURESINy ... 131PtNCENT OF huSEums 3.0
/ FuRNINNE ....w.4 PERCENT (If HOSEDNS
1.65737,6
I GUN 001PERCENT Of HUSEUN3 16.2NO801. - 196PIRCENT Of NOSEUK6 4.5HOWILOSICAL 145PERCENT Of HuSEURS ...... 3,3HuHuir ANT) Nums6NAIIC.... 274PERCENT Uf HURONS . 6.4NusicAE 111610umENIS ..... 596PERCENT Ut NUSEUNS .. 13.5puiLAtatCAL 80PIRCENT t4F nuSEutis 1.6RELIGIONS . 443PERCENT Elf Ho6EURS . 10.0THEAIR1cA1. 178PERCENT UP MUSLIN'S 4.0TUy AND DOLL. 1.065PERCENT Of Nuautl$ 24.2INANSPuRTATIon .. 630PERCENT OF RoSEURS 14.3MAR SPEClAtI7t0 311PERCENT of HOsEUmS .. 7.0
TYPE 4F MOWN
ART COLDRENiS GENERAL I NISTURYPARKS ANOVISITORCENTE4S
SCIENCE SPECIALIZED
100 13 259 1.479 48 104 107
16.4 26.2 67.9 67.1 28,6 13.0 54.636 2 73 661 27 36 22
5.9 3,9 19.2 30,9 16.4 4 4.5 11.329 3 60 354 56 106 33
4.0 5.1 17.0 16.1 33,6 13.5 16.81 5 14 17 0 1 5
.2 10.0 3.6 .6 .0 .1 2.310 9 50 173 10 27 40
1.6 17.1 13,1 7,9 6,1 3.4 20.474 21 179 904 35 51 36
13.0 41.2 46,9 41.0 21.2 6.4 19.33 0 6 26 0 1 1
.4 .0 1,6 1.3 .0 .1 .50 0 lb 52 16 39 7
.0 .0 4,1 2.4 10.6 4.9 3.797 5 212 1.213 26 39 64
16,0 9.0 55,4 66.1 16.7 4.0 32.634 0 107 571 28 33 28
5.6 .0 26,0 250 17.0 4.1 14.310 1 40 121 3 4 19
1.6 2.1 10.5 5.5 1.5 .5 9,714 0 27 77 0 25 2
2.3 .0 7,0 3.5 .0 3.1 1.113 2 54 149 6 37 13
2.1 3.9 14.2 6.6 3.3 4.7 6.726 11 69 418 1 26 26
4.3 22.1 23.2 19.0 .6 3.2 13.13 5 16 35 0 17 4
.5 6.6 4.1 1.6 .0 2.1 2.127 2 63 266 9 31 27
4.4 3.9 16,4 13.0 5.2 3.6 13.610 0 3 154 3 1 2
i.0 11.6 .6 7,0 1.6 .1 .064 23 165 755 5 20 34
10.4 46,1 43.3 34.2 2.7 2.5 17,213 6 73 431 16 19 70
2.1 12.1 MI 19.6 10.9 2.3 35,637 4 60 149 7 15 40
6.0 6.9 15,7 6.8 3,9 4.3 10.1
.... '1t J

Table 7.--Museums With Fire And Burglar Alarms, By TypeN=4,408
Type of Museum
Fire Alarms Burglar Alarms
System inExistence
Connected toLocal Authorities
All Museums(it of Museums)
2,310
(53.0)
1,724(75.0)
Art 443 344
(%) (73.0) (78.0)
Children's 34 27(%) (67.0) (80.0)
General 200 149
System in 1 Connected toExistence Local Authorities
2,420(55.0)
506
(83.0)
29
(57.0)
239
1,825
(75.0)
415
(82.0)
23
;79.0)
168
wIw(%)
History
(%)
(52.0)
1,049
(48.0)
(75.0)
834
(80.0)
(62.0)
1,085(49.0)
(70.0)
809(75.0)
Parks & Visitor Centers 73 36
(%) (44.0) (49.0)
Science 408 253
($) (51.0) (62.0)
Specialized 103 81
(%) (53.0) (78.0)
70
(42.0)
375
(47.0)
45
(64.0)
283(75.0)
116 83
(59.0) (71.0)
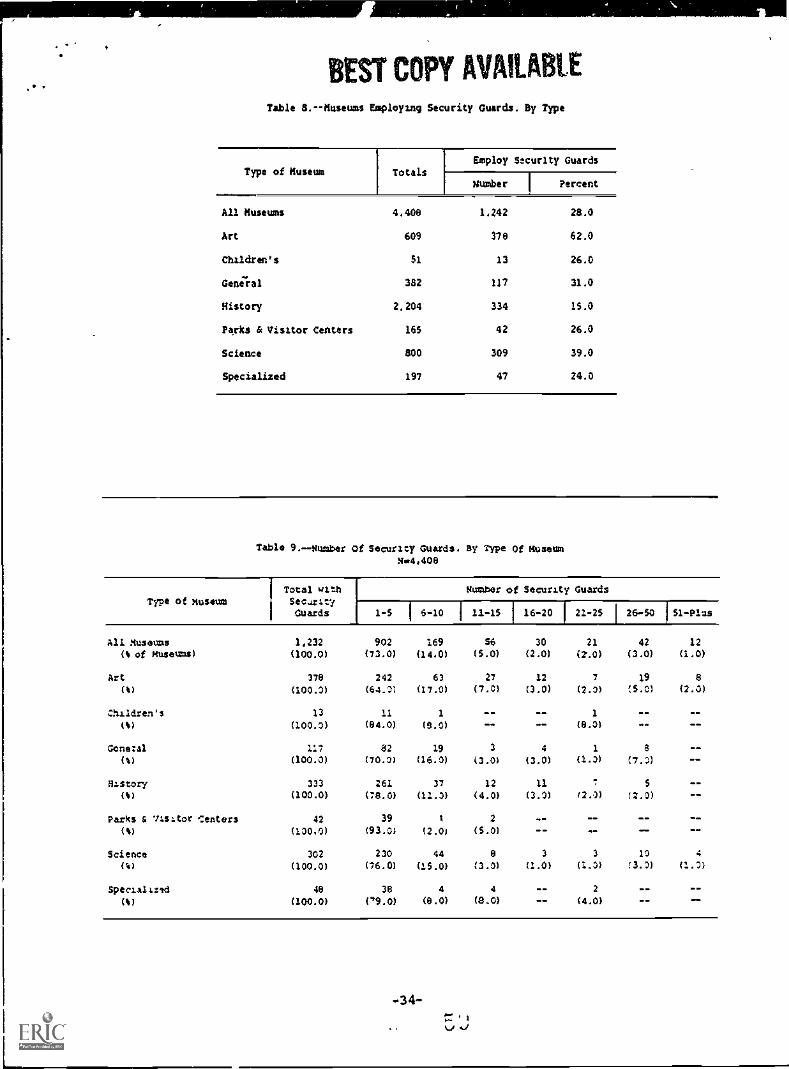
BEST COPY AMAMITable 8.--Museums Employing Security Guards. By Type
Type of Museum TotalsEmploy Stcurity Guards
Number Percent
All Museums 4,408 1,242 28.0
Art 609 378 62.0
Children's $1 13 26.0
General 382 137 31.0
History 2,204 334 15.0
Parks & Visitor Centers 165 42 26.0
Science 800 309 39.0
Specialized 197 47 24.0
Table 9.--Number Of Security Guards. By Type Of Museummw4,408
Type of MuseumTotal withSec.mityGuards
Number of Security Guards
1-5 6-10 I 11-15 16-20 121-25 26-50 1 51-P1us
ALL XUSOUMS(% of Museums)
1,232 902 169 S6 30 21 42 12
(100.0) (73.0) (14,0) (5.0) (2.0) (2.0) (3.0) (1.0)
Art(i)
Children's1%)
Gcne:al(t)
History(i)
Parks 6 Visitor :enters
Science
378
(100.0)
13
(100.3)
117
(100.0)
333
(100.0)
42
(130.0)
302
242
(64.2)
11
(84.0)
82
(70.3)
261(78.0)
39
(93.0)
230
63
(17.0)
1
(8.0)
19
(16.0)
37
(11.3)
t
(2.0)
44
27
(7.0)
3
(3.0)
12
(4.0)
2
(5.0)
8
12
(3.0)
4
(3.0)
11
(3.0)
3
7
(2.0)
1
(8.01
1
(1.3)
(2.0)
3
19
(S.0)
8
(7.3)
5
(2.0)
10
8(2.0)
4
(%) (100.0) (76.0) (15.0) (3.0) (1.0) (1.3) (3.2) (1.3)
Specializtd 48 38 4 4 2
(%) (100.0) (19.0) (8.0) (8.0) (4.0)
-34-

Table 10.--Museums With Security Training Programs, By Type
Type of Museum TotalsHave Security Training Programs
Number I Percent
All Museums 4,408 708 16.0
Art 609 186 31.0
Children's 51 3 5.0
General 382 66 17.0
History 2,204 218 10.0
Parks & Visitor Centers 165 46 28.0
Science 800 157 20.0
Specialized 197 33 17.0
Table 11.--museums Doing Conservation On Objects Not Belonging ToTheir Own Institution, By Type Of Museum
Type of Museum TotalsConservation Done for Others
Number Percent
All Museums 4,408 528 12.0
Art 609 103 20.0
Children's 51 1
General 382 49 9.0
History 2,204 146 28.0
Parks & Visitor Centers 165 14 3.0
Sciencc 800 199 38.0
Specialized 197 17 3.0
-35-
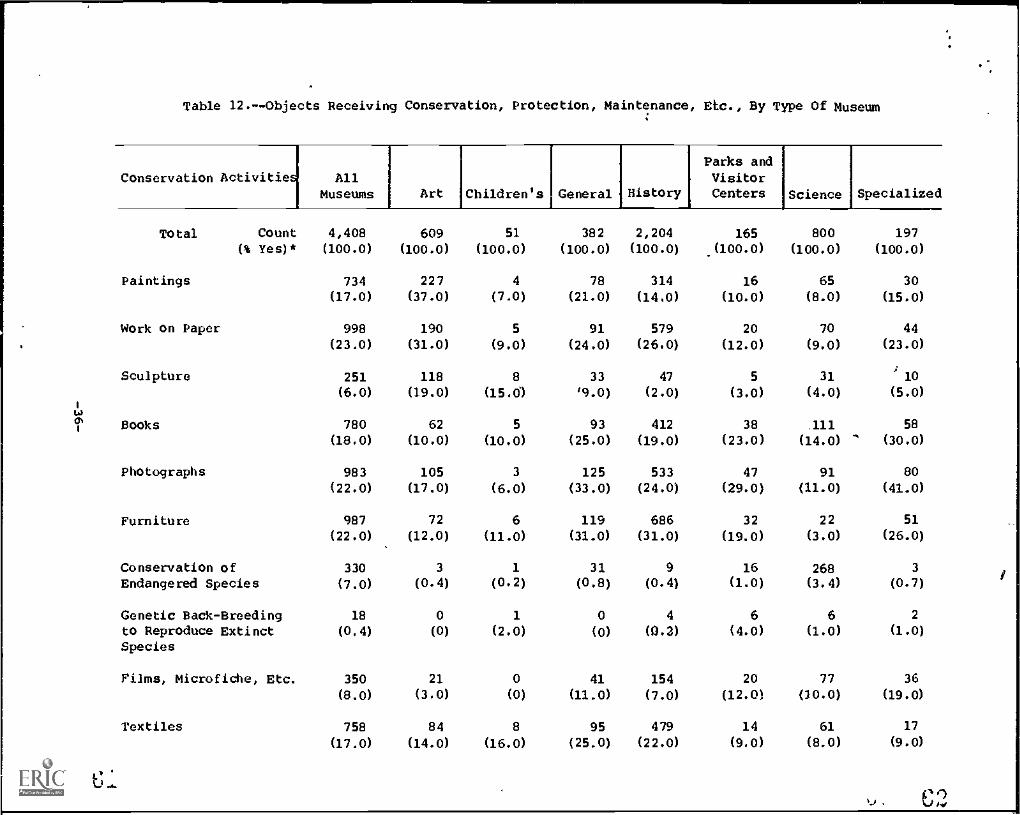
Table 12.--Objects Receiving Conservation, Protection, Maintenance, Etc., By Type Of Museum
Parks andConservation Activities All Visitor
Museums Art Children's General History Centers Science Specialized
Total Count(% Yes) *
Paintings
Work on Paper
4,408(100.0)
734
(17.0)
998
609(100.0)
227(37.0)
190
51
(100.0)
4(7.0)
5
382
(100.0)
78
(21.0)
91
2,204
(100.0)
314
(14.0)
579
165
(100.0)
16
(10.0)
20
800(100.0)
65
(8.0)
70
(23.0) (31.0) (9.0) (24.0) (26.0) (12.0) (9.0)
Sculpture 251 118 8 33 47 5 31
(6.0) (19.0) (15.0) '9.0) (2.0) (3.0) (4.0)sweli
Books 780 62 5 93 412 38 .111
(18.0) (10.0) (10.0) (25.0) (19.0) (23.0) (14.0)
Photographs 983 105 3 125 533 47 91
(22.0) (17.0) (6.0) (33.0) (24.0) (29.0) (11.0)
Furniture 987 72 6 119 686 32 22
(22.0) (12.0) (11.0) (31.0) (31.0) (19.0) (3.0)
Conservation of 330 3 1 31 9 16 268Endangered Species (7.0) (0.4) (0.2) (0.8) (0.4) (1.0) (3.4)
Genetic Back-Breeding 18 0 1 0 4 6 6to Reproduce Extinct (0.4) (0) (2.0) (0) (0.2) (4.0) (1.0)
Species
Films, Microfiche, Etc. 350 21 0 41 154 20 77
(8.0) (3.0) (0) (11.0) (7.0) (12.0) (20.0)
Textiles 758 84 8 95 479 14 61
197
(100.0)
30
(15.0)
44
(23.0)
10
(5.0)
58
- (30.0)
80
(41.0)
51
(26.0)
3
(0.7)
2
(1.0)
36
(19.0)
17
(17.0) (14.0) (16.0) (25.0) (22.0) (9.0) (8.0) (9.0)

Table 12.--Objects Receiving Conservation, Protection, Maintenance, Etc., By Type Of Museum (continued)
Parks andConservation Activities All Visitor
Museums Art Children's General History Centers Science Specialized
Instruments
Ethnographical
337 12 5 44 203 15 36 22
(8.0) (2.0) (9.0) (11.0) (9.0) (9.0) (5.0) (11.0)
300 .. 24 11 46 91 13 113 1
(7.0) (4.0) (22.0) (12.0) (4.0) (8.0) (14.0) (1.0)
Paleontological 114 3 4 16 21 10 61 0
(3.0) (0.4) (7.0) (4.0) (1.0) (6.0) (8.0) (0)
Mounted Zoological 301 3 12 58 45 28 148 7
(7.0) (0.4) (24.0) (15.0) (2.0) (17.0) (19.0) (4.0)
Mounted Botanical 198 2 8 28 24 27 109 0(4.0) (0.3) (16.0) (7.0) (1.0) (16.0) (14.0) (0)
Other 584 27 1 60 254 19 154 69
(13.0) (4.0) (2.0) (16.01 (12.0) (12.0) (19.0) (35.0)
* Percents do not add to 100 since more than one activity can take place.
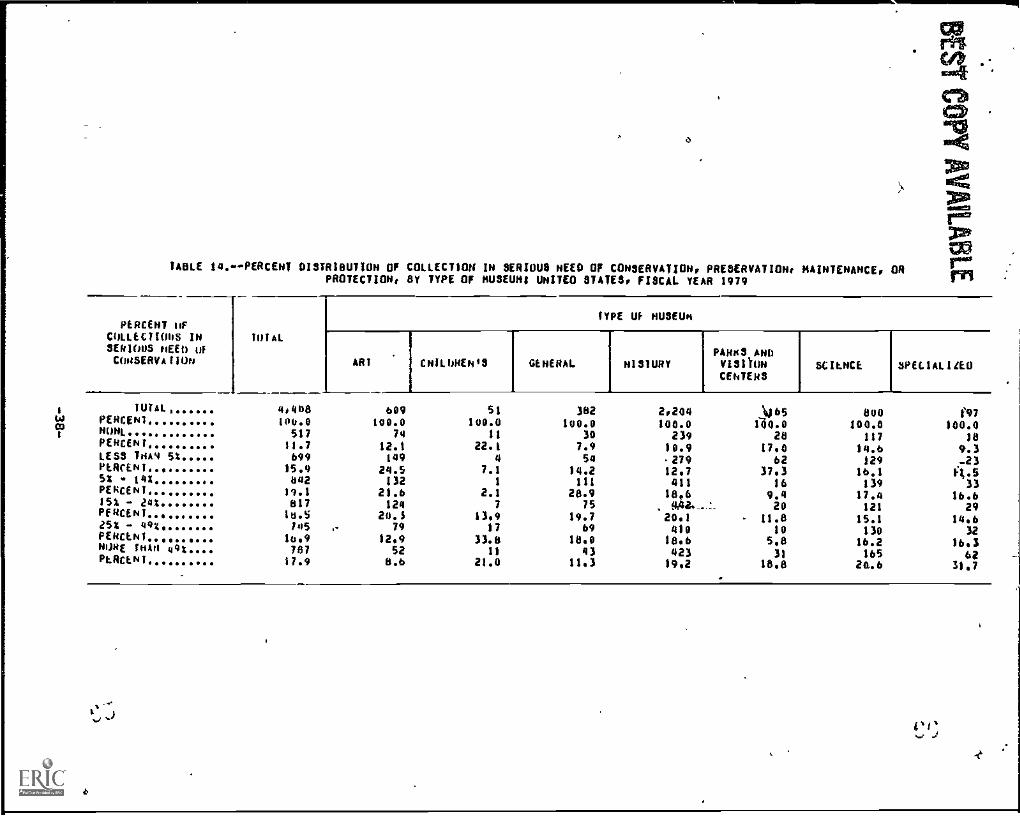
6
TABLE I4. PERCENT DISTRIBUTION OF COLLECTION IN smous HEED OF CONSERVATION, PRESERVATION, MAINTENANCE, ORPROTECTION, 8Y TYPE OF OUSEUNs UNITED STATES, FISCAL YEAR 1979
PERCENT OFCOLLECTIONS INSERIOUS NEED 117cousgRyAtioN
TUT AL
TYPE UP HUHU.,
ART CHILDREN'S GENERAL HISTURYPAM'S AHD
CENTERS
oturAL 4,408
ta ecocENI macoI
NON', 517PERCENT 11.7LESS TA4 5% 699PERCENT 15.95% 14I 842PERCENT 19.1IS% 24% 817PERCENT.., 16.525% 49% , 7 45PERCENT..,,.., 16.9HIRE THAN 49% 787PERCENT 17.9
609 51 382 2,204 $)65100.0 100.0 100.0 100.0 100.0
74 11 30 239 2812.1 22.1 7.9 10.9 17,0149 4 54 279 62
24.5 7.1 14.2 12,7 37,3132 1 111 411 16
21.6 2.1 28.9 18,6 9.4124 7 75 , !I,4i,' 20
20.1 13,9 19.7 20,1 - 11.879 17 69 410 10
12,9 33.8 18,0 18,6 5,852 11 43 423 318.6 21.0 11,3 19,2 18,8
SCIENCE SPE(IALILLO
800 I'97
100.0 100.0117 18
14.6 9.3129 -23
16.1 ft.5139 33
17.4 16.6121 29
15.1 14,6130 32
16.2 164165 62
20.6 31,7
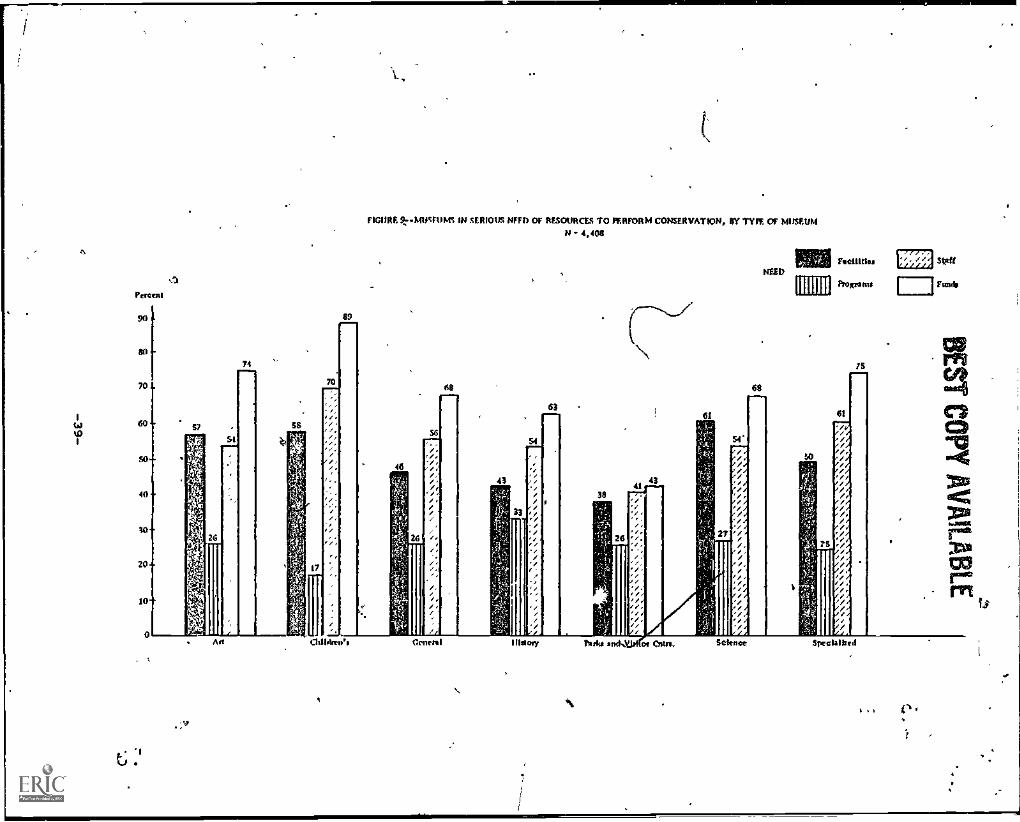
!3
Perea0
90 $90
mime 9.7.1,0MURR IN SERIOUS NEED OF RESOURCES TO PERFORM CONSERVATION, RY WEE OF MUSEUMN -4,408
74
FeclUtlesNEED
hog rams
oss 6$1--
6361
S7
54
, ,
43
40
33
/20
10
.1
Are ernes* I Nary Rork* a Of °dn.
61.07
75
7S
Sprclalbeil
tal Stan
Ftatb
C,ct-04
N4aaaatXfs
wfit
fs
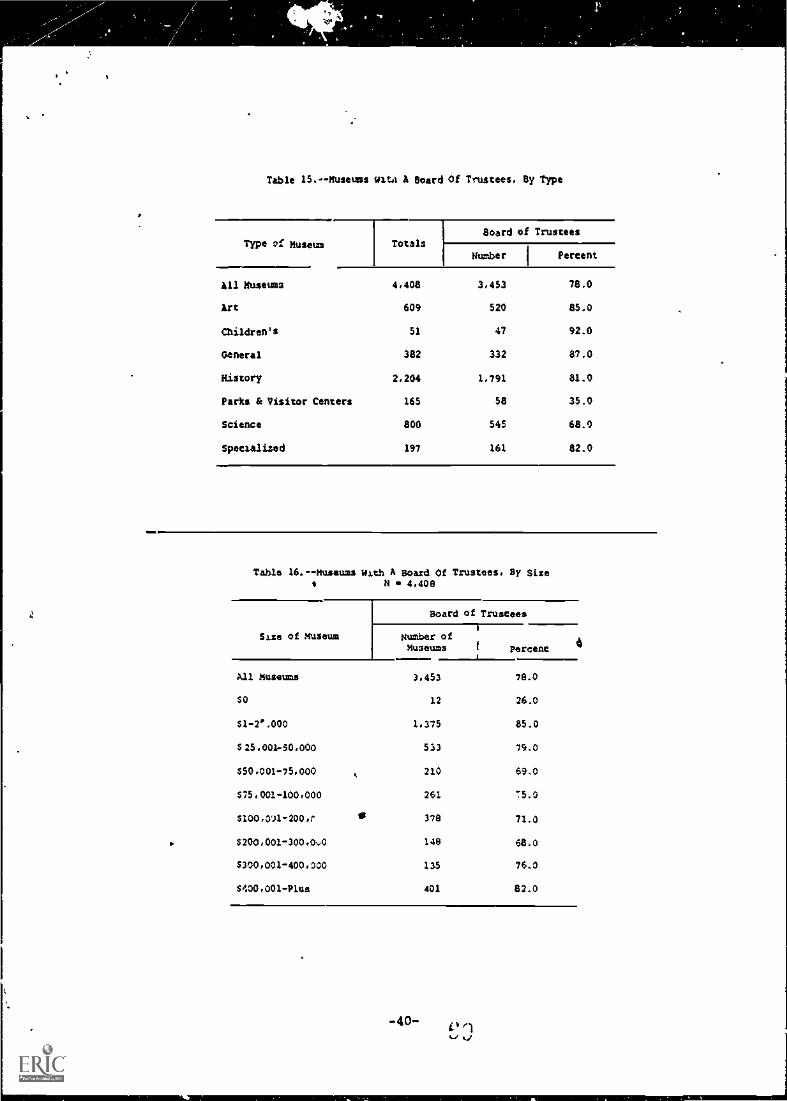
Table 15.-MUseums Bit4 A Board Of Trustees, By Type
Type a' Museum TotalsBoard of Trustees
Humber 1 Percent
All Museums 4,408 3,453 78.0
Art 609 520 85.0
Children's 51 47 92.0
General 382 332 87.0
History 2.204 1,791 81.0
Parks & Visitor Centers 165 58 35.0
Science 800 545 68.0
Specialised 197 161 82.0
Table 16.--Museums kith A Board Of Trustees. By SizeN 4,408
Size of museum
Board of Trustees
Number ofmuseums f percent 4
All Museums 3.453 78.0
SO 12 26.0
$1-2',000 1.375 85.0
$ 25.001-30.000 533 79.0
$50.001-75,000 210 69.0
$75,001-100,000 261 75.0
$100,071 -200,r 378 71.0
5200.001-300.0A 148 68.0
$300,001-400.000 135 76.0
$400,001-Plus 401 82.0
40
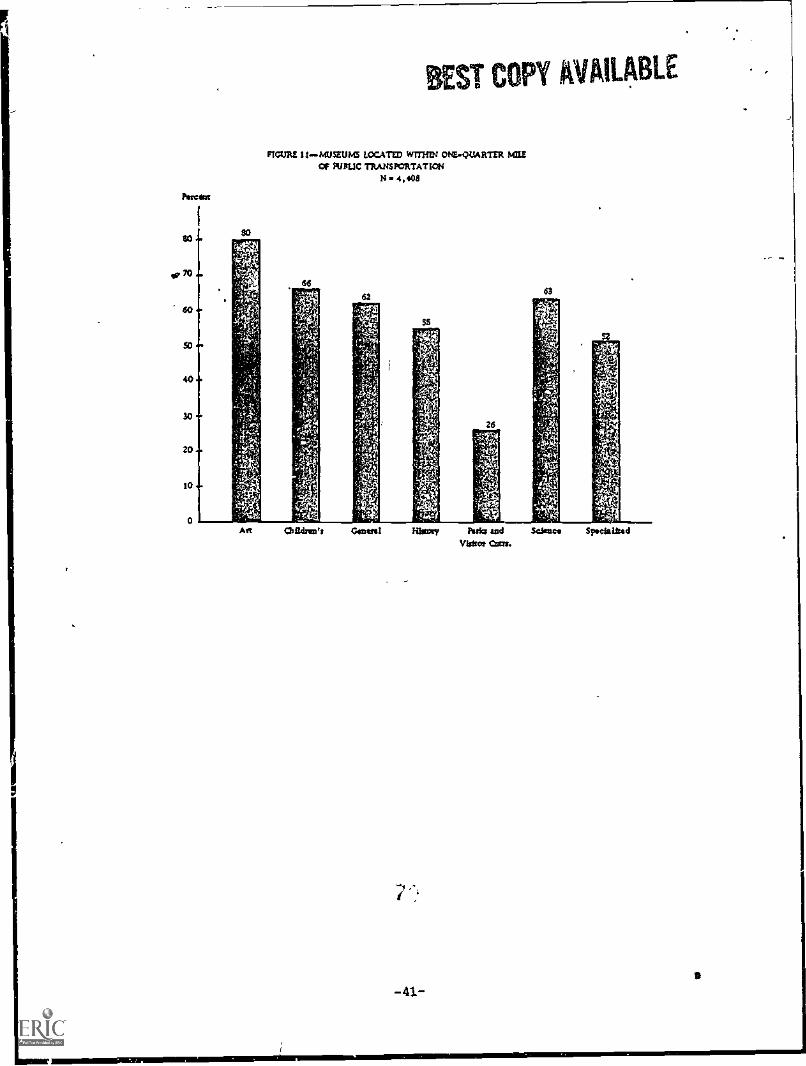
Abram
ST COPY AVAILABLE
mum it...MUSZUM LOCATED WITHIN ONE.QUARTZR MILEOR IIIPLIC TRANSPORTATION
N.4.408
1 2
-41-0

TABLE 20.-44UsEUHs WITH GENERAL ADHISSION FEES, BY TYPE OF NUMMI WITTED STATES, FISCAL YEAR 1Ci9
GtNERAL A6N1SsIoN FEt 7 IL TAI.
ANT CHILDHENIS GENERAL
TYPE OF NWSENN
t115101TyPARKS Am)VIS17011CENTERS
SCIENCE SPEL1ALIIEB
s
AuNJ1
TOTALPERLENT
YesPERCENT
No...PERCEN1
4,4081000
1.40131.8
3,00768.2
609100,6
97
15'9
51284,1
51100.0
2140.7
3059.3
382100.0
9524.8
20875.2
2,204100.0
73333.3
1,47166.7
105100.0
2514.8
141
85.2
800100.0
31038.8
49061.2
197100.0
.al
61.5
7638.5

TABLE 21.4.001$TRIOOTIOR OF DAILY GENERAL ADMISSION FEES FOR ADULT MEMBERS. BY TYPE OF MOWN UNITED STATES. FISCAL YEAR 1979
TYPE OF MUSEUM
AU UL IS VITAL
AR' CHILDREN'S GENERAL HISTORYPARKS ANDVISITORCENTERS
TOIAL 4,408 609 SI 382 2.204 165PERCENT ...... 100.0 100.0 100.0 100.0 100.0 100.0NI) CHANGE 4,328 608 50 379 2.158 162PERCENT 98.2 99.0 97.9 99.1 97,9 97.9$ .01 $ .50 11 - . . 9PERCENT .2 - . - .4$ .S1 $1.00 48 1 1 3 32PERCENT 1.1 .2 2.1 .1 1.511.01 6I.50....... 4 .
PERCENT .1 -$1.51 $2.00 11 . 4PERCENT.... .2 .3 2.1$2.01 $0.00 7PEACE NT.... .1 .2
SCIENCE SPECIALIZED
800 197100.0 100.0
780 19297.5 97.5
2
7
.94
.56.8
t
TABLE 2180.DISIRIBOTION OF DAILY GENERAL ADMISSION FEES FOR CHILD MEMBERS. BY TYPE OF MUSEUMS UNITED STATES. FISCAL YEAR 1979 tium.
/2Ts
.10
SPEC I ALI ZED en
CHILDREN IH) AL
TYPE OF MOWN
Akt catokiti.s GENERAL HISTORYPARKS ANDVISITORCENTERS
SCIENCE
TOIAL ...... 4.408 609 51 382 2.204 165 800 197PERCENT 100.0 160.0 100.0 100.0 100.0 100.0 10010 100.0HO CHARGE 4,346 600 50 379 2,168 165 784 192PERCENT. 98.6 99.8 97.9 99.) 98.4 100.0 98.1 97.5$ .01 1 .50 47 1 1 4 31 - 7 4PERCENT 1.1 .2 2.4 .9 1.4 . .8 2.0$ .SI 11.00 14 . - - 5 - 9 .
PERU NI .3 . . .2 - 1.1$1.41 .. 11.50. I - - . . - 1PERCFNI..... .0 . - . . . - .5

TAKE 21-E,-DISTRI8UTION OF DAILY GENERAL ADNISSION FEES FOR STUDENT mENBERS, BY TYPE OF MUSEUMS UNITED STATES, FISCAL YEAR 1979
StuOtNIS TRIAL
TYPE OF BMW
ANT CHILDREN'S GENERAL HISTORYPARKS AND9181THRCENTERS
SCIENCE 'SPECIALIZED
tutAL 4,408 609 51 382 2,204 165 800 197PERCENT 106.0 1000 100.0 100,0 100,0 100,0 100,0 100,0NO OP"( 4,382 600 51 379 2,195 165 789 196MUNI 99.0 99.8 100.0 99,1 99.6 100.0 98.6 99.5$ ,01 - $ .50 10 1 - 4 5 .
1 'PEREgul .c .2 - .9 .2 . .t -$ .51 - 81.00 IS - - . S w 9 1PERCENT .3 - - - .2 . 1,1 .5 Ca$1.01 - $1.50 t - - . . .
1 . rinPERCENT.. .0 . . .. . - .1 -
cd
C,='CImg:
22,
30SENIOR CM/1.MS
PARKS ANDAR1 CHILDR(Nts GENERAL HISTORY BISItutt SCIENCE SPECIALIZED
CENTERS MPfm"
1
AA TABLE 21-0.-DISTRIBUTION OF DAILY GENERAL ADRISSIoN FEES FOR aERIOR CITIZEN RENDERS, BY TYPE OF BMW,
UNITED STATES, FISCAL YEAR 1979
TYPE uF NUMB
IHIAL
TRIAL 4,408 669 St 382 2,2011 165 800 197!AMEN1 100.0 100.0 100,0 100,0 100,0 100.0 100.0 100.0NO CHARGE 0,391 609 51 382 2,195 165 793 196PERCENT. 99,6 100.0 100,0 100,0 99.6 100,0 99.1 99,5$ .01 .- $ .50 6 . - - 5 .
1 -PERUNI oo .1 - - . .2 - .1 -$ .51 - $1.00 7 . . . . 6 1
PERCENT .2 .8 ,5$1.01 - )1,56 ... 5 - . . S . - .
PtRumt .1 - - . .2 . . -

TABLE 214.DISTRISOTION OF DAILY GENERAL ADMISSION FEES FOR GROUP KNURL BY TYPE OF NUMMI UNITED STATES, FISCAL YEAR 1979
660UP NAIL I INIAL
1YPE OF MUSEUM
A01 CHILDREN'S GENERAL HISTORYPARKS ARO
VISITORCENTERS
SCIENCE SPECIALIZED
MAC 4/408 609 S1 302 2,204 103 800 197PERCENT 100.0 100.0 100.0 100.0 100.0 100.0 100.0 100.0NO CHANGE 4,389 609 St 380 2,193 165 793 197PERCENT 99.6 100.0 100,0 99.3 99.6 100.0 99.2 100.04 .01 6 .S0 9 a S 5PERCENT .2 .64 .51 11.00... 4 3 . .
1
PERCENT .1 .7 . . .141.01 11.59 0 - ft
PERLENI .. a
41.51 12.00 6 1 SPENCE1+1 .1 - .2
Un
TABLE 214.DISTRI8OTION OF DAILY GENERAL ADMISSION FEES FOR OTHER REHM°, ElY TYPE OF NUMMI UNITED STATES, FISCAL YEAR 19792dia
OTHENS I TH1AL
TYPE OF MUSEUM "114
1st .
Ana
ANT CHILDREN'S GENERAL mimi(PARKS ANDVISITORCENTERS
SCIENCE SPECIALIZED
TOTAL 4,400 609 SI 382 21204 165 000 197'1?)
PERCENT 100.0 100.0 100.0 100.0 100.0 100.0 100.0 100.0 13NO CNARGF 4,308 604 S1 381 2, A 165 797 197 r`A's
PERLFH1.. . 94,5 100.0 100.0 99.7 99.3 100.0 99.6 100.0 irrtS .01 ,1 .$4 - . - . . . .
PERCENT . . . 01 .S1 41.00 16 - 0 16 . - -FIERCE'/, .4 . . . .7 0 - .11.01 11.50 I - .
1. . - .
FERCEN1 0 . - .3 . . -
41.51 $200 - . - - - . - -PEACINI - - . - - 0 .0
12.01 10.00 41, - 0 - 0PERCENT . - - . - . .. -$4.0i $b.00 3 - . 0I 0 3 -
PERCENT .1 . . . . .. 11
Li

SS
SO
45
40
35
30 41*
25..
20
15 -
10-
0
C VAILABLF
rtonz 04(115ZI110 CHARGING ADMISSION nu, SY SHE Or MUSEUM
28 2$
45
58
41
SO S 1.25, COO $25, 001. $ 50,001. $75,001. $100, 001. S 200,001 S300,001 $ 403,00250,000 75,000 100,000 200,000 300,000 40,000 Plts
OFCRATING INCOM

TABLE 23.TOTAL OPERATING INCOME, SY TYPE OF MUSEUM AND SOURCE OF OPERATING INCONEI UNITED STATES, FISCAL YEAR 1979
SOURCE OFUPERATING /NCOE
TOTAL
TYPE UF"MUSEUN
*RI CHILDREN'S GENERAL HISTORYPARKS ANDVISITORCENTERS
SCIENCE SPECIALIZED
TUIALPERCENT
1,080, 086,833100.0
.294,443,244100.0
8,449,054too."
asoisgss4144.0
260,712,515100.0
29,732,499180.0
579,818,004100.8
26,613,2 08104.0
FEDERAL GOVERNNENI 147,744,726 24,712,941 931,725 8,579,755 44,452,5/7 12,653,896 51,629,947 945,026'PERCENT 13.6 8.4 11.0 9.3 18.6 42.6 13.6 3.7STATE GHVER4H(41 126,466,372 14,429,149 406,490 14,012,640 67,427,167 .4,064,509 24,440,704 1,445,694PrICCENt .. 11.6 4.8 4.4 15.9 25.9 1.7 6.5 5.6LOCAL GOVERNMENT.. 187,798,795 42,068,837 1,991,254 20,874,193 ;4,243,069 6,188,787 95,325,443 2,947,213PERCENTF004041IONS
17.345,639,386
111.316,045,1110
23.6587,136
23.63,267,914
7.06,201,371
20.8737,840
25.214,020,685
10.9770,630
PERCENT 4.2 5.4 6.9 3.7 2.4 2.5 4.7 2.9CODP00411063 25,904,160 13,676,011 404,251 1,622,831 3,050,921. 2,500 4,349,430 7911,397
PERCENT 2.4 4.6 4.8 1.8 1.2 .0 1.7 3,0INDIVIDUALCONTRIOOTIONS 47,097,193 18,570,564 670,167 3,411,419 4,536, 306 372,637 13,719,106 1,416,597
PERCENI 4.3 6.3 7.9 3.9 3.3 1.3 3.6 6.8EARNED INV**PERCENT
459,712,46442.2
142,413,04848.4
3,248,72438.0
31,377,42235.5
101,301,27334.9
4,962,59216.7
160,060,02642.1
10,149,72960,8
01MER SOURCES 47,725,337 22,526,770 250,11* 5,368,501 7,499,891 750,139 9,064,043 1,443,014PERCENT..1 4.4 T.T 3.0 6.1 2.9 2.5 2.5 6.2
k
Q .:
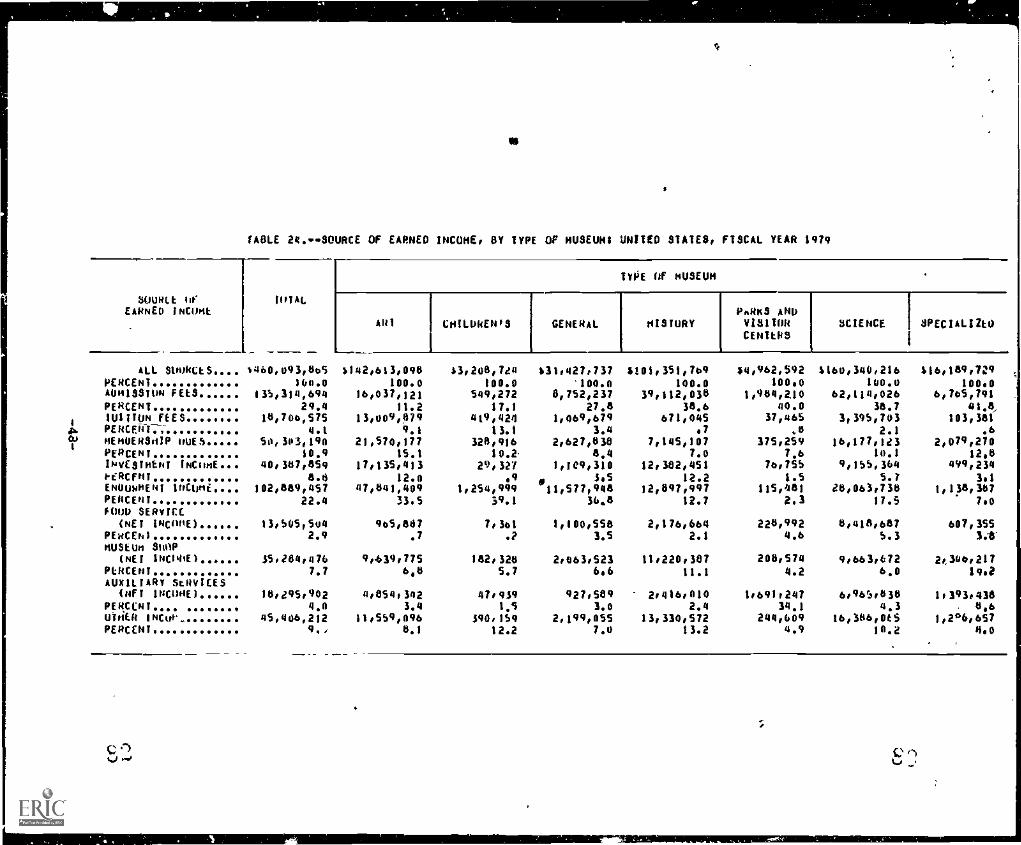
0
.
(ABLE 24.SOURCE Of EARNED INCOME, BY TYPE Of NUSEUN$ UNITED STATES, FISCAL YEAR 1979
4
46Cu
SOURCE 1WEARNED INCNNE
(UT AL
IOC OF MUSEUM
Atli CHILDREN'S GENERAL MISTURYPftRKS ANDVI31ZONCENTERS
SCIENCE SPECIALIZED
ALL SURRLESPERCENT400.1155111 FEES
PERCENT1U1ITON FEESPERC04-1-.7-MENOEOSIP RUESPERCENTINVESTNENT INCNNE...PfRCENTENOURNENI INENNCPERCENTFOOD SERYICC
(NET 144c1E)PERCEN1NUSEUN SNOOP
(NET 10041E)PERCENTAUXILIARY SERVICES
(RFT 1NC11NEIPERCLNT.... ...WEI, ONO,. .
PERCENT
*460,093,005160.0
135,114,69429.4
10,704,5754.1
50,103,19010.9
40,387,8548.0
102,889,45722.4
13,505,54442.9
15,284,4767.7
10,05,9024.0
45,406,2129.,
5142,613,098100.0
16,037,12111.2
13,009,8799.1
21,570,17715.1
17,135,43112.0
47,041,40933.5
405,887.7
9,639,7756,8
4,854,3423.4
11,559,0968.1
43,208,7e4100.0
549,27217,1
419,42413.1
328,91610.2
29,327
.91,254,999
39.1
7, 3o1
.?
182,3285.7
47,4191,5
190,15412.2
631,427,737'100.0
8,752,23727.8
1,069,6793.4
2,627,8388.4
1,IC4,310SoS
M11,577,448770483648
1,100,5583.S
2,063,5236.6
927,5893.0
2,144,0557.0
8101,351,764100.0
39,112,03838.6
671,045.7
7,145,1077.0
12, 382,45112.2
12,897,99712.7
2,176,6642.1
11,220,387110
2,416,0102.4
13,330,57213.2
54,962,592100.0
1,904,21040.0
37,465.0
375,2597,6
76,7551.5
115,4812.3
228,99211.6
208,5744.2
1,691,24734.1
244,6094.9
5160,344,216100.0
62,114,42638.7
3,395,7032.1
16,177,1e110.1
9,155,3645.2
48,061,73817.5
8,418,6875.3
9,663,0726,0
6,965,0104.3
16,386,ots10.a
116,184,724100.0
6,745,74101.0,
103,381.6
2,079,27012.8
999,2343.1
1,138,307
7.0
607, 3SS3.1-
2,306,21714.2
1,393,4380.6
1,2*6,6S7NO
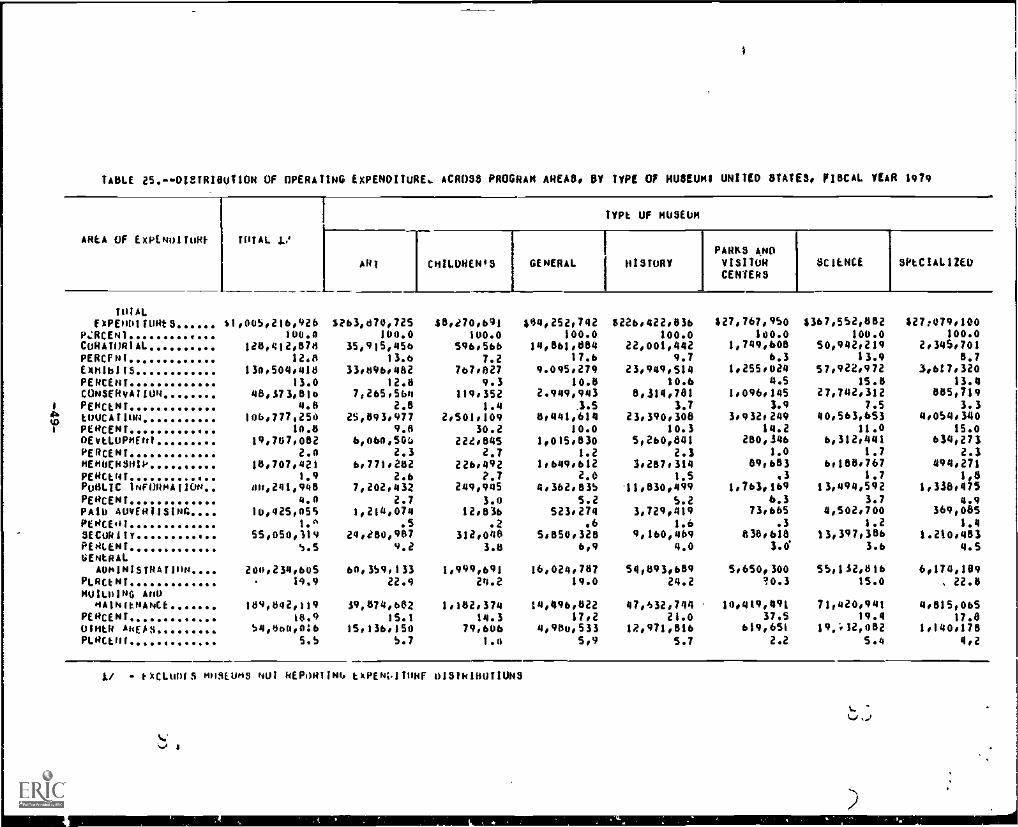
TABLE 259DI8IRIOUT1ON OF OPERATING EXPENDITURE, ACROSS PROGRAM AREAS, BY TYPE Of HU$EUMI UNITED STATES, FISCAL YEAR 1979
AREA OF EXPENOITORI TOTAL L:
rift OF MUSEUM
ART TCHILDREN'S GENERAL HISTORYPARKG A40VISITORCENTERS
SCIENCE SPICIALIZED
TOTALEAFEHOITURIS *1,005,214,924 S263,870,725 08.e70,641 404,2520742 822'4,422,634 $27,767,950 4347,552,682 327:079,160
PERCENT 100.0 100.0 100.0 1004 100,0 100.0 100.0 100.0CURATORIAL 128,412478 35,915,456 594,544 14,861,189 22,001,442 1,749,601 50,942,219 2,34%701PERCFM 129A 13.6 7.2 174 9,7 6.3 13.9 197EXHINIIS 130,504,418 33,896,482 767.027 9.095,279 23,949,514 4255.024 57,922,972 3,617,320PERCENT 13.0 12.8 9.3 10.8 10,6 4.5 15.8 13.4CONSERvAII04 40073,010 7,265,564 119,352 2.949,943 8414,781 1,096,145 27,742,312 885,719
1 PERCENT 4.6 2.8 1.4 .3.5 3.7 3.9 7.5 3.3
,1
LOCATIONPERCENT ..
106,777,25010.0
25,693,9779.6
2,501,10930.2
8,401,6141090
2309000810.3
3,932,24914.2
40,563,65311.0
4,054,34015.0
DEVILOPHFO1 19,707,082 4,464,50:b 222.845 1,015,830 5,260,641 210,446 6,312,441 634,27)PERCENT 2.0 2.3 2.7 1.2 2.3 1.0 1.7 2.3HERHEN001 16,707,421 6,771.282 226,492 1,649,612 3,287.314 89,613 6,118,767 694,272PEUtiNT .. 1.9 2.6 ?.7 2.0 195 .3 1.7 14PUBLIC INFOOmAlloo.. 411,2111,946 7,202,432 249,945 4,362435 11,830,499 1,763,169 13,494,592 1,338.475PERCENT 4.4 2.7 390 5.2 S.2 693 3.7 499PATO AUVER116161:PEOCEolSECOR11T ..
10,42S,OSS1.A
55,450,119
1,214,074.5
24,280,907
12,036.2
Moms
523.27496
5450,321
3,729,4191.6
9,160,469
73,665.3
838,618
4,502,7001.2
13,397,386
369,085194
1.210,483PEOLENT 5.5 9.2 3.8 6,9 44 S.W 3.6 4.5UENtRAL
A0141H1sTRAtloo. 206,234,605 60,359,133 1,999,691 16,024,787 54,893,619 5,650,300 55,132,816 6,174,189PLRCtNT 19.9 22.9 24.2 19.0 24.2 ?0.3 15.0 22.8RUILOING AND
HA1N1tuA1itt
PERCENT'89,842,119
18.939,874,082
15.11,102,374
14.314,494,822
17,247,432,744
21.010019,49i
37,S71,420,943
19.44,815,065
17.8UIMIk ANEO$ 54,1a4,414 15,136,150 79,606 4,900,533 1Z,971,816 619,651 19,:12,0S2 1,140,171PLACE!!! 5.5 5.7 1.0 5,9 5.7 2.2 5.4 4,2
Li txCLoOfS Ho$LONS NUT REPORTiN6 IA11'441010 0161N100TIUNS

III. FINANCE
As discussed in Chapter II, museums were estimated to have received approx-imately 350 million visitors last year. Visitors supported museums through mem-berships, admission fees, and purchases in museum-run shops or cafeterias.However, such support was often not sufficient to maintain museums because mostmuseums. relied on outside sources for over half of their operating income. Theincreased flow of visitors through museums appeared also to have taken its tollon the buildings and exhibits because over one-third of all museum expenditureswere used for building/maintenance and exhibit expenses.
This chapter analyzes survey responses relating to finance and attempts toanswer the following questions about the financial status of museums in 1979:
What was the demand for museum services?
What was the level of rivate su ort of museums?
What was the level of Federal support?
How many museums experienced severe financial problems in 1979?
How did museums experiencing financial difficulty differ fromother museums regarding their policies for user programs andfees, types and numbers of staff, and conservation needs?
Were museums able to absorb the impact of inflation on the costof salaries, wages, goods, and services without reducing thelevel of current o erations below the rior year's level?
1. WHAT WAS. THE DEMAND FOR MEM SERVICES?
Attendance figures reported for 1979 were most often based on estimates.Less than half /.45 percent) of all museums were able to base their attendanceupon an accurate count to determine 1979 attendance; many museum directors indi-cated they had not-et closed out their books for the 1979 fiscal year and hadto make projections for the remaining weeks of the year. Other museums simplydid not maintain reliable records of attendance.
Those museums able to provide accurate attendance figures relied primarilyon a checker/head count (see Table 27, end of chapter). Over half of all muse-ums providing accurate attendance measurements used this method; attendancemeasurements were least likely to be obtained from turnstile counts (estimated4 percent). Between 1975 and 1979, the majority (around 60 percent) of allmuseums had between 1 and 25,000 visitors per year (see Table 28, end ofchapter). Over the five-year period, there was a decrease in the number of
-50-
11
museums reporting no attendance (e.g., museums not yet opened or closed forrenovation). In 1975, an estimated 10 percent of all museums fell in this cafegory The steady decline of such museums (less than 1 percent in 1979) wasmost likely'rIge o museum openings during that period.
What types of museums received the greatest number of visitors? In theLive-year period studied, approximately halt of all museums receiving over300,000 visitors per year were science museums (see Table 29, end of chapter).The trends in total attendance over the five-year period differed markedlyacross museum types. For example, history museums experienced a surge of visi-
- tors during the bicentennial--total attendance went up approximately 28 percentfrom 1975 to 1976; however, the total 1979 attendance for history museumsdropped back down to only 1 percent above the 1975 figure. Attendance in parksand visitor centers also peaked 1976. Attendance at children's museums, onthe other hand, rose steadily from 1975 through 1979. The 1979 attendance atchildren's museums was over two and one-half times as great as 1975 figures (seeTable 30, end of chapter).
Table 31 displays average annual attendance by museum type, from which onecan assess the differential volume of visitor flows. Parks and visitor centersand science museums had the largest average annual attendances. The averageannual attendance for both museum types was approximately 147,M) in 1975; forscience museums, the average rose to approximately 188,000 in 1979 aad for parksand visitor centers to 160,000. The lowest average annvia attendance was foundat children's museums in 1975 (approximately 20,000 visitors); however, by 1979,the average had risen to 54,000, surpassing both history and specialized museumsin average annual attendance.
2. WHAT WAS THE LEVEL OF PRIVATE SUPPORT OF MUSEUMS?
In 1979, museums received less than one-fourth of their total operatingincome from private sources, such as foundations, corporations, individual con-tributions, and other sources. Art museums received the greatest relative per-centage of their total operating income from private sources (25 percent) andparks and visitor centers the least (6 percent). On the whole, museums receivedapproximately the same financial support (4 percent of total opertinq income)from each of foundations, individuals, and other sources. Financial supportfrom corporations made up only an estimated 2 percent *f total operating income(see Table 32).
Science museums received the greatest percentage (5 percent of total oper-ating income) of their private support from foundations. Children's, special-ized, and history museums received the greatest private support iron: indivlduals(8, 7, and 3 percent, respectively); and art and general museums rece,,:ed thegreatest private support (8 and 6 percent of total operating income, respec-tively) frrA other sources, such as universities, community or re:igious groups,and alit, private sources.
3. WHAT WAS THE LEVEL OF FEDERAL SUPPOAT OF MUSEUMS,
MuseuMs continued to rely on financial support from the Federal government,but it appeared that most Federal support tame from sources other tt'an the
Smithsonian, Institute of Museum Services, Nettonal Scie,:e Foundation, National
....1..........................7.,..........................,.........

TABLE 510...AVERAGE ANNUAL ATTENDANCE, 1975+1979, SY TYPE DP mecum UNITED STATES, FISCAL YEAR 1979
ayfRahE471044141.
ANT
TYPE 0 MUSEUM-----
CH11.1)01105 GtNEHAL HISTORYPARRS AHDVISITORCENTERS
SCIEOCL SPECIALIZED
1975 09,141 20.609 53,206 58,289 146,460 147,079 45,794197o 09,031 24,245 60,417 43,918 167,123 114,894 47,5651977 72,277 43,023 59,901 91,078 157,954 198,058 50,1911970 74,4b9 40,751 61,544 80,065 160,1,82 09,898 49,7461979 81,817 55,566 38,04o 158,788 187,820 44,445
Table 32.--Percentages Of Total Cash Operating Income From Foundations.Corporations, And Other Hon-Government Sources
Parks andVisitor
All Museums Art Children's General History Centers Science Specialised
Total OveratiNg Income(Percent)
$1,000,046,733
(100.0)
$294,443,182(100.0)
$8,449,854(100.0)
$08,315,163(100.0)
$260,712,507(100.03
$29,732,898(100.0)
$379,817.942(100.n)
$26,615,197(100.0)
Total Private SuPPort 166,364,067 70.819.159 1,911,664 13,671,125 25,288,409 1,863,116 47,761,870 5,040,637
(% Total Oporating Income) (15.0) (25.0) (23.0) (16.0) (9.0) (6.0) (13.0) (19.0)
PoondatIons 45,639,383
(% Total Operating income) (4.2) (5.4) (6.9) (3.7) (2.3) (2.5) (4.7) (2.8)
Corporations 25,904,158
(% Total Operating Income) (2.3) (4.6) (4.8) (1.8) (1.2) (I.7) (2.9)
Individual Contributions 47,097,190
(% Total Oporattml Income) (4.3) (6.3) (7.9) (3.9) (3.3) (1.2) (3.6) (6.0)
Other 0,741,336(% Total OPerat)ng Income) (4.4) (7.6) (2.9) (6.0) (2.9) (2.5) (2.5) (6.2)
C..."(;)

Endowments for the Arts and Humanities,, and the Office of EdUcation. Parks andvisitor centers received the greatest relative percentage of support (estimated42 percent of total operating income) from Federal sources, and specializedmuseums received the least (estimated 4 percent; see Table 33, end of chapter).
All museum types received the largest percentage of Federal support(72 percent) from a combination of other sources, including the Department ofthe Interior, National Park Service, Young Adult Conservation Corps, NationalTrust for Historic Preservation, Department of Labor, and other sources (Fig-ure 17). Parks and visitor centers received virtually all of their Federalsupport from these sources. The Smithsonian and Office of Education providedthe least Federal support (less than one percent of total Federal support).
FIGURE I neTOTAL =UAL SUPPORT FROM SPECIFIC SOURCES
Peres=-r
Stri ithiCh
414.11
hiatitute or NationalMust= Servitor Seesaw
F000detioo
NarkedEeticemest for Sadessoest
the Ana forfluasasitIes
Office ofEdoestioe
4. NOW MANY MUSEUMS EXPERIENCED SEVERE FINANCIAL DIFFICULTIES?
OtherFederalSommer
Even with Federal and private financial support, some museums were not ableto avoid financial losses. By subtracting total operating expenditures) /fromtotal operating income, all uuseums were classified into three categories:
Financial Category Percent of Museums
Experienced an Operating Gan (+ value) 36%Experienced an Operating Loss (- value) AtBroke Even (ro difference t $1,000) 53%
1/ In the final months of the present prr.,Ject, a -trification study of thetetal museum operating expenditures ducted. Appendix E provides an over-view of that szedy.
-53-

This rather simplistic classification has certain limitations. A financialloss in one year is not necessarily reflective of longer-term financial difficul-ties. The problem could be for one year only, such as a deficit due to a large /unexpected maintenance expense.
Half of all museums broke even; parks and visitor centers had the highestrelative percent of museums in that category (74 percent) and art museums thelowest (39 percent). Compared to other museum types, art museums were mostlikely to experience both a gain (44 percent) and a loss (18 percent). Unlikeother types, more art museums experienced a gain (44 percent) than broke even(39 percent, see Figure 18). Because of the tendency of parks and visitor cen-ters to have equal income and expenditures, those museums were least likely toexperience a gain (24 percent) or a loss (2 percent). For example, a number ofmuseums were run by a central administrative office; operating expenses for thattype of museum came from one large fund in the central office. Any deficits orgains were absorbed by the central office and, thus, were not reflected in thebudget of the museum. A number of the parks and visitor centers and historicalsocieties were operated in such a manner.
Another indicator of the financial status of a museum is whether it hadendowment funds. Approximately one-fourth of all museums had endowment funds in1979. Art museums were most likely to have endowment funds; one out of two artmuseums had such funds. Parks and visitor centers were least likely to haveendowment funds (see Table 34, end of chapter).
As might be expected, art museums also received the greatest amount offinancial support from endowments compared to other museum types. An estimated18 percent of all art museums with endowment funds had funds of $1 million ormore. Next to parks and visitor centers, specialized museums received the leastsupport from endowments. For specialized museums, less than 16 percent had anyendowment funds, and the majority of those funds were less than $50,000.
A final indicator of tie financial status of museums is a comparison ofcapital expenditures to operating expenditures. Evidence of capital expendi-tures implies that a museum had the ability to meet day-to-day operating expen-ditures and could also afford long-term additions or, possibly, acquisitions.The ability to make capital expenditures could also have been provided by aspecific grant for that purpose. Table 35 displays the ratio of the two typesof expenditures by type of museum. For all museums, total capital expenditureswere less than one-fourth of total operating expenditures in 1979.
Children's museums had the highest ratio of capital expenditures to operat-ing expenditures; parks and visitor centers and specialized museums had thelowest. For children's museums, total capital expenditures were equivalent tohalf the amount of the total operating expenditures. These figures, coupledwith the significant increase in attendance at children's museums from 1975 to1979, suggest that children's museums are expanding their facilities and collec-tions in number and size to accommodate the increasing interest of the public intheir programs.
Parks and visitor centers had the lowest ratio of capital to operatingexpenditures (.126:1), as might be expected due to the nature of theirfacilities.
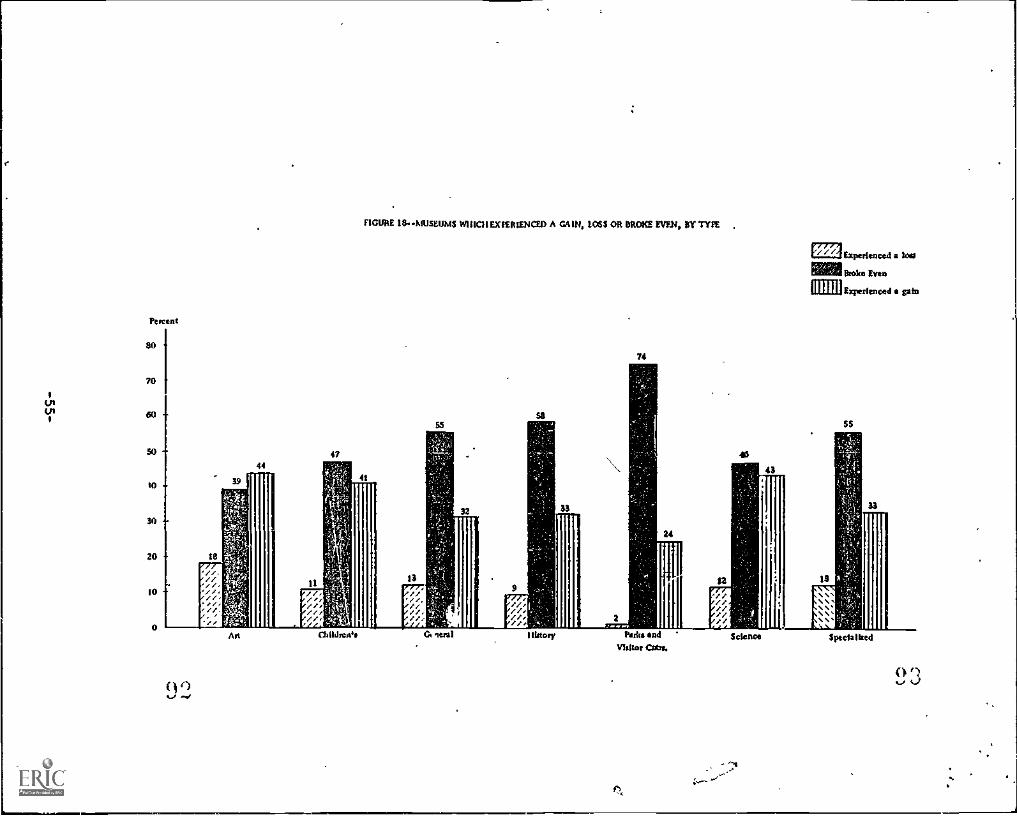
?meat
80
70
60
SO 4744 43
10
30
20
10
FIGURE 18.1USEI1MS W11101EXPERIENC20 A CAIN, tOSS OR ORME Weis SY DM
74
Experts:m*4 a 1040
MalBroke Even
MIExperienced s gab
SS
G ieral Ilittory Parka and
Visitor Cabs.

I
4
WCOI
I., ..-------
r
TABLE 35,..RATIO OF CAPITAL:EXPENDITURES TO OPERATING EXPENDITURES, BY TYPE OF MUSEUMSUNITED STATES, FISCAL YEAR 1979
,..
ISPE OF HUSEomi
1PIAL CAPITAL EXPE4011URLS
1
TOTAL OPLRAT1NO EXPENO1TURE3 RATIO.
..
TOTAL ...ARTCHILDREN'SWIEHAL4.... ...NISIONy .
PARKS AND 91StloR CENTERSSCIENCE ' ,
SPECIALWO ....... ....
Ae41,258,18174,346,9574,214,35117,938,44160,244,4623,509,380
79,105,9973,898,593
.. ,
$1,016,195,023275,263,725
8,270,69184,435,840226,422,83627,767,950
367,552,08227,079,100
0.239 S 1
.270 1 1
.510 1 I
.212 S I
.266 I 1
.126 1 1
.215 S 1
.144 1 1
.i
n1
i
t
1
..
.1s -4.
:,
n.
k
law
1

S. HOW DID MUSEUMS EnERIENCING FINANCIAL DIFFICULTY DIFFER FROM MUSEUMSEXPERIENCING A NET GAIN REGARDING THEIR POLICIES FOR USER PROGRAMS ANDFEES, TYPES AND NUMBER OF STAFF, AND CONSERVATION NEEDS?
There were some orved differences in the activities and numbers and typeof staff between thoselffiuseums experiencing a net gain (i.e., positive operating
\-income less operating expenditures) and those experiencing a net loss in 1979.This section compares the activities of the two groups in the areas of member-ship and admission fees and policies, number and type of staff, and conserva-tion activities and needs.
As mentioned in the last section, approximately half of all museums wereestimated to have equal operating expenses and incomes, 11 percent experienceda loss, and 36 percent a gain. Slightly more (three-fourths) of thoseftuseumsexperiencing a net lots had a membership program than those with a net gain(two-thirds). The median number of members among net loss museums (895) wasalso higher than those at net gain (504) museums and those that broke even(243). This,corld possibly suggest that, although some museums were experi-encing financial difficulties, it was not due to declining public interestand/or support. On the other hand, it may also suggest that museums havingfinancial difficulty are responding by building up membership programs.
Examination of median membership fees by museum categories provides furthersupport of the above findings. Median membership fees of various types werealmost always higher at museums that experienced a net loss.
Median Membership Fees, by Net Operating Income
Type ofMembership Fee Net Loss Broke Even Net Gain
Individual $ 9.96 $ 3.88 $ 8.52Fam3.ly 21.67 7.76 16.96
Student 5.70 3.16 5.32Donor 58.96 46.79 56.99
Senior Citizen 7.33 3.48 4.62
Patron 81.85 44.85 90.04
Business 79.82 68.55 110.48
Other $170.87 $120.64 $135.83
It would appear that fees are higher at museums experiencing financial dif-ficulty; however, they also have relaively high patron support. Durirg tele-phone fellow -ups, one museum director stated that the membership program at hisinstitution was not undertaken to increase revenue hut, rather, to increaseexposure to museum activities and to encourage attendance. At the same insti-
tutio^ the costs of mailings and other benefits ofereti to members outweighedthe revenue from membership dues. For all museums, income from membershipsaccountea fr.. only 5 percent of total operating income. It would appear thatmembership programs may not be a viable approach to overcoming significantfinancial problems.

On the other hand, admission fees at all museums accounted for 12 percentof total operating income. Yet only an estimated 47 percent of museums with anet loss and 43 percent of those with a net gain charged admission. For museumsin both categories, over 90 percent of each had fixed admission fees, not sug-gested fees. Unlike membership fees, the median admission fees of various typesat net loss museums were not consistently higher than at net gain institutions.
Financial Status
Nonmember Fees Net Loss Broke Even Net Gain
Adult $1.18 $.71 $1.02
Child .40 .25 .35
Student .46 .4.3 .47
Senior Citizen .67 .42 .84
Group Rate .77 .56 .84
Other .29 .35 0
.14
On the aver...ge, museums experiencing a net loss employed a greater numberof total staff than those with a net gain. The mean number of regular full-timestaff at museums experiencing a net loss oas 23; approximately half that numberwere employed on the average at museums experiencing a net gain.
Mean Number of Total Staff, by Net Income
Regular
All Museums Net Loss Net Gain
Full-time 9 23 12
Part-time i 7 4
Temporary1 2 1
fart-time 2 6 3
VolunteerFull-time -
Part -time 23 47 33
CETAFull-time 1 1 1
Pad -time
Museums experiencing a net loss also employed twice as many temporary staff(8) as those with a net gain (4).
Examining the type of staff employed by the two museum groups indicatedthat the types of staff employed were quite similar regardless of the museum'sfinancial situation. Museum staff in all three groups were found to be concen-trated in the areas of general administration, building/maintenance, security,education, and curatorial (see Table 36).
- 5 8 _"*
-

F*assorts' MAO
yam. 36,Moan Mat/ By Type, by Not hum=
Conmsvation Stoc.olon Ihvelopmeal Membership Ifsullobstormotloo
Mossy Goronellit GtSP.IllAshettolstrattoo
SeossIty halals* Other
RM1111Al1 F .4.-TIME
c'sAU Mossums
lsi Loss
Net GAM
1 1 1
3 2 t 2
I t 1 1
REGIRAR PART-TIME
All 3110CUIIIS --
Mei toss -- -4. --
Net Coln
1
2
1
...
Ow
NOM
4.- 2 1 2
1 1 3 3 4
1 1 2 t 2
.6.1 COO Ile
....0. 411b. moll mnOt
I
I
O..
O..
O..
.. limb

Almost half (47 percent and 48 percent, respectively) of the institutionsexperiencing either financial difficulties or financial gains had their ownfacilities for conservation, preservation, and/or protection of their collec-tions. A slightly smaller percentage (40 percent) of the facilities breakingeven had conservation facilities, indicating that there is no clear relationshipbetween net income and 'having such facilities. The greatest frequency of muse-ums experiencing a net loss'to also have facilities was fouri at specializedmuseums (80 percent), and the lowest (31 percent) was found at general museums(see Table 37, end of chapter).
On the other hand, comparing museum estimates,of the percent of collectionsneeding conservation, preservation, and maintenance suggests there was essen-tially no difference in conservation needs between the two groups (see Table 38,end of chapter).
6. WERE MUSEUMS ABLE TO ABSORB THE IMPACT OF INFLATION ON THE COST OFSALARIES, WAGES, GOODS, AND SERVICES WITHOUT REDUCING THE LEVEL OF CURRENTOPERATIONS BELOW THE PRIOR YEAR'S LEVEL?
Most museums (65 percent) indicated that they had been able to maintaintheir level of activity despite inflation.. The museum types most likely toreduce their level of operations due to the impact of inflation were specialized(46 percent) and science museums (43 percent). Children's museums were leastlikely (26 percent) to reduce operations because of inflation (Figure 19).
Across the nation, slightly less than one-half (44 percent) of the museumsin the Great Lakes/Plains States had to reduce operations because of inflation:in contrast, an estimated one-fourth of the museums in the Southeast were notable to absorb the impact of inflation (see Table 39, end of chapter).
Museum directors who reported that their museum was unable to absorb theimpact of inflation in 1979 were asked to indicate the extent of reduction inoperations (if any) required in curatorial, education, security, exhibition,conservation/preservation, and other areas. The areas most affected by therising cost of salaries, wages, goods, and services were exhibits and conserva-tion of exhibits. Approximately three-fourths of the museums forced to reduceoperations were forced to cut back in both of these areas.
Different museum types had varying priority areas that were reduced as aresult of inflation. Art and science museums most frequently reduced exhibitactivities. (n estimated 88 percent of the art museums and 81 percent ofv.ience museums unable to absorb inflation reduced activities related to exhib-its.) All of the children's museums that had to reduce.activities reportedcutbacks in education. Three-fourths of general museums and 67 percent ofspecialized museum: forced to reduce activities had to cut back in curatorialefforts. And, although conservation was found to be a major activity of historymuseums, approximately three-fourths (73 percent) of history museums forced toreduce activilies reduced conservation activities (see Table 40, end of
chapter).
-60-
Nra- 1101WMmmImIP

o
FIGURE 19./ALISEUMS MAIL: TO ABSORB THE IMPACT OFINFLATION WITHOUT REDUCING THE LEVELOF OIVAATIONS, BY ME
Art Chiles:Vs Comsat
-61-
Pula and Science Special bidVhdtcv Cook
e

0
.
P
s
TABLES AND FIGURES AT
END OF CHAPTER Il
1 1 )k.. A.
. ..
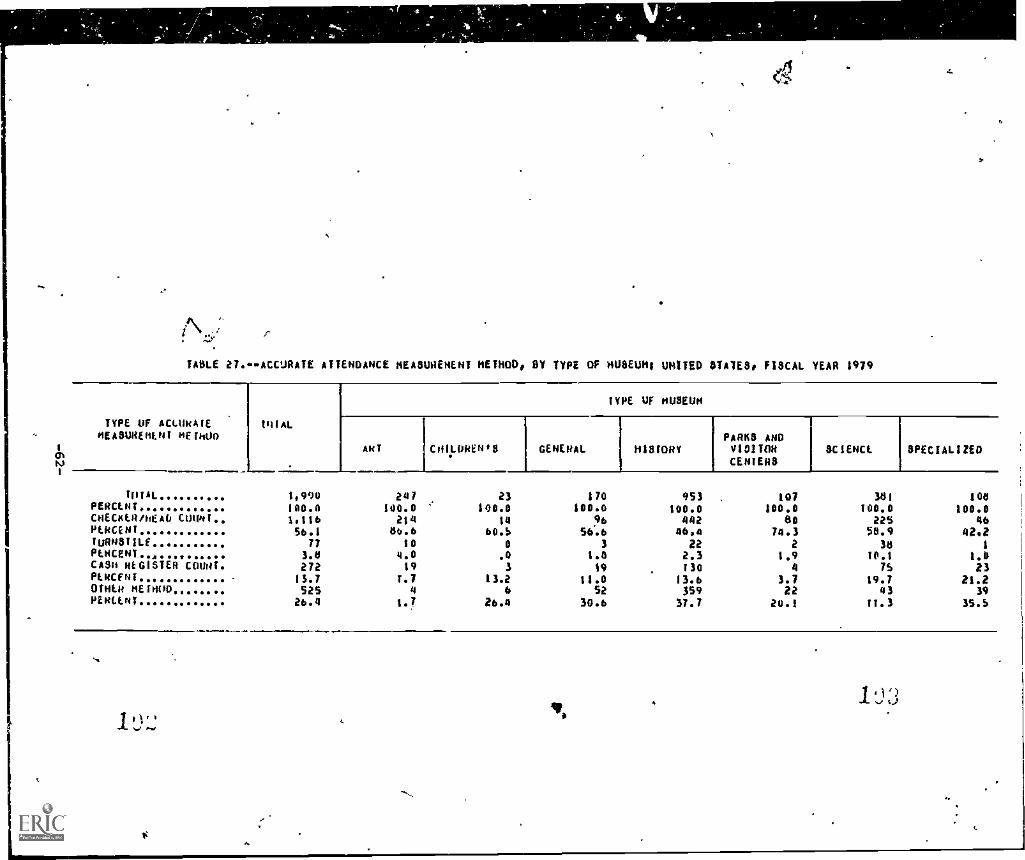
f
EMILE 27.- ACCURATE ATTENDANCE REASURENENT METHOD, BY TYPE OF MUSEUMS UNITED 61A1111, FISCAL YEAR 1979
TYPE OF ACENNAIEMEMO/RENEW mEFROD
ONN
TI1IAL
TYPE OF MUSEUM
*KT CHILDREN'S GENERAL HISTORY
1PARKS ANDVISITORCENTERS
SCIENCE SPECIALIZED
I
TOTAL 1,990 247 23 170 953 107 381 100PERCENT 100.0 100.0 100.0 ;00.0 100.0 100.0 100.0 100.0CHECKER/NE*6 MINI 1,110 214 14 96 442 ao 225 46PERCENT 56.1 86.0 60.5 56..6 48,0 74.3 50.9 42.2IURNSIILE 71 10 0 3 22 2 38 1PERCENT..,,...... 3.0 14.0 .0 10 2.3 1.9 10.1 1.0CASN REGISTER COUNT 272 ;9 3 19 130 4 75 23PERCENT 13.7 7.7 13.2 11.0 13.6 3.7 19.7 21.2OMR MEINOD 525 4 6 52 359 22 43 39PERCENT 26.4 1.! 26.4 30.6 37.7 20.1 11.3 35.5
...
1 0v. 4 1 ':3
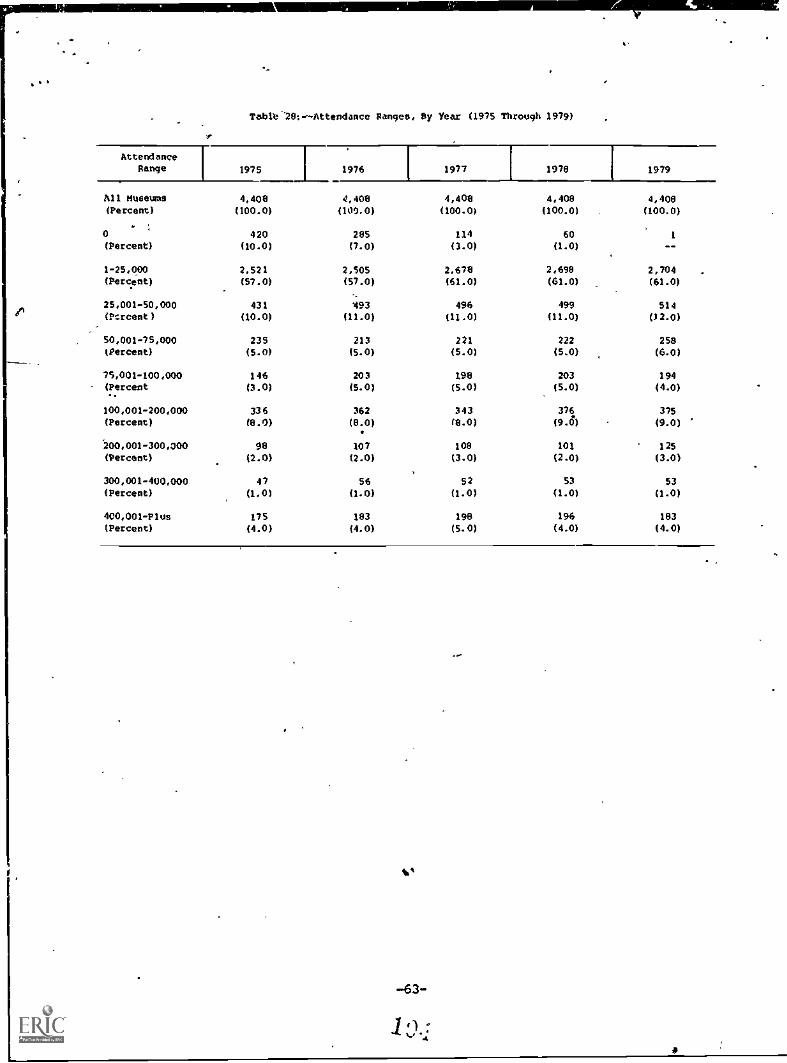
Tab1t**281--Attendance Ranges, By Year (1975 Through 1979)
AttendanceRange 1975 1976 1977
I I
1970 1979
A11 Museums 4,408 4,408 4,408 4,408 4,400
(Percent) (100.0) (100.0) (100.0) (100.0) (100.0)
. .
0 420(Percent) (10.0)
1- 25,000 2,521(Percent) (57.0)
25,001-50,000 431(nrcent) (10.0)
50,001-79.000
(Percent)
75.001-100,000(Percent
100,001-200,000(Percent)
200,001-300,000(Percent)
300,001-400,000(Percent)
400,001-P1us(Percent)
285 114 60
(7.0) (3.0) (1.0)
2,505 2,678 2,698(57.0) (61.0) (61.0)
493 496 499
(11.0) (11.0) (11.0)
1
--
2,704(61.0)
514(12.0)
235 213 221 222 258(5.0) (5.0) (5.0) (5.0) (6.0)
146 203 198 203 194
(3.0) (5.0) (5.0) (5.0) (4.0)
336 362 343 376 375
(8.0) (0.0) (8.0) (9.6) (9.0)
98 107 108 101 125
(2.0) (2.0) (3.0) (2.0) (3.0)
47 56 52 53 53
(1.0) (1.0) (1.0) (1.0) (1.0)
175 183 198 196 183
(4.0) (4.0) (5.0) (4.0) (4.0)
4
-63-

"*.:
DUE 29,ANNUAL ATTENOANCEI 1979, BY TYPE Of NUSEUN1 UNITED STATE., FISCAL YEAR 1979
AITENOANCEs 1919 WAL
TYPE OF PRISM%.
ART COI DRENIS . GENERAL ,NITITURY
PARKS ANDVISITORCENTERS
F.SCIENCE SPECIALIZLO
TOTAL 4.. 4,44e 449 .U1 352 2,204 165 800 19JPERCENT 100.0 :4d.4 100.0 100.0 1400 100.0' 100.0 100.0NO ATTENDANCE ,: I
. - .. . . 1
PERCENT .0 . .. . .5
1 - 25,000 2,704 329 28 245 1,458 50 327 117PERCENT 61.3 54.1 54.2 64.1 73.0 30.0 40.9 V),1125,001 - 50,000 514 79 7 45 196 23 127 r Sil
PERCENT 11.7 13.0 13.1 11.9 0.9 13.9 15.8 19.350,001 - '50,080 452 88 10 39 179 18 97 21
PERCENT 10.3 14.4 20.2 10.2 0.1 g 4_ 10.9 12.2 10.4100,001 - 200,000 375 10 5 24 132 '',6. 42 89 12OFRCENT 8.5' 11.5 10.4 . 6.4 6.0 '.*t5.2 11.1 6.3200,001 - 300,040 125 16 0 5 49 13 41 1
PERCENT. 2.5 2.7 - 1.3 2.2 7.9 5.1 .5300,001 -, 400,000 53 6 - 5 4 3 28 5PERcUlt 1.2 1.0 .. 1.3 .3 - 1.0 3.5 2,3*ROVE 404,000 183 21 1 10 33 17 90 2
tINI PERCFNI 4.2 3.5 2.1 4.7 1.3 10.3 11.2 1.1
,.16.
.
TABLE 30. -TOTAL ANNUAL ATIENDANCi, 197519798 BY TYPE OF MUSEUMS UNITED 8707E88 FISCAL YEAR 1979
TYPE OF NOSLUm I 1975 I 1916 1977
TOTAL 298,314,686 3458620,472 3528404,113PERCENT 100,0 100.0ANT 02,107,542'. 0 280314:4 44,016,078PERCENT
1
12.2 12.5CRILPREN'S 1,015,11$1;; 10439,418 2,159,572PERCENT .3 .4 .6GCRERAL 20065,757 23,091,311 22,594,294PERCENT 0.0 4.5RIS IURY..a 84,376,219 10709%!6! 90,522,485PERCENT" 28.3 25.7PARKS AND vISITOR CtoTENs 24,1658961 27,5758320 26,061,761PERCENT..., 5.1 8.0 7.4SCIENCE 117,661,344 134,313,130 1548844,059PERCENT 39.4 38.9 44.5SPECIALIZE') 8,621,352 9,363,632 9,550,544PERCENT 2.9 2.7 2.0
1978 1979
339,559,622100.0
458351,16613.3
205189".7
23,521,9806.9
08,284,20426,0
2u,S49,20l.0
1438910,53542.3
9,792,951
151,%.? 1
347,757,044100.0
49,825,72714.3
2,726,529.5
24,410,7967.4
05,590,06824.6
26,199,9467.5
150,254851243.2
88749,465 .
2,5

Table 33.--Total Cash Operating income From Federal Government Sources, By Type
Income Source
_
All
Museums Art Children's General
p
I
Parks andHistory Visitor
I
Centers
o
Science Specialized
I
Total Operating Income(Percent)
$1,000,086,733(100.0)
$294,443,102
(100.0)
800149,054
(100.0)
$00,315,153(100.0)
$260,712,507
(100.0)
$29,732,090
(100.0)
$379,017,942(100.0)
$26,61$.1,7"(100.0)
Total Federal Income 147,744,709 24,712,955 931,724 0,379,754 40,452,516 12,653,096 51,629,937 903,926(t Operating Income? (1d.0) (0.0) (11.0) (0.0) (19.0) (42.0) 414.0) (4.0)
(Percent') (100.0) (100.0) (100.0) (100.0) (100.0) 4100.01 (100.0) 4160.01
Smithsonian NMA 229,666(Percent Federal Income) (0) (0) (0) (0) (0) (0) (0) (0)
Institute of Museum 5,435.005Services (1MS)
(Percent Federal Income) (4.0) (5.0) (17.0) (5.0) 13.0) (0) (4.0) (1...0)
National Science 5,262,033Foundation (NSF)(Percent Federal Income) (4.0) (1.0) (:.0) (6.0) (0) (0) (9.0) (0)
National endowment forthe Arts (NRA)
13,321,267
(Percent Federal income) (9.0) (34.0) (15.0) (11.0) (5.0) (0) (2) (15.01
National endowment forthe'llumanities (NEM
16,676,391
(Percent Federal Income) (11.0) (20.0) (0.0) (21.0) (13.0) (0) (7.0) (23.0)
Office of Education (0e) 494,355
(Percent Federal Income) (0) (0) (11.0) (0) (0) (0) (1.0) (0)
Other Federal 106,325,111(Percent Fedetat Income) (72.0) (4 n) (44.0) (56.0) (79.0) (100.0) (37.0) (50.0)
1, 1
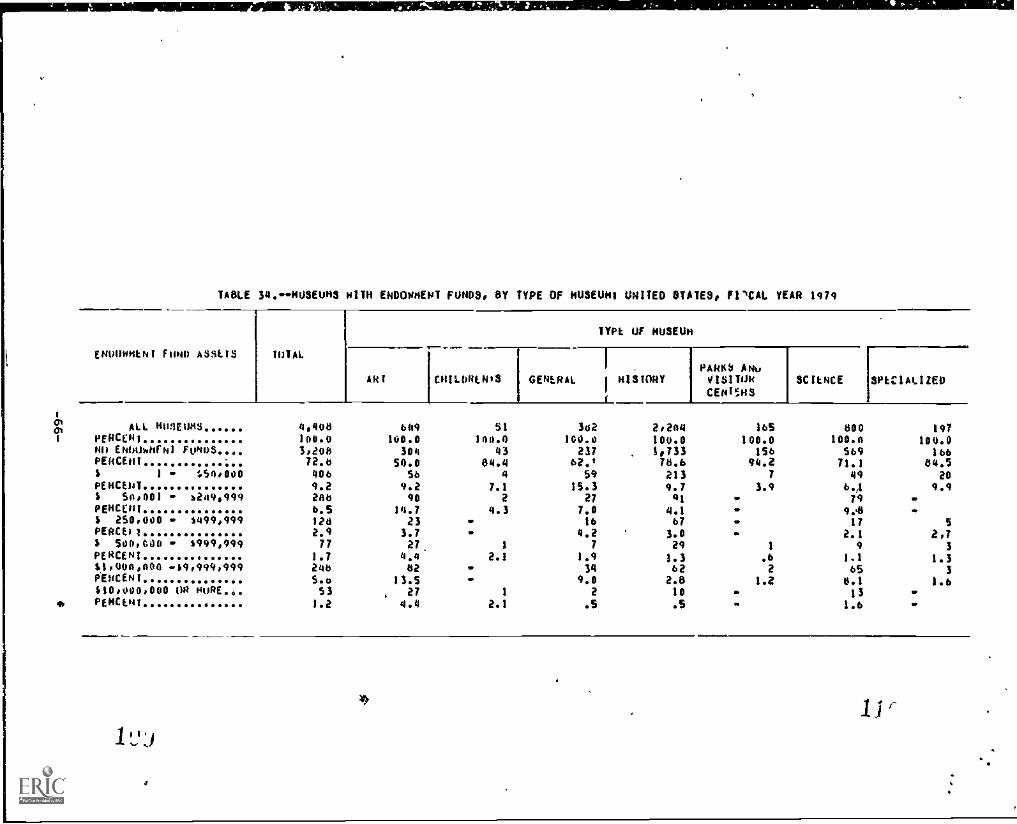
TABLE 30,1USEUMS WITH ENDOWMENT FUNDS, BY TYPE OF MUSEUM' UNITED STATES, F11CA1. YEAR 1070
ENUONNLNI FOND ASSEI$ TOTALr^
ART CHILDREN'S GENERAL
ALL NIMEUKS 4,408 609 51 3021 PERCEN1 100.0 100.0 180.0 100.0
NO ENDOWN1 FUNDS..,,, 3#206 304FERMI 7200 54.0
4380.4
23762,*
1 1.50,000 406 56PENCENT 9.2 9.2
4
7.159
15.3$ 54,001 1249,499 Zee 90 2 27PERCENT 6.5 14.7 4.3 7.0$ 250,01)0 1499,994 128 23 . 16PERCE11 2.4 3.7 .. 4,2$ 500,600 S994,999 77 27 1 7PERCENT 1.7 4,4 2.1 1.911,000,004 ..e4,949,499 245 52 34PENCENI 5.0 13.5 . 9.0$10000,000 OR Hon.,. 53 , 27 1 2
4, PE110.41 1.2 4.4 2.1 .5
TYPE OF HUHU.'
I HISTORYPARR( ANuVISITORCENISHS
SCIENCE SFEE1ALIZED
2,204 165 000 197100.0 100.0 100.6 100.01,733 156 569 16678,6 44.2 71.1 04,5213 7 49 20
9.7 3.6 64 0.0qt - 79
4.1 . 0.467 . 17 5
3.0 2.1 2,729 1 9 3
1.3 .6 1.1 1.362 2 65 32.8 1.2 6.1 1.6to 13.5 1.6
r

A
Table 37.--Mureums With Facilities For Conservation And ?reservation,By Type And P,*. Income
Net Loss1
Broke Ever I- Net 041A
All museums 471 932 1,580(47.0) (40.0) (48.0)
Art 45 69 83(42.0) (29.0) (31.0)
Children's 2 7 5
(38.0) (29.0) (24.0)
General 15 94 61(31.3) (45.0) (49.0)
History 79 43S 308(43.0) (34.0) (43.0),
Part's 4 Vlsir^r Centers 2 52 21,67.0) (43.0) (51.0)
scsence 60 226 239(65.0) (62.0) (70.0)
Specialized 20 SO 42(80.0) (46.0) (65.0)
Controlling for net income, the percentage of each type of Institution withfacilities for conservation and preservation.
Table 38.--Percent 01 Collections NeedingUpkeep, By Net Income
Percent of CollectionsNeeding Upkeep
AllMuseums
Net BrokeLoss Even
NetGain
Total 4.408 473 2,354 1,580
(100.0) (100.0) (100.0) (100.0)
None 517 57 355 105
(12.0) (12.0) (15.0) (7.C)
Less Than S 699 100 337 253
(16.0) (21.0) (14.0) (11.0)
5 - 14 842 71 512 '259(19.0) (15.0) (22.0) (16.0)
15 - 24 817 95 422 701
(18.0) (20.0) (18.0) (19.0)
25 - 49% 745 64 334 347
Greater Than 49%
(17.0) (14.0) (14.0) (22.0)
787 86 396 305
(18.0) (18.0) (17.0) (19.2)
-67-
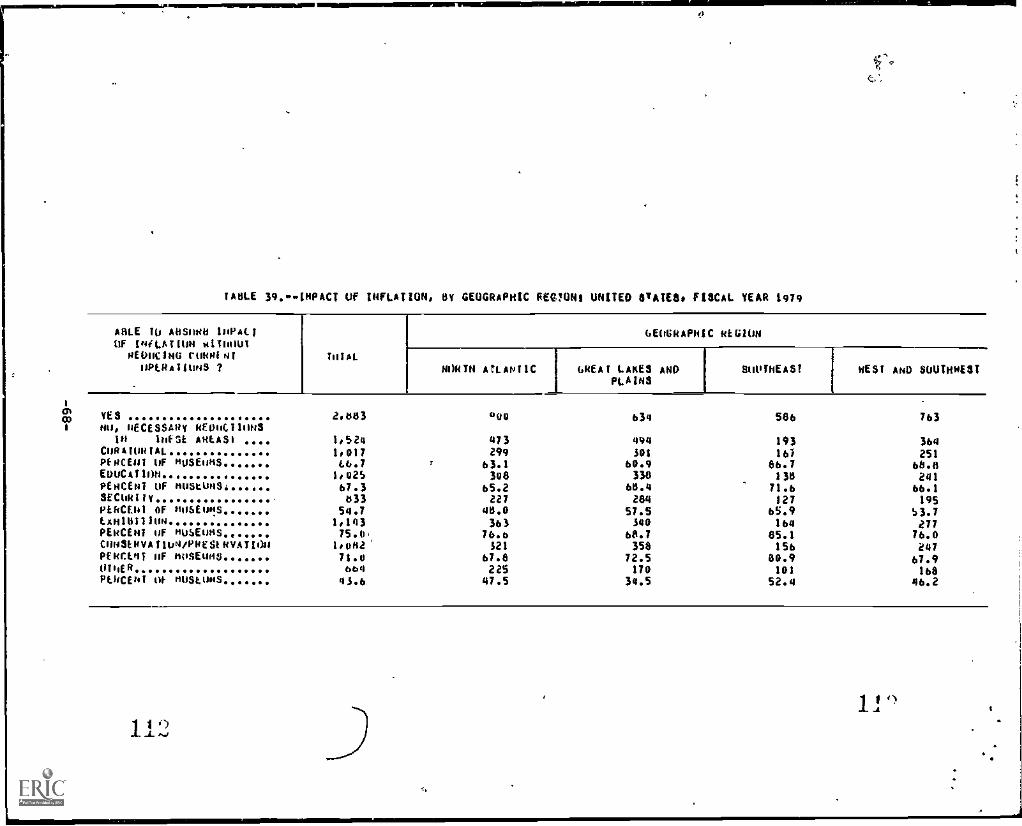
TABLE 39.INPACT OF INFLATION, BY GEOGRAPHIC AEGION1 UNITED STATES, FISCAL YEAR 1979
i
ASCE TO Alismil INPACTOF INiLATIUN wiThowREDUCING CUROINIUPLRAIIUND ?
THIAL
GEOGRAPHIC RtGION
NORTH ATLANTIC GREAT LAKES ANDPLAINS
SoUrNEAST WEST
coi
YeSNi,, NECESSARy REONCTIONS
2,1103 000 634 586
in INESE MASI 1,524 1173 494 193CURATORTAL 1,017 299 101 16/PERCENT of nOSENNS 46.7 63.1 60.9 86.7EDUCATION 1,025 3u8 338 130PERCENT of nuSLURS, 67.3 65.2 60.4 71.6SecoSily 1133 227 284 127PEkceNi of noSENs 54.7 40.0 57.5 65.9tANIDTITOR 1,143 361 340 164PERCENT of nUSEoRs 75.0. 76.4 68.7 85.1CONSEOyArioN/POESERYATION 1,042' S21 158 156PERCLNI of hPSCOMO 71.0 67.8 72.5 80.9DINER . 664 225 170 101PLNCENT OE nUStUos 41.6 47.5 34.5 52.4
AND SOUTHWEST
763
364251
68.8241
66.1195
S3.727776.024767.9168
46.2
1 I 0 aS.
1 1 4).1. -A t
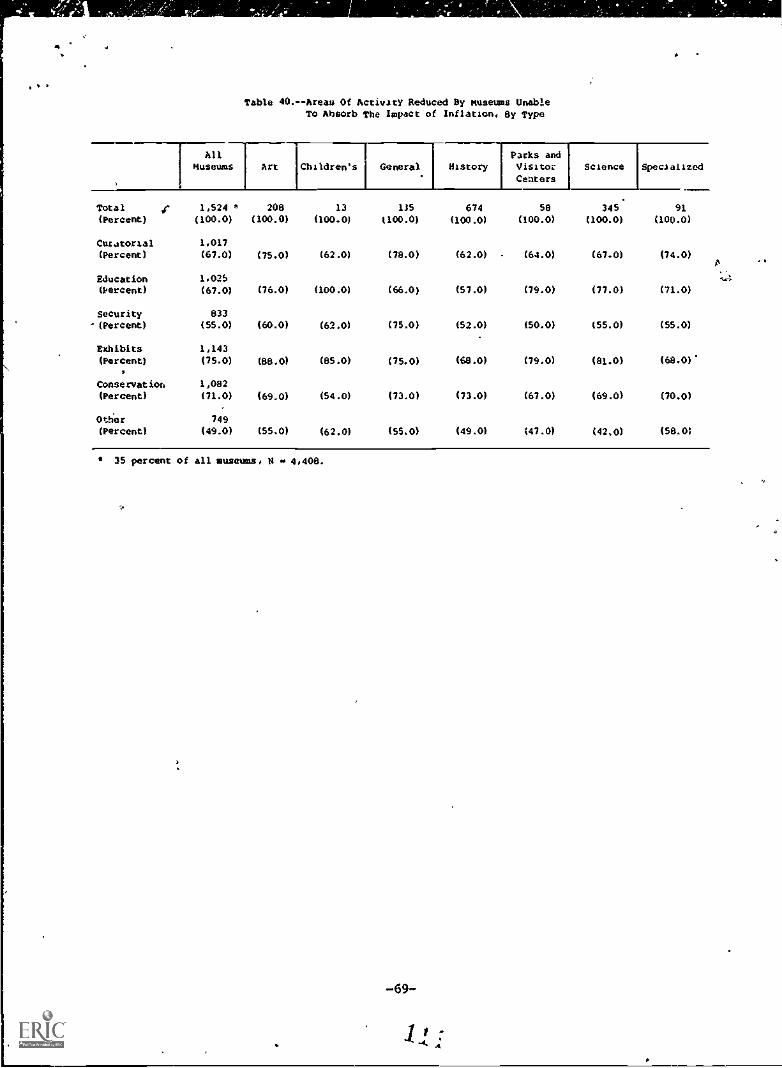
Table 40.--Arean Of Activity Reduced 8y museums UnableTO Absorb The Impact of Inflation, By Type
All Parks andMuseums Art Children's i General History Visitor Science Specialized
Centers
Total 1,524 208 13 135 674 50 345 91
(Percent) (100.0) (100.0) (100.0) (100.0) (100.0) (100.0) (100.0) (100.0)
Curatorial 1,017
(Percent) (67.0) (75.0) (62.0) (78.0) (62.0) (64.0) (67.0) (74.0)
Education 1,025
(Percent) (67.0) (76.0) (100.0) (66.0) (57.0) (79.0) (77.0) (71.0)
Security 833
(Percent) (55.0) (60.0) (62.0) (75.0) (52.0) (50.0) (55.0) (55.0)
Exhibits 1,143
(Percent) (75.0) (88.0) (85.0) (75.0) (68.0) (79.0) (81.0) (68.0).
Conservation 1,082
(Percent) (71.0) (69.0) (54.0) (73.0) (73.0) (67.0) (69.0) (70.0)
Other 749
(Percent) (49.0) (55.0) (62.0) (55.0) (49.0) (47.0) (42.0) (58.01
35 percent of all museums, H o* 4,408.
-69-

.IV. EDUCATIONAL PROGRAMS
1. EDUCATIONAL ROLE OF THE INSTITUTION
To determine the status of museum-based educational activities, institu-tions were asked whether they perceived their educational role to be increasing,decreasing, or remaining the same. Responses were analyzed by museum type,operating income, and geographic region. In 1979, an estimated 67 percent ofall museums believed their educational roles were increasing, whereas only2 percent had decreasing roles. The educational roles of the remaining insti-tutions (approximately 31 percent) were remaining the same. Across museum types,children's museums had the largest estimated percentage (81 percent) of indi-vidual institutions with increasing edudational roles. No children's museumsreported decreasing educational roles. On the other hand, it was estimated thatonly 40 percent of the parks and visitor centers had increasing educationalroles and that approximately 10 percent had decreasing roles.- Thus, half of thepatks andevisitor centers had roles that were staying the same (See Table 41,end of chapter).
When the data concerning educational roles were analyzed according tooperating income, a fairly clear relationship was discernible. Museums withhigher operating income were more likely to have increasing educational roles.Conversely, those institutions" with the lowest operating incomes were morelikely to indicate that their educational roles were staying the same. Becauseof the small number of.museumi reporting decreasing educational roles, no sig-nificant trends in this area were apparent (see Table 42).
Data on educational roles were also analyzed according to geographicregion. The Great Lakes and Plains region had the largest percentage of Fsti-tutions reporting increased educational roles (approximately 70 percent) and theWest/Southwest the smallest' percentage (approximately 61 percent; see Figure20).
2. GENERAL EDUCATIONAL PROGRAM EVENTS
Survey data on eight different categories of educational events were col-lected and analyzed according to the type of participant (i.e., the generalpublic, elementary school students, secondary school students, college or uni-versity students, and other participants).
(1) Tours
An estimated 95 percent of all museums offered tours for one or moretypes of participants in 1979. When analyzed according to participanttype, the data revealed that more institutions Offered tours for elemen-tary school students than for any other type of participant. Almost
:70-
1 I

1A8LE 42,-1REND3 IN EDUCATIONAL ROLES, BY SIZE OF TOTAL OPERATING EXPENDITURE* UNITED OTATE8, FISCAL YEAR 1979
TRENDS INEDUCATIONAL NOLL 1UTAL
.010.10
TOTAL UPENATINU EXPENDITIAL
MINE 31 -425,000
4251001*50,040
$501001$75.000
175,001.$100.041)
$1001001$240.000
5200,00p.6306,000
S300,001-:400,000
NONE THAN '
1400,000.;
TOTAL 4, 08 65 1,800 578 365 269 545 173 150 463PENcENT 1000 100.0 100,0 100.0 100,0 , 100,0 100,0 100.0 100.0 100,0INERE4s1h1 2,935 18 1,003 422 269 195 396 140 103 390PERCENT 66.6 27.1 55,7 73.1 73.6 72.6 72.7 80.8 68.7 84,1DEckEASINI 89 0 so 8 4 1i 6 4 5 3PLKENT 2,0 .0 2.7 1.3 1,1 4.1 10 2.0 3.0 .7REMAINS THE SANE 11384 47 748 148 93 63 143 30 43 71PERCENT 31,4 72,4 4I,5 25,6 25,3 23.41 26.3 17,2 28,1 15,2

.
10
Ipo
li P.11'
111I
114,
!',11:2110.
natu 20-8DMATIONAL ROLL Sn MUSEUMS, CIDGRAMIC RECLON
y4
fit
'Ilri0.9 feN501,
D SS
69.6
...
011,1
;..
010k2.2
28.2
s.
1 0 35
68.6
.11'1
t;Rith
gv'..11..x
I
28.4
14
61.2
ilt
it ;I b.
36.3
2.5 "' it; 1.
I 0 35
Mm6Mitittk . GrestUMmuW Soltdrust , gat and Soutionst
I 0 Isamu*Ds DmmtsitgUU. Staillog tho Sims
88 percent of the museums offered tours for elementary school students.Tours offered for the general public and for secondary school studentswere also quite common (app?oxiffiStely 86 percent and 73 percent, respec-tively). Few museums offered tours for college or university students(8 percent) or for other participants (14 percent).
For every type of. participant, there were minimal differences inthepercentages of the various museum types that offered tours. Two points,however, should be highlighted. For every type of participant, children's
r.
f

I
if
museums were less likely to provide 'tours than were other museum types.Conversely, for every type of participant except the general public, artmuseums were most likely to provide tour (see Table 43-A, end of chapter).
(2) Demonstrations,
Approximately half of all museums off some type of demonstrationprogram in fiscal year 1979 (for any type f patticipant). An estimated44 percent of the institutions offered demo strations for members of thegeneral public, making that audience the one mpst likely to be offered suchprograms. Demonstrations for elementary schoi students ranked second interms of frequency (estimated 34 percent of museums). Less frequentwere demonstrations for secondary school students (23 percent), college oruniversity students (21 percent),.and other participants (6 percent). Whenanalyzed by museum type, only one' outstanding pattern emerged: for everytype of participant, the percentage of histoey museums that conducteddemonstration programs was lower than for any other museum type (see Table43-B, end of chapter).
(3) Special Lectures
An estimated 67 percent of the milieuims sponso6d specill lectures forat least one type of participant. More museums\ (56 percent) sponsoredspecial lecturesfor the generalptibli'o than for any other type of partici=,pant. The percentage of institutions, that sponsored special lectures forcollege or uni.ysksity students, elementary school tudents, and secondaryschool studenys was fairly uniform (* to 30 percert). Among the variousmuseum types,Ithere were no discernible patterns i the data except thatchildren's anakspecialized museums generally had fetlfer institutions offer-ing special lec tures (gee Table 43-C, end of Chapter).
(4) Classes, Workshops, And Seminars
An .estimated 45 percent of the museum univerise conducted classes,workshops, or seminars for some type of audience. Approximately one-thirdof all museums sponsored classes, workshops, or seminars for the generalpublic, whereas one-fifth sponsored programs foT 'elementary/secondaryschool and university students. Table 43-D, at t4 end of this chapter,presents ddta on classes, workshops, and seminars 14 type of museum and byparticipant.
(5) Performing Arts Programs
Only about one-19prth of all museums sponsored:a performing arts pro-gram for one or more types of participants. Most programs were offered for
o the general public (one-fifth of all museums). A. small percentage (lessthan 10 percent) of all museums had performing artE programs specificallyfor the other four categories of participants. Among museum types, art
omuseums consistently had the highest percentaie of individual institutionsthat sponsored performing arts programS for every type of participant (seeTable 43-E, end of chapter). For every type of participant except univer-sity students, children's museums ranked second in sponsoring performingarts programs (see Figure 21).
-73 -
I
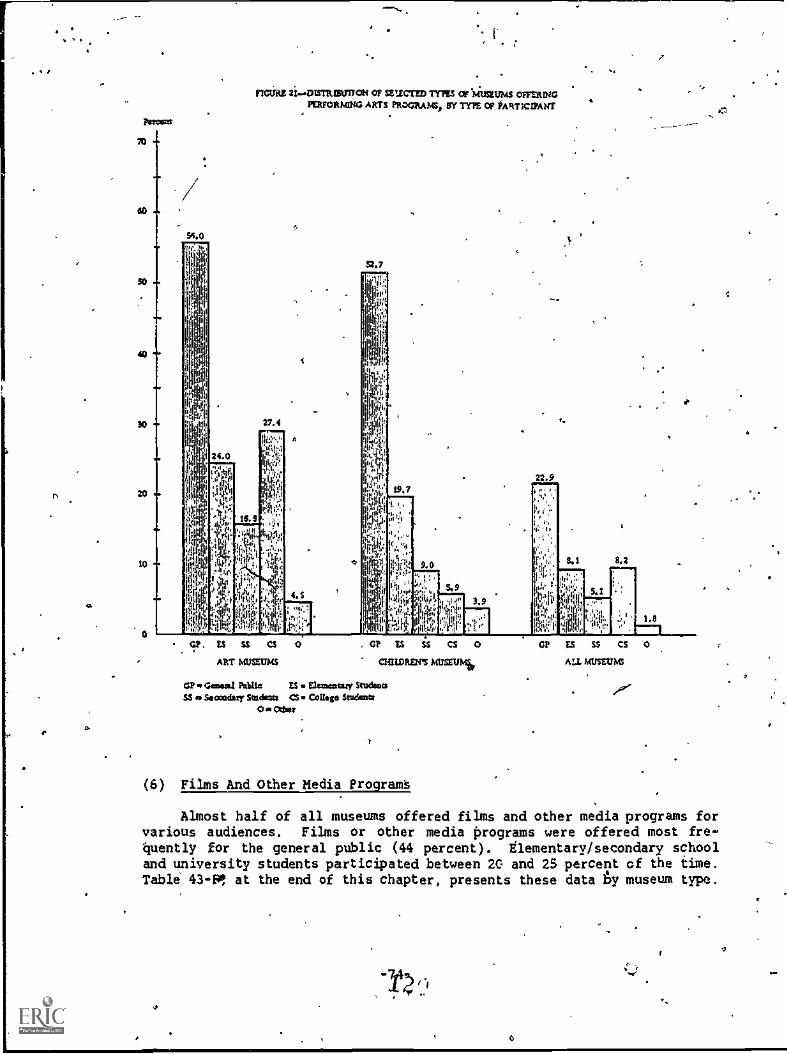
70
do..
SO
40 r.
ricuRz 21.6.0tsTRORTDON OF smarm) TYPES CV MUMS OFFUUNGPERFORMING ARTS PROGRAMS, SY TYPE OF PARTICIPANT
S2.7
r.
20
10
4=1
61, ES u aART MUSEUMS
0 GP U SS CS 0CHILDREN'S MUSEUM
GP 64401 Mine ES Elemagetsy Studs=SS Si Secondirt Seackset OS. Collage Saulfmti
Om Cebu
(6) Films And Other Media Program's
Almost half of all museums offered films and other media programs forvarious audiences. Films or other media programs were offered most fre-quently for the general public (44 percent). Elementary /secondary schooland university students participated between 20 and 25 percent of the time.Table 43-F1 at the end of this chapter, presents these data by museum type.

Y. 4
(7) Outreach Programs
Only about one-third of the institutions had outreach programs for oneor more audiences. These programs were most frequently directed towardelementary school students or the general public (one-fourth of all muse-ums). Programs a.L.aed at other audiences were less frequent. No singlemuseum type was more likely than the rest to sponsor outreach programs forone or more audiences. However, outreach p7ogeams for the eneral publicwere frequent for parks and visitor centers, science museums, and artmuseums (approximately one-third of each of these museum typed. As wouldbe expected, children's museums most frequently directed outreach programsto the elementary school audience (58 percent). (See Table 43-G, at theend of this chapter, for more detail.) Table 43-H, at the end of thischapter, presents data on programs other than those already discussed.
3. SPECIFIC PROGRAMS
An estimated 66 percent of all museums offered some type of specific pro-gram in fiscal year 1979. Children's museums (83 percent) and art and sciencemuseums (78 percent) were more likely to have specific programs than other typesof museums (see Figure 22).
RCM 72..OSTMOUTION OF INST1TUT1014 OFFERINGSPECIFIC PROGRAMS, BMW. OF MUSEUM
6
83.1
-75-
t
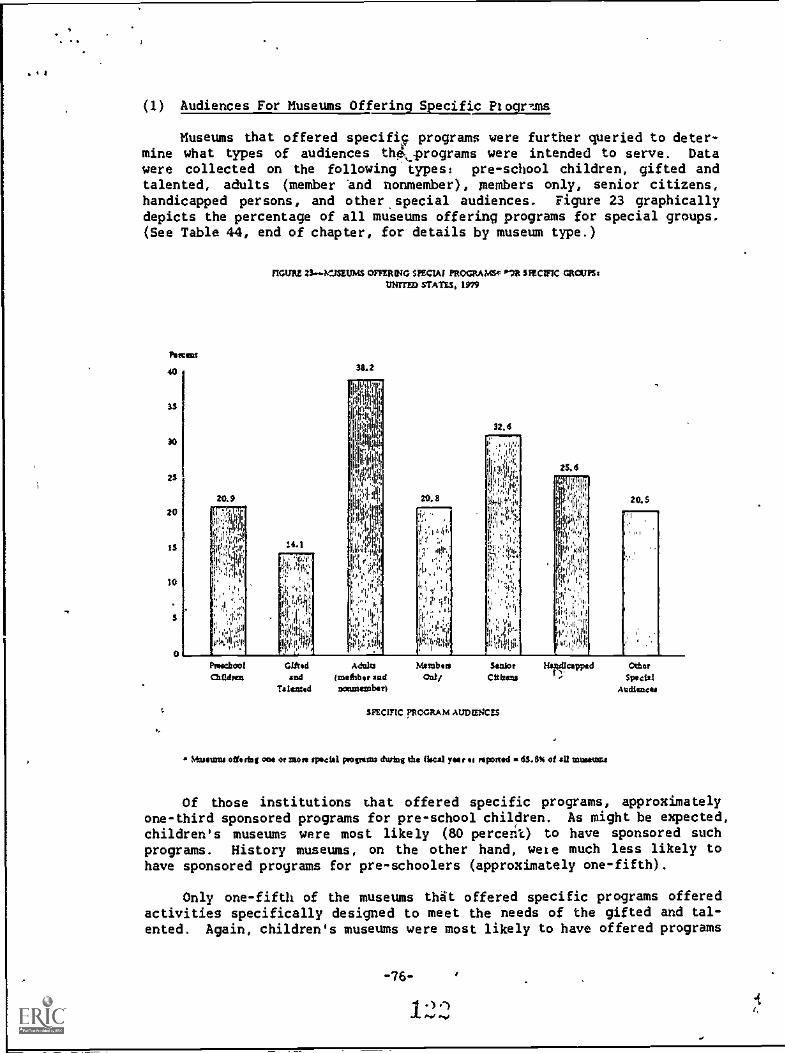
(1) Audiences For Museums Offering Specific Plogrtms
Museums that offered specifiF programs were further queried to deter-mine what types of audiences ths.,:programs were intended to serve. Datawere collected on the following types: pre-school children, gifted andtalented, adults (member and nonmember), members only, senior citizens,handicapped persons, and other special audiences. Figure 23 graphicallydepicts the percentage of all museums offering programs for special groups.(See Table 44, end of chapter, for details by museum type.)
Pascont
40
35
30
25
20
15
10
5
0.
20.9
FIGURE 23...-le:USIEUMS OFFERING SPECIAi PROGRAMS,* ,R srlanc GROUPS:
warm STATES. wiso
38.2
Giftedsod
Tate:aid
20.8
V:
sl
25.6
20.5
MambasOrti/
Senioratime=
SPECIFIC PROGRAM AUDIENCES
MiAdiammd
* Motet= *Serbs oat or moss specie' pogroms during the fbeal year ell tojonid 65.8% of all engines
OtherSpoebl
Madialeft
Of those institutions that offered specific programs, approximatelyone-third sponsored programs for pre-school children. As might be expected,children's museums were most likely (80 percent) to have sponsored suchprograms. History museums, on the other hand, were much less likely tohave sponsored programs for pre-schoolers (approximately one-fifth).
Only one-fifth of the museums thdt offered specific programs offeredactivities specifically designed to meet the needs of the gifted and tal-ented. Again, children's museums were most likely to have offered programs
-7b-

for this audience (approximately half of the children's museums had suchprograms); science museums were second (approximately one-third sponsoredsuch programs).
An estimated 58 percent of all institutions with specific programs-offered programs specifically designed f'r adults (members and nonmembers);art museums were most likely (65 percent) to have such programs. Slightlyover half of the general museums, history museums, parks and visitor cen-ters, science lmuseums, and specialized museums sponsored programs spe-cifically designed for adult members and nonmembers. As was expected,children's museums ranked last (estimated 38 percent).
Further analysis indicated that approximately one-third of the rele-vant museums offered special programs for members only. Among museum types,art museums were most likely to sponsor programs specifically designed formembers only (approximately one-half) and parks and visitor centers wereleast likely (approximately one-tenth).
About half of all museums with special programs had specific programsfor senior citizens. With the exception.of children's museums, where only17 percent offered specific programs for senior citizens, this percentagedid not wary substantially across museum types (see Table 44, end ofchapter).
Almost 40 percent of the relsvant institutions had specific programsfor the handicapped in fiscal year 1979. Parks and vie.ttor centers andscience museums were most likely to sponsor programs for tht,handicapped(slightly over one-half), whereas history museums were least likely(approximately one-third).
4. ETHNIC AUDIENCES FOR MUSEUM EDUCATIONAL PROGRAMS
Museums were also queried as to whether they conducted educational programsspecifically designed to serve various ethnic audiences, including: (1) Ameri-can Indian or Alaskan Native, (2) Asian or Pacific Islanders, (3; Black notHispanic, and (4) Hispanic. An analysis of the weighted response by type ofmuseum and by geographic region is presented in Tables 45 and 46, at the end ofthis chapter. Figure 24 highlights the pircentage of programs for the fourethnic groups.
(1) American Indian or Alaskan Native
Approximately one out of ten museums conducted programs specificallydesigned to serve 1.nerican Indians or Alaskan Natives. However, one out offive general museums sponsored some type of educational program specifi-cally designed for this audience, making this type of institution morelikely than any other to sponsor such a program. Conversely, specializedmuseums were least likely (about 4 percent).
Of more interest were variations across geographic region. Approxi-mately one-half of all museums with programs targeted to American Indians
-77-.vo
t.1
,

%at
9
6
4
3
2
I
0
MAW 24-4Useums OFFERING SPECIAL PROGRAMS FORSPEC= MINORITY GROUPSium= STATES, 1979
N ,408
9.0
r.
2.4*It I
I.dy.,
2,1.10,i I :A
6.1
I I"
g'
.1.. e
I
4.6
Ararat.= Wine Muer UmIcsam HimmoIrsor Pulite 11LI*Mo
AlrelmaNahme Wradm
MU ORITY GROUPS
or Alaskan Natives are in the West/Southwest (areas with large concentra-tions of American Indians). One out of every five museums in this geo-graphic region sponsored such programs. Less than 10 percent of the insti-
tutions in each of the other three regions (North Atlantic, Great Lakes andPlains, and Southeast) reported sponsoring such programs.
(2) Asian Or Pacific Islanders
Very few (eStimated 2 percent) museums conducted educational programsspecifically designed to serve Asians or Pacific Islanders. Due to thepaucity of these .programs, analysis by museum type and geographic regionwas of little interest.
(3) Black Not Hispanic
Only 6 percent of the museums conducted educational programs specific-ally designed to serve blacks. Art museum* were most likely (one out offive) to sponsor such programs, whereas specialized museums were leastlikely (estimated 2 percent). Almost 10 percent of the museums in theSoutheast had programs specifically designed to serve the black population.About one out of eiery 20 museums in the remaining three geographic regionshad such programs.
It
(4) Hispanics
One out of 20 museums sponsored programs specifically designed forHispanics. More children's museums (one out of five) offered programs forHispanics than any other type of institution; conversely, history museumsoffered the lowest percentage (estimated 2 percent). Approximately 8 per-cent of the institutions in the West/Southwest sponsored programs designedspecifically for Hispanics, and these institutions accounted for almosthalf of the total number of institutions with such programs.
5. OTHER EDUCATIONAL ACTIVITIES
Four additional variables were examined that provided a measure of museum-based educational activities and public programs, including teacher training,programs for academic credit, exhibition loans, and assessment of the effective-ness of exhibitions. These variables are analyzed below.
(1) Teacher Training
Approximately one-fourth of the museums offered teacher training peri-odically or on a regular basis on how to use museum resources. An esti-mated 65 percent of the children's museums offered teacher training.Around 40 percent of science museums and art museums offered such train-ing; only 16 percent of the specialized museums offered some type ofteacher training (see Figure 25).
(2) Programs For Academic Credit
Approximately one-third of the institutions cooperated with an accred-ited school, college, or university to provide a program for academiccredit. Art museums were most likely (onu-half of all art museums) to haveprovided such a program. Approximately 40 percent of science museums andchildren's museums also sponsored such a program, whereas only one out offive parks and visitor centers had programs for academic credit (seeFigure 26).
(3) Exhibition Loans
Approximately one-half of the museums loaned exhibitions to schools.shopping malls, or other organizations. More l'hildren's museums (approxi-mately 82 percent) than any other type of museum loaned exhibitions. Onthe other hand, only one-fourth of the parks and visitor centers loanedexhibitions (see Figure 27).
(4) Assessment Of The Effectiveness Of Exhibitions
Last, about one-half of the museums undertook activities to assessthe effectiveness of their exhibitions. A substantial percentage (60 to70 percent) of children's museums, art museums, and science museumsassessed the effectiveness of their exhibitions. However, history muse-ums proved to be least likely to assess the effectiveness of their exhibi-tions (see Figure 28).
-79-rw,

60
SO
30
20
10
0
42.0
65.3
Mt Oaf Idaesit
TIMMS 25.44.13313745 Oral MG TUCKER Tamsuc,SY TYPL OP MUSEUM
32.8
17.1
42.9
Got* Ada 2WAgue Calm
SeStsseit Specitlkad
J.

nava 26MVSEUMS PROVIDING PROGRAMS FORACADEMIC CREDIT, WW1%
*
1')"
-81-
r .
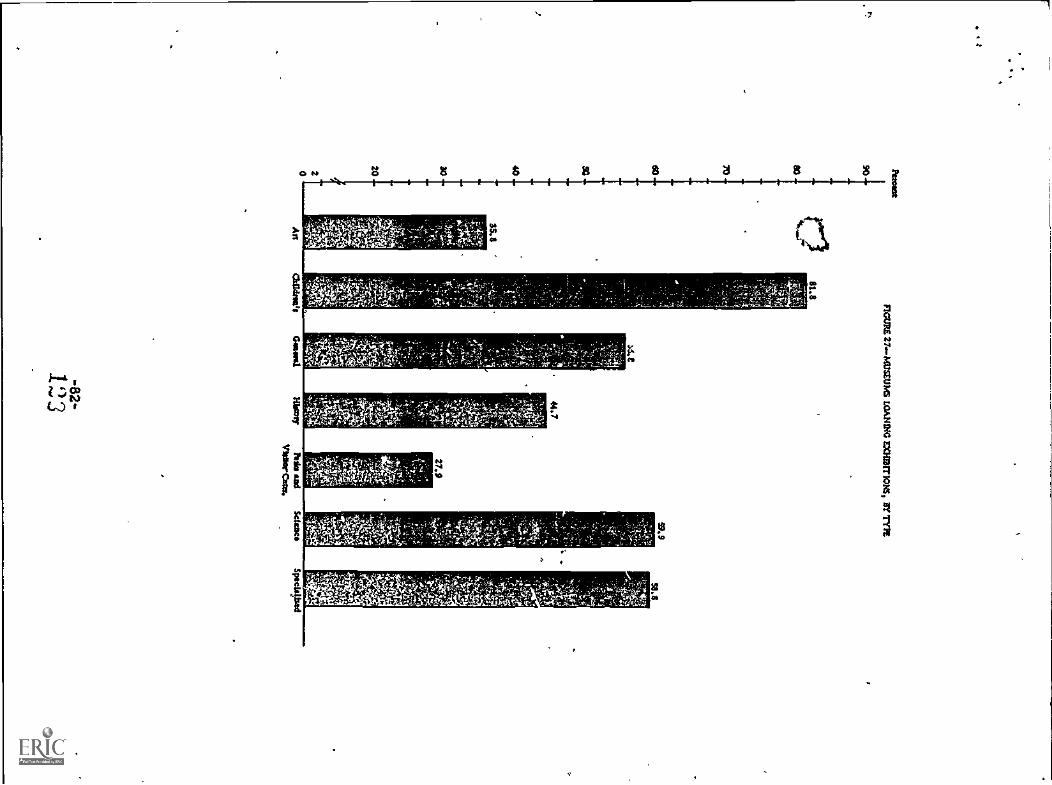
_
4'747:4,t1-a
rJ ^ / \-
--ft 5-731- :=.7'---11=tit-,r,-'-7.=
"'"

45
40
$5
50
45
40 4.
55 ....
0
FIGURe 26-1.1=1.0 ASSIS3000 T1 Memo= OF LOMMONS.Ict 'FM .
11,3
60.0
40.1
Childres' Gomel HINcatY Puki and $41asetVithor Olta6
-83-
Spitialized

4
4
OW
TABLES AT END OFCHAPTER IV
13()
On,
ft.
1

TABLE 41,TREND8 IN EDUCATIONAL ROLES, SY TYPE UP MUSEUMS UNITED STATES, FISCAL YEAR lala
INENOS INEDUCATIONAL RULE
IOIAL
WE OF MUSEUH
ANT CHILDREN'S GENERAL HISTIlKYPARKS ANDVISITORCV/TENS
SCIENCE SPECIALIZED
)
IN1AL ... 00100 609 SI 382 . 2,204 163 800 197PERCENT...... 100.0 100.0 100.0 100.0 100,0 100.0 100.0 100,0INCREASING 2.935 474 41 273 10359 66. 587 13SPERM'', 66.6 77.9 01.0 71.5' 61.7 40.0 73.3 68,4DECREASING 89 19 0 6 27 16 le 6
PERCENT 2.0 3.1 .0 1,6 1.2 9,7 1.9 2,8REMAINS THE SAME, 10384 116 '10 103 018 SS 198 57
PERCER1 . 000 31.4 19.0 19.0 26,9 37.1. 50.3 24,7 28,8
TABLE 43,GEHERAL EDUCATIONAL PROGRAMS OFFERED TOURS, SY TYPE Of MUSEUM AND PARTICIPANTS;UNITED STATES, FISCAL YEAR 1979 A
TYPE OFPARIICIPKNT MIALN = 4,408
TYPE OF MUSEUM
ART CriILDKENIS GENERAL HISTORYPATOIS AND
VISITORCENTERS
SCIENCE SPEITALIZEO
GENERAL PUBLIC., 3.804 509PERCENT OF HOSEONS 86.3 83.6ELEHENTARy SCHOOL SOIDENIS 3863 562PERCENT Rf MUSEUMS R7.7 92,3SECUHUARY SCHH0L STUDENTS S.207 S32PERCENT DT MUSEUNS. . 72.8 87.9CULLEGE He oH1vEN8TIT
STUDENTS. 2,555 998PERCENT 0 muetu"s .. .. 50.0 73.6ughal pARIICIPAhI$ 617 IORPERCENI HF HOSEuH8 ... 10.0 17,0
2345.3
37
73,119
30.2--. .
...!12
.' 23.56
11.0
331'86,9329
86,0260
73.3
23962.6
6015.7
2.02291.61,97689.71,58672,0
1.14151.8'27512.5
131
79.1125
?Sop105
63,6
8953.6
2817.0
60775,9667
83,4550
60.8
53166.4119
14.9
*et02,1167
85,0130
611.1
9508,0
2614,1
m

TABLE 43-0,*GENERAL EDUCATIONAL PROGRAMS OFFERED DEMONSTRATIONS. 15Y TM OF MUSEUM AND PARTICIPANTS,UNITED STATES. FISCAL YEAR 1979
4.
WE of PARTICIPANT TOTALN .4,400
Tyet OF MUSEUH
AHT CHILDREN'S GENERAL HISTORYPAM, AND9I0ITuRCENTERS
SCIENCE SPECIALIZED
GENERAL PUBLIC 1.9311 313 28,A.
PIRCENI 01 RUSEuR$ 43.9 51.3 55.6ifELERENTARy SCuoUL 310ENTS.. 1,475 210 37PERCENT OF RoSEuRS 33.9 34,5 72.!SEcuRDANy sCHtioL MOWS 14029 160 19,PERCENT Uf RU$1001$ »23,4 27.6 37.9CoLLEGE OR DR1VeR0III ,
SIDOENTR . 920 I90 7PERCENT Of RuSEuRS 20.9 31.2 13.1OTHER PARTICPART0 256 38 4PERCENT UI Hu$E010 5.8 6.2 8,0
20052.2154
40,3104
27.2
992S.9
359.0
73533.456625.7337
15.3
27012.3
843.8
859.4
7645.8
0
7343.9
4124,8
21
12.4
47859.7383
47.9202
35.2
26933.7
475.9
8342.2
4921.1
. 4723.9
4422.2
2014.3
WUI
TABLE 43-CoGENERAL EDUCATIONAL PROGRAMS OFFERED SPECIAL LECTURES. OY TYPE OF MUSEUM AND PARTICIPANTS$UNITED STATES. FISCAL YEAR 1979
TYPE of PA IICIPAHI 107141.
N = 4,405ANT CR1LONENIS
TYPE OF MUSEUM
17-GENERAL HISTORY
PARKS ANUVISITORLENTEN!)
SCIENCE SPECIALIZED
AGENERAL POLI 2.471 494 8 2$4v 1.093 69 527 79
PERCENT OF No FORS 56.1 81.1" 16.4 66.4 47.3 41.5 65.9 39.9ELEHENTART SCiall. STUDENTS 1.274 / 195 20 133 550 60 294 36
PERCENT OF mu Eutis 8..9 : 32.0 39.0 34.9 24.0 39.7 36.7 10.00ECoNDARy gmluL $TuDERia 1,140 01 4 118 450 64 204 32
PEIICFNI 01? 144SEWIS 26.0 32,3 8.0 .30,9 20.4 30.5 . 35,5 16.0
MEW ON u IvENS1ITSTUDENTS 1.353 327 6 160 390 59 367 43
PERCENT OF 0 viols 30,7 53.7 11.3 - 42.4 17.7 ', 35.$ 45.9 RJ.1WHEN PANTIL PANTS... 302 51 . 3 37 ' 127 15 57 13
KNEEN; Uf MJ6tUm$ 6.0 8.3 5.1 9,7. 5.8 8.8 7.2 6.6
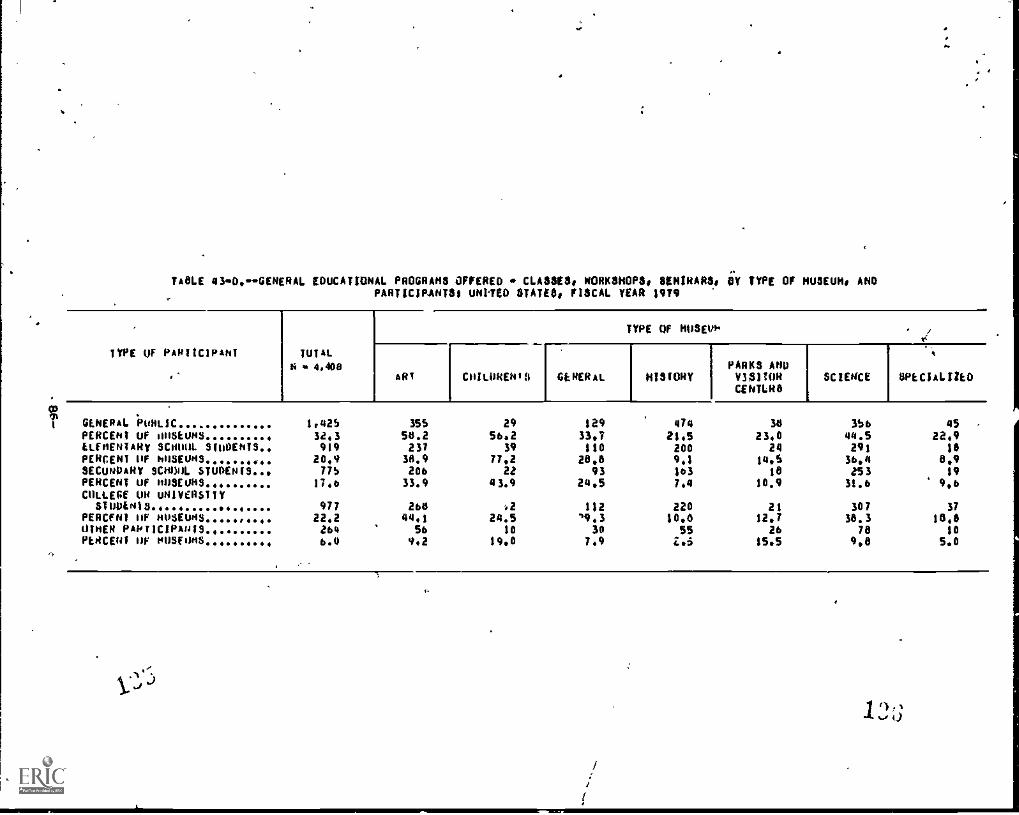
TOLE 430,--GENERAL EDUCATIONAL PROGRAMS OFFERED CLASSES, WORKSHOPS, SEMINARS, SY TYPE OF MUSEUM, ANDPARTICIPANTS, UNITED MHO, FISCAL YEAR $919
TYPE OF PARTICIPANT TUTALIZ . 4,400
TYPE OF WWI.
AKA CMILDRENID GENERAL HISTORYPARKS AMUSTSITORCENTLR8
SCIENCE SPECIALIZES
GENERAL PuliLIC 1,425 355 29 129 474 30 3b0 45PERCENT UP 'MEWS 32.3 58.2 5062 330 21.5 23.0 44.5 22.9ELFRERTARt SCHUIN. STUDENTS. 919 237 39 110 200 24 291 18PERCENT OF MUSEUMS 20.9 38.9 77,2 28,8 9.1 14.5 36,4 8,9SECUNIJARY SCHOOL STUDENTS... 77b 206 22 93 103 ta 253 19PERCENT UP MUSEUMS . 170 33.9 43.9 24,5 7.4 10.9 31.6 9,6COLLEGE UN uNITERsliy
SIODEN18 ..... .. 977 26a .2 112 220 21 307 37PERM' uF RusEums ...... 22.2 44.1 24.5 '9.3 10.0 120 38.3 10.8OTHER PARTICIPAuts .. 264
.
So 10 30 55 26 78 10pLAceut 1W KUSFOHS.......... 0.0 9.2 190 7.9 Z. 15.5 9,8 5.0
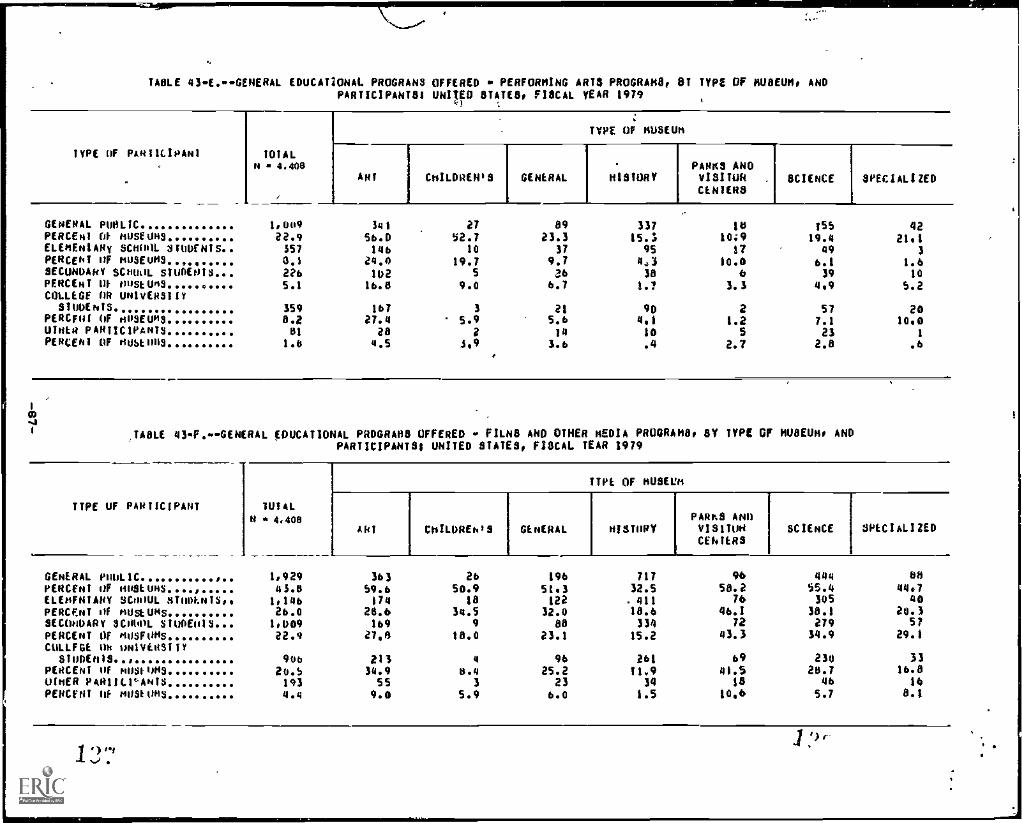
TABLE 43E.GENERAL EDUCATIONAL. PROGRANS OFFERED PERFORMING ARTS PROGRAMS, 8T TYPE OF MUSEUM, ANDPARTICIPANT8I UNITED STATES, FISCAL YEAR 1979
ki
TYPE OF PAH ;ILIPANI TOTALN -4.406
TYPE Of MUM,*
ART CNILDREHIS GENERAL HISTORYPARKS ANOVISITORCENIENS
SCIENCE SPECIALIZED
GENERAL PUNLIC 1,009 341 27 89 337 10 156 42PERCENI Of NoSEum3 22.9 S6.0 32.7 23.3 154 19:9 19.4 21.1ELENENIARy SCN041. SIDDENIS., 357 146 10 37 95 17 49 3PENCENI oF MuSE003, .... 0.1 24,0 19,7 9.7 443 10,0 6.1 1.6SECuNDANV SCNooL MOWS 226 102 S 36 38 6 39 10PF.NCENT Of ooStUm3 5.1 16.8 9,0 6,7 1.7 3,3 4,9 6.2COLLEGE OR UNi0ER3I1*SIUDENIS 359 167 3 21 9D 2 57 20
PERCFNI OF NNSEUNS. .. 0.2 27.4 5.9 5.6 4.1 1.2 7.1 10,0OMER PARTICIPANTS 81 aa a 19 19 5 23 1
PERCENT OF NuSt103, .. 1.0 4,5 4,9 3,6 .4 2.7 2.8 .6
JAIME 43,4...GENERAL EDUCATIONAL PROGRANS OFFERED FILNS AND OTHER MEDIA PROGRAMS, SY TYPE OF MUSEUM, ANDPARTICIPANTS* UNITED STATES, FISCAL. TEAR 1979
TTPE OF PARTICIPANT TOTALN 4.00
ITPE OF NUSEUN
Am* CNILDRENIS GENERAL HISTORYPARA$ ANDVISITUNCENTERS
SCIENCE SPECIALIZED
GENERAL PoDLIC. .. 1,929 363 26 196 717 96 444 86PUMP*, ilF NNSEUNS . 43,11 69.6 50.9 51.3 32.5 58.2 E5.4 44.7(UNWARY SOMA. 8TOOLNIS,. 1,146 174 18 122 . 411 76 305 40PERCENT 'I! mUstUNS 26,0 28,6 34.3 32.0 18.6 46,1 38.1 20,3SECONDARY SCHOOL SIODENIS 1,009 169 9 88 334 72 279 57PERCENT Of NOSFOMS 22,9 27,0 18.0 23,1 15.2 43,3 34,9 29,1COLLEGE Oh UNIVERSITYSTUDENTS 906 213 4 96 261 69 230 33
PERCENT of NoS1-1413 26.6 34.9 0.4 25.2 11,9 41.5 20.7 16.8DINER PARmic.Amis 193 SS 3 23 34 18 46 16PERM, Of NOSIOmS 4.4 9,0 5.9 6,0 1,5 10,6 S.7 8.1
19'.../ .
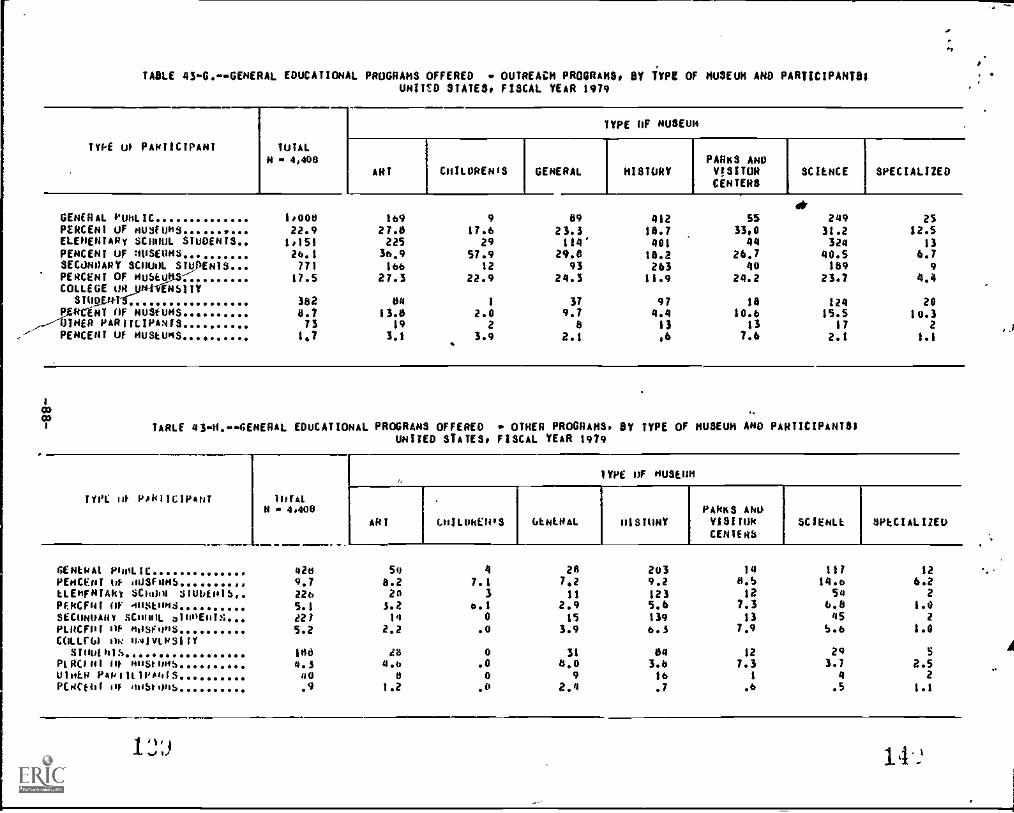
TABLE 43GeGENERAL EDUCATIONAL PROGRAMS OFFERED OUTREACH PROGRAMS, sy TYPE OF MUSEUM AND PARTICIPANTS/UNITED STATES, FISCAL YEAR 1979
TYPE UI PARTICIPANT tUIALN 4,408
GENERAL PURL IC 1,000PINCER' 0 RusTuRS 22,9ELEMENTARY SCIRRIL STUDENTS 1,151PERCENT OF NUSERRS 26,1SECdNUARY SCHOOL STU (NIS 771PERCENT OF NuSE110.5 17.5COLLEGE ult_uNTEERsITT
STImEniir 382P CIRY OF MUSEUMS 8.7ITHIR PARTICIPANTS 73PERCENT Of MUStURS 1.7
1
TYPE OF MUSEUM
ART CHILDRENIS GENERAL HISTORYPARKS ANDVISITORCENTERS
SCIENCE SPECIALIZED
al,
169 9 89 412 SS 249 2S27.8 17.6 23.3 1897 33.0 31.2 12.5225 29 114' 401 44 324 13
36,9 57.9 29,0 14,2 26,7 40,5 6,7166 12 93 263 40 189 9
27.3 22.9 24.3 11.9 24.2 23.7 4,4
04 1 37 47 18 124 2013.8 2.0 9.7 4.4 10.6 15.5 10.3
19 2 8 13 13 17 23,1 3.9 2.1 $6 7.6 2,1 1,1
TARLE 43H,GENERAL EDUCATIONAL PROGRAMS OFFERED OTHER PROGRAMS, BY TYPE OF MUSEUM AND PARTICIPANTS/UNITED STATES, FISCAL YEAR 1474
TYPE o8 PARIICIP4Nr 11441.N 4.400
1YPE OF MUSEUM
ART LNILUkElloS UNEHAL HISTORYPARKS 4NOVESITORCENTERS
SCIENLL 4PkCIALTIED
GENLNAI 11004.11: 426 50 4 28 203 14 117 12
PERCENT Of oUSFONS 9.7 8.2tLENFNTAky SCRO4 STUDEHIS 226 20
7.13
7.211
9.2123
8,
1214.6
546.2
2PERCERI OF ustoNj 5.1 3.2 o.I 2,9 5,6 7.3 6.8 1.0SECONUARY SCHOOL OWEN'S 121 14 0 15 139 13 45 2
PLUM! 111 MOSFON3 5.2 2.2 .0 3.9 6.3 7.9 5.6 1.0C011(61 eN: 1141%0LNSIIY
STNuthih IRO 413 0 31 04 12 29 5PLACINI 101 miaow, 4.3 4.6u114.11 PARIMARAht5 40 ti
.00
6.09
3.616
7.31
3.74
2.52
PCNC1h1 14 """my .9 1.2 .0 2.4 .7 .6 .5 1.1
1

TAKE 44. m..AUOIENCES FOR MUSEUMS OFFERING SPECIFIC PROGRAMS* 8Y TYPE OF MUSEOM1 UNITED STATES* FISCAL YEAR 1979 3414111NCkS 11ITAL
N 4,400
TYPE OF MUSEUN
*RI LIIILUNLN +S GENERAL MiSlUltyPARKS AMUVISIIUNCLN1ERS
SCUTTLE SPLCIALIZEOCZ
UFfc1410 slIC1F1C PRI11DN4140, 2,94 l74 44 254 19298 99 618 116PERCENTP11E04411 C11ILIN4N
65.4920
77.9141
83.134
66.5114
58.9261
59.750
77.3292
59.129
le1
WPERrENTWan Am JALENITO
40.9641
73.2106
66.2a'
29.754
11.8185
30.025
36.5Z22
10,67
2:0I' PERcf 01 14.1 17.5 42.i 14.1 0,4 15.2 27.0 3.b rmgNLNHERs Ono 14N6MLNOthS
(4)41-1S) 1,644 300 16 146 770 59 322 3PkRcENTolts6kR0 s14IT ....
30.Z915
50.6241
31.5$4
30.1e5
35.0330
35,511
40.4198
32.2as
4g,rim
PERCENT, te.a 39.5 27.6 22.1 15,3 6.4 24.8 ta,sSENISIR Cil17ENS 1,446 221 7 147 b40 58 294 68Pkfictt41 ... .. . 32.6 36.4 19,1 38.4 29.0 34.8 36.0N4N41C4PPEN 1e13o 176 19 102 409 52 324 48Pt4CLNT . 21g 20.0 37,6 26.6 10.5 31.5 40.5 24,5UPT14 ANWNEES ... .. . 145 17 91 354 33 199 67PERaN1 24 5 73.7 53.5 23,7 16,1 20,0 24.9 33,9
1.E 2
14:

TABLE 45-PROGRAHS DESIGNED FOR SPECIFIC ETHNIC GROUPS, BY TYPE OF MUSEUMUNITED STATES, FISCAL. YEAR 1979
41
ETHNIC AuP1LNCtIN .. 4.406
1101AL
IYPE OF HOEHN
4141 CNILONEWS GENLNAL HIS1uNYPARKS AND9ISITURCENTERS
SCIENCE SPECIALIZED
ANERILAN INuIAto ilkALASIIAN NAIIVF, 194 55 7 70 166 II 06 7
pEnt01 of 44SEONS.. 4.0 9.0 14.1 18,2 7.1 6.7 10.7 3.6ASIAN uN PACIFIC
ISLANuL46 .. 100 45 I 7 16 I 31 6pERcENI OF MUSEUMS 2.4 7.3 2.0 1,9 ,7 .6 3.9 2,0ULACK N111 HISPANIC 214 100 6 34 89 7 31 3PCNeeNT OF h4S1411S 6.1 16.5 12.1 8.8 4,0 3.9 3.9 1.5HISPANIC 202 60 9 25 45 4 47 12PERCINT,01. ubfuft5 4.6 9.9 17.1 6,4 2.0 2.4 5.9 '6.2
4:,0 TABLE 46..PPOGRAHS DESIGNED FUR SPECIFIC ETHNIC GRDUP8, BY GEOGRAPHIC REGION'UNITED STATES, FISCAL YEAR 1979
11U11. 04001iNgt IHIALN 4,408
ANtkICAu loOlAh ow
BLISHAPHIC
0111011 AILANIIC MAI LAKES ANDPLAINS
SOUTHIASI NW AND WANNEST
ALADAAu kAIIVF.... 196 SO 91 46 209Pc4CENT HI. hwituelS., 9,4 3.6 0.1 5.9 18.5ASIAN Ilk PACIFIC
151.444'LOS 106 JO 20 12 10
Ptotcrht IIF 040301n4 2.4 2.0 2,5 1.6 1.4BtAcog 1.01 N1SPA11 27u 80 47 74 68PFPCENI til. ofi5(03 6.1 5,9 4.2 9.5 6.1
1.15P4N11. 202 61 31 19 91
Primikt 1* ml$1:65 4,6 4.5 2.0 2.4 4.1

.
V. FACILITIES
1. WHO OWNS THE FACILITIES?
In 2979, an estimated 21 percent of the museums' facilities were ownedand/or operated' by an entity other than the governing authority.1/ Children'smuseums were most likely to be owned or operated by another entity (42 percent),and parks and visitor centers were least likely (7 percent; see Figure 29).
noun 256 ME MS WITH FACI11733 owe AND/Olt OINTIA77D$it AN WITT OTIER THAN T} GOVERNING A =MUM$Y TM
1/Governing authority was defined in Chapter III as the agency that owns the
collections and assets of the institution but not necessarily its facilities.

A further examination of those museums owned or operated by an entity etherthan the governing authority showed that an estimated 64 percent of theties were owned but not operated, 12 percent were operated but not owned, and24 percent were both owned and operated. The distribution of museums withfacilities owned but not operated by an entity other than the governing author-.ity was fairly uniform across museum type; five out of seven types reported amajority of institutions (approximately 60-90 percent) in this category. Gen-eral and spetialized museums were the exceptions, with slightly less than halfwith facilities owned by a entity distinct from the governing authority_ (seeTable 47, end of chapter).
2. WHAT KINDS OF FACILITIES WERE AVAILABLE IN MUSEUMS FOR PUBLIC USE?
The analysis of facilities available for public use is presented in foursections dealing with: (1) auditorium, classroom, and studio' facilities;(2) auxiliary facilities; (3) library facilities; and (4) facilities for thephysically handicapped. Table 48, at the end of this chapter, presents data oneach of these, subjects.
(1) Auditorium/Theater, Classroom, And Studio Facilities
Approximately one-third of the museums had auditorium/theater facili-ties, with parks and visitor centers most likely to have such facilities(52 percent; see Table 48, end of chapter). One-fourth of all museums hadclassroom facilities. Children's, science, and art museums were mostlikely to have such facilities: 57 percent, 47 percent, and 43.percent,respectively, reported the existence of classroom facilities. For theremaining font' museum types, the percentage with classroom facilitiesranged from 24 percent (general museums) to 12 percent (history museums).,,Only 8 percent of all museums were estimated to have studio facilities.Across museum types, the distribution of those having such facilities wasfairly predictable. Thirty-one percent of the art museums had studios,accounting for 52 percent of the total number of institutions with suchfacilities. Approximately 26 percent of the children's museums had studiofacilities. Ten percent or less of the remaining museum types had studiofacilities (no parks and visitor centers had such facilities).
(2) Auxiliary Facilities
Museum directors were asked to provide information on the followingfive categories of auxiliary facilities: public parking, public restau-rant/cafeteria, book/sales shop, conference/meeting facilities, and other
facilities. If an insiktution had such facilities, the data were furtheranalyzed to determine whEther the facilities were operated in-house orcontracted out. Information was also obtained on whether the facility wasincome producing. Table 48 presents detailed data on each of these areas.It was estimated that 67percent of all museums had some type of parkingfacility; of those, 97 percent were in-house operationR and 3 percent werecontracted out. Among the different types of museums, art museums had thelargest percentage (11 percent) with parking facilities that were con-tracted out. Conversely, all children's museums and specialized museumshad facilities that were operated in-house. For those muse-ms with parkingfacilities, only 4 percent were income producing.

A much smaller percentage (17 percent) of the universe was estimatedto have had a -public restaurant or cafeteria; of those,' 52 percent hadfacilities that were operated_ in-house. For art, general, science, andspecialized museums, a majority of the individual institutions had in-houserestaurant cafeteria facilities. On the other hand, the majority ofrestaurant/cafeteria facilities in children's museums, history museums, andparks and visitor centers were contracted out. ,For all museums, the major-ity (71 pernt) of restaurantjcafeteria operations were income producing.
Data were also collected on book/sales.shop facilities. It was esti-mated that 61 percent of allmuseums had at least one such shop, of which,over 9D percent were operated in-house:and 88 percent were income produc-ing.li Parks and visitor centers with shops had the lowest percentage thatwere income producing (slightly over half), whereas all of the children'smuseums with'shops were reportedto hive income-producing shops.
Conference/meeting facilities were available in 45 percent of themuseums; of those, .almost all (99 percent) were managed in-house and 32percent were income producing.
(3) Library Facilities
The majority (67 percent) of all museums had library facilities. Thedistribution of museums with library facilities across museum type wasfairly uniform; history museums had, the lowest percentage (62 percent)and science museums the highest percentage (79 perceng).
The sample of those museums with library facilities was furtheranalyzed to determine the kinds of services available (see Table 49, end ofchapter). Fifty-eight percent of those museums with library facilities hadfacilities that were open .Lo the public. The distribution across museumtypes was, again, relatively uniform. Survey data were also collected toascertain whether library facilities were used exclusively for research orexclusively for lending purposes. Approximately 82 percent of those withlibrary facilities had facilities for research purposes only; approxi-mately 4 percent were for lending purposes only. Standing out from therest, only 44 percent of children's museums with library facilities hadfacilities for research purposes only, and about 16 percent were for lend-ing purposes only.
Those institutions with library facilities were also asked it they hadmaterials in audiovisual form; a majority (67 percent) did, ranging from57 percent for children's museums to 83 percent for specialized museums.
The survey also estimated the size of an institution's library facili-ties according to the number of titles of books and periodicals (see
Tables 50 and 51, end of chapter, for detailed data). Most (84 percent) of
2/Percentages add to more than 100 because a few facilities had both an in-
house shop and one that was contracted out.
-93- 4,4A 1

the museums with libraries had 5,000 or fewer distinct book titl (seeFigure 30). Most (84 percent) of the institutions with libraries also had50 or,:less periodical subscriptions.
015
7.0
410
3.0
4.0
3.0
2.0
0.4
aFIGURE 30....01STRIBUT1014 OF 141JSEU1.G, Ft NUMIER Of BOOK 11117.5
4,408
84.0
2.7
2.3
10,03115.000
15,001-30,030
30.001'45,000
45,00140,00)
60,001-Plus
(4) Facilities For The Physically Handicapped
About half of the museums (estimated 54 percent) had accommodationsfor the physically handicapped. .,Parks and visitor centers were most likelyto have such facilities (estimated 79 percent), whereas history museumsand specialized museums, were least likely (42 and 47 percent, respectively;see Figure 31).
Additional data were obtained to determine the approximate percent ofthe facility accessible to the mobility impaired. Across museum types,44 percent of the art museums had facilities that were 100 percent acces-sible, whereas only 16 percent of the history museums were 100 percentaccessible. An estimated 12 percent had facilities that were completelyinaccessible to the mobility impaired (see Figure 32).
441 j

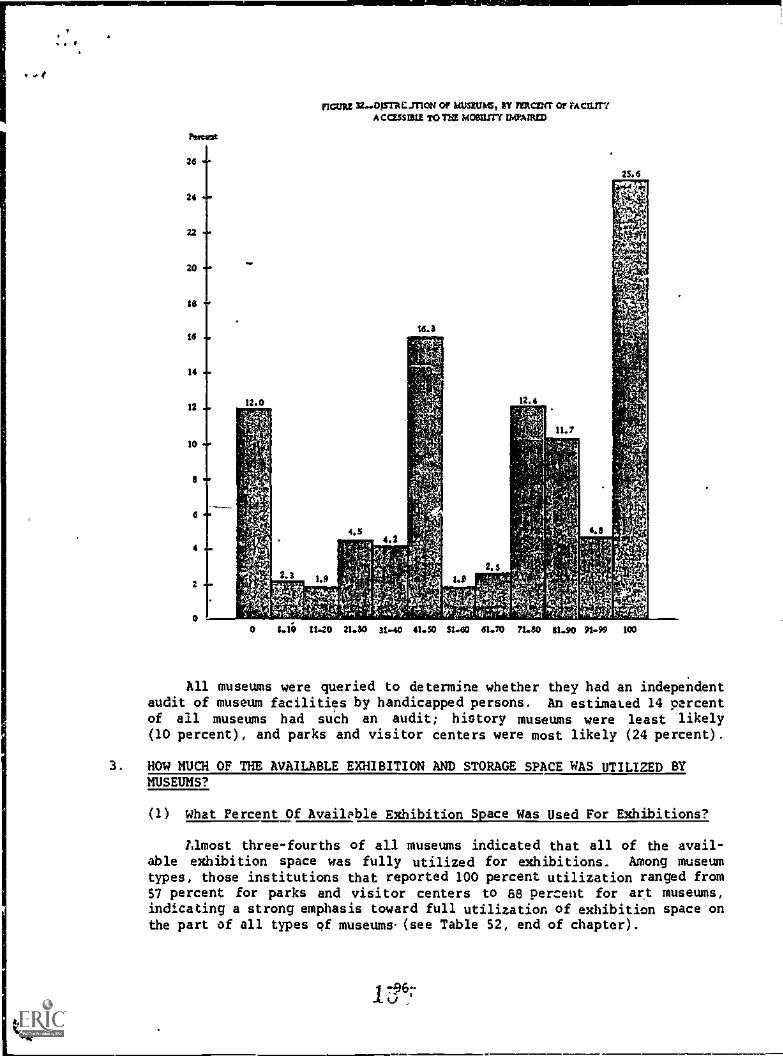
noun 32-01STRCJTION Of 1d).11111k4S, EY faCtra or Men=ACCESS1111 TO TM MO111171t VOA=
1-10 11.20 21.30 31-40 41.50 SIAM 61.70 71-80 01.90 91-99 100
All museums were queried to determine whether they had an independentaudit of museum facilities by handicapped persons. An estimated 14 percentof all museums had such an audit; history museums were least likely(10 percent), and parks and visitor centers were most likely (24 percent).
3. HOW MUCH OF THE AVAILABLE EXHIBITION AND STORAGE SPACE WAS UTILIZED BYMUSEUMS?
(1) What Percent Of Available Exhibition Space Was Used For Exhibitions?
Almost three-fourths of all museums indicated that all of the avail-able exhibition space was fully utilized for exhibitions. Among museumtypes, those institutions that reported 100 percent utilization ranged from57 percent for parks and visitor centers to 88 percent for art museums,indicating a strong emphasis toward full utilization of exhibition space onthe part of all types of museums(see Table 52, end of chapter).

..
(2) What Percent Of Available Storage Space Was Used For Storage?
Approximately 63 percent of the museums fully utilized the availablestorage space for its intended purpose. Although the percent of utiliza-tion for storage space was not quite as large as for exhibition space, itstill represents a significant commitment to utilization of availablespace. Among museum types, percentage utilization ranged from one-halfwith full utilization (parks and visitor centers) to three-quarters withlull utilization (art museums; see Table 53, end of chapter).
'NV
-97-
$ V
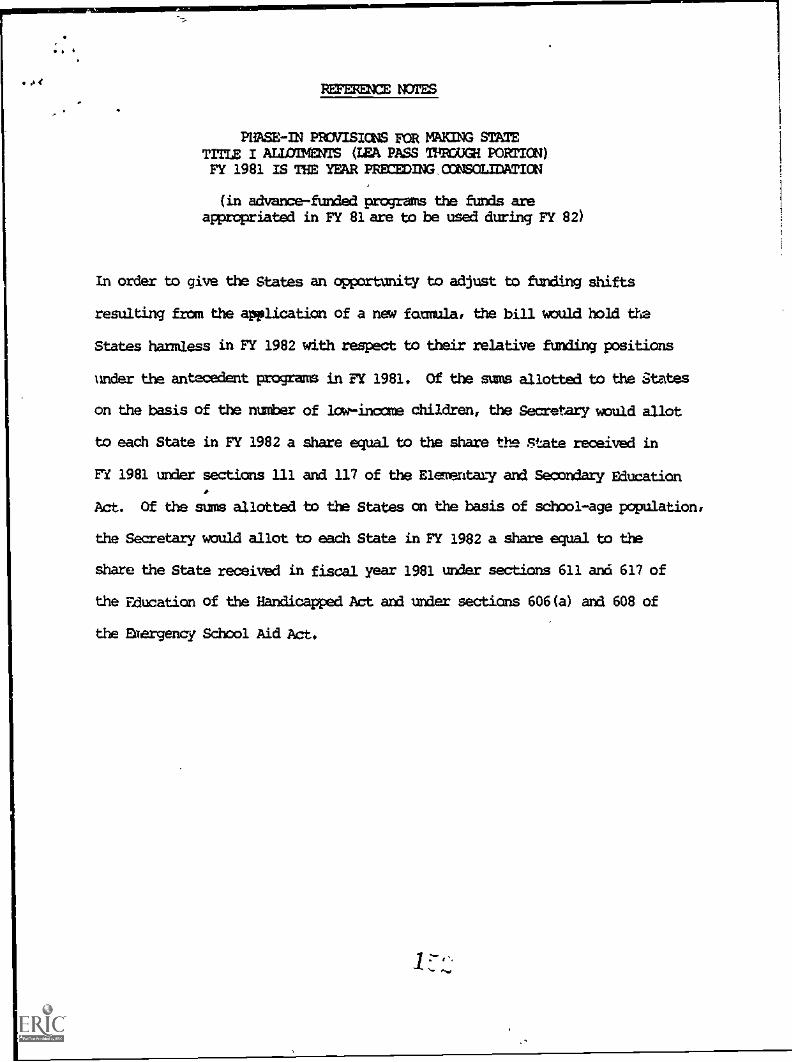
REFERENCE NOTES
PHASE-IN PROVISIONS FOR MAKING STATETITLE I ALIMENTS (LEA PASS TPROUGH PORTION)FY 1981 IS THE YEAR PRECEDING.CONSCLIDATION
(in advance - fended programs the funds areappropriated in FY 81 are to be used during FY 82)
In order to give the States an opportunity to adjust to funding shifts
resulting from the application of a new founula, the bill would hold the
States harmless in FY 1982 with respect to their relative funding positions
under the antecedent programs in F 1981. Of the sums allotted to the States
on the basis of the number of low-income children, the Secretary would allot
to each State in FY 1982 a share equal to the share the State received in
FY 1981 under sections 111 and 117 of the Elementary and Secondary Education
Act. Of the sums allotted to the States on the basis of school-age population,
the Secretary would allot to each State in FY 1982 a share equal to the
share the State received in fiscal year 1981 under sections 611 and 617 of
the Education of the Handicapped Act and under sections 606(a) and 608 of
the Eaergency School Aid Act.

.
TABLES AT END OFCHAPTER V

Table 47.--Distribution Of Museums Owned And/Or Operated By An EntityOther Than The Governing Authority. 81,TYPe
Type of Museum ITotals Owned I Operated [Owned/Operated
All Museums 925 589 115 221
(Percent) (100.0) (64.0) (12.0) (24.0)
Art(Percent)
Children's(Percent)
General(Percent)
145
(100.0)
21(100.0)
106
(100.0)
114
(79.0)
19(91.0)
:46.0)
17
(12.0)
24
(22.0)
14
(10.0)
2
(9.0)
34(32.0)
History 444 270 36 138
(Percent) (100.0) (61.0) (8.0) (31.0)
Parks 4 Visitor Centers 9 1 2
(Percent) (100.0) (74.0) (9.0) (17.0)
Science 148 105 20 23
(Percent) (200.0) (71.0) (14.0) (15.0)
Spacialized 49 23 18 9
(Percent) (100.0) (47.0) (36.0) (18.0)
Totals may not add to 100 due to rounding.
1:7-98- s.0
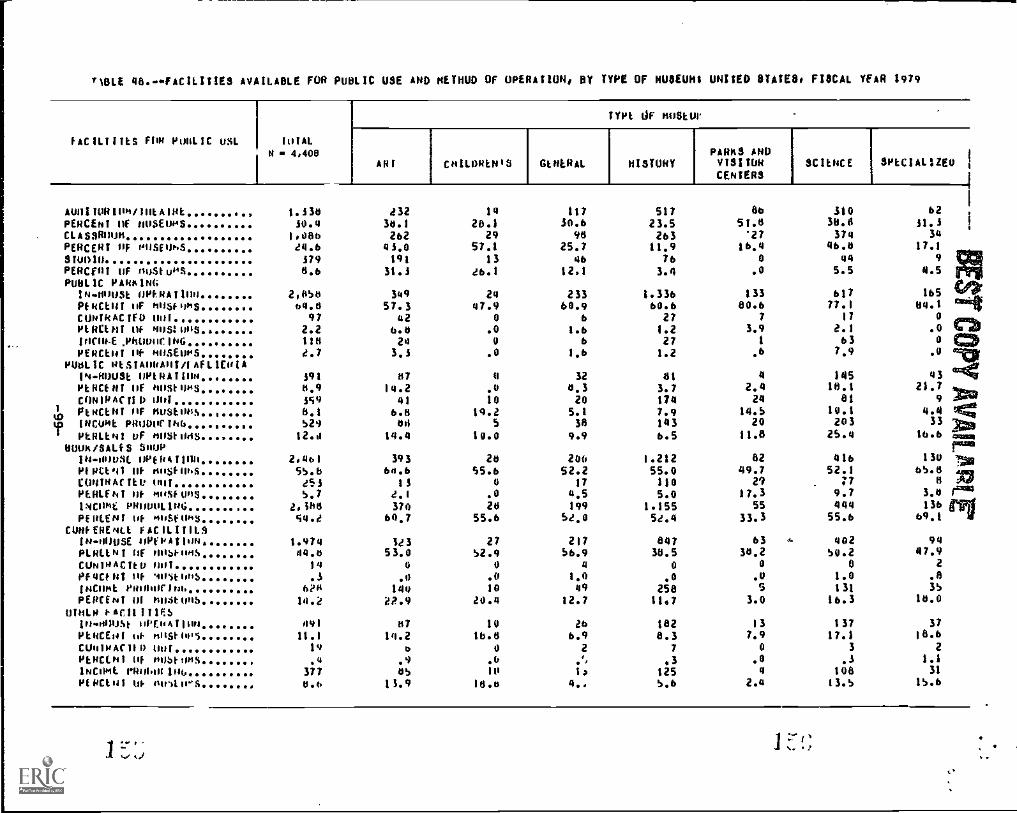
/ISLE 48+444C1LITIE8 AYAIL4OLE FUR PuOLIC USE AND Knapp OF OPER411014, BY TYPE OF NOUN UNITED 8TAIE8, FIIIE4L YEAR 1479
14c11.11IL5 FOP Pu4LIC USL lo1ALI8 - 4,400
111.01 th; 008114,
AI If CH11.081808 GINERAL Ht0Tukt,
141188 AND8131108 ScILNCE I SPLCIAL$2E0CEN1ER8
AmI1U111161/111kAllaPEFICEN1 OF MUSEUMSClitssitoun .. ..PERCER1 uf mistohs ...310018 .PERMIT oF ooStuoS14181.1C MAN4186
18.81J11ft 010f8Al11111PfliCiO1 oF ouSfoh0CUmik4C1F0 OoIPLUEttlf Of 4,141 'los
000E .1411/04111N6 ...PERCLO1 of HoSEopS
P00L1C 8151Ao84011/(AfLIE1IIA104-KUM uM1 8A1184.PLIICE41 OF hostomsC1)N1RaC110 OIII
I Ist4CLIII (IF 4u81100S ...0y Waft PROOOrIha1 Mt81.041 oF 41181.09S8UO8/0ALfS 8810
1N-ouu1t oPt8411181 .1)10C1.11 Of 8116fokS1:0014411111 ootME1111141 Of moSf443lmcoht twoutiLltio; . ..
pf4Effs1 of 04.51'1645CO4ffNEPOA FACILI111.9
111.4005( OPFNAIlooPLOOAN1 OF ftom5CUNImacito 11111PF9C1411 of 4105119,5IOCIIIIL eg000rlokPERCEN1 14 owito4b
UI41.9 f4CIIIMS1.9011J4f o11.0.411114PiNCEo1 of nosfopsCU0i144c11 0 our
PI4Ctol Of Milbtfi nSINDINE r9144111116Minton of ow)110'0
1.13050.01,08444.61790.6
2,0S464.8
972.21180.7
3914.93598.1S29
12.11
2.46155.645iS.?
2,38454.4
1.97444.4
14.3
61014.2
491
11.119.4
3774.6
43234.1262
41.0191
31.1
34957.;
426.4211
3,i
8714.2
416,0
411
14.4
39364.6
IS4.1370
811.7
Te353.0
0
.0140
02.9
4714.2
4
.9es
15.0
14
28.129
57.113
46,1
2447.9
0
.00
08
.010
19,45
14.0
2455,6
0
.020
554
27S29
0.010
20.4
1016.4
0
.610
16.0
11730,694
25,746
12,1
23360.9
61.6
61,6
324.320
5.134
9.9
20052.2
174.5199
54,0
21756,9
a
1.049
12,7
266.9
2,.ts
4..
51723.526311.9763.4
1.33660.6271.2271.2
013.71747.91436,5
1.21255.01105.0
1.1555e,4
84738,5
0
.0258110
1828.3
731255,6
86
51.8"27
16.40
0133
80.67
3,91
64
2.424
14.520
11.8
8249.7
2917.3
5533.3
63 ..
34,20
05 s
3.0
137.9
0
. 0
44.4
31034.0374
46.444
5.5
61177.1
172,1637.9
14510.1
8110.1203
2$.4
41652.1
:79.7444
55.4
40254.2
0
1.0131
16.3
13717.1
3
. 1
108I3.5
6231.3
34
17.1
01 e 5:11'64
a440 "lt
0 at.9
4321,7
ICND4,4 44
33 321116,6 mumtam
130 12.65.0 44OM
4 Alf3.4 emis134 gIll691
9447,9
283s
14,0
37
18.02
1.131
15.6
1;"'.,t
. .
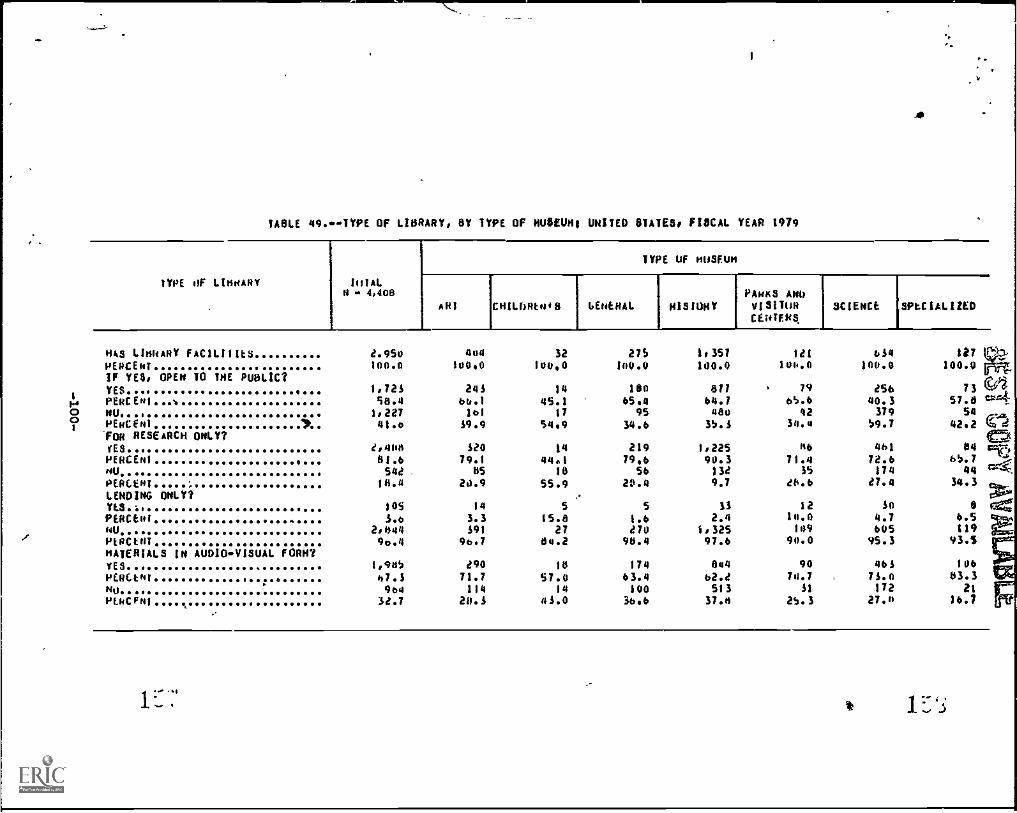
TAW 490.IYPE OF LIBRARY, 81, TYPE OF MUSEUM UNITED STATES. FISCAL YEAR 1919
TYPE NF 1.10KARy VITAL4,408
TYPE Uf MUSEUM
AR1 CHILDRt4#8 GENERAL HIS LUNYPANICS AN0U141104CERTEMA
SCIENCE SPECIALIZED
HAS LJ,UARY FACILI1IES i.95u 404 32 275 1,357 lei 614 117PERCENT 100.0 100.0 100,0 140.0 100.4 100.0 100.0 100.0IF YES, OPEN TO IRE PUBLIC?YES... 1,721 241 14 180 871 . 79 C56 73 CA
1.14 PERCE41...). 58.4 66.1 45.1 65,4 64.1 65.6 40.3 57.d 1=4
Oc)NU 1,227 let 17 95 480 42 379 54 .
iPENCEN1. lo 41.0 19.9 54,9 34.6 35.1 34.4 59.7 42.2 e--.4FOR RESEARCH ONLY? 4=fES... e,4011 1?0 14 219 1.225 46 461 44 cvl,PERCENT .... 81.6 79.1 44.1 79,6 90.3 71.4 72.6 65.7
"110008 54C - 45 18 56 13C 35 174 44 vo%4.
PERCENT 18.4 20.9 55.9 20.4 9.7 d6.6 i7.4 34.3 apwLENDING ONLY? .. do."
YtS.: $ I0S 14 5 5 SS 12 14 log'PERCEN1kU ....
S.42,044
3.3$1
15.827
1.6i70
2.41,325
14.0109
4.7605 119
6.5
Nt4Ct4T 90.4 90.7 d4.2 911.4 97.6 90.0 95.3 93.5MATERIALS IN AUDIOVISUAL FORM?YES 1,945 C90 18 174 844 90 461 106MUNI 07.1 71.7 57.0 63.4 62.i 74.7 71.0 83.3 CC"0004 904 114 14 100 513 11 172 atPLkCFNI 3i.7 24.1 41.0 36,6 37.4 2S.3 27.n 16.7
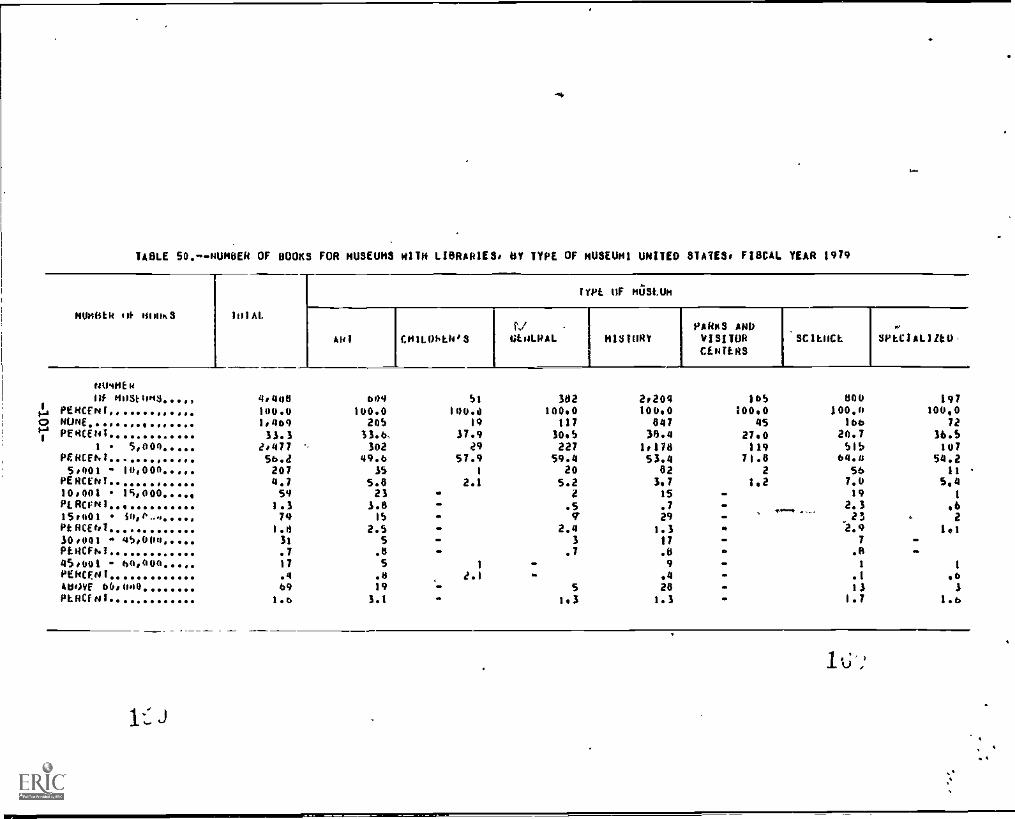
TABLE 50.-.NONBER OF BOOKS FOR MUSEUMS WITH LIBRARIES, BY TYPE OF NUMMI UNITED STASES, FISCAL YEAR 1919
RUBBER 4* 'monks 1IIIAL
TYPE OF 663E66
AN1 CNILONLIOS UMLPAL NISIBMY}ARKS ANDVISITORWIENS
SCIENCE SPLCIALIZEO
1,....
C)t'A1
NOmftEw
1* NoStN NSPENCfN(..RUNEPERCENT
1 5,000KWh," .5,001 10,000
PERCENT10,001 15,000PERCFN1 ...15,001 14,P-.,,,,PENCENI14,001 45,000PLOCFNI.. ..45,001 04,004PENCCNT.ABOVE 66040PLACFNI
4, 400
100.01,4693$.3
2,47756.42074.759
1.3791.031
.717.469
1.b
604100.0245
1.4'49.6
$55.823
1.815
2.55.85.019
3.1
.
-.
-..
-
51100.0
19
ILE;
57.91
2.1
1
4.1 .
302100.0
11730.5227
59.420
5.24
.5g
2.43
.7
51.3
2,204100.0
84739.41,17853.4
823.715 .
.7 .
29 .
1.317 .
.11
9 .
.4 -
28 -1.3 -
165 000100.0 100,0
45 16627.0 20.7119 515
71.8 64.02 56
1.2 7.019
, 1.-..,...2.3.232.9
7
.61
.11$
1.7
.
-
197100.0
7236.51U7
54.211
5.41
.62
1.1
1
.61
1.6
J

I
s
...
a i C.
I
TABLE 51NUMBER OF PERIODICAL SUBSCRIPTIONS FOR HUMORS WITH LIBRARIES, BY TYPE OF POSEUR! UNITES STATES, FISCAL YEAR 1979
PfdluOlCol
5066C6IPIIIMS
!HIM.
ME or dOSEUm
okI
.9
0,11111401S Gotom. hisTonYPAW'S AhpVIWORtfNIER8
SCIENCE 8PicIALIZEO
1
ia0t.)i
m.94(11lif Montoi$
PCRCENINIINL
PERCENTI SO
11141.2147
SI 100
PEOCFN1101 150PERCE01151 240PERCENT201 090
PERCrutAOUVE 400PERCENI
=
-
4,40416001,87742.6
4.07047.01593.531.2641.489
2.09b
2.2'
b09100.0
26633.7316
S2.238
6.2IS
2.57
1.17
1.1 -
19 . ft
3.1
Si104.0
2144.9
2345,1
1
2I
4
7.9
'
.
302100.0,
15340,0206
53.814
3,5
2S4.
1.14
1.1
2,1041u0.01.176535
- 86939.5
502.2
a
.4221.055
?,5221.0
.
.
.
Ibb160.0
SI30,9100
64,62
1.2
7
3.9
63.3
004100.4
18623.2452
56.553
6.630
3.818
2.322
2.730
4.9
.
197100,0
0141.1102
51,92
11
4
2.3I
.66
3.$
lt1
%..$ ....
1
5
.
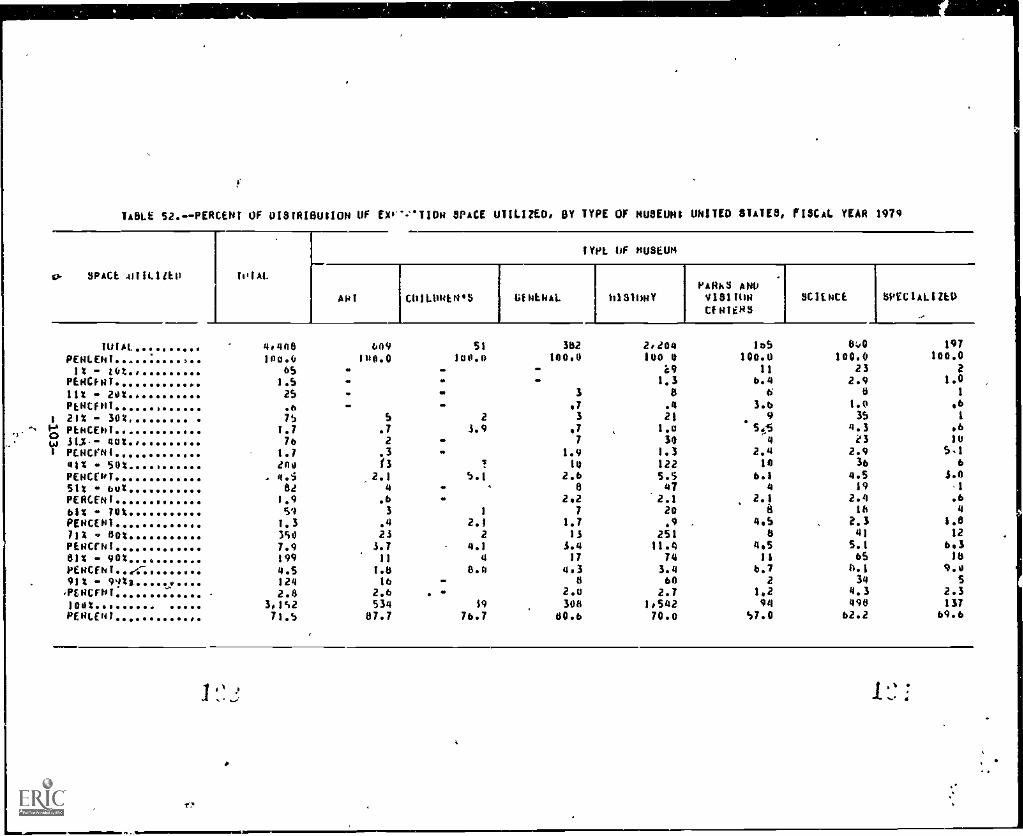
TABLE 52.aPERCENt OF DISIRIBUSION OF EXI'''TION SPACE UTILIZED, BY TYPE OF NUSEUNI UNITED STATES, FISCAL YEAR 1979
0- SPACE m111.11t0 IIIIAL
1YPL OF HUSELIN
001 C1111.01WI'S 141,114AL 1131110YPARKS ANVVIS11110
CINUNSSCUNCE ;SPECIALIZED
1D1AL 4,440 609 51 382 2.204 145 840 197
PEOLE111 140.6 100.0 100.4 140.0 100 0 100.0 100.0 100.0
1% - 16t 65 - - i9 11 23 a
KHOO. 1.5 - - - 1.3 6.4 2.9 1.0
11% - 20% 25 . - 3 8 6 0 1
PLIMF141 .6 - - .7 .4 3.6 1.0 06
g 21% SO% , 7S $ 2 3 21 9 35 1
1'4 11%00011CIOto) 31j 40Y..1 pcocrot
1.7761.7
.72
.3
3.9-w
.77
1.9
1o030
1.3
504
2.4
4.3i3
2.9
gb10
5,1
41% 50% 240 S ! 10 122 14 36 6
PENCrbt . 4.i 2.1 5.1 2.6 5.5 6.1 4.5 3.4
51% 60% fir 4 - 8 47 4 19 1KRUM! 1.9 .6 2.2 '2.1 2.1 2.4 .6
61% 70% SI 3 1 7 20 8 16 4
PENCEPI 1.3 .4 2.1 1.7 .9 4.5 2.3 1.8
71Z 80% 3S0 23 2 13 251 8 41 12
PENCfNI 7.9 3.7 4.1 3.4 11.4 4.5 5.1 6.381% 90% 199 11 4 17 74 11 65 18
PENCF 141 ...- 4.5 1.8 8.0 4.3 3.4 6.7 0.1 9.091% 94%:
,124 ta - 8 64 2 34 s
1E01:F141 2.8 2.6 . 2.0 2.7 1.2 4.3 2.3100% 3.1S2 534 $9 348 1,542 94 490 137
0101.(41 71.5 87.7 76.7 80.6 70.0 S7.0 62.2 69.6
.,I.. .
s' 4
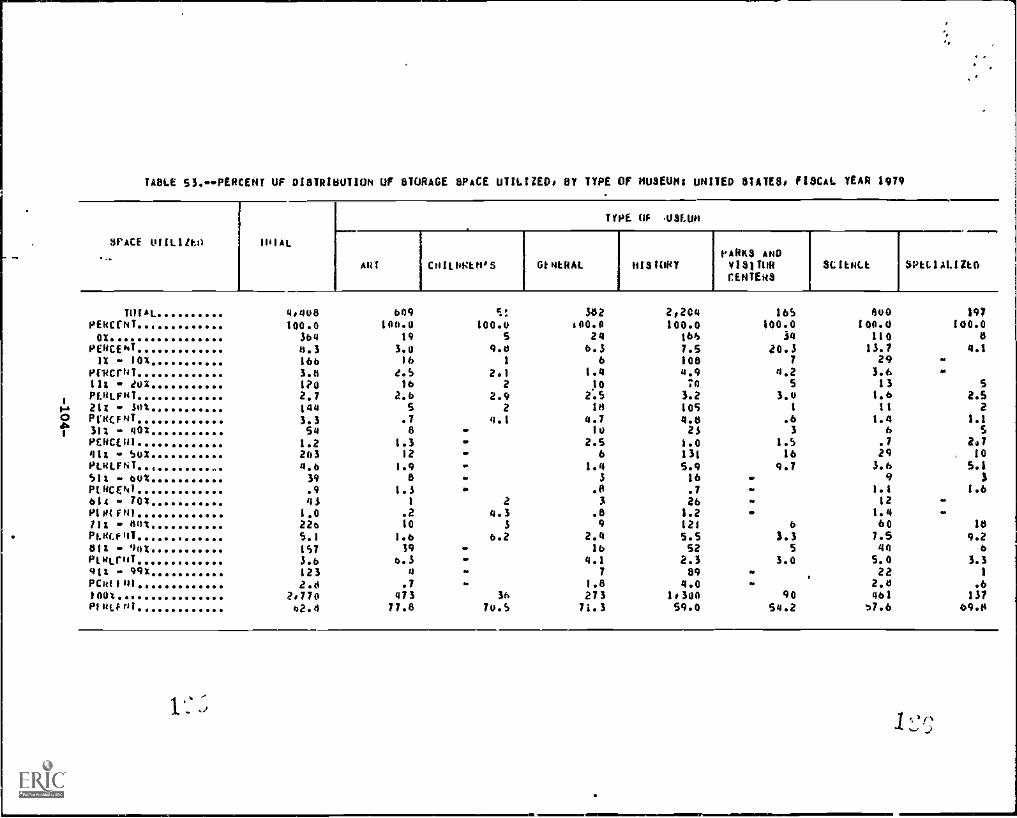
TAM 53.--PERCENT OF DISTRIBUTION UF STORAGE SPACE UTILIZED, BY TYPE OF MUSEUM' UNITED STATES, FISCAL YEAR 1979
SPACE 4111.111..0
1111. OF 401 8.1
C11itlant5 ontRAL HISIDRYpAINO ANDvlSilullCENTERS
SCIENCE SPLLIALtZtO
IMAL 4,440 649 5: 382 2,2C4 165 800 $91PERCENT... 100.11 100.0 100.0 soo.o 100.0 100.0 100.0 100.0Ox 309 19 5 24 165 ill 110 8
PERCENT 8.3 3.0 9.0 6.3 7.5 40.3 13.7 4.1IX - lox 160 16 1 6 108 7 29 -
mato 3.8 1.5 2,1 1.4 4.9 4.2 3.611; - 40x l ?0 16 2 10 To 5 13 5
i 121.4f14, 2.7 2.6 2.9 2.5 3.2 3.0 1.6 248-6 21x - Sot 144 5 2 In 105 1 11 2C) POMO 3.3 .7 4.1 4.7 4.8 .6 1.4 1.1
131% 402 so 6 - to 23 3 6 5
ab
KRUM 1.2 1.3 - 2.5 1.0 1.5 .7 2,7811 SO 203 12 - 6 131 16 29 , 10
Ptnirra ... 4.6 1.9 - 1.4 5.9 9.7 3.6 5.151$ - 60% 39 8 - 3 16 . 9 3POMO, .9 1.$ .. .0 .7 .. 1.1 1.661A « 101 43 1 2 3 46 - 12 -
PIWN1 1.0 .2 4.3 .8 1.2 - 1.4 -/1 g 601 226 10 3 9 121 6 60 18
Pl.ncfliT 5.1 1.6 b.2 2.4 5.5 3.3 1.5 9.2811 - 90% 157 19 - 16 52 5 40 6novo 3.6 o.3 - 4.1 2.3 3.0 5.0 3.391: 99x 123 0 - 7 89 . 22 1
12011411 2.d .7 - 1.8 4.0 - 2.0 .6
1001.., 2,770 473 36 273 1,300 90 461 1371314041 .. 62.4 77.8 70.5 7i.3 59.0 54.2 57.6 69.8
1 ::

Vi. PERSONNEL
1. WERE THE NUMBERS OF PERSONNEL WITH EDUCATIONAL RESPONSIBILITIES INCREASINGWHILE THOSE IN CURATORIAL (INCLUDING RESEARCH) AND CONSERVATION WEREDECREASING?
(1) Regular Full-Time Staff
In 1979, an estimated two-fifths of the regular, full-time museumpersonnel in all museums spent a majority of their time in either generaladministration or building and maintenance, making these areas the twowith the greatest percentage of total personnel. Three areas of responsi-bility--development, membership, and public information--accounted forless than 3 percent each of the total personnel (see Figure 33).
MUM no+DISTASTRION OF RIGUIAR FULLAMME AMA OFRESPONSIBIUFY
On*. briathis Cower. gdu Gent. Mier- POW Lanny Gam. Owen* Smwtey It& Otbntorts' vitiost atlas omen bezhip Cater. Alla Admits. lag and
=Um Wisdom Admictioanion
-1"T--_05-

About one out of every ten regular, full-time staff persons 4as con-cerned primarily with education; a slightly higher percentage (12 percent)had primarily curatorial responsibilities, which included research and reg-istration. Only about 4 percent were primarily concerned with conservation(see Table 54, end of chapter, for distribution of personnel by area ofresponsibility and by museum type). Fiscal year 1972 data from MuseumsUSA: A Survey Report were examined to determine trends rmong areas ofresponsibility. However, the Museums USA survey used 5 rather than 13areas of responsiblity and, therefore, comparability is limited. The per-centage of personnel devoted to educational responsibilities remained thesame in both years (approximately one out of every ten). In 1972, thecuratorial/display/exhibit category used in the Museums USA report alsoincluded conservation, whereas in 1979 curatorial, exhibits, and conserva-tion were three distinct areas of responsibility. Moreover, research wasincluded in the curatorial category in 1979 but was a distinct category in1972. For purposes of comparison, the 1972 curatorial/exhibit/display andresearch categories were consolidated (17 percent and 6 percent, respec-tively) and the 1979 curatorial, exhibits, and conservation categories weresummed (12, 10, and 4 percent, respectively) to yield equivalent catego-ries. Because of the variation in classification, caution should be usedin interpreting the results of the analysis. With this in mind, it appearsthat the percentage of personnel with curatorial, exhibit, and conservationresponsibilities remained substantially unchanged (an estimated one-fourthof the total) and that the percentage of personnel with educational respon-sibilities has remained fairly constant in relation to curatorial and con-servation personnel.
(2) Other Staff
Few (estimated 15 percent) museums employed full-time temporary staff,and only about one-third of the museums employed part-time temporaries. Ofthe total number of temporary personnel (both full- and part - time), thelargest number (one-third of the total) had primarily educational responsi-bilities. The number of temporaries with curatorial or conservationresponsibilities was somewhat lower (about 10 percent or less). No compar-able data from previous surveys were available to determine whether thenumber of temporary personnel with educational responsibilities wasincreasing in relation to temporary staff with curatorial or conservationresponsibilities.
Only about one out of every ten museums had full-time volunteers,whereas six out of ten had part-time volunteers. Only about 6 percent ofall museums had one or two full-time volunteers; 19 percent had between oneand five part-time volunteers. Moreover, about 14 percent of all museumshad more than 41 part-time volunteers. As was the case with temporary per-sonnel, the largest number of volunteers (one-third of the total) had pri-marily educational responsibilities, whereas only about one out of everyten had primarily curatorial or conservation responsibilities.
I

Only one-fifth of the museums had either full- or part-time CETAYpersonnel. An estimated one-third of the total number of CETA staff mem-bers had building and maintenance responsibilities, making this area ofresponsibility the one with the largest number of CETA employees. Thenumber of CETA personnel with educational and curatorial responsibilitieswas approximately equal (about one out of every 10); only about 5 percentof the CETA employees had conservation responsibilities.
2. DID MUSEUM WORKERS CONTINUE TO RECEIVE RELATIVELY LOW WAGES COMPARED TOOTHERS WORKING IN SIMILAR POSITIONS AT OTHER INSTITUTIONS?
In fiscal year 1979, the median salary for all full-time museum employeeswas $12,225 (see Figure 34).
The general administration staff had the highest median income ($12,957)and the security staff the lowest ($9,651). The technical staff (individualswith curatorial, exhibit, conservation, education, development, membership,public information, library, and general responsibilities) had a median incomeof $12,762. In contrast, Bureau of Labor Statistics data showed that the mediansalary for classroom teachers in cities with populations over 100,000 wasbetween $16,500 and 816,0002V and for library professionals approximately816,660)21 (see also Tables SSA-N, end of chapter).
1/- Comprehensive Employment and Training Act. Prime sponsors are authorizedto fund CETA positions in the fine and performing arts. In museums, a widerange of positions have been ftnded, including curatorial aide, guard, theatermanager, and mail clerk.
gi U.S. Department of Labor, Bureau ofpublished in Current Wage Developmehts,
3/ U.S. Department Of Labor, Bureau ofLions from the current population survey,
Labor Statistics Salary Trend Survey,May 1980, Bureau of Labor Statistics.
Labor Statistics, unpublished tabula-1979.
-107-Jo,,..)

21.2
MORE 14.UN1VAINATE ONTRIMSTIONS Of SMART RANGES FORMUSEUM STAFF FOR ALL MUSEUM& UNITE0 STATES, MO
40.2
11.6
2.2
AU mgAnyses
Moils& Sassy, $12.22S
To:161ga S 611*
212,262
1.1
Garrard AAGAtokttalen
$12,227
Cufatmlid. 64040, c..../evolun, adosatloa, Jorotopoom, mob614e6.1p, rablic inturoseles, 1114ary, gener116,
I
SC
INN%SNN
ssN%NN%NNN
SNN%sNN%%1/4%s%N%sNNNNNN $42%1/4
NNNNSNNNNNNNNNNNN%NNNNN%AN
NN%\\NNNN%NNN%\\NNNNN
NNN\N
sNN%S
%Ns%NN%\NNN%NN%NN%NN%
NNNsNN%N%NNN 1/4NNNNN
NN%N1/41/4
NN%
11111"
SALARY RANGES
SosisIty
29,1151
1.2
ft 0NNNNNNNNNNNNNsNNNNNNNN Ns.%NNNNNNNNNNNNNNNNNNNNNNNNNNNNN 1/4%NNNNNNNNNNNNNNNNNNNN
N1/41/4NN Ns
N NV.NNN%NNNNNNNNNNNNNNNNN Ns
NNE'LS N NN1/4..1/4+1/4.+1/41/4.0.1
SILO
2.6
44.2NNs%% N
%%N%NN%sss
%W.6N %
ss%Ns%Nss%NNN%NNNNNNSNNNNNNNNNNNNNNNNN
NN%1/4NN
NNNNN1/41/4%
NNNNNNNNNsNsNNNNNNNNNNNN\NV.NNNNNNNNNNNN
NNNNNNNNN%NNNNNNNNNNNNNN%N1/41/4%
%1/41/4
N1/41/41/4
NNN%NNNNN1/41/41/40. 2
1.6
tending and Motatssmac,
C 0
&ha
210,616
III Undo$4.222
..iZ29.22.000
922
210,000214,999
111111
IP,
212,0002111,922
220.000222,000
Owes
220,000

TABLES AT THE END OFCHAPTER VI
.11111M1d1
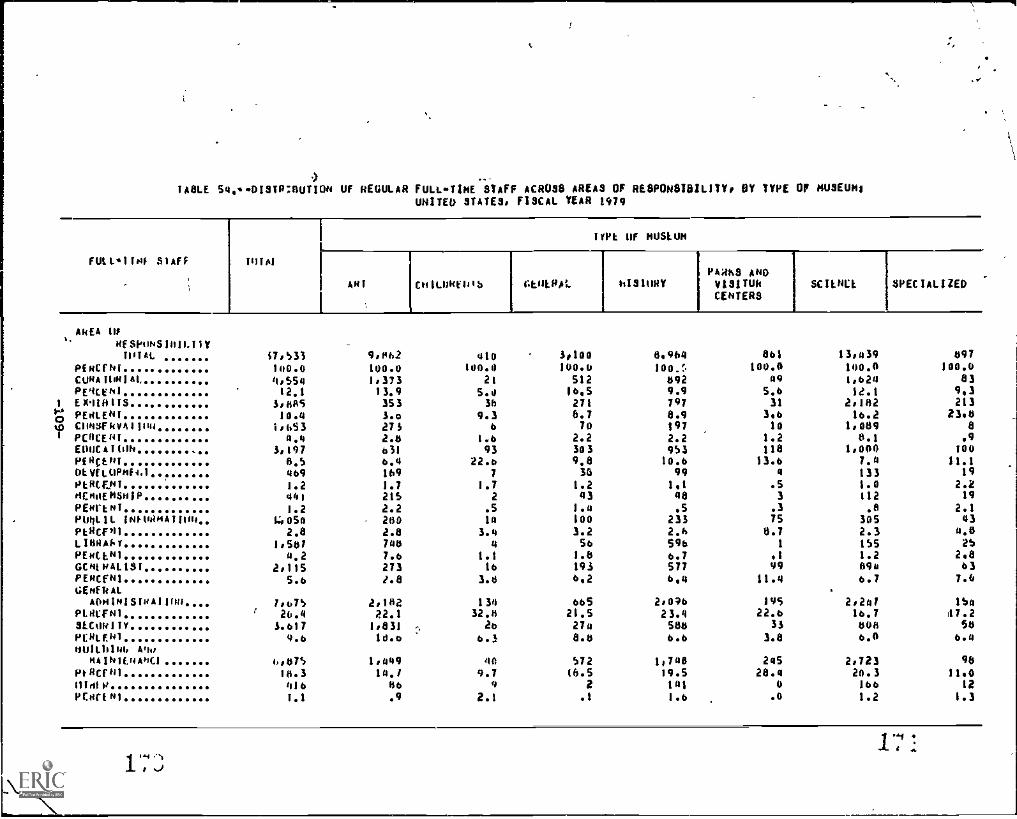
148LE 54,DISTR:RUTION OF REGULAR FULL -TIME STAFF ACROSS AREAS OF RESPONSIBILITY, BY TYPE OF HUSEUNUNITED STATES, FISCAL YEAR 1414
FUEL.!!" SlAFF 1U161
1TPt UF MUSEUM
ANT cHILMEN$5
AREA II?ofSlotINS10111171111A.
fIRCFN1CuP4140fial ....Avicehl
1 EX410118 .....id 00 .EOLEN1 ........lo ComsrkvAlim .
PMENI0604110hPikttlfl ...OtVELUPmf4.1pot4(ENI ..
....
....PIEMOEHSHIPPEOrtml . ....P041.11. INP144m4,10,,..etHCFNILIONOTPEOCEN1GCNtNAL1S1PE4CFNIGE9f041.
AOHINISINAlinuPIALFNI31.ColillyPERLEW0010140 Imo
neilhi(rwictPSCFU1111x11410
17,535140.04,55412.1
lini,0534.4
3,1976,54691.20411.2
60542.8
1,5614.2
2,1155.6
7,07Sf 20.4
3.6179.6
4,67510.3416
9,042100.01,37313.93533.92732,06516.41691.721S2.22602.87467.02731.8
2;1211,83116.0
"1:14.1
1$6
:.
410100.0
21
S.d36
9.36
1.6
227!7
1,72.514
3,44
1.11634
13432.o
2b
63
449.7
9
114:i
27116.5
6,170
2.23039,8
1,236
431.41003.2561.01946.2
66521.5274ao
57214,5
2
KIS1ORYPARKS ANDVISITUbCENTERS
6064 861
100. 100.0092 499.9 5,6797 3111,9 3,6197 102.2 1.2953 lie10,6 13.6991,1
4
.548 3.5 .3
233 752,$ 0,7596 1
6.7 .1577 496.4 11.4
2;039.1)1 19522,6
588 33
44 3.8
10746 24539.5 20,4141 0
SCURLE SPECIALIZED
13,439 697100.0 100.0
83
:52 2139,3
16.2 23961, 8110.7
.91,000 10074
1.0
110)
2.2133
112 19.8 2.1
305 432,3 4,0155 251.2 298896 636.7 7.4
2,241 15416.7
2,67:3
476!gi
004
9624,3 11 . 0
1601.1 .9 2.1 .1 1.6 .0 1.2
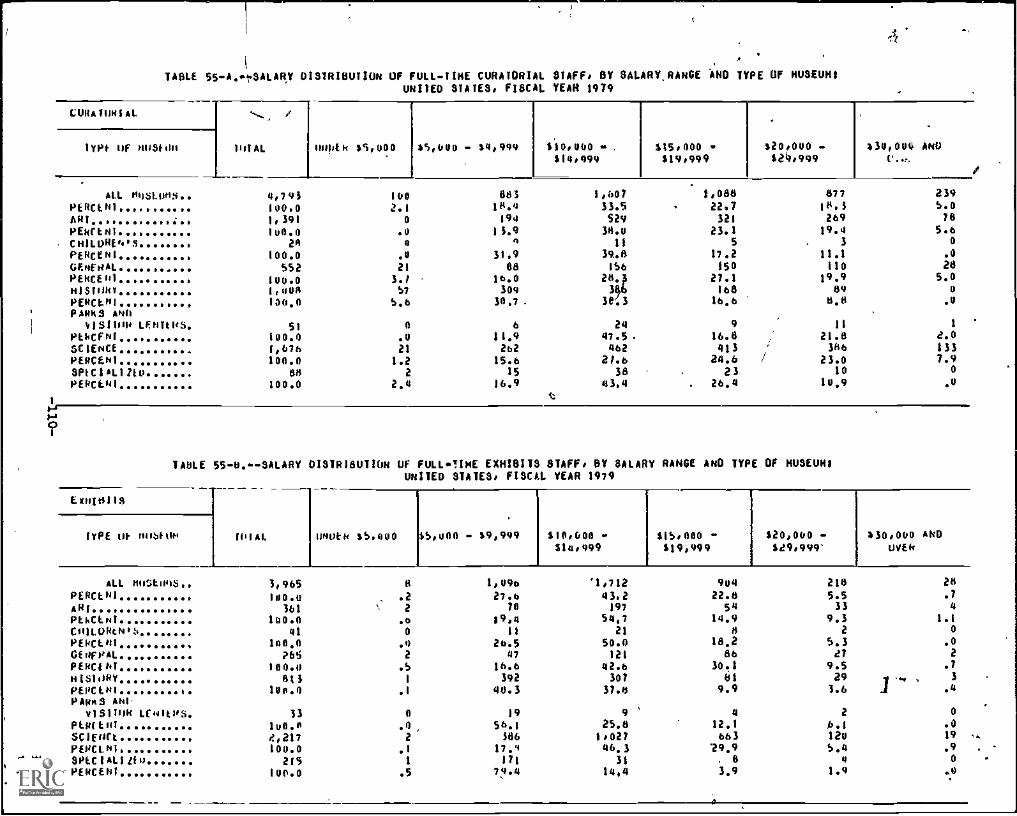
4i
.
, '
TABLE 55 -AonSALARY DISTRIBUTION OF FULL -TINE CURATORIAL STAFF, BY SALARY.RANDE AND TYPE OF MUSEUMSUNITED STATES, FISCAL YEAR 1979 .
CURATORIAL /
I INTAL uopek $5,000 45,600 14,999 310,000$14,999
$15,000 -$19,999
$20,000 -$29,999
630,004 AND
if
1Y14 OF ROSION
.
ALL RosLoNS.. 4,791 160 883 1,607 1,080 877 239
Pt4C141.. . 100.0 2.1 18.4 33.5 22.7 18.5 S.0
AR, 1,391 0 194 S29 321 269 78
PEkftNICHILDRws
100.024
.00
1 /.9A
38.011
23.15
19.43
5.60
PERCX41 100.0 .0 31.9 39.8 11.2 11.1 .0
GENfRAL 552 21 08 156 150 110 28RERUN'HISTORY
100.01,404
3.1S7
16.0309 2803
27.1168
19.989
5.00
RERUN' 1 100.0 S.6 30.7. 38.3 16.6 13.8 .0
pARKS ANOMISI1110 LENItHs 51 0 6 24 9 11 1
FothCFNI 100.0 .0 11.9 47.5. 16.8 21.0 2.0SCiENCE ....... , 1,676 21 262 462 413 386 133PERCENT 100.0 1.2 15.6 21.0 24.6 23.0 7.9SP1cIAL1255) 88 2 15 38 23 10 0
PE4cE41 100.0 2.4 16.9 43,4 . 26.4 10.9 .0
1t
I-,0ra
1
TABLE 55-B...ALARY DISTRIBUTION OF FULLTINE EXHIBITS STAFF, BY SALARY RANGE AND TYPE OF MUSEUM'UNITED STATES, FISCAL. YEAR 1919
Ex11101111
DIAL u817fk 35,080 $5,018 39,949 $10.600$14099
315,000 -S19,999
$20,000$29,999'
630,000 ANDUVEk
lyPE OF Niobium
1
ALL RoUtons., 1,965 11 1,090 '1012 984 218 28
PERCEN1 100.0 .2 27.6 43.2 22.8 5.5 .7
ART.. ... ... 361 2 70 197 54 33 4
RkhCENT 100.0 .6 89,4 54,7 14.9 9.3 1.1
C111LURtNet. 41 0 11 21 a 2 0
PERCEN1 1000 .9 26.5 50.0 18.2 5.3 .0GENFRAL P65 2 41 121 86 27 2
PERU*** 104.0 .S 16.6 42.6 30.1 9.5 .7
813104Y 413 I 392 307 81 29 1 3
PEKIN' 6. 1011.0 .1 48.3 37.8 9.9 3.6 .1 .4
PARS Am.91$11104 Lomps 33 o 19 9 4 2 0
PER(00 tu0.0 .0 56.1 25.0 12.1 6.1 .0scauft ...
puicLNI...4,211100.0
2
.1
,
50617.4
1,02746.;
663"29.9
120S.4
19
.9
....
.
,
SPEC !ALI ito 215 1 171 31 . e 4 0
-' PERCENT 100.0 .5 79.4 14,4 3.9 1.9 .0

.
TABLE 55C.SALARY DISTRIBUTION OF FULLTIME CUNSERYATION STAFF, BY SALARY RANGE AND TYPE OF MUSEUMSUNITED PATES, FISCAL YEAR 1979
CONSERYAtIoN
tom. OMEN $5,000 $5,000 $0,444 $10,000$14:444
$15 000519,994
.
$20,00)A29.999
I
30,400OYER
ANDTyPt Ilf 01Stor1
ALL 11051.101$ 1.747 eo 410 720 412 150 18PERCEN1 100.0 1.1 eS.1) 41.2 IL!) 9.1 1.0ART ..... 274 0 37 02 80 64 12PERCEN1 100.0 .0 13.3 24.9 29.1 e3.3 43CHILDREN'S 15 0 5 7 1 0 0P,NcEnT 1110.0 .0 SO. 1 48.1 ' 21.6 .0 .0GENEHAL 74 1 14 27 18 13 1
PERCENT 100.0 1.1 10.5 16.1 24.9 17.8 1.iHISTORY 252 16 60 125 33 10 0PERCEN1 100.0 6.1 27.0 49.5 11.2 1.9 .0PARKS AND
VIS110N LEN1ER3 10 0 0 41 6 U 0
PtkCEN1 100.0 .0 .0 40.0 60.0 .0 .0SCIENCE 1.1111 3 291 470 269 72 5PERCEN1 100.0 .1 e6.2 42.4 24.2 6.4 .5SPECIALIZED 11 0 4 5 2 0 0PERCENT.. 100.0 .0 17.6 43.1 19.3 .0 .0
1
Wa1-,
Wa1
TABLE 550.SALARY DISTRIBUTION OF FULLTIN. EDUCATION STAFF. BY SALARY RANGE AND TYPE OF MUSEUMSUNITED STATES, FISCAL YEAR 1979 .
CDOCATIoN .
wisl. ODIN $i000 $5000TYPE Of ONSEDM j
ALL DOSLOHS 3.112 13PERCENT 100.d 1.0AN1 65S 0
PERCENT 104.0 .4ColIDRWS 119 II
PENCE41 100.0 .04t41.1/AL ISS 6PENCE NI 100.0 1.0HISTORY . 910 16PENCENI 140.0 1.7PAkAS ANI.
IFISIINIT Ct4IERS 117 0
PENCr'41 100.0 90SC IINCE 1,040 11
eulttoo 100.1' 1.1sPLLIALleto 100 u
PINCE1810010.101.0 100 0 .0
.
69,999 $10.000 SIS,000 $20,000 $30,0110 AND
$14,999 $19,999 $29,999 Oftlt
1,003 1.369 621
emxermll
253 3430.3157
41.3114
18.7 ,
1227.6 1.055 7
24.0 40.0 io.b 8.3 1.1
91 49 23 5 u
14.0 41.5 19.3 4.3 .0TO 125 HI 30 4
2:,.2 17.4 24.3 V.1 1.2
410 SlaS 117 25 0
44.5 30.7 12.4 2.7 .0
44 44 23 7 0
37.1 37.1 19.1 6.0 .0225 420 202 120 ee
21.4 40.1 21.1 12.2 e.1si ss is ? 0
11.0 51.4 19.4 2.1
L.,5

TABLE 55E,SALARY DISTRIBU11UN 'IF TULL0T1ME DEVELOPMENT STAFF, BY SALARY RANGE AND TYPE OF MUSEUM=UNITED STATES, FISCAL YEAR MA
OfVeLOPNEN1I
1
TYPE 01 441bEtEm (alai, oNvER 41,0100 35,000 - 44,999 110,080 - 615,000 - 620,000 - 630,000 AND614,999 419,999 429,949 UVLB
ALL NoStoNS.. 404 i 97 1S3 98 85 S5PERCENI ... .. 100.0 a 19.8 31,4 20.0 17.4 11.2Aki . .. .. 1/1 II 40 43 31 3u 27PERCEOI .. 140.4 .0 23.7 25.2 18.3 1713 1S.5CHILUREN$G . .. 7 0 1 4 2 0 0PERCINI .. .. 100.4 .0 15,7 52.9 31,4 .0 .0
Gt4ERAL ..... .. 40 I, 13 7 0 9 3PERCEN1 .. 100.0 .0 32.0 160 20.5 22.6 7.60131ORY .. 112 0 13 57 27 13 4
PERCENT... .. 100.0 .0 11.2 50.5 24.1 11.2 3.1PARKS ANN
VIS1TUN LLNIER$. 4 0 0 3 0 0 1
PERM+, ... .. 100.0 .0 .0 75.0 .0 .0 25.0SCIENCE.... 135 1 22 35 27 30 21PERCENT 100.0 .0 16.0 2S.9 19.9 21.9 1S.4SPECIALIZEP . .. 19 0 8 S 2 4 0
. PERCENT.... .. 100.0 .0 40.0 270 11.4 21.2 .0
rj
TABLE 55-F.--SALARY DISTRIUUTION OF FULL.TIME HEIOERSHIP STAFF, BY SALARY RANGE AND TYPE OF MUSEUMSUNITED STATES, FISCAL YEAR 1979
MEMBERSHIP
TYPE OE 4oSlot. NNOE1 $5,000 1/000 :9,999 $10,000$14,999
115,000$19,999
$20,06'.. A
429,999630,000 AND
UON
ALL mostO4S.. 461 4 102 210 36 24 1
PERCENT ... .. . 100.0 1.7 39.5 4S.5 7.0 S.2 .1ARE ... .. 216 0 77 119 lb 5 U
PUICENI 140.0 .0 35.6 54.8 7.2 2.4 .0(0111DRENIS ........ a 0 1 I 0 0 0PERCENT .. 1400 .0 50.0 S0,0 .0 .0 .0GENERAL ........... 41 0 IS 23 2 0 0PERUNI 10G.4 .0 33.0 S6.9 5.1 .0 $0HIGIuRt .... 6S 5 29 19 to 1 1
PENCENI 100.0 7.0 44.0 29,9 15.1 2.2 2.2PANvS AN!.VISITOR LEN1INS i 0 2 1 0 0 0
PLNCEN1 :00.0 .0 66.7 330 .0 .0 .0SCIENLL I IS 4 SS 41 7 8 0 ..PERCEN1 ...... 140.0 1.1 47.4 15,9 6.4 7,2 ,0SPEC14-1:70 .. 19 0 3 6 1 9 0PERCENT..... 100.4 .0 17.6 29.4 S.3 47.7 .1,0

?AIM 550. -SALARY DISTRIOOLION OF FULLTINE PUBLIC INfORNATION STAFF, 07 SALARY RANGE AND POI Of MUSEUM'UNITED STATES, FISCAL YEAR 19/9
POOLIC INIOh041100i
fflIAL UNOi0 V1000 *5,000 . $90099 $100000414,999
$0,000 .519.999
A20,400 .819,999
$30,000 Ah0ling
TYPE lif plOSi'014
ALL RuStumS 1,:49 15 326 453 209 9$ 11
PERUN1 100.0 1.3 29.6 40.9 15.9 8.9 1.0
ART .... 285 0 100 93 58 31 3
PtRUNI 140.4 .0 $5.2 52.6 20.4 10.8 1.1
CHILDREWS $5 0 3 h 3 1 0
PERcENI 100.0 .0 17.4 59.0 21.3 7.3 .0
GEKHAL 109 it 28 26 31 18 2
PERCEN1 100.0 5.2 25.6 24.0 20.4 16.9 1.9
HIS11IkY 265 5 73 132 45 9 1
PERCEN1 106.0 1.7 27,5 49.0 11.1 3.9 .4
PARKS ANDVISITOR LEMURS 75 4 22 44 6 1 0
PERCENI 100.0 4.7 20.7 58.0 7.5 1.3 .0
SCIENtE 317 2 07 gay bo 34 5
PERCEPT 100.0 .0 27.5 40.6 10.8 10.7 1.7
SPECIALI/tu 43 1 15 22 1 4 0
PERcENt 100.0 4.1 35.6 50.1 2.6 9.5 .0
TABLE 55-N.9ALARY DISTRIBUTION OF FULLTINE LIORARY STAFF, Sly SALARY RANGE AND TYPE OF MUSEUMSUNITED STATES, FISCAL YEAR 1979
LIBRARY
'MAL NOER Sh,000 $5,090 S4,999 610,0006140999
$150000619,999
$00,000$29,999
150,000 ANUMRTOE OF OOSI-UR
ALL RUMORS 1,573 17 340 830 291 89 7
PERCENT 100.0 1.0 21.6 52.8 18.5 5.6 .5
ARI. .MRCENI . ..
CHILDRWSPERIANI.
723100.0
4104.0
0
.40
.0
8511.5
250.0
n4361.3
1
250
15020.7
1
25.0
425.9
0.0
4
.12
o.0
GENERAL 57 0 11 33 6 5 2
Pt oLNI 100.0 .0 $9.2 57.6 10.7 8.9 3.6
RISTIN4' S97 15 199 269 93 22 0
PERCtNI 100.0 2.5 33.2 44.9 15.6 3.7 .0
PARKS MN)VISIIOR CLOW'S 1 0 0 0 I 0 0
PCRCLN; 104.4 .A .0 .0 100.0 .0 .0
SCIEOCt 163 2 37 69 37 Id 1
PERCENT 140.4 .9 22.5 42.2 22.7 11.0 .7
SPEC1AL1/1U 27 0 8 16 2 1 0
pEt41111 $00.0 .0 e9.9 57.7 8.2 4.1 lc) .0

TAME 5501.0-SALARY DISTRIBUTION OF FULL-TIME GENERALIST STAFF, BY SALARY RANGE AND TYPE OF MUSEUM;UNITED STATES, FISCAL YEAR 1979
6E0E144E151
TYPE Of MUSEUM 141AL 14N1)$R 1S,000 45,000 $4,999 310,000314,999
315,000119,444
$20,060329,999
430,000 ANDOVER
ALL hUSt0145 2,344 31 093 955 325 101 33POILLNI .. 160.0 1.6 30.0 40.7 13.0 4.6 $.4ART 325 2 122 141 32 16 6PERCER1 100.0 .6 37.S 45,2 9.9 4.9 1.8C1t1LORE413 07 0 5 11 U 0
PEICLNI 100.0 .0 20.4 65.1 6.5 .4 .0GENERAL 197 2 90 13 21 9 2
PERCENT 100.0 1.0 45.9 36.9 10.8 4.3 1.0RISIORY 734 28 300 251 112 26 11PERCEN1 100.0 3.7 41.9 34.2 15.2 3.5 1.5PA116$ AND
VISIO0. CINTL45 107 0 6 64 21 14 0
PERCENT 160.0 .0 7.5 59.8 19.6 13.1 .0SCIENCE 119 3 320 381 131 40 14PERCENT 100.0 ./ 35.8 43.3 14.7 4.4 1.5SPEC 1AL 1 it I. 7/!. 2 40 at 6 3 0
PERCENT 100.4 2.9 54.1 29.6 8.4 4.3 .0
TABLE 55-J.SALARY DISTRIBUTION OF FULL -TINE GENERAL ADMINISTRATION STAFF, BY SALARY RANGE AND TYPE OF MUSEUMSUNITED STATES, FISCAL YEAR 1919
61:111-144E 4144IIbibAllim
voiAt 4,44Lo 0)000 6'5,000 .49,949
-
)10,000tI4,999
315,000019,444
I
440,000$29,949
a 430,460['YEN
A4Dtypt In. NI'S. 101
ALL 010N1 Dos., 7,401 05 2,334 207$ 1,324 961 563PERC1N1 '104.4 1.1 34.1) 3140 17.4 12.6 7.4ARI ?a2b 12 730 728 524 227 206PERLIN1 140.0 .e+ 32.0 32.7 14.6 10.2 4.2CH1141103 137 0 33 61 21 15 6
PERCLo1 100.0 .0 24.4 44.0 15.3 U.S 4.2otoFRAL 676 10 201 191 133 To 57PENEE01 100.0 24.7 24.2 19.6 11.3 0.4HISTuRy 2,0SS 48 683 633 354 210 . 4,4
PC0C1301 100.0 Z.I 31.2 30.0 17.2 15.1 v.3.3P41105 OW.
vI$1104 cfNltr:$ e0, 0 40 51 42 S8 4
PINLER1 100.4 .0 21.7 25.2 20.5 26.6 2.0$C11-61( 2,105 I 591 657 431 300 205Pt14/41 100.0 .0 0.1 30.1 19.7 13.7 9,4SPICIALI/lo 16? 7 40 51 23 15 ITPt6LINI 160.0 4.3 29.6 31.7 14.3 9.3 111.0:

1
TABLE 55-11.SALARY DISTRIBUTION UF FULL-TIME SECURITY STAFF, BY SALARY RANGE AND TYPE OF MUSEUMUNITED STATES, FISCAL YEAR 1979
SEColellY
lyPt I* 941S1-04 WI AL
1
1440f0 45000 Sbe000 $9.999 310,046 - SI5.004 ., i20,004 430.00u AND114.999 419,999 $29,999 t0.114
ALL 00Sk005.. 3.035 117 1.935 1,427 292 b9 il
PERCE41. 100.0 3.1 50.5 37.2 7,b 1.5 sA41 ... 1,910 54 1,00, 729 74 24 I114(feelCH1LOOEWS
Iou.ti
2924
0
54,029
38,04
J.B0
1,31
20
PERCENS 100.0 .0 $1,4 14.9 .0 3.7 .0UENE4A1 ..... ?Or 1 119 B1 69 13 0PL100J.1 ..... 144.0 / .4 42.1 20.4 24.5 4.6 0seSseoky. ... 1459 39 385 190 42 4 010(14CUl ..... 1u0.0 5.9 54,4 20.0 b.3 .b .0PARob AN)
41311110 e111711 S. II 0 12 16 3 2 01.10tFul 100.0 .0 36,4 48.5 9.1 6.1 .05C1E411 ..... 051 10 341 381 103 15 1
1.14aN1 ...... 100.4 1.1 44.1 44.8 12.2 1.7 .1OPFC1AL17Eu 64 14 19 27 1 0 0Ptkatii 100.0 23.4 10,9 44,1 1.7 .0 .0
1
TABLE 55*L.....SALANY DISTRIBUTION OF FuLL»TIME BUILDING AND MAINTENANCE STAFF, BY SALARY RANGE, AND TYPE UF ROLM!UNITED STATES, FISCAL. YEAR 1979
001101m.
h.4o HAj611.4Antt
041,4 10.0th 1,)004 1.03004 - e9,919 14,000114099
.
15.400*194999
t44,o004e4,999
.4 1.50060041-9
ANDWI id oilbt
Al I "UM 111$..efkettil .
040,
Pteettul ......(811010140$PtkaHl.UfhfRALPlorful.HI,Iony.wiecht.Pio- A41.
VISIIIIK Cthicvs.Ptwrttli.SCIfhlkPENL1111
SPECIAL1/fuP1eettre1 ...
7.1441160.01,0i0..!
tol.o411
loo.0ST4
100.01,012100.0
245100.44'074100.0
114104.0
1141.5
140
.14
6
.4h
1.1
1217.4
I
.4Is
1.10
.0
i'Sb035.4S1434.7
do59.3245
4c).9
79445.0
1434,3050
29.5SO
lib. (I
2,75730.601
fib.?
11
22.2132
21.250.1
32.2
410
S9.91.21042,0
4743.b
1.24017.12021/.6
b
13.1160
40,0222
12.2
5020.2b47
20.414
12,5
197
5.671
(1.8
3
5,426
4,0bb47
214.2log6.6
o
.11
lb.2
b
U
.01
20
.0
0.09
.30
.os

TOILE 55-H.*SALARY DISTRIBUTION OF FULL.TIHE UTHER STAFF, BY SALARY RANGE AND TYPE OF MUSEUM'UNITED STATES, FISCAL YEAR 1979
DINER
TYPE NI tIOOStiOs IntAl (brill 8 1C,044 *5,400 - $9,499 510,000 S15,144 w $26,0o0 -
S14,949 S10.494 $29,444
ALL ons1.046.. 550 g 247 154 toil 33PLRCt01 100.0 1.5 44i9 28.1 10.9 6.1ART 96 3 39 34 15 4PtoftNI 100.0 3.1 40.8 35.4 0.4 9.5CNILONLN'S It 0 3 2 3
PthCENI 100.0 .0 22.$ 19.4 29.1 29.1bvtENAL 10 0 1s 5 1 oPLNEEni 160.0 .o 66.1 28.4 5.5 .0OISIONY 237 6 105 75 45 bIINCEN1 100.0 2./ 44.4 31.6 19.1 2.5PAtos AN1.
91511104 CEN1too 1 0 0 0 1 0litNCts1 14401 .0 .d .h 100.0 .0SCIENCt ... 175 tl 70 38 36 20PERci H I tob.o .0 44.7 21.9 20.0 is .Ssoul/its/to la 0 10 0 a 0
PtoCcht 160.0 0 01.1 .0 18.9 .0
1
4100100 ANNwait
3.6
1
1.00
.00
.00
.0
0.02
1.20
It 0
TOILE 55-0,-.SALARY DISTRIBUTION or TUTAL FULLTINE STAFF, BY SALARY RANGE AND TYPE OF HUSEUHIUNITED STATES, FISCAL YEAR 1979
TOTAL St411
InIAL unlit* 15,044 sy,004 .. 1.4,494 $10,404 .. AISOdd - S2tI,00tt - w34,400 AlmTYPE 00 n0S0ON514,994 514,494 529,999 not 14
ALL nn-;/n45.. 50,972* 426 12,313 14,720 6,441 3,359 1,013PtNCLN1 v 140.0 1.6 31.4 37.0 17.8 0.4 2.6ART 14,123 4 3,200 0,134 1,478 071 356litotEnT . 104.0 .0 31.4 40.8 14.0 0.6 3.51.811.8PWS 411 0 166 192 77 34 b
PENCENT 1010.4 .0 35,0 40.5 16.2 7.1 toi6E"cNAL 1,2411 60 975 1,400 767 337 toaPfketNI 140.0 1.0 14.4 34.9 23.7 10.4 3.1
01811INY ... 9,544 ib 0 1,774 3,384 1,349 5d9 OHPEKE tilpANos ANP
144.4 io 39.5 35S 14.1 6.2 .9
Y1511100 ttN1143 oot 5 23a 356 164 110 6
PL4rInl 144.0 .S 260 40.4 14.6 13.3 .7SCICNCL 11,765 91 3,544 5,3e7 3,607 lose 030Pfltatli 110.0 .7 25.7 38.7 21.8 9,9 3.2SP1CIA1, Iatt 941 21 424 122 104 52 17PENUNT .. 1110.0 2.9 44,9 34.2 10.4 S.5 1.8
Tot Ai dues twtt Utpte, I Nit-t i tat. staff on Table )2 den to difference testilting from 'WA ietputation0 for IOnVOSpOnstata.I ..'
$... . .."

VII. MUSEUM PRIORITIES
Museum directors were asked to rank four areas of museum activity: educa-tion, exhibition,,cOnservation/preservation, and research, in order of priority.Museums' highest 'priorities were either in the area of education or exhibits.Art, general, history, and specialized museums most often indicated that exhib-its were the highest priority; children's museums, parks and visitor centers,and science museums most often ranked education as the highest priority (seeTable 56).
Over half of all types of meseums ranked edUcation as having either thehighest or next highest priority. Children's museums, displayed the greatestunanimity in their ranking of education. Over 90 percent indicated that educa-tion was the highest,priority, and the.remaining children'Is museums placed it assecond in importance. It is quite evident from all of the relevant survey datathat children's museums have displayed a strong commitment to education. His-tory and general museums were least likely to dank education as a high museumpriority; approximately 60 percent of each ranked education as most or secondmost important (see Table 577A).
Art museums displayed the greatest tendency to rank exhibits as having thehighest priority; an estimated 65 percent of art museums indicated that exhibitswere the most important to their museums. For children's museums, exhibits weresecond most important after education. Approximately 00 percent of all types ofmuseums indicated that exhibits were first or second most important.(see Table57-0.
Conservation was third most important to the majority RA museums in eachrm:f.eum type. The greatest tendency to place conservation as mutt important camefrom history museums (estiMated 27 percent; see Table 57-C). Responses fromhistory museums in other areas consistently displayed their concern with theconservation of museum objeCts.
Research activities di4'not appear to be as important to museums. Very fewmuseums (estimated '2 percent) indicated that research was most important, andover 70 percent indicated that research was either the next to the lowest orlowest priority or not applicable to the museum (see Table 57-D).
Museum directors were:provided an opportunity to spedify anadditional,priority activity and rank' it less than 15percent took this opportunity..Activities included were acquisition of objects, community lei-/ice, entertain-ment, and development. An 6timated 15 percent of all parks an4visitor.centersadded such activities and racked them first or second (see Tablei57-0).
-
1 ()II-117-
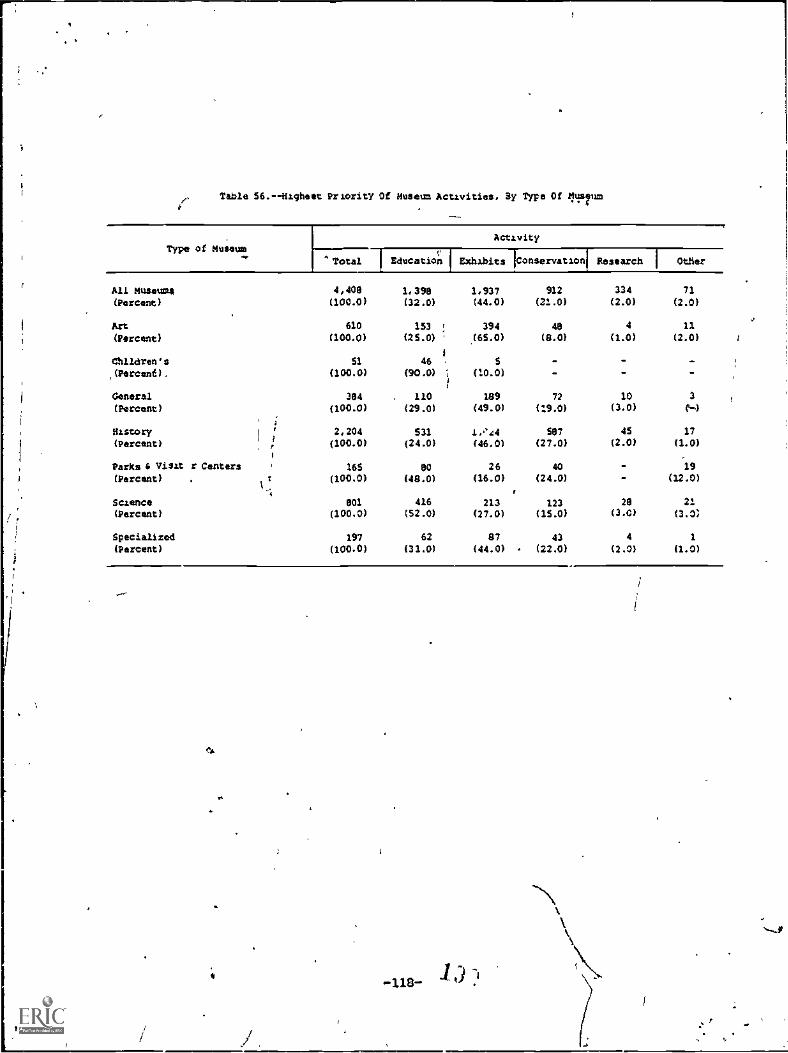
Table 56.--Migheet Priority Of Museum Activities, 3y Type Of Museum
Type of Museum41,
Activity
" Total I Education I Exhibits 1Conservationl Research I Other
All museums(Percent?
Art(Percent)
Children's
4,408 1,398 1,937
(100.0) (32.0) (44.0)
610 153!
394
(100.0) (25.0) (65.0)
51 46I
5
,(percent), (100.0) (90.0) 1 (20.0)
1
General(Percent)
Oiscory(percent)
parks i visit r Centers
(Percent)
384 110 189
(100.0) (29.0) (49.0)
2,204 531 1.441
(100.0) (24.0) (46.0)
4;
Science 801 416 213 123 28 21(Percent) (100.0) (52.0) (27.0) (15.0) (3.0) (3.0)
912 334 71
(21.0) (2.0) (2.0)
48 4 11
(8.0) (1.0) (2.0) 1
72 10 3
(19.0) (3.0) tm?
587 45 17
(27.0) (2.0) (1.0)
165 80 26 40 . 19
(100.0) (48.0) (16.0) (24.0) (12.0)
Specialized 197 62 87 43 4 1
(Percent) (100.0) (31.0) (44.0) (22.0) (2.0) (1.0)
CA
-lie- -1' ?

I
TABLE 57- A.-- EDUCATION PRIORITY OF NUMB ACTIVITIES, BY TYPE OF NU8ELIN1 UNITED STATES, FISCAL YEAR 1914
L00(41111. PkW11y 11111.
TYPE Of BOSOM
01t1 C411 414E1.1$ OLRERAL 818104Ye01+88 010)
VISITORCE01(08
SCILKA SPIAIALIZEO
10141.. I . 1,448 wo 51 382 2,244 165 804 191100,0 106.0 140,0 140.0 104.0 146.0 140.0 100.0
HiGHPS1 1,196 155 46 110 531 BO gto 62PEPCFNI 31,7 25.1 90.0 28.7 24.1 06,5 51.9 SI.?SUMO 1.593 531 5 117 766 49 240 84PERCLol 50.1 54.4 9.4 30.6 14.8 29.7 30.4 42.1111100 1.061 90 - 116 601 23 116 41PL0CFH1 24.1 14.0 30.3 to 30.9 13.9 13.7 21.0POHOTH 405 34 - 30 184 7 29 6PENCtul1.100.11I
PCHCCH1HOF 0PPL1C001.1.
6.4 5.2 -11 t -.2 .2 -b2 e -
.7.8
10
6.c4.2112
3.9--
7
3.75
.6-
3.2I
4052
PIOLLH1 1.4 .3 - 2.13 1.9 3.9 - 1.0
TABLE, 57 -f5.- EXHIBITION PRIORITY OF MUSEUM ACTIVITIES, BY TYPE OF NUMMI UNITED HATES, MICA. YEAR 1919
imi0111.1H PHloollY 11 H1AL
AK1
lYPt OF hO8LUM
i P01186 0110
CHILHOW$ GL4tRAL HIMONT 1/18110CE4lEkS
SLIENCE SPELIALIZED
101411. 4,406 049 SI 382 2,204 165 800 197
PrOC of 104.0 100.0 100.0 100.0 100.0 100.0 100.4 MOrifo ,CSI 1,937 594 5 169 1,024 Zo 213 87P (FM 43.9 04.1 4,4 0,4 46.4 15.8 21).6 44,0
CHO 1.500 104 45 118 716 67 362 63Plytrol 35,4 27.8 87.7 30.9 34.5 52.4 45.3 12.311415411 406 31 - 64 i13 38 14S 34
PERCEN1 14,2 5.0 - 16.7 14.2 22.7 16.2 18.3FOOkIR 257 14 2 11 138 4 74 11
PEOFFH1 5.8 2.3, 2.9 2.8 6.3 2.4 9.8 5.51.041s1 24 1 - - 12 10
P(Rtrt$1 .5 .2 - . .5 6.1 .2 """.1NT APPL1CAo1.E 5 - - 1 3 t
- 1r
PINCFN1 .1 - .3 .1 .6 a
1 1'a.) ..:..

49
145LE 57C.CONSTR0A1ION PRIORITY OF ROSE1/5 ACID/IMO, BY TYPE OF RUSEURf 1,1411E0 8141ES, FISCAL YEAR 1979.
CoNaRvAlloo p1.114411y 50141.
1114( OF NUStom
AR) CO1L041-416 61PEPAL N1S1ONYPARKS ANO91511ukLt.IIDMS
SCItott PtCZALIZto
'MAC 4,406 609 51 362 2,244 16S 600 197PE4Lt41 100.') 100.4 100.0 100.0 1000 100.0 106.0 1410..0
111461S1 914 46 a 72 587 45 123 41PE4CL41 20.7 1.9 a 18.7 26.6 24.2 15.3 21.7SEtoo4 015 S7 .. 93 672 20 135 40PthLfhl 18.5 9.3 - 24.3 21.4 11.6 16.0 20.4161140 1o140 266 35 I4S 736 59 370 79PLNC1.41 39.S 410 60.6 370 , 33.4 S3.6 46.3 40.4Fookris 760 151 11 SO 377 7 133 30PL4C1-9; 11.4 24.0 22,3 15,2 17.I 4.2 16.7 15.2LowEs1 59 23 1 7 14 6 9 1
PENC/01 1.3 3.7 2.0 1.7 .6 3.3 1.I .Shop APP41L*61t 114 4S 4 9 19 S 31 4PLOCtol 4.6 7.1 6.9 2.2 .5 2.7 3.0 1.0
145LE 5700RESEARCH PRIORITY OF NUM AC110ITIESs BY TYPE OF ROSEO41 UNI1E0 SY41E5 FISCAL YEAR 1979
NtsEAHEN P9119t111 1orAL
1YPE OF MILS 8$
I--
61.NLOAL OISIMYNARKS *op9101101(CEN1tRS
SElthtt W-LtIALIZLO6111------IcO1LOot41K
1o1AL ... 4,408 409 Si 302 2,280. 16S ben 197
PENLC41 ... 100.0 10.,.0 100.0 100.0 100.0 100.0 1000 00.001611ri1.:... .. au 4 - Ito 4S 25 a
',MEN' 2.0 .0 a 2.5 2.0 - 3.5 2.1SECOND.. 3413 ?2 - 49 226 3 Si 9
PFOICLUi 8.2 3.6 - 12.7 10.a 1.9 6.6 4.1MPH/ 764 139 12 36 410 12 131 33
PERLLN1 17.7 02.4 23.1 9.S 19.0 7.0 16.3 17.HFONHfN 00)9 330 la 232 1,31n 126 464 110PLNCpI S9.1 55.2 70.6 60.7 59o5 76,4 Shoo SS.0LOPU41 027 Si 1 15 74 6 69 8
PcouN1 . 5.1 0.7 2.1 3.9 3.3 4.5 5.6 4.2401 APPLI1A14If 3111 56 2 41 124 17 56 $3
PtO(141 i.o 9.2 3.9 10.1 So8 10.3 7.0 16.4
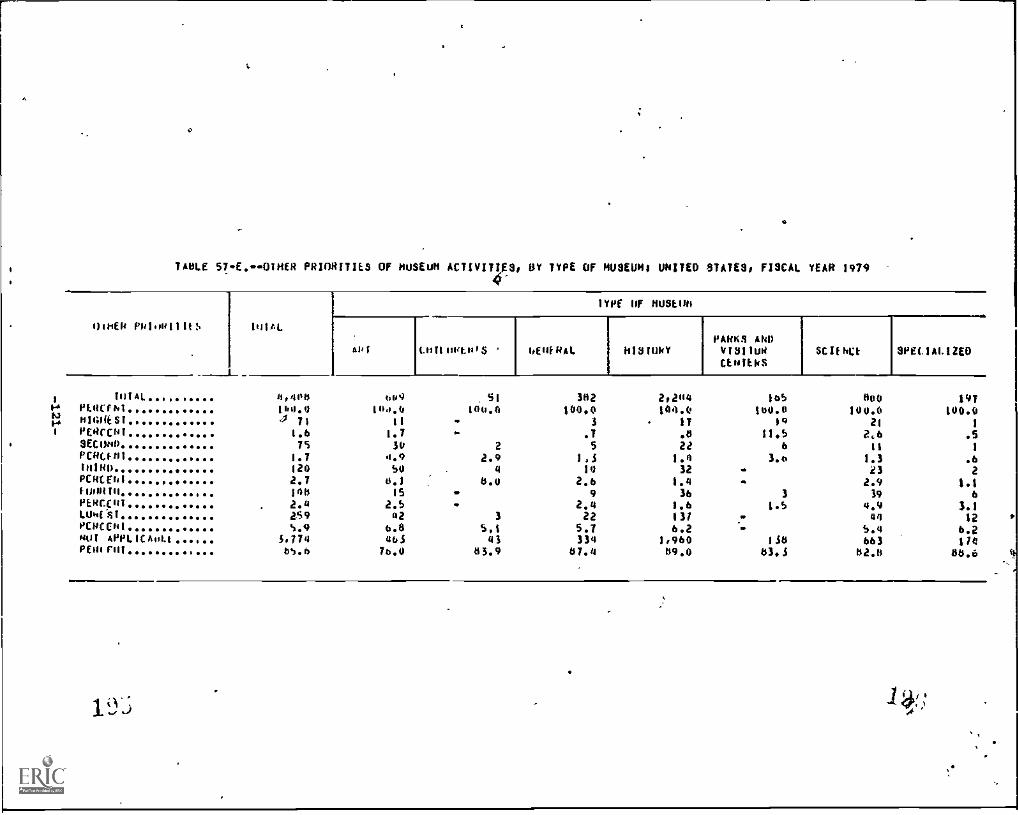
TAKE $7..E.w.OIMER PRIORITIES OF MUSEUM ACTIVITS, OY TYPE OF MUSEUM' UNITED STATES, FISCAL YEAR 1979
081414 PUloollIts OilAL
1YPf OF MUSLIM
MIS IL.Hilui to 6E018AL HISTUkYPARKS ANDV1811o8CtmILIIS
SCIthEt SPECIALIZED
1101A1 0 044 649 SI 302 2,204 165 800 19T
N PL8CF61 164.4 164.6 t04.4 100.0 104.0 100.0 100.0 100.0.. m160k Si 4 71 II 3 IT 09 21 1
1 PEOCCNI 1.6 1.7 .T .6 11.5 2,6 .5SECOND 75 30 2 22 6 11 1
PCOCI81 1.7 4.9 2.9 1.3 1.4 3.0 1.3 .610180 120 SO 4 10 32 23 2PCIME61 2.7 4.1 8.0 2.6 1.4 . 2.9 1.11101018 148 15 9 36 3 39 6PERCE4I 2.4 2.5 2.4 1.6 1.5 4.9 3.1LU4W 2.49 42 3 22 131 " 44 12PC8CC41 S.9 6.8 5,1 5.7 6.2 . 5.4 6.2mu$ APpLICA11.1 5.774 463 41 334 1.960 138 663 114PERM,' 65.6 76.0 05.9 87.0 09.0 83.3 02.0 88.6

4.*
APPENDIX A
COVER LETTERS AND SURVEY INSTRUMENTS--1978 AND1979 SURVEYS

1979 MUSEUM SAMPLE SURVEY

t
Dear Colleague:
DEPARTMENT OF HEALTH, EDUCATION, AND WELFARE
OFFICE OF THE ASSISTANT SECRETARY FOR EDUCATION
WASNINGTON D.C. 20202
DEC 5 1979
APPENDIX A(1)
NATIONAI. CENTER MREDUCATION STATISTICS
',The Institute of Museum Services (INS), which administers Federal grantsto museums, and the National Center for Education Statistics (LACES) areconducting a survey of a random sample of 1,400 museums and related in-stitutiow., throughout the United States.
This survey, which is the first effort of its type since the MuseumsUSA Survey of 1974., will provide the National Museum Services Board andINS with current information on the characteristics and heeds of museums.INS needs this information to develop policies and programs of istpportto museums for the future.
In order to reduce the time eiquired to complete the survey, we havelimited the questions to those areas which will provide the most essen-tial inforhation. Representatives from iany.different types of museums,museum associations, and Federal and State museum-funding agencies assist-,ed in the.development of the survey. This participation has resulted ina questionnaire which will not only meet LACES' and INS' needs, butwillalso benefit other agencihs, individual museums, museum. associations, theresearch community, an4 the general public.
To ensure reliable national and regional estimates, it is vital thatcomplete and accurate responses be obtained. NCES has contracted withMacro Systems,Inc.*(MACRO) of Silver Spring, Maryland to conduct thesurvey operations. Please completethe enclosed survey instrument andreturn in the stamped and addressed return envelope. If you have anyquestions on the questionnaires or its processing, please contactLisa DiR3cco at MACRO (301) 588-5484.
We look forward to your response. On behalf` of the museum profession,we hope you will giye it your earliest consideration so that we canmake the results of this survey available to you as soon as possible.
S1ncerely yours,
Lee KimcheDirectorInstitute of Museum Services
Enclosure
Marie D. EldridgeAdministrator%National Center for Education Statistics
1 "''
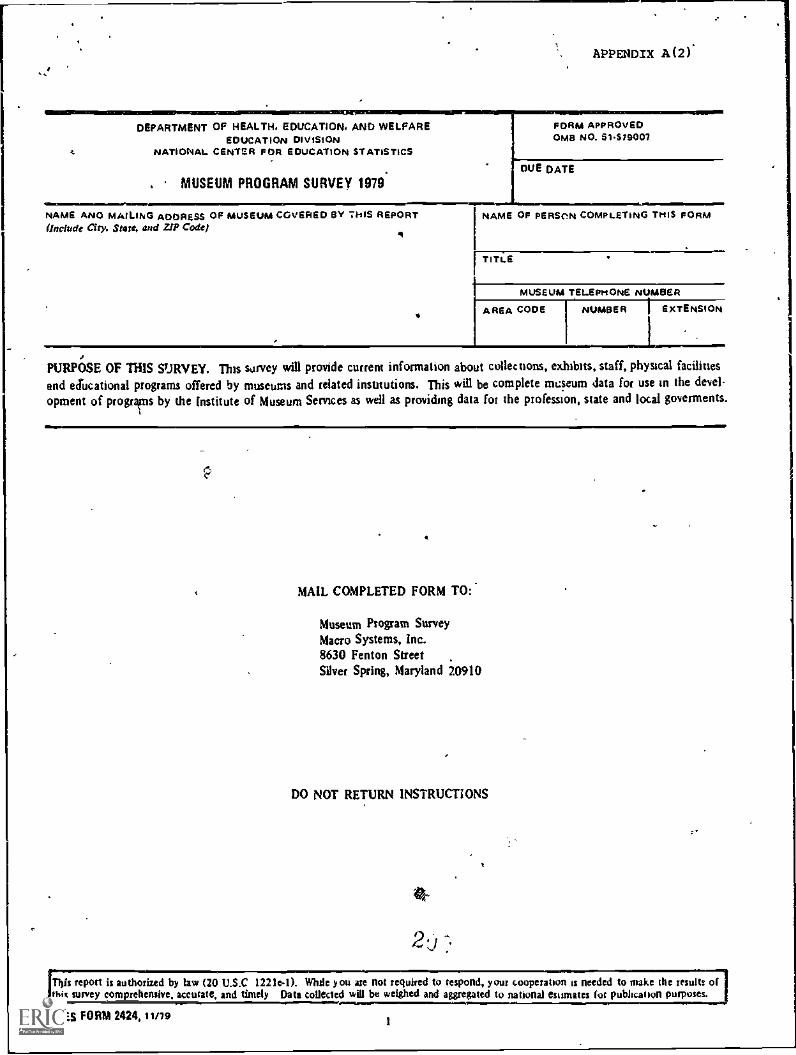
APPENDIX A (2 ).
DEPARTMENT OF HEALTH, EDUCATION. AND WELFAREEDUCATION DIVISION
NATIONAL CENTER FOR EDUCATION STATISTICS
MUSEUM PROGRAM SURVEY 1979.
NAME ANO MA11.11103 ADDRESS OF MUSEUM COVERED BY TI-OS REPORT(Include City. Store, and ZIP Code)
FORM APPROVEDOMB NO. 51.579007
DUE DATE
MI=.11, ,...Mb==1NAME OF PERSON COMPLETING THIS FORM
TITLE
MUSEUM TELEPHONE NUMBER
AREA CODE NUMBER EXTENSION
PURPOSE OF THIS SURVEY. This survey will provide current information about collections, exhibits, staff, physical facilitiesand educational programs offered by museums and related institutions. This will be complete miseum data for use in the devel-opment of programs by the Institute of Museum Services as well as providing data for the profession, state and local goverments.
ec.
MAIL COMPLETED FORM TO:
Museum Program SurveyMacro Systems, Inc.8630 Fenton StreetSilver Spring, Maryland 20910
DO NOT RETURN INSTRUCTIONS
This report is authorized by law (20 U.S.0 1221x1). While you are not required to respond, your cooperation is needed to make the results ofthis survey comprehensive, accurate, and timely Data collected will be weighed and aggregated to national emanates for publication purposes.
ACES FORM 2424, 11/79 I

4
1
APPENDIX A (3 )
PART 1. PURPOSE AND GOVERNING AUTHORITY
no.
CARDTYPE
01
A. GOVERNING AUTHORITY IS THE AGCNCY WHICH OWNS THE COLLECTIONS AND ASSETS OF YOUR INSTITUTION, BUT NOT /NECESSARILY'ITS FACILITIES. CHECK THE .ONEMOST APPLICABLE.
OloC NIONPROFIT (private organization).
.. I
08.
.-....
0 PUBLIC SCHOOL fliTRICT.
02. CO MUNICIPAL GOVERNMENT 09. 0 PUBLIC COLLEGE /UNIVERSITY
..
03.0 COUNTY GOVERNMENT 10.. .
0 CHURCH, DENOMINATIONAL GROSIP10-11
04.0 STATE GOVERNMENT '11. 0 INDUSTRIAL OR COMMERCIAL CORPORATION
OS. 0 FEDERAL GOVERNMENT 12. 0 PRIVATE INDIVIDUAL
06. 0 PRIVATE ELEMENTARY/SECONDARY SCHOOL
.
13.
.
0 OTHER (specify)
12-1307. 0 PRIVATE COLLEGE / UNIVERSITY...
B. I. ARE THE INSTITUTIONS rACILmes OWNED OR OPERATED BY AN ENTITY OTHER THAN THE GOVERNING AUTHORITY?
.(es0 YES 20 NO14
2. IF YES. CHECK THE ONEwHscei APPLIES: 10 OWNED 20 OPERATED 3 DOWNED/OPERATED ISMIMI=M81.1
C. DOES THE INSTITUTION HAVE A BOARD OF TRUSTEES OR OTHER ADVISORY BOARD WITH 'DIRECT RESPONSIBILITY FOR THEINSTITUTION'S POLICv7 : 10 YES 20 NO
16
CI RANK IN ORDER OF PRIORITY THE FOLLOWING ACTIVITIES OF YOUR MUSEUM/INSTITUTION (number I has the highest, and S thelowest)
ACTIVITYPRIORITYRANKING
`'4
3 -..'..?"..P.' hi. k .'f . 4" 1:-
ti.?-;` ,,,:.: ;4',:- - :4 i'" 4' t
1. EDUCATION 17
.,,,, :0.. ,,,... . .."$...* .v. b.......34. . ' .1 41.: . v- - *-/-.."*`c,s,,,t v'..,- '.
- aria '.;,,,--:=4,1;,:: -- -...e;44;.V.,-,-; ,':-z .4- 's4.-. A.,e; <...: ,,,,,, ,:-. ...so ;...s.
2. EXHIBITION 18:,- .(-:S,...1.$ '' o 4.-e
..ks...., ;044\ -,, ; i...t, v,..1. ,..- ,2z ,i,e,t:t:,:,;,;. ,NA.. ,r,47(41 ,,,,,........., ../ F. ,. A. A,
**wow..
3. CONSERVATION/PRESERVATION 19
A
£..' I : , .; ,.,..
4. RESEARCH 20
. .
* > ',..0,.4.----1.--- , .......4.,
1,4%.-<:; ..,. s*n.:, i
54 OTHER (Specify, , 21
22.23
....................- '.*. ; 4 ...
Ar ...
',.. .%
% ...
.< , - ."t . ':. :-
.
2
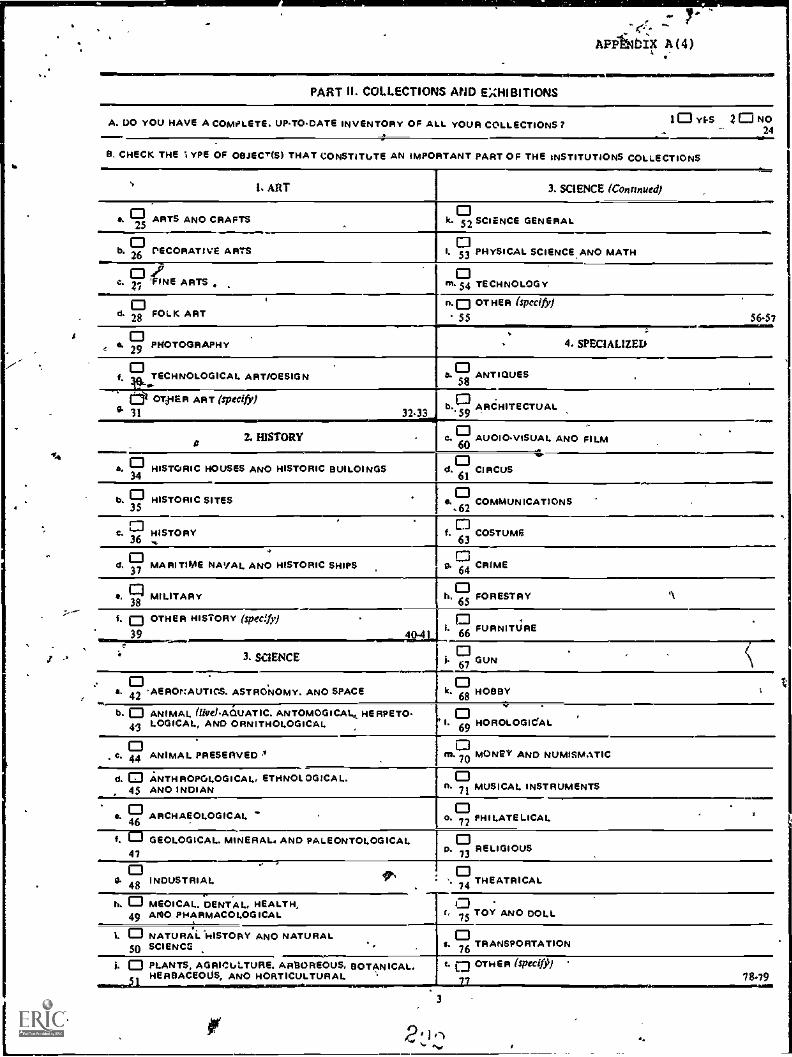
7'APPbbIX A(4)
PART IL COLLECTIONS AHD
A. DO YOU HAVE A COMPLETE, UPTODATE INVENTORY OF ALL YOUR COLLECTIONS? 10 YtS 2 0 NO. 24
B. CHECK THE ; YPE OF OBJEC*(S) THAT CONSTITUTE AN IMPORTANT PART OF THE INSTITUTIONS COLLECTIONS
I. ART 3. SCIENCE (Continued)
a. ID ARTS AND CRAFTS25
b.260 incoRATIvE ARTS
k.5252 SCIENCE GENERAL
I. 53 PHYSICAL SCIENCE AND MATH
c. 'FINE ARTS ,
d. 280 FOLK ART
m.54 TECHNOLOGY
0.10 OTHER (specify)
55 56-57
14 a. 29 PHOTOGRAPHY 4. SPECIALIZED
TECHNOLOGICAL ART/OESIGN
Ilia OVER ART (specify)g" 31
b. ANTIQUES58
32.33b.
59ARCHITECTUAL
A2. HISTORY c. 0 AUDIONISUAL AND FILM
60
s. 0 HISTORIC HOUSES AND HISTORIC BUILDINGS
b.35
HISTORIC SITES
0d. CIRCUS
61
0a.
.62COMMUNICATIONS
c.36
HISTORY
d. 0 MARITIME NAVAL AND HISTORIC SHIPS37
a. CI38
MILITARY
f.63
COSTUME
9. CRIME
b, FORESTRY65
f. 0 OTHER HISTORY (specify)
39 40-4FURNITURE66
3. SCIENCE 067 GUN
.. 0a. AERONAUTIOS. ASTRONOMY. AND SPACE HOBBY42 68
b. 0 ANIMAL iliveiAQUATIC. ANTOMOGICAL HERPETO-43 LOGICAL, AND ORNITHOLOGICAL
0HOROLOGICAL
69
C. 440
ANIMAL PRESERVED .4 m.70 Mums" AND NUMISMATIC
d. >s ANTHROPOLOGICAL, ETHNOLOGICAL. 0. MUSICAL INSTRUMENTS45 AND INDIAN
a. 0 ARCHAEOLOGICAL PHILATELICAL46 o. 720
I. 0 GEOLOGICAL MINERAL. AND PALEONTOLOGICAL47
00.
48INDUSTRIAL
b. 0 MEDICAL. DENTAL, HEALTH,49 AND PHARMACOLOGICAL
p.73
RELIGIOUS
0THEATRICAL74
1, TOY AND DOLL
I. 0 NATURACHISTORY AND NATURAL.50 SCIENCE a.
0TRANSPORTATION
76
1. 0 PLANTS, AGRICULTURE. ARBOREOUS, BOTANICAL.HERBACEOUS, AND HORTICULTURAL
t. OTHER (specifh
.173
78.79

APPENDIX A(5)
PART III. CONSERVATION/PROTECTION02
A. ODES YOUR INSTITUTION HAVE ITS OWN FACILITIES E014 THE PR5S2PVATION, CONSERVATION, OR MAINTENANCE OFOBJECTS OR FOR THE PROTECTION OF ENDANGERRO SPECIES?
IF YES, ANSWER THE FOLLOWING OUESTIONS:
1.a. DO YOU HAVE A STAFF TRAINING PROGRAM FOR SUCH ACTIitTIES?
b. IF YES. CHECK THE FOLLOWING WHICH APPLY:
IN CONJUNCTION WITH ANY UNIVCRSITIES12
IN CONJUNCTION WITH OTHER MUSEUMSI?
IN CONJUNCTION WITH OTHER ORGANIZATIONS (specify)14
...mbwOl
1 YES 2 0 N 010
1vas 20 No11
2. 00 YOU 00 CONSERVATION WORK ON OBJECTS OR SPECIMEN OTHER THAN THOSE BELONGING TO YOUR OWNvas 2 No iiINSTITUTION?
1
3. CHECK THOSE AREAS OF CONSERVATION/PRESERVATION UNDERTAKEN BY YOUR INSTITUTION:
PAINTINGS18'
WORKS ON PAPER19
SCULPTURE20
:WOKS21
PHOTOGRAPHS22
FURNITURE23
CONSERVATION OF ENOANGERED SPECIES24 (plants or animals)
GENETIC BACKOREEOING TO REPRODUCE25 AN EXTINCT SPECIES (plants or animals)
r
FILMS. MICROFICHE, ETC.26
TEXTILES27
C...1 INSTRUMENTS28
ETHNOGRAPHICAL29
PaLsoNvot.00:cm.30
MOUNTED 200LOGICXL31
mouNve 0 BOTANICAL32 .
OTHE F 'Tecib933
:
...
15-16
8. INDICATE IF FOR SOME OR ALL OF YOUR EXHIBITIONS YOUR INSTITUTION HAS CONTROLS FON:.
TEMPERATURE36
HUMIDITY37
34.35
C CHECK THE APPROXIMATE PERCENTAGE OF YOUR COLLECTIONS WFW:1-1 ARE CURRENTLY IN SERIOUS NEED OF CONSERVA-TION. PRESERVATION. MAINTENANCE. OR PROTECTION
1 NONE 2 LESS THAN 5% 3 s to 14% 4 is to 24% 5 25 TO 49% 6 GREATER THAN 49% 38
D. INDICATE THE SPECIFIC AllEAISI CURRENTLY IN SERIOUS NEED OF RESOURCES IN YOUR COLLECTIONS:
FACILITIES39
PROGRAMS40
STAFF41
FUNDS42
20-

APPENDIX A (6)
1.MaRlIr.PART IV. EDUCATION AND PUBLIC PROGRAMS
wassismitsmr.Mli
A. THE FOLLOWING APIE SOME EDUCATIONAL ACTIVITIES OR GENERAL PROGRAM EVENTS uNozRTAKEN BY MUSEUMS. FOREACH TYPE OF PROGRAM OFFEREO BY YOUR .NST+.4TION DURING THE LAST FISCAL YEAR, INDICATE THE TYPES OFPEOPLE WHO PARTICIPATED. PLACE AN "X" IN EACH APPROPRIATE BOX (Columns a through el.
OUR INSTITUTIONOFFERED THIS PROGRAM
TYPE OF PARTICIPANT
GENERALPUBLIC
let
ELEMENTARYSCHOOLSTUDENTS
lb)
_
SECONOARYSCHOOL
STUDENTS(el
COLLEGE ORUNIVERSITY
STUDENTSIdl
OTHER PARTICIPANT (specify)
43.44It)
1. TOURS 04$
01 46
047
048
049
2. DEMONSTRATIONS$0 $1 S2 S3
0S4
3. SPECIAL LECTURES 0SS
0S6
0S7
0S8
0.
S9
4. CLASSES, WORKSHOPS.SEMINAR
60 61 -062 63
.
64
5. PERFORMING ARTSPROGRAM 6$ 66 67 68 69
6. FILMS AND OTHER 0 0MEDIA PROGRAMS 70 71 72 73 74
7. OUTREACH PROGRAMSCARD TYPE 03
10 11 12 13 14
B. OTHER PROGRAM (Specify) 0IS 16 17 18 19
.p/Mr 20-21
B.s. DID OUR INSTITUTION OFFER SPECIFIC PROGRAMS DURING THE FISCAL YEAR AS REPORTED (in aidago,, to the general
1 YES 4)2 0 NO22
program?)
b. IF YES, INDICATE BELOW:
PRESCHOOL CHILDREN23
GIFTED ANO TALENTED24
ADULTS (member and nottmember)2$
MEMBERS ONLY26
O SENIOR CITIZENS27
O HANDICAPPED28
O OTHER SPECIAL AUDIENCES (specify)29
30-31
C. ARE ANY OF YOUR PROGRAMS SPECIFICALLY OESIGNED TO SERVE ANY OF THE FOLLOWING GROUPS?
AMERICAN INDIAN OR ALASKAN NATIVE32
ASIAN OR PACIFIC ISLANDEFIS33
BLACK NOT HISPANIC34
HISPANIC3$
D. ODES YOUR INSTITUTION OFFER TEACHER TRAINING PERIODICALLY OR ON A REGULAR BASIS ON HOW TO USE MUSEUMRESOURCES?
1 0 YES 2 0 NO36
E. DOES YOuct INSTITUTION COOPERATE WITH AN ACCREDITED SL.HOoL, COLLEGE OR UNIVERSITY TO PROVIDE A PROGRAMFOR ACADEMIC CREDIT?
F. ODES YOUR INSTITUTION LOAN EXHIBITIONS TO SCHOOLS. SHOPPING MALLS, ETC.?
G. IS THE EDUCATION ROLE OF YOUR INSTITUTION (check one)
10 INCREASING? 20 DECREASING? 3 STAYING THE SAME?
H. DOES YOUR INSTITUTION ASSESS THE EFFECT'VENESS OF YOUR EXHIBITIONS?
IF YES, SPEI.IFY
YES 2 No37
I YES 2 NO38
10 YES
39
2 NO40
4142
2'
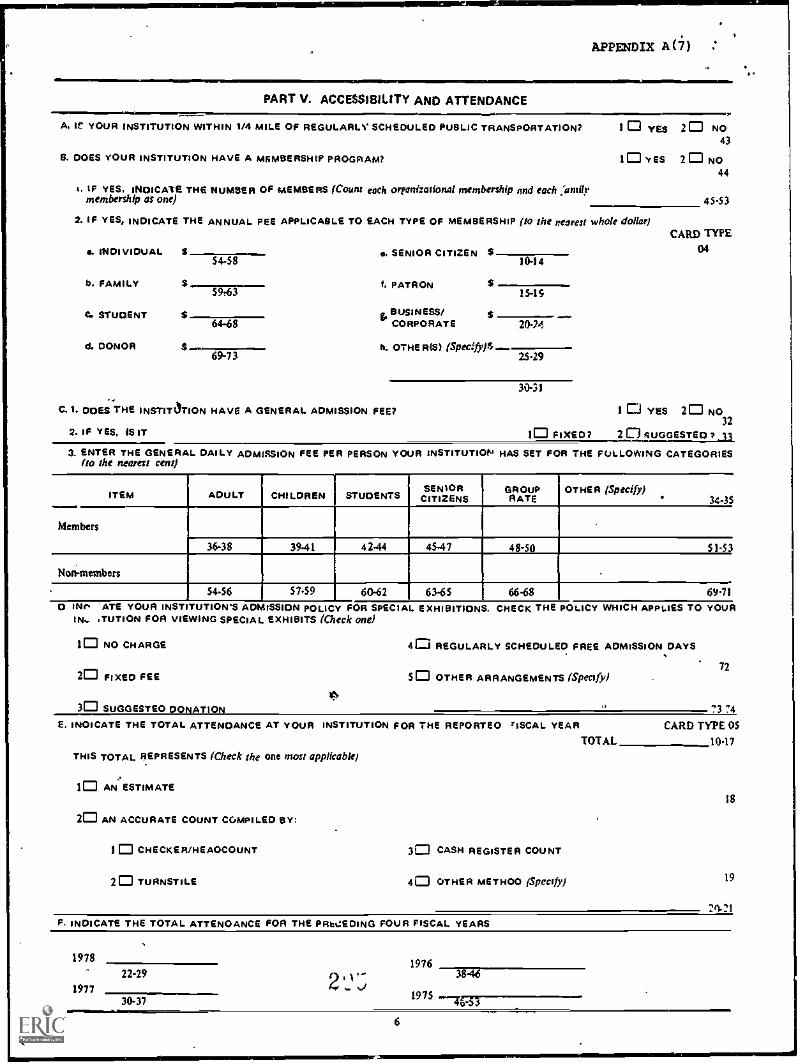
dr , ..4.444
APPENDIX A(i) :
PART V. ACCESSIBILITY AND ATTENDANCE
A, IC YOUR INSTITUTION WITHIN 1/4 MILE OF REGULARLY SCHEDULED PUBLIC TRANSPORTATION?
13. DOES YOUR INSTITUTION HAVE A MEMBERSHIP PROGRAM?
I YES 2 NO43
1 in YES 2 0 NO44
I. IF YES. INDICATE THE NUMBER OF MEMBERS (Count each ortanizational membership and each ;amitymembership as one)
2. IF YES, INDICATE THE ANNUAL FEE APPLICABLE TO EACH TYPE OF MEMBERSHIP Ito the nearest whole dollar)
s. INDIVIDUAL S to. SENIOR CITIZEN $54-58
tr. FAMILY59143
I. PATRON $
10.14
15-15
C STUDENT S- &BUSINESS/CORPORATE
S64-68 2044
d. DONOR S-..69-73
A. oTHERM (Specifrle.--25.29
3031-
C.1. DOES THE INSTITUTION HAVE A GENERAL ADMISSION FEE?
2. IF YES. NIT
45.53
CARD TYPE
04
1 0 YES 2 NO32
1 FIXED? 2 SUGGESTED ?33.
3. ENTER THE GENERAL DAILY ADMISSION FEE PER PERSON YOUR INSTITUTION HAS SET FOR THE FOLLOWING CATEGORIESIto the nearest cent)
ITEM ADULT CHILDREN STUDENTSSENIORCITIZENS
GROUPRATE
OTHER (Specify)34-35
Members
36-38 3941 42-44 4547 48-50 51-53
Noma embers
54-56 57.59 60.62 63.65 66.68 69.71
O IMP 'ATE YOUR INSTITUTION'S ADMISSION POLICY FOR SPECIAL EXHIBITIONS.IN.. ,TUTION FOR VIEWING SPECIAL EXHIBITS (Check one)
l NO CHARGE
2 FIXED FEE
3 SUGGESTED DONATIONIA
CHECK THE POLICY WHICH APPLIES TO YOUR
40 REGULARLY SCHEDULED FREE ADMISSION DAYS
SO OTHER ARRANGEMENTS (Specify)
E. INOICATE THE TOTAL ATTENDANCE AT YOUR INSTITUTION FOR THE REPORTEO riSCAL YEAR
THIS TOTAL REPRESENTS (Check the one most applicable)
1 AN ESTIMATE
2 AN ACCURATE COUNT COMPILED BY:
ICI CHECKER/HEAOCOUNT
2 TURNSTILE
3 CASH REGISTER COUNT
4 OTHER METHOO (Specify)
TOTAL
72
73 '4CARD TYPE OS
10.17
18
19
F. INDICATE THE TOTAL ATTENOANCE FOR THE PRtLIEDING FOUR FISCAL YEARS
1978
22-29
197730-37
2'`'_ 1/4,
19763846
1975 4-536

APPENDIX A(8)
PART VI. PERSONNEL gq1306
A COUNT EACH EMPLOY EE ONLY ONCE. REPORT THAT PERSON IN THE AREA OF RESPONSi Bi Li TV WHERE HE/SHE SPENOu ATLEAST 50% OF HISME A TIME. REPORT AS GENERAL ADMINISTRATION ONE PERSON OPERATIONS. REPORT AS GENERALISTSTHOSE EMPLOYEES. WHO HAVE COMBINED RESPONSIBILITIES BUT 00 NOT SPEND AT LEAST S0 % OF THEIR LIME IN ONE AREA
0
AREA OF RESPONSIBILITYSee Instructi ons and DefintnentPart VII
REGULARSTAFF
TEMPORARY* UNPAIDVOLUNTEER
CETA
FULLTIME
PARTTIME
FULLTIME
PARTTIME
FULLTIME
PARTTIME
FULLTIME
PARTTIME
I. CURATORIAL (Includes research and' registrattons
12. EXHIBITS
13. CONSERVATION 14nbnareand rnanIntatel
14. EDUCATION
/5. DEVELOPMENT
X. MEMBERSHIP
(17, PUBLIC INFORMATION
)8. LIBRARY
09. GENERALIST..
..
10. GENERAL ADMINISTRATION
- .
11. SECURITY
12. BUILDING AND MAINTENANCE
O. OTHEP /Specify/
14. TOTAL
0
10-11 12.16 17.21 22.26 27.31 32-36 37 .41 42-46 47.51
Includes Qoliese work/studY. interns, seasonal workers end other shOtt term Personnel.Parttome work week ss less than 35 hours.
IMIMMONNEfib7
ams.ms.

APPENDIX A (9) :
PART VI. PERSONNEL (Continued) CARD TYPE 07.1=1111......w.r. =1=.8. REPORT THE NUMBER OF FULL-TIME EMPLOYEES IN THE FOLLOWING ANNUAL SALARY RANGES BY AREA OF RESPONSIBILITY
AREA OF
OF
RESPONSIBILITY
SALARY RANGES
UNDERS 4,992
55.000..59.999
610,000-114,999
515,000-519,999
520,000.529,999
OVER530,000
01. CURATORIAL(Includes Pastorali and
regunation)
02. EXHIBITS
03. CONSERVATION(Animate andtrainman)
04. EDUCATION
OS. DEVELOPMENT
06. MEMBERSHIP
..,
UCLICP07.
INFORMATION
08. LIBRARY
09. GENERALIST
N. GENERALADMINISTRATION
II. SECURITY
12. BUILDING ANDMAINTENANCE
L-
13, OTHER (SpecIfy)
TOTAL FULL-". TIME EMPLOYEES
10.11 12.16 17.21 22.26
2
27.31 32-36 37-41
8

APPENDIX A(10)
PARI VII. FINANCES AND BUDGET(For last completed fiscal year ending prior to January I. 1980j
CARDTYPE
OS
A. TOTAL OPERATING INCOME FROM EACH OF THE SOURCES LISTED BELOW (Report only whole dollars)
1. FEDERAL GOVERNMENT GRANT AMOUNT YOUR INSTITUTION RECEIVED IN THE LASTCOMPLETEO FISCAL YEAR (total of a thru g)
$ 1017
44. 77 ,,,,:,4-4.,,A.S4'4"e:. '_., 825' . 1: -. - . . 1... - .""a. SMITHSONIAN NATIONAL MUSEUM ACT Imola
b. INSTITUTE OF MUSEUM SERVICES (IMS) ,ifs 4 " ' .7,I; 26-33..m.t0 ''''s
O. NATIONAL SCIENCE FOUNDATION (NSF)>t*"417.7771'.:10W ' .,4 4
'"3441
...e.:« -"' , «.
Q. NATIONAL ENDOWMENT FOR THE ARTS iN e A )« ...-.;,, ,1,. 4 f' 42-49
..!"741:4X. ti ,*. NATIONAL ENDOWMENT FOR HUMANITIES (NEH)
.ctr,-, .3, ,,w'-,),
. 1 wo ,...+,10.,ey. +k ?,r; ti , 50-57
f. OFFICE OF EDUCATION (OE)
ii1000 40.
, 5845*I x
. OTHER FEOERAt. (Specify).
%, , ,s... 66434 -I 74-75. ,....,..f., 'it
2. STATE GOVERNMENT 3CARD TYPE 09
10.17
3. LOCAL GOVERNMENT (Municipal and County) 18.25
4. FOUNDATIONS 26-33
S. CORPORATIONS 34-41
6. INOIVIDUAL CONTRIBUTIONS 42.49
7. OTHER (Specify)f
50-57
59.59
8. EARNEO INCOME (Total of a thru i) S 6047
MOMPREZZ71.."-.7761CARD TYPE 10 10.17
a. ADMISSION FEES (Less taxes)b. TUITION FEES (Classes and seminars)
*. MEMBERSHIP DUES :2, s " 18.25d. INVESTMENT INCOME ' 7--, S-'7%1.1^. ' .'°' - 26-33e. ENDOWMENT INCOME rY.;Wer4P;7;1'," , 3441.I. FOOD SERVICE (Net) (":4-.<. 1 '''.:.g.."... $47 ;;;..','. , v. , , 4249p. MUSEUM SHOP (Nell ;,:,,. '44 ':f,' r ' 50'57M. AUXILIARY SERVICES (Ned >;,4> i 7::,,,,,),( "4,, i i8.65I. OTHER (specify) eA'61fg"";1 1P;4.17* '',.. '," s 66-73
1:;.:';:',4;',.--.):T'-'..
T9. TOTAL CASH OPERATING INCOME (Exclude volunteer and goods and services) (ink:ad) s CARD1
YPE0
11-17
O. DOES YOUR INSTITUTION HAVE ENDOWMENT FUNDS? 10 YES 20 NO18
CHECK THE RANGE INDICATING THE TOTAL ASSETS IN THE ENDOWMENT FUND
ChtiNOE R 9S0,00o
2'J SS0.001S249.9993 $2S0.000 $499.9994 0 $500.000-6999,9995 0 81.000.000 $9.900.9006 E3 S10.000.000 OR MORE, INDICATE AND ROUND TO THE NEAREST MILLION
MILLION

APPENDIX A (11)
b
PART VII. FINANCES AND BUDGET (Continued](FoLlast cnmv eted fiscal r to Ja
C. TOTAL CAPITAL EXPENOITURES FOR PAST FISCAL YEAR (Excludes operating expenses, but in.dude. Avtds allocated for major equipment. capital improvements. and major acquisition for yourpermanent collections)
$ 23-30
D. TOTAL OPERATING EXPENDITURES FOR PAST FISCAL YEAR (excludes in.klnd goods andservices. overhead and maintenance provided by another or parent organization. as well as CETA andOther paid personnel which may not be part of the institution's direct expenditures but are integral tooperating)
S 3138
1. PAYROLL ANO RELATED EXPENOITURES (Included In Item Di $ 39 .46
2. ACQUISITION EXPENOITURIS S ' 47-54
E, OOLLAR VALUE OF CONTRIBUTED VOLUNTEER SERVICES S 55-62
F. OOLLAR VALUE OF CONTRIBUTED GOODS ANO OTHER SERVICES (Exclude capital assets) $ 63.70
G. HOW WERE TOTAL OPERATING EXPENOITURES DISTRIBUTED AMONG THE VARIOUS AREAS OF YOUR INSTITUTION? ESTI.MATE THE PERCENTAGE FOR EACH APPLICABLE AREA. THE TOTAL SHOULD BE 100%
CARD TYPE 12
c 1. CURATORIAL (research and registration. I % 1042
13-15
1648
19.21
22.24
25-27
1-30
31-33
34.36
37.39
2. EXHIBITS
3. CONSERVATION 'animate and inanimate)
4. EOUCATION
E. DEVELOPMENT
E. MEMBERSHIP
,7. PUBLIC INFORMATION
B. PAID AOVERT1SINGA_
9. SECURITY
10. GENERAL ADMINISTRATION
11. BUILDING AND MAINTENANCE
12. OTHER
TOTAL 100
40-42
43.45
42' '....,
10
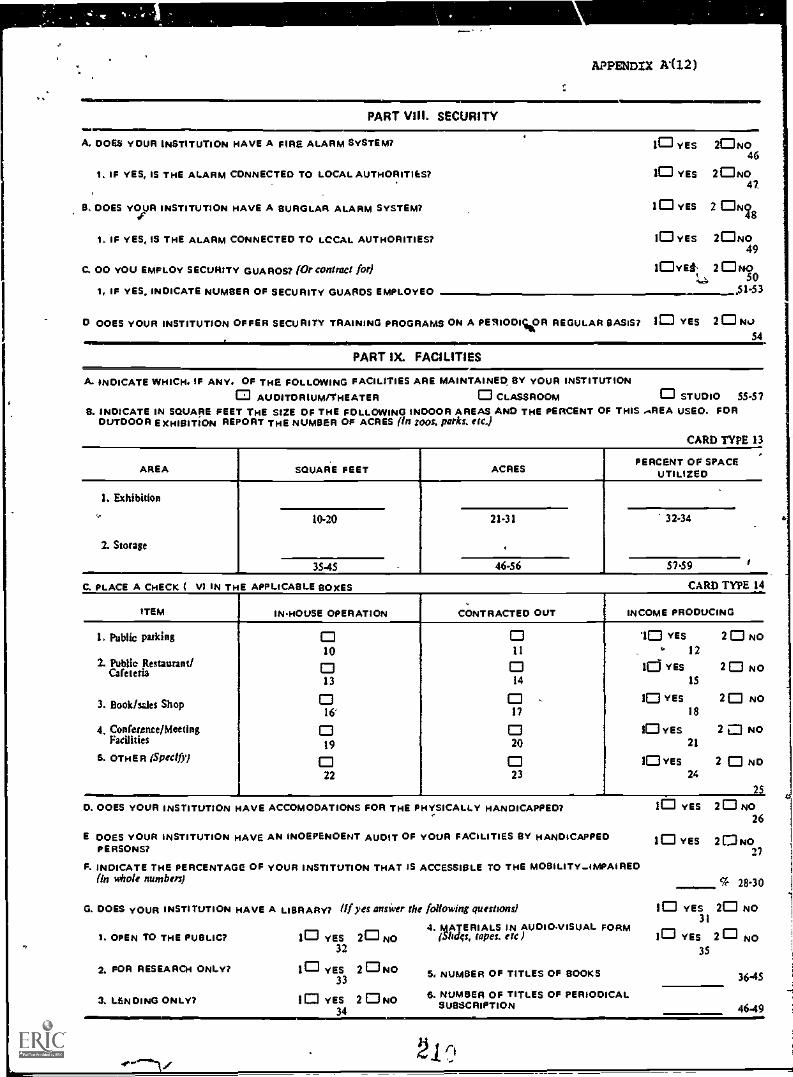
1 APPENDIX A112)
PART VIII. SECURITY
A. DOES YOUR INSTITUTION HAVE A FIRE ALARM SYSTEM? 10 YES 2ONO46
I. IF YES, IS THE ALARM CONNECTED TO LOCAL AUTHORITIES? 10 YES 2ONO47_
B. DOES YOUR INSTITUTION HAVE A BURGLAR ALARM SYSTEM?II. IF YES, IS THE ALARM CONNECTED TO LCCAL AUTHORITIES?
C. 00 YOU EMPLOY SECURITY WARM (Or contract for)
10 YES 2 ONo48
10 YES 2ONO49
'Ova 2ONO..A .. 50
I, IF YES, INDICATE NUMBER OF SECURITY GUARDS EMPLOYED .51-53
D DOES YOUR INSTITUTION OFFER SECURITY TRAINING PROGRAMS ON A PERIODIC OR REGULAR BASIS? IC] YES 20 luss54pl!..
PART IX. FACILITIESMI,
A. NOICATE WHICH. IF ANY. OF THE FOLLOWING FACILITIES ARE MAINTAINED, BY YOUR INSTITUTIONAUCHTORIUM/THEATER 0 CLASSROOM 0 STUDIO 55-57ME
B. INDICATE IN SQUARE FEET THE SIZE OF THE FOLLOWING INDOOR AREAS AND THE PERCENT OF THIS -AEA uSEO FOROUTDOOR EXHIBITION REPORT THE NUMBER OF ACRES (In 200s. parks. etc.)
CARD TYPE 13
AREA SQUARE FEET ACRESPERCENT OF SPACE
UTILIZED
.
...
1. Exhibition
,..
2. Storage
_
.
i
10-20 21-31 32-34
35.45 46-56 57.59
C. PLACE A CHECK I VI IN THE APPLICABLE BOXES CARD TYPE 14
ITEM INHOUSE OPERATION CONTRACTED OUT INCOME PRODUCING
1. Public parking 0 0 '10 YES 20 NO10 11 ' 12
2. Public Restaurant/Cafeteria 0 0 Id YES 2 0 NO
13 14 15
3. Book/Wes Shop 0 0 10 YES 2 0 NO16' 17 18
4. ConferanceNeeting 0 0 10 YES 2 0 NOFacilities 19 20 21
S. OTHER (Specify; 0 0 10 YES 2 0 ND22 23 24
I 2$
D. ODES YOUR INSTITUTION HAVE ACCOMODATIONS FOR THE PHYSICALLY HANDICAPPED?
E DOES YOUR INSTITUTION HAVE AN INOEPENOENT AUDIT OP YOUR FACILITIES BY HANDICAPPEDPERSONS?
F. INDICATE THE PERCENTAGE OF YOUR INSTITUTION THAT IS ACCESSIBLE TO THE MOBILITY IMPAIREDOn whole numbers;
G. DOES YOUR INSTITUTION HAVE A
I. OPEN TO THE PUBLIC?
a. FOR RESEARCH ONLY?
3. LENDING ONLY?
LIBRARyt af yes answer the following questions)
4. MATERIALS IN AUDIO-VISUAL FORM10 YES 20 NO (Sblct, tapes. etc)
32
10 YES 2 0 NO33
t 0 vas 2ONO34
5. NUMBER OF TITLES OF BOOKS
6. NUMBER OF TITLES OF PERIODICALSUBSCRIPTION
10 YES
10 YES
20 NO26
2 En NO27
% 28-30
10 YES 20 NO31
IC vas 2O NO35
36-45
46 .49
-,-,--"-k, 211.1-
11
1

IBMWM.IldPART X. IMPACT OF it`1FS.ATION
APPENDIX A (13)
M=MINE.
A. HA!. YOUR MUSEUM BEEN AGILE TO ADSORB THE IMPACT OF INFLATION ON THE COST OF SALARIES, WAGES, GOODS ANOSERVICES WITHOUT REOUC:NG THE LEVEL OF ITS CURRENT OPtRATIONS LAMING THE YEAR ENOING PRIOR TO JANUARY 1,1980 BELOW THE LEVEL OF THE PRECEDING YEAR? !OYES 2 0 NO
SO
tF NO, HOW EXTENSIVE WAS THE REOUCTION OF THE LEVEL. OF OPERATIONS IN THE FOLLOWING AREAS.
AREAS EXTENT OF REDUCTION
SMALL SUBSTANTIAL SEVERE
1. Curatorial
2. Education
3, Security
4. Exhibition
S. Conservation/ Preservadoi
6. Other (Specify!
051
054
057
060
063
066
052
0SS
058
061
064
067
0S3
056
059
062
065
068
69-70dr
2E
12

DEPARTMENT OF HEALTH, EDUCATION. AND WELFARE
NATIONAL CENTER FOR EDUCATION STATISTICS- WASHINGTON. D.C. 20202
INSTRUCTIONS FOR COMPLETINGMUSEUM PROGRAM SURVEY, 1979
GENERAL INSTRUCTIONS AND DEFINITIONS
A MUSEUM- for the purpose of this survey isan institution organized on a permanent basisfor essentially educational or aesthetic pur-poses, Which utilizes a staff. owns L.. usestangible objects, whether animate or inani-mate, cares for these objects and exhibitsthem to the public on a regular basis.
IDENTIFICATION NUMBER - The identificationnumber appears on the mailing label. If thequestionnaire becomes separated, enter theidentification number at the top of eachpage.
NEED FOR ESTIMATES - Do not leave any itemsblank. Enter °0' if the appropriate entryfor an item is zero or."none". Enter "N.app." if an iten does ,not apply to yourmuseum. If an exact figure is not availa-ble for a particular item, but it is knownthat 'the amount is greater than zero, ENTERAN ESTIMATE OF THE AMOUNT. Indicate that thefigure is an estimate by parentheses. Esti-mates are important if exact data are notavailable.
REPORTING YEAR IS THE FISCAL YEAR ENDINGPRIOR TO JANUARY 1, 1980.
SPECIFIC INSTRUCTIONS AND DEFINITIONS
PART 1. GOVERNING AUTHORITY AND PURPOSE
1. GOVERNING AUTHORITY (QuestionCheck the gal that best describes thegoverning authority of your museum/institution. ifnone of the typesofgoverning authority is applicable, pleasecheck "other" and specify your governing
authority.
2. OPERATION ANC) OWNERSHIP OF FACILITIES(Question I.B.) Check "yes" only iffacilities are either owned, operated,or oth by someone other than thegoverning authority indicated in Ques-tion t.A.
Facilities: for definition see instruc-tion NO. 37.
NCE$ FORM 2424, 11/T9 .
21
APPENDIX A(14)
FORM APPROVEDO.N.O. NO. 91479007
3. BOARD OF TRUSTEES (Question I.C.) Check"yes", only if board has direct, respon-sibility for institution's policy.
4. ACTIVITIES OF MUSEUM /INSTITUTION(Question T.D.) Rank current priority ofactivities in your institution by a scaleranging from 1,to 5, with number onedesignating highest priority.
PART II. COLLECTIONS AND EXHIBITIONS
S. INVENTORY OF COLLECTIONS AND EXHIBITIONS(Question II.A.) Check "yes", only ifyou have a listing, catalog, or inven-tor of essentially all your'collec-tions.
6. IMPORTANT TYPES OF-COLLECTIONS (QuestionII.B.) Indicate the major types of
. objects which constitute an importantpart of your institution's collectionsend/or exhibitions. Depending on yourholdings, it may be appropriate to checkmore than one type.
PART III. CONSERVATION/PROTECTION
7. FACILITIES FOR PRESERVATION, CONSERVA-TION, OR MAINTENANCE OF OBJECTS OR FORTHE PROTECTION OF ENDANGERED SPECIES:(Question //1.A.1 Question III A. Ifthe answer to this question is "no", goon to Question
8. NEED FOR CONSERVATION, PRESERVATION,MAINTENANCE, OR PROTECTION (QuestionIII.C.) Estimate the percentage of yourcollection which is in serious need ofconservation, preservation, maintenance,or protection. indicate area(s) wherethese collections need resources, i.e.,staff funds, facilities, programs, oractivities.
PART IV. EDUCATION AND PUBLIC. PROGRAMS
9. TYPE OF PARTICIPANT IN THE ACTIVITY/PROGRAMS OF INSTITUTION (Question IV.A.)If the type of participant does not comeunder the given types of participants,please enter under "other" and specifythe type. Also, if the activity/programis-not listed enter under "other Pro-grams" and specify.

10. SPECIFIC PROGRAMS (Question IV.B.) Thisquestion requests information onspecific, not the general program, andinquires as to the type of audiencetoward whom specific programs wereprovided. If the specific program wasfor an ethnic or racial group, indicateappropriate group on form,
PART V. ACCESSIBILITY AND ATTENDANCE
11. MEMBERSHIP PROGRAM (Question V.B.) Eachfamily membership and each organiza-tional membership should be counted asgm member in this program. It yourinstitution has other types of member -shipe, please specify under "other" andgive fee.
12. ADMISSION PEES (Question V.C.) If yourcategories for admission fees aredifferent or more extensive, pleaseindicate under"Other (specify)",an4give fee.
13. ADMISSION POLICY FOR SPECIAL EXHIBITIONS(Question V.D.) If your institution hasvarious policies for admission tospecial exhibition, indicate under"other arrangements" and specify.
14. TOTAL ATTENDANCE AND METHOD'OF ACCOUNT-ING (Question V.E.) If exact total isnot ,available, please estimate.(indi-eating an estimate in parentheses).
IS. TOTAL ATTENDANCE FOR PRECEDING FISCALYEARS (Question V.P.) Report totalattendance for fiscal year as follows:
Por 1978 - fiscal year ending beforeJanuary 1, 1979For 1977 - Fiscal year ending beforeJanuary 1, 1978'For 1976 -,fiscal year ending beforeJanuary 1, 1977For 1975 - fiscal year ending beforeJanuary I, 1976
PART VI. PERSONNEL
AREA OF RESPONSIBILITY (Question VI.A.)For purposes of uniformity of data inthis survey, the following definitionsindicate which positions are under thedesignated "areas of responsibility"in Question VI.A. 1 - 14.
.16. CURATORIAL responsibilities are those"activities performed by a CURATORREGISTRAR and a COLLECTIONS MANAGER.
The CURATOR is a specialist in theacademic disciplipe relevant to themuseum's collection. The curator isdirectly .responsible for the care andacademic interpretation of all objects,materiels and specimens belonging orlent to the museum; 4ecommendations foracquisition, deaccession, attributionand authentication; and research on thecollections and the publication of theresults of that research. 'The curatoralso may, have administrative and/orexhibition responsibilities and shouldbe sensitive to sound conservationpractices. .2.
APPENDIX A(15)
The REGISTRAR is responsible for cre-ating, organizing and maintainingorderly forms, legal documents, filesand retrieval systems associated withthe following: acquisitions, acces-sioning, cataloging, loans, packing,shipping, inventory, insurance andstorage, pursuant to the caret'eustodyand control of the objects in perpetu-ity. A registrar organizes, documeptsand coordinattis all aspectsf borrowingand lending objects, which includesresponsibility for the handling and/orpacking,of objects, negotiating insur-ance coverage, processing insuranceclaims, making-shipping arrangements,arranging for security, handling customsprocedures, processing incoming and out-going loans, and processing requests forrights and reproductions: The registrarorganizes data so that facts and ideasmay be usefully extracted.
The COLLECTIONS MANAGER3 is responsiblefor supervising, numbering, catalogingand storing the specimens within eachdeoartment,er division, and may perforththe combined functions of register andcuratorial assistant. .
17. EXHIBITS responsibilities are thoseactivities performed by an EXHIBITSDESIGNER.
The EXHIBITS DESIGNER translates cura-torial and educational staff ideas intopermanent, temporary or circulating
?
-exhibitions. The designer is responsi-ble for the esthetic planning and designof exhibitions through renderings,.drawings, scale models, lighting andarrangements of objects and signage.The exhibits designer may supervise theproductiOn of exhibitions and haveadministrative responsibilities.
18. CONSERVATION responsibilities are thoseactivities performed by a CONSERVATOR.
The CONSERVATOR, on a scientific basis,examines museum objects, works to pre-vent their deterioration, and treatsand repairs them when necessary. Theconservator sees that objects are fumi,gated,. kept at proper level's of temper-ature and relative humidity, and pro-tected from airpollutants and exposure,to damaging light iptensities,and wave-lengths. The conservator will dsuallyhave the specialized knowledge to treata certain class of objects such aspaintings, sculpture, textiles, ceram-ics, glass, metals, furniture andwoodwork, books and art on paper; and,should know where to refer materialsthat cannot be treAted in the museum,laboretory. In order to keep hisknowledge current, the conservator maybelong to a professional conservationorganization which expects adherence toa code of ethnics.
414:p EDUCATION responsibilities are thoseactivities performed by an EDUCATOR.
The EDUCATOR, develops, Implements,evaluates and/or supervises the museum's
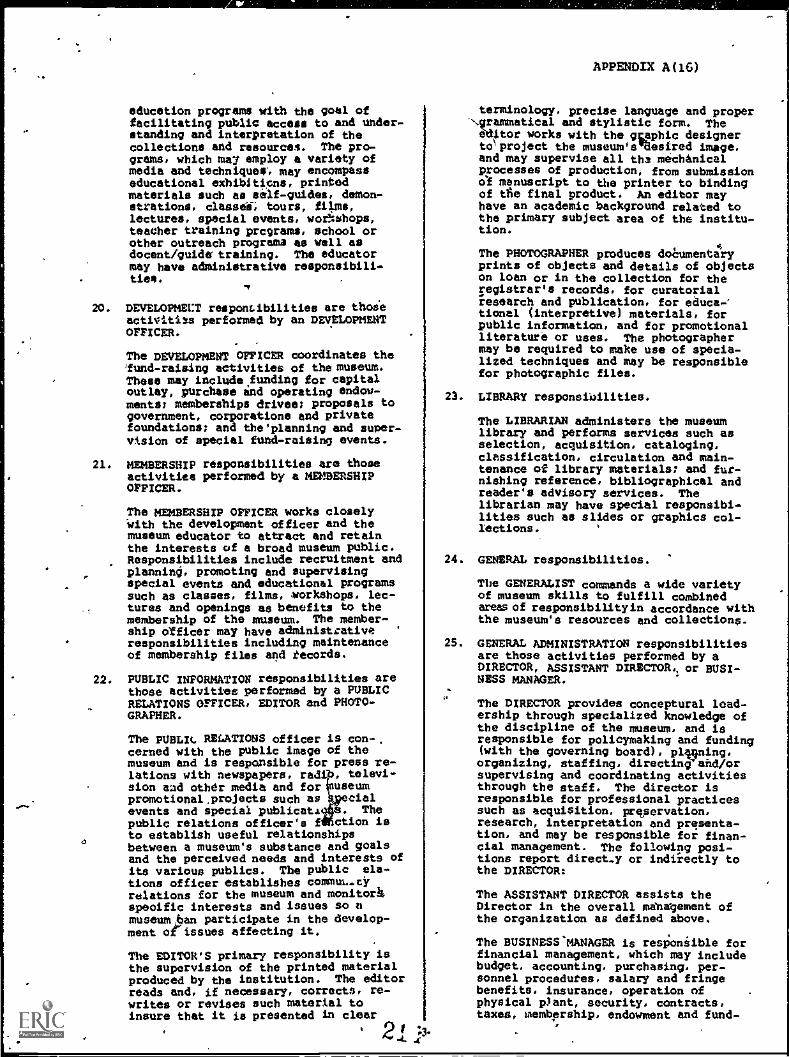
educetion programs with the goal offacilitating public access to and under-standing and interpretation of thecollections and resources. The pro-grams, which may employ a variety ofmedia and technique.., may encompasseducational exhibitions, printedmaterials such as self-guides, demon-strations, claasea-, tours, films,lectures, special events, worNshops,teacher training programs, school orother outreach programa as well asdocent/guider training. The educatormay have administrative responsibili-ties.
20. DEVELOPMEUT responsibilities are thoseactivities performed by en DEVELOPMENTOFFICER.
. -
The DEVELOPMENT OFFICER coordinates the'fund - raising activities of the museum.These may include funding for capitaloutlay, purchase and operating endow-ments: memberships drive.; proposals togovernment, corporations and privatefoundations; and the'planning and super-vision of special fund-raising events.
21. MEMBERSHIP responsibilities are thoseactivities performed by a MEMBERSHIPOFFICER.
The MEMBERSHIP OFFICER works closelywith the development officer and themuseum educator to attract and retainthe interests of a broad museum public.Responsibilities include recruitment andplanning, promoting and supervisingspecial events and educational programssuch as classes, films, morkshops, lec-tures and openings as benefits to themembership of the museum. The member-ship officer may have administrative '
responsibilities including maintenanceof membership files and records.
22. PUBLIC INFORMATION responsibilities arethose activities performed by a PUBLICRELATIONS OFFICER, EDITOR and PHOTO-GRAPHER.
The PUBLIC RELATIONS officer is con-,cerned with the public image of themuseum and is responsible for press re-lations with newspapers, radi , televi-sion sad other media and for useumpromotional, projects such as vialevents and special publicat . Thepublic relations officer's f ction isto establish useful relationshipsbetween a museum's substance and goalsand the perceived needs and interests ofits various publics. The public ela-tion; officer establishes commuc.eyrelations for the museum and monitorspeoific interests and issues somuseum an participate in the develop-ment of-issues affecting it.
The EDITOR'S primary responsibility isthe supervision of the printed materialproduced by the institution. The editorreads and, if necessary, corrects, re-writes or revises such material toinsure that it is presented in clear
APPENDIX A(16)
terminology, precise language and proper-N.grammatical and stylistic form. Theeditor works with the gophic designertcOproject the museum's 'aesired image,and may supervise all the mechanicalprocesses of production, from submissionof manuscript to the printer to bindingof tI%e final product. An editor mayhave an academic background related tothe primary subject area of the institu-tion.
The PHOTOGRAPHER produces doeumentATprints of objects and details of objectson loan or in the collection for theregistrar's records, for curatorialresearch and publication, for educa-tional (interpretive) materials, forpublic information, and for promotionalliterature or uses. The photographermay be required to make use of specia-lized techniques and may be responsiblefor photographic files.
23. LIBRARY responsibilities.
The LIBRARIAN administers the museumlibrary and performs services such asselection, acquisition, cataloging,classification, circulation and main-tenance of library materials; and fur-nishing reference, bibliographical andreader's advisory services. Thelibrarian may have special responsibi-lities such as slides or graphics col-lections.
24. GENERAL responsibilities.
The GENERALIST commands a wide varietyof museum skills to fulfill combinedareas of responsibility in accordance withthe museum's resources and collections.
25. GENERAL ADMINISTRATION responsibilitiesare those activities performed by aDIRECTOR, ASSISTANT DIRECTOR,, or BUSI-NESS MANAGER.
The DIRECTOR provides conceptural lead-ership through specialized knowledge ofthe discipline of the museum, and isresponsible for policymaking and funding(with the governing board), plegning,organizing, staffing, directing and/orsupervising and coordinating activitiesthrough the staff. The director isresponsible for professional practicessuch as acquisition, privervation,research, interpretation and presenta-tion, and may be responsible for finan-cial management. The following posi-tions report direct.y or indirectly tothe DIRECTOR:
The ASSISTANT DIRECTOR assists theDirector in the overall ma'na'gement ofthe organization as defined above.
The BUSINESS'MANAGER is responsible forfinancial management, which may includebudget, accounting, purchasing, per-sonnel procedures, salary and fringebenefits, insurance, operation ofphysical pant, security, contracts,taxes, membership, endowment and fund-
,

raising records. May be responsible forrevenue-producing activities such assales shops and food services.
26. SECURITY responsibilities are thoseactivities performed by a GUARD, floor -man, patrolman, special police, andwatchman.
The SECURITY PERSON stands guard orwalks about premises to prevent theft,violence, or infractions of the rules,directs patrons, answers questionsrelative to service of the establish-ment. Patrols assigned areas, warnsviolators of such things as smoking orcarrying forbidden articles, expelsmiscreants. May collect tickets orexamine credentials. In museums, also,provides protection to paintings orexhibits from fires, theft or damage.
21. BUILDING AND MAINTENANCE responsibili-tiesare those activities performed bya SUPERINTENDENT and his staff.
The SUPERINTENDENT is in charge of themuseum buildings and grounds, theirsecurity, cleanliness, safety and main-tenance. The superintendent may over-see the mechanical and electrical equip-ment, undertake repairs, and supervisesecurity staff, custodians, grounds-keepers, engineers and workshop per-sonnel.
28. REGULAR STAFF RANGES (Question v/.11.)Indicate the number of regular full-timestaff by their area of responsibilityin the appropriate salary range. Totalshould not excNd total in VI A 1-14column "Regular Staff Full-Time".
29. PROFESSIONAL STAFF. For purposes ofthis survey, the professional staff ofan institution, whether paid or unpaid,devote their time primarily to theacquisition, care, or exhibition to thepublic of objects owned by the institu-tion.
PART VII. FINANCE AND BUDGET
',Of 30. TOTAL OPERATION INCOME BY SOURCE (Ques-tion VIX.A.) Indicate total federe.Igrant movies for the last complete fis-cal year ending prior to January 1,1980.6fIn /II.A.1 a - g indicate incre-ments of'total amount (VII A.1) byfederal agency issuing grant.
31. STATE, LOCAL AND SPECIAL CONTRIBUTORS(Questions vII.A. 2, 3, 4, S, 6, and 1)Indicate contributions which do notspeciiically fit under 2, 3, 4, 5,.and6, under "other (specify)".
APPENDIX A(17)
0
32. EARNED INCOME (Question VII. A.S. a - i)Indicate total amount for VII A.8 andbreak into individual components ina -i.
33. TOTAL CASH OPERATING INCOME (QuestionVI/.A.9) This total consists of VII.A.1, 2, 3, 4, 5, 6, 7, and 8 given above.
34. ENDOWMENT liNDS (Question VII.B.) Forpurposes of this survey, endowment fundsare those funds given to the museum/institution with the restriction thatsuch assets remain intact for a statedperiod of time or until the happenidgof a particular event.
-4-
35. EXPENDITURES (Question VII.C, D, E, andF.) Total Capital expenditures (C) in-cludes funds for major equipment, capi-tal improvement, vehicles, and majoracquisitions for the permanent collec-tion.
Total Operating Expenditures (D) in-cludes all direct expenditures which areenlintegral part of the institution's.0operation. Excluded are those thingsreported in VII.0 and in-kind goods and ,
services, overhead, maintenance providedby another or parent organizations andCETA and other paid personnel not partof institution's direct expenditures.
. CONTRIBUTED VOLUNTEER SERVICES AND CON-TRIBUTED GOODS and OTHER.SERVICES (Ques-tion VII.E and F:) Estimates the dollarvalue of these services and goods.
PERCENTAGE OF OPERATING EXPENDITURESUSED FOR EACH AREA OF RESPONSIBILITY(Question Estimate the percent-age of the total operating expendituresfor each of the museum /institution areasof responsibility. The percentage musttotal 100X.
PART VIII. fECURITY
36. ALARM SYSTEM (Question VII:, A-D.)Local authorities denotes law enforce-ment agencies or alarm system agency.
PART IX. FACILITIES
37. FACILITIES (Questions IX.A - G.) Forpurposes of this survey, facilitiesdenote the physical plant used, main-tained and operated by your institutionfor the furtherance of the institution'smission. It consists of the sum of allareas on all floors of building(s) thathave been assigned to or are used formuseum functions or purposes. It in-cludes space for visitors, exhibitcases, displays, storage facilities,etc. Outside areas are to be measured,in acres, indoor area in square feet.If all space is not utilized, indicatein appropriate box the percentage of theutilized space.

38. IN-HOUSE AND CONTRACTUAL OPERATIONS(Question IX.c.) In-house operationsare those managed by the regular museumstaff and responsible to the ,directorof the institution; operations handledby contract or similar arrangement areto be indicated.
4
39. FACILITIES FOR HANDICAPPED PERSONS(Question IX.D-F.) For the purpose ofthis, survey the term physically handi-capped relates only to mobility impairedpersons who are defined as any personwho must use a standird manual oreledtric whee)chair or other assistivedevice to move febm place to place. orany person who otherwise finds stairs.and other similar physical featuresimpediments to movement.
40. LIBRARY (Question IX.G.) A LIBRARY is"an organised collection of publishedand other materials with a staff traimmV"-,to provide and interpret such materialas required to meet the informational,educational and/or recreational needs ofthe clientele; alsoits"physical facili-
,APPENDIX A(18)
-
ties. Libraries contain various typesof materials. The questions relate tothe three different Javlspf_materials'which are'defined belofti
1°AUDIO-VISUAL MATERIALS. Nonbook librarymaterials, such as recordings, trans-parencies, tapes, slides, films, andfilmstrips,. which require the use ofspecial equipment in order to be seenor heard.
BOORS are units of publication. eitherbibliogrhphically independent or volumes ,in a series published, under the sametitle, consisting of leaves, sheets,, orsignatures sewn or otherwise bound to-gether,covered or uncovered. Boundvolumes of periodicals and nevspapersare not considered books.
PERIODICALS are serial publipationswhich constitute one issue in a continu-ous series under the same title, usuallypublishedat regular intervals over anindefinite period, individual issues inthe series being numberebonsecntivelyor each issue being dated.
A
2-S.
4...1 441 14

4.
4
1978 MUSEUM UNIVERSE SURVEY
r

APPENDIX A(19)
DEPARTMENT OF HEALTH. EDUCATION. AND WELFAREINSTITUTE OF MUSEUM SERVICES
WASHINGTON, D.C. 10104
Dear Colleague:
The National Center for Education Statistics (NCES) isconducting a survey of Museums and Related Institutionsto develop a listing for the Institute of Museum Services(IMS), which will use this information in its grants pro-grams and other types of assistance. Additionally, sum-mary data will be made available in a separite publics-tion. If your institution responds, a comp imentary copywill be sent to you. ,\
This is the first time a complete survey of the entiremuseum universe has been attempted. Your cooperation inproviding the requested information will enable NCESto provide IMS with complete and up-to-date data for usein the development and administration of the museftm,pro-gram. It also will provide; for the first time47a com-
. prehensive base of informatidn for the profession, local,state, and federal governments, and the public.
A museum, for the purposes of this survey is defined as,an institution organized on a permanent basis for essen-tially educational or aesthetic purposes, which, utilizinga staff, owns or uses tangible objects, whether animate orinanimate, cares for these objects and exhibits them tothe public on a regular basis.
If there are any questions regarding the form or contentof this survey, please direct:them to Nicholas Osso,NCES Project Officer (202) 245-8638. Please return, assoon as possible, your completed form in the enclosedself-addressed envelope.
Your prompt response will assist us in making this uni-verse survey a success. Your cooperation will be greatlyappreciated.
Marie D. EldridgeAdministratorNational Center for Education
Statistics
2 's
Lee KimcheDirectorInstitute of MuseumServices

' DEPARTMENT OF HEALTH, EDUCATION, AND WELFAREEX.:ATION DIVISION
NATIONAL CENTER FOR EDUCATION STATISTICSWASHINGTON, D.C. 20202
UNIVERSE QUESTIONNAIRE FOR MUSEUMS AND RELATED
APPENDIX A(20)OMB NO. 051- S78024APPROVAL EXPIRES; 12-79Due DateJanuary 5, 1979
INSTITUTIONS
NAME AND MAILING ADDRESS OF MUSEUM COVERED BYTHIS REPORT (Include cit#, State, and ZIP code)
USE TO CORRECT MAILING LABELINFORMATION ONLYNAME OF INSTITUTION
STREET
CITY STATE ZIP
FUSON IN CHARGE OF MUSEUM MUSEUM TELEPHONE
NAME AREA CODE NUMBER EXTENSION
A MUSEUM - is an institution organized on a permanent basis for essentially educationalor aesthetic purposes, which, utilizing a staff, owns or uses tangible objects, whetheranimate or inanimate, cares for these objects and exhibits them to the public on a regular.basis.
1.
Reporting Year is the fiscal year endihg prior to July 1, 1978CONTROL OF INSTITUTION
PRIVATE: (check one)
g Profit. If profit is :pecked, stop here andreturn form in enclosed envetope.
h Nonprofit(under 501(c)(3), Internal RevenueCode) IRS Tax Exempt Number:
PUBLICS`
a Federalb Statec Municipald Countye College/Universityf Other (specify)
(check one)
2. TYPE OF INSTITUTIONRefer to the "Code List of Institutions by Type" for the appropriate latter andnumber which moat nearly describes your institution's primary activity.
Letter Number If appropriate type does not appear on the code list, checkhere and describe
`'year chartered
4. NUMBER OF EMPLOYEESEmployees who devote their time primarily_ to the acquisition, care, or exhibition tothe public objects owned or used by the institution.
number paid number unpaid
5. WEEKS OPEN PER YEAR --------------6. ANNUAL ATTENDANCENumber of weeks per year open Number of visitors during reporting yearto the public Check here if this number is an estimate
7. CURRENT OPERATING EXPENDITURES DURING THE REPORTING YEARTotal, all .functions Current Operating Expenditures - include totalMuseum function only charges incurred, whether paid or unpaid. Exclude
capital outlay, debt service or acquisitions.THANKS FOR YOUR COOPERATION. Please return completed form in enclosed return
addressed envelope.
NCES -2421 2 "i

.
LETTER AND NUMBERCODE LIST OF INSTITUTIONS BY TYPE
ART 12.
13.
APPENDIX A(h)
HerbariumsHerpetology Museums
1. Art Associations, Councils and 14. Industrial MuseumsCommissions, Foundations and
_Institutes15. Medical, Dental, Health, Phar-
macology, Apothecary and2. Art Association Galleries Psychiatry Museums3. Art Museums and Galleries 16. Natural History and Natural4. Arts and Crafts and Museums Science Museums5. China, Glass and Silver Museums 17. Nature Centers6. Civil Art and Cultural Centers7. Decorative Arts Museums
18. .Planetariuths, Observatories,and Astronomy Museums
8. Folk Art Museums 19. Science Museums (General9. Textile Museums ' Science, Physical Science,
Science,- Technology Center)B. CHILDREN'S AND JUNIOR MUSEUMS 20. Wildlife Refuges and Bird
SanctuariesC. GENERAL MUSEUMS 21. Zoology Museums, Zoos, Chil-
dren's ZoosD. HISTORY
1.
G.Historic Agencies, Councils,
SPECIAL/ZED
Commiisinls, Foundations, 1. Antiques Museumsand'Reseruch Institutes 2. Architecture Museums
.2. Historic Houses and Historic 3. Audio-Visual and Film MuseumsBuildings 4. Circus Museums
3. Historic Sites 5. Communications Museums4. Historical and Preservation 6. Costume Museums
Societies 7. Crime Museums5. Historical Society Museums 8. Forestry Museums6. History Museums 9. -Furniture Museums7. Maritime and Naval Museums and 10. Gun Museums
Historic Ships 11. Hobby Museums8. Military Museums 12. Horological Museums9. Preservation Projects 13. Money and Numismatics Museums
14. Musical Instruments MuseumsE. PARK MUSEUMS AND VISITOR CENTERS 15. Outdoor Museums
16. Philatelic MuseumsF. SCIENCE 17. Religious Museums
18. Theater MuseumsL. Academies, Associations, Institutes 19. Toy and Doll Museums
and Foundations 20. Transportation Museums2. Aeronautics and Space Museums 21. Wax Museums3. Agriculture4. Anthropology, Ethnology and Source:
S.
Indian MuseumsAquariums, Marine Museums andOceanariums
American Association of MuseumsMembership Directory
6. Arboretums7. Archaeology Museulas and Archaeological
Sites
8. Aviaries and Ornithology Museums9. Botanical Conservatories, and Horti-
cultural Societies10. Entomology Museums and Insect Collections),11. Geology, Mineralogy and Paleontology ht
*PO 958.2%1Museums
APPENDIX B(1)
APPN.DIX
MUSEUMS AND PROFESSIONALS INVOLVED IN THEDEVELOPMENT OF THE SURVEY, INSTRUMENT
The survey instrument contained in Appendix A was developed through con-sultation with a review panel of museum professionals, a survey pretest, and aninformal tryout throtigh consultation.
1. REVIEW PANEL
Members of the review panel included:
Jane Glaser -- Office of Museum Programs, Smithsonian Institution
Seviralpretest.
Ellen Hicks--Editor, Museum News
Jane Horsley--General Curator, National Zoo
Tom Litkowsky--Research Specialist, National Endowment for theArts
Jemise Martin -- Director, African-American Museums Association
Robert Peck--Special Assistant, Federal 'Council on the Arts andHumanities
Paul Perrdt--Assistant Secretary for Museum Programs, SmithsonianInstitution
consultations were held with the review panel before and after the
2. PRETEST -
The draft survey instrument was pretested by NCES in the following ninemuseums:
The John Young Museum and Planetarium, Orlando, FloridaThe Museum of Natural History, Eugene, OregonThe Pawtucket Children's Museum, Pawtucket, Rhode IslandThe Indiana State Museum, Indianapolis, IndianaThe Cleveland Museum of Natural Histor/, Cleveland, OhioThe Morris Arboretum, Philadelphia, PennsylvaniaThe Exploratoriujn, San Francisco, CaliforniaThe Topeka Zoological Park, Topeka, KansasCarson County Square House Museum, Panhandle, Texas
221

APPENDIX B(2)
All but one respondent agreed that the information sought was within easyaccess of the chief executive of the institution. The one exception was thatthe respondent had to obtain the financial information from the accountant'soffice. Depending on the museum size, the estimated time for completion rangedfrom approximately one hour to four and one-half hours. Although the responsetime was lengthy, none of the respondents objected. Instead, these respondentssuggested the addition of more data cells.
3. INFORMAL TRYOUT THROUGH CONSULTATION
To comply with a request of the NCES Clearance Officer, an informal tryoutthrough consultation of the draft Museum Program Survey instrument was conductedduring July 1979.
The consultation was conducted as follows:
A consultant interviewed 13 museum administrators,* including:
Bonnie Baskin--Lawrence Hall of ScienceMichel Botwinick--The Brooklyn MuseumLorenz Either -- Stanford Art Galley and Stanford Art MuseumPam Johnson--American Association of MuseumsWilson Jones--San Francisco Botanical ConservatorySaul Kitchner --San Francisco ZooThomas Litkowski- -National Endowment for the ArtsLaurence Morrisori--Old Sturbridge VillageFrank Oppenheimer --ExploratoriumRobert Ornduff--Berkeley Botanical Gardens*Martin Sullivan--National Endowment for the HumanitiesGeorge Tressel--National Science FoundationSteve Weil--Hirshorn Museum
In addition, R. Beazley consulted with five museums in Columbus,Ohio; F. Schick consulted with two musems in Dallas, Texas; andthe ten OE Regional Offices consulted with 67 museums in tenstates.
4. SUMMARY
(1) The consultation resulted in an approximate one-third change of thesurvey form.
(2) A substantial contribution was made by the ten OE /Regional Offices inconducting 67 of the 87 interviews.
(3) The recommendations made through these "informal tryouts through con-sultations" were approved by the OMB Clearance Officers.
* Russ-Eft, Darlene. Formative Evaluations of the 1979 Museum Survey Form,Statistical Analysis Group in Education - American Institutes for Research, PaloAlto, California, 1979.
2"

APPENDIX C
P P6.001 X
SAMPLING VARIANCES
The Museum Program Survey 1979 contained almost 600 data items, which were
grouped into nine general categories based. on item content and/or response type.
Variance estimates of means and totals were computed for selected items in each
group btype of museum and for all museums. ,Coefficients of variation of the
total were computed for each item selected (see'Exhibit C-1). In an attempt to
develop generalized variance- functions, scattergrams and -related regression
analyses were computed between means (X) and relvariances (V2) within each
group. If a regression analysis function could be found that provided a good
fit to the data, then one could predict relvariances of similar survey items
based or their survey estimates, the result being a model for generalizing
variances. Examination of the scattergrams and regression analyses showed three
1/groups of items well fit by a power function model (log V2 = a b log x).
The groups fit were Group I, types of objects in collection (Part II of the
survey form; n=10); Group II, educational activities or general program events
(Part IV.A. of the survey form; n=10); and*Group IX, selected categorical items
(Parts I.A.; III.C.; IV.C.-H.; V.D., E.; B., D.; IX.A., D., E., G. of
the survey form; n=9). An R2 of .836, .914, and .882 resulted for Group I,
Groap II, and Group IX, respectively. The function plotted on each graph (see
Exhibits C-2, C-3, and C-4), allows estimation of the relliariance within the
specified group of survey items. Locate the mean on the X-axis, find the cor-
responding point on the funct.on, and read the predicted relvariancelf corre-
sponding to this point on the Y-axis. Other groups of items were poorly fit by
the model and variances could not be generalized.
A detailed discussion of the methodology for estimating sampling variancesis provided in the Technical Methodology And Evaluation Report, a companion tothis report.
11 Other models typically used were investigated, e.g., V2
the power function model provided the best fit.
2/ The coefficient of variance cavbe found by taking therelvariance.
2 4) ')
= a b/x; however,
square root of the

EXHIBIT C-1(1)
National Center for Education Statistics
COEFFICIENT OP VARIATION OP THE T0TAD1
SurveyItem
Number Item
TYPE OP MUSEUM
All Art Children's General History
.
Parksand Viaitor
Canters
.
Science OPecialiced
I.A. a ship by a Private School .7746 .7746 .0000 .0000 .0000 .0000 .0000 .000011.8.1 dberical Importance of Decorative Arts .0571 .0748 .2770 .0840 .0895 4.3264 .2917 .1374
11.8.1 Numeric'] importance of Fine Arts .0467 .0309 .2778 .0376 .1064 .2639 .2572 .054411.9.3. Numerical Importance of Archaeol.Objects .0837 .2211 .3096 .0619 .1613 .1933 .1119 -.339011.0.3. Numerical Importance of Agricultural .0787 .3907 .2412 .1329 .2033 .1954 .0928 .0993
Objects11.0.3. Numerical Importance of General Science .1246 .5533 .1566 .1626 .4685 .5788 .1378 .0000
Objects11.8.3 Numerical Importance of Other Science .3004 .0000 .5774 .0000 .0000 .0000 .4098 .0000
Object!
11.0.4. Numerical Importance of Guns .0990 .1418 .0000 .0881 .1347 .3093 .4417 .301911.8.4. Numerical Importance of Clocks .1949 .3513 .0000 .2032 .3374 .0000 .3282 .0000
11.8.4. Numerical Importance of Honey Objects .1395 .2355 .7071 .1472 .2249 .9045 .4130 .092611.0.4. Numerical Importance of Musical Objects .1221 .1514 .1660 .0733 .1686 .0000 .5581 .3224
111.C. Percent of Collection in Need of Upkee) .0486 .1020 .1262 .0619 .0858 .1118 .1065 .1864Less than 5 Percent
III.C. Percent of Collection in Need of Upkeep: .0630 .1510 .0000 .0737 .1069 .2304 .1328 .22615 Percent - 14 Percent
Iv.A.1. Tours -. -Elementary Students .0149 .0231 .0795 .0254 .0245 .0957 .0350 .0270IV.A.1 Tours - -College Students .0318 .0379 .1388 .0518 .0622 .1403 .0557 .0931IV.A.1 Tours -- Others .0981 .1655 .1549 .0958 .2037 .2575 .1031 .0906IV.A.2. Demos. -- Elementary Students .0492 .0771 ' .0963 .0453 .1110 .1299 .0775 .0798IV.A.2 Demos. - -Other Participants .1072 .2361 .2995 .1325 .2822 .2546 .1585 .1164Zv.A.3. Lectures - -Other Participanie .1334 .1566 .3344 .1370 .2950 .3824 .1711 .1282IV.A.4. Classes - -Secondary Students .0502 .0655 .1378 .0996 .1561 .2116 .0946 .0649IV.A.S. Performing Arts - -General Public .0545 .0517 .0698 .0970 .1341 .2576 .1514 .1215IV.A.6 Films - -Elementary Students .0597 .0994 .1067 .0527 .1392 .1609 .0985 .0588IV.A.0. Other Programa - -College Students .1612 .2014 .0000 .0714 .3400 .4602 .2102 .6928IV.C. Programs for American Indians .1214 .1856 .0000 .1122 .2527 .4591 .2534 .40721V.N. Assessment of Exhibitions .0427 .0540 .0924 .0493 .0977 .1231 .0590 .0608V.8.1. Number of members .9570 .2881 .0619 .0231 .9573 .0468 .p2se .0050V.D. Special Exhibits Admission Paltry .1721 .5533 .5774 .7071 .2722 .0000 .7001 .0000U.S. Total Attendance - -1979 .0301 .0278 .0386 .0565 .6824 .1073 .0461 .0346V.C.1. Estimated ibtaI Attendance? .0293 .0423 .1152 .0452 .0502 .0944 .0619 .0786V.F. Total Attendance - -1978 .0377 .0206 .0376 .0503 .0001 .1181 .0660 .0393V.F. Total Attendance - -1977 .0387 .0332 .0333 .0578 .0960 .1356 .0617 .0376V.F. Total Attendance - -1976 .0439 .0349 .D341 .0576 .0971 .1257 .0762 .0371
V.P. Total Attendance - -1975 .0433 .0344 .0414 .0635 .1112 .1236 .0690 .0404
- _1/ Coefficient of variation of the Total +. Coefficient of Variation of the Nean..(variance of the Total /Total2)1
2''5X
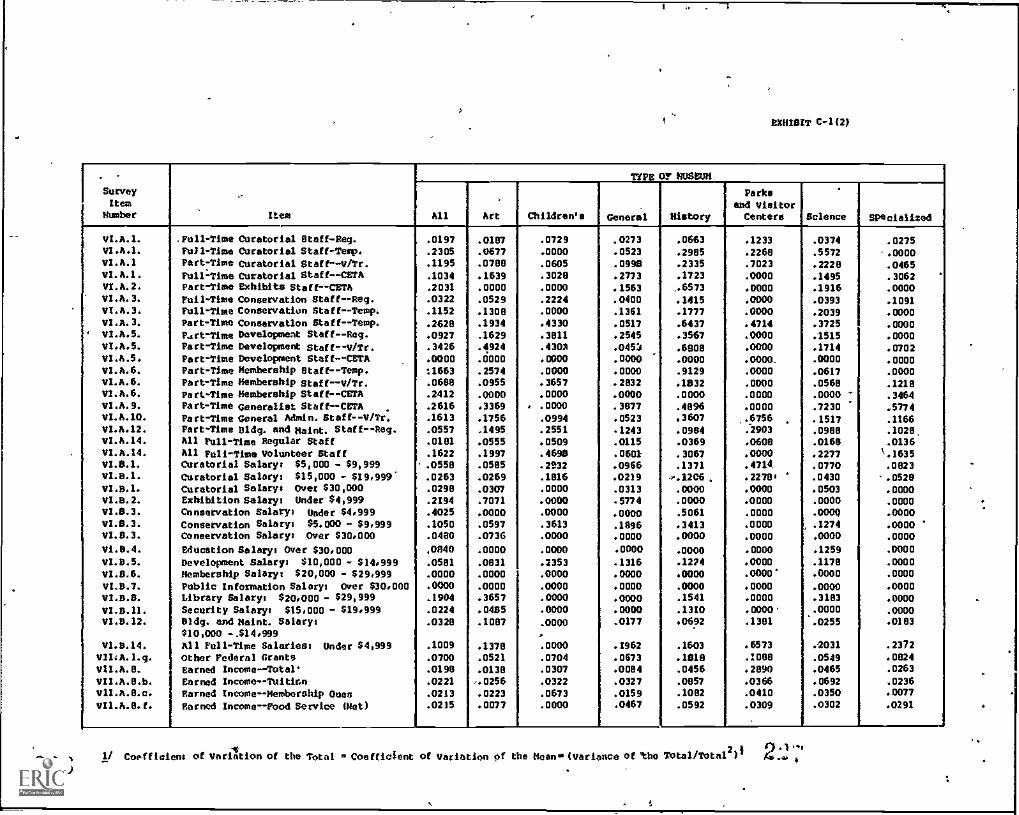
EXHIBIT C-1(2)
'Su-I
SurveyItem
Humber item
TYPE 0.? NUS 1H
Dill Art Children's General
I
History
Parksand VisitorCenter' Science Specialized
VI.B.1. .Full -Time Curatorial Staff-Reg. .0197 .0187 .0729 .0273 .0663 .1233 .0374 .0275VI.h.l. Full-Time Curatorial Staff -Tete. .2305 .0677 .0000 .0523 .2985 .2268 .5572 .0000VI.h.1 Part-Time Curatorial Staff -- Ali /Tr. .1195 .0788 .0605 .0990 .2335 .7023 .2228 .0465VI.h.l. Pull1Time Curatorial Staff- -CETA .1034 .1639 .3029 .2773 .1723 .0000 .1495 .3062 '
VI.h.2. Part -Time Exhibits Staff- -CETh .2031 .0000 .0000 .1563 .6573 .0000 .1916 .0000VI.A.3. Full-Time Conservation Staff - -Reg. .0322 .0529 .2224 .0400 .1415 .0000 .0393 .1091VI.h.3. Pull-Time Conservation Staff - -Tea,. .1152 .1308 .0000 .1361 .1777 .0000 .2039 .0000VI.B.3. Part-Time Conservation Staff - -Temp. .2628 .1934 .4330 .0517 .6437 .4714 .3725 .0000
. 11/.h.5. P.Irt-Time bevelopmeat Staff - -Reg. .0927 .1629 .3811 .2545 .3567 .0000 .1515 .0000VI.A.5. Part-Time Development Staff - -v/Tr. .3426 .4924 .430A .045'z .6908 .0000 .1714 .0702VI.h.5. Part-Time Development Staff - -CETh .0000 .0000 .0000 .0000 .0000 .0000 .0000 .0000VI.A.6. Part-Time Membership Staff- -Temp. :1663 .2574 .0000 .0000 .9129 .0000 .0617 .0000VI.A.6. Part-Time Membership staff - -v/Tr. .0688 .0955 .3657 .2832 .1832 .0000 .0568 .1218VI.A.6. Part-Time Membership Staff- -mit .2412 .0000 .0000 .0000 .0000 .0000 .0000 .3464VI.A.9. Part-Time Generalist Staff- -CITA . .2616 .3369 .0000 .3877 .4896 .0000 .7230 .5774VI.h.10. Part -Time General Admin. Staff- -V/Tr. .1613 .1756 .0994 .0523 3607 .6756 . .1517 .1166VI.h.12. Part-Time Dldg. and /taint. Staff - -Reg. .0557 .1495 .2551 .1243 .0964 .2903 .0988 .1028,VI.h.14. Ail Full -Time Regular Staff .0181 .0555 .0509 .0115 .0369 .0608 .0166 .013611/.h.14. Ail full-Time Volunteer Staff .1622 .1997 .4690 .0601 .3067 .0000 .2277 .1635V1.8.1. Curatorial Salary: $5,000 - $9,999 .055S .0585 .2932 .0966 .1371 .4714 .0770 .0823VI.B.1. Curatorial Salary: $15,000 - $19,999 .0263 .0269 .1816 .0219 4..1706. .22780 ' .0430 .0520VI.8.1. Curatorial Salary* Over $30,000 .0298 .0307 .0000 .0313 .0000 .0000 .0503 .0000VI.8.2. Exhibition Salary: Under $4,999 .2194 .7071 .0000 .5774 .0000 .0000 .0000 .0000VI.0.3. Conservation Salary: Under $4,999 .4025 .0000 .0000 .0000 .5061 .0000 .0000 .0000VI.0.3. Conservation Salary, $5.000 - $9,999 .1050 .0597 .3613 .1096 .3413 .0000 .1274 .0000VI.8.3. Conservation Salary: Over $30,000 .0460 .0736 .0000 .0000 .0000 .0000 .0000 .0000
VI.B.4. Education Salary: Over $30,000 40040 .0000 .0000 .0000 .0000 .0000 .1259 .0000
Vi.b.5. Development Salary: $10,000 - $14,999 .0581 .0831 .2353 .1316 .1274 .0000 .1178 .0000VI.B.6. Membership Salary: $20,000 - $29,999 .0000 .0000 .0000 .0000 0000 .0000' .0000 .0000
Vi.b.7. Public Information Salary: over $30,000 .0000 .0000 .0000 .0000 .0000 .0000 .0000 .0000VI.D.S. Library Salary: $20,000 - $29,999 .1904 .3657 .0000 .0000 .1541 .0000 .3183 .0000
VI.0.11. Security Salary, $15,000 - $19,999 .0224 .0465 .0000 .0000 .1310 .0000 .0000 .0000Vi.b.12. Bldg. and (taint. Salary: .0328 .1087 .0000 .0177 06. 92 .1381 .0255 .0183
$10,000 -.$14,999 .
Vl.b.14. All Full-Time Salaries: Under $4,999 .1009 .1378 .0000 .i962 .1603 .6573 .2031 .2372VlIch.l.g. Other Federal Grants .0700 .0521 .0704 .0673 .1819 .1008 .0549 .0824
VII.A.S. Earned Income - -Total' .0190 .0138 .0307 .0084 .0456 .2890 .0465 .0263
VII.A.S.b. Earned Income -- Tuition .0221 ...0256 .0322 .0327 .0057 .0366 .0692 .0236
V1I.A.8.c. Earned Income--Membership Oues .0213 .0223 .0673 .0159 .1082 .0410 .0350 .0077
VIl.h.S.f. Earned Income - -Food Service (Het) .0215 .0077 .0000 .0467 .0592 .0309 .0302 .0291
1/ Coefficient of Vttriation of the Total Coaffic1ent of Variation of the Moony (Variance of 'the Total/Tote12) .4, 6

EXHIBIT C-1(3)
Serve 1
lies
Humber item
TYPE OP MUSEUM
All Art Chlldrenor General History
Parksand VisitorCenters
....-Science Specialised
V1I.A.B.h. Earned Income-Auxiliary Services .0702 .0403 .0000 .0202 .1023 1222 .0155 40073V11.C. Total Capital Expenditures .0412 .0300 .0V03 .0265 .0775 ' .1288 .1091 .0203V1I.D. TOtal Operating Expenditures .0160 .0310 .0404 .0237 .041: .1954 .0225 .0098VItt0,1. Payroll and Related Expenditures .0174 .0441 .0371 .0127 .0417 .0755 .0245 .0117VII.G.2. Operating Expenditures: .0452 .0952 .0369 .0410 .0688 .3569 .1260 .0540
Percent for ExhibitsVII,G.O. Operating Expenditures: .0679 .0791 .3651 .2441 .1272 .0500 .1545 .0460
q Percent for Advertising .
Vt1.0.9. Operating Expenditures: .0710 .1223 .2205 .1243 .1157 .4195 .2928 .0633Percent for Security
rit.h. Maintains Auditorium/Theatre .0638 .0519 .0605 .0666 .1533 .0081 .0060 .07991X.C.3. Book Shop, In-House Operation .0338 .0467 .0506 .0572 .0631 .0009 .0550 .05931X.C.3, Book Shop, Contracted Out .1436 .3510 .0000 .1242 .2823 ' .1001 .2228 .2211
1X.C.4. Conference Facilities: Contracted Out .4099 .0000 .0000 .0000 t0000 .0000 .6021 .57141X.D. Handicap Facilities . .0363 .0501 .0207 .0497 .0011 .0675 .0603 .0215
. .
223
1/ Coo:ancient of variation of the Total « Coefficient of variation of the Mean. (Variance of the Totelhotal2)/
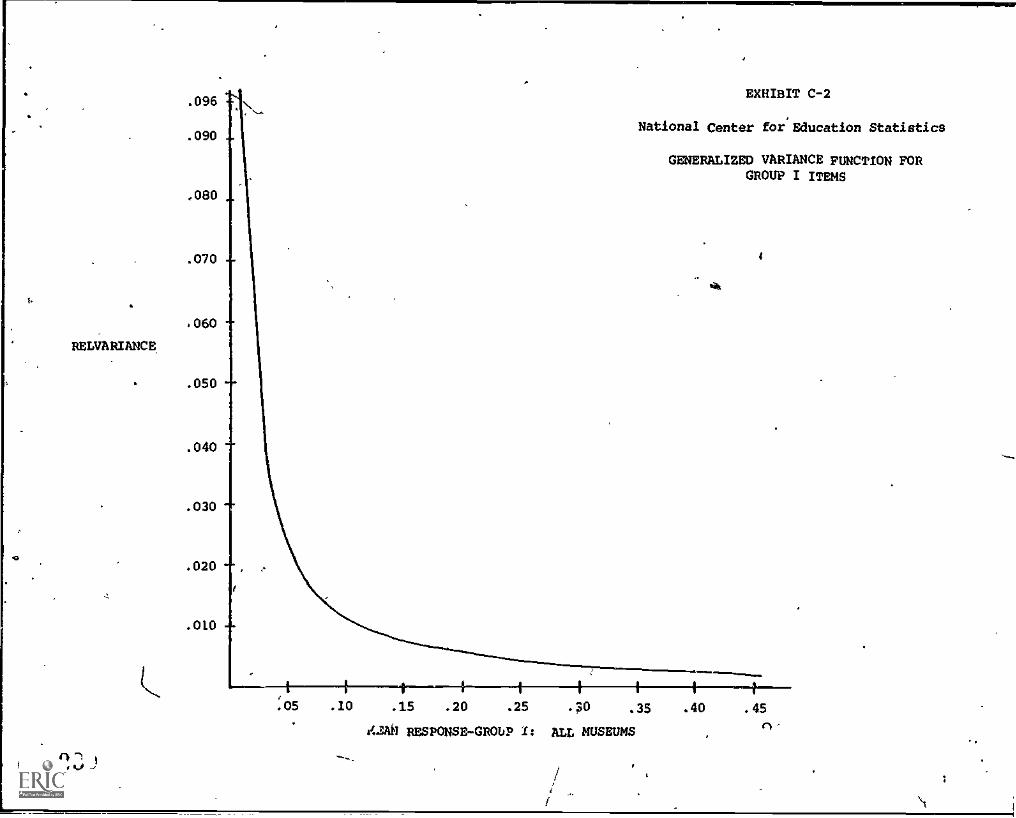
RELVARIANCE
2
.096
.090
,080
.070
060
.050
.040
.030 -r
.020
.01.0
EXHIBIT C-2
National Center for'Education Statistics
GENERALIZED VARIANCE FUNCTION FORGROUP I ITEMS
4
ak
11114MM11111.1111111,....05 .10 .15 .20 .25 .30 .35 .40 .45
n42AM RESPONSE- GROUP Is ALL MUSEUMS

RELVARIANCE
.040
.035
.030
.025
.020
.015
.010
.050
EXHIBIT C-3
National Center for Education Statistics
GENERAL/ZED VARIANCE FUNCTION FOR.GROUP II ITEMS
.10 .20 .30 .40 .50 .60 .70 .80
MEAN RESPONSE-GROUP II: ALL MUSEUMS
.90
2
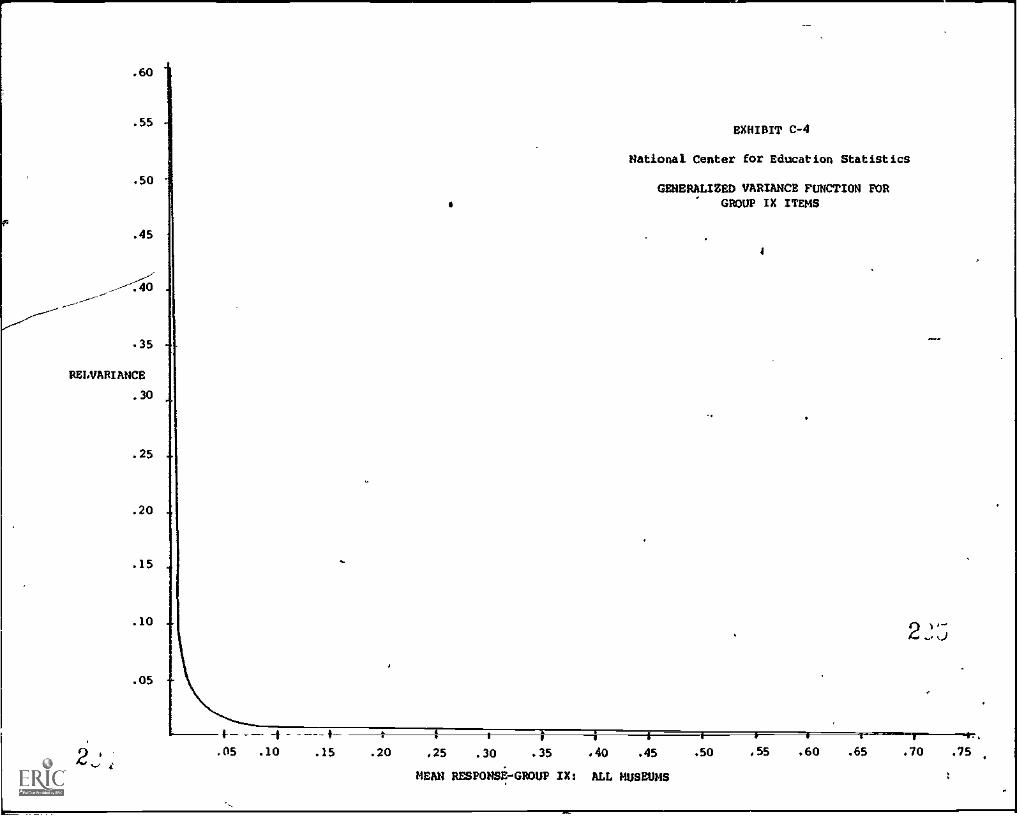
.60
. 55
.50
. 45
.35
RELVARIANCE
.30
. 25 -
. 20
. 15 .
. 10
.05
2
EXHIBIT C-4
National Center for Education Statistics
GENERALIZED VARIANCE FUNCTION FORGROUP IX ITEMS
I
-t.05 .10 .15 .20 .25 .30 .35 .40 .45
MEAN RESPONSE-GROUP IX: ALL MUSEUMS
.50 .55 .60 .65
2
.70 .75

APPENDIX D APPENDIX D(1)
ADDITIONAL TABLES
INDEX OF TABLES IN APPENDIX D
D -1. Distribution of Museums, by Control and Type of Museum: UnitedStates, Fiscal Year 1979
D-2. Distribution of Museums, by Size of Total Operating Expenditure andType of Museum: United States, Fiscal Year 1979
D-3. Frequencies of Museums Involved with Preservation, Conservation, orMaintenance Activities for ejects or for Protection of EndangeredSpecies, by Type of Museum: United States, Fiscal Year 1979
8-4. Percent Distribution of Collection in Serious Need of Conservation,Preservation, Maintenance, or Protection, by Geographic Region:United States, Fiscal Year 1979
D-S. Specific Areas Currently in Serious Need of resources, by Type ofMuseum: United States, Fiscal Year 1979
D-6. Specific Areas Currently in Serious Need of Resources, by GeographicRegion: United States, Fiscal Year 1979
D-7. Museums with Membership Programs:by Size of Total Operating Expendi-ture and Number of Members: United States, Fiscal Year 1979
D-8-A-H. Annual Program Fees for Museums wi,h Membership Programs, by Type ofMuseum: United States, Fiscal Yepr 1979
D-9-A-H. Annual Program Fees for Museums with Membership Programs, by Size ofTotal Operating Expenditure: United States, Fiscal Year 1979
D-10. Museums with General Admission Fees, by Type of Museum and Type, ofAdmission Fee: United States, Fiscal Year 1979
D-11-A.. Distribution of Daily 'General Admission Fies for Adult Nonmeneffg, byType of Museum: United States, Fiscal Year 1979
D-11-B. Distribution of Daily General Admission Fees for Child Nonmembers, byType of Museum: United States, Fiscal Year 1979
D-11-C. Distribution of Daily General Admission Fees for Student Nonmembers,by Type of Museum: United States, Fiscal Year 1979
D-11-D. Distribution of Daily General AdOission Fees for Senior CitizenNonmembers, by Type of Museum: United States, Fiscal Year 1979

D-11-E.
D-11-F.
D-12.
D-13.
D-14.
D-15.
D -16.
D-17.
D-18.
D-19.
D-20.
D-21.
D-22.
D-23.
D-24.
D-25.
D-26.
APPENVIX D(2)
Distribution of Daily General Admission Fees for Group Nonmembers, byType of Museum: United States, Fiscal Year 1979
Distribution of Daily General Admission Fees for Other Nonmembers, byType of Museum: United States, Fiscal Year 1979
Total Operating Income, by Control of Museum and Source of OperatingIncome: United States, Fiscal Year 1979
Total Operating Income, by Size of Total Operating Expenditure andSource of Operating Income: United States, Fiscal Year 1979
Total Operating Income, by Geographic Region and Source of OperatingIncome: United States, Fiscal Year 1979
Distribution of Operating Expenditures across Program Areas, by Con-trol of Museum: United States, Fiscal Year 1979
Distribution of Operating Expenditures across Program Areas,. by Sizeof Total Operating Expenditure: United States, Fiscal Year 1979
Distribution ofgraphic Region:
Source of EarnedYear 1979
Operating Expenditures across Program Areas, by Geo-United States, Fiscal Year 1979
Income, by Control of Museum: United States, Fiscal
Source of Ear :.ed Income by Size of Total Operating Expenditure:United States, Fiscal Year 1979
Source of Earned Income, by Geographic Region: United States, FiscalYear 1979
Comparison of Operating Expenditures, by Type of Museum: UnitedStates, Fiscal Year 1979
Comparison of Operating Expenditures, by Control of Museum: UnitedStates, Fiscal Year 1979
Comparison of Operating Expenditures, by Size of Total OperatingExpenditure: United States, Fiscal Year 1979
Attendance Measurement Methods, by Type of Museum: United States,Fiscal Year 1979
Average Annual Attendance, 1975-1979, by Control of Museum: UnitedStates, Fiscal Year 1979
Average Annual Attendance, 1975-1979, by Size of Total OperatingExpenditure: United States, Fiscal Year 1979

Ir
APPENDIX D(3)
D-27. Average Annual Attendance, 1975-1979, by Geographic Region: UnitedStates, Fiscal Year 1979
D-28. Total Annual Attendance, 1975-1979, by Size of Total Operating Expen-diture: United Stateso, Fiscal Year 1979
D-29. Total Annual Attendance, 1975-1979, by Geographic Region: UnitedStates, Fiscal Year 1979
D-30. Total Annual Atttendance, 1975-1979, by Control of Museum: UnitedStates,. Fiscal Year 1979
D-31. Federal Source of Income, by Type of Museum: United States, FiscalYear 1979
D32. Federal Source of Income, by Size of Total Operating Expenditure:United States, Fiscal Year 1979
D-33. Distribution of Museums Experiencing No Financial Difficulty andMuseums Experiencing Some Financial Difficulty, by Type of Museum:United States, Fiscal Year 1979
D-34. Museums with Endowment Funds, by Size of Total Operating Expenditure:United States, Fiscal Year 1979
D-35. Ratio of Capital Expenditures to Operating Expenditures, by Control ofMuseum: United States, Fiscal Year 1979
D-36. Ratio of Capital Expenditures to Operating Expenditures, by Size ofTotal Operating Expenditure: United States, Fiscal Year-1979
D-37. Impact of Inflation, by Type of Museum: United States, Fiscal Year1979
D-38. Impact of Inflation, by Control of Museum: United States, Fiscal Year1979
9 ,11".° .4

760LE 0-1,-.DISTRIBUTION OF NO311013, RV CONTROL. AND TYPE OF MUSEUM UNITED IITATE0p FISCAL YEAH 1979
jvpE no- 005100
I
1101.L
commit. or INS11181,1110
holm«Prukii
0001E-IPAL
10/941.14LIO
COOH1V606001.081.1
3/Att6o0.9NAlult
FLIILRAL01114190'
Mut
P0IV618ILENER-IARVIatom«paySCOWL
PRI641LcuLLI,OL*OWEN-3ITT
PUNLICSCHOOLOWMCI
PUBLICCULLUMiONI
9LR8III,
CRUNCH/DENniiINAT-!ORALMOP
NOS«IRIAL
CUOPOPMOPRIVAILINUI-
9IDUAL.iIIILIA
4t.1. WISPkteCt01ARS ...
PERCC$4 ...C111.0KfUst.nitwit ,..UPARALPloatist i.0161U1 <yPL0Cf411049116 404)
V13ttup(1911.9S
Pk9C161SC1L0LFPr4C11,1sprcim tztoPt 'Mt 41
4,4J011610MI9
194.0St
14110Pt0
140.42.244ju0.6
105190.0404
144.4, 197
144.4
2,15453.4367
60.232
A3.1193
54.51,11564,6
150,8ets14.$144
71.6
919U.S36
5.9S
9.9'Ili
12.4,1474.7
7
8.9155
19.923
11.4
2154.417
2.7--
411.1
731.1
b
1.h67
0.9la
4.9
46611.1
11
5.4-.
340.935410.1
Si24.9
465.4
44.1
3447.8
91.5
-.
7
ion172701
9758.8
55eon
4
2.0
3
.13
.4..
-««
.
-
1513,444
13.1..
215.5
9
.4
«
304.7
Ai
1.0
at
.93
.412
22.63
.84
.2
292.4
-
2016.400
13,1.-
217.135
1.6
1
.6130
16.29
4.3
23.5
.
..
.
.5
1.219.9
-
-.-
-.
6
.1..
.4.
.«.
.;
-.
.
.
511.1
.
4.
.-.
'11
2.3
-....-
35
.8%.8a
.1.9
3.
.01
.0
6
3.317
2.11
..5
No
2:i'a 2 4 I. ..

TABLE D*2.**0151NIBUTION OF NUSEUM3, NY 3I2E.UF TU1AL OPERATING EXPL44DI1URE AND TYPE OF MUSEUM UNITED 8141E8, FISCAL YEAR 1979
JyPi 14 4011.114 1u141
TuTAL UPLOI A I 114. APLN14111141
401a 41 *.ey.604
SOS.041*4S4,444
454,001*4/5.(00
175.001*4144.04i
6100.00104204.460
1400.001.1300.800
4304,001*4400,00o
14/14L MAN4400.000
ALI 111)14. 4,408FINCL41Poll
110.4s49 .
PL4(141 , 144.0 .
Co11.014140; Si .
lothuN1 110.46E4114AL 142PE4CLN1NISTUkt
104.04,404 /
PCNCE61 100.8PA045 414,
4,1511u4 (461tioS 14S..
-PINCE41. 144.0SCIENCI . . 86411'40.61 104.4$PLCIAL12F4 191PL4CL01., 140.4 ,
,
05I.S
4
.942.2
.
131.6
I
.5
v
1,80844.0102
16./14
14.'4
14n110..,
1.134am1.5
4029.1196
24.5114
S7.7
57813.1
90
16.1II
14.736
9.4. 320
14.01
18- 10.0
789.0*5
7.7
J054.1
12.2a
12.014
3.71547.0
2615.083
10.4a
3.9
2696.141
6,72
4.323
7.21474,9
1014.0'577,1to
8.4
545
121140'
18.06
10.842
11.022510.2
2514.8.122
136316
0.1
.
1713.934
5.65
10.412
3.259
2.7
IS'
9.145
5.03
1:7
1503.4
10
4.92
4.110
2.0. 6,1
2.3
31.0Su
6.e
2.1
.
4
44310.5140
14.05
9.448
12.41014.6
140.2157
19.820
9.9
2 4
21
L

TABLt D3.FREDUENCIES OF MUSEUMS INVOLVED WITH PRESERVATION, CONSERVATION, OR MAINTENANCE ACTIVITIES FOR OBJECTSOR FOR PROTECTION OF ENDANGERED SPECIES, BY TYPE OF MUSEUM' UNITED STATES, FISCAL YEAR 1979
t 'PRESLUVAIIND, (D430001110,AAIDUNADCI, Ai.11Y111EJ
TIP !AL
H 4.400
TYPE 01 NUSENN
ANTi 1:11111)(4tN'S
1
61.tti NAL HIsTOKYpA4hS A14)
VIS1104CkhaRS
Ail mt: WELIAL10.0
4051:411 0AS 11..4 1.4%1.11011-8 to/
0(11v1ilts /prk(t4/ .0 0051.'419
1,9144e.7
It vES, wis :1141F INAI6IM6P014.444 i141 ALT1V111LC, 900
PFKLINI 4 AUbk40% ,, 44.5111 114$ 104C I ION 60 Ill
unlvi 144111/ 4 202PF14th1 of tilo5V1101-----7----,..___L"no__ID CD4.10(I100 0111.1 OTDE0DO5 DW1 .......... 30e
POCI NI 60 MOM tied', .. 12.4111 0401,1e11O4 wt lb W4t4
11N440114 T10'44 00PEOCt:11 i 401.1061$ .. 21.8004401.15 Al 11V1111$ 0110
441,111'14 1111.066100, 1$) 111h1011.S1111111141* 528
pftClmt 'if huh, 04S P7.0
61119.11
Zh37.6
S4
14100.1
923.b
37.74
11011.7
8944.8
34
14.5
3515.8
4024,8
4928.8
8?223.3
31340.1
498.3
13415.5
18319.4
1461717
IS70.3
5337.9
b4.1
1215.9
400S,S
1418.0
SeS44.t.
28782.4
141/O.?
7311.6
1 '8
20.S
149
J7.6
11273.1
61OS.2
94.0
147.7
S919.5
1715.0
43
4.3
It10.7
103S2.1
0
.4
630.8
1
7.7

1
TABLE 0+4.- PERCENT DISTRIbUTION OF COLLECTION IN SERIOUS NELD OF CONSERVATION, PRESERVATION, NAINTENANCE, URPROTECTION, BY GEOGRAPHIC REGIUN1 UNITED STATER. FISCAL YEAR 1979
1.$14101 OF
CM LI 1-114111S It,
St KIN0S IA f 0 01CHuS$Htfc1110t
101L
6L01.46$1001L RE01104
N0010 41161911C 0RIA1 LA5L$ A00PLAINS
SNUIREASI 5F31 AND SUU1H0LST
1041. noon 1,173 1,129 779 1.127POO-10f 106.0 100.0 100.0 100.0 100.0Hollif 517 tit 97 102 1S1PE0CLul 11.7 10.0 6.6 ILO 10.1LESS 1.1A0 St 019 205 157 136 200PE0LE1 15.9 14.9 13.9 17.7 17.75% 14X bat VI 240 199 177Peoctol 19.1 19.9 22.0 18.4 15.715% - 2'4t. 017 213 204 157 214PINI 1'1..1 15.5 15.5 18.1 23.9 19.0Z5% - 44% 745 203 190 tsJ 191PfttCLNI 16.9 20.0 10.0 10.5 10.9Hilki. IttAt. 49% /n/ 261 233 127 104PC0Citit 17.9 19.2 20.7 16.3 19.0
1AULE 0-5.-..3PLCIFIC AREAS CURRENTLY IN SERIOUS NEED OF RLSUURCES, BY TYRE OF NUSEUNI UNITED STATES, FISCAL YEAR 1979
AK AS P. 011 0
{
Imo
kill
TM t* 0US1101
Lofl11-014 NS 60.4141. 0ISIURYPARKS AND .
9131I00CIMIL03
SC IL141,L I 3/ EC IAL 1 ILO
FACIL111tS 2.151 ;as 10 177 907 63 491 . 99PONA01 10 $tuSItt0s 15.n 21.11 33.4 20.2 6.0 20.0 22.6 20.40.016140.5 1.100 i$11 9 100 726 03 214 49FENCI 111 14 005f 004 7.7 9.9 7.9 13.9 9.2 10.9 11.0 12.2Wt. 2'374 12/ 30 215 1.131 07 432 120PERCENT $4 '1410 4md lo.o 02. 3 41.3 31.4 8.5 24.0 21.4 14.51441$4; 4.414 453 115 261 1.395 71 541 140PLACTul 1* 010Stimi ,16.1 lobo II 51.0 38.? 10.0 22.4 24.9 17.6

TABLE 0-6.....SPECIFIC AREAS CURRENTLY IN SLRIOUS NEED OF RESOURCES, SY GEOGRAPNIC RE410111 UNITED STATES, FISCAL YEAR 1474
AS NI taj 1111 At
(rtOGHAPHIC HIGIbm
HowI0 ATLAHT1E PLAT LAi(L3 ANDPLAINS
311DIoLAs; $40 Ahu Ut01InOES1
FACILI1IES 2,151 620 613 374 S45PLNCto1 s* AosfomS. 15.0 14.4 15.4 13.7 15.6P0110/Aws 1,360 340 41d 202 290
PLRELorolr mostop0., 7.7 7.d 8.1 6,4 6.4
SlAff 2074 82S 640 378 S3Spc' tii sof :11$31 UPS 16.6 *0.2 15.9 15.3 16.2
FIRWS 1,914 983 024 437 674PERCIA1 of m4y11415 roo 11.5 19.4 18.5 20.3
TABLE 0.7.- MUSEUMS WITH MEMBERSHIP PROGRAMS, by SIZE OF TOTAL OPERATING EXPENDITURE AND NUMBER OF NEMbENS,UNITED STATES, FISCAL YEAR 1979
141AL
IUTAL 111404106 LANA18111111L
el
fey, 44'145.441..
$54.1;41.AS0,601«4IS,044
175,041)140,404
1164.441..Ad44,460
8260,041,'130u,400
6144,601 -A440,044
14110E DIAN1400,440
1E4bLW1411,1114i4kAds 1, 446 1,44d eti$ 140 124 274 113 143 349
fork(041 lobo 42.4 11.1 7.S 5.1 11.9 4.s 4.1 14,6MOWER OF MENDERS
1 )54 pig WO WI 4e 43 :72 27 14 18PVdCfki 144.4 011.1 7.5 4.7 4.9 8.2 4.1 1.5 d.0
/51 SO4 dela 129 SS 3d 43 11 6 dBP1 1CL041 144.4 47.9 11.0 9.e 5.4 7.3 3.S 1.0 4.7
541 354 04 Ito 43 45 n 4d 9 6 16Pfhtillf }boo) Se. 1 Iola ilia 6.2 13.0 3.0 e.0 4,4
151 ilu )d 14 20 16 44 17 a 29FLULfhl 104.4 15.0 7.1 11.1 10.1 24.9 4.S 4.5 16.S1.001 - ),044 )44 - 47 1 6 6$ 23 $4 OSPFRLLot 304.0 - 10.7 2.8 2.d 25.4 9.1 1S.6 76.1
db . - It . 2 6 16 'IS
11 kik 10 $44.0 13.0 P.S 7.S 20.1 So.03.041 4.4P 6$ . . 9 . 6 3 6 PI1141.14I 144.b - 14.1 - 9.5 4.4 9.5 61.64.441 - 5.440 11 . . . . . 6 0 21PF4(1.41 ...... Ipp . . . . . 14.4 6.5 64,1AHHV1 leb )4 a . 7 4711(4(1111 Juno 10.1 .0 4.4 1.6 .- 5.6 b9.0
2 172' "
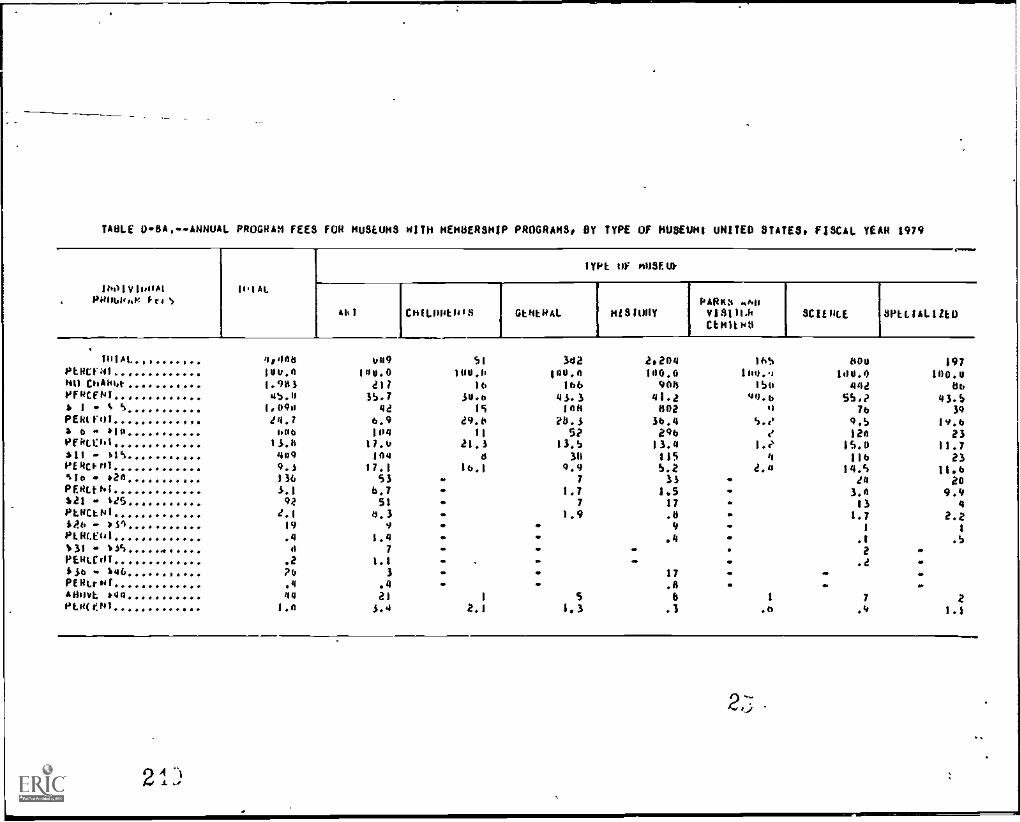
TABLE Q11A,»»AmmuAL PROGRAM FEES FOR HMOS WITH MEMBERSHIP PROGRAMS. BY TYPE OF NOSEOM1 UNITED STATES. FISCAL YEAR 1979
1NMV1NNA1PRMaii,..: Fr. )
IP141.
lyPt oF m114Et1'
.$1 chloptoils GENERAL.PARKS fthnvISIliit
CitlitN6KU HL( SPELIALlItO
Pilot . 4,408 049 51 342 2.209 165 004 197PLRCI;iI g000l 144.0 100.11 100.0 109.0 144.., 140.0 104.4NI) 091441. 1.943 211 lb lab 908 154 in BbPF9CfN1 45.4 35.7 $4.4 4$.3 41.2 40.0 55.? 45.5b 1 - S S 1.040 41 15 144 642 41 76 54PERtrol 14.7 6.9 29.4 78.$ 58.4 5.0 4.5 14.6A 8 » 110 006 104 11 5? 296 e 120 2314'9E001 1$.4 17.4 21.3 15.5 13.4 1.e 15.0 11.7s11 - s(S 544 144 4 38 115 I 114 23PI Rci N1 9.$ 17.1 16.1 4.9 5.2 2.q 19.5 11.4eta )20 136 53 7 15 - 14 204F01.4 h; $.1 4.7 - 1.7 1.5 . 3.4 9.9$21 $15 92 51 7 17 13 9PL4C01 1.1 4.5 1.9 .8 - 1.7 2.21a6 4,0 19 9 - - 9 - 1 I
PLOCEal .9 1.4 . .4 . .1 .5$31 - $35 . d 7 . . . 2 .PE41101 .2 1.1 - . .1S$6 . $44 24 3 . . 17 . - -4(111_,Nr .9 .4 - .8 . .Hint )04 44 21 1 5 8 1 7 214.4(041 1.0 $.4 2.1 1.3 .3 .8 .9 1.1
2-k;
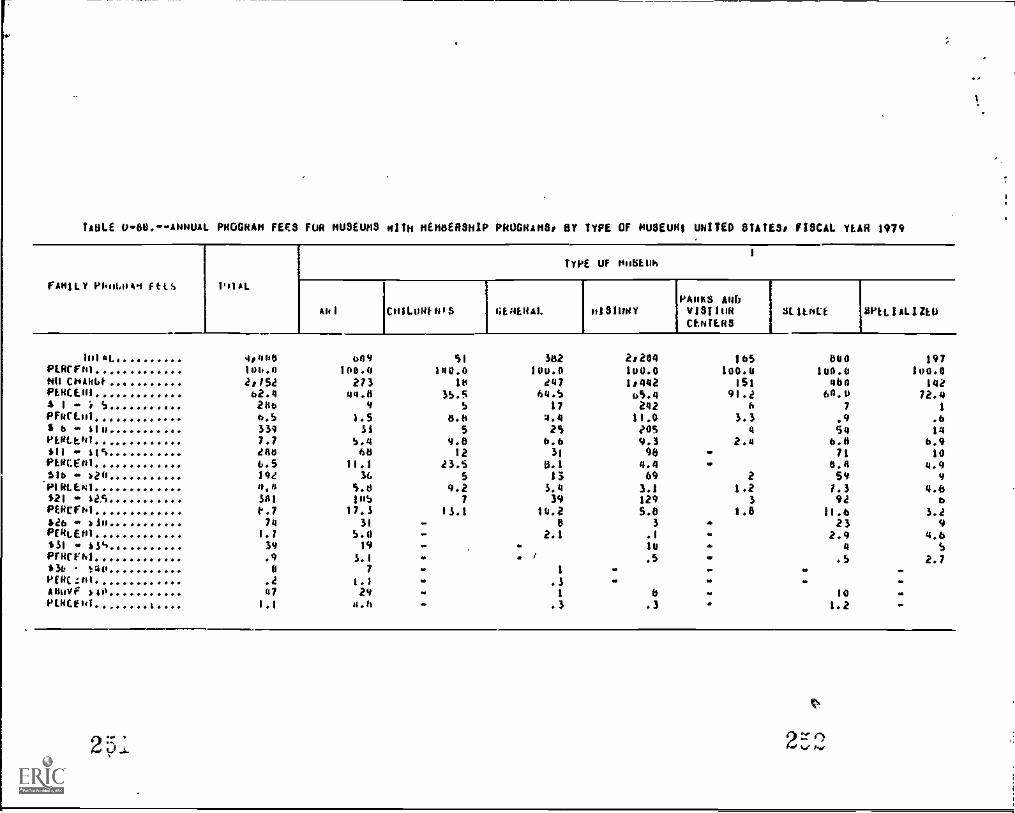
TAMA u-88.--ANNUAL PHOGRAH FEES FUR MUSEUMS HIM HEIH8ER3HIP PROGNAH16 BY TYPE OF museum wino STATES, FISCAL YEAH 1979
FAMILY Pki,1144 FUS 1.110.
TYPE Uf WISAPhI
Alt I C1111.01.11414 GENEHAL 41514KY1,448$ A4PvISI1uRCENTERS
8L1Lhit SPKIALIZIO
10111.
PERCF41Nil cwkw....pviumi* 1 * i 5PF411.41s 6 - 114110t4.41*11 - 115pinctil.. .
sib . ball.
.6,14tENI
$21 - 1451:14(fhl
426 - 'IN.PERLEN1151 - 13%',Mod*36 9.44
114C -41Milo* )40PLI1Cf41. ....
4,408144.02, 15262.42466.53397.7e486.519e4.4sal1.7741.139.94
.247
1.1
604100.427344.4
91.5SS
5.468
11.13.
5.8m17.5
31
5.019
5.17
1.129
4.6
Si140.0
35t.
58.6
59.812
23.55
9.27
15.1.----
--
382104.0247
64.$17
4.425
6.031
8.1135.439
10.2B
2.1-
- /
1
.51
.3
2.204
65.424211.0?OS9.396
4.469
3.11295.8
3
.1
10
.5-
-0
.3
185
1091:.!
6
3.34
2.4--
21.2
3
1.8.
-.
---..
800100.0444
01.47
.954
0.071
8.4591.392
11.623
2.94
.5-.
101.2
197100.0
14272.4
1
.s14
6.910
4.99
4.60
3.29
4.6$
2.7.
.
2p1
tst
2:-."°,,..,
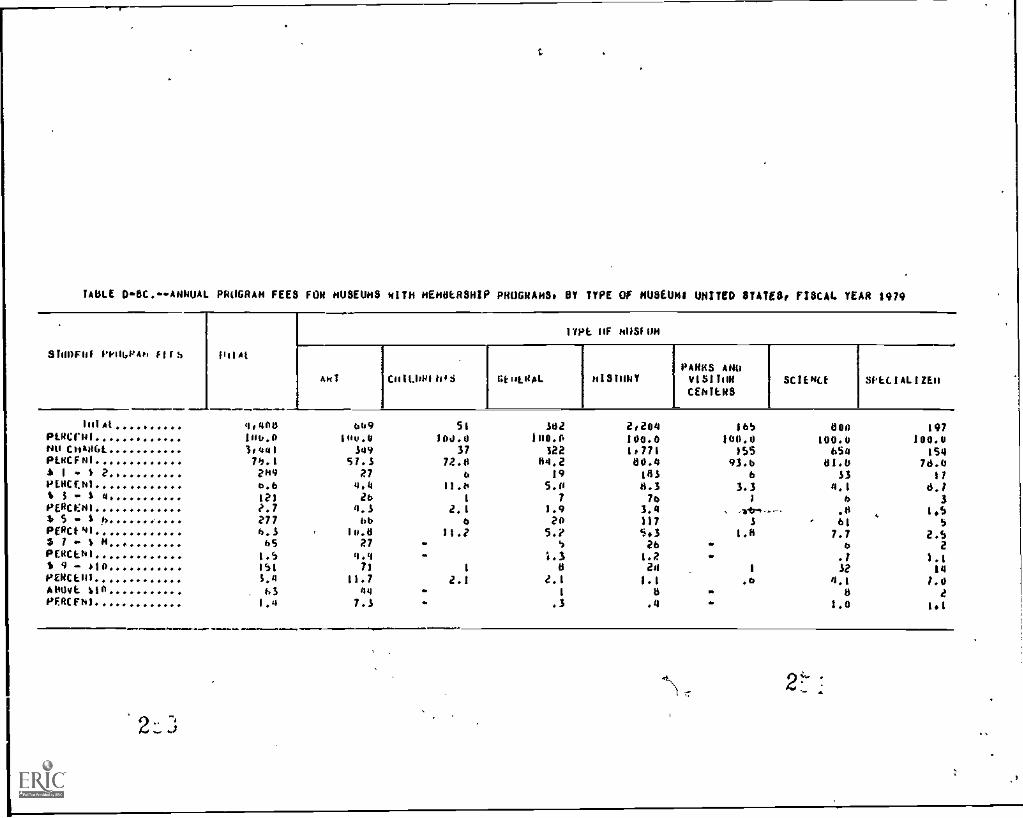
TABLE 0.41C41410JAL PROGRAM FEES FOR MUSEUMS WITH MEMBERSHIP PROGRAMS, BY TYPE OF MBSEBNI UNITED STATES, FISCAL. YEAR 1979
Sioffni PF14,0414 Ftrh PIM
Ifft 11F 401101
APIT CuILORIWS GIA4AL HI81111kYPAH88 AHOV 151111K
CENTERSSCIENCE SPECIAL12E0
!WM 4.400 6o9 51 SO2 2,204 16S 800 197Putcrop 100.0 1110o' 14.0 1110.0 100.0 100.0 100.0 100.0NU CsA061. 1.441 349 37 322 1071 155 654 154PEHCFNI 79.I 51.3 72.0 84.2 80.4 93.b 81.b 76.0* 1 .. S 2 249 21 6 19 18S 6 S3 11PEOCEN1 6.6 4.4 11.6 5.0 8.3 3.3 4.1 6.7t1w1 4 121 2b 1 7 76 1 6 3PERCENT 2.7 4.3 2.1 1.9 3.4 .0 1.5$ 5 S h 217 bb 4 20 117 3 , 61 SPERC1.41 6.3 10.0 11.2 5.? 5.3 IA 7.7 2.5$ 1. 1 A 65 27 . s 26 . 6 2PERCENT 1.S 4.4 LI 1.7. - 4 1.1S 9 - *10 IS1 71 1 8 24 1 32 14PERCERI 3,4 11.7 2.1 2.1 1.1 .6 4.1 1.0ANOVL X111 63 44 .
1 8 . 8 2PFACFN1 1.4 7.S .3 .4 - 1.0 1.1
2_3

r
/._c ---.....
TABLE DBli.*SANUAL PHOGRAM FEES FUR NUSCUNS.WITH NENSER11IP. PROGRA08, DV TYPE OF MUSEUN$ UNITED BUM, FISCAL YEAR 1979r
i
I
0110404 P6004001 141S
.IYPt OF AUSLOO
AR1 C1111.011081$
1
1,1310NY
101AL.. OOOOO ... 4.40u 609 Si 362 2,204PENCfN7 140,0 100.0 I04.0 100,J 100,6Nu CAAA6I OO 1.331 357 21 080 1,762PIRCEUI 75.7 S0.6 44,0 79-.4 00.111 I IS A8 9 7 1? 55PENCINI 0.0 8.5 13.0 3.1 7.5
S in.. , 234 30 9 23 110PENCF41 S.I 4.9 18.2 5.9 S,0$31 ng 39 12 0 S ISPLALFNI .9 J.0 2.9 1.3 .6 1
igto * 64 OO 290 77 r 17 143 /
PLOCterl bob 12.6 4.3 4,5 6.5 (
66$ - /5 IS 7 r 1 IS 1
PINILAT .0 -- -771676 Si 00 7 ' 5 « . .
10041,(:4r OOOOO . . .2 .7 - .i91 . 614$ ...... 166 311 5 13 51
PEOLIOI 3.6 6.3 10.0 3.3 2.304619( *los . 011 lY to 24 S5PERCOI A , n.0 12.3 7.0 6.2 2.5
PAP88 ANO0$81TOkCLNIER8
scst.Net-/')
t
fa
*
a
165shoo157
vs.a
1
.6
1
.6
l 800100.0576
72.0.3
617.6
1.947
5.9
1.i. I
. .3I 46
.6 6.15 4S
3.0 S.7
811CIALIZLO
....=111.1.
1971011.0
17689.3
2.0
I
.61
.6
1.4
1.1
14N-4.6
.4
1.9
2'7:- ..d
1
4

TABLE U.SE...ANNUAL PROGRAM FEt$ Pm MUSEUMS 01IN SE/48E0301P PROGRAMS, SY TYPE OF NUIIEUS1 UNITED STATES, FISCAL. YEAR 1979
SEN104 011113111,1016Rs0 11.t5
1111 AL
1YPE UF MUSE SO
101 coltoOtNi fiLNL444' DISIONYPAhk$ ANtI01$11014
CLIAILk$$C114C1 SPILIALsiLD
_._.-.
this'. lobo 049 Si 302 4304 165 1140 197
PEkerN1 140.4 140.0 140.0 100.0 100.0 100.0 104.4 104.6NO CostosE 4,047 495 45 358 .0,032 164 727 187ktRtiol 90.9 01.2 00.6 93.5 1:2.2 99.4 96.6 95.1
S 1 .. $ S iT4 56 4 lb 114 37 3
PFNCE41 5.1 11.2 7.1 4.1 hoz ... 4.1 Le$ b )10 141 44 S 0 at 1 34 6PrIMEN1 $.2 1.2 11.9 2.1 2.1 .6 4.2 2.0
111 .0 %1 20 11 - - 7 1 -Pf0C(61 .5 2.7 - . .3 - .1 -116 )20 .. 3 . . . 1 - - i 1
PINLFNI .1 .
*el » )2,1 . .
P1NLINI .. . -
.3- . .
. -
.1-_
.$
.
ST6 s$6lottt-N1.
SS1 - sS51,14c1o1
Sip -' )44
. . . . . . - .
. . . . . . . .
. . - . . . . .
. .14.111.1gt - . . . .
011111vi. 144 9 4 .. 5. -
ytkriol .2 .7 - .2 -. .
2.- '. 4
2-.,,.., j

TAM D11F.,«AMi4UAL PROGRAM FEES FUR MUSEUMS WITH MEMBERSHIP PROGRAMS, OY TYPE OF MUSEUHI UNITED STATES, FISCAL YEAR 1979
PA 1110,1 Plt064043 FtEs 1.11 AL
F*1:1 jChILOmENPU GINENAL
lypE 01 H0S111$
018111141
PARRS AND4181ToRCENTERS
0CIENCL SPELIALI20
IUTAL 4,000 609 51 302 2.204 165 800 197
MITC1141 100.4 100.0 100.0 100.0 100.0 1004 100.0 100.0
MO (MARIA 3,051 271 22 263 1.621 158 556 150
PLOCFNI, 69.2 44.6 43.9 60.9 73.5 95.8 69.7 80.2
* 1 - t SO 405 65 12 .30 315 1 54 9
PCOLLN1 11.9 16.3 22.6 7.6 14.5 .6 6.0 4.5
1 51 1140 415 112 11 45 173 1 66 8
tiftkiNt 9.4 18.3 21.2 11.8 7,9 .6 boa moo
Jim $1.0 25 11 4 4 5 1.
PLIOTNI .6 1.0 7.9 1.1 .2 - .i -
sit - 14,0 34 17 « 10 3 3 iPERC701 .0 2.7 - ,4 1.8 .4 1.1
1141 - *4411 114 50 1 17 15 .. 31 1
PINC,:ttl 2.6 0.2 2,1 4,4 .7 - 3.6 .6
401 - *640 145 xy - to 38 2 51 5
PcRcet los coN - 1.5 1.7 1.0, 6.5 0.4
MAW *046 142 47 I 14 29
Pf 10.E01 5.2 7.7 2.1 3.5 1.3 g. 4.7 7$
259 260

TAKE 0-0G.-ANNUAL PROGRAM FEES FUR MUSEUMS 01TH MEMBERSHIP PROGRAMS' BY TYPE OF MUSEUM; UNITED STATES, FISCAL YEAR 1979
111141m1S5/rompmmAloPP11644 .Lts
1t)si114.1 1PoS littithAL
TYPE sof ROSfuR
h1STOOVPARKS Amo9131'06CENTI46
6C1ENtt WiLIAL12ko )
luIAL 404K 669 $1 38? 2.204 165 tilols 197PtlaTmI loo.4 100.0 101.0.1P 146.0 100.0 144.0 160.6 104.4Ml gmA1.44 3.574 38, 13 313 1.636 159 064 177PERL1 NI 01,0 61.5 4.1 41.0 03.4 96.4 43.0 89.9I 1 $ $4 01 a$ 0 16 136 21 Ito
Pt$0.4 VT S.i 1.3 11.6 4.1 0.2 3.4 4,9$ SI 1100 "4 5/ 3 10 129 4 37 3orm(.1mI 5.7 V.4 5.1 4.7 5.6 2.4 4.6 1.3)141 10110 4.6 7 2 7 31 - 40
1
',Entail .... i.1 1.1 3.9 1.7 1.4 1.1 S)col #14,4 71 23 4 11 17 14 3Ft 0C101 1.6 3./ 6.9 2.9 .7 1.1. 1.71141 1644. ... 144 11 6 32 a 24 iPLR(fm1 2.4 6.0 1.1 1.5 I.? 3.0 0Aolmm 6610 liS SS 9 0 2? - 14 IPrimo II Z.4 9.1 1.2 a.' 1.0 - 3.1 1.1
4
262
261

1
141114 1180.ANNUAL PROGRAM FEES FOR MUSEUMS WITH HEMOERSHIP PROGRAMS, 47 TYPE OF MOSEU041 UNITES STATES, FISCAL YEAR 1979
Ofmkk PHOGRAr 1115 NIA
*ht 0'11.010 NIS 144E441.
I 111 OF MUST um
1.1161100
PARKS 46041161104CFHILKS
AL1LNCt SPtCIALt1E0
IOIAL 0, 08 004 51 341 2,204 105 640 197PLOC141 16,0, 100.1, 140.9 140.0 100.0 100.0 100.4 100.0Nil CHAIM 5te42 387 17 106 1,001 100 614 164PEALLNI. 7 1.6 63.6 /1.6 13.2 72.6 97.4 76.7 83.34 1 4 14,6pERCENI
LA,In.9
6$filo)
14ifl.i
$313.0
41214.6
1
1.279
9.913
6.51151 1 304 109 1/ 10 SA 10 U
Pttotsi 2.S i.8 - 2.6 2.6 2.S 3.04 301 4,6 9 3 - - . . 0 .
Pt ite,Eu 1 .2 .11 . . .0 .
$451 - i t.4o 121 33 It 31 1 37 h
PEKLF1-11 2.7 $.4 . 3.0 1.4 .0 0.0 4.14041 - $ 75o 0 e 4 aPEAC1h1 .1 .3 - .2 . - .
1751 1 10t, 3 3 . . . .
PLALEH1 .1 .4 . - . .
4941 11456 142 02 - 19 66 1 311 7Pf4([111 4.4 14.1 - 4.9 3.0 .6 4.8 3.34aphot tiugio 70 39 . 16 13 1 0 -
PLA1 01 1.4 0.3 - 1.5 .0 .6 .9 -

TABLE B..4A.....ANNUAL PROGRAM FEES FOR MUSEUMS WM MENDERSHIP PROGRAMS, 07 512E OF 707AL OPERATING EXPENDITURESUNI7E0 STATES, FISCAL YEAR 1979
IOTAL OPERATING L01001114411141141PM'.
0114L
tPP1864/00 ft(S
mint Al $25,441 $50,041 $1!),9111. 04.001 )eouo01 4344,001- 804E INAN1250:00 fb4.040 $75,000 11.04,000 $204,004 304.4, *400,440 4400,400
I11141 4.404 0" 104o SIN 365 264 545 173 150 463Ptiqthr 14 J.0 140.4 100,11 100.0 140.4 104,0 100.0 100.0 144.0 100.0No mow 1,983 6S 172 285 104 145 2414 68 1,1 226PERCL41 45.0 11111.0 42.9 49.3 49.3 54.1 53.3 39.2 34.6 27.21jis 1,41911 149 121 64 40 24 17 9 19PENCLN1 24.7 93.14 40.9 17.4 17.9 4.5 9.9 0.0 4,0
*11 046 11.4 129 54 50 90 30 30 43TIOCLNI 11.0 9.1 22.0 14,0 10.7 10.4 17.2 25.3 4.4ill /IS 109 34 2S 37 14 42 39 P9 143PfKCEN1 9, 3 1.6 4.3 10.1 5.2 17.0 22.3 19.4 10,01,16 1211 ...... 136 - 17 12 5 3 27 S 9 S9pEkup42 . S.1 .9 2, 1. 1.4 .9 4.9 3.0 6.1 12,721 12s 92 - a 14 9 ? 4 $ bt
PtICLt111.30
?,19 9
1,0-
3.7-
3.2.
.4-
2.3S -
5.3 10.96
PENCLN1 . .4 .5 - « . - 2.40 . 1.3*35 R - . - 3 - - 4
PLXCEN1 .2 - - 4$ - - t? - .0/3. f44 20 11 - - 3 . -141001 .4 .9 - - .5 'MIME 1.44 44 g . 9 9 5 5 13PEOrEtel P.O .2 . 2.5 1.6 2.7 /.3 2.$
4ft,,,,_
2°Jt-v
2°6

4.1
i
TABLE 0-90.-ANNUAL PROGRAM FELS FUR MUSEUMS WITH HEMBERSNIP PROGRAmS. BY SIZE OF TOTAL OPERATING EXPENOITURE;UNI1ED STATES. FISCAL YEAR $979
f1;41LY Push Ahr Ftt 3 I lulAi
1NT6L oPLNAIING fiulLmujima
NW*
-I-se5.. 650,40 5,000 $100.000 4200.000 6300.6441 - 145.401 115100.01 175,001 1164001 salmon'.0 6 0
$300,0416440,044
4114t. MAN$4u0,0011
los141. .. 4,404 oS 1,e46 514 165 209 545 115 150 46311141141 104.6 100.0 100.0 100.0 100.4 100.0 100.0 104.4 10u.0 140,0NO 01061 2,752 44 1,03 . 504 247 161 319 SO 63 170PLkethl he.4 100.0 70.1 66.4 61.7 59.8 56.6 47.4 41.9 16.7I 1 - 5 ebh . eSu 2u I 9 4. 3 - .
Pi knelt 6.5 - 19.1 1.4 .3 3.4 - 1.7 -
I 6 $10 119 - 165 bS 23 31 af, 7 4 $9
PL0CENI 1.1 , 9.2 11.1 6.2 11.5 4.7 4.0 2.7 4.1111 $15 244 - 77 5s1 20 24 50 aa 17 10PL0(141 h.S . 4.2 4.6 5.5 0.9 9.2 12.5 11.3 6.4116 120 192 . 15 06 112 9 39 9 21 32
Pik(01 .. 4,4 - .11 4.5 11.5 3,5 7.1 5.3 11.0 6.912 1 105 101 19 34 10 29 75 44 32 131PthCL41 . e .1 - 1.1 5.9 4,9 10,0 13,7 25.0 21.0 61,1146 $34 ... .... 74 . 7 - 4 . l' 2 5 4e11.6CLNI .. 1.7 - .4 ..- 1.1 2.7 1.2 3.0 9.0431 '35 39 . 2 - 11 1 11 1 5 14PL4(191 .9 - .1 - ?.2 .4 .6 .6 1.0 3,9/So 1.40 41 - « . « 4 2 - 2
PENcLN 1 ... .e - . - - .7 1.0 .. .4400114 $40 47 . . - 3 5 14 2 5 200114(f01 1.1 - . . .7 1,7 2.6 .9 3 3 4,1
2.'37 2C8

1
TAKE 009C.444UAL FROMM, FEES FOR MUSEUMS WITH MEMBERSHIP PRUBR1C1$31 BY SIZE OF TOTAL OFENATING EXPENDIURE1UNITED STATE3.1ISCAL YEAR 1979
11.11,11 OPEWAlitih EXPENWOHE
81414.41 PRIPGRAA tfts IO1PL
/---
Nom'
I
bi . sesomi 164,441. 375,601*. ,blootout- 3200/001. 33000)01. tipa THAN3/15,404 1S4,440 175,040 $190,044 ataataao 3300,440 401+0040, 3440,000
i /oTAI 4,444 '05 Itt41 574 36S e69 545 173 ISO 463PEWM41....... 100.0 3110.4 100.0 100.0 100.4 100.0 10001 100. 140.0 100.01.01 CH*061 1,141 65 1,55$ 445 251 227 415 lei. hS 278PihEtMl... ........ /11.1 140.0 $6.? 77.4 66.7 84,5 76.2 71.5 56.$ 60.0* 1 0. t 2 ea9 - 16e 4S 32 14 14 5 10 10PEOriod 0.4 - 4.0 7.7 8.8 5.0 2.5 2,9 6.3 2,1$ i .... 4 121 - 42 49 11 5 S . - 10PE0CINI....... e.7 - e.3 0.4 3.0 . 1.9 99 - . e.1$ S 4 b... e77 - 19 33 ao 10 72 30 eT adpo,(0.1... 6.3 - 2.1 5.7 11.0 3.7 14.2 ITO 17.6 6.03 7 t 0 ... 65 - . 11 4 19 9 5 24priiittil I.s - - - e.9 1.5 LS e.0 5.0 ft 5.1* 4 - 1.14... 151 - b 7 12 3 It a 20 OS1'L4c1-.N1 1.1 - .3 1.2' 3.2 1.1 . 2.2 4.7 1301 17.0AuOld. 10........... 63 - - 9 6 9 $ 5 sePE0LEN1....... 1.0 - . - a 2.5 2.2 1.6 1.8 3.3 60
270
2 %, D
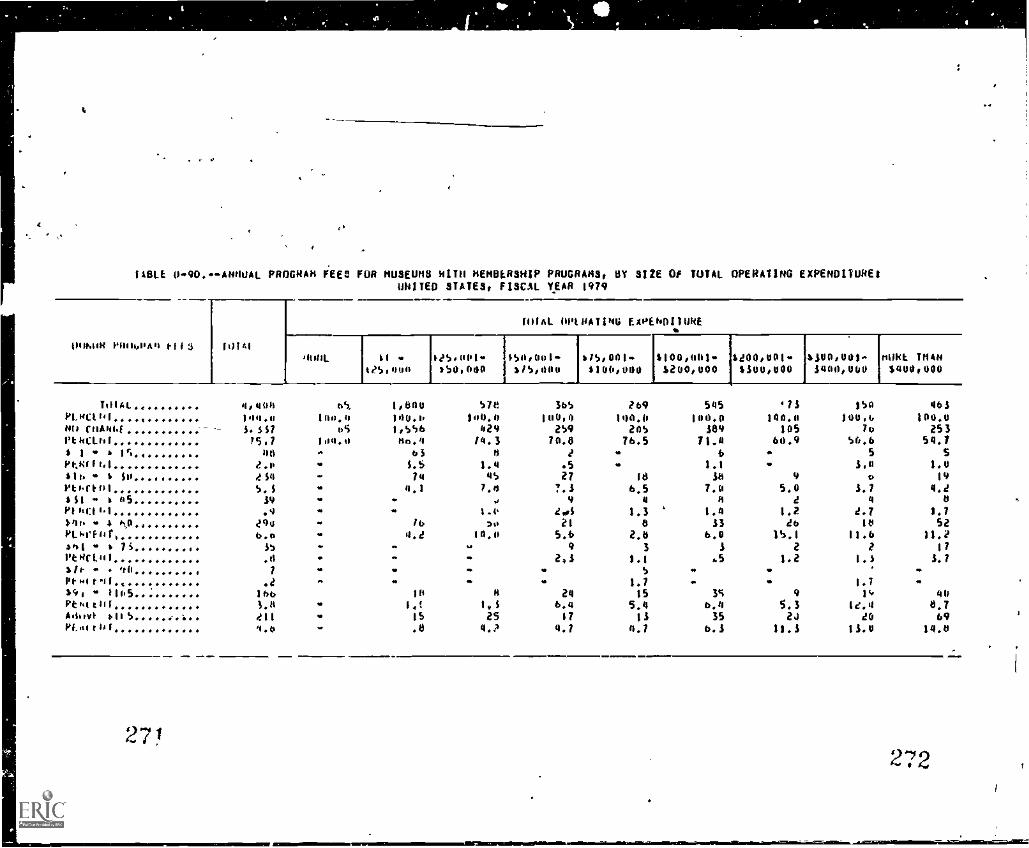
4
t
c 0
f
1110.1 4»90.--ANNUAL PROGRAM FEES FOR MUSEUMS WITH MEMBLRSHIP PRUGRAOSt SI' SIZE Of TOTAL OPERATING EXPENDITURESUNITED STATES FISCAL YEAR 1979
1411.104 141064A4 1-113 On AI
FHIAL 11P1ATINU CAPEN411uNE
41011 II
t150041e5441v'50.040 1
1
154,041-A/5,046
475,001 -1106,0011
$100,001.1400,000
$200,001 -$30u,000
>300,00I-%400,O40
t111111 THAN
5400,000
TOW. 4,444 05 1,60u 57e 365 169 545 71 ISA 463P1. I4C1111 104.4 140.0 140.0 100.0 100,0 104.0 100.0 140.4 100.6 100.0NO roANOf 1.S$7 05 1,556 429 2S9 ZOS 389 105 10 253114c011 15.7 100.0 46.4 /4.3 70.8 76.5 71.4 60.9 56.6 54.7$ I - t IC WO - 61 4 e 6 - 5 SPtloot.$ e.0 - S. 1.4 .5 1.1 3.0 1.0sih - $ 0 ..... 414 - 74 45 27 ITS 18 9 0 191014101 5.5 - 4.1 7.11 7.1 6.5 7.0 5.0 Ll 4.2s$1 - k 65 39 - . 0 9 a a 2 11 0pi 011 g'l .4 - . 1. t 2.0$ 1.3 4 1.4 1.2 2.7 1.7>4o - 4 /1,0 00 - lb ,t ?I 8 13 26 It 52Pihrfor . 6.0 - 4.2 10.4 5.6 2.6 6.0 15.1 11.6 11.1411 4 7S .. 15 - -
.. 9 3 I Z 1 17PeNc0#1 .0 - - .. Z43 1.1 .5 1.2 I.) SO>ft- - t0 7
. . - . S - -Pt Ho r ^II .2 - . . .. 1.7 - 1.7 -scot I105 166 IR 8 24 15 35 9 1', 441.1141011 1.4 1,1 1.1 6.4 5.4 6.4 S.3 12.4 8.7Aduv1 411 S - IS 25 $7 IS 35 24 20 69PLo1011 1.4 - .8 4.? 4.7 4.7 0.1 11.1 li.0 140
271272
1

IABLE D9E.ANNOAL PROGRAM FEES FOR MUSEUMS WITH MEMBERSHIP PROGRAMS, BY SIZE OF TOTAL OPERATING EXPENDITURESUNITED STATES, FISCAL YEAR 1979
ghlfilt I.111/01414040,40 111.S loin!
1111AL JP/ 041140 EXPENDITURE
1411141 $1 -1?5,004
$eS,441S0,000
550,00157S.p00
slbOalm$3°14°04
$ie4,aot-1.2o0,000
$200,001-4J00,400
$300,061.*4'0,000
MORE IRAN4006bUOU
11,1 Ai ... 4,468 bc 1,600 5/4 305 269 545 173 VW 463PEN 16I 100.0 1600 100.0 100.0 (00.4 100.4 100.0 100.0 100.4 160.0NO 01010 400/ 65 1.684 501 306 260 496 151 III 393PE4CE01 90.9 100.0 93.5 410.2 09.2 90.8 91.0 07.5 741.0 040S 1 1 S 204 * 06 45 23 5 31 0 16 $0Ptitctill ),I - 4.6 7.0 6.5 1.7 5.0 4.6 14.1 x".1S 6 - 114 101 - 50 12 12 4 14 10 10 $1
114(101 3.e .. 1.7 2.0 3.1 1.5 2.6 5.9 12.0 9.0S11 I. 24 - - 5 4 2 topoIrtli .s - - 1.4 - .0 t.e 2,9$1e $)4 3 - - - - 3roan; .1 - - - . . .r ... - 7s?' - $es - - - . . . - - -Pkkrtut.. - - - - .. .. .. ..
470 130 - - . - - - .PCHLthl . « - «$31 '35 0PLWC10I . - . - - - .
$in - 144 - - - .. - - .. - -PtIc(En1 - . - - .. .. .. -A0409E $41 V - 5 JPOrtri .2 - - - . .9 3.3 .5
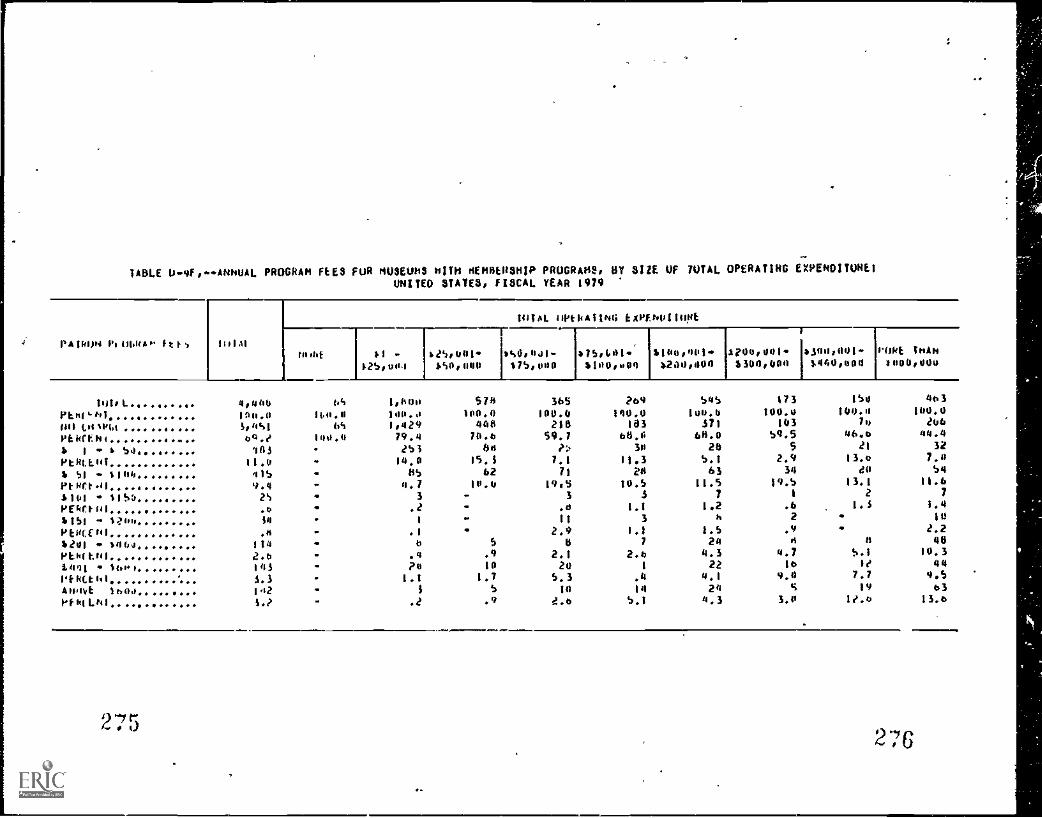
TABLE 1.19f,AMmuAL PROGRAM FEES FUR MUSEUNS NUM 11E1111ENSMIP PROGRAHE, SY SIZE OF 7UTAL OPERATING EXPEMBITUNEtUNITED STATES, FISCAL YEAR 1979
PA 119.11,1 Po 111.40$ 0 It 1, 1 1101A1
11004 I 11 25,401 0%4,4411/2504°4 650,440 675,400
tmIAL 11P(6411046 0111144,1100E.
0/50(0616100,004
6140,411162010,1144
i
1?04,441 0344,401.. POPE 00114$344,400 3.440,000 1004,400
Will- ..... 4,444 041 1,400 574 365 ?b'4 54S 173 154 403
P1 Kt 100.4 11.0.4 140.,0 100.4 100.4 140.0 104.4 100.0 144.4 100.0011 1,141461 ... ..... . %,1141 645 1,429 441 210 103 371 143 ho 246
PkkrtH,............. 09.e 140.4 79.4 10.6 59.7 66.0 66.0 59.5 44.6 44.4
6 I & 50 ...... ... 143 . 2S3 80 ?..t 34 26 5 21 32
10011180............. 11.4 14.0 14.3 7.1 11.3 5.1 2.9 13.4 7.11
6 sl 1140.- ..... 01y - 85 62 71 24 63 34 dil 54
PtHrt11 '1.4 , 4.7 10.4 195 10.5 $1.5 19.5 13.1 11.6
6101 11to 2S . 3 , 3 3 7 1 2 7
lofkr,t 111 .0 . .2 .d 1.1 1.2 .6 1.5 1.4*151 " 1>"" 14 - 1 11 3 #, 2 - 10
10E4E111 .0 .1 . 2.9 1.1 1.5 .9 . 2.2
6241 146,0.... 114 . 0 5 11 7 24 0 a 40
PLIfthml
118(161.-$.441 1000
APPOIA 1b011,1101.141..
1_
. . ,.
2.01033.3id21.?
-.
-
1.1?0.4
a3
1.7
.910
.44,
2.1
5.3
.1'0,
24
la
2.1,
50
.414
1
4.3
4.1
4.320
224.7
9.4
3.0
16
ifie.b
%.1
7.719
le10.3
13.0
9.S44
o3
2-712 76
.
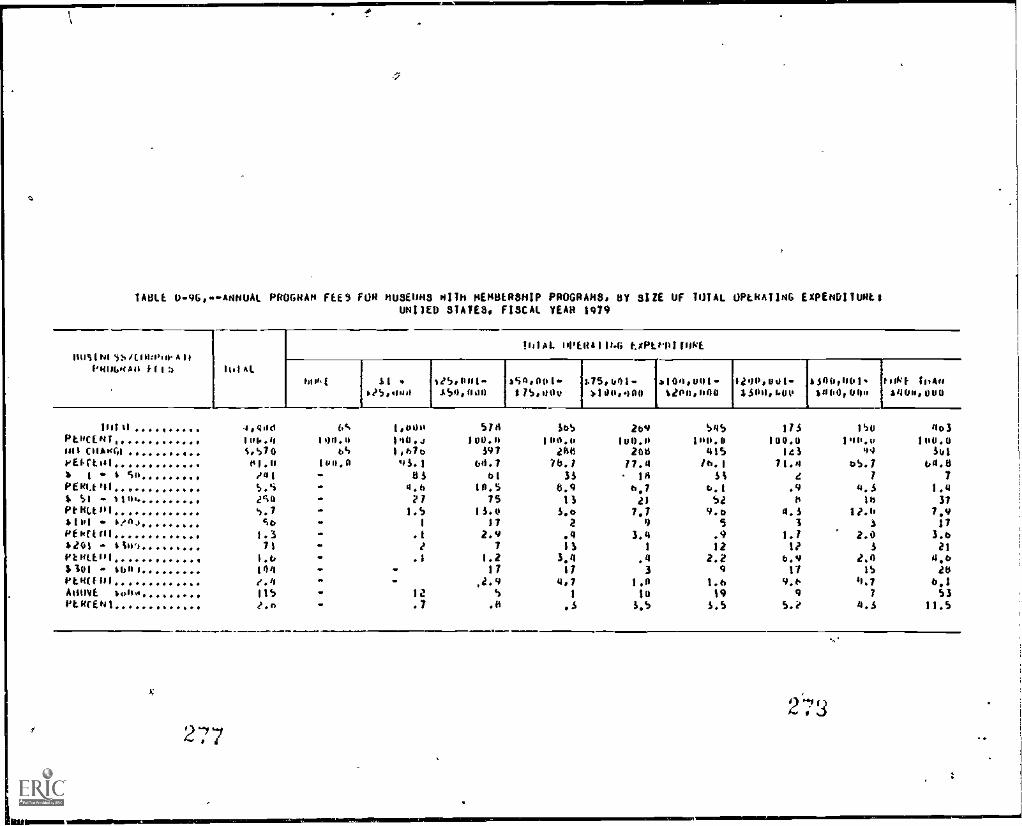
%
TABLE 09G,-411OUAL PROGRAM FEES FOR MUSEUMS WM MEMBERSHIP PROGRAMS. BY BIZ( OF TOTAL OPERATING EXPENDITURE..UNITED STATES. FISCAL YEAR 1979
00SINI1b/t110010.411p1to6o40 1.114 114 AL
IN1I11. WO/1111.6 EXPIPMIIMPE
611k t SI e.
425.1mg4/5,041-A50,040
4S4,001t/S.40v
S75,401b100.000
410m,u4112141,440
4i0,0014$000.0p
100,110118004 OM,
took/ 104uS4611,01/0
1111 41 4,1dd 4 1,644 514 SbS 269 545PL0CENI 100.4 100.0 10.4 100.11 100.0 100.0 100.0101 CfiA061 S,570 64 1,06 517 VIII 206 415PE14t01 01.0 100.0 v5.1 61.7 76.1 17.0 /6.1D 1 .- 4 So /41 - 115 bl 35 10 SiPE 01.1 PI 1 S.5 - 1.6 10.5 0.4 6,7 6.1$ SI - 4101. 2S0 - 21 75 11 21 52WILAIII ').7 - 1.5 15.0 1.0 7.7 9.D6101 - /04 Sb - 1 17 2 0 SPE 0/1 fl I 1.3 - .1 2.9 .4 3.4 .91201 tilo 71 - / 7 11 1 12Ptm(001 1.6 - .1 1.2 3,4 .4 2.2$101 460,not(tilf
101/.4
--
-.
17,2.9
174,7
3
1.0
9
1.6AotIVE 104 115 - 12 5 1 10 19PLRCER 1 2.4 - .7 .11 .5 5,5 5.5
IFS100.0
14171.4
.9Is
4.51
1.11?
6.917
9.69
5.2
1410
Iv0.6v4
405100.0
Slat
oS.7 64.11
1 7
4.5 1.416 37
10.4 7,91 17
2.0 5.65 21
2.0 4,6IS 26
4.7 6,17 53
4.5 11.S
277

I
TABLE 0.01...ANNUAL PRUGNAM FELS FUN MUSEUMS NM NENSER5NIP PROGRAMS, SY SIZE OF TOTAL OPERATING EXPENDITURE!UNITED STATES, FISCAL YEAR 1979
01 01 It P0111,0 All t 1 1 o--- II I 1A1
11061. OPEkAIING EXPENDITURE
misNL 11 +teatee9
80SP 44i.$50p 0110
150.0$1050°0
475,001 -
8100,:100
$100,0016E00,000
1200, 001 -
$300,0011$300,0011404 '000
6001 1/0INto00,000
1411 At
PEKEhl....... OOOOOONU (nalIGE.
PEKCtsT O$ 1 I ISO ...Pt8(tta$451 I 1100..1'E80111.......63/11 1 4'30.. ..
PEPCLulsus' - 1 4V4PENCtul$001 - $ 7"PERattl,/TS, $ "I)PEKIN 1$5001 - IleieP$OrtNTAfttP/E 191850Pergilli, e
4,448 ItS
1004.A 140.43.e42 o511.0 100.0n5/ .
14.9 -104 .
4.S -
9 -
od -121O./ -
6
.1 -I -
.1 -192 .
4.4 '74 -
1.0 -
10041041.0106400.P285
IS:it
0.5
.
b
.3
..
--
11
.6-
-
$74
1018:67.112$
22.111
2.2-
S
.0-.
345,012
Ede
36S
"IA:70.8
0712.9
9
2.S3
.7
236.2
.-
+-
236.3
3
.1
260100.021210.9
228.1
3
1.1
a0
2.6°
124.612
4.3
S4$100.0
73.5400
Sb
illi;
$.1:
5
.0IS
2.8-..
-IS
6.515
2.7
173180.0
11767.6
eo11.6
5e.7
.
-IE
7.0-.
-19
11.0-..
150100.0
7o50.3
$E21.J
a
e.J--
19
12.5-
..
6J./IS
10.0
4o10u,0
58.905
14.015
3.32.5341
7.J6
1.33
.S'5Z
11.215
3.1
TABLE 0-10,--140$Eums 111TH GENERAL ADMISSION FEES, BY TYPE OF MUSEUM AND TYPE OF ADMISSION FEE! UNITED STATES, FISCAL YEAR 1979
Itig 1 MOP 14Sitio Fit IiIIAL
,
/
ANI C011100606
TYPI III olt$LOA
41SIUKYl'AOK$ 606Y1811400CF01000
SCIOtt SPLUALIZEo
Ifilol 1,401 41 Et 9S 731 ES J10 121$10110.1 100.0 100.0 100.0 100.0 100.0 100.0 100.0 100.0
,-.$
FIATI4 0 1,PIS 69 IF 117 612 ES 30$ 117Pt0(001 .. 40.0 11.0 0E.2 91.6 83.5 100.0 90.7 91.0
SU061SItO I 160 4,0 0 o 1E1 0 4 4PthCLol 1004 08.4 11.0 0.4 I6.S .0 1.3 J.0
°..) .-4()". 1 If 280

TABLE 01101."018181007ION OF DAILY GENERAL ADMISSION FEES FOR ADULT NONNENDERS, DY TYPE OF MUSEUM, UNITED STATES, FISCAL YEAR 1979
Aol0.15 VITAL
Typt. OF 4USEU1,
ANT CHUOkfNey GENERAL kij SION Y
PAKKS ANOVISIlflk(141106
SCTE SPEOALILEO
10IAL ......PCRCEN1 .No ENANuE ....PERCENT$ .61 T. .50PERCENTi .51 - $1.60Pt.NCENT.41.01 $1.54 . ..
PEOI,EN111.51 14:00PERCEN142.01 14.09PeRCeN1....MAW 44.40PERCENT
4.440140.03.44409.52525.7497
11.32085.61404.?1443.11$ -
.4
'801100.4Sid
04.119
3.139
8.419
$.1IS
2.48
.9
0
.
-
51100.6
30t9.3
4
8.07
11114.3
7
I
2.11
2.1
SiSe
100.0290.
751022
5.63280IS
3.8143.7
7
1.93
,6
igii1567.1297
13.51804.9OS309b5
2.99
.4
$851044
144407.8
51.0
3
110
7
.1.9
7
4.2D.
004100.05i4
88.419
2.494
11.7857.054
8.039
4.9a
,..
.4
1971804
39.027
28::::35
5i.i
2010.1
2
1.1
0
7018LE 0113.DISTRIDOTION OF DAILY GENERAL ADMISSION FEES FOR CILD NONMEMBERS, BY TYPE OP moms ONI7E6 STATES* FISCAL YEAR 1979
LOILVOIO 1014L
TYPE OF 40$EUN
Me/ Coli4140$0 GENERAL N1$111RYPARKS ANDVISITORCENTERS
311110E SPECIALIZED
1.
1101 1 4.448 009 Si 342 2.204 165 800 197
PERC101 . 140.0 100.0 100.0 100.0 180.0 100.0 100.0 100.0NO CNARGE.... 1.437 544 SS 334 1.701 w' 154 590 99PERCEN1 74.0 89.4 69.8 82.1 77.2 93.3 73.7 50.j$ .01 1 .15 264 21 3 22 185 1 40 17
PERC1Mi . .. 8.1 5.4 5.4 5.b 7.5 DO 5.0 0.8s .ee, .S4 SU IS 3 28 191 4 88 34PINC11.1.. 7.9 4.0 .^ 5.9 7.2 6.7 2.4 8.4 .48.4I .51 1 .7S Ilg 0 2 5 SS e 44 0PERCF101 « 4.7 102 4.3 1.2 2.4 1.2 50d 4.0t .76 - 11,04 159 9 4 14 81 2 44 29PC4(141.. S.b 1.4 8.2 2.b 2.8 1.2 5.5 14.0 "WO 11.40. 70 3 3 5' 33 e 17 12PERCE41.. 1., .5 8.1 1.4 1.5 1.2 2.2 8.0
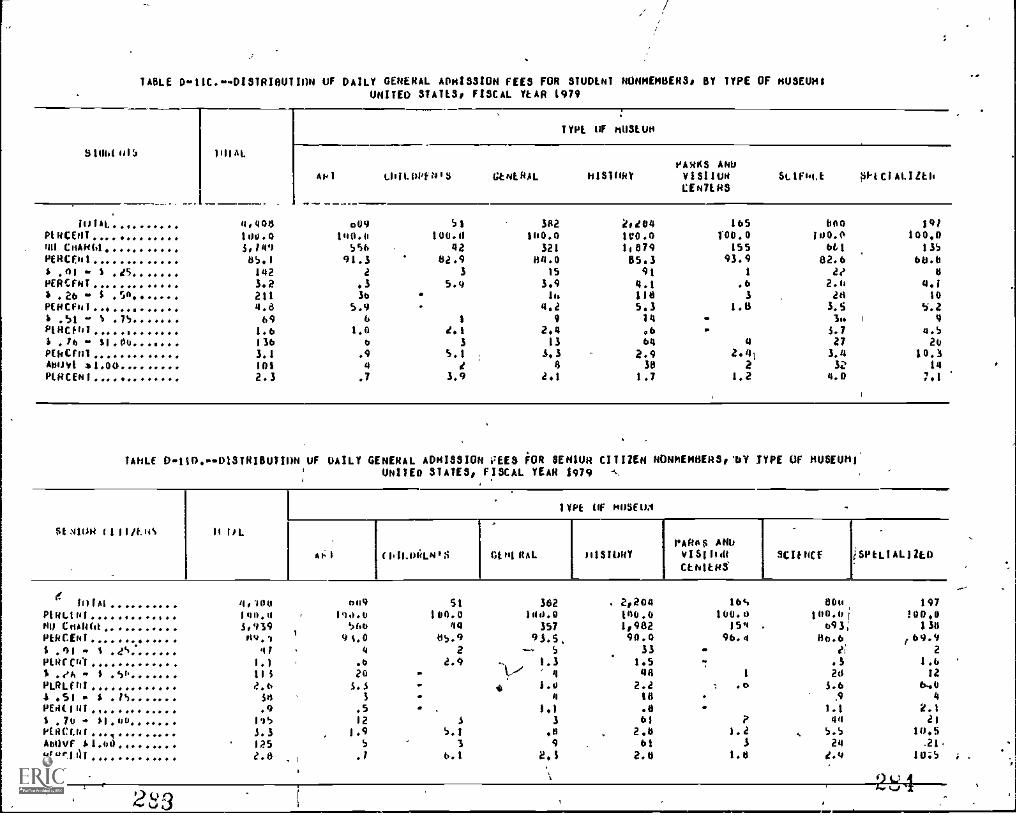
IA8LE 0-11C.»DISIRIMIIM uf DAILY GENERAL *MISSION FEES FOR SIUDENI NONMEMBERS, SY IYPE OF mUSEM$UNITED STARS, FISCAL YEAR 1079
S1111111115
1
illIAL
1701 Of nUSL1.60
1,466$ 490All LIIILDPIWS GENERAL 11161oRY Millig St1fLE 61104112E6
CENTERS
WIAL.... 9,406 009 51 382 2,04 165 444 191P10(E0i 100.0 100.0 100.6 100.0 1e0.4 1'00.0 1o0.0 10001fin Co0161,....... 30140 556 42 321 1,079 155 6t1 135PERC(010000.0000.000 65.1 91.3 82.9 64.0 85.3 93.9 82.6 60.11
S .01 . 1 6. 142 2 3 15 91 1 2? 6OERCF61., 3.2 .3 5.9 3.9 9.1 .6 2.8 9.1$ 26 a. $ S° 211 36 - ift 116 3 28 10PWCF611... 00000000 4.6 5.9 4.2 5.3 1.8 3.5 5.2S .51 - $ .75 69 6 1 9 14 . 3o 1 9P1HCfNI.......... 1.6 1.0 2.1 2.4 .6 a 3.7 4.5$ .70 - 11.04.. 136 6 3 13 64 4 27 2011111(F01 3.1 .9 5.1 SO 2.9 2.91 3.9 10.1400141 61.00 101 4 e 0 38 2 SZ 14
FIRCE611 2.3 .7 3.9 2.1 1.7 1.2 4.0 7,1
IANLE D-110-DISIRIOUTION uf DAILY GENERAL ADMISSION FEES fOR SENIUR CIIITEN NONMEMBERS, 114 TYPE OF 11uSEumi.UNITED SIAM. FISCAL YEAR 1979 -k
$1 :11UN 1 $ 11 /1-.14% 11 In.
WE OF muSE08
At; I (01.0h0i$ 0101 NAL 11161097OOS AMPVIS'Igat
CE611E0a9(1114C1 iSPELIALITED
e011A1..... 40404 609 S1 362 2,204 16S 00u 197
P190811........ o 169.0 190.6 160.0 198.0 190.0 100.0 160.0t 1000MU CO1116t.. 3.939 566 44 357 1,982 159 . 693; 130istmcE9I..... n0.1 94.0 65.9 93.5, 90.0 96.4 06,6 ,69.9$ .01 - $ .25.. o If 4 2 -.. 5 33 .. 1'it(0...... . 2.4 31. 1.5 '7 .5 1.6I ,eA - $ .sr... o 11 3 2 0 44 1 2d 12001(41 2.6 S.S - 14 10 2.2 .0 3.6 6-.04 51 - S .14.. 38 3 - 9 16 .9 4emilli .9 .5 - - 1.1 .8 1.1 ki1 11010 . 11 105 12 $ 3 61 40 21.P0001..., 3.3 1.9 5.1 .6 2.0 1.2 4 5.5 10,54101vF 11.00.. 125 5 3 9 61 3 20 .21,Pr0colt 2.8 .1 60 RS 2.0 1.11 2.4 16;S
23LOV

TABLE D.11E,.. DISIR180TION OF DAILY GENERAL ADMISSION RES FOR GROUP NONMEMBERS: by TYPE OF MUSEUM, UNITED STATES, FISCAL YEAR 1979,
OROOP 4S0. 11410_
lypt OF mN$L104
Ali I COLOOLNIS GtelEkat. SLIENCt SP1.1. IAL 1 ILD
INIALFIRCI41NO L11AN6!PEOCFm,$ .01 - 4 esPIRCEN14 .28 - 1 .5011McSNI$ .51 -. I .75PERCCUI6 7h -.61.00PLKCCNTAmyl 11.000111(441
4,4481114.0
3,76505.4
791.8WI2.6I ?0
2.7104l.54205.0
044144.4S72
94.011
1.710
lob3
.45419
1.4
SS
140.444
79.04
6.93
5.11
2.12
2.9a
3.9
382100.0
33408.6
306
1.60
4.19
2.417
4,5
10
4,200100.01,091186.1
291.354
2.449
2.262
2.81135,1
165
100.4154
95.1$
-.
3
1.41
.6--
7
4.2
440100,4047
80.940S.5 .
273.438
4.715
1.945
5,6
197
100.0114
58.05
0.512
6.422
11.0to
8.420
14.2
TABLE 0.01F...*DISIRMUTION OF DAILY 6LNERAL ADMISSION RES FOR OMER NONMEMBERS, BY TYPE OF NOSEOM1 UNITED STATES, FISCAL YEAR 1979
411441.Ph OF1AL
AN 1 (411.14ON'S
--I
I ;LIILkAL
tyPt Of MUSEUM
PARKS AROHISTORY VISITOR
CINILI1SSC UK! 41-.LC IAL I st 0
1111 AL
P MCFNI0 CNA061Imam,4 1 4 .ePERCH,,4 4o - 4 .50P1.41 UT4 .SI - S ./S ...P LRCERT$ .76 - 11..,0P CRCLNIAioNft 61.40PERCF41
jt. -
---C77.,:tr-
4,400100.44,21345.0
4
.2831.4to
.a38
.4751.7
-
-
.
4149
104.004144.0
1
.z
.7
1.1
*I
SI100.4
4640.0
35.!
e4.3
OD
MI
41
3821000
37197.0
2.52
.s0
2.0
2,204140.02,111.96.0
7.330
1.11-.
7
.394
2.0
Ar
105140.0
15094.5
1
.66
3.62
1.2
1104
100.4729
91.11
.1
34
3.77
.923
4.0ti
1.4 I,
197104.0
19490.4.
.-
-
.
IS
e1,1
-:!i.,:fl../ 17

TABLE D!2,tOTAL OPEMAIING INCOME, By cutomm OF MUSEUM AND SOURCE OF OPERATING INCOMES UNITED SIAM, FISCAL. YEAR $979
CO0101oL 1411.51it1111114 '111 AL
IENtRALW14E080E91
5161L4114L100.801
LOCALhuVEHNN01 FOoNDAIION3
"IMP'AM ONS
INDIVIDUALCL01101501..
OHS
FANNEDINLO*
IIIMLN
SoUNCES
101AI 1.000.406,033 in7,744,726 1e6,466,172 107.790,795 45,b$9.366 25.904,160 97,097.193 459,712.064 47.721.337PENCENI 160,0 13,6 11,6 17.5 4,2 e.4 a 4.3 42,2 4,4NON.PNOFI1 634,4e7,584 51,501,160 24.708,595 77,244,710 39,405,092 23,045,750 40.650065 359.991.480 e2,340.120PINLEN1 100,0 8.1 3.9 12.1 6.2 3.6 6.4 56.2 3.5MUNICIPAL
61141101.401 1e4,654,932 4,443051 6,679,393 66.475.997 1010.237 588,917 1,285,482 41078,986 3,491,069PER1181 100.0 3.S ..",.4 52.9 .8 .5 1.0 33.2 2,5COUN1Y 610400141J11 $6.090,310 1,327,174 245,510 24,160,025 356,100 35,54s 795,567 9,017,197 674.109PEk(ENT 100.0 3.6 .7 65,5 1,0 .1 2.2 25.e 1,8SIAN POYEININE111. 104.001,390 4.5d0.909 71.541,349 2,024,174 1,586,036 1,06,365 417.151 23,256,005 365,350PFrIcENI 100.0 3,4 68.7 1.9 1,0 1.0 .4 22,3 .9FEDERAL
600E884E43 0404600 70,574,504 2010,412 1.340,311 596,974 211,070 667,297 4,260.949 1,407052PERLIN! 1000 07.6 2.9 1.5 .7 .2 .7 4,0 1.6PRIVATE
ELEHLomeit,SECONOAIYSC om .. 310,000 0 0 0 0 0 0 330,000 0
PLI.CENI 100.0 .0 .0 .0 .0 .0 .0 100.0 .0PNIVAIE ENL1E6f/
UNIVENSIIY 21.555.218 2.120,365 519,000 50,446 494,940 '4 ,465 1,455,000 5,303,279 7,500,120PLRCENI 104.0 9,9 e.4 .2 2.3 i 4 9.1 38.5 36.2PUOL1C 301..i1IL
DISIMIC1 5,062.413 99,305 13!1,009 3,059,915 176,045 0,600 43,030 954,515 b7,.493PEN(ENI... 160.0 eo 7.4 60,4 3.5 .1 .9 19,5 11.3PURL IL LuLLE6f/
10114E8511Y $9.314779 4,500,715 12.440.119 184,574 037,213 553,711 900,793 6,170,276 h,154,066FWENI 100.0 13.0 37.6 .5 2.4 1.6 2.6 18.0 23,0Lo0NeN up
OLOONINAiloNktG10010 1Oet,A44 $53,016 10,298 179.700 0 0 4 185,066 1,190,500
PINLEN1 100.0 0.6 .4 7.7 .0 .0 .0 0,0 77,3INVOSIP1ALCONPupoim 944047 0 444.697 0 0 0 0 0 0
PERCENT 100.0 0 100.0 .0 ,0 ,0 .0 .0 .0PREVAIL
1001411.4AL 6,U0 0 0 0 0 0 0 6.120 0
PEIELNI.. . 100.0 .0 .0 .0 .0 .0 .0 100,0 .01110EN i0,071,e6s 1, 51.4,020 6,041..046 13,569,537 389,051 81,240 351,971 0.256,978 5.109,64ePENCL41 100.0 4,H 11.1 45,6 1,4 .3 1,2 21.0 3,9
287 288
.4
r:
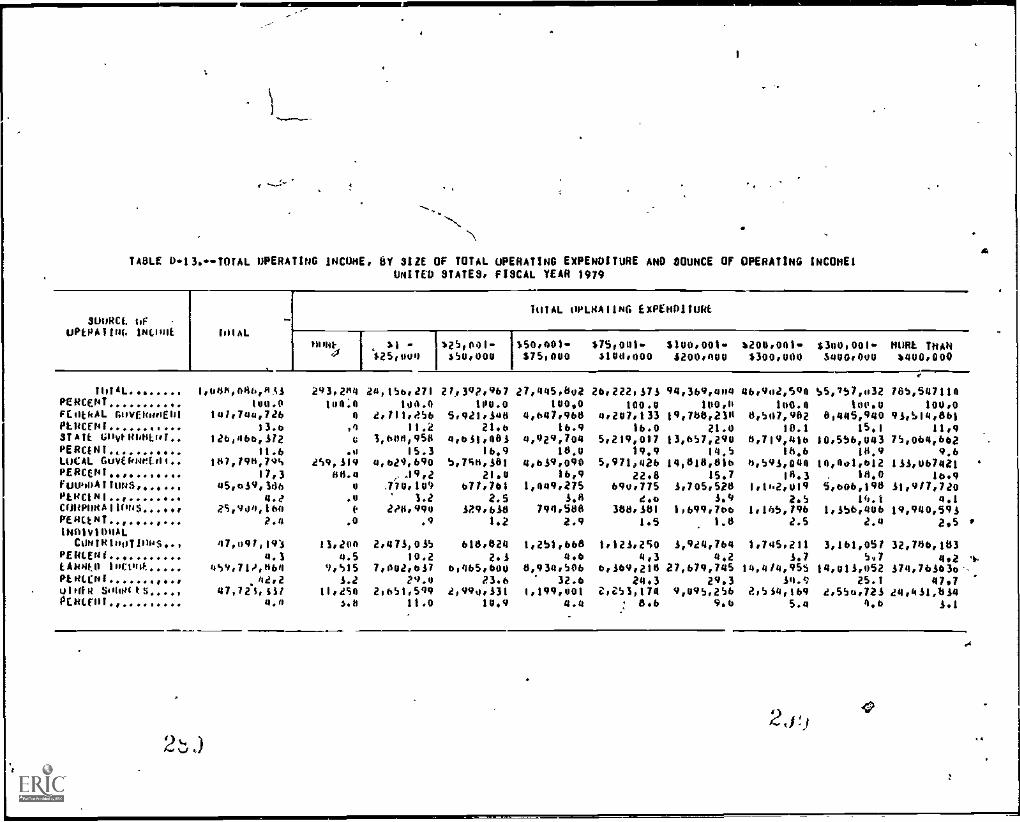
, .....:
-.......-....
1TABLE D.13.- -TOTAL OPERATING INCOME, fiY SIZE OF TOTAL OPERATING EXPENDITURE AND BOUNCE OF OPERATING INCONEI
UNITED STATES, FISCAL YEAR 1979
.
SOURCE, uFuPEPAIIN6 !Non* WM
IOIAL 11PLNAI1NG EXPENDItURE
11101,11-i -
$251ous,25,641-350,000
$59.601$75,000
$75,001-31011,000
$100,001-8200,400
6200.041*4300,000
$300,001..5400.004
MORE THAN6000.000
TOTAL. 1.0911,046.AA1 293,204 24,156,271 21,392,967 27,445602 26,222,171 94,369,404 46,902,594 55,757,032 /85,547114PERCENT 140.0 104.4 104.0 104.0 1100.0 100.4 100.0 100.0 140.0 100,0FEOtkAL GulakollEni 141,744,716 0 2,111,R56 5.921.140 4,647.968 4.207,133 19,760,2181 0,507,982 8,445,940 91,514,861PLOCENI 13.o 4 11.2 21.6 16.9 16.0 21.0 18.1 15.1 11,9STATE GOORHOLiff 126,466,172 it 3,600,958 4,611,481 4,929,704 5,219,017 13,657,290 4,714,416 10,556,443 75,064,662PERU NI 11.6 .1 15.3 16,9 16.0 19.9 14.5 lh,6 10.9 9.6LOCAL GuvfloNeLNI 1 07,790,74% 254,119 0,629,690 5,750.181 4,614.490 5,9710426 14018,016 6,541,044 14,401,612 111,067421PERCENT 17,3 00.4 A9.2 21.0 16,9 22.6 15,7 16.3 . 10,4 16.9FOU404INHS ....... 45,619,1db 4 .770,109 671.761 1,449.275 690.775 1,705,520 1.0.21019 5.606,190 11.9/7.720PLRC1NT ... ,,,, 4.e .4 1.2 2.5 1,0 2.0 1.9 2.5 14.1 4.1COUPOKA11141$ ...... 05.944,164 C 200,494 129,60 799.500 360,10i 1,644,706 1.10,146 1.156.496 19,940,591PEREVIT ........... 0.4 .0 .0 1.2 2.9 1.5 1.8 2.5 2.4 2.51$011110HAL
CO4W100111145.., 47,09/,193 11.206 2.471,015 618.024 1,251,668 1,121,250 1,924,764 1.745.011 1.141.051 12.766.161PERLEN1 ... 4.3 4.5 10.2 2.1 4,6 4.3 4.2 1,7 5.7 4,2 4EANN0 loscouf W19,710,064 9,S15 7.002.617 6,465.600 6.934.506 0.169.210 27,679,745 14,4/4,955 14,011,052 174,761630-PL01.(141 .42,2 1.2 09.4 23.6 32.6 24.3 29.3 14.4; 25.1 47.7uttli i/ S11111" t S 47,721,11/ 11,250 2.651,599 2,990.131 1.199001 2,251,174 4,445,256 2,50,169 2,556,721 20,411,810Oconrot... 4.4 $.4 11.0 10,9 4.4 : 8,6 4.6 5.4 4,6 1.1
9 14., ,.., .1
43
Ai

a
.Y
JTABLE 0.44.--TOTAL OPERATING INCONE, BY GE116RAPHIC REWON AND SOURCE OF OPIRATINO INCOMES UNITED STATES, FISCAL YEAR 1979
hooNct 111
UPLRAI1NN INCO*4 1nTAL
GIONNAPHIC kr01UN
WNW A1LAtl1J 6RLAT LAOLS AnnPLAINS
SOUTHEAST NM AND SUOIHNEST
101A1. 10018.486,055 410,216,836 273,243,606 146,209.393 25u,Aaa,ettepi:NO.41FF41-4AL 1.10.14nutN1primtNtslAlt wf144.40t....prkwil.." .
104.0147,744.726
11.6126,466.572
11.6
164.474.00S.73$
18.156.691.01
n.9
100.020,160035
7.436073,746
13.5
100.020,049,833
16.421,781t081
14.9
!twoeo.000,3as
tt.o38,117,891
12.0LULA. 6110$4;41111.... 1071198,736 49.487,A17 59,220.54r 28,284,957 50,873,661PLIICEHI 17.5 12.1 21.7 19.3 19.7FOOtinAtioNt; 4,3.639,506 17,b20,130 14.983,576 2,963,411 14,144,269pfliLENT 4.2 0.1 4,0 2.0 5,5CONPONAIWNS 2b,944,100 10088,634 7,32t,245 1,763,630 4,016,62SPFACEN1 d.4 2.6 2,11 I.2 2.3IHDIVIPnAl.
. EOn11.14)011onS.., 47.447.1675 20010,458 a 10.086.37S 3056,994 ;1037,seoPilot's! 4.3 5.0 4.0 204 4.6LARnLO 1$400E ... 459, 712,K611 105,359,216 113.018i867 57,846,404 14b,488,7/6PENCLNI 42.2 44.7 41.4 S9.6 40.8*d11114 $st1J10.11) 47,723)337 16,038,197 14.570019 5,717.58S 9,576,936KRUM . 4.4 4.4 5.3 3.9 3.6
II
291. 232

;7-
TABLE 0-15.--01sTmlooiluN OF OPERATING txPENUITURES ACROSS PROGRAM AREAS, BY CoNTROL OF 01o3foA, WITCO SLATES, FISCAL YEAR 1974
ANFA OFtOt4411441 110141.1/
NNN
TOIALEx101.44114613 Z/. 1,445,21/ 590,415
1110.1N1 140.d 140.0CoRATUNIAL 128,413 07,404PEREtNI 12.4 11.3ExH1dlis 130,5014 72,633PCNCiNI 13.6 or.dCu4SEN9AII1" 48,3/4 24,4730ENCtol 4.8EVOCA1144 146.177 61,4166.
PERCLN1 14.4 11.401:4(LOP4t4t 19.191 14,320PENCV4I 2.4 2.401(4411014111 10,74/ 15,026PERCE1 1.9 2.5Potitit iNf4444t104 40,44d 26,1010PLMUNI 4.4 4.4PAID Apvt4110146 16,425 it670PfOCFRI 1.6' 1.3SECuRItY 115,650 32',406
5.5 5.4Ofeat4AL
4001NISINA1144 494.../35 120,064
PENCEN/ 19.9 21.21111L111141 P$60
1461111LokOri 1119,49e 104074PiocE0I 10.9 17.4ofuIR ARrAs S90b9 S6,951PENCFI 6.a
ttONIL"
IF At.
GINOtit
coNyttot of losttiUt1114
PRIVATE CHURLH/Ca041 Y 3141E FMK**. ttAREN 1181110f Hunt. IC PUOL1C HtNN 10040.. P414AItGOWAN. 41141014» GMEHN 10y/ COLLEGE SCHOOL CflttEGE 1111411. 11441Ht NT HtNt HEN1 won. 1101111.R U13 /1141 IUNAL CONNOR VIOUAL
DANT SlTY IRICI YENS1Ty 614110P AtlONSCNI)I)L
111,782 31,44)4
100.4 100014,545 6,601
9.4 10.129,601 5, 792
22.0 15.510,445 1,119
9.3 3.00,044 4,123
7.11 11.02,557 451
2.3 .11.227 441
1.1 1.22,549 716
r.s 1.91,355 Su
1%4 .1
6,247 2,191S.o 0.1
17.1.7215.8
24.31414.2
5.5555.6
06,548100.011,192
12.69,09318.3
4,0264.5
11,01312.4
1,1401.3564.6
4,7145.3
1,0461.2
0,0140.8
5,752 17,05515.3 19.4
6,344 19,505ad.s 22.01,014 3,201
4:tt 3.6
1.185,309 335 2a,199 5,175 30,575 1,030 1,454 4 25.304144.4 100.0 1110.0 100.0 106.0 104.0 100.4 100.0 100.0
14,289 67 4,965 191 7.752 265 351 0 2,1'24
19.15,756
26.004
22.42,444
7.6447 5
15.7 20.0O
.00
9.63,041
6.7 ./5.0 13,3 8.6 17.3 .8 .0 .0 15,25,97t 34 755 36 913 tS b 573
7.4 10.0 3.4 .7 3.0 1.r .0 140.0 2.37,610 511 2954i 2,106 3,9673,967 -" 9 0 738
8.9 15.0 11.4 41.0 13.0 .9 .6 .0 1.9330 4 369 19 537 0 0 0 440.4 .0 1.7 .4 .4 .0 .0 1.4
223 0 421 14 315 1 0 0 472.3 .0 1.9 .3 1.0 .1 .0 1.9
4,017 f. 602 150 1,063 4 0 2634.7 .0 2.7 3.1 3.5 .4 .0 .0 1.064 0 24 139 0 0 0 001 .0 .1 .1 .5 .0 .0 .0 .1
4,109 44 1,130 2111 lenice 1 0 0 7324.9 11.0 5.1 4.2 5.0 .1 .0 .0 1.9
15,945 27 5.299 731 5,1454 440 654 0 4,17918.1 4.0 23.9 14.1 19.1 34.6 51.0 .0 10.5
23,170al.?
309.0
2,55411.5
83616.2
1.7405.7
'alIa.',
25110.0
0.0
8,29432.0
1,7302.4 .0
5802.6
1563.0
1,2e34.0
19418.4
0
.00 3, 4S5
13.7
1/ » 01F10S 1.0o0t 1.th 011.1.1o6 14114A31, 401 III 140440INGa/ . 10 11010sAch;; ',f Ifritl.t 414S
2'1
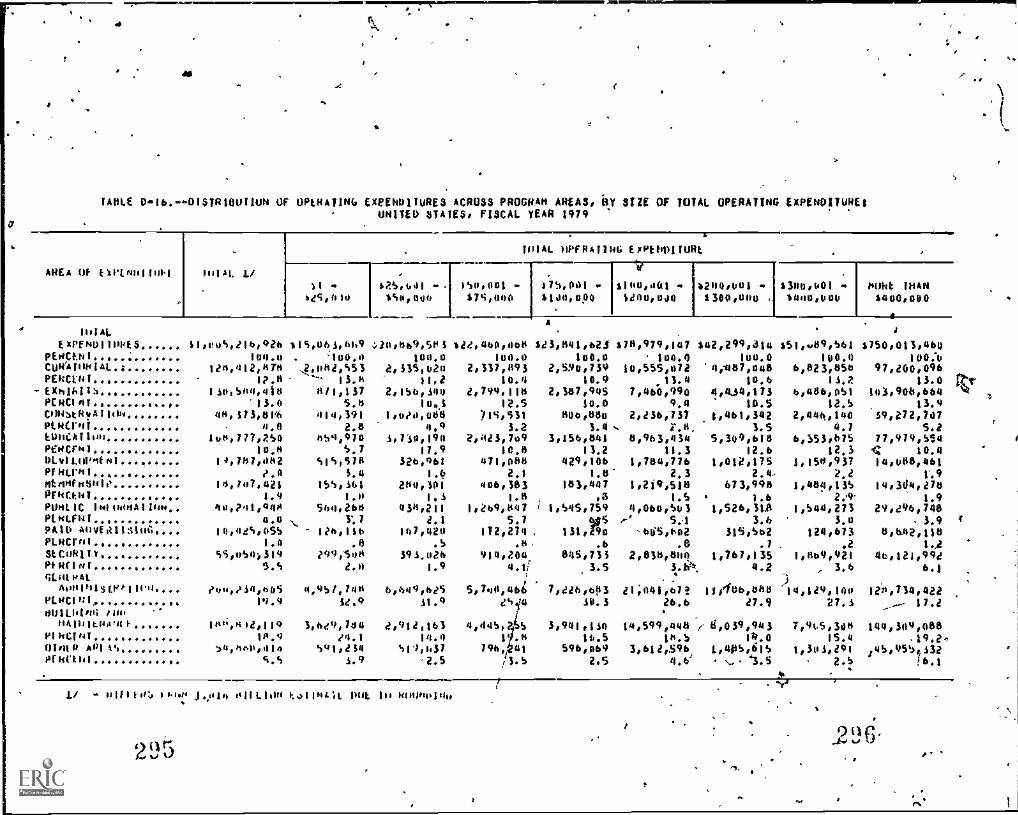
TAKE 016.-.01STR1OUTION OF OPLNAT1N0 EXPENDITURES ACROSS PROGRAM AREAS, BY SIZE OF TOTAL OPERATING ExPENDITURE1UNTIED STATES/ FISCAL YEAR 1979
AKA tk16110111111 WIAL 1/11 -
44,2,14:1[-
1.2y:toll -. 154,041 -$54,446 $75,444
1111 AL
ExPFND1101+ES 11,04/16,626 ils,66,1,669 .;24,469,501PENCI.H1 104,4 '104.4 104.4CuleAMPIAL 11,101207h 2044,551 2,315,024
PENCT NI 5.1$ 10.1
PEWNI 12.11 ."
-EXP1111115 114'504,410 011,137 2,156:1;4
CONstkvAil04 44,173:= 414091 1,061081114.11aN1 . 4.0 2.8 4.9EIHICA1104 101,7770S0 054,970 1,714,194000Cf41DivILDP1141 14,7$70112
10.8515,578
5,7326,961
17.9
PFHLN1 2.0 3.4 1.9tiEN1114SHIe 14,747.421 155,161 204,141PFNCANT 1.9 1.0 1.30041.1C 1o1100HAIPm 44041,944 544,260 430,211PENLFNIPAID 41110411a14G 14,4e5,455 1?b,11b
4.0 .... I'd
putcrw 1.4 .0131197.1:!:111i
PINCIN1SLCIJK1II S5054019
5.5e/9;540
1.9
PL0C1N1, ..4.401111s EVA 111'4 (.40.14,hos u,451,::: 6,h490.6
19.9 14.9 11.9
51.4104t
..HU1L101,16 e im.
01NwiT101,014,119 1,449,744 4912,161
10.9
HA pH ;morn 1
Dint 0 401 v, ..,4,404,414 591,234/4.1 14.0
519,637OFNON1 5.5 3.9 2.5
L/ - 01f/104 110 J.014 111104 1.4114L ii. DuL Il 144041144'
I. \ 1
. . *I
.2ijr Y9 A .
. A
' .....
foIAL uPflIATING Ex1'END1TuRL
37 5,041$1.00,044
V$104,401 - b204,601 .3440,0.04 1340,400 .
$340,001 -$4u4,040
A
0011t THAN$440,000
a
e
$26460,440 $43041,621 $711,979047 342,299,314 351,m09,501 $750011,980100.0 100.4 104.0 100.0 144.0 100:0
2,117,093 2,590,739 10,555,072 '4;407,440 6023,854 97,200,096
9.4 10.54,400,451 141,9401,:b: rtr
14.9 11.4 10.8 1.1.
2,7991,7i: 2,107,945 7,460,990 4,0,34,173
Y1S: 0461,1111i: 2,236,737 1,461,342 2,446,140 39,272,74712.5 13.9
3.2 1.4 .... i".11. LS 4.7 5.22,423,749 3,156,041 8,903,11311 5,309,618 6,353,675 77,979,554
471:4:$3.2 11.3 12.6 12.3 'C 10.4
429,146 1,704,776 1012,175 lo50,937 14,000,4612.1
406,103 183,447 1,219.:i/12,4, 2.2 49
673,99a 1,aoflo3s 14,3d4, 2761.8 . pa 1.5 1.6 2,.9 1.9
1,269,047 i 1,545,759 4,064,501 1,526,30 1,544,271 29,496,740
172,274. 131,294 -905b025.7 %0S P. 5.1
315,C.:3.0 . 3.9 4
.0.124,673 0,642,118
4.1f8115,133 2,016,044 1,767,135 104.9,921 44,121,99e
.6 .8 .7 . .2 1.2914,244
3.5 3.0k. 4.2 , 3.b 6.1
5,744,46i 7,226,603 i1;0111,0? 11i100Z )14,129,140 12 ",734,42230.3
r
. :
014 26.8 27.3 .- 17.2
4,445, 45 3,941,1.14 14,599,448 / 1i,439,943 7,445,348 144,309,4801y.4 0.5 I4.0 15.4 y19.20
796 41 596,069 3,612,596 1,405,01S 1,31s3,291 145,955413211/1.5
sri
2.5 4.61 N.. '3.5 2.b !6.1

,
..
.
4 -
Al - 141111 4S /wit+ 1.036 41ILInw tbi1w4it 00f 10 101041)11.0
2 ',' 7 '
211(.1'
.,.
.
#
*
TAM 0..17...01STOI8UTION OF OPERATING EXPENDITURES ACROSS PROGRAM AREAS, OY GEOGRAPHIC REGION,UNITED STATES. FISCAL YEAR 1979
I
ANtA or COLOolluNt 11114i 1/
GIU6114Plilt KULP,.
motill 411/4411 60,04 LASES AND'otitis
SoOTOLASI WEST 4WD 1,001HREST
ffilal
E xe, miji(owt 4 $1005,216.946 104.783.159 $255.578.e11 121430044 %230.527.212P( RC!. t.p 1 44.0 100.0 100.0 104.0 100.004411141AL 120,412,018 50,347.037 24,441,523 100 Is,744 24,441,760PERCFki 11.11 15.2 11.4 8.5 12.5LxwidlIs 134,S110,418 44.91)5,514 32,864.039 20,417,009 34,257,052Pf0(t41l 11.0 10.6 12.9 15.4 15.3004E444111m 40.371.414 111054011 13.051055 b.009,Sro 11.557.400%1.4.6ftNI 11.0 4.4 5.3 1) 4,900C4f1(4 140.777-re4k
_44.943,490 27,736,140 14.771,124 19,324.40
Pt0CINI 10.8"-' 12.2 10.9 11.s 8.2OEVELHP01N1 ,, .. 1400,002 7,914,525 3050.641 2,669,171 5,31840441PENCEht 2.0 2.1 1.5 e.; 2.4 _
wEll4Lw4wIP 14,747,421 7004,943 4,099.524 1,475,84 5,447,041prkcENT 1.9 1.9 1.6 1.1 2.3(444.1c 1414,44110w 40.?41,948 13,327.042 10.100.405 5059,074 11,451.347PIIICANI 4.0 3.$ 4,0 4.2 4,8PA10 44ftW1TS106 14.425.055 2.109,571 1.772.508 1.723011 4,734,078010CE:top 1.0 .6 .7 I.% 0,0btlowIlY . 55,450019 25.592.613 10,322.156 0,442,474 12,173,074IIRCER/ S.5 b.7 4,0 5. 5,1OwtHAL
40w(WhIR411.(44, 204,234,645 79.537,540 47.208,834 26,400,80 07,507,420P14(1.1.1 19.9 20.7 18.5 20.e 20.161111P10w *NO
wAlwilsoANCL 109,442,119 48,0684090 53.668,640 25,01,431 41,353,450P(wC01(Unfit A4(Ab
1,1.9V1,1460.01;2
17.914,012.14(
21.020.648,06S
g4..?
Sp50472417.$
11.849.4611010CLW., S.S 4.4 8.1 4.$ 5.0

TABLE 0+111....SOURCE OF EARNED INCUKE, SY CUNTriL OF MUSEUM UNITES STATES, FISCAL YEAR 1979
SOUPL# Hp
CoNtOoL td. IOSIIMIIM
1:11=.4 CHURCH/
flmt4 INCONt 1041 J./ 1.1461C,, CNUNIY 31411. FLOLOAL PRIVATE PUIILIC PUBLIC 4E1644.. PKIVAIE4114- !PAL 60000o !.'!VENN- hOVEkh- 74011r1 CoLLLI $Cohlt COLLEGE 1,01 Ihbl
PINIFII 6°4144. dtht 6041 4Lht Wm.. HINT- otS- /Uhl. 1UNAL 010114L
NtNI OM( vENSI1Y 10MT VI 4,117 014118P
SCNIIUL
S
Whitt
i
ALL hNoRLES.. 464,094 359,492 41,405 9..111 23.250 4,01 33 0,303 90S 6.178 OS 6
PLOCL1 100.0 140.6 100.0 100.0 140.0 104.0 100,0 100.4 100.0 100,0 146,0 1166.4
4014108111N 1113 135, Sts 07,975 24.052 5,245 14,581 1,404 0 927 03 034 60 0
PLOCINI 29.4 24.5 57.4 S4.1 42.7 30.8 .0 5.1 0.4 13,5 37.6 .0
1011,0N FLIS 10,707 17,214 56a 92 Sd 111 U 228 7 394 0 0
PtOCENI 11.1 4.0 1.4 1.0 .2 2.6 .0 2.7 .7 6,4 .0 .0
ML1.NE0SNIP ONLS 50,J0J 41,714 5.J911 330 635 169 0 027 41 751 49 3
PLOCINi 10.9 11.6 11.9 LS 2,7 4.0 .0 10.0 4.1 12.1 26.3 41.2INOLOI1Jk01 14004 40.300 37.736 810 129 292 44 0 808 S 99 7S 0
1401(4.41 0.0 10.5 1.9 1.9 t.3 1.1 .0 10.5 .5 1,h 40.4 .0LNON0NtH1 1hClosE (02,089 90,489 1,31)3 1,1)20 560 847 330 4,179 799 2,570 0 8plots...I 22.4 25.3 J.2 10.9 2.4 19.9 100,0 S0.3 80.7 41.61 .0 .0FNUO SPNVIELL a
(Hf 1 INCI)AI 13,506 10,155 2,111 079 271 0 0 0 0 SO 0 0
1414CfNI 2.9 2.14 5.0 9.4 1.2 44 .0 .0 .0 .9 .0 .0NOSt44 SooP
(NEI INCNNI) 3!).200 20,736 3,020 9eS 3.401 933 0 SOO 48 606 0 4PIPLf41 7.7 6,9 9.1 9.9 *4.6 21.9 .0 6.0 4.8 9.8 .0 50.0Aux1LIARY $10y1L1S
($11 1,4.1411) 114296 15,646 457 40 613 SI 0 29S 1 202 0 0
PLPEAdi 40 4.2 1.1 .4 2,6 1.3 .0 3.6 .1 3.3 .0 .0N1NLN INCONL 45,406 3.1.622 3,34S 6153 2,031 415 0 970 6 042 1 0
PIN(CN1 9.9 9.4 8,0 7.3 12,2 14.4 ,0 11.8 .6 10,7 .5 .0
e.02S6104.0
5729.134S
3916.3327S.2300S.0
31
.$
3125.0
1,40525.3
2.46542.6
1/ - IN IN4011AN0b 10, ouLL414$
3022 99

TABLE D19.SOURCE Of EARNED 1NCUI4E OY SIZE Of TOTAL OPERATING EXPENDITURE! UNITED STATES, FISCAL YEAR 1979
311063E 64
14019E0 WOK 111141.
1411AL O1'ENA1164 ExPENDI11IHEI
nuNi. 61 -425,004
415.011I-$50,400
$50,401675.000
.175,0013100000
$140,401.,
$200,004$200,0016300,000
4340.4411-4400,1104
mold ;NAN$400,000
ALL 31444As. 6464,693,845 19,515 67,004961 14,404,200 48,490,0D 46,369,218 *27,679,745 6141474,955 314,013,054 6375,089,627FENCE01 .. 140.J 100.0 100,0 130.0 100.0 104.4 140.0 100.0 100.0 100,04uP4135100 ELLS 155,314,694 4 1,541,190 1,121,520 1,336,044 1,466,304 6,466,036 4,063,695 3,404,045 115,470,604nano! 29.4 .0 22.0 17, 3 14.9 23.5 24,9 26.1 24.3 30.8T4III04 fits... 16,746,575 II 09,752 142,475 214,040 604,374 605,495 687,967 704,064 15,409,007PfRCtUi 9.1 .0 1.3 2.2 2.4 9.6 2.5 4,0 5.6 4,1M.01 0E06010 031/4.. 54.303096 16% 1,706,704 1,577,544 1,424000 768.025 3,330,094 1,787,723 2,373,087 31,334,181PENCENT I0.9 1.7 24.4 24.4 15.9 14).1 12.0 12.4 16.4 10.01NVESIKLN1 191011 40,301.854 1,100 774579 9511.102 901.979 545,125 2,131,783 847,896 1,994,416 32,936,4460ERcfn1 8.8 1101 11.0 14.5 4.5 5.7 7.7 5.9 14.4 8.0fNuomMEN1 1104 142,469,45/ I. 310,415 437,398 2,484,1346 1,059,491 6,009,405 2,300,73; 1,304,525 06,260,635Pi RC. 07
% 02.4 .4 4.7 9,9 53.2 16.6 21.7 15,9 9,3 25.5FOOD 31111/1ft
INfl MC10161 13.505.594 0 34.791 24,197 13,496 16,471 295,015 240,921 720,674 12,156,046PIRCENT 2.9 .0 .5 .4 .2 .3 1.1 1,7 5.1 5.24461.44 S111 .P
furl 11 +cuti) 35,04.476 9 1,024,555 745,430 6101,354 1,2014400 9,110,417 3,846,676 1,258,74)0 24,220,504PLNCL41 7.1 .0 14.1 11.4 9,0 10.9 14.9 12.0 9.0 6.580x11.1407 11.vvIL1t,
C41' iNcuhtl 38,295,90? 0 122.104 135,471 495:735 113,162 54u,317 552,094 596,434 15,706,781PI Nat'l 41,.3, A 1.0 2.1 5.5 1.0 2.1 3,7 4.3 4.20110.6 loot toil 45,444,414 4,454 1,315,339 1,123,587 1,261.558 744,469 3,630,901 do1b60150 1,515,030 33/513,02701;10.101 4.9 44.i 14.4 17.4 14,0 11.7 I5A 15.0 11,2 6.9
11 I)I)tJ .... 1.,
3) I

TABLE 0.q0,....souNCE cif EARRED NOME, AY GEOGNAPH1C REGION} UNITED STATES, FUCA YEAR 1479
SuONLI utEANliku woo* IIIIAL
0L18141APli1t RPG1441
14.4118 'ATIANIIC GREAT LAZES AN°PLAINS
SOUTHEAS1',.
PEST ANTI 3011.4451
ALL 5.444CtS,, 1.466,043,66s 1 143,366,u6 3113046.667 $67.922,494 $145.765.20ZPERCLO1 144.4 144,4 144,0 140.0 100,0 .A06105114( fEtS 155,514.694 56,653.707 Z9, 493,267 Z4,184,086 46,083,554PENILN1 0.4 19.4 ' Z6.1 41,8 43,610111104 Pas 10.704075 9,009,720 5.777051
. 750,636 2,286.760PENCEN1 9.1 5.4 6.1 1.3 Z.ZtiEN6E4s01P 1,1115 56.545.194 21.377.651 11,Z10.419 6,444,098 12.249.022PCHCE41 10.9 11,7 9,9 9,4 11.619%45104Ni 141.11t,,, 411,54/.454 U,064.914 7,726.501 4,976,471 4,919.964PFRIA1 8,11 12,5 6.0 0.6 4.4tnONftuttt1 !Num 140.449.657 56,042,344 Z4.592.77$ 4.611,052 I5.452.619PIRcitit
ft400 cL141.1Lt
?e.4 310 Z5.? 7,8 12.3
MT 1NLP40 13045,1)(14 2.274,244 6.278,969 2.465,131 3,047,204 'ENUENTmuSt114 buNP
2.9 1.Z 4.7 3,6 3.7
MI 0010.t, 56,244,476 11.7001.8'30 4,526.19 6.019,616 4,4069.490Pt HCEN1 7.7 6,4 7.5 10,4, 4.5.i14XIL1 ANY SI*. Vt. 1 S
(NO 10,0011 19296.002 5.645038 5, 025,252 1.84Z,784 6, 762,1410API 4,0 3.1 4,4 3.2 6.5NINFN 1L01 450001212 . 17.145.619 11,464.111 4,127.216 4.01.246Pt PU1..1 9.9 9,4 10,1 14,0 4.Z
3 t)394
k

;ABLE 021,...CBNPARISUN OF OPERATING ExPENUITURES, 07 TYPE OF NUSEUM$ UNITED STATES, FISCAL YEAR 1979
opLKAIING lol4LPOINGITIOS
iAU I CH11.001618
TYPE 111 :1411$11114
aultRAL °IVORY
I
PARKS AMUVISITOR SCIENCLCENTERS
SPLCIAL1219
$01A1ckPEN011UNIS 1101n,743,023 &275,203,725 480279,091 344.4 35,640 6226,422,836 627,767,950 4367,552,082 $27079,100
PERCENT 160.0 100.0 100.0 160.0 100.4 100.0 100.0 1600PAYR4LL AI4 NTLAllu
FAPEN0(1114S 60,4s0,012 154,347,915 5,461,194 513,417,926 133,489e481 16,321,592 2 32,712,9 77 13,120,927PERCENT ....41.411IS111104
59.9 56.1 06.0 63.3 590 58.0 63.3 46.5
EAPENOINOLS 47,so8,196 27,o2o,I2o 375,027 3,203,369 5,295,363 1,0 36,470 9,693,914 666,921PrRCFNI 4.7 10.0 4.5 3.8 2.3 3.7 2.6 2.5MIRO 10114111NNts 4.0,414,810 93,209,603 2,433,870 27,014,545 87,637,991 10, 409002 125,145,991 13,24 3,251PLatc41 35.4 33.9 29.4 32.9 30.7 37.5 34.0 44,1
TOLL D-22..CWPARISON OF OPERATING ExPiotiu0E0, HY CONTROL OF MUSEUM UNITED STATES, FISCAL YEAR 1979
ookuAliN8
cCON1kOL oF 1661'101111R
pRIVAIE COURCN/FM.1,0.11061 S 1IIIAL L
NON-MUNit''PAL
CONNlY61141:00-
RIAUboVENN
FEDERALGOVEGO
tLEMEN.,TANI,/
PRIVAIECOLLEGE
PUBLICSCHOOL
Put4LIC
CuLLIGEDEN! 111k41.
INDUSTRIAL
NW/ATE UINER
PNUFil 001,1.101. 01411 NENT Om SECOG /UNI- Dia /0141.. 10NAL CIO0d. IOW..Nt NI DANy VERSITY %ICI VERSITY GROUP ATIUN vIDOAL
0LNUUL1
101ALExP1N11110016 1,014,/95 o07.791 111,702 37,404 80,548 85,309 335 22,199 5,175 30,575 1,030 1,254 6 25,304
PENCEol 100.4 100.0 100.0 10404 100.0 100.0 100.0 100.0 100.0 100.0 100. 100.0 104,0 100.0PAYINIL1 A00) PLI41E
E xpe 00 g libit s 000,060 341014 6h,002 20,163 58,791 62,557 195 13,556 3,399 22,353 021 440 0 14,193PIRC(NI. 59.4 46.2 59.6 64,4 66.4 73.3 56.2 61.1 65.6, 73.1 79.7 15.1 .0 56.1ACONISITIPN
LIWiNPLIO0tb 47,646 32,781 e,999 1,513 4,962 1,596 10 1.431 33 2,175 0 u 0 309PrA1,M1 4.7 5.4 e.1 4.0 50 1.9 5.4 6.4 .0 7.1 .0 .0 .0 1.5UIMIU 1.704NPI1NNES 300,015 231.176 42,144 11,020 24,795 21,156 122 7,211 1,744 6,046 ens 814 0 10,721FEN(Ful. 35.4 36.4 17.1 31.6 28.0 24.0 36.4 32.3 33.6 19.6 20.3 04.9 100.0 42.4
L/ - IN 11440SAN1I, 117 OIL( 41I6
....)

TABLE 0a23.--.CUMPARISUN OF OPERATING EXPENDITURES, BY SIZE OF TOTAL OPERATING EXPENOITUREs UNITED 310E3, FISCAL YEAR 1979
unuAl1S10
FXPEN1 11111:ts Total
FOFAL OPEHA1166 t101$401/UNE
$1429,1100
42S,401-650,000
$50,001 -$T9,004
375.001-$100,000
1104,4011240,004
$200,001.1300,000
$300,001+$460,000
MORE lhAh$440,000
MIAEXPE001115 11,014,745,023 Sgs,ottb.: 1,20969,$W$22,641,166
411414/4I 160.0 140.0P0/104.1. Anb PFLAIE4
100.0
EXPLO4114014 604040,011 7,864096 12,902,518 12,01,607PrOLFNI. 59.9 142.Z 95.6.... 61.8ALON15111(.4
1,0'1041108LS 415,12n47094,190 376,764 662,510PERCLN1 4.7 5.9 1.0 2.91.011111( ExP1001110915 169,1314,414 b, 105,945 7,594,105 9,392,969PERCFN1 35.n 10.4 56.4 41.5
$23,041,623100.4
19,94/o444$6./
035,9653.5
7,103,21529.0
$70,979,147104.0
$0,929,07064.$
2,959,1913.1
25,59001632.4
442,299,014100,0
25,142,95459.4
1,550,7503.7
15,60640316.9
S51,609,561100,0
30,70)1,79*.
$0.4
1,169,0492.1
20.310,93139.3
$761,406,460100,0
451,141,94659.5
40,029,444$.3
260,015,07035.2
TAW D211- ATTENDANCE MEASUREMENT METHODS, IIY TYPE OF 80301,11 UNITED STATES. FISCAL YEAR 1979
AC11.10DANU.MenSONL4f/41 0l11406
Ivpi OF HOLM
461 ukt;,J (1t141161. NISINItyPARKS ANDVISIIRMCEN1ERS
8C110LE 5H.LIAL1ZEO
111111.. .. 4.404 609 SI 302 2,204 165 Ouo 1971100.91 , 100.0 100.0 100.0 100.0 100.0 100.0 100.9 100.0L$ 119411.0 WIWI ?Oil) 162 27 212 1.251 S4 419 ki1\PEOLFNI b4.6 S9,4 53.9 55,9 $6.0 34.2 92.3 44.6wACCUkAIE 41440 . 1.990 141 23 170 953 101 301 100110C)'64 . 0.1 46.6 40.1 44.5 43.7 64.4 47.7 55.1
...
398
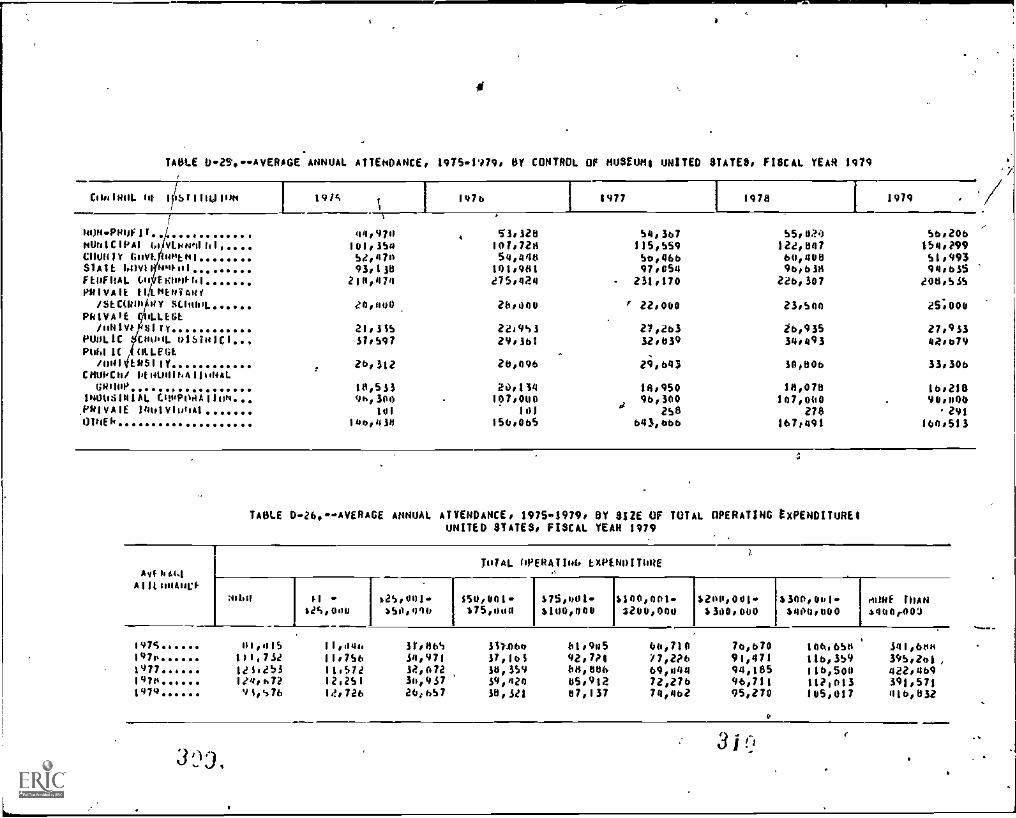
TOLE 025,AvERAGEANNUAL ATTENDANCE, 1915/790 OY CONTROL OF musgums UNITED MATEO, FISCAL YEAR 1979
C0041404 14 1 IIS1111411144 14/; 1976 1977 1978 I
1979
404wP144:11 4 44,970 4 51,120 S11,30 55,029 Sb.20bNUN1CIPAI 4,1IAJ48n1141 , 141,154 107,728 115, 559 124,847 154,200CO0NlY 6001.1WILMI S4470 54,440 S4,466 60,400 51.993SIAIL 60VII440.111
I93,130 101,981 97,854 90614 94,635
Ft4F104 64, it(4061 210,414 275,424 - 211,170 22b,107 e08,s3sPnivAli 10.1410Y44f
/5tC0,14A17lt SW41114 40,400 28,000 ' 22,040 23,500 45,004Pk10Alk tLIGL/uNIVI WY 21,11S 2249S1 27ab3 b,935 27,933
0.10LIC CO0o4. 016181C1.44 31,597 29,361 32.839 34.493 42o079P8611( i SNAFU .
matlunsily 26, 312 20,096 29,643 10,006 33,30bCHURCo/ 1414411/.4111,NALGROW 18,531 20,134 18,950 18,070 !ba18
140001b1AL 000010110h, 9h,300 107,000 96,300 107,000 90,000PR1VA1E 14010110W 101 101
a250 278 "291
OT14E1( 106,414 150,0b5 b43,obb 1671491 160,515
TAOLE D26,..AVERAGE ANNUAL ATTENDANCE, 1975.'1979, OY SIZE OF TOTAL OPERATING EXPENDITURESUNITED STATES, FISCAL YEAR 1979
AO It 44.1
A I It e1llAisCI-
Jo/AL 001067,46 LXPENNITURF
1$ -1d'1,0110
25,041 -)S0,446
00,001..*75,000
$75.91/1"
S100,000$100,001-2200,000
S2011,001+$ 300, 000
S300, Oo I .
$400,000Ao41 MAN4100r400
1975 o1,015 11,044 3t,06S 1114166 111,905 66,710in7 111,714 11,7Sb 34,971 17,101 92,7P1 I7,2PbI77 141,453 11,572 12,072 10, 359 64,846 69,11441970 14,4,02 12,251 34,937 39,424 05,912 72,27b1979 95,576 14724 20,b57 18,121 07,137 74,462
76,00 Inkiest' snsoetim91,471 110,359 595,261,94,05 I I b,500 422,46994,711 112,013 391,57195,270 105,017 416,052
31r' .
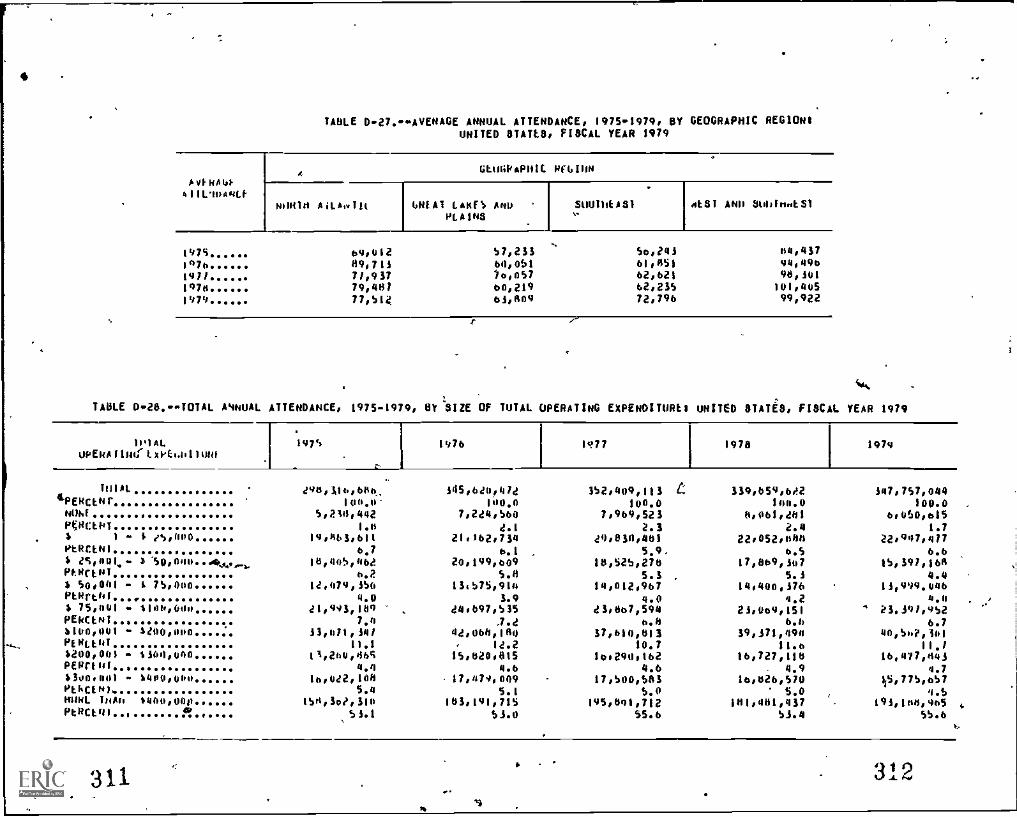
TABLE D27.AVENAGE ANNUAL ATTENDANCE, 1975-1979, DY GEOGRAPHIC REGIONSUNITED STATES, FISCAL YEAR 1979
1411016!4111.16A4LF
4 14.01405PHIC PfGION
NO RIA AiLwIll GMAT LANS'S ANDPLAINS
SUU14EAS)...
461 OP 30610.t61
147S 69,612 57,211 Saadi 44,4671076 69,713 60,051 61,651 94,0961971 71,937 /6057 62,621 96,011976 79,461 60,219 62,235 101,4051474 77,514 61,809 72,796 99,922
I*.
TABLE 01.28.TOTAL ANNUAL ATTENDANCE, 1975..1979, BY 'SIZE OF TUTAL OPERATING EXPENDITURE' UNITED STATES, FISCAL YEAR 1979
11'1 AI,
UPEkA find- L X al.1$11k1411975 1976 141177 1978 1974
i11151.
tPEKCLNrV40,616,686,,
140.0"105,60,474
100.0352,409,113
100.0i: 339,459,65.2
100.0147,757,044
100.0NO61 5,210,442 7,244,560 7,969,523 0061,461 6,450,615ONRUPT 1.0 4.1 2.3 2.4 1.75 1 I 55,040 19046,611 210162,730 40,860,461 22.052068 22047,4/710t6rANI
6.7 6.1 , 5.9. 6.5 6.6$ ZS,001.4. S '50040.......-1. j6,40S064 20,1490)49 18o52,878 17,669,107 15,397,168PkliftNi 6.2 5.0 5.3 . 5.3 4.45 50,001 ! 75,040 11,479,350 13,575,914 10,012,907 14,440,176 11,949,046pt6rehl.... 0.0 3.9 4.0 4,2 4,05 750401 1104,400 41,943,160 44.497,535 43,80,594 21,069,151 23,391,452PEK(00 ... 7.4 .7.4 6.6 6.6 6.75100,061 w S200,400 13,471,10/ 04,066,180 67,610,613 39,671,494 40,Sh?,31,1PE0L01 11.1 , U.2 10.7 11.6 I5.15200,001 - 1160,644 11,246,606 15,620015 166290062 16,727,116 16,077,446PE14141 ... 0.4 4.6 4.6 . 0.9 *la3340001 * 5400040 16,142,106 17,474,009 17,500o503 16,026,570 kS,77S,6S7lotkCE41 . 5.4 5.1 5.0 5.0 4.5Kiln THAI, ,4110,0441
PERCtoll ... 44ISA, he', 310
53.1163,191,715
53.0145,041,712
55.6101,401,437
53.4191,104,965
4.
55.4v,
311as
312

T.:LE 029..0TAL ANNUAL ATTENDANCE, 19751979, by GEOGRAPHIC REGIONS UNITED STATES, FISCAL YEAR 1979
i975 14766FuboAvolIC 411.1.1;4 1977 1 1970 1979 -
HUAI 294,5148486 345.62084/2 55284098115 339,859,622 347.7578044PETICEMI 146.0 100.0 100.0 100.0 140.0multrm AILANI1L 44,151,004 1238150,121 1048904,651 1098112,107 144,401.0091'L4Cf61. .. 1 51.11 35.b 50.4 52.1 30.6U4tAl LAKES Auu PLAINS 64,594,055 67.770,538 bb,844,751 47.949,040 74,060,442PEkCLol 21.7 14.6 24.4 20.0 20.7SOUTHLAST 4510eS$7!0 48.1938084 408793,100 44.4928560 56,721,035PELCLOT 14.7 13.9 13.8 14.5 16.3NEST ANO 5141144LST 95,161,416 108,6988728 110,786,630 114.285,887 $12:614,554PLItcth1 51.9 50.8 31.4 33.6 4 32.4
TABLE 030.TOTAL ANNUAL ATTENDANCE, 19751979, UY CONTROL OF NUSEUN1 UNITED 3TATE3, 'IS& YEAR 1979
C041,44. HT 1.451 110111W 1976 1977 19761
1979
IdIALPERUHI6414.1114011
PERCLof k.MUNICIPAL 611akr441N1PERCLoiCOUOTY NwilmcmullPLIgCkmi l'STATE 6fivfkNo1N1PLUCE61F LI11HAL WilltrinCUIPEnCLNiPUIVATC f1.161-4144y
/sEcimmitior 504101
PLIMAolW11%111 Collat. I
mm1%464111,rEPCLA1Pu811N SOUK 0310,11.TPENCE41PHNLIC L101.1,141
11.6,110$-SIIV
PIPTtillCHURCH/ O1dNNI.A1114.AL
440m,Pint NI1TION51414i 1 140414411101Pt4T110PRIvAit 101.001PNAIP140101.14104..
PE411.11
P8010,666100.00
10584428040. 35.49
42071,5b4)14.e4
51251,9db5./7
45,449857215.06
6,056,14725.16
bu#060.11j
S864'1.0151.04
1,525.74951
7,5119,0od. la
626,25414
Se9.4b0.16
5.131.00
5.0/4,0661.70
515.620,47e100.00
1258537,57154.52
458146,65013.04
11,442.41S3.38
49,744846614.44
94,621,92027.30
70.000.02
5.4508035Lou
18190.019.34
7.889,9122.28
465.0d?OS
b408500.17
5,131.04
5,199,7571.50
352,409,113100.00
127,983,96036.32
408450865513.74
12,119,3375.44
478366847613.44
,.... 79.410.51922.54
5b,000.02
4,10083061.17
1.3308972.38
8024, 092.36
435.439.12
529,6501b
13,051.00
- 22003,0426.33
3598459102e100.00
1298519.34350.11
518445,27415.13
128961,2065.61
478157.b9613.08
77,747,88022.80
56,750.02
48056,4041.19
1.390.010.41
884b0,8172.55
415,805At
5011.540
.1714,059
.005,005,b00
1.71
1 Ig.))
.4. 1
547,7518404100.04
152015841350.05
N4,644.59118.6U
11,155,586Lel
48,1110,22715.28
718642.10920.60
62,540.02
8.2169.2071.2$
1.729,777.50
9,353,130e.49
375.024.11
445,044.14
14.750.00
5,541,770. 1.60
1 3' :1

1
TABLE 031.FEDEHAL SOURCE OF INCOHL, BY TYPE OF museums UNTIED 87047E8. F18CAL YEAR *979
SOURCE 01F 18C044. OITA'.
Mk OF 05Etm
AI,I ChILD0W0 dkRIRAL HISIORYPARKS ANT)VISITORCENTkHS
.3Cit-ttCk_ _ ,SPECIALIIER
10161.
FLuitoL S1111111.LS $147,744,7e0 104,110,901 $931,726 1+3,579,755 448,452,517 512,853,898 851.629,947 3903,926PtilLthl 160.0 1110.0 100.0 100.4 100.0 100.0 140.0 100,051417141141AN
mAT1oNAL 4031.1fi1
ACT 6)9,006 405010 0 119,607 0 0 14,069 0116CFul .0 .0 .0 1.4 .0 .0 .0 .0IRSTII011 OF Houton
51-.1tViCt4 5o35,665 1,11)5,116 144,118 442,390 1,469,572 28,771 2,103,494 10,625KRUM 5.7 4.7 17.2 4.0 3.0 .2 4.1 11.80410 IIINAL St it:41 i
FUURRA1WA Speo?.8114 241;219 45,440 534,322 0 01,020 0,404,605 0PEttLE6! 3.6 1.4 4.8 6.4 .0 .3 0.5 .0NAT litNAL L1011104.14 IFUR 10/ *1Rib 13.30.240 8,521,182 143,671 900,444 2,386,783 16,039 1,244,721 140,425
PENCEN1 9.4 34.5 15.4 14.7. 4.9 .1 2.3 1S.1RA1104AL 1001,41,R1FUR 1004011jhS 14,0409O 4,074,013 75,708 1,752,304 6.21'5,027 28,173 3,456,466
, 00,700PF10EN1 11.3 19.7 8.1 20.9 13.0 .2 6.7 23.2
"UIFICE I), CORCAlitib 494,355 1,604 99,954 7,754 05,444 0 299,396 01,16Ct61 .3 .d 14.1 .1 .2 .0 .6 .00111ER FLOWL
5401.14 106,16,126 4,832,500 407,7.98 4,662,05 38,225,535 12,539,205 48,166,396 441,174PtRLEN1 72.0 59.0 43.7 55.6 70.9 99.8 77.0 49.9
3 I 53' (3

TABLE D32.FEDENAL SOURCE OF INCOME, BY SIZE OF TOTAL. OPERATING EXPENDITUREI UNITED STATES, FISCAL YEAR 1979
5014tik III Iikoht loIAL
TOTAL UPENAEINN EXPEN411144
11
125,460}?.5,001 -
)50,000150,001-175,004
$75,001*100,000
$100,0014200,004
5200,.001.1300 MO
$144,001-*.044,004
MIME 'DAN1400,000
T111 AL
FEDiRAt 8010(115... 4197,704,726 42,711,256 15,921,340 '4,647,968 19,207,1.33 019,760,135 )8,507,982 *8,445,960 $91,514,861PERCENT.. ... .. 100.0 11.0.0 100.0 100.0 100.0 1000. 100.0 woe 100.05411008uNIAu
NATIONAL 4115041ACT 2P9,666 0 0 48,724 0 42,543 0 o 138,395
PENCENI .
.2 .0 .0 1.0 .0 .2 .0 .0 .1
INSTITUTE or moon'semv3cts.: 5,415,045 138,667 52,489 301,215 328,024 1,041,656 156,642 809,232 2,606,462
PERCENT.... 3.7 5.1 .9 4:5 7.8 5.3 1.4 9.6 2.11
NATIONAL 3CIE9CIfOONNATINN 5,262,014 0 o 75,520 9,100 20,840 445,006 139,800 4,572,558
PERCENT 1.6 .0 .0 1.6 .2 .1 5.2 1.7 4.9144:1114AL toDUrN.LaI/11N 141 AIM 13,32I.260 260,754 164,683 230,135 307,127 0,267,717 06P,867 3741126 9,993,660
PENCERI 9.0 9.4 2.7 5.0 8.7 6.4 7.4 4.4 10.7NATIONAL FNININNINTFUN ol11ANI1or 14,670,192 41 1aw 466,623 344,342 112,126 1,252,208 155,970 1,293,160 11,014,747
PERCENj 11.3 15.2 8.2 7.5 2.7 6.3 1.14 15.3 13.S',MCA IIF L00E4;1404 999,A5 5,250 0 117,000 0 0 7,1404 46,700 317,526PERCEN1 .3 .2 .0 2.5 .0 .0 .1 .6 .3OWN Ft0INALSONRCfs 146,W2,174 1,609,320 5,221050 3,50021 3,390,756 16,163,266 7,079,915 5082,123 63,271,550
pENCLbI ... .. 7P.4 69.7 6e.1 75.9 80.6 81.7 83.2 68.5 67.7
TABLE D*33.*POISTRIBO1IUR OF MUSEUMS ExPERIENCIRC NO FINANCIAL DI'FICOLTY AND MOANS EXPERIENCING SONE FINANCIAL DIFFICULTY,BY TYPE OF HMOs WHITED STATES, FISCAL YEAR 1979
FISCAL YkAtt 441.440 IoIAL
TYR Of NOON
Ai. 1 1.411.4Ittli1b
t
IttNERAL OISIONYPAW; ANTIVISITORCENTERS
SCIINEI. SPECIALIZED
loTAL 4,468 609 SI 382 2,204 165 800 07PfRCENT 104.0 100.0 100.6 140.0 100.0 100.0 100.0 140.0POSITIVE. 3N11011 1,475 462 43 311 1,897 159 654 151PCHCCNI 43.4 75.0 43.8 81.3 06.1 96.1 81.7 74.5411411V1 INcooli 7.4 147 0 71 306 7 . 146 46PERCENT 16.4 .34.2 16.2 18.7 13.9 3.9 18.3 23.5
317f% a r)
1

TABLE 1154.tHOSEURS NITH ENDOHNENT FORM BY SIZE OF TOTAL OPERATING EXPENOITURE1 UNITED STATES, FISCAL YEAR 1979
t0V400ENT INUO ASStIS futAl
Tilt AL 0110ATING:EXPENOITORE
01111 11
$250096,)5,001350,040 $75,900
175001..$1C4,00..
1100,0011290:900
4206,001..6504.000
$500,001...$400.000
4101 THAN5400.000
ALL 00a1046 4,408 65 1,006 578 565 269 54S 175 150 463PCH(.IHT 106.0 100.4 100.0 100.0 100.4 100.0 100.0 100.4 100.0 100.0NU kN1)L140/01 F0011$,, 5.449 65 1,666 476 260 200 349 95 8S 193PEIUANT 72.4 100.0 .42.5 02.4 71.1 74.3 64.1' S4.9 56.7 41.6
3 150,000 406 q. 176 59 44 21 40 12 17 31PENCIN1 9.2 - 9.8 10.2 11.9 7.4 a,s 7.0 11.4 6,73 50,001 $249,994 268 - 66 14 39 12 59 31 10 26PI,NCENI 6.5 . 4.8 3.0 10.7 4.3 10.8 17.9 14.1 SoS$ 450,000 A999,999 828 - 27 18 6 22 15 9 S 26
NC1,0 I. 2.9 - 1.5 1.1 8.6 8.0 2.8 S.3 5.3 5.7S40040 . )999,999 77 - - 7 9' 9 2S 8 6 14
1.7 - .. 1.2 2.5 5.2 4.5 4.7 4,0 5.031,040,440 19,999,999 444 - 46 .. a 7 51 17 17 1440FNC101 5.6 - 1.9 - 2.2 2.4 9.3 9.6 11.5 26.7$14000,400 110 )000... 55 - . - . - 1 2 SO0ENLt s1 1.2 - - - - .6 1.0 14,6
TABLE 0. 55,-*NATIO OF CAPITAL EMPENOITUREG 10 OPERATING EXPENOITURE8, BY CONTROL OF NUSEUN1UNITED STATES, FISCAL YEAR 1979
CuotauL iii 146T1101114IJ
11114E CAP1141. 1414.001I4001 WIAL OPLNAT100 111PFN0IIVRL5 NATIo
MAI8181 .pH41.11
AhhILIPAL uflofeems1N1.L PPPP hlY WilltklarE61
:I 14iit 4114 01,0104,1114 FAL 611V1 04.1, 41
3205.eh0,191129,9S1,55145.755.6245,159,754$3,150,41910020,690
91,016,795,023647,791,374111,782.123'57064,12649,540,30045,549,400
0.239 t.214 $.449 1.157 t.314 t.144 I
PO1VAlt EIL0RNIANY /411.0494Ft!Albeit 180108 335,900 01S0 I
PuivAll CuiLEGF /u0110(kSITY 2,536070 22.198.550 .104 t00.111. 81101L 1,1b1411.1 140,843 5,175,941 .020 IPooLIC II11LI61. /1011vIRI0110 0,409002 30.574,050 .310 $C10041m/ 01m1IhI6 AIWWIL 6000P $24,5110 1.050,068 .511 I
114011511.14 ti9;094411001... 110,000 1,259,000 040 j11#10A11, 10i1V1041 0 6,120 .000 1.11)00 6,40?.950 25.563.571 .2S6 $
tA ,j 320

a
. TABLE 036. .RAIla OF CAPITAL EXPENDITURES TO OPERATING EXPENDITURES. SY 812E OP TOTAL OPERATING EXPENDITURE)UNITED STATES. FISCAL YEAR 1979
i
11PfKAlit0; IkPikolimh11111AL LAP11AL EXPENOITOHLS IIITAL OPLKATING ESPEN0170E8
, . .
.
.
1011A1 RAilu
11.11A$
1111hE ,............sa43.058.181
261.24411,016,793,023
0
0.2::s
1
1 a 25.666 . ; ... 4.844.672 15,063069. .654 I
S 25.441 3 50,140 13.719.210 20.669,503 .657 I
1 50.001 1 75,000... 5,993,322 22.643.166 .265 I
S ?Cowl $160,044 4,778,573 23,841.623
13;5!
360,061 3240,044 .... 24. 382.126 7d.979.147
1
411264.061 - *3001.060 ....... 7,004,674' 42,299,014 .167 i%
50lioet $4011,440...,mukk tool 14011,un. .
loa64,19e153.930.163
51.689,561161.406.460 .202
1
:
IlIc
TAOLE 0037.INPACI UF INFLATION, BY TYPE OF NUSEUSS UNITED OTATES, FISCAL YEAR 979
ABLE 111 40y066 10PAriOF iNILAIION IIIINflut
KENJI' i ill; ( teurti hi. UPINATI1i43 I.
THIAL
TYPE OF OU8EUN
ART CRURRERIS GENT RAL NISINRYPARKS ANDVldiTuRCENTERS .
SCIENCE SPECIALliED
YES 0.003 401Nu. NECESSARY kfouc1106S
IN ltiI.Sl. ARtAs: ,s,. 1.524 20dCuRAmOIAL 1,011 157PEkCI'II Ili RuScufl4 .. 66.7 151.4
tRUCA1Mu ......... 1.025 159PE6CE11 : off 4NAN$4. .. 67.3 7.4SECURITY... 194 120
PI.K.1141 OF nO4LONS ... 54.1 59.6noi101111*1. . 1,143 183PERMIT Ili HUSIflh* 75.0 87.1WNSFRVAINU/POIWVAllu4 1.442 144PLRCERi of 009100%. 71,6 69.2flillik, . 664 . 112PLACEN1 of 011110 "S... 11.6 53.6
30
13o
56.913
10(0,0
060,7
1077.2
7
49.36
05,5
247.
135105
77.791
67.081
59.9101740
9d72.5
6749,6
1,529.
674415
61.6305
57.1353
52.3462684493
73.0272
40,4
108
5037
64.546
84,029
50.446
79.139
67.025
43,5
455
345229
66.6266
77.2lats
$4.7e79
81.1238
69.2144
30.0
106
9167
74.865
71.6so
55.462
68.364
70.148
53,2
f*

O
.$
4
TAIILE-0-50.-14PACT OF INFLATION, OY CONTROL or 400111 UNITED STATES, t!$CAL YiAR 1979
AMA fo Ah$0046Wk.,
OF 1NFLAITO 6Sit1J111 WIAL NNN1L- ElluNlY 8101E FET4401.REDOLIO6 COPOO11l- MAI MAL 6UVEKO- GOvikN. (mown-oPER6i1ONS'1 PIA OF 11 %;tivt-ili MINI ottit Nf01
11 Nt,t#T
I.
1
#
CHONUL 111 1481110/0N A
11010611ELL4E..'ANY/MOW,. 004Y1SC kUUL
Pk19/ATECOLLEGE/UNi
ViRSITY
PUMICSEHUOI.
018-141C1
MattCuLLE01itml
vERSITY
YE3ko, NECE8644Y
9104C11N08 INTHE I 6144S:
C1014I01141.
PERC OT of bloanNSEOUC 1004PF4Etkl uf nubFums,,SLCI 1TYPEk (HI Al o4I5FOOSEms WINNPEN ENT uF PINUONoCONTR94TINN Atm
14M0y6T1ooNrr crks us. imbcollsinetPPE CENT 14 1.0104645
2,99$
1#51,41166.710Q507,3035
S4.71,10375.6
1,40271.0664
01.6
1,614
744510
L44.6507
64,1S91
52.653071.2
Soib7.4367
49.3
?SS
1b6112
b7.7109
bs.975
45.0144
1$9,5
1J14,4.7
5935,18
1S8
5746
63.7311
59.3i5
44.347
82,3
40'04.9
2090.6
Sul
.
187106
56.6131
69,994
50.4151
80.4
140
74.018
4148
239
10490
00.0oz.
74,506
82.895
90.9
9994.7
2725.4
0
3
3
100.03
140,03
100.03
100.0,
3100.0
0
.0
!es
4634
73632
70,326
Sb.037
81.3
A SO05.9
1839.6
26
15$4
93.3pc
93,314
93.3I5
t04.0
104,6.7
7'
43.3
149
13291
68.4108
01,067
50.098
74 ;2
10370.0
5642.2
CHURCH,OMAN.10A1-1UNAL0491P
INDUS-TRIALMTN*61Tuk
PN1941E1601-
9101161.
UltiEk
6 u 15 23
t7 6 46 1212 41 0
70.6 .0 .0 031.:0 0 0 6
.0 .0 .0 SO,S12 o 39 5
70.0 .0 100.0 42.212 b 0 11
70,6 100.0 .0 91,7
0 0 36 11.0 .0 100.0 91.117 , 6 0 7
100.0 100.0 .0 58.7
3g3 4
32:
4 i.
i

C1
APPENDIX E
VERIFICATION STUDY OF THE 1979 MUSEUM PROGRAMSURVEY OPERATING EXPENDITURES
3'.3
I
. .
M
I .

MP
I
APPENDIX E
VERIFICATION STUDY OF THE 1979 MUSEUM PROGRAMSURVEY OPERATING EXPENDITURES
A subsample of 401 museums from the original sample of 1,373 was drawn, andthe reported value of thi 1979 operating expenditure was verified through a mailquestionnaire followed up 17 a telephone interview. At the same time, a compar-able 1978 estimate was obtained, rnd Teasons for discrepancies from the reportedvalues were noted, with suggestions for improving future surveys. The mainresults are as follows:
The estimate of 1979 total operating expenditure based on theverification study was $1.042 billion, 2.56 percent ($26 million)higher than the estimate of $1.016 billion obtained in the orig-inal 1979 survey.
One very large museum accounted for most (80 percent) of the$26 million national difference between total verified andoriginal operating expenditures.
The comparable 1978 estimate was $976 million, reflecting a7 percent increase from 1978 to 1979 (01.042 billion).
The complete methodology, .findings, and recommendations are reported inthe Verification Study Of the 1979 Museum Program Survey Operating Expenditures,submitted by Macro Systems, Inc., to the National Center for Education Statis-tics, March 1981._._,
t
3 '2 5


