Embed Size (px)
Citation preview
1
NIUST – Deepwater Horizon Oil Spill Response Cruise
Dr. A.-R. Diercks National Institute for Undersea Science and Technology
Undersea Vehicle Technology Center University of Southern Mississippi
UM Field Station 15 CR 2078 Abbeville, MS 38601 USA
Dr. V. L. Asper
Department for Marine Science University of Southern Mississippi
1020 Balch Blvd. Stennis Space Center, MS 39529 USA
Dr. R. Highsmith
National Institute for Undersea Science and Technology UM Field Station 15 CR 2078
Abbeville, MS 38601 USA
M. Woolsey National Institute for Undersea Science and Technology
Undersea Vehicle Technology Center University of Southern Mississippi
UM Field Station 15 CR 2078 Abbeville, MS 38601 USA
Dr. S. Lohrenz
Department for Marine Science University of Southern Mississippi
1020 Balch Blvd Stennis Space Center, MS 39529 USA
K. McLetchie
National Institute for Undersea Science and Technology Undersea Vehicle Technology Center University of Southern Mississippi
UM Field Station 15 CR 2078 Abbeville, MS 38601 USA
A. Gossett
National Institute for Undersea Science and Technology Seabed Technology Research Center
University of Mississippi MMRI-CMRET 110 Old Chemistry Bldg
University, MS 38677 USA
M. Lowe III National Institute for Undersea Science and Technology
Seabed Technology Research Center
978-1-4244-4333-8/10/$25.00 ©2010 IEEE
2
University of Mississippi MMRI-CMRET 110 Old Chemistry Bldg
University, MS 38677 USA
D. Joung Department for Marine Science
University of Southern Mississippi 1020 Balch Blvd
Stennis Space Center, MS 39529 USA
L. McKay Department of Marine Sciences University of North Carolina, Chapel Hill, NC 27599, USA
Dr. S. Joye
Department of Marine Sciences University of Georgia,
Athens, GA 30602, USA
Dr. A. Teske Department of Marine Sciences University of North Carolina, Chapel Hill, NC 27599, USA
Abstract -- In May 2010, the National Institute for Undersea Science and Technology (NIUST) had a 17-day research cruise aboard the UNOLS vessel R/V Pelican scheduled. NIUST is a partnership of the University of Mississippi, the University of Southern Mississippi and NOAA. Before sailing, the Deepwater Horizon oil platform burned and sank, resulting in an uncontrolled oil spill at a depth of 5000 ft at Mississippi Canyon Block 252. Subsequently, the decision was made to abort the planned hydrate and ship wreck research in favor of an oil spill response. The primary goals of the redefined cruise were to acquire baseline and early impact data for seafloor sediments and subsurface distribution of oil and gas hydrates as close as possible in time and space to the origin of the oil spill.
Investigating an oil spill nearly a mile deep in the ocean presents special benthic sampling and subsurface oil detection challenges. NIUST’s AUV’s were unloaded from the ship and a larger main winch installed to allow operation of a large box corer for collecting sediment samples in water depths up to 2000 m. During the first five-day leg of the cruise, a total of 28 box cores were collected. The Pelican returned to port (Cocodrie, LA) to drop off sediment and water samples for immediate analyses, and to take on more sampling gear and supplies for the second leg of the cruise, including an Acrobat, a CDOM fluorometer, a Video Ray ROV, and a CO2 sensor in addition to the already installed CTD Rosette with O2 sensor and light transmissometer.
During Leg 2, box core samples were collected until weather prohibited safe operations. CTD stations were plotted to cover the area surrounding the wreck site and at various depths to cover the water column in order to map the subsurface water column structure and chemistry as baseline values for future investigations and especially to look for submerged oil and/or gas hydrates.
Early in the water column sampling, a subsurface feature was discovered at 1200 to 1400 m depth. This layer was detected by three independent sensors, CDOM (colored dissolved organic matter) fluorometer, light transmissometer, and oxygen sensor. All three instruments responded in unison with greater fluorescence and beam attenuation and decreased O2 concentration. These signals were first observed at a station 5 miles from the accident site. Second and third station measurements, exactly half the distance to the spill site from the previous one, at 2.5 miles, and at 1.25 miles, showed the same signal
but with significantly greater magnitude. Following this discovery, the sampling plan for the remaining days of the cruise was changed to map the newly discovered feature.
This paper will discuss methods, pursuit of leads, gear and instrumentation utilized, resulting in the initial discovery of deep hydrocarbon plume features resulting from the uniquely deep oil spill.
I. INTRODUCTION In May 2010, the UNOLS vessel R/V Pelican had been
scheduled to carry out Multi Beam surveys and wreck investigations in the vicinity of Mississippi Canyon block 118 (MC-118), approximately 12 km northwest of the Deepwater Horizon wellhead site in block MC252. MC-118 is the location of the long term study of a region of methane hydrate deposits [1] in the northern Gulf of Mexico.
The objectives of the cruise were redirected to examine the subsurface oceanographic characteristics around the spill site with the approval of federal response teams and on-site personnel managing the operations at the wellhead site. Upon receiving the go-ahead, both AUV’s already setup for operation on the vessel were removed and a large winch to manage a box-corer at depths of 1500m and more was installed on the vessel. A series of 42 stations were occupied (Table 1) to capture the extent of the early on discovered subsurface plume which was characterized by decreased oxygen levels and elevated CDOM fluorescence and beam attenuation at water depths greater than 1000 m. 28 Box core stations (Table 4), provided sediment samples, in addition to numerous measurements of irradiance reflectance, CO2 concentration, and water samples collected for PAH and trace metal analyses during the duration of the
3
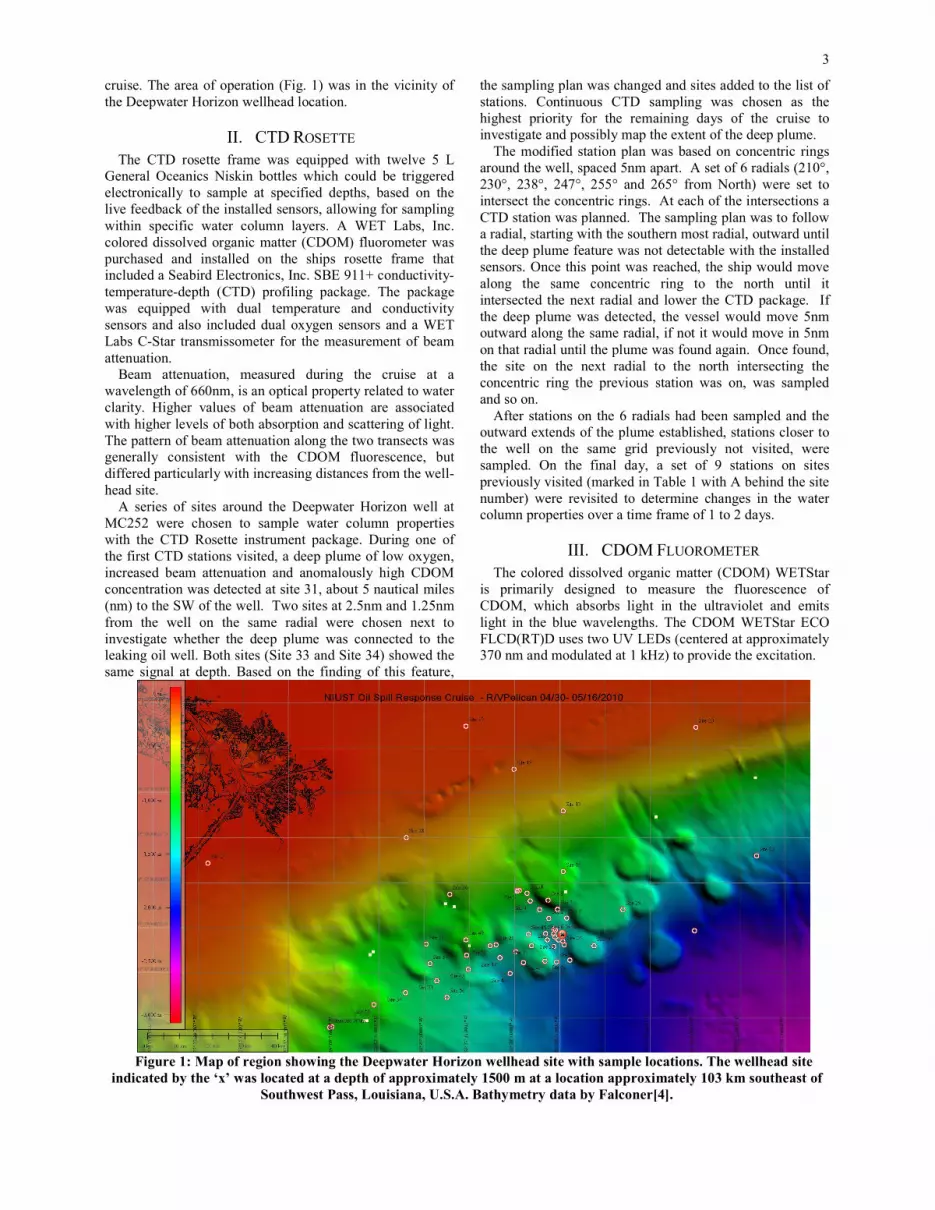
cruise. The area of operation (Fig. 1) was in the vicinity of the Deepwater Horizon wellhead location.
II. CTD ROSETTE The CTD rosette frame was equipped with twelve 5 L
General Oceanics Niskin bottles which could be triggered electronically to sample at specified depths, based on the live feedback of the installed sensors, allowing for sampling within specific water column layers. A WET Labs, Inc. colored dissolved organic matter (CDOM) fluorometer was purchased and installed on the ships rosette frame that included a Seabird Electronics, Inc. SBE 911+ conductivity-temperature-depth (CTD) profiling package. The package was equipped with dual temperature and conductivity sensors and also included dual oxygen sensors and a WET Labs C-Star transmissometer for the measurement of beam attenuation.
Beam attenuation, measured during the cruise at a wavelength of 660nm, is an optical property related to water clarity. Higher values of beam attenuation are associated with higher levels of both absorption and scattering of light. The pattern of beam attenuation along the two transects was generally consistent with the CDOM fluorescence, but differed particularly with increasing distances from the well-head site.
A series of sites around the Deepwater Horizon well at MC252 were chosen to sample water column properties with the CTD Rosette instrument package. During one of the first CTD stations visited, a deep plume of low oxygen, increased beam attenuation and anomalously high CDOM concentration was detected at site 31, about 5 nautical miles (nm) to the SW of the well. Two sites at 2.5nm and 1.25nm from the well on the same radial were chosen next to investigate whether the deep plume was connected to the leaking oil well. Both sites (Site 33 and Site 34) showed the same signal at depth. Based on the finding of this feature,
the sampling plan was changed and sites added to the list of stations. Continuous CTD sampling was chosen as the highest priority for the remaining days of the cruise to investigate and possibly map the extent of the deep plume.
The modified station plan was based on concentric rings around the well, spaced 5nm apart. A set of 6 radials (210°, 230°, 238°, 247°, 255° and 265° from North) were set to intersect the concentric rings. At each of the intersections a CTD station was planned. The sampling plan was to follow a radial, starting with the southern most radial, outward until the deep plume feature was not detectable with the installed sensors. Once this point was reached, the ship would move along the same concentric ring to the north until it intersected the next radial and lower the CTD package. If the deep plume was detected, the vessel would move 5nm outward along the same radial, if not it would move in 5nm on that radial until the plume was found again. Once found, the site on the next radial to the north intersecting the concentric ring the previous station was on, was sampled and so on.
After stations on the 6 radials had been sampled and the outward extends of the plume established, stations closer to the well on the same grid previously not visited, were sampled. On the final day, a set of 9 stations on sites previously visited (marked in Table 1 with A behind the site number) were revisited to determine changes in the water column properties over a time frame of 1 to 2 days.
III. CDOM FLUOROMETER The colored dissolved organic matter (CDOM) WETStar
is primarily designed to measure the fluorescence of CDOM, which absorbs light in the ultraviolet and emits light in the blue wavelengths. The CDOM WETStar ECO FLCD(RT)D uses two UV LEDs (centered at approximately 370 nm and modulated at 1 kHz) to provide the excitation.
Figure 1: Map of region showing the Deepwater Horizon wellhead site with sample locations. The wellhead site
indicated by the ‘x’ was located at a depth of approximately 1500 m at a location approximately 103 km southeast of Southwest Pass, Louisiana, U.S.A. Bathymetry data by Falconer[4].
4
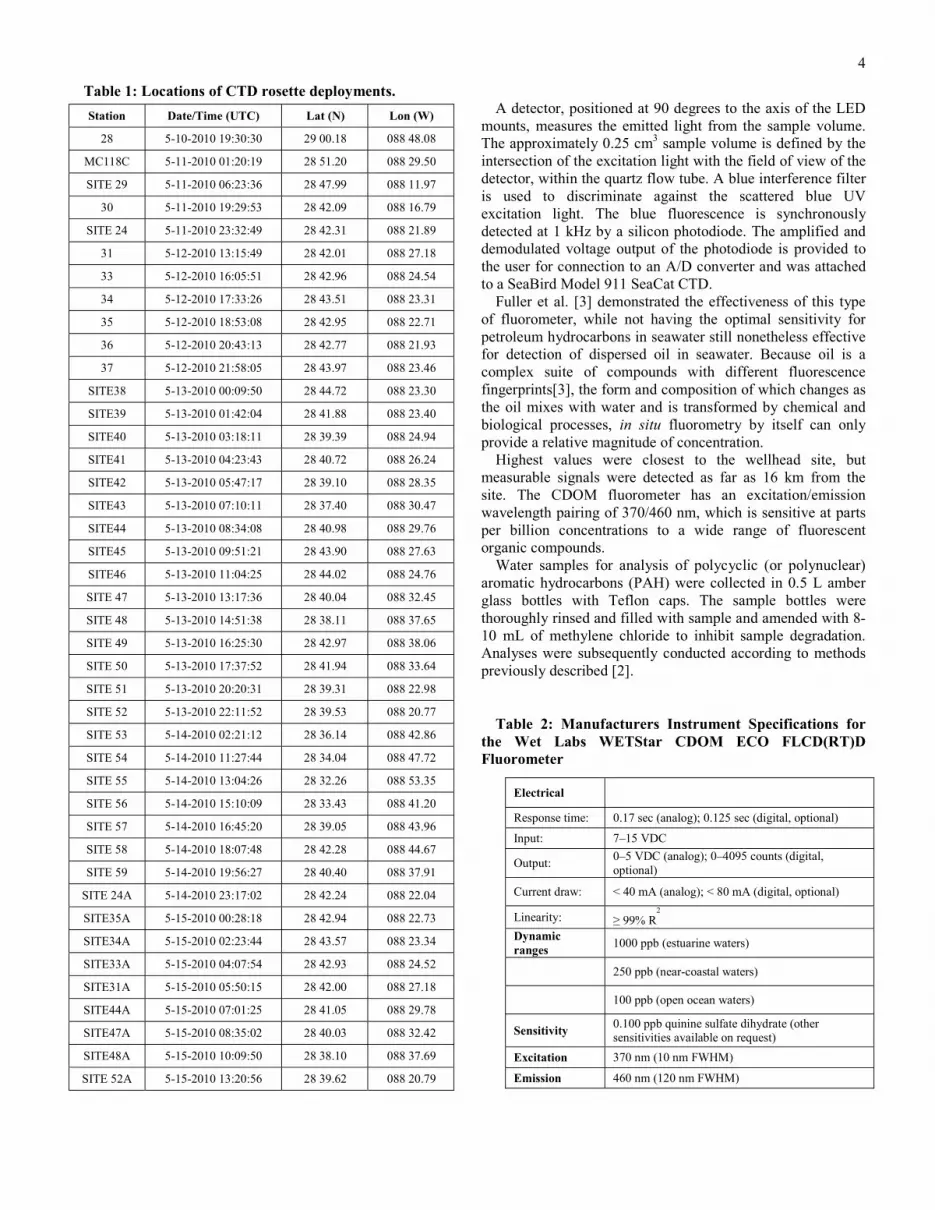
Table 1: Locations of CTD rosette deployments. A detector, positioned at 90 degrees to the axis of the LED
mounts, measures the emitted light from the sample volume. The approximately 0.25 cm3 sample volume is defined by the intersection of the excitation light with the field of view of the detector, within the quartz flow tube. A blue interference filter is used to discriminate against the scattered blue UV excitation light. The blue fluorescence is synchronously detected at 1 kHz by a silicon photodiode. The amplified and demodulated voltage output of the photodiode is provided to the user for connection to an A/D converter and was attached to a SeaBird Model 911 SeaCat CTD.
Fuller et al. [3] demonstrated the effectiveness of this type of fluorometer, while not having the optimal sensitivity for petroleum hydrocarbons in seawater still nonetheless effective for detection of dispersed oil in seawater. Because oil is a complex suite of compounds with different fluorescence fingerprints[3], the form and composition of which changes as the oil mixes with water and is transformed by chemical and biological processes, in situ fluorometry by itself can only provide a relative magnitude of concentration.
Highest values were closest to the wellhead site, but measurable signals were detected as far as 16 km from the site. The CDOM fluorometer has an excitation/emission wavelength pairing of 370/460 nm, which is sensitive at parts per billion concentrations to a wide range of fluorescent organic compounds.
Water samples for analysis of polycyclic (or polynuclear) aromatic hydrocarbons (PAH) were collected in 0.5 L amber glass bottles with Teflon caps. The sample bottles were thoroughly rinsed and filled with sample and amended with 8-10 mL of methylene chloride to inhibit sample degradation. Analyses were subsequently conducted according to methods previously described [2].
Table 2: Manufacturers Instrument Specifications for
the Wet Labs WETStar CDOM ECO FLCD(RT)D Fluorometer
Station Date/Time (UTC) Lat (N) Lon (W)
28 5-10-2010 19:30:30 29 00.18 088 48.08
MC118C 5-11-2010 01:20:19 28 51.20 088 29.50
SITE 29 5-11-2010 06:23:36 28 47.99 088 11.97
30 5-11-2010 19:29:53 28 42.09 088 16.79
SITE 24 5-11-2010 23:32:49 28 42.31 088 21.89
31 5-12-2010 13:15:49 28 42.01 088 27.18
33 5-12-2010 16:05:51 28 42.96 088 24.54
34 5-12-2010 17:33:26 28 43.51 088 23.31
35 5-12-2010 18:53:08 28 42.95 088 22.71
36 5-12-2010 20:43:13 28 42.77 088 21.93
37 5-12-2010 21:58:05 28 43.97 088 23.46
SITE38 5-13-2010 00:09:50 28 44.72 088 23.30
SITE39 5-13-2010 01:42:04 28 41.88 088 23.40
SITE40 5-13-2010 03:18:11 28 39.39 088 24.94
SITE41 5-13-2010 04:23:43 28 40.72 088 26.24
SITE42 5-13-2010 05:47:17 28 39.10 088 28.35
SITE43 5-13-2010 07:10:11 28 37.40 088 30.47
SITE44 5-13-2010 08:34:08 28 40.98 088 29.76
SITE45 5-13-2010 09:51:21 28 43.90 088 27.63
SITE46 5-13-2010 11:04:25 28 44.02 088 24.76
SITE 47 5-13-2010 13:17:36 28 40.04 088 32.45
SITE 48 5-13-2010 14:51:38 28 38.11 088 37.65
SITE 49 5-13-2010 16:25:30 28 42.97 088 38.06
SITE 50 5-13-2010 17:37:52 28 41.94 088 33.64
SITE 51 5-13-2010 20:20:31 28 39.31 088 22.98
SITE 52 5-13-2010 22:11:52 28 39.53 088 20.77
SITE 53 5-14-2010 02:21:12 28 36.14 088 42.86
SITE 54 5-14-2010 11:27:44 28 34.04 088 47.72
SITE 55 5-14-2010 13:04:26 28 32.26 088 53.35
SITE 56 5-14-2010 15:10:09 28 33.43 088 41.20
SITE 57 5-14-2010 16:45:20 28 39.05 088 43.96
SITE 58 5-14-2010 18:07:48 28 42.28 088 44.67
SITE 59 5-14-2010 19:56:27 28 40.40 088 37.91
SITE 24A 5-14-2010 23:17:02 28 42.24 088 22.04
SITE35A 5-15-2010 00:28:18 28 42.94 088 22.73
SITE34A 5-15-2010 02:23:44 28 43.57 088 23.34
SITE33A 5-15-2010 04:07:54 28 42.93 088 24.52
SITE31A 5-15-2010 05:50:15 28 42.00 088 27.18
SITE44A 5-15-2010 07:01:25 28 41.05 088 29.78
SITE47A 5-15-2010 08:35:02 28 40.03 088 32.42
SITE48A 5-15-2010 10:09:50 28 38.10 088 37.69
SITE 52A 5-15-2010 13:20:56 28 39.62 088 20.79
Electrical
Response time: 0.17 sec (analog); 0.125 sec (digital, optional)
Input: 7–15 VDC
Output: 0–5 VDC (analog); 0–4095 counts (digital, optional)
Current draw: < 40 mA (analog); < 80 mA (digital, optional)
Linearity: ≥ 99% R2
Dynamic ranges 1000 ppb (estuarine waters)
250 ppb (near-coastal waters)
100 ppb (open ocean waters)
Sensitivity 0.100 ppb quinine sulfate dihydrate (other sensitivities available on request)
Excitation 370 nm (10 nm FWHM)
Emission 460 nm (120 nm FWHM)
5
Additional samples for laboratory optical characterization were filtered through a 0.2 µm pore size 47 mm diameter polycarbonate membrane filter (Whatman) using an all-glass filtration apparatus.The filtered samples were stored in amber glass bottles with Teflon-lined caps in darkness at 4o C until analysis in the laboratory. Fluorescence EEM spectroscopy was performed using a Shimadzu RF-5301 spectrofluorometer
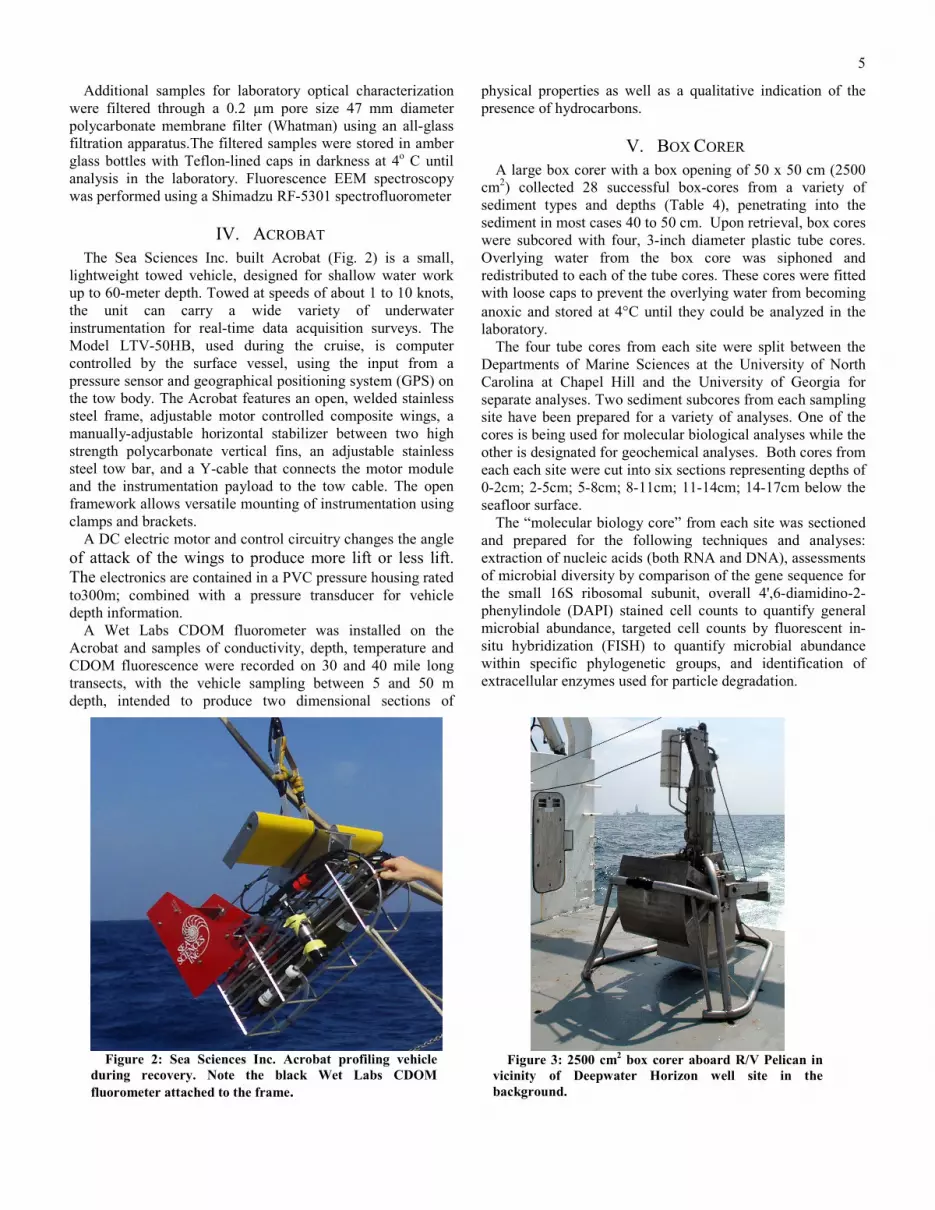
IV. ACROBAT The Sea Sciences Inc. built Acrobat (Fig. 2) is a small,
lightweight towed vehicle, designed for shallow water work up to 60-meter depth. Towed at speeds of about 1 to 10 knots, the unit can carry a wide variety of underwater instrumentation for real-time data acquisition surveys. The Model LTV-50HB, used during the cruise, is computer controlled by the surface vessel, using the input from a pressure sensor and geographical positioning system (GPS) on the tow body. The Acrobat features an open, welded stainless steel frame, adjustable motor controlled composite wings, a manually-adjustable horizontal stabilizer between two high strength polycarbonate vertical fins, an adjustable stainless steel tow bar, and a Y-cable that connects the motor module and the instrumentation payload to the tow cable. The open framework allows versatile mounting of instrumentation using clamps and brackets.
A DC electric motor and control circuitry changes the angle of attack of the wings to produce more lift or less lift. The electronics are contained in a PVC pressure housing rated to300m; combined with a pressure transducer for vehicle depth information.
A Wet Labs CDOM fluorometer was installed on the Acrobat and samples of conductivity, depth, temperature and CDOM fluorescence were recorded on 30 and 40 mile long transects, with the vehicle sampling between 5 and 50 m depth, intended to produce two dimensional sections of
physical properties as well as a qualitative indication of the presence of hydrocarbons.
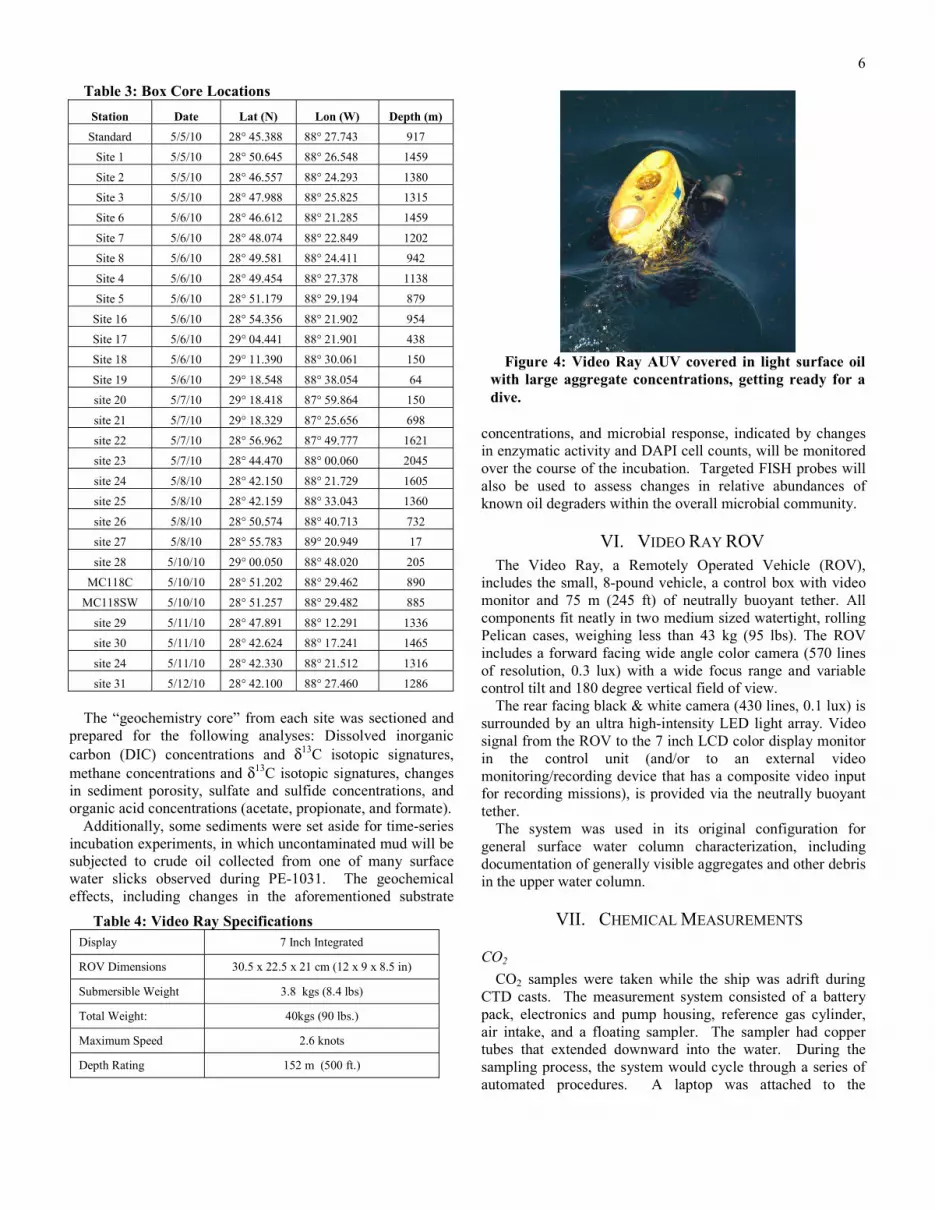
V. BOX CORER A large box corer with a box opening of 50 x 50 cm (2500
cm2) collected 28 successful box-cores from a variety of sediment types and depths (Table 4), penetrating into the sediment in most cases 40 to 50 cm. Upon retrieval, box cores were subcored with four, 3-inch diameter plastic tube cores. Overlying water from the box core was siphoned and redistributed to each of the tube cores. These cores were fitted with loose caps to prevent the overlying water from becoming anoxic and stored at 4°C until they could be analyzed in the laboratory.
The four tube cores from each site were split between the Departments of Marine Sciences at the University of North Carolina at Chapel Hill and the University of Georgia for separate analyses. Two sediment subcores from each sampling site have been prepared for a variety of analyses. One of the cores is being used for molecular biological analyses while the other is designated for geochemical analyses. Both cores from each each site were cut into six sections representing depths of 0-2cm; 2-5cm; 5-8cm; 8-11cm; 11-14cm; 14-17cm below the seafloor surface.
The “molecular biology core” from each site was sectioned and prepared for the following techniques and analyses: extraction of nucleic acids (both RNA and DNA), assessments of microbial diversity by comparison of the gene sequence for the small 16S ribosomal subunit, overall 4',6-diamidino-2-phenylindole (DAPI) stained cell counts to quantify general microbial abundance, targeted cell counts by fluorescent in-situ hybridization (FISH) to quantify microbial abundance within specific phylogenetic groups, and identification of extracellular enzymes used for particle degradation.
Figure 2: Sea Sciences Inc. Acrobat profiling vehicle during recovery. Note the black Wet Labs CDOM fluorometer attached to the frame.
Figure 3: 2500 cm2 box corer aboard R/V Pelican in
vicinity of Deepwater Horizon well site in the background.
6
Table 3: Box Core Locations Station Date Lat (N) Lon (W) Depth (m)
Standard 5/5/10 28° 45.388 88° 27.743 917
Site 1 5/5/10 28° 50.645 88° 26.548 1459
Site 2 5/5/10 28° 46.557 88° 24.293 1380
Site 3 5/5/10 28° 47.988 88° 25.825 1315
Site 6 5/6/10 28° 46.612 88° 21.285 1459
Site 7 5/6/10 28° 48.074 88° 22.849 1202
Site 8 5/6/10 28° 49.581 88° 24.411 942
Site 4 5/6/10 28° 49.454 88° 27.378 1138
Site 5 5/6/10 28° 51.179 88° 29.194 879
Site 16 5/6/10 28° 54.356 88° 21.902 954
Site 17 5/6/10 29° 04.441 88° 21.901 438
Site 18 5/6/10 29° 11.390 88° 30.061 150
Site 19 5/6/10 29° 18.548 88° 38.054 64
site 20 5/7/10 29° 18.418 87° 59.864 150
site 21 5/7/10 29° 18.329 87° 25.656 698
site 22 5/7/10 28° 56.962 87° 49.777 1621
site 23 5/7/10 28° 44.470 88° 00.060 2045
site 24 5/8/10 28° 42.150 88° 21.729 1605
site 25 5/8/10 28° 42.159 88° 33.043 1360
site 26 5/8/10 28° 50.574 88° 40.713 732
site 27 5/8/10 28° 55.783 89° 20.949 17
site 28 5/10/10 29° 00.050 88° 48.020 205
MC118C 5/10/10 28° 51.202 88° 29.462 890
MC118SW 5/10/10 28° 51.257 88° 29.482 885
site 29 5/11/10 28° 47.891 88° 12.291 1336
site 30 5/11/10 28° 42.624 88° 17.241 1465
site 24 5/11/10 28° 42.330 88° 21.512 1316
site 31 5/12/10 28° 42.100 88° 27.460 1286 The “geochemistry core” from each site was sectioned and
prepared for the following analyses: Dissolved inorganic carbon (DIC) concentrations and δ13C isotopic signatures, methane concentrations and δ13C isotopic signatures, changes in sediment porosity, sulfate and sulfide concentrations, and organic acid concentrations (acetate, propionate, and formate).
Additionally, some sediments were set aside for time-series incubation experiments, in which uncontaminated mud will be subjected to crude oil collected from one of many surface water slicks observed during PE-1031. The geochemical effects, including changes in the aforementioned substrate
concentrations, and microbial response, indicated by changes in enzymatic activity and DAPI cell counts, will be monitored over the course of the incubation. Targeted FISH probes will also be used to assess changes in relative abundances of known oil degraders within the overall microbial community.
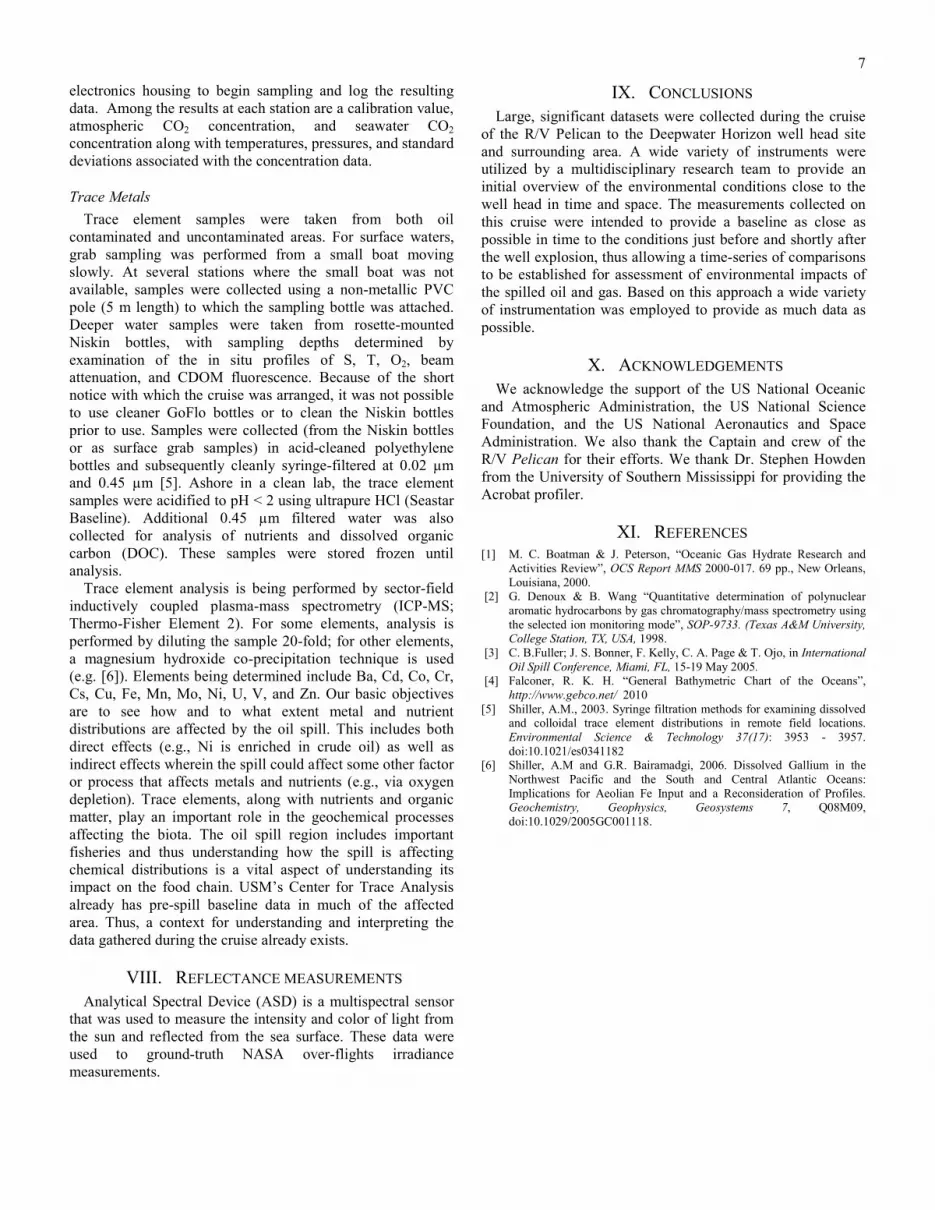
VI. VIDEO RAY ROV The Video Ray, a Remotely Operated Vehicle (ROV),
includes the small, 8-pound vehicle, a control box with video monitor and 75 m (245 ft) of neutrally buoyant tether. All components fit neatly in two medium sized watertight, rolling Pelican cases, weighing less than 43 kg (95 lbs). The ROV includes a forward facing wide angle color camera (570 lines of resolution, 0.3 lux) with a wide focus range and variable control tilt and 180 degree vertical field of view.
The rear facing black & white camera (430 lines, 0.1 lux) is surrounded by an ultra high-intensity LED light array. Video signal from the ROV to the 7 inch LCD color display monitor in the control unit (and/or to an external video monitoring/recording device that has a composite video input for recording missions), is provided via the neutrally buoyant tether.
The system was used in its original configuration for general surface water column characterization, including documentation of generally visible aggregates and other debris in the upper water column.
VII. CHEMICAL MEASUREMENTS
CO2 CO2 samples were taken while the ship was adrift during
CTD casts. The measurement system consisted of a battery pack, electronics and pump housing, reference gas cylinder, air intake, and a floating sampler. The sampler had copper tubes that extended downward into the water. During the sampling process, the system would cycle through a series of automated procedures. A laptop was attached to the
Table 4: Video Ray Specifications Display 7 Inch Integrated
ROV Dimensions 30.5 x 22.5 x 21 cm (12 x 9 x 8.5 in)
Submersible Weight 3.8 kgs (8.4 lbs)
Total Weight: 40kgs (90 lbs.)
Maximum Speed 2.6 knots
Depth Rating 152 m (500 ft.)
Figure 4: Video Ray AUV covered in light surface oil
with large aggregate concentrations, getting ready for a dive.
7
electronics housing to begin sampling and log the resulting data. Among the results at each station are a calibration value, atmospheric CO2 concentration, and seawater CO2 concentration along with temperatures, pressures, and standard deviations associated with the concentration data.
Trace Metals Trace element samples were taken from both oil
contaminated and uncontaminated areas. For surface waters, grab sampling was performed from a small boat moving slowly. At several stations where the small boat was not available, samples were collected using a non-metallic PVC pole (5 m length) to which the sampling bottle was attached. Deeper water samples were taken from rosette-mounted Niskin bottles, with sampling depths determined by examination of the in situ profiles of S, T, O2, beam attenuation, and CDOM fluorescence. Because of the short notice with which the cruise was arranged, it was not possible to use cleaner GoFlo bottles or to clean the Niskin bottles prior to use. Samples were collected (from the Niskin bottles or as surface grab samples) in acid-cleaned polyethylene bottles and subsequently cleanly syringe-filtered at 0.02 µm and 0.45 µm [5]. Ashore in a clean lab, the trace element samples were acidified to pH < 2 using ultrapure HCl (Seastar Baseline). Additional 0.45 µm filtered water was also collected for analysis of nutrients and dissolved organic carbon (DOC). These samples were stored frozen until analysis.
Trace element analysis is being performed by sector-field inductively coupled plasma-mass spectrometry (ICP-MS; Thermo-Fisher Element 2). For some elements, analysis is performed by diluting the sample 20-fold; for other elements, a magnesium hydroxide co-precipitation technique is used (e.g. [6]). Elements being determined include Ba, Cd, Co, Cr, Cs, Cu, Fe, Mn, Mo, Ni, U, V, and Zn. Our basic objectives are to see how and to what extent metal and nutrient distributions are affected by the oil spill. This includes both direct effects (e.g., Ni is enriched in crude oil) as well as indirect effects wherein the spill could affect some other factor or process that affects metals and nutrients (e.g., via oxygen depletion). Trace elements, along with nutrients and organic matter, play an important role in the geochemical processes affecting the biota. The oil spill region includes important fisheries and thus understanding how the spill is affecting chemical distributions is a vital aspect of understanding its impact on the food chain. USM’s Center for Trace Analysis already has pre-spill baseline data in much of the affected area. Thus, a context for understanding and interpreting the data gathered during the cruise already exists.
VIII. REFLECTANCE MEASUREMENTS Analytical Spectral Device (ASD) is a multispectral sensor
that was used to measure the intensity and color of light from the sun and reflected from the sea surface. These data were used to ground-truth NASA over-flights irradiance measurements.
IX. CONCLUSIONS Large, significant datasets were collected during the cruise
of the R/V Pelican to the Deepwater Horizon well head site and surrounding area. A wide variety of instruments were utilized by a multidisciplinary research team to provide an initial overview of the environmental conditions close to the well head in time and space. The measurements collected on this cruise were intended to provide a baseline as close as possible in time to the conditions just before and shortly after the well explosion, thus allowing a time-series of comparisons to be established for assessment of environmental impacts of the spilled oil and gas. Based on this approach a wide variety of instrumentation was employed to provide as much data as possible.
X. ACKNOWLEDGEMENTS We acknowledge the support of the US National Oceanic
and Atmospheric Administration, the US National Science Foundation, and the US National Aeronautics and Space Administration. We also thank the Captain and crew of the R/V Pelican for their efforts. We thank Dr. Stephen Howden from the University of Southern Mississippi for providing the Acrobat profiler.
XI. REFERENCES [1] M. C. Boatman & J. Peterson, “Oceanic Gas Hydrate Research and
Activities Review”, OCS Report MMS 2000-017. 69 pp., New Orleans, Louisiana, 2000.
[2] G. Denoux & B. Wang “Quantitative determination of polynuclear aromatic hydrocarbons by gas chromatography/mass spectrometry using the selected ion monitoring mode”, SOP-9733. (Texas A&M University, College Station, TX, USA, 1998.
[3] C. B.Fuller; J. S. Bonner, F. Kelly, C. A. Page & T. Ojo, in International Oil Spill Conference, Miami, FL, 15-19 May 2005.
[4] Falconer, R. K. H. “General Bathymetric Chart of the Oceans”, http://www.gebco.net/ 2010
[5] Shiller, A.M., 2003. Syringe filtration methods for examining dissolved and colloidal trace element distributions in remote field locations. Environmental Science & Technology 37(17): 3953 - 3957. doi:10.1021/es0341182
[6] Shiller, A.M and G.R. Bairamadgi, 2006. Dissolved Gallium in the Northwest Pacific and the South and Central Atlantic Oceans: Implications for Aeolian Fe Input and a Reconsideration of Profiles. Geochemistry, Geophysics, Geosystems 7, Q08M09, doi:10.1029/2005GC001118.


