Embed Size (px)
Citation preview

European Journal of Political Economy 5 (1989) 5.5-569. North-Holland
NEW MODELS OF PRESIDENTIAL APPROVAL
Carter, Reagan and their Predecessors
Harold D. CLARKE
University of North Texas, Denton, TX 76203. USA
Euel ELLIOTT
University of Georgia, Athens, GA 30602, USA
Many analysts have uncritically assumed that macroeconomic conditions affect presidential approval according to a reward-punishment model. They thereby have ignored the possibility that presidential approval may be governed by perceived differences in the macroeconomic priorities of presidential and opposition parties and that the impact of the macroeconomy varies according to prevailing contexts of political debate. Also, many previous models may be misleading because important political interventions have been omitted or inappropriately specified. The theoretical and methodological limitations of existing research raise a number of questions about the nature, generality and relative significance of macroeconomic influences on presidential support. Here, these questions are addressed by analyses of presidential approval during the presidencies of Carter, Reagan and their predecessors.
1. Introduction
This study tests alternative models of presidential approval. These include the traditional reward-punishment model, an issue-priority model, and variants of a political debate model. The reward-punishment model of presidential approval [Key (1966)] holds ‘pride of place’ in most studies of presidential support.’ This model postulates that increases in inflation and unemployment invariably diminish support for governing parties and their leaders, such decreases being accompanied by enhanced support for the opposition. The reward-punishment model is incumbency orientated; res- ponses of the electorate are based solely on the performance of the
‘As Monroe and Erickson (1987, p. 619) note, ‘this logic is tested in some form by virtually every analyst in the field’. Presidential approval analyses include, inter alia Frey and Schneider (1978, 1980); Kernel1 (1978); Hibbs (1982a); Norpoth and Yantek (1983); Monroe (1984); Norpoth (1984); Whiteley (1984); Chappell and Keech (1985); Ostrom and Simon (1985); Yantek (1988). Useful reviews of this and related party popularity function literature include Paldam (1981); Monroe (1984); Whiteley (1986a); Miller (1989).
01762680/90/$03.50 0 1990-Elsevier Science Publishers B.V. (North-Holland)
552 H.D. Clarke and E. Elliott, Models of presidential approval
administration, with no consideration given to possible alternative outcomes under an opposition government.
This model ignores voters’ perceptions of parties’ issue-priorities. Accord- ing to the issue-priority model [Budge and Farlie (1983); Clarke, Stewart and Zuk (1986)], the salience of economic issues covaries with macroecono- mic conditions, especially rates of inflation and unemployment, and voters offer or withdraw support according to the perceived macroeconomic priorities and competencies of competing parties, In the context of American presidential politics this means that voters would not punish a Republican administration for price increases because they perceive that the Republicans are more concerned about and can deal more effectively with inflation than can Democratic administrations. Similarly, voters would not withdraw support from a Democratic administration during a period of increasing unemployment because they believe that Democrats assign unemployment a higher priority than do Republicans and are more successful in dealing with the problem.2
In contrast to the reward-punishment model, the issue-priority model requires prospective judgments about parties’ policy intentions and capabili- ties. Although the assumption of a retrospectively oriented electorate has dominated the political support literature [Monroe (1984)], research indi- cates prospective as well as retrospective thinking in the American and other electorates [e.g., Fiorina (1981, p. 197); Kuklinski and West (1981, p. 443); Lewis-Beck (1986, 1988)J Relatedly, evidence of issue-priority effects on presidential/party support may be found in some individual- and aggregate- level analyses [e.g., Kiewiet (1983, ch. 5); Monroe (1984); Clarke, Stewart and Zuk (1986)].
The political debate model [Clarke and Zuk (1987); Miller (1989)] posits that economic influences on support are shaped by the context of political discussion and debate between parties and the electorate, with support being governed by the persuasiveness of arguments put forth by parties and their leaders and the resonance of economic issues for the electorate. Two variants of the political debate model are theoretically attractive in that they posit systematic macroeconomic effects on political support. The first is consistent with the general direction of effects seen under reward-punishment. Deterior- ating economic conditions always have negative consequences for presiden- tial support, but their magnitude and timing change from one political context to the next. The second version posits issue-priority type effects, but
%ch beliefs would seem to be grounded in reality. Hibbs (1977) finds a 5% difference (favouring the Democrats) in equilibrium levels of unemployment under Democratic versus Republican presidents. In a subsequent debate between Beck (1982) and Hibbs (1983) a consensus was reached that party differences in macroeconomic outcomes, while smaller than the above estimate, are still significant.

H.D. Clarke and E. Elliott, Models of presidential approval 553
again these vary in magnitude and timing according to the context and substance of discourse between the parties. However, as with the ‘pure’ reward-punishment and issue-priority models, both variants of the political debate model are plausible only if the lags for the economic effects in question are reasonable.
There are two other types of political debate model which are inconsistent with fundamental assumptions about the systematic relevance of macroeco- nomic variables for political support. One such model would have economic conditions exhibiting purely idiosyncratic effects in which their influence ‘flip- flops’ from reward-punishment to issue-priority patterns (or vice versa) although there is no evidence of significant changes in economic conditions or parties’ macroeconomic policy priorities. A second unacceptable model would have unemployment producing positive effects on Republican admi- nistrations, and inflation, positive effects on Democratic ones. Such effects would be perverse according to either reward-punishment or issue-priority processes.
To test the several models discussed above requires that several additional assumptions about the nature of presidential support be reconsidered. First, previous studies have assumed, often implicitly, that presidential approval functions are invariant over time and with regard to the partisanship of the incumbent president. The assumption of invariant approval functions has prompted researchers to employ time-series data that span several administ- rations. Such cross-administration analyses ignore the possibility that the impact of particular economic conditions, e.g., inflation or unemployment, may vary for Democratic and Republican presidents. The invariance assump- tion also has blinded analysts to the more general possiblity that the effects of macroeconomic conditions may change either gradually or more abruptly over time [see, e.g., Alt (1979); Whiteley (1984, 1986b)].
Many analysts also have assumed that changes in economic conditions have immediate or very short-lagged effects on presidential approval which erode rapidly or disappear forthwith.3 They thereby ignore the possibility that economic effects are products not only of direct experience in the market place and/or the rapid diffusion of information by the mass media but also of more slowly paced processes of interpersonal communication [Whiteley (1986b)]. There is a related tendency to confuse individual- and aggregate-level effects. Whereas macroeconomic influences on presidential approval may begin very quickly at the individual level, their aggregate significance may occur after a substantial delay, as individual effects accumu- late. Moreover, since opinions decay as well as diffuse, aggregate effects may not continue over multiple time periods. Although extremely long lags are
3An exception is Hibbs (1982a, b) whose distributed lag models indicate the presence of both short- and long-lagged macroeconomic effects.

554 H.D. Clarke and E. Elliott, Models qf presidential approval
unreasonable, evidence of lagged macroeconomic influences should not be dismissed, and their failure to persist does not necessarily mean that they are abruptly exhausted at the individual level. Rather, models incorporating lagged, single period effects may accurately reflect the aggregate dynamics of presidential approval in particular political-economic contexts.
It is also important to recognize that presidential support is influenced by many domestic and international events. To date, most research has either ignored such events, or considered only a few of the most highly salient ones, typically the Vietnam War and the Watergate scandal [see e.g., Kernel1 (1978); Hibbs (1987)]. Except for Mueller’s early work (1970, 1973) on the ‘rally’ effects produced by wars, only a few studies [e.g., MacKuen (1983); Monroe (1984); Norpoth (1984); Ostrom and Simon (1985)] have made political events a major focus of inquiry. To understand the nature and relative importance of macroeconomic conditions as determinants of presi- dential approval requires that economic and political variables be modeled simultaneously.
Two general classes of political events may be distinguished: ‘systemic’ interventions that are integral to a particular political system and thereby recur at frequent or regular intervals (e.g., by-elections, off-year congressional elections), and ‘one-off’ shocks (e.g., a hostage crisis, a political scandal). Many presidential approval models are misspecified because interventions of one or both types are omitted. Others include such interventions but fail to recognize that their effects may be both complex and dynamic. The omission or misspecification of political interventions may produce misleading results concerning the significance and relative explanatory power of macro- economic variables in approval functions.
There is no theoretical guide for selecting the particular shock interven- tions to be modeled. However, efforts should be made to select those events for which there is prima facie evidence that they may have contributed in a substantial way to influencing support for the president. In this endeavor we rely upon the work of prominent political commentators to inform our selections. Since the number of data points for each president is limited, only those events for which there is wide consensus about their putative import-
ance are considered.
2. Measures and methods
The measure of presidential approval is that employed in monthly Gallup Poll surveys, i.e., ‘Do you approve or disapprove of the way - is handling
his job as President?’ Economic series were obtained from the OECD Main Economic Indicators and the Survey of Current Business. Inflation is the percentage change in the consumer price index computed at an annual rate.

H.D. Clarke and E. Elliott, Models of presidential approval 555
Unemployment is the seasonally adjusted percentage of the labor force
unemployed per month. Model estimates are generated using Box-Tiao (1975) and Box-Jenkins
(1976) procedures that enable one to assess the effects of both continuous and dichotomous variables on an outcome series. These techniques provide an effective means of detecting lag structures and allow for the testing of causal relationships using the logic proposed by Granger [Granger (1969); Freeman (1983)]. The techniques differ from OLS and GLS procedures by permitting one to control for complex autoregressive or moving-average processes that might otherwise distort the estimates.
Box-Jenkins-Tiao modeling begins with the use of autocorrelation (ACF)
and partial autocorrelation (PACF) functions to identify time-series depen- dencies in the outcome (dependent) and independent continuous variables [see e.g., McCleary and Hay (1980); Norpoth (1986)]. Such variables must be stationary in their mean and variance, and where non-stationarity is present, this must be addressed through differencing or (natural) log transformations. The next step involves estimation of autoregressive (AR) or moving average (MA) parameters (‘noise models’) for the independent variables. These noise models are then used to filter or ‘pre-whiten’ the outcome series of interest. The residuals from the univariate models of the independent variables are then cross-correlated with the pre-whitened outcome series to help specify the time lags at which the independent variables influence the outcome series [McCleary and Hay (1980, pp. 243-257)]. The CCF analysis is an aid in model specification, and it is the responsibility of the analyst to ensure that the lag structures are theoretically plausible. Estimating the effects of the predictor variables is the next step. The original (stationary) independent and dependent variables, rather than those that have been tiltered for purposes of the CCF analysis, are used at this stage. Finally, the residuals of the outcome series are diagnosed to assure that all time-series dependencies that might distort the estimates have been modeled correctly. If the residuals are not white noise, then AR or MA parameters are added to the model and it is reestimated and rediagnosed. This iterative process continues until the diagnostics indicate all time-series dependencies have been adequately addressed.
Modeling dichotomous independent variables (interventions) is a similar, albeit simpler, process in that plausible time lags are specified a priori rather than identified through the use of cross-correlations. As with the continuous independent variables, a variety of lag structures and dynamic effects may be specified. Further, interventions may be modeled as having either temporary or permanent effects. However, if one wishes to model an intervention as temporary and the outcome series has been differenced to achieve station- arity, then the intervention must be differenced - otherwise it would have permanent effects. Again, model residuals must be white noise and, to assure

556 H.D. Clarke and E. Elliott, Models of presidential approval
38 --
/I: carter B: Reagan-l& Term C:Reagan-2nd Term
2e
2- Et- 2- 8- 2- 8- 2- B- 2- 8- Z- B- 2- 13- 2- 8- 2- B- 2- 8- 2- B- 2- B- 77 77 78 78 79 79 88 88 81 81 82 82 83 83 84 84 85 85 86 86 87 87 88 88
Date
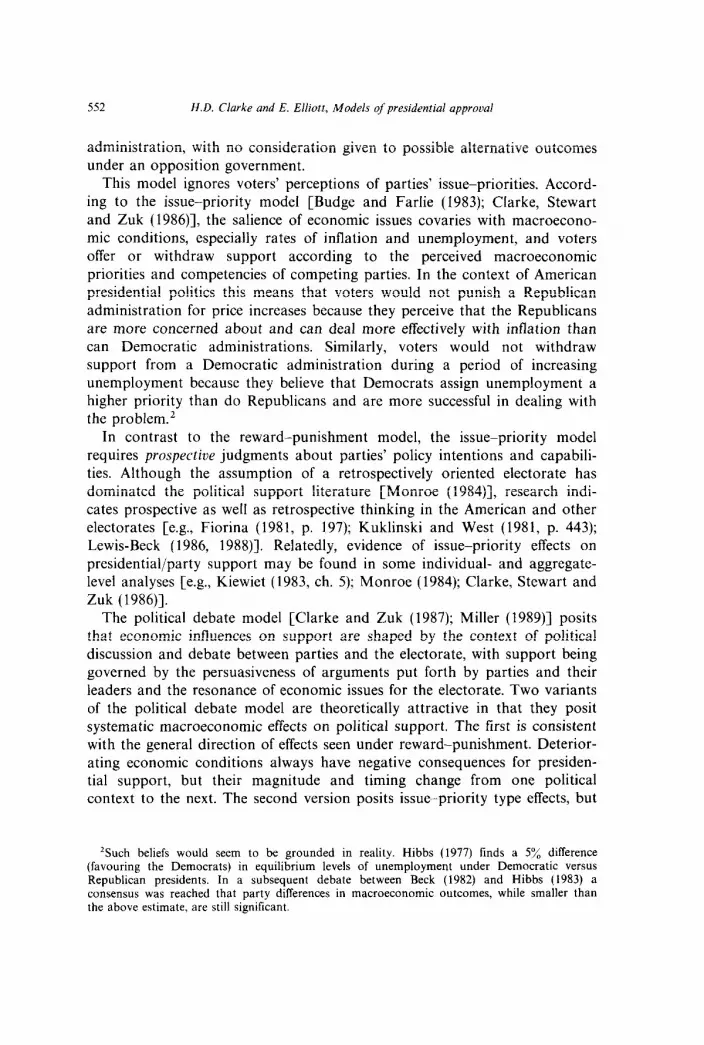
Fig. 1. Presidential approval ratings, Carter and Reagan.
this, appropriate AR or MA parameters may be required. Models analyzed in this paper contain a combination of continuous and dichotomous predictor variables.
3. Modeling presidential approval
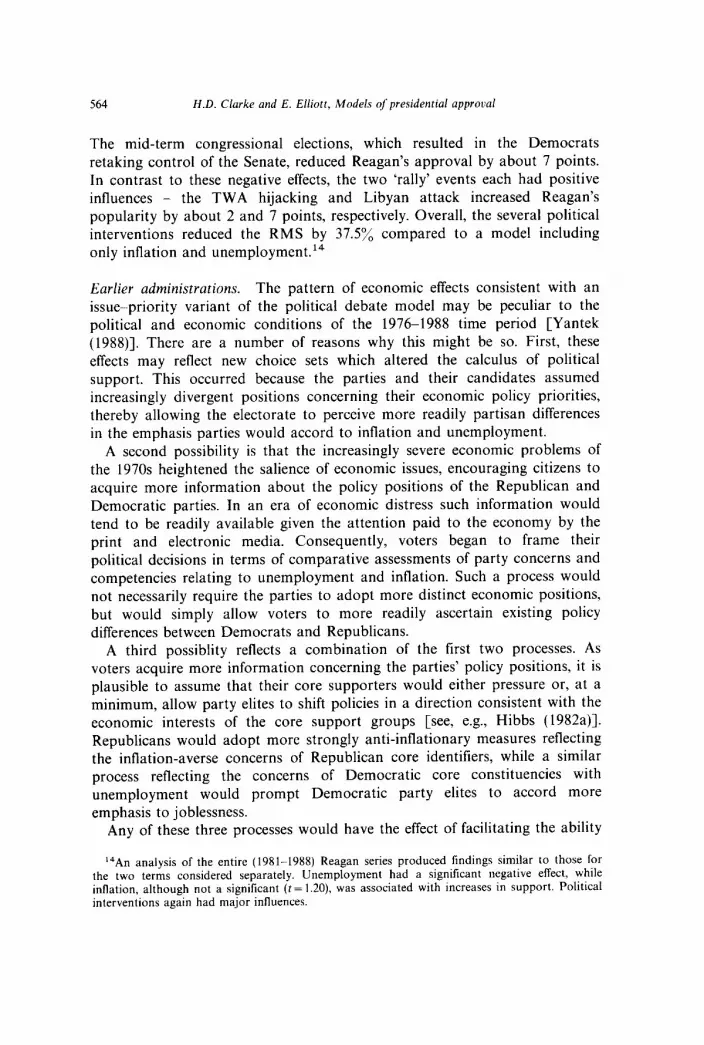
Carter. The Carter approval series is shown in fig. 2.A. In February 19774 his approval rating stood at 71% (see fig. 1). Public support for the new president subsequently declined before rebounding in 1978. Carter’s approval reached its nadir in the summer of 1979, and then surged after the Iranian hostage crisis and the Soviet invasion of Afghanistan, before sinking steadily to 32:/, at the time of the 1980 presidential election. The Carter series was non-stationary in its mean and accordingly was first-differenced. ARIMA diagnostics (ACF, PACF) for the differenced series indicated that it required an MA parameter (lag 6). Inspection of the ACF, PACF and Ljung-Box (1978) statistic (LBQ) for the residuals of the univariate model confirms this diagnosis.
Regarding the economy, unemployment stood at 7.3% in February 1977
and declined gradually throughout that year, leveling off in 1978 at just under 6%. Joblessness subsequently increased, racing upward in 1980. Inflation, which fluctuated between 6 and 6.5% in 1977, rose sharply in 1978 and 1979 - reaching 15% in June 1979 before receding slowly. The
4The Carter series begins in February rather than January 1977 because no data on presidential approval are available in the January 1977 Gallup Poll.

CI\KrER APPRWLIL, z/77 - 12/81
68”
p 55” . r SCJ”
(‘4) ‘. 4s..
2 48.-
35.’
::t. nontll
REAGAN nPPROU*L, l/81 - 12/84
,i: tbnth
Fig. 2. Presidential approvals. (A) Carter. (B) Reagan 1st term. (<‘) Reagan 2nd term

558 H.D. Clarke and E. Elliott, Models of presidential approval
unemployment and inflation series were non-stationary and required differ- encing. Diagnostics indicated that unemployment was a simple (0, 1, 0) process. Inflation was complex, and was identified as a (1, 1, 1) process requiring first-order autoregressive and moving-average filters. These ARIMA models of unemployment and inflation yielded white noise residuals and statistically insignificant LBQs at 20 lags. Cross-correlation functions (CCFs) for Carter approval, on the one hand, and unemployment and inflation, on the other, suggested lagged effects at four and seven months, respectively.
Several prominent political events and conditions also were modeled. There are, of course, many domestic and international political events that might influence presidential approval [MacKuen (1983)-J. Those included here represent a plausible group of commonly acknowledged important events occurring during Carter’s presidency [Pomper (1981)]: (1) the Lance resignation of October 1977 modeled as a one-month pulse; (2) the ratitica- tion of the Panama Canal Treaty in April 1978 - a one-month pulse; (3) the dramatic Camp David Accord of September 1978 - a pulse which persists at a declining rate in subsequent months;5 (4) the Israel-Egypt Treaty of March 1979 - a one-month pulse; (5) the signing of the Salt II Treaty in June 1979 - a one-month pulse; (6) the Iran hostage crisis - a complex dynamic effect which influenced Carter’s approval positively for three months before reaching a plateau, and then negatively throughout the rest of his presidency; (7) the 1980 presidential election outcome - a one-month pulse.6 The latter is an example of a systemic effect integral to the American political system, whereas the others are non-systemic ‘shocks’ operating in a particular political context.
Table 1 displays the estimates for this model. Again, as noted above, at this stage the original non-filtered dependent and independent variables are used, although the analyst must ensure that all series are stationary in level and variance. Prices and jobs are both strongly significant. Importantly, however, their signs are reversed - a 1% rise in inflation produced a 5% decrease in Carter’s approval rating, whereas a 1% rise in unemployment
‘The pulse-decay model for the Camp David intervention means that it is likely to be collinear with the effects of the 1978 congressional elections. Thus, an intervention for the latter is not included in the Carter model. The impact of off-year congressional elections is illustrated in the Reagan analyses below.
6Following Box-Tiao (1975) procedures these interventions and those in the analyses below are treated as l&l dichotomies. Political interventions vary in duration and complexity. Here, for example, the Camp David Accord and the Iranian hostage crisis are hypothesized to have dynamic effects over several months, thereby requiring the modeling of adjustment (6) parameters, The hostage crisis also is an example of an event that is hypothesized to have both initial positive and longer lagged negative effects. Thus, it is modeled with multiple impact (0) parameters. Although observers have speculated that events such as the Iranian crisis have complex effects [e.g., Pomper (1981, pp. 840)], attempts to model them have seldom been forthcoming. A recent exception is Norpoth’s (1987a, b) analyses of how the Falklands War affected support for Prime Minister Thatcher and the British Conservative Party.

H.D. Clarke and E. Elliott, Models of presidential approval 559
Table 1
Effects on inflation, unemployment and political interventions on President Carter’s approval rating.
Predictor variable Standard
Coetlicient error td
Inflation rate Unemployment Lance affair Panama Canal treaty Salt II treaty Camp David Accord
Israel-Egypt treaty Iran hostage crisis
Presidential election
4B’) wm w(B’) wuw w(@‘) 49’) &B’) w(B”) w(@‘) w( 9’) w(B*) w(B4) S(B’) w(BO)
Residual mean square (RMS) = 8.51 Ljung-Box Q(df=20)= 12(p=NS)
- 5.07 1.67 8.62 2.90
- 5.66 3.12 - 3.23 2.11 -4.31 2.07
4.83 1.96 0.70 0.18 8.30 2.35 9.76 3.07
14.63 2.98 7.89 3.48
- 7.72 3.52 0.92 0.09
-4.29 2.12
- 3.03” 2.98”
- l.81b - 1.53’ - 2.08
2.46” 3.78” 3.54” 3.17a 4.91” 2.26b
-2.19b 10.02”
- 2.02b
ap~o.ol. bp 5 0.05. ‘pJO.10. dTwo-tailed test for unemployment; one-tailed test for other variables.
yielded an 8.6% increase.’ These findings are consistent with an issue- priority, rather than a reward-punishment model.
Turning to the political interventions, Camp David contributed to a nearly 5 point gain and, as indicated by the adjustment parameter (6=0.7), it persisted over several months. The effects of the hostage crisis were complex and profound. Initially, it raised Carter’s popularity substantially, with an immediate increment of 10% being supplemented in the two succeeding months by gains of 15% and S%, respectively.8 These increases were followed by a protracted decline beginning in the fourth month. As indicated by the t -4 impact parameter (-7.7) and the very large adjustment parameter (6 = 0.92), Cater’s eventual losses due to the hostage crisis endured throughout the remainder of this presidency.
‘The interpretation of inflation and unemployment effects is straightforward. Since inflation is defined as a rare of change variable, and since both the popularity and inlation series have been diflerenced to achieve stationarity, a coefficient measuring the impact of inflation is interpreted as the result produced by a one point increase in the rate at which prices grow. Regarding unemployment, since it is measured as a level variable (the percent unemployed in a given month), and since both unemployment and presidential support are analyzed in differenced form, the estimated coefficient for unemployment is interpreted as the impact of a one-point increase in the level of joblessness.
*The latter coefficient likely also reflects public reactions to the Soviet invasion of Afghanistan which occurred two months after the seizure of the American embassy in Teheran.

560 H.D. Clarke and E. Elliott, Models of presidential approval
As for other interventions, the Israel-Egypt peace treaty had a temporary So/, positive impact. In contrast, the Lance affair and the Panama and Salt II treaties had negative effects. The former operated as anticipated. However, the estimates for the two treaties contradict conventional wisdom that they constituted popular foreign policy successes for the president.g The presi- dential election outcome had a negative impact of about four points on Carter’s already low approval, as public opinion was reinforced by news that an already unpopular incumbent had been rejected at the polls.
Diagnostic checks [McCleary and Hay (1980, pp. 251-252)] indicate that model specification is satisfactory. The ACF for the Carter approval residuals shows that they are white noise at l-20 lags and the LBQ is insignificant (p>O.O5). Similarly, the CCFs for the residuals of the univariate models of unemployment and inflation, on the one hand, and the approval residuals, on the other, show that all correlations are insignificant at &- 12 lags.” Although the results demonstrate that both macroeconomic conditions and political interventions influence presidential approval, the latter have consi- derably more explanatory power than the former. Modeling the inflation and unemployment effects by themselves yields a residual mean square (RMS) of 25.2, an 8.9% improvement over the univariate model. The addition of the political interventions drives the RMS to 8.5, a further 66.3% reduction, thereby clearly indicating the importance of including political as well as economic variables in models of presidential support.
Reagan - First term. The Reagan approval series began in January 1981 at a modest 51%” but climbed dramatically in suceeding months (fig. 2.B).
Reagan’s popularity peaked in May 1981 at 68% and then began a slide which bottomed out at 35% in January 1983. His rating then recovered, and was sustained throughout the remainder of his first term. The series was non- stationary in its mean and required first-differencing. The ACF, PACF and LBQ for the differenced series were insignificant, indicating the adequacy of an (0, 1, 0) univariate model.
Between 1981 and 1984 unemployment and inflation exhibited a classic ‘criss-cross’ or Phillips curve pattern. Unemployment rose steadily beginning
9Re: Salt II, positive effects may have been swamped by mounting frustration with gasoline shortages and the president’s inability to alleviate the problem, the latter being dramatized by Congress’ refusal a month earlier (May, 1979) to grant him standby rationing authority. More generally, the late 1970s was a period of growing public anxiety about U.S. military capabilities Pomper (1981, p, 40), and this may have been exacerbated by public debate over national security implications of the treaty.
“‘As a further check on model specification, the analysis was rerun including personal income as a control variable. The estimates were essentially unchanged from those in table 1 and the effects of income were trivial (p>O.lO). Similar findings obtained for all of the other analyses presented below.
“Reagan’s initial approval rating was the lowest of any newly elected president in the post- World War II era. [See Monroe (1984, p. 107)].

H.D. Clarke and E. Elliott, Models of presidential approval 561
in late 1981 and reached 10.8% in December 1982 before gradually declining. Inflation diminished after 1981, falling to 2.2% per annum in July 1983. Although the economy subsequently gained strength, price increases remained modest (less than 4O/, per annum) in the latter part of Reagan’s first term. Both unemployment and inflation required first-differencing to ensure mean stationarity, and both had complex error structures. Unemployment contained first- and second-order autoregressive effects, whereas inflation was a first- and second-order moving-average process. CCFs suggested that unemployment influenced Reagan’s approval with a two-month lag, and inflation did so with a one-month lag.
The political interventions for the Reagan series included: (1) the Hinckley assassination attempt of 3tst March, 1981; (2) the administration’s victories on tax cuts in July, 1981 modeled in conjunction with the nomination of Sandra Day O’Connor to the Supreme Court; (3) the off-year congressional elections of November 1982; (4) the Beirut bombing/Grenada invasion;” (5) the presidential campaign kickoff in September 1984; (6) the presidential election result. These interventions are modeled as pulse effects.
Table 2 shows that the influence of unemployment is significant (p<O.O5) - a 1% increase in joblessness reduced presidential support by slightly over 3 points. The impact of inflation, although not trivial (o = 1.12), was smaller and does not quite attain statistical significance (t= 1.54, p>O.lO), two-tailed test). Importantly, the signs of unemployment and inflation are opposite to those for the Carter analyses where unemployment had a positive effect, and inflation had a negative impact. The contrasting signs for inflation and unemployment in the models for a Republican as opposed to a Democratic president are consistent with an issue-priority rather than a reward- punishment model. Also, the fact that the timing of the effects differs for the two analyses suggests that macroeconomic influences on presidential support are conditioned by the context of political debate.
Regarding the non-systemic political interventions, the assassination attempt produced an immediate one-month gain for the president of nearly 9%. Reagan’s congressional tax-cut victory, coinciding with the nomination of Judge O’Connor provided a temporary approval gain of about 4 points.13 The Beirut/Grenada intervention yielded a more modest boost of approx- imately 2%. As for the systemic interventions, the 1982 mid-term congressio- nal elections, which produced a loss of 26 Republican House seats, were associated with a 3% decline. The 1984 presidential campaign kickoff
‘*The bombing of the Marine barracks in Beirut and the Grenada invasion occur in the same month (October, 1983). Here, in keeping with the hypothesis of ‘rally’ effects generated by international conflicts Mueller (1970, 1973); Kernel1 (1978); Norpoth (1984, 1987a, 1987b), it is anticipated that both events had positive impacts on Reagan’s support.
“The finding that the tax cut had a positive impact is consistent with research by Ostrom and Simon (1985) who find that presidential approval ratings respond positively to a president’s legislative successes.

562 H.D. Clarke and E. Elliott, Models of presidential approval
Table 2
Effects of inflation, unemployment and political interventions on President Reagan’s approval rating, 1981-1984.
Predictor variable Standard
Coefficient error td
Inflation rate Unemployment Assassination attempt Tax Cut/Judge O’Connor Congressional elections Beirut/Grenada Presidential election
campaign Presidential election
Residual mean square (RMS) = 4.52 Ljung-Box Q(df=20)=21(p=NS)
1.12 0.73 -3.10 1.53 _
8.63 1.53 5.45 1.58
-3.09 1.51 -
2.05 1.52
3.80 2.26 3.39 1.51
1.54 2.03b 5.64” 3.44” 2.05b 1.35’
1 .6gb 2.55b
ap~o.ol. bp 5 0.05. cpjo.10. “Two-tailed test for inflation: one-tailed test for other variables
provided a one-month increment of about 4 points. The 1984 presidential election outcome also had a temporary impact, giving Reagan a bonus of about 3%. Diagnostic checks suggested the model’s adequacy.
The RMS statistics demonstrate that the political interventions explain much more of the variance in Reagan’s popularity than do the economic variables. A model including only unemployment and inflation has an RMS of 10.2 - a 9.1% reduction in the variance of the univariate model. The addition of the political interventions markedly strengthens the effects of one of the economic variables (unemployment) and lowers the RMS by a further 56.3x, to 4.4. These results again indicate the importance of including political as well as economic variables in presidential approval functions.
Reagan - Second term. This analysis begins in January 1985 and continues through August 1988. Reagan’s approval fluctuated around a mean of about 60% for the first two years of his second term before dropping precipitously in December 1986 following the Iran-Contra revelations (fig. 2.C). Although Reagan recovered somewhat in the summer of 1988, he never regained the support levels seen prior to the scandal. The series was non-stationary, requiring first-differencing.
Unemployment declined rather steadily throughout the second term, from 7.4% in January 1985 to 5.4% in July 1988. Inflation ranged between 3 to 4% for the first year, before tapering off. It increased in early 1987 to about 4.5% and then receded again. ARIMA diagnostics demonstrated both the unem- ployment and inflation series were non-stationary, and first differences were applied. Further checks showed the presence of a first-order autoregressive

H.D. Clarke and E. Elliott, Models of presidential approval 563
Table 3
Effects of inflation, unemployment and political interventions on President Reagan’s approval rating, 1985-1988.
Predictor variable Standard
Coefficient error td
Inflation rate Unemployment TWA hijacking Libya bombing Congressional elections Iran-Contra affair Bork nomination INF treaty
wm 4B3) 4B”) 43’) 4B”) w(B’) w(B’) 4B”)
1.49 - 6.99
2.12 7.11
- 7.67 - 15.94
- 2.29 - 2.49
1.37 1.09 4.06 - 1.72b 2.05 1.03 2.16 3.30” 2.95 - 2.60” 4.01 - 3.97” 2.32 - 0.99 2.35 - 1.06
Residual mean square (RMS) = 8.06 Ljung-Box Q(df=20)=26(p=NS)
ap~o.ol. bp 5 0.05. cpjo.lo. dTwo-tailed test for inflation; one-tailed test for other variables.
process for unemployment. Inflation was characterized by both first- and second-order autoregressive processes. CCFs suggested that unemployment affected Reagan’s approval at a lag of three months, while inflation did so after two months.
Political interventions for the second term include: (1) the TWA hijacking of July 1985; (2) the U.S. attack on Libya in April 1986; (3) the November 1986 mid-term congressional elections; (4) the Iran-Contra scandal which broke in late November 1986; (5) the Bork Supreme Court nomination defeat in the Senate in October 1987; (6) the Reagan-Gorbachev INF treaty signing in December 1987. All of these interventions are treated as pulses, except for ‘Irangate’ which is hypothesized to exert a permanent step effect.
The impact of inflation and unemployment was similar to that in Reagan’s first term. Increases in inflation had a positive, albeit statistically insignifi- cant, influence - an increase of one point improved Reagan’s rating by about 1.5% (table 3). In contrast, each percentage point rise in unemployment reduced his support by nearly 7 points (p ~0.01). Hence, an issue-priority type model of economic effects on presidential support is sustained through- out the Reagan presidency.
Political interventions again exerted strong influences. This is most clearly seen in the massive impact of the Iran-Contra scandal which reduced Reagan’s popularity by nearly 16 points. The Bork Senate rejection and INF treaty signing each produced temporary declines of about 2 points. The findings for the INF treaty might seem perverse, but it should be recalled that this event was nearly coterminous with a highly publicized congressional report extremely critical of the President’s handling of the Iran-Contra affair.
564 H.D. Clarke and E. Elliott, Models of presidential approval
The mid-term congressional elections, which resulted in the Democrats retaking control of the Senate, reduced Reagan’s approval by about 7 points. In contrast to these negative effects, the two ‘rally’ events each had positive influences - the TWA hijacking and Libyan attack increased Reagan’s popularity by about 2 and 7 points, respectively. Overall, the several political interventions reduced the RMS by 37.5% compared to a model including only inflation and unemployment.i4
Earlier administrations. The pattern of economic effects consistent with an issue-priority variant of the political debate model may be peculiar to the political and economic conditions of the 1976-1988 time period [Yantek (1988)]. There are a number of reasons why this might be so. First, these effects may reflect new choice sets which altered the calculus of political support. This occurred because the parties and their candidates assumed increasingly divergent positions concerning their economic policy priorities, thereby allowing the electorate to perceive more readily partisan differences in the emphasis parties would accord to inflation and unemployment.
A second possibility is that the increasingly severe economic problems of the 1970s heightened the salience of economic issues, encouraging citizens to acquire more information about the policy positions of the Republican and Democratic parties. In an era of economic distress such information would tend to be readily available given the attention paid to the economy by the print and electronic media. Consequently, voters began to frame their political decisions in terms of comparative assessments of party concerns and competencies relating to unemployment and inflation. Such a process would not necessarily require the parties to adopt more distinct economic positions, but would simply allow voters to more readily ascertain existing policy differences between Democrats and Republicans.
A third possiblity reflects a combination of the first two processes. As voters acquire more information concerning the parties’ policy positions, it is plausible to assume that their core supporters would either pressure or, at a minimum, allow party elites to shift policies in a direction consistent with the economic interests of the core support groups [see, e.g., Hibbs (1982a)]. Republicans would adopt more strongly anti-inflationary measures reflecting the inflation-averse concerns of Republican core identifiers, while a similar process reflecting the concerns of Democratic core constituencies with
unemployment would prompt Democratic party elites to accord more emphasis to joblessness.
Any of these three processes would have the effect of facilitating the ability
14An analysis of the entire (1981-1988) Reagan series produced lindings similar to those for the two terms considered separately. Unemployment had a significant negative effect, while inflation, although not a significant (t= 1.20), was associated with increases in support. Political interventions again had major influences.

H.D. Clarke and E. Elliott, Models of presidential approval 565
of the electorate to make comparative assessments of the two parties’ economic priorities. This, in turn, allows for a prospective component to the decision-making calculus which is required under the assumptions of the issue-priority model or its political debate variant.
To investigate the applicability of issue-priority type effects for the pre- 1976 period, each administration for which complete presidential approval data existed was examined in a manner similar to that for Presidents Carter and Reagan. Although space limitations prevent a detailed discussion of the findings, the analyses show that an issue-priority type model was not operative during the pre-Carter period (table 4). Rather, the impact of inflation and unemployment consistently conformed to a reward-punishment model from the Eisenhower through the Ford presidencies. The advent of the Carter administration thus signalled a sea change in the relationship between the economy and presidential support. Again, the varying time lags for the impact of inflation and unemployment on support in the pre-Carter eras suggest that macroeconomic influences are conditioned by specific political contexts.
Also critical to an understanding of presidential support in these earlier administrations were the dramatic effects resulting from political interven- tions of both the one-off and systemic varieties. Various interventions were modeled such as Eisenhower’s ordering of federal troops to Little Rock and the U2 spy-plane incident, Kennedy’s response to the Cuban missile crisis, and the events associated with the Vietnam War during Johnson’s presi- dency. The analyses of the Nixon presidency included events such as the Vietnam settlement and Watergate. Ford’s abbreviated presidency and consequently truncated approval series allowed only modeling of the Maya- guez incident - the Nixon pardon occurring too early in Ford’s admini- stration to be considered.” Several of the political interventions had major effects (see table 4) and, similar to the Carter and Reagan analyses, they produced large reductions in the RMS statistics.
4. Summary and conclusions
This paper has sought to assess reward-punishment, issue-priority, and political debate models of the effects of inflation and unemployment on presidential approval, and to demonstrate that noneconomic events and conditions do much to explain variation in presidential support. For the Carter and Reagan presidencies the findings are consistent with the issue- priority variant of the political debate model. Over the past decade the American electorate evidently has not merely made general retrospective
15Since the pardon evidently had a major impact on Ford’s approval rating, we began the analysis in October 1974, the month after the pardon was granted.

566 H.D. Clarke and E. Elliott, Models of presidential approval
Table 4
Effects of inflation, unemployment and political interventions on Presidential approval rating, Eisenhower to Ford.
Predictor variable Coefficient Standard error
A. Eisenhower Inflation rate c@‘) Unemployment w(B4) 1954, 1958 Congressional
elections c@) 1956 Presidential election 0’) Troops to Little Rock w(B’) Goodwill visit w(B’) UN speech w(B’) Indochina truce w(B’) Sputnik w(B’) U2 incident o(B’) Noise model Q(B’)
Residual mean square (RMS) = 7.87 LjunggBox Q(df=20)= 15(p=NS)
-2.99 0.94 -1.67 0.77
-5.88 1.62 - 3.62” 5.04 2.28 2.20b 4.10 2.48 1 .65b 6.38 2.28 2.79” 4.05 2.01 2.01b 6.92 2.30 3.01”
- 0.60 2.19 -0.28 - 7.44 2.07 - 3.60”
0.29 0.12 2.48”
B. Kennedy Inflation rate w(B“) Unemployment o(B’) Stock market decline 0’) Cuban missile crisis w(B’) March on Washington w(B’)
Residual mean square (RMS) = 6.61 Ljung-Box Q(df=20)=24(p=NS)
- 1.81 1.38 -3.98 2.58 - 2.84 2.61
6.45 2.00 -4.96 1.89
C. Johnson Inflation rate Unemployment Vietnam pessimism Tet offensive Six day war Marines to Santo Domingo Democratic convention
m(B’) -4.28 1.79
m(B’) 8.08 3.48
w(B’) - 8.77 2.83
w(B’) -6.32 2.83
w(B’) 4.31 2.05
w(B’) 3.59 2.11
o(B’) -4.89 2.02
Residual mean square (RMS) = 7.93 Ljung-Box Q(df = 20) = 23(p = NS)
D. Nixon Inflation rate Unemployment 1970 Congressional elections 1972 Presidential election Vietnamization speech China, Russia visits Vietnam settlement Watergate
MB*) - 1.66 0.85
4B3) - 4.04 1.57
4B’) -1.15 2.87
w(B’) 4.64 2.9 1 w(B’) 7.24 2.86
0’) 4.73 2.07 u(B’) 4.38 2.73
w(B’) - 8.04 3.43
w(B’) - 6.82 2.82
w(B6) -4.92 3.39
td - 2.46” -2.18b
te - 1.32’ - 1.55 - 1.09
3.22” - 2.63”
te - 2.39” - 2.32” -3.10” - 2.23b
2.11b 1.70b
- 2.42”
td - 1.95’ - 2.58” - 0.40
1.59’ 2.53” 2.28b 1.60’
- 2.34b - 2.42” - 1.45’

H.D. Clarke and E. Elliott, Models ofpresidential approval
Table 4 (continued)
567
Standard Predictor variable Coefficient error
Noise Model (0’) 0.65 0.13 5.00”
Residual mean square (RMS)=9.61 Ljung-Box Q(df= 20) = 22(p= NS)
E. Ford t d Inflation rate o(B’) -2.36 0.55 4.39” Unemployment w(D’) - 1.02 1.08 -0.94 Mayaguez incident @“) 6.79 1.17 5.82’ Noise model W4) 0.92 0.09 9.84a
Residual mean square (RMS) = 2.48 Ljung-Box Q(df= 20) = 15(p= NS)
“p<O.Ol. bp<0.05. ‘p<O.lO. dTwo-tailed test for inflation; one-tailed test for other variables. ‘Two-tailed test for unemployment; one-tailed test for other variables.
assessments of the state of the economy during a president’s term in office, and then either rewarded or punished the incumbent. Between 1976 and 1988, voters appear to have granted or withdrawn presidential support on the basis of the perceived policy priorities of the respective parties. Separate examinations of earlier Democratic and Republican administrations show, in contrast, the reward-punishment version of the political debate model was at work regardless of the partisanship of the president. These sharply contrast- ing findings strongly argue that multiple administration analyses obfuscate the true dynamics of presidential approval. Our analyses of the several administrations also demonstrate the importance of considering salient domestic and international political events for understanding both the economics and politics of presidential support.
The existence of issue-priority type effects since the mid-1970s implies that American voters now distinguish parties’ economic policy biases. Although one might expect that the public could make such distinctions in countries such as Great Britain where the major parties long have occupied different positions on a left-right ideological continuum and have been supported by very different core coalitions [Hibbs (1982b)J their ability to do so in the United States runs counter to the familiar image of American parties as ideologically centrist electoral brokers with diverse class clienteles. This, in turn, suggests that the American electorate now may have a more sophisti- cated view of parties’ macroeconomic priorities than is often assumed. In this regard, public perceptions of the available policy choice sets may have changed concomitant with an increasing ideological polarization of the party system and the heightened salience of economic issues which accompanied the advent of stagflation in the mid-1970s.

568 H.D. Clarke anal E. Elliotr, ~Models of presidential approval
References
Alt, James, 1979, The politics of economic decline (Cambridge University Press, Cambridge). Beck, Nathaniel, 1982, Parties administrations and macro-economic outcomes, American
Political Science Review 76, 83-93. Box, George E.P. and Gwilym Jenkins, 1976, Time series analysis: Forecasting and control.
revised edition (Holden-Day, San Francisco). Box, George E.P. and George C. Tiao, 1975, Intervention analysis with application to economic
and environmental problems. Journal of the American Statistical Association 70, 70-79. Budge, Ian and Dennis Farlie, 1983, Explaining and Predicting Elections (Allen and tinwin.
London). Chappell, Henry and William R. Keech. 1985, A new view of political accountability for
economic performance. American Political Science Review 79, l&27. Clarke, Harold D. and Gary Zuk, 1987. The politics of party popularity: Canada 1974 1979.
Comparative Politics 19, 299.-315. Clarke, Harold D.. Marianne C. Stewart and Gary Zuk, 1986. Politics. economics and part)
popularity in Britain, 1979-1983. Electoral Studies 5. 123-141. Fiorina, Morris, 1981, Retrospective voting in American National elections [Yale University
Press, New Haven and London). Freeman, John R.. 1983, Granger causality and the time-series analysis of political relationships.
American Journal of Political Science 27. 327-358. Frey, Bruno and Friedrich Schneider. 1978. An empirical study of politico-economic interaction
in the United States. Review of Economics and Statistics 60. 174-183. Frey, Bruno and Friedrich Schneider, 1980, Popularity functions: The case of the U.S. and West
Germany, In: Models of political economy Paul Whiteley, ed. (Sage Publications. Beverly Hills).
Granger, C.W., 1969, Investigating causal relations by econometric methods and cross spectral methods. Econometrika 37. 424-438.
Hibbs, Douglas A.. 1977. Political parties and macroeconomic policy, American Political Science Review 76, 83-93.
Hibbs, Douglas A., with the assistance of R.D. Rivers and Nicholas Vasilatos, 1982a, The dynamics of political support for American presidents among occupational and partisan groups, American Journal of Political Science 26, 312-332.
Hibbs, Douglas A., 1982b. Economic outcomes and political support for British Governments among the occupational classes: A dynamic analysis. American Political Science Review 76. 259-279.
Hibbs, Douglas A., 1983. Comment on Beck, American Political Science Review 77, 135.~138. Hibbs, Douglas A.. 1987, The American political economy (Harvard University Press, Cam-
bridge, MA). Kernel], Samuel, 1978. Explaining presidential popularity, American Political Science Review 75,
435441. Key, V.O., 1966, The responsible electorate (Vintage Books, New York). Kiewiet, D. Roderick. 1983. Macroeconomics and micropolitics (University of Chicago Press,
Chicago and London). Kuklinski, James H. and Darrell M. West, 1981. Economic expectations and voting behavior in
the United States house and senate elections, American Political Science Review 75, 436-447. Lewis-Beck, Michael, 1986. Comparative economic voting: Britain, France, Germany, Italy.
American Journal of Political Science 30, 315-346. Lewis-Beck, Michael, 1988, Economics and the American voter: Past, present, future. Political
Behavior 10. 5-21. Ljung, G. and George E.P. Box. 1978, On a measure of lack of fit in time series models,
Biometrica 65, 297-304. MacKuen, Michael. 1983, Political drama. economic conditions and the dynamics of presidential
popularity, American Journal of Political Science 27. 165-192. McCleary, Richard and Richard G. Hay, Jr.. 1980, Applied time series analysis for the social
sciences (Sage Publications Ltd., Beverly Hills).

H.D. Clarke and E. Elliott, Models of presidential approval 569
Miller, William, 1989, Studying how the economy affects political attitudes and behavior: Problems and prospects. In: Economic decline and political change: Canada, Great Britain, the United States, H. Clarke, M. Stewart and G. Zuk eds., (University of Pittsburgh Press, Pittsburgh, PA).
Monroe, Kristen, 1984, Presidential popularity and the economy (Praeger, New York). Monroe, Kristen and Linda Erickson, 1986, The economy and political support: The Canadian
case, Journal of Politics 48, 616-647. Mueller, John E., 1970, Presidential popularity from Truman to Johnson, American Political
Science Review 68, 18-34. Mueller, John E., 1973, Wars, presidents and public opinion (Wiley, New York). Norpoth, Helmut, 1984, Economics, politics and the cycle of presidential popularity, Political
Behavior 6, 253-273. Norpoth, Helmut, 1986, Transfer function analysis, In: New tools for social scientists, William D.
Berry and Michael S. Lewis-Beck eds., (Sage Publications, Beverly Hills). Norpoth, Helmut, 1987a, The Falklands war and government popularity in Britain: Rally
without consequences or surge without decline, Electoral Studies 6, 3-16. Norpoth, Helmut, 198713, Guns and butter and government popularity in Britain, American
Political Science Review 81, 949-960. Norpoth, Helmut and Thorn Yantek, 1983, Macroeconomic conditions and fluctuations of
presidential popularity: The questions of lagged effects, American Journal of Political Science 27, 785-807.
Organization for Economic Cooperation and Development, Main economic indicators: historical statistics, selected volumes (OECD, Paris).
Ostrom, Charles W. and Dennis M. Simon, 1985, Promise and performance: A dynamic model of presidential popularity, American Political Science Review 79, 334-359.
Paldam, Martin, 1981, A preliminary survey of the theories and findings on vote and popularity functions, European Journal of Political Research 9, 181-199.
Pomper, Gerald and others, 1981, The election of 1980 (Chatham House, Chatham, NJ). Whiteley, Paul, 1984, Inflation, unemployment and government popularity: Dynamic models for
the United States, Britain and West Germany, Electoral Studies 3, 3-24. Whiteley, Paul, 1986a, Political control of the macroeconomy (Sage Publications Ltd., Beverly
Hills). Whiteley, Paul, 1986b, Macroeconomic performance and government popularity in Britain: The
short run dynamics, European Journal of Political Science 14, 45-61. Yantek, Thorn, 1988, Polity and economy under extreme economic conditions: A comparative
study of the Reagan and Thatcher experiences, American Journal of Political Science 32, 196-216.


