Embed Size (px)
Citation preview
Neighborhoods and Fertility in Accra, Ghana: An AMOEBA-based Approach
John R. Weeks
Department of Geography San Diego State University
Arthur Getis
Department of Geography San Diego State University
Allan G. Hill
Harvard School of Public Health Harvard University
Samuel Agyei-Mensah
Department of Geography University of Ghana, Legon
David Rain
Department of Geography George Washington University
Accepted for publication in the Annals of the Association of American Geographers, 2010
Direct correspondence to: John R. Weeks, Department of Geography, San Diego State University, San Diego, CA 92182-4493, USA; email: [email protected]
2
Neighborhoods and Fertility in Accra, Ghana: An AMOEBA-based Approach
ABSTRACT
Fertility levels remain high in most of sub-‐Saharan Africa, despite recent declines, and even in a
large capital city such as Accra, Ghana, women are having children at a pace that is well above
replacement level and this will contribute to significant levels of future population growth in the
city. Our purpose in this paper is to evaluate the way in which neighborhood context may shape
reproductive behavior in Accra. In the process, we introduce several important innovations to the
understanding of intra-‐urban fertility levels in a sub-‐Saharan African city: (1) despite the near
explosion of work on neighborhoods as a spatial unit of analysis, very little of this research has
been conducted outside of the richer countries; (2) we characterize neighborhoods on the basis of
local knowledge of what we call “vernacular neighborhoods;” (3) we then define what we call
“organic neighborhoods” using a new clustering tool—the AMOEBA algorithm—to create these
neighborhoods; and then (4) we evaluate and explain which of the neighborhood concepts has the
largest measurable contextual effect on an individual woman’s reproductive behavior. Multi-‐level
regression analysis suggests that vernacular neighborhoods are more influential on a woman’s
decision to delay marriage, whereas the organic neighborhoods based on socioeconomic status
better capture the factors that shape fertility decisions after marriage.
Key words: Fertility, Neighborhoods, AMOEBA, multi-level analysis, Accra
3
Neighborhoods and Fertility in Accra, Ghana: An AMOEBA-based Approach
INTRODUCTION
The achievement of low fertility in the richer nations and the widespread, albeit uneven, declines
experienced by less-‐rich nations have taken attention away from fertility levels as a topic of interest
among geographers and other social scientists in richer countries. But there is now a huge
demographic divide in the world, created by the different timings of the various components of the
demographic transition—the health and mortality transition, the fertility transition, the age
transition, the migration and urban transitions, and the family and household transitions that make
up the overall demographic transition (Weeks 2008). Sub-‐Saharan Africa, in particular, continues to
have much higher mortality, higher fertility, a younger age structure, a more robust pattern of rural
to urban migration, and a more traditional pattern of family and household structure than do the
richer countries. It is one of the few areas of the world where the United Nations Population
Division does not predict fertility to drop to replacement level by the middle of this century (United
Nations Population Division 2009).
At the end of World War II, fertility averaged about six children in sub-‐Saharan Africa and
has declined since then through a combination of increasing use of contraception (and abortion)
and later age at marriage, which have had to counteract the increasing levels of fecundity
(biological ability to reproduce) brought about by improved reproductive health in the region
(Garenne 2008). Despite this decline, in Ghana, as in virtually all of West Africa, fertility is still well
above replacement level and even stalled at more than four children per woman during the late
1990s, based on data from the last five rounds of the Ghana Demographic and Health Surveys
(1988, 1993, 1998, 2003, and 2008) as shown in Table 1. In particular, the stall has continued in
4
urban areas, although the most recent data show a drop in the capital city of Accra, where women
are now having 2.5 children each (Ghana Statistical Service, Ghana Health Service, and ICF Macro
2009). At its current pace of population growth, Ghana will be dealing with twice as many people by
mid-‐century as there are today, and the United Nations Population Division (2008) projects that
Accra will grow from its current 2.1 million to 3.4 million by 2025, fueled by its own high rate of
natural increase and by a steady flow of in-‐migrants from rural areas. By mid-‐century the city could
potentially have three times its current population, unless fertility drops rather dramatically
throughout the country in the very near future.
TABLE 1 ABOUT HERE
Since the world’s population, including that in sub-‐Saharan Africa, is increasingly urban
(United Nations Population Division 2008), we would expect that the impact of higher levels of
urbanization would be to push fertility levels ever lower. However, urbanization in much of sub-‐
Saharan Africa is associated with a growing slum population, which may place people in
environments that are similar in many respects to the social and economic conditions that prevail
in poor rural villages (UN Habitat 2006). For this reason, urban “amenities” such as ready access to
schooling and the general availability of well-‐paid jobs that often operate to encourage smaller
family size may be substantially diminished in their impact. We cannot assume that the conditions
are automatically and ubiquitously present in urban areas to dramatically limit fertility. In
particular, fertility-‐dampening conditions may vary considerably from one part of the city to the
next, and so it is important to understand the intra-‐urban spatial variability in fertility levels and in
the determinants of those fertility levels in light of the role that neighborhoods often play as action
sites for the provision of health and social services.
Fertility levels are generally considered to be influenced by the ideational changes that
occur in a person’s life associated with characteristics such as education and income. These changes
in a person’s perspective on life do not occur in a vacuum, however, and so the diffusion of ideas
5
within and between groups is also known to have a potentially very important influence beyond the
original agents of change (Casterline 2001; Hägerstrand 1967). These ideational factors affect
fertility by motivating a woman to delay marriage and childbearing and then, within a sexual union,
by motivating her and/or her partner to implement one or more means of preventing a live birth.
Education, for example, is a powerful predictor of fertility levels among women all over the world.
Women who delay marriage are more likely to stay in school and then, upon receiving more
education than other women, will likely find employment and other opportunities that compete
with family-‐building, thus leading to lower fertility than among less educated women. Indeed, one
possible source of the stall in fertility has been identified as the reversal in some places within sub-‐
Saharan Africa of the gains in education among young women. Given the influence of education on
fertility, a slowdown in educational attainment, especially among girls, could have the effect of
slowing down the decline in fertility (Derose and Kravdal 2007). However, the 2000 Census data for
Ghana do not provide any evidence of educational reversals among women in Accra—younger
cohorts of adult women are consistently better educated than each successively older cohort-‐-‐so
this seems unlikely to be a contributing factor, at least in Accra.
Furthermore, despite the potential power of education to reduce fertility, that reduction is
relative to place. For example, data from the Demographic and Health Surveys (DHS) show that
women with a secondary education in sub-‐Saharan Africa will have considerably higher levels of
fertility than will similarly educated women in South Asia, who in turn have higher levels of fertility
than similarly educated women in South America (a good example of spatial heterogeneity). Put
another way, it is the differentiation among women by education, along with the interaction of
education and culture, that seem to influence fertility, rather than there being a specific educational
level that triggers a specific reproductive response among women. Education shapes behavior, but
does not determine it.
6
While “place” in the survey data refers to regions and nations, the same variability (spatial
heterogeneity) in the relationship between education and fertility can be observed within
countries. Data from the 2003 and 2008 Ghana Demographic and Health Surveys (GDHS) and from
the 2000 Census of Ghana (made available to the Minnesota Population Center, www.ipums.org, by
Ghana Statistical Services) confirm that women with a secondary level of education will have
considerably fewer children if they live in the Accra region than if they live, for example, in the
adjacent Central region. We believe that the relevance of place in such relationships also operates at
the intra-‐urban spatial scale of the neighborhood context, which may play a potentially strong, even
if indirect, role in the reproductive behavior of women.
Some micro studies conducted in Accra in the early 1990s also show the potential effects of
spatial variability in fertility outcomes. In the elite suburb of Airport Residential Area of Accra,
parents were concerned about the quality of their children and the quality of their proposed
spouses. As a result, their actual and preferred family size has converged at around three children,
with successful family limitation achieved by easily accessible contraception. In contrast urban
poor women start childbearing early, either inside or outside of marriage, but thereafter practice
birth control (Agyei-‐Mensah, Aase, and Awusabo-‐Asare 2003). Other interesting findings on
contextual effects of fertility can be seen in the edited volume on reproductive change in Sub-‐
Saharan Africa, which covers countries such as Ghana, Kenya, Malawi, Sudan, and Zambia, Mali and
Ethiopia (Agyei-‐Mensah and Casterline 2003). The novelty of these studies is their localized nature
which makes it possible to probe certain topics more intensively than is feasible in studies with
broader geographic coverage, such as DHS.
In this paper we test the hypothesis that fertility levels in Accra, Ghana, are shaped and
influenced by the neighborhood contexts in which women live, even when controlling for the
individual characteristics of women. In the process, we introduce several important innovations to
the understanding of intra-‐urban fertility levels in a sub-‐Saharan African city: (1) despite the near
7
explosion of work on neighborhoods as a spatial unit of analysis, very little of this research has
been conducted outside of the richer countries; (2) we characterize neighborhoods on the basis of
local knowledge of what we call “vernacular neighborhoods;” (3) we then define what we call
“organic neighborhoods” as contiguous agglomerations of census-‐based enumeration areas that are
similar to one another with respect to contextual characteristics, using a new clustering tool—the
AMOEBA algorithm—to create these neighborhoods; and then (4) we evaluate and explain which of
the neighborhood concepts has the largest measurable contextual effect on an individual woman’s
reproductive behavior.
NEIGHBORHOOD CONTEXT AS A FACTOR IN FERTILITY LEVELS
If we are to understand inequality in human society, we must understand that “[t]he answer to the
question of who ends up where is that people’s social environments largely influence what rung of
the ladder they end up on…Context matters tremendously” (Fischer et al. 1996:8). Within a city the
social context will vary from place to place, in a pattern of intra-‐urban ecology (see, for example,
MacIntyre and Ellaway 2003; MacIntyre, Ellaway, and Cummins 2002; Diez Roux 2001; Oakes
2004; Sampson 2003; Weeks et al. 2004). Applying this concept to an analysis of human
reproduction suggests that if we are to understand fertility levels we must understand not only the
characteristics of the people who are having children and creating families, but also the
characteristics of their environment, in particular those environments that may either promote
higher fertility than would otherwise be expected in an urban environment or at least prevent
fertility from dropping to the low levels that are typically expected in urban areas. Yet, no matter
how much agreement there might be that context matters-‐-‐that neighborhoods are powerful
factors in the social world-‐-‐there is remarkably little agreement about what constitutes a
neighborhood, and this may help explain why the research to date has shown only modest
8
neighborhood effects in relationship to demographic phenomena, even when we expect fairly large
effects (Entwisle 2007), as we discuss below.
Martin (2003) has emphasized the contingent nature of the concept of neighborhood:
neighborhoods are spatially and socially constituted, but their salience to human behavior depends
importantly on the way in which people, both within and outside of the neighborhood, “imagine” or
mentally conceptualize the place. The idea of a neighborhood will differ, she argues, depending
upon what is being examined. Furthermore, researchers may have very different ideas about
neighborhood identification and definition than do the people who live there. If we accept the idea
that neighborhood definitions depend upon the “context” in which we wish to understand them, we
are left with the prospect that researchers may never agree on a single definition of a
neighborhood, and so the task of researchers becomes to define and defend the neighborhoods that
are created for any particular analysis.
Our focus in this analysis is on the role that neighborhoods might play in the level of
childbearing activity that takes place among its inhabitants. Conceptually, we must understand that
the physical environment is imbued with social meaning—the physical and social are constitutively
entangled (Fayard and Weeks 2007). For example, the type of housing and its infrastructure, the
level of crowding and cleanliness, the quality of roads and accessibility of shops and other
amenities will not necessarily have the same impact on the behavior of all people. The environment
(like education, as noted earlier) shapes behavior, but does not determine it. We can assess the
material aspect of the environment with relative ease (although we can only guess at the way in
which humans interact with the built environment in most instances), but the social aspect tends to
be latent and thus more difficult to measure.
The built environment is usually defined in terms of neighborhoods, which are typically
based on pre-‐existing administrative boundaries such as zip codes, census tracts, or census block
groups. These boundaries are used largely because data tend to be aggregated at these geographic
9
levels and researchers would need a compelling rationale to collect large amounts of data for areas
defined differently than these. Furthermore, despite the potential variability in a neighborhood’s
definition, if it is to be a useful concept in helping us to better understand how the world works, the
neighborhood boundaries must be clearly georeferenced and based on clearly recognizable
landmarks (Hipp 2007). Thus, existing boundaries are very useful as proxies for neighborhood
boundaries because they do not require re-‐invention or re-‐delineation by the researcher, and other
researchers can validate the claims made by accessing similar data. In the United States, census
tracts are probably the most often used proxies for neighborhoods, made famous by the clustering
techniques of Claritas, which put a name to each census tract in the United States on the premise
that “you are where you live” (Weiss 2000). These names include categories such as “God’s
Country,” characterized as exurban areas populated by upper income baby boomers, or the
“Bohemian Mix” described as an area with a collection of young, mobile urbanites, or “Back Country
Folks,” which are poor, remote farming villages. Emerging techniques of spatial analysis have
allowed Claritas to expand its categorization of neighborhoods from census tracts to the
geographically smaller block group level and to the geographically more general ZIP code areas,
recognizing that different users of their information may have different ideas of what constitutes
the neighborhood of interest (Claritas 2006).
Characterizing neighborhoods in this way works well for countries that are data-‐rich-‐-‐
which tend to be those countries that are rich in a variety of ways. Geodemographics companies
have accomplished these tasks for the United States, Canada, and much of western Europe (Harris,
Sleight, and Webber 2005). The situation is more complex for developing nations, where a weak
data collection infrastructure is layered onto a built environment that may also have a weak
infrastructure. Urban informality has become the norm throughout cities of developing nations, as
people are forced to create and negotiate neighborhoods without much oversight or assistance
from official government resources (Roy and Alsayyad 2004). Informality may express itself most
10
overtly through inadequate water supplies, poor sewerage, haphazard construction of dwellings,
and crowding. These are the general features of slums, which form the predominant type of
neighborhood in cities of sub-‐Saharan Africa. The UN-‐Habitat estimates that nearly three out of
four urban dwellers in sub-‐Saharan Africa are living in slums (UN Habitat 2006). Thus, slums are
the norm, rather than the exception in most cities, but this also means that “when slums constitute
the largest proportion
of a city, differentials between, even within, slums also become apparent”
(U
N Habitat 2006:21).
Informal settlements or slums provide their residents with a context that is distinctly
different from a more elite neighborhood with paved streets, piped water and sewerage, and large
well-‐constructed houses. Such differences in the built environment are obvious even to the casual
observer, but in what ways might these different contexts help to shape reproductive behavior?
Following Coale (1973) we note that there are three important elements to a woman’s level of
fertility: (1) the belief that reproduction is under a woman’s own control; (2) the motivation to
limit fertility if a woman believes that she is in control of this aspect of her life ; and (3) availability
of the means to delay or limit fertility once the motivation exists to do so. What aspect of a
neighborhood might influence one or more of these preconditions for a fertility decline? We know
from research in Egypt (Entwisle, Casterline, and Sayed 1989), Kenya (Kohler, Behrmen, and
Watkins 2001) and elsewhere that the interaction among women in an area can influence attitudes
towards family size norms as well as the means used (or not used) to deliberately control
reproduction. We can hypothesize that low-‐rise, high density neighborhoods characterized by
pedestrian traffic will increase the likelihood of intimate contact with other people in the
neighborhood and thus increase the chance that the behaviors and attitudes of others will be
influential. These are also the same physical and social interaction settings in which traditional
behaviors are apt to be reinforced. We know from the well-‐established literature on the “strength of
weak ties” (Granovetter 1973, 1983, 2005) and “structural holes” (Burt 1992) that innovative
11
behavior—the kind that is apt to lead to decisions to delay marriage and delay children within
marriage—is more likely when people are in contact with others who are outside their intimate
group.
We can also expect that places that afford greater opportunities for women are
neighborhoods that will promote the kinds of decisions that will lead to lower fertility. This can be
thought of as a latent social variable-‐-‐status and opportunity available to neighborhood residents
that ultimately increase the motivation to limit fertility as a means for achieving a higher standard
of living-‐-‐which is routinely indexed by the material condition of the neighborhood. The
expectation is that an informal, low status neighborhood will have fewer opportunities for women
than will a higher status neighborhood characterized, for example, by an improved level of
infrastructure.
As noted above, despite the seemingly strong conceptual basis for expecting neighborhoods
to have an influence on fertility, the evidence of neighborhood effects on a range of demographic
behaviors remains relatively weak (Entwisle 2007). Part of the explanation may be that most
research takes for granted that neighborhood influences are exogenous to the individual residents:
Moenvi
str ornemseenartcsh: tchoe nc“etrpitcukale lizedso wpne.o” pWle itahs raesffpecectetd toa nndei cgohnbsotrrhaoinoedd efbfyec ftesatures of local
thpaes sdivaeta r aththaet ra treha n anaacltyivzeed a gaenntd sw, cithar
or, residents are
taken. At a moment in time, people rthesepo hndieraingrc thoic tahle s ctarotisssti-‐cseactl aiopnparol chacharaesct ther at ofa remu ochfte onf
netimigeh, bohorhwoeovdesr, a ndth/eoy r mdoaiyng cshange
eth afefmec teind and constrained
omething to changa e vtahriee nety igohfbo wby aytsh eibry e nmvioronvinmg enbtestw. Oeveenr
inthdeoivryid uoafl sn. Aeiggehnbcoyrh moaoyd tsa kaen dd iffeheraelthnt fothrums needs to in
rhood in which they live. A
understanding of health and context. First, pes, ofopluer mof awkeh iccho rsporate agency on the part of
which they live. Second, as a consechoic
eeesm a bopautrtic thuela nerlyi grhebolevrahnoto tdos ain n
opander atdees tdiinrateciontly mto ay chanbe
gech annegeighbd iornqu beotnche ofcom repsiosdeintitonial mobility, neighbor
hood conditionsand structure. Thir
hoodsd, peop
ofl eor migiay n
relating to a local sociospatial context (Entwisle 2007:694). Fou
. rth, people may be selective in
Thus, we must be open to the possibility that neighborhoods are endogenous to behavior—being
partly determined by human agency—rather than simply exogenous contexts in which life is played
out. Furthermore, even the exogenous influence may differ from person to person. In particular,
12
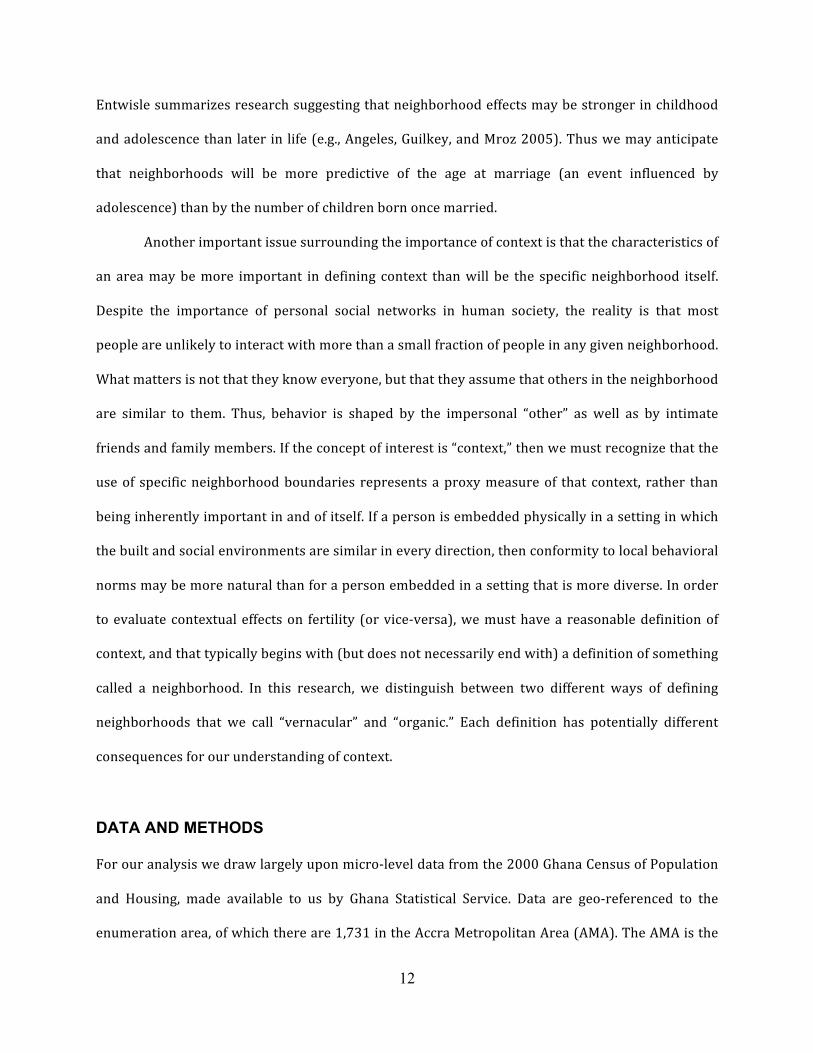
Entwisle summarizes research suggesting that neighborhood effects may be stronger in childhood
and adolescence than later in life (e.g., Angeles, Guilkey, and Mroz 2005). Thus we may anticipate
that neighborhoods will be more predictive of the age at marriage (an event influenced by
adolescence) than by the number of children born once married.
Another important issue surrounding the importance of context is that the characteristics of
an area may be more important in defining context than will be the specific neighborhood itself.
Despite the importance of personal social networks in human society, the reality is that most
people are unlikely to interact with more than a small fraction of people in any given neighborhood.
What matters is not that they know everyone, but that they assume that others in the neighborhood
are similar to them. Thus, behavior is shaped by the impersonal “other” as well as by intimate
friends and family members. If the concept of interest is “context,” then we must recognize that the
use of specific neighborhood boundaries represents a proxy measure of that context, rather than
being inherently important in and of itself. If a person is embedded physically in a setting in which
the built and social environments are similar in every direction, then conformity to local behavioral
norms may be more natural than for a person embedded in a setting that is more diverse. In order
to evaluate contextual effects on fertility (or vice-‐versa), we must have a reasonable definition of
context, and that typically begins with (but does not necessarily end with) a definition of something
called a neighborhood. In this research, we distinguish between two different ways of defining
neighborhoods that we call “vernacular” and “organic.” Each definition has potentially different
consequences for our understanding of context.
DATA AND METHODS
For our analysis we draw largely upon micro-‐level data from the 2000 Ghana Census of Population
and Housing, made available to us by Ghana Statistical Service. Data are geo-‐referenced to the
enumeration area, of which there are 1,731 in the Accra Metropolitan Area (AMA). The AMA is the
13
largest District within the Greater Accra Region, which is one of ten regions comprising the entire
country. The EAs represent the basic geographic building blocks for our analysis, and EAs are
roughly comparable to census tracts in the United States or enumeration areas in the United
Kingdom. As part of our research, we have created the first digital boundary file of those EAs,
working from paper maps that are not-‐to-‐scale along with a high spatial resolution satellite imagery
to do so.
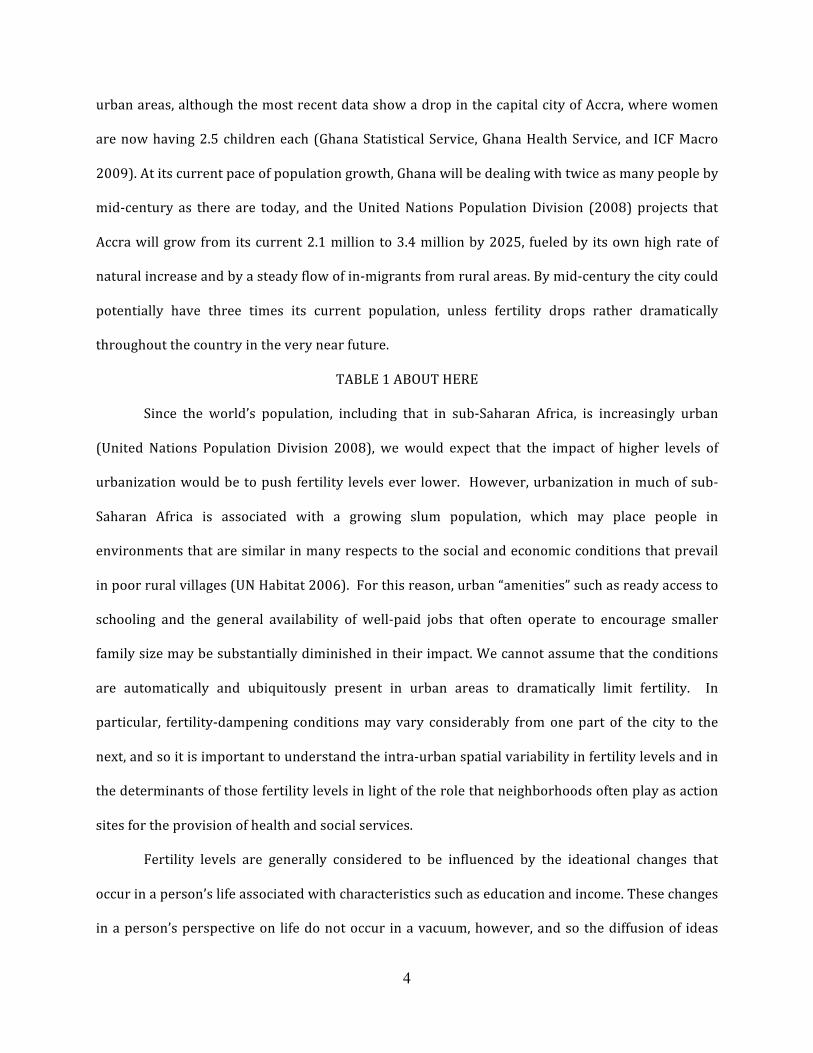
Vernacular Neighborhoods
The term “vernacular neighborhoods” refers to neighborhood boundaries that are broadly
recognized and agreed to by residents of a given city—in this case Accra, Ghana-‐-‐even if they may
have no premeditated and formal definition. These are the place names, for example, that would be
provided to a taxi driver, especially since there is no comprehensive street address system in Accra.
In Accra, 88 of these neighborhood boundaries have been created by Ghana Statistical Service (GSS)
by grouping together contiguous EAs, and are shown in Figure 1.
FIGURE 1 ABOUT HERE
A few of the neighborhoods are special purpose areas, such as the presidential palace
(Flagstaff House), the juvenile facility (Borstal Institute), the Police Training Depot, the Military
Hospital, the International Trade Fair Center, and the University of Ghana, Legon. Most, however,
are residential or mixed commercial/retail/residential and they average 20 EAs per neighborhood,
with a minimum of one and a maximum of 85. The first neighborhoods in Accra were the largely
autonomous Ga settlements of Nleshi (James Town—English Accra), Kinka (Ussher Town—Dutch
Accra, originally Fort Crèvecoeur), and Osu (site of Christiansborg Castle—Danish Accra). These
places date back to the 17th century and were still the essence of Accra in 1875 (Parker 2000).
During the first quarter of the 20th century, Accra grew. “As elsewhere in the colonial world,
advances in Western medicine interacted with imperial ideologies to create a new emphasis on
sanitation, order, and racial segregation, which conditioned the reformulation of urban space and of
14
social relations in the growing city” (Parker 2000:195-‐196). It was during this time, for example,
that the “Cantonments” neighborhood was planned, financed and acquired by the colonial
government for expatriate civil servants (Agyei-‐Mensah and Owusu 2009; Acquah 1958). It is
located to the northeast of central Accra and is still one of the more elite areas of the city, and is
home to many foreign embassies, including that of the United States. “Characteristic of the rigid
social structure of the colonial period were the sharp boundaries between these elite preserves and
the bordering slums and squatter settlements. Administrative divisions created highly visible
ecological barriers in Accra” (Brand 1972:297). At the same time, however, a more middle class
neighborhood, Adabraka, was established in the 1920s as a new residential and commercial area to
the northwest of the older parts of the city (Pellow 1977).
The original villages that eventually formed the city were scattered along the coastline
because the Ga were, and still are, active in the fishing trade. Newer neighborhoods have generally
been created inland. In the 1880s a “zongo” (quarter) was built north of Ussher Town. This was by
Salaga market (the first and largest market in the city) and the area was settled by Hausa (Muslim)
settlers from northern Nigeria (Parker 2000). Another predominantly Muslim quarter, Sabon
Zongo, was settled in 1907, in order to relieve some of the congestion in the older quarter (Pellow
2002). The village of Nima was built outside of the city boundaries after WWII for returning Hausa
soldiers (Acquah 1958). It became part of the municipality in 1953, and by 1958 it was officially
designated as a slum needing remediation (Harvey and Brand 1974).
The post-‐WWII era saw the building of the airport to the northeast of Nima, and the
University in Legon to the north of the airport. These have been relatively elite areas since their
inception. After independence in 1957 the city expanded considerably, and many of the vernacular
neighborhoods shown in Figure 1 have grown up in the post-‐Independence period, a time that has
also been associated with an increase of the Akan population in the city.
15
Another set of vernacular neighborhoods for Accra is associated with a map created by the
Center for Remote Sensing and Geographic Information Systems (CERSGIS) at the University of
Ghana and used by Songsore et al (2005) and by Agyei-‐Mensah and Owusu (2009). The
disadvantage of the CERSGIS map, however, is that the boundaries are not linked directly to the
census EAs, and so it is difficult to relate the census data to that map. However, we have been able
to re-‐project the CERSGIS map and after overlaying it with the GSS vernacular neighborhoods, we
found a high degree of consistency in neighborhood definitions. In other words, there is a high
degree of reliability in these neighborhood definitions among people in Accra.
Organic Neighborhoods
Organic neighborhoods refer to agglomerations of EAs that are similar to one another in terms of
underlying structural characteristics and, at the same time, are contiguous to one another. They
represent contexts, rather than specifically named neighborhoods. In this approach to creating
contextual boundaries, the problem of aggregation of spatial data is conceptualized as a special case
of clustering in which the geographical contiguity between the elements to be grouped should be
considered. This particular case of clustering methods is usually known as contiguity-‐constrained
clustering or simply the regionalization problem (Duque, Ramos, and Surinach 2007). Each EA is
compared to its neighbors to see if the neighbors are more like the “kernel” EA than would be
expected by chance alone. If so, the neighbor is attached to the kernel EA, and then this new
agglomerated EA is compared with neighbors. The process is iterative, working toward a stable
solution in which all agglomerations (the “organic neighborhoods”) represent the maximum
homogeneity within neighborhoods, and the maximum heterogeneity between neighborhoods.
Previous approaches include Openshaw’s Automated Zoning Procedure (AZP) (Openshaw and Rao
1995), the SAGE system developed by Haining and his associates (Wise, Haining, and Ma 2001), and
the Max-‐P-‐Region algorithm (Duque, Anselin, and Rey 2007).
16
In this research we accomplish the task of creating organic neighborhoods through an
innovative application of the AMOEBA algorithm developed by Aldstadt and Getis (2006). In its
original form AMOEBA was designed to identify “hot spots” in regions in which there may be found
statistically significant spatial clusters of a variable of interest for which a simple distance or
contiguity spatial weights ma
A
tri
M
x did not adequately describe the pattern of clustering. The
acronym, AMOEBA, stands for ultidirectional Optimal Ecotope-‐Based Algorithm. For this work
on identifying Accra neighborhoods, the algorithm was expanded to exhaustively classify all sub-‐
areas (EAs) into clusters regardless of statistical significance. In this way, areas of homogeneity of a
variable can be delimited across the entire city without the restriction that the areas must be hot or
cold spots. Briefly, for a variable, the technique requires that each EA be evaluated for the strength
of its association with contiguous EAs. The association is measured using any one of the local
spatial autocorrelation statistics such as local Moran’s I, local Geary’s C, or the Getis-‐Ord Gi* statistic
(which was employed in this analysis). The EAs are then ordered from highest to lowest
association with its neighbors. The highest contiguous association is selected as the seed to begin a
process in which through a sequential operation the contiguous neighbors of the highest EA are
included in a cluster if those contiguous neighbors raise the level of association by their inclusion in
a cluster. The sequential operation continues by selecting the contiguous neighbors of the
previously selected contiguous neighbors that increase the association of the EAs already selected.
When the level of association is reduced by the addition of a contiguous neighbor, the process
comes to an end and the boundary of the group of associated neighbors is identified. This first
region of homogeneity is ineligible for the selection of the next possible high association between
an EA and its contiguous neighbors and so on. In this way the algorithm continues to find
associated neighbors until all EAs are included within clusters. There is no restriction on the shape
or size of the delimited neighborhoods (Aldstadt and Getis 2006).
17
The first step in creating organic neighborhoods was to characterize each of the 1,731
enumeration areas that served as the building blocks. We employed principal components analysis
(PCA) as a way of reducing sets of variables into coherent components that could be used as
composite indices of an EA’s characteristics. Note that we used PCA instead of cluster analysis (as
might be done in a typical geodemographic analysis) because our goal was to create a single
variable that characterized an EA, rather than create neighborhood classifications.
We initially organized the variables available to us into two categories: (1) built
environment; and (2) sociodemographic composition. The variables are summarized in Table 2.
Built environment variables were drawn from questions on the census about the type of building in
which the household lives; infrastructure related to water, liquid and solid waste, bathing and toilet
facilities; cooking facilities and fuel, and the proportionate abundance of vegetation and impervious
surface in the EA, as derived from the classification of remotely sensed imagery. With respect to
housing, a compound is the urban embodiment of a typical West African rural housing arrangement
in which several rooms face an open, inner courtyard, with the entire structure surrounded by a
high wall and typically having one entrance. On average, 49 percent of buildings in an EA were
compounds, with some EAs having no compounds, and other EAs having only compounds. The
other variables are more self-‐evident. The sociodemographic variables were drawn from census
questions related to ethnicity, religion, place of birth, educational attainment, labor force
participation, employment sector if in the labor force, occupation if employed, family structure,
crowding in the household, and whether or not the family rents or owns their residence.
TABLE 2 ABOUT HERE
PCA was done separately for the built environment variables and the sociodemographic
variables, but the correlation coefficient between the two separate components (.694) suggested to
us that the entire set of variables was too interrelated to be treated separately. Thus, the analysis
was done on the entire set of variables shown in Table 2. We worked iteratively to eliminate
18
variables that lacked a reasonable level (.500) of communality, and to eliminate those that cross-‐
loaded significantly (.500 or higher) on two or more components. Four components emerged with
eigenvalues greater than one, accounting for a total of 71 percent of the variance in the set of
variables. However, only one of those components, with an eigenvalue of 11.1, was clearly above
one, and it alone accounted for 51 percent of the total variance. The unrotated component matrix
had the best structure and the highest loadings, so it was used. The variables that loaded
significantly (.500 or higher) without cross-‐loading are flagged in Table 2. Those with the highest
loadings include, in order of importance, the existence of a separate cooking room, the type of fuel
used for cooking, having one’s own toilet, females being regular employees in the formal sector of
the economy, the proportion of an EA’s surface area that was classified as vegetation, females
employed in higher occupational statuses, males employed in higher occupational statuses, women
with an education beyond high school, and being connected to a sewer. We call this factor
“STATUS,” in which high values represent higher status, and lower values represent lower status.
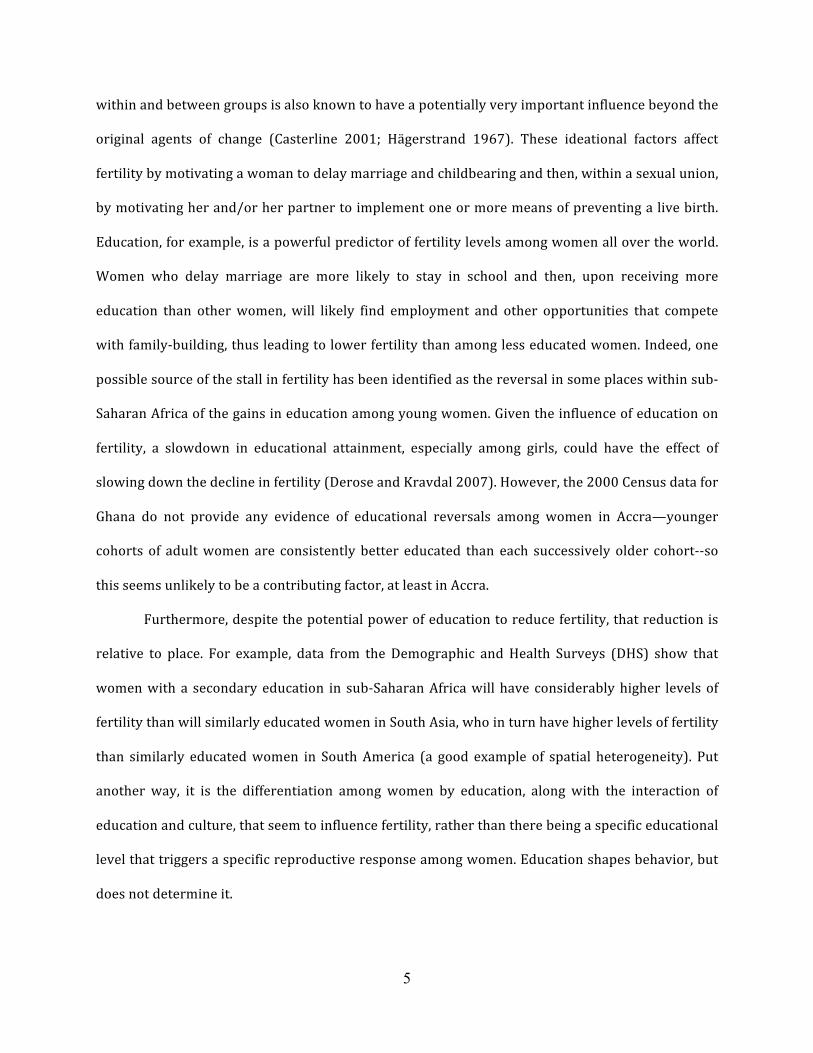
We added two to each score, so that all scores would be positive. The spatial distribution of all EAs
according to their STATUS score is shown in Figure 2, with an overlay of the vernacular
neighborhoods.
FIGURE 2 ABOUT HERE
Figure 2 shows that the original Ga villages and the predominantly Muslim zongos identified
among the vernacular neighborhoods (see Figure 1 for neighborhood names) tend to have the
lower status scores, whereas the areas that were originally established for the expatriate
community still tend to be among those areas with the highest status scores. There are clear
clusters of high and low status, although the clusters are quite irregular in size and shape. Figure 2
also shows that some of the vernacular neighborhoods appear to be quite consistently of one status
or another, but others appear to have a mix of statuses. This suggests that the identification of a
19
person as living in one or another vernacular neighborhood might not appropriately identify the
context within which such a person lives.
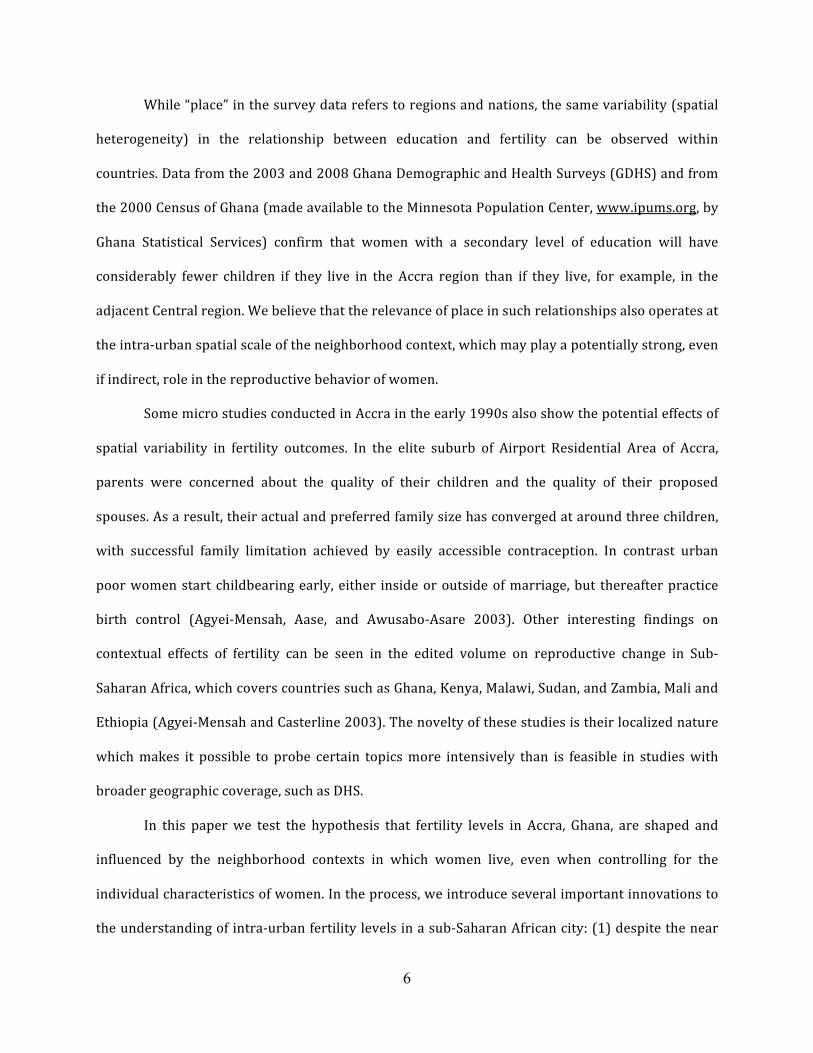
The organic neighborhood concept attempts to control for the variability in context by
creating areas that have similar characteristics and are contiguous to one another. We implemented
the AMOEBA partitioning algorithm with the Getis-‐Ord Gi* statistic as the indicator of spatial
association because of its compatibility with an additive approach to clustering, that is, nearby
areas are added to one another and evaluated for the degree of spatial autocorrelation. We used a
first-‐order rook contiguity spatial weights matrix, and we required a minimum of four EAs to create
a “neighborhood.” In theory, this could have produced as many as 432 neighborhoods, but in fact
the algorithm generated just 72 different organic neighborhoods, and they are shown in Figure 3.
Almost certainly by chance alone, there are 72 vernacular neighborhoods with four or more
constituent EAs. We calculated the average variability in the STATUS score among the constituent
EAs in both the vernacular and the organic neighborhoods. We found that the intra-‐neighborhood
variability in STATUS was twice as high in the vernacular neighborhoods as it was in the organic
neighborhoods. This is consistent with our expectation that the organic neighborhoods generate a
better approximation of context than do the vernacular neighborhoods.
FIGURE 3 ABOUT HERE
FERTILITY LEVELS BY NEIGHBORHOOD CONTEXT
Having established two different ways of conceptualizing neighborhood context, we turn now to the
measures of fertility that we hypothesize will be related to the context within which people live. We
divided the analysis into two separate, albeit intimately related parts: (1) age at marriage; and (2)
children born within marriage. In societies such as Ghana, where out-‐of-‐wedlock births appear to
be relatively rare, a delay in marriage will have an important impact on the overall birth rate, and
this effect has been noted for other sub-‐Saharan African nations (Garenne 2008). A rise in the age at
20
marriage will have the effect of delaying childbearing (a tempo effect, as described by Bongaarts
and Feeney 1998), but a delay in marriage also foreshadows a smaller number of children born to a
woman once she does marry (the quantum effect). Since the decision to marry may be made in a
very different context than the decision to have children once married, we have separated them in
the analysis.
Delayed Marriage
Despite the substantial number of women in Accra with large families (there were 24 women
enumerated in the census who reported having given birth to 18 children, and there were 3,533
women with ten or more children), young women in Accra have been delaying marriage and
childbearing. This is a national trend that has been noticed in the Demographic and Health Surveys
(Ghana Statistical Service, Noguchi Memorial Institute for Medical Research, and ORC Macro 2004),
and it is especially obvious in Accra. The 2000 census data indicate that 87 percent of women aged
15-‐19 had never married, and 95 percent of those single women were childless. At ages 20-‐24, 66
percent were still single, and 88 percent of those single women were childless. At ages 25-‐29, 38
percent reported never having married, and 75 percent of those women were childless. Even at
ages 30-‐34, 17 percent of women reported being still single, and 60 percent of them were childless.
This is occurring within the context of a country in which marriage patterns are described as
follows: “Voluntary childlessness is uncommon and currently married women with no live births
are likely to be those who are unable to bear children. The level of childlessness among married
women at the end of their reproductive lives can be used as an indicator of the level of primary
sterility. In Ghana, primary sterility among older currently married women is less than 2 percent”
(Ghana Statistical Service, Noguchi Memorial Institute for Medical Research, and ORC Macro
2004:59).
21
Delaying marriage only affects fertility levels, of course, if it is associated with a very low
level of out-‐of-‐wedlock births, as appears to be the case in Accra. There are three principal ways to
accomplish this: (1) abstinence; (2) contraception; and (3) abortion. There is evidence that in Accra
young women who adhere to Charismatic protestant religious groups are especially likely to be
involved in activities designed to encourage abstinence, at least partly to reduce the risk of HIV
(Beal 2005), and this activity may also encourage the postponing of marriage. Data from the Ghana
Demographic and Health Surveys (GDHS) suggest that contraception utilization among young
people is fairly limited, but this may be counter-‐balanced by the hidden use of abortion, which is
not legal in most circumstances (Blanc and Gray 2000; Oliveras et al. 2008). In all events, we know
from the GDHS that the proportion of females aged 15-‐19 who have never married has been
steadily increasing in Ghana (even as the fertility declined stalled), and we know as well that most
unmarried women at the younger ages are childless.
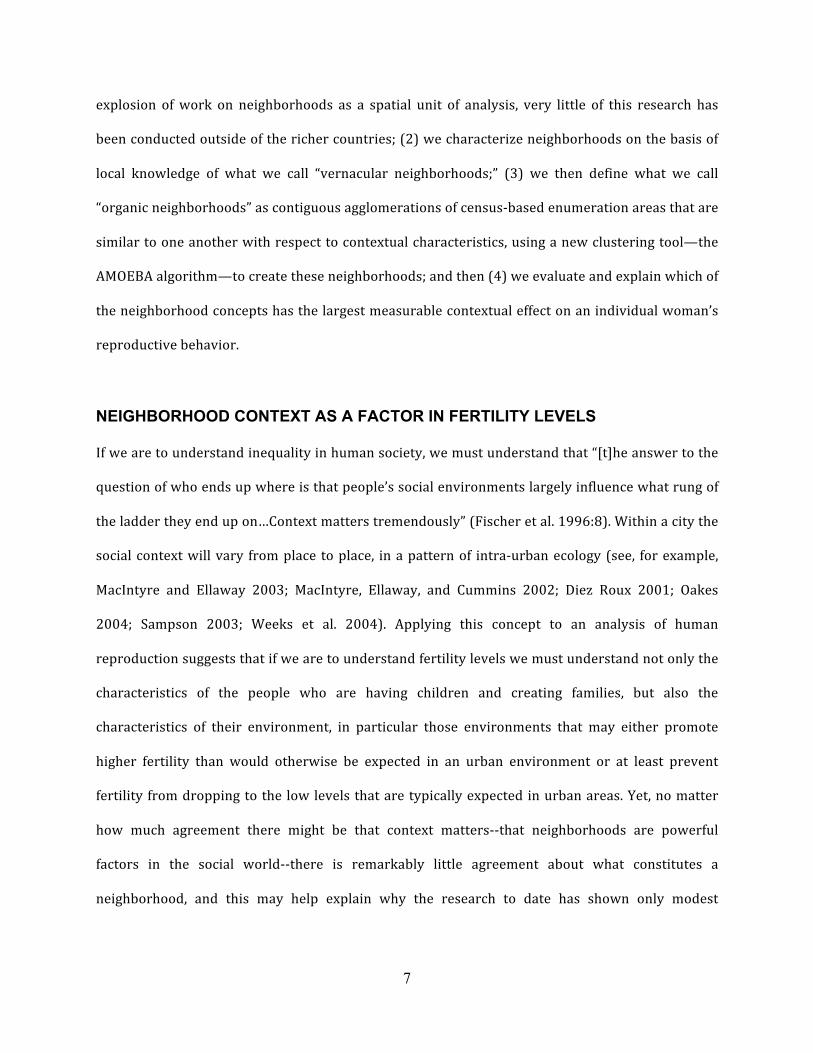
We use the percentage of women aged 15-‐24 who are still single, according to the 2000
census, as the neighborhood-‐level measure of delayed marriage. Does this vary by neighborhood?
Part A of Figure 4 shows that there is a clear spatial pattern among the vernacular neighborhoods,
with delayed marriage being more common in the elite neighborhoods, and less common especially
in the older Ga villages along the coast. The lowest value (57 percent never married) is found in
Chorkor, a predominantly lower-‐status Ga area, whereas the highest value (93 percent) is in
Legon—the University of Ghana. The predominantly Muslim area of Nima also has a fairly high
percent never married (81 percent). Moran’s I for this pattern is .27 (z = 4.36), indicating a
statistically significant level of spatial autocorrelation. Part B of Figure 4 shows that there is also a
spatial pattern among the organic neighborhoods, which is not unlike that shown by the vernacular
neighborhoods. Moran’s I for this pattern is .24 (z = 3.72), again confirming the spatial
autocorrelation in the pattern of delayed marriage.
FIGURE 4 ABOUT HERE
22
What are the neighborhood characteristics that are most associated with delayed marriage?
The candidate variables are those listed in Table 2, from which we derived our STATUS variable,
which incorporates more than a dozen of those variables. Higher status neighborhoods can be
expected to provide opportunities and motivations for women to delay marriage, although we can
also appreciate the endogeneity built into this relationship, since over time delayed marriage
among women is likely to increase their status and thus the status of their neighborhood. We can
also anticipate that cultural and religious attributes of neighborhoods may play a role in shaping
attitudes toward delayed marriage.
Among the vernacular neighborhoods, the combination of STATUS, percent Protestant,
percent Muslim, percent Ga, and percent Akan accounted for 65 percent of the variability from
neighborhood to neighborhood in the percent of women 15-‐24 who were never married. The
residu
2
als were spatially autocorrelated and a spatial error model implemented in Geoda improved
the R to .68. The highest beta coefficient was found for the percent Ga, which drove down the
percent never married, followed by the percent Protestant, which drove it up, STATUS, which drove
it up, and then the percent Muslim, which also drove up the percent never married. The percent
Akan was not a significant factor.
Among the organic neighborhoods, which were of course built on the basis of the STATUS
variable, that variable turned out to have the greatest influence on the percent never married,
followed by the percent Ga, percent Protestant, and percent Muslim. Again, the percent Akan was
not significant. These variables explained 49 percent of the organic neighborhood variability in
percent of young women who had never married. Once again, the residuals were spatially
autocorrelated, and a spatial error model increased the R2 to .55.
Do these same variables explain delayed marriage at the individual level? We first explored
the answer to that question with a multilevel binary logistic regression model, implemented in
MLwiN software, using Markov chain Monte Carlo (MCMC) procedures (Browne 2009). The
23
dependent variable was whether or not a woman aged 15-‐24 was single (never-‐married). The set of
fixed factors at the individual level included the cultural factors of ethnicity and religion, the
sociodemographic factors of education, having been born outside of Accra, and living in a home
where the cooking is done with charcoal (one of the variables that loaded highest on the STATUS
component at the neighborhood level), along with a control for age within the ten-‐year cohort of
women we are investigating. We acknowledge the possibility for endogeneity with respect to
education—a delay in marriage almost certainly facilitates the acquisition of more education, but
we assume that most of the effect is in the opposite direction—that women with more education
have more opportunities in their life than marriage and family-‐building and so they will delay
marriage to take advantage of those opportunities. Model 1 in Table 3 shows the relationship
between these variables and marital status for young women.
TABLE 3 ABOUT HERE
The results at the individual level are generally consistent with the neighborhood-‐level
analysis. Being of Ga ethnicity lowers the odds of being never-‐married, compared to the Akan,
whereas the Ewe are slightly more likely to delay marriage. Being Protestant increases the chances
of delaying marriage relative to being Catholic. Although people who practice traditional religions,
no religion, or some other religion have significantly lower chances of delaying marriage, there are
relatively few of them in Accra (fewer than five percent of women aged 15-‐24 in Accra in 2000
indicated a religious preference that was not Christianity or Islam). Education was clearly the most
important predictor of delayed marriage. Young women with a secondary or post-‐secondary level
of education are more than three times as likely to be still single as women with no schooling, and
about twice as likely as those with only a primary education. Note that education was incorporated
into the STATUS component at the neighborhood level and so was not entered separately into the
neighborhood-‐level models. Having been born outside of Accra (probably in a rural area) lowered
24
the odds of delaying a marriage, and living in a household that uses charcoal for fuel also
si
gnificantly lowered the odds of delaying marriage.
The Nagelkerke R Square (a pseudo-‐R Square value calculated in SPSS) for model 1 was .18,
indicating the presence of considerable residual variance. Is that variance accounted for by
variability at the neighborhood level? Models 2 and 3 in Table 3 help to answer that question.
Model 2 introduces variability at the vernacular neighborhood level, whereas Model 3 uses the
variability among organic neighborhoods. In both models, key neighborhood level variables are
introduced as fixed effects, and the neighborhood variance component is captured by the random
intercept. It can be seen that the introduction of the neighborhood level variability does not
significantly alter any of the individual level coefficients. Furthermore, the only fixed neighborhood
effect that is statistically significant among vernacular neighborhoods is the percent Ga, whereas
that and the percent Protestant are statistically significant among the organic neighborhoods. The
deviance information criterion (DIC) is improved for both of the two-‐level models compared to the
single-‐level model, so we can conclude that there is some measureable neighborhood effect.
Following Rasbash et al (2009) we estimate the size of that effect by calculating .
For the vernacular neighborhoods, this produces a value of just less than two percent, and for the
organic neighborhoods the value is just above two percent. If we add this to the 18 percent
explained at the individual level, we can infer that we have explained about 20 percent of the
variability in the propensity of a young woman to delay marriage and about 10 percent of that
explained variance (2/20) is accounted for by the neighborhood context. Furthermore, these
estimates suggest that it does not make much difference whether the context is defined in terms of
the vernacular or the organic neighborhoods. We will return to a further discussion of these results
later in the paper. We now turn, however, to the second aspect of fertility rates in Accra, relating to
the number of children born among women who have begun family-‐building.
25
Children Born to Women
Data from the census provide information only on the number of children ever born, not on the age
at which they were born, so we are unable to measure the tempo of childbearing (the spacing of
children), but we can measure the number of children born up to the current age. Our focus here is
on women who have put themselves in the path of building a family through marriage or an
equivalent acknowledged relationship. To maintain the same metrics (e.g., logistic regression at the
individual level) that we used in the analysis of delayed marriage, the dependent variable is
measured as a binary response in terms of whether an ever-‐married woman aged 15-‐49 had given
birth to fewer than three children.
The average ever-‐married woman of reproductive age in Accra had given birth to 2.64
children as of 2000, and 55 percent had given birth to fewer than three. The pattern by vernacular
and organic neighborhoods is shown in Figure 5. Of considerable interest is the fact that the spatial
pattern of this variable is not statistically significantly clustered spatially among the vernacular
neighborhoods, and there is no correlation from neighborhood to neighborhood between the
proportion of women who are never married and the proportion of ever-‐married women who have
fewer than three children. To be sure, there is a higher percentage of low fertility women in the
Cantonments than in Nima, but the overall pattern is not consistent with the pattern of delayed
marriage. On the other hand, there is a clearly visible spatial pattern among the organic
neighborhoods (Moran’s I of 0.14, with a z-‐score of 3.77), although once again it is not the same
pattern observed with respect to delayed marriage.
FIGURE 5 ABOUT HERE
Using the same variables that were employed in the neighborhood-‐level analysis of delayed
marriage, we ran OLS regression models for both the vernacular and organic neighborhoods, with
the addition of a control for the average age of ever-‐married women, and we also included the
percent never married, even though there was no zero-‐order correlation. For the vernacular
26
neighborhoods, the adjusted R2
the residuals. With respect to fertility among ever-‐married women, there seems to be no
explanatory power inherent in the vernacular neighborhoods. However, among the organic
neighborhoods, this combination of variables explained 17 percent of the neighborhood variability
in the percent of women with fewer than three children, and all of that explanatory came from one
statistically significant variable—the status score of the neighborhood. The higher the status, the
more likely was it that women would have fewer than three children. There was evidence of spatial
autocorrelation
2
in the residuals and the diagnostics suggested a lag spatial model. This model
improved the R to .33, with the spatial weight coefficient being the most important predictor,
followed by the status score of the neighborhood, and also by the percent never married. Thus,
when spatial relations are taken into account, a higher percent of never married women was, in
fact, related to a lower percent of women with fewer than three children, as expected.
We used the same individual level variables as potential predictors of whether ever-‐
married women had given birth to fewer than three children as we had used to predict whether
younger women had delayed marriage. The results are shown in Table 4, where it can be seen that
none of the ethnic categories is statistically significant from the others in this regard. Being
Protestant was associated with slighty lower fertility (since a positive value indicates having fewer
than three children), whereas adherence to Islam is associated with higher fertility. None of the
other religious categories was statistically significant. As was true with delayed marriage, education
was statistically significantly associated with lower fertility. Women with at least secondary
education were about 50 percent more likely to have fewer than three children, compared to
women with no schooling. Cooking with charcoal also was significant and in the expected
direction—lower status (associated with the use of charcoal) is associated with higher fertility.
was zero, and there was no evidence of spatial autocorrelation in
TABLE 4 ABOUT HERE
27
The Nagelkerke R Square calculated for model 1 was .30, but almost all of that effect was
captured by age alone. In other words, after controlling for age, the other variables—even those
that are statistically significant—contribute very little to our understanding of the variability in
fertility from woman to woman. Furthermore, the contextual effects are also negligible. The DIC
drops slightly when neighborhood variability is taken into account, but neither neighborhood
definition contributes even one percent of explanation to the residual variance.
DISCUSSION AND CONCLUSION
The study of fertility in sub-‐Saharan Africa is fraught with the complexity of its family arrangements
(Lesthaeghe 1989). Depending upon the region and ethnic group, husbands and wives may spend
little time actually living together, children may routinely be shared among families (fosterage),
uncles may be more important than fathers in terms of childrearing, mothers may be more
dependent upon their children than upon a husband for security, and women may find themselves
in a polygynous relationship with an older man. These more traditional variations on family life are,
of course, less common in cities, where Westernization has brought social change, not just
economic change. Nonetheless, it is important to note that we have relatively few measures of these
important aspects of life beyond ethnicity and religion, which serve as proxies for the type of family
system in which a woman in likely to be enmeshed.
We have shown that there is a very clear spatial pattern in Accra of delayed marriage, and it
is slightly better aligned with the vernacular neighborhoods than with the organic neighborhoods.
This seems to be related to the fact that delayed marriage is influenced by ethnicity and religion,
and the vernacular neighborhoods appear to capture variability in these characteristics, whereas
we created the organic neighborhoods on the basis of a set of variables that were defined as status,
since the enumeration areas were statistically more differentiated on that basis than on the basis of
ethnicity and religion.
28
There is a less clear spatial pattern of childbearing after marriage, but it seems more closely
aligned with the organic neighborhoods than with the vernacular neighborhoods. Thus, a woman’s
cultural group seems to be more influential in the decision to delay marriage, whereas status seems
to be the more important predictor of fertility within marriage. The slum neighborhood of Nima
provides an interesting example of this. A majority of the adult population is Muslim and ethnically
they are neither Ga nor Akan (the numerically largest ethnic groups in Accra). At the same time, it
has one of the lowest status scores of any of Accra’s vernacular neighborhoods. The cultural mix is
associated with one of the highest levels of delayed marriage, but the generally low status is
associated with one of the highest percentages of ever-‐married women with at least three children.
Nima’s overall level of fertility among women of reproductive age is lower than would be expected
solely on the basis of status because the cultural pattern in the area is to delay marriage, even
though fertility is high once a woman is married. Delayed marriage is seemingly not a route to
lower fertility in this neighborhood, at least partly because it is not associated with women using
that delay as an opportunity to improve their education. In Nima, 32 percent of women aged 15-‐24
had no schooling, and 76 percent had less than a secondary level of education, which are among the
highest levels in Accra. Nor are they working in substantially higher proportions than in other
neighborhoods. Forty percent of women 15-‐24 worked outside the family for even one day a week
in Nima, which was only slightly higher than the average of 35 percent for all neighborhoods. It is
probable that they are in charge of domestic duties within the household, perhaps including baby-‐
sitting, but we could only know that from fieldwork, not from the census.
We measured the overall level of fertility in a neighborhood by creating an individual-‐level
age-‐standardized measure of fertility that could then be directly aggregated to the neighborhood
level. From the census we calculated the mean and standard deviation of the number of children
ever born to women according to single year of age between the ages of 15 and 49. We then
calculated each woman’s difference from the mean for her age in standard deviation units (z-‐
29
scores). We label this as CEBz. Thus, a CEBz of zero means that a woman has borne exactly the
same number of children as the average for all women her age in Accra. A positive value indicates
that she has more children than average, and a negative value indicates that she has fewer children
than the average for all women her age. We then aggregated the individual scores to the
neighborhood level to generate an average fertility score for each neighborhood. This allowed us to
decompose the overall level of fertility into the share attributable to delayed marriage and that
attributable to childbearing after marriage.
Among the vernacular neighborhoods, the combination of the percent of women 15-‐24 who
were never-‐married and the percent of women 15-‐49 who had given birth to fewer than three
children accounted for 82 percent of the variability in CEBz, and the standardized beta coefficient
for delayed marriage was almost twice the size of the coefficient for fertility after marriage. Thus,
we can conclude that 64 percent of the variability in overall fertility was due to delayed marriage
and the remainder to childbearing after marriage. The explained variance in overall fertility was
also .82 among the organic neighborhoods, and delayed marriage was the most important
component, but less than so than among the vernacular neighborhoods. Delayed marriage
accounted for 55 percent of the overall level of fertility and childbearing after marriage accounted
for 45 percent. These calculations underscore our results that suggest that the spatial dynamics and
predictors of delayed marriage are different from those of reproduction after marriage. These
findings also suggest that the context within which decisions about marriage are made are likely to
be different from those in which decisions will be made about how many children to have, once at
risk of having children.
At the individual level, we found a measurable contextual effect only for delayed marriage,
and not for fertility after marriage. This is consistent with the literature, noted above, that
neighborhood context may be more influential at the younger ages than at the older ages. However,
the overall lack of explanatory power at the individual level is puzzling. It is not simply that the
30
contextual effects do not emerge strongly—none of the fixed effects were powerful predictors. To
be sure, all relationships were in the expected direction, especially the relationship with education,
but the overall size of the effects was relatively small. We tried every possible combination of
variables (not shown) without any improvement in the results. The census data have the strong
advantage that they permit a detailed spatial analysis, but they have the strong disadvantage that
the relatively limited number of questions asked on the census appear not to be capturing those
things that are most influencing reproductive decisions in Accra.
The relatively small contextual effects, regardless of how spatially bounded the context (e.g,
vernacular or organic in nature), fits into the larger discussion in the literature about the nature of
these effects (see, for example, Subramanian et al. 2009). Entwisle (2007) and Matthews (2008) are
among those who have noted that (1) neighborhoods of residence (at which location we collect
most data in the social sciences) may not be as salient as we think in determining human behavior;
and (2) even if they are, the multilevel statistical techniques currently employed, as in this research,
may not be as appropriate as we would like them to be for this task. We agree with both Entwisle
and Matthews that the next step must involve more intensive field research that includes a clear
spatial component. This may also require that we turn the tables on the usual approach to defining
neighborhoods which is, as we did in this research, to define them on the basis of the expected
“predictor variables,” and then we see whether the observed data, in this case fertility levels, match
our expectations. Most research findings, including our own in this research, produce very modest
levels of explanation of behavior at the individual level and so an alternative research strategy may
be to create “contexts” of high and low fertility and then investigate, through data mining and field
work, the factors that explain the individual variability in behavior among people living in those
differing contexts.
In this paper, we have been able to take only a cross-‐sectional slice of fertility behavior in
Accra, during a transitional time when fertility had stalled in Ghana and in Accra more specifically,
and so we are not in a position from these data to fully understand these potentially dynamic
factors underlying fertility change. Nonetheless, we have shown that an important component of
the variability in fertility levels in Accra is the age at which young women marry. Over time,
increasingly delayed marriage would have the effect of lowering overall levels of fertility through
its tempo effect. In order for this to be associated with a stall in fertility, however, it would had to
have meant that reproduction was actually rising within marriage. And, in fact, data from the GDHS
do show that in 2003 the number of children ever born to ever-‐married women aged 25 through 39
was higher than it had been among ever-‐married women of the same age in 1998. From this, we can
infer that the stall in fertility in Accra was due to the tempo effect from delayed marriage
counterbalanced by the quantum effect of higher fertility within marriage. On the other hand, data
from the 2008 GDHS show that the delay in marriage leveled off between 2003 and 2008 after
reaching near universality among women 15-‐19 and more than two-‐thirds of women aged 25-‐29.
At the same time, the number of children born to ever-‐married women was lower at every age in
2008 than it had been in 2003, leading to an overall drop in fertility among women in Accra. We will
be able to test the expected spatial patterns of these changes within the city after completion of the
2010 Census of Population and Housing.
Th
ACKNOWLEDGMENTS
is resea
rch was supported by grant number R01 HD054906 from the
National Institute of Child Health and Human Development. Earlier versions of this paper were
presented at the annual meeting of the Population Association of America, New York, March 2007,
the annual meeting of the Association of American Geographers, San Francisco, April 2007, the
Social Science in Place Seminar Series, Survey Research Center, University of California, Berkeley,
November 2007, the Initiative in Population Research Seminar Series at The Ohio State University,
Eunice Kennedy Shriver
February 2008, a colloquium at the Office of Pop
31
ulat
ion Research, Princeton University, April 2008,
32
and the IUSSP International Seminar on Human Fertility in Africa: Trends in the Last Decade and
Prospects for Change, Cape Coast, Ghana, 2008. We thank Jared Aldstadt for providing us with the
ArcGIS toolboxes for AMOEBA, Lawrence Brown for insightful comments on an earlier version of
this paper, S.V. Subramanian for advice regarding the multilevel modeling, and Mei-‐Po Kwan and
the anonymous reviewers for numerous valuable suggestions for revision. Justin Stoler and Dean
Daniels provided important assistance with the classification of the remotely sensed imagery.
33
References
Acquah, I. 1958. . London: University of London Press Ltd.
Agyei-‐Mensah, S.
Ac
, A
c
.
r
A
a
a
S
s
u
e
r
,
v
a
e
n
y
d K. Awusabo-‐Asare. 2003
Re
. S
p
o
r
c
o
ia
d
l
u
S
c
e
ti
t
o
ti
n
n
a
g
n
, Bi
d
rth Timing, and
Su
Sah
b
ar
se
an
qu
e
A
n
fr
t
i
Fe
ca
rtility in the Ghanaian South. In
, eds. S. Agyei-‐Mensah
Re
an
p
d
ro
J
d
.
u
B
c
.
t
C
io
a
n
st
a
er
n
l
d
in
S
e
o
.
c
W
ia
e
l
s
C
t
o
p
n
o
t
r
S
t,
o
c
C
i
T
al
:
C
G
o
r
n
ee
te
n
x
w
t
o
in
o
S
d
u
P
b
r
-
ess.
Agyei-‐Me
Col
ns
le
a
c
h
t
,
i
on
S.,
a
of
n
M
d J
ic
.
r
B
o
.
-
C
De
as
m
te
o
r
g
li
r
n
a
e
p
.
h
2
i
0
c
0
S
3
tu
.
. Greenwich, CT: Praeger P
ex
u
t
b
i
l
n
is
s
h
u
i
b
n
-
g
Sah
.
aran Africa: A
Agyei-‐Mensah, S., and G. Owusu. 2009. Segre
d
g
i
a
es
ted by Neighborhoods? A Portrait of Ethnic Diversity
in the Neighborhoods of the Accra Metropolitan Area, Ghana. Population, Space and Place in
press, but online.
Aldstadt, J., and A. Getis. 2006. Using AM
Spatial Clusters.
Angeles, G., D. K. Guilkey
Ge
, an
o
d
gr
T
a
.
p
A.
hi
c
M
a
r
l
o
A
z
n
O
al
E
y
BA
sis
to Create a Spatial Weights Matrix and Identify
38:327-‐343.
. 2005.
Programs on Fertility in Indonesia. Econ
T
o
h
m
e
i
E
c
f
D
fe
e
c
v
t
e
s
l
o
o
p
f
m
Ed
e
u
n
c
t
a
a
t
n
io
d
n
C
a
u
n
lt
d
u
r
F
a
a
l
m
C
i
h
ly
a
n
P
g
la
e
nning
54:165-‐201.
Beal, K.
Se
E.
x
2
u
0
al
0
i
5
t
.
y
Re
in
l
A
ig
f
i
r
o
ic
s
a
ity and HIV Risk Among Adolescents in Accra: A Qualitative Analysis.
2 (2):1-‐5.
Blanc, A. K., and S. Gray. 2000. Greater Than Expected Fertility Decline in Ghana: An Examination of
the Evidence. Calverton, MD: Macro International, Inc.
Bongaar
De
ts,
v
J
e
.,
l
o
a
p
nd G. Feen Population and
Brand, R. R. 197
m
2.
e
T
n
h
t
e
R
e
S
v
p
i
e
e
y
w
. 1998. On the Quantum and Tempo of Fertility.
24 (2):271-‐292.
atial Organization of Residential Areas in Accra, Ghana, with Particular
Reference to Aspects of Modernization. 48 (3):284-‐298.
Browne, W. J. 2009.
Economic Geography
MCMC Estimation in MLwiN, Version 2.13. Bristol, UK: Centre for MultiLevel
Modelling, University of Bristol.
34
Burt, R. S. 1992. . Cambridge: Harvard
Universit
St
y
r
P
u
r
c
e
t
s
u
s
r
.
al
Holes: The Social Structure of Competition
Casterlin
Pr
e
o
, J
c
.
e
B
ss
. 2001. Diffusion Processes and Fertility Transition: Introduction. In
, ed. J. B. Casterline. W
Di
a
f
s
fu
h
s
i
i
n
o
g
n
t
on, DC:
Nationa
e
l
s
R
a
e
nd
se
a
F
r
e
c
r
h
ti
C
lit
o
y
u
Tr
nc
an
il.
sition: Selected Perspectives
Claritas. 2006. PRIZM NE methodology Summary.
Coale, A. 1973. The Demographic Transition. Paper read at International Population Conference, at
Liege, Belgium.
Derose, L. F., and O. Kravdal. 2007. Educational Reversals and Firts-‐Birth Timing in Sub-‐Saharn
Africa: A Dynamic Mulitlevel Approach. 44 (1):59-‐77.
Diez Rou
Pub
x, A.
lic
V
H
.
e
2
a
0
l
0
th
1. Investigating neighborhoo
De
d
m
an
o
d
g
r
a
a
r
p
e
h
a
y
effects on health.
91:1783-‐1789.
American Journal of
Duque, J. C., L. Anselin, and S. J. Rey. 2007. The Max-‐P-‐Region problem. San Diego: Regional Analysis
Laboratory, San Diego State University.
Duque, J. C., R. Ra
Entwisle
In
,
te
B.
r
2
n
0
a
0
tio
mos, and J
7.
n
Put
al R
ti
e
ng
gio
Pe
n
.
a
Surinach. 2007
o
l
pl
Sc
e
i
e
int
nc
o
e
Pl
Re
a
v
c
i
e
ew
. Supervised Regionalization Methods: A Survey.
30:195-‐220.
. 44 (4):687-‐703.
Entwisle, B., J. Caster
Am
line
eri
, a
ca
nd
n
H
So
.
ci
A.
o
-‐A.
log
Saye
Demography
ical R
d.
e
1
vi
9
e
8
w
9. Villages as contexts for contraceptive behavior in
rural Egypt. 54:1019-‐1034.
Fayard, A.-‐L., and J. W
Or
e
g
e s
. a
k
ni
.
Interaction z
2007.
ation
S
P
t
hot
udi
oc
es
opiers and Water-‐coolers: The Affordances of Informal
28 (5):605-‐634.
Fischer, C. S., M. Hout, M. Sanchez Inequality by
Garenne
De
, M
si
.
g
M
n
.
:
2
C
0
ra
0
c
8
k
.
i
F
n
e
g
r
t
t
h
il
e
it
B
y
e
C
l
h
l C
J
u
an
rv
k
e
ow
My
s
t
k
h
i, S. R. Lucas, A. Swidler, and K. Vos. 1996.
. Princeton, NJ: Prince
anges in Sub-‐Saharan Africa. In DHS
ton
U
Co
n
m
iv
p
e
a
r
r
s
a
it
t
y
iv
P
e
r
R
e
e
s
p
s.
o
rts No. 18.
Calverton, MD: Macro International Inc.
35
Ghana Statistical Service, Ghana Health Service, and ICF Macro. 2009. Ghana Demographic and
Health Survey. Calverton, MD: ICF Macro.
Ghana S
Gh
tat
a
is
n
t
a
ic
D
al
e
m
Se
o
r
g
v
r
ic
a
e
p
,
h
N
ic
o
a
gu
nd
ch
H
i
e
M
a
e
lt
m
h
o
S
r
u
i
rv
al
e
I
y
n
s
2
t
0
it
0
u
3
te for Medical Research, and ORC Macro. 2004.
Am
. C
er
a
i
lverton, MD: ORC Macro.
Granovetter, M. 1973. The Strength of Weak Ties. 78 (6):1360-‐1380.
———. 1983. The Strength of Weak Ties: A Network Th
c
e
a
o
n
r
y
Jo
R
u
e
r
v
n
i
a
s
l
i
t
o
e
f
d
S
.
ociology
Sociological Theory 1:201-‐
233.
———. 2005. The Impact of Social Structure on Economic Outcomes.
19 (1):33-‐50.
The Journal of Economic
Hägerst
Pe
ran
rs
d
p
,
e
T
c
.
t
1
iv
9
e
6
s
7.
Harris, R., P. Sleight, an
In
d
n
R
v
.
a
W
tio
e
n
b
b
D
e
i
r
ffu
. 2005.
sion a
s a Spatial Process
Chichester, England: John Wiley & S
Ge
on
o
s
d
,
e
Lt
m
d.
og
raphics,
. C
GI
h
S
i
a
c
n
ag
d
o
N
: U
ei
n
gh
iv
b
e
o
r
r
s
h
it
o
y
o
o
d
f
Ta
Ch
r
i
g
c
e
a
t
g
i
o
n
P
g
ress.
.
Harvey, M., an Geographical
Hipp, J. R
Re
. 2
vi
0
e
0
w
d R. Brand. 1974. The Spatial Allocation of Migrants in Accra, Ghana.
64 (1):1-‐30.
7. Bloc, Tract, and Lev
Am
els
e
o
r
f
ic
A
a
g
n
g
S
re
o
g
ci
a
o
t
l
i
o
o
g
n
i
:
c
N
al
e
Re
igh
v
b
ie
o
w
rhood Structure and Crime and
Disorder as a Case in Point. 72:659-‐680.
Kohler, H., J. Behrmen, and S. Watkins. 2001. The Den
De
sit
m
y
o
o
g
f
r
S
a
o
p
c
h
ia
y
l Networks and Fertility Decisions:
Evidence from South Nyanza Dis
Lesthaeghe, R. J. ed. 1989.
Los Angeles: Unive
Re
rsi
p
t
r
y
o
of
du
Cal
ctio
if
n
or
a
tr
n
ic
d
t
nia
S
,
o
K
c
e
i
n
a
y
l Or
a.
Press.
ganization in
3
S
8
u
(
b
1
-Sah
):43
ar
-‐58.
an
Africa. Berkeley and
MacInty
He
re,
a
S
lt
.,
h
and A. Ellaway. 2003. Neighborhoods and Health: An Overview. In
, eds. I. Kawachi and L. F. Berkman. Oxford: Oxford University Pres
Ne
s.
ighborhoods and
MacIntyre, S., A. Ellaway, and S. Cummins. 2
Soc
00
i
2
al
. P
Sc
la
i
c
e
e
n
e
ce
ff
e
an
cts on health: how can we conceptualise,
operationalise and measure them? d Medicine
Urban Geography
55:125-‐139.
Martin, D. G. 2003. Enacting Neighborhood. 24(5):361-‐385.
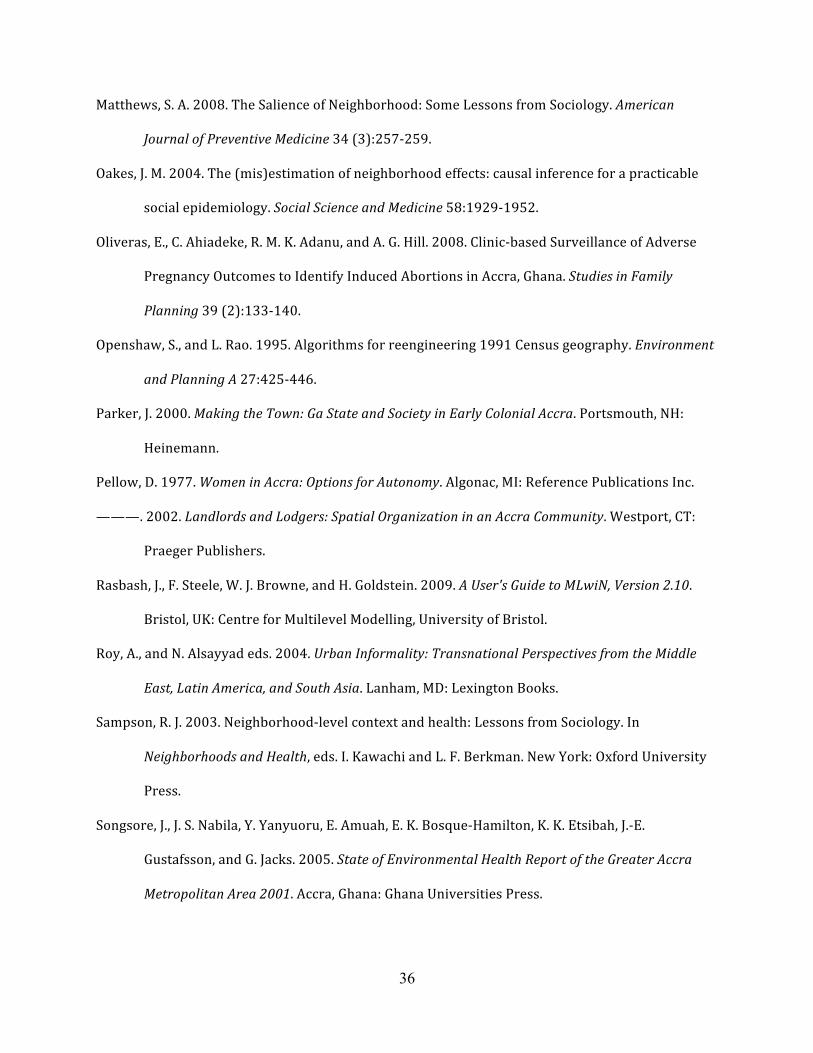
36
Matthews, S. A. 2008. The Salience of Neighborhood: Some Lessons from Sociology. American
Oakes, J
Jo
. M
u
.
r
2
n
0
al
0
of Preventiv 34 (3):257-‐259.
4. The (mis)
e
e
M
st
e
im
di
a
c
t
in
Social Sc
io
e
n
ie
n
o
c
f
e
n
an
eig
d
h
M
bo
e
r
di
h
c
o
i
o
n
d
e
effects: causal inference for a practicable
social epidemiology. 58:1929-‐1952.
Oliveras, E., C. Ahiadeke, R. M. K. Adanu, and A. G. Hill. 2008. Clinic-‐based Surveillance of Adverse
Pr
Pla
e
nni
gna
ng
ncy Outcomes to Identify Induced Abortions in Accra, Ghana.
39 (2):133-‐140.
Studies in Family
Opensha
an
w
d
, S
P
.,
l
an
an
n
d
i
n
L
g
.
R
A
ao. 1995. Algorithms for reengineering 1991 Census geography. Environment
Parker, J. 2000.
Heinema
Ma
n
k
2
n .
ing th
7
e
:4
T
2
o
5
w
-‐446.
n: Ga
State and Society in Early Colonial Accra. Portsmouth, NH:
Pellow, D. 1977.
———. 2002.
Women in Accra: Options for Autonomy
Praege
Lan
r Publ
dlor
is
ds
he
an
rs.
d
Lodgers: Spatial Organizati
. A
on
l
g
in
o
n
an
ac
A
, M
cc
I
r
: R
a Co
efe
mmu
renc
n
e
i
P
ty
ublications Inc.
. Westport, CT:
Rasbash, J., F. Steele, W. J. Browne, and H. Goldstein. 2009. .
Bristol, UK: Centre for Multilevel Modelling, Univer
A
si
U
ty
s
e
o
r
f
'
s
Br
G
i
u
s
i
t
d
o
e
l.
to MLwiN, Version 2.10
Roy, A.,
Ea
and N. Als Urban Info
st, Latin
a
Am
yya
e
d
r
i
e
c
d
a
s
,
.
a
2
n
0
d
0
S
4
o
.
u
th Asia. La
r
n
m
ha
a
m
lit
, M
y: Tr
D:
a
L
ns
ex
na
in
t
g
io
to
na
n B
l Pe
oo
r
k
sp
s.
e
ctives from the Middle
Sampson
Ne
, R
ig
.
h
J.
b
2
o
0
rh
0
o
3
o
.
d
N
s
e
a
igh
nd
b
He
orh
a
ood
lth
-‐level context and health: Lessons from Sociology. In
, eds. I. Kawachi and L. F. Berkman. New York: Oxford University
Press.
Songsore, J., J. S. Nabila, Y. Yanyuoru, E.
St
A
at
m
e
u
ah
of
,
E
E
n
.
v
K
ir
.
on
Bos
m
q
e
u
n
e
tal
-‐Ha
H
m
eal
ilton, K. K. E
Gustafsson, and G. Jacks. 2005. th Report of
ts
t
i
h
b
e
a
h
G
,
r
J
e
.
at
-‐E.
e
r Accra
Metropolitan Area 2001. Accra, Ghana: Ghana Universities Press.
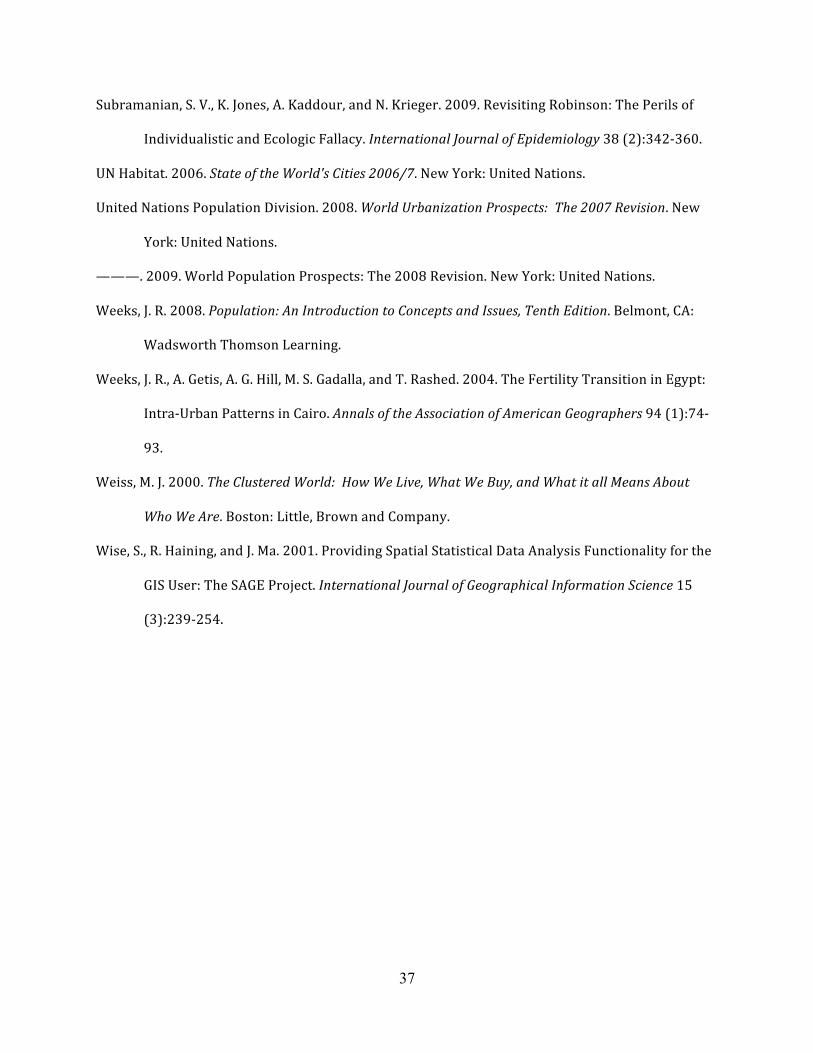
37
Subramanian, S. V., K. Jones, A. Kaddour, and N. Krieger. 2009. Revisiting Robinson: The Perils of
Individualistic and Ecologic Fallacy. 38 (2):342-‐360.
UN Habitat. 2006.
International Journal of Epidemiology
United Nations Pop
St
u
at
la
e
ti
of
on
t
Di
he
v
W
is
or
ion
ld'
. 2
s
0
Ci
0
t
8
ie
.
s 2006/7
York: United Nations.
World Ur
. N
ba
e
n
w
iz
Y
at
o
io
rk
n
:
U
Pr
n
o
i
s
t
p
e
e
d
c
N
ts
a
:
t
T
io
h
n
e
s
2
.
007 Revision. New
———. 2009. World Population Pro
Weeks, J. R. 2008.
Wadswort
Po
h T
p
h
ul
o
a
m
ti
s
o
o
n:
n
L
A
e
n
a
I
r
nt
ni
r
s
o
p
d
e
uc
cts
ti
:
o
T
n
h
t
e
o
2
C
0
o
0
nc
8 R
ep
e
t
v
s
i
a
s
nd
ion
I
. N
ssue
ew
s,
Y
Te
or
nt
k:
h
U
Ed
ni
i
t
t
e
io
d
n
Nations.
. Belmont, CA:
ng.
Weeks, J. R., A. Getis, A. G. Hill, M. S. Gadalla, and T. Rashed. 2004. T
Intra-‐Urban Patterns in Cairo.
93.
Annals of the Association of Am
he
e
F
ri
e
c
r
a
t
n
il
i
G
ty
e
o
T
g
r
r
a
a
n
p
s
h
it
e
i
r
o
s
n in Egypt:
94 (1):74-‐
Weiss, M. J. 2000. The
. B
C
o
l
s
us
to
t
n
e
:
r
L
ed
it
W
tle
o
, B
rld
ro
:
w
H
n
o
a
w
n
W
d C
e L
o
i
m
ve
p
,
a
W
ny
ha
.
t We Buy, and What it all Means About
Wise, S.,
Wh
R.
o
H
a
We
ini
A
ng
re
, and J. Ma. 2001. Providing Spa
GIS User: The SAGE Project.
(3):239-‐254.
International Jo
ti
u
a
r
l
n
S
a
ta
l
t
o
i
f
st
G
ic
e
a
o
l
g
D
ra
a
p
ta
h
i
A
ca
na
l In
ly
fo
sis
r
m
Func
atio
t
n
io
S
na
cie
li
n
ty
ce
for the
15
Figure 1. Vernacular Neighborhoods of Accra, Ghana
Source: Shapefile created by authors from data provided by Ghana Statistical Service
Figure 2. Accra Enumeration Areas (EAs) According to the PCA-‐Derived Status Score, Overlaid by the Boundaries of the Vernacular Neighborhoods
Source: Shapefile created by authors from data provided by Ghana Statistical Service
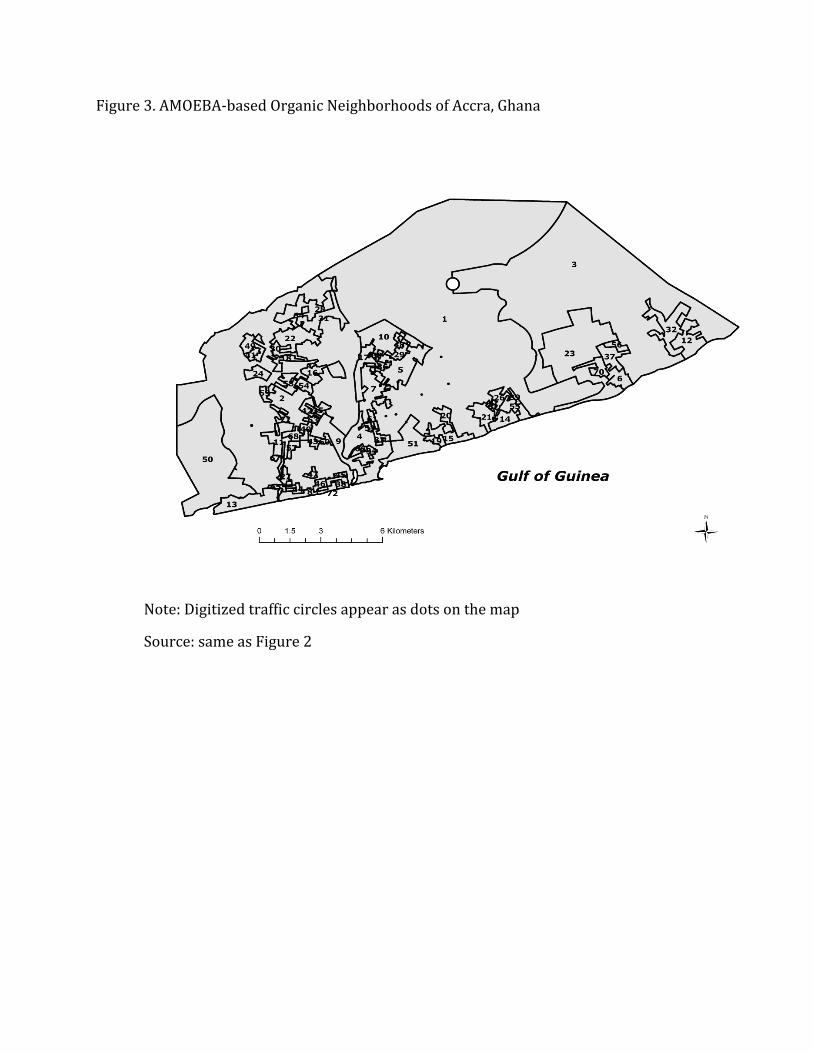
Figure 3. AMOEBA-‐based Organic Neighborhoods of Accra, Ghana
Note: Digitized traffic circles appear as dots on the map
Source: same as Figure 2
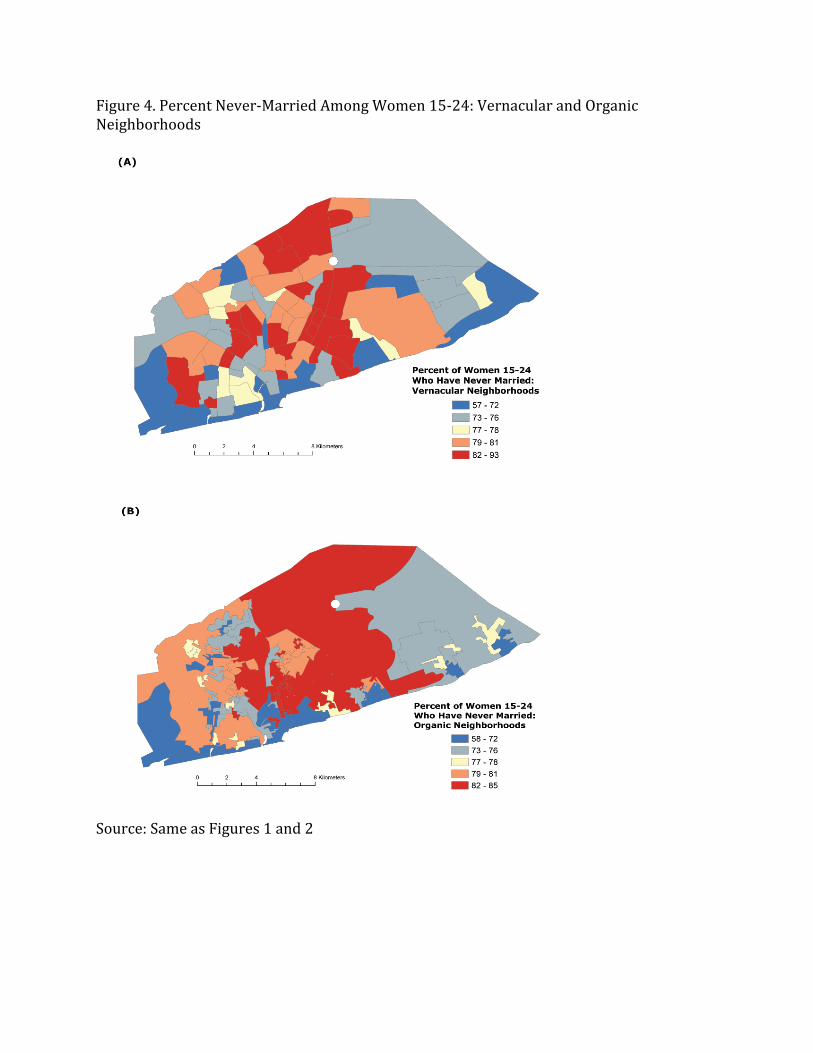
FigNeighbure 4.
orhoods Percen
t Never-‐Married Among Women 15-‐24: Vernacular and Organic
Source: Same as Figures 1 and 2
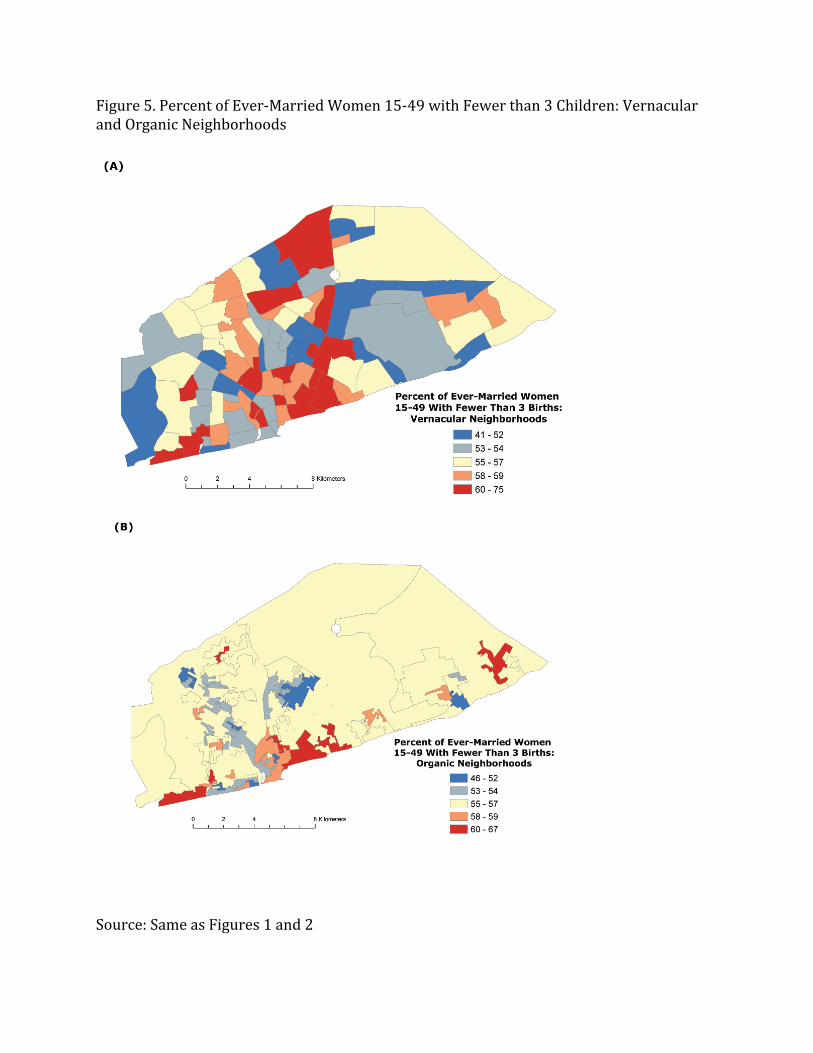
andFigu
Orre gani5. Percen
c Neight ofbo Everrhoo
-‐Mards
ried Women 15-‐49 with Fewer than 3 Children: Vernacular
Source: Same as Figures 1 and 2

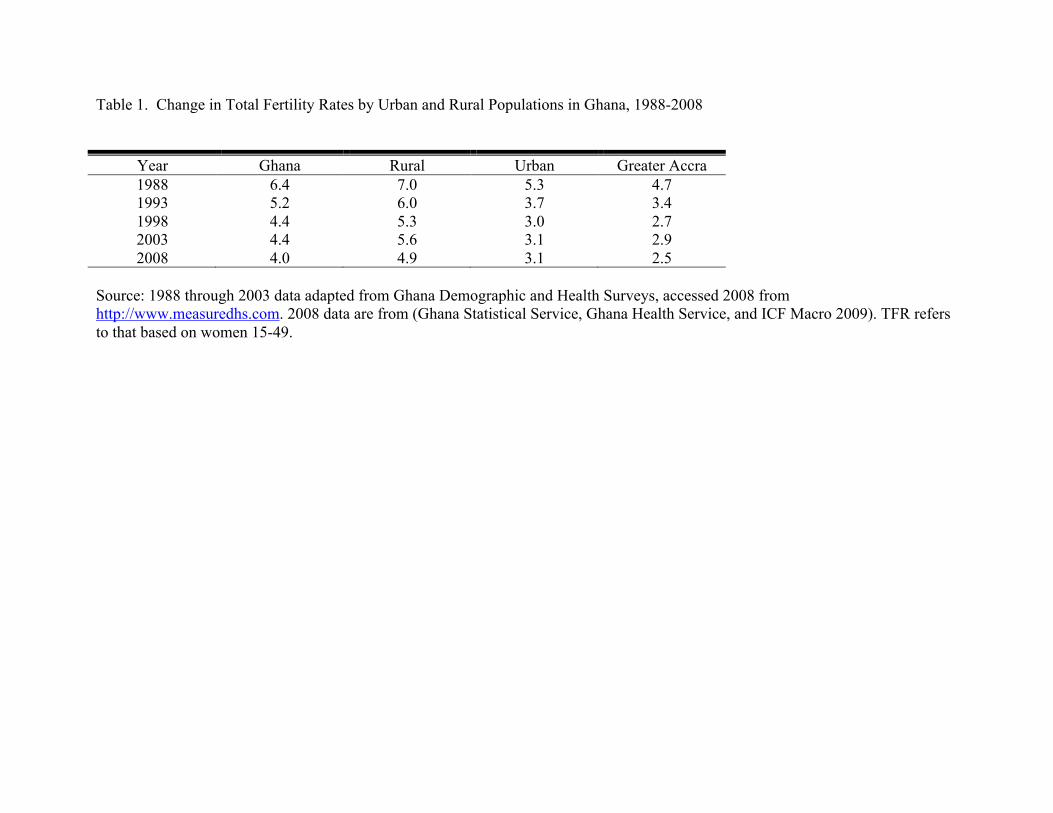
Table 1. Change in Total Fertility Rates by Urban and Rural Populations in Ghana, 1988-2008
Year 1988
Ghana 6.4
Rural 7.0
Urban 5.3
Greater Accra 4.7
1993 5.2 6.0 3.7 3.4 1998 4.4 5.3 3.0 2.7 2003 4.4 5.6 3.1 2.9 2008
4.0 4.9 3.1 2.5
Source: 1988 through 2003 data adapted from Ghana Demographic and Health Surveys, accessed 2008 from http://www.measuredhs.com. 2008 data are from (Ghana Statistical Service, Ghana Health Service, and ICF Macro 2009). TFR refers to that based on women 15-49.
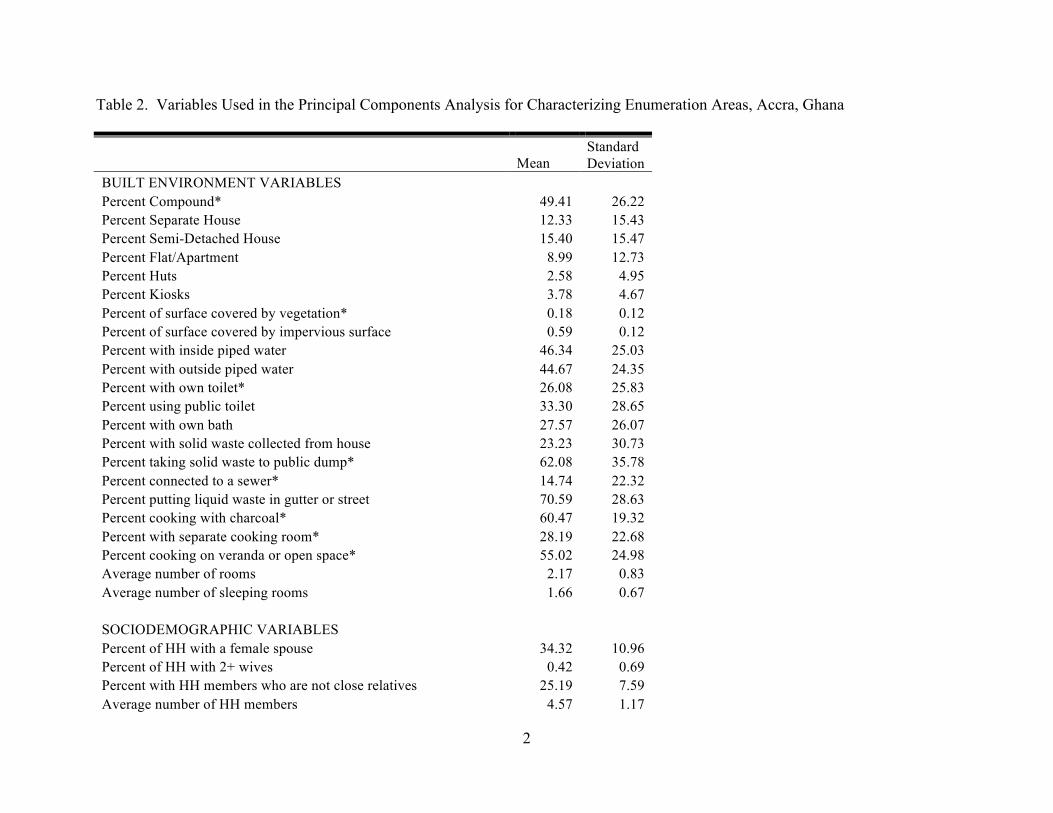
2
Table 2. Variables Used in the Principal Components Analysis for Characterizing Enumeration Areas, Accra, Ghana
Standard Mean Deviation BUILT ENVIRONMENT VARIABLES Percent Compound* 49.41 26.22 Percent Separate House 12.33 15.43 Percent Semi-Detached House 15.40 15.47 Percent Flat/Apartment 8.99 12.73 Percent Huts 2.58 4.95 Percent Kiosks 3.78 4.67 Percent of surface covered by vegetation* 0.18 0.12 Percent of surface covered by impervious surface 0.59 0.12 Percent with inside piped water 46.34 25.03 Percent with outside piped water 44.67 24.35 Percent with own toilet* 26.08 25.83 Percent using public toilet 33.30 28.65 Percent with own bath 27.57 26.07 Percent with solid waste collected from house 23.23 30.73 Percent taking solid waste to public dump* 62.08 35.78 Percent connected to a sewer* 14.74 22.32 Percent putting liquid waste in gutter or street 70.59 28.63 Percent cooking with charcoal* 60.47 19.32 Percent with separate cooking room* 28.19 22.68 Percent cooking on veranda or open space* 55.02 24.98 Average number of rooms 2.17 0.83 Average number of sleeping rooms 1.66 0.67 SOCIODEMOGRAPHIC VARIABLES Percent of HH with a female spouse 34.32 10.96 Percent of HH with 2+ wives 0.42 0.69 Percent with HH members who are not close relatives 25.19 7.59 Average number of HH members 4.57 1.17
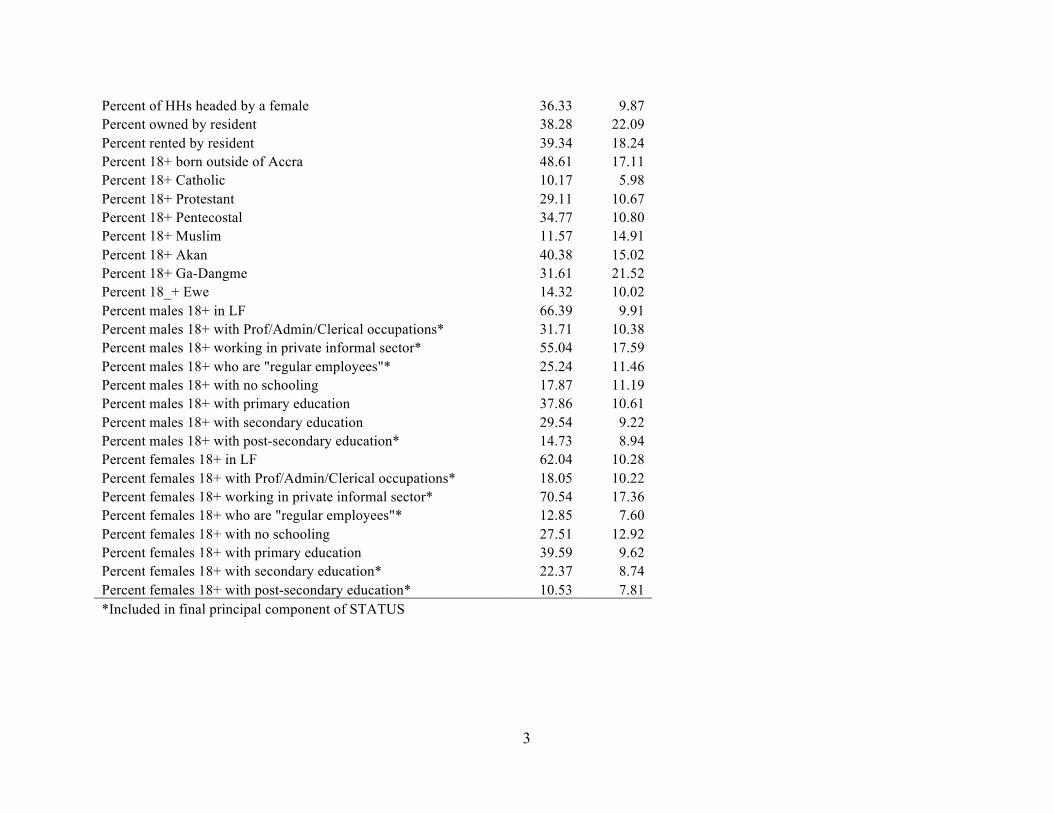
3
Percent of HHs headed by a female 36.33 9.87 Percent owned by resident 38.28 22.09 Percent rented by resident 39.34 18.24 Percent 18+ born outside of Accra 48.61 17.11 Percent 18+ Catholic 10.17 5.98 Percent 18+ Protestant 29.11 10.67 Percent 18+ Pentecostal 34.77 10.80 Percent 18+ Muslim 11.57 14.91 Percent 18+ Akan 40.38 15.02 Percent 18+ Ga-Dangme 31.61 21.52 Percent 18_+ Ewe 14.32 10.02 Percent males 18+ in LF 66.39 9.91 Percent males 18+ with Prof/Admin/Clerical occupations* 31.71 10.38 Percent males 18+ working in private informal sector* 55.04 17.59 Percent males 18+ who are "regular employees"* 25.24 11.46 Percent males 18+ with no schooling 17.87 11.19 Percent males 18+ with primary education 37.86 10.61 Percent males 18+ with secondary education 29.54 9.22 Percent males 18+ with post-secondary education* 14.73 8.94 Percent females 18+ in LF 62.04 10.28 Percent females 18+ with Prof/Admin/Clerical occupations* 18.05 10.22 Percent females 18+ working in private informal sector* 70.54 17.36 Percent females 18+ who are "regular employees"* 12.85 7.60 Percent females 18+ with no schooling 27.51 12.92 Percent females 18+ with primary education 39.59 9.62 Percent females 18+ with secondary education* 22.37 8.74 Percent females 18+ with post-secondary education* 10.53 7.81 *Included in final principal component of STATUS
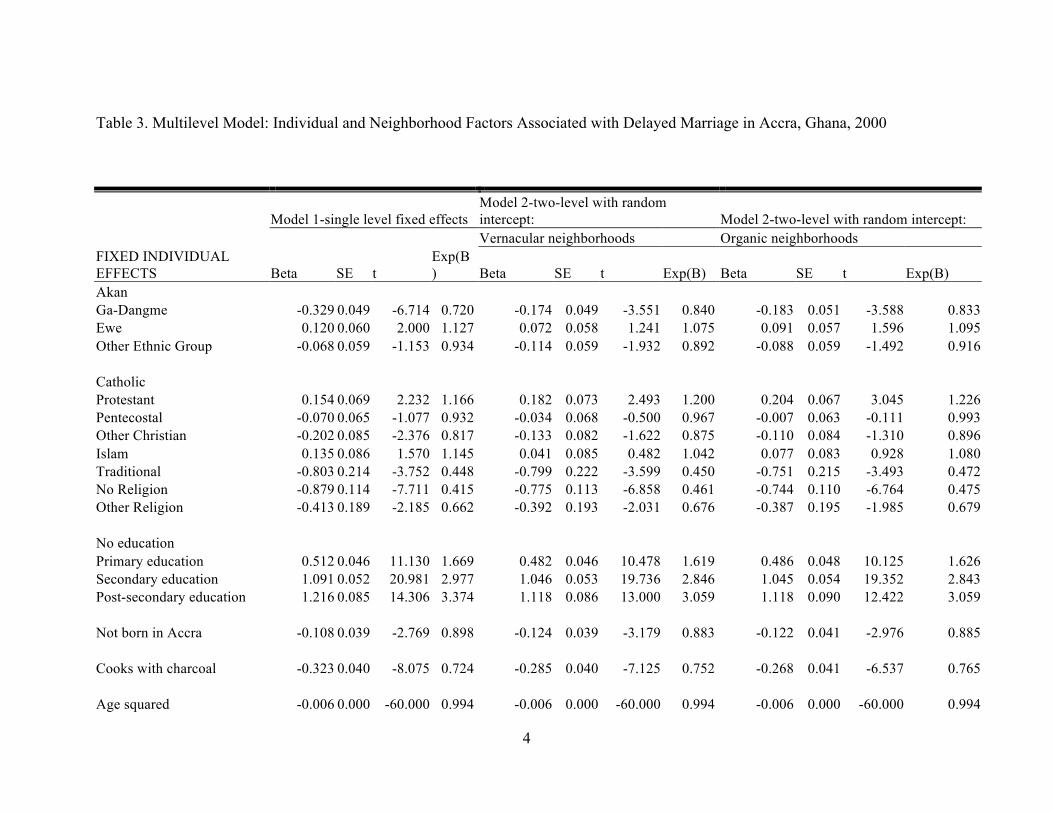
4
Table 3. Multilevel Model: Individual and Neighborhood Factors Associated with Delayed Marriage in Accra, Ghana, 2000
Model 2-two-level with random FIXED INDIVIDUAL EFFECTS
Model 1-single level fixed effects intercept: Model 2-two-level with random intercept:
Beta
SE
t
Exp(B)
Vernacular neighborhoods Organic neighborhoods
Beta SE t Exp(B) Beta SE t Exp(B) Akan Ga-Dangme Ewe
-0.329 0.120
0.049 0.060
-6.714 2.000
0.720 1.127
-0.174 0.072
0.049 0.058
-3.551 1.241
0.840 1.075
-0.183 0.091
0.051 0.057
-3.588 1.596
0.833 1.095
Other Ethnic Group -0.068 0.059 -1.153 0.934 -0.114 0.059 -1.932 0.892 -0.088 0.059 -1.492 0.916 Catholic Protestant 0.154 0.069 2.232 1.166 0.182 0.073 2.493 1.200 0.204 0.067 3.045 1.226 Pentecostal -0.070 0.065 -1.077 0.932 -0.034 0.068 -0.500 0.967 -0.007 0.063 -0.111 0.993 Other Christian -0.202 0.085 -2.376 0.817 -0.133 0.082 -1.622 0.875 -0.110 0.084 -1.310 0.896 Islam 0.135 0.086 1.570 1.145 0.041 0.085 0.482 1.042 0.077 0.083 0.928 1.080 Traditional -0.803 0.214 -3.752 0.448 -0.799 0.222 -3.599 0.450 -0.751 0.215 -3.493 0.472 No Religion Other Religion
-0.879 -0.413
0.114 0.189
-7.711 -2.185
0.415 0.662
-0.775 -0.392
0.113 0.193
-6.858 -2.031
0.461 0.676
-0.744 -0.387
0.110 0.195
-6.764 -1.985
0.475 0.679
No education Primary education Secondary education Post-secondary education
0.512 1.091 1.216
0.046 0.052 0.085
11.130 20.981 14.306
1.669 2.977 3.374
0.482 1.046 1.118
0.046 0.053 0.086
10.478 19.736 13.000
1.619 2.846 3.059
0.486 1.045 1.118
0.048 0.054 0.090
10.125 19.352 12.422
1.626 2.843 3.059
Not born in Accra -0.108 0.039 -2.769 0.898 -0.124 0.039 -3.179 0.883 -0.122 0.041 -2.976 0.885 Cooks with charcoal -0.323 0.040 -8.075 0.724 -0.285 0.040 -7.125 0.752 -0.268 0.041 -6.537 0.765 Age squared -0.006 0.000 -60.000 0.994 -0.006 0.000 -60.000 0.994 -0.006 0.000 -60.000 0.994
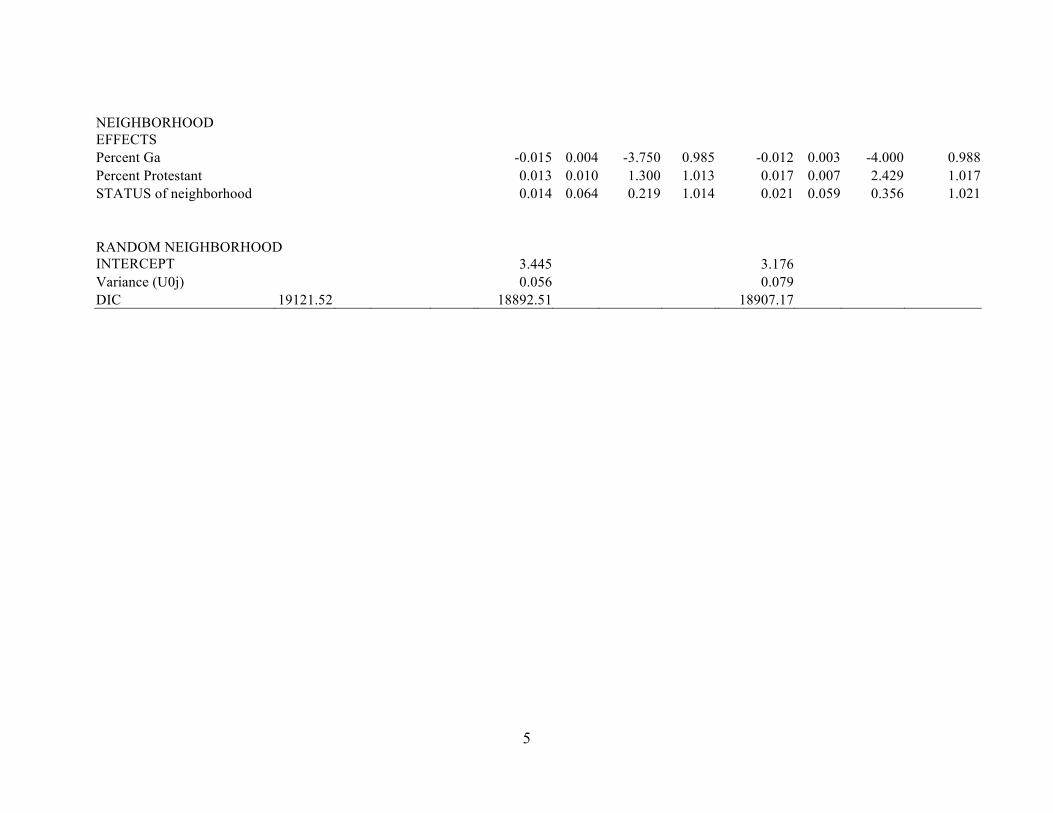
5
NEIGHBORHOOD EFFECTS Percent Ga -0.015 0.004 -3.750 0.985 -0.012 0.003 -4.000 0.988 Percent Protestant 0.013 0.010 1.300 1.013 0.017 0.007 2.429 1.017 STATUS of neighborhood 0.014 0.064 0.219 1.014 0.021 0.059 0.356 1.021 RANDOM NEIGHBORHOOD INTERCEPT 3.445 3.176 Variance (U0j) 0.056 0.079 DIC 19121.52 18892.51 18907.17
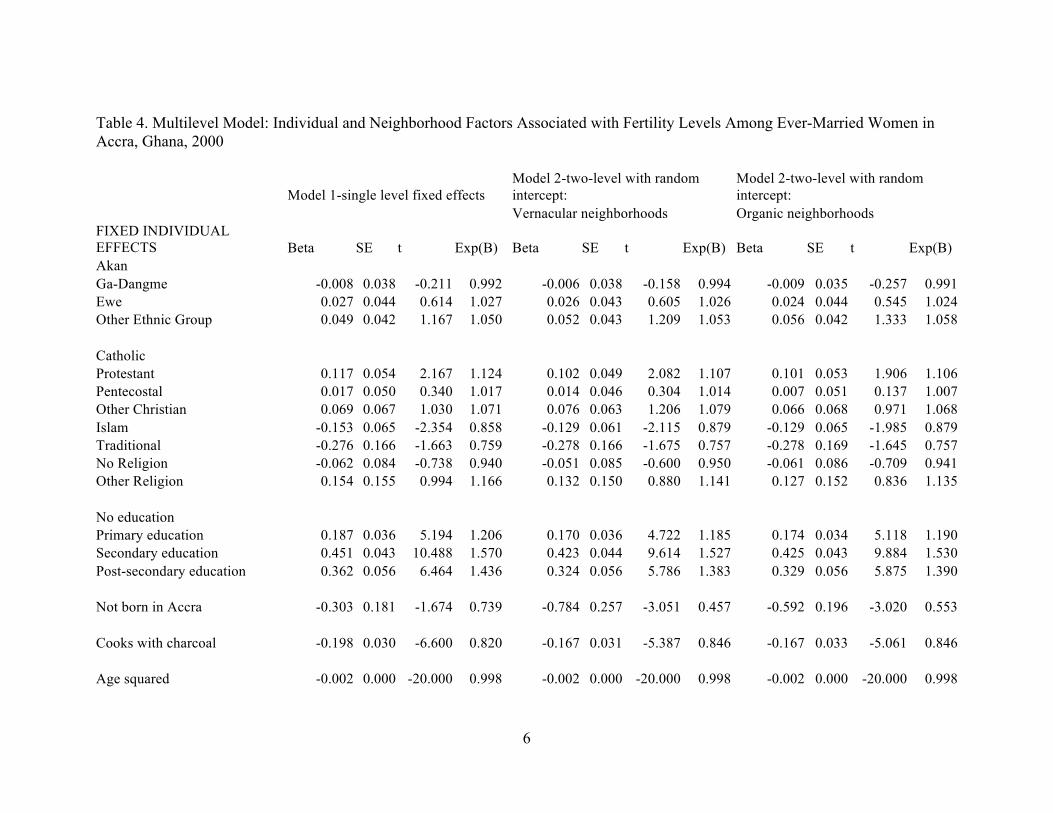
Table 4. Multilevel Model: Individual and Neighborhood Factors Associated with Fertility Levels Among Ever-Married Women in Accra, Ghana, 2000
Model 2-two-level with random Model 2-two-level with random Model 1-single level fixed effects intercept: intercept: Vernacular neighborhoods Organic neighborhoods FIXED INDIVIDUAL EFFECTS Beta SE t Exp(B) Beta SE t Exp(B) Beta SE t Exp(B) Akan Ga-Dangme -0.008 0.038 -0.211 0.992 -0.006 0.038 -0.158 0.994 -0.009 0.035 -0.257 0.991 Ewe 0.027 0.044 0.614 1.027 0.026 0.043 0.605 1.026 0.024 0.044 0.545 1.024 Other Ethnic Group 0.049 0.042 1.167 1.050 0.052 0.043 1.209 1.053 0.056 0.042 1.333 1.058 Catholic Protestant 0.117 0.054 2.167 1.124 0.102 0.049 2.082 1.107 0.101 0.053 1.906 1.106 Pentecostal 0.017 0.050 0.340 1.017 0.014 0.046 0.304 1.014 0.007 0.051 0.137 1.007 Other Christian 0.069 0.067 1.030 1.071 0.076 0.063 1.206 1.079 0.066 0.068 0.971 1.068 Islam -0.153 0.065 -2.354 0.858 -0.129 0.061 -2.115 0.879 -0.129 0.065 -1.985 0.879 Traditional -0.276 0.166 -1.663 0.759 -0.278 0.166 -1.675 0.757 -0.278 0.169 -1.645 0.757 No Religion -0.062 0.084 -0.738 0.940 -0.051 0.085 -0.600 0.950 -0.061 0.086 -0.709 0.941 Other Religion 0.154 0.155 0.994 1.166 0.132 0.150 0.880 1.141 0.127 0.152 0.836 1.135 No education Primary education 0.187 0.036 5.194 1.206 0.170 0.036 4.722 1.185 0.174 0.034 5.118 1.190 Secondary education 0.451 0.043 10.488 1.570 0.423 0.044 9.614 1.527 0.425 0.043 9.884 1.530 Post-secondary education 0.362 0.056 6.464 1.436 0.324 0.056 5.786 1.383 0.329 0.056 5.875 1.390 Not born in Accra -0.303 0.181 -1.674 0.739 -0.784 0.257 -3.051 0.457 -0.592 0.196 -3.020 0.553 Cooks with charcoal -0.198 0.030 -6.600 0.820 -0.167 0.031 -5.387 0.846 -0.167 0.033 -5.061 0.846 Age squared -0.002 0.000 -20.000 0.998 -0.002 0.000 -20.000 0.998 -0.002 0.000 -20.000 0.998
6
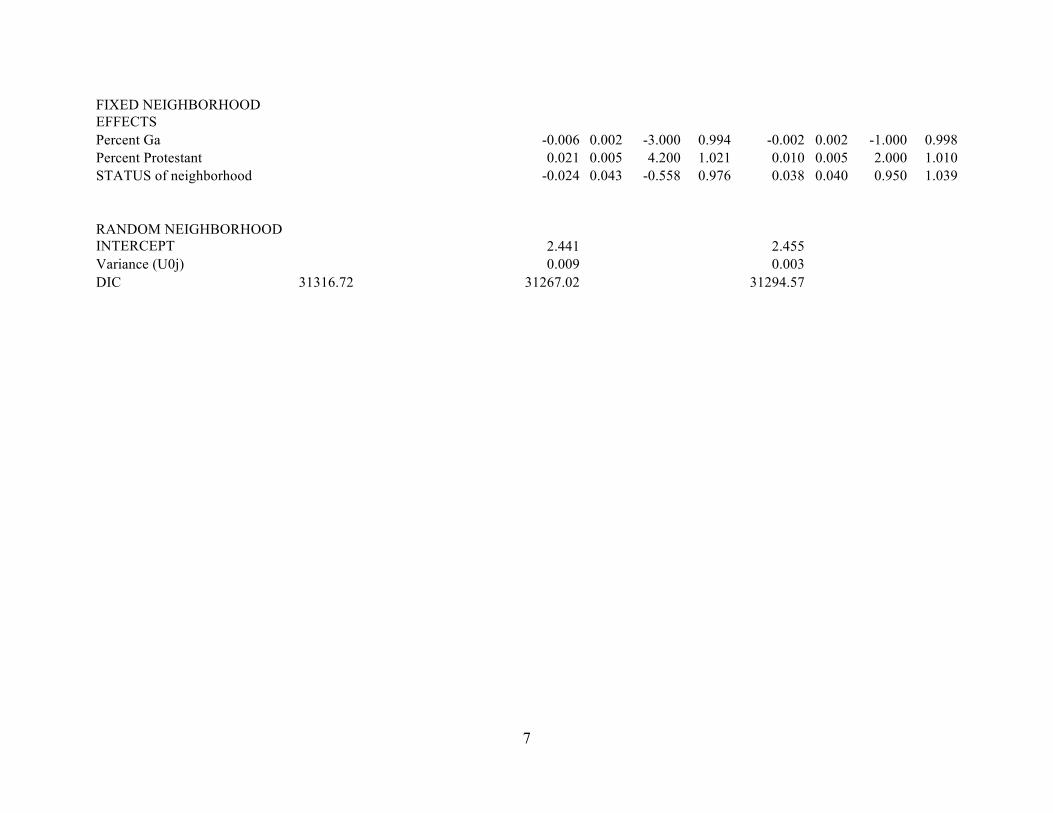
7
FIXED NEIGHBORHOOD EFFECTS Percent Ga -0.006 0.002 -3.000 0.994 -0.002 0.002 -1.000 0.998 Percent Protestant 0.021 0.005 4.200 1.021 0.010 0.005 2.000 1.010 STATUS of neighborhood -0.024 0.043 -0.558 0.976 0.038 0.040 0.950 1.039 RANDOM NEIGHBORHOOD INTERCEPT 2.441 2.455 Variance (U0j) 0.009 0.003 DIC 31316.72 31267.02 31294.57