Embed Size (px)
Citation preview
NDR2 AND FILAMIN A AS MODULATORS
OF INTEGRIN ACTIVATION DURING
DENDRITIC GROWTH
Dissertation
zur Erlangung des akademischen Grades
doctor rerum naturalium (Dr. rer. nat.)
genehmigt durch die Fakultät für Naturwissenschaften
der Otto-von-Guericke-Universität Magdeburg
von
Yunus Emre Demiray, MSc.
geboren am 27.08.1990 in Goztepe/Istanbul
eingereicht am 24.11.2020.
verteidigt am 07.05.2021.
Gutachter: Prof. Dr. Oliver Stork
Gutachter: Prof. Dr. Amparo Acker-Palmer DDC: 573.848
ii
TABLE OF CONTENTS
LIST OF TABLES iv
LIST OF FIGURES v
LIST OF ABBREVIATIONS vii
ABSTRACT ix
ZUSAMMENFASSUNG x
Introduction 1 1.1 Integrin Receptors 1
1.1.1 Structure of integrin receptors 2 1.1.2 Integrin subtypes and their ligand specificity 5 1.1.3 Function of integrin receptors in neurons 7
1.2 Ndr2 Kinase 11 1.2.1 Ndr2 kinase: Structure and Homologs 11 1.2.2 Regulation of Ndr2 kinase activity 13 1.2.3 Functions of Ndr2 kinase in neurons 15 1.2.4 Role of Ndr2 in neurite extension of PC12 cells 17
1.3 Filamin A 21 1.3.1 Structure of Filamin A 22 1.3.2 Regulation of Filamin A expression and activity 24 1.3.3 Functions of Filamin A 27
1.4 Aims of the study 32
Materials and Methods 34 1.1 DNA constructs 34 1.2 NIH3T3 and HEK293T cell culture and transfections 36 1.3 PC12 cell culturing and differentiation 37 1.4 Establishing neuronal and glial cell cultures 38 1.5 Transfection of neurons with Calcium/Phosphate method 39 1.6 Production of viral particles and transduction of cells 40
1.6.1 Lentivirus production 40 1.6.2 AAV production 41 1.6.3 In vitro transduction of cells 42
1.7 Immunoblotting 43 1.7.1 Lysis of the cells 43 1.7.2 Protein concentration quantification 44 1.7.3 SDS-PAGE and Western blotting 45 1.7.4 Antibodies used in the study 46
1.8 Immunocytochemistry 47 1.9 Protein database analysis against phosphorylation motifs 48
iii
1.10 Sholl analysis of dendritic morphology 48 1.11 Statistical analysis 49
RESULTS 50 1.1 Ndr2 modulates 1 integrin distribution during neurite growth 50 1.2 Ndr2 controls dendritic branching in primary neurons 51 1.3 Ndr2 kinase targets Filamin A as a downstream substrate 54 1.4 Filamin A levels control dendritic branching of hippocampal neurons 59 1.5 1 integrin levels are crucial for dendritic branching 66 1.6 shFlnA mediated dendritic hypertrophy is dependent on 1 integrin activity 68 1.7 WT FlnA mediated dendritic hypertrophy can persist under FAK inhibition 71 1.8 Efficient transduction neuronal cultures with lentiviral particles 74 1.9 Lack of FlnA causes abnormal Akt phosphorylation after integrin receptor
stimulation 75 1.10 WT FlnA and dendritic branching 78 1.11 Developing new tools for manipulation of endogenous FlnA 82
1.11.1 CRISPR knockout of FlnA via Cas9 editing system 82 1.11.2 Transcriptional activation FlnA expression via catalytically defective Cas9 85
DISCUSSION 93 1.1 ECM and neurite growth 93 1.2 Integrins and substrate selectivity 96 1.3 A drawbridge between Ndr2 and integrin receptors: FlnA 99 1.4 Precise levels of FlnA: less is more 102 1.5 Targeting the middleman: 1 integrin, FAK and actin 105 1.6 A possible shift in the RhoA/Rac1 balance 107 1.7 Development of new and more specific intervention tools 111 1.8 Limitations of the study 113 1.9 Concluding remarks 116
REFERENCES 118
APPENDIX 134 1.1 Supplementary materials 134
1.1.1 DNA constructs used in this study 134 1.1.2 Positional scanning peptide library 137 1.1.3 List of proteins containing RxP(S/T) motif in integrin adhesome 138 1.1.4 Ndr2 and FlnA S2152 phosphorylation in T-cells (Waldt et al. 2018) 139 1.1.5 Neurotrophin signaling on FlnA expression 140 1.1.6 Single AAV system for transcriptional activation via dCas9-VPR 140
1.2 Ehrenerklärung 142

iv
LIST OF TABLES
Table 1: Primary antibodies used in this study for Western blotting and immunocytochemistry. 46 Table 2: shRNA hairpin sequences used in this study. ............................................................... 134 Table 3: Expression vectors used in this study ............................................................................ 134 Table 4: CRISPR vectors used in this study. ............................................................................... 135
Table 5: List of proteins in integrin adhesome network containing the recently identified Ndr2
target RxP(S/T) motif .................................................................................................................. 138
v
LIST OF FIGURES
Figure 1: Structure of integrin heterodimers on the membrane. ...................................................... 5 Figure 2: Structure of Ndr2 kinase. ............................................................................................... 13 Figure 3: Substrate specific control of neurite outgrowth of PC12 cells via Ndr2 kinase. ........... 19
Figure 4: Lack of 11 integrin receptor activation in Ndr2 overexpressing PC12 cells. ............. 21 Figure 5: Structure of FlnA ........................................................................................................... 24 Figure 6: Lentiviral transfer plasmid containing an U6-hairpin and a reporter GFP cassette. ...... 34 Figure 7: Single AAV transfer plasmid containing the Cas9 and gRNA. ..................................... 36
Figure 8: Representative images of control and shFlnA lentiviral supernatants on HEK293T cells.
....................................................................................................................................................... 41
Figure 9: Localization of 1 integrin in differentiating Ndr2 PC12 cells...................................... 50
Figure 10: Total 1 integrin expression level in Ndr2 PC12 cells during differentiation. ............ 51
Figure 11: Ndr2 kinase overexpression impairs 11 integrin dependent growth of hippocampal
primary neurons. ............................................................................................................................ 53 Figure 12: Ndr2 kinase is required for LN111 mediated dendritic growth of hippocampal
neurons. ......................................................................................................................................... 54 Figure 13: Identification of RXP(S/T) motif as Ndr2 substrate and integrin adhesome sequence
search. ............................................................................................................................................ 56 Figure 14: Ndr2 phosphorylates FlnA on S2152. .......................................................................... 58
Figure 15: FlnA and integrin 1 expression during hippocampal neuronal differentiation. .......... 59 Figure 16: Silencing and re-expression of FlnA via acute transfections of fibroblasts. ................ 60 Figure 17: shFlnA can efficiently silence endogenous FlnA levels in cortical neurons. .............. 61
Figure 18: Manipulation of FlnA expression in hippocampal neurons affect dendrite morphology.
....................................................................................................................................................... 63 Figure 19: FlnA levels alter the dendritic length depending on the coating substrate. ................. 64 Figure 20: Silencing of FlnA with a second small hairpin RNA (shFlnA_v2) produces a similar
dendritic hypertrophy. ................................................................................................................... 65
Figure 21: Reduced 1 integrin levels impair dendritic growth and this morphology can be
rescued by FlnA reduction. ............................................................................................................ 67
Figure 22: 1 integrin activity is required for shFlnA mediated dendritic hypertrophy. ............... 70
Figure 23: 1 integrin activity controls the total dendritic length of hippocampal neurons. ......... 70 Figure 24: WT FlnA mediated dendritic arborization does not depend on FAK activity. ............ 73 Figure 25: Focal adhesion kinase is indispensable for dendritic growth of hippocampal neurons.
....................................................................................................................................................... 73
Figure 26: CMV promoter activity in developing neurons is induced by neuronal activity. ........ 75 Figure 27: shFlnA neurons display significantly increased Akt activation upon integrin receptor
stimulation. .................................................................................................................................... 77
Figure 28: Pure overexpression of hWT FlnA in mouse hippocampal neurons enhances dendritic
arborization and extension. ............................................................................................................ 79 Figure 29: Efficient actin crosslinking by FlnA is required for hWT FlnA mediated dendritic
growth. ........................................................................................................................................... 80 Figure 30: Serine 2152 phosphorylation of FlnA does not play an important role during dendritic
branching. ...................................................................................................................................... 82
vi
Figure 31: Lentiviral delivery of Cas9-GFP and gRNA-mCherry to disturb FlnA gene in NIH3T3
cells. ............................................................................................................................................... 83
Figure 32: Single-AAV system to deliver Cas9 and gRNA for FlnA genome editing. ................ 84 Figure 33: Cas9-AAV particles targeting FlnA gene significantly reduces FlnA protein in cortical
neurons. ......................................................................................................................................... 85 Figure 34: Transcriptional activation with dCas9-VP64 /MS2-p65-HSF1 system in HEK293T
cells. ............................................................................................................................................... 87
Figure 35: Targeting FlnA gene in NIH3T3 cells using dCas9-VP64 and MS2-p65-HSF1. ........ 87 Figure 36: Targeting FlnA gene in NIH3T3 cells with multiplex gRNA sets. ............................. 88 Figure 37: Transcriptional activation with two-vector dCas9-VPR / U6-gRNA system. ............. 89 Figure 38: Lentiviral delivery of dCas9-VPR and U6-gRNA in NIH3T3 cells. ........................... 90 Figure 39: Lentiviral delivery of syn-dCas9-VPR and U6-gRNA to mouse cortical neurons. ..... 91
Figure 40: Hippocampal neurons co-transfected with dCas9-VPR and FlnA-gRNA mix............ 92
Figure 41: Suggested model for shFlnA mediated dendritic remodelling. ................................. 111 Appendix Figure 42: Mouse transcript targeting shRNAs used in this study. ............................ 137
Appendix Figure 43: FlnA-S2152 phosphorylation by Ndr2 in Jurkat T cells (from Waldt et al.,
2018) ............................................................................................................................................ 139 Appendix Figure 44: BDNF and NGF signaling affects FlnA expression in a time dependent
manner. ........................................................................................................................................ 140
Appendix Figure 45: Single-AAV system for transcriptional activation using dCas9-VPR ...... 140
vii
LIST OF ABBREVIATIONS
0C degree of celcius
AAK1 ap2 associated kinase
AAV adeno associated virus
ABD actin binding domain
AIS autoinhibitory segment
AP-2 adapter protein 2
AS activation segment
BDNF brain derived neurotrophic factor
CamKII ca2+/calmodulin dependent protein kinase 2
CMV cytomegalovirus
CNS central nervous system
CRISPR clustered regularly interspaced short palindromic repeats
dCas9 catalytically defective Cas9
DIg24 loss of Ig24
DIV days in vitro
DMEM Dulbecco's Modified Eagle Medium
ECM extracellular matrix
FAK focal adhesion kinase
FBS fetal bovine serum
FlnA filamin A
FN fibronectin
gRNA guide RNA
HBSS Hank's Balanced Salt Solution
HDR homology-directed-repair
HM hydrophobic motif
HPC hippocampal primary culture
HSBP1 heat shock factor binding protein 1
Ig immunoglobulin like repeat
ILK integrin linked kinase
KO knockout
LETS large external-transformation sensitive proteins
LN111 laminin-111
LSD least significant difference
Luc luciferase
MAPK mitogen activated protein kinase
MIDAS metal ion dependent adhesion site
miniCMV minimal CMV promoter
NBM neurobasal media
viii
Ndr2 nuclear dbf2-related 2
NGF nerve growth factor
NTR N-terminal regulatory motif
PAK1 p21 activated kinase
PC12 rat adrenal phaeochromocytoma cell line
PDL poly-D-lysine
PFA paraformaldehyde
PH periventricular heterotopia
PI3K phosphoinositide 3-kinase
PKA protein kinase A
PKC protein kinase C
PSI plexin-semaphorin-integrin
PTEN Phosphatase and tensin homolog
PTPRA receptor-type tyrosine-protein phosphatase alpha
ROCK Rho associated protein kinase
RSK ribosomal S6 kinase
S2152 serine 2152
tdTom tdTomato
Trc tricornered
VPR VP64-p65-Rta
ix
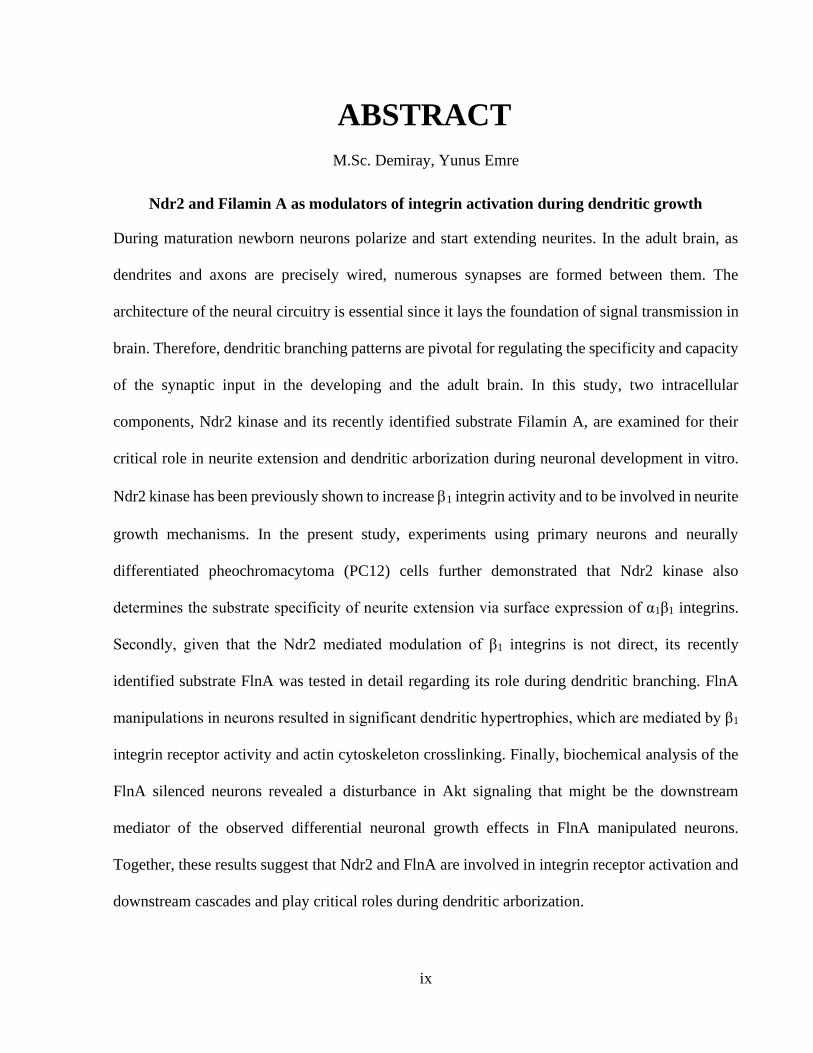
ABSTRACT
M.Sc. Demiray, Yunus Emre
Ndr2 and Filamin A as modulators of integrin activation during dendritic growth
During maturation newborn neurons polarize and start extending neurites. In the adult brain, as
dendrites and axons are precisely wired, numerous synapses are formed between them. The
architecture of the neural circuitry is essential since it lays the foundation of signal transmission in
brain. Therefore, dendritic branching patterns are pivotal for regulating the specificity and capacity
of the synaptic input in the developing and the adult brain. In this study, two intracellular
components, Ndr2 kinase and its recently identified substrate Filamin A, are examined for their
critical role in neurite extension and dendritic arborization during neuronal development in vitro.
Ndr2 kinase has been previously shown to increase 1 integrin activity and to be involved in neurite
growth mechanisms. In the present study, experiments using primary neurons and neurally
differentiated pheochromacytoma (PC12) cells further demonstrated that Ndr2 kinase also
determines the substrate specificity of neurite extension via surface expression of α1β1 integrins.
Secondly, given that the Ndr2 mediated modulation of β1 integrins is not direct, its recently
identified substrate FlnA was tested in detail regarding its role during dendritic branching. FlnA
manipulations in neurons resulted in significant dendritic hypertrophies, which are mediated by β1
integrin receptor activity and actin cytoskeleton crosslinking. Finally, biochemical analysis of the
FlnA silenced neurons revealed a disturbance in Akt signaling that might be the downstream
mediator of the observed differential neuronal growth effects in FlnA manipulated neurons.
Together, these results suggest that Ndr2 and FlnA are involved in integrin receptor activation and
downstream cascades and play critical roles during dendritic arborization.
x
ZUSAMMENFASSUNG
M.Sc. Demiray, Yunus Emre
Ndr2 and Filamin A as modulators of integrin activation during dendritic growth
Neugeborene Neurone polarisieren sich während der Reifung und verlängern ihre Neuriten. Im
adulten Gehrin reifen Neuriten zu Dendriten und Axonen, die über Synapsen präzise miteinander
verschaltet sind. Da die Architektur solcher neuronalen Schaltkreise die Grundlage der
Signalübertragung im Gehirn bildet, sind dendritische Verzweigungsmuster sowohl im adulten als
auch im sich entwickelnden Gehirn entscheidend für die Regulierung der Spezifität und Kapazität
des synaptischen Inputs. In dieser Studie werden zwei intrazelluläre Komponenten, die Ndr2
Kinase und ihr kürzlich identifiziertes Substrat Filamin A, auf ihre grundlegende Rolle bei der
Neuritenausdehnung und der dendritischen Verästelung während der neuronalen Entwicklung in
vitro untersucht. Es wurde bereits früher gezeigt, dass die Ndr2 Kinase die Aktivität von 1-Integrin
erhöht und dadurch am Wachstumsn von Neuriten beteiligt ist. In der vorliegenden Studie wird
mittels Experimenten mit primären Neuronen und neural differenzierten Phäochromazytom-Zellen
(PC12) außerdem gezeigt, dass auch die Substratspezifität der Neuritenausdehnung durch die Ndr2
Kinase bestimmt wird. Dies erfolgt über die Oberflächenexpression von α1β1 Integrinen. Da die
Ndr2-vermittelte Modulation der β1 Integrine indirekt erfolgt, wurde das kürzlich identifizierte
Substrat FlnA hinsichtlich seiner Rolle bei der dendritischen Verzweigung eingehend getestet.
FlnA Manipulationen in Neuronen führt zu signifikanten dendritischen Hypertrophien, die durch
β1 Integrinrezeptor-Aktivität und Aktin-Zytoskelett-Vernetzung vermittelt werden. Die
biochemische Analyse von FlnA defizienten Neurone ergibt außerdem, dass der Akt Signalweg
gestört ist, der als nchgeschaltetere Mediator für die beobachteten differentiellen neuronalen
Wachstumseffekte in FlnA manipulierten Neuronen in Frage kommt. Zusammengenommen deuten

xi
diese Ergebnisse darauf hin, dass Ndr2 und FlnA an der Aktivierung der Integrinrezeptoren und
den nachgeschalteten Kaskaden beteiligt sind und während der dendritischen Arborisierung eine
entscheidende Rolle spielen.
1
INTRODUCTION
1.1 Integrin Receptors
The transition from unicellular microbes to multicellular organisms required novel cell-cell
communication and cell adhesion mechanisms. To adapt into this new cellular environment, one
of the most important mechanism that emerged specifically in the animal kingdom is the integrin
mediated cell signaling (Whittaker and Hynes, 2002; Nichols et al., 2006; Sebé-Pedrós et al.,
2010). However, it took scientists a long time until they successfully purify and study structure and
functions of integrin receptors.
The notion that there must be a transmembrane bridge on the cell membrane between extracellular
matrix proteins (ECM) and cytoskeleton was emerging in 1970s. Early evidence of such receptors
came from the studies linking the large external-transformation sensitive proteins (LETS, which
coined the term “fibronectin” later) to the actin cytoskeleton of the cells. Using human, mouse and
hamster cells, scientists showed that adhesion and morphology of the cells can be modified via
actin cytoskeleton after addition or removal of fibronectins from the extracellular space (Ali et al.,
1977; Heggeness, Ash and Singer, 1978). Accumulating evidences and hypotheses resulted to first
papers speculating a transmembrane receptor (Hynes and Yamada, 1982) that can specifically bind
fibronectin and induce intracellular signaling cascades via candidates such as vinculin or spectrin
to modify actin cytoskeleton. With the discovery of more and more antibodies that can block
adhesion of cells to specific extracellular proteins (Greve and Gottlieb, 1982; Neff et al., 1982;
Knudsen, Horwitz and Buck, 1985), it did not take very long time for the first receptors to be fully
identified from cDNA libraries that encodes the receptor protein involved in fibronectin-induced
cell adhesion (Tamkun et al., 1986). This cDNA sequence also revealed that the receptor has

2
transmembrane domains and several phosphorylation residues on its intracellular tail. As an
integral membrane complex bridging intra- and extracellular proteins, the name “integrin” was
given which gave rise to the integrin receptor family (Tamkun et al., 1986).
1.1.1 Structure of integrin receptors
Like many other adhesion receptors on the membrane, an integrin receptor has an extracellular
domain receiving the outside cues, a transmembrane domain and finally an intracellular part that
interacts with downstream components (Askari et al., 2009). Furthermore, integrins are
heterodimers that consist of two non-covalently bound and subunits (Figure 1). Since integrins
are relatively large membrane receptors, it took a lot of effort to resolve its 3D structure in high
resolution. When the crystal structure of V integrins was published very first time in 2001, it
revealed further structural details: two globular head domains on the extracellular side of each
subunit; a seven-bladed -propeller structure (each is about 60 amino acids) on and a von
Willebrand factor A domain on subunit respectively (Xiong et al., 2001). Globular head
structures of integrins also contain an I-domain, either between beta sheets 2-3 on subunit or on
the subunit head depending on the integrin subtype. These I-domains are important for the
integrin ligand binding (Luo, Carman and Springer, 2007). I-domains are also flanked with metal
ion dependent adhesion sites (MIDAS), in which divalent cations can bind to the integrins and
modulate its conformation. Studies show that while divalent ions such as Mg2+ and Mn2+ promotes
ligand binding and activation of the integrins, Ca2+ has more biphasic effects depending on its
concentration (Zhang and Chen, 2012). It has been shown that millimolar concentrations of calcium
ion (which is close to the body fluid concentration) inhibits the integrin adhesion. Lower

3
concentrations of calcium can still increase integrin-ligand binding combined with low Mn2+
concentrations (Chen, Salas and Springer, 2003).
Ligand binding head domains of integrin subunits are followed by so-called leg structures which
provide the moving parts for the bent and active conformation. subunit has relatively a simpler
leg domain which is divided into thigh domain (upper leg) and calf-1 / calf-2 domains (lower leg).
Besides the MIDAS in the head domains, an extra Ca2+ binding site is present between thigh and
calf-1 domain, which is involved in concentration dependent Ca2+ modulation of integrin
conformation (Luo, Carman and Springer, 2007). -subunit’s leg domain is a hybrid structure that
consist of a plexin/semaphorin/integrin (PSI) domain and four epidermal growth factor-like
domains. As shown by electron microscopy, the “joint” that provides the bending movement of the
integrins is located between the thigh and calf-domain 1 on a subunit and between the EGF-
domains 1 and 2 on subunit (Nishida et al., 2006). The bent conformation of the receptor masks
the hybrid domain on the subunit; hence it often serves as the target of integrin activity reporter
or integrin activating antibodies (Mould et al., 2005).
Extracellular domains of each integrin subunit are followed by single spanning transmembrane
helices. Resolving the structure of 2b3 integrins via NMR revealed hydrophobic and electrostatic
interactions between the transmembrane helices of and subunits, which consequently stabilizes
the overall integrin heterodimer structure (Lau et al., 2009). Moreover, introducing stable disulfide
bonds between the subunits via amino acid substitutions impairs the outside-in ligand activation of
the integrins. Hence disassociation of these transmembrane helices upon ligand binding is also
required for integrin activation (Zhu et al., 2007).
4
Finally, at the intracellular side, integrins have a C-terminal tail domain where the intracellular
components can interact with the receptor. Although tails are short (20-80 amino acid long), they
interact with a large set of intracellular proteins and these interactions are orchestrated with the
activation state of the receptor. Integrin tail domains also display a flexible structure, which can
mask/unmask binding domains depending on the interacting partners (Morse, Brahme and
Calderwood, 2014).
Sequences of integrin tails are rather distinct from each other among different subtypes except
for a conserved GFFKR motif close to the cell membrane (Morse, Brahme and Calderwood, 2014).
The conserved GFFKR motif has been shown to interact with integrin modulators such as
SHARPIN, PP2A and Rab21 (Gushiken et al., 2008; Pellinen et al., 2008; Rantala et al., 2011).
Unlike integrins, subunit tails share higher homology among subtypes (except for integrin 4,
see below). Thus, integrin tail/intracellular protein interactions are well studied due to their
similar mode of action among different integrin subtypes. The most studied motif on integrin
tails is the NPxY sequence which occurs at two different locations on C terminal and binds to most
integrin regulatory proteins (Morse, Brahme and Calderwood, 2014). Talin and Kindlin proteins
are the two most important interacting partners that binds the NPxY motifs and are required for
integrin activation (Moser et al., 2008; Margadant et al., 2012). Moreover, actin-binding protein
Filamin A also binds the integrin tail using the NPxY which overlaps with Talin/Kindlin binding.
Therefore, Filamin A serves as a competitive negative regulator of integrin activity (Kiema et al.,
2006; Nieves et al., 2010).
The relatively short C-terminal tail of integrin subunits have one exception: integrin 4. It
contains a uniquely long C-terminal, around 1072 amino acids (Hogervorst et al., 1990), which
5
could be explained by its function. Studies have shown that this long tail is required to concentrate
intracellular components of the hemidesmosomes, a distinct connection of epithelial cells to ECM
via integrin 4, which maintains integrity of the skin (Spinardi et al., 1995).
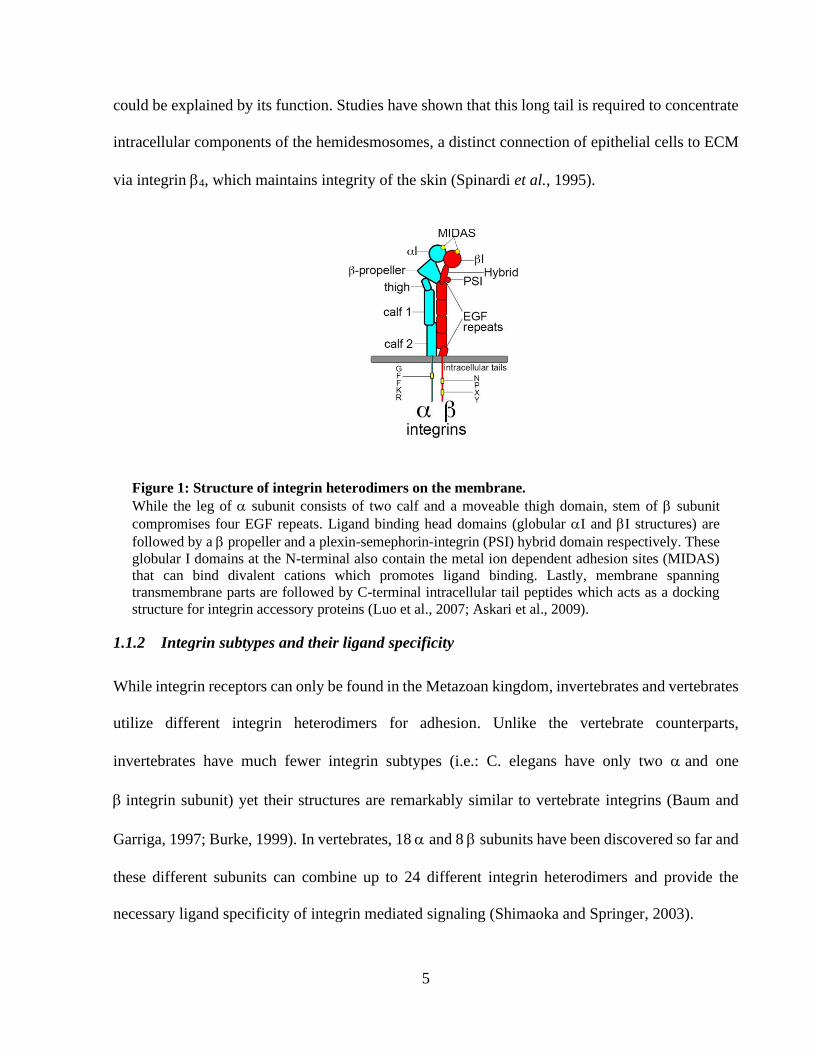
Figure 1: Structure of integrin heterodimers on the membrane.
While the leg of subunit consists of two calf and a moveable thigh domain, stem of subunit
compromises four EGF repeats. Ligand binding head domains (globular I and I structures) are
followed by a propeller and a plexin-semephorin-integrin (PSI) hybrid domain respectively. These
globular I domains at the N-terminal also contain the metal ion dependent adhesion sites (MIDAS)
that can bind divalent cations which promotes ligand binding. Lastly, membrane spanning
transmembrane parts are followed by C-terminal intracellular tail peptides which acts as a docking
structure for integrin accessory proteins (Luo et al., 2007; Askari et al., 2009).
1.1.2 Integrin subtypes and their ligand specificity
While integrin receptors can only be found in the Metazoan kingdom, invertebrates and vertebrates
utilize different integrin heterodimers for adhesion. Unlike the vertebrate counterparts,
invertebrates have much fewer integrin subtypes (i.e.: C. elegans have only two and one
integrin subunit) yet their structures are remarkably similar to vertebrate integrins (Baum and
Garriga, 1997; Burke, 1999). In vertebrates, 18 and 8 subunits have been discovered so far and
these different subunits can combine up to 24 different integrin heterodimers and provide the
necessary ligand specificity of integrin mediated signaling (Shimaoka and Springer, 2003).
6
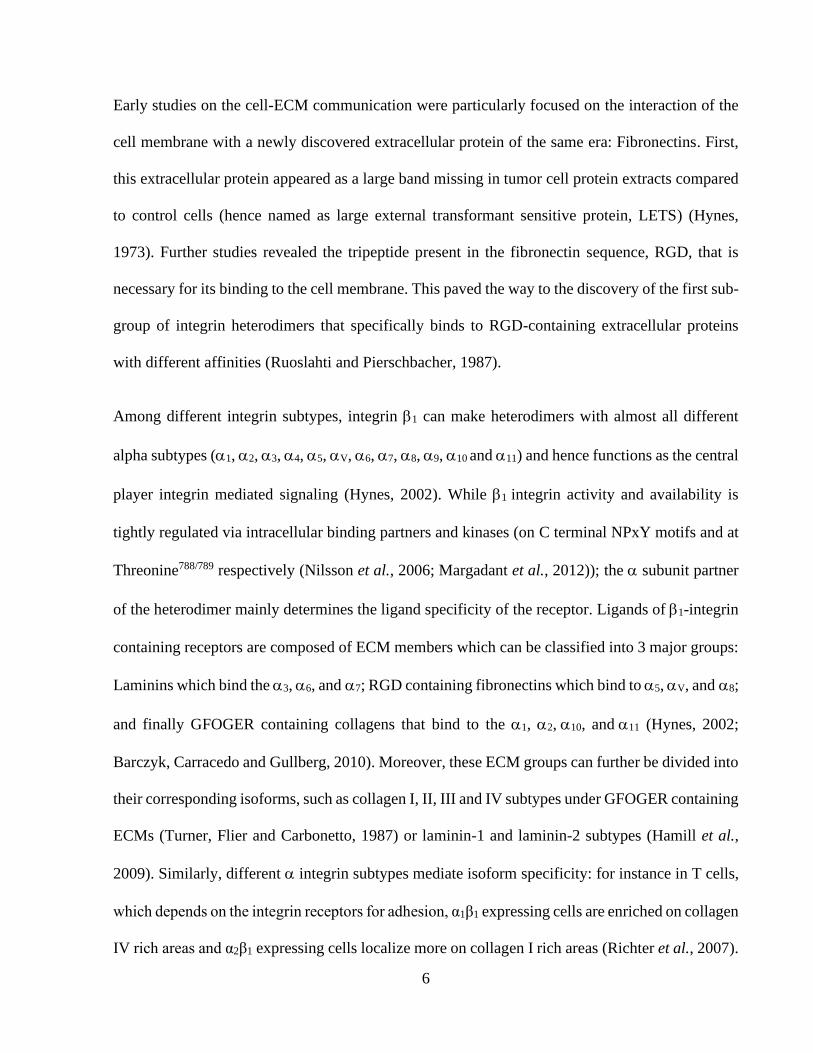
Early studies on the cell-ECM communication were particularly focused on the interaction of the
cell membrane with a newly discovered extracellular protein of the same era: Fibronectins. First,
this extracellular protein appeared as a large band missing in tumor cell protein extracts compared
to control cells (hence named as large external transformant sensitive protein, LETS) (Hynes,
1973). Further studies revealed the tripeptide present in the fibronectin sequence, RGD, that is
necessary for its binding to the cell membrane. This paved the way to the discovery of the first sub-
group of integrin heterodimers that specifically binds to RGD-containing extracellular proteins
with different affinities (Ruoslahti and Pierschbacher, 1987).
Among different integrin subtypes, integrin 1 can make heterodimers with almost all different
alpha subtypes (1, 2, 3, 4, 5, V, 6, 7, 8, 9, 10 and 11) and hence functions as the central
player integrin mediated signaling (Hynes, 2002). While 1 integrin activity and availability is
tightly regulated via intracellular binding partners and kinases (on C terminal NPxY motifs and at
Threonine788/789 respectively (Nilsson et al., 2006; Margadant et al., 2012)); the subunit partner
of the heterodimer mainly determines the ligand specificity of the receptor. Ligands of 1-integrin
containing receptors are composed of ECM members which can be classified into 3 major groups:
Laminins which bind the 3, 6, and 7; RGD containing fibronectins which bind to 5, V, and 8;
and finally GFOGER containing collagens that bind to the 1, 2, 10, and 11 (Hynes, 2002;
Barczyk, Carracedo and Gullberg, 2010). Moreover, these ECM groups can further be divided into
their corresponding isoforms, such as collagen I, II, III and IV subtypes under GFOGER containing
ECMs (Turner, Flier and Carbonetto, 1987) or laminin-1 and laminin-2 subtypes (Hamill et al.,
2009). Similarly, different integrin subtypes mediate isoform specificity: for instance in T cells,
which depends on the integrin receptors for adhesion, α1β1 expressing cells are enriched on collagen
IV rich areas and α2β1 expressing cells localize more on collagen I rich areas (Richter et al., 2007).
7
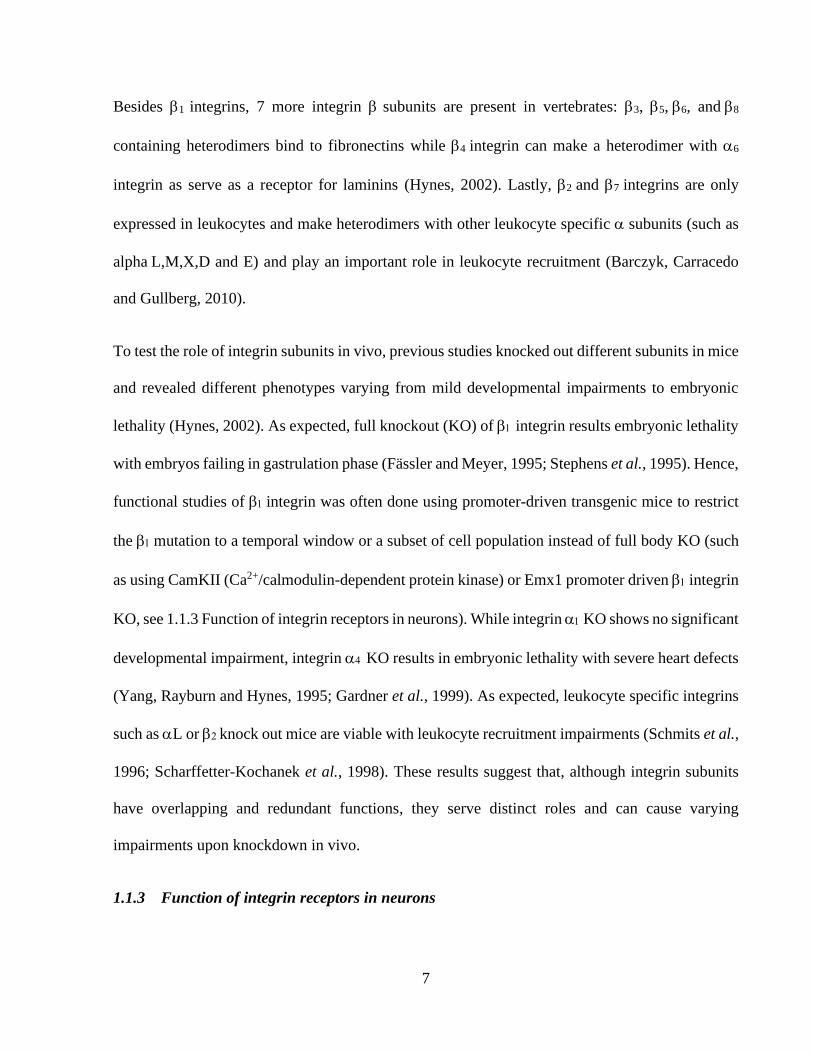
Besides 1 integrins, 7 more integrin subunits are present in vertebrates: 3, 5, 6, and 8
containing heterodimers bind to fibronectins while 4 integrin can make a heterodimer with 6
integrin as serve as a receptor for laminins (Hynes, 2002). Lastly, 2 and 7 integrins are only
expressed in leukocytes and make heterodimers with other leukocyte specific subunits (such as
alpha L,M,X,D and E) and play an important role in leukocyte recruitment (Barczyk, Carracedo
and Gullberg, 2010).
To test the role of integrin subunits in vivo, previous studies knocked out different subunits in mice
and revealed different phenotypes varying from mild developmental impairments to embryonic
lethality (Hynes, 2002). As expected, full knockout (KO) of integrin results embryonic lethality
with embryos failing in gastrulation phase (Fässler and Meyer, 1995; Stephens et al., 1995). Hence,
functional studies of integrin was often done using promoter-driven transgenic mice to restrict
the mutation to a temporal window or a subset of cell population instead of full body KO (such
as using CamKII (Ca2+/calmodulin-dependent protein kinase) or Emx1 promoter driven integrin
KO, see 1.1.3 Function of integrin receptors in neurons). While integrin KO shows no significant
developmental impairment, integrin KO results in embryonic lethality with severe heart defects
(Yang, Rayburn and Hynes, 1995; Gardner et al., 1999). As expected, leukocyte specific integrins
such as L or knock out mice are viable with leukocyte recruitment impairments (Schmits et al.,
1996; Scharffetter-Kochanek et al., 1998). These results suggest that, although integrin subunits
have overlapping and redundant functions, they serve distinct roles and can cause varying
impairments upon knockdown in vivo.
1.1.3 Function of integrin receptors in neurons

8
Once neurons are produced from progenitor cells in subventricular zone, they are guided to their
target region via adhesion mediated migration. As they are reaching to their destination, they start
to polarize and extend neurites to join the brain circuitry. For all these steps, neurons rely on
integrin heterodimers on their membrane because of their ECM ligand specificity and downstream
cytoskeleton signaling. Throughout the brain development, integrin subunits have different spatial
and temporal expression which is critical for proper brain architecture (Schmid and Anton, 2003).
integrin is the central player in integrin mechanisms in the brain and ablation of subunit causes
severe developmental perturbations of cortical and cerebellar structures (Graus-Porta et al., 2001).
While and integrin subunits are also expressed throughout the brain, leukocyte
specific integrin was not detected in neurons (Schmid and Anton, 2003; Nieuwenhuis et al.,
2018). While earlier studies reported an exceedingly rare integrin labelling in neurons, further
studies implicated its expression with reactive oxygen species in neurons (Pinkstaff et al., 1999;
Su et al., 2007). Among integrins, all subunits are expressed in the neurons except for leukocyte
specific alpha integrins (as L, M, X, D and E), 10 and 11. Lastly, 9 can be detected in glial cells
and not in neurons (Schmid and Anton, 2003; Nieuwenhuis et al., 2018).
During brain development, neural stem cells divide into undifferentiated progenitors which then
produces the glia and neurons (Gage, 2000). Several studies have found that integrin can be used
as a marker as it is enriched in neural stem cells and integrin mediated MAPK (mitogen activated
protein kinase) signaling is critical for neural stem cell function (Campos et al., 2004; Hall et al.,
2006). Besides, lack of integrin results to a significant reduction of neural stem cell proliferation
and decreases the lifespan of produced neurons (Leone et al., 2005). As in for cerebral
9
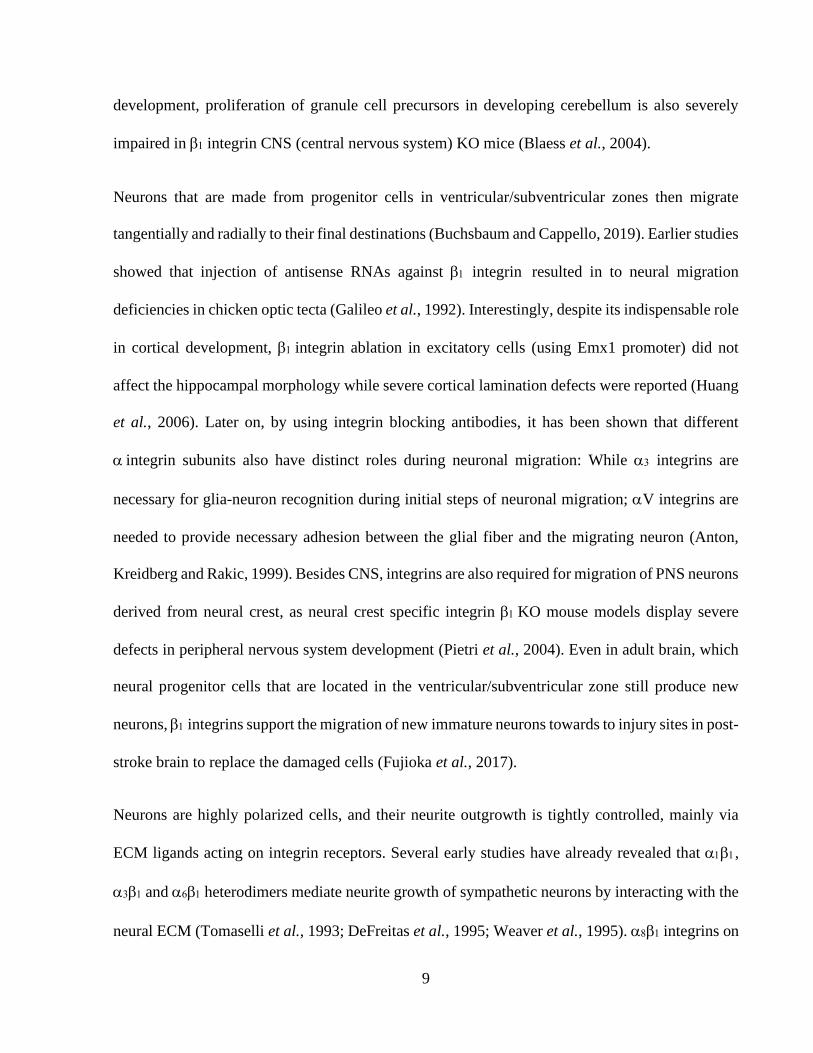
development, proliferation of granule cell precursors in developing cerebellum is also severely
impaired in integrin CNS (central nervous system) KO mice (Blaess et al., 2004).
Neurons that are made from progenitor cells in ventricular/subventricular zones then migrate
tangentially and radially to their final destinations (Buchsbaum and Cappello, 2019). Earlier studies
showed that injection of antisense RNAs against integrin resulted in to neural migration
deficiencies in chicken optic tecta (Galileo et al., 1992). Interestingly, despite its indispensable role
in cortical development, integrin ablation in excitatory cells (using Emx1 promoter) did not
affect the hippocampal morphology while severe cortical lamination defects were reported (Huang
et al., 2006). Later on, by using integrin blocking antibodies, it has been shown that different
integrin subunits also have distinct roles during neuronal migration: While integrins are
necessary for glia-neuron recognition during initial steps of neuronal migration; V integrins are
needed to provide necessary adhesion between the glial fiber and the migrating neuron (Anton,
Kreidberg and Rakic, 1999). Besides CNS, integrins are also required for migration of PNS neurons
derived from neural crest, as neural crest specific integrin KO mouse models display severe
defects in peripheral nervous system development (Pietri et al., 2004). Even in adult brain, which
neural progenitor cells that are located in the ventricular/subventricular zone still produce new
neurons, integrins support the migration of new immature neurons towards to injury sites in post-
stroke brain to replace the damaged cells (Fujioka et al., 2017).
Neurons are highly polarized cells, and their neurite outgrowth is tightly controlled, mainly via
ECM ligands acting on integrin receptors. Several early studies have already revealed that ,
and heterodimers mediate neurite growth of sympathetic neurons by interacting with the
neural ECM (Tomaselli et al., 1993; DeFreitas et al., 1995; Weaver et al., 1995). integrins on

10
neurons can also bind to Tenascin-C, another important neural ECM molecule that is associated
with neurite outgrowth (Varnum-Finney et al., 1995). A number of other studies also demonstrated
that activation of integrins promotes the neurite outgrowth of neurons using ligands such as
laminins and semaphorins (Pasterkamp et al., 2003; Moresco et al., 2005; Tucker, Rahimtula and
Mearow, 2005). Interestingly, loss of responsiveness to ECM ligands and in late embryonic
neurons can be rescued by increasing integrin receptor activity (for instance via divalent cations)
and this rescue is sensitive to integrin blocking (Ivins, Yurchenco and Lander, 2000). These
findings suggest a developmental decrease in activity of integrin receptors in CNS, which could
explain the decreased regeneration of CNS neurons over time. Even on chondroitin sulphate
proteoglycan ligand, which accumulates at nerve injury sites and inhibits regeneration, forced
activation of integrins via divalent cations or activating antibodies can overcome the inhibitory
effect and can improve the axon regeneration (Tan et al., 2011). integrin heterodimers are also
implicated in dendritic stability, as inactivation of integrins causes rapid dendritic retractions
and loss of distal filopodia dynamics (Marrs et al., 2006).
Besides neurite extension and stability, integrin receptor activity can promote spine maturation and
stability (Shi and Ethell, 2006; Bourgin et al., 2007; Ning et al., 2013). Because of their
involvement in spine dynamics, blocking the integrin activity results in impaired synaptic
responses and decay of LTP both in mouse and rat models (Chun et al., 2001; Huang et al., 2006).
As expected from its role in dendritic morphogenesis and spine maturation, neuron specific ablation
of integrin reduces synaptic density and impairs novel object recognition and working memory
tasks in mouse models (Chan et al., 2006; Warren et al., 2012).
11
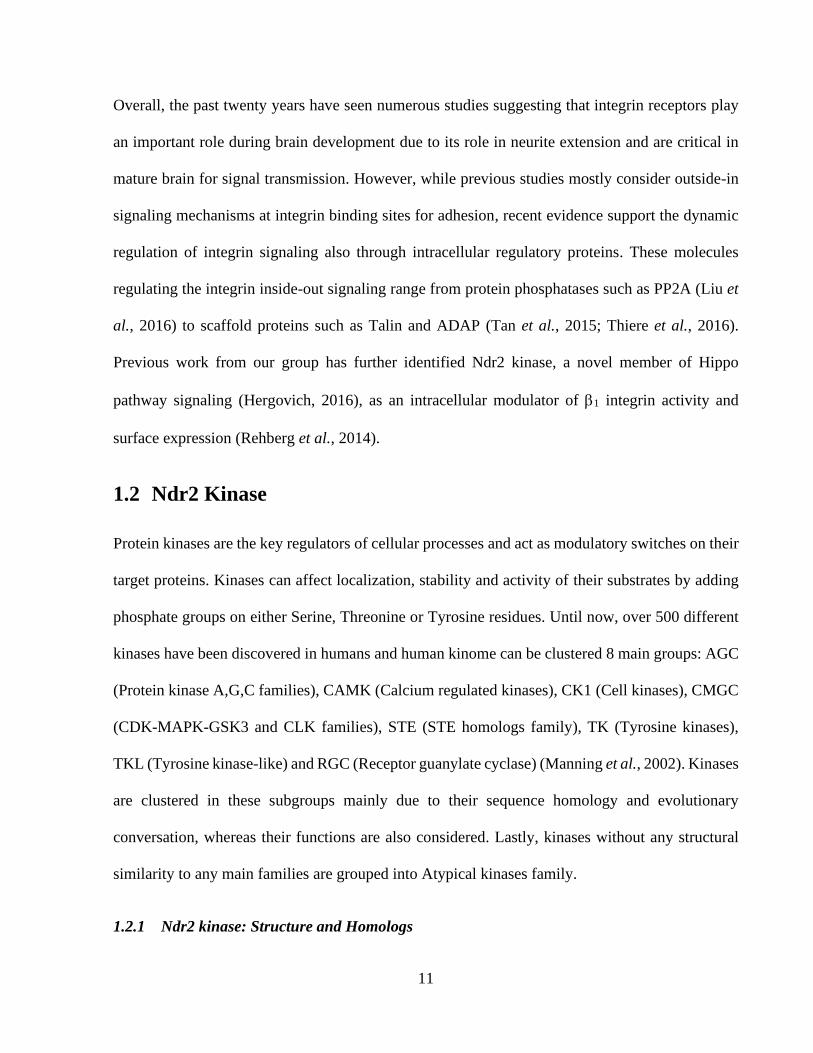
Overall, the past twenty years have seen numerous studies suggesting that integrin receptors play
an important role during brain development due to its role in neurite extension and are critical in
mature brain for signal transmission. However, while previous studies mostly consider outside-in
signaling mechanisms at integrin binding sites for adhesion, recent evidence support the dynamic
regulation of integrin signaling also through intracellular regulatory proteins. These molecules
regulating the integrin inside-out signaling range from protein phosphatases such as PP2A (Liu et
al., 2016) to scaffold proteins such as Talin and ADAP (Tan et al., 2015; Thiere et al., 2016).
Previous work from our group has further identified Ndr2 kinase, a novel member of Hippo
pathway signaling (Hergovich, 2016), as an intracellular modulator of 1 integrin activity and
surface expression (Rehberg et al., 2014).
1.2 Ndr2 Kinase
Protein kinases are the key regulators of cellular processes and act as modulatory switches on their
target proteins. Kinases can affect localization, stability and activity of their substrates by adding
phosphate groups on either Serine, Threonine or Tyrosine residues. Until now, over 500 different
kinases have been discovered in humans and human kinome can be clustered 8 main groups: AGC
(Protein kinase A,G,C families), CAMK (Calcium regulated kinases), CK1 (Cell kinases), CMGC
(CDK-MAPK-GSK3 and CLK families), STE (STE homologs family), TK (Tyrosine kinases),
TKL (Tyrosine kinase-like) and RGC (Receptor guanylate cyclase) (Manning et al., 2002). Kinases
are clustered in these subgroups mainly due to their sequence homology and evolutionary
conversation, whereas their functions are also considered. Lastly, kinases without any structural
similarity to any main families are grouped into Atypical kinases family.
1.2.1 Ndr2 kinase: Structure and Homologs
12
The AGC kinase family contains around 60 members that are implicated in diverse cellular
functions. Their malfunction can result to many diseases such as cancer and diabetes (Pearce,
Komander and Alessi, 2010). Some members of the AGC kinase family are the protein kinase A,
protein kinase G, protein kinase C, Akt, RSK and nuclear Dbf2 related kinases (Pearce, Komander
and Alessi, 2010).
Ndr2 (nuclear Dbf2 related-2) kinase (also known as serine/threonine kinase 38-like protein,
STK38l) belongs to the nuclear Dbf2 related (NDR) kinases along with Ndr1 and Lats1/2. While
Ndr1 and Ndr2 are very close homologs, both Lats and Ndr kinases are under control of Hippo
pathway, which mainly controls cell proliferation (Gógl et al., 2015). Conserved homologs of
mammalian Ndr2 is also present in other species: As its name refers (nuclear Dbf2 related), Dbf2p
is the Ndr2 homolog present in yeast (Frenz et al., 2000). Ndr2 homologs Tricornered (Trc) and
Sax-1 are also widely studied in Drosophila and C. elegans species respectively (Zallen et al., 2000;
Emoto et al., 2006). Although they are close isoforms, previous studies have shown that Ndr2 is
the primary Ndr kinase in mouse brain and Ndr1 protein was not detected in neither cortex nor
hippocampus tissue from mice (as opposed to rats) (Cornils et al., 2010; Rehberg et al., 2014).
Catalytic core of Ndr2 consists of 12 kinase domains that is also conserved among other AGC
kinases (Hanks and Hunter, 1995) (Figure 2). Different than other of AGC kinases, an N-terminal
regulatory motif (NTR) is also present in Ndr2. This motif contains a Threonine residue (T75) which
is absent in lower organisms such as S. cerevisiae’s Dbf2p (Stegert et al., 2004). Moreover, the
NTR domain contains a stretch of hydrophobic amino acids where S100B and Mob proteins can
interact with Ndr2 kinase (Millward et al., 1998; Bichsel et al., 2004).
13
Another conserved phosphorylation domain is present at Serine282 which is between catalytic
domains VII and VIII. This subdomain is also referred as activation segment (AS) of Ndr2
(Hergovich et al., 2006). N-terminal of the AS is known as autoinhibitory segment (AIS), a 30-60
amino acid stretch enriched with basic amino acids (lysine and arginine) that reduces the catalytic
activity of the Ndr2 kinase (Bichsel et al., 2004). Recently, it has been shown that deletion of AIS
from Ndr1 increases Ndr association with its activators thus stimulates its kinase activity (Xiong
et al., 2018). AIS also acts as a nuclear localization signal in Ndr1 kinase, a close homolog of Ndr2
that mainly localized in nucleus (Millward, Cron and Hemmings, 1995).
Lastly, at the C-terminal of Ndr1/2 kinase, a hydrophobic motif (HM) can be found that is
conserved among AGC kinases. The HM domain contains a Threonine442 phosphorylation site that
is important for the Ndr2 catalytic activity (Stegert et al., 2005).
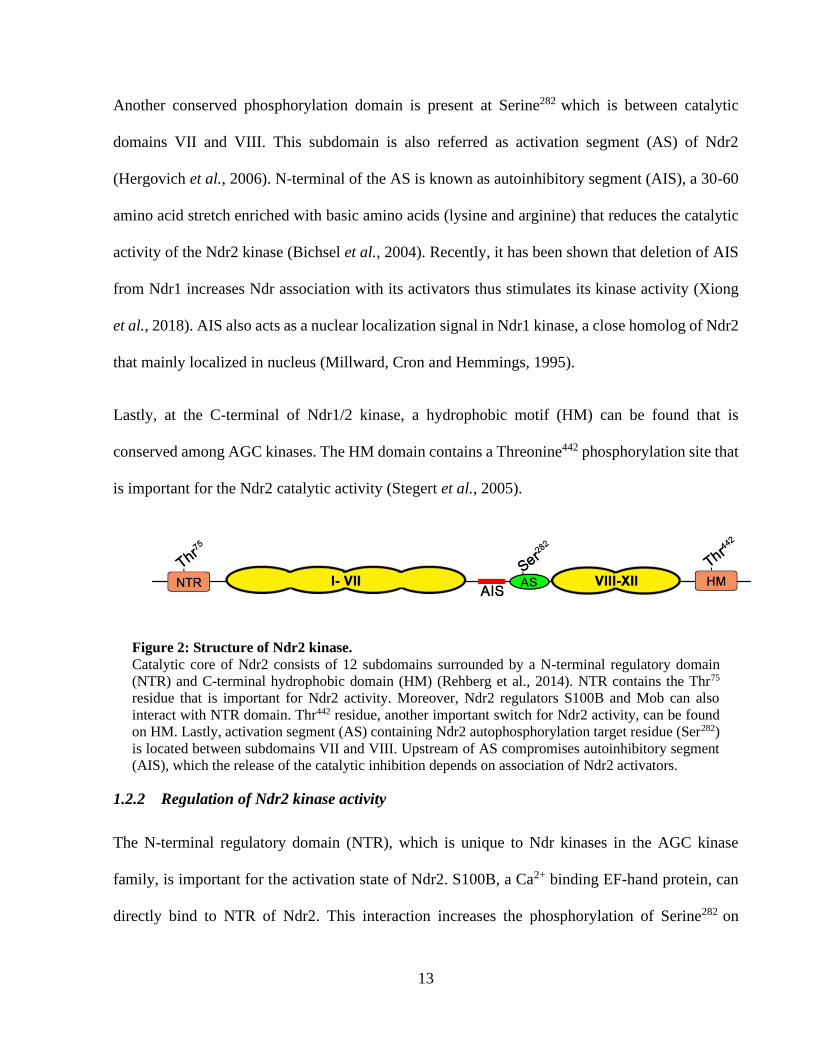
Figure 2: Structure of Ndr2 kinase.
Catalytic core of Ndr2 consists of 12 subdomains surrounded by a N-terminal regulatory domain
(NTR) and C-terminal hydrophobic domain (HM) (Rehberg et al., 2014). NTR contains the Thr75
residue that is important for Ndr2 activity. Moreover, Ndr2 regulators S100B and Mob can also
interact with NTR domain. Thr442 residue, another important switch for Ndr2 activity, can be found
on HM. Lastly, activation segment (AS) containing Ndr2 autophosphorylation target residue (Ser282)
is located between subdomains VII and VIII. Upstream of AS compromises autoinhibitory segment
(AIS), which the release of the catalytic inhibition depends on association of Ndr2 activators.
1.2.2 Regulation of Ndr2 kinase activity
The N-terminal regulatory domain (NTR), which is unique to Ndr kinases in the AGC kinase
family, is important for the activation state of Ndr2. S100B, a Ca2+ binding EF-hand protein, can
directly bind to NTR of Ndr2. This interaction increases the phosphorylation of Serine282 on
14
activation segment and Threonine442 on C-terminal hydrophobic motif. Importantly, S100B
mediated Ndr2 activation is calcium dependent, thus connecting Ndr2 catalytic activity to
intracellular calcium concentration (Tamaskovic et al., 2003). Besides S100B, Mob1 also binds to
NTR of Ndr2 and acts as a co-activator by releasing the autoinhibition from the AIS subdomain
(Bichsel et al., 2004). Mst1 and Mst2 phosphorylation of Mob1 co-activator can also affect the
affinity of Mob1 for the NTR domain (Ni et al., 2015; Kim et al., 2016). Due to its binding to
S100b and Mob1 co-activator proteins, NTR domain of Ndr kinases is also known as
S100B/hMob1 association domain (Hergovich et al., 2006).
Serine282 on activation segment (AS) and Threonine442 on hydrophobic motif (HM) are the main
regulatory sites of Ndr2 kinase. Interestingly, Serine282 site is not the main target of upstream
kinases but rather it is auto phosphorylated by Ndr2 after activation. Threonine site on the N-
terminal regulatory domain (Threonine75) is also important as its T75A mutations significantly
decreases Ndr2 catalytic activity (Stegert et al., 2004).
Threonine442 on HM is the main target of the upstream kinases on Ndr2, which increases its
catalytic activity upon phosphorylation. Previous studies showed that Ste20-like kinases can act
upstream of Ndr2 homologs in other organisms: for example, in Saccharomyces cerevisiae, Ste20-
like kinase Cdc15p can phosphorylate Dbf2p on Serine374 and Threonine544 (Mah, Jang and
Deshaies, 2001). In the same line, mammalian Ste20-like kinase Mst3 can selectively
phosphorylate Threonine442 on Ndr2 kinase and increase its kinase activity up to 10-fold (Stegert
et al., 2005). Another follow-up study also reported that Mst1 kinase phosphorylates Threonine442
and activate Ndr2 upon TNF stimulation (Vichalkovski et al., 2008).
15
Overall, previous studies suggest that binding of co-activators such as Mob1 to N-terminal of Ndr2
kinase induces its activity by releasing the auto-inhibitory mechanisms. The Threonine442 at the C-
terminal is the main switch for the Ndr2 activity and can be phosphorylated by upstream Mst
kinases whereas auto-phosphorylation of Serine282 on the activation segment is also critical for full
Ndr2 activity. Involvement of Mst kinases and Mob proteins for the Ndr2 activation also indicates
the importance of Ndr2 kinase in Hippo pathway, a highly conserved tumor suppressor pathway
that regulates proliferation and tissue growth (Hergovich, 2016).
1.2.3 Functions of Ndr2 kinase in neurons
Neuronal tiling is an important process during circuit formation as it allows neurons to extend
neurites to innervate a subfield with minimal overlap, via extension and retraction dynamics
(Cameron and Rao, 2010). Ndr homologs Sax-1 and Sax-2 are important in tiling of
mechanosensory neurons during C. elegans nerve development. While Sax mutants fail to slow
down neurite growth and inhibit tiling, Sax overexpression leads to early neurite termination and
impair neurite growth (Gallegos and Bargmann, 2004). Another study also reported that Sax-1
mutant neurons have enlarged somas and excess neurites suggesting a crucial role for Ndr2 in
neuronal shape (Zallen et al., 2000). Similarly, Ndr homolog Trc in Drosophila contributes to the
dendritic arborization during neuronal tiling of class IV neurons (Emoto et al., 2006). Same study
also demonstrated that Trc mediated neurite tiling in Drosophila is controlled by Hippo signaling
pathway.
Analysis of gene expression changes in mouse amygdala has led to identification of Ndr2 kinase
during an mRNA screen after fear conditioning. Ndr2 expression was significantly increased in
amygdala 6 hours after Pavlovian conditioning and returned to baseline levels within 24 hours
16
(Stork et al., 2004). Furthermore, Ndr2 mRNA was also detected in several brain regions and
associated with actin cytoskeleton in soma, neurites and spines in subcellular level (Stork et al.,
2004). In the same study, neurite outgrowth of rat pheochromocytoma (PC12) cells were
significantly increased by Ndr2 overexpression, which indicates a similar role of Ndr2 in
mammalian neurons as in lower organisms. In addition, another group reported that mammalian
Ndr kinases are required for the polarity of hippocampal neurons and Ndr loss of function results
to mutant neurons with ectopic axons (Yang et al., 2014). Accordingly, it was demonstrated that
Ndr2 is required for hippocampal dendritic development and loss of Ndr2 results to arbor specific
impairments and premature branching in the hippocampus of Ndr2 deficient transgenic mice and
rats (Ultanir et al., 2012; Rehberg et al., 2014). By addressing the cellular mechanisms of Ndr2
mediated dendritic growth, it was shown that Ndr2 is involved in inside-out signaling of 1
integrins by modulating its trafficking to the surface and activity state (Rehberg et al., 2014).
Both the transient increase of Ndr2 mRNA expression in amygdala after fear conditioning (Stork
et al., 2004) and control of 1 integrin activity by Ndr2 kinase (Rehberg et al., 2014; Demiray et
al., 2018) suggested an important role for Ndr2 in memory consolidation. Therefore, how Ndr2
kinase might affect synaptic processes, signal transmission and memory formation in mouse
hippocampus has been under investigation. On-going studies have demonstrated a significant
reduction of PSD95 labelling in Ndr2-deficient hippocampal neurons which can be rescued by re-
expression of Ndr2. Moreover, Golgi-Cox staining of the Ndr2 KO mice revealed decreased spine
density on both apical and basal CA1 dendrites of hippocampus compared to the wild type mice
(Atsuhiro Tsutiya & Oliver Stork, unpublished data). Accordingly, electrophysiological
characterization of the Ndr2 KO mice demonstrated a deficit in long term potentiation in CA1 area
(Hussam Hayani & Alexander Dityatev, personal communication). Finally, behavioral analysis of
17
these mutants revealed impairments in water cross maze task, a spatial learning paradigm
dependent on CA1 area of hippocampus (Kul Madencioglu, 2019- Doctoral Thesis). Collectively,
these on-going studies indicate that Ndr2 kinase is critical for spine formation and signal
transmission in the hippocampus and identify a novel role of Ndr2 in learning and memory.
1.2.4 Role of Ndr2 in neurite extension of PC12 cells
PC12 cells are originated from rat pheochromocytoma cell line and can be maintained in a routine
cell culture either in an immortalized proliferative state or in a differentiated state (into sympathetic
neuron-like morphology with extended neurites) after addition of NGF. Despite originating from
rat adrenal medulla, these cells are extensively used in neurite-growth assays due to their ease of
cell culturing, genetic manipulation and pharmacological/extracellular matrix assays (reviewed in
Wiatrak et al., 2020).
Previous research has shown that Ndr2 kinase controls integrin dependent dendritic and axonal
growth in mouse hippocampal neurons (Rehberg et al., 2014). However, how extracellular
substrates and Ndr2 mediated morphology may interact via integrin heterodimers had not been
examined. To investigate the role of Ndr2 kinase in neurite growth on different substrates, a
previously established EGFP-Ndr2 stable-transfected PC12 cell line (Ndr2 PC12) was used along
with EGFP transfected PC12 cells as controls (EGFP PC12) (Stork et al., 2004). These cells were
seeded on different substrates (such as collagen IV, laminin, fibronectin etc.) and treated with NGF
(nerve growth factor) to analyze their neurite growth (in cooperation with Dr. Kati Rehberg,
Demiray et al., 2018). Both cell lines showed efficient neurite formation in which >98% of cells
showed discernible neurites on both PDL (poly-D-lysine) and collagen IV. Laminin was also
efficient at inducing neurite formation both cell lines, whereas fibronectin, gelatin and collagen I
18
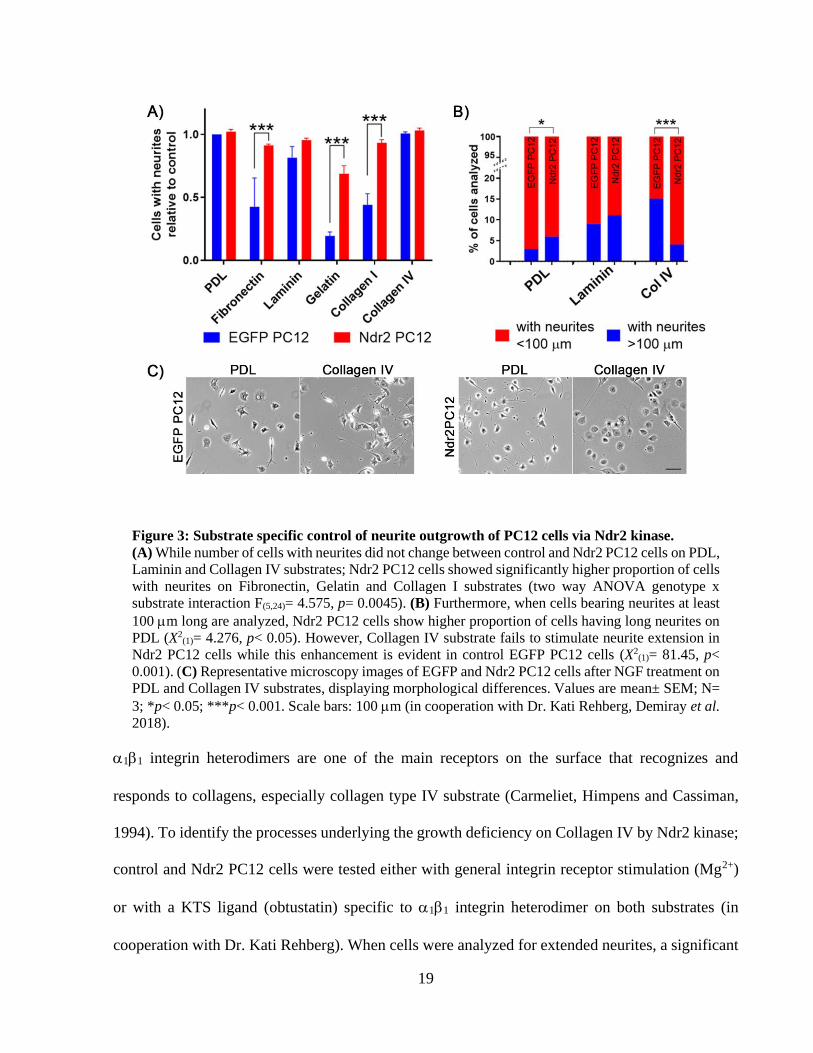
was less favorable where only less than 50% of control PC12 cells displayed neurites (Figure 3A).
Moreover, on those less efficient substrates, Ndr2 PC12 cells displayed significantly higher
proportion of cells with neurites compared to EGFP PC12 (Figure 3A, two way ANOVA genotype
x substrate interaction F(5,24)= 4.575, p= 0.0045). To test any differences in neurite extension by
Ndr2, cells were further analyzed for neurites extending beyond 100 m. For neurite extension,
PDL, laminin and collagen IV substrates were selected since they resulted to almost complete
neuronal differentiation in both cell lines. As in measure of cells with neurites, Laminin did not
cause a significant difference in proportion of cells bearing >100m neurites between EGFP and
Ndr2 PC12 cells (Figure 3B; on Laminin: X2(1)= 0.1364, p= 0.71). On PDL, Ndr2 PC12 line showed
significantly higher proportion of cells bearing long neurites (Error! Reference source not
found.Figure 3B; on PDL: X2(1)= 4.276, p< 0.05). On the other hand, on collagen IV substrate,
Ndr2 PC12 cells displayed significantly reduced neurite extension compared to control cells
(Figure 3B; on Col IV: X2(1)= 81.45, p< 0.001). Therefore, PDL and collagen IV substrates were
tested in further experiments to examine how Ndr2 kinase affects this substrate specific control of
neurite extension.
19
Figure 3: Substrate specific control of neurite outgrowth of PC12 cells via Ndr2 kinase.
(A) While number of cells with neurites did not change between control and Ndr2 PC12 cells on PDL,
Laminin and Collagen IV substrates; Ndr2 PC12 cells showed significantly higher proportion of cells
with neurites on Fibronectin, Gelatin and Collagen I substrates (two way ANOVA genotype x
substrate interaction F(5,24)= 4.575, p= 0.0045). (B) Furthermore, when cells bearing neurites at least
100 m long are analyzed, Ndr2 PC12 cells show higher proportion of cells having long neurites on
PDL (X2(1)= 4.276, p< 0.05). However, Collagen IV substrate fails to stimulate neurite extension in
Ndr2 PC12 cells while this enhancement is evident in control EGFP PC12 cells (X2(1)= 81.45, p<
0.001). (C) Representative microscopy images of EGFP and Ndr2 PC12 cells after NGF treatment on
PDL and Collagen IV substrates, displaying morphological differences. Values are mean± SEM; N=
3; *p< 0.05; ***p< 0.001. Scale bars: 100 m (in cooperation with Dr. Kati Rehberg, Demiray et al.
2018).
11 integrin heterodimers are one of the main receptors on the surface that recognizes and
responds to collagens, especially collagen type IV substrate (Carmeliet, Himpens and Cassiman,
1994). To identify the processes underlying the growth deficiency on Collagen IV by Ndr2 kinase;
control and Ndr2 PC12 cells were tested either with general integrin receptor stimulation (Mg2+)
or with a KTS ligand (obtustatin) specific to 11 integrin heterodimer on both substrates (in
cooperation with Dr. Kati Rehberg). When cells were analyzed for extended neurites, a significant
20
interaction between Ndr2 expression, integrin stimulation and coating substrate (three way
ANOVA genotype x substrate x treatment interaction F(2,24)= 19.16, p< 0.0001) were observed.
Moreover, neurite extension between Ndr2 genotypes on different substrates revealed a significant
difference between treatments (genotype on substrates x treatment interaction F(6,24)= 41.05, p<
0.0001) (Figure 4). Under NGF-only treatment, a significant enhancement of neurite growth by
collagen IV substrate was observed in EGFP PC12 cells as previously. However, Ndr2 PC12 cells
again failed to enhance growth on collagen IV coating. Next, Mg2+ ions were used as a divalent
cation to increase general affinity of integrin receptors via MDIAS (Luo, Carman and Springer,
2007; Nunes et al., 2018). Under NGF+ 0.3mM Mg2+ treatment, EGFP PC12 cells again showed
an increased neurite growth on Collagen IV substrate. While Ndr2 PC12 cells under Mg2+ treatment
also increased neurite growth regardless of the substrate; they remained significantly lower than
EGFP PC12 cells on collagen IV, re-iterating the deficiency of collagen IV mediated neurite
extension in Ndr2 PC12 cells. In order to specifically address the role of 11 integrin receptor in
PC12 neurite extension, a synthetic KTS ligand peptide (CWKTSLTSHYC) was applied on
control and Ndr2 PC12 cells (Marcinkiewicz et al., 2003; Moreno-Murciano et al., 2003). This
specific stimulation of 11 integrin receptor via KTS peptide resulted the maximal growth of
EGFP PC12 cells on both substrates. In Ndr2 PC12 cells, however, 11 integrin agonist KTS
ligand entirely failed to induce neurite growth on any substrate; in spite of the previously shown
increase in 1 integrin phosphorylation and surface expression (Rehberg et al., 2014), (Figure 4).
Overall, this data indicated a substrate specific growth deficiency in Ndr2 PC12 cells which is
likely to involve 1 integrin regulation during differentiation.
21
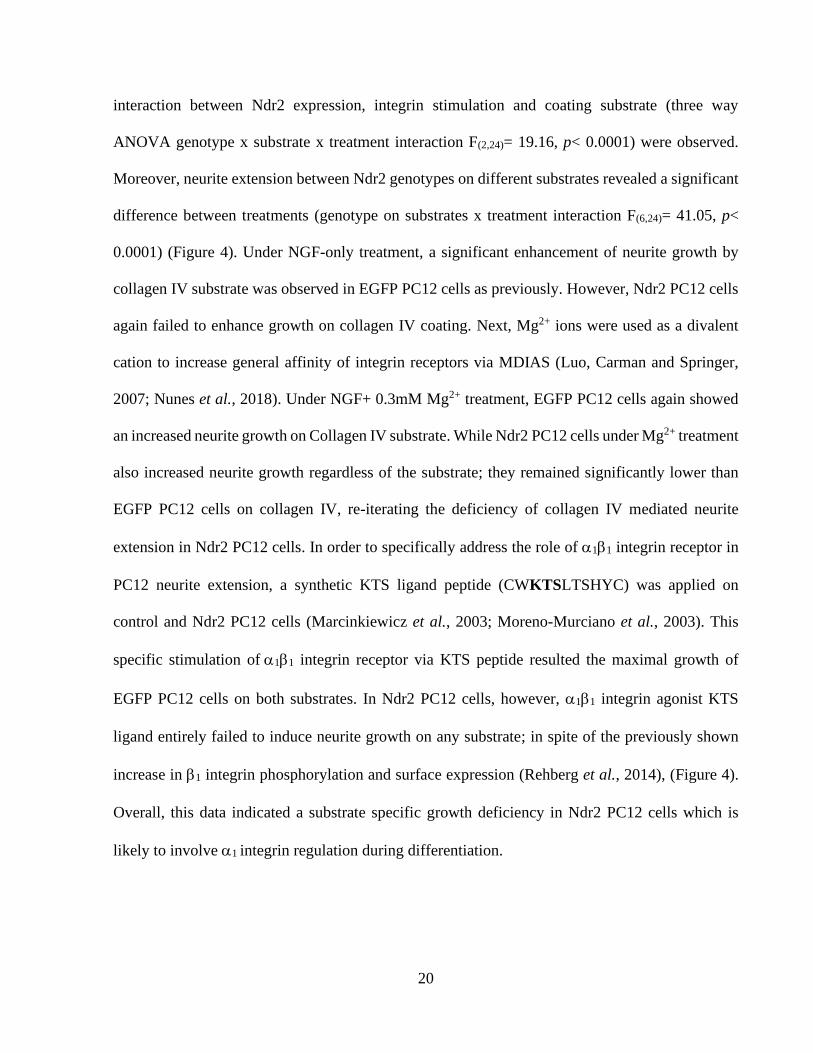
Figure 4: Lack of 11 integrin receptor activation in Ndr2 overexpressing PC12 cells.
Under NGF only, Collagen IV substrate stimulated a significant enhancement in neurite extension
only in control and not in Ndr2 PC12 cells. General enhancement of integrin mediated adhesion by
0.3 mM Mg2+ somewhat increases the neurite growth in Ndr2 PC12 cells, however, still significantly
below the proportion of neurite extended EGFP PC12 cells on Collagen IV. The synthetic KTS
peptide obtustatin induces neurite growth in control cells on PDL to the same high levels as in
Collagen IV. On the other hand, 11 integrin ligand did not stimulate neurite growth of Ndr2 PC12
cells on neither substrate. To summarize, 11 integrin stimulation by either with Collagen IV or KTS
ligand obtustatin only stimulates growth in EGFP PC12 and not in Ndr2 PC12 cells (two way
ANOVA: genotype on substrates x treatment interaction F(6,24)= 41.05, p< 0.0001). Values are mean±
SEM; N= 3; ***p< 0.001. (in cooperation with Dr. Kati Rehberg, Demiray et al. 2018).
Despite the fact that previous studies have shown that Ndr2 induces 1 integrin Thr788/Thr789
phosphorylation, in vitro kinase assays demonstrated no evidence of direct phosphorylation of 1
integrins by Ndr2 (Rehberg et al., 2014). We have recently identified Filamin A as a downstream
substrate of Ndr2 kinase (Figure 13, Figure 14, Appendix Figure 43), which can modulate 1
integrin activity therefore might be involved in Ndr2 mediated inside-out integrin signaling in
neurons.
1.3 Filamin A
22
Most eukaryotic cells have a highly polarized shape and finely tuned movements as a consequence
of their cytoskeleton dynamics. Cytoskeleton provides this mechanical support through three major
classes of fibers: Microtubules are the largest filament with 25 nm diameter, intermediate filaments
are around 10 nm and microfilaments are the smallest sized filaments with 6 nm diameter
(O’Connor, Adams and Fairman, 2010). Microfilaments consist of highly conserved actin
monomer subunits, which in fact makes it the most abundant protein in eukaryotic cells.
Microfilaments are very dynamic structures that undergo constant
polymerization/depolymerization, which is the main, but not the only way to maintain its flexibility
(Dominguez and Holmes, 2011). Besides actin treadmilling, interaction of actin-binding-proteins
with microfilaments can further modify the actin cytoskeleton. For instance, actin filaments can be
bundled together by Fimbrin to form tightly packed filaments (Glenney, Kaulfus and Weber, 1981),
form multiple branches via Arp2/3 nucleation (Goley and Welch, 2006) or assemble into networks
through Filamin mediated cross-linking (Popowicz et al., 2006).
In early 1970s, two independent group successfully purified a cytoskeletal accessory protein from
both muscle and non-muscle cells. It was simultaneously named as actin-binding-protein 280 due
to its large size and Filamin since it was found to associated with actin filaments (Hartwig and
Stossel, 1975; Wang, Ash and Singer, 1975; Baldassarre and Calderwood, 2018). In the past four
decades of research, Filamin A has been extensively studied regarding with respect to its actin-
binding features, involved signaling pathways and surface receptor interactions.
1.3.1 Structure of Filamin A
Filamin has three isoforms in humans that are encoded by three different genes, referred as Filamin
A (FlnA), Filamin B and Filamin C. All three isoforms share around 70% homology between their
23
sequences except their loop domains which is more divergent (around 55%). Among different
isoforms, Filamin C is mostly restricted in striated muscle cells. While FlnA and Filamin B are
ubiquitously expressed in variety of tissues such as bone, kidney and skin cells; FlnA is the more
dominant isoform in brain tissue (van der Flier and Sonnenberg, 2001; Hu et al., 2017).
FlnA protein, also referred as actin binding protein 280 or Filamin-1 in earlier studies, is encoded
by the gene on X chromosome (Xq28, NCBI GeneID: 2316) (Gariboldi et al., 1994). It is a
homodimer consists of two 280 kDA subunit which forms a V-shaped structure (Figure 5). Each
subunit is around 2691 amino acid long and contains 24 immunoglobulin-like tandem repeats (Ig).
Each repeat-domain is ≈96 amino acid long and divided with two hinge domains (≈34 amino acids)
that are located between Ig 15-16 and Ig 23-24. These hinge domains provide further flexibility to
the overall FlnA structure (Yue, Huhn and Shen, 2013). N-terminal of FlnA protein contains an
actin-binding-domain (ABD) that is ≈275 amino acid long and resembles the ABD of other
cytoskeleton accessory proteins such as alpha-actinin (van der Flier and Sonnenberg, 2001). On
the C-terminal, last ≈60 amino acids function as the dimerization domain (Ig 24) for the FlnA
subunits, which confers the V-shape of the overall protein and plays a crucial role in FlnA-induced
actin gelation (Nakamura et al., 2007).

24
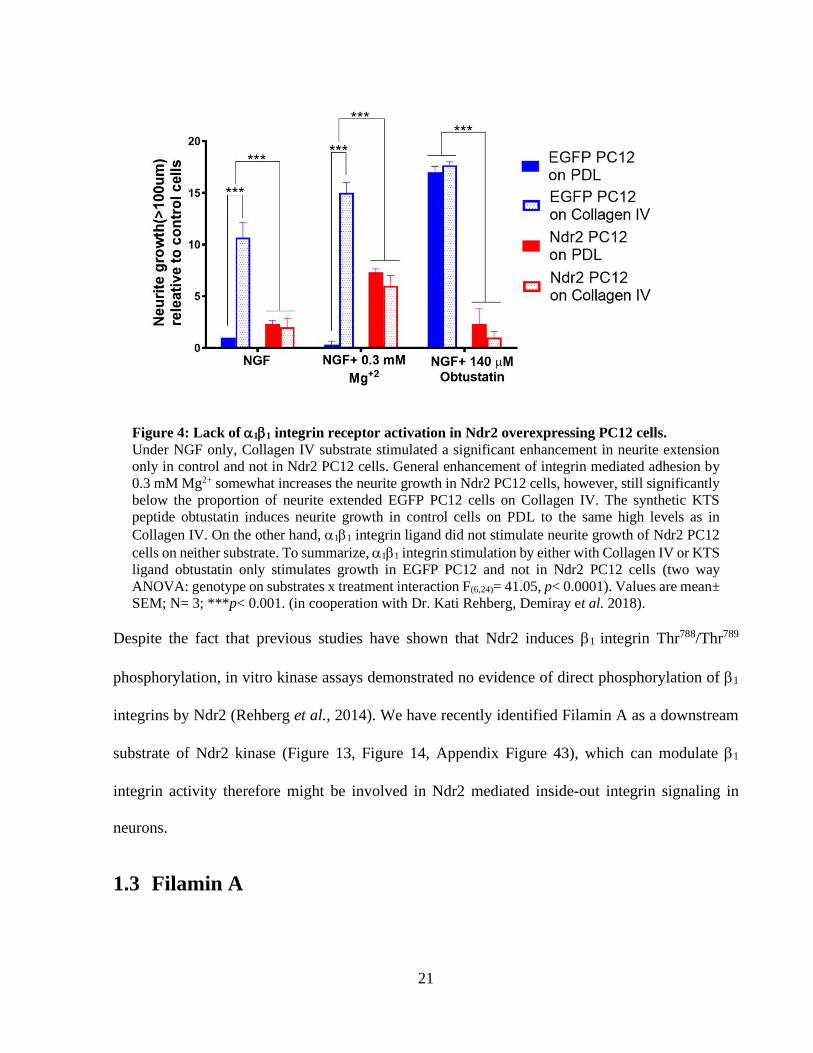
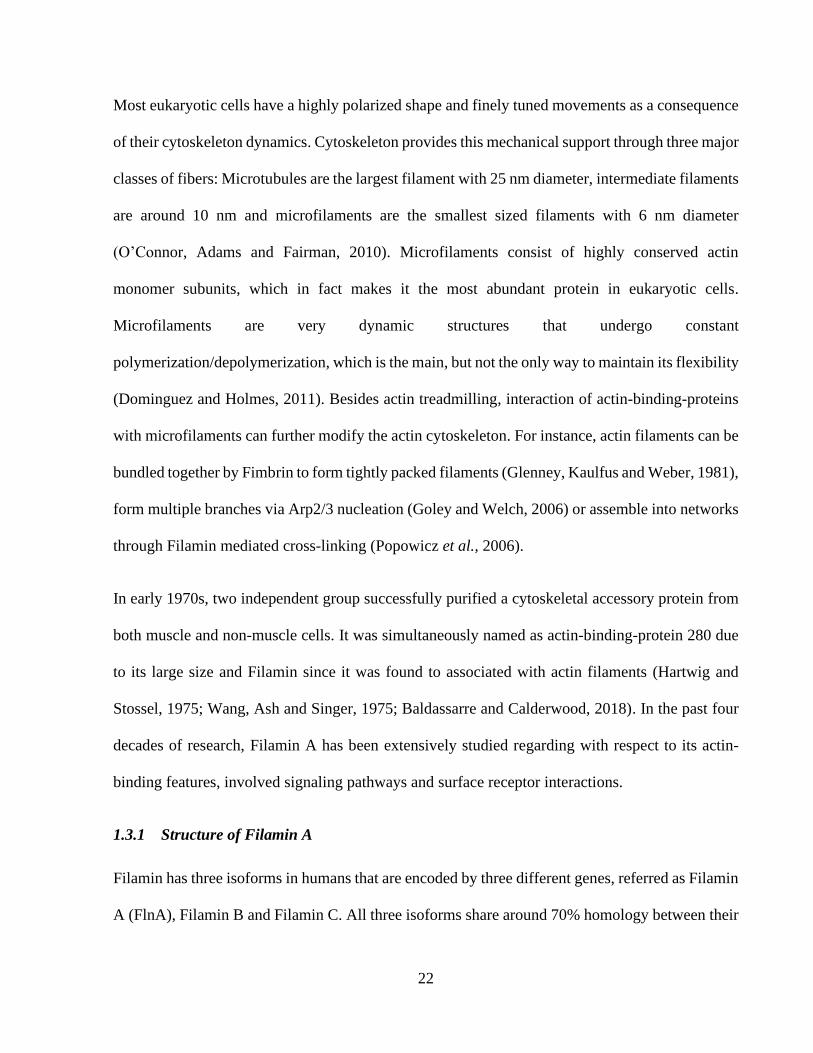
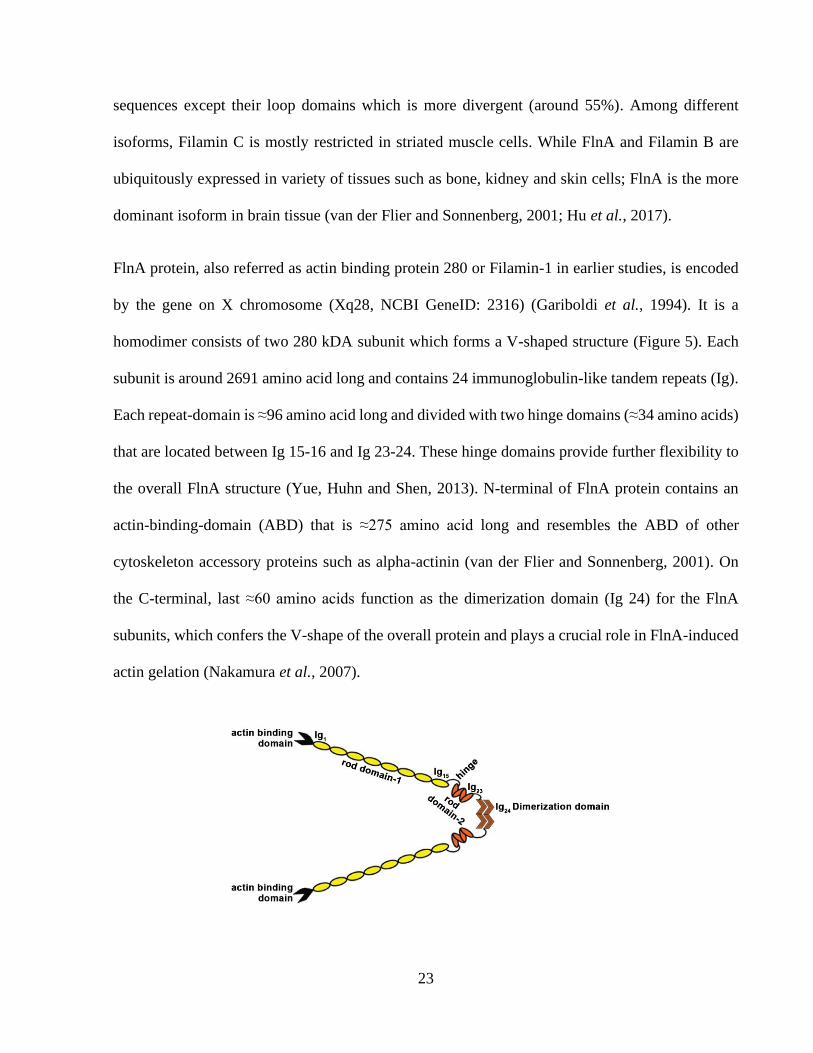
Figure 5: Structure of FlnA
Two identical subunits consisting of 24 immunoglobulin-like repeats (Ig) are dimerized at Ig24 and
result to mature FlnA protein. These 24 tandem repeats are divided by two hinge domains after Ig15
and Ig23. N-terminal of the protein contains the actin binding domain. Rod-domain-2 closer to the tip
of V-shape structure is also the main substructure that can interact with other proteins such as integrin
receptors (Yue et al., 2013).
1.3.2 Regulation of Filamin A expression and activity
During brain development, FlnA serves critical roles due to its interaction with cytoskeleton and
membrane receptors (see section 1.3.3), therefore it is highly expressed throughout all cortical
layers (Sheen et al., 2002). While its expression subsequently downregulated postnatally in mature
brains (Fox et al., 1998), FlnA can still be detected in adult brains and serve important functions
to regulate membrane receptor dynamics (Petrecca, Miller and Shrier, 2000; Wang, Frankfurt and
Burns, 2008). Moreover, in-depth characterization of FlnA in adult rat brain revealed an intense
labelling of FlnA in pyramidal neurons in neocortex, hippocampus and basolateral amygdala along
with other basal forebrain nuclei (Noam et al., 2012). Subcellular analysis of FlnA
immunoreactivity exhibits FlnA puncta in soma and dendrites while labelling in dendritic spines
could not detected in early studies (Nestor et al., 2011; Noam et al., 2012). However, using a high-
resolution structured illumination microscopy and YFP-filled neurons for better spine
visualization, a recent study reported a prominent FlnA labelling on dendritic spines of
hippocampal neurons (Segura et al., 2016).
Due to its function as a bridge between actin cytoskeleton and ECM receptors, FlnA expression
levels can also be controlled by external mechanical force applied on cells. Mechanical force
induces p38 mitogen activated kinase redistribution, which in turn phosphorylates Sp1, a zinc
finger transcription factor. This results to transcriptional activation FlnA gene due to the Sp1-
binding sites on its promoter (D’Addario et al., 2002). Next to its expression levels, external
mechanical stimuli also affect FlnA activity by modulating its overall flexible structure. FlnA
25
interacts with its association partners mostly via domains located between hinge 1 and hinge 2
(Figure 5). -sheet repeats that are responsible for this interaction can be masked and auto-inhibited
due to overall conformation of FlnA domains. Applied mechanical forces can alter FlnA
conformation and expose these hidden binding sites on FlnA (especially between Ig 16-24)
(Pentikäinen and Ylänne, 2009). This force-activatable characteristics of FlnA can rapidly change
upon stimuli and plays an important role controlling the FlnA-1 integrin binding dynamics
(Ehrlicher et al., 2011; Rognoni et al., 2012).
Phosphorylation is a crucial posttranslational mechanism that can regulate the function of
downstream targets by changing their overall conformation, kinetic activity or cellular
localization/stability. FlnA is a substrate of several protein kinases and the Serine residue at 2152
(S2152) in Ig-repeat-domain 20 is the main target of the kinases (see below). Phosphorylation
status of S2152 is an important modulator of FlnA function by affecting its stability, interaction-
partners and cellular localization.
Protein kinase A (PKA), a cAMP dependent protein kinase, phosphorylates FlnA on S2152 in the
presence of cAMP-elevating agents such as forskolin and isobutyl methylxanthine (Jay, García and
de la Luz Ibarra, 2004). Moreover, this PKA-mediated phosphorylation can protect FlnA from
proteolysis, especially from calpain cleavage (Chen and Strachers, 1989). Calpains are calcium-
dependent proteases which can bind and cleave the FlnA from both hinge domains. This cleavage
produces a 190 kDA fragment (repeats 1-15) and 90 kDA fragment (repeats 16-23) (Dyson et al.,
2003). Interestingly it has been also shown that the smaller cleaved fragment can still be transported
into nucleus and can interact with transcription factors, such as transactivated androgen receptors
(Loy, Sim and Yong, 2003). S2152 of FlnA is also subjected to dephosphorylation by calcineurin,
26
a calmodulin dependent serine/threonine phosphatase, which can mediate calpain-induced
proteolysis of FlnA (García, Stracher and Jay, 2006).
Besides PKA, protein kinase C (PKC), a family of phospholipid dependent kinases, can also
phosphorylate FlnA on S2152 and regulate FlnA-actin interactions in membrane invaginations
(Muriel et al., 2011). The PKC mediated FlnA phosphorylation has shown to be isoform specific:
only FlnA and FlnC can be phosphorylated by PKC while FlnB is not a substrate (Tigges et al.,
2003). Ribosomal S6 kinase (RSK) is an important member of Ras-mitogen activated kinase
pathway and can be activated by MAPK/Erk activity. It has been shown that RSK phosphorylates
FlnA on S2152 in response to growth factors such as EGF (Woo et al., 2004). It has also been
reported that a well-known carcinogen, trivalent Arsenic (As3+), activates Akt kinase which in turn
phosphorylates FlnA on S2152 (Li et al., 2015). Recently, studies in T-cells showed that Ndr2
kinase phosphorylates S2152 on FlnA upon T-cell receptor stimulation and induce the
disassociation of FlnA from integrin LFA-1 receptors (Waldt et al., 2018). The phosphorylation
status of S2152 also determines the subcellular localization of FlnA protein. By expressing either
phosphodeficient (S2152A) or phosphomimetic (S2152D) FlnA in neuroblastoma cells, it was
demonstrated that S2152A FlnA prominently localized around the cell membrane and overlapped
with actin fibers where S2152D FlnA was more uniformly diffused throughout the cytoplasm
(Zhang et al., 2012).
Overall, all these upstream kinases that act on S2152 affects the stability of the full protein (Chen
and Strachers, 1989; García, Stracher and Jay, 2006), can change the steric hindrance on the C-
terminal of FlnA which in turn affects its affinity for interaction partners such as integrin receptors
in a cell type specific manner (Chen, Kolahi and Mofrad, 2009; Waldt et al., 2018) or controls the
27
localization of the protein in the cells with respect to actin cytoskeleton (Muriel et al., 2011; Zhang
et al., 2012).
1.3.3 Functions of Filamin A
1.3.3.1 Filamin A and integrin receptors
As mentioned in section 1.1.3, various studies have demonstrated the role of integrins in dendrite
and axon growth (Pasterkamp et al., 2003; Moresco et al., 2005; Marrs et al., 2006). These growth
processes are under tight control by integrins, which regulate the dendritic/axonal growth in
response to both intrinsic (inside-out) and extrinsic signals (outside-in signaling) (Hynes, 2002). In
fact, researchers have found that FlnA can interact with integrin subunits such as , , and
(Sharma, Ezzell and Arnaout, 1995; Loo, Kanner and Aruffo, 1998; Travis et al., 2004, Donada
et al., 2019). Blocking the integrin activity in HEK cells reduced the localization of FlnA in cell
extensions and silencing of endogenous FlnA impaired the spreading of cells on collagen coated
surfaces, suggesting a crosstalk between FlnA and integrin functions (Kim et al., 2008). FlnA-
integrin interaction is also implicated in mechanotransduction of cells. External forces are sensed
by integrin receptors and translated into local actin accumulations through PKC-mediated FlnA
phosphorylation (Glogauer et al., 1998).
Moreover, association of Talin to the integrin tails is one of the main activity markers of integrin
receptors (Margadant et al., 2012). FlnA competes for the binding to the same NPxY domains,
therefore acts as a negative regulator of integrin activity (Kiema et al., 2006; Nieves et al., 2010).
Increased FlnA binding to integrin subunits also impair cell migration, due to impairments in
integrin-dependent membrane protrusions (Calderwood, 2004). One mechanism that can displace
FlnA from integrins is the Migfilin, a cytoskeletal adaptor protein that is enriched in integrin
28
adhesion sites. Researchers have shown that Migfilin can bind to FlnA and leads to its
disassociation from integrin cytoplasmic tail therefore promotes integrin activation (Ithychanda et
al., 2009). Furthermore, FlnA can be disassociated from integrin receptors when phosphorylated
by Ndr2 kinase on S2152. This dissociation is an important step in inside-out signaling of integrin
receptors as it results to subsequent binding of activators such as Talin and kindlin to integrin
cytoplasmic tail (Waldt et al., 2018).
1.3.3.2 Filamin A and actin cytoskeleton
Filamin is a very efficient actin cross linker and can stabilize orthogonally branching filaments
(Hartwig, Tyler and Stössel, 1980). Besides its high affinity ABD at N-terminal, secondary F-actin
binding domains is also present along the rod-1, which provides a high avidity for F-actin binding
(Nakamura, Stossel and Hartwig, 2011). A large and growing body of literature has investigated
the importance of actin cytoskeleton dynamics in regulating shape and motility of the cells
(summarized in Pollard and Cooper, 2009). Therefore, FlnA, as an important actin-binding protein,
is also subjected in-depth analysis for its effects on cell spreading and motility. An early study that
analyzed human malignant melanoma cell lines reported that in three (named as M1-3) out of seven
independent malignant melonama lines showed impaired motility and did not grew any actin
bundles (Cunningham et al., 1992). Further protein analysis revealed that while there were not any
significant alterations in the levels of actin-binding proteins such as gelsolin, -actinin or profilin;
FlnA protein was undetectable in lines M1 to M3 in which significant impairments of cell motility
had been observed. This study was an important cornerstone in the FlnA research as the M2 cell
line was later employed by numerous studies as FlnA-null model to study the role of FlnA in actin
dynamics (often with cell line A7 as control, where FlnA cDNA is stably transfected into M2 line).
For example, FlnA-null M2 cell line was used to demonstrate how lack of FlnA impairs active cell
29
stiffening and prevents actin remodeling in response to changes in extracellular matrix stiffness
(Byfield et al., 2009; Kasza et al., 2009).
The deficiencies in actin mediated cell motility caused by FlnA loss is particularly focused in
cancer research, as an approach to inhibit tumor migration and invasion, namely metastasis (Ji et
al., 2018). Re-expression of full length FlnA could rescue the migration impairments in Filamin
deficient cells, however, re-expression of mutant FlnA lacking the Ig 19-21 was unable to recover
neither cell spreading nor cell motility (Baldassarre et al., 2009). It is worth noting that Ig 19-21 of
FlnA are the C-terminal structures involved in integrin receptor association (Loo, Kanner and
Aruffo, 1998; Travis et al., 2004). These results suggest that, besides ABD at FlnA N-terminals,
interaction of integrin and FlnA is also important for FlnA mediated actin dynamics. Actin
cytoskeleton controls membrane shape and structure such as fast transitioning membrane ruffles or
relatively stable membrane caveolae (invaginations). It has been shown that p21-activated kinase
1 (Pak1), an important serine/threonine kinase upstream of actin cytoskeleton, can phosphorylate
FlnA on S2152 and mediates such membrane ruffling events that are important in cell shape and
migration (Vadlamudi et al., 2002). Similarly, PKC-dependent FlnA-S2152 phosphorylation and
FlnA-actin interaction are required to maintain membrane caveolae dynamics (Muriel et al., 2011).
Lastly, it is also important the note that intracellular calcium levels can also affect the affinity of
FlnA for the actin. Upon Ca2+ increase, calcium-bound calmodulin binds to FlnA ABD and
disassociates FlnA from actin cytoskeleton (Nakamura et al., 2005). Considering the prominent
role of integrins on actin remodeling, FlnA thereby provides an important link downstream of
integrin outside-in signaling to actin cytoskeleton.
1.3.3.3 Role of Filamin A in neurons
30
As explained above, FlnA is an important adapter between actin cytoskeleton and integrin receptors
on the membrane, therefore of major interest for the development and function of the nervous
system. In fact, mutations in the FlnA gene in humans result in Periventricular Heterotopia (PH),
a neurological disorder that causes brain malformations caused by impaired neuronal proliferation
and migration (Fox et al., 1998; Lian and Sheen, 2015). Actin cytoskeleton plays an important role
during neural progenitor proliferation, due to actin’s role in mitosis. FlnA can also be
phosphorylated by cyclin dependent kinase 1 in the beginning of the mitosis and phosphodeficient
FlnA mutants impair cytokinesis after mitosis (Cukier, Li and Lee, 2007; Szeto et al., 2015). In the
same line, FlnA KO mice show prolonged cell cycle in neural progenitor cells which leads to
reduced brain size (Lian et al., 2012). As brain development progresses, neural progenitor cells
start to divide asymmetrically to generate the post-mitotic neurons in subventricular zone. These
neurons need to migrate along radial glial structures to reach their final destinations using actin
cytoskeletal mechanisms (Lian and Sheen, 2015). At this embryonic stage, it has been shown that
lack of FlnA disrupts cell adhesion and neuronal migration in a FlnA KO mouse model (Zhang et
al., 2013). As a side note, these transgenic mice are only viable for embryonic development studies
since full body FlnA KO mice display high embryonic and early postnatal lethality, especially due
to cardiac problems (Feng et al., 2006). Interestingly, besides loss of FlnA, increased expression
of FlnA or its S2152 phosphorylation also impair neuronal migration (Zhang et al., 2012);
suggesting a precise balance of FlnA expression for accurate FlnA function.
As they migrate from ventricular zone through cortical plates, post-mitotic neurons adopt a bipolar
shape by extending leading neurite processes. A recent paper showed that FlnA and more
importantly its ABD is required for this morphological transformation of newborn neurons
(Kurabayashi et al., 2018). Neuronal morphology is under tight control by extracellular factors that
31
are transmitted through integrin receptors and intracellular actin cytoskeleton dynamics. Therefore,
it can reasonably be assumed that FlnA, a cytoskeletal bridge that can coordinate these intra and
extracellular factors, plays an important role in neuronal morphology. Along this line, it was
recently shown that both FlnA and its S2152 phosphorylation are increased in the neurons of TSC1
null mouse, a mouse model for tuberous sclerosis syndrome which is associated with abnormal
dendritic complexity. Reducing the increased levels of FlnA in the TSC1 brains lowered the
abnormal dendritic complexity and improved the neurophysiological abnormalities (Zhang et al.,
2014). Interestingly, same study also demonstrated that both overexpression and silencing of FlnA
resulted to abnormal and more complex dendritic trees in olfactory bulb of mice in vivo. In line
with its role in dendritic branching, it has also been shown that FlnA contributes axonal dynamics
in neurons. Axons of motor neurons travel long distances from CNS to their target neuromuscular
junctions and FlnA loss-of-function mutations impair this routing (Zheng et al., 2011). Guidance
of axons through this long distance is synchronized with extracellular guidance cues and receptors
on growth cones. One important neuronal growth cue is Semaphorin 3a and FlnA S2152
phosphorylation is critical for Semaphorin-3a mediated actin dynamics in growth cones (Nakamura
et al., 2014). Moreover, it has been shown that nerve injury increases the FlnA expression in axons
and interfering with FlnA function impairs injury-induced microtubule dynamics thus reduces
axonal regeneration (Cho, Park and Cavalli, 2015). Besides neurite growth, FlnA contributes to the
maturation of actin-rich dendritic spines as both silencing and overexpression of FlnA decreases
the dendritic protrusion density and increases the protrusion length, resulting to a, immature spine
phenotype (Segura et al., 2016). These results indicate, yet again, how precise regulation of FlnA
expression is needed both in neuronal migration, differentiation and maturation mechanisms.
32
However, the contribution of integrin receptors in these FlnA mediated neural differentiation
mechanisms remained largely unexplored.
1.4 Aims of the study
Integrins are an array of heterodimeric surface receptors that can control the neurite growth based
on extracellular ligands. Their surface expression and ligand affinity are under tight control and
integrin receptors signal bidirectionally: binding to ECM proteins induces signaling cascades
within the cell (outside-in signaling) while cytosolic accessory proteins that can bind the
intracellular tail of integrins regulate its conformation and ECM ligand binding (inside-out
signaling) (Bridgewater, Norman and Caswell, 2012). Previous evidence has suggested that Ndr2
kinase can modulate 1 integrin inside-out signaling that affects 1 integrin activity and
consequentially neurite outgrowth of hippocampal neurons. However, whether Ndr2 kinase
modulates the neurite outgrowth in an ECM ligand-specific manner or whether there are other
intermediary proteins between Ndr2 and integrin activation remained unexplored. Therefore,
following aims were set to elucidate the Ndr2 dependent integrin inside-out signaling and
contribution of FlnA, its recently identified substrate, in this mechanism during dendritic
arborization.
Aim 1 - Testing the relevance of Ndr2 mediated integrin regulation of neurite growth: Based on
the previous data, which demonstrated an ECM- specific disturbance of neurite extension in Ndr2
overexpressing cells, my first aim was to identify underlying receptor mechanism that causes this
selectivity. Based on the integrin-ECM substrate interactions and importance of Ndr2 in integrin
surface expression, I tested whether 1 integrin is differentially regulated by Ndr2 overexpression
33
in a PC12 cell model. Additionally, I aimed to investigate how this Ndr2-induced differential
modulation would manifest in dendritic development of mouse hippocampal neurons.
Aim 2 –Studying the role of FlnA, a newly identified substrate of Ndr2, in integrin mediated
dendritic growth: In parallel, in silico and in vitro experiments were conducted which identified
FlnA as a downstream substrate of Ndr2 and a potential mediator of Ndr2 developmental effects
in neurons. Based on the previously published research about FlnA-integrin interaction and FlnA
mediated actin crosslinking, I hypothesized that FlnA is partly responsible for dendritic
arborization and acts as a bridge between the integrin receptors and downstream signaling cascades.
To elucidate the role of FlnA, different aspects of the dendritic arborization mechanisms, such as
ECM, 1 integrin activity, FAK signaling, and actin crosslinking, were rigorously tested using
genetic and pharmacological interventions in mouse neuronal culture.
Aim 3 – Developing tools for future in vivo physiological analysis of FlnA functions: In order to
transfer these findings and test the role of FlnA in hippocampal circuitry in vivo, my final aim was
to establish a state-of-the-art CRISPR/Cas9 system that enables to genetically disturb or
transcriptionally activate the mouse FlnA gene, which can also be delivered efficiently and in a
region-specific manner in the mouse brain.
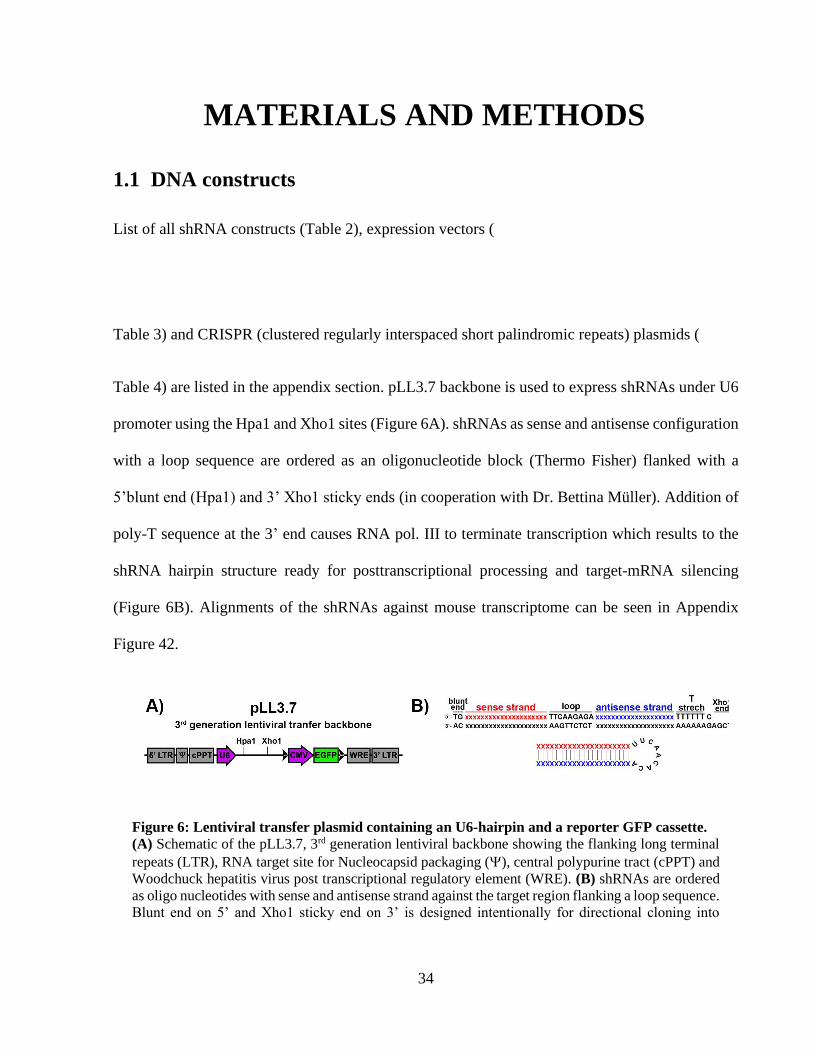
34
MATERIALS AND METHODS
1.1 DNA constructs
List of all shRNA constructs (Table 2), expression vectors (
Table 3) and CRISPR (clustered regularly interspaced short palindromic repeats) plasmids (
Table 4) are listed in the appendix section. pLL3.7 backbone is used to express shRNAs under U6
promoter using the Hpa1 and Xho1 sites (Figure 6A). shRNAs as sense and antisense configuration
with a loop sequence are ordered as an oligonucleotide block (Thermo Fisher) flanked with a
5’blunt end (Hpa1) and 3’ Xho1 sticky ends (in cooperation with Dr. Bettina Müller). Addition of
poly-T sequence at the 3’ end causes RNA pol. III to terminate transcription which results to the
shRNA hairpin structure ready for posttranscriptional processing and target-mRNA silencing
(Figure 6B). Alignments of the shRNAs against mouse transcriptome can be seen in Appendix
Figure 42.
Figure 6: Lentiviral transfer plasmid containing an U6-hairpin and a reporter GFP cassette.
(A) Schematic of the pLL3.7, 3rd generation lentiviral backbone showing the flanking long terminal
repeats (LTR), RNA target site for Nucleocapsid packaging (), central polypurine tract (cPPT) and
Woodchuck hepatitis virus post transcriptional regulatory element (WRE). (B) shRNAs are ordered
as oligo nucleotides with sense and antisense strand against the target region flanking a loop sequence.
Blunt end on 5’ and Xho1 sticky end on 3’ is designed intentionally for directional cloning into
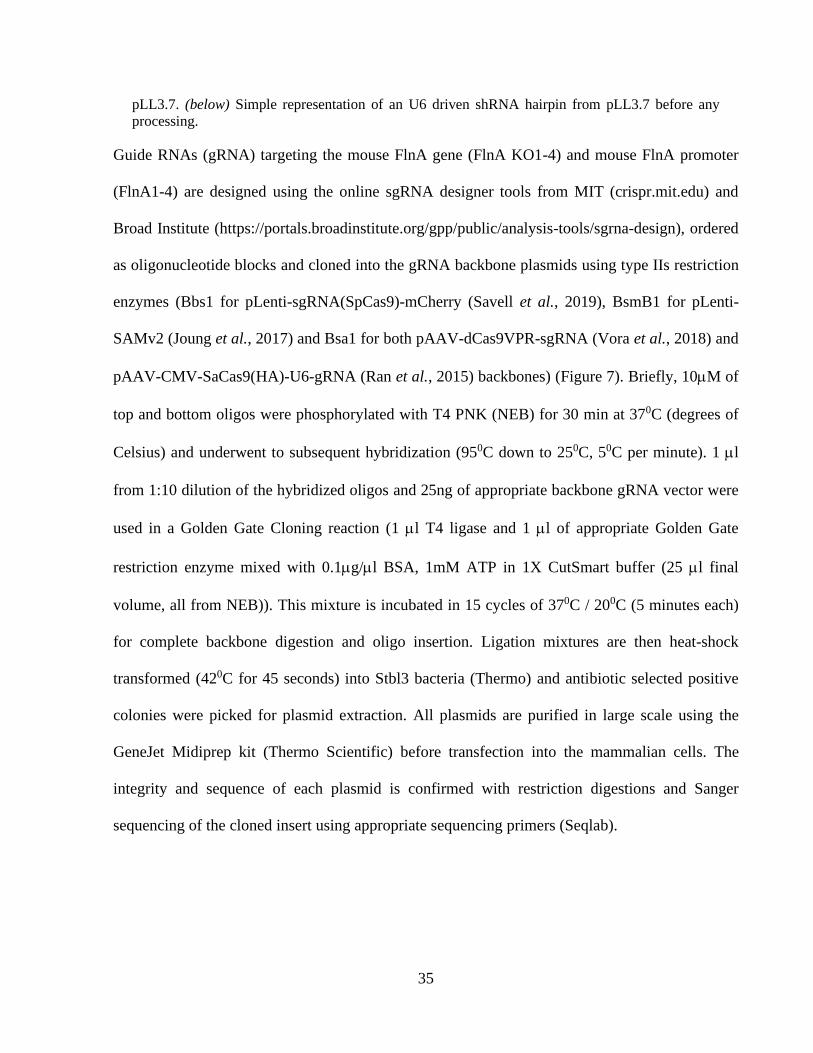
35
pLL3.7. (below) Simple representation of an U6 driven shRNA hairpin from pLL3.7 before any
processing.
Guide RNAs (gRNA) targeting the mouse FlnA gene (FlnA KO1-4) and mouse FlnA promoter
(FlnA1-4) are designed using the online sgRNA designer tools from MIT (crispr.mit.edu) and
Broad Institute (https://portals.broadinstitute.org/gpp/public/analysis-tools/sgrna-design), ordered
as oligonucleotide blocks and cloned into the gRNA backbone plasmids using type IIs restriction
enzymes (Bbs1 for pLenti-sgRNA(SpCas9)-mCherry (Savell et al., 2019), BsmB1 for pLenti-
SAMv2 (Joung et al., 2017) and Bsa1 for both pAAV-dCas9VPR-sgRNA (Vora et al., 2018) and
pAAV-CMV-SaCas9(HA)-U6-gRNA (Ran et al., 2015) backbones) (Figure 7). Briefly, 10M of
top and bottom oligos were phosphorylated with T4 PNK (NEB) for 30 min at 370C (degrees of
Celsius) and underwent to subsequent hybridization (950C down to 250C, 50C per minute). 1 l
from 1:10 dilution of the hybridized oligos and 25ng of appropriate backbone gRNA vector were
used in a Golden Gate Cloning reaction (1 l T4 ligase and 1 l of appropriate Golden Gate
restriction enzyme mixed with 0.1g/l BSA, 1mM ATP in 1X CutSmart buffer (25 l final
volume, all from NEB)). This mixture is incubated in 15 cycles of 370C / 200C (5 minutes each)
for complete backbone digestion and oligo insertion. Ligation mixtures are then heat-shock
transformed (420C for 45 seconds) into Stbl3 bacteria (Thermo) and antibiotic selected positive
colonies were picked for plasmid extraction. All plasmids are purified in large scale using the
GeneJet Midiprep kit (Thermo Scientific) before transfection into the mammalian cells. The
integrity and sequence of each plasmid is confirmed with restriction digestions and Sanger
sequencing of the cloned insert using appropriate sequencing primers (Seqlab).
36
Figure 7: Single AAV transfer plasmid containing the Cas9 and gRNA.
(A) Schematic of the pAAV-CMV_Cas9-U6_gRNA AAV backbone showing the flanking AAV
inverted terminal repeats (ITR), CMV driven Staphylococcus aureus (Sa. Cas9) with an HA tag and
U6 driven gRNA cloning cassette followed by gRNA scaffold sequence. (B) (above) Guide RNA
sequences are ordered as short oligos with 5’ and 3’ overhangs that would directionally ligate to
(below) Bsa1 cut sites on pAAV backbone. (C) Simple representation of targeted double stranded
break created by gRNA guided Cas9.
1.2 NIH3T3 and HEK293T cell culture and transfections
NIH3T3 (mouse fibroblasts) and HEK293T (human embryonic kidney cells) cell lines were kept
in DMEM (Dulbecco's Modified Eagle Medium) media (Gibco) with 10% FBS (fetal bovine
serum, Gibco) at 37 0C with 5% CO2. Cells were grown in T75 flasks (Corning) and passaged at
least two times a week to avoid full confluence in the back-up flasks. To split the cells between
passages, cells were scraped from the T75 flask using a cell scraper and 1:20 dilution were made
with a fresh DMEM+10%FBS media. Cells were routinely tested against mycoplasma
contamination using MycoAlert detection kit (Lonza) and constantly kept in antibiotic-free media
to detect any contamination quickly before experiments. The day before transfection, adherent cells
were disassociated with TrypLE Express (Gibco) and seeded on multiple well plates (Corning) to
have full confluency on the day of transfection (≈30000 NIH3T3 cells/cm2 and ≈60000 HEK293T
cells/cm2). Transfection of the cells were done using Lipofectamine 2000 (Thermo Fisher)
37
according to the manufacturer’s instructions. Briefly, for a 6-well plate, 3 g DNA and 12 l
Lipofectamine 2000 reagent were diluted in 150 l Opti-MEM media in separate tubes. DNA and
lipofectamine tubes were mixed and incubated for 5 min at room temperature (during which media
of the cells is replaced with fresh prewarmed media) and added onto cells dropwise for liposome-
mediated transfection. Lipofectamine 3000 reagent (Thermo Fisher) was used to transfect cells for
Cas9 and gRNA containing plasmid transfections for improved efficiency according to the
manufacturer instructions. Briefly, for a 6-well plate, 2.5 g DNA and 7.5 l Lipofectamine3000
reagent were diluted in 125 l Opti-MEM media in separate tubes. 5 l P3000 enhancer was further
added into DNA tube and mixture was vortexed. DNA and lipofectamine tubes were mixed and
incubated for 15 min at room temperature (during which media of the cells is replaced with fresh
prewarmed media) and added onto cells dropwise for liposome-mediated transfection. Cells were
further incubated for 2 days before lysis, protein extraction and subsequent western blotting
analysis. Cells were checked under fluorescence microscope the day after with appropriate filter
cubes (GFP or tdTom (tdTomato)) to confirm the transfection protocol.
1.3 PC12 cell culturing and differentiation
EGFP expressing control PC12 cells (EGFP PC12) and EGFP-Ndr2 expressing PC12 cells (Ndr2
PC12) were previously established with stable-transfections of the constructs (Stork et al., 2004).
Once thawed from liquid nitrogen glycerol stocks, EGFP and EGFP Ndr2 expressing rat
pheochromocytoma (PC12) cells were cultured in RPMI medium (Gibco) supplemented with 10%
horse serum, 5% fetal bovine serum,100 U/ml Penicillin-Streptomycin (PS) (Gibco) and 200 µg/ml
Geneticin (ThermoFisher). PC12 cells were routinely passaged via cell scraper before reaching full
confluence for maintenance. For differentiation, PC12 cells were seeded on glass coverslips or
38
multiwell plates that were coated with 50 g/ml poly-d-lysine (PDL, SigmaAldrich) in 0.15 M
Borate buffer (pH 8.4) overnight at 4 0C and when indicated with 100 g/ml Collagen IV (Col IV,
SigmaAldrich) in 30% ethanol for few hours in 370C incubator. Cells were either seeded on glass
coverslips with 5000 cells/cm2 density for immunocytochemistry or in 6-well plates with 15000
cells/cm2 for immunoblotting in low RPMI medium (RPMI+ 0.2% horse serum, 1x PS and 200
µg/ml Geneticin). Once the PC12 cells were settled, they were supplemented with 50 ng/ml neurite
growth factor (NGF, Gibco) to induce neurite extension until indicated times (3 and 6 days for
immunoblotting, 6 days for immunocytochemistry).
1.4 Establishing neuronal and glial cell cultures
Astrocyte cultures: Since the hippocampal neurons were plated on glass coverslips without any
glial co-culture, glial factors were supplemented via addition of astrocyte conditioned media
(media that was incubated on confluent astrocyte cultures for 72 hours). Astrocytes were isolated
from postnatal day 1 (P1) pups using Milteny Biotec Neural Tissue disassociation kit, following
the manufacturer’s instructions. Cortices from two pups were pooled in one T75 culture flask in
DMEM+10%FBS media supplemented with 100U/ml Penicillin-Streptomycin (PS) and 2 mM
GlutaMax (both from Gibco). Cells were cultured in T75 flasks with media replacements every 3
days. Once the astrocytes were fully confluent (around after 2 weeks), glial culture media was
replaced with neuronal growth media (NBM (neurobasal media) with 1x B27+ 0.5 mM GlutaMax)
and kept on the astrocytes for conditioning. 72 hours later, conditioned media was replaced with
fresh neural growth media for another round of conditioning. Finally, both conditioned media
batches were mixed, filtered with 0.20 m filter and stored in -20 0C. Conditioned media aliquots
were mixed with 1:1 with fresh neuronal media and used on hippocampal neurons when needed.
39
Neuronal Culturing: Hippocampi were dissected from embryonic day 18 (E18) to E19 mice were
dissected using fine forceps under stereo microscope in ice-cold HBSS (Hank's Balanced Salt
Solution) buffer. Dissected hippocampi were then disassociated into neurons using MACS Neural
Tissue Disassociation Kit (Milteny). Disassociated cells were plated either on poly-D-lysine (10
µg/cm2, in 0.15 M Borate buffer pH 8.4, Sigma-Aldrich) or with poly- D-lysine+ Laminin111
(0.45 µg/cm2, in PBS, Biolamina) or poly- D-lysine+ Fibronectin (50 µg/ml, in PBS, Roche) coated
coverslips (25,000-30,000 cells/cm2) when indicated. While poly-D-lysine coating was done
overnight at 40C, fibronectin and laminin-111 was applied at 370C at least 2 hours. As a side note,
coverslips were not let dry at any time after coating. Neurons were plated in plating media
(DMEM+10% FBS + 2 mM GlutaMax + 100U/ml Penicillin/Streptomycin) until they adhere to
the bottom of the well (≈few hours). Once they settled, media was changed to neurobasal media
supplemented with B27 (2%) and GlutaMax (0.5 mM). (for hippocampal cultures, this media had
been 1:1 mixed with glial conditioned media, see astrocyte culturing for details). At indicated
experiments, neurons were treated with either 25 g/ml anti-CD29 antibody (clone Ha2/5, 555002,
BD Biosciences) and 1 M FAK (focal adhesion kinase) inhibitor 14 (Y15, Sigma Aldrich) from
DIV (days in vitro) 4 to DIV6 to inhibit 1 integrin and FAK activity, respectively.
1.5 Transfection of neurons with Calcium/Phosphate method
Cultured hippocampal neurons were transfected with calcium phosphate method due to its low but
sparse efficiency that allows easier identification/tracing of dendritic morphology. Hippocampal
neurons were transfected at DIV3. 1 hour before transfection, neuronal medium was changed with
prewarmed and CO2-conditioned NBM only media. For transfection of shRNAs or expression
vectors; 4 g total transfer plasmid and 0.25 g pCMV_tdTomato plasmid were dissolved in 60 l
40
of 250 mM CaCl2 solution (CalPhos, Takara). Transfer plasmids were used to manipulate gene
expression levels while tdTom protein filled the neurons for better tracing of the transfected
neurons. After a brief vortex of this mixture, 60 l of 2x HBS buffer (CalPhos, Takara) was added
slowly into to DNA tubes dropwise to acquire a fine and homogeneous DNA/calcium precipitate.
This mixture was then added onto neurons dropwise and cells were returned to the incubator
immediately for DNA precipitates to settle. Plates were checked every 10 minutes to detect the
optimal precipitates formation on neurons (small, homogeneous formation that can be easily
endocytosed by neurons with relatively low toxicity). Around 20-30 minutes, the transfection
media was aspirated from neurons and dishes were washed with two times with HBSS -/- for 5
minutes to remove remaining precipitates. Finally, prewarmed and CO2-conditioned neurobasal
media supplemented with B27 (2%) and GlutaMax (0.5 mM) was added onto the cells. Neurons
were briefly checked 2 days later under fluorescence microscope to confirm the fluorescent signal.
1.6 Production of viral particles and transduction of cells
To achieve the highest efficiency of genetic manipulation for biochemical analysis of proteins,
unconcentrated lentivirus and adeno-associated-virus (AAV) viral supernatants were produced
using HEK293T cells. For viral production, HEK293T cells were seeded, transfected, and kept in
viral packaging medium (Opti-MEM supplemented with 2mM GlutaMax, 1mM Sodium Pyruvate
and 5% FBS (all from Gibco)) instead of standard DMEM+10% FBS growth media. All the viral
work described below was handled in S2 level certified rooms. Solid materials in contact and
liquids containing viral particles were collected separately from any other waste. Replication-
incompetent 3rd generation lentiviral production, storage and waste disposal were performed
following institutional guidelines.
41
1.6.1 Lentivirus production
For lentiviral supernatant production, 1.5 million HEK239T cells were seeded in 2 ml viral
packaging media per well into 6-well plates. Transfection of 3rd generation lentiviral helper
plasmids and transfer plasmids was done using Lipofectamine 3000 reagent according to
manufacturer’s instructions. DNA mixture consisted of 1.5 g pLenti transfer plasmid, 750 ng
pMDLg/pRRE, 450 ng pMD2.G and 375 ng pRSV-REV packaging plasmids in 250 ul OptiMem
media. 6 l of P3000 reagent was added to the DNA solution prior to the mixing with
Lipofectamine 3000 dilution. Once the Lipofectamine 3000 mixture (7 l of Lipofectamine3000
in 250 l OptiMem media) was added onto DNA mixture; DNA-lipid complexes were incubated
in room temperature for 15 minutes. During this incubation tube, half of the packaging media was
removed from the 6-well plates and DNA-lipid complexes were then added dropwise onto the cells.
6 hours post transfection; whole media was replaced with 2ml fresh viral packaging media. Next
day, ≈24 hours post-transfection, entire media was harvested and replaced with 2ml fresh
packaging media. Harvested supernatant was stored in +4 0C until the next day. After the second
harvest at ≈52 hours post-transfection, all collected 4 ml of supernatant was centrifuged 2000 rpm
for 10 minutes to remove any cellular debris and finally filtered using a 45 m filter. Cleared
supernatants were then aliquoted and stored in -80 0C until used for in vitro transduction of cultured
neurons. A representative titration of lentiviral supernatants on HEK293T cells can be seen in
Figure 8.
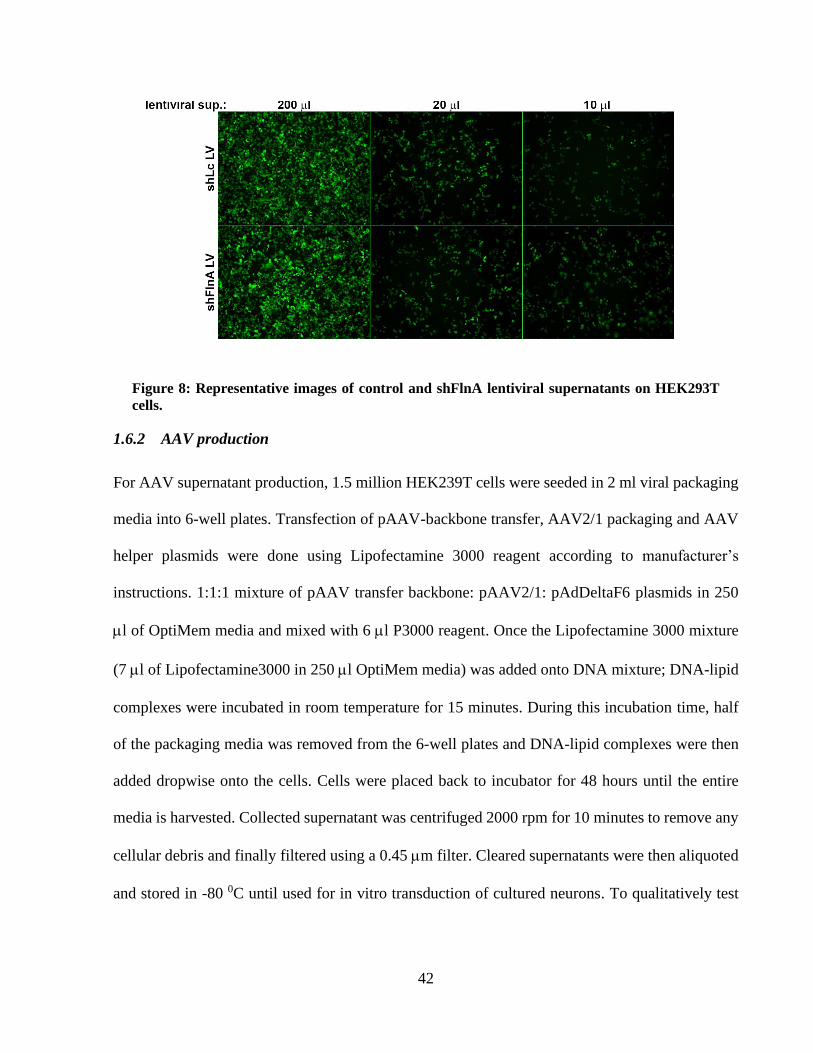
42
Figure 8: Representative images of control and shFlnA lentiviral supernatants on HEK293T
cells.
1.6.2 AAV production
For AAV supernatant production, 1.5 million HEK239T cells were seeded in 2 ml viral packaging
media into 6-well plates. Transfection of pAAV-backbone transfer, AAV2/1 packaging and AAV
helper plasmids were done using Lipofectamine 3000 reagent according to manufacturer’s
instructions. 1:1:1 mixture of pAAV transfer backbone: pAAV2/1: pAdDeltaF6 plasmids in 250
l of OptiMem media and mixed with 6 l P3000 reagent. Once the Lipofectamine 3000 mixture
(7 l of Lipofectamine3000 in 250 l OptiMem media) was added onto DNA mixture; DNA-lipid
complexes were incubated in room temperature for 15 minutes. During this incubation time, half
of the packaging media was removed from the 6-well plates and DNA-lipid complexes were then
added dropwise onto the cells. Cells were placed back to incubator for 48 hours until the entire
media is harvested. Collected supernatant was centrifuged 2000 rpm for 10 minutes to remove any
cellular debris and finally filtered using a 0.45 m filter. Cleared supernatants were then aliquoted
and stored in -80 0C until used for in vitro transduction of cultured neurons. To qualitatively test
43
the unconcentrated viral titer, each produced viral supernatant was used to transduce HEK293T
cells in 12-well plates and fluorescence signal was confirmed under microscope.
1.6.3 In vitro transduction of cells
To transduce mouse fibroblast cells (NIH3T3) with control and shNdr2 lentiviruses for FBS
stimulation, 1x10⁶ NIH3T3 cells were seeded in a 100mm dish. Next day, when cells were around
50% confluent, whole media was aspirated, 1ml fresh media (supplemented with 3 g/ml
Polybrene) with 2ml viral supernatant was added on the cells and dishes were gently swirled before
returning to the incubator. 4-6 hours later, 9 ml fresh media was added onto each 10 cm dish and
cells were placed back to the incubator. Two days after transduction, virus contained media was
removed and transduced cells from 10 cm dishes were split into 12-well plates. Before lysis, cells
were serum starved overnight and stimulated with 20% FBS in indicated time points (for pFlnA
S2152 induction). GFP expression of the wells were confirmed before stimulation and lysis. When
indicated, transduced fibroblasts were treated with 1 M okadaic acid (Calbiochem, Merck) for 1
hour to stimulate Ndr activity (Devroe et al., 2004; Waldt et al., 2018).
Primary neurons were transduced based on the Ritter et al., 2017 on DIV1. Briefly, half of the
neuronal growth media from each well was collected and stored in a separate tube. Neurons were
then transduced with 300 l of lentiviral supernatant (or 200 l AAV1 supernatant) per well for 3
hours. After three hours, virus-containing media was removed and replaced with 1:1 mixture of
pre-transduction collected: fresh prewarmed neuronal growth media and neurons were placed back
to incubator immediately. Next day, to stimulate CMV (cytomegalovirus) promoter in in vitro
cultured neurons, neurons were supplemented with 20mM KCl (Wheeler and Cooper, 2001).
Fluorescent signal was checked and confirmed from transduced neurons before lysis. Before acute
44
activation of integrins at DIV5, culturing media was replaced with neurobasal media without any
supplements to synchronize the cells. 2 hours later, neurons were treated with 10 g Fibronectin
(#11-051-407-001, Roche) and 500 M MnCl2 in the same media before lysis for indicated time
points.
1.7 Immunoblotting
1.7.1 Lysis of the cells
On the day of lysis, media was aspirated under laminar flow hood and cells were carefully washed
with PBS (prewarmed HBSS for neuronal cultures). For 6 well plates, 200 l of Lysis buffer (1%
lauryl maltoside N-dodecyl-β-D-maltoside (Merck), 1% NP-40 (Sigma Aldrich), 1 mM Na-
orthovanadate, 2 mM EDTA, 50 mM Tris-HCl, 150 mM NaCl, 0.5% deoxycholic acid, 1 mM 4-
(2-Aminoethyl) benzene sulfonyl fluoride hydrochloride, 1 µM Pepstatin A, 1 mM NaF and
protease inhibitor cocktail (one tablet per 50 ml, Pierce)) was added on each well and cells were
incubated on ice for further 5 minutes. Next, 200 l cell suspensions were pipetted into pre-cooled
Eppendorf tubes which were then rotated for 30 minutes in cold room for sufficient lysis of the
cells. Lastly, tubes were centrifuged for 30 minutes at 13,000 rpm in a pre-cooled (+40C) benchtop
centrifuge, supernatants were transferred into a new tube and stored in -80 0C until further use.
Cortical primary cultures and transduced cell lines that were stimulated were lysed directly with
1X Laemmli sample buffer (1-part 4x Laemmli buffer (252 mM Tris-HCl (pH 6.8), 8% SDS (w/v),
40% Glycerol (v/v), 0,04% Bromophenol blue (w/v), 20% -mercaptoethanol) diluted in 3 parts of
Lysis buffer) after the indicated times and kept on ice for 5 minutes. Lysates were heated for 10
minutes on 95 0C on a heat block for denaturation and stored in -20 0C until loading into SDS-
PAGE gels.

45
1.7.2 Protein concentration quantification
For a standard protein curve, BSA protein standards in lysis buffer were prepared ranging from 0
to 8 µg/µl. Lysis buffer treated cell extracts were thawed on ice and their protein concentration was
quantified using DC Protein Assay from Bio-Rad, which was based on the widely used Lowry
method with some improvements (Lowry et al., 1951). Briefly, 5 µl BSA standards and protein
samples were loaded into a 96 well plate (BSA standards as triplicates and protein samples as
duplicates). 25 µl of Reagent A (alkaline copper) and 200 µl Reagent B (folin) was added onto
each well respectively. Samples were then incubated in dark for 15 minutes for color development
and absorbance of each well was measured at 750 nm using a plate reader (Tecan M200). BSA
standard values were used to plot a calibration curve and sample protein concentrations were
calculated according to the linear regression line of the curve. Protein samples to load to SDS-
PAGE gels were then prepared using 4x Laemmli sample buffer into equal concentrations and
boiled at 95 0C for 10 minutes on a heat block for denaturation. These ready-to-load probes were
stored in -200C until running in SDS-PAGE gels.
In case of directly 1X Laemmli sample buffer treated (containing -mercaptoethanol and
bromophenol blue already) and boiled cell lysates (such as cortical culture extracts), after a brief 1
minute 13000 rpm centrifugation, equal volumes of the lysate was directly loaded onto each well
for SDS-PAGE.
1.7.3 SDS-PAGE and Western blotting
Mini-Trans-Blot Electrophoresis system (Bio-Rad) was used for separating the proteins in SDS-
PAGE gels and consecutive transfer into PVDF membranes. Due to rather large size of the FlnA
protein (280 kDA), 8% poly-acrylamide gels were used to run the protein samples (8.37 ml H2O;
46
4.77 30% Acrylamide 37.5:1; 4,5 ml 1.5M Tris-HCl (pH 8.8), 180 l 10% SDS, 180 l 10% APS
and 18 l TEMED for 2 mini-gels). These resolving gels were topped with 5% stacking gels (3.4
ml H2O; 0.83 30% Acrylamide 37.5:1; 0.63 ml 1.0M Tris-HCl (pH 6.8), 50 l 10% SDS, 50 l
10% APS and 5 l TEMED for 2 mini-gels). These house-made polyacrylamide gels were put into
the tanks filled with SDS-running buffer (25mM Tris (pH 8.3), 250 mM Glycine, 0.1% SDS in
water) and equal volumes of samples were loaded onto each well along with 6 l PageRuler Plus
Prestained protein marker (ThermoFisher) for size determination and verify transfer efficiency.
Empty wells were also loaded with a mixture of Laemmli buffer and lysis buffer to keep the stacked
proteins as a straight-line during electrophoresis. Gels were run first at 80V until samples are
stacked in a flat line through stacking gel and later voltage is increased to 120V until sufficient
separation of the pre-stained protein bands are achieved. Gel was then removed from the glass
plates, washed with distilled water and equilibrated in transfer buffer (25 mM Tris, 192 mM
Glycine, %10 Methanol). At the same time, PVDF membranes were activated in methanol for 10
second, washed with water and equilibrated in transfer buffer. Protein transfers from gel to the
membranes were done at constant 120 V for 1:15 hour at +4 0C. After transfer, gels were discarded
and PVDF membranes were dried until further use. Transfer efficiency is confirmed qualitatively
using the pre-stained protein marker. Once the PVDF membranes were re-activated using
methanol, they were blocked with Intercept blocking buffer (in TBS, Licor) for 1 hour at room
temperature; to prevent non-specific background signal.
1.7.4 Antibodies used in the study
Primary and secondary antibodies were also diluted in Intercept blocking buffer+ 0.2% Tween20
for blotting and incubated overnight at +4 0C and 1 hour at room temperature, respectively. Primary
antibodies used in immunoblotting is listed in Table 1 with their dilution factors and catalogue
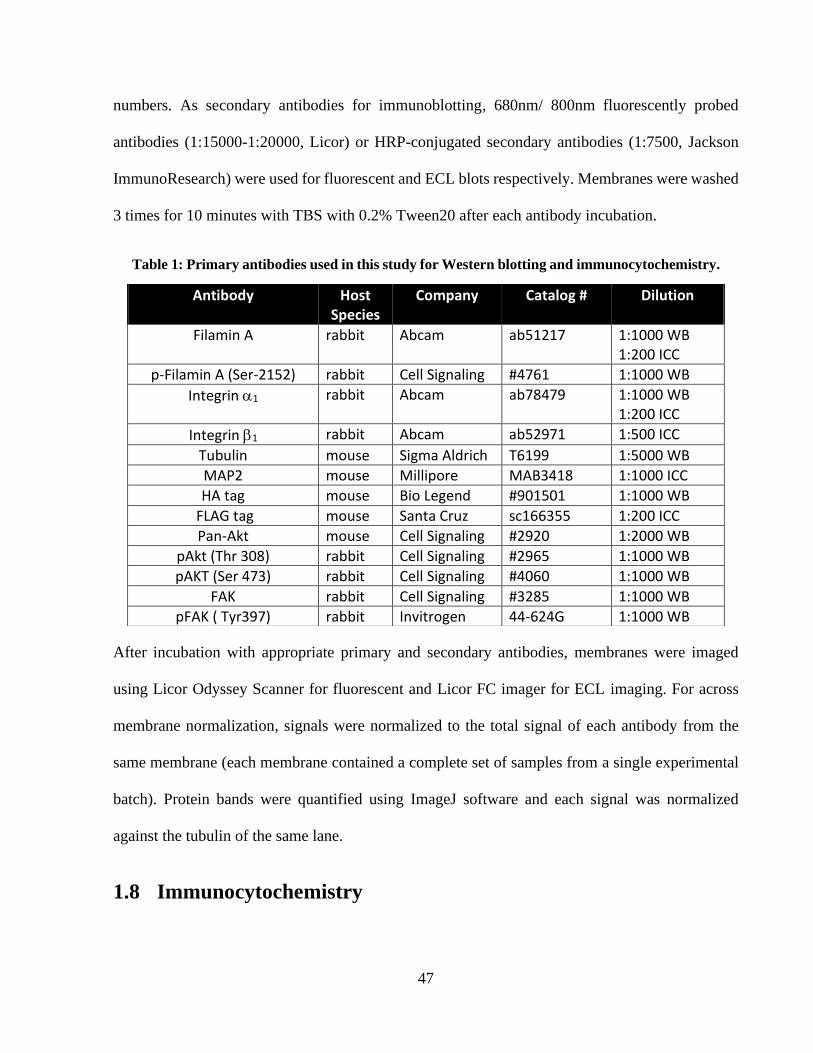
47
numbers. As secondary antibodies for immunoblotting, 680nm/ 800nm fluorescently probed
antibodies (1:15000-1:20000, Licor) or HRP-conjugated secondary antibodies (1:7500, Jackson
ImmunoResearch) were used for fluorescent and ECL blots respectively. Membranes were washed
3 times for 10 minutes with TBS with 0.2% Tween20 after each antibody incubation.
Table 1: Primary antibodies used in this study for Western blotting and immunocytochemistry.
After incubation with appropriate primary and secondary antibodies, membranes were imaged
using Licor Odyssey Scanner for fluorescent and Licor FC imager for ECL imaging. For across
membrane normalization, signals were normalized to the total signal of each antibody from the
same membrane (each membrane contained a complete set of samples from a single experimental
batch). Protein bands were quantified using ImageJ software and each signal was normalized
against the tubulin of the same lane.
1.8 Immunocytochemistry
Antibody Host Species
Company Catalog # Dilution
Filamin A rabbit Abcam ab51217 1:1000 WB 1:200 ICC
p-Filamin A (Ser-2152) rabbit Cell Signaling #4761 1:1000 WB
Integrin 1 rabbit Abcam ab78479 1:1000 WB 1:200 ICC
Integrin 1 rabbit Abcam ab52971 1:500 ICC
Tubulin mouse Sigma Aldrich T6199 1:5000 WB
MAP2 mouse Millipore MAB3418 1:1000 ICC
HA tag mouse Bio Legend #901501 1:1000 WB
FLAG tag mouse Santa Cruz sc166355 1:200 ICC
Pan-Akt mouse Cell Signaling #2920 1:2000 WB
pAkt (Thr 308) rabbit Cell Signaling #2965 1:1000 WB
pAKT (Ser 473) rabbit Cell Signaling #4060 1:1000 WB
FAK rabbit Cell Signaling #3285 1:1000 WB
pFAK ( Tyr397) rabbit Invitrogen 44-624G 1:1000 WB
48
On the day of fixation, entire media was removed, and cells were washed once with pre-warmed
PBS. Cells were then fixed in 4% PFA (paraformaldehyde)/ Sucrose solution (in 0.1M PBS) for
20 minutes under the fume hood. Following the fixation, dishes were washed two times with PBS
for 5 minutes in room temperature. If the cells were used for fluorescent imaging for dendritic
tracing/ Sholl analysis, coverslips were directly mounted on slides. For immunocytochemistry with
antibodies, cells were first permeabilized using 0.3% TritonX in PBS at room temperature for 10
minutes, washed 3 times with PBS for 5 minutes and proceeded to blocking with 5% BSA in PBS
for 1 hour at room temperature. Coverslips are then incubated with primary antibodies diluted in
blocking buffer overnight at +4 0C (antibodies and their dilutions are listed in Table 1).
Fluorescently probed secondary antibodies (1:1000, Invitrogen) or biotinylated-secondary
antibodies (1:200, Vector Labs) were applied 1 hour at room temperature followed by 30 minutes
incubation of fluorescently conjugated streptavidin (against biotin, 1:1000 in PBS, Jackson
ImmunoResearch). Coverslips were washed 3 times for 10 minutes with PBS between antibody
incubations. To stain actin filaments, 5 µl of rhodamine-phalloidin (Invitrogen) was diluted in 200
µl of PBS and added onto coverslips for 20 minutes. Lastly, coverslips were mounted on glass
slides (brand!) using ImmunoMount (Thermo) mounting media and were stored at +4 0C until
imaging. Images were taken using Leica DMI6000 epifluorescence microscope using the
appropriate fluorescence filter cubes. All images used for side-by-side comparison of fluorescence
signal were imaged with same light intensity and exposure time during microscopy and brightness/
contrast levels set to same values during image export.
1.9 Protein database analysis against phosphorylation motifs
Identified RxP(S/T) substrate motif (from Ndr2 positional peptide library scanning) was used in
ScanProsite tool (https://prosite.expasy.org/scanprosite/). Option-2 of motif search (submit motifs
49
to scan them against a PROTEIN sequence database) was used and Swiss-Prot is selected as
database (with Mus musculus filter (taxon ID:10090)). Identified Uniprot-IDs from this search then
filtered for duplicates (mostly isoforms). This list was compared to the in-silico integrin adhesome
components (http://adhesome.org/) for proteins that are involved in the adhesome complex.
Common proteins were finally used in PhosphoSitePlus
(https://www.phosphosite.org/homeAction.action) tool and in literature search for previously
shown phosphorylation modifications on the Serine and Threonine residue of RxP(S/T) motif and
their role in neuronal development regarding integrin receptors.
1.10 Sholl analysis of dendritic morphology
During microscopy, GFP and tdTom co-expressing neurons were selected with two main criteria:
not being accompanied by any transfected neighboring cells to allow fine tracing of dendrites and
to have a typical pyramidal morphology (being a multipolar cell with multiple thick dendrites with
a clearly differentiated/extended axon) (Hanamura et al., 2010). Texas Red channel of the pictures
was exported as Tiff files and all images were pooled to randomize file names using the Fiji plugin.
Dendrites of the randomized images were then traced blind to the genotypes and converted to
binary pictures using Qwin software (Leica). Finally, these binary images were imported to ImageJ
(NIH) and converted to 8-bit. To quantify the complexity of dendritic trees, Sholl analysis plug-in
-which analyzes the number of dendritic intersections at various concentric circles drawn around
the neuron soma at various intervals (Sholl, 1953)- was used on 8-bit skeleton images.
1.11 Statistical analysis
Statistical analysis and data representation (plots) were done using GraphPad Prism 8. The number
of cells with long neurites (>100 µm) and short neurites (<100 µm) were compared using Chi-
50
square tests. Immunofluorescence data were log-transformed before statistical analysis. For Sholl
analysis of dendrites, repeated two-way ANOVA using distance as repeating factor for each neuron
is followed by Fisher Least Significant (LSD) test for multiple comparisons (in case of a significant
interaction). One-way ANOVA was used in case of only one factor was present as an independent
variable (such as total dendritic length across genotypes). Pairwise comparisons were done using
Student’s t-test when appropriate and a statistical threshold for significance was set at p< 0.05 in
all the tests. While reporting post-hoc multiple comparison results (when significant interaction is
present), instead of annotating each data point individually, portions of the line graphs were
selected and noted with the least significance figure available in that portion; for better clarity and
readability in the graphs.
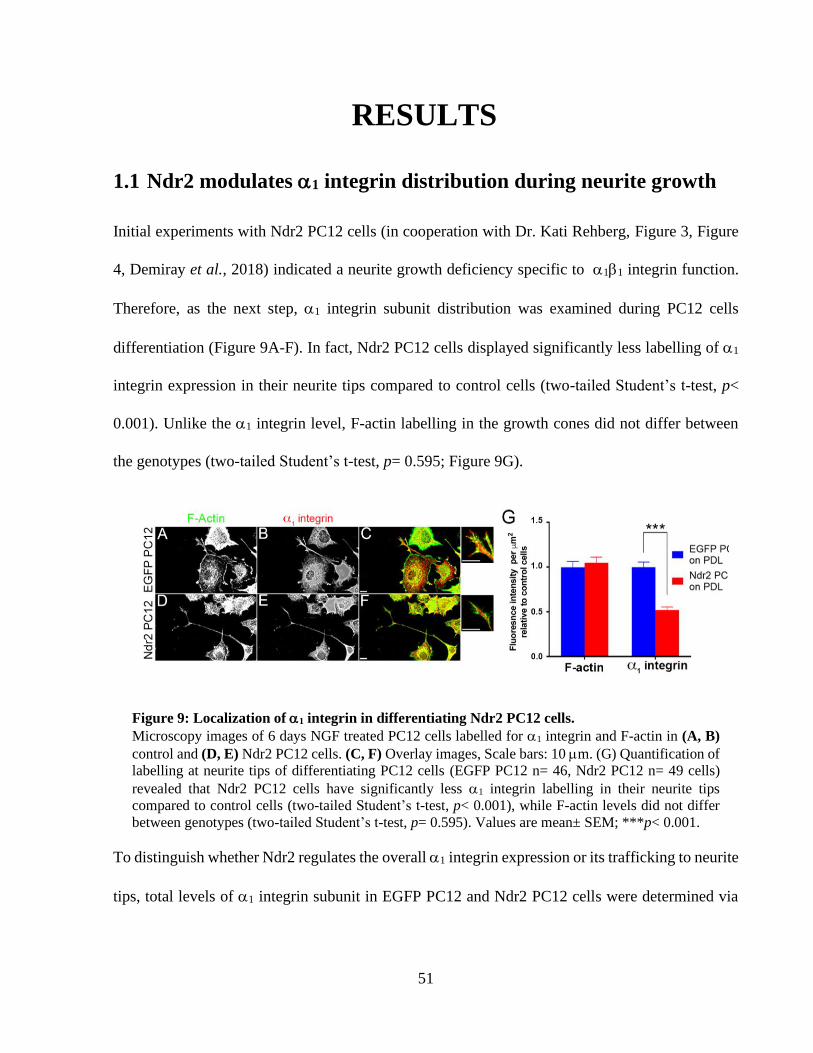
51
RESULTS
1.1 Ndr2 modulates 1 integrin distribution during neurite growth
Initial experiments with Ndr2 PC12 cells (in cooperation with Dr. Kati Rehberg, Figure 3, Figure
4, Demiray et al., 2018) indicated a neurite growth deficiency specific to 11 integrin function.
Therefore, as the next step, 1 integrin subunit distribution was examined during PC12 cells
differentiation (Figure 9A-F). In fact, Ndr2 PC12 cells displayed significantly less labelling of 1
integrin expression in their neurite tips compared to control cells (two-tailed Student’s t-test, p<
0.001). Unlike the 1 integrin level, F-actin labelling in the growth cones did not differ between
the genotypes (two-tailed Student’s t-test, p= 0.595; Figure 9G).
Figure 9: Localization of 1 integrin in differentiating Ndr2 PC12 cells.
Microscopy images of 6 days NGF treated PC12 cells labelled for 1 integrin and F-actin in (A, B)
control and (D, E) Ndr2 PC12 cells. (C, F) Overlay images, Scale bars: 10 m. (G) Quantification of
labelling at neurite tips of differentiating PC12 cells (EGFP PC12 n= 46, Ndr2 PC12 n= 49 cells)
revealed that Ndr2 PC12 cells have significantly less 1 integrin labelling in their neurite tips
compared to control cells (two-tailed Student’s t-test, p< 0.001), while F-actin levels did not differ
between genotypes (two-tailed Student’s t-test, p= 0.595). Values are mean± SEM; ***p< 0.001.
To distinguish whether Ndr2 regulates the overall 1 integrin expression or its trafficking to neurite
tips, total levels of 1 integrin subunit in EGFP PC12 and Ndr2 PC12 cells were determined via
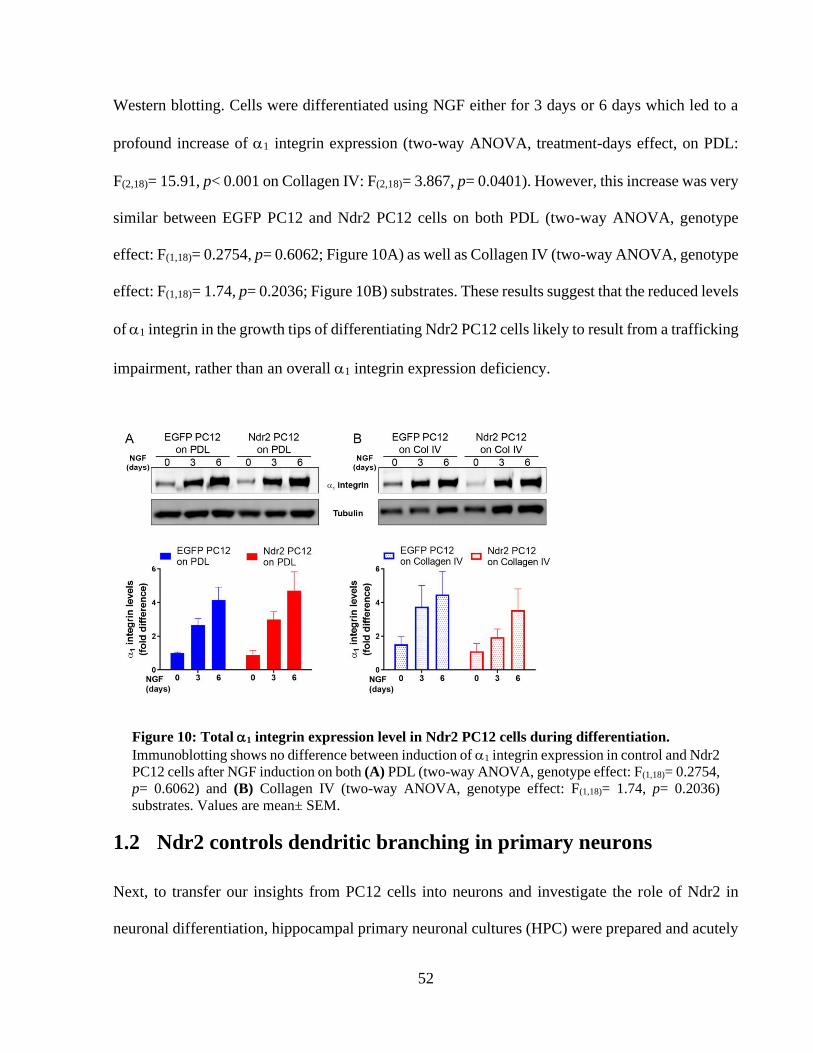
52
Western blotting. Cells were differentiated using NGF either for 3 days or 6 days which led to a
profound increase of 1 integrin expression (two-way ANOVA, treatment-days effect, on PDL:
F(2,18)= 15.91, p< 0.001 on Collagen IV: F(2,18)= 3.867, p= 0.0401). However, this increase was very
similar between EGFP PC12 and Ndr2 PC12 cells on both PDL (two-way ANOVA, genotype
effect: F(1,18)= 0.2754, p= 0.6062; Figure 10A) as well as Collagen IV (two-way ANOVA, genotype
effect: F(1,18)= 1.74, p= 0.2036; Figure 10B) substrates. These results suggest that the reduced levels
of 1 integrin in the growth tips of differentiating Ndr2 PC12 cells likely to result from a trafficking
impairment, rather than an overall 1 integrin expression deficiency.
Figure 10: Total 1 integrin expression level in Ndr2 PC12 cells during differentiation.
Immunoblotting shows no difference between induction of 1 integrin expression in control and Ndr2
PC12 cells after NGF induction on both (A) PDL (two-way ANOVA, genotype effect: F(1,18)= 0.2754,
p= 0.6062) and (B) Collagen IV (two-way ANOVA, genotype effect: F(1,18)= 1.74, p= 0.2036)
substrates. Values are mean± SEM.
1.2 Ndr2 controls dendritic branching in primary neurons
Next, to transfer our insights from PC12 cells into neurons and investigate the role of Ndr2 in
neuronal differentiation, hippocampal primary neuronal cultures (HPC) were prepared and acutely
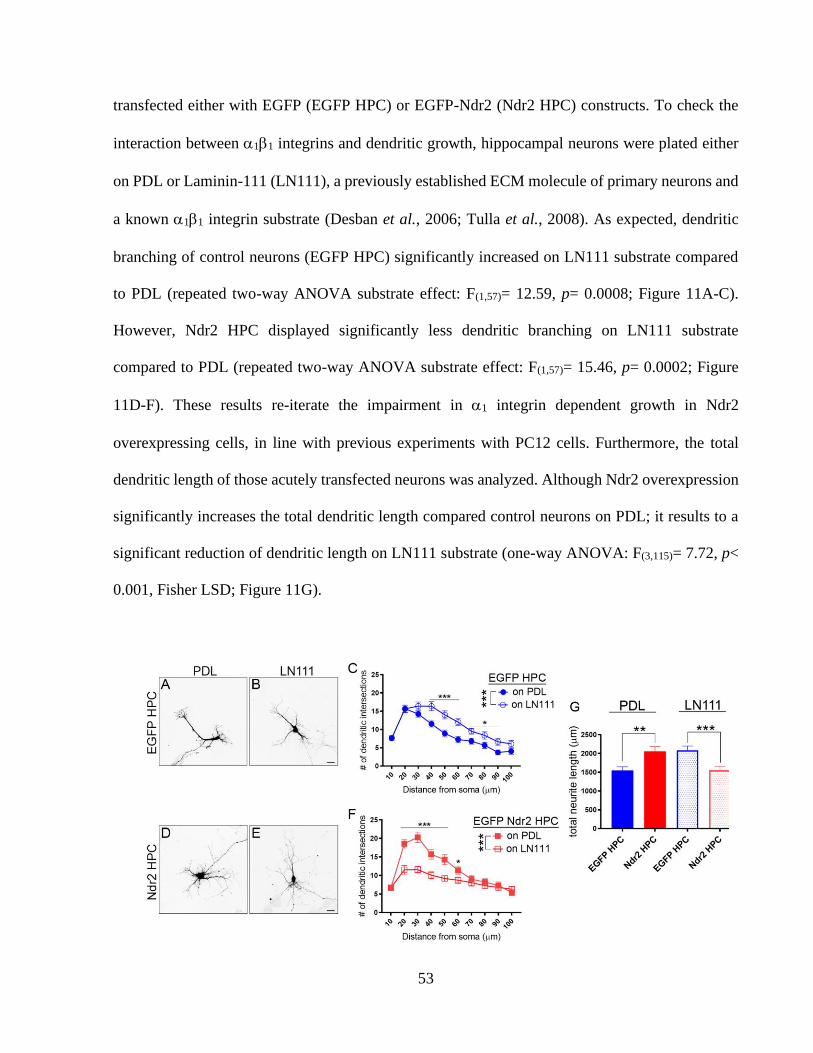
53
transfected either with EGFP (EGFP HPC) or EGFP-Ndr2 (Ndr2 HPC) constructs. To check the
interaction between 11 integrins and dendritic growth, hippocampal neurons were plated either
on PDL or Laminin-111 (LN111), a previously established ECM molecule of primary neurons and
a known 11 integrin substrate (Desban et al., 2006; Tulla et al., 2008). As expected, dendritic
branching of control neurons (EGFP HPC) significantly increased on LN111 substrate compared
to PDL (repeated two-way ANOVA substrate effect: F(1,57)= 12.59, p= 0.0008; Figure 11A-C).
However, Ndr2 HPC displayed significantly less dendritic branching on LN111 substrate
compared to PDL (repeated two-way ANOVA substrate effect: F(1,57)= 15.46, p= 0.0002; Figure
11D-F). These results re-iterate the impairment in 1 integrin dependent growth in Ndr2
overexpressing cells, in line with previous experiments with PC12 cells. Furthermore, the total
dendritic length of those acutely transfected neurons was analyzed. Although Ndr2 overexpression
significantly increases the total dendritic length compared control neurons on PDL; it results to a
significant reduction of dendritic length on LN111 substrate (one-way ANOVA: F(3,115)= 7.72, p<
0.001, Fisher LSD; Figure 11G).
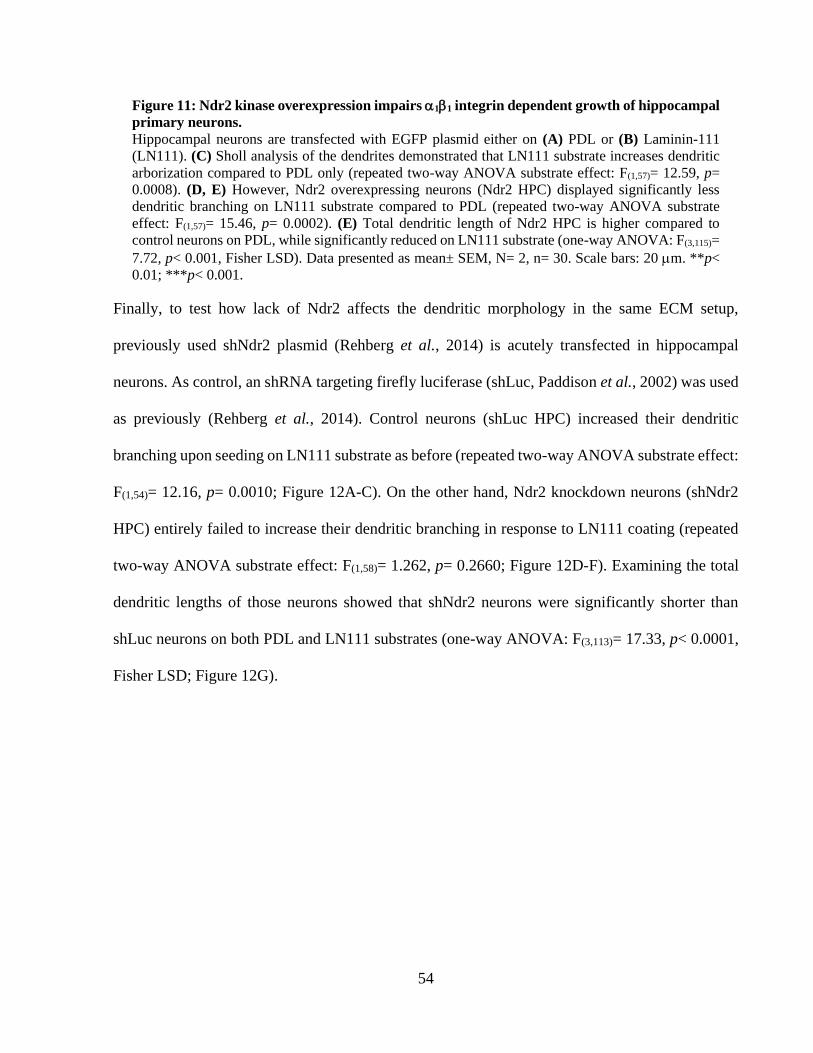
54
Figure 11: Ndr2 kinase overexpression impairs 11 integrin dependent growth of hippocampal
primary neurons.
Hippocampal neurons are transfected with EGFP plasmid either on (A) PDL or (B) Laminin-111
(LN111). (C) Sholl analysis of the dendrites demonstrated that LN111 substrate increases dendritic
arborization compared to PDL only (repeated two-way ANOVA substrate effect: F(1,57)= 12.59, p=
0.0008). (D, E) However, Ndr2 overexpressing neurons (Ndr2 HPC) displayed significantly less
dendritic branching on LN111 substrate compared to PDL (repeated two-way ANOVA substrate
effect: F(1,57)= 15.46, p= 0.0002). (E) Total dendritic length of Ndr2 HPC is higher compared to
control neurons on PDL, while significantly reduced on LN111 substrate (one-way ANOVA: F(3,115)=
7.72, p< 0.001, Fisher LSD). Data presented as mean± SEM, N= 2, n= 30. Scale bars: 20 m. **p<
0.01; ***p< 0.001.
Finally, to test how lack of Ndr2 affects the dendritic morphology in the same ECM setup,
previously used shNdr2 plasmid (Rehberg et al., 2014) is acutely transfected in hippocampal
neurons. As control, an shRNA targeting firefly luciferase (shLuc, Paddison et al., 2002) was used
as previously (Rehberg et al., 2014). Control neurons (shLuc HPC) increased their dendritic
branching upon seeding on LN111 substrate as before (repeated two-way ANOVA substrate effect:
F(1,54)= 12.16, p= 0.0010; Figure 12A-C). On the other hand, Ndr2 knockdown neurons (shNdr2
HPC) entirely failed to increase their dendritic branching in response to LN111 coating (repeated
two-way ANOVA substrate effect: F(1,58)= 1.262, p= 0.2660; Figure 12D-F). Examining the total
dendritic lengths of those neurons showed that shNdr2 neurons were significantly shorter than
shLuc neurons on both PDL and LN111 substrates (one-way ANOVA: F(3,113)= 17.33, p< 0.0001,
Fisher LSD; Figure 12G).

55
Figure 12: Ndr2 kinase is required for LN111 mediated dendritic growth of hippocampal
neurons.
Hippocampal neurons are transfected with shLuc control plasmid either on (A) PDL or (B) Laminin-
111 (LN111). (C) In line with previous observations, Sholl analysis of the dendrites demonstrated
that LN111 substrate increases dendritic arborization of control neurons (repeated two-way ANOVA
substrate effect: F(1,54)= 12.16, p= 0.0010). (D, E) On the other hand, in shNdr2 transfected
hippocampal neurons (shNdr2 HPC), dendritic branching between PDL and LN111 did not change
(repeated two-way ANOVA substrate effect: F(1,58)= 1.262, p= 0.2660). (E) In fact, shNdr2 HPC
group displayed significantly less dendritic length on both PDL and LN111 substrate compared to
control neurons, re-iterating its role in dendritic growth (one-way ANOVA: F(3,113)= 17.33, p< 0.0001,
Fisher LSD). Data presented as mean± SEM, N= 2, n= 30. Scale bars: 20 m. *p< 0.05; ***p< 0.001.
1.3 Ndr2 kinase targets Filamin A as a downstream substrate
Previous work showed that Ndr2 can increase the phosphorylation (T788/T789) and surface
expression of 1 integrins (Rehberg et al., 2014; Demiray et al., 2018). However, neither okadaic
acid stimulated nor an constitutively active form of Ndr2 could phosphorylate the cytoplasmic tail
of 1 integrins in an in vitro kinase assay (Rehberg et al., 2014). This indicates an indirect effect
on 1 integrin activity by Ndr2 kinase rather than a direct phosphorylation. Therefore, as the next
step, the question of which integrin-activity modulator might be the downstream target of Ndr2
was addressed. First, using purified WT Ndr2/Mob2 heterodimer, a positional peptide library
scanning with radioactively labelled ATP identified the R-X-P-(S/T) motif as the optimal amino
56
acid substrate for Ndr2 kinase (in cooperation with Eric Devroe & Benjamin Turk, see 1.1.2 for
details; Figure 13A, left; Waldt et al., 2018). Normalized data from two independent runs were
then averaged, log transformed, and heat maps were generated (Figure 13A, right). It should be
noted that same reaction is also performed with catalytically inactive (K119A) Ndr2 mutant to
confirm the labelling is not performed by contaminating kinase (personal communication, Eric
Devroe & Benjamin Turk). Next, the identified RXP(S/T) motif was scanned in the mouse protein
database using ScanProsite (Expasy tools); which resulted 3486 different proteins. This list is then
aligned with an in-silico integrin adhesome network which consists of 221 proteins identified via
biomedical literature and protein databases (Zaidel-Bar et al., 2007; Winograd-Katz et al., 2014).
This approach has identified 28 different proteins in integrin adhesome containing the RXP(S/T)
motif (Figure 13B, full list can be seen in Table 5). Of this 28 proteins, to distinguish previously
observed posttranslational modifications on the phosphoacceptor residue from any non-specific
RXP(S/T) motifs, PhosphoSitePlus tool (Cell Signaling) and further literature search has been
used, which resulted into 3 possible downstream candidate of Ndr2 phosphorylation via this motif:
protein tyrosine phosphatase receptor A (PTPRA-S204), heat shock binding protein 1 (HSBP-1-
S15) and Filamin A (FlnA-S2152), which are listed with their interaction partners from integrin
adhesome network in Figure 13C-E. Filamin A was the most interesting candidate among them by
directly interacting with different integrin subunits in the adhesome network (Travis et al., 2004;
Kim et al., 2008; Takala et al., 2008) and with actin cytoskeleton (Nakamura et al., 2002, 2005;
Mammoto, Huang and Ingber, 2007).
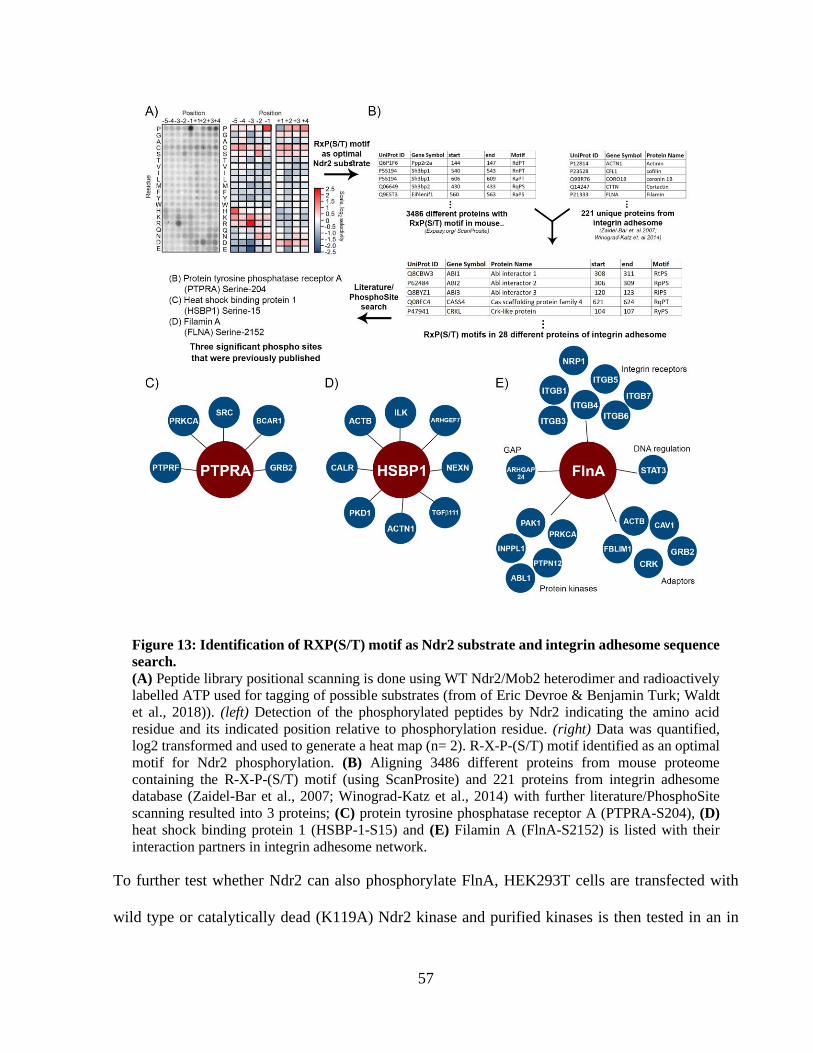
57
Figure 13: Identification of RXP(S/T) motif as Ndr2 substrate and integrin adhesome sequence
search.
(A) Peptide library positional scanning is done using WT Ndr2/Mob2 heterodimer and radioactively
labelled ATP used for tagging of possible substrates (from of Eric Devroe & Benjamin Turk; Waldt
et al., 2018)). (left) Detection of the phosphorylated peptides by Ndr2 indicating the amino acid
residue and its indicated position relative to phosphorylation residue. (right) Data was quantified,
log2 transformed and used to generate a heat map (n= 2). R-X-P-(S/T) motif identified as an optimal
motif for Ndr2 phosphorylation. (B) Aligning 3486 different proteins from mouse proteome
containing the R-X-P-(S/T) motif (using ScanProsite) and 221 proteins from integrin adhesome
database (Zaidel-Bar et al., 2007; Winograd-Katz et al., 2014) with further literature/PhosphoSite
scanning resulted into 3 proteins; (C) protein tyrosine phosphatase receptor A (PTPRA-S204), (D)
heat shock binding protein 1 (HSBP-1-S15) and (E) Filamin A (FlnA-S2152) is listed with their
interaction partners in integrin adhesome network.
To further test whether Ndr2 can also phosphorylate FlnA, HEK293T cells are transfected with
wild type or catalytically dead (K119A) Ndr2 kinase and purified kinases is then tested in an in
58
vitro kinase assay using GST-FlnA fragment (repeats 19-24, containing Serine-2152 residue) as
substrate (Figure 14A; in cooperation with Dr. Stefanie Kliche; Waldt et al. 2018). High levels of
FlnA S2152 phosphorylation was detected specifically in wild type Ndr2 and not in K119A kinase-
dead mutant elutes. It should also be noted that, S2152 phosphorylation of FlnA fragment by Ndr2
occurred specifically in okadaic acid (OA) pre-treated cells, which has previously shown to
stimulate Ndr2 activity and inhibit phosphatases (Devroe et al., 2004). Next, NIH3T3 fibroblast
line were used to test how FlnA phosphorylation is controlled by Ndr2 kinase in mouse cells. To
manipulate Ndr2 levels, unconcentrated lentiviral particles were produced in HEK293T cells using
either a control (shLuc) or a Ndr2 shRNA (Rehberg et al., 2014; Figure 14B). To stimulate FlnA
phosphorylation in fibroblasts, cells were serum starved overnight and stimulated with FBS (Woo
et al., 2004; Zhang et al., 2013) for indicated time points. Immunoblotting against phosphorylated
FlnA at Serine-2152 residue showed that silencing Ndr2 significantly reduced FlnA
phosphorylation levels upon FBS stimulation in untreated (Figure 14C; two-way ANOVA
genotype effect: F(1,80)= 6.004, p= 0.0165) and OA pre-treated cells (Figure 14D; two-way ANOVA
genotype effect: F(1,72)= 7.442, p= 0.0080). In parallel, using a more specific stimulation of Ndr2-
FlnA axis other than FBS, it has been shown that T-cell receptor activation induces Ndr2 mediated
S2152 phosphorylation. While control Jurkat T-cells displayed a significant increase of FlnA
S2152 phosphorylation, shNdr2 or kinase-dead (K119A) Ndr2 transfected cells failed to respond
to the CD3 stimulation did not phosphorylate FlnA S2152 (in cooperation with Dr. Stefanie Kliche;
Appendix Figure 43; Waldt et al., 2018).
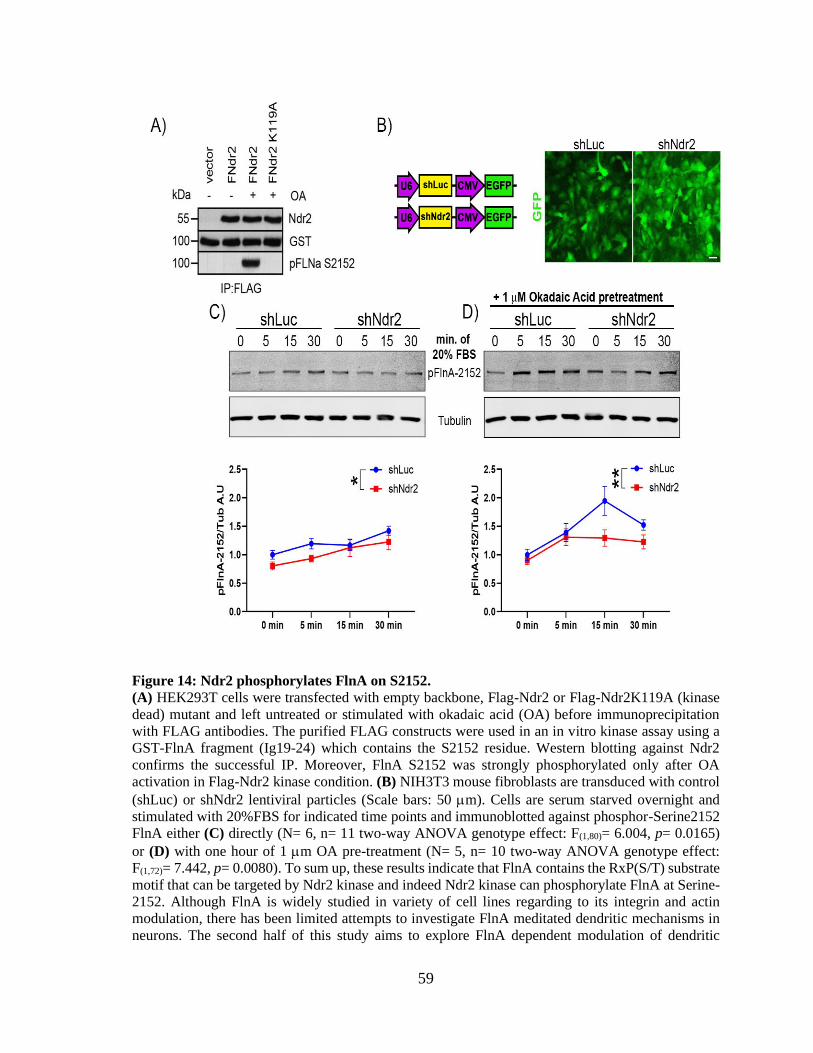
59
Figure 14: Ndr2 phosphorylates FlnA on S2152.
(A) HEK293T cells were transfected with empty backbone, Flag-Ndr2 or Flag-Ndr2K119A (kinase
dead) mutant and left untreated or stimulated with okadaic acid (OA) before immunoprecipitation
with FLAG antibodies. The purified FLAG constructs were used in an in vitro kinase assay using a
GST-FlnA fragment (Ig19-24) which contains the S2152 residue. Western blotting against Ndr2
confirms the successful IP. Moreover, FlnA S2152 was strongly phosphorylated only after OA
activation in Flag-Ndr2 kinase condition. (B) NIH3T3 mouse fibroblasts are transduced with control
(shLuc) or shNdr2 lentiviral particles (Scale bars: 50 m). Cells are serum starved overnight and
stimulated with 20%FBS for indicated time points and immunoblotted against phosphor-Serine2152
FlnA either (C) directly (N= 6, n= 11 two-way ANOVA genotype effect: F(1,80)= 6.004, p= 0.0165)
or (D) with one hour of 1 m OA pre-treatment (N= 5, n= 10 two-way ANOVA genotype effect:
F(1,72)= 7.442, p= 0.0080). To sum up, these results indicate that FlnA contains the RxP(S/T) substrate
motif that can be targeted by Ndr2 kinase and indeed Ndr2 kinase can phosphorylate FlnA at Serine-
2152. Although FlnA is widely studied in variety of cell lines regarding to its integrin and actin
modulation, there has been limited attempts to investigate FlnA meditated dendritic mechanisms in
neurons. The second half of this study aims to explore FlnA dependent modulation of dendritic
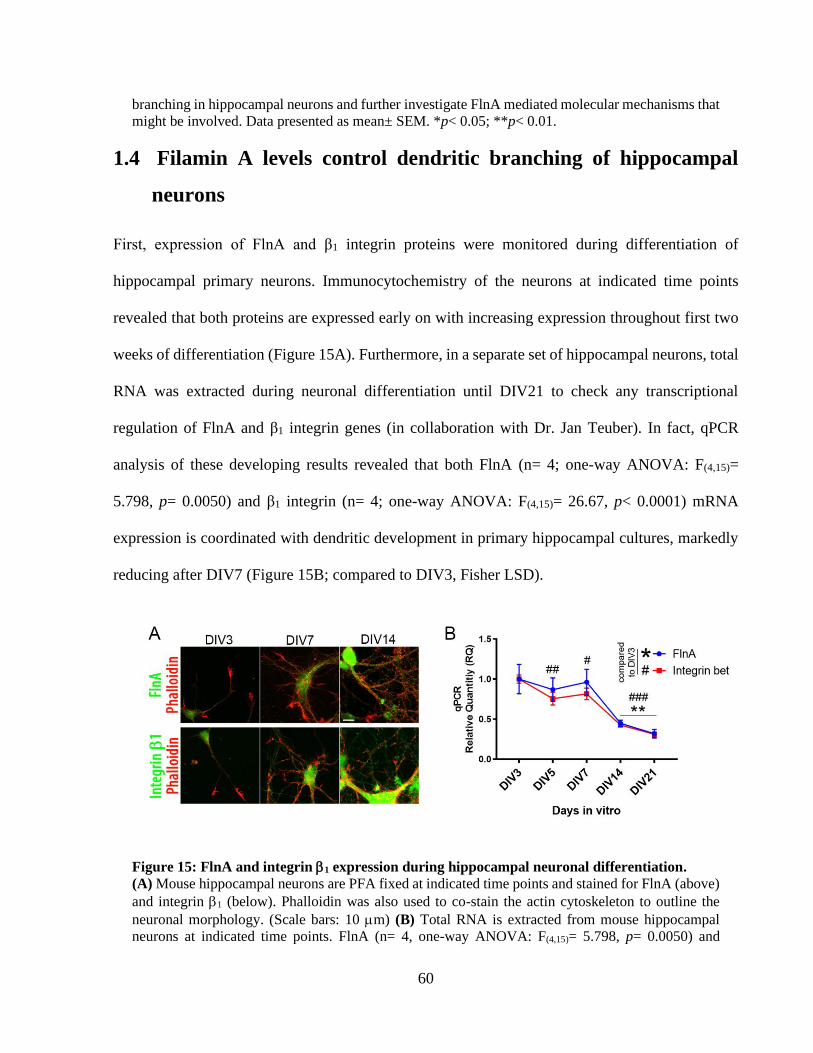
60
branching in hippocampal neurons and further investigate FlnA mediated molecular mechanisms that
might be involved. Data presented as mean± SEM. *p< 0.05; **p< 0.01.
1.4 Filamin A levels control dendritic branching of hippocampal
neurons
First, expression of FlnA and β1 integrin proteins were monitored during differentiation of
hippocampal primary neurons. Immunocytochemistry of the neurons at indicated time points
revealed that both proteins are expressed early on with increasing expression throughout first two
weeks of differentiation (Figure 15A). Furthermore, in a separate set of hippocampal neurons, total
RNA was extracted during neuronal differentiation until DIV21 to check any transcriptional
regulation of FlnA and β1 integrin genes (in collaboration with Dr. Jan Teuber). In fact, qPCR
analysis of these developing results revealed that both FlnA (n= 4; one-way ANOVA: F(4,15)=
5.798, p= 0.0050) and β1 integrin (n= 4; one-way ANOVA: F(4,15)= 26.67, p< 0.0001) mRNA
expression is coordinated with dendritic development in primary hippocampal cultures, markedly
reducing after DIV7 (Figure 15B; compared to DIV3, Fisher LSD).
Figure 15: FlnA and integrin 1 expression during hippocampal neuronal differentiation.
(A) Mouse hippocampal neurons are PFA fixed at indicated time points and stained for FlnA (above)
and integrin 1 (below). Phalloidin was also used to co-stain the actin cytoskeleton to outline the
neuronal morphology. (Scale bars: 10 m) (B) Total RNA is extracted from mouse hippocampal
neurons at indicated time points. FlnA (n= 4, one-way ANOVA: F(4,15)= 5.798, p= 0.0050) and
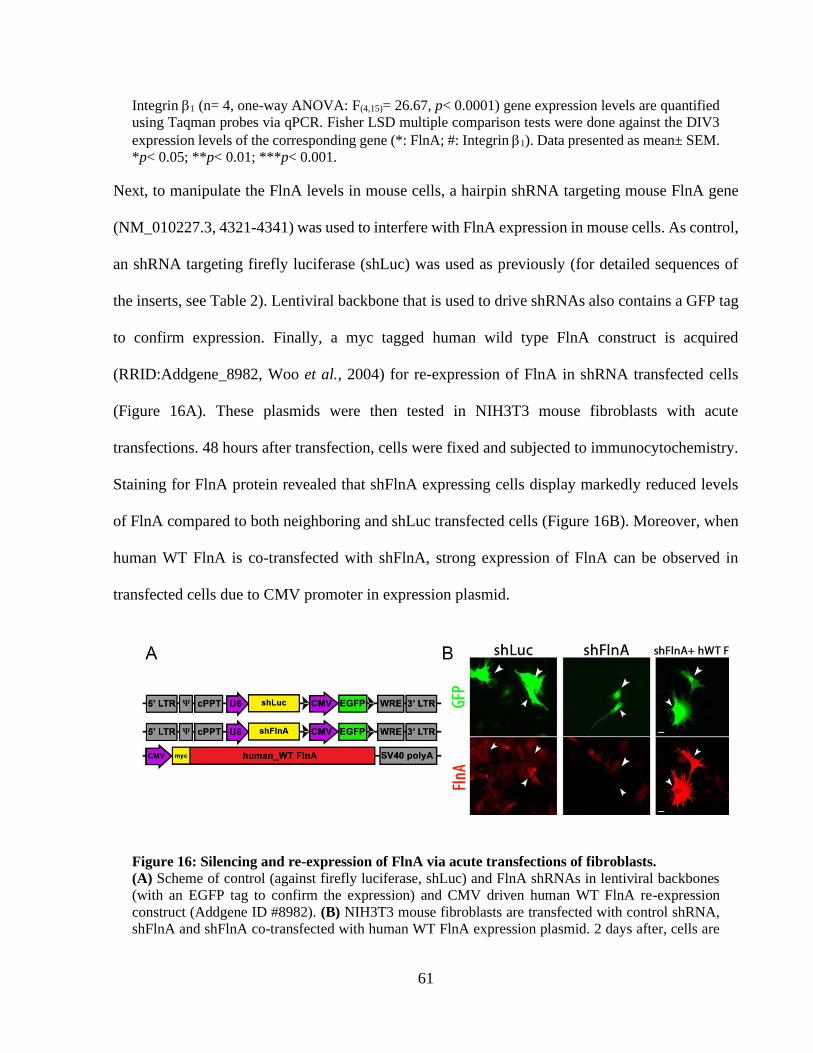
61
Integrin 1 (n= 4, one-way ANOVA: F(4,15)= 26.67, p< 0.0001) gene expression levels are quantified
using Taqman probes via qPCR. Fisher LSD multiple comparison tests were done against the DIV3
expression levels of the corresponding gene (*: FlnA; #: Integrin 1). Data presented as mean± SEM.
*p< 0.05; **p< 0.01; ***p< 0.001.
Next, to manipulate the FlnA levels in mouse cells, a hairpin shRNA targeting mouse FlnA gene
(NM_010227.3, 4321-4341) was used to interfere with FlnA expression in mouse cells. As control,
an shRNA targeting firefly luciferase (shLuc) was used as previously (for detailed sequences of
the inserts, see Table 2). Lentiviral backbone that is used to drive shRNAs also contains a GFP tag
to confirm expression. Finally, a myc tagged human wild type FlnA construct is acquired
(RRID:Addgene_8982, Woo et al., 2004) for re-expression of FlnA in shRNA transfected cells
(Figure 16A). These plasmids were then tested in NIH3T3 mouse fibroblasts with acute
transfections. 48 hours after transfection, cells were fixed and subjected to immunocytochemistry.
Staining for FlnA protein revealed that shFlnA expressing cells display markedly reduced levels
of FlnA compared to both neighboring and shLuc transfected cells (Figure 16B). Moreover, when
human WT FlnA is co-transfected with shFlnA, strong expression of FlnA can be observed in
transfected cells due to CMV promoter in expression plasmid.
Figure 16: Silencing and re-expression of FlnA via acute transfections of fibroblasts.
(A) Scheme of control (against firefly luciferase, shLuc) and FlnA shRNAs in lentiviral backbones
(with an EGFP tag to confirm the expression) and CMV driven human WT FlnA re-expression
construct (Addgene ID #8982). (B) NIH3T3 mouse fibroblasts are transfected with control shRNA,
shFlnA and shFlnA co-transfected with human WT FlnA expression plasmid. 2 days after, cells are
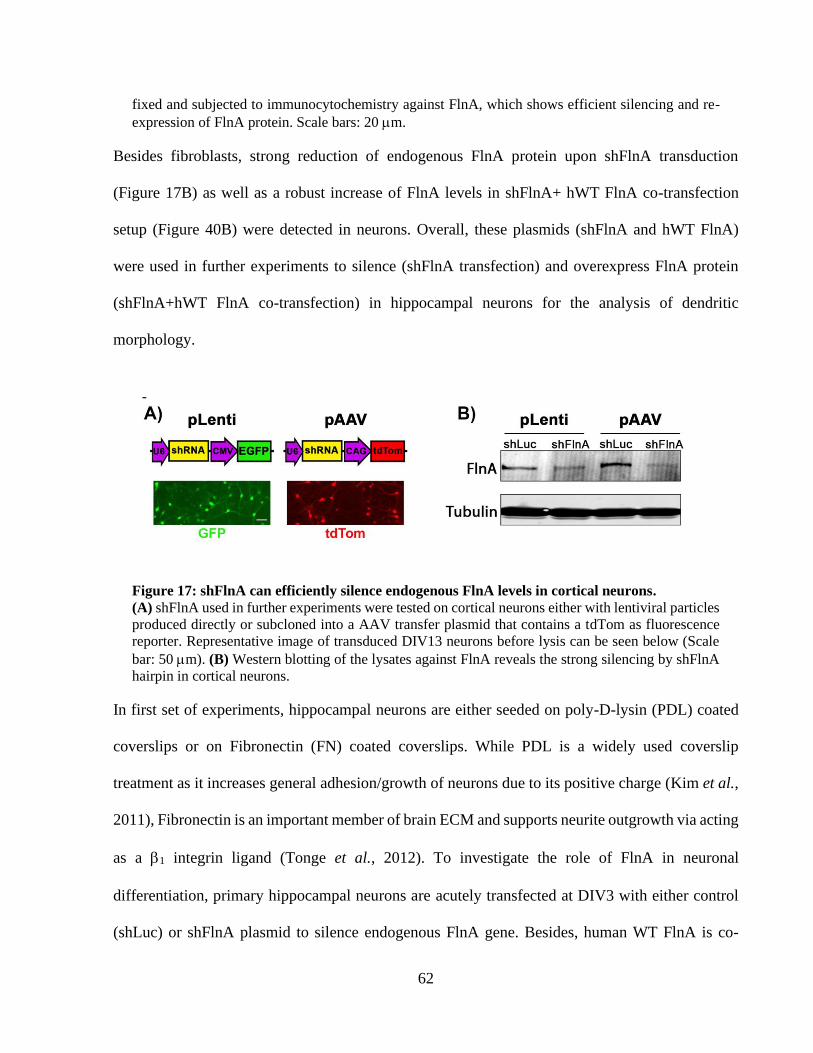
62
fixed and subjected to immunocytochemistry against FlnA, which shows efficient silencing and re-
expression of FlnA protein. Scale bars: 20 m.
Besides fibroblasts, strong reduction of endogenous FlnA protein upon shFlnA transduction
(Figure 17B) as well as a robust increase of FlnA levels in shFlnA+ hWT FlnA co-transfection
setup (Figure 40B) were detected in neurons. Overall, these plasmids (shFlnA and hWT FlnA)
were used in further experiments to silence (shFlnA transfection) and overexpress FlnA protein
(shFlnA+hWT FlnA co-transfection) in hippocampal neurons for the analysis of dendritic
morphology.
Figure 17: shFlnA can efficiently silence endogenous FlnA levels in cortical neurons.
(A) shFlnA used in further experiments were tested on cortical neurons either with lentiviral particles
produced directly or subcloned into a AAV transfer plasmid that contains a tdTom as fluorescence
reporter. Representative image of transduced DIV13 neurons before lysis can be seen below (Scale
bar: 50 m). (B) Western blotting of the lysates against FlnA reveals the strong silencing by shFlnA
hairpin in cortical neurons.
In first set of experiments, hippocampal neurons are either seeded on poly-D-lysin (PDL) coated
coverslips or on Fibronectin (FN) coated coverslips. While PDL is a widely used coverslip
treatment as it increases general adhesion/growth of neurons due to its positive charge (Kim et al.,
2011), Fibronectin is an important member of brain ECM and supports neurite outgrowth via acting
as a 1 integrin ligand (Tonge et al., 2012). To investigate the role of FlnA in neuronal
differentiation, primary hippocampal neurons are acutely transfected at DIV3 with either control
(shLuc) or shFlnA plasmid to silence endogenous FlnA gene. Besides, human WT FlnA is co-
-
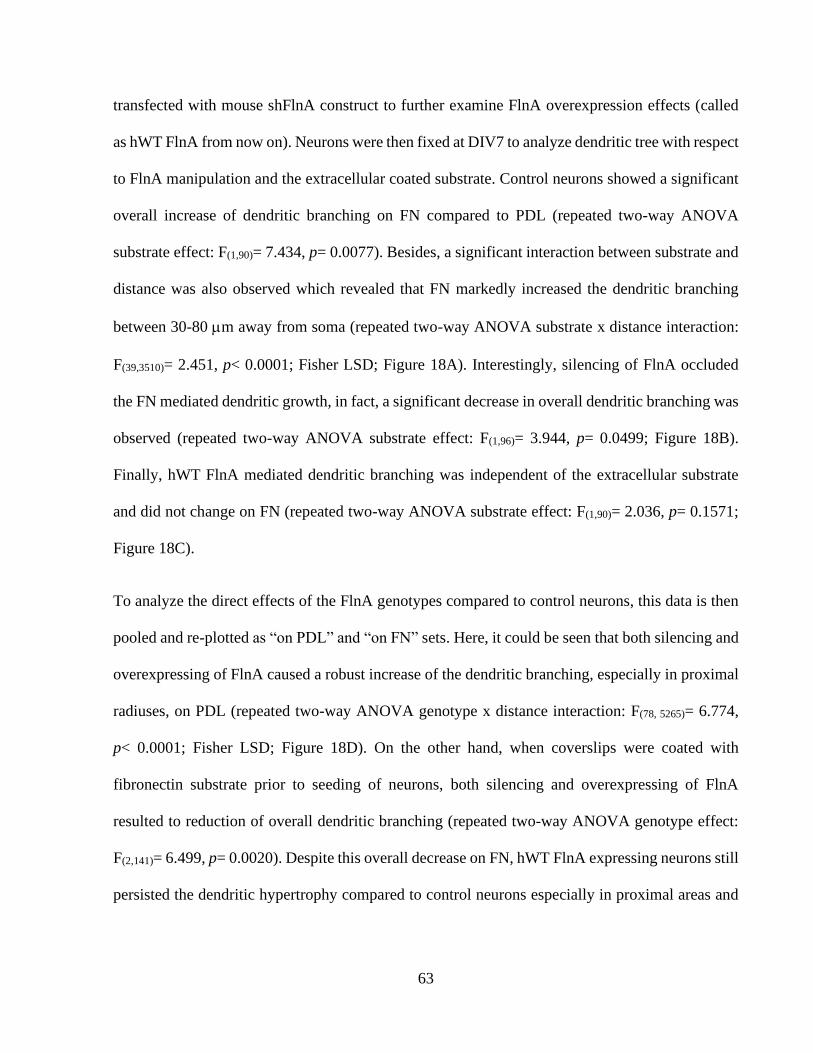
63
transfected with mouse shFlnA construct to further examine FlnA overexpression effects (called
as hWT FlnA from now on). Neurons were then fixed at DIV7 to analyze dendritic tree with respect
to FlnA manipulation and the extracellular coated substrate. Control neurons showed a significant
overall increase of dendritic branching on FN compared to PDL (repeated two-way ANOVA
substrate effect: F(1,90)= 7.434, p= 0.0077). Besides, a significant interaction between substrate and
distance was also observed which revealed that FN markedly increased the dendritic branching
between 30-80 m away from soma (repeated two-way ANOVA substrate x distance interaction:
F(39,3510)= 2.451, p< 0.0001; Fisher LSD; Figure 18A). Interestingly, silencing of FlnA occluded
the FN mediated dendritic growth, in fact, a significant decrease in overall dendritic branching was
observed (repeated two-way ANOVA substrate effect: F(1,96)= 3.944, p= 0.0499; Figure 18B).
Finally, hWT FlnA mediated dendritic branching was independent of the extracellular substrate
and did not change on FN (repeated two-way ANOVA substrate effect: F(1,90)= 2.036, p= 0.1571;
Figure 18C).
To analyze the direct effects of the FlnA genotypes compared to control neurons, this data is then
pooled and re-plotted as “on PDL” and “on FN” sets. Here, it could be seen that both silencing and
overexpressing of FlnA caused a robust increase of the dendritic branching, especially in proximal
radiuses, on PDL (repeated two-way ANOVA genotype x distance interaction: F(78, 5265)= 6.774,
p< 0.0001; Fisher LSD; Figure 18D). On the other hand, when coverslips were coated with
fibronectin substrate prior to seeding of neurons, both silencing and overexpressing of FlnA
resulted to reduction of overall dendritic branching (repeated two-way ANOVA genotype effect:
F(2,141)= 6.499, p= 0.0020). Despite this overall decrease on FN, hWT FlnA expressing neurons still
persisted the dendritic hypertrophy compared to control neurons especially in proximal areas and
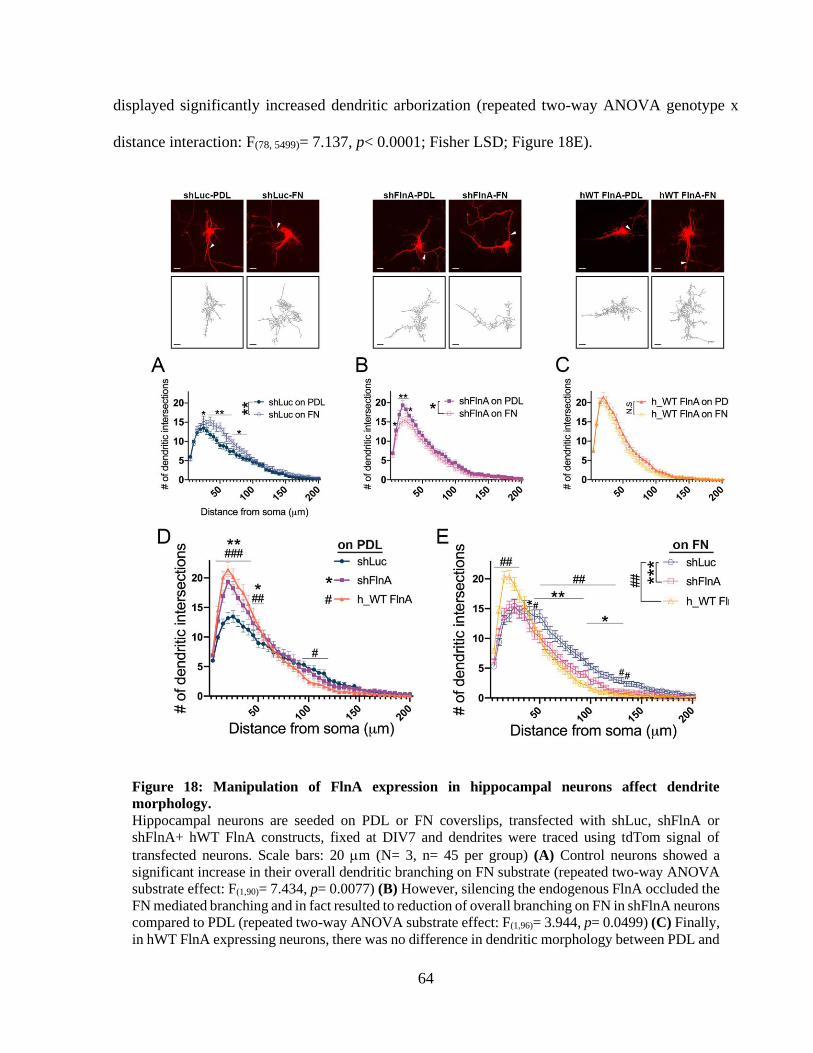
64
displayed significantly increased dendritic arborization (repeated two-way ANOVA genotype x
distance interaction: F(78, 5499)= 7.137, p< 0.0001; Fisher LSD; Figure 18E).
Figure 18: Manipulation of FlnA expression in hippocampal neurons affect dendrite
morphology.
Hippocampal neurons are seeded on PDL or FN coverslips, transfected with shLuc, shFlnA or
shFlnA+ hWT FlnA constructs, fixed at DIV7 and dendrites were traced using tdTom signal of
transfected neurons. Scale bars: 20 m (N= 3, n= 45 per group) (A) Control neurons showed a
significant increase in their overall dendritic branching on FN substrate (repeated two-way ANOVA
substrate effect: F(1,90)= 7.434, p= 0.0077) (B) However, silencing the endogenous FlnA occluded the
FN mediated branching and in fact resulted to reduction of overall branching on FN in shFlnA neurons
compared to PDL (repeated two-way ANOVA substrate effect: F(1,96)= 3.944, p= 0.0499) (C) Finally,
in hWT FlnA expressing neurons, there was no difference in dendritic morphology between PDL and
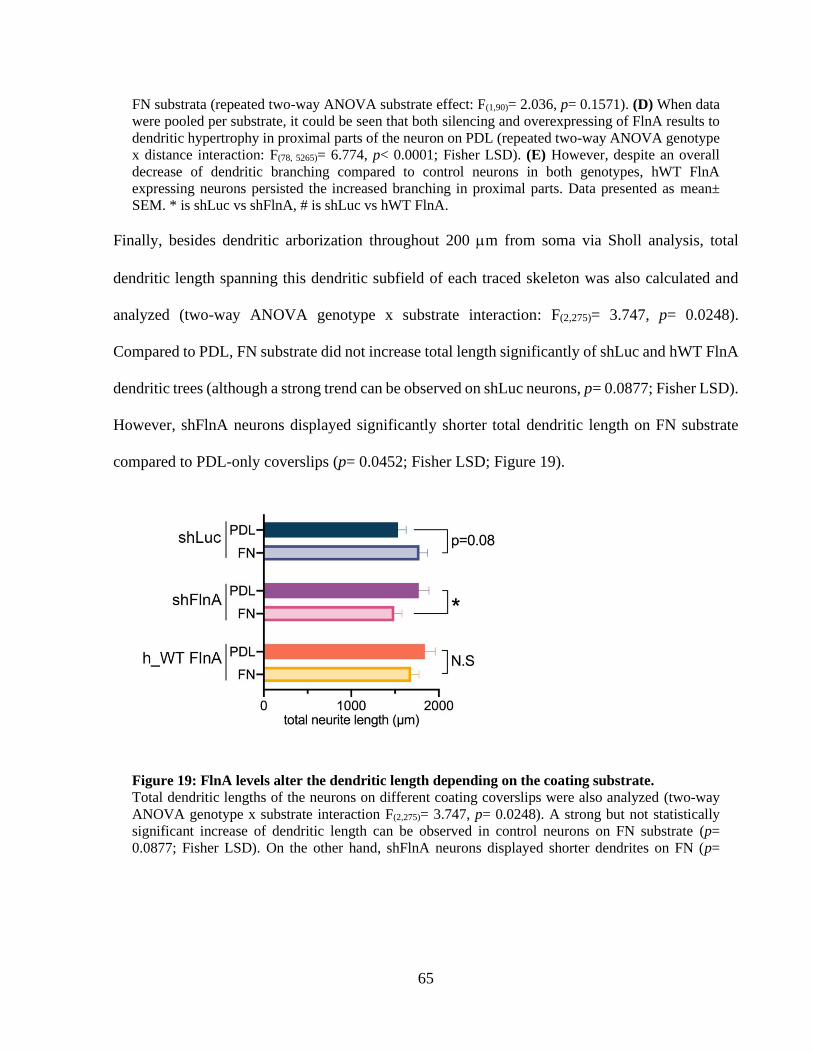
65
FN substrata (repeated two-way ANOVA substrate effect: F(1,90)= 2.036, p= 0.1571). (D) When data
were pooled per substrate, it could be seen that both silencing and overexpressing of FlnA results to
dendritic hypertrophy in proximal parts of the neuron on PDL (repeated two-way ANOVA genotype
x distance interaction: F(78, 5265)= 6.774, p< 0.0001; Fisher LSD). (E) However, despite an overall
decrease of dendritic branching compared to control neurons in both genotypes, hWT FlnA
expressing neurons persisted the increased branching in proximal parts. Data presented as mean±
SEM. * is shLuc vs shFlnA, # is shLuc vs hWT FlnA.
Finally, besides dendritic arborization throughout 200 m from soma via Sholl analysis, total
dendritic length spanning this dendritic subfield of each traced skeleton was also calculated and
analyzed (two-way ANOVA genotype x substrate interaction: F(2,275)= 3.747, p= 0.0248).
Compared to PDL, FN substrate did not increase total length significantly of shLuc and hWT FlnA
dendritic trees (although a strong trend can be observed on shLuc neurons, p= 0.0877; Fisher LSD).
However, shFlnA neurons displayed significantly shorter total dendritic length on FN substrate
compared to PDL-only coverslips (p= 0.0452; Fisher LSD; Figure 19).
Figure 19: FlnA levels alter the dendritic length depending on the coating substrate.
Total dendritic lengths of the neurons on different coating coverslips were also analyzed (two-way
ANOVA genotype x substrate interaction F(2,275)= 3.747, p= 0.0248). A strong but not statistically
significant increase of dendritic length can be observed in control neurons on FN substrate (p=
0.0877; Fisher LSD). On the other hand, shFlnA neurons displayed shorter dendrites on FN (p=
66
0.0452; Fisher LSD) while hWT FlnA neurons did not change between the substrates (p= 0. 2760;
Fisher LSD; repeated-measures two-way ANOVA substrate effect: F(1,90)= 7.434, p= 0.0077).
Moreover, an alternative small hairpin RNA targeting mouse FlnA transcript (Figure 20A, named
as shFlnA_v2) is further used to confirm the observed dendritic morphology. Transfection of
shFlnA_v2 into mouse fibroblasts demonstrated the silencing of the endogenous mouse FlnA
similar to original shFlnA hairpin (Figure 20B). shFlnA_v2 also caused a dendritic hypertrophy
compared to control neurons (repeated two-way ANOVA substrate effect: F(1,86)= 11.47, p=
0.0011; Figure 20C-D). Moreover, shFlnA_v2 also caused a significant increase in total dendritic
length compared to control neurons on PDL (two-tailed Student’s t-test, p< 0.0001; Figure 20E).
Figure 20: Silencing of FlnA with a second small hairpin RNA (shFlnA_v2) produces a similar
dendritic hypertrophy.
(A) BLAST search of previously used shFlnA and the alternative shFlnA_v2 in mouse RefSeq
transcript database. (B) NIH3T3 cells are transfected with control, shFlnA or shFlnA_v2 plasmids
and lysed 48 hours later. Western blotting of the lysates demonstrates the efficient silencing of the
endogenous FlnA by both FlnA shRNAs. (C) Hippocampal neurons are transfected with shLuc and
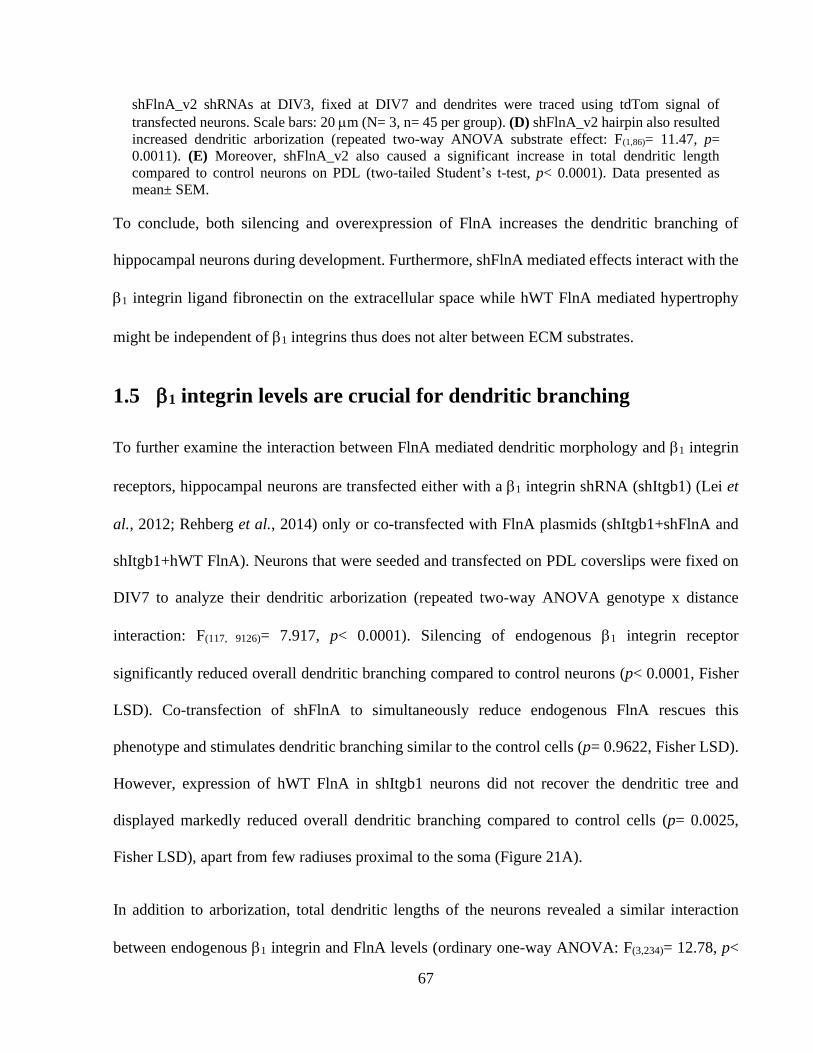
67
shFlnA_v2 shRNAs at DIV3, fixed at DIV7 and dendrites were traced using tdTom signal of
transfected neurons. Scale bars: 20 m (N= 3, n= 45 per group). (D) shFlnA_v2 hairpin also resulted
increased dendritic arborization (repeated two-way ANOVA substrate effect: F(1,86)= 11.47, p=
0.0011). (E) Moreover, shFlnA_v2 also caused a significant increase in total dendritic length
compared to control neurons on PDL (two-tailed Student’s t-test, p< 0.0001). Data presented as
mean± SEM.
To conclude, both silencing and overexpression of FlnA increases the dendritic branching of
hippocampal neurons during development. Furthermore, shFlnA mediated effects interact with the
1 integrin ligand fibronectin on the extracellular space while hWT FlnA mediated hypertrophy
might be independent of 1 integrins thus does not alter between ECM substrates.
1.5 1 integrin levels are crucial for dendritic branching
To further examine the interaction between FlnA mediated dendritic morphology and 1 integrin
receptors, hippocampal neurons are transfected either with a 1 integrin shRNA (shItgb1) (Lei et
al., 2012; Rehberg et al., 2014) only or co-transfected with FlnA plasmids (shItgb1+shFlnA and
shItgb1+hWT FlnA). Neurons that were seeded and transfected on PDL coverslips were fixed on
DIV7 to analyze their dendritic arborization (repeated two-way ANOVA genotype x distance
interaction: F(117, 9126)= 7.917, p< 0.0001). Silencing of endogenous 1 integrin receptor
significantly reduced overall dendritic branching compared to control neurons (p< 0.0001, Fisher
LSD). Co-transfection of shFlnA to simultaneously reduce endogenous FlnA rescues this
phenotype and stimulates dendritic branching similar to the control cells (p= 0.9622, Fisher LSD).
However, expression of hWT FlnA in shItgb1 neurons did not recover the dendritic tree and
displayed markedly reduced overall dendritic branching compared to control cells (p= 0.0025,
Fisher LSD), apart from few radiuses proximal to the soma (Figure 21A).
In addition to arborization, total dendritic lengths of the neurons revealed a similar interaction
between endogenous 1 integrin and FlnA levels (ordinary one-way ANOVA: F(3,234)= 12.78, p<
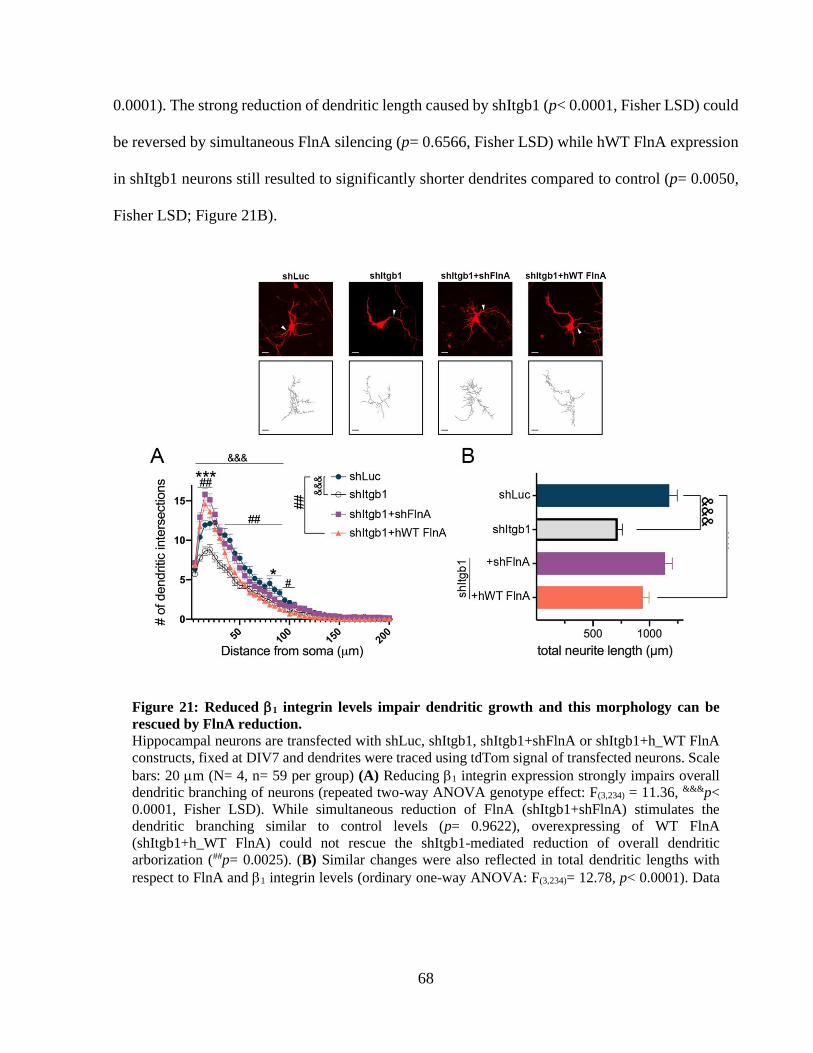
68
0.0001). The strong reduction of dendritic length caused by shItgb1 (p< 0.0001, Fisher LSD) could
be reversed by simultaneous FlnA silencing (p= 0.6566, Fisher LSD) while hWT FlnA expression
in shItgb1 neurons still resulted to significantly shorter dendrites compared to control (p= 0.0050,
Fisher LSD; Figure 21B).
Figure 21: Reduced 1 integrin levels impair dendritic growth and this morphology can be
rescued by FlnA reduction.
Hippocampal neurons are transfected with shLuc, shItgb1, shItgb1+shFlnA or shItgb1+h_WT FlnA
constructs, fixed at DIV7 and dendrites were traced using tdTom signal of transfected neurons. Scale
bars: 20 m (N= 4, n= 59 per group) (A) Reducing 1 integrin expression strongly impairs overall
dendritic branching of neurons (repeated two-way ANOVA genotype effect: F(3,234) = 11.36, &&&p<
0.0001, Fisher LSD). While simultaneous reduction of FlnA (shItgb1+shFlnA) stimulates the
dendritic branching similar to control levels (p= 0.9622), overexpressing of WT FlnA
(shItgb1+h_WT FlnA) could not rescue the shItgb1-mediated reduction of overall dendritic
arborization (##p= 0.0025). (B) Similar changes were also reflected in total dendritic lengths with
respect to FlnA and 1 integrin levels (ordinary one-way ANOVA: F(3,234)= 12.78, p< 0.0001). Data
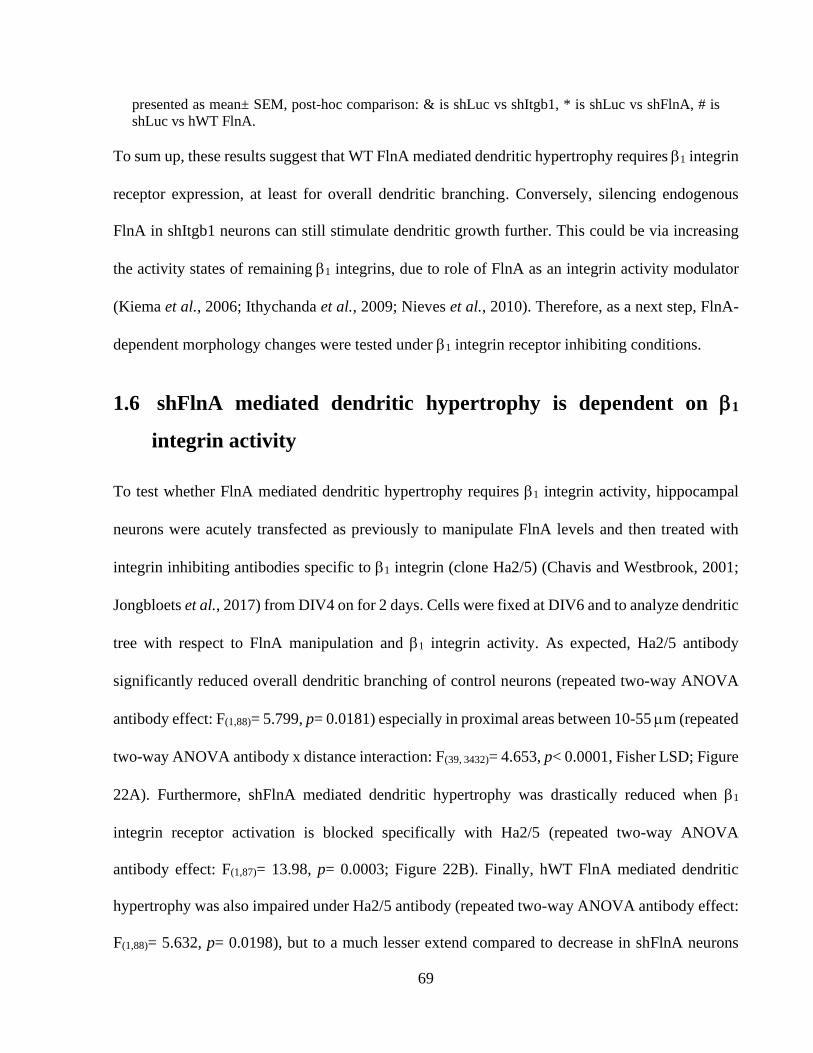
69
presented as mean± SEM, post-hoc comparison: & is shLuc vs shItgb1, * is shLuc vs shFlnA, # is
shLuc vs hWT FlnA.
To sum up, these results suggest that WT FlnA mediated dendritic hypertrophy requires 1 integrin
receptor expression, at least for overall dendritic branching. Conversely, silencing endogenous
FlnA in shItgb1 neurons can still stimulate dendritic growth further. This could be via increasing
the activity states of remaining 1 integrins, due to role of FlnA as an integrin activity modulator
(Kiema et al., 2006; Ithychanda et al., 2009; Nieves et al., 2010). Therefore, as a next step, FlnA-
dependent morphology changes were tested under 1 integrin receptor inhibiting conditions.
1.6 shFlnA mediated dendritic hypertrophy is dependent on 1
integrin activity
To test whether FlnA mediated dendritic hypertrophy requires 1 integrin activity, hippocampal
neurons were acutely transfected as previously to manipulate FlnA levels and then treated with
integrin inhibiting antibodies specific to 1 integrin (clone Ha2/5) (Chavis and Westbrook, 2001;
Jongbloets et al., 2017) from DIV4 on for 2 days. Cells were fixed at DIV6 and to analyze dendritic
tree with respect to FlnA manipulation and 1 integrin activity. As expected, Ha2/5 antibody
significantly reduced overall dendritic branching of control neurons (repeated two-way ANOVA
antibody effect: F(1,88)= 5.799, p= 0.0181) especially in proximal areas between 10-55 m (repeated
two-way ANOVA antibody x distance interaction: F(39, 3432)= 4.653, p< 0.0001, Fisher LSD; Figure
22A). Furthermore, shFlnA mediated dendritic hypertrophy was drastically reduced when 1
integrin receptor activation is blocked specifically with Ha2/5 (repeated two-way ANOVA
antibody effect: F(1,87)= 13.98, p= 0.0003; Figure 22B). Finally, hWT FlnA mediated dendritic
hypertrophy was also impaired under Ha2/5 antibody (repeated two-way ANOVA antibody effect:
F(1,88)= 5.632, p= 0.0198), but to a much lesser extend compared to decrease in shFlnA neurons
70
(Figure 22C). When data plotted together per treatment, the dendritic hypertrophy caused by FlnA
silencing and overexpression could be observed as previously (repeated two-way ANOVA
genotype effect: F(2,132)= 9.751, p< 0.0001; Figure 22D). WT FlnA mediated increase in dendritic
branching still persisted even under Ha2/5 antibody treatment (repeated two-way ANOVA
genotype effect: F(2,131)= 4.463, p= 0.0133, Fisher LSD p= 0.0038), while shFlnA neurons did not
significantly differ, albeit still markedly higher, compared to control neurons treated with Ha2/5
antibody (Fisher LSD p= 0.0601; Figure 22E).
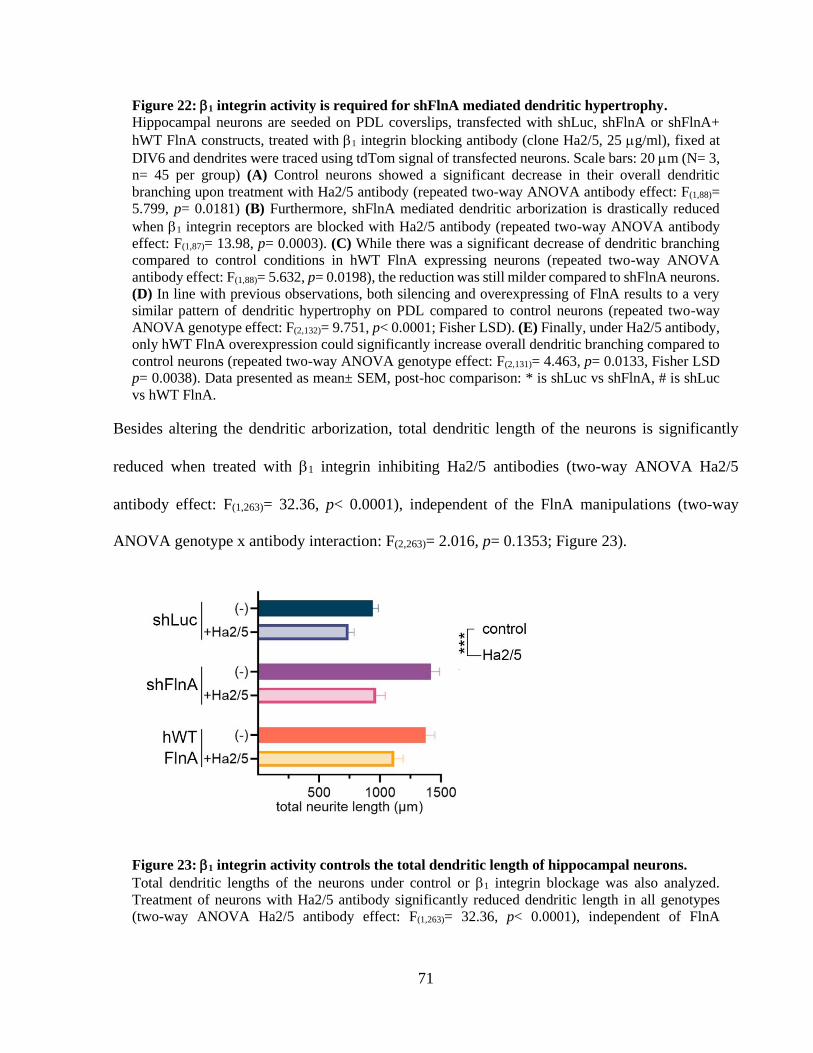
71
Figure 22: 1 integrin activity is required for shFlnA mediated dendritic hypertrophy.
Hippocampal neurons are seeded on PDL coverslips, transfected with shLuc, shFlnA or shFlnA+
hWT FlnA constructs, treated with 1 integrin blocking antibody (clone Ha2/5, 25 g/ml), fixed at
DIV6 and dendrites were traced using tdTom signal of transfected neurons. Scale bars: 20 m (N= 3,
n= 45 per group) (A) Control neurons showed a significant decrease in their overall dendritic
branching upon treatment with Ha2/5 antibody (repeated two-way ANOVA antibody effect: F(1,88)=
5.799, p= 0.0181) (B) Furthermore, shFlnA mediated dendritic arborization is drastically reduced
when 1 integrin receptors are blocked with Ha2/5 antibody (repeated two-way ANOVA antibody
effect: F(1,87)= 13.98, p= 0.0003). (C) While there was a significant decrease of dendritic branching
compared to control conditions in hWT FlnA expressing neurons (repeated two-way ANOVA
antibody effect: F(1,88)= 5.632, p= 0.0198), the reduction was still milder compared to shFlnA neurons.
(D) In line with previous observations, both silencing and overexpressing of FlnA results to a very
similar pattern of dendritic hypertrophy on PDL compared to control neurons (repeated two-way
ANOVA genotype effect: F(2,132)= 9.751, p< 0.0001; Fisher LSD). (E) Finally, under Ha2/5 antibody,
only hWT FlnA overexpression could significantly increase overall dendritic branching compared to
control neurons (repeated two-way ANOVA genotype effect: F(2,131)= 4.463, p= 0.0133, Fisher LSD
p= 0.0038). Data presented as mean± SEM, post-hoc comparison: * is shLuc vs shFlnA, # is shLuc
vs hWT FlnA.
Besides altering the dendritic arborization, total dendritic length of the neurons is significantly
reduced when treated with 1 integrin inhibiting Ha2/5 antibodies (two-way ANOVA Ha2/5
antibody effect: F(1,263)= 32.36, p< 0.0001), independent of the FlnA manipulations (two-way
ANOVA genotype x antibody interaction: F(2,263)= 2.016, p= 0.1353; Figure 23).
Figure 23: 1 integrin activity controls the total dendritic length of hippocampal neurons.
Total dendritic lengths of the neurons under control or 1 integrin blockage was also analyzed.
Treatment of neurons with Ha2/5 antibody significantly reduced dendritic length in all genotypes
(two-way ANOVA Ha2/5 antibody effect: F(1,263)= 32.36, p< 0.0001), independent of FlnA
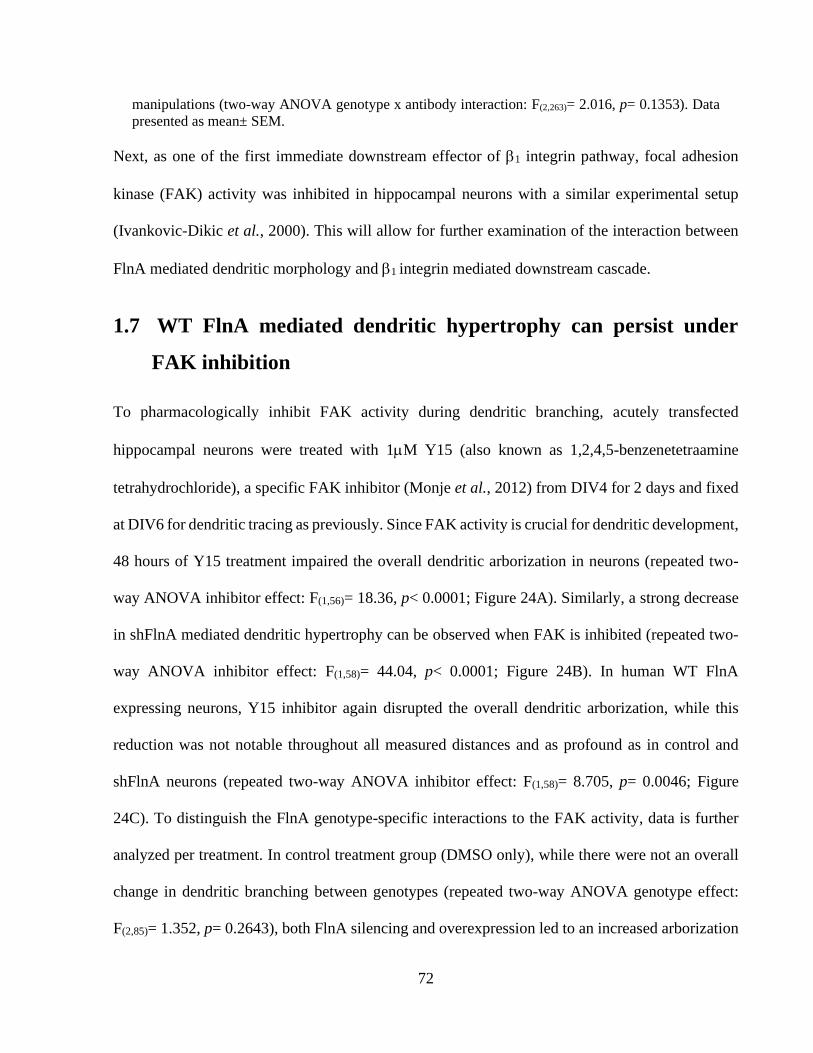
72
manipulations (two-way ANOVA genotype x antibody interaction: F(2,263)= 2.016, p= 0.1353). Data
presented as mean± SEM.
Next, as one of the first immediate downstream effector of 1 integrin pathway, focal adhesion
kinase (FAK) activity was inhibited in hippocampal neurons with a similar experimental setup
(Ivankovic-Dikic et al., 2000). This will allow for further examination of the interaction between
FlnA mediated dendritic morphology and 1 integrin mediated downstream cascade.
1.7 WT FlnA mediated dendritic hypertrophy can persist under
FAK inhibition
To pharmacologically inhibit FAK activity during dendritic branching, acutely transfected
hippocampal neurons were treated with 1M Y15 (also known as 1,2,4,5-benzenetetraamine
tetrahydrochloride), a specific FAK inhibitor (Monje et al., 2012) from DIV4 for 2 days and fixed
at DIV6 for dendritic tracing as previously. Since FAK activity is crucial for dendritic development,
48 hours of Y15 treatment impaired the overall dendritic arborization in neurons (repeated two-
way ANOVA inhibitor effect: F(1,56)= 18.36, p< 0.0001; Figure 24A). Similarly, a strong decrease
in shFlnA mediated dendritic hypertrophy can be observed when FAK is inhibited (repeated two-
way ANOVA inhibitor effect: F(1,58)= 44.04, p< 0.0001; Figure 24B). In human WT FlnA
expressing neurons, Y15 inhibitor again disrupted the overall dendritic arborization, while this
reduction was not notable throughout all measured distances and as profound as in control and
shFlnA neurons (repeated two-way ANOVA inhibitor effect: F(1,58)= 8.705, p= 0.0046; Figure
24C). To distinguish the FlnA genotype-specific interactions to the FAK activity, data is further
analyzed per treatment. In control treatment group (DMSO only), while there were not an overall
change in dendritic branching between genotypes (repeated two-way ANOVA genotype effect:
F(2,85)= 1.352, p= 0.2643), both FlnA silencing and overexpression led to an increased arborization
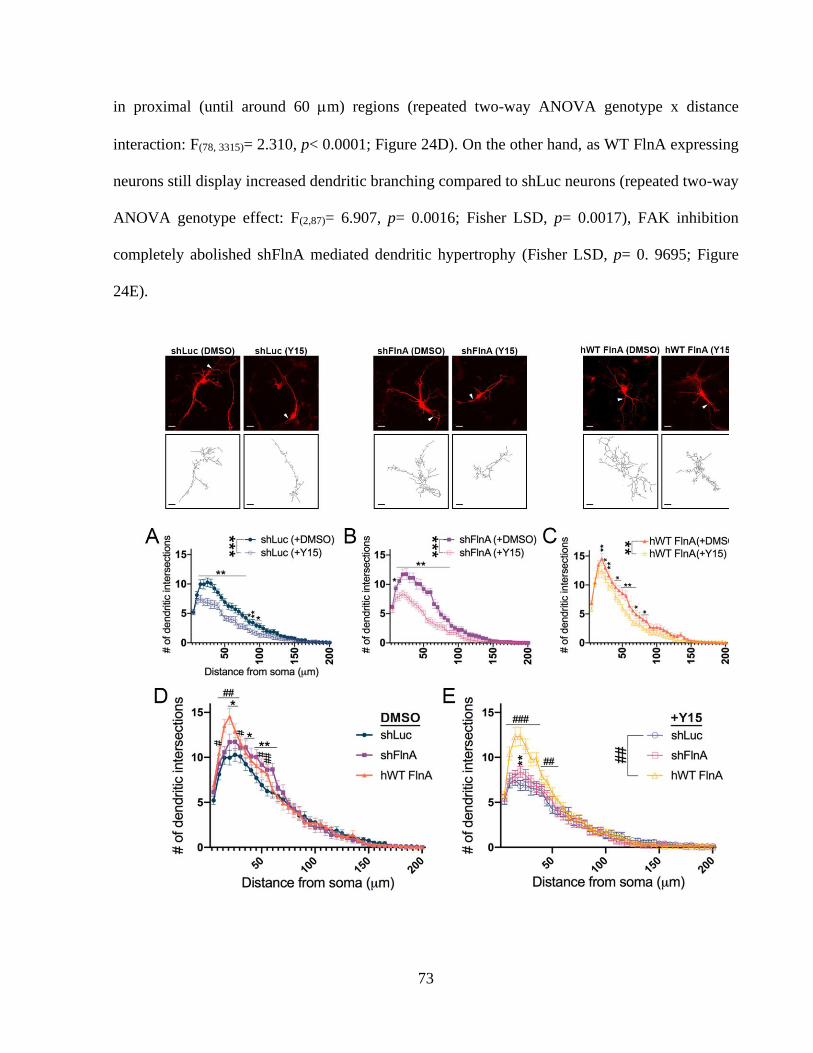
73
in proximal (until around 60 m) regions (repeated two-way ANOVA genotype x distance
interaction: F(78, 3315)= 2.310, p< 0.0001; Figure 24D). On the other hand, as WT FlnA expressing
neurons still display increased dendritic branching compared to shLuc neurons (repeated two-way
ANOVA genotype effect: F(2,87)= 6.907, p= 0.0016; Fisher LSD, p= 0.0017), FAK inhibition
completely abolished shFlnA mediated dendritic hypertrophy (Fisher LSD, p= 0. 9695; Figure
24E).
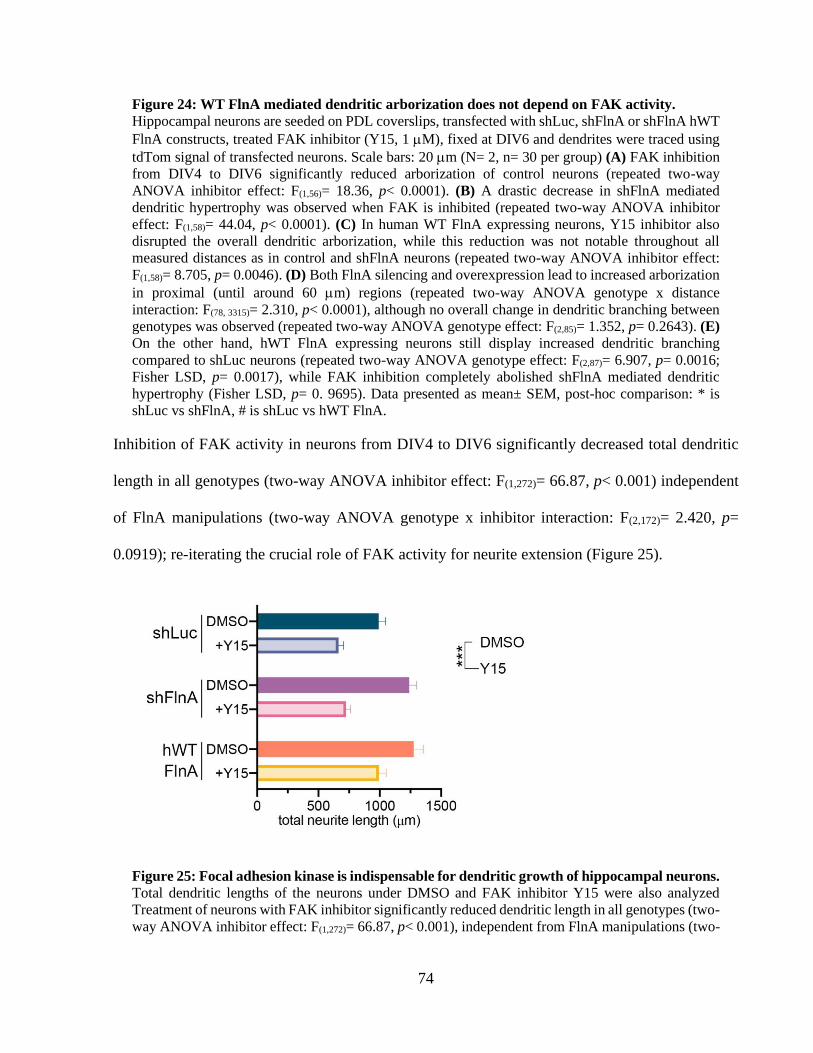
74
Figure 24: WT FlnA mediated dendritic arborization does not depend on FAK activity.
Hippocampal neurons are seeded on PDL coverslips, transfected with shLuc, shFlnA or shFlnA hWT
FlnA constructs, treated FAK inhibitor (Y15, 1 M), fixed at DIV6 and dendrites were traced using
tdTom signal of transfected neurons. Scale bars: 20 m (N= 2, n= 30 per group) (A) FAK inhibition
from DIV4 to DIV6 significantly reduced arborization of control neurons (repeated two-way
ANOVA inhibitor effect: F(1,56)= 18.36, p< 0.0001). (B) A drastic decrease in shFlnA mediated
dendritic hypertrophy was observed when FAK is inhibited (repeated two-way ANOVA inhibitor
effect: F(1,58)= 44.04, p< 0.0001). (C) In human WT FlnA expressing neurons, Y15 inhibitor also
disrupted the overall dendritic arborization, while this reduction was not notable throughout all
measured distances as in control and shFlnA neurons (repeated two-way ANOVA inhibitor effect:
F(1,58)= 8.705, p= 0.0046). (D) Both FlnA silencing and overexpression lead to increased arborization
in proximal (until around 60 m) regions (repeated two-way ANOVA genotype x distance
interaction: F(78, 3315)= 2.310, p< 0.0001), although no overall change in dendritic branching between
genotypes was observed (repeated two-way ANOVA genotype effect: F(2,85)= 1.352, p= 0.2643). (E)
On the other hand, hWT FlnA expressing neurons still display increased dendritic branching
compared to shLuc neurons (repeated two-way ANOVA genotype effect: F(2,87)= 6.907, p= 0.0016;
Fisher LSD, p= 0.0017), while FAK inhibition completely abolished shFlnA mediated dendritic
hypertrophy (Fisher LSD, p= 0. 9695). Data presented as mean± SEM, post-hoc comparison: * is
shLuc vs shFlnA, # is shLuc vs hWT FlnA.
Inhibition of FAK activity in neurons from DIV4 to DIV6 significantly decreased total dendritic
length in all genotypes (two-way ANOVA inhibitor effect: F(1,272)= 66.87, p< 0.001) independent
of FlnA manipulations (two-way ANOVA genotype x inhibitor interaction: F(2,172)= 2.420, p=
0.0919); re-iterating the crucial role of FAK activity for neurite extension (Figure 25).
Figure 25: Focal adhesion kinase is indispensable for dendritic growth of hippocampal neurons.
Total dendritic lengths of the neurons under DMSO and FAK inhibitor Y15 were also analyzed
Treatment of neurons with FAK inhibitor significantly reduced dendritic length in all genotypes (two-
way ANOVA inhibitor effect: F(1,272)= 66.87, p< 0.001), independent from FlnA manipulations (two-
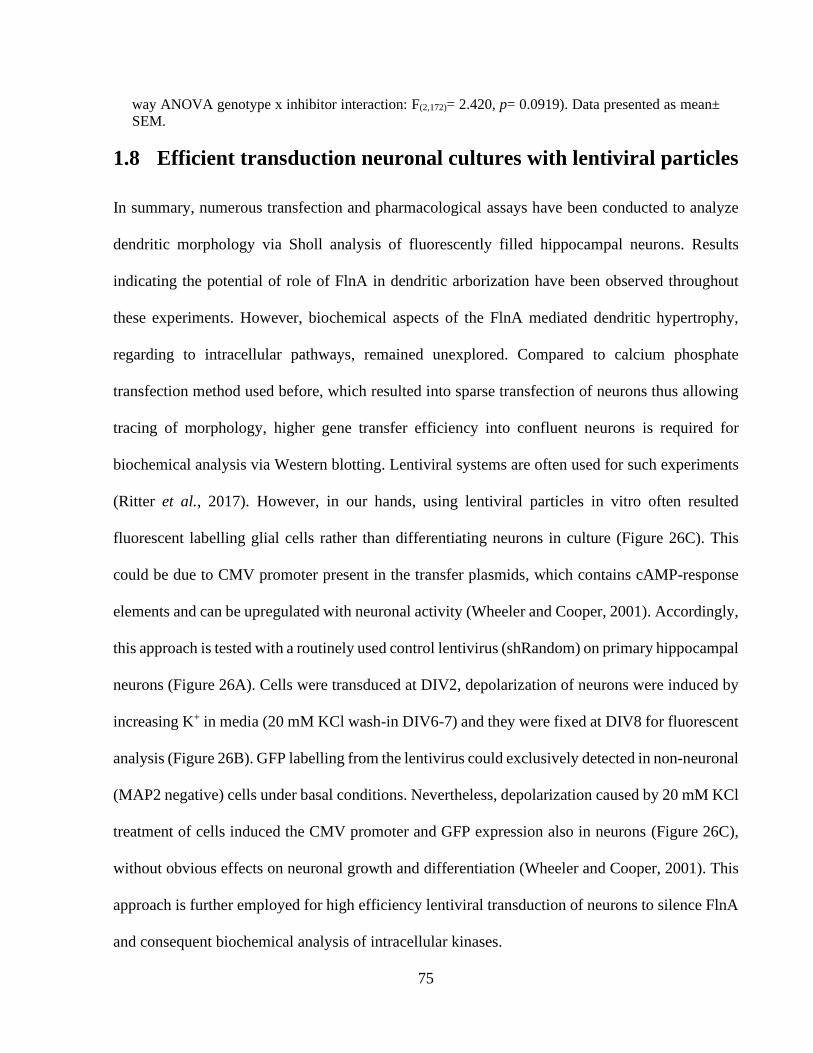
75
way ANOVA genotype x inhibitor interaction: F(2,172)= 2.420, p= 0.0919). Data presented as mean±
SEM.
1.8 Efficient transduction neuronal cultures with lentiviral particles
In summary, numerous transfection and pharmacological assays have been conducted to analyze
dendritic morphology via Sholl analysis of fluorescently filled hippocampal neurons. Results
indicating the potential of role of FlnA in dendritic arborization have been observed throughout
these experiments. However, biochemical aspects of the FlnA mediated dendritic hypertrophy,
regarding to intracellular pathways, remained unexplored. Compared to calcium phosphate
transfection method used before, which resulted into sparse transfection of neurons thus allowing
tracing of morphology, higher gene transfer efficiency into confluent neurons is required for
biochemical analysis via Western blotting. Lentiviral systems are often used for such experiments
(Ritter et al., 2017). However, in our hands, using lentiviral particles in vitro often resulted
fluorescent labelling glial cells rather than differentiating neurons in culture (Figure 26C). This
could be due to CMV promoter present in the transfer plasmids, which contains cAMP-response
elements and can be upregulated with neuronal activity (Wheeler and Cooper, 2001). Accordingly,
this approach is tested with a routinely used control lentivirus (shRandom) on primary hippocampal
neurons (Figure 26A). Cells were transduced at DIV2, depolarization of neurons were induced by
increasing K+ in media (20 mM KCl wash-in DIV6-7) and they were fixed at DIV8 for fluorescent
analysis (Figure 26B). GFP labelling from the lentivirus could exclusively detected in non-neuronal
(MAP2 negative) cells under basal conditions. Nevertheless, depolarization caused by 20 mM KCl
treatment of cells induced the CMV promoter and GFP expression also in neurons (Figure 26C),
without obvious effects on neuronal growth and differentiation (Wheeler and Cooper, 2001). This
approach is further employed for high efficiency lentiviral transduction of neurons to silence FlnA
and consequent biochemical analysis of intracellular kinases.
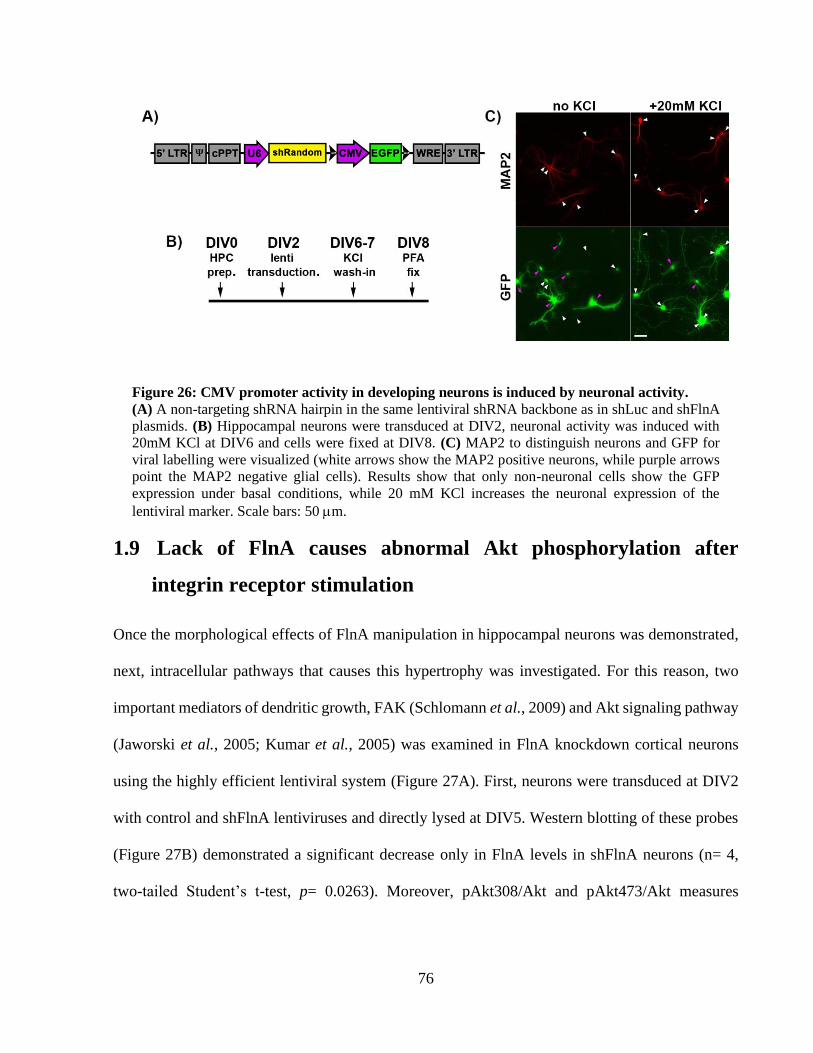
76
Figure 26: CMV promoter activity in developing neurons is induced by neuronal activity.
(A) A non-targeting shRNA hairpin in the same lentiviral shRNA backbone as in shLuc and shFlnA
plasmids. (B) Hippocampal neurons were transduced at DIV2, neuronal activity was induced with
20mM KCl at DIV6 and cells were fixed at DIV8. (C) MAP2 to distinguish neurons and GFP for
viral labelling were visualized (white arrows show the MAP2 positive neurons, while purple arrows
point the MAP2 negative glial cells). Results show that only non-neuronal cells show the GFP
expression under basal conditions, while 20 mM KCl increases the neuronal expression of the
lentiviral marker. Scale bars: 50 m.
1.9 Lack of FlnA causes abnormal Akt phosphorylation after
integrin receptor stimulation
Once the morphological effects of FlnA manipulation in hippocampal neurons was demonstrated,
next, intracellular pathways that causes this hypertrophy was investigated. For this reason, two
important mediators of dendritic growth, FAK (Schlomann et al., 2009) and Akt signaling pathway
(Jaworski et al., 2005; Kumar et al., 2005) was examined in FlnA knockdown cortical neurons
using the highly efficient lentiviral system (Figure 27A). First, neurons were transduced at DIV2
with control and shFlnA lentiviruses and directly lysed at DIV5. Western blotting of these probes
(Figure 27B) demonstrated a significant decrease only in FlnA levels in shFlnA neurons (n= 4,
two-tailed Student’s t-test, p= 0.0263). Moreover, pAkt308/Akt and pAkt473/Akt measures
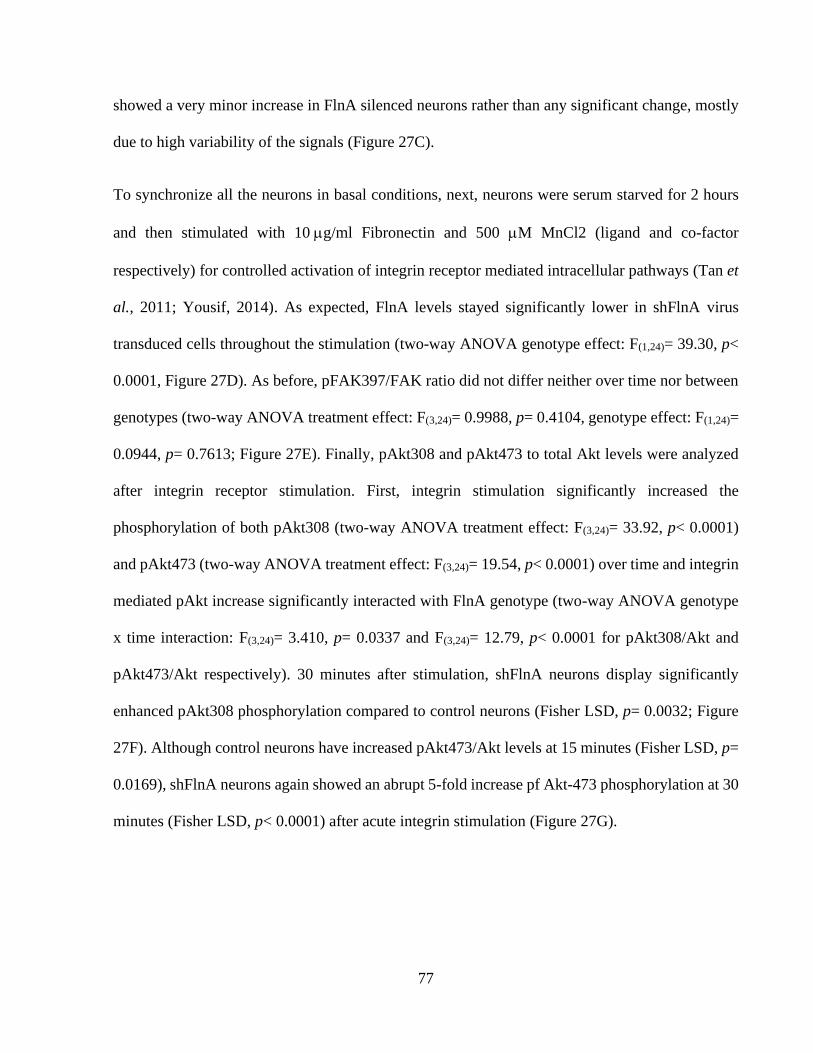
77
showed a very minor increase in FlnA silenced neurons rather than any significant change, mostly
due to high variability of the signals (Figure 27C).
To synchronize all the neurons in basal conditions, next, neurons were serum starved for 2 hours
and then stimulated with 10 g/ml Fibronectin and 500 M MnCl2 (ligand and co-factor
respectively) for controlled activation of integrin receptor mediated intracellular pathways (Tan et
al., 2011; Yousif, 2014). As expected, FlnA levels stayed significantly lower in shFlnA virus
transduced cells throughout the stimulation (two-way ANOVA genotype effect: F(1,24)= 39.30, p<
0.0001, Figure 27D). As before, pFAK397/FAK ratio did not differ neither over time nor between
genotypes (two-way ANOVA treatment effect: F(3,24)= 0.9988, p= 0.4104, genotype effect: F(1,24)=
0.0944, p= 0.7613; Figure 27E). Finally, pAkt308 and pAkt473 to total Akt levels were analyzed
after integrin receptor stimulation. First, integrin stimulation significantly increased the
phosphorylation of both pAkt308 (two-way ANOVA treatment effect: F(3,24)= 33.92, p< 0.0001)
and pAkt473 (two-way ANOVA treatment effect: F(3,24)= 19.54, p< 0.0001) over time and integrin
mediated pAkt increase significantly interacted with FlnA genotype (two-way ANOVA genotype
x time interaction: F(3,24)= 3.410, p= 0.0337 and F(3,24)= 12.79, p< 0.0001 for pAkt308/Akt and
pAkt473/Akt respectively). 30 minutes after stimulation, shFlnA neurons display significantly
enhanced pAkt308 phosphorylation compared to control neurons (Fisher LSD, p= 0.0032; Figure
27F). Although control neurons have increased pAkt473/Akt levels at 15 minutes (Fisher LSD, p=
0.0169), shFlnA neurons again showed an abrupt 5-fold increase pf Akt-473 phosphorylation at 30
minutes (Fisher LSD, p< 0.0001) after acute integrin stimulation (Figure 27G).
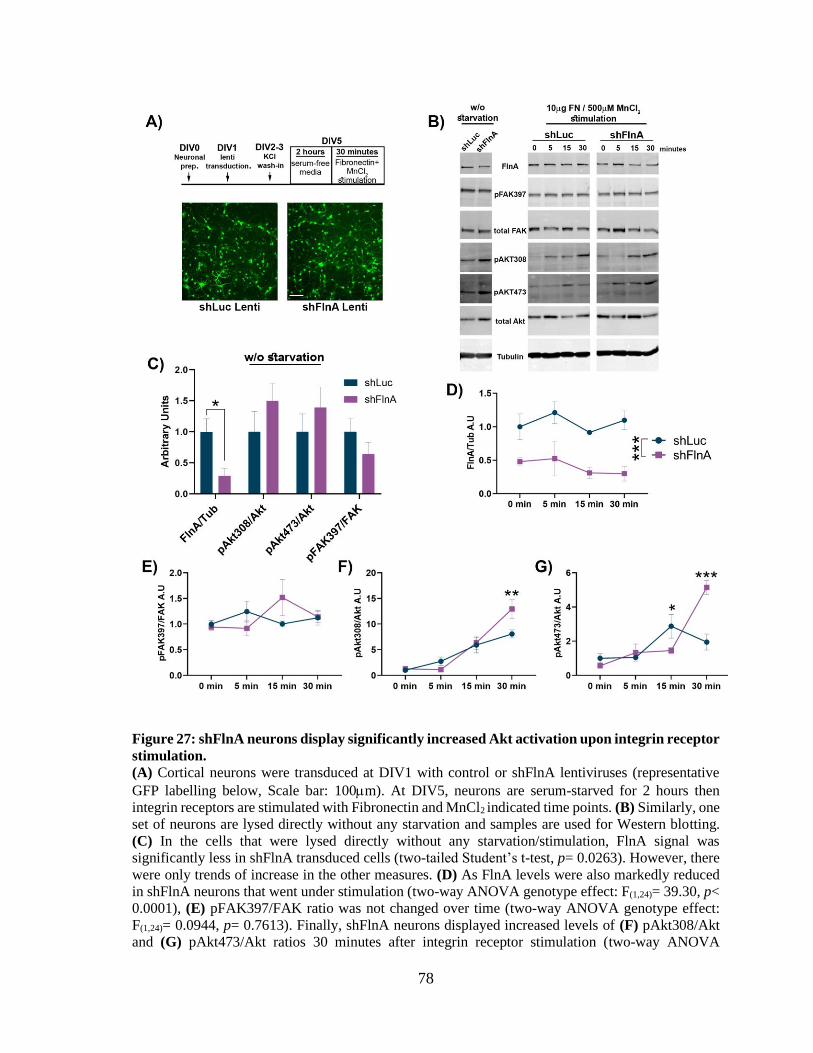
78
Figure 27: shFlnA neurons display significantly increased Akt activation upon integrin receptor
stimulation.
(A) Cortical neurons were transduced at DIV1 with control or shFlnA lentiviruses (representative
GFP labelling below, Scale bar: 100m). At DIV5, neurons are serum-starved for 2 hours then
integrin receptors are stimulated with Fibronectin and MnCl2 indicated time points. (B) Similarly, one
set of neurons are lysed directly without any starvation and samples are used for Western blotting.
(C) In the cells that were lysed directly without any starvation/stimulation, FlnA signal was
significantly less in shFlnA transduced cells (two-tailed Student’s t-test, p= 0.0263). However, there
were only trends of increase in the other measures. (D) As FlnA levels were also markedly reduced
in shFlnA neurons that went under stimulation (two-way ANOVA genotype effect: F(1,24)= 39.30, p<
0.0001), (E) pFAK397/FAK ratio was not changed over time (two-way ANOVA genotype effect:
F(1,24)= 0.0944, p= 0.7613). Finally, shFlnA neurons displayed increased levels of (F) pAkt308/Akt
and (G) pAkt473/Akt ratios 30 minutes after integrin receptor stimulation (two-way ANOVA
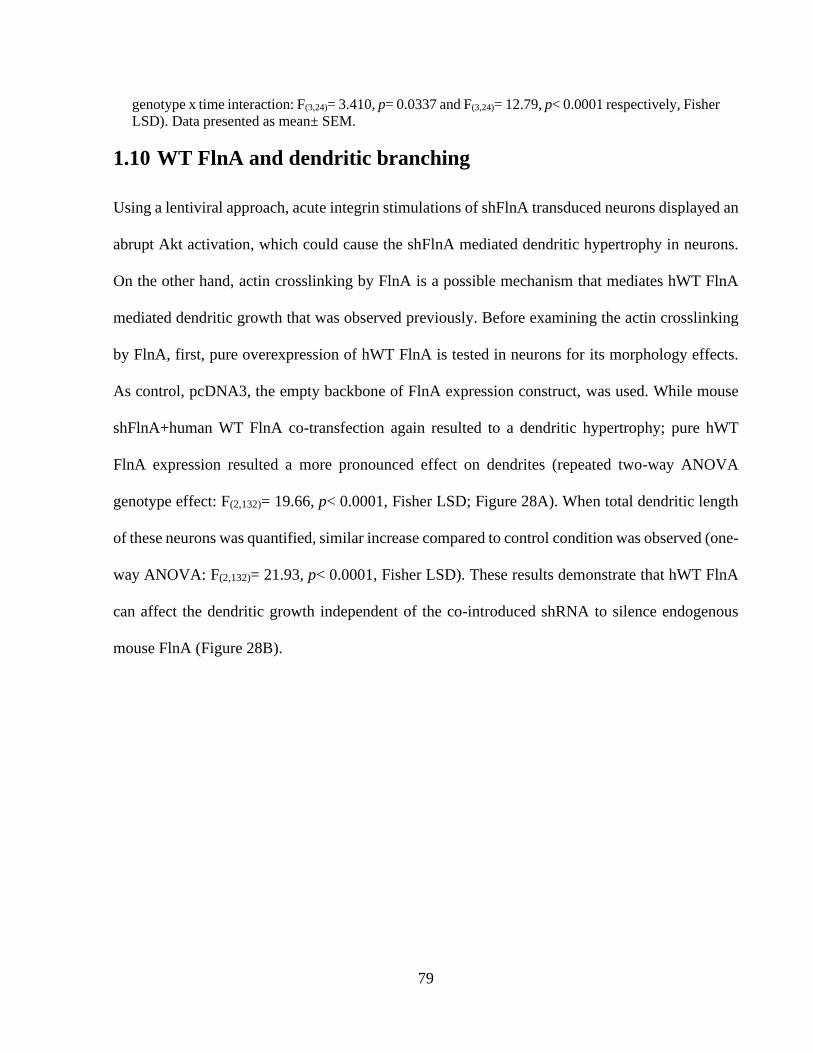
79
genotype x time interaction: F(3,24)= 3.410, p= 0.0337 and F(3,24)= 12.79, p< 0.0001 respectively, Fisher
LSD). Data presented as mean± SEM.
1.10 WT FlnA and dendritic branching
Using a lentiviral approach, acute integrin stimulations of shFlnA transduced neurons displayed an
abrupt Akt activation, which could cause the shFlnA mediated dendritic hypertrophy in neurons.
On the other hand, actin crosslinking by FlnA is a possible mechanism that mediates hWT FlnA
mediated dendritic growth that was observed previously. Before examining the actin crosslinking
by FlnA, first, pure overexpression of hWT FlnA is tested in neurons for its morphology effects.
As control, pcDNA3, the empty backbone of FlnA expression construct, was used. While mouse
shFlnA+human WT FlnA co-transfection again resulted to a dendritic hypertrophy; pure hWT
FlnA expression resulted a more pronounced effect on dendrites (repeated two-way ANOVA
genotype effect: F(2,132)= 19.66, p< 0.0001, Fisher LSD; Figure 28A). When total dendritic length
of these neurons was quantified, similar increase compared to control condition was observed (one-
way ANOVA: F(2,132)= 21.93, p< 0.0001, Fisher LSD). These results demonstrate that hWT FlnA
can affect the dendritic growth independent of the co-introduced shRNA to silence endogenous
mouse FlnA (Figure 28B).
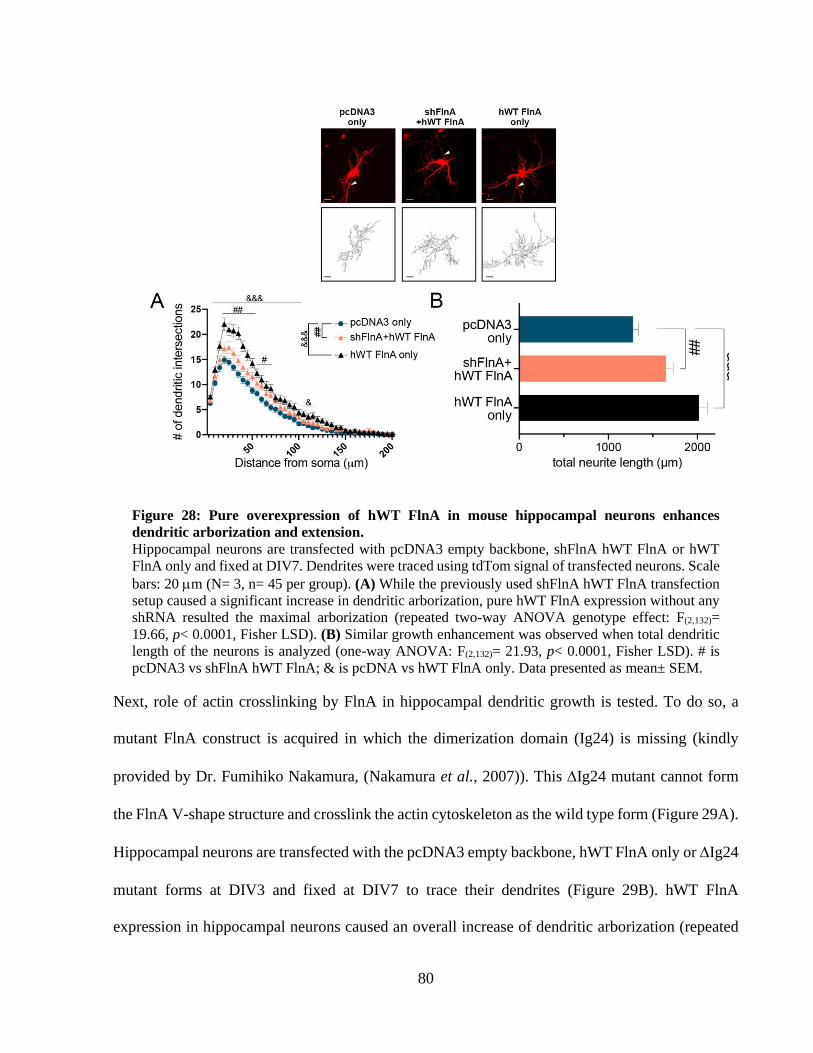
80
Figure 28: Pure overexpression of hWT FlnA in mouse hippocampal neurons enhances
dendritic arborization and extension.
Hippocampal neurons are transfected with pcDNA3 empty backbone, shFlnA hWT FlnA or hWT
FlnA only and fixed at DIV7. Dendrites were traced using tdTom signal of transfected neurons. Scale
bars: 20 m (N= 3, n= 45 per group). (A) While the previously used shFlnA hWT FlnA transfection
setup caused a significant increase in dendritic arborization, pure hWT FlnA expression without any
shRNA resulted the maximal arborization (repeated two-way ANOVA genotype effect: F(2,132)=
19.66, p< 0.0001, Fisher LSD). (B) Similar growth enhancement was observed when total dendritic
length of the neurons is analyzed (one-way ANOVA: F(2,132)= 21.93, p< 0.0001, Fisher LSD). # is
pcDNA3 vs shFlnA hWT FlnA; & is pcDNA vs hWT FlnA only. Data presented as mean± SEM.
Next, role of actin crosslinking by FlnA in hippocampal dendritic growth is tested. To do so, a
mutant FlnA construct is acquired in which the dimerization domain (Ig24) is missing (kindly
provided by Dr. Fumihiko Nakamura, (Nakamura et al., 2007)). This Ig24 mutant cannot form
the FlnA V-shape structure and crosslink the actin cytoskeleton as the wild type form (Figure 29A).
Hippocampal neurons are transfected with the pcDNA3 empty backbone, hWT FlnA only or Ig24
mutant forms at DIV3 and fixed at DIV7 to trace their dendrites (Figure 29B). hWT FlnA
expression in hippocampal neurons caused an overall increase of dendritic arborization (repeated
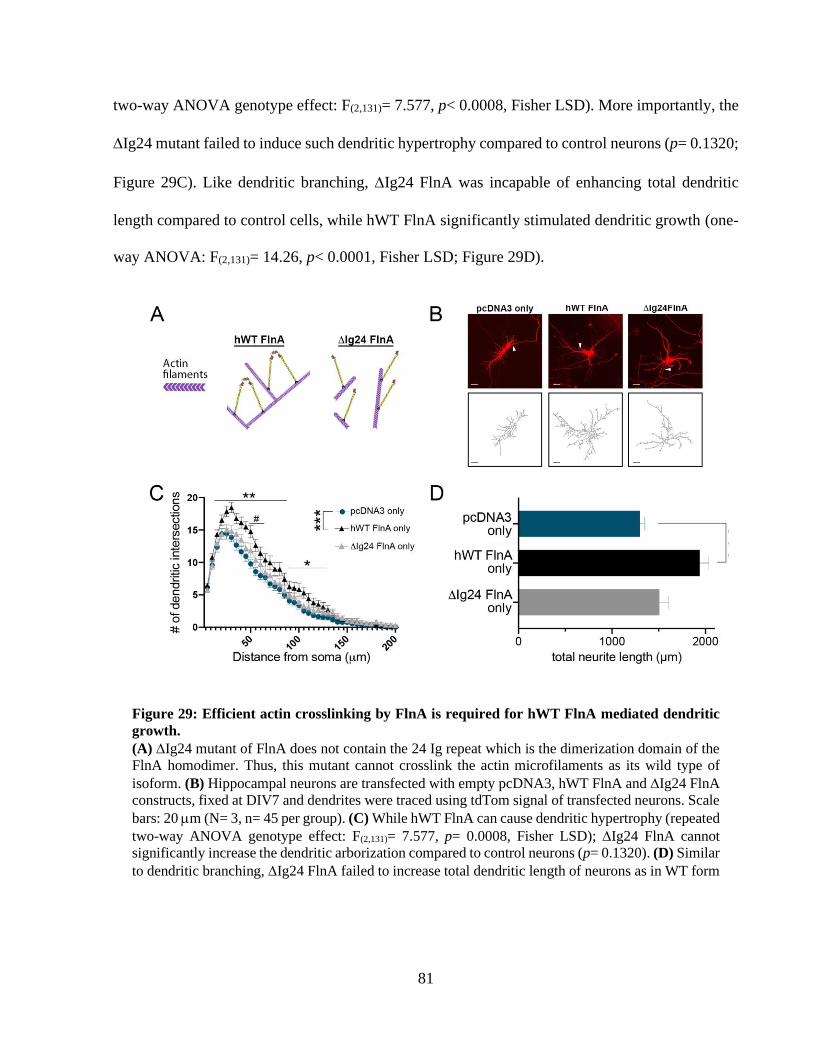
81
two-way ANOVA genotype effect: F(2,131)= 7.577, p< 0.0008, Fisher LSD). More importantly, the
Ig24 mutant failed to induce such dendritic hypertrophy compared to control neurons (p= 0.1320;
Figure 29C). Like dendritic branching, Ig24 FlnA was incapable of enhancing total dendritic
length compared to control cells, while hWT FlnA significantly stimulated dendritic growth (one-
way ANOVA: F(2,131)= 14.26, p< 0.0001, Fisher LSD; Figure 29D).
Figure 29: Efficient actin crosslinking by FlnA is required for hWT FlnA mediated dendritic
growth.
(A) Ig24 mutant of FlnA does not contain the 24 Ig repeat which is the dimerization domain of the
FlnA homodimer. Thus, this mutant cannot crosslink the actin microfilaments as its wild type of
isoform. (B) Hippocampal neurons are transfected with empty pcDNA3, hWT FlnA and Ig24 FlnA
constructs, fixed at DIV7 and dendrites were traced using tdTom signal of transfected neurons. Scale
bars: 20 m (N= 3, n= 45 per group). (C) While hWT FlnA can cause dendritic hypertrophy (repeated
two-way ANOVA genotype effect: F(2,131)= 7.577, p= 0.0008, Fisher LSD); Ig24 FlnA cannot
significantly increase the dendritic arborization compared to control neurons (p= 0.1320). (D) Similar
to dendritic branching, Ig24 FlnA failed to increase total dendritic length of neurons as in WT form
82
(one-way ANOVA: F(2,132)= 14.26, p< 0.0001, Fisher LSD). * is pcDNA3 vs hWT FlnA only; # is
pcDNA3 vs Ig24 FlnA only. Data presented as mean± SEM.
Lastly, role of Serine 2152 phosphorylation of FlnA was tested during dendritic branching of
hippocampal neurons. To this end, we have acquired the phosphodeficient mutant of human WT
FlnA, in which the conserved Serine-2152 residue is converted to Alanine (S2152A) via site-
directed mutagenesis (Woo et al., 2004; Figure 30A). Hippocampal neurons are then transfected
with shFlnA targeting endogenous mouse FlnA and co-transfected either with WT or S2152A FlnA
constructs at DIV3. Besides PDL, S2152A FlnA transfected neurons were also tested on
Fibronectin substrate to further explore the interaction between S2152 phosphorylation and integrin
activation (Figure 30B). Analysis of transfected neurons on DIV7 revealed no significant
difference between genotypes neither in dendritic branching (repeated two-way ANOVA genotype
effect: F(2,84)= 0.6574, p= 0.5208; Figure 30C) nor in total dendritic length (one-way ANOVA:
F(2,84)= 1.405, p= 0.2510; Figure 30D).
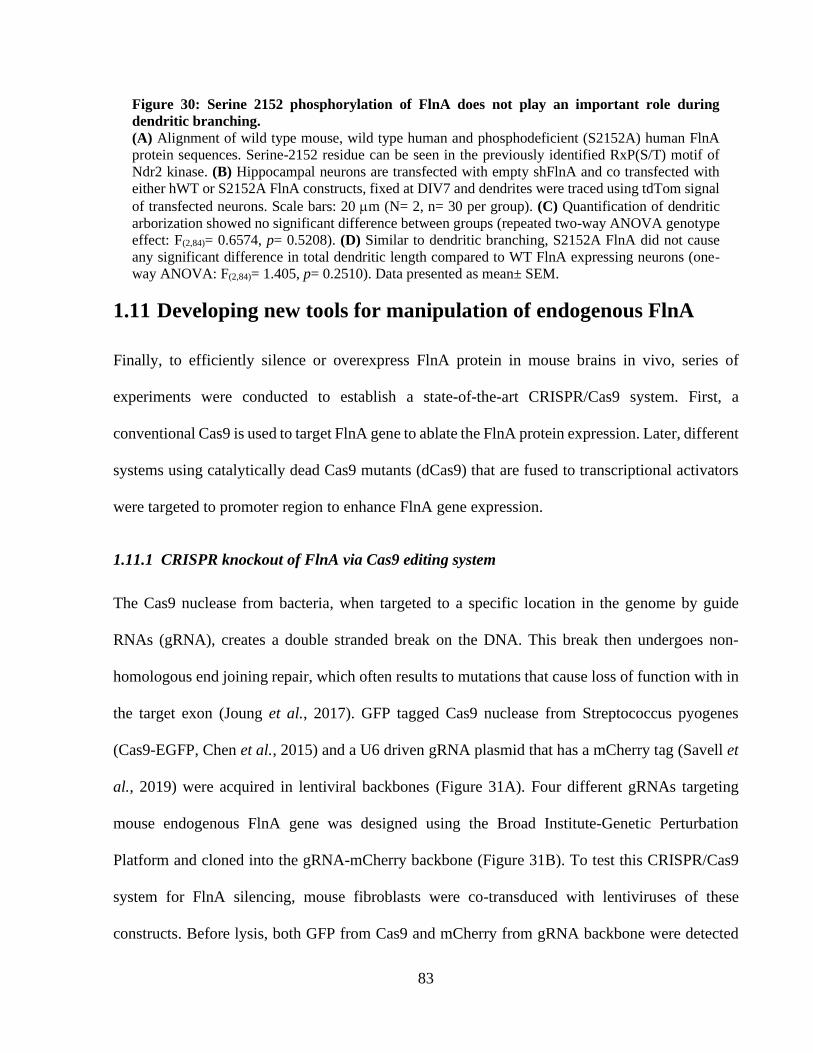
83
Figure 30: Serine 2152 phosphorylation of FlnA does not play an important role during
dendritic branching.
(A) Alignment of wild type mouse, wild type human and phosphodeficient (S2152A) human FlnA
protein sequences. Serine-2152 residue can be seen in the previously identified RxP(S/T) motif of
Ndr2 kinase. (B) Hippocampal neurons are transfected with empty shFlnA and co transfected with
either hWT or S2152A FlnA constructs, fixed at DIV7 and dendrites were traced using tdTom signal
of transfected neurons. Scale bars: 20 m (N= 2, n= 30 per group). (C) Quantification of dendritic
arborization showed no significant difference between groups (repeated two-way ANOVA genotype
effect: F(2,84)= 0.6574, p= 0.5208). (D) Similar to dendritic branching, S2152A FlnA did not cause
any significant difference in total dendritic length compared to WT FlnA expressing neurons (one-
way ANOVA: F(2,84)= 1.405, p= 0.2510). Data presented as mean± SEM.
1.11 Developing new tools for manipulation of endogenous FlnA
Finally, to efficiently silence or overexpress FlnA protein in mouse brains in vivo, series of
experiments were conducted to establish a state-of-the-art CRISPR/Cas9 system. First, a
conventional Cas9 is used to target FlnA gene to ablate the FlnA protein expression. Later, different
systems using catalytically dead Cas9 mutants (dCas9) that are fused to transcriptional activators
were targeted to promoter region to enhance FlnA gene expression.
1.11.1 CRISPR knockout of FlnA via Cas9 editing system
The Cas9 nuclease from bacteria, when targeted to a specific location in the genome by guide
RNAs (gRNA), creates a double stranded break on the DNA. This break then undergoes non-
homologous end joining repair, which often results to mutations that cause loss of function with in
the target exon (Joung et al., 2017). GFP tagged Cas9 nuclease from Streptococcus pyogenes
(Cas9-EGFP, Chen et al., 2015) and a U6 driven gRNA plasmid that has a mCherry tag (Savell et
al., 2019) were acquired in lentiviral backbones (Figure 31A). Four different gRNAs targeting
mouse endogenous FlnA gene was designed using the Broad Institute-Genetic Perturbation
Platform and cloned into the gRNA-mCherry backbone (Figure 31B). To test this CRISPR/Cas9
system for FlnA silencing, mouse fibroblasts were co-transduced with lentiviruses of these
constructs. Before lysis, both GFP from Cas9 and mCherry from gRNA backbone were detected
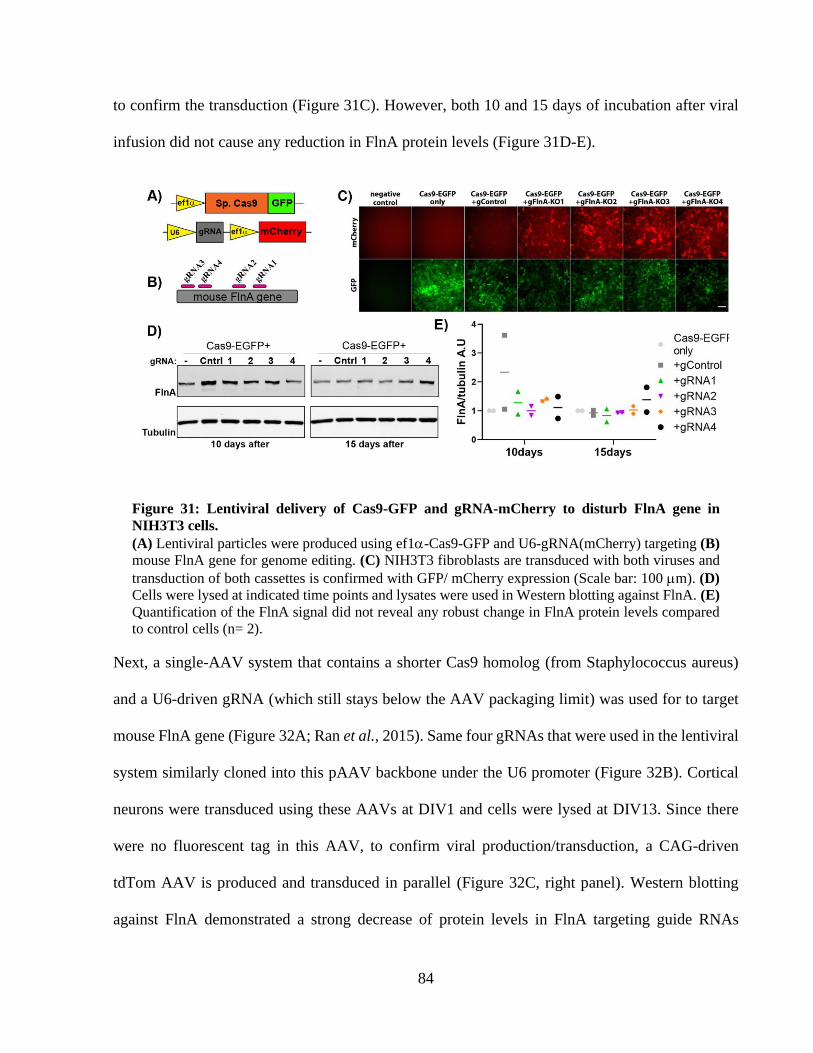
84
to confirm the transduction (Figure 31C). However, both 10 and 15 days of incubation after viral
infusion did not cause any reduction in FlnA protein levels (Figure 31D-E).
Figure 31: Lentiviral delivery of Cas9-GFP and gRNA-mCherry to disturb FlnA gene in
NIH3T3 cells.
(A) Lentiviral particles were produced using ef1-Cas9-GFP and U6-gRNA(mCherry) targeting (B)
mouse FlnA gene for genome editing. (C) NIH3T3 fibroblasts are transduced with both viruses and
transduction of both cassettes is confirmed with GFP/ mCherry expression (Scale bar: 100 m). (D)
Cells were lysed at indicated time points and lysates were used in Western blotting against FlnA. (E)
Quantification of the FlnA signal did not reveal any robust change in FlnA protein levels compared
to control cells (n= 2).
Next, a single-AAV system that contains a shorter Cas9 homolog (from Staphylococcus aureus)
and a U6-driven gRNA (which still stays below the AAV packaging limit) was used for to target
mouse FlnA gene (Figure 32A; Ran et al., 2015). Same four gRNAs that were used in the lentiviral
system similarly cloned into this pAAV backbone under the U6 promoter (Figure 32B). Cortical
neurons were transduced using these AAVs at DIV1 and cells were lysed at DIV13. Since there
were no fluorescent tag in this AAV, to confirm viral production/transduction, a CAG-driven
tdTom AAV is produced and transduced in parallel (Figure 32C, right panel). Western blotting
against FlnA demonstrated a strong decrease of protein levels in FlnA targeting guide RNAs
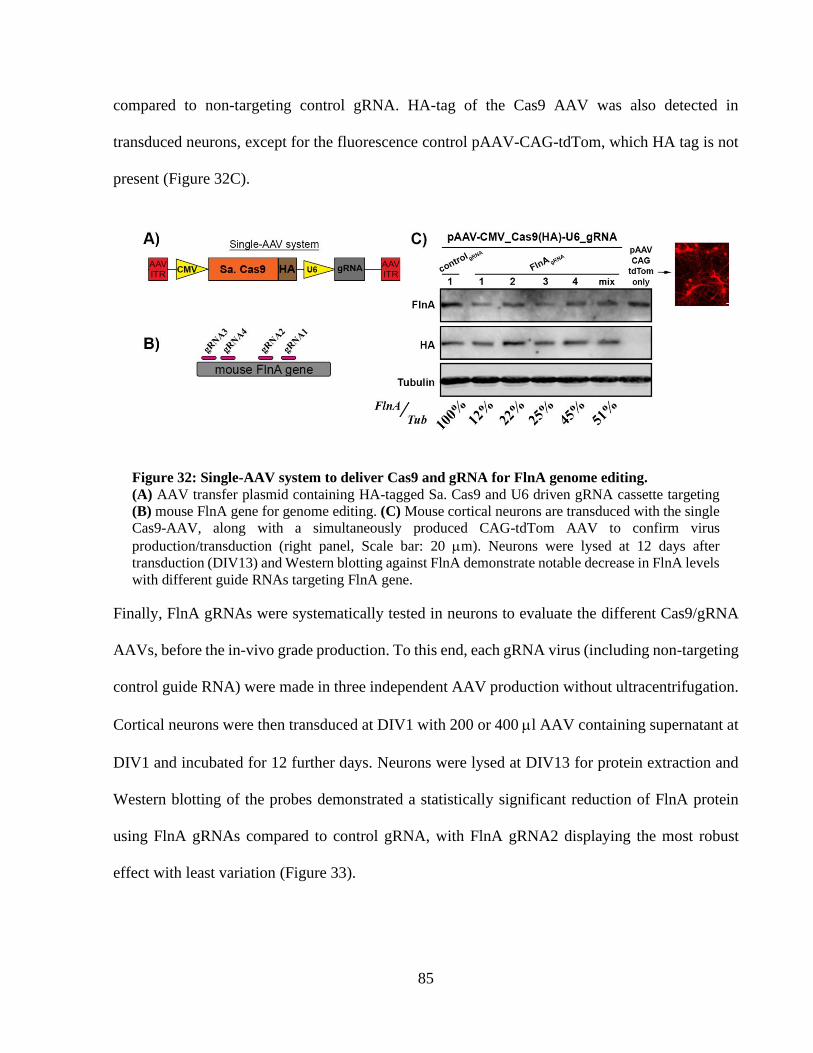
85
compared to non-targeting control gRNA. HA-tag of the Cas9 AAV was also detected in
transduced neurons, except for the fluorescence control pAAV-CAG-tdTom, which HA tag is not
present (Figure 32C).
Figure 32: Single-AAV system to deliver Cas9 and gRNA for FlnA genome editing.
(A) AAV transfer plasmid containing HA-tagged Sa. Cas9 and U6 driven gRNA cassette targeting
(B) mouse FlnA gene for genome editing. (C) Mouse cortical neurons are transduced with the single
Cas9-AAV, along with a simultaneously produced CAG-tdTom AAV to confirm virus
production/transduction (right panel, Scale bar: 20 m). Neurons were lysed at 12 days after
transduction (DIV13) and Western blotting against FlnA demonstrate notable decrease in FlnA levels
with different guide RNAs targeting FlnA gene.
Finally, FlnA gRNAs were systematically tested in neurons to evaluate the different Cas9/gRNA
AAVs, before the in-vivo grade production. To this end, each gRNA virus (including non-targeting
control guide RNA) were made in three independent AAV production without ultracentrifugation.
Cortical neurons were then transduced at DIV1 with 200 or 400 l AAV containing supernatant at
DIV1 and incubated for 12 further days. Neurons were lysed at DIV13 for protein extraction and
Western blotting of the probes demonstrated a statistically significant reduction of FlnA protein
using FlnA gRNAs compared to control gRNA, with FlnA gRNA2 displaying the most robust
effect with least variation (Figure 33).
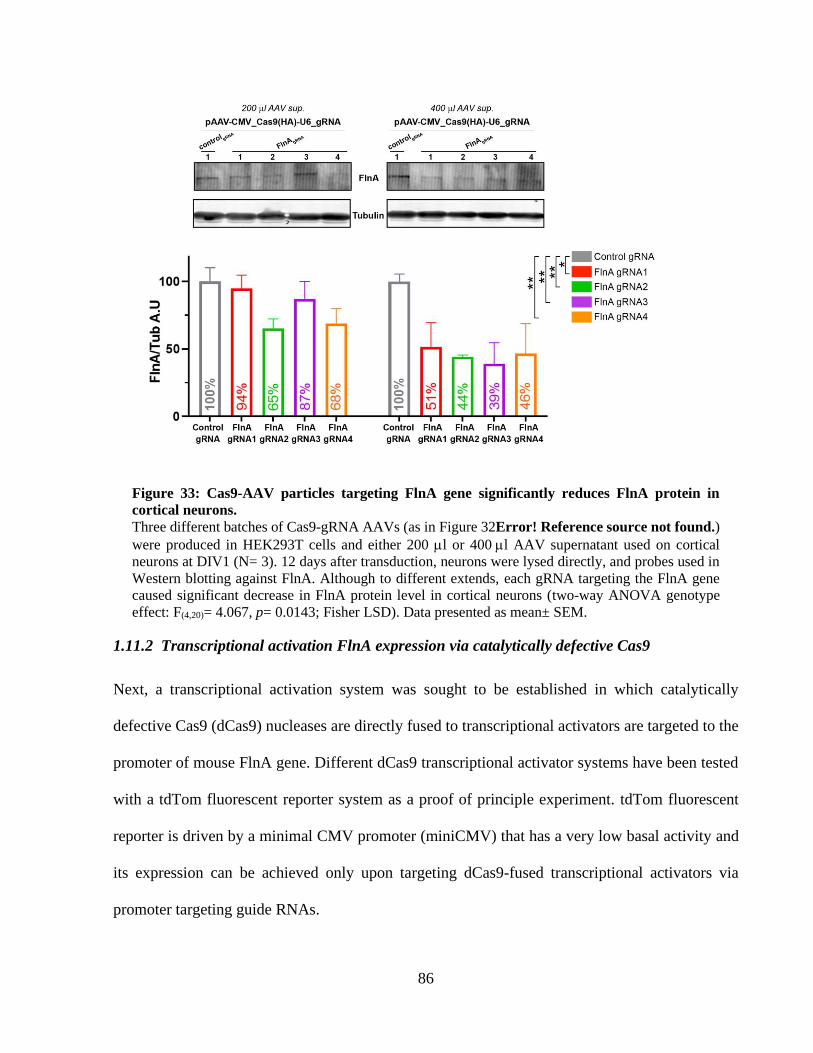
86
Figure 33: Cas9-AAV particles targeting FlnA gene significantly reduces FlnA protein in
cortical neurons.
Three different batches of Cas9-gRNA AAVs (as in Figure 32Error! Reference source not found.)
were produced in HEK293T cells and either 200 l or 400 l AAV supernatant used on cortical
neurons at DIV1 (N= 3). 12 days after transduction, neurons were lysed directly, and probes used in
Western blotting against FlnA. Although to different extends, each gRNA targeting the FlnA gene
caused significant decrease in FlnA protein level in cortical neurons (two-way ANOVA genotype
effect: F(4,20)= 4.067, p= 0.0143; Fisher LSD). Data presented as mean± SEM.
1.11.2 Transcriptional activation FlnA expression via catalytically defective Cas9
Next, a transcriptional activation system was sought to be established in which catalytically
defective Cas9 (dCas9) nucleases are directly fused to transcriptional activators are targeted to the
promoter of mouse FlnA gene. Different dCas9 transcriptional activator systems have been tested
with a tdTom fluorescent reporter system as a proof of principle experiment. tdTom fluorescent
reporter is driven by a minimal CMV promoter (miniCMV) that has a very low basal activity and
its expression can be achieved only upon targeting dCas9-fused transcriptional activators via
promoter targeting guide RNAs.

87
First system that was tested contains a dCas9 fused to a VP64 activation domain (Joung et al.,
2017). Besides, the gRNA backbone that targets the dCas9-VP64 to the promoter contains MS2
loops which can further recruit the heterelougsly expressed p65-HSF1 activation domains for
enhancement of transcription (Figure 34A-B). To test the system, a guide RNA targeting the
promoter of tdTom (-100 of transcription start site) is cloned into the gRNA backbone for
controlled activation of tdTom fluorescence via dCas9-VP64 (Figure 34C). HEK293T cells were
transfected with the miniCMV_tdTom reporter along with either MS2-p65-HSF1 only, dCas9-
VP64+gRNACMV together or all three components together (Figure 34D). MS2-65-HSF1
transfection had no effect on tdTom expression (Figure 34D1), while dCas9-VP64/gRNACMV co-
transfection resulted a minimal increase in the fluorescence (Figure 34D2). Finally, combining the
VP64 fused dCas9, miniCMV promoter targeting gRNA and p65-HSF1 transcriptional activators
caused a very strong increase in tdTom fluorescence, indicating successful transcriptional
activation (Figure 34D3).
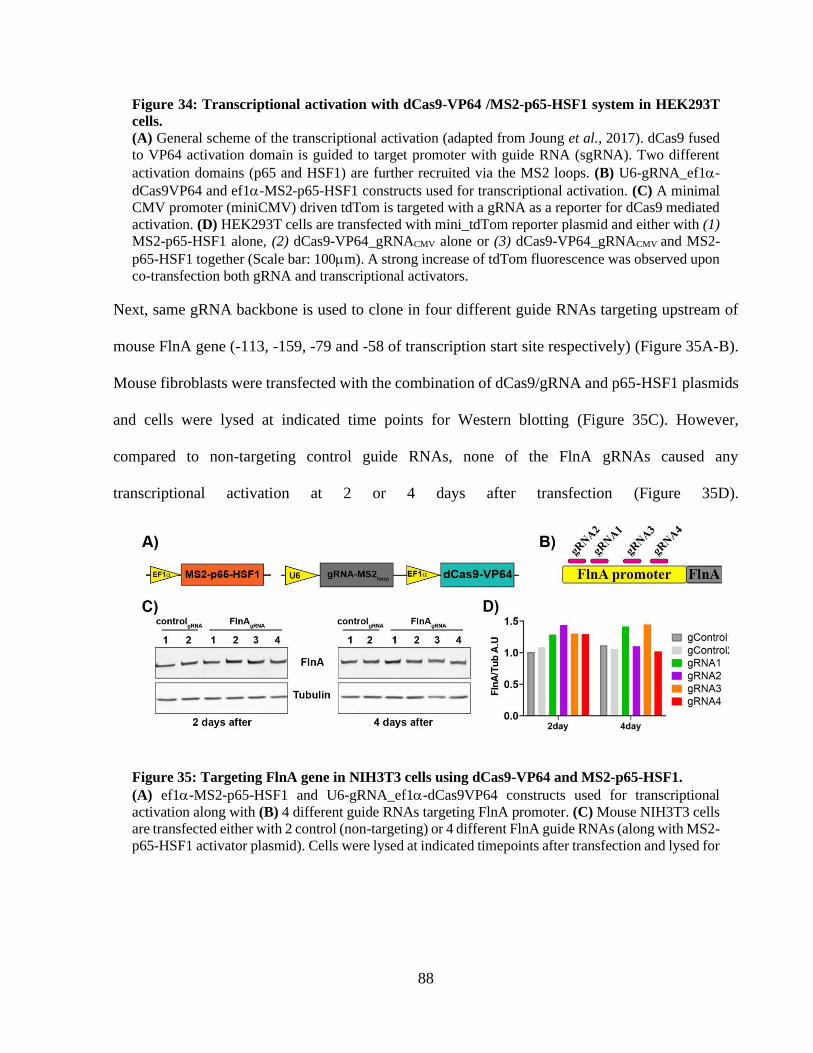
88
Figure 34: Transcriptional activation with dCas9-VP64 /MS2-p65-HSF1 system in HEK293T
cells.
(A) General scheme of the transcriptional activation (adapted from Joung et al., 2017). dCas9 fused
to VP64 activation domain is guided to target promoter with guide RNA (sgRNA). Two different
activation domains (p65 and HSF1) are further recruited via the MS2 loops. (B) U6-gRNA_ef1-
dCas9VP64 and ef1-MS2-p65-HSF1 constructs used for transcriptional activation. (C) A minimal
CMV promoter (miniCMV) driven tdTom is targeted with a gRNA as a reporter for dCas9 mediated
activation. (D) HEK293T cells are transfected with mini_tdTom reporter plasmid and either with (1)
MS2-p65-HSF1 alone, (2) dCas9-VP64_gRNACMV alone or (3) dCas9-VP64_gRNACMV and MS2-
p65-HSF1 together (Scale bar: 100m). A strong increase of tdTom fluorescence was observed upon
co-transfection both gRNA and transcriptional activators.
Next, same gRNA backbone is used to clone in four different guide RNAs targeting upstream of
mouse FlnA gene (-113, -159, -79 and -58 of transcription start site respectively) (Figure 35A-B).
Mouse fibroblasts were transfected with the combination of dCas9/gRNA and p65-HSF1 plasmids
and cells were lysed at indicated time points for Western blotting (Figure 35C). However,
compared to non-targeting control guide RNAs, none of the FlnA gRNAs caused any
transcriptional activation at 2 or 4 days after transfection (Figure 35D).
Figure 35: Targeting FlnA gene in NIH3T3 cells using dCas9-VP64 and MS2-p65-HSF1.
(A) ef1-MS2-p65-HSF1 and U6-gRNA_ef1-dCas9VP64 constructs used for transcriptional
activation along with (B) 4 different guide RNAs targeting FlnA promoter. (C) Mouse NIH3T3 cells
are transfected either with 2 control (non-targeting) or 4 different FlnA guide RNAs (along with MS2-
p65-HSF1 activator plasmid). Cells were lysed at indicated timepoints after transfection and lysed for
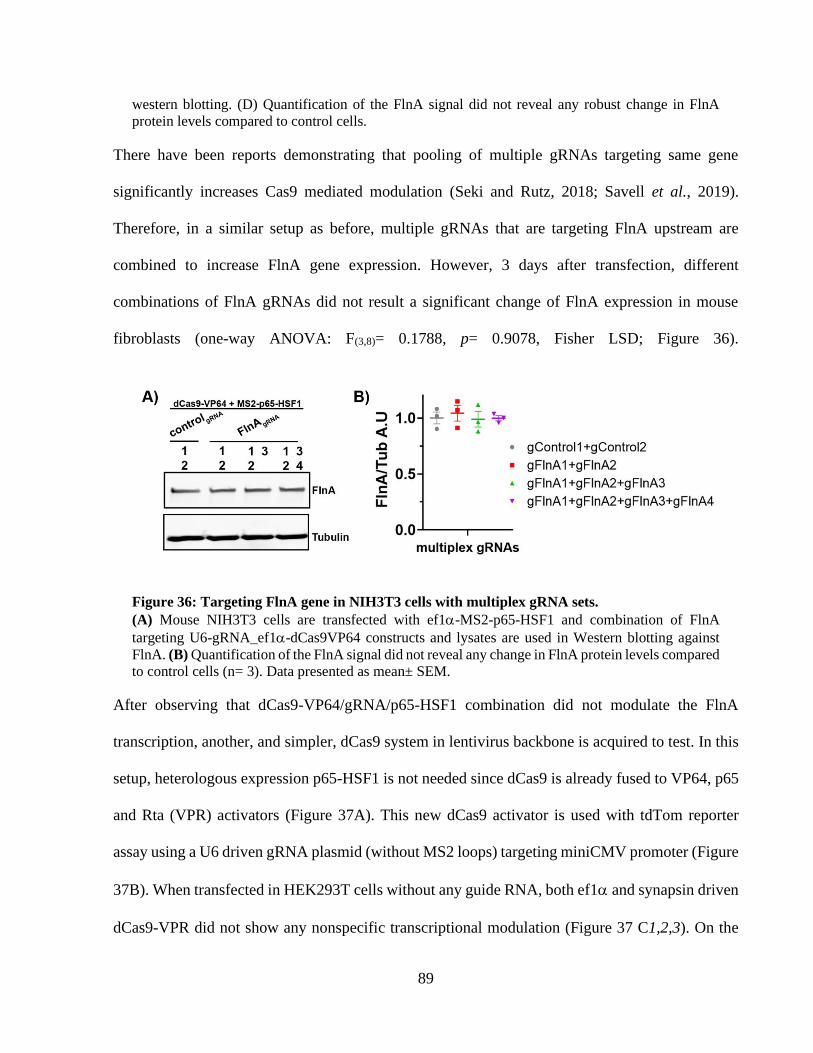
89
western blotting. (D) Quantification of the FlnA signal did not reveal any robust change in FlnA
protein levels compared to control cells.
There have been reports demonstrating that pooling of multiple gRNAs targeting same gene
significantly increases Cas9 mediated modulation (Seki and Rutz, 2018; Savell et al., 2019).
Therefore, in a similar setup as before, multiple gRNAs that are targeting FlnA upstream are
combined to increase FlnA gene expression. However, 3 days after transfection, different
combinations of FlnA gRNAs did not result a significant change of FlnA expression in mouse
fibroblasts (one-way ANOVA: F(3,8)= 0.1788, p= 0.9078, Fisher LSD; Figure 36).
Figure 36: Targeting FlnA gene in NIH3T3 cells with multiplex gRNA sets.
(A) Mouse NIH3T3 cells are transfected with ef1-MS2-p65-HSF1 and combination of FlnA
targeting U6-gRNA_ef1-dCas9VP64 constructs and lysates are used in Western blotting against
FlnA. (B) Quantification of the FlnA signal did not reveal any change in FlnA protein levels compared
to control cells (n= 3). Data presented as mean± SEM.
After observing that dCas9-VP64/gRNA/p65-HSF1 combination did not modulate the FlnA
transcription, another, and simpler, dCas9 system in lentivirus backbone is acquired to test. In this
setup, heterologous expression p65-HSF1 is not needed since dCas9 is already fused to VP64, p65
and Rta (VPR) activators (Figure 37A). This new dCas9 activator is used with tdTom reporter
assay using a U6 driven gRNA plasmid (without MS2 loops) targeting miniCMV promoter (Figure
37B). When transfected in HEK293T cells without any guide RNA, both ef1 and synapsin driven
dCas9-VPR did not show any nonspecific transcriptional modulation (Figure 37 C1,2,3). On the
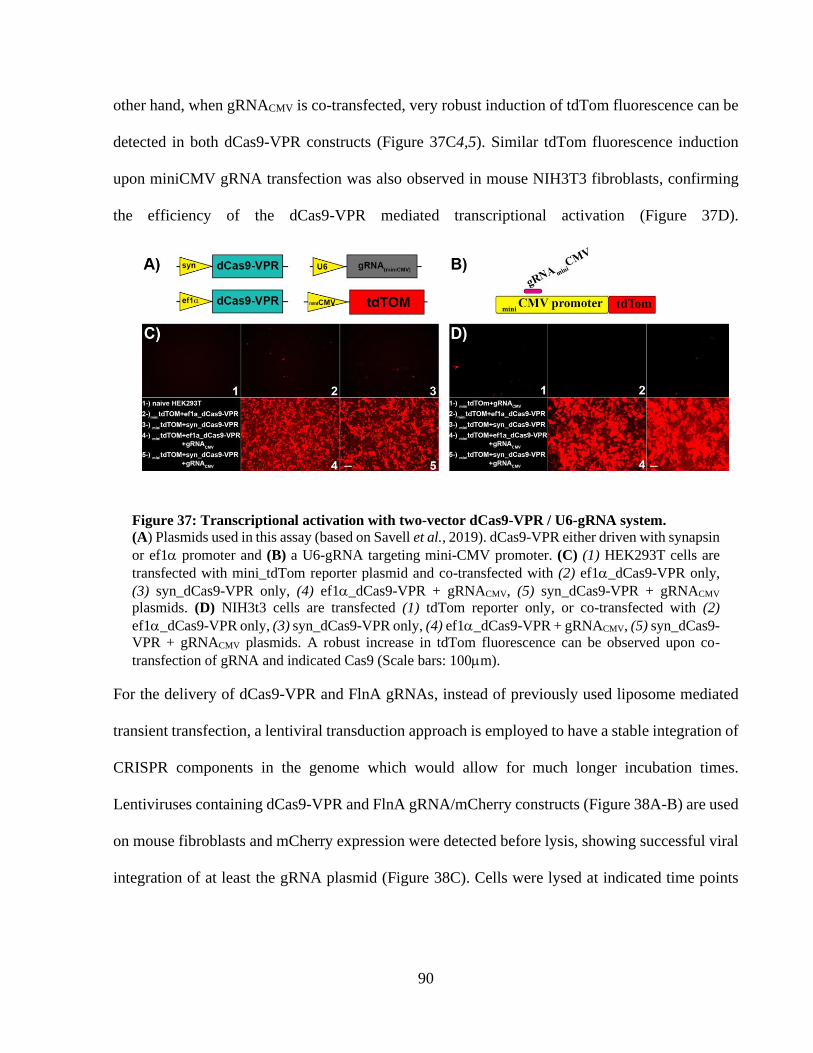
90
other hand, when gRNACMV is co-transfected, very robust induction of tdTom fluorescence can be
detected in both dCas9-VPR constructs (Figure 37C4,5). Similar tdTom fluorescence induction
upon miniCMV gRNA transfection was also observed in mouse NIH3T3 fibroblasts, confirming
the efficiency of the dCas9-VPR mediated transcriptional activation (Figure 37D).
Figure 37: Transcriptional activation with two-vector dCas9-VPR / U6-gRNA system.
(A) Plasmids used in this assay (based on Savell et al., 2019). dCas9-VPR either driven with synapsin
or ef1 promoter and (B) a U6-gRNA targeting mini-CMV promoter. (C) (1) HEK293T cells are
transfected with mini_tdTom reporter plasmid and co-transfected with (2) ef1_dCas9-VPR only,
(3) syn_dCas9-VPR only, (4) ef1_dCas9-VPR + gRNACMV, (5) syn_dCas9-VPR + gRNACMV
plasmids. (D) NIH3t3 cells are transfected (1) tdTom reporter only, or co-transfected with (2)
ef1_dCas9-VPR only, (3) syn_dCas9-VPR only, (4) ef1_dCas9-VPR + gRNACMV, (5) syn_dCas9-
VPR + gRNACMV plasmids. A robust increase in tdTom fluorescence can be observed upon co-
transfection of gRNA and indicated Cas9 (Scale bars: 100m).
For the delivery of dCas9-VPR and FlnA gRNAs, instead of previously used liposome mediated
transient transfection, a lentiviral transduction approach is employed to have a stable integration of
CRISPR components in the genome which would allow for much longer incubation times.
Lentiviruses containing dCas9-VPR and FlnA gRNA/mCherry constructs (Figure 38A-B) are used
on mouse fibroblasts and mCherry expression were detected before lysis, showing successful viral
integration of at least the gRNA plasmid (Figure 38C). Cells were lysed at indicated time points
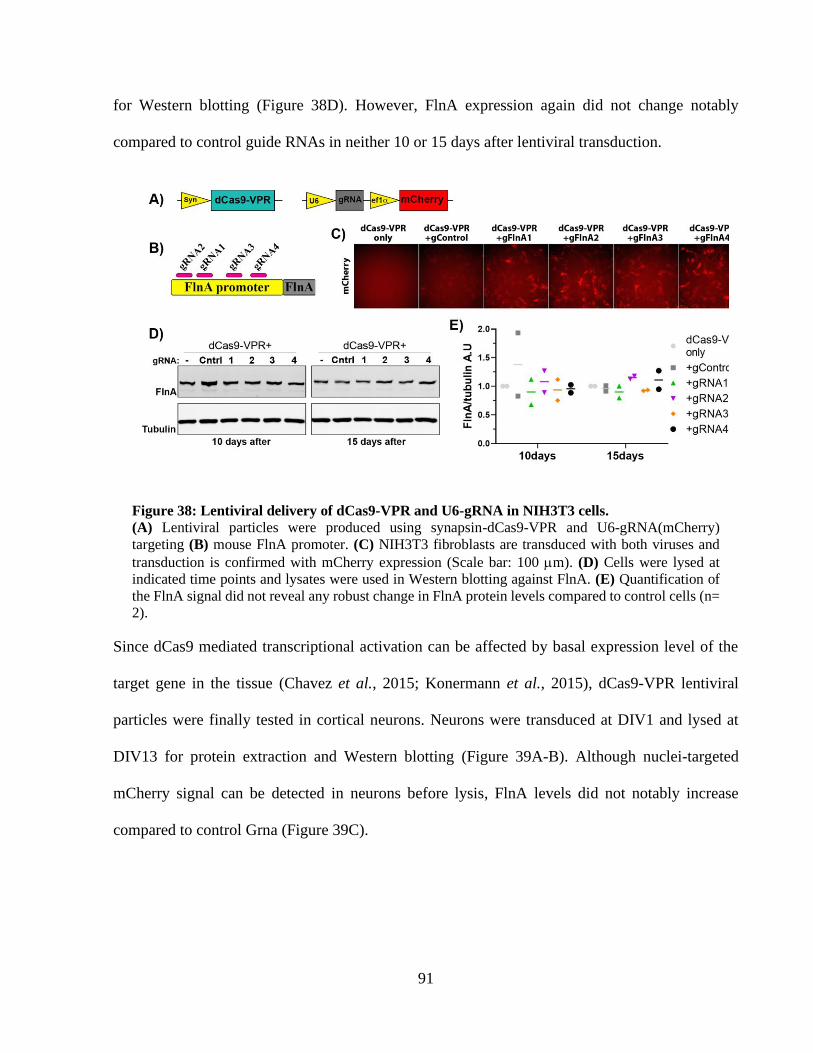
91
for Western blotting (Figure 38D). However, FlnA expression again did not change notably
compared to control guide RNAs in neither 10 or 15 days after lentiviral transduction.
Figure 38: Lentiviral delivery of dCas9-VPR and U6-gRNA in NIH3T3 cells.
(A) Lentiviral particles were produced using synapsin-dCas9-VPR and U6-gRNA(mCherry)
targeting (B) mouse FlnA promoter. (C) NIH3T3 fibroblasts are transduced with both viruses and
transduction is confirmed with mCherry expression (Scale bar: 100 m). (D) Cells were lysed at
indicated time points and lysates were used in Western blotting against FlnA. (E) Quantification of
the FlnA signal did not reveal any robust change in FlnA protein levels compared to control cells (n=
2).
Since dCas9 mediated transcriptional activation can be affected by basal expression level of the
target gene in the tissue (Chavez et al., 2015; Konermann et al., 2015), dCas9-VPR lentiviral
particles were finally tested in cortical neurons. Neurons were transduced at DIV1 and lysed at
DIV13 for protein extraction and Western blotting (Figure 39A-B). Although nuclei-targeted
mCherry signal can be detected in neurons before lysis, FlnA levels did not notably increase
compared to control Grna (Figure 39C).
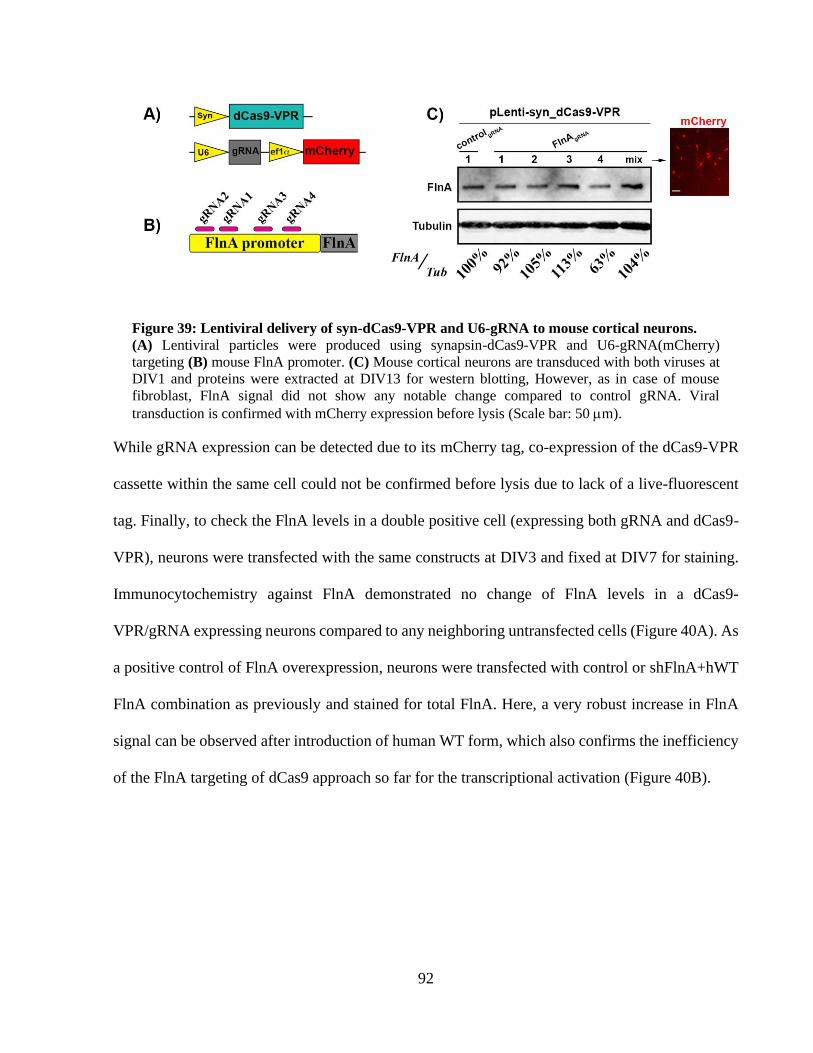
92
Figure 39: Lentiviral delivery of syn-dCas9-VPR and U6-gRNA to mouse cortical neurons.
(A) Lentiviral particles were produced using synapsin-dCas9-VPR and U6-gRNA(mCherry)
targeting (B) mouse FlnA promoter. (C) Mouse cortical neurons are transduced with both viruses at
DIV1 and proteins were extracted at DIV13 for western blotting, However, as in case of mouse
fibroblast, FlnA signal did not show any notable change compared to control gRNA. Viral
transduction is confirmed with mCherry expression before lysis (Scale bar: 50 m).
While gRNA expression can be detected due to its mCherry tag, co-expression of the dCas9-VPR
cassette within the same cell could not be confirmed before lysis due to lack of a live-fluorescent
tag. Finally, to check the FlnA levels in a double positive cell (expressing both gRNA and dCas9-
VPR), neurons were transfected with the same constructs at DIV3 and fixed at DIV7 for staining.
Immunocytochemistry against FlnA demonstrated no change of FlnA levels in a dCas9-
VPR/gRNA expressing neurons compared to any neighboring untransfected cells (Figure 40A). As
a positive control of FlnA overexpression, neurons were transfected with control or shFlnA+hWT
FlnA combination as previously and stained for total FlnA. Here, a very robust increase in FlnA
signal can be observed after introduction of human WT form, which also confirms the inefficiency
of the FlnA targeting of dCas9 approach so far for the transcriptional activation (Figure 40B).
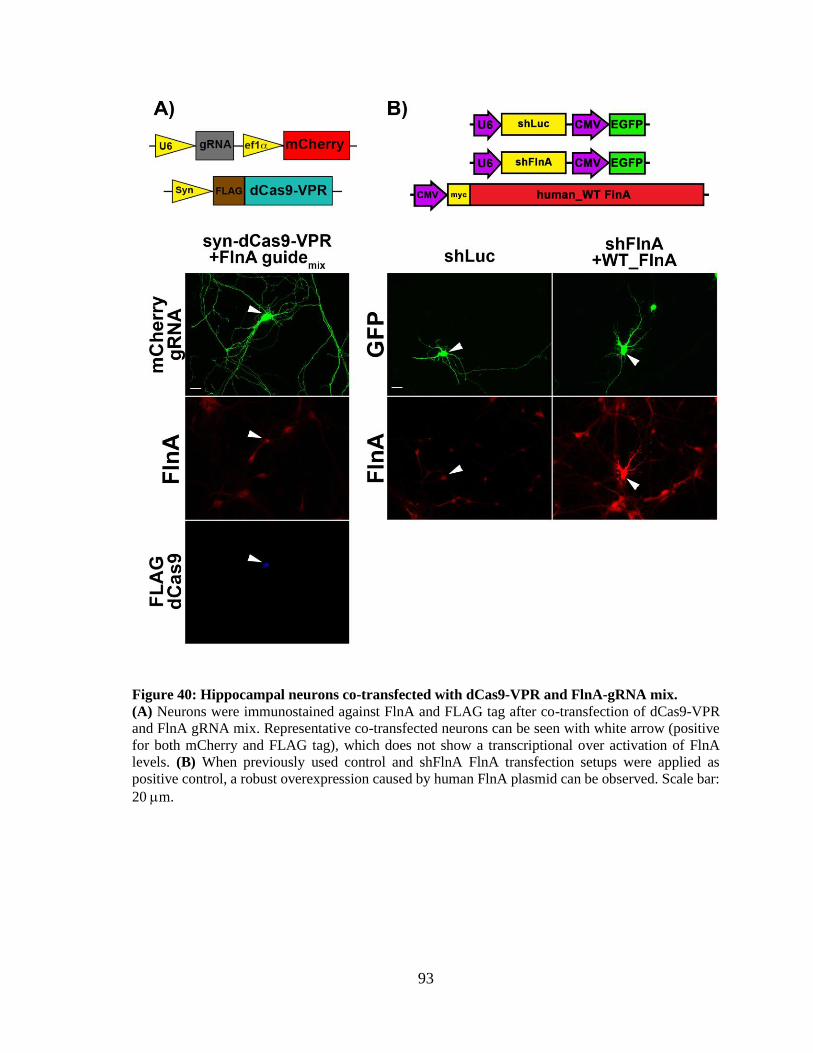
93
Figure 40: Hippocampal neurons co-transfected with dCas9-VPR and FlnA-gRNA mix.
(A) Neurons were immunostained against FlnA and FLAG tag after co-transfection of dCas9-VPR
and FlnA gRNA mix. Representative co-transfected neurons can be seen with white arrow (positive
for both mCherry and FLAG tag), which does not show a transcriptional over activation of FlnA
levels. (B) When previously used control and shFlnA FlnA transfection setups were applied as
positive control, a robust overexpression caused by human FlnA plasmid can be observed. Scale bar:
20 m.
94
DISCUSSION
Integrins form an important signaling hub on the membrane that controls the neuronal
development. They signal bidirectionally where both extracellular and intracellular components
can act on. The latter comprise of signaling proteins that can bind to intracellular tail of integrin
receptors and contribute to tight regulation of integrin activity, called as inside-out signaling. In
this study, two intracellular proteins, Ndr2 kinase, a target of Hippo pathway in brain; and its
recently described downstream substrate, Filamin A, were investigated for their role in integrin
inside-out signaling. Experiments were designed to test their critical function in dendritic
arborization regarding ECM specificity, integrin engagement and actin cytoskeleton. Findings
from PC12 cultures and hippocampal neurons suggest that Ndr2 determines the substrate
specificity of neurite extension via surface expression of α1β1 integrins. Moreover, results from
various genetical and pharmacological manipulations indicated that its substrate FlnA plays a
crucial role during dendritic arborization of neurons downstream of integrin signaling and via actin
crosslinking.
1.1 ECM and neurite growth
Neurite growth and dendritic branching are shaped not only by the intracellular neural signaling
but also by the signals from their microenvironment, namely ECM. ECM in brain is a
heterogeneous mixture of proteins and proteoglycans surrounding the neurons and astrocytes
varying in a temporal (developmental) manner (Barros, Franco and Müller, 2011). Although once
seen as a simple physical scaffold, studies have increasingly revealed its important role in
regulating neuronal differentiation and neurite growth. Several studies showed that members of the
ECM proteins or their combinations improve the survival/neurite growth of differentiating neurons
95
(O’Connor et al., 2001; Fusaoka-Nishioka et al., 2011; Tonge et al., 2012). ECM specificity of
neurite growth is obtained via different ligand affinities of integrin subtypes that reside on the
membrane. Among the integrin receptors, 1 containing heterodimers are the main receptor type
for neurite growth mechanisms in neurons, while subunits provide the ligand specificity for ECM
(Denda and Reichardt, 2007; Wu and Reddy, 2012). Since the role of Ndr2 in neurons regarding
1 integrin function was previously described (Rehberg et al., 2014), I further explored whether
Ndr2 plays any role in ECM substrate specificity of neurite growth.
To do so, stably transfected PC12 cells were employed, due to their ease of culturing and ability to
differentiate/extend neurites upon acute NGF stimulation. Although ECM is a heterogenous
mixture of different glycoproteins and proteoglycans, ECM substrates can be classified into 3 major
groups depending on their integrin recognition sequences: laminins, fibronectins (RGD sequence
containing) and collagens (GFOGER sequence containing) (Barczyk, Carracedo and Gullberg,
2010). On an array of these substrates, Ndr2 overexpressing PC12 cells displayed more neurite
initiation compared to control cells (Figure 3A). This is likely to be caused by increased 1 integrin
activation via Ndr2 (Rehberg et al., 2014; Demiray et al., 2018) as 1 integrins have a major role
in recognition of each ECM substrate subtypes that were used (Hynes, 2002). It should also be
noted that, even in the absence of NGF, Ndr2 PC12 cells displayed short, but noticeable neurites
during routine passaging in flasks (data not shown). These culture flasks were not coated with any
specific ECM and control PC12 cells appeared round in the same conditions. This further indicates
an NGF-independent neurite initiation by Ndr2 overexpression, possibly via overactivation of the
PI3K (phosphoinositide 3-kinase) pathway components. PI3K axis have been shown to be a
positive regulator of PC12 neurite extension (Jackson et al., 1996; Kim et al., 2004) and, two of is
important members, Akt and Tuberin, displayed significantly increased phosphorylation in
96
unstimulated Ndr2 PC12 cells (Daniel Lang & Oliver Stork, unpublished data), which could
underlie those short neurites in basal conditions.
To examine a substrate-specific interaction of neurite growth and Ndr2 kinase, EGFP and Ndr2
PC12 cells grown were further analyzed for their neurite length (in cooperation with Dr. Kati
Rehberg, Demiray et al., 2018). PDL, laminin and collagen IV substrates were used for this
approach since they caused maximal neurite initiation in both the control and Ndr2 PC12 cells
without any genotype difference (Figure 3A). In this analysis, collagen IV caused a striking contrast
to the overall morphology effects caused by Ndr2. Compared to control cells, significantly less
number of Ndr2 PC12 cells were induced by collagen IV substrate to extend long neurites (Figure
3B-C). On the other hand, the previously reported Ndr2 mediated increase of PC12 neurite
extension was also observed on PDL (Stork et al., 2004). On laminin substrate, there were no
differences between genotypes, possibly due to its high efficiency of neurite extension also in
control cells. Thus, neurite growth of Ndr2 PC12 cells on PDL and collagen IV substrates were
tested further to address potential mechanisms that may cause the unresponsiveness of Ndr2
overexpressing cells to collagen IV signaling.
Twenty-eight different collagen subtypes have been identified so far and among them, collagen
subtypes I, II, III and IV were shown to induce neurite extension of PC12 cells in a Mg2+ dependent
manner (Turner, Flier and Carbonetto, 1987). Control PC12 cells already displayed a significant
boost in neurite extension on collagen IV after NGF, via mediating the collagen IV-integrin
receptor interactions (Tomaselli, Damsky and Reichardt, 1987; Ali, Pappas and Parnavelas, 1998).
On the other hand, Ndr2 PC12 cells did not alter in their neurite morphology between PDL and
collagen IV, underscoring the lack of collagen IV response (Figure 4). Divalent ions such as Mg2+
or Mn2+ prime the integrins to their activation state by binding to metal ion dependent adhesion
97
sites (Zhang and Chen, 2012). Accordingly, the observed moderate enhancement of neurite growth
of the Ndr2 PC12 cells on both PDL and collagen IV substrates by Mg2+ (Figure 4) could result
from the combination of the divalent ion mediated priming and Ndr2 mediated intracellular
activation of 1 integrin receptors (β1 pThr788/789) at neurite tips (Rehberg et al., 2014; Demiray et
al., 2018).
1.2 Integrins and substrate selectivity
One possible explanation of unresponsiveness to collagen IV could be a disturbance of collagen
IV induced integrin signaling in Ndr2 PC12 cells. Due to the redundancy of integrin-ligand
interactions, collagen IV substrate was first reported to be recognized by both α1β1 and α2β1 integrin
heterodimers (Vandenberg et al., 1991). However, previous studies suggest that α1β1 integrin
heterodimer has higher affinity and mainly interacts with collagen IV (Knight et al., 2000; Becker
et al., 2013). This was indeed quantitatively shown using purified integrin receptors and ligands in
which α1β1 integrins displayed 4-fold higher affinity to Collagen IV compared to α2β1 integrins in
the presence of divalent ions (Kern et al., 1993). Moreover, T-cells, which use integrin receptors
for adhesion, display a differential distribution along the lung tissue depending on the collagen
subtype of the basement membrane. In the same study, it has been shown that α1β1 integrin
expressing T-cells enriched on collagen IV rich surfaces where α2β1 expressing cells rather localize
on collagen I enriched spaces (Richter et al., 2007). Differential affinity of the two closely related
integrin to collagen subtypes can be explained via existence of the I domain in their integrin N
terminus. This I domain is a common feature in collagen subtypes and it has been shown that α1I
domain has the highest affinity to the collagen IV while α2-I domain to the collagen types I-III
(Tulla et al., 2001).
98
To specifically address this question, a diffusible ligand that mimics collagen IV mediated binding
to integrin receptors was tested on Ndr2 PC12 cells. KTS ligand peptide (CWKTSLTSHYC) which
derived from the larger disintegrin obtustatin and has shown to specifically bind α1β1 integrin dimer
was utilized for this purpose (Moreno-Murciano et al., 2003). Although higher concentration of
this disintegrin is used as an antagonist for the α1β1 function, at the concentration used in the
experiments described here (140 µM; based on Marcinkiewicz et al., 2003), the synthetic KTS
ligand did not induce any change in the flattening of the cells that would indicate a generally altered
adhesion (data not shown). More importantly, control cells did not show any difference and could
successfully reach their maximal levels in the neurite extension between the PDL and Collagen IV
substrate under 140 µM KTS ligand (Figure 4). This corroborates the notion that the concentration
used in experiments did not cause any inhibition of the α1β1 integrin-Collagen IV interaction.
Strikingly, in spite of the increased β1 integrin phosphorylation (pThr788/799) via Ndr2 (Rehberg et
al., 2014; Demiray et al., 2018), the KTS ligand failed to induce any neurite extension in the Ndr2
PC12 cells. The failure of the KTS stimulation in Ndr2 PC12 cells was evident both on the PDL
and Collagen IV, which strongly indicates a disturbance specifically in the α1β1 integrin
mechanism. In line with morphology, immunocytochemistry of those cells demonstrated that Ndr2
PC12 cells expressed significantly less α1 integrin in their neurite tips (Figure 9). Moreover, when
total α1 integrin levels were investigated during NGF stimulation, no significant differences were
observed between the genotypes on both substrates (Figure 10). It is important to note that α1
integrin protein levels increased up to 5-fold in 6 days of NGF treatment compared to day 0 in both
genotypes (Figure 10). This is in line with earlier reports that α1 integrin mRNA expression
markedly increases with NGF treatment and correlates with level of adhesion on collagen
substrates and neurite extension of PC12 cells (Zhang, Tarone and Turner, 1993). The observed
99
null difference in neurite initiation between the genotypes on collagen IV (Figure 3A) may arise
from the low dependence on α1 integrin expression during early phases of differentiation of PC12
cells.
Given the role of Ndr2 in control of β1 integrin trafficking to the membrane (Rehberg et al., 2014),
it is no surprise that Ndr2 can modulate the localization of another integrin subunit, α1. It has been
shown that α integrin subunits are internalized and can be recycled via Rab-mediated pathways via
their conserved Rab-interacting domains (Pellinen et al., 2008; Caswell, Vadrevu and Norman,
2009). Since the association of Ndr2 to Rab5/Rab11 positive early/late endosomes in neurons was
previously demonstrated (Rehberg et al., 2014), it is highly likely that Ndr2 also regulates the
integrin trafficking in differentiating PC12 cells via aforementioned Rab-dependent mechanisms.
Moreover, Rabin8, a Rab-8 guanine exchange factor, has been identified as a substrate for Ndr2
kinase (Ultanir et al., 2012). Rabin8 plays an important role in neurite outgrowth as it controls the
Rab-dependent endosomal trafficking in PC12 cells (Homma and Fukuda, 2016).
To translate these observed effects of from PC12 cells in a neuron-like environment, mouse
hippocampal neurons were transfected with Ndr2 overexpression or silencing vectors. Here,
LN111 coating was used as an extracellular substrate, since it has been previously shown bind α1β1
integrins during neuronal development in vitro (Desban et al., 2006; Tulla et al., 2008). Similar to
EGFP PC12 cells on collagen IV, control neurons on LN111 displayed enhanced dendritic growth.
α1β1 substrate LN111 again failed to stimulate dendritic growth in Ndr2 overexpressing
hippocampal neurons, which indicates the persistence of α1 integrin disturbance (Figure 11). The
differential trafficking of subunit may be mediated by clathrin dependent vesicular endocytosis,
which is an important aspect of integrin trafficking (Bridgewater, Norman and Caswell, 2012). For
100
example, α1-3 but not α5 or αV integrin subunits are regulated by Dab2 adaptor protein which
interacts with clathrin coated vesicles, which can cause such differential sorting mechanisms
(Teckchandani et al., 2009). Adapter-protein-2 (AP2) is another crucial scaffold for clathrin-
dependent endocytosis and redistributed in the PC12 cells membrane after NGF treatment (Beattie
et al., 2000). Likewise, α2 and α6, but not α1 integrin receptors incorporate the binding domain for
AP2 (De Franceschi et al., 2016). Intriguingly, AP2 associated kinase (AAK1), which can regulate
AP2 binding affinity. is a previously shown downstream target of Ndr kinase in the brain (Ultanir
et al., 2012). It is plausible to assume that Ndr2 interacts with such adaptor proteins which warrants
further investigation of Ndr2 kinase in vesicular trafficking of integrin receptor subtypes. Silencing
of Nd2, however, inhibited proper dendritic branching on both PDL and LN111 (Figure 12). The
overall decrease of dendritic branching could be caused by the reduced β1 integrin activity in
shNdr2 neurons as β1 containing heterodimers are responsible for overall neurite differentiation in
neurons (Marrs et al., 2006; Warren et al., 2012).
1.3 A drawbridge between Ndr2 and integrin receptors: FlnA
Ndr2 sits downstream of Mst kinases as a target of hippo pathway and exact mechanisms of how
it can mediate 1 integrin activity was still unclear up to this point. Thr788/789 site on the 1 integrin
tail is an important regulator for its activation state (Nilsson et al., 2006) and has been shown to be
targeted by CamKII and PKC (Suzuki and Takahashi, 2003; Stawowy et al., 2005). Indeed,
activated Ndr2 can also induce Thr788/789 phosphorylation, and this action is sensitive to CamKII
and PKC inhibitors. However, the Thr788/789 phosphorylation was not direct since activated Ndr2
did not phosphorylate the cytoplasmic tail of 1 integrins in an in vitro kinase assay (Rehberg et
al., 2014). This prompted us to investigate whether there is an adaptor protein downstream of Ndr2
101
that may mediate its effects on 1 integrin (in cooperation with Eric Devroe & Benjamin Turk,
Waldt et al., 2018; Figure 13A). As a side note, kinase regulator Mob2 was also present during
radioactive phosphorylation labelling as it has been shown to drastically stimulate Ndr catalytic
activity (Devroe et al., 2004).
Determining R-X-P-(S/T) as the optimal Ndr2 target motif led to identification of three significant
phosphorylation substrates in the integrin adhesome containing this motif (Figure 13). Next to the
prominent integrin association by FlnA, R-X-P-(S/T) motif in the HSBP- S15 and protein tyrosine
phosphatase receptor A at S204 are worth taking note. Although it has only shown by high
throughput mass spectrometry (Ewing et al., 2007), interaction between HSBP1 and integrin linked
kinase (ILK) can be critical as ILK is one of the downstream effector of integrin receptors and can
regulate dendritic initiation and growth (Naska et al., 2006). Heat-shock activated chaperone
proteins including HSBP1 are linked to peripheral neuropathies and S15 phosphorylation of
HSBP1 affects its structure and chaperone activity (Rogalla et al., 1999; Weeks et al., 2018).
Besides HSBP1, phosphorylation of S204 on PTPRA has been shown to enhance its phosphatase
activity and substrate specificity. Activation of PTPRA is important tyrosine phosphatase since it
targets variety of downstream kinases such as Src and thereby modulates their activity (Zheng,
Resnick and David, 2002). This may then also play an important role due to involvement of Src in
dendritic morphogenesis and spinogenesis (Kotani et al., 2007). Given these evidence, potential
Ndr2 mediated PTPRA-Src pathway warrants further investigation in the context of neuronal
growth.
In the present study, S2152 phosphor acceptor residue on FlnA was focused primarily, and has
been shown to directly phosphorylated by active Ndr2 (Figure 14A). Ndr2 mediated FlnA
phosphorylation was further tested and silencing of Ndr2 disturbed the FlnA phosphorylation in
102
both mouse fibroblast (NIH3T3) and human Jurkat T-cell lines (Figure 14, Appendix Figure 43).
Results obtained from T-cells using CD3 stimulation demonstrated a much stronger difference in
Ndr2-mediated FlnA 2152 phosphorylation compared to FBS treated NIH3T3 cells. It is important
to underline that mouse NIH3T3 cells have relatively similar Ndr2 and Ndr1 expression levels
(Cornils et al., 2010) and both isoforms are known to be activated with okadaic acid (Devroe et al.,
2004). The effects of shNdr2 thus can be diluted to some extend by Ndr1 mediated RxP(S/T)
phosphorylation on FlnA in mouse NIH3T3 cells. On the other hand, Jurkat T cells that were used
in CD3 stimulation express much higher Ndr2 relative to Ndr1 isoform, therefore providing a more
suitable environment to quantify Ndr2-FlnAS2152 axis under shNdr2 manipulation (Waldt et al.,
2018). Most importantly, differential expression of Ndr1 and Ndr2 isoforms have been
demonstrated throughout different mouse tissues. As opposed to rat brain, Ndr1 protein was not
detected in mouse brain tissue while Ndr2 was profoundly expressed both in mouse cortex and
hippocampus (Cornils et al., 2010; Rehberg et al., 2014). Together, these findings indicate that
Ndr2 phosphorylates FlnA on S2152 and is the primary Ndr kinase in the brain. It is worth noting
that in Ndr2 KO mouse neurons, Ndr1 protein expression was not upregulated (Kul Madencioglu,
2019- Doctoral Thesis). Due to this lack of compensation, neuronal cultures are valuable tools to
study Ndr2 mediated S2152 FlnA phosphorylation and its effects in vitro in future. Cells expressing
an activated or kinase-dead Ndr2 and different FlnA phosphomutants (S2152A and S2152E) might
further reveal any Ndr2 targeted FlnA-S2152 specific effects in dendritic morphology. Aside from
that, by analyzing a developmental profile of FlnA phosphorylation compared to wild type mice,
Ndr2 KO mouse model that is available (Rehberg et al., 2014) will be a particularly useful tool for
first in vivo Ndr2 mediated FlnA S2152 description from the brain.
103
Another reason for the pronounced FlnA phosphorylation effect in CD3 stimulated Jurkat T cells
compared to mouse fibroblasts could be the heterogenous nature of FBS stimulation, which may
also activate Ndr independent phosphorylation of FlnA via other previously reported upstream
kinases such as PKA, PKC or RSK (Jay, García and de la Luz Ibarra, 2004; Woo et al., 2004;
Muriel et al., 2011). More importantly, FlnA S2152 phosphorylation in Jurkat T cells induces its
release from LFA1 integrins, which allow activators such as talin and kindlin to associate to the
receptors intracellular tail (Waldt et al., 2018). Therefore, FlnA may act as an on/off switch on the
intracellular side of the integrins depending on its physical association with the receptor.
FlnA is critically positioned beneath the neuronal membrane where it connects the integrin
mediated signaling to intracellular actin dynamics. Therefore, it is of particular interest when it
comes to exploring mechanisms of dendritic growth. However, since the loss of FlnA function in
humans is the most frequent cause of PH (accumulation of neurons that fail to properly migrate
into cerebral cortex) (Lange et al., 2015), the research to date mostly focused on how FlnA controls
neuronal migration. Thus, the knowledge about FlnA effects on dendritic growth was limited.
Accordingly, first, the role of FlnA expression on dendritic growth were tested in hippocampal
neurons. Considering the downregulation of FlnA mRNA after DIV7 (Figure 15), likely due to the
maturation of dendritic tree, neurons were transfected at DIV3 and analyzed at DIV7 to manipulate
FlnA during this critical developmental stage.
1.4 Precise levels of FlnA: less is more
Intriguingly, both under and overexpression of FlnA in hippocampal neurons displayed dendritic
hypertrophy (Figure 18D). Moreover, another shRNA targeting FlnA transcript (Figure 20) and
pure overexpression of FlnA (Figure 28) verify that it is the main effect of FlnA manipulation and
104
is not caused e.g. by a side effect of the hairpin or co-transfections. This was not surprising since
there have been several studies reporting similar consequences of FlnA manipulation. For instance,
although comprising of a very distinct neuronal population compared to hippocampus, olfactory
bulb neurons also display an increase in dendritic arbor numbers after silencing as well as
overexpression of FlnA (Zhang et al., 2014). In more mature hippocampal neurons (DIV14), both
increase and silencing of FlnA caused similar immature spine phenotype on dendrites (Segura et
al., 2016). Increased expression or S2152 phosphorylation of FlnA, as well as its loss via transgenic
mouse model, exhibited similar impairments in neuronal migration (Zhang et al., 2012, 2013).
Lastly, in Drosophila, two different mutant fly lines that shows aberrant FlnA expression were
described in a behavioral screen (Cher and Joy mutants, decreased and increased FlnA expression
levels respectively). Accordingly, both mutant lines displayed disturbance in long term memory
after one-day spaced training (Bolduc et al., 2010). In summary, these results, including the
hippocampal neurons morphology from experiments reported here, suggest that precise regulation
of FlnA is needed in neurons for proper neuronal migration, dendritic/spine development, and
synaptic functioning.
Given the role of FlnA in modulation of integrin activity, we then tested how the FlnA silenced
and overexpressed neurons would grow on Fibronectin, a known 1 integrin ligand that supports
neurite growth (Tonge et al., 2012; Nieuwenhuis et al., 2018). On Fibronectin, the FlnA effects
were dissociated in such that the proximal dendritic hypertrophy still persisted in hWT FlnA
expressing neurons, while shFlnA mediated arborization were disturbed significantly (Figure 18E).
As a negative regulator of integrin activity, silencing FlnA may cause an increased 1 activity on
the growing neurite tips and this mild increase can be advantageous for branching on PDL only.
On the other hand, on the fibronectin-precoated coverslip, this increased activation may cause a
105
hyper adhesion state that disturbs the dendritic arborization. It is worth noting that ECM is
collectively synthesized by both neurons and glia (Dzyubenko, Gottschling and Faissner, 2016).
Hippocampal neurons used in dendritic morphology experiments were fed with a media that was
conditioned on confluent astrocytes for 72 hours. Thus, on PDL only coverslips, there is an
accumulated basal amount of ECM to which shFlnA neurons can respond and branch efficiently.
The integrin dependent growth on PDL only coverslips were further observed as growth
impairments after 1 integrin silencing (Figure 21) or after 1 integrin activity blocking (Figure 23).
On the other hand, fibronectin coated coverslips contain a high density of immobilized RGD
ligands on the ECM, whereby disturbing of the integrin activation dynamics by shFlnA impairs the
arborization. Even more striking result that was evident from this experiment was the fact that hWT
FlnA mediated dendritic hypertrophy persisted as it did not change between PDL and fibronectin
substrates (Figure 18C). This finding suggests that hWT FlnA induced arborization might be
independent of integrin receptor modulation. A possible mechanism that may mediate the observed
effects is its actin crosslinking.
If the effects of FlnA under and overexpression are distinguished by integrin activity, then 1
integrin level, as the main integrin receptor in neurons, should play a pivotal role in this mechanism.
Therefore, as the next step, whether the detrimental effects of 1 integrin reduction can be rescued
by either FlnA genotype was tested. Co-transfection of shFlnA with shItgb1 rescued the overall
deficiency in dendritic branching length and enhanced it to similar levels as control neurons,
consistent with the notion of augmented integrin activation upon FlnA silencing. However, hWT
FlnA co-expression did not rescue the growth impairment caused by 1 integrin reduction. Despite
prior evidence showing hWT FlnA could increase the dendritic branching independent of ECM-
integrin interaction (possibly via direct actin cytoskeleton association), these results suggest that
106
FlnA induced actin crosslinking still relies on the presence of integrin receptors to stimulate
branching. It has been shown that FlnA can bind to intracellular tail of 1 integrins (Gehler et al.,
2009; Nieves et al., 2010). This binding may serve as a docking station for the heterologous
expressed hWT FlnA and may be crucial for its actin-mediated stimulation of dendritic
arborization.
1.5 Targeting the middleman: 1 integrin, FAK and actin
Moreover, to test whether activity of 1 integrins is required for FlnA genotype effects, neuronal
cultures were then treated with a 1 specific blocking antibody Ha2/5 (Chavis and Westbrook,
2001). The previously observed dendritic hypertrophy caused by FlnA manipulation could still be
observed in untreated neurons (Figure 22D). Ha2/5 treatment significantly reduced dendritic
branching in all genotypes to different extent and shFlnA neurons displayed the most drastic
decrease (Figure 22A-C). The Ha2/5 treatment showed a more coherent disassociation of FlnA
mediated effects on dendritic growth and their integrin receptor activity dependency. Nevertheless,
hWT FlnA expressing neurons also displayed a mild but significant decrease of dendritic branching
under Ha2/5 antibody. This decrease was also anticipated as 1 integrin activity is a big component
of growth mechanisms and actin crosslinking might not compensate for the whole disturbance.
Nevertheless, the significant hypertrophy mediated by hWT FlnA expression persisted in
comparison to control and shFlnA neurons under Ha2/5 antibody. Interestingly, total length of the
dendritic tree was significantly reduced overall in all genotypes (Error! Reference source not
found.), suggesting that the FlnA mediated enhancements are arborization-specific rather than
increasing the overall growth rate.
FAK has been highly associated with integrin signaling since its discovery (Kornberg et al., 1992),

107
and is widely implicated with neuronal development, with a prominent role of first downstream
effector of integrin-ECM interactions (Navarro and Rico, 2014). FAK serves as a docking station
below the membrane after integrin engagement and orchestrates downstream signals that
eventually remodels local cytoskeleton via effector proteins such as Src, RhoA and Rac (Parsons,
2003). As a highly enriched kinase in neural growth cones and given its crucial position ‘below of’
integrin receptor and ‘above from’ actin cytoskeleton, FAK was targeted pharmacologically in
shFlnA and hWT FlnA genotypes. The findings from FAK inhibitor Y15 experiments highlighted
a clear distinction between the dendritic arborization effects: hWT FlnA expression could still
enhance branching, since its actin crosslinking function could serve as a downstream
compensation. Remarkably, as with 1 integrin blocking experiments, total dendritic length was
significantly disturbed in each genotype, confirming the arborization-specificity of the FlnA
effects.
The notion that actin crosslinking is the main reason behind the hWT FlnA branching effects was
only hypothesized up to this point and required direct evidence. To test this, a mutant FlnA that
cannot dimerize, thus cannot crosslink actin filaments as in WT form, was expressed in
hippocampal neurons. And indeed, dimerization mutant FlnA failed to stimulate dendritic
branching compared to control neurons (Figure 29). An earlier study using a similar dominant
negative FlnA, which lacks the ABD but retains its V-shape, demonstrated results akin to here.
This actin binding mutant failed to rescue the cortical radial migration disturbances in mouse in
contrast to the WT FlnA form (Kurabayashi et al., 2018). These observations together indicate that
efficient actin crosslinking by FlnA is crucial for significant FlnA effects in neurons. The
importance of actin branching and cross linking for neuronal development and memory formation
has become more evident in respect to a more recognized actin branching factor: Arp2/3 (Kim et
108
al., 2013; Spence et al., 2016). Arp2/3 has been implicated in controlling dendritic arborization
during neuronal development and its overactivation was reported to increase dendritic branching
in hippocampal neurons (Rocca et al., 2008). Interestingly, Arp2/3 mediated dendritic arborization
was also more prominent in the proximal parts as revealed by the Sholl analysis of transfected
hippocampal neurons (Rocca et al., 2008), similar to hWT FlnA results presented in the current
work. Studies comparing FlnA and Arp2/3 showed that FlnA- and Arp2/3-mediated actin
crosslinking are complementary and both necessary for proper actin dynamics and maintenance of
filament stability (Flanagan et al., 2001; Nakamura et al., 2002). Lastly, most of the hWT FlnA
genotype effects were reflected in the dendritic arborization while the total length of the dendritic
tree is reduced similar to control neurons (Figure 23, Figure 25). Interestingly, in a very recent
preprint, researchers systematically analyzed microtubule and microfilament distributions from
live Drosophila sensory neurons and found that local microtubule and microfilament levels are
associated with dendritic elongation and branching respectively (Nanda et al., 2020). In light of
this new evidence, a better understanding of how actin cytoskeleton is differentially regulated in
hWT FlnA neurons needs be investigated in future research. This could be carried out by combining
FlnA manipulation and staining of actin filaments (i.e., phalloidin followed by high resolution
microscopy) or following their dynamics with tracking methods such as LifeAct.
1.6 A possible shift in the RhoA/Rac1 balance
The contribution of shFlnA on dendritic branching is well demonstrated throughout this study
regarding their dependency on integrin activity and FAK. Finally, the influence of FlnA silencing
on intracellular pathways, primarily on PI3K-Akt signaling, was explored to gain a better insight
on its downstream action in neurons. Akt activity has been shown to be critical for neuronal survival
and differentiation. Akt converges different growth signals (such as ECM ligands-1 integrin
109
engagement or neurotrophin signaling) as an important downstream effector (Kaplan and Miller,
2000; Rodgers and Theibert, 2002; Velling et al., 2004). Similar to its role in hippocampal neurons,
Akt also regulates dendrite morphology of cortical neurons (Dijkhuizen and Ghosh, 2005). For
high throughput biochemistry assays, mouse cortical neurons were used in the present study for the
lentiviral transduction and subsequent Western blotting experiments. Cortical neurons displayed a
strong induction of Akt phosphorylation at Thr308 and Ser473 after stimulation of integrin
receptors. Interestingly, as the Akt induction tapers down over time in control neurons, aberrant
activation of Akt was observed in shFlnA neurons 30 minutes after acute integrin stimulation
(Figure 27). Increased dendritic arborization via shFlnA may be attributed to abnormal Akt
phosphorylation during neurite growth. It has been shown that expression of constitutively active
Akt or its pharmacological inhibition significantly enhanced and disturbed hippocampal dendritic
branching respectively (Jaworski et al., 2005). Moreover, a recent paper reported a negative
correlation between FlnA levels and Akt activity upon growth factor signaling in colorectal cancer
cell lines (Wang, Zhu and Zhao, 2019), in line with integrin mediated aberrant Akt phosphorylation
in shFlnA neurons.
The mechanisms behind controlled activation of Akt is an extensively studied topic as it plays a
central role in growth dynamics. Three members of the Rho family of GTPases; RhoA, Rac1 and
Cdc42, are among the most extensively studied organizers of actin cytoskeleton dynamics and can
control dendritic branching in opposite directions in neurons (Stankiewicz and Linseman, 2014).
For instance, silencing of Rac1 in hippocampal neurons significantly impairs dendritic growth
(Gualdoni et al., 2007). Overactivation of RhoA results in a significant simplification of dendritic
tree and disturbs arborization in hippocampal neurons (Nakayama, Harms and Luo, 2000).
Moreover, RhoA can affect dendritic arbor stability downstream of integrin mediated activation of

110
Abelson and Abelson-related-gene kinases (Moresco et al., 2005; Lin, Yeckel and Koleske, 2013).
Besides their distinct effects on dendritic tree, crosstalk between Rac1 and RhoA cascades
converge on Akt and control its activation in opposite directions: while Rac1 increases Akt activity
via PI3K, RhoA activity inhibits Akt through ROCK (Rho associated protein kinase) and PTEN
(phosphatase and tensin homolog) (Stankiewicz and Linseman, 2014). Therefore, the balance
between Rac1 and RhoA activation during adhesion is crucial for accurate growth dynamics. Rac1
activation and RhoA inhibition is associated with early adhesion upon integrin engagement and
induces actin nucleation/polymerization beneath growing tips. Consecutively, as nascent adhesion
complex maturates and RhoA becomes activated, it signals down its effectors such as ROCK and
limits further growth (Govek, Newey and Aelst, 2005; Lawson and Burridge, 2014). Interestingly,
fibronectin binding to the cells significantly reduces RhoA activation at first (nascent adhesion
phase), which is then recovered after 30 minutes of stimulation; indicating its role in integrin
mediated growth dynamics. It should be also noted that this temporal regulation of RhoA activity
is highly dependent on FAK and does not take place in FAK KO cells (Lim et al., 2008). FAK
Tyr397 phosphorylation, as a readout for its activity, was also examined in Fibronectin/Mn2+
treated neurons. However, no significant change was detected under acute integrin stimulations
(Figure 27E). Although an increase in the FAK activation was expected upon integrin stimulation,
it could be that immunoblotting of whole cell lysates might have diluted the expected increase in
FAK pTry397, as it is primarily localized in active adhesion sites for autophosphorylation (Parsons,
2003).
It has been shown that RhoA silencing or RhoA dominant-negative mutant in fact causes an
increase in Akt phosphorylation, since Akt activity is negatively regulated by RhoA-ROCK-PTEN
pathway (Yang and Kim, 2012). It is plausible to consider that silencing of FlnA disturbs this on-
111
off balance, impairs the late RhoA activation and therefore leads to an aberrant phosphorylation of
Akt after acute stimulation. It has been further shown that FlnA can physically interact with RhoA
GTPase and loss of FlnA caused a dysregulation in RhoA activation in neural progenitor cells (Lian
et al., 2019). RhoA activity can be suppressed by another GTPase, p190RhoGAP, which has been
shown to interact with FlnA. The same study demonstrates that the interaction between FlnA and
p190RhoGAP prevents p190RhoGAP from blocking RhoA activity in round cells. However,
during cell spreading, FlnA levels are reduced via calpain cleavage, which allows p190RhoGAP
localization in growing lipid raft and block local Rho activity (Mammoto, Huang and Ingber,
2007). It could be that in shFlnA neurons, RhoA inhibition was augmented due to the lack of FlnA
and increased p190RhoGAP suppression on RhoA. Next to RhoA, its mutual antagonist, Rac1, can
also be modulated by FlnA. A FlnA associated RhoGTPase activating protein, FilGAP, targets and
inhibits Rac1 upon binding to FlnA (Ohta, Hartwig and Stossel, 2006). It is worth noting that
FilGAP can also be phosphorylated by ROCK, and thereby can mediate the antagonist crosstalk
between RhoA and Rac1 dynamics. Considering the findings of the current study and observations
from the literature, the suggested overall scheme of FlnA-Akt mediated dendritic hypertrophy can
be seen below (Figure 41). Further experiments are necessary to demonstrate role of FlnA in
dendritic branching with respect to RhoA/Rac1 balance by quantifying their activity levels in FlnA
manipulated neurons and needs to be further confirmed with RhoA/Rac1 pharmacological
interventions.
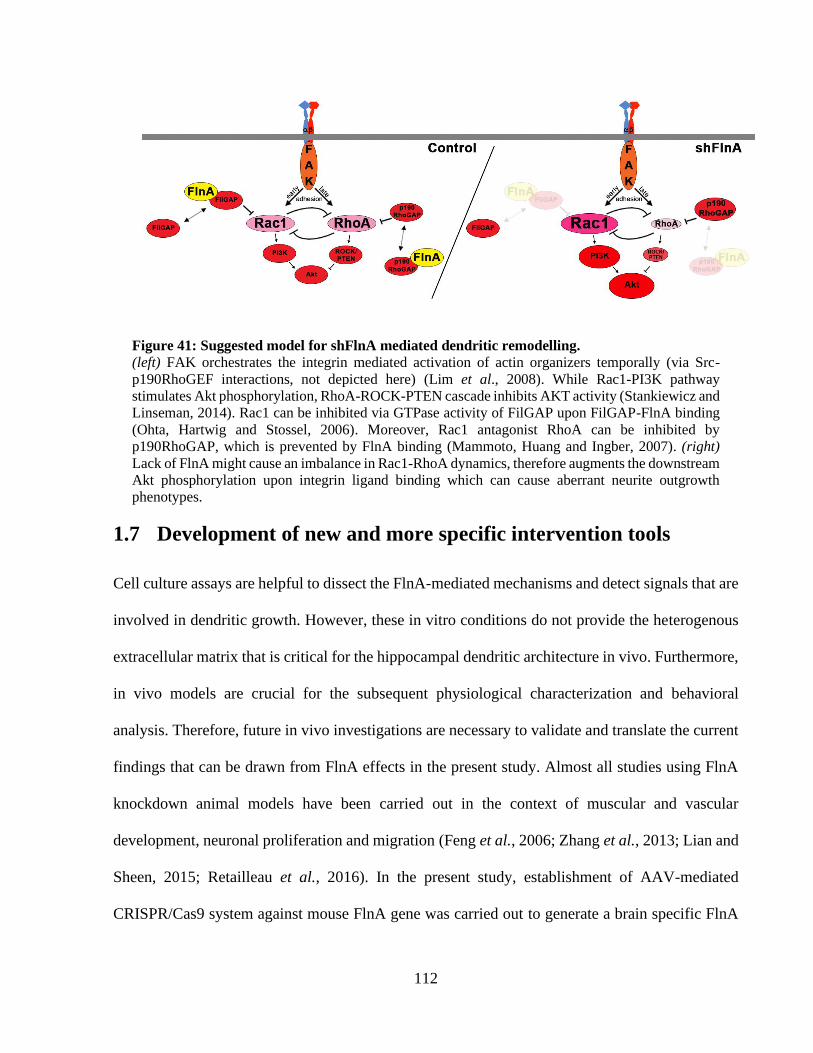
112
Figure 41: Suggested model for shFlnA mediated dendritic remodelling.
(left) FAK orchestrates the integrin mediated activation of actin organizers temporally (via Src-
p190RhoGEF interactions, not depicted here) (Lim et al., 2008). While Rac1-PI3K pathway
stimulates Akt phosphorylation, RhoA-ROCK-PTEN cascade inhibits AKT activity (Stankiewicz and
Linseman, 2014). Rac1 can be inhibited via GTPase activity of FilGAP upon FilGAP-FlnA binding
(Ohta, Hartwig and Stossel, 2006). Moreover, Rac1 antagonist RhoA can be inhibited by
p190RhoGAP, which is prevented by FlnA binding (Mammoto, Huang and Ingber, 2007). (right)
Lack of FlnA might cause an imbalance in Rac1-RhoA dynamics, therefore augments the downstream
Akt phosphorylation upon integrin ligand binding which can cause aberrant neurite outgrowth
phenotypes.
1.7 Development of new and more specific intervention tools
Cell culture assays are helpful to dissect the FlnA-mediated mechanisms and detect signals that are
involved in dendritic growth. However, these in vitro conditions do not provide the heterogenous
extracellular matrix that is critical for the hippocampal dendritic architecture in vivo. Furthermore,
in vivo models are crucial for the subsequent physiological characterization and behavioral
analysis. Therefore, future in vivo investigations are necessary to validate and translate the current
findings that can be drawn from FlnA effects in the present study. Almost all studies using FlnA
knockdown animal models have been carried out in the context of muscular and vascular
development, neuronal proliferation and migration (Feng et al., 2006; Zhang et al., 2013; Lian and
Sheen, 2015; Retailleau et al., 2016). In the present study, establishment of AAV-mediated
CRISPR/Cas9 system against mouse FlnA gene was carried out to generate a brain specific FlnA
113
KO animal model. This approach has successfully disturbed mouse FlnA gene in cultured cortical
neurons (Figure 32, Figure 33). This CRISPR approach will therefore be employed in future in
vivo for testing FlnA loss-of-function in the brain. Interestingly, same gRNAs did not disturb the
mouse FlnA gene when lentiviral vectors have been used for delivery in mouse fibroblasts (Figure
31). It should be noted that two lentiviral constructs were used simultaneously to utilize both
canonical Streptococcus pyogenes and gRNAs. Their respective GFP and mCherry labels indicate
that they might not completely overlap during the transduction phase (Figure 31C). This might
hinder the Cas9 mediated genetic perturbation as it requires both components. Therefore, single
AAV delivery of the CRISPR elements (Cas9 and gRNA) provided a more robust approach for
targeting the FlnA gene for knockdown.
On the other hand, gain of function studies were classically accomplished using an expression
construct from gene of interest. However, this limits the scope of the studies to the available cDNA
libraries and the packaging size limits of the carrying vector. This limitation was apparent during
biochemistry assays in the present study as well, in which 9 kb FlnA transcript was too large to
be packaged in the available AAV or lentiviral transfer particles. Recent advances in CRISPR-
Cas9 field allow researchers to regulate transcription of target genes without genome editing. These
systems employ catalytically-death Cas9 (dCas9) fused with transcriptional activator to target
promoters specifically via gRNAs. However, transcriptional activation of mouse FlnA gene failed
in different dCas9 systems using both liposome mediated transfections for short and lentiviral
delivery for longer incubation times (Figure 35, Figure 36, Figure 38, Figure 39, Figure 40). This
could also be caused by previously reported inverse correlation between the basal expression level
of the gene of interest and acquired transcriptional activation (Konermann et al., 2015; Vora,
Cheng, Xiao, VanDusen, et al., 2018). Due to successful Cas9 mediated genome editing in a single-
114
AAV system, similar single-AAV transfer plasmid containing a short dCas9-VPR and gRNA
cassette was recently acquired. Proof of principles assays demonstrated a successful induction of
tdTom fluorescence reporter in HEK293T cells (Appendix Figure 45) and further testing needs to
be done after cloning the FlnA promoter targeting gRNAs.
1.8 Limitations of the study
The present study contributes to our knowledge by addressing the crucial roles of Ndr2 kinase and
its recently identified substrate FlnA in determining ECM specificity of neurite growth, integrin
activation and downstream actin re-organization pathways, however with some limitations. First
and foremost, all the dendritic branching quantifications were conducted on fixed neurons at
DIV6-7, and therefore do not reflect the quantification of growth dynamics. Future experiments
using live cell imaging are needed to assess whether dendritic arborization, stability or retraction
are affected specifically by FlnA manipulations. Secondly, FlnA mediated-integrin dependent
intracellular mechanisms are deeply examined throughout a classical PDL coated substrates
containing a minimal ECM. However, FlnA mediated ECM remodeling has not been considered.
It has been shown that FlnA controls the extracellular substrate abundance and organization via
affecting ECM degradation pathways and secreted proteases such as matrix metalloproteinases
(Baldassarre et al., 2012; Mezawa et al., 2016). Immunostaining of the ECM from these cultures
needs to be done to test for any significant extracellular changes after FlnA manipulations. Future
in vivo studies are also needed to test how FlnA mediated dendritic architecture will translate in
brain where ECM is highly heterogenous and integrin receptor activity is tightly regulated.
One main FlnA manipulation that was used in the experiments was heterologous expression of
human wild type FlnA (hWT FlnA genotype) rather than homologous overexpression of mouse
115
FlnA cDNA in mouse hippocampal neurons in vitro. Nevertheless, similar heterologous
expression of human and rat FlnA in mouse olfactory bulbs could successfully affect dendritic
morphology suggesting that it is still functional in mouse cells (Zhang et al., 2014). Moreover, this
heterologous expression system allowed neurons to overexpress human FlnA via strong CMV
promoter since the used shRNA was mouse FlnA transcript specific (Figure 40B).
The exact role of Ndr2 mediated FlnA S2152 phosphorylation during dendritic branching
remained unexplored up to this point. To address the principal role of FlnA Serine-2152 in FlnA
mediated dendritic morphology, first, S2152A FlnA mutant was used in the same setup during
dendritic arborization. However, even though S2152 residue has been shown to significantly
regulate FlnA activity, no differences in dendritic development were observed between WT and
phosphodeficient FlnA expressing neurons (Figure 30). It could be that FlnA phosphorylation
during dendritic development in vitro were at its basal levels thus the introduced S2152A FlnA
did not differ significantly from its WT isoform. Western blotting of forebrain and whole brain
lysates also revealed profoundly low pS2152 FlnA levels in embryonic mice (E16.5, which
corresponds to the developmental timeline of in vitro neuronal cultures) (Zhang et al., 2012). To
this end, S2152E FlnA (Muriel et al., 2011) is also acquired which might overcome the low-
phosphorylation issue via mimicking phosphorylated FlnA electrostatically.
Another challenge in the S2152A FlnA transfections was the altered total FlnA protein levels upon
transfection, irrespective of Serine 2152 residue. Expression constructs of FlnA used in neurons
cause an overshoot in the expression due to its strong CMV promoter (Figure 16B, Figure 40B).
Based on results presented here and previous research suggesting precise level of FlnA is needed
for proper neuronal differentiation, such synthetic promoters might prevent identifying any role of
FlnA Serine-2152 residue in neuronal development. Upregulation of both WT and S2152A FlnA
116
proteins after the transfections thus might hinder the phosphorylation-specific effects.
An alternative genome modification approach based on CRISPR might solve the gene dosage
issue: CRISPR toolbox is now widely used in neuronal and non-neuronal for ablation or
transcriptionally activating target genes, expanding the available canonical intervention method.
Cas9 mediated double stranded DNA breaks usually undergo non-homologous-end-joining which
is prone to make error and create non-sense mutations within coding parts (hence the ablation of
the target gene occurs such as FlnA in Figure 32, Figure 33). An alternative approach is providing
a repair template with the Cas9/gRNA complex, which can be integrated to the target site via
homology directed repair (HDR). As HDR is mainly restricted in G2 and S phase of dividing cells,
alternative HDR independent approaches are developed to efficiently modify the genome in
neurons (Gao et al., 2019; Willems et al., 2020). Moreover, precise single base edits can also be
introduced with the developing cytosine and adenosine base editors fused to dCas9/gRNA
complexes for single amino acid substitutions without double strand breaks (Yeh et al., 2018).
These recent advances in the CRISPR field might allow a more suitable intervention of Serine-
2152 residue on endogenous FlnA gene, where S2152A and S2152E FlnA mutant neurons can be
used to study the role of FlnA phosphorylation during dendritic growth in more natural gene
expression dosage.
Besides its phosphorylation, intrinsic regulation of FlnA expression has not been considered in the
present study since silencing/overexpression manipulations were present throughout experiments,
which result in strong FlnA genotypes. Furthermore, as mentioned before, not enough attention has
been paid to regulation of FlnA during learning and memory processes. In this line, as a relevant
activation pathway that can translate in vitro FlnA findings to brain function, BDNF (brain derived
neurotrophic factor) and NGF neurotrophin signaling were tested to collect preliminary data on
117
FlnA expression regulation. BDNF and NGF were selected as they are consistently associated with
learning and memory events, LTP and associated structural changes in dendrites (Falkenberg et al.,
1992; Morimoto et al., 1998; Hall, Thomas and Everitt, 2000; Mizuno et al., 2000; Ji et al., 2005;
Lazo et al., 2013), in which FlnA might be involved. Preliminary data gathered from acute
treatments of neurons with neurotrophins indicated a time-dependent differential regulation of
FlnA expression in vitro (Appendix Figure 44). In parallel, NGF receptor TrkA is temporally
regulated in cultured neurons with high levels around DIV4 and declines significantly overtime,
e.g. at DIV7 and later (Culmsee et al., 2002), which might contribute to the observed FlnA
regulation. Future experiments are needed to further confirm and develop these initial findings
from neurotrophins-FlnA crosstalk how it might affect FlnA S2152 phosphorylation dynamics.
Moreover, cultured neurons from Ndr2 KO mouse brain will also be useful to test contribution of
Ndr2-FlnA axis in the neurotrophin signaling.
1.9 Concluding remarks
Disturbances in the dendritic architecture are prominent hallmarks of number of brain disorders
ranging from autism-spectrum-disorders to schizophrenia (reviewed in Kulkarni and Firestein,
2012). FlnA, next to being the most common cause of inherited PH (Sheen, 2012), has also attracted
much attention in the past years as an important protein mediating tau phosphorylation in
Alzheimer’s disease (Wang et al., 2012; Burns and Wang, 2017) and causing abnormal dendritic
complexity in Tuberous sclerosis (Zhang et al., 2014). Further on, recent advances in FlnA research
led to a discovery of small molecule drug PTI-125, which can bind and inhibit aberrant FlnA
activity in neurons, and paved the way for launching therapeutical approaches in Alzheimer’s
disease and cortical malformation models such as Tuberous sclerosis and focal cortical dysplasia
in mice (Wang et al., 2017; Zhang et al., 2020). These findings provide insights for future treatment
118
strategies to target FlnA pharmacologically in such neurological diseases in humans
(clinicaltrial.gov # NCT04388254, Sumifilam (PTI-125) in Alzheimer’s Disease patients).
The findings presented here add to a growing body of research that implicates FlnA with 1 integrin
activity and describe its effects on the downstream actin cytoskeleton remodeling during dendritic
differentiation of neurons. Based on the important roles of integrin and actin cytoskeleton for
neuronal transmission, future investigations are necessary to test the critical role of FlnA in vivo
during development and plasticity of hippocampal dendrites and in the hippocampal circuits that
mediate memory formation. Next to investigating basic mechanisms of FlnA effects in healthy
conditions, future studies should also focus on the FlnA levels in diseases with abnormal dendritic
architecture as its precise levels are needed for proper arborization.
119
REFERENCES
Ali, S. A., Pappas, I. S. and Parnavelas, J. G. (1998) ‘Collagen type IV promotes the differentiation of neuronal
progenitors and inhibits astroglial differentiation in cortical cell cultures’, Developmental Brain Research, 110(1), pp.
31–38.
Ali, U. et al. (1977) ‘Restoration of normal morphology, adhesion and cytoskeleton in transformed cells by addition
of a transformation-sensitive surface protein’, Cell, 11(May), pp. 115–126.
Anton, E. S., Kreidberg, J. A. and Rakic, P. (1999) ‘Distinct functions of α3 and α(v) integrin receptors in neuronal
migration and laminar organization of the cerebral cortex’, Neuron, 22(2), pp. 277–289.
Askari, J. A. et al. (2009) ‘Linking integrin conformation to function.’, Journal of cell science, 122(Pt 2), pp. 165–
170.
Baldassarre, M. et al. (2009) ‘Filamins regulate cell spreading and initiation of cell migration’, PLoS ONE, 4(11).
Baldassarre, M. et al. (2012) ‘Filamin A controls matrix metalloproteinase activity and regulates cell invasion in human
fibrosarcoma cells’, Journal of Cell Science, 125(16), pp. 3858–3869.
Baldassarre, M. and Calderwood, D. A. (2018) ‘Filamin A’, in Choi, S. (ed.) Encyclopedia of Signaling Molecules.
Cham: Springer International Publishing, pp. 1731–1737.
Barczyk, M., Carracedo, S. and Gullberg, D. (2010) ‘Integrins’, Cell and Tissue Research, 339(1), pp. 269–280.
Barros, C. S., Franco, S. J. and Müller, U. (2011) ‘Extracellular Matrix: Functions in the nervous system’, Cold Spring
Harbor Perspectives in Biology, 3(1), pp. 1–24.
Baum, P. D. and Garriga, G. (1997) ‘Neuronal migrations and axon fasciculation are disrupted in ina-1 integrin
mutants’, Neuron, 19(1), pp. 51–62.
Beattie, E. C. et al. (2000) ‘NGF signals through TrkA to increase clathrin at the plasma membrane and enhance
clathrin-mediated membrane trafficking.’, The Journal of neuroscience : the official journal of the Society for
Neuroscience, 20(19), pp. 7325–33.
Becker, H. M. et al. (2013) ‘α1β1 Integrin-Mediated Adhesion Inhibits Macrophage Exit from a Peripheral
Inflammatory Lesion’, The Journal of Immunology, 190(8), pp. 4305–4314.
Bichsel, S. J. et al. (2004) ‘Mechanism of activation of NDR (nuclear Dbf2-related) protein kinase by the hMOB1
protein’, Journal of Biological Chemistry, 279(34), pp. 35228–35235.
Blaess, S. et al. (2004) ‘β1-Integrins Are Critical for Cerebellar Granule Cell Precursor Proliferation’, Journal of
Neuroscience, 24(13), pp. 3402–3412.
Bolduc, F. V et al. (2010) ‘Fragile x mental retardation 1 and filamin a interact genetically in Drosophila long-term
memory.’, Frontiers in neural circuits, 3(January), p. 22.
Bourgin, C. et al. (2007) ‘The EphA4 receptor regulates dendritic spine remodeling by affecting β1-integrin signaling
pathways’, Journal of Cell Biology, 178(7), pp. 1295–1307.
Bridgewater, R. E., Norman, J. C. and Caswell, P. T. (2012) ‘Integrin trafficking at a glance’, Journal of Cell Science,
125, pp. 3695–3701.
Buchsbaum, I. Y. and Cappello, S. (2019) ‘Neuronal migration in the CNS during development and disease: Insights
from in vivo and in vitro models’, Development (Cambridge), 146(1).
Burke, R. D. (1999) ‘Invertebrate integrins: Structure, function, and evolution’, International Review of Cytology, 191,
120
pp. 257–284.
Burns, L. H. and Wang, H.-Y. (2017) ‘Altered filamin A enables amyloid beta-induced tau hyperphosphorylation and
neuroinflammation in Alzheimer’s disease’, Neuroimmunology and Neuroinflammation, 4(12), p. 263.
Byfield, F. J. et al. (2009) ‘Absence of filamin A prevents cells from responding to stiffness gradients on gels coated
with collagen but not fibronectin’, Biophysical Journal. Biophysical Society, 96(12), pp. 5095–5102.
Calderwood, D. (2004) ‘Integrin activation.’, Journal of cell science, 117, pp. 657–66.
Cameron, S. and Rao, Y. (2010) ‘Molecular mechanisms of tiling and self-avoidance in neural development’,
Molecular Brain, 3(1), pp. 1–7.
Campos, L. S. et al. (2004) ‘β1 integrins activate a MAPK signalling pathway in neural stem cells that contributes to
their maintenance’, Development, 131(14), pp. 3433–3444.
Carmeliet, G., Himpens, B. and Cassiman, J. J. (1994) ‘Selective increase in the binding of the alpha 1 beta 1 integrin
for collagen type IV during neurite outgrowth of human neuroblastoma TR 14 cells.’, Journal of cell science, 107 ( Pt
1, pp. 3379–3392.
Caswell, P. T., Vadrevu, S. and Norman, J. C. (2009) ‘Integrins: masters and slaves of endocytic transport.’, Nature
reviews. Molecular cell biology, 10, pp. 843–853.
Chan, C.-S. et al. (2006) ‘β1-Integrins Are Required for Hippocampal AMPA Receptor-Dependent Synaptic
Transmission, Synaptic Plasticity, and Working Memory’, Journal of Neuroscience, 26(1), pp. 223–232.
Chavez, A. et al. (2015) ‘Highly efficient Cas9-mediated transcriptional programming’, Nature Methods, 12(4), pp.
326–328.
Chavis, P. and Westbrook, G. (2001) ‘Integrins mediate functional pre- and postsynaptic maturation at a hippocampal
synapse’, Nature, 411(6835), pp. 317–321.
Chen, H. S., Kolahi, K. S. and Mofrad, M. R. K. (2009) ‘Phosphorylation facilitates the integrin binding of filamin
under force’, Biophysical Journal. Biophysical Society, 97(12), pp. 3095–3104.
Chen, J. F., Salas, A. and Springer, T. A. (2003) ‘Bistable regulation of integrin adhesiveness by a bipolar metal ion
cluster’, Nature Structural Biology, 10(12), pp. 995–1001.
Chen, M. and Strachers, A. (1989) ‘In Situ Phosphorylation of Platelet Actin-binding Protein by dependent Protein
Kinase Stabilizes It against Proteolysis by Calpain ”’, Journal of Biological Chemistry, 264(24), pp. 14282–14289.
Chen, S. et al. (2015) ‘Genome-wide CRISPR screen in a mouse model of tumor growth and metastasis’, Cell. Elsevier
Inc., 160(6), pp. 1246–1260.
Cho, Y., Park, D. and Cavalli, V. (2015) ‘Filamin a is required in injured axons for HDAC5 activity and axon
regeneration’, Journal of Biological Chemistry, 290(37), pp. 22759–22770.
Chun, D. et al. (2001) ‘Evidence that integrins contribute to multiple stages in the consolidation of long term
potentiation in rat hippocampus’, Neuroscience, 105(4), pp. 815–829.
Cornils, H. et al. (2010) ‘Ablation of the Kinase NDR1 Predisposes Mice to the Development of T Cell Lymphoma’,
Science Signaling, 3(126).
Cukier, I. H., Li, Y. and Lee, J. M. (2007) ‘Cyclin B1/Cdk1 binds and phosphorylates Filamin A and regulates its
ability to cross-link actin’, FEBS Letters, 581(8), pp. 1661–1672.
Culmsee, C. et al. (2002) ‘Nerve growth factor survival signaling in cultured hippocampal neurons is mediated through
TrkA and requires the common neurotrophin receptor P75’, Neuroscience. Elsevier, 115(4), pp. 1089–1108.
121
Cunningham, C. C. et al. (1992) ‘Actin-binding protein requirement for cortical stability and efficient locomotion’,
Science, 255(5042), pp. 325–327.
D’Addario, M. et al. (2002) ‘Interaction of p38 and Sp1 in a mechanical force-induced, β1 integrin-mediated
transcriptional circuit that regulates the actin-binding protein filamin-A’, Journal of Biological Chemistry, 277(49),
pp. 47541–47550.
DeFreitas, M. F. et al. (1995) ‘Identification of integrin α3β1 as a neuronal thrombospondin receptor mediating neurite
outgrowth’, Neuron, 15(2), pp. 333–343.
Demiray, Y. E. et al. (2018) ‘Ndr2 Kinase Controls Neurite Outgrowth and Dendritic Branching Through α1 Integrin
Expression’, Frontiers in Molecular Neuroscience, 11(March), p. 66.
Denda, S. and Reichardt, L. F. (2007) ‘Studies on Integrins in the Nervous System’, Methods in Enzymology, 426(07),
pp. 203–221.
Desban, N. et al. (2006) ‘α1β1-Integrin Engagement To Distinct Laminin-1 Domains Orchestrates Spreading,
Migration and Survival of Neural Crest Cells Through Independent Signaling Pathways’, Journal of Cell Science,
119(15), pp. 3206–3218.
Devroe, E. et al. (2004) ‘Human Mob proteins regulate the NDR1 and NDR2 serine-threonine kinases’, Journal of
Biological Chemistry, 279(23), pp. 24444–24451.
Dijkhuizen, P. A. and Ghosh, A. (2005) ‘BDNF regulates primary dendrite formation in cortical neurons via the PI3-
kinase and MAP kinase signaling pathways’, Journal of Neurobiology, 62(2), pp. 278–288.
Dominguez, R. and Holmes, K. C. (2011) ‘Actin structure and function’, Annual Review of Biophysics, 40(1), pp. 169–
186.
Donada, A. et al. (2019) ‘Disrupted filamin A/aIIbb3 interaction induces macrothrombocytopenia by increasing RhoA
activity’, Blood, 133(16), pp. 1778–1788.
Dyson, J. M. et al. (2003) ‘SHIP-2 forms a tetrameric complex with filamin, actin, and GPIb-IX-V: Localization of
SHIP-2 to the activated platelet actin cytoskeleton’, Blood, 102(3), pp. 940–948.
Dzyubenko, E., Gottschling, C. and Faissner, A. (2016) ‘Neuron-Glia Interactions in Neural Plasticity: Contributions
of Neural Extracellular Matrix and Perineuronal Nets’, Neural Plasticity, 2016.
Ehrlicher, A. J. et al. (2011) ‘Mechanical strain in actin networks regulates FilGAP and integrin binding to filamin A’,
Nature, 478(7368), pp. 260–263.
Emoto, K. et al. (2006) ‘The tumour suppressor Hippo acts with the NDR kinases in dendritic tiling and maintenance.’,
Nature, 443(7108), pp. 210–213.
Ewing, R. M. et al. (2007) ‘Large-scale mapping of human protein-protein interactions by mass spectrometry’,
Molecular Systems Biology, 3(89), pp. 1–17.
Falkenberg, T. et al. (1992) ‘Increased expression of brain-derived neurotrophic factor mRNA in rat hippocampus is
associated with improved spatial memory and enriched environment’, Neuroscience letters. Elsevier, 138(1), pp. 153–
156.
Fässler, R. and Meyer, M. (1995) ‘Consequences of lack of beta 1 gene expression in mice’, Genes & development,
pp. 1896–1908.
Feng, Y. et al. (2006) ‘Filamin A (FLNA) is required for cell-cell contact in vascular development and cardiac
morphogenesis.’, Proceedings of the National Academy of Sciences of the United States of America, 103(52), pp.
19836–41.

122
Flanagan, L. A. et al. (2001) ‘Filamin A, the Arp2/3 complex, and the morphology and function of cortical actin
filaments in human melanoma cells’, Journal of Cell Biology, 155(3), pp. 511–517.
van der Flier, A. and Sonnenberg, A. (2001) ‘Structural and functional aspects of filamins’, Biochimica et Biophysica
Acta (BBA) - Molecular Cell Research, 1538(2–3), pp. 99–117.
Fox, J. W. et al. (1998) ‘Mutations in filamin 1 prevent migration of cerebral cortical neurons in human Periventricular
heterotopia’, Neuron, 21(6), pp. 1315–1325.
De Franceschi, N. et al. (2016) ‘Selective integrin endocytosis is driven by interactions between the integrin α-chain
and AP2’, Nature Structural & Molecular Biology. Nature Publishing Group, (January), pp. 1–10.
Frenz, L. M. et al. (2000) ‘The budding yeast Dbf2 protein kinase localises to the centrosome and moves to the bud
neck in late mitosis.’, J Cell Sci, 113, pp. 3399–3408.
Fujioka, T. et al. (2017) ‘β1 Integrin Signaling Promotes Neuronal Migration Along Vascular Scaffolds in the Post-
Stroke Brain’, EBioMedicine. 3-V Biosciences, 16, pp. 195–203.
Fusaoka-Nishioka, E. et al. (2011) ‘Differential effects of laminin isoforms on axon and dendrite development in
hippocampal neurons’, Neuroscience Research, 71(4), pp. 421–426.
Gage, F. H. (2000) ‘Mammalian neural stem cells’, Science. American Association for the Advancement of Science,
287(5457), pp. 1433–1438.
Galileo, D. S. et al. (1992) ‘Retrovirally introduced antisense integrin RNA inhibits neuroblast migration in vivo’,
Neuron. Cell Press, 9(6), pp. 1117–1131.
Gallegos, M. E. and Bargmann, C. I. (2004) ‘Mechanosensory neurite termination and tiling depend on SAX-2 and the
SAX-1 kinase’, Neuron, 44(2), pp. 239–249.
Gao, Y. et al. (2019) ‘Plug-and-Play Protein Modification Using Homology-Independent Universal Genome
Engineering’, Neuron. Elsevier Inc., 103(4), pp. 583-597.e8.
García, E., Stracher, A. and Jay, D. (2006) ‘Calcineurin dephosphorylates the C-terminal region of filamin in an
important regulatory site: A possible mechanism for filamin mobilization and cell signaling’, Archives of Biochemistry
and Biophysics, 446(2), pp. 140–150.
Gardner, H. et al. (1999) ‘Absence of integrin α 1 β 1 in the mouse causes loss of feedback regulation of collagen
synthesis in normal and wounded dermis’, 272, pp. 263–272.
Gariboldi, M. et al. (1994) ‘Comparative mapping of the actin-binding protein 280 genes in human and mouse’,
Genomics. Elsevier, 21(2), pp. 428–430.
Gehler, S. et al. (2009) ‘Filamin A–β1 Integrin Complex Tunes Epithelial Cell Response to Matrix Tension’, Molecular
Biology of the Cell, 20, pp. 3224–3238.
Glenney, J. R., Kaulfus, P. and Weber, K. (1981) ‘F-Actin Binding and Bundling Properties of Fibrin, a Major
Cytoskelatal Protein of Microvilus Core Filaments’, The Journal of biological chemistry, 256(17), pp. 9283–9288.
Glogauer, M. et al. (1998) ‘The role of actin-binding protein 280 in integrin-dependent mechanoprotection’, Journal
of Biological Chemistry, 273(3), pp. 1689–1698.
Gógl, G. et al. (2015) ‘The Structure of an NDR/LATS Kinase–Mob Complex Reveals a Novel Kinase–Coactivator
System and Substrate Docking Mechanism’, PLoS Biology, 13(5), pp. 1–32.
Goley, E. D. and Welch, M. D. (2006) ‘The ARP2/3 complex: An actin nucleator comes of age’, Nature Reviews
Molecular Cell Biology, 7(10), pp. 713–726.
123
Govek, E., Newey, S. E. and Aelst, L. Van (2005) ‘The role of the Rho GTPases in neuronal development’, pp. 1–49.
Graus-Porta, D. et al. (2001) ‘β1-Class integrins regulate the development of laminae and folia in the cerebral and
cerebellar cortex’, Neuron, 31(3), pp. 367–379.
Greve, J. M. and Gottlieb, D. I. (1982) ‘Monoclonal Antibodies Which Alter the Morphology of Cultured Chick
Myogenic Cells’, Journal of Cellular Biochemistry, 18(2), pp. 221–229.
Gualdoni, S. et al. (2007) ‘Normal levels of Rac1 are important for dendritic but not axonal development in
hippocampal neurons’, Biology of the Cell, 99(8), pp. 455–464.
Gushiken, F. C. et al. (2008) ‘Protein phosphatase 2A negatively regulates integrin αIIbβ3 signaling’, Journal of
Biological Chemistry, 283(19), pp. 12862–12869.
Hall, J., Thomas, K. L. and Everitt, B. J. (2000) ‘Rapid and selective induction of BDNF expression in the hippocampus
during contextual learning’, Nature neuroscience. Nature Publishing Group, 3(6), pp. 533–535.
Hall, P. E. et al. (2006) ‘Integrins Are Markers of Human Neural Stem Cells’, Stem Cells, 24(9), pp. 2078–2084.
Hamill, K. J. et al. (2009) ‘Laminin deposition in the extracellular matrix: A complex picture emerges’, Journal of
Cell Science, 122(24), pp. 4409–4417.
Hanamura, K. et al. (2010) ‘Low accumulation of drebrin at glutamatergic postsynaptic sites on GABAergic neurons’,
Neuroscience. Elsevier Inc., 169(4), pp. 1489–1500.
Hanks, S. K. and Hunter, T. (1995) ‘ The eukaryotic protein kinase superfamily: kinase (catalytic) domain structure
and classification 1 ’, The FASEB Journal, 9(8), pp. 576–596.
Hartwig, J. H. and Stossel, T. P. (1975) ‘Isolation and properties of actin, myosin, and a new actin binding protein in
rabbit alveolar macrophages’, Journal of Biological Chemistry, 250(14), pp. 5696–5705.
Hartwig, J. H., Tyler, J. and Stössel, T. P. (1980) ‘Actin-binding Protein Promotes the Bipolar and Perpendicular
Branching of Actin Filaments Morphology of Actin Copolymerized with Actin-’, The Journal of cell biology, 87(7),
pp. 841–848.
Heggeness, M. H., Ash, J. F. and Singer, S. J. (1978) ‘Transmembrane linkage of fibronectin to intracellular actin-
containing filaments in cultured human fibroblasts.’, Annals of the New York Academy of Sciences. United States, 312,
pp. 414–417.
Hergovich, A. et al. (2006) ‘NDR kinases regulate essential cell processes from yeast to humans.’, Nature reviews.
Molecular cell biology, 7(4), pp. 253–64.
Hergovich, A. (2016) ‘The roles of NDR protein kinases in hippo signalling’, Genes, 7(5), pp. 1–16.
Hogervorst, F. et al. (1990) ‘Cloning and sequence analysis of beta-4 cDNA: An integrin subunit that contains a unique
118 kd cytoplasmic domain’, EMBO Journal, 9(3), pp. 765–770.
Homma, Y. and Fukuda, M. (2016) ‘Rabin8 regulates neurite outgrowth in both a GEF-activity-dependent and -
independent manner.’, Molecular biology of the cell, 27, pp. 2107–2118.
Hu, J. et al. (2017) ‘Opposing FlnA and FlnB interactions regulate RhoA activation in guiding dynamic actin stress
fiber formation and cell spreading’, 26(7), pp. 1294–1304.
Huang, Z. et al. (2006) ‘Distinct Roles of the β1-Class Integrins at the Developing and the Mature Hippocampal
Excitatory Synapse’, Journal of Neuroscience, 26(43), pp. 11208–11219.
Hutti, J. E. et al. (2004) ‘A rapid method for determining protein kinase phosphorylation specificity’, Nature Methods,
1(1), pp. 27–29.
124
Hynes, R. O. (1973) ‘Alteration of cell surface proteins by viral transformation and by proteolysis’, Proceedings of the
National Academy of Sciences of the United States of America, 70(11), pp. 3170–3174.
Hynes, R. O. (2002) ‘Integrins: Bidirectional, allosteric signaling machines’, Cell, 110(6), pp. 673–687.
Hynes, R. O. and Yamada, K. M. (1982) ‘Fibronectins: multifunctional modular glycoproteins.’, The Journal of cell
biology. United States, 95(2 Pt 1), pp. 369–377.
Ithychanda, S. S. et al. (2009) ‘Migfilin, a molecular switch in regulation of integrin activation’, Journal of Biological
Chemistry, 284(7), pp. 4713–4722.
Ivankovic-Dikic, I. et al. (2000) ‘Pyk2 and FAK regulate neurite outgrowth induced by growth factors and integrins’,
Nature Cell Biology, 2(9), pp. 574–581.
Ivins, J. K., Yurchenco, P. D. and Lander, A. D. (2000) ‘Regulation of neurite outgrowth by integrin activation’, The
Journal of neuroscience : the official journal of the Society for Neuroscience, 20(17), pp. 6551–6560.
Jackson, T. R. et al. (1996) ‘Initiation and maintenance of NGF-stimulated neurite outgrowth requires activation of a
phosphoinositide 3-kinase’, Journal of Cell Science, 109(2), pp. 289–300.
Jaworski, J. et al. (2005) ‘Control of Dendritic Arborization by the Phosphoinositide- 3 -Kinase – Akt – Mammalian
Target of Rapamycin Pathway’, The Journal of Neuroscience, 25(49), pp. 11300–11312.
Jay, D., García, E. J. and de la Luz Ibarra, M. (2004) ‘In situ determination of a PKA phosphorylation site in the C-
terminal region of filamin’, Molecular and Cellular Biochemistry, 260(1), pp. 49–53.
Ji, Y. et al. (2005) ‘Cyclic AMP controls BDNF-induced TrkB phosphorylation and dendritic spine formation in mature
hippocampal neurons’, Nature Neuroscience, 8(2), pp. 164–172.
Ji, Z. et al. (2018) ‘Silencing Filamin A Inhibits the Invasion and Migration of Breast Cancer Cells by Up-regulating
14-3-3σ’, Current medical science. Springer, 38(3), pp. 461–466.
Jongbloets, B. C. et al. (2017) ‘Stage-specific functions of Semaphorin7A during adult hippocampal neurogenesis rely
on distinct receptors’, Nature Communications. Nature Publishing Group, 8, p. 14666.
Joung, J. et al. (2017) ‘Genome-scale CRISPR-Cas9 knockout and transcriptional activation screening’, Nature
Protocols. Nature Publishing Group, 12(4), pp. 828–863.
Kaplan, D. R. and Miller, F. D. (2000) ‘Neurotrophin signal transduction in the nervous system’, Current Opinion in
Neurobiology, 10(3), pp. 381–391.
Kasza, K. E. et al. (2009) ‘Filamin A is essential for active cell stiffening but not passive stiffening under external
force’, Biophysical Journal. Biophysical Society, 96(10), pp. 4326–4335.
Kern, A. et al. (1993) ‘Interaction of type IV collagen with the isolated integrins α1β1 and α2β1.’, European journal
of biochemistry / FEBS, 215(1), pp. 151–9.
Kiema, T. et al. (2006) ‘The molecular basis of filamin binding to integrins and competition with talin’, Molecular
Cell, 21(3), pp. 337–347.
Kim, H. et al. (2008) ‘Filamin A regulates cell spreading and survival via β1 integrins’, Experimental Cell Research,
314(4), pp. 834–846.
Kim, I. H. et al. (2013) ‘Disruption of Arp2/3 Results in Asymmetric Structural Plasticity of Dendritic Spines and
Progressive Synaptic and Behavioral Abnormalities’, Journal of Neuroscience, 33(14), pp. 6081–6092.
Kim, S. Y. et al. (2016) ‘Structural basis for autoinhibition and its relief of MOB1 in the Hippo pathway’, Scientific
Reports. Nature Publishing Group, 6(June), pp. 1–15.
125
Kim, Y. et al. (2004) ‘A positive role of the PI3-K/Akt signaling pathway in PC12 cell differentiation’, Molecules and
Cells, 18(3), pp. 353–359.
Kim, Y. H. et al. (2011) ‘Enhancement of neuronal cell adhesion by covalent binding of poly-d-lysine’, Journal of
Neuroscience Methods. Elsevier B.V., 202(1), pp. 38–44.
Knight, C. G. et al. (2000) ‘The Collagen-binding A-domains of Integrins α1β1 and α2β1 Recognize the Same Specific
Amino Acid Sequence, GFOGER, in Native (Triple-helical) Collagens’, The Journal of Biological Chemistry, 275(1),
pp. 35–40.
Knudsen, K. A., Horwitz, A. F. and Buck, C. A. (1985) ‘A Monoclonal Antibody Identifies a Glycoprotein Complex
Involved in Cell-Substratum Adhesion’, Experimental Cell Research, 57, pp. 218–226.
Konermann, S. et al. (2015) ‘Genome-scale transcriptional activation by an engineered CRISPR-Cas9 complex’,
Nature. Nature Publishing Group, 517(7536), pp. 583–588.
Kornberg, L. et al. (1992) ‘Cell adhesion or integrin clustering increases phosphorylation of a focal adhesion-
associated tyrosine kinase’, Journal of Biological Chemistry, 267(33), pp. 23439–23442.
Kotani, T. et al. (2007) ‘Constitutive activation of neuronal Src causes aberrant dendritic morphogenesis in mouse
cerebellar Purkinje cells’, Neuroscience Research, 57(2), pp. 210–219.
Kul Madencioglu, D. A. (2019) Roles of the Hippo pathway kinase Ndr2 in neural development and behavior. Doctoral
Thesis - Otto von Guericke University.
Kulkarni, V. A. and Firestein, B. L. (2012) ‘The dendritic tree and brain disorders’, Molecular and Cellular
Neuroscience. Elsevier Inc., 50(1), pp. 10–20.
Kumar, V. et al. (2005) ‘Regulation of Dendritic Morphogenesis by Ras–PI3K–Akt-mTOR and Ras–MAPK Signaling
Pathways’, The Journal of Neuroscience, 25(49), pp. 11288–11299.
Kurabayashi, N. et al. (2018) ‘The LPA-LPA4 axis is required for establishment of bipolar morphology and radial
migration of newborn cortical neurons’, Development, 145(17), p. dev162529.
Lange, M. et al. (2015) ‘47 patients with FLNA associated periventricular nodular heterotopia’, Orphanet Journal of
Rare Diseases. Orphanet Journal of Rare Diseases, pp. 1–11.
Lau, T. L. et al. (2009) ‘The structure of the integrin αiIbΒ3 transmembrane complex explains integrin transmembrane
signalling’, EMBO Journal, 28(9), pp. 1351–1361.
Lawson, C. D. and Burridge, K. (2014) ‘The on-off relationship of Rho and Rac during integrin-mediated adhesion
and cell migration’, Small GTPases, 5, p. e27958.
Lazo, O. M. et al. (2013) ‘BDNF Regulates Rab11-Mediated Recycling Endosome Dynamics to Induce Dendritic
Branching’, 33(14), pp. 6112–6122.
Lei, W.-L. et al. (2012) ‘Laminin/β1 integrin signal triggers axon formation by promoting microtubule assembly and
stabilization’, Cell Research, pp. 954–972.
Leone, D. P. et al. (2005) ‘Regulation of neural progenitor proliferation and survival by β1 integrins’, Journal of Cell
Science, 118(12), pp. 2589–2599.
Li, L. et al. (2015) ‘Filamin A phosphorylation by Akt promotes cell migration in response to arsenic’, Oncotarget,
6(14), pp. 12009–12019.
Lian, G. et al. (2012) ‘Filamin A Regulates Neural Progenitor Proliferation and Cortical Size through Wee1-Dependent
Cdk1 Phosphorylation’, Journal of Neuroscience, 32(22), pp. 7672–7684.
126
Lian, G. et al. (2019) ‘Cytoskeletal associated filamin a and RhoA affect neural progenitor specification during
mitosis’, Cerebral Cortex, 29(3), pp. 1280–1290.
Lian, G. and Sheen, V. L. (2015) ‘Cytoskeletal proteins in cortical development and disease: Actin associated proteins
in periventricular heterotopia’, Frontiers in Cellular Neuroscience, 9(APR), pp. 1–13.
Lim, Y. et al. (2008) ‘PyK2 and FAK connections to p190Rho guanine nucleotide exchange factor regulate RhoA
activity, focal adhesion formation, and cell motility’, Journal of Cell Biology, 180(1), pp. 187–203.
Lin, Y.-C., Yeckel, M. F. and Koleske, A. J. (2013) ‘Abl2/Arg Controls Dendritic Spine and Dendrite Arbor Stability
via Distinct Cytoskeletal Control Pathways’, Journal of Neuroscience, 33(5), pp. 1846–1857.
Liu, X. et al. (2016) ‘PRG-1 Regulates Synaptic Plasticity via Intracellular PP2A/β1-Integrin Signaling’,
Developmental Cell, 38(3), pp. 275–290.
Loo, D. T., Kanner, S. B. and Aruffo, A. (1998) ‘Filamin binds to the cytoplasmic domain of the β1-integrin:
Identification of amino acids responsible for this interaction’, Journal of Biological Chemistry, 273(36), pp. 23304–
23312.
Lowry, O. H. et al. (1951) ‘Protein measurement with the Folin phenol reagent.’, The Journal of biological chemistry.
United States, 193(1), pp. 265–275.
Loy, C. J., Sim, K. S. and Yong, E. L. (2003) ‘Filamin-A fragment localizes to the nucleus to regulate androgen
receptor and coactivator functions.’, Proceedings of the National Academy of Sciences of the United States of America,
100(8), pp. 4562–7.
Luo, B.-H., Carman, C. V and Springer, T. a (2007) ‘Structural basis of integrin regulation and signaling.’, Annual
review of immunology, 25, pp. 619–47.
Mah, A. S., Jang, J. and Deshaies, R. J. (2001) ‘Protein kinase Cdc15 activates the Dbf2-Mob1 kinase complex’,
Proceedings of the National Academy of Sciences of the United States of America, 98(13), pp. 7325–7330.
Mali, P., Aach, J., et al. (2013) ‘CAS9 transcriptional activators for target specificity screening and paired nickases for
cooperative genome engineering’, Nature Biotechnology. Nature Publishing Group, 31(9), pp. 833–838.
Mali, P., Yang, L., et al. (2013) ‘RNA-guided human genome engineering via Cas9’, Science, 339(6121), pp. 823–
826.
Mammoto, A., Huang, S. and Ingber, D. E. (2007) ‘Filamin links cell shape and cytoskeletal structure to Rho regulation
by controlling accumulation of p190RhoGAP in lipid rafts’, Journal of Cell Science, 120(3), pp. 456–467.
Manning, G. et al. (2002) ‘The protein kinase complement of the human genome’, Science. American Association for
the Advancement of Science, 298(5600), pp. 1912–1934.
Marcinkiewicz, C. et al. (2003) ‘Obtustatin: a potent selective inhibitor of alpha1beta1 integrin in vitro and
angiogenesis in vivo.’, Cancer research, 63(9), pp. 2020–2023.
Margadant, C. et al. (2012) ‘Distinct roles of talin and kindlin in regulating integrin α5β1 function and trafficking’,
Current Biology, 22(17), pp. 1554–1563.
Marrs, G. S. et al. (2006) ‘Dendritic arbors of developing retinal ganglion cells are stabilized by β1-integrins’,
Molecular and Cellular Neuroscience, 32(3), pp. 230–241.
Mezawa, M. et al. (2016) ‘Filamin A regulates the organization and remodeling of the pericellular collagen matrix’,
The FASEB Journal, 30(10), pp. 3613–3627.
Millward, T. A. et al. (1998) ‘Calcium regulation of NDR protein kinase mediated by S100 calcium-binding proteins’,
EMBO Journal, 17(20), pp. 5913–5922.
127
Millward, T., Cron, P. and Hemmings, B. A. (1995) ‘Molecular cloning and characterization of a conserved nuclear
serine(threonine) protein kinase’, Proc Natl Acad Sci U S A, 92(May), pp. 5022–5026.
Mizuno, M. et al. (2000) ‘Involvement of brain-derived neurotrophic factor in spatial memory formation and
maintenance in a radial arm maze test in rats’, Journal of Neuroscience. Soc Neuroscience, 20(18), pp. 7116–7121.
Monje, F. J. et al. (2012) ‘Focal Adhesion Kinase Regulates Neuronal Growth , Synaptic Plasticity and Hippocampus-
Dependent Spatial Learning and Memory’, Neurosignals, 20, pp. 1–14.
Moreno-Murciano, M. P. et al. (2003) ‘Amino acid sequence and homology modeling of obtustatin, a novel non-RGD-
containing short disintegrin isolated from the venom of Vipera lebetina obtusa.’, Protein science : a publication of the
Protein Society, 12(2), pp. 366–71.
Moresco, E. M. Y. et al. (2005) ‘Integrin-mediated dendrite branch maintenance requires Abelson (Abl) family
kinases.’, The Journal of neuroscience : the official journal of the Society for Neuroscience, 25(26), pp. 6105–6118.
Morimoto, K. et al. (1998) ‘Time-dependent changes in neurotrophic factor mRNA expression after kindling and long-
term potentiation in rats’, Brain research bulletin. Elsevier, 45(6), pp. 599–605.
Morse, E. M., Brahme, N. N. and Calderwood, D. A. (2014) ‘Integrin cytoplasmic tail interactions’, Biochemistry,
53(5), pp. 810–820.
Moser, M. et al. (2008) ‘Kindlin-3 is essential for integrin activation and platelet aggregation’, Nature Medicine, 14(3),
pp. 325–330.
Mould, A. P. et al. (2005) ‘Evidence that monoclonal antibodies directed against the integrin β subunit
plexin/semaphorin/integrin domain stimulate function by inducing receptor extension’, Journal of Biological
Chemistry, 280(6), pp. 4238–4246.
Muriel, O. et al. (2011) ‘Phosphorylated filamin A regulates actin-linked caveolae dynamics.’, Journal of cell science,
124, pp. 2763–2776.
Nakamura, F. et al. (2002) ‘Comparison of filamin A-induced cross-linking and Arp2/3 complex-mediated branching
on the mechanics of actin filaments’, Journal of Biological Chemistry, 277(11), pp. 9148–9154.
Nakamura, F. et al. (2005) ‘Ca2+ and calmodulin regulate the binding of filamin A to actin filaments’, Journal of
Biological Chemistry, 280(37), pp. 32426–32433.
Nakamura, F. et al. (2007) ‘Structural basis of filamin A functions’, Journal of Cell Biology, 179(5), pp. 1011–1025.
Nakamura, F. et al. (2014) ‘Amino- and carboxyl-terminal domains of Filamin-A interact with CRMP1 to mediate
Sema3A signalling’, Nature Communications. Nature Publishing Group, 5, p. 5325.
Nakamura, F., Stossel, T. P. and Hartwig, J. H. (2011) ‘The filamins: Organizers of cell structure and function’, Cell
Adhesion and Migration, 5(2), pp. 160–169.
Nakayama, a Y., Harms, M. B. and Luo, L. (2000) ‘Small GTPases Rac and Rho in the maintenance of dendritic spines
and branches in hippocampal pyramidal neurons.’, The Journal of neuroscience : the official journal of the Society for
Neuroscience, 20(14), pp. 5329–38.
Nanda, S. et al. (2020) ‘Distinct Roles of Microtubules and Actin Filaments in Defining Dendritic Architecture’,
bioRxiv.
Naska, S. et al. (2006) ‘An essential role for the integrin-linked kinase-glycogen synthase kinase-3β pathway during
dendrite initiation and growth’, Journal of Neuroscience, 26(51), pp. 13344–13356.
Navarro, A. I. and Rico, B. (2014) ‘Focal adhesion kinase function in neuronal development’, Current Opinion in
Neurobiology. Elsevier Ltd, 27, pp. 89–95.

128
Neff, N. T. et al. (1982) ‘A monoclonal antibody detaches embryonic skeletal muscle from extracellular matrices’,
Journal of Cell Biology, 95(2), pp. 654–666.
Nestor, M. W. et al. (2011) ‘The actin binding domain of βI-spectrin regulates the morphological and functional
dynamics of dendritic spines’, PLoS ONE, 6(1).
Ni, L. et al. (2015) ‘Structural basis for Mob1-dependent activation of the core Mst–Lats kinase cascade in Hippo
signaling’, Genes and Development, 29(13), pp. 1416–1431.
Nichols, S. A. et al. (2006) ‘Early evolution of animal cell signaling and adhesion genes’, Proceedings of the National
Academy of Sciences, 103(33), pp. 12451–12456.
Nieuwenhuis, B. et al. (2018) ‘Integrins promote axonal regeneration after injury of the nervous system’, Biological
Reviews, 93(3), pp. 1339–1362.
Nieves, B. et al. (2010) ‘The NPIY motif in the integrin β1 tail dictates the requirement for talin-1 in outside-in
signaling’, Journal of Cell Science, 123(8), pp. 1216–1226.
Nilsson, S. et al. (2006) ‘Threonine 788 in integrin subunit β1 regulates integrin activation’, Experimental Cell
Research. Elsevier Inc., 312(6), pp. 844–853.
Ning, L. et al. (2013) ‘Interactions between ICAM-5 and β1 integrins regulate neuronal synapse formation’, Journal
of Cell Science, 126(1), pp. 77–89.
Nishida, N. et al. (2006) ‘Activation of Leukocyte β2 Integrins by Conversion from Bent to Extended Conformations’,
Immunity, 25(4), pp. 583–594.
Noam, Y. et al. (2012) ‘Distinct Regional and Subcellular Localization of the Actin- Binding Protein Filamin A in the
Mature Rat Brain’, J Comp Neurol., 520(13), pp. 3013–3034.
Nunes, A. M. et al. (2018) ‘Magnesium Activates Microsecond Dynamics to Regulate Integrin-Collagen Recognition
Magnesium Activates Microsecond Dynamics to Regulate Integrin-Collagen Recognition’, Structure, 26, pp. 1080–
1090.
O’Connor, C. M., Adams, J. U. and Fairman, J. (2010) ‘Essentials of cell biology’, Cambridge, MA: NPG Education,
1, p. 54.
O’Connor, S. M. et al. (2001) ‘Survival and neurite outgrowth of rat cortical neurons in three-dimensional agarose and
collagen gel matrices’, Neuroscience Letters, 304(3), pp. 189–193.
Ohta, Y., Hartwig, J. H. and Stossel, T. P. (2006) ‘FilGAP, a Rho- and ROCK-regulated GAP for Rac binds filamin A
to control actin remodelling’, Nature Cell Biology, 8(8), pp. 803–814.
Paddison, P. J. et al. (2002) ‘Short hairpin RNAs ( shRNAs ) induce sequence-specific silencing in mammalian cells’,
Genes & development, 16, pp. 948–958.
Parsons, J. T. (2003) ‘Focal adhesion kinase: The first ten years’, Journal of Cell Science, 116(8), pp. 1409–1416.
Pasterkamp, R. J. et al. (2003) ‘Semaphorin 7A promotes axon outgrowth through integrins and MAPKs’, Nature,
424(6947), pp. 398–405.
Pearce, L. R., Komander, D. and Alessi, D. R. (2010) ‘The nuts and bolts of AGC protein kinases’, Nature Reviews
Molecular Cell Biology. Nature Publishing Group, 11(1), pp. 9–22.
Pellinen, T. et al. (2008) ‘Integrin Trafficking Regulated by Rab21 Is Necessary for Cytokinesis’, Developmental Cell,
15(3), pp. 371–385.
Pentikäinen, U. and Ylänne, J. (2009) ‘The Regulation Mechanism for the Auto-Inhibition of Binding of Human
129
Filamin A to Integrin’, Journal of Molecular Biology. Elsevier Ltd, 393(3), pp. 644–657.
Petrecca, K., Miller, D. M. and Shrier, A. (2000) ‘Localization and enhanced current density of the Kv4.2 potassium
channel by interaction with the actin-binding protein filamin’, J Neurosci, 20(23), pp. 8736–8744.
Pietri, T. et al. (2004) ‘Conditional β1-integrin gene deletion in neural crest cells causes severe developmental
alterations of the peripheral nervous system’, Development, 131(16), pp. 3871–3883.
Pinkstaff, J. K. et al. (1999) ‘Integrin subunit gene expression is regionally differentiated in adult brain’, Journal of
Neuroscience, 19(5), pp. 1541–1556.
Pollard, T. D. and Cooper, J. A. (2009) ‘Actin, a central player in cell shape and movement’, Science (New York, N.Y.),
326(5957), pp. 1208–1212.
Popowicz, G. M. et al. (2006) ‘Filamins: promiscuous organizers of the cytoskeleton’, Trends in Biochemical Sciences,
31(7), pp. 411–419.
Ran, F. A. et al. (2015) ‘In vivo genome editing using Staphylococcus aureus Cas9’, Nature, 520(7546), pp. 186–191.
Rantala, J. K. et al. (2011) ‘SHARPIN is an endogenous inhibitor of β1-integrin activation’, Nature Cell Biology.
Nature Publishing Group, 13(11), pp. 1315–1324.
Rehberg, K. et al. (2014) ‘The Serine/Threonine Kinase Ndr2 Controls Integrin Trafficking and Integrin-Dependent
Neurite Growth’, Journal of Neuroscience, 34(15), pp. 5342–5354.
Retailleau, K. et al. (2016) ‘Arterial Myogenic Activation through Smooth Muscle Filamin A’, Cell Reports, 14(9),
pp. 2050–2058.
Richter, M. et al. (2007) ‘Collagen Distribution and Expression of Collagen-Binding α1β1 (VLA-1) and α2β1 (VLA-
2) Integrins on CD4 and CD8 T Cells during Influenza Infection’, The Journal of Immunology, 178(7), pp. 4506–4516.
Ritter, B. et al. (2017) ‘A lentiviral system for efficient knockdown of proteins in neuronal cultures’, MNI Open
Research, 1(May), p. 2.
Rocca, D. L. et al. (2008) ‘Inhibition of Arp2/3-mediated actin polymerization by PICK1 regulates neuronal
morphology and AMPA receptor endocytosis’, Nature Cell Biology, 10(3), pp. 259–271.
Rodgers, E. E. and Theibert, A. B. (2002) ‘Functions of PI 3-kinase in development of the nervous system’,
International Journal of Developmental Neuroscience, 20(3–5), pp. 187–197.
Rogalla, T. et al. (1999) ‘Regulation of Hsp27 oligomerization, chaperone function, and protective activity against
oxidative stress/tumor necrosis factor by phosphorylation’, Journal of Biological Chemistry, 274(27), pp. 18947–
18956.
Rognoni, L. et al. (2012) ‘Dynamic force sensing of filamin revealed in single-molecule experiments’, Proceedings of
the National Academy of Sciences, 109(48), pp. 19679–19684.
Ruoslahti, E. and Pierschbacher, M. D. (1987) ‘New perspectives in cell adhesion: RGD and integrins’, Science.
American Association for the Advancement of Science, 238(4826), pp. 491–497.
Savell, K. E. et al. (2019) ‘A neuron-optimized CRISPR/dCas9 activation system for robust and specific gene
regulation’, eNeuro, 6(1), pp. 1–17.
Scharffetter-Kochanek, K. et al. (1998) ‘Spontaneous skin ulceration and defective T cell function in CD18 null mice’,
Journal of Experimental Medicine, 188(1), pp. 119–131.
Schlomann, U. et al. (2009) ‘The stimulation of dendrite growth by Sema3A requires integrin engagement and focal
adhesion kinase.’, Journal of cell science, 122(Pt 12), pp. 2034–2042.

130
Schmid, R. S. and Anton, E. S. (2003) ‘Role of Integrins in the Development of the Cerebral Cortex’, Cerebral Cortex,
13, pp. 219–224.
Schmits, R. et al. (1996) ‘LFA-1-deficient mice show normal CTL responses to virus but fail to reject immunogenic
tumor’, Journal of Experimental Medicine, 183(4), pp. 1415–1426.
Sebé-Pedrós, A. et al. (2010) ‘Ancient origin of the integrin-mediated adhesion and signaling machinery’, Proceedings
of the National Academy of Sciences, 107(22), pp. 10142 LP – 10147.
Segura, I. et al. (2016) ‘The Oxygen Sensor PHD2 Controls Dendritic Spines and Synapses via Modification of Filamin
A’, Cell Reports, 14(11), pp. 2653–2667.
Seki, A. and Rutz, S. (2018) ‘Optimized RNP transfection for highly efficient CRI SPR/Cas9-mediated gene knockout
in primary T cells’, Journal of Experimental Medicine, 215(3), pp. 985–997.
Sharma, C. P., Ezzell, R. M. and Arnaout, M. a (1995) ‘Direct interaction of filamin (ABP-280) with the beta 2-integrin
subunit CD18.’, Journal of immunology, 154(8), pp. 3461–3470.
Sheen, V. L. et al. (2002) ‘Filamin A and Filamin B are co-expressed within neurons during periods of neuronal
migration and can physically interact’, Human Molecular Genetics, 11(23), pp. 2845–2854.
Sheen, V. L. (2012) ‘Periventricular Heterotopia: Shuttling of Proteins through Vesicles and Actin in Cortical
Development and Disease.’, Scientifica, 2012, p. 480129.
Shi, Y. and Ethell, I. M. (2006) ‘Integrins Control Dendritic Spine Plasticity in Hippocampal Neurons through NMDA
Receptor and Ca’, The Journal of Neuroscience, 26(6), pp. 1813–1822.
Shimaoka, M. and Springer, T. A. (2003) ‘Therapeutic antagonists and conformational regulation of integrin function’,
Nat Rev Drug Discov, 2, pp. 703–716.
Sholl, D. A. (1953) ‘Dendritic organization in the neurons of the visual and motor cortices of the cat.’, Journal of
anatomy, 87(4), pp. 387–406.
Spence, E. F. et al. (2016) ‘The Arp2/3 Complex Is Essential for Distinct Stages of Spine Synapse Maturation,
Including Synapse Unsilencing’, Journal of Neuroscience, 36(37), pp. 9696–9709.
Spinardi, L. et al. (1995) ‘A recombinant tail-less integrin β4 subunit disrupts hemidesmosomes, but does not suppress
α6β4-mediated cell adhesion to laminins’, Journal of Cell Biology, 129(2), pp. 473–487.
Stankiewicz, T. R. and Linseman, D. A. (2014) ‘Rho family GTPases: Key players in neuronal development, neuronal
survival, and neurodegeneration’, Frontiers in Cellular Neuroscience, 8(OCT), pp. 1–14.
Stawowy, P. et al. (2005) ‘Protein kinase C epsilon mediates angiotensin II-induced activation of β1-integrins in
cardiac fibroblasts’, Cardiovascular Research, 67(1), pp. 50–59.
Stegert, M. R. et al. (2004) ‘Regulation of NDR2 protein kinase by multi-site phosphorylation and the S100B calcium-
binding protein’, Journal of Biological Chemistry, 279(22), pp. 23806–23812.
Stegert, M. R. et al. (2005) ‘Regulation of NDR Protein Kinase by Hydrophobic Motif Phosphorylation Mediated by
the Mammalian Ste20-Like Kinase MST3’, Molecular and Cellular Biology, 25(24), pp. 11019–11029.
Stephens, L. E. et al. (1995) ‘Deletion of β1 integrins in mice results in inner cell mass failure and peri-implantation
lethality’, Genes and Development, 9(15), pp. 1883–1895.
Stork, O. et al. (2004) ‘Neuronal functions of the novel serine/threonine kinase Ndr2’, Journal of Biological Chemistry,
279(44), pp. 45773–45781.
Su, L. et al. (2007) ‘Safrole oxide induces neuronal apoptosis through inhibition of integrin β4/SOD activity and
131
elevation of ROS/NADPH oxidase activity’, Life Sciences, 80(11), pp. 999–1006.
Suzuki, K. and Takahashi, K. (2003) ‘Reduced Cell Adhesion during Mitosis by Threonine Phosphorylation of β1
Integrin’, Journal of Cellular Physiology, 197(2), pp. 297–305.
Szeto, S. G. Y. et al. (2015) ‘Phosphorylation of filamin A by Cdk1 regulates filamin A localization and daughter cell
separation’, Experimental Cell Research. Elsevier, 330(2), pp. 248–266.
Takala, H. et al. (2008) ‘β2 integrin phosphorylation on Thr758 acts as a molecular switch to regulate 14-3-3 and
filamin binding.’, Blood. United States, 112(5), pp. 1853–1862.
Tamaskovic, R. et al. (2003) ‘Mechanism of Ca2+-mediated regulation of NDR protein kinase through
autophosphorylation and phosphorylation by an upstream kinase’, Journal of Biological Chemistry, 278(9), pp. 6710–
6718.
Tamkun, J. W. et al. (1986) ‘Structure of integrin, a glycoprotein involved in the transmembrane linkage between
fibronectin and actin’, Cell, 46(2), pp. 271–282.
Tan, C. L. et al. (2011) ‘Integrin activation promotes axon growth on inhibitory chondroitin sulfate proteoglycans by
enhancing integrin signaling’, Journal of Neuroscience, 31(17), pp. 6289–6295.
Tan, C. L. et al. (2015) ‘Full length talin stimulates integrin activation and axon regeneration’, Molecular and Cellular
Neuroscience. The Authors, 68, pp. 1–8.
Teckchandani, A. et al. (2009) ‘Quantitative proteomics identifies a Dab2/integrin module regulating cell migration’,
Journal of Cell Biology, 186(1), pp. 99–111.
Thiere, M. et al. (2016) ‘Integrin Activation Through the Hematopoietic Adapter Molecule ADAP Regulates Dendritic
Development of Hippocampal Neurons’, Frontiers in Molecular Neuroscience, 9(September), pp. 1–14.
Tigges, U. et al. (2003) ‘The F-actin cross-linking and focal adhesion protein filamin A is a ligand and in vivo substrate
for protein kinase Cα’, Journal of Biological Chemistry, 278(26), pp. 23561–23569.
Tomaselli, K. J. et al. (1993) ‘Expression of beta 1 integrins in sensory neurons of the dorsal root ganglion and their
functions in neurite outgrowth on two laminin isoforms.’, J. Neurosci., 13(11), pp. 4880–4888.
Tomaselli, K. J., Damsky, C. H. and Reichardt, L. F. (1987) ‘Interactions of a neuronal cell line (PC12) with laminin,
collagen IV, and fibronectin: identification of integrin-related glycoproteins involved in attachment and process
outgrowth’, The Journal of cell biology. The Rockefeller University Press, 105(5), pp. 2347–2358.
Tonge, D. A. et al. (2012) ‘Fibronectin supports neurite outgrowth and axonal regeneration of adult brain neurons in
vitro’, Brain Research. Elsevier B.V., 1453(November 2016), pp. 8–16.
Travis, M. A. et al. (2004) ‘Interaction of filamin A with the integrin β7 cytoplasmic domain: Role of alternative
splicing and phosphorylation’, FEBS Letters, 569(1–3), pp. 185–190.
Tucker, B. A., Rahimtula, M. and Mearow, K. M. (2005) ‘Integrin activation and neurotrophin signaling cooperate to
enhance neurite outgrowth in sensory neurons’, Journal of Comparative Neurology, 486(3), pp. 267–280.
Tulla, M. et al. (2001) ‘Selective Binding of Collagen Subtypes by Integrin α1I, α2I, and α10I Domains’, Journal of
Biological Chemistry, 276(51), pp. 48206–48212.
Tulla, M. et al. (2008) ‘Effects of conformational activation of integrin α1I and α2I domains on selective recognition
of laminin and collagen subtypes’, Experimental Cell Research, 314(8), pp. 1734–1743.
Turner, D. C., Flier, L. A. and Carbonetto, S. (1987) ‘Magnesium-dependent attachment and neurite outgrowth by
PC12 cells on collagen and laminin substrata’, Developmental Biology, 121(2), pp. 510–525.
132
Ultanir, S. K. et al. (2012) ‘Chemical Genetic Identification of NDR1/2 Kinase Substrates AAK1 and Rabin8 Uncovers
Their Roles in Dendrite Arborization and Spine Development’, Neuron. Elsevier Inc., 73(6), pp. 1127–1142.
Vadlamudi, R. K. et al. (2002) ‘Filamin is essential in actin cytoskeletal assembly mediated by p21-activated kinase
1’, Nature Cell Biology, 4(9), pp. 681–690.
Vandenberg, P. et al. (1991) ‘Characterization of a type IV collagen major cell binding site with affinity to the α1β1
and the α2β1 integrins’, Journal of Cell Biology, 113(6), pp. 1475–1483.
Varnum-Finney, B. et al. (1995) ‘The integrin receptor α8β1 mediates interactions of embryonic chick motor and
sensory neurons with tenascin-C’, Neuron, 14(6), pp. 1213–1222.
Velling, T. et al. (2004) ‘β1-Integrins induce phosphorylation of Akt on serine 473 independently of focal adhesion
kinase and Src family kinases’, EMBO Reports, 5(9), pp. 901–905.
Vichalkovski, A. et al. (2008) ‘NDR Kinase Is Activated by RASSF1A/MST1 in Response to Fas Receptor Stimulation
and Promotes Apoptosis’, Current Biology. Elsevier Ltd, 18(23), pp. 1889–1895.
Vora, S., Cheng, J., Xiao, R., Vandusen, N. J., et al. (2018) ‘Rational design of a compact CRISPR- ‐ Cas9 activator
for AAV- ‐ mediated delivery’, 9.
Vora, S., Cheng, J., Xiao, R., VanDusen, N., et al. (2018) ‘Rational design of a compact CRISPR-Cas9 activator for
AAV-mediated delivery’, bioRxiv, 9, p. 298620.
Waldt, N. et al. (2018) ‘Filamin A Phosphorylation at Serine 2152 by the Serine/Threonine Kinase Ndr2 Controls
TCR-Induced LFA-1 Activation in T Cells’, Frontiers in Immunology, 9(December), pp. 1–16.
Wang, H. Y. et al. (2012) ‘Reducing amyloid-related Alzheimer’s disease pathogenesis by a small molecule targeting
filamin A’, Journal of Neuroscience, 32(29), pp. 9773–9784.
Wang, H. Y. et al. (2017) ‘PTI-125 binds and reverses an altered conformation of filamin A to reduce Alzheimer’s
disease pathogenesis’, Neurobiology of Aging. Elsevier Inc, 55, pp. 99–114.
Wang, H. Y., Frankfurt, M. and Burns, L. H. (2008) ‘High-affinity naloxone binding to filamin A prevents Mu opioid
receptor-Gs coupling underlying opioid tolerance and dependence’, PLoS ONE, 3(2), pp. 1–10.
Wang, K., Ash, J. F. and Singer, S. J. (1975) ‘Filamin, a new high-molecular-weight protein found in smooth muscle
and non-muscle cells.’, Proceedings of the National Academy of Sciences of the United States of America, 72(11), pp.
4483–6.
Wang, K., Zhu, T. N. and Zhao, R. J. (2019) ‘Filamin A regulates EGFR/ERK/Akt signaling and affects colorectal
cancer cell growth and migration’, Molecular Medicine Reports, 20(4), pp. 3671–3678.
Warren, M. S. et al. (2012) ‘Integrin β1 Signals through Arg to Regulate Postnatal Dendritic Arborization, Synapse
Density, and Behavior’, Journal of Neuroscience, 32(8), pp. 2824–2834.
Weaver, C. D. et al. (1995) ‘Expression and in vitro function of β1-integrin laminin receptors in the developing avian
ciliary ganglion’, Journal of Neuroscience, 15(7 II), pp. 5275–5285.
Weeks, S. D. et al. (2018) ‘Characterization of human small heat shock protein HSPB1 α-crystallin domain localized
mutants associated with hereditary motor neuron diseases’, Scientific Reports, 8(1), p. 688.
Wheeler, D. G. and Cooper, E. (2001) ‘Depolarization Strongly Induces Human Cytomegalovirus Major Immediate-
Early Promoter/Enhancer Activity in Neurons’, Journal of Biological Chemistry, 276(34), pp. 31978–31985.
Whittaker, C. A. and Hynes, R. O. (2002) ‘Distribution and evolution of von Willebrand/integrin A domains: widely
dispersed domains with roles in cell adhesion and elsewhere’, Molecular biology of the cell. American Society for Cell
Biology, 13(10), pp. 3369–3387.
133
Wiatrak, B. et al. (2020) ‘PC12 Cell Line: Cell Types, Coating of Culture Vessels, Differentiation and Other Culture
Conditions’, Cells, 9(4), p. 958.
Willems, J. et al. (2020) ‘ORANGE: A CRISPR/Cas9-based genome editing toolbox for epitope tagging of
endogenous proteins in neurons.’, PLoS biology, 18(4), p. e3000665.
Winograd-Katz, S. E. et al. (2014) ‘The integrin adhesome: From genes and proteins to human disease’, Nature
Reviews Molecular Cell Biology, 15(4), pp. 273–88.
Woo, M. S. et al. (2004) ‘Ribosomal S6 Kinase ( RSK ) Regulates Phosphorylation of Filamin A on an Important
Regulatory Site’, Molecular and Cellular Biology, 24(7), pp. 3025–3035.
Wu, X. and Reddy, D. S. (2012) ‘Integrins as receptor targets for neurological disorders’, Pharmacology and
Therapeutics, 134(1), pp. 68–81.
Xiong, J.-P. et al. (2001) ‘Crystal structure of the extracellular segment of integrin αVβ3’, Science. American
Association for the Advancement of Science, 294(5541), pp. 339–345.
Xiong, S. et al. (2018) ‘Structural Basis for Auto-Inhibition of the NDR1 Kinase Domain by an Atypically Long
Activation Segment’, Structure. Elsevier Ltd., 26(8), pp. 1101-1115.e6.
Yang, J. T., Rayburn, H. and Hynes, R. O. (1995) ‘Cell adhesion events mediated by α4 integrins are essential in
placental and cardiac development’, Development, 121(2), pp. 549–560.
Yang, R. et al. (2014) ‘Rassf5 and Ndr kinases act in a novel pathway regulating neuronal polarity through Par3
phosphorylation’, Journal of Cell Science, 127(16), pp. 3463–3476.
Yang, S. and Kim, H. M. (2012) ‘The RhoA-ROCK-PTEN pathway as a molecular switch for anchorage dependent
cell behavior’, Biomaterials. Elsevier Ltd, 33(10), pp. 2902–2915.
Yeh, W. H. et al. (2018) ‘In vivo base editing of post-mitotic sensory cells’, Nature Communications. Springer US,
9(1), pp. 1–10.
Yousif, N. G. (2014) ‘Fibronectin promotes migration and invasion of ovarian cancer cells through up-regulation of
FAK-PI3K/Akt pathway’, Cell Biology International, 38(1), pp. 85–91.
Yue, J., Huhn, S. and Shen, Z. (2013) ‘Complex roles of filamin-A mediated cytoskeleton network in cancer
progression.’, Cell & bioscience, 3(1), p. 7.
Zaidel-Bar, R. et al. (2007) ‘Functional atlas of the integrin adhesome’, Nature Cell Biology, 9, pp. 858–867.
Zallen, J. A. et al. (2000) ‘Neuronal Cell Shape and Neurite Initiation Are Regulated by the Ndr Kinase SAX-1 , a
Member of the Orb6 / COT-1 / Warts Serine / Threonine Kinase Family’, Molecular Biology of the Cell,
11(September), pp. 3177–3190.
Zhang, J. et al. (2012) ‘Brefeldin A-inhibited Guanine Exchange Factor 2 Regulates Filamin A Phosphorylation and
Neuronal Migration’, Journal of Neuroscience, 32(36), pp. 12619–12629.
Zhang, J. et al. (2013) ‘Filamin A Regulates Neuronal Migration through Brefeldin A-Inhibited Guanine Exchange
Factor 2-Dependent Arf1 Activation’, Journal of Neuroscience, 33(40), pp. 15735–15746.
Zhang, K. and Chen, J. (2012) ‘The regulation of integrin function by divalent cations’, Cell adhesion & migration.
Taylor & Francis, 6(1), pp. 20–29.
Zhang, L. et al. (2014) ‘MEK-ERK1/2-Dependent FLNA Overexpression Promotes Abnormal Dendritic Patterning in
Tuberous Sclerosis Independent of mTOR’, Neuron, 84(1), pp. 78–91.
Zhang, L. et al. (2020) ‘Filamin A inhibition reduces seizure activity in a mouse model of focal cortical malformations’,

134
Science Translational Medicine, 12(532), pp. 1–13.
Zhang, Z., Tarone, G. and Turner, D. C. (1993) ‘Expression of integrin α1β1 is regulated by nerve growth factor and
dexamethasone in PC12 cells. Functional consequences for adhesion and neurite outgrowth.’, The Journal of
Biological Chemistry, 268(8), pp. 5557–5565.
Zheng, L. et al. (2011) ‘Drosophila Ten-m and filamin affect motor neuron growth cone guidance’, PLoS ONE, 6(8).
Zheng, X. M., Resnick, R. J. and David, S. (2002) ‘Mitotic activation of protein-tyrosine phosphatase α and regulation
of its Src-mediated transforming activity by its sites of protein kinase C phosphorylation’, Journal of Biological
Chemistry, 277(24), pp. 21922–21929.
Zhu, J. et al. (2007) ‘Tests of the Extension and Deadbolt Models of Integrin Activation *’, 282(16), pp. 11914–11920.
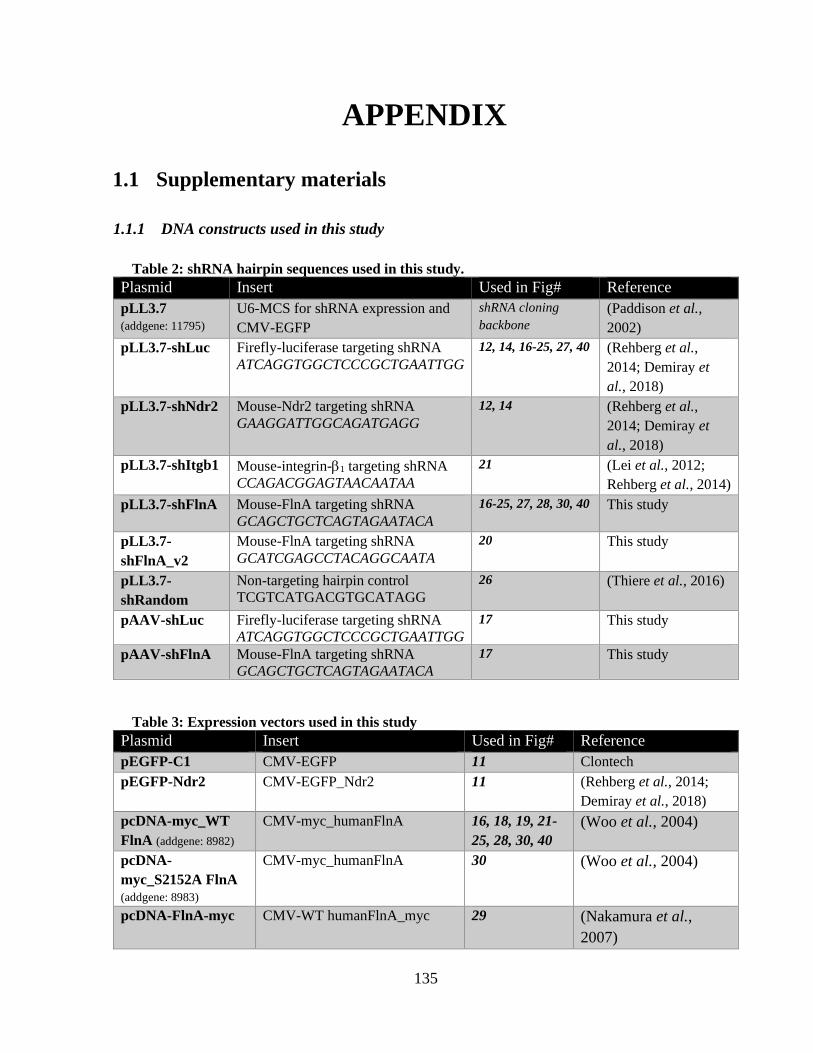
135
APPENDIX
1.1 Supplementary materials
1.1.1 DNA constructs used in this study
Table 2: shRNA hairpin sequences used in this study.
Plasmid Insert Used in Fig# Reference
pLL3.7
(addgene: 11795) U6-MCS for shRNA expression and
CMV-EGFP
shRNA cloning
backbone
(Paddison et al.,
2002)
pLL3.7-shLuc Firefly-luciferase targeting shRNA
ATCAGGTGGCTCCCGCTGAATTGG
12, 14, 16-25, 27, 40 (Rehberg et al.,
2014; Demiray et
al., 2018)
pLL3.7-shNdr2 Mouse-Ndr2 targeting shRNA
GAAGGATTGGCAGATGAGG
12, 14 (Rehberg et al.,
2014; Demiray et
al., 2018)
pLL3.7-shItgb1 Mouse-integrin-1 targeting shRNA
CCAGACGGAGTAACAATAA
21 (Lei et al., 2012;
Rehberg et al., 2014)
pLL3.7-shFlnA Mouse-FlnA targeting shRNA
GCAGCTGCTCAGTAGAATACA
16-25, 27, 28, 30, 40 This study
pLL3.7-
shFlnA_v2
Mouse-FlnA targeting shRNA
GCATCGAGCCTACAGGCAATA
20 This study
pLL3.7-
shRandom
Non-targeting hairpin control
TCGTCATGACGTGCATAGG
26 (Thiere et al., 2016)
pAAV-shLuc Firefly-luciferase targeting shRNA
ATCAGGTGGCTCCCGCTGAATTGG
17 This study
pAAV-shFlnA Mouse-FlnA targeting shRNA
GCAGCTGCTCAGTAGAATACA
17 This study
Table 3: Expression vectors used in this study
Plasmid Insert Used in Fig# Reference
pEGFP-C1 CMV-EGFP 11 Clontech
pEGFP-Ndr2 CMV-EGFP_Ndr2 11 (Rehberg et al., 2014;
Demiray et al., 2018)
pcDNA-myc_WT
FlnA (addgene: 8982)
CMV-myc_humanFlnA 16, 18, 19, 21-
25, 28, 30, 40
(Woo et al., 2004)
pcDNA-
myc_S2152A FlnA
(addgene: 8983)
CMV-myc_humanFlnA 30 (Woo et al., 2004)
pcDNA-FlnA-myc CMV-WT humanFlnA_myc 29 (Nakamura et al.,
2007)
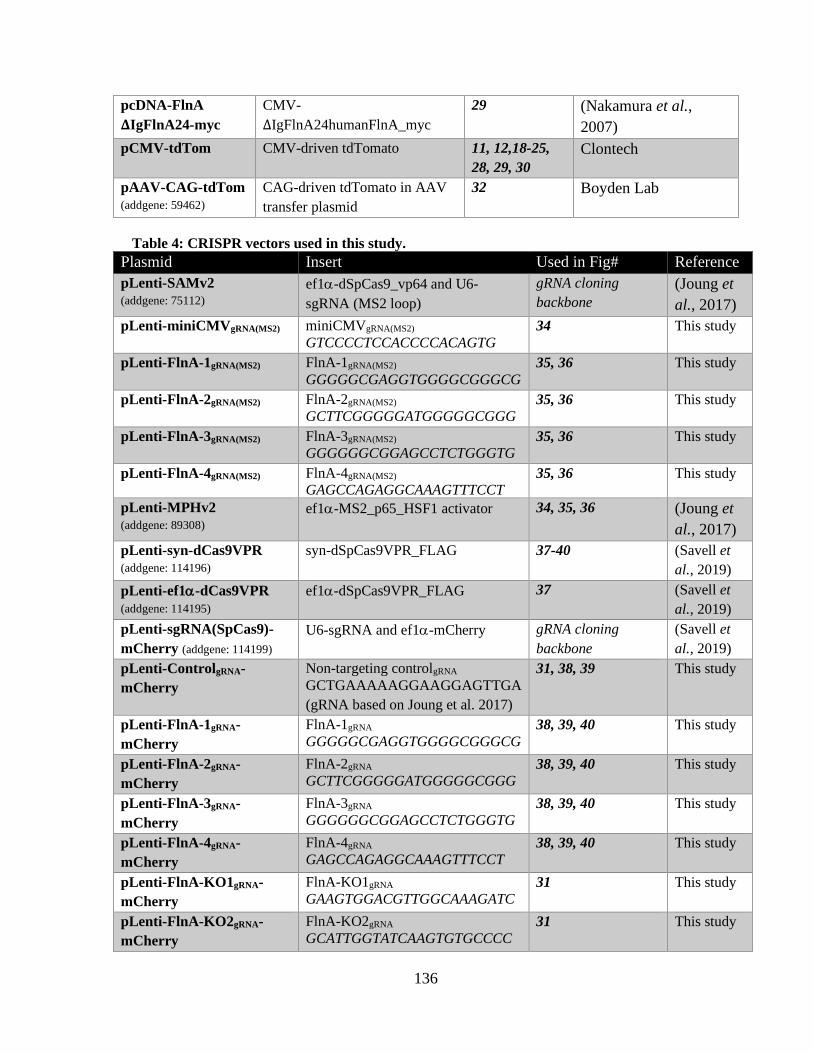
136
pcDNA-FlnA
𝚫IgFlnA24-myc
CMV-
ΔIgFlnA24humanFlnA_myc
29 (Nakamura et al.,
2007)
pCMV-tdTom CMV-driven tdTomato 11, 12,18-25,
28, 29, 30
Clontech
pAAV-CAG-tdTom
(addgene: 59462)
CAG-driven tdTomato in AAV
transfer plasmid
32 Boyden Lab
Table 4: CRISPR vectors used in this study.
Plasmid Insert Used in Fig# Reference
pLenti-SAMv2
(addgene: 75112) ef1-dSpCas9_vp64 and U6-
sgRNA (MS2 loop)
gRNA cloning
backbone
(Joung et
al., 2017)
pLenti-miniCMVgRNA(MS2) miniCMVgRNA(MS2)
GTCCCCTCCACCCCACAGTG
34 This study
pLenti-FlnA-1gRNA(MS2) FlnA-1gRNA(MS2)
GGGGGCGAGGTGGGGCGGGCG 35, 36 This study
pLenti-FlnA-2gRNA(MS2) FlnA-2gRNA(MS2)
GCTTCGGGGGATGGGGGCGGG 35, 36 This study
pLenti-FlnA-3gRNA(MS2) FlnA-3gRNA(MS2)
GGGGGGCGGAGCCTCTGGGTG 35, 36 This study
pLenti-FlnA-4gRNA(MS2) FlnA-4gRNA(MS2)
GAGCCAGAGGCAAAGTTTCCT 35, 36 This study
pLenti-MPHv2
(addgene: 89308) ef1-MS2_p65_HSF1 activator 34, 35, 36 (Joung et
al., 2017)
pLenti-syn-dCas9VPR
(addgene: 114196)
syn-dSpCas9VPR_FLAG 37-40 (Savell et
al., 2019)
pLenti-ef1-dCas9VPR
(addgene: 114195)
ef1-dSpCas9VPR_FLAG 37 (Savell et
al., 2019)
pLenti-sgRNA(SpCas9)-
mCherry (addgene: 114199)
U6-sgRNA and ef1-mCherry gRNA cloning
backbone
(Savell et
al., 2019)
pLenti-ControlgRNA-
mCherry
Non-targeting controlgRNA
GCTGAAAAAGGAAGGAGTTGA
(gRNA based on Joung et al. 2017)
31, 38, 39 This study
pLenti-FlnA-1gRNA-
mCherry
FlnA-1gRNA
GGGGGCGAGGTGGGGCGGGCG
38, 39, 40 This study
pLenti-FlnA-2gRNA-
mCherry
FlnA-2gRNA
GCTTCGGGGGATGGGGGCGGG
38, 39, 40 This study
pLenti-FlnA-3gRNA-
mCherry
FlnA-3gRNA
GGGGGGCGGAGCCTCTGGGTG
38, 39, 40 This study
pLenti-FlnA-4gRNA-
mCherry
FlnA-4gRNA
GAGCCAGAGGCAAAGTTTCCT
38, 39, 40 This study
pLenti-FlnA-KO1gRNA-
mCherry
FlnA-KO1gRNA
GAAGTGGACGTTGGCAAAGATC
31 This study
pLenti-FlnA-KO2gRNA-
mCherry
FlnA-KO2gRNA
GCATTGGTATCAAGTGTGCCCC
31 This study
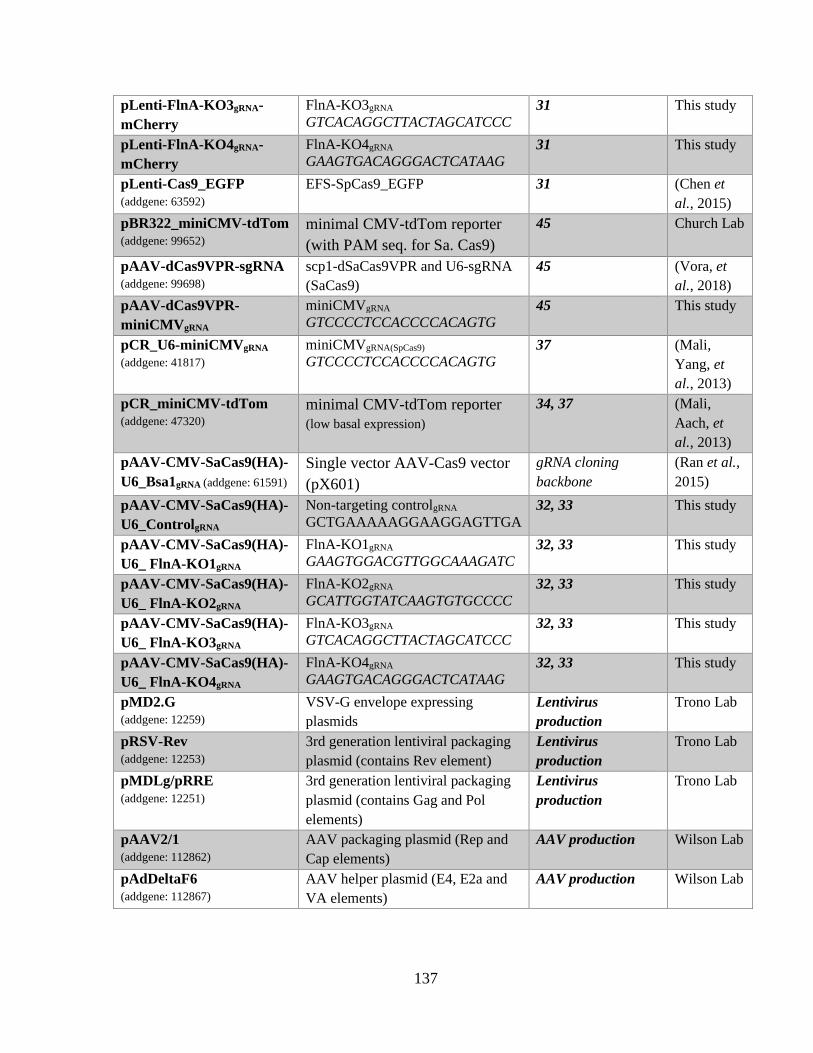
137
pLenti-FlnA-KO3gRNA-
mCherry
FlnA-KO3gRNA
GTCACAGGCTTACTAGCATCCC
31 This study
pLenti-FlnA-KO4gRNA-
mCherry
FlnA-KO4gRNA
GAAGTGACAGGGACTCATAAG
31 This study
pLenti-Cas9_EGFP
(addgene: 63592)
EFS-SpCas9_EGFP 31 (Chen et
al., 2015)
pBR322_miniCMV-tdTom
(addgene: 99652) minimal CMV-tdTom reporter
(with PAM seq. for Sa. Cas9)
45 Church Lab
pAAV-dCas9VPR-sgRNA
(addgene: 99698)
scp1-dSaCas9VPR and U6-sgRNA
(SaCas9)
45 (Vora, et
al., 2018)
pAAV-dCas9VPR-
miniCMVgRNA
miniCMVgRNA
GTCCCCTCCACCCCACAGTG
45 This study
pCR_U6-miniCMVgRNA
(addgene: 41817)
miniCMVgRNA(SpCas9)
GTCCCCTCCACCCCACAGTG
37 (Mali,
Yang, et
al., 2013)
pCR_miniCMV-tdTom
(addgene: 47320) minimal CMV-tdTom reporter
(low basal expression)
34, 37 (Mali,
Aach, et
al., 2013)
pAAV-CMV-SaCas9(HA)-
U6_Bsa1gRNA (addgene: 61591)
Single vector AAV-Cas9 vector
(pX601)
gRNA cloning
backbone
(Ran et al.,
2015)
pAAV-CMV-SaCas9(HA)-
U6_ControlgRNA
Non-targeting controlgRNA
GCTGAAAAAGGAAGGAGTTGA
32, 33 This study
pAAV-CMV-SaCas9(HA)-
U6_ FlnA-KO1gRNA
FlnA-KO1gRNA
GAAGTGGACGTTGGCAAAGATC
32, 33 This study
pAAV-CMV-SaCas9(HA)-
U6_ FlnA-KO2gRNA
FlnA-KO2gRNA
GCATTGGTATCAAGTGTGCCCC
32, 33 This study
pAAV-CMV-SaCas9(HA)-
U6_ FlnA-KO3gRNA
FlnA-KO3gRNA
GTCACAGGCTTACTAGCATCCC
32, 33 This study
pAAV-CMV-SaCas9(HA)-
U6_ FlnA-KO4gRNA
FlnA-KO4gRNA
GAAGTGACAGGGACTCATAAG
32, 33 This study
pMD2.G
(addgene: 12259)
VSV-G envelope expressing
plasmids
Lentivirus
production
Trono Lab
pRSV-Rev
(addgene: 12253)
3rd generation lentiviral packaging
plasmid (contains Rev element)
Lentivirus
production
Trono Lab
pMDLg/pRRE
(addgene: 12251)
3rd generation lentiviral packaging
plasmid (contains Gag and Pol
elements)
Lentivirus
production
Trono Lab
pAAV2/1
(addgene: 112862)
AAV packaging plasmid (Rep and
Cap elements)
AAV production Wilson Lab
pAdDeltaF6
(addgene: 112867)
AAV helper plasmid (E4, E2a and
VA elements)
AAV production Wilson Lab
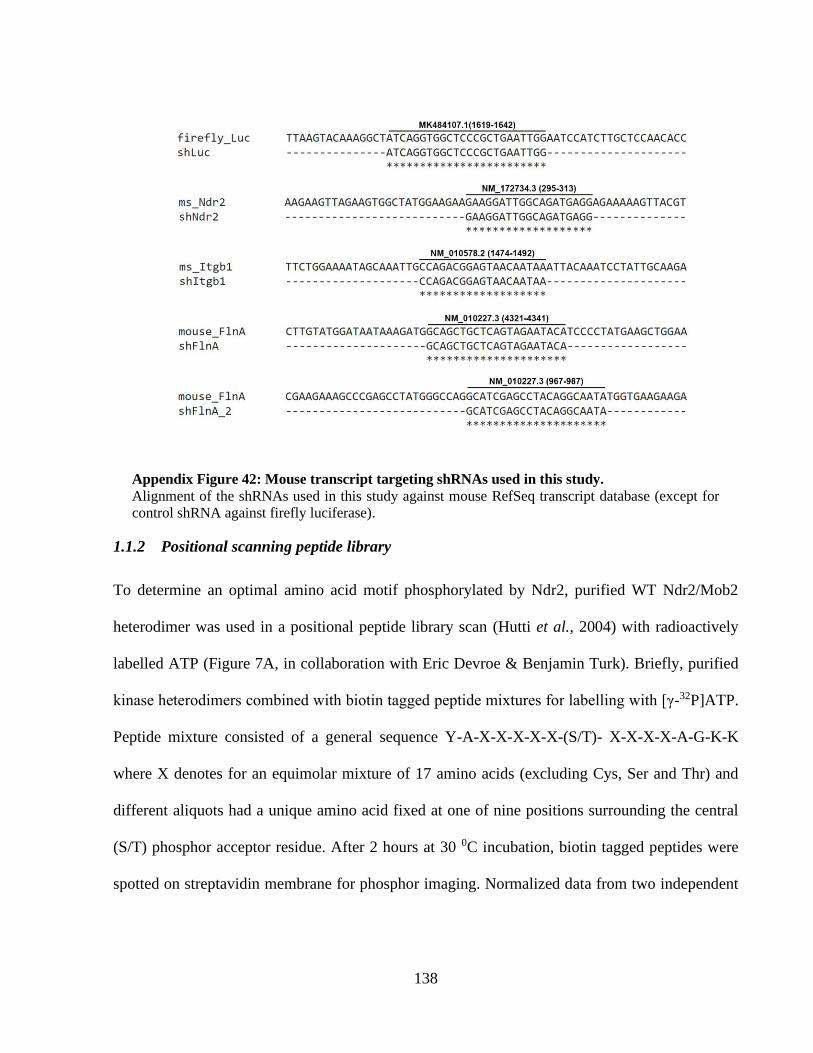
138
Appendix Figure 42: Mouse transcript targeting shRNAs used in this study.
Alignment of the shRNAs used in this study against mouse RefSeq transcript database (except for
control shRNA against firefly luciferase).
1.1.2 Positional scanning peptide library
To determine an optimal amino acid motif phosphorylated by Ndr2, purified WT Ndr2/Mob2
heterodimer was used in a positional peptide library scan (Hutti et al., 2004) with radioactively
labelled ATP (Figure 7A, in collaboration with Eric Devroe & Benjamin Turk). Briefly, purified
kinase heterodimers combined with biotin tagged peptide mixtures for labelling with [γ-32P]ATP.
Peptide mixture consisted of a general sequence Y-A-X-X-X-X-X-(S/T)- X-X-X-X-A-G-K-K
where X denotes for an equimolar mixture of 17 amino acids (excluding Cys, Ser and Thr) and
different aliquots had a unique amino acid fixed at one of nine positions surrounding the central
(S/T) phosphor acceptor residue. After 2 hours at 30 0C incubation, biotin tagged peptides were
spotted on streptavidin membrane for phosphor imaging. Normalized data from two independent
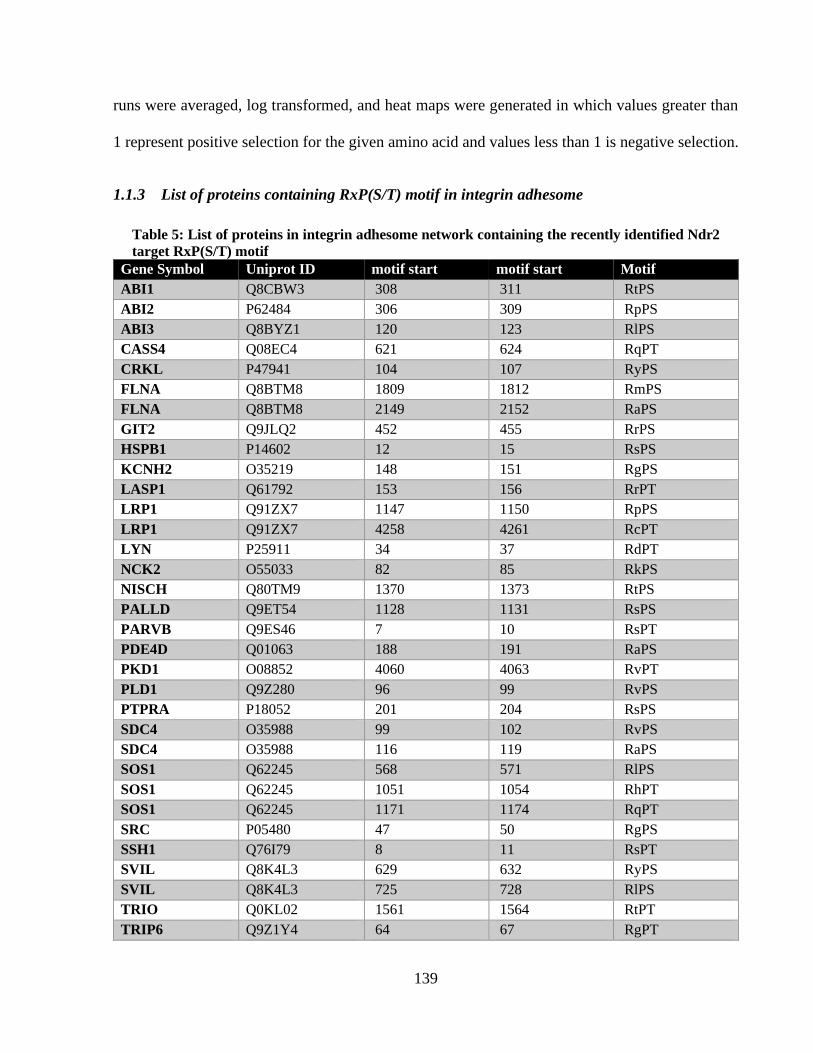
139
runs were averaged, log transformed, and heat maps were generated in which values greater than
1 represent positive selection for the given amino acid and values less than 1 is negative selection.
1.1.3 List of proteins containing RxP(S/T) motif in integrin adhesome
Table 5: List of proteins in integrin adhesome network containing the recently identified Ndr2
target RxP(S/T) motif
Gene Symbol Uniprot ID motif start motif start Motif
ABI1 Q8CBW3 308 311 RtPS
ABI2 P62484 306 309 RpPS
ABI3 Q8BYZ1 120 123 RlPS
CASS4 Q08EC4 621 624 RqPT
CRKL P47941 104 107 RyPS
FLNA Q8BTM8 1809 1812 RmPS
FLNA Q8BTM8 2149 2152 RaPS
GIT2 Q9JLQ2 452 455 RrPS
HSPB1 P14602 12 15 RsPS
KCNH2 O35219 148 151 RgPS
LASP1 Q61792 153 156 RrPT
LRP1 Q91ZX7 1147 1150 RpPS
LRP1 Q91ZX7 4258 4261 RcPT
LYN P25911 34 37 RdPT
NCK2 O55033 82 85 RkPS
NISCH Q80TM9 1370 1373 RtPS
PALLD Q9ET54 1128 1131 RsPS
PARVB Q9ES46 7 10 RsPT
PDE4D Q01063 188 191 RaPS
PKD1 O08852 4060 4063 RvPT
PLD1 Q9Z280 96 99 RvPS
PTPRA P18052 201 204 RsPS
SDC4 O35988 99 102 RvPS
SDC4 O35988 116 119 RaPS
SOS1 Q62245 568 571 RlPS
SOS1 Q62245 1051 1054 RhPT
SOS1 Q62245 1171 1174 RqPT
SRC P05480 47 50 RgPS
SSH1 Q76I79 8 11 RsPT
SVIL Q8K4L3 629 632 RyPS
SVIL Q8K4L3 725 728 RlPS
TRIO Q0KL02 1561 1564 RtPT
TRIP6 Q9Z1Y4 64 67 RgPT
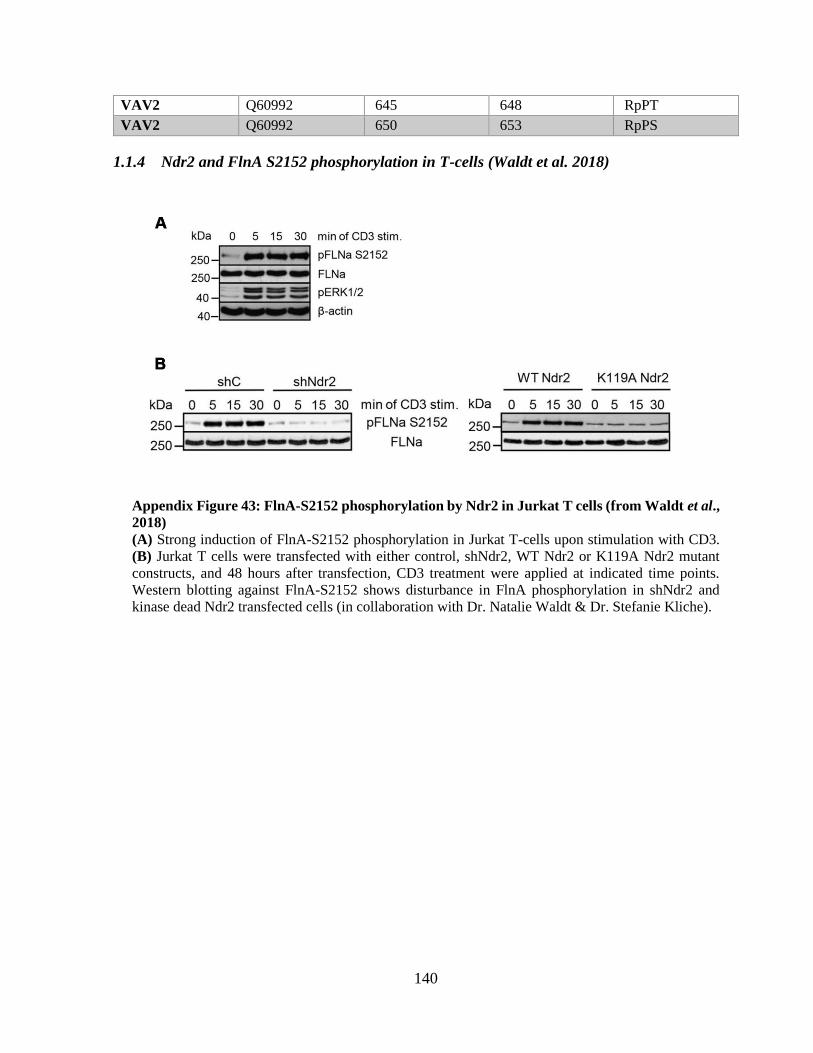
140
VAV2 Q60992 645 648 RpPT
VAV2 Q60992 650 653 RpPS
1.1.4 Ndr2 and FlnA S2152 phosphorylation in T-cells (Waldt et al. 2018)
Appendix Figure 43: FlnA-S2152 phosphorylation by Ndr2 in Jurkat T cells (from Waldt et al.,
2018)
(A) Strong induction of FlnA-S2152 phosphorylation in Jurkat T-cells upon stimulation with CD3.
(B) Jurkat T cells were transfected with either control, shNdr2, WT Ndr2 or K119A Ndr2 mutant
constructs, and 48 hours after transfection, CD3 treatment were applied at indicated time points.
Western blotting against FlnA-S2152 shows disturbance in FlnA phosphorylation in shNdr2 and
kinase dead Ndr2 transfected cells (in collaboration with Dr. Natalie Waldt & Dr. Stefanie Kliche).
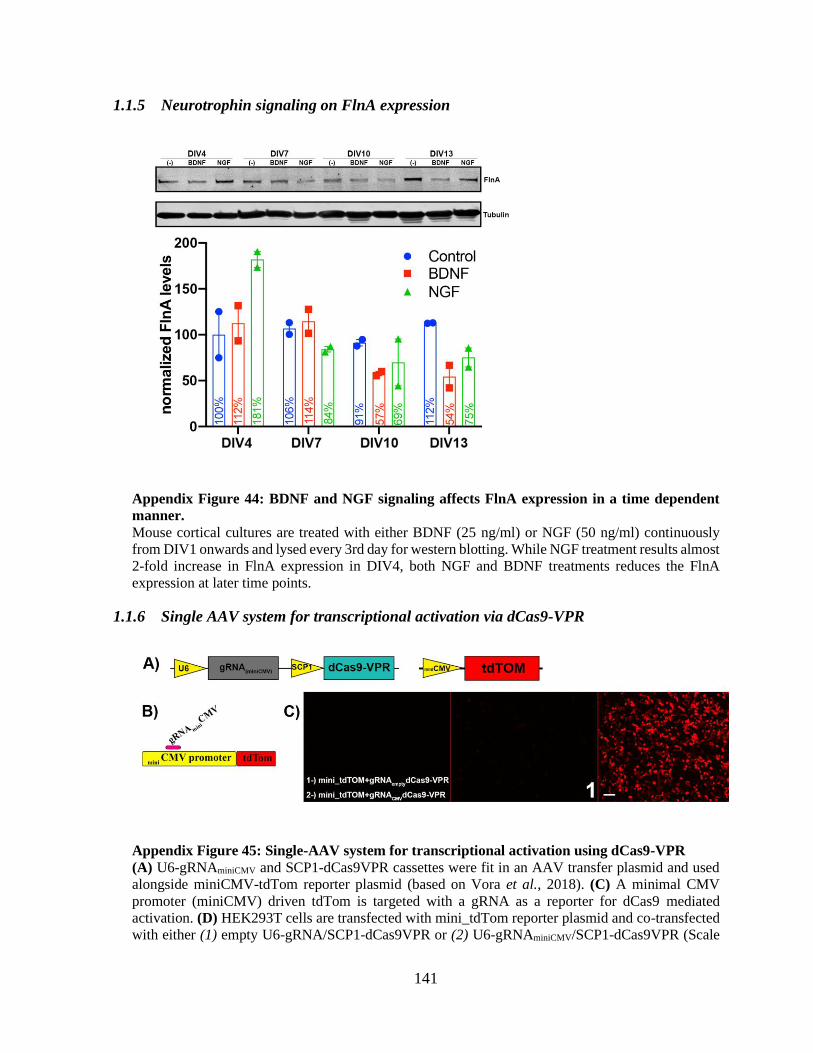
141
1.1.5 Neurotrophin signaling on FlnA expression
Appendix Figure 44: BDNF and NGF signaling affects FlnA expression in a time dependent
manner.
Mouse cortical cultures are treated with either BDNF (25 ng/ml) or NGF (50 ng/ml) continuously
from DIV1 onwards and lysed every 3rd day for western blotting. While NGF treatment results almost
2-fold increase in FlnA expression in DIV4, both NGF and BDNF treatments reduces the FlnA
expression at later time points.
1.1.6 Single AAV system for transcriptional activation via dCas9-VPR
Appendix Figure 45: Single-AAV system for transcriptional activation using dCas9-VPR
(A) U6-gRNAminiCMV and SCP1-dCas9VPR cassettes were fit in an AAV transfer plasmid and used
alongside miniCMV-tdTom reporter plasmid (based on Vora et al., 2018). (C) A minimal CMV
promoter (miniCMV) driven tdTom is targeted with a gRNA as a reporter for dCas9 mediated
activation. (D) HEK293T cells are transfected with mini_tdTom reporter plasmid and co-transfected
with either (1) empty U6-gRNA/SCP1-dCas9VPR or (2) U6-gRNAminiCMV/SCP1-dCas9VPR (Scale

142
bar: 100m). A strong increase of tdTom fluorescence was observed after transfection of gRNA
against minimal CMV promoter.

143
1.2 Ehrenerklärung
Ich versichere hiermit, dass ich die vorliegende Arbeit ohne unzulässige Hilfe Dritter und ohne
Benutzung anderer als der angegebenen Hilfsmittel angefertigt habe; verwendete fremde und
eigene Quellen sind als solche kenntlich gemacht.
Ich habe insbesondere nicht wissentlich:
• Ergebnisse erfunden oder widersprüchlich Ergebnisse verschwiegen,
• statistische Verfahren absichtlich missbraucht, um Daten in ungerechtfertigter Weise zu
interpretieren,
• fremde Ergebnisse oder Veröffentlichungen plagiiert,
• fremde Forschungsergebnisse verzerrt wiedergegeben.
Mir ist bekannt, dass Verstöße gegen das Urheberrecht Unterlassungs- und Schadensersatz-
ansprüche des Urhebers sowie eine strafrechtliche Ahndung durch die Strafverfolgungsbe- hörden
begründen kann.
Ich erkläre mich damit einverstanden, dass die Arbeit ggf. mit Mitteln der elektronischen
Datenverarbeitung auf Plagiate überprüft werden kann.
Die Arbeit wurde bisher weder im Inland noch im Ausland in gleicher oder ähnlicher Form als
Dissertation eingereicht und ist als Ganzes auch noch nicht veröffentlicht.
Magdeburg, 23.11.2020.
Yunus Emre Demiray


