Embed Size (px)
Citation preview
polymers
Article
Natural Rubber Latex Foam Reinforced with Micro-and Nanofibrillated Cellulose via Dunlop Method
Sirilak Phomrak 1, Adun Nimpaiboon 2 , Bi-min Zhang Newby 3 andMuenduen Phisalaphong 1,*
1 Department of Chemical Engineering, Faculty of Engineering, Chulalongkorn University, Phayathai Road,Bangkok 10330, Thailand; [email protected]
2 Rubber Technology Research Centre (RTEC), Faculty of Science, Mahidol University,Nakhon Pathom 73170, Thailand; [email protected]
3 Department of Chemical, Biomolecular and Corrosion Engineering, The University of Akron,Akron, OH 44325-3906, USA; [email protected]
* Correspondence: [email protected]; Tel.: +66-2218-6875
Received: 12 July 2020; Accepted: 26 August 2020; Published: 29 August 2020�����������������
Abstract: Natural rubber latex foam (NRLF) was reinforced with micro- and nanofibrillated cellulose ata loading content of 5–20 parts per hundred of rubber (phr) via the Dunlop process. Cellulose powderfrom eucalyptus pulp and bacterial cellulose (BC) was used as a microcellulose (MC) and nanocellulose(NC) reinforcing agent, respectively. NRLF, NRLF-MC, and NRLF-NC exhibited interconnectedmacroporous structures with a high porosity and a low-density. The composite foams containedpores with sizes in a range of 10–500 µm. As compared to MC, NC had a better dispersion inside theNRLF matrix and showed a higher adhesion to the NRLF matrix, resulting in a greater reinforcement.The most increased tensile strengths for MC and NC incorporated NRLF were found to be 0.43 MPa(1.4-fold increase) and 0.73 MPa (2.4-fold increase), respectively, by reinforcing NRLF with 5 phr MCand 15 phr NC, whereas the elongation at break was slightly reduced. Compression testing showedthat the recovery percentage was improved to 34.9% (1.3-fold increase) by reinforcement with 15 phrNC, whereas no significant improvement in the recovery percentage was observed with MC. BothNRLF-MC and NRLF-NC presented hydrophobic surfaces and good thermal stability up to 300 ◦C.Due to their highly porous structure, after a prolong immersion in water, NRLF composites had highwater uptake abilities. According to their properties, the composite foams could be further modifiedfor use as green absorption or supporting materials.
Keywords: natural rubber latex foam; Dunlop method; reinforcement; microcellulose; nanocellulose
1. Introduction
Cellular rubber, or natural rubber latex foam (NRLF), has long been considered as an economicalmaterial with advantageous properties, such as light weight, buoyancy, cushioning performance,thermal and acoustic insulation, inertness, high porosity, robust micro/nanostructures and good agingproperties [1,2]. The Dunlop process is a main NRLF manufacturing method invented by E.A. Murphyin the late 1920s for manufacturing latex from the sap of rubber trees. In this process, natural rubberlatex (NRL) is compounded with vulcanizing agents and whipped into froth by an assistance of afoaming agent. A delayed-action gelling agent such as sodium silicofluoride (SSF) is added into thefluid foam and subsequently injected into a mold. The fluid foam is allowed to be gelled into solid foamat ambient temperature and baked in a vulcanization oven. After the foam is baked, it is removed fromthe mold, washed, and then heated a second time to remove moisture from the final product. The resultis dense, durable latex foam that retains its elasticity. The Dunlop process is widely used because
Polymers 2020, 12, 1959; doi:10.3390/polym12091959 www.mdpi.com/journal/polymers
Polymers 2020, 12, 1959 2 of 16
the production process is simple, reliable, economical and energy-efficient [3]. However, to improveNRLF properties with environmentally friendly construction, natural materials, such as cellulose fromplants or byproducts from animals, have been used as reinforcing agents. Bashir et al. [1] attemptedto use eggshell to reinforce the NRLF and concluded that the modulus at 100% elongation (M100),compression stress, compression set, hardness, rubber filler interaction and density were increasedwith an eggshell filler loading up to 10 parts per hundred of rubber (phr). To apply natural fibers,Karim et al. [4] prepared kenaf-filled NRLF and concluded that the increasing content of kenaf reducedthe tensile strength, elongation at break and compressive strength of modified NRLF, whereas the M100and density were enhanced with an increase in filler loading. An agricultural by-product, rice huskpowder, was also used as a reinforcing agent for NRLF via the Dunlop process, and it was reportedthat an increase in rice husk powder loading reduced the elasticity of modified NRLF, resulting instiffer and more rigid foam, which led to lower resistance to failure (Ramasamy et al. [5]).
In our previous research work, we improved the mechanical and physical properties of naturalrubber composite films by reinforcing them with bacterial nanocellulose (BC) via a latex aqueousmicrodispersion process and found that the tensile strength of NR and BC (NRBC) composite filmswith BC loaded at 80 wt % was 94% higher than that of pure NR films [6]. BC is a product from primarymetabolism processes of microbes, such as Acetobacter xylinum. BC has been extensively reported ashaving unique properties, including high mechanical strength, high water absorption capacity andhigh crystallinity [6–8]. BC is also widely used as biomaterials for medicinal purposes [7–11].
In this study, composites of NRLF reinforced with microcellulose (MC) and nanocellulose (NC)were fabricated via the Dunlop process, in which the pulp of the eucalyptus tree was used as asource of MC and BC was used as a source of NC. The effects of MC and NC loading as reinforcingagents of NRLF on its physical structure, mechanical properties, solvent uptake and thermal stabilitywere investigated. The goal of this work is to develop NRLF composites with improved mechanicalproperties and absorption capacity, which would be further applied in the biomedical field as wounddressing and as absorption materials for oil–water mixtures.
2. Materials and Methods
2.1. Materials
High ammonia NRL (HA-NRL) with 60% dry rubber content (DRC) was purchased from theRubber Research Institute of Thailand (Bangkok, Thailand). BC (98–99% water content in wet weight)was kindly provided by Pramote Thamarat (Institute of Research and Development of Food Product,Kasetsart University, Bangkok, Thailand). Eucalyptus pulp sheets were kindly supported by theTeppatana Paper Mill Co., Ltd. (Bangkok, Thailand). All other chemical reagents were purchased fromSigma-Aldrich (Bangkok, Thailand).
2.2. Preparation of Cellulose Powder
For the preparation of MC, eucalyptus pulp (white cellulose compressed sheets made from 100%cellulose fibers, kindly provided by Teppattana Paper Mill Co., Ltd., Bangkok, Thailand) was soakedin deionized (DI) water for 5 min and was cut into small piece (size 5 × 5 cm2). Then it was dried ina general drying oven at 105 ◦C for 24 h to remove moisture. Next it was grinded into powder byusing ball mill (PM 100, Haan, Germany) and sieved in order to obtain the powder with a size of lessthan 200 µm.
For the preparation of NC, the small cubes of BC hydrogel (size 1 × 1 × 1 cm3) were purifiedby washing with DI water, then soaked with 1 wt % sodium hydroxide (NaOH) for 48 h to removebacterial cells, and finally rinsed with DI water until the pH was 7.0. After that, BC was thoroughlycrushed and homogenized by using a blender at room temperature. Then the BC slurry was dried in ageneral drying oven at 105 ◦C for 24 h to remove moisture. Next it was grinded into powder by usingball mill (PM 100, Haan, Germany) and sieved in order to obtain the powder with a size of ≤ 200 µm.
Polymers 2020, 12, 1959 3 of 16
2.3. Characterization of Cellulose
Scanning electron microscopy (SEM) micrographs were taken on a JSM-5410LV (JEOL, Tokyo,Japan). The eucalyptus pulp and BC slurry were dried and sputtered with a 200-Å layer of gold ina Balzers-SCD 040 sputter coater (Liechtenstein). The images of cellulose fibers were immediatelyviewed at an accelerating voltage of 2 kV.
The definitive structural information and crystallinity were characterized by X-ray diffraction(XRD). XRD patterns of the cellulose powder were determined with a diffractometer (Bruker AXSModel D8 Discover) under 40 kV and 30 mA. X-ray diffraction measurements were performed in the2θ range of 5–40◦ using Cu-Ka radiation. The percentage of crystallinity were obtained from the X-rayempirical method proposed by Segal et al. [12].
Thermogravimetric analysis (TGA) of MC and NC powders were performed using a TGAQ50 V6.7 Build 203, Universal V4.5A (TA Instruments, New Castle, DE, USA) equipped with aplatinum cell in a nitrogen atmosphere. The scanning range was 35–600 ◦C using a heating rateof 10 ◦C min−1. The temperature for different percentages of weight loss, the initial degradationtemperature (Td), and temperature at maximum decomposition were determined from the TGA anddifferential thermogravimetry (DTG) curves.
2.4. Preparation of NRLF and Reinforced NRLF
First, NRL was thoroughly mixed with MC or NC powders dispersed in DI water (at concentrationvaried from 0, 5, 10, 15 and 20 phr) for 5 min in a beater homogenizer (Kenwood, KVL6320S). Then themixture was added with potassium oleate soap to make foam until the volume increased up to threetimes the initial volume (beating time 3 min). After foaming, sulfur, zinc diethyldithiocarbamate(ZDEC), zinc 2-mercaptobenzhiozolate (ZMBT) and phenolic-type antioxidant (Wingstay L) wereadded to the foam and mixed at low speed for 2 min. Then ZnO slurry and 1,3-diphenylguanidine(DPG) were added as the secondary gelling agent and mixed at low speed for 2 min. Next, the primarygelling agent, sodium silicofluoride (SSF), was quickly added, and the mixture was homogenized foranother 90 s. The details on the main compounds and their amounts in the composites are summarizedin Table 1. Finally, the foam was immediately poured into the aluminum mold and allowed to be gelledfor 3 min at ambient temperature. The gelled NRLF was then vulcanized in a steam oven at 100 ◦Cfor 1 h. The vulcanized foam was stripped out from the mold and aged at ambient temperature for24 h. The aged NRLF was washed with DI water to remove the potassium oleate soap and excessivenon-reacted elements. After washing, NRLF was dried in a hot-air oven at 70 ◦C for 24 h.
Table 1. Formulation of the natural rubber latex (NRL) compounds for the synthesis of reinforcingNRL foam (NRLF).
Ingredient Amount (phr)
60% DRC HA-NRL 100MC or NC 5, 10, 15, 20
10 wt % Potassium oleate soap 1.550 wt % Sulfur 2.0
50 wt % Phenolic Adhesive Antioxidant 1.050 wt % ZMBT 1.050 wt % ZDEC 1.050 wt % ZnO 5.033 wt % DPG 1.012.5 wt % SSF 1.0
NRLF reinforced with MC in concentrations of 5, 10, 15 and 20 phr are named as NRLF-MC5,NRLF-MC10, NRLF-MC15 and NRLF-MC20, respectively, and NRLF reinforced with NC inconcentrations of 5, 10, 15 and 20 phr are named as NRLF-NC5, NRLF-NC10, NRLF-NC15 andNRLF-NC20, respectively.
Polymers 2020, 12, 1959 4 of 16
2.5. Characterization of NRLF, NRLF-MC and NRLF-NC
SEM images were taken with a SEM (model JSM-5410LV, JOEL, Tokyo, Japan). The samples ofNRLF, NRLF-MCs and NRLF-NCs were frozen in liquid nitrogen, immediately snapped and thenvacuum-dried. The free surfaces were sputtered with gold and imaged. SEM was obtained at 15 kV.
Foam density of NRLF, NRLF-MCs and NRLF-NCs was determined using an analytical balancewith a density kit. The report values were the average values determined from five specimens.
Crosslink density of NRLF, NRLF-MCs and NRLF-NCs was determined using swelling methodat room temperature according to ASTM D471. Each test specimens were cut into 2 × 2 × 0.6 cm3.The weight of each sample was measured before and after immersed into toluene for 48 h. The cross-linkdensity was determined by equilibrium swelling in toluene, based on the Flory–Rehner equation [13–15]as shown in Equation (1).
−
{ln(1−Vr) + Vr + χV2
r
}= ρV0M−1
c V13r (1)
where χ is the interaction parameter between rubber and toluene, which is 0.42, ρ is the density ofrubber composite (g/cm3), V0 is the molar volume of toluene (cm3/mol), Mc is the physical crosslinkconcentration (mol/cm3) and Vr is the volume fraction of the rubber in the swollen sample, which isobtained by Equation (2).
Vr =
(Xrρr
)(
Xrρr
)+
(Xsρs
) (2)
where ρs is the density of toluene (g/cm3), ρr is the density of rubber (g/cm3), Xr is the mass fractionof rubber, which can be obtained using Equation (3), and Xs is the mass fraction of toluene, which isobtained by Equation (4).
Xr = 1−Xs (3)
Xs =ms −md
ms(4)
where ms is mass of swollen sample and md is dry mass. After estimating Mc from Equation (1) usingthe experimentally determined ms and md, the physical crosslink density, [X]phys, can be obtained byEquation (5) [16].
[X]phys =1
2Mc(5)
For tensile property testing, samples of NRLF, NRLF-MCs and NRLF-NCs were cut into a dumbbellshaped specimen, with an overall length of 115 mm and a narrow section of 33 mm wide (accordingto die C). The maximum tensile strength and break strain of the samples were determined with auniversal testing machine (Hounsfield model H10 KM, USA). The test conditions followed ASTM D412.The reported tensile strength and break strain were the average values determined from 5 specimens.
Compression test for NRLF, NRLF-MCs and NRLF-NCs were performed through a Hounsfield H10 KM universal testing machine (Scientific and Technological Research Equipment Centre, ChulalongkornUniversity, Bangkok, Thailand). The samples were cut into of 50× 50× 25 mm3 (length ×width × thickness).The samples were placed between the plates of the compression device and compressed to 25% of itsoriginal thickness. Within 15 min, compressed specimens and the device were placed in an air ovenfor a period of 22 h at a test temperature of 70± 2 ◦C. After 22 h, the specimens were immediatelyremoved from the device and allowed to recover for 30 min. Thickness of the specimens was measuredafter the recovery. Compression properties, such as constant deflection compression set and recoverypercentage, were calculated according to ASTM C165.
The water contact angle under ambient condition was measured by using a contact anglegoniometer (Ramé-hart. Instrument Co., USA, model 100-00) equipped with a Gilmont syringe and22-gauge flat-tipped needle.
Polymers 2020, 12, 1959 5 of 16
The water uptake of NRLF, NRLF-MCs and NRLF-NCs was determined at room temperatureaccording to ASTM D471. Each test specimens were in the form of 2 × 2 × 0.6 cm3. The mass ofeach sample was measured before and after immersed into water for 72 h. The degree of uptake wascalculated as;
Degree o f uptake (%) =Ww −Wd
Wd× 100 (6)
where, Ww and Wd denote the weight of wet and dry samples, respectively.Thermal stability of the composite foams was performed using a TGA Q50 V6.7 Build 203,
Universal V4.5A (TA Instruments, New Castle, DE, USA) equipped with a platinum cell in a nitrogenatmosphere. The scanning range was 35–600 ◦C using a heating rate of 10 ◦C min−1. The temperaturefor different percentages of weight loss, Td, temperature at maximum decomposition, and residuelevel at 600 ◦C of NRLF and NRLF-MCs and NRLF-NCs were determined from the thermogravimetricanalysis (TGA) and derivative thermogravimetric (DTG) curves.
3. Results and Discussion
3.1. Characterization of Cellulose Fibers/Powders
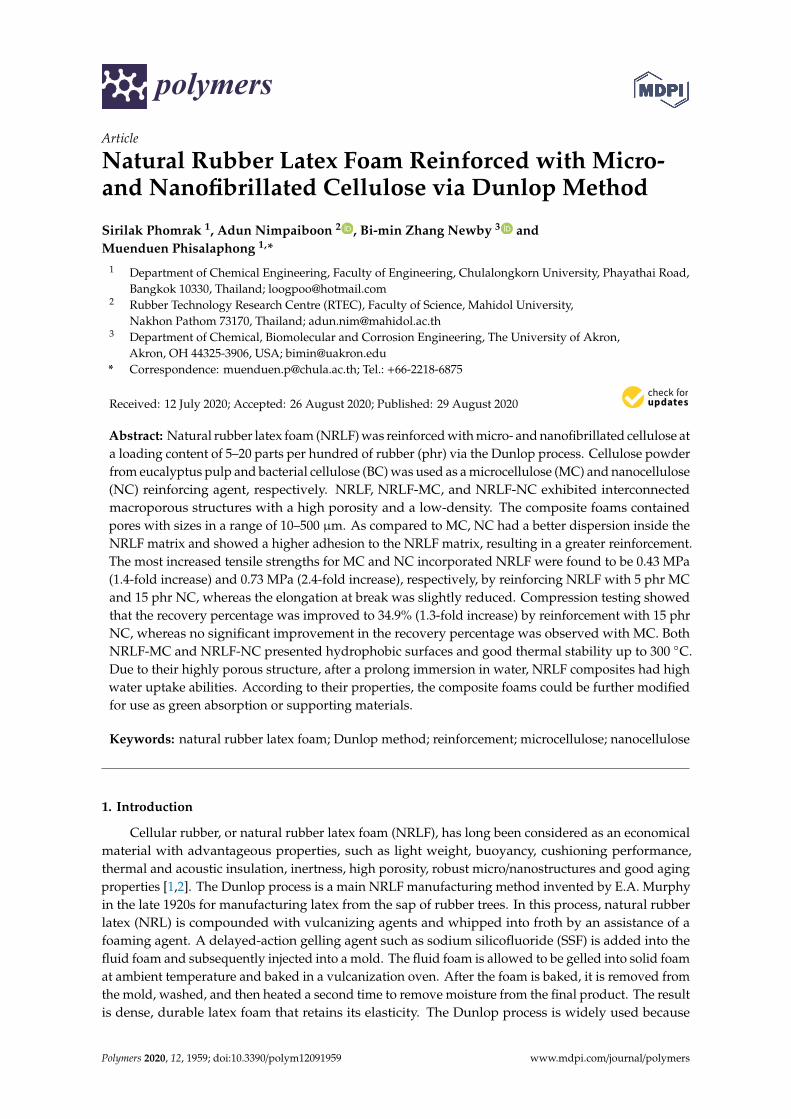
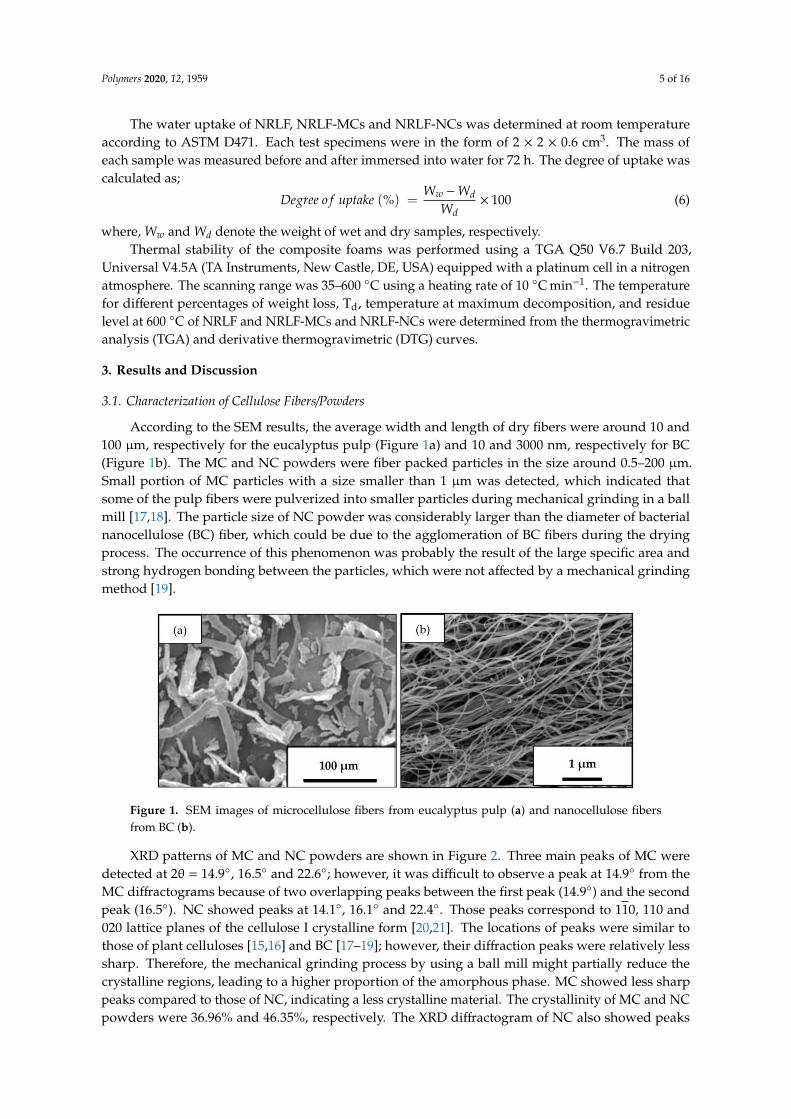
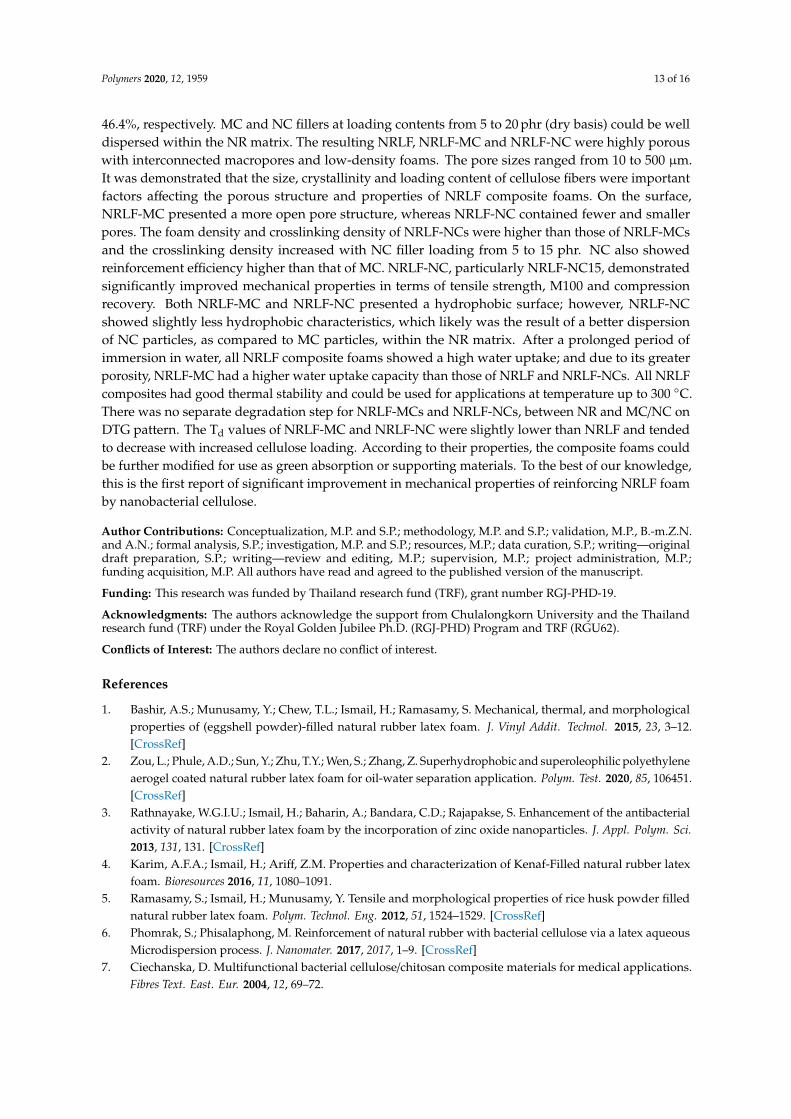
According to the SEM results, the average width and length of dry fibers were around 10 and100 µm, respectively for the eucalyptus pulp (Figure 1a) and 10 and 3000 nm, respectively for BC(Figure 1b). The MC and NC powders were fiber packed particles in the size around 0.5–200 µm.Small portion of MC particles with a size smaller than 1 µm was detected, which indicated thatsome of the pulp fibers were pulverized into smaller particles during mechanical grinding in a ballmill [17,18]. The particle size of NC powder was considerably larger than the diameter of bacterialnanocellulose (BC) fiber, which could be due to the agglomeration of BC fibers during the dryingprocess. The occurrence of this phenomenon was probably the result of the large specific area andstrong hydrogen bonding between the particles, which were not affected by a mechanical grindingmethod [19].
Polymers 2020, 12, x FOR PEER REVIEW 5 of 17
Chulalongkorn University, Bangkok, Thailand). The samples were cut into of 50 × 50 × 25 mm3 162 (length × width × thickness). The samples were placed between the plates of the compression device 163 and compressed to 25% of its original thickness. Within 15 min, compressed specimens and the 164 device were placed in an air oven for a period of 22 h at a test temperature of 70 ± 2 °C. After 22 h, the 165 specimens were immediately removed from the device and allowed to recover for 30 min. Thickness 166 of the specimens was measured after the recovery. Compression properties, such as constant 167 deflection compression set and recovery percentage, were calculated according to ASTM C165. 168
The water contact angle under ambient condition was measured by using a contact angle 169 goniometer (Ramé-hart. Instrument Co., USA, model 100-00) equipped with a Gilmont syringe and 170 22-gauge flat-tipped needle. 171
The water uptake of NRLF, NRLF-MCs and NRLF-NCs was determined at room temperature 172 according to ASTM D471. Each test specimens were in the form of 2 × 2 × 0.6 cm3. The mass of each 173 sample was measured before and after immersed into water for 72 h. The degree of uptake was 174 calculated as; 175
𝐷𝑒𝑔𝑟𝑒𝑒 𝑜𝑓 𝑢𝑝𝑡𝑎𝑘𝑒 (%) =𝑊𝑤 − 𝑊𝑑
𝑊𝑑
× 100 (6)
where, Ww and Wd denote the weight of wet and dry samples, respectively. 176 Thermal stability of the composite foams was performed using a TGA Q50 V6.7 Build 203, 177
Universal V4.5A (TA Instruments, New Castle, DE, USA) equipped with a platinum cell in a 178 nitrogen atmosphere. The scanning range was 35–600 ºC using a heating rate of 10 °C min−1. The 179 temperature for different percentages of weight loss, Td, temperature at maximum decomposition, 180 and residue level at 600 °C of NRLF and NRLF-MCs and NRLF-NCs were determined from the 181 thermogravimetric analysis (TGA) and derivative thermogravimetric (DTG) curves. 182
3. Results and Discussion 183
3.1. Characterization of Cellulose Fibers/Powders 184
According to the SEM results, the average width and length of dry fibers were around 10 and 185 100 µm, respectively for the eucalyptus pulp (Figure 1a) and 10 and 3000 nm, respectively for BC 186 (Figure 1b). The MC and NC powders were fiber packed particles in the size around 0.5–200 µm. 187 Small portion of MC particles with a size smaller than 1 µm was detected, which indicated that some 188 of the pulp fibers were pulverized into smaller particles during mechanical grinding in a ball mill 189 [17,18]. The particle size of NC powder was considerably larger than the diameter of bacterial 190 nanocellulose (BC) fiber, which could be due to the agglomeration of BC fibers during the drying 191 process. The occurrence of this phenomenon was probably the result of the large specific area and 192 strong hydrogen bonding between the particles, which were not affected by a mechanical grinding 193 method [19]. 194
195
Figure 1. SEM images of microcellulose fibers from eucalyptus pulp (a) and nanocellulose fibers 196 from BC (b). 197
Figure 1. SEM images of microcellulose fibers from eucalyptus pulp (a) and nanocellulose fibersfrom BC (b).
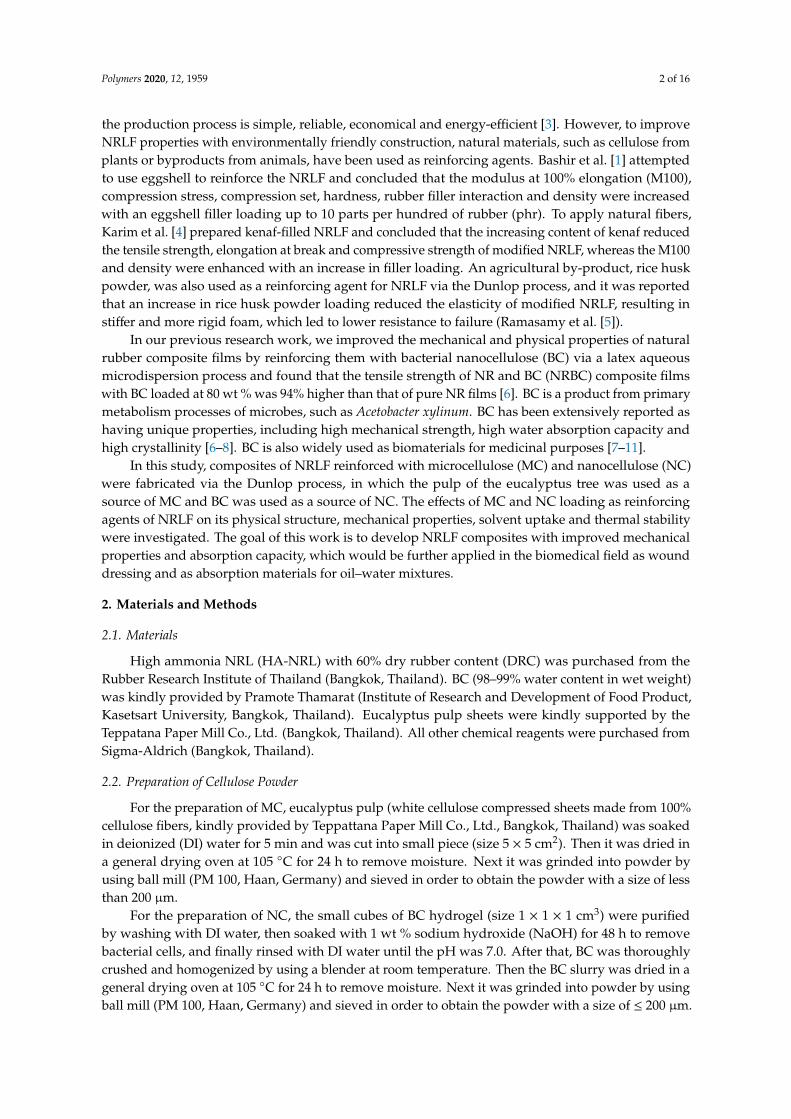
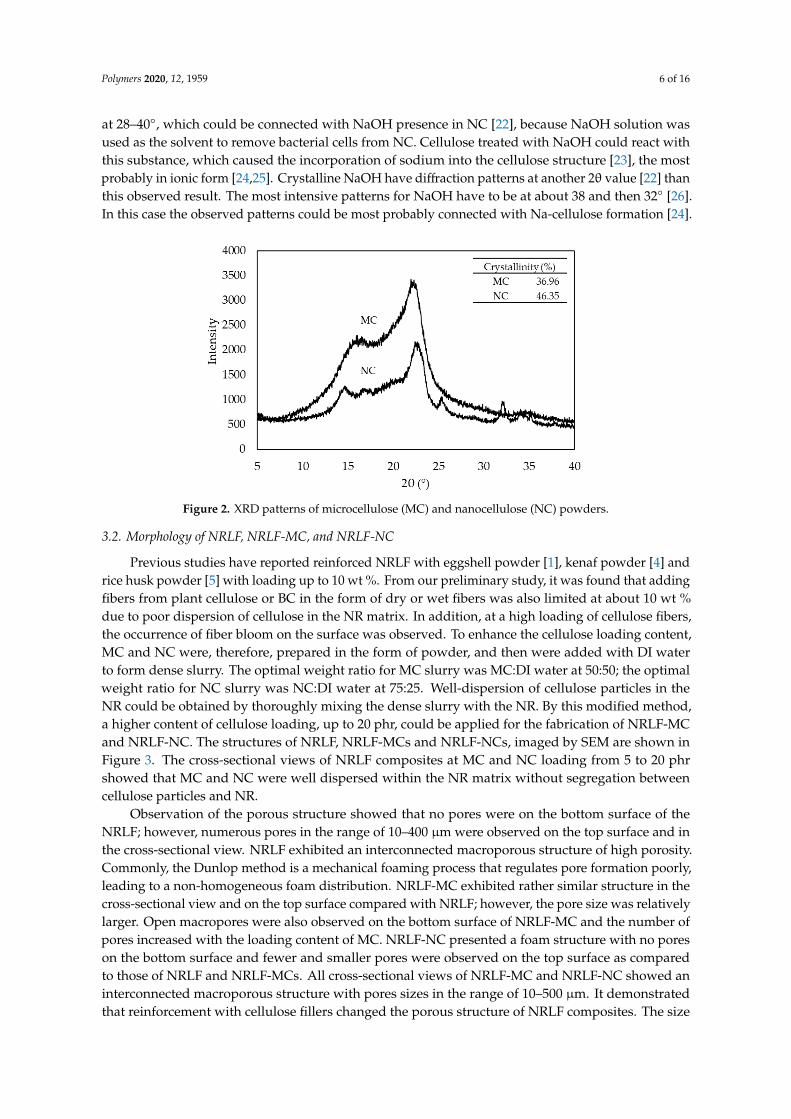
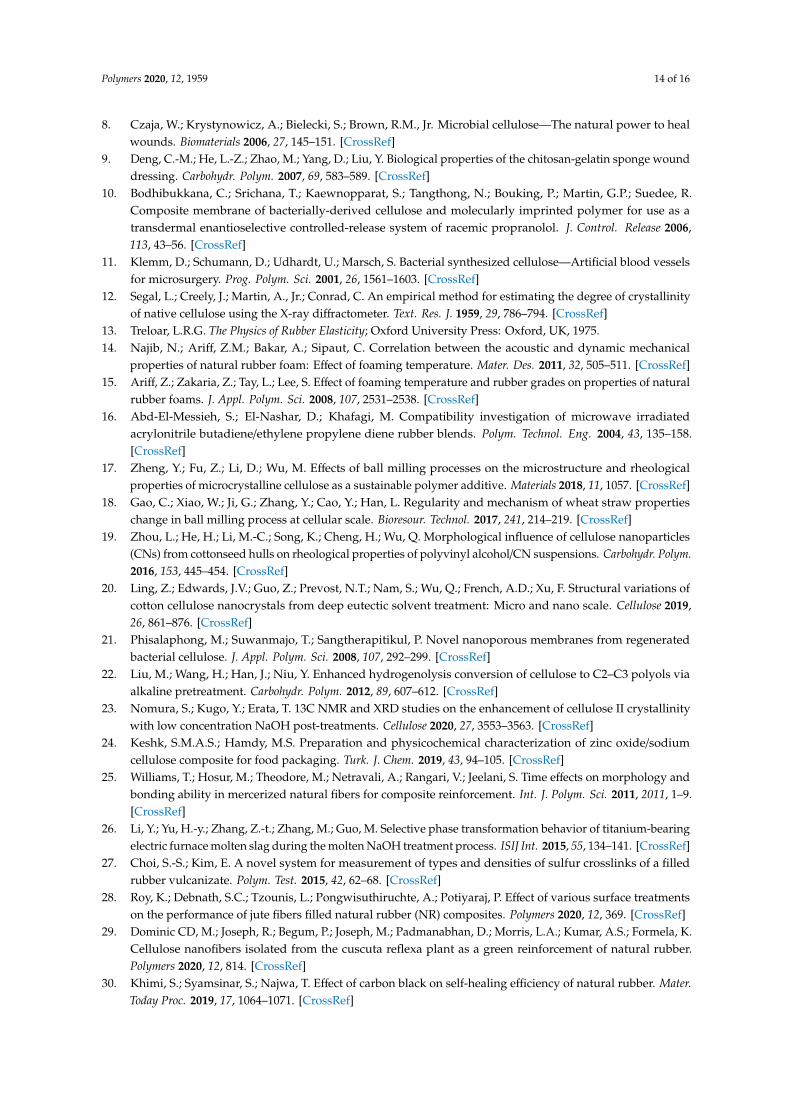
XRD patterns of MC and NC powders are shown in Figure 2. Three main peaks of MC weredetected at 2θ = 14.9◦, 16.5◦ and 22.6◦; however, it was difficult to observe a peak at 14.9◦ from theMC diffractograms because of two overlapping peaks between the first peak (14.9◦) and the secondpeak (16.5◦). NC showed peaks at 14.1◦, 16.1◦ and 22.4◦. Those peaks correspond to 110, 110 and020 lattice planes of the cellulose I crystalline form [20,21]. The locations of peaks were similar tothose of plant celluloses [15,16] and BC [17–19]; however, their diffraction peaks were relatively lesssharp. Therefore, the mechanical grinding process by using a ball mill might partially reduce thecrystalline regions, leading to a higher proportion of the amorphous phase. MC showed less sharppeaks compared to those of NC, indicating a less crystalline material. The crystallinity of MC and NCpowders were 36.96% and 46.35%, respectively. The XRD diffractogram of NC also showed peaks
Polymers 2020, 12, 1959 6 of 16
at 28–40◦, which could be connected with NaOH presence in NC [22], because NaOH solution wasused as the solvent to remove bacterial cells from NC. Cellulose treated with NaOH could react withthis substance, which caused the incorporation of sodium into the cellulose structure [23], the mostprobably in ionic form [24,25]. Crystalline NaOH have diffraction patterns at another 2θ value [22] thanthis observed result. The most intensive patterns for NaOH have to be at about 38 and then 32◦ [26].In this case the observed patterns could be most probably connected with Na-cellulose formation [24].
Polymers 2020, 12, x FOR PEER REVIEW 6 of 17
XRD patterns of MC and NC powders are shown in Figure 2. Three main peaks of MC were 198 detected at 2θ = 14.9°, 16.5° and 22.6°; however, it was difficult to observe a peak at 14.9° from the 199 MC diffractograms because of two overlapping peaks between the first peak (14.9°) and the second 200 peak (16.5°). NC showed peaks at 14.1°, 16.1° and 22.4°. Those peaks correspond to 110, 110 and 020 201 lattice planes of the cellulose I crystalline form [20,21]. The locations of peaks were similar to those of 202 plant celluloses [15,16] and BC [17–19]; however, their diffraction peaks were relatively less sharp. 203 Therefore, the mechanical grinding process by using a ball mill might partially reduce the crystalline 204 regions, leading to a higher proportion of the amorphous phase. MC showed less sharp peaks 205 compared to those of NC, indicating a less crystalline material. The crystallinity of MC and NC 206 powders were 36.96% and 46.35%, respectively. The XRD diffractogram of NC also showed peaks at 207 28–40°, which could be connected with NaOH presence in NC [22], because NaOH solution was 208 used as the solvent to remove bacterial cells from NC. Cellulose treated with NaOH could react with 209 this substance, which caused the incorporation of sodium into the cellulose structure [23], the most 210 probably in ionic form [24,25]. Crystalline NaOH have diffraction patterns at another 2θ value [22] 211 than this observed result. The most intensive patterns for NaOH have to be at about 38 and then 32° 212 [26]. In this case the observed patterns could be most probably connected with Na-cellulose 213 formation [24]. 214
215
216
Figure 2. XRD patterns of microcellulose (MC) and nanocellulose (NC) powders. 217
3.2. Morphology of NRLF, NRLF-MC, and NRLF-NC 218
Previous studies have reported reinforced NRLF with eggshell powder [1], kenaf powder [4] 219 and rice husk powder [5] with loading up to 10 wt %. From our preliminary study, it was found that 220 adding fibers from plant cellulose or BC in the form of dry or wet fibers was also limited at about 221 10 wt % due to poor dispersion of cellulose in the NR matrix. In addition, at a high loading of 222 cellulose fibers, the occurrence of fiber bloom on the surface was observed. To enhance the cellulose 223 loading content, MC and NC were, therefore, prepared in the form of powder, and then were added 224 with DI water to form dense slurry. The optimal weight ratio for MC slurry was MC:DI water at 225 50:50; the optimal weight ratio for NC slurry was NC:DI water at 75:25. Well-dispersion of cellulose 226 particles in the NR could be obtained by thoroughly mixing the dense slurry with the NR. By this 227 modified method, a higher content of cellulose loading, up to 20 phr, could be applied for the 228 fabrication of NRLF-MC and NRLF-NC. The structures of NRLF, NRLF-MCs and NRLF-NCs, 229 imaged by SEM are shown in Figure 3. The cross-sectional views of NRLF composites at MC and NC 230 loading from 5 to 20 phr showed that MC and NC were well dispersed within the NR matrix without 231 segregation between cellulose particles and NR. 232
Observation of the porous structure showed that no pores were on the bottom surface of the 233 NRLF; however, numerous pores in the range of 10–400 µm were observed on the top surface and in 234 the cross-sectional view. NRLF exhibited an interconnected macroporous structure of high porosity. 235
Figure 2. XRD patterns of microcellulose (MC) and nanocellulose (NC) powders.
3.2. Morphology of NRLF, NRLF-MC, and NRLF-NC
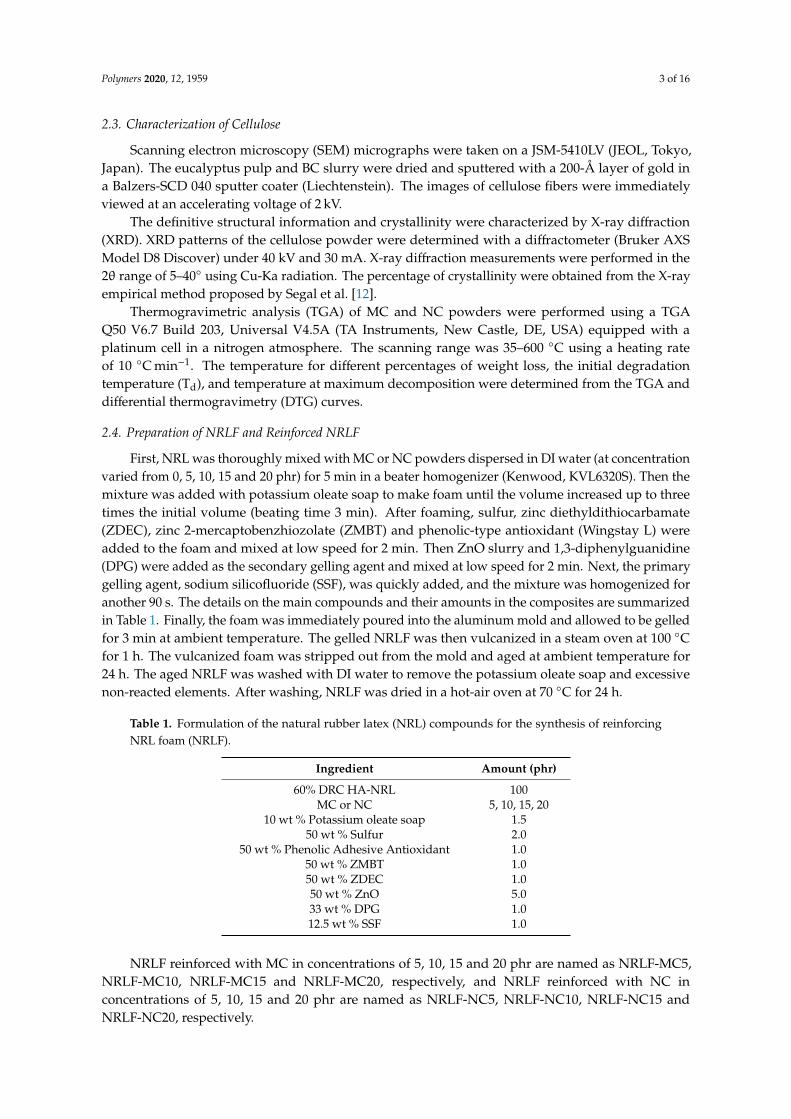
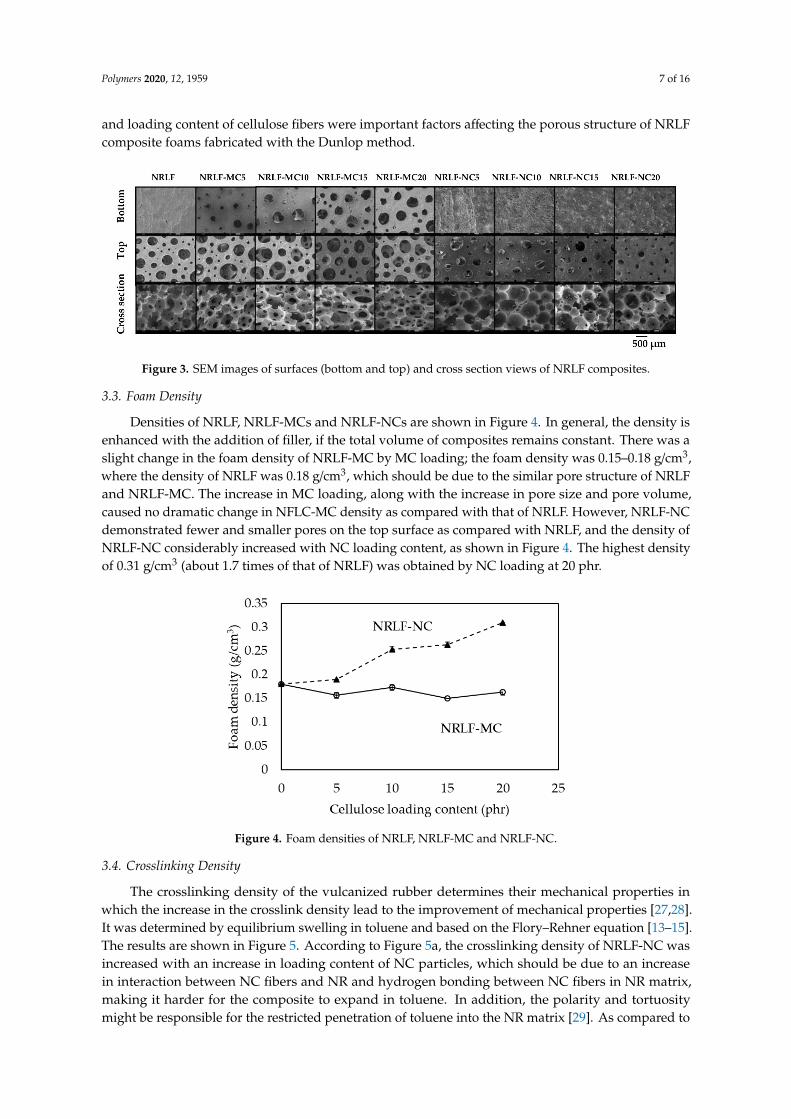
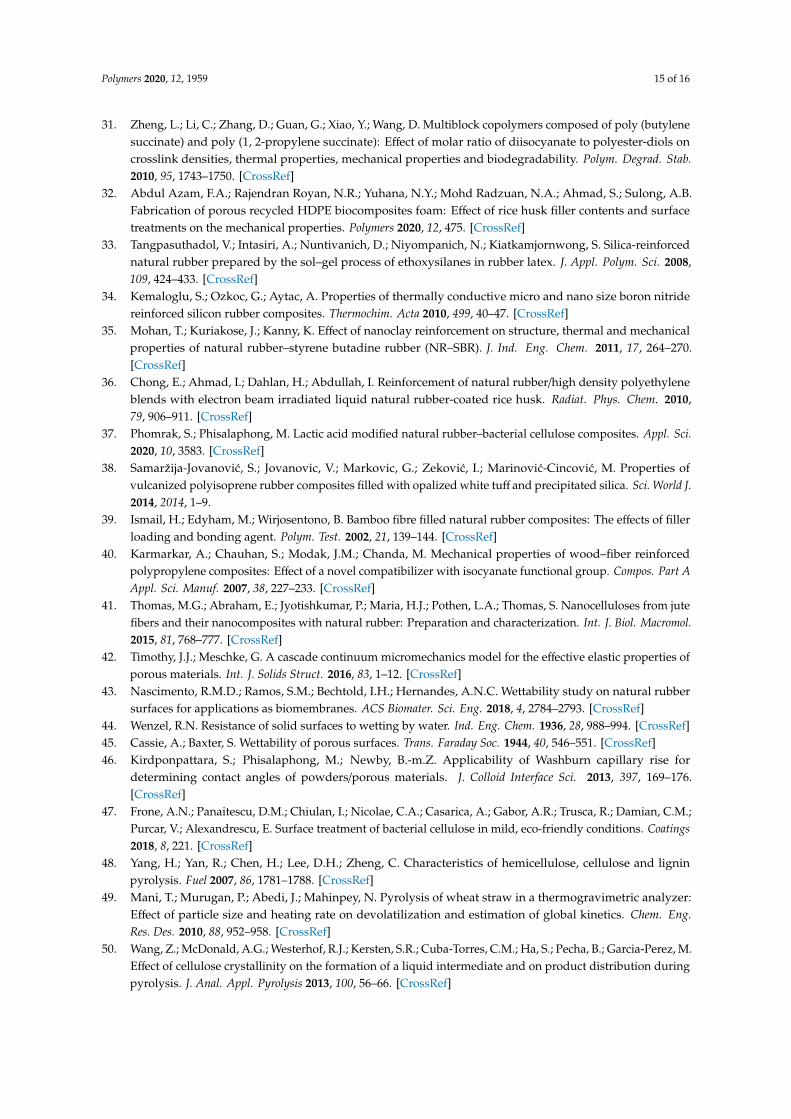
Previous studies have reported reinforced NRLF with eggshell powder [1], kenaf powder [4] andrice husk powder [5] with loading up to 10 wt %. From our preliminary study, it was found that addingfibers from plant cellulose or BC in the form of dry or wet fibers was also limited at about 10 wt %due to poor dispersion of cellulose in the NR matrix. In addition, at a high loading of cellulose fibers,the occurrence of fiber bloom on the surface was observed. To enhance the cellulose loading content,MC and NC were, therefore, prepared in the form of powder, and then were added with DI waterto form dense slurry. The optimal weight ratio for MC slurry was MC:DI water at 50:50; the optimalweight ratio for NC slurry was NC:DI water at 75:25. Well-dispersion of cellulose particles in theNR could be obtained by thoroughly mixing the dense slurry with the NR. By this modified method,a higher content of cellulose loading, up to 20 phr, could be applied for the fabrication of NRLF-MCand NRLF-NC. The structures of NRLF, NRLF-MCs and NRLF-NCs, imaged by SEM are shown inFigure 3. The cross-sectional views of NRLF composites at MC and NC loading from 5 to 20 phrshowed that MC and NC were well dispersed within the NR matrix without segregation betweencellulose particles and NR.
Observation of the porous structure showed that no pores were on the bottom surface of theNRLF; however, numerous pores in the range of 10–400 µm were observed on the top surface and inthe cross-sectional view. NRLF exhibited an interconnected macroporous structure of high porosity.Commonly, the Dunlop method is a mechanical foaming process that regulates pore formation poorly,leading to a non-homogeneous foam distribution. NRLF-MC exhibited rather similar structure in thecross-sectional view and on the top surface compared with NRLF; however, the pore size was relativelylarger. Open macropores were also observed on the bottom surface of NRLF-MC and the number ofpores increased with the loading content of MC. NRLF-NC presented a foam structure with no poreson the bottom surface and fewer and smaller pores were observed on the top surface as comparedto those of NRLF and NRLF-MCs. All cross-sectional views of NRLF-MC and NRLF-NC showed aninterconnected macroporous structure with pores sizes in the range of 10–500 µm. It demonstratedthat reinforcement with cellulose fillers changed the porous structure of NRLF composites. The size
Polymers 2020, 12, 1959 7 of 16
and loading content of cellulose fibers were important factors affecting the porous structure of NRLFcomposite foams fabricated with the Dunlop method.
Polymers 2020, 12, x FOR PEER REVIEW 7 of 17
Commonly, the Dunlop method is a mechanical foaming process that regulates pore formation 236 poorly, leading to a non-homogeneous foam distribution. NRLF-MC exhibited rather similar 237 structure in the cross-sectional view and on the top surface compared with NRLF; however, the pore 238 size was relatively larger. Open macropores were also observed on the bottom surface of NRLF-MC 239 and the number of pores increased with the loading content of MC. NRLF-NC presented a foam 240 structure with no pores on the bottom surface and fewer and smaller pores were observed on the top 241 surface as compared to those of NRLF and NRLF-MCs. All cross-sectional views of NRLF-MC and 242 NRLF-NC showed an interconnected macroporous structure with pores sizes in the range of 10–500 243 µm. It demonstrated that reinforcement with cellulose fillers changed the porous structure of NRLF 244 composites. The size and loading content of cellulose fibers were important factors affecting the 245 porous structure of NRLF composite foams fabricated with the Dunlop method. 246
247
248
Figure 3. SEM images of surfaces (bottom and top) and cross section views of NRLF composites. 249
3.3. Foam Density 250
Densities of NRLF, NRLF-MCs and NRLF-NCs are shown in Figure 4. In general, the density is 251 enhanced with the addition of filler, if the total volume of composites remains constant. There was a 252 slight change in the foam density of NRLF-MC by MC loading; the foam density was 0.15–0.18 253 g/cm3, where the density of NRLF was 0.18 g/cm3, which should be due to the similar pore structure 254 of NRLF and NRLF-MC. The increase in MC loading, along with the increase in pore size and pore 255 volume, caused no dramatic change in NFLC-MC density as compared with that of NRLF. However, 256 NRLF-NC demonstrated fewer and smaller pores on the top surface as compared with NRLF, and 257 the density of NRLF-NC considerably increased with NC loading content, as shown in Figure 4. The 258 highest density of 0.31 g/cm3 (about 1.7 times of that of NRLF) was obtained by NC loading at 20 phr. 259
260
261
Figure 4. Foam densities of NRLF, NRLF-MC and NRLF-NC. 262
Figure 3. SEM images of surfaces (bottom and top) and cross section views of NRLF composites.
3.3. Foam Density
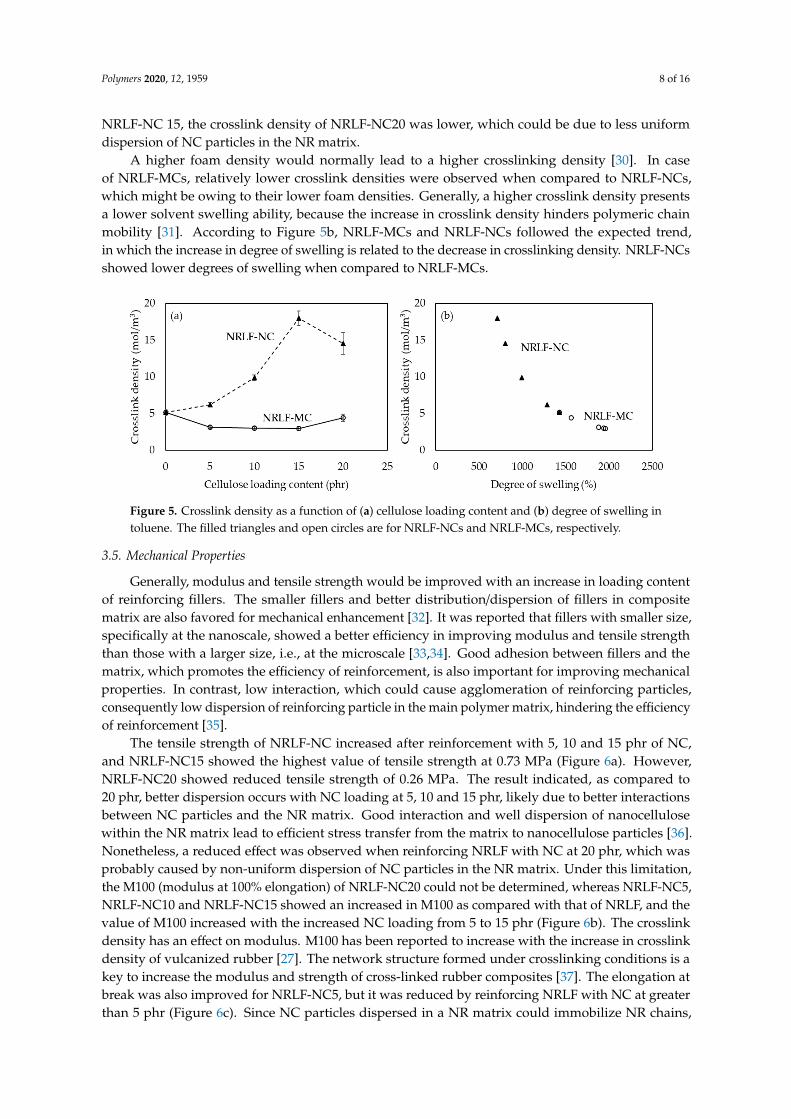
Densities of NRLF, NRLF-MCs and NRLF-NCs are shown in Figure 4. In general, the density isenhanced with the addition of filler, if the total volume of composites remains constant. There was aslight change in the foam density of NRLF-MC by MC loading; the foam density was 0.15–0.18 g/cm3,where the density of NRLF was 0.18 g/cm3, which should be due to the similar pore structure of NRLFand NRLF-MC. The increase in MC loading, along with the increase in pore size and pore volume,caused no dramatic change in NFLC-MC density as compared with that of NRLF. However, NRLF-NCdemonstrated fewer and smaller pores on the top surface as compared with NRLF, and the density ofNRLF-NC considerably increased with NC loading content, as shown in Figure 4. The highest densityof 0.31 g/cm3 (about 1.7 times of that of NRLF) was obtained by NC loading at 20 phr.
Polymers 2020, 12, x FOR PEER REVIEW 7 of 17
Commonly, the Dunlop method is a mechanical foaming process that regulates pore formation 236 poorly, leading to a non-homogeneous foam distribution. NRLF-MC exhibited rather similar 237 structure in the cross-sectional view and on the top surface compared with NRLF; however, the pore 238 size was relatively larger. Open macropores were also observed on the bottom surface of NRLF-MC 239 and the number of pores increased with the loading content of MC. NRLF-NC presented a foam 240 structure with no pores on the bottom surface and fewer and smaller pores were observed on the top 241 surface as compared to those of NRLF and NRLF-MCs. All cross-sectional views of NRLF-MC and 242 NRLF-NC showed an interconnected macroporous structure with pores sizes in the range of 10–500 243 µm. It demonstrated that reinforcement with cellulose fillers changed the porous structure of NRLF 244 composites. The size and loading content of cellulose fibers were important factors affecting the 245 porous structure of NRLF composite foams fabricated with the Dunlop method. 246
247
248
Figure 3. SEM images of surfaces (bottom and top) and cross section views of NRLF composites. 249
3.3. Foam Density 250
Densities of NRLF, NRLF-MCs and NRLF-NCs are shown in Figure 4. In general, the density is 251 enhanced with the addition of filler, if the total volume of composites remains constant. There was a 252 slight change in the foam density of NRLF-MC by MC loading; the foam density was 0.15–0.18 253 g/cm3, where the density of NRLF was 0.18 g/cm3, which should be due to the similar pore structure 254 of NRLF and NRLF-MC. The increase in MC loading, along with the increase in pore size and pore 255 volume, caused no dramatic change in NFLC-MC density as compared with that of NRLF. However, 256 NRLF-NC demonstrated fewer and smaller pores on the top surface as compared with NRLF, and 257 the density of NRLF-NC considerably increased with NC loading content, as shown in Figure 4. The 258 highest density of 0.31 g/cm3 (about 1.7 times of that of NRLF) was obtained by NC loading at 20 phr. 259
260
261
Figure 4. Foam densities of NRLF, NRLF-MC and NRLF-NC. 262
Figure 4. Foam densities of NRLF, NRLF-MC and NRLF-NC.
3.4. Crosslinking Density
The crosslinking density of the vulcanized rubber determines their mechanical properties inwhich the increase in the crosslink density lead to the improvement of mechanical properties [27,28].It was determined by equilibrium swelling in toluene and based on the Flory–Rehner equation [13–15].The results are shown in Figure 5. According to Figure 5a, the crosslinking density of NRLF-NC wasincreased with an increase in loading content of NC particles, which should be due to an increasein interaction between NC fibers and NR and hydrogen bonding between NC fibers in NR matrix,making it harder for the composite to expand in toluene. In addition, the polarity and tortuositymight be responsible for the restricted penetration of toluene into the NR matrix [29]. As compared to
Polymers 2020, 12, 1959 8 of 16
NRLF-NC 15, the crosslink density of NRLF-NC20 was lower, which could be due to less uniformdispersion of NC particles in the NR matrix.
A higher foam density would normally lead to a higher crosslinking density [30]. In caseof NRLF-MCs, relatively lower crosslink densities were observed when compared to NRLF-NCs,which might be owing to their lower foam densities. Generally, a higher crosslink density presentsa lower solvent swelling ability, because the increase in crosslink density hinders polymeric chainmobility [31]. According to Figure 5b, NRLF-MCs and NRLF-NCs followed the expected trend,in which the increase in degree of swelling is related to the decrease in crosslinking density. NRLF-NCsshowed lower degrees of swelling when compared to NRLF-MCs.
Polymers 2020, 12, x FOR PEER REVIEW 8 of 17
3.4. Crosslinking Density 263
The crosslinking density of the vulcanized rubber determines their mechanical properties in 264 which the increase in the crosslink density lead to the improvement of mechanical properties [27,28]. 265 It was determined by equilibrium swelling in toluene and based on the Flory–Rehner equation 266 [13-15]. The results are shown in Figure 5. According to Figure 5a, the crosslinking density of 267 NRLF-NC was increased with an increase in loading content of NC particles, which should be due to 268 an increase in interaction between NC fibers and NR and hydrogen bonding between NC fibers in 269 NR matrix, making it harder for the composite to expand in toluene. In addition, the polarity and 270 tortuosity might be responsible for the restricted penetration of toluene into the NR matrix [29]. As 271 compared to NRLF-NC 15, the crosslink density of NRLF-NC20 was lower, which could be due to 272 less uniform dispersion of NC particles in the NR matrix. 273
A higher foam density would normally lead to a higher crosslinking density [30]. In case of 274 NRLF-MCs, relatively lower crosslink densities were observed when compared to NRLF-NCs, 275 which might be owing to their lower foam densities. Generally, a higher crosslink density presents a 276 lower solvent swelling ability, because the increase in crosslink density hinders polymeric chain 277 mobility [31]. According to Figure 5b, NRLF-MCs and NRLF-NCs followed the expected trend, in 278 which the increase in degree of swelling is related to the decrease in crosslinking density. NRLF-NCs 279 showed lower degrees of swelling when compared to NRLF-MCs. 280
Figure 5. Crosslink density as a function of (a) cellulose loading content and (b) degree of swelling in 281 toluene. The filled triangles and open circles are for NRLF-NCs and NRLF-MCs, respectively. 282
3.5. Mechanical Properties 283
Generally, modulus and tensile strength would be improved with an increase in loading 284 content of reinforcing fillers. The smaller fillers and better distribution/dispersion of fillers in 285 composite matrix are also favored for mechanical enhancement [32]. It was reported that fillers with 286 smaller size, specifically at the nanoscale, showed a better efficiency in improving modulus and 287 tensile strength than those with a larger size, i.e., at the microscale [33,34]. Good adhesion between 288 fillers and the matrix, which promotes the efficiency of reinforcement, is also important for 289 improving mechanical properties. In contrast, low interaction, which could cause agglomeration of 290 reinforcing particles, consequently low dispersion of reinforcing particle in the main polymer 291 matrix, hindering the efficiency of reinforcement [35]. 292
The tensile strength of NRLF-NC increased after reinforcement with 5, 10 and 15 phr of NC, and 293 NRLF-NC15 showed the highest value of tensile strength at 0.73 MPa (Figure 6a). However, 294 NRLF-NC20 showed reduced tensile strength of 0.26 MPa. The result indicated, as compared to 20 295 phr, better dispersion occurs with NC loading at 5, 10 and 15 phr, likely due to better interactions 296 between NC particles and the NR matrix. Good interaction and well dispersion of nanocellulose 297 within the NR matrix lead to efficient stress transfer from the matrix to nanocellulose particles [36]. 298 Nonetheless, a reduced effect was observed when reinforcing NRLF with NC at 20 phr, which was 299
Figure 5. Crosslink density as a function of (a) cellulose loading content and (b) degree of swelling intoluene. The filled triangles and open circles are for NRLF-NCs and NRLF-MCs, respectively.
3.5. Mechanical Properties
Generally, modulus and tensile strength would be improved with an increase in loading contentof reinforcing fillers. The smaller fillers and better distribution/dispersion of fillers in compositematrix are also favored for mechanical enhancement [32]. It was reported that fillers with smaller size,specifically at the nanoscale, showed a better efficiency in improving modulus and tensile strengththan those with a larger size, i.e., at the microscale [33,34]. Good adhesion between fillers and thematrix, which promotes the efficiency of reinforcement, is also important for improving mechanicalproperties. In contrast, low interaction, which could cause agglomeration of reinforcing particles,consequently low dispersion of reinforcing particle in the main polymer matrix, hindering the efficiencyof reinforcement [35].
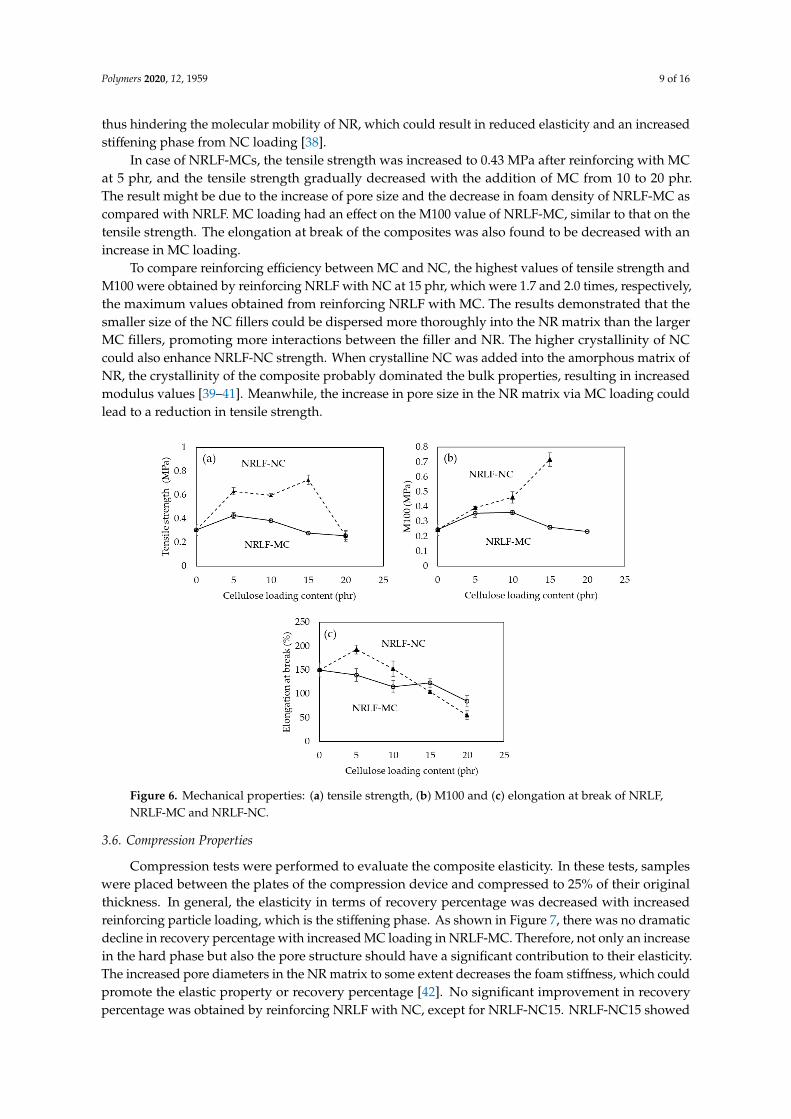
The tensile strength of NRLF-NC increased after reinforcement with 5, 10 and 15 phr of NC,and NRLF-NC15 showed the highest value of tensile strength at 0.73 MPa (Figure 6a). However,NRLF-NC20 showed reduced tensile strength of 0.26 MPa. The result indicated, as compared to20 phr, better dispersion occurs with NC loading at 5, 10 and 15 phr, likely due to better interactionsbetween NC particles and the NR matrix. Good interaction and well dispersion of nanocellulosewithin the NR matrix lead to efficient stress transfer from the matrix to nanocellulose particles [36].Nonetheless, a reduced effect was observed when reinforcing NRLF with NC at 20 phr, which wasprobably caused by non-uniform dispersion of NC particles in the NR matrix. Under this limitation,the M100 (modulus at 100% elongation) of NRLF-NC20 could not be determined, whereas NRLF-NC5,NRLF-NC10 and NRLF-NC15 showed an increased in M100 as compared with that of NRLF, and thevalue of M100 increased with the increased NC loading from 5 to 15 phr (Figure 6b). The crosslinkdensity has an effect on modulus. M100 has been reported to increase with the increase in crosslinkdensity of vulcanized rubber [27]. The network structure formed under crosslinking conditions is akey to increase the modulus and strength of cross-linked rubber composites [37]. The elongation atbreak was also improved for NRLF-NC5, but it was reduced by reinforcing NRLF with NC at greaterthan 5 phr (Figure 6c). Since NC particles dispersed in a NR matrix could immobilize NR chains,
Polymers 2020, 12, 1959 9 of 16
thus hindering the molecular mobility of NR, which could result in reduced elasticity and an increasedstiffening phase from NC loading [38].
In case of NRLF-MCs, the tensile strength was increased to 0.43 MPa after reinforcing with MCat 5 phr, and the tensile strength gradually decreased with the addition of MC from 10 to 20 phr.The result might be due to the increase of pore size and the decrease in foam density of NRLF-MC ascompared with NRLF. MC loading had an effect on the M100 value of NRLF-MC, similar to that on thetensile strength. The elongation at break of the composites was also found to be decreased with anincrease in MC loading.
To compare reinforcing efficiency between MC and NC, the highest values of tensile strength andM100 were obtained by reinforcing NRLF with NC at 15 phr, which were 1.7 and 2.0 times, respectively,the maximum values obtained from reinforcing NRLF with MC. The results demonstrated that thesmaller size of the NC fillers could be dispersed more thoroughly into the NR matrix than the largerMC fillers, promoting more interactions between the filler and NR. The higher crystallinity of NCcould also enhance NRLF-NC strength. When crystalline NC was added into the amorphous matrix ofNR, the crystallinity of the composite probably dominated the bulk properties, resulting in increasedmodulus values [39–41]. Meanwhile, the increase in pore size in the NR matrix via MC loading couldlead to a reduction in tensile strength.
Polymers 2020, 12, x FOR PEER REVIEW 9 of 17
probably caused by non-uniform dispersion of NC particles in the NR matrix. Under this limitation, 300 the M100 (modulus at 100% elongation) of NRLF-NC20 could not be determined, whereas 301 NRLF-NC5, NRLF-NC10 and NRLF-NC15 showed an increased in M100 as compared with that of 302 NRLF, and the value of M100 increased with the increased NC loading from 5 to 15 phr (Figure 6b). 303 The crosslink density has an effect on modulus. M100 has been reported to increase with the increase 304 in crosslink density of vulcanized rubber [27]. The network structure formed under crosslinking 305 conditions is a key to increase the modulus and strength of cross-linked rubber composites [37]. The 306 elongation at break was also improved for NRLF-NC5, but it was reduced by reinforcing NRLF with 307 NC at greater than 5 phr (Figure 6c). Since NC particles dispersed in a NR matrix could immobilize 308 NR chains, thus hindering the molecular mobility of NR, which could result in reduced elasticity 309 and an increased stiffening phase from NC loading [38]. 310
In case of NRLF-MCs, the tensile strength was increased to 0.43 MPa after reinforcing with MC 311 at 5 phr, and the tensile strength gradually decreased with the addition of MC from 10 to 20 phr. The 312 result might be due to the increase of pore size and the decrease in foam density of NRLF-MC as 313 compared with NRLF. MC loading had an effect on the M100 value of NRLF-MC, similar to that on 314 the tensile strength. The elongation at break of the composites was also found to be decreased with 315 an increase in MC loading. 316
To compare reinforcing efficiency between MC and NC, the highest values of tensile strength 317 and M100 were obtained by reinforcing NRLF with NC at 15 phr, which were 1.7 and 2.0 times, 318 respectively, the maximum values obtained from reinforcing NRLF with MC. The results 319 demonstrated that the smaller size of the NC fillers could be dispersed more thoroughly into the NR 320 matrix than the larger MC fillers, promoting more interactions between the filler and NR. The higher 321 crystallinity of NC could also enhance NRLF-NC strength. When crystalline NC was added into the 322 amorphous matrix of NR, the crystallinity of the composite probably dominated the bulk properties, 323 resulting in increased modulus values [39–41]. Meanwhile, the increase in pore size in the NR matrix 324 via MC loading could lead to a reduction in tensile strength. 325
326
Figure 6. Mechanical properties: (a) tensile strength, (b) M100 and (c) elongation at break of NRLF, 327 NRLF-MC and NRLF-NC. 328
Figure 6. Mechanical properties: (a) tensile strength, (b) M100 and (c) elongation at break of NRLF,NRLF-MC and NRLF-NC.
3.6. Compression Properties
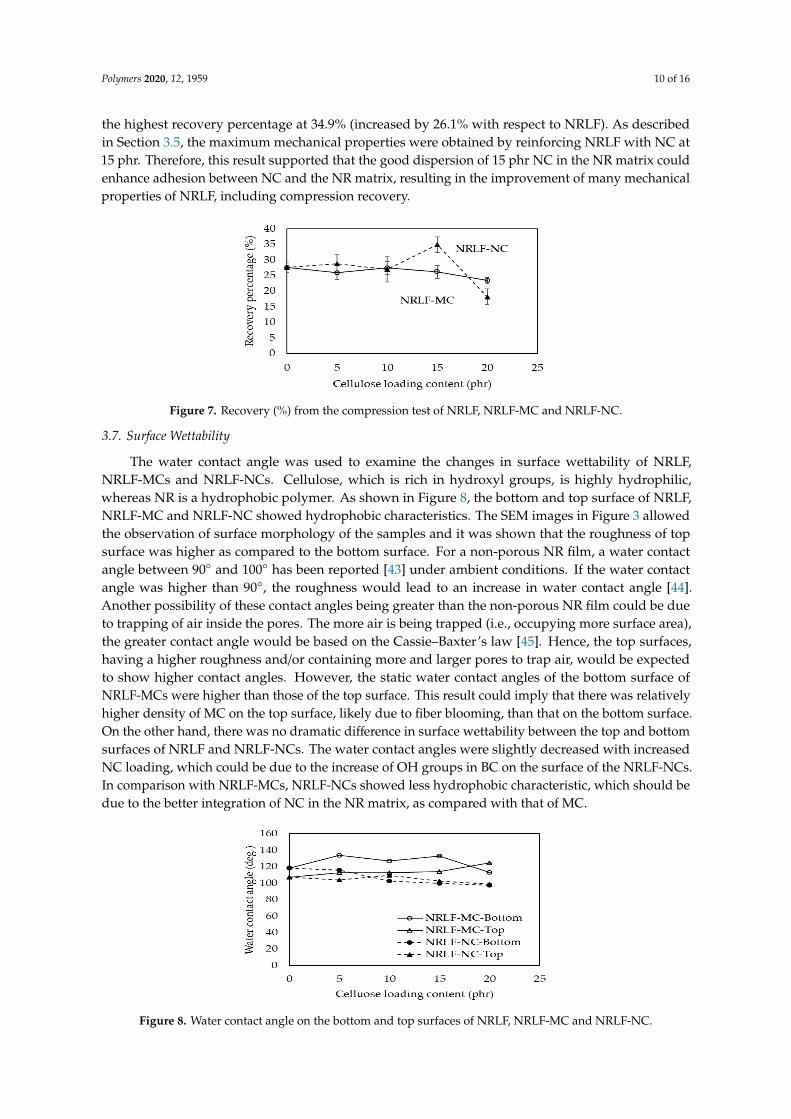
Compression tests were performed to evaluate the composite elasticity. In these tests, sampleswere placed between the plates of the compression device and compressed to 25% of their originalthickness. In general, the elasticity in terms of recovery percentage was decreased with increasedreinforcing particle loading, which is the stiffening phase. As shown in Figure 7, there was no dramaticdecline in recovery percentage with increased MC loading in NRLF-MC. Therefore, not only an increasein the hard phase but also the pore structure should have a significant contribution to their elasticity.The increased pore diameters in the NR matrix to some extent decreases the foam stiffness, which couldpromote the elastic property or recovery percentage [42]. No significant improvement in recoverypercentage was obtained by reinforcing NRLF with NC, except for NRLF-NC15. NRLF-NC15 showed
Polymers 2020, 12, 1959 10 of 16
the highest recovery percentage at 34.9% (increased by 26.1% with respect to NRLF). As describedin Section 3.5, the maximum mechanical properties were obtained by reinforcing NRLF with NC at15 phr. Therefore, this result supported that the good dispersion of 15 phr NC in the NR matrix couldenhance adhesion between NC and the NR matrix, resulting in the improvement of many mechanicalproperties of NRLF, including compression recovery.
Polymers 2020, 12, x FOR PEER REVIEW 10 of 17
3.6. Compression Properties 329
Compression tests were performed to evaluate the composite elasticity. In these tests, samples 330 were placed between the plates of the compression device and compressed to 25% of their original 331 thickness. In general, the elasticity in terms of recovery percentage was decreased with increased 332 reinforcing particle loading, which is the stiffening phase. As shown in Figure 7, there was no 333 dramatic decline in recovery percentage with increased MC loading in NRLF-MC. Therefore, not 334 only an increase in the hard phase but also the pore structure should have a significant contribution 335 to their elasticity. The increased pore diameters in the NR matrix to some extent decreases the foam 336 stiffness, which could promote the elastic property or recovery percentage [42]. No significant 337 improvement in recovery percentage was obtained by reinforcing NRLF with NC, except for 338 NRLF-NC15. NRLF-NC15 showed the highest recovery percentage at 34.9% (increased by 26.1% 339 with respect to NRLF). As described in Section 3.5, the maximum mechanical properties were 340 obtained by reinforcing NRLF with NC at 15 phr. Therefore, this result supported that the good 341 dispersion of 15 phr NC in the NR matrix could enhance adhesion between NC and the NR matrix, 342 resulting in the improvement of many mechanical properties of NRLF, including compression 343 recovery. 344
345
346 347 348 349 350 351 352 353
Figure 7. Recovery (%) from the compression test of NRLF, NRLF-MC and NRLF-NC. 354
3.7. Surface Wettability 355
The water contact angle was used to examine the changes in surface wettability of NRLF, 356 NRLF-MCs and NRLF-NCs. Cellulose, which is rich in hydroxyl groups, is highly hydrophilic, 357 whereas NR is a hydrophobic polymer. As shown in Figure 8, the bottom and top surface of NRLF, 358 NRLF-MC and NRLF-NC showed hydrophobic characteristics. The SEM images in Figure 3 allowed 359 the observation of surface morphology of the samples and it was shown that the roughness of top 360 surface was higher as compared to the bottom surface. For a non-porous NR film, a water contact 361 angle between 90° and 100° has been reported [43] under ambient conditions. If the water contact 362 angle was higher than 90°, the roughness would lead to an increase in water contact angle [44]. 363 Another possibility of these contact angles being greater than the non-porous NR film could be due 364 to trapping of air inside the pores. The more air is being trapped (i.e., occupying more surface area), 365 the greater contact angle would be based on the Cassie–Baxter’s law [45]. Hence, the top surfaces, 366 having a higher roughness and/or containing more and larger pores to trap air, would be expected to 367 show higher contact angles. However, the static water contact angles of the bottom surface of 368 NRLF-MCs were higher than those of the top surface. This result could imply that there was 369 relatively higher density of MC on the top surface, likely due to fiber blooming, than that on the 370 bottom surface. On the other hand, there was no dramatic difference in surface wettability between 371 the top and bottom surfaces of NRLF and NRLF-NCs. The water contact angles were slightly 372 decreased with increased NC loading, which could be due to the increase of OH groups in BC on the 373 surface of the NRLF-NCs. In comparison with NRLF-MCs, NRLF-NCs showed less hydrophobic 374 characteristic, which should be due to the better integration of NC in the NR matrix, as compared 375 with that of MC. 376
Figure 7. Recovery (%) from the compression test of NRLF, NRLF-MC and NRLF-NC.
3.7. Surface Wettability
The water contact angle was used to examine the changes in surface wettability of NRLF,NRLF-MCs and NRLF-NCs. Cellulose, which is rich in hydroxyl groups, is highly hydrophilic,whereas NR is a hydrophobic polymer. As shown in Figure 8, the bottom and top surface of NRLF,NRLF-MC and NRLF-NC showed hydrophobic characteristics. The SEM images in Figure 3 allowedthe observation of surface morphology of the samples and it was shown that the roughness of topsurface was higher as compared to the bottom surface. For a non-porous NR film, a water contactangle between 90◦ and 100◦ has been reported [43] under ambient conditions. If the water contactangle was higher than 90◦, the roughness would lead to an increase in water contact angle [44].Another possibility of these contact angles being greater than the non-porous NR film could be dueto trapping of air inside the pores. The more air is being trapped (i.e., occupying more surface area),the greater contact angle would be based on the Cassie–Baxter’s law [45]. Hence, the top surfaces,having a higher roughness and/or containing more and larger pores to trap air, would be expectedto show higher contact angles. However, the static water contact angles of the bottom surface ofNRLF-MCs were higher than those of the top surface. This result could imply that there was relativelyhigher density of MC on the top surface, likely due to fiber blooming, than that on the bottom surface.On the other hand, there was no dramatic difference in surface wettability between the top and bottomsurfaces of NRLF and NRLF-NCs. The water contact angles were slightly decreased with increasedNC loading, which could be due to the increase of OH groups in BC on the surface of the NRLF-NCs.In comparison with NRLF-MCs, NRLF-NCs showed less hydrophobic characteristic, which should bedue to the better integration of NC in the NR matrix, as compared with that of MC.Polymers 2020, 12, x FOR PEER REVIEW 11 of 17
377
Figure 8. Water contact angle on the bottom and top surfaces of NRLF, NRLF-MC and NRLF-NC. 378
3.8. Water Uptake 379
Water was used as a polar solvent for the determination of the degree of solvent uptake of 380 NRLF, NRLF-MCs and NRLF-NCs, as shown in Figure 9. For hydrophobic foams, water uptake was 381 not expected. However, we did notice water uptake after the composite foams were immersed in 382 water, potentially due to migration/segregation of hydrophilic constitutes in the foams to the 383 surface. The details on the mechanism were not investigated in this study. NRLF showed high-water 384 uptake rates initially (first 12 h) and then the degree of uptake rate gradually decreased with time. 385 The water uptake of NRLF-MC continuously increased during the 72-h immersion experiment, 386 demonstrating that the absorption might not be saturated at 72 h. At 72 h of absorption, the water 387 uptake capacity of NRLF-MC was higher than that of NRLF; the maximum water uptakes at 513–388 565% (1.50–1.66 folds of NRLF) were obtained from NRLF-MC10, NRLF-MC15 and NRLF-MC20. 389 The increased water uptake capability of NRLF-MCs should be due to the more porous structure of 390 the NR matrix loaded with MC. NRLF-NC had a water uptake rate pattern similar to that of NRLF; 391 however, a higher water uptake rate was observed at the initial period (6 h), and after that the degree 392 of uptake rate gradually decreased (or the water uptake value remained almost constant) over time. 393 The NRLF-NC composite was saturated with water during 24–72 h immersion. The addition of NC 394 filler increased the water absorption rate initially, but because NRLF-NC composites had a denser 395 structure (less porosity), the maximum water uptakes of NRLF-NC10, NRLF-NC15 and NRLF-NC20 396 were less than that of NRLF. Only NRLF-NC5 showed slightly higher water uptake capacity than 397 NRLF. The higher porosity of NRLF-MCs could promote the water uptake ability. General, porosity 398 and pore size have effects on the penetration of liquid into porous materials [46], in which higher 399 porosity could promote the liquid uptake capacity. 400
401
402
Figure 9. Water uptakes of NRLF, NRLF-MC and NRLF-NC. 403
Figure 8. Water contact angle on the bottom and top surfaces of NRLF, NRLF-MC and NRLF-NC.
Polymers 2020, 12, 1959 11 of 16
3.8. Water Uptake
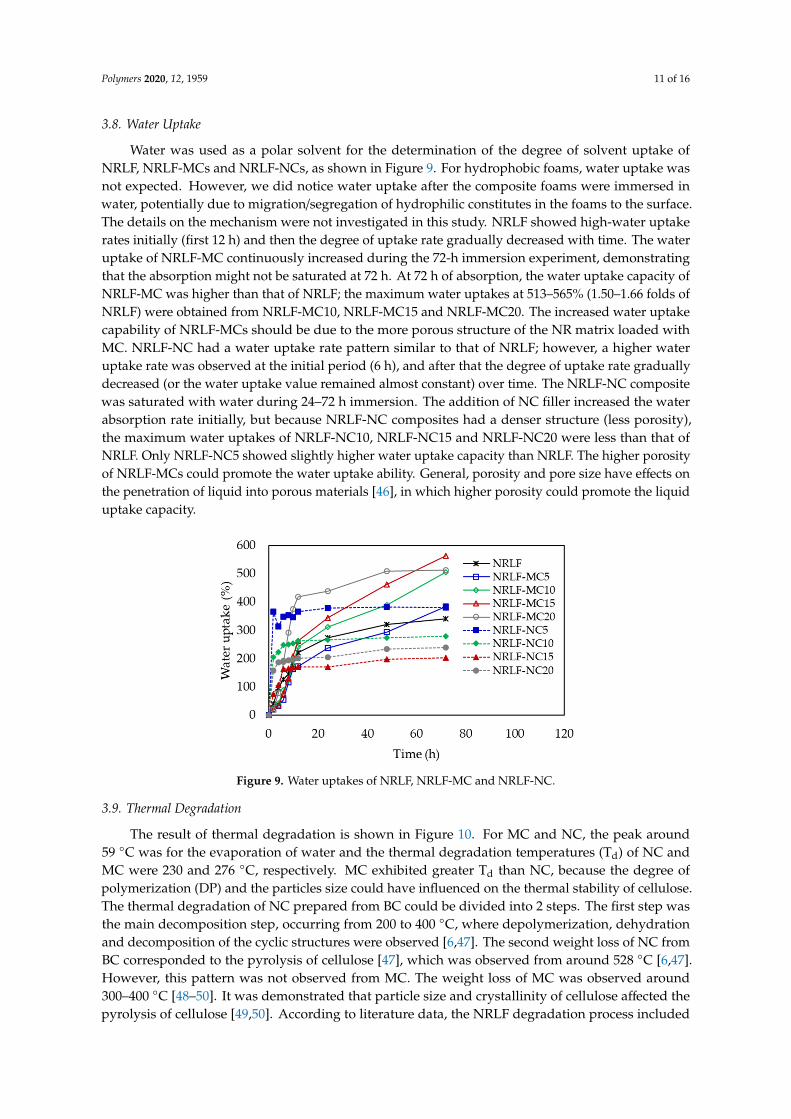
Water was used as a polar solvent for the determination of the degree of solvent uptake ofNRLF, NRLF-MCs and NRLF-NCs, as shown in Figure 9. For hydrophobic foams, water uptake wasnot expected. However, we did notice water uptake after the composite foams were immersed inwater, potentially due to migration/segregation of hydrophilic constitutes in the foams to the surface.The details on the mechanism were not investigated in this study. NRLF showed high-water uptakerates initially (first 12 h) and then the degree of uptake rate gradually decreased with time. The wateruptake of NRLF-MC continuously increased during the 72-h immersion experiment, demonstratingthat the absorption might not be saturated at 72 h. At 72 h of absorption, the water uptake capacity ofNRLF-MC was higher than that of NRLF; the maximum water uptakes at 513–565% (1.50–1.66 folds ofNRLF) were obtained from NRLF-MC10, NRLF-MC15 and NRLF-MC20. The increased water uptakecapability of NRLF-MCs should be due to the more porous structure of the NR matrix loaded withMC. NRLF-NC had a water uptake rate pattern similar to that of NRLF; however, a higher wateruptake rate was observed at the initial period (6 h), and after that the degree of uptake rate graduallydecreased (or the water uptake value remained almost constant) over time. The NRLF-NC compositewas saturated with water during 24–72 h immersion. The addition of NC filler increased the waterabsorption rate initially, but because NRLF-NC composites had a denser structure (less porosity),the maximum water uptakes of NRLF-NC10, NRLF-NC15 and NRLF-NC20 were less than that ofNRLF. Only NRLF-NC5 showed slightly higher water uptake capacity than NRLF. The higher porosityof NRLF-MCs could promote the water uptake ability. General, porosity and pore size have effects onthe penetration of liquid into porous materials [46], in which higher porosity could promote the liquiduptake capacity.
Polymers 2020, 12, x FOR PEER REVIEW 11 of 17
377
Figure 8. Water contact angle on the bottom and top surfaces of NRLF, NRLF-MC and NRLF-NC. 378
3.8. Water Uptake 379 Water was used as a polar solvent for the determination of the degree of solvent uptake of 380
NRLF, NRLF-MCs and NRLF-NCs, as shown in Figure 9. For hydrophobic foams, water uptake was 381 not expected. However, we did notice water uptake after the composite foams were immersed in 382 water, potentially due to migration/segregation of hydrophilic constitutes in the foams to the 383 surface. The details on the mechanism were not investigated in this study. NRLF showed high-water 384 uptake rates initially (first 12 h) and then the degree of uptake rate gradually decreased with time. 385 The water uptake of NRLF-MC continuously increased during the 72-h immersion experiment, 386 demonstrating that the absorption might not be saturated at 72 h. At 72 h of absorption, the water 387 uptake capacity of NRLF-MC was higher than that of NRLF; the maximum water uptakes at 513–388 565% (1.50–1.66 folds of NRLF) were obtained from NRLF-MC10, NRLF-MC15 and NRLF-MC20. 389 The increased water uptake capability of NRLF-MCs should be due to the more porous structure of 390 the NR matrix loaded with MC. NRLF-NC had a water uptake rate pattern similar to that of NRLF; 391 however, a higher water uptake rate was observed at the initial period (6 h), and after that the degree 392 of uptake rate gradually decreased (or the water uptake value remained almost constant) over time. 393 The NRLF-NC composite was saturated with water during 24–72 h immersion. The addition of NC 394 filler increased the water absorption rate initially, but because NRLF-NC composites had a denser 395 structure (less porosity), the maximum water uptakes of NRLF-NC10, NRLF-NC15 and NRLF-NC20 396 were less than that of NRLF. Only NRLF-NC5 showed slightly higher water uptake capacity than 397 NRLF. The higher porosity of NRLF-MCs could promote the water uptake ability. General, porosity 398 and pore size have effects on the penetration of liquid into porous materials [46], in which higher 399 porosity could promote the liquid uptake capacity. 400 401
402
Figure 9. Water uptakes of NRLF, NRLF-MC and NRLF-NC. 403 Figure 9. Water uptakes of NRLF, NRLF-MC and NRLF-NC.
3.9. Thermal Degradation
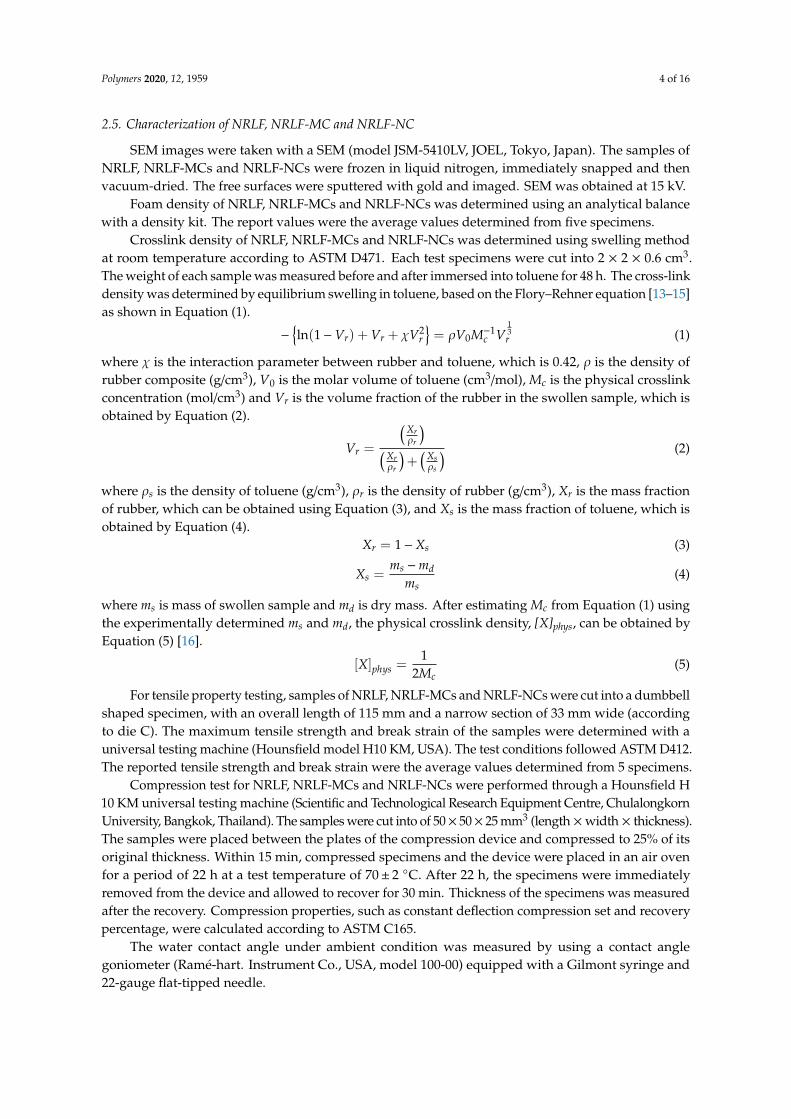
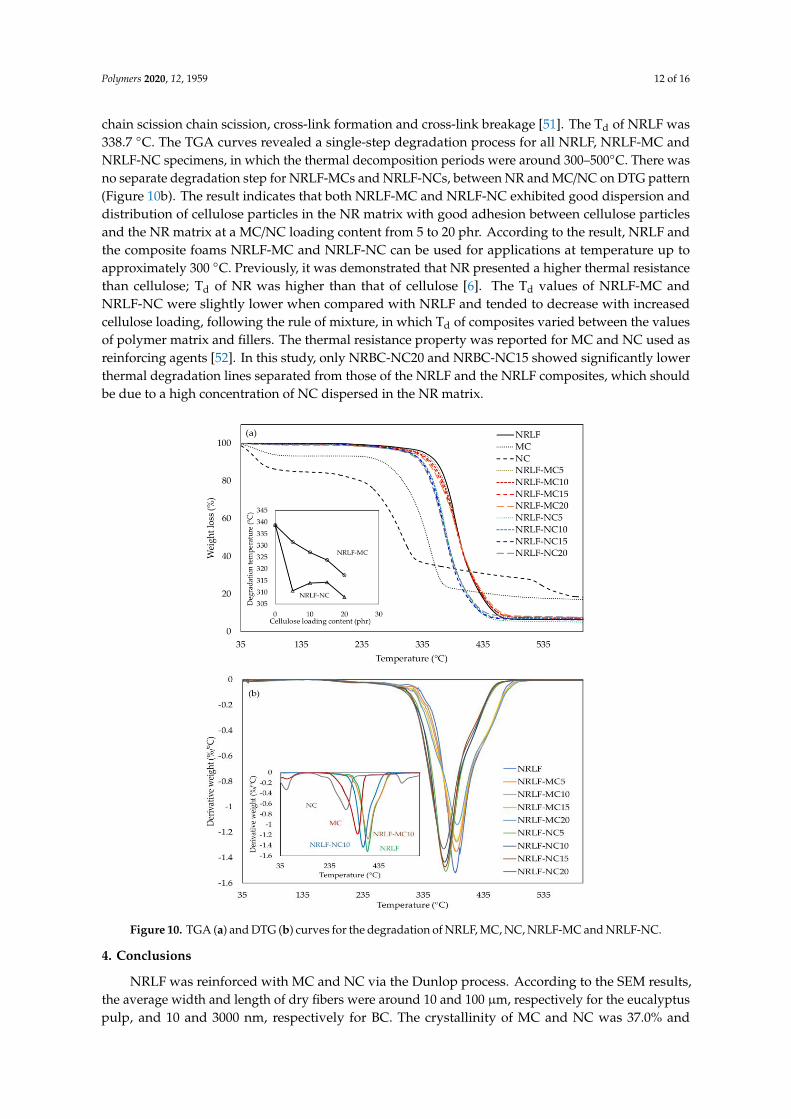
The result of thermal degradation is shown in Figure 10. For MC and NC, the peak around59 ◦C was for the evaporation of water and the thermal degradation temperatures (Td) of NC andMC were 230 and 276 ◦C, respectively. MC exhibited greater Td than NC, because the degree ofpolymerization (DP) and the particles size could have influenced on the thermal stability of cellulose.The thermal degradation of NC prepared from BC could be divided into 2 steps. The first step wasthe main decomposition step, occurring from 200 to 400 ◦C, where depolymerization, dehydrationand decomposition of the cyclic structures were observed [6,47]. The second weight loss of NC fromBC corresponded to the pyrolysis of cellulose [47], which was observed from around 528 ◦C [6,47].However, this pattern was not observed from MC. The weight loss of MC was observed around300–400 ◦C [48–50]. It was demonstrated that particle size and crystallinity of cellulose affected thepyrolysis of cellulose [49,50]. According to literature data, the NRLF degradation process included
Polymers 2020, 12, 1959 12 of 16
chain scission chain scission, cross-link formation and cross-link breakage [51]. The Td of NRLF was338.7 ◦C. The TGA curves revealed a single-step degradation process for all NRLF, NRLF-MC andNRLF-NC specimens, in which the thermal decomposition periods were around 300–500◦C. There wasno separate degradation step for NRLF-MCs and NRLF-NCs, between NR and MC/NC on DTG pattern(Figure 10b). The result indicates that both NRLF-MC and NRLF-NC exhibited good dispersion anddistribution of cellulose particles in the NR matrix with good adhesion between cellulose particlesand the NR matrix at a MC/NC loading content from 5 to 20 phr. According to the result, NRLF andthe composite foams NRLF-MC and NRLF-NC can be used for applications at temperature up toapproximately 300 ◦C. Previously, it was demonstrated that NR presented a higher thermal resistancethan cellulose; Td of NR was higher than that of cellulose [6]. The Td values of NRLF-MC andNRLF-NC were slightly lower when compared with NRLF and tended to decrease with increasedcellulose loading, following the rule of mixture, in which Td of composites varied between the valuesof polymer matrix and fillers. The thermal resistance property was reported for MC and NC used asreinforcing agents [52]. In this study, only NRBC-NC20 and NRBC-NC15 showed significantly lowerthermal degradation lines separated from those of the NRLF and the NRLF composites, which shouldbe due to a high concentration of NC dispersed in the NR matrix.
Polymers 2020, 12, x FOR PEER REVIEW 12 of 17
3.9. Thermal Degradation 404
The result of thermal degradation is shown in Figure 10. For MC and NC, the peak around 59 405 °C was for the evaporation of water and the thermal degradation temperatures (Td) of NC and MC 406 were 230 and 276 °C, respectively. MC exhibited greater Td than NC, because the degree of 407 polymerization (DP) and the particles size could have influenced on the thermal stability of 408 cellulose. The thermal degradation of NC prepared from BC could be divided into 2 steps. The first 409 step was the main decomposition step, occurring from 200 to 400 °C, where depolymerization, 410 dehydration and decomposition of the cyclic structures were observed [6,47]. The second weight loss 411 of NC from BC corresponded to the pyrolysis of cellulose [47], which was observed from around 528 412 °C [6,47]. However, this pattern was not observed from MC. The weight loss of MC was observed 413 around 300–400 °C [48–50]. It was demonstrated that particle size and crystallinity of cellulose 414 affected the pyrolysis of cellulose [49,50]. According to literature data, the NRLF degradation 415 process included chain scission chain scission, cross-link formation and cross-link breakage [51]. The 416 Td of NRLF was 338.7 °C. The TGA curves revealed a single-step degradation process for all NRLF, 417 NRLF-MC and NRLF-NC specimens, in which the thermal decomposition periods were around 300–418 500°C. There was no separate degradation step for NRLF-MCs and NRLF-NCs, between NR and 419 MC/NC on DTG pattern (Figure 10b). The result indicates that both NRLF-MC and NRLF-NC 420 exhibited good dispersion and distribution of cellulose particles in the NR matrix with good 421 adhesion between cellulose particles and the NR matrix at a MC/NC loading content from 5 to 20 422 phr. According to the result, NRLF and the composite foams NRLF-MC and NRLF-NC can be used 423 for applications at temperature up to approximately 300 °C. Previously, it was demonstrated that 424 NR presented a higher thermal resistance than cellulose; Td of NR was higher than that of cellulose 425 [6]. The Td values of NRLF-MC and NRLF-NC were slightly lower when compared with NRLF and 426 tended to decrease with increased cellulose loading, following the rule of mixture, in which Td of 427 composites varied between the values of polymer matrix and fillers. The thermal resistance property 428 was reported for MC and NC used as reinforcing agents [52]. In this study, only NRBC-NC20 and 429 NRBC-NC15 showed significantly lower thermal degradation lines separated from those of the 430 NRLF and the NRLF composites, which should be due to a high concentration of NC dispersed in 431 the NR matrix. 432
433
Polymers 2020, 12, x FOR PEER REVIEW 13 of 17
434
435
Figure 10. TGA (a) and DTG (b) curves for the degradation of NRLF, MC, NC, NRLF-MC and 436 NRLF-NC. 437
4. Conclusions 438
NRLF was reinforced with MC and NC via the Dunlop process. According to the SEM results, 439 the average width and length of dry fibers were around 10 and 100 µm, respectively for the 440 eucalyptus pulp, and 10 and 3000 nm, respectively for BC. The crystallinity of MC and NC was 441 37.0% and 46.4%, respectively. MC and NC fillers at loading contents from 5 to 20 phr (dry basis) 442 could be well dispersed within the NR matrix. The resulting NRLF, NRLF-MC and NRLF-NC were 443 highly porous with interconnected macropores and low-density foams. The pore sizes ranged from 444 10 to 500 µm. It was demonstrated that the size, crystallinity and loading content of cellulose fibers 445 were important factors affecting the porous structure and properties of NRLF composite foams. On 446 the surface, NRLF-MC presented a more open pore structure, whereas NRLF-NC contained fewer 447 and smaller pores. The foam density and crosslinking density of NRLF-NCs were higher than those 448 of NRLF-MCs and the crosslinking density increased with NC filler loading from 5 to 15 phr. NC 449 also showed reinforcement efficiency higher than that of MC. NRLF-NC, particularly NRLF-NC15, 450 demonstrated significantly improved mechanical properties in terms of tensile strength, M100 and 451 compression recovery. Both NRLF-MC and NRLF-NC presented a hydrophobic surface; however, 452 NRLF-NC showed slightly less hydrophobic characteristics, which likely was the result of a better 453 dispersion of NC particles, as compared to MC particles, within the NR matrix. After a prolonged 454 period of immersion in water, all NRLF composite foams showed a high water uptake; and due to its 455 greater porosity, NRLF-MC had a higher water uptake capacity than those of NRLF and NRLF-NCs. 456 All NRLF composites had good thermal stability and could be used for applications at temperature 457 up to 300 °C. There was no separate degradation step for NRLF-MCs and NRLF-NCs, between NR 458 and MC/NC on DTG pattern. The Td values of NRLF-MC and NRLF-NC were slightly lower than 459 NRLF and tended to decrease with increased cellulose loading. According to their properties, the 460 composite foams could be further modified for use as green absorption or supporting materials. To 461 the best of our knowledge, this is the first report of significant improvement in mechanical 462 properties of reinforcing NRLF foam by nanobacterial cellulose. 463
Author Contributions: Conceptualization, M.P. and S.P.; methodology, M.P. and S.P.; validation, 464 M.P., B.Z.N. and A.N.; formal analysis, S.P.; investigation, M.P. and S.P.; resources, M.P.; data 465 curation, S.P.; writing—original draft preparation, S.P.; writing—review and editing, M.P.; 466 supervision, M.P.; project administration, M.P.; funding acquisition, M.P. All authors have read and 467 agreed to the published version of the manuscript. 468
Funding: This research was funded by Thailand research fund (TRF), grant number RGJ-PHD-19. 469
Figure 10. TGA (a) and DTG (b) curves for the degradation of NRLF, MC, NC, NRLF-MC and NRLF-NC.
4. Conclusions
NRLF was reinforced with MC and NC via the Dunlop process. According to the SEM results,the average width and length of dry fibers were around 10 and 100 µm, respectively for the eucalyptuspulp, and 10 and 3000 nm, respectively for BC. The crystallinity of MC and NC was 37.0% and
Polymers 2020, 12, 1959 13 of 16
46.4%, respectively. MC and NC fillers at loading contents from 5 to 20 phr (dry basis) could be welldispersed within the NR matrix. The resulting NRLF, NRLF-MC and NRLF-NC were highly porouswith interconnected macropores and low-density foams. The pore sizes ranged from 10 to 500 µm.It was demonstrated that the size, crystallinity and loading content of cellulose fibers were importantfactors affecting the porous structure and properties of NRLF composite foams. On the surface,NRLF-MC presented a more open pore structure, whereas NRLF-NC contained fewer and smallerpores. The foam density and crosslinking density of NRLF-NCs were higher than those of NRLF-MCsand the crosslinking density increased with NC filler loading from 5 to 15 phr. NC also showedreinforcement efficiency higher than that of MC. NRLF-NC, particularly NRLF-NC15, demonstratedsignificantly improved mechanical properties in terms of tensile strength, M100 and compressionrecovery. Both NRLF-MC and NRLF-NC presented a hydrophobic surface; however, NRLF-NCshowed slightly less hydrophobic characteristics, which likely was the result of a better dispersionof NC particles, as compared to MC particles, within the NR matrix. After a prolonged period ofimmersion in water, all NRLF composite foams showed a high water uptake; and due to its greaterporosity, NRLF-MC had a higher water uptake capacity than those of NRLF and NRLF-NCs. All NRLFcomposites had good thermal stability and could be used for applications at temperature up to 300 ◦C.There was no separate degradation step for NRLF-MCs and NRLF-NCs, between NR and MC/NC onDTG pattern. The Td values of NRLF-MC and NRLF-NC were slightly lower than NRLF and tendedto decrease with increased cellulose loading. According to their properties, the composite foams couldbe further modified for use as green absorption or supporting materials. To the best of our knowledge,this is the first report of significant improvement in mechanical properties of reinforcing NRLF foamby nanobacterial cellulose.
Author Contributions: Conceptualization, M.P. and S.P.; methodology, M.P. and S.P.; validation, M.P., B.-m.Z.N.and A.N.; formal analysis, S.P.; investigation, M.P. and S.P.; resources, M.P.; data curation, S.P.; writing—originaldraft preparation, S.P.; writing—review and editing, M.P.; supervision, M.P.; project administration, M.P.;funding acquisition, M.P. All authors have read and agreed to the published version of the manuscript.
Funding: This research was funded by Thailand research fund (TRF), grant number RGJ-PHD-19.
Acknowledgments: The authors acknowledge the support from Chulalongkorn University and the Thailandresearch fund (TRF) under the Royal Golden Jubilee Ph.D. (RGJ-PHD) Program and TRF (RGU62).
Conflicts of Interest: The authors declare no conflict of interest.
References
1. Bashir, A.S.; Munusamy, Y.; Chew, T.L.; Ismail, H.; Ramasamy, S. Mechanical, thermal, and morphologicalproperties of (eggshell powder)-filled natural rubber latex foam. J. Vinyl Addit. Technol. 2015, 23, 3–12.[CrossRef]
2. Zou, L.; Phule, A.D.; Sun, Y.; Zhu, T.Y.; Wen, S.; Zhang, Z. Superhydrophobic and superoleophilic polyethyleneaerogel coated natural rubber latex foam for oil-water separation application. Polym. Test. 2020, 85, 106451.[CrossRef]
3. Rathnayake, W.G.I.U.; Ismail, H.; Baharin, A.; Bandara, C.D.; Rajapakse, S. Enhancement of the antibacterialactivity of natural rubber latex foam by the incorporation of zinc oxide nanoparticles. J. Appl. Polym. Sci.2013, 131, 131. [CrossRef]
4. Karim, A.F.A.; Ismail, H.; Ariff, Z.M. Properties and characterization of Kenaf-Filled natural rubber latexfoam. Bioresources 2016, 11, 1080–1091.
5. Ramasamy, S.; Ismail, H.; Munusamy, Y. Tensile and morphological properties of rice husk powder fillednatural rubber latex foam. Polym. Technol. Eng. 2012, 51, 1524–1529. [CrossRef]
6. Phomrak, S.; Phisalaphong, M. Reinforcement of natural rubber with bacterial cellulose via a latex aqueousMicrodispersion process. J. Nanomater. 2017, 2017, 1–9. [CrossRef]
7. Ciechanska, D. Multifunctional bacterial cellulose/chitosan composite materials for medical applications.Fibres Text. East. Eur. 2004, 12, 69–72.
Polymers 2020, 12, 1959 14 of 16
8. Czaja, W.; Krystynowicz, A.; Bielecki, S.; Brown, R.M., Jr. Microbial cellulose—The natural power to healwounds. Biomaterials 2006, 27, 145–151. [CrossRef]
9. Deng, C.-M.; He, L.-Z.; Zhao, M.; Yang, D.; Liu, Y. Biological properties of the chitosan-gelatin sponge wounddressing. Carbohydr. Polym. 2007, 69, 583–589. [CrossRef]
10. Bodhibukkana, C.; Srichana, T.; Kaewnopparat, S.; Tangthong, N.; Bouking, P.; Martin, G.P.; Suedee, R.Composite membrane of bacterially-derived cellulose and molecularly imprinted polymer for use as atransdermal enantioselective controlled-release system of racemic propranolol. J. Control. Release 2006,113, 43–56. [CrossRef]
11. Klemm, D.; Schumann, D.; Udhardt, U.; Marsch, S. Bacterial synthesized cellulose—Artificial blood vesselsfor microsurgery. Prog. Polym. Sci. 2001, 26, 1561–1603. [CrossRef]
12. Segal, L.; Creely, J.; Martin, A., Jr.; Conrad, C. An empirical method for estimating the degree of crystallinityof native cellulose using the X-ray diffractometer. Text. Res. J. 1959, 29, 786–794. [CrossRef]
13. Treloar, L.R.G. The Physics of Rubber Elasticity; Oxford University Press: Oxford, UK, 1975.14. Najib, N.; Ariff, Z.M.; Bakar, A.; Sipaut, C. Correlation between the acoustic and dynamic mechanical
properties of natural rubber foam: Effect of foaming temperature. Mater. Des. 2011, 32, 505–511. [CrossRef]15. Ariff, Z.; Zakaria, Z.; Tay, L.; Lee, S. Effect of foaming temperature and rubber grades on properties of natural
rubber foams. J. Appl. Polym. Sci. 2008, 107, 2531–2538. [CrossRef]16. Abd-El-Messieh, S.; El-Nashar, D.; Khafagi, M. Compatibility investigation of microwave irradiated
acrylonitrile butadiene/ethylene propylene diene rubber blends. Polym. Technol. Eng. 2004, 43, 135–158.[CrossRef]
17. Zheng, Y.; Fu, Z.; Li, D.; Wu, M. Effects of ball milling processes on the microstructure and rheologicalproperties of microcrystalline cellulose as a sustainable polymer additive. Materials 2018, 11, 1057. [CrossRef]
18. Gao, C.; Xiao, W.; Ji, G.; Zhang, Y.; Cao, Y.; Han, L. Regularity and mechanism of wheat straw propertieschange in ball milling process at cellular scale. Bioresour. Technol. 2017, 241, 214–219. [CrossRef]
19. Zhou, L.; He, H.; Li, M.-C.; Song, K.; Cheng, H.; Wu, Q. Morphological influence of cellulose nanoparticles(CNs) from cottonseed hulls on rheological properties of polyvinyl alcohol/CN suspensions. Carbohydr. Polym.2016, 153, 445–454. [CrossRef]
20. Ling, Z.; Edwards, J.V.; Guo, Z.; Prevost, N.T.; Nam, S.; Wu, Q.; French, A.D.; Xu, F. Structural variations ofcotton cellulose nanocrystals from deep eutectic solvent treatment: Micro and nano scale. Cellulose 2019,26, 861–876. [CrossRef]
21. Phisalaphong, M.; Suwanmajo, T.; Sangtherapitikul, P. Novel nanoporous membranes from regeneratedbacterial cellulose. J. Appl. Polym. Sci. 2008, 107, 292–299. [CrossRef]
22. Liu, M.; Wang, H.; Han, J.; Niu, Y. Enhanced hydrogenolysis conversion of cellulose to C2–C3 polyols viaalkaline pretreatment. Carbohydr. Polym. 2012, 89, 607–612. [CrossRef]
23. Nomura, S.; Kugo, Y.; Erata, T. 13C NMR and XRD studies on the enhancement of cellulose II crystallinitywith low concentration NaOH post-treatments. Cellulose 2020, 27, 3553–3563. [CrossRef]
24. Keshk, S.M.A.S.; Hamdy, M.S. Preparation and physicochemical characterization of zinc oxide/sodiumcellulose composite for food packaging. Turk. J. Chem. 2019, 43, 94–105. [CrossRef]
25. Williams, T.; Hosur, M.; Theodore, M.; Netravali, A.; Rangari, V.; Jeelani, S. Time effects on morphology andbonding ability in mercerized natural fibers for composite reinforcement. Int. J. Polym. Sci. 2011, 2011, 1–9.[CrossRef]
26. Li, Y.; Yu, H.-y.; Zhang, Z.-t.; Zhang, M.; Guo, M. Selective phase transformation behavior of titanium-bearingelectric furnace molten slag during the molten NaOH treatment process. ISIJ Int. 2015, 55, 134–141. [CrossRef]
27. Choi, S.-S.; Kim, E. A novel system for measurement of types and densities of sulfur crosslinks of a filledrubber vulcanizate. Polym. Test. 2015, 42, 62–68. [CrossRef]
28. Roy, K.; Debnath, S.C.; Tzounis, L.; Pongwisuthiruchte, A.; Potiyaraj, P. Effect of various surface treatmentson the performance of jute fibers filled natural rubber (NR) composites. Polymers 2020, 12, 369. [CrossRef]
29. Dominic CD, M.; Joseph, R.; Begum, P.; Joseph, M.; Padmanabhan, D.; Morris, L.A.; Kumar, A.S.; Formela, K.Cellulose nanofibers isolated from the cuscuta reflexa plant as a green reinforcement of natural rubber.Polymers 2020, 12, 814. [CrossRef]
30. Khimi, S.; Syamsinar, S.; Najwa, T. Effect of carbon black on self-healing efficiency of natural rubber. Mater.Today Proc. 2019, 17, 1064–1071. [CrossRef]
Polymers 2020, 12, 1959 15 of 16
31. Zheng, L.; Li, C.; Zhang, D.; Guan, G.; Xiao, Y.; Wang, D. Multiblock copolymers composed of poly (butylenesuccinate) and poly (1, 2-propylene succinate): Effect of molar ratio of diisocyanate to polyester-diols oncrosslink densities, thermal properties, mechanical properties and biodegradability. Polym. Degrad. Stab.2010, 95, 1743–1750. [CrossRef]
32. Abdul Azam, F.A.; Rajendran Royan, N.R.; Yuhana, N.Y.; Mohd Radzuan, N.A.; Ahmad, S.; Sulong, A.B.Fabrication of porous recycled HDPE biocomposites foam: Effect of rice husk filler contents and surfacetreatments on the mechanical properties. Polymers 2020, 12, 475. [CrossRef]
33. Tangpasuthadol, V.; Intasiri, A.; Nuntivanich, D.; Niyompanich, N.; Kiatkamjornwong, S. Silica-reinforcednatural rubber prepared by the sol–gel process of ethoxysilanes in rubber latex. J. Appl. Polym. Sci. 2008,109, 424–433. [CrossRef]
34. Kemaloglu, S.; Ozkoc, G.; Aytac, A. Properties of thermally conductive micro and nano size boron nitridereinforced silicon rubber composites. Thermochim. Acta 2010, 499, 40–47. [CrossRef]
35. Mohan, T.; Kuriakose, J.; Kanny, K. Effect of nanoclay reinforcement on structure, thermal and mechanicalproperties of natural rubber–styrene butadine rubber (NR–SBR). J. Ind. Eng. Chem. 2011, 17, 264–270.[CrossRef]
36. Chong, E.; Ahmad, I.; Dahlan, H.; Abdullah, I. Reinforcement of natural rubber/high density polyethyleneblends with electron beam irradiated liquid natural rubber-coated rice husk. Radiat. Phys. Chem. 2010,79, 906–911. [CrossRef]
37. Phomrak, S.; Phisalaphong, M. Lactic acid modified natural rubber–bacterial cellulose composites. Appl. Sci.2020, 10, 3583. [CrossRef]
38. Samaržija-Jovanovic, S.; Jovanovic, V.; Markovic, G.; Zekovic, I.; Marinovic-Cincovic, M. Properties ofvulcanized polyisoprene rubber composites filled with opalized white tuff and precipitated silica. Sci. World J.2014, 2014, 1–9.
39. Ismail, H.; Edyham, M.; Wirjosentono, B. Bamboo fibre filled natural rubber composites: The effects of fillerloading and bonding agent. Polym. Test. 2002, 21, 139–144. [CrossRef]
40. Karmarkar, A.; Chauhan, S.; Modak, J.M.; Chanda, M. Mechanical properties of wood–fiber reinforcedpolypropylene composites: Effect of a novel compatibilizer with isocyanate functional group. Compos. Part AAppl. Sci. Manuf. 2007, 38, 227–233. [CrossRef]
41. Thomas, M.G.; Abraham, E.; Jyotishkumar, P.; Maria, H.J.; Pothen, L.A.; Thomas, S. Nanocelluloses from jutefibers and their nanocomposites with natural rubber: Preparation and characterization. Int. J. Biol. Macromol.2015, 81, 768–777. [CrossRef]
42. Timothy, J.J.; Meschke, G. A cascade continuum micromechanics model for the effective elastic properties ofporous materials. Int. J. Solids Struct. 2016, 83, 1–12. [CrossRef]
43. Nascimento, R.M.D.; Ramos, S.M.; Bechtold, I.H.; Hernandes, A.N.C. Wettability study on natural rubbersurfaces for applications as biomembranes. ACS Biomater. Sci. Eng. 2018, 4, 2784–2793. [CrossRef]
44. Wenzel, R.N. Resistance of solid surfaces to wetting by water. Ind. Eng. Chem. 1936, 28, 988–994. [CrossRef]45. Cassie, A.; Baxter, S. Wettability of porous surfaces. Trans. Faraday Soc. 1944, 40, 546–551. [CrossRef]46. Kirdponpattara, S.; Phisalaphong, M.; Newby, B.-m.Z. Applicability of Washburn capillary rise for
determining contact angles of powders/porous materials. J. Colloid Interface Sci. 2013, 397, 169–176.[CrossRef]
47. Frone, A.N.; Panaitescu, D.M.; Chiulan, I.; Nicolae, C.A.; Casarica, A.; Gabor, A.R.; Trusca, R.; Damian, C.M.;Purcar, V.; Alexandrescu, E. Surface treatment of bacterial cellulose in mild, eco-friendly conditions. Coatings2018, 8, 221. [CrossRef]
48. Yang, H.; Yan, R.; Chen, H.; Lee, D.H.; Zheng, C. Characteristics of hemicellulose, cellulose and ligninpyrolysis. Fuel 2007, 86, 1781–1788. [CrossRef]
49. Mani, T.; Murugan, P.; Abedi, J.; Mahinpey, N. Pyrolysis of wheat straw in a thermogravimetric analyzer:Effect of particle size and heating rate on devolatilization and estimation of global kinetics. Chem. Eng.Res. Des. 2010, 88, 952–958. [CrossRef]
50. Wang, Z.; McDonald, A.G.; Westerhof, R.J.; Kersten, S.R.; Cuba-Torres, C.M.; Ha, S.; Pecha, B.; Garcia-Perez, M.Effect of cellulose crystallinity on the formation of a liquid intermediate and on product distribution duringpyrolysis. J. Anal. Appl. Pyrolysis 2013, 100, 56–66. [CrossRef]
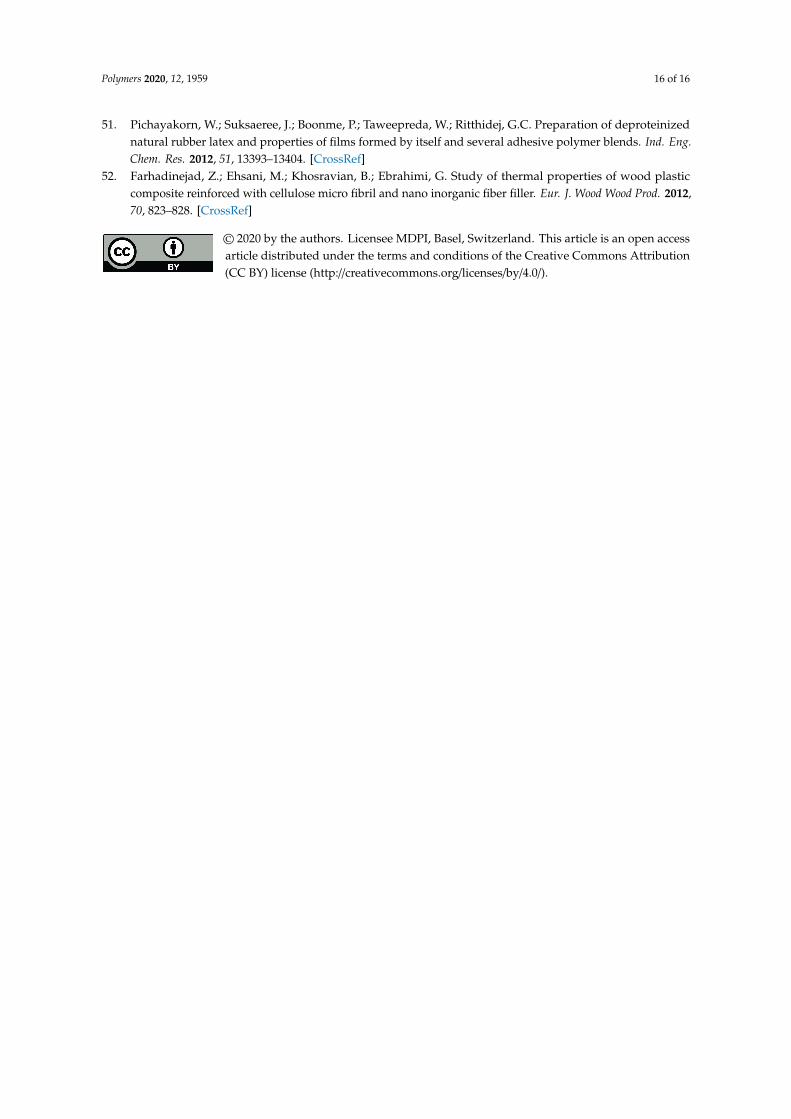
Polymers 2020, 12, 1959 16 of 16
51. Pichayakorn, W.; Suksaeree, J.; Boonme, P.; Taweepreda, W.; Ritthidej, G.C. Preparation of deproteinizednatural rubber latex and properties of films formed by itself and several adhesive polymer blends. Ind. Eng.Chem. Res. 2012, 51, 13393–13404. [CrossRef]
52. Farhadinejad, Z.; Ehsani, M.; Khosravian, B.; Ebrahimi, G. Study of thermal properties of wood plasticcomposite reinforced with cellulose micro fibril and nano inorganic fiber filler. Eur. J. Wood Wood Prod. 2012,70, 823–828. [CrossRef]
© 2020 by the authors. Licensee MDPI, Basel, Switzerland. This article is an open accessarticle distributed under the terms and conditions of the Creative Commons Attribution(CC BY) license (http://creativecommons.org/licenses/by/4.0/).