Embed Size (px)
Citation preview
Master’s Degree programme (Second Cycle D.M. 270/2004) in
Conservation Science and Technology for Cultural Heritage
Final Thesis
Naples yellow and Pb-Sn-Sb yellow:
characterization and evaluation of their stability
through a multi-analytical approach
Supervisors
Prof. ssa Ligia Maria Moretto
Prof. ssa Karolien De Wael
Graduand
Laura Rabbachin
838746
A.A 2016/2017
CONTENTS
1.Introduction....................................................................................................................... .... 1
1.1 History of the pigments.......................................................................................... ................ 1
1.1.1 Naples yellow............................................................................................ ..................... 1
1.1.2 Lead-tin-antimony yellow................................................................. ............................. 4
1.2 Chemical composition and crystalline structure.............................................................. ....... 6
1.2.1 Chemical composition............................................................................................ ........ 6
1.2.2 Crystalline structure...................................................................... ................................ 7
1.3 Degradation of the pigments......................................................................................... .......... 10
1.3.1 Pb-based pigments degradation.................................... ................................................ 11
1.3.2 What is known about the degradation of Pb2Sb2O7 and Pb2SbSnO6.5?.......... ............... 11
2. Aim of the thesis......................................................................................................... .......... 14
3. Materials and methods.................................................. ..................................................... 15
3.1 Samples............................................................................................. ...................................... 15
3.1.1 Mock-up pain samples preparation............................................................... ................ 16
3.1.2 Cross-section preparation........................................................................ ..................... 17
3.2 Experimental procedures.............................................................................. .......................... 17
3.2.1 Irradiation experiment with blue laser ................................................................ ......... 17
3.2.2 Climate chamber (UV aging).................................................. ....................................... 18
3.2.3 Chemical aging................................................................................ .............................. 19
3.3 Analytical Techniques................................................................... ......................................... 20
3.3.1 Micro-Raman Spectroscopy (µ-RS)................................. .............................................. 20
3.3.2 Diffuse Reflectance UV-Vis Spectroscopy (DR-UV-Vis)................... ............................ 22
3.3.3 Photo-electrochemistry.................................... .............................................................. 23
3.3.4 X-Ray Fluorescence (XRF)................................. ........................................................... 25
3.3.5 Colorimetry......................................................................................... ........................... 25
3.3.6 Scanning electron microscopy (SEM-EDX)................................................................... 26
3.3.7 X-ray powder diffraction (XRPD)............................................. ..................................... 27
4. Results and discussion......................................................................................................... 30
4.1 Characterization of the pigments......................................................... ................................... 30
4.1.1 XRF analysis........................................................................ .......................................... 30
4.1.2 Raman analysis.................................................................................... .......................... 31
4.1.3 XRD analysis.................................................................................................................. 35
4.1.4 Colorimetric measurements.................................................................... ....................... 38
4.2 Naples yellow and lead-tin-antimony yellow: evaluation of their stability................. ........... 40
4.2.1 Light-induced degradation.............................................................. ............................... 40
4.2.1.1 Green laser experiment.............................................................. ............................ 41
4.2.1.2 DR-UV-vis measurements and photo-electrochemistry...................... .................. 43
4.2.1.3 Blue laser experiment.......................................................................... .................. 50
4.2.1.4 Climate chamber (UV light)................................................ .................................. 52
4.2.2 Chemical stability.............................................................................. ............................ 55
4.2.2.1 Naples yellow (LAY)....................................................... ..................................... 56
4.2.2.2 Lead-tin-antimony yellow (LTAY).................................... ................................... 59
4.2.2.3 Genuine Naples Yellow dark (NG)....................................................... ................ 62
5. Conclusions............................................................................................................................ 64
Bibliography...................................................................................... ........................................ 67
1
1. Introduction
1.1 History of the pigments
1.1.1 Lead antimonate yellow
Lead antimonate yellow, or Naples Yellow, is one of the most common yellow
pigments used in Western European art, mainly in the period from 1500 to 18501.
However its history is much older and goes back to the early 2nd millennium BC.
Along with Egyptian blue, lead antimonate is one of the oldest synthetically produced
pigments known. It has been frequently identified as an opacifying and colorant agent
in Egyptian glass from the 18th Dynasty (1550-1295 BC), period that coincide with the
development of glass itself2. The pigment was also known in the Mesopotamian,
Babylonian and Assyrian cultures where it was used as a colorant in glazed bricks and
tiles3. Around the first and second centuries BC is reported that Naples Yellow was
used by the Romans for yellow glasses4.
As a pigment, lead antimonate yellow has been lost and rediscovered a number
of times throughout history. After enjoying a great popularity in ancient cultures
where it was the only yellow colorant and opacifier used in glass and glazes, it
appears that in various parts of Europe, by the end of the 4th century A.D., the pigment
was completely replaced by lead-tin oxide. Literature reports that during the Middle
Ages lead antimonate yellow seems to have been limited to the Slavonian, Islamic5
and Byzantine world as observed by Kirmizi et al. in late Byzantine glazed pottery
from Turkey and the Former Yugoslav Republic of Macedonia6.
Curiously 1200 years later (c.1500) the pigment reappears in the Western
culture to be then again replaced within a relatively short period of time3. It’s also not
clear how Naples yellow re-emerged during the 15th century in Italian art. The most
likely hypothesis is that the know-how on the production of lead antimonate was
introduced by foreign artists, mostly Arab, to the Venetian glass workshops. Indeed,
during the 15th century, after the fall of two main glass production centers such as
Damascus (around 1400) and Constantinople (1452), two large waves of immigration
of glassworkers from the Eastern Mediterranean to Venice are documented (1400
2
Syrian glass artists, 1453 glass artists from Byzantium)1,5.
During the 16th century the production of Naples yellow is still closely connected
with the glass and ceramic industries, as reported in many treatises from the time in
which we can find the earliest recorded recipes. In 1540, Biringuccio, in his treatise
Pirotechnia wrote about the use of antimony in making yellow glass enamels, while in
the late 1550s, Piccolpasso published a treatise on the potter’s craft (Li tre libri
dell’arte del vasaio) that contains a series of recipes for lead antimonate to obtain
yellow glazes on majolica. Another relevant reference about the production of Naples
yellow in the glass industry is the Venetian Darduin manuscript (Secreti per far lo
smalto et vetri colorati, 1644) where a collection of technical recipes on glass coloring
can be found1.
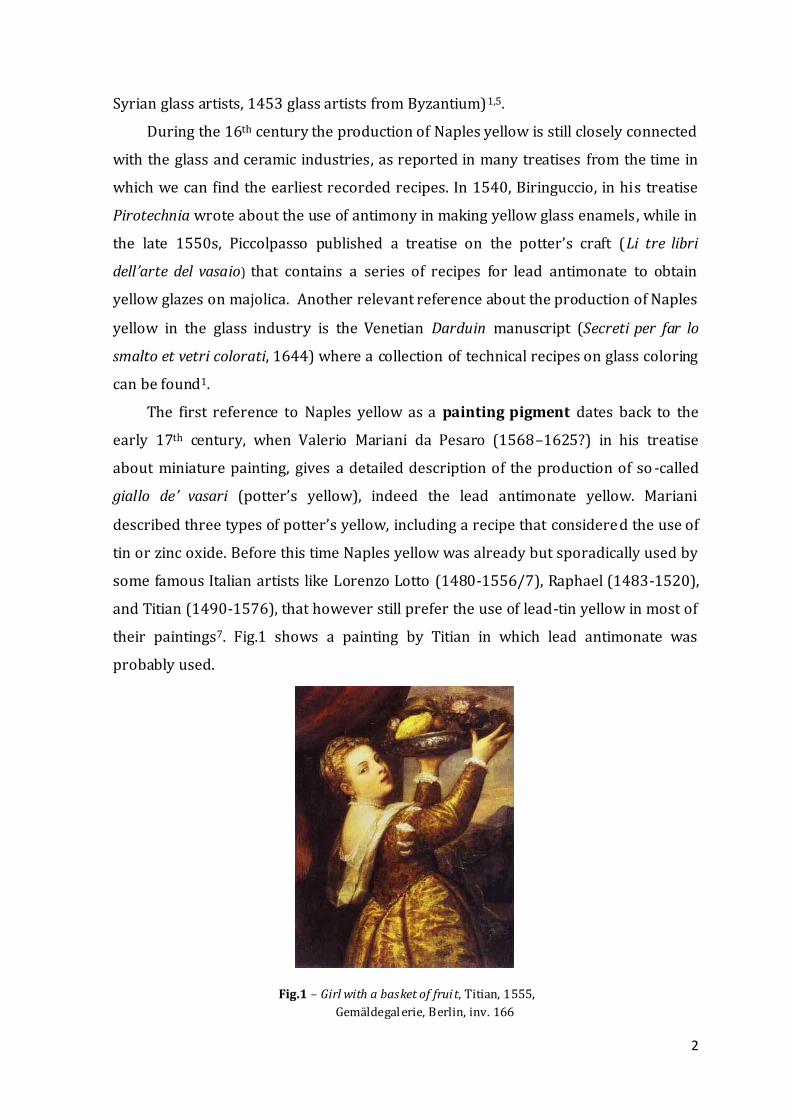
The first reference to Naples yellow as a painting pigment dates back to the
early 17th century, when Valerio Mariani da Pesaro (1568–1625?) in his treatise
about miniature painting, gives a detailed description of the production of so -called
giallo de’ vasari (potter’s yellow), indeed the lead antimonate yellow. Mariani
described three types of potter’s yellow, including a recipe that considered the use of
tin or zinc oxide. Before this time Naples yellow was already but sporadically used by
some famous Italian artists like Lorenzo Lotto (1480-1556/7), Raphael (1483-1520),
and Titian (1490-1576), that however still prefer the use of lead-tin yellow in most of
their paintings7. Fig.1 shows a painting by Titian in which lead antimonate was
probably used.
Fig.1 – Girl with a basket of frui t, Titian, 1555,
Gemäldegal erie, Berlin, inv. 166
3
It’s not always easy to confirm the use of this pigment on paintings considering
that from the 14th century onwards various lead-based yellow pigments, notably the
two types of lead stannate, the lead antimonate and the lead tin antimony oxide, all go
under the name giallolino, which had caused, together with the similar composition,
some misleading interpretation regarding the identification of the pigment.
From the second quarter of the 17th century Naples yellow begun to replace the
traditional lead tin yellow pigment which falls in complete disuse by 1740 5,3. By the
beginning of 18th century Naples yellow becomes one of the most popular yellow
pigments in European artists’ palette. Canaletto (1697-1768), William Hogarth
(1697-1764) and Joshua Reynolds (1723-1792) are just a few examples of painters
that largely used it.
Naples yellow was much appreciated by artists for its intense bright hue, notably
for giving a straw-colored both on yellow monochromatic areas and details. Due to its
bright hue, it was also used for highlights and often mixed with green earths to obtain
specific tints. As an example, Hogart mixes lead antimonate with blue pigments to
achieve peculiar shades of green otherwise not obtainable with traditional green
pigments.
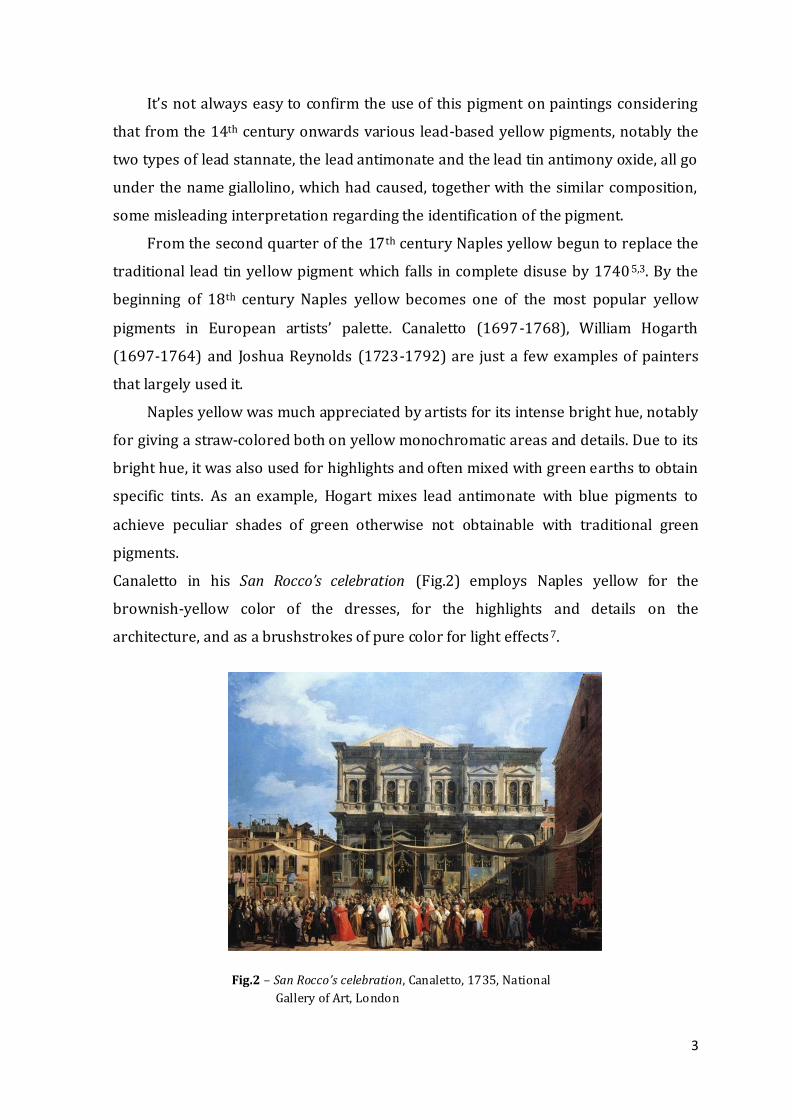
Canaletto in his San Rocco’s celebration (Fig.2) employs Naples yellow for the
brownish-yellow color of the dresses, for the highlights and details on the
architecture, and as a brushstrokes of pure color for light effects7.
Fig.2 – San Rocco’s celebration, Canaletto, 1735, National
Gallery of Art, London
4
During the 18th century, when lead antimonate was introduced to Northern
European painting, there was a widespread rumor according to which the pigment
was a natural volcanic mineral found around the Mount Vesuvius in the Bay of Naples,
hence the name Naples yellow was coined. The first reference to the name Naples
yellow is the misleading Latin name Luteolum Neapolitanum given to the pigment by
Andrea Pozzo in his treatise published in Rome between 1690-1700. Northern artists
were not aware of the synthetic origin of lead antimonate since the handwritten
recipes of Italian origin were intended for personal use and often kept secret by
artisans. The production process of Naples yellow was not published until 1758 by
the Italian Passeri, but the publication remained largely unnoticed in Northern
Europe where the spread of knowledge about the real origin of the pigment has to be
attributed to Fougeroux de Bondaroy (1769). Before then, lead antimonate was
imported from across the Alps and only after the middle of the 18th century the
production of this pigment started also in Northern Europe5.
After enjoying its highest popularity in European art, from 1850 onwards it
appears that Naples yellow was gradually replaced by cheaper and safer yellow
pigments like lead chromate and cadmium sulfide.
Naples yellow was mainly used in oil on canvas, miniatures and only rarely on
murals paintings7. In general it seems that the pigment was not recommended for
watercolor painting (with an exception in Northern Europe during the 17th century)
and in the fresco technique.
1.1.2 Lead-tin-antimony yellow
As mentioned previously, the identification and differentiation of lead-based
yellow pigments on works of art has been difficult due to the confusing historical
terminology of the pigments themselves and their reagents, vague information
regarding their manufacture in ancient recipes, together with a lack of suitable
scientific analysis for their characterization. This is especially the case of lead-tin-
antimony yellow that was rediscover in the last decade of the 20th century, and only
since then it has been unequivocally identified in artworks and distinguished from
Naples yellow. Precisely, in 1998 Roy and Berrie announced the rediscovery of this
pigment, based on its elemental characterization and identification on several
seventeenth-century Italian paintings8.
5
The history of lead-tin-antimony yellow is closely linked to the one of Naples
yellow and like the latter, also finds its origin in the manufacturing of glass, enamels
and majolica as an opacifying and coloring agent. According to Sandalinas and Ruiz-
Moreno (2004)9 the earliest recipes for the manufacture of a yellow pigment
containing lead, tin and antimony appeared in the Venetian Darduin Ricettario, Secreti
per far lo smalto et vetri colorati, a glass-manufacturing codex dating from 1644. Roy
and Berrie suggest that the pigment originated as a by-product of the ceramic and
glass industry and it was later adopted by painters in their palette.
The use of lead-tin-antimony yellow as a painting pigment spread throughout
the 17th century in Italy. Roy and Berrie relate it specifically to paintings produced in
Rome. In their work they identify the pigment in several artworks (from the 17th
century) from different artists (O.Gentileschi, G.Lanfranco, Pietro da Cortona, N.
Poussin and S. Rosa) all connected to the city of Rome.
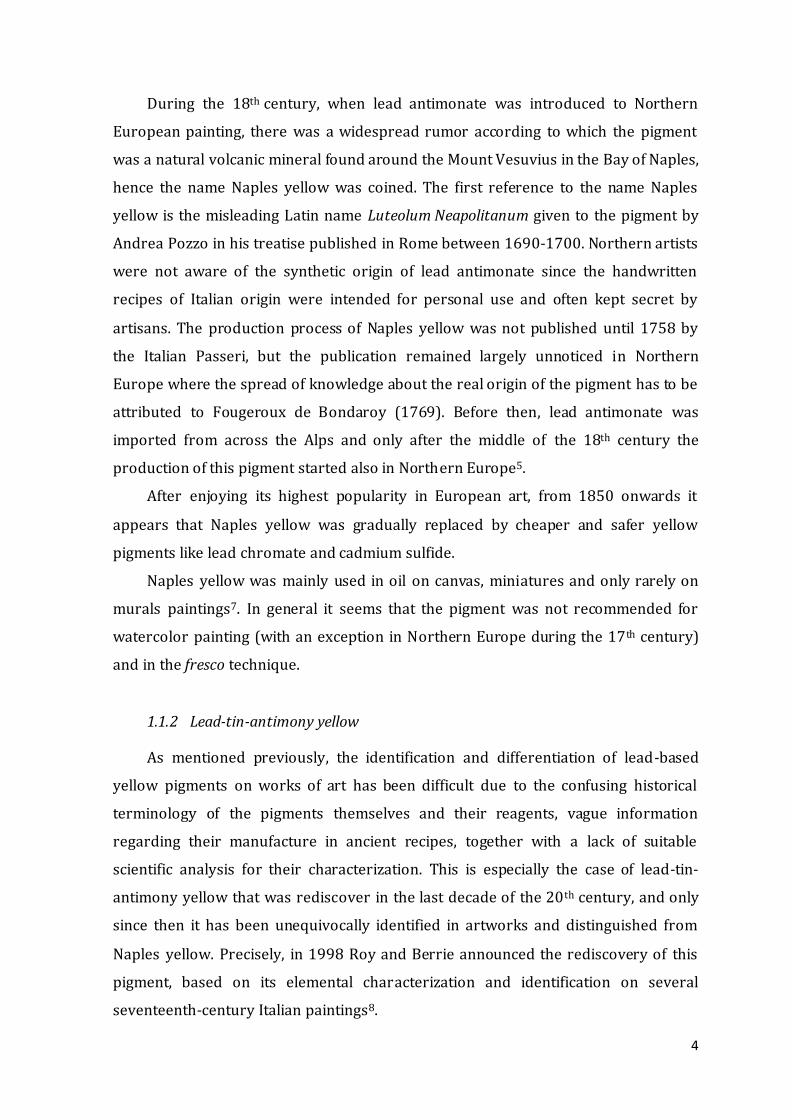
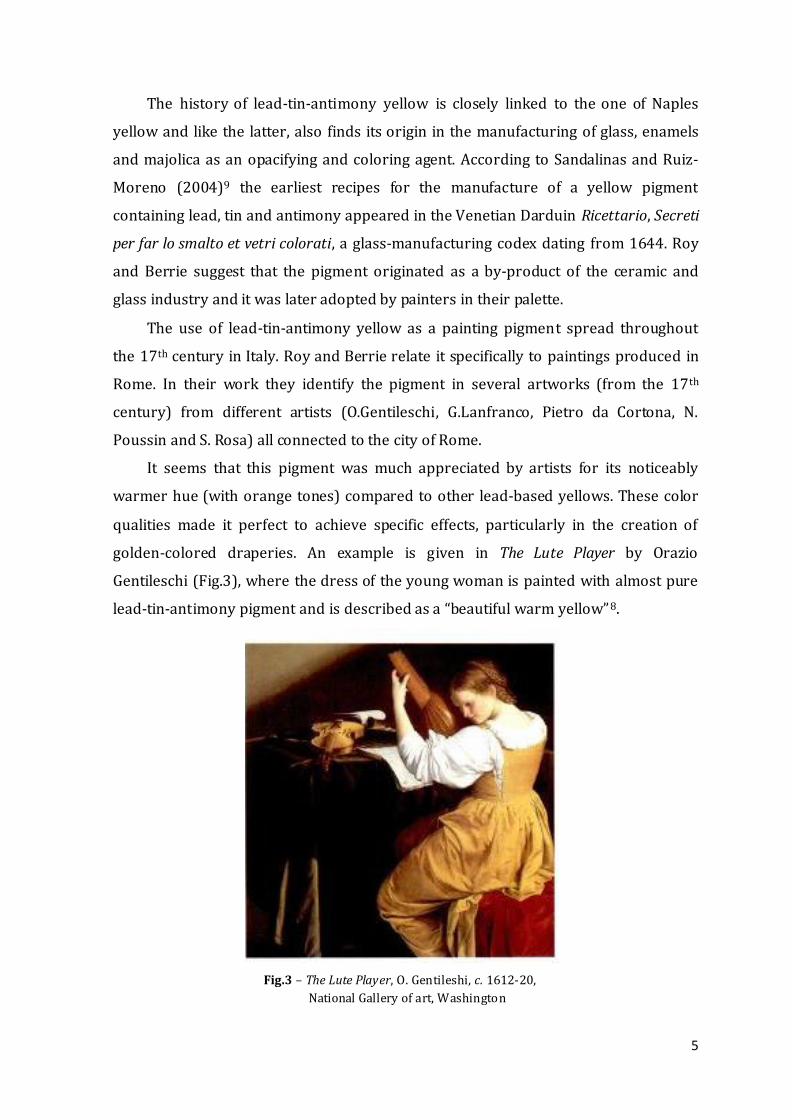
It seems that this pigment was much appreciated by artists for its noticeably
warmer hue (with orange tones) compared to other lead-based yellows. These color
qualities made it perfect to achieve specific effects, particularly in the creation of
golden-colored draperies. An example is given in The Lute Player by Orazio
Gentileschi (Fig.3), where the dress of the young woman is painted with almost pure
lead-tin-antimony pigment and is described as a “beautiful warm yellow”8.
Fig.3 – The Lute Player, O. Gentileshi, c. 1612-20,
National Gallery of art, Washington
6
However, the relation between lead-tin-antimony yellow and other yellows it’s
not clear and it’s uncertain what caused simultaneous usage of Naples and Pb -Sb-Sn
yellows. It is possible that the composition of these yellow pigments depended on the
accessibility of the raw materials so their use was both temporally and geographically
very specific10. Sandalinas and Ruiz-Moreno in 20049 confirmed the use of lead-tin-
antimony yellow by many Italian artists from the 17th century and they identified the
pigment in paintings by G.B Langetti and L.Giordano, both working in Venice in the
17th century. They also reported that the Spanish painter Velazquez used this pigment
(most likely during his staying in Rome). In 2007 Hradil and al. studied the
occurrence of Pb-Sn-Sb yellow in five Mid-European oil paintings from the 18th and
19th centuries10 while recent studies7 show that Pb-Sn-Sb yellow was used also by the
famous English painter Joshua Reynolds.
Lead-tin-antimony yellow was not only used in oil on canvas but also on murals
with fresco technique and on paper supports. It’s found very often mixed with other
pigments like ferric ochres (in warm yellows) and with Ultramarine and Prussian
blue or green earths and copper greens to create different shades of green.7,9,10
1.2 Chemical composition and crystalline structure
1.2.1 Chemical composition
Lead antimonate Pb2Sb2O7 and lead-tin-antimony yellow Pb2SbSnO6.5 are
synthetic pigments produced by calcinating a ground mixture of antimony, lead and
tin compounds, sometimes mixed with other materials. There is not one precise
recipe to produce the pigments since many different ingredients were use d during
time, but it’s possible to summarize the most common ones .
Lead compounds:
metallic lead [Pb], lead monoxide [PbO], lead white [2PbCO3·Pb(OH)2], minium
[Pb3O4], lead nitrate [Pb(NO3)2]
Antimony compounds:
metallic antimony [Sb], antimony oxide [Sb2O3], potassium antimony oxide
[KSbO3], emetic tartar [K(SbO)C4H4O6 · ½H2O], antimony trisulfide [Sb2S3]
7
Tin compound:
tin dioxide [SnO2]
Other compounds (mostly used as flux agents):
sodium chloride [NaCl], potassium hydrogen tartrate [C4H4K2O6], potassium
carbonate [K2CO3], potassium nitrate [KNO3], ammonium chloride [NH4Cl],
silicium oxide [SiO2], sodium carbonate [Na2CO3], zinc oxide [ZnO]
The exact ratio between the elements, reaction time and temperature (between
700 and 1000 °C) are usually unknown parameters in the historical recipes and they
vary significantly depending on the production methods, leading to different final
products in composition and colour.
It is discussed in literature how artists chose their painting materials; if they
choice of a Naples yellow instead of lead-tin-antimony yellow was only because of the
specific hue or there was a knowledge of the production methods, hence of the
chemical composition. It is possible that the composition of the pigments used by
artists depended on the accessibility of the raw materials as well as on the cost.
However, it does not have to be excluded that lead-tin-antimony yellow had some
technological peculiarity10, for which it was chosen compared to other yellow
pigments.
1.2.2 Crystalline structure
Is known from literature1-11 that both Naples yellow and lead-tin-antimony
yellow belong to the class of cubic pyrochlore oxides. In particular lead antimonate
yellow is the isostructural anhydrous analogue of the mineral bindheimite Pb2Sb2O6O’,
that however seems to be never used as a painting pigment3.
The general formula for cubic pyrochlore oxides is A2B2O6O’. A and B are metals
and depending on their oxidation state, oxide pyrochlores can be classified as
A23+B24+O7 and A22+B25+O7 types12 (Naples yellow belongs to the second type
Pb2Sb2O7). The stability of this structure strongly depends on the ionic radius ratio
(rA/rB)13 with the A cation that must be appreciably larger than the B cation.
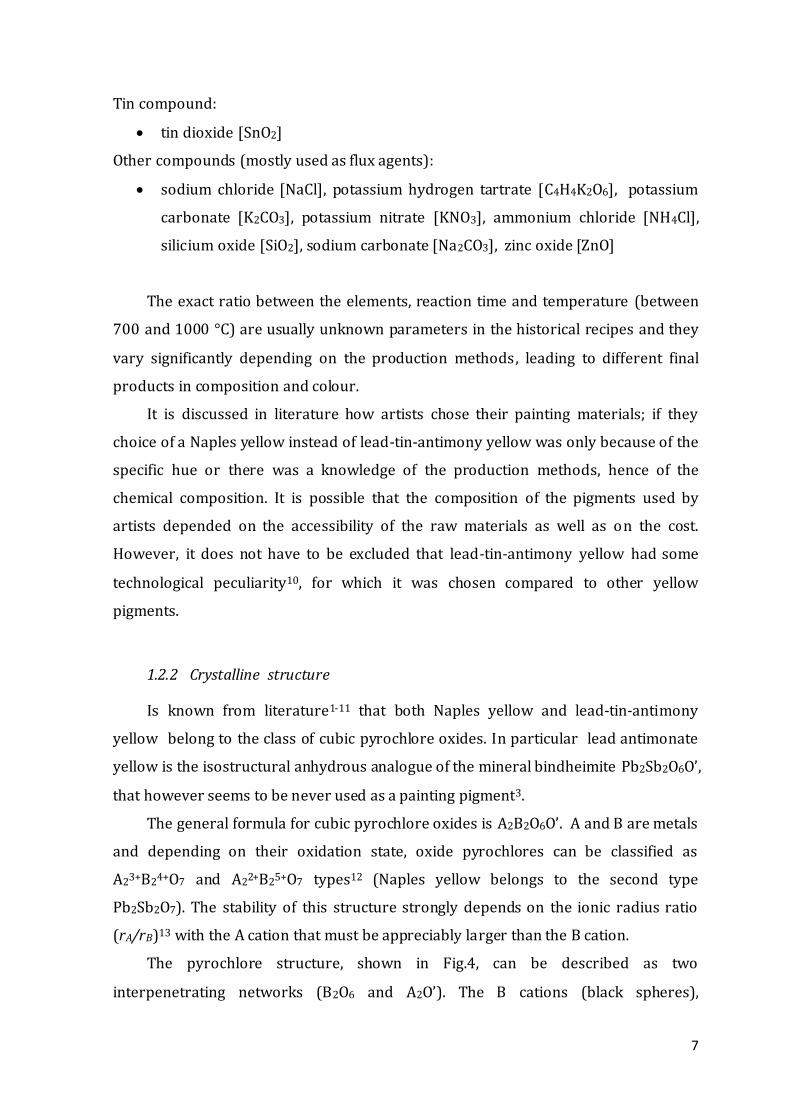
The pyrochlore structure, shown in Fig.4, can be described as two
interpenetrating networks (B2O6 and A2O’). The B cations (black spheres),
8
corresponding to Sb for Naples yellow, is six coordinated and located within an
octahedra with oxygen atoms at the vertices; the BO6 octahedra share all vertices
forming large cavities. The A2O’ network consists, instead, of O’ anions tetrahedrally
coordinated with A cations (white spheres), corresponding to Pb for Naples yellow.
Fig.4 – Ideal crystal structure of pyrochlore compounds14
The two structures are interwoven such that the O’ anions of the A2O’ network
occupy the centers of the cavities formed between the BO6 octahedra while A cations
are positioned in hexagonal crowns formed by oxygen in the B2O6 framework. The O’
ions are coordinate only with A cations, that have a final coordination number of eight,
while the O ions are coordinate to two A and two B cations11,12.
Pyrochlores are very interesting compounds because of the possibility of a wide
variety of chemical substitution at the A and B sites. The structure also tolerates
vacancies at the A and O sites allowing cation migration within the solid. These
compounds exhibit also an exceptional range of physical properties that goes from a
highly insulating through semiconducting to metallic behavior that can be controlled
by doping13,15.
= O’ = O = Sb = Pb
9
In the pyrochlore structure of lead-tin-antimony yellow the third cation Sn4+
enters in the lead antimony phase replacing some of the Sb5+ ions in the octahedral
(SbO6) sites 1,10,11,16. Cartechini et al.16 and Hradil et al.10report that the introduction
of tin (larger than antimony) in the binary pyroantimonate leads to an expansion of
the lattice size and to a distortion of the local symmetry of the Sb-O polyhedra.
It has been reported in literature that it is difficult to synthesize Naples yellow
and lead-tin antimony yellow with pure pyrochlore structure. Usually, in the
pigments, by-products can be observed. As seen before, to facilitate the production of
a homogeneous powder and also to improve the colour, historical recipes suggest,
during the calcination process, the use of flux agents, which are a common way to
enhance the crystal growth10. However, the addition of these compounds might leave
a residue in the final product. NaCl and related compounds like oxychlorides are
found only after short calcination times and with the temperature kept below 800 °C
3,10. Nonetheless chlorine can react with the other reagents forming products
containing Pb and Cl as pointed out by Agresti7 who suggested that Cl can be present
in the lead antimonate lattice (Cl-Pb-Cl bond). Hradil et al. reported that, with an
excess of wine lees (K2CO3), K is either converted to potassium antimonate or
remained unconsumed. In some cases K might also be present in the pyrochlore
lattice10. Also Dik et al. found that in the Naples yellow calcinated with K-tartrate, by-
products containing potassium can be detected, e.g. K2NaSb3O9 and K3Sb3O9.
Moreover, Naples yellow can present more than one phase of Pb2Sb2O7 with slightly
different unit cells, which seems to depend on the ratio of Pb and Sb.
With respect to lead-tin-antimony yellow, small amounts of SnO2 are always
found in the final compound1,9,10 because of incomplete reaction of the starting
materials. It seems that calcination temperature (680-1000°C) together with the
proportions between the base oxides (PbO, SnO2 and Sb2O3) are very important
parameters to determine the composition of the pigment obtained. To produce a final
compound containing for the most part pyrochlore Pb2SnSbO6.5 and only a negligible
quantity of SnO2, the molar ratios of the reagents needs to be Pb:Sn:Sb = 2:1:1. A
variation in the stoechiometry of the base oxides will lead to a heterogeneous
pigment powder mixed with other compounds.
10
1.3 Degradation of the pigments
A pigment is define as an insoluble coloring substance which, mixed with an
aqueous or oily media, is able to impart color to objects through a covering layer.
Pigments are mainly inorganic materials, with the exception of lake pigments
(organic); they can be natural, if coming from minerals and earths, or synthetic, if
man-made by chemical processes.
Pigments have a wide variety of characteristics and properties but there is one
thing almost all of them have in common: they degrade over time. Degradation occurs
in very different ways involving chemical and physical processes, often combined
together. Considering that color is probably the most important property in a art
object, especially in paintings, many researchers focused their attention on pigment
degradation. What it is perceive as a change in the color properties (fading,
discoloration, darkening) corresponds most of the time to a specific
chemical/physical process (a change in the crystalline structure, a
reduction/oxidation process, formation of new compounds etc.). It is not always easy
to study and understand degradation phenomena, most of the time because the
number of parameters implicated it’s huge (light, moisture, binding medium,
interaction between incompatible pigments, influence of particulate matter...) and the
effect is synergetic.
Studies on pigment degradation usually focus on chemical analysis of historical
paint samples and monitoring studies of model samples aged under specific
conditions17. In order to do so, XRD, SEM-EDX, FTIR and Raman spectroscopy are
some of the classical techniques employed. More advanced methods based on X-rays
synchrotron radiation have recently permitted a better insight in the alteration
mechanism of some pigments such as vermillion, Prussian blue, smalt, cadmium
yellow and lead chromate18. Recent studies19,20,21,22 focused their attention on light-
induced pigment degradation using also a new approach based on
(photo)electrochemical methods. In particular some semiconductor pigments were
investigated considering the potential synergistic effect of light exposure and
particulate matter (PM). Indeed, in the last years, the impact of the air quality inside
museum on complex objects of cultural relevance has raised interest and factors like
11
illumination conditions, inorganic pollutants, and volatile organic compounds have
been studied23.
1.3.1 Pb-based pigments degradation
In general lead-based pigments can be affected by sulfur containing pollutants,
acid solutions (rain, CO2, microbial activity) and light, leading to a wide variety of
degradation products, such as PbSO4, PbCO3, 2PbCO3∙Pb(OH)2 and PbS, that strongly
affect the pigments appearance. Some lead-based pigments (lead-white, massicot, red
lead) and their degradation products are sensitive to light and a reduction of the lead
compounds occurs on the surface of artworks with the formation of metallic lead
and/or PbO2, or, in the case of red lead a darkening can be observed (lead(IV) oxide).
All lead pigments are reported to turn black after exposure to H2S vapors due to the
formation of PbS23.
Organic pollutants, such as acetic acid and formic acid, often present in museums,
can also affect Pb-based pigments as pointed out in a recent study by De Laet et al.
that shows how red lead, lead white and lead-tin yellow degraded towards lead
acetate after exposure to acetic acid vapors24.
Lead pigments are known to be good driers in oil paintings and they were
sometimes added intentionally in mixture with other pigments as siccatives in order
to guarantee a better polymerization of the oil. On the other hand lead pigments,
when in contact with oil, are also known to form lead soaps (metal ions + fatty acids),
which negatively affect the appearance of the paintings. Higgitt et al. report that the
formation of lead soaps is related to the presence of available Pb(II) ions in the
pigment mixed with the oil25.
1.3.2 What is known about the degradation of Pb2Sb2O7 and Pb2SbSnO6.5?
Little is known about the degradation of Naples yellow and no references were
found about lead-tin-antimony yellow. Coccato et al. report that Naples yellow is
known to degrade but they do not consider the pigment in the cited study23. In
Analytical Chemistry for Cultural Heritage the degradation of Naples yellow is also
mentioned, however is not later expalined26. In the section about lead antimonate
yellow in Artists’ pigments3, Naples yellow is described as alkali-fast, insoluble in
12
organic solvents and because of the presence of lead darkened by atmospheric
hydrogen sulfide. Concerning the pigment-medium interaction two specific cases
about Naples yellow are found in literature : (1) Keune et al.27 described the presence
of lead soaps in naturally and artificially aged Naples yellow-containing linseed oil
paint samples, while (2) Tumosa et al. 28 reported a study by Van der Weerd29
showing, in presence of Naples yellow, the hydrolysis of the oil as well as lead soaps
formation by means of FTIR.
There is an interesting issue about Naples yellow being affected by contact with
iron, well summed up by Wainwright et al. in Artists’ pigments3. The authors report
that in 1764 Dossie voiced the belief that the use of a metal palette knife might cause
the discoloration of lead antimonate. Field (1835) adds that not only metal palette
knife are dangerous for Naples yellow but also warns about mixing this pigment with
any iron-containing pigments such as ochre or Prussian blue30. Later authors (Stokier,
Church, Doerner) remarked that lead antimonate yellow is affected by iron, but they
also report that the mixture with iron-containing pigments does not have any effect.
Specifically Church (1915) reports that:
“true Naples yellow is undoubtedly spoilt by contact with a steel spatula,
because the metal of the latter takes away oxygen from, or ' reduces ' the lead
antimonate of which the former consists. But such an action is impossible
with yellow ochre, for this iron compound is a stable substance, containing
already all the oxygen it can take up” and again “Naples yellow, in contact with
metallic iron, tin, pewter, zinc, and several other metals, is discoloured and
blackened. An ivory instead of a steel spatula, or palette knife, should be used
with this pigment. The darkening in question is due in part to attrition, owing
to the extreme hardness of the particles of the lead antimoniate, however
finely the material may have been ground, and partly to the reducing effect of
the above-named metals upon this antimoniate. Iron in the form of its oxide
or hydrate (as in light red or yellow ochre), or in complex combinations (such
as Prussian blue), does not exert any effect upon Naples yellow.” 31e
Wainwright et al. hypothesized that the changing to gray or grayish green is due
to residual chlorides or other impurites reacting with iron and forming iron chloride
or other compounds3. Interestingly, even nowadays, the producer of the lead
antimonate used for this study (Chap.3 - 3.1 Samples) declares that Naples yellow
“because it tends to react when parsed with steel rollers, to this day” he “still grind it
with stone”32.
13
According to Church31 Naples yellow is darkened by Cadmium yellow and it is
affected or it affects organic pigments such as Indian yellow and red lakes. Moreover
lead antimonate yellow is reported to be unstable in contact with Barium yellow in
fresco3.
14
2. Aims of the thesis
The aim of this thesis is the evaluation of the stability under different aging
conditions of Naples yellow (Pb2Sb2O7 – LAY) and the less known lead-tin-antimony
yellow (Pb2SbSnO6.5 - LTAY) pigments. In the last years a renewed interest on the
production and identification of these pigments raised from the scientific community,
but still little is known about their degradation.
The first goal was to gather a good knowledge of the elemental composition and
crystalline structure of the pigments, necessary before proceeding with degradation
studies. Therefore, in order to achieve a complete characterization of the pigments, X-
ray fluorescence (XRF), µ-Raman spectroscopy (µ-RS) and X-ray diffraction (XRD)
were employed. In addition colorimetric measurements were carried out to describe
the hue of the pigments used in this work.
The ultimate aim of this thesis, was to study the behaviour of the two pigments
under different aging conditions. The starting point was to evaluate the pigments
sensitivity to light. Since recent studies pointed out that some inorganic yellow
pigments, such as cadmium yellow and chrome yellow, act like semiconducting
materials, hence sensitive to light, the aim was to study if Naples yellow and lead-tin-
antimony yellow might also have the same properties. In order to do so a new
approach based on DR-UV-Vis spectroscopy and photo-electrochemical methods was
employed. In addition, experiments using lights at different wavelengths (green
514.5nm, blue 405 nm, UV ~300nm) were carried out. µ-RS and colorimetry were
used to monitor the eventual light-induced degradation.
The second part of this thesis was aimed to investigate the chemical stability of
the two yellow pigments. Two common organic pollutants (acetic acid and formic
acid) in museum environments were chosen for an initial study, the aim is also to
verify if under exposure to their vapors tin might have an influence in the eventual
degradation process, as recently noticed in literature for Pb-Sb-Sn alloys.
After these tests, samples and eventual degradation products were
characterized with µ-Raman spectroscopy, XRD and SEM-EDX. A possible color
change was evaluated by colorimetric measurements.
15
3. Materials and methods
3.1 Samples
For this study, two pigment powders and one commercial oil paint were used.
The Naples yellow and lead-tin-antimony yellow pigments were produced at the
Department of cultural heritage sciences of the University of Tuscia (Viterbo, Italy),
according to the following recipes.
Naples yellow, Pb2Sb2O7, (LAY) was synthesized according to an ancient recipe
by Piccolpasso in Li tre libri dell’arte del vasaio (Zallolino A):
Lead(II,IV) oxide (minium), Pb3O4 = 4,91 g
Antimony oxide, Sb2O3 = 3,27 g
Potassium tartrate (wine residue), C4H4K2O6 = 2,76 g
Sodium chloride, NaCl = 2,76 g
The reagents were mixed in a agate mortar and the obtained powder was put in the
kiln on a terracotta tile for 5 hours at 800 °C.
Lead-tin-antimony yellow (LTAY) was synthesized according to the
stoichiometric ratio of the chemical elements in the final compound (Pb 2SnSbO6.5):
Lead monoxide (litharge), PbO = 8,90 g
Antimony oxide, Sb2O3 = 2,90 g
Tin dioxide (cassiterite), SnO2 = 3,00 g
The reagents were mixed in a agate mortar and the obtained powder was put in a kiln
on a terracotta tile for 5 hours at 925 °C.
The commercial oil paint (NG) belongs to the series Michael Harding’s artists oil
colors35 and it is named Genuine Naples Yellow dark (No.606). As reported in the
website the paint is supposed to contain a “genuine pigment” mixed with a very low
quantity of linseed oil. The pigment is indicated as PY 41, corresponding to lead
antimonate in the Color Index (Fig.5).
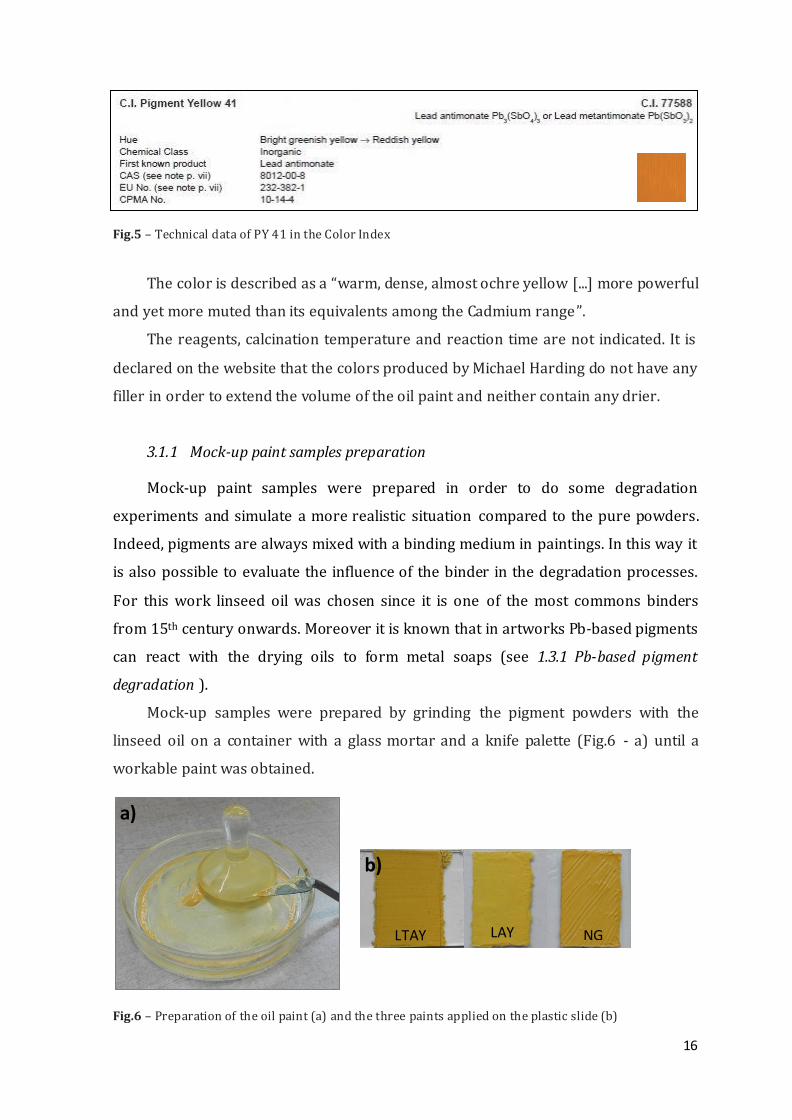
16
Fig.5 – Technical data of PY 41 in the Color Index
The color is described as a “warm, dense, almost ochre yellow [...] more powerful
and yet more muted than its equivalents among the Cadmium range”.
The reagents, calcination temperature and reaction time are not indicated. It is
declared on the website that the colors produced by Michael Harding do not have any
filler in order to extend the volume of the oil paint and neither contain any drier.
3.1.1 Mock-up paint samples preparation
Mock-up paint samples were prepared in order to do some degradation
experiments and simulate a more realistic situation compared to the pure powders.
Indeed, pigments are always mixed with a binding medium in paintings. In this way it
is also possible to evaluate the influence of the binder in the degradation processes.
For this work linseed oil was chosen since it is one of the most commons binders
from 15th century onwards. Moreover it is known that in artworks Pb-based pigments
can react with the drying oils to form metal soaps (see 1.3.1 Pb-based pigment
degradation ).
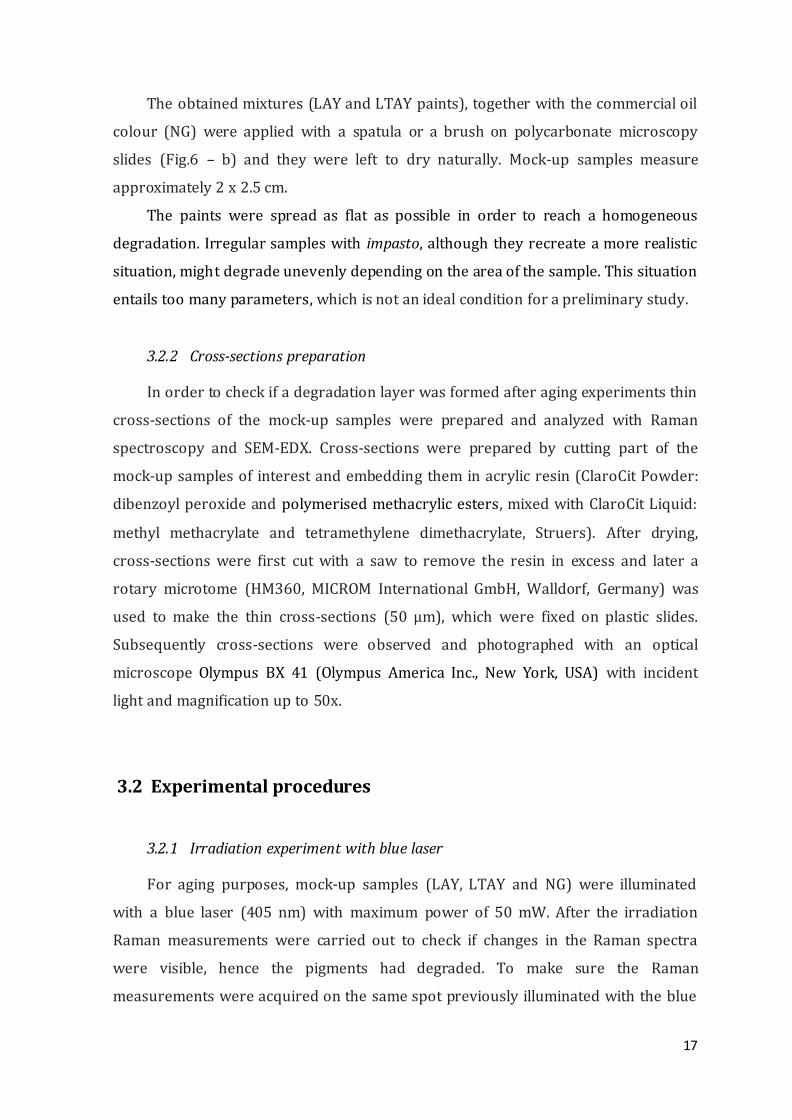
Mock-up samples were prepared by grinding the pigment powders with the
linseed oil on a container with a glass mortar and a knife palette (Fig.6 - a) until a
workable paint was obtained.
Fig.6 – Preparation of the oil paint (a) and the three paints applied on the plastic slide (b)
LTAY LAY NG
b)
a)
17
The obtained mixtures (LAY and LTAY paints), together with the commercial oil
colour (NG) were applied with a spatula or a brush on polycarbonate microscopy
slides (Fig.6 – b) and they were left to dry naturally. Mock-up samples measure
approximately 2 x 2.5 cm.
The paints were spread as flat as possible in order to reach a homogeneous
degradation. Irregular samples with impasto, although they recreate a more realistic
situation, might degrade unevenly depending on the area of the sample. This situation
entails too many parameters, which is not an ideal condition for a preliminary study.
3.2.2 Cross-sections preparation
In order to check if a degradation layer was formed after aging experiments thin
cross-sections of the mock-up samples were prepared and analyzed with Raman
spectroscopy and SEM-EDX. Cross-sections were prepared by cutting part of the
mock-up samples of interest and embedding them in acrylic resin (ClaroCit Powder:
dibenzoyl peroxide and polymerised methacrylic esters, mixed with ClaroCit Liquid:
methyl methacrylate and tetramethylene dimethacrylate, Struers). After drying,
cross-sections were first cut with a saw to remove the resin in excess and later a
rotary microtome (HM360, MICROM International GmbH, Walldorf, Germany) was
used to make the thin cross-sections (50 µm), which were fixed on plastic slides.
Subsequently cross-sections were observed and photographed with an optical
microscope Olympus BX 41 (Olympus America Inc., New York, USA) with incident
light and magnification up to 50x.
3.2 Experimental procedures
3.2.1 Irradiation experiment with blue laser
For aging purposes, mock-up samples (LAY, LTAY and NG) were illuminated
with a blue laser (405 nm) with maximum power of 50 mW. After the irradiation
Raman measurements were carried out to check if changes in the Raman spectra
were visible, hence the pigments had degraded. To make sure the Raman
measurements were acquired on the same spot previously illuminated with the blue
18
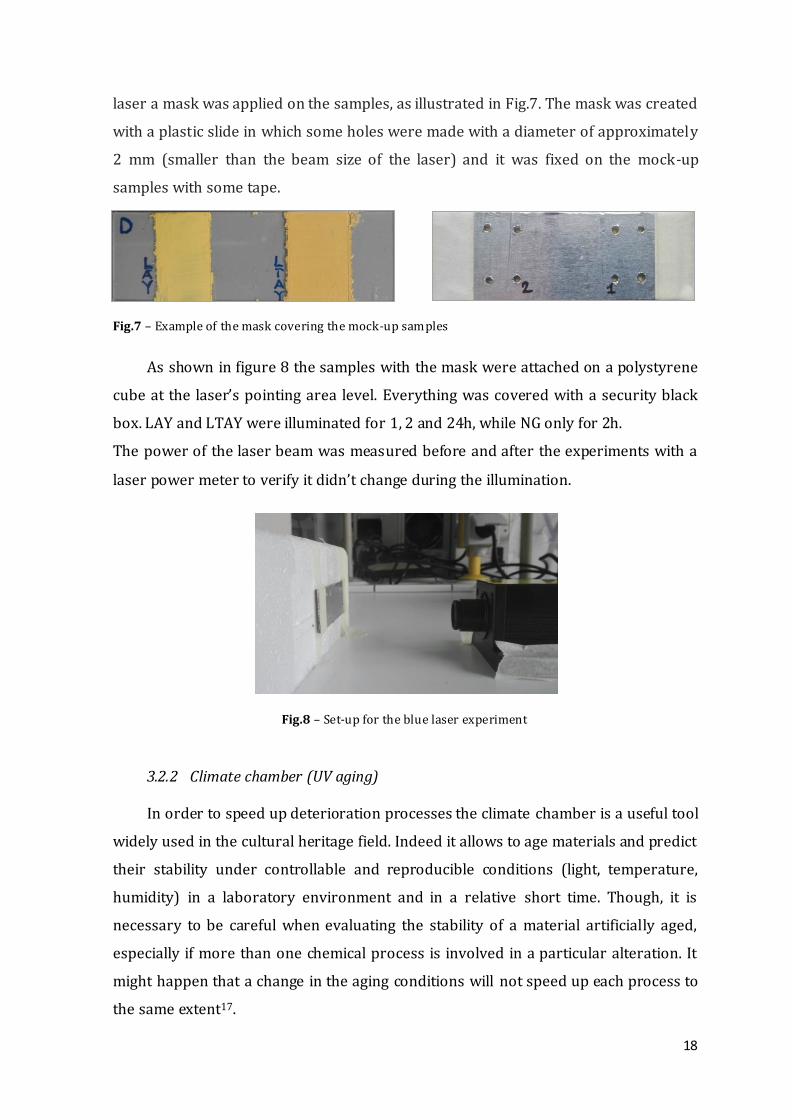
laser a mask was applied on the samples, as illustrated in Fig.7. The mask was created
with a plastic slide in which some holes were made with a diameter of approximately
2 mm (smaller than the beam size of the laser) and it was fixed on the mock-up
samples with some tape.
Fig.7 – Example of the mask covering the mock-up samples
As shown in figure 8 the samples with the mask were attached on a polystyrene
cube at the laser’s pointing area level. Everything was covered with a security black
box. LAY and LTAY were illuminated for 1, 2 and 24h, while NG only for 2h.
The power of the laser beam was measured before and after the experiments with a
laser power meter to verify it didn’t change during the illumination.
Fig.8 – Set-up for the blue laser experiment
3.2.2 Climate chamber (UV aging)
In order to speed up deterioration processes the climate chamber is a useful tool
widely used in the cultural heritage field. Indeed it allows to age materials and predict
their stability under controllable and reproducible conditions (light, temperature,
humidity) in a laboratory environment and in a relative short time. Though, it is
necessary to be careful when evaluating the stability of a material artificially aged,
especially if more than one chemical process is involved in a particular alteration. It
might happen that a change in the aging conditions will not speed up each process to
the same extent17.
19
The climate chamber used to age the mock-up paint samples of LAY, LTAY and
NG had only a UV light (530 W/m2) and a temperature of around 30°. No humidity
was involved. The samples were aged for 1000h.
3.2.3 Chemical aging
In order to investigate the chemical stability of the pigments, preliminary
experiments with acetic (CH3COOH) and formic (HCOOH) acid were carried out. To
expose the pigment powders and mock-up samples to the acids vapors, samples were
placed in a dessicator that allowed to maintain a controlled environment.
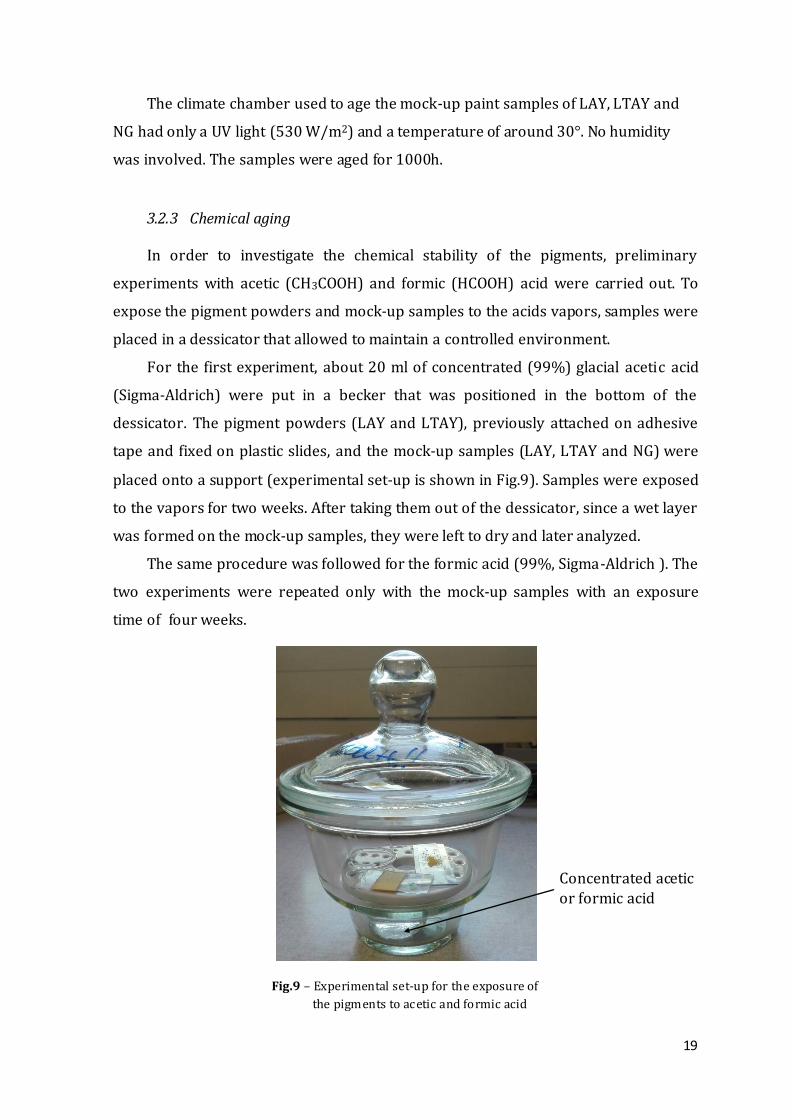
For the first experiment, about 20 ml of concentrated (99%) glacial acetic acid
(Sigma-Aldrich) were put in a becker that was positioned in the bottom of the
dessicator. The pigment powders (LAY and LTAY), previously attached on adhesive
tape and fixed on plastic slides, and the mock-up samples (LAY, LTAY and NG) were
placed onto a support (experimental set-up is shown in Fig.9). Samples were exposed
to the vapors for two weeks. After taking them out of the dessicator, since a wet layer
was formed on the mock-up samples, they were left to dry and later analyzed.
The same procedure was followed for the formic acid (99%, Sigma-Aldrich ). The
two experiments were repeated only with the mock-up samples with an exposure
time of four weeks.
Fig.9 – Experimental set-up for the exposure of
the pigments to acetic and formic acid
Concentrated acetic or formic acid
20
3.3 Analytical techniques
3.3.1 Micro-Raman Spectroscopy (µ-RS)
Micro-Raman spectroscopy is a molecular analytical technique that relies on
inelastic scattering, or Raman scattering, of monochromatic light. When
monochromatic light, usually from a laser, interacts with the sample, molecules are
excited into a “virtual” state, highly unstable, decaying instantaneously and emitting
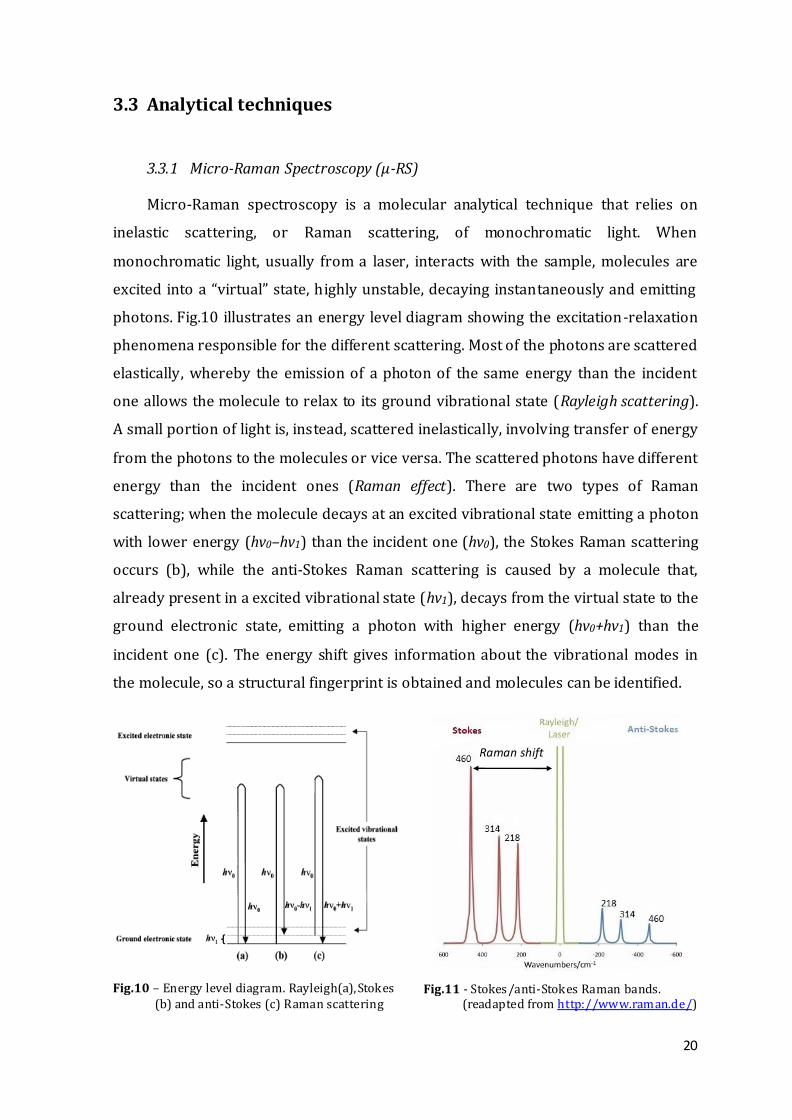
photons. Fig.10 illustrates an energy level diagram showing the excitation-relaxation
phenomena responsible for the different scattering. Most of the photons are scattered
elastically, whereby the emission of a photon of the same energy than the incident
one allows the molecule to relax to its ground vibrational state (Rayleigh scattering).
A small portion of light is, instead, scattered inelastically, involving transfer of energy
from the photons to the molecules or vice versa. The scattered photons have different
energy than the incident ones (Raman effect). There are two types of Raman
scattering; when the molecule decays at an excited vibrational state emitting a photon
with lower energy (hv0–hv1) than the incident one (hv0), the Stokes Raman scattering
occurs (b), while the anti-Stokes Raman scattering is caused by a molecule that,
already present in a excited vibrational state (hv1), decays from the virtual state to the
ground electronic state, emitting a photon with higher energy (hv0+hv1) than the
incident one (c). The energy shift gives information about the vibrational modes in
the molecule, so a structural fingerprint is obtained and molecules can be identified.
Fig.10 – Energy level diagram. Rayleigh(a),Stokes (b) and anti-Stokes (c) Raman scattering
Raman shift
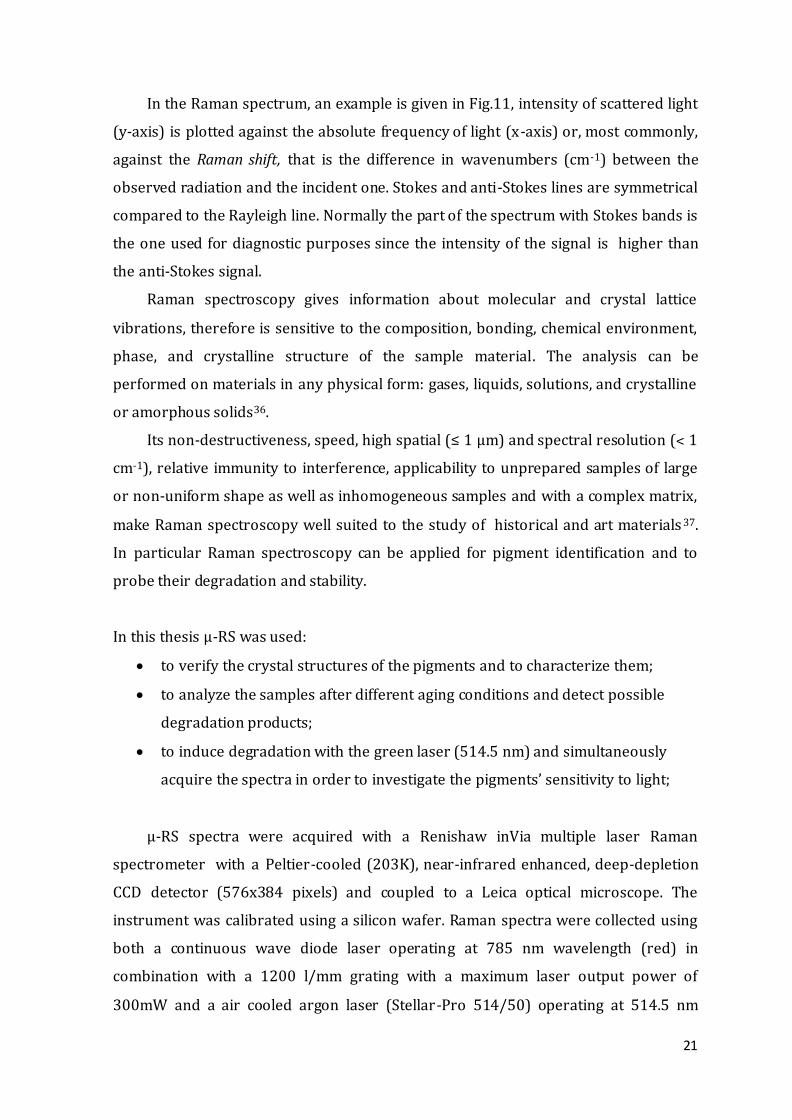
Fig.11 - Stokes/anti-Stokes Raman bands. (readapted from http://www.raman.de/)
21
In the Raman spectrum, an example is given in Fig.11, intensity of scattered light
(y-axis) is plotted against the absolute frequency of light (x-axis) or, most commonly,
against the Raman shift, that is the difference in wavenumbers (cm-1) between the
observed radiation and the incident one. Stokes and anti-Stokes lines are symmetrical
compared to the Rayleigh line. Normally the part of the spectrum with Stokes bands is
the one used for diagnostic purposes since the intensity of the signal is higher than
the anti-Stokes signal.
Raman spectroscopy gives information about molecular and crystal lattice
vibrations, therefore is sensitive to the composition, bonding, chemical environment,
phase, and crystalline structure of the sample material. The analysis can be
performed on materials in any physical form: gases, liquids, solutions, and crystalline
or amorphous solids36.
Its non-destructiveness, speed, high spatial (≤ 1 µm) and spectral resolution (˂ 1
cm-1), relative immunity to interference, applicability to unprepared samples of large
or non-uniform shape as well as inhomogeneous samples and with a complex matrix,
make Raman spectroscopy well suited to the study of historical and art materials 37.
In particular Raman spectroscopy can be applied for pigment identification and to
probe their degradation and stability.
In this thesis µ-RS was used:
to verify the crystal structures of the pigments and to characterize them;
to analyze the samples after different aging conditions and detect possible
degradation products;
to induce degradation with the green laser (514.5 nm) and simultaneously
acquire the spectra in order to investigate the pigments’ sensitivity to light;
µ-RS spectra were acquired with a Renishaw inVia multiple laser Raman
spectrometer with a Peltier-cooled (203K), near-infrared enhanced, deep-depletion
CCD detector (576x384 pixels) and coupled to a Leica optical microscope. The
instrument was calibrated using a silicon wafer. Raman spectra were collected using
both a continuous wave diode laser operating at 785 nm wavelength (red) in
combination with a 1200 l/mm grating with a maximum laser output power of
300mW and a air cooled argon laser (Stellar-Pro 514/50) operating at 514.5 nm
22
wavelength (green) in combination with a 1800 l/mm grating with a maximum laser
output power of 50mW. The laser was focused onto the samples through 50x
objective achieving a spatial resolution of a few micrometers. Depending on the
sample analyzed, the laser (red or green) and the power were changed. Precise
parameters are given when discussing the spectra. Exposure time varied between 10
and 60 seconds with 1 up to 10 accumulations to obtain an adequate signal-to-noise
ratio. Measurements were repeated from 5 up to 10 times for each sample. Data
acquisition was carried out with Renishaw WiRE 2.0 software.
3.3.2 Diffuse Reflectance UV-Vis Spectroscopy (DR-UV-Vis)
Diffuse reflectance UV-Vis spectroscopy is one of the most employed optical
methods to calculate the band gap. In the absorption spectrum, at a given wavelength,
there is an increase in the absorbance that indicates the optical excitation of the
electrons from the valence band to the conduction band38. The linear section in the
diffuse reflectance spectra is taken for measuring the band gap energy; by
extrapolating the linear portion of the absorption curve with the wavelength axis, the
absorption wavelength is deduced and converted to the band gap energy19,21. To
calculate the band gap energy (Eg) the following equation is used:
where (h) is the Planck’s constant = 6.626 x 10⁻³⁴ J∙s = 4,136 x 10-15 eV∙s and (c) the
velocity of light = 3 x 10⁸ m/s. The equation can be re-written as:
DR-UV-Vis spectroscopy was used to obtain absorption spectra in order to
determine the band gap energy of the pigment powders.
DR-UV-Vis measurements of Naples yellow and lead-tin-antimony yellow were
carried out with an Evolution 500 UV-Vis double-beam spectrophotometer with RSA-
UC-40 DR-UV integrated sphere, Thermo Electron Corporation, Waltham,
Massachusetts. The pigment powders were mixed and crushed with KBr dried at
200°C (0.02 g of pigment powders in 0.98 g KBr). The mixtures were homogeneous
23
and positioned in the DR-UV-Vis cell for measuring in the 250 to 800 nm range. The
measurements were carried out in collaboration with the LADCA research group
(University of Antwerp, Department of Chemistry).
3.3.3 Photo-electrochemistry
The aim of this experiment was to check if the pigments (LAY and LTAY),
develop a photo-current under irradiation of a laser, hence they were reactive to
light . In order to do so, potentiometry (OCP) and amperometry (with the use of a
laser) were employed.
Potentiometry is a non-dynamic electrochemical method in which the potential
is monitored in function of time. Amperometry is instead a dynamic electro chemical
method that measures the current in function of time at a imposed potential. Details
on the measurements are given below.
Electrochemical set-up
Graphite rods working electrodes were prepared by mechanical polishing with a
P800 SiC paper. The electrodes were rinsed with deionised water and ethanol in an
ultrasonic bath for 15 s each to remove any adherent SiC particle. In order to deposit
the pigments on the working electrode, suspensions of 50 mg of LAY or LTAY pigment
powder in 1 mL of ethanol were prepared. With a micropipette a drop of 1.5 µL of the
suspension was deposited on the working electrode and left to dry. A thin layer of the
respective pigment was formed after solvent evaporation. The modified electrodes
are denoted as G|Pb2Sb2O7 and G|Pb2SbSnO6.5, referring to the electrode material
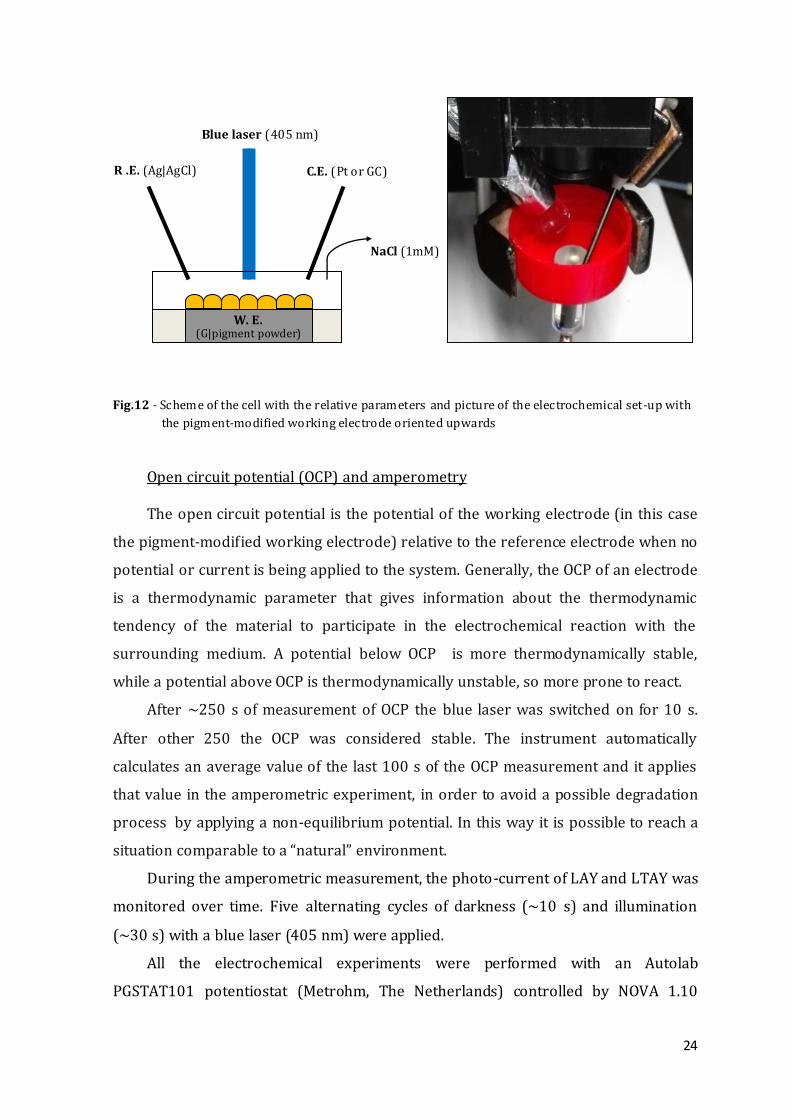
followed by the respective pigment. As illustrated in Fig.12 the working electrode
(W.E.) was mounted in an open container with the pigment-modified side oriented
upwards, so that pigment irradiation with a 30 mW blue laser (405 nm) pointing
downward was possible. The container was subsequently filled with 6mL of
electrolyte solution (1 mM NaCl). A silver-silver chloride (Ag|AgCl) in saturated KCl
electrode was used as reference electrode (R.E.) and was protected from light
illumination by covering it with aluminum foil. To complete the electrochemical cell a
glassy carbon rod (GC) or platinum electrode (Pt) were used as counter electrodes
(C.E).
24
Fig.12 - Scheme of the cell with the relative parameters and picture of the electrochemical set-up with
the pigment-modified working electrode oriented upwards
Open circuit potential (OCP) and amperometry
The open circuit potential is the potential of the working electrode (in this case
the pigment-modified working electrode) relative to the reference electrode when no
potential or current is being applied to the system. Generally, the OCP of an electrode
is a thermodynamic parameter that gives information about the thermodynamic
tendency of the material to participate in the electrochemical reaction with the
surrounding medium. A potential below OCP is more thermodynamically stable,
while a potential above OCP is thermodynamically unstable, so more prone to react.
After ~250 s of measurement of OCP the blue laser was switched on for 10 s.
After other 250 the OCP was considered stable. The instrument automatically
calculates an average value of the last 100 s of the OCP measurement and it applies
that value in the amperometric experiment, in order to avoid a possible degradation
process by applying a non-equilibrium potential. In this way it is possible to reach a
situation comparable to a “natural” environment.
During the amperometric measurement, the photo-current of LAY and LTAY was
monitored over time. Five alternating cycles of darkness (~10 s) and illumination
(~30 s) with a blue laser (405 nm) were applied.
All the electrochemical experiments were performed with an Autolab
PGSTAT101 potentiostat (Metrohm, The Netherlands) controlled by NOVA 1.10
Blue laser (405 nm)
R .E. (Ag|AgCl) C.E. (Pt or GC)
W. E. (G|pigment powder)
NaCl (1mM)
25
software.
No photo-electrochemical experiments were performed on the commercial
Naples Yellow (NG) since the binding medium contained in it would have probably
interfered in the measurements.
3.3.4 X-Ray Fluorescence (XRF)
XRF analysis is an non-destructive technique of semi-quantitative elemental
analysis based on the detection of the X-ray fluorescence emitted by a sample being
irradiated by an energetic beam of primary X-rays. The energy of the fluorescent
photons is the difference in energy between the vacancy, that is the result of the
ionization process, and the electronic state of the electron filling the vacancy 29. The
characteristic radiation emitted by the ionized atoms contains information on the
nature and the abundance of the elements in the sample; specifically in the XRF
spectrum the energy is connected to the nature of the elements present in the sample,
while the intensity (counts) is connected to their abundance39.
XRF was used to verify the elemental composition of the pigments, especially for
the NG sample since, being a commercial paint, the composition was uncertain.
XRF spectra were acquired with a Minipal-2 (Panalytical) spectrometer , which
is equipped with a low power, air-cooled Rh-anode X-ray tube and a Si-PIN detector.
The Minipal-2 has a maximum power, current and voltage of respectively 9W, 1000
µA and 30 kV. All samples were measured with a live time of 1000 s by applying a
voltage of 30 kV and current of 3 µA and using a 50 µm Al filter between the X-ray
tube and the sample. All spectra were analysed using the bAXIL software package
(BrightSpec).
3.3.5 Colorimetry
Colorimetry quantitatively measures the reflection properties of a material as a
function of wavelength, describing in a objective and mathematical way the human
colour perception. A colorimeter can detect minimal colour changes, not perceptible
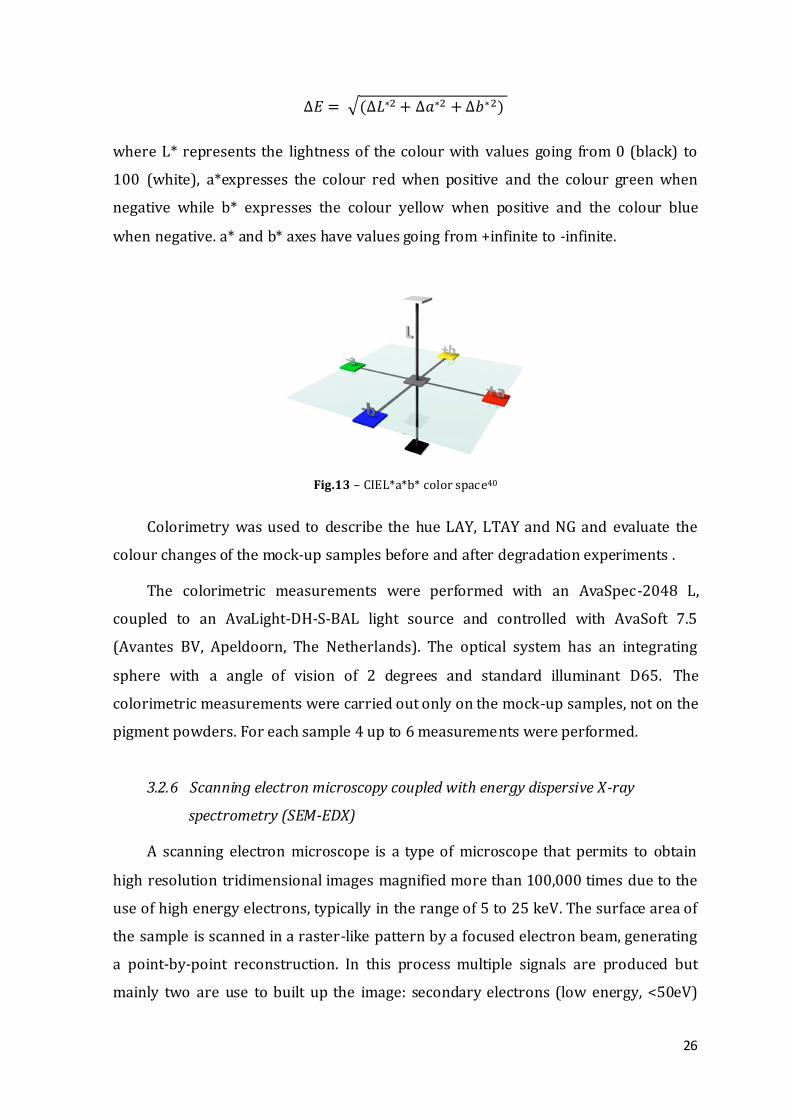
at the human eye. Colors can be represented in the CIEL*a*b* colour space, illustrated
in Fig.13, where the total colour change, ΔE, is calculated as the distance between two
points, using the following formula:
26
where L* represents the lightness of the colour with values going from 0 (black) to
100 (white), a*expresses the colour red when positive and the colour green when
negative while b* expresses the colour yellow when positive and the colour blue
when negative. a* and b* axes have values going from +infinite to -infinite.
Fig.13 – CIEL*a*b* color space40
Colorimetry was used to describe the hue LAY, LTAY and NG and evaluate the
colour changes of the mock-up samples before and after degradation experiments .
The colorimetric measurements were performed with an AvaSpec-2048 L,
coupled to an AvaLight-DH-S-BAL light source and controlled with AvaSoft 7.5
(Avantes BV, Apeldoorn, The Netherlands). The optical system has an integrating
sphere with a angle of vision of 2 degrees and standard illuminant D65. The
colorimetric measurements were carried out only on the mock-up samples, not on the
pigment powders. For each sample 4 up to 6 measurements were performed.
3.2.6 Scanning electron microscopy coupled with energy dispersive X-ray
spectrometry (SEM-EDX)
A scanning electron microscope is a type of microscope that permits to obtain
high resolution tridimensional images magnified more than 100,000 times due to the
use of high energy electrons, typically in the range of 5 to 25 keV. The surface area of
the sample is scanned in a raster-like pattern by a focused electron beam, generating
a point-by-point reconstruction. In this process multiple signals are produced but
mainly two are use to built up the image: secondary electrons (low energy, <50eV)
27
and primary electrons that are also elastically scattered by the sample material and
scattered back from the sample to the detector. The higher the atomic number of the
specimen atoms, the stronger the scattering and the more backscattered electrons
that reach the detector. While secondary electrons give information about the
morphology of the surface, backscattered electrons give information about the
variation of chemical composition in the sample. The image is built up in a grey-scale
where the brightness is function of the atomic number of the elements. The SEM used
was coupled to an X-ray detector for the acquisition of detailed elemental
information17.
SEM-EDX was used to observe the cross-sections after degradation experiments
in order to check if a degradation layer was formed. Additionally also elemental
mapping and EDX point measurements were performed.
The samples were examined with a Field Emission Gun – Environmental
Scanning Electron Microscope (FEG-ESEM) equipped with an Energy Dispersive X-
Ray (EDX) detector (FEI Quanta 250, USA; at AXES and EMAT research groups,
University of Antwerp), using an accelerating voltage of 20kV, a take-off angle of 30°,
a working distance of 10 mm and a sample chamber pressure of 10-4 Pa. Imaging was
performed based upon secondary electrons (SE), back-scattered electrons (BSE) and
characteristic X-rays (EDX). For the latter elemental distribution maps (Sample1: 50
frames, Sample 6: 102 frames) were recorded with a beam current of ~0.3 nA at a
magnification 1500x (Sample1) and 2000x (Sample6), a resolution of 512x352, and a
dwell time of 100 µs per pixel, resulting in a total scan duration between 3000 –
4000s. EDX point spectra were acquired, using a beam current of ~0.3 nA and a dwell
time of 30 s per spectrum. All the surfaces examined were previously coated with a
thin carbon layer in order to obtain a conductive surface.
3.3.7 X-ray powder diffraction (XRPD)
X-ray diffraction is a rapid analytical technique primarily used to obtain
information about the crystallographic structure of a material. XRD is based on
constructive interference of monochromatic X-rays and a crystalline sample. X-rays
are directed toward the sample with a θ angle and when conditions satisfy the
Bragg’s Law (nλ = 2d sinθ) the interaction between the incident rays and the sample
28
produces constructive interference (and a diffracted ray). The X-rays are diffracted at
specific angles from each set of lattice planes in the sample. Because each crystalline
material has a characteristic atomic structure, it will diffract X-rays in a unique
characteristic pattern. The diffraction peaks (depending from 2θ) can be converted to
d-spacing allowing the identification of the material by comparison of d-spacing
standard reference patterns41. When applied to cultural heritage artifacts, reflection-
XRPD allows the identification of crystalline pigments, and since it is a surface-
sensitive technique is useful in the detection of surface degradation products.
Initially XRD was used to characterize the pigment powders and the commercial
paint and have a better insight of their crystal structure. After degradation
experiments this technique was used on the mock-up samples in order to identify
possible degradation products.
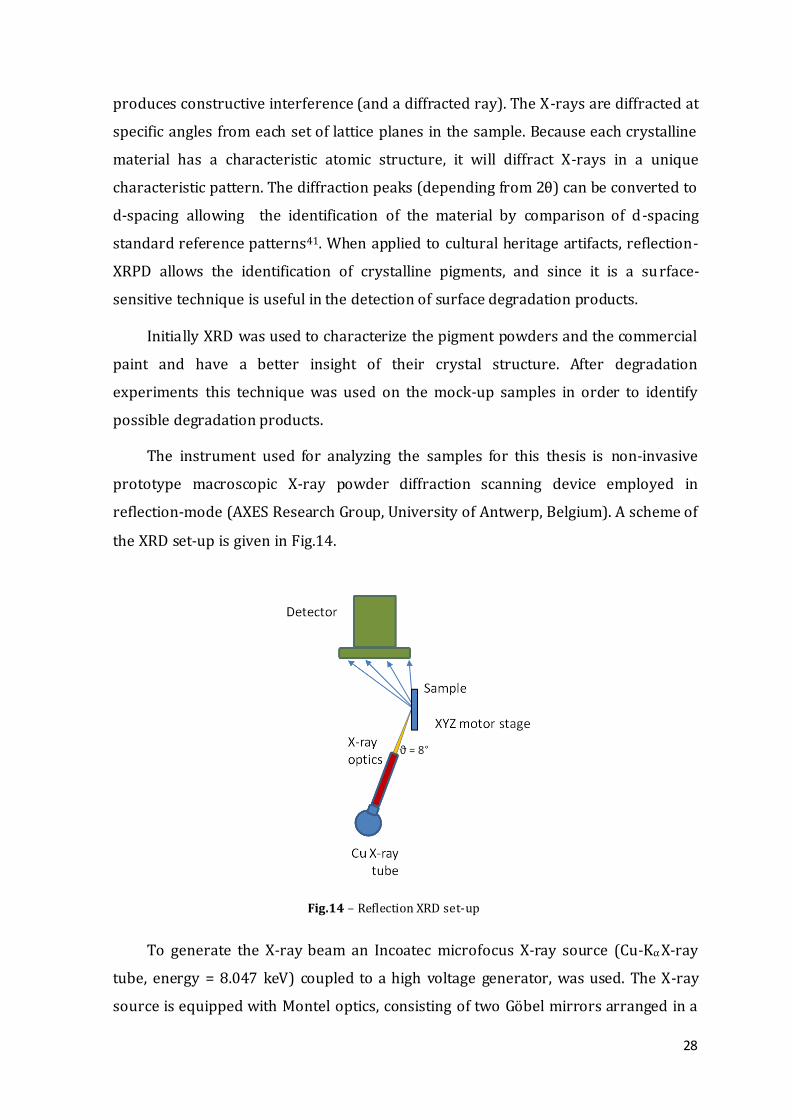
The instrument used for analyzing the samples for this thesis is non-invasive
prototype macroscopic X-ray powder diffraction scanning device employed in
reflection-mode (AXES Research Group, University of Antwerp, Belgium). A scheme of
the XRD set-up is given in Fig.14.
Fig.14 – Reflection XRD set-up
To generate the X-ray beam an Incoatec microfocus X-ray source (Cu-Kα X-ray
tube, energy = 8.047 keV) coupled to a high voltage generator, was used. The X-ray
source is equipped with Montel optics, consisting of two Göbel mirrors arranged in a
29
90° side-by-side geometry, which focuses the X-ray beam in both dimensions. The
incident angle (θ) was 8° and the spot size (h x v) 1x0.15 mm². The samples were
attached to a sample holder and mounted on top of a set of three motor stages
(Newport corp.) which allow the sample to be moved in the X, Y and Z direction.
During the scanning operation, the sample is moved in the X (maximum range: 100
mm) and Y (maximum range: 250 mm) directions, while the Z stage allows the
positioning of the focal point of the X-ray beam on the desired part of the sample. For
detection of the diffracted X-rays a Pilatus 200K (Dectris), a two-dimensional hybrid
pixel array detector (HPAD), was used.
The in-house developed software package XRDUA was used for data processing.
XRDUA provides the necessary tools for extracting crystalline-specific distributions
from the large number of 2D diffraction patterns obtained during XRPD imaging
experiments. Using reference files from the PDF-2 and COD database various
crystalline phases present in the samples could be identified. In the diffractograms
obtained the Q-space (1/nm) is a energy independent parameter where Q = 2π/d.
The instrumental parameters employed are the same for all samples:
- Voltage: 50 kV
- Current: 1 mA
- Exposure time: 10 s/pt
30
4. Results and discussion
4.1 Characterization of the pigments
In order to have a complete overview of the elemental composition and crystal
structure of the pigments studied in this thesis, µ-Raman spectroscopy, X-ray
diffraction and XRF were used. Colorimetric measurement were carried out to
describe the hue of the three colors and to monitor their color variation after
degradation experiments.
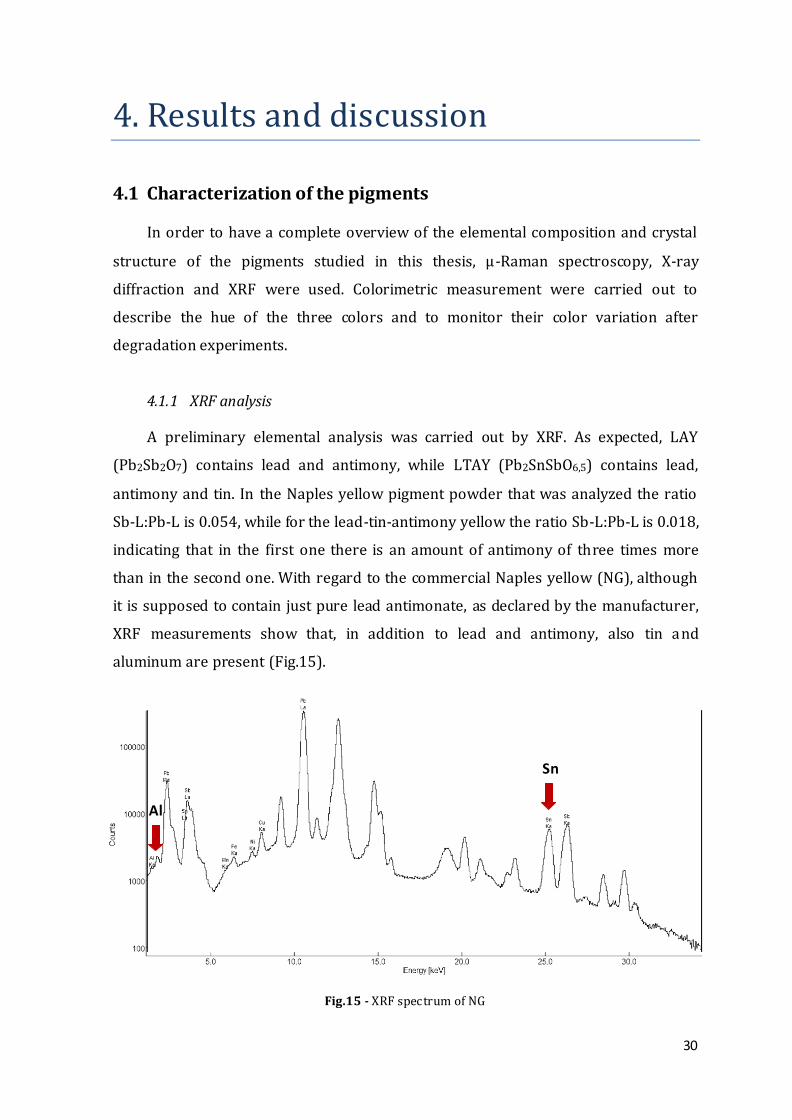
4.1.1 XRF analysis
A preliminary elemental analysis was carried out by XRF. As expected, LAY
(Pb2Sb2O7) contains lead and antimony, while LTAY (Pb2SnSbO6,5) contains lead,
antimony and tin. In the Naples yellow pigment powder that was analyzed the ratio
Sb-L:Pb-L is 0.054, while for the lead-tin-antimony yellow the ratio Sb-L:Pb-L is 0.018,
indicating that in the first one there is an amount of antimony of three times more
than in the second one. With regard to the commercial Naples yellow (NG), although
it is supposed to contain just pure lead antimonate, as declared by the manufacturer,
XRF measurements show that, in addition to lead and antimony, also tin and
aluminum are present (Fig.15).
Fig.15 - XRF spectrum of NG
Sn
Al
31
4.1.2 Raman analysis
As presented in Chapter 1 (par. 1.2.2) Naples yellow and lead-tin-antimony
yellow have a cubic pyrochlore structure with the difference that, in the latter, also tin
is present in the crystal lattice. Is known from literature11,16,42 that the introduction of
a third cation in the binary structure of lead antimonate (Pb2Sb2O7) strongly affects
the Raman vibrational spectra of this pigment due to a deformation of the pyrochlore
structure to which Raman spectroscopy is very sensitive. Indeed the two pigments
are well discernible with this technique11,42.The Raman scattering features obtained
for the three pigments considered in this study are presented in Table 1 and are in
good agreement with the ones from literature10,11, 42,43.
Table 1 - Raman bands of the analyzed pigments (red laser, λ=785 nm)
Sample Pigment Chemical formula Wavenumber (cm-1)*
LAY (powder)
Naples yellow Pb2Sb2O7
128vw, 198m, 228m, 298m(br), 348w, 394w, 504vs, 794w(br)
LTAY (powder)
Lead-tin-antimony yellow
Pb2SnSbO6,5 139vs, 298w, 337s, 450w, 508m, 775w(br)
NG (paint)
Genuine Naples yellow dark
PY41
Pb3(SbO4)3
or Pb(SbO3)2**
140vs, 302w, 342m, 459w, 507m, 755w(br)***
*vs=very strong, s=strong, m=medium, w=weak, vw=very weak, (br)=broad **as reported in the Colour Index ***bands of the binding medium are not considered
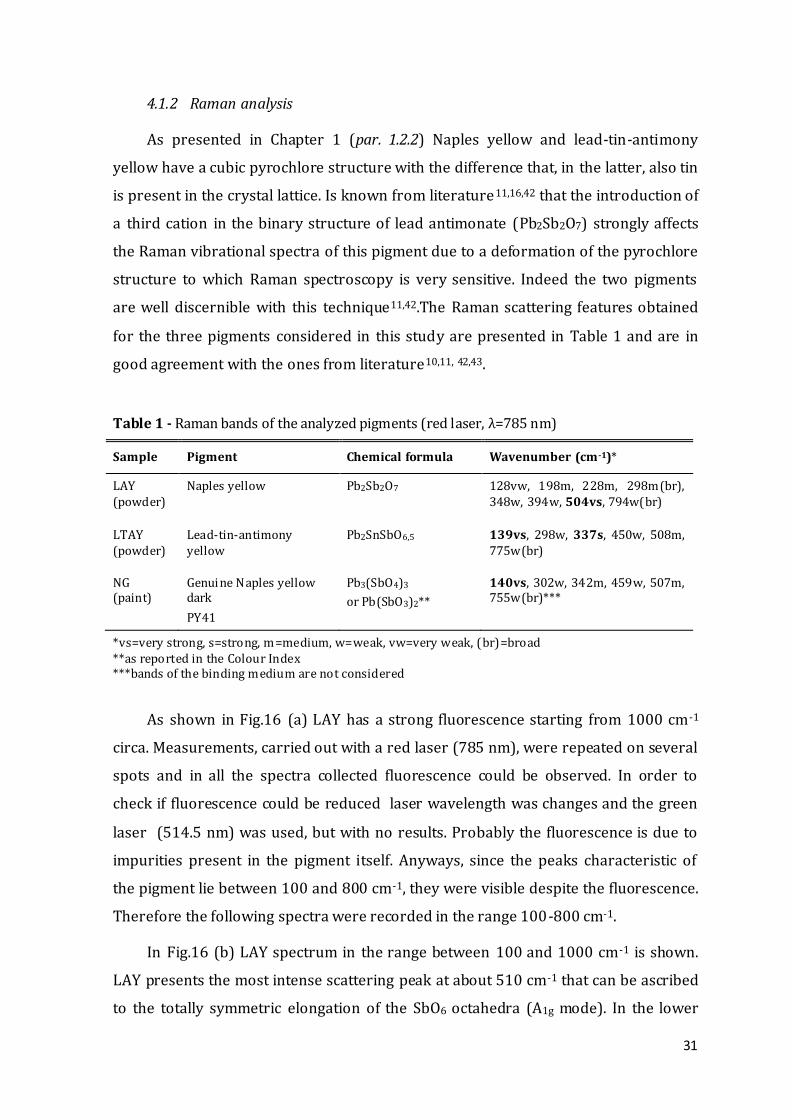
As shown in Fig.16 (a) LAY has a strong fluorescence starting from 1000 cm-1
circa. Measurements, carried out with a red laser (785 nm), were repeated on several
spots and in all the spectra collected fluorescence could be observed. In order to
check if fluorescence could be reduced laser wavelength was changes and the green
laser (514.5 nm) was used, but with no results. Probably the fluorescence is due to
impurities present in the pigment itself. Anyways, since the peaks characteristic of
the pigment lie between 100 and 800 cm-1, they were visible despite the fluorescence.
Therefore the following spectra were recorded in the range 100-800 cm-1.
In Fig.16 (b) LAY spectrum in the range between 100 and 1000 cm-1 is shown.
LAY presents the most intense scattering peak at about 510 cm-1 that can be ascribed
to the totally symmetric elongation of the SbO6 octahedra (A1g mode). In the lower
32
spectral range (100-300 cm-1) the bands are assigned to the Pb4O tetrahedral
vibrations; between 110 and 147 cm-1 a strong band attributed to a lattice Pb-O
stretching mode is expected but it’s not observed in the LAY spectrum because of the
cut-off of the instrument used. The peak visible at 298 cm-1 could be attributed to the
vibrational mode F2g while the peak at 348 cm-1 to the vibrational mode Eg, both
related to Sb-O and Pb-O bonds. The band at 794 cm-1 does not have an unequivocal
assignment11.
Fig.16 – Raman spectrum of LAY in the range 100-3200 cm-1 (a) and in the range 100-1000 cm-1 (b)
(red laser, 0,1%)
The two bands at 198 and 228 cm-1 have not been identified but, as reported by
some authors, additional bands in the Raman spectrum of lead pyroantimonates
might be related to a disorder-induced symmetry lowering due to distortion of the
SbO6 octahedra or displacement of the Pb cations11. Agresti et al.43 report that the
bands between 180 and 230 cm-1 could be ascribed to Cl-Pb-Cl bond suggesting the
formation of compounds where the two elements are associated. The possible
presence of Cl is connected to the use of NaCl as a flux agent in the calcination process.
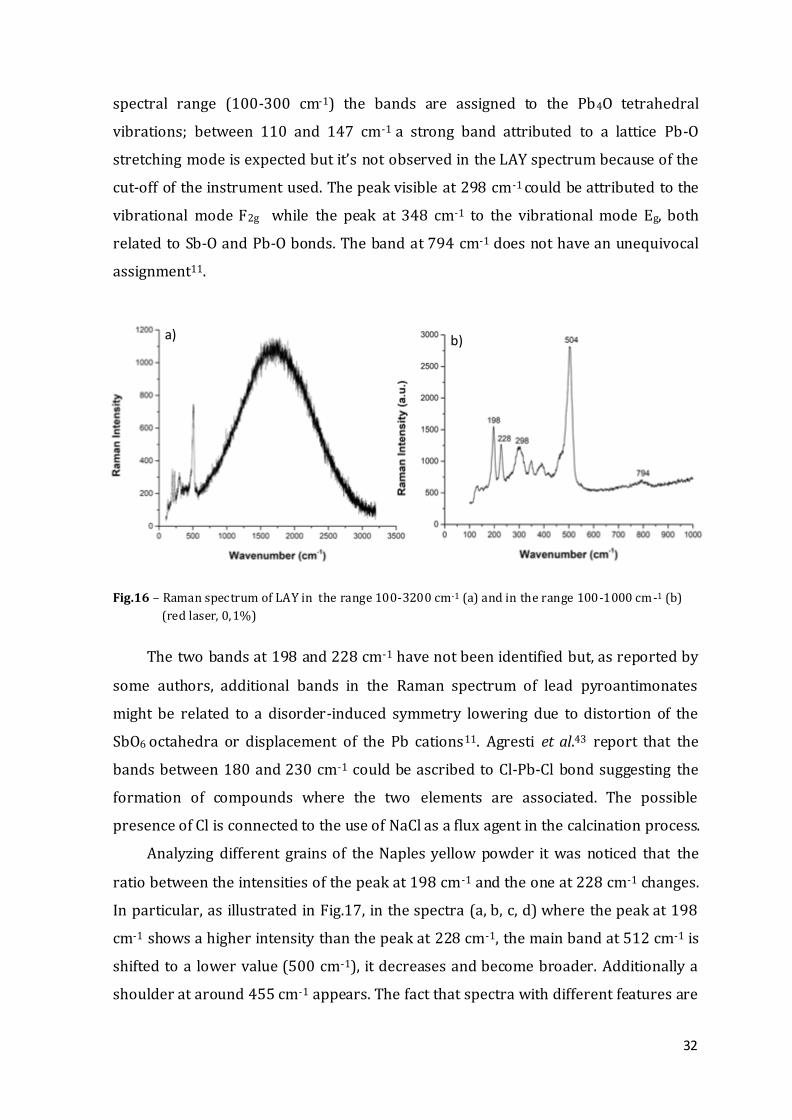
Analyzing different grains of the Naples yellow powder it was noticed that the
ratio between the intensities of the peak at 198 cm-1 and the one at 228 cm-1 changes.
In particular, as illustrated in Fig.17, in the spectra (a, b, c, d) where the peak at 198
cm-1 shows a higher intensity than the peak at 228 cm-1, the main band at 512 cm-1 is
shifted to a lower value (500 cm-1), it decreases and become broader. Additionally a
shoulder at around 455 cm-1 appears. The fact that spectra with different features are
a) b)
33
obtained from the same sample suggests that the pigment powder is not
homogeneous; two or more phases of Pb2Sb2O7 with different molar ratio of Pb and
Sb might be present. Indeed, a similar behavior was reported by Rosi et al.11 while
studying the influence of different molar ratio (Pb:Sb) in lead antimonates. They
showed that an excess of Pb entails a decrease of the peak at around 510 cm -1
combined with the increase of a peak at around 460 cm-1. So, this might be the case
also for the Naples yellow analyzed in this study (see XRD results).
Fig.17 – Micro-Raman spectra collected from different grains of the Napl es yellow powder.
Inset: enlarged view of the main band at around 510 cm -1 of spectra (h) and (d)
showing the different intensity (green laser, 0,5%)
On the contrary of Naples yellow, lead-tin-antimony yellow does not show any
difference in the spectra depending on the point of analysis and neither shows
fluorescence. Repetition of Raman measurements on different grains of LTAY
pigment powder presented the same spectral pattern, as shown in Fig.18 – b.
As discussed before, is known from literature that lead-tin-antimony yellow is
well discernible from Naples yellow with Raman spectroscopy. Indeed, in Fig.18 a
comparison between Raman spectra of Naples yellow (a) and lead-tin-antimony
34
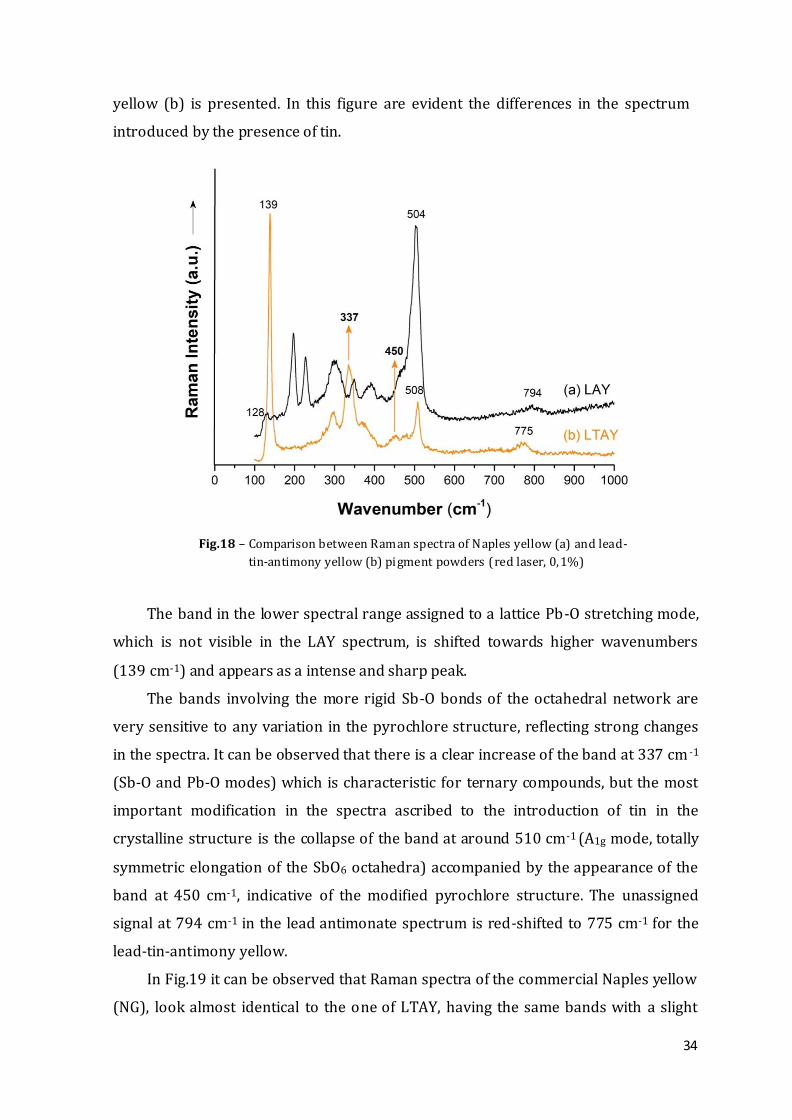
yellow (b) is presented. In this figure are evident the differences in the spectrum
introduced by the presence of tin.
Fig.18 – Comparison between Raman spectra of Naples yellow (a) and lead-
tin-antimony yellow (b) pigment powders (red laser, 0,1%)
The band in the lower spectral range assigned to a lattice Pb-O stretching mode,
which is not visible in the LAY spectrum, is shifted towards higher wavenumbers
(139 cm-1) and appears as a intense and sharp peak.
The bands involving the more rigid Sb-O bonds of the octahedral network are
very sensitive to any variation in the pyrochlore structure, reflecting strong changes
in the spectra. It can be observed that there is a clear increase of the band at 337 cm -1
(Sb-O and Pb-O modes) which is characteristic for ternary compounds, but the most
important modification in the spectra ascribed to the introduction of tin in the
crystalline structure is the collapse of the band at around 510 cm-1 (A1g mode, totally
symmetric elongation of the SbO6 octahedra) accompanied by the appearance of the
band at 450 cm-1, indicative of the modified pyrochlore structure. The unassigned
signal at 794 cm-1 in the lead antimonate spectrum is red-shifted to 775 cm-1 for the
lead-tin-antimony yellow.
In Fig.19 it can be observed that Raman spectra of the commercial Naples yellow
(NG), look almost identical to the one of LTAY, having the same bands with a slight
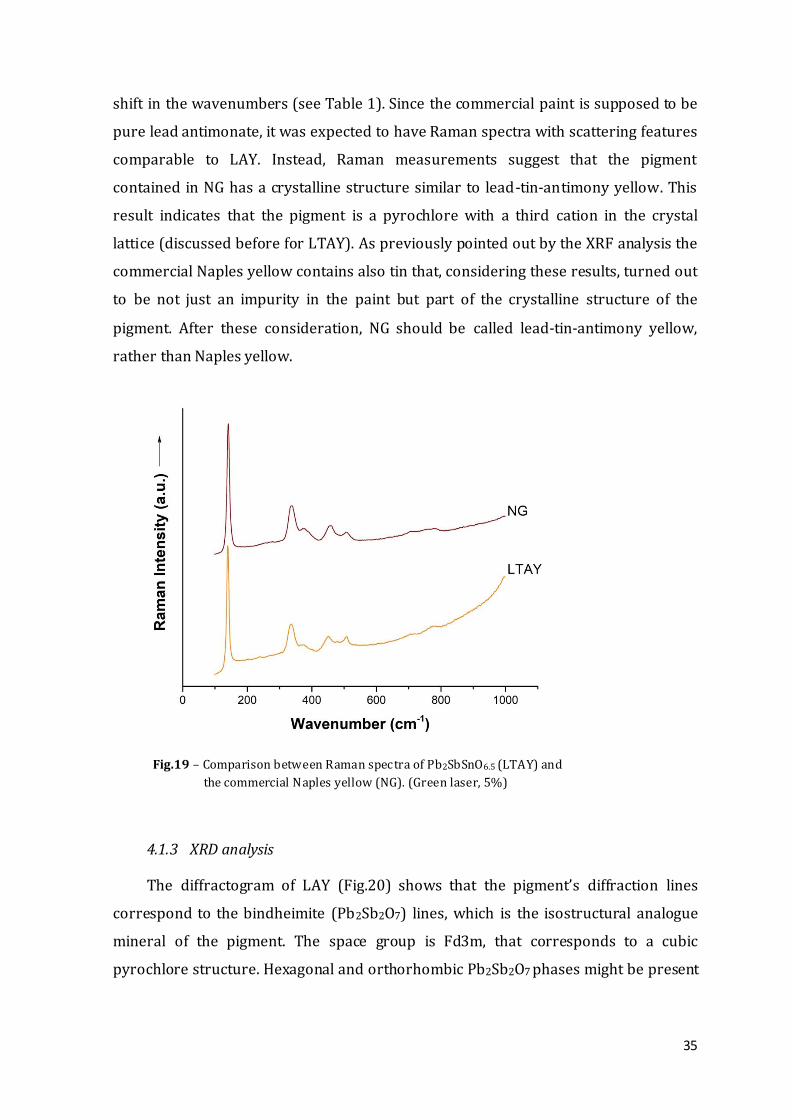
35
shift in the wavenumbers (see Table 1). Since the commercial paint is supposed to be
pure lead antimonate, it was expected to have Raman spectra with scattering features
comparable to LAY. Instead, Raman measurements suggest that the pigment
contained in NG has a crystalline structure similar to lead-tin-antimony yellow. This
result indicates that the pigment is a pyrochlore with a third cation in the crystal
lattice (discussed before for LTAY). As previously pointed out by the XRF analysis the
commercial Naples yellow contains also tin that, considering these results, turned out
to be not just an impurity in the paint but part of the crystalline structure of the
pigment. After these consideration, NG should be called lead-tin-antimony yellow,
rather than Naples yellow.
Fig.19 – Comparison between Raman spectra of Pb2SbSnO6.5 (LTAY) and
the commercial Naples yellow (NG). (Green laser, 5%)
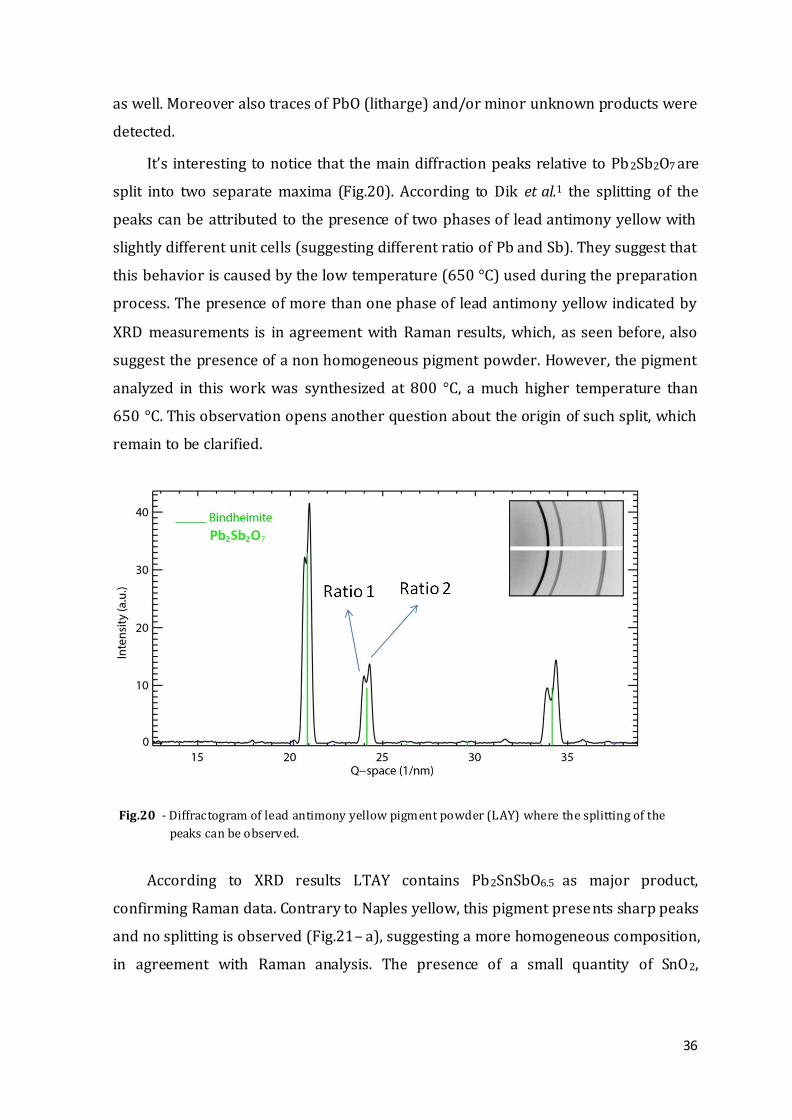
4.1.3 XRD analysis
The diffractogram of LAY (Fig.20) shows that the pigment’s diffraction lines
correspond to the bindheimite (Pb2Sb2O7) lines, which is the isostructural analogue
mineral of the pigment. The space group is Fd3m, that corresponds to a cubic
pyrochlore structure. Hexagonal and orthorhombic Pb2Sb2O7 phases might be present
36
as well. Moreover also traces of PbO (litharge) and/or minor unknown products were
detected.
It’s interesting to notice that the main diffraction peaks relative to Pb 2Sb2O7 are
split into two separate maxima (Fig.20). According to Dik et al.1 the splitting of the
peaks can be attributed to the presence of two phases of lead antimony yellow with
slightly different unit cells (suggesting different ratio of Pb and Sb). They suggest that
this behavior is caused by the low temperature (650 °C) used during the preparation
process. The presence of more than one phase of lead antimony yellow indicated by
XRD measurements is in agreement with Raman results, which, as seen before, also
suggest the presence of a non homogeneous pigment powder. However, the pigment
analyzed in this work was synthesized at 800 °C, a much higher temperature than
650 °C. This observation opens another question about the origin of such split, which
remain to be clarified.
Fig.20 - Diffractogram of lead antimony yellow pigment powder (LAY) where the splitting of the
peaks can be observed.
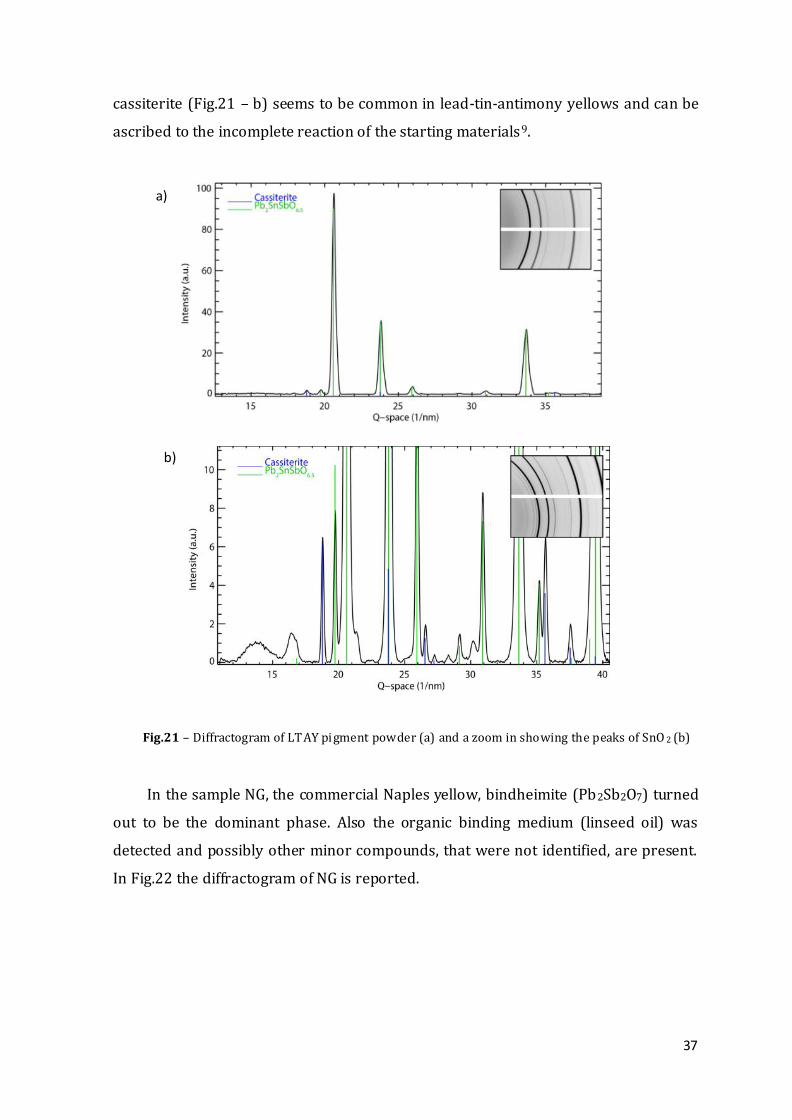
According to XRD results LTAY contains Pb2SnSbO6.5 as major product,
confirming Raman data. Contrary to Naples yellow, this pigment presents sharp peaks
and no splitting is observed (Fig.21– a), suggesting a more homogeneous composition,
in agreement with Raman analysis. The presence of a small quantity of SnO2,
Pb2Sb2O7
37
cassiterite (Fig.21 – b) seems to be common in lead-tin-antimony yellows and can be
ascribed to the incomplete reaction of the starting materials9.
Fig.21 – Diffractogram of LTAY pigment powder (a) and a zoom in showing the peaks of SnO 2 (b)
In the sample NG, the commercial Naples yellow, bindheimite (Pb2Sb2O7) turned
out to be the dominant phase. Also the organic binding medium (linseed oil) was
detected and possibly other minor compounds, that were not identified, are present.
In Fig.22 the diffractogram of NG is reported.
a)
b)
38
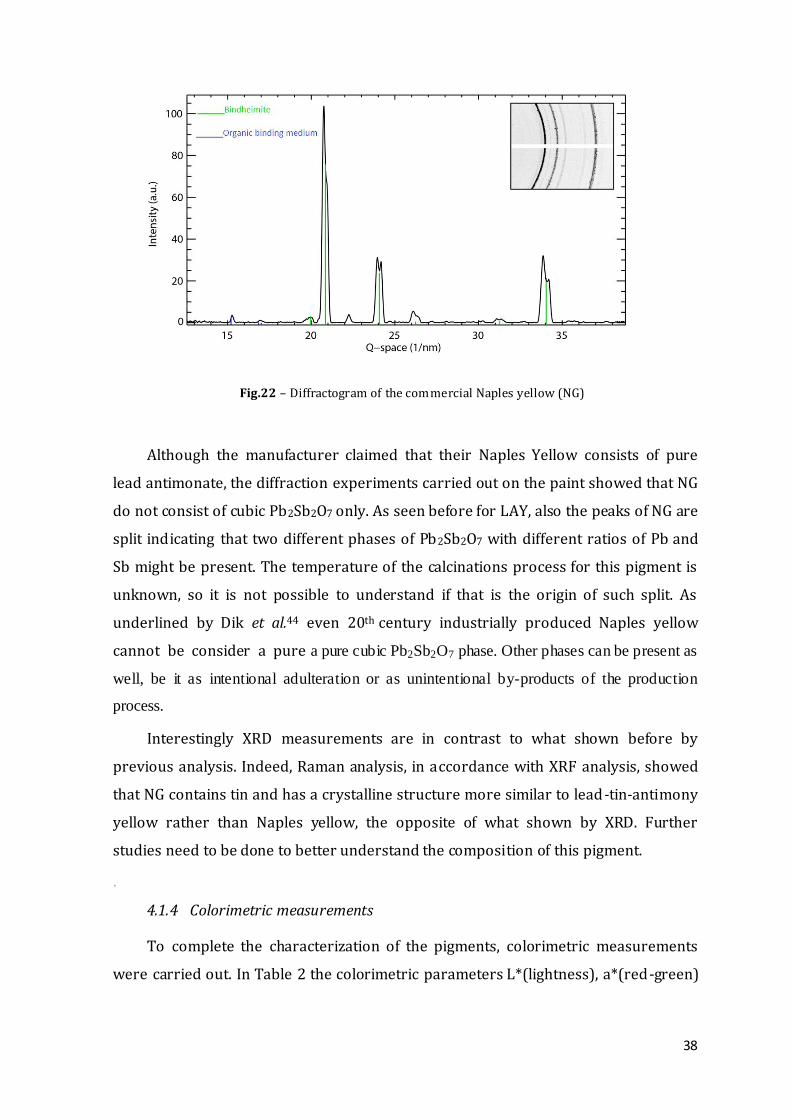
Fig.22 – Diffractogram of the commercial Naples yellow (NG)
Although the manufacturer claimed that their Naples Yellow consists of pure
lead antimonate, the diffraction experiments carried out on the paint showed that NG
do not consist of cubic Pb2Sb2O7 only. As seen before for LAY, also the peaks of NG are
split indicating that two different phases of Pb2Sb2O7 with different ratios of Pb and
Sb might be present. The temperature of the calcinations process for this pigment is
unknown, so it is not possible to understand if that is the origin of such split. As
underlined by Dik et al.44 even 20th century industrially produced Naples yellow
cannot be consider a pure a pure cubic Pb2Sb2O7 phase. Other phases can be present as
well, be it as intentional adulteration or as unintentional by-products of the production
process.
Interestingly XRD measurements are in contrast to what shown before by
previous analysis. Indeed, Raman analysis, in accordance with XRF analysis, showed
that NG contains tin and has a crystalline structure more similar to lead-tin-antimony
yellow rather than Naples yellow, the opposite of what shown by XRD. Further
studies need to be done to better understand the composition of this pigment.
.
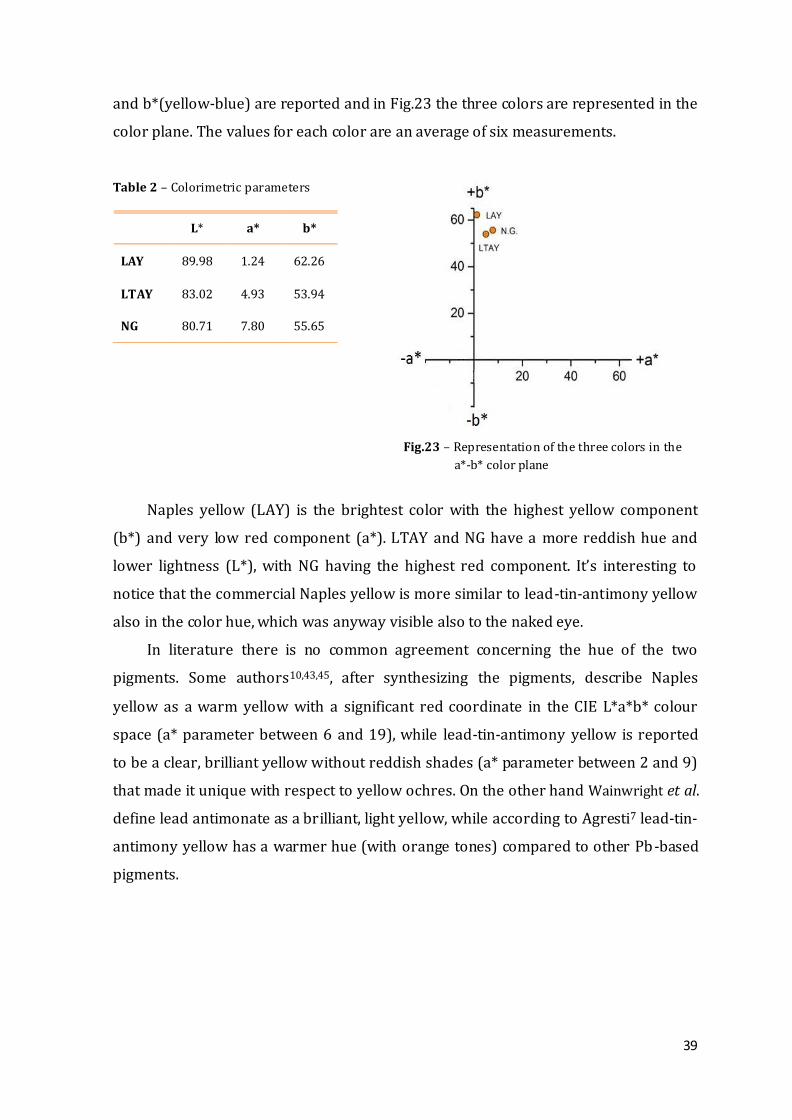
4.1.4 Colorimetric measurements
To complete the characterization of the pigments, colorimetric measurements
were carried out. In Table 2 the colorimetric parameters L*(lightness), a*(red-green)
39
and b*(yellow-blue) are reported and in Fig.23 the three colors are represented in the
color plane. The values for each color are an average of six measurements.
Table 2 – Colorimetric parameters
Naples yellow (LAY) is the brightest color with the highest yellow component
(b*) and very low red component (a*). LTAY and NG have a more reddish hue and
lower lightness (L*), with NG having the highest red component. It’s interesting to
notice that the commercial Naples yellow is more similar to lead-tin-antimony yellow
also in the color hue, which was anyway visible also to the naked eye.
In literature there is no common agreement concerning the hue of the two
pigments. Some authors10,43,45, after synthesizing the pigments, describe Naples
yellow as a warm yellow with a significant red coordinate in the CIE L*a*b* colour
space (a* parameter between 6 and 19), while lead-tin-antimony yellow is reported
to be a clear, brilliant yellow without reddish shades (a* parameter between 2 and 9)
that made it unique with respect to yellow ochres. On the other hand Wainwright et al.
define lead antimonate as a brilliant, light yellow, while according to Agresti7 lead-tin-
antimony yellow has a warmer hue (with orange tones) compared to other Pb-based
pigments.
L* a* b*
LAY 89.98 1.24 62.26
LTAY 83.02 4.93 53.94
NG 80.71 7.80 55.65
Fig.23 – Representation of the three colors in the
a*-b* color plane
40
4.2 Naples yellow and lead-tin-antimony yellow: evaluation of their
stability
4.2.1 Light-induced degradation
As mentioned in Chapter 1 recent studies20,21pointed out that some pigments,
such as CdS, α-HgS, and chrome yellow, are semiconducting materials, so more prone
to degrade towards light. In these studies a new approach was used based on photo -
electrochemical experiments employed to investigate the mechanism of the
degradation processes. This method allows to mimic a potentially harmful
environment combing the effect of light (laser) with an electrolyte compound present
in atmosphere (e.g. water-soluble salts, present in airborne particles, an organic acid
etc.)20. By applying proper electrochemical methods it is possible to gather
information about the degradation and monitor the processes in real-time. For
example, by means of amperometry the photocurrent developed by the pigments
under illumination can be measured, whereas additional information about the
degradation products can be obtain by applying linear/cyclic sweep voltammetry.
A similar approach was adopted in this thesis work in order to check if the
pigments considered in this study, Naples yellow and lead-tin-antimony yellow, are
sensitive to light and might act as semiconductors materials. For the same purpose
additional experiments with different lasers (green and blue) were carried out on
mock-up samples and powders. Aging with UV light (climate chamber) was also
tested. In addition preliminary DFT calculations helped to have a better insight of the
electronic properties of the pigments.
Results of light-induced degradation are presented in this chapter.
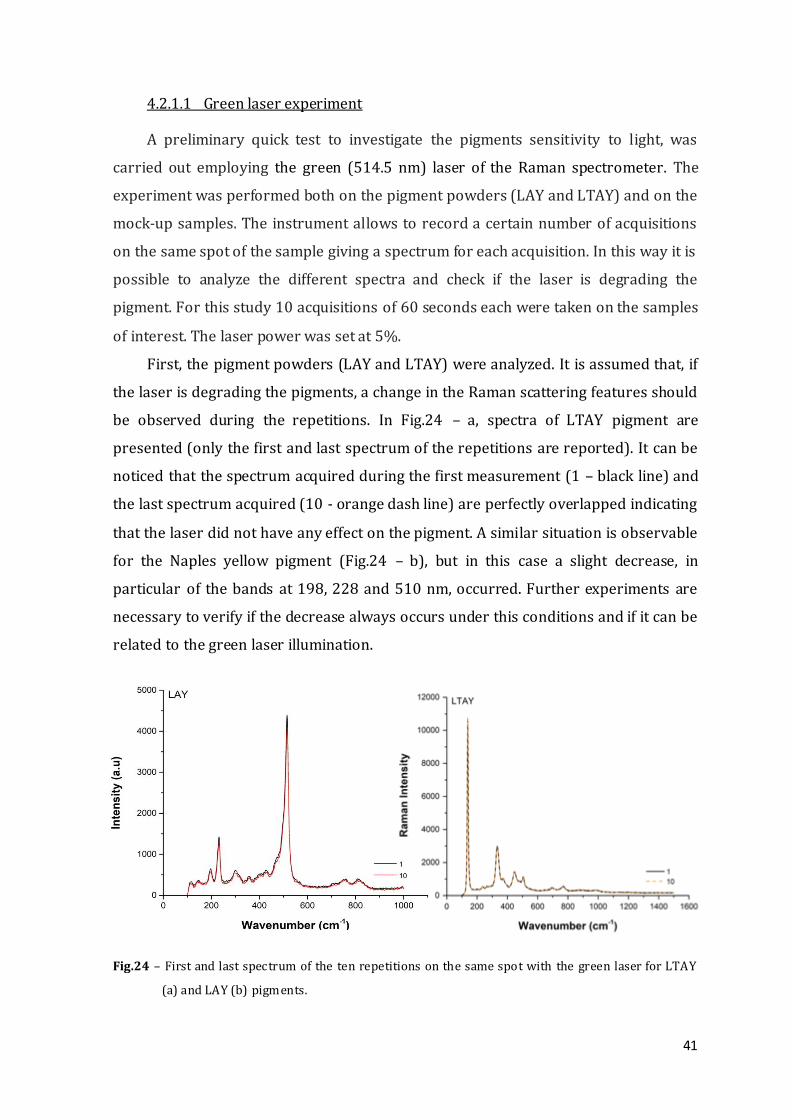
41
4.2.1.1 Green laser experiment
A preliminary quick test to investigate the pigments sensitivity to light, was
carried out employing the green (514.5 nm) laser of the Raman spectrometer. The
experiment was performed both on the pigment powders (LAY and LTAY) and on the
mock-up samples. The instrument allows to record a certain number of acquisitions
on the same spot of the sample giving a spectrum for each acquisition. In this way it is
possible to analyze the different spectra and check if the laser is degrading the
pigment. For this study 10 acquisitions of 60 seconds each were taken on the samples
of interest. The laser power was set at 5%.
First, the pigment powders (LAY and LTAY) were analyzed. It is assumed that, if
the laser is degrading the pigments, a change in the Raman scattering features should
be observed during the repetitions. In Fig.24 – a, spectra of LTAY pigment are
presented (only the first and last spectrum of the repetitions are reported). It can be
noticed that the spectrum acquired during the first measurement (1 – black line) and
the last spectrum acquired (10 - orange dash line) are perfectly overlapped indicating
that the laser did not have any effect on the pigment. A similar situation is observable
for the Naples yellow pigment (Fig.24 – b), but in this case a slight decrease, in
particular of the bands at 198, 228 and 510 nm, occurred. Further experiments are
necessary to verify if the decrease always occurs under this conditions and if it can be
related to the green laser illumination.
Fig.24 – First and last spectrum of the ten repetitions on the same spot with the green laser for LTAY
(a) and LAY (b) pigments.
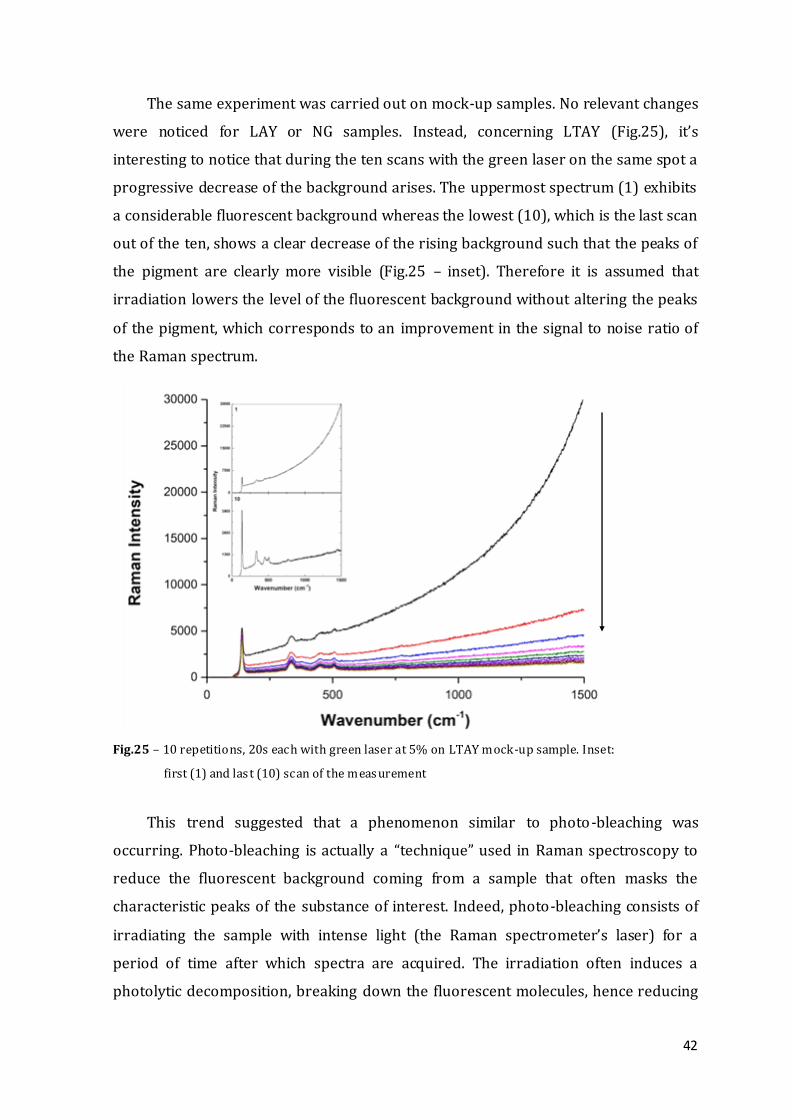
42
The same experiment was carried out on mock-up samples. No relevant changes
were noticed for LAY or NG samples. Instead, concerning LTAY (Fig.25), it’s
interesting to notice that during the ten scans with the green laser on the same spot a
progressive decrease of the background arises. The uppermost spectrum (1) exhibits
a considerable fluorescent background whereas the lowest (10), which is the last scan
out of the ten, shows a clear decrease of the rising background such that the peaks of
the pigment are clearly more visible (Fig.25 – inset). Therefore it is assumed that
irradiation lowers the level of the fluorescent background without altering the peaks
of the pigment, which corresponds to an improvement in the signal to noise ratio of
the Raman spectrum.
Fig.25 – 10 repetitions, 20s each with green laser at 5% on LTAY mock-up sample. Inset:
first (1) and last (10) scan of the measurement
This trend suggested that a phenomenon similar to photo-bleaching was
occurring. Photo-bleaching is actually a “technique” used in Raman spectroscopy to
reduce the fluorescent background coming from a sample that often masks the
characteristic peaks of the substance of interest. Indeed, photo-bleaching consists of
irradiating the sample with intense light (the Raman spectrometer’s laser) for a
period of time after which spectra are acquired. The irradiation often induces a
photolytic decomposition, breaking down the fluorescent molecules, hence reducing
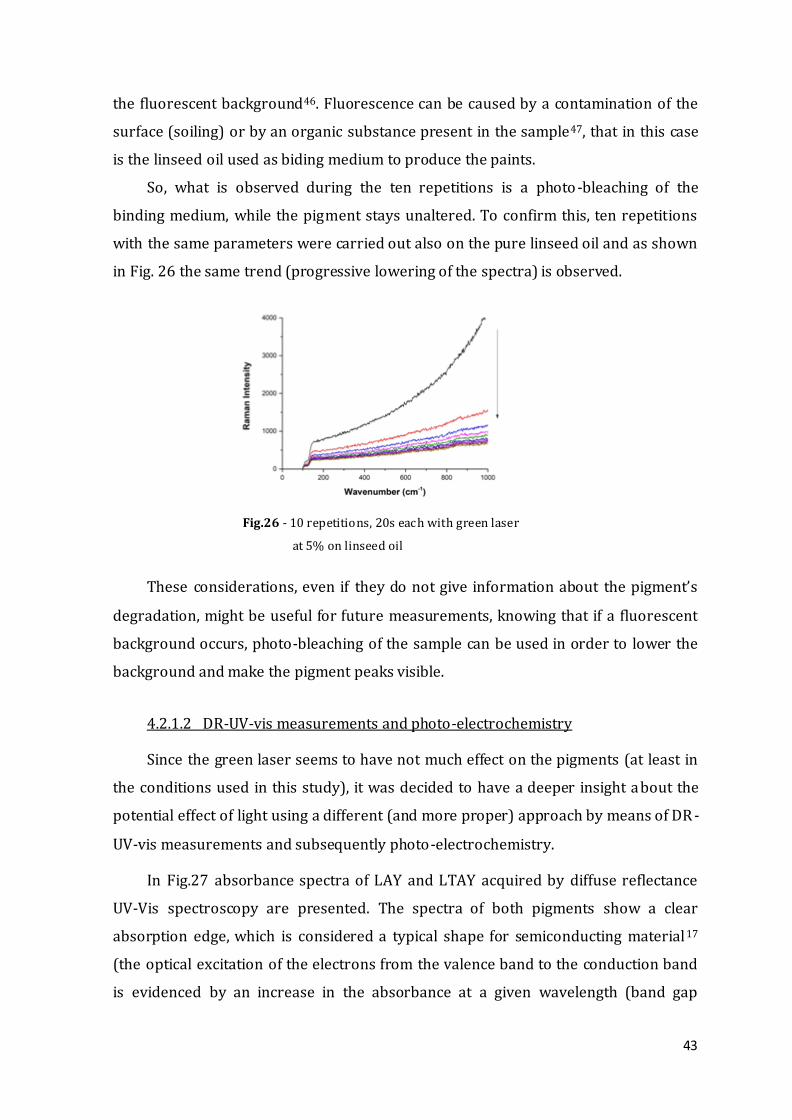
43
the fluorescent background46. Fluorescence can be caused by a contamination of the
surface (soiling) or by an organic substance present in the sample47, that in this case
is the linseed oil used as biding medium to produce the paints.
So, what is observed during the ten repetitions is a photo-bleaching of the
binding medium, while the pigment stays unaltered. To confirm this, ten repetitions
with the same parameters were carried out also on the pure linseed oil and as shown
in Fig. 26 the same trend (progressive lowering of the spectra) is observed.
Fig.26 - 10 repetitions, 20s each with green laser
at 5% on linseed oil
These considerations, even if they do not give information about the pigment’s
degradation, might be useful for future measurements, knowing that if a fluorescent
background occurs, photo-bleaching of the sample can be used in order to lower the
background and make the pigment peaks visible.
4.2.1.2 DR-UV-vis measurements and photo-electrochemistry
Since the green laser seems to have not much effect on the pigments (at least in
the conditions used in this study), it was decided to have a deeper insight about the
potential effect of light using a different (and more proper) approach by means of DR -
UV-vis measurements and subsequently photo-electrochemistry.
In Fig.27 absorbance spectra of LAY and LTAY acquired by diffuse reflectance
UV-Vis spectroscopy are presented. The spectra of both pigments show a clear
absorption edge, which is considered a typical shape for semiconducting material17
(the optical excitation of the electrons from the valence band to the conduction band
is evidenced by an increase in the absorbance at a given wavelength (band gap
44
energy)38). In order to measure the band gap energy the linear section of the
absorbance edge was taken and the corresponding absorption wavelength was
determined and converted in Eg(eV). Results are summarized in Table 3. For Naples
yellow the corresponding wavelength is 540 nm and the band gap 2,3 eV. Lead-tin-
antimony yellow has a sharper absorption edge with a corresponding wavelength of
554,5 and a band gap of 2,24 eV, slightly lower than the one of LAY.
Fig.27 – DR-UV-vis measurements of Pb2SnSbO6,5 and Pb2Sb2O7. The wavelength corresponding
to the band gap energy is indicated.
The band gaps values are relatively small and consistent with the color of the
pigments. The Naples yellow is only excited with illumination of light with λ ≤ 540 nm
(Eg = 2.3 eV). Lead-tin-antimony yellow, on the other hand, having a lower band gap
energy (Eg = 2.24 eV), allows electron excitation from λ ≤ 554,5 nm. Previous
studies20,21 showed that semiconducting pigments such as CdS and PbCrO4 have
absorbance spectra with a clear absorption edge (an example is reported in Fig.28 for
CdS) and a band gap energy of 2,4 eV and 2,2 eV, respectively, so very similar to the
values calculated for the pigments in this study.
Pigment Wavelenght (nm)
Band gap (eV)
Pb2SnSbO6,5 554,5 2,24
Pb2Sb2O7 540 2,3
λ(nm) ≤ 1241/Eg (eV)
Table 3 – Wavelength and relative band gap energy of the two pigments
45
Fig.28 – DR-UV-Vis spectrum of CdS17
From these results, the hypothesis that Naples yellow and lead-tin-antimony
yellow might be also semiconducting pigments was considered. Therefore the next
step was to verify if under illumination the pigments were photo -active, hence a
photocurrent could be measured. For the electrochemical experiments a laser with a
supra band gap energy was chosen (blue laser – 405 nm) to make sure the light was
fully absorbed by the pigments.
After deposition of a thin layer of lead-tin-antimony yellow (LTAY) on the
working electrode OCP and amperometry with cycles of darkness and illumination
were performed. The experiment was repeated for three different electrodes. Since
the procedure of deposition does not allow the perfect control of the amount and
distribution of the pigment on the electrode, the reproducibility was not perfect. The
choice of the suspension concentration (50 mg pigment in 1 mL ethanol) for these
experiments was based on previous studies20 showing that it is the one with the
lowest standard deviation.
In Fig.29 the OCP of LTAY is presented. A drop of potential is observed
immediately after the laser was switched on. After illumination the OCP slowly
stabilizes, but not completely. The OCP value is subsequently taken as the fixed
potential in the amperometric experiment. In this way the electrode is near the
equilibrium in the dark and the background is not influenced by any overpotential
reaching a situation comparable to a “natural” environment20.
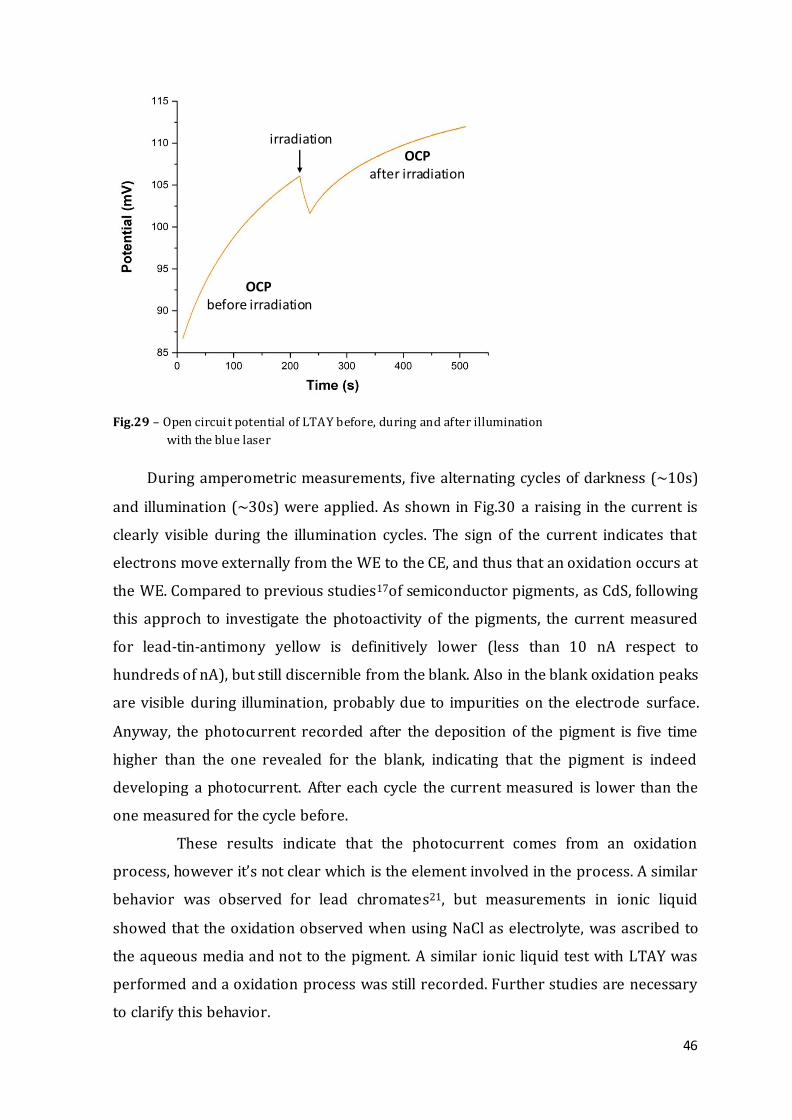
46
Fig.29 – Open circuit potential of LTAY before, during and after illumination
with the blue laser
During amperometric measurements, five alternating cycles of darkness (~10s)
and illumination (~30s) were applied. As shown in Fig.30 a raising in the current is
clearly visible during the illumination cycles. The sign of the current indicates that
electrons move externally from the WE to the CE, and thus that an oxidation occurs at
the WE. Compared to previous studies17of semiconductor pigments, as CdS, following
this approch to investigate the photoactivity of the pigments, the current measured
for lead-tin-antimony yellow is definitively lower (less than 10 nA respect to
hundreds of nA), but still discernible from the blank. Also in the blank oxidation peaks
are visible during illumination, probably due to impurities on the electrode surface.
Anyway, the photocurrent recorded after the deposition of the pigment is five time
higher than the one revealed for the blank, indicating that the pigment is indeed
developing a photocurrent. After each cycle the current measured is lower than the
one measured for the cycle before.
These results indicate that the photocurrent comes from an oxidation
process, however it’s not clear which is the element involved in the process. A similar
behavior was observed for lead chromates21, but measurements in ionic liquid
showed that the oxidation observed when using NaCl as electrolyte, was ascribed to
the aqueous media and not to the pigment. A similar ionic liquid test with LTAY was
performed and a oxidation process was still recorded. Further studies are necessary
to clarify this behavior.
irradiation
OCP before irradiation
OCP after irradiation
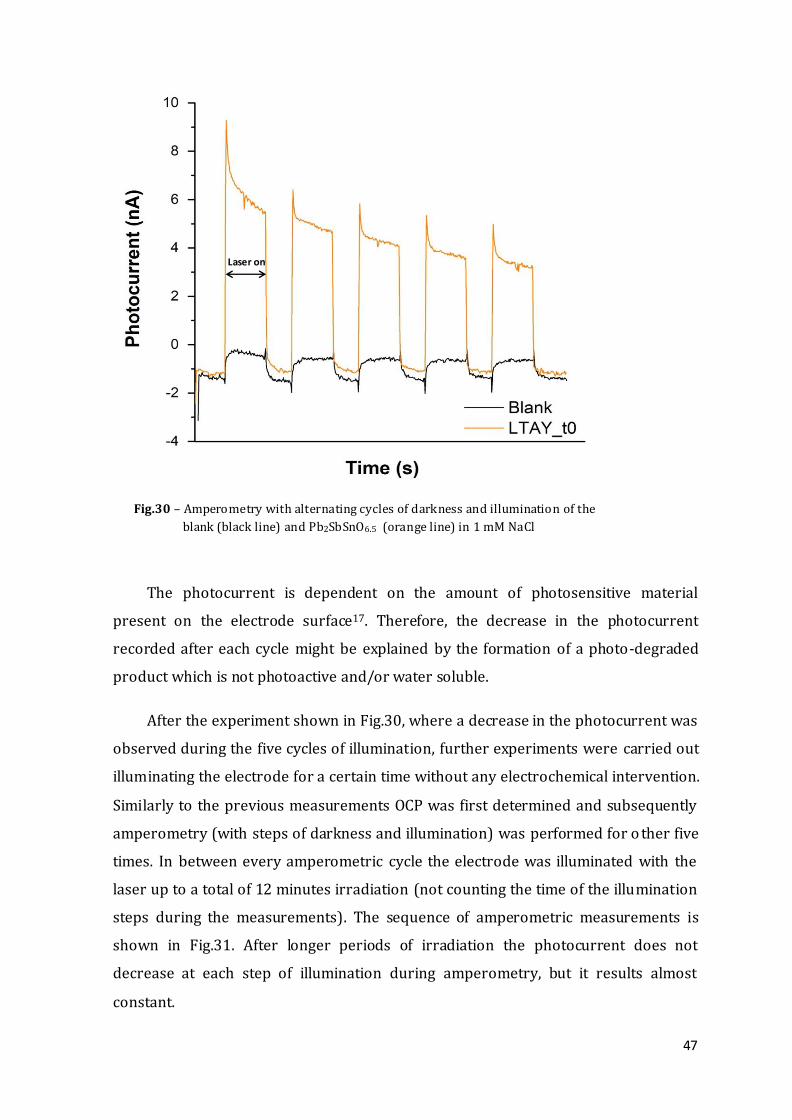
47
Fig.30 – Amperometry with alternating cycles of darkness and illumination of the
blank (black line) and Pb2SbSnO6.5 (orange line) in 1 mM NaCl
The photocurrent is dependent on the amount of photosensitive material
present on the electrode surface17. Therefore, the decrease in the photocurrent
recorded after each cycle might be explained by the formation of a photo-degraded
product which is not photoactive and/or water soluble.
After the experiment shown in Fig.30, where a decrease in the photocurrent was
observed during the five cycles of illumination, further experiments were carried out
illuminating the electrode for a certain time without any electrochemical intervention.
Similarly to the previous measurements OCP was first determined and subsequently
amperometry (with steps of darkness and illumination) was performed for o ther five
times. In between every amperometric cycle the electrode was illuminated with the
laser up to a total of 12 minutes irradiation (not counting the time of the illumination
steps during the measurements). The sequence of amperometric measurements is
shown in Fig.31. After longer periods of irradiation the photocurrent does not
decrease at each step of illumination during amperometry, but it results almost
constant.
Laser on
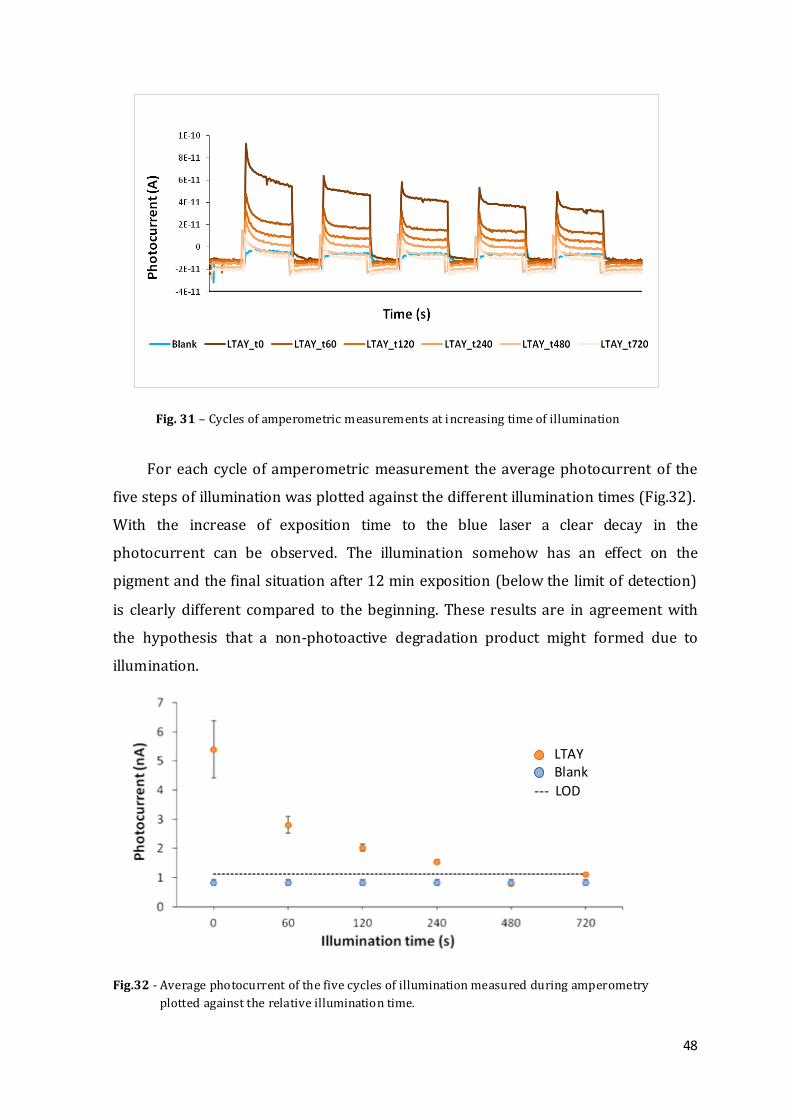
48
Fig. 31 – Cycles of amperometric measurements at increasing time of illumination
For each cycle of amperometric measurement the average photocurrent of the
five steps of illumination was plotted against the different illumination times (Fig.32).
With the increase of exposition time to the blue laser a clear decay in the
photocurrent can be observed. The illumination somehow has an effect on the
pigment and the final situation after 12 min exposition (below the limit of detection)
is clearly different compared to the beginning. These results are in agreement with
the hypothesis that a non-photoactive degradation product might formed due to
illumination.
Fig.32 - Average photocurrent of the five cycles of illumination measured during amperometry
plotted against the relative illumination time.
LTAY Blank
--- LOD
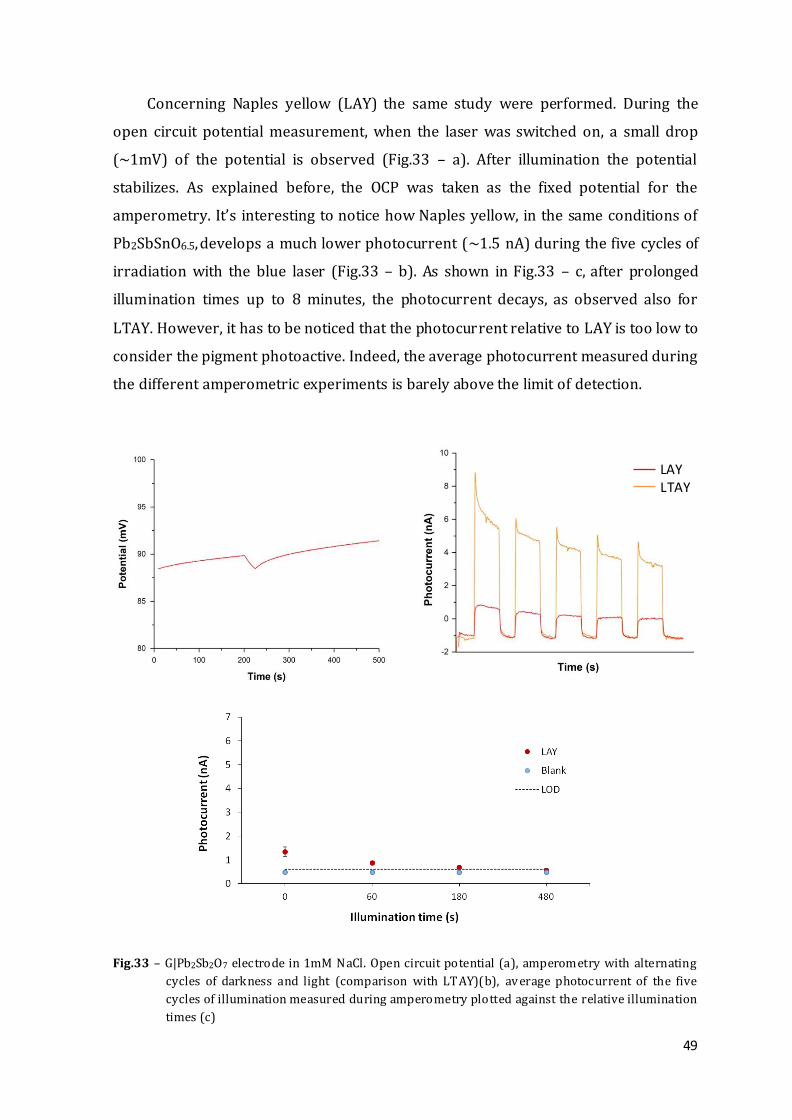
49
Concerning Naples yellow (LAY) the same study were performed. During the
open circuit potential measurement, when the laser was switched on, a small drop
(~1mV) of the potential is observed (Fig.33 – a). After illumination the potential
stabilizes. As explained before, the OCP was taken as the fixed potential for the
amperometry. It’s interesting to notice how Naples yellow, in the same conditions of
Pb2SbSnO6.5, develops a much lower photocurrent (~1.5 nA) during the five cycles of
irradiation with the blue laser (Fig.33 – b). As shown in Fig.33 – c, after prolonged
illumination times up to 8 minutes, the photocurrent decays, as observed also for
LTAY. However, it has to be noticed that the photocurrent relative to LAY is too low to
consider the pigment photoactive. Indeed, the average photocurrent measured during
the different amperometric experiments is barely above the limit of detection.
Fig.33 – G|Pb2Sb2O7 electrode in 1mM NaCl. Open circuit potential (a), amperometry with alternating
cycles of darkness and light (comparison with LTAY)(b), average photocurrent of the five
cycles of illumination measured during amperometry plotted against the relative illumination
times (c)
LAY LTAY
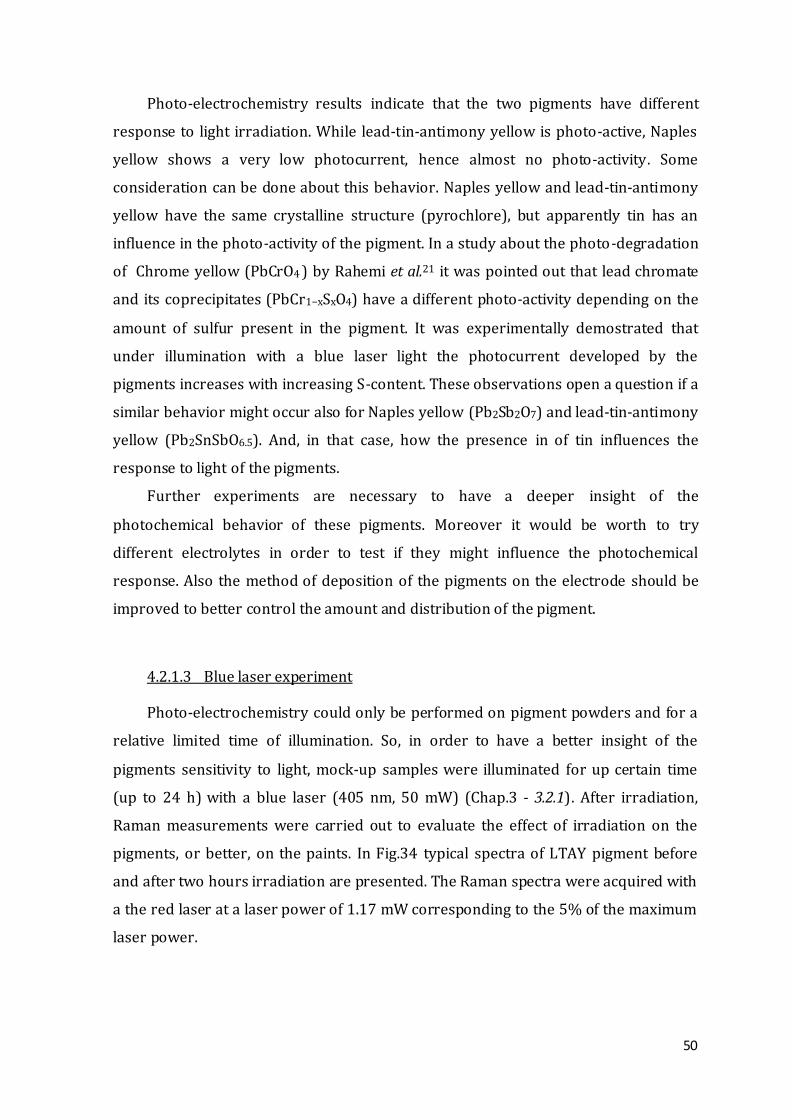
50
Photo-electrochemistry results indicate that the two pigments have different
response to light irradiation. While lead-tin-antimony yellow is photo-active, Naples
yellow shows a very low photocurrent, hence almost no photo-activity. Some
consideration can be done about this behavior. Naples yellow and lead-tin-antimony
yellow have the same crystalline structure (pyrochlore), but apparently tin has an
influence in the photo-activity of the pigment. In a study about the photo-degradation
of Chrome yellow (PbCrO4 ) by Rahemi et al.21 it was pointed out that lead chromate
and its coprecipitates (PbCr1−xSxO4) have a different photo-activity depending on the
amount of sulfur present in the pigment. It was experimentally demostrated that
under illumination with a blue laser light the photocurrent developed by the
pigments increases with increasing S-content. These observations open a question if a
similar behavior might occur also for Naples yellow (Pb2Sb2O7) and lead-tin-antimony
yellow (Pb2SnSbO6.5). And, in that case, how the presence in of tin influences the
response to light of the pigments.
Further experiments are necessary to have a deeper insight of the
photochemical behavior of these pigments. Moreover it would be worth to try
different electrolytes in order to test if they might influence the photochemical
response. Also the method of deposition of the pigments on the electrode should be
improved to better control the amount and distribution of the pigment.
4.2.1.3 Blue laser experiment
Photo-electrochemistry could only be performed on pigment powders and for a
relative limited time of illumination. So, in order to have a better insight of the
pigments sensitivity to light, mock-up samples were illuminated for up certain time
(up to 24 h) with a blue laser (405 nm, 50 mW) (Chap.3 - 3.2.1). After irradiation,
Raman measurements were carried out to evaluate the effect of irradiation on the
pigments, or better, on the paints. In Fig.34 typical spectra of LTAY pigment before
and after two hours irradiation are presented. The Raman spectra were acquired with
a the red laser at a laser power of 1.17 mW corresponding to the 5% of the maximum
laser power.
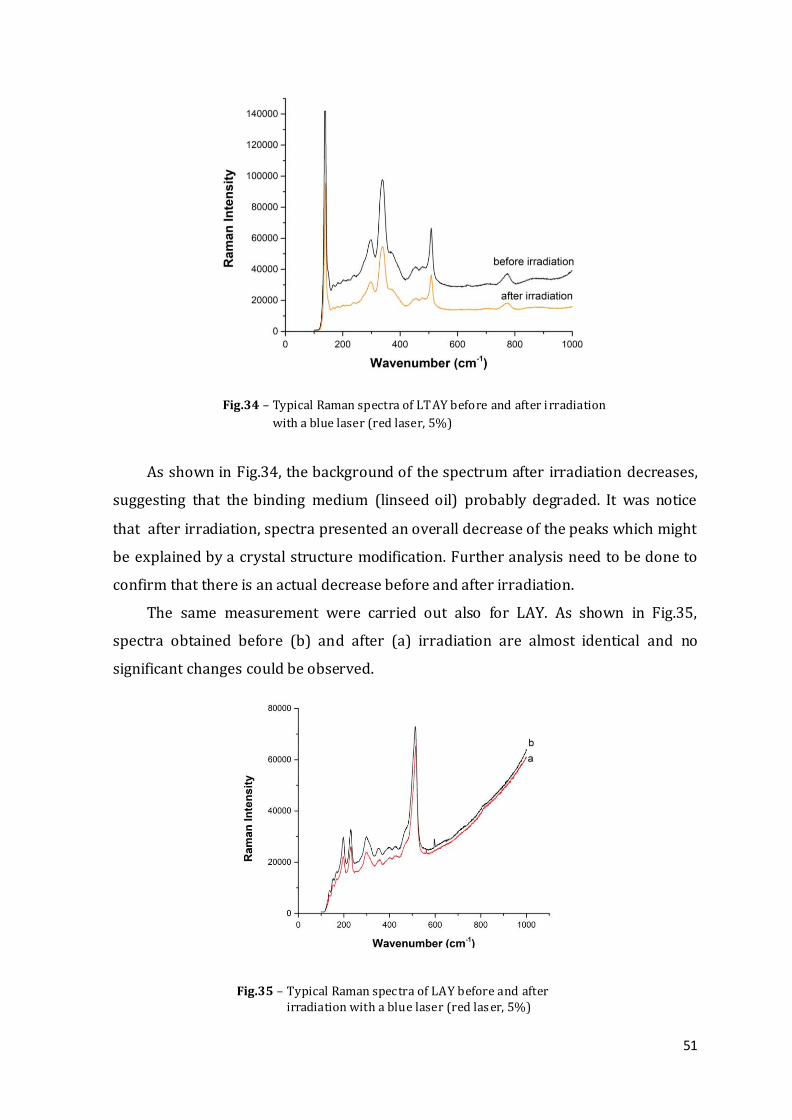
51
Fig.34 – Typical Raman spectra of LTAY before and after irradiation
with a blue laser (red laser, 5%)
As shown in Fig.34, the background of the spectrum after irradiation decreases,
suggesting that the binding medium (linseed oil) probably degraded. It was notice
that after irradiation, spectra presented an overall decrease of the peaks which might
be explained by a crystal structure modification. Further analysis need to be done to
confirm that there is an actual decrease before and after irradiation.
The same measurement were carried out also for LAY. As shown in Fig.35,
spectra obtained before (b) and after (a) irradiation are almost identical and no
significant changes could be observed.
Fig.35 – Typical Raman spectra of LAY before and after irradiation with a blue laser (red laser, 5%)
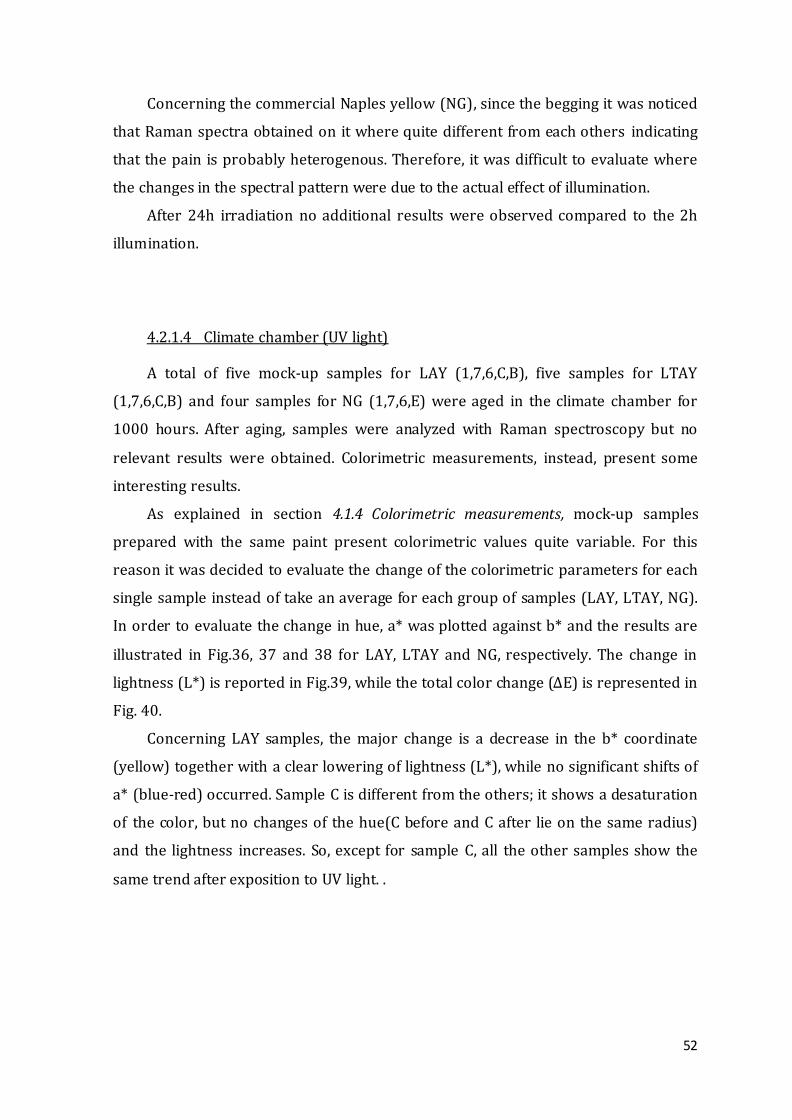
52
Concerning the commercial Naples yellow (NG), since the begging it was noticed
that Raman spectra obtained on it where quite different from each others indicating
that the pain is probably heterogenous. Therefore, it was difficult to evaluate where
the changes in the spectral pattern were due to the actual effect of illumination.
After 24h irradiation no additional results were observed compared to the 2h
illumination.
4.2.1.4 Climate chamber (UV light)
A total of five mock-up samples for LAY (1,7,6,C,B), five samples for LTAY
(1,7,6,C,B) and four samples for NG (1,7,6,E) were aged in the climate chamber for
1000 hours. After aging, samples were analyzed with Raman spectroscopy but no
relevant results were obtained. Colorimetric measurements, instead, present some
interesting results.
As explained in section 4.1.4 Colorimetric measurements, mock-up samples
prepared with the same paint present colorimetric values quite variable. For this
reason it was decided to evaluate the change of the colorimetric parameters for each
single sample instead of take an average for each group of samples (LAY, LTAY, NG).
In order to evaluate the change in hue, a* was plotted against b* and the results are
illustrated in Fig.36, 37 and 38 for LAY, LTAY and NG, respectively. The change in
lightness (L*) is reported in Fig.39, while the total color change (∆E) is represented in
Fig. 40.
Concerning LAY samples, the major change is a decrease in the b* coordinate
(yellow) together with a clear lowering of lightness (L*), while no significant shifts of
a* (blue-red) occurred. Sample C is different from the others; it shows a desaturation
of the color, but no changes of the hue(C before and C after lie on the same radius)
and the lightness increases. So, except for sample C, all the other samples show the
same trend after exposition to UV light. .
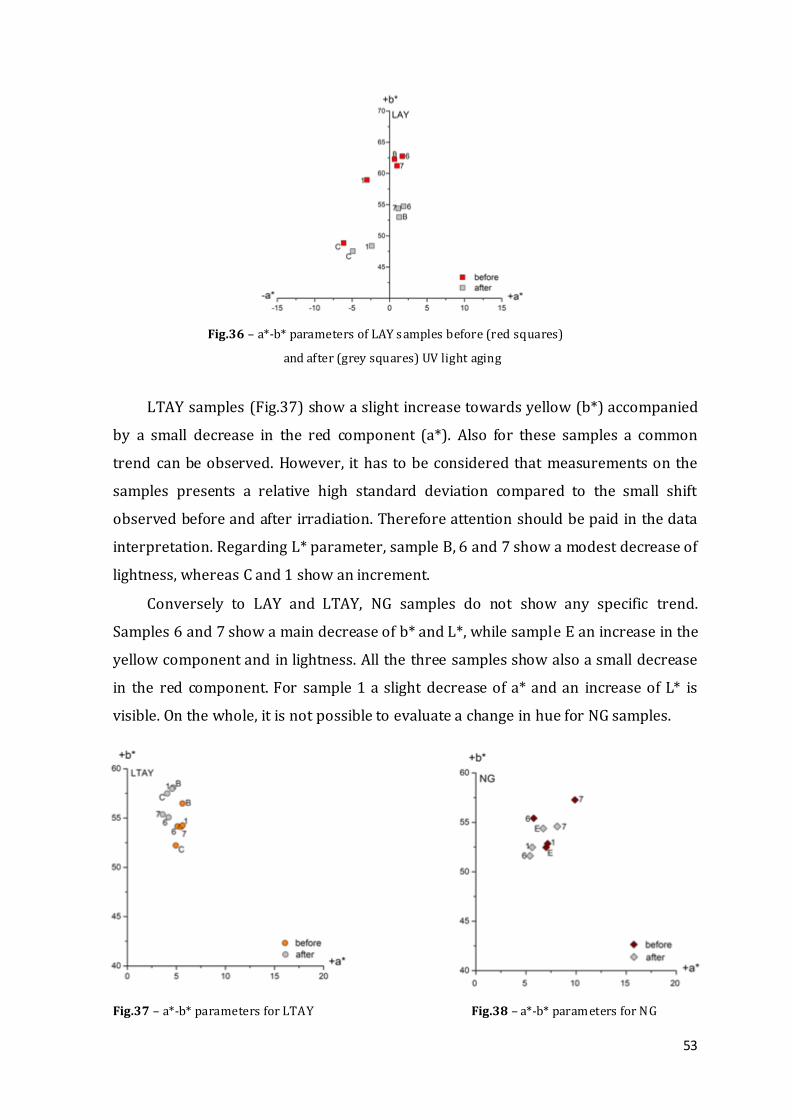
53
Fig.36 – a*-b* parameters of LAY samples before (red squares)
and after (grey squares) UV light aging
LTAY samples (Fig.37) show a slight increase towards yellow (b*) accompanied
by a small decrease in the red component (a*). Also for these samples a common
trend can be observed. However, it has to be considered that measurements on the
samples presents a relative high standard deviation compared to the small shift
observed before and after irradiation. Therefore attention should be paid in the data
interpretation. Regarding L* parameter, sample B, 6 and 7 show a modest decrease of
lightness, whereas C and 1 show an increment.
Conversely to LAY and LTAY, NG samples do not show any specific trend.
Samples 6 and 7 show a main decrease of b* and L*, while sample E an increase in the
yellow component and in lightness. All the three samples show also a small decrease
in the red component. For sample 1 a slight decrease of a* and an increase of L* is
visible. On the whole, it is not possible to evaluate a change in hue for NG samples.
Fig.37 – a*-b* parameters for LTAY Fig.38 – a*-b* parameters for NG
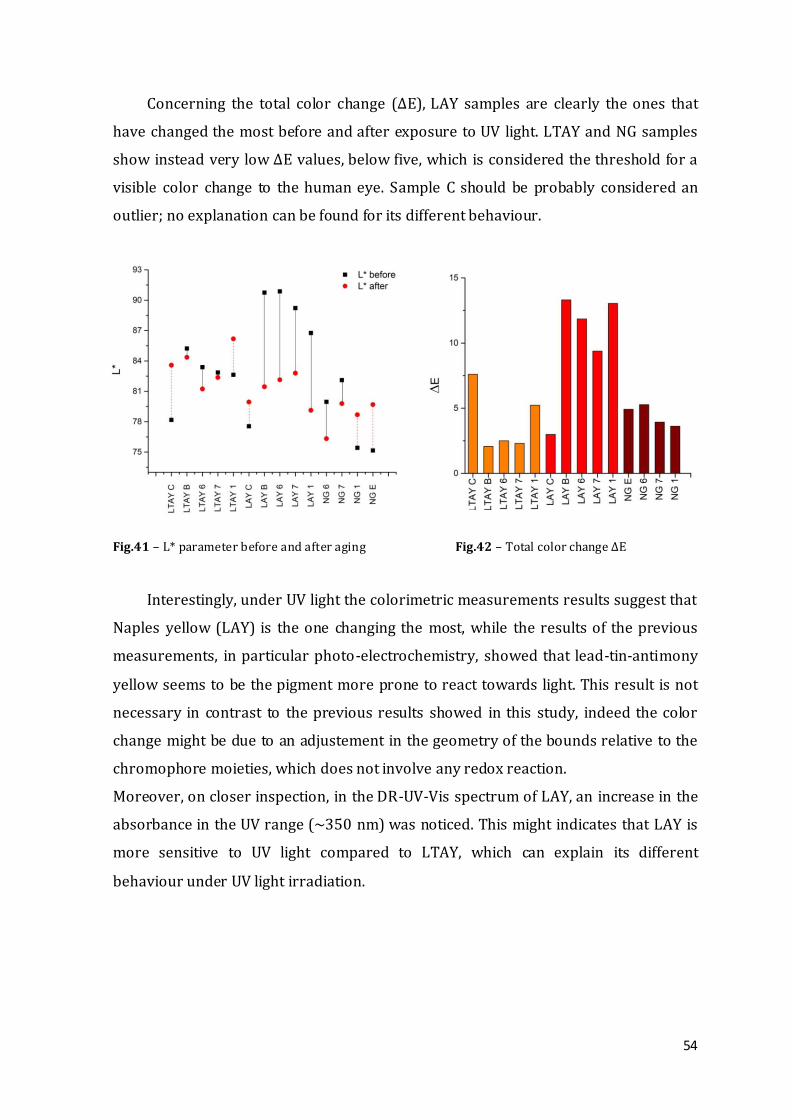
54
Concerning the total color change (∆E), LAY samples are clearly the ones that
have changed the most before and after exposure to UV light. LTAY and NG samples
show instead very low ∆E values, below five, which is considered the threshold for a
visible color change to the human eye. Sample C should be probably considered an
outlier; no explanation can be found for its different behaviour.
Fig.41 – L* parameter before and after aging Fig.42 – Total color change ∆E
Interestingly, under UV light the colorimetric measurements results suggest that
Naples yellow (LAY) is the one changing the most, while the results of the previous
measurements, in particular photo-electrochemistry, showed that lead-tin-antimony
yellow seems to be the pigment more prone to react towards light. This result is not
necessary in contrast to the previous results showed in this study, indeed the color
change might be due to an adjustement in the geometry of the bounds relative to the
chromophore moieties, which does not involve any redox reaction.
Moreover, on closer inspection, in the DR-UV-Vis spectrum of LAY, an increase in the
absorbance in the UV range (~350 nm) was noticed. This might indicates that LAY is
more sensitive to UV light compared to LTAY, which can explain its different
behaviour under UV light irradiation.
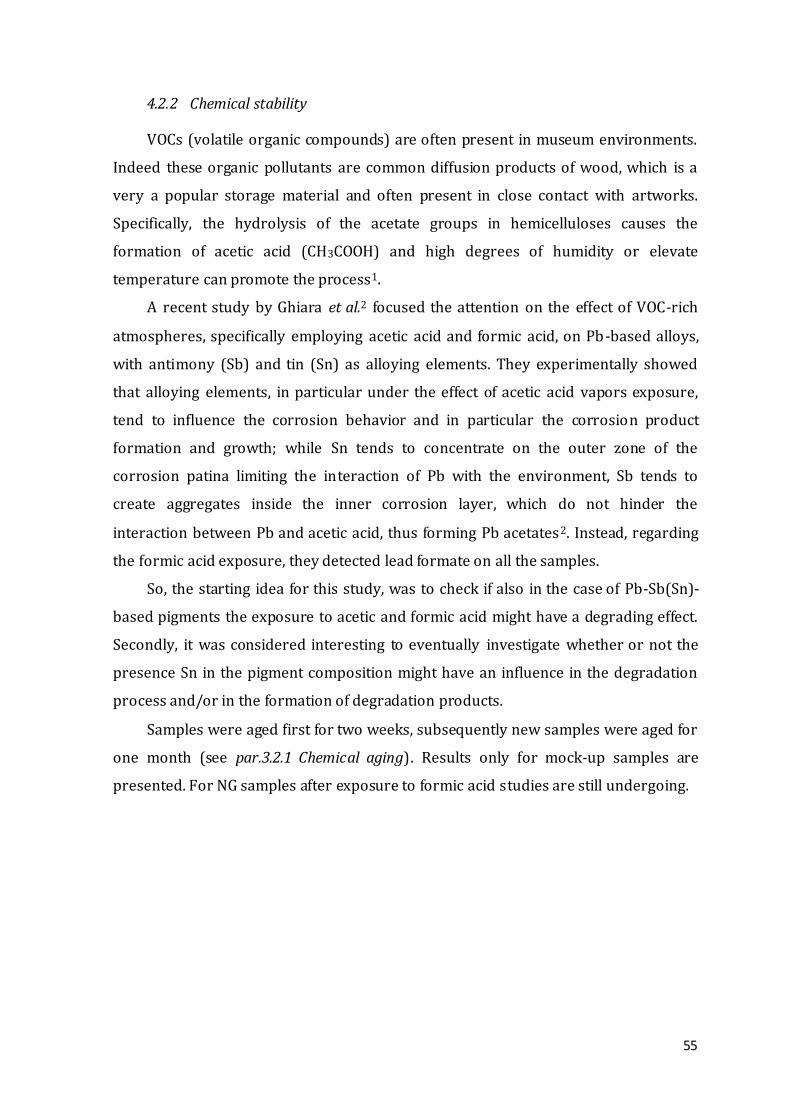
55
4.2.2 Chemical stability
VOCs (volatile organic compounds) are often present in museum environments.
Indeed these organic pollutants are common diffusion products of wood, which is a
very a popular storage material and often present in close contact with artworks.
Specifically, the hydrolysis of the acetate groups in hemicelluloses causes the
formation of acetic acid (CH3COOH) and high degrees of humidity or elevate
temperature can promote the process1.
A recent study by Ghiara et al.2 focused the attention on the effect of VOC-rich
atmospheres, specifically employing acetic acid and formic acid, on Pb-based alloys,
with antimony (Sb) and tin (Sn) as alloying elements. They experimentally showed
that alloying elements, in particular under the effect of acetic acid vapors exposure,
tend to influence the corrosion behavior and in particular the corrosion product
formation and growth; while Sn tends to concentrate on the outer zone of the
corrosion patina limiting the interaction of Pb with the environment, Sb tends to
create aggregates inside the inner corrosion layer, which do not hinder the
interaction between Pb and acetic acid, thus forming Pb acetates2. Instead, regarding
the formic acid exposure, they detected lead formate on all the samples.
So, the starting idea for this study, was to check if also in the case of Pb-Sb(Sn)-
based pigments the exposure to acetic and formic acid might have a degrading effect.
Secondly, it was considered interesting to eventually investigate whether or not the
presence Sn in the pigment composition might have an influence in the degradation
process and/or in the formation of degradation products.
Samples were aged first for two weeks, subsequently new samples were aged for
one month (see par.3.2.1 Chemical aging). Results only for mock-up samples are
presented. For NG samples after exposure to formic acid studies are still undergoing.
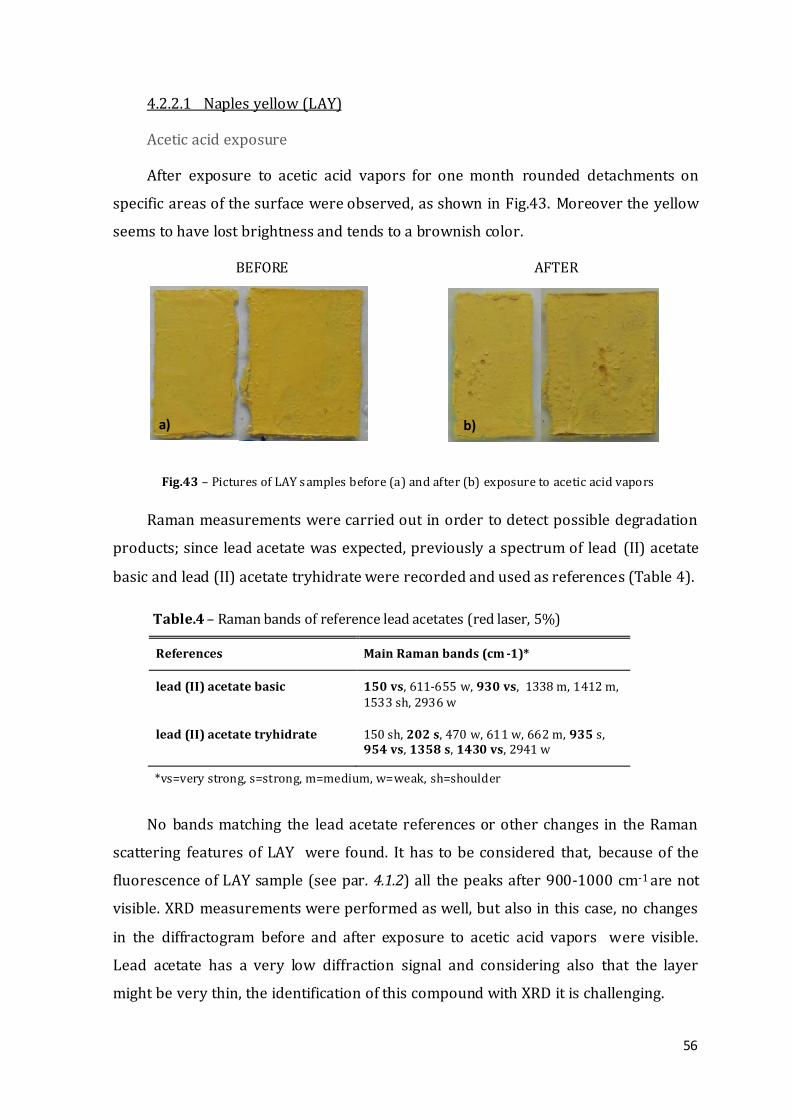
56
4.2.2.1 Naples yellow (LAY)
Acetic acid exposure
After exposure to acetic acid vapors for one month rounded detachments on
specific areas of the surface were observed, as shown in Fig.43. Moreover the yellow
seems to have lost brightness and tends to a brownish color.
Fig.43 – Pictures of LAY samples before (a) and after (b) exposure to acetic acid vapors
Raman measurements were carried out in order to detect possible degradation
products; since lead acetate was expected, previously a spectrum of lead (II) acetate
basic and lead (II) acetate tryhidrate were recorded and used as references (Table 4).
Table.4 – Raman bands of reference lead acetates (red laser, 5%)
References Main Raman bands (cm -1)*
lead (II) acetate basic 150 vs, 611-655 w, 930 vs, 1338 m, 1412 m, 1533 sh, 2936 w
lead (II) acetate tryhidrate 150 sh, 202 s, 470 w, 611 w, 662 m, 935 s, 954 vs, 1358 s, 1430 vs, 2941 w
*vs=very strong, s=strong, m=medium, w=weak, sh=shoulder
No bands matching the lead acetate references or other changes in the Raman
scattering features of LAY were found. It has to be considered that, because of the
fluorescence of LAY sample (see par. 4.1.2) all the peaks after 900-1000 cm-1 are not
visible. XRD measurements were performed as well, but also in this case, no changes
in the diffractogram before and after exposure to acetic acid vapors were visible.
Lead acetate has a very low diffraction signal and considering also that the layer
might be very thin, the identification of this compound with XRD it is challenging.
BEFORE AFTER
a) b)
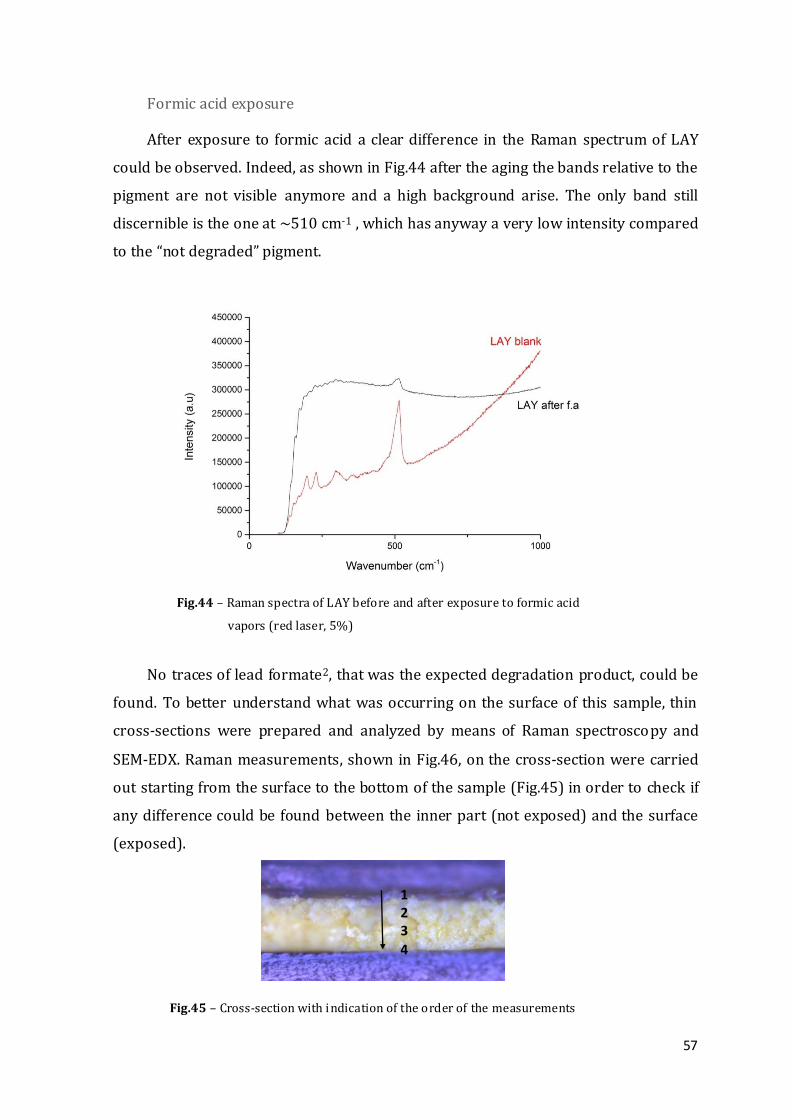
57
Formic acid exposure
After exposure to formic acid a clear difference in the Raman spectrum of LAY
could be observed. Indeed, as shown in Fig.44 after the aging the bands relative to the
pigment are not visible anymore and a high background arise. The only band still
discernible is the one at ~510 cm-1 , which has anyway a very low intensity compared
to the “not degraded” pigment.
Fig.44 – Raman spectra of LAY before and after exposure to formic acid
vapors (red laser, 5%)
No traces of lead formate2, that was the expected degradation product, could be
found. To better understand what was occurring on the surface of this sample, thin
cross-sections were prepared and analyzed by means of Raman spectroscopy and
SEM-EDX. Raman measurements, shown in Fig.46, on the cross-section were carried
out starting from the surface to the bottom of the sample (Fig.45) in order to check if
any difference could be found between the inner part (not exposed) and the surface
(exposed).
Fig.45 – Cross-section with indication of the order of the measurements
1 2 3
4
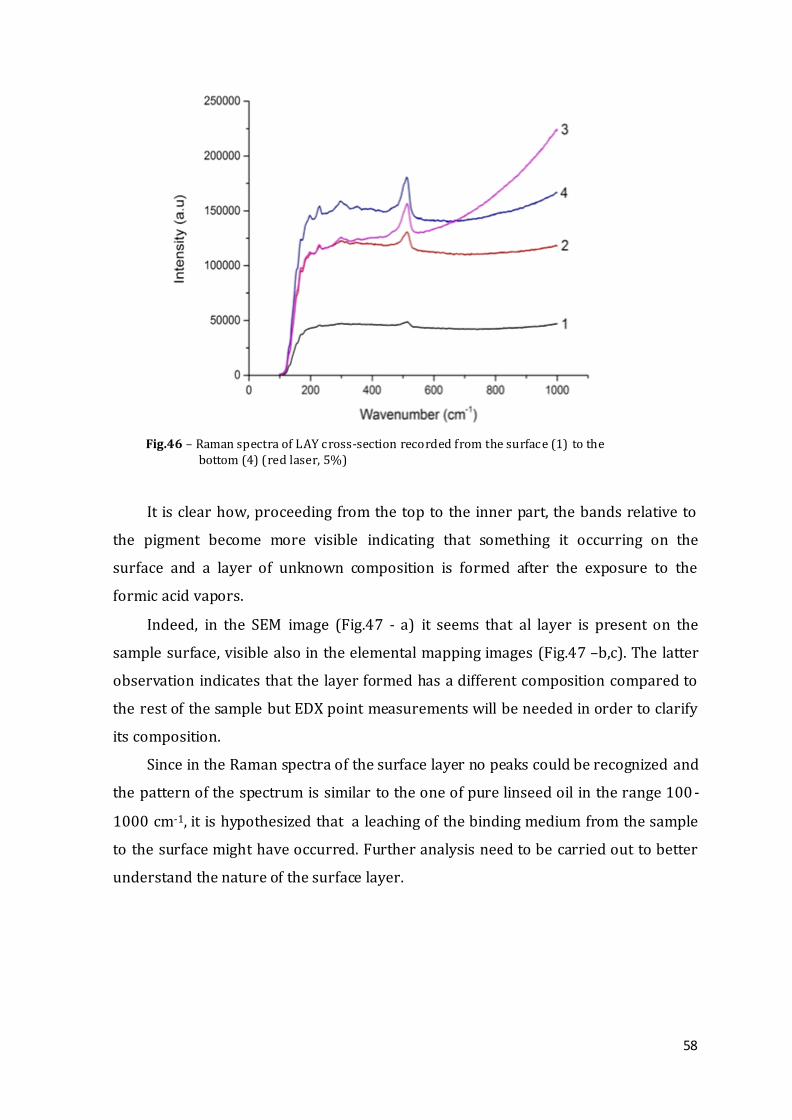
58
Fig.46 – Raman spectra of LAY cross-section recorded from the surface (1) to the bottom (4) (red laser, 5%)
It is clear how, proceeding from the top to the inner part, the bands relative to
the pigment become more visible indicating that something it occurring on the
surface and a layer of unknown composition is formed after the exposure to the
formic acid vapors.
Indeed, in the SEM image (Fig.47 - a) it seems that al layer is present on the
sample surface, visible also in the elemental mapping images (Fig.47 –b,c). The latter
observation indicates that the layer formed has a different composition compared to
the rest of the sample but EDX point measurements will be needed in order to clarify
its composition.
Since in the Raman spectra of the surface layer no peaks could be recognized and
the pattern of the spectrum is similar to the one of pure linseed oil in the range 100 -
1000 cm-1, it is hypothesized that a leaching of the binding medium from the sample
to the surface might have occurred. Further analysis need to be carried out to better
understand the nature of the surface layer.
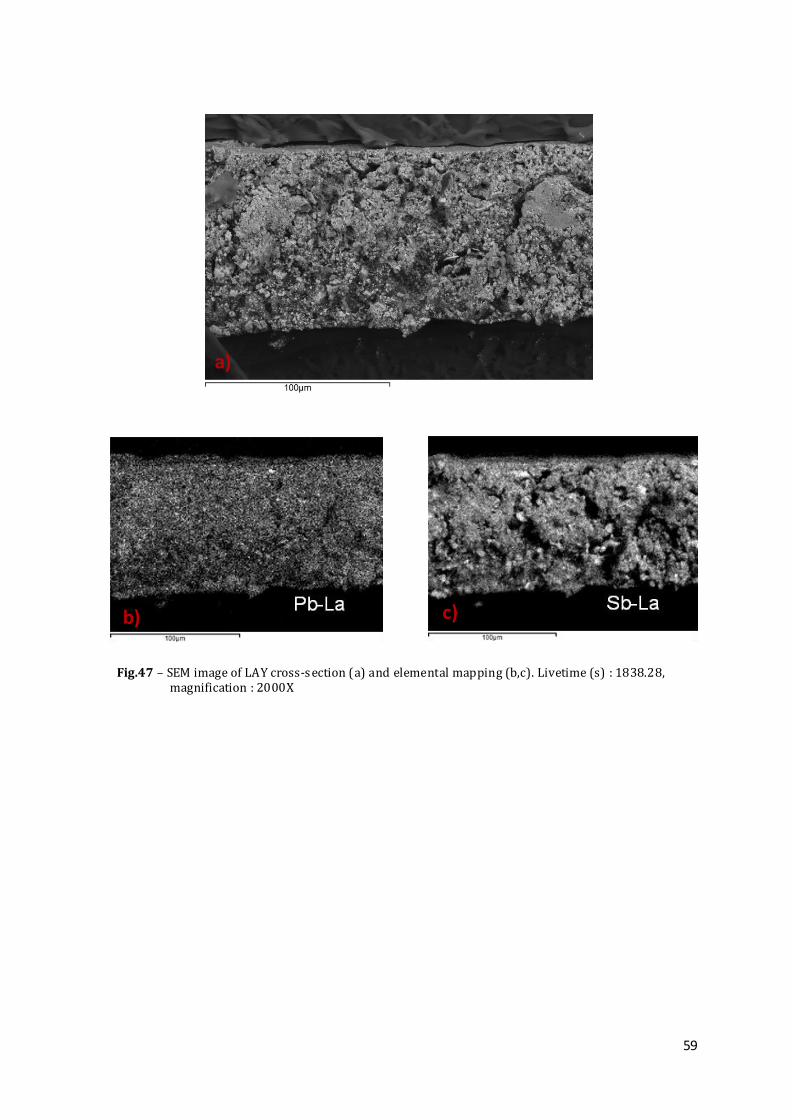
59
Fig.47 – SEM image of LAY cross-section (a) and elemental mapping (b,c). Livetime (s) : 1838.28,
magnification : 2000X
a)
c)
b)
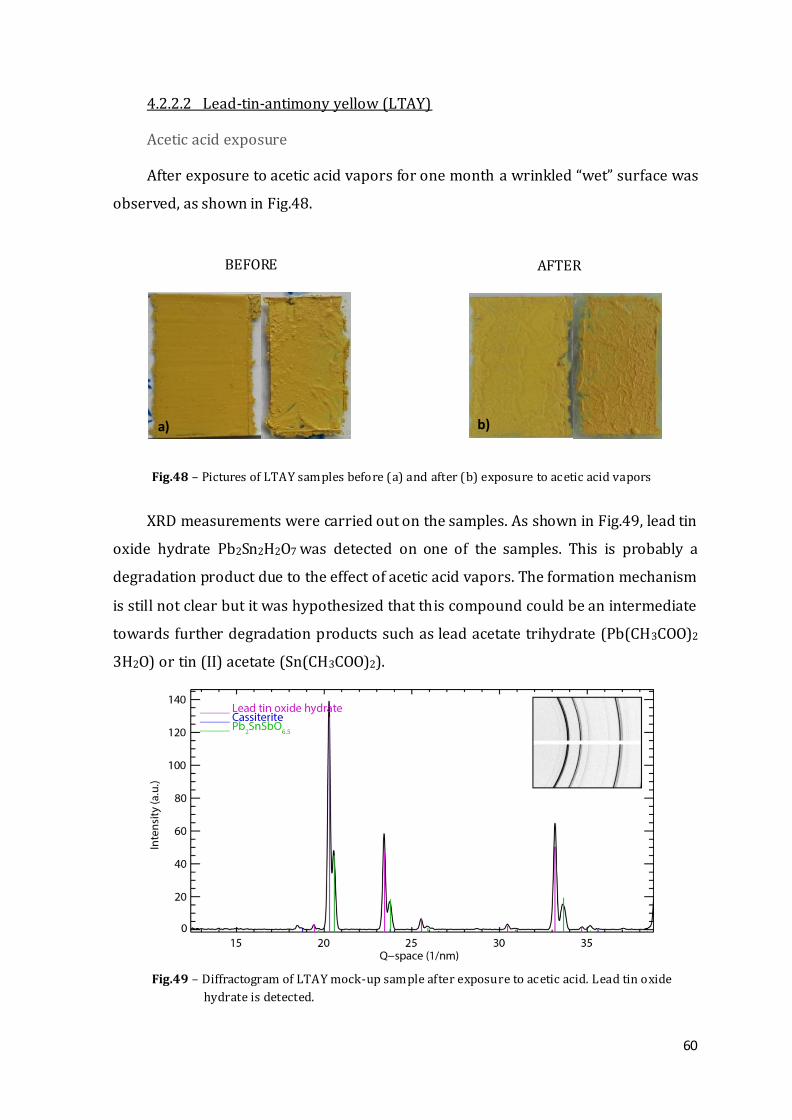
60
4.2.2.2 Lead-tin-antimony yellow (LTAY)
Acetic acid exposure
After exposure to acetic acid vapors for one month a wrinkled “wet” surface was
observed, as shown in Fig.48.
Fig.48 – Pictures of LTAY samples before (a) and after (b) exposure to acetic acid vapors
XRD measurements were carried out on the samples. As shown in Fig.49, lead tin
oxide hydrate Pb2Sn2H2O7 was detected on one of the samples. This is probably a
degradation product due to the effect of acetic acid vapors. The formation mechanism
is still not clear but it was hypothesized that this compound could be an intermediate
towards further degradation products such as lead acetate trihydrate (Pb(CH3COO)2
3H2O) or tin (II) acetate (Sn(CH3COO)2).
Fig.49 – Diffractogram of LTAY mock-up sample after exposure to acetic acid. Lead tin oxide
hydrate is detected.
BEFORE AFTER
a) b)
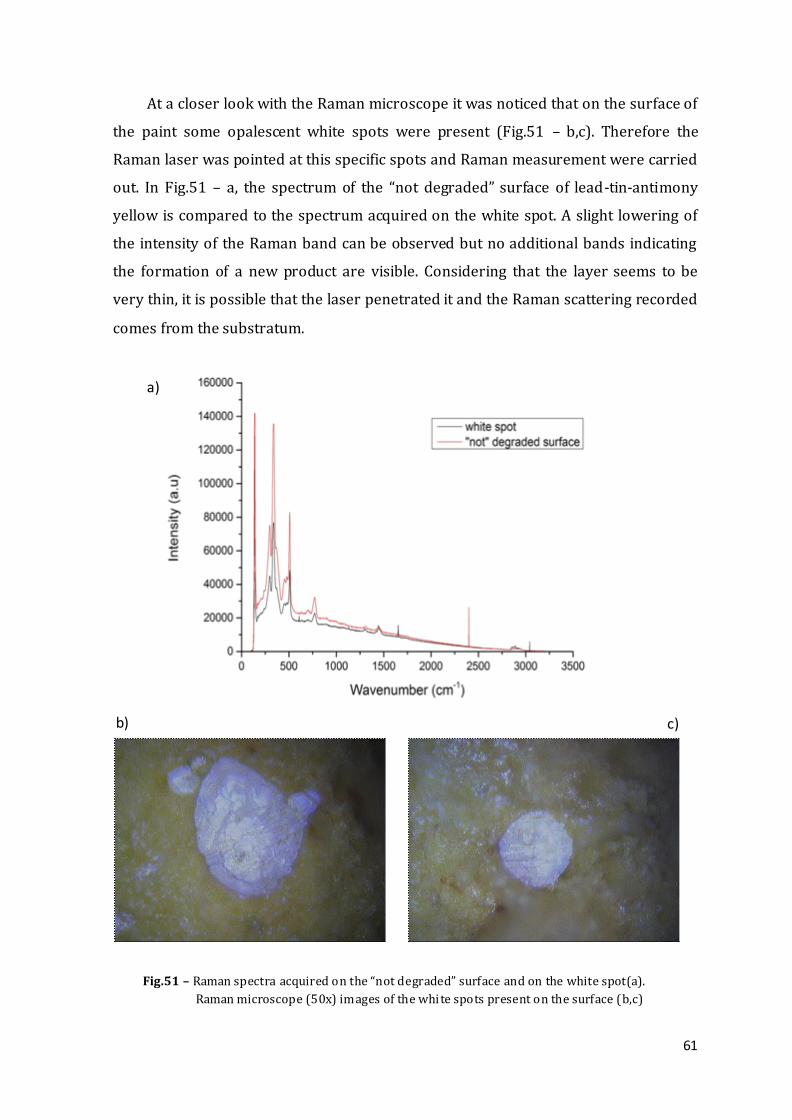
61
At a closer look with the Raman microscope it was noticed that on the surface of
the paint some opalescent white spots were present (Fig.51 – b,c). Therefore the
Raman laser was pointed at this specific spots and Raman measurement were carried
out. In Fig.51 – a, the spectrum of the “not degraded” surface of lead-tin-antimony
yellow is compared to the spectrum acquired on the white spot. A slight lowering of
the intensity of the Raman band can be observed but no additional bands indicating
the formation of a new product are visible. Considering that the layer seems to be
very thin, it is possible that the laser penetrated it and the Raman scattering recorded
comes from the substratum.
Fig.51 – Raman spectra acquired on the “not degraded” surface and on the white spot(a).
Raman microscope (50x) images of the white spots present on the surface (b,c)
a)
b) c)
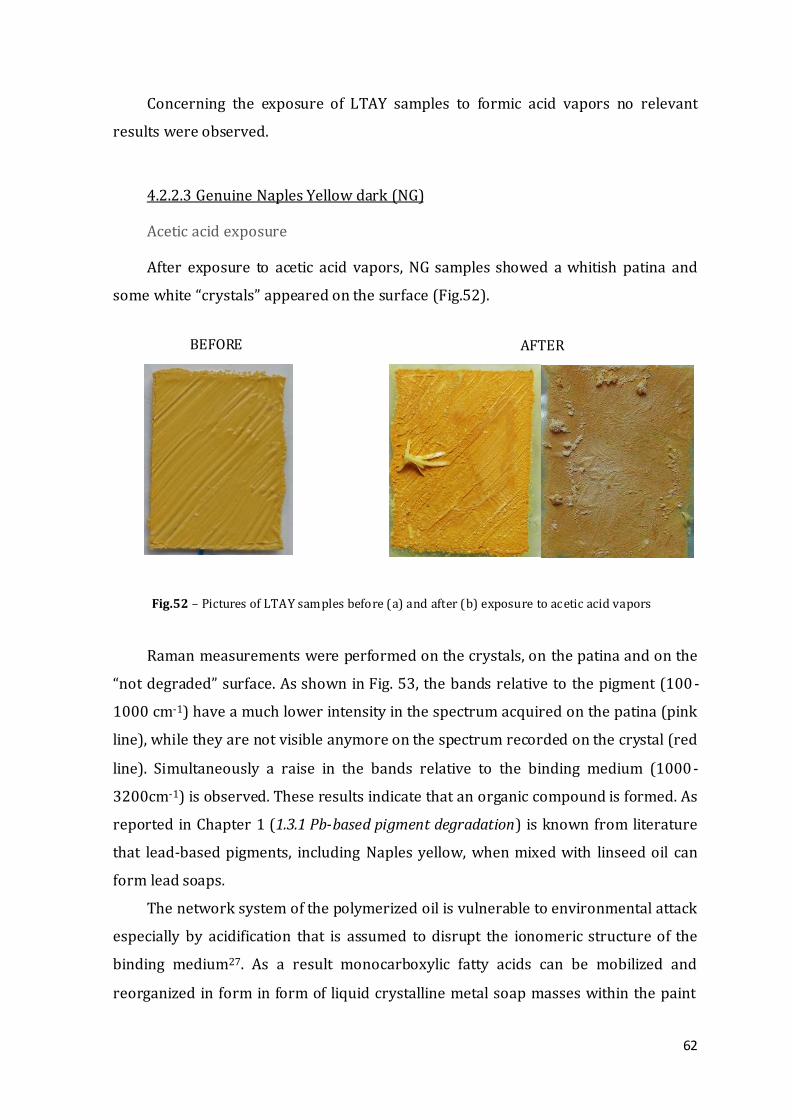
62
Concerning the exposure of LTAY samples to formic acid vapors no relevant
results were observed.
4.2.2.3 Genuine Naples Yellow dark (NG)
Acetic acid exposure
After exposure to acetic acid vapors, NG samples showed a whitish patina and
some white “crystals” appeared on the surface (Fig.52).
Fig.52 – Pictures of LTAY samples before (a) and after (b) exposure to acetic acid vapors
Raman measurements were performed on the crystals, on the patina and on the
“not degraded” surface. As shown in Fig. 53, the bands relative to the pigment (100 -
1000 cm-1) have a much lower intensity in the spectrum acquired on the patina (pink
line), while they are not visible anymore on the spectrum recorded on the crystal (red
line). Simultaneously a raise in the bands relative to the binding medium (1000-
3200cm-1) is observed. These results indicate that an organic compound is formed. As
reported in Chapter 1 (1.3.1 Pb-based pigment degradation) is known from literature
that lead-based pigments, including Naples yellow, when mixed with linseed oil can
form lead soaps.
The network system of the polymerized oil is vulnerable to environmental attack
especially by acidification that is assumed to disrupt the ionomeric structure of the
binding medium27. As a result monocarboxylic fatty acids can be mobilized and
reorganized in form in form of liquid crystalline metal soap masses within the paint
BEFORE AFTER
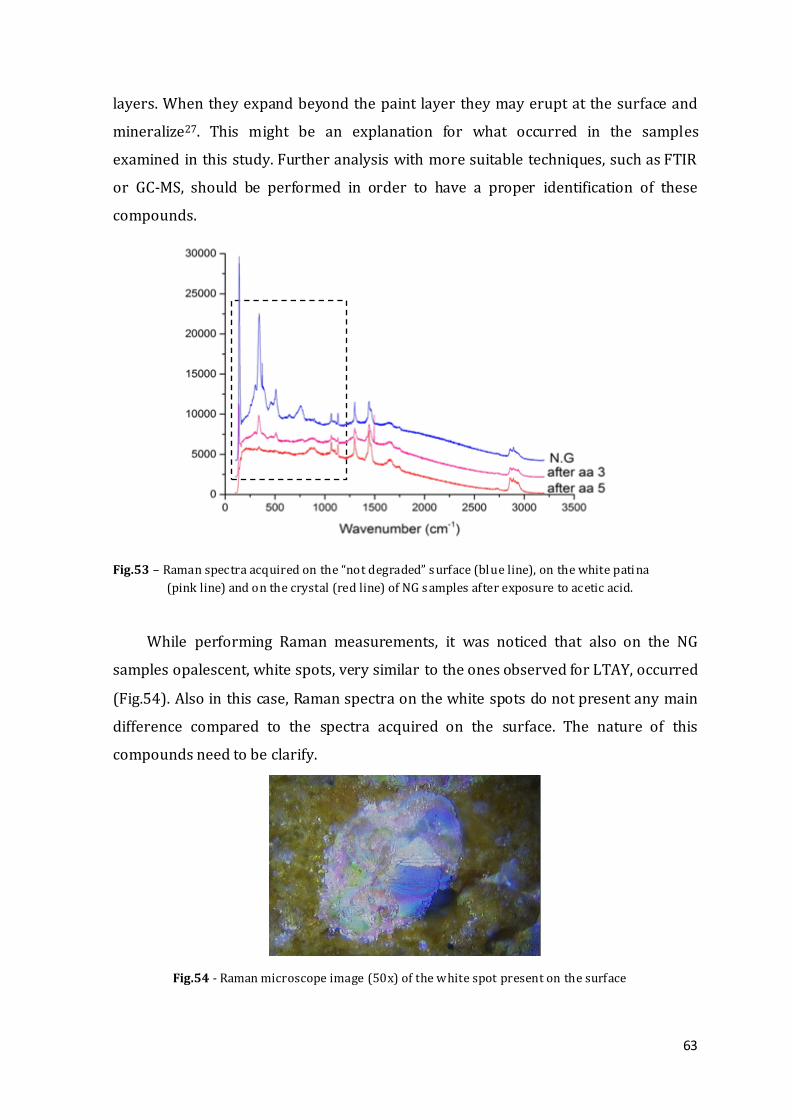
63
layers. When they expand beyond the paint layer they may erupt at the surface and
mineralize27. This might be an explanation for what occurred in the samples
examined in this study. Further analysis with more suitable techniques, such as FTIR
or GC-MS, should be performed in order to have a proper identification of these
compounds.
Fig.53 – Raman spectra acquired on the “not degraded” surface (blue line), on the white patina (pink line) and on the crystal (red line) of NG samples after exposure to acetic acid.
While performing Raman measurements, it was noticed that also on the NG
samples opalescent, white spots, very similar to the ones observed for LTAY, occurred
(Fig.54). Also in this case, Raman spectra on the white spots do not present any main
difference compared to the spectra acquired on the surface. The nature of this
compounds need to be clarify.
Fig.54 - Raman microscope image (50x) of the white spot present on the surface
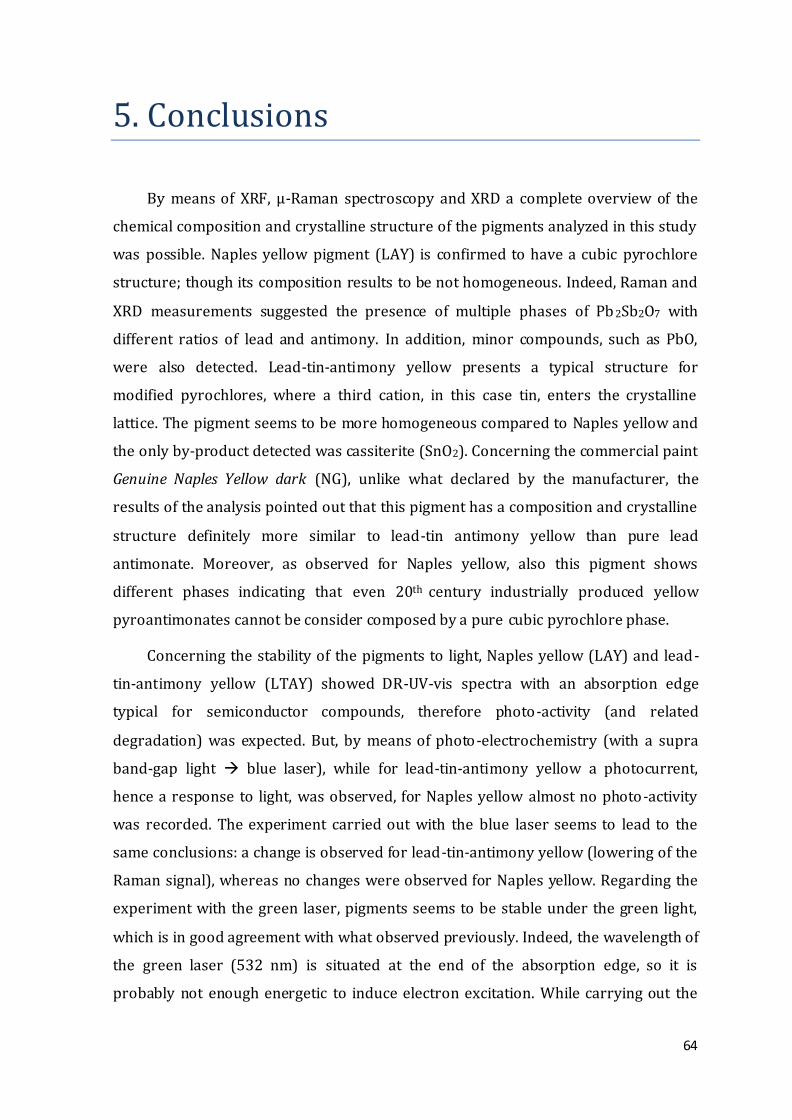
64
5. Conclusions
By means of XRF, µ-Raman spectroscopy and XRD a complete overview of the
chemical composition and crystalline structure of the pigments analyzed in this study
was possible. Naples yellow pigment (LAY) is confirmed to have a cubic pyrochlore
structure; though its composition results to be not homogeneous. Indeed, Raman and
XRD measurements suggested the presence of multiple phases of Pb 2Sb2O7 with
different ratios of lead and antimony. In addition, minor compounds, such as PbO,
were also detected. Lead-tin-antimony yellow presents a typical structure for
modified pyrochlores, where a third cation, in this case tin, enters the crystalline
lattice. The pigment seems to be more homogeneous compared to Naples yellow and
the only by-product detected was cassiterite (SnO2). Concerning the commercial paint
Genuine Naples Yellow dark (NG), unlike what declared by the manufacturer, the
results of the analysis pointed out that this pigment has a composition and crystalline
structure definitely more similar to lead-tin antimony yellow than pure lead
antimonate. Moreover, as observed for Naples yellow, also this pigment shows
different phases indicating that even 20th century industrially produced yellow
pyroantimonates cannot be consider composed by a pure cubic pyrochlore phase.
Concerning the stability of the pigments to light, Naples yellow (LAY) and lead-
tin-antimony yellow (LTAY) showed DR-UV-vis spectra with an absorption edge
typical for semiconductor compounds, therefore photo-activity (and related
degradation) was expected. But, by means of photo-electrochemistry (with a supra
band-gap light blue laser), while for lead-tin-antimony yellow a photocurrent,
hence a response to light, was observed, for Naples yellow almost no photo-activity
was recorded. The experiment carried out with the blue laser seems to lead to the
same conclusions: a change is observed for lead-tin-antimony yellow (lowering of the
Raman signal), whereas no changes were observed for Naples yellow. Regarding the
experiment with the green laser, pigments seems to be stable under the green light,
which is in good agreement with what observed previously. Indeed, the wavelength of
the green laser (532 nm) is situated at the end of the absorption edge, so it is
probably not enough energetic to induce electron excitation. While carrying out the
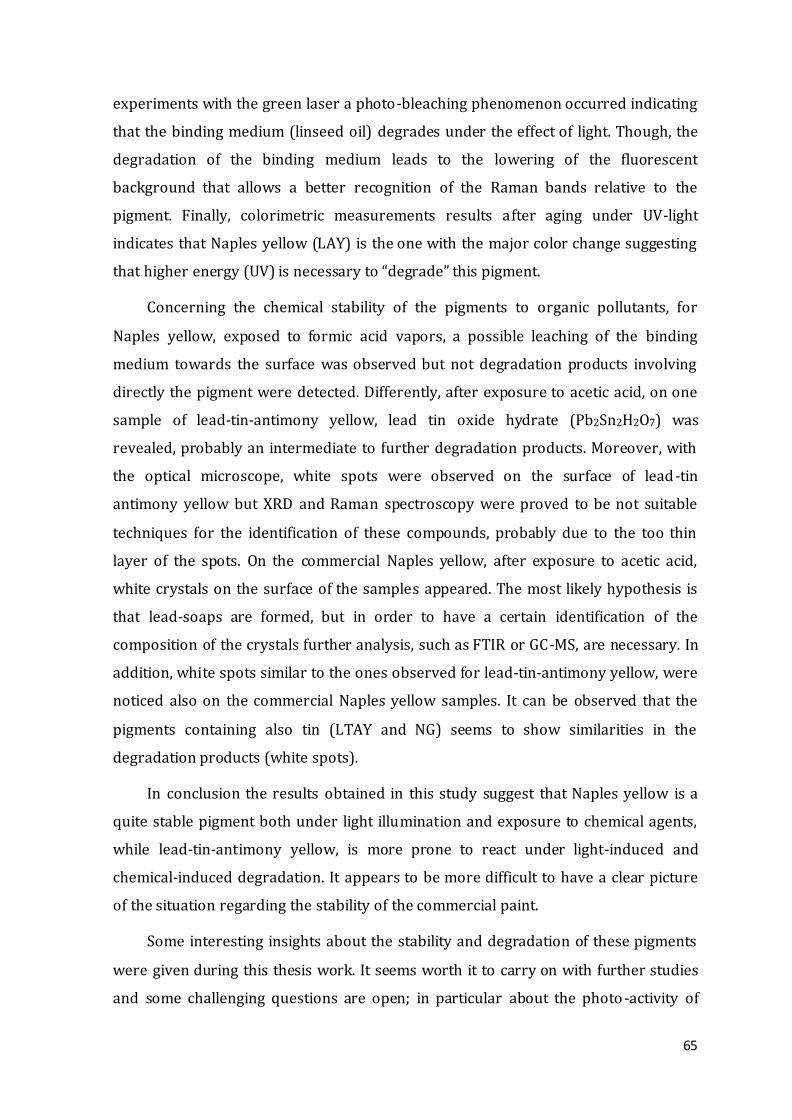
65
experiments with the green laser a photo-bleaching phenomenon occurred indicating
that the binding medium (linseed oil) degrades under the effect of light. Though, the
degradation of the binding medium leads to the lowering of the fluorescent
background that allows a better recognition of the Raman bands relative to the
pigment. Finally, colorimetric measurements results after aging under UV-light
indicates that Naples yellow (LAY) is the one with the major color change suggesting
that higher energy (UV) is necessary to “degrade” this pigment.
Concerning the chemical stability of the pigments to organic pollutants, for
Naples yellow, exposed to formic acid vapors, a possible leaching of the binding
medium towards the surface was observed but not degradation products involving
directly the pigment were detected. Differently, after exposure to acetic acid, on one
sample of lead-tin-antimony yellow, lead tin oxide hydrate (Pb2Sn2H2O7) was
revealed, probably an intermediate to further degradation products. Moreover, with
the optical microscope, white spots were observed on the surface of lead-tin
antimony yellow but XRD and Raman spectroscopy were proved to be not suitable
techniques for the identification of these compounds, probably due to the too thin
layer of the spots. On the commercial Naples yellow, after exposure to acetic acid,
white crystals on the surface of the samples appeared. The most likely hypothesis is
that lead-soaps are formed, but in order to have a certain identification of the
composition of the crystals further analysis, such as FTIR or GC-MS, are necessary. In
addition, white spots similar to the ones observed for lead-tin-antimony yellow, were
noticed also on the commercial Naples yellow samples. It can be observed that the
pigments containing also tin (LTAY and NG) seems to show similarities in the
degradation products (white spots).
In conclusion the results obtained in this study suggest that Naples yellow is a
quite stable pigment both under light illumination and exposure to chemical agents,
while lead-tin-antimony yellow, is more prone to react under light-induced and
chemical-induced degradation. It appears to be more difficult to have a clear picture
of the situation regarding the stability of the commercial paint.
Some interesting insights about the stability and degradation of these pigments
were given during this thesis work. It seems worth it to carry on with further studies
and some challenging questions are open; in particular about the photo -activity of

66
lead-tin-antimony yellow and its reaction mechanism (oxidation), as well as the role
of tin in the degradation processes, which seems to be a relevant factor in the stability
of the pigments studied.
67
Bibliography
1. Dik, J., Hermens, E., Peschar, R. & Schenk, H. Early production recipes for lead
antimonate yellow in Italian art. Archaeometry 47, 593–607 (2005).
2. Eastaugh, N., Walsh, V., Chaplin, T. & Ruth, S. Pigment Compendium: A
Dictionary and Optical Microscopy of Historical Pigments. in 226–227 (Elsevier,
2008).
3. Wainwright, I. N. M. R., Taylor, J. M., and Harley, R. D. Lead antimonate yellow.
in Artists’ pigments: a handbook of their history and characteristics (ed. Feller, R.
L.) vol.1, 219–254 (National Gallery of Art,Washington DC, 1986).
4. Chiarantini, L. et al. Early Renaissance production recipes for Naples Yellow
pigment: A mineralogical and lead isotope study of Italian Majolica from
Montelupo (Florence). Archaeometry 57, 879–896 (2015).
5. Dik, J., Peschar, R., and Schenk, H. The introduction of lead antimonate yellow in
the 18th century. Zeitschrift für Kunsttechnologie und Konserv. 20, 138–46
(2006).
6. Kirmizi, B., Göktürk, E. H. & Colomban, P. Colouring Agents in the Pottery Glazes
of Western Anatolia: New Evidence for the Use of Naples Yellow Pigment
Variations During The Late Byzantine Period. Archaeometry 57, 476–496
(2015).
7. Agresti, G. I gialli di piombo, stagno, antimonio: colore e materia dell’opera
d’arte. (PhD Thesis University of Tuscia, Viterbo (Italy), 2014).
8. Roy, A. & Berrie, B. H. A new lead-based yellow in the seventeenth century. Stud.
Conserv. 43:sup1, 160–165 (1998).
9. Sandalinas, C. & Ruiz-moreno, S. Lead-Tin-Antimony Yellow. Historical
manufacture, molecular characterization and identification in seventeenth-
century Italian paintings. Stud. Conserv. 49, 41–52 (2004).
10. Hradil, D. et al. Microanalytical identification of Pb-Sb-Sn yellow pigment in
historical European paintings and its differentiation from lead tin and Naples
68
yellows. J. Cult. Herit. 8, 377–386 (2007).
11. Rosi, F. et al. Raman scattering features of lead pyroantimonate compounds.
Part I: XRD and Raman characterization of Pb2Sb2O7 doped with tin and zinc. J.
Raman Spectrosc. 40, 107–111 (2009).
12. Radhakrishnan, A. N., Prabhakar Rao, P., Sibi, K. S., Deepa, M. & Koshy, P. Order-
disorder phase transformations in quaternary pyrochlore oxide system:
Investigated by X-ray diffraction, transmission electron microscopy and Raman
spectroscopic techniques. J. Solid State Chem. 182, 2312–2318 (2009).
13. Stránská, L., Šulcová, P. & Vlček, M. Synthesis and properties of inorganic
pigments based on pyrochlore compounds with different lanthanides. J. Therm.
Anal. Calorim. 113, 127–135 (2013).
14. Mizoguchi, H., Eng, H. W. & Woodward, P. M. Probing the Electronic Structures
of Ternary Perovskite and Pyrochlore Oxides Containing Sn4+ or Sb5+. Inorg.
Chem. 43, 1667–1680 (2004).
15. Subramanian, M. A., Aravamudan, G. & Subba Rao, G. V. Oxide pyrochlores - A
review. Prog. Solid State Chem. 15, 55–143 (1983).
16. Cartechini, L. et al. Modified Naples yellow in Renaissance majolica: study of
Pb–Sb–Zn and Pb–Sb–Fe ternary pyroantimonates by X-ray absorption
spectroscopy. J. Anal. At. Spectrom. 26, 2500 (2011).
17. Anaf, W. The influence of particulate matter on cultural heritage. Chemical
characterisation of the interaction between the atmospheric enviroment and
pigments. (University of Antwerp, 2014).
18. Monico, L. et al. Degradation process of lead chromate in paintings by vincent
van gogh studied by means of spectromicroscopic methods. 4. Artificial aging of
model samples of Co-precipitates of lead chromate and lead sulfate. Anal. Chem.
85, 860–867 (2013).
19. Anaf, W., Schalm, O., Janssens, K. & De Wael, K. Understanding the (in)stability
of semiconductor pigments by a thermodynamic approach. Dye. Pigment. 113,
409–415 (2015).
20. Anaf, W. et al. Electrochemical photodegradation study of semiconductor
69
pigments: Influence of environmental parameters. Anal. Chem. 86, 9742–9748
(2014).
21. Rahemi, V. et al. Unique Optoelectronic Structure and Photoreduction
Properties of Sulfur-Doped Lead Chromates Explaining Their Instability in
Paintings. Anal. Chem. 89, 3326–3334 (2017).
22. Vermeulen, M. et al. The darkening of copper- or lead-based pigments
explained by a structural modification of natural orpiment: a spectroscopic and
electrochemical study. J. Anal. At. Spectrom. 32, 1331–1341 (2017).
23. Coccato, A., Moens, L. & Vandenabeele, P. On the stability of mediaeval
inorganic pigments: a literature review of the effect of climate, material
selection, biological activity, analysis and conservation treatments. Herit. Sci. 5,
1–25 (2017).
24. De Laet, N., Lycke, S., Van Pevenage, J., Moens, L. & Vandenabeele, P.
Investigation of pigment degradation due to acetic acid vapours: Raman
spectroscopic analysis. Eur. J. Mineral. 25, 855–862 (2013).
25. Izzo, F. C. Metal soap efflorescence in contemporary oil paintings. 430 (2014).
doi:10.1007/978-3-319-10100-2
26. Noble, P., van Loon, A. & Boon, J. J. Chemical changes in old master paintings II :
darkening due to increased transparency as a result of metal soap formation.
ICOM-CC, 14th Trienn. Meet. Hague Prepr. 496–503 (2005).
27. Boon, J. J., Hoogland, F. & Keune, K. Chemical Processes in Aged Oil Paints
Affecting Metal Soap Migration and Aggregation. AIC Paint. Spec. Gr. Postprints
18–32 (2007).
28. Higgitt, C., Spring, M. & Saunders, D. Pigment-medium Interactions in Oil Paint
Films containing Red Lead or Lead-tin Yellow. Natl. Gall. Tech. Bull. 24, 75–95
(2003).
29. Mazzeo, R. Analytical Chemistry for Cultural Heritage. (Springer International
Publishing, 2017).
30. Keune, K., Hoogland, F., Boon, J. J., Peggie, D. & Higgitt, C. Evaluation of the
‘added value’ of SIMS: A mass spectrometric and spectroscopic study of an
70
unusual Naples yellow oil paint reconstruction. Int. J. Mass Spectrom. 284, 22–
34 (2009).
31. Tumosa, C. S. & Mecklenburg, M. F. The influence of lead ions on the drying of
oils. Stud. Conserv. 50, 39–47 (2005).
32. Van der Weerd, J. Microspectroscopic analysis of traditional oil paint.
(University of Amsterdam, 2002).
33. Field, G. Chromatography; or, A treatise on colours and pigments, and of their
powers in painting. (London, C. Tilt, 1835).
34. Church, A. H. The chemistry of paints and paintings. (1915).
35. Michael Harding | Artist quality handmade oil colours. Available at:
http://www.michaelharding.co.uk/.
36. Smith, G. D. & Clark, R. J. H. Raman microscopy in archaeological science. J.
Archaeol. Sci. 31, 1137–1160 (2004).
37. Smith, G. D. & Clark, R. J. H. Raman microscopy in art history and conservation
science. Stud. Conserv. 46, 92–106 (2001).
38. López, R. & Gómez, R. Band-gap energy estimation from diffuse reflectance
measurements on sol-gel and commercial TiO2: A comparative study. J. Sol-Gel
Sci. Technol. 61, 1–7 (2012).
39. Poldi, G. & Villa, G. C. F. Dalla conservazione alla storia dell’arte: Riflettografia e
analisi non invasive per lo studio dei dipinti. (Edizioni della Normale, 2006).
40. Raman spectroscopy. Available at: https://www.xrite.com/.
41. XRD. Available at:
https://serc.carleton.edu/research_education/geochemsheets/techniques/XR
D.html.
42. Rosi, F. et al. Raman scattering features of lead pyroantimonate compounds:
Implication for the non-invasive identification of yellow pigments on ancient
ceramics. Part II. in situ characterisation of Renaissance plates by portable
micro-Raman and XRF studies. J. Raman Spectrosc. 42, 407–414 (2011).
43. Agresti, G., Baraldi, P., Pelosi, C. & Santamaria, U. Yellow pigments based on lead,
71
tin, and antimony: Ancient recipes, synthesis, characterization, and hue choice
in artworks. Color Res. Appl. 41, 226–231 (2016).
44. Dik, J., Tichelaar, F., Goubitz, K., Peschar, R., and Schenk, H. 19th century Naples
Yellow re-examinated. Zeitschrift für Kunsttechnologie und Konserv. 16, 291–
306 (2002).
45. Sakellariou, K., Miliani, C., Morresi, A. & Ombelli, M. Spectroscopic investigation
of yellow majolica glazes. J. Raman Spectrosc. 35, 61–67 (2004).
46. Dennis, A. Photo-Bleaching and Automatic Baseline Correction for Raman
Spectroscopy. (2007). Available at:
http://www.perkinelmer.de/CMSResources/Images/44-
74254APP_RamanPhoto-BleachingAutoCorrection.pdf.
47. Macdonald, A. M. & Wyeth, P. On the use of photobleaching to reduce
fluorescence background in Raman spectroscopy to improve the reliability of
pigment identification on painted textiles. J. Raman Spectrosc. 37, 830–835
(2006).
48. Ghiara, G. et al. Micro Raman investigation on corrosion of pbbased alloy
Replicas of letters from the museum Plantin-Moretus, Antwerp. J. Raman
Spectrosc. 45, 1093–1102 (2014).


