Embed Size (px)
Citation preview
THE RELATIONSHIP BETWEEN CONFORMITY, INDEPENDENCE,
ANTICONFORMITY, AND CERTAIN PERSONALITY
CHARACTERISTICS
APPROVED:
Major Professor
A/ Minor Processor
SVUL~>
Education Dean of the Schoo
Deancof the Graduate School
THE RELATIONSHIP BETWEEN CONFORMITY, INDEPENDENCE,
ANTICONFORMITY, AND CERTAIN PERSONALITY
CHARACTERISTICS
THESIS
Presented to the Graduate Council of the
North Texas State University in Partial
Fulfillment of the Requirements
For the Degree of
MASTER OF SCIENCE
By
Patricia S. Mantheiy, B. S.
Denton, Texas
August, 1969
TABLE OF CONTENTS
Page
LIST OF TABLES iv
Chapter
I. INTRODUCTION . . . . . . . 1
Related Research Purpose of the Study Statement of the Problem Hypotheses Chapter Bibliography
II. METHOD . 42
Subjects Description of Instruments Design Procedure Chapter Bibliography
III. ANALYSIS AND DISCUSSION OF RESULTS 54
IV. SUMMARY AND CONCLUSIONS 66
APPENDIX 70
BIBLIOGRAPHY . . . 75
XXX

LIST OF TABLES
Table Page
I.
II.
III.
IV.
V.
Means and Standard Deviations of Dependent Variable Scores for Conformers, Independents, and Anticonformers. . .
Summary of Analysis of Variance of Conformers Independents, and Anticonformers on Need for Affiliation
Summary of Analysis of Variance of Conformers Independents and Anticonformers on Dependency Needs
Summary of Analysis of Variance of Conformers Independents, and Anticonformers on Overt Anxiety
Summary of Analysis of Variance of Conformers Independents, and Anticonformers on Covert Anxiety
54
55
57
. 58
60
IV
CHAPTER I
INTRODUCTION
An understanding of conformity and nonconformity is
particularly important in these days of social unrest.
Most of the research has emphasized understanding the process
of conformity, with nonconformity either being ignored or
considered the opposite of conformity. This unidimensional
approach with conformity on one end and nonconformity on the *«
other was conceptualized by Allport (1) in his J curve
hypothesis of conformity. Asch (3) continued the unidimen-
sional approach by contrasting conformity with independence. ,
This unidimensional approach has been followed in a vast
amount of literature which contrasts conformity with either
nonconformity or independence.
There are certain difficulties which are encountered in
studying conformity and nonconformity. Many studies have
failed to distinguish between congruence conformity, which
is measured in terms of the extent of agreement between a
given response and the normative ideal, and movement conformity,
which is defined as a change in response due to group
pressure (21) .
Another difficulty encountered in the study of conformity
was suggested by McGee (29) when he did a study designed to
•
determine whether or not individuals who tend to choose
acquiescent options in response to test items would tend to
display socially oriented behavior® Seven measures of
acquiescence and two independent behavioral tasks were
administered to 104 undergraduate psychology students.
McGee found that the agreeing response tendency had very
little if any relationship to social behavior.
Diab (14) suggested that deviation and conformity are
really one and the same process. He argued that when a
person deviates from a certain standard or norm# he is in
fact conforming to another standard or norm. This is in
opposition to the view expressed by Asch (4) that deviation
and conformity are in opposition to each other and have
their sources in distinct considerations and motives.
Recently a two-dimensional approach to the study of
conformity has been adopted which contrasts conformity with
two varieties of nonconformity; independence and anticonformity,
or counterformity as it is sometimes referred to. Theoretical
descriptions of the independent and counterformity persons
have been given by several authors.

Although they did not support their views with research,
Kretch, Crutchfield and Ballachy (25) pointed out that not
all nonconformity is the same. One type of nonconformity is
counterformity, in which the person is actively opposing the
group, being hostile, negativistic and compulsively dissenting
from it. The counterformist may be driven to repduiate the
groups beliefs or actions even when he believes the group is
right. This kind of nonconformity is to be distinguished from
independence of judgement in which the person is neither
unduly susceptible to the pressure of the group nor unduly
driven by forces of alienation from the group. Kretch,
Crutchfield and Ballachy (25) also distinguished between two
types of conformity, expedient conformity, in which the
individual outwardly agrees with the group but remains in
inward disagreement, and true conformity, in which the
individual both inwardly and outwardly is brought to agree
with the group.
In another theoretical article Crutchfield (12) further
elaborated on the definition of the independent person. He
stated that the independent person is able to maintain an
optimal balance between self reliance and group identification.
He is able to escape the oversocialization of the extreme
conformist, which involves violating the validity of his own
experiences and betraying his own thought processes and
judgments, and yet does achieve a sufficient degree of ,
socialization so as to not divorce himself from the essential
resources of society's thinking, as in the case of the
extreme counterformist. According to Crutchfield (12) the
truly independent person is often highly conventional in
ways that facilitate group life but do not impede his own
aims. The independent person has learned to accept society
without denying himself.
Crutchfield (12) also theorized about the motivations
of the counterformist. He suggested that the motivation
impelling the counterformist involved needs for defending
his identity, becoming emancipated from the groups authority
and expressing hostile impulses toward others. The counter-
formist strives for difference for difference's sake.
Willis (45) is another advocate of two varieties of
nonconformity. However, in addition to conformity,
independence and anticonformity, Willis (45) suggested the
response mode of variability. Variability occurs when the
individual invariably changes his response if given an
opportunity, without regard for the fact that one of the
responses is defined as correct and the other as wrong.
Variability reflects complete indecision. As soon as the
person responds one way, he changes his mind.
The Foundation for Research on Human Behavior (16)
recognized three types of conformity as well as independence
and nonconformity. The "cognitive" conformer is looking for
a solution? he needs information and accepts the opinion of
the group as being the most likely answer. The "expedient"
conformer believes he has the correct answer, but goes along
with the group on the wrong answer in spite of this. The
"passively suggestible" conformer lacks confidence in himself
and his opinions and therefore accepts the groups opinion in
the belief that they must be right and he must be wrong.
Related Research
Asch (3) contributed greatly to research on conformity
by developing a method of measuring movement conformity, or
yielding to group pressure0 A group of seven to nine indi-
viduals was instructed to match the length of a given line
with one of three other lineso One of the three comparison
lines was equal to the standard; the others differed consid-
erably. All but one of the subjects had met previously with
the experimenter and were instructed on certain trials to
respond verbally with wrong and unanimous judgments. This
placed the critical subject in the position of a minority of
one against a wrong and unanimous majority. The critical
subject's estimate might be correct and therefore a measure
of independence from the majority, or in error, in which
case the number of errors was taken as an index of the
effect the majority exerted on the minority of one,
Crutchfield (11) criticized Asch's (3) technique because
of the severely unfavorable ratio of confederates to true
subjects. To improve upon this procedure he constructed an
apparatus consisting of five adjacent electrical panels.
The subjects could not see each other in these panels, but
they could all see slides which were projected on a wall
directly facing the subjects. These slides called for
various kinds of judgments—lines, figures, vocabulary items,
etc.—to which the subjects replied on the electrical panel.
The subjects were told that the apparatus was so wired that
information could be sent by each man to all the others.
Although the subjects believed the panel lights were a
communication system between booths, actually all the lights
were controlled by the experimenter. In this way each of
the subjects could be confronted with an apparent unanimous
group opinion contrary to his own.
The Asch (3) technique and the Crutchfield (11) technique
are the two most commonly used methods of measuring movement
conformity, or a change in response due to group pressure.
A large variety of paper and pencil tests have been devised
to measure congruence conformity, or the extent of agreement
between a given response and the normative ideal.
Conformity and nonconformity have been studied with
regard to the situational variables that affect conformity
behavior and with regard to the relationship between the
personality of the individual and his tendency to conform,
remain independent or anticonform. A few examples of
situational studies will be given, but the remainder of the
research survey will concern itself with the relationship
between personality and conformity due to the vast amount
of literature on this subject.
One situational variable which has been studied is
group size. Gerard, Wilhelmy and Conolley (17) asked 154
high school students to make judgments of Asch's lines in
groups of 2, 3, 4, 5, 6, 7 and 8 under two treatments of
perceived contingency. In one treatment the subjects were
induced to perceive that the others might be following the
leader, but in the other treatment condition the subjects
were led to believe that the others were responding
independently,, It was hypothesized that conformity to
group opinion should increase with group size if the subject
perceives the others as independent operators, but if he
8
perceives them as dependent in their responses, the subject
would be unaffected by an increase in group size. The
results showed that conformity increased as the size of the
group increased under both treatment conditions.
Another situational variable which has been studied is
group attractiveness as a determinant of conformity.
Rotter (35) did a study in which twenty-eight students were
divided into groups of three and asked to complete a modified
version of the Strong Vocational Interest Blank. Then each
subject was asked to indicate how well he liked the other
two members of the group based on the answers to the Strong
Blanks. The subjects were then handed summaries which
indicated how well the other group members liked them. These
summaries were filled in by the experimenter, with half the
subjects receiving a "liked" rating and the other half a
"disliked" rating. Conformity was measured by a modification
of the Asch line judgment. Group attractiveness, i,.e_., liking
for the group* was found to be unrelated to yielding.
Costanzo, Reitan, and Shaw (10) studied conformity as a
function of experimentally induced competance. With the use
of a Crutchfield apparatus 26 subjects, assigned to groups
of four, viewed geometric figures of different sizes and were
told to judge which of the three figures was largest in area.
9
The subjects were told to write down their answers on a sheet
of paper. The experimenter supposedly "graded" the papers
and announced aloud whether the subject had been correct
(high competence) or incorrect (low competence) on each of
the ten practice trials. The experimenter actually randomly
manipulated levels of competence, varying the number of high
competent and low competent members in each group.
The subjects were then presented a set of twenty
stimulus cards and were told to respond by means of switches.
Since all the switches were controlled by the experimenter,
this placed each subject in the position of being a minority
of one against a unanimous but erring majority, as in the
traditional CrutchfieId situation. In this study, however,
the supposed competence levels of the subjects in the
simulated majority were known to each subject as well as
his own supposed competence.
It was hypothesized that the low competent members would
conform more than the high competent members to the unanimous
but erring majority. It was further predicted that
conformity would vary with the number of supposedly high
competent members in the simulated majority.
As predicted, low competent individuals conformed more
than those high in competence regardless of the levels of
10
competence in the majority. The results also indicated that
the greater the number of the supposedly high competent
individuals in the simulated majority, the greater the
conformity of the minority subject.
The relationship between levels of prior agreement with
others and conformity was studied by Julian, Regula, and
Hollander (23)0 Levels of agreement with others were created
in a Crutchfield situation by having a 100 per cent agreement .
condition, a 75 per cent agreement condition, a 50 per cent,
25 per cent, and 0 per cent agreement on judgments.,
Conformity was assessed during a second phase in terms of
the number, of trials of twenty in which the subject matched
the erroneous judgments of the others. Levelsof agreement
was found to be curvilinearly related to conformity with
highest conformity following unanimous agreement, least
conformity following strong majority support (75 per cent)
and moderate conformity following agreement from a minority
of peers.
The large majority of studies relating conformity to
personality employ the unidimensional approach, with
conformity on one end and nonconformity or independence on
the other. Some of these studies describe the general
personality characteristics of either conformers or nonconformers
11
on the assumption that the traits assigned to conformers
are opposite to those assigned to nonconformers. Other
studies relate conformity to specific personality traits,
such as anxiety or dependence, on the assumption that
conformers have either more or less of these specific traits
than nonconformers.
One of the earliest studies relating conformity to
general personality characteristics was done in 1930 by
Barry (5). Barry developed a paper and pencil test which
he called a test for S. According to Barry, S seemed to
measure the amount of resistance to social stimuli. For
want of a better, word, compliance was identified with high
positive values for S while negativism or the habitual
resistance to social stimuli was identified with negative
values for S. Barry stated that the correlates of high
positive values for S seem to be amenability, deference to
the opinion of others and, in some cases, punctiliousness.
The dominant motive in the person with high S score would
be social rather than individual. Persons with low S scores
tended to be critical, derogatory and irritable.
In another, early study, Allport and Solomon (2)
measured conformity by lengths of conversation in the
library and church. Allport and Solomon concluded that
12
judging from investigations, with other types of behavior*
individuals possessing high degrees of talkativeness,
sociability or other traits which deviate considerably from
the average fall far out on the steps of lesser conformity.
He also stated that the fact of conformity means a less
complete expression of natural individual differences*
particularly near the mean.
In a more recent study, Hoffman (19) measured conformity
in terms of the extent to which reported judgments of two
distances were changed in the direction of announced bogus
group-average judgments. Those conforming most and least
were divided into two groups and given a sentence completion
test, two attitude questionnaires and thirteen cards from the
Thematic Apperception Test. The conforming group, compared , ,
to the group which did not conform, scored lower on various
measures of ego strength and significantly higher on measures
of parental dominance, intropunitive handling of hostility,
inability to tolerate impulses, overconcern for the well-
being of parents, overidealization of and less ability to
critically evaluate parents, strict moralism, success
strivings, positive attitude toward authority and conservative
political and religious attitudes.
13
The Foundation for Research on Human Behavior (16) used
a Crutchfield technique to measure conformity and a wide
variety of personality tests to study the relationship
between conformity and personality. According to this report,
conformers have inadequate self-perception# are high on
scales of doubt and anxiety* feel inferior and are unable to '
cope under stress. Nonconformity is related to intelligence,
ego strength, dominance, ascendancy, masculinity and social
acuity, or the ability to understand other people.
In reviewing a large variety of studies relating
personality to conformity, Blake and Mouton (7) stated that
the kind of person who is least able to resist conformity
pressures is submissive, lacking in self-confidence, less
intelligent, lacking in originality, authoritarian-minded,
lacking in achievement motivation, conventional and search-
ing for social approval.
Bass (6) also reviewed a large variety of studies on
conformity and personality and stated that yielders to
simulated group pressure were much more likely to be
conventional, nurturant, affiliative, conscientious and
sociable. He suggested that conforming behavior was
correlated with the generalized tendency to acquiesce, the
generalized need for certainty and assuredness and generalized
feelings of insecurity.
14
Crutchfield (12) in measuring conformity by the use of
his technique has correlated conformity with several person-
ality variables. He stated that conformers have a rigidity
of cognitive processes, are lower in ego strength and ability
to cope with stress* have more emotional constriction and
lack spontaneity. They have a repression of impulse and a
tendency toward indirect expression of hostility, Conformers
have pronounced feelings of inferiority and inadequacy, lack
self confidence, are less insightful and are less realistic
in self conception. According to Crutchfield (12) the
conformist exhibits an intense preoccupation with other
people and dependence on them, while at the same time a
disturbed and distrustful attitude towards others. Conformers
are more anxious, insistent on securing a stable and safe
environment, and desirous of avoiding uncertainty and
ambiguity at any cost. In another study Crutchfield (13)
stated that those with lower conformity scores tend to be
superior in intelligence, originality, ego strength, self-
confidence and effective social relations.
Moeller and Applezweig (33) related conformity as
measured by an Asch type situation to needs for social
approval and self approval as measured by the Behavior
Interpretation Inventory. They hypothesized that persons
15
with high social approval and low self-approval motivation
would yield to a unanimous but erring majority more
frequently than would persons with high self approval and
low social approval motivations. The results were in
accord with the major hypothesis.
Centers and Horowitz (9) measured conformity by a
questionnaire designed to elicit expression of opinion.
In the experimental groups a paragraph was added to the
instructions which stated that the opinions of numbers of
well-known and important people would be indicated by means
of an asterisk at one of the choice alternatives. They then
related conformity to inner-directedness and other-directedness
as measured by the 1-0 Social Preference Scale. The results
indicated that other-directed persons were more influenced
to conform in their views in the direction of the fictitious
important people than the inner-directed persons.
In contrast to these studies, Endler (15) found no
relationship between conformity and general personality
characteristics. Endler used as his conformity measure a
forty-eight item scale consisting of twenty-three conformity
items and twenty-five neutral ones. Personality was measured
by the Public Opinion Survey and eight scales from the
Edwards Personal Preference Schedule. The EPPS scales were
16
achievement, deference, autonomy, affiliation, succorance,
dominance, abasement, and agression.
The studies cited above describe the general personality
characteristics of conformers and nonconformers. The following
studies relate conformity or nonconformity to specific
personality traits, rather than general personality
characteristics.
Taylor and Vaughan (40) did a study relating clinical
depression to conformity. The neurotic depressive subjects
were twenty-two undergraduate students referred by a
professional clinical psychologist. They displayed symptoms
of dejection, lethargy, feelings of isolation, disinterest
in everyday affairs and a reluctance to make decisions.
Scores on the Depressive Scale of the MMPI were also gathered.
The normal subjects were selected from bottom quartiles on
the Depressive Scale. The conformity measure was a
Crutchfield visual signaling apparatus. The results
indicated that conformity scores for depressives as a whole
were approximately 54 per cent lower than for normals.
Taylor and Vaughan indicated that the low conformity of the
depressives seems to derive from their general state of
disinterest and consequent social apathy.
1 7
Another specific personality trait that has been studied
in connection with conformity is authoritarianism. Smith,
Murphy, and Wheeler (38) measured conformity by an Asch-type
conformity situation and correlated it with scores on the
California £ Scale and Army GT scores (general intelligence).
P scale scores were negatively correlated with intelligence
and positively correlated with Asch-type conformity.
Intelligence also showed a significant negative correlation
with conformity. When the effects of intelligence were
partialled out, the positive correlation between the F scale
and conformity remained significantly high, but when removing
the effects of authoritarianism the negative correlation
between intelligence and conformity was no longer significant.
It seemed that the California F Scale did have some value
in predicting conformity behavior, but within the limited
range tested, intelligence per se did not.
Another study on conformity and authoritarianism was
done by Vaughan and White (42). This study differed from
other studies in that conformity was measured in the transit-
uational sense and a forced choice version of the F scale,
known as the FCF scale, was used to measure authoritarianism.
Three measures of conformity were used: group pressure through
the use of the Crutchfield technique; normative pressure which
1 8
involved the manipulation of artificial norms to induce
opinion shift in individual subjects; and the Social Acqui-
w-
escence Scale/ a questionnaire which has been found to
discriminate between high and low scores on the acquiescence
dimension. The high conformity and low conformity groups
were selected from the upper and lower quartiles of group
pressure and normative pressure and from a median cut on the
Social Acquiescence Scale. The results indicated that high
conformity subjects scored significantly higher on the FCF
than did low conformity subjects.
The need for affiliation is another personality trait
that has been studied in connection with conformity. McGhee
and Teevan (30) measured need for affiliation by stories
written to four Thematic Apperception Test slides. Subjects
were divided into high and low need for affiliation groups
depending upon whether their score was above or below the
median score. Conformity was measured with the use of a
modified version of the Crutchfield apparatus in which only
perceptual tasks were used so that a situation might be
established in which the subject's judgment was clearly
objectively correct but differed from that of an erring
unanimous majority. The results indicated that the high
need-for-affiliation subjects conformed significantly more
than the low-need-for-affiliation subjects.
19
Hardy (18) studied the effects of affiliative motivation
and social support upon conformity. Subjects were divided
into high, medium, and low-need for affiliation groups on the
basis of a TAT-type measure of affiliative motivation. The
•subjects were given a pretest concerning their attitude
toward divorce. Then each subject met with a group of six
students, all confederates of the experimenter, in which
their previously measured attitude toward divorce was either
unanimously opposed, or opposed with the exception of one
supporter. The critical subject was then given a post-
test questionnaire about divorce. Conformity was measured
as shifts in the direction of group influence. The results
indicated conformity to be a joint function of affiliative
motivation and conditions of social support. The group with
medium need scores conformed under both conditions. The
high-need group conformed under conditions of no support,
but not under support conditions. The low-need group changed
more under conditions of support than no support, but were
considered as responding more to the content of the influence
situation than to its social structure.
Walker and Heyns (43) studied need for affiliation and
need for achievement in connection with conformity. By
using good friends and supposedly putting them in two groups,
20
a conflict was created between need for affiliation and need
for achievement. In order for a girl to achieve in her
group, she had to encode or scramble the largest number of
words. In the decoding group, the girl that could decode or
unscramble the highest percentage of words would achieve.
Therefore, if a girl encoded or scrambled a large number of
words, it was difficult for her friend to decode the highest
percentage. Actually all the girls were in the encoding
group. The girls all received a written request from the
experimenter, which they thought was from their friend in
the decoding group, to "please slow down." Those subjects
who tested high in need for affiliation and low in need for
achievement on previously administered personality tests
conformed to their friend's request to slow down. Those who
tested high in need for achievement and low in need for
affiliation did not conform to their friend's request to
slow down.
Levy (27) measured conformity with a Crutchfield
situation and persgnality with the Edwards Personal Preference
Schedule. He found need for affiliation to show a positive
relation to conformity.
The relationship between dependency and group conformity
has also been studied. Kagen and Mussen (24) defined dependency
21
as "the need for emotional or authoritative support in most
situations, difficulty in making independent decisions and
taking on responsibilities and the dread of loneliness,,"
According to Kagen and Mussen, since the dependent individual
would regard the opinion of a group as wiser and more reliable
than his own, it might be predicted that he would conform to
group judgments. Dependency was measured by responses to
eight TAT cards in which the hero sought help from another
in solving a personal problem or was disturbed over loss of
love and support„ Conformity was measured by an Asch type
conformity situation. The results indicated that every one
of the 10 subjects who produced two or more dependency
themes yielded to the incorrect majority opinion.
In another study, Bradbard (8) used the Navran Dependency
Scale derived from the MMPI to classify subjects along a
continuum of expression of dependence, ranging from dependency-
denier (low score) through dependency-flexible to dependency-
acceptor (high score). Bradbard hypothesized that both
dependency-acceptors and dependency-deniers would show
higher amount of yielding in a Crutchfield conformity situation
than would dependency-flexibles. The hypothesis was not
supported. High dependency scores, which he termed dependency-»«
acceptors, were significantly related to high conformity scores.
22
In studying conformity in a Crutchfield situation,
Sistrunk and McDavid (36) used two classes of judgments,
soluble tasks, involving perceptual judgments of differences
that were discriminable with at least 95 per cent accuracy
by pretest subjects, and insoluble tasks, involving perceptual
judgments of indiscriminable pairs of identical stimuli in
which the contrived majority agreed on an arbitrarily
selected member of an indiscriminable pair. Forty measures
of personality were used. It was inferred from these
measures that conformity to a group of unanimous peers who
have expressed a judgment in obvious contradiction to logic
and reason is associated with timidity, deference to others,
tendencies to avoid argument or conflict with others and
generally components of deference and dependence. Conformity
to judgments of a unanimous group of peers in an otherwise
ambiguous situation is associated with not only components
of deference and dependence, but trust and faith in other
people, conventionality and persistence in seeking closure
and successful completion of problems or tasks undertaken,,
Anxiety is the trait most thoroughly researched in
connection with conformity. Meunier and Rule (31) in relating
test anxiety to conformity used the seventeen-item Test
Anxiety Scale as a measure of anxiety and an Asch situation

23
as a measure of conformity. High test-anxious persons "
conformed significantly more than low test-anxious persons
in this study.
Meyers and Hohle (32) used three test-anxiety scales
and an Asch conformity situation to study the relationship
of test-anxiety to conformity,, They found a positive
relation between conformity and test anxiety.
Walters, Marshall, and Shooter (44) investigated the
effects of anxiety and isolation upon social influence,.
Anxiety was measured by two self-report anxiety scales„ On
the assumption that the giving of suggestions and the dis-
pensing of social reinforcers such as right and good could
be regarded as alternative ways of inducing susceptibility
to social influence# susceptibility measures were responses
of subjects to contrary judgments of distances and the speed
with which the subjects were conditioned to emit a specific
response. The subjects were divided into four groups,
isolated anxious, isolated nonanxious, nonisolated anxious,
and nonisolated nonanxious, and tested for suggestibility in
the autokinetic situation. Anxious subjects showed a
greater increase in suggestibility in response to contrary
judgments than did nonanxious subjects and were more quickly
conditioned to a specific class of judgments,, No differences
were found between isolated and nonisolated subjects.
24
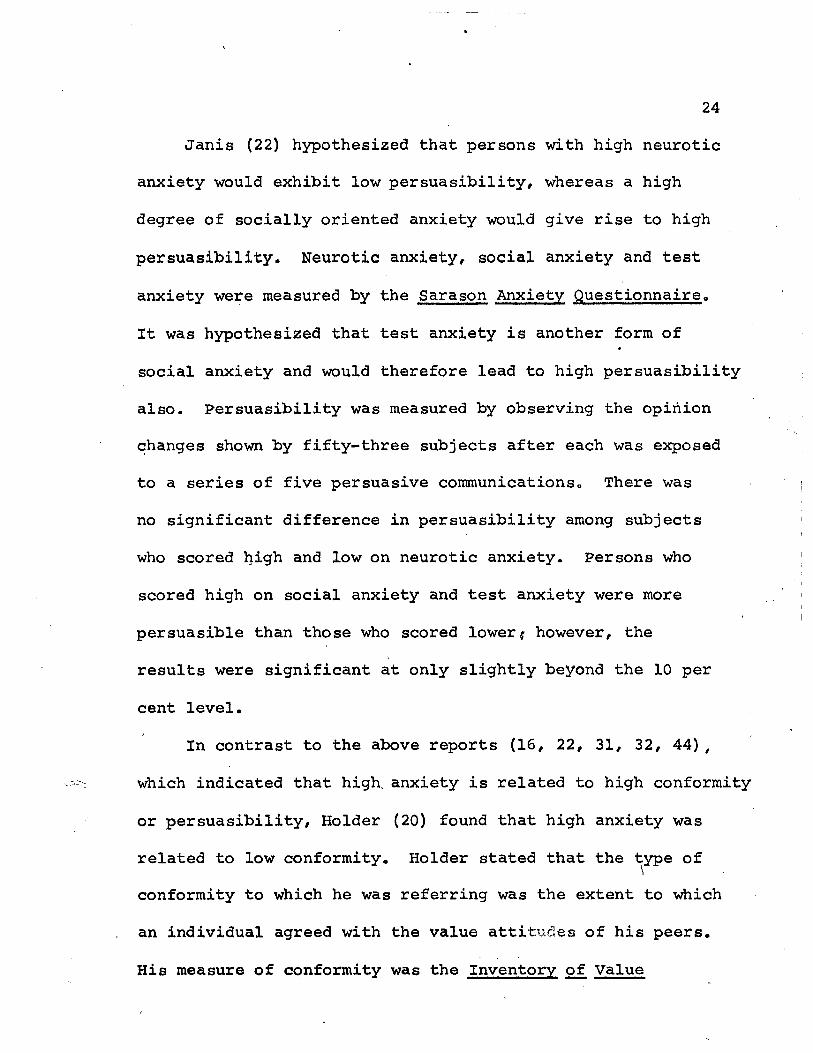
Janis (22) hypothesized that persons with high neurotic
anxiety would exhibit low persuasibility, whereas a high
degree of socially oriented anxiety would give rise to high
persuasibility. Neurotic anxiety, social anxiety and test
anxiety were measured by the Sarason Anxiety Questionnaire,,
It was hypothesized that test anxiety is another form of •
social anxiety and would therefore lead to high persuasibility
also. Persuasibility was measured by observing the opinion
changes shown by fifty-three subjects after each was exposed
to a series of five persuasive communications„ There was
no significant difference in persuasibility among subjects
who scored high and low on neurotic anxiety. Persons who
scored high on social anxiety and test anxiety were more
persuasible than those who scored lower; however, the
results were significant at only slightly beyond the 10 per
cent level.
In contrast to the above reports (16, 22, 31, 32, 44),
which indicated that high, anxiety is related to high conformity
or persuasibility, Holder (20) found that high anxiety was
related to low conformity. Holder stated that the type of
conformity to which he was referring was the extent to which
an individual agreed with the value attitudes of his peers.
His measure of conformity was the Inventory of Value
25
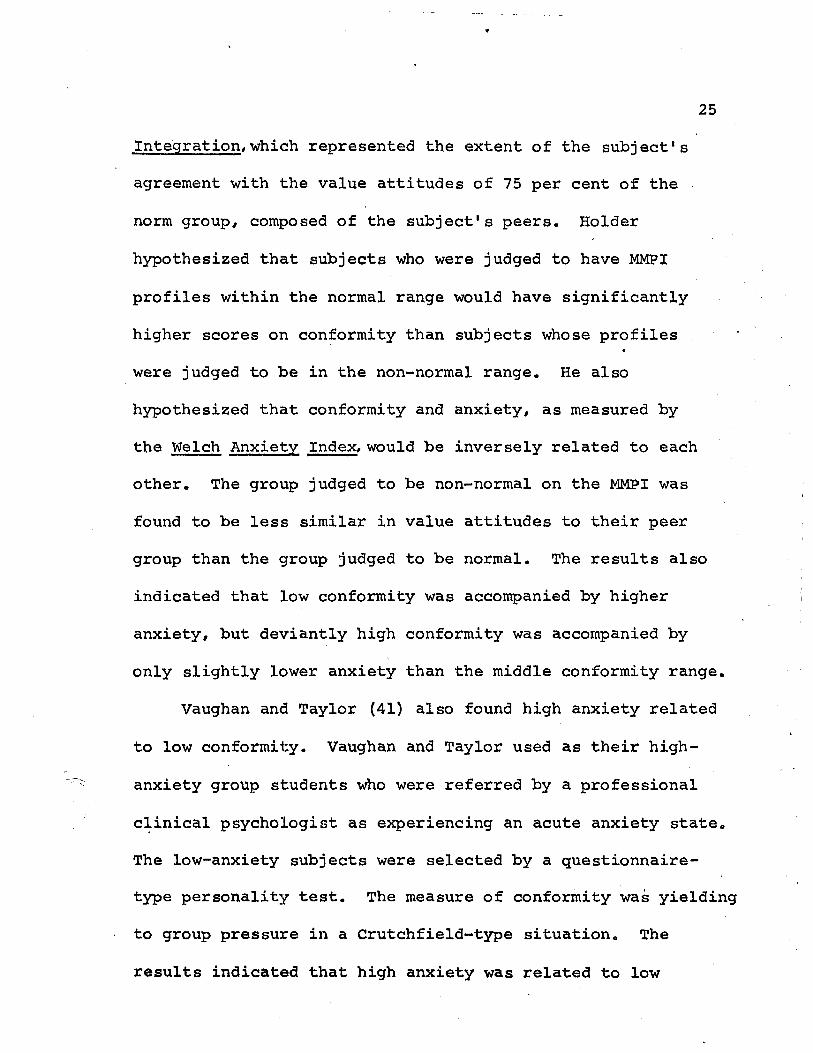
Integration,which represented the extent of the subject's
agreement with the value attitudes of 75 per cent of the
norm group, composed of the subject's peers. Holder
hypothesized that subjects who were judged to have MMPI
profiles within the normal range would have significantly
higher scores on conformity than subjects whose profiles '
were judged to be in the non-normal range. He also
hypothesized that conformity and anxiety, as measured by
the Welch Anxiety Index, would be inversely related to each
other. The group judged to be non-normal on the MMPI was
found to be less similar in value attitudes to their peer
group than the group judged to be normal. The results also
indicated that low conformity was accompanied by higher
anxiety, but deviantly high conformity was accompanied by
only slightly lower anxiety than the middle conformity range.
Vaughan and Taylor (41) also found high anxiety related
to low conformity. Vaughan and Taylor used as their high-
anxiety group students who were referred by a professional
clinical psychologist as experiencing an acute anxiety state.
The low-anxiety subjects were selected by a questionnaire-
type personality test. The measure of conformity was yielding
to group pressure in a Crutchfield-type situation. The
results indicated that high anxiety was related to low
26
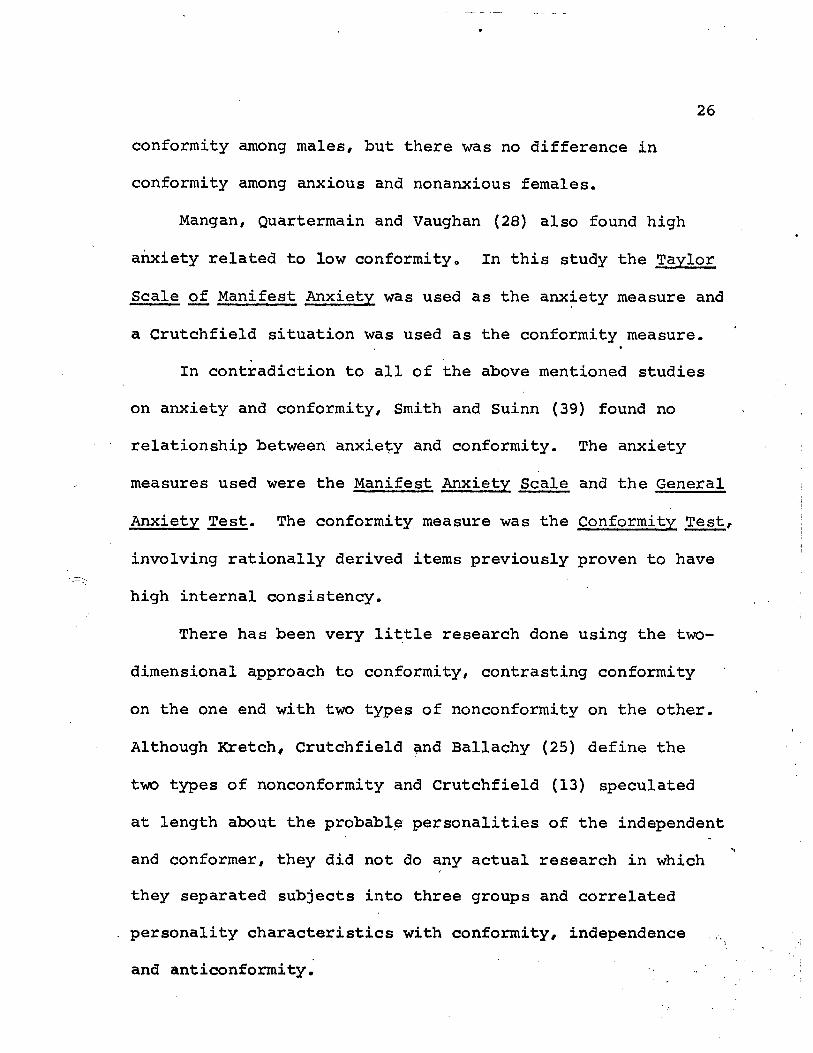
conformity among males, but there was no difference in
conformity among anxious and nonanxious females.
Mangan, Quartermain and Vaughan (28) also found high
anxiety related to low conformity. In this study the Taylor
Scale of Manifest Anxiety was used as the anxiety measure and
a Crutchfield situation was used as the conformity measure.
In contradiction to all of the above mentioned studies
on anxiety and conformity, Smith and Suinn (39) found no
relationship between anxiety and conformity. The anxiety
measures used were the Manifest Anxiety Scale and the General
Anxiety Test. The conformity measure was the Conformity Test,
involving rationally derived items previously proven to have
high internal consistency.
There has been very little research done using the two-
dimensional approach to conformity, contrasting conformity
on the one end with two types of nonconformity on the other.
Although Kretch, Crutchfield and Ballachy (25) define the
two types of nonconformity and Crutchfield (13) speculated
at length about the probable personalities of the independent
and conformer, they did not do any actual research in which
they separated subjects into three groups and correlated
personality characteristics with conformity, independence
and anticonformity.

27
Willis (46) did a study to demonstrate that conformity,
independence and anticonformity reactions can be brought
under experimental control and can be substantially and
differentially produced in the laboratory. By simultaneously
manipulating a number of independent variables, conditions
for one group were designed to maximize conformity, those
of a second group to maximize independence and those of a
third to maximize anticonformity. Differences among the
experimental groups were sizable and supported his prediction
that these three response modes could be produced. Willis
indicated that he was concerned with responses, however,
and not the processes underlying these responses0
Pepinsky (34) did a study of girls on a college campus
who were rated as nonconformers by their peers, but neverthe-
less were highly productive. She contrasted these girls with
girls who were described as nonconforming, but were not
productive. Using a wide variety of personality measures,
she described productive nonconformers as being high in ego
strength and having an internalized, well-integrated set of
standards. They have both spontaneity and self control;
they can be alone without discomfort, but are able to form
warm, nonexploitative attachments. They accept some limits
as inevitable# but their attitude toward authority is one of

28
critical respect, rather than of unquestioning servility.
They conform on trivial matters, but can maintain their
positions under pressure on matters they feel are important.
Their typical set is one of constructive restructuring.
Because they can see both sides* they sometimes have difficulty
making decisions, but they can and do get things done.
Pepinsky (34) stated that in negative conformity there
is a rebellion against authority without the development of
an integrated set of personal standards. There may be a
confused wavering between one set of values and the other,
and in some instances there appeared to be an internalization
of a set of defensive-repressive standards representing an
attempt to deny a need for other—an affiliative reaction
f
formation.
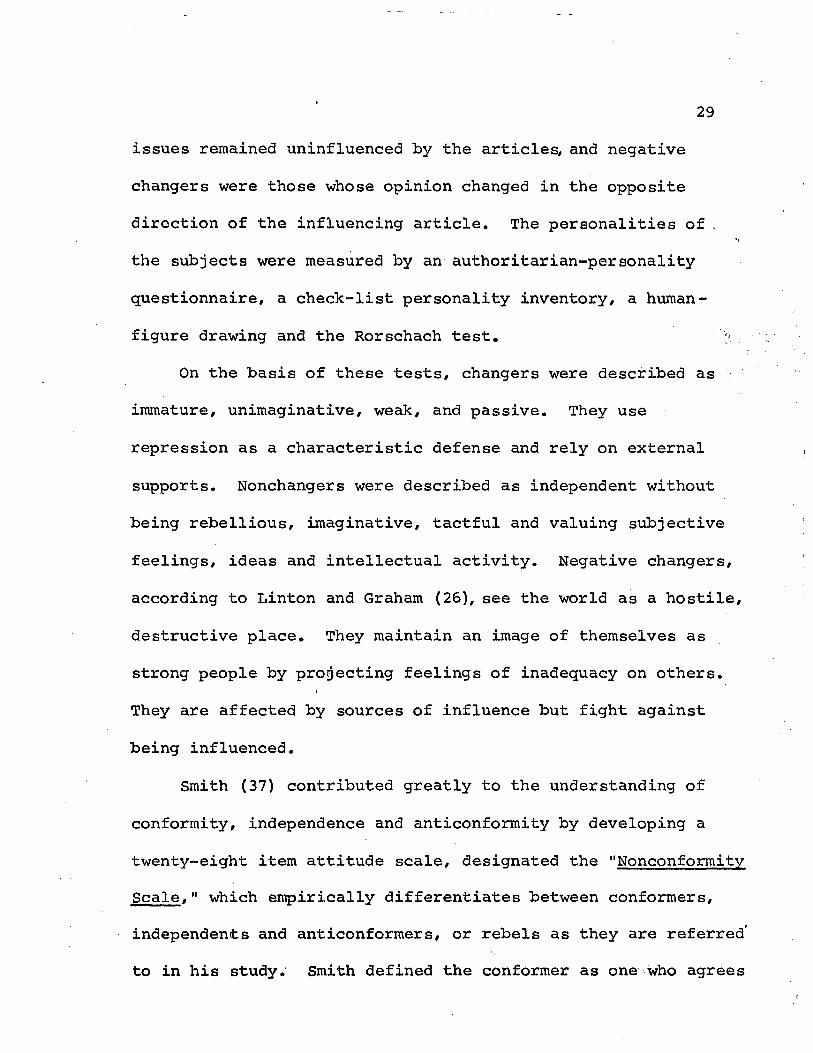
On the basis of the opinion-change test, Linton and
Graham (26) divided subjects into three groups, changers,
nonchangers and negative changers. Subjects were asked
questions on three controversial topics. At a later session
the subjects were given supposedly authoritative articles
on the topics which took a definite stand on the issue*
Then the subjects were again asked the original questions.
Changers were those that changed in the direction of the
article, nonchangers were those whose opinions on all three
29
issues remained uninfluenced by the articles, and negative
changers were those whose opinion changed in the opposite
direction of the influencing article. The personalities of .
the subjects were measured by an authoritarian-personality
questionnaire, a check-list personality inventory, a human-
figure drawing and the Rorschach test.
On the basis of these tests, changers were described as
immature, unimaginative, weak, and passive. They use
repression as a characteristic defense and rely on external
supports. Nonchangers were described as independent without
being rebellious, imaginative, tactful and valuing subjective
feelings, ideas and intellectual activity. Negative changers,
according to Linton and Graham (26), see the world as a hostile,
destructive place. They maintain an image of themselves as
strong people by projecting feelings of inadequacy on others.
They are affected by sources of influence but fight against
being influenced.
Smith (37) contributed greatly to the understanding of
conformity, independence and anticonformity by developing a
twenty-eight item attitude scale, designated the "Nonconformity
Scale," which empirically differentiates between conformers,
independents and anticonformers, or rebels as they are referred'
to in his study. Smith defined the conformer as one who agrees
30
consistently with modal social attitudes and responds in
keeping with the hypothetical usual or normal response. The
independent is defined as one who agrees with some modal
responses and disagrees with others and behaviorally neither
categorically acts against nor is totally accepting of the
modal response from situation to situation. The rebel dis-
agrees consistently with modal social responses and responds
in opposition to the hypothetical usual or normal response.
Smith (37) measured behavioral correlates of conformity,
independence and rebellion by the Figure Preference Test,
which is a response-style scale, and the two-person nonzero
sum game, which is a situational test. Between-groups
differences did not reach the .05 level of significance on
the Figure Preference Test. The rebels were more competitive
than either of the two groups on the two-person nonzero sum
game. Independents were more cooperative than both conformers
and rebels on the game, with conformers and rebels not differing
significantly.
Personality correlates of the three groups were measured
by the Rorschach test and the well-being scale, the self-
control scale, and the achievement -via-conformity scale of
the California Psychological Inventory. The results of the
Rorschach test revealed no significant differences between
31
the three groups on experience-balance subtypes, space, or
popular responses. However, movement responses were
significantly more common among rebels than among either
independents or conformers. The results of the California
Psychological Inventory indicated that the independents scored
significantly higher on the well-being scale than did either
the conformer or the rebel. The rebel scored lower than the
conformer, but not significantly so. The independents showed
significantly more self-control than did either the conformer
or the rebel, with the conformer and the rebel scoring very
similarly on this dimension. The rebels indicated less
achievement via conformity than did the conformer and the
independent.
At the conclusion of his study, Smith (37) stated that
significant differences on the Rorschach and the game suggest
that beneath surface-level differences, conformers and rebels
may be similarly motivated. The rebel and the conformer may
be at different ends of the attitude continuum, but the
personality dynamics underlying the overt responses seem to
share a similar base. Smith stated that rebels have
characteristics of conforming nonconformers,while both rebels
and conformers differ from the independents on several
dimensions. -
32
Purpose of the Study
As a review of the literature indicates, conformity and
nonconformity has been studied in many ways and in relation
to many aspects of personality. The conception of conformity
which considers conformity, independence and anticonformity
as separate response modes hold much promise in clarifying
the conflicts in the literature and in helping to understand
these methods of behavior and their relationship to personality.
The development of an,easily administered and easily
scored test by Smith (37) which differentiates conformers,
independents,.and anticonformers facilitates study of these (
three groups. The suggestion by Smith (37) that conformers
and anticonformers might have similar motivations underlying
their different surface behavior seems worthy of further
study. The Foundation for Research on Human Behavior (16)
also suggested similar motivations by stating that the contra-
suggestible person has a great deal in common with the
conformer. However, €hey did not elaborate further on this
point.
If conformers and anticonformers do indeed have similar
underlying motivation for their different surface bahaviors,
this might explain why researchers such as Endler (15) found
no relationship between conformity and personality. On a test
33
measuring only conformity-nonconformity without measuring
independence, the anticonformists would score as nonconformers.
However, on a personality test which revealed underlying
motivations, the anticonformers would score similarly to the
conformers, causing the results of the experiment to be
confused and perhaps suggesting to the researcher that there
was no relationship between personality and conformity.
Statement of the Problem
Although there have been suggestions about the
similarity of motivations of conformers and anti-conformers,
to date there has been no scientific investigation into this
area. The purpose of this research then was to conduct an
exploratory study into this area, using the Smith nonconformity,
scale as a measure of conformity, independence, and anticon-
formity. Is there a similarity of underlying motivations in
conformers and anticonformers, particularly in relation to
the personality traits, need for affiliation, dependency
needs, and anxiety?
Hypotheses
The specific hypotheses are based on the survey of
the literature. Several studies (18, 27, 30, 43) have
indicated that conformers are high in need for affiliation.
34
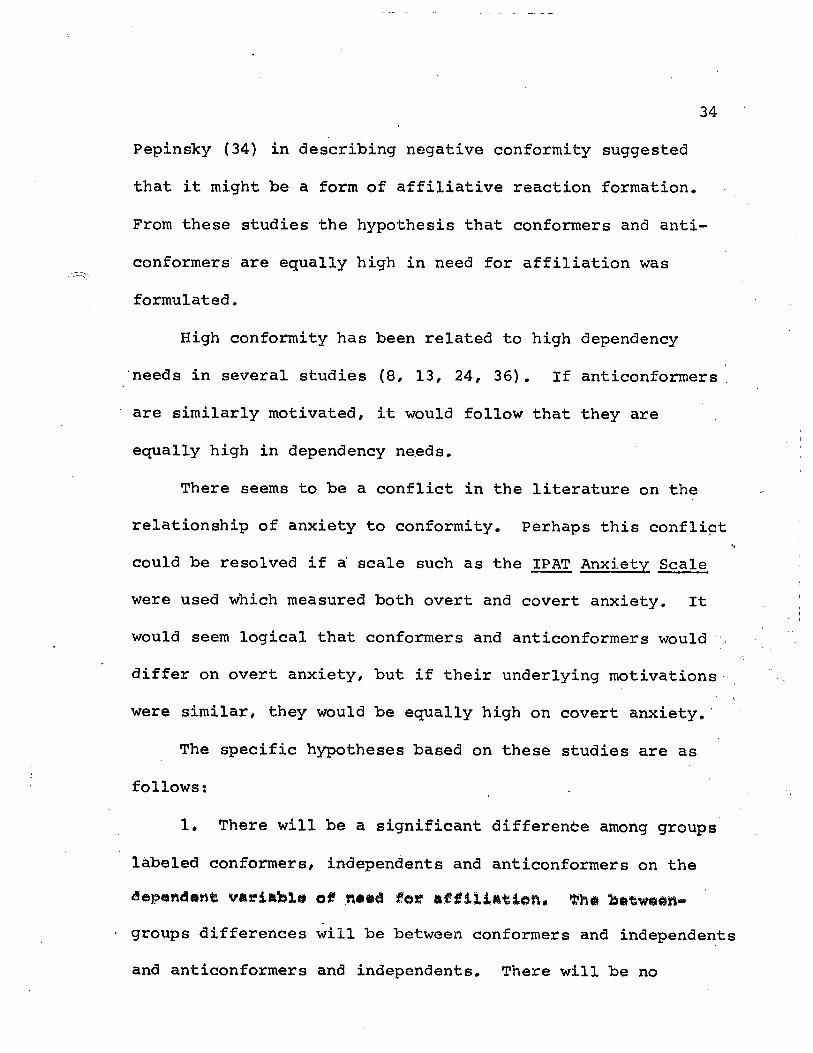
PepinsTcy (34) in describing negative conformity suggested
that it might be a form of affiliative reaction formation.
From these studies the hypothesis that conformers and anti-
conformers are equally high in need for affiliation was
formulated.
High conformity has been related to high dependency
needs in several studies (8, 13, 24, 36). If anticonformers
are similarly motivated, it would follow that they are
equally high in dependency needs.
There seems to be a conflict in the literature on the
relationship of anxiety to conformity. Perhaps this conflict •«
could be resolved if a scale such as the IPAT Anxiety Scale
were used which measured both overt and covert anxiety. It
would seem logical that conformers and anticonformers would J
differ on overt anxiety, but if their underlying motivations
were similar, they would be equally high on covert anxiety.
The specific hypotheses based on these studies are as
follows:
1. There will be a significant difference among groups
labeled conformers, independents and anticonformers on the
<Sep«n<S#nfe variable of n««d for affiliation. $h«
groups differences will be between conformers and independents
and anticonformers and independents. There will be no
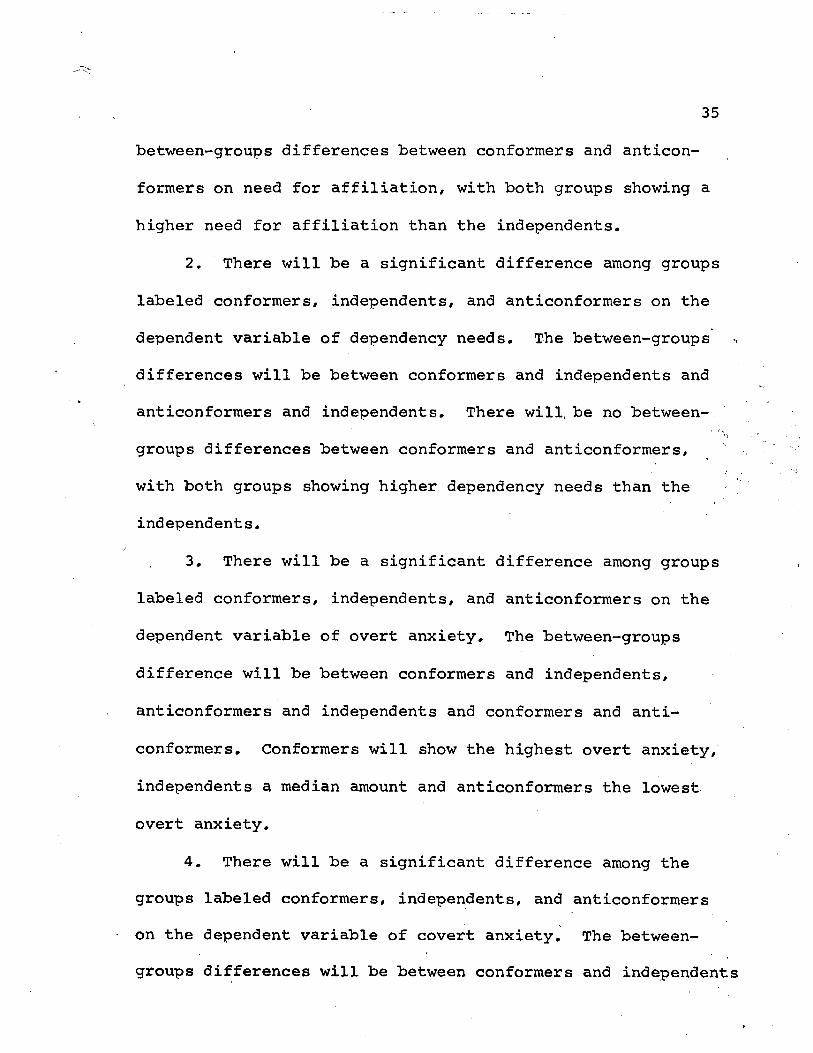
35
between-groups differences between conformers and anticon-
formers on need for affiliation, with both groups showing a
higher need for affiliation than the independents.
2. There will be a significant difference among groups
labeled conformers, independents, and anticonformers on the
dependent variable of dependency needs. The between-groups
differences will be between conformers and independents and
anticonformers and independents. There will, be no between-
groups differences between conformers and anticonformers,
with both groups showing higher dependency needs than the
independents.
3. There will be a significant difference among groups
labeled conformers, independents, and anticonformers on the
dependent variable of overt anxiety. The between-groups
difference will be between conformers and independents,
anticonformers and independents and conformers and anti-
conformers. Conformers will show the highest overt anxiety,
independents a median amount and anticonformers the lowest
overt anxiety.
4. There will be a significant difference among the
groups labeled conformers, independents, and anticonformers
on the dependent variable of covert anxiety. The between-
groups differences will be between conformers and independents
36
and anticonformers and independents. There will be no
between-groups differences between conformers and anticon-
formers, with both groups showing higher covert anxiety than
the independents.
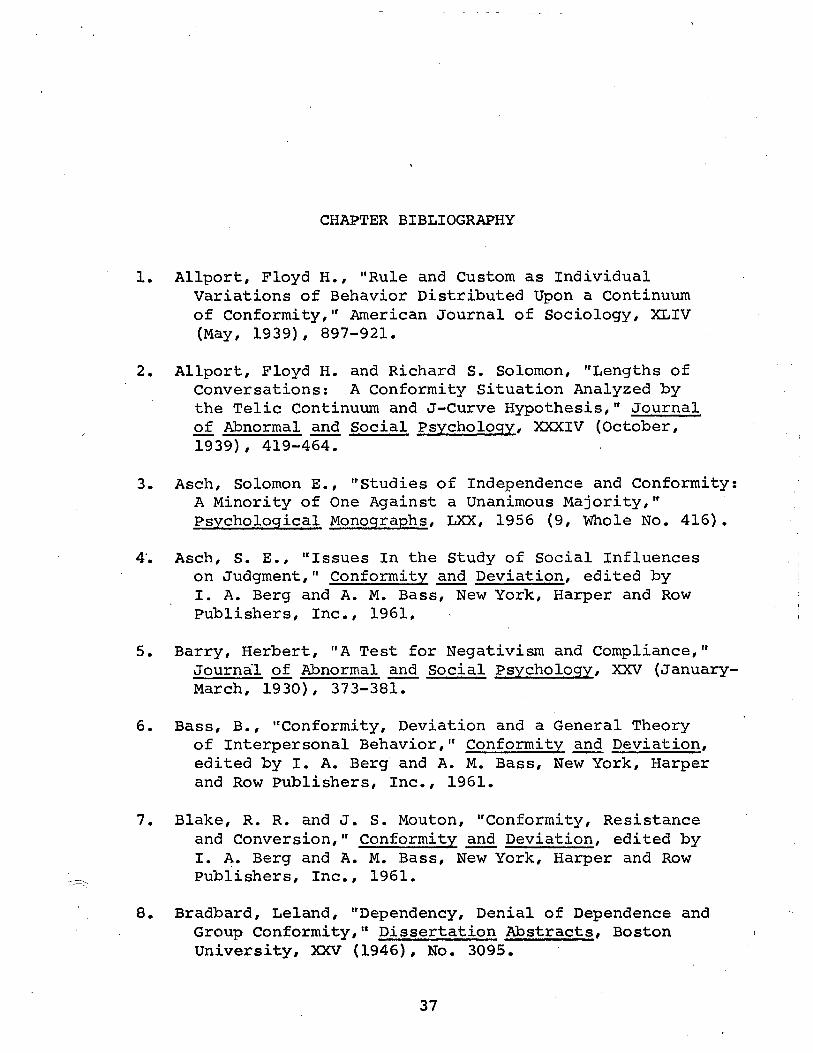
CHAPTER BIBLIOGRAPHY
1. Allport, Floyd H., "Rule and Custom as Individual Variations of Behavior Distributed Upon a Continuum of Conformity/' American Journal of Sociology, XLIV (May, 1939), 897-921.
2. Allport, Floyd H. and Richard S. Solomon, "Lengths of Conversations: A Conformity Situation Analyzed by the Telic Continuum and J-Curve Hypothesis," Journal of Abnormal and Social Psychology, XXXIV (October, 1939), 419-464.
3. Asch, Solomon E., "Studies of Independence and Conformity: A Minority of One Against a Unanimous Majority," Psychological Monographs, LXX, 1956 (9, Miole No. 416).
4'. Asch, S. E., "Issues In the Study of Social Influences on Judgment," Conformity and Deviation, edited by I. A. Berg and A. M. Bass, New York, Harper and Row Publishers, Inc., 1961,
5. Barry, Herbert, "A Test for Negativism and Compliance," Journal of Abnormal and Social Psychology, XXV (January-March, 1930), 373-381.
6. Bass, B., "Conformity, Deviation and a General Theory of Interpersonal Behavior," Conformity and Deviation, edited by I. A. Berg and A. M. Bass, New York, Harper and Row Publishers, Inc., 1961.
7. Blake, R. R. and J. S. Mouton, "Conformity, Resistance and Conversion," Conformity and Deviation, edited by I. A. Berg and A. M. Bass, New York, Harper and Row Publishers, Inc., 1961.
8. Bradbard, Leland, "Dependency, Denial of Dependence and Group Conformity," Dissertation Abstracts, Boston University, XXV (1946), No. 3095.
37
38
9. Centers, Richard and Mirian Horowitz, "Social Character and Conformity: A Differential in Susceptibility to Social Influence," Journal of Social Psychology, LX (August, 1963), 343-349.
10. Costanzo, Philip R., Harold T. Reitan, and Marvin E. Shaw, "Conformity as a Function of Experimentally Induced Minority and Majority Competence," Psychonomic Science, X (April, 1968), 329-330.
11. Crutchfield, Richard S., "Conformity and Character," American Psychologist, X (May, 1955), 191-198.
12. , "Conformity and Creative Thinking," Contemporary Approaches to Creative Thinking, edited by Howard E. Gruber, Glenn Terrell, -and Michael Wertheimer, New York, Atherton Press, 1962.
13. , "Personal and Situational Factors in Conformity to Group Pressure," Acta Psychologica, XV (August, 1959), 386-388.
14. Diab, Lutfy N., "Conformity and Deviations Two Processes or One," Psychological Reports, XXII (June, 1968), 1134-1136.
15. Endler, Norman S., "Conformity Analyzed and Related to Personality," Journal of Social Psychology, LIII (April, 1961), 271-283.
16. Foundation for Research on Human Behavior, Creativity and Conformity, A Problem for Organizations, Ann Arbor, Michigan, Braun and Brumfield, 1958.
17. Gerard, Harold B., Roland A. wilhelmy, and Edward S. Conolley, "Conformity and Group Size," Journal of Personality and Social Psychology, VIII (January, 1968), 79-82.
18. Hardy, Kenneth R., "Determinants of Conformity and Attitude Change," Journal of Abnormal and Social Psychology, LIV (May, 1957), 289-294.
39
19. Hoffman, Martin L., "Some Psychodynamic Factors in Compulsive Conformity," Journal of Abnormal and Social Psychology. XLVIII (July, 1953), 383-393.
20. Holder, Wayne B., "Value Conformity in Normal and Non-Normal Groups," Journal of Social Psychology, XLVIII (August, 1958), 147-154.
21. Hollander, Edwin P. and Richard H. Willis, "Some Current Issues in the Psychology of Conformity and Nonconformity, Psychological Bulletin, LXVIII (July, 1967), 62-76.
22. Janis, Irving L., "Anxiety Indices Related to Suscep-tibility to Persuasion," Journal of Abnormal and Social Psychology, LI (July, 1955), 663-667.
23. Julian, James W., Robert C. Regula, and Edwin P. Hollander, "Effects of Prior Agreement by Others on Task Confidence and Conformity," Journal of Personality and Social Psychology, IX (June, 1968), 171-178.
24. Kagan, Jerome and Paul H. Mussen, "Dependency Themes on the TAT and Group Conformity," Journal of Consulting Psychology, XX (January, 1956), 29-32.
25. Krech, David, Richard S. Crutchfield, and Egerton L. Ballachey, Individual In Society, New York, McGraw-Hill Book Company, Inc., 1962.
26. Linton, H. and E. Graham, "Personality Correlates of Persuasibility," Personality and Persuasibility, edited by C. I. Hovland and I. L. Janis, New Haven, Yale University Press, 1959.
27. Levy, Leo, "A Study of Some Personality Attributes of Independents and Conformers," Dissertation Abstracts, University of Washington, XIX (1958), No. 1823.
28. Mangan, G. L., D. Quartermain, and G. M. Vaughan, "Taylor MAS and Group Conformity Pressure," Journal of Abnormal and Social Psychology, LXI (July, 1960), 146-147.
29. McGee, Richard K., "The Relationship Between Response Style and Personality Variables," Journal of Abnormal and Social Psychology, LXV (November, 1962), 347-351.
40
30. McGhee, Paul E. and Richard C. Teevan, "Conformity Behavior and Need for Affiliation," Journal of Social Psychology LXXII (June, 1967), 117-121.
31. Meunier, Clement and Brendan G. Rule, "Anxiety, Confi-dence and Conformity," Journal of Personality, XXXV (September, 1967), 498-504.
32. Meyers, William J. and Raymond H. Hohle, "Questionnaire Anxiety and Social Conformity," Psychological Reports, XI (October, 1962), 436.
33. Moeller, George and Mortimer H. Applezweig, "A Motiva- \ tional Factor in Conformity," Journal of Abnormal and Social Psychology, LV (July, 1957), 114-120.
34. Pepinsky, P. N., "Social Exceptions that Prove the Rule," Conformity and Deviation, edited by I. A. Berg and A. M. Bass, New York, Harper and Row Publishers, Inc., 1961.
35. Rotter, George S., "An Experimental Evaluation of Group Attractiveness as a Determinant of Conformity," Human Relations, XX (August, 1967), 273-281.
36. Sistrunk, Frank and John W. McDavid, "Personality Correlates of Two Kinds of Conforming Behavior," Journal of Personality, XXXII (September, 1964), 420-435.
37. Smith, Robert J., "Explorations in Nonconformity," Journal of Social Psychology, LXXI (February, 1967), 133-150.
38. Smith, Steward, Donald B. Murphy, and Ladd S. Wheeler, "Relation of Intelligence and Authoritarianism to Behavioral Contagion and Conformity," Psychological Reports, XIV (February, 1964), 248.
39. Smith, Thomas L. and Richard M. Suinn, "A Note on Identification, Self Esteem, Anxiety, and Conformity," Journal of Clinical Psychology, XXI (July, 1965), 286.
41
40. Taylor, A. J. W. and G Depression and Confo^: Skills, XXV (August,
ipahara M. Vaughan, "Clinical mity," Perceptual and Motor 1967), 257-260.
41. Vaughan, Graham M. and A. J. W. Taylor, "Clinical Anxiety and Conformity,,r Perceptual and Motor Skills, XXII (June, 1966), 719-722.
42.
43.
44.
Vaughan, Graham M. and and Authoritarianism and Social Psychology
Walker, Edward L. and Conformity, Englewoocl Hall, Inc., 1962.
Ipger W. Heyns, An Anatomy for Cliffs, New Jersey, Prentice-
Walters, Richard H., Wi. Shooter, "Anxiety, I Social Influence," J; (December, 1960), 518
lliam E. Marshall, and Richard J. ^olation, and Susceptibility to ournal of Personality, XXVIII
45.
46.
Willis, Richard H., "C Anticonformity, " Hum^: 1965), 373-387.
Willis, Richard H. and Study of Three Respori Situations," Journal LXIX (August, 1964),
Kenneth D. White, "Conformity Reexamined," Journal of Personality
III (March, 1966), 363-366.
•529.
qnformity, Independence, and n Relations, XVIII (November,
E. P. Hollander, "An Experimental se Modes in Social Influence of Abnormal and Social Psychology, 150-156.
CHAPTER II
METHOD
Subjects
The subjects for this study consisted of 73 members of
two intact freshman psychology classes at North Texas State
University. Although the subjects did not volunteer in
advance to participate in this study, they were told before
the tests were given that they were free to leave. Therefore,
they may be considered as volunteers. The subjects were not
classified as to age, sex, social class or other variables
as it was not considered necessary for the purposes' of this
study. <
Description of Instruments
• Three objective paper and pencil tests were used for
this study; the Nonconformity Scale.developed by Smith, the
Edwards Personal Preference Schedule? and the IPAT Anxiety
Scale Questionnaire.
The Nonconformity Scale was developed as a measure for
defining three groups, conformers, independents and
42
43
anticonformers, or rebels as referred to by Smith (5). Some
items were taken from existing attitude tests such as the
Cattell 16 P.JF. test,with new items designed by Smith. The
scale was developed by having ten judges from* the graduate
school and faculty of the University of Miami Psychology
Department rate 125 items. After being given a comprehensive
definition of the rebel, the conformer, and the independent,
the judges were to respond to each item in terms of how he
thought a rebel, an independent and a conformer would respond
to the item, that is, whether he would agree or disagree
with the item.
The modal attitudes of the conformers, rebels, and
independents were defined by the judges' agreement as to
how the three groups would respond to the scale items.
From the 125 items, 36 items garnered judgesJ agreement
indexes of 75 perocent or better. The first 36-item edition
of the Nonconformity Scale was administered to 21 male
junior college students. Following an item analysis and
the rating by judges of an additional group of 77 newly
constructed statements, the scale assumed its final form,
consisting of 33 items, 28 of which were scorable and 5
filler items. The total score on the Nonconformity Scale
resulted from assigning numbers 1 to 9 to percentage
44
options on the basis of the direction in which the item was
keyed. For an item where an extreme conformist would agree
100 per cent, a subject agreeing 100 per cent would be given
a score of 9 and a subject disagreeing 100 per cent would
be given a score of 1. For an item where an extreme conformer
would disagree 100 per cent, a subject disagreeing 100 per
cent would receive a score of 9 and a subject agreeing 100
per cent would receive a score of 1. Therefore, the highest
scores on the scale defined the conformer, the lowest scores
defined the anticonformer, or rebel,and the median scores
defined the independent.
Smith (5) validated his test on a sample of 162 male
undergraduates and found significant differences between the
three groups in regard to certain personality and behavioral
characteristics.
In a follow-up study Smith (6) administered the
Nonconformity Scale to 177 male undergraduates at a Mid-
western university. Significant differences between the
three groups were found on three scales of the California
Psychological Inventory, the achievement-via-conformance
scale, the well-being scale and the self-control scale.
A new factor, psychological anomie, was tested, and it was
45
found that anticonforming subjects expressed more anomic
feelings than the conformers or the independents.
To date, these two studies by Smith (5, 6) are the only
ones in which the Nonconformity Scale has been used.
Therefore, no other information is available as to the
validity and reliability of the scale than what is given in
the two studies by Smith.
The Edwards Personal Preference Schedule has generated
a considerable amount of research as evidenced by the fact
that 326 articles about the scale are listed in the Sixth
Mental Measurements Yearbook by Buros (1). In connection
with validity the correlations between the EPPS scores and
corresponding self-ratings, when computed on an individual
basis, ranged from -.59 to .90 with a median of .39. Test-
retest reliability ranged from .55 to .87 with a median of
.73.
Although the entire EPPS was administered, the only
scales that were scored were affiliation, deference,
succorance, abasement, autonomy and dominance. The need-
for-affiliation scale of the EPPS was scored separately as
an indicator of the need to make friends, participate in
friendly groups and in general to be with friends (3).
The deference, succorance, abasement, autonomy and dominance
46
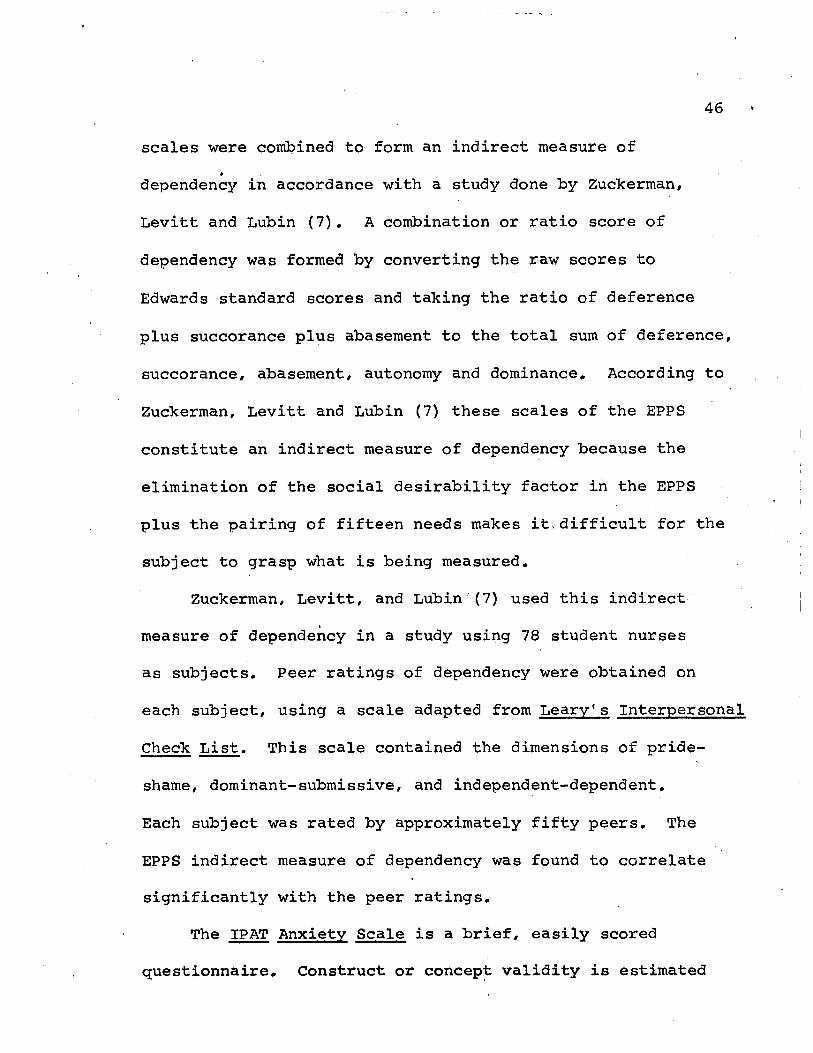
scales were combined to form an indirect measure of *
dependency in accordance with a study done by Zuckerman,
Levitt and Lubin (7). A combination or ratio score of
dependency was formed by converting the raw scores to
Edwards standard scores and taking the ratio of deference
plus succorance plus abasement to the total sum of deference,
succorance, abasement, autonomy and dominance. According to
Zuckerman, Levitt and Lubin (7) these scales of the EPPS
constitute an indirect measure of dependency because the
elimination of the social desirability factor in the EPPS
plus the pairing of fifteen needs makes it,difficult for the
subject to grasp what is being measured.
Zuckerman, Levitt, and Lubin (7) used this indirect
measure of dependency in a study using 78 student nurses
as subjects. Peer ratings of dependency were obtained on
each subject, using a scale adapted from Leary's Interpersonal
Check List. This scale contained the dimensions of pride-
shame, dominant-submissive, and independent-dependent.
Each subject was rated by approximately fifty peers. The
EPPS indirect measure of dependency was found to correlate
significantly with the peer ratings.
The IPAT Anxiety Scale is a brief, easily scored
questionnaire. Construct or concept validity is estimated
47
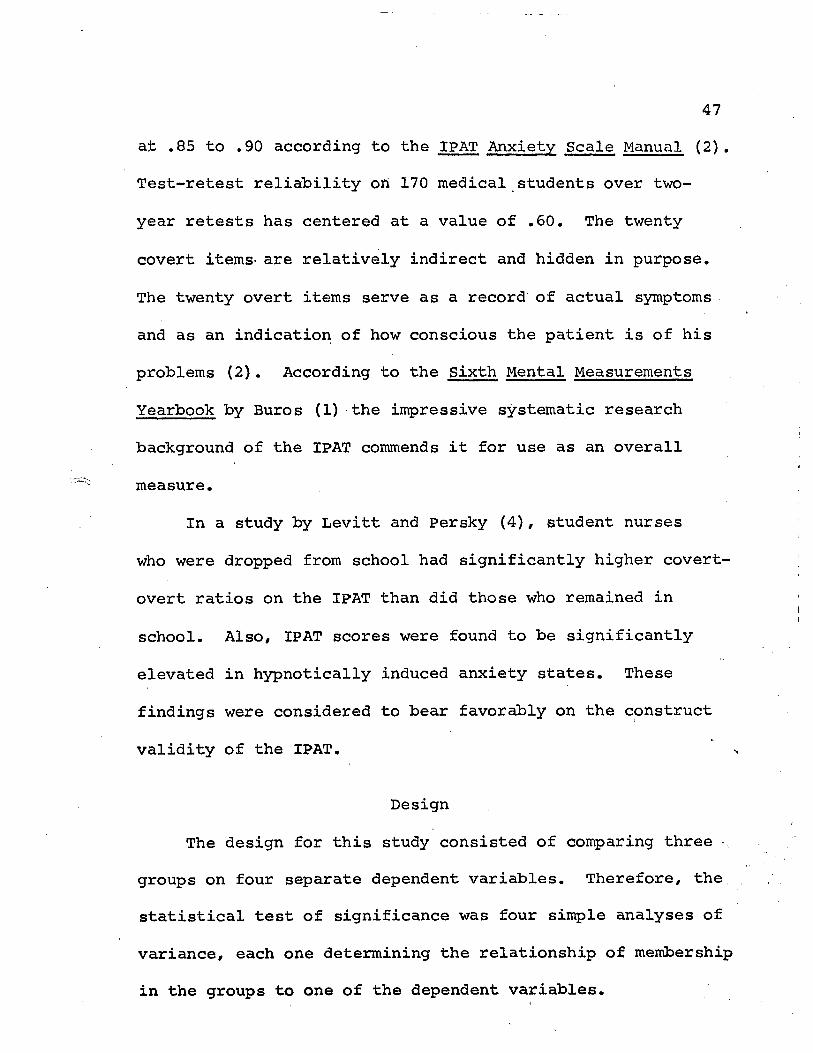
at .85 to .90 according to the IPAT Anxiety Scale Manual (2).
Test-retest reliability ori 170 medical students over two-
year retests has centered at a value of .60. The twenty
covert items- are relatively indirect and hidden in purpose.
The twenty overt items serve as a record of actual symptoms
and as an indication of how conscious the patient is of his
problems (2). According to the Sixth Mental Measurements
Yearbook by Buros (1) the impressive systematic research
background of the IPAT commends it for use as an overall
measure.
In a study by Levitt and Persky (4), student nurses
who were dropped from school had significantly higher covert-
overt ratios on the IPAT than did those who remained in
school. Also, IPAT scores were found to be significantly
elevated in hypnotically induced anxiety states. These
findings were considered to bear favorably on the construct
validity of the IPAT.
Design
The design for this study consisted of comparing three ,
groups on four separate dependent variables. Therefore, the
statistical test of significance was four simple analyses of
variance, each one determining the relationship of membership
in the groups to one of the dependent variables.
48
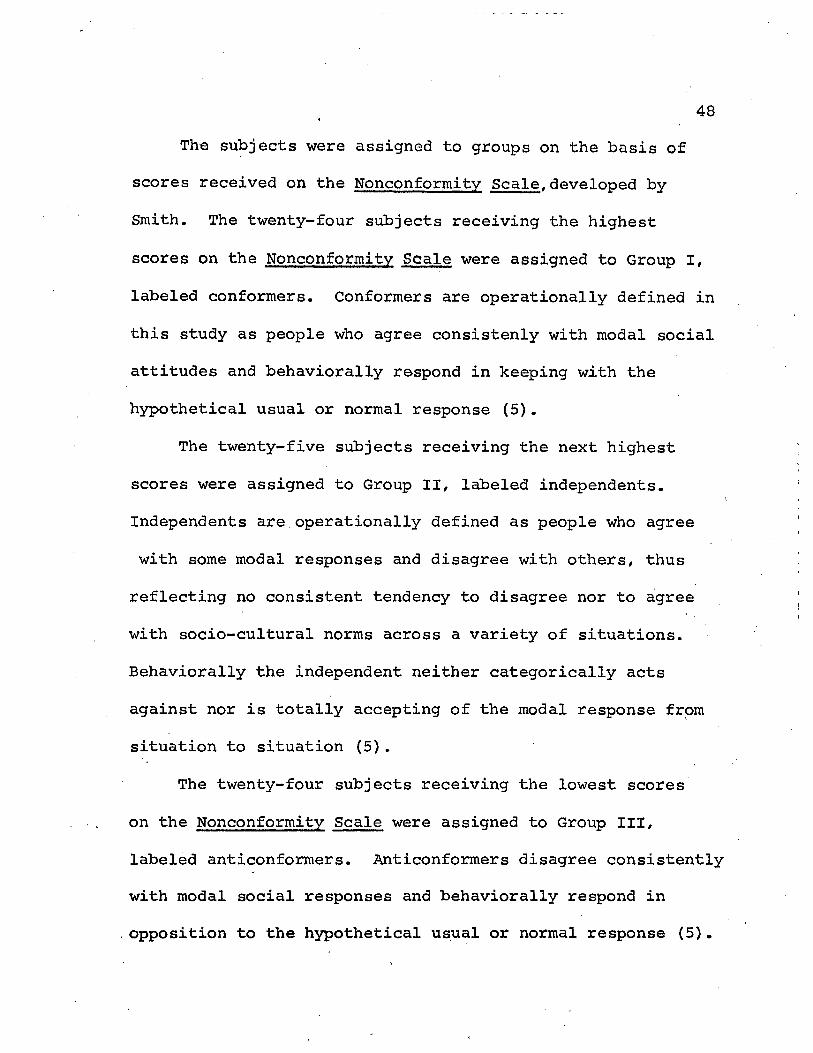
The subjects were assigned to groups on the basis of
scores received on the Nonconformity Scale, developed by-
Smith. The twenty-four subjects receiving the highest
scores on the Nonconformity Scale were assigned to Group I,
labeled conformers. Conformers are operationally defined in
this study as people who agree consistenly with modal social
attitudes and behaviorally respond in keeping with the
hypothetical usual or normal response (5).
The twenty-five subjects receiving the next highest
scores were assigned to Group II, labeled independents.
Independents are operationally defined as people who agree
with some modal responses and disagree with others, thus
reflecting no consistent tendency to disagree nor to agree
with socio-cultural norms across a variety of situations.
Behaviorally the independent neither categorically acts
against nor is totally accepting of the modal response from
situation to situation (5).
The twenty-four subjects receiving the lowest scores
on the Nonconformity Scale were assigned to Group III,
labeled anticonformers. Anticonformers disagree consistently
with modal social responses and behaviorally respond in
opposition to the hypothetical usual or normal response (5).

49
The assignment of subjects to the groups constitutes
the independent variable of this study. The dependent
variables in this study are need for affiliation, dependency
needs, overt anxiety, and covert anxiety.
Need for affiliation as used in this study is defined
by the scores received on the affiliation scale of the
Edwards Personal Preference Schedule. According to the
Edwards Manual, need for affiliation measures the desire
To be loyal to friends, to participate in friendly groups, to do things for friends, to form new friendships, to make as many friends as possible, to share things with friends, to do things with friends rather than alone, to form strong attachments, to write letters to friends (3, p. 11).
Dependency needs are defined by the score received by
taking the ratio of the Edwards standard scores on the
scales of deference, succorance and abasement to scores
received on the scale of deference, succorance, abasement,
autonomy and dominance. The concept of dependency, which
this ratio score measures, is the compliant or moving-toward-
people personality. The three traits of the compliant
personality are a marked need for affection and approval
from others (succorance), a tendency to subordinate oneself
to others and to inhibit assertiveness and criticality
(deference and abasement) and the tendency toward self-blame
50
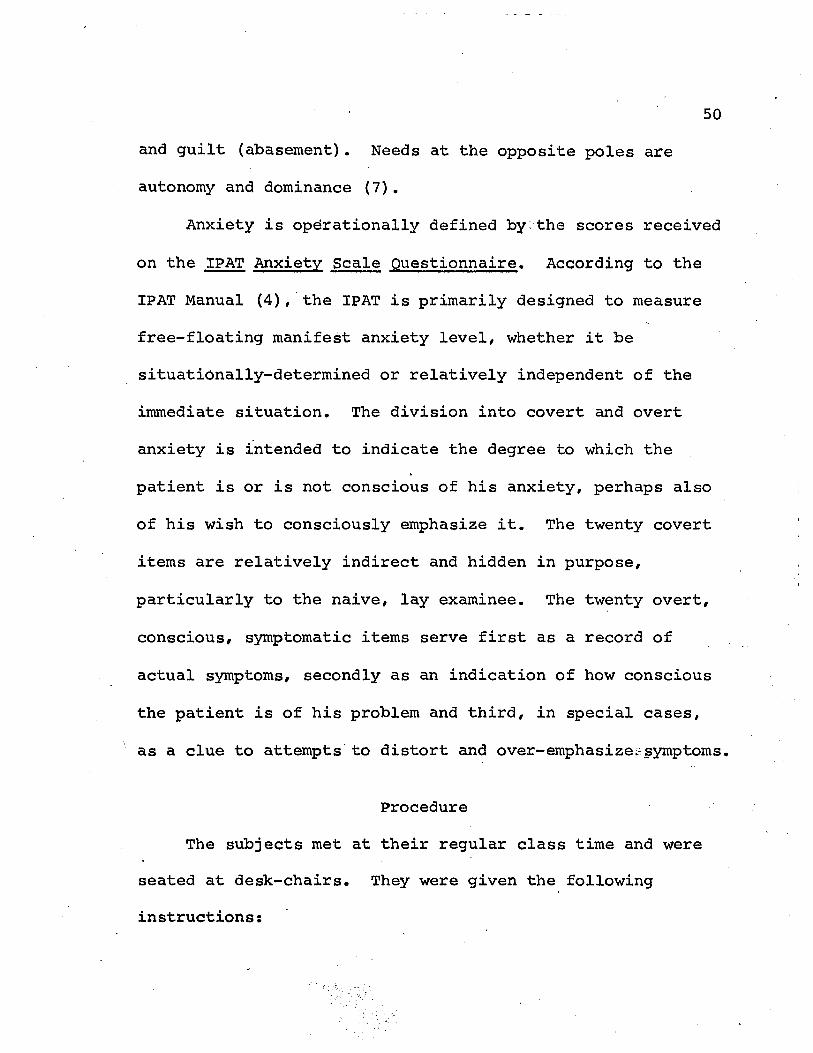
and guilt (abasement). Needs at the opposite poles are
autonomy and dominance (7).
Anxiety is operationally defined by:the scores received
on the IPAT Anxiety Scale Questionnaire. According to the
IPAT Manual (4), the IPAT is primarily designed to measure
free-floating manifest anxiety level, whether it be
situatiOnally-determined or relatively independent of the
immediate situation. The division into covert and overt
anxiety is intended to indicate the degree to which the
patient is or is not conscious of his anxiety, perhaps also
of his wish to consciously emphasize it. The twenty covert
items are relatively indirect and hidden in purpose,
particularly to the naive, lay examinee. The twenty overt,
conscious, symptomatic items serve first as a record of
actual symptoms, secondly as an indication of how conscious
the patient is of his problem and third, in special cases,
as a clue to attempts to distort and over-emphasizes symptoms.
Procedure
The subjects met at their regular class time and were
seated at desk-chairs. They were given the following
instructions:
51
I would appreciate it if you would fill in these three questionnaires to be used as part of the research for my master's thesis. Your replies will be completely' anonymous, so please be frank.
I am going to pass out a sheet with 50 numbers on. it. Please circle one number and put this number on all three answer sheets.
The directions are clearly printed on each test. Read them carefully and begin working. If there are any questions, I will be happy to answer!them. As soon as you are through with the first test, come up and get the second, when you are through with the second test, come and get the third. That way you can work at your own rate and leave when you are finished.
I appreciate your cooperation in this matter. This is strictly voluntary, however, and if you don't want to fill in these questionnaires, feel free to leave.
The subjects were given the Edwards Personal Preference
Schedule first, then the IPAT Anxiety Scale and then the
Nonconformity Scale, developed by Smith. It was felt that
by giving the tests in this order, it would be more difficult
for the subjects to grasp what was being measured, and
therefore, it would be easier to get a measure of underlying
motivations.
The Nonconformity Scale» the deference, succorance,
abasement, autonomy, dominance and need for affiliation
scales of the Edwards Personal Preference Schedule?and the
IPAT Anxiety Scale Questionnaire were hand scored. All of
the raw scores of the Edwards Personal Preference Schedule
were converted to standard scores by the use of the standard
52
scores given in the Edwards Manual (3). The dependency
ratio, as previously described, was computed. On the basis
of scores received on the Nonconformity Scale the subjects
were divided into conformers, independents and anticon-
formers. The range of scores of the group labeled conformers
was from 156 to 202. The range of scores of the group
labeled independents was from 139 to 154. The range of
scores of the group labeled anticonformers was from 100
to 138. Scores for the three groups on need for affiliation,
dependency needs, overt anxiety and covert anxiety were
recorded on four separate sheets. These dependent variable
scores were fed into an IBM 1620 computer and an analysis
of variance for each of the dependent variables was done by
the computer. The results of this analysis were used to
test the research hypotheses.
CHAPTER BIBLIOGRAPHY
1. Buros, Oscar, editor, The Sixth Mental Measurements Yearbook, Highland Park, New Jersey, The Gryphon Press, 1965.
2. Cattell, Raymond B. and Ivan H. Scheier, Handbook for the IPAT Anxiety Scale Questionnaire, Institute for Personality and Ability Testing, Champaign, Illinois, 1963.
3. Edwards, Allen L., Edwards Personal Preference Schedule Manual, New York, The Psychological Corporation, 1959.
4. Levitt, Eugene E. and Harold Persky, "Experimental Evidence for the Validity of the IPAT Anxiety Scale," Journal of Clinical Psychology, XVIII (October, 1962), 458-461.
5. Smith, Robert J., "Explorations in Nonconformity," Journal of Social Psychology, LXXI (February, 1967), 133-150.
6. , "Further Evidence for Two Varieties of Nonconformity," Psychological Reports, XX (June, 1967), 885-886.
7. Zuckerman, Marvin, Eugene E. Levitt, and Bernard Lubin, "Concurrent and Contruct Validity of Direct and Indirect Measures of Dependency," Journal of Consulting Psychology, XXV (August, 1961), 316-323.
53

CHAPTER III
ANALYSIS AND DISCUSSION OP RESULTS
Table I lists the means and standard deviations of the
four dependent variable scores for the three groups labeled
conformers, independents, and;anticonformers. The analyses
of variance for the data will be presented in the same order
in which the hypotheses were stated.
TABLE I
MEANS AND STANDARD DEVIATIONS OF DEPENDENT VARIABLE SCORES FOR CONFORMERS, INDEPENDENTS,
AND ANTICONFORMERS
Means Standard Deviations
Variable c* I** C* I**
Need for Affiliation 49.0416 44.3200 46.5000 11.4872 10.8322 10.5277
Dependency Needs .6062 .5992 .5662 .0682 .0517 .0616
Overt Anxiety 15.2916 18.8800 16.3333j 6.0241 6.2630 8.5423
Covert Anxiety 17.9166 19.5200 17.5000 4.6540 4.4910 5.4772
•Conformers. ••Independents• ***Anticonformers.
54
55
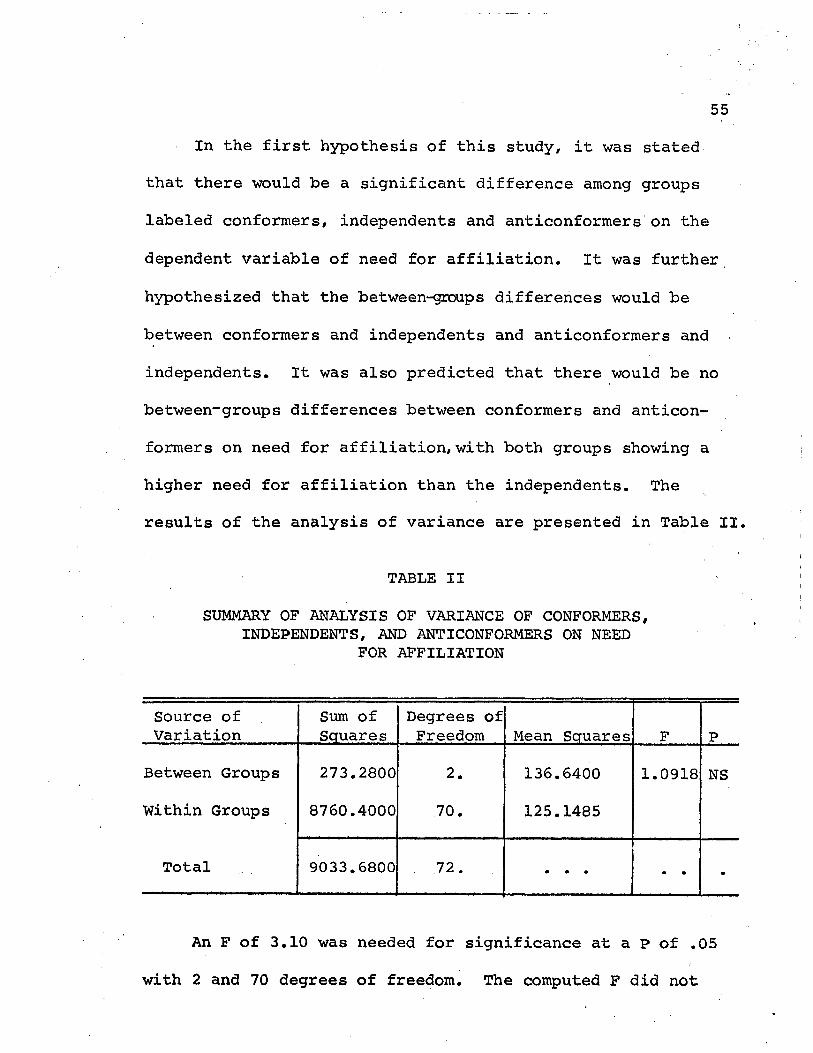
In the first hypothesis of this study, it was stated
that there would be a significant difference among groups
labeled conformers, independents and anticonformers on the
dependent variable of need for affiliation. It was further
hypothesized that the between-groups differences would be
between conformers and independents and anticonformers and
independents. It was also predicted that there would be no
between-groups differences between conformers and anticon-
formers on need for affiliation, with both groups showing a
higher need for affiliation than the independents. The
results of the analysis of variance are presented in Table II.
TABLE II
SUMMARY OF ANALYSIS OP VARIANCE OF CONFORMERS, INDEPENDENTS, AND ANTICONFORMERS ON NEED
FOR AFFILIATION
Source of Variation
Sum of Squares
Degrees of Freedom Mean Squares F P
Between Groups 273.2800 2. 136.6400 1.0918 NS
Within Groups 8760.4000 70. 125.1485
Total 9033.6800 . .72. • • • • • •
An F of 3.10 was needed for significance at a P of .05
with 2 and 70 degrees of freedom. The computed F did not
56
reach that level, which indicated that there was no signi-
ficant difference among the groups labeled conformers,
independents and anticonformers on the variable of need for
affiliation. Since there was no significant difference
among the groups, it was not necessary to run b-tests for
differences between pairs of means. Hypothesis 1 is there-
fore rejected. A visual inspection of Table I shows that
conformers were slightly higher in need for affiliation than
anticonformers, with independents indicating a slightly lower
need for affiliation than either of the other two groups.
In the second hypothesis of this study, it was stated
that there would, be a significant difference among groups
labeled conformers, independents, and anticonformers on the
variable of dependency needs. It was further hypothesized
that the between-group differences, would be between conformers
and independents and anticonformers and independents. It
was also predicted that there would be no between-group
differences between conformers and anticonformers, with both
groups showing higher dependency needs than the independents.
The results of the statistical test of significance are
presented in Table III.
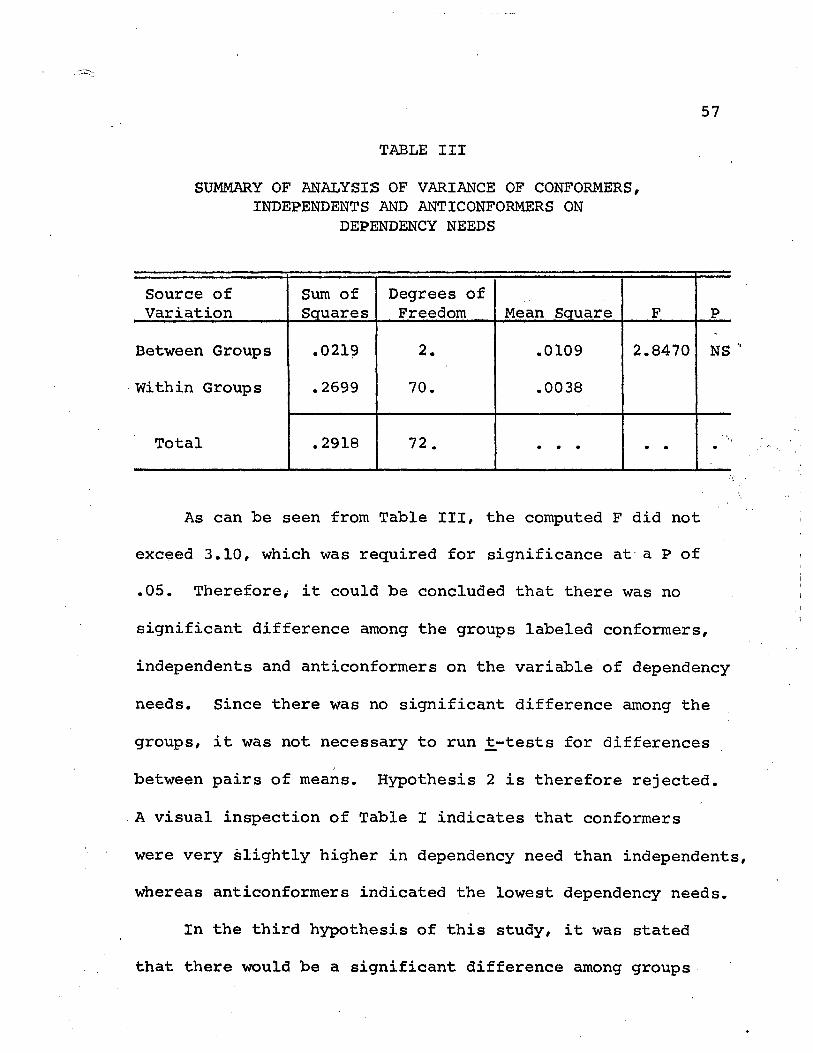
TABLE III
SUMMARY OF ANALYSIS OF VARIANCE OF CONFORMERS, INDEPENDENTS AND ANTICONFORMERS ON
DEPENDENCY NEEDS
57
Source of Variation
Sum of Squares
Degrees of Freedom Mean Square F P
Between Groups .0219 2. .0109 2.8470 NS
Within Groups .2699 70. .0038
Total .2918 72 . • • • • •
As can be seen from Table III, the computed F did not
exceed 3.10, which was required for significance at a P of
.05. Therefore> it could be concluded that there was no
significant difference among the groups labeled conformers,
independents and anticonformers on the variable of dependency
needs. Since there was no significant difference among the
groups, it was not necessary to run jt-tests for differences
between pairs of means. Hypothesis 2 is therefore rejected.
A visual inspection of Table I indicates that conformers
were very slightly higher in dependency need than independents,
whereas anticonformers indicated the lowest dependency needs.
In the third hypothesis of this study, it was stated
that there would be a significant difference among groups
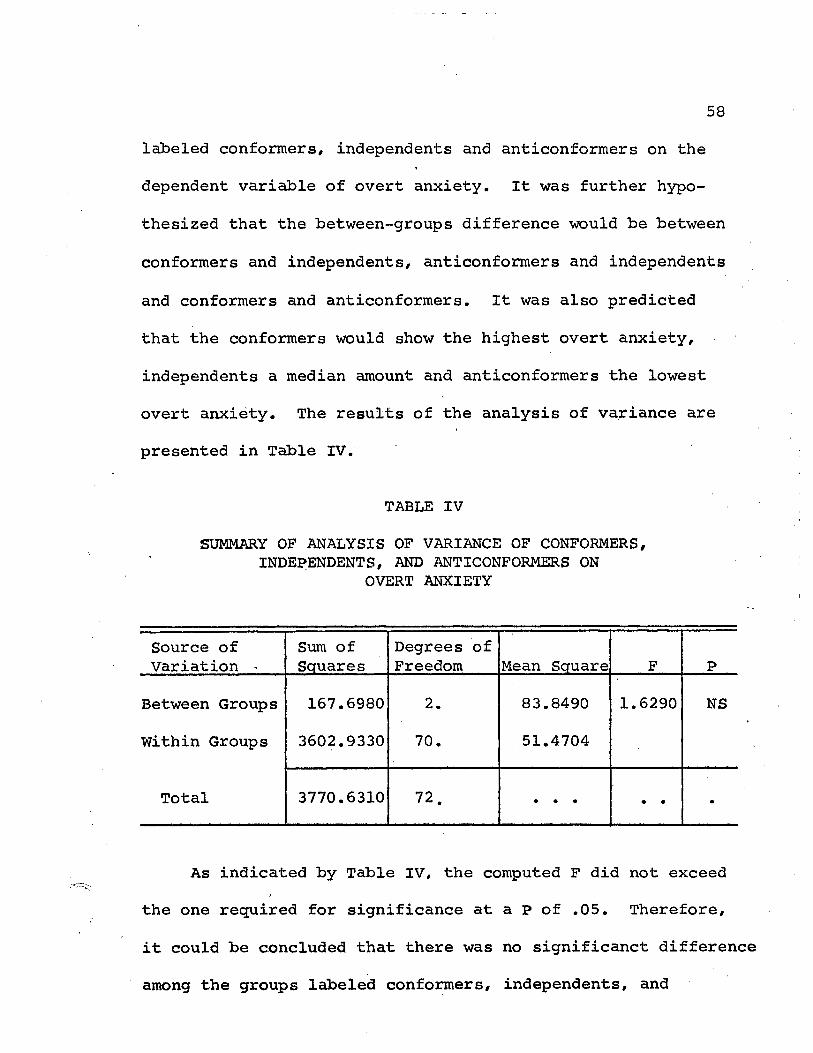
58
labeled conformers, independents and anticonformers on the
dependent variable of overt anxiety. It was further hypo-
thesized that the between-groups difference would be between
conformers and independents, anticonformers and independents
and conformers and anticonformers. It was also predicted
that the conformers would show the highest overt anxiety,
independents a median amount and anticonformers the lowest
overt anxiety. The results of the analysis of variance are
presented in Table IV.
TABLE IV
SUMMARY OF ANALYSIS OP VARIANCE OF CONFORMERS, INDEPENDENTS, AND ANTICONFORMERS ON
OVERT ANXIETY
Source of Variation -
Sum of Squares
Degrees of Freedom Mean Square F P
Between Groups 167.6980 2. 83.8490 1.6290 NS
Within Groups 3602.9330 70. 51.4704
Total 3770.6310 72. • • • • • •
As indicated by Table IV, the computed F did not exceed
the one required for significance at a P of .05. Therefore,
it could be concluded that there was no significanct difference
among the groups labeled conformers, independents, and
5 9
anticonformers on the variable of overt anxiety. Since there
was no significant difference among the groups, it was not
necessary to run jt-tests for differences between pairs and
means. Hypothesis 3 is therefore rejected. A visual inspec-
tion of Table I indicates that the independents had the
highest amount of overt anxiety, the anticonformers a median^
amount and the conformers the lowest amount of overt anxiety.
In the fourth hypothesis of this study, it was stated
that there would be a significant difference among groups
labeled conformers, independents, and anticonformers on the
dependent variable of covert anxiety. It was further
hypothesized that the between-group differences would be
between conformers and independents and anticonformers and
independents. It was also predicted that there would be
no between-groups differences between conformers and anti*-
conformers, with both groups showing higher covert anxiety
than the independents. The results of the statistical test
of significance are presented in Table V.
An inspection of Table V shows that the computed F
did not exceed the one required for significance at a P of
.05. Therefore, it could be concluded that there was no
. significant difference among the groups labeled conformers,
independents, and anticonformers on the variable of covert anxiety.
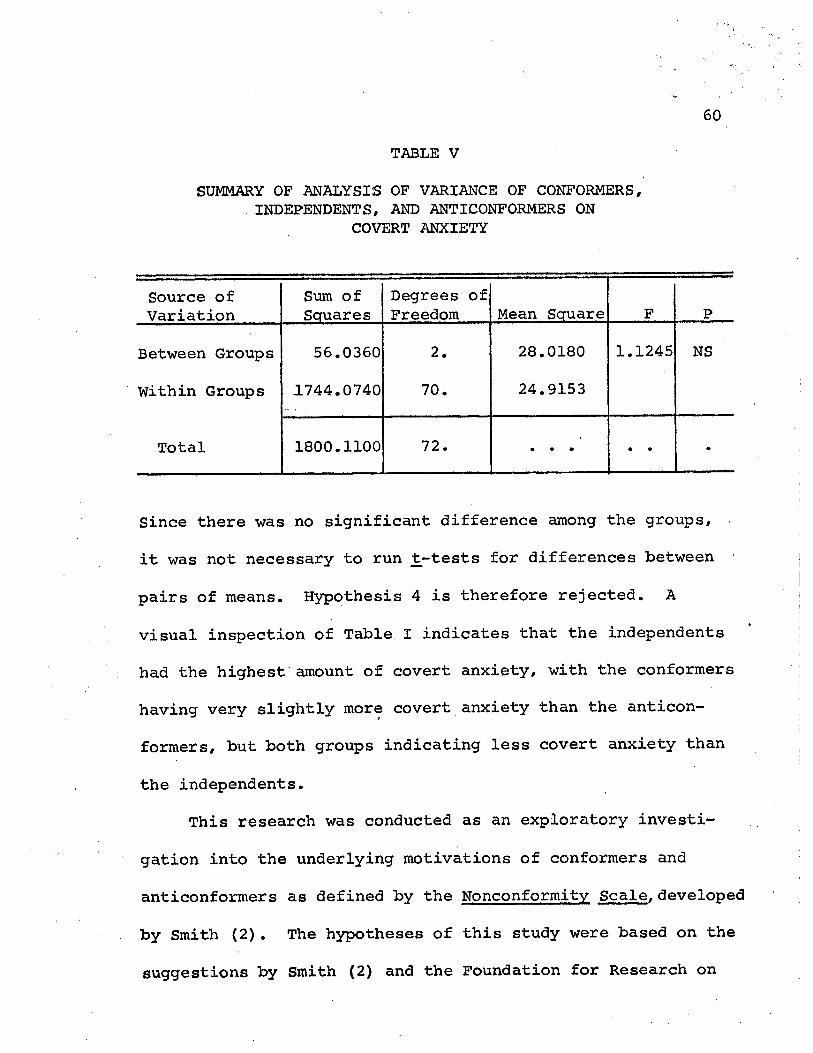
60
TABLE V
SUMMARY OP ANALYSIS OF VARIANCE OF CONFORMERS, INDEPENDENTS, AND ANTICONFORMERS ON
COVERT ANXIETY
Source of Variation
Sum of Squares
Degrees of Freedom Mean Square F P
Between Groups 56.0360 2. 28.0180 1.1245 NS
Within Groups 1744.0740 70. 24.9153
Total 1800.1100 72. • • • • • •
Since there was no significant difference among the groups,
it was not necessary to run t.-tests for differences between
pairs of means. Hypothesis 4 is therefore rejected. A
visual inspection of Table I indicates that the independents
had the highest amount of covert anxiety, with the conformers
having very slightly more covert anxiety than the anticon-
formers, but both groups indicating less covert anxiety than
the independents.
This research was conducted as an exploratory investi-
gation into the underlying motivations of conformers and
anticonformers as defined by the Nonconformity Scale, developed
by Smith (2). The hypotheses of this study were based on the
suggestions by Smith (2) and the Foundation for Research on
61
"i
Human Behavior (1) that there might be a similarity of under-
lying motivations in conformers and anticonformers. There
are several weaknesses of the present study which need to be.
considered before one could conclude that the hypotheses of
this study, concerned with the underlying motivations of
need for affiliation, dependency needs and covert and overt
anxiety, were completely without merit.
One of the major weaknesses of the present study was
in the area of subject selection. Since two intact freshman
psychology classes were used, the subjects were in no way
a random sample, even of freshman psychology students at
North Texas State University. Another possible weakness in
subject selection is that both males and females were used
in this study, whereas Smith (2) developed and refined the
Nonconformity Scale with the use of male subjects only.
Also, the number of subjects used was not sufficient for a
really definitive investigation.
The factor that probably contributed most to the non-
significant results was the homogeneity of the subjects
used in regard to conformity, independence, and anticonformity
as defined by Smith (2). The lowest possible score on the
Nonconformity Scale, developed by Smith (2>, is twenty-eight,
defining extreme anticonformity. The highest possible score
62
is 252, defining extreme conformity. The range of scores in
this sample was from 100 to 202, which definitely skewed the
entire distribution of this study in the direction of
conformity. Since the range of scores of the group labeled
conformers was from 156 to 202, the range of scores of the
group labeled independents was from 139 to 154, and the
range of scores of the group labeled anticonformers was from
100 to 138, it is perhaps not surprising that there were no
significant differences among the three groups on the
dependent variables.
If this study were to be replicated using many
universities from different parts of the country, it is
possible that a wider distribution of scores on the
Nonconformity Scale would be obtained which include both
anticonformers, independents and extreme conformers. In
this case, it is possible that the hypotheses in this study
might be confirmed.
Another possible weakness in this study concerns the
measuring instruments used to measure the dependent variables
of need for affiliation, dependency needs, covert anxiety
and overt anxiety. Since this study was designed to measure
underlying and perhaps unconscious motivations, it is possible
that the measures used to test the dependent variables were
63
not subtle enough. The fact that the Edwards Personal
Preference Schedule measures fifteen different needs,
including need for affiliation, made it seem likely that the
subjects could not grasp the fact that need for affiliation
was being measured. Also the use of the deference, succorance,
abasement, autonomy and dominance scales of the Edwards to
compute a dependency ratio seemed to make it difficult for
the subjects to grasp that dependency was being measured.
However, the Edwards does ask rather direct questions and
perhaps the use of projective techniques to measure affilia-
tion and dependency would have been better. The IPAT Anxiety '
Scale Questionnaire is supposed to be relatively disguised
on the covert part, especially for the naive layman.
Perhaps the fact that-these subjects were interested enough
in psychology to be enrolled in a psychology class might
mean that they were able to grasp what was being measured.
In this case, also, a projective measure of anxiety might
have been more effective.
It is felt that if this study were replicated so that
the weaknesses were corrected, valuable information might
be obtained which would contribute to our understanding of
the processes of conformity, independence and anticonformity
and their relationship to personality. This understanding
64
might be of help to those who are concerned with the seemingly
great increase in nonconformity in the present society.
CHAPTER BIBLIOGRAPHY
1. Foundation for Research on Human Behavior, Creativity and Conformity, a. Problem for Organizations/ Ann Arbor, Michigan, Braun and Brumfield, 1958.
2. Smith, Robert J., "Explorations in Nonconformity," Journal of Social Psychology, EXXI (February, 1967) , 133-150.
65
CHAPTER IV
SUMMARY AND CONCLUSIONS
The purpose of this study was to determine if con-
formers and anticonformers as defined by scores received
on the Nonconformity Scale, developed by Smith, were similar
in their underlying motivations, particularly in the areas
of need for affiliation, dependency needs, overt anxiety
and covert anxiety.
Members of two freshman psychology classes were
administered the Nonconformity Scale, the Edwards Personal
Preference Schedule and the IPAT Anxiety Scale Questionnaire.
On the basis of scores obtained on the Nonconformity Scale, -
the subjects were divided into three groups labeled conformers,
independents, and anticonformers. Need-for-affiliation was
measured by the need for affiliation scale of the Edwards
Personal Preference Schedule. Dependency needs were measured
by a dependency ratio calculated by taking the ratio of the
Edwards scores on scales of deference plus succorance plus
abasement to the sum of deference plus succorance plus
abasement plus autonomy plus dominance. Overt and covert
66
67
anciety was measured by the IPAT Anxiety Scale Questionnaire.
Four separate analyses of variance were computed, yielding
the following results on the following hypotheses:
1. There would be a significant difference among
groups labeled conformers, independents# and anticonformers
on the dependent variable of need for affiliation. The
between-group differences would be between conformers and
independents and anticonformers and independents. There
would be no between-group s, differences between conformers
and anticonformers on need for affiliation with both groups
showing a higher need for affiliation than the independents.
Since the differences among the groups were nonsignificant
as a P of .05, it was not necessary to run t.-tests to make
further comparisons between means. Therefore, hypothesis
one was rejected.
2. There would be a significant difference among
groups labaled conformers, independents, and anticonformers
on the dependent variable of dependency needs. The between-
group differences would be between conformers and independents
and anticonformers and independents. There would be no
between-groups differences between conformers and anti-
conformers, with both groups showing higher dependency needs
than the independents. Since the differences among the
68
groups were nonsignificant at a P of .05, it was not
necessary to run t-tests to make further comparisons between
means. Therefore, hypothesis two was rejected.
3. There would be a significant difference among groups
labeled conformers, independents, and anticonformers on the
dependent variable of overt anxiety. The between-groups
difference would be between conformers and independents,
anticonformers and independents and conformers and anti-
conformers. Conformers would show the highest overt anxiety,
independents a median amount and anticonformers the lowest
overt anxiety. Since the differences among the groups were
nonsignificant at a P of .05, it was not necessary to run
t-tests to make further comparisons between means.
Therefore, hypothesis three was rejected.
4. There would be a significant difference among
groups labeled conformers, independents, and anticonformers
on the dependent variable of covert anxiety. The between-
group differences would be between conformers and independents
and anticonformers and independents. There would be no
between-groups differences between conformers and anticon-
formers, with both groups showing higher covert anxiety than
the independents. Since the differences among the groups
were nonsignificant at a P of .05, it was not necessary to run
6 9
_t-tests to make further comparisons between means. Therefore,
hypothesis four was rejected.
A replication of this study was recommended, using a
larger number of subjects from various universities so that
a broader range of scores on the Nonconformity Scale might
be obtained and the three groups might more adequately
represent conformers, independents, and anticonformers.
It was further recommended that some additional or new
dependent variable measures be used that might more adequately
measure underlying motivations.
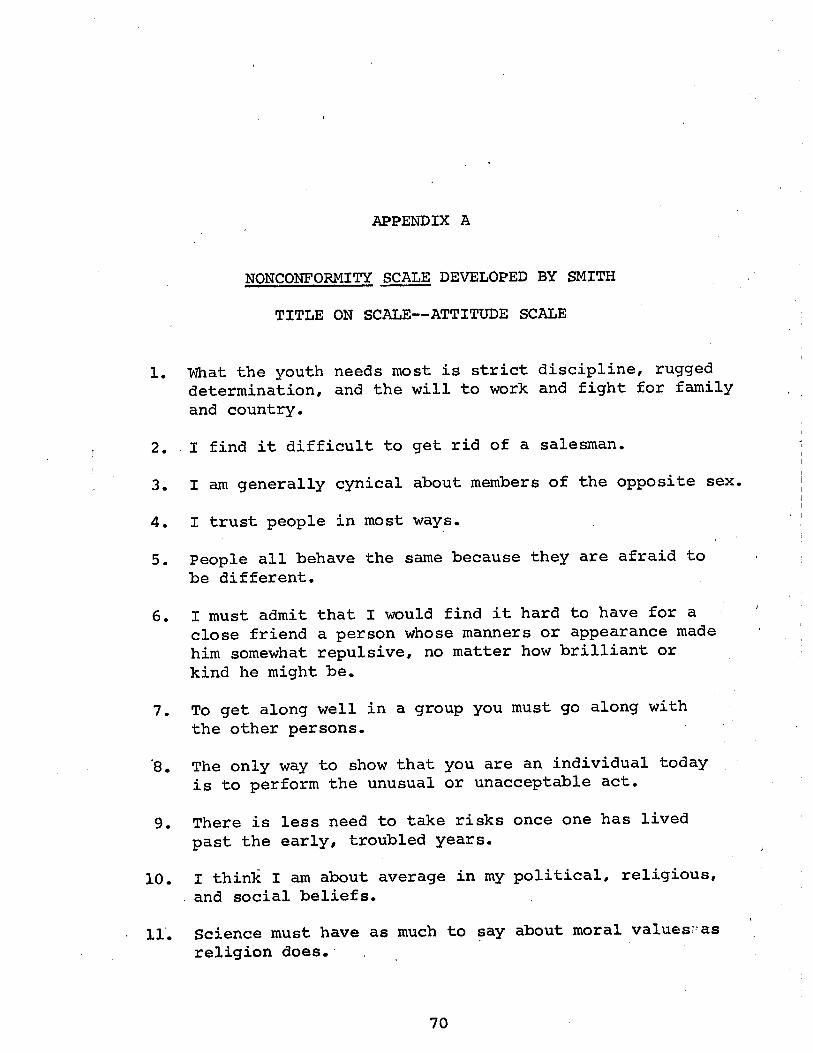
APPENDIX A
NONCONFORMITY SCALE DEVELOPED BY SMITH
TITLE ON SCALE—ATTITUDE SCALE
1. "What the youth needs most is strict discipline, rugged determination, and the will to work and fight for family and country.
2. I find it difficult to get rid of a salesman.
3. I am generally cynical about members of the opposite sex.
4. I trust people in most ways.
5. People all behave the same because they are afraid to be different.
6. I must admit that I would find it hard to have for a close friend a person whose manners or appearance made him somewhat repulsive, no matter how brilliant or kind he might be.
7. To get along well in a group you must go along with the other persons.
'8. The only way to show that you are an individual today is to perform the unusual or unacceptable act.
9. There is less need to take risks once one has lived past the early, troubled years.
10. I think I am about average in ray political, religious, and social beliefs.
11. Science must have as much to say about moral values:as religion does.
70
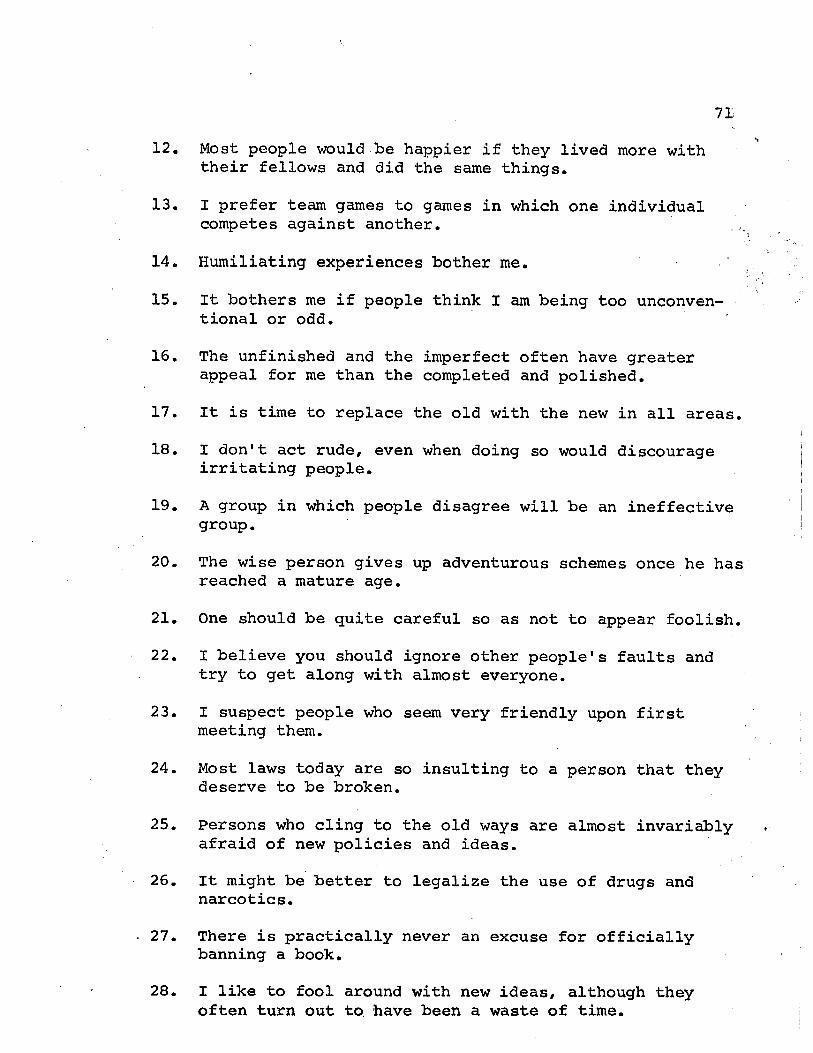
71
12. Most people would be happier if they lived more with their fellows and did the same things.
13. I prefer team games to games in which one individual competes against another.
14. Humiliating experiences bother me.
15. It bothers me if people think I am being too unconven-tional or odd.
16. The unfinished and the imperfect often have greater appeal for me than the completed and polished.
17. It is time to replace the old with the new in all areas.
18. I don't act rude, even when doing so would discourage irritating people.
19. A group in which people disagree will be an ineffective group.
20. The wise person gives up adventurous schemes once he has reached a mature age.
21. One should be quite careful so as not to appear foolish.
22. I believe you should ignore other people's faults and try to get along with almost everyone.
23. I suspect people who seem very friendly upon first meeting them.
24. Most laws today are so insulting to a person that they deserve to be broken.
25. Persons who cling to the old ways are almost invariably afraid of new policies and ideas.
26. It might be better to legalize the use of drugs and narcotics.
27. There is practically never an excuse for officially banning a book.
28. I like to fool around with new ideas# although they often turn out to. have been a waste of time.
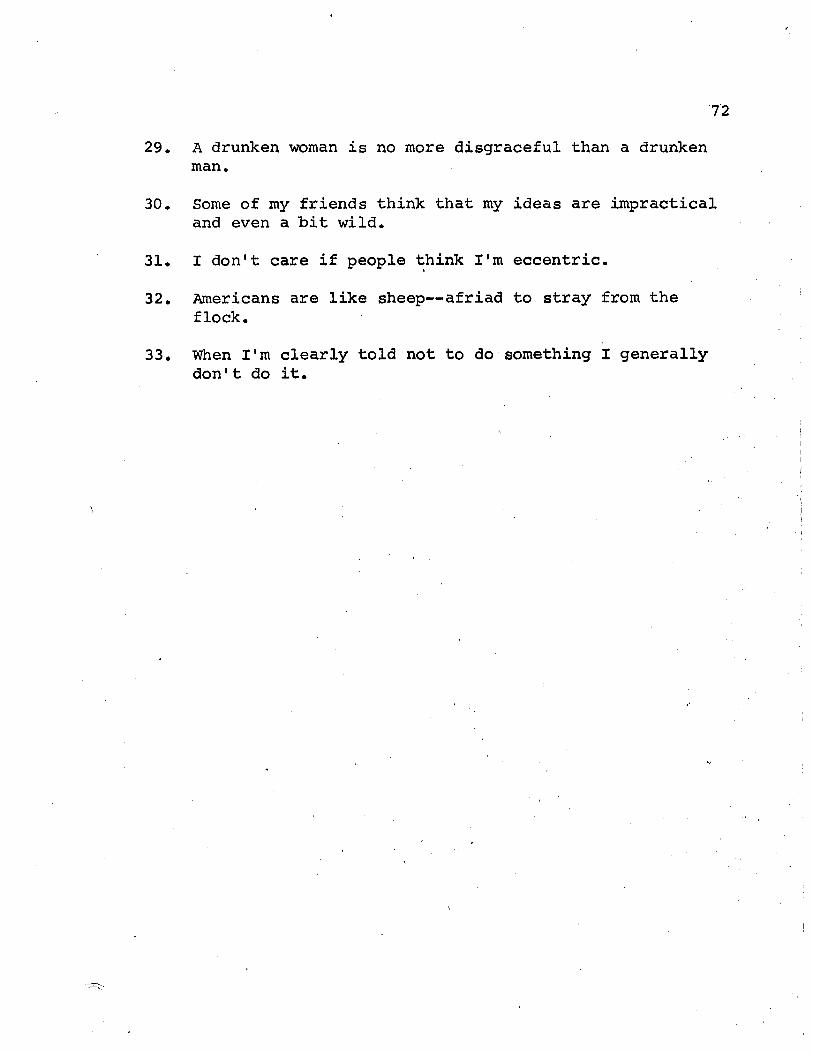
72
29. A drunken woman is no more disgraceful than a drunken man.
30. Some of my friends think that my ideas are impractical and even a bit wild.
31. I don't care if people think I'm eccentric.
32. Americans are like sheep—afriad to stray from the flock.
33. When I'm clearly told not to do something I generally don't do it.
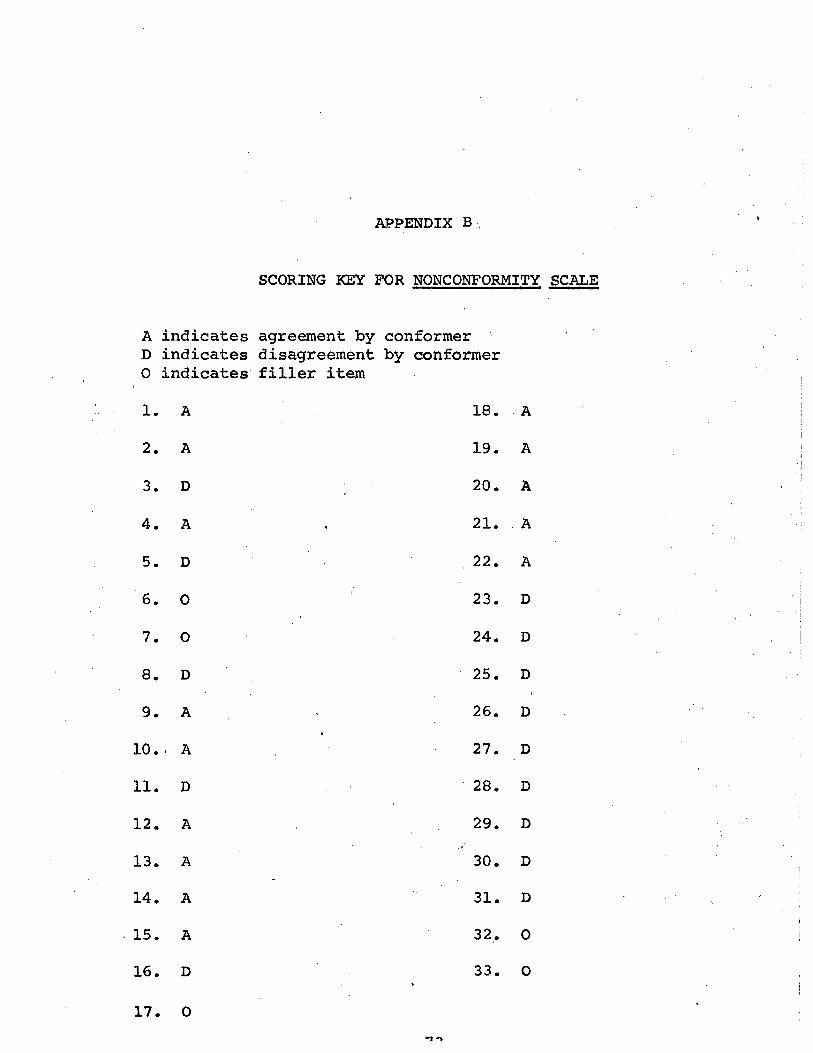
APPENDIX B .
SCORING KEY FOR NONCONFORMITY SCALE
A indicates agreement by conformer D indicates disagreement by conformer 0 indicates filler item
1. A 18. . A
2. A 19. A
3. D 20. A
4. A , 21. A
5. D 22. A
6. O 23. D
1.0 24. D
8. D 25. D i
9. A 26. D
10. A 27. D
11. D 28. D
12. A 29. D
13. A 30. D
14. A 31. D
15. A 32. O
16. D 33. O
17. O
*1, <"»
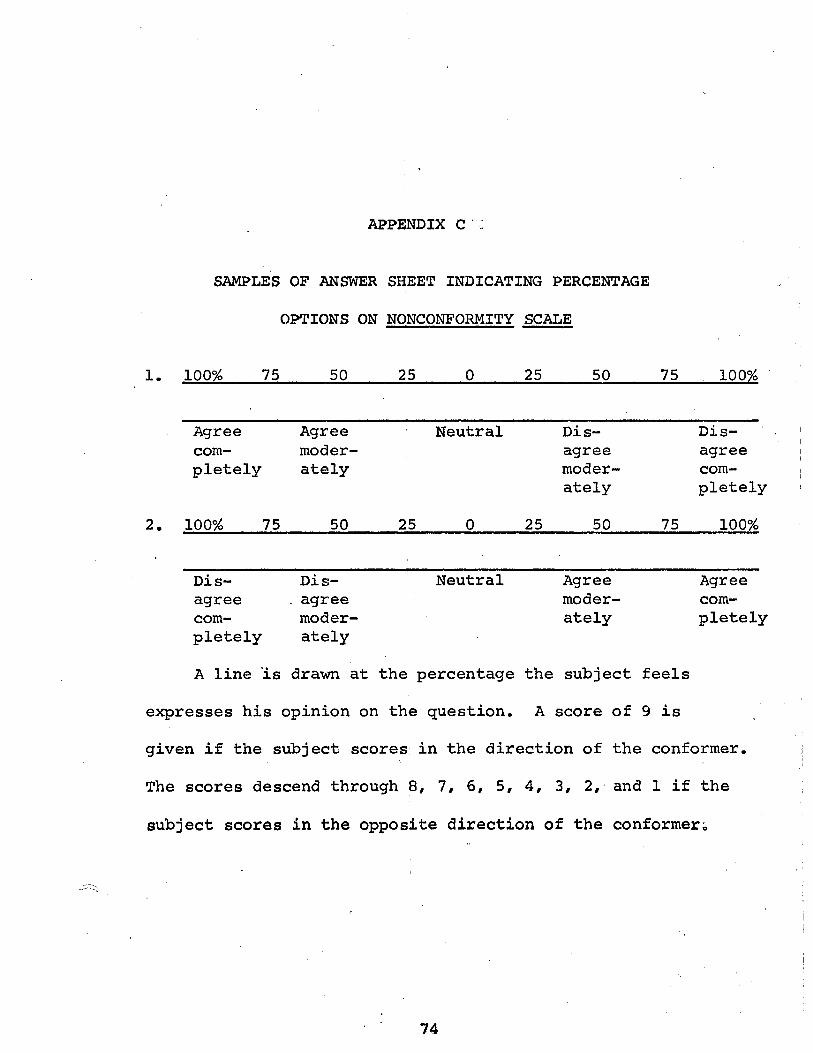
APPENDIX C "
SAMPLES OF ANSWER SH EET INDICATING PERCENTAGE
OPTIONS ON NONCONFORMITY SCALE
1. 100% 75 50 2 5 0 25 50 75 100%
Agree Agree Neutral Dis- Dis- ' com- moder- agree agree j pletely ately moder- com- j
ately pletely ;
2. 100% 75 50 2 5 0 25 50 75 100%
Dis- Dis- Neutral Agree Agree agree , agree moder- com-com- moder- ately pletely pletely ately
A line is drawn at the percentage the subj ect feels
expresses his opinion on th e question. A score of 9 is i
given if the subject scores in the direction of the conformer. s
The scores descend through 8, 7, 6, 5, 4, 3, 2, and 1 if the
subject scores in the oppos ite direction of the conformeri
74
BIBLIOGRAPHY
Books
Asch, Solomon E., "Issues in the Study of Social Influences on Judgment," Conformity and Deviation, edited by I. A. Berg and A. M. Bass, New York, Harper and Row Publishers, Inc., 1961.
Bass, B., "Conformity, Deviation and a General Theory of Interpersonal Behavior," Conformity and Deviation, edited by I. A. Berg and A. M. Bass, New York, Harper and Row Publishers, Inc., 1961.
Blake, R. R. and J. S. Mouton, "Conformity Resistance and Conversion," Conformity and Deviation, edited by I. A. Berg and A. M. Bass, New York, Harper and Row Publishers, Inc., 1961.
Buros, Oscar, editor. The Sixth Mental Measurements Yearbook, Highland Park, N. J., The Gryphon Press, 1965.
Cattell, Raymond B. and Ivan H. Scheier, Handbook for the IPAT Anxiety Scale Questionnaire, Institute for Personality and Ability Testing, Champaign, Illinois, 1963.
Crutchfield, Richard S., "Conformity and Creative Thinking," Contemporary Approaches to Creative Thinking, edited by Howard E. Gruber, Glenn Terrell and Michael Wertheimer, New York, Atherton Press, 1962.
Edwards, Allen L., Edwards Personal Preference Schedule Manual, New York, The Psychological Corporation, 1959.
Foundation for Research on Human Behavior, Creativity and Conformity, A Problem for Organizations, Ann Arbor, Michigan, Braun and Brumfield, 1958.
75
76
Krech, David, Richard S. Crutchfield, and Egerton L. Ballachey, Individual In Society, New York, McGraw-Hill Book, Inc., 1962.
Linton, H. and E. Graham, "Personality Correlates of Persuasibility," Personality and Persuasibility, edited by C. I. Hovland and I. L. Janis, New Haven, Yale University Press, 1959.
Pepinsky, P. N., "Social Exceptions that Prove the Rule," Conformity and Deviation, Edited by I. A. Berg and A. M. Bass, New York, Harper and Row Publishers, Inc., 1961.
Walker, Edward L. and Roger W. Heyns, An Anatomy for Conformity, Englewood Cliffs, N. J., Prentice-Hall, Inc., 1962.
Articles
Allport, Floyd H., "Rule and Custom as Individual Variations of Behavior Distributed Upon a Continuum of Conformity," American Journal of Sociology, XLIV (May, 1939), 897-921.
Allport, Floyd H. and Richard S. Solomon, "Lengths of Conversations: A Conformity Situation Analyzes by the Telic Continuum and J-Curve Hypothesis," Journal of Abnormal and Social Psychology, XXIV (October, 1939),
Asch, Solomon E., "Studies of Independence and Conformity: A Minority of One Against a Unanimous Majority," Psychological Monographs, EXX (1956), 9.
Barry, Herbert, "A Test for Negativism and Compliance," Journal of Abnormal and Social Psychology, XXV (January-March, 1930), 383-381.
Bradbard, L^land, "Dependency, Denial of Dependence and Group Conformity," Dissertation Abstracts, Boston University, XXV (1946), 3095.
Centers, Richard and Miriam Horowitz, "Social Character and Conformity: A Differential in Susceptibility to Social Influence," Journal of Social Psychology, LX (August, 1963), 343-349.
77-
Costanzo, Philip R., Harold T. Reitan, and Marvin E. Shaw, "Conformity as a Function of Experimentally Induced Minority and Majority Competence" Psychonomic Science, X (April, 1968), 329-330.
Crutchfield, Richard S., "Conformity and Character," American Psychologist, X (May, 1955), 191-198.
, "Personal and Situational Factors in Conformity to Group Pressure," Acta Psychologica, XV (August, 1959), 386-388.
Diab, Lutfy N., "Conformity and Deviation: Two Processes, or One,"Psychological Reports, X X W (June, 1968), 1134-1136.
Endler, Norman S., "Conformity Analyzed and Related to Personality, '.'"Journal of Social Psychology, LIII (April, 1961), 271-283.
Gerard, Harold B., Roland A. Wilhelmy, and Edward S. Conolley, "Conformity and Group Size," Journal of Personality and Social Psychology, VIII (January, 1968), 79-82.
Hardy, Kenneth R., "Determinants of Conformity and Attitude Change," Journal of Abnormal and Social Psychology, LIV (May,"1957), 289-294.
Hoffman, Martin L,, "Some Psychodynamic Factors in Compulsive Conformity," Journal of Abnormal and Social Psychology, XLVIII (July, 1953), 383-393.
Holder, Wayne B., "Value Conformity in Normal and Non-Normal Groups," Journal of Social Psychology, XLVIII (August, 1958), 147-154.
Hollander, Edwin P. and Richard H. Willis, "Some Current Issues in the Psychology of Conformity and Nonconformity," Psychological Bulletin, LXVIII (July, 1967), 62-76.
Janis, Irving L., "Anxiety Indices Related to Susceptibility to Persuasion," Journal of Abnormal and Social Psychology, LI (July, 1955), 663-667.
78.
Julian, James W., Robert C. Regula, and Edwin P. Hollander, "Effects of Prior Agreement by Others on Task Confidence and Conformity, •! Journal of Personality and Social Psychology, IX (June, 1968), 171-178.
Kagan, Jerome and Paul H. Mussen, "Dependency Themes on the TAT and Group Conformity," Journal of Consulting Psychology, XX (January, 1956), 29-32.
Levitt, Eugene E. and Harold Persky, "Experimental Evidence for the Validity of the IPAT Anxiety Scale," Journal of Clinical Psychology, XVIII (October, 1962), 458-461.
Levy, Leo, "A Study of Some Personality Attributes of Independents and Conformers," Dissertation Abstracts, University of Washington, (1958), 1823.
Mangan, G. L., D. Quartermain, and G. M. Vaughan, "Taylor MAS and Group Conformity Pressure," Journal of Abnormal and Social Psychology, LXI (July, 1960), 146-147.
McGee, Richard K., "The Relationship Between Response Style and Personality Variables," Journal of Abnormal and Social Psychology, LXV (November, 1962), 347-351.
McGhee, Paul E. and Richard C. Teevan, "Conformity Behavior and Need for Affiliation," Journal of Social Psychology, LXXII (June, 1967), 117-121.
Meunier, Clement and Brendan G. Rule, "Anxiety, Confidence, and Conformity," Journal of Personality, XXXV (September, 1967), 498-504.
Meyers, William J. and Raymond H. Hohle, "Questionnaire Anxiety and Social Conformity," Psychological Reports, XI (October, 1962), 436.
Moeller, George and Mortimer H. Applezweig, "A Motivational Factor in Conformity," Journal of Abnormal and Social Psychology, LV (July, 1957), 114-120.
Rotter, George S., "An Experimental Evaluation of Group Attractiveness as a Determinant of Conformity" Human Relations, XX (August, 1967), 273-281.
79
Sistrunk, Frank and John W. McDavid, "Personality Correlates of Two Kinds of Conforming Behavior," Journal of Personality, XXXII (September, 1964), 420-435.
Smith, Robert J., "Explorations in Nonconformity," Journal of Social Psychology, EXXI (February, 1967), 133-150.
, "Further Evidence for Two Varieties of Nonconformity," Psychological Reports, XX (June, 1967), 885-886.
Smith, Seward, Donald B. Murphy, and Ladd S. "Wheeler, "Relation of Intelligence and Authoritarianism to Behavioral Contagion and Conformity," Psychological Reports, XIV (February, 1964), 248.
Smith, Thomas L. and Richard M. Suinn, "A Note on Identifi-cation, Self Esteem, Anxiety, and Conformity,'/ Journal of Clinical Psychology, XXI (July, 1965), 286.
Taylor, A. J. w. and Graham M. Vaughan, "Clinical Depression and Conformity," Perceptual and Motor Skills, XXV (August, 1967), 257-260.
Vaughan, Graham M. and A. J. W. Taylor, "Clinical Anxiety and Conformity," Perceptual and Motor Skills. XXII (June, 1966), 719-722.
Vaughan, Graham M. and Kenneth D. white, "Conformity and Authoritarianism Reexamined," Journal of Personality and Social Psychology, III (March, 1966), 363-366.
Walters, Richard H., William E. Marshall, and Richard J. Shooter, "Anxiety, Isolation, and Susceptibility to v
Social Influence," Journal of Personality, XXVIII (December, 1960), 518-529.
Willis, Richard H., "Conformity, Independence, and Anti-Conformity," Human Relations, XVIII (November, 1965), 373-387.
Willis, Richard H. and E. P. Hollander, "An Experimental Study of Three Response Modes in Social Influence Situation,^' Journal of Abnormal and Social Psychology,
805
Zuckerman, Marvin, Eugene E. Levitt, and Bernard Lubin, "Concurrent and Construct Validity of Direct and Indirect Measures of Dependency," Journal of Consulting Psychology, XXV (August, 1961), 316-323.


