Embed Size (px)
Citation preview
1 1, -7 2 1 7 icineBiology and Med' '(TID-
4500)AEC Research and
Development Report
.·
CFSTI PRICES
11':6 * i_ti) Inli „if/7
9700 South Cass Avenue60439Argonne, Illinois
HEALTH DIVISIONGAMMA- RAY SPECTROSCOPY GROUP
ANNUAL REPORT
1964 through June 1965· July
Asher 3. Yinkel,ALI.,
-*\Division Director
-00- 003,r.% Ars-AVA,-\ 18 'v --\-
- - -'---CE-GA L-N-0 T ICE-----
This report was prepared ae an account of Government sponeored work. Neither the United
Staw, nor the Commission, nor any person acting on behalf of the Commission:
A. Makes any warranty or representation, expreseed or im'plled, with respect to the accu-
racy, completeness, or usefulness of the information conuned in thie report, or that the use
of any informauon. appiratus, method, or process dlsciosed inthis report msy not infringe
privately owned rights: or .B. Assumes any ilabilities with respect to the use Of, or for damnges resulting from the
use of any information, apparatus, method, or process disclosed inthis report,
As used in the above. "pereon acting on behalf of the Commission" includes ony em-
ployee or contractor of the Commission, or employee of such contractor, to the extent that
'
' such employee or contractor of the Commiwion, or employee of such contractor prepares,
, disseminates, or provides acc/8 0, any fnformation pursuant to his employment or contract
with the Comm selon, or hli employment with such contractor.
The University of ChicagoOperatedby
under 38Contract W-31-109-eng-with the
U. S. Atomic Energy Commission
1

DISCLAIMER
This report was prepared as an account of work sponsored by anagency of the United States Government. Neither the United StatesGovernment nor any agency Thereof, nor any of their employees,makes any warranty, express or implied, or assumes any legalliability or responsibility for the accuracy, completeness, orusefulness of any information, apparatus, product, or processdisclosed, or represents that its use would not infringe privatelyowned rights. Reference herein to any specific commercial product,process, or service by trade name, trademark, manufacturer, orotherwise does not necessarily constitute or imply its endorsement,recommendation, or favoring by the United States Government or anyagency thereof. The views and opinions of authors expressed hereindo not necessarily state or reflect those of the United StatesGovernment or any agency thereof.

DISCLAIMER
Portions of this document may be illegible inelectronic image products. Images are producedfrom the best available original document.
3
TABLE OF CONTENTS
Page
A Reexamination of Retention Patterns in Patients Who ReceivedRadium by Multiple Injections 33 Years Earlier
Charles E. Miller and. Asher J. Finkel...... .......... 5
Evaluation of the Improved Power Function
Charles E. Miller and Asher J. F i n k e l. . . . . . . . . . . . . . . . . . 91
Cesium-137 Retention inMice of Different Ages
Charles E. Miller, Asher J. Finkel and Nandy B. Wright..... 103
Move of the Whole-Body Counter
Charles E. Miller. . . . . . . . . . . . . . . 125
Calibration of Cesium-137 Rod Standards
Charles E. Miller and Carter A. Priess . . . . . . . . . . . . . . . . 133
Publications . . . . . . . . . . . . . . . . . . . . . · . . 147
5
A REEXAMINATION OF RETENTION PATTERNS INPATIENTS WHO RECEIVED RADIUM BY
MULTIPLE INJECTIONS 33 YEARS EARLIER
Charles E. Miller and Asher J. Finkel
CONTENTS
Page
A b s·t r a c t. . . . . . . . . . . . . . . . . . . . . . . . . . . . . . . . . . . . . . . . . 7
I n t r o d u c t i o n. . . . . . . . . . . . . . . . . . . . . , . . . . . . . . . . . . . . . . . . 7
Clinical Material 9
Measurement Techniques. . . . . . . . . . . . . . . . . . . . . . . . . . . . . 10
Original and Adjusted Data. . . . . . . . . . . . . . . . . . . . . . . . . . . . 14
Analysis of Data by Curve Fitting . . . . . . . . . . . . . . . . . . . . . . . 15
Patient 03-101
Patient 03- 102
Patient 03- 109
Patient 03-110
Patient 03-111
Patient 03- 112
Patient 03-114
Patient 03-115
Patient 03-116
Patient 03-121
Patient 03- 126
Average Power Function . . . . . . . . . . . . . . . . . . . . . . . . . . . . . . . 39
Average Single Exponential Function.......................,.. 67
Retrospective Calculation of Amount Administered............ 69
6
CONTENTS
Page
Retrospective Estimates of the Pattern of Radium Retention withT i m e. . . . . . . . . . . . . . . . . . . . . 70
Retrospective Calculation of Radium Buildup and CumulativeMicrocurie-Days . . . . . . . . . . . . . . . . . . . . . . . . . . . . . . . . . . 74
Discussion and Conclusions . . . . . . . . . . . . . . . . . . . . . . . . . . . 76
Appendix ·I. Data from Additional Patients.. . . . . . . . . . . . . . . . . 83
Appendix II. Effect of Nonuniformity of Radium Depo.sition,in the86Skeleton...,,..... .. ......
References .................... 9o
7
A REEXAMINATION OF RETENTION PATTERNS INPATIENTS: WHO RECEIVED RADIUM BY
MULTIPLE INJECTIONS 33 YEARS EARLIER
Charles E. Miller and Asher J. Finkel
Abstract
Radium retention data have been analyzed in detail for a smallseries of eight patients who received known amounts of Ra by weekly
226
intravenous injection in 1931 and who have been measured in a whole-body counter in recent years. When individual power function parameterswere computed for each patient, the slopes ranged from -0.191 to -0.634and the one-day intercepts from 0.029 to 0.977. These parameters arehighly correlated (r = 0.83) so that the power· function does not have twoindependent parameters. Although the parameters for the "average"power function can be coinputed in several ways, a reasonable set ofmean values gives a slope ef -0.4383 and a one-day intercept of 0.3015.The same data starting one year after injection can be fitted equally wellif not better with a single exponential term so that retention after oneyear decreases with a half-time of 14.98 years. About 2.5 percent·of theadministered radium disappears from the body in accordance with thi ssingle exponential term, 97.5 percent having been eliminated within thefirst year. Retrospective estimates of the maximum radium body bur -den, which occurred immediately after the· last injection of 10 IICi, werecomputed on the basis of the best-fitting power function for each patient.Although the patients received total amounts ranging· from 150 to 300 Mci,the estimates of maximum body radium ranged from 17.6 to 27.8 11Ci.The relative merits of the power function and the single exponential func -tion for describing radium retention patterns are discussed in light of thedata and the analyses.
Introduction
During the last fifteen years, many persons who have radium de-posited in their skeletal tissues have been studied by several groups efinvestigators in a number of countries. In these studies, the· radium con-tained by the patient has been measured and various types of clinical datahave been recorded. The central problem in all of these studies is thefact that observations of clinical importance are correlated with con-temporary or terminal body burdens, although the radium may have beenpresent for· from 30 to 45 years and the pathological changes may havebeen in the making for an unknown, and perhaps unknowable, number ofyears.
J
8
On the other hand, persons responsible for radiation safety· arenot concerned with the current level of radium in any one person butrather with the maximum amount present at any time. The concept ofMaximum Permissible Level (MPL) for any radioactive material isbased on the amount that a person may safely accumulate and that willnot lead to deleterious effects at a later date. It would be exceedinglyvaluable if the scientific investigator who attempts .to determine the dose-
response patterns for human subjects were able to calculate the amountof radium present in the body at any time during the exposure period aswell as during the remainder of life after the exposure. Since it is notknown at this time whether it is the maximum body burden, which usuallyoccurs at the time of the last exposure, or some function of the totalaccumulated dose to the body over an unspecified period of years that isimportant in producing clinical changes, the radium retention pattern withtime should be reconstructed for correlation studies with the disease
processes. For these reasons, it is helpful to have a mathematical expres-sion for the pattern of radium retention in man in order to interpret theclinical effects in persons who have retained the radium for long periods6f time. Such an expression could then be employed in the case of singleinjection, or of multiple injections, or of uniform continuous ingestion for
< different lengths of time.
The derivation of a mathematical expression for radium retentionproperly requires many measurements of the same subject spanning theentire era of interest. A limited series of four or five measurements
might be fitted approximately with either a single exponential function ora power function, and can be fitted exactly by the sum of two or three ex-
ponentials. However, intermediate measurements,· which further delineatethe true r.etention curve, may demonstrate that the actual retention patterndeviates from that predicted by a mathematical function that has been fittedto four or five points located at the beginning or the end of the time span.In the case of human subjects, a sufficiently large series of measurementsis not available for a precise derivation of a retention expression forradium.
Where a large number of measurements on the same patient do notexist, .the validity of the various mathematical expresssions can be testedonly by the goodness of fit provided by these functions to the limited seriesof measurements that does exist. In other words, the retention of radiurn
must arbitrarily be assumed to follow a particular mathematical expression.The parameters of the appropriate mathematical terms that provide the bestfit to the data can then be determined and evaluated by a variety of criteria
for goodness of fit.
Inthe absence of more suitable data, ameager series of uptoeightmeasurements that are available for each of eleven patients· who receivedsupposedly known amounts of radium in 1931 has been analyzed extensively.
9
The data available for these patients have been fitted with both a powerfunction and a single exponential term.. The optimum expression for radi-um retention based on goodness of fit of this limited number of pointsshould not, however, be used as an explanation of the metabolism of radi-um in humans. The calculations presented in this paper were made in anattempt.to derive the maximum amount of information from the data avail-able for the only series of long-term radium patients whose injectionhistory is reasonably well known and who have been studied by modern,accurate whole-body measurement techniques.
Clinical Material
In 1931, radium chloride was administered intravenously to a groupof patients in the Elgin State Hospital (ESH) in Illinois in a study of thetherapeutic value of radium. The patients were given a series of from 7 to45 injections of 10 IICi of radium chloride dissolved in 2 cc isotonic sodiumchloride solution per injection. The number of injections and the dates ofthe first and last injection varied from patient to patient, since the weeklytreatmenta were administered on an individual basis.
The radiuin contained by these patients was first measured bySchlundt et al. during the last week of December, 1931, and againsix months later in June, 1932. The results of these gamma-ray andradon breath measurements were gi·ven in a publication in which 24 patientswere identified by code letters from A to· X along with the total amount ofradium given to each patient and the elapsed time from the last injectionto the first measurement.1 At about this time, private reports listing thenames of the patients, the amount of radium administered to each patient,and clinical changes, if any, were also sent to the supplier of the radiumpreparation.
In 1950 and subsequently, investigators from Argonne NationalLaboratory located and compiled all of the available reports and recordsconcerning this group of patients. The key to the original Schlundt codewas:reconstructed by a comparison of the amount of radium given to eachpatient in the published paper, in which the patients were listed by codeletter, and the values given in the private reports to the commercial sup-plier, in which the patients were identified by name. Consequently, eachpatient measured by Schlundt was identified, and the radium body valuespublished by Schlundt could be assigned to particular patients. A searchof the numerous case histories of other patients who were in the hospitalfrom 1931 to 1933 led ta the discovery of several other patients who hadreceived radium either after the Schlundt measurements in 1931 or 1932,or who were not measured by Schlundt.
In 1951, 14 of the 24 patients measured by Schlundt were located,and their contained radium was determined by whole-body counts and
10
radon breath analyses with field equipment taken to the hospital. Twoother patients who had not been studied by Schlundt were also measured.In 1953, 11 of the original 24 patients were remeasured by the same tech-niques. The results of the 1951 and 1953 measurements, along with theSchlundt measurements, were analyzed by Norris et al. to determine theparameters of a power function for the retention of radium in humans :For these analyses, the injection schedule given by Schlundt was approxi-mately employed in the analysis of data for each patient.
Between 1959 and 1964, gamma-ray measurements of those pa-tients who were still alive were made in the whole-body counter at ArgonneNational Laboratory. Ten of the'original 24 patients were remeasuredalong with 6 patients who had not been measured previously. The whole-body measurements of these patients comprise the largest set of radiumretention measurements extant in man over the long span of time requiredfor suitable mathematical analysis. Eight of this group of patients had atleast four breath radon and gamma-ray measurements of whole-body radi-um over the 33-year span, and the presentation and evaluation of thesedata comprise this report.
Measurement Techniques
The various whole-body measurement techniques employed. in thecurrent series 0f studies from 1959 through 1964 at Argonne National
Laboratory will be discussed first. The information obtained by thesetechniques, especially that relating to the distribution of radium in thebody, will be used ·to evaluate the accuracy of the results obtained by theearlier procedures.
The patients were measured with the 1-meter-arc technique in
1959, the 1.75-meter-arc technique in 1960, the tilting- chair technique onthree occasions between 1959 and 1964, and the 7-crystal-position method
during 1963-1964. The 1-meter-arc technique was used to determine theabsolute amount of Radium B and Radium C and to calibrate the tilting-chair technique for radium measurements. The patient was placed on hisside on a bed in a curve so that his posterior surface touched the surfaceof a thin metal 1-meter arc. The 8-inch diameter by 4-inch thick NaI(Tl)scintillation crystal was placed at the center of the 1-meter arc, and thepatient· s gamma-ray spectrum was recorded with a 256-channel magneticmemory, pulse-height analyzer. The patient was then curved backward sothat his anterior surface touched. the metallic arc, and the gamma-rayspectrum was again recorded.
The two spectra obtained from ·the human subject were averagedin order to make a comparison with the spectrum obtained frem a pointsource: in the center of a solid phantom. A 1 .0-11 C i radium source
'
11
calibrated by the National Bureau of Standards was placed in the centerof a 17-cm-thick Presdwood phantom located on the bed in the center ofthe position occupied by the human. The thickness of Presdwood betweenthe source and the crystal and the thickness of Presdwood behind thesource were varied until the shape of the spectrum obtained from thesource in the phantom matched the shape of the 'average spectrum obtainedfrom the patient. Optimum correspondence was obtained when the phantomwas 14 cm thick. The amount of radium present in the patient was thendetermined from the· ratio of the height of the average spectrum from thepatient to that from the 1.0-Bci source in the phantom. The value thuscalculated for each patient was accepted as the absolute quantity.
Each patient was then seated in the tilting chair and his gamma-ray spectrum recorded. Each patient's spectrum was divided by theradium content determined by the 1 -meter-arc technique. This new spec-trum was the spectrum that would be obtained from 1.0 IICi of radium inthis patient. The various spectra obtained for the patients were thenaveraged to obtain a typical calibration spectrum for the tilting chair for1.0 PC i in the body. The patients were then' measured in the tilting chairon subsequent visits to the Laboratory, and this calibration spectrum wasused to calculate the radium content. The tilting- chair technique wasused instead of the 1-meter-arc technique because of the shorter count-ing times required. The counting rate with the tilting chair per micro-curie of radium in the body is four times that obtained with the 1 -meter arc.
The patients were also measured on a 1.75-meter arc at a laterdate. · This technique is similar to that ,employed with a 1 -meter arc ex-cept that the radius of the arc is oriented vertically instead of horizontally.The 1.75-meter-arc technique, while yielding a result that is less depen-dentuponthe distribution inthe body, requires ten times as longa countingtime as the tilting-chair technique to yield the same statistical accuracy.It was used principally because it entailed much less discomfort to thepatient than did the 1-meter arc.3
In 1963, the patients were measured with the 7-crystal-positiontechnique,4 in which the crystal is, placed in turn at seven equally spacedpositions along the body and the patient's gamma-ray spectrum obtained.These measurements and 49 additional spectra obtained from appropriatephantom measurements are analyzed with the aid of an electronic com-puter. The individual magnitudes of seven point sources are determined,which, if uniformly spaced along the body, would yield the same radio-active profile as that observed along the patient. The sum of the sevensources yields the total-body content of radium, and the magnitudes ofthe· individual sources are equal to the amount in each one-seventh seg-ment of the body. These measurements disclosed that the radium was notalways distributed uniformly along the length of the skeleton and that anyparticular segment of the body might contain an· extraordinarily large
12 -
percentage of the total-body radium. This nonuniformity of distributionobserved in the body in 1964 will be referred to later in this paper to ex-plain apparent errors in earlier measurements (see Appendix II).
The deck-chair technique, which was also calibrated with the1-meter-arc technique, was used for most of the measurements in 1951-1953. Four patients were each in turn curved in a 1-meter arc and mea-sured witha 1.25-inch diameter by 2„inch-long crystal placed at the centerof the arc. Since the pulses from the crystal were sorted with a singlechannel analyzer, it was not feasible to obtain the shape of the spectrumat that time. Instead, the patients were counted twice, once with the dis-criminator adjusted to span the energy band from 25 keV to 450 keV anda second time to span from 450 keV to infinity. After each patient wasmeasured, first facing the crystal and then away from the crystal, a10-1/Ci source was then counted both one meter from the crystal in theopen air and with the 10-BCi source placed at several selected positionsbehind the patient's back. These measurements were then substitutadinto an appropriate equations and the amount of radium in the patient calcu-lated. The patient was then seated in a canvas chair and the count ratesdetermined in the same energy bands with the crystal located parallel and10 cm from the lower spinal column; the top of the crystal was located60 crn from the floor.
The count rate from each patient was divided by the amount ofradium determined by the 1 -meter-arc technique. Three of the patientsyielded a counting rate when seated in the canvas chair about four timesthat found when they were counted on the 1 -meter arc, while the fourth
patient yielded a ninefold value when seated. When these four ratios wereaveraged, the mean calibration factor for the deck chair obtained in thisway was approximately five times the counting rate per microcurie ob-tained with the 1 -meter arc. Since these four patients were the only oneswho contained enough radium to be measured on the 1 -meter arc with thesmall crystal available at that time, the other patients, who had consider-
ably smaller amounts, were measured in the deck chair only and the meancalibration factor obtained for the four high-value patients was used tocalculate the amount that the other patients contained.
In light of the information recently obtained with the 7-crystal-position technique, it can now be seen that the measurements made withthe deck-chair technique may have resulted in sizeable errors. Thedeck-chair technique will yield a whole-body value that is much too lowif a large percentage of the .radium is present either in the patient's skull
or in his lower limbs. The radium in each of these locations is counted
less efficiently than that in the torso, since it is further from the crystaland since in the case of the legs there is also a larger amount of tissue
between the radium and the detector. Consequently, a large uncertaintymust be assigned to these measurements made in 1951-1953.
13
The radon content of the breath of these patients was measuredduring the same period by Stehney et al.6 The radon breath measurementscontain uncertainties due to two causes. First is the well-known.fact thatthe radon concentration in the breath varies inversely with the respira- ,tion rate. Second, the radon breath measurements are variable becausesome of the.patients were not cooperative and in many instances foughtthe breathing mask. Thus, the breath samples were collected undervery adverse conditions and could not be considered to be complete col-lections in all cases.
Earlier, in 1931-1932, Schlundt measured the patients in the hos-pital under field conditions. He measured the gamma-rays from Radium Band Radium C by placing a Wulf-Hess electroscope a specific distance be-hind the seated patient. His electroscope had been cross-calibrated withone belonging to Knowles by measurement of gold radon seeds placedthroughout the body of a cadaver.1 In a prepublication copy of his paperSchlundt listed values for the patients that were 10 percent higher thanthose ultimately published in the literature. Evidently, Schlundt alteredhis calibration 10 percent downward between the time of his first draftand his final publication.
Schlundt's gamma-ray measurements undoubtedly contain system-atic errors from patient to patient because of nonuniform distribution ofradium within the body. If these nonuniform distributions that were pres-ent in 1964 existed in 1931, Schlundt's measurement of a patient who con-tained large amounts in the pelvis or femur would probably be lower than .the true amount. His measurement of a patient who contained a largepercentage in the head would probably be slightly low, while his measure-ment of a patient who contained most of the radium in the upper spinewould be considerably high. For these reasons, the Schlundt measure-ments will be reviewed in this paper in the light of current knowledge ofspecific nonuniformity in radium deposition in the same patients(Appendix II).
Schlundt also made radon breath measurements of the patients.The patients exhaled breath for three to four minutes through a dryingtrain in series with a 2.7-liter volume Lind electroscope. He calculatedthe amount of radon present in the 2.7-liter electroscope from the rateof discharge of the electroscope observed 10 minutes and 30 minutesafter the sample collection. Schlundt assumed a breathing rate of 7.5.litersper minute for all patients, or that the radon in the 2.7-liter volume repre-sented the radon exhaled from the body in 21.6 seconds. In his paperSchlundt stated, "Several patients could not be induced to blow normallyand a few refused to blow at all. "1 It is thus obvious that these breathmeasurements may contain a large error. From recent experience itcan be concluded that Schlundt' s breath measurements could easily rangefrom a factor of too high to a very small percentage of the true value.
14
Original and Adjusted Data
The available radium retention data for each patient are com-
piled in Tables lA to 1 lA. Each A table has the same format and contains,in successive columns, the following information: (1) the number ofelapsed days between the last injection and each measurement; (2) theamount of radium present in the body that gives rise to the radon that isexhaled in the breath; (3) the amount of Radium B and Radium C determined
by gamma-ray measurements; (4) the total radium in the body (sums ofthe values of columns 2 and 3), which comprises both the radium daughterslost by exhalation and those retained in the body; (5) the retention ratio ofradon daughters derived from the earlier measurements and consisting ofthe ratio of Radium B and Radium C in the body to total-body radium.These first five columns are derived from previously published data alongwith our more recent measurements in the whole-body counter.
In an effort to secure more accurate data retrospectively, adjustedwhole-body radiurn values have been calculated independently for each pa-tient from the breath radon data and from the Radium B and Radium C
gamma-ray measurements. Studies made during the past few years withmice, along with data compiled for the retention of radon daughters inrats, dogs, and.man, have demonstrated that the retention of radon in theskeleton follows a power function expression,
Radon retention = c td. ( 1)
In this equation, t is the elapsed time in days since the injection, and cand d are parameters that seem to be identical for all species.7,8 Formice, and presumably for man, d has a value of about 0.18.9 Since radondaughter retention is a function of time, the total-body radium at a spe-cific time can be calculated from either the radon breath measurement orthe garnma-ray measurement by the use of this retention equation.
For the data in the present study, the expected mean radon re-tention ratio was derived for the time of each measurement. A computerwas programmed to calculate the amounts of radium and of RaB and RaCpresent at the time of the measurement from each injection that the patienthad received. For example, if a patient had received 15 weekly injectionsof radium and was measured on the 30th day after the last injection, theamounts of radium present from the injections on the 30th, 37th, 44th,...,128th days were calculated and summed. For these calculations, the re-tention of radium was assumed to follow the power function,R = 0.479 t- 0.434
. These parameters, which differ somewhat from those
given by Norris, were obtained in a preliminary analysis of the data dis-cussed in detail in this paper. The fact that the final values obtained byfurther analysis are somewhat lower than these preliminary values doesnot introduce more than a tiny error. RaB and RaC were computed for
15
each injection by multiplying the radium retained from each injection bythe expected radon retention on the day of measurement. For this pur-pose the equation, Radon retention = 5.79 to.18'' was used,9 and the RaBand RaC yalues so obtained were similarly summed. The effective radonretention for the 30th day after the last injection was found by dividing thetotal RaB and RaC by the total radium. Since the amount of radium con-tributed to the total by each preceding injection decreases, the radonretention values found by this technique are a few percent lower than thevalues obtained when the individual radon retention ratios calculated forthe 15 different days are averaged directly.
The expected radon retention ratio for each measurement for theappropriate number of injections calculated in this way for each patientis given in column 6, in Table s 1 A- 1 1 A. The measured breath radon values
given in column 2 were divided by (1 - expected radon retention ratio) inorder to calculate the adjusted total-body radium from the breath measure-ment, and these values are listed in column 7. Similarly, the adjustedvalues in the last column were computed by dividing the measured RaBand RaC values-in column 3 by the expected radon retention ratio in col-umn 6. The total-body radium calculated from the Radium B and Radium Cgamma-ray measurements would be identical with that computed frombreath radon at any one time if the breath and gamma-ray measurementswere accurate and if radon retention followed this equation. The differencesbetween the two "adjusted" total-body radium values in this series of mea-surements are due principally to errors in the measurements.
Analysis of Data by Curve Fitting
A.limited series of six or seven measurements of the radium con-tained by a patient is not sufficient to demonstrate conclusively whetherthe retention follows a power function, a series of exponentials, or someother mathematical expression. Such a series of maasurements can be
used only to determine the parameters that provide the best fit to eachset of data by an arbitrarily selected function. The parameters computedfor each of the various patients can then be used as an indication of theextent of variability of retention within the group.
0.52 2,10The power function, R = 0.54 t- , proposed by Norris et al.has been widely used for describing the retention of radium in man. SinceNorris and his associates derived the value of these parameters from thevery patients discussed in thi s paper, it is of some interest to reexamine
the older data along with more recent measurements of the same individ-uals. For this purpose the parameters of the power function, a tb, thatprovide the best fit to the data for each patient were determined with theaid of an electronic computer. Since the power function is not a linearfunction with either time or amount, the parameters that provide the best
16
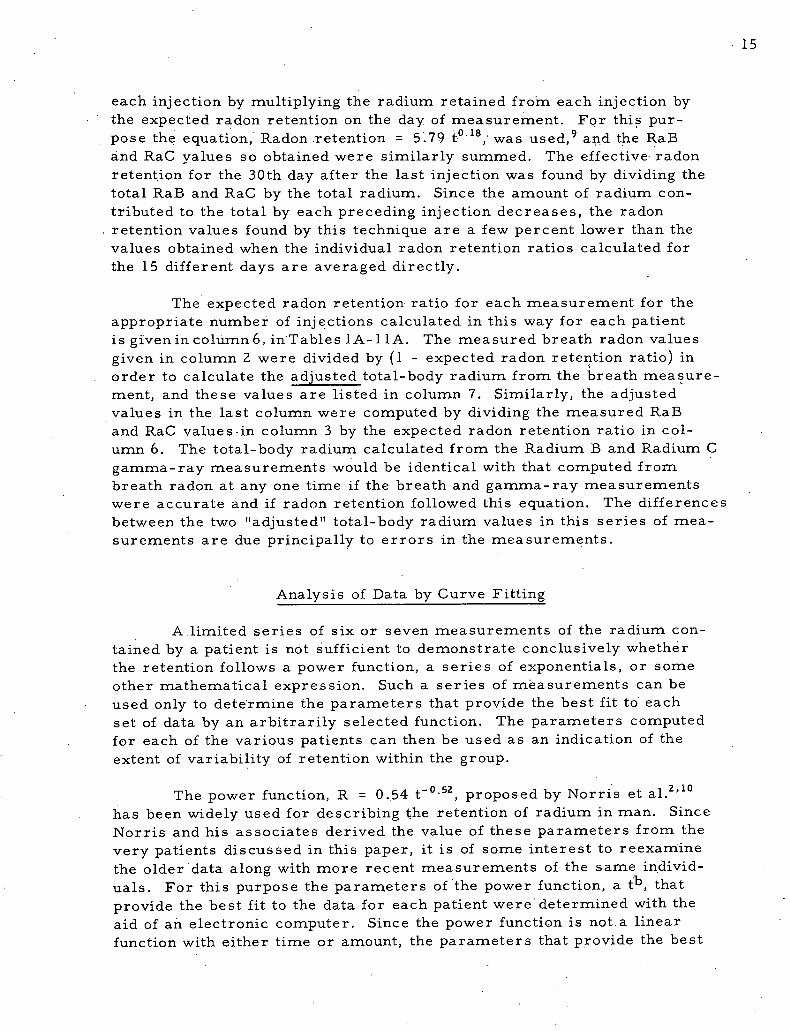
fit to data obtained for persons who received numerous injections cannotbe determined by simple graphical analysis. The amount present, forexample, on the 200th day after the last injection in a patient who received15 injections is the sum .of the amounts from each individual injection.The radium contained by a patient who received 15 injections, each ofwhich was assumed to be metabolized in identical fashion in accordancewith Norris' values, is depicted in Figure 1. Onthe first day after thefirst injection of 10 BCi the patient would have contained 5.4 /1Ci of radium,and the radium content would then have decreased along a straight line to1.96 B Ci on the seventh day, at which time the patient would have receivedan additional 10 BCi of radium. If the patient. had not received the secondinjection, his radium content would have continued to follow a projectionof this straight-line segment. The amount present from the second injec-tion, if plotted from the next day onward, would also follow the straight-line section shown for the first injection. However, when it is added tothe amount present from the first injection the combined radium contentfrom the 8th to the 15th day follows the curved line shown in the double-
log plot in Figure 1. The addition of each injection yields successivecurved sections. After the last injection the curve drops quite steeplyfor a few days and then flattens out, and after a number of years ap-proaches the slope of a single injection., If the quantity present after the
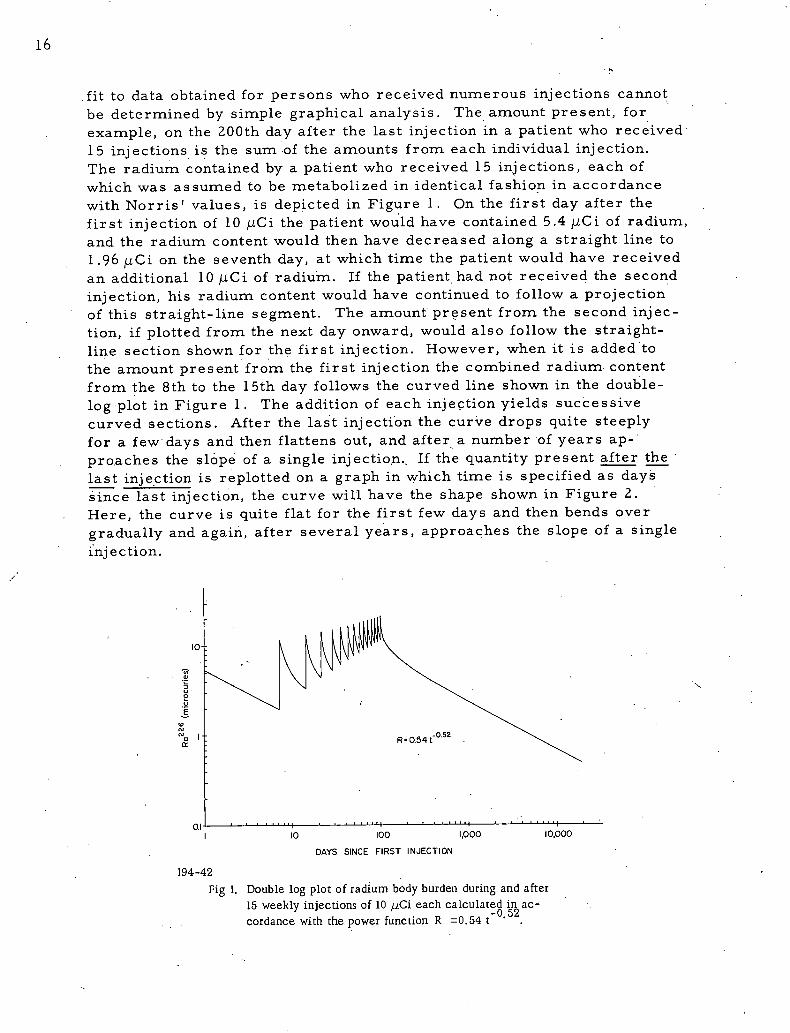
last injection is replotted on a graph in which time is specified as dayssince last injection, the curve will have the shape shown in Figure 2.Here, the curve is quite flat for the first few days and then bends over
gradually and again, after several years, approaches the slope of a singleinjection.
I »»»E
i.. D
0. li R=0.54 t-0.52a: -
CA ' • • '• '''I • ' ' ' ''''I ' ' ' ' ' '''I ' ' ' ' ''''I '1 10 100 ID0O 10.000
DAYS SINCE FIRST INJECTION
194-42
Fig 1. Double log plot of radium body burden during and after15 weekly injections of 10 liCi each calculated in ac-cordance with the power function R =0.54 t-0.52
17
10-
2.C
§-
'E. -0.52R=054t:N O' | -
ac -
QI ' . .'''.,1 ' ' ....''I , ''',''I . ..'',.11 10 100 1,000 10,000
DAYS SINCE LAST INJECTION
194-32
Fig. 2. Double log plot of radium body burden starting one day aftera series of 15 weekly injections of 10 IICi each calculated iiiaccordance with the power function R = 0.54 t-0·52.
The availability of high-speed electronic computers permitted usto analyze the data in which each radium measurement could be consideredas the sum of the individual amounts remaining from each of the 15 to36 injectiohs administered a specified number of days before the measure-ments. A computer program, written for the CDC-3600 computer byDr. Ronald Hamelink, and which employed the Davidon Variable MetricMinimization (VMM) technique,11 calculated the parameters a and b forthe power function that would yield the best fit to each set of data for whichthe number of weekly .injections is specified. For each best fit, the pro-gram also calculated the amount that each patient contained immediatelyafter the last injection, the' amount present ori the day of each measure-ment, and the amount present at any arbitrary time after the last injection.
The parameters of a single exponential function that provided thebest fit to the data were alsodetermined. This function has the form,
- Xt/T„fRetention =a e (2)
where a is the zero time intercept, t is time in days, X is 0.693146, andTi/2 is the half-time of the exponential term in days. A computer pro-gram that also employed the Davidon VMM function was written byMr. Donald F. Jordan for this analysis. Since an exponential function islinear along the time axis, the number of injections did not have to be con-sidered here. No attempt was made to fit the data with the sum of a seriesof exponentials because of the limited number of measurements available,especially at time intervals soon after the injections when the whole-bodyradium values would have been changing rapidly.
18
Since the individual measurements for each patient contain errorsthat are dependent upon physical and physiological conditions at the timeof a particular measurement, and which may have been absent on otheroccasions, the parameters that provide the best fit to the entire seriesmay be unduly influenced by one divergent measurement. The set ofparameters that provided the best fit to the greatest series of measure-ments was considered to ·represent the retention for the particular pa-tient. The various combinations of measurements that were used, theparameters that provided the best fit to these data, and the resultantdiscrepancies between calculated and measured values will be discussedseparately for each patient, since each case is characterized by its ownset of problems.
The same format for presentation of analyses will be followed foreach patient. All of the original and adjusted measurements for the patientare given in Table A of each set. Curve-fitting to original data for eachpatient is given in Table B, while that for adjusted data is presented inTables C and D.
In each Table B, the first two columns list the number of dayssince the last injection and the measured values for total radium. Vari-ous combinations of these measured values were fitted with a power func -tion and with a single exponential function by the methods described above.The values computed by the best fit in each case is listed for those dayswhere the measured data were used. The appropriate parameters aregiven for each computation along with two. indices of goodness of fit, themean error sum and the mean percent deviation between calculated andrneasured data.
The mean error sum is a calculated error function that is theaverage of the square of the difference between the computed and mea-sured values divided by the computed value. This term is similar tochi square used for frequency distributions. This expression weightsmore heavily the fit to the larger quantities at earlier times than the fitto the smaller quantities at later times. The mean percent deviation, onthe other hand, weights the percent fit to all points equally.
Similar computations are listed in each Table C for whole-bodyradium values adjusted from radon breath values and in each Table D forwhole-body radium derived from gamma-ray measurements. The resultsfor each patient will be discussed in detail seriatim.
Patient 0 3-1 0 1
Clinical Summary. Female. Born 1908. Onset of illness in 1928when she became depressed and exhibited peculiar behavior. Admitted toESH in May, 1930 with diagnosis of dementia praecox, paranoid type. Radi-um chloride, total of 150 Bg reputedly given intravenously in 15 weekly
19
injections from March to July, 1931,1 although hospital progress notes./ indicate that she may still have been receiving weekly radium injections
as late asSestember
and November, 1931. . Listed as Patient A in previ-ous papers.
Discussion. We have used 30 days as the interval between ·thelast injection and the first measurement even though Schlundt reported6 months and Norris employed 201 days. An entry on this patient'shospital progress report dated September 8, 1931 states, '!Wing Cot-tage 2, receiving Ra chloride weekly, " and an entry on September 28,1931 states, "Is receiving radium chloride intravenously. " Both of theseentries were signed by the same resident physician. Another physicianon November 17, 1931 wrote, "Wing Cottage, receiving radium chloride."After a recent conversation with the physician who signed the first twoentries cited above, we concluded that these notes made by two residentphysicians are more reliable than the dates published by persons notdirectly associated with the day-to-day clinical aspects of this researchand who were involved principally with the radium measurements duringthe last week of December, 1931 and in June, 1932. Accordingly, we haveassumed that this patient definitely received weekly radium injectionsfrom September 8 through November 17, 1931, or 11 injections during aperiod of atleast 10 weeks. A total of 150 MCi given in 15 injectionswould have covered a span of 14 weeks. If the injection program had beenunder way for two weeks on September 8, two more weeks after Novem-ber 17 would have closed the injection span on December 1. Since themeasurements were made during the last week of December, we havearbitrarily chosen 30 days as the interval between the last injection andfirst measurement. We have also assumed that 150 BCi were injected inaccordance with the value given in Schlundt's private reports and publica-tions, since the total amount administered is not given in the hospitalrecords.
Eight measurements are accordingly available for patient 03-101from the 30th day to the 11,709th day after the last injection (Table lA).Both breath and gamma-ray measurements were made on the first fouroccasions, gamma-ray only on the fifth, sixth and eighth, and breath onlyon the seventh occasion.
Three subsets of these original measurements have been fittedwith both a power function and a single exponential function. The param-eters for the power function that provide the best fit to all eight measure-ments are given in column 3 of Table l B. With this fit, the computedvalue at 30 days is 10.2 percent low, while that for the 213th day is42.25 percent high.
When the 213-day measurement was omitted from the sequence andthe remaining seven measurementswere fitted with a new power function,
20
the slope for this combination was -0.3368, which compares fairly wellwith the slope of -0.3220 found when the second point was included. Thevalue of a, the one-day intercept, was 0.2291 in the latter case, in con-trast to 0.1931 when all eight points were included. When the secondpoint was omitted the mean error sum and mean percent deviation wereconsiderably smaller than the corresponding values found when all eightpoints were included.
The reverse combination was used in which the first value Wasomitted and the second value included. The slope of the power functionfor this combination is -0.2160 and the value of a is O.0756. The meanerror sum and mean percent deviation were practically identical wheneither the first or the second points were omitted and were much lowerthan those found when all eight points were included. However, the slopesof the retention curve and the amount retained on the first day differgreatly. Thus, the data for Patient A can be used to demonstrate thatthe slope of the power function is either -0.2160 or -0.3368, dependingupon which measurement is omitted, or -0.3220 when all the points areincluded.
In the absence of any justifiable reason for discarding any ofthese measurements, the parameters obtained for the complete set of
eight measurements, designated by an arrow (Table lB), were entered inthe summary table. Similar parameters from each patient will be se-lected to obtain the best general set of parameters.
The same three combinations of measurements that were fittedwith a power function were also fitted with a single exponential. Theexponential that provided the best fit to all eight values had a half-timeof 16.136 years and a value at day zero of 4.809. The values computedby this optimum exponential term yielded a value that was 41 percent lowfor the 30-day measurement and 37.9 percent high for the 2.13-dayIneasurernent.
In view of the results of the many retention studies with animals,one would not expect a single exponential term to fit the data from earlytimes onward. Nevertheless, the parameters for an exponential termwere determined that provided the best fit to the seven remaining mea-surements when the 213-day value was omitted and again when the30-day value was omitted. The half-time of the exponential for the firstcombination was 11.128 years, and it was 24.107 years when the 30-daymeasurement was omitted.
The single exponential provided almost as good a fit to the datafrom 213 days through 11,876 days as did the power function. However,the exponential function did not fit the seven points that included the30-day value and omitted the 213-day value as well as did the power
/
21
function, nor did it fit quite as well as did the power function when alleight points were used. The parameters for the exponential term foundto fit the data from 213 days onward were entered in the summaryTable 1 6.
The adjusted radium values based on the breath radon measure-ments are given in column 2 of Table 1C. The parameters for the powerfunction that provided the best fit to these five measurements are givenin column 3. The slope of the power function is -0.3419, in comparisonwith a slope of -0.3220 when the original values for total radium wereused. It was impractical to fit these data with a single exponential sincethe value obtained for the last measurement on the 11,515th day was equalto the value of the measurement on the 7,118th day, and both values wereconsiderably below that on the 7,878th day.
The.adjusted total-body radium calculated from the gamma-raymeasurements is given in column 2 of Table 1 D. The results of fittingthe power function are given in column 3. Here, the calculated valuesagreed very well with the measured values for the 30-, 213- and10,264-day measurements and were quite close for the 7,118-, 7,878-and 10,108-day measurements. The power function greatly overestimatedthe 11,709-day value.
All seven measurements adjusted from gamma-ray measurementswere also fitted with a single exponential (Table l D, column 4). The bestfitting exponential had a biological half-time of 12.724 years and a zero-day value of 6.782. The calculated values found with this exponential termunderestimated the measured value on the 30th day by 16.7 percent andoverestimated the value on the 213 th day by 15.2 percent. When the30 - day point was omitted and the remaining six values fitted with a singleexponential, the best' fitting exponential had a biological half-time of14.496 years and a zero-day.value of 5.760. Significantly, all of the value sfrom 213 days on fit the measurements quite well and had a mein percentdeviation of only 5.76 percent. The parameters of this fit were .enteredin the summary table. Omission of the first two values yielded a some-what longer half-time without a corresponding improvement in goodnessof fit.
When plotted on log-log paper, the first four gamma-ray mea-suremerits seemed to follow one fairly flat power function while the lastfive· measurements appeared to folldw a much steeper power.function.Consequently, the first four and the last six measured values were eachfitted with separate power functions as were the first four and last fivevalues derived from gamma-ray measurements. The parameters andcalculated values for these combinations are given in Table l E. Whilethe measured values support power functions of similar slopes, thegamma- ray data can be fitted very well with two extremely different
22
power functions. Here, the first four measurements fall along a slopeof -0.2982 and the last five along a, slope of -0.8443. It was in fact con-siderations such as these that prompted us to reexamine the singleexponential as a description of the later phases of radium retention.
Patient 03-102
Clinical Summary. Male. Born 1905. Onset of illness dated to
1928 when he became seclusive and destitute. Admitted to ESH in October,1930 with diagnosis of dementia praecox, hebephrenic type. Radium chlo-ride, total of 150 Bg, reputedly given intravenously in 15 weekly injectionsfrom March to July, 1931.1 Transferred to Manteno State Hospital in 1935.Most recent examination at Argonne National Laboratory on February 18,1964. Listed as Patient B in previous papers.1,2
Discussion. Radium was never mentioned in this patient's hospitalrecords at ESH. Consequently, we have used Schlundt's value of 183 days(six months) as the elapsed time between the last injection and the first
measurement. The fact that this patient received the same number of
injections as Patient A (03-101) and that the same injection period was
given for both patients might be used to justify the use of the same30-day interval that we used for patient 03-101. However, in the absence
of any supporting entries in the hospital record we have followed Schlundt' s
reported interval.
The data for patient 03-102 are given in Tables 2A-D. Bothbreath radon measurements and total-body gamma-ray determinations
are available for the first three measurements (Table 2A), while onlytotal-body gamma-ray measurements are available for the last two dates.
The values for both the breath radon and the tobal-body gamma-ray forthe measurement 7,261 days after the last injection are obviously incor-rect since the sum of the two measurements and the total-body radiumcalculated from either measurement are both considerably less than theradium values found at two later dates by modern techniques. We have
accordingly omitted this point from the analysis.
Table 2B gives the power function parameters for various combina-
tions of these measurements as well as the quantities computed to be pres-ent at the time of each measurement by the power function fitting the. data
best. Although the fit was very good when both the 183- and 7,261-dayvalues were omitted from the computation, the power function should applyto early measurements as well as later ones. For this reason, the slopeselected for the final tabulation was -0.5549, since it was computed fromfour rather than three points, with only the 7,261-day value legitimatelyomitted. When the three measurements starting at one year were alsofitted with a single exponential term (column 7), the values yielded a bio-
logical half-time of 13.55 years.

"...i
23
The radium values adjusted from the radon breath measurementsare given in column 2 of Table 2C. The resultant parameters, meanerrors and computed values when four combinations of values were fittedwith a power function and two combinations with a single exponential aregiven in the appropriate columns. The parameters are very close to thesefound when the original measurements were used (Table 2B) since thetotal-body content as determined by the breath radon measurements isvery close to' the total-body values.
The radium values adjusted from the gamma-ray measurementsare given in column 2 of Table 2D. The resultant parameters, meanerrors and computed values when four combinations of values were fittedwith a power function and three combinations with a single exponentialare given in the appropriate columns. The results obtained with the powerfunction will be discussed first.
As in Table 2A, the 7,261-day value (Table 2D) is obviously inerror since it is considerably lower than the later two measurements.When this value is omitted and the remaining four values employed, thevalues calculated with the optimum power function are low for the first,fourth and fifth measurements (third omitted) and high for the secondvalue. This observation suggests that the second value (356-day) waslow, or the first value high. Consequently, the second, fourth and fifthvalues and the first, fourth and fifth were fitted with a power function.The parameters obtained for the latter set of values agree substantiallywith those found when five or four values were used but are substantiallysmaller than those found to fit the original or adjusted breath *alues.The extremely low value of a found when the second, fourth and fifthvalues were used suggests that the 356-day value is in fact low. Never-theless, the parameters found to fit the set of four will be used in thesummary since there is no proof that the first value is not high.
When the four values are fitted with a single exponential term, thecalculated value for the 183rd day is 36:6 percent low and.the value forthe 356th day is 37.8 percent high (column 7). Omission of either the356-day value (column 8) or the 183-day value (colurnn 9) results in avery good fit to the remaining three values with exponentials of very dif-ferent half-times. On the basis of the values obtained for either set ofthree values, .there is no reason to select either set of parameters forinclusion in the summary table. In view of the fact that the power func -tion analyses seemed to indicate that the 356-day value was low, onemight be tempted to select the parameters obtained when the 183-dayvalue was included. However, it is unrealistic to employ the fit obtainedwith the one function to justify a fit obtained with the other function if themain purpose of the analysis is to evaluate the two functions. For sum-mary.purposes,the intermediate half-time given by the curve for fewerpoints was selected.
--'
24
Patient 03-109
Clinical Summary. Female. Born 1904. Onset of illness in 1928with three brief hospitalizations before admission to ESH in November,1930 with diagnosis of dementia praecox, hebephrenic type. Radiumchloride, total of 180 pg, reputedly given intravenously in 18 weekly in-jections from March to July, 1931.1 No recent examination at ArgonneNational Laboratory. Death from carcinoma of bladder in September,1957. Listed as Patient I in previous papers.1,2
Discussion. A notation on the hospital record on May 29, 1931states, "She received 10 treatments of radium chloride." If this patientreceived a total of 18 injections as Schlundt states, and if the irijectionswere begun in the middle of March, the tenth injection would have been
given within the week preceding the entry in the hospital record, and the18th injection would have been given about August 25, 1931. Consequently,we have assumed an elapsed time of 155 days between the last injectionand first Schlundt measurement instead of the 6-month period stated bySchlundt and used by Norris.
The measured and adjusted radium values for patient 03-109 aregiven in Table 3A. Only four sets of breath ahd total-body measurements,two sets by Schlundt and two by Norris, are available on this ·patient, whodied in 1957. The four total-body values were fitted best with a powerfunction that had a slope of -0.6271 and a one-day intercept of 0.8927
(Table 3B). This power function underestimates the 155-day value by15.8 percent and overestimates the 338-day point by 98.5 percent, asituation that resembles the adjusted gamma-ray data of patient 03-102.When the 338-day value is omitted, the slope of the power function re-mains almost unchanged but the one-day intercept increases to 1.0655or greater than one. An intercept value greater than one implies thatmore radium was present in the patient's body one day after injectionthan was administered. Since this is impos sible, this power function maybe used to express radium retention after long intervals but it fails atvery short times after injection. When the 155-day value is omitted, thevalue of b is reasonable but the value of the dne-day intercept is ex-tremely small (0.0813). Since neither set of three measurements
yielded realistic parameters, those obtained when the total series offour were employed must be chosen as representative for this patient.
When the.total series of four measurements were fitted with asingle exponential, the calculated 155-day value was less than one-halfof the observed value and the calculated 338-day value was 1.57 timesthe observed value. With the 155-day measurement omitted, the remain-ing three measurements were fitted with a single exponential, and a half-time of 13.71 years was obtained and, as expected, the curve fit the dataquite well since only three points were used.
25
Similar calculations were made for radium values adjusted frombreath radon measurements (Table 3C) and substantially· identical resultswere obtained.
For the adjusted, gamma-ray analysis only three values could beused since the 338-day value., which was lower than the 7,243- and8,003-day values, was undoubtedly incorrect. The parameters for thepower function and the single exponential that fit these three points aregiven in Table 3D.
Patient 0 3-1 1 0
Clinical Summary. Female. Born 1899. Onset of illness in 1929with' hospitalization at private sanitarium. Admitted to ESH in August,1930 with diagnosis of dementia praecox, paranoid type. Radium chloride,total of 200 Bg reputedly given intravenously in 20 weekly injections fromMarch to July, 1931.1 However, hospital progress notes indicate thatpatient was receiving radium treatments in late January, 1931, and anote dated September 28, 1931 states that the patient had received"thirty.doses of radium.chloride." Most recent examination at ArgonneNational Laboratory on August 6; 1964. Listed as Patient J in previous
12papers.'
Discussion. We have assumed that the hospital records wereprobably correct and have recalculated the elapsed time based on 30 in-jections instead of 20. If this patient received the first injection duringlate January (assume January 22, 1931) and had received a total of 30 in-jections, the last injection would have been given on August 18, 1931, or130 days before Schlundt' s first measurement. Consequently, our compu-tations were based on 30 weekly injections of 10 lig each between theabove dates. Schlundt stated that six months had elapsed between the lastinjection and his first measurement while Norrisz employed an elapsedtime of 166 days and 6 total of 20 injections.
The seven measurements available on patient 03-110 are givenin Table 4A. Both radon breath measurements and total-body gamma -ray measurements are available for the first four measurements.Only total-body gamma-ray measurements are available for the lastthree measurements. The parameters and the calculated values for thepower function that provide the best fit to these seven measurements aregiven in Table 4B, column 3, along with the associated error indices.The calculated values agree quite well .with the measured values althoughthey are progressively higher than.the measured values for the sixth andseventh measurements. This same trend was observed for the gamma-raymeasurements of patient 03-101, for whom the measured values after longiritervals also fell much faster than that predicted by the power function.
26
The first four and the last five measured values were fitted with
power functions (see columns 4 and 5, Table 4B). A very good fit to eachset of data is realized with these two discontinuous, somewhat overlappingpower functi6ns. Of particular significance is the fact that the more re-cent, and probably more accurate, measurements support a power functionthat has a very steep slope. This power function will undoubtedly fit futuremeasurements much better than that found to fit the series of all sevenmeasurements. Nevertheless, the parameters found to fit all the data willbe included in the summary table.
Since a single exponential term could not fit both of the early mea-surements and also the last terms, the first measurement was omitted andthe remaining six values employed (column 6). In addition, the last fivemeasurements from 7,218 days onward were fitted with the exponential.The last five measurements could be fitted quite well with a single expo-nential term whose half-life was 16.400 years and whose zero-day valueis 2.272. This exponential term underestimates the 30-day measuredvalue bya factor of 2.7 and the 313-day value by a factor of 2. 'Although theretention of radium by this patient.from 7,218 through 12,037 days defi-nitely follows a 16.4-year half-time, the value of 10.3 years, which wasfound when the 313-day value was included, will be used in the summarytable.
As found fdr the directly measured values, the power function fitsall the adjusted breath data (Table 4C, column 3) from 130 days through10,202 days fairly well and then progressively overestimates the lasttwo values. The parameters found to fit the breath data, particularly thevalue of a, are larger than those found to fit the measured values. Also,as with the measured values, the first four breath (column 3) values can
be fitted very well with one power function and the last five (column 5)with a second power function.
The last five values, from 7,218 to 12,037 days, can be fitted with
an exponential term of 17.144-year half-time. The breath values at 130
and 313 days are about three and two times, respectively, the value pre-
dicted by this single exponential. Again, the half-time of 9.32 years found
by using all the data, starting at 313 days, will be used for summarypurposes.
The radium values adjusted from the gamma-ray rneasurementsare given in column 2 of Table 4D. The value for the 313th day is obvi-
ously wrong since it was less than the four values between the 7,218th dayand the 11,806th day. The remaining six gamma-ray values, when fitted
with a power function, yielded a slope of -0.2702 and a one-day interceptof 0.0286. This extremely low one-day intercept would suggest that thi spower function would not be valid at very early times. The last five mea-
surements from 7,218 days through 12,037 days could be fitted with a
27
power function (Table 4D, column 3) that has a slope of 1.222 and aone-day intercept value of 183.50. ,Obviously, this retention curve isonly valid pver the time span of these measurements and cannot be pro-jected back to early times. As a result, these gamma-ray data do notsupport a power function as an expression for retention.
On the other hand, the six valid gamma-ray measurements canbe fitted very well with an exponential term (column 5, of Table 4D)whose half-time is 18.33 years; the cemputed magnitude at day zero is2.02 11(i. The calculated values with this exponential agree quite wellwith the measured values for all times including 130 days after injection.The parameters of the exponential that provide the best fit to the last fivemeasurements are fairly close to that found for the six measurementsthat include the 130-day measurement. Extrapolation of this latter expo-nential term back to 130 days overestimates the amount present at thattime by about 20 percent. In view of the agreement between these twosets of parameters, the parameters based on the set of six that includesthe 130-day value will be included in the summary table.
The fact that the analyses of the measured values and of thebreath values yield similar parameters for the power function mightbe interpreted to suggest that these values were correct. Actually, suchagreement will exist for any set of data in which the gamma-ray value sare low. In the case of this patient, for example, the radium valueadjusted from the breath radon on the 130th day would be expected to be84.7 percent of the total. The omission of the expected gamma-ray valuefrom the measured total would yield a value only 15.3 percent below thatcalculated from the breath fraction. Disagreement will exist only be-tween the parameters found for the measured and breath values if eitherthe gamma-ray values are extremely high (by a factor of three or more)or if the breath value is appreciably low.
Patient 03-111
Clinical Summary. Female. Born 1909. Onset of illness in 1928and admitted to ESH in January, 1930 with diagnosis of dementia praecox,hebephrenic type. Radium chloride, total of 200 Bg, reputedly given intra-venously in 20 weekly injections between March and July, 1931.1 A hospitalprogress note dated May 29, 1931 states that the patient had received
10 injections of radium chloride. Most recent examination at Argonne Na-tional Laboratory on December 18, 1963. Listed as Patient K inprevious
12papers.'
Discussion. We have assumed that the hospital progress noteof May 29, 1931, which state.s that the pati-ent had received 10 injectiofisof radium chloride, to mean that .the patient had received only 10 injec-tions before this date. ·Consequently, if the patient received 20 weekly
28
injections, the last injection would have been given by August 7, 1931.The first Schlundt measurement during the last week of December wouldhave occurred about 141 days after the last injection instead of six monthsas stated by Schlundt, or the 166 days employed by Norris.
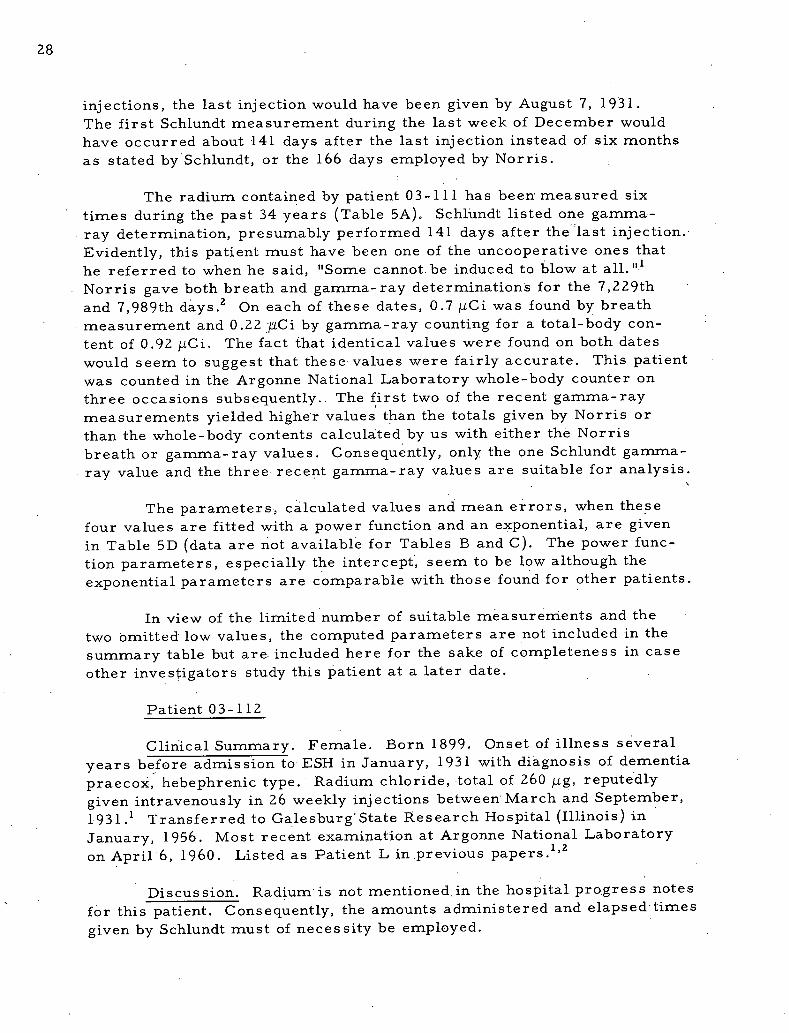
The radium contained by patient 03-111 has been' measured sixtimes during the past 34 years (Table 5A). Schlundt listed one gamma -ray determination, presumably performed 141 days after the 'last injection.Evidently, this patient must have been one of the uncooperative ones thathe referred to when he said, "Some cannot be induced to blow at all.".1Norris gave both breath and gamma-ray determinations for the 7,229thand 7,989th days.2 On each of these dates, 0.7 MCi was found by breathmeasurement and 0.22 BCi by gamma-ray counting for a total-body con-tent of 0.92 BCi. The fact that identical values were found on both dateswould seem to suggest that these values were fairly accurate. This patientwas counted in the Argonne National Laboratory whole-body counter onthree occasions subsequently. The first two of the recent gamma-raymeasurements yielded higher values than the totals given by Norris orthan the whole-body contents calculated by us with either the Norrisbreath or gamma-ray values. Consequently, only the one Schlundt gamma-ray value and the three recent gamma-ray values are suitable for analysis.
The parameters, calculated values and mean errors, when thesefour values are fitted with a power function and an exponential, are givenin Table 5D (data are not available for Tables B and C). The power func -tion parameters, especially the intercept, seem to be low although theexponential parameters are comparable with those found for other patients.
In view of the limited number of suitable measurements and thetwo omitted low values, the computed parameters are not included in thesummary table but are included here for the sake of completeness in caseother investigators study this patient at a later date.
Patient 0 3-1 1 2
Clinical Summary. Female. Born 1899. Onset of illness several
years before admission to ESH in January, 1931 with diagnosis of dementiapraecox, hebephrenic type. Radium chloride, total of 260 Bg, reputedlygiven intravenously in 26 weekly injections between March and September,1931.1 Transferred to Galesburg State Research Hospital (Illinois) inJanuary, 1956. Most recent examination at Argonne National Laboratory
on April 6, 1960. Listed as Patient L in previous papers.1,2
Discussion. Radium is not mentioned. in the hospital progress notes
for this patient. Consequently, the amounts administered and elapsed times
given by Schlundt must of necessity be employed.
29
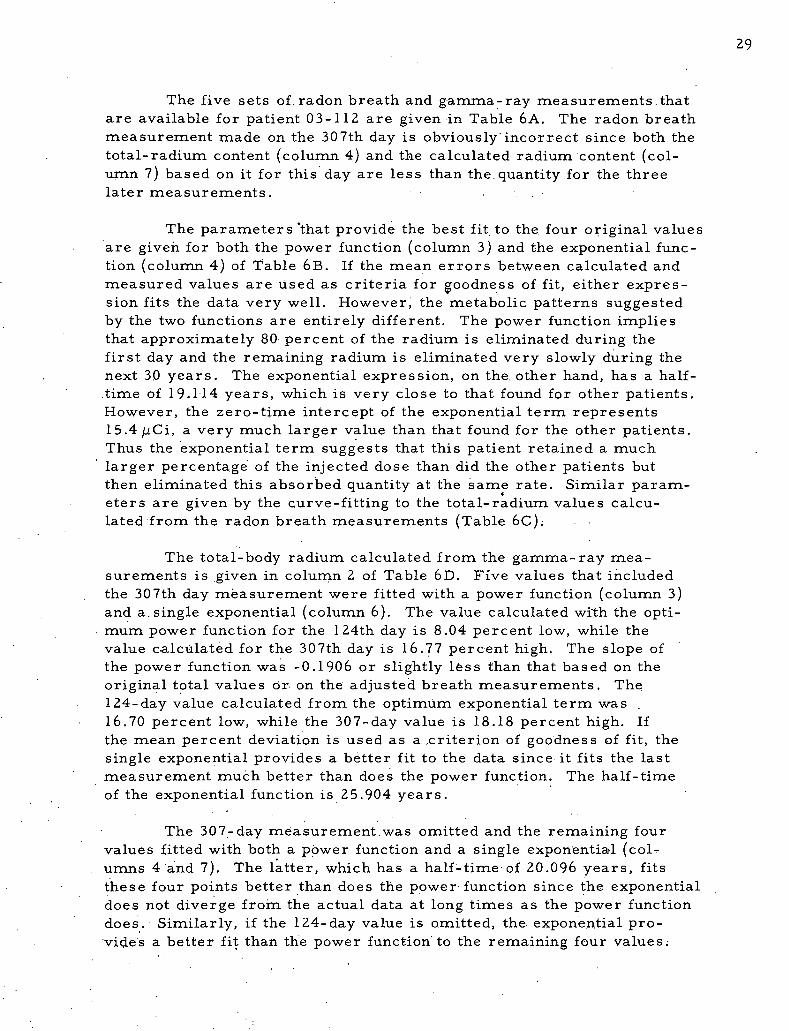
The five sets of. radon breath and gamma-ray measurements,thatare available for patient 03-112 are given in Table 6A. The radon breathmeasurement made on the 307th day is obviously incorrect since both thetotal-radium content (colurnn 4) and the calculated radium content (col-umn 7) based onit for this day are less than the.quantity for the threelater measurements.
The parameters 'that provide the best fit to the four original valuesare given for both the power function (column 3) and the exponential func -tion (column 4) of Table 6B. If the mean errors between calculated andmeasured values are used as criteria for goodness of fit, either expres-sion fits the data very well. However, the metabolic patterns suggestedby the two functions are entirely different. The power function impliesthat approximately 80 percent of the radium is eliminated during thefirst day and the remaining radium is eliminated very slowly during thenext 30 years. The exponential expression, on the other hand, has a half-time of 19.114 years, which is very close to that found for other patients.However, the zero-time intercept of the exponential term represents15.4 IICi, a very much larger value than that found for the other patients.Thus the exponential term suggests that this patient retained a much
larger percentage of the injected dose than did the other patients butthen eliminated this absorbed quantity at the same rate. Similar param-eters are given by the curve-fitting to the total-radium values calcu-lated from the radon breath measurements (Table 6C).
The total-body radium calculated from the gamma-ray mea-surements is given in column 2 of Table 6 D. Five values that includedthe 307th day measurement were fitted with a power function (column 3)and a. single exponential (column 6). The value calculated with the opti-mum power function for the 124th day is 8.04 percent low, while thevalue calculated for the 307th day is 16.77 percent high. The slope ofthe power function was -0.1906 or slightly less than that based on theoriginal tgtal values or on the adjusted breath measurements. The124-day value calculated from the optimum exponential term was16.70 percent low, while the 307-day value is 18.18 percent high. Ifthe mean percent deviation is used as a .criterion of goodness of fit, thesingle exponential provides a better fit to the data since it fits the lastmeasurement much better than does the power·function. The half-timeof the exponential function is 25.904 years.
The 307- day measurement was omitted and the remaining fourvalues fitted with both a power function and a single exponential (col-umns 4 and 7). The latter, which has a half-time of 20.096 years, fitsthese four points better than does the power function since the exponentialdoes not diverge from the actual data at long times as the power functiondoes. Similarly, if the 124-day value is omitted, the. exponential pro-vides a better fit than the power function to the remaining four values:
E
30
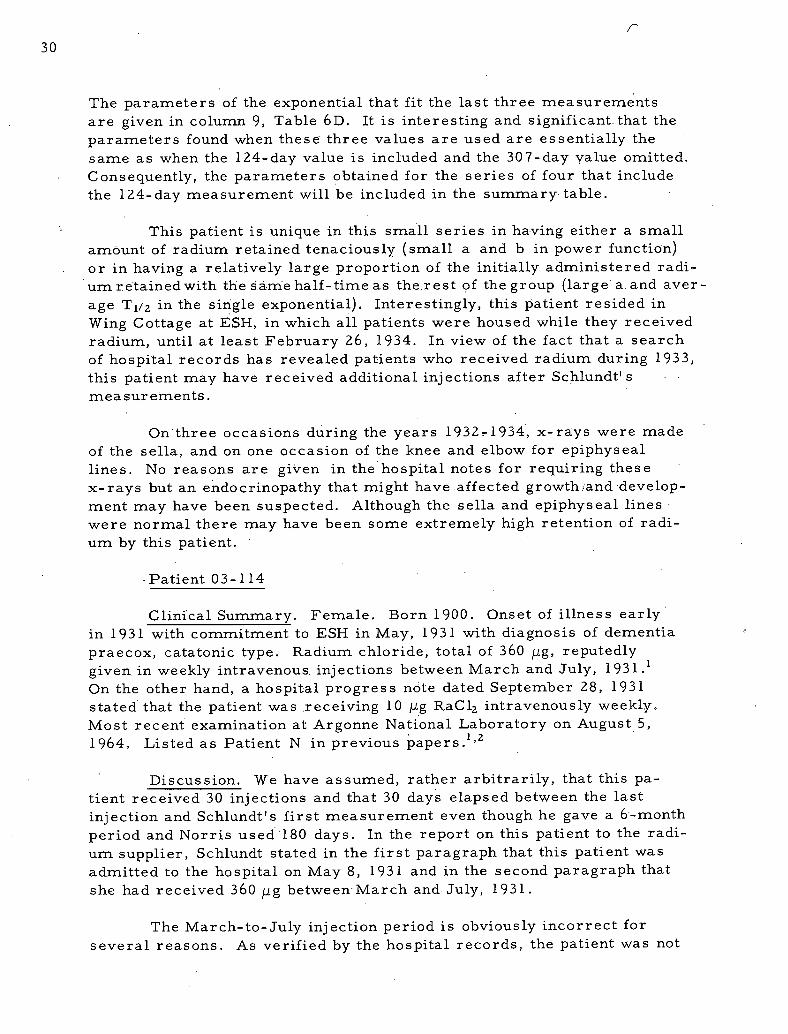
The parameters of the exponential that fit the last three measurements
are given in column 9, Table 6D. It is interesting and significant that theparameters found when these three values are used are essentially thesame as when the 124-day value is included and the 307-day value omitted.Consequently, the parameters obtained for the series of four that includethe 124-day measurement will be included in the summary table.
' This patient is unique in this small series in having either a smallamount of radium retained tenaciously (small a and b in power function)or in having a relatively large proportion of the initially administered radi-umretainedwith the dame half-time as the rest of the group (large a. and aver-age Tl/2 in the single exponential). Interestingly, this patient resided inWing Cottage at ESH, in which all patients were housed while they receivedradium, until at least February 26, 1934. In view of the fact that a searchof hospital records has revealed patients who received radium during 1933,this patient may have received additional injections after Schlundt' srneasurements.
On three occasions during the years 1932-1934, x-rays were madeof the sella, and on one occasion of the knee and elbow for epiphyseallines. No reasons are given in the hospital notes for requiring these
x-rays but an endocrinopathy that might have affected growth,and develop-ment may have been suspected. Although the sella and epiphyseal lineswere normal there may have been some extremely high retention of radi-um by this patient.
Patient 03-114
Clinical Summary. Female. Born 1900. Onset of illness earlyin 1931 with commitment to ESH in May, 1931 with diagnosis of dementia 'praecox, catatonic type. Radium chloride, total of 360 Mg, reputedlygiven in weekly intravenous injections between March and July, 1931.1On the other hand, a hospital progress note dated September 28, 1931stated that the patient was receiving 10 Bg RaClz intravenously weekly.Most recent examination at Argonne National Laboratory on August 5,1964. Listed as Patient N in previous papers. 1,2
Discussion. We have assumed, rather arbitrarily, that this pa-tient received 30 injections and that 30 days elapsed between the last
injection and Schlundt' s first measurement even though he gave a 6-month
period and Norris used 180 days. In the report on this patient to the radi-um supplier, Schlundt stated in the first paragraph that this patient wasadmitted to the hospital on May 8, 1931 and in the second paragraph thatshe had received 360 ilg between March and July, 1931.
The March-to-July injection period is obviously incorrect forseveral reasons. As verified by the hospital records, the patient was not
31
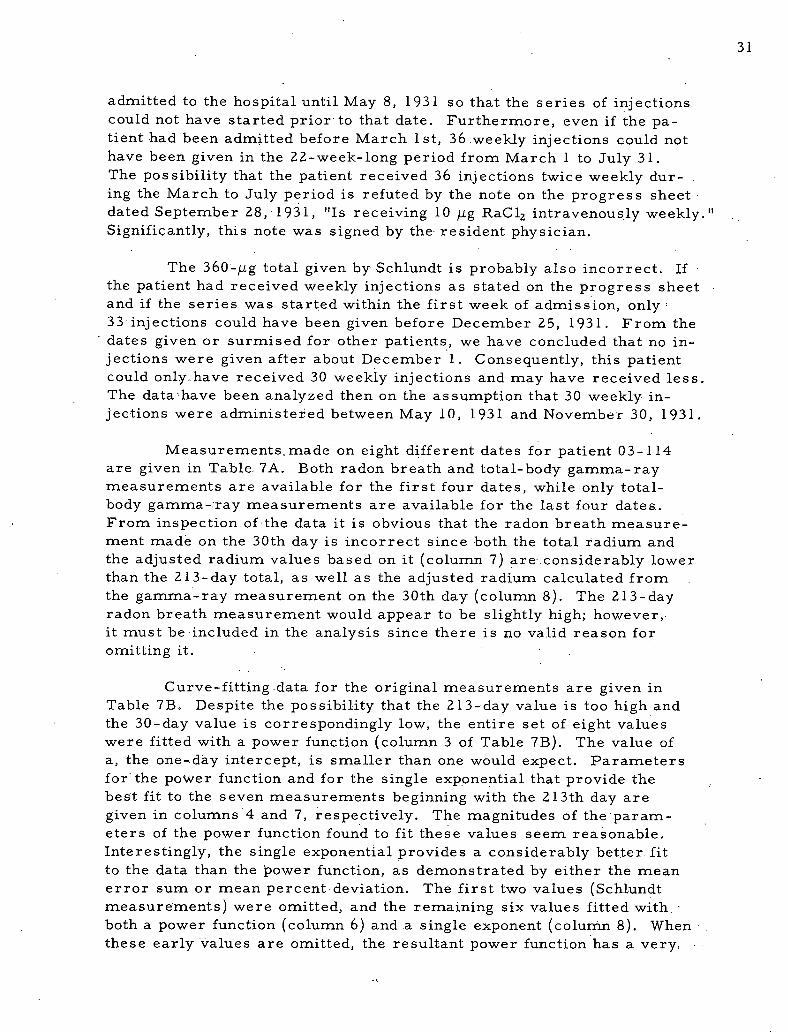
admitted to the hospital until May 8, 1931 so that the series of injectionscould not have started prior to that date. Furthermore, even if the pa-tient had been admitted before March 1st, 36 weekly injections could nothave been given in the 22-week-long period from March 1 to July 31.The possibility that the patient received 36 injections twice weekly dur-ing the March to July period is refuted by the note on the progress sheetdated September 28,1931, "Is receiving 10 lig RaC 12 intravenously weekly. "Significantly, this note was signed by the resident physician.
The 360-Bg total given by Schlundt is probably also incorrect. Ifthe patient had received weekly injections as stated on the progress sheetand if the series was started within the first week of admission, only33 injections could have been given before December 25, 1931. From thedates given or surmised for other patients, we have concluded that no in-jections were given after about December 1. Consequently, this patientcould only.. have received 30 weekly injections and may have received less.The data'have been analyzed then on the assumption that 30 weekly in-jections were administered between May 10, 1931 and November 30, 1931.
Measurements,made on eight different dates for patient 03-114are given in Table. 7A. Both radon breath and total-body gamma-raymeasurements are available for the first four dates, while only total-body gamma-:ray measurements are available for the last four dates.From inspection of the data it is obvious that the radon breath measure-ment made on the 30th day is incorrect since both the total radium andthe adjusted radium values based on it (column 7) are considerably lowerthan the 213-day total, as well as the adjusted radium calculated fromthe gamma-ray measurement on the 30th day (column 8). The 213-dayradon breath measurement would appear to be slightly high; however,it must be included in the analysis since there is no valid reason foromitting it.
Curve-fitting data for the original measurements are given inTable 7B. Despite the possibility that the 213-day value is too high andthe 30-day value is correspondingly low, the entire set of eight valueswere fitted with a power function (column 3 of Table 7B). The value ofa, the one-day intercept, is smaller than one would expect. Parametersfor the power function and for the single exponential that provide thebest fit to the seven measurements beginning with the 213th day aregiven in columns 4 and 7, respectively. The magnitudes of the par am-eters of the power function found to fit these values seem reasonable.Interestingly, the single exponential provides a considerably better fitto the data than the power function, as demonstrated by either the meanerror sum or mean percent deviation. The first two values (Schlundtmeasurements) were omitted, and the remaining six values fitted withboth a power function (column 6) and a single exponent (colurrin 8). Whenthese early values are omitted, the resultant power function has a very,
32
much steeper slope than when one or both of the early measurements wereincluded, while the exponential has a lower slope than if only the 213-dayvalue (column 7) is used to anchor the low end and a slightly steeper slopethan if the 30-day value (column 9) were included.
As with the other patients, the single power function (column 4) fitsthe Schlundt measurements (only one used in this case) very well, underesti-mates Norris' measurements and then progressively overestimates thelater measurements. The second, third and fourth measurements can befitted almost exactly by a power function, R = 0.2419 t- 0.4192 (column 5)while the third through eighth measurements can be fitted quite well with
1.1626a very steep power function, R = 185.25 t- . Consequently, the use oftwo discontinuous power functions may be an advantage in interpreting thedata of this patient.
The results obtained when the radium values calculated from thebreath measurements are fitted with a power function or an exponential are
practically identical (Table 7C) with those found when the original measuredvalues were analyzed.
The total-body radium values adjusted from the total-body gamma-
ray measurements are given in column 2 of Table 7D. The· results of fittingthese data with a power function and a single exponential term are given incolumns 3 and 6, respectively. Again, the single exponential expressionprovides a better fit to the data than the power function, especially when the30-day value is excluded. The power function does provide a better fit tothe 30-day and the 213-day values than the single exponential but it doesnot fit the last five measurements well. It underestimates the measure-
ments at 7,118 days and 7,878 days and progressively overestimates thevalue for the last three measurements. On the other hand, a single expo-nential fits the last five measurements very well from 7,118 days on,although it underestimates the 30-day measurement and overestimatesthe 213-day measurement. The seven values from 213 days on can befitted very well with a single exponential (column 7).
When the first two values are omitted, the. remaining six mea-surements can be fitted very well with a single exponential (column 8).Here, the· mean percent deviation between the calculated and observed is
only 2.37 percent, and, significantly, the parameters are almost identicalto those obtained when the 213-day value was included. Thus the gamma-ray measurements of this patient from 213 days through 11,941 days canbe fitted with a single exponential of 12.66 year half-time.
As with the unadjusted measured values, the first four measure-
ments can be fitted with one power function where the slope is fairlyflat (b = -0.3526) while the last six measurements can be fitted with asecond power function where the slope is very steep (b = -1.3916).
33
Patient 0 3-1 1 5
Clinical Surnmary. Female. Born 1906. Onset of illnesssix months before admission to ESH in March, 1931 with diagnosis ofdementia praecox, catatonic type. Radium chloride, total of 260 Bg,reputedly given intravenously in 26 weekly injections from March toDecember, 1931,1 although one hospital progress note dated June 16,1931 states, "Transferred to Wing Cottage for treatment, " and anothernote dated September 8,. 1931 states, "Has received six radium chloridetreatments to date. This note implies that injections began late in July,11
1931. Most recent examination at Argonne National Laboratory was onAugust 6, 1964. Listed as Patient 0 in previous papers.1,2
Discussion. The 23-day elapsed time between the last injectionand first measurement as well as the 260 IICi total radium injected re-ported by Schlundt were used in our analyses. These values imply thatthe first injection was given about June 14 if the patient actually received26 weekly irijections. This date does not agree with either Schlundt'sMarch date or the implied date of late July, but it is not impossible inview of the June 16, 1931 note, "Transferred to Wing Cottage for treat-ment" (note past tense). If this patient had in fact received only six in-jections by September 8, 1931 and continued to receive weekly injectionsuntil about December 3, 1931, she could have received only 18.6 r 19 in-jections. For these reasons we have assumed that 26 weekly injectionswere given from about mid-June to about December 7, 1931.
All of the measurements available on patient 03-115 are givenin Table 8A. Both radon breath and total-body gamma-ray measurementsare available for the first four dates and only gamma-ray measurementsfor the last three times. The 7,871-day breath (and the resultant total)values are slightly hi her than the earlier 7,111-day breath and resultanttotal values. However, from inspection of these data, it cannot be arbi-trarily stated that any particular value is incorrect.
Curve fitting to the original total-body radium values is given inTable 8 B. Parameters for the power function that provide the best fit toall seven measurements and the· mean errors are given in column 3.Calculated values from this optimum power function for the 23rd day are7.5 percent low while the value for the 206th day is 30.07 percent high.The parameters that provide the best fit to three other combinations ofmeasurements are given in columns 4, 5 and 6. The slope of the powerfunction is not changed greatly by these manipulations., Parameters forthe single exponential that provide the·best fit to five measurements (withthe 23-day and 7,111-day measurements omitted) are given in the lastcolumn of Table 8B. These results demonstrate that the measurementsfor this patient can be fitted quite well from 206 days on with a singleexponential of 14.14 year half-time.
34
Curve fitting to the total-body radium values calculated fromthe breath measurements are given in Table 8C. Parameters for thepower function that provide the best fit to the seven measurements are
given in column 3. This power function, which overestimates the 206-dayvalue by 34.81 percent, fits the other six values quite well. The 206-dayvalue was omitted and a very good fit obtained for the remaining six valueswith a power function (column 4). The 23-day value was omitted and anequally good fit obtained for the six values that included the 206-day value(column 5). The magnitudes of these parameters are considerably smallerthan those obtained for the previous two combinations, and the extremelysmall one-day intercept would seem to indicate that the 206-day value islow. However, in lieu of any proof that the 23-day value is any more ac-curate than the 206-day value, the parameters found to fit the entireseries of seven values will be incorporated in the summary table.
Of the numerous combinations of data fitted with an exponentialterm, the parameters,· calculated values and mean errors for three are
given in columns 6, 7 and 8. The best fit is obtained to the series offive that omits the 23-day and 7,111-day values.
Curve fitting to the total-body radium values adjusted from thegamma-ray measurements is given in Table 8D. Parameters for the
power function that provide the best fit to the seven measurements are
given in column 3. As observed for other patients, the calculated valueswith this optimum power function underestimates the first measurement,overestimates the second, underestimates the 7,111-day and 7,871-daymeasurements and progressively overestimates the last three measure-ments. Omission of the 23-day value (column 4) does not lead to an im-proved fit. The first four measurements can be fitted fairly well with apower function whose slope was -0.4539 (column 5), and the last five mea-surements can be fitted very well with a very steep power function(slope = -1.1187) (column 6). In the case of the first four values, thepower function overestimates the 206-day value by 17 percent.
Three combinations of the gamma-ray measurements were fittedwith an exponential term. A single exponential term cannot fit both ofthe early values (column 7) nor would one expect a single.term to fit them.A single term of 11.437-year half-time does provide a good fit to the lastsix values (column 8) that includes the 206-day value overestimated bythe power function.
The single exponential that provides the best fit to the last five mea-surements beginning with 7,111 days after the last injection (column 9) hasa slightly longer half-time than that found when the 206-day measurementwas included.
35
In summary, the retention of radium in patient 03-115 from206 days until 11,930 days after the last injection can be fitted somewhatbetter with a single exponential term than with a power function.
Patient 0 3-1 1 6 ·
Clinical Summary. Female. Born 1908. Onset of illness in 1928';further deterioration led to admission to ESH in February, 1931 with diag-nosis of dementia praecox, catatonic type. Radium chloride, total of250 Bg, reputedly giv.en intravenously in 25 weekly injections from July toSeptember, 1931,1 although hospital progress notes imply weekly injec-tions from June through November, 1931. Transferred to Manteno StateHospital(Illinois) in July, 1935. Most recent examination at Argonne Na-tional Laboratory on February 18, 1964. Listed as Patient P in previous
12papers.,
Discussion. The 30-day value published by Schlundt for the inter-val between the last injection and the first measurement should not be inerror by more than a few days. A note in the hospital records datedNovember 17, 1931 states, "Receiving radium chloride weekly. " SinceSchlundt measured these patients the last week in December, the intervalcould not have exceeded 45 days and may have been less. A n6te onJune 16, 1931 states, "Transferred.to Wing Cottage for treatment" and anote on the next day (June 17, 1931) states, "Ra chloride once weekly. "If the first injection was given on June 16, 1931, the 25th injection wouldhave been given on December 1, 1931 and the interval would have beenabout 30 days. The dates for this patient seem to be the most reliable ofthis series.
Five measurements for patient 03-1:16 are given in Table 9A.Both radon breath and total-body gamma-ray measurements are avail-able for the first three values and only gamma-ray measurements for thelast two values. Although the total-body values from the Radium B andRadium C values are systematically higher than the total-body radiumcalculated from the radon breath values, none of the values is obviouslyincorrect. In fact, the extraordinarily high concentration of radium foundin this patient's torso with the 7-crystal-position technique at the time of'the last whole-body measurement would yield high gamma-ray valueswhen the patient was measured by the technique employed by both Schlundtand Norris.
The parameters of the power function and the single exponential thatprovide the best fit to the total-radium values are given in Table 9B. Ifmean percent deviation is used to evaluate the fit, the single exponentialprovidgs a better fit to the total series of measurements than does thepower function. The power function, which.has an extremely low one-dayintercept, fits the 30-day and 213-day'measurements very well but
36 -
progressively overestimates the three later measurements. On theother hand, the single exponential underestimates the 30-day measure-ment, overestimates the 213-day measurement, but fits the lastthree measurements quite well. The four measurements beginning withthe 213th day can be fitted very well with a single exponential (column 5)but the half-time for this term is slightly longer. 17.434 years versus15.554 years, than when all five values are used.
Total-body radium calculated from the radon breath measure-ments is given in column 2 of Table 9C. The parameters for the powerfunction and the single exponential when all five .measurements were in-cluded are given in columns 3 and 4. The parameters and mean errorsare in very good agreement with those given in Table 9B for curve fittingwith the original total radium measurements.
Total-body radium values calculated from the gamma-ray mea-surements are given in column 2 of Table 9D. Parameters for both thepower function and the single exponential that provide the best fit to thefive measurements are given in columns 3 and 5. Again, the single ex-ponential provides a better fit to the data than does the power function,which fits very early measurements quite well but progressively over-estimates the two later measurements. A single exponential underesti-mates the 30-day measurement and overestimates the 213-day measurement.Both.functions underestimate the third measurement on the 7,118th day,so that this measured value of 3.301 Mci based on the gamma-ray measure-
ment may be too high. The radium value for this date found by radon breath
measurement,.2.247 IiCi, was considerably lower and is much closer to thecalculated values for this data·.
The 7,118-day value was omitted and the four gamma-ray valuesfitted with both functions (columns 4 and 6). For these measurements, thepower function provides a much better fit than the exponential since it fitsall four values while the single exponential term cannot fit both earlyIneasurements.
Two other permutations of data were fitted with the exponentialterms (columns 7 and 8) and approximately the same parameters obtained.In view of the closeness of the two sets of parameters and of the fact. thatthe best fit was obtained with the power function when the 7,118-day valuewas omitted, the set based on the three measurements will be used in the
surnnlary table.
The·parameters of the power functions found to fit these data arevery interesting. Up to now, a·value of ai the one-day intercept; of 0.10or lower seemed to us to be unreasonably small and was interpreted todemonstrate that some of the measurements were.in error. With pa-tient 03-116 values of 0.1020, 0.1024 and either 0.1244 or 0.1718 were
37
found for a when the total, breath and gamma-ray data, respectively, werefitted with a power function. The. fact that the parameters based on thegamma-rays are higher than the other two sets could be interpreted todemonstrate that the other values are low. However, this patient wasfound to contain 68.6 percent of her total radium in her torso, whereasif the radium were uniformly distributed in the skeleton this section ofthe body would contain only 42.0 percent. Under these conditions, the firsttwo gamma-ray'measurements could be too high and this fact would accountfor the steeper slope. Significantly, the data for this patient, for whom theinjection schedule seems most reliable, yield small values for a and b.
Patient 03-121
Clinical Summary. Female. Born 1909. Onset of illness inDecember, 1930 when she became depressed and withdrawn. Admittedto ESH in September, 1931 with diagnosis of dementia praecox, catatonictype. Radium chloride, total of 90 Bg, reputedly given in nine weeklyintravenous injections between October and December, 1931.1 Most re-cent examination at Argonne National Laboratory on December 19, 1963.Listed as Patient U in previous reports.1,2
Discussion. The total number of injections and interval betweenthe last injection and first measurement published by Schlundt for thi spatient seem to be fairly accurate. Since she was admitted to ESH onSeptember 16, 1931, the first injection was given sometime after thatdate. A hospital progress note dated November 18, 1931 states, "Annex 4.Given malaria treatment at Wing Cottage and was then returned to An-nex 40." Evidently she was transferred from Wing Cottage by November 18,1931 and the radium treatments probably terminated. Nine weekly injec-tions could have been given in this interval if the first one was given withinthe first week after she was admitted. If the radium was administeredwithin this period, the interval to the first measurement was 40 to 45 daysinstead of the 30 days given by Schlundt. We have used the 30-day intervalsince the use of 40 or 45 days will not change the parameters greatly.
Eight gamma-ray and two breath measurements are available forpatient 03-121 (Table l OA). Since Schlundt did not obtain breath measure-ments on this patient, and since the two Norris breath measurementsyield calculated radium body values that are lower than the total-bodyradium values based on later gamma-ray measurements performed in awhole-body counter, these breath measurements will not be used.
The complete set of gamma-ray measurements were fitted with apower function (Table lOD, column 3) and a single exponential (column 4).For this patient, the power function overestimates the first value (30 days)and underestimates the second·value (21·3 days). This is the opposite effectnoted for previous patients. The power function fits the next three values
38
fairly well but then progressively overestimates the last three values.The exponential function fits the first two measurements quite well, over-estimates the next two and then underestimates the last four values. As
judged from the mean error, the exponential still provided a better fitto the entire series of measurements than did the power function.
Three additional combinations of data were fitted with the expo-nential function. These parameters, calculated values and rriean errorsar,e given in columns 5,6 and 7. Although a fairly good fit was obtained toseven measurements (7,118-day omitted), and to the last five measure-ments, the half-times of the two exponentials are not very different.These values will not be included in the summary table but are presentedfor the sake of completeness.
Patient 0 3-1 2 6
Clinical Summary. Female. Born 1911. Onset of illness in 1927with hospitalization in private sanitarium. Admitted to ESH in December,1930 with diagnosis of dementia praecox, catatonic. Radium chloride,total of 200 lig, reputedly given intravenously in 20 weekly injections, pre-sumably in 1.931.1 No mention of radium in ESH records. Upper rightthigh amputation in 1956 because of complications resulting from attack
by another patient. Died in June, 1965 with carcinoma of sphenoid sinus.One examination at Argonne National Laboratory in July, 1960. Listedas Patient Rose D in previous papers.1,2
Discussion. There is no information available at this time thatcan be used to calculate the interval between the last injection and thefirst measurement. In the published report in 1933, Schlundti includedthe name of this patient with the names of a group that had been dis -charged and not measured. He did state, however, that she had received200 Bg. In a private report to the radium supplier dated 1932 (no day ormonth), which antedated the publication of the results of the ESH cases,he gave the results of measurements made on this patient in the office ofa private physician. Why, then, were not these values included in the
published paper? Since the name of J. Paul Morris, who assisted Schlundtwith the ESH measurements, was included in the private report, it wouldseem that this patient was in fact measured along with the others at thetime of the December visit to ESH. In the case of this patient not onlyis the injection period not known but the date of the measurement is alsounknown. The known data and the as sumed time intervals are given inTable 11 A.
We first assumed a 1.66-day interval. and fitted the data with both a
power function and an exponential (Tables 11B, 11C and llD). The one-dayintercept of the power function for these three sets of data ranged from0.8978 to 0.9828 (column 3 of each table). Since these values seemed
39
unrealistically high, an interval of 30 days between the last inj ection andfirst measurement was employed. The parameters of the power functionfound to fit the data for this interval are given in the last column of eachtable. The one-day intercepts ranged from 0.3277 to 0.3428 and the valuesof b ranged from -0.4036 to -0.4159.
The parameters of the exponential term found to fit the last twomeasurements, if the first interval was 166 days, are given in each table.These values, in view of the fact that they are based on only two measure-ments, one of which was corrected for a missing leg, are not of any par-ticular value.
The parameters for this patient are not included in the summarytable used to obtain an average function. The measurements are includedhere for the benefit of those investigators who may study bone samplesthat are now available for analysis.
Average Power Function
The parameters of the power functions that were adjudged to pro-vide the best fit to the original data, to the adjusted data based on radonbreath data, and to the adjusted data based on gamma-ray measurementsare given in Table 12. The parameters are included for the eight patientsfor whom four or more total, breath, and gamma-ray measurements wereavailable. The parameters for the three patients for whom either gamma-ray measurements alone or for whom only three total, breath and gamma-ray measurements were available will be discussed later (Appendix I).
For the original and breath data, the -magnitudes of the coefficient,a, ranged from a low of 0.1020 to maxima of 0.892.7 and 0.9766, respec-tively, and the magnitudes of the exponents, b, ranged from 0.2240 to0.6347. In general, for each patient the value of b found to fit the breathdata agreed quite well with that found to fit the original data. For thegamma-ray data, however, the magnitudes of the coefficient, a, rangedfrom 0.0286 to 0.5922 and the magnitudes of the exponent, b, ranged from0.1906 to 0.5650. For five of the eight patients, the exponents and coeffi-cients that were found to fit the gamma- ray data were considerably smallerthan those found for the original and breath measurements. The good agree-ment between the parameters for the breath data and the original measure-ments does not demonstrate that the former were more accurate than thegamma-ray results but rather reflects the fact that the breath measure-ment contributed 85 to 90 percent of the total measurement at the time ofthe Schlundt measurements. Consequently, the total unadjustedvalue (column 4 of each A table for each patient) will be within 10 percentof the adjusted breath value (column 7, A tables) even if the gamma-raymeasurement (column 3) is high by a factor of two, and it will be within
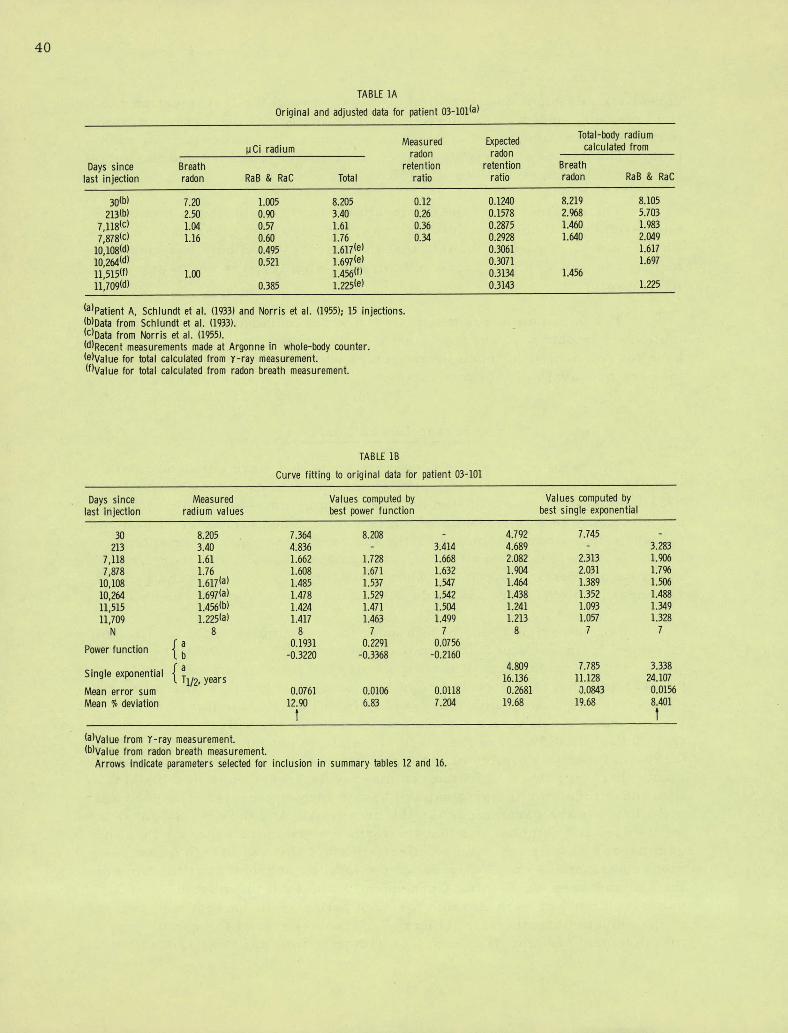
40
TABLE lA
Original and adjusted data for patient 03-101(a)
Total-body radiumMeasured Expected
UCi radium calculated fromradon radon
Days since Breath retention retention Breath
last injection radon RaB & RaC Total ratio ratio radon RaB & RaC
30(b) 7.20 1.005 8.205 0.12 0.1240 8.219 8.105
213(b) 2.50 0.90 3.40 0.26 0.1578 2.968 5.703
7,118(c) 1.04 0.57 1.61 0.36 0.2875 1.460 1.983
7,878(c) 1.16 0.60 1.76 0.34 0.2928 1.640 2.049
10108(d) 0.495 1.617(e) 0.3061 1.617
10,264(d) 0.521 1.697(e) 0.3071 1.697
11,515(f) 1.00 1.456(f} 0.3134 1.456
11,709(d) 0.385 1.225(e) 0.3143 1.225
(a)Patient A, Schlundt et al. (1933) and Norris et al. (1955); 15 injections.(b)Data from Schlundt et al. (1933).(C)Data from Norris et al. (1955).(d)Recent measurements made at Argonne in whole-body counter.(e)Value for total calculated from y-ray measurement.(f)value for total calculated from radon breath measurement
TABLE 18
Curve fitting to original data for patient 03-101
Days since Measured Values computed by Values computed by
last injection radium values best power function best single exponential
30 8.205 7.364 8.208 - 4.792 7.745 -
213 3.40 4.836 - 3.414 4.689 - 3.283
7,118 1.61 1.662 1.728 1.668 2.082 2.313 1.906
7,878 1.76 1.608 1.671 1.632 1.904 2.031 1.796
10,108 1.617(a) 1.485 1.537 1.547 1.464 1.389 1.506
10,264 1.697(a) 1.478 1.529 1.542 1.438 1.352 1.488
11,515 1.456(b) 1.424 1.471 1.504 1.241 1.093 1.349
11,709 1.225(a) 1.417 1.463 1.499 1.213 1.057 1.328
N 8 8 7 7 8 7 7f a 0.1931 0.2291 0.0756
Power function 1 b -0.3220 -0.3368 -0.2160
a
L Tl/2,years
4.809 7.785 3.338single exponential f 16.136 11.128 24.107
Mean error sum 0.0761 0.0106 0.0118 0.2681 0.0843 0.0156
Mean % deviation 12.90 6.83 7.204 19.68 19.68 8.401
1 1
Ca)Value from Y-ray measurement.(b)Value from radon breath measurement.
Arrows indicate parameters selected for inclusion in summary tables 12 and 16.

41
TABLE 1C
Curve fitting to adjusted data for patient 03-101
Days since Radium adjusted from Values computed by bestlast injection breath radon measurements power function
30 8.219 7.274213 2.%8 4.651
7,118 1.460 1.496
7,878 1.640 1.445
10,108 -
10,264 -
11,515 1.456 1.270
11,709 -
N 5 5
Powerfunction < 0.2074-0.3419
Mean error sum 0.1572Mean % deviation 19.06
f
Arrow indicates parameters selected for inclusion in summary Tables 12 and 16.
TABLE lD
Curve fitting to adjusted data for patient 03-101
Radium adjustedDays since from Y-ray Values computed by best Values computed by best
last injection measurements power function single exponential
30 8.105 8.314 6.752 -
213 5.703 5.465 6.570 5.602 -
7,118 1.983 1.883 2.346 2.269 2.106
7,878 2.049 1.823 2.094 2.054 1.956
10,108 1.617 1.683 1.502 1.534 1.574
10,264 1.697 1.675 1.467 1.503 1.550
11,515 - -
11,709 1.225 1.606 1.183 1.244 1.347
7 7 7 6 5
0.2173Power
function _0.3212Single exponential6.782 5.760 4.214
l Tl/2,years 12.724 14.496 19.481
Mean error sum 0.0203 0.0676 0.0116 0.0050
Mean % deviation 8.48 10.93 5.76 6.40
1 1Arrows indicate parameters selected for inclusion in summary tables 12 and 16.
TABLE lE
Additional curve fitting to original and adjusted data for patient 03-101
Radium adjustedDays since Measured Values computed by from Y-ray Values computed by
last injection radium values best power function measurements best power function
30 8.205 7.408 - 8.105 8.206 -
213 3.40 4.766 - 5.703 5.562 -
7,118 1.61 1.557 1.751 1.983 2.069 2.118
7,878 1.76 1.505 1.684 2.049 2.007 1.946
10,108 1.617 - 1.533 1.617 - 1.578
10,264 1.697 - 1.524 1.697 - 1.558
11,515 1.456 - 1.459 - -
11,709 1.225 - 1.450 1.225 - 1.394
N 8 4 6 7 4 5f a 0.2071 0.3427 0.1946 25.398Power function 1 b -0.3372 -0.3807 -0.2982 -0.8443
Mean error sum 0.1306 0.0123 0.0023 0.0096
Mean % deviation 16.92 7.83 2.52 7.264
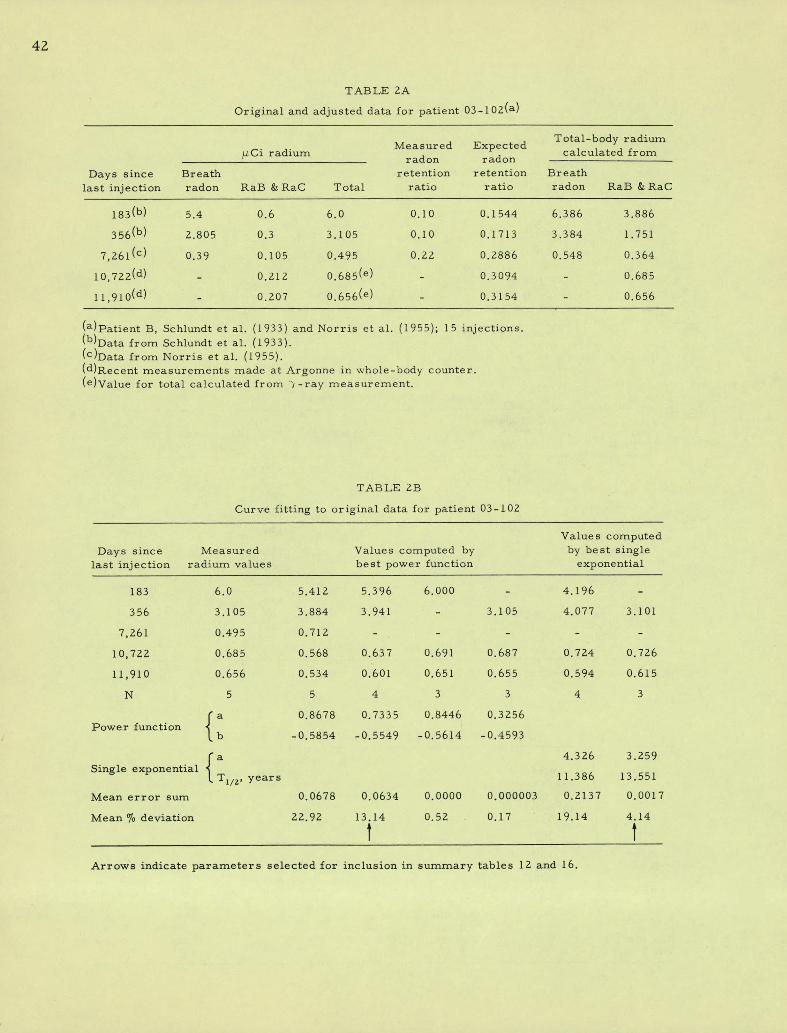
42
TABLE 2A
Original and adjusted data for patient 03-102(a)
Total-body radiumMeasured ExpectedMCi radium calculated fronnradon radon
Days since Breath retention retention Breathlast injection radon RaB & RaC Total ratio ratio radon RaB & RaC
183(b) 5.4 0.6 6.0 0.10 0.1544 6.386 3.886
356(b) 2.805 0.3 3.105 O.10 0.1713 3.384 1.751
7,261(c) 0.39 0.105 0.495 0.22 0.2886 0.548 0.364
10,722(d) - 0.212 0.685(e) - 0.3094 0.685
11,910(d) - 0.207 0.656(e) 0.3154 - 0.656
(a)Patient B, Schlundt et al. (1933) and Norris et al. (1955); 15 injections.(b)Data from Schlundt et al. (1933).(c)Data from Norris et al. (1955).(d)Recent measurements made at Argonne in whole-body counter.(e)Value for total calculated from -)' -ray measurement.
TABLE 2B
Curve fitting to original data for patient 03 - 102
Value s computedDays since Measured Values computed by by best single
last injection radium values best power function exponential
183 6.0 5.412 5.396 6.000 - 4.196 -
356 3.105 3.884 3.941 - 3,105 4.077 3.101
7,261 0.495 0.712 - - - - -
10,722 0.685 0.568 0.637 0.691 0.687 0.724 0.726
11,910 0.656 0.534 0.601 0.651 0.655 0.594 0.615
N 5 5 4 3 3 4 3
f a 0.8678 0.7335 0.8446 0.3256Power function b -0.5854 -0.5549 -0.5614 -0.4593
f a 4.326 3.259
Single exponential 1LT 11.386 13.551
1/2, Years
Mean error sum 0.0678 0.0634 0.0000 0.000003 0.2137 0.0017
Mean % deviation 22.92 13.14 0.52 0.17 19.14 4.14
Arrows indicate parameters selected for inclusion in summary tables 12 and 16.
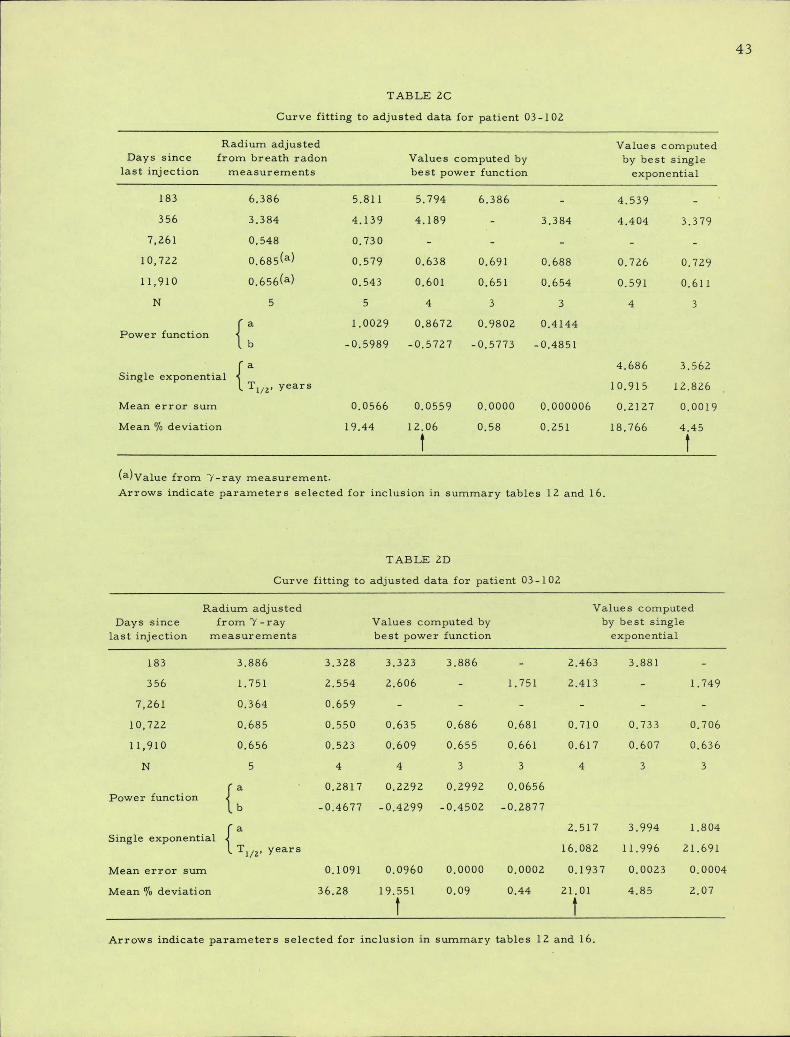
43
TABLE 2C
Curve fitting to adjusted data for patient 03-102
Radium adjusted Values computedDays since from breath radon Values computed by by best single
last injection measurements best power function exponential
183 6.386 5.811 5.794 6.386 4.539
356 3.384 4.139 4.189 3.384 4.404 3.379
7,261 0.548 0.730
10,722 0.685(a) 0.579 0.638 0.691 0.688 0.726 0.729
11,910 0.656(a) 0.543 0.601 0.651 0.654 0.591 0.611
N 5 5 4 3 3 4 3
f a 1.0029 0.8672 0.9802 0.4144Power function b -0.5989 -0.5727 -0.5773 -0.4851
fa 4.686 3.562Single exponential i
l Ti/2, years 10.915 12.826
Mean error sum 0.0566 0.0559 0.0000 0.000006 0.2127 0.0019
Mean % deviation 19.44 12.06 0.58 0.251 18.766 4.45
t
(a)Value from 7-ray measurement.Arrows indicate parameters selected for inclusion in summary tables 12 and 16.
TABLE 2D
Curve fitting to adjusted data for patient 03 -102
Radium adjusted Values computedDays since from 7 -ray Values computed by by best single
last injection measurements best power function exponential
183 3.886 3.328 3.323 3.886 2.463 3.881
356 1.751 2.554 2.606 - 1.751 2.413 - 1.749
7,261 0.364 0.659
10,722 0.685 0.550 0.635 0.686 0.681 0.710 0.733 0.706
11,910 0.656 0.523 0.609 0.655 0.661 0.617 0.607 0.636
N 5 4 4 3 3 4 3 3
fa- 0.2817 0.2292 0.2992 0.0656
Power function b -0.4677 -0.4299 -0.4502 -0.2877
r a 2.517 3.994 1.804Single exponential 4
L Tl/z, years 16.082 11.996 21.691
Mean error sum 0.1091 0.0960 0.0000 0.0002 0.1937 0.0023 0.0004
Mean % deviation 36.28 19.551 0,09 0.44 21.01 4.85 2.07
t
Arrows indicate parameters selected for inclusion in summary tables 12 and 16.
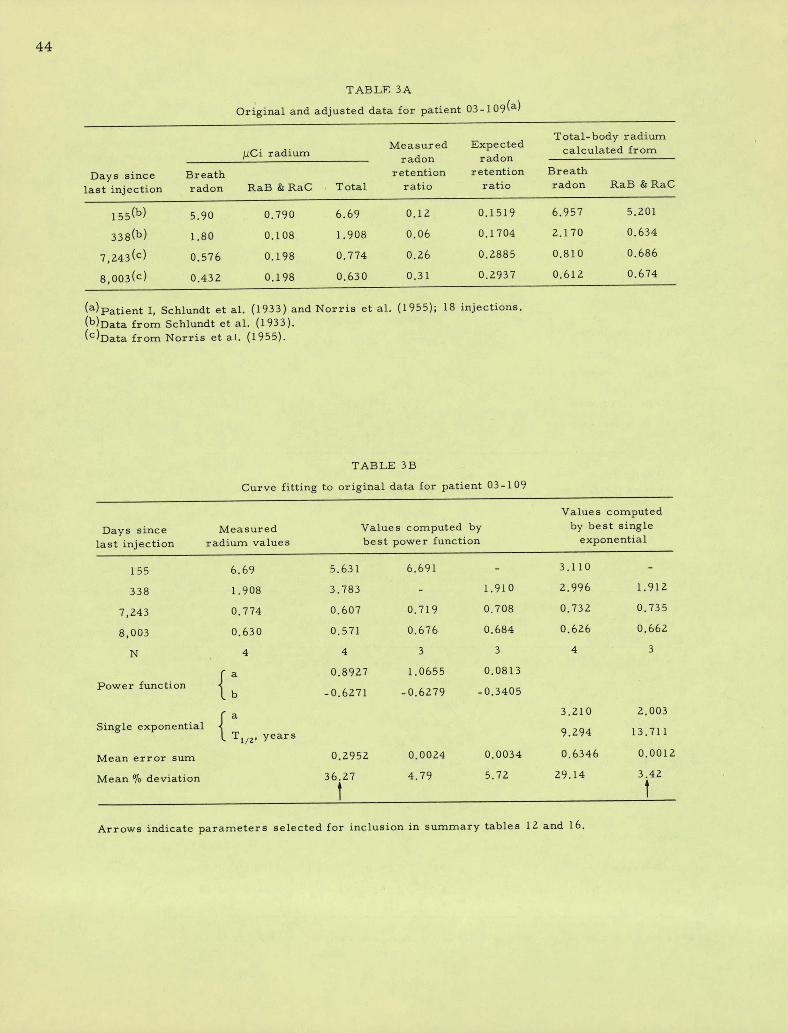
44
TABLE 3A
Original and adjusted data for patient 03 - 109(a)
Total-body radiumMeasured Expected
;ICi radium calculated fromradon radon
Days since Breath retention retention Breath
last injection radon RaB & RaC Total ratio ratio radon RaB & RaC
155(b) 5.90 0.790 6.69 0.12 0.1519 6.957 5.201
338(b) 1.80 0.108 1.908 0.06 0.1704 2.170 0.634
7,243(c) 0.576 0.198 0.774 0.26 0.2885 0.810 0.686
8,003(c) 0.432 0.198 0.630 0.31 0.2937 0.612 0.674
(a)Patient I, Schlundt et al. (1933) and Norris et al. (1955); 18 injections.(b)Data from Schlundt et al. (1933).(C)Data from Norris et al. (1955).
TABLE 3 B
Curve fitting to original data for patient 03-109
Values computed
Days since Measured Values computed by by best single
last injection radium values best power function exponential
155 6.69 5.631 6.691 - 3.110 -
338 1.908 3.783 - 1.910 2.996 1.912
7,243 0.774 0.607 0,719 0.708 0.732 0.735
8,003 0.630 0.571 0.676 0.684 0.626 0.662
N 4 4 3 3 4 3
ra 0.8927 1.0655 0.0813
Power function b -0.6271 -0.6279 -0.3405
fa 3.210 2.003
Single exponential 4l T 9.294 13.7111/2'years
Mean error sum 0.2952 0.0024 0.0034 0.6346 0.0012
Mean % deviation 36.27 4.79 5.72 29.14 3.42
Arrows indicate parameters selected for inclusion in summary tables 12 and 16.
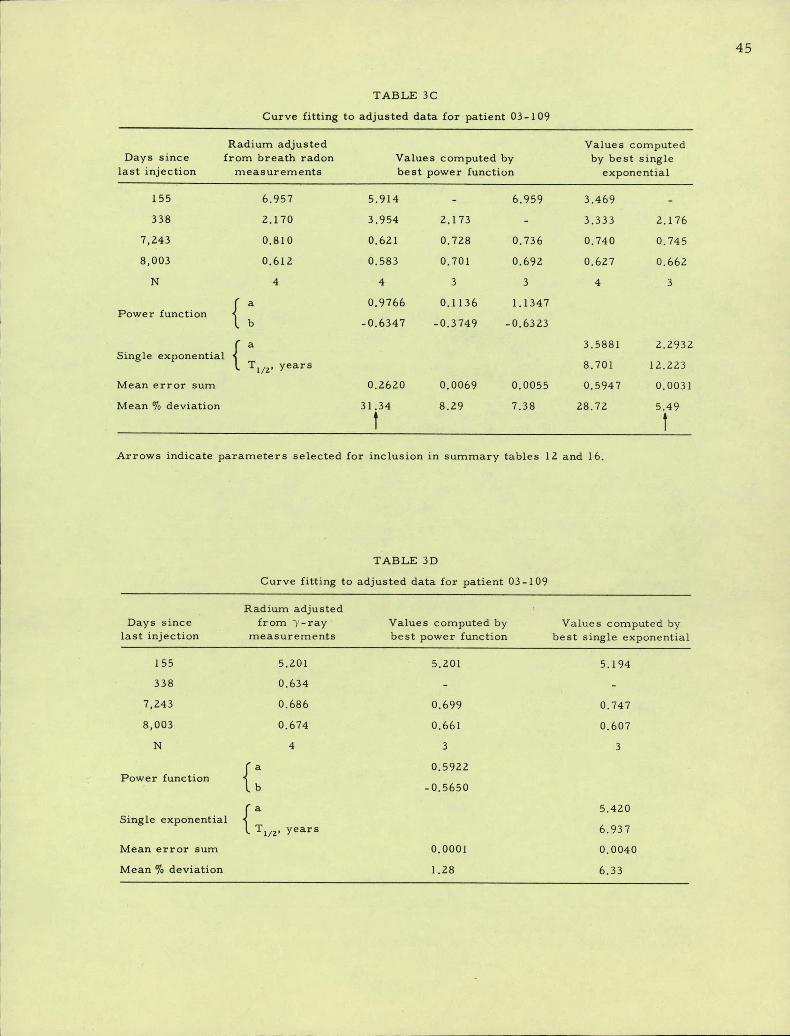
45
TABLE 3C
Curve fitting to adjusted data for patient 03- 109
Radium adjusted Values computedDays since from breath radon Values computed by by best single
last injection measurements best power function exponential
155 6.957 5.914 - 6.959 3.469 -
338 2.170 3.954 2.173 - 3.333 2.176
7,243 0.810 0.621 0.728 0.736 0.740 0.745
8,003 0.612 0.583 0.701 0.692 0.627 0.662
N 4 4 3 3 4 3
Powerfunction a
0.9766 0.1136 1.1347
b -0.6347 -0.3749 -0.6323
f a 3.5881 2.2932Single exponential 1
l Tl/2, years 8.701 12.223
Mean error sum 0.2620 0.0069 0.0055 0.5947 0.0031
Mean % deviation 31.34 8.29 7.38 28.72 5.49
Arrows indicate parameters selected for inclusion in summary tables 12 and 16.
TABLE 3D
Curve fitting to adjusted data for patient 03 - 109
Radium adjustedDays since from 7-ray Values computed by Values computed by
last injection measurements best power function best single exponential
155 5.201 5.201 5.194
338 0.634
7,243 0.686 0.699 0.747
8,003 0.674 0.661 0.607
N 4 3 3
f a 0.5922Power function b -0·5650
f a 5.420Single exponential Tl/2, years 6.937
Mean error sum 0.0001 0.0040
Mean % deviation 1.28 6.33
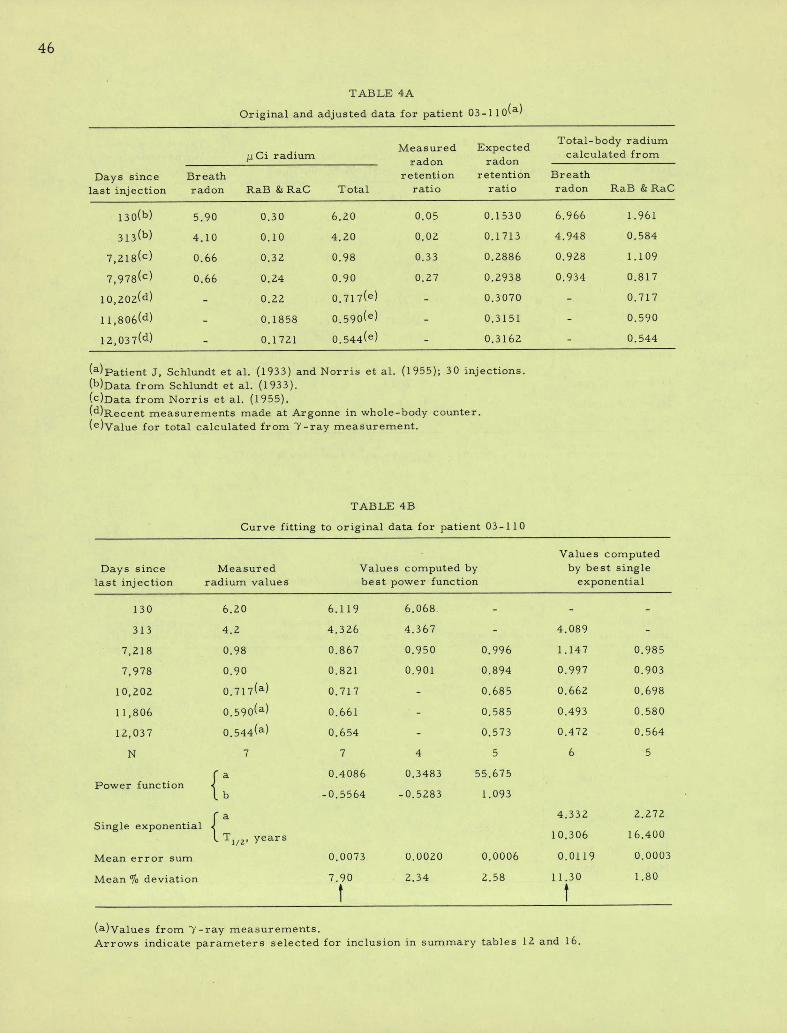
46
TABLE 4A
Original and adjusted data for patient 03-110(a)
Total-body radiumMeasured Expected
M Ci radium calculated frornradon radon
Days since Breath retention retention Breathlast injection radon RaB & RaC Total ratio ratio radon RaB & RaC
130(b) 5.90 0.30 6.20 0.05 0.1530 6.966 1.961
313(b) 4.10 O.10 4.20 0.02 0.1713 4.948 0.584
7,218(c) 0.66 0.32 0.98 0.33 0.2886 0.928 1.109
7,978(C) 0.66 0.24 0.90 0.27 0.2938 0.934 0.817
10,202(d) - 0.22 0.717(e) - 0.3070 - 0.717
11,806(d) - 0.1858 0.590(e) _ 0.3151 - 0.590
12,037(d) - 0.1721 0.544(e) - 0.3162 - 0.544
(a)Patient J, Schlundt et al. (1933) and Norris et al. (1955); 30 injections.(b)Data from Schlundt et al. (1933).(c)Data from Norris et al. (1955).(d)Recent measurements made at Argonne in whole-body counter.(e)Value for total calculated from 7 -ray measurement.
TABLE 4B
Curve fitting to original data for patient 03-110
Values computedDays since Measured Values computed by by best single
last injection radium value s best power function exponential
130 6.20 6.119 6.068. - - -
313 4.2 4.326 4.367 - 4.089 -
7,218 0.98 0.867 0.950 0.996 1.147 0.985
7,978 0.90 0.821 0.901 0.894 0.997 0.903
10,202 0.717(a) 0.717 - 0.685 0.662 0.698
11,806 0.590(a) 0.661 0.585 0.493 0.580
12,037 0.544(a) 0.654 - 0.573 0.472 0.564
N 7 7 4 5 6 5
r a 0.4086 0.3483 55.675Power function b -0.5564 -0.5283 1.093
ra 4.332 2.272Single exponential 1
L 'I't/2, years 10.306 16.400
Mean error sum 0.0073 0.0020 0.0006 0.0119 0.0003
Mean % deviation 7.90 2.34 2.58 11.30 1.80
(a)Values from 7-ray measurements.Arrows indicate parameters selected for inclusion in summary tables 12 and 16.
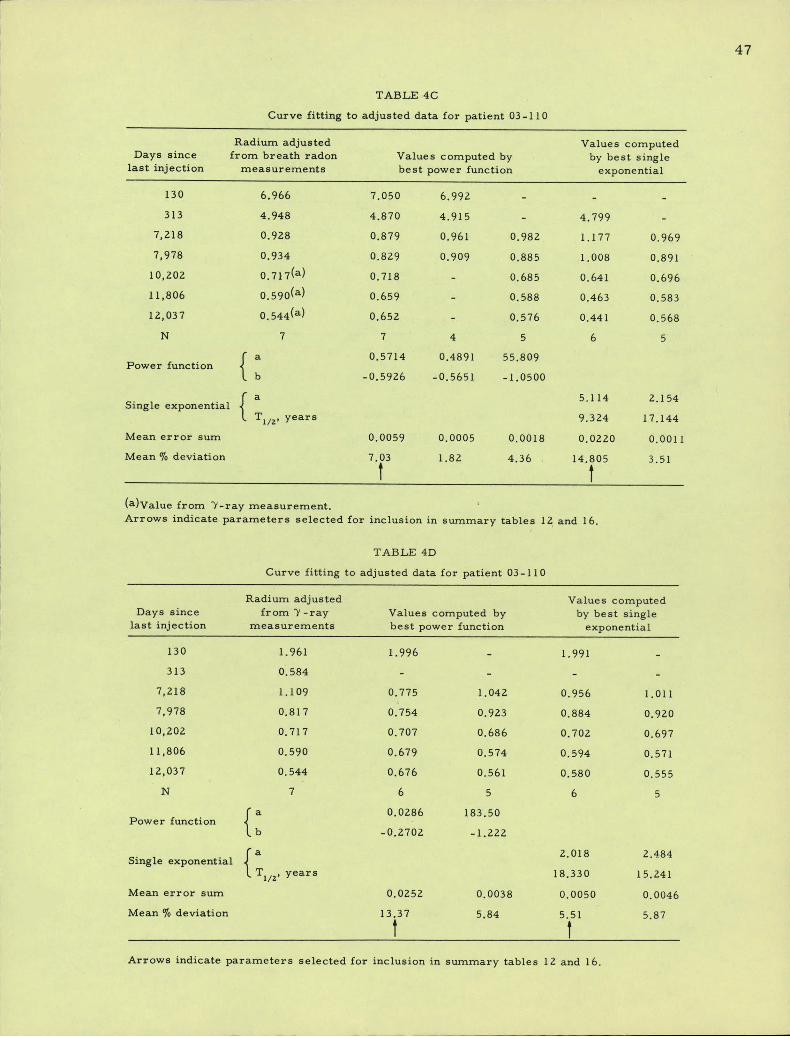
47
TABLE 4C
Curve fitting to adjusted data for patient 03-110
Radium adjusted Values computedDays since from breath radon Values computed by by best single
last injection measurements best power function exponential
130 6.966 7.050 6.992
313 4.948 4.870 4.915 4.799
7,218 0.928 0.879 0.961 0.982 1.177 0.969
7,978 0.934 0.829 0.909 0.885 1.008 0.891
10,202 0.717(a) 0.718 0.685 0.641 0.696
11,806 0.590(a) 0.659 0.588 0.463 0.583
12,037 0.544(a) 0.652 0,576 0.441 0.568
N 7 7 4 5 6 5
Powerfunction a
0.5714 0.4891 55.809
b -0.5926 -0.5651 -1.0500
Single exponential a5.114 2.154
Tl/2' years 9.324 17.144
Mean error sum 0.0059 0.0005 0.0018 0.0220 0.0011
Mean % deviation 7.03 1.82 4.36 14.805 3.51
(a)Value from 7-ray measurement. 'Arrows indicate parameters selected for inclusion in summary tables 12 and 16.
TABLE 4D
Curve fitting to adjusted data for patient 03-110
Radium adjusted Values computedDays since from 7-ray Values computed by by best single
last injection measurements best power function exponential
130 1.961 1.996 1.991
313 0.584
7,218 1.109 0.775 1.042 0.956 1.011
7,978 0.817 0.754 0.923 0.884 0.920
10,202 0.717 0.707 0.686 0.702 0.697
11,806 0.590 0.679 0.574 0.594 0.571
12,037 0.544 0,676 0.561 0.580 0.555
N 7 6 5 6 5fa 0.0286 183.50
Power function i b -0·2702 -1.222
fa 2.018 2.484Single exponential 4
L Tl/z' years 18.330 15.241
Mean error sunn 0.0252 0.0038 0.0050 0.0046
Mean % deviation 13.37 5.84 5.51 5.87
Arrows indicate parameters selected for inclusion in summary tables 12 and 16.
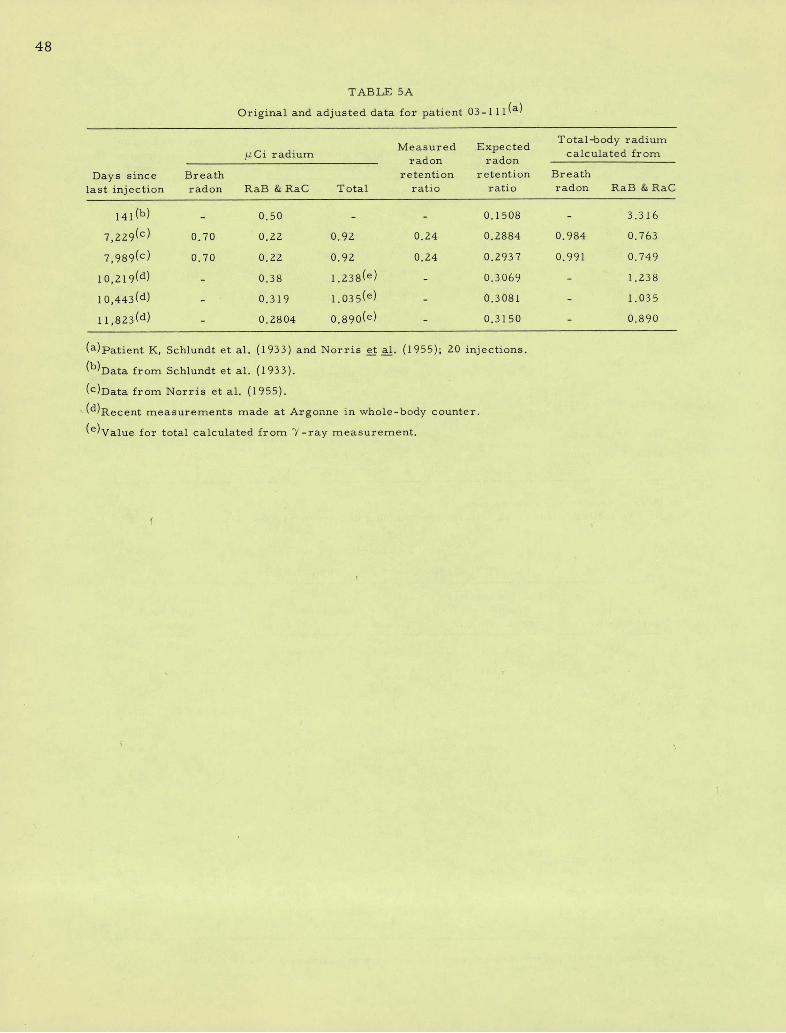
48
TABLE 5A
Original and adjusted data for patient 03-111(a)
Total-body radiumMeasured ExpectedM Ci radium calculated fromradon radon
Days since Breath retention retention Breathlast injection radon RaB & RaC Total ratio ratio radon RaB & RaC
141(b) - 0.50 - - 0.1508 - 3.316
7,229(c) 0.70 0.22 0.92 0.24 0.2884 0.984 0.763
7,989(c) 0,70 0.22 0.92 0.24 0.2937 0.991 0.749
10,219(d) - 0.38 1.238(e) 0.3069 - 1.238
10,443(d) - 0.319 1.035(e) - 0.3081 - 1.035
11,823(d) - 0.2804 0.890(e) _ 0.3150 - 0.890
(a) patient K. Schlundt et al. (1933) and Norris Ei &1. (1955); 20 injections.
(b)Data from Schlundt et al. (1933).(c)Data from Norris et al. (1955).
(d)Recent measurements made at Argonne in whole-body counter.
(e)value for total calculated from 7 -ray measurement.
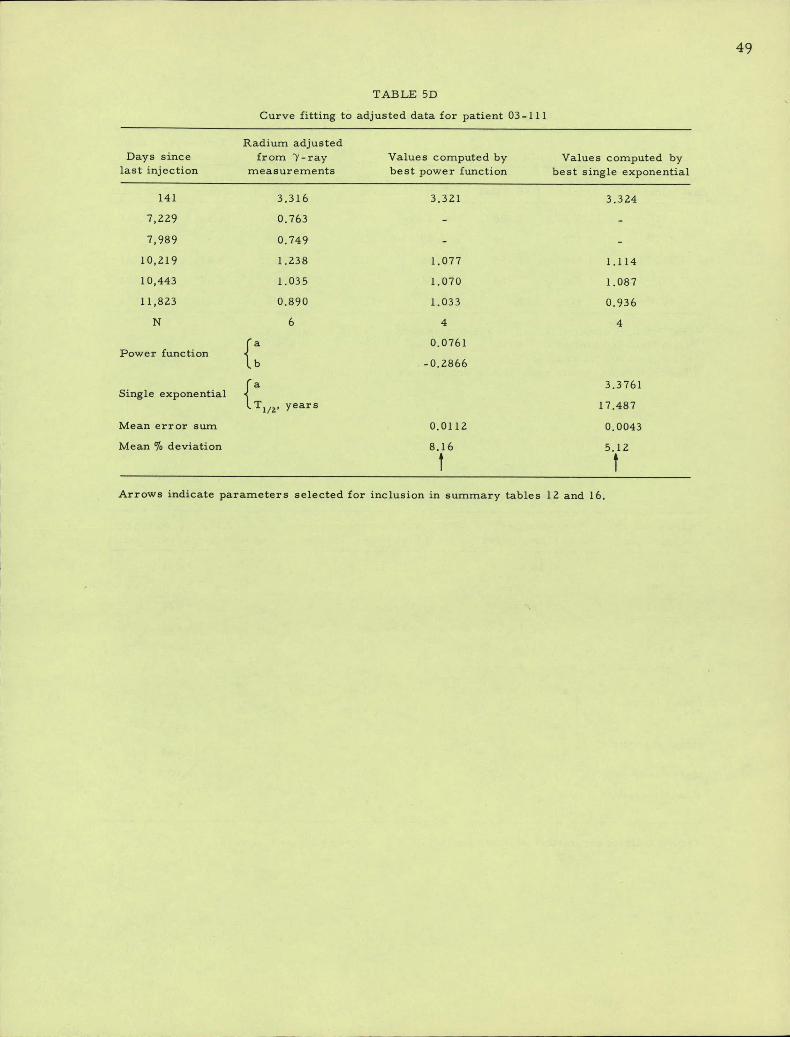
49
TABLE 5D
Curve fitting to adjusted data for patient 03-111
Radium adjustedDays since fronn 7-ray Values computed by Values computed by
last injection measurements best power function best single exponential
141 3.316 3.321 3.324
7,229 0.763 -
7,989 0.749 -
10,219 1.238 1.077 1.114
10,443 1.035 1.070 1.087
11,823 0.890 1.033 0.936
N 6 4 4
fa 0.0761
Power function· b -0.2866ra 3.3761
Single exponential 1(Tl/2, years 17.487
Mean error sum 0.0112 0.0043
Mean % deviation 8.16 5.12
ItArrows indicate parameters selected for inclusion in summary tables 12 and 16.
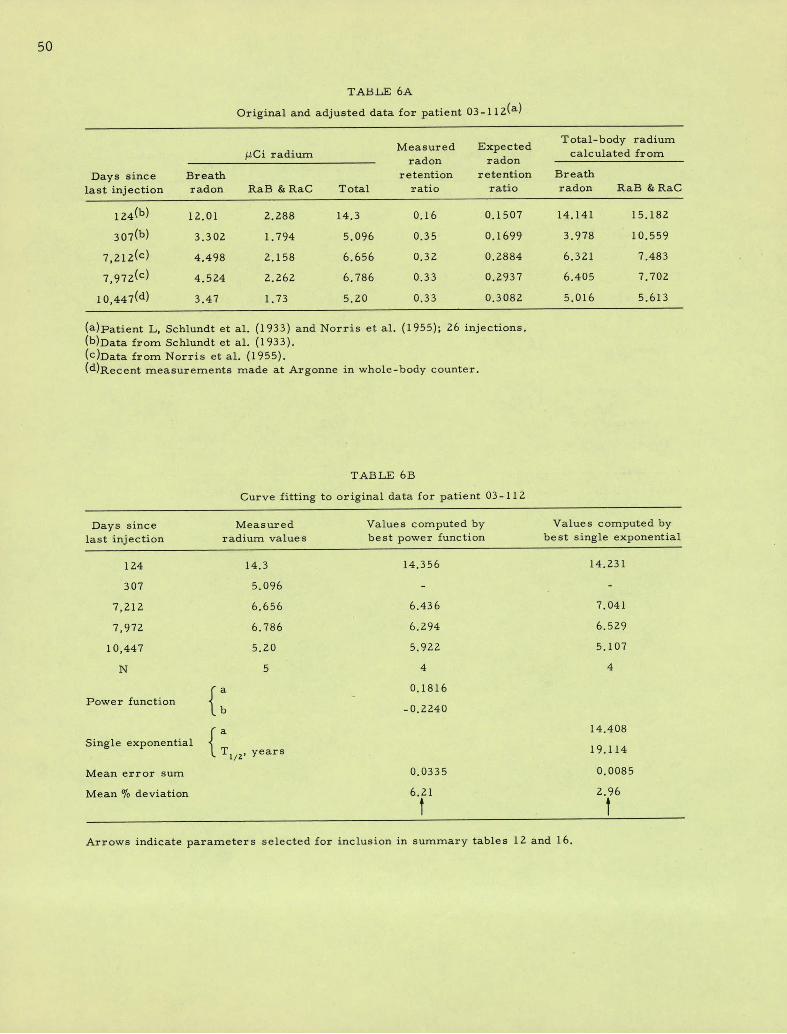
50
TABLE 6A
Original and adjusted data for patient 03- 112(a)
Total-body radiumMeasured ExpectedMCi radium calculated fromradon radon
Days since Breath retention retention Breathlast injection radon RaB & RaC Total ratio ratio radon RaB & RaC
124(b) 12.01 2.288 14.3 0.16 0.1507 14.141 15.182
307(b) 3.302 1.794 5.096 0.35 0.1699 3.978 10.559
7,212(c) 4.498 2.158 6.656 0.32 0.2884 6.321 7.483
7,972(c) 4.524 2.262 6.786 0.33 0,2937 6.405 7.702
10,447(d) 3.47 1.73 5.20 0.33 0.3082 5.016 5.613
(a)Patient L, Schlundt et al. (1933) and Norris et al. (1955); 26 injections.(b)Data from Schlundt et al. (1933).(c)Data from Norris et al. (1955).(d)Recent measurements made at Argonne in whole-body counter.
TABLE 6B
Curve fitting to original data for patient 03- 1 1 2
Days since Measured Values computed by Values computed bylast injection radium values best power function best single exponential
124 14.3 14.356 14.231
307 5.096 - -
7,212 6.656 6.436 7.041
7,972 6.786 6.294 6.529
10,447 5.20 5.922 5.107
N 5 4 4
fa 0.1816Power
function 1 b -0·2240
( a 14.408Single exponential 1
L Ti/Z' years 19.114
Mean error sum 0.0335 0.0085
Mean % deviation 6.21 2.96
t
Arrows indicate parameters selected for inclusion in summary tables 12 and 16.
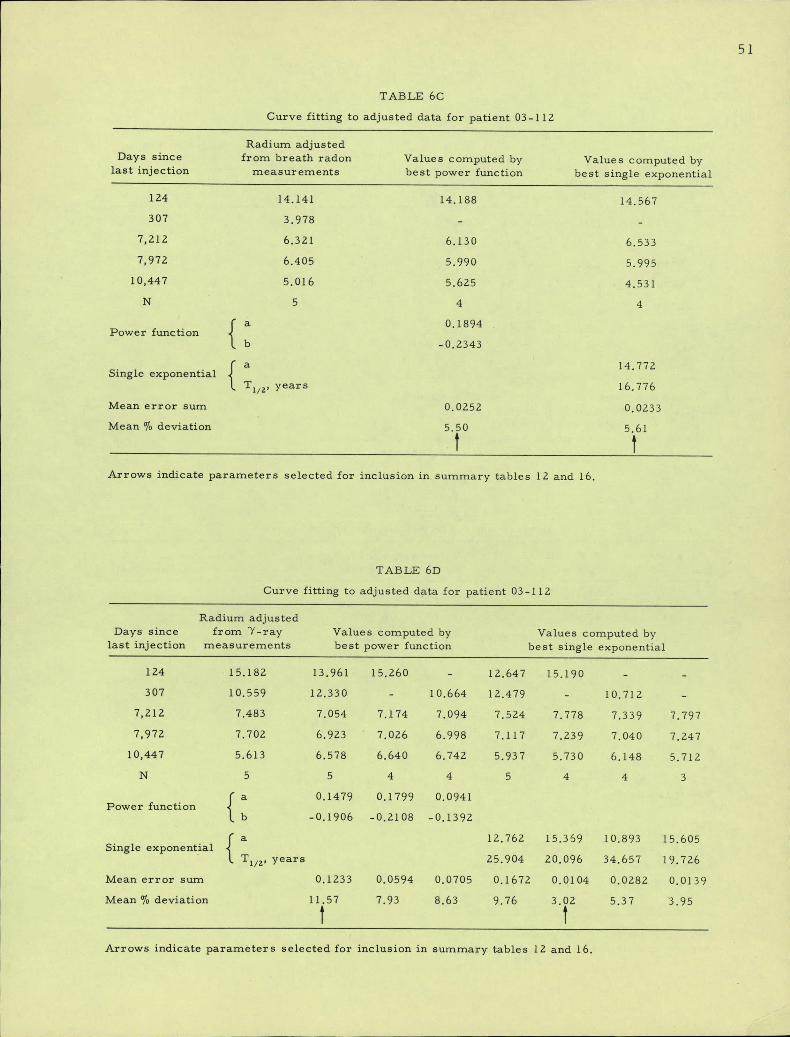
51
TABLE 6C
Curve fitting to adjusted data for patient 03 -112
Radium adjustedDays since from breath radon Values computed by Value s computed by
last injection measurements best power function best single exponential
124 14.141 14.188 14.567
307 3.978 -
7,212 6.321 6.130 6.533
7,972 6.405 5.990 5.995
10,447 5.016 5.625 4.531
N 5 4 4
Powerfunction {
a 0.1894
b -0.2343
Singleexponential < a 14.772
Ti/2, years 16.776
Mean error sum 0.0252 0.0233
Mean % deviation 5.50 5.61
t
Arrows indicate parameters selected for inclusion in summary tables 12 and 16.
TABLE 6D
Curve fitting to adjusted data for patient 03-112
Radium adjustedDays since from 7-ray Value s computed by Values computed by
last injection measurements best power function best single exponential
124 15.182 13.961 15.260 - 12.647 15.190 -
307 10.559 12.330 - 10.664 12.479 - 10.712 -
7,212 7.483 7.054 7.174 7.094 7.524 7.778 7.339 7.797
7,972 7.702 6.923 7,026 6.998 7.117 7.239 7.040 7.247
10,447 5.613 6.578 6.640 6.742 5.937 5.730 6.148 5.712
N 5 5 4 4 5 4 4 3
f a 0.1479 0.1799 0.0941Power function b -0.1906 -0.2108 -0.1392
f a 12.762 15.369 10.893 15.605Single exponential 1
L Ti/2, years 25.904 20.096 34.657 19.726
Mean error sum 0.1233 0.0594 0.0705 0.1672 0.0104 0.0282 0.0139
Mean % deviation 11.57 7.93 8.63 9.76 3.02 5.37 3.95
Arrows indicate parameters selected for inclusion in summary tables 12 and 16.
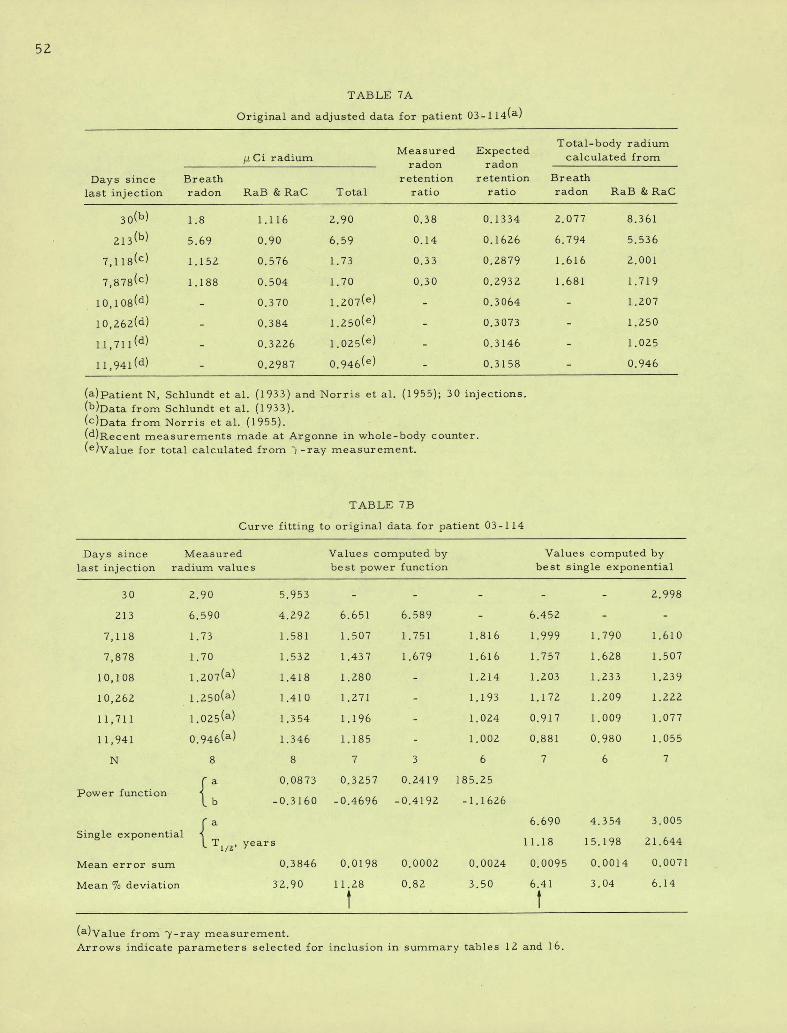
52
TABLE 7A
Original and adjusted data for patient 03- 114(a)
Total-body radiumMeasured Expected
B Ci radium calculated fromradon radon
Days since Breath retention retention Breathlast injection radon RaB & RaC Total ratio ratio radon RaB & RaC
30(b) 1.8 1.116 2.90 0.38 0.1334 2.077 8.361
213(b) 5.69 O.90 6.59 0.14 0.1626 6.794 5.536
7,118(c) 1.152 0.576 1.73 0.33 0.2879 1.616 2.001
7,878(c) 1.188 0.504 1.70 0.30 0.2932 1.681 1.719
10,108(d) 0.370 1.207(e) 0.3064 1.207
10,262(d) 0.384 1.250(e) 0.3073 1.250
11,711(d) 0.3226 1.025(e) 0.3146 1.025
11,941(d) 0.2987 0.946(e) 0.3158 0.946
(a)Patient N, Schlundt et al. (1933) and Norris et al. (1955); 30 injections.(b)Data from Schlundt et al. (1933).(C)Data from Norris et al. (1955).(d)Recent measurements made at Argonne in whole-body counter.(e)Value for total calculated from 1 -ray measurement.
TABLE 7B
Curve fitting to original data for patient 03- 114
Days since Measured Values computed by Values computed bylast injection radium values best power function best single exponential
30 2.90 5.953 2.998
213 6.590 4.292 6.651 6.589 6.452
7,118 1.73 1.581 1.507 1.751 1.816 1.999 1.790 1.610
7,878 1.70 1.532 1.437 1.679 1.616 1.757 1.628 1.507
10,108 1.207(a) 1.418 1.280 - 1.214 1.203 1.233 1.239
10,262 1.250(a) 1.410 1.271 1.193 1.172 1.209 1.222
11,711 1.025(a) 1.354 1.196 - 1.024 0.917 1.009 1.077
11,941 0.946(a) 1.346 1.185 - 1.002 0.881 0.980 1.055
N 8 8 7 3 6 7 6 7
f a0.0873 0.3257 0.2419 185.25
Power function b -0.3160 -0.4696 -0.4192 -1.1626
f a 6.690 4.354 3.005Single exponential Ti/Z' years 11.18 15.198 21.644
Mean error sum 0.3846 0.0198 0.0002 0.0024 0.0095 0.0014 0.0071
Mean % deviation 32.90 11.28 0.82 3.50 6.41 3.04 6.14
t
(a)Value from 7-ray measurement.Arrows indicate parameters selected for inclusion in summary tables 12 and 16.
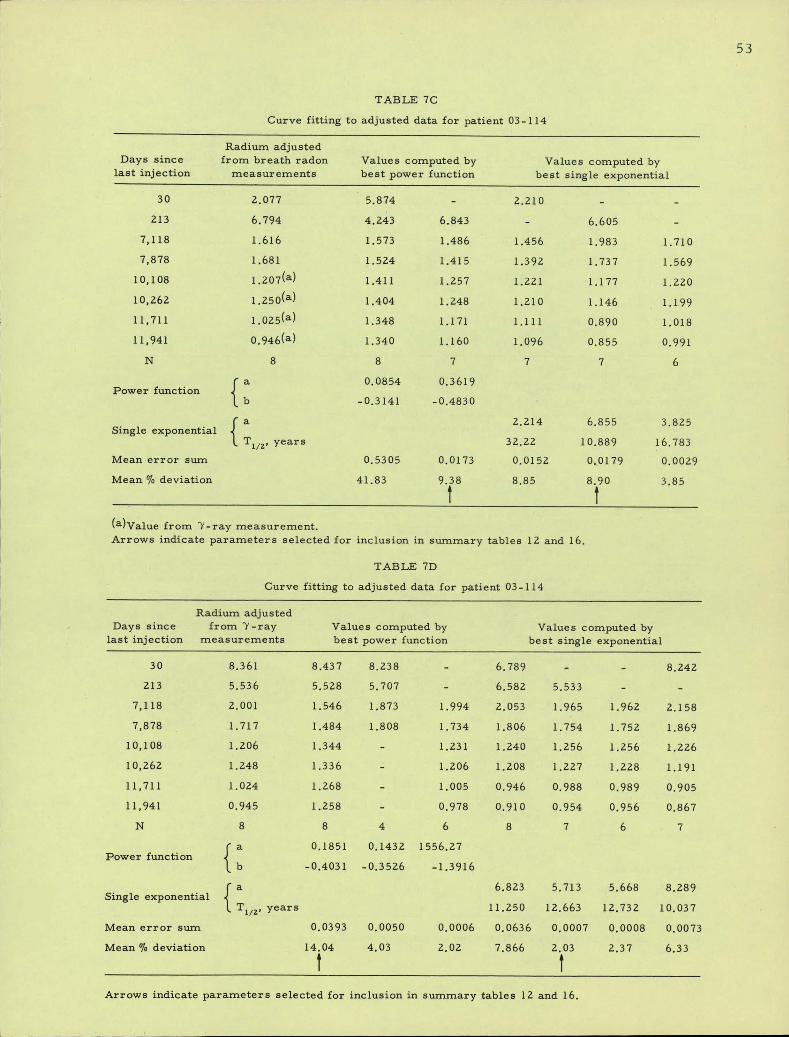
53
TABLE 7C
Curve fitting to adjusted data for patient 03-114
Radium adjustedDays since from breath radon Values computed by Values computed by
last injection measurernents best power function best single exponential
30 2.077 5.874 2.210
213 6.794 4.243 6.843 6.605
7,118 1.616 1.573 1.486 1.456 1.983 1.710
7,878 1.681 1.524 1.415 1.392 1.737 1.569
10,108 1.207(a) 1.411 1.257 1.221 1.177 1.220
10,262 1.250(a) 1.404 1.248 1.210 1.146 1.199
11,711 1.025(a) 1.348 1.171 1.111 0.890 1.018
11,941 0.946(a) 1.340 1.160 1.096 0.855 O.991
N 8 8 7 7 7 6ra 0.0854 0.3619
Power function i b -0.3141 -0.4830
fa 2.214 6.855 3.825Single exponential .1
l Ti/Z' years 32.22 10.889 16.783
Mean error sum 0.5305 0.0173 0.0152 0.0179 0.0029
Mean % deviation 41.83 9.38 8.85 8.90 3.85
(a)Value from 7-ray measurement.Arrows indicate parameters selected for inclusion in summary tables 12 and 16.
TABLE 7D
Curve fitting to adjusted data for patient 03 - 114
Radium adjustedDays since from 7-ray Values computed by Values computed by
last injection measurements best power function best single exponential
30 8.361 8.437 8.238 6.789 8.242
213 5.536 5.528 5.707 6.582 5.533
7,118 2.001 1.546 1.873 1.994 2.053 1.965 1.962 2.158
7,878 1.717 1.484 1.808 1.734 1.806 1.754 1.752 1.869
10,108 1.206 1.344 1.231 1.240 1.256 1.256 1.226
10,262 1.248 1.336 1.206 1.208 1.227 1.228 1.191
11,711 1.024 1.268 1.005 0.946 0.988 0.989 0.905
11,941 0.945 1.258 0.978 0.910 0.954 0.956 0.867
N 8 8 4 6 8 7 6 7
ra 0.1851 0.1432 1556.27Power function i b -0.4031 -0.3526 -1.3916
fa 6.823 5.713 5.668 8.289Single exponential .1
l Ti/2, years 11.250 12.663 12.732 10.037
Mean error sunn 0.0393 0.0050 0.0006 0.0636 0.0007 0.0008 0.0073
Mean % deviation 14.04 4.03 2.02 7.866 2.03 2.37 6.33
1 1
Arrows indicate parameters selected for inclusion in summary tables 12 and 16.
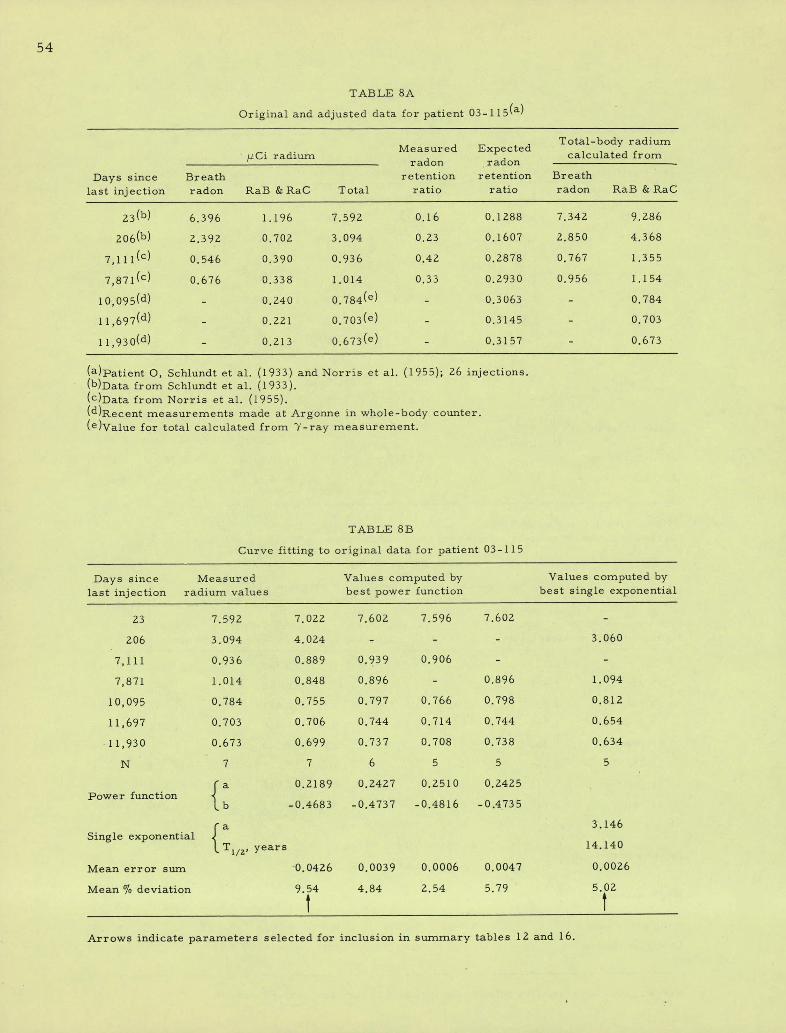
54
TABLE 8A
Original and adjusted data for patient 03-115(a)
Total-body radiumMeasured Expected
MCi radium calculated fromradon radon
Days since Breath retention retention Breath
last injection radon RaB & RaC Total ratio ratio radon RaB & RaC
23(b) 6.396 1.196 7.592 0.16 0.1288 7.342 9.286
206(b) 2.392 0.702 3.094 0.23 0.1607 2.850 4.368
7,111(c) 0.546 0.390 0,936 0.42 0.2878 0.767 1.355
7,871(c) 0.676 0.338 1.014 0.33 0.2930 0.956 1.154
10,095(d) 0.240 0.784(e) 0.3063 0.784
11,697(d) 0.221 0.703(e) 0.3145 0.703
11,930(d) 0.213 0.673(e) 0.3157 0.673
(a)Patient 0, Schlundt et al. (1933) and Norris et al. (1955); 26 injections.(b)Data from Schlundt et al. (1933).(C)Data from Norris et al. (1955).(d)Recent measurements made at Argonne in whole-body counter.(e)Value for total calculated from 7 -ray measurement.
TABLE 8B
Curve fitting to original data for patient 03 -115
Days since Measured Values computed by Values computed bylast injection radiurn values best power function best single exponential
23 7.592 7.022 7.602 7.596 7.602
206 3.094 4.024 3.060
7,111 0.936 0.889 0.939 0.906
7,871 1.014 0.848 0.896 0.896 1.094
10,095 0.784 0.755 0.797 0.766 0.798 0.812
11,697 0.703 0.706 0.744 0.714 0,744 0.654
11,930 0.673 0.699 0.737 0.708 0.738 0.634
N 7 7 6 5 5 5
Ca 0.2189 0.2427 0.2510 0.2425Power function b -0.4683 -0.4737 -0,4816 -0,4735
ra 3.146Single exponential 4
l TI/Z' years 14.140
Mean error sum 0.0426 0.0039 0.0006 0.0047 0,0026
Mean % deviation 9.54 4.84 2.54 5.79 5.02
Arrows indicate parameters selected for inclusion in summary tables 12 and 16.
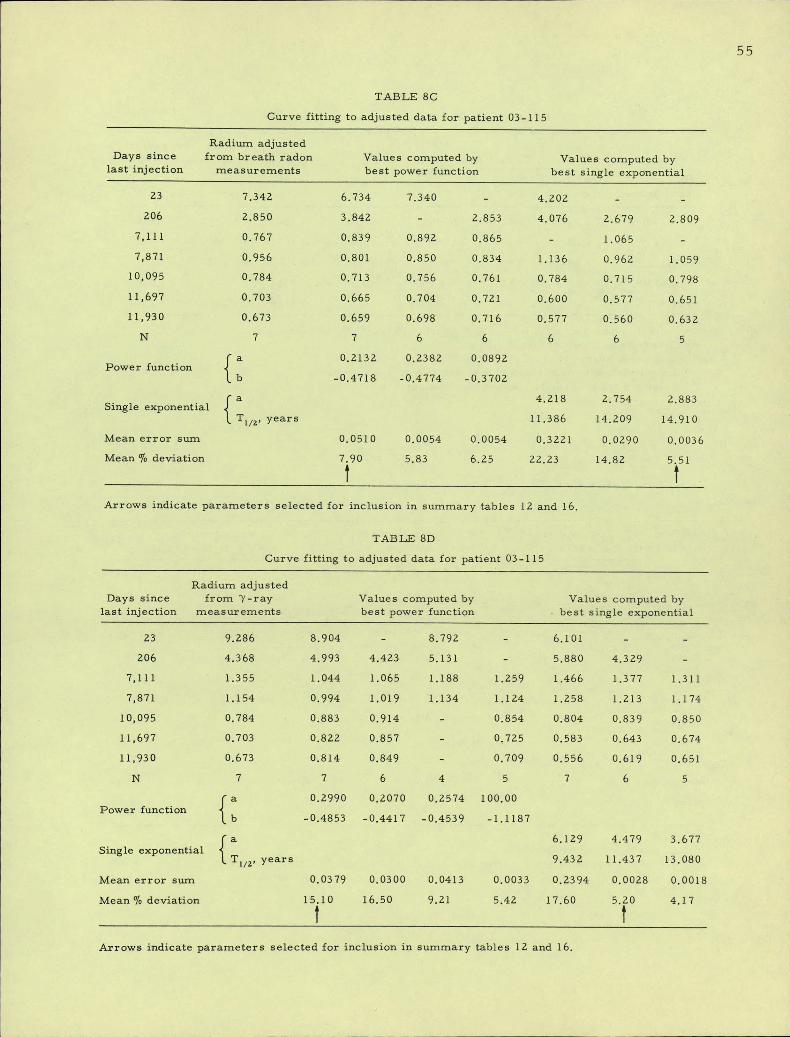
55
TABLE 8C
Curve fitting to adjusted data for patient 03-115
Radiunn adjustedDays since from breath radon Values computed by Values computed by
last injection measurements best power function best single exponential
23 7.342 6.734 7.340 - 4.202 -
206 2.850 3.842 - 2.853 4.076 2.679 2.809
7,111 0.767 0.839 0.892 0,865 - 1.065
7,871 0.956 0.801 0.850 0.834 1.136 0.962 1.059
10,095 0,784 0.713 0.756 0.761 0.784 0.715 0.798
11,697 0.703 0.665 0.704 0.721 0.600 0.577 0.651
11,930 0.673 0.659 0.698 0.716 0.577 0.560 0.632
N 7 7 6 6 6 6 5
fa 0.2132 0.2382 0.0892Power function b -0.4718 -0.4774 -0.3702
fa 4.218 2.754 2.883Single exponential 4
l Ti/2, years 11.386 14.209 14.910
Mean error sum 0.0510 0.0054 0.0054 0.3221 0.0290 0.0036
Mean % deviation 7.90 5.83 6.25 22.23 14.82 5.51
Arrows indicate parameters selected for inclusion in summary tables 12 and 16.
TABLE 8D
Curve fitting to adjusted data for patient 03 -1 1 5
Radium adjustedDays since from 7-ray Values computed by Values computed by
last injection ineasurements best power function · best single exponential
23 9.286 8.904 - 8.792 - 6.101 - -
206 4.368 4.993 4.423 5.131 - 5.880 4.329 -
7,111 1.355 1.044 1.065 1.188 1.259 1.466 1.377 1.311
7,871 1.154 0.994 1.019 1.134 1.124 1.258 1.213 1.174
10,095 0.784 0.883 0.914 - 0.854 0.804 0.839 0.850
11,697 0.703 0.822 0.857 - 0.725 0.583 0.643 0.674
11,930 0.673 0.814 0.849 - 0.709 0.556 0.619 0.651
N 7 7 6 4 5 7 6 5
f a 0.2990 0.2070 0.2574 100.00Power function b -0.4853 -0.4417 -0.4539 -1.1187
fa 6.129 4.479 3.677Single exponential 1
L Tl/2'years 9.432 11.437 13.080
Mean error sum 0.0379 0.0300 0.0413 0.0033 0.2394 0.0028 0.0018
Mean % deviation 15.10 16.50 9.21 5.42 17.60 5.20 4.17
Arrows indicate parameters selected for inclusion in summary tables 12 and 16.
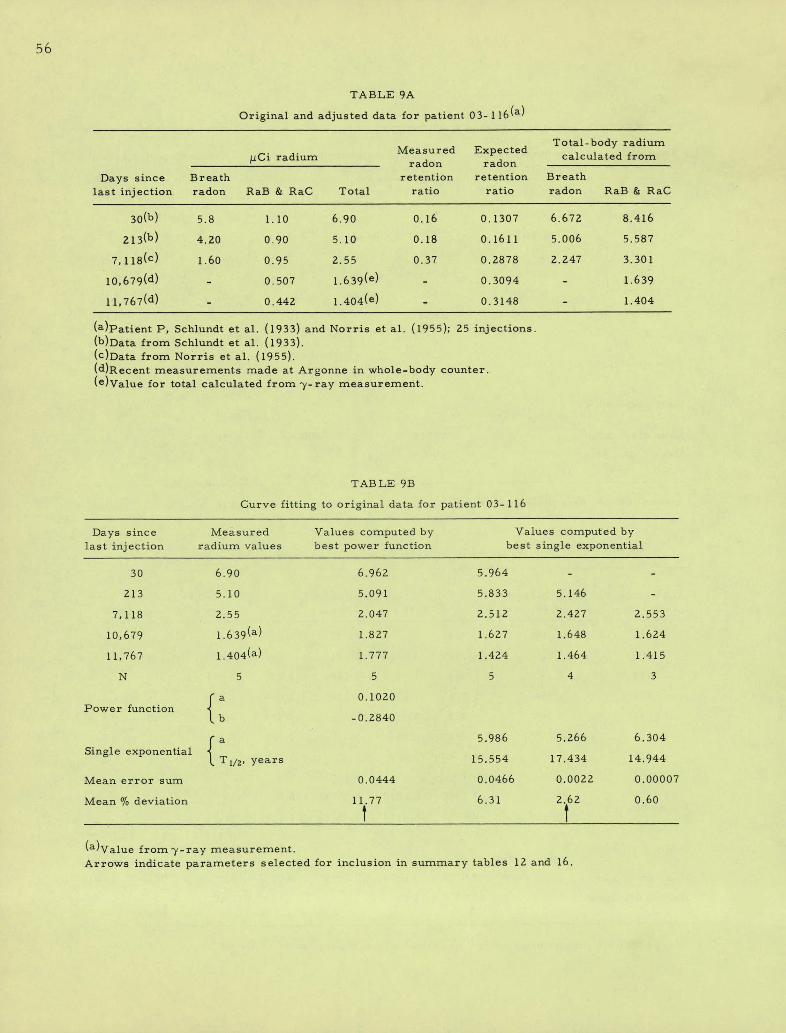
56
TABLE 9A
Original and adjusted data for patient 03-116(a)
Total-body radiunnMeasured ExpectedFi Ci radium calculated from
radon radon
Days since Breath retention retention Breathlast injection radon RaB & RaC Total ratio ratio radon RaB & RaC
30(b) 5.8 1.10 6.90 0.16 0.1307 6.672 8.416
213(b) 4.20 O.90 5.10 0.18 0.1611 5.006 5.587
7,118(c) 1.60 0.95 2.55 0.37 0.2878 2.247 3.301
10,679(d) - 0.507 1.639(e) - 0.3094 - 1.639
11,767(d) - 0.442 1.404(e) - 0.3148 - 1.404
(a)Patient P, Schlundt et al. (1933) and Norris et al. (1955); 25 injections.(b)Data from Schlundt et al. (1933).(c)Data from Norris et al. (1955).(d)Recent measurements made at Argonne in whole-body counter.(e)V lue for total calculated from 7-ray measurement.
TAB LE 9B
Curve fitting to original data for patient 03- 116
Days since Measured Values computed by Values computed bylast injection radium values best power function best single exponential
30 6.90 6.962 5.964 - -
213 5.10 5.091 5.833 5.146 -
7,118 2.55 2.047 2.512 2.427 2.553
10,679 1639(a) 1.827 1.627 1.648 1.624
11,767 1.404(a) 1.777 1.424 1.464 1.415
N 5 5 5 4 3
F a 0.1020Power function 11, -0·2840f a 5.986 5.266 6.304
Single exponential 1l TIA• years 15.554 17.434 14.944
Mean error sum 0.0444 0.0466 0.0022 0.00007
Mean % deviation 11.77 6.31 2.62 0.60
(a)Value from -1-ray measurement.Arrows indicate parameters selected for inclusion in summary tables 12 and 16.
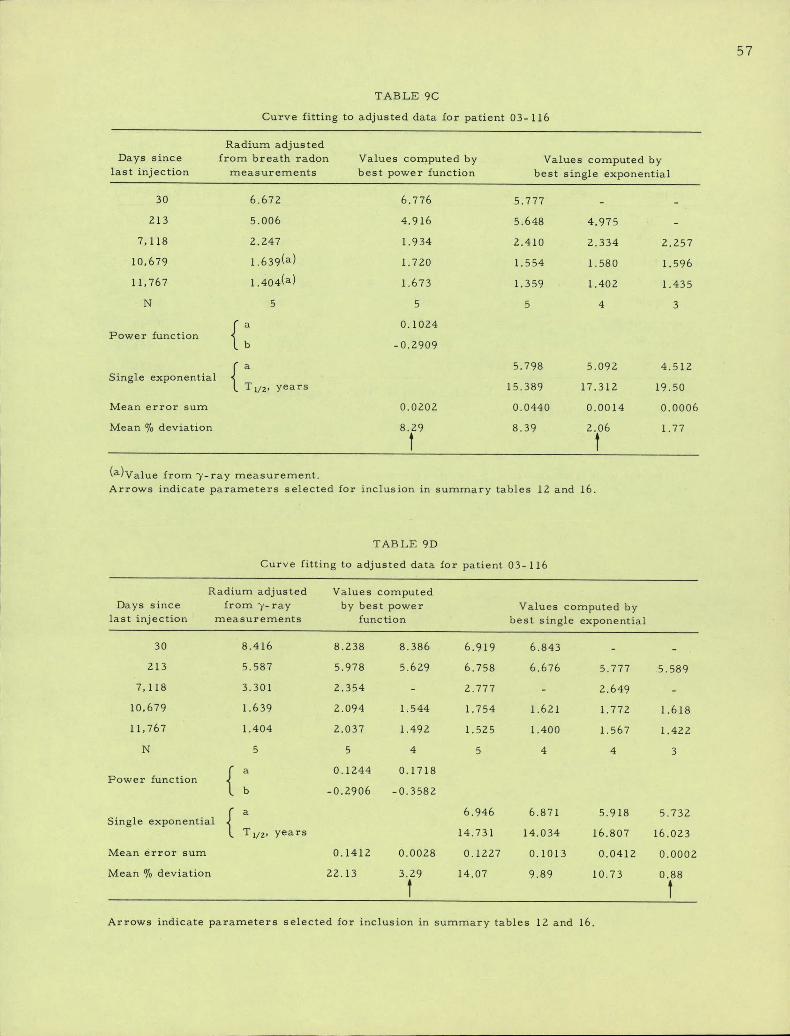
57
TABLE 9C
Curve fitting to adjusted data for patient 03- 116
Radium adjustedDays since frorn breath radon Values computed by Values computed by
last injection measurements best power function best single exponential
30 6.672 6.776 5.777
213 5.006 4.916 5.648 4.975 -
7,118 2.247 1.934 2.410 2.334 2.257
10,679 1.639(a) 1.720 1.554 1.580 1.596
11,767 1.404(a) 1.673 1.359 1.402 1.435
N 5 5 5 4 3
f a 0,1024Power function 1 b -0·2909
f a 5.798 5.092 4.512Single exponential 1
L Tl/2, years 15.389 17.312 19.50
Mean error sum 0.0202 0.0440 0.0014 0.0006
Mean % deviation 8.29 8.39 2.06 1.77
(a)Value from 7-ray measurement.Arrows indicate parameters selected for inclusion in summary tables 12 and 16.
TABLE 9D
Curve fitting to adjusted data for patient 03- 116
Radium adjusted Values computedDays since from y-ray by best power Values computed by
last injection Ineasurernents function best single exponential
30 8.416 8.238 8.386 6.919 6.843
213 5.587 5.978 5.629 6.758 6.676 5.777 5.589
7.118 3.301 2.354 - 2.777 - 2.649
10,679 1.639 2.094 1.544 1.754 1.621 1.772 1.618
1 11,767 1.404 2.037 1.492 1.525 1.400 1.567 1.422
N 5 5 4 5 4 4 3
Powerfunction
a 0.1244 0.1718
b -0.2906 -0.3582
Single exponential a6.946 6.871 5.918 5.732
Tl/2, years 14.731 14.034 16.807 16.023
Mean error sum 0.1412 0.0028 0.1227 0.1013 0.0412 0.0002
Mean % deviation 22.13 3.29 14.07 9.89 10.73 0.88
Arrows indicate parameters selected for inclusion in summary tables 12 and 16.
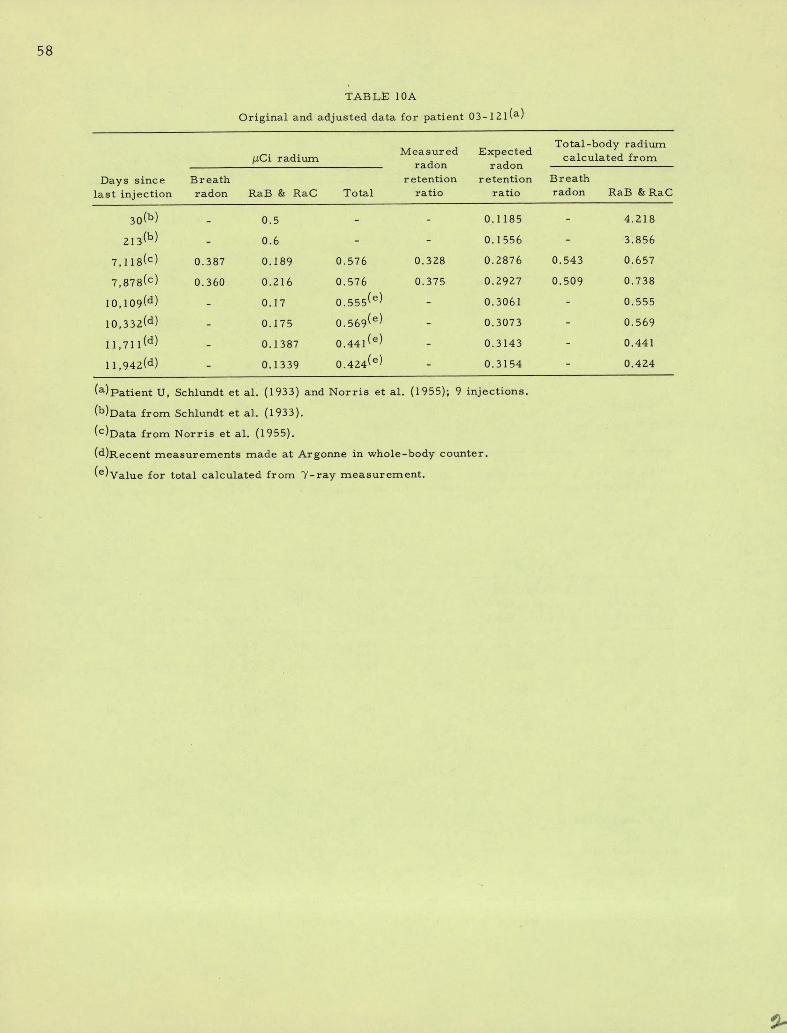
58
TAB LE 1 OA
Original and adjusted data for patient 03-121(a)
Total-body radiumMeasured ExpectedIICi radium calculated from
radon radon
Days since Breath retention retention Breathlast injection radon RaB & RaC Total ratio ratio radon RaB & RaC
30(b) 0.5 0.1185 - 4.218
213(b) 0.6 0.1556 - 3.856
7,118(c) 0.387 0.189 0.576 0.328 0.2876 0.543 0.657
7,878(C) 0.360 0.216 0.576 0.375 0.2927 0.509 0.738
10,109(d) 0.17 0.555(e) 0.3061 - 0.555
10,332(d) 0.175 0.569(e) 0.3073 - 0.569
11,711(d) 0.1387 0.441(e) 0.3143 - 0.441
11,942(d) 0.1339 0.424(e) 0.3154 - 0.424
(a)Patient U, Schlundt et al. (1933) and Norris et al. (1955); 9 injections.
(b)Data from Schlundt et al. (1933).(c)Data from Norris et al. (1955).
(d)Recent measurements made at Argonne in whole-body counter.
(e)value for total calculated from 7-ray measurement.
9-
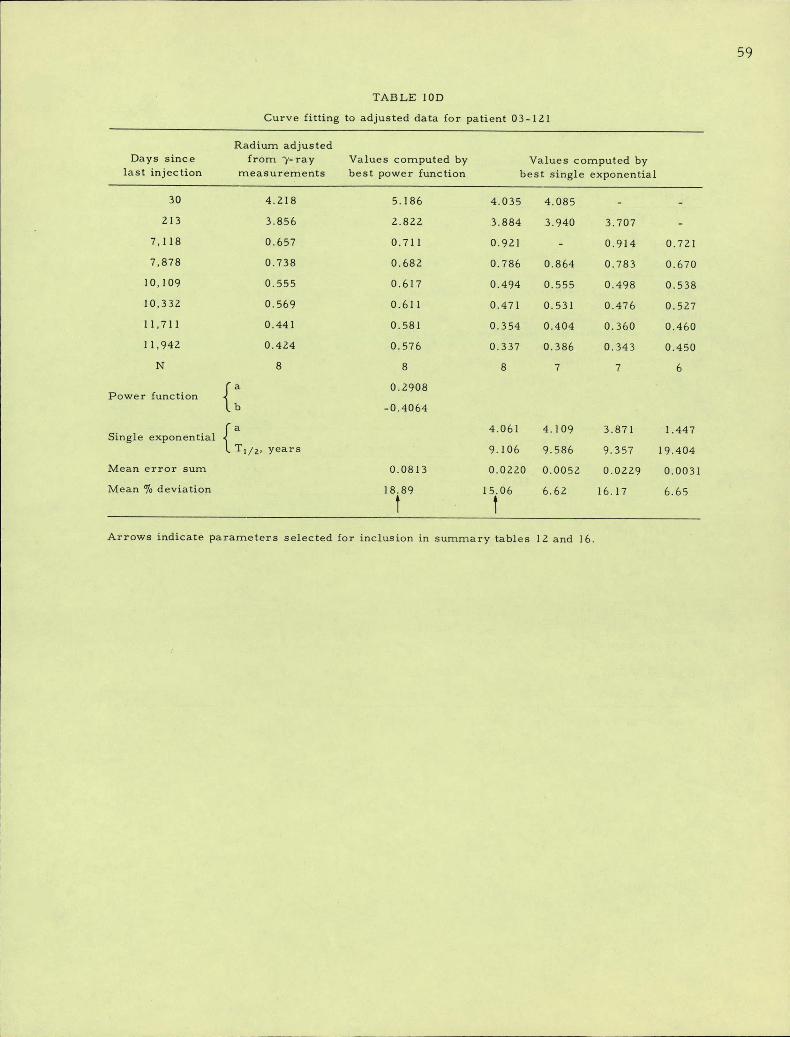
59
TABLE l OD
Curve fitting to adjusted data for patient 03-121
Radium adjustedDays since frorn 7-ray Values cornputed by Values computed by
last injection measurements best power function best single exponential
30 4.218 5.186 4.035 4.085 -
213 3.856 2.822 3.884 3.940 3.707 -
7,118 0.657 0.711 0.921 - 0.914 0.721
7,878 0.738 0.682 0.786 0.864 0.783 0.670
10,109 0.555 0.617 0.494 0.555 0.498 0.538
10,332 0.569 0.611 0.471 0.531 0.476 0.527
11,711 0.441 0.581 0.354 0.404 0.360 0.460
11,942 0.424 0.576 0.337 0.386 0.343 0.450
N 8 8 8 7 7 6
ra 0.2908Power function b -0·4064
f a 4.061 4.109 3.871 1.447Single exponential 4
L Tl/2, years 9.106 9.586 9.357 19.404
Mean error sum 0.0813 0.0220 0.0052 0.0229 0.0031
Mean % deviation 18.89 15.06 6.62 16.17 6.65
t
Arrows indicate parameters selected for inclusion in summary tables 12 and 16.
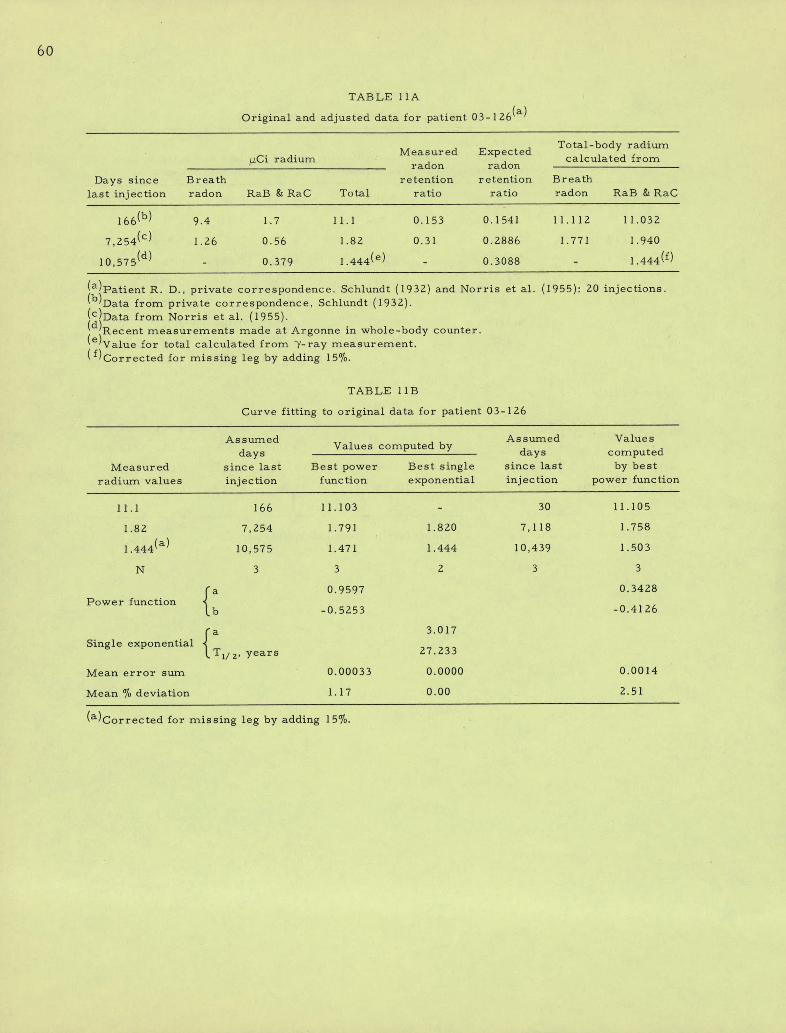
60
TABLE 11A
Original and adjusted data for patient 03-126(a)
Total-body radiumMeasured Expected
BCi radium calculated fronnradon radon
Days since Breath retention retention Breathlast injection radon RaB & RaC Total ratio ratio radon RaB & RaC
166(b) 9.4 1.7 11.1 0.153 0.1541 11.112 11.032
7,254(c) 1.26 0.56 1.82 0.31 0.2886 1.771 1.940
10,575 - 0.3088 - 1.444(f)(d) - 0.379 1.444(e)
(a)Patient R. D., private correspondence. Schlundt (1932) and Norris et al. (1955): 20 injections.(b)Data from private correspondence, Schlundt (1932).(c)Data from Norris et al. (1955).(d)Recent measurements made at Argonne in whole-body counter.(e)Value for total calculated from 7-ray measurement.( f)Corrected for missing leg by adding 15%.
TABLE 1 1 B
Curve fitting to original data for patient 03-126
Assumed Assumed ValuesValues computed by
days days conaputedMeasured since last Best power Best single since last by best
radium values injection function exponential injection power function
11.1 166 11.103 - 30 11.105
1.82 7,254 1.791 1.820 7,118 1.758
1.444(a) 10,575 1.471 1.444 10,439 1.503
N 3 3 2 3 3
fa 0.9597 0.3428Power function tb -0.5253 -0.4126
fa 3.017Single exponential 1l'rl/2, years 27.233
Mean error sunn 0.00033 0.0000 0.0014
Mean % deviation 1.17 0.00 2.51
(a)Corrected for missing leg by adding 15%.
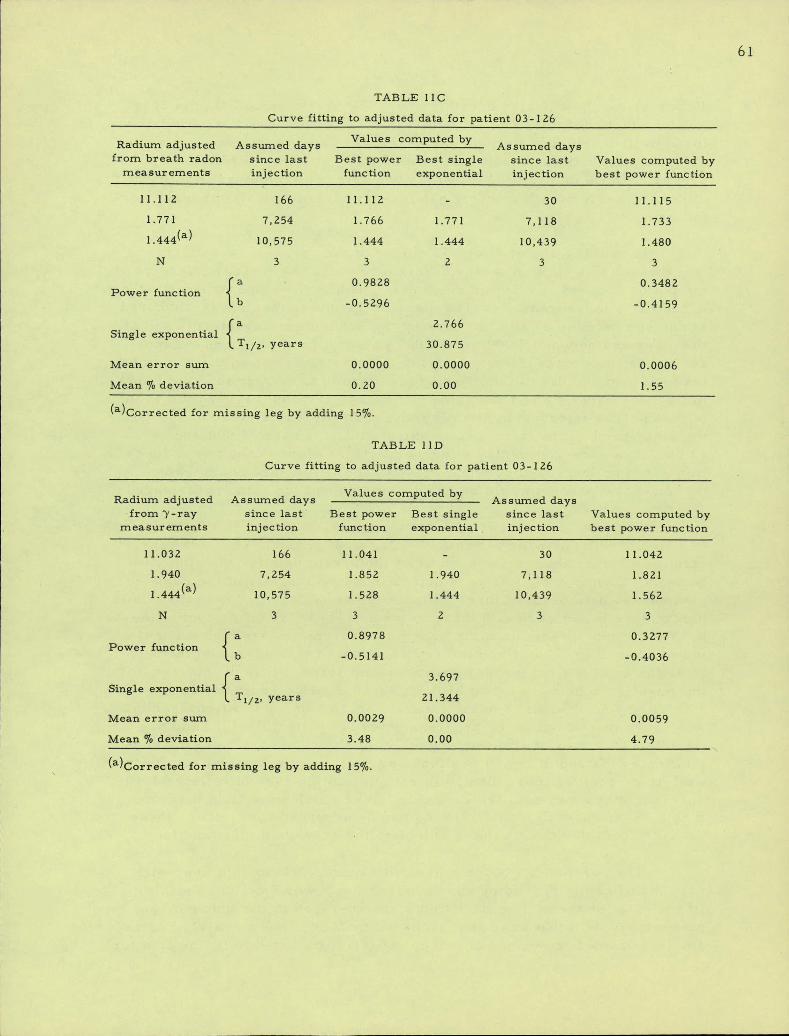
61
TABLE 1 1 C
Curve fitting to adjusted data for patient 03- 126Values computed byRadium adjusted Assumed days Assumed days
from breath radon since last Best power Best single since last Values cornputed bymeasurements injection function exponential injection best power function
11.112 166 11.112 - 30 11.115
1.771 7,254 1.766 I.771 7,118 1.733
1.444(a) 10,575 1.444 1.444 10,439 1.480
N 3 3 2 3 3
fa 0.9828 0.3482Power function b -0.5296 -0.4159
fa 2.766Single exponential iL Ti/2, years 30.875
Mean error sum 0.0000 0.0000 0.0006
Mean % deviation 0.20 0.00 1.55
(a)corrected for missing leg by adding 15%.
TABLE I l D
Curve fitting to adjusted data for patient 03- 126
Values computed byRadium adjusted Assumed days Assumed daysfrom 7-ray since last Best power Best single since last Values computed by
measurements injection function exponential injection best power function
11.032 166 11.041 - 30 11.042
1.940 7,254 1.852 1.940 7,118 1.821
1.444(a) 10,575 1.528 1.444 10,439 1.562
N 3 3 2 3 3
f a 0.8978 0.3277Power function b -0.5141 -0.4036
f a 3.697Single exponential 1
L Ti/2, years 21.344
Mean error surn 0.0029 0.0000 0.0059
Mean % deviation 3.48 0.00 4.79
(a)Corrected for missing leg by adding 15%.
62
20 percent of the adjusted breath value if the breath value (column 2) islow by a factor of two. Consequently, agreement between the parametersfound to fit the adjusted breath values and the adjusted gamma- ray value ssuggests that both the breath and gamma-ray values were reasonablyaccurate, while disparity between the two sets of parameters implies thateither the early breath or early gamma-ray measurements, or both, wereincorrect.
In general, the greater variability of the values of a reflects thefact that for this limited series of measurements the one-day intercept ofthe power function is affected much more than is the slope by small errorsin the early measurements. The slope of the power function is anchoredat one end between 30 and 300 days by the Schlundt measurements and atthe other end between 7,000 and 12,000 days by the earlier and the morerecent Argonne measurements. A few percent reduction in the values be-tween 30 and 300 days would reduce the slope of the power function foundto fit these data by about the same percentage but would reduce the valueof the one-day interceptbyslightly more than twice this percentage. Onthe other hand, if the later measurements made between 7,000 and12,000 days were reduced by a few percent, the slope of the power func-tion would be increased by about one-half the percentage change whilethe one-day intercept would be increased by about the same percentage.
The parameters, particularly the coefficients found to fit theadjusted breath data, for patients 03-102, 03-109, and 03-110 are sub-
stantially higher than those found to fit the breath data for the other fivepatients. Significantly, the parameters found by analysis of the adjustedgamma-ray data of these three patients are considerably lower than those
parameters based on breath measurement. These results suggest thepos sibility that either the early breath measurements are high, or thatthe number of injections and the reputed elapsed times between the lastinjection and the first measurements are incorrect. It is of interest thatthe injection schedule for two of these three patients could not be sub-stantiated. As discussed in the separate section on each patient, radiumwas never mentioned in the progress notes for patient 03-102, and pa-tient 03-110 received at least 30 weekly injections according to the hos-pital notes instead of the 20 published by Schlundt; this patient may verywell have received more than 30 injections. In the case of patient 03-109,only four measurements are available, all of which were field measure-ments. Consequently, valid reasons can be advanced for omitting thesepatients from the group used to calculate the average power function.
Thg parameters of the so-called "average power function" willvary significantly depending upon whether the power functions found tofit the data for the individual patients are averaged in the linear or logplane, a problem that has been discussed by McWilliams et al. For ex-12
ample, consider the values of two power functions found to fit the data for
63
patients .03-112 and 03-115, Riiz = 0.1816 t-0,2240 and R.115·= 0.2189 t-03383.Of the power functions found to fit the data of the five patients for whom re-liable time intervals are available, these two power functions yielded thehighest and lowest body burdens, respectively, from 30 days through30,000 days. Each of these power functions can be used to generate radi-um values for 1, 3, 10, 30, 300, 1000, 3000, 10,000 and 30,000 days aftera single intravenous injection. The two values found for each time can beaveraged directly (in the so-called natural plane), or the logarithms of thetwo values at each time can be averaged and the antilog of the averagevalue determined (so-called log plane). When plotted on log-log paper, theset of arithmetic means found in the natural plane will yield a curved line,concave upward, whose radius of curvature increases with time, while theaverage found in the log plane will yield a straight line that can be de-scribed exactly by a third power function, R = 0.1994 t-0.3462. When powerfunctions are averaged in the log plane, as in the latter case, the coefficientof the average power function is the geometric mean of the coefficients(0.1816 and 0.2189) and the exponent (0.3462) is the arithmetic mean of theexponents (0.2240 and 0.4683) of the individual power functions.
On the other hand, when the natural plane arithmetic averages forthe times listed for the two functions are employed, the power functionthat gave the best fit to these averages was found to be R = 0.1925 t-0.3045The coefficient here agrees fairly well with that found in the log plane, butthe exponent is significantly smaller. Furthermore, when the values start-ing at the earliest times were successively omitted from the series andpower function parameters were calculated that fit the remaining data best,the values of a and b decreased progressively. For example,,the powerfunction, R = 0.1624 t-0.2760, was obtained with values from 30 days to30,000 days and the power function, R = 0.1459 t , was obtained for0.2624
the values from 300 to 30,000 days. The addition of a few points at othertimes between 1 and 100 days will increase the slope over that found toprovide the best fit to the original series of times. Conversely, the addi-tion of a few values at later times will decrease the slope of the powerfunction.
In summary, the values of a and b found to provide the best fit,to the arithmetic average of two power functions depend both upon the timespan of the measurements and upon the relative number of measurements -within the various time intervals. This result implies that divergent radi-um values of two or more patients should not be averaged and the meansthen fitted with a power function, but rather that the parameters of thepower function should be found that provide the best fit to the data foreach patient. The parameters of the average power function should thenbe obtained from the geometric mean of the coefficients and the arithmeticmean of the exponents. This procedure essentially fits the combined datain the log plane by averaging a series of straight lines on a double log plot.
64
The geometric mean of the coefficients and the arithmetic meanof the exponents for all eight patients, and for five selected patients, aregiven on the last two lines of Table 12. These means are the parametersof the average power function found when the separate power functionsfor the patients are averaged in the log plane. As would be expected, theparameters of the average power function based on the 9riginal data forall eight patients agree very well with the parameters of the· averagepower function based on the breath data for these patients. The param-eters of the average power function based on the gamma-ray data aresignificantly smaller than those based on the original data or breath data.
When the parameters obtained for patients 03-102, 03-109 and03-110 are omitted and the means based on the other five patients arecalculated, these means based on the original measurement, .on thebreath measdrement and on the gamma-ray measurement all agree verywell with the means found for all eight patients based on gamma-raymeasurement. Consequently, an average power function, based on analy-hes of the original measurements, the breath measurements and thegamma-ray measurements for these five patients and of the gamma-ray
0.3619measurements on all eight patients, is given by R = 0.1923 t
When the parameters of the average power function are defined asthe geometric and arithmetic mean of the parameters obtained for the in-dividual patients, the power functions for all patients are weighted equally,regardless of the number of measurements employed to calculate the
parameters for the individual patient or of the goodnes s of fit obtainedwith each power function to the data for each patient. Nevertheless, themean slope derived in this way from data on the group of eight patientsshould be used judiciously since the addition of retention data from a fewmore patients could alter this slope significantly. The slopes computedfrom this limited number of patients should be used only as an indicationof the approximate range of values that may occur.
Another complicating feature results from the impression, sug-gested by inspection of Table 12, that the power function parameters, .a andb, are not independent of each other. In fact, analysis of the data yields
, "·*rcorrelation coefficients of 9.832, 0.854 and 0.814 between a and b for theoriginal, adjusted breath, and adjusted gamma-ray data, respectively, withP 9 0.004. Similarly, correlation coefficients for log a and b are 0.885,0.895 and 0.715, respectively, for the original and adjusted data, again withP 1 0.004. Absolute values of b have been used here for purposes ofsimplicity.
Regression lines have been computed for the absolute values of a
and b, and for log a and log b. The regression parameters and standarderror of estimate are given in Table 13. The regression of b on a givesa much better fit than a on b for all three sets of data, and this situation
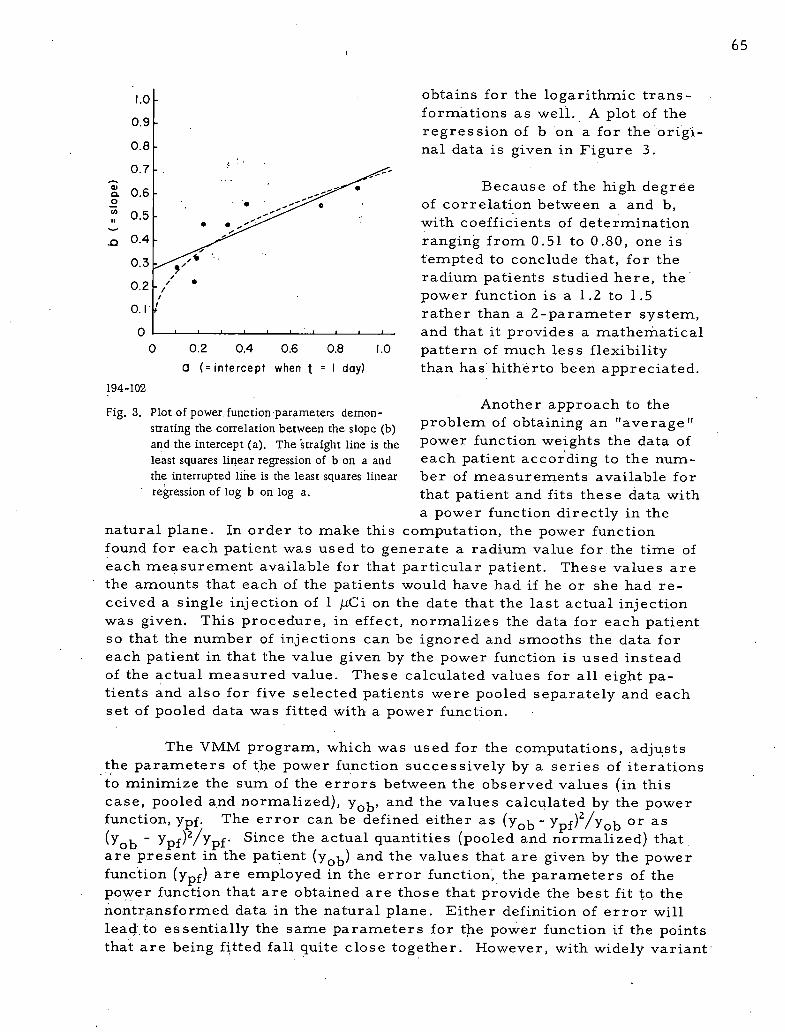
65
obtains for the logarithmic trans-1.0-
formations as well. A plot of the0.9 -regression of b on a for the origi-
0.8 - nal data is given in Figure 3.0.7 --
-6 0.6 ---- . Because of the high degree
0 • -- e of correlation between a and b,-
„ 0.5 .0--
0 ... with coefficients of determinationV I*-0 0.4- ranging from 0.51 to 0.80, one is,
0.3- ,/0 tempted to conclude that, for theradium patients studied here, the0.2 -,' 0power function is a 1.2 to 1.5
0.1 i rather than a 2-paranneter systern,0 • • and that it provides a mathenlatical0 0.2 0.4 06 OB 1.0 pattern of much less flexibility
a( = intercept when t=I day) than has hitherto been appreciated.194-102
Another approach to theFig. 3. Plot of power. function·parameters demon-
problem of obtaining an "average"suating the correlation between the slope (b)and the intercept (a). The ktraight line is the power function weights the data ofleast squares linear regression of b on a and each patient according to the num-the interrupted line is the least squares linear ber of measurements available forregression of log b on log a. that patient and fits these data with
a power function directly in thenatural plane. In order to make this computation, the power functionfound for each patient was used to generate a radium value for the time ofeach measurement available for that particular patient. These values arethe amounts that each of the patients would have had if he or she had re-ceived a single injection of 1 BCi on the date that the last actual injectionwas given. This procedure, in effect, normalizes the data for each patientso that the number of injections can be ignored and smooths the data foreach patient in that the value given by the power function is used insteadof the actual measured value. These calculated values for all eight pa-tients and also for five selected patients were pooled separately and eachset of pooled data was fitted with a power function.
The VMM program, which was used for the computations, adjuststhe parameters of the power function successively by a series of iterationsto minimize the sum of the errors between the observed values (in thiscase, pooled and normalized), yob' and the values calculated by the powerfunction, ypf. The error can be defined either as (yob - Ypf)2/yob or as ob - Ypf)2/ypf Since the actual quantities (pooled and normalized) thatare present in the patient (yob) and the values that are given by the powerfunction (ypf) are employed in the error function, the parameters of thepower function that are obtained are those that provide the best fit to thenontransformed data in the natural plane. Either definition of error willlead to essentially the same parameters for t e power function if the pointsthat are being fitted fall quite close together. However, with widely variant
66
data, the parameters of the power function will differ considerably, de-pending upon which definition of error is employed.
This point can be demonstrated quite easily with the aid of asimple analysis with the two power functions employed previously. Thetwo power functions obtained for patients 03-112 and 03-115 predict0.1816 and 0.2189 IICi, respectively, at one day after a single injectionof 1 ·MCi, and 0.2115 and 0.0024511Ci, respectively, 40 years later. Forthese two sets of values the average power function that yields the smallest
Z
error surn, (Yob -Ypf)
. predicts 0.199 and 0.0045 MCi at one day andYob
0.395140 years, respectively, and is given by R = 0.199 t- . In contrast, the2
average power function that minimizes the error sum, (Yob -Ypf) , pre-
Ypfdicts 0.201 and 0.015 IiCi at one day and 40 years, respectively, and is givenby R = 0.201 t- . The coefficients of these two power functions agree0;2706
very well because the two one-day values that anchor the power function arevery close together. But the exponents are quite different as are the40-year values predicted by the two "average " power functions. This ex-ample highlights the problem of fitting an "average " power function to dataof several patients.
Because of these difficulties, the pooled data for eight patients, andalso for a selected group of five of these patients, were fitted with an "aver-
age" power function by use of both error functions, and the results are
given in Table 14. The resultant error sum for each fit is given alongsideeach set of parameters. As expected from the above discussion of theaverage of only two power functions, the exponent (b).of the power function
2
is significantly lower when the error sum (Yob -Ypf) is minimized than
Ypf
r (Yob - Ypf)2when the error sum Zi is used. However, since in each· case
Yobthe latter error sum is smaller, perhaps the larger exponents should bethe ones selected as the valid parameters for the "averhge" power function.
A third method was also used to fit these data. The amouhts andtimes of all of the individual measurements were converted to logarithmsand these log values were fitted with linear regression lines, y=a+ bt.This is equivalent to log R= log a+b log t where R i s the amount, a i sthe coefficient and b is the exponent of the power function. In this case,the sum of the squared deviations are minimized and the data are fitted inthe log plane. The power function parameters derived in this way are12
given in Table 15 and are very close in most instances to the larger ex-ponents calculated by the pooled, normalized data method discussed above.
67
For purpose of comparison, the "average" power function param-eters computed by each of three sets of methods are listed in Table 15 bymethod and by source of data. When all eight patients are considered,seven of the nine slopes are in the neighborhood of -0.43, and the re-spective intercepts range from 0.18 to 0.33 (with a mean of 0.27). On theother hand, when the data are restricted to five selected patients for whomthe early information is more reliable, all nine slopes cluster closelyabout a mean of -0.3750, and the mean of the associated intercepts is0.2068.
The problem of deciding which parameters should be used for an"average" power function now becomes a matter of selection from amongthe values arrayed in Table 15. One is tempted simply to use the originaldata for eight patients for which separate power functions were fitted andthe appropriate means were calculated. This selection would yield a slopeof -0.438 and an intercept of 0.302, and we are, in fact, using these param-eters.in some retrospective computations of maximum body burden incases of continuous ingestion. However, the more reliable set of data forfive selected patients yields a set of parameters that are remarkably uni -form and that have the lower values given above. In any case, the selectionof any "average" power function is an arbitrary procedure and probablymakes only a small difference in the results. It is rnore important to beaware of the fact that the carefully examined data for eight patients yielda family of power functions whose slopes range from -0.224 to -0.627, andwhose one-day intercepts range from 0.102 to 0.893. No matter how the"average" power function is computed, its parameters are substantiallylower than those given by Norris et al. for earlier data on the same2,10
patients, and these lower values may have some important bearing on theretrospective estimates of maximum body burdens when these estimatesare based on measurements ·made 30 to 40 years after the maximumoccurred.
Average Single Exponential Function
The parameters of the single exponential term that provided thebest fit to the original data, and to the adjusted breath radon and gamma-ray data of each patient are given in Table 1 6. The magnitudes of thecoefficients, a, given in this table are slightly larger (by 0.5 to 2 percent)than those given in Tables B, C and D for the individual patients. Theparameters in the latter tables are those that provide the best fit to theradium burdens of each patient when the time of each measurement wasdefined as the elapsed time since the last injection. This analysis ne-glected the fact that the patient had received a number of weekly injectionsand, consequently, that the actual elapsed tirne between the first measure-ment and each preceding injection increased seven days per injection. Inorder to calculate the :coefficient applicable to a single injection of
.68
one microcurie of radium, the single exponential derived for each patientfor each set of data was projected backward in time to the center of the
injection period so that the resulting intercept value is now somewhat
larger. Then, the value of each revised coefficient was divided by thetotal amount of radium administered to the patient to obtain a ratio, a/A,that gives the proportion of the total amount injected that is retained inaccordance with the single exponential term.
Paired comparisons of the means for a/A and for Ti/2 fail to re-veal statistically significant differences, although the mean half-time forthe adjusted breath data is somewhat lower than that for the other two setsof data. Similarly, the ratio a/A is consistently large for patient 03-112but in no case does the ratio for this patient exceed 2.4 times the standarddeviation for each set of ratios and, hence, it cannot be excluded from theanalysis.
In order to obtain the parameters of an "average" single exponen-tial term, the coefficient ratios and half-times, respectively, based on the
original, breath and gamma-ray data were pooled and the means andstandard errors were determined. The 24 coefficient ratios and half-timesyielded a mean a/A of 0.0246 + 0.0031 and a mean Tl/2 of 14.984 +0.801 years. These data suggest that from approximately one year through34 years after injection the retention of radium in man follows the singleexponential given by
R = 0.0246 A-0.6931;/14:984
where A is the total amount administered, and t is the time of interest.Since the variability of the parameters is less for the expenential termsthan it is for power functions, the geometric mean of the 24 half-times(14.507 years) is very close to the arithmetic mean (14.984 years).· Forthis reason, the type of problem that was encountered in averaging powerfunctions is not as important in the case of averaging single exponentials.
The average single exponential term given above implies that2.46 percent of the injected radium is retained with an average half-timeof about 15 years from about one year after injection to 33 years later,.In many individual cases, a single exponential term provides a better fitfor this time span than does a power function. But the single exponentialterm does not give any information by which the retention pattern for theinjection period and for the first year thereafter can be reconstructed. Inother words, the retention pattern for the 97.54 percent of the injected ra-dium that is eliminated during the first year is not available from thi sanalysis. , Unlike the case of the power function, there is no significantcorrelation between the· parameters (a and Tl/2) of the exponential termobtained for each of these patients (r = 0.42, 0.44 and -0.14 for the origi-nal and the adjusted breath radon and garnma-ray data, respectively). Not
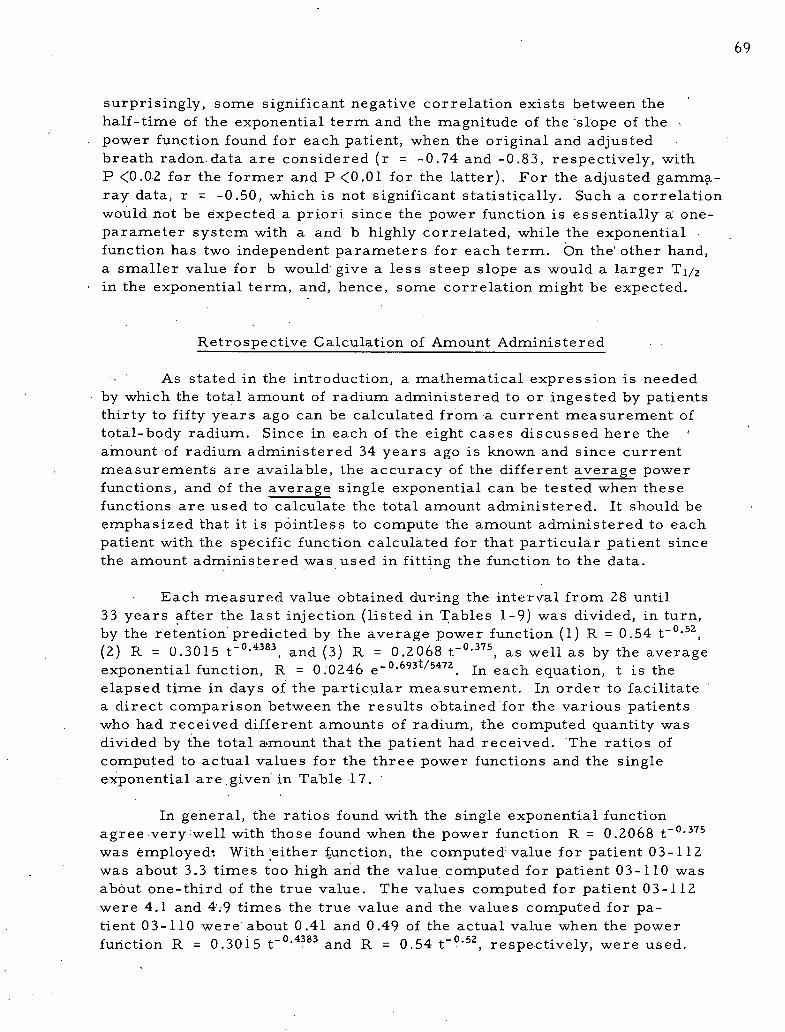
69
surprisingly, some significant negative correlation exists between thehalf-time of the exponential term and the magnitude of the -slope of thepower function found for each patient, when the original and adjustedbreath radon data are considered (r = -0.74 and -0.83, respectively, withP <0.02 for the former and P <0.01 for the latter). For the adjusted gamma-ray data, r = -0.50, which is not significant statistically. Such a correlationwould not be expected a priori since the power function is essentially a one-parameter system with a and b highly correlated, while the exponentialfunction has two independent parameters for each term. On the' other hand,a smaller value for b would give a less steep slope as would a larger Tl/2in the exponential term, and, hence, some correlation might be expected.
Retrospective Calculation of Amount Administered
As stated in the introduction, a mathematical expression is neededby which the total amount of radium administered to or ingested by patientsthirty to fifty years ago can be calculated from a current measuremeht oftotal-body radium. Since in each of the eight cases discussed here the 'amount of radium administered 34 years ago is known and since currentmeasurements are available, the accuracy of the different average powerfunctions, and of the average single exponential can be tested when thesefunctions are used to calculate the total amount administered. It should beemphasized that it is p6intless to compute the amount administered to eachpatient with the specific function calculated for that particular patient sincethe amount administered was used in fitting the function to the data.
Each measured value obtained during the interval from 28 until33 years after the last injection (listed in Tables 1-9) was divided, in turn,by the retention predicted by the average power function (1) R = 0.54 t-O.52(2) R = 0.3015 t-0.4383, and (3) R = 0.2068 t- 0.375
, as well as by the averageexponential function, R=O.0246 e-0·693t/5472 . In each equation, t is theelapsed time in days of the particular measurement. In order to facilitatea direct comparison between the results obtained for the various patientswho had received different amounts of radium, the computed quantity wasdivided by the total a·mount that the patient had received. The ratios ofcomputed to actual values for the three power functions and the singleexponential are.given in Table 17.
In general, the ratios found with the single exponential functionagree very:well with those found when the power function R = 0.2068 t- 0.375
was employed: With 'either function, the computed value for patient 03-112was about 3.3 times too high and the value computed for patient 03-110 wasab6ut one-third of the true value. The values computed for patient 03-112were 4.1 and 4.9 times the true value and the values computed for pa-tient 03-110 were about 0.41 and 0.49 of the actual value when the power
0 4383function R = 0.3015 t- . and R = 0.54 t-9 52, respectively, were used.
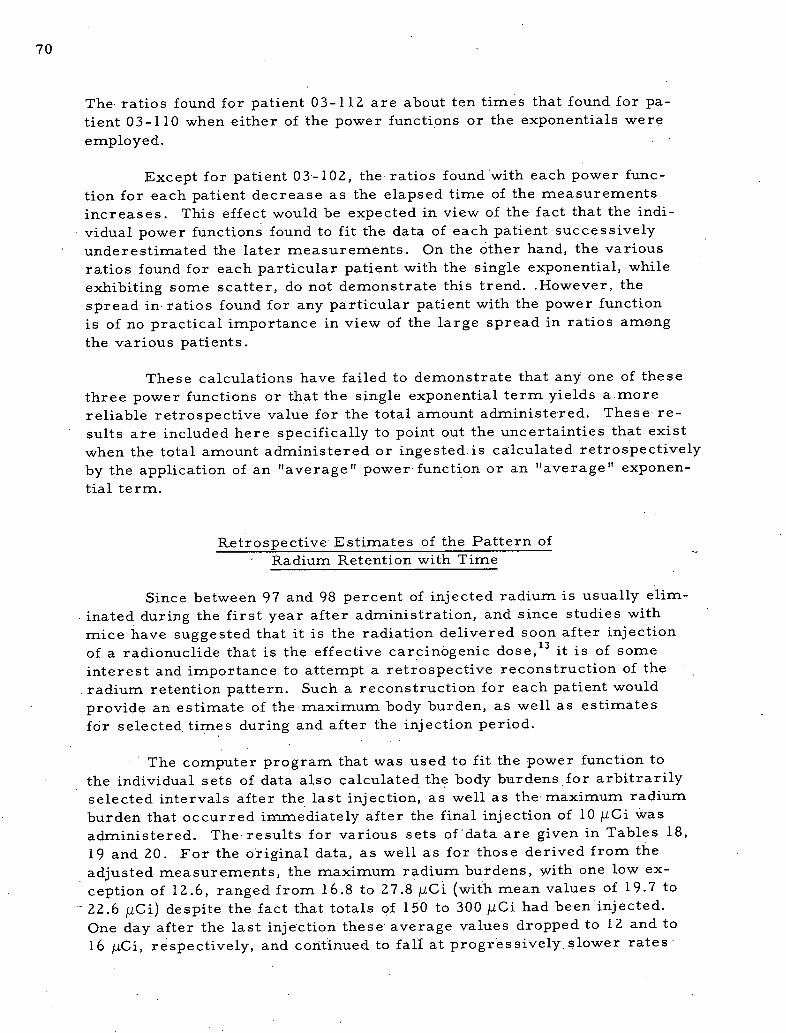
70
The ratios found for patient 03-112 are about ten times that found for pa-tient 03- 110 when either of the power functions or the exponentials wereemployed.
Except for patient 03-102, the ratios found with each power func -tion for each patient decrease as the elapsed time of the measurementsincreases. This effect would be expected in view of the fact that the indi-vidual power functions found to fit the data of each patient successivelyunderestimated the later measurements. On the other hand, the variousratios feund for each particular patient with the single exponential, while
exhibiting some scatter, do not demonstrate this trend. .However, the
spread in· ratios found for any particular patient with the power functionis of no practical importance in view of the large spread in ratios amengthe various patients.
These calculations have failed to demonstrate that any one of thesethree power functions or that the single exponential term yields a morereliable retrospective value for the total amount administered. These re-sults are included here specifically to point out the uncertainties that existwhen the total amount administered or ingested is calculated retrospectively
by the application of an "average" power function or an "average" exponen-tial term.
Retrospective Estimates of the Pattern ofRadium Retention with Time
Since between 97 and 98 percent of injected radium is usually elim-inated during the first year after administration, and since studies withmice have suggested that it is the radiation delivered soon after injection
13 ·of a radionuclide that is the effective carcinogenic dose, lt iS of someinterest and importance to attempt a retrospective reconstruction of theradium retention pattern. Such a reconstruction for each patient would
provide an estimate of the maximum body burden, as well as estimatesfor selected times during and after the injection period.
The computer program that was used to fit the power function tothe individual sets of data also calculated the body burdens for arbitrarilyselected intervals after the last injection, as well as the maximum radiumburden that occurred immediately after the final injection of 10 MCi wasadministered. The results for various sets of data are given in Tables 18,19 and 20. For the original data, as well as for those derived from the
adjusted measurements, the maximum radium burdens, with one low ex-ception of 12.6, ranged from 16.8 to 27.8 BCi (with· mean values of 19.7 to
- 22.6 ACi) despite the fact that totals of 150 to 300 /1Ci had been injected.One day after the last injection these average values dropped to 12 and to16 IICi, respectively, and continued to fall at progressively slower rates
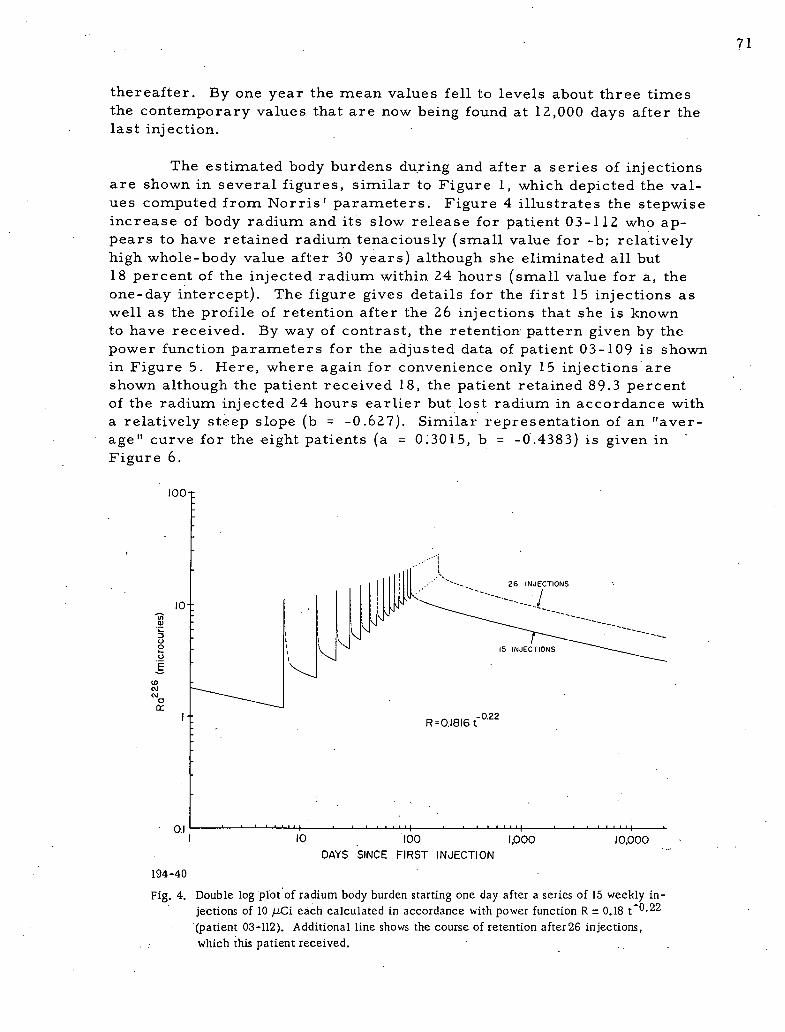
71
thereafter. By one year the mean values fell to levels about three timesthe contemporary values that are now being found at 12,000 days after thelast injection.
The estimated body burdens during and after a series of injectionsare shown in several figures, similar to Figure 1, which depicted the val-ues computed from Norris' parameters. Figure 4 illustrates the stepwiseincrease of body radium and its slow release for patient 03-112 who ap-pears to have retained radium tenaciously (small value for -b; relativelyhigh whole-body value after 30 years) although she eliminated all but18 percent of the injected radium within 24 hours (small value for a, theone-day intercept). The figure gives details for the first 15 injections aswell as the profile of retention after the 26 injections that she is knownto have received. By way of contrast, the retention pattern given by thepower function parameters for the adjusted data of patient 03-109 is shownin Figure 5. Here, where again for convenience only 15 injections areshown although the patient received 18, the patient retained 89.3 percentof the radium injected 24 hours earlier but lost radium in accordance witha relatively steep slope (b = -0.627). Similar representation of an "aver-age" curve for the eight patients (a = 0.3015, b = -0.4383) is given inFigure 6.
100-
0. .1.fILL <-----*-.0-----26-1 J N --------1
-
1 i':..LIC..
---
M- 15 INJECTIONS
S \\85 -
R .0.1816 t 0'22
O.I ' ' ' ''-7 '-i'U-1 ' ' ' ' ' ' ' 'I '1 10 100 1,000 10,000
DAYS SINCE FIRST INJECTION
194-40
Fig; 4. Double log plot of radium body burden starting one day after a series of 15 weekly in-jections of 10 MCi each calculated in accordance with power function R = 0.18 t -0.22
(patient 03-112). Additional line shows the course of retention after 26 injections,which this patient received.
72
, . '1111/illi
1.«CVVG ..U.0
1- 0.627
R=0.89t(C)
No 1-as -
-
0.1 ' ' ' ' ' • ' 'I '
1 10 100 1,000 10,000
DAYS SINCE FIRST INJECTION
194-101
Fig. 5. Double log plot of radium body burden during and after 15 weekly injec-tions of 10 ALCi each calculated in accordance with power functionR = 0.89 t-0·627. (patient 03-109)
10-
-'0 -
i ELLIC2 I..-6-R= 0.30 2-0.438
6
No 1-a: -
0.1 ' ' ' ' ' ' '
1 10 100 1,000 10.000
DAYS SINCE FIRST INJECTION
194-100
Fig. 6. Double log plot of radium body burden during and after 15 weeklyinjections of 10 Ci each calculated in accordance with a newly-.
-0 438derived average power function R . 0.30 t
While all three curves are similar.in shape, .they are sufficientlydifferent to alter the retention after 30 years, as the superimposition ofthe curves in Figure 7 demonstrate. These differing curves also empha-size the importance of the range of values that power function parameters
may assume and warn against naive dependence upon "average" values.
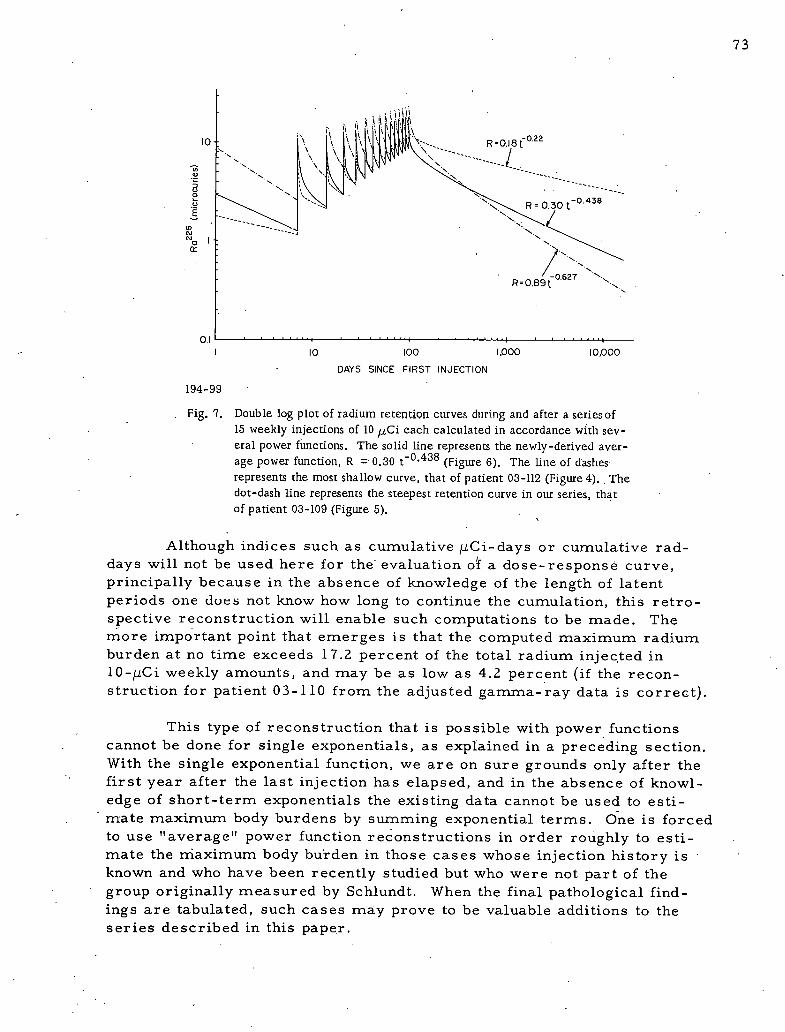
73
. i 1 1 1,1. i i j j i 21
i o- , \ \ \ \J 111 4.. R =0.18 t 0.22
: . . . . \, - ... til...&LIZAJZ<jv/'...../- S . \ --- --
P ..... t. \ ---0* * -0.438.9 R 0.30 t& 1.--brrx . ......:<(0
2 --- I -----** . --
N 1 -
'2
//)'.'.'. .-R=0.892 0.627 ..$ \
- I.
0.1 • • • • • · · ·1
I lo loo 1,000 10,000
DAYS SINCE FIRST INJECTION
194-99
Fig. 7. Double log plot of radium retention curves diiri.ng and after a series of15 weekly injections of 10 ;LCi each calculated in accordance with sev-eral power functions. The solid line represents the newly-derived aver-
- age power function, R =· 0.30 t-0.438 (Figure 6). The line of dashesrepresents the most shallow curve, that of patient 03-112 (Figure 4).. Thedot-dash line represents the steepest retention curve in our series, thatof patient 03-109 (Figure 5).
Although indices such as cumulative MCi-days or cumulative rad-days will not be used here for the evaluation ok a dose-response curve,principally because in the absence of knowledge of the length of latentperiods one does not know how long to continue the cumulation, this retro-spective reconstruction will enable such computations to be made. Themore important point that emerges is that the computed maximum radiumburden at no time exceeds 17.2 percent of the total radium injected in10-MCi weekly amounts, and may be as low as 4.2 percent (if the recon-struction for patient 03-110 from the adjusted gamma-ray data is correct).
This type of reconstruction that is possible with power func tionscannot be done for single exponentials, as explained in a preceding section.With the single exponential function, we are on sure grounds only after thefirst year after the last injection has elapsed, and in the absence of knowl-edge of short-term exponentials the existing data cannot be used to esti-mate maximum body burdens by summing exponential terms. One is forcedto use "average" power function reconstructions in order roughly to esti-mate the rriaximum body burden in those cases whose injection history isknown and who have been recently studied but who were not part of thegroup originally measured by Schlundt. When the final pathological find -ings are tabulated, such cases may prove to be valuable additions to theseries described in this paper.
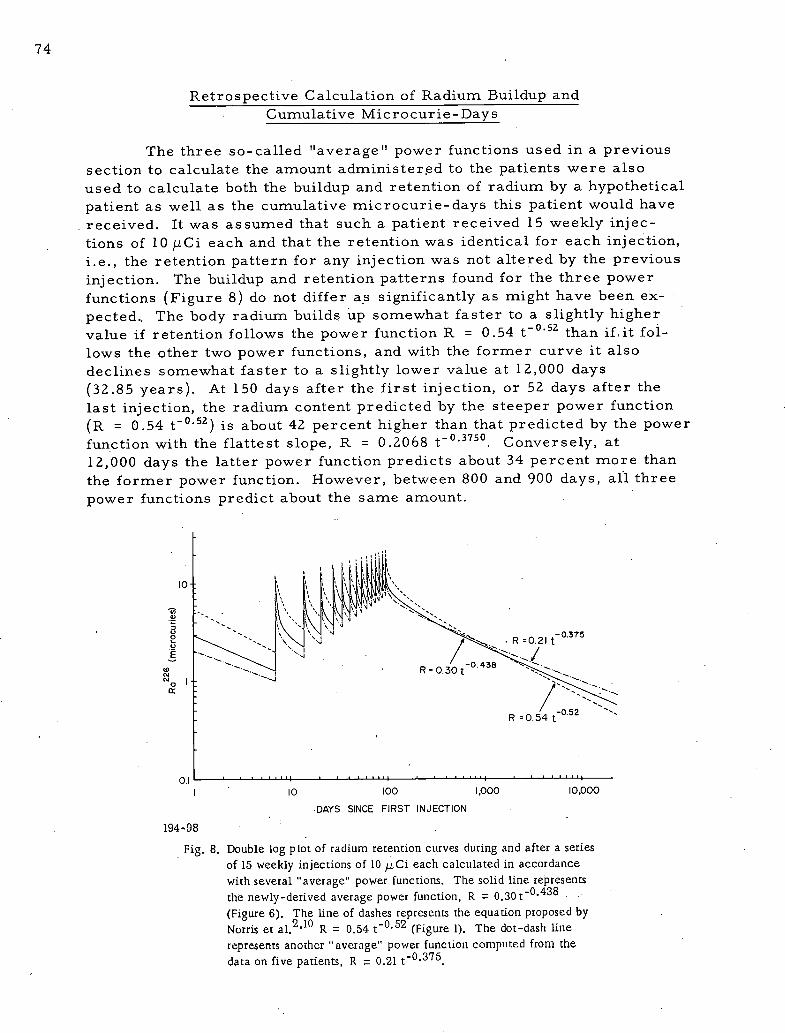
74
Retrospective Calculation of Radium Buildup andCumulative Microcurie-Days
The three so-called "average" power functions used in a previoussection to calculate the amount administered to the patients were alsoused to calculate both the buildup and retention of radium by a hypotheticalpatient as well as the cumulative microcurie-days this patient would havereceived. It was assumed that such a patient received 15 weekly injec-tions of 10 Mci each and that the retention was identical for each injection,i.e., the retention pattern for any injection was not altered by the previousinjection. The buildup and retention patterns found for the three powerfunctions (Figure 8) do not differ as significantly as might have been ex-pected., The body radium builds up somewhat faster to a slightly highervalue if retention follows the power function R = 0.54 t- 0.52 than if. it fol-
lows the other two power functions, and with the former curve it alsodeclines somewhat faster to a slightly lower value at 12,000 days(32.85 years). At 150 days after the first injection, or 52 days after the
last injection, the radium content predicted by the steeper power function
(R = 0.54 t-052) is about 42 percent higher than that predicted by the powerfunction with the flattest slope, R=0.2068 t- 0.3750
. Conversely, at12,000 days the latter power function predicts about 34 percent more thanthe former power function. However, between 800 and 900 days, all three
power functions predict about the same amount.
6 ' ..1. 11, , ,
::.-- ·.. " 1 i ,£1. ·4·:v ·<:.....5.- ....8 . -0.3754 <Il.- ....... 'Ar...4
/»».- , R.,/1 tg --.-.---\ - ....'0
-,--'-r- R =0.30 60.438 J.-·-.- -
X9 13 -r -
R =0.54 t 052
0.1 ' ' • ' ' ' - ' ' ' 'I ' ' ' ' ' ' ' 'I ' ' ' ' '-1 10 100 1,000 10.000
DAYS SINCE FIRST INJECTION
194-98
Fig. 8. Double log plot of radium retention curves during and after a seriesof 15 weekly injections of 10 »Ci each calculated in accordancewith several "
average" power functions. The solid line representsthe newly-derived average power function, R = 0.30 t 0.438
(Figure 6). The line of dashes represents the equation proposed byNorris et al. 0.54 I- (Figure 1). The dot-dash line2,10 R= 0.52
represents another " average" power function compilted from thedata on five patients, R = 0.21 t-0.375*
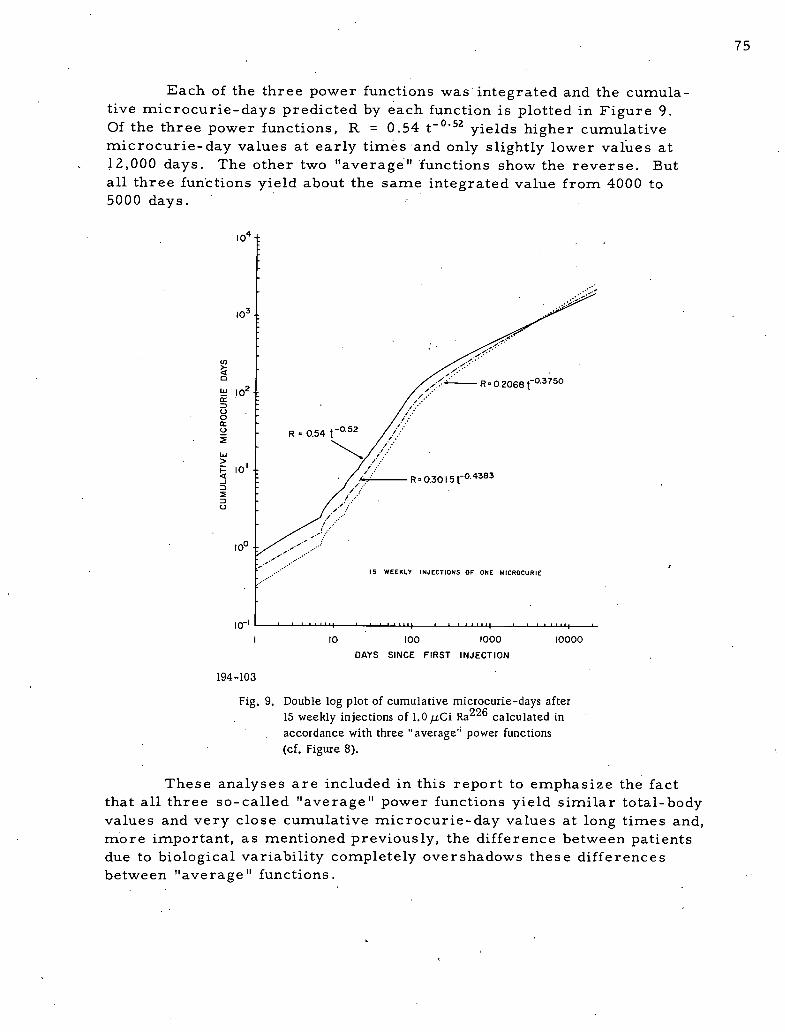
75
Each of the three power functions was integrated and the cumula-tive microcurie-days predicted by each function is plotted in Figure 9.
0.52Of the three power functions, R = 0.54 t- yields higher cunnulativemicrocurie-day values at early times and only slightly lower values at12,000 days. The other two "average" functions show the reverse. Butall three functions yield about the same integrated value from 4000 to5000 days.
|04 -
'03_
4'·I
6 -
i - I..,
W |OT_,·,4--- R = 0.2068 t-0.3750
S .''
M ':- R = 0.54 t -0.52 ,5 1.
A;\
,
5 101 - /..: R=0.3015r0.4383' -
E i0 '
1
loo _
15 WEEKLY INJECTIONS OF ONE MICROCURIE
10-1
1 10 100 1000 10000
DAYS SINCE FIRST INJECTION
194-103
Fig. 9. Double log plot of cumulative microcurie-days after15 weekly injections of 1.0 E.LCi Ra calculated in226
accordance with three " average'; power functions(cf. Figure 8).
These analyses are included in this report to emphasize the factthat all three so-called "average" power functions yield similar total-bodyvalues and very close cumulative microcurie-day values at long times and,more important, as mentioned previously, the difference between patientsdue to biological variability completely overshadows these differencesbetween "average" functions.
76
Discussion and Conclusions
Several questions remain unanswered after this rather exhaus-tive analysis of the radium data, some of which were originally used byNorris to arrive at the power function, R = 0.54 t- 0.52
. Is the powerfunction a valid expres sion for the retention of radium in humans overthe time span of 30 days through 33 years covered by these measure-ments? Does the retention of radium in humans follow this power func-tion from the first day on, or from perhaps only the 20th or 100th dayon? What is the significance of the correlation found between a and bin the power function for these patients? Are there perhaps bettermathematical descriptions of the pattern of radium retention?
It is impossible to demonstrate conclusively from any analysisof these data whether the retention of radium in humans follows eitherthe power function or the single exponential. The schedule and numberof injections given to the patients are simply not known with completeassurance. The early nleasurenlents are not accurate enough, and mea-surements that could be used to establish a distinction between thesetwo functions are not available for the critical time of about 3,000 days.
The retention of radium in these patients is definitely below thatpredicted by the power function for the time span from 21 to 33 yearsafter the last injection. Also, for several patients the power function
consistently underestimates the radium content of the patient on the dayof the first Schlundt measurement and overestimates it on the occasionof the second Schlundt measurement. These trends suggest that thepower function may not fit very well at either end of this time span, al-though the new average function, R = 0.3015 t-0.4383 provides a betterfit to these data than did the previous power function, 0.54 t-0.52
The validity of the power function as an expression for the re-tention of radium at short times cannot be demonstrated by a direct
analysis of these data but can be evaluated only by an examination ofthe retention patterns predicted for earlier times. The retrospectivecalculations of the amounts present durin the course of the injections,made by use of the various power functions derived for the individualpatients, demonstrate that the rate of accumulation during the course
of injection is inversely related to the amounts present after long times.
For a constant number of hypothetical injections at uniform inter-vals, the person with the largest -b value (steepest loss slope) wouldalso have the highest one-day intercept, a, and would thus have the fast-est buildup and the highest body burden after the last injection. No de-pendable data exist in the literature to support or disprove this view.
77
The high degree of correlation found to exist between the powerfunction parameters a and b might be due to the fact that the uptake inpatients is inversely related to the elimination. On the other hand, thi scorrelation between a and b may reflect some factor other than reten-tion in the human. The most obvious explanation is that the earlySchlundt measurements happened to be very low for those people whoexhibit small values of a and high for those people who have largevalues of a. Yet this explanation seems unlikely in view of the fact thatboth the breath measurements and the gamma-ray measurements, whichare technically independent of each other, yield equivalent values of a and b.
What, then, are the relative merits of the power function and thesingle exponential function in describing radium retention? The detailedanalyses set forth here have shown that:
1) An improved version of the power function can be derived,namely, R = 0.3015 t-0 .4383 , for a series of eight patients forwhom radium measurements are available for a 33 -year span.
2) For individual cases there is a wide range of values for thepower function parameters a and b.
3) These parameters, a and b, are highly and significantlycorrelated, especially if a logarithmic transformation is used.
4) While the power function does not fit the known data over thetime span from one to 30 years as well as a single exponen-tial term, it can be used to calculate retrospectively the day-by-day course of radium retention during the perhaps crucialperiod during which the injections occurred, and for thefirst year thereafter. The accuracy of these computationscannot be established from currently-available data, butone may presume that they are approxinnately correct.
The single exponential function, on the other hand, also has cer-tain advantage s and limitations:
1) It provides an excellent fit to the data from one to 33 yearsafter administration and surpasses the power function in thisrespect for the period from 21 to 33 years.
2) Although the single exponential cannot be used to describeradium retention during the course of injections and thefirst year thereafter, it can provide an estimate of the totalamount injected that may be more accurate than that pre-dicted by the power function after the first year.
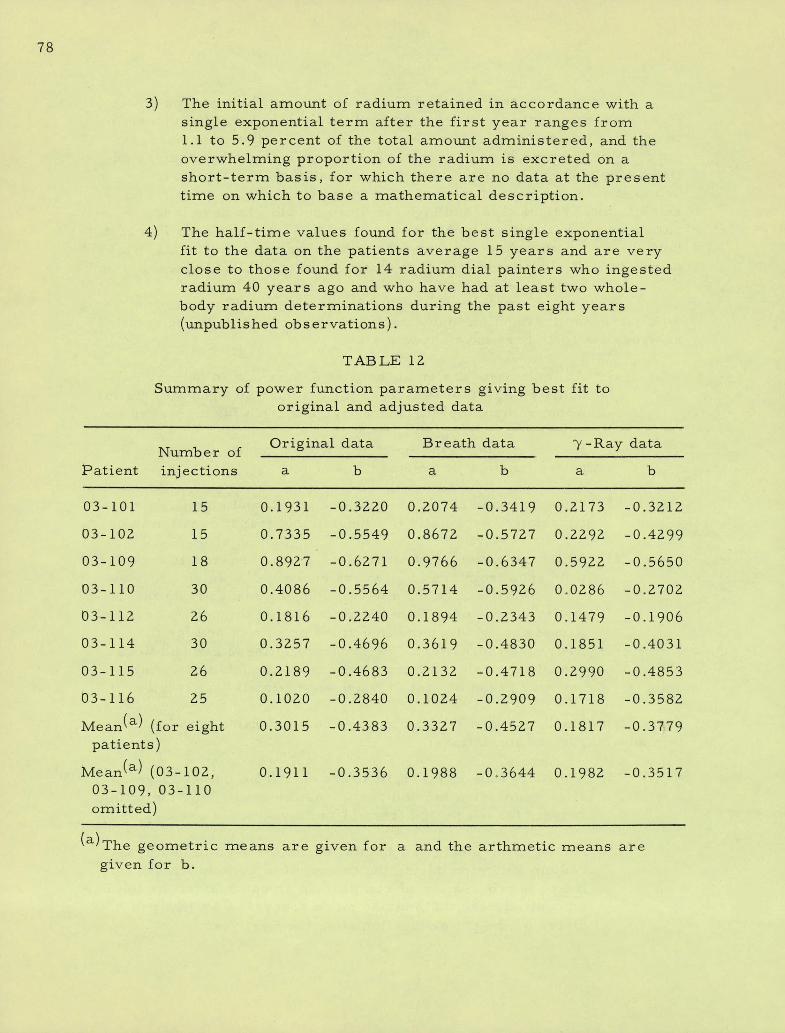
78
3) The initial amount of radium retained in accordance with asingle exponential term after the first year ranges from1.1 to 5.9 percent of the total amount administered, and theoverwhelming proportion of the radium is excreted on ashort-term basis, for which there are no data at the presenttime on which to base a mathematical description.
4) The half-time values found for the best single exponentialfit to the data on the patients average 15 years and are veryClose to those found for 14 radium dial painters who ingestedradium 40 years ago and who have had at least two whole-body radium determinations during the past eight years(unpublished observations).
TAB LE 12
Summary of power function parameters giving best fit tooriginal and adjusted data
Original data Breath data 7 -Ray dataNumber ofPatient injections a b a b a b
03-101 15 0.1931 -0.3220 0.2074 -0.3419 0.2173 -0.3212
03-102 15 0.7335 -0.5549 0.8672 -0.5727 0.2292 -0.4299
03-109 18 0.8927 -0.6271 0.9766 -0.6347 0.5922 -0.5650
03-110 30 0.4086 -0.5564 0.5714 -0.5926 0.0286 -0.2702
03-112 26 0.1816 -0.2240 0.1894 -0.2343 0.1479 -0.1906
03-114 30 0.3257 -0.4696 0.3619 -0.4830 0.1851 -0.4031
03-115 26 0.2189 -0.4683 0.2132 -0.4718 0.2990 -0.4853
03-116 25 0.1020 -0.2840 0.1024 -0.2909 0.1718 -0.3582
Mean(a) (for eight 0.3015 -0.4383 0.3327 -0.4527 0.1817 -0.3779
patients)
Mean(a) (03-102, O.1911 -0.3536 0.1988 -0.3644 0.1982 -0.351703-109, 03-110omitted)
(a) The geometric means are given for a and the arthmetic means aregiven for b.
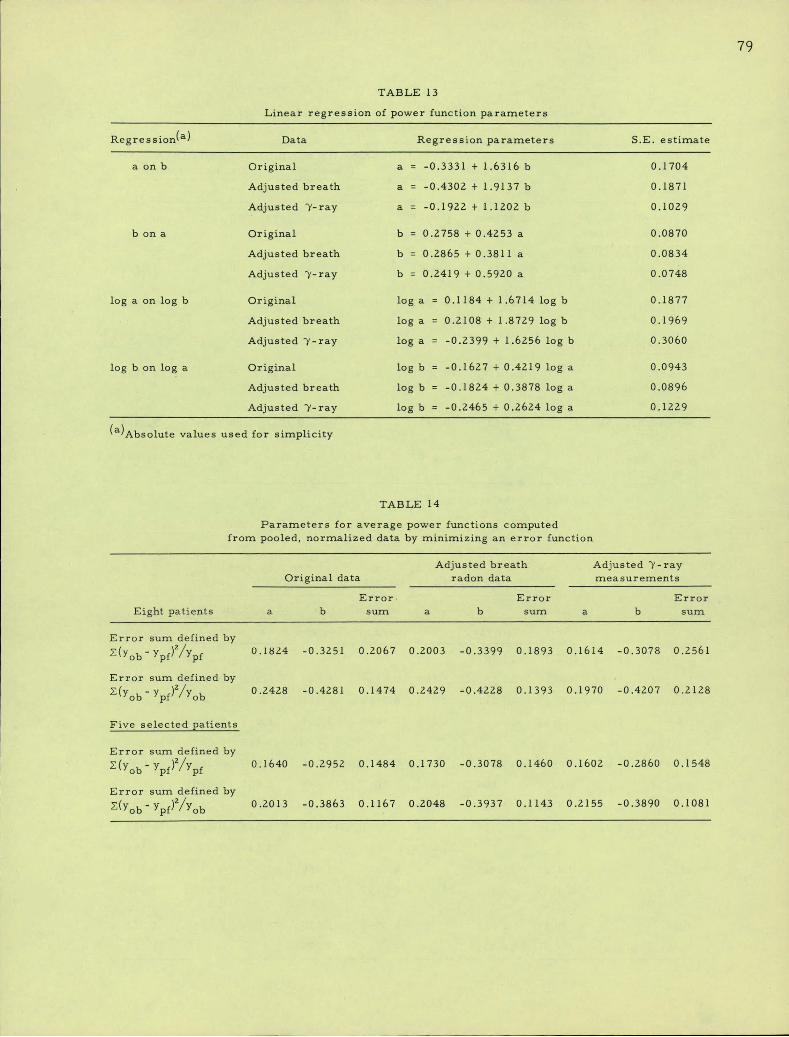
79
TABLE 13
Linear regression of power function parameters
Regression(a) Data Regression parameters S.E. estimate
a on b Original a = -0.3331 + 1.6316 b 0.1704
Adjusted breath a = -0.4302 + 1.9137 b 0.1871
Adjusted 7-ray a = -0.1922 + 1.1202 b 0.1029
b on a Original b = 0.2758 + 0.4253 a 0.0870
Adjusted breath b = 0.2865 + 0.3811 a 0.0834
Adjusted 7-ray b = 0.2419 + 0.5920 a 0.0748
log a on log b Original log a = 0.1184 + 1.6714 log b 0.1877
Adjusted breath log a = 0.2108 + 1.8729 log b 0.1969
Adjusted 7-ray log a = -0.2399 + 1.6256 log b 0.3060
log b on log a Original log b = -0.1627 + 0.4219 log a 0.0943
Adjusted breath log b = -0.1824 + 0.3878 log a 0.0896
Adjusted 7-ray log b = -0.2465 + 0.2624 log a 0.1229
(a)Absolute values used for simplicity
TABLE 14
Parameters for average power functions computedfrom pooled, normalized data by minimizing an error function
Adjusted breath Adjusted 7-rayOriginal data radon data measurements
Error· Error ErrorEight patients a b sum a b sum a b sum
Error sum defined by2(yob - ypf)2/ypf 0.1824 -0.3251 0.2067 0.2003 -0.3399 0.1893 0.1614 -0.3078 0.2561
Error sum defined by
61(Yob - ypf)2/yob 0.2428 -0.4281 0.1474 0.2429 -0.4228 0.1393 0.1970 -0.4207 0.2128
Five selected patients
Error sum defined by
E(Yob- VPf)2/Ypf 0.1640 -0.2952 0.1484 0.1730 -0.3078 0.1460 0.1602 -0.2860 0.1548
Error sum defined byE(Yob - Ypf)2/yob 0.2013 -0.3863 0.1167 0.2048 -0.3937 0.1143 0.2155 -0.3890 0.1081
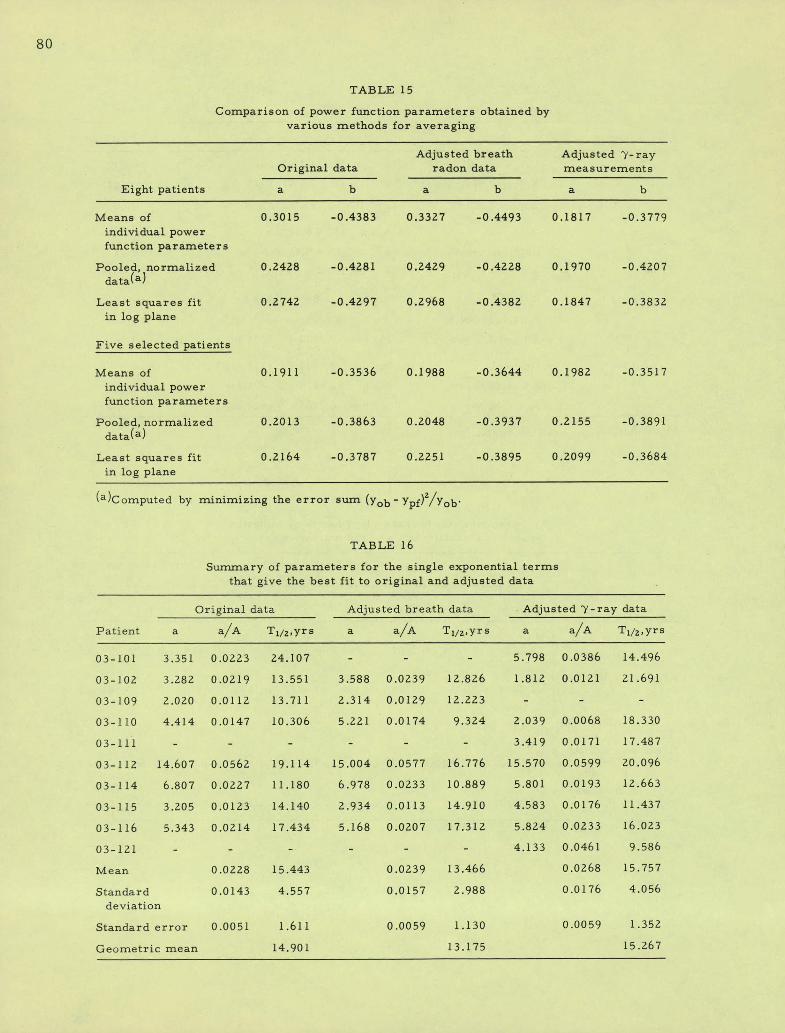
80
TABLE 15
Comparison of power function parameters obtained byvarious methods for averaging
Adjusted breath Adjusted 7- rayOriginal data radon data Ineasurements
Eight patients a b a b a b
Means of 0.3015 -0.4383 0.3327 -0.4493 0.1817 -0.3779individual powerfunction parameters
Pooled, normalized 0.2428 -0.4281 0.2429 -0.4228 0.1970 -0.4207data(a)
Least squares fit 0.2742 -0.4297 0.2968 -0.4382 0.1847 -0.3832in log plane
Five selected patients
Means of 0.1911 -0.3536 0.1988 -0.3644 0.1982 -0.3517individual powerfunction paranleters
Pooled, normalized 0.2013 -0.3863 0.2048 -0.3937 0.2155 -0.3891data(a)
Least squares fit 0.2164 -0.3787 0.2251 -0.3895 0.2099 -0.3684in log plane
(a)Computed by minimizing the error sum (yob - Ypf)2/yob
TABLE 16
Summary of parameters for the single exponential termsthat give the best fit to original and adjusted data
Original data Adjusted breath data Adjusted 7-ray data
Patient a a A Ti/2,yrsaa/A Ti/2,yrs a a/A Tl/2,yrs
03-101 3.351 0.0223 24.107 - - - 5.798 0.0386 14.496
03-102 3.282 0.0219 13.551 3.588 0.0239 12.826 1.812 0.0121 21.691
03-109 2.020 0.0112 13.711 2.314 0.0129 12.223 - - -
03-110 4.414 0.0147 10.306 5.221 0.0174 9.324 2.039 0.0068 18.330
03-111 - - - - - - 3.419 0.0171 17.487
03-112 14.607 0.0562 19.114 15.004 0.0577 16.776 15.570 0.0599 20.096
03-114 6.807 0.0227 11.180 6.978 0.0233 10.889 5.801 0.0193 12.663
03-115 3.205 0.0123 14.140 2.934 0.0113 14.910 4.583 0.0176 11.437
03-116 5.343 0.0214 17.434 5.168 0.0207 17.312 5.824 0.0233 16.023
03-121 - - - - - - 4.133 0.0461 9.586
Mean 0.0228 15.443 0.0239 13.466 0.0268 15.757
Standard 0.0143 4.557 0.0157 2.988 0.0176 4.056
deviation
Standard error 0.0051 1.611 0.0059 1.130 0.0059 1.352
Geometric mean 14.901 13.175 15.267

81
TABLE 17
Tests of retrospective calculations of total radium administeredwhen different mathematical functions are used
Recent whole-bodyrn.easurennent
Days 226Total elapsed
Ratio of computed to actual amount of Raadministered if retention followsamount since
injected, last Arnount, Power Power Power SinglePatient MCi injection MCi function(a) function(b) function(c) exponential(d)
03-101 150 10108 1.617 2.414 2.035 1.655 1.576
10264 1.697 2.553 2.150 1.747 1.687
11709 1.225 1.974 1.644 1.324 1.463
03-102 150 10722 0.685 1.054 0.885 0.717 0.722
11910 0.656 1.067 0.888 0.714 0.804
03-110 300 10202 0.717 0.538 0.453 0.368 0.354
11842 0.590 0.478 0.398 0.320 0.358
12073 0.544 0.445 0.370 0.298 0.340
03-111 200 10219 1.238 1.394 1.174 0.954 0.918
10443 1.035 1.178 0.991 0.804 0.790
11823 0.890 1.081 0.900 0.724 0.809
03-112 260 10447 5.613 4.917 4.134 3.356 3.295
03-114 300 10104 1.207 0.901 0.759 0.618 0.588
10264 1.252 0.942 0.793 0.644 0.622
11707 1.025 0.826 0.688 0.554 0.612
11936 0.946 0.770 0.640 0.515 0.581
03-115 260 10095 0.784 0.674 0.569 0.463 0.440
11697 0:703 0.653 0.544 0.438 0.484
11930 0.673 0.632 0.525 0.423 0.477
03-121 90 10109 0.555 1.382 1.165 0.947 0.903
10332 0.569 1.433 1.206 0.979 0.952
11711 0.441 1.185 0.987 0.796 0.878
11942 0.424 1.152 0.958 0.771 0.870
03-125 200 10575 1.444 1.654 1.390 1.127 1.120
(a)power function R = 0.54 t-0.52(b)Power function R=0.3015 t-0.4383(C)Power function R = 0.2068 t-0 .3750
(d)Single exponential R = 0.0246 e-0:693 t 5472
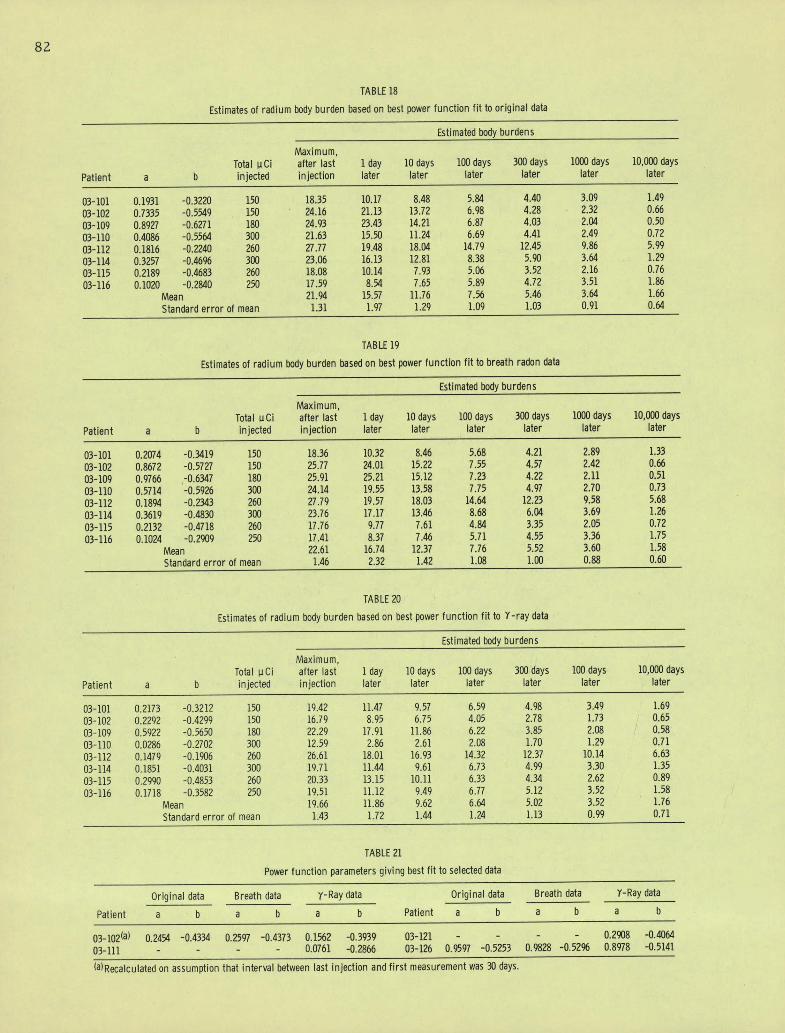
82
TABLE 18
Estimates of radium body burden based on best power function fit to original data
Estimated body burdens
Maximum,Total 11 Ci after last 1 day 10 days 100 days 300 days 1000 days 10,000 days
Patient a b injected injection later later later later later later
03-101 0.1931 -0.3220 150 18.35 10.17 8.48 5.84 4.40 3.09 1.49
03-102 0.7335 -0.5549 150 24.16 21.13 13.72 6.98 4.28 2.32 0.66
03-109 0.8927 -0.6271 180 24.93 23.43 14.21 6.87 4.03 2.04 0.50
03-110 0.4086 -0.5564 300 21.63 15.50 11.24 6.69 4.41 2.49 0.72
03-112 0.1816 -0.2240 260 27.77 19.48 18.04 14.79 12.45 9.86 5.99
03-114 0.3257 -0.4696 300 23.06 16.13 12.81 8.38 5.90 3.64 1.29
03-115 0.2189 -0.4683 260 18.08 10.14 7.93 5.06 3.52 2.16 0.76
03-116 0.1020 -0.2840 250 17.59 8.54 7.65 5.89 4.72 3.51 1.86
Mean 21.94 15.57 11.76 7.56 5.46 3.64 1.66
Standard error of mean 1.31 1.97 1.29 1.09 1.03 0.91 0.64
TABLE 19
Estimates of radium body burden based on best power function fit to breath radon data
Estimated body burdens
Maximum,Total IICI after last 1 day 10 days 100 days 300 days 1000 days 10,000 days
Patient a b injected injection later later later later later later
03-101 0.2074 -0.3419 150 18.36 10.32 8.46 5.68 4.21 2.89 1.33
03-102 0.8672 -0.5727 150 25.77 24.01 15.22 7.55 4.57 2.42 0.66
03-109 0.9766 ,-0.6347 180 25.91 25.21 15.12 7.23 4.22 2.11 0.51
03-110 0.5714 -0.5926 300 24.14 19.55 13.58 1 J5 4.97 2.70 0.73
03-112 0.1894 -0.2343 260 27.79 19.57 18.03 14.64 12.23 9.58 5.68
03-114 0.3619 -0.4830 300 23.76 17.17 13.46 8.68 6.Ott 3.69 1.26
03-115 0.2132 -0.4718 260 17.76 9.77 7.61 4.84 3.35 2.05 0.72
03-116 0.1024 -0.2909 250 17.41 8.37 7.46 5.71 4.55 3.36 1.75
Mean 22.61 16.74 12.37 7.76 5.52 3.60 1.58
Standard error of mean 1.46 2.32 1.42 1.08 1.00 0.88 0.60
TABLE 20
Estimates of radium body burden based on best power function fit to Y-ray data
Estimated body burdens
Maximum,Total IiCi after last 1 day 10 days 100 days 300 days 100 days 10,000 days
Patient a b injected injection later later later later later later
03-101 0.2173 -0.3212 150 19.42 11.47 9.57 6.59 4.98 3.49 1.69
03-102 0.2292 -0.4299 150 16.79 8.95 6.75 4.05 2.78 1.73 0.65
03-109 0.5922 -0.5650 180 22.29 17.91 11.86 6.22 3.85 2.08'
0.58
03-110 0.0286 -0.2702 300 12.59 2.86 2.61 2.08 1.70 1.29 0.71
03-112 0.1479 -0.1906 260 26.61 18.01 16.93 14.32 12.37 10.14 6.63
03-114 0.1851 -0.4031 300 19.71 11.44 9.61 6.73 4.99 3.30 1.35
03-115 0.2990 -0.4853 260 20.33 13.15 10.11 6.33 4.34 2.62 0.89
03-116 0.1718 -0.3582 250 19.51 11.12 9.49 6.77 5.12 3.52 1.58
Mean 19.66 11.86 9.62 6.64 5.02 3.52 1.76
Standard error of mean 1.43 1.72 1.44 1.24 1.13 0.99 0.71
TABLE 21
Power function parameters giving best fit to selected data
Original data Breath data r-Ray data Original data Breath data Y-Ray data
Patient a ba b a b Patient a b a b a b
03-102(a) 0.2454 -0.4334 0.2597 -0.4373 0.1562 -0.3939 03-121 - - - - 0.2908 -0.4064
03-111 - - - - 0.0761 -0.2866 03-126 0.9597 -0.5253 0.9828 -0.5296 0.8978 -0.5141
la)Recalculated on assumption that interval between last injection and first measurement was 30 days.
83
APPENDIX I. DATA FROM ADDITIONAL PATIENTS
For the sake of completeness, the parameters of the power func-tion that provide the best fit to the data of three additional patients, aswell as to data for patient 03-102 when a different injection schedulewas used, are given in Table 21. The parameters for patients 03-111 and03-121 were not included in the previous tables, since only gamma-raymeasurements were available. The exponents for both patients and thecoefficient for patient 03-121 are very comparable to those found forthe eight patients discussed in detail. The parameters for patient 03-126are based on only three rather questionable measurements. The date ofthe Schlundt measurement could not be ascertained and the last measure-ment, which in itself was quite accurate, was arbitrarily increased by15 percent to correct for a missing limb. These parameters, which areconsiderably higher than the mean values, might reflect erroneouselapsed times instead of a higher than average retention pattern.
The parameters given for patient 03-102 are quite interesting.No dates could be found for the administration of radium to this patient.The fact that Schlundt listed the same total quantity, injection schedulesand elapsed time for patient 03-102 as he did for patient 03-101, alongwith his listing of these patients serially as "A" and "B, " led us to re-analyze the data on the supposition that 15 weekly injections had beenreceived by both patients between about August 20, 1931 and Novem-ber 26, 1931 (the schedule used for patient 03-101 based on hospitalnotes). The curve-fitting for various combinations of the original, breath,and gamma- ray data with the power function and the single exponentialare given in Tables 22A-D. These parameters agree extremely well withthe average values given for all eight patients in Table 1 2. If these param-eters of Table 22 are substituted for those for patient 03-102 in Table 12,then only the parameters for patients 03-109 and 03-110 would seem outof line with the values for the other patients.
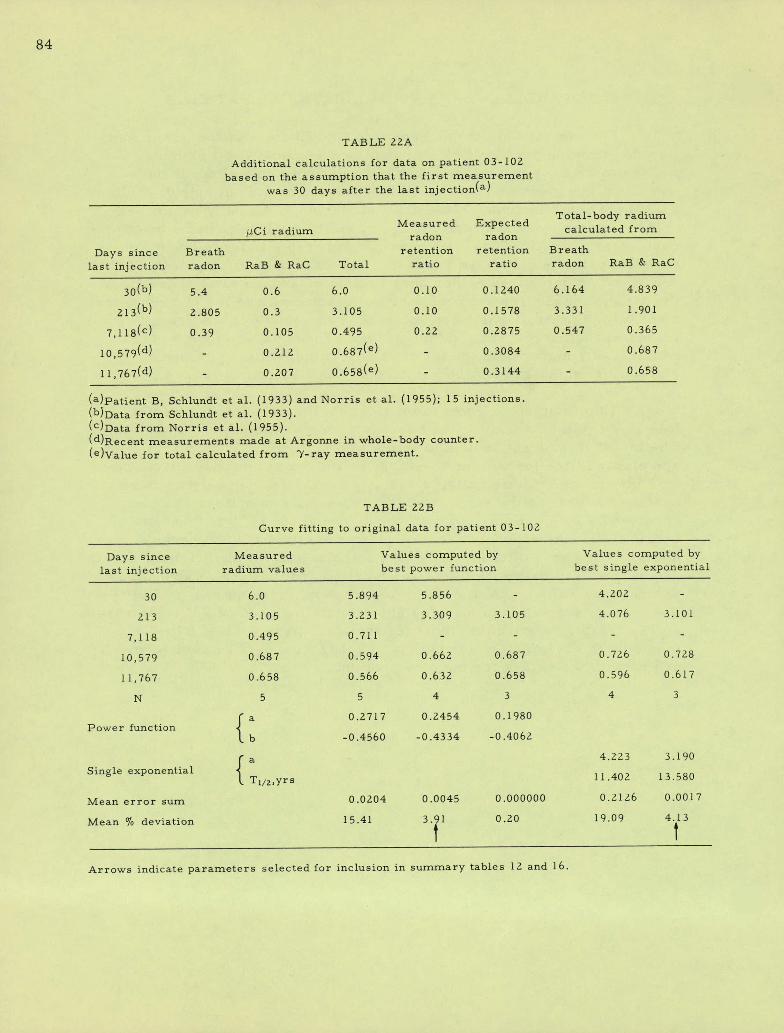
84
TABLE 22A
Additional calculations for data on patient 03-102based on the assumption that the first measurement
was 30 days after the last injection(a)
Total-body radiumMeasured Expected
MCi radium calculated fromradon radon
Dayssince Breath retention retention Breath
last injection radon RaB & RaC Total ratio ratio radon RaB & RaC
30(b) 5.4 0.6 6.0 0.10 0.1240 6.164 4.839
213(b) 2.805 0.3 3.105 O.10 0.1578 3.331 1.901
7,118(c) 0.39 0.105 0.495 0.22 0.2875 0.547 0.365
10,579(d) - 0.212 0.687(e) - 0.3084 - 0.687
11,767(d) - 0.207 0.658(e) - 0.3144 - 0.658
(a)Patient B, Schlundt et al. (1933) and Norris et al. (1955); 15 injections.(b)Data from Schlundt et al. (1933).(C)Data from Norris et al. (1955).(d)Recent measurements made at Argonne in whole-body counter.(e)Value for total calculated from 7- ray measurement.
TABLE 22B
Curve fitting to original data for patient 03-102
Days since Measured Values computed by Values computed bylast injection radium values best power function best single exponential
30 6.0 5.894 5.856 - 4.202 -
213 3.105 3.231 3.309 3.105 4.076 3.101
7,118 0.495 0.711 - - - -
10,579 0.687 0.594 0.662 0.687 0.726 0.728
11,767 0.658 0.566 0.632 0.658 0.596 0.617
N 5 5 4 3 4 3
Powerfunction < a
0.2717 0.2454 0.1980
-0.4560 -0.4334 -0.4062
a4.223 3.190
Single exponential Ti/z,yrs 11.402 13.580
Mean error surn 0.0204 0.0045 0.000000 0.2126 0.0017
Mean % deviation 15.41 3.91 0.20 19.09 4.13
Arrows indicate parameters selected for inclusion in summary tables 12 and 16.
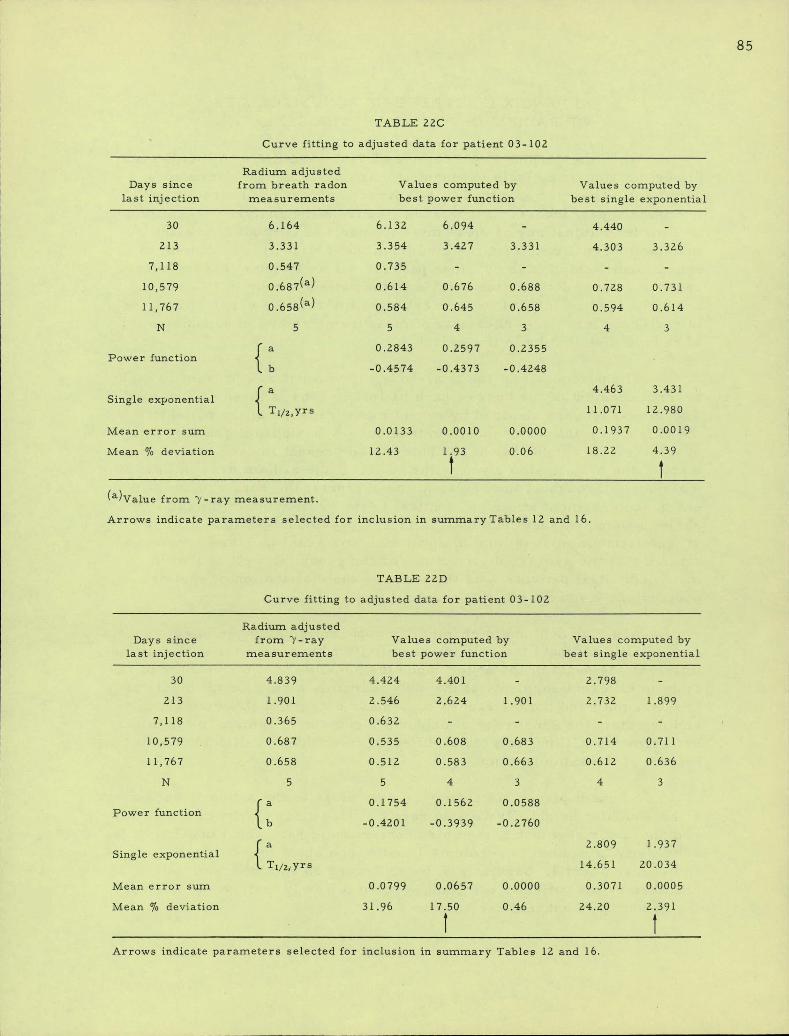
85
TABLE 22C
Curve fitting to adjusted data for patient 03-102
Radium adjustedDays since frorn breath radon Values computed by Values computed by
last injection measurements best power function best single exponential
30 6.164 6.132 6.094 4.440
213 3.331 3.354 3.427 3.331 4.303 3.326
7,118 0.547 0.735
10,579 0.687(a) 0.614 0.676 0.688 0.728 0.731
11,767 0.658(a) 0.584 0.645 0.658 0.594 0.614
N 5 5 4 3 4 3
Power function a 0.2843 0.2597 0.2355
l b -0.4574 -0.4373 -0.4248
a 4.463 3.431Single exponential Ti/2,yrs 11.071 12.980
Mean error sum 0.0133 0.0010 0.0000 0.1937 0.0019
Mean % deviation 12.43 1.93 0.06 18.22 4.39
t
(a)Value from 7-ray measurement.
Arrows indicate parameters selected for inclusion in summary Tables 12 and 16.
TABLE 22D
Curve fitting to adjusted data for patient 03-102
Radium adjustedDays since from 7-ray Values computed by Values computed by
last injection measurements best power function best single exponential
30 4.839 4.424 4.401 2.798
213 1.901 2.546 2.624 1.901 2.732 1.899
7,118 0.365 0.632
10,579 0.687 0.535 0.608 0.683 0.714 0.711
11,767 0.658 0.512 0.583 0.663 0.612 0.636
N 5 5 4 3 4 3
a 0.1754 0.1562 0.0588Power function ' b -0.4201 -0.3939 -0.2760
f a 2.809 1.937Single exponential Tl/z,yrs 14.651 20.034
Mean error sun:1 0.0799 0.0657 0.0000 0.3071 0.0005
Mean % deviation 31.96 17.50 0.46 24.20 2.391
t
Arrows indicate parameters selected for inclusion in summary Tables 12 and 16.
86
APPENDIX II. EFFECT OF NONUNIFORMITYOF RADIUM DEPOSITION IN THE SKELETON
When the various combinations of data were fitted with either apower function or a single exponential, each Schlundt and Norris mea-surement was either assumed to be correct and was used directly, or ifit was obviously incorrect, it was omitted from the analysis. No attemptwas made to adjust any of these measurements to correct for variationsin detector sensitivity that resulted from the distribution of radium in anonuniform fashion in the various patients. If we assume that the samerelative radium distribution existed in the patient's body in 1931-1932and 1951-1952 as in 1964, we can estimate the relative error introducedin each case into the earlier sets of measurements by the nonuniformityof radium distribution in the body.
The percentage of the total-body radium that was present in eachseventh segment of the body of each patient in 1964 is given in Table 23.These results were obtained by recent measurements of the patients bythe single-crystal, seven-position technique.4 In addition, the percentageof the skeletal weight that is computed to be present in each seventh seg-ment of the body is also given in the table. If the radium were uniformlydistributed throughout the skeleton, the percentage of body radium pres-ent in each segment would be identical to the percentage of the totalskeletal weight in that segment. In fact, a previously published study
14
of the distribution of radium in about 40 former dial painter s demon-strated that the average distribution for the group, as well as that inmany individual patients, was the same as the distribution of skeletal
proportions given here.
Although Schlundt's chamber is apparently no longer in existence,we can still estimate the relative sensitivity of this detector to radium indifferent segments of the body. Since the sensitivity of the counter to ra-dium in different segments of the body is mainly a function of the distanceto the radium and the interposed body mass between the radium depositand detector, the sensitivity of Schlundt's counter to radium in the differ-
ent segments will not be greatly different from that of a NaI(Tl) crystallocated at the same position.
Schlundt placed his chamber fairly close to the patient's back atabout shoulder height. If we arbitrarily as sign a sensitivity of one to theradium in our segment 2, then his counter would have about one-half thi ssensitivity to radium in segments 1 and 3, and about one-fourth the sensi-tivity in segment 4. Segments 5,6 and 7 were so shielded from thechamber by the patient's body and were so far away that we can neglectthe radium present in these volumes.
87
For the 1951-1953 measurements, a small NaI(Tl) crystal wasplaced behind and 10 cm from the seated patient's hips. In this case, ifwe assume that the radium in our segment 4 was counted with a sensitivityof one, the radium in segment 3 was counted with about one-half this ef-ficiency, the radium in segment 2 with about one-fourth, and the radiumin segment 1 with about one-eighth. The radium in the legs was shieldedfrom the counter to such a degree that we can neglect the component forthese calculations.
For Schlundt's measurements, the sum of the percentage of radiumin segment 2, one-half the percentage in segments 1 and 3, plus one-fourththe percentage in segment 4, can be compared to the sum of the fractionsof skeleton in these sections. In the case of patient 03-101, Schlundt'scounter would have a relative sensitivity of 0.415 compared to an expectedvalue of 0.354 based on skeletal distribution. Consequently, his measure-ment was probably 17 percent high for this patient.
For Norris' measurements, the sum of the percentage of radiumin segment 4 can be added to one-half that of segment 4, one-fourth ofthat in segment 2 and one-eighth of that in segment 1. Again, in the caseof patient 03-101, the counter employed during 1951-1953 would have arelative sensitivity to the radium present of about 0.305 compared to anexpected sensitivity based on skeletal distribution of about 0.275. Thusthese measurements would also be about 11 percent high.
These errors of 17. and 11 percent are relatively unimportant,for if the measured values were corrected by these amounts, the param-eters of the power function would be reduced only slightly. Since theparameters for tlii s patient based on the original garnma-ray measure-ments agree quite well with those based on breath measurements, thefornner are probably reasonably correct.
By a similar analysis one can conclude that the Schlundt gamma-ray measurement on patient 03-102 was probably about 35 percent lowwhile the Norris measurement was about 20 percent low. In terms ofthe curve-fitting to the set of data for this patient, the Norris measure-ment was at least 50 percent low. This conclusion is consistent with thefact that the power function parameters found to fit the gamma-ray dataare very much smaller than those found to fit the breath values.
Although patient 03-110 contains a relatively large percentage ofher total radium in her skull, both the Schlundt and Norris measurementsyielded values that were about 10 percent high. The extremely low radiumvalues found by Schlundt cannot be explained by the distribution present inthis patient's body today unless 1) the radium in segments 1 and 3 wascounted with less relative sensitivity with respect to the radium in seg-ment 2 than is assumed for these calculations, or 2) the radium was notconcentrated in the skull of this patient in 1931.
88
Both patients 03- 114 and 03- 115 contain a considerably higher thanaverage percentage of total-body radium in positions 3 and 4 and a smallerthan average percentage in the first segment. Based on the assumed sensi-tivities, Schlundt's measurement would be about 15 percent high whileNorris' measurement would be about 75 percent high. It is significant thatthe gamma-ray data of both of these patients supported two discontinuous
power functions (Tables 7D and 8D). This apparent break in the retentioncurve can now be explained by the fact that the 7,111 and 7,871-day mea-
surements were too high.
Patient 03- 116 contains higher than average amounts of radium insegments 2, 3 and 4, and less than average in the other four segments.Schlundt's and Norris' gamma-ray measurements were probably about 24and 17 percent high, respectively. These high measurements could accountfor the fact that the power function parameters based on the gamma-raymeasurements were larger than those based on breath radon.
Five of these six patients contain more than the average amount ofradium in the upper torso. Consequently, Schlundt's gamma-ray measure-ments for these patients could have ranged from 10 to 24 percent high.However, in the absence of any information concerning his absolute calibra-tion, we are not justified in reducing all or any of his values by an arbitraryamount. Nevertheless, the fact is inescapable that either his gamma-rayvalue for patient 03- 102 is considerably low or· his values for the other
patients are very high. The discrepancy between the parameters found tofit the breath and gamma-ray data for patient 03-102 can now be explained.
A somewhat greater variability due to nonuniformity of radium dis-tribution in the body exists in the Norris measurements. If we assume thathis absolute calibration was correct, then his published value for one pa-tient was low,' the values for three patients were 10 to 15 percent high andthe values for two patients were about 175 percent of the true value.
Acknowledgement
The authors are pleased to acknowledge the assistance of Dr. RonaldA. Hamelink, Mr. Burton S. Garbow, and Mr. Donald F. Jordan of the AppliedMathematics Division, who provided considerable assistance with the corn-
puter programs used in the preparation of this paper. Mr. Henry F. Lucas
kindly provided us with radon breath analyses for some of the patients.Mr. John B. Corcoran and Mr. Carter A. Priess provided technical assis-tance with the whole-body measurements. Mrs. Marilyn Langler, R.N.,Miss Regina Wall, R.N., and Mrs. Edna Fadden, R.N. helped with thehandling of patients. The interest and cooperation of Dr. Werner Tuteurof the Elgin State Hospital and Dr. R. J. Graff of the Manteno State Hospitalmade the recent studies possible.
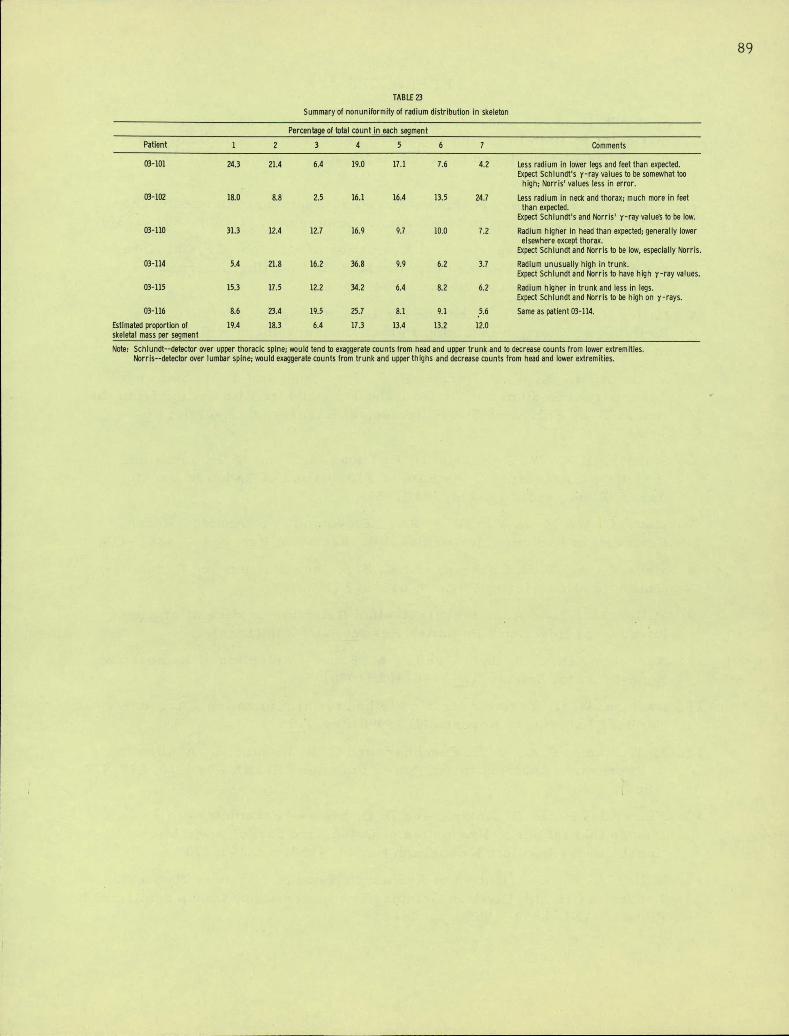
89
TABLE 23
Summary of nonuniformity of radium distribution in skeleton
Percentage of total countin_exh segment
Patient 1 2 3 4 5 6 7 Comments
03-101 24.3 21.4 6.4 19.0 17.1 7.6 4.2 Less radium In lower legs and feet than expected.
Expect Schlundt's y-ray values to be somewhat toohigh; Norris' values less In error.
03-102 18.0 8.8 2.5 16.1 16.4 13.5 24.7 Less radium in neck and thorax; much more in feetthan expected.
Expect Schlundt's and Norris' y-ray values to be low.
03-110 31.3 12.4 12.7 16.9 9.7 10.0 7.2 Radium higher in head than expected; generally lower
elsewhere except thorax.Rpect Schlundtand Norris to be low, especially Norris.
03-114 5.4 21.8 16.2 36.8 9.9 6.2 3.7 Radium unusually high In trunk.
Expect Schlundt and Norris to have high y-ray values.
03-115 15.3 17.5 12.2 34.2 6.4 8.2 6.2 Radium higher in trunk and less in legs.
Expect Schlundt and Norris to be high on y-rays.03-116 8.6 23.4 19.5 25.7 8.1 9.1 5.6 Same as patient 03-114.
Estimated proportion of 19.4 18.3 6.4 17.3 13.4 13.2 12.0
skeletal mass per segment
Note: Schlundt--detector over upper thorack spine; would tend to exaggerate counts from head and upper trunk and to decrease counts from lower extremities.Norris--detector over lumbar spine; would exaggerate counts from trunk and upper thighs and decrease counts from head and lower extremities.
90
REFERENCES
1. Schlundt, H., J. T. Nerancy, and J. P. Morris. The Detection and Esti-mation of Radium in Living Persons. IV. The Retention of Soluble Ra-dium Salts Administered Intravenously. Am. J. Roentgenol. 30, 515-522(1933).
2. Norris, W. P., T. W. Speckman, and P. F. Gustafson. Studies of theMetabolism of Radium in Man. Am. J. Roentgenol. 73, 785-802 (1955).
3. Miller, C.E. An Experimental Evaluation of Multiple-C rystal Arraysand Single-Crystal Techniques. Whole Body Counting, InternationalAtomic Energy Agency, Vienna, 1962, pp. 81-120.
4. Miller, C.E. A New Technique for Determining the Distribution ofRadium and Thorium in Living Persons. Assessment of Radioactivityin Man, International Atomic Energy Agency, Vienna, 1964, pp. 67-77.
5. Marinelli, L. D., W. P. Norris, P. F. Gustafson, and T. W. Speckman.Transport of Radium Sulfate from the Lung and Its Elimination from theHuman Body Following Single Accidental Exposures. Radiology 61,903-914 (1953).
6. Stehney, A. F., W. P. Norris, H. F. Lucas, Jr., and W. H. Johnston.A Method for Measuring the Rate of Elimination of Radon in Breath.
Am. J. Roentgenol. 73, 774-783 (1955).
7. Mays, C. W., M. A. Van Dilla, R. L. Floyd, and J. S. Arnold. RadonRetention in Radium-Injected Beagles. Radiation Res. 8, 480-489 (1958).
8. Mays, C. W., T. H. Cochran, and W. S. S. Jee. Radium and Radon Re-tention in Mice, Health Phys.-9, 615-619 (1963).
9. Miller, C. E., and A. J. Finkel. Radium Retention in Mice after SingleIntravenous Injection. Radiation Res. 26, 269-286 (1965).
10. Norris, W. P., S. A. Tyler, and A. M. Brues. Retention of RadioactiveBone-Seekers. Science 128, 456-462 (1958).
11. Davidon, W. C. Variable Metric Method for Minimization. ArgonneNational Laboratory Report ANL-5990 Rev. (1959).
12. McWilliams, P. C., J. E. Furchner, and C. R. Richmond. Applicationof Regression Analysis to the Power Function. Health Phys. 12, 817-822(1964).
13. Finkel, M. P., P. B. Jinkins, and B. 0. Biskis. Parameters of Radiation
Dosage that Influence Production of Osteogenic Sarcomas in Mice. Na-tional Cancer Institute Monograph No. 14, 1964, pp. 243-270.
14. Miller, C.E. Distribution of Radium in Humans . Argonne NationalLaboratory Health Division Gamma-Ray Spectroscopy Group SemiannualReport. ANL-6839 (1965), pp. 18-23.
91
EVALUATION OF THE IMPROVED POWER FUNCTION
Charles E. Miller and Asher J. Finkel
Speckman and Norrisl and Decker, Kasper and Norrisz have demon-strated that the retention of Sr85 in mice, rats and dogs injected at any agecan be fitted more accurately with the expression, R = a(t + d)-b than withthe simple power function, R = a t- b. They state 1) that the optimum valueof d required to provide the best fit to .the experimental data is a functionof the age of the animals, 2) that the value of b, which may vary from spe-cies to species, is constant for animals of all ages within any species if theoptimum value of d is employed, and 3) that the value of b found with theimproved power function is the same value that fits the long-term measure-ment with a simple power function. They propose that once the equation ford as a function of age and the value of b are deterrinined for a particularisotope for a given species, it will then be possible to calculate the buildupand retention of this isotope in the animal under the conditions of constantingestion.
In a recent paper,3 we fitted retenti6n data for radium in mice bothwith a series of discontinuous power functions and with the sums of a seriesof exponential terms. These analyses demonstrated that the retention ofradium in one mouse ,(No. 52), for example, could be appr oximated by onepower function (slope = -0.2046) from 250 through 20,000 minutes, and witha second power function (slope = -0.2919) from 20,000 through 628,000 min-utes. Similarly, the retention by another mouse (No. 54) could be fitted byone power function (slope = -0.2531) from 250 through 39,000 minutes, by asecond power function (slope = -0.4458) from 39,000 through 100,000 minutes,and by a third power function (slope = -0.2916) from 100,000 through586,000.minutes (see Figure 10). It was also shown that the sum of fourexponential terms fitted the experimental data almost exactly from the tim eof injection, instead of from 250 minutes on, Uritil the death of the animal.These mouse data, which are very accurate, have been used to study theimproved power function, R = a(t +.d)-b.
Methods and Results
Application of the Improved Power Function to Mouse Data
In order to be able to evaluate the improvement in fit provided byincremental changes in d and to employ an existing computer programthat fitted the data with the simple power function,.R=a t-b, the followingprocedure was employed. Arbitrarily selected values of time, d, such as50, 100, 200 minutes, etc., were added in turn to the time of each measure-ment made on a particular mouse·. Each complete series of measurements
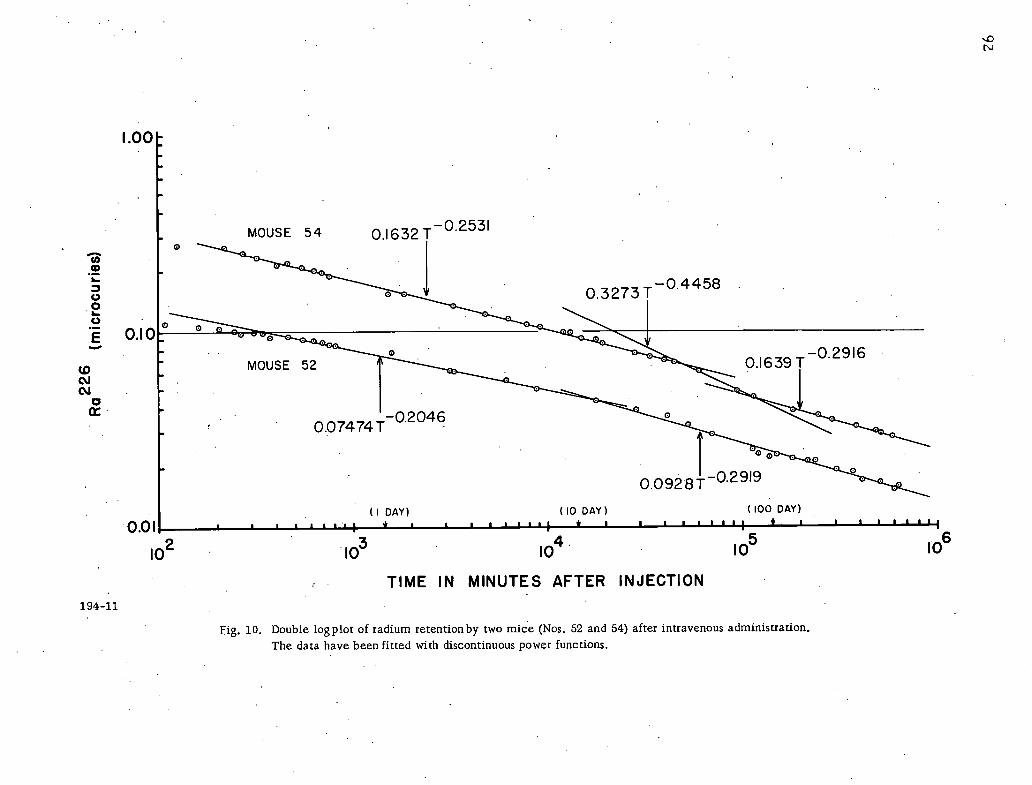
.0rv
1.00
-0.2531MOUSE 54 0.1632 T0
-2
f -0.4458O V 0.3273T
023 \\\1 OAO. 0 0 4 .0 9*I - 0 -0.2916
Co MOUSE 52 01639-CJCJ0 Wa: .
-0.2046 e0.07474 T
A
0e
0.0928 -0 2919
(1 DAY) (10 DAY) ( 100 DAY)
0.01 ..1 * ' 'll I.''I * I " / " / 1,/1 * 1 I I I, '''I
2 3 4 5 610 10 10 10 10
TIME IN MINUTES AFTER INJECTION194-11
Fig. 10. Double log plot of radium retention by two mice (Nos. 52 and 54) after intravenous administration.The data have been fitted with discontinuous power functions.
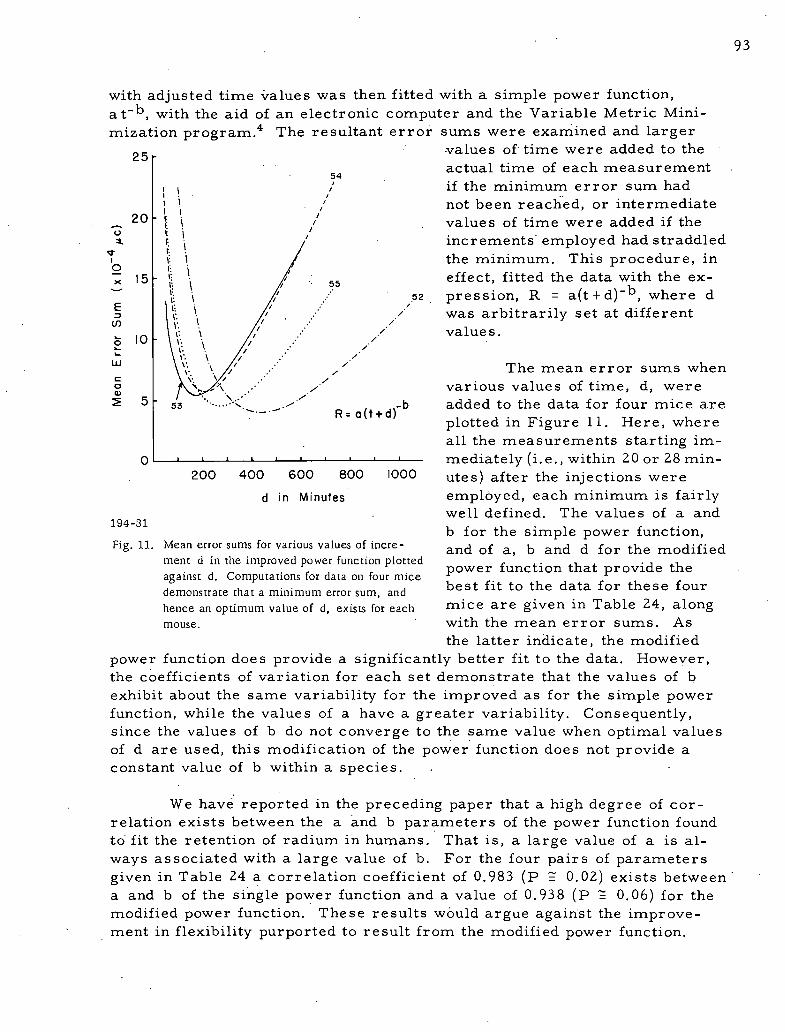
93
with adjusted time *alues was then fitted with a simple power function,at-b, with the aid of an electronic computer and the Variable Metric Mini-mization program.4 The resultant error sums were examined and larger
25- -values of time were added to theactual time of each measurement
54
i if the minimum error sum had11 / not been reached, or intermediate
_ 20 - 1 values of time were added if theO tl
4. ; i increments employed had straddled.t
1 E 1 the minimum. This procedure, in2 ' :1 ' effect, fitted the data with the ex-x 1 5- 1,j j 55-
li / 52 pression, R = a(t+d)-b, where d/
E 1: 13 ,. , ' / was arbitrarily set at different0 1. 1 / ·' /t
1 0 - t.: 1.1, · ./ values.'
/. / I- E \ / C /LU \· · : The mean error sums whenc i.. 1, ,/ ..· .//O .. -7\. .... / various values of time, d, were· 05 5- .......
53 .- -b added to the data for four mice are%.-IM R=a(t+d)plotted in Figure 11. Here, whereall the measurements starting im-
O ··• mediately (i.e., within 20 or 28 min-200 400 600 800 1000 utes) after the injections were
d in Minutes employed, each minimum is fairlywell defined. The values of a and
194-31b for the simple power function,
Fig. 11. Mean error sums for various values of incre- and of a, b and d for the modifiedment d in the improved power function plotted
power function that provide theagainst d. Computations for data on four micebest fit to the data for these fourdemonstrate that a minimum error sum, and
hence an optimum value of d, exists for each mice are given in Table 24, alongmouse. with the mean error sums. As
the latter indicate, the modifiedpower function does provide a significantly better fit to the data. However,the coefficients of variation for each set demonstrate that the values of bexhibit about the same variability for the improved as for the simple powerfunction, while the values of a have a greater variability. Consequently,since the values of b do not converge to the same value when optimal valuesof d are used, this modification of the power function does not provide aconstant value of b within a species.
We have reported in the preceding paper that a high degree of cor-relation exists between the a and b parameters of the power function foundto fit the retention of radium in humans. That is, a large value of a is al-ways associated with a large value of b. For the four pairs of parametersgiven in Table 24 a correlation coefficient of 0.983 (P 2 0.02) exists betweena and b of the single power function and a value of 0.938 (P Z 0.06) for themodified power function. These results w6uld argue against the improve-ment in flexibility purported to result from the modified power function.
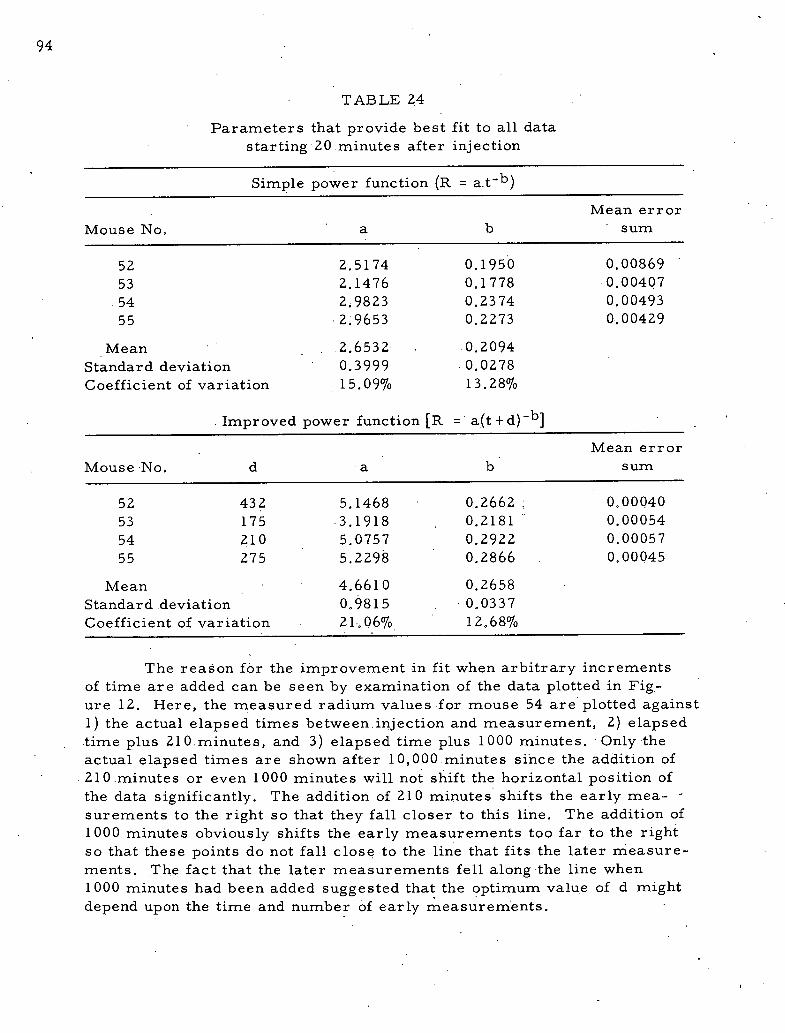
94
TABLE 24
Parameters that provide best fit to all datastarting 20 minutes after injection
Simple power function (R = a.t-b)Mean error
Mouse No. a b sum
52 2.5174 0.1950 0.0086953 2.1476 0.1778 .0.00407
54 2.9823 0.2374 0.0049355 2.9653 0.2273 0.00429
Mean 2.6532 0.2094
Standard deviation 0.3999 0.0278
Coefficient of variation 15.09% 13.28%
Improved power function [R = a(t + d) -b]Mean error
Mouse No. d a b sum
52 432 5.1468 0.2662 0o 00040
53 175 .3.1918 0.2181 0.0005454 210 5.0757 0.2922 0.0005755 275 5.2298 0.2866 0.00045
Mean 4.6610 0.2658Standard deviation 0.9815 0.0337Coefficient of variation 21·.06% 12.68%
The reagon for the improvement in fit when arbitrary incrementsof time are added can be seen by examination of the data plotted in Fig-ure 12. Here, the measured radium values for mouse 54 are plotted against1) the actual elapsed times between injection and measurement, 2) elapsedtime plus 210 minutes, and 3) elapsed time plus 1000 minutes. Only theactual elapsed times are shown after 10,000 minutes since the addition of210 minutes or even 1000 minutes will not shift the horizontal position ofthe data significantly. The addition of 210 minutes shifts the early mea- «surements to the right so that they fall closer to this line. The addition of1000 minutes obviously shifts the early measurements too far to the rightso that these points do not fall close to the line that fits the later measure-ments. The fact that the later measurements fell along the line when1000 minutes had been added suggested that the optimum value of d mightdepend upon the time and number of early measurements.
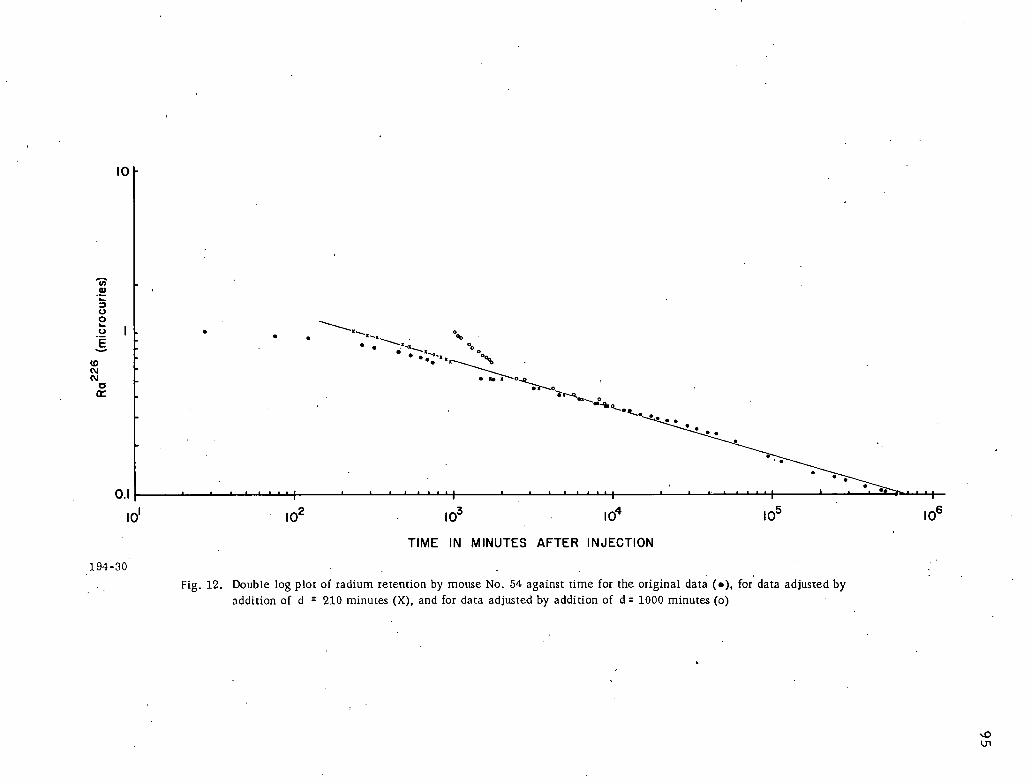
10 -
3a'.-
&5009 1. -I...0
.-, «%E . . \-:.-I-I0. C.... 0.4*
80 2 .4.-.-
-ix--4--00-*C.<. 0. . .....
..0.1 1 1 1 1 ' ...··1
i o' 1 02 1 03 1 04 1 05 1 06
TIME IN MINUTES AFTER INJECTION
194-30
Fig. 12. Double log plot of radium retention by mouse No. 54 against time for the original data (•), for' data adjusted byaddition of d : 210 minutes (X), and for data adjusted by addition of d = 1000 minutes (o)
\0Ul
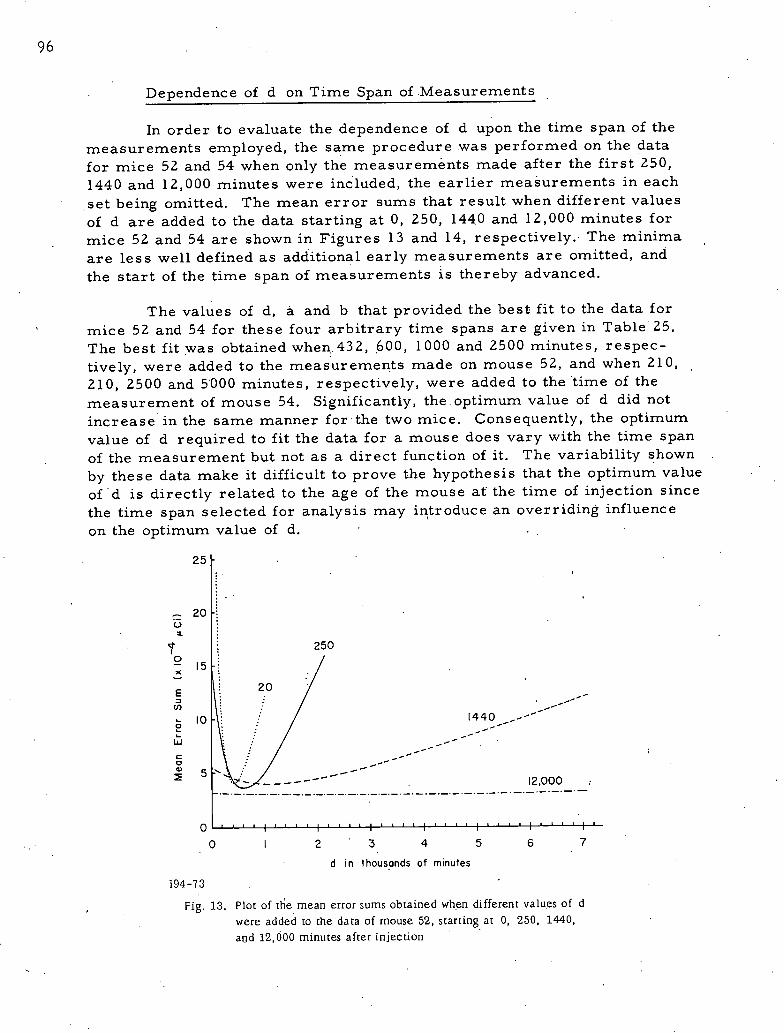
96
Dependence of d on Time Span of Measurements
In order to evaluate the dependence of d upon the time span of themeasurements employed, the same procedure was performed on the datafor mice 52 and 54 when only the measurements made after the first 250,1440 and 12,000 minutes were included, the earlier measurements in eachset being omitted. The mean error sums that result when different valuesof d are added to the data starting at 0, 250, 1440 and 12,000 minutes formice 52 and 54 are shown in Figures 13 and 14, respectively. The minimaare less well defined as additional early measurements are omitted, andthe start of the time span of measurements is thereby advanced.
The values of d, a and b that provided the best fit to the data formice 52 and 54 for these four arbitrary time spans are given in Table 25.The best fit was obtained when. 432, 600, 1000 and 2500 minutes, respec-tively, were added to the measurements made on mouse 52, and when 210,210, 2500 and 5000 minutes, respectively, were added to the time of themeasurement of mouse 54. Significantly, the optimum value of d did notincrease in the same manner for·the two mice. Consequently, the optimumvalue of d required to fit the data for a mouse does vary with the time spanof the measurement but not as a direct function of it. The variability shownby these data make it difficult to prove the hypothesis that the optimum valueof d is directly related to the age of the mouse at the time of injection since
the time span selected for analysis may introduce an overriding influenceon the optimum value of d.
25 -
- 20 -D E/
i 250
E 15 711. 29 1 ---E
--
fo Ii: 1440 .,-<---
-2 U i / --a kil -"'
\:1 - -
, I:/ ----
a 5 .> A-/ / - ----1-L ----I 12,000
-.-.
0
0 2 3 4 5 6 7d in thousands of minutes
194-73
Fig. 13. Plot of the mean error sums obtained when different values of dwere added to the data of mouse 52, starting at 0, 250, 1440,and 12,000 minutes after injection
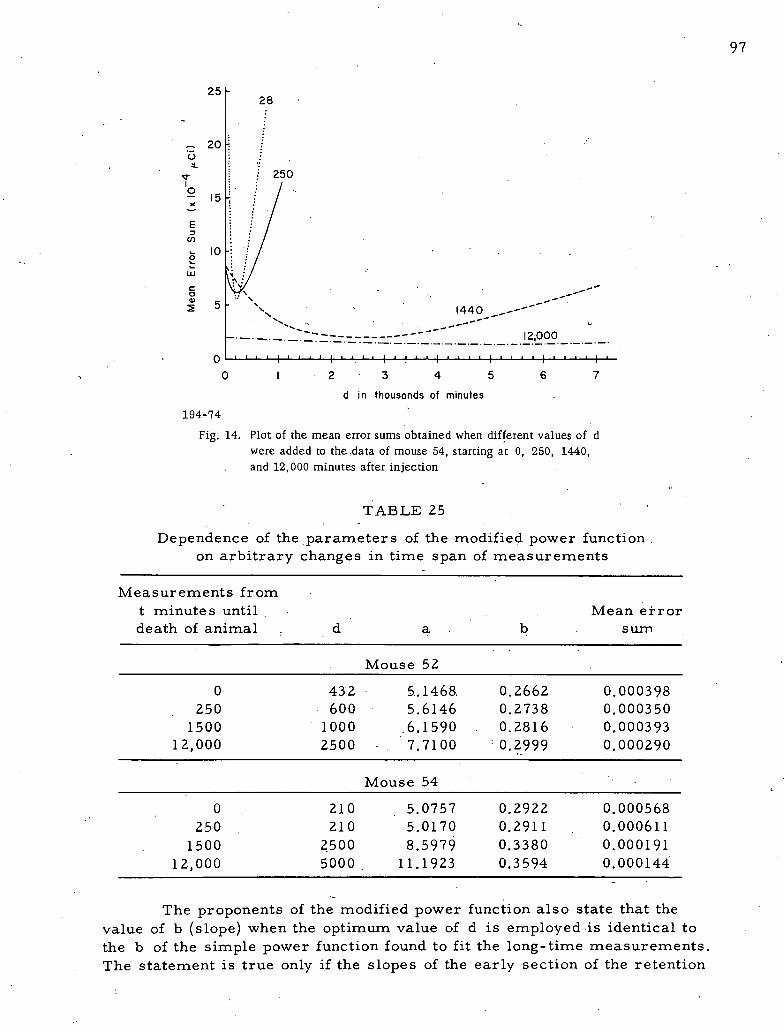
97
25 -28
/ i250
2 15 1
E
(/)
loB &
g .\ .. --
----
5 - ': 1440_----'<-
12,000
0
0 2 3 4 5 6 7d in thousands of minutes
194-74
Fig. 14. Plot of the mean error sums obtained when different values of dwere added to the :data of mouse 54, starting at 0, 250, 1440,and 12, 000 minutes after injection
TABLE 25
Dependence of the parameters of the modified power functionon arbitrary changes in time span of measurements
Measurements fromt minute s until Mean etrordeath of animal d a b sum
Mouse 52
0 432 5.1468. 0.2662 0.000398250 600 5.6146 0.2738 0.000350
1500 1000 .6.1590 0.2816 0.00039312,000 2500 7.7100 0.2999 0.000290
Mouse 54
0 210 5.0757 0.2922 0.000568250 210 5.0170 0.2911 0.000611
1500 2500 8.5979 0.3380 0.000191
12,000 5000 11.1923 0.3594 0.000144
The proponents of the modified power function also state that thevalue of b (slope) when the optimum value of d is employed is identical tothe b of the simple power function found to fit the long-time measurements.The statement is true only if the slopes of the early section of the retention
98
curve are never steeper than the long-term segment. As can be seen inTable 25, the value of b found for both mice increased progressively as themeasurements made during the first 250, 1400 and 12,000 minutes wereomitted. The later two values of b (0.2816 and 0.2999) found to fit the data
' for mouse 52 starting at 1500 and 12,000 minutes, respectively, do agreequite well with the value of 0.2919 found to fit the last portion of the datawith the simple power function (Figure 10). Moreover, for mouse 54 thevalues of b (0.2922 and 0.2911) found to fit all of the data or those from250 minutes onward, respectively, do agree with the value of b (0.2916)for the last portion of the data fit by the simple power function found to fit.However, the values of b (0.3380 and 0.3594) found to fit the data from 1500and 12,000 minutes onward were much higher than the final slope due to thesteep middle section. It thus appears that the use of the modified powerfunction [R = a(t + d)-b] may or may not yield a value of b which.is thesame as the long-term value or the same value for all animals of the samespecies.
Interdependence of a on b and b on d
From a visual inspection of the values of a, b and d given.inTable 25 for either mouse, one would suspect that these terms are highlycorrelated with each other but not with the time span of the measurementsemployed. By computer analysis, correlation coefficients of 0.997 and0.993 (P < 0.01) were found between a and b, and of 0.978 and 0.979(P - 0.02) between d and b for mice 52 and 54, respectively. This highdegree of correlation simply means that a and b .increase in a predictablemanner as d is increased.
The thesis has been put forth that the introduction of the d terminto the power function permits the a term to assume magnitudes differentfrom the actual one-day value.1 Consequently, the modified power functionsupposedly has one more degree of freedom than the simple power function.Actually, the value of a is still almost completely defined by the value ofb and is, in effect, the one-day value of the simple power function requiredto fit data.that have been translated d amount of time to. the right along thex axis. In practice, the fact that the a of the modified power function hasa.value different from the actual one-day value only complicates the prob-lem since now the magnitude of a varies over a wide range.
This situation can be demonstrated with the results obtained whenthe data of mice 52 and 54 from 12,000 minutes onward were fitted with themodified power function. The values of a, b and the resultant mean errorsums found for different values of d-from 0 to 10,000 minutes are given inTable 26. Practically the same fit to the data, i.e., mean error sum, wasobtained for any value of d from 0 to 10,000, For both mice and for thisrange of d, the value of b increased about 18 percent while the value of adoubled. Although this change in b might be considered to be insignificant,
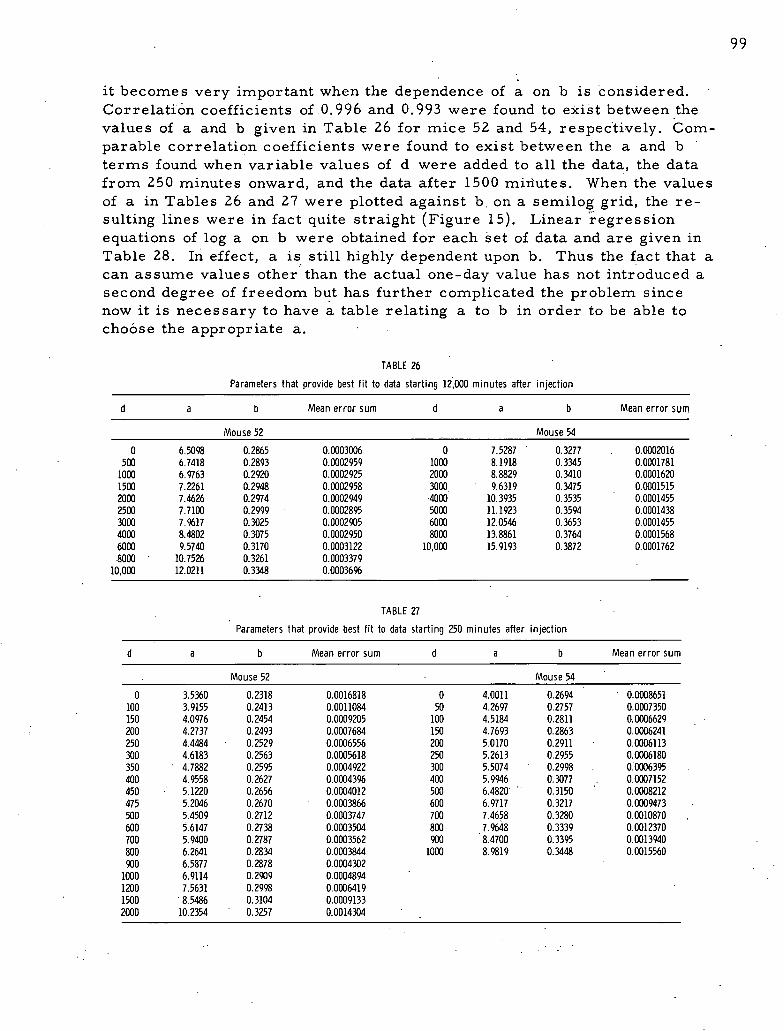
99
it becomes very important when the dependence of a on b is considered.Correlati6n coefficients of 0.996 and 0.993 were found to exist between thevalues of a and b given in Table 26 for mice 52 and 54, respectively. Com-parable correlation coefficients were found to exist between the a and bterms found when variable values of d were added to all the data, the datafrom 250 minutes onward, and the data after 1500 miriutes. When the valuesof a in Tables 26 and 27 were plotted against b on a semilog grid, the re-sulting lines were in fact quite straight (Figure 15). Linear regressionequations of log a on b were obtained for each set of data and are given inTable 28. In effect, a is still highly dependent upon b. Thus the fact that acan assume values other than the actual one-day value has not introduced asecond degree of freedom but has further complicated the problem sincenow it is necessary to have a table relating a to b in order to be able tochoose the appropriate a.
TABLE 26
Parameters that provide best fit to data starting 12,000 minutes after injection
d a b Mean error sum d a b Mean error sum
Mouse 52 Mouse 54
0 6.5098 0.2865 0.0003006 0 7.5287 0.3277 0.0002016
500 6.7418 0.2893 0.0002959 1000 8.1918 0.3345 0.0001781
1000 6.9763 0.2920 0.0002925 2000 8.8829 0.3410 0.0001620
1500 7.2261 0.2948 0.0002958 3000 9.6319 0.3475 0.0001515
2000 7.4626 0.2974 0.0002949 ·4000 10.3935 0.3535 0.0001455
2500 7.7100 0.2999 0.0002895 5000 11.1923 0.3594 0.0001438
3000 7.%17 0.3025 0.0002905 6000 12.0546 0.3653 0.0001455
4000 8.4802 0.3075 0.0002950 8000 13.8861 0.3764 0.0001568
6000 9.5740 0.3170 0.0003122 10,000 15.9193 0.3872 0.0001762
8000 10.7526 0.3261 0.0003379
10,000 12.0211 0.3348 0.00036%
TABLE 27
Parameters that provide best fit to data starting 250 minutes after injection
d a b Mean error sum d a b Mean error sum
Mouse 52 Mouse 54
0 15360 0.2318 0.0016818 0 4.0011 0.2694 0.0008651
100 3.9155 0.2413 0.0011084 50 4.2697 0.2757 0.0007350
150 4.0976 0.2454 0.0009205 100 4.5184 0.2811 0.0006629
200 4.2737 0.2493 0.0007684 150 4.7693 0.2863 0.0006241
250 4.4484 0.2529 0.0006556 200 5.0170 0.2911 0.0006113
300 4.6183 0.2563 0.0005618 250 5.2613 0.2955 0.0006180
350 4.7882 0.2595 0.0004922 300 5.5074 0.2998 0.0006395
400 4.9558 0.2627 0.0004396 400 5.9946 0.3077 0.0007152
450 5.1220 0.2656 0.0004012 500 6.4820 0.3150 0.0008212
475 5.2046 0.2670 0.0003866 600 6.9717 0.3217 0.0009473
500 5.4509 0.2712 0.0003747 700 7.4658 0.3280 0.0010870
600 5.6147 0.2738 0.0003504 800 7.9648 0.3339 0.0012370
700 5.9400 0.2787 0.0003562 900 8.4700 0.3395 0.0013940
800 6.2641 0.2834 0.0003844 1000 8.9819 0.3448 0.0015560
900 6.5877 0.2878 0.0004302
1000 6.9114 0.2909 0.0004894
1200 7.5631 0.2998 0.0006419
1500'
8.5486 0.3104 0.0009133
2000 10.2354 0.3257 0.0014304
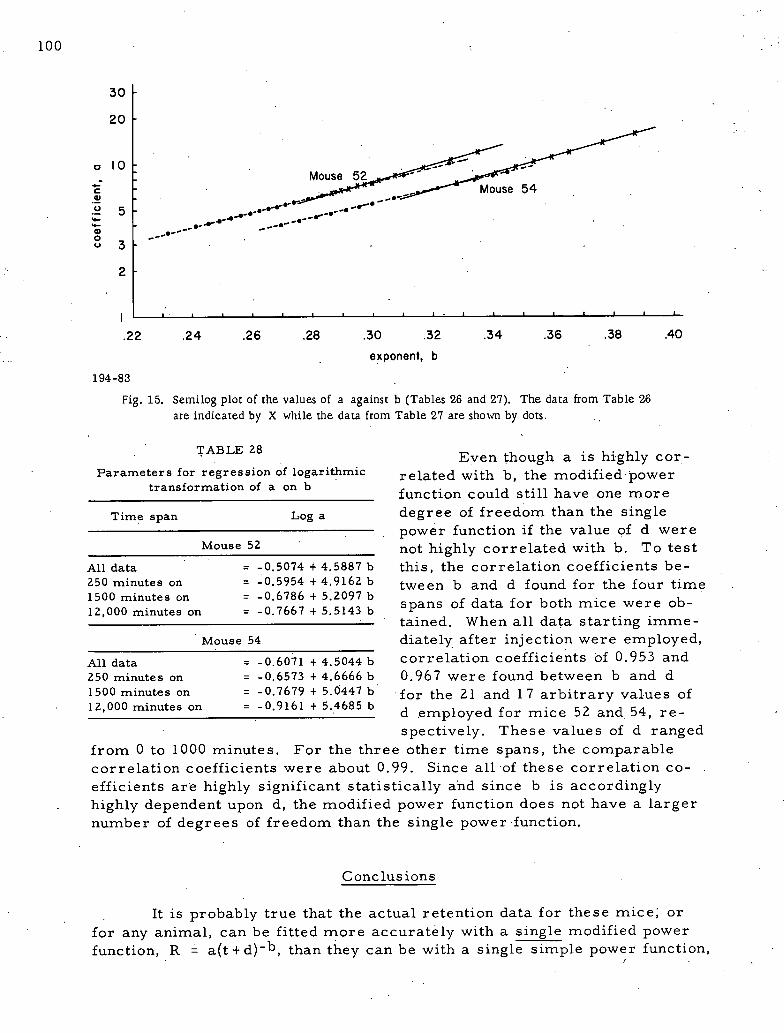
100
30 -
20 -
O 10 - r--
- Mouse ..524 :,r --13:
-:- '*0 + *:-
Mouse 54
2 5- ......'. -4.04- A-4-400 --It-.-- -'. -
.,
8 -.-----O 3-
2-
1
.22 .24 .26 .28 .30 .32 .34 .36 .38 .40
exponent, b
194-83
Fig. 15. Semilog plot of the values of a against b (Tables 26 and 27). The data from Table 26are indicated by X while the data from Table 27 are shown by dots.
TABLE 28 Even though a is highly cor-Parameters for regression of logarithmic related with b, the modified·power
transformation of a on b function could still have one moreTime span Log a degree of freedom than the single
power function if the value of d wereMouse 52 not highly correlated with b. To test
All data = -0.5074 + 4.5887 b this, the correlation coefficients be-250 minute s on = -0.5954 + 4.9162 b tween b and d found for the four time1500 minutes on = -0.6786 + 5.2097 b
spans of data for both mice were ob-12,000 minutes on = -0.7667 + 5.5143 btained. When all data starting imme-
Mouse 54 diately after injection were employed,All data = -0.6071 + 4.5044 b correlation coefficients of 0.953 and250 minutes on = -0.6573 + 4.6666 b 0.967 were found between b and d1500 minutes on = -0.7679 + 5.0447 b for the 21 and 17 arbitrary values of12,000 minutes on = -0,9161 + 5.4685 b
d employed for mice 52 and 54, re-spectively. These values of d ranged
from 0 to 1000 minutes. For the three other time spans, the comparablecorrelation coefficients were about 0.99. Since all of these correlation co-efficients are highly significant statistically and since b is accordinglyhighly dependent upon d, the modified power function does not have a largernumber of degrees of freedom than the single power function.
Conclusions
It is probably true that the actual retention data for these mice; orfor any animal, can be fitted more accurately with a single modified powerfunction, R = a(t + d)-b, than they can be with a single simple power function,

101
R = at- b. The addition of optimum value of d effectively transposes theearly measurements to appropriate times either longer or shorter than theactual. times so that they fall closer to the straight line prescribed by thesimple power function. that fits the long-term measurement.
However, it is doubtful that the constants for a generally improvedpower function that fits all animals of different ages within a species canbe derived. The magnitude of d required to provide.the best· fit to a par-ticular set of retention data is highly dependent upon the time schedule ofmeasurements after the injection. Since this value of d does not vary sys-tematically for all animals as the elapsed time between injection and thefirst measurement is increased, the value of d cannot be related only tothe age of the animal at the time of injection.
The magnitude of both a and.b depends both upon the time span ofthe measurement and the value of d employed. In addition, even if the long-term retentions in animals of all ages were identical, the value of b wouldconverge to the value of the simple power function required to fit the long-term retention only if the slope of the retention curve during earlier timewere never steeper than the final section.
The substitution of the modified power function for the simple powerfunction destroys the usual arguments put forth in behalf of the simplepower function over the sum of a series of exponentials, i.e., the .simplicityof the function and the fact that there are only two constants whose magni-tudes are fairly well known and which can be easily remembered. Now,instead, there are three interrelated constants and the magnitude of a, inparticular, varies over a. wide ra.nge.
REFERENCES
1. Speckman, T. W., and W. P. Norris. The Age-Dependence of StrontiumRetention in Rats and Mice. Radiation Res. 23, 461 (1964).
2. Decker, C. F., L. V. Kaspar, and W. P. Norris. The Variation ofStrontium Metabolism with Age in the Dog. Radiation Res. 23, 475 (1964).
3. Miller, C. E., and A. J. Finkel. Radium Retention in Mice after SingleIntravenous Injection. Radiation Res. 26, 269 (1965).
4. Davidon, W. C. Variable Metric Method for Minimization. ArgonneNational Laboratory Report ANL-5990 Rev.. (1959).
103
CESIUM- 137 RETENTION IN MICE OF DIFFERENT AGES
Charles E. Miller, Asher J. Firikel, and Nancy B. Wrigh *
137Some question exists as to the biological half-time of Cs in man.At the international symposium on Assessment of Radioactivity in Manheld in Heidelberg, Germany, May, 1964, a number of papers were devotedto a review of the results obtained by investigations in several countries.1Some investigators reported half-times as short as 10 days for newbornhumans, 30 or 40 days for children and 60 to 150 days for adults. Since thisage effect is opposite to that we had observed for the retention of radium inmice, we undertook a study of the retention of Cs in rnice as a function of137
age.
CS137 chloride was injected intravenously into mice of varying ages:21 days, 30 days, 3 months, 1'1 months, 22 months and 32 months. Eachinjection of 0.1 mlcontained about 0.2 Mci CS 13; which gave about50,000 counts per minute in the mouse with our counting system. Each agegroup consisted of six female mice except for the oldest group, which con-sisted of five mice. Each mouse was placed in a thin, perforated holderand counted under the face of an 8-inch-diameter by 4-inch-thick NaI (Tl)crystal that was located in the human whole-body counter.
»
The Cs content of each mouse was measured 2 minutes after in-137
jection and again about 400 minutes later. Subsequent measurements weremade every day for the next 15 days and then less frequently until the Cs 137
content haddecreasedto 0.1 percent of the amount injected (35th to 65th day).
Results and Analysis of Data
The average Cs content of the mice in each age group and the137
elapsed time between injection and rneasurement are given in detail inTables 36 to 41 of the Appendix. The Cs content is given as ta fraction of137
the quantity present at the time of the first measurement immediately afterinjection.
The results obtained for the six age groups form a rather consistentpattern. In general, the younger the mice, the more rapidly they lost cesium(Table 29). After the mice were one year. old the retention values tended tocluster together and the very old mice appeared to retain cesium somewhatless avidly than did the mice that were 11 and 22 months old at the time ofinjection.
*Biological and Medical Research Division.
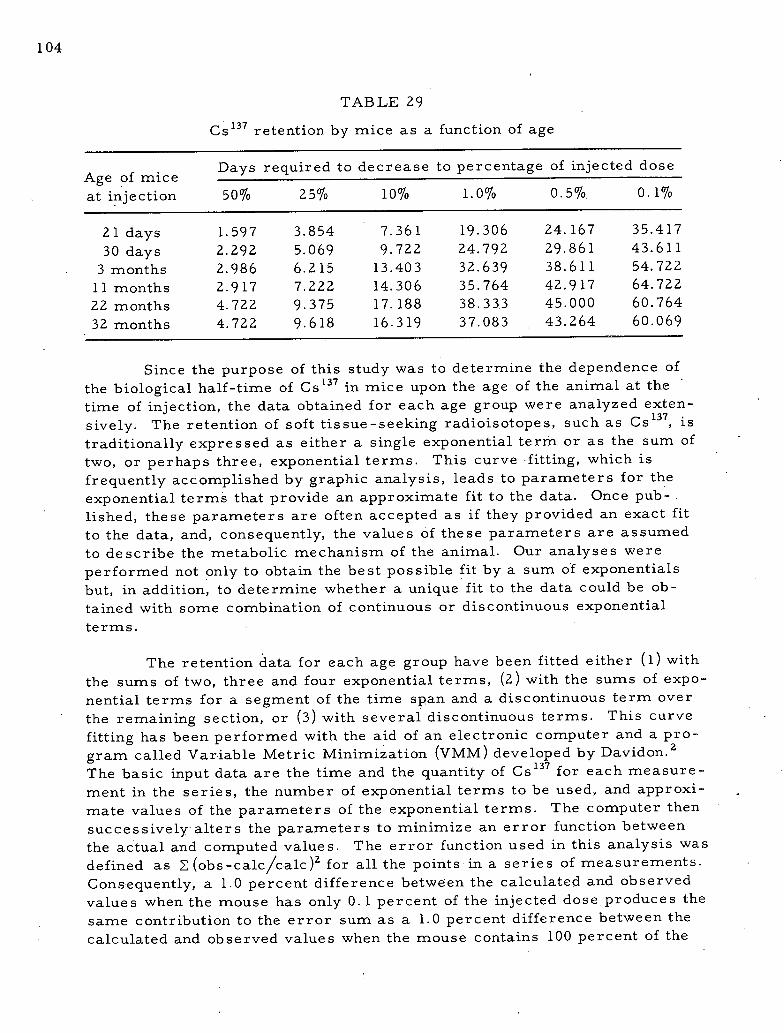
104
TABLE 29
CS137 retention by mice as a function of age
Days required to decrease to percentage of injected doseAge of miceat injection 50% 25% 10% 1.0% 0.5%. 0.1%
21 days 1.597 3.854 7.361 19.306 24.167 35.417
30 days 2.292 5.069 9.722 24.792 29.861 43.611
3 rrlonths 2.986 6.215 13.403 32.639 38.611 54.722
11 nlonths 2.917 7.222 14.306 35.764 42.917 64.722
22 nlonths 4.722 9.375 17.188 38.333 45.000 60.764
32 nlonths 4.722 9.618 16.319 37.083 43.264 60.069
Since the purpose of this study was to determine the dependence of137the biological half-time of Cs in mice upon the age of the animal at the
time of injection, the data obtained for each age group were analyzed exten-137
sively. The retention of soft tissue-seeking radioisotopes, such as Cs , istraditionally expressed as either a single exponential term or as the sum oftwo, or perhaps three, exponential terms. This curve fitting, which isfrequently accomplished by graphic analysis, leads to parameters for theexponential terms that provide an approximate fit to the data. Once pub -lished, these parameters are often accepted as if they provided an exact fit
to the data, and, consequently, the values 6f these parameters are assumedto describe the metabolic mechanism of the animal. Our analyses wereperformed not only to obtain the best possible fit by a sum of exponentialsbut, in addition, to determine whether a unique fit to the data could be ob-tained with some combination of continuous or discontinuous exponentialterrns.
The retention data for each age group have been fitted either (1) withthe sums of two, three and four exponential terms, (2) with the sums of expo-nential terms for a segment of the time span and a discontinuous term overthe remaining section, or (3) with several discontinuous terms. This curve
fitting has been performed with the aid of an electronic computer and a pro-gram called Variable Metric Minimization (VMM) developed by Davidon. 2The basic input data are the time and the quantity of Cs 137 for each measure-ment in the series, the number of exponential terms to be used, and approxi-mate values of the parameters of the exponential terms. The computer thensuccessively· alters the parameters to minimize an error function betweenthe actual and computed values. The error function used in this analysis wasdefined as E (obs-calc/calc)2 for all the points inaseries of measurements.
Consequently, a 1.0 percent difference between the calculated and observedvalues when the mouse has only 0.1 percent of the injected dose produces thesame contribution to the error sum as a 1.0 percent difference between thecalculated and observed values when the mouse contains 100 percent of the
105
injected dose. It was necessary to define the error sum in this way if thesmall values at long times were to contribute a large enough component tothe error function to enable the computer to fit these small values with along half-time term.
This program includes one feature that can be of importance fordata fitting. The program cannot employ more exponential terms than
specified on the input format but it can and will, for all practical purposes,eliminate terms by converging the half-time of two or more exponents tothe same value if the data can be best fitted by fewer terms than specified.If a sufficient number of accurate measurements are available, the programwill arrive at the unique solution of, for instance, three exponential terms,even though the observations span a relatively small lapse of time.
For the time of each measurement the computer output lists theobserved values, the values calculated by use of the parameters that providedthe best fit, and the percentage difference between actual and computedvalues. In addition, the computer gives the parameters for the best fit andthe total error sum. These quantities, particularly the percentage differ-ences, can be visually scanned to evaluate the fit and to determine whetherthe set of parameters provide a unique fit (i.e., computed values departfrom the observed values within the limits of counting errors) or on].y thebest fit with a given function.
It turns out that the retention data for Cs injected intravenously137
into mice of various ages cannot be fitted with the same number of exponen-tial terms by permitting only the parameters to vary. Consequently, theanalysis of the data for each age group will be discussed separately.
21-Day-Old Mice
When plotted on semilog paper, all of the retention data of the
21-day-old mice from 2 minutes after injection through 55,000 minute s(38 days), when they contained less than 0.1 percent of the amount injected,fell along a continuous curve which approached a straight line at long time s(Figure 16). This entire set of data can be fittedvery closely with the sum ofthree expohential terms. Although measurements (on the 11.2 and 32nd days)fell about 6 percent above and ohe measurement (on the 16.9th day) fell about5 percent below the values predicted by the sum of three exponentials, mostof the actual values fell within 1 percent of the computed values.
The parameterh obtained for the sum of a series of two, three andfour terms and the resultant error sums are given in Table 30. The sum oftwo exponential terms did not provide as good a fit to the data as did the sumof three exponentials. When four terms were employ'ed, the computer re-duced two exponents to the same value and effectively returned to the salhevalues that were found when only three terms were employedy The sum ofthree exponentials can be accepted as a reasonably exact fit to the data.
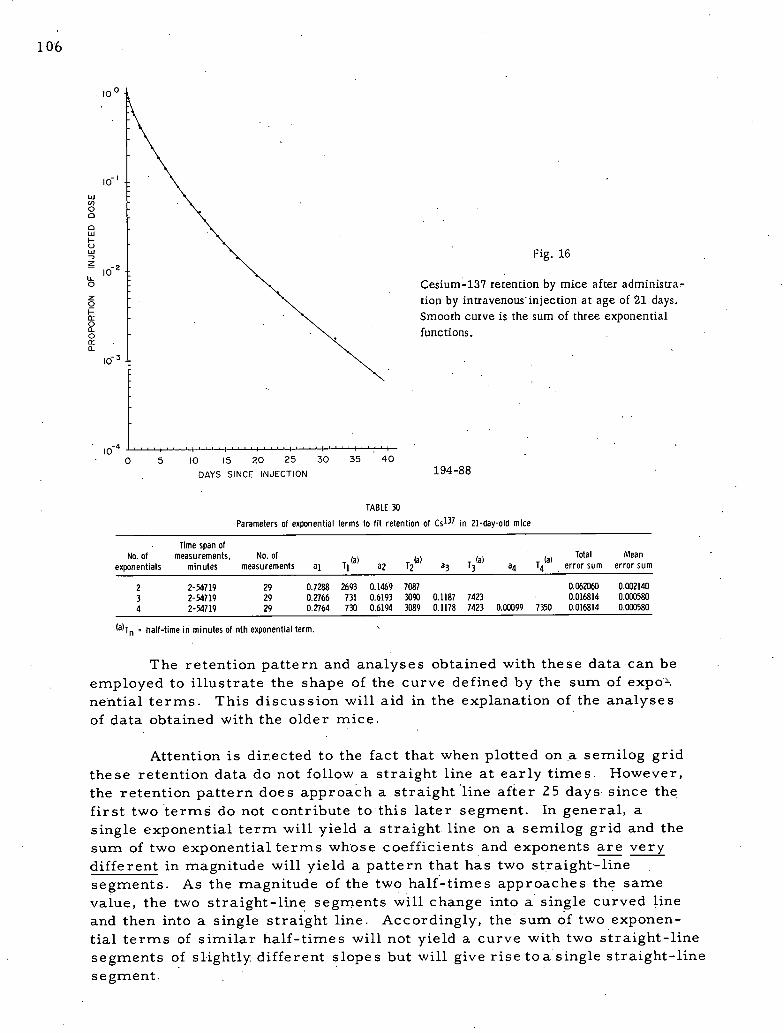
106
to 0 -
10-1 -
0W
t!g Fig. 16K 10-2 Cesium-137 retention by mice after administra-
tion by intravenous-injection at age of 21 days.Smooth curve is the sum of three exponential
S functions.0:a_
10-3 -
10-4 '.- 1'.''I'',.1,'',1,'',1,'',1'.''I'',,10 5 10 15 20 25 30 35 40
DAYS SINCE INJECTION 194-88
TABLE 30
Parameters of exponential terms to fit retention of CS137. in 21-day-old mice
Time span ofNo. of measurements, No. 01 (al (al (al (al
Total Mean
exponentials minutes measurements al Tl a2 T2 a3 T3 4 4 error sum error sum
2 2-54719 29 0.7288 2693 0.1469 7087 0.062060 0.002140
3 2-54719 29 0.2766 731 0.6193 3090 0.1187 7423 0.016814 0.000580
4 2-54719 29 0.2764 730 0.6194 3089 0.1178 7423 0.00099 7350 0.016814 0.000580
(a)Tn " half4ime in minutes of nth exponential term.
The retention pattern and analyses obtained with these data can beemployed to illustrate the shape of the curve defined by the sum of expofnential terms. This discussion will aid in the explanation of the analysesof data obtained with the older mice.
Attention is dir.ected to the fact that when plotted on a semilog gridthese retention data do not follow a straight line at early times. However,the retention pattern does approach a straight line after 25 days since thefirst two termi do not contribute to'this later segment. In general, asingle exponential term will yield a straight line on a semilog grid and thesum of two exponential terms whose coefficients and exponents are verydifferent in magnitude will yield a pattern that has two straight·-linesegments. As the magnitude of the two half-times approaches the samevalue, the two straight-line segments will change into a single curved lineand then into a single straight line. Accordingly, the sum of two exponen-tial terms of similar half-times will not yield a curve with two straight-linesegments of slightly. different slopes but will give rise toa single straight-linesegment.

107
30-Day-Old Mice
The retenti6n data of the 30-day-old mice followed a slightly morecomplicated pattern than that of the 2 1-day-old mice. When plotted on semi-log paper, the dita from 2 to 24,000 minutes could be fitted with a gentlysloping curve that became tangential to a straight-line section from28,930 through 44,674 minutes (Figure 17). The points from 44,674 through64,971 minutes were considerably above the projection of this straight-linesegment but appeared to fall along a second straight line. These twostraight-line segments can be fitted separately by graphic methods withexponentials having half-times of 7400 and 8600 minutes, respectively.
o The- parameters of theI0
: exponential terms obtained with- the aid of the VMM program when
all of the data were fitted withtwo, three and four terms are
10-1 - given on the first three lines ofm f
Table 31. The last two terms of
8. I the series of four have about the
5- same half-times (9651.1 and
3 10-2 7 9623.8 minutes, respectively) as0 - the third term of the series of5 2 three (9650.6 minutes). Also, the'-
r= sum of the coefficients of the third22
0 10-3 -
and fourth terms is identical to- the coefficient of the third term of
-
: the series of three. The fact thatthe cornputer reduces a series offour terms to a series of three
|04 terms ·when all of the data are0 5 10 15 20 25 30 35 40 45 employed demonstrates that this
DAYS SINCE INJECTIONretention curve for 30-day-old
194-95 mice does not follow the sum ofFig, 17. Cesium'-137 retention by mice after administra- four exponentials. It also casts
tion by intravenous injection at age of 30 days. doubt on the practical wisdom ofSmooth curve is the sum of three exponentialfunctions that fit the data Well Up to 31 days the often heard statement that aafter injection. curve can be fitted with the sum of
a series of any mathematical ex-pression and that the fit improves as more terms are employed in the series.On the other hand, the fact that the computer returns to a series of three terms
TABLE 31
Parameters of exponential terms to fit retention of Cs137 in 30-day-old mice
Time span ofNo. of measurements, No. of Total Mean
(al laI (al laI
exponentials minutes measurements al Tl a2 72 a3 T3 84 T4 error sum error sum
2 2-64971 28 0.7489 3060 0.2221 7968 0.052694 0.001882
3 2-64971 28 0.5081 2028 0.4264 5141 0.0827 %51 0.014715 0.000526
4 2-64971 28 0.5081 2027 0.4264 5140 0.0813 %51 0.0014 9624 0.014715 0.000526
3 2-44674 25 0.5134 2072 0.3711 4914 0.1314 8614 0.009919 0.000354
1 44674-64971 4 0.1513 8680 0.003083 0.000110
ta)Tn " half-time in minutes of nth exponential term.
108
does not prove that the sum of three terms represents a unique fit to thedata but only that the data can be fitted as well with three terms as withfour terms.
The presence of two straight-line segments by graphic analysisprompted us to analyze the data in another fashion. The data from 2 through44,674 minutes were fitted with the sum of three continuous exponentialterms and the remaining data from 44,674 through 64,971 minutes werefitted with a single exponential term (the value at 44,674 was common to
both groups). The parameters of the sum of three terms and of the singleterm, as well as the resultant error sums, are given in the lower portionof Table 31. The mean error sum for the 29 points is 0.000464 when thedata are divided into two sections and fitted in this fashion compared witha mean error sum of 0.000526 when the entire set is fitted with the set ofthree exponential terms. This improvement may or may not be significant.
The parameters of the third term (a = 0.1314, Tl/2 = 8613.9) foundto fit the data from 2 to 44,674 minutes and the parameters of the singleterm (a = 0.1513, Ti/2 - 8680.2) found to fit the data from 44,674 to64,971 minutes are interesting when compared to each other and when com-pared with the parameters of the third term (a = 0.0827, Ti/2 - 9650.6)found to fit the whole series. The relative close agreement between theformer two terms would suggest that the third term of the set when all datawere employed would fall midway between these two values. Instead,because of the interaction of terms in the entire series, the half-time ofthe third term is appreciably longer and the coefficient is considerablysmaller. This difference emphasizes the·danger of using a retention equationthat fits a given time span to predict the amount present at later times. Thevalue predicted for 200,000 minutes (139 days) by the three-term expressionbased onall the data is 2.8 times that predicted bythe single term that fitsthe last segment.
3-Month-Old Mice
The retention pattern exhibited by the 3-month-old inice is in turn
different from that of the 21-day and 30-day-old mice. When plotted on alarge semilog grid (Figure 18), the values from 2 through 5.790 minutes fallon a smooth curve that becomes tangential to a straight line over the segmentfrom 7129 through 2 0,1 8 1 minute s (T 1 /2 - 6850.6 minutes). The values from23,051 through 50,696 minutes fall along a second straight line (T 1/2' =8610.4 minutes), while those from 66,452 through 86,649 fall along a thirdstraight-line segment (T 1/2
= 10,818 minutes). The value at 60,745 minute sfalls slightly above both of these straight-line segments and suggests asmooth transition from one segment to the next. The value at 82,322 minute s
is too high and has been omitted from the analysis.
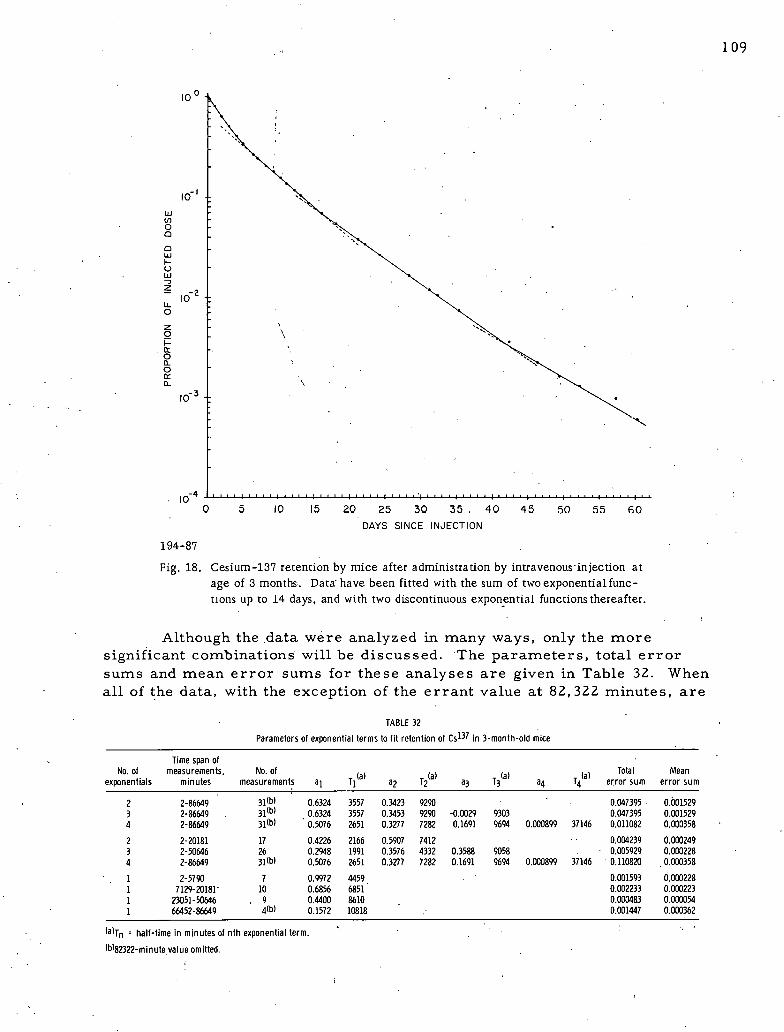
109
lo 0
10'
0LU1-
18
2 -210 -
LL0
5 \
i,
CL \
10-3 _
\
|040 5 10 15 20 25 30 35 40 45 50 55 60
DAYS SINCE INJECTION
194-87
Fig. 18. Cesium-137 retention by mice after administration by intravenous'injection atage of 3 months. Data- have been fitted with the sum of two exponential func-tions up to 14 days, and with two discontinuous expon-ential functions thereafter.
Although the data were analyzed in many ways, only the moresignificant combinations will be discussed. The parameters, total errorsums and mean error sums for these analyses are given in Table 32. Whenall of the data, with the exception of the errant value at 82,322 minutes, are
TABLE 32
Parameters of exponential terms to fit retention of Cs137 in 3-month-old mice
Time span ofNo. of measurements, No. of Total Mean
(al (al (at (a)exponentials minutes measurements al Tl a2 T2 a3 b 84 Tll error sum error sum
2 2-86649 31(bl 0.6324 3557 0.3423 9290 0.047395 0.001529
3 2-86649 31(bl 0.6324 3557 0.3453 9290 -0.0029 9303 0.047395 0.001529
4 2-86649 31(b) ' 0.5076 2651 0.3277 7282 0.1691 9694 0.000899 37146 0.011082 0.000358
2 2-20181 17 0.4226 2166 0.5907 7412 0.004239 0.000249
3 2-50646 26 0.2948 1991 0.3576 4332 0.3588 9058 0.005929 0.000228
4 2-86649 31(bl 0.5076 2651 0.3277 7282 0.1691 9694 0.000899 37146 0.110820 0.000358
1 2-5790 7 0.9972 4459 0.001593 0.000228
1 7129-20181- 10 0.6856 6851 0.002233 0.000223
1 23051-50646 . 9 0.4400 8610 0.000483 0.000054
1 66452-86649 4(b) 0.1572 10818 0.001447 0.000362
Ca)Tn - half-time in minutes of nth exponential term.
Cb)82322-minute value omitted.
110
fitted with the sum of three exponentials, the parameters of these terms arealmost exactly reduced to those obtained when the data are analyzed as thesum of two terms. Four terms, on the other hand, yield a somewhat differentarray of paranneters.
The data from 2 through 20,181 minutes, which span the curved
section plus one straight-line segment, could be fitted with the sum of twoterms but not by three terms since three terms were always reduced totwo by the computer. The data from 2 through 50,646 minutes could be fittedby the sum of three terms but not.by the sum of four terms. The entire setof data from 2 through 86,649 minutes (value at 82,322 minutes omitted)could be fitted with the sum of four terms but not by three since the computeralways reduced the set of three terms to the same set of two obtained if theanalysis employed only two. The observation that the data in the time spanfrom 2 through 20,181 minutes would only support a series of two terms andthat the time span from 2 through 50,646 minutes would support only threeterms while the entire set ·of data supported four terms suggests that thesum of exponentials provides an appropriate fit to the data but not aunique fit.
The data for each of four time segments were fitted separately withsingle exponential terms. The time span of the measurements, along withthe parameters and errors, are also given in Table 32. By an examinationof these mean error sums, it is not possible to state unequivocally that re-tention follows either the sum of exponentials or the discontinuous singleexponential terms. The mean error sums are 0.000249 and 0.000225, 6rabout equal, when the data from 2 through 20, 18 1 minutes were fitted with thesum of two terms and with two discontinuous terms, respectively. Thecomparable values are 0.000228 and 0.000166 when the data from 2 through50,646 minutes are fitted with the sum of three terms and with three dis-continuous curves, respectively. In this latter case, discontinuous terms
provide a slightly better fit. However, the goodness of fit obtained for thethird section of data with a single term is probably significant. Eight of thenine measurements between 23,051 and 50,646 minutes fall within 1.0. percentand the ninth measurement falls within 1.43 percent of the line described bythe single exponential (Ti 2 = 8610.4) found to fit this span.
This degree of goodness of fit to the data over this time span could beobtained with the sum of two exponentials only if the fir st had a half-timefairly close to 8610 minutes and the second term had a half-time that wasseveral times this value. The sum of these two te·rms cannot yield the changeof slope that occurs between 50,646 to 66,452 minutes and the straight-linesegment (Ti/2 = 10,818 minutes) from 66,452 to 86,649 minutes.
137These data suggest that the retention of Cs simply changes withtime and that the pattern is not readily describable mathematically.
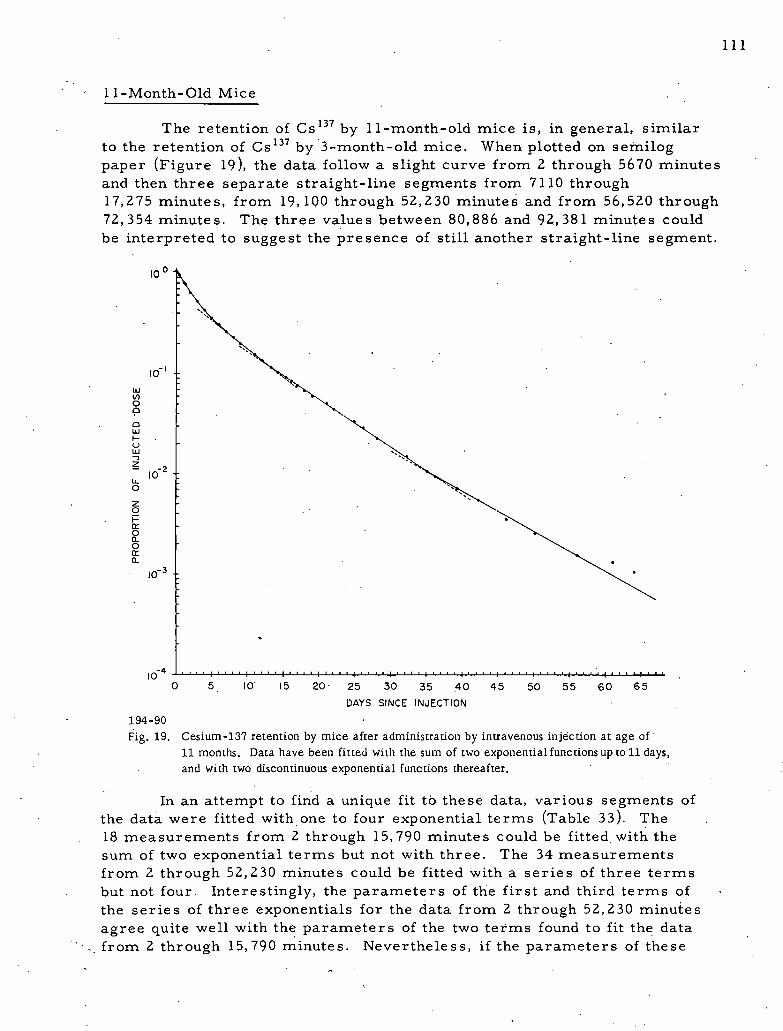
111
11-Month-Old Mice
The retention of Cs by 11-month-old mice is, in general, similar137
to the retention of Cs by 3-month-old mice. When plotted on semilog137
paper (Figure 19), the data follow a slight curve from 2 through 5670 minute sand then three separate straight-line segments from 7110 through17,275 minutes, from 19,100 through 52,230 minutes and from 56,520 thr ough72,354 minutes. The three values between 80,886 and 92,381 minutes couldbe interpreted to suggest the presence of still another straight-line segment.
10 0
10'
:80LU»8 «
f 9-2-
a .Alm(ra-
10-3 -
\
|040 5 10 15 20 - 25 30 35 40 45 50 55 60 65
DAYS SINCE INJECTION
194-90
Fig. 19. Cesium -137 retention by mice after administration by intravenous injection at age of 11 months. Data have been fitted with the sum of two exponential functions Up to 11 days,and with tWO discontinuous exponential functions thereafter.
In an attempt to find a unique fit to these data, various segments ofthe data were fitted with one to four exponential terms (Table 33). The18 measurements from 2 through 15,790 minutes could be fitted. with thesum of two exponential terms but not with three. The 34 measurementsfrom 2 through 52,230 minutes could be fitted with a series of three termsbut not four. Interestingly, the parameters of the first and third terms ofthe series of three exponentials for the data from 2 through 52,230 minute sagree quite well with the parameters of the two terms found to fit the data
. from 2 through 15,790 minutes. Nevertheless, if the parameters of these
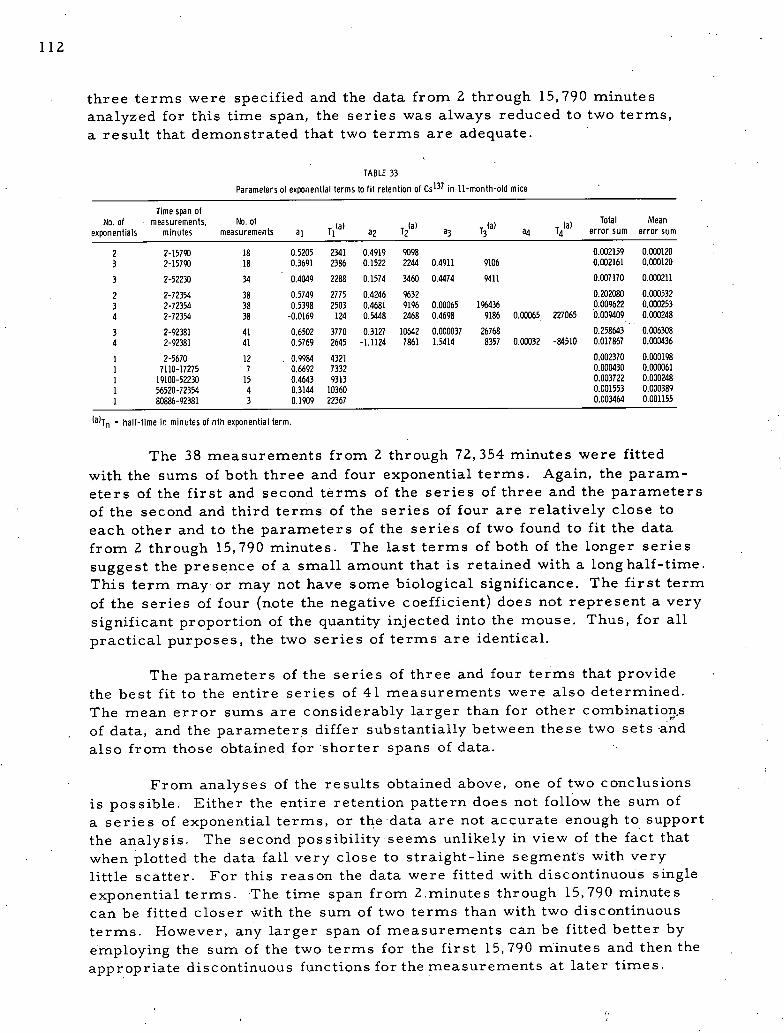
112
three terms were specified and the data from 2 thr ough 15,790 minute sanalyzed for this time span, the series was always reduced to two terms,a result that demonstrated that two terms are adequate.
TABLE 33
Parameters of exponential terms to fit retention of Csl37 in 11-month-old mice
Time span ofNo. of measurements, No. of Total Mean
(al (a) (a) (a)exponentials minutes measurements al Tl a2 T2 a3 b all Ttl error sum error sum
2 2-15790 18 0.5205 2341 0.4919 9098 0.002159 0.000120
3 2-15790 18 0.3691 2386 0.1522 2244 0.4911 9106 0.002161 0.000120
3 2-52230 34 0.4049 2288 0.1574 3460 0.4474 9411 0.007170 0.000211
2 2-72354 38 0.5749 2775 0.4246 9632 0.202080 0.000532
3 2-72354 38 0.5398 2503 0.4681 9196 0.00065 1%436 0.009622 0.000253
4 2-72354 38 -0.0169 124 0.5448 2468 0.4698 9186 0.00065 227065 0.009409 0.000248
3 2-92381 41 0.6502 3770 0.3127 10642 0.000037 26768 0.258643 0.006308
4 2-92381 41 0.5769 2645 -1.1124 7861 1.5414 8357 0.00032 -84510 0.017867 0.0001136
1 2-5670 12 0.9984 4321 0.002370 0.000198
1 7110-17275 7 0,6692 7332 0.000430 0.000061
1 19100-52230 15 0,4643 9313 0.003722 0.000248
1 56520-72354 4 0.3144 10360 0.001553 0.000389
1 80886-92381 3 0.1909 22367 0.003464 0.001155
la)Tn " half-time in minutes of nth exponential term.
The 38 measurements from 2 through 72,354 minutes were fittedwith the sums of both three and four exponential terms. Again, the param-eters of the first and second terms of the series of three and the parametersof the second and third terms of the series of four are relatively close toeach other and to the parameters of the series of two found to fit the datafrorn 2 through 15,790 minutes. The last terms of both of the longer seriesSuggest the presence of a small amount that is retained with a long half-time.This term may or may not have some biological significance. The first termof the series of four (note the negative coefficient) does not represent a very
significant proportion of the quantity injected into the mouse. Thus, for allpractical purposes, the two series of terms are identi€al.
The parameters of the series of three and four terms that providethe best fit to the entire series of 41 measurements were also determined.The mean error sums are considerably larger than for other combinatiop,sof data, and the parameters differ substantially between these two sets -andalso from those obtained for shorter spans of data.
From analyses of the results obtained above, one of two conclusionsis possible. Either the entire retention pattern does not follow the sum ofa series of exponential terms, or the data are not accurate enough to supportthe analysis. The second possibility seems unlikely in view of the fact thatwhen plotted the data fall very close to straight-line segments with verylittle scatter. For this reason the data were fitted with discontinuous singleexponential terms. The. time span from 2.minutes through 15,790 minute scan be fitted closer with the sum of two terms than with two discontinuousterms. However, any larger span of measurements can be fitted better byemploying the sum of the two terms for the first 15,790 minutes and then theappropriate discontinuous functions for the measurements at later times.

113
22-Month-Old Mice
When plotted on semilog paper (Figure 20), the r.etention data of the, 22-month-old mice follow three separate straight-line segments and do not
demonstrate the curved section found at early times for the younger mice.The eleven measurements from 2 through 12,908 minutes fall on a line de-fined by a half-time of 6806. 1 minutes, the twelve measurements from14,345 to 36,183 minutes (value of 21,542 minutes omitted) yield a half-timeof 8412.6 minutes while the nine measurements from 40,454 through85,276 minutes indicateahalf-time of 9789.4 minutes (Table 34). The value s
loo
I0
ill
U)
g.
0LU
-3
% -2I0
LL
0,
5F
a:a-
103_
|040 5 10 15 20 25 30 35 40 45 50 55 60 65 70
DAYS SINCE INJECTION
194-96
Fig. 20. Cesium-137 retention by mice after administration by intravenous injection at ageof 22 months. Data have been fitted with three discontinuous exponential functions.
TABLE 34
Parameters of exponential terms to fit retention of Cs137 in 22-month-old mice
Time span ofNo. of measurements, NO. of Total Mean
la) (al Wexponentials minutes measurements al Tl a2 TZ 83 b error sum .error sum
1 2-12908 11 0,9992 6806 0.001958 .0.000178
1 -14345-36183 12 0.7753 8412 0.001636 0.000136
1 40454-85276 9 0.4977 9789 0.016186 ·0.001798
2 2-38000 23(b) 0.3473 3769 0.6688 8848 0.003923 0.000171
2 2-85276 32 0.5444 4955 0.4607 9916 0.023910 0.000747
.3 2-85276 32 0.5857 5191 0.4157 10182 -0.000059 -149269 0.023316 0.000729
(a)Tn = half-time in minutes of nth exponential term.
(b)21542-minute value omitted.
114
at 92,156 and 99,360 minutes, which fall about equal distances onoppositesides of this last segment, were omitted from the analyses since they intro-duce a large component into the error sum and unduly influence the finalvalues 6f the parameters obtained with the VMM program.
The 23imeasurements between 2 and 36,183 minutes can be fitted bythe sum of two exponential terms (maximum error of 2.3 percent) but abetter fit is obtained if these measurements are separated into two groupsand each group fitted with a separate term. The 32 measurements between2 and 85,276 minutes were fitted with both the sum of two and three exponen-tial terms. A slightly better fit to the data was obtained with three termsthan with two terms, but the VMM program always set the coefficient andexponent of the third term negative. Consequently, the magnitude of thisnegative third term increases with time. For this reason, this series ofthree terms cannot be used to predict the amount of Cs present in mice
137
at times considerably longer than that covered by these measurements since137
it is impossible for the mouse to have an increasing body content of Cs
32-Month-Old Mice
When plotted on semilog paper (Figure 21), the retention data forthe 32-month-old mice fell along straight-line segments from 2 through19,947 minutes, from 22,982 through 64,659 minutes, and from 64,659 through84,760 minutes. The measurements within each segment could be fittedvery
closely with a single exponential term. The coefficients and half-times ofthese three terms are given in Table 35 and are very similar to those ob-tained with 22-month-old mice (Table 34). These terms are discontinuousin that each one fit only a section of the data.
The data from 2 through 64,659 minutes were fitted with the sum oftwo exponentials. The computed values exceed the observed values byseveral percent at each end of the straight-line segments and are lower byseveral percent in the middle of each straight-line segment, while theappropriate single term fits the data over the entire straight-line segment.This trend demonstrates that, while retention of cesium does not actuallyfollow the sum of two exponentials, the sum of the two terms provides anapproximate fit to the data.
The entire set of data from 2 through 84,769 minutes was fittedwith the sum of both two and three exponential terms. As demonstrated bythe error sums, a considerably better fit to the data was obtained with threeterms than with two terms. However, an even better fit was obtained withthe three single discontinuous terms. Significantly, the coefficient of thethird term was positive while the exponent was negative.
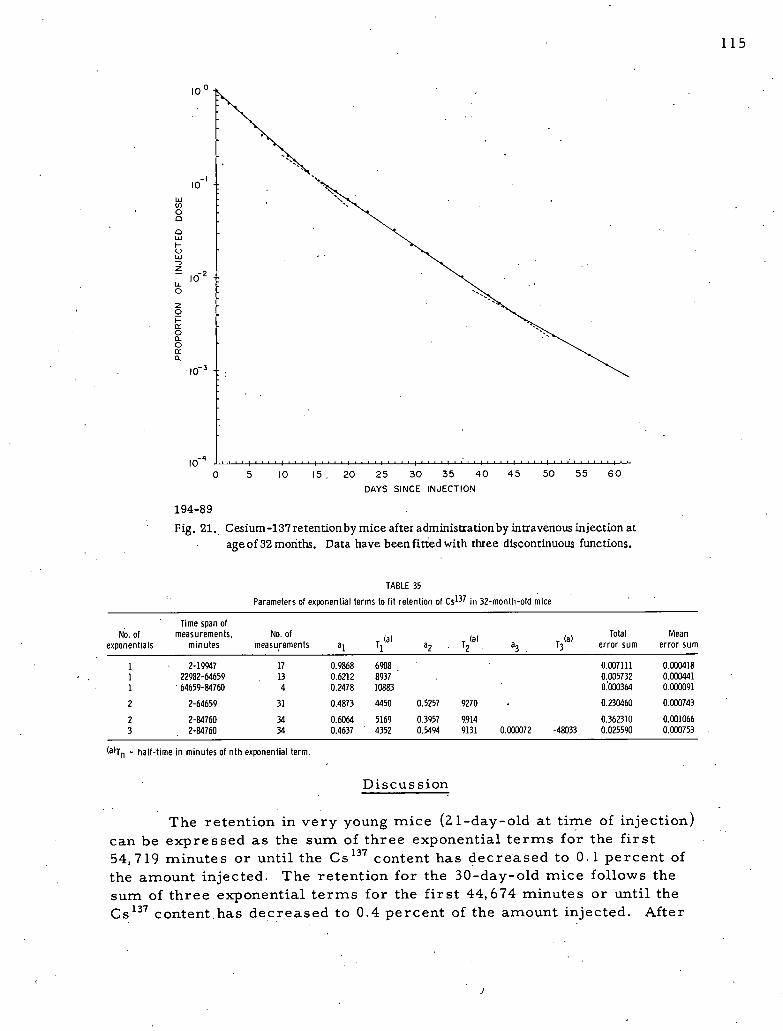
115
loo
10 i
8:0 -0 -0-LLI
»0 -LLI-)
f -2LL |0 30
· 8 »CM -
£2 -a-
10-3 _:
E-4 ,,:,1,,,,i,,··i·,,,i·,,,i,···i,···i,,'',i''i,t':''I'''''I'·''I'·0 5 10 15 20 25 30 35 40 45 50 55 60
DAYS SINCE INJECTION
194-89
Fig. 21. Cesium-137 retentionby mice after administrationby intravenous injection atage o f 32 months. Data have been fitted with three discontinuous functions.
TABLE 35
Parameters of exponential terms to fit retention of Csl37 in 32-month-old mice
Time span ofNo. of measurements, No. of Total Mean
(a) W (a)exponentials minutes measurements al Tl a2 T2 a3 . b error sum error sum
1 2-19947 17 0.9868 6908 0.007111 0.000418
1 22982-64659 13 0.6212 8937 0.005732 0.000441
1 ' 64659-84760 4 0.2478 10883 0.000364 0.000091
2 2-64659 31 0.4873 4450 0.5257 9270 · 0.230460 0.000743
2 2-84760 34 0.6064 5169 0.3957 9914 0.362310 0.001066
3 2-84760 34 0.4637 4352 0.5494 9131 0.000072 -48033 0.025590 0.000753
(a)Tn 9 half-time in minutes of nth exponential term.
Discussion
The retention in very young mice (2 1-day-old at time of injection)can be expressed as the sum of three exponential terms for the first
54,719 minutes or until the Cs content has decreased to O.lpercent of137
the amount injected. The retention for the 30-day-old mice follows thesum of three exponential terms for the first 44,674 minutes or until theCs 137 content.has decreased to 0.4 percent of the amount injected. After
)
116
this time, the retention seems to follow a slightly longer single exponential.The retention in both the 3-month and 11-month-old mice from 2 until 20,181and 17,275 minutes, respectively, after injection could be considered tofollow the sum of two exponential terms. The retention after these time sfollows a series of two straight-line sections for the 3-month-old mice andthree straight-line segments for the 11-month-old mice. The retention curvefor the 11-month-old mice demonstrates the largest number of distinct
changes of slope. The retention data for the 22-month and 32-month-oldmice do not demonstrate an early curvilinear section but both follow threedistinct, discontinuous, single exponential terms. The half-times of thethree terms found for the 22-month-old mice are not greatly different fromthose found for the 32-month-old mice, but the coefficients are considerablydifferent. The older (32-month-old) mice follow the shorter half-time term
for a longer time span and thus effectively lose the Cs faster.137
The observation that the retention does not follow the sums of aseries of exponentials but rather a series of single terms whose biologicalhalf-times vary with time and age is not incomprehensible. The sum of aseries of terms would be associated with a multicompartmental model,whereas Cs is deposited mainly in the soft tissue that could be represented137
by a one-compartmental model in which the fraction of a single dose de-posited in the skeleton is evidently very small.
Conclusions and Summary
Analyses of the retention data of mice of various ages demonstratethat after intravenous injection of the chloride, the retention of Cs varies137
as a function both of the age of the animal at the time of injection and of thetime since injection. The effective retention of cesium was lowest in the
youngest mice, progressively higher for the older mice and then somewhatlower again for the oldest group. Furthermore, these analyses demonstratethat the retention does not change in a uniform manner that can be describedby the sum of a series of exponential terms. If the retention is to be des-cribed accurately, it is necessary to use a series of discontinuous termswhereby each term is employed to describe the retention over a limited timespan.
These analyses also demonstr·ate the danger inherent in the use of afunction determined from one time span to predict the amount of C s pres-
137
ent at much later times.
Acknowledgeineht
On the basis of these results with mice, it can be predicted thatstudies on very young humans will yield a much shorter biological half-timefor cesium retention than would be shown by young or old adults.

117
REFERENCES
1. Assessment of Radioactivity in Man. International Atomic EnergyAgency,. Vienna, Austria, 1964, Vols. land II.
2. Davidon, W. C. Variable Metric Method for Minimization. ArgonneNational Laboratory report ANL-5990 Rev. (1959).
\
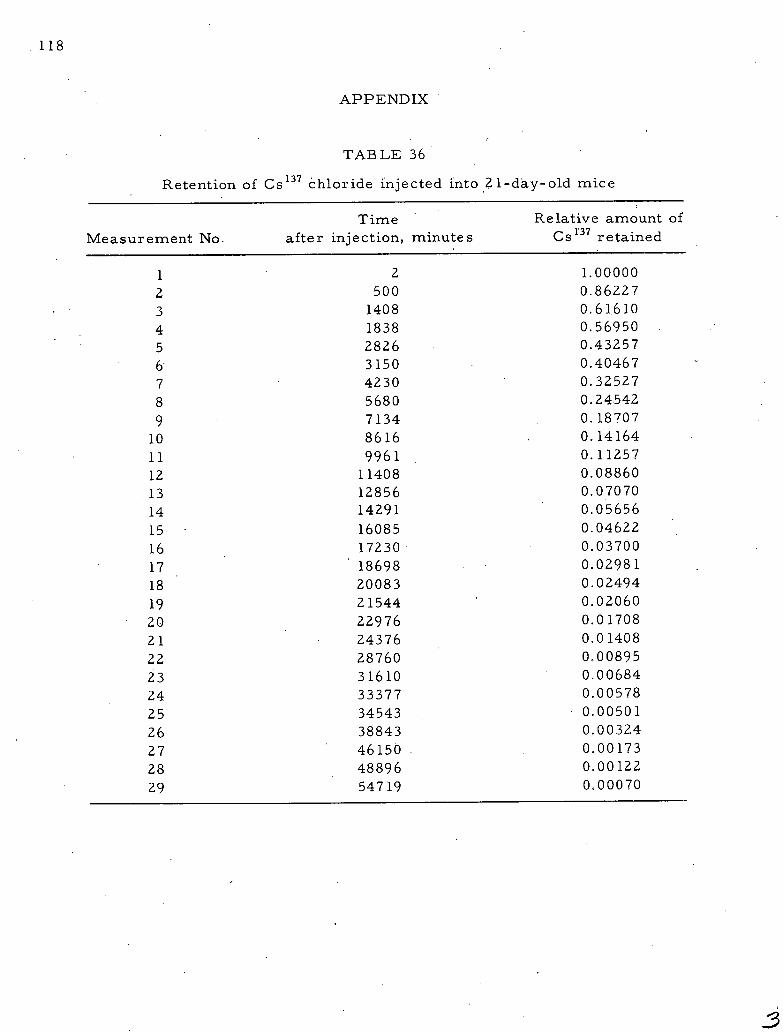
118
APPENDIX
TABLE 36
Retention of Cs 137 chloride injected into 21-day-old mice
Time Relative amount ofMeasurement No. after injection, minute s CS 1.37 retained
1 2 1.000002 500 0.86227
3 1408 0.61610
4 1838 0.56950
5 2826 0.43257
6 3150 0.404677 4230 0.32527
8 5680 0.24542
9 7134 0.18707
10 8616 0.14164
11 9961 0.11257
12 11408 0.08860
13 12856 0.07070
14 14291 0.05656
15 16085 0.04622
16 17230 0.03700
17 18698 0.02981
18 20083 0.02494
19 21544 ' 0.0206020 22976 0.01708
21 24376 0.01408
22 28760 0.00895
23 31610 0.00684
24 33377 0.00578
25 34543 0.00501
26 38843 0.00324
27 46150 0.00173
28 48896 0.00122
29 54719 0.00070
3
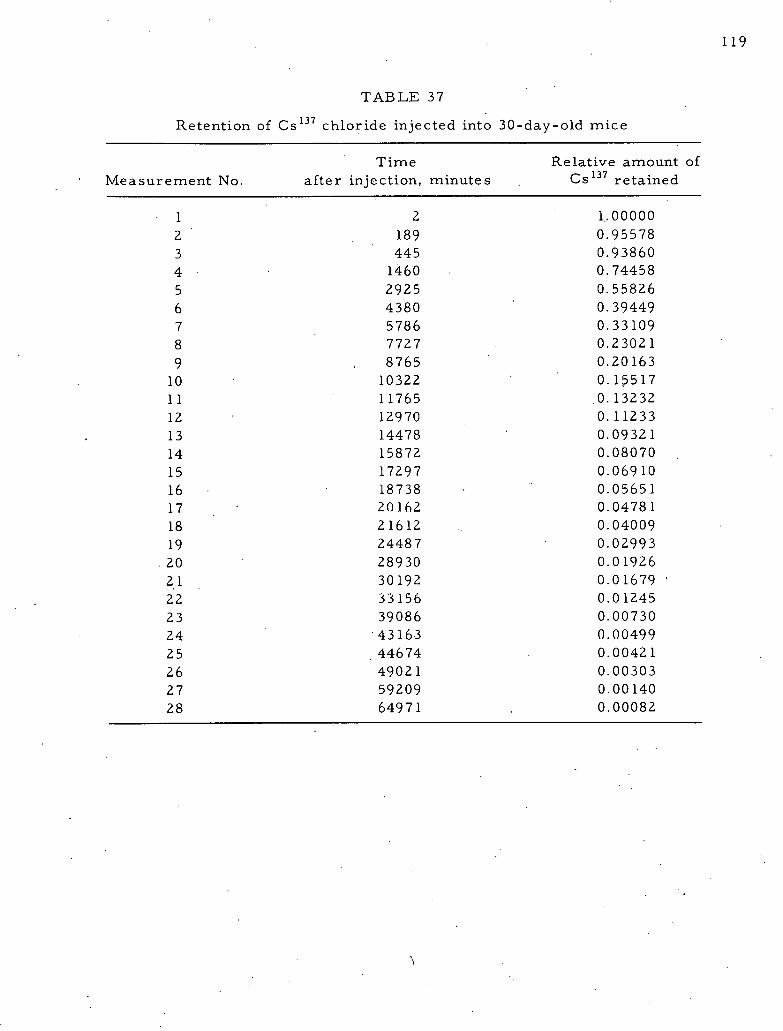
119
TABLE 37
Retention of Cs chloride injected into 30-day-old mice137
Time Relative amount ofMeasurement No. after injection, minutes CS 137 retained
1 2 1.000002 189 0.955783 445 0.938604 · 1460 0.74458
5 2925 0.55826
6 4380 0.394497 5786 0.331098 7727 0.23021
9 8765 0.20163
10 10322 0.1551711 11765 .0.13232
12 12970 0.11233
13 14478 0.0932114 15872 0.08070
15 17297 0.0691016 18738 0.0565117 20]62 0.04781
18 21612 0.04009
19 24487 0.0299320 28930 0.0192621 30192 0.0167922 33156 0.01245
23 39086 0.00730
24 43163 0.0049925 44674 0.00421
26 49021 0.0030327 59209 0.00140
28 64971 0.00082
\
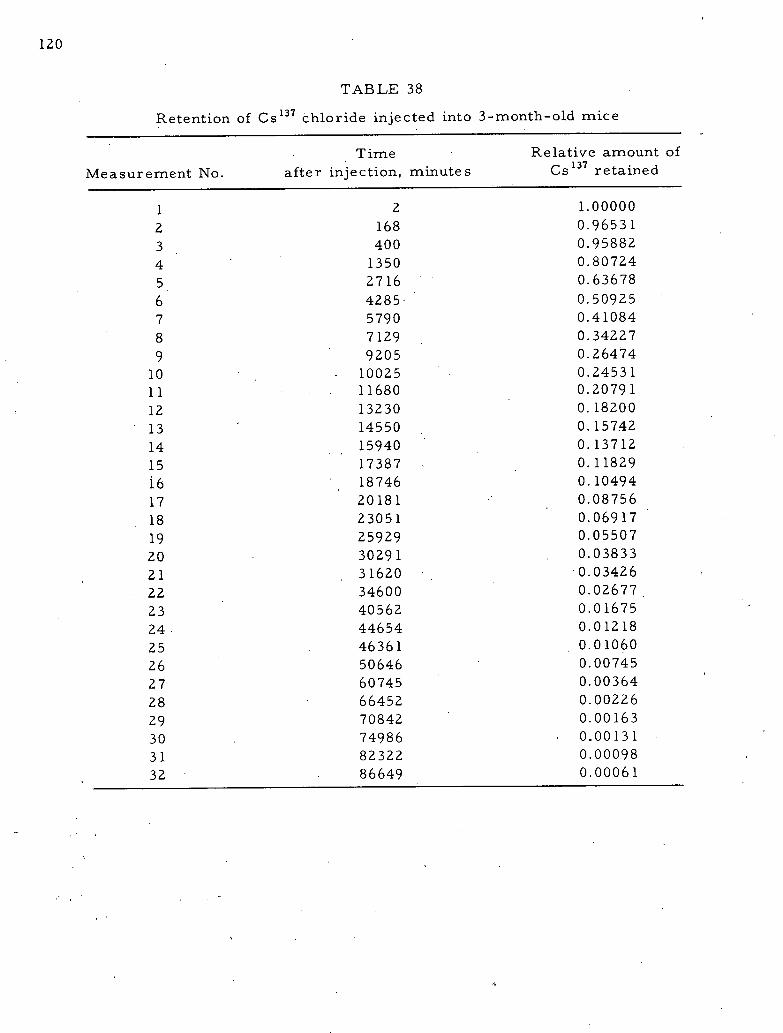
120
TABLE 38
Retention of Cs chloride injected into 3-nnonth-old rnice137
Time Relative amount of
Measurement No. after injection, minute s Cs 137 retained
1 2 1.000002 168 0.96531
3 400 0.95882
4 1350 0.80724
5 2716 0.63678
6 4285. 0.509257 5790 0.41084
8 7129 0.34227
9 9205 0.26474
10 10025 0.24531
11 · 11680 0.20791
12 13230 0.18200
13 14550 0.15742
14 15940 0.13712
15 17387 0.11829
i 6 18746 0.10494
17 20181 0.08756
18 23051 0.06917
19 25929 0.05507
20 30291 0.03833
21 31620 0.03426
22 34600 0.02677
23 40562 0.01675
24· 44654 0.01218
25 46361 0.01060
26 50646 0.0074527 60745 0.00364
28 66452 0.00226
29 70842 0.00163
30 74986 . 0.00131
31 82322 0.00098
32 86649 0.00061
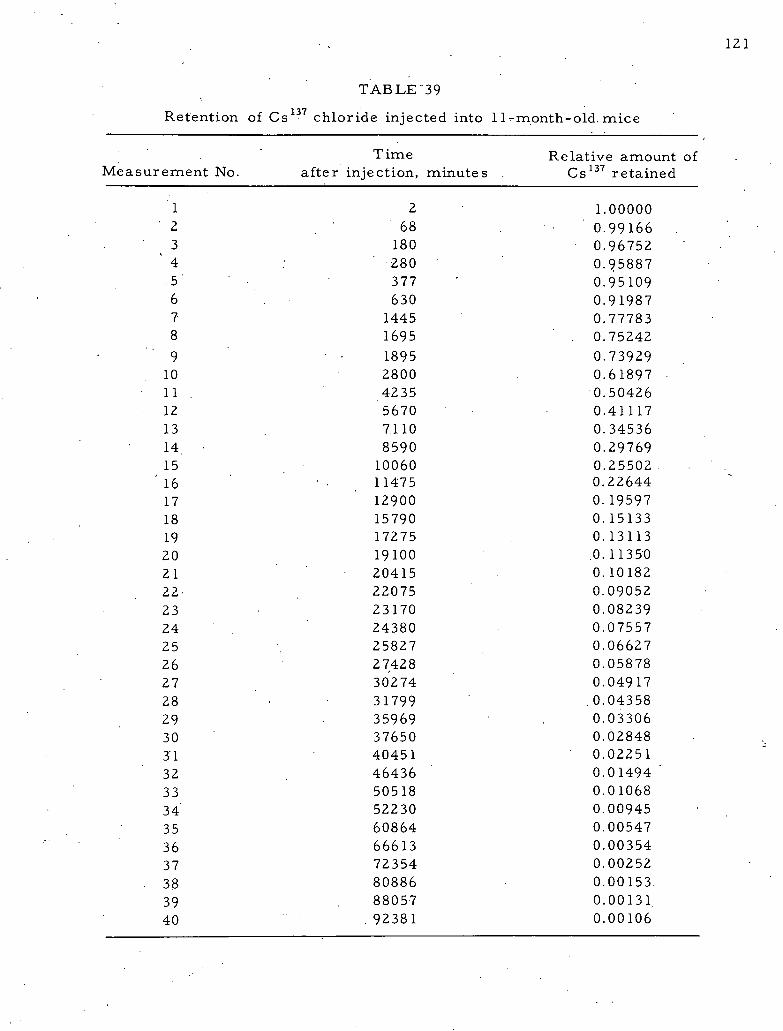
121
TABLE-39137Retention of Cs chloride injected into 11-month-old. mice
T ime Relative amount ofMeasurement No. after injection, minutes Cs 137 retained
1 2 1.000002 68 0.991663 180 0.967524 280 0.958875 377 0.951096 630 0.919877 1445 0.777838 1695 0.75242
9 1895 0.7392910 2800 Q.6189711 4235 0.5042612 5670 0.4111713 7110 0.3453614 · 8590 0.2976915 10060 0.2550216 11475 0.2264417 12900 0.1959718 15790 0.15133
19 17275 0.13113
20 19100 .0.11350
21 20415 0.1018222 22075 0.0905223 23170 0.0823924 24380 0.0755725 25827 0.06627
26 27428 0.05878
27 30274 0.0491728 · 31799 0.04358
29 35969 0.0330630 37650 0.02848
31 40451 0.02251
32 46436 0.0149433 50518 0.01068
34 52230 0.0094535 60864 0.00547
36 66613 0.00354
37 72354 0.00252
38 80886 0.00153.
39 88057 0.00131
40 92381 0.00106
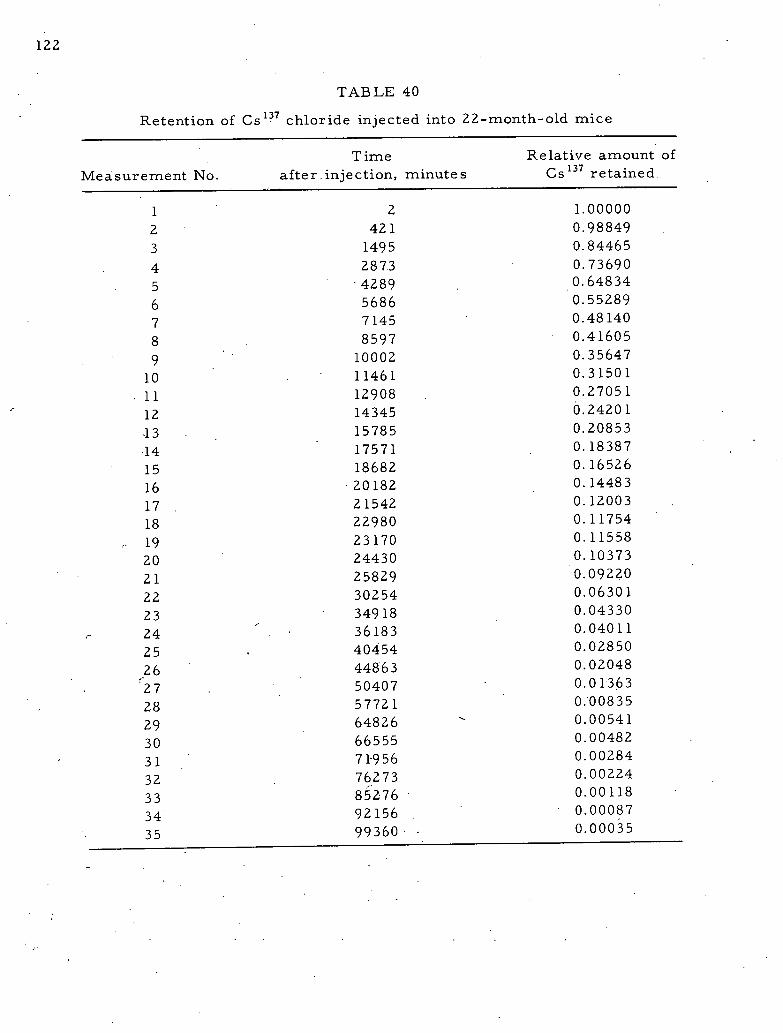
122
TAB LE 40
Retention of Cs 137 chloride injected into 22-month-old mice
T ime Relative amount ofMea surement No. after.injection, minute s Cs 137 retained
1 2 1.000002 421 0.98849
3 1495 0.84465
4 2873 0.73690
5 '4289 0.64834
6 5686 0.55289
7 7145 0.48140
8 8597 0.41605
9 10002 0.35647
10 11461 0.31501
11 12908 0.27051
12 14345 0.24201
.13 15785 0.20853
14 17571 0.18387
15 18682 0.16526
16 20182 0.14483
17 21542 0.12003
18 22980 0.11754
19 23170 0.11558
20 24430 0.10373
21 25829 0.09220
22 30254 0.06301
23 34918 0.04330
r 24 ' 36183 0.04011
25 40454 0.02850
26 44863 0.02048
27 50407 0.01363
28 57721 0:00835
29 64826 - 0.00541
30 66555 0.00482
31 71956 0.00284
32 76273 0.00224
33 85276 0.00118
34 92156- 0.00087
35 99360 . 0.00035
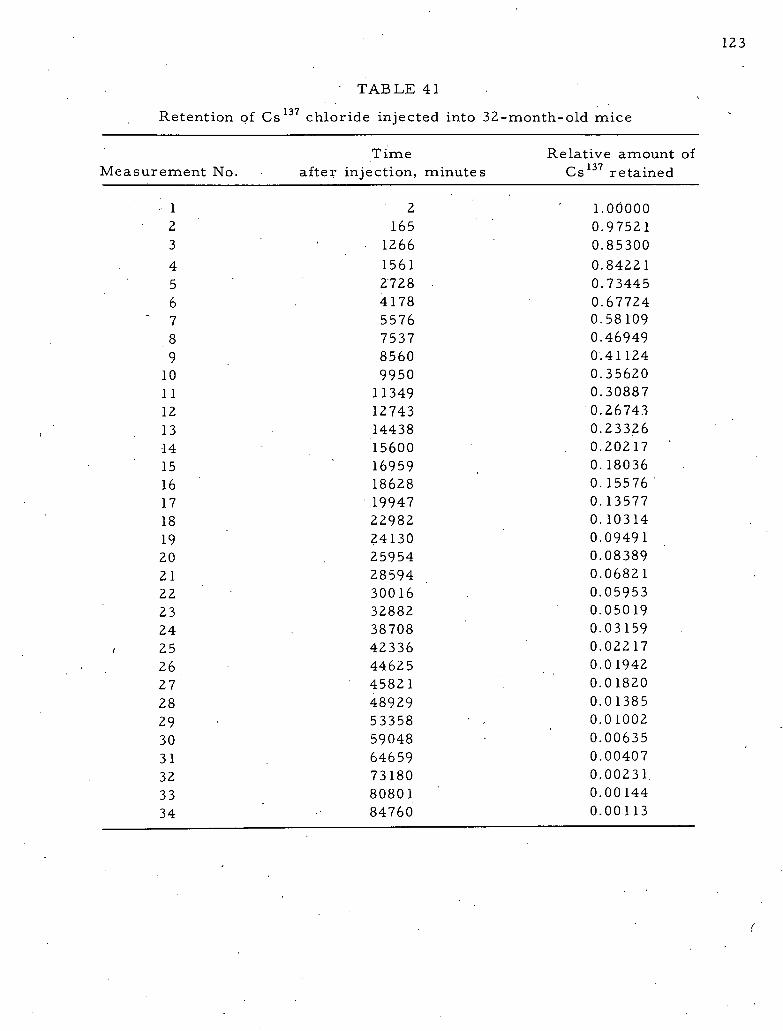
123
TAB LE 41
Retention of Cs chloride injected into 32-month-old mice137
Time Relative amount ofMeasurement No. after injection, minute s Cs 137 retained
1 2 ' 1.000002 165 0.975213 1266 0.85300
4 1561 0.84221
5 2728 0.73445
6 4178 0.677247 5576 0.581098 7537 0.46949
9 8560 0.41124
10 9950 0.35620
11 11349 0.30887
12 12743 0.26743
13 14438 0.23326
14 15600 0.20217
15 16959 0.18036
16 18628 0.15576
17 19947 0.13577
18 22982 0.10314
19 24130 0.09491
20 25954 0.08389
21 28594 0.06821
22 30016 0.0595323 32882 0.05019
24 38708 0.03159
25 42336 0.02217
26 44625 0.01942
27 45821 0.01820
28 48929 0.01385
29 53358 0.0100230 59048 · 0.0063531 64659 0.00407
32 73180 0.00231
33 80801 0.00144
34 84760 0.00113
(
125
MOVE OF THE WHOLE-BODY COUNTER
Charles E. Miller
Introduction
The whole-body counter, usually designated either as the ArgonneNational Laboratory Human Gamma-ray Spectrometer No. 1 or the portableIron Room, was developed in 1954 in order to reduce the background countdetected by NaI scintillation crystals.1,2 It was disassembled, moved, andreassembled in a new location during January, 1965. Since its constructionin 1954, the counter had been located at one end of a large unfinished area,30 feetwideby 60 feetlong, of the service floo'r (basement) of the Physicsbuilding. During recent years for a number of reasons, it had become pro-gressively more difficult, if not impossible, to make accurate measurementsof the radioactive content of normal, healthy humans with the room in thislocation.
As additional equipment for upstairs laboratories was installed onthe service floor, the room temperature vatied greatly. In the vicinity ofthe whole-body counter, the temperature varied seasonally from 70'F toover 100'F and diurnally during the summer from perhaps 800F to 1000F.While the changes in ambient room temperature may not have significantlyaffected the older vacuum-tube type of pulse height analyzer, .the tempera-ture changes caused the transistorized equipment in use since 1963 todrift widely and, in some instances, to malfunction completely.
The gamma-ray backgrounds within the whole-body counter, whichoriginally had been very reproducible, were no longer stable. Diiring thefirst few years the presence of Ar from the stack effluent of the research41.
reactor CP-5, which was located about three-quarters of a mile to thesouth, might be detected for a short period of time on a few occasions peryear when the wind was directly out of the south. More recently, largerconcentrations of Art*1 have been detected more frequently as the power ofthe reactor was increased. In addition, short-lived airborne radioisotopesproduced by the beam of either a cyclotron or, a Van de Graaff also becamea problem as more particle accelerators were built in various directionsnot far from the location of the whole-body counter. Before the whole-bodycounter was moved, a study was made to evaluate these sources of increasedbackground.
Sealed Room Experiment
Small Cave
The contribution of airborne radioactivity to the background withinan iron shield was first studied with a small cave that had 8-in.-thick walls
126
of laminated steel. A sodium iodide, thallium activated crystal, 9 inches in diam-eter by 4 inches thick, was placed in the cave and an aluminum box was builtaround the cave. The base of the aluminum box was sealed to the singlefloor plate, which projected several inches beyond each side of the cave.The cable from the preamplifier and photomultiplier tube attached to the
crystal was brought out through a gasketed hole so that the box was practi-cally airtight. The gamma-ray background of the crystal contained enoughwell-defined photopeaks from the radium in the photomultiplier tubes topermit us to determine the energy calibration of the over-all system atany time.
The output pulses of the crystal were sorted and stored with aTechnical Measurements Corporation Model 404 pulse height analyzer.The analyzer was ope:dated in the automatic mode so that pulses were ac-cumulated for a preset time and the data were punched onto tape, after whichthe memory was cleared to zero and the cycle repeated. A series of40-minute and 100-minute backgrounds was accumulated in this wayover aseveral-week period. The energy calibration drifted downward slightlyduring the first few days and then became stabilized. The backgrounds inthe various energy bands (after the particular groups of channel# wereadjusted to correct for drift) fell within the range of values expected byprobability statistics and demonstrated 1) that earlier variations in back-
ground were due to airborne contamination and 2) that stable, reproduciblebackgrounds could be obtained under the proper conditions.
Whole-body Counter
The large whole-body counter was sealed as well as possible without
disassembling the room in order to evaluate the influence of airborne con-tamination and to determine if stable backgrounds could be obtained by someair lock system. The floor of the room could not be sealed satisfactorily.
The base of the Iron Room consisted of three sheets of steel plates,3 feet wideby 10 feet long by 1/4 inch thick, laid sideby side. The internal frameof the room hadbeenbolted to the floor plate and 32 layers of 1/4-inch-thickfloor plates were stacked on this base. The three steel base plates pro-jected about 4 inches beyond the 8-inch-thick walls, which were attached to theupright frame. It was not possible to seal or weld the two cracks betweenthe three base plates without removing the entire 8-inch-thick floor as wellas two of the walls. Aluminum plates, 6 inches wide by 1/4 inch thick, were
placed around the four sides of the base plates and sealed to the steel base
plates. A welded aluminum box was built around the entire room and weldedto the aluminum plates attached to the steel base plate. A gasketed alu-minum door that could be screwed tightly to the aluminum box around all
edges of the door was provided. All electrical leads and service lines intothe room were gasketed and sealed where they passed through the aluminumwall. The same 9-inch-diameter by 4-inch-thick NaI(Tl) crystal wasernployed.
127
A series of 40-minute and 100-minute backgrounds was recoFdedduring the next several weeks. The gamma-ray background .within thesealed room increased to about twice the background of the unsealed roomand then fluctuated systematically around this high value. Two 40-minute
backgrounds would yield about the same count rate, the next three wouldincrease equal amounts, the next two were about equal, and then the nextthree backgrounds would decrease to the minimum. .This cycle repeateditself again and again. Examination of the difference between the spectrumof the unsealed room and that of the sealed room suggested that the increasein background was due to the buildup of radon daughters within the roomand not to the presence of any other airborne contaminant.
It was not possible to locate the source of the radium producing theradon without dismantling the room to seal the cracks in the· floor. Theradium might have been present as a contaminant on the surface of the
32 layers of 1/4-inch-thick steelplates ineachwall, floor andceiling. However,it was felt that a more likely source was the radon that escaped from theconcrete floor beneath the room and seeped up through the cracks in thefloor and into the interior of the room. This hypothesis was substantiatedby Mr. Henry F. Lucas of the Radiological Physics Division, who found thatwhen a small hole was drilled through the aluminum wall and a tube insertedinto the room, samples of room air showed very high humidity, as well ashigh radon concentration. These results indicated that water vapor wasdefinitely entering the room from the outside.
The cyclic changes in the background were found to be due tosystematic changes in the energy calibration. The count rates in fixed
groups of channels had been used to compare the backgrounds of one run tothe next. A careful analysis of the energy calibration disclosed that the gainof the detector (crystal, phototube and cathode follower preamplifier) wasincreasing and decreasing about 1 percent. The apparent change in back-ground count rate actually reflected the fact that the fixed group of channelsspanned a different energy band from one run to the next. When the numberof channels in each group were adjusted to span the same energy bands foreach measurement, reproducible stable backgrounds were obtained. Furtherinvestigation disclosed that the heat exchanger inside the whole-bodycounter ran for about 20 minutes commencing with start of the two lowest40-minute backgrounds. Consequently, it was con'cluded that the tempera-ture changes within the room accounted for the change in energy calibrationand the apparent variation in backgrounds.
Temperature-sensing thermocouples were attached to the glassenvelope of the photomultiplier, and the gain changes were correlated withtemperature changes of the photomultiplier tube. The temperature of theglass envelope of the photomultiplier did not begin to drop until 60 to80 minutes after the heat exchanger had cycled and cooledthe interior of theroom. Consequently, the energy calibration was the same for these two
128
runs and these two backgrounds were equal. The temperature of thephotomultiplier then decreased during the next three 40-minute measure-ments, remained relatively constant for the next two 40-minute measure-ments, then increased during the next three 40-minute measurements.The gain varied inversely as did the temperature. This series of mea-surements demonstrated the necessity of maintaining the detector at aconstant temperature if accurate and reproducible results are to beobtained.
Move of the Iron Room
It was necessary either to move the counter into an air-conditionedlaboratory or to air-condition the area in which the counter was located.In the latter event it would still be desirable to place a vapor barrier underthe room to eliminate the radon seepage into the room.
An air-conditioned, humidity-controlled space, formerly occupied bythe Applied Mathematics Division, became available. This space is ideallysuitable since it is centrally located near the building elevator and has well-regulated temperature and humidity, tiled floor, and finished walls andceiling. A further advantage is that the air of this laboratory is recircu-lated, a fact which makes it practically a closed sy'stem. Although the airconditioning equipment is located outside the room, the air is taken·from theroom, cooled, humidified, and distributed back into the room through aplenum. A small amount of makeup air is obtained from the service flooroutside the room. Consequently, the whole-body counter could be disas-sembled, moved to the new location and reassembled on a large metal plateat a small cost compared with the installation of a gas-tight, metal barrierbeneath the counter in its old location and refurbishing and air -conditioningthe area.
The physical dimensions of the whole-body counter were not alteredfor the following reasons. This whole-body counter had been used since1957 to measure the radium content of humans who had ingested radium orhad received it by intravenous injection 30 to 40 years ago. These patients,who have been measured two or three times during the past eight years, willbe remeasured every two or three years, if p6ssible, in order to delineatethe long-term retention of radium in man. Since the radium content ofhumans decreases very slowly at long times after intake of the radium, eachmeasurement must either be very accurate or, if incorrect on an absolutebasis, at least contain the same systematic error.
Consequently, in order to avoid recalibration and the inherent errorstherein, the whole-body counter was reassembled almost exactly as it wasbefore except for two details. The IronRoomwas placed ona.1/8-,inch-thick·-sheet of aluminum, which projected several inches beyond all sides of the
129
Iron Room, instead of directly on the concrete floor, in order to provide avapor barrier between the floor and the Iron Room. The aluminum boxwas placed around the room and welded to the base sheet of aluminumunder the room. As the room was originally constructed, the steel platesthat formed the floor of the room did not touch two of the exterior walls.This space, which was originally filled with scrap bars of iron, was nowfilled instead with iron shot. Neither of these changes altered the dimen-sions, geometrical arrangement or scatter within the room. Thus thecalibration constants previously determined for any isotope with anycounting geometry should be valid in the room at the new location.
The lead liner for the interior surfaces of the room and the firstfew interior layers of steel plates were washed before reassembly.Otherwise, the plates were not cleaned unless a worker had obviouslystepped on a plate and left a footprint.
Gamma-Ray Background at New Location 1
The gamma-ray background in the energy band from 25 keV to1.575 MeV is about 800 counts per minute with the whole-body counter inthe new location versus 910 counts per minute at the old.location. Thisreduction in background might result from 1) increased shielding ofcosmic-ray secondary particles provided by the presence of two concretefloors overhead instead of the one floor at the old location, 2) a lower radonconcentration in the room since radon cannot seep in through the bottom,3) the fact that some radioactivity might have been cleared from the interiorlining of lead and the first few plates, or 4) the use of iron shot instead ofscrap at the floor and wall seams.
Radon Buildup
The gamma-ray spectrometer was calibrated on a Friday afternoonand the aluminum box sealed with rubber gaskets around the door. A seriesof 100-minute background measurements was made for the next5300 minutes, or until the following Tuesday morning. The background from25 keV to 1.575 MeV was 802 counts per minute for the first 100-minutemeasurement and was 63.8 counts per minute higher after the following5300-minute period. The doors were then opened, and after the interiorof the Iron Room was flushed with air from the new laboratory, a series of40-minute backgrounds was measured. The gamma-ray background im-mediately after flushing was 810 counts per minute as compared to802 counts per minute immediately before the room was sealed.
The rate of increase of background while the room was sealed wasconsistent with the pattern expected for the buildup of radon from an '
emanating radium source. Since the background increased 64 counts in
130
5300 minutes during the time required for radon to reach.one-half of theequilibrium value, the background would have increased 130 counts perminute if the room had remained sealed for 30 days. Previous calibrationsdemonstrated that 1.0 11/1Ci of radon per liter of air in the room yieldedabout 100 counts per minute. The above 130 counts per minute indicatesthe presence of about 1.3 1111Ci of radon per liter, equivalent to about
0.01 BCi in the 8000 liters volume of the room, or the presence of0.01 BCi of emanating Ra within the aluminum box. This relatively small226
amount of radium, which might be distributed over the surfaces of the32, lay.ers· of plates in dach.wall; willnot affect.the.background sighificantlyif the Iron Room is ventilated with air from the surrounding laboratory.
' Stability of Background
As a matter of standard procedure, series of 40-minute or 100-minute gamma-ray backgrounds are recorded from approximately 5:00 p.m.until 8:30 a.m. every night and from Friday evening until Monday morningeach weekend unless the room is otherwise in use. The presence of a trace
41 41ofAr has been observed on a few occasions. The concentration of Ar ,while high enough to influence the measurement of normal K in humans ona few occasions, does not build up to the high levels observed in the previous
41location. The presence ofAr can probably be avoided completely if themakeup air intake is closed any time· the wind blows from the south. The
integral background in the energy band from 25 keV to 1.575 MeV haschanged about 20 counts per minute during some series of measurements.This variation undoubtedly reflects changes in the radon concentration inthe atmosphere.3
Summary
The translocation of the original 46-ton Iron Room to an air-conditioned room was accomplished in January, 1965. In its new locationthe Iron Room rests on a single sheet of aluminum and has a controlled airsupply. Background counts in the energy range from 25 keV to 1.575 MeVare quite stable and have been reduced from 910 to 800 counts per minute.
Acknowledgement
Mr. John B. Corcoran and Mr. Carter A. Priess made many of thetechnical measurements before and after the whole-body counter was moved.
131
REFERENCES
1. Miller, C. E., L. D. Marinelli, R. E. Rowland, and J. E. Rose.Reduction of NaI Background. Nucleonics 14, 40-43 (1956).
2. Miller, C. E., L. D. Marinelli, R. E. Rowland, and J. E. Rose. AnAnalysis of the Background Radiation Detected by NaI Crystals. IRETrans. Prof. Group on Nuclear Science NS-3, 90-96 (1956).
3. Moses, H., A. F. Stehney, and H. F. Lucas, Jr. The Effect of Meteoro-logical Variables upon the Vertical and Temporal Distributions ofAtmospheric Radon. J. Geophys. Res. 65, 1223-1238 (1960).
133
CALIBRATION OF CESIUM-137 ROD STANDARDS
Charles E. Miller and Carter A. Priess
In September, 1962 a special meeting was held at the Second Sym-posium on Radioactivity in.Mani to discuss the fluctuations.in Cs137 mea-surements made by whole-body counter groups located in various parts ofthe United States. These investigators had made weekly measurements ofnormal persons who did not work with radioactive materials in order to
137acquire information on the amount of Cs in the civilian population livingin various areas of the United States. The rate of change of whole-bodyCS137 values also provided at least a rough indication of the fallout rate inthese sections of the country.
The average Cs values reported by sorne of the laboratories varied137
up and down by a factor of 2 or 3.from week to week. Since the half-time ofCS137 inthe adult human lies between 60 and 150. days,2,3 the average invivoCS137 content of a group of humans could not decrease more than about 8%during any one week if the half-time in every individual in the study was theminimum 60-day value. The Cs content could increase significantly dur -
137
ing any week.if the intake of cesium were high during that we'ek, but theCs137 value for the following weeks would also remain high. Moreover, theaverage Cs values reported by some groups were higher by a factor of
137
2 or 3 than the results reported by other groups. This variability might re-flect different fallout patterns or it could indicate that the absolute calibra-tions of the whole-body counters were incorrect. The average weekly Cs 137
levels.reported by some laboratories possibly reflected either instrumenta-tion, positioning, or calibration errors, or the presence of surface contami-nation,on the subject.
Anad hoc committee was organized to review the problems en-c ounte r e d in C s measurement and to recommend procedures for calibra-137
tion. of whole-body counters. This committee proposed a three-step program.1) Each laboratory would receive a calibrated National Bureau of Standardsring-type massless point source that could be used to check absolute cali-bration of its whole-body counter. 2) Each group would receive.a set ofthree rod-type secondary Cs standards of 0.01; 0.1 and 1.0 B Ci. The137
activity was to be deposited at a specified depth at a point on the axis withinthe rod so that each rod could be counted from the sides or from one end.The ratios among these sources were to be known to within 1.0%. Eachgroup was to measure these sources accurately in order to determine ifits equipment corrected for dead time at high count rates, did not drift athigh count rate,s, or otherwise performed accurately. 3) After each grouphad measured both the primary point source and the secondary standardsand had eliminated any electronic difficulties, a normal person who con-tained the average amount of Cs found in the civilian population plus a
137
tagged subject who contained a considerably larger, well-documented amount
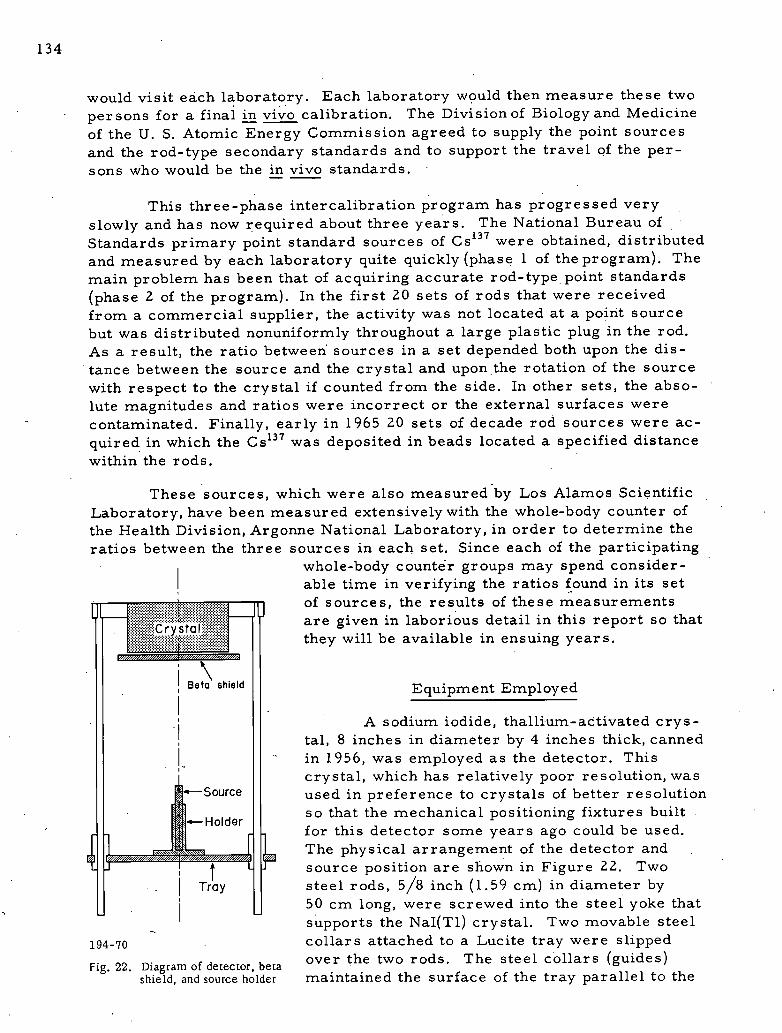
134
would visit each laboratory. Each laboratory would then measure these twopersons for a finai ill vivo calibration. The Division of Biology and Medicineof the U. S. Atomic Energy Commission agreed to supply the point sourcesand the rod-type secondary standards and to support the travel of the per-sons who would be the in vivo standards.
This three-phase intercalibration program has progressed veryslowly and has now required about three years. The National Bureau ofStandards primary point standard sources of Cs were obtained, distributed137
and measured by each laboratory quite quickly (phase 1 of the program). Themain problem has been that of acquiring accurate rod-type point standards
(phase 2 of the program). In the first 20 sets of rods that were receivedfrom a commercial supplier, the activity was not located at a point sourcebut was distributed nonuniformly throughout a large plastic plug in the rod.As a result, the ratio between sources in a set depended both upon the dis-tance between the source and the crystal and upon the rotation of the source
with respect to the crystal if counted from the side. In other sets, the abso-lute magnitudes and ratios were incorrect or the external surfaces were
- contaminated. Finally, early in 1965 20 sets of decade rod sources were ac-quired in which the Cs was deposited in beads located a specified distance137
within the rods.
These sources, which were also measuredby Los Alamos ScientificLaboratory, have been measured extensively with the whole-body counter ofthe Health Division, Argonne National Laboratory, in order to determine theratios between the three sources in each set. Since each of the participating
whole-body counte-r groups may spend consider-able time in verifying the ratios found in its set
Ul ·· · , 1 . , ·lu
of sources, the results of these measurements
Crystalare given in laborious detail in this report so thatthey will be available in ensuing years.
Beta shield Equipment Employed
A sodium iodide, thallium-activated crys-tal, 8 inches in diameter by 4 inches thick, cannedin 1956, was employed as the detector. Thiscrystal, which has relatively poor resolution, was
-Soume used in preference to crystals of better resolution
1111-Holderso that the mechanical positioning fixtures built
Nli for this detector sorne years ago could be used.1 m [1....................1 The physical arrangement of the detector and8 jwmwmmwmwme«wwm M#00 M source position are sliown in Figure 22. Two
Tray steel rods, 5/8 inch (1.59 cm) in diameter by50 cm long, were screwed into the steel yoke thatsupports the NaI(Tl) crystal. Two movable steel
194-70 collars attached to a Lucite tray were slipped
Fig. 22. Diagram of detector, betaover the two rods. The steel collars (guides)
shield, and source holder maintained the surface of the tray parallel to the
135
face of the crystal, and locking screws located in each collar permittedthe tray to be clamped at any distance up to·46 cm from the face of thecrystal. Fine indexing grooves, 1 cm apart, had been machined around therods, and a 1 0 millimeter scale was built into each collar. With reason-able care it is thus possible, by aligning the marks on the rod and the lineson the scale, to position or reposition the tray at any millimeter distancefrom the crystal face. It was not possible to reposition the tray accuratelyto a fraction of a millimeter since a vernier scale was not built into thefixture. A Lucite "candlestick" holder was placed on the center of the trayand the source was placed handle-end down in this holder. The bead sourcewas thus positioned along the axis of the crystal and the distance of the beadfrom the crystal face was determined by the distance from the handle endof the rod to the face of the crystal.
The pulses from the single 5-inch diameter photomultiplier that isoptically coupled to the 8- by 4-inch crystal were routed to the first200 channels of a Technical Measurements Corporation Model 404 pulseheight analyzer via input 1. The gain of this amplifier was adjusted on
137May 2 6, 1 9 6 5 s o that the C s photopeak was centered at channel 100.
' Neither the gain nor the high voltage changed during the next six weeks,and the C s photopeaks all fell in channel 100 during the hundreds of137
measurements that were made during this six-week period.
The output of a mercury-wetted relay type pulse generator drivenfrom the 60-cycle line voltage was fed into the second 200 channels of theanalyzer through a second amplifier via input 3 in the analyzer. The gainof this amplifier and the pulse generator output were adjusted so that thepulse generator pulses all fell in channel 300.
The recorded count rate from the pulse generator was employed toevaluate several systems in the Technical Measurements Corporation ana-lyzer. The number of pulses recorded per minute, which should number3600 counts per minute, provides a check on the live timer built with theanalyzer. In addition, any base level shifts introduced into the analog-to-digital converter (ADC) section of the analyzer by high count rates pro-duced by the Cs source or chance coincidences betweenthe pulse generator137
pulse and the Cs pulse would shift the pulse generator pulses fr.om chan-137
nel 300.into an adjacent channel, since the output pulses from both ampli-fiers are sorted by the same ADC.
Tray Position Employed
The rod sources were measured with the tray located at both 16 and44.5 cm from the face of the crystal. When the rod sources were placedhandle end down in the candlestick holder with the tray at these two dis-tances, the center of the bead source was located either 3.3 or 31.8 cm from
136
the crystal face. Consequently, the flat National Bureau of Standards pointsource, which was employed to obtain an absolute calibration of the system,was measured with the tray located at 3.3 and 31.8 cm.
Energy Band Employed to Determine Count Rate under the Photopeak
The count rate within a relatively wide energy band around the photo-peak was employed in order to minimize the effect of any potential change
137in energy calibration. A Cs spectrum was displayed on the scope of thepulse height analyzer and a group of channels selected visually with the aidof the "spectrum resolver." Channel 78 was chosen as the lower limit ofthe band since this channel fell in the trough between the Compton regionand the photopeak. Channel 119 was chosen as the upper limit since the netcount rate from Cs was practically zero in channels around 119.137
The count rate in channels 130 through 199 was employed to monitor41the room background in order to provide as surance that Ar or any other
airborne contamination was not present in the room, particularly whilecounting the 0.01 Ii Ci sources at 3.3 cm or.the 0.1 61 Ci and 0.01 B Ci sourcesat 31.8 cm. Any increase of the count rate in this energy band, which av-eraged 65% of that in.the photopeak band, indicated either an increasedgamma-ray background within the room, or a count rate high enough thatpulses were being missorted because of either pileup or chance coincidences,
Data Reduction
The data accumulated during each measurement were punched onpaper tape. The tapes were analyzed with the aid of an existing computerprogram and the Argonne-built computer called "Gus. " As used for theseanalyses, the computer was programmed to divide each measurement bythe length of time of the run, which is punched in the first data block, sub-tract the net background measurement from the net source measurement,and then add the net count rates in any desired groups of channels--in thiscase, channels 78 through 119 and 130 through 199.
The net counts under the photopeak of the several determinationsmade on each source were then punched onto cards, and means, variances,standard deviations and standard errors were computed for each group ofmeasurements with the aid of a Control Data Corporation 160-A computer.
Dead Time, Pileup, and Coincidence Correction
Because of pileup and chance coincidences between pulses, the countrate per microcurie of activity accumulated under the photopeak will stillvary, at least to a small degree, as a function of count rate even though the
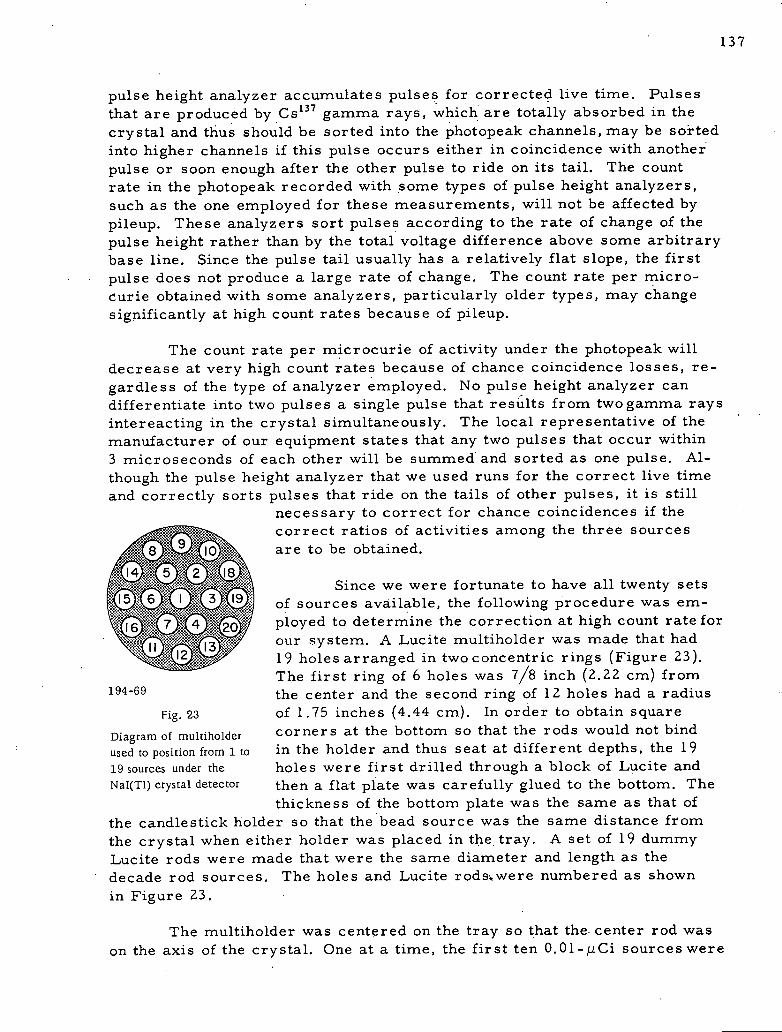
137
pulse height analyzer accumulates pulses for corrected live time. Pulsesthat are produced by Cs gamma rays, which are totally absorbed in the137
crystal and thus should be sorted into the photopeak channels, may be sottedinto higher channels if this pulse occurs either in coincidence with another
pulse or soon enough after the other pulse to ride on its tail. The countrate in the photopeak recorded with some types of pulse height analyzers,such as the one employed for these measurements, will not be affected bypileup. These analyzers sort pulses according to the rate of change of thepulse height rather than by the total voltage difference above some arbitrarybase line. Since the pulse tail usually has a relatively flat slope, the first
pulse does not produce a large rate of change. The count rate per micro-curie obtained with some analyzers, particularly older types, may changesignificantly at high count rates because of pileup.
The count rate per microcurie of activity under the photopeak willdecrease at very high count rates because of chance coincidence losses, re-gardless of the type of analyzer employed. No pulse height analyzer candifferentiate into two pulses a single pulse that res(lts from twogamma raysintereacting in the crystal simultaneously. The local representative of themanufacturer of our equipment states that any two pulses that occur within3 microseconds of each other will be summed and sorted as one pulse. Al-though the pulse height analyzer that we used runs for the correct live timeand correctly sorts pulses that ride on the tails of other pulses, it is still
necessary to correct for chance coincidences if thecorrect ratios of activities among the three sources
/(A (31 66- are to be obtained.
C-@78 12712, i Since we were fortunate to have all twenty setsi <gi rE-i (1*3568')} of sources available, the following procedure was em-
.( h- }t .' ployed to determine the correction at high count rate for.-I
our system. A Lucite multiholder was made that had.
j.!.1, 62.1 l!31.. 19 holes arranged intwoconcentric rings (Figure 23).\--_ZZL-/
The first ring of 6 holes was 7/8 inch (2.22 cm) from194-69 the center and the second ring of 12 holes had a radius
Fig. 23 of 1.75 inches (4.44 cm). In order to obtain square
Diagram of multiholder corners at the bottom so that the rods would not bindused to position from 1 to in the holder and thus seat at different depths, the 1919 sources under the holes were first drilled through a block of Lucite andNaI(Tl) crystal detector then a flat plate was carefully glued to the bottom. The
thickness of the bottom plate was the same as that ofthe candlestick holder so that the bead source was the same distance fromthe crystal when either holder was placed in the tray. A set of 19 dummyLucite rods were made that were the same diameter and length as thedecade rod sources. The holes and Lucite rods.were numbered as shown
in Figure 23.
The multiholder was centered on the tray so that the center rod wasonthe axis of the crystal. One atatime, the first ten 0.01-IICi sourceswere
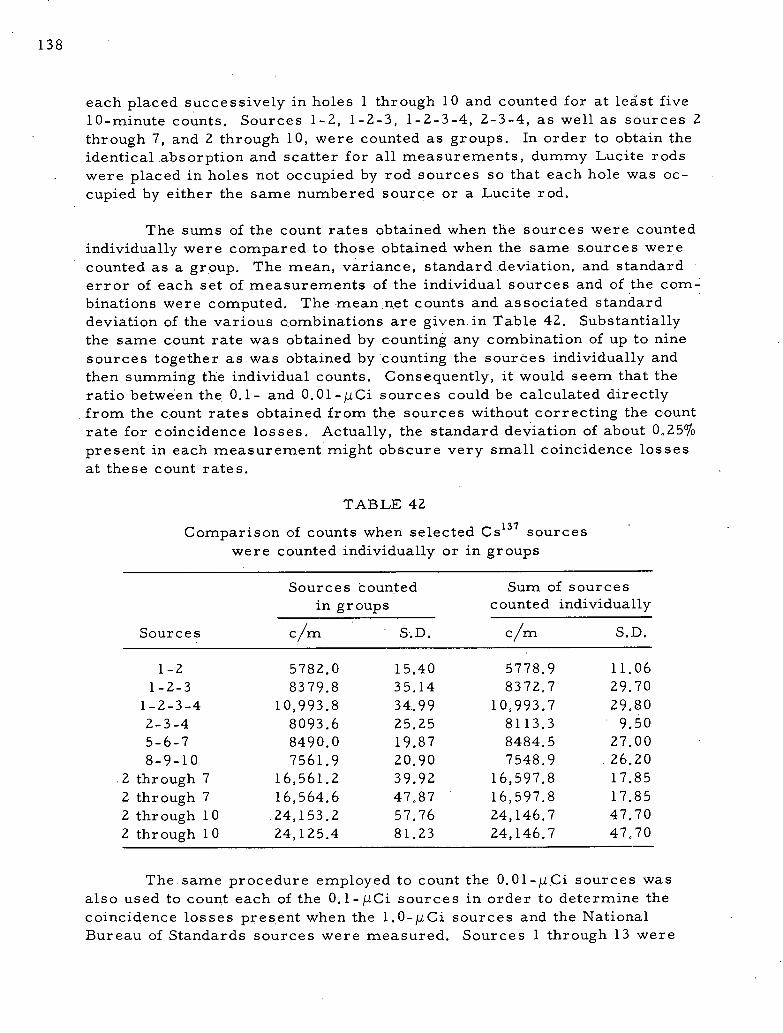
138
each placed successively in holes 1 through 10 and counted for at leist five10-minute counts. Sources 1-2, 1-2-3, 1-2-3-4, 2-3-4, as well as sources 2
through 7, and 2 through 10, were counted as groups. In order to obtain theidentical absorption and scatter for all measurements, dummy Lucite rods
were placed in holes not occupied by rod sources so that each hole was oc-cupied by either the same numbered source or a Lucite rod.
The sums of the count rates obtained when the sources were countedindividually were compared to those obtained when the same sources werecounted as a group. The mean, variance, standard deviation, and standarderror of each set of measurements of the individual sources and of the com-binations were computed. The mean net counts and associated standarddeviation of the various combinations are given in Table 42. Substantiallythe same count rate was obtained by counting any combination of up to ninesources together as was obtained by counting the sources individually andthen summing the individual counts. Consequently, it would seem that theratio between the 0.1- and 0.01-Mci sources could be calculated directlyfrom the count rates obtained from the sources without correcting the countrate for coincidence losses. Actually, the standard deviation of about 0.25%present in each measurement might obscure very small coincidence lossesat the s e c ount r ate s.
TABLE 42137
Comparison of counts when selected Cs sourceswere counted individually or in groups
Sources counted Sum of sourcesin groups counted individually
Sources clrn S.D. c rn S.D.
1-2 5782.0 15.40 5778.9 11.061-2-3 8379.8 35.14 8372.7 29.70
1-2-3-4 10,993.8 34.99 10,993.7 29.802-3-4 8093.6 25.25 8113.3 9.505-6-7 8490.0 19.87 8484.5 27.008-9-10 7561.9 20.90 7548.9 26.20
2 thr ough 7 16,561.2 39.92 16,597.8 17.85
2 thr ough 7 16,564.6 47,87 16,597.8 17.85
2 thr ough 10 24,153.2 57.76 24,146.7 47.70
2 thr ough 10 24,125.4 81.23 24,146.7 47.70
The same procedure employed to count the 0.01-B,Ci sources wasalso used to count each of the 0.1-Iici sources in order to determine thecoincidence losses present when the 1.0-IICi sources and the NationalBureau of Standards sources were measured. Sources 1 through 13 were
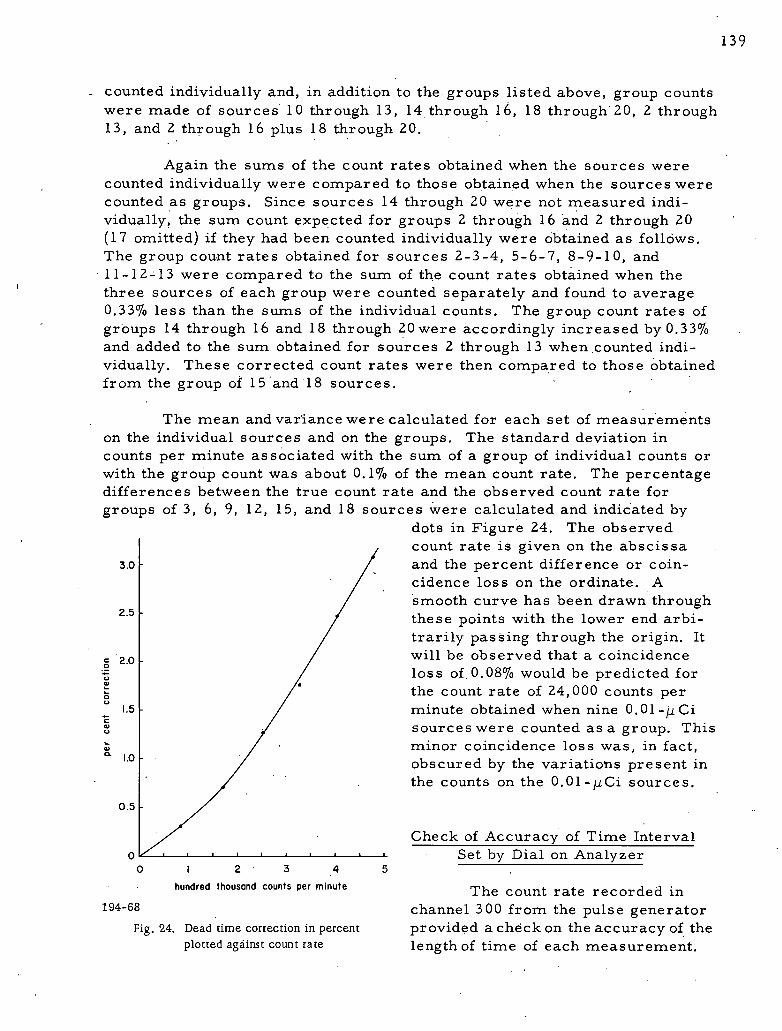
139
_ counted individually and, in addition to the groups listed above, group countswere made of sources 10 through 13, 14 through 16, 18 through 20,2 through13, and 2 through 16 plus 18 through 20.
Again the sums of the count rates obtained when the sources werecounted individually were compared to those obtained when the sources werecounted as groups. Since sources 14 through 20 were not measured indi-vidually, the sum count expected for groups 2 thr ough 16 and 2 through 20(17 omitted) if they had been counted individually were obtained as follaws.The group count rates obtained for sources 2-3-4, 5-6-7, 8-9-10, and11-12-13 were compared to the sum of the count rates obtained when thethree sources of each group were counted separately and found to average0.33% less than the sums of the individual counts. The group count rates ofgroups 14 through 16 and 18 through 20 were accordingly increased by 0.33%and added to the sum obtained for sources 2 thr ough 13 when counted indi-vidually. These corrected count rates were then compared to those obtainedfrom the group of 15 and 18 sources.
The mean and variance were calculated for each set of measurementson the individual sources and on the groups. The standard deviation incounts per minute as sociated with the sum of a group of individual counts orwith the group count was about 0.1% of the mean count rate. The percentagedifferences between the true count rate and the observed count rate forgroups of 3, 6, 9, 12, 15, and 18 sources were calculated and indicated by
dots in Figure 24. The observedcount rate is given on the abscissa
3.0 and the percent difference or coin-cidence loss on the ordinate. Asmooth curve has been drawn through
2.5 these points with the lower end arbi-trarily passing through the origin. It
c 2.0 will be observed that a coincidence0- loss of 0.08% would be predicted for-0.t the count rate of 24,000 counts per00
1.5 minute obtained when nine 0.01-IICi-C
8 sources were counted as a group. ThisZ minor coincidence loss was, in fact,= 1.0
obscured by the variations present inthe counts on the 0.01-iici sources.
0.5
Check of Accuracy of Time Intervalo Set by Dial on Analyzer0 1 2 3 4 5
hundred thousand counts per minute The count rate recorded in194-68 channel 300 from the pulse generator
Fig. 24. Dead time correction in percent provided a chdck on the accuracy of theplotted against count rate length of time of each measurement.
140
A count rate of 3614 counts per minute was recorded in channel 300 for allruns of from 1 to 100 minutes, while very low count rates from the Cs 137
were being accumulated in the first 200 channels. The fact that this ana-lyzer accumulates pulses for about 0.4% longer (3614 counts per minuteinstead of the expected 3600 counts per minute) than the actual time arbi-trarily selected by a dial is not important as long as the duration of anytime measurement is always long or short by the same percentage. Theinternal timer would introduce a significant error, particularly for a shortmeasurement, if each measurement were a constant number of secondslonger or shorter.than observed.
The recorded count rate from the pulse generator decreased wheha high c ount r ate fr om the C s source was sorted via input 1 because of
137
coincidence losses in the ADC between the Cs pulses and the pulse gener-137
ator pulse. The percentage decrease in the pulse generator count rateagreed with the percentage coincidence losses derived experimentally forthese count rates by counting sources individually and as groups. Never-theless, another test of the timing system was made.
Since counting times of 1, 4, and 10 minutes were used when the1.0-, 0.1-, and 0.01-iici sources, respectively, were counted at 3.3 cm,series of runs were made at various count rates to determine if the 4- and10-minute counts were actually four and ten times as long as the 1 -minutecount. The NBS source was located at both 31,8 cm and 3.3 cm from theface of the crystal, and numerous repetitive 1 -, 4-, and 10-minute measure-ments recorded. The mean and standard deviation of each series of runswas computed and found to agree with the other measurement made at thatdistance. Consequently, the 4- and 10-minute measurements are four andten times as long as the 1 -minute measurement for the count rates presentwhen the 1.0-BCi source was counted at 31.8 or 3.3 cmorthe 0.1 BCisourceat 3.3 crn.
Measurements of Rod Standards
31.8-cm Position
C.«
The tray was first positioned so that the center of the radioactivebead of Cs was 31.8 cm from the face of the 8- by 4-inch crystal. Each137
of the 20 "nominal 1.0" Bci cesium sources was counted in turn for three4-minute measurements, and the entire series was repeated. The six mea-surements of each source were examined to determine if the individualmeasurements fell within the expected Poisson statistical limits.* In oneinstance, one set of three measurements was consistently above the other
*S.D. = . //6 ounts/minute'V minutes
141
three measurements. Investigation disclosed that this source rod was over-sized and tended to bind just before being seated on.the base of the candle-stick holder. When it was counted a third time while properly seated in theholder, a count rate in agreement with the lower of the first two sets ofcounts was obtained. A "nominal l.0" IICi source at this distance yieldedabout 29,000 counts per minute under the photopeak. Based on the coin-cidence loss curve of Figure 24, this count rate is approximately. 0.1% low.
Each 0.1 - 11Ci source was then counted at the same distance for atleast three 10-minute counts. The 0.1-BCi sources yielded on the averageabout 2330 counts per minute under the photopeak.
The 0.01- liCi sources numbered 1, 7, and 15 were also counted atthis distance. Seven replicate 100-minute measurements were made ofbackground, source 7, background, source 13, background, source 1, back-ground. The 0.01-Mci source yielded about 220 counts per minute underthe photopeak. It was .obviously impractical to measure all the 0.01- BCisources at this distance.
3.3-cm Position
In order to obtain a higher and more accurate count rate from the0.01-MCi sources, the tray was raised so that the center of the bead sourcewas only 3.3 cm from the face of the crystal. The distance of 3.3 cm wasnot selected as an optimum distance but rather from the fact that the traywas positioned so that two engraved lines 1 cm apart on the rod matchedexactly the engraved 0 and 10 mm lines on the tray. With the tray at thi sheight, the 1.0-Mci sources were each counted for at least four 1-minutecounts, the 0.1-Mci sources for five or more 4-minute counts and the0.01-BCi sources for three or more 10-minute counts. These sourcesyielded count rates under the photopeak of about 376,000, 30,400, and 2,911counts per minute with sustained coincidence losses of about 2.22,. 0.11,and 0.01%, respectively. The appropriate correction for each 1.0-BCisource was obtained from the curve, while a correction of 0.1% was arbi-trarily used for all measurements of the 0.1-BCi sources at 3.3 cm.
Ratios between.the 1.0- BCi and 0.1-iici Sources in Each Set
The net count under the photopeak of each measurement was punchedonto a conventional computer card. All of the measurements on each sourceat each distance were analyzed with a computer to determine the mean,variance, standard deviation, and standard error of each set of measure-ments. The mean count rates, corrected for coincidence losses, of each1.0-Bci source in the set when counted at 3.3 and 31.8 cm were divided bythe mean count rates of the 0.1-iici sources (corrected for losses if nec-essary) from that set when counted at the same distance. The two ratios
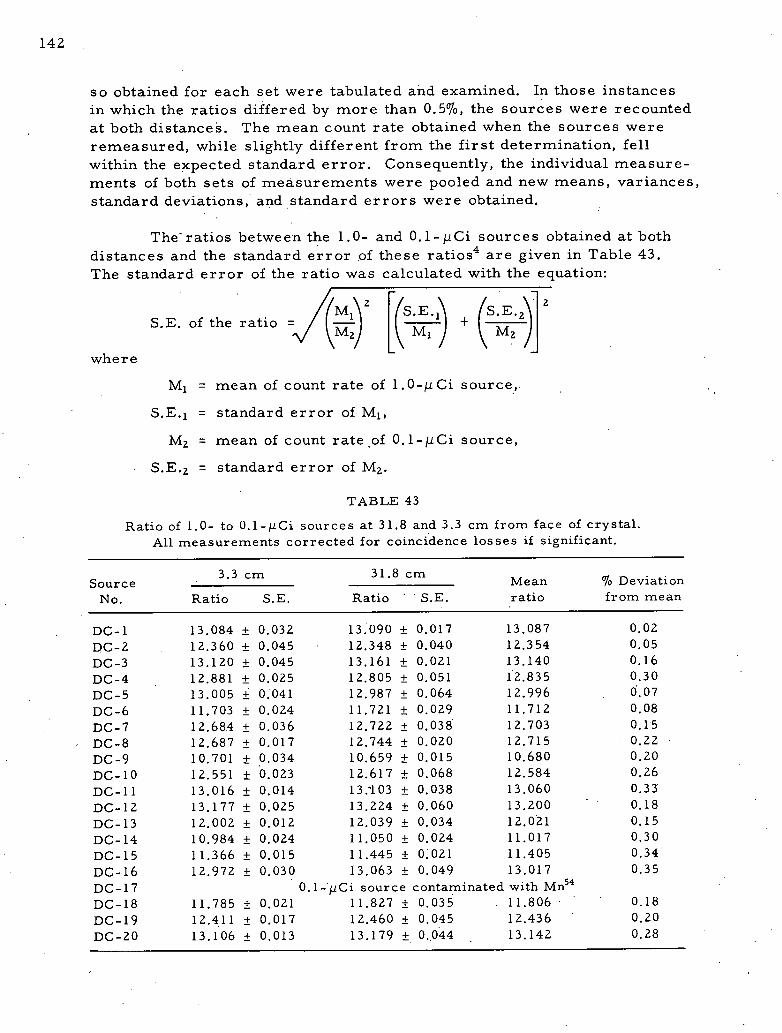
142
so obtained for each set were tabulated and examined. In those instancesin which the ratios differed by more than 0.5%, the sources were recountedat both distances. The mean count rate obtained when the sources wereremeasured, while slightly different from the first determination, fellwithin the expected standard error. Consequently, the individual measure-ments of both sets of measurements were pooled and new means, variances,standard deviations, and standard errors were obtained.
The ratios between the 1.0- and 0.1-Ii Ci sources obtained at bothdistances and the standard error of these ratios4 are given in Table 43.The standard error of the ratio was calculated with the equation:
S.E. of the ratio = »1\ 2 / \S.E.,) S.E.A '+,1/ Mq _(-Mi-7 \ M, 1
where
Mi = mean of count rate of 1.0-B Ci source,
S.E.1 = standard error of Ml,Mz = mean of count rate of 0.1-;ICi source,
S.E.2 = standard error of M2.
TABLE 43
Ratio of 1.0- to 0.1-Mci sources at 31.8 and 3.3 cm from face of crystal.All measurements corrected for coincidence losses if significant.
3.3 crn 31.8 cnnSource Mean % Deviation
No. Ratio S.E. Ratio
S.E. ratio from mean
DC-1 13.084 i 0.032 13.090 + 0.017 13.087 0.02
DC-2 12.360 1 0.045 12.348 + 0.040 12.354 0.05
DC-3 13.120 + 0.045 13.161 + 0.021 13.140 0.16
DC-4 12.881 + 0.025 12.805 + 0.051 12.835 0.30
DC-5 13.005 + 0,041 12.987 + 0.064 12.996 0.07
DC-6 11.703 i 0.024 11.721 + 0.029 11.712 0.08
DC-7 12.68.4 + 0.036 12.722 i 0.038 12.703 0.15
DC-8 12.687 + 0.017 12.744 i 0.020 12.715 0.22
DC-9 10.701 + 0.034 10.659 + 0.015 10.680 0.20
DC-10 12.551 + 0.023 12.617 + 0.068 12.584 0.26
DC-11 13.016 + 0.014 13.'103 + 0.038 13.060 0.33
DC-12 13.177 + 0.025 13.224 + 0.060 13.200 0.18
DC-13 12.002 + 0.012 12.039 + 0.034 12.021 0.15
DC-14 10.984 + 0.024 11,050 + 0,024 11.017 0.30
DC-15 11.366 + 0.015 11.445 + 0.021 11.405 0.34
DC-16 12.972 i 0.030 13.063 + 0.049 13.017 0.35
DC-17 540. 1- 51 Ci source contaminated with Mn
DC-18 11.785 + 0.021 11.827 + 0.035 11.806 0.18
DC-19 12.411 + 0.017 12.460 + 0.045 12.436 0.20
DC-20 13.106 + 0.013 13.179 + 0..044 13.142 0.28
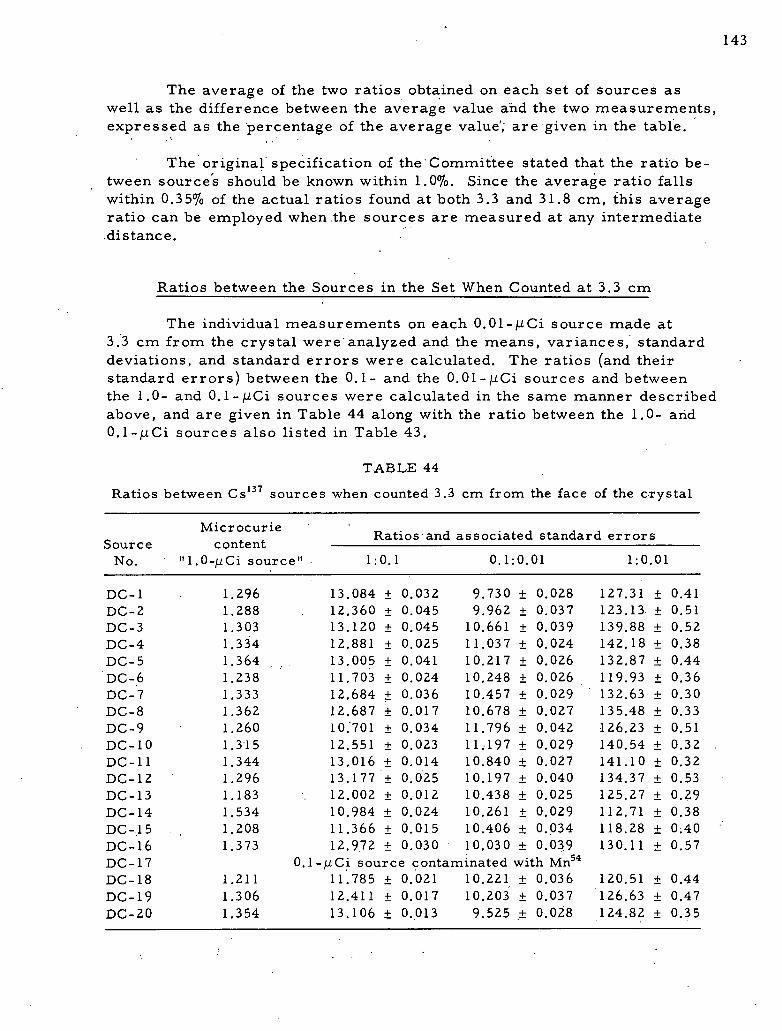
143
The average of the two ratios obtained on each set of sources aswell as the difference between the average value ahd the two measurements,expressed as the 'percentage of the average value; are given in the table.
The original specification of the Committee stated that the ratio be-
tween sources should be known within 1.0%. Since the average ratio fallswithin 0.35% of the actual ratios found at both 3.3 and 31.8 cm, this averageratio can be employed when the sources are measured at any intermediatedistance.
Ratios between the Sources in the Set When Counted at 3.3 cm
The individual measurements on each 0.01-BCi source made at3.3 cm from the crystal were analyzed and the means, variances, standarddeviations, and standard errors were calculated. The ratios (and theirstandard errors) between the 0.1- and the 0.01-BCi sources and betweenthe 1.0- and 0.1-Bci sources were calculated in the same manner describedabove, and are given in Table 44 along with the ratio between the 1.0- and0.1-11 Ci sources also listed in Table 43.
TABLE 44
Ratios between Cs sources when counted 3.3 cm from the face of the c.rystal137
MicrocurieRatios and associated standard errors
Source contentNo. '11.0-MCi source" 1:0.1 0.1:0.01 1:0.01
DC-1 1.296 13.084 + 0.032 9.730 + 0.028 127.31 1 0.41DC-2 1.288 12.360 f 0.045 9.962 + 0.037 123.13 1 0.51DC-3 1.303 13.120 i 0.045 10.661 + 0.039 139,88 + 0.52DC-4 1.334 12.881 + 0.025 11.037 + 0.024 142.18 + 0.38DC-5 1.364 13.005 + 0.041 10.217 + 0.026 132.87 + 0.44DC-6 1.238 11.703 + 0.024 10.248 + 0.026 . 119.93 + 0.36DC-7 1.333 12.684 1 0.036 10.457 + 0.029 132.63 + 0.30DC-8 1.362 12.687 + 0.017 10.678 + 0.027 135.48 + 0.33DC-9 1.260 10.701 + 0.034 11.796 + 0.042 126.23 + 0.51DC-10 1.315 12.551 + 0.023 11.197 + 0.029 140.54 =t 0.32
DC-11 1.344 13.016 + 0.014 10.840 k 0.027 141.10 + 0.32DC-12 1.296 13.177 + 0.025 10.197 + 0.040 134.37 + 0.53DC-13 1.183 12.002 + 0.012 10.438 8 0.025 125.27 + 0.29DC-14 1.534 10.984 + 0.024 10.261 + 0.029 112.71 + 0.38DC -:15 1.208 11.366 + 0.015 10.406 + 0.034 118.28 + 0.40DC-16 1.373 12.972 + 0.030 10.030 + 0.039 130.11 + 0.57DC-17 540.1-*Ci source contaminated with MnDC-18 1.211 11.785 + 0.021 10.221 + 0.036 120.51 + 0.44DC-19 1.306 12.411 + 0.017 10.203 + 0.037 126.63 + 0.47DC-20 1.354 13.106 + 0..013 9.525 .1 0.028 124.82 + 0.35
144
The ·ratios (not given) between the 0.1- and 0.01-IICi sources ofsets 1, 7, and 13 when located at 31.8.cnn agreed within the stahdard errorsofthe ratios found when these sources,were located at 3..3 cm. This factalso supports the contention that the appropriate cortection for coincidencelosses has been made on the 0.1-kici measurement at 3.3 cm.
Absolute Activity
Although the rod sources were originally, intended to be used onlyas secondary standards, we have attempted to determine fairly preciselythe amount of C s present in.the "nominal 1.0" IICi rods. To do this, the137
NBS massless point source was placed on the tray and the height of thetray was adjusted so that the point source coincided with the position occu-pied by the center of the bead in the rod source (31.8 cm from the crystalface). After several measurements were made, a right cylinder block of
Lucite, 5/8 inch (1.59 cm) in diameter by 0.310 inch (0.79 cm) thick,* wasplac.ed over the point source to introduce the same absorption and scatter
present in the rod sources and several more measurements were made.The tray was raised so that the point source was:3.3 cnn from the crystaland the same procedure was repeated. The count rate in the photopeak de-creased 5.5% at both distances when the Lucite block was added.
137The calibration factor used to calculate the absolute Cs content137of the rod sources was based on National Bureau of Standards Cs point
source 189. This Cs s.ource was certified to emit 50.1 x 10³ gamma rays137
per second on August 1, 1963. A ratio of 85 gamma rays per 100 disinte-grations was employed to calculate the microcurie content and a half-timeof 29.78 years was used to correct for physical decay from August 1, 1963until July 1, 1965.
The count rates under. the photopeaks obtained when the NBS sourcewas covered with a 0.310-inch thick block of Lucite and located at both 31.8and 3.3 cm were divided by the calculated microcurie content to obtain·thecalibration-fac:tors. These count rates were also corrected for coincidencelosses.
The count rates obtained from the 1.0-Mci sources at 31.8 and3.3 cm were divided by the count rates per microcurie calculated from theNBS source at these two positions. As would be expected from the fact thatthe ratios obtained for some sets at 31.8 and 3.3 cm differed by as muchas.0.7%, the two values calculated for some sources also differed by asmuch as 0.7%. The values calculated for the two distances were averagedand are listed in Table 44. These values should be well within 1.0% of thecorrect value.
*A shadowgraph was used to measure the distance from the center of thebead to the end of the rod, and thereby to determine the 0.310-inch thick-ne s s of the block.
145
The absolute activities of the 0.1- and 0.01-Mci sources were notgiven·. If the value for the "nominal 1.0" IICi source in the set is dividedby the appropriate ratio, the values for the other sources in the set can becalculated to within 1.0% of the true value·. :
Ratio from the Side
The 1.0- and 0.1-Mci source's of set 1 were also counted from theside to determine if the ratio between the sources differed significantlyfrom the ratio found when the sources were counted from the end. Eachsource was placed on its side on the :tray with the label placed first uptoward the crystal and then with the label placed away from the crystal.The bead source was on the axis of the crystal about 15.25 cm from theface of the crystal. The axis of the handle of the rod source was at rightangles to the crystal axis.
The ratios between the 1.0- and 0.1-IICi sources of set 1 were 13.16when the label was placed toward and 13.20 when the label was placed awayfrom the crystal face. These ratios are in fair agreement with the ratio of13.09. found from the end of the source and verify the fact that the same ratioshould be obtained by counting the source either from the side or the end.
Conclusions
The ratios of activities between 19 sets of these decade sources andthe absolute activities of the "nominal 1.0" iici sources of each set havebeen measured and·set forth in detail. Since the standard errors of theratios are all within-0.5%, substantially all of the ratios should be within1.0% of the true value if the sources are counted from the end. The abso-lute activities of the "nominal l.O" IICi sources should also be within 1.0%of the true value. When compared to a point massless source, these rodstandards would appear to contain 5.5% less Cs than stated because of137
absorption and scatter in the Lucite rods in which they are imbedded.
146
REFERENCES
1. Lough, S. Allan, Chairman. A Discussion of the Accuracy and Precisionof the Measurement of Cs Burdens by Whole-Body Counting Methods.137
Radioactivity in-Man, ed. G. R. Meneely and S. M. Linde. Charles C.Thomas, Springfield, Ill., 1965, pp. 157-176.
2. Rundo, J. and B. T. Taylor. The Assessment of Radioactive Cesiumin Man. Symposium on As sessment of Radioactive Body Burdens inMan, Heidelberg, Germany, May 11-16, 1964. International AtomicEnergy Agency, Vienna, Austria, 1965.
3. Rundo, J., J. I. Mason, D. Newton, and B. T. Taylor. Biological Half-Life of Cesium in Man in Acute and Chronic Exposure, Nature 200,188 (1963).
4. Tippett, L. H. C. The Methods of Statistics. Williams and Norgate,Ltd., London, England, 1948.
147
PUBLICATIONS
Papers
Hasterlik, R. J., C. E. Miller, and A. J. Finkel. Carcinoma of the Mastoidand Paranasal Sinuses in Radium-Bearing Patients. Acta, Unio Intern.Contra Cancrum 20, 1194-1195 (1964).
Miller, C. E. A New Technique for ·Determining the Distribution of Radiumand Thorium in Living Persons. Assessment of Radioactivity in Man. In-ternational Atomic Energy Agency, Vienna, Austria, 1964, Vol. I, pp. 67-77,
137Miller, C. E. Retention and Distribution of Cs after AccidentalInhalation. Health Phys. 10, 1065-1070 (1964).
Hasterlik, R. J. and A. J. Finkel. Diseases of Bones and Joints Associatedwith Intoxication by Radioactive Substances, Principally Radium. Med.Clin. N. Am. 49, 285-296 f1965); Enfermedades de Huesos y ArticulacionesAsociadas con Intoxicacion por Substancias Radiactivas PrincipalmenteRadio, Clinicas Medicas de Norte America (Editorial Inter Americana,S.A., Mexico City, Mexico, 1965) pp. 285-296.
Remenchik, A. P" r. J. Talso, and C. E. Miller. Correlation of Total-n
Body Potassium and Tissue Potassium Measurements. Radioactivity inMan. .C. C. Thomas, Springfield, Illinois, 1965, pp. 203-209.
Abstracts
Miller, C. E. and A. J. Finkel. Reexamination of the P6wer Function De-scription. of Long-Term Radium Retention in Man. Radiation Res. 25, 187(May 1965).
Miller, C. E. and A. J. Finkel. The Single Exponential as a Descriptionof Long-Term Radium Retention in Man. Radiation Res. 25, 218 (May 1965):


