Embed Size (px)
Citation preview

Myristate Exposure in the HIV-1 Matrix Protein is Modulated bypH
Emily L. Fledderman1, Ken Fujii2, Ruba H. Ghanam1, Kayoko Waki2, Peter E. Prevelige1,Eric O. Freed2, and Jamil S. Saad1,*1Department of Microbiology, University of Alabama at Birmingham, Birmingham, AL 352942Virus-Cell Interaction Section, HIV Drug Resistance Program, National Cancer Institute atFrederick, Frederick, MD 21702
AbstractHuman immunodeficiency virus type-1 (HIV-1) encodes a polypeptide called Gag that is capableof forming virus-like particles (VLPs) in vitro in the absence of other cellular or viral constituents.During the late phase of HIV-1 infection, Gag polyproteins are transported to the plasmamembrane (PM) for assembly. A combination of in vivo, in vitro and structural studies haveshown that Gag targeting and assembly on the PM are mediated by specific interactions betweenthe myristoylated matrix (myr(+)MA) domain of Gag and phosphatidylinositol-(4,5)-bisphosphate(PI(4,5)P2). Exposure of the MA myristyl (myr) group is triggered by PI(4,5)P2 binding and isenhanced by factors that promote protein self-association. In the studies reported herein, wedemonstrate that myr exposure in MA is modulated by pH. Our data show that deprotonation ofthe His89 imidazole ring in myr(+)MA destabilizes the salt bridge formed between His89(Hδ2)and Glu12(COO-), leading to tight sequestration of the myr group and a shift in the equilibriumfrom trimer to monomer. Furthermore, we show that oligomerization of a Gag-like constructcontaining matrix-capsid is also pH-dependent. Disruption of the His-Glu salt bridge by singleamino acid substitutions greatly altered the myr-sequestered–myr-exposed equilibrium. In vivointracellular localization data revealed that H89G mutation retargets Gag to intracellularcompartments and severely inhibits virus production. Our findings reveal that the MA domain actsas a “pH sensor” in vitro, suggesting that the effect of pH on HIV-1 Gag targeting and binding tothe PM warrants investigation.
KeywordsHuman immunodeficiency virus types 1 and 2 (HIV-1 and HIV-2); myristyl (myr); matrix (MA);nuclear magnetic resonance (NMR); His-Glu salt bridge
Corresponding Author: Jamil S. Saad, Ph.D., 845 19th Street South, Birmingham, AL 35294; Phone: 205-996-9282; Fax:205-996-4008; [email protected] INFORMATION AVAILABLE2D 1H-15N HSQC NMR spectra of myr(−) and myr(+)MA as a function of pH (Figs. S1 and S2); 3D 13C-edited/12C-double-half-filtered NOE spectrum of myr(+)MA at pH 5.5 (Fig. S3); sedimentation equilibrium profiles for myr(+)MA at different pH values(Fig. S4); plots of chemical shift changes vs. pH used to determine the pKa value of His89 for myr(−)MA (Fig. S5); sedimentationequilibrium and velocity profiles for WT CA and various MACA mutants as a function of pH (Fig. S6-S9); 2D NMR HSQC spectra(Fig. S10), sedimentation velocity profiles (Fig. S11) and CD spectra (Fig. S12) for MA H89G mutants; 2D HSQC spectra andsedimentation velocity profiles of MA E12A mutants (Fig. S13); sedimentation velocity profiles for myr(+)MA-E12A/W184A/M185A as a function of pH (Fig. S14); structural representation of salt bridge formation in the HIV-1 MA structures (Fig. S15); and,SDS-PAGE showing the effect of His89 and E12 mutations on virus production (Fig. S16). This material is available free of chargevia the Internet at http://pubs.acs.org.
NIH Public AccessAuthor ManuscriptBiochemistry. Author manuscript; available in PMC 2011 November 9.
Published in final edited form as:Biochemistry. 2010 November 9; 49(44): 9551–9562. doi:10.1021/bi101245j.
NIH
-PA Author Manuscript
NIH
-PA Author Manuscript
NIH
-PA Author Manuscript

Retroviral genomes encode a polyprotein called Gag that contains all the viral elementsrequired for virus assembly and is capable of forming virus-like particles (VLPs) in vitro inthe absence of viral and cellular constituents (1,2). Subsequent to their synthesis, Gagpolyproteins are transported to the plasma membrane (PM) for assembly and budding (3–6).During or shortly after budding, the Gag proteins are cleaved by the viral protease intomatrix (MA), capsid (CA), nucleocapsid (NC), and short peptides (SP1, SP2 and P6), whichrearrange to form mature and infectious virions (4–6).
It is widely accepted that HIV-1 Gag budding and assembly occur predominantly on the PM(6–15). Membrane binding is mediated by Gag’s N-terminal myristoylated MA domain(myr(+)MA). The myristyl group (myr) functions in concert with a group of conserved basicresidues to facilitate membrane anchoring and assembly of Gag (4–6). Mutations that eitherblock myristoylation or disrupt the basic patch lead to inefficient Gag targeting to the PM,resulting in dramatically reduced virus production (9,16–19).
NMR-based structural studies confirmed that the myr group of HIV-1 MA can adoptsequestered (myr(s)) and exposed (myr(e)) conformations (20). Extrusion of the myr groupcan be increased by factors that promote protein self-association, such as increasing proteinconcentration or inclusion of the CA domain (20). Equilibrium data revealed that whilemyr(+)MA resides in monomer-trimer equilibrium, the myr(−)MA protein maintains themonomeric character in solution under all conditions (20). In addition, exposure of the myrgroup is coupled with protein trimerization (20). Despite a high degree of sequence andstructural homology, we have recently shown that factors affecting the myr switchmechanism are significantly different for the HIV-1 and HIV-2 MA proteins (21). Structuralstudies on HIV-2 MA revealed that the myr group is tightly sequestered and the protein is inthe monomeric state, indicating that key differences in the myr switch mechanism can existbetween closely related retroviruses (21).
Studies by Freed, Ono and co-workers demonstrated that the ultimate localization of HIV-1Gag at virus assembly sites is dependent on phosphatidylinositol-(4,5)-bisphosphate(PI(4,5)P2) (22–24), a cellular factor localized at the inner leaflet of the PM (25–27).Subsequent structural studies revealed that PI(4,5)P2 binds directly to HIV-1 MA, inducinga conformational change that triggers myr exposure (28). On the other hand, although HIV-2Gag localization on the PM is also dependent on PI(4,5)P2, structural studies have shownthat the myr switch of HIV-2 MA is less sensitive to PI(4,5)P2 binding than that of HIV-1(21).
To dissect the underlying differences in the myr switch mechanism in HIV-1 and HIV-2 MAproteins, we focused on some key differences in the N-terminal domain including the first20 residues. We observed that Glu12 in HIV-1 MA is substituted with Lys in HIV-2 MA(21). Analysis of the HIV-1 myr(+)MA structure revealed that the imidazole ring of His89,which is highly conserved among all strains of HIV-1, HIV-2, and simianimmunodeficiency virus (SIV) (Los Alamos National Laboratory, http://www.hiv.lanl.gov),forms a salt bridge with Glu12(COO-) in HIV-1 myr(−)MA but not in the myr(+)MAprotein (Fig. 1).
Histidines are central in biological activities because of their frequent inclusion in the activesites of enzymes and their contributions to protein stability and function. The intrinsic pKaof the histidine imidazole group typically lies between 6.0 and 7.0 (29,30), but can varydepending on the degree of burial or exposure within proteins (30). Earlier studies haveshown that mutation of His89 and other residues in the vicinity led to targeting of Gag tointracellular compartments and severely reduced virus production (18). These findings,
Fledderman et al. Page 2
Biochemistry. Author manuscript; available in PMC 2011 November 9.
NIH
-PA Author Manuscript
NIH
-PA Author Manuscript
NIH
-PA Author Manuscript
combined with our recent structural studies, indicate that His89 may play a central role indetermining the site of Gag assembly and ultimately efficient virus production.
We have employed NMR, biophysical techniques, mutagenesis and in vivo studies toidentify the precise functional role of the His89-Glu12 salt bridge in regulating the myrswitch mechanism, HIV-1 Gag targeting, and virus replication. Our results demonstrate thatextrusion of the myr group in the HIV-1 MA protein is sensitive to changes in pH. In vivointracellular localization data revealed that H89G mutation retargets Gag to intracellularcompartments and severely inhibits virus production.
EXPERIMENTAL PROCEDURESSample preparation
A co-expression vector encoding the HIV-1 MA gene and a yeast N-myristyl transferase(yNMT) was kindly provided by Dr. Michael Summers (HHMI, UMBC). To construct theMACA clone, the MACA coding sequence was PCR-amplified from the pNL4-3 isolate(NCBI accession code: M15390) and cloned into the co-expression vector described aboveat its NcoI and XhoI sites in-frame with the C-terminal His6 tag and stop codon of theplasmid. An expression vector encoding for the HIV-1 CA domain was kindly provided byDr. Peter Prevelige (UAB). QuickChange XL site-directed mutagenesis kit (Stratagene, LaJolla, CA) was used to generate a subset of MA and MACA mutants (MA-H89G, MA-E12A, MACA-W184/M185A, and MACA-E12A/W184A/M185A). Mutations were verifiedby plasmid sequencing at the Center for AIDS Research core facility (UAB).
Preparation of MA, CA, and MACA protein samples has been described elsewhere(20,28,31–33). Mutant MA samples were prepared similar to wild-type (WT) MA.However, although the myr(−)MA H89G protein was very soluble, the myr(+)MA H89Gprotein was found exclusively in the pellet, purified under denaturing conditions (8M urea)and refolded through extensive stepwise dialysis. Due to sample precipitation, myr(+)MAH89G samples were kept at concentrations lower than ∼40 µM. Molecular weights ofproteins and efficiency of myristoylation were confirmed by electrospray ionization massspectrometry. Samples for all NMR experiments were prepared in 50 mM sodiumphosphate, 100 mM NaCl, and 2 mM DTT. NMR sample concentrations of MA proteinsvaried from 50 to 700 µM.
NMR spectroscopyNMR data were collected on a Bruker Avance II (700 MHz 1H) spectrometer equipped witha cryoprobe, processed with NMRPIPE (34) and analyzed with NMRVIEW (35). Two-andthree-dimensional NOESY data were obtained for natural abundance, 15N- and 15N-, 13C-labeled protein samples (pH 7.2, 35°C). Protein signal assignments were describedelsewhere (20,28,31,32). 1H-1H NOEs between 15N-, 13C-labeled protein and unlabeledmyristate group were assigned from 2D (1H-1H) and 3D (13C- and 13C-edited/12C-double-half-filtered) NOESY data (see references (36,37) and citations there-in).
Determination of the His89 pKa valueThe pKa value of His89 for myr(−) and myr(+)MA proteins was calculated based on the pH-dependent His Hε1 and Cε1 chemical shifts extracted from the 2D HMQC (heteronuclearmultiple quantum coherence) data. Protein concentrations were at 150 µM. Sample pH wasadjusted to the desired values with DCl or NaOD. pH values were measured at roomtemperature before and after NMR data collection. The values were not corrected for thedeuterium isotope effect. NMR spectra were recorded at pH values between pH 4.2 and pH8.8. No chemical shift changes occurred below pH 4.2 and above pH 8.8. The pH titration
Fledderman et al. Page 3
Biochemistry. Author manuscript; available in PMC 2011 November 9.
NIH
-PA Author Manuscript
NIH
-PA Author Manuscript
NIH
-PA Author Manuscript

curves were fitted to a modified Henderson-Hasselbalch equation by nonlinear least-squaresanalysis:
in which δobs is the chemical shift observed at each pH value and δacid and δbase are thechemical shift values for the protonated and deprotonated histidine, respectively. Curve fitswere performed using ORIGIN 8.1 software (OriginLab, Northampton, MA).
Analytical UltracentrifugationSedimentation velocity (SV) and sedimentation equilibrium (SE) measurements werecollected on a Beckman XL-I Optima system equipped with a four-hole An-60 rotor(Beckman Coulter). Protein samples were prepared in 50 mM sodium phosphate buffer, 100mM NaCl and 2 mM Tris (2-carboxy-ethyl)-phosphine-HCl. Loading concentrations variedfrom 30 to 150 µM for MA and CA samples, while concentrations for MACA samples werefrom 7 to 30 µM. Rotor speed for sedimentation velocity experiments was set at 40,000 rpm,while sedimentation equilibrium data were collected at 22,000, 26,000 and 30,000 rpm(20°C). Scans were acquired at wavelengths of 280, 290 or 295 nm. Partial specific volumes(v-bar) and molar extinction coefficients were calculated by using the program SEDNTERPand buffer densities were measured pycnometrically. Sedimentation velocity data analysiswere performed by using SEDFIT (38,39), while sedimentation equilibrium data wereanalyzed by NONLIN (40) and HeteroAnalysis (James L. Cole and Jeffrey W. Larry, Storrs,CT) (41). Sedimentation coefficients were corrected to 20 °C and infinite dilution in water,s20,w. Equilibrium association constants were determined by global analysis of data acquiredfrom samples prepared at three loading concentrations and centrifuged at three rotor speeds.Samples were sedimented at each velocity until equilibrium was achieved as judged byWinMatch (David Yphantis, University of Connecticut, Jeff Larry, National AnalyticalUltracentrifugation Center, Storrs, CT).
CD SpectroscopyCD spectra were acquired on a Jasco J815 spectropolarimeter at 25 °C from 260 to 185nm.Scanning rate was set to 50 nm/min. Loading concentrations were 8 µM in buffer containing50 mM sodium phosphate, 100 mM NaCl and 2 mM Tris (2-carboxy-ethyl)-phosphine-HCl.). The background signal from the buffer solution was subtracted from each spectrum.
Virus replicationHIV-1 replication in T-cell lines was determined by transfecting full-length pNL4-3molecular clones (42) encoding WT or mutant MA domains by using the DEAE-dextrantransfection methods (18). Cells were split 1:3 every two days and virus replication wasmonitored by reverse transcriptase (RT) activity in the supernatant.
Gag localizationImmunostaining of transfected HeLa cells was performed essentially as described previously(19,43). Gag localization was determined by using a p17(MA)-specific monoclonal antibody(Advanced Biotechnologies, Columbia, MD). CD63 staining was performed with anantibody from Santa Cruz Biotechnology (Santa Cruz, CA). Images were acquired with aDeltaVision RT deconvolution microscope.
Fledderman et al. Page 4
Biochemistry. Author manuscript; available in PMC 2011 November 9.
NIH
-PA Author Manuscript
NIH
-PA Author Manuscript
NIH
-PA Author Manuscript

NomenclatureIn the current study, MA mutants are named based on the N-terminal Met, which is absent inthe myristoylated protein, being designated as residue 1. In contrast, previous studies thatperformed the initial characterization of the mutants investigated here (18,43–45) consideredthe N-terminal Gly of the myristoylated protein as residue 1. Thus, the mutant names areoffset by one residue.
RESULTSNMR pH titrations of HIV-1 MA
It is well established that myristoylation of HIV-1 MA does not induce significant structuralchanges in the overall shape of the protein (20,28). However, significant NMR spectral andstructural differences are evident for residues Ala3-Lys18 in myr(+)MA when compared tothe myr(−)MA protein (20,28). These spectral differences reflect minor structuraladjustments of the first loop (Ala3-Gly10) and helix I (Gly11-Lys18) to allow forsequestration of the myr group (20,28). The structure of the myr(−)MA protein is considereda representative model of myr(e)MA. One major difference between the structures ofmyr(+)- and myr(−)MA proteins involves long-range interactions between the side chains ofHis89 and Glu12 (Fig. 1). The carboxyl group of Glu12, which is located near the N-terminus of helix I, does not make long-range contacts in myr(+)MA but forms a salt bridgewith His89-Hδ2 in myr(−)MA (21,28).
To test whether manipulation of the electronic properties of the imidazole group of His89 bychanging the solution pH has an impact on the myr switch mechanism, we collected2D 1H- 15N HSQC NMR data for both myr(+)- and myr(−)MA proteins upon increasing thepH from 5.5 to 8.0 in 0.5 increments. As shown in Fig. 2, substantial changes in the 1H- 15Nresonances ((Δδ1 H)2 +(Δδ15 N)2)1/2 = 0.5 – 3.0 ppm) were observed upon varying the pH(complete sets of HSQC data are shown in Supplementary Fig. S1). These residues reside onthe N-terminal loop (Ala3-Ser9) and helix I (Gly10-Lys18). For residues in helices II-VI, themost pronounced perturbations in 1H and 15N resonances were observed for Glu52 andHis89. Interestingly, substantial differences in chemical shift changes for myr(+) andmyr(−)MA as a function of pH were observed for residues localized in the N-terminal loopand helix I. Of particular note, for myr(+)MA the 1H-15N resonance of Leu8 shifteddramatically upon increasing the pH from 5.5 to 8.0, while chemical shift changes ofLeu8(NH) for myr(−)MA are negligible (Fig. 2). Furthermore, while increasing the solutionpH for myr(+) and myr(−)MA led to dramatic chemical shift changes of the 1H-15Nresonances of Glu52 and His89, the 1H-15N resonance of Ser9 exhibited a substantial shiftonly in the case of myr(−)MA. Lowering the pH of MA samples from 8.0 to 5.5 restored theoriginal spectrum, indicating a reversible process.
The direction and, to a lesser extent, the magnitude of the chemical shift perturbationsobserved for myr(+)MA upon increasing the pH are very similar to those observedpreviously upon stabilizing the myr(s) form (20). Previous studies have shown thatthe 1H-15N resonance of Leu8 is an excellent “NMR reporter” that is very sensitive to themovement of the myr group (20,28,32). Structural studies of myr(+)MA revealed thatmovement of helix I induces a conformational change by which Leu8 is repositioned toaccommodate the myr group into the hydrophobic cavity (20,28). Taken together, our NMRdata suggest that varying the pH caused local conformational changes in the N-terminaldomain of MA, which may affect the myr(s)–myr(e) equilibrium.
Fledderman et al. Page 5
Biochemistry. Author manuscript; available in PMC 2011 November 9.
NIH
-PA Author Manuscript
NIH
-PA Author Manuscript
NIH
-PA Author Manuscript

Determination of the microscopic ionization constant of His89The intrinsic pKa of the histidine imidazole group typically lies between 6.0 and 7.0 (29,30),but can vary depending on the degree of burial or exposure within proteins (30). For thisreason and because our NMR titration data described above suggest that His89 is present inthe protonated and deprotonated states at pH 5.5 and 8, respectively, we employed 2D NMRmethods to precisely determine the microscopic ionization constant of the imidazole groupof His89. Chemical shift perturbations of imidazole's Hε1 and Cε1 signals were monitoredin the HMQC spectra as function of varying pH of the NMR sample. The pKa value ofHis89 imidazole group was found to be 6.5 ± 0.1 for both myr(−) and myr(+)MA(Supplementary Fig. S2). His89 is ∼80–90% protonated at pH 5.5 and ∼90% deprotonatedat pH 8.0. These results are in good agreement with the above data, which altogether suggestthat altering the electronic state of His89 side chain triggers conformational changes thataffect the myr(s)–myr(e) equilibrium.
NMR spectral properties as a function of pHStructural studies on the HIV-1 myr(+)MA protein revealed that the myr switch mechanismis sensitive to protein concentration (20). These and all subsequent studies were conductedat pH 5.5 (20,28,32,46). 2D 1H–15N HSQC spectra obtained for myr(+)MA atconcentrations < 100 µM revealed that resonances of Ala3–Lys18, Arg-39, and Gly-49deviate significantly from those of myr(−)MA, but progressively shift toward thefrequencies of myr(−)MA as the concentration is increased. However, at concentrations >200 µM, the NMR signals became broad and protein started to precipitate out. Structuraldata indicate that increasing protein concentration promoted myr exposure (20). To examinewhether increasing the solution pH of myr(+)MA alters the sensitivity of the myr(s)–myr(e)equilibrium to concentration, we collected 2D HSQC NMR data at pH 7 as a function ofincreasing protein concentration (50, 150 and 500 µM; Supplementary Fig. S3).Interestingly, the chemical shift changes observed for residues A3-Lys18 are very minimalcompared to those observed previously (20) at pH 5.5, indicating that exposure of the myrgroup becomes less sensitive to changing protein concentration at pH 7.
Since increasing protein concentration of myr(+)MA to 500 µM did not cause significantsignal broadening and/or protein precipitation, we collected a set of 2D NOESY, 3D 13C-edited and 15N-edited NOE data for myr(+)MA at pH 7.2 to precisely elucidate thestructural and conformational changes that may occur upon changing the pH. UnambiguousNOE cross-peaks were observed between the myr group and the side chains of Val7, Leu8,Leu16, Ile34, Ala38, Glu48, Leu51, Glu52, and Ile85, indicating that the myr group issequestered. 3D 13C-edited/12C-double-half-filtered NOE data collected for 13C-labeledmyr(+)MA with unlabeled myr group confirmed all NOE cross-peaks between proteinresidues and the myr group (Fig. 3). Strong NOE cross-peaks were observed between theterminal methyl group (myr-C14H3; ∼0.5 ppm) and the side chains of Ile85 and Ile34,indicating a close packing of the myr group against these hydrophobic residues.Collectively, NMR data indicate that the myr group is buried within the core of the proteinand makes contacts with the side chains of Val7, Leu8, Trp16, Ile34, Ala38, Leu51, Glu52,and Leu85. For comparison, the 3D 13C-edited/12C-double-half-filtered NOE data collectedfor 13C-labeled myr(+)MA at pH 5.5 (Supplementary Fig. S4) revealed that the NOE cross-peaks between the myr group and the side chains of these hydrophobic residues are weakerthan the corresponding NOEs observed at pH 7.2, consistent with the finding that asignificant population of myr(e) is present at pH 5.5 (20). Taken together, our data indicatethat the structures of myr(+)MA must be similar at pH 5.5 and pH 7.0 and that increasing thepH does not induce major changes in the structure of MA protein, but rather stabilizes themyr(s) form.
Fledderman et al. Page 6
Biochemistry. Author manuscript; available in PMC 2011 November 9.
NIH
-PA Author Manuscript
NIH
-PA Author Manuscript
NIH
-PA Author Manuscript

MA oligomerization is regulated by pHSE data obtained previously for myr(+)MA at pH 5.5 best fit a monomer-trimer equilibriumwith association constant (Ka) = 2.5 × 10⁸ M−2 (20,32,46). To study the effect of pH on theoligomerization properties of MA, we have conducted SV and SE experiments on bothmyr(+)MA and myr(−)MA at pH 5.5, 7.0 and 8.0. The SV profile of myr(+)MA at pH 5.5exhibits two sedimentation boundaries. Analysis of the data using SEDFIT (38,39) yieldedtwo peaks of approximately 1.5S (∼70%) and 2.4S (∼30%) (Fig. 4). Further analysis of theSV data using molecular weight distribution revealed an approximate molecular weight of17 (monomer) and 54 kDa (trimer), respectively. At pH 7, the trimer peak shifts toward themonomer peak, indicating a transient state brought about by rapid dissociation of the trimerform. At pH 8, the myr(+)MA protein is present as a monomer (1.47S). Rapid dissociationof the trimer form of myr(+)MA upon increasing pH was confirmed by SE data (Table 1 andSupplementary Fig. S5). Analysis of the SE data afforded Ka values of 1.8 ± 0.5 and 0.7 ±0.1 × 10⁸ M−2 at pH 5.5 and 7.0 (20 °C), respectively. At pH 8.0, the SE data best fit amonomer model. On the other hand, the myr(−)MA protein exhibits a single boundary,which fits a monomer (1.5S) at all pH values (Fig. 4). Taken together, SV and SE datademonstrate that the oligomerization properties of MA are governed by pH.
HIV-1 MACA switches from trimer to dimerSince our data show that the oligomerization properties of MA can be manipulated byvarying pH, we have extended our studies to include longer constructs containing the CAdomain. Extensive analysis of Gag multimerization properties established that the CAdomain plays a central role in mediating Gag-Gag interactions (5,47–52). In solution, theCA protein dimerizes with a dissociation constant (Kd) of 18 µM (Ka = 5.5 × 10⁴ M−1), anddimerization is dependent on the C-terminal domain (CTD) (53,54). It has been shown thatappending the CA domain to myr(+)MA increases the trimer population by ∼ 20-fold (20).To assess if varying the solution pH can alter the multimerization properties of MACA, wecollected SV data for myr(+)MACA proteins at pH 5.5, 7.0 and 8.0. The SV profile ofmyr(+)MACA at pH 5.5 exhibits two sedimentation boundaries. As shown in Fig. 5,analysis of the data yielded two peaks of approximately 3.0S (30%) and 4.3S (∼70%). At pH7, the major peak shifts toward a lower S value (3.7S), consistent with a smaller molecularweight species, while the minor peak shifted slightly to a lower sedimentation coefficientvalue (2.75S). Increasing the pH to 8 led to shifting of the major and minor peaks to 3.6 and2.7S, respectively (Fig. 5). Notice that the two peaks overlap at higher pH, indicating a rapiddissociation of the major species.
As mentioned above, previous SE data at pH 5.5 revealed that myr(+)MACA is inmonomer-trimer equilibrium (20). So it is reasonable to suggest that the two peaks at 4.3Sand 3.0S represent the trimer and monomer species, respectively. However, because thesedimentation coefficients of both the major and minor peaks are sensitive to pH, wehypothesized that the minor peak probably represents a monomer-dimer in fast equilibrium.To test this hypothesis, we have collected SE data for myr(+)MACA as a function of pH(Supplementary Fig. S6). At pH 5.5, SE data best fit monomer-trimer equilibrium with Ka =1.4 ± 0.3 × 10¹⁰ M−2. The Ka is decreased by 4-fold upon increasing the pH from 5.5 to 7.0(Table 1), indicating rapid dissociation of the trimer form. Interestingly, the SE data onmyr(+)MACA at pH 8 best fit a monomer-dimer equilibrium and afforded a Ka of 3.3 ± 0.5× 10⁴ M−1, which is similar to that observed for the CA domain (53,54).
One explanation for the pH dependency of the S value of the minor species in the SV data isthat myr(+)MACA resides in a monomer-dimer-trimer equilibrium, but the dimericintermediate is not significantly populated. To test this possibility, we subjected thesedimentation equilibrium data to nonlinear square fitting analysis using a monomer-dimer-
Fledderman et al. Page 7
Biochemistry. Author manuscript; available in PMC 2011 November 9.
NIH
-PA Author Manuscript
NIH
-PA Author Manuscript
NIH
-PA Author Manuscript

trimer model. The dimerization equilibrium constant tends to yield a very small value (nearzero), consistent with the hypothesis that there is little information in the data for a thirdspecies. In summary, the data are best described by monomer-trimer equilibrium. However,we cannot rule out the possibility of a dimeric state that is not significantly populated underthese conditions.
This alternative model has been tested by various approaches. First, we examined whetherdimerization of CA is pH-dependent. To do so, we collected SV data for myr(−)MACA andCA as a function of pH. The SV profile of myr(−)MACA exhibits one major sedimentationboundary that is insensitive to pH. As shown in Fig. 5, analysis of the data yielded twopeaks of approximately 3.4S (∼95%) and 2.2S (< 5%). The SE data (not shown) confirmedthat the major boundary represents monomer-dimer equilibrium with Ka varying slightly as afunction of pH (Table 1). The second minor peak at 2.2S is likely an impurity since it wasnot observed in other samples. Likewise, SV data obtained for CA at pH 5.5, 7.0 and 8.0show a single boundary (∼2.7S) at all pH values (Supplementary Fig. S7), indicating anintermediate value representing monomer-dimer equilibrium (53,54).
The second approach involved alteration of the monomer-dimer properties of MACA bymutagenesis. We generated a myr(+)MACA double mutant with Trp184 and Met185 in theCA domain substituted with alanine residues (W184A/M185A). These amino acidsubstitutions were shown to significantly inhibit CA dimerization (53). Interestingly, SVdata obtained for myr(+)MACA-W184A/M185A at pH 5.5 yielded a single boundary with asedimentation coefficient value at 2.7S (Supplementary Fig. S8), which indicates thatformation and stability of trimer form of MACA is dependent on the dimer interface of CA.The finding that myr(+)MACA trimerization is disrupted by mutation of Trp184 andMet185 is very similar to that observed for myr(−)Gagδp6 bound to inositol phosphates(55). Increasing the pH shifted the S values only slightly to 2.55 and 2.5 at pH 7 and 8,respectively. Since SV and SE data on CA and myr(−)MACA revealed that dimerization ofCA is not pH-dependent, sensitivity of sedimentation coefficient to pH in myr(+)MACA-W184A/M185A is likely to be attributed to the MA domain. The nature of theoligomerization for myr(+)MACA-W184A/M185A was determined by SE data. At pH 5.5,SE data analysis best fit a monomer-dimer equilibrium with Ka = 6.0 ± 0.1 × 10³ M−1
(Supplementary Fig. S9). Since the sedimentation coefficient and sensitivity to pH of theminor peak for WT myr(+)MACA (Fig. 5) is very similar to that observed formyr(+)MACA-W184A/M185A, it is very likely that the minor peak at 3.0S (Fig. 5)represents monomer and dimer species that are in fast exchange. Taken together, our datademonstrate that the myr(s)–myr(e) equilibrium in a Gag-like construct is also sensitive topH and that the MA domain can dictate the type of multimers in solution at any given pH.
NMR and biophysical characterization of MA mutants that disrupt the His-Glu salt bridgePrevious studies have shown that mutations in helix V of the MA domain, including L85R,Y86G, C87S, V88E, and H89G, led to retargeting of the majority of virus particle formationto intracellular compartments and severely defective virus replication in the CEM(12D-7)cell line (18). Structural characterization of the myr(+)MA protein (20) revealed that theseresidues are located in or near the hydrophobic cavity occupied by the myr group and maycontribute to the stabilization of the pocket. Thus, it is likely that disrupting the hydrophobiccavity and altering the myr switch mechanism contribute to the retargeting of Gag tointracellular compartments.
To confirm that importance of salt bridge in regulating the myr(s)–myr(e) equilibrium, wemade H89G and E12A MA mutants and examined their structural properties by NMR andbiophysical methods. Protein expression and purification were achieved according to astandard protocol (20,28,32). However, in sharp contrast to the WT myr(+)MA protein, the
Fledderman et al. Page 8
Biochemistry. Author manuscript; available in PMC 2011 November 9.
NIH
-PA Author Manuscript
NIH
-PA Author Manuscript
NIH
-PA Author Manuscript
myr(+)MA-H89G protein was found exclusively in inclusion bodies and was extractedunder denaturing conditions. The protein was poorly soluble (concentration = ∼40 µM).NMR and SV data conducted on myr(+)MA-H89G (Supplementary Figs. S10 and S11)revealed that the protein forms large molecular weight aggregates that caused considerablebroadening in the NMR signal. SV data show multiple peaks with large sedimentationcoefficient values. Changes in the pH do not appear to affect the type or nature ofmyr(+)MA-H89G aggregates.
To assess whether the His89 mutation caused unfolding in the tertiary structure of MA and/or induced dramatic conformational changes leading to the formation of high molecularweight aggregates, the myr(−)MA-H89G mutant was made and characterized by the samemethods. Interestingly, the protein was soluble and present in the monomeric state(Supplementary Fig. S11). CD data confirmed that the MA protein maintains its secondarystructure in the context of the H89G mutation (Supplementary Fig. S12). These resultssuggest that substitution of His89 not only disrupted the His-Glu salt bridge but alsodestabilized the tertiary structure, triggering myr exposure and promoting high-order proteinself-association.
Since the imidazole group of His89 is also engaged in another intramolecular H-bond withthe carbonyl group of Leu51, substitution with a Gly may cause larger conformationalchanges that may contribute to loss of stability of the hydrophobic pocket and in turn todisruption of the myr switch mechanism. We predicted that substitution of Glu12 is lesscomplex. To examine this possibility, we have substituted Glu12 with Ala and examined itsbiophysical characteristics by NMR and sedimentation methods. Both myr(−)- andmyr(+)MA-E12A proteins were made. Both proteins were very soluble and purification wasachieved as described for WT proteins. These substitutions did not adversely affectmyristylation efficiencies (∼100%, compared to ∼90/10% myr/myr(−) for the wild-type MAprotein). 1H and 15N NMR signals observed in two dimensional (2D) [1H–15N] HSQCspectra of myr(+) and myr(−)MA were substantially different for the first ∼20 amino acids,indicating sequestration of the myr group (Supplementary Fig. S13). Indeed, SV dataconfirmed that the myr(+)MA-E12A protein is a monomer and insensitive to changes in pH(Supplementary Figs. S13). Collectively, our data demonstrate that disruption of the His89-Glu12 salt bridge alters the myr(s)–myr(e) equilibrium, although substitution of His89appear to have much larger effect on the stability of the hydrophobic cavity.
As discussed earlier, substitution of Trp184 and Met185 with Ala residues in myr(+)MACAinhibited the formation of the trimer form. However, SV and SE data revealed thatmyr(+)MACA-W184A/M185A resides in a monomer-dimer equilibrium where dimerizationappears to be induced by the MA domain. Since substitution of Glu12 to Ala completelyabolished trimer formation for myr(+)MA, we predicted that E12A mutation in MACA willmodulate the oligomerization properties of MACA. As shown in Supplementary Figure S14,the SV profile of myr(+)MACA-E12A/W184A/M185A exhibits a single sedimentationboundary that is insensitive to pH. Analysis of the data yielded one peak at 2.4S, consistentwith the monomeric character of myr(+)MACA. In summary, we conclude that substitutionof Glu12 modulates the myr(s)–myr(e) equilibrium of MA and MACA in vitro.
His-Glu salt bridge, an important structural element in HIV-1 MAIt has been established that for a stable salt bridge to form between oppositely chargedresidues (such as Asp or Glu with Arg, Lys or His), the two following criteria becomecritical (56,57): (i) The centroids of the side-chain charged groups in oppositely chargedresidues are within 4 Å of each other (58); and (ii) at least one pair of Asp or Glu side-chainCOO- oxygen atoms and side-chain nitrogen atoms of Arg, Lys or His are within a 4.0 Ådistance. To verify the formation of a salt bridge between the side chains of His89 and
Fledderman et al. Page 9
Biochemistry. Author manuscript; available in PMC 2011 November 9.
NIH
-PA Author Manuscript
NIH
-PA Author Manuscript
NIH
-PA Author Manuscript

Glu12 in HIV-1 myr(−)MA, distances between the centroid of COO- and His89 nitrogenatom were measured and found to be within 4 Å in both X-ray and NMR structures ofmyr(−)MA (Supplementary Fig. S15) (20,28,59). However, this distance is significantlylarger in the myr(+)MA structure (20,28).
As described above, significant structural differences between the myr(e)- and myr(s)MAproteins involve the positioning and packing of helix I (20,21,28). For both myr(e) andmyr(s)MA, the imidazole group of His89 is locked in a unique orientation in which Nε2forms a salt bridge with the carbonyl group of Leu51. For myr(e)MA, tight packing of helixI against helices II and V is stabilized by a Glu12(COO-)–His89(Hδ2) salt bridge andGlu12(COO-)–Ser9(NH) hydrogen bond (Fig. 6). As shown in Figure 2, increasing thesolution pH for myr(−)MA led to dramatic chemical shift changes of the HN resonances ofSer9, Glu52 and His89. These residues are directly involved in a web of hydrogen bondsthat stabilize the packing of helix I. In comparison, helix I is moved away in myr(s)MA toallow for sequestration of the myr group and contacts between Glu12(COO-) and bothHis89(Hδ2) and Ser9(NH) are no longer present (Fig. 6). Our data clearly show thatmanipulation of the electronic properties of the imidazole group of His89 by varying thesolution pH drastically alters the myr(s)– myr(e) equilibrium.
The subcellular site of HIV-1 Gag assembly is altered by H89G mutationA previous study demonstrated that the subcellular site of HIV-1 Gag assembly is altered byH89G mutation (18). However, the identity of the site at which the H89G mutant assembleshas not been previously defined. To address this issue, we performed dual immunostainingwith an anti-MA antibody and an antibody specific for the tetraspanin CD63 in HeLa cellstransfected with WT and the H89G mutant molecular clones. CD63 is commonly used as amarker for the late endosomal/MVB compartment (60,61). The H89G mutant displayed aninternal localization distinct from the largely PM distribution observed with the WT. Theinternal Gag puncta observed with H89G colocalized extensively with CD63, suggestingMVB localization (Fig. 7A). As a control, we also included the K30E/K32E mutant,previously shown to be MVB-targeted (43). These results indicate that the H89G and L30E/K32E mutants are targeted to the same internal, CD63-positive compartment. Consistentwith previous results (18), we also determined by radioimmunoprecipitation analysis that theH89G mutant displayed a marked reduction in the efficiency of virus particle production, asdid the V7R mutant, previously shown to be defective for Gag-membrane association (45)due to a defect in myristate exposure (32) (Figure 7B). Although the V7R mutation reducesthe amount of cell-associated p24, the overall Gag expression level for this mutant is similarto that of WT Gag (Supplementary Fig. S16). Gag expression and processing profiles for theH89G were similar to those of the WT (Supplementary Fig. S16). Taken together, theseresults indicate that His89 is essential for proper targeting of Gag to the PM and efficientparticle formation in HeLa cells.
As discussed above, previous studies have shown that the H89G mutation led to severelydefective virus replication in the CEM(12D-7) T-cell line (18). To verify whether thisphenotype is cell type-dependent, we assessed the effect of the H89G mutation on virusreplication in additional T-cell lines. The Jurkat and MT-4 T-cell lines were transfected withmolecular clones encoding WT or H89G–mutant MA. As controls, we included thepreviously described V7R and K30E/K32E mutants (43,45). The results demonstrated thatthe H89G mutation blocked virus replication in both T-cell lines (Fig. 7C). In comparison,the V7R mutant replicated with a delay of ∼6 days in MT-4 cells but did not replicate inJurkat cells (Fig. 7C). These results indicate that the H89G mutant is replication defective ina range of T-cell lines.
Fledderman et al. Page 10
Biochemistry. Author manuscript; available in PMC 2011 November 9.
NIH
-PA Author Manuscript
NIH
-PA Author Manuscript
NIH
-PA Author Manuscript

Our NMR and biophysical studies revealed that E12A mutation led to tight sequestration ofthe myr group and inhibited trimer formation. To test whether this mutation has an effect onvirus production, HeLa cells transfected with WT or E12A–mutant molecular clones weremetabolically radiolabeled and cell and virus lysates were immunoprecipitated with HIV-Ig.Our data show that E12A had a only a small effect on virus production compared to H89G(Supplementary Fig. S16), suggesting that salt bridge partners have very different effects onvirus production. In addition, we performed dual immunostaining with an anti-MA antibodyand an antibody specific for the tetraspanin CD63 in HeLa cells transfected with the E12Amutant molecular clone. The E12A mutant displayed a localization pattern similar to the WTGag (Supplementary Fig. S16).
DISCUSSIONStructural studies have demonstrated that the myr group of HIV-1 MA can adoptsequestered and exposed conformations (20). Exposure of the myr group is coupled withprotein trimerization and is enhanced by factors that promote protein self-association, suchas increasing protein concentration or appending the CA domain (20). Here we provideevidence that myr exposure in HIV-1 MA is modulated by pH. We also show that extrusionof the myr group becomes less sensitive to protein concentration and attachment of CA atpH ≥ 7. Intriguingly, increasing the pH to 8 inhibited the formation of trimers for MA andMACA (Fig. 8). These findings indicate that trimerization of Gag in vitro, althoughenhanced by CA, is solely driven by the MA domain and tightly regulated by pH.
HIV-1 Gag myristoylation and multimerization are directly linked to efficient membranebinding and are required for particle formation and viral infectivity (13,44,62,63). Theoligomerization properties of HIV-1 Gag, MA and MACA constructs have been extensivelystudied (13,20,32,46,49,55,64–68). The CA domain is known to play a central role inmediating Gag-Gag interactions (5,47–52). Other domains, including SP1 and NC are alsosuggested to play important roles in Gag assembly (2,47,52,63,65,69–71). Despite theevidence that MA can form trimers and assemble on membrane as hexamers (68,72), therole of MA-MA interactions in stabilizing Gag-Gag interactions is still controversial(20,55,64–66,68,73). While it appears that interactions between the myr group andmembrane are essential for Gag-Gag interactions in living cells (13), electroncryotomography studies of immature virions revealed that CA and SP1 form orderedhexagonal shells, but MA and NC shells lack an ordered structure (52). Our findings supportthe hypothesis that myristoylation is important for Gag multimerization and reveal that pH isan additional factor that governs the type of Gag multimers in solution.
Rein and co-workers have recently examined the oligomerization properties of Gag in theabsence or presence of inositol phosphates (55). The Gag construct used in these studieslacks the myr group and the p6 domain (myr(−)GagΔp6). SE data obtained formyr(−)GagΔp6 at pH 7.4 indicate that the protein is in monomer-dimer equilibrium with Kd= 5.5 µM (Ka = 1.8 × 10⁵ M−1) or 14 µM (Ka = 6.7 × 10⁴ M−1) depending on the method ofmeasurement. Interestingly, these Kd values are very similar to that obtained formyr(−)MACA at a similar pH value (Table 1), suggesting that the NC domain has minimalor no role in Gag multimerization in the absence of bound RNA. At this point, it is not clearwhether inositol-phosphate-driven multimerization of MA and Gag proteins is pH-dependent.
Implications for Gag-membrane bindingIt is now established that PI(4,5)P2 is critical for HIV-1 and HIV-2 Gag assembly andbinding to the PM (21–23,28). Recent studies have revealed that targeting of Moloneymurine leukemia virus (MMLV) Gag to the PM is also PI(4,5)P2-dependent (74). Earlier
Fledderman et al. Page 11
Biochemistry. Author manuscript; available in PMC 2011 November 9.
NIH
-PA Author Manuscript
NIH
-PA Author Manuscript
NIH
-PA Author Manuscript

studies revealed that HIV-1 and MMLV are enriched in phosphoinositides includingPI(4,5)P2 (75). Consistent with these findings, in vitro studies have shown that binding ofHIV-1 Gag (23), MA and MACA (76), as well as MMLV MA (74) to membrane models isenhanced by addition of PI(4,5)P2 and phosphatidylserine (76). Despite our currentunderstanding of the effect of pH on the myr(s)–myr(e) equilibrium and the possibleconsequences for membrane binding, it has yet to be established whether actual binding ofMA and Gag to membranes in vivo is pH-dependent. In vitro studies of Gag assembly haveprovided insights into the process of Gag-Gag interactions and multimerization. Gag iscapable of forming VLPs in vitro in the absence of other viral and cellular constituents (1,2).Authentic-like particles can be formed by addition of RNA or inositol phosphates to Gag(1,2,77). Various biochemical assays have been devised to study binding of MA, MACAand Gag proteins to membrane models. In these experiments, liposomes were at pH 7 to 8and often, yielded variable binding affinities (17,67,76,78). Based on the present findings, itis reasonable to suggest that changes in pH may have an effect on the affinity of MA andGag binding to membranes.
Relationship between His-Glu salt bridge and virus productionA significant point emerged from this study is the interplay between Gag targeting,membrane binding and virus production. Here we show that mutation of His89 induced theretargeting of the Gag protein to MVBs and severely reduced virus replication. Interestingly,the in vivo phenotype displayed by the Gag H89G mutant is very different from that of G2A,V7R or L8I and L8A mutants, which displayed a hazy, non-punctate staining pattern typicalof HIV-1 Gag mutants that are defective in membrane binding (18,32,45,79,80). Structuralstudies revealed that Val7 and Leu8 mutations shut off the myr switch and stabilize themyr(s) form (32). Thus, it appears that sequestration or lack of myr group favors cytosoliclocalization rather than MVB association. Despite the extensive analysis of the effect of Gagmutations on intracellular localization and their effect on virus production and infectivity, itis not yet clear how and why some Gag mutants are associated with MVBs. Although earlierstudies have shown that targeting of the Gag K30E/K32E mutant to MVB compartments ledto severely defective virus particle production in HeLa cells (43), recent evidence revealedthat it can still support highly efficient assembly and release in T cells (10). It was suggestedthat under some circumstances, late endosomal compartments can serve as productive sitesfor HIV assembly in some cell types (10).
Based on the current understanding of the effect of some of MA mutations on the myrswitch mechanism, it is reasonable to suggest that formation of Gag aggregates caused bysubstitution of His89 (and possibly other residues in the vicinity) may be responsible forassociation with MVBs. Structural, biophysical and biochemical characterizations of MAmutants may help in explaining localization pathways of Gag.
Our structural and biophysical data on the E12A mutant clearly indicate that the myr groupis tightly sequestered. One possibile explanation for this finding is that mutation of E12could disrupt the E12-S9 salt bridge and favor the myr(s) form. However, since our datademonstrate that myr exposure is modulated by pH and that deprotonation of His89 appearsto be important in regulating the myr switch mechaism in vitro, the E12-S9 salt bridge mustbe of a secondary importance or inconsequential. The slight effect of E12A mutation onvirus production and WT-like Gag subcellular localization suggest that His-Glu is either notvery important for replication or that other factors contributing to Gag targeting andassembly may still be involved. For example, it has yet to be determined whether binding ofPI(4,5)P2 to MA-E12A triggers myr exposure and promotes oligomerization. Efficient virusproduction is directly linked to Gag-PI(4,5)P2 binding and subsequent myr exposure. Wehave shown that the myr group in HIV-2 MA is tightly sequestered and that PI(4,5)P2binding, although identical to that of HIV-1, is unable to trigger exposure of the myr group
Fledderman et al. Page 12
Biochemistry. Author manuscript; available in PMC 2011 November 9.
NIH
-PA Author Manuscript
NIH
-PA Author Manuscript
NIH
-PA Author Manuscript

(21). However, our in vivo data revealed that the efficiency of HIV-2 virus production isvery similar to that of HIV-127. In other words, we believe the interplay between myrexposure, Gag targeting, and virus production is more complex than initially thought.
Implications for other retroviral Gag proteinsSeveral structures of retroviral myr(−)MA(81–86) and myr(+)MA proteins(20,21) have beensolved by NMR or X-ray methods. In contrast to their low sequence homology, structures ofretroviral MA proteins are remarkably similar. Phylogenetic sequence analysis revealed thatHis89 is highly conserved across all known strains of HIV-1, HIV-2 and SIV, suggestingthat its structural role in regulating the myr switch mechanism is probably important for Gagassembly, virus infectivity and production at least in the lentiviruses genus. Despite theirhigh sequence and structural homology, the myr switch mechanism is significantly differentfor HIV-1 and HIV-2 MA proteins (21). The myr group of HIV-2 MA is tightly sequesteredand the protein is a monomer (21). These observations indicate that key differences in themyr switch mechanism can exist between closely related retroviruses. In HIV-2 MA, Glu12is substituted by Lys. Previous studies have shown that the pKa value of a buried Lys residuecan be abnormally low (∼5.6) compared to Lys residues that are usually found at the surfaceand interact extensively with water (pKa = ∼10.5) (87). In this case, Lys side chain is presentin the neutral state (NH2). The pKa values of the side chains of His89 and Lys12 in HIV- 2MA are not known and, thus, it unclear whether varying pH can trigger myr exposure inHIV-2 MA.
In summary, we have now established that the MA domain of HIV-1 Gag acts as a “pHsensor” and that, at least in vitro, myr exposure is regulated by pH. We also suggest that ourresults may have broader implications for the nature and type of Gag multimers present invivo. A potential role of pH variations in subcellular localization and targeting of the HIV-1Gag protein is not known. Fluctuations in intracellular pH (6.3 to 7.8) are often observed inresponse to cell growth, development, and apoptosis (88–90). Even alterations in PMfunction can be induced by cytopathic viruses including HIV-1 (91). A significant decreasein pH from 7.2 to as low as 6.0 was observed in cells infected by HIV-1 (91). As suggestedby one reviewer of this article, our findings may suggest that given that the intracellular pHin healthy cells is around 7 – 7.2, Gag-multimerization-induced myristate exposure wouldoccur only under specific conditions (e.g., when cytopathic effects take place). Thus,exposure of myr group upon Gag multimerization is probably not triggered unconditionally.While it has yet to be established whether manipulation of intracellular pH can alter kineticpathways and sites or efficiency of Gag assembly, this possibility warrants furtherinvestigation.
Supplementary MaterialRefer to Web version on PubMed Central for supplementary material.
AcknowledgmentsWe thank Dr. Michael F. Summers (HHMI, UMBC) for providing the MA co-expression molecular clone.
This work was supported by the UAB Comprehensive Cancer Center (NIH/NCI grant P30CA13148) to JSS, theIntramural Research Program of the Center for Cancer Research (National Cancer Institute) and the IntramuralAIDS Targeted Antiviral Program (to EOF).
Abbreviations
HIV-1 Human immunodeficiency virus type 1
Fledderman et al. Page 13
Biochemistry. Author manuscript; available in PMC 2011 November 9.
NIH
-PA Author Manuscript
NIH
-PA Author Manuscript
NIH
-PA Author Manuscript

HIV-1 MA HIV-1 matrix protein
HIV-1 Gag myristoylated HIV-1 Gag polyprotein
myr(−) unmyristoylated protein
myr(+) myristoylated protein
CA capsid
MACA matrix-capsid
MVB multivesicular body
PI(4,5)P2 phosphatidylinositol-(4,5)-bisphosphate
NMR nuclear magnetic resonance
SV sedimentation velocity
SE sedimentation equilibrium
REFERENCES1. Campbell S, Fisher RJ, Towler EM, Fox S, Issaq HJ, Wolfe T, Phillips LR, Rein A. Modulation of
HIV-like particle assembly in vitro by inositol phosphates. Proc. Natl. Acad. Sci. 2001; 98:10875–10879. [PubMed: 11526217]
2. Campbell S, Rein A. In vitro Assembly Properties of Human Immunodeficiency Virus Type 1 GagProtein Lacking the p6 Domain. J. Virol. 1999; 73:2270–2279. [PubMed: 9971810]
3. Chu H, Wang JJ, Spearman P. Human Immunodeficiency Virus Type-1 Gag and Host VesicularTrafficking Pathways. Curr. Top. Microbiol. Immunol. 2010; 339:67–84. [PubMed: 20012524]
4. Adamson CS, Freed EO. Human Immunodeficiency Virus Type 1 Assembly, Release andMaturation. Adv. Pharmacol. 2007; 55:347–387. [PubMed: 17586320]
5. Ganser-Pornillos BK, Yeager M, Sundquist WI. The structural biology of HIV assembly. Curr.Opin. Struct. Biol. 2008; 18:203–217. [PubMed: 18406133]
6. Ono A. HIV-1 assembly at the plasma membrane: Gag trafficking and localization. Future Virol.2009; 4:241–257. [PubMed: 19802344]
7. Finzi A, Orthwein A, Mercier J, Cohen EA. Productive Human Immunodeficiency Virus Type 1Assembly Takes Place at the Plasma Membrane. J. Virol. 2007; 81:7476–7490. [PubMed:17507489]
8. Gousset K, Ablan SD, Coren LV, Ono A, Soheilian F, Nagashima K, Ott DE, Freed EO. Real-timevisualization of HIV-1 GAG trafficking in infected macrophages. PLoS Biol. 2008; 4:e1000015.
9. Hermida-Matsumoto L, Resh MD. Localization of Human Immunodeficiency virus Type 1 Gag andenv at the Plasma Membrane by Confocal Imagine. J. Virol. 2000; 74:8670–8679. [PubMed:10954568]
10. Joshi A, Ablan SD, Soheilian F, Nagashima K, Freed EO. Evidence that productive humanimmunodeficiency virus type 1 assembly can occur in an intracellular compartment. J. Virol. 2009;83:53755387.
11. Jouvenet N, Bieniasz PD, Simon SM. Imaging the biogenesis of individual HIV-1 virions in livecells. Nature. 2008; 454:236–240. [PubMed: 18500329]
12. Jouvenet N, Neil SJD, Bess C, Johnson MC, Virgen CA, Simon SM, Bieniasz PD. Plasmamembrane is the site of productive HIV-1 particle assembly. PLoS Biol. 2006; 4:2296–2310.
13. Li H, Dou J, Ding L, Spearman P. Myristoylation is required for human immunodeficiency virustype 1 Gag-Gag multimerization in mammalian cells. J. Virol. 2007; 81:12899–12910. [PubMed:17881447]
14. Ono A. Relationships between plasma membrane microdomains and HIV-1 assembly. Biol. Cell.2010; 102:335–350. [PubMed: 20356318]
Fledderman et al. Page 14
Biochemistry. Author manuscript; available in PMC 2011 November 9.
NIH
-PA Author Manuscript
NIH
-PA Author Manuscript
NIH
-PA Author Manuscript

15. Welsch S, Keppler OT, Habermann A, Allespach I, Krijnse-Locker J, Kräusslich H-G. HIV-1 budspredominantly at the plasma membrane of primary human macrophages. PLoS Pathog. 2007;3:e36. [PubMed: 17381240]
16. Bryant M, Ratner L. Myristoylation-Dependent Replication and Assembly of HumanImmunodeficiency Virus 1. Proc. Natl. Acad. Sci. 1990; 87:523–527. [PubMed: 2405382]
17. Spearman P, Horton R, Ratner L, Kuli-Zade I. Membrane binding of human immunodeficiencyvirus type 1 matrix protein in vivo supports a conformational myristyl switch mechanism. J. Virol.1997; 71:6582–6592. [PubMed: 9261380]
18. Freed EO, Orenstein JM, Buckler-White AJ, Martin MA. Single Amino Acid Changes in theHuman Immunodeficiency Virus Type 1 Matrix Protein Block Virus Particle Production. J. Virol.1994; 68:5311–5320. [PubMed: 8035531]
19. Ono A, Orenstein JM, Freed EO. Role of the Gag Matrix Domain in Targeting HumanImmunodeficiency Virus Type 1 assembly. J. Virol. 2000; 74:2855–2866. [PubMed: 10684302]
20. Tang C, Loeliger E, Luncsford P, Kinde I, Beckett D, Summers MF. Entropic switch regulatesmyristate exposure in the HIV-1 matrix protein. Proc. Natl. Acad. Sci. USA. 2004; 101:517–522.[PubMed: 14699046]
21. Saad JS, Ablan SD, Ghanam RH, Kim A, Andrews K, Nagashima K, Soheilian F, Freed EO,Summers MF. Structure of the myristylated HIV-2 MA protein and the role ofphosphatidylinositol-(4,5)-bisphosphate in membrane targeting. J. Mol. Biol. 2008; 382:434–447.[PubMed: 18657545]
22. Ono A, Ablan SD, Lockett SJ, Nagashima K, Freed EO. Phosphatidylinositol (4,5) bisphosphateregulates HIV-1 Gag targeting to the plasma membrane. Proc. Natl. Acad. Sci. 2004; 101:14889–14894. [PubMed: 15465916]
23. Chukkapalli V, Hogue IB, Boyko V, Hu W-S, Ono A. Interaction between HIV-1 Gag matrixdomain and phosphatidylinositol-(4,5)-bisphosphate is essential for efficient Gag-membranebinding. J. Virol. 2008; 82:2405–2417. [PubMed: 18094158]
24. Chukkapalli V, Oh SJ, Ono A. Opposing mechanisms involving RNA and lipids regulate HIV-1Gag membrane binding through the highly basic region of the matrix domain. Proc. Natl. Acad.Sci. 2010; 107:1600–1605. [PubMed: 20080620]
25. Martin TFJ. PI(4,5)P2 regulation of surface membrane traffic. Curr. Opin. Cell Biol. 2001;13:493–499. [PubMed: 11454457]
26. Behnia R, Munro S. Organelle identity and the signposts for membrane traffic. Nature. 2005;438:597–604. [PubMed: 16319879]
27. McLaughlin S, Murray D. Plasma membrane phosphoinositide organization by proteinelectrostatics. Nature. 2005; 438:605–611. [PubMed: 16319880]
28. Saad JS, Miller J, Tai J, Kim A, Ghanam RH, Summers MF. Structural basis for targeting HIV-1Gag to virus assembly sites on the plasma membrane. Proc. Natl. Acad. Sci. 2006; 103:11364–11369. [PubMed: 16840558]
29. Liu T, Ryan M, Dahlquist FW, Griffith OH. Determination of pKa values of the histidine sidechains of phosphatidylinositol-specific phospholipase C from Bacillus cereus by NMRspectroscopy and site-directed mutagenesis. Protein. Sci. 1997; 6:1937–1944. [PubMed: 9300493]
30. Edgcomb SP, Murphy KP. Variability in the pKa of histidine side-chains correlates with burialwithin proteins. Proteins: Struct. Funct. Genet. 2002; 49:1–6. [PubMed: 12211010]
31. Massiah MA, Starich MR, Paschall C, Summers MF, Christensen AM, Sundquist WI. Threedimensional structure of the human immunodeficiency virus type 1 matrix protein. J. Mol. Biol.1994; 244:198–223. [PubMed: 7966331]
32. Saad JS, Loeliger E, Luncsford P, Liriano M, Tai J, Kim A, Miller J, Joshi A, Freed EO, SummersMF. Point mutations in the HIV-1 matrix protein turn off the myristyl switch. J. Mol. Biol. 2007;366:574–585. [PubMed: 17188710]
33. Lanman J, Sexton J, Sakalian M, Prevelige PE Jr. Kinetic analysis of the role of intersubunitinteractions in human immunodeficiency virus type 1 capsid protein assembly in vitro. J. Virol.2002; 76:6900–6908. [PubMed: 12072491]
Fledderman et al. Page 15
Biochemistry. Author manuscript; available in PMC 2011 November 9.
NIH
-PA Author Manuscript
NIH
-PA Author Manuscript
NIH
-PA Author Manuscript

34. Delaglio F, Grzesiek S, Vuister GW, Zhu G, Pfeifer J, Bax A. NMRPipe: A multidimensionalspectral processing system based on UNIX pipes. J. Biomol. NMR. 1995; 6:277–293. [PubMed:8520220]
35. Johnson BA, Blevins RA. NMRview: a Computer Program for the Visualization and Analysis ofNMR Data. J. Biomol. NMR. 1994; 4:603–614.
36. Folkers PJM, Folmer RHA, Konings RNH, Hilbers CW. Overcoming the ambiguity problemencountered in the analysis of nuclear Overhauser magnetic resonance spectra of symmetric dimerproteins. J. Am. Chem. Soc. 1993; 115:3798–3799.
37. Wüthrich, K. NMR of Proteins and Nucleic Acids. New York: John Wiley & Sons; 1986.38. Schuck P. On the analysis of protein self-association by sedimentation velocity analytical
ultracentrifugation. Anal. Biochem. 2003; 320:104–124. [PubMed: 12895474]39. Schuck P, Perugini MS, Gonzales NR, Howlett GJ, Schubert D. Size-distribution analysis of
proteins by analytical ultracentrifugation: strategies and application to model systems. Biophys. J.2002; 82:1096–1111. [PubMed: 11806949]
40. Johnson ML, Faunt LM. Parameter estimation by least-squares methods. Methods Enzymol. 1992;210:1–37. [PubMed: 1584035]
41. Cole JL. Analysis of heterogeneous interactions. Methods Enzymol. 2004; 384:212–232. [PubMed:15081689]
42. Adachi A, Gendelman HE, Koenig S, Folks T, Willey R, Rabson A, Martin MA. Production ofAcquired Immunodeficiency Syndrome-Associated Retrovirus in Human and Nonhuman CellsTransfected with an Infectious Molecular Clone. J. Virol. 1986; 59:284–291. [PubMed: 3016298]
43. Ono A, Freed EO. Cell-Type-Dependent Tageting of Human Immunodeficiency Virus Type 1Assembly to the Plasma Membrane and the Multivesicular body. J. Virol. 2004; 78:1552–1563.[PubMed: 14722309]
44. Ono A, Demirov D, Freed EO. Relationship between human immunodeficiency virus Type-1 Gagmultimerization and membrane binding. J. Virol. 2000; 74:5142–5150. [PubMed: 10799589]
45. Ono A, Freed EO. Binding of Human Immunodeficiency Virus Type 1 gag to membrane: Role ofthe matrix amino terminus. J. Virol. 1999; 73:4136–4144. [PubMed: 10196310]
46. Saad JS, Kim A, Ghanam RH, Dalton AK, Vogt MV, Wu Z, Lu W, Summers MF. Mutations thatmimic phosphorylation of the HIV-1 matrix protein do not perturb the myristyl switch. Protein.Sci. 2007; 16:1793–1797. [PubMed: 17656588]
47. Briggs JAG, Riches JD, Glass B, Bartonova V, Zanetti G, Kräusslich H-G. Structure and assemblyof immature HIV. Proc. Natl. Acad. Sci. 2009; 106:11090–11095. [PubMed: 19549863]
48. Ganser-Pornillos BK, Cheng A, Yeager M. Structure of full-length HIV-1 CA: A model for themature capsid lattice. Cell. 2007; 131:70–79. [PubMed: 17923088]
49. Hogue IB, Hoppe A, Ono A. Quantitative FRET Microscopy Analysis of HIV-1 Gag-GagInteraction: The Relative Contributions of CA and NC Domains, and Membrane Binding. J. Virol.2009; 83:7322–7336. [PubMed: 19403686]
50. Joshi A, Nagashima K, Freed EO. Mutation of dileucine-like motifs in the humanimmunodeficiency virus type 1 capsid disrupts virus assembly, gag-gag interactions, gag-membrane binding, and virion maturation. J. Virol. 2006; 80:7939–7951. [PubMed: 16873251]
51. Li S, Hill CP, Sundquist WI, Finch JT. Image reconstructions of helical assemblies of the HIV-1CA protein. Nature. 2000; 407:409–413. [PubMed: 11014200]
52. Wright ER, Schooler JB, Ding HJ, Kieffer C, Fillmore C, Sundquist WI, Jensen GJ. Electroncrytomography of immature HIV-1 virions reveals the structure of the CA and SP1 Gag shells.EMBO J. 2007; 26:2218–2226. [PubMed: 17396149]
53. Gamble TR, Yoo S, Vajdos FF, von Schwedler UK, Korthylake DK, Wang H, McCutcheon JP,Sundquist WI, Hill CP. Structure of the carboxyl-terminal dimerization domain of the HIV-1capsid protein. Science. 1997; 278:849–853. [PubMed: 9346481]
54. Yoo S, Myszka DG, Yeh C, McMurray M, Hill CP, Sundquist WI. Molecular recognition in theHIV-1 capsid/cyclophilin A complex. J. Mol. Biol. 1997; 269:780–795. [PubMed: 9223641]
55. Datta SAK, Zhao Z, Clark PK, Tarasov S, Alexandratos JN, Campbell SJ, Kvaratskhelia M,Lebowitz J, Rein A. Interactions between HIV-1 Gag Molecules in Solution: An InositolPhosphate-mediated Switch. J. Mol. Biol. 2007; 365:799–811. [PubMed: 17098251]
Fledderman et al. Page 16
Biochemistry. Author manuscript; available in PMC 2011 November 9.
NIH
-PA Author Manuscript
NIH
-PA Author Manuscript
NIH
-PA Author Manuscript

56. Kumar S, Nussinov R. Salt Bridge Stability in Monomeric Proteins. J. Mol. Biol. 1999; 293:1241–1255. [PubMed: 10547298]
57. Kumar S, Nussinov R. Relationship between Ion Pair Geometries and Electrostatic Strengths inProteins. Biophys. J. 2002; 83:1595–1612. [PubMed: 12202384]
58. Barlow DJ, Thornton JM. Ion-pairs in Proteins. J. Mol. Biol. 1983; 168:867–885. [PubMed:6887253]
59. Hill CP, Worthylake D, Bancroft DP, Christensen AM, Sundquist WI. Crystal Structures of theTrimeric HIV-1 Matrix Protein: Implications for Membrane Association. Proc. Natl. Acad. Sci.1996; 93:3099–3104. [PubMed: 8610175]
60. Pelchen-Matthews A, Krameer B, Marsh M. Infectious HIV-1 assembles in late endosomes inprimary macrophages. J. Cell Biol. 2003; 162:443–445. [PubMed: 12885763]
61. Garcia E, Pion M, Pelchen-Matthews A, Collinson L, Arrighi JF, Blot G, Leuba F, Escola JM,Demaurex N, Marsh M, Piguet V. HIV-1 trafficking to the dendritic cell-T-cell infectious synapseuses a pathway of tetraspanin sorting to the immunological synapse. Traffic. 2005; 6:488–501.[PubMed: 15882445]
62. Lindwasser OW, Resh MD. Multimerization of human immunodeficiency virus type 1 Gagpromotes its localization to barges, raft-like membrane microdomains. J. Virol. 2001; 75:7913–7924. [PubMed: 11483736]
63. Burniston MT, Cimarelli A, Colgan J, Curtis SP, Luba J. Human Immunodeficiency virus type 1Gag polyprotein multimerization requires the nucleocapsid domain and RNA and is promoted bythe capsid-dimer interface and the basic region of matrix protein. J. Virol. 1999; 73:8527–8540.[PubMed: 10482606]
64. Dou J, Wang J-J, Chen X, Li H, Ding L, Spearman P. Characterization of a myristoylated,monomeric HIV Gag protein. Virology. 2009; 387:341–352. [PubMed: 19285328]
65. Morikawa Y, Hockley DJ, Nermut Mv, Jones IM. Roles of matrix, p2, and N-terminalmyristoylation in Human Immunodeficiency Virus Type 1 Gag assembly. J. Virol. 2000; 74:16–23. [PubMed: 10590086]
66. Morikawa Y, Zhang W-H, Hockley DJ, Nermut MV, Jones IM. Detection of a Trimeric HumanImmunodeficiency Virus Type 1 Gag Intermediate Is Dependent on Sequences in the MatrixProtein, p17. J. Virol. 1998; 72:7659–7663. [PubMed: 9696871]
67. Dalton AK, Ako-Adjei D, Murray PS, Murray D, Vogt MV. Electrostatic Interactions DriveMembrane Association of the Human Immunodeficiency Virus Type 1 Gag MA Domain. J. Virol.2007; 81:6434–6445. [PubMed: 17392361]
68. Alfadhli A, Huseby D, Kapit E, Colman D, Barklis E. Human Immunodeficiency Virus Type 1Matrix Protein Assembles on Membranes as a Hexamer. J. Virol. 2007; 81:1472–1478. [PubMed:17108052]
69. Cimarelli A, Sandin S, Hoglund S, Luban J. Basic residues in human immunodeficiency virus type1 nucleocapsid promote virion assembly via interaction with RNA. J. Virol. 2000; 74:3046–3057.[PubMed: 10708419]
70. Dawson L, Yu XF. The role of nucleocapsid of HIV-1 in virus assembly. 1998; 251:141–157.71. Muriaux D, Mirro J, Harvin D, Rein A. RNA is a structural element in retrovirus particles. Proc.
Natl. Acad. Sci. U.S.A. 2001; 98:5246–5251. [PubMed: 11320254]72. Alfadhli A, Barklis RL, Barklis E. HIV-1 matrix organizes as a hexamer of trimers on membranes
containing phosphatidylinositol-(4,5)-bisphosphate. Virology. 2009; 387:466–472. [PubMed:19327811]
73. Franke EK, Yuan HEH, Bossolt KL, Goff SP, Luban J. Specificity and sequence requirements forinteractions between various retroviral Gag proteins. J. Virol. 1994; 68:5300–5305. [PubMed:8035530]
74. Hamard-Peron E, Juilliard F, Saad JS, Roy C, Roingeard P, Summers MF, Darlix JL, Picart C,Muriaux D. Targeting of MuLV Gag to the plasma membrane is mediated by PI(4,5)P2/PS and apolybasic region in the Matrix. J. Virol. 2010; 84:503–515. [PubMed: 19828619]
75. Chan R, Uchil PD, Jin J, Shui G, Ott DE, Mothes W, Wenk MR. Retroviruses HumanImmunodeficiency Virus and Murine Leukemia Virus Are Enriched in Phosphoinositides. J. Virol.2008; 82:11228–11238. [PubMed: 18799574]
Fledderman et al. Page 17
Biochemistry. Author manuscript; available in PMC 2011 November 9.
NIH
-PA Author Manuscript
NIH
-PA Author Manuscript
NIH
-PA Author Manuscript

76. Alfadhli A, Still A, Barklis E. Analysis of Human Immunodeficiency Virus Type 1 Matrix Bindingto Membranes and Nucleic Acids. J. Virol. 2009; 83:12196–12203. [PubMed: 19776118]
77. Campbell S, Vogt VM. Self-assembly in vitro of of purifyed CA-NC proteins from Rous sarcomavirus and human immunodeficiency virus type 1. J. Virol. 1995; 69:6487–6497. [PubMed:7666550]
78. Ehrlich LS, Fong S, Scarlata S, Zybarth G, Carter C. Partitioning of HIV-1 gag and gag-relatedproteins to membranes. Biochemistry. 1996; 35:3933–3943. [PubMed: 8672424]
79. Ono A, Huang M, Freed EO. Characterization of human immunodeficiency virus type 1 matrixrevertants: effects on virus assembly, Gag processing, and Env incorporation into virions. J. Virol.1997; 71:4409–4418. [PubMed: 9151831]
80. Paillart J-C, Gottlinger HG. Opposing effects of human immunodeficiency virus type 1 matrixmutations support a myristyl switch model of Gag membrane targeting. J. Virol. 1999; 73:2604–2612. [PubMed: 10074105]
81. Conte MR, Klikova M, Hunter E, Ruml T, Matthews S. The three-dimensional solution structureof the matrix protein from the type D retrovirus, the Mason-Pfizer monkey virus, and implicationsfor the morphology of retroviral assembly. EMBO J. 1997; 16:5819–5826. [PubMed: 9312040]
82. Hatanaka H, Iourin O, Rao Z, Fry E, Kingsman A, Stuart DI. Structure of the Equine InfectiousAnemia Virus Matrix protein. J. Virol. 2002; 76:1876–1883. [PubMed: 11799182]
83. Christensen AM, Massiah MA, Turner BG, Sundquist WI, Summers MF. Three-dimensionalstructure of the HTLV-II matrix protein and comparative analysis of matrix proteins from thedifferent classes of pathogenic human retroviruses. J. Mol. Biol. 1996; 264:1117–1131. [PubMed:9000634]
84. McDonnell JM, Fushman D, Cahill SM, Zhou W, Wolven A, Wilson CB, Nelle TD, Resh MD,Wills J, Cowburn D. Solution structure and dynamics of the bioactive retroviral M domain fromRous sarcoma virus. J. Mol. Biol. 1998; 279:921–928. [PubMed: 9642071]
85. Riffel N, Harlos K, Lourin O, Rao Z, Kingsman A, Stuart D, Fry E. Atomic Resolution Structureof Moloney Leukemia virus Matrix protein and Its Relationship to Other Retroviral MatrixProteins. Structure. 2002; 10:1627–1636. [PubMed: 12467570]
86. Matthews S, Mikhailov M, Burny A, Roy P. The solution structure of the bovine leukemia virusmatrix protein and similarity with lentiviral matrix proteins. EMBO J. 1996; 15:3267–3274.[PubMed: 8670827]
87. Takayama Y, Castaeda CA, Chimenti M, Garca-Moreno B, Iwahara J. Direct Evidence forDeprotonation of a Lysine Side Chain Buried in the Hydrophobic Core of a Protein. J. Am. Chem.Soc. 2008; 130:6714–6715. [PubMed: 18454523]
88. Gottlieb RA, Giesing HA, Zhu JY, Engler RL, Babior BM. Cell acidification in apoptosis:granulocyte colony-stimulating factor delays programmed cell death in neutrophils by up-regulating the vacuolar H(+)-ATPase. Proc. Natl. Acad. Sci. 1995; 92:5965–5968. [PubMed:7541139]
89. Moolenaar WH, Tsien RY, van der Saag PT, de Laat SW. Na+/H+ exchange and cytoplasmic pHin the action of growth factors in human fibroblasts. Nature. 1983; 304:645–648. [PubMed:6410286]
90. Schuldiner S, Rozengurt E. Na+/H+ antiport in Swiss 3T3 cells: mitogenic stimulation leads tocytoplasmic alkalinization. Proc. Natl. Acad. Sci. 1982; 79:7778–7782. [PubMed: 6961450]
91. Makutonina A, Voss TG, Plymale DR, Fermin CD, Norris CH, Vigh S, Garry RF. Humanimmunodeficiency virus infection of T-lymphoblastoid cells reduces intracellular pH. J. Virol.1996; 70:7049–7055. [PubMed: 8794349]
Fledderman et al. Page 18
Biochemistry. Author manuscript; available in PMC 2011 November 9.
NIH
-PA Author Manuscript
NIH
-PA Author Manuscript
NIH
-PA Author Manuscript

Figure 1.Comparison of HIV-1 and HIV-2 MA protein structures. The imidazole ring of His89 formsa salt bridge with Glul2(COO) in HIV-1 myr(−)MA but not in the myr(+)MA protein. ForHIV-2, Glul2 is substituted with Lys, which can form a hydrogen bond with deprotonatedHis89 in myr(−)MA.
Fledderman et al. Page 19
Biochemistry. Author manuscript; available in PMC 2011 November 9.
NIH
-PA Author Manuscript
NIH
-PA Author Manuscript
NIH
-PA Author Manuscript
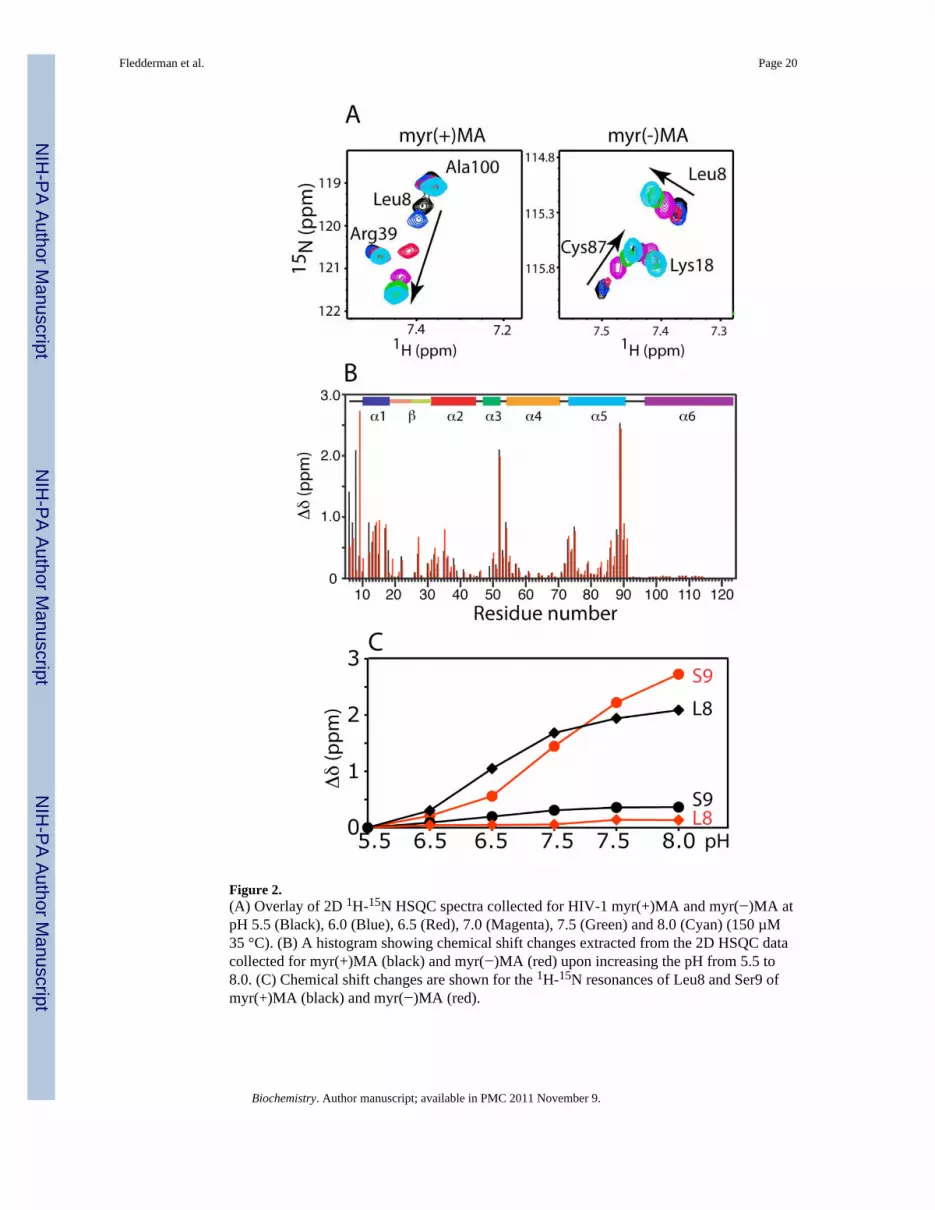
Figure 2.(A) Overlay of 2D 1H-15N HSQC spectra collected for HIV-1 myr(+)MA and myr(−)MA atpH 5.5 (Black), 6.0 (Blue), 6.5 (Red), 7.0 (Magenta), 7.5 (Green) and 8.0 (Cyan) (150 µM35 °C). (B) A histogram showing chemical shift changes extracted from the 2D HSQC datacollected for myr(+)MA (black) and myr(−)MA (red) upon increasing the pH from 5.5 to8.0. (C) Chemical shift changes are shown for the 1H-15N resonances of Leu8 and Ser9 ofmyr(+)MA (black) and myr(−)MA (red).
Fledderman et al. Page 20
Biochemistry. Author manuscript; available in PMC 2011 November 9.
NIH
-PA Author Manuscript
NIH
-PA Author Manuscript
NIH
-PA Author Manuscript

Figure 3.3D 13C-edited/12C-double-half-filtered NOE data obtained for HIV-1 myr(+)MA at pH 7.2showing unambiguously assigned NOE cross-peaks between the myr group and key residuesof a Relabeled protein sample (myr group is unlabeled). Solid lines denote 1H-12Cbreakthrough doublets NOE peaks.
Fledderman et al. Page 21
Biochemistry. Author manuscript; available in PMC 2011 November 9.
NIH
-PA Author Manuscript
NIH
-PA Author Manuscript
NIH
-PA Author Manuscript

Figure 4.Sedimentation coefficient distributions, c(s), obtained from the sedimentation profiles formyr(+)MA and myr(−)MA as a function of pH.
Fledderman et al. Page 22
Biochemistry. Author manuscript; available in PMC 2011 November 9.
NIH
-PA Author Manuscript
NIH
-PA Author Manuscript
NIH
-PA Author Manuscript

Figure 5.Sedimentation coefficient distributions, c(s), obtained from the sedimentation profiles formyr(+)MACA and myr(−)MACA at different pH values. The small peaks marked withasterisk indicate uncharacterized minor species likely to be impurity.
Fledderman et al. Page 23
Biochemistry. Author manuscript; available in PMC 2011 November 9.
NIH
-PA Author Manuscript
NIH
-PA Author Manuscript
NIH
-PA Author Manuscript

Figure 6.A structural view of the HIV-1 myr(+)MA protein in the myr-sequestered (green) and myr-exposed (brown) forms. Notice the conformational change involving Leu8, which acts as a“NMR reporter” for the movement of the myr group.
Fledderman et al. Page 24
Biochemistry. Author manuscript; available in PMC 2011 November 9.
NIH
-PA Author Manuscript
NIH
-PA Author Manuscript
NIH
-PA Author Manuscript
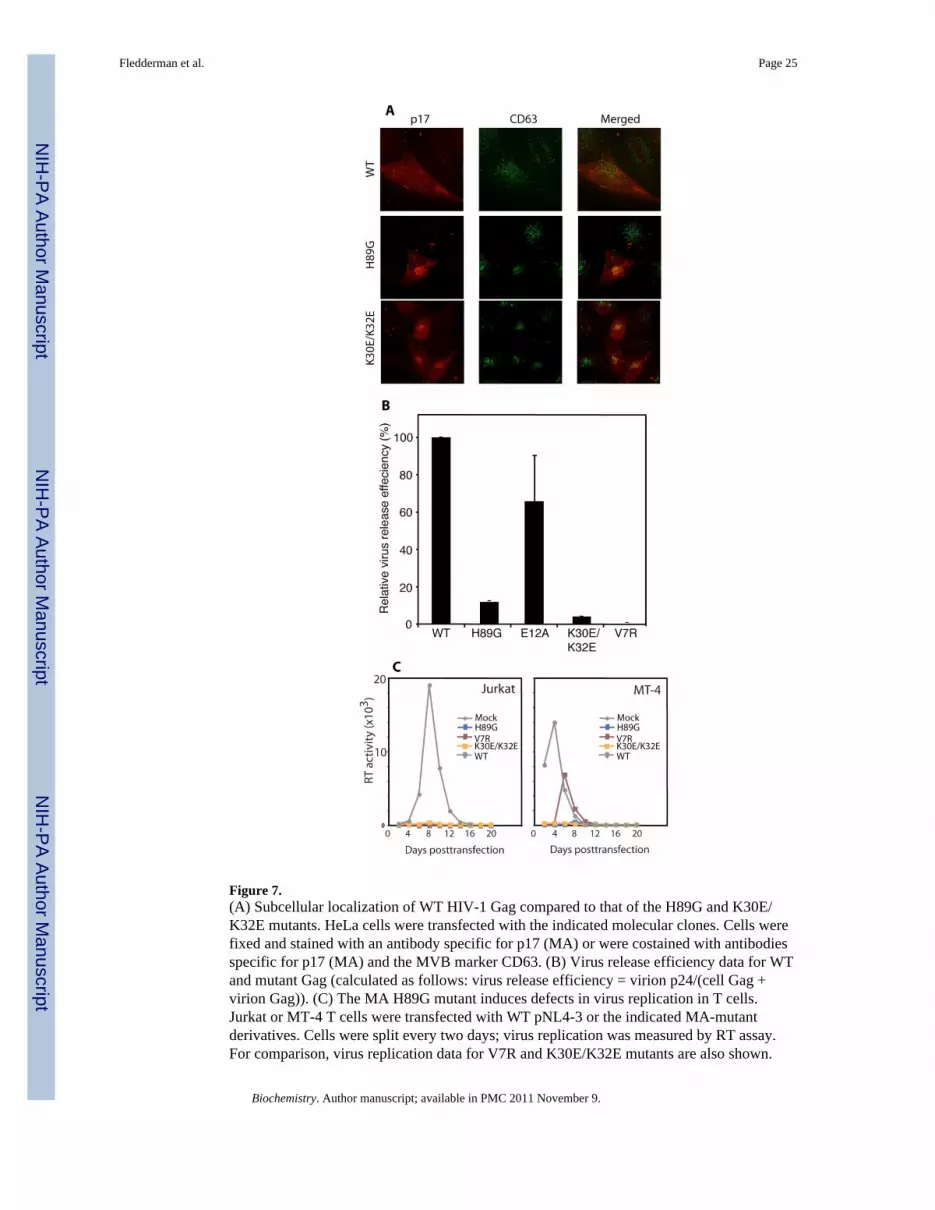
Figure 7.(A) Subcellular localization of WT HIV-1 Gag compared to that of the H89G and K30E/K32E mutants. HeLa cells were transfected with the indicated molecular clones. Cells werefixed and stained with an antibody specific for p17 (MA) or were costained with antibodiesspecific for p17 (MA) and the MVB marker CD63. (B) Virus release efficiency data for WTand mutant Gag (calculated as follows: virus release efficiency = virion p24/(cell Gag +virion Gag)). (C) The MA H89G mutant induces defects in virus replication in T cells.Jurkat or MT-4 T cells were transfected with WT pNL4-3 or the indicated MA-mutantderivatives. Cells were split every two days; virus replication was measured by RT assay.For comparison, virus replication data for V7R and K30E/K32E mutants are also shown.
Fledderman et al. Page 25
Biochemistry. Author manuscript; available in PMC 2011 November 9.
NIH
-PA Author Manuscript
NIH
-PA Author Manuscript
NIH
-PA Author Manuscript
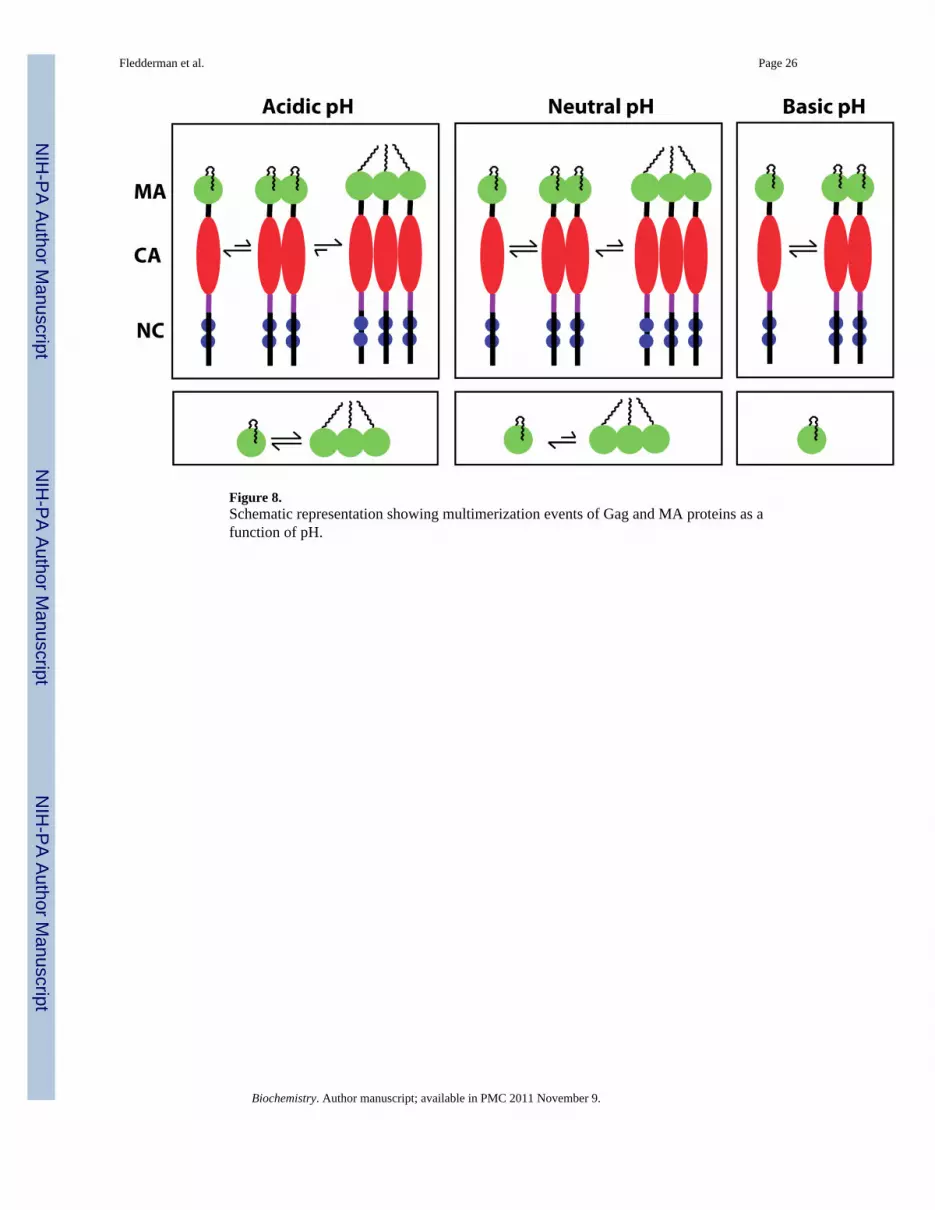
Figure 8.Schematic representation showing multimerization events of Gag and MA proteins as afunction of pH.
Fledderman et al. Page 26
Biochemistry. Author manuscript; available in PMC 2011 November 9.
NIH
-PA Author Manuscript
NIH
-PA Author Manuscript
NIH
-PA Author Manuscript

NIH
-PA Author Manuscript
NIH
-PA Author Manuscript
NIH
-PA Author Manuscript
Fledderman et al. Page 27
TABLE 1
Association constants calculated for HIV-1 MA, CA and MACA proteins at different pH values.
Protein pH Equilibrium Ka
myr(+)MAa 5.5 monomer-trimer 1.8 ± 0.5 × 10s M−2
7.0 monomer-trimer 0.7 ± 0.1 × 10⁸M−2
8.0 monomer -
myr(−)MA 5.5, 7, 8 monomer -
myr(+)MACA 5.5 monomer-trimer 1.4 ± 0.3 × 10¹⁰M−2
7.0 monomer-trimer 0.3 ± 0.3 × 10¹⁰M−2
8.0 monomer- dimer 3.3 ± 0.5 × 10⁴M−1
myr(−)MACA 5.5 monomer- dimer 3.3 ± 0.4 × 10⁴M−1
7.0 monomer-dimer 1.1 ± 0.4 × 10⁵M−1
8.0 monomer-dimer 2.4 ± 0.2 × 10⁵ M−1
myr(+)MACA(W184A/ M185A)
5.5 monomer-dimer 6.0 ± 0.1 × 10³ M−1
7.0 monomer-dimer 2.0 ± 0.3 × 10³ M−1
8.0 monomer -
CAb 7.0 monomer-dimer 5.5 × 10⁴ M−1
bKa is similar to that obtained in previous studies (20)
bReferences (53,54)
Biochemistry. Author manuscript; available in PMC 2011 November 9.


