Embed Size (px)
Citation preview
ISSN (e): 2250 – 3005 || Vol, 04 || Issue, 12 || December – 2014 ||
International Journal of Computational Engineering Research (IJCER)
www.ijceronline.com Open Access Journal Page 43
Multimode Vector Modalities of HMM-GMM in Augmented
Categorization of Bioacoustics’ Signals
Mayorga P.1, Ibarra D.
1,Druzgalski C.
2
1 Depto.de Posgrado, Instituto Tecnológico de Mexicali
2 Elec. Eng. Dept., California State. University
I. INTRODUCTION
Bioacoustic approach involving evaluation of the production and perception of biological sounds,
including in this case lung sounds (LS) and heart sounds (HS) [2] can be used as a useful diagnostic indicator.
The environmental conditions and including air pollution are among critical factors contributing to the increase
of respiratory and cardiovascular diseases. Thus, as a part of screening and classification of diagnostic indicators
during assisted auscultation one can diagnose the existence of abnormalities of cardiopulmonary origin; for
example for the heart, the sounds could make evident the possible presence of Stenosis and Ventricular Septal
Defect (VSD) as considered in this project, and for example for the lung’s ventilation limitations. Invariably,
these sounds and their detection via auscultation, using a traditional stethoscope or other devices including an
electronic stethoscope has been a standard practice in medicine. However, the use of a traditional acoustic-
mechanical stethoscope is hindered by the degree of the physician’s or nurse’s experience and their sensory
abilities. A description of acoustic indicators by its qualitative nature is frequently used in a subjective way
fashion, especially when being evaluated by different medical personnel.
ABSTRACT: A Merged Hidden Markov Model and Gaussian Mixed Models (HMM-GMM) can serve as
a very usefultool in classification of dominant characteristics in biological data. In particular, the
aimof this approach was to enhance classifications of lung sounds (LS) and heart sounds (HS). In
order to achieve these objectives, the LS and HS signals were expressed in terms of Mel-frequency
cepstral coefficients (MFCCs) and Quantile acoustic vectors. Once the signals were vectorized, a
clusters’ quantity analysis for the LS and HS signals was executed for both classes, representing
normal abnormal sounds, in such a way that a criterion for the model’s size was obtained. The
clusters’ quantity analysis was carried out applying dendrograms, silhouettes and the Bayesian
Information Criterion (BIC). Starting from these computations, the HMM-GMM model
architecture for the normal and abnormal classes were conceptualized.The models for the LS
signals using Quantile vectors, specifically Quartile, yielded excellent results, while for HS signals,
the best results for the HMM-GMM models were obtained with MFCC vectors. In both cases, i.e.,
LS and HS signals, a close to 100% classification efficiency was achieved for studied cases.
Furthermore, the evaluations were assessed in terms of sensitivity and specificity defined as a true
positive rate and a true negative rate respectively; LS signals achieved a 100% in sensitivity and
specificity, while HS signals also reached a 100%,excludingthe normal vs stenosis case, which
obtained a 85% in specificity. The importance of this approach lies is the possibility of
implementing automated assessment diagnostics for patients with respiratory and cardiac
disorders, and essentially the ability to bring this diagnostic capability to remote and limited
medical resource areas utilizing low cost technologies.
KEYWORDS:Cluster, Stethoscope, Quantile, MFCC, HMM, Dendrogram, Silhouette, BIC.
Multimode Vector Modalities of HMM-GMM in Augmented …
www.ijceronline.com Open Access Journal Page 44
To overcome the drawbacks previously mentioned, one can utilize quantitative methods based among
others on pattern recognition. Within the existing methodologies considered were Support Vector Machines
(SVM), Linear Discriminant Analysis, Gaussian Mixed Models (GMM) and Hidden Markov Models (HMM).
The most important difference is in their way to process data. The HMM processes data or as time series as of
state sequences associated to the signal’s events, while the other techniques are focused on clusters regardless of
the sequences in which they are produced. In other application areas [5], it has been observed that HMM
modeling is more susceptible to information loss than to noise, while cluster modeling is more susceptible to
noise than to information loss [11, 12]. In this sense, HMM models have advantage in noisy environments, even
though it could be computationally costly.
Another attribute about the methodologies mentioned above is the feasibility of their implementation on
a simple laptop computer, and could be available in almost all socio-economic scenarios and in remote locations.
This is relevant because the world’s prevailing socio-economic level is low, for example, in Latin America 70%
of the population is lives below the average poverty rate [6]. Moreover, many applications are not necessarily
oriented to a traditional third world but to patient’s evaluation settings in general [7-9]. In this context, often
patient’s evaluation settings are located in areas with environmental noise, which interferes with the recordings
of LS or HS signals and may negatively impact diagnostic procedures.
An intelligent system (either for voice, cardiopulmonary or other sound signals) simulates the
recognition process that the human hearing mechanism performs on the acoustic signal, or in our case an acoustic
peculiar event [10]. Most approaches used in intelligent systems for the LS or HS signal classification are based
in clusters, classic filtering and other approximations susceptible to noise and to signal degradation during the
filtering process. Specifically, the LS signals share a significant frequency range with the HS signals, which
suggests that HMM could be a good alternative in this domain [14], since they are oriented to detect event
sequences. This project deals with the application of HMM models to LS and HS signals assessment. Besides,
two modalities are used as a feature extractor, MFCC already successful in voice and another feature extractor
inspired on classifying pathologies based on lung function testing [13]. The HMM models need feature vectors to
train the models, which are a state sequences and these states are modeled by Gaussian Mixed Models.
II. MFCC AND QUANTILE FEATURE VECTORS
The feature vectors highlight relevant characteristics of a class by means of values, in such a way that
the classification is improved. In this section, the approximations used in the experiments are described and they
include MFCC and quantiles.
2.1 Mel-frequency cepstral coefficients (MFCCs) vectors
The MFCC vectors reflect a successful methodology in acoustic featuring, based on
cepstraldeconvolution. The cepstrum represents a method based on the Fourier transform, which allows the
extraction of the acoustic signal’s fundamental frequencies. The MFCC vectors are an extension of the cepstral
principles, and their transformation to a nonlinear frequency space is related to human hearing [15-18].
In MFCC, the sounds are parameterized by doing a pre-emphasis with FIR filters, followed by a
Hamming window applied to each analysis frame. In this paper, the experiments were carried out using 30 ms
Hamming windows with a 15 ms shift for HS signals, to which the Fast Fourier Transform (FFT) was applied;
subsequently, the module is obtained and then multiplied by a filter bank whose frequency range and central
frequencies are distributed according to the Mel or Bark scale. This is followed by calculating a log stage of the
values previously obtained from each filter and subsequently the Inverse Fourier Transform. The outcome is a
feature vector called MFCC [15, 19].
2.2Quantile Vectors
Another acoustic vector is the quantile, which is based on the cumulative distribution function (CDF). A
random variable’squantile is defined as the smallest value q in such a way that the cumulative distribution
function is greater than or equal to a probabilityp, where p is . This can be calculated from a
continuous density probability function f(x) through the Eq.1:
(1)
For acoustic featuring purposes, it is needed to find the quantile coefficients , and for that reason one
must start with the CDF inverse function. In the case of acoustic signals such as LS and HS, it isimportant to
Multimode Vector Modalities of HMM-GMM in Augmented …
www.ijceronline.com Open Access Journal Page 45
perform the calculations within the limit of stationarity; this limit is determined by the time in which the events
are stably generated. Considering a rate of 15 breaths per minute (the usual range for healthy adult subjects is
from 12 to 20 breaths per minute and much higher for toddlers), the stationarity is related to the duration of the
inhalation, exhalation and the silences in between, which were experimentally determined, obtaining 400 ms
(considering about 3 seconds including inhalation, silence and exhalation) [20,21]. A similar analysis was
applied to HS signals. In this process, the first stage consists in reading the signal, starting from a *.wav archive;
subsequently, the FFT is applied. Fulfilling a basic principle for a probability distribution function, the spectral
distribution is normalized (Eq. 2).
(2)
The Eq. 2 guarantees that the sum of the distribution of the frequency values obtained from the FFT
will be equal to Eq. 1, therefore N implies a normalization process. A particular quantile example is the use of
quartiles, calculated by Eq 3, where each frequency value corresponds to its respective quartil
coefficient. The calculation of the last quartil is not important because it always equals 1, hence a 3 three
dimensional vector is obtained.
(3)
Algorithmically, , is calculated by an iterative sum to obtain the area and detect the frequency values
in which the obtained area is . The same principle applies to Octile and any other quartil
type. For a more extensive description, the paper [21] should be reviewed.
III. CLUSTERS’ QUANTITY ANALYSIS FOR THE MODEL DEVELOPMENT
The clusters’ quantity used for the model calculation can be defined by means of various techniques.
Specifically, the agglomerated data visualization represents an important criterion for the clusters’ quantity
definition. In this section, some techniques to optimize the results are assessed through an analytical approach.
The techniques discussed include the analysis with dendrograms, silhouettes, and the Bayesian Information
Criterion (BIC).
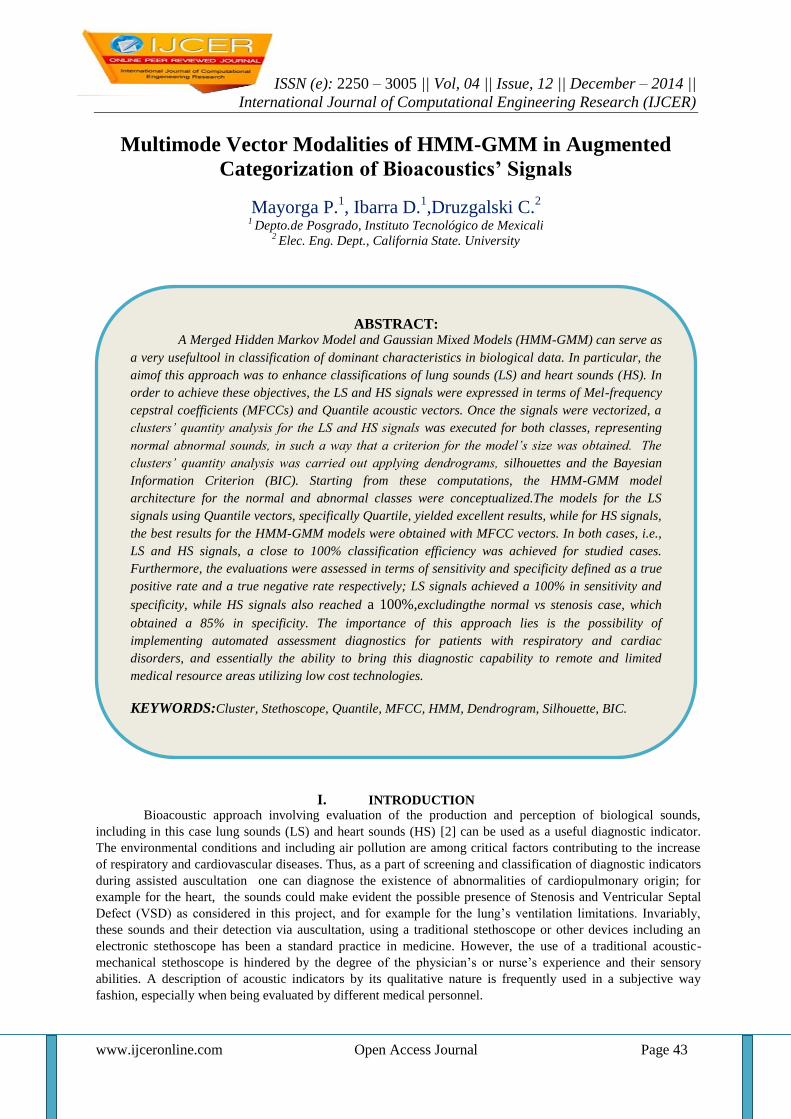
A dendrogram is basically a tree diagram based on the distance from each datum point against the
others, which associates those closer together (considering a distance metric, e.g., Euclidean). Here, it is meant
that the closer the data points are, the greater the probability of belonging to the same cluster. With this, the data
points are linked one to one until all data is related to one cluster, as shown in Figure 1 [33].
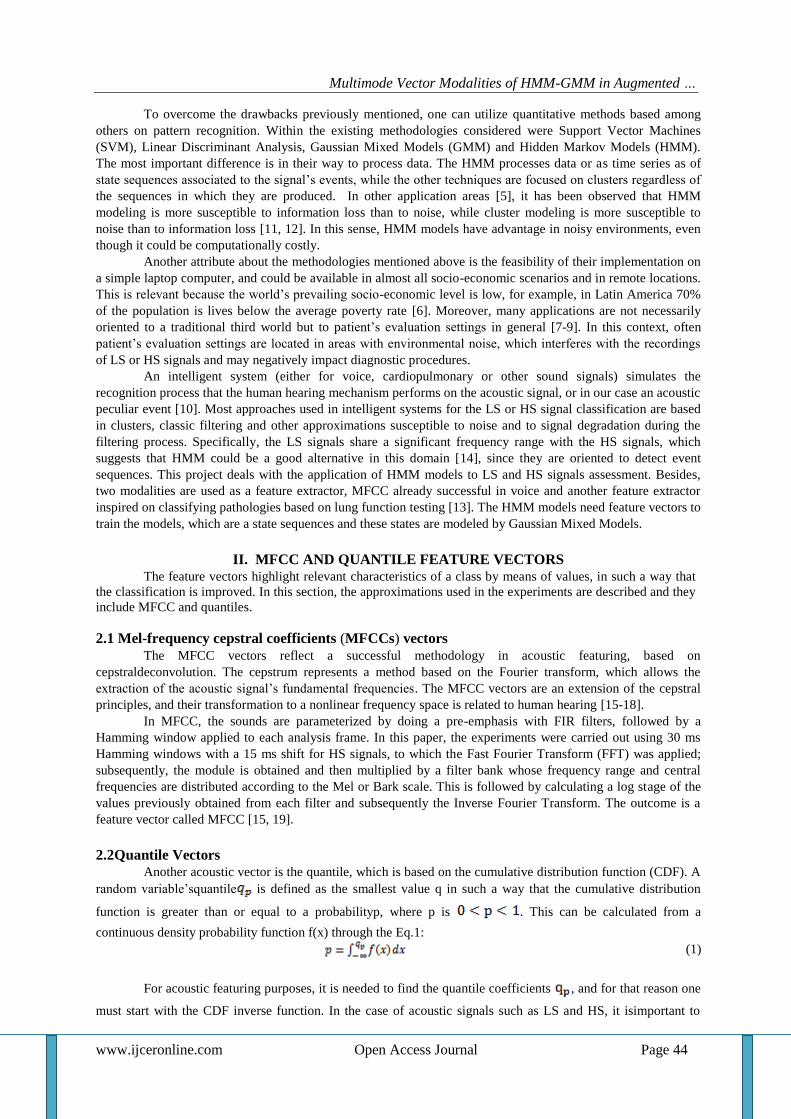
The silhouettes represent the number of existing clusters in a time series. Firstly, the quantity of clusters
is chosen. Subsequently, the silhouettes divide the data in the quantity of clusters specified, showing the
probability of belonging to a cluster (Figure 2, right side), and the uncertainty of not belonging to such cluster
(Figure 2, left side) [34, 35].
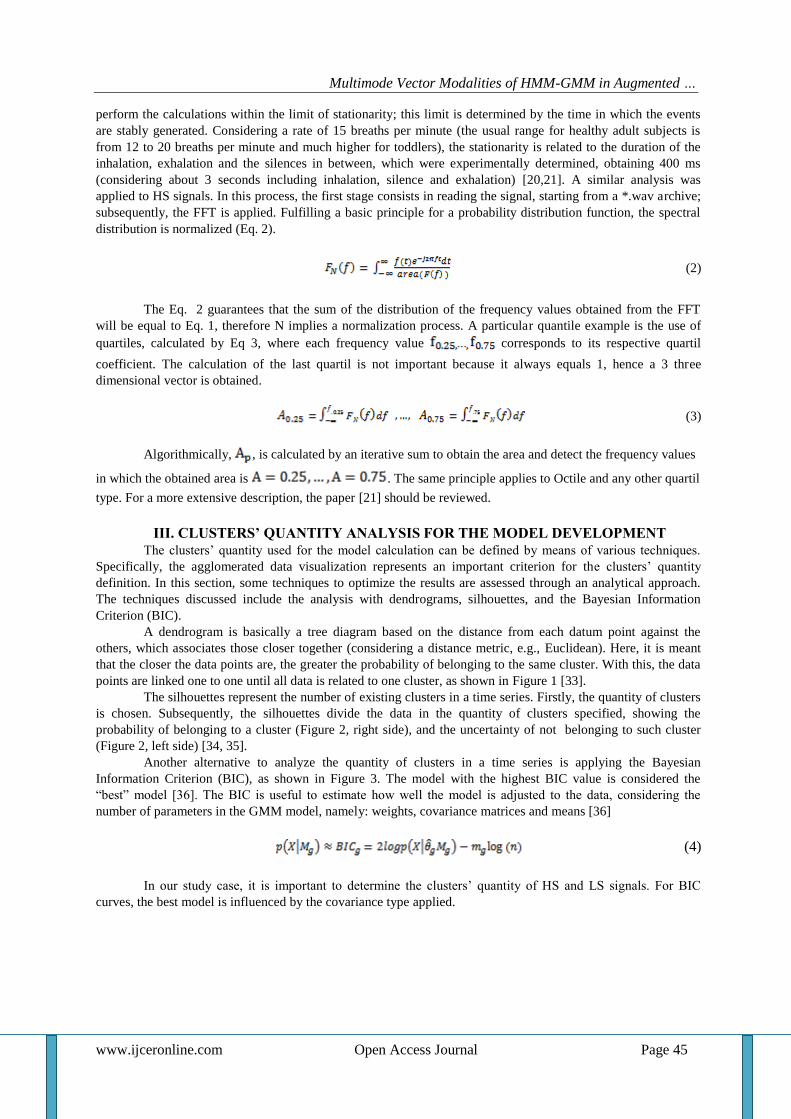
Another alternative to analyze the quantity of clusters in a time series is applying the Bayesian
Information Criterion (BIC), as shown in Figure 3. The model with the highest BIC value is considered the
“best” model [36]. The BIC is useful to estimate how well the model is adjusted to the data, considering the
number of parameters in the GMM model, namely: weights, covariance matrices and means [36]
(4)
In our study case, it is important to determine the clusters’ quantity of HS and LS signals. For BIC
curves, the best model is influenced by the covariance type applied.
Multimode Vector Modalities of HMM-GMM in Augmented …
www.ijceronline.com Open Access Journal Page 46
Figure 1.Dendrogramfor normal LS signal
Figure 2.Silhouttefor normal LS signal
Figure 3. Bestmodelaccording BIC curve for LS normal signal
IV. MODELLING
4.1 Gaussian Mixed Models (GMM) and Hidden Markov Model (HMM)
In this project, the GMM was applied as an emission function for the HMM states. Since the GMM
models have been successful in other areas related to analysis of acoustic signals, they are used in thisproject as a
representation of the states in the HMM models for the LS and HS signals.
4.1.1 GMM Models
A GMM model represents a triplet composed by the means, covariances and weights; generally, each
class is represented by a GMM model (in our case the model’s states). A model is trained with the acoustic
vectors obtained from the signals’ sampled data. The GMM modeling uses the expectation–maximization (EM)
Multimode Vector Modalities of HMM-GMM in Augmented …
www.ijceronline.com Open Access Journal Page 47
algorithm to train the models . This calculation is performed with the acoustic vectors extracted
from the different recordings (LS or HS). The mean represents the average over all the vectors, while the
covariance matrix models the characteristics variability on the acoustic class [16, 22].
(5)
Where is a random D-dimensional vector (MFCC, Octile or Quartile acoustic vectors),
are the component densities and are the mixtures weight [5, 23-25].Here,
represents a mean vector and is the covariance matrix. Besides, the weights for the mixtures must satisfy the
constraint . The GMM models are parameterized by mean vectors, covariance matrices and Gaussian
mixture weights constituting each state of the HMM model. Then, each Gaussian density contains the parameters
represented by the following expression [5, 23-25]:
(6)
4.1.2 HMM Models
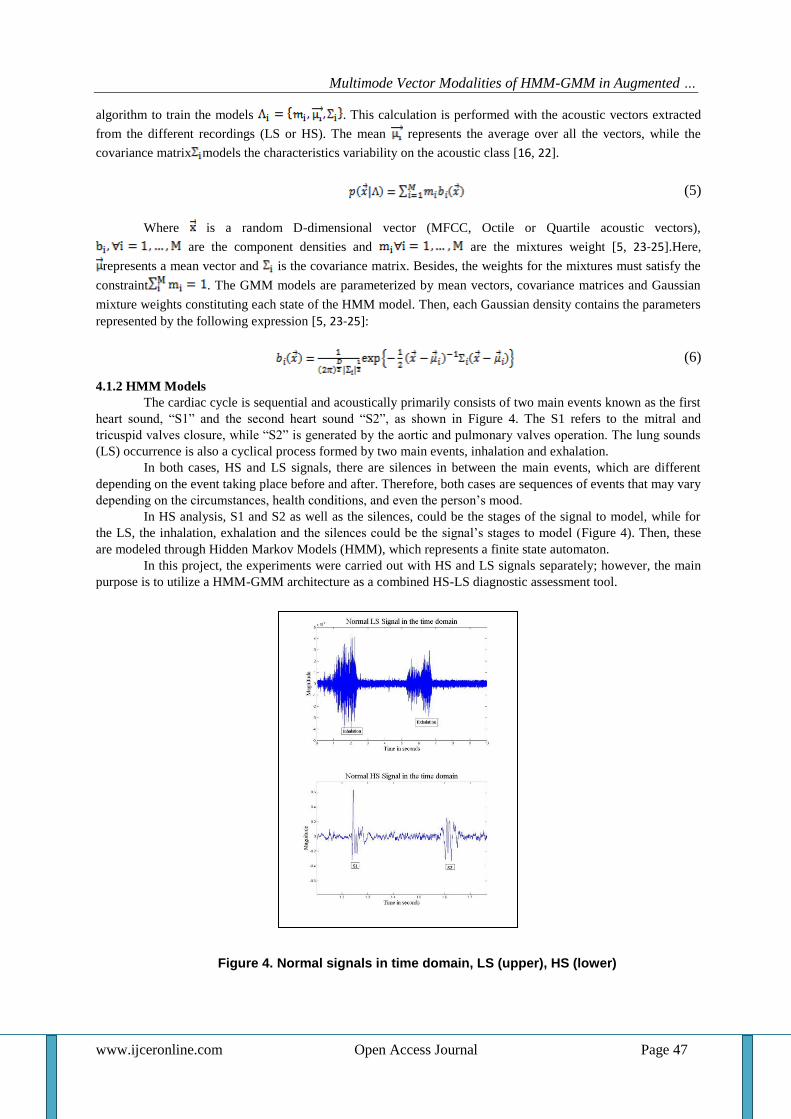
The cardiac cycle is sequential and acoustically primarily consists of two main events known as the first
heart sound, “S1” and the second heart sound “S2”, as shown in Figure 4. The S1 refers to the mitral and
tricuspid valves closure, while “S2” is generated by the aortic and pulmonary valves operation. The lung sounds
(LS) occurrence is also a cyclical process formed by two main events, inhalation and exhalation.
In both cases, HS and LS signals, there are silences in between the main events, which are different
depending on the event taking place before and after. Therefore, both cases are sequences of events that may vary
depending on the circumstances, health conditions, and even the person’s mood.
In HS analysis, S1 and S2 as well as the silences, could be the stages of the signal to model, while for
the LS, the inhalation, exhalation and the silences could be the signal’s stages to model (Figure 4). Then, these
are modeled through Hidden Markov Models (HMM), which represents a finite state automaton.
In this project, the experiments were carried out with HS and LS signals separately; however, the main
purpose is to utilize a HMM-GMM architecture as a combined HS-LS diagnostic assessment tool.
Figure 4. Normal signals in time domain, LS (upper), HS (lower)
Multimode Vector Modalities of HMM-GMM in Augmented …
www.ijceronline.com Open Access Journal Page 48
A HMM can be considered as a state-based model, in which each state is not directly observed, in fact,
each one is characterized by a GMM that models the observations (acoustic vectors) corresponding to the state.
Formally, a HMM is defined by the following components [26]:
is the finite set of posible states (hidden);
The transition matrix , corresponding to the probability to transit from a state
to a state . with the constraint ,
where denotes an occupied state at a time .
The emission function of a state (in our case a GMM) , denotes the emission
probability for an observation when the system is at the state ; corresponds to continuous
observations, for this project experiments, MFFC or Quantile acoustic vectors were applied, hence
is a GMM model.
, the probabilities of initially being in a state , Con
and .
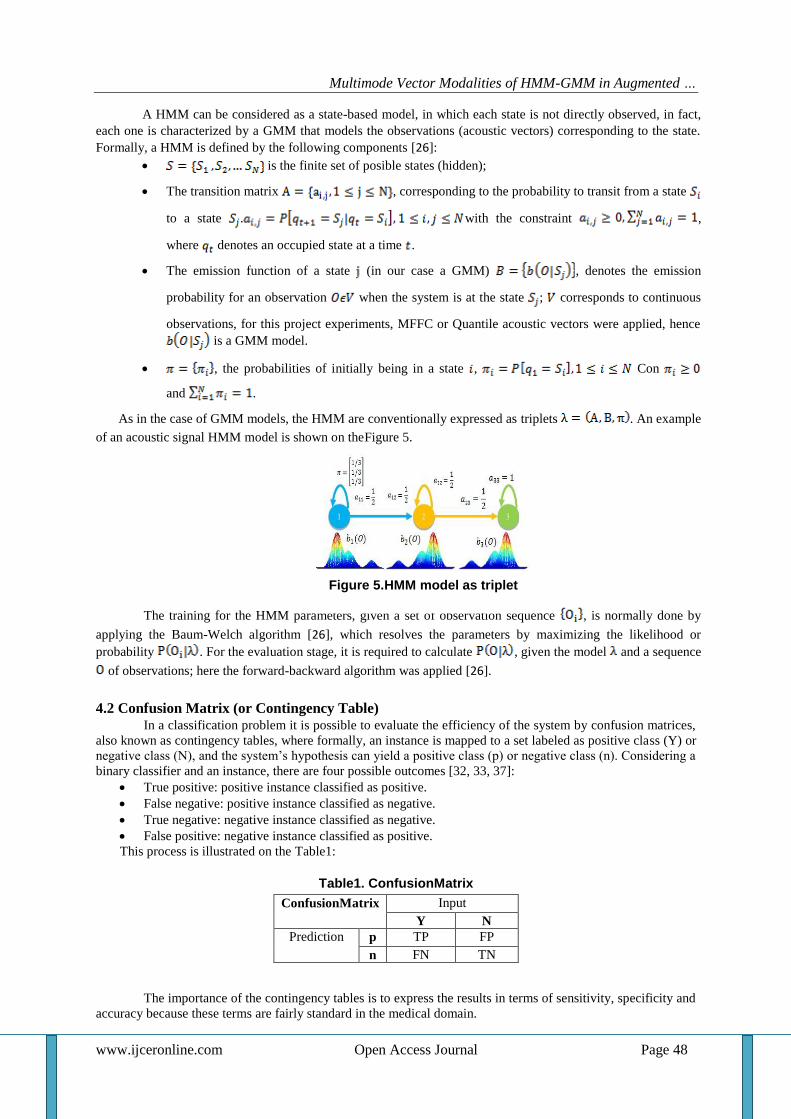
As in the case of GMM models, the HMM are conventionally expressed as triplets . An example
of an acoustic signal HMM model is shown on theFigure 5.
The training for the HMM parameters, given a set of observation sequence , is normally done by
applying the Baum-Welch algorithm [26], which resolves the parameters by maximizing the likelihood or
probability . For the evaluation stage, it is required to calculate , given the model and a sequence
of observations; here the forward-backward algorithm was applied [26].
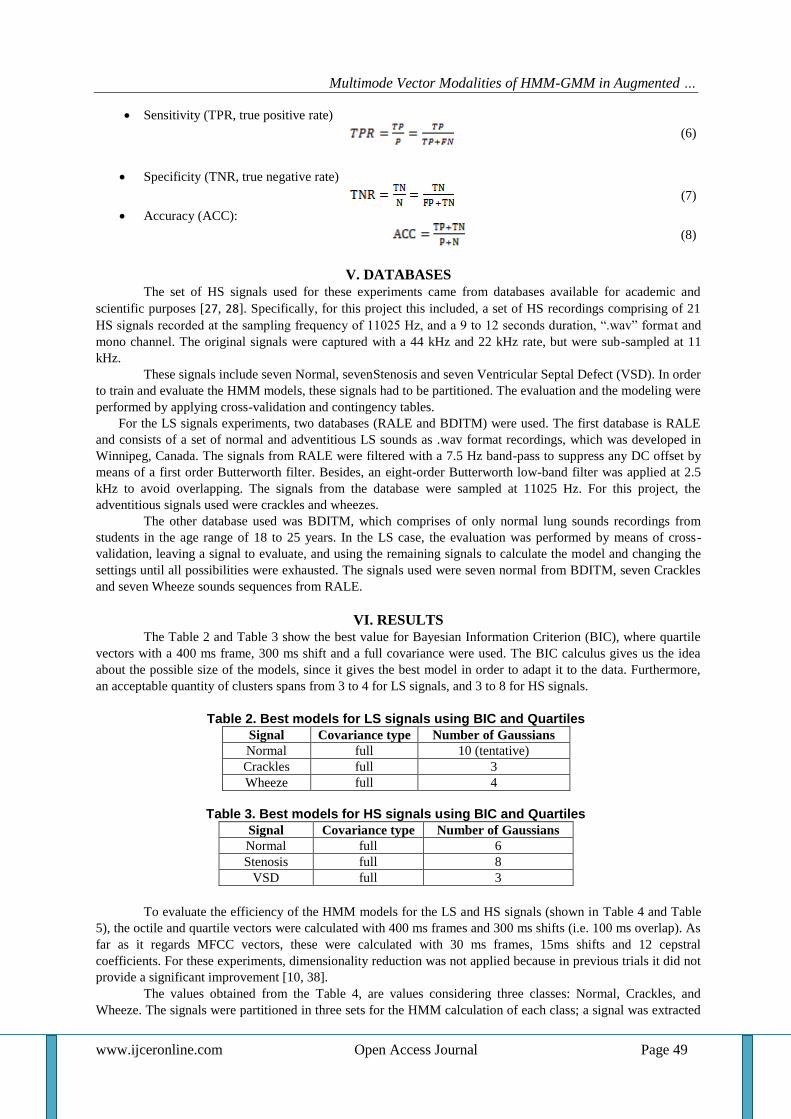
4.2 Confusion Matrix (or Contingency Table)
In a classification problem it is possible to evaluate the efficiency of the system by confusion matrices,
also known as contingency tables, where formally, an instance is mapped to a set labeled as positive class (Y) or
negative class (N), and the system’s hypothesis can yield a positive class (p) or negative class (n). Considering a
binary classifier and an instance, there are four possible outcomes [32, 33, 37]:
True positive: positive instance classified as positive.
False negative: positive instance classified as negative.
True negative: negative instance classified as negative.
False positive: negative instance classified as positive.
This process is illustrated on the Table1:
Table1. ConfusionMatrix
The importance of the contingency tables is to express the results in terms of sensitivity, specificity and
accuracy because these terms are fairly standard in the medical domain.
ConfusionMatrix Input
Y N
Prediction p TP FP
n FN TN
Figure 5.HMM model as triplet
Multimode Vector Modalities of HMM-GMM in Augmented …
www.ijceronline.com Open Access Journal Page 49
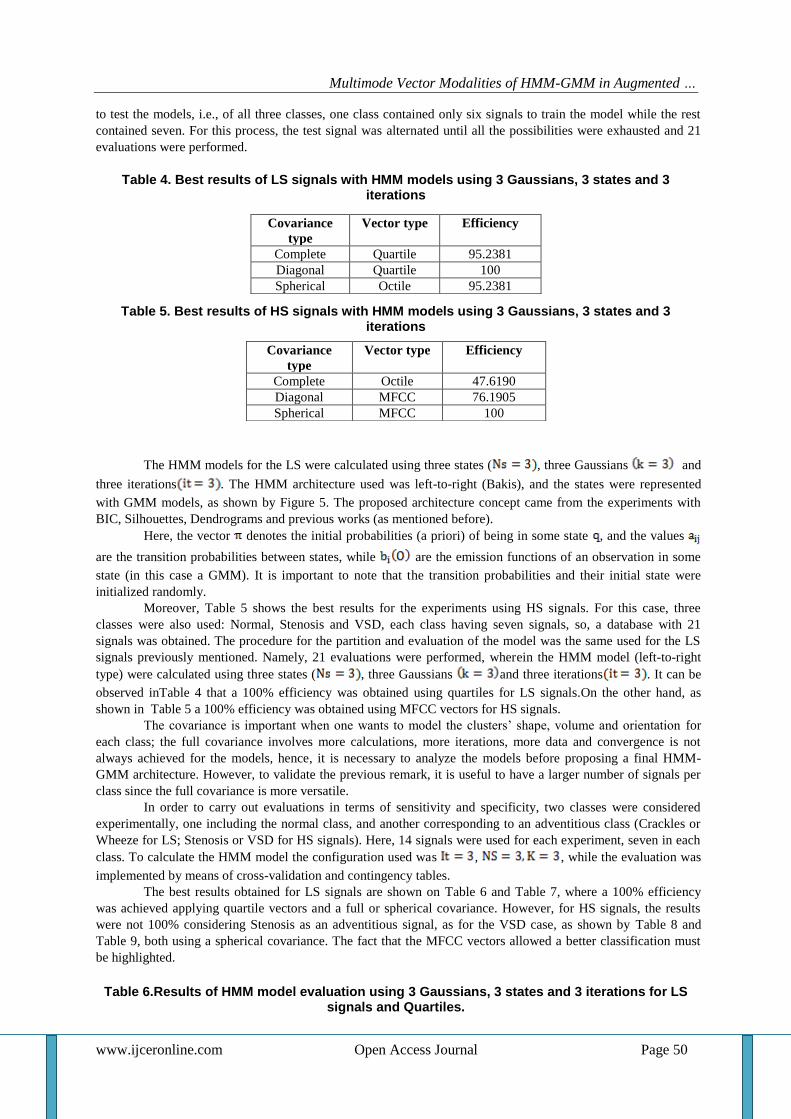
Sensitivity (TPR, true positive rate)
(6)
Specificity (TNR, true negative rate)
(7)
Accuracy (ACC):
(8)
V. DATABASES
The set of HS signals used for these experiments came from databases available for academic and
scientific purposes [27, 28]. Specifically, for this project this included, a set of HS recordings comprising of 21
HS signals recorded at the sampling frequency of 11025 Hz, and a 9 to 12 seconds duration, “.wav” format and
mono channel. The original signals were captured with a 44 kHz and 22 kHz rate, but were sub-sampled at 11
kHz.
These signals include seven Normal, sevenStenosis and seven Ventricular Septal Defect (VSD). In order
to train and evaluate the HMM models, these signals had to be partitioned. The evaluation and the modeling were
performed by applying cross-validation and contingency tables.
For the LS signals experiments, two databases (RALE and BDITM) were used. The first database is RALE
and consists of a set of normal and adventitious LS sounds as .wav format recordings, which was developed in
Winnipeg, Canada. The signals from RALE were filtered with a 7.5 Hz band-pass to suppress any DC offset by
means of a first order Butterworth filter. Besides, an eight-order Butterworth low-band filter was applied at 2.5
kHz to avoid overlapping. The signals from the database were sampled at 11025 Hz. For this project, the
adventitious signals used were crackles and wheezes.
The other database used was BDITM, which comprises of only normal lung sounds recordings from
students in the age range of 18 to 25 years. In the LS case, the evaluation was performed by means of cross-
validation, leaving a signal to evaluate, and using the remaining signals to calculate the model and changing the
settings until all possibilities were exhausted. The signals used were seven normal from BDITM, seven Crackles
and seven Wheeze sounds sequences from RALE.
VI. RESULTS
The Table 2 and Table 3 show the best value for Bayesian Information Criterion (BIC), where quartile
vectors with a 400 ms frame, 300 ms shift and a full covariance were used. The BIC calculus gives us the idea
about the possible size of the models, since it gives the best model in order to adapt it to the data. Furthermore,
an acceptable quantity of clusters spans from 3 to 4 for LS signals, and 3 to 8 for HS signals.
Table 2. Best models for LS signals using BIC and Quartiles
Signal Covariance type Number of Gaussians
Normal full 10 (tentative)
Crackles full 3
Wheeze full 4
Table 3. Best models for HS signals using BIC and Quartiles
Signal Covariance type Number of Gaussians
Normal full 6
Stenosis full 8
VSD full 3
To evaluate the efficiency of the HMM models for the LS and HS signals (shown in Table 4 and Table
5), the octile and quartile vectors were calculated with 400 ms frames and 300 ms shifts (i.e. 100 ms overlap). As
far as it regards MFCC vectors, these were calculated with 30 ms frames, 15ms shifts and 12 cepstral
coefficients. For these experiments, dimensionality reduction was not applied because in previous trials it did not
provide a significant improvement [10, 38].
The values obtained from the Table 4, are values considering three classes: Normal, Crackles, and
Wheeze. The signals were partitioned in three sets for the HMM calculation of each class; a signal was extracted
Multimode Vector Modalities of HMM-GMM in Augmented …
www.ijceronline.com Open Access Journal Page 50
to test the models, i.e., of all three classes, one class contained only six signals to train the model while the rest
contained seven. For this process, the test signal was alternated until all the possibilities were exhausted and 21
evaluations were performed.
Table 4. Best results of LS signals with HMM models using 3 Gaussians, 3 states and 3 iterations
Table 5. Best results of HS signals with HMM models using 3 Gaussians, 3 states and 3
iterations
The HMM models for the LS were calculated using three states ( , three Gaussians and
three iterations . The HMM architecture used was left-to-right (Bakis), and the states were represented
with GMM models, as shown by Figure 5. The proposed architecture concept came from the experiments with
BIC, Silhouettes, Dendrograms and previous works (as mentioned before).
Here, the vector denotes the initial probabilities (a priori) of being in some state , and the values
are the transition probabilities between states, while are the emission functions of an observation in some
state (in this case a GMM). It is important to note that the transition probabilities and their initial state were
initialized randomly.
Moreover, Table 5 shows the best results for the experiments using HS signals. For this case, three
classes were also used: Normal, Stenosis and VSD, each class having seven signals, so, a database with 21
signals was obtained. The procedure for the partition and evaluation of the model was the same used for the LS
signals previously mentioned. Namely, 21 evaluations were performed, wherein the HMM model (left-to-right
type) were calculated using three states ( , three Gaussians and three iterations . It can be
observed inTable 4 that a 100% efficiency was obtained using quartiles for LS signals.On the other hand, as
shown in Table 5 a 100% efficiency was obtained using MFCC vectors for HS signals.
The covariance is important when one wants to model the clusters’ shape, volume and orientation for
each class; the full covariance involves more calculations, more iterations, more data and convergence is not
always achieved for the models, hence, it is necessary to analyze the models before proposing a final HMM-
GMM architecture. However, to validate the previous remark, it is useful to have a larger number of signals per
class since the full covariance is more versatile.
In order to carry out evaluations in terms of sensitivity and specificity, two classes were considered
experimentally, one including the normal class, and another corresponding to an adventitious class (Crackles or
Wheeze for LS; Stenosis or VSD for HS signals). Here, 14 signals were used for each experiment, seven in each
class. To calculate the HMM model the configuration used was , , while the evaluation was
implemented by means of cross-validation and contingency tables.
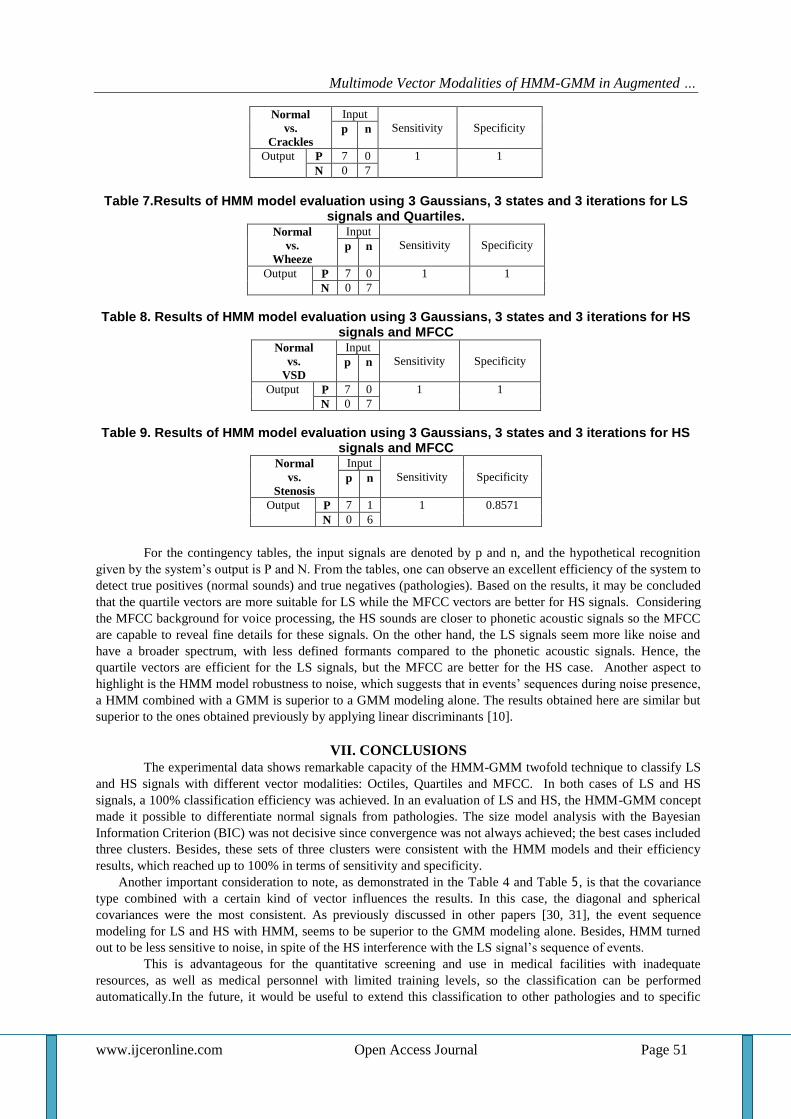
The best results obtained for LS signals are shown on Table 6 and Table 7, where a 100% efficiency
was achieved applying quartile vectors and a full or spherical covariance. However, for HS signals, the results
were not 100% considering Stenosis as an adventitious signal, as for the VSD case, as shown by Table 8 and
Table 9, both using a spherical covariance. The fact that the MFCC vectors allowed a better classification must
be highlighted.
Table 6.Results of HMM model evaluation using 3 Gaussians, 3 states and 3 iterations for LS signals and Quartiles.
Covariance
type
Vector type Efficiency
Complete Quartile 95.2381
Diagonal Quartile 100
Spherical Octile 95.2381
Covariance
type
Vector type Efficiency
Complete Octile 47.6190
Diagonal MFCC 76.1905
Spherical MFCC 100
Multimode Vector Modalities of HMM-GMM in Augmented …
www.ijceronline.com Open Access Journal Page 51
Normal
vs.
Crackles
Input
Sensitivity
Specificity p n
Output P 7 0 1 1
N 0 7
Table 7.Results of HMM model evaluation using 3 Gaussians, 3 states and 3 iterations for LS signals and Quartiles.
Normal
vs.
Wheeze
Input
Sensitivity
Specificity p n
Output P 7 0 1 1
N 0 7
Table 8. Results of HMM model evaluation using 3 Gaussians, 3 states and 3 iterations for HS signals and MFCC
Normal
vs.
VSD
Input
Sensitivity
Specificity p n
Output P 7 0 1 1
N 0 7
Table 9. Results of HMM model evaluation using 3 Gaussians, 3 states and 3 iterations for HS signals and MFCC
Normal
vs.
Stenosis
Input
Sensitivity
Specificity p n
Output P 7 1 1 0.8571
N 0 6
For the contingency tables, the input signals are denoted by p and n, and the hypothetical recognition
given by the system’s output is P and N. From the tables, one can observe an excellent efficiency of the system to
detect true positives (normal sounds) and true negatives (pathologies). Based on the results, it may be concluded
that the quartile vectors are more suitable for LS while the MFCC vectors are better for HS signals. Considering
the MFCC background for voice processing, the HS sounds are closer to phonetic acoustic signals so the MFCC
are capable to reveal fine details for these signals. On the other hand, the LS signals seem more like noise and
have a broader spectrum, with less defined formants compared to the phonetic acoustic signals. Hence, the
quartile vectors are efficient for the LS signals, but the MFCC are better for the HS case. Another aspect to
highlight is the HMM model robustness to noise, which suggests that in events’ sequences during noise presence,
a HMM combined with a GMM is superior to a GMM modeling alone. The results obtained here are similar but
superior to the ones obtained previously by applying linear discriminants [10].
VII. CONCLUSIONS
The experimental data shows remarkable capacity of the HMM-GMM twofold technique to classify LS
and HS signals with different vector modalities: Octiles, Quartiles and MFCC. In both cases of LS and HS
signals, a 100% classification efficiency was achieved. In an evaluation of LS and HS, the HMM-GMM concept
made it possible to differentiate normal signals from pathologies. The size model analysis with the Bayesian
Information Criterion (BIC) was not decisive since convergence was not always achieved; the best cases included
three clusters. Besides, these sets of three clusters were consistent with the HMM models and their efficiency
results, which reached up to 100% in terms of sensitivity and specificity.
Another important consideration to note, as demonstrated in the Table 4 and Table 5, is that the covariance
type combined with a certain kind of vector influences the results. In this case, the diagonal and spherical
covariances were the most consistent. As previously discussed in other papers [30, 31], the event sequence
modeling for LS and HS with HMM, seems to be superior to the GMM modeling alone. Besides, HMM turned
out to be less sensitive to noise, in spite of the HS interference with the LS signal’s sequence of events.
This is advantageous for the quantitative screening and use in medical facilities with inadequate
resources, as well as medical personnel with limited training levels, so the classification can be performed
automatically.In the future, it would be useful to extend this classification to other pathologies and to specific
Multimode Vector Modalities of HMM-GMM in Augmented …
www.ijceronline.com Open Access Journal Page 52
sectors of the population to assess the effects of localized pollution. In addition, the implementation of inclusive
architecture to classify LS and HS signals with indexed events will represent beneficial diagnostic tool.
REFERENCES [1] Kosmidou V E, Hadjileontiadis L J. "Sign language recognition using intrinsic-mode sample entropy on sEMG and accelerometer
data". IEEE Trans Biomed Eng, 2009; 56(12): 2879-90.
[2] Gaunt S L, Nelson D A, Dantzker M S, Budney G F, Bradbury J W, Zink R. "New directions for bioacoustics collections". The Auk, 2005; 122(3): 984-987.
[3] Reyna-Carranza M A, Moreno-Flores A P, Lopez-Avitia R. "Acute respiratory infections and its Spearman correlation with
meteorological and air pollutants data from Mexicali, BC, Mexico". PAHCE-2010 (Pan American Health Care Exchanges Conf. 2010), 2010; Lima, Peru
[4] Reyna-Carranza M A, Merida-Palacio J V, Soria-Rodriguez C. "Acute effects of the PM10 and O3 in the healthy school children
pulmonary function from Mexicali, BC, Mexico". PAHCE-2010 (Pan American Health Care Exchanges Conf. 2010), 2010; Lima, Peru
[5] Mayorga P, Besacier L, Lamy R, Serignat J F. "Audio packet loss over IP and speech recognition". Automatic Speech Recognition
and Understanding, 2003. ASRU '03. 2003 IEEE Workshop on, 2003; [6] (CEPAL) C E P A L Y E C. "Panorama Social de AméricaLatina
http://www.eclac.org/publicaciones/xml/5/48455/PanoramaSocial2012DocI-Rev.pdf". 2012;
[7] Moussavi Z. "Respiratory sound analysis". IEEE Engineering in Medicine and Biology Magazine, 2007; 26 (1): 15. [8] Gnitecki J, Moussavi Z, Pasterkamp H. "Diagnostic potential in state space parameters of lung sounds". Medical & biological
engineering & computing, 2008; 46(1): 93-99.
[9] Charleston-Villalobos S, Martinez-Hernandez G, Gonzalez-Camarena R, Chi-Lem G, Carrillo J G, Aljama-Corrales T. "Assessment of multichannel lung sounds parameterization for two-class classification in interstitial lung disease patients". Comput Biol Med,
2011; 41(7): 473-82.
[10] Mayorga Ortiz P, Druzgalski C, Criollo Arellano M, González Arriaga O. "GMM y LDA Aplicado a la Detección de Enfermedades Pulmonares". Revista Mexicana de Ingeniería Biomédica, 2013; 34(2):
[11] Solé-Casals J, Zaiats V. "Advances in nonlinear speech processing". International Conference on Nonlinear Speech Processing,
NOLISP 2009, 2009; [12] Milner B, James A. "Robust speech recognition over mobile and IP networks in burst-like packet loss". Audio, Speech, and
Language Processing, IEEE Transactions on, 2006; 14(1): 223-231.
[13] Kiyokawa H, Pasterkamp H. "Volume-dependent variations of regional lung sound, amplitude, and phase". Journal of Applied Physiology, 2002; 93(3): 1030-1038.
[14] Besacier L, Mayorga P, Bonastre J F, Fredouille C, Meignier S. "Overview of compression and packet loss effects in speech
biometrics". Vision, Image and Signal Processing, IEE Proceedings -, 2003; 150(6): 372-376. [15] Istrate D M. "Detection et Reconnaissance des Sons pour la Surveillance Médicale, These Doctorale, France". INPG, 2003; 183.
[16] Mayorga P, Druzgalski C, Vidales J. "Quantitative Models for Assessment of Respiratory Diseases". PAHCE-2010 (Pan American
Health Care Exchanges Conf. 2010), 2010; Lima, Peru. DOI: 10.1109/PAHCE.2010.5474607
[17] Milner B, Semnani S. "Robust Speech Recognition over IP Networks". IEEE Int. Conf. on Acoustics, Speech, and Signal
Processing, ICASSP2000, Jun 2000; Istambul, Turkey
[18] Pearce D. "An Overview of ETSI Standards Activities for Distributed Speech Recognition Front-Ends". AVIOS 2000: The Speech Applications Conference, May 22-24 2000; San Jose, CA, USA
[19] Fredouille C, Mariéthoz J, Jaboulet C, Hennebert J, Mokbel C, Bimbot F. "Behavior of a Bayesian Adaptation Method for
Incremental Enrollment in Speaker Verification". IEEE Int. Conf. on Acoustics, Speech ans Signal Processsing (ICASSP2000), 2000; Istambul, Turkey
[20] Mayorga P, Olguín M, González O H, Flores N, Luis V. "Quantile Acoustic Vectors vs. MFCC Applied to Speaker Verification".
International Journal of Advanced Robotic Systems, 2013; [21] Mayorga P, Druzgalski C, González O H, Lopez H S. "Modified classification of normal Lung Sounds applying Quantile Vectors".
Engineering in Medicine and Biology Society (EMBC), 2012 Annual International Conference of the IEEE, 2012; [22] Mayorga P, Druzgalski C, González O H, Zazueta A, Criollo M A. "Expanded Quantitative Models for Assessment of Respiratory
Diseases and Monitoring". PAHCE-2011 (Pan American Health Care Exchanges Conf. 2011), March 2011; Rio de Janeiro, Brazil.
DOI: 10.1109/PAHCE.2011.5871917 [23] Pearce D. "An Overview of ETSI Standards Activities for Distributed Speech Recognition Front-Ends". AVIOS 2000: The Speech
Applications Conference, 2000.; San Jose, California, USA
[24] Reynolds D. A. "Gaussian Mixture Modeling Approach to Text-Independent speaker Identification ". Georgia Institute of Tecnology, 1992;
[25] Webb Andrew R. Statistical Pattern Recognition. John Wiley & Sons Ltd, 2002.
[26] Rabiner L R, Juang B H. Fundamentals of speech recognition. PTR Prentice Hall (Englewood Cliffs, N.J.), 1993. [27] "Boston Children's Hospital http://www.childrenshospital.org/".
[28] "Texas Heart Institute http://www.texasheartinstitute.org/AboutUs/index.cfm".
[29] Mayorga P, Druzgalski C, Gonzalez O H. "Quantile vectors based verification of normal lung sounds". PAHCE-2012 (Pan American Health Care Exchanges Conf. 2012), 2012; Miami, Florida. DOI: 10.1109/PAHCE.2012.6233424
[30] Mayorga P, Druzgalski C, Miranda J, Zeljkovic V, Gonzalez O H. "The HMM diagnostic models of respiratory sounds". PAHCE-
2014 (Pan American Health Care Exchanges Conf. 2014) 2014; Brasilia, Brazil. DOI: 10.1109/PAHCE.2014.6849611 [31] Mayorga P, Druzgalski C, Calderas D, Zeljkovic V. "Multimodal classification of heart sounds attributes". PAHCE-2014 (Pan
American Health Care Exchanges Conf. 2014) 2014; Brasilia, Brazil. DOI: 10.1109/PAHCE.2014.6849615
[32] Fawcett T. "An Introduction to ROC Analysis". Pattern Recognition Letters, ElSEVIER, 2005; [33] Benabdeslem, K.; Bennani, Y., "Dendogram based SVM for multi-class classification," Journal of Computing and Information
Technology-CIT 14, 2006, 4, 283-289;
[34] Xue Mei Lu; Sung Jong Eun; Taeg Keun Whangbo, "Vector Silhouette Extraction for Generating Blueprint," Automation and Logistics, 2007 IEEE International Conference on , vol., no., pp.2946,2951, 18-21 Aug. 2007
[35] Xuejun, Li; Jiaguang, Sun; Changgui, Yang, "Extracting silhouette curves of NURBS sufaces by tracing silhouette points,"
Tsinghua Science and Technology, vol. 3, no. 2, pp. 1005, 1008, June 1998.

Multimode Vector Modalities of HMM-GMM in Augmented …
www.ijceronline.com Open Access Journal Page 53
[36] Jianhua Zhao, "Efficient Model Selection for Mixtures of Probabilistic PCA Via Hierarchical BIC," Cybernetics, IEEE Transactions
on , vol.44, no.10, pp.1871,1883, Oct. 2014.
[37] Marom, N.D.; Rokach, L.; Shmilovici, A., "Using the confusion matrix for improving ensemble classifiers," Electrical and Electronics Engineers in Israel (IEEEI), 2010 IEEE 26th Convention of , vol., no., pp.000555,000559, 17-20 Nov. 2010
[38] Mayorga Ortiz P, Druzgalski C, Miranda Vega, J. E., Calderas Ochoa D. O. "Modelos Acústicos HMM Multimodales para Sonidos
Cardiacos y Pulmonares". Revista Mexicana de Ingeniería Biomédica, 2014; 35(3).