Embed Size (px)
Citation preview
1
Multifield phonon spectrometrics of structured crystals and liquids
39 k Words, 41 figs, 371 refs
Chang Q. Sun1,2*, Xuexian Yang
3, Yi Sun
4, Yongli Huang5,*
Highlight
Development of regulations for the multifield bond oscillation dynamics and energetics.
Bond vibration frequencies vary with programmed perturbation of the crystal potentials.
Frequency shift correlates the perturbation-relaxation-property of a substance.
Phonon spectrometrics offers ever-unexpected information on the performance of bonds.
4 8 12353
354
355
418
420
atomic - CN
A1g
(c
m-1)
WS2
E12g
a
4 8 12
382
383
384
404
406
408 b
A1g
E12g
MoS2
4 8 12247
248
249
257
258
259
260 c
A1g
E12g
WSe2
4 8 12240
241
242
284
285
286
287 d
E12g
A1g
MoSe2
Key Points
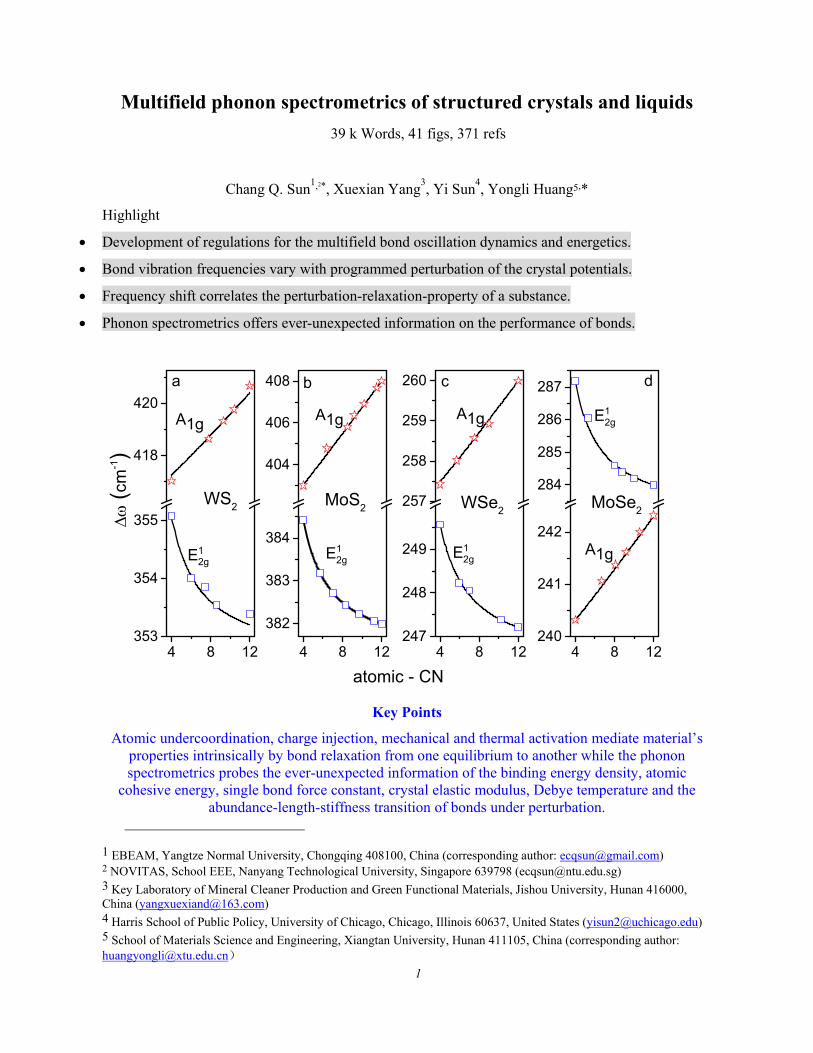
Atomic undercoordination, charge injection, mechanical and thermal activation mediate material’s properties intrinsically by bond relaxation from one equilibrium to another while the phonon spectrometrics probes the ever-unexpected information of the binding energy density, atomic
cohesive energy, single bond force constant, crystal elastic modulus, Debye temperature and the abundance-length-stiffness transition of bonds under perturbation.
1 EBEAM, Yangtze Normal University, Chongqing 408100, China (corresponding author: [email protected]) 2 NOVITAS, School EEE, Nanyang Technological University, Singapore 639798 ([email protected]) 3 Key Laboratory of Mineral Cleaner Production and Green Functional Materials, Jishou University, Hunan 416000, China ([email protected]) 4 Harris School of Public Policy, University of Chicago, Chicago, Illinois 60637, United States ([email protected]) 5 School of Materials Science and Engineering, Xiangtan University, Hunan 411105, China (corresponding author: [email protected])
2
Abstract
Bond relaxation from one equilibrium to another under perturbation matters uniquely the performance
of a substance and thus it has enormous impact to materials science and engineering. However, the
basic rules for the perturbation-bond-property correlation and efficient probing strategies for high-
resolution detection stay yet great challenge. This treatise features recent progress in this regard with
focus on the multifield bond oscillation notion and the theory-enabled phonon spectrometrics. From
the perspective of Fourier transformation and the Taylor series of the potentials, we correlate the
phonon spectral features directly to transition of the characteristic bonds in terms of stiffness
(frequency shift), number fraction (integral of the differential spectral peak), structure fluctuation
(linewidth), and the macroscopic properties of the substance. A systematic examination of the spectral
feature evolution for group IV, III-V, II-VI crystals, layered graphene nanoribbons, black phosphor,
(W, Mo)(S2, Se2) flakes, typical nanocrystals, and liquid water and aqueous solutions under
perturbation has enabled the ever-unexpected information on the perturbation-bond-property
regulations. Consistency between predictions and measurements of the crystal size-resolved phonon
frequency shift clarifies that atomic dimer oscillation dictates the vibration modes showing blueshift
while the collective vibration of oscillators formed between a certain atom and its nearest neighbors
governs the modes of redshift when the sample size is reduced. Theoretical matching to the phonon
frequency shift due to atomic undercoordination, mechanical and thermal activation, and aqueous
charge injection by solvation has been realized. The reproduction of experimental measurements has
turned out quantitative information of bond length, bond energy, single bond force constant, binding
energy density, vibration mode activation energy, Debye temperature, elastic modulus, and the number
and stiffness transition of bonds from the mode of references to the conditioned upon perturbation.
Findings prove not only the essentiality of the multifield lattice oscillating dynamics but also the
immense power of the phonon spectrometrics in revealing the bond-phonon-property correlation of
solid and liquid substance.
Keywords: mechanics; thermodynamics; mechanisms and modelling; macroscopic properties;
multifield lattice dynamics; phonon spectroscopy
3
Multifield mediation of the bonding energetics and properties of structured crystals and liquids .................................................................................................................................................... 1
Abstract ................................................................................................................................................. 2
1. Wonders of Multifield Lattice Oscillation ..................................................................................... 5 1.1. Significance of Multifield Lattice Oscillation ................................................. 6 1.2. Outline of Experimental Observations ............................................................ 8
1.2.1. Size Matter – Atomic Undercoordination .................................................................................... 8 1.2.2. Compression and Directional Uniaxial-stain ............................................................................. 11 1.2.3. Debye Thermal Decay ................................................................................................................ 13
1.3. Overview on Theoretical Progress ................................................................ 14 1.3.1. Quantum Size Trends ................................................................................................................. 14
1.3.1.1. Empirical Formulation ............................................................................................... 14 1.3.1.2. Hwang’s Scheme ....................................................................................................... 16
1.3.2. Grüneisen Notion for Compression and Thermal Excitation .................................................... 18 1.3.3. Phonon Optical-Acoustic Thermal Degeneration ...................................................................... 20
1.4 Motivation and Objectives ............................................................................ 21 1.5 Scope ............................................................................................................. 23
2. Theory: Multifield Oscillation Dynamics ............................................................................ 26 2.1. Lattice Oscillation Dynamics ........................................................................ 27
2.1.1. Single-Body Hamiltonian ........................................................................................................... 27 2.1.2. Atomic Chains ............................................................................................................................ 29 2.1.3. Lagrangian Mechanics of Coupled Oscillators .......................................................................... 30 2.1.4. Collective Oscillation ................................................................................................................. 31
2.2. Taylor Coefficients versus Observables ........................................................ 31 2.3. Single Bond Multifield Oscillations .............................................................. 32
2.3.1. Bond Length and Energy Relaxation ......................................................................................... 32 2.3.2. Phonon Frequency Relaxation ................................................................................................... 34
2.4. Formulation of Multifield Perturbation ......................................................... 36 2.4.1. Atomic Undercoordination ......................................................................................................... 36
2.4.1.1. BOLS-LBA approach ................................................................................................ 36 2.4.1.2. Atomic-site and Crystal-size Resolved Shift ............................................................ 37
2.4.2. Thermal Excitation: Debye Thermal Decay .............................................................................. 38 2.4.2.1. Lattice Debye Thermal Expansion ............................................................................ 38 2.4.2.2. Debye Thermal Decay: Debye Temperature and Cohesive Energy ......................... 40
2.4.3. Mechanical Compression: Elasticity and Energy Density ........................................................ 41 2.4.4. Uniaxial Stretch: Single Bond Force Constant .......................................................................... 42
2.5. From spectroscopy to Spectrometrics ........................................................... 43 2.6. Summary ....................................................................................................... 44
3. Layered Structures ................................................................................................................ 45 3.1. Wonders of the 2D Structures ....................................................................... 46
3.1.1. Orbital Hybridization and Structure Configuration ................................................................... 46 3.1.2. Phonon Frequency Tunability .................................................................................................... 48
3.2. Numerical Reproduction of Phonon Relaxation ............................................ 51 3.2.1. Number-of-layer Dependence .................................................................................................... 51
3.2.1.1. Formulation ................................................................................................................ 51 3.2.1.2. Graphene and Black Phosphorus ............................................................................... 51 3.2.1.3. (W, Mo)(S, Se)2 ......................................................................................................... 53
4
3.2.1.4. Atomic-CN versus the Number-of-layer ................................................................... 55 3.2.2. Strain-induced Phonon Softening and Band Splitting ............................................................... 56 3.2.3. Mechanical Compression and Thermal Excitation .................................................................... 58
3.2.3.1. Formulation ................................................................................................................ 58 3.2.3.2. MX2 Debye Thermal Decay ...................................................................................... 59 3.2.3.3. BP and (W, Mo)S2 ..................................................................................................... 60 3.2.3.4. Carbon Allotropes ...................................................................................................... 62
3.2.4. Edge Discriminative Raman Reflectivity .................................................................................. 64
3.3. Summary ....................................................................................................... 66
4. Sized Crystals ......................................................................................................................... 68 4.1. Skin Thickness of the Core-shelled Structures ............................................. 69 4.2. Nanocrystals: Size and Thermal Effects ........................................................ 70
4.2.1. Raman Shift of the Core-shelled Crystals .................................................................................. 70 4.2.2. Skin dominated Size Dependency .............................................................................................. 71
4.2.2.1. Group IV Nanocrystals .............................................................................................. 71 4.2.2.2. TiO2 ............................................................................................................................ 72 4.2.2.3. CeO2, SnO2, ZnO, CdS, CdSe, and Bi2Se3 ................................................................ 74
4.2.3. Intergrain Interaction Derived THz Phonons ............................................................................. 75 4.2.4. Joint Size and Thermal Effect .................................................................................................... 77 4.2.5. Vibration Amplitude and Frequency .......................................................................................... 78
4.3. Bulk Crystals: Compression and Thermal Excitation ................................... 78 4.3.1. Group IV Semiconductors .......................................................................................................... 78 4.3.2. Group III-Nitrides ....................................................................................................................... 79 4.3.3. TiO2 and ZnO ............................................................................................................................. 81 4.3.4. Other Compounds ....................................................................................................................... 85
4.4. Summary ....................................................................................................... 87
5. Water and aqueous solutions ........................................................................................................ 89 5.1. Water and Aqueous Solutions ....................................................................... 89 5.2. Water and Ice: O:H−O Segmental Specific Heats ........................................ 92
5.2.1. Conservation and Restriction ..................................................................................................... 92 5.2.2. Specific Heat and Density Oscillation ....................................................................................... 93 5.2.3. O:H–O Length-stiffness Cooperative Relaxation ...................................................................... 94
5.3. Lewis-Hofmeister Solutions .......................................................................... 96 5.3.1. Conservation Rules Broken ........................................................................................................ 96 5.3.2. DPS of Lewis-Hofmeister Solutions .......................................................................................... 97 5.3.3. Fraction of Bond Transition and Molecular Interactions ........................................................ 101
5.4. Solution Properties versus Hydrogen Bond Transition .............................. 103 5.5. Summary ..................................................................................................... 105
6. Concluding Remarks ................................................................................................................... 109
Nomenclature ................................................................................................................................... 112
Acknowledgement ............................................................................................................................ 112
5
1. Wonders of Multifield Lattice Oscillation
Highlights
Substance evolves its structures and properties when subjecting to perturbation.
Bond relaxation and the associated electronic energetics dictate material’s performance.
Correlating and resolving the bond-phonon-property of a substance is a high challenge.
Phonon spectrometrics resolves ever-unexpected information and deepens the physical insight.
6
1.1.Significance of Multifield Lattice Oscillation
Much attention has been paid to bond formation and dissociation by chemical reaction that revolves
the materials properties in an abrupt way [1]. For instance, nitrogenation turns the metallic Gallium
into the semiconductive GaN for intense blue light emission [2]. Oxidation transits Zn and Al into the
wide bandgap ZnO semiconductors for electronic optical devices and into Al2O3 insulator for fast
thermal energy dissipation [3]. However, bond gradual relaxation has been less attended from one
equilibrium to another or from formation to dissociation by external perturbation such as compressing,
heating, stretching, atomic undercoordination by defect, nanostructure and surface formation,
contamination by charge injection, doping and impurities. Bond relaxation and the associated
electronic localization, energetics, entrapment, and polarization of electrons in various energy bands
dictate the performance of substance under perturbation [4].
Variation of the size and shape of a crystal has created tremendous fascinations, which has formed the
foundations for nanoscience and nanotechnology being recognized as a thrust to the science and
technology of the concurrent century and future generations [5, 6]. Nanostructured materials perform
differently from their bulk counterparts as the quantities like elastic modulus, dielectric constant, work
function, band gap, critical temperatures for phase transition, keep no longer constant but vary with
the size and shape of nanostructures. Bond order deficiency shortens and stiffens the bonds between
the fewer-coordinated atoms (called confinement in occasions) [7-9]. Atomic undercoordination
strengthens the nanocrystals leading to the inverse Hall-Patch effect - hardest at the 10s nanometer
scale [7, 10] but depresses or raises the critical temperatures for phase transition [11]. Hetero-
coordination may harden the twin grain boundaries [12] by energy densification or soften some other
materials at the interfaces by polarization [13].
Multifield lattice oscillation of the sized crystals have received extensive attention [14-16] because
the phonon behavior influences directly on the electrical and optical transport dynamics in
semiconductors [17, 18], such as electron-phonon coupling, photoabsorption, photoemission and
waveguide devices for light transportation. The Raman-active modes of Bi2Se3 nano-pallets shift a
few wavenumbers lower as the thickness is decreased in the vicinity of ∼ 15 nm [19], similar to that
of the D and 2D modes in the number-of-layer resolved graphene [20, 21]. The LO mode softening
has also been observed in a CdS film thinner than 80 nm [22]. The frequency of the LO mode for a
9.6 nm-sized CdSe dot is slightly lower than that of the corresponding CdSe bulk at room
7
temperature. As the CdSe crystal size is reduced to 3.8 nm, the peak frequency shifts to a lower
frequency by about 3 cm-1 (ref [23]).
Considerable attention has also been paid to the study of bulk compounds due to their intriguing
thermal and mechanical properties. Efforts have also made to potential applications in optoelectronic
devices such as waveguides, laser frequency folding, high capacity memory, sensors, actuators, etc.
[24, 25]. Materials under mechanical and thermal perturbation vary their structures and properties such
as phase transition or mechanical hardness [26]. Compression hardens a substance and raises the
vibration frequency and the critical pressure for phase transition or regular substance. Heating and
stretching have the opposite effect of compression to narrow the bans gap and lower the work function.
The volume concentration of nanopores below a certain value can harden the substance but above the
critical value causes detrimental to the yield strength of the porous materials [7].
In conjunction to the Raman shift, the bulk modulus B or the inverse of expansibility are correlated
to the material’s performance such as acoustic transmission, Debye temperature, specific heat
capacity, and thermal conductivity, which keep constant at the ambient atmospheres. However, the
modulus turns to be tunable with the variation of the T and P [27-30]. Atomistic simulations have
revealed that the B of a substance is softened under elevated temperature and stiffened under
increased pressure [28].
The macroscopic properties of a substance depend functionally on the bond length, bond energy, and
valence electron configuration. For instance, the band gap and dielectrics varies with the interatomic
bond energy and the electronic occupancy in the conduction and in the valence bands [31]. Likewise,
the local bond energy density governs the elastic modulus and the yield strength at failure [32]; the
atomic cohesive energy [26] dictates the phase transition temperatures, catalytic activation, interatomic
diffusion, etc. The competition of binding energy density and atomic cohesive energy determines the
inverse Hall-Petch relationship and the maximal hardness of a crystal at the nanometer scale [33].
The curvature of the bond potentials at equilibrium r = d determines the frequency of vibration in
the form of 2x2 = [U(d) + U(d)x/3]x2 where the nonlinear term can be omitted in the harmonic
approximation that is proper at the equilibrium. According to the dimensional analysis, the is
proportional to the bond length d and energy E as formulated as ()2 E/(d2) [34] with being the
reduced mass of the vibrating dimer. Any perturbation will relax the bond and shift the phonon
8
frequency. Therefore, external stimulus changes the material’s properties by relaxing its chemical bond
and the crystal potentials, which provides one with opportunities to calibrate and control the property
change of a substance.
1.2.Outline of Experimental Observations
1.2.1.Size Matter – Atomic Undercoordination
The Raman-active modes and the IR-active modes for the sized and the layered two-dimensional (2-
D) structures show various vibration frequency-shift trends [35-39]:
1) The transverse (TO) and the longitudinal optical (LO) vibrational modes shift toward either
higher or lower frequencies.
2) The E2g mode for WX2 and TiO2 and the G mode for graphene undergo blueshift as the feature
size is reduced.
3) The A1g mode and the D mode shift to lower frequency when the features size decreases.
4) Low-frequency Raman (LFR) acoustic vibration presents at a few or a few tens cm-1 wave
numbers, or in the THz range (~ 33 cm-1), and this mode undergoes a blueshift when the feature
size is reduced. The LFR disappears at infinitely large crystal size.
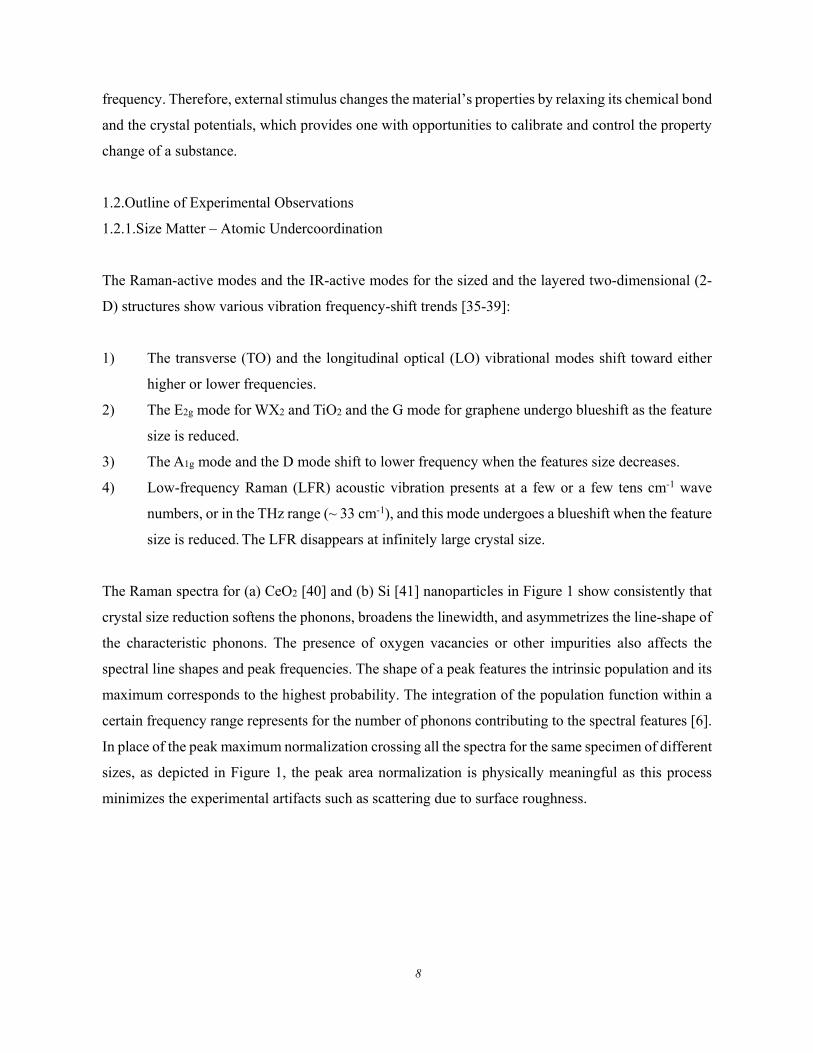
The Raman spectra for (a) CeO2 [40] and (b) Si [41] nanoparticles in Figure 1 show consistently that
crystal size reduction softens the phonons, broadens the linewidth, and asymmetrizes the line-shape of
the characteristic phonons. The presence of oxygen vacancies or other impurities also affects the
spectral line shapes and peak frequencies. The shape of a peak features the intrinsic population and its
maximum corresponds to the highest probability. The integration of the population function within a
certain frequency range represents for the number of phonons contributing to the spectral features [6].
In place of the peak maximum normalization crossing all the spectra for the same specimen of different
sizes, as depicted in Figure 1, the peak area normalization is physically meaningful as this process
minimizes the experimental artifacts such as scattering due to surface roughness.
9
400 420 440 460 480 500
I (
arbi
tra
ry u
nit)
(cm-1)
pellet 25 nm 15 10 7.4 6.1
CeO2
a
460 470 480 490 500 510 520 530
I (
arbi
trar
y un
it)
(cm-1)
0 min 10 15 30 60 90 100
Sib Etching time
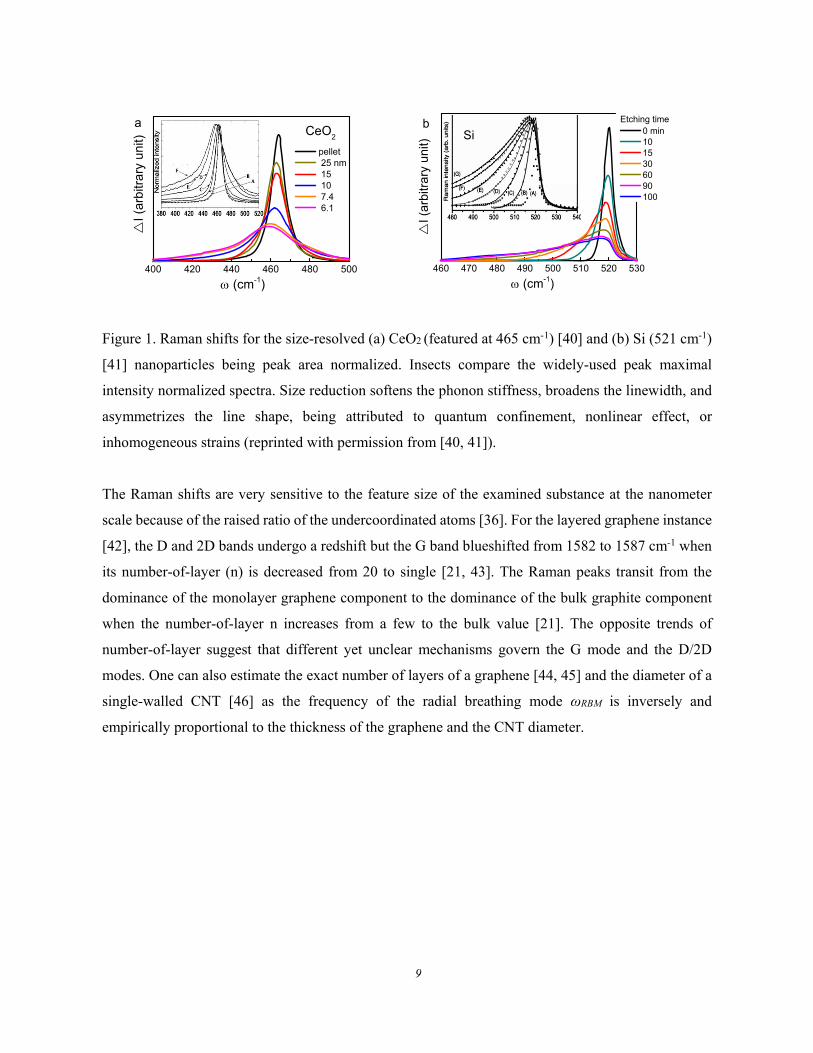
Figure 1. Raman shifts for the size-resolved (a) CeO2 (featured at 465 cm-1) [40] and (b) Si (521 cm-1)
[41] nanoparticles being peak area normalized. Insects compare the widely-used peak maximal
intensity normalized spectra. Size reduction softens the phonon stiffness, broadens the linewidth, and
asymmetrizes the line shape, being attributed to quantum confinement, nonlinear effect, or
inhomogeneous strains (reprinted with permission from [40, 41]).
The Raman shifts are very sensitive to the feature size of the examined substance at the nanometer
scale because of the raised ratio of the undercoordinated atoms [36]. For the layered graphene instance
[42], the D and 2D bands undergo a redshift but the G band blueshifted from 1582 to 1587 cm-1 when
its number-of-layer (n) is decreased from 20 to single [21, 43]. The Raman peaks transit from the
dominance of the monolayer graphene component to the dominance of the bulk graphite component
when the number-of-layer n increases from a few to the bulk value [21]. The opposite trends of
number-of-layer suggest that different yet unclear mechanisms govern the G mode and the D/2D
modes. One can also estimate the exact number of layers of a graphene [44, 45] and the diameter of a
single-walled CNT [46] as the frequency of the radial breathing mode ωRBM is inversely and
empirically proportional to the thickness of the graphene and the CNT diameter.
10
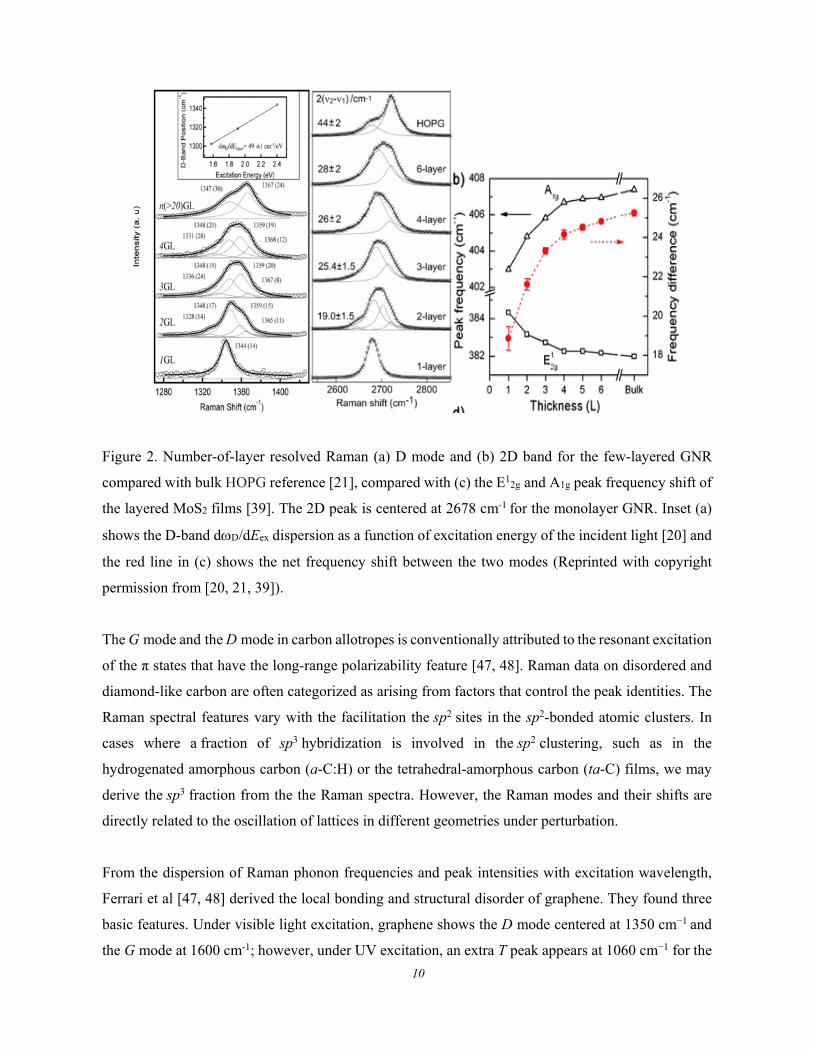
Figure 2. Number-of-layer resolved Raman (a) D mode and (b) 2D band for the few-layered GNR
compared with bulk HOPG reference [21], compared with (c) the E12g and A1g peak frequency shift of
the layered MoS2 films [39]. The 2D peak is centered at 2678 cm-1 for the monolayer GNR. Inset (a)
shows the D-band dD/dEex dispersion as a function of excitation energy of the incident light [20] and
the red line in (c) shows the net frequency shift between the two modes (Reprinted with copyright
permission from [20, 21, 39]).
The G mode and the D mode in carbon allotropes is conventionally attributed to the resonant excitation
of the π states that have the long-range polarizability feature [47, 48]. Raman data on disordered and
diamond-like carbon are often categorized as arising from factors that control the peak identities. The
Raman spectral features vary with the facilitation the sp2 sites in the sp2-bonded atomic clusters. In
cases where a fraction of sp3 hybridization is involved in the sp2 clustering, such as in the
hydrogenated amorphous carbon (a-C:H) or the tetrahedral-amorphous carbon (ta-C) films, we may
derive the sp3 fraction from the the Raman spectra. However, the Raman modes and their shifts are
directly related to the oscillation of lattices in different geometries under perturbation.
From the dispersion of Raman phonon frequencies and peak intensities with excitation wavelength,
Ferrari et al [47, 48] derived the local bonding and structural disorder of graphene. They found three
basic features. Under visible light excitation, graphene shows the D mode centered at 1350 cm−1 and
the G mode at 1600 cm-1; however, under UV excitation, an extra T peak appears at 1060 cm−1 for the
11
H-free carbons and at 980 cm−1 for the hydrogenated ones. The G peak shows structural disorder being
attributed to the stretching motion of sp2 pairs. This G peak disperses only in the amorphous networks.
The D peak disperses swiftly in the ordered structure but it is weak for the amorphous carbon.
Figure 2 shows the D/2D and the G mode frequency evolution with the GNRs thickness compared
with bulk highly oriented pyrolytic graphite (HOPG) reference [20, 21]. When the bulk graphite
evolves into the monolayer GNR, the D/2D peaks shift down from 1368/2714 to 134/2678 cm-1. In
contrast, the G band shifts up when the number-of-layer turns to be fewer [43]. The G-mode blueshift
follows the empirical relations [49]: ωG(n) = 1581.6 + 5.5/n, or ωG(n) = 1581.6 + 11/(1+n1.6).
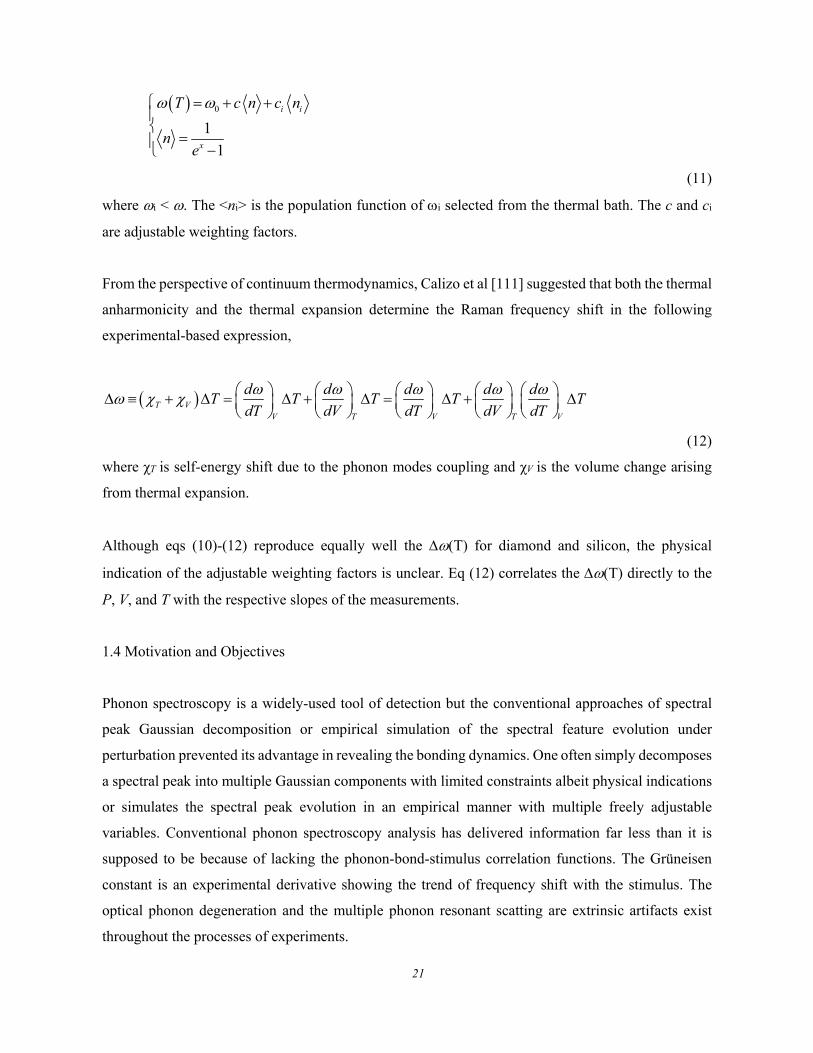
Likewise, the layered MX2 (X = S, Se; M = W, Mo) semiconductors show the same trends of phonon
frequency relaxation to graphene [50-59]. The E12g phonon bandf undergoes a blueshift but the A1g
band a redshift as the MoS2 number-of-layer is decreased [39]. Along with the phonon frequency shift,
the number-of-layer reduction deepens the surface-potential-well of the MoS2 [60], which evidences
the BOLS prediction of the surface bond contraction and local bond potential depression [61].
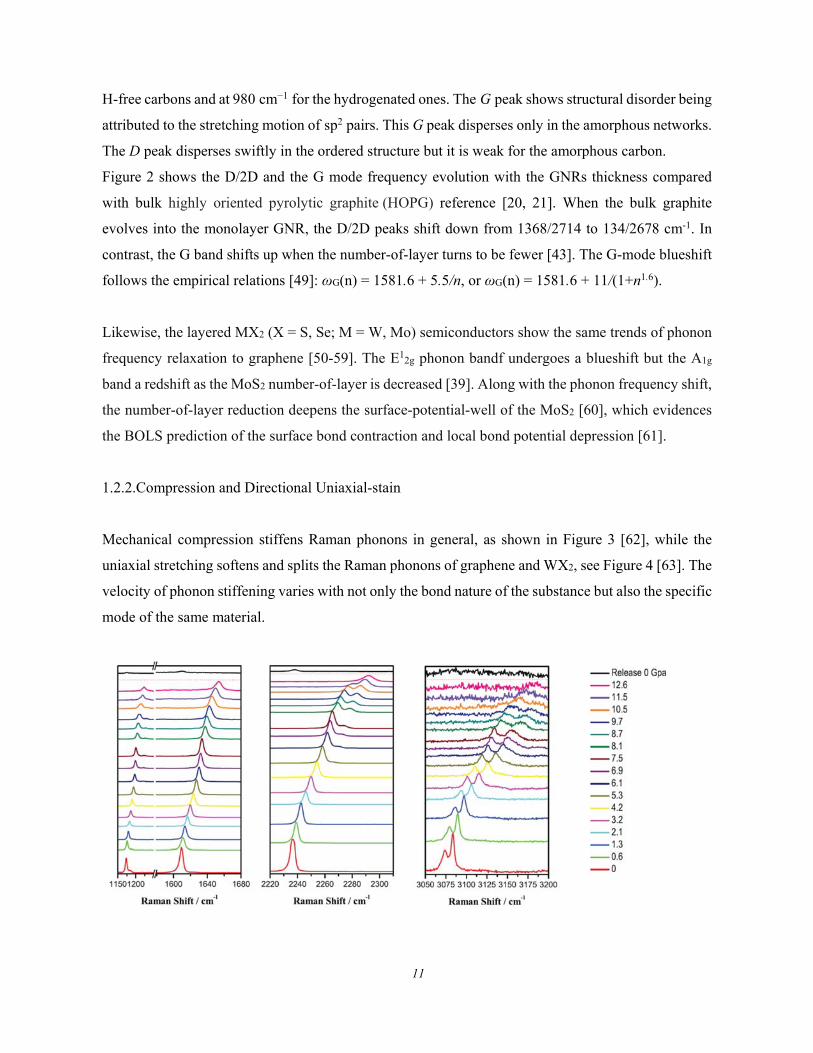
1.2.2.Compression and Directional Uniaxial-stain
Mechanical compression stiffens Raman phonons in general, as shown in Figure 3 [62], while the
uniaxial stretching softens and splits the Raman phonons of graphene and WX2, see Figure 4 [63]. The
velocity of phonon stiffening varies with not only the bond nature of the substance but also the specific
mode of the same material.
12
Figure 3. Pressure dependence of the Raman phonon shift for a TPN (Terephthalonitrile) crystal.
(Reprinted with permission from [62])
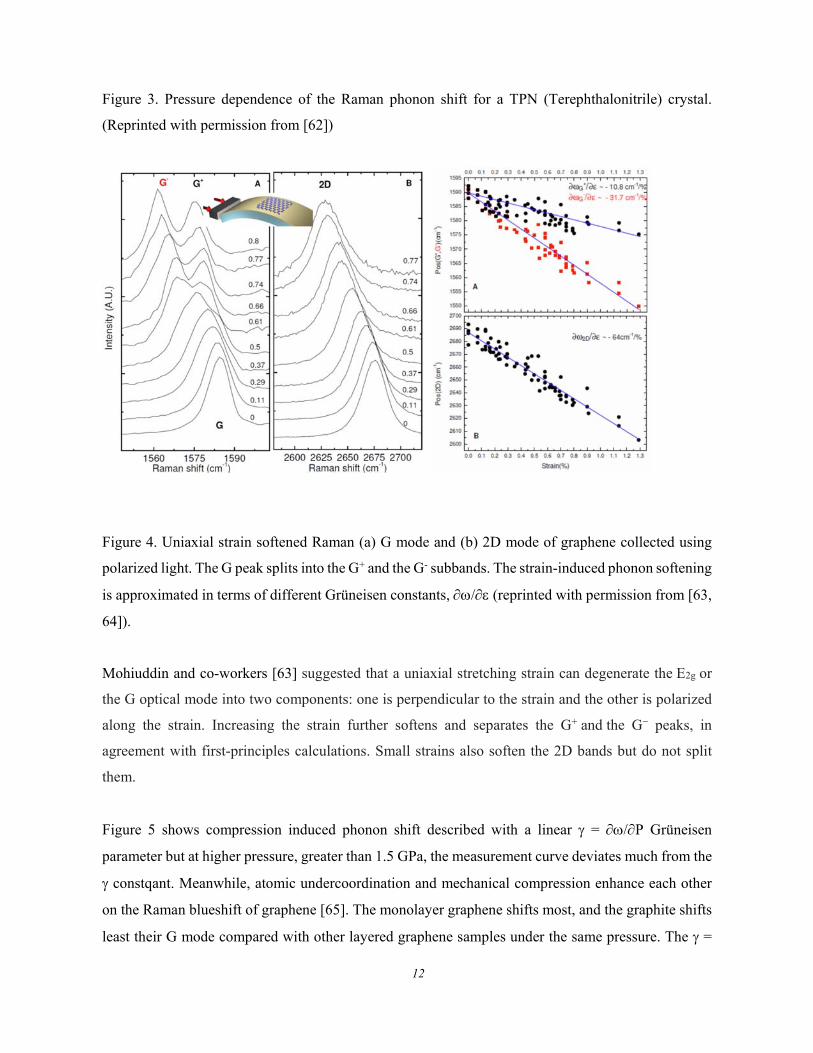
Figure 4. Uniaxial strain softened Raman (a) G mode and (b) 2D mode of graphene collected using
polarized light. The G peak splits into the G+ and the G- subbands. The strain-induced phonon softening
is approximated in terms of different Grüneisen constants, / (reprinted with permission from [63,
64]).
Mohiuddin and co-workers [63] suggested that a uniaxial stretching strain can degenerate the E2g or
the G optical mode into two components: one is perpendicular to the strain and the other is polarized
along the strain. Increasing the strain further softens and separates the G+ and the G− peaks, in
agreement with first-principles calculations. Small strains also soften the 2D bands but do not split
them.
Figure 5 shows compression induced phonon shift described with a linear = /P Grüneisen
parameter but at higher pressure, greater than 1.5 GPa, the measurement curve deviates much from the
constqant. Meanwhile, atomic undercoordination and mechanical compression enhance each other
on the Raman blueshift of graphene [65]. The monolayer graphene shifts most, and the graphite shifts
least their G mode compared with other layered graphene samples under the same pressure. The =
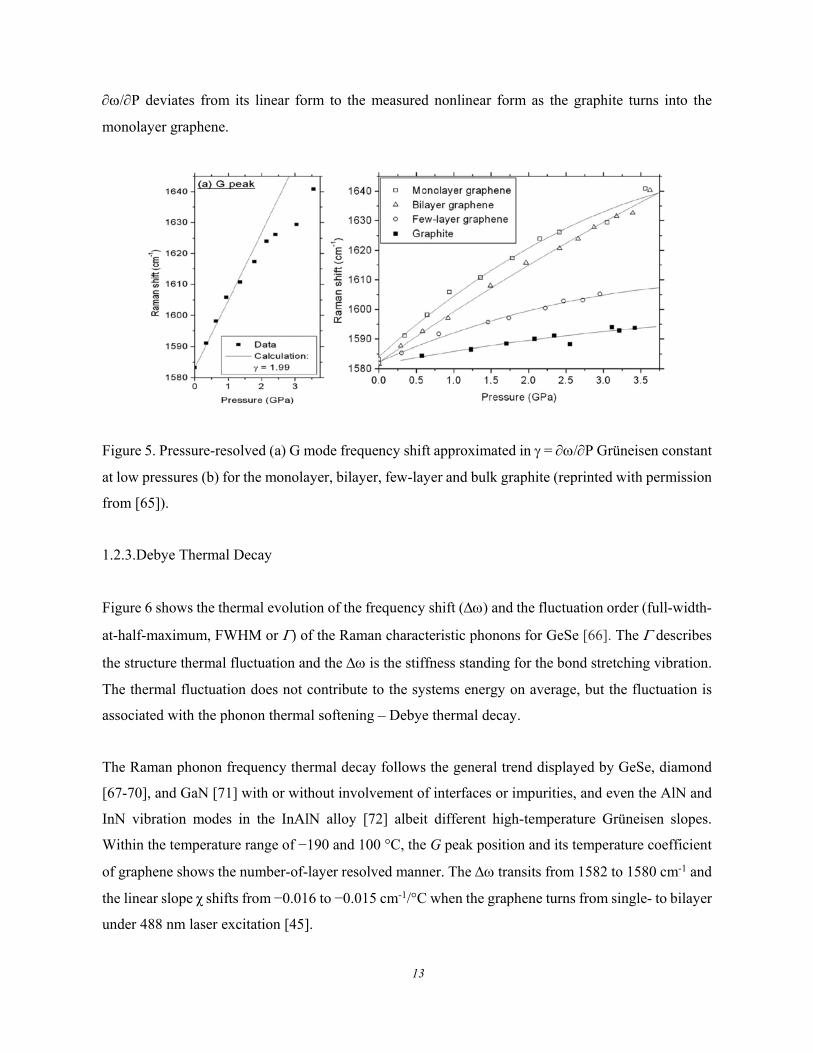
13
/P deviates from its linear form to the measured nonlinear form as the graphite turns into the
monolayer graphene.
Figure 5. Pressure-resolved (a) G mode frequency shift approximated in = /P Grüneisen constant
at low pressures (b) for the monolayer, bilayer, few-layer and bulk graphite (reprinted with permission
from [65]).
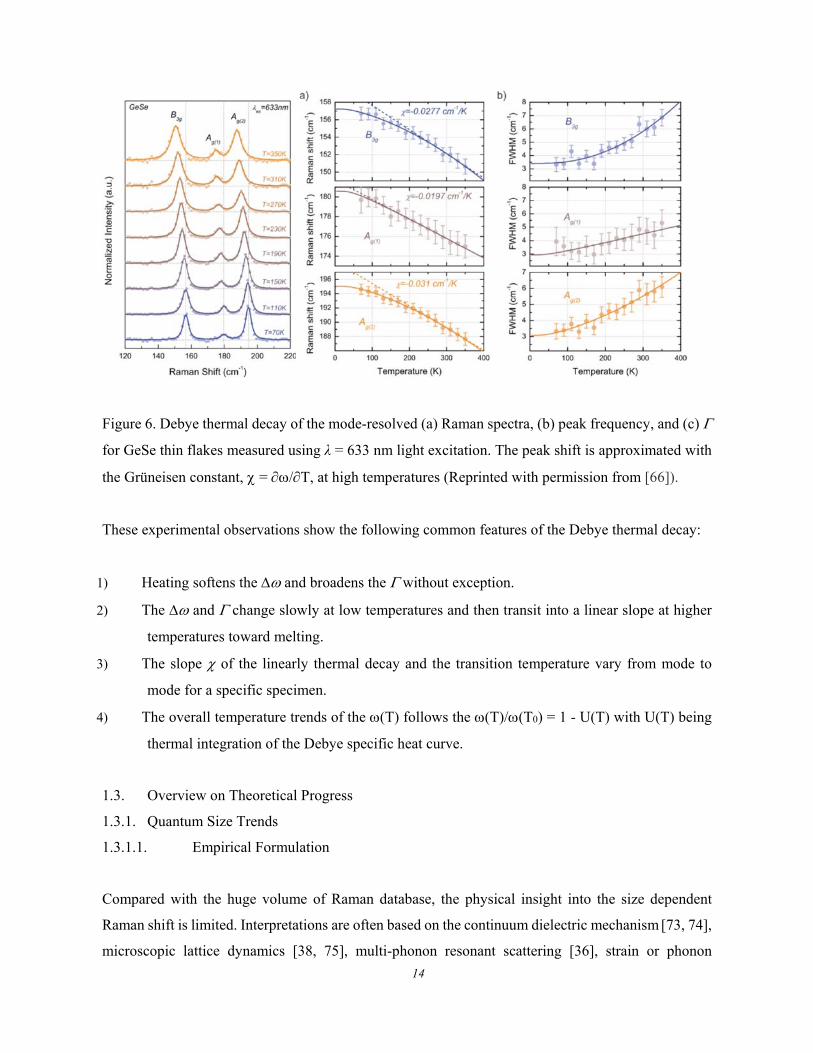
1.2.3.Debye Thermal Decay
Figure 6 shows the thermal evolution of the frequency shift () and the fluctuation order (full-width-
at-half-maximum, FWHM or ) of the Raman characteristic phonons for GeSe [66]. The describes
the structure thermal fluctuation and the is the stiffness standing for the bond stretching vibration.
The thermal fluctuation does not contribute to the systems energy on average, but the fluctuation is
associated with the phonon thermal softening – Debye thermal decay.
The Raman phonon frequency thermal decay follows the general trend displayed by GeSe, diamond
[67-70], and GaN [71] with or without involvement of interfaces or impurities, and even the AlN and
InN vibration modes in the InAlN alloy [72] albeit different high-temperature Grüneisen slopes.
Within the temperature range of −190 and 100 °C, the G peak position and its temperature coefficient
of graphene shows the number-of-layer resolved manner. The transits from 1582 to 1580 cm-1 and
the linear slope χ shifts from −0.016 to −0.015 cm-1/°C when the graphene turns from single- to bilayer
under 488 nm laser excitation [45].
14
Figure 6. Debye thermal decay of the mode-resolved (a) Raman spectra, (b) peak frequency, and (c)
for GeSe thin flakes measured using λ = 633 nm light excitation. The peak shift is approximated with
the Grüneisen constant, = /T, at high temperatures (Reprinted with permission from [66]).
These experimental observations show the following common features of the Debye thermal decay:
1) Heating softens the and broadens the without exception.
2) The and change slowly at low temperatures and then transit into a linear slope at higher
temperatures toward melting.
3) The slope of the linearly thermal decay and the transition temperature vary from mode to
mode for a specific specimen.
4) The overall temperature trends of the (T) follows the (T)/(T0) = 1 - U(T) with U(T) being
thermal integration of the Debye specific heat curve.
1.3. Overview on Theoretical Progress
1.3.1. Quantum Size Trends
1.3.1.1. Empirical Formulation
Compared with the huge volume of Raman database, the physical insight into the size dependent
Raman shift is limited. Interpretations are often based on the continuum dielectric mechanism [73, 74],
microscopic lattice dynamics [38, 75], multi-phonon resonant scattering [36], strain or phonon
15
confinement [40-42]. Dynamic information could not be available on the bond formation, bond
dissociation, bond relaxation and bond vibration under given perturbations. Particularly, for the size-
reduction induced phonon frequency blueshift, redshift, and LFR creation are beyond capacity of
available theories.
One often describes the size-dependent Raman shifts in the following hypothetic relation with multiple
freely adjustable parameters [35, 38],
,
where Af and are adjustables. The d0 is the bond length that contracts with the solid dimension or
size [76]. K is the dimensionless size of the crystal. For the LFR in the THz frequencies, Af > 0, = 1.
When the particle size approaches infinity, the LFR mode disappears, () = 0. For the redshift, Af <
0. For Si example, () = 520 cm-1, varies from 1.08 to = 1.44, depending on experimental
conditions.
Turning the number-of-layer from a monolayer to the bulk can soften the phonon frequency and
lower the photon energy or the band gap EG of a semicopndctor [77, 78]. The photon energy EG and
phonon frequency shift under perturbation of size N, pressure P, and temperature T follow the
hypothetic empirical relationships with numerous adjustable parameters [25, 35, 79, 80]:
0
2 1G 0
0 e d
20
/
A B C
( ) ( )
qN d a N
E N E N N
T T T
P kP lP
(1)
where ω0 is the reference frequency and E0 the photon energy for the bulk. N is the number of atomic
layers. The a is the lattice constant. A, B, C, and d, q, k, and l are hypothetic fitting parameters. The
terms of N −1 stands for the potential energy and the N −2 for the exciton (electron−hole pair) kinetic
energy in the quantum confinement scheme. These hypothetic models can reproduce observations
albeit the unclear physical meanings.
KdAK f 0)()(
16
1.3.1.2. Hwang’s Scheme
Hwang and co-workers [81] presented a sophisticated theory describing the size effect on the Raman
shift of the optical and the LFR mode. The LFR is attributed to the quadruple vibration, lattice
contraction, and the size-induced optical softening due to quantum confinement. The LFR mode at the
THz regime is associated with the dimer oscillation between nanoparticles. The phonon frequencies
are crystal size and host-matrix dependent. The LFR for Al2O3 [82] and SiO2 [83] embedded Ag
nanoclusters was attributed to being arisen from the quadrupolar vibration modes. The surface plasmas
of the encapsulated Ag particles enhanced quadrupolar modes. The stronger plasmon-phonon coupling
was deemed to stem the LFR scattering.
One can also ascribe the polarized LFR peaks as the confined LA-like and the depolarized LFR as the
TA acoustic phonons [84]. The interaction between the support matrix and the nanoparticle softens the
depolarized and polarized LFR modes.
Hwang et al also suggested that the size-reduction induced lattice contraction stems the LFR blueshift.
For example, B2O3-SiO2 embedded CdSxSe1-x nanocrystals are subject to the size-induced
compressive strain [85]. The surface tension increases with bond strain. It is suggested that the
compressive stress overcomes the redshift of the confined phonon due to negative dispersion and thus
drives the LFR blue shift. The LFR blueshift was also related to the bond relaxation to the latent heat
of fusion and entropy in the classical thermodynamic manner [86].
The high-frequency optical modes shift in opposite directions. The Raman blueshift is usually
suggested to be activated by surface disorder [87], surface stress [88, 89], surface chemical and phonon
quantum confinement [90, 91]. TiO2 particles’ Raman shifts were attributed to the effects of particle
size reduction. Size reduction varies the force constants and amplitudes of the vicinal bonds [92]. In
contrast, the stress effect is insignificant for the hydrogenated [93, 94].
Hwang et al [95] deals with phonon redshifts of nanostructured CdSe embedded by consideringthe
effect of bond contraction,
(1)
KKK CDL
17
where L is the bulk value of the LO phonon frequency. D(K) and C(K) are the frequency shifts
due to dispersion and lattice contraction, respectively. The D(K) follows,
(2)
where the L defines the dispersivity. The np is the np 0 root of the tan(np) = np equation. The
is formulated as [85]:
where,
(3)
The and are the nanocrystal thermal-expansion coefficient and the embedding matrix,
respectively. represents the Grüneisen parameter. Tg is the annealing temperature and T the testing
temperature. The c is the compressibility and the is the bulk value of surface tension. The b
describes the size-effect on surface tension that contributes to the frequency shift insignificantly. The
first term in eq (3) describes the crystal-matric interface thermal-mismatching. The second term
features the crystal size reduction enhancement of the surface tension. Combining eq (3) and (2),
yields,
(4)
For a free surface, = , and b = 0. As remarked on by Hwang et al [95], limitations exist to use this
formulation, because thermal-expansion coefficient in the T - Tg range is hard to detect. The B value
in eq (4) is determined by the phonon dispersion and the surface tension. Therefore, a B >0 value
2
0
2212
0
22
2
KdKdK np
L
LL
npLLD
KC
d
Kd
d
KdK LLC
313
1
20
200
3'
23
2'
Kd
bTT
Kd
b
KdTT
d
Kd
cg
cg
2
20
2
2
1'3
BKA
KdbTTK
CL
pnL
gL
18
suggests that the negative phonon dispersion overtones the size-effect on the surface tension to causes
a phonon frequency redshift. On the contrary, phonon frequency blueshift will occur. If the two effect
are comparable, B = 0, the size dependence disappears.
1.3.2. Grüneisen Notion for Compression and Thermal Excitation
Besides the hypothetically polynomial expressions [96, 97], one often uses the Grüneisen parameter,
or to describe the effect of strain or compression on the phonon
frequency shift. The Grüneisen parameter is the slope of the experimental - curve. The following
addresses the E2g mode shift of graphene in terms of the Grüneisen parameter and the shear deformation
potential E2g [63, 65]:
;
(5)
where h = ll + tt is the hydrostatic component of the applied uniaxial strain and s = ll - tt is the shear
component of the strain, l is along the strain direction, and t is the transverse direction; is the
referential G peak position under zero strain.
On the other hand, the thermal expansion coefficient (t) varies non-linearly in the low temperatures
and then increases with temperature toward a constant. The (t) also varies with the feature size of
nanostructures [98, 99]. X-ray absorption fine structure spectroscopy (XAS) investigations [100]
suggested that within the 20-300 K range the first Au-Au neighbor distance in the 2.4-50.0 nm sized
gold nanoparticles is different from that of the bulk counterpart. Atomic undercoordination has an
opposite effect to compensate for thermal expansion on the lattice constant [9].
According to Cardona [101], the bond thermal expansion could be formiulated in terms of the lattice
vibration frequency q and the Grüneisen parameter, q,
LnLnE
h
hgE
gEgE
2
02
21
s
sgE
gEgE
2
02
21
02gE
19
0
13
0
1
3 2
2
exp / 1 1 / 2
( )
D
q B qq
q DC
q
dT n
d BV
kTT
BV
kT d else
Ln
Ln V
(6)
where V is the volume and B is the bulk modulus. The nB(q) is the Bose-Einstein population function.
VC is the unit cell volume and the <q> is an average of q. Grüneisen [102] derived the volumetric
thermal expansion coefficient as a function of the specific heat Cv, , V, and B,
v
T
C
VB
(7)
One may note that the bandgap, elastic modulus, and the phonon frequency follow the same trend of
Debye thermal decay. The following equation empirically describes the thermal evolution of the
photonic bandgap Eg [80, 103], with β being a fitting parameter θD the Debye temperature.
2
g g0D
( )T
E T ET
(8)
Typically, the thermal evolution of the elastic modulus Y or the bulk modulus B follows the empirical
relationships [104, 105],
,
where,
(9)
)/exp( 010 TTTbYY
)(3
00
D
TH
V
TRYY
TT VTT dTTTBB 0
0000
0 )()(exp
T
xDD
D
e
dxxTTH
/
0
33
13
20
where is the Young’s modulus and the bulk modulus at T = 0 K. The B is correlated to Y by
Y/B = 3 (1 - 2) 3B, as the Poisson ratio is negligible. The parameters and are arbitrary
constants for data fitting. is Grüneisen parameter and is Anderson constant. The and
are respectively the volume thermal expansion coefficient, the Anderson-Grüneisen parameter.
Numerically, the first expression could fit the linear part and the last two could reproduce
measurements over the entire temperature range despite the freely adjustable parameters such as the
and that are hardly experimentally available. The physical origin for the thermally driven elastic
softening is still open for exploration.
1.3.3. Phonon Optical-Acoustic Thermal Degeneration
The thermal evolution of the and are often attributed to the anharmonic phonon–phonon
interactions, lattice-mismatch, volume thermal expansion, and the optical phonon degeneration into
multiple acoustic phonons [66, 106]. On the base of the extended Klemens–Hart–Aggarwal–Lax
premise [107, 108], Balkanski et al described the (T) and (T) in the following forms [109]:
(10)
where x = ћ0/kBT with ћ being the Plank constant and kB the Boltzmann constant. The ћ0 is the
phonon energy at T = 0 K from which the (T) and (T) shift. A, B, C and D are adjustable
parameters. This notion attributes the (T) and (T) to the cubic and quartic anharmonicity of
lattice potential. This approach turns the optical branch into two (A) or three (B) components of
acoustic branches.
Comparatively, Kolesov considered an alternative on the process of phonon excitation in a (T)
function of anharmonic vibration of the chemical bonds [110]:
0Y 00TB
1b 0T
0V )(0 T
23/3/
2/
1
3
1
31
1
21
xx
x
ee
eDC
BA
T
T
21
0
1
1
i i
x
T c n c n
ne
(11)
where i < . The <ni> is the population function of i selected from the thermal bath. The c and ci
are adjustable weighting factors.
From the perspective of continuum thermodynamics, Calizo et al [111] suggested that both the thermal
anharmonicity and the thermal expansion determine the Raman frequency shift in the following
experimental-based expression,
T VV T V T V
d d d d dT T T T T
dT dV dT dV dT
(12)
where χT is self-energy shift due to the phonon modes coupling and χV is the volume change arising
from thermal expansion.
Although eqs (10)-(12) reproduce equally well the (T) for diamond and silicon, the physical
indication of the adjustable weighting factors is unclear. Eq (12) correlates the (T) directly to the
P, V, and T with the respective slopes of the measurements.
1.4 Motivation and Objectives
Phonon spectroscopy is a widely-used tool of detection but the conventional approaches of spectral
peak Gaussian decomposition or empirical simulation of the spectral feature evolution under
perturbation prevented its advantage in revealing the bonding dynamics. One often simply decomposes
a spectral peak into multiple Gaussian components with limited constraints albeit physical indications
or simulates the spectral peak evolution in an empirical manner with multiple freely adjustable
variables. Conventional phonon spectroscopy analysis has delivered information far less than it is
supposed to be because of lacking the phonon-bond-stimulus correlation functions. The Grüneisen
constant is an experimental derivative showing the trend of frequency shift with the stimulus. The
optical phonon degeneration and the multiple phonon resonant scatting are extrinsic artifacts exist
throughout the processes of experiments.
22
The key challenge is a theory to reproduce observations because of bond relaxation in length and
energy and the bond-phonon-property correlation of the examined substance to reconcile as many as
perturbations to the phonon frequency shift in terms of excited bond relaxation. One needs to correlate
the , , A(abundance) intrinsically to the bond length an energy relaxed by external stimuli.
Therefore, bond relaxation is profoundly and ubiquitously important to engineering of materials and
thus should receive deserved attention.
We devoted to modeling the multifield lattice oscillation in the past decade to meet the following
targets:
1) Theoretical reproduction of the phonon spectroscopy measurements with physically meaningful
parameters.
2) Provision of atomistic, local, quantitative, elemental information on bonding dynamics from the
measurements.
3) Comprehension of the physical mechanism and basic rules governing observations.
4) Correlation of the detectable quantities, Q(xi)/Q(xi0) = f(xi, d(xi), E(xi)), to the bond length and
energy that relax upon perturbation by the degree of freedom xi.
This article deals with the multifield lattice oscillation dynamics to amplify the Coordination-resolved
Electron Spectrometrics [6, 112] and its analytical strategies to the current Multifield Phonon
Spectrometrics [113-115] for consistent insight into phonon relaxation with derivative of
conventionally-unexpected quantitative information. From the viewpoint of local bond averaging
(LBA) approach and Fourier transformation [7], we will be focused on formulating the Raman shifts
of structured crystals a functions of the length, order, and strength of the representative bond
responding to the externally applied perturbations.
Theoretical reproduction of the experimental observations clarifies the mechanism behind the
observations with ever-unexpected information. The information includes the frequency of
reference and its bulk shift, atomic cohesive energy Ecoh, bond energy , binding energy density Eden,
compressibility , Debye temperature , elastic modulus B, force constant k, and the effective atomic
CN for the structured crystals.
1
bE
D
23
1.5 Scope
This work begins with an overview on the significance of bond relaxation, lattice oscillation, available
experimental database, and theoretical approaches to naming challenges and potential opportunities.
Focus is given on generalizing the trends of phonon frequency shift due to activation of multifield in
terms of atomic undercoordination, mechanical activation, thermal excitation and available theoretical
descriptions. Thus, we can discriminate the intrinsic effects from those extrinsic artifacts and specify
rooms for theoretical unification to gain consistent insight and the ever-unexpected information on
bond relaxation by perturbations, in terms of degrees of freedom. It is exciting to find out that crystal
size reduction creates three types of phonon frequency shifts unseen in the bulk – size-reduction
induced E2g blueshift, A1g redshift, and the emerging of the low-frequency Raman (LFR) mode in the
THz frequencies that undergoes blueshift with the inverse of size. The Raman shift, bandgap, and
elastic modulus follows a Debye thermal decay – drops nonlinearly and then linearly as temperature
rises in a way of 1-U(T)/Econ with U(T) and Econ being the integral of the Debye specific heat and the
atomic cohesive energy. Compression stiffens the phonon frequency nonlinearly and the mechanical
compression enhances the effect of atomic undercoordination on the phonon relaxation. However, it
is inspiring to note the large gap to be filled for the bond-phonon-property correlation. Overwhelming
debating approaches exist from various, intrinsic and extrinsic, perspectives for a specific phenomenon.
The conventional spectral peak decomposition and evolution simulation with freely-adjustable
parameters with limited information hindered the progress in understanding the nature of observations.
It is urgent to develop a theory to reconcile the perturbation-bond-property correlation and to derive
information on bonding dynamics, which drove the presented dedication made in past decade.
Section 2 is dedicated to developing the average-bond oscillating dynamics notion to incorporate the
quantum approaches and Fourier transformation. Conventionally, the phonon relaxation is described
from the perspective of Gibbs free energy, Grüneisen parameters, /xi, or their similarities, with xi
being the specific degree of freedom. In contrast, we consider the Hamiltonian, Schrödinger equation,
Lagrangian oscillation mechanics, Fourier transformation, and Taylor series of potentials with focus
on the bond relaxation by external perturbation. The function dependence of a detectable quantity Q(xi)
on the bond length and energy is necessary. To seeks for the relative change of a detectable quantity,
Q(xi)/Q(xi0) = f(xi, d(xi), E(xi)) with xi being any stimulus taken as a hidden factor driving bond
relaxation. The Q(xi) can be phonon frequency, bandgap, elastic modulus, etc. This way of approach
24
reconciles the perturbations of atomic and molecular undercoordination, temperature, strain, pressure
into one equation.
Section 3 examined the two-dimensional layered graphene, black phosphorus, and (W, Mo)(S, Se)2
structures by theoretically reproducing their Raman shifts due the number-of-layers, orientational
strain, compression, and thermal activation with derivative of ever-unexpected information. The
information includes the bond length and energy, band nature index, the dimer vibration frequency of
reference, Debye temperature, atomic cohesive energy, thermal expansion coefficient, compressibility,
elastic modulus, binding energy density, which should be the capability of the spectrometrics. It is
uncovered that the single dimer-vibration and the collective dimer-vibration govern the number-of-
layer reduction induced blue and red phonon frequency shift. The slope of the Debye thermal decay of
the (T), /T, at higher temperatures is the inverse of atomic cohesive energy and the pressure slope
of the (P) profile, or the /P, approaches the inverse of binding energy density.
Section 4 proved first the core-shell structures of water droplets and nanocrystals with derive of the
skin thickness of 0.09 nm for the water droplets and two atomic diameters, 0.5 nm for CeO2
nanocrystals. The skins follow the universal bond order-length-strength (BOLS) notion that specify
the shorter and stiffer bonds between undercoordinated atoms. Examination of the sized crystals from
nanoscale to the bulk of group IV, III-nitride, II-oxide under the perturbation of size reduction, pressure
and temperature derived the same kind information described in section 3.
Section 5 introduces briefly the recent work [116-120] focusing on the effect of pressure, temperature,
molecular undercoordination, and charge injection by acid, base, and salt solvation on the performance
of water ice. Aqueous charge injection in forms of anions, cations, electrons, lone pairs, molecular
dipoles, and protons modulates the hydrogen bonding (O:H–O) and properties of a solution
through O:H formation, HH and O::O repulsions, electrostatically screened polarization,
solute-solute interaction, and H–O bond contraction due to bond order deficiency. Polarization by
charge injection and molecular undercoordination modify the critical pressures and temperatures for
the confined ice-quasisolid and the salted water-ice phase transition under heating and compression.
Consistency between theoretical predictions and measurements confirms the ever-unaware issues such
as quasisolid phase of negative thermal expansion (NTE) due to O:H–O bond segmental specific heat
disparity. Molecular coordination deficiency and electrostatic polarization result in the supersolid
phase. Excessive protons and lone pairs form the H3O hydronium and HO- hydroxide, which turns an
25
O:H–O bond into the HH anti–hydrogen-bond upon acid solvation and O::O super–hydrogen-
bond on base solvation. The aqueous molecular nonbonding can extend to other molecular crystals and
to the negative thermal expansion of other solid substance.
The last section 6 summarizes the attainment, limitation, and forward-looking directions. The phonon
spectrometrics detects directly the bond responding to perturbation but the electron spectrometrics
probes the behavior of electrons in various bands/levels due to bond relaxation, which are totally
different but complement each other. This set of spectrometrics provides a powerful technique
applicable to situations when electrons and phonons are involved and under any external perturbation
– for atomistic, dynamic, local, and quantitative information on bond and electron performance and
consistent insight into the nature of observations, an essential theoretical and experimental strategies
for functional materials devising.
26
2. Theory: Multifield Oscillation Dynamics
Highlights
Bond order, length, and strength stem the phonon frequency, bandgap, and elasticity.
Perturbation relaxes the bond and evolves the phonon and related properties.
Phonon relaxation fingerprints the intrinsic manner of bond response to perturbation.
Spectrometrics enables the ever-unexpected information on bond-phonon-property cooperativity.
27
2.1. Lattice Oscillation Dynamics
2.1.1. Single-Body Hamiltonian
There are three major approaches for the oscillation dynamics of a bond that is relaxed in length and
energy by perturbing its crystal potential or by applying an external force: resolution to the Schrödinger
equation [121], monatomic and diatomic chain dispersion [122], and the Lagrangian oscillation
mechanics for the coupled oscillators [123, 124].
Bond relaxation and associated electronic redistribution in the real and energy spaces mediate the
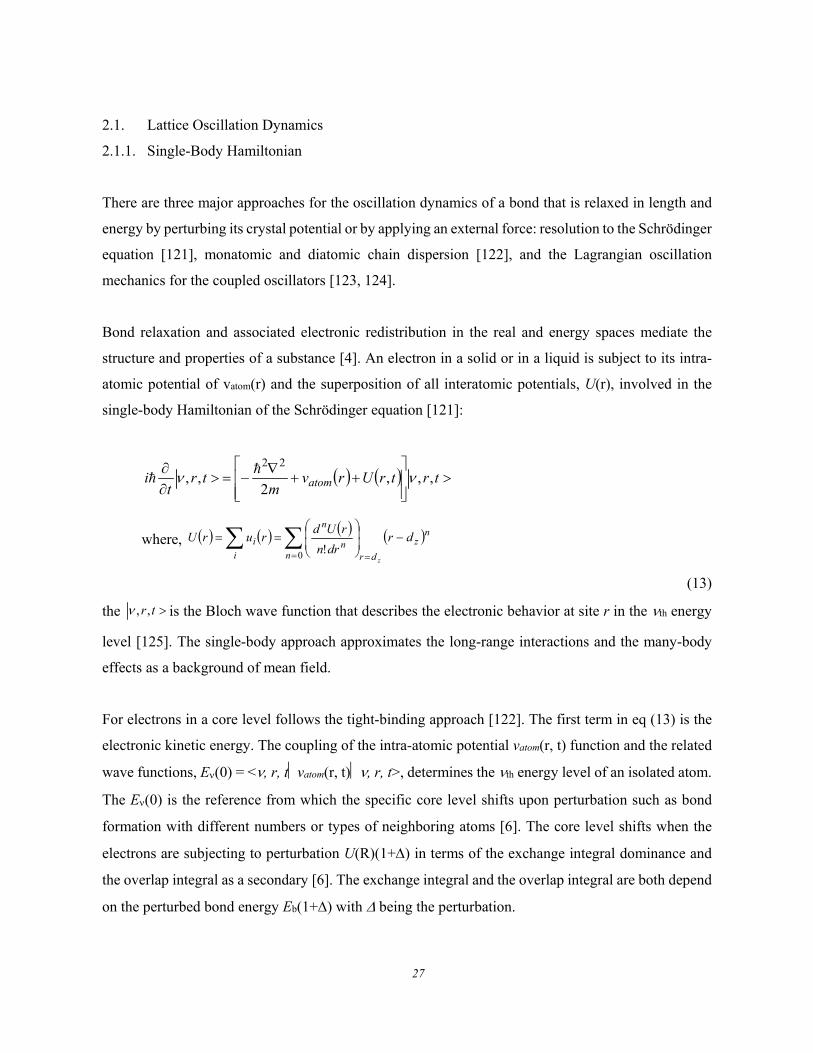
structure and properties of a substance [4]. An electron in a solid or in a liquid is subject to its intra-
atomic potential of vatom(r) and the superposition of all interatomic potentials, U(r), involved in the
single-body Hamiltonian of the Schrödinger equation [121]:
trtrUrvm
trt
i atom ,,,2
,,22
where, nz
drnn
n
i
i drdrn
rUdrurU
z
0 !
(13)
the tr,, is the Bloch wave function that describes the electronic behavior at site r in the th energy
level [125]. The single-body approach approximates the long-range interactions and the many-body
effects as a background of mean field.
For electrons in a core level follows the tight-binding approach [122]. The first term in eq (13) is the
electronic kinetic energy. The coupling of the intra-atomic potential vatom(r, t) function and the related
wave functions, E(0) = <, r, tvatom(r, t), r, t>, determines the th energy level of an isolated atom.
The E(0) is the reference from which the specific core level shifts upon perturbation such as bond
formation with different numbers or types of neighboring atoms [6]. The core level shifts when the
electrons are subjecting to perturbation U(R)(1+) in terms of the exchange integral dominance and
the overlap integral as a secondary [6]. The exchange integral and the overlap integral are both depend
on the perturbed bond energy Eb(1+) with being the perturbation.
28
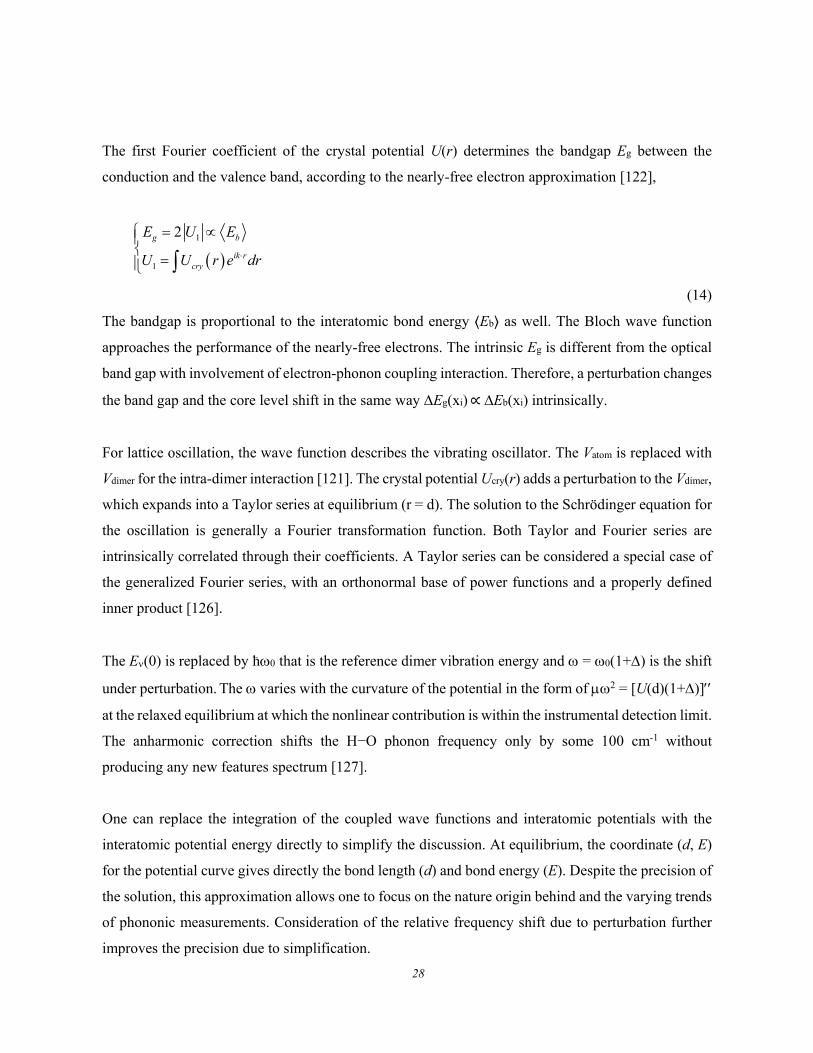
The first Fourier coefficient of the crystal potential U(r) determines the bandgap Eg between the
conduction and the valence band, according to the nearly-free electron approximation [122],
1
1
2g b
ik rcry
E U E
U U r e dr
(14)
The bandgap is proportional to the interatomic bond energy ⟨Eb⟩ as well. The Bloch wave function
approaches the performance of the nearly-free electrons. The intrinsic Eg is different from the optical
band gap with involvement of electron-phonon coupling interaction. Therefore, a perturbation changes
the band gap and the core level shift in the same way Eg(xi) ∝ Eb(xi) intrinsically.
For lattice oscillation, the wave function describes the vibrating oscillator. The Vatom is replaced with
Vdimer for the intra-dimer interaction [121]. The crystal potential Ucry(r) adds a perturbation to the Vdimer,
which expands into a Taylor series at equilibrium (r = d). The solution to the Schrödinger equation for
the oscillation is generally a Fourier transformation function. Both Taylor and Fourier series are
intrinsically correlated through their coefficients. A Taylor series can be considered a special case of
the generalized Fourier series, with an orthonormal base of power functions and a properly defined
inner product [126].
The E(0) is replaced by ћ0 that is the reference dimer vibration energy and = 0(1+) is the shift
under perturbation. The varies with the curvature of the potential in the form of 2 = [U(d)(1+)]
at the relaxed equilibrium at which the nonlinear contribution is within the instrumental detection limit.
The anharmonic correction shifts the H−O phonon frequency only by some 100 cm-1 without
producing any new features spectrum [127].
One can replace the integration of the coupled wave functions and interatomic potentials with the
interatomic potential energy directly to simplify the discussion. At equilibrium, the coordinate (d, E)
for the potential curve gives directly the bond length (d) and bond energy (E). Despite the precision of
the solution, this approximation allows one to focus on the nature origin behind and the varying trends
of phononic measurements. Consideration of the relative frequency shift due to perturbation further
improves the precision due to simplification.
29
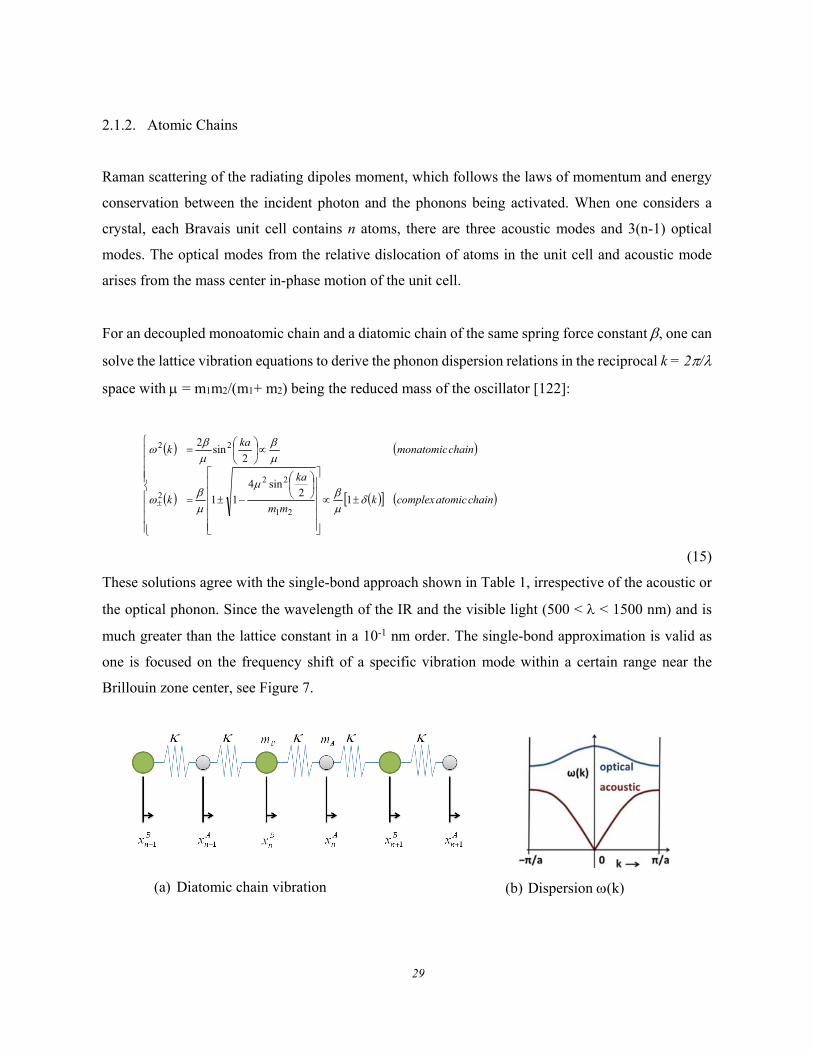
2.1.2. Atomic Chains
Raman scattering of the radiating dipoles moment, which follows the laws of momentum and energy
conservation between the incident photon and the phonons being activated. When one considers a
crystal, each Bravais unit cell contains n atoms, there are three acoustic modes and 3(n-1) optical
modes. The optical modes from the relative dislocation of atoms in the unit cell and acoustic mode
arises from the mass center in-phase motion of the unit cell.
For an decoupled monoatomic chain and a diatomic chain of the same spring force constant , one can
solve the lattice vibration equations to derive the phonon dispersion relations in the reciprocal k = 2/
space with = m1m2/(m1+ m2) being the reduced mass of the oscillator [122]:
(15)
These solutions agree with the single-bond approach shown in Table 1, irrespective of the acoustic or
the optical phonon. Since the wavelength of the IR and the visible light (500 < < 1500 nm) and is
much greater than the lattice constant in a 10-1 nm order. The single-bond approximation is valid as
one is focused on the frequency shift of a specific vibration mode within a certain range near the
Brillouin zone center, see Figure 7.
(a) Diatomic chain vibration (b) Dispersion (k)
chainatomiccomplexkmm
ka
k
chainmonatomicka
k
12
sin4
11
2sin
2
21
22
2
22
30
Figure 7. Illustration of (a) the diatom chain vibration (K = is the force constant) and (b) shows the
dispersion of the acoustic and optical phonons in the momentum domain. The acoustic phonon
dispersion holds for monatomic chain as well. The IR and visible light is within the tiny k = 2/ (>>
a) value at the Brillouin center [122].
2.1.3. Lagrangian Mechanics of Coupled Oscillators
An alternative yet efficient way to deals with oscillating system is solving the Lagrangian oscillation
equation. For aqueous solutions, the segmented O–H:O bond approaches an asymmetrical oscillator
pair coupled by the O-O Coulomb repulsion [124]. The oscillator pair follows Lagrangian motion
equation [128]:
(16)
The Lagrangian L = T U consists of the potential energy U and the kinetic energy T of the oscillating
system. The Qi is the non-conservative forces due to perturbation. The non-conservative forces include
electrification, molecular undercoordination, mechanical compression, radiation absorption, thermal
excitation, etc. [129]. The action of a Qi force relaxes the bond from one equilibrium to another. The
time dependent , represents the generalized variables, denoting the coordinates of an atom
composed the oscillator. The kinetic energy T sums vibration energies of the individual atoms, in the
form of 2Ti = mi(dqi(t)/dt)2. The potential energy U is composed of all interatomic interactions. The ui
is the coordinate of the ith atom.
Resolution to the O–H:O coupled oscillator pair [128] turned out the segmental x(kx) dispersion (x =
H and L for the HO and the O:H segment, respectively). The kx and kC correspond to the segmental
force constant and the OO coupler [123, 124]. The mx is the reduced mass of the oscillator.
1 x Cx
x
2πk k
cm
(17)
Because of the segmental kx disparity, this dispersion specifies that under any perturbation, the O
ions dislocate in the same direction by different amount along the O–H:O. The O:H relaxes always
iii
L
tq
L
t
ddd
d
tqi
31
more than the HO does. Consequently, if one segment becomes longer, its phonon turns to be
softer, and vice versa. Decoupling the kC, the dispersion degenerates into the isolated oscillators,
which is the non-segmented A-B type bond approximation, which is equivalent to eq (15) in the
Brillouin zone center and kx = being the force constant.
2.1.4. Collective Oscillation
The vibration amplitude is the dislocation of an atom with its equilibrium position x = r – d0. The high-
order terms of the potentials contribute to the nonlinear behavior. For a dimer oscillator, the atomic
coordination number is z = 1; for collective oscillation, z > 1, summing over all neighboring
coordinating atoms. Since the dimer vibration amplitude x << d0, the mean contribution to the force
constant and to the magnitude of the atomic vibration approximates [34],
,
and, .
Hence, the resultant binding energy of a given atom to its z neighbors,
(18)
This relation features the phonon frequency as a function of bond order-length-energy, in terms of the
curvature of the resultant potential.
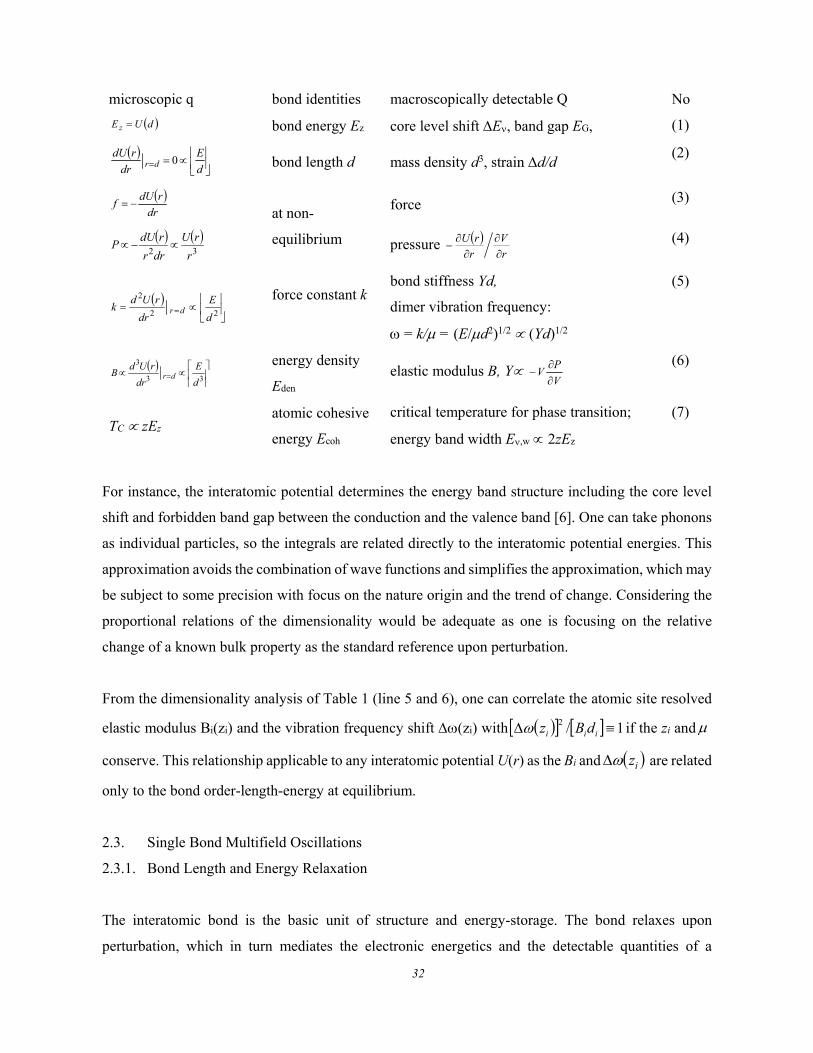
2.2. Taylor Coefficients versus Observables
The crystal potential Ucry(r) and the associated electron distribution uniquely determine the
performance of a substance that is represented by an average of the whole pack of bonds in the
substance [6, 7, 9, 36, 130]. As exemplified in Table 1, the Taylor coefficients correspond directly to
the detectable quantities in terms of the dimensionality.
Table 1. Correlation between the macroscopic detectable quantities and the Taylor series coefficients.
221 )( ckkk iz
zdrxxx z )( 021
...!2
20
0
2
2
drdr
ruzdzEru
d
b
32
microscopic q bond identities macroscopically detectable Q No
bond energy Ez core level shift E, band gap EG, (1)
bond length d mass density d3, strain d/d (2)
at non-
equilibrium
force (3)
pressure (4)
force constant k
bond stiffness Yd,
dimer vibration frequency:
= k/ = (E/d2)1/2 (Yd)1/2
(5)
energy density
Eden elastic modulus B, Y
(6)
TC zEz atomic cohesive
energy Ecoh
critical temperature for phase transition;
energy band width E,w 2zEz
(7)
For instance, the interatomic potential determines the energy band structure including the core level
shift and forbidden band gap between the conduction and the valence band [6]. One can take phonons
as individual particles, so the integrals are related directly to the interatomic potential energies. This
approximation avoids the combination of wave functions and simplifies the approximation, which may
be subject to some precision with focus on the nature origin and the trend of change. Considering the
proportional relations of the dimensionality would be adequate as one is focusing on the relative
change of a known bulk property as the standard reference upon perturbation.
From the dimensionality analysis of Table 1 (line 5 and 6), one can correlate the atomic site resolved
elastic modulus Bi(zi) and the vibration frequency shift (zi) with if the zi and
conserve. This relationship applicable to any interatomic potential U(r) as the Bi and are related
only to the bond order-length-energy at equilibrium.
2.3. Single Bond Multifield Oscillations
2.3.1. Bond Length and Energy Relaxation
The interatomic bond is the basic unit of structure and energy-storage. The bond relaxes upon
perturbation, which in turn mediates the electronic energetics and the detectable quantities of a
dUEz
d
E
dr
rdUdr 0
dr
rdUf
32 r
rU
drr
rdUP
r
V
r
rU
22
2
d
E
dr
rUdk dr
33
3
d
E
dr
rUdB dr V
PV
1/2 iii dBz
iz
33
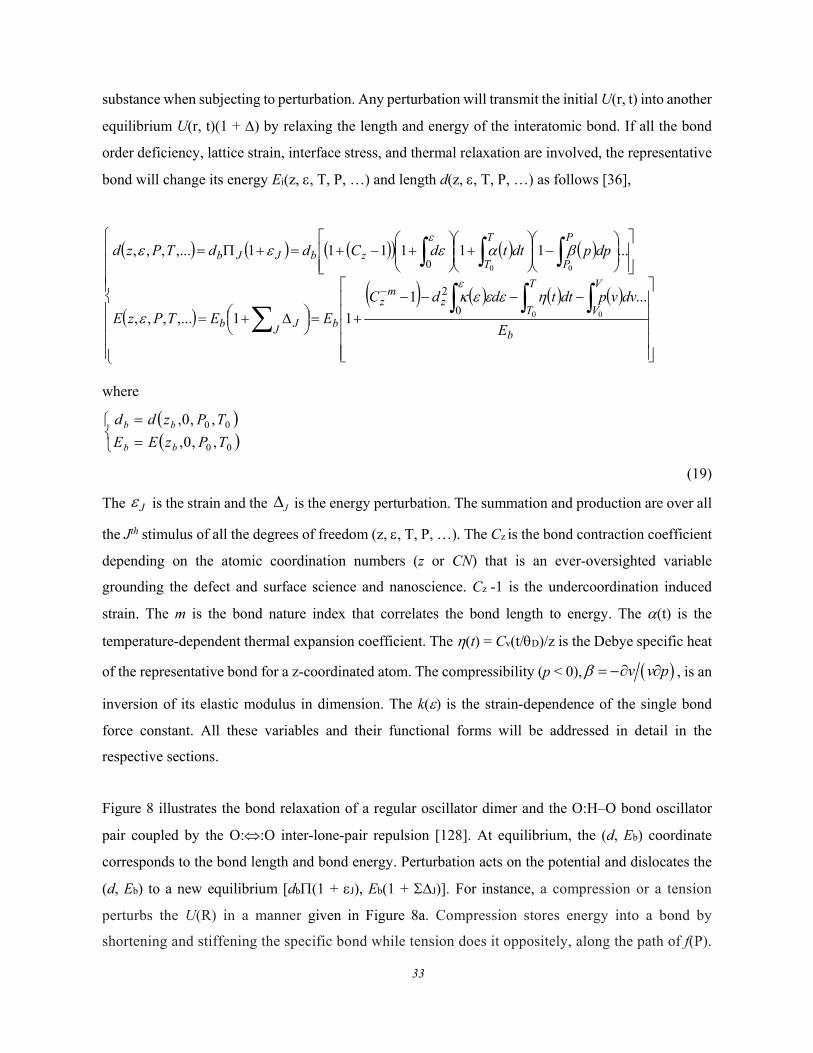
substance when subjecting to perturbation. Any perturbation will transmit the initial U(r, t) into another
equilibrium U(r, t)(1 + ) by relaxing the length and energy of the interatomic bond. If all the bond
order deficiency, lattice strain, interface stress, and thermal relaxation are involved, the representative
bond will change its energy Ei(z, , T, P, …) and length d(z, , T, P, …) as follows [36],
where
(19)
The is the strain and the is the energy perturbation. The summation and production are over all
the Jth stimulus of all the degrees of freedom (z, , T, P, …). The Cz is the bond contraction coefficient
depending on the atomic coordination numbers (z or CN) that is an ever-oversighted variable
grounding the defect and surface science and nanoscience. Cz -1 is the undercoordination induced
strain. The m is the bond nature index that correlates the bond length to energy. The (t) is the
temperature-dependent thermal expansion coefficient. The (t) = Cv(t/D)/z is the Debye specific heat
of the representative bond for a z-coordinated atom. The compressibility (p < 0), v v p , is an
inversion of its elastic modulus in dimension. The k() is the strain-dependence of the single bond
force constant. All these variables and their functional forms will be addressed in detail in the
respective sections.
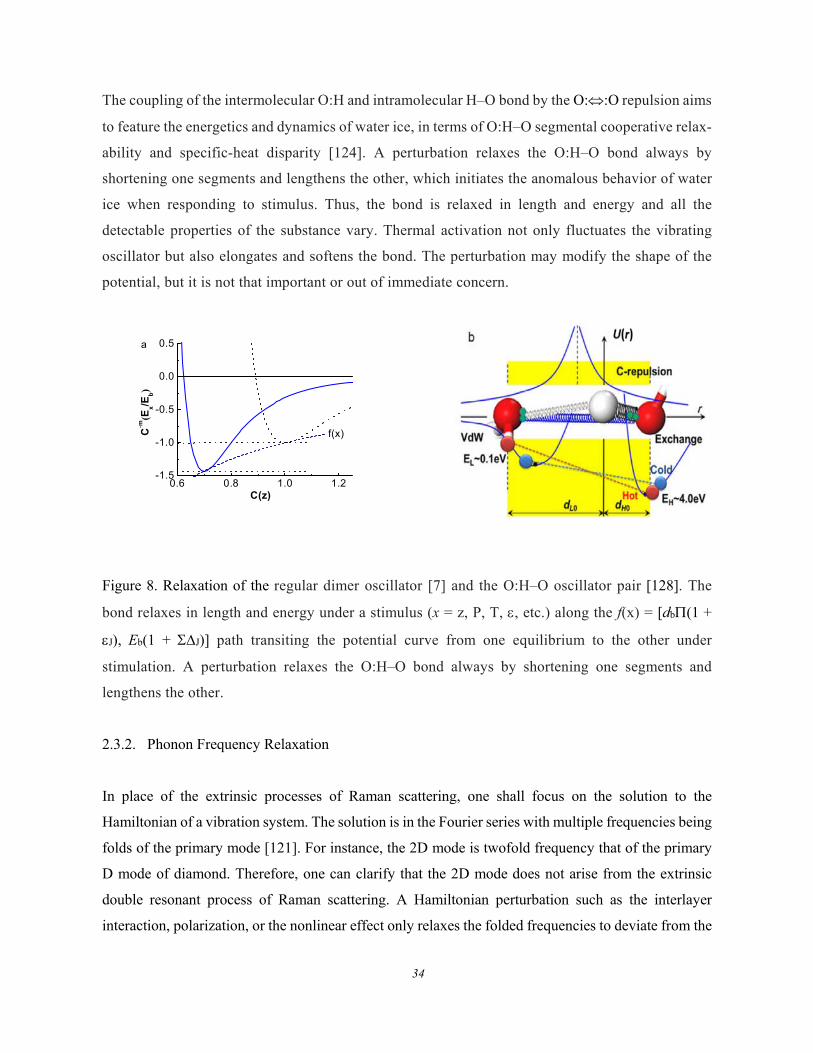
Figure 8 illustrates the bond relaxation of a regular oscillator dimer and the O:H–O bond oscillator
pair coupled by the O::O inter-lone-pair repulsion [128]. At equilibrium, the (d, Eb) coordinate
corresponds to the bond length and bond energy. Perturbation acts on the potential and dislocates the
(d, Eb) to a new equilibrium [db(1 + J), Eb(1 + J)]. For instance, a compression or a tension
perturbs the U(R) in a manner given in Figure 8a. Compression stores energy into a bond by
shortening and stiffening the specific bond while tension does it oppositely, along the path of f(P).
b
T
T
V
Vz
mz
bJ Jb
P
P
T
TzbJJb
E
dvvpdttddC
EETPzE
dppdttdCddTPzd
0 0
00
...1
11,...,,,
...111111,...,,,
0
2
0
00
00
,,0,
,,0,
TPzEE
TPzdd
bb
bb
J J
34
The coupling of the intermolecular O:H and intramolecular H–O bond by the O::O repulsion aims
to feature the energetics and dynamics of water ice, in terms of O:H–O segmental cooperative relax-
ability and specific-heat disparity [124]. A perturbation relaxes the O:H–O bond always by
shortening one segments and lengthens the other, which initiates the anomalous behavior of water
ice when responding to stimulus. Thus, the bond is relaxed in length and energy and all the
detectable properties of the substance vary. Thermal activation not only fluctuates the vibrating
oscillator but also elongates and softens the bond. The perturbation may modify the shape of the
potential, but it is not that important or out of immediate concern.
0.6 0.8 1.0 1.2-1.5
-1.0
-0.5
0.0
0.5
C-m
(Ex/E
b)
f(x)
C(z)
a
Figure 8. Relaxation of the regular dimer oscillator [7] and the O:H–O oscillator pair [128]. The
bond relaxes in length and energy under a stimulus (x = z, P, T, , etc.) along the f(x) = [db(1 +
J), Eb(1 + J)] path transiting the potential curve from one equilibrium to the other under
stimulation. A perturbation relaxes the O:H–O bond always by shortening one segments and
lengthens the other.
2.3.2. Phonon Frequency Relaxation
In place of the extrinsic processes of Raman scattering, one shall focus on the solution to the
Hamiltonian of a vibration system. The solution is in the Fourier series with multiple frequencies being
folds of the primary mode [121]. For instance, the 2D mode is twofold frequency that of the primary
D mode of diamond. Therefore, one can clarify that the 2D mode does not arise from the extrinsic
double resonant process of Raman scattering. A Hamiltonian perturbation such as the interlayer
interaction, polarization, or the nonlinear effect only relaxes the folded frequencies to deviate from the
35
references. In fact, the number-of-layer reduction shifts the D/2D peaks from 1367/2720 to 1344/2680
cm-1, is within this right expectation.
The number-of-layer derived contrasting trends of the Raman frequency shift for graphene suggest
that the origin of the G mode is completely different from that of the D/2D modes. On the other hand,
an application of any perturbation will relax the involved bonds, resulting in the phonon frequencies
change. Phonon band splitting is with expectation if the direction mismatch between the uniaxial strain
and the C–C bond in the graphene.
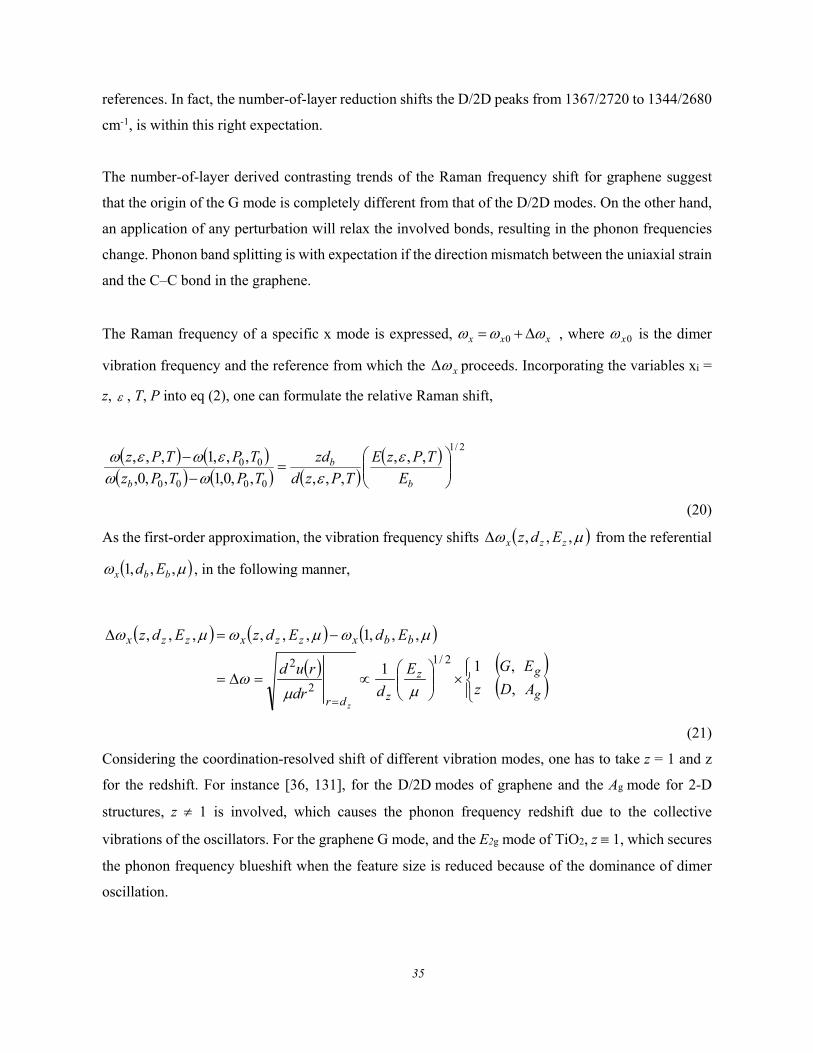
The Raman frequency of a specific x mode is expressed, , where is the dimer
vibration frequency and the reference from which the proceeds. Incorporating the variables xi =
z, , T, P into eq (2), one can formulate the relative Raman shift,
(20)
As the first-order approximation, the vibration frequency shifts from the referential
, in the following manner,
(21)
Considering the coordination-resolved shift of different vibration modes, one has to take z = 1 and z
for the redshift. For instance [36, 131], for the D/2D modes of graphene and the Ag mode for 2-D
structures, z 1 is involved, which causes the phonon frequency redshift due to the collective
vibrations of the oscillators. For the graphene G mode, and the E2g mode of TiO2, z 1, which secures
the phonon frequency blueshift when the feature size is reduced because of the dominance of dimer
oscillation.
xxx 0 0x
x
2/1
0000
00 ,,,
,,,,,0,1,,0,
,,,1,,,
b
b
b E
TPzE
TPzd
zd
TPTPz
TPTPz
,,, zzx Edz
,,,1 bbx Ed
g
gz
zdr
bbxzzxzzx
ADz
EGE
ddr
rud
EdEdzEdz
z
,
,11
,,,1,,,,,,
2/1
2
2
36
2.4. Formulation of Multifield Perturbation
2.4.1. Atomic Undercoordination
2.4.1.1. BOLS-LBA approach
The BOLS notion [9] suggests that bonds between fewer-coordinated atoms shrink spontaneously. The
charge and energy densities are higher and the local potential well becomes deeper associated with and
quantum entrapment. The locally densely entrapped charge will in turn polarize the valence electrons
of atoms at the open end of the crystal. Hence, the BOLS defines the atomic cohesive energy, binding
energy density at the atomic site, which provides perturbation to the Hamiltonian of the entire system.
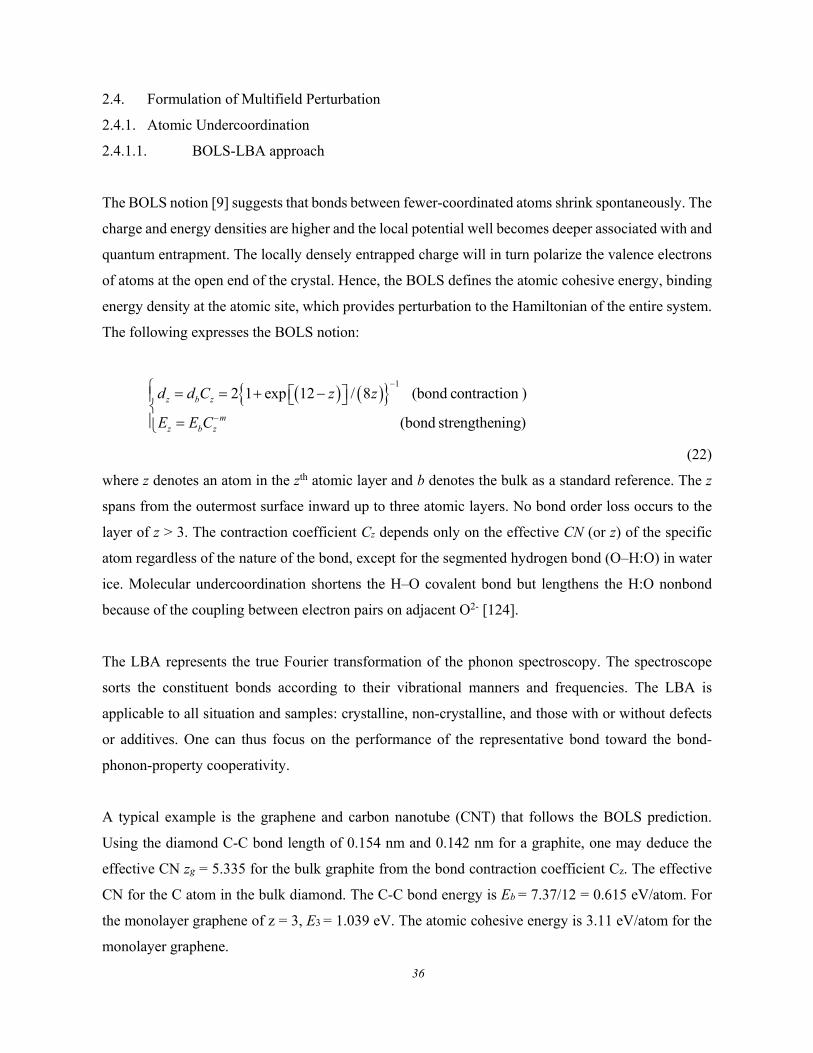
The following expresses the BOLS notion:
12 1 exp 12 / 8 (bond contraction )
(bond strengthening)
z b z
mz b z
d d C z z
E E C
(22)
where z denotes an atom in the zth atomic layer and b denotes the bulk as a standard reference. The z
spans from the outermost surface inward up to three atomic layers. No bond order loss occurs to the
layer of z > 3. The contraction coefficient Cz depends only on the effective CN (or z) of the specific
atom regardless of the nature of the bond, except for the segmented hydrogen bond (O–H:O) in water
ice. Molecular undercoordination shortens the H–O covalent bond but lengthens the H:O nonbond
because of the coupling between electron pairs on adjacent O2- [124].
The LBA represents the true Fourier transformation of the phonon spectroscopy. The spectroscope
sorts the constituent bonds according to their vibrational manners and frequencies. The LBA is
applicable to all situation and samples: crystalline, non-crystalline, and those with or without defects
or additives. One can thus focus on the performance of the representative bond toward the bond-
phonon-property cooperativity.
A typical example is the graphene and carbon nanotube (CNT) that follows the BOLS prediction.
Using the diamond C-C bond length of 0.154 nm and 0.142 nm for a graphite, one may deduce the
effective CN zg = 5.335 for the bulk graphite from the bond contraction coefficient Cz. The effective
CN for the C atom in the bulk diamond. The C-C bond energy is Eb = 7.37/12 = 0.615 eV/atom. For
the monolayer graphene of z = 3, E3 = 1.039 eV. The atomic cohesive energy is 3.11 eV/atom for the
monolayer graphene.
37
Numerical match to the measured elastic modulus [132-134], melting temperature of the SWCNT
[132, 135], and the C 1s energy shifts for the edge and interior of a graphene, bulk graphite and
diamond [136] has revealed consistently that the C-C bond at the graphene edge contracts from 0.154
to 0.107 nm with a 30% bond contraction and a 152% bond energy gain [132, 133]. The bond
contraction induced polarization dictates the width dependence of the band gap of GNR [137], and the
Dirac-Fermi polariton generation [61]. The C-C bond between the 3-coordinated atoms in GNR
contracts by 18.5% to 0.125 nm with a 68% increase of bond energy [133]. The Young’s modulus of
the SWCNT is 2.6 TPa compared to the bulk value of 865 GPa. The wall thickness is 0.142 nm rather
than the layer spacing of 0.34 nm for the SWCNT. Breaking a C-C bond between 2-coordinated carbon
atoms requires 7.50 eV/bond that is 32% higher than the amount (5.67 eV/bond) required for breaking
a bond between 3-coordinated atoms in a monolayer graphene [138].
2.4.1.2. Atomic-site and Crystal-size Resolved Shift
Any perturbation x mediates a detectable property Q at an atomic site or for a cluster of given size and
shape in the following core-shell manners [9]:
(23)
The q being the density of the Q is a function of bond length d, bond energy E, and bond order z. j is
the number or volume ratio between the jth atomic layer and the entire specimen with subscript j
counting from the outermost atomic layer inward up to three. = 1, 2, 3 is the dimensionality for the
thin plate, a cylindrical rod, and a spherical dot. The K features the size of the nanocrystal, which is
the number of atoms lined along the feature size. For bonds between atoms at sites of point defects,
monatomic chains, monolayer atomic sheets or monolayer skins, no weighted superposition is
considered.
)(4;2,/75.014
;
23121
3 0
0
0
dotsphericalzzzzKzK
C
N
N
V
V
shapesizexq
xq
siteatomicxq
xq
xQ
xQ
jjjj
j j
38
The nanostructure core-shell configuration and the LBA approach [139], yields the following relation
with zib = zi/zb for the size-reduction induced Raman red (z 1) and blueshift (z = 1),
(24)
where xi and x0 correspond to the phonon frequency at the ith surface atomic shell and inside the
bulk. The x(1) for an isolated dimer is the reference from which the frequency shift takes place upon
nanocrystal and bulk formation.
The vibration of oscillator formed between nanosolid and host matrix or between grains stems the LFR
mode in the THz regime. The relative motion of the individual atoms in a complex unit cell determines
the optical modes.
2.4.2. Thermal Excitation: Debye Thermal Decay
2.4.2.1. Lattice Debye Thermal Expansion
In place of the Grüneisen notion description, one may consider the thermal expansion coefficient (t)
for the LBA as follows [140]. From the definition, one can transit 0 01
TL L t dt to
1
10 0 0
1 tdL L dut A r t
L dt L u dt L F r
(25)
where is the inverse of the gradient of the interatomic potential u(r d) nearby
equilibrium. The du/dt is the specific heat of Debye approximation. A(r) = (-L0F(r))-1 approaches the
invers of binding energy near equilibrium. Compared to the Grüneisen’s volumetric thermal expansion
coefficient (TEC) [102], the (t) = (VBT)-11(t) , /(VBT) = [L0F(r)]-1 constant is in the dimension
of energy.
11
11
0)1(
,
111
3
)12(3
)12(
3 zC
zzCz
Kor
K
i
mii
i
miibi
i b
iiR
R
R
1 FuL
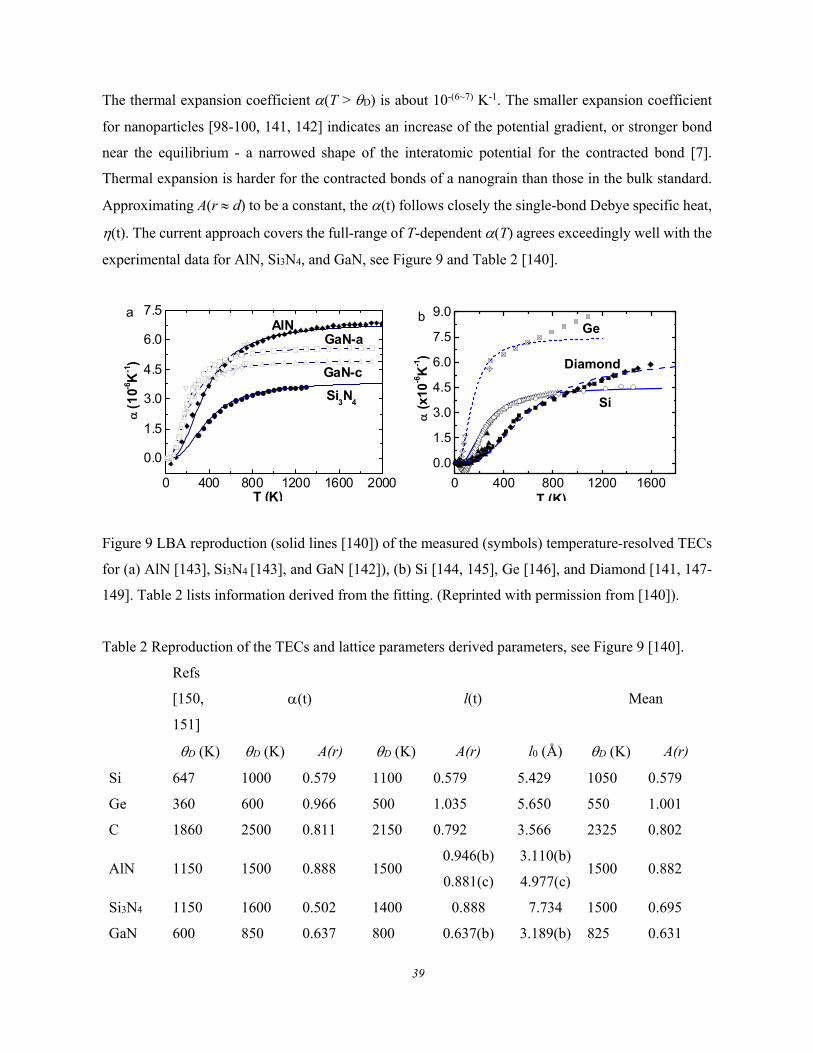
39
The thermal expansion coefficient (T > D) is about 10-(6~7) K-1. The smaller expansion coefficient
for nanoparticles [98-100, 141, 142] indicates an increase of the potential gradient, or stronger bond
near the equilibrium - a narrowed shape of the interatomic potential for the contracted bond [7].
Thermal expansion is harder for the contracted bonds of a nanograin than those in the bulk standard.
Approximating A(r d) to be a constant, the (t) follows closely the single-bond Debye specific heat,
(t). The current approach covers the full-range of T-dependent (T) agrees exceedingly well with the
experimental data for AlN, Si3N4, and GaN, see Figure 9 and Table 2 [140].
0 400 800 1200 1600 2000
0.0
1.5
3.0
4.5
6.0
7.5
GaN-c
GaN-a
Si3N
4
(1
0-6K
-1)
T (K)
aAlN
0 400 800 1200 1600
0.0
1.5
3.0
4.5
6.0
7.5
9.0
(
x10-6
K-1)
T (K)
b
Diamond
Si
Ge
Figure 9 LBA reproduction (solid lines [140]) of the measured (symbols) temperature-resolved TECs
for (a) AlN [143], Si3N4 [143], and GaN [142]), (b) Si [144, 145], Ge [146], and Diamond [141, 147-
149]. Table 2 lists information derived from the fitting. (Reprinted with permission from [140]).
Table 2 Reproduction of the TECs and lattice parameters derived parameters, see Figure 9 [140].
Refs
[150,
151]
(t) l(t) Mean
D (K) D (K) A(r) D (K) A(r) l0 (Å) D (K) A(r)
Si 647 1000 0.579 1100 0.579 5.429 1050 0.579
Ge 360 600 0.966 500 1.035 5.650 550 1.001
C 1860 2500 0.811 2150 0.792 3.566 2325 0.802
AlN 1150 1500 0.888 1500 0.946(b)
0.881(c)
3.110(b)
4.977(c) 1500 0.882
Si3N4 1150 1600 0.502 1400 0.888 7.734 1500 0.695
GaN 600 850 0.637 800 0.637(b) 3.189(b) 825 0.631
40
0.618(c) 5.183(c)
a The reference Debye temperature is documented in ref [100] for a-axis b and c-axis c.
However, the negative TECs is beyond the scope of the present expression. Materials possessing
negative TECs are often ascribed as the negative Grüneisen parameters of the transverse acoustic
phonons. Generally, most materials expand upon being heated. Expansional cooling expansion such
as graphite [152], graphene oxide [153], ZrWO3 [154, 155], and compounds composed of N, F, and O
[156] do exist because of the involvement of multiple-type interactions and their correlations like water
ice [157]. Therefore, a superposition of the segmental specific heats and considers the coupling of the
inter- and intra-molecular interactions would be necessary to reproduce the negative TECs [158].
2.4.2.2. Debye Thermal Decay: Debye Temperature and Cohesive Energy
The specific heat 1(t) and its thermal integration is the conventionally termed internal energy,
U(T/D). When x << 1, 1+ x approximation exp(x) is applied to describe the thermal bond expansion.
The integration of the Debye specific heat η(t) from 0 K to T yields the T-induced bond weakening,
∆ET,
(26)
Where R is the ideal gas constant, θD is the Debye temperature, and Cv the specific heat. The reduced
form of temperature y = θD/T. The η(t) is the specific heat per bond, which follows the specific heat of
Debye approximation and closes to a constant value of 3R/z at high temperature. Figure 10 illustrates
the Debye temperature dependence of the remnant energy of a bond subjecting to heating. The
DU T is the loss of energy by thermalization toward bond dissociation and 1- U(T/D)/Eb(0) is the
remnant fraction of the bond energy.
T
D
T T T
D
T
v
T
D
y
y
y
yD
dye
eyT
z
RT
dtdye
eyT
z
R
z
dttCdttE
0
33
2
4
0 0 0
3
0
1
9
]1
9[
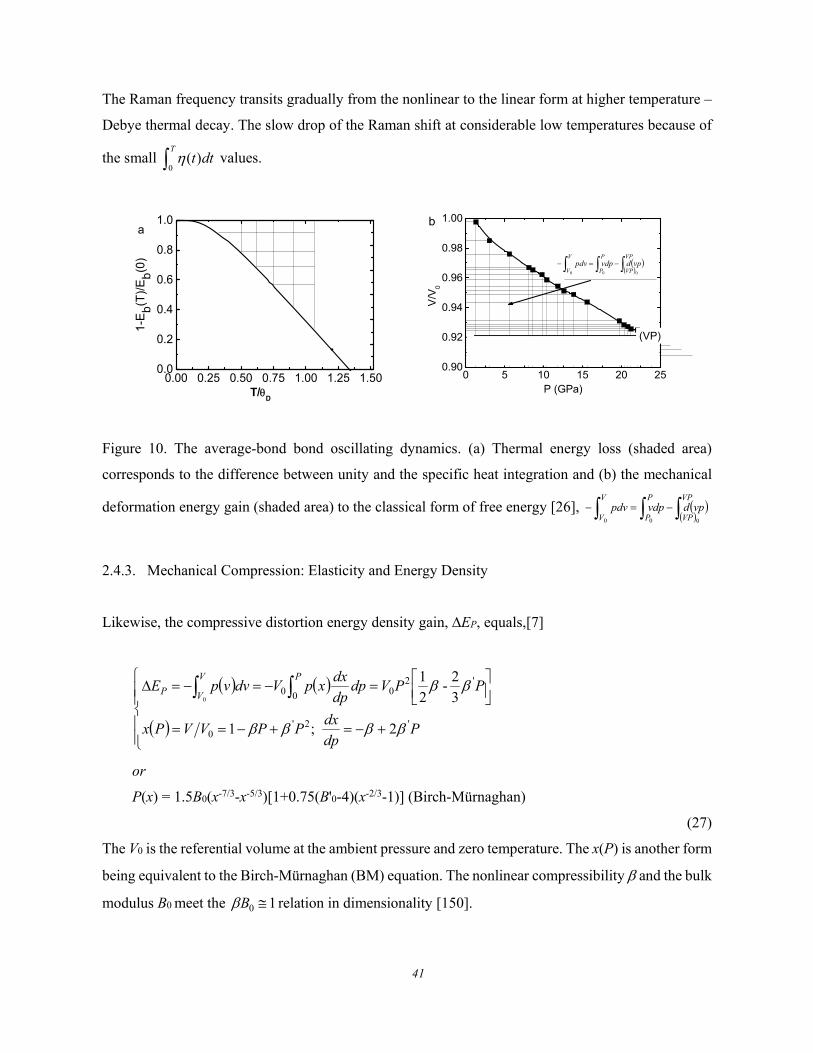
41
The Raman frequency transits gradually from the nonlinear to the linear form at higher temperature –
Debye thermal decay. The slow drop of the Raman shift at considerable low temperatures because of
the small 0
( )T
t dt values.
0.00 0.25 0.50 0.75 1.00 1.25 1.500.0
0.2
0.4
0.6
0.8
1.0
1-E
b(T)/
Eb
(0)
T/D
a
0 5 10 15 20 25
0.90
0.92
0.94
0.96
0.98
1.00
V/V
0
P (GPa)
V
V
VP
VP
P
Pvpdvdppdv
0 00
(VP)
b
Figure 10. The average-bond bond oscillating dynamics. (a) Thermal energy loss (shaded area)
corresponds to the difference between unity and the specific heat integration and (b) the mechanical
deformation energy gain (shaded area) to the classical form of free energy [26],
2.4.3. Mechanical Compression: Elasticity and Energy Density
Likewise, the compressive distortion energy density gain, ∆EP, equals,[7]
or
P(x) = 1.5B0(x-7/3-x-5/3)[1+0.75(B'0-4)(x-2/3-1)] (Birch-Mürnaghan)
(27)
The V0 is the referential volume at the ambient pressure and zero temperature. The x(P) is another form
being equivalent to the Birch-Mürnaghan (BM) equation. The nonlinear compressibility and the bulk
modulus B0 meet the relation in dimensionality [150].
V
V
VP
VP
P
Pvpdvdppdv
0 00
Pdp
dxPPVVPx
PPVdpdp
dxxpVdvvpE
PV
VP
'2'0
'2000
2;1
3
2-
2
10
10 B
42
Figure 10b illustrates the P-V profile and its integration. In the P-V profile, only the gridded area
0 0
V p
V p
dVpdV p dp
dp contributes to the density of energy for the whole body [97]. In dealing with
the single average bond, the bond length d(z, t, p) replaces the atomic volume V(z, t, p) and a force f
replaces the pressure. The (p) keeps a constant for the elastic deformation and then the integration
0
Pp dp P holds [159, 160].
For a given sized specimen, one can formulate the T and P resolved B and by joining Eqs (26) and
(27),
T PTP
T PTP
dppdttE
EE
dppdttE
EE
PTB
PTB
0 0
2/1
0
0 00
'exp1
'3exp1
0,0
,0,0
,
2.4.4. Uniaxial Stretch: Single Bond Force Constant
The data of tensile strain for the monolayer graphene [161] and MoS2 [162] enabled the derived
information of the average-bond force constant and the relative direction between the strain and a
specific bond in the specimen. The strain-effect is given as [163],
1/221/2
10
1/22
1, 1,0 0
,0 1,0 0 1
1 ' '
1 '
zd d Ez d E
z d E
With 2' 2 constantz zd E
(18)
To feature the orientation mismatch between a bond and the uni-axial strain, one can introduce a strain
coefficient bounded by 0 1. The = is for a bond that is not along the applied strain. The
effective force constant being constant at limited strain. In the experiment, one can
hardly measure the force constant for a certain bond but the average strain of the entire specimen.
The characterizes the actual strain of the orientated bonds in a basic unit from the complex of multiple
2'2 zz dE
0
43
bonds in different orientations. The strain can be along ( = 1) or perpendicular ( = 0) or random (0
< < 1) to a certain bond in the specimen. The bond along the strain is subject to a maximal extension
and its phonon frequency shifts most; the bond perpendicular to the strain is subject to zero extension
and keeps its phonon frequency. It is therefore not surprising that the uniaxial strain can split the
phonon band into two components and the component separation varies with the angle between the
bond and the uniaxial strain [36].
2.5. From spectroscopy to Spectrometrics
A phonon spectral peak, a vibration mode or a phonon band, probed by either Raman scattering or
infrared absorption, features the Fourier transformation of all bonds vibrating in the similar frequency,
irrespective of their locations or orientations or structural phases. Fourier transformation gathers the
vibration modes according to the bond stiffness and their population in terms of the intrinsic oscillators’
force constants. The force constant corresponds to the curvature of the resultant potentials that the
vibrating dimer is subject at equilibrium. Multifield activation, electron entrapment and polarization,
and light radiation contribute to the crystal potentials whose curvatures determine intrinsically the
lattice oscillation dynamics.
Amplifying the phonon spectroscopy to spectrometrics aims to capturing the conventionally-
unexpected information on the bonding dynamics by avoiding spectral peak decomposition or
empirical simulation using hypothetic models. Compared with the electron spectrometrics that applies
to conductive or semiconductive substance under high vacuum, the phonon spectrometrics extends to
liquidius and insulating species under multifield perturbation. The phonon spectrometrics directly
captures bond relaxation information but the electron spectrometrics captures the effect of bond
relaxation on the electronic dynamics in various energy levels or bands [6].
When an external perturbation is applied, the interatomic potential will change, and the characteristic
phonon frequency will evolve or transit from its first state to a new one in terms of abundance, stiffness,
and fluctuation order, which gives profound information on the bond relaxation that triggers the
electronic structure and properties of the substance. External perturbations include atomic irregular-
coordination, mechanical activation, thermal excitation, charge injection by doping and aqueous
solvation, electrification and magnification, radiation, etc. Correlating the phonon relaxation to the
applied perturbation yields the ever-unexpected information.
44
Besides direct calculation of the (x) to match the measured frequency shift of a substance under x
perturbation, the other convenient method is to find the fraction of abundance transition and frequency
shift using the differential phonon spectrometrics (DPS) strategy [112, 164]. The DPS strategy distills
only the phonon abundance and bond stiffness transition from the reference to conditioned states. This
strategy monitors the phonon and bond relaxation both statically and dynamically. The DPS peak
integral gives the fraction of bonds, or number of phonons transiting from the standard reference to
the conditioned states under the change of the degree of freedom such as the solute concentration C in
aqueous solutions and crystal size D for nanostructures,
2
2
0,,
, 0,
M
M M
mm m
H Osolutionx
solution H O
II Cf C d
I C d I d
.
The division, f(C)/C, is the vicinal number of bonds per solute in the hydration volumes, which features
the hydration volume and its local electric field. The center-of-gravity (COG) of the frequency COG
is obtained by integrating the population I(x) from xm = 0 to xM = 0 [165].
2.6. Summary
From the perspective of Fourier transformation and LBA consideration, one can resolve the multifield
bond oscillation dynamics and direct measure the (z, d, E, ) without involving the Grüneisen
constants or the extrinsic multiple phonon resonant scattering or the optical phonon degeneration.
Reproduction of the excited by perturbations such as bond-order-imperfection, compression,
tension, thermal activation, and charge injection by solvation turns out the ever-unexpected
information on the bond length and energy, single-bond force-constant, binding energy density, mode
cohesive energy, elastic modulus, Debye temperature, etc.. One can thus reconcile the perturbation-
relaxation-property cooperativity of a substance. This set of theoretical and experimental approaches
provide not only efficient means for the local, dynamics, and quantitative information on the multifield
bond oscillation dynamics but also comprehension of the physics behind observations.
M
m
M
m
dI
dI
COG
45
3. Layered Structures
Highlights
Atomic-undercoordination induced phonon relaxation imprints the bond order-length-energy.
Compression stiffened phonons yield the binding energy density and elastic modulus.
Phonon Debye thermal decay turns out Debye temperature and atomic cohesive energy.
Stretching softened and separated phonon band leads to the single bond force constant.
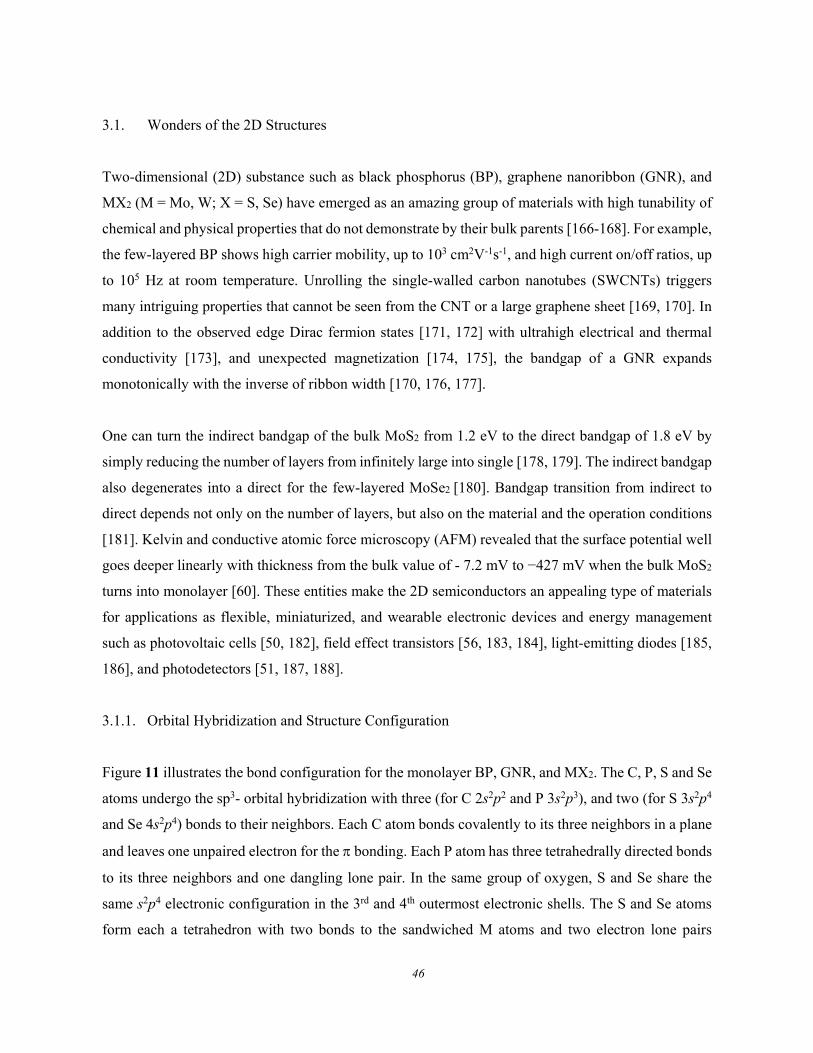
46
3.1. Wonders of the 2D Structures
Two-dimensional (2D) substance such as black phosphorus (BP), graphene nanoribbon (GNR), and
MX2 (M = Mo, W; X = S, Se) have emerged as an amazing group of materials with high tunability of
chemical and physical properties that do not demonstrate by their bulk parents [166-168]. For example,
the few-layered BP shows high carrier mobility, up to 103 cm2V-1s-1, and high current on/off ratios, up
to 105 Hz at room temperature. Unrolling the single-walled carbon nanotubes (SWCNTs) triggers
many intriguing properties that cannot be seen from the CNT or a large graphene sheet [169, 170]. In
addition to the observed edge Dirac fermion states [171, 172] with ultrahigh electrical and thermal
conductivity [173], and unexpected magnetization [174, 175], the bandgap of a GNR expands
monotonically with the inverse of ribbon width [170, 176, 177].
One can turn the indirect bandgap of the bulk MoS2 from 1.2 eV to the direct bandgap of 1.8 eV by
simply reducing the number of layers from infinitely large into single [178, 179]. The indirect bandgap
also degenerates into a direct for the few-layered MoSe2 [180]. Bandgap transition from indirect to
direct depends not only on the number of layers, but also on the material and the operation conditions
[181]. Kelvin and conductive atomic force microscopy (AFM) revealed that the surface potential well
goes deeper linearly with thickness from the bulk value of - 7.2 mV to −427 mV when the bulk MoS2
turns into monolayer [60]. These entities make the 2D semiconductors an appealing type of materials
for applications as flexible, miniaturized, and wearable electronic devices and energy management
such as photovoltaic cells [50, 182], field effect transistors [56, 183, 184], light-emitting diodes [185,
186], and photodetectors [51, 187, 188].
3.1.1. Orbital Hybridization and Structure Configuration
Figure 11 illustrates the bond configuration for the monolayer BP, GNR, and MX2. The C, P, S and Se
atoms undergo the sp3- orbital hybridization with three (for C 2s2p2 and P 3s2p3), and two (for S 3s2p4
and Se 4s2p4) bonds to their neighbors. Each C atom bonds covalently to its three neighbors in a plane
and leaves one unpaired electron for the bonding. Each P atom has three tetrahedrally directed bonds
to its three neighbors and one dangling lone pair. In the same group of oxygen, S and Se share the
same s2p4 electronic configuration in the 3rd and 4th outermost electronic shells. The S and Se atoms
form each a tetrahedron with two bonds to the sandwiched M atoms and two electron lone pairs
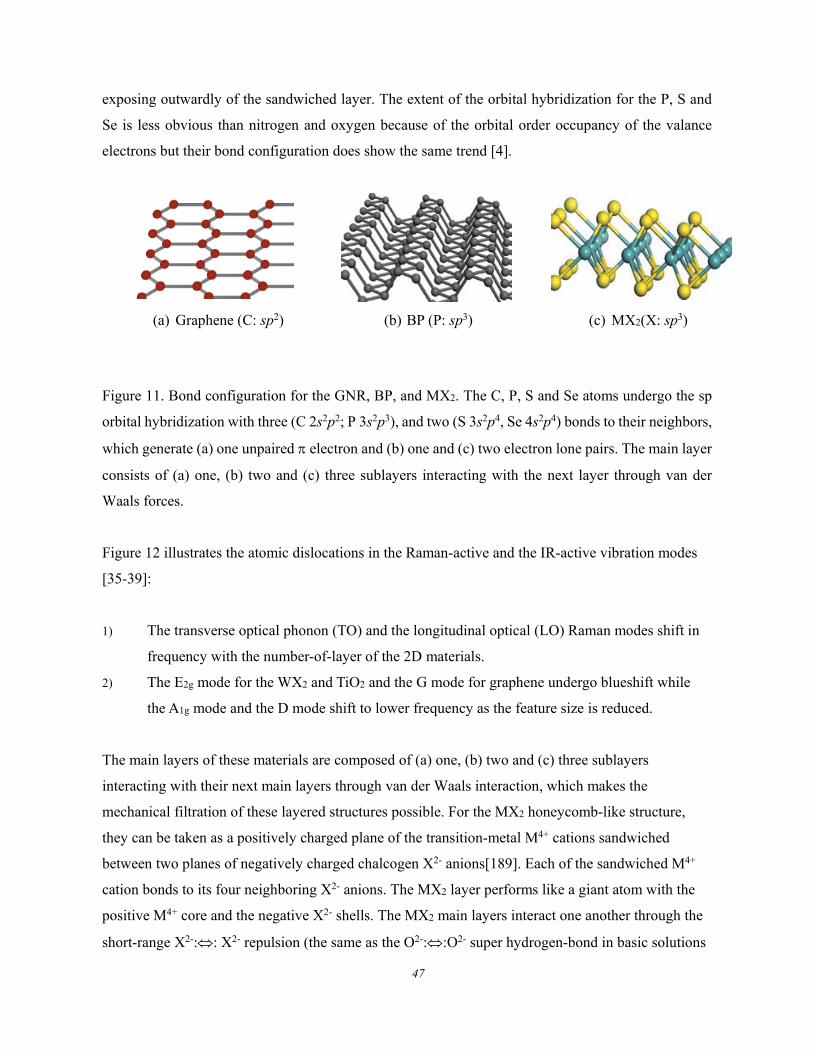
47
exposing outwardly of the sandwiched layer. The extent of the orbital hybridization for the P, S and
Se is less obvious than nitrogen and oxygen because of the orbital order occupancy of the valance
electrons but their bond configuration does show the same trend [4].
(a) Graphene (C: sp2) (b) BP (P: sp3) (c) MX2(X: sp3)
Figure 11. Bond configuration for the GNR, BP, and MX2. The C, P, S and Se atoms undergo the sp
orbital hybridization with three (C 2s2p2; P 3s2p3), and two (S 3s2p4, Se 4s2p4) bonds to their neighbors,
which generate (a) one unpaired electron and (b) one and (c) two electron lone pairs. The main layer
consists of (a) one, (b) two and (c) three sublayers interacting with the next layer through van der
Waals forces.
Figure 12 illustrates the atomic dislocations in the Raman-active and the IR-active vibration modes
[35-39]:
1) The transverse optical phonon (TO) and the longitudinal optical (LO) Raman modes shift in
frequency with the number-of-layer of the 2D materials.
2) The E2g mode for the WX2 and TiO2 and the G mode for graphene undergo blueshift while
the A1g mode and the D mode shift to lower frequency as the feature size is reduced.
The main layers of these materials are composed of (a) one, (b) two and (c) three sublayers
interacting with their next main layers through van der Waals interaction, which makes the
mechanical filtration of these layered structures possible. For the MX2 honeycomb-like structure,
they can be taken as a positively charged plane of the transition-metal M4+ cations sandwiched
between two planes of negatively charged chalcogen X2- anions[189]. Each of the sandwiched M4+
cation bonds to its four neighboring X2- anions. The MX2 layer performs like a giant atom with the
positive M4+ core and the negative X2- shells. The MX2 main layers interact one another through the
short-range X2-:: X2- repulsion (the same as the O2-::O2- super hydrogen-bond in basic solutions
48
[190]) and the slightly longer M4+ ~ X2- Coulomb attraction. Such a set of interactions stabilizes the
layered structures.
Figure 12. Atomic displacements of the four Raman-active modes and one IR-active mode (E1u) in
the unit cell of the bulk MoS2 crystal as viewed along the [1000] direction (Reprinted with copyright
permission from [39])
Furthermore, ribbons of these layered stuff have zigzag- and armchair-edge. Most importantly, bonds
between undercoordinated atoms in the layered structures are shorter and stronger and the bonds at
edges are even shorter and stronger than they are in the bulk trunks. The bond contraction and the
associated core electron quantum entrapment and valence electron polarization govern the
performance of these undercoordinated systems [6, 9].
3.1.2. Phonon Frequency Tunability
A huge database has been established toward the phonon spectroscopy/microscopy of the layered 2D
structures and their nanoribbons subjecting to various stimuli. The stimuli include the number-of-layer
(n) [21, 43, 49, 191, 192], uniaxial strain () [63, 193, 194], mechanical compression (P) [65], thermal
excitation (T) [111, 195], defect density and location [196], substrate interaction [197, 198],
hydrogenation or passivation [199, 200], impurity or doping [201], incident photon polarization [202],
edge conditioning [203, 204], etc.
Graphene shows two Raman active modes as do its allotropes. The G mode at ~1580 cm−1 was assumed
to result from the sp2 network planer vibration [205]. The 2D mode at ~2680 cm−1 was understood as
a second-order scattering of double resonant process [206]. In the presence of defects or edge atoms,
the defect-induced D band appears at frequencies around 1345 cm−1 with intensity being varied with
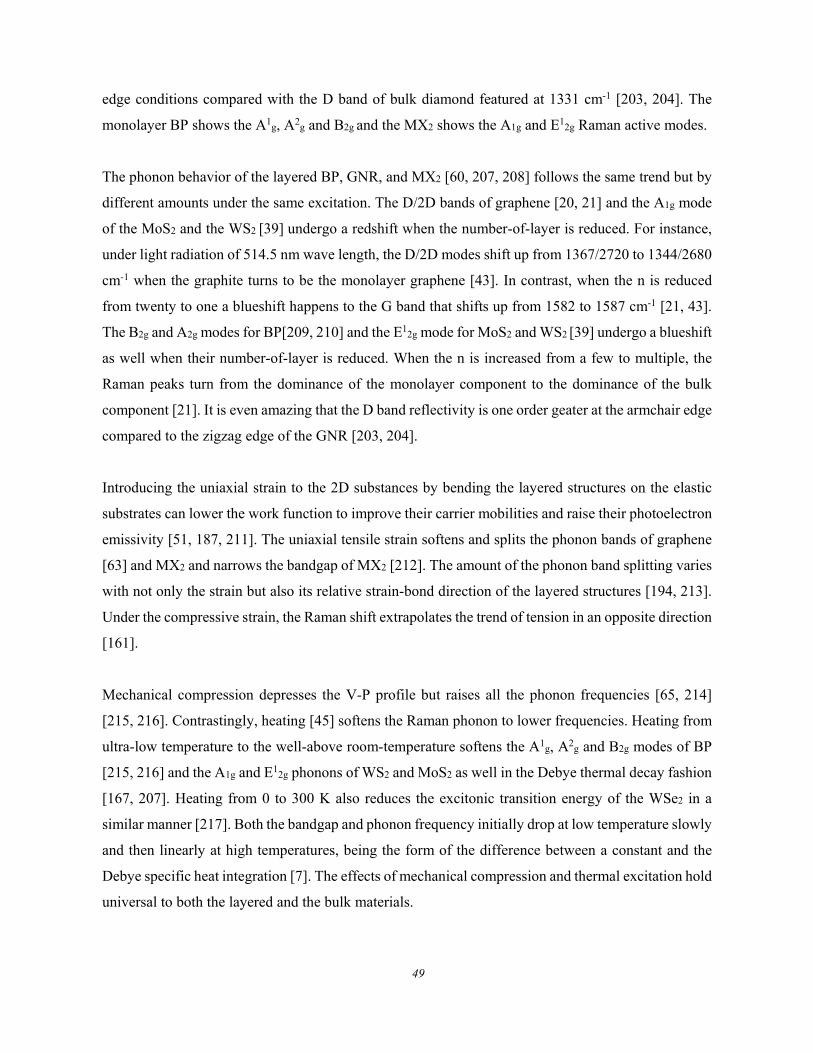
49
edge conditions compared with the D band of bulk diamond featured at 1331 cm-1 [203, 204]. The
monolayer BP shows the A1g, A2
g and B2g and the MX2 shows the A1g and E12g Raman active modes.
The phonon behavior of the layered BP, GNR, and MX2 [60, 207, 208] follows the same trend but by
different amounts under the same excitation. The D/2D bands of graphene [20, 21] and the A1g mode
of the MoS2 and the WS2 [39] undergo a redshift when the number-of-layer is reduced. For instance,
under light radiation of 514.5 nm wave length, the D/2D modes shift up from 1367/2720 to 1344/2680
cm-1 when the graphite turns to be the monolayer graphene [43]. In contrast, when the n is reduced
from twenty to one a blueshift happens to the G band that shifts up from 1582 to 1587 cm-1 [21, 43].
The B2g and A2g modes for BP[209, 210] and the E12g mode for MoS2 and WS2 [39] undergo a blueshift
as well when their number-of-layer is reduced. When the n is increased from a few to multiple, the
Raman peaks turn from the dominance of the monolayer component to the dominance of the bulk
component [21]. It is even amazing that the D band reflectivity is one order geater at the armchair edge
compared to the zigzag edge of the GNR [203, 204].
Introducing the uniaxial strain to the 2D substances by bending the layered structures on the elastic
substrates can lower the work function to improve their carrier mobilities and raise their photoelectron
emissivity [51, 187, 211]. The uniaxial tensile strain softens and splits the phonon bands of graphene
[63] and MX2 and narrows the bandgap of MX2 [212]. The amount of the phonon band splitting varies
with not only the strain but also its relative strain-bond direction of the layered structures [194, 213].
Under the compressive strain, the Raman shift extrapolates the trend of tension in an opposite direction
[161].
Mechanical compression depresses the V-P profile but raises all the phonon frequencies [65, 214]
[215, 216]. Contrastingly, heating [45] softens the Raman phonon to lower frequencies. Heating from
ultra-low temperature to the well-above room-temperature softens the A1g, A2
g and B2g modes of BP
[215, 216] and the A1g and E12g phonons of WS2 and MoS2 as well in the Debye thermal decay fashion
[167, 207]. Heating from 0 to 300 K also reduces the excitonic transition energy of the WSe2 in a
similar manner [217]. Both the bandgap and phonon frequency initially drop at low temperature slowly
and then linearly at high temperatures, being the form of the difference between a constant and the
Debye specific heat integration [7]. The effects of mechanical compression and thermal excitation hold
universal to both the layered and the bulk materials.
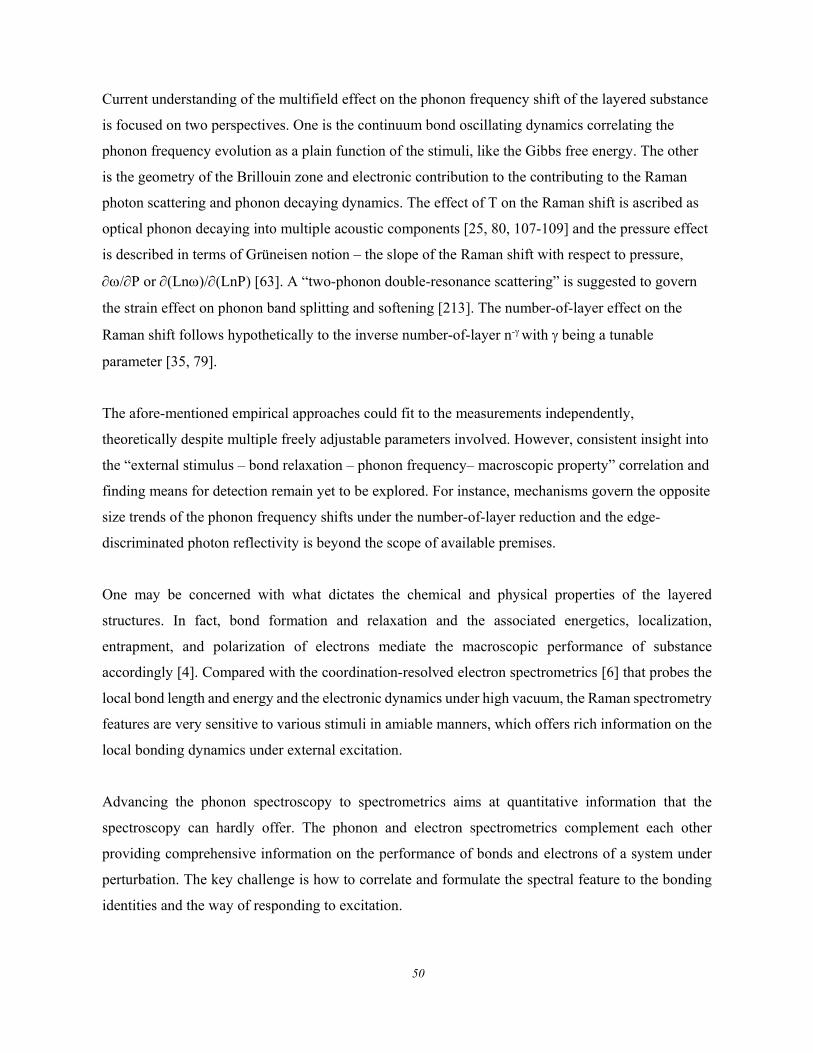
50
Current understanding of the multifield effect on the phonon frequency shift of the layered substance
is focused on two perspectives. One is the continuum bond oscillating dynamics correlating the
phonon frequency evolution as a plain function of the stimuli, like the Gibbs free energy. The other
is the geometry of the Brillouin zone and electronic contribution to the contributing to the Raman
photon scattering and phonon decaying dynamics. The effect of T on the Raman shift is ascribed as
optical phonon decaying into multiple acoustic components [25, 80, 107-109] and the pressure effect
is described in terms of Grüneisen notion – the slope of the Raman shift with respect to pressure,
/P or (Ln)/(LnP) [63]. A “two-phonon double-resonance scattering” is suggested to govern
the strain effect on phonon band splitting and softening [213]. The number-of-layer effect on the
Raman shift follows hypothetically to the inverse number-of-layer n- with being a tunable
parameter [35, 79].
The afore-mentioned empirical approaches could fit to the measurements independently,
theoretically despite multiple freely adjustable parameters involved. However, consistent insight into
the “external stimulus – bond relaxation – phonon frequency– macroscopic property” correlation and
finding means for detection remain yet to be explored. For instance, mechanisms govern the opposite
size trends of the phonon frequency shifts under the number-of-layer reduction and the edge-
discriminated photon reflectivity is beyond the scope of available premises.
One may be concerned with what dictates the chemical and physical properties of the layered
structures. In fact, bond formation and relaxation and the associated energetics, localization,
entrapment, and polarization of electrons mediate the macroscopic performance of substance
accordingly [4]. Compared with the coordination-resolved electron spectrometrics [6] that probes the
local bond length and energy and the electronic dynamics under high vacuum, the Raman spectrometry
features are very sensitive to various stimuli in amiable manners, which offers rich information on the
local bonding dynamics under external excitation.
Advancing the phonon spectroscopy to spectrometrics aims at quantitative information that the
spectroscopy can hardly offer. The phonon and electron spectrometrics complement each other
providing comprehensive information on the performance of bonds and electrons of a system under
perturbation. The key challenge is how to correlate and formulate the spectral feature to the bonding
identities and the way of responding to excitation.
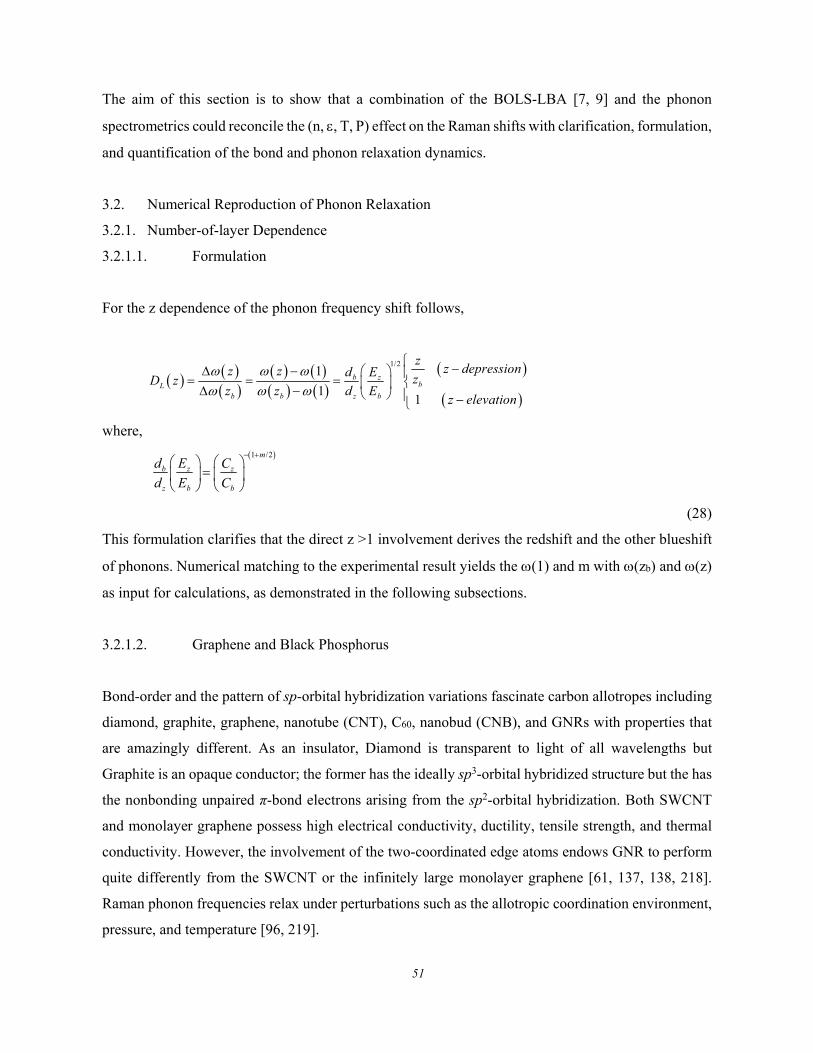
51
The aim of this section is to show that a combination of the BOLS-LBA [7, 9] and the phonon
spectrometrics could reconcile the (n, , T, P) effect on the Raman shifts with clarification, formulation,
and quantification of the bond and phonon relaxation dynamics.
3.2. Numerical Reproduction of Phonon Relaxation
3.2.1. Number-of-layer Dependence
3.2.1.1. Formulation
For the z dependence of the phonon frequency shift follows,
1/21
11
b zbL
b b z b
zz depressionz z d E zD z
z z d Ez elevation
where,
1 /2m
b z z
z b b
d E C
d E C
(28)
This formulation clarifies that the direct z >1 involvement derives the redshift and the other blueshift
of phonons. Numerical matching to the experimental result yields the (1) and m with (zb) and (z)
as input for calculations, as demonstrated in the following subsections.
3.2.1.2. Graphene and Black Phosphorus
Bond-order and the pattern of sp-orbital hybridization variations fascinate carbon allotropes including
diamond, graphite, graphene, nanotube (CNT), C60, nanobud (CNB), and GNRs with properties that
are amazingly different. As an insulator, Diamond is transparent to light of all wavelengths but
Graphite is an opaque conductor; the former has the ideally sp3-orbital hybridized structure but the has
the nonbonding unpaired π-bond electrons arising from the sp2-orbital hybridization. Both SWCNT
and monolayer graphene possess high electrical conductivity, ductility, tensile strength, and thermal
conductivity. However, the involvement of the two-coordinated edge atoms endows GNR to perform
quite differently from the SWCNT or the infinitely large monolayer graphene [61, 137, 138, 218].
Raman phonon frequencies relax under perturbations such as the allotropic coordination environment,
pressure, and temperature [96, 219].
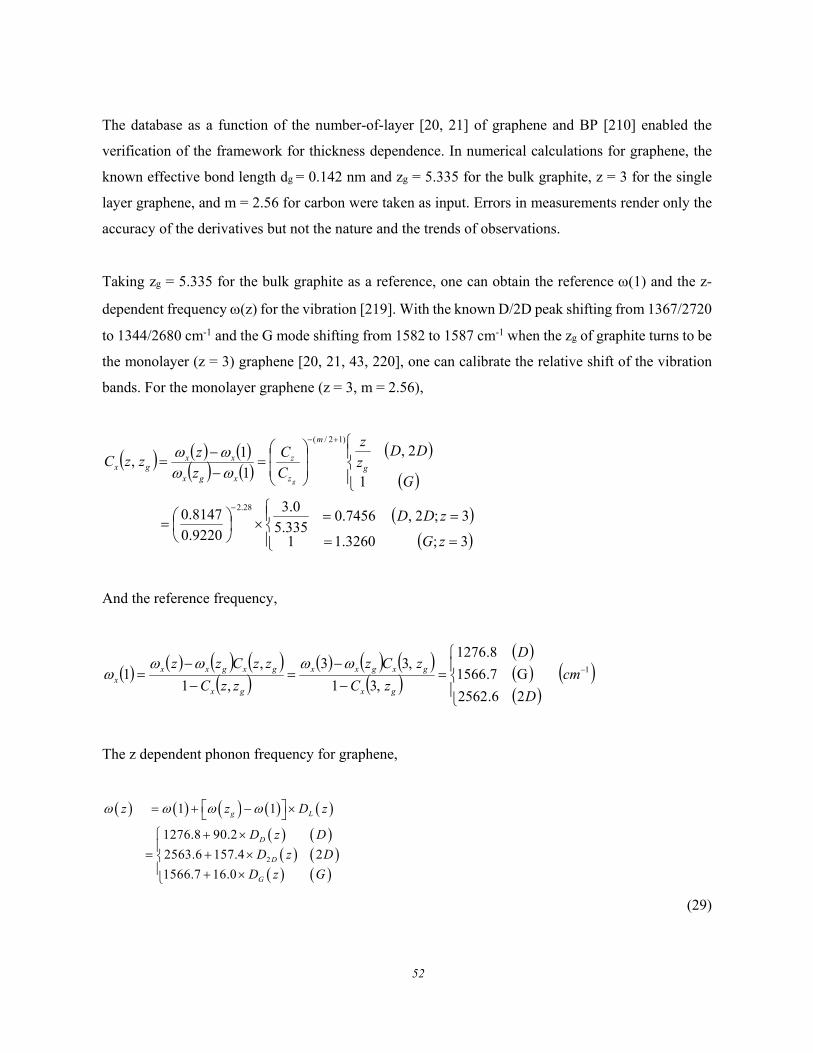
52
The database as a function of the number-of-layer [20, 21] of graphene and BP [210] enabled the
verification of the framework for thickness dependence. In numerical calculations for graphene, the
known effective bond length dg = 0.142 nm and zg = 5.335 for the bulk graphite, z = 3 for the single
layer graphene, and m = 2.56 for carbon were taken as input. Errors in measurements render only the
accuracy of the derivatives but not the nature and the trends of observations.
Taking zg = 5.335 for the bulk graphite as a reference, one can obtain the reference (1) and the z-
dependent frequency (z) for the vibration [219]. With the known D/2D peak shifting from 1367/2720
to 1344/2680 cm-1 and the G mode shifting from 1582 to 1587 cm-1 when the zg of graphite turns to be
the monolayer (z = 3) graphene [20, 21, 43, 220], one can calibrate the relative shift of the vibration
bands. For the monolayer graphene (z = 3, m = 2.56),
And the reference frequency,
The z dependent phonon frequency for graphene,
2
1 1
1276.8 90.2
2563.6 157.4 2
1566.7 16.0
g L
D
D
G
z z D z
D z D
D z D
D z G
(29)
3;3260.11
3;2,7456.0335.5
0.3
9220.0
8147.0
1
2,
1
1,
28.2
)12/(
zG
zDD
G
DDz
z
C
C
z
zzzC g
m
z
z
xgx
xxgx
g
1
26.2562
G.71566
8.1276
,31
,33
,1
,1
cm
D
D
zC
zCz
zzC
zzCzz
gx
gxgxx
gx
gxgxxx
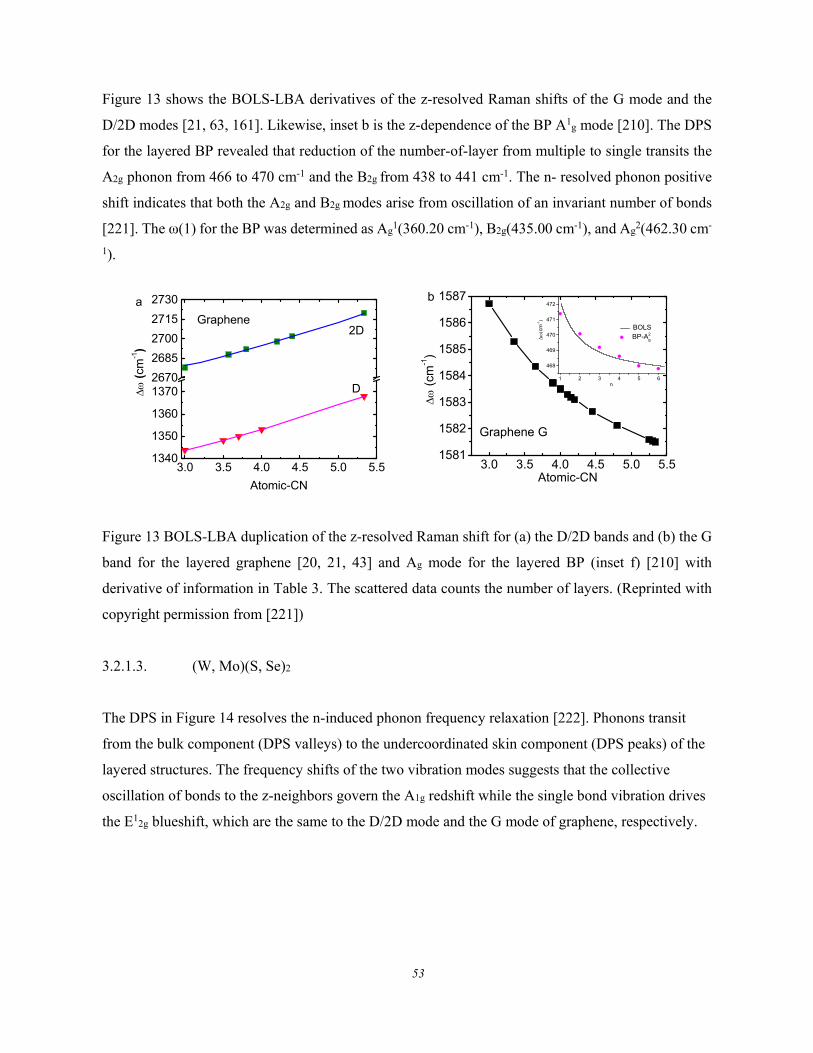
53
Figure 13 shows the BOLS-LBA derivatives of the z-resolved Raman shifts of the G mode and the
D/2D modes [21, 63, 161]. Likewise, inset b is the z-dependence of the BP A1g mode [210]. The DPS
for the layered BP revealed that reduction of the number-of-layer from multiple to single transits the
A2g phonon from 466 to 470 cm-1 and the B2g from 438 to 441 cm-1. The n- resolved phonon positive
shift indicates that both the A2g and B2g modes arise from oscillation of an invariant number of bonds
[221]. The ω(1) for the BP was determined as Ag1(360.20 cm-1), B2g(435.00 cm-1), and Ag
2(462.30 cm-
1).
3.0 3.5 4.0 4.5 5.0 5.51340
1350
1360
13702670
2685
2700
2715
2730
(
cm-1)
Atomic-CN
a
2D
D
Graphene
3.0 3.5 4.0 4.5 5.0 5.51581
1582
1583
1584
1585
1586
1587
(cm
-1)
Atomic-CN
1 2 3 4 5 6
468
469
470
471
472
c
m-1
n
BOLS BP-A2
g
b
Graphene G
Figure 13 BOLS-LBA duplication of the z-resolved Raman shift for (a) the D/2D bands and (b) the G
band for the layered graphene [20, 21, 43] and Ag mode for the layered BP (inset f) [210] with
derivative of information in Table 3. The scattered data counts the number of layers. (Reprinted with
copyright permission from [221])
3.2.1.3. (W, Mo)(S, Se)2
The DPS in Figure 14 resolves the n-induced phonon frequency relaxation [222]. Phonons transit
from the bulk component (DPS valleys) to the undercoordinated skin component (DPS peaks) of the
layered structures. The frequency shifts of the two vibration modes suggests that the collective
oscillation of bonds to the z-neighbors govern the A1g redshift while the single bond vibration drives
the E12g blueshift, which are the same to the D/2D mode and the G mode of graphene, respectively.
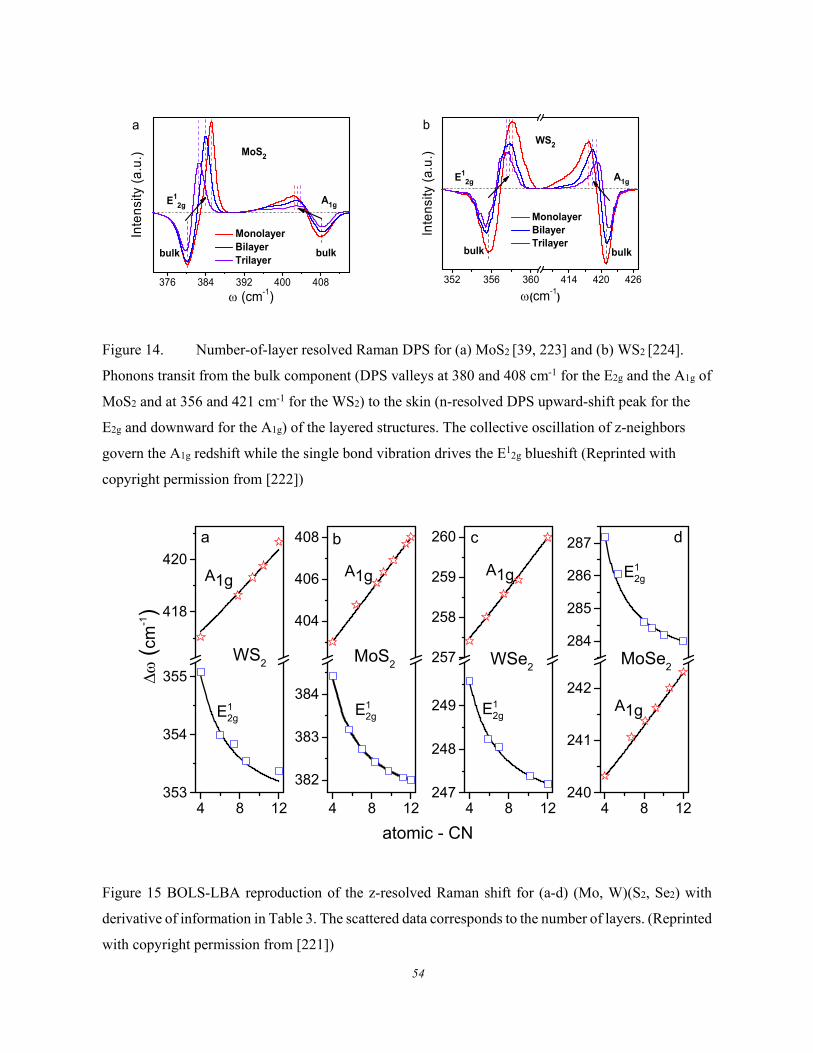
54
376 384 392 400 408
Inte
nsi
ty (
a.u
.)
(cm-1)
Monolayer Bilayer Trilayer
bulk bulk
E12g
A1g
MoS2
a
352 356 360 414 420 426
Inte
nsity
(a.
u.)
(cm-1)
Monolayer Bilayer Trilayer
E12g A1g
WS2
bulk bulk
b
Figure 14. Number-of-layer resolved Raman DPS for (a) MoS2 [39, 223] and (b) WS2 [224].
Phonons transit from the bulk component (DPS valleys at 380 and 408 cm-1 for the E2g and the A1g of
MoS2 and at 356 and 421 cm-1 for the WS2) to the skin (n-resolved DPS upward-shift peak for the
E2g and downward for the A1g) of the layered structures. The collective oscillation of z-neighbors
govern the A1g redshift while the single bond vibration drives the E12g blueshift (Reprinted with
copyright permission from [222])
4 8 12353
354
355
418
420
atomic - CN
A1g
(cm
-1)
WS2
E12g
a
4 8 12
382
383
384
404
406
408 b
A1g
E12g
MoS2
4 8 12247
248
249
257
258
259
260 c
A1g
E12g
WSe2
4 8 12240
241
242
284
285
286
287 d
E12g
A1g
MoSe2
Figure 15 BOLS-LBA reproduction of the z-resolved Raman shift for (a-d) (Mo, W)(S2, Se2) with
derivative of information in Table 3. The scattered data corresponds to the number of layers. (Reprinted
with copyright permission from [221])
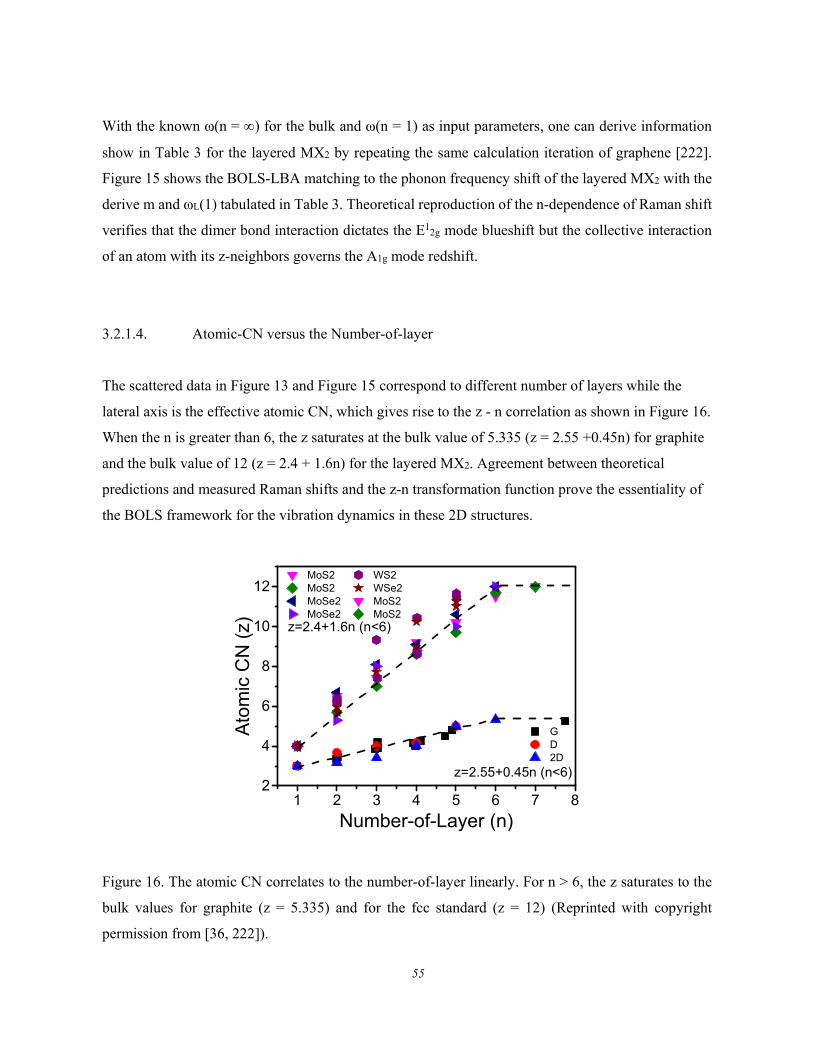
55
With the known ω(n = ) for the bulk and ω(n = 1) as input parameters, one can derive information
show in Table 3 for the layered MX2 by repeating the same calculation iteration of graphene [222].
Figure 15 shows the BOLS-LBA matching to the phonon frequency shift of the layered MX2 with the
derive m and ωL(1) tabulated in Table 3. Theoretical reproduction of the n-dependence of Raman shift
verifies that the dimer bond interaction dictates the E12g mode blueshift but the collective interaction
of an atom with its z-neighbors governs the A1g mode redshift.
3.2.1.4. Atomic-CN versus the Number-of-layer
The scattered data in Figure 13 and Figure 15 correspond to different number of layers while the
lateral axis is the effective atomic CN, which gives rise to the z - n correlation as shown in Figure 16.
When the n is greater than 6, the z saturates at the bulk value of 5.335 (z = 2.55 +0.45n) for graphite
and the bulk value of 12 (z = 2.4 + 1.6n) for the layered MX2. Agreement between theoretical
predictions and measured Raman shifts and the z-n transformation function prove the essentiality of
the BOLS framework for the vibration dynamics in these 2D structures.
1 2 3 4 5 6 7 82
4
6
8
10
12 MoS2 WS2 MoS2 WSe2 MoSe2 MoS2 MoSe2 MoS2
z=2.55+0.45n (n<6)
Ato
mic
CN
(z)
Number-of-Layer (n)
G D 2D
z=2.4+1.6n (n<6)
Figure 16. The atomic CN correlates to the number-of-layer linearly. For n > 6, the z saturates to the
bulk values for graphite (z = 5.335) and for the fcc standard (z = 12) (Reprinted with copyright
permission from [36, 222]).
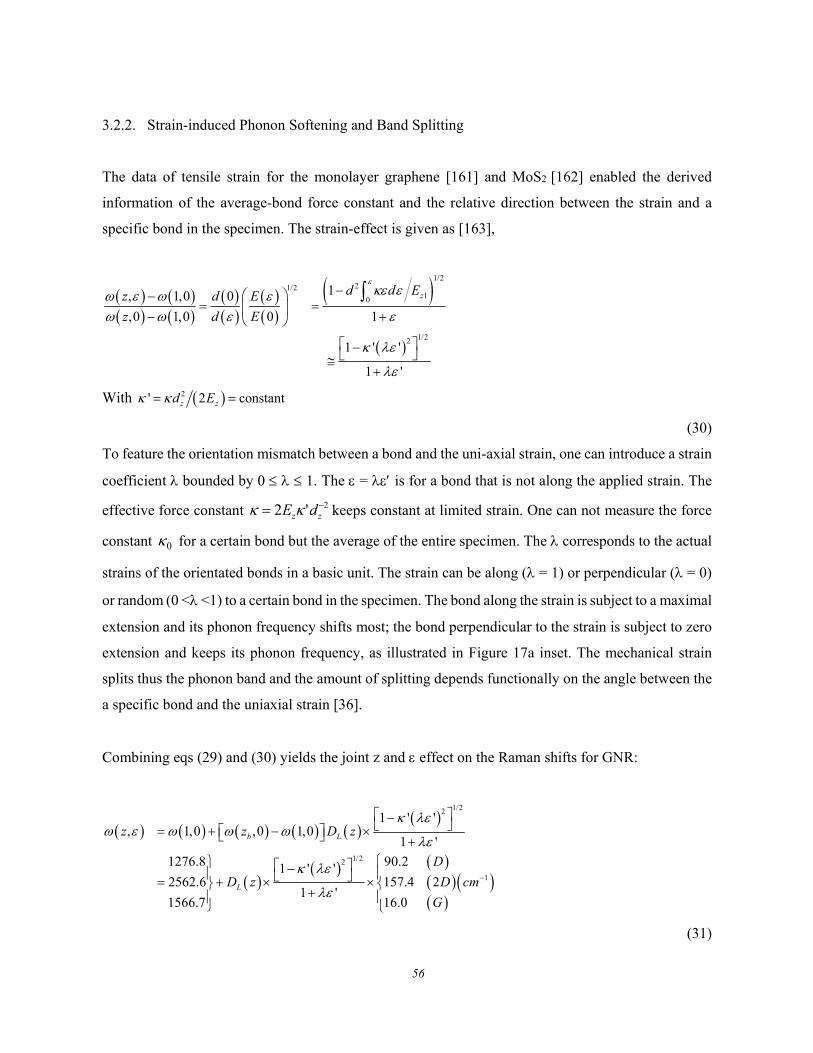
56
3.2.2. Strain-induced Phonon Softening and Band Splitting
The data of tensile strain for the monolayer graphene [161] and MoS2 [162] enabled the derived
information of the average-bond force constant and the relative direction between the strain and a
specific bond in the specimen. The strain-effect is given as [163],
1/221/2
10
1/22
1, 1,0 0
,0 1,0 0 1
1 ' '
1 '
zd d Ez d E
z d E
With 2' 2 constantz zd E
(30)
To feature the orientation mismatch between a bond and the uni-axial strain, one can introduce a strain
coefficient bounded by 0 1. The = is for a bond that is not along the applied strain. The
effective force constant keeps constant at limited strain. One can not measure the force
constant for a certain bond but the average of the entire specimen. The corresponds to the actual
strains of the orientated bonds in a basic unit. The strain can be along ( = 1) or perpendicular ( = 0)
or random (0 < <1) to a certain bond in the specimen. The bond along the strain is subject to a maximal
extension and its phonon frequency shifts most; the bond perpendicular to the strain is subject to zero
extension and keeps its phonon frequency, as illustrated in Figure 17a inset. The mechanical strain
splits thus the phonon band and the amount of splitting depends functionally on the angle between the
a specific bond and the uniaxial strain [36].
Combining eqs (29) and (30) yields the joint z and effect on the Raman shifts for GNR:
1/22
1/22
1
1 ' ', 1,0 ,0 1,0
1 '
1276.8 90.21 ' '2562.6 157.4 2
1 '1566.7 16.0
b L
L
z z D z
D
D z D cm
G
(31)
2'2 zz dE
0
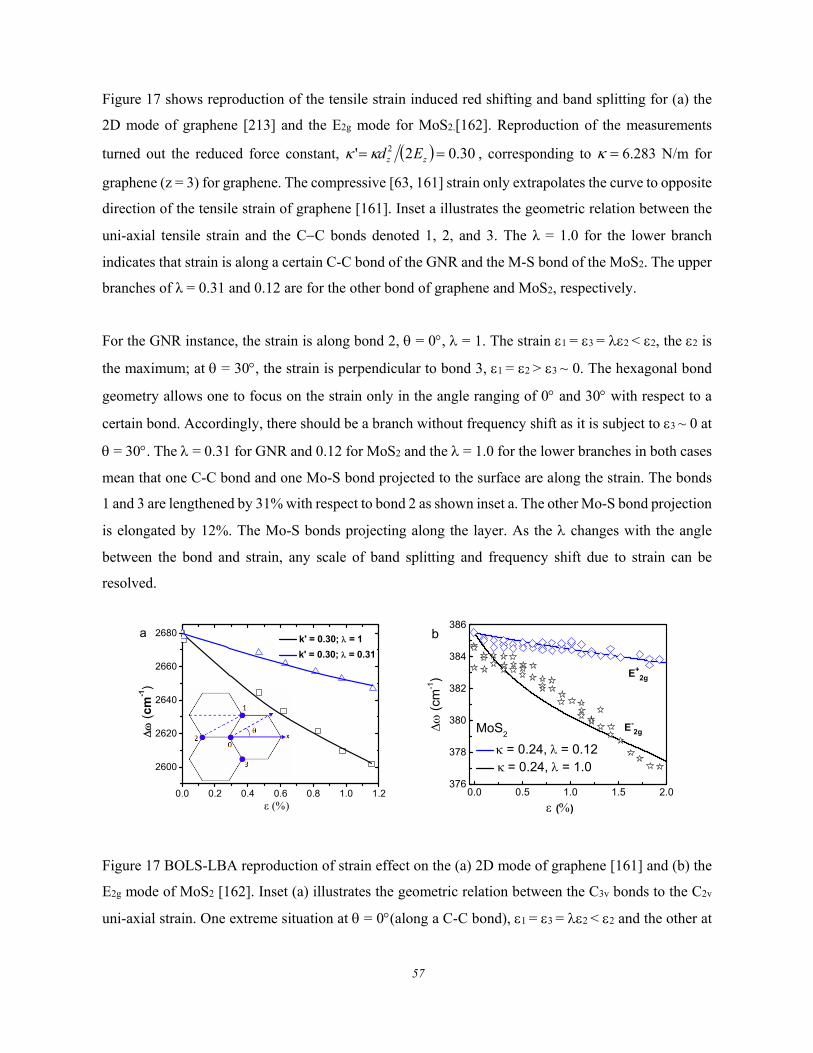
57
Figure 17 shows reproduction of the tensile strain induced red shifting and band splitting for (a) the
2D mode of graphene [213] and the E2g mode for MoS2.[162]. Reproduction of the measurements
turned out the reduced force constant, , corresponding to 6.283 N/m for
graphene (z = 3) for graphene. The compressive [63, 161] strain only extrapolates the curve to opposite
direction of the tensile strain of graphene [161]. Inset a illustrates the geometric relation between the
uni-axial tensile strain and the CC bonds denoted 1, 2, and 3. The λ = 1.0 for the lower branch
indicates that strain is along a certain C-C bond of the GNR and the M-S bond of the MoS2. The upper
branches of λ = 0.31 and 0.12 are for the other bond of graphene and MoS2, respectively.
For the GNR instance, the strain is along bond 2, = 0, = 1. The strain 1 = 3 = 2 < 2, the 2 is
the maximum; at = 30, the strain is perpendicular to bond 3, 1 = 2 > 3 ~ 0. The hexagonal bond
geometry allows one to focus on the strain only in the angle ranging of 0 and 30 with respect to a
certain bond. Accordingly, there should be a branch without frequency shift as it is subject to 3 ~ 0 at
= 30. The = 0.31 for GNR and 0.12 for MoS2 and the = 1.0 for the lower branches in both cases
mean that one C-C bond and one Mo-S bond projected to the surface are along the strain. The bonds
1 and 3 are lengthened by 31% with respect to bond 2 as shown inset a. The other Mo-S bond projection
is elongated by 12%. The Mo-S bonds projecting along the layer. As the changes with the angle
between the bond and strain, any scale of band splitting and frequency shift due to strain can be
resolved.
0.0 0.2 0.4 0.6 0.8 1.0 1.2
2600
2620
2640
2660
2680
(cm
-1)
k' = 0.30; = 1
k' = 0.30; = 0.31
a
0.0 0.5 1.0 1.5 2.0376
378
380
382
384
386
(c
m-1)
()
MoS2
= 0.24,= 0.12 = 0.24,= 1.0
E+2g
E-2g
b
Figure 17 BOLS-LBA reproduction of strain effect on the (a) 2D mode of graphene [161] and (b) the
E2g mode of MoS2 [162]. Inset (a) illustrates the geometric relation between the C3v bonds to the C2v
uni-axial strain. One extreme situation at = 0(along a C-C bond), 1 = 3 = 2 < 2 and the other at
30.02' 2 zz Ed
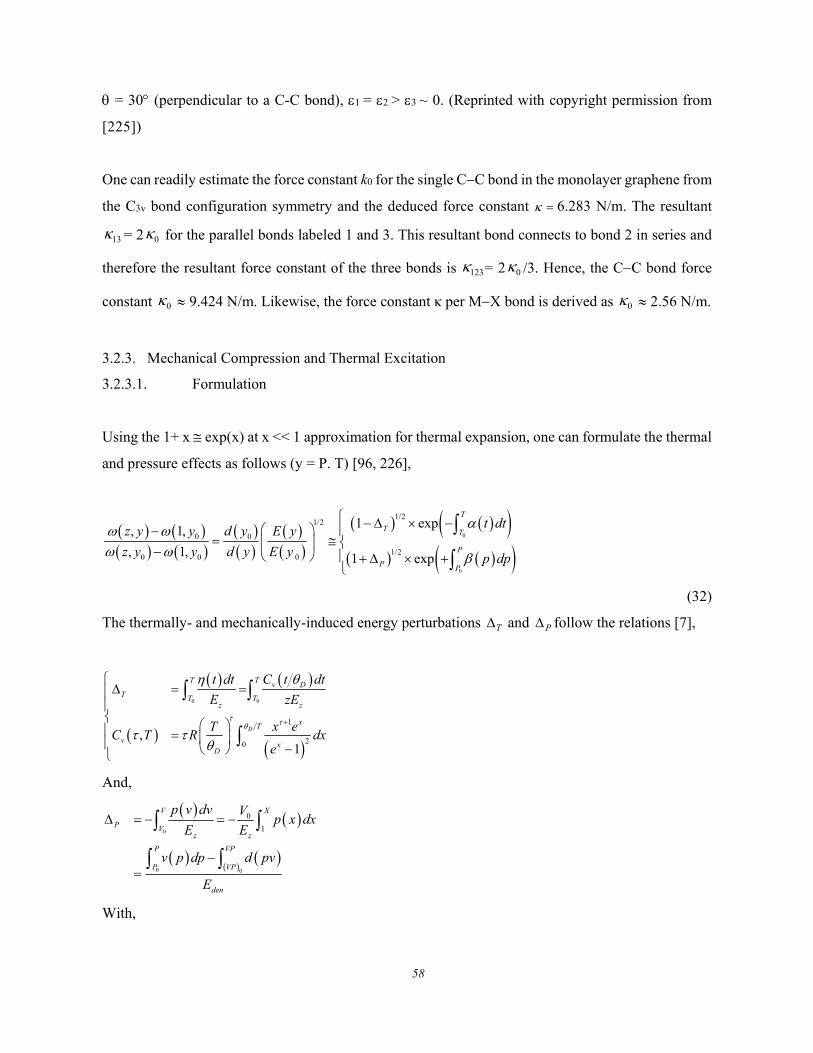
58
= 30 (perpendicular to a C-C bond), 1 = 2 > 3 ~ 0. (Reprinted with copyright permission from
[225])
One can readily estimate the force constant k0 for the single CC bond in the monolayer graphene from
the C3v bond configuration symmetry and the deduced force constant 6.283 N/m. The resultant
= 2 for the parallel bonds labeled 1 and 3. This resultant bond connects to bond 2 in series and
therefore the resultant force constant of the three bonds is = 2 /3. Hence, the CC bond force
constant 9.424 N/m. Likewise, the force constant κ per MX bond is derived as 2.56 N/m.
3.2.3. Mechanical Compression and Thermal Excitation
3.2.3.1. Formulation
Using the 1+ x exp(x) at x << 1 approximation for thermal expansion, one can formulate the thermal
and pressure effects as follows (y = P. T) [96, 226],
0
0
1/21/2
0 0
1/20 0 0
1 exp, 1,
, 1, 1 exp
T
T T
P
P P
t dtz y y d y E y
z y y d y E y p dp
(32)
The thermally- and mechanically-induced energy perturbations and follow the relations [7],
0 0
1
20,
1
D
T T v DT T T
z z
xT
v xD
t dt C t dt
E zE
T x eC T R dx
e
And,
0
0 0
0
1
V X
P Vz z
P VP
P VP
den
p v dv Vp x dx
E E
v p dp d pv
E
With,
13 0
123 0
0 0
T P
59
' 2/307/3 5/30
2
4 131 3
2 4
1 '
B xBp x x x B M
x p P P Polynomial
(33)
The is the integral of the Debye specific heat division by the bond energy. At temperature T higher
than D, the two-dimensional specific heat Cv converges a constant of R with R being the idea gas
constant. The Debye temperature D and the atomic cohesive energy Ecoh = zEz are adjustable
parameters used in calculating the . The is derived from the integral of the Birch-Mürnaghan
state-of-equation [227, 228]. The V0 denotes the volume of a bond under the ambient pressure.
The compressibility , and binding energy density Eden = Ez /V0 are tunable parameters variables
used in calculating . The x(P) is an alternative of the equation- of-state. Matching the Birch-
Mürnaghan equation to the measured x(P) curve, one can derive the , , the bulk modulus B0 (B0
1) and its first-order differentiation . Substituting the integrals (33) into (32), one can derivatives
of the D, , and Eden and the compressibility derived from the x(P) relation with the known Ecoh by
reproducing the P- and T-resoved Raman frequency shifts.
3.2.3.2. MX2 Debye Thermal Decay
Figure 18 shows the reproduction of the thermally softened Raman shifts for the MX2 with derived
Ecoh, and θD given in Table 3. The ωx(1) and Δωx can also be obtained from matching the number-of-
layer effect on the phonon frequency shift. Theoretical match is realized by adjusting the θD and the
Ecoh without needing any hypothetic parameters [229], as the Raman shift features the (E/d2)1/2 that
relaxes following functionally the integration of Debye specific heat. The small 0
Tdt value at very
low temperatures determines the slow decay of the Raman shift as the ( )t is proportional to T for
the -dimensional system. Therefore, the θD determines the width of the shoulder, the 1/Ecoh and the
thermal expansion coefficient determine the slope of the curve at high temperatures.
Results derived from the matching to measurements favor the BOLS-LBA notion of the bond
thermal relaxation. The atomic cohesive energy for the MX2 follows the Ecoh-MoS2(1.35) < Ecoh-
WS2(2.15) < Ecoh-MoSe2(2.30) < Ecoh-WSe2(3.21) order. The MoS2 shows a higher rate of bond energy
T
T P
P
0'B
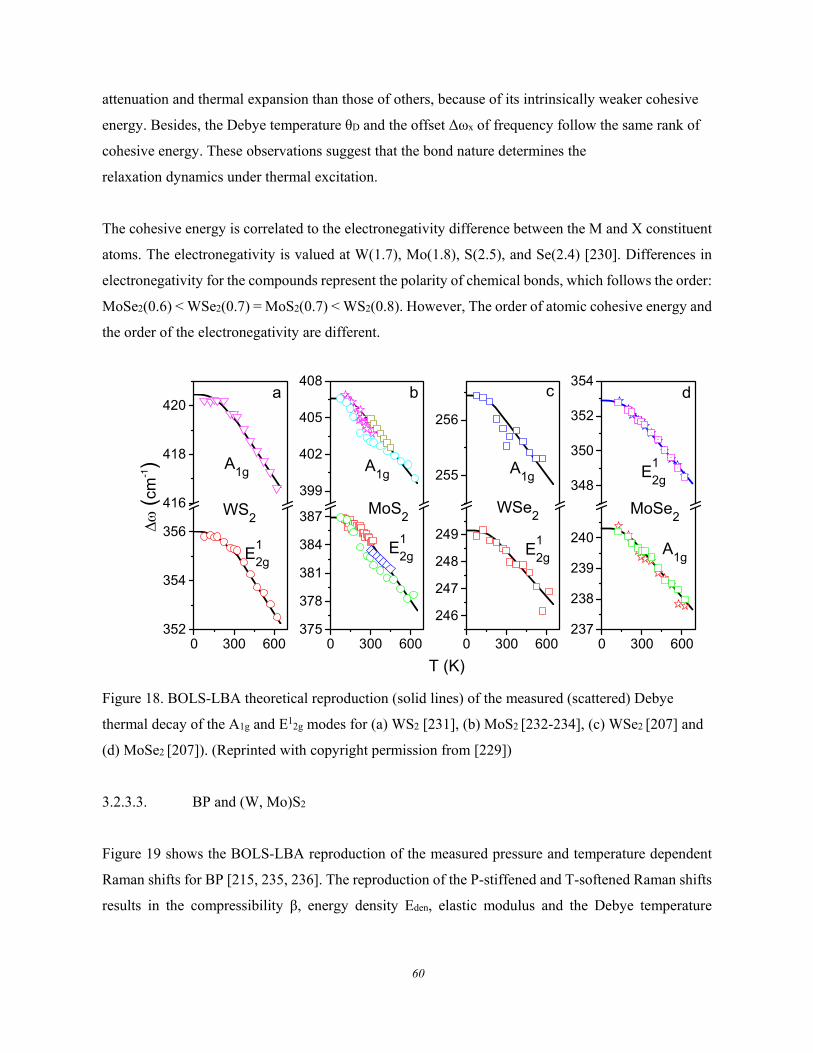
60
attenuation and thermal expansion than those of others, because of its intrinsically weaker cohesive
energy. Besides, the Debye temperature θD and the offset Δωx of frequency follow the same rank of
cohesive energy. These observations suggest that the bond nature determines the
relaxation dynamics under thermal excitation.
The cohesive energy is correlated to the electronegativity difference between the M and X constituent
atoms. The electronegativity is valued at W(1.7), Mo(1.8), S(2.5), and Se(2.4) [230]. Differences in
electronegativity for the compounds represent the polarity of chemical bonds, which follows the order:
MoSe2(0.6) < WSe2(0.7) = MoS2(0.7) < WS2(0.8). However, The order of atomic cohesive energy and
the order of the electronegativity are different.
0 300 600352
354
356
416
418
420
E12g
A1g
WS2
(cm
-1)
a
0 300 600375
378
381
384
387
399
402
405
408
T (K)
E1
2g
A1g
MoS2
b
0 300 600
246
247
248
249
255
256
E1
2g
A1g
WSe2
c
0 300 600237
238
239
240
348
350
352
354
MoSe2
A1g
E1
2g
d
Figure 18. BOLS-LBA theoretical reproduction (solid lines) of the measured (scattered) Debye
thermal decay of the A1g and E12g modes for (a) WS2 [231], (b) MoS2 [232-234], (c) WSe2 [207] and
(d) MoSe2 [207]). (Reprinted with copyright permission from [229])
3.2.3.3. BP and (W, Mo)S2
Figure 19 shows the BOLS-LBA reproduction of the measured pressure and temperature dependent
Raman shifts for BP [215, 235, 236]. The reproduction of the P-stiffened and T-softened Raman shifts
results in the compressibility β, energy density Eden, elastic modulus and the Debye temperature
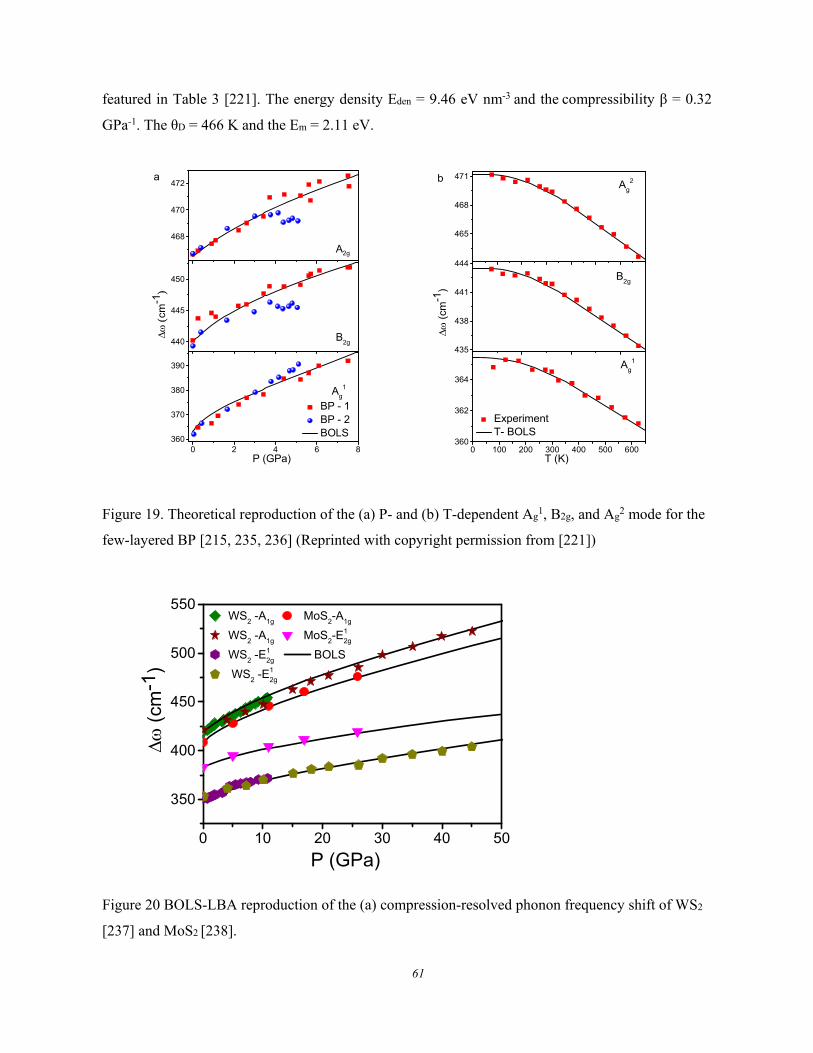
61
featured in Table 3 [221]. The energy density Eden = 9.46 eV nm-3 and the compressibility β = 0.32
GPa-1. The θD = 466 K and the Em = 2.11 eV.
468
470
472
BP - 1 BP - 2 BOLS
c
m-1
A2g
440
445
450
B2g
0 2 4 6 8360
370
380
390
a
P (GPa)
Ag
1
465
468
471
(
cm-1
)
Experiment T- BOLS
Ag
2b
435
438
441
444
B2g
0 100 200 300 400 500 600360
362
364
T (K)
Ag1
Figure 19. Theoretical reproduction of the (a) P- and (b) T-dependent Ag1, B2g, and Ag
2 mode for the
few-layered BP [215, 235, 236] (Reprinted with copyright permission from [221])
0 10 20 30 40 50
350
400
450
500
550
(c
m-1
)
P (GPa)
WS2 -A
1g MoS
2-A
1g
WS2 -A
1g MoS
2-E1
2g
WS2 -E1
2g BOLS
WS2 -E1
2g
Figure 20 BOLS-LBA reproduction of the (a) compression-resolved phonon frequency shift of WS2
[237] and MoS2 [238].
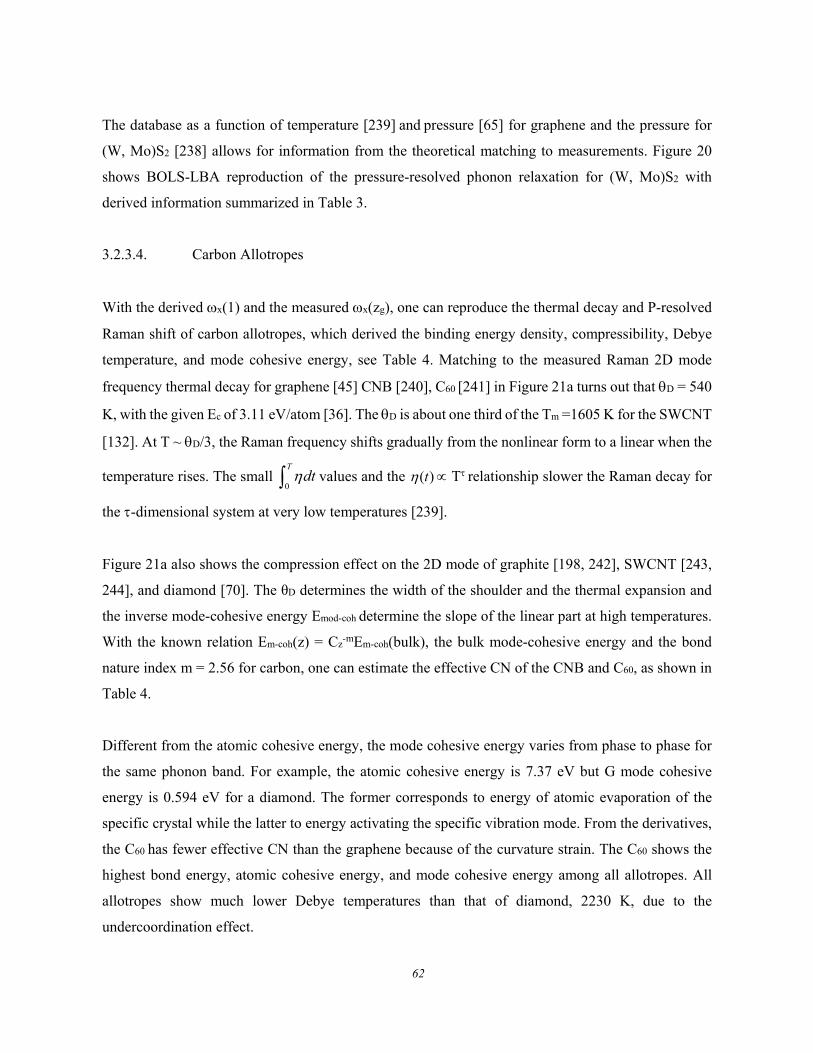
62
The database as a function of temperature [239] and pressure [65] for graphene and the pressure for
(W, Mo)S2 [238] allows for information from the theoretical matching to measurements. Figure 20
shows BOLS-LBA reproduction of the pressure-resolved phonon relaxation for (W, Mo)S2 with
derived information summarized in Table 3.
3.2.3.4. Carbon Allotropes
With the derived x(1) and the measured x(zg), one can reproduce the thermal decay and P-resolved
Raman shift of carbon allotropes, which derived the binding energy density, compressibility, Debye
temperature, and mode cohesive energy, see Table 4. Matching to the measured Raman 2D mode
frequency thermal decay for graphene [45] CNB [240], C60 [241] in Figure 21a turns out that D = 540
K, with the given Ec of 3.11 eV/atom [36]. The D is about one third of the Tm =1605 K for the SWCNT
[132]. At T ~ D/3, the Raman frequency shifts gradually from the nonlinear form to a linear when the
temperature rises. The small 0
Tdt values and the ( )t T relationship slower the Raman decay for
the -dimensional system at very low temperatures [239].
Figure 21a also shows the compression effect on the 2D mode of graphite [198, 242], SWCNT [243,
244], and diamond [70]. The θD determines the width of the shoulder and the thermal expansion and
the inverse mode-cohesive energy Emod-coh determine the slope of the linear part at high temperatures.
With the known relation Em-coh(z) = Cz-mEm-coh(bulk), the bulk mode-cohesive energy and the bond
nature index m = 2.56 for carbon, one can estimate the effective CN of the CNB and C60, as shown in
Table 4.
Different from the atomic cohesive energy, the mode cohesive energy varies from phase to phase for
the same phonon band. For example, the atomic cohesive energy is 7.37 eV but G mode cohesive
energy is 0.594 eV for a diamond. The former corresponds to energy of atomic evaporation of the
specific crystal while the latter to energy activating the specific vibration mode. From the derivatives,
the C60 has fewer effective CN than the graphene because of the curvature strain. The C60 shows the
highest bond energy, atomic cohesive energy, and mode cohesive energy among all allotropes. All
allotropes show much lower Debye temperatures than that of diamond, 2230 K, due to the
undercoordination effect.
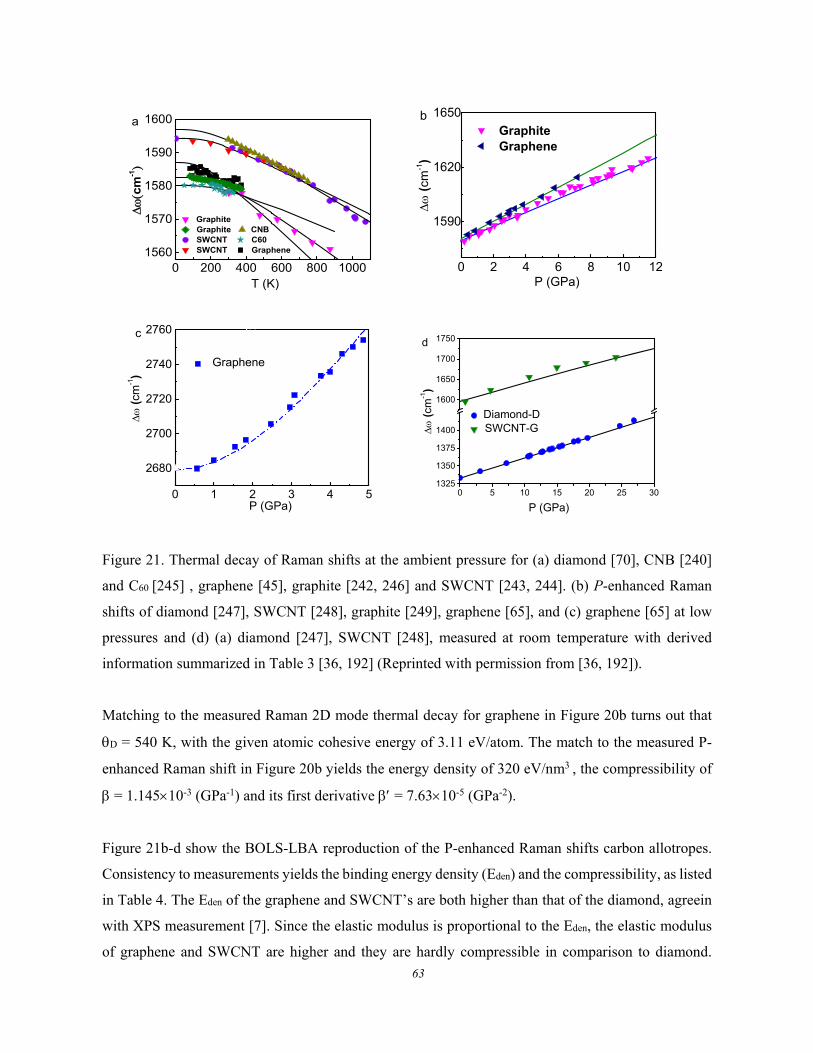
63
0 200 400 600 800 10001560
1570
1580
1590
1600
c
m-1
T (K)
Graphite Graphite CNB SWCNT C60 SWCNT Graphene
a
0 2 4 6 8 10 12
1590
1620
1650
(cm
-1)
P (GPa)
Graphite Graphene
b
0 1 2 3 4 5
2680
2700
2720
2740
2760
(
cm-1)
P (GPa)
Graphene
c
0 5 10 15 20 25 301325
1350
1375
1400
1600
1650
1700
1750
(cm
-1)
P (GPa)
Diamond-D SWCNT-G
d
Figure 21. Thermal decay of Raman shifts at the ambient pressure for (a) diamond [70], CNB [240]
and C60 [245] , graphene [45], graphite [242, 246] and SWCNT [243, 244]. (b) P-enhanced Raman
shifts of diamond [247], SWCNT [248], graphite [249], graphene [65], and (c) graphene [65] at low
pressures and (d) (a) diamond [247], SWCNT [248], measured at room temperature with derived
information summarized in Table 3 [36, 192] (Reprinted with permission from [36, 192]).
Matching to the measured Raman 2D mode thermal decay for graphene in Figure 20b turns out that
D = 540 K, with the given atomic cohesive energy of 3.11 eV/atom. The match to the measured P-
enhanced Raman shift in Figure 20b yields the energy density of 320 eV/nm3 , the compressibility of
= 1.14510-3 (GPa-1) and its first derivative = 7.6310-5 (GPa-2).
Figure 21b-d show the BOLS-LBA reproduction of the P-enhanced Raman shifts carbon allotropes.
Consistency to measurements yields the binding energy density (Eden) and the compressibility, as listed
in Table 4. The Eden of the graphene and SWCNT’s are both higher than that of the diamond, agreein
with XPS measurement [7]. Since the elastic modulus is proportional to the Eden, the elastic modulus
of graphene and SWCNT are higher and they are hardly compressible in comparison to diamond.
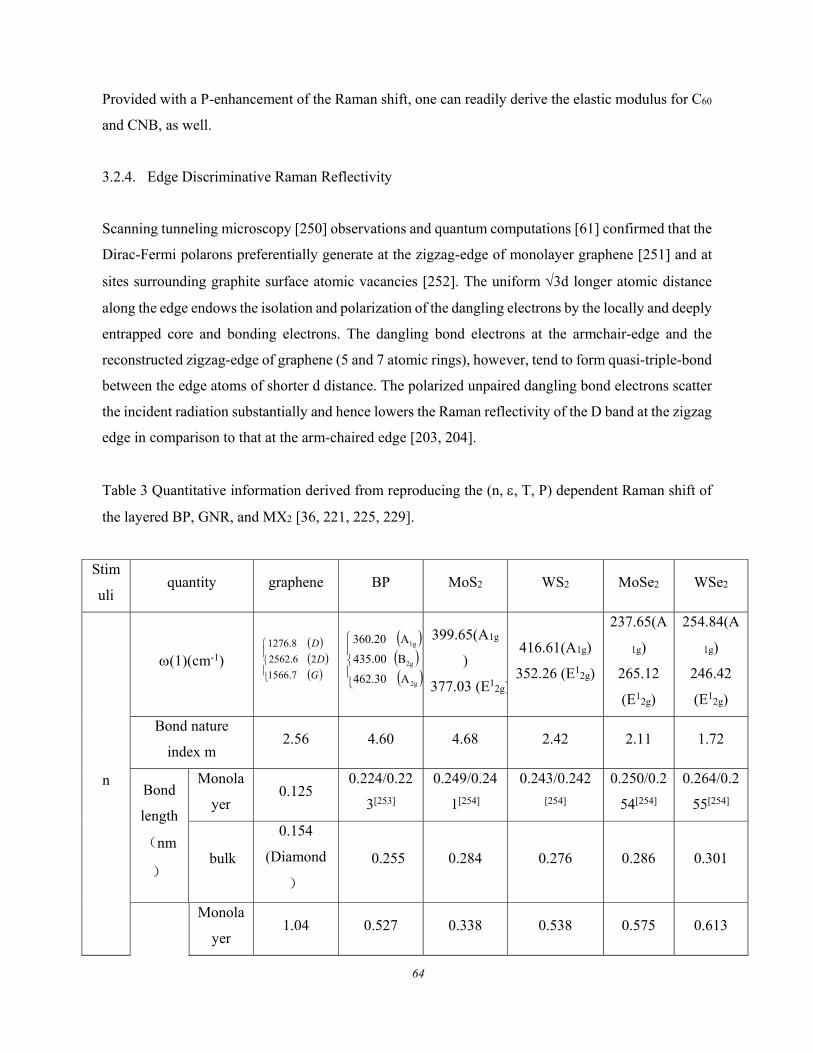
64
Provided with a P-enhancement of the Raman shift, one can readily derive the elastic modulus for C60
and CNB, as well.
3.2.4. Edge Discriminative Raman Reflectivity
Scanning tunneling microscopy [250] observations and quantum computations [61] confirmed that the
Dirac-Fermi polarons preferentially generate at the zigzag-edge of monolayer graphene [251] and at
sites surrounding graphite surface atomic vacancies [252]. The uniform 3d longer atomic distance
along the edge endows the isolation and polarization of the dangling electrons by the locally and deeply
entrapped core and bonding electrons. The dangling bond electrons at the armchair-edge and the
reconstructed zigzag-edge of graphene (5 and 7 atomic rings), however, tend to form quasi-triple-bond
between the edge atoms of shorter d distance. The polarized unpaired dangling bond electrons scatter
the incident radiation substantially and hence lowers the Raman reflectivity of the D band at the zigzag
edge in comparison to that at the arm-chaired edge [203, 204].
Table 3 Quantitative information derived from reproducing the (n, , T, P) dependent Raman shift of
the layered BP, GNR, and MX2 [36, 221, 225, 229].
Stim
uli quantity graphene BP MoS2 WS2 MoSe2 WSe2
n
(1)(cm-1)
399.65(A1g
)
377.03 (E12g)
416.61(A1g)
352.26 (E12g)
237.65(A
1g)
265.12
(E12g)
254.84(A
1g)
246.42
(E12g)
Bond nature
index m 2.56 4.60 4.68 2.42 2.11 1.72
Bond
length
(nm
)
Monola
yer 0.125
0.224/0.22
3[253]
0.249/0.24
1[254]
0.243/0.242
[254]
0.250/0.2
54[254]
0.264/0.2
55[254]
bulk
0.154
(Diamond
)
0.255 0.284 0.276 0.286 0.301
Monola
yer 1.04 0.527 0.338 0.538 0.575 0.613
G
D
D
7.1566
26.2562
8.1276
2g
2g
1g
A 30.462
B 435.00
A 60.203
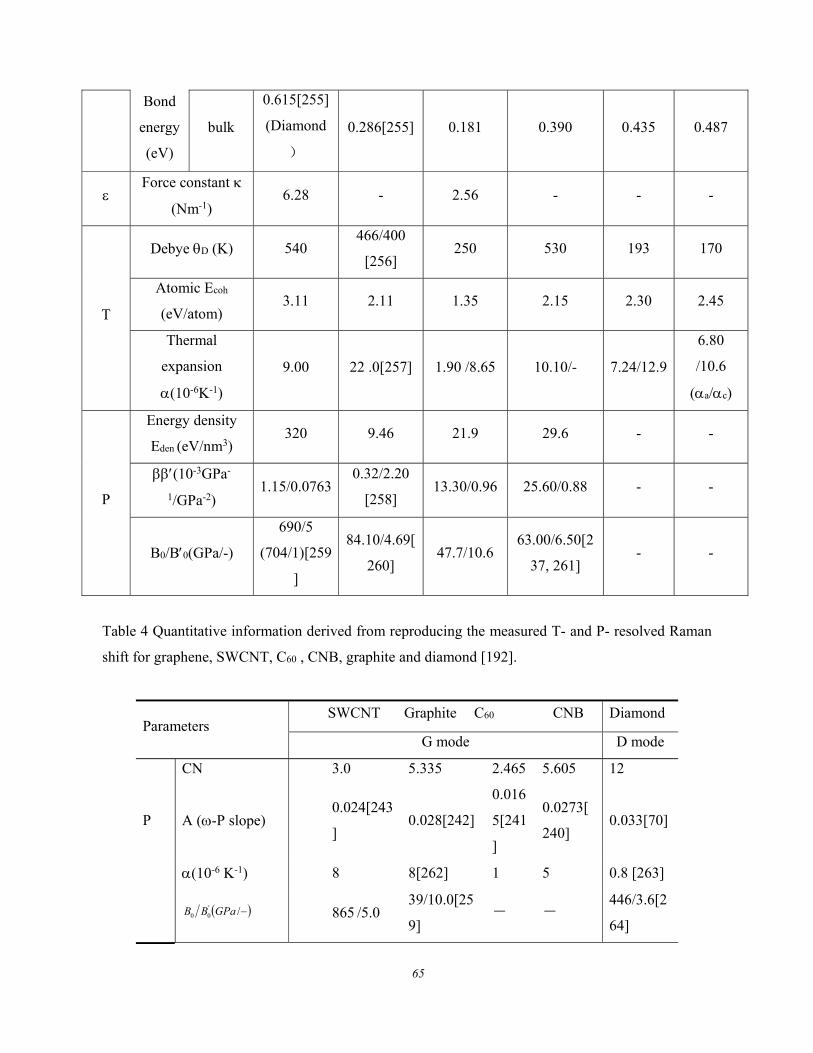
65
Bond
energy
(eV)
bulk
0.615[255]
(Diamond
)
0.286[255] 0.181 0.390 0.435 0.487
Force constant
(Nm-1) 6.28 - 2.56 - - -
T
Debye D (K) 540 466/400
[256] 250 530 193 170
Atomic Ecoh
(eV/atom) 3.11 2.11 1.35 2.15 2.30 2.45
Thermal
expansion
(10-6K-1)
9.00 22 .0[257] 1.90 /8.65 10.10/- 7.24/12.9
6.80
/10.6
(a/c)
P
Energy density
Eden (eV/nm3) 320 9.46 21.9 29.6 - -
(10-3GPa-
1/GPa-2) 1.15/0.0763
0.32/2.20
[258] 13.30/0.96 25.60/0.88 - -
B0/B0(GPa/-)
690/5
(704/1)[259
]
84.10/4.69[
260] 47.7/10.6
63.00/6.50[2
37, 261] - -
Table 4 Quantitative information derived from reproducing the measured T- and P- resolved Raman
shift for graphene, SWCNT, C60 , CNB, graphite and diamond [192].
Parameters SWCNT Graphite C60 CNB Diamond
G mode D mode
CN 3.0 5.335 2.465 5.605 12
P A (-P slope) 0.024[243
] 0.028[242]
0.016
5[241
]
0.0273[
240] 0.033[70]
(10-6 K-1) 8 8[262] 1 5 0.8 [263]
865 /5.0 39/10.0[25
9] - -
446/3.6[2
64] /'
00 GPaBB
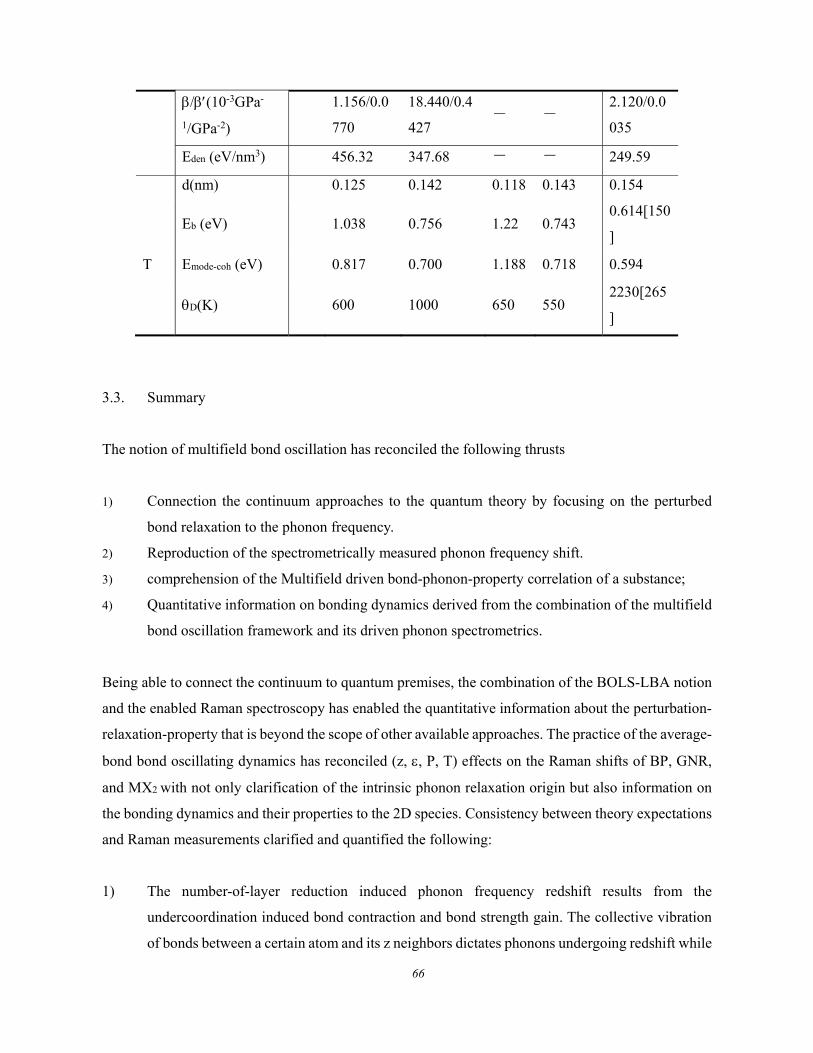
66
/(10-3GPa-
1/GPa-2)
1.156/0.0
770
18.440/0.4
427 - -
2.120/0.0
035
Eden (eV/nm3) 456.32 347.68 - - 249.59
d(nm) 0.125 0.142 0.118 0.143 0.154
Eb (eV) 1.038 0.756 1.22 0.743 0.614[150
]
T Emode-coh (eV) 0.817 0.700 1.188 0.718 0.594
D(K) 600 1000 650 550 2230[265
]
3.3. Summary
The notion of multifield bond oscillation has reconciled the following thrusts
1) Connection the continuum approaches to the quantum theory by focusing on the perturbed
bond relaxation to the phonon frequency.
2) Reproduction of the spectrometrically measured phonon frequency shift.
3) comprehension of the Multifield driven bond-phonon-property correlation of a substance;
4) Quantitative information on bonding dynamics derived from the combination of the multifield
bond oscillation framework and its driven phonon spectrometrics.
Being able to connect the continuum to quantum premises, the combination of the BOLS-LBA notion
and the enabled Raman spectroscopy has enabled the quantitative information about the perturbation-
relaxation-property that is beyond the scope of other available approaches. The practice of the average-
bond bond oscillating dynamics has reconciled (z, , P, T) effects on the Raman shifts of BP, GNR,
and MX2 with not only clarification of the intrinsic phonon relaxation origin but also information on
the bonding dynamics and their properties to the 2D species. Consistency between theory expectations
and Raman measurements clarified and quantified the following:
1) The number-of-layer reduction induced phonon frequency redshift results from the
undercoordination induced bond contraction and bond strength gain. The collective vibration
of bonds between a certain atom and its z neighbors dictates phonons undergoing redshift while
67
the dimer interaction dictates the phonons undergoing blueshift occurred when the number-of-
layer is reduced. Matching the number-of-layer reduction induced phonon frequency shift
offers the local bond length, bond energy, band nature index, referential wavenumber ω(1) and
its bulk shift, and the effective coordination numbers for the layered 2D structures.
2) Bond stretching by the directional strain resolves the phonon red-shifting and phonon band
splitting. Reproduction of the strain effect on phonon relaxation gives rise to the average-bond
force constant and the relative direction between the bond and the strain.
3) Bond thermal expansion softens all phonons. One can derive the mode cohesive energy Ecoh
and Debye temperature θD from reproducing the Debye thermal decay of phonon frequencies.
4) Mechanical compression stiffens all phonons. Theoretical matching to the effect of
compression derives the binding energy density Eden, compressibility β, bulk modulus B0 and
their first derivatives β' and B'0.
Findings proved the essentiality of the BOLS-LBA notion that has empowered the Raman
spectroscopy substantially in gaining coordination-resolved, quantitative information about the
multifield dynamics of the representative bond and the properties of a crystal. Most strikingly, freely
hypothetic adjustable parameters are avoided in the entire process of data analysis. The attainments
may inspire a new yet practical way of thinking about the stimulus-bond-property correlation and
approaches dealing with substance from the perspective of average-bond approach with
interdisciplinary nature, offering references for functional materials design and synthesis. Extending
the exercises to covering more stimuli and more properties would be even more challenging,
fascinating and rewarding.
68
4. Sized Crystals
Highlight
DPS resolves the skin thickness of the core-shell structured nanocrystals and liquid droplets.
Intergrain coupling emits THz waves with frequency proportional to the inverse of grain size.
Dimer and collective oscillators originate optical phonon frequency shift contrastingly.
Phonon frequency and elasticity hold the same trends of compression and Debye thermal decay.
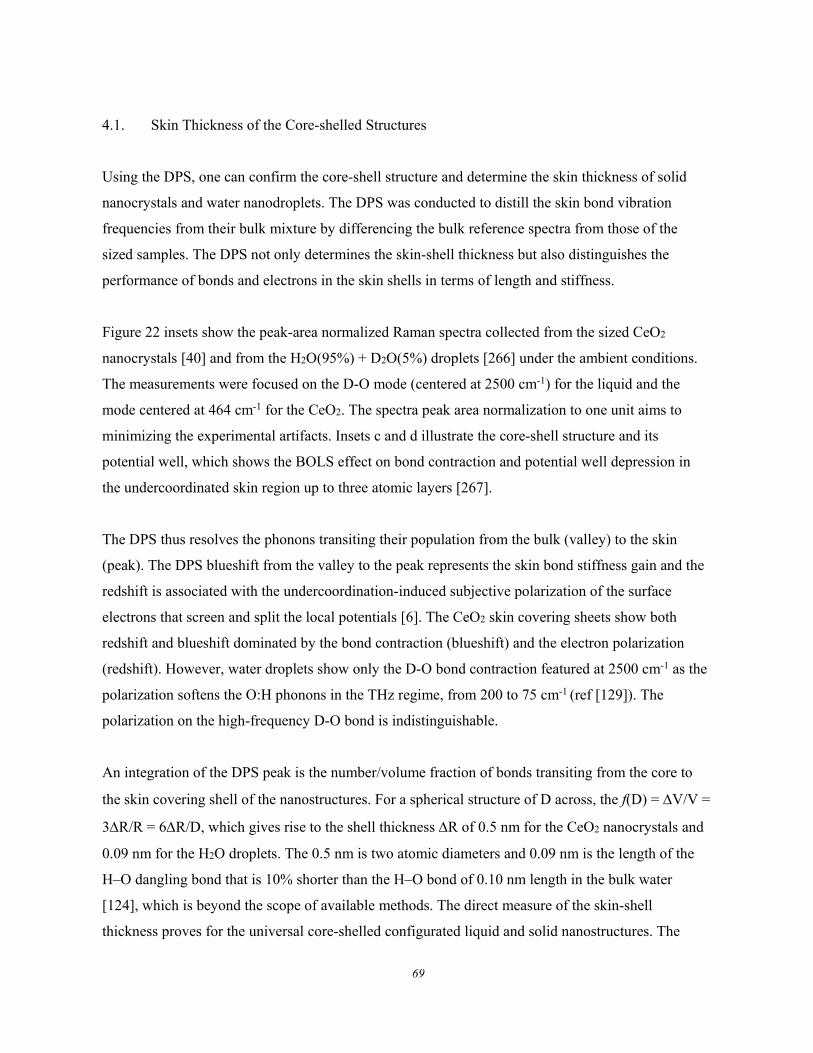
69
4.1. Skin Thickness of the Core-shelled Structures
Using the DPS, one can confirm the core-shell structure and determine the skin thickness of solid
nanocrystals and water nanodroplets. The DPS was conducted to distill the skin bond vibration
frequencies from their bulk mixture by differencing the bulk reference spectra from those of the
sized samples. The DPS not only determines the skin-shell thickness but also distinguishes the
performance of bonds and electrons in the skin shells in terms of length and stiffness.
Figure 22 insets show the peak-area normalized Raman spectra collected from the sized CeO2
nanocrystals [40] and from the H2O(95%) + D2O(5%) droplets [266] under the ambient conditions.
The measurements were focused on the D-O mode (centered at 2500 cm-1) for the liquid and the
mode centered at 464 cm-1 for the CeO2. The spectra peak area normalization to one unit aims to
minimizing the experimental artifacts. Insets c and d illustrate the core-shell structure and its
potential well, which shows the BOLS effect on bond contraction and potential well depression in
the undercoordinated skin region up to three atomic layers [267].
The DPS thus resolves the phonons transiting their population from the bulk (valley) to the skin
(peak). The DPS blueshift from the valley to the peak represents the skin bond stiffness gain and the
redshift is associated with the undercoordination-induced subjective polarization of the surface
electrons that screen and split the local potentials [6]. The CeO2 skin covering sheets show both
redshift and blueshift dominated by the bond contraction (blueshift) and the electron polarization
(redshift). However, water droplets show only the D-O bond contraction featured at 2500 cm-1 as the
polarization softens the O:H phonons in the THz regime, from 200 to 75 cm-1 (ref [129]). The
polarization on the high-frequency D-O bond is indistinguishable.
An integration of the DPS peak is the number/volume fraction of bonds transiting from the core to
the skin covering shell of the nanostructures. For a spherical structure of D across, the f(D) = V/V =
3R/R = 6R/D, which gives rise to the shell thickness R of 0.5 nm for the CeO2 nanocrystals and
0.09 nm for the H2O droplets. The 0.5 nm is two atomic diameters and 0.09 nm is the length of the
H–O dangling bond that is 10% shorter than the H–O bond of 0.10 nm length in the bulk water
[124], which is beyond the scope of available methods. The direct measure of the skin-shell
thickness proves for the universal core-shelled configurated liquid and solid nanostructures. The
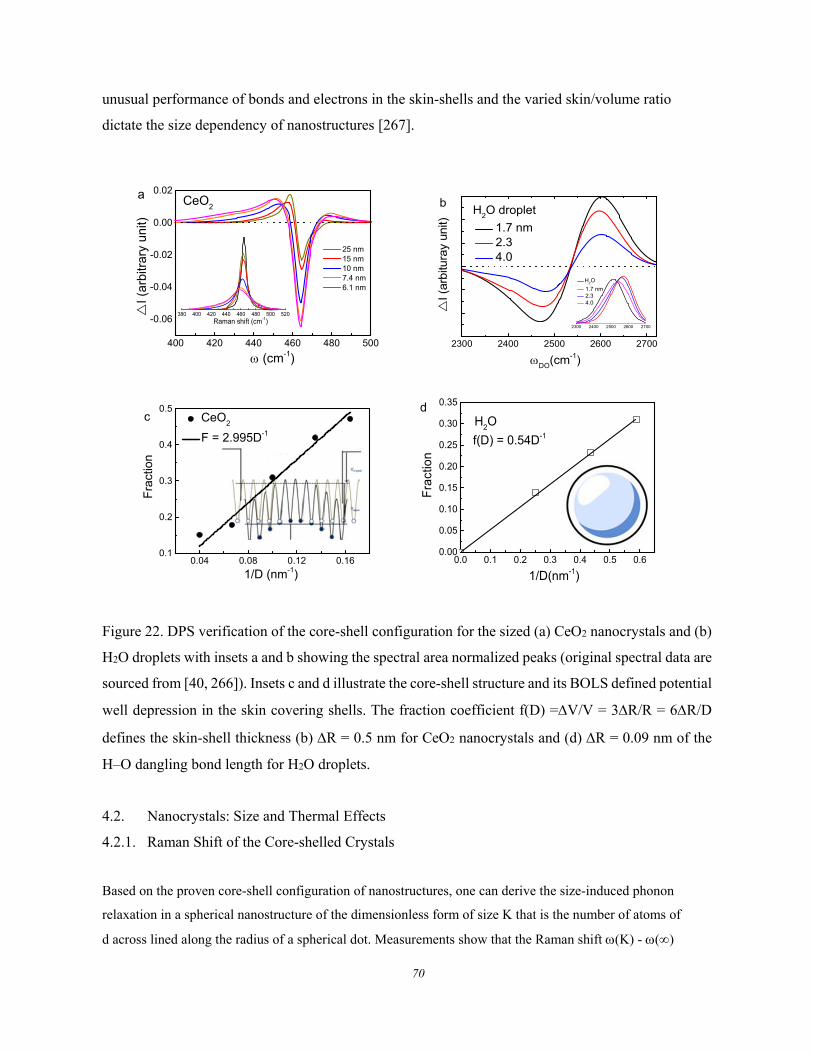
70
unusual performance of bonds and electrons in the skin-shells and the varied skin/volume ratio
dictate the size dependency of nanostructures [267].
400 420 440 460 480 500
-0.06
-0.04
-0.02
0.00
0.02
380 400 420 440 460 480 500 520
Raman shift (cm-1)
pellet 25 nm 15 nm 10 nm 7.4 nm 6.1 nm
I (
arbi
trar
y un
it)
(cm-1)
25 nm 15 nm 10 nm 7.4 nm 6.1 nm
CeO2
a
2300 2400 2500 2600 2700
I (
arbitu
ray
unit)
DO
(cm-1)
1.7 nm 2.3 4.0
bH
2O droplet
H2O
1.7 nm 2.3 4.0 20 40 60
2300 2400 2500 2600 2700
0.04 0.08 0.12 0.160.1
0.2
0.3
0.4
0.5
1/D (nm-1)
Fra
ctio
n
CeO2
F = 2.995D-1
c
0.0 0.1 0.2 0.3 0.4 0.5 0.60.00
0.05
0.10
0.15
0.20
0.25
0.30
0.35
1/D(nm-1)
Fra
ctio
n
d
f(D) = 0.54D-1
H2O
Figure 22. DPS verification of the core-shell configuration for the sized (a) CeO2 nanocrystals and (b)
H2O droplets with insets a and b showing the spectral area normalized peaks (original spectral data are
sourced from [40, 266]). Insets c and d illustrate the core-shell structure and its BOLS defined potential
well depression in the skin covering shells. The fraction coefficient f(D) =V/V = 3R/R = 6R/D
defines the skin-shell thickness (b) R = 0.5 nm for CeO2 nanocrystals and (d) R = 0.09 nm of the
H–O dangling bond length for H2O droplets.
4.2. Nanocrystals: Size and Thermal Effects
4.2.1. Raman Shift of the Core-shelled Crystals
Based on the proven core-shell configuration of nanostructures, one can derive the size-induced phonon
relaxation in a spherical nanostructure of the dimensionless form of size K that is the number of atoms of
d across lined along the radius of a spherical dot. Measurements show that the Raman shift (K) - ()
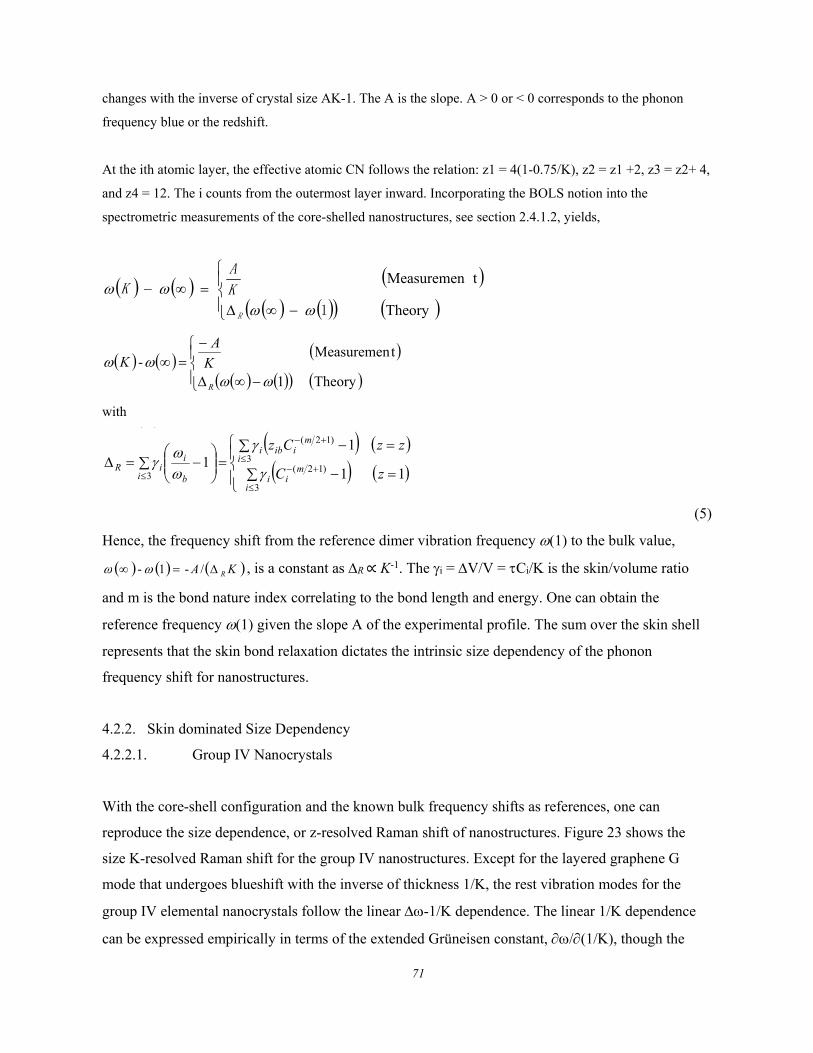
71
changes with the inverse of crystal size AK-1. The A is the slope. A > 0 or < 0 corresponds to the phonon
frequency blue or the redshift.
At the ith atomic layer, the effective atomic CN follows the relation: z1 = 4(1-0.75/K), z2 = z1 +2, z3 = z2+ 4,
and z4 = 12. The i counts from the outermost layer inward. Incorporating the BOLS notion into the
spectrometric measurements of the core-shelled nanostructures, see section 2.4.1.2, yields,
Theory
tMeasuremen
1
R
K
A
K
with
(5)
Hence, the frequency shift from the reference dimer vibration frequency (1) to the bulk value,
, is a constant as R ∝ K-1. The i = V/V = Ci/K is the skin/volume ratio
and m is the bond nature index correlating to the bond length and energy. One can obtain the
reference frequency (1) given the slope A of the experimental profile. The sum over the skin shell
represents that the skin bond relaxation dictates the intrinsic size dependency of the phonon
frequency shift for nanostructures.
4.2.2. Skin dominated Size Dependency
4.2.2.1. Group IV Nanocrystals
With the core-shell configuration and the known bulk frequency shifts as references, one can
reproduce the size dependence, or z-resolved Raman shift of nanostructures. Figure 23 shows the
size K-resolved Raman shift for the group IV nanostructures. Except for the layered graphene G
mode that undergoes blueshift with the inverse of thickness 1/K, the rest vibration modes for the
group IV elemental nanocrystals follow the linear -1/K dependence. The linear 1/K dependence
can be expressed empirically in terms of the extended Grüneisen constant, /(1/K), though the
Theory 1
tMeasuremen -
R
K
AK
11
11
3
)12(3
)12(
3 zC
zzCz
i
mii
i
miibi
i b
iiR
KA R /-1-
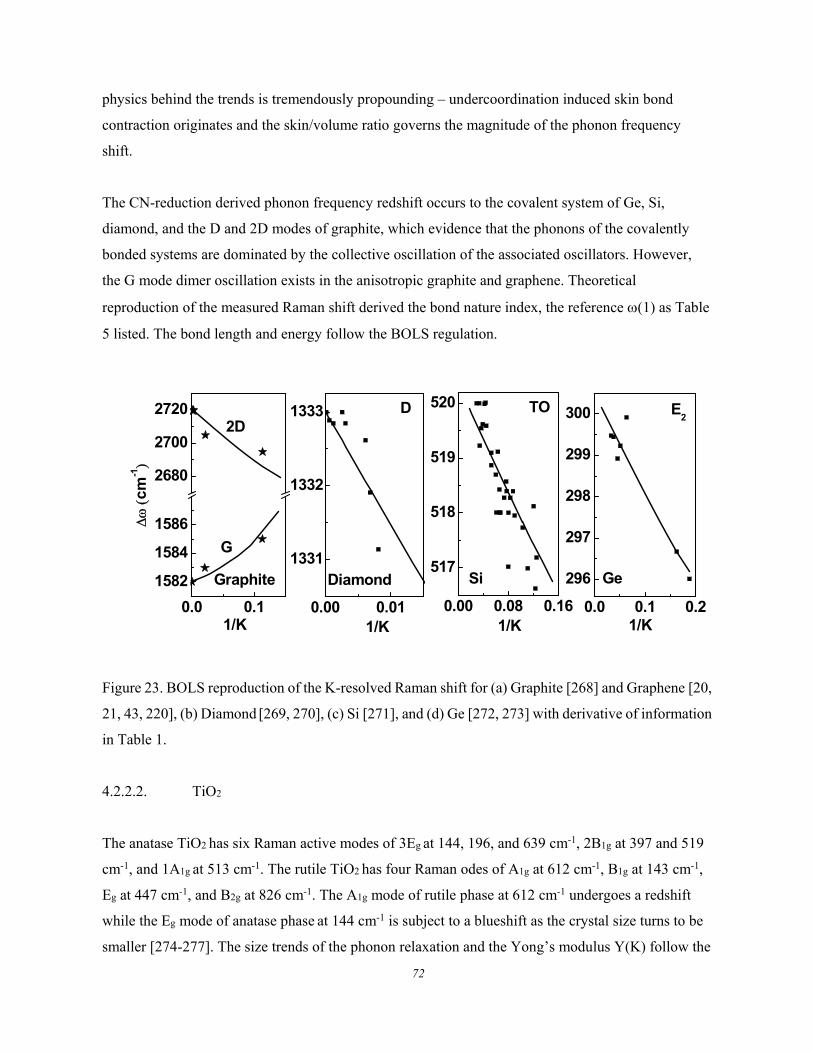
72
physics behind the trends is tremendously propounding – undercoordination induced skin bond
contraction originates and the skin/volume ratio governs the magnitude of the phonon frequency
shift.
The CN-reduction derived phonon frequency redshift occurs to the covalent system of Ge, Si,
diamond, and the D and 2D modes of graphite, which evidence that the phonons of the covalently
bonded systems are dominated by the collective oscillation of the associated oscillators. However,
the G mode dimer oscillation exists in the anisotropic graphite and graphene. Theoretical
reproduction of the measured Raman shift derived the bond nature index, the reference (1) as Table
5 listed. The bond length and energy follow the BOLS regulation.
0.00 0.01
1331
1332
1333
c
m-1
Diamond
D
0.0 0.1
1582
1584
1586
2680
2700
2720
1/K1/K1/K1/K
Graphite
2D
G
0.0 0.1 0.2
296
297
298
299
300
Ge
E2
0.00 0.08 0.16
517
518
519
520 TO
Si
Figure 23. BOLS reproduction of the K-resolved Raman shift for (a) Graphite [268] and Graphene [20,
21, 43, 220], (b) Diamond [269, 270], (c) Si [271], and (d) Ge [272, 273] with derivative of information
in Table 1.
4.2.2.2. TiO2
The anatase TiO2 has six Raman active modes of 3Eg at 144, 196, and 639 cm-1, 2B1g at 397 and 519
cm-1, and 1A1g at 513 cm-1. The rutile TiO2 has four Raman odes of A1g at 612 cm-1, B1g at 143 cm-1,
Eg at 447 cm-1, and B2g at 826 cm-1. The A1g mode of rutile phase at 612 cm-1 undergoes a redshift
while the Eg mode of anatase phase at 144 cm-1 is subject to a blueshift as the crystal size turns to be
smaller [274-277]. The size trends of the phonon relaxation and the Yong’s modulus Y(K) follow the
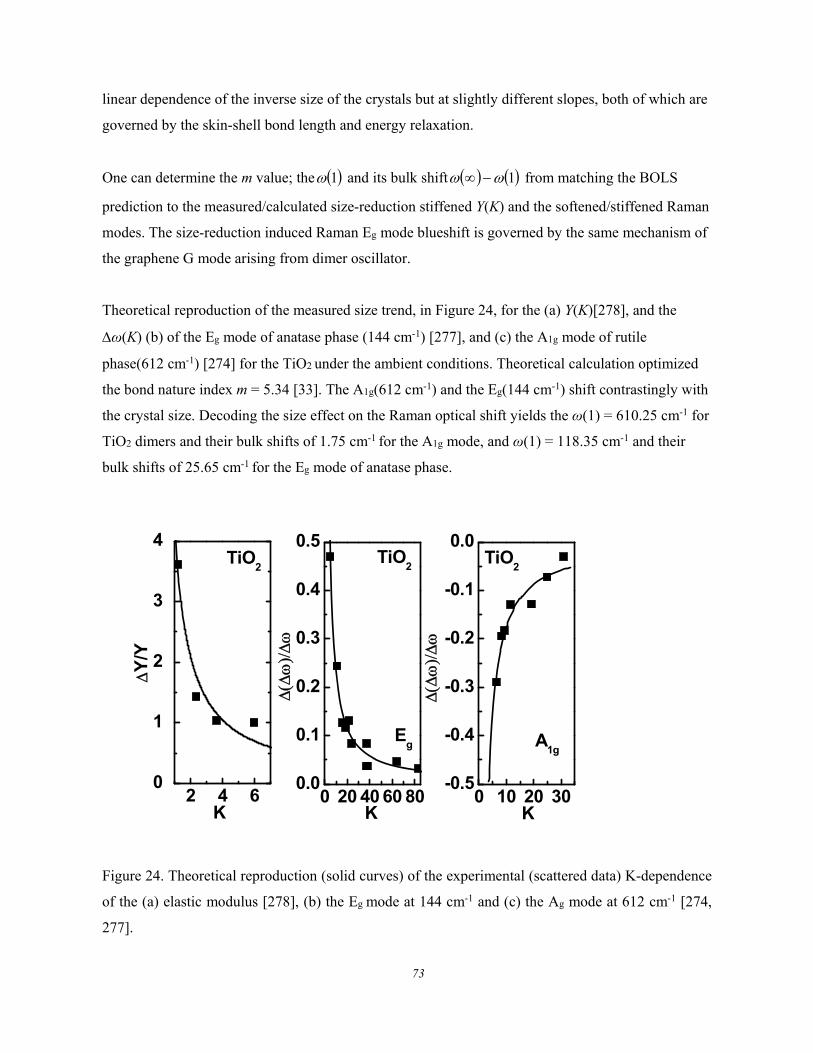
73
linear dependence of the inverse size of the crystals but at slightly different slopes, both of which are
governed by the skin-shell bond length and energy relaxation.
One can determine the m value; the and its bulk shift from matching the BOLS
prediction to the measured/calculated size-reduction stiffened Y(K) and the softened/stiffened Raman
modes. The size-reduction induced Raman Eg mode blueshift is governed by the same mechanism of
the graphene G mode arising from dimer oscillator.
Theoretical reproduction of the measured size trend, in Figure 24, for the (a) Y(K)[278], and the
ω(K) (b) of the Eg mode of anatase phase (144 cm-1) [277], and (c) the A1g mode of rutile
phase(612 cm-1) [274] for the TiO2 under the ambient conditions. Theoretical calculation optimized
the bond nature index m = 5.34 [33]. The A1g(612 cm-1) and the Eg(144 cm-1) shift contrastingly with
the crystal size. Decoding the size effect on the Raman optical shift yields the ω(1) = 610.25 cm-1 for
TiO2 dimers and their bulk shifts of 1.75 cm-1 for the A1g mode, and ω(1) = 118.35 cm-1 and their
bulk shifts of 25.65 cm-1 for the Eg mode of anatase phase.
2 4 60
1
2
3
4
Y/Y
K
TiO2
0 20 40 60 800.0
0.1
0.2
0.3
0.4
0.5TiO
2
A1g
K
Eg
0 10 20 30-0.5
-0.4
-0.3
-0.2
-0.1
0.0TiO
2
K
Figure 24. Theoretical reproduction (solid curves) of the experimental (scattered data) K-dependence
of the (a) elastic modulus [278], (b) the Eg mode at 144 cm-1 and (c) the Ag mode at 612 cm-1 [274,
277].
1 1
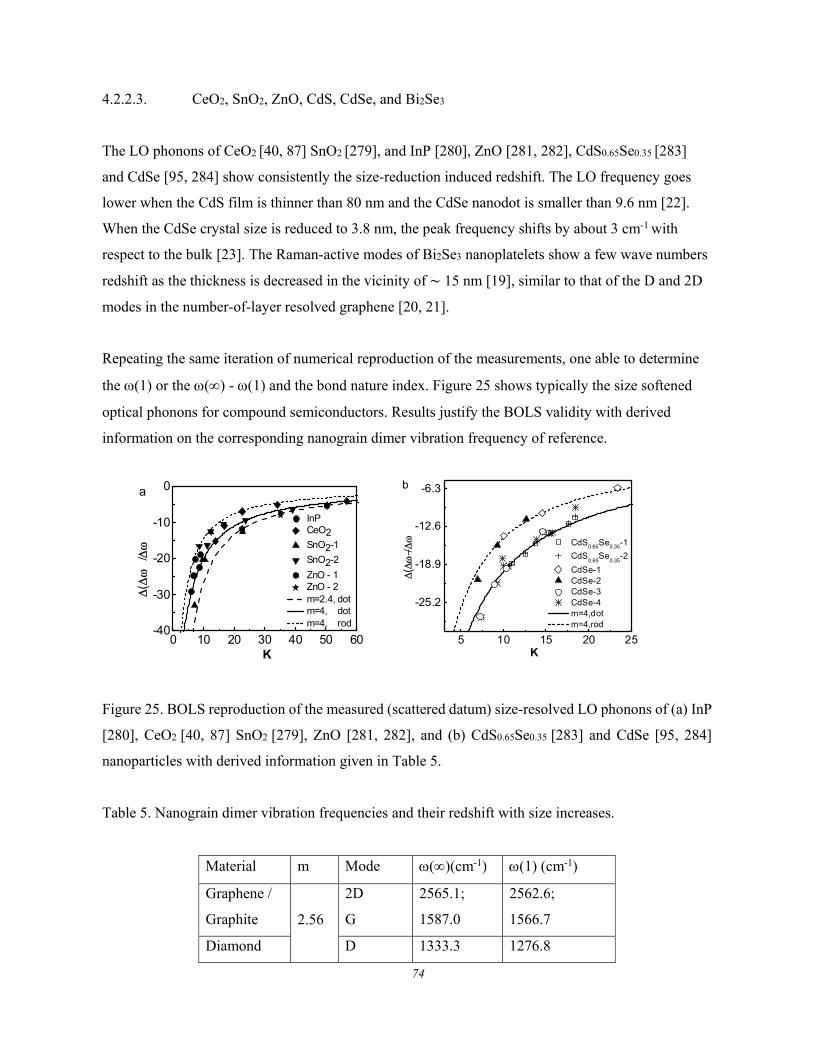
74
4.2.2.3. CeO2, SnO2, ZnO, CdS, CdSe, and Bi2Se3
The LO phonons of CeO2 [40, 87] SnO2 [279], and InP [280], ZnO [281, 282], CdS0.65Se0.35 [283]
and CdSe [95, 284] show consistently the size-reduction induced redshift. The LO frequency goes
lower when the CdS film is thinner than 80 nm and the CdSe nanodot is smaller than 9.6 nm [22].
When the CdSe crystal size is reduced to 3.8 nm, the peak frequency shifts by about 3 cm-1 with
respect to the bulk [23]. The Raman-active modes of Bi2Se3 nanoplatelets show a few wave numbers
redshift as the thickness is decreased in the vicinity of ∼ 15 nm [19], similar to that of the D and 2D
modes in the number-of-layer resolved graphene [20, 21].
Repeating the same iteration of numerical reproduction of the measurements, one able to determine
the (1) or the () - (1) and the bond nature index. Figure 25 shows typically the size softened
optical phonons for compound semiconductors. Results justify the BOLS validity with derived
information on the corresponding nanograin dimer vibration frequency of reference.
0 10 20 30 40 50 60-40
-30
-20
-10
0
K
(
InP CeO2 SnO2-1
SnO2-2
ZnO - 1 ZnO - 2 m=2.4, dot m=4, dot m=4, rod
a
5 10 15 20 25
-25.2
-18.9
-12.6
-6.3
b
K
(
CdS0.65
Se0.35
-1
CdS0.65
Se0.35
-2
CdSe-1 CdSe-2 CdSe-3 CdSe-4 m=4,dot m=4,rod
Figure 25. BOLS reproduction of the measured (scattered datum) size-resolved LO phonons of (a) InP
[280], CeO2 [40, 87] SnO2 [279], ZnO [281, 282], and (b) CdS0.65Se0.35 [283] and CdSe [95, 284]
nanoparticles with derived information given in Table 5.
Table 5. Nanograin dimer vibration frequencies and their redshift with size increases.
Material m Mode ()(cm-1) (1) (cm-1)
Graphene /
Graphite 2.56
2D
G
2565.1;
1587.0
2562.6;
1566.7
Diamond D 1333.3 1276.8
75
Si 4.88 TO 520.0 502.3
Ge 4.88 E2 302 290.6
TiO2 5.34
A1g 612 610.25
Eg 639 600.00
Eg 144 118.35
CeO2
4.0
LO 464.5 415.1
SnO2 A1g 637.5 613.8
InP LO 347 333.5
ZnO E2 441.5 380
CdS0.65Se0.35
LO1
CdSe-like203.4 158.8
LO2 CdS-
like 303 257.7
CdSe LO 210 195.2
CdS LO 106.23 106.57
Bi2Se3 A21g 72.55 40.57
4.2.3. Intergrain Interaction Derived THz Phonons
The LFR phonon frequency shifts linearly with the inverse size K. The K increases toward infinity,
the LFR disappears, = 0. This fact implies simply that the intergrain interactions originate both
the LFR mode and its LFR blueshift due to size reduction. The nanoparticle-substrate and intergarain
interactions determine the slope of the -1/K profile. Different from the Raman mode redshift
arising from collective vibration in the surface region of the nanograin, the LFR blueshift is
predominated by intergrain interactions. Linearization of the LFR size trend yields information about
the interparticle interaction, as slisted in Table 6 [285].
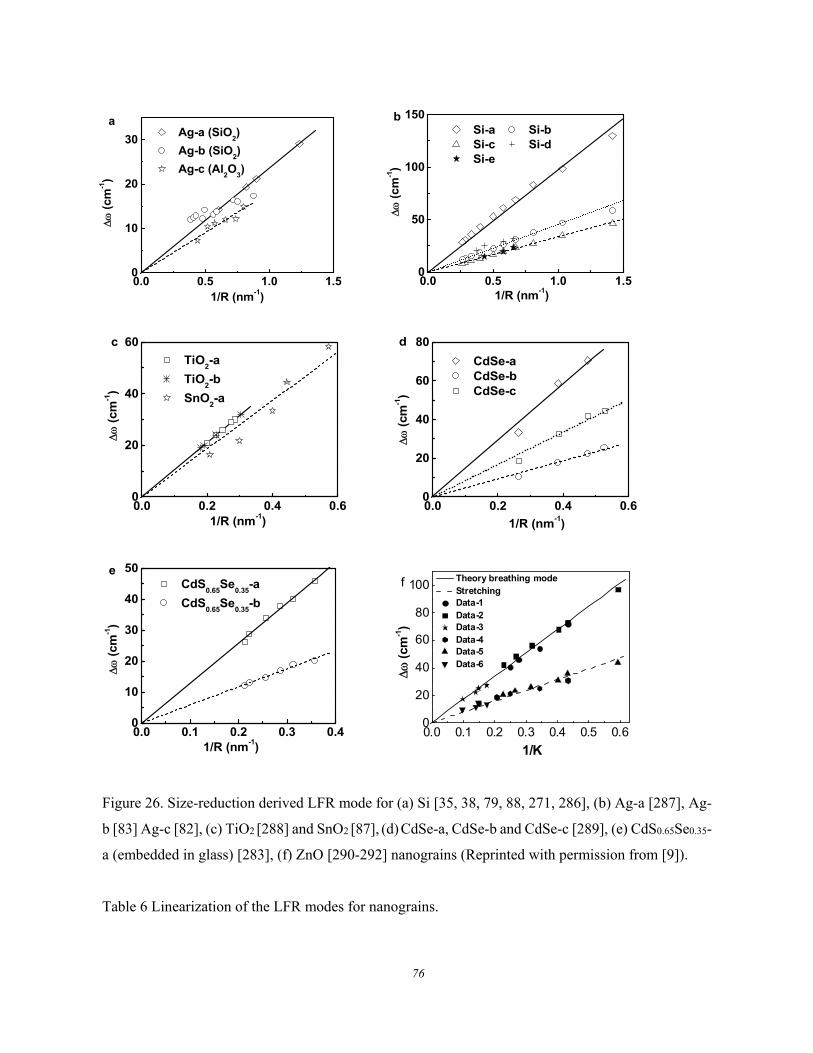
76
0.0 0.5 1.0 1.50
10
20
30
a Ag-a (SiO
2)
Ag-b (SiO2)
Ag-c (Al2O
3)
(cm
-1)
1/R (nm-1)
0.0 0.5 1.0 1.50
50
100
150
b Si-a Si-b Si-c Si-d Si-e
(
cm-1)
1/R (nm-1)
0.0 0.2 0.4 0.60
20
40
60
c
1/R (nm-1)
(cm
-1)
TiO2-a
TiO2-b
SnO2-a
0.0 0.2 0.4 0.60
20
40
60
80
d
CdSe-a CdSe-b CdSe-c
1/R (nm-1)
(cm
-1)
0.0 0.1 0.2 0.3 0.40
10
20
30
40
50
e
1/R (nm-1)
(
cm
-1)
CdS0.65
Se0.35
-a
CdS0.65
Se0.35
-b
0.0 0.1 0.2 0.3 0.4 0.5 0.60
20
40
60
80
100f
(c
m-1)
1/K
Theory breathing mode Stretching Data-1 Data-2 Data-3 Data-4 Data-5 Data-6
Figure 26. Size-reduction derived LFR mode for (a) Si [35, 38, 79, 88, 271, 286], (b) Ag-a [287], Ag-
b [83] Ag-c [82], (c) TiO2 [288] and SnO2 [87], (d) CdSe-a, CdSe-b and CdSe-c [289], (e) CdS0.65Se0.35-
a (embedded in glass) [283], (f) ZnO [290-292] nanograins (Reprinted with permission from [9]).
Table 6 Linearization of the LFR modes for nanograins.
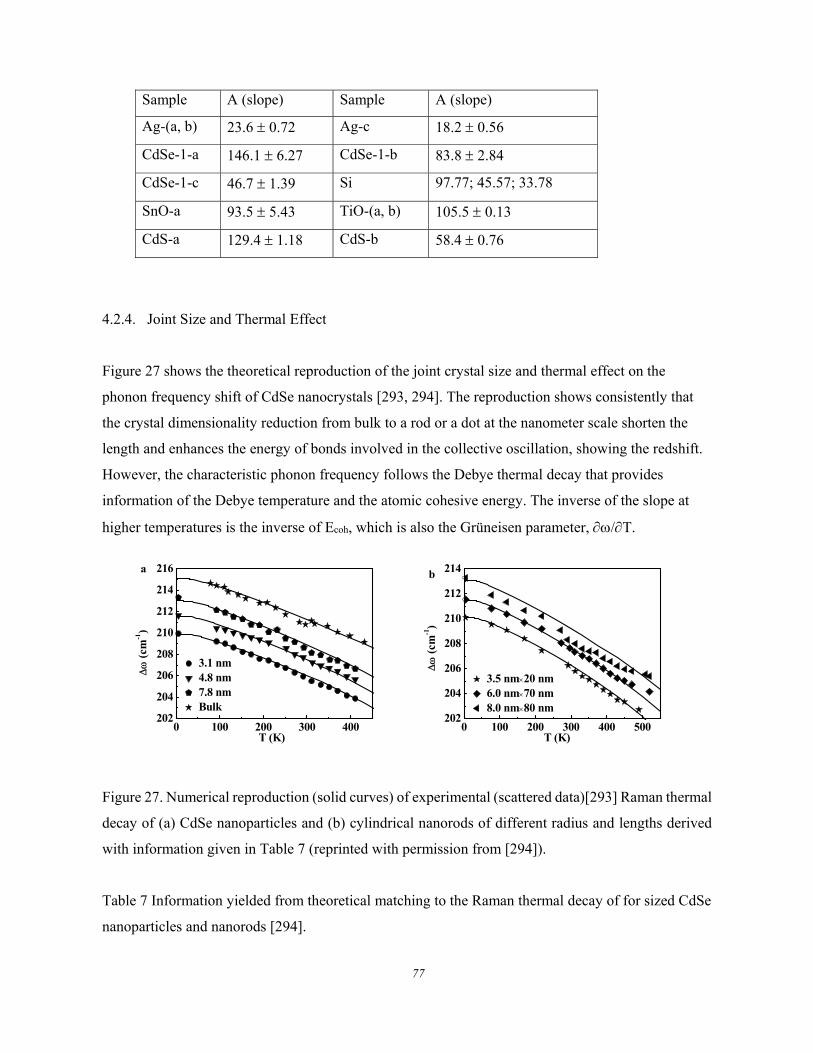
77
Sample A (slope) Sample A (slope)
Ag-(a, b) 23.6 0.72 Ag-c 18.2 0.56
CdSe-1-a 146.1 6.27 CdSe-1-b 83.8 2.84
CdSe-1-c 46.7 1.39 Si 97.77; 45.57; 33.78
SnO-a 93.5 5.43 TiO-(a, b) 105.5 0.13
CdS-a 129.4 1.18 CdS-b 58.4 0.76
4.2.4. Joint Size and Thermal Effect
Figure 27 shows the theoretical reproduction of the joint crystal size and thermal effect on the
phonon frequency shift of CdSe nanocrystals [293, 294]. The reproduction shows consistently that
the crystal dimensionality reduction from bulk to a rod or a dot at the nanometer scale shorten the
length and enhances the energy of bonds involved in the collective oscillation, showing the redshift.
However, the characteristic phonon frequency follows the Debye thermal decay that provides
information of the Debye temperature and the atomic cohesive energy. The inverse of the slope at
higher temperatures is the inverse of Ecoh, which is also the Grüneisen parameter, /T.
0 100 200 300 400202
204
206
208
210
212
214
216
(cm
-1)
T (K)
3.1 nm 4.8 nm 7.8 nmBulk
a
0 100 200 300 400 500202
204
206
208
210
212
214
(cm
-1)
T (K)
3.5 nm20 nm6.0 nm70 nm8.0 nm80 nm
b
Figure 27. Numerical reproduction (solid curves) of experimental (scattered data)[293] Raman thermal
decay of (a) CdSe nanoparticles and (b) cylindrical nanorods of different radius and lengths derived
with information given in Table 7 (reprinted with permission from [294]).
Table 7 Information yielded from theoretical matching to the Raman thermal decay of for sized CdSe
nanoparticles and nanorods [294].
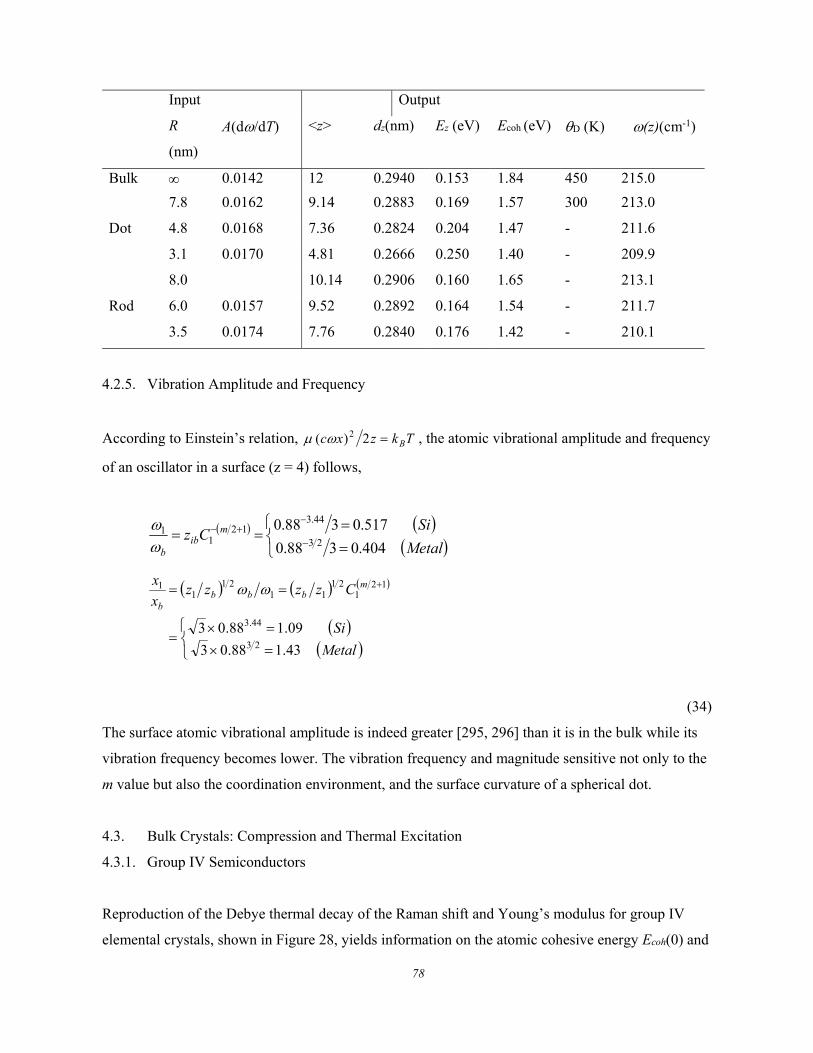
78
Input Output
R
(nm)
A(d/dT) <z> dz(nm) Ez (eV) Ecoh (eV) D (K) �(z)(cm-1)
Bulk 0.0142 12 0.2940 0.153 1.84 450 215.0
Dot
7.8 0.0162 9.14 0.2883 0.169 1.57 300 213.0
4.8 0.0168 7.36 0.2824 0.204 1.47 - 211.6
3.1 0.0170 4.81 0.2666 0.250 1.40 - 209.9
Rod
8.0 10.14 0.2906 0.160 1.65 - 213.1
6.0 0.0157 9.52 0.2892 0.164 1.54 - 211.7
3.5 0.0174 7.76 0.2840 0.176 1.42 - 210.1
4.2.5. Vibration Amplitude and Frequency
According to Einstein’s relation, , the atomic vibrational amplitude and frequency
of an oscillator in a surface (z = 4) follows,
(34)
The surface atomic vibrational amplitude is indeed greater [295, 296] than it is in the bulk while its
vibration frequency becomes lower. The vibration frequency and magnitude sensitive not only to the
m value but also the coordination environment, and the surface curvature of a spherical dot.
4.3. Bulk Crystals: Compression and Thermal Excitation
4.3.1. Group IV Semiconductors
Reproduction of the Debye thermal decay of the Raman shift and Young’s modulus for group IV
elemental crystals, shown in Figure 28, yields information on the atomic cohesive energy Ecoh(0) and
Tkzxc B2)( 2
Metal
SiCz m
ibb 404.0388.0
517.0388.023
44.312
11
Metal
Si
Czzzzx
x mbbb
b
43.188.03
09.188.0323
44.3
121
2111
211
1
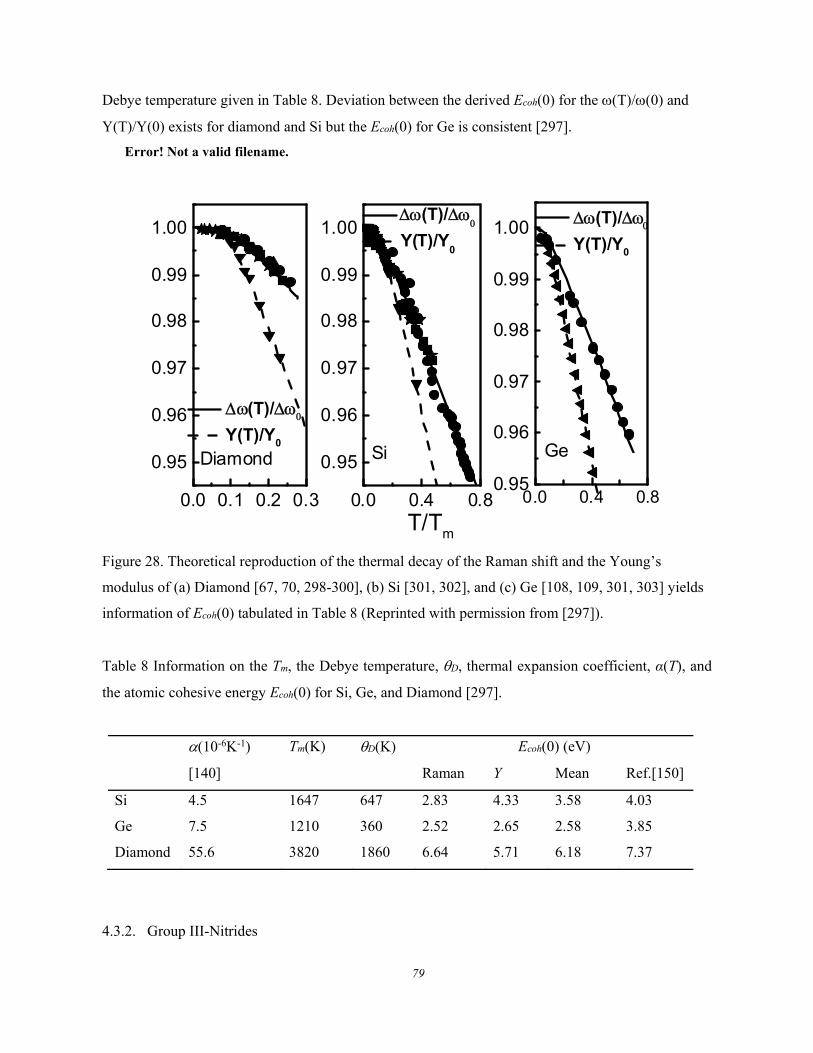
79
Debye temperature given in Table 8. Deviation between the derived Ecoh(0) for the (T)/(0) and
Y(T)/Y(0) exists for diamond and Si but the Ecoh(0) for Ge is consistent [297].
Error! Not a valid filename.
0.0 0.1 0.2 0.3
0.95
0.96
0.97
0.98
0.99
1.00
T/Tm
(T)/
Y(T)/Y0
Diamond
0.0 0.4 0.8
0.95
0.96
0.97
0.98
0.99
1.00 (T)/
Y(T)/Y0
Si
0.0 0.4 0.80.95
0.96
0.97
0.98
0.99
1.00 (T)/ Y(T)/Y0
Ge
Figure 28. Theoretical reproduction of the thermal decay of the Raman shift and the Young’s
modulus of (a) Diamond [67, 70, 298-300], (b) Si [301, 302], and (c) Ge [108, 109, 301, 303] yields
information of Ecoh(0) tabulated in Table 8 (Reprinted with permission from [297]).
Table 8 Information on the Tm, the Debye temperature, D, thermal expansion coefficient, α(T), and
the atomic cohesive energy Ecoh(0) for Si, Ge, and Diamond [297].
(10-6K-1)
[140]
Tm(K) D(K) Ecoh(0) (eV)
Raman Y Mean Ref.[150]
Si 4.5 1647 647 2.83 4.33 3.58 4.03
Ge 7.5 1210 360 2.52 2.65 2.58 3.85
Diamond 55.6 3820 1860 6.64 5.71 6.18 7.37
4.3.2. Group III-Nitrides
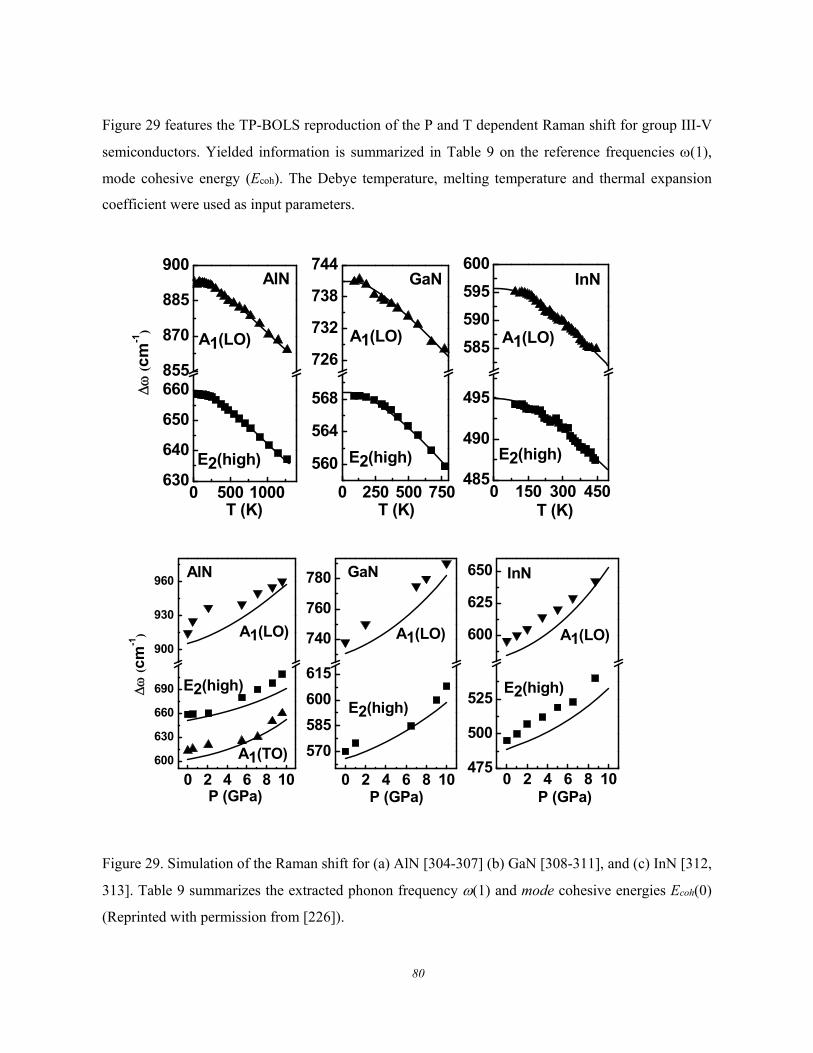
80
Figure 29 features the TP-BOLS reproduction of the P and T dependent Raman shift for group III-V
semiconductors. Yielded information is summarized in Table 9 on the reference frequencies (1),
mode cohesive energy (Ecoh). The Debye temperature, melting temperature and thermal expansion
coefficient were used as input parameters.
0 500 1000630
640
650
660855
870
885
900
E2(high)
A1(LO)
AlN
(c
m-1
)
T (K)T (K)
0 250 500 750
560
564
568
726
732
738
744
E2(high)
A1(LO)
GaN
0 150 300 450485
490
495
585
590
595
600
E2(high)
A1(LO)
InN
T (K)
0 2 4 6 8 10600
630
660
690
900
930
960
(cm
-1)
A1(TO)
E2(high)
A1(LO)
AlN
0 2 4 6 8 10
570
585
600
615
740
760
780
P (GPa)P (GPa)
E2(high)
A1(LO)
GaN
P (GPa)
0 2 4 6 8 10475
500
525
600
625
650
A1(LO)
E2(high)
InN
Figure 29. Simulation of the Raman shift for (a) AlN [304-307] (b) GaN [308-311], and (c) InN [312,
313]. Table 9 summarizes the extracted phonon frequency (1) and mode cohesive energies Ecoh(0)
(Reprinted with permission from [226]).
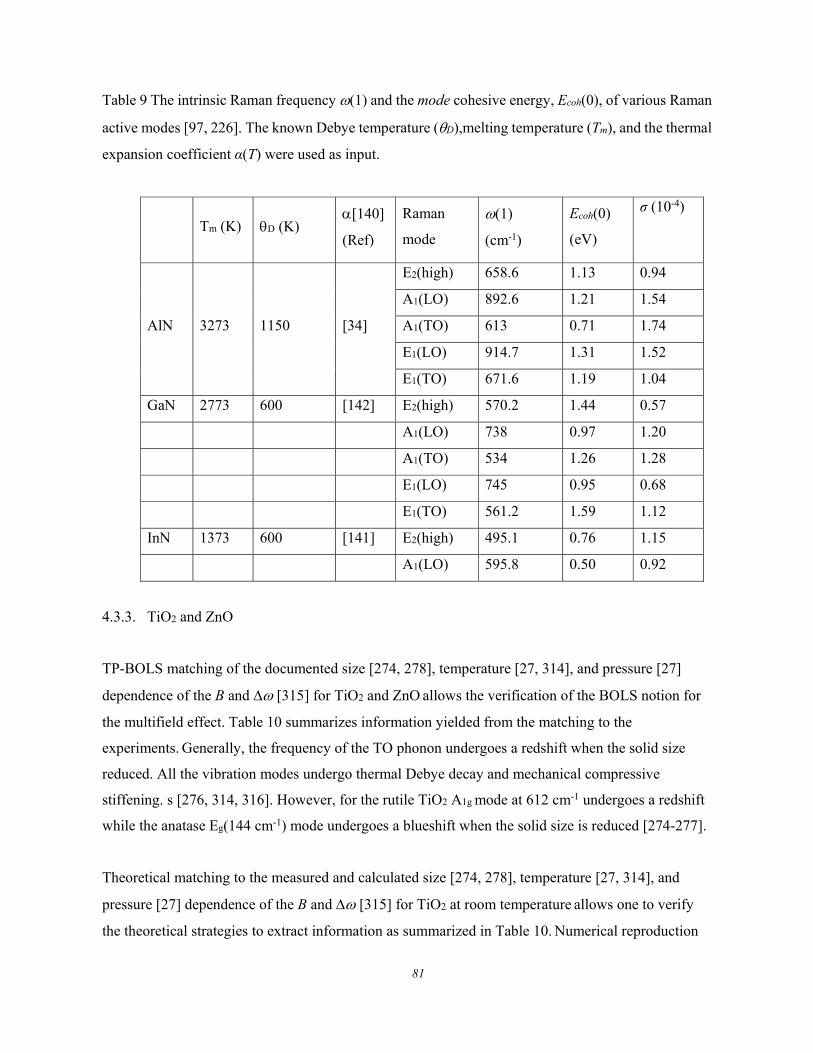
81
Table 9 The intrinsic Raman frequency (1) and the mode cohesive energy, Ecoh(0), of various Raman
active modes [97, 226]. The known Debye temperature (D),melting temperature (Tm), and the thermal
expansion coefficient α(T) were used as input.
Tm (K) D (K) [140]
(Ref)
Raman
mode
(1)
(cm-1)
Ecoh(0)
(eV)
σ (10-4)
AlN 3273 1150 [34]
E2(high) 658.6 1.13 0.94
A1(LO) 892.6 1.21 1.54
A1(TO) 613 0.71 1.74
E1(LO) 914.7 1.31 1.52
E1(TO) 671.6 1.19 1.04
GaN 2773 600 [142] E2(high) 570.2 1.44 0.57
A1(LO) 738 0.97 1.20
A1(TO) 534 1.26 1.28
E1(LO) 745 0.95 0.68
E1(TO) 561.2 1.59 1.12
InN 1373 600 [141] E2(high) 495.1 0.76 1.15
A1(LO) 595.8 0.50 0.92
4.3.3. TiO2 and ZnO
TP-BOLS matching of the documented size [274, 278], temperature [27, 314], and pressure [27]
dependence of the B and [315] for TiO2 and ZnO allows the verification of the BOLS notion for
the multifield effect. Table 10 summarizes information yielded from the matching to the
experiments. Generally, the frequency of the TO phonon undergoes a redshift when the solid size
reduced. All the vibration modes undergo thermal Debye decay and mechanical compressive
stiffening. s [276, 314, 316]. However, for the rutile TiO2 A1g mode at 612 cm-1 undergoes a redshift
while the anatase Eg(144 cm-1) mode undergoes a blueshift when the solid size is reduced [274-277].
Theoretical matching to the measured and calculated size [274, 278], temperature [27, 314], and
pressure [27] dependence of the B and [315] for TiO2 at room temperature allows one to verify
the theoretical strategies to extract information as summarized in Table 10. Numerical reproduction
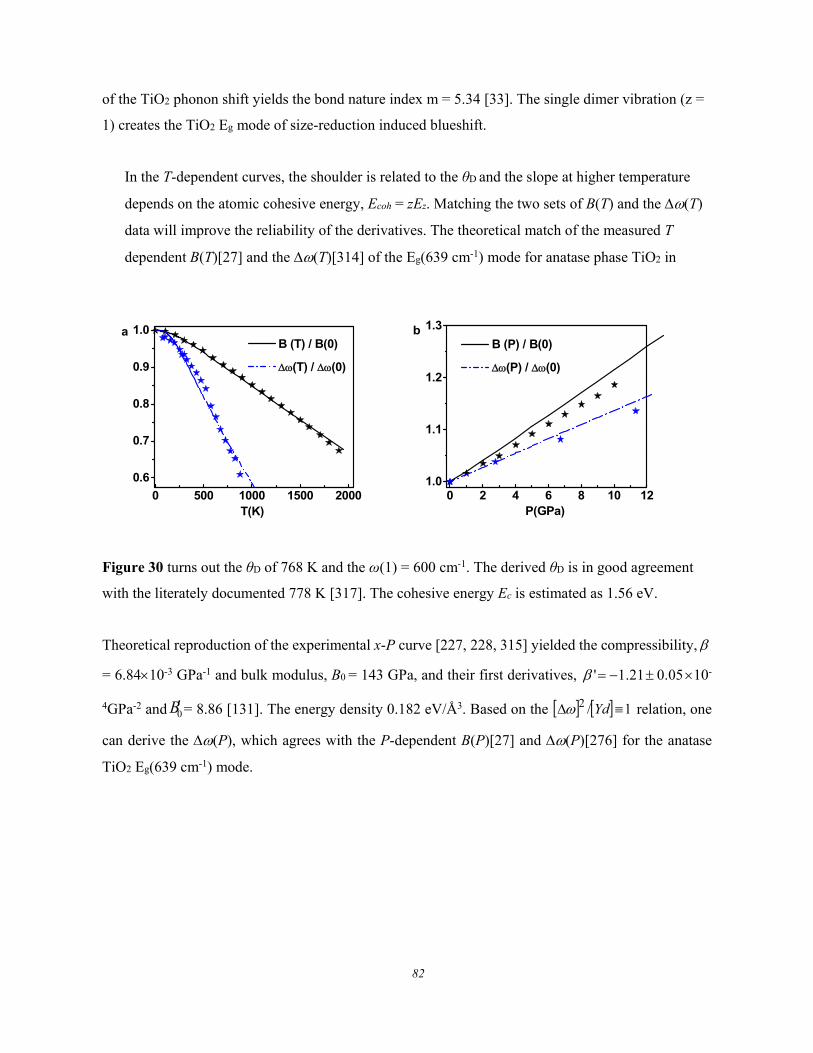
82
of the TiO2 phonon shift yields the bond nature index m = 5.34 [33]. The single dimer vibration (z =
1) creates the TiO2 Eg mode of size-reduction induced blueshift.
In the T-dependent curves, the shoulder is related to the θD and the slope at higher temperature
depends on the atomic cohesive energy, Ecoh = zEz. Matching the two sets of B(T) and the (T)
data will improve the reliability of the derivatives. The theoretical match of the measured T
dependent B(T)[27] and the (T)[314] of the Eg(639 cm-1) mode for anatase phase TiO2 in
0 500 1000 1500 2000
0.6
0.7
0.8
0.9
1.0
T(K)
B (T) / B(0)
(T) / (0)
a
0 2 4 6 8 10 121.0
1.1
1.2
1.3
b
P(GPa)
B (P) / B(0)
(P) / (0)
Figure 30 turns out the θD of 768 K and the ω(1) = 600 cm-1. The derived θD is in good agreement
with the literately documented 778 K [317]. The cohesive energy Ec is estimated as 1.56 eV.
Theoretical reproduction of the experimental x-P curve [227, 228, 315] yielded the compressibility,
= 6.8410-3 GPa-1 and bulk modulus, B0 = 143 GPa, and their first derivatives, 05.021.1' 10-
4GPa-2 and 0B= 8.86 [131]. The energy density 0.182 eV/Å3. Based on the relation, one
can derive the (P), which agrees with the P-dependent B(P)[27] and (P)[276] for the anatase
TiO2 Eg(639 cm-1) mode.
1/2 Yd
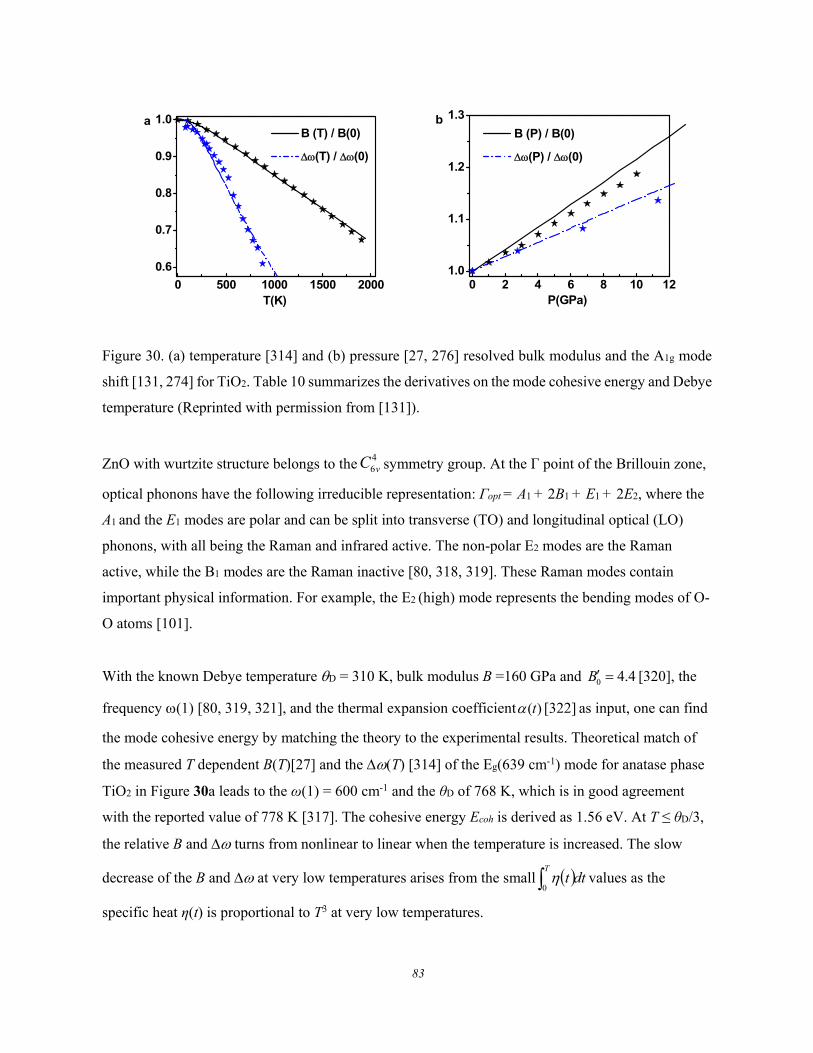
83
0 500 1000 1500 2000
0.6
0.7
0.8
0.9
1.0
T(K)
B (T) / B(0)
(T) / (0)
a
0 2 4 6 8 10 121.0
1.1
1.2
1.3
b
P(GPa)
B (P) / B(0)
(P) / (0)
Figure 30. (a) temperature [314] and (b) pressure [27, 276] resolved bulk modulus and the A1g mode
shift [131, 274] for TiO2. Table 10 summarizes the derivatives on the mode cohesive energy and Debye
temperature (Reprinted with permission from [131]).
ZnO with wurtzite structure belongs to the 46vC symmetry group. At the Г point of the Brillouin zone,
optical phonons have the following irreducible representation: Гopt = A1 + 2B1 + E1 + 2E2, where the
A1 and the E1 modes are polar and can be split into transverse (TO) and longitudinal optical (LO)
phonons, with all being the Raman and infrared active. The non-polar E2 modes are the Raman
active, while the B1 modes are the Raman inactive [80, 318, 319]. These Raman modes contain
important physical information. For example, the E2 (high) mode represents the bending modes of O-
O atoms [101].
With the known Debye temperature D = 310 K, bulk modulus B =160 GPa and 0 4.4B [320], the
frequency (1) [80, 319, 321], and the thermal expansion coefficient ( )t [322] as input, one can find
the mode cohesive energy by matching the theory to the experimental results. Theoretical match of
the measured T dependent B(T)[27] and the (T) [314] of the Eg(639 cm-1) mode for anatase phase
TiO2 in Figure 30a leads to the ω(1) = 600 cm-1 and the θD of 768 K, which is in good agreement
with the reported value of 778 K [317]. The cohesive energy Ecoh is derived as 1.56 eV. At T ≤ θD/3,
the relative B and turns from nonlinear to linear when the temperature is increased. The slow
decrease of the B and at very low temperatures arises from the small values as the
specific heat η(t) is proportional to T3 at very low temperatures.
dttT
0
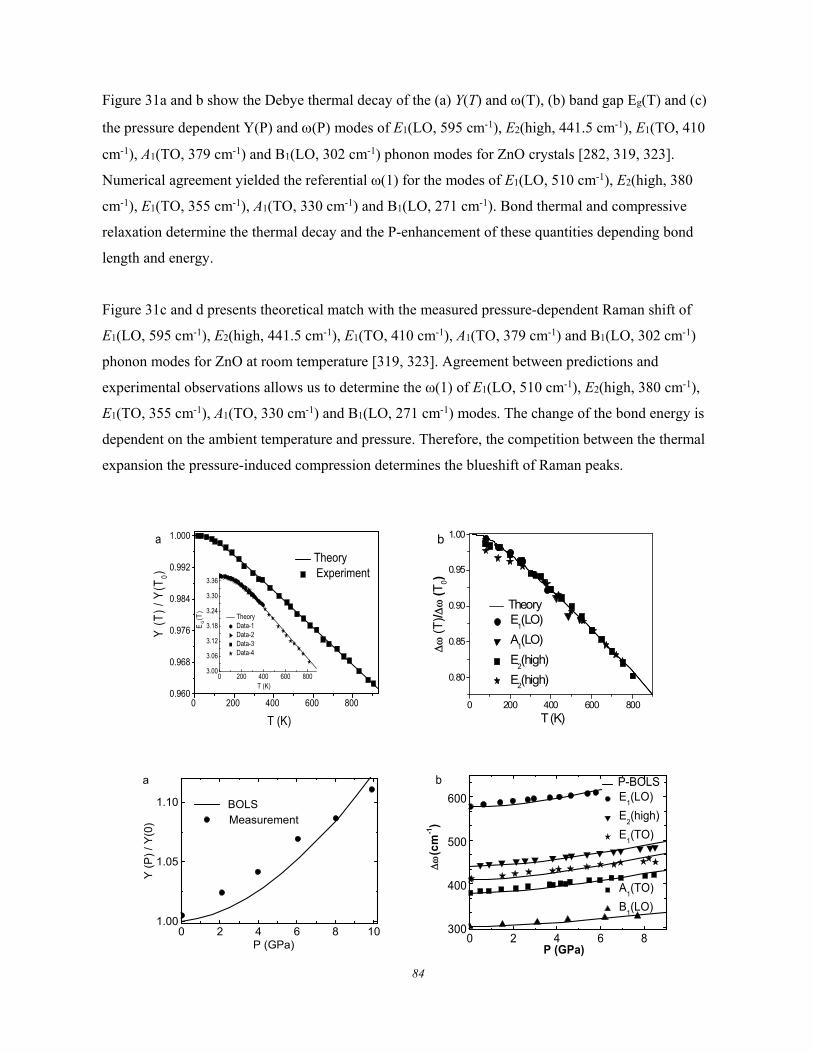
84
Figure 31a and b show the Debye thermal decay of the (a) Y(T) and (T), (b) band gap Eg(T) and (c)
the pressure dependent Y(P) and (P) modes of E1(LO, 595 cm-1), E2(high, 441.5 cm-1), E1(TO, 410
cm-1), A1(TO, 379 cm-1) and B1(LO, 302 cm-1) phonon modes for ZnO crystals [282, 319, 323].
Numerical agreement yielded the referential ω(1) for the modes of E1(LO, 510 cm-1), E2(high, 380
cm-1), E1(TO, 355 cm-1), A1(TO, 330 cm-1) and B1(LO, 271 cm-1). Bond thermal and compressive
relaxation determine the thermal decay and the P-enhancement of these quantities depending bond
length and energy.
Figure 31c and d presents theoretical match with the measured pressure-dependent Raman shift of
E1(LO, 595 cm-1), E2(high, 441.5 cm-1), E1(TO, 410 cm-1), A1(TO, 379 cm-1) and B1(LO, 302 cm-1)
phonon modes for ZnO at room temperature [319, 323]. Agreement between predictions and
experimental observations allows us to determine the ω(1) of E1(LO, 510 cm-1), E2(high, 380 cm-1),
E1(TO, 355 cm-1), A1(TO, 330 cm-1) and B1(LO, 271 cm-1) modes. The change of the bond energy is
dependent on the ambient temperature and pressure. Therefore, the competition between the thermal
expansion the pressure-induced compression determines the blueshift of Raman peaks.
0 200 400 600 8000.960
0.968
0.976
0.984
0.992
1.000
0 200 400 600 8003.00
3.06
3.12
3.18
3.24
3.30
3.36
EG
(T)
T (K)
Theory Data-1 Data-2 Data-3 Data-4
T (K)
Y (
T)
/ Y(T
0)
Theory Experiment
a
0 200 400 600 800
0.80
0.85
0.90
0.95
1.00
(T)/
(T
0)
T (K)
Theory E
1(LO)
A1(LO)
E2(high)
E2(high)
b
0 2 4 6 8 101.00
1.05
1.10
Y (
P)
/ Y(0
)
P (GPa)
BOLS Measurement
a
0 2 4 6 8300
400
500
600
(cm
-1)
P (GPa)
P-BOLS E
1(LO)
E2(high)
E1(TO)
A1(TO)
B1(LO)
b
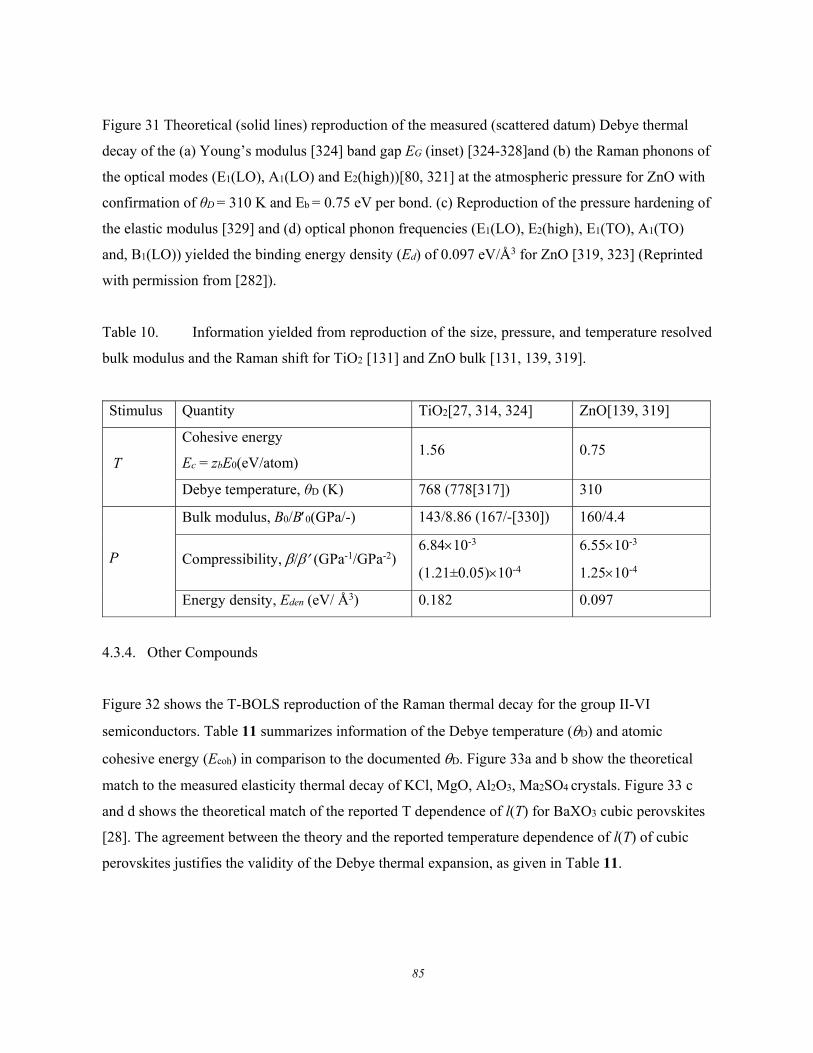
85
Figure 31 Theoretical (solid lines) reproduction of the measured (scattered datum) Debye thermal
decay of the (a) Young’s modulus [324] band gap EG (inset) [324-328]and (b) the Raman phonons of
the optical modes (E1(LO), A1(LO) and E2(high))[80, 321] at the atmospheric pressure for ZnO with
confirmation of θD = 310 K and Eb = 0.75 eV per bond. (c) Reproduction of the pressure hardening of
the elastic modulus [329] and (d) optical phonon frequencies (E1(LO), E2(high), E1(TO), A1(TO)
and, B1(LO)) yielded the binding energy density (Ed) of 0.097 eV/Å3 for ZnO [319, 323] (Reprinted
with permission from [282]).
Table 10. Information yielded from reproduction of the size, pressure, and temperature resolved
bulk modulus and the Raman shift for TiO2 [131] and ZnO bulk [131, 139, 319].
Stimulus Quantity TiO2[27, 314, 324] ZnO[139, 319]
T
Cohesive energy
Ec = zbE0(eV/atom) 1.56 0.75
Debye temperature, θD (K) 768 (778[317]) 310
P
Bulk modulus, B0/B0(GPa/-) 143/8.86 (167/-[330]) 160/4.4
Compressibility, / (GPa-1/GPa-2) 6.8410-3
(1.21±0.05)10-4
6.5510-3
1.2510-4
Energy density, Eden (eV/ Å3) 0.182 0.097
4.3.4. Other Compounds
Figure 32 shows the T-BOLS reproduction of the Raman thermal decay for the group II-VI
semiconductors. Table 11 summarizes information of the Debye temperature (D) and atomic
cohesive energy (Ecoh) in comparison to the documented D. Figure 33a and b show the theoretical
match to the measured elasticity thermal decay of KCl, MgO, Al2O3, Ma2SO4 crystals. Figure 33 c
and d shows the theoretical match of the reported T dependence of l(T) for BaXO3 cubic perovskites
[28]. The agreement between the theory and the reported temperature dependence of l(T) of cubic
perovskites justifies the validity of the Debye thermal expansion, as given in Table 11.
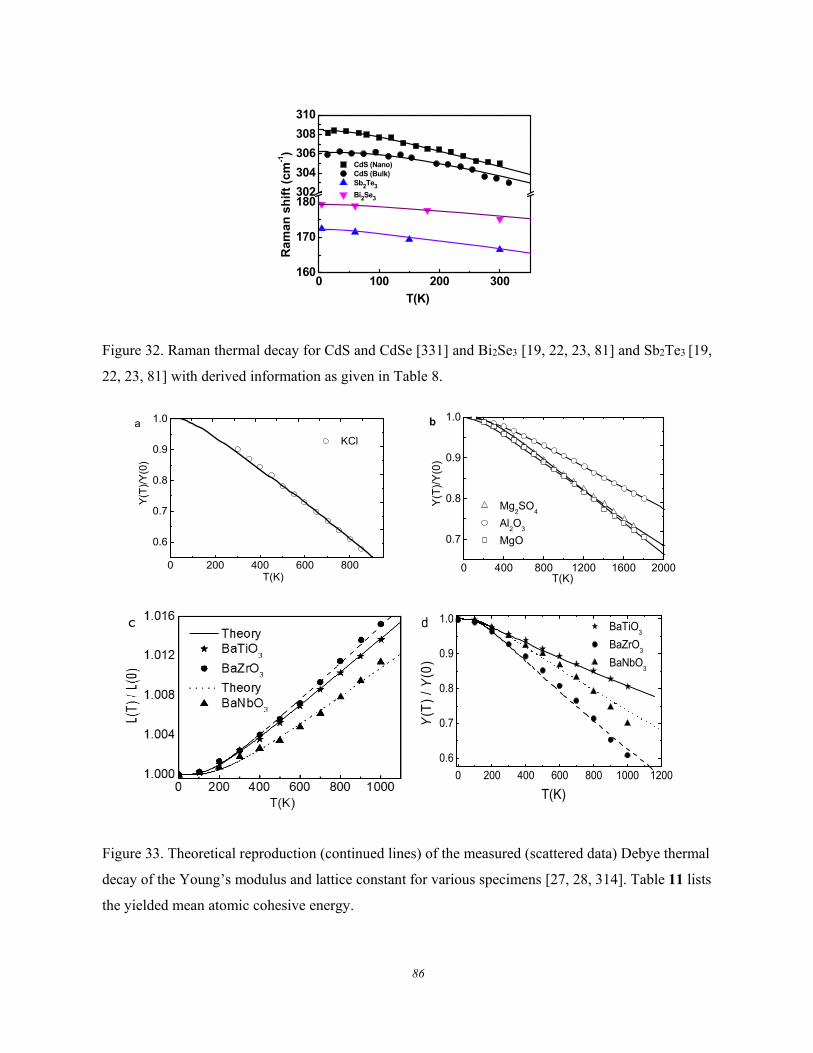
86
0 100 200 300160
170
180302
304
306
308
310
CdS (Nano) CdS (Bulk) Sb2Te3
Bi2Se3
Ram
an s
hif
t (c
m-1)
T(K)
Figure 32. Raman thermal decay for CdS and CdSe [331] and Bi2Se3 [19, 22, 23, 81] and Sb2Te3 [19,
22, 23, 81] with derived information as given in Table 8.
0 200 400 600 800
0.6
0.7
0.8
0.9
1.0a
KCl
Y(T
)/Y
(0)
T(K)
0 400 800 1200 1600 2000
0.7
0.8
0.9
1.0
Mg2SO
4
Al2O
3
MgO
Y(T
)/Y
(0)
T(K)
b
0 200 400 600 800 1000 1200
0.6
0.7
0.8
0.9
1.0
d
Y(T
) / Y
(0)
T(K)
BaTiO3
BaZrO3
BaNbO3
Figure 33. Theoretical reproduction (continued lines) of the measured (scattered data) Debye thermal
decay of the Young’s modulus and lattice constant for various specimens [27, 28, 314]. Table 11 lists
the yielded mean atomic cohesive energy.
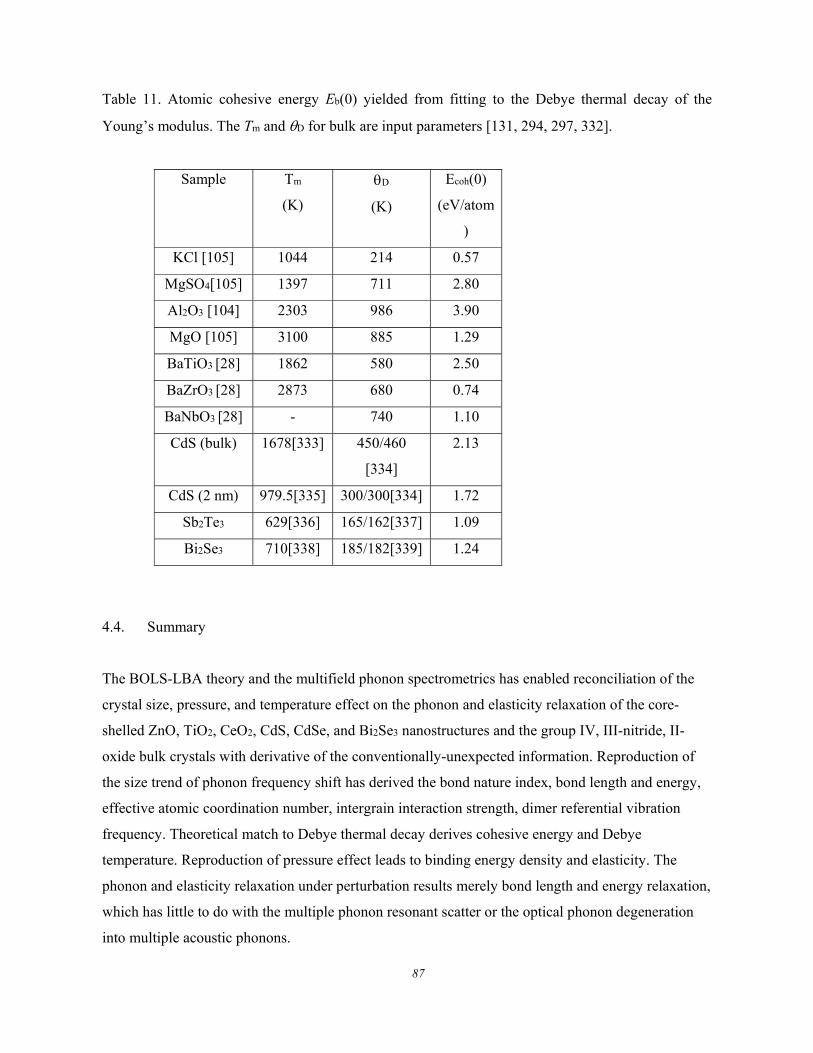
87
Table 11. Atomic cohesive energy Eb(0) yielded from fitting to the Debye thermal decay of the
Young’s modulus. The Tm and D for bulk are input parameters [131, 294, 297, 332].
Sample Tm
(K)
D
(K)
Ecoh(0)
(eV/atom
)
KCl [105] 1044 214 0.57
MgSO4[105] 1397 711 2.80
Al2O3 [104] 2303 986 3.90
MgO [105] 3100 885 1.29
BaTiO3 [28] 1862 580 2.50
BaZrO3 [28] 2873 680 0.74
BaNbO3 [28] - 740 1.10
CdS (bulk) 1678[333] 450/460
[334]
2.13
CdS (2 nm) 979.5[335] 300/300[334] 1.72
Sb2Te3 629[336] 165/162[337] 1.09
Bi2Se3 710[338] 185/182[339] 1.24
4.4. Summary
The BOLS-LBA theory and the multifield phonon spectrometrics has enabled reconciliation of the
crystal size, pressure, and temperature effect on the phonon and elasticity relaxation of the core-
shelled ZnO, TiO2, CeO2, CdS, CdSe, and Bi2Se3 nanostructures and the group IV, III-nitride, II-
oxide bulk crystals with derivative of the conventionally-unexpected information. Reproduction of
the size trend of phonon frequency shift has derived the bond nature index, bond length and energy,
effective atomic coordination number, intergrain interaction strength, dimer referential vibration
frequency. Theoretical match to Debye thermal decay derives cohesive energy and Debye
temperature. Reproduction of pressure effect leads to binding energy density and elasticity. The
phonon and elasticity relaxation under perturbation results merely bond length and energy relaxation,
which has little to do with the multiple phonon resonant scatter or the optical phonon degeneration
into multiple acoustic phonons.

88
89
5. Water and aqueous solutions
Highlight
Hydration of ions, lone pairs, protons, dipoles mediates the O:H–O network and solution properties.
DPS distills the phonon abundance-order-stiffness transition of O:H–O bonds under perturbation.
Ionic screened polarization and interanion repulsion stem the Hofmeister hydration volume.
HH and O::O repulsion, ionic polarization, and solute bond shrinkage feature Lewis
solutions.
5.1. Water and Aqueous Solutions
Water ice is ubiquitously important to agriculture, climate, environment, quality-of-life, and
sustainability. O:H dissociation for water harvesting and H–O bond dissociation for H2 generating
are strategies to conquering resource crisis; hydration and solvation laid foundations to ionic
rejection in water desalination and protein dissolution; aqueous drug-cell and water-protein
interfaces are of great importance to microbiology, disease curing, DNA regulating and signaling.
Therefore, grasp with factors dictating the performance of the undercoordinated H2O molecules and
their electrons is pivotal to engineering the surface water and controlling its reaction, transition, and
transport dynamics as one wishes.
Water ice responds to perturbation such as compression, heating, electromagnetic radiation, and
molecular undercoordination leading to anomalies such as ice friction, ice floating, regelation,
supercooling/superheating, warm water cooling faster, etc. Acid, base and salt solvation makes the
solution even amazing. The O:H–O bonds (or HB) in the hydration shells of solutes perform
differently from they do in the ordinary water.
Much work has been focused on the motion manner and dynamics of the excessive hydrated charge
(proton and line-pair) and molecules with debating mechanisms. One often considers the solute motion
dynamics in terms of phonon or molecular lifetime in the hydrating states, drift motion diffusivity, by
taking the H2O motif as the basic structural unit. Unfortunately, progress in understanding the solute
capabilities of mediating the solution HB network and properties is slower than it should be because
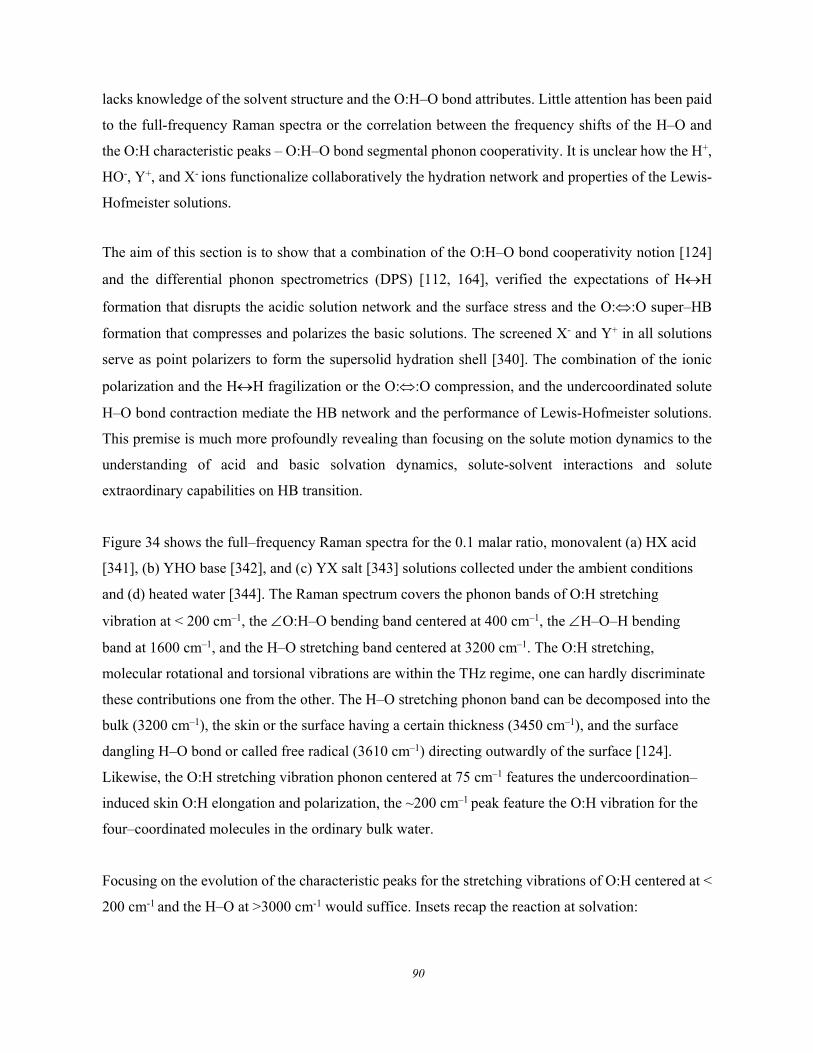
90
lacks knowledge of the solvent structure and the O:H–O bond attributes. Little attention has been paid
to the full-frequency Raman spectra or the correlation between the frequency shifts of the H–O and
the O:H characteristic peaks – O:H–O bond segmental phonon cooperativity. It is unclear how the H+,
HO-, Y+, and X- ions functionalize collaboratively the hydration network and properties of the Lewis-
Hofmeister solutions.
The aim of this section is to show that a combination of the O:H–O bond cooperativity notion [124]
and the differential phonon spectrometrics (DPS) [112, 164], verified the expectations of HH
formation that disrupts the acidic solution network and the surface stress and the O::O super–HB
formation that compresses and polarizes the basic solutions. The screened X- and Y+ in all solutions
serve as point polarizers to form the supersolid hydration shell [340]. The combination of the ionic
polarization and the HH fragilization or the O::O compression, and the undercoordinated solute
H–O bond contraction mediate the HB network and the performance of Lewis-Hofmeister solutions.
This premise is much more profoundly revealing than focusing on the solute motion dynamics to the
understanding of acid and basic solvation dynamics, solute-solvent interactions and solute
extraordinary capabilities on HB transition.
Figure 34 shows the full–frequency Raman spectra for the 0.1 malar ratio, monovalent (a) HX acid
[341], (b) YHO base [342], and (c) YX salt [343] solutions collected under the ambient conditions
and (d) heated water [344]. The Raman spectrum covers the phonon bands of O:H stretching
vibration at < 200 cm–1, the O:H–O bending band centered at 400 cm–1, the H–O–H bending
band at 1600 cm–1, and the H–O stretching band centered at 3200 cm–1. The O:H stretching,
molecular rotational and torsional vibrations are within the THz regime, one can hardly discriminate
these contributions one from the other. The H–O stretching phonon band can be decomposed into the
bulk (3200 cm–1), the skin or the surface having a certain thickness (3450 cm–1), and the surface
dangling H–O bond or called free radical (3610 cm–1) directing outwardly of the surface [124].
Likewise, the O:H stretching vibration phonon centered at 75 cm–1 features the undercoordination–
induced skin O:H elongation and polarization, the ~200 cm–1 peak feature the O:H vibration for the
four–coordinated molecules in the ordinary bulk water.
Focusing on the evolution of the characteristic peaks for the stretching vibrations of O:H centered at <
200 cm-1 and the H–O at >3000 cm-1 would suffice. Insets recap the reaction at solvation:
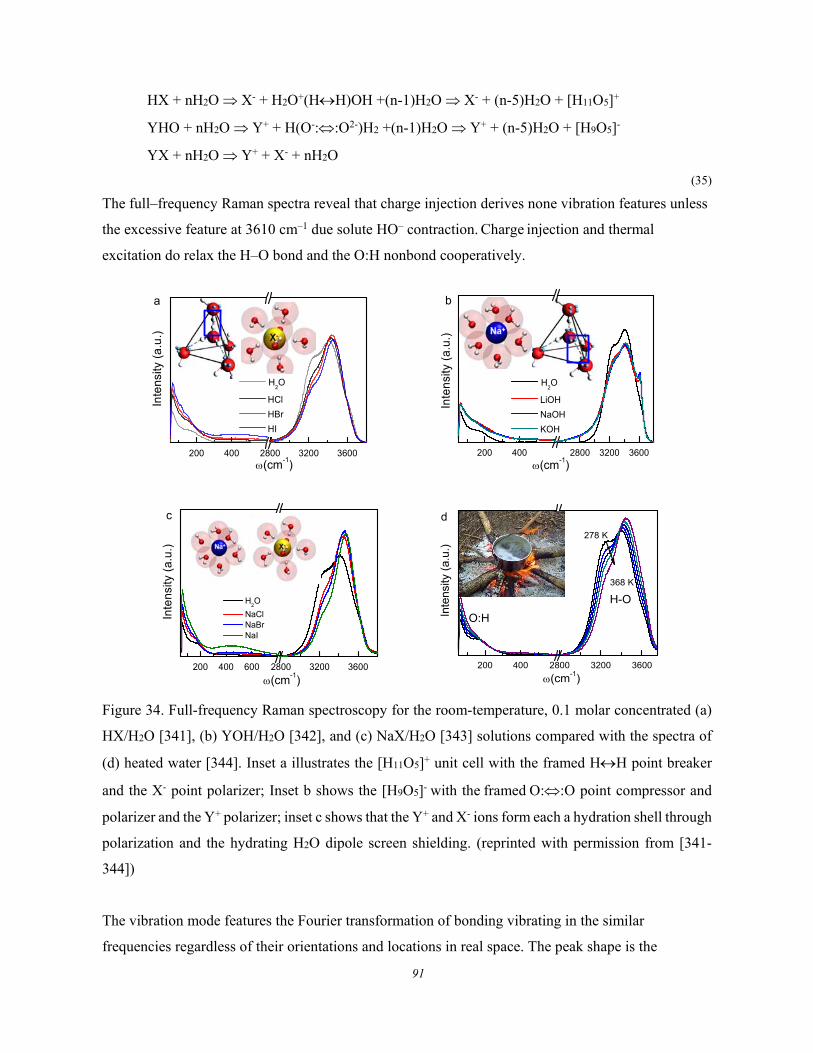
91
HX + nH2O X- + H2O+(HH)OH +(n-1)H2O X- + (n-5)H2O + [H11O5]+
YHO + nH2O Y+ + H(O-::O2-)H2 +(n-1)H2O Y+ + (n-5)H2O + [H9O5]-
YX + nH2O Y+ + X- + nH2O
(35)
The full–frequency Raman spectra reveal that charge injection derives none vibration features unless
the excessive feature at 3610 cm–1 due solute HO– contraction. Charge injection and thermal
excitation do relax the H–O bond and the O:H nonbond cooperatively.
H2O
HCl
HBr
HI
200 400 2800 3200 3600
Inte
nsity
(a
.u.)
(cm-1)
a
200 400 2800 3200 3600
(cm-1)
Inte
nsi
ty (
a.u.
)
H2O
LiOH
NaOH
KOH
b
200 400 600 2800 3200 3600
Inte
nsity
(a.
u.)
(cm-1)
H2O
NaCl NaBr NaI
c
200 400 2800 3200 3600
Inte
nsi
ty (
a.u.)
(cm-1)
278 K
368 K
H-O
O:H
d
Figure 34. Full-frequency Raman spectroscopy for the room-temperature, 0.1 molar concentrated (a)
HX/H2O [341], (b) YOH/H2O [342], and (c) NaX/H2O [343] solutions compared with the spectra of
(d) heated water [344]. Inset a illustrates the [H11O5]+ unit cell with the framed HH point breaker
and the X- point polarizer; Inset b shows the [H9O5]- with the framed O::O point compressor and
polarizer and the Y+ polarizer; inset c shows that the Y+ and X- ions form each a hydration shell through
polarization and the hydrating H2O dipole screen shielding. (reprinted with permission from [341-
344])
The vibration mode features the Fourier transformation of bonding vibrating in the similar
frequencies regardless of their orientations and locations in real space. The peak shape is the
92
population function and the peak maximum the highest popularity, the peak central x represent the
stiffness of the vibrating bonds as a function of bond length dx and bond energy Ex, (x)2 Ex/dx2.
The peak integral is proportional to the number of bonds contributing to the phonon abundance of the
vibration mode x. Thus, one can distill the fraction-stiffness transition of the O:H–O phonons by
differentiating the spectrum from deionized water as a reference from those collected from solutions
or water under perturbation such as heating and compressing upon all the spectral peak area being
normalized [340]. This (DPS) strategy gives direct information on the O:H–O bonds transition from
its vibration mode of ordinary water to the hydrating in terms of the number fraction (phonon
abundance), stiffness (frequency shift), and fluctuation (line width) with much more ease and
quantitative information than using the conventional spectral peak Gaussian-type decomposition.
5.2. Water and Ice: O:H−O Segmental Specific Heats
5.2.1. Conservation and Restriction
We proposed, verified and systematically demonstrated the impact of his unique ‘hydrogen bond
theory’. Firstly, we coupled the O:H van der Walls and the H–O intramolecular interactions using the
O::O inter-lone-pair repulsion to feature the energetics and dynamics of water ice, in terms of
hydrogen bond segmental cooperative relax-ability and specific-heat disparity. The specific-heat
defines the structure phases at the ambient pressure, density anomalies, and the quasisolid (QS)
phase of cooling expansion. Wen then examined the response of O:H–O bonds and electrons to
mechanical and thermal excitation, electrostatic polarization, magnetization, molecular
undercoordination, charge injection by acid, base, salt, and molecular solvation, and their programmed
combinations. The examination was conducted by employing electron and phonon spectroscopy, surface
stress and solution viscosity detection, quantum computations, Lagrangian-Laplacian oscillation
dynamics, and Fourier fluid transport thermodynamics, in combination with ultrafast phonon
spectroscopy and X-ray K-edge absorption analysis.
Figure 35a illustrates the 2H2O unit cell (or 5H2O motif) of C3v symmetry having four HBs bridging
oxygen anions. It is essential to treat water as a crystalline–like structure with well–defined lattice
geometry, strong correlation, and high fluctuation. For a specimen containing N number of O2-
anions, there are 2N protons H+ and 2N lone pairs “:” and the O:H−O bond configuration conserve
regardless of structural phase [345] unless excessive H+ or “:” is introduced [341, 342].
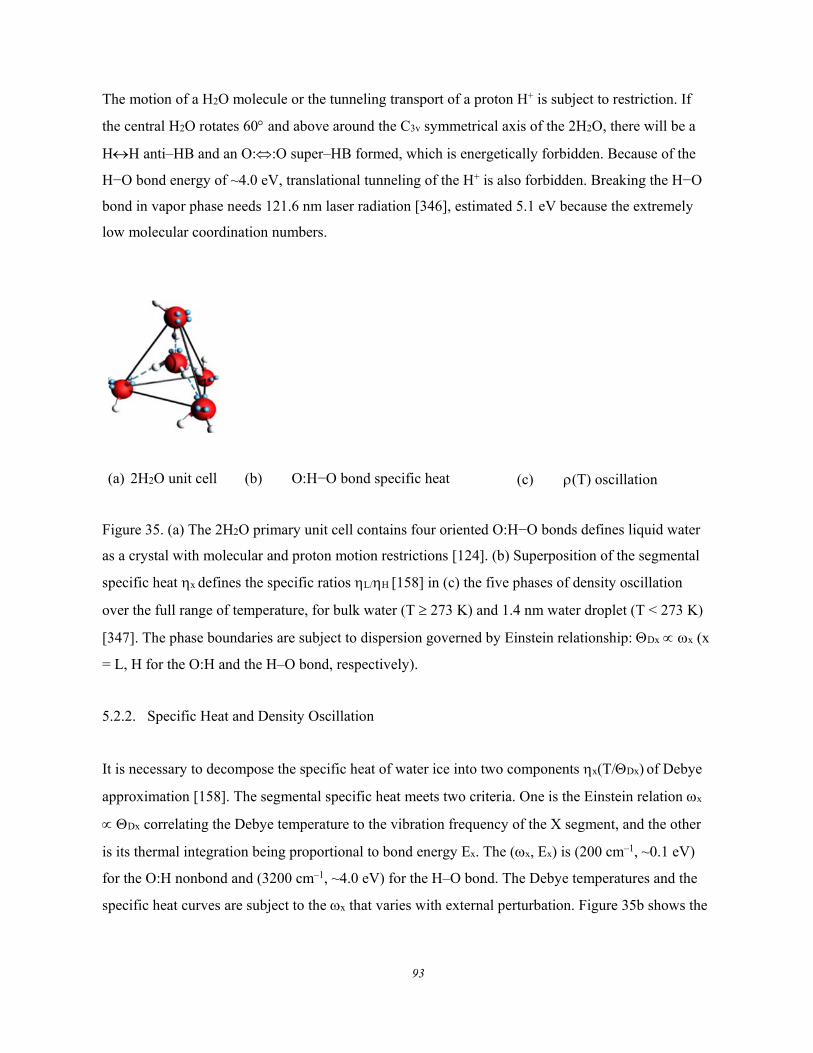
93
The motion of a H2O molecule or the tunneling transport of a proton H+ is subject to restriction. If
the central H2O rotates 60 and above around the C3v symmetrical axis of the 2H2O, there will be a
HH anti–HB and an O::O super–HB formed, which is energetically forbidden. Because of the
H−O bond energy of ~4.0 eV, translational tunneling of the H+ is also forbidden. Breaking the H−O
bond in vapor phase needs 121.6 nm laser radiation [346], estimated 5.1 eV because the extremely
low molecular coordination numbers.
(a) 2H2O unit cell (b) O:H−O bond specific heat (c) (T) oscillation
Figure 35. (a) The 2H2O primary unit cell contains four oriented O:H−O bonds defines liquid water
as a crystal with molecular and proton motion restrictions [124]. (b) Superposition of the segmental
specific heat x defines the specific ratios L/H [158] in (c) the five phases of density oscillation
over the full range of temperature, for bulk water (T 273 K) and 1.4 nm water droplet (T < 273 K)
[347]. The phase boundaries are subject to dispersion governed by Einstein relationship: Dx x (x
= L, H for the O:H and the H–O bond, respectively).
5.2.2. Specific Heat and Density Oscillation
It is necessary to decompose the specific heat of water ice into two components x(T/Dx) of Debye
approximation [158]. The segmental specific heat meets two criteria. One is the Einstein relation x
Dx correlating the Debye temperature to the vibration frequency of the X segment, and the other
is its thermal integration being proportional to bond energy Ex. The (x, Ex) is (200 cm–1, ~0.1 eV)
for the O:H nonbond and (3200 cm–1, ~4.0 eV) for the H–O bond. The Debye temperatures and the
specific heat curves are subject to the x that varies with external perturbation. Figure 35b shows the
94
superposition of the specific heats x, which defines five phases in Figure 35c showing density
oscillation over the full temperature range [158].
The hydrogen bonding thermodynamics at a certain temperature is subject to the specific heat ratio,
L/H. The segmental having a lower specific heat follows the regular thermal expansion but the
other segment responds to thermal excitation oppositely because of the HB cooperativity by
repulsion between electron pairs on adjacent O2-.
5.2.3. O:H–O Length-stiffness Cooperative Relaxation
As the basic structural and energy exchange unit, the O:H−O bond integrates the intermolecular
weaker O:H nonbond (or called van der Waals bond with ~0.1 eV energy) and the intramolecular
stronger H−O polar–covalent bond (~4.0 eV), rather than either of the O:H or the H–O alone. The
characteristics of the O:H−O bond is its asymmetrical and short–range interactions and coupled with
the Coulomb repulsion between electron pairs on adjacent oxygen ions [124]. O:H−O bond
segmental length and bond angle relaxation changes system energy, but structural fluctuation
contributes little to the system energy on an average.
With the known H−O and O:H segmental length relaxation derived from (P) (1/V(P)) profile measured
from compressed ice [348, 349] and the framework of tetrahedral-coordination for a water molecule
[129], one can correlate the size dH, separation dOO, bond geometry, and mass density of molecules
packed in water and ice in the following manner [350],
/
0
0
1
0
0
3
1.
2.6950
2;
1 ( / 0.24280004 1.6946 4
) H L
H
OO
L
L H
d
d
d exp d
Molecular separation
d and d at Cd
(36)
The O:H nonbond and the H−O bond segmental disparity and the O−O coupling dislocate the O2- along
the segmented O:H−O bond in the same direction but by different amounts under an external stimulus
[158, 348, 351, 352]. The softer O:H nonbond always relaxes more than the stiffer H−O bond with
respect to the H+ as the coordination origin. The O:H−O angle relaxation contributes to the
geometry and mass density. The H−O relaxation absorbs or emits energy and the O:H relaxation
dissipates energy caped with the 0.1 eV. The O:H−O bond segmental energy and specific heat disparity
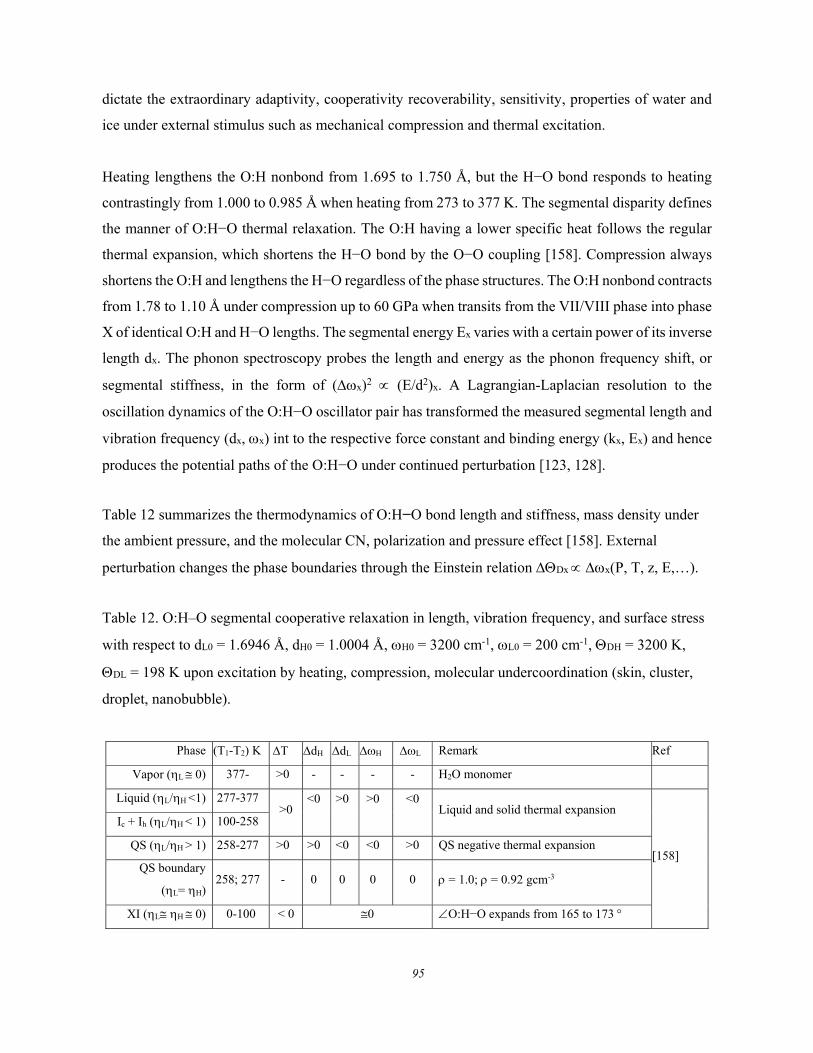
95
dictate the extraordinary adaptivity, cooperativity recoverability, sensitivity, properties of water and
ice under external stimulus such as mechanical compression and thermal excitation.
Heating lengthens the O:H nonbond from 1.695 to 1.750 Å, but the H−O bond responds to heating
contrastingly from 1.000 to 0.985 Å when heating from 273 to 377 K. The segmental disparity defines
the manner of O:H−O thermal relaxation. The O:H having a lower specific heat follows the regular
thermal expansion, which shortens the H−O bond by the O−O coupling [158]. Compression always
shortens the O:H and lengthens the H−O regardless of the phase structures. The O:H nonbond contracts
from 1.78 to 1.10 Å under compression up to 60 GPa when transits from the VII/VIII phase into phase
X of identical O:H and H−O lengths. The segmental energy Ex varies with a certain power of its inverse
length dx. The phonon spectroscopy probes the length and energy as the phonon frequency shift, or
segmental stiffness, in the form of (x)2 (E/d2)x. A Lagrangian-Laplacian resolution to the
oscillation dynamics of the O:H−O oscillator pair has transformed the measured segmental length and
vibration frequency (dx, x) int to the respective force constant and binding energy (kx, Ex) and hence
produces the potential paths of the O:H−O under continued perturbation [123, 128].
Table 12 summarizes the thermodynamics of O:H−O bond length and stiffness, mass density under
the ambient pressure, and the molecular CN, polarization and pressure effect [158]. External
perturbation changes the phase boundaries through the Einstein relation Dx x(P, T, z, E,…).
Table 12. O:H–O segmental cooperative relaxation in length, vibration frequency, and surface stress
with respect to dL0 = 1.6946 Å, dH0 = 1.0004 Å, H0 = 3200 cm-1, L0 = 200 cm-1, DH = 3200 K,
DL = 198 K upon excitation by heating, compression, molecular undercoordination (skin, cluster,
droplet, nanobubble).
Phase (T1-T2) K T dH dL H L Remark Ref
Vapor (L 0) 377- >0 - - - - H2O monomer
Liquid (L/H <1) 277-377 >0
<0
>0
>0
<0
Liquid and solid thermal expansion
[158]
Ic + Ih (L/H < 1) 100-258
QS (L/H > 1) 258-277 >0 >0 <0 <0 >0 QS negative thermal expansion
QS boundary
(L= H) 258; 277 - 0 0 0 0 = 1.0; = 0.92 gcm-3
XI (L H 0) 0-100 < 0 0 O:H−O expands from 165 to 173
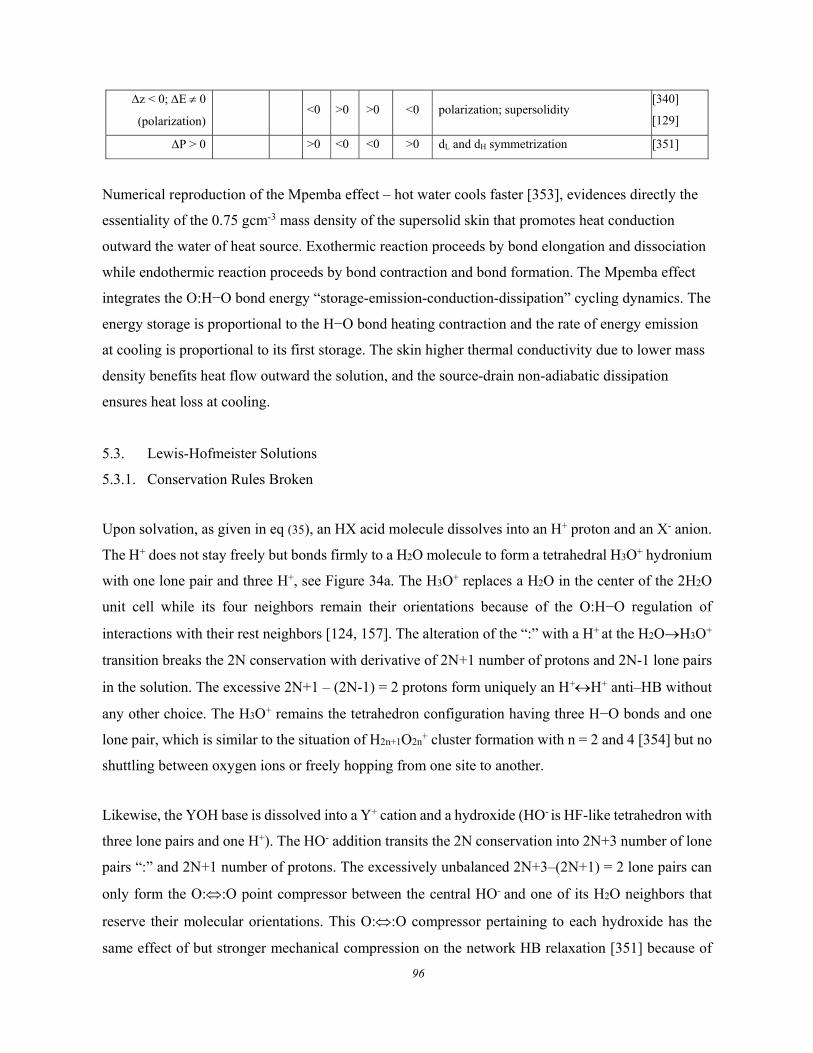
96
z < 0; E 0
(polarization) <0 >0 >0 <0 polarization; supersolidity
[340]
[129]
P > 0 >0 <0 <0 >0 dL and dH symmetrization [351]
Numerical reproduction of the Mpemba effect – hot water cools faster [353], evidences directly the
essentiality of the 0.75 gcm-3 mass density of the supersolid skin that promotes heat conduction
outward the water of heat source. Exothermic reaction proceeds by bond elongation and dissociation
while endothermic reaction proceeds by bond contraction and bond formation. The Mpemba effect
integrates the O:H−O bond energy “storage-emission-conduction-dissipation” cycling dynamics. The
energy storage is proportional to the H−O bond heating contraction and the rate of energy emission
at cooling is proportional to its first storage. The skin higher thermal conductivity due to lower mass
density benefits heat flow outward the solution, and the source-drain non-adiabatic dissipation
ensures heat loss at cooling.
5.3. Lewis-Hofmeister Solutions
5.3.1. Conservation Rules Broken
Upon solvation, as given in eq (35), an HX acid molecule dissolves into an H+ proton and an X- anion.
The H+ does not stay freely but bonds firmly to a H2O molecule to form a tetrahedral H3O+ hydronium
with one lone pair and three H+, see Figure 34a. The H3O+ replaces a H2O in the center of the 2H2O
unit cell while its four neighbors remain their orientations because of the O:H−O regulation of
interactions with their rest neighbors [124, 157]. The alteration of the “:” with a H+ at the H2OH3O+
transition breaks the 2N conservation with derivative of 2N+1 number of protons and 2N-1 lone pairs
in the solution. The excessive 2N+1 – (2N-1) = 2 protons form uniquely an H+H+ anti–HB without
any other choice. The H3O+ remains the tetrahedron configuration having three H−O bonds and one
lone pair, which is similar to the situation of H2n+1O2n+ cluster formation with n = 2 and 4 [354] but no
shuttling between oxygen ions or freely hopping from one site to another.
Likewise, the YOH base is dissolved into a Y+ cation and a hydroxide (HO- is HF-like tetrahedron with
three lone pairs and one H+). The HO- addition transits the 2N conservation into 2N+3 number of lone
pairs “:” and 2N+1 number of protons. The excessively unbalanced 2N+3–(2N+1) = 2 lone pairs can
only form the O::O point compressor between the central HO- and one of its H2O neighbors that
reserve their molecular orientations. This O::O compressor pertaining to each hydroxide has the
same effect of but stronger mechanical compression on the network HB relaxation [351] because of
97
the clustering of the two pairs of lone pairs and their weak binding energy to O2-. The clustering of
four electrons and weak bonding to O2- specify the point polarizer instead of a point breaker. X- and
Y+ in all solutions only polarize their neighboring H2O molecules to form hydration shells.
5.3.2. DPS of Lewis-Hofmeister Solutions
The DPS distils only phonons transiting into their hydration states as a peak above the x–axis, which
equals the abundance loss of the ordinary HBs as a valley below the axis in the DPS spectrum. This
process removes the spectral areas commonly–shared by the ordinary water and the high–order
hydration shells. The DPS resolves the transition of the phonon stiffness (frequency shift) and
abundance (peak area) by solvation. The fraction coefficient, fx(C), being the integral of the DPS
peak, is the fraction of bonds, or the number of phonons transiting from water to the hydration states
at a solute concentration C.
YOH solvation broadens the main peak shifting to lower frequencies [355-357]. The solute type and
concentration resolved DPS shown in Figure 36 confirmed that YOH solvation indeed softens the H
phonon – O::O compression lengthens the neighboring H–O bond and softens its phonon to 3100
cm-1 and below. Besides, a sharp peak appears at 3610 cm-1 that is identical to the dangling H–O bond
at water surface. The sharp peaks feature the less ordered H–O bond due the HO- The x is less
sensitive to the type of the alkali cations of the same concentration. These observations confirm that
the O::O super–HB has the same but stronger effect of mechanical compression [358] and that the
bond order-length-strength (BOLS) correlation [359] applies to aqueous solutions - bonds between
undercoordinated atoms become shorter and stronger.
Observations justify that the O::O super–HB point compression (< 3100 cm-1; > 220 cm-1) has the
same but much stronger effect of mechanically bulk compression (< 3300 cm-1; > 200 cm-1) at the
critical pressure 1.33 GPa for the room-temperature water-ice transition [351], compared to the
compression effect on water and ice. The L for the YOH solutions at lower concentrations duplicates
the L feature of the mechanically compressed water, because of the compression and polarization
[348]. Compression lengthens the solvent H–O bond and softens its phonon but relaxes the O:H
nonbond contrastingly. The strong effect of compression overtones the effect of Y+ polarization. The
excessive peak at 3610 cm-1 features the bond-order-deficiency induced H–O contraction of the due
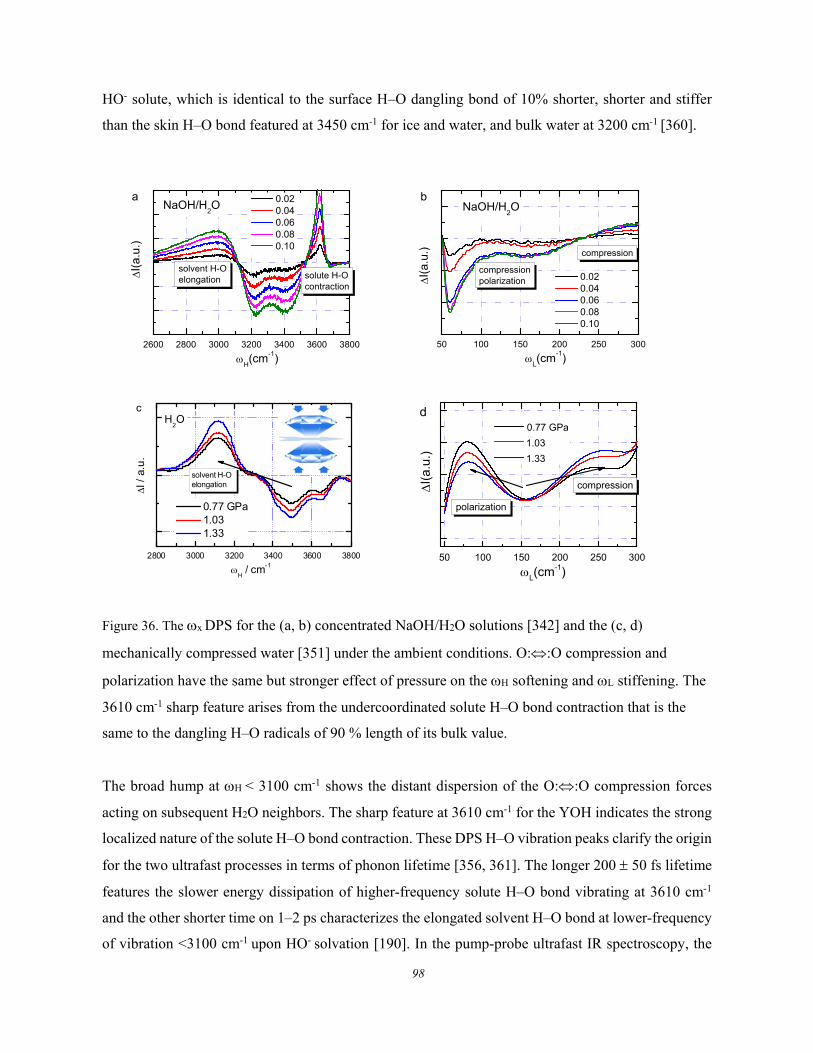
98
HO- solute, which is identical to the surface H–O dangling bond of 10% shorter, shorter and stiffer
than the skin H–O bond featured at 3450 cm-1 for ice and water, and bulk water at 3200 cm-1 [360].
2600 2800 3000 3200 3400 3600 3800
solute H-Ocontraction
H(cm-1)
I(a
.u.)
0.02 0.04 0.06 0.08 0.10
aNaOH/H
2O
solvent H-Oelongation
50 100 150 200 250 300
compressionpolarizationI
(a.u
.)
L(cm-1)
0.02 0.04 0.06 0.08 0.10
bNaOH/H
2O
compression
2800 3000 3200 3400 3600 3800
H / cm-1
I /
a.u
.
0.77 GPa 1.03 1.33
cH
2O
solvent H-O elongation
50 100 150 200 250 300
0.77 GPa
1.03
1.33
L(cm-1)
I(a
.u.)
d
polarization
compression
Figure 36. The x DPS for the (a, b) concentrated NaOH/H2O solutions [342] and the (c, d)
mechanically compressed water [351] under the ambient conditions. O::O compression and
polarization have the same but stronger effect of pressure on the H softening and L stiffening. The
3610 cm-1 sharp feature arises from the undercoordinated solute H–O bond contraction that is the
same to the dangling H–O radicals of 90 % length of its bulk value.
The broad hump at H < 3100 cm-1 shows the distant dispersion of the O::O compression forces
acting on subsequent H2O neighbors. The sharp feature at 3610 cm-1 for the YOH indicates the strong
localized nature of the solute H–O bond contraction. These DPS H–O vibration peaks clarify the origin
for the two ultrafast processes in terms of phonon lifetime [356, 361]. The longer 200 50 fs lifetime
features the slower energy dissipation of higher-frequency solute H–O bond vibrating at 3610 cm-1
and the other shorter time on 1–2 ps characterizes the elongated solvent H–O bond at lower-frequency
of vibration <3100 cm-1 upon HO- solvation [190]. In the pump-probe ultrafast IR spectroscopy, the
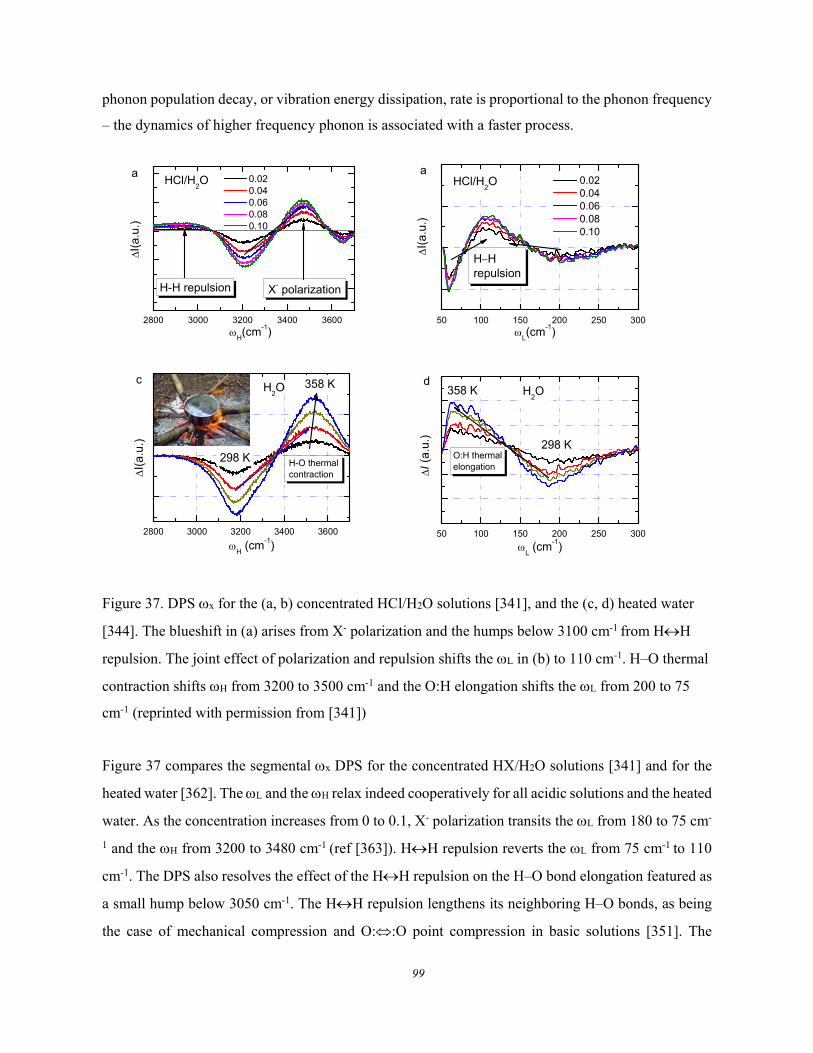
99
phonon population decay, or vibration energy dissipation, rate is proportional to the phonon frequency
– the dynamics of higher frequency phonon is associated with a faster process.
2800 3000 3200 3400 3600
I(a
.u.)
H(cm-1)
0.02 0.04 0.06 0.08 0.10
aHCl/H
2O
X- polarizationH-H repulsion
50 100 150 200 250 300
0.02 0.04 0.06 0.08 0.10
HHrepulsion
I(a
.u.)
L(cm-1)
aHCl/H
2O
2800 3000 3200 3400 3600
I
(a.u
.)
H (cm-1)
c 358 K
298 K H-O thermalcontraction
H2O
50 100 150 200 250 300
298 K
I
(a.
u.)
L (cm-1)
dH
2O358 K
O:H thermalelongation
Figure 37. DPS x for the (a, b) concentrated HCl/H2O solutions [341], and the (c, d) heated water
[344]. The blueshift in (a) arises from X- polarization and the humps below 3100 cm-1 from HH
repulsion. The joint effect of polarization and repulsion shifts the L in (b) to 110 cm-1. H–O thermal
contraction shifts H from 3200 to 3500 cm-1 and the O:H elongation shifts the L from 200 to 75
cm-1 (reprinted with permission from [341])
Figure 37 compares the segmental x DPS for the concentrated HX/H2O solutions [341] and for the
heated water [362]. The L and the H relax indeed cooperatively for all acidic solutions and the heated
water. As the concentration increases from 0 to 0.1, X- polarization transits the L from 180 to 75 cm-
1 and the H from 3200 to 3480 cm-1 (ref [363]). HH repulsion reverts the L from 75 cm-1 to 110
cm-1. The DPS also resolves the effect of the HH repulsion on the H–O bond elongation featured as
a small hump below 3050 cm-1. The HH repulsion lengthens its neighboring H–O bonds, as being
the case of mechanical compression and O::O point compression in basic solutions [351]. The
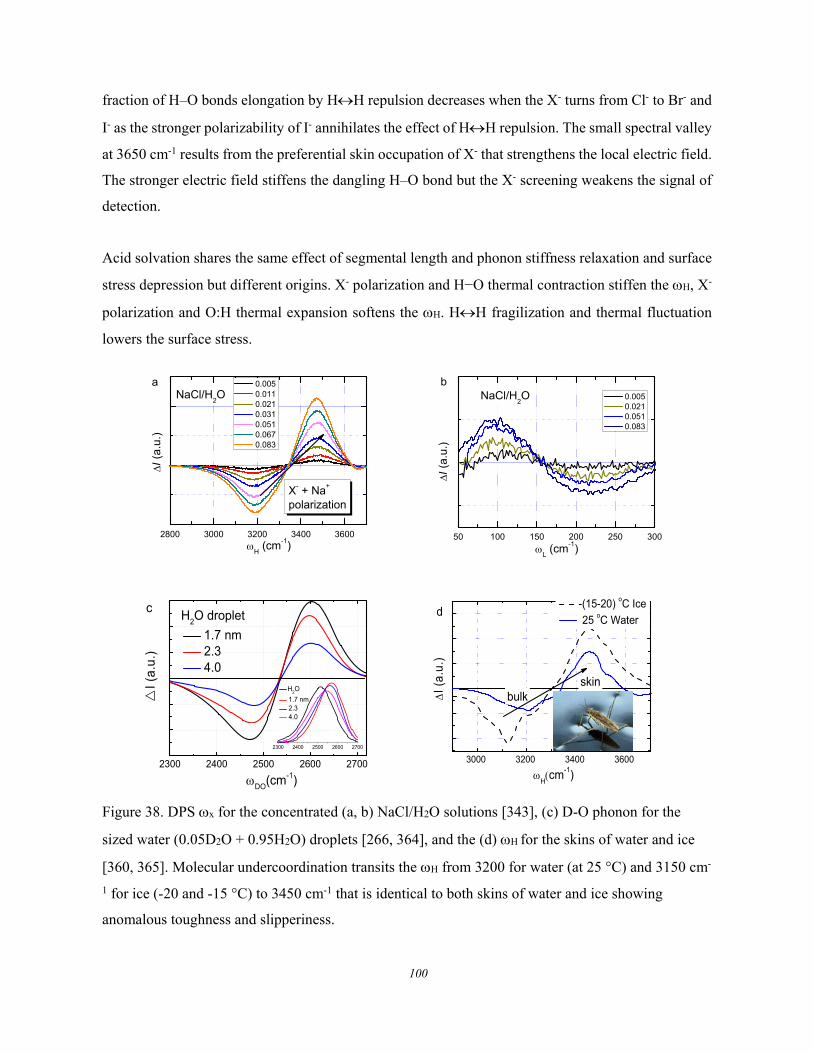
100
fraction of H–O bonds elongation by HH repulsion decreases when the X- turns from Cl- to Br- and
I- as the stronger polarizability of I- annihilates the effect of HH repulsion. The small spectral valley
at 3650 cm-1 results from the preferential skin occupation of X- that strengthens the local electric field.
The stronger electric field stiffens the dangling H–O bond but the X- screening weakens the signal of
detection.
Acid solvation shares the same effect of segmental length and phonon stiffness relaxation and surface
stress depression but different origins. X- polarization and H−O thermal contraction stiffen the H, X-
polarization and O:H thermal expansion softens the H. HH fragilization and thermal fluctuation
lowers the surface stress.
2800 3000 3200 3400 3600
0.005 0.011 0.021 0.031 0.051 0.067 0.083
I
(a.
u.)
H (cm-1)
NaCl/H2O
a
X- + Na+ polarization
50 100 150 200 250 300
0.005 0.021 0.051 0.083
NaCl/H2O
L (cm-1)
I (
a.u.
)
b
2300 2400 2500 2600 2700
I (
a.u
.)
DO
(cm-1)
1.7 nm 2.3 4.0
cH
2O droplet
H2O
1.7 nm 2.3 4.0 20 40 60
2300 2400 2500 2600 2700
3000 3200 3400 3600
I (
a.u
.)
Hcm-1)
d
skinbulk
-(15-20) oC Ice
25 oC Water
Figure 38. DPS x for the concentrated (a, b) NaCl/H2O solutions [343], (c) D-O phonon for the
sized water (0.05D2O + 0.95H2O) droplets [266, 364], and the (d) H for the skins of water and ice
[360, 365]. Molecular undercoordination transits the H from 3200 for water (at 25 °C) and 3150 cm-
1 for ice (-20 and -15 °C) to 3450 cm-1 that is identical to both skins of water and ice showing
anomalous toughness and slipperiness.
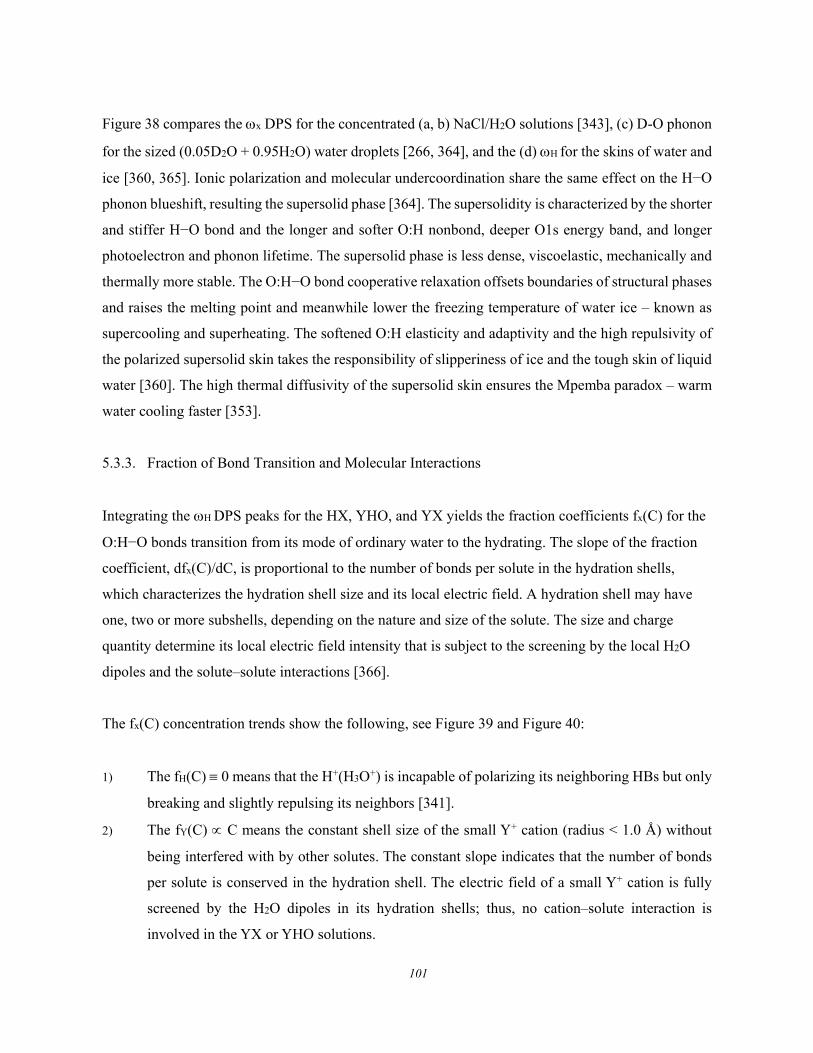
101
Figure 38 compares the x DPS for the concentrated (a, b) NaCl/H2O solutions [343], (c) D-O phonon
for the sized (0.05D2O + 0.95H2O) water droplets [266, 364], and the (d) H for the skins of water and
ice [360, 365]. Ionic polarization and molecular undercoordination share the same effect on the H−O
phonon blueshift, resulting the supersolid phase [364]. The supersolidity is characterized by the shorter
and stiffer H−O bond and the longer and softer O:H nonbond, deeper O1s energy band, and longer
photoelectron and phonon lifetime. The supersolid phase is less dense, viscoelastic, mechanically and
thermally more stable. The O:H−O bond cooperative relaxation offsets boundaries of structural phases
and raises the melting point and meanwhile lower the freezing temperature of water ice – known as
supercooling and superheating. The softened O:H elasticity and adaptivity and the high repulsivity of
the polarized supersolid skin takes the responsibility of slipperiness of ice and the tough skin of liquid
water [360]. The high thermal diffusivity of the supersolid skin ensures the Mpemba paradox – warm
water cooling faster [353].
5.3.3. Fraction of Bond Transition and Molecular Interactions
Integrating the H DPS peaks for the HX, YHO, and YX yields the fraction coefficients fx(C) for the
O:H−O bonds transition from its mode of ordinary water to the hydrating. The slope of the fraction
coefficient, dfx(C)/dC, is proportional to the number of bonds per solute in the hydration shells,
which characterizes the hydration shell size and its local electric field. A hydration shell may have
one, two or more subshells, depending on the nature and size of the solute. The size and charge
quantity determine its local electric field intensity that is subject to the screening by the local H2O
dipoles and the solute–solute interactions [366].
The fx(C) concentration trends show the following, see Figure 39 and Figure 40:
1) The fH(C) 0 means that the H+(H3O+) is incapable of polarizing its neighboring HBs but only
breaking and slightly repulsing its neighbors [341].
2) The fY(C) C means the constant shell size of the small Y+ cation (radius < 1.0 Å) without
being interfered with by other solutes. The constant slope indicates that the number of bonds
per solute is conserved in the hydration shell. The electric field of a small Y+ cation is fully
screened by the H2O dipoles in its hydration shells; thus, no cation–solute interaction is
involved in the YX or YHO solutions.
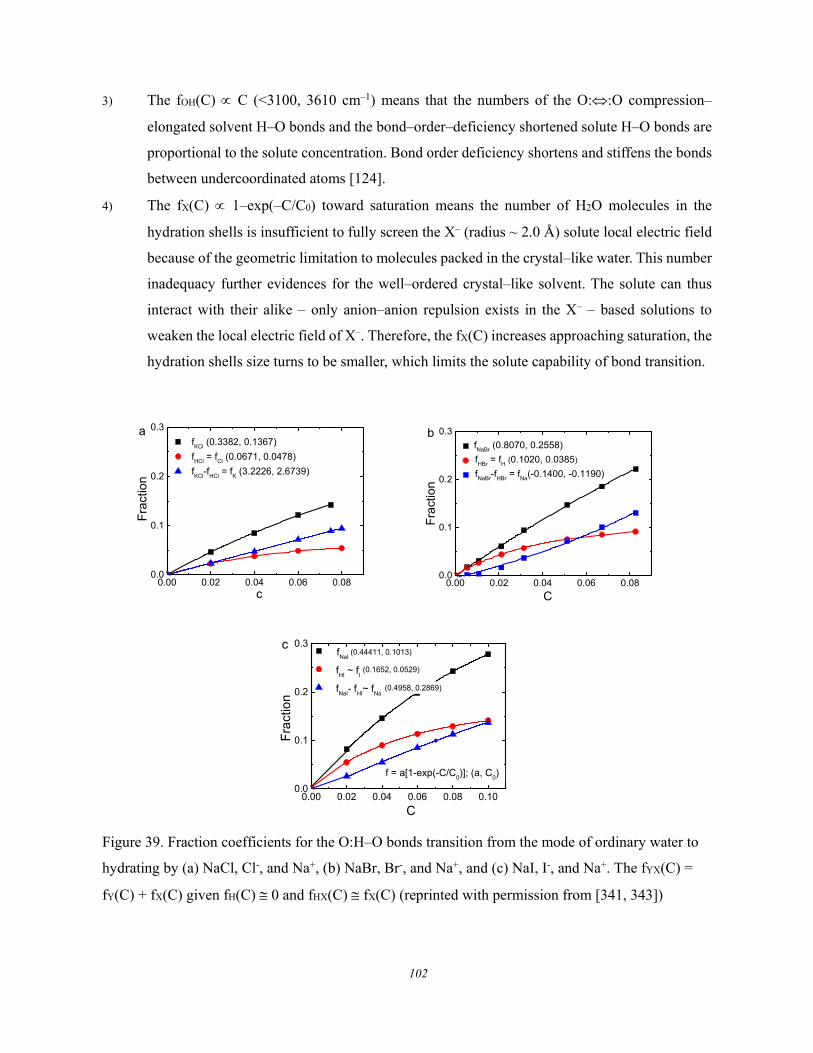
102
3) The fOH(C) C (<3100, 3610 cm–1) means that the numbers of the O::O compression–
elongated solvent H–O bonds and the bond–order–deficiency shortened solute H–O bonds are
proportional to the solute concentration. Bond order deficiency shortens and stiffens the bonds
between undercoordinated atoms [124].
4) The fX(C) 1–exp(–C/C0) toward saturation means the number of H2O molecules in the
hydration shells is insufficient to fully screen the X– (radius ~ 2.0 Å) solute local electric field
because of the geometric limitation to molecules packed in the crystal–like water. This number
inadequacy further evidences for the well–ordered crystal–like solvent. The solute can thus
interact with their alike – only anion–anion repulsion exists in the X– – based solutions to
weaken the local electric field of X–. Therefore, the fX(C) increases approaching saturation, the
hydration shells size turns to be smaller, which limits the solute capability of bond transition.
0.00 0.02 0.04 0.06 0.080.0
0.1
0.2
0.3
fKCl
(0.3382, 0.1367)
fHCl
= fCl
(0.0671, 0.0478)
fKCl
-fHCl
= fK (3.2226, 2.6739)
Fra
ctio
n
c
a
0.00 0.02 0.04 0.06 0.080.0
0.1
0.2
0.3
fNaBr
(0.8070, 0.2558)
fHBr
= fH (0.1020, 0.0385)
fNaBr
-fHBr
= fNa
(-0.1400, -0.1190)
Fra
ctio
n
C
b
0.00 0.02 0.04 0.06 0.08 0.100.0
0.1
0.2
0.3
A
(0.44411, 0.1013)
(0.1652, 0.0529)
fNaI
fHI
~ fI
fNaI
- fHI
~ fNa
Fra
ctio
n
C
c
(0.4958, 0.2869)
f = a[1-exp(-C/C0)]; (a, C
0)
Figure 39. Fraction coefficients for the O:H–O bonds transition from the mode of ordinary water to
hydrating by (a) NaCl, Cl-, and Na+, (b) NaBr, Br-, and Na+, and (c) NaI, I-, and Na+. The fYX(C) =
fY(C) + fX(C) given fH(C) 0 and fHX(C) fX(C) (reprinted with permission from [341, 343])
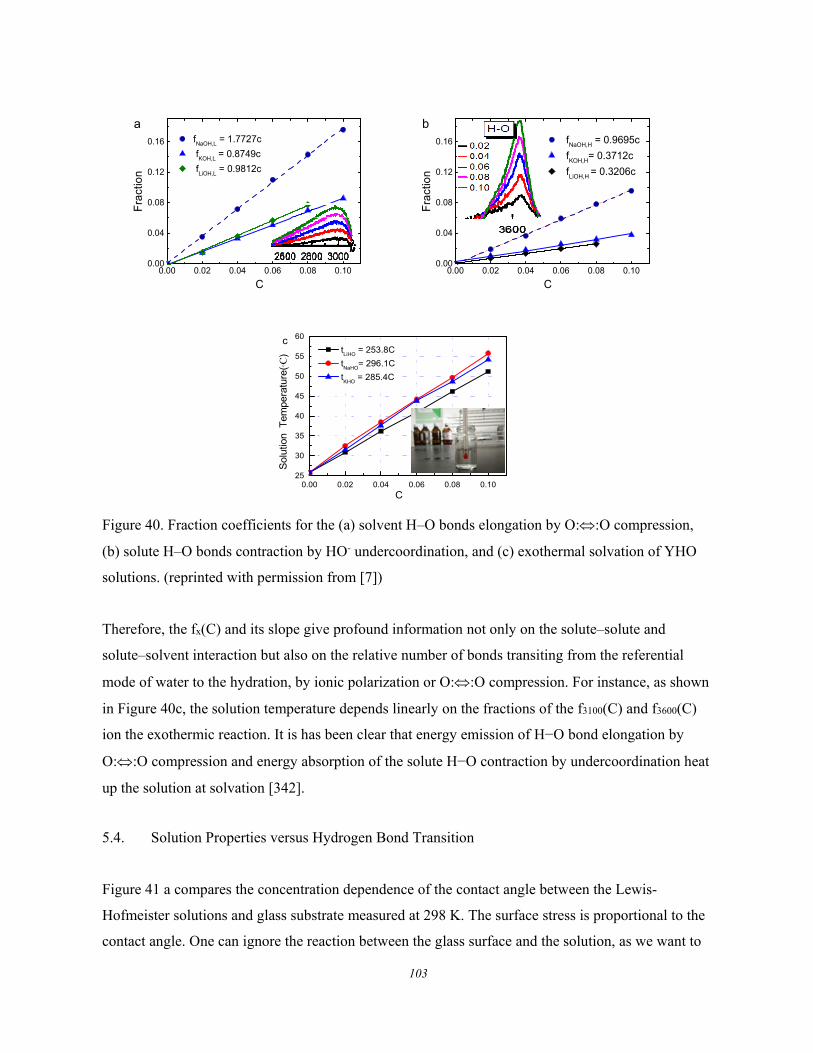
103
0.00 0.02 0.04 0.06 0.08 0.100.00
0.04
0.08
0.12
0.16F
ract
ion
C
fNaOH,L
= 1.7727c
fKOH,L
= 0.8749c
fLiOH,L
= 0.9812c
a f
NaOH,H = 0.9695c
fKOH,H
= 0.3712c
fLiOH,H
= 0.3206c
0.00 0.02 0.04 0.06 0.08 0.100.00
0.04
0.08
0.12
0.16
Fra
ctio
n
C
b
0.00 0.02 0.04 0.06 0.08 0.1025
30
35
40
45
50
55
60
Sol
utio
n T
empe
ratu
re(°
C)
C
tLiHO
= 253.8C
tNaHO
= 296.1C
tKHO
= 285.4C
c
Figure 40. Fraction coefficients for the (a) solvent H–O bonds elongation by O::O compression,
(b) solute H–O bonds contraction by HO- undercoordination, and (c) exothermal solvation of YHO
solutions. (reprinted with permission from [7])
Therefore, the fx(C) and its slope give profound information not only on the solute–solute and
solute–solvent interaction but also on the relative number of bonds transiting from the referential
mode of water to the hydration, by ionic polarization or O::O compression. For instance, as shown
in Figure 40c, the solution temperature depends linearly on the fractions of the f3100(C) and f3600(C)
ion the exothermic reaction. It is has been clear that energy emission of H−O bond elongation by
O::O compression and energy absorption of the solute H−O contraction by undercoordination heat
up the solution at solvation [342].
5.4. Solution Properties versus Hydrogen Bond Transition
Figure 41 a compares the concentration dependence of the contact angle between the Lewis-
Hofmeister solutions and glass substrate measured at 298 K. The surface stress is proportional to the
contact angle. One can ignore the reaction between the glass surface and the solution, as we want to
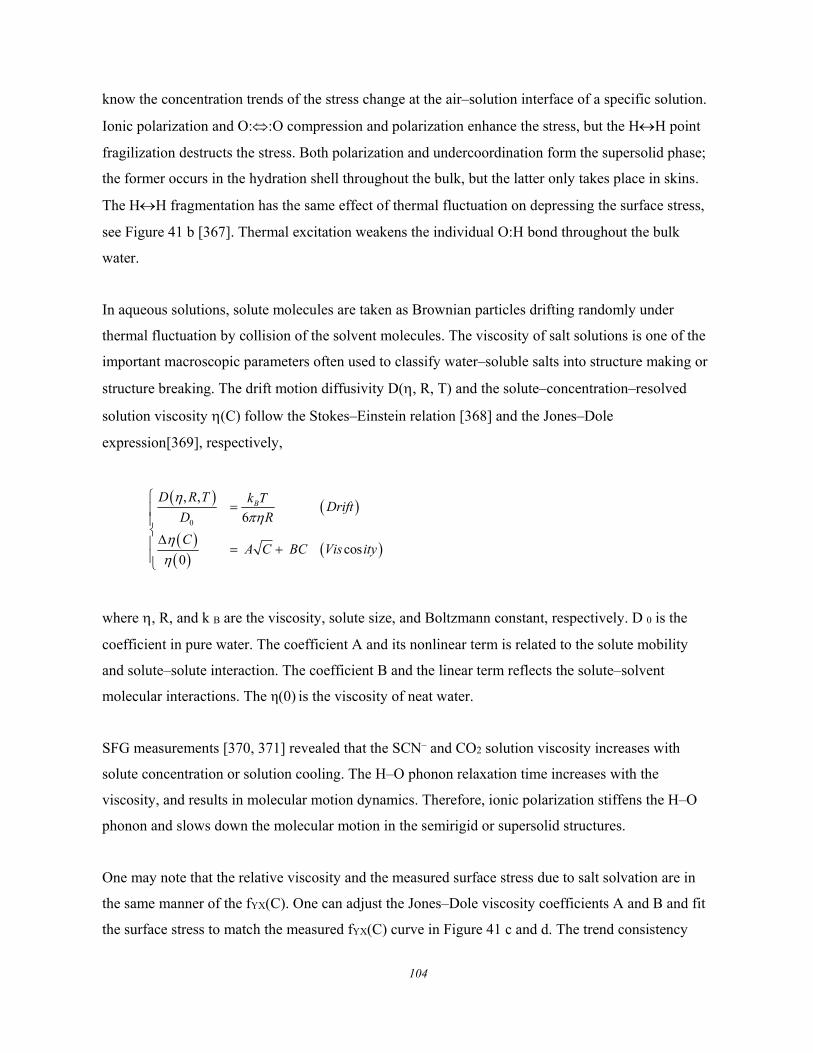
104
know the concentration trends of the stress change at the air–solution interface of a specific solution.
Ionic polarization and O::O compression and polarization enhance the stress, but the HH point
fragilization destructs the stress. Both polarization and undercoordination form the supersolid phase;
the former occurs in the hydration shell throughout the bulk, but the latter only takes place in skins.
The HH fragmentation has the same effect of thermal fluctuation on depressing the surface stress,
see Figure 41 b [367]. Thermal excitation weakens the individual O:H bond throughout the bulk
water.
In aqueous solutions, solute molecules are taken as Brownian particles drifting randomly under
thermal fluctuation by collision of the solvent molecules. The viscosity of salt solutions is one of the
important macroscopic parameters often used to classify water–soluble salts into structure making or
structure breaking. The drift motion diffusivity D(, R, T) and the solute–concentration–resolved
solution viscosity (C) follow the Stokes–Einstein relation [368] and the Jones–Dole
expression[369], respectively,
0
0
, ,
6
cos
BD R T
CA C B
k TDrift
D R
Vis ityC
where , R, and k B are the viscosity, solute size, and Boltzmann constant, respectively. D 0 is the
coefficient in pure water. The coefficient A and its nonlinear term is related to the solute mobility
and solute–solute interaction. The coefficient B and the linear term reflects the solute–solvent
molecular interactions. The η(0) is the viscosity of neat water.
SFG measurements [370, 371] revealed that the SCN– and CO2 solution viscosity increases with
solute concentration or solution cooling. The H–O phonon relaxation time increases with the
viscosity, and results in molecular motion dynamics. Therefore, ionic polarization stiffens the H–O
phonon and slows down the molecular motion in the semirigid or supersolid structures.
One may note that the relative viscosity and the measured surface stress due to salt solvation are in
the same manner of the fYX(C). One can adjust the Jones–Dole viscosity coefficients A and B and fit
the surface stress to match the measured fYX(C) curve in Figure 41 c and d. The trend consistency
105
clarifies that the linear term corresponds to Y+ hydration shell size and the nonlinear part to the
resultant of X––water and X––X– interactions. It is clear now that both the solution viscosity and the
surface stress are proportional to the extent of polarization or to the sum of O:H–O bonds in the
hydration shells for the monovalent salt solutions, at least. Therefore, polarization raises the surface
stress, solution viscosity and rigidity, H–O phonon frequency, and H–O phonon lifetime but
decreases the molecular drift mobility, consistently by shortening the H–O bond and lengthening the
O:H nonbond.
0.00 0.02 0.04 0.06 0.08 0.1060
65
70
75
80
85
90
95
Con
tact
ang
le (
o)
C
a
NaF NaCl NaBr NaI HCl HBr HI NaOH KOH
s(T)=78.80-0.17(T-273) mN/m
0 100 200 300 4000.6
0.8
1.0
1.2
1.4
s(T)/ b
T (K)
Theory Experiment
D
LeV
= 0.162 mJ/(m2K)
b
0.00 0.02 0.04 0.06 0.08 0.100.0
0.1
0.2
0.3
Fra
ctio
n
C
NaIC1/2 +1.75C
fNaI
= 0.5252(1-exp(-C/0.1142)
NaCl
C1/2 +1.75C f
NaCl = 0.6180(1-exp(-C/0.2473)
c
Figure 41. (a) Concentration resolved contact angles between YX, YHO and HX solutions on glass
substrate [119] and (b) the thermal decay of the surface stress of liquid water [367]. Reproduction of
the (c) fNaCl(C) and fNaI(C) for Na(Cl, I) solutions and (d) contact angle LiBr(C) for LiBr solution by
the Jones–Dole’s expression of viscosity [369]. Reproduction of the S(T) 1 – U(T/DL)/Ecoh = 1–
U(T/192)/0.38 turns out 192 K Debye temperature and the EL = 0/38/4 = 0.095 eV for the O:H
nonbond. U(T/DL) is the integral of the Debye specific heat.
5.5. Summary
0.00 0.02 0.04 0.06 0.08 0.100.0
0.1
0.2
0.3
C
0.9C1/2+0.05C Experiment 0.32[1-exp(-C/0.05)]
d
C
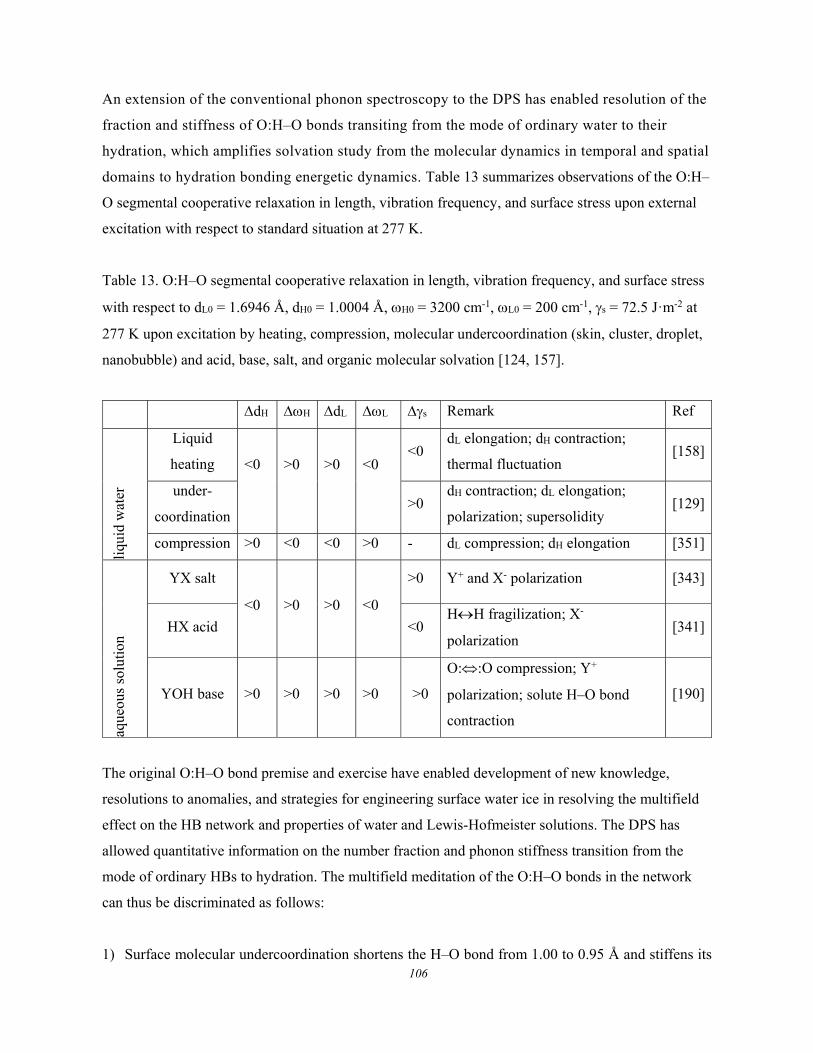
106
An extension of the conventional phonon spectroscopy to the DPS has enabled resolution of the
fraction and stiffness of O:H–O bonds transiting from the mode of ordinary water to their
hydration, which amplifies solvation study from the molecular dynamics in temporal and spatial
domains to hydration bonding energetic dynamics. Table 13 summarizes observations of the O:H–
O segmental cooperative relaxation in length, vibration frequency, and surface stress upon external
excitation with respect to standard situation at 277 K.
Table 13. O:H–O segmental cooperative relaxation in length, vibration frequency, and surface stress
with respect to dL0 = 1.6946 Å, dH0 = 1.0004 Å, H0 = 3200 cm-1, L0 = 200 cm-1, s = 72.5 Jꞏm-2 at
277 K upon excitation by heating, compression, molecular undercoordination (skin, cluster, droplet,
nanobubble) and acid, base, salt, and organic molecular solvation [124, 157].
dH H dL L s Remark Ref
liqu
id w
ater
Liquid
heating <0
>0
>0
<0
<0 dL elongation; dH contraction;
thermal fluctuation [158]
under-
coordination >0
dH contraction; dL elongation;
polarization; supersolidity [129]
compression >0 <0 <0 >0 - dL compression; dH elongation [351]
aque
ous
solu
tion
YX salt
<0 >0 >0 <0
>0 Y+ and X- polarization [343]
HX acid <0 HH fragilization; X-
polarization [341]
YOH base >0
>0
>0
>0
>0
O::O compression; Y+
polarization; solute H–O bond
contraction
[190]
The original O:H–O bond premise and exercise have enabled development of new knowledge,
resolutions to anomalies, and strategies for engineering surface water ice in resolving the multifield
effect on the HB network and properties of water and Lewis-Hofmeister solutions. The DPS has
allowed quantitative information on the number fraction and phonon stiffness transition from the
mode of ordinary HBs to hydration. The multifield meditation of the O:H–O bonds in the network
can thus be discriminated as follows:
1) Surface molecular undercoordination shortens the H–O bond from 1.00 to 0.95 Å and stiffens its
107
phonon from 3200 to 3450 cm-1, meanwhile, lengthens the O:H nonbond from 1.70 to ~1.95 Å and
softens the O:H phonon from 200 to 75 cm-1. The dangling H–O bond is 0.90 Å long and its phonon
frequency is 3610 cm-1. The O:H–O bond segmental energies transit from (0.2, 4.0) to (0.1, 4.6)
eV when moving from the bulk to the skin in comparison to the gaseous H–O energy of 5.10 eV.
The skin mass density drops from the bulk standard of 1.0 to 0.75 gcm-3, which raised the skin
thermal diffusivity by a factor of 4/3. Theoretical reproduction of the Mpemba paradox profiles –
warm water cools more quickly, evidences the essentiality of the skin high thermal diffusivity.
2) The nonbonding electron polarization furnishes the surface with excessive charge and dipoles. The
O:H–O bond relaxation and electronic polarization endowed the aqueous surface with supersolidity
that is highly elastic, semi-rigid, electrostatic repulsive, hydrophobic, slippery, thermally more
diffusive and stable with higher melting point Tm, surface stress, mechanical strength, but lower
freezing TN and evaporation point TN and mass density. The degree of supersolidity increases with
the surface curvature or with further lowing of the molecular coordination numbers. The
supersolidity of nanodroplets, nanobubbles, and molecular clusters is higher than that of a flat
surface, resulting in the super-heating/cooling/cooling of melting/freezing/evaporating. For
instance, a 1.4 nm sized droplet freezes at 205 K [347] instead of the bulk at 258 K [158]. Smaller
water supersolid droplet shows superfluidity, superlubricity, and superhydrophobicity, which
enables its rapid flow when passing through carbon nanotubes or microchannels.
3) Strikingly, Raman spectroscopy revealed that the skins of 25 C water and –(15~20) C ice share
H–O bonds of identical length, energy, and vibration frequency of 3450 cm-1. X-ray K edge
absorption and Raman scattering unveiled that the deformed skin H–O bond is thermally much
more stable than it is in the bulk. The supersolidity of the nanodroplet skin hinders vibration energy
dissipation to lengthen the H–O phonon lifetime, according to the ultrafast IR spectroscopy.
4) The O:H/H–O segmental phonon frequency softening/stiffening offset their Debye temperatures
and disperses outwardly the QS phase boundaries. Hence, the supersolid skin is neither a liquid
nor a solid at the ambient but rather an extended QS phase having a higher Tm (~330 K), lower TN
and TV.
5) The skin supersolidity is engineerable by O:H–O relaxation and polarization through programed
stimulation. Electrostatic polarization by a parallel electric field enhances the supersolidity, which
enables the water floating bridge to form and be sustained between two filled cups. An ion forms
a semi-rigid supersolid hydration volume, which separates graphene oxide sheets up to 1.5 nm for
the selective ion rejection. However, a superposition of the applied field and the ionic field breaks
the floating bridge of acid or salt solutions; a mixture of soil grains and aqueous ions also weakens
108
their fields than either of them alone to accelerate soil wetting by the salt solutions. Molecular
undercoordination and electrostatic polarization enhances each other to lengthen and weaken the
O:H nonbond whose energy dictates the TN and TV, being beneficial to evaporation and bio-product
cryogenic reservation. Magnetization applies a Lorentz field to flowing water dipoles, which adds
a translational/rotational component to the rotational/translational motion and hence raises the
mobility of the dipoles to promote the micro-circulation of human body fluid and blood. Both
liquid heating and acid solvation depress the skin supersolidity - heating softens and fluctuates the
O:H nonbond but acid solvation disrupts the network through HH fragmentation. Base solvation
creates the O::O that has the same effect of mechanical compression and polarization; O::O
compression weakens the H–O bond, which emits energy heating up the solution. The H–O bond
weakening by base solvation or liquid cooling eases hydrogen generation.
6) Examination of the multifield effect on surface O:H–O bonds and electrons has cultivated new
knowledge and strategies of regulating water evaporation and desalination, hydrogen generation,
and skin supersolidity modulation for friction and hydrophobicity, etc. Besides, the theory has
enabled quantitative resolutions to anomalies such as ice buoyancy, ice regelation, critical energies
for phase transition, energy exchange by H–O bond relaxation, hydration shell size and droplet
skin thickness determination, etc. The theory also recommends referential means for hypertension
medication and prevention, DNA fragmentation, protein denaturation, energy storage and
structural stability of the energetic CNHO crystals and cyclo-N5- complexes, as an extension of the
theory. Systematic attainments substantially complement what could be derived from molecular
spatial-temporal motion dynamics and classical statistic thermodynamics.
Regarding the aqueous solutions, we have obtained quantitative information that may complement to
the premises of continuum thermodynamics, molecular dynamics:
1) H3O+ hydronium formation in acid solution creates the HH anti–HB that serves as a point
breaker to disrupt the HBr solution network and the surface stress. The Br– polarization dictates
the O:H (from 200 partially to 110 and 300 cm–1) and the H–O phonon (from 3200 to 3480 cm–1)
frequency cooperative shift. Acid solvation has the same effect of liquid heating on the O:H–O
bond network and phonon relaxation through, respectively, HH fragilization and thermal
fluctuation.
2) OH– hydroxide forms the O::O super–HB point compressor to soften the nearest solvent H–O
bond (from above 3100 cm–1 to below), and meanwhile, the solute H–O bond shortens to its
109
dangling radicals featured at 3610 cm–1. The Y+ polarization effect has been annihilated by the
O::O compression and the solute H–O contraction. Base solvation has partly the effect of
mechanical compression that lengthens and softens the H–O bond and shortens the O:H nonbond.
3) Y+ and X– ions serve each as a point polarizer that aligns, stretches, and polarizes the surrounding
O:H–O bonds and makes the hydration shell supersolid. The polarization transits the L from 200
to 100 cm–1 and the H from 3200 to 3480 cm–1. Salt solvation has the same effect of molecular
undercoordination to form the supersolid states.
4) The solute capability of bond transition follows: fH(C) = 0, fY(C) fOH(C) C, and fX(C) 1–
exp(–C/C0) toward saturation, which indicate the nonparaxiality of protons, invariant hydration
volume size of Y+ and HO-, and the variant X- - X- repulsion, respectively, and hence evidence the
high structure order of H2O molecular in the solvent matrix. The concentration trends consistent
among the salt solution viscosity, surface stress, and the fYX(C) suggest their common origin of
polarization associated with O:H–O bond transition from water to hydration shells.
5) Solvation and compression have the opposite effect on O:H–O relaxation and the shortened H–O
bond by polarization can hardly elongated than the H–O bond in pure water. At constant
concentration, the TC shows the Hofmeister sequences, but the involvement of the anion-anion
repulsion alters the pattern of the critical pressure for the phase transition for the concentrated salt
solutions.
6) Compression, confinement, and heating of the QS phase compensate one another other on the
critical pressure of ice/QS transition at the ambient as compression always shortens the O:H
nonbond while heating and confinement do oppositely in the QS phase of negative thermal
expansion - H–O undergoes heating and compression elongation and O:H contraction but
confinement does oppositely.
6. Concluding Remarks
The presented notion of multifield bonding dynamics and the theory-driven phonon spectrometrics
have enabled the ever-deep and consistent insight into the perturbation-relaxation-property
correlation of structured crystals, as summarized as follows:
1) The LBA approach and the multifield bond oscillation have reconciled the effect of P, T, CN, and
charge injection on the bond relaxation and property evolution of the liquid and solid crystals. A
stimulus mediates the properties by bond relaxation from one equilibrium to another.
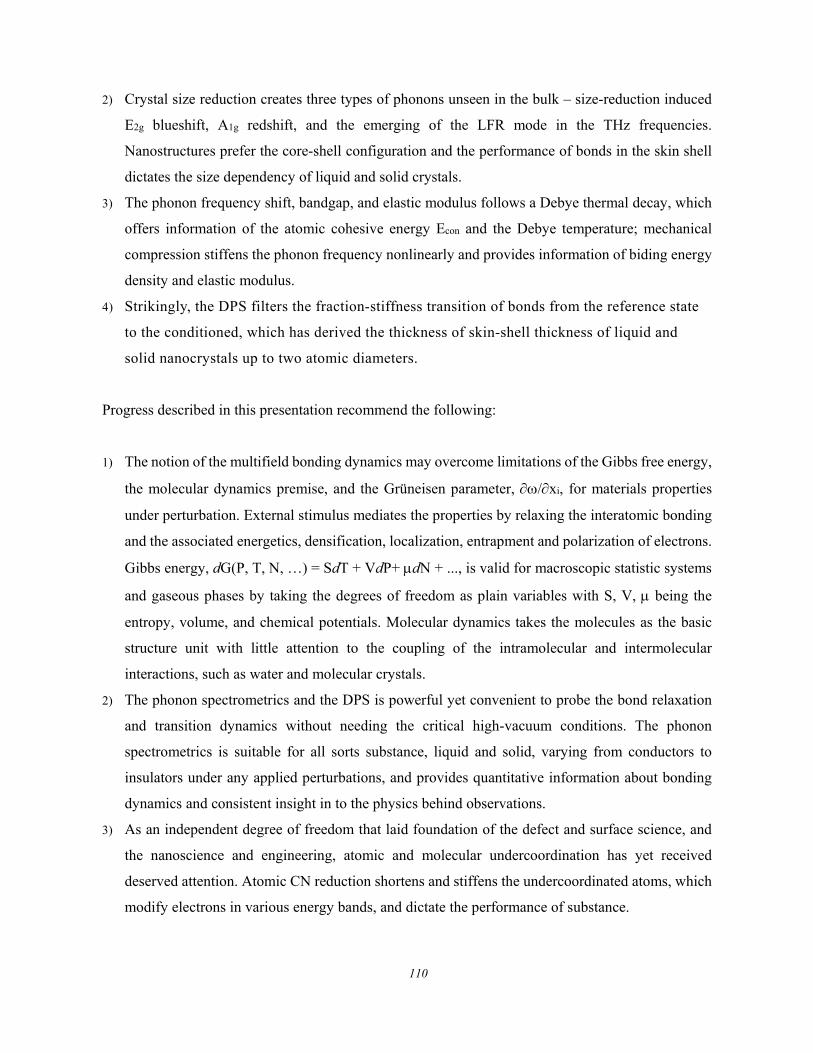
110
2) Crystal size reduction creates three types of phonons unseen in the bulk – size-reduction induced
E2g blueshift, A1g redshift, and the emerging of the LFR mode in the THz frequencies.
Nanostructures prefer the core-shell configuration and the performance of bonds in the skin shell
dictates the size dependency of liquid and solid crystals.
3) The phonon frequency shift, bandgap, and elastic modulus follows a Debye thermal decay, which
offers information of the atomic cohesive energy Econ and the Debye temperature; mechanical
compression stiffens the phonon frequency nonlinearly and provides information of biding energy
density and elastic modulus.
4) Strikingly, the DPS filters the fraction-stiffness transition of bonds from the reference state
to the conditioned, which has derived the thickness of skin-shell thickness of liquid and
solid nanocrystals up to two atomic diameters.
Progress described in this presentation recommend the following:
1) The notion of the multifield bonding dynamics may overcome limitations of the Gibbs free energy,
the molecular dynamics premise, and the Grüneisen parameter, /xi, for materials properties
under perturbation. External stimulus mediates the properties by relaxing the interatomic bonding
and the associated energetics, densification, localization, entrapment and polarization of electrons.
Gibbs energy, dG(P, T, N, …) = SdT + VdP+ dN + ..., is valid for macroscopic statistic systems
and gaseous phases by taking the degrees of freedom as plain variables with S, V, being the
entropy, volume, and chemical potentials. Molecular dynamics takes the molecules as the basic
structure unit with little attention to the coupling of the intramolecular and intermolecular
interactions, such as water and molecular crystals.
2) The phonon spectrometrics and the DPS is powerful yet convenient to probe the bond relaxation
and transition dynamics without needing the critical high-vacuum conditions. The phonon
spectrometrics is suitable for all sorts substance, liquid and solid, varying from conductors to
insulators under any applied perturbations, and provides quantitative information about bonding
dynamics and consistent insight in to the physics behind observations.
3) As an independent degree of freedom that laid foundation of the defect and surface science, and
the nanoscience and engineering, atomic and molecular undercoordination has yet received
deserved attention. Atomic CN reduction shortens and stiffens the undercoordinated atoms, which
modify electrons in various energy bands, and dictate the performance of substance.

111
Understanding and strategies may extend to wherever the regular chemical bonds and the segmented
hydrogen bonds are involved. It would be very promising for one to keep arm and mind open, and
always move and look forward to developing experimental strategies and innovating theories toward
resolution to the wonders.
112
Nomenclature
Grüneisen parameter
x(T) Segmental specific heat featured by the DX and the Ex (specific heat integral)
BOLS Bond order-length-strength correlation for undercoordinated atoms and molecules
BP Black phosphorus
CN Coordination number, z
DFT Density functional theory
DPS Differential phonon spectrometrics
Ecoh Cohesive energy
Eden Binding energy density
Eg Bandgap; Raman translational vibration mode
FTIR Fourier transformation of infrared spectroscopy
FWHM Full width at half maximum
GNR Graphene nanoribbon
LBA Local bond average
LFR Low-frequency Raman mode
MD Molecular dynamics
Pc/Tc Critical pressure/temperature for phase transition
PC/TC Critical pressure/temperature for phase transition
SWCNT Single-walled carbon nanotube
TO/LO Translational/Longitudinal optical wave
O:H-O Hydrogen bond
HH anti-hydrogen bond
O::O super hydrogen bond
Acknowledgement
Financial support from the National Natural Science Foundation (Nos. 11602094; 11872052) is all
gratefully acknowledged.
113
––
References
1. C.Q. Sun, Oxidation electronics: bond-band-barrier correlation and its applications. Progress in Materials Science, 48(6): 521-685, (2003).
2. C. Liu, F. Yun, and H. Morkoc, Ferromagnetism of ZnO and GaN: A review. Journal of Materials Science-Materials in Electronics, 16(9): 555-597, (2005).
3. J.W. Li, X.J. Liu, L.W. Yang, Z.F. Zhou, G.F. Xie, Y. Pan, X.H. Wang, J. Zhou, L.T. Li, L.K. Pan, Z. Sun, and C.Q. Sun, Photoluminescence and photoabsorption blueshift of nanostructured ZnO: Skin-depth quantum trapping and electron-phonon coupling. Applied Physics Letters, 95(3): 3184566, (2009).
4. G.W. Shim, K. Yoo, S.-B. Seo, J. Shin, D.Y. Jung, I.-S. Kang, C.W. Ahn, B.J. Cho, and S.-Y. Choi, Large-area single-layer MoSe2 and its van der Waals heterostructures. ACS Nano, 8(7): 6655-6662, (2014).
5. C. Tan, X. Cao, X.-J. Wu, Q. He, J. Yang, X. Zhang, J. Chen, W. Zhao, S. Han, and G.-H. Nam, Recent advances in ultrathin two-dimensional nanomaterials. Chemical reviews, 117(9): 6225-6331, (2017).
6. X.J. Liu, M.L. Bo, X. Zhang, L. Li, Y.G. Nie, H. TIan, Y. Sun, S. Xu, Y. Wang, W. Zheng, and C.Q. Sun, Coordination-resolved electron spectrometrics. Chemical Reviews, 115(14): 6746-6810, (2015).
7. C.Q. Sun, Thermo-mechanical behavior of low-dimensional systems: The local bond average approach. Progress in Materials Science, 54(2): 179-307, (2009).
8. M.C. Daniel and D. Astruc, Gold nanoparticles: Assembly, supramolecular chemistry, quantum-size-related properties, and applications toward biology, catalysis, and nanotechnology. Chemical Reviews, 104(1): 293-346, (2004).
9. C.Q. Sun, Size dependence of nanostructures: Impact of bond order deficiency. Progress in Solid State Chemistry, 35(1): 1-159, (2007).
10. J.R. Trelewicz and C.A. Schuh, The Hall--Petch breakdown at high strain rates: Optimizing nanocrystalline grain size for impact applications. Applied Physics Letters, 93(17): 171916-3, (2008).
11. C.Q. Sun, W.H. Zhong, S. Li, B.K. Tay, H.L. Bai, and E.Y. Jiang, Coordination imperfection suppressed phase stability of ferromagnetic, ferroelectric, and superconductive nanosolids. Journal of Physical Chemistry B, 108(3): 1080-1084, (2004).
12. Y.J. Tian, B. Xu, D.L. Yu, Y.M. Ma, Y.B. Wang, Y.B. Jiang, W.T. Hu, C.C. Tang, Y.F. Gao, K. Luo, Z.S. Zhao, L.M. Wang, B. Wen, J.L. He, and Z.Y. Liu, Ultrahard nanotwinned cubic boron nitride. Nature, 493(7432): 385-388, (2013).
13. Y. Wang, Y. Pu, Z. Ma, Y. Pan, and C.Q. Sun, Interfacial adhesion energy of lithium-ion battery electrodes. Extreme Mechanics Letters, 9: 226-236, (2016).
14. J. Linder, T. Yokoyama, and A. Sudbø, Anomalous finite size effects on surface states in the topological insulator Bi2Se3. Phys Rev B, 80(20): 205401-205406, (2009).
15. B.F. Variano, N.E. Schlotter, D.M. Hwang, and C.J. Sandroff, Investigation of finite size effects in a first order phase transition: High pressure Raman study of CdS microcrystallites. J Chem Phys, 88(4): 2848-2851, (1988).
16. Y. Wang and N. Herron, Quantum size effects on the exciton energy of CdS clusters. Phys Rev B, 42(11): 7253-7255, (1990).
17. A.W. Schill and M.A. El-Sayed, Wavelength-Dependent Hot Electron Relaxation in PVP Capped CdS/HgS/CdS Quantum Dot Quantum Well Nanocrystals. J Phys Chem B, 108(36): 13619-13625, (2004).
18. H. Borchert, D. Dorfs, C. McGinley, S. Adam, T. Möller, H. Weller, and A. Eychmüller, Photoemission Study of Onion Like Quantum Dot Quantum Well and Double Quantum Well Nanocrystals of CdS and HgS. J Phys Chem B, 107(30): 7486-7491, (2003).
114
19. J. Zhang, Z. Peng, A. Soni, Y. Zhao, Y. Xiong, B. Peng, J. Wang, M.S. Dresselhaus, and Q. Xiong, Raman Spectroscopy of Few-Quintuple Layer Topological Insulator Bi2Se3 Nanoplatelets. Nano Lett, 11(6): 2407-2414, (2011).
20. A.K. Gupta, T.J. Russin, H.R. Gutierrez, and P.C. Eklund, Probing Graphene Edges via Raman Scattering. ACS Nano, 3(1): 45-52, (2008).
21. D. Graf, F. Molitor, K. Ensslin, C. Stampfer, A. Jungen, C. Hierold, and L. Wirtz, Spatially Resolved Raman Spectroscopy of Single- and Few-Layer Graphene. Nano Letters, 7(2): 238-242, (2007).
22. D.S. Chuu and C.M. Dai, Quantum size effects in CdS thin films. Phys Rev B, 45(20): 11805-11810, (1992).
23. A. Tanaka, S. Onari, and T. Arai, Raman scattering from CdSe microcrystals embedded in a germanate glass matrix. Phys Rev B, 45(12): 6587, (1992).
24. O. Auciello, J.F. Scott, and R. Ramesh, The physics of ferroelectric memories. Phys Today, 51: 22, (1998).
25. J. Liu and Y.K. Vohra, Raman Modes of 6H Polytype of Silicon Carbide to Ultrahigh Pressures: A Comparison with Silicon and Diamond. Physical Review Letters, 72(26): 4105-4108, (1994).
26. Z.W. Chen, C.Q. Sun, Y.C. Zhou, and O.Y. Gang, Size dependence of the pressure-induced phase transition in nanocrystals. Journal of Physical Chemistry C, 112(7): 2423-2427, (2008).
27. J. Zhu, J.X. Yu, Y.J. Wang, X.R. Chen, and F.Q. Jing, First-principles calculations for elastic properties of rutile TiO2 under pressure. Chin Phys B, 17(6): 2216, (2008).
28. N. Iles, A. Kellou, K.D. Khodja, B. Amrani, F. Lemoigno, D. Bourbie, and H. Aourag, Atomistic study of structural, elastic, electronic and thermal properties of perovskites Ba(Ti,Zr,Nb)O-3. Computational Materials Science, 39(4): 896-902, (2007).
29. B.B. Karki, L. Stixrude, S.J. Clark, M.C. Warren, G.J. Ackland, and J. Crain, Structure and elasticity of MgO at high pressure. Am Mineral, 82: 51-60, (1997).
30. A. Bouhemadou and K. Haddadi, Structural, elastic, electronic and thermal properties of the cubic perovskite-type BaSnO3. Solid State Sci, 12: 630-636, (2010).
31. L.K. Pan, C.Q. Sun, T.P. Chen, S. Li, C.M. Li, and B.K. Tay, Dielectric suppression of nanosolid silicon. Nanotechnology, 15(12): 1802-1806, (2004).
32. X.J. Liu, Z.F. Zhou, L.W. Yang, J.W. Li, G.F. Xie, S.Y. Fu, and C.Q. Sun, Correlation and size dependence of the lattice strain, binding energy, elastic modulus, and thermal stability for Au and Ag nanostructures. Journal of Applied Physics, 109(7): 074319-5, (2011).
33. X.J. Liu, L.W. Yang, Z.F. Zhou, P.K. Chu, and C.Q. Sun, Inverse Hall-Petch relationship of nanostructured TiO2: Skin-depth energy pinning versus surface preferential melting. Journal of Applied Physics, 108: 073503, (2010).
34. L.K. Pan, C.Q. Sun, and C.M. Li, Elucidating Si-Si dimmer vibration from the size-dependent Raman shift of nanosolid Si. Journal of Physical Chemistry B, 108(11): 3404-3406, (2004).
35. J. Zi, H. Büscher, C. Falter, W. Ludwig, K. Zhang, and X. Xie, Raman shifts in Si nanocrystals. Appl Phys Lett, 69(2): 200-202, (1996).
36. X.X. Yang, J.W. Li, Z.F. Zhou, Y. Wang, L.W. Yang, W.T. Zheng, and C.Q. Sun, Raman spectroscopic determination of the length, strength, compressibility, Debye temperature, elasticity, and force constant of the C-C bond in graphene. Nanoscale, 4(2): 502-10, (2012).
37. M. Fujii, Y. Kanzawa, S. Hayashi, and K. Yamamoto, Raman scattering from acoustic phonons confined in Si nanocrystals. Physical Review B, 54(12): R8373-R8376, (1996).
38. W. Cheng and S.F. Ren, Calculations on the size effects of Raman intensities of silicon quantum dots. Physical Review B, 65(20): 205305, (2002).
39. C. Lee, H. Yan, L.E. Brus, T.F. Heinz, J. Hone, and S. Ryu, Anomalous lattice vibrations of single-and few-layer MoS2. ACS Nano, 4(5): 2695-2700, (2010).
40. J.E. Spanier, R.D. Robinson, F. Zheng, S.W. Chan, and I.P. Herman, Size-dependent properties of CeO2-y nanoparticles as studied by Raman scattering. Physical Review B, 64(24): 245407, (2001).
41. H. Mavi, A. Shukla, R. Kumar, S. Rath, B. Joshi, and S. Islam, Quantum confinement effects in silicon nanocrystals produced by laser-induced etching and cw laser annealing. Semiconductor science and technology, 21(12): 1627, (2006).
42. S. Kim, D. Hee Shin, C. Oh Kim, S. Seok Kang, S. Sin Joo, S.-H. Choi, S. Won Hwang, and C. Sone, Size-dependence of Raman scattering from graphene quantum dots: interplay between shape and thickness. Applied Physics Letters, 102(5): 053108, (2013).
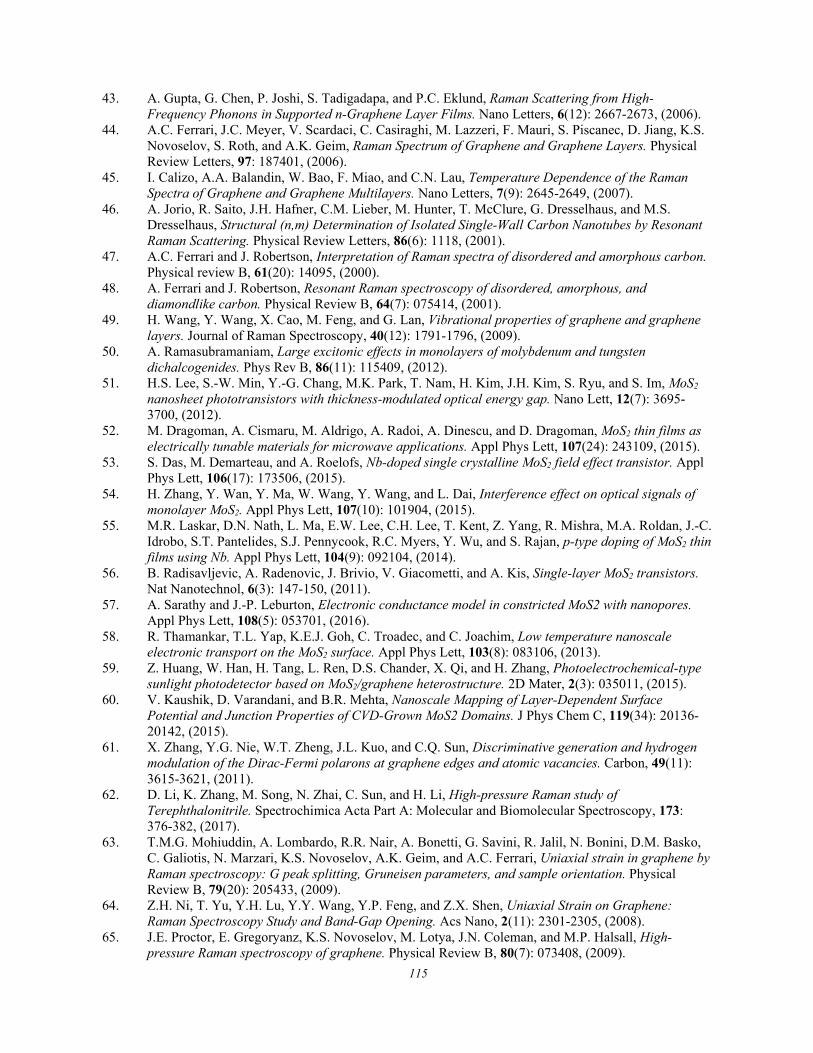
115
43. A. Gupta, G. Chen, P. Joshi, S. Tadigadapa, and P.C. Eklund, Raman Scattering from High-Frequency Phonons in Supported n-Graphene Layer Films. Nano Letters, 6(12): 2667-2673, (2006).
44. A.C. Ferrari, J.C. Meyer, V. Scardaci, C. Casiraghi, M. Lazzeri, F. Mauri, S. Piscanec, D. Jiang, K.S. Novoselov, S. Roth, and A.K. Geim, Raman Spectrum of Graphene and Graphene Layers. Physical Review Letters, 97: 187401, (2006).
45. I. Calizo, A.A. Balandin, W. Bao, F. Miao, and C.N. Lau, Temperature Dependence of the Raman Spectra of Graphene and Graphene Multilayers. Nano Letters, 7(9): 2645-2649, (2007).
46. A. Jorio, R. Saito, J.H. Hafner, C.M. Lieber, M. Hunter, T. McClure, G. Dresselhaus, and M.S. Dresselhaus, Structural (n,m) Determination of Isolated Single-Wall Carbon Nanotubes by Resonant Raman Scattering. Physical Review Letters, 86(6): 1118, (2001).
47. A.C. Ferrari and J. Robertson, Interpretation of Raman spectra of disordered and amorphous carbon. Physical review B, 61(20): 14095, (2000).
48. A. Ferrari and J. Robertson, Resonant Raman spectroscopy of disordered, amorphous, and diamondlike carbon. Physical Review B, 64(7): 075414, (2001).
49. H. Wang, Y. Wang, X. Cao, M. Feng, and G. Lan, Vibrational properties of graphene and graphene layers. Journal of Raman Spectroscopy, 40(12): 1791-1796, (2009).
50. A. Ramasubramaniam, Large excitonic effects in monolayers of molybdenum and tungsten dichalcogenides. Phys Rev B, 86(11): 115409, (2012).
51. H.S. Lee, S.-W. Min, Y.-G. Chang, M.K. Park, T. Nam, H. Kim, J.H. Kim, S. Ryu, and S. Im, MoS2 nanosheet phototransistors with thickness-modulated optical energy gap. Nano Lett, 12(7): 3695-3700, (2012).
52. M. Dragoman, A. Cismaru, M. Aldrigo, A. Radoi, A. Dinescu, and D. Dragoman, MoS2 thin films as electrically tunable materials for microwave applications. Appl Phys Lett, 107(24): 243109, (2015).
53. S. Das, M. Demarteau, and A. Roelofs, Nb-doped single crystalline MoS2 field effect transistor. Appl Phys Lett, 106(17): 173506, (2015).
54. H. Zhang, Y. Wan, Y. Ma, W. Wang, Y. Wang, and L. Dai, Interference effect on optical signals of monolayer MoS2. Appl Phys Lett, 107(10): 101904, (2015).
55. M.R. Laskar, D.N. Nath, L. Ma, E.W. Lee, C.H. Lee, T. Kent, Z. Yang, R. Mishra, M.A. Roldan, J.-C. Idrobo, S.T. Pantelides, S.J. Pennycook, R.C. Myers, Y. Wu, and S. Rajan, p-type doping of MoS2 thin films using Nb. Appl Phys Lett, 104(9): 092104, (2014).
56. B. Radisavljevic, A. Radenovic, J. Brivio, V. Giacometti, and A. Kis, Single-layer MoS2 transistors. Nat Nanotechnol, 6(3): 147-150, (2011).
57. A. Sarathy and J.-P. Leburton, Electronic conductance model in constricted MoS2 with nanopores. Appl Phys Lett, 108(5): 053701, (2016).
58. R. Thamankar, T.L. Yap, K.E.J. Goh, C. Troadec, and C. Joachim, Low temperature nanoscale electronic transport on the MoS2 surface. Appl Phys Lett, 103(8): 083106, (2013).
59. Z. Huang, W. Han, H. Tang, L. Ren, D.S. Chander, X. Qi, and H. Zhang, Photoelectrochemical-type sunlight photodetector based on MoS2/graphene heterostructure. 2D Mater, 2(3): 035011, (2015).
60. V. Kaushik, D. Varandani, and B.R. Mehta, Nanoscale Mapping of Layer-Dependent Surface Potential and Junction Properties of CVD-Grown MoS2 Domains. J Phys Chem C, 119(34): 20136-20142, (2015).
61. X. Zhang, Y.G. Nie, W.T. Zheng, J.L. Kuo, and C.Q. Sun, Discriminative generation and hydrogen modulation of the Dirac-Fermi polarons at graphene edges and atomic vacancies. Carbon, 49(11): 3615-3621, (2011).
62. D. Li, K. Zhang, M. Song, N. Zhai, C. Sun, and H. Li, High-pressure Raman study of Terephthalonitrile. Spectrochimica Acta Part A: Molecular and Biomolecular Spectroscopy, 173: 376-382, (2017).
63. T.M.G. Mohiuddin, A. Lombardo, R.R. Nair, A. Bonetti, G. Savini, R. Jalil, N. Bonini, D.M. Basko, C. Galiotis, N. Marzari, K.S. Novoselov, A.K. Geim, and A.C. Ferrari, Uniaxial strain in graphene by Raman spectroscopy: G peak splitting, Gruneisen parameters, and sample orientation. Physical Review B, 79(20): 205433, (2009).
64. Z.H. Ni, T. Yu, Y.H. Lu, Y.Y. Wang, Y.P. Feng, and Z.X. Shen, Uniaxial Strain on Graphene: Raman Spectroscopy Study and Band-Gap Opening. Acs Nano, 2(11): 2301-2305, (2008).
65. J.E. Proctor, E. Gregoryanz, K.S. Novoselov, M. Lotya, J.N. Coleman, and M.P. Halsall, High-pressure Raman spectroscopy of graphene. Physical Review B, 80(7): 073408, (2009).
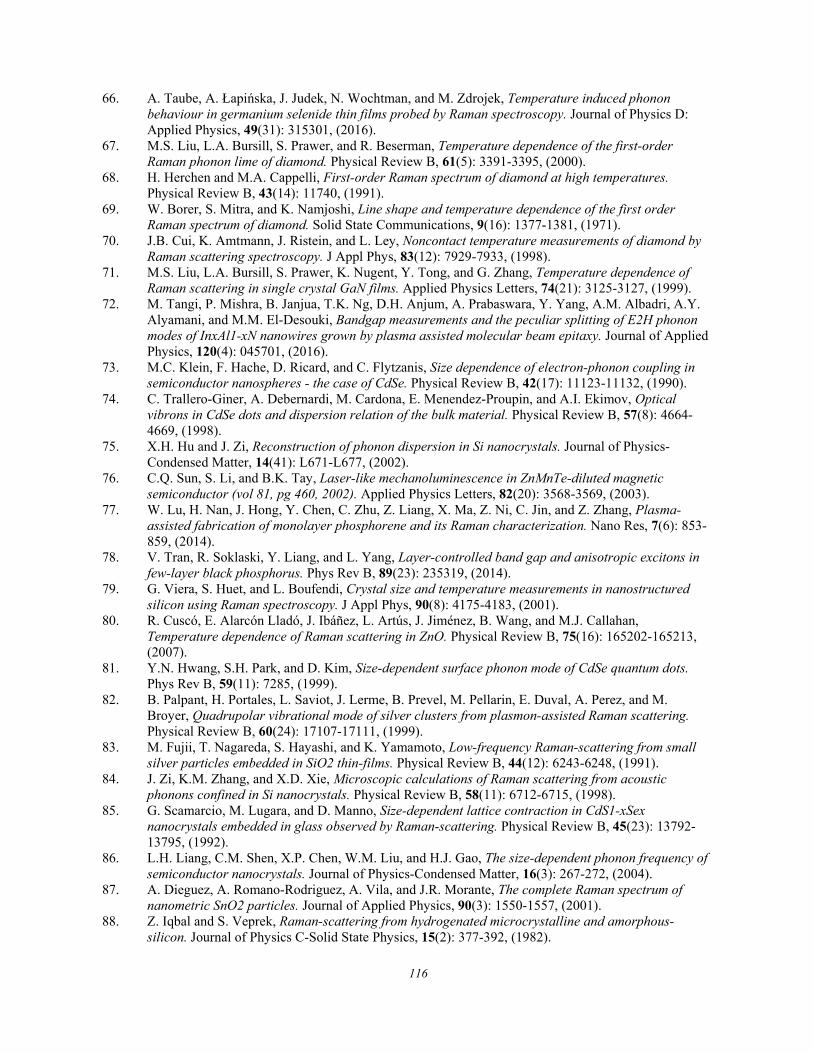
116
66. A. Taube, A. Łapińska, J. Judek, N. Wochtman, and M. Zdrojek, Temperature induced phonon behaviour in germanium selenide thin films probed by Raman spectroscopy. Journal of Physics D: Applied Physics, 49(31): 315301, (2016).
67. M.S. Liu, L.A. Bursill, S. Prawer, and R. Beserman, Temperature dependence of the first-order Raman phonon lime of diamond. Physical Review B, 61(5): 3391-3395, (2000).
68. H. Herchen and M.A. Cappelli, First-order Raman spectrum of diamond at high temperatures. Physical Review B, 43(14): 11740, (1991).
69. W. Borer, S. Mitra, and K. Namjoshi, Line shape and temperature dependence of the first order Raman spectrum of diamond. Solid State Communications, 9(16): 1377-1381, (1971).
70. J.B. Cui, K. Amtmann, J. Ristein, and L. Ley, Noncontact temperature measurements of diamond by Raman scattering spectroscopy. J Appl Phys, 83(12): 7929-7933, (1998).
71. M.S. Liu, L.A. Bursill, S. Prawer, K. Nugent, Y. Tong, and G. Zhang, Temperature dependence of Raman scattering in single crystal GaN films. Applied Physics Letters, 74(21): 3125-3127, (1999).
72. M. Tangi, P. Mishra, B. Janjua, T.K. Ng, D.H. Anjum, A. Prabaswara, Y. Yang, A.M. Albadri, A.Y. Alyamani, and M.M. El-Desouki, Bandgap measurements and the peculiar splitting of E2H phonon modes of InxAl1-xN nanowires grown by plasma assisted molecular beam epitaxy. Journal of Applied Physics, 120(4): 045701, (2016).
73. M.C. Klein, F. Hache, D. Ricard, and C. Flytzanis, Size dependence of electron-phonon coupling in semiconductor nanospheres - the case of CdSe. Physical Review B, 42(17): 11123-11132, (1990).
74. C. Trallero-Giner, A. Debernardi, M. Cardona, E. Menendez-Proupin, and A.I. Ekimov, Optical vibrons in CdSe dots and dispersion relation of the bulk material. Physical Review B, 57(8): 4664-4669, (1998).
75. X.H. Hu and J. Zi, Reconstruction of phonon dispersion in Si nanocrystals. Journal of Physics-Condensed Matter, 14(41): L671-L677, (2002).
76. C.Q. Sun, S. Li, and B.K. Tay, Laser-like mechanoluminescence in ZnMnTe-diluted magnetic semiconductor (vol 81, pg 460, 2002). Applied Physics Letters, 82(20): 3568-3569, (2003).
77. W. Lu, H. Nan, J. Hong, Y. Chen, C. Zhu, Z. Liang, X. Ma, Z. Ni, C. Jin, and Z. Zhang, Plasma-assisted fabrication of monolayer phosphorene and its Raman characterization. Nano Res, 7(6): 853-859, (2014).
78. V. Tran, R. Soklaski, Y. Liang, and L. Yang, Layer-controlled band gap and anisotropic excitons in few-layer black phosphorus. Phys Rev B, 89(23): 235319, (2014).
79. G. Viera, S. Huet, and L. Boufendi, Crystal size and temperature measurements in nanostructured silicon using Raman spectroscopy. J Appl Phys, 90(8): 4175-4183, (2001).
80. R. Cuscó, E. Alarcón Lladó, J. Ibáñez, L. Artús, J. Jiménez, B. Wang, and M.J. Callahan, Temperature dependence of Raman scattering in ZnO. Physical Review B, 75(16): 165202-165213, (2007).
81. Y.N. Hwang, S.H. Park, and D. Kim, Size-dependent surface phonon mode of CdSe quantum dots. Phys Rev B, 59(11): 7285, (1999).
82. B. Palpant, H. Portales, L. Saviot, J. Lerme, B. Prevel, M. Pellarin, E. Duval, A. Perez, and M. Broyer, Quadrupolar vibrational mode of silver clusters from plasmon-assisted Raman scattering. Physical Review B, 60(24): 17107-17111, (1999).
83. M. Fujii, T. Nagareda, S. Hayashi, and K. Yamamoto, Low-frequency Raman-scattering from small silver particles embedded in SiO2 thin-films. Physical Review B, 44(12): 6243-6248, (1991).
84. J. Zi, K.M. Zhang, and X.D. Xie, Microscopic calculations of Raman scattering from acoustic phonons confined in Si nanocrystals. Physical Review B, 58(11): 6712-6715, (1998).
85. G. Scamarcio, M. Lugara, and D. Manno, Size-dependent lattice contraction in CdS1-xSex nanocrystals embedded in glass observed by Raman-scattering. Physical Review B, 45(23): 13792-13795, (1992).
86. L.H. Liang, C.M. Shen, X.P. Chen, W.M. Liu, and H.J. Gao, The size-dependent phonon frequency of semiconductor nanocrystals. Journal of Physics-Condensed Matter, 16(3): 267-272, (2004).
87. A. Dieguez, A. Romano-Rodriguez, A. Vila, and J.R. Morante, The complete Raman spectrum of nanometric SnO2 particles. Journal of Applied Physics, 90(3): 1550-1557, (2001).
88. Z. Iqbal and S. Veprek, Raman-scattering from hydrogenated microcrystalline and amorphous-silicon. Journal of Physics C-Solid State Physics, 15(2): 377-392, (1982).
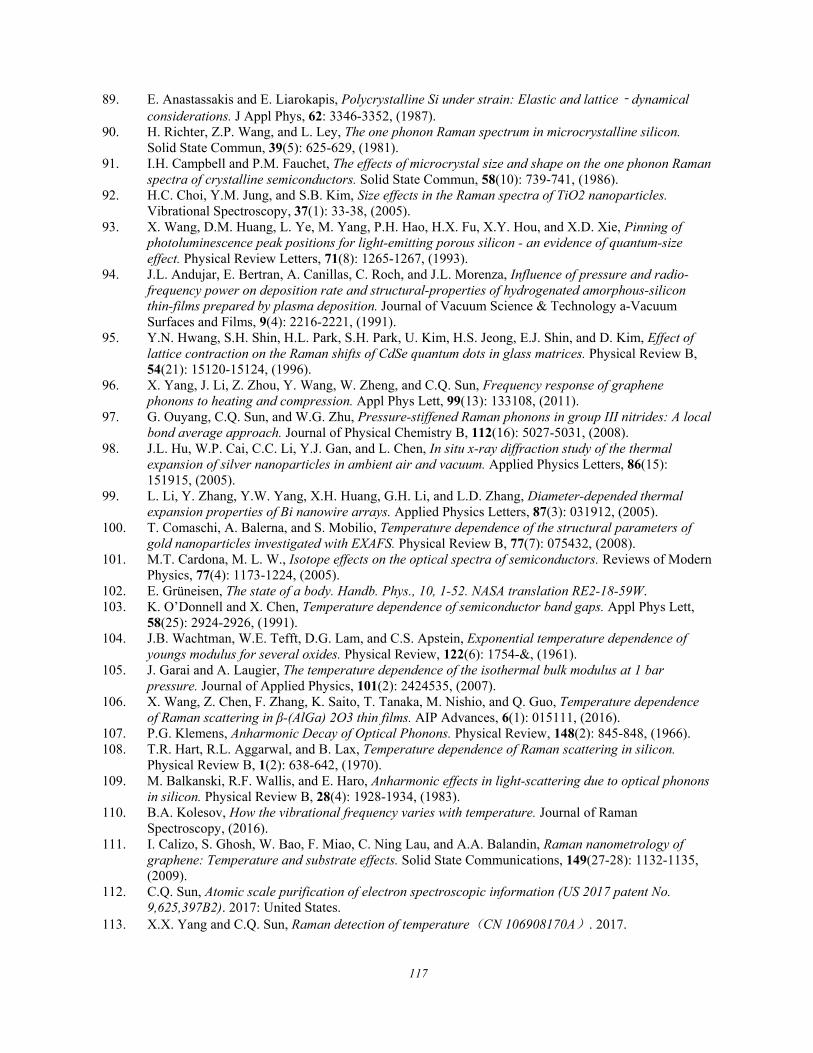
117
89. E. Anastassakis and E. Liarokapis, Polycrystalline Si under strain: Elastic and lattice‐dynamical considerations. J Appl Phys, 62: 3346-3352, (1987).
90. H. Richter, Z.P. Wang, and L. Ley, The one phonon Raman spectrum in microcrystalline silicon. Solid State Commun, 39(5): 625-629, (1981).
91. I.H. Campbell and P.M. Fauchet, The effects of microcrystal size and shape on the one phonon Raman spectra of crystalline semiconductors. Solid State Commun, 58(10): 739-741, (1986).
92. H.C. Choi, Y.M. Jung, and S.B. Kim, Size effects in the Raman spectra of TiO2 nanoparticles. Vibrational Spectroscopy, 37(1): 33-38, (2005).
93. X. Wang, D.M. Huang, L. Ye, M. Yang, P.H. Hao, H.X. Fu, X.Y. Hou, and X.D. Xie, Pinning of photoluminescence peak positions for light-emitting porous silicon - an evidence of quantum-size effect. Physical Review Letters, 71(8): 1265-1267, (1993).
94. J.L. Andujar, E. Bertran, A. Canillas, C. Roch, and J.L. Morenza, Influence of pressure and radio-frequency power on deposition rate and structural-properties of hydrogenated amorphous-silicon thin-films prepared by plasma deposition. Journal of Vacuum Science & Technology a-Vacuum Surfaces and Films, 9(4): 2216-2221, (1991).
95. Y.N. Hwang, S.H. Shin, H.L. Park, S.H. Park, U. Kim, H.S. Jeong, E.J. Shin, and D. Kim, Effect of lattice contraction on the Raman shifts of CdSe quantum dots in glass matrices. Physical Review B, 54(21): 15120-15124, (1996).
96. X. Yang, J. Li, Z. Zhou, Y. Wang, W. Zheng, and C.Q. Sun, Frequency response of graphene phonons to heating and compression. Appl Phys Lett, 99(13): 133108, (2011).
97. G. Ouyang, C.Q. Sun, and W.G. Zhu, Pressure-stiffened Raman phonons in group III nitrides: A local bond average approach. Journal of Physical Chemistry B, 112(16): 5027-5031, (2008).
98. J.L. Hu, W.P. Cai, C.C. Li, Y.J. Gan, and L. Chen, In situ x-ray diffraction study of the thermal expansion of silver nanoparticles in ambient air and vacuum. Applied Physics Letters, 86(15): 151915, (2005).
99. L. Li, Y. Zhang, Y.W. Yang, X.H. Huang, G.H. Li, and L.D. Zhang, Diameter-depended thermal expansion properties of Bi nanowire arrays. Applied Physics Letters, 87(3): 031912, (2005).
100. T. Comaschi, A. Balerna, and S. Mobilio, Temperature dependence of the structural parameters of gold nanoparticles investigated with EXAFS. Physical Review B, 77(7): 075432, (2008).
101. M.T. Cardona, M. L. W., Isotope effects on the optical spectra of semiconductors. Reviews of Modern Physics, 77(4): 1173-1224, (2005).
102. E. Grüneisen, The state of a body. Handb. Phys., 10, 1-52. NASA translation RE2-18-59W. 103. K. O’Donnell and X. Chen, Temperature dependence of semiconductor band gaps. Appl Phys Lett,
58(25): 2924-2926, (1991). 104. J.B. Wachtman, W.E. Tefft, D.G. Lam, and C.S. Apstein, Exponential temperature dependence of
youngs modulus for several oxides. Physical Review, 122(6): 1754-&, (1961). 105. J. Garai and A. Laugier, The temperature dependence of the isothermal bulk modulus at 1 bar
pressure. Journal of Applied Physics, 101(2): 2424535, (2007). 106. X. Wang, Z. Chen, F. Zhang, K. Saito, T. Tanaka, M. Nishio, and Q. Guo, Temperature dependence
of Raman scattering in β-(AlGa) 2O3 thin films. AIP Advances, 6(1): 015111, (2016). 107. P.G. Klemens, Anharmonic Decay of Optical Phonons. Physical Review, 148(2): 845-848, (1966). 108. T.R. Hart, R.L. Aggarwal, and B. Lax, Temperature dependence of Raman scattering in silicon.
Physical Review B, 1(2): 638-642, (1970). 109. M. Balkanski, R.F. Wallis, and E. Haro, Anharmonic effects in light-scattering due to optical phonons
in silicon. Physical Review B, 28(4): 1928-1934, (1983). 110. B.A. Kolesov, How the vibrational frequency varies with temperature. Journal of Raman
Spectroscopy, (2016). 111. I. Calizo, S. Ghosh, W. Bao, F. Miao, C. Ning Lau, and A.A. Balandin, Raman nanometrology of
graphene: Temperature and substrate effects. Solid State Communications, 149(27-28): 1132-1135, (2009).
112. C.Q. Sun, Atomic scale purification of electron spectroscopic information (US 2017 patent No. 9,625,397B2). 2017: United States.
113. X.X. Yang and C.Q. Sun, Raman detection of temperature(CN 106908170A). 2017.
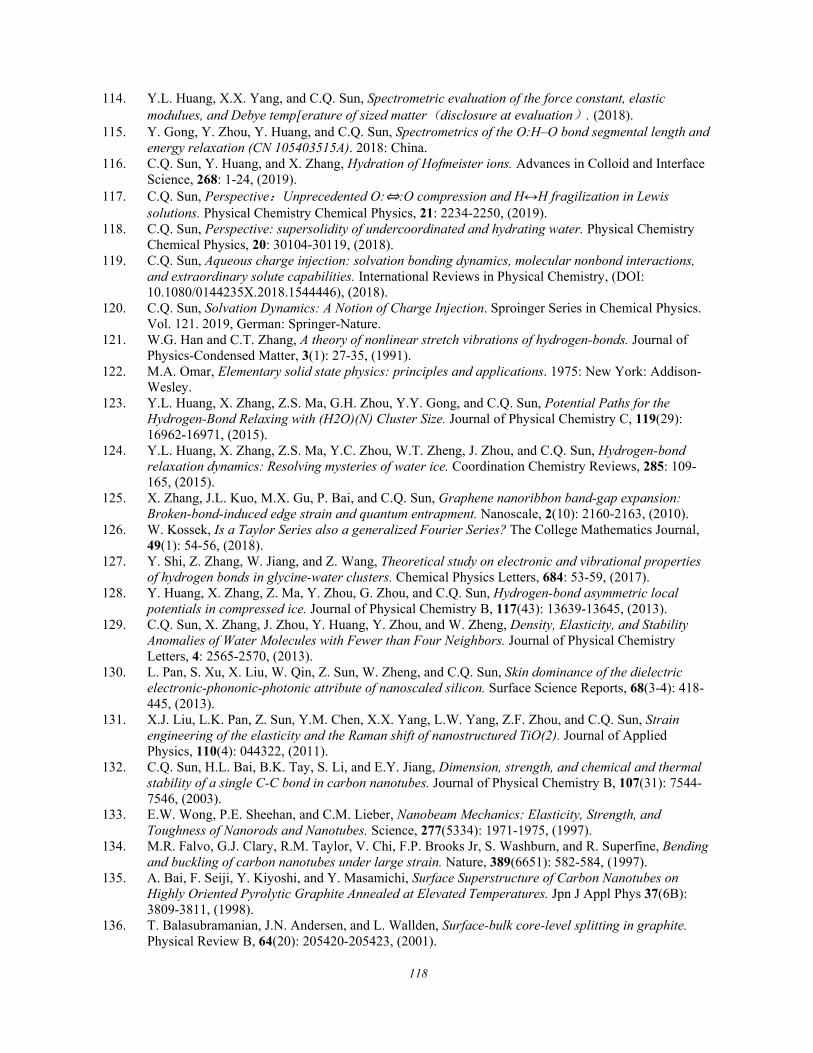
118
114. Y.L. Huang, X.X. Yang, and C.Q. Sun, Spectrometric evaluation of the force constant, elastic modulues, and Debye temp[erature of sized matter(disclosure at evaluation). (2018).
115. Y. Gong, Y. Zhou, Y. Huang, and C.Q. Sun, Spectrometrics of the O:H–O bond segmental length and energy relaxation (CN 105403515A). 2018: China.
116. C.Q. Sun, Y. Huang, and X. Zhang, Hydration of Hofmeister ions. Advances in Colloid and Interface Science, 268: 1-24, (2019).
117. C.Q. Sun, Perspective:Unprecedented O:⇔:O compression and H↔H fragilization in Lewis solutions. Physical Chemistry Chemical Physics, 21: 2234-2250, (2019).
118. C.Q. Sun, Perspective: supersolidity of undercoordinated and hydrating water. Physical Chemistry Chemical Physics, 20: 30104-30119, (2018).
119. C.Q. Sun, Aqueous charge injection: solvation bonding dynamics, molecular nonbond interactions, and extraordinary solute capabilities. International Reviews in Physical Chemistry, (DOI: 10.1080/0144235X.2018.1544446), (2018).
120. C.Q. Sun, Solvation Dynamics: A Notion of Charge Injection. Sproinger Series in Chemical Physics. Vol. 121. 2019, German: Springer-Nature.
121. W.G. Han and C.T. Zhang, A theory of nonlinear stretch vibrations of hydrogen-bonds. Journal of Physics-Condensed Matter, 3(1): 27-35, (1991).
122. M.A. Omar, Elementary solid state physics: principles and applications. 1975: New York: Addison-Wesley.
123. Y.L. Huang, X. Zhang, Z.S. Ma, G.H. Zhou, Y.Y. Gong, and C.Q. Sun, Potential Paths for the Hydrogen-Bond Relaxing with (H2O)(N) Cluster Size. Journal of Physical Chemistry C, 119(29): 16962-16971, (2015).
124. Y.L. Huang, X. Zhang, Z.S. Ma, Y.C. Zhou, W.T. Zheng, J. Zhou, and C.Q. Sun, Hydrogen-bond relaxation dynamics: Resolving mysteries of water ice. Coordination Chemistry Reviews, 285: 109-165, (2015).
125. X. Zhang, J.L. Kuo, M.X. Gu, P. Bai, and C.Q. Sun, Graphene nanoribbon band-gap expansion: Broken-bond-induced edge strain and quantum entrapment. Nanoscale, 2(10): 2160-2163, (2010).
126. W. Kossek, Is a Taylor Series also a generalized Fourier Series? The College Mathematics Journal, 49(1): 54-56, (2018).
127. Y. Shi, Z. Zhang, W. Jiang, and Z. Wang, Theoretical study on electronic and vibrational properties of hydrogen bonds in glycine-water clusters. Chemical Physics Letters, 684: 53-59, (2017).
128. Y. Huang, X. Zhang, Z. Ma, Y. Zhou, G. Zhou, and C.Q. Sun, Hydrogen-bond asymmetric local potentials in compressed ice. Journal of Physical Chemistry B, 117(43): 13639-13645, (2013).
129. C.Q. Sun, X. Zhang, J. Zhou, Y. Huang, Y. Zhou, and W. Zheng, Density, Elasticity, and Stability Anomalies of Water Molecules with Fewer than Four Neighbors. Journal of Physical Chemistry Letters, 4: 2565-2570, (2013).
130. L. Pan, S. Xu, X. Liu, W. Qin, Z. Sun, W. Zheng, and C.Q. Sun, Skin dominance of the dielectric electronic-phononic-photonic attribute of nanoscaled silicon. Surface Science Reports, 68(3-4): 418-445, (2013).
131. X.J. Liu, L.K. Pan, Z. Sun, Y.M. Chen, X.X. Yang, L.W. Yang, Z.F. Zhou, and C.Q. Sun, Strain engineering of the elasticity and the Raman shift of nanostructured TiO(2). Journal of Applied Physics, 110(4): 044322, (2011).
132. C.Q. Sun, H.L. Bai, B.K. Tay, S. Li, and E.Y. Jiang, Dimension, strength, and chemical and thermal stability of a single C-C bond in carbon nanotubes. Journal of Physical Chemistry B, 107(31): 7544-7546, (2003).
133. E.W. Wong, P.E. Sheehan, and C.M. Lieber, Nanobeam Mechanics: Elasticity, Strength, and Toughness of Nanorods and Nanotubes. Science, 277(5334): 1971-1975, (1997).
134. M.R. Falvo, G.J. Clary, R.M. Taylor, V. Chi, F.P. Brooks Jr, S. Washburn, and R. Superfine, Bending and buckling of carbon nanotubes under large strain. Nature, 389(6651): 582-584, (1997).
135. A. Bai, F. Seiji, Y. Kiyoshi, and Y. Masamichi, Surface Superstructure of Carbon Nanotubes on Highly Oriented Pyrolytic Graphite Annealed at Elevated Temperatures. Jpn J Appl Phys 37(6B): 3809-3811, (1998).
136. T. Balasubramanian, J.N. Andersen, and L. Wallden, Surface-bulk core-level splitting in graphite. Physical Review B, 64(20): 205420-205423, (2001).
119
137. W.T. Zheng and C.Q. Sun, Underneath the fascinations of carbon nanotubes and graphene nanoribbons. Energy & Environmental Science, 4(3): 627-655, (2011).
138. C.Ö. Girit, J.C. Meyer, R. Erni, M.D. Rossell, C. Kisielowski, L. Yang, C.H. Park, M.F. Crommie, M.L. Cohen, S.G. Louie, and A. Zettl, Graphene at the Edge: Stability and Dynamics. Science, 323(5922): 1705-1708, (2009).
139. J.W. Li, L.W. Yang, Z.F. Zhou, X.J. Liu, G.F. Xie, Y. Pan, and C.Q. Sun, Mechanically Stiffened and Thermally Softened Raman Modes of ZnO Crystal. J Phys Chem B, 114(4): 1648-1651, (2010).
140. M.X. Gu, Y.C. Zhou, and C.Q. Sun, Local bond average for the thermally induced lattice expansion. Journal of Physical Chemistry B, 112(27): 7992-7995, (2008).
141. G.A. Slack and S.F. Bartram, Thermal expansion of some diamondlike crystals. Journal of Applied Physics, 46(1): 89-98, (1975).
142. R.R. Reeber and K. Wang, Lattice parameters and thermal expansion of GaN. Journal of Materials Research, 15(1): 40-44, (2000).
143. R.J. Bruls, H.T. Hintzen, G. de With, R. Metselaar, and J.C. van Miltenburg, The temperature dependence of the Gruneisen parameters of MgSiN2, AlN and beta-Si3N4. Journal of Physics and Chemistry of Solids, 62(4): 783-792, (2001).
144. K.G. Lyon, G.L. Salinger, C.A. Swenson, and G.K. White, Linear thermal-expansion measurements on silicon from 6 to 340 K. Journal of Applied Physics, 48(3): 865-868, (1977).
145. R.B. Roberts, Thermal-expansion reference data - silicon 300-850 K. Journal of Physics D-Applied Physics, 14(10): L163-L166, (1981).
146. H.P. Singh, Determination of thermal expansion of germanium rhodium and iridium by x-rays. Acta Crystallographica Section a, A 24: 469-&, (1968).
147. T. Sato, K. Ohashi, T. Sudoh, K. Haruna, and H. Maeta, Thermal expansion of a high purity synthetic diamond single crystal at low temperatures. Physical Review B, 65(9): 092102, (2002).
148. C. Giles, C. Adriano, A.F. Lubambo, C. Cusatis, I. Mazzaro, and M.G. Honnicke, Diamond thermal expansion measurement using transmitted X-ray back-diffraction. Journal of Synchrotron Radiation, 12: 349-353, (2005).
149. K. Haruna, H. Maeta, K. Ohashi, and T. Koike, Thermal-expansion coefficient of synthetic diamond single-crystal at low-temperatures. Japanese Journal of Applied Physics Part 1-Regular Papers Short Notes & Review Papers, 31(8): 2527-2529, (1992).
150. C. Kittel, Intrduction to Solid State Physics. 8 ed. 2005, New York: John Willey & Sons, Inc. 151. http://www.infoplease.com/periodictable.php. 152. Q.H. Tang, T.C. Wang, B.S. Shang, and F. Liu, Thermodynamic Properties and Constitutive
Relations of Crystals at Finite Temperature. Sci China-Phys Mech Astron, G 55: 933, (2012). 153. Y.J. Su, H. Wei, R.G. Gao, Z. Yang, J. Zhang, Z.H. Zhong, and Y.F. Zhang, Exceptional negative
thermal expansion and viscoelastic properties of graphene oxide paper. Carbon, 50(8): 2804-2809, (2012).
154. C. Martinek and F.A. Hummel, Linear thermal expansion of 3 tungstates. Journal of the American Ceramic Society, 51(4): 227-&, (1968).
155. T.A. Mary, J.S.O. Evans, T. Vogt, and A.W. Sleight, Negative thermal expansion from 0.3 to 1050 Kelvin in ZrW2O8. Science, 272(5258): 90-92, (1996).
156. C.Q. Sun, Dominance of broken bonds and nonbonding electrons at the nanoscale. Nanoscale, 2(10): 1930-1961, (2010).
157. C.Q. Sun and Y. Sun, The Attribute of Water: Single Notion, Multiple Myths. Springer Ser. Chem. Phys. Vol. 113. 2016, Heidelberg: Springer-Verlag. 494 pp.
158. C.Q. Sun, X. Zhang, X. Fu, W. Zheng, J.-l. Kuo, Y. Zhou, Z. Shen, and J. Zhou, Density and phonon-stiffness anomalies of water and ice in the full temperature range. Journal of Physical Chemistry Letters, 4: 3238-3244, (2013).
159. M. Pravica, Z. Quine, and E. Romano, X-ray diffraction study of elemental thulium at pressures up to 86 GPa. Physical Review B, 74(10): 104107, (2006).
160. B. Chen, D. Penwell, L.R. Benedetti, R. Jeanloz, and M.B. Kruger, Particle-size effect on the compressibility of nanocrystalline alumina. Physical Review B, 66(14): 144101, (2002).
161. F. Ding, H. Ji, Y. Chen, A. Herklotz, K. Dorr, Y. Mei, A. Rastelli, and O.G. Schmidt, Stretchable Graphene: A Close Look at Fundamental Parameters through Biaxial Straining. Nano Letters, 10(9): 3453-3458, (2010).
120
162. C. Rice, R. Young, R. Zan, U. Bangert, D. Wolverson, T. Georgiou, R. Jalil, and K. Novoselov, Raman-scattering measurements and first-principles calculations of strain-induced phonon shifts in monolayer MoS2. Phys Rev B, 87(8): 081307, (2013).
163. X.X. Yang, Y. Wang, J.W. Li, W.H. Liao, Y.H. Liu, and C.Q. Sun, Graphene phonon softening and splitting by directional straining. Applied Physics Letters, 107(20): 203105, (2015).
164. Y. Gong, Y. Zhou, and C. Sun, Phonon spectrometrics of the hydrogen bond (O:H-O) segmental length and energy relaxation under excitation, B.o. intelligence, Editor. 2018: China.
165. A. Wong, L. Shi, R. Auchettl, D. McNaughton, D.R. Appadoo, and E.G. Robertson, Heavy snow: IR spectroscopy of isotope mixed crystalline water ice. Physical Chemistry Chemical Physics, 18(6): 4978-4993, (2016).
166. S. Liu, N. Huo, S. Gan, Y. Li, Z. Wei, B. Huang, J. Liu, J. Li, and H. Chen, Thickness-dependent Raman spectra, transport properties and infrared photoresponse of few-layer black phosphorus. J Mater Chem C, 3(42): 10974-10980, (2015).
167. W. Zhao, Z. Ghorannevis, L. Chu, M. Toh, C. Kloc, P.-H. Tan, and G. Eda, Evolution of electronic structure in atomically thin sheets of WS2 and WSe2. ACS Nano, 7(1): 791-797, (2012).
168. X. Fan, C.-H. Chang, W. Zheng, J.-L. Kuo, and D.J. Singh, The Electronic Properties of Single-layer and Multi-layer MoS2 under High Pressure. J Phys Chem C, 119: 10189–10196, (2015).
169. C.Q. Sun, S.Y. Fu, and Y.G. Nie, Dominance of Broken Bonds and Unpaired Nonbonding pi-Electrons in the Band Gap Expansion and Edge States Generation in Graphene Nanoribbons. Journal of Physical Chemistry C, 112(48): 18927-18934, (2008).
170. O. Hod, V. Barone, J.E. Peralta, and G.E. Scuseria, Enhanced half-metallicity in edge-oxidized zigzag graphene nanoribbons. Nano Letters, 7(8): 2295-2299, (2007).
171. L. Brey and H.A. Fertig, Electronic states of graphene nanoribbons studied with the Dirac equation. Physical Review B, 73(23): 235411, (2006).
172. F.M.D. Pellegrino, G.G.N. Angilella, and R. Pucci, Strain effect on the optical conductivity of graphene. Physical Review B, 81(3): 035411, (2010).
173. S.H.M. Jafri, K. Carva, E. Widenkvist, T. Blom, B. Sanyal, J. Fransson, O. Eriksson, U. Jansson, H. Grennberg, O. Karis, R.A. Quinlan, B.C. Holloway, and K. Leifer, Conductivity engineering of graphene by defect formation. Journal of Physics D: Applied Physics, 43(4): 045404, (2010).
174. Y.W. Son, M.L. Cohen, and S.G. Louie, Energy Gaps in Graphene Nanoribbons. Physical Review Letters, 97(21): 216803-4, (2006).
175. M. Fujita, K. Wakabayashi, K. Nakada, and K. Kusakabe, Peculiar Localized State at Zigzag Graphite Edge. J Phys Soc Jpn, 65(7): 1920 - 1923, (1996).
176. L. Yang, C.-H. Park, Y.-W. Son, M.L. Cohen, and S.G. Louie, Quasiparticle Energies and Band Gaps in Graphene Nanoribbons. Physical Review Letters, 99(18): 186801, (2007).
177. V. Barone, O. Hod, and G.E. Scuseria, Electronic Structure and Stability of Semiconducting Graphene Nanoribbons. Nano Letters, 6(12): 2748-2754, (2006).
178. K.F. Mak, C. Lee, J. Hone, J. Shan, and T.F. Heinz, Atomically thin MoS2: a new direct-gap semiconductor. Phys Rev Lett, 105(13): 136805, (2010).
179. A. Kumar and P. Ahluwalia, Electronic structure of transition metal dichalcogenides monolayers 1H-MX2 (M= Mo, W; X= S, Se, Te) from ab-initio theory: new direct band gap semiconductors. Eur Phys J B, 85(6): 1-7, (2012).
180. S. Tongay, J. Zhou, C. Ataca, K. Lo, T.S. Matthews, J. Li, J.C. Grossman, and J. Wu, Thermally Driven Crossover from Indirect toward Direct Bandgap in 2D Semiconductors: MoSe2 versus MoS2. Nano Lett, 12(11): 5576-5580, (2012).
181. W. Zhao, R. Ribeiro, M. Toh, A. Carvalho, C. Kloc, A. Castro Neto, and G. Eda, Origin of indirect optical transitions in few-layer MoS2, WS2, and WSe2. Nano Lett, 13(11): 5627-5634, (2013).
182. A. Kuc, N. Zibouche, and T. Heine, Influence of quantum confinement on the electronic structure of the transition metal sulfide TS2. Phys Rev B, 83(24): 245213, (2011).
183. L. Li, Y. Yu, G.J. Ye, Q. Ge, X. Ou, H. Wu, D. Feng, X.H. Chen, and Y. Zhang, Black phosphorus field-effect transistors. Nat Nanotechnol, 9(5): 372-377, (2014).
184. H. Liu, A.T. Neal, Z. Zhu, Z. Luo, X. Xu, D. Tománek, and P.D. Ye, Phosphorene: an unexplored 2D semiconductor with a high hole mobility. ACS Nano, 8(4): 4033-4041, (2014).
121
185. H. Li, Z. Yin, Q. He, H. Li, X. Huang, G. Lu, D.W.H. Fam, A.I.Y. Tok, Q. Zhang, and H. Zhang, Fabrication of Single‐and Multilayer MoS2 Film‐Based Field‐Effect Transistors for Sensing NO at Room Temperature. Small, 8(1): 63-67, (2012).
186. K.F. Mak, K. He, J. Shan, and T.F. Heinz, Control of valley polarization in monolayer MoS2 by optical helicity. Nat Nanotechnol, 7(8): 494-498, (2012).
187. S. Kim, A. Konar, W.-S. Hwang, J.H. Lee, J. Lee, J. Yang, C. Jung, H. Kim, J.-B. Yoo, and J.-Y. Choi, High-mobility and low-power thin-film transistors based on multilayer MoS2 crystals. Nat Commun, 3: 1011, (2012).
188. C. Zhu, Z. Zeng, H. Li, F. Li, C. Fan, and H. Zhang, Single-layer MoS2-based nanoprobes for homogeneous detection of biomolecules. J Am Chem Soc, 135(16): 5998-6001, (2013).
189. C. Ataca, H. Sahin, and S. Ciraci, Stable, single-layer MX2 transition-metal oxides and dichalcogenides in a honeycomb-like structure. The Journal of Physical Chemistry C, 116(16): 8983-8999, (2012).
190. Y. Zhou, D. Wu, Y. Gong, Z. Ma, Y. Huang, X. Zhang, and C.Q. Sun, Base-hydration-resolved hydrogen-bond networking dynamics: Quantum point compression. Journal of Molecular Liquids, 223: 1277-1283, (2016).
191. Y. Hao, Y. Wang, L. Wang, Z. Ni, Z. Wang, R. Wang, C.K. Koo, Z. Shen, and J.T.L. Thong, Probing Layer Number and Stacking Order of Few-Layer Graphene by Raman Spectroscopy. Small, 6(2): 195-200, (2010).
192. X.X. Yang, Z.F. Zhou, Y. Wang, J.W. Li, N.G. Guo, W.T. Zheng, J.Z. Peng, and C.Q. Sun, Raman spectroscopic determination of the length, energy, Debye temperature, and compressibility of the C–C bond in carbon allotropes. Chemical Physics Letters, 575: 86-90, (2013).
193. T. Yu, Z. Ni, C. Du, Y. You, Y. Wang, and Z. Shen, Raman Mapping Investigation of Graphene on Transparent Flexible Substrate: The Strain Effect. The Journal of Physical Chemistry C, 112(33): 12602-12605, (2008).
194. M. Huang, H. Yan, T.F. Heinz, and J. Hone, Probing Strain-Induced Electronic Structure Change in Graphene by Raman Spectroscopy. Nano Letters, 10(10): 4074-4079, (2010).
195. J.L. Dattatray, U. Maitra, L.S. Panchakarla, U.V. Waghmare, and C.N.R. Rao, Temperature effects on the Raman spectra of graphenes: dependence on the number of layers and doping. Journal of Physics: Condensed Matter, 23(5): 055303, (2011).
196. E.H. Martins Ferreira, M.V.O. Moutinho, F. Stavale, M.M. Lucchese, R.B. Capaz, C.A. Achete, and A. Jorio, Evolution of the Raman spectra from single-, few-, and many-layer graphene with increasing disorder. Physical Review B, 82(12): 125429-125438, (2010).
197. S. Berciaud, S. Ryu, L.E. Brus, and T.F. Heinz, Probing the Intrinsic Properties of Exfoliated Graphene: Raman Spectroscopy of Free-Standing Monolayers. Nano Letters, 9(1): 346-352, (2008).
198. I. Calizo, W. Bao, F. Miao, C.N. Lau, and A.A. Balandin, The effect of substrates on the Raman spectrum of graphene. Applied Physics Letters, 91: 201904, (2007).
199. Z. Luo, T. Yu, K.J. Kim, Z. Ni, Y. You, S. Lim, Z. Shen, S. Wang, and J. Lin, Thickness-Dependent Reversible Hydrogenation of Graphene Layers. ACS Nano, 3(7): 1781-1788, (2009).
200. L.M. Xie, L.Y. Jiao, and H.J. Dai, Selective Etching of Graphene Edges by Hydrogen Plasma. Journal of the American Chemical Society, 132(42): 14751-14753, (2010).
201. H.J. Shin, W.M. Choi, D. Choi, G.H. Han, S.M. Yoon, H.K. Park, S.W. Kim, Y.W. Jin, S.Y. Lee, J.M. Kim, J.Y. Choi, and Y.H. Lee, Control of Electronic Structure of Graphene by Various Dopants and Their Effects on a Nanogenerator. Journal of the American Chemical Society, 132(44): 15603-15609, (2010).
202. L.G. Cancado, M.A. Pimenta, B.R.A. Neves, M.S.S. Dantas, and A. Jorio, Influence of the atomic structure on the Raman spectra of graphite edges. Physical Review Letters, 93(24): 247401, (2004).
203. B. Krauss, P. Nemes Incze, V. Skakalova, L.P. Biro, K.V. Klitzing, and J.H. Smet, Raman Scattering at Pure Graphene Zigzag Edges. Nano Letters, 10(11): 4544-4548, (2010).
204. Y. You, Z. Ni, T. Yu, and Z. Shen, Edge chirality determination of graphene by Raman spectroscopy. Applied Physics Letters, 93(16): 163112-163115, (2008).
205. M.A. Pimenta, G. Dresselhaus, M.S. Dresselhaus, L.G. Cancado, A. Jorio, and R. Saito, Studying disorder in graphite-based systems by Raman spectroscopy. Physical Chemistry Chemical Physics, 9(11): 1276-1290, (2007).
122
206. M.S. Dresselhaus, A. Jorio, and R. Saito, Characterizing Graphene, Graphite, and Carbon Nanotubes by Raman Spectroscopy. Annual Review of Condensed Matter Physics, 1(1): 89-108, (2010).
207. D.J. Late, Temperature dependent phonon shifts in single-layer WS2. ACS Appl Mater Inter, 6(2): 1158-1163, (2014).
208. M. Staiger, P. Rafailov, K. Gartsman, H. Telg, M. Krause, G. Radovsky, A. Zak, and C. Thomsen, Excitonic resonances in WS2 nanotubes. Phys Rev B, 86(16): 165423, (2012).
209. A. Favron, E. Gaufrès, F. Fossard, P. Lévesque, A. Phaneuf-L'Heureux, N. Tang, A. Loiseau, R. Leonelli, S. Francoeur, and R. Martel, Exfoliating pristine black phosphorus down to the monolayer: photo-oxidation and electronic confinement effects. arXiv:14080345, (2014).
210. X. Wang, A.M. Jones, K.L. Seyler, V. Tran, Y. Jia, H. Zhao, H. Wang, L. Yang, X. Xu, and F. Xia, Highly anisotropic and robust excitons in monolayer black phosphorus. Nat Nanotechnol, 10(6): 517-521, (2015).
211. J. Jiang, S. Xiu, M. Zheng, T. Jia, H. Liu, Y. Zhang, and G. Chen, Indirect–direct bandgap transition and gap width tuning in bilayer MoS2 superlattices. Chem Phys Lett, 613: 74-79, (2014).
212. H.J. Conley, B. Wang, J.I. Ziegler, R.F. Haglund Jr, S.T. Pantelides, and K.I. Bolotin, Bandgap engineering of strained monolayer and bilayer MoS2. Nano Lett, 13(8): 3626-3630, (2013).
213. D. Yoon, Y.-W. Son, and H. Cheong, Strain-Dependent Splitting of the Double-Resonance Raman Scattering Band in Graphene. Physical Review Letters, 106(15): 155502, (2011).
214. P. Johari and V.B. Shenoy, Tuning the electronic properties of semiconducting transition metal dichalcogenides by applying mechanical strains. ACS Nano, 6(6): 5449-5456, (2012).
215. D.J. Late, Temperature dependent phonon shifts in few-layer black phosphorus. ACS Appl Mater Inter, 7(10): 5857-5862, (2015).
216. S. Appalakondaiah, G. Vaitheeswaran, S. Lebegue, N.E. Christensen, and A. Svane, Effect of van der Waals interactions on the structural and elastic properties of black phosphorus. Phys Rev B, 86(3): 035105, (2012).
217. A. Arora, M. Koperski, K. Nogajewski, J. Marcus, C. Faugeras, and M. Potemski, Excitonic resonances in thin films of WSe2: from monolayer to bulk material. Nanoscale: 10421-9, (2015).
218. K.S. Novoselov, Z. Jiang, Y. Zhang, S.V. Morozov, H.L. Stormer, U. Zeitler, J.C. Maan, G.S. Boebinger, P. Kim, and A.K. Geim, Room-temperature quantum hall effect in graphene. Science, 315(5817): 1379-1379, (2007).
219. Y. Wang, X. Yang, J. Li, Z. Zhou, W. Zheng, and C.Q. Sun, Number-of-layer discriminated graphene phonon softening and stiffening. Appl Phys Lett, 99(16): 163109, (2011).
220. C. Thomsen and S. Reich, Double Resonant Raman Scattering in Graphite. Phys Rev Lett, 85(24): 5214-5217, (2000).
221. Y. Liu, X. Yang, M. Bo, X. Zhang, X. Liu, C.Q. Sun, and Y. Huang, Number‐of‐layer, pressure, and temperature resolved bond–phonon–photon cooperative relaxation of layered black phosphorus. Journal of Raman Spectroscopy, 47(11): 1304-1309, (2016).
222. Y. Liu, M. Bo, Y. Guo, X. Yang, X. Zhang, C.Q. Sun, and Y. Huang, Number‐of‐layer resolved (Mo, W)‐(S2, Se2) phonon relaxation. Journal of Raman Spectroscopy, (2017).
223. M. Boukhicha, M. Calandra, M.-A. Measson, O. Lancry, and A. Shukla, Anharmonic phonons in few-layer MoS 2: Raman spectroscopy of ultralow energy compression and shear modes. Phys Rev B, 87(19): 195316, (2013).
224. W. Zhao, Z. Ghorannevis, K.K. Amara, J.R. Pang, M. Toh, X. Zhang, C. Kloc, P.H. Tan, and G. Eda, Lattice dynamics in mono-and few-layer sheets of WS2 and WSe2. Nanoscale, 5(20): 9677-9683, (2013).
225. Y. Liu, X. Yang, M. Bo, C. Ni, X. Liu, C.Q. Sun, and Y. Huang, Multifield-driven bond–phonon–photon performance of layered (Mo, W)–(S 2, Se 2). Chemical Physics Letters, 660: 256-260, (2016).
226. M.X. Gu, L.K. Pan, T.C. Au Yeung, B.K. Tay, and C.Q. Sun, Atomistic Origin of the Thermally Driven Softening of Raman Optical Phonons in Group III Nitrides. The Journal of Physical Chemistry C, 111(36): 13606-13610, (2007).
227. F. Birch, Finite Elastic Strain of Cubic Crystals. Physical Review, 71(11): 809-824, (1947). 228. F.D. Murnaghan, The Compressibility of Media under Extreme Pressures. Proceedings of the
National Academy of Sciences of the United States of America, 30(9): 244-247, (1944).
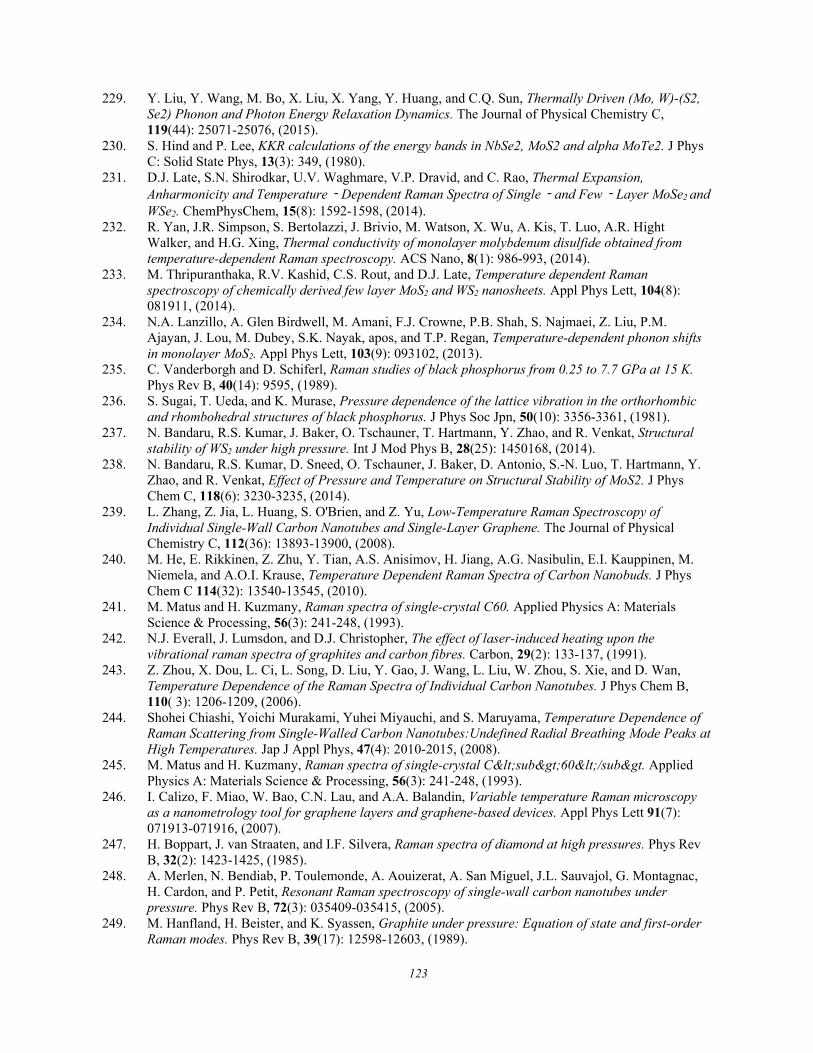
123
229. Y. Liu, Y. Wang, M. Bo, X. Liu, X. Yang, Y. Huang, and C.Q. Sun, Thermally Driven (Mo, W)-(S2, Se2) Phonon and Photon Energy Relaxation Dynamics. The Journal of Physical Chemistry C, 119(44): 25071-25076, (2015).
230. S. Hind and P. Lee, KKR calculations of the energy bands in NbSe2, MoS2 and alpha MoTe2. J Phys C: Solid State Phys, 13(3): 349, (1980).
231. D.J. Late, S.N. Shirodkar, U.V. Waghmare, V.P. Dravid, and C. Rao, Thermal Expansion, Anharmonicity and Temperature‐Dependent Raman Spectra of Single‐and Few‐Layer MoSe2 and WSe2. ChemPhysChem, 15(8): 1592-1598, (2014).
232. R. Yan, J.R. Simpson, S. Bertolazzi, J. Brivio, M. Watson, X. Wu, A. Kis, T. Luo, A.R. Hight Walker, and H.G. Xing, Thermal conductivity of monolayer molybdenum disulfide obtained from temperature-dependent Raman spectroscopy. ACS Nano, 8(1): 986-993, (2014).
233. M. Thripuranthaka, R.V. Kashid, C.S. Rout, and D.J. Late, Temperature dependent Raman spectroscopy of chemically derived few layer MoS2 and WS2 nanosheets. Appl Phys Lett, 104(8): 081911, (2014).
234. N.A. Lanzillo, A. Glen Birdwell, M. Amani, F.J. Crowne, P.B. Shah, S. Najmaei, Z. Liu, P.M. Ajayan, J. Lou, M. Dubey, S.K. Nayak, apos, and T.P. Regan, Temperature-dependent phonon shifts in monolayer MoS2. Appl Phys Lett, 103(9): 093102, (2013).
235. C. Vanderborgh and D. Schiferl, Raman studies of black phosphorus from 0.25 to 7.7 GPa at 15 K. Phys Rev B, 40(14): 9595, (1989).
236. S. Sugai, T. Ueda, and K. Murase, Pressure dependence of the lattice vibration in the orthorhombic and rhombohedral structures of black phosphorus. J Phys Soc Jpn, 50(10): 3356-3361, (1981).
237. N. Bandaru, R.S. Kumar, J. Baker, O. Tschauner, T. Hartmann, Y. Zhao, and R. Venkat, Structural stability of WS2 under high pressure. Int J Mod Phys B, 28(25): 1450168, (2014).
238. N. Bandaru, R.S. Kumar, D. Sneed, O. Tschauner, J. Baker, D. Antonio, S.-N. Luo, T. Hartmann, Y. Zhao, and R. Venkat, Effect of Pressure and Temperature on Structural Stability of MoS2. J Phys Chem C, 118(6): 3230-3235, (2014).
239. L. Zhang, Z. Jia, L. Huang, S. O'Brien, and Z. Yu, Low-Temperature Raman Spectroscopy of Individual Single-Wall Carbon Nanotubes and Single-Layer Graphene. The Journal of Physical Chemistry C, 112(36): 13893-13900, (2008).
240. M. He, E. Rikkinen, Z. Zhu, Y. Tian, A.S. Anisimov, H. Jiang, A.G. Nasibulin, E.I. Kauppinen, M. Niemela, and A.O.I. Krause, Temperature Dependent Raman Spectra of Carbon Nanobuds. J Phys Chem C 114(32): 13540-13545, (2010).
241. M. Matus and H. Kuzmany, Raman spectra of single-crystal C60. Applied Physics A: Materials Science & Processing, 56(3): 241-248, (1993).
242. N.J. Everall, J. Lumsdon, and D.J. Christopher, The effect of laser-induced heating upon the vibrational raman spectra of graphites and carbon fibres. Carbon, 29(2): 133-137, (1991).
243. Z. Zhou, X. Dou, L. Ci, L. Song, D. Liu, Y. Gao, J. Wang, L. Liu, W. Zhou, S. Xie, and D. Wan, Temperature Dependence of the Raman Spectra of Individual Carbon Nanotubes. J Phys Chem B, 110( 3): 1206-1209, (2006).
244. Shohei Chiashi, Yoichi Murakami, Yuhei Miyauchi, and S. Maruyama, Temperature Dependence of Raman Scattering from Single-Walled Carbon Nanotubes:Undefined Radial Breathing Mode Peaks at High Temperatures. Jap J Appl Phys, 47(4): 2010-2015, (2008).
245. M. Matus and H. Kuzmany, Raman spectra of single-crystal C<sub>60</sub>. Applied Physics A: Materials Science & Processing, 56(3): 241-248, (1993).
246. I. Calizo, F. Miao, W. Bao, C.N. Lau, and A.A. Balandin, Variable temperature Raman microscopy as a nanometrology tool for graphene layers and graphene-based devices. Appl Phys Lett 91(7): 071913-071916, (2007).
247. H. Boppart, J. van Straaten, and I.F. Silvera, Raman spectra of diamond at high pressures. Phys Rev B, 32(2): 1423-1425, (1985).
248. A. Merlen, N. Bendiab, P. Toulemonde, A. Aouizerat, A. San Miguel, J.L. Sauvajol, G. Montagnac, H. Cardon, and P. Petit, Resonant Raman spectroscopy of single-wall carbon nanotubes under pressure. Phys Rev B, 72(3): 035409-035415, (2005).
249. M. Hanfland, H. Beister, and K. Syassen, Graphite under pressure: Equation of state and first-order Raman modes. Phys Rev B, 39(17): 12598-12603, (1989).
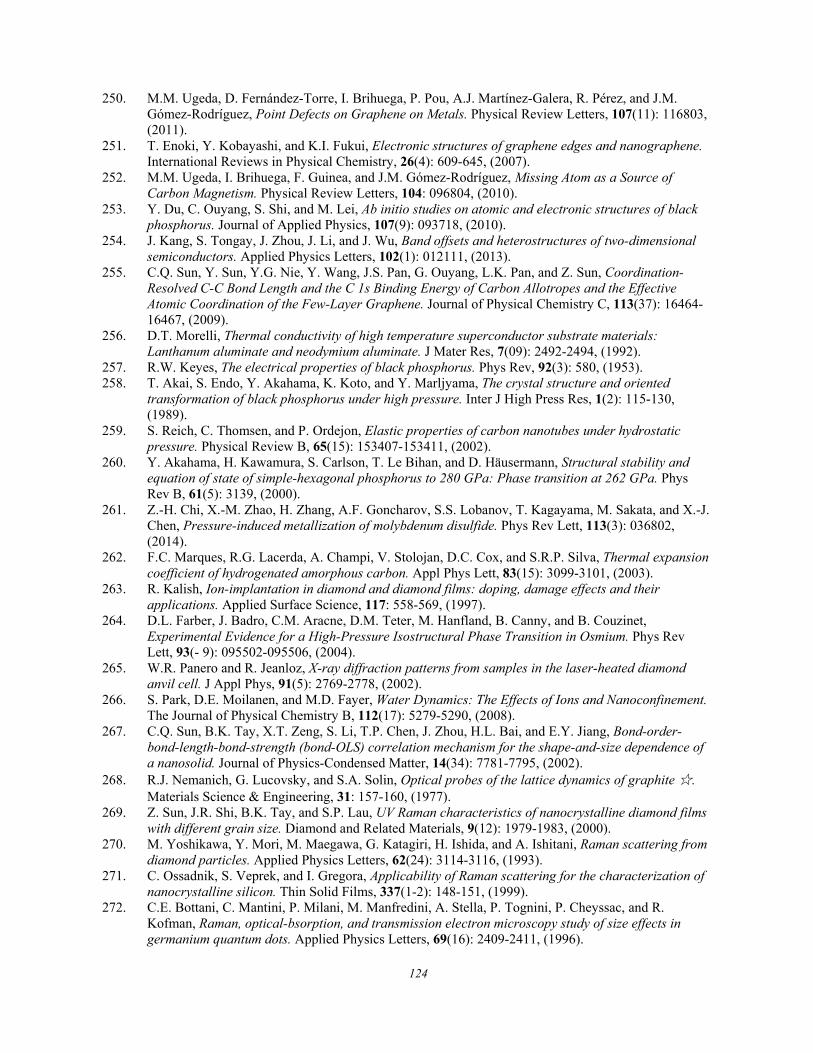
124
250. M.M. Ugeda, D. Fernández-Torre, I. Brihuega, P. Pou, A.J. Martínez-Galera, R. Pérez, and J.M. Gómez-Rodríguez, Point Defects on Graphene on Metals. Physical Review Letters, 107(11): 116803, (2011).
251. T. Enoki, Y. Kobayashi, and K.I. Fukui, Electronic structures of graphene edges and nanographene. International Reviews in Physical Chemistry, 26(4): 609-645, (2007).
252. M.M. Ugeda, I. Brihuega, F. Guinea, and J.M. Gómez-Rodríguez, Missing Atom as a Source of Carbon Magnetism. Physical Review Letters, 104: 096804, (2010).
253. Y. Du, C. Ouyang, S. Shi, and M. Lei, Ab initio studies on atomic and electronic structures of black phosphorus. Journal of Applied Physics, 107(9): 093718, (2010).
254. J. Kang, S. Tongay, J. Zhou, J. Li, and J. Wu, Band offsets and heterostructures of two-dimensional semiconductors. Applied Physics Letters, 102(1): 012111, (2013).
255. C.Q. Sun, Y. Sun, Y.G. Nie, Y. Wang, J.S. Pan, G. Ouyang, L.K. Pan, and Z. Sun, Coordination-Resolved C-C Bond Length and the C 1s Binding Energy of Carbon Allotropes and the Effective Atomic Coordination of the Few-Layer Graphene. Journal of Physical Chemistry C, 113(37): 16464-16467, (2009).
256. D.T. Morelli, Thermal conductivity of high temperature superconductor substrate materials: Lanthanum aluminate and neodymium aluminate. J Mater Res, 7(09): 2492-2494, (1992).
257. R.W. Keyes, The electrical properties of black phosphorus. Phys Rev, 92(3): 580, (1953). 258. T. Akai, S. Endo, Y. Akahama, K. Koto, and Y. Marljyama, The crystal structure and oriented
transformation of black phosphorus under high pressure. Inter J High Press Res, 1(2): 115-130, (1989).
259. S. Reich, C. Thomsen, and P. Ordejon, Elastic properties of carbon nanotubes under hydrostatic pressure. Physical Review B, 65(15): 153407-153411, (2002).
260. Y. Akahama, H. Kawamura, S. Carlson, T. Le Bihan, and D. Häusermann, Structural stability and equation of state of simple-hexagonal phosphorus to 280 GPa: Phase transition at 262 GPa. Phys Rev B, 61(5): 3139, (2000).
261. Z.-H. Chi, X.-M. Zhao, H. Zhang, A.F. Goncharov, S.S. Lobanov, T. Kagayama, M. Sakata, and X.-J. Chen, Pressure-induced metallization of molybdenum disulfide. Phys Rev Lett, 113(3): 036802, (2014).
262. F.C. Marques, R.G. Lacerda, A. Champi, V. Stolojan, D.C. Cox, and S.R.P. Silva, Thermal expansion coefficient of hydrogenated amorphous carbon. Appl Phys Lett, 83(15): 3099-3101, (2003).
263. R. Kalish, Ion-implantation in diamond and diamond films: doping, damage effects and their applications. Applied Surface Science, 117: 558-569, (1997).
264. D.L. Farber, J. Badro, C.M. Aracne, D.M. Teter, M. Hanfland, B. Canny, and B. Couzinet, Experimental Evidence for a High-Pressure Isostructural Phase Transition in Osmium. Phys Rev Lett, 93(- 9): 095502-095506, (2004).
265. W.R. Panero and R. Jeanloz, X-ray diffraction patterns from samples in the laser-heated diamond anvil cell. J Appl Phys, 91(5): 2769-2778, (2002).
266. S. Park, D.E. Moilanen, and M.D. Fayer, Water Dynamics: The Effects of Ions and Nanoconfinement. The Journal of Physical Chemistry B, 112(17): 5279-5290, (2008).
267. C.Q. Sun, B.K. Tay, X.T. Zeng, S. Li, T.P. Chen, J. Zhou, H.L. Bai, and E.Y. Jiang, Bond-order-bond-length-bond-strength (bond-OLS) correlation mechanism for the shape-and-size dependence of a nanosolid. Journal of Physics-Condensed Matter, 14(34): 7781-7795, (2002).
268. R.J. Nemanich, G. Lucovsky, and S.A. Solin, Optical probes of the lattice dynamics of graphite ☆. Materials Science & Engineering, 31: 157-160, (1977).
269. Z. Sun, J.R. Shi, B.K. Tay, and S.P. Lau, UV Raman characteristics of nanocrystalline diamond films with different grain size. Diamond and Related Materials, 9(12): 1979-1983, (2000).
270. M. Yoshikawa, Y. Mori, M. Maegawa, G. Katagiri, H. Ishida, and A. Ishitani, Raman scattering from diamond particles. Applied Physics Letters, 62(24): 3114-3116, (1993).
271. C. Ossadnik, S. Veprek, and I. Gregora, Applicability of Raman scattering for the characterization of nanocrystalline silicon. Thin Solid Films, 337(1-2): 148-151, (1999).
272. C.E. Bottani, C. Mantini, P. Milani, M. Manfredini, A. Stella, P. Tognini, P. Cheyssac, and R. Kofman, Raman, optical-bsorption, and transmission electron microscopy study of size effects in germanium quantum dots. Applied Physics Letters, 69(16): 2409-2411, (1996).
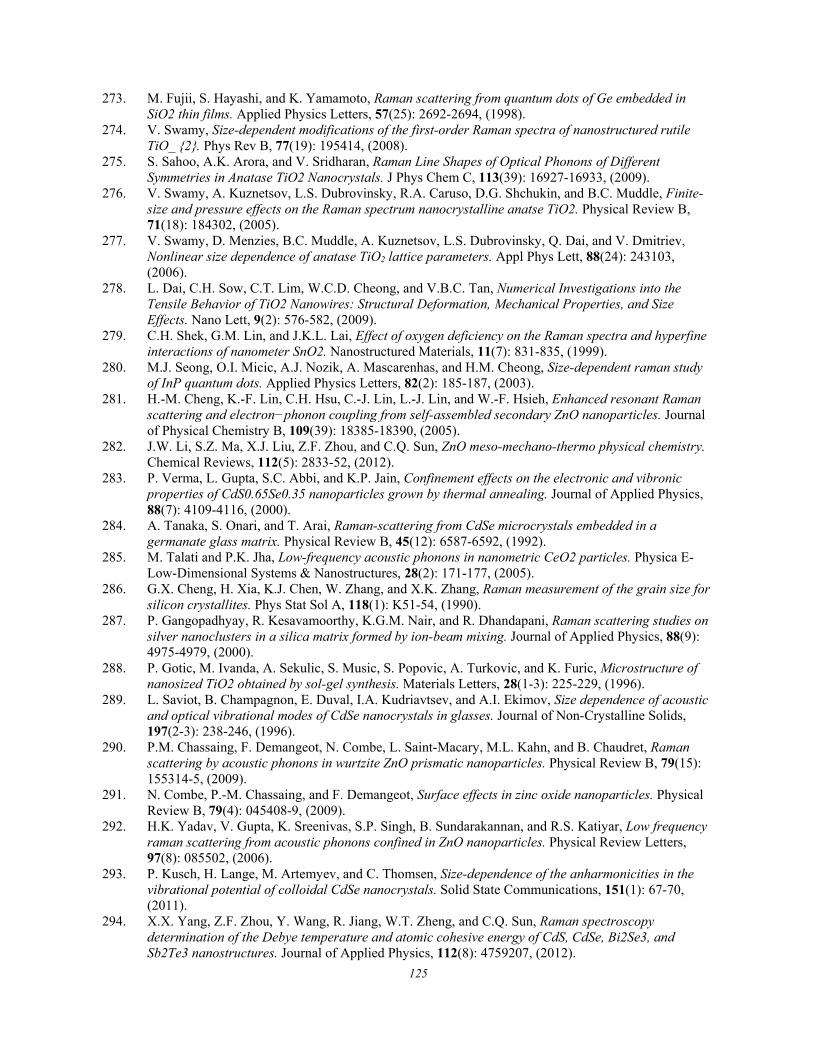
125
273. M. Fujii, S. Hayashi, and K. Yamamoto, Raman scattering from quantum dots of Ge embedded in SiO2 thin films. Applied Physics Letters, 57(25): 2692-2694, (1998).
274. V. Swamy, Size-dependent modifications of the first-order Raman spectra of nanostructured rutile TiO_ {2}. Phys Rev B, 77(19): 195414, (2008).
275. S. Sahoo, A.K. Arora, and V. Sridharan, Raman Line Shapes of Optical Phonons of Different Symmetries in Anatase TiO2 Nanocrystals. J Phys Chem C, 113(39): 16927-16933, (2009).
276. V. Swamy, A. Kuznetsov, L.S. Dubrovinsky, R.A. Caruso, D.G. Shchukin, and B.C. Muddle, Finite-size and pressure effects on the Raman spectrum nanocrystalline anatse TiO2. Physical Review B, 71(18): 184302, (2005).
277. V. Swamy, D. Menzies, B.C. Muddle, A. Kuznetsov, L.S. Dubrovinsky, Q. Dai, and V. Dmitriev, Nonlinear size dependence of anatase TiO2 lattice parameters. Appl Phys Lett, 88(24): 243103, (2006).
278. L. Dai, C.H. Sow, C.T. Lim, W.C.D. Cheong, and V.B.C. Tan, Numerical Investigations into the Tensile Behavior of TiO2 Nanowires: Structural Deformation, Mechanical Properties, and Size Effects. Nano Lett, 9(2): 576-582, (2009).
279. C.H. Shek, G.M. Lin, and J.K.L. Lai, Effect of oxygen deficiency on the Raman spectra and hyperfine interactions of nanometer SnO2. Nanostructured Materials, 11(7): 831-835, (1999).
280. M.J. Seong, O.I. Micic, A.J. Nozik, A. Mascarenhas, and H.M. Cheong, Size-dependent raman study of InP quantum dots. Applied Physics Letters, 82(2): 185-187, (2003).
281. H.-M. Cheng, K.-F. Lin, C.H. Hsu, C.-J. Lin, L.-J. Lin, and W.-F. Hsieh, Enhanced resonant Raman scattering and electron−phonon coupling from self-assembled secondary ZnO nanoparticles. Journal of Physical Chemistry B, 109(39): 18385-18390, (2005).
282. J.W. Li, S.Z. Ma, X.J. Liu, Z.F. Zhou, and C.Q. Sun, ZnO meso-mechano-thermo physical chemistry. Chemical Reviews, 112(5): 2833-52, (2012).
283. P. Verma, L. Gupta, S.C. Abbi, and K.P. Jain, Confinement effects on the electronic and vibronic properties of CdS0.65Se0.35 nanoparticles grown by thermal annealing. Journal of Applied Physics, 88(7): 4109-4116, (2000).
284. A. Tanaka, S. Onari, and T. Arai, Raman-scattering from CdSe microcrystals embedded in a germanate glass matrix. Physical Review B, 45(12): 6587-6592, (1992).
285. M. Talati and P.K. Jha, Low-frequency acoustic phonons in nanometric CeO2 particles. Physica E-Low-Dimensional Systems & Nanostructures, 28(2): 171-177, (2005).
286. G.X. Cheng, H. Xia, K.J. Chen, W. Zhang, and X.K. Zhang, Raman measurement of the grain size for silicon crystallites. Phys Stat Sol A, 118(1): K51-54, (1990).
287. P. Gangopadhyay, R. Kesavamoorthy, K.G.M. Nair, and R. Dhandapani, Raman scattering studies on silver nanoclusters in a silica matrix formed by ion-beam mixing. Journal of Applied Physics, 88(9): 4975-4979, (2000).
288. P. Gotic, M. Ivanda, A. Sekulic, S. Music, S. Popovic, A. Turkovic, and K. Furic, Microstructure of nanosized TiO2 obtained by sol-gel synthesis. Materials Letters, 28(1-3): 225-229, (1996).
289. L. Saviot, B. Champagnon, E. Duval, I.A. Kudriavtsev, and A.I. Ekimov, Size dependence of acoustic and optical vibrational modes of CdSe nanocrystals in glasses. Journal of Non-Crystalline Solids, 197(2-3): 238-246, (1996).
290. P.M. Chassaing, F. Demangeot, N. Combe, L. Saint-Macary, M.L. Kahn, and B. Chaudret, Raman scattering by acoustic phonons in wurtzite ZnO prismatic nanoparticles. Physical Review B, 79(15): 155314-5, (2009).
291. N. Combe, P.-M. Chassaing, and F. Demangeot, Surface effects in zinc oxide nanoparticles. Physical Review B, 79(4): 045408-9, (2009).
292. H.K. Yadav, V. Gupta, K. Sreenivas, S.P. Singh, B. Sundarakannan, and R.S. Katiyar, Low frequency raman scattering from acoustic phonons confined in ZnO nanoparticles. Physical Review Letters, 97(8): 085502, (2006).
293. P. Kusch, H. Lange, M. Artemyev, and C. Thomsen, Size-dependence of the anharmonicities in the vibrational potential of colloidal CdSe nanocrystals. Solid State Communications, 151(1): 67-70, (2011).
294. X.X. Yang, Z.F. Zhou, Y. Wang, R. Jiang, W.T. Zheng, and C.Q. Sun, Raman spectroscopy determination of the Debye temperature and atomic cohesive energy of CdS, CdSe, Bi2Se3, and Sb2Te3 nanostructures. Journal of Applied Physics, 112(8): 4759207, (2012).
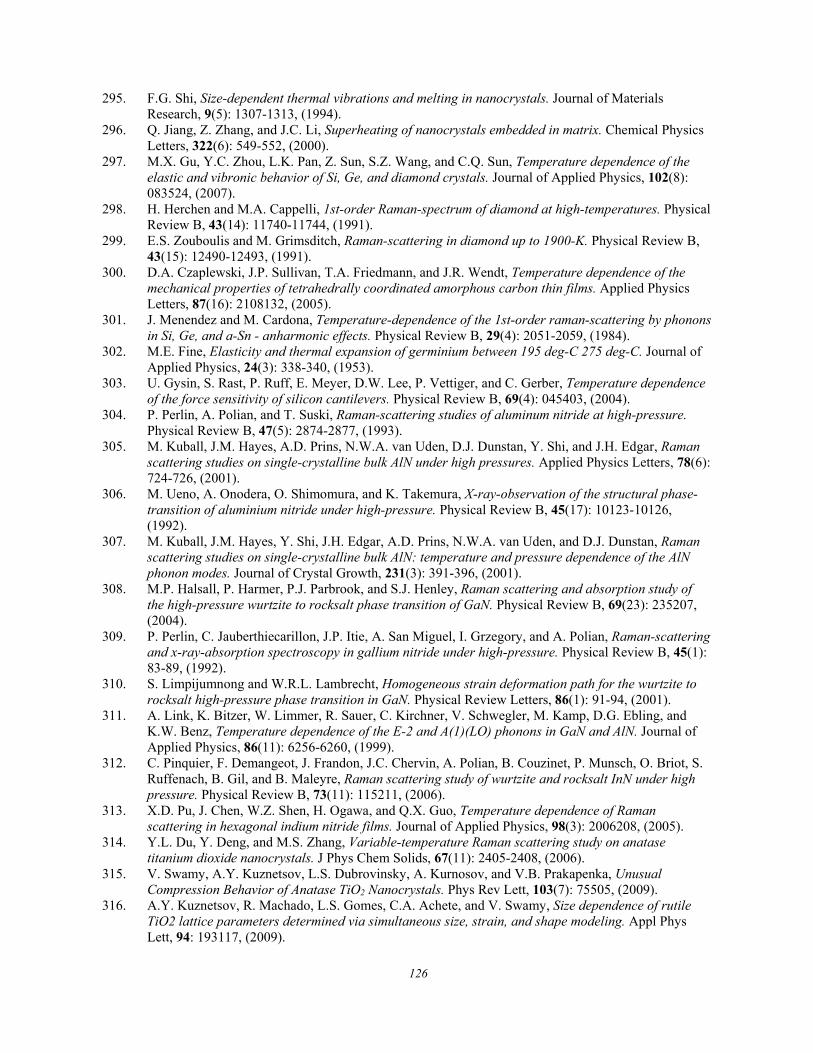
126
295. F.G. Shi, Size-dependent thermal vibrations and melting in nanocrystals. Journal of Materials Research, 9(5): 1307-1313, (1994).
296. Q. Jiang, Z. Zhang, and J.C. Li, Superheating of nanocrystals embedded in matrix. Chemical Physics Letters, 322(6): 549-552, (2000).
297. M.X. Gu, Y.C. Zhou, L.K. Pan, Z. Sun, S.Z. Wang, and C.Q. Sun, Temperature dependence of the elastic and vibronic behavior of Si, Ge, and diamond crystals. Journal of Applied Physics, 102(8): 083524, (2007).
298. H. Herchen and M.A. Cappelli, 1st-order Raman-spectrum of diamond at high-temperatures. Physical Review B, 43(14): 11740-11744, (1991).
299. E.S. Zouboulis and M. Grimsditch, Raman-scattering in diamond up to 1900-K. Physical Review B, 43(15): 12490-12493, (1991).
300. D.A. Czaplewski, J.P. Sullivan, T.A. Friedmann, and J.R. Wendt, Temperature dependence of the mechanical properties of tetrahedrally coordinated amorphous carbon thin films. Applied Physics Letters, 87(16): 2108132, (2005).
301. J. Menendez and M. Cardona, Temperature-dependence of the 1st-order raman-scattering by phonons in Si, Ge, and a-Sn - anharmonic effects. Physical Review B, 29(4): 2051-2059, (1984).
302. M.E. Fine, Elasticity and thermal expansion of germinium between 195 deg-C 275 deg-C. Journal of Applied Physics, 24(3): 338-340, (1953).
303. U. Gysin, S. Rast, P. Ruff, E. Meyer, D.W. Lee, P. Vettiger, and C. Gerber, Temperature dependence of the force sensitivity of silicon cantilevers. Physical Review B, 69(4): 045403, (2004).
304. P. Perlin, A. Polian, and T. Suski, Raman-scattering studies of aluminum nitride at high-pressure. Physical Review B, 47(5): 2874-2877, (1993).
305. M. Kuball, J.M. Hayes, A.D. Prins, N.W.A. van Uden, D.J. Dunstan, Y. Shi, and J.H. Edgar, Raman scattering studies on single-crystalline bulk AlN under high pressures. Applied Physics Letters, 78(6): 724-726, (2001).
306. M. Ueno, A. Onodera, O. Shimomura, and K. Takemura, X-ray-observation of the structural phase-transition of aluminium nitride under high-pressure. Physical Review B, 45(17): 10123-10126, (1992).
307. M. Kuball, J.M. Hayes, Y. Shi, J.H. Edgar, A.D. Prins, N.W.A. van Uden, and D.J. Dunstan, Raman scattering studies on single-crystalline bulk AlN: temperature and pressure dependence of the AlN phonon modes. Journal of Crystal Growth, 231(3): 391-396, (2001).
308. M.P. Halsall, P. Harmer, P.J. Parbrook, and S.J. Henley, Raman scattering and absorption study of the high-pressure wurtzite to rocksalt phase transition of GaN. Physical Review B, 69(23): 235207, (2004).
309. P. Perlin, C. Jauberthiecarillon, J.P. Itie, A. San Miguel, I. Grzegory, and A. Polian, Raman-scattering and x-ray-absorption spectroscopy in gallium nitride under high-pressure. Physical Review B, 45(1): 83-89, (1992).
310. S. Limpijumnong and W.R.L. Lambrecht, Homogeneous strain deformation path for the wurtzite to rocksalt high-pressure phase transition in GaN. Physical Review Letters, 86(1): 91-94, (2001).
311. A. Link, K. Bitzer, W. Limmer, R. Sauer, C. Kirchner, V. Schwegler, M. Kamp, D.G. Ebling, and K.W. Benz, Temperature dependence of the E-2 and A(1)(LO) phonons in GaN and AlN. Journal of Applied Physics, 86(11): 6256-6260, (1999).
312. C. Pinquier, F. Demangeot, J. Frandon, J.C. Chervin, A. Polian, B. Couzinet, P. Munsch, O. Briot, S. Ruffenach, B. Gil, and B. Maleyre, Raman scattering study of wurtzite and rocksalt InN under high pressure. Physical Review B, 73(11): 115211, (2006).
313. X.D. Pu, J. Chen, W.Z. Shen, H. Ogawa, and Q.X. Guo, Temperature dependence of Raman scattering in hexagonal indium nitride films. Journal of Applied Physics, 98(3): 2006208, (2005).
314. Y.L. Du, Y. Deng, and M.S. Zhang, Variable-temperature Raman scattering study on anatase titanium dioxide nanocrystals. J Phys Chem Solids, 67(11): 2405-2408, (2006).
315. V. Swamy, A.Y. Kuznetsov, L.S. Dubrovinsky, A. Kurnosov, and V.B. Prakapenka, Unusual Compression Behavior of Anatase TiO2 Nanocrystals. Phys Rev Lett, 103(7): 75505, (2009).
316. A.Y. Kuznetsov, R. Machado, L.S. Gomes, C.A. Achete, and V. Swamy, Size dependence of rutile TiO2 lattice parameters determined via simultaneous size, strain, and shape modeling. Appl Phys Lett, 94: 193117, (2009).
127
317. A.Y. Wu and R.J. Sladek, Elastic Debye temperatures in tetragonal crystals: Their determination and use. Phys Rev B, 25(8): 5230, (1982).
318. L.W. Yang, X.L. Wu, G.S. Huang, T. Qiu, and Y.M. Yang, In situ synthesis of Mn-doped ZnO multileg nanostructures and Mn-related Raman vibration. Journal of Applied Physics, 97(1): 014308-4, (2005).
319. F. Decremps, J. Pellicer-Porres, A.M. Saitta, J.-C. Chervin, and A. Polian, High-pressure Raman spectroscopy study of wurtzite ZnO. Physical Review B, 65(9): 092101, (2002).
320. H. Karzel, W. Potzel, M. K 鰂 ferlein, W. Schiessl, M. Steiner, U. Hiller, G.M. Kalvius, D.W. Mitchell, T.P. Das, P. Blaha, K. Schwarz, and M.P. Pasternak, Lattice dynamics and hyperfine interactions in ZnO and ZnSe at high external pressures. Physical Review B, 53(17): 11425, (1996).
321. K. Samanta, P. Bhattacharya, and R.S. Katiyar, Temperature dependent E[sub 2] Raman modes in the ZnCoO ternary alloy. Physical Review B (Condensed Matter and Materials Physics), 75(3): 035208-5, (2007).
322. A.A. Khan, X-ray determination of thermal expansion of zinc oxide. Acta Crystallographica Section A, 24 (3): 403-403, (1968).
323. J. Serrano, A.H. Romero, F.J. Manjon, R. Lauck, M. Cardona, and A. Rubio, Pressure dependence of the lattice dynamics of ZnO: An ab initio approach. Physical Review B, 69(9): 094306, (2004).
324. A.K. Swarnakar, L. Donzel, J. Vleugels, and O. Van der Biest, High temperature properties of ZnO ceramics studied by the impulse excitation technique. Journal of the European Ceramic Society, 29(14): 2991-2998, (2009).
325. H. Alawadhi, S. Tsoi, X. Lu, A.K. Ramdas, M. Grimsditch, M. Cardona, and R. Lauck, Effect of temperature on isotopic mass dependence of excitonic band gaps in semiconductors: ZnO. Physical Review B, 75(20): 205207, (2007).
326. V.V. Ursaki, I.M. Tiginyanu, V.V. Zalamai, E.V. Rusu, G.A. Emelchenko, V.M. Masalov, and E.N. Samarov, Multiphonon resonant Raman scattering in ZnO crystals and nanostructured layers. Physical Review B, 70(15): 155204, (2004).
327. S.H. Eom, Y.M. Yu, Y.D. Choi, and C.S. Kim, Optical characterization of ZnO whiskers grown without catalyst by hot wall epitaxy method. Journal of Crystal Growth, 284(1-2): 166-171, (2005).
328. R. Hauschild, H. Priller, M. Decker, J. Bruckner, H. Kalt, and C. Klingshirn, Temperature dependent band gap and homogeneous line broadening of the exciton emission in ZnO. Physica Status Solidi C, 3(4): 976-979, (2006).
329. Y. Fei, S. Cheng, L.B. Shi, and H.K. Yuan, Phase transition, elastic property and electronic structure of wurtzite and rocksalt ZnO. Journal of Synthetic Crystals, 38(6): 1527-1531, (2009).
330. B. Chen, H. Zhang, K. Dunphy-Guzman, D. Spagnoli, M. Kruger, D. Muthu, M. Kunz, S. Fakra, J. Hu, Q. Guo, and J. Banfield, Size-dependent elasticity of nanocrystalline titania. Physical Review B, 79(12): 125406, (2009).
331. E.S.F. Neto, N.O. Dantas, S.W.d. Silva, P.C. Morais, M.A.P.d. Silva, A.J.D. Moreno, V.L. Richard, G.E. Marques, and C.T. Giner, Temperature-dependent Raman study of thermal parameters in CdS quantum dots. Nanotechnology, 23(12): 125701, (2012).
332. J. Li, Y.X. Li, X. Yu, W.J. Ye, and C.Q. Sun, Local bond average for the thermally driven elastic softening of solid specimens. Journal of Physics D-Applied Physics, 42(4): 045406, (2009).
333. C. Yang, Z.F. Zhou, J.W. Li, X.X. Yang, W. Qin, R. Jiang, N.G. Guo, Y. Wang, and C.Q. Sun, Correlation between the band gap, elastic modulus, Raman shift and melting point of CdS, ZnS, and CdSe semiconductors and their size dependency. Nanoscale, 4: 1304-1307, (2012).
334. J. Rockenberger, L. Tröger, A. Kornowski, T. Vossmeyer, A. Eychmüller, J. Feldhaus, and H. Weller, EXAFS Studies on the Size Dependence of Structural and Dynamic Properties of CdS Nanoparticles. J Phys Chem B, 101(14): 2691 (1997).
335. G. AN, E. CM, and A. AP, Melting in semiconductor nanocrystals. Science, 256(5062): 1425, (1992). 336. S. Budak, C.I. Muntele, R.A. Minamisawa, B. Chhay, and D. Ila, Effects of MeV Si ions
bombardments on thermoelectric properties of sequentially deposited Bi x Te 3 /Sb 2 Te 3 nano-layers Nuclear Instruments & Methods in Physics Research, 261(1-2): 608-611, (2007).
337. J.S. Dyck, W. Chen, C. Uher, Č. Drašar, and P. Lošt’ák, Heat transport in Sb_{2-x}V_{x}Te_{3} single crystals. Phys Rev B, 66(12): 125206, (2002).
338. S.M. Kang, S.S. Ha, W.G. Jung, M. Park, H.S. Song, B.J. Kim, and J.I. Hong, Two-dimensional nanoplates of Bi2Te3 and Bi2Se3 with reduced thermal stability. Aip Advances, 6(2): 801, (2016).
128
339. G.E. Shoemake, J.A. Rayne, and R.W.J. Ure, Specific Heat of n- and p-Type Bi_{2}Te_{3} from 1.4 to 90°K. Phys Rev, 185(3): 1046, (1969).
340. C.Q. Sun, J. Chen, Y. Gong, X. Zhang, and Y. Huang, (H, Li)Br and LiOH solvation bonding dynamics: Molecular Nonbond Interactions and Solute Extraordinary Capabilities. Journal of Physical Chemistry B, 122(3): 1228-1238, (2018).
341. X. Zhang, Y. Zhou, Y. Gong, Y. Huang, and C. Sun, Resolving H(Cl, Br, I) capabilities of transforming solution hydrogen-bond and surface-stress. Chemical Physics Letters, 678: 233-240, (2017).
342. C.Q. Sun, J. Chen, X. Liu, X. Zhang, and Y. Huang, (Li, Na, K)OH hydration bondin thermodynamics: Solution self-heating. Chemical Physics Letters, 696: 139-143, (2018).
343. Y. Zhou, Y. Huang, Z. Ma, Y. Gong, X. Zhang, Y. Sun, and C.Q. Sun, Water molecular structure-order in the NaX hydration shells (X= F, Cl, Br, I). Journal of Molecular Liquids, 221: 788-797, (2016).
344. Y. Zhou, Y. Zhong, Y. Gong, X. Zhang, Z. Ma, Y. Huang, and C.Q. Sun, Unprecedented thermal stability of water supersolid skin. Journal of Molecular Liquids, 220: 865-869, (2016).
345. X. Zhang, P. Sun, Y. Huang, T. Yan, Z. Ma, X. Liu, B. Zou, J. Zhou, W. Zheng, and C.Q. Sun, Water’s phase diagram: from the notion of thermodynamics to hydrogen-bond cooperativity. Progress in Solid State Chemistry, 43: 71-81, (2015).
346. S.A. Harich, D.W.H. Hwang, X. Yang, J.J. Lin, X. Yang, and R.N. Dixon, Photodissociation of H2O at 121.6 nm: A state-to-state dynamical picture. The Journal of chemical physics, 113(22): 10073-10090, (2000).
347. F. Mallamace, C. Branca, M. Broccio, C. Corsaro, C.Y. Mou, and S.H. Chen, The anomalous behavior of the density of water in the range 30 K < T < 373 K. Proceedings of the National Academy of Sciences of the United States of America, 104(47): 18387-91, (2007).
348. C.Q. Sun, X. Zhang, and W.T. Zheng, Hidden force opposing ice compression. Chem Sci, 3: 1455-1460, (2012).
349. Y. Yoshimura, S.T. Stewart, M. Somayazulu, H.K. Mao, and R.J. Hemley, Convergent Raman Features in High Density Amorphous Ice, Ice VII, and Ice VIII under Pressure. Journal of Physical Chemistry B, 115(14): 3756-3760, (2011).
350. Y. Huang, X. Zhang, Z. Ma, Y. Zhou, J. Zhou, W. Zheng, and C.Q. Sun, Size, separation, structure order, and mass density of molecules packing in water and ice. Scientific Reports, 3: 3005, (2013).
351. Q. Zeng, T. Yan, K. Wang, Y. Gong, Y. Zhou, Y. Huang, C.Q. Sun, and B. Zou, Compression icing of room-temperature NaX solutions (X= F, Cl, Br, I). Physical Chemistry Chemical Physics, 18(20): 14046-14054, (2016).
352. Q. Zeng, C. Yao, K. Wang, C.Q. Sun, and B. Zou, Room-Temperature NaI/H2O Compression Icing: solute–solute interactions. PCCP, 19: 26645-26650 (2017).
353. X. Zhang, Y. Huang, Z. Ma, Y. Zhou, J. Zhou, W. Zheng, Q. Jiang, and C.Q. Sun, Hydrogen-bond memory and water-skin supersolidity resolving the Mpemba paradox. Physical Chemistry Chemical Physics, 16(42): 22995-23002, (2014).
354. D. Marx, M.E. Tuckerman, J. Hutter, and M. Parrinello, The nature of the hydrated excess proton in water. Nature, 397(6720): 601-604, (1999).
355. Y. Crespo and A. Hassanali, Characterizing the local solvation environment of OH− in water clusters with AIMD. The Journal of chemical physics, 144(7): 074304, (2016).
356. A. Mandal, K. Ramasesha, L. De Marco, and A. Tokmakoff, Collective vibrations of water-solvated hydroxide ions investigated with broadband 2DIR spectroscopy. J Chem Phys, 140(20): 204508, (2014).
357. S.T. Roberts, P.B. Petersen, K. Ramasesha, A. Tokmakoff, I.S. Ufimtsev, and T.J. Martinez, Observation of a Zundel-like transition state during proton transfer in aqueous hydroxide solutions. Proceedings of the National Academy of Sciences, 106(36): 15154-15159, (2009).
358. J. Chen, C. Yao, X. Liu, X. Zhang, C.Q. Sun, and Y. Huang, H2O2 and HO- Solvation Dynamics: Solute Capabilities and Solute-Solvent Molecular Interactions. ChemSelect, 2: 8517-8523, (2017).
359. C.Q. Sun, Relaxation of the Chemical Bond. Springer Ser. Chem. Phys. Vol. 108. 2014, Heidelberg: Springer-Verlag. 807 pp.
360. X. Zhang, Y. Huang, Z. Ma, Y. Zhou, W. Zheng, J. Zhou, and C.Q. Sun, A common supersolid skin covering both water and ice. Physical Chemistry Chemical Physics, 16(42): 22987-22994, (2014).
129
361. M. Thämer, L. De Marco, K. Ramasesha, A. Mandal, and A. Tokmakoff, Ultrafast 2D IR spectroscopy of the excess proton in liquid water. Science, 350(6256): 78-82, (2015).
362. X. Zhang, T. Yan, Y. Huang, Z. Ma, X. Liu, B. Zou, and C.Q. Sun, Mediating relaxation and polarization of hydrogen-bonds in water by NaCl salting and heating. Physical Chemistry Chemical Physics, 16(45): 24666-24671, (2014).
363. Y. Gong, Y. Zhou, H. Wu, D. Wu, Y. Huang, and C.Q. Sun, Raman spectroscopy of alkali halide hydration: hydrogen bond relaxation and polarization. Journal of Raman Spectroscopy, 47(11): 1351–1359, (2016).
364. C.Q. Sun, Perspective: Supersolidity of the undercoordionated and the hydrating water. Phys Chem Chem Phys, accepted, (2018).
365. T.F. Kahan, J.P. Reid, and D.J. Donaldson, Spectroscopic probes of the quasi-liquid layer on ice. Journal of Physical Chemistry A, 111(43): 11006-11012, (2007).
366. Y. Zhou, Yuan Zhong, X. Liu, Y. Huang, X. Zhang, and C.Q. Sun, NaX solvation bonding dynamics: hydrogen bond and surface stress transition (X = HSO4, NO3,ClO4, SCN). Journal of Molecular Liquids, 248: 432-438, (2017).
367. M. Zhao, W.T. Zheng, J.C. Li, Z. Wen, M.X. Gu, and C.Q. Sun, Atomistic origin, temperature dependence, and responsibilities of surface energetics: An extended broken-bond rule. Physical Review B, 75(8): 085427, (2007).
368. J.C. Araque, S.K. Yadav, M. Shadeck, M. Maroncelli, and C.J. Margulis, How is diffusion of neutral and charged tracers related to the structure and dynamics of a room-temperature ionic liquid? Large deviations from Stokes–Einstein behavior explained. The Journal of Physical Chemistry B, 119(23): 7015-7029, (2015).
369. G. Jones and M. Dole, The viscosity of aqueous solutions of strong electrolytes with special reference to barium chloride. Journal of the American Chemical Society, 51(10): 2950-2964, (1929).
370. T. Brinzer, E.J. Berquist, Z. Ren, S. Dutta, C.A. Johnson, C.S. Krisher, D.S. Lambrecht, and S. Garrett-Roe, Ultrafast vibrational spectroscopy (2D-IR) of CO2 in ionic liquids: Carbon capture from carbon dioxide’s point of view. The Journal of chemical physics, 142(21): 212425, (2015).
371. Z. Ren, A.S. Ivanova, D. Couchot-Vore, and S. Garrett-Roe, Ultrafast structure and dynamics in ionic liquids: 2D-IR spectroscopy probes the molecular origin of viscosity. The Journal of Physical Chemistry Letters, 5(9): 1541-1546, (2014).


