Embed Size (px)
Citation preview

Acta Biomaterialia 9 (2013) 9036–9048
Contents lists available at SciVerse ScienceDirect
Acta Biomaterialia
journal homepage: www.elsevier .com/locate /ac tabiomat
Multiaxial mechanical properties and constitutive modeling of humanadipose tissue: A basis for preoperative simulations in plastic andreconstructive surgery
1742-7061/$ - see front matter � 2013 Acta Materialia Inc. Published by Elsevier Ltd. All rights reserved.http://dx.doi.org/10.1016/j.actbio.2013.06.011
⇑ Corresponding author. Addresses: Institute of Biomechanics, Graz University ofTechnology, Kronesgasse 5/I, 8010 Graz, Austria; Department of Solid Mechanics,School of Engineering Sciences, Royal Institute of Technology (KTH), Teknikringen8d, 100 44 Stockholm, Sweden. Tel.: +43 316 873 1625.
E-mail address: [email protected] (G.A. Holzapfel).
Gerhard Sommer a, Maximilian Eder b, Laszlo Kovacs b, Heramb Pathak c, Lars Bonitz d, Christoph Mueller c,Peter Regitnig e, Gerhard A. Holzapfel a,f,⇑a Institute of Biomechanics, Center of Biomedical Engineering, Graz University of Technology, Austriab Research Group Computer Aided Plastic Surgery (CAPS), Department of Plastic Surgery and Hand Surgery, Klinikum rechts der Isar, Technische Universität München, Germanyc CADFEM GmbH, Grafing near Munich, Germanyd Department of Cranial and Maxillofacial Surgery, Plastic Operations, Klinikum Dortmund GmbH, University Witten/Herdecke, Germanye Institute of Pathology, Medical University Graz, Austriaf Department of Solid Mechanics, School of Engineering Sciences, Royal Institute of Technology (KTH), Stockholm, Sweden
a r t i c l e i n f o a b s t r a c t
Article history:Received 17 February 2013Received in revised form 17 May 2013Accepted 6 June 2013Available online 28 June 2013
Keywords:Multiaxial mechanical propertiesBiaxial tensile testTriaxial shear testHuman abdominal adipose tissueConstitutive parameters
A preoperative simulation of soft tissue deformations during plastic and reconstructive surgery is desir-able to support the surgeon’s planning and to improve surgical outcomes. The current development ofconstitutive adipose tissue models, for the implementation in multilayer computational frameworksfor the simulation of human soft tissue deformations, has proved difficult because knowledge of therequired mechanical parameters of fat tissue is limited. Therefore, for the first time, human abdominaladipose tissues were mechanically investigated by biaxial tensile and triaxial shear tests. The results ofthis study suggest that human abdominal adipose tissues under quasi-static and dynamic multiaxialloadings can be characterized as a nonlinear, anisotropic and viscoelastic soft biological material. Thenonlinear and anisotropic features are consequences of the material’s collagenous microstructure. Thealigned collagenous septa observed in histological investigations causes the anisotropy of the tissue. Ahyperelastic model used in this study was appropriate to represent the quasi-static multiaxial mechan-ical behavior of fat tissue. The constitutive parameters are intended to serve as a basis for soft tissue sim-ulations using the finite element method, which is an apparent method for obtaining promising results inthe field of plastic and reconstructive surgery.
� 2013 Acta Materialia Inc. Published by Elsevier Ltd. All rights reserved.
1. Introduction
A considerable number of plastic surgery patients are related tothe field of reconstructive surgery associated with complex soft tis-sue contour defects, mainly subcutaneous adipose tissue, in differ-ent anatomical regions related to trauma, burn injuries, cancerresections and congenital deformities [1]. These patients often suf-fer from severe body disfigurements caused by mutilating injuriesand surgeries inducing tremendous physical and psychologicalstresses, resulting in personal and social burdens [2–4]. Autologoustissue transfer from the patient’s own healthy body regions to theaffected anatomical area, is the most appropriate surgical interven-tion [5–7]. By reconstructing the contour defect with equivalent
soft tissue, optimal restoration of its form and function can be ob-tained. The so-called local or microvascular transplanted free flapsconsist mainly of different soft tissue layers such as skin, fat ormuscle. These flaps are subjected to significant intra- and postop-erative soft tissue deformations, which require the development ofmethods to quantify three-dimensional (3-D) soft tissue changesaccurately, are non-invasive and without major side effects orinconvenience for the patient [8]. A preoperative simulation ofthe resulting soft tissue deformation would be desirable to supportthe surgeon’s preoperative planning and to potentially improvesurgical outcomes [9]. Promising results in the field of plastic andreconstructive surgery are apparent in breast and facial soft tissuesimulation using the finite element (FE) method [10,11]. The abilityof these FE models to predict the soft tissue behavior depends on(i) accurate geometric anatomical models, (ii) realistic boundaryand loading conditions, (iii) the development of reliable constitu-tive models and (iv) the accuracy of the (assumed) mechanicalproperties of the implemented tissue components [12]. Thedevelopment of constitutive adipose tissue models, which can be

G. Sommer et al. / Acta Biomaterialia 9 (2013) 9036–9048 9037
implemented in multilayer computational frameworks for humansoft tissue deformation simulation, is currently difficult. This isdue to the limited and inconsistent knowledge of the mechanicalparameters of fat tissue because of the inherent geometric soft tis-sue complexity, heterogeneous and varying boundary conditions[13].
Adipose tissue is a soft connective tissue which is placed underthe dermal layer of skin and it is mainly composed of lipid filledcells, called adipocytes [14]. From the mechanical point of view,adipocytes are enclosed with an extracellular matrix which ismade of two collagen main structures, the reinforced basementmembrane and the interlobular fibers. In particular, the reinforcedbasement membrane (with a thickness of about 100 nm) consistsof sheet-like type IV collagen adjacent to the phospholipid mem-brane of the adipocyte [15]. The interlobular septa consists of longfibrous bundles of predominantly type I collagen and are severalmillimeters in length and can range in diameter from 10 nm (fora single fiber) to 30 lm (for a bundle of fibers). The septa bundlesshare a similar structure to that of fibrous collagen bundles in thedermis, where arteries and veins align with the septa [15].
The mechanical properties of adipose tissue are usually deter-mined using unconfined compression tests [16–20], sometimesindentation tests [21,22] or uniaxial tension tests [19,23]. Undercompression and indentation, adipose tissue exhibits a nonlinearstress versus strain response at large strains [16–19]. At a lowstrain level, the response is linear whereas at strain levels above30%, the tissue ‘locks up’ and the stress level increases rapidly[19,20,24]. Rheological shear experiments on porcine subcutane-ous adipose tissue showed that the linear regime is only valid forvery small strains up to 0.1% [25]. Under uniaxial tension, porcineadipose tissue showed also nonlinear behavior, very similar to thebehavior in unconfined compression [19]. Although the adiposetissue reveals nonlinear mechanical properties in compression[21,22] and tension [19], in many studies only linear material mod-el parameters, i.e., the Young’s modulus, are stated (see, e.g.,[22,26]). Only a few studies are known which state (nonlinear)hyperelastic parameters to characterize the nonlinear mechanicalresponse of the adipose tissue [19,21,23].
All the above mentioned studies treated the adipose tissue asisotropic and do not account for any possible anisotropic featuresof adipose tissues. Moreover, for the characterization of themechanical behavior of the adipose tissue, previous studies per-formed only uniaxial tests on mainly animal adipose tissue speci-mens. Since every tissue in the body is subjected to multiaxialloadings, our goal is to identify the multiaxial mechanical proper-ties of human adipose tissue with the aid of biaxial tensile and tri-axial shear tests. These types of tests represent the physiologicalstate better than uniaxial tests, and additionally provide direc-tion-dependent mechanical information of the tested tissues.
The aim of this study is to determine the multiaxial mechanicalresponse of human adipose tissue and its mathematically repre-sentation in terms of constitutive parameters of a hyperelasticstrain-energy function. Additionally, the tissue’s microstructureresponsible for the mechanical properties is utilized by histologicalinvestigations. These novel and compact set of data are indented toserve as a basis for soft tissue simulations using the finite elementmethod, which is an apparent method for obtaining promising re-sults in the field of plastic and reconstructive surgery.
2. Materials and methods
2.1. Material
Remaining human abdominal adipose tissue samples (n = 9) ob-tained from breast reconstruction and abdominal plastic surgeries
were mechanically investigated. The Declaration of Helsinki proto-cols were followed and all patients gave their written informedconsent with all surgical and non-surgical procedures in accor-dance with the Ethical Committee of the Medical Faculty at theKlinikum rechts der Isar of the Technische Universität München,Germany. The schematic in Fig. 1(a) shows the location in the bodyfrom where the samples were obtained. In seven out of nine cases,the tissue sample was obtained from the right side of the donor’sbody (Table 1). Donor information, i.e., age, weight, size, and bodymass index (BMI) are stated in Table 1. After removal, all sampleswere stored in phosphate-buffered physiological saline (PBS) at4 �C and tested within 36 h. A representative tissue sample ob-tained from surgery is shown in Fig. 1(b).
2.2. Preparations and mechanical test
2.2.1. Biaxial tensile testFor the biaxial tensile tests, squared (cuboid) specimens with
the dimensions 50 � 50� �5 mm were prepared. Preliminarystudies revealed varying mechanical properties of the tissue withdistance from the skin. In particular, we observed stiffer behaviorof the adipose tissue directly under the skin and in deep regionsat a distance of �30–40 mm from the skin (see discussion in sec-tion 4). Therefore, specimens were prepared only from the middlepart of the tissue sample, at a distance between 10 to 20 mm fromthe skin. From cooled (�4 �C) adipose tissue, it was possible to pre-pare uniformly thick slices with the aid of an electric universal cut-ter (Silva AS 522). At 4 �C, the adipose tissue showed higher formstability than at room temperature, and therefore allowed properspecimen preparation. From these slices, squared specimens witha side-length of 50 mm were cut with their sides aligned in thetransversal and longitudinal directions of the human body(Fig. 1). Unfortunately, due to the limited thickness of the samplesobtained, we were not able to prepare biaxial tensile specimensoriented also in the sagittal direction. For the Cauchy stress calcu-lations, the thickness of the specimen was measured before andafter testing by means of a videoextensometer. For the deformationmeasurements during biaxial testing, four black markers were at-tached in the center of each specimen with a distance of�10 mm and tracked by the aid of a videoextensometer. For properclamping of this very soft and fragile tissue, we used specially de-signed clamps made of acrylic glass. Each clamp consists of anupper and a lower plate with a distance of 4 mm in order to avoidsqueezing of the fat tissue. The plates were reusable due to thescrewable design (Fig. 2(a)). Cyanoacrylate adhesive was used tobond the tissue to the plates of the clamps. Therefore, a thin layerof cyanoacrylate adhesive was spread on the upper and lower plateto hold the tissue from both sides. Then, the specimen could easilybe mounted in the biaxial testing rig (Fig. 2(b)).
A custom-built low-force planar biaxial soft tissue system wasused to perform the biaxial tests. In particular, four electromechan-ical actuators are mounted every 90� to a user configurable isola-tion table, to prevent the vibrations caused by other laboratoryequipment from compromising the integrity of the measurements.A temperature-controlled tissue bath is available to simulate thephysiological environment for the specimen. The non-contact 2Dvideo strain measurement technique (videoextensometer) includ-ing analysis software are able to determine accurately the highdeformations of the specimen during biaxial testing. Each of thefour linear actuators operates with a stroke resolution of 1 lmand a maximum travel range of 50 mm. The four load-cells arewaterproof and specified by the manufacturer with a maximumload capacity of 100 N and a resolution of 0.6 mN. Actuator controland data acquisition is achieved using the software ‘Test&Motion’Version 2.0 by DOLI Elektronik Gmbh, Munich, Germany. For thenon-contacting strain-measurements we used the software ‘Laser

Fig. 1. (a) Schematic of the position of the sample in the body: 1 – abdominal upper right outside; 2 – abdominal upper right middle side. (b) Photograph of an adipose tissuesample. The orientation in the body is indicated by the r-(sagittal), h-(transversal) and z-(longitudinal) directions, respectively.
Table 1Information of donors (donor number, location of the sample in the abdomen, age, weight, size and BMI), the distance of the specimen’s location from the skin, and the thicknessof the biaxially tested specimen.
Donor Body side Age (yrs) Weight (kg) Size (cm) BMI (kg=cm2) Depth (mm) Thickness (mm)
I right 51 64 173 21 10 –II right 51 95 164 35 15 4:2III left 65 62 168 22 15 4:0IV left 44 72 165 26 15 5:2V right 48 82 164 30 15 5:5VI right 25 74 175 24 20 4:9VII right 47 118 163 44 12:5 4:8VIII right 59 72 160 28 10 4:8IX right 49 60 164 22 20 4:8
Mean 49 78 166 28 14.7 4:8SD 11 19 5 8 3.6 0.5
BMI, body mass index.
(a) (b)
Fig. 2. Photographs of (a) a prepared adipose tissue specimen ready for biaxial tensile testing and of (b) a biaxially stretched specimen inserted in the biaxial tensile device.
9038 G. Sommer et al. / Acta Biomaterialia 9 (2013) 9036–9048
Speckle Extensometer’ Version 2.23.3.0 by Messphysik MaterialsTesting, Fuerstenfeld, Austria.
During the biaxial tensile test, the specimens were submergedin PBS at body-temperature (�37 �C). The nylon sutures of theclamps were connected to specially designed carriages that al-lowed for self-equilibrated loads of each suture line. The specimenwas mounted so that it was stretched along the transversal andlongitudinal directions regarding the body (see Fig. 2(b)).
2.2.1.1. Biaxial tensile test protocol. The specimens were quasi-stat-ically stretched with actuators speed of v ¼ 4 mm/min using astretch-controlled protocol and different stretch ratios in the x-and y-directions of the setup (1:1, 1:0.75, 0.75:1, 1:0.5, 0.5:1,
and 1:1), where the x-direction corresponded to the transversaldirection and the y-direction to the longitudinal direction. Thisso-called ‘true’ biaxial testing approach covers a big range ofdeformations of the tissue and can, therefore, provide a uniqueset of constitutive parameters for the tested specimen [27]. Dif-ferent stretches starting at 1.075 up to 1.2 in 0.025 steps wereapplied. Each specimen was preconditioned through four loadingand unloading cycles to the same ratio. Data from the fifth cyclewas then used for further data analysis. Additionally, for somespecimens, relaxation tests with 10-times higher speed(v ¼ 40 mm/min) and 20-times higher speed (v ¼ 80 mm/min)were conducted in order to account for viscoelastic features ofthe tissue.
G. Sommer et al. / Acta Biomaterialia 9 (2013) 9036–9048 9039
For the equibiaxial stretch-controlled protocol (kh : kz ¼ 1 : 1),the mean ultimate tensile stresses (rh;max;rz;max) and the corre-sponding stretch values (kh;max; kz;max) in the transversal and longi-tudinal directions, which caused the specimens to rupture, wererecorded and compared using paired Student’s t-test. A p-value<0.05 was considered statistically significant. For the ulti-mate tensile stress and stretch calculations, we assumed failureof the tissue within the gage region. All values were expressed asmean � SD.
After testing, the gage region of the specimen was cut out andthe thickness of the gage region was measured again by meansof a videoextensometer.
2.2.2. Triaxial shear testFor the triaxial shear tests, three adjoining cubic specimens
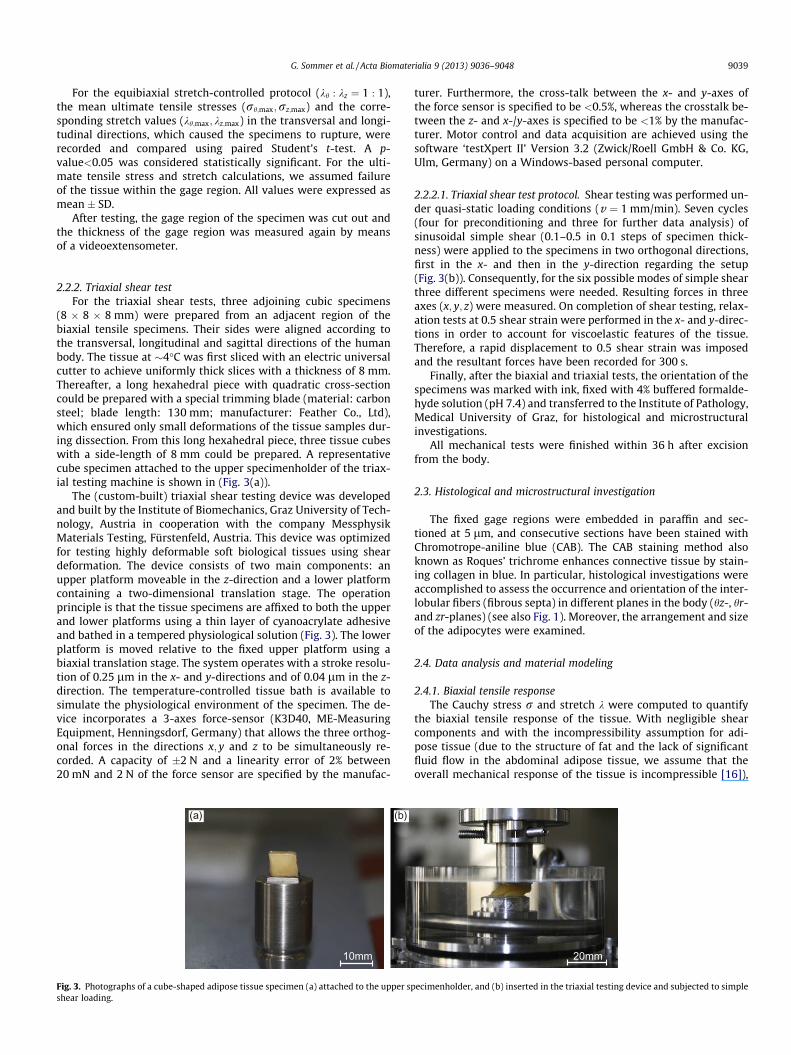
(8 � 8 � 8 mm) were prepared from an adjacent region of thebiaxial tensile specimens. Their sides were aligned according tothe transversal, longitudinal and sagittal directions of the humanbody. The tissue at �4�C was first sliced with an electric universalcutter to achieve uniformly thick slices with a thickness of 8 mm.Thereafter, a long hexahedral piece with quadratic cross-sectioncould be prepared with a special trimming blade (material: carbonsteel; blade length: 130 mm; manufacturer: Feather Co., Ltd),which ensured only small deformations of the tissue samples dur-ing dissection. From this long hexahedral piece, three tissue cubeswith a side-length of 8 mm could be prepared. A representativecube specimen attached to the upper specimenholder of the triax-ial testing machine is shown in (Fig. 3(a)).
The (custom-built) triaxial shear testing device was developedand built by the Institute of Biomechanics, Graz University of Tech-nology, Austria in cooperation with the company MessphysikMaterials Testing, Fürstenfeld, Austria. This device was optimizedfor testing highly deformable soft biological tissues using sheardeformation. The device consists of two main components: anupper platform moveable in the z-direction and a lower platformcontaining a two-dimensional translation stage. The operationprinciple is that the tissue specimens are affixed to both the upperand lower platforms using a thin layer of cyanoacrylate adhesiveand bathed in a tempered physiological solution (Fig. 3). The lowerplatform is moved relative to the fixed upper platform using abiaxial translation stage. The system operates with a stroke resolu-tion of 0.25 lm in the x- and y-directions and of 0.04 lm in the z-direction. The temperature-controlled tissue bath is available tosimulate the physiological environment of the specimen. The de-vice incorporates a 3-axes force-sensor (K3D40, ME-MeasuringEquipment, Henningsdorf, Germany) that allows the three orthog-onal forces in the directions x; y and z to be simultaneously re-corded. A capacity of �2 N and a linearity error of 2% between20 mN and 2 N of the force sensor are specified by the manufac-
(a) (b)
10mm
Fig. 3. Photographs of a cube-shaped adipose tissue specimen (a) attached to the upper spshear loading.
turer. Furthermore, the cross-talk between the x- and y-axes ofthe force sensor is specified to be <0.5%, whereas the crosstalk be-tween the z- and x-/y-axes is specified to be <1% by the manufac-turer. Motor control and data acquisition are achieved using thesoftware ‘testXpert II’ Version 3.2 (Zwick/Roell GmbH & Co. KG,Ulm, Germany) on a Windows-based personal computer.
2.2.2.1. Triaxial shear test protocol. Shear testing was performed un-der quasi-static loading conditions (v ¼ 1 mm/min). Seven cycles(four for preconditioning and three for further data analysis) ofsinusoidal simple shear (0.1–0.5 in 0.1 steps of specimen thick-ness) were applied to the specimens in two orthogonal directions,first in the x- and then in the y-direction regarding the setup(Fig. 3(b)). Consequently, for the six possible modes of simple shearthree different specimens were needed. Resulting forces in threeaxes (x; y; z) were measured. On completion of shear testing, relax-ation tests at 0.5 shear strain were performed in the x- and y-direc-tions in order to account for viscoelastic features of the tissue.Therefore, a rapid displacement to 0.5 shear strain was imposedand the resultant forces have been recorded for 300 s.
Finally, after the biaxial and triaxial tests, the orientation of thespecimens was marked with ink, fixed with 4% buffered formalde-hyde solution (pH 7.4) and transferred to the Institute of Pathology,Medical University of Graz, for histological and microstructuralinvestigations.
All mechanical tests were finished within 36 h after excisionfrom the body.
2.3. Histological and microstructural investigation
The fixed gage regions were embedded in paraffin and sec-tioned at 5 lm, and consecutive sections have been stained withChromotrope-aniline blue (CAB). The CAB staining method alsoknown as Roques’ trichrome enhances connective tissue by stain-ing collagen in blue. In particular, histological investigations wereaccomplished to assess the occurrence and orientation of the inter-lobular fibers (fibrous septa) in different planes in the body (hz-, hr-and zr-planes) (see also Fig. 1). Moreover, the arrangement and sizeof the adipocytes were examined.
2.4. Data analysis and material modeling
2.4.1. Biaxial tensile responseThe Cauchy stress r and stretch k were computed to quantify
the biaxial tensile response of the tissue. With negligible shearcomponents and with the incompressibility assumption for adi-pose tissue (due to the structure of fat and the lack of significantfluid flow in the abdominal adipose tissue, we assume that theoverall mechanical response of the tissue is incompressible [16]),
20mm
ecimenholder, and (b) inserted in the triaxial testing device and subjected to simple

9040 G. Sommer et al. / Acta Biomaterialia 9 (2013) 9036–9048
the Cauchy stresses in transversal and longitudinal directions canbe determined from the conveniently obtainable first Piola–Kirch-hoff stresses in the transversal, Phh, and longitudinal direction, Pzz.Thus,
rhh ¼ khPhh ¼ khfh
TLz; rzz ¼ kzPzz ¼ kz
fz
TLh; ð1Þ
where kh ¼ xh=Xh and kz ¼ xz=Xz represent the tissue stretches ineach direction based on the marker distances in the loaded (xh; xz)and unloaded (Xh;Xz) configuration. The measured forces in eachdirection are denoted as fh and fz; T is the mean thickness in the un-loaded reference configuration, and Lh and Lz are the measurableside-lengths in the transversal and longitudinal directions of thespecimen in the undeformed state.
2.4.1.1. Material modeling of the biaxial tensile response. For materialmodeling of the quasi-static biaxial mechanical behavior, we usedthe hyperelastic strain-energy function (SEF) W developed for arte-rial walls [28,29], and generally suggested for collagen-reinforcedsoft biological tissues. This SEF is separated into two terms relatedto the isotropic matrix and the anisotropic fiber/septa behaviors ofthe tissue, i.e., W ¼ Wm þWf . According to SEM investigations ofadipose tissue the assembly of adipocytes and their reinforcedbasement membranes can be resembled as an isotropic ‘closed cellfoam’ [20]. This isotropic cell foam is considered as an isotropicneo-Hookean solid Wm ¼ c ðI1 � 3Þ=2, where c is the shear modulusand I1 ¼ trC is the first invariant [30] of the right Cauchy-Greentensor C ¼ FTF, with F as the deformation gradient [31]. The behav-ior of the tissue related to the interlobular septa fibers and partlythe reinforced basement membranes is modeled using a combinedpseudo-invariant I�4 ¼ jI1 þ ð1� 3jÞI4, which is a mixture of theisotropic invariant I1 and an anisotropic (directionally dependent)pseudo-invariant I4 ¼ C : A0 ¼ k2
f (the square of the stretch in thefiber direction), where A0 ¼ a0 � a0 is a material structure tensorfor the fiber reinforcement, with a0 denoting the unit direction vec-tor in the reference configuration. Furthermore, I�4 includes a dis-persion parameter j, which is based on the circular von Misesprobability density function and ranges from 0 to 1=3. The lowerlimit of this dispersion parameter, i.e., j ¼ 0, describes the idealalignment of ‘collagen fibers’, and the upper limit, i.e., j ¼ 1=3, de-scribes the isotropic distribution of the ‘collagen fibers’ [28]. Theused SEF can be written as
W ¼ c2ðI1 � 3Þ þ k1
k2exp k2 jI1 þ ð1� 3jÞI4 � 1½ �2
n o� 1
� �; ð2Þ
with
I1 ¼ k2h þ k2
z þ k2r ; ð3Þ
I4 ¼ k2h cos2 uþ k2
z sin2 u; ð4Þ
where c > 0 and k1 > 0 are stress-like parameters, k2 > 0 is adimensionless parameter, and kh; kz and kr are principal stretchesin the transversal, longitudinal and sagittal directions, respectively.A fundamental hypothesis of the used SEF is that the ‘collagen fi-bers’ cannot support any compression and would buckle underthe smallest compressive load.
For biaxial testing, the interlobular septa bundles are assumedto be solely oriented in the hz-plane. The consideration of a inter-lobular septa bundles component in the thickness direction ofthe specimens leads to a small modification. However, due to thesmall thickness of the specimens we assume that this componentis negligible. Consequently, the parameter u in (4)2 denotes the an-gle of the (mean) fiber direction with regard to the transversaldirection h in the hz-plane, and, therefore, acts as a geometricalparameter (see also [28]). In the adipose tissue, the anisotropic con-
tribution of the ‘collagen fibers’ in the SEF is interpreted as theinterpenetrating collagen fibers, the so-called interlobular septabundles. Since the orientation and the dispersion of these collagenfibers were not determined in this study, the parameters u and jare used as phenomenological parameters.
Cauchy stresses can be expressed as derivatives of the SEF Wwith respect to the work conjugate strain measures [31]. Forincompressible hyperelastic materials, this leads to the constitutiveequations
rWaa ¼ ka
@W@ka� p; a ¼ h; z; r; ð5Þ
where rWaa indicate Cauchy stresses in each direction derived from
W, and p serves as an indeterminate Lagrangian multiplier, whichcan be identified as a hydrostatic pressure and can be determinedfrom boundary conditions [31], i.e., p can be determined fromrrr ¼ 0 in biaxial tensile tests in the hz-plane. Hence, with the Eqs.(2)–(4) and the incompressibility condition (kr ¼ k�1
h k�1z ), for the
normal Cauchy stresses we obtain
rWhh ¼ 2ðk2
h � k�2h k�2
z ÞW1 þ 2k2h cos2 uW4; ð6Þ
rWzz ¼ 2ðk2
z � k�2z k�2
h ÞW1 þ 2k2z sin2 uW4; ð7Þ
where the abbreviation Wi ¼ @W=@Ii (i ¼ 1;4) has been used. Notethat the stress relations Eqs. (6) and (7) are only valid with negligi-ble shear deformations during testing.
The data from the five biaxial protocols (kh : kz = 1:1, 1:0.75,0.75:1, 1:0.5, 0.5:1) associated with the transversal and longitudi-nal directions at the maximum stretch level of 15% were simulta-neously fit to the material model (Eq. (2)). Therefore, ‘best fitvalues’ of the constitutive parameters of the used SEF W have beendetermined by means of a nonlinear least squares regression meth-od using Mathematica software package, Version 6:0, Wolfram Re-search Inc., Illinois, USA. In particular, the global minimum of theobjective function
v2 ¼Xn
i¼1
rhh � rWhh
� �2
i þ rzz � rWzz
� �2
i
h ið8Þ
is required, where n is the number of data points considered. Con-sequently, the five parameters (c; k1; k2;u;j) were obtained foreach specimen.
For a measure of the ‘goodness of fit’, the square of the Pearson’scorrelation coefficient r2 was computed for both the transversaland the longitudinal Cauchy stresses. Additionally, an error mea-sure e, which is based on the objective function v2, as given in(8), was calculated to evaluate the ‘goodness of fit’. For more de-tails the reader is referred to [32].
2.4.2. Triaxial shear responseShear strains and corresponding shear stresses were computed
to quantify the triaxial shear response of the abdominal adipose tis-sue specimens. In general, for simple shear the shear strain c is de-fined as the relative in-plane displacement of two parallel layers in amaterial body divided by their separation distance. Here, c rangesfrom 0 to 0.5 with 0.1 steps, and the separation distance is theside-length of the specimen cube L ¼ 8 mm. In general, for simpleshear the shear stress s is defined as the ratio of shear force f , toshear area a. In particular, the shear strain c and stress s are given as
c ¼ DlL; s ¼ f
L2 ; ð9Þ
where Dl denotes the shear displacement.
2.4.2.1. Material modeling of the triaxial shear response. For materialmodeling of the triaxial shear characteristics of the tissue, we used

G. Sommer et al. / Acta Biomaterialia 9 (2013) 9036–9048 9041
the same SEF (2) as for modeling the biaxial tensile response. Incontrast, for simple shear the first invariant becomes [31]
I1 ¼ 3þ c2; ð10Þ
where c denotes the shear strain.Instead of one angle measure describing the mean in-plane col-
lagen fiber orientation for the biaxial tensile modeling, we intro-duced an second angle for the description of the three-dimensional collagen orientation and its dispersion in cubic speci-mens for the triaxial shear modeling. Hence, for a right-handedCartesian coordinate system, where the axes h; z and r coincidewith the transversal, longitudinal and sagittal directions in the hu-man body (Fig. 1), it follows that the inclination angle # is the incli-nation from the r-axis and the azimuth angle u is measured fromthe h-axis in the (h; z)-plane.
As mentioned previously, there are six possible modes of simpleshear for the specimen cubes (Fig. 4). Each mode has a differentdeformation gradient F, and, therefore, a different fourth invariantI4 and predicted shear stress by the SEF. Briefly, e.g., for shearing inthe rh-mode (Fig. 4(a)) the deformation gradient is
F½ �rh ¼
@xh@Xh
@xh@Xz
@xh@Xr
@xz@Xh
@xz@Xz
@xz@Xr
@xr@Xh
@xr@Xz
@xr@Xr
2664
3775 ¼
1 0 c0 1 00 0 1
264
375; ð11Þ
where xi and Xi ði ¼ h; z; rÞ are the displacements in the loaded (cur-rent) and unloaded (reference) configuration, respectively. For thatshear mode, the fourth invariant becomes
I4;rh ¼ ½F�Trh ½F�rh : a0 � a0 ¼¼ ð1þ c2Þ cos2 #þ 2c cos # cos u sin #þ cos2 u sin2
#þ sin2# sin2 u; ð12Þ
where the unit vector a0 ¼ fcos u sin #; sin u sin #; cos #g de-scribes the preferred fiber direction in the 3D space. Consequently,for the shear stress of the rh-mode obtained from the SEF it follows,
rWrh ¼ 2cW1 þ 2W4 cos#ðc cos#þ cos u sin#Þ; ð13Þ
where the abbreviation Wi ¼ @W=@Ii, (i ¼ 1;4) has been used.Similar to the biaxial tensile test modeling, the ‘best fit values’
for the constitutive parameters of the used SEF W were determinedby means of a nonlinear least squares regression method. There-
Fig. 4. Sketches of the six possible modes of simple shear for the specimen cubesdefined with respect to the transversal (h-axis), longitudinal (z-axis) and sagittal (r-axis) directions in the human body: each mode is a plane strain deformation. Themodes are designated (ij), where i; j 2 fh; z; rg, corresponding to shear in the ij-planewith shear in the j direction. Thus, the first letter in (ij) denotes the normal vector ofthe face that is shifted by the simple shear, whereas the second denotes thedirection in which that face is shifted. Arrows on the cubes indicate sheardirections.
fore, the data at the maximum strain level of 0.5 from all six shearmodes (rh; rz, zh; zr; hr; hz) from three cubes of a sample weresimultaneously fit to the material model (2). In contrast, six consti-tutive parameters (c; k1; k2;u; #;j) were obtained for the triaxialshear properties of each adipose samples. The additional parame-ter # acts as a further geometrical parameter and is defined asthe inclination from the r-axis (sagittal direction). If the inclinationangle # ¼ 90�, the azimuth angle u in Eqs. (12) and (13) has thesame meaning as u for the biaxial tensile modeling (Eqs. (4), (6)and (7)), i.e., the collagen fiber orientation in the hz-plane.
Analogous to the biaxial tensile modeling, as a measure of the‘goodness of fit’, the square of Pearson’s correlation coefficientsr2 and the error measure e for all six shear modes were computed.
2.4.2.2. Combined material modeling of biaxial tensile and triaxialshear responses. To obtain one set of material parameters account-ing for both the biaxial tensile and triaxial shear behaviors of asample, we minimized the objective function regarding themechanical stress data of both test types, in particular the equibi-axial tensile data at maximum stretch of 15% and the triaxial sheardata at 0:3 strain, and the corresponding stresses predicted by thematerial model, i.e., Eq. (2). Therefore, eight stress–strain curves,two obtained from the equibiaxial tensile testing and six fromthe triaxial shear testing, have to be represented by the six consti-tutive parameters of the used model.
3. Results
The distance of the biaxial and triaxial specimens locations fromthe skin and the thicknesses of the biaxially tested specimens arestated in Table 1. Unfortunately, due to the size of the sample onlytriaxial specimens could be obtained from sample I. The averagedepth (distance from the skin) from which the specimens for thebiaxial tension and triaxial shear tests were obtained was deter-mined to be 14.5 � 4.4 mm (mean � SD), with a range from 10 to20 mm. The mean thickness of the biaxial specimens was deter-mined to 4.7 � 0.4 mm (mean � SD), with a range from 4.0 to5.5 mm.
3.1. Biaxial mechanical response
Fig. 5(a) shows a representative preconditioning behavior at anequibiaxial stretch of 1.15 (sample II). During preconditioning,stress softening from cycle to cycle was observed in all specimens.Furthermore, sample II reveals pronounced anisotropic behavior inequibiaxial tension with pronounced stiffer response in the longi-tudinal than in the transversal direction. Further, Cauchy stress–stretch responses of the human abdominal adipose tissue (sampleIII) under (quasi-static) equibiaxial loading at stretch levels rangingfrom 1.075 to 1.2 in 0.025 steps are illustrated in Fig. 6(a). Equibi-axial tensile tests of sample III revealed only marginal anisotropicresponse with slightly stiffer behavior in the longitudinal than inthe transversal direction. In general, the difference between thelongitudinal and the transversal direction varied from specimento specimen, but with primarily stiffer behavior in the longitudinalthan in the transversal direction. Representative plots during relax-ation tests (Cauchy stress vs. time) of specimen IV at two differentactuator speeds are shown in Fig. 5(b). The average stress increasefrom tests at normal speed (v ¼ 4 mm/min) to a 10-times higherspeed (v ¼ 40 mm/min) was determined to be approximately50%, for a 20-times higher speed (v ¼ 80 mm/min) even 100%.For the relaxation tests, we waited about 10 min between each testto let the tissue recover. A comparison of the uniaxial and equibi-axial response of the tissue at 1.15 stretch is depicted in Fig. 6(b).The uniaxial data showed marginal lower stresses in comparison

Fig. 5. (a) Representative preconditioning behavior of sample II at 15%-stretch. First and last (fifth) cycle are indicated with arrows. (b) Representative relaxation behavior ofthe human abdominal adipose tissue (sample IV) at two different speeds (i.e., 40 and 80 mm/min) and an applied maximal stretch of 20%. Transversal and longitudinaldirections are indicated by solid and dotted curves, respectively.
Fig. 6. (a) Representative equibiaxial stress-stretch responses of the human abdominal adipose tissue (sample III) at stretch levels ranging from 1.075 to 1.2 in 0.025 steps.For each stretch level the fifth loading–unloading cycle in the transversal (solid curves) and longitudinal (dashed curves) directions is shown. (b) Comparison of uniaxial andequibiaxial responses of sample III at maximum stretch of 15%. For each stretch level the fifth loading–unloading cycle in the transversal (solid curves) and longitudinal(dashed curves) direction is shown.
9042 G. Sommer et al. / Acta Biomaterialia 9 (2013) 9036–9048
with the stresses from the equibiaxial data. The pronounced non-linear exponential stiffening of the tissue is clearly evident, whichis typical for soft collagenous biological tissues. The forming hys-teresis loop between loading and unloading was small indicatingthat the energy dissipated is low in biaxial tension. At higherspeeds, we observed much bigger hysteresis loops, e.g., at 5-timeshigher speed (v ¼ 20 mm/min) the hysteresis area increase wasbetween 100% and 150% (not shown here).
With the requirement that the tissue ruptured in the gage re-gion of the specimen, the mean ultimate tensile stresses rh;max
and rz;max were computed to be 10 � 6 kPa and 13 � 11 kPa,respectively. At the 0.05-level, both means were not significantlydifferent (p = 0:36), i.e., the failure of adipose tissue was not signif-icantly direction-dependent or anisotropic. Both correspondingmean maximal stretches kh;max and kz;max were determined to be1.21 � 0.08. The force, which caused visible damage and ruptureto the tissue in biaxial tension showed a big range from 0.4 to5.8 N. The lowest failure force of 0.4 N was observed in the trans-versal direction of specimen VIII, whereas the highest failure forceof 5.8 N was observed in the longitudinal direction of specimen III.The reason for this very high failure force of specimen III was prob-ably a bundle of septa fibers along the longitudinal direction,which was even visible with the naked eye. The mean failure forceswere determined to be 1.5 � 0.9 N in the transversal direction and1.9 � 1.5 N in the longitudinal direction.
A representative ‘true’ biaxial tensile response at differentstretch ratios between the transversal and the longitudinal direc-tion is shown in Fig. 7. Corresponding model fits are also indicatedin this figure. The used model (2) was able to represent the ‘true’biaxial response very well, indicated by the mean squared correla-tion coefficient r2 of 0.99 close to 1 and the low mean error mea-sure e of 4.8%. Model parameters, and associated mean and SDvalues of all samples are summarized in Table 2. On average, thephenomenologically determined geometrical parameter u, the fi-ber angle, is bigger than 45�, which reveals anisotropy with higherstiffness in the longitudinal direction. The phenomenologicallydetermined dispersion parameters have a broad range from 0.03to 0.17, i.e., the predicted collagen structures range from almostperfectly aligned to highly distributed. This fact and the broaddistribution of the other model parameters indicate a large inter-specimen variation of the mechanical properties and the micro-structure of the tissue. However, the determination of thegeometrical parameters (orientation u and dispersion j of the col-lagen structures) by means of further microstructural investiga-tions will certainly lead to more distinct constitutive parameters.
3.2. Triaxial mechanical response
Results from a representative shear test, in which seven cycles(four preconditioning and three measurement cycles) of sinusoidal

G. Sommer et al. / Acta Biomaterialia 9 (2013) 9036–9048 9043
shear strain with an amplitude of 0.5 were applied to the rz-mode,are presented in Fig. 8(a). The typical preconditioning behavior wasobserved in all specimens, i.e., the stress was always greater on theinitial displacement in positive and negative directions than insubsequent cycles. After about three to four cycles, shear stress–strain loops were reproducible. Viscoelastic properties of this adi-pose sample are evident in the shear stress–strain hysteresis(Fig. 8)) and in the stress relaxation behavior after 0.5 step shear
Fig. 7. Experimental data (broken curves) of the human abdominal adipose tissue (samplein (a) the transversal and (b) the longitudinal directions. The constitutive parameters us
Table 2Constitutive parameters (c; k1; k2;u;j) (mean and SD) obtained by fitting the SEF (2) tokmax ¼ 1:15 of adipose tissue samples (n = 8). Mean and SD values of squared Pearson’s comeasures e.
Donor Constitutive parameters (biaxial tension)
c k1 k2 u;
II 0.1 0.3 92.5 57.1III 0.3 1.7 15.4 51.4IV 0.6 1.7 34.9 41.0V 0.2 0.4 97.1 46.9VI 0.5 0.1 45.5 50.5VII 0.2 2.0 34.0 46.3VIII 0.2 0.3 19.8 33.9IX 0.5 0.1 39.1 50.4Mean 0.3 0.8 47.3 47.2SD 0.2 0.8 30.9 7.1
Fig. 8. (a) Shear stress–strain relationship during seven sinusoidal simple shear cycles in0.5. (b) Shear stress as a function of time (in minutes) for a simple shear strain step of
strain (Fig. 8(b)). Corresponding viscoelastic behavior was ob-served in all specimens. Interestingly, the resulting hysteresis dur-ing shearing was bigger than the hysteresis during biaxial tensileloading (compare Figs. 5(a), 6 and 9).
Fig. 9(a) and (b) illustrate the final cycles of a series of tests per-formed in different shear modes of sample VIII, with shear strainamplitudes increasing in steps of 0.1 up to 0.5. Stress–strain loopsat increasing shear strain amplitudes show strain softening, i.e., as
III) during biaxial tensile tests with corresponding constitutive model (solid curves)ed are given in Table 2.
the biaxial experimental data for different stretch ratios and maximum stretch ofrrelation coefficients for the transversal r2
hh and longitudinal r2zz directions and error
Sq. corr. coeff. e
j r2hh r2
zz %
0.07 0.996 0.996 3.90.13 0.998 0.999 1.70.17 0.990 0.965 5.10.10 0.997 0.996 3.00.07 0.975 0.981 7.10.13 0.994 0.998 3.40.03 0.982 0.943 7.50.03 0.975 0.981 7.10.09 0.990 0.980 4.80.05 0.008 0.021 2.2
the rz-mode of an adipose tissue cube (sample III). Maximum applied shear strain is0.5 in rh-mode (solid curve) and rz-mode (dotted curve) (sample I).

Fig. 9. Shear stress–strain relationship of sample VIII during final cycles of simpleshear in the rh-mode (solid curves) and the rz-mode (dotted curves) in (a), in the zh-mode (solid curves) and the zr-mode (dotted curves) in (b), and in the hr-mode
9044 G. Sommer et al. / Acta Biomaterialia 9 (2013) 9036–9048
the maximum shear deformation experienced by the tissue gets in-creased, at any shear strains the corresponding shear stresses aredecreased. Similar effects are seen in all different shear modes.
The used model was also appropriate to characterize shear datain different shear modes with good accuracy, which is indicated bythe mean ‘goodness of fit’ parameters r2 ¼ 0:99 and e ¼ 7:2% in Ta-ble 3. Unfortunately, from samples V and IX no appropriate three-some of specimens for the triaxial shear testing could be obtained.Representative model fit results are given as solid curves in theFig. 10(a)–(f). Mean and SD values of the related material parame-ters of all samples are summarized in Table 3. The mean phenom-enologically determined fiber angle u is consistent with the udetermined from biaxial tensile data, but with a distinctly largerstandard deviation. A possible reason for this difference is theinteraction of the two fiber angles u and #. By comparing the shearproperties of the two shear directions for each cube it follows alsomarginal anisotropic shear properties of the adipose tissue. Onaverage, the longitudinal direction z shows stiffer shear behaviorthan the transversal direction h during shearing in the rh- and rz-modes, the transversal direction h shows stiffer behavior than thesagittal direction r during shearing in the zh- and zr-modes, andthe sagittal direction r shows stiffer behavior than the longitudinalz direction during shearing in the hr- and hz-modes (see Table 3).
3.3. Combined material modeling of the biaxial tensile and triaxialshear response
The model parameters obtained for the simultaneously fit of thebiaxial tensile and triaxial shear data are stated in Table 4. Themodel showed the ability to give a good representation of the (qua-si-static) equibiaxial tensile and triaxial shear responses (seesquared correlation coefficients and error measures in Table 4).However, the ‘goodness of fit’ for combined fitting was worse thanfor separate fitting of the biaxial tensile and the triaxial shearresponse.
3.4. Histology
Fig. 11(a)–(d) show representative histological images of thehuman abdominal adipose tissue. Similarly, in Fig. 11(a) and (b)the microstructure of the tissue in the hz-plane in 5- and 40-timesmagnifications are shown. Similarly, in Fig. 11(c) and (d) the hr-plane in 5- and 40-times magnifications are shown. In all fourimages, the reinforced basement membranes surrounding the adi-pocytes and fibrous septa are clearly visible. The diameter of theadipocytes ranged from about 50 to 70 lm (see Fig. 11(b) and(d)). By comparing several histological slides in different orienta-tions, we were unable to identify a preferred orientation of the fi-brous septa.
(solid curves) and the hz-mode (dotted curves) in (c). Maximum shear strain isprogressively increased from 0.1 to 0.5. Data illustrate history dependence of strainsoftening.
4. DiscussionIn previous studies the adipose tissue was treated as an isotro-pic material and identified as a nonlinear, isotropic and viscoelasticmaterial using uniaxial (unconfined) compression [16–19], inden-tation [21,22] and tensile tests [19,23]. We found, however, a clearindication of mechanical anisotropy for this tissue under biaxialextension and triaxial shear tests. For some specimens the aniso-tropic behavior seen by the presented data were small, seeFig. 6(a). For such cases the mechanical data could also be repre-sented with a good approximation by using an isotropic modelonly. Nevertheless, we stated and represented the obtainedmechanical data as accurate as possible. To the best of our knowl-edge, this work represents the first multiaxial tensile and shearmeasurements of adipose material stiffness in different directions.
The anisotropic behavior differed from specimen to specimen inour tests, as depicted in Figs. 5 and 6 and 9 and 10. The anisotropicresponses are also indicated by the model parameters u; # and j inthe Tables 2, 3.
In general, during biaxial tension the tissue showed stiffer prop-erties in longitudinal than in transversal direction, with the excep-tions of specimens IV and VIII, which is also indicted by u inTable 2. In triaxial shear such a trend with stiffer behavior in a par-ticular direction could not be observed. The adipose tissue revealeda slightly softer behavior in uniaxial tension than in equibiaxialtension (see Fig. 6(b)). This difference is a consequence of the dif-ferent boundary conditions during uniaxial and biaxial loading

Table 3Constitutive parameters (c; k1; k2 ;u; #;j) (mean and SD) obtained by fitting the SEF (2) to the triaxial shear data at 0:5 strain for six different shear modes of adipose tissuesamples (n = 7). Mean and SD values of squared Pearson’s correlation coefficients for all six modes and error measures e.
Donor Constitutive parameters (triaxial shear) Squared correlation coefficients e
c k1 k2 u; #; j r2rh r2
rz r2zh r2
zr r2hr r2
hz %
I 0.00 0.1 5.8 33.9 45.4 0.03 0.99 0.99 0.99 0.99 0.98 0.99 9.0II 0.04 0.3 107.2 50.8 77.2 0.23 0.99 0.99 0.99 0.99 0.99 0.99 2.3III 0.04 0.1 14.1 86.8 66.0 0.13 0.95 0.99 0.99 0.99 0.99 0.99 5.8IV 0.00 0.4 80.5 69.6 50.2 0.13 0.99 0.99 0.95 0.99 0.98 0.99 4.2VI 0.04 0.1 20.7 48.4 62.7 0.17 0.99 0.98 0.99 0.99 0.99 0.99 7.4VII 0.00 0.7 45.8 32.7 87.0 0.27 0.99 0.96 0.99 0.99 0.99 0.99 4.9VIII 0.01 0.1 6.5 37.3 71.0 0.03 0.99 0.96 0.99 0.99 0.99 0.99 8.1Mean 0.02 0.3 40.0 51.4 65.6 0.14 0.99 0.99 0.99 0.99 0.99 0.99 6.0SD 0.01 0.1 23.9 12.1 8.8 0.05 0.02 0.02 0.02 0.01 0.01 0.01 2.4
Fig. 10. Experimental data (dotted curves) and corresponding material model (solid curves) for different shear modes (a)–(f) of human abdominal adipose tissue (sampleVIII). In particular, (a) corresponds to shear in rh-mode, (b) in rz-mode, (c) in zh-mode, (d) in zr-mode, (e) in hr-mode and (f) in hz-mode. The constitutive parameters used aregiven in Table 3.
G. Sommer et al. / Acta Biomaterialia 9 (2013) 9036–9048 9045

Table 4Constitutive parameters (c; k1 ; k2;u; #;j) (mean and SD) obtained by fitting the SEF (2) to the equibiaxial tensile data (k = 1.15) and the triaxial shear data for six different shearmodes (c = 0.3) of adipose tissue samples (n = 6). Mean and SD values of squared Pearson’s correlation coefficients for the eight deformation modes and error measures e.
Donor Const. parameters (bi- and triaxial) Biax. corr./ e Triax. corr. coeff./ e
c k1 k2 u; #; j r2hh r2
zz % r2rh r2
rz r2zh r2
zr r2hr r2
hz %
II 0.4 0.3 287.8 24.2 27.6 0.10 0.99 0.99 4.7 0.92 0.98 0.92 0.89 0.99 0.87 10.5III 0.1 10.1 60.5 10.5 82.9 0.30 0.99 0.98 12.8 0.99 0.99 0.99 0.99 0.99 0.99 5.8IV 0.2 16.9 28.7 8.6 72.4 0.30 0.99 0.99 10.5 0.99 0.99 0.99 0.98 0.99 0.99 8.2VI 0.1 0.4 214.7 20.1 16.3 0.17 0.99 0.99 4.1 0.97 0.99 0.96 0.93 0.98 0.97 11.5VII 0.1 24.9 34.6 8.0 86.6 0.30 0.99 0.99 12.0 0.99 0.99 0.99 0.99 0.99 0.99 6.5VIII 0.2 4.2 145.1 78.0 60.0 0.30 0.99 0.99 4.0 0.99 0.99 0.99 0.99 0.99 0.99 11.8Mean 0.2 9.5 128.6 24.9 57.7 0.24 0.99 0.99 8.0 0.98 0.99 0.97 0.96 0.99 0.97 9.0SD 0.1 9.9 106.3 26.8 29.4 0.05 0.01 0.01 4.2 0.03 0.01 0.03 0.04 0.01 0.05 2.6
Fig. 11. Representative histological images of the microstructure in the hz-plane of the tested human adipose tissue at (a) 5� and (b) 40� original magnification; (c) and (d)are corresponding images in the hr-plane. Chromotrope-aniline blue staining, 5lm thick sections.
9046 G. Sommer et al. / Acta Biomaterialia 9 (2013) 9036–9048
and the fact of a 3D cross-linked mechanically load-bearing ultra-structure of the tissue. During tension in one direction only, thealignment of the collagen fibers is not constraint in comparisonto the biaxial case and therefore, the elongation of the tissue in thisdirection is associated with less effort. During tension of the spec-imen in two orthogonal directions the elongation in one directionaffects the elongation in the other direction, and vice versa. This ef-fect is also known as the ‘Poisson effect’. Hence, biaxial tensile test-ing is more vital for the understanding and investigating of themechanical properties of multiaxial loaded soft biological tissuessuch as the abdominal human adipose tissue. Interestingly, witha Cauchy stress of approx. 0.1 kPa at a stretch of 15%, porcine adi-pose tissue under quasi-static uniaxial tension [19] showed a muchsofter behavior than human adipose tissue under uniaxial loadingat the same stretch (Fig. 6(b)). In particular, for human adipose tis-sue with Cauchy stresses of 1.5–2.5 kPa at a stretch of 15%, we ob-served a 15–25-times higher stress than for porcine adipose tissue[19]. This difference shows the necessity of testing human tissueobtained from similar regions to identify reasonable constitutiveparameters for the tissue of interest.
Preliminary results revealed depth-dependent biaxial mechani-cal behavior of the tested tissue. In particular, in comparison with
tissue from the middle region, we observed stiffer behavior of thetissue obtained near an adjacent region of the skin and in a dis-tance larger than 30 mm from the skin. In fact, the subcutaneousadipose tissue of the lower trunk and the gluteal-thigh regioncan be divided into two distinct layers, the superficial and the deepsubcutaneous adipose tissue [33,25]. In these layers, morphologi-cal and metabolic differences were found [34,33]. These facts area possible explanation of the dependency of the mechanical prop-erties with depth.
A further principal aim of the present study was to characterizethe shear behavior of the abdominal adipose tissue and to deter-mine the extent to which the material behavior reflects the (aniso-tropic) structure of the tissue. The tests performed have shownthat the shear properties are nonlinear, viscoelastic and clearlydependent on local adipose microstructure or architecture. Theadipose tissue exhibited strain softening with increasing sheardeformation (Fig. 9). Moreover, the hysteresis associated with cyc-lic testing and the stress relaxation seen during step tests indicatesthat adipose tissue has viscoelastic properties also under sheardeformation. Viscoelasticity reflects energy losses due to frictionalprocesses such as tissue fluid movement and that is commonly ob-served in soft biological tissues [35]. However, the history-depen-

G. Sommer et al. / Acta Biomaterialia 9 (2013) 9036–9048 9047
dent behavior seen in this study cannot only be explained by visco-elastic phenomena. As the maximum strain was increased, thestiffness gets decreased, i.e., the level of stress reached at any strainwas reduced. This softening was observed for maximum sheardeformations ranging from 10% to 50%, and it stabilized after aboutfour loading cycles. Therefore, a significant part of the strain soft-ening could be explained by the preconditioning procedure, wherethe extracellular connective tissue rearranges with cyclic mechan-ical loadings [35]. This rearrangement results in less stress beingrequired to produce deformations in the tissue.
To make meaningful comparisons between shear properties indifferent directions within and between specimens, it was neces-sary that strain histories were carefully matched. For this reason,the same sequence of shear testing (maximum shear displace-ments 10–50%) was imposed for each specimen in the two orthog-onal directions. The maximum shear displacements used here (10–50%) cover a wide range of shear deformations in the human abdo-men. Our results demonstrate anisotropy in response to simpleshear. However, there were variations in the absolute values ofshear stresses between the adipose samples. A possible explana-tion for these intersample differences is the intersample variationin tissue architecture and collagen density observed at histologicalinvestigations.
During simple shear deformation the collagenous septa in thetissue get extended, and, therefore, we can compare stress–straincurves obtained under tensile testing in the transversal and longi-tudinal directions with corresponding shear testing results. Theshear modes zh and zr cause extension of the septa in the longitu-dinal direction, whereas the modes hr and hz causes extension inthe transversal direction (Fig. 4). It is difficult to predict which sep-ta extension corresponds to the maximum shear displacement of50%, and, therefore, only qualitative comparisons between tensileand shear data can be made. Under uni- and biaxial tension we ob-served primarily stiffer behavior in the longitudinal than in thetransversal direction (Fig. 6), which is consistent to the corre-sponding average shear results in the zh-, zr- and hr-, hz-modes,respectively (see Table 3).
The techniques used in this investigation have a number of lim-itations. Our used clamping method for the biaxial testing imposesstress concentrations on the specimens close to the lateral edges ofthe clamps. These stress concentrations are a consequence of theconstrained deformation ability of the tissue close to the clampsfront. Therefore, the load initiation into the gage region and alsothe stress distribution within the gage region of the specimensare not optimal. But in consideration of the softness of the tissue,this clamping method was the best possible technique to insertthis very soft and fragile tissue into the biaxial testing apparatus.During triaxial shear testing, our testing apparatus imposes strictboundary conditions on specimens, whereas abdominal adiposetissue in vivo (and in situ) is not constrained to the same degree.The same concern implies during the biaxial tensile testing. By cut-ting the isolated specimens for both biaxial tensile and triaxialshear tests, we run to risk disrupt their structural and, therefore,mechanical integrity. Although considerable effort is taken to pre-serve the principal structural integrity of the adipose tissue, it isinevitable that the preparation and testing procedures have someinfluence on the measured material properties. Finally, the lownumber of tested specimens makes it difficult to conduct meaning-ful comparisons between the mechanical features in differentdirections of the tissue.
5. Conclusion
In conclusion, the results of this study suggest that humanabdominal adipose tissue under quasi-static and dynamic multiax-
ial loadings can be characterized as a nonlinear, anisotropic andviscoelastic soft biological material. To our knowledge, this is thefirst investigation in which the mechanical properties of adiposetissue have been characterized under biaxial tensile and triaxialshear loadings. The nonlinear and anisotropic features are conse-quences of the material’s collagenous microstructure, which is typ-ical for soft biological tissue. The aligned collagenous septaobserved in histological investigations drives the anisotropy ofthe tissue. The hyperelastic model used in this study was appropri-ate to represent the mechanical behavior of the adipose tissue un-der biaxial tensile and triaxial shear testing.
A future perspective is the determination of the geometricalparameters, the ‘fiber angle’ u and the ‘fiber dispersion’ j, comingfrom successive investigations of the microstructure, e.g., frompolarized light microscopy of a series of picrosirius black stainedhistological sections in different orientations [36] or multi-photonmicroscopy. Therefore, a variety of further tests on more adiposetissue samples should be performed in order to prevent some lim-itations of this study. Nonetheless, the model parameters stated inthis preliminary study are intended to serve as a basis for finite ele-ment models of clinical intervention methods and related prob-lems, and thus to help in identifying possible improvements orsolutions in the near future after clinical implementation.
Acknowledgements
The authors thank Dr. Thomas S.E. Eriksson for his valuable sup-port during the preparation of this paper and his fruitful discus-sion. Further, we would like to thank Prof. Dr. H.-G. Machens,Director of the Department of Plastic Surgery and Hand Surgery,Klinikum rechts der Isar, Technische Universität München, Ger-many for his continuous support of our projects, which has enabledthis study.
Appendix A. Figures with essential colour discrimination
Certain figures in this article, particularly Figs. 1–3, 11, are dif-ficult to interpret in black and white. The full color images can befound in the on-line version, at http://dx.doi.org/10.1016/j.actbio.2013.06.011.
References
[1] Mathes S, Nahai F. Clinical application for muscle and musculocutaneous flaps.3rd ed. St. Louis, Missouri: The C.V. Mosby Company; 1982.
[2] Henker FO. Body-image conflict following trauma and surgery. Psychosomatics1979;20:812–20.
[3] Wassner A. The impact of mutilating surgery or trauma on body-image. IntNurs Rev 1982;29:86–90.
[4] Maguire P, Parkes CM. Coping with loss: surgery and loss of body parts. Br MedJ 1998;316:1086–8.
[5] Gottlieb LJ, Krieger LM. From the reconstructive ladder to the reconstructiveelevator (Editorial). Plast Reconstr Surg 1994;93:1503–4.
[6] Godina M. Early microsurgical reconstruction of complex trauma of theextremities. Plast Reconstr Surg 1986;78:285–92.
[7] McCarthy CM, Cordeiro PG. Microvascular reconstruction of oncologic defectsof the midface. Plast Reconstr Surg 2010;126:1947–59.
[8] Kovacs L, Zimmermann A, Wawrzyn H, Schwenzer K, Seitz H, Tille C, et al.Computer aided surgical reconstruction after complex facial burn injuries –opportunities and limitations. Burns 2005;31:85–91.
[9] Kovacs L, Eder M. Three-dimensional visualization in Plastic andReconstructive Surgery after oncologic procedures/interventions. In: DösselO, Schlegel WC, editors. Image processing, biosignal processing, modelling andsimulation, biomechanics, world congress on medical physics and biomedicalengineering, September 7–12, 2009, vol. 25/4 of IFMBE proceedings. Berlin,Heidelberg: Springer; 2010. p. 2350.
[10] Barbarino GG, Jabareen M, Trzewik J, Nkengne A, Stamatas G, Mazza E.development and validation of a three-dimensional finite element model ofthe face. J Biomech Eng 2009;131:041006-11.
[11] del Palomar AP, Calvo B, Herrero J, López J, López M. A finite element model toaccurately predict real deformations of the breast. Med Eng Phys2008;30:1089–97.

9048 G. Sommer et al. / Acta Biomaterialia 9 (2013) 9036–9048
[12] Rajagopal V, Nielsen PMF, Nash MP. Modeling breast biomechanics for multi-modal image analysis–successes and challenges. Wiley Interdiscip Rev SystBiol Med 2010;2:293–304.
[13] Holzapfel GA. Computational biomechanics of soft biological tissue. In: Stein E,de Borst R, Hughes TJR, editors. Encyclopedia of computational mechanics, vol.2. Solids and structures. Chichester: John Wiley & Sons; 2004. p. 605–35.
[14] Goldberg B, Rabinovitch M. Connective tissue. In: Weiss L, editor. Histology,Cell and Tissue Biology. Elsevier Science Ltd; 1983. p. 139–77.
[15] Comley K, Fleck NA. A micromechanical model for the Young’s modulus ofadipose tissue. Int J Solids Struct 2010;47:2982–90.
[16] Miller-Young JE, Duncan NA, Baroud G. Material properties of the humancalcaneal fat pad in compression: experiment and theory. J Biomech2002;35:1523–31.
[17] Gefen A, Haberman E. Viscoelastic properties of ovine adipose tissue coveringthe gluteus muscles. J Biomech Eng 2007;129:924–30.
[18] Wu W, Qi M, Liu XP, Yang DZ, Wang WQ. Delivery and release of nitinol stentin carotid artery and their interactions: a finite element analysis. J Biomech2007;40:3034–40.
[19] Comley K, Fleck NA. The high strain rate response of adipose tissue. In:Gladwell GML, Moreau R, Zhao H, Fleck NA, editors. IUTAM symposium onmechanical properties of cellular materials. vol. 12 of IUTAMBookseries. Netherlands: Springer; 2009. p. 27–33.
[20] Comley K, Fleck NA. The toughness of adipose tissue: measurements andphysical basis. J Biomech 2010;43:1823–6.
[21] Samani A, Plewes D. A method to measure the hyperelastic parameters ofex vivo breast tissue samples. Phys Med Biol 2004;49:4395.
[22] Samani A, Zubovits J, Plewes D. Elastic moduli of normal and pathologicalhuman breast tissues: an inversion-technique-based investigation of 169samples. Phys Med Biol 2007;52:1565–76.
[23] Chen K, Weiland JD. Mechanical properties of orbital fat and its encapsulatingconnective tissue. J Biomech Eng 2011;133:064505.
[24] Holzapfel GA. Biomechanics of soft tissue. In: Lemaitre J, editor. The handbookof materials behavior models. Vol. III, Multiphysics behaviors, chapter 10,composite media, biomaterials. Boston: Academic Press; 2001. p. 1049–63.
[25] Geerligs M, Peters GWM, Ackermans PAJ, Oomens CWJ, Baaijens FPT. Linearviscoelastic behavior of subcutaneous adipose tissue. Biorheology2008;45:677–88.
[26] Nightingale K, McAleavey S, Trahey G. Shear-wave generation using acousticradiation force: in vivo and ex vivo results. Ultrasound Med Biol2003;29:1715–23.
[27] Choi HS, Vito RP. Two-dimensional stress–strain relationship for caninepericardium. J Biomech Eng 1990;112:153–9.
[28] Gasser TC, Ogden RW, Holzapfel GA. Hyperelastic modelling of arterial layerswith distributed collagen fibre orientations. J R Soc Interface 2006;3:15–35.
[29] Holzapfel GA. Collagen in arterial walls: biomechanical aspects. In: Fratzl P,editor. Collagen. Structure and mechanics. Heidelberg: Springer-Verlag; 2008.p. 285–324.
[30] Spencer AJM. Part III. Theory of invariants. In: Eringen AC, editor. Continuumphysics. Vol. I – Mathematics. New York: Academic Press; 1971. p. 239–353.
[31] Holzapfel GA. Nonlinear solid mechanics. A continuum approach forengineering. Chichester: John Wiley & Sons; 2000.
[32] Sommer G, Holzapfel GA. 3D constitutive modeling of the biaxial mechanicalresponse of intact and layer-dissected human carotid arteries. J Mech BehavBiomed Mater 2012;5:116–28.
[33] Smith SR, Lovejoy JC, Greenway F, Ryan D, deJonge L, de la Bretonne J, et al.Contributions of total body fat, abdominal subcutaneous adipose tissuecompartments, and visceral adipose tissue to the metabolic complications ofobesity. Metabolism 2001;50:425–35.
[34] Lovejoy JC, Smith SR, Rood JC. Comparison of regional fat distribution andhealth risk factors in middle-aged white and African American women: thehealthy transitions study. Obes Res 2001;9:10–6.
[35] Fung YC. Biomechanics. Mechanical properties of living tissues. 2nd ed. NewYork: Springer-Verlag; 1993.
[36] Canham PB, Talman EA, Finlay HM, Dixon JG. Medial collagen organization inhuman arteries of the heart and brain by polarized light microscopy. ConnectTissue Res 1991;26:121–34.


