Embed Size (px)
Citation preview
Multi-date ERS tandem interferogram analysis:
application to alpine glaciers
Lionel Bombrun, Ivan Petillot, Gabriel Vasile, Michel Gay, Emmanuel Trouve,
Philippe Bolon, Jean-Marie Nicolas, Tania Landes
To cite this version:
Lionel Bombrun, Ivan Petillot, Gabriel Vasile, Michel Gay, Emmanuel Trouve, et al.. Multi-date ERS tandem interferogram analysis: application to alpine glaciers. MULTITEMP’2007,2007, Leuven, Belgium. pp.1-6, 2007. <halshs-00264864>
HAL Id: halshs-00264864
https://halshs.archives-ouvertes.fr/halshs-00264864
Submitted on 26 May 2008
HAL is a multi-disciplinary open accessarchive for the deposit and dissemination of sci-entific research documents, whether they are pub-lished or not. The documents may come fromteaching and research institutions in France orabroad, or from public or private research centers.
L’archive ouverte pluridisciplinaire HAL, estdestinee au depot et a la diffusion de documentsscientifiques de niveau recherche, publies ou non,emanant des etablissements d’enseignement et derecherche francais ou etrangers, des laboratoirespublics ou prives.
Multi-date ERS tandem interferogram analysis:application to alpine glaciers
Lionel Bombrun∗, Ivan Petillot†, Gabriel Vasile∗,†, Michel Gay∗, Emmanuel Trouve∗,†,Philippe Bolon†, Jean-Marie Nicolas‡ and Tania Landes§∗Grenoble Image Parole Signal et Automatique (GIPSA-lab),
CNRS INPG - 961, Rue de la Houille Blanche - BP 46 - 38402 Saint-Martin-d’Heres, FranceEmail: {lionel.bombrun|michel.gay}@gipsa-lab.inpg.fr
†Laboratoire d’Informatique, Systemes, Traitement de l’Information et de la ConnaissancePolytech’Savoie - Universite de Savoie - BP 80439 - 74944 Annecy-le-Vieux Cedex, France
Email: {ivan.petillot|gabriel.vasile|emmanuel.trouve|philippe.bolon}@univ-savoie.fr‡Departement Traitement du Signal et des Images
CNRS GET-Telecom Paris - 46, Rue Barrault - 75013 Paris - FranceEmail: [email protected]
§Equipe Photogrammetrie et Geomatique - UMR MAPCNRS INSA Strasbourg - 24, Bd de la Victoire - 67084 Strasbourg Cedex - France
Email: [email protected]
Abstract—Temperate glaciers are an indicator of the localeffects of global climate change. For economical and securityreasons in the surrounding areas, the monitoring of thosegeophysical objects is being a necessity. SAR data are expectedto provide dense measurements of physical parameters whichare necessary to detect significant changes and to constrainglacier flow models. In this paper, five descending one-day ERS-1/2 tandem interferometric data pairs from July 1995 to April1996 are studied in the Chamonix Mont-Blanc area (FrenchAlps). This multi-temporal interferogram series is used to analysethe coherence levels and fringe patterns over nine glaciers.Moreover, when the coherence is sufficient, Differential SARInterferometry (D-InSAR) processing are applicable to derive athree-dimensional (3-D) velocity fields. An expert knowledge anda ten years measurements analysis of glacier flow are used to fixthe line of sight (LOS) displacement offset. Finally, an analysis ofthe wrapped phase difference between interferograms is exposedto detect the presence of residual topographic fringes and tocharacterize the surface flow field evolution.
I. INTRODUCTION
Temperate glaciers are an indicator of the local effects ofglobal climate change. For economical and security reasonsin the surrounding areas, the monitoring of those geophysicalobjects is being a necessity. Compared to sparse terrestrialground measurements, Synthetic Aperture Radar (SAR)allows regular acquisitions on mountainous areas. SAR dataare expected to provide dense measurements of physicalparameters which are necessary to detect significant changesand to constrain glacier flow models. For example, InSARtechniques can be applied to measure glacier surface flowfields which can reach several decimeters per day in theFrench Alps. Spaceborne data from ERS-1/2 tandem missionhave been successfully used to derive velocity fields [1],mainly during the cold season because of the strong temporal
decorrelation in summer [2].
In the first part of this paper, five descending one-dayERS-1/2 tandem interferometric data pairs from July 1995to April 1996 are studied in the Chamonix Mont-Blanc area(French Alps). This multi-temporal interferogram series isused to analyse the coherence levels and fringe patterns overnine glaciers. Like coherence is a criteria of interferometricprocessing performance, an analysis of multi-date coherencein glaciers and non-glaciers areas is exposed. A survey con-cerning the altitude influence on coherence preservation isachieved.
Next, when the coherence is sufficient, Differential Interfer-ometry SAR processing is applicable to derive a 3-D velocityfield. However, several difficulties have to be overcame. Dueto the high topography, most of the Chamonix Valley glaciersare visible only on descending pass. Since, one pass interfero-metric phase provides the 3-D surface displacement projectedon the SAR line of sight axis, only one velocity componentis available. Moreover the phase unwrapping step providesover each glaciers a displacement field with an unknownoffset. An expert knowledge and a ten years measurementsanalysis of glacier flow allow the detection of areas wherethe velocity is stationary during different seasons. Annual in-situ measurements are taken into account to fix this LOSdisplacement offset. A displacement profile is shown and acomparison with differential GPS measurements is exposed.
Finally, an analysis of the wrapped phase difference betweeninterferograms is proposed. A method based on a comparisonof the fringes with the perpendicular baseline is described.It determines if residual topographic fringes are correctlyremoved or not in the interferogrmas. Therefore, Digital Ter-rain Model (DTM) errors can be retrieved by this analysis.
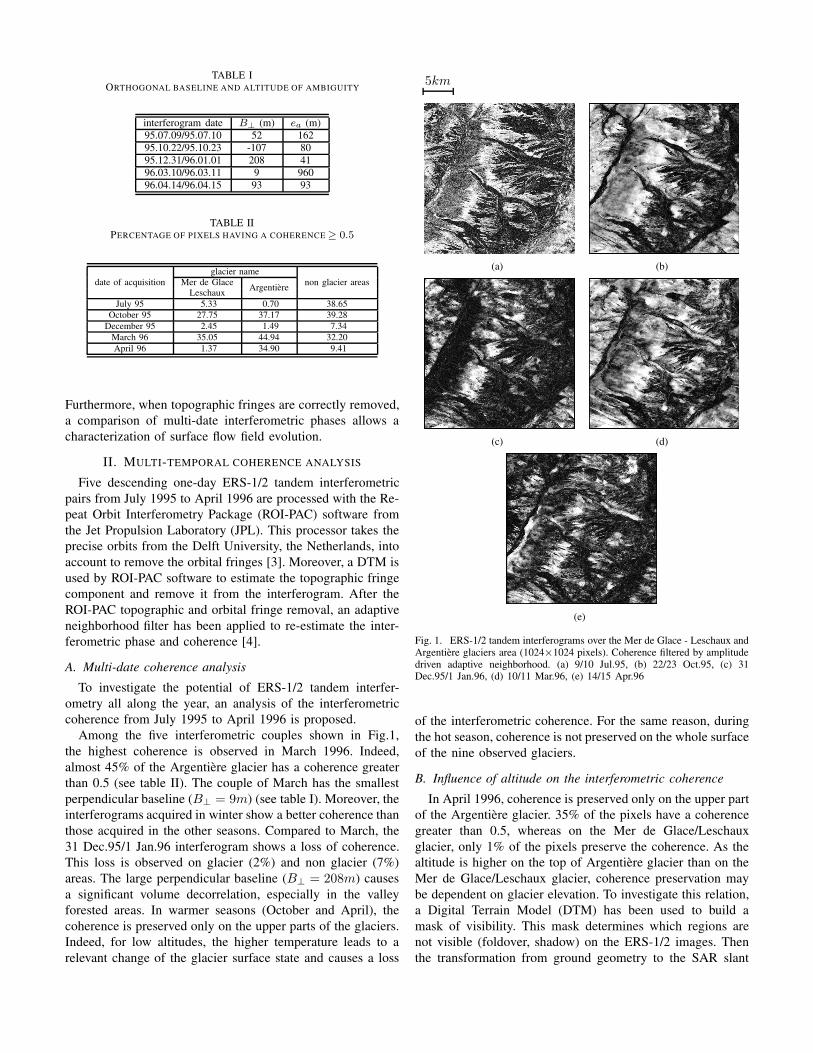
TABLE IORTHOGONAL BASELINE AND ALTITUDE OF AMBIGUITY
interferogram date B⊥ (m) ea (m)95.07.09/95.07.10 52 16295.10.22/95.10.23 -107 8095.12.31/96.01.01 208 4196.03.10/96.03.11 9 96096.04.14/96.04.15 93 93
TABLE IIPERCENTAGE OF PIXELS HAVING A COHERENCE ≥ 0.5
date of acquisitionglacier name
non glacier areasMer de GlaceArgentiere
LeschauxJuly 95 5.33 0.70 38.65
October 95 27.75 37.17 39.28December 95 2.45 1.49 7.34
March 96 35.05 44.94 32.20April 96 1.37 34.90 9.41
Furthermore, when topographic fringes are correctly removed,a comparison of multi-date interferometric phases allows acharacterization of surface flow field evolution.
II. MULTI-TEMPORAL COHERENCE ANALYSIS
Five descending one-day ERS-1/2 tandem interferometricpairs from July 1995 to April 1996 are processed with the Re-peat Orbit Interferometry Package (ROI-PAC) software fromthe Jet Propulsion Laboratory (JPL). This processor takes theprecise orbits from the Delft University, the Netherlands, intoaccount to remove the orbital fringes [3]. Moreover, a DTM isused by ROI-PAC software to estimate the topographic fringecomponent and remove it from the interferogram. After theROI-PAC topographic and orbital fringe removal, an adaptiveneighborhood filter has been applied to re-estimate the inter-ferometric phase and coherence [4].
A. Multi-date coherence analysis
To investigate the potential of ERS-1/2 tandem interfer-ometry all along the year, an analysis of the interferometriccoherence from July 1995 to April 1996 is proposed.
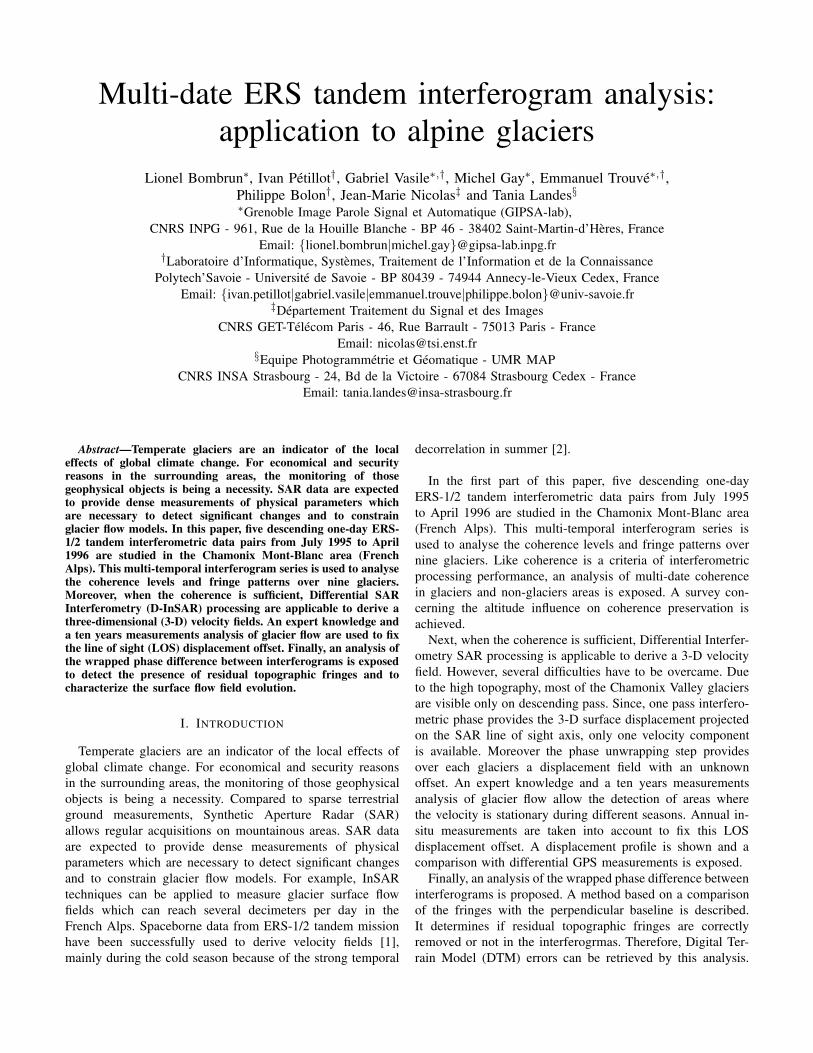
Among the five interferometric couples shown in Fig.1,the highest coherence is observed in March 1996. Indeed,almost 45% of the Argentiere glacier has a coherence greaterthan 0.5 (see table II). The couple of March has the smallestperpendicular baseline (B⊥ = 9m) (see table I). Moreover, theinterferograms acquired in winter show a better coherence thanthose acquired in the other seasons. Compared to March, the31 Dec.95/1 Jan.96 interferogram shows a loss of coherence.This loss is observed on glacier (2%) and non glacier (7%)areas. The large perpendicular baseline (B⊥ = 208m) causesa significant volume decorrelation, especially in the valleyforested areas. In warmer seasons (October and April), thecoherence is preserved only on the upper parts of the glaciers.Indeed, for low altitudes, the higher temperature leads to arelevant change of the glacier surface state and causes a loss
5km
(a) (b)
(c) (d)
(e)
Fig. 1. ERS-1/2 tandem interferograms over the Mer de Glace - Leschaux andArgentiere glaciers area (1024×1024 pixels). Coherence filtered by amplitudedriven adaptive neighborhood. (a) 9/10 Jul.95, (b) 22/23 Oct.95, (c) 31Dec.95/1 Jan.96, (d) 10/11 Mar.96, (e) 14/15 Apr.96
of the interferometric coherence. For the same reason, duringthe hot season, coherence is not preserved on the whole surfaceof the nine observed glaciers.
B. Influence of altitude on the interferometric coherence
In April 1996, coherence is preserved only on the upper partof the Argentiere glacier. 35% of the pixels have a coherencegreater than 0.5, whereas on the Mer de Glace/Leschauxglacier, only 1% of the pixels preserve the coherence. As thealtitude is higher on the top of Argentiere glacier than on theMer de Glace/Leschaux glacier, coherence preservation maybe dependent on glacier elevation. To investigate this relation,a Digital Terrain Model (DTM) has been used to build amask of visibility. This mask determines which regions arenot visible (foldover, shadow) on the ERS-1/2 images. Thenthe transformation from ground geometry to the SAR slant

2400 2500 2600 2700 2800 29000
0.2
0.4
0.6
0.8
1
Altitude (m)
Coh
eren
ce
July 95October 95December 95March 96April 96
(a)
0 1000 2000 3000 40000
0.2
0.4
0.6
0.8
1
Altitude (m)
Coh
eren
ce
July 95October 95December 95March 96April 96
(b)
Fig. 2. Influence of altitude on multi-date ERS-1/2 tandem interferometriccoherence. (a) on the Argentiere glacier, (b) on non glacier areas
range geometry is coded in a look up table which is used toconvert the mask of visibility and resample the DTM in slantrange. Only the visible regions are taken into account in theplot of the coherence as a function of altitude. Fig.2 showsthe average coherence as a function of the altitude on theArgentiere glacier (Fig.2(a)) and on non glacier areas (figure2(b)).
A low coherence can be observed in December 1995 (greenline) due to the large baseline of this interferometric pair.Although coherence is well preserved on July 1995 (blackline) on non glaciers areas, on the Argentiere glacier, thesignificant change of the glacier surface state in summer doesnot allow a coherence preservation. Note that in October 1995,March and April 1996, coherence increases with altitude onthe Argentiere glacier. The higher the glacier is, the morecoherence is preserved. This relation cannot be established onnon glacier areas because coherence varies a lot, with a strongeffect of the slope on high altitudes areas.
III. 3-D SURFACE DISPLACEMENT
When the coherence is sufficient, glacier displacement canbe monitored by Differential SAR Interferometry processing.Three-dimensional (3-D) velocity fields can be derived withERS 1-day interferograms from October 1995 to April 1996on most of the glaciers of the studied area.
The phase unwrapping step provides over each glaciers adisplacement field with an unknown offset. To fix this constant,
9.57 9.58 9.59 9.6 9.61 9.62 9.63 9.64
x 105
2.114
2.115
2.116
2.117
2.118
2.119
x 106
X axis (Lambert−2)
Y a
xis
(Lam
bert
−2)
Profile2
Profile7
Profile4
Profile5
15 cm/day
(a)
(b)
0 1000 2000 3000 4000 5000 6000 70000
5
10
15
20
25
30
35
Distance (m)
Vel
ocity
(cm
/day
)
22 & 23 October 199531 December 1995 & 1 january 199610 & 11 March 199614 & 15 April 1996In situ measurments
(c)
Fig. 3. Analysis of Argentiere glacier displacement: (a) Displacementvelocity field (red arrows), location of the annual measurements presentedin Fig. 3(b)) and position of the longitudinal profile (blue line) presented inFig. 3(c) , (b) Comparison of annual displacement from 1994 to 2004 at 4altitudes, (c) Longitudinal velocity profile from the upper part (2900m asl) upto profile 4 (2300m asl)
a common technique is to find a part of the glacier wherethe displacement is assume to be zero. Unfortunately, suchassumption cannot be done on the Argentiere glacier due tothe quite steep slope.
An expert knowledge and a ten year measurement analysisof glacier flow allow the detection of areas where the velocityis stationary during different seasons. Fig.3(b) shows the

annual displacement of the Argentiere glacier from 1994 to2004 at 4 altitudes. Note that at 2700m above sea level (asl)(profile7 on Fig.3(a)) the displacement is the same every year.Moreover an expert knowledge confirms that the displacementin this part of the glacier is stationary during different seasons.Consequently, an annual in situ measurements at 2700m aslcan be used to fix the one-day LOS displacement offset.
Since, one pass interferometric phase provides the 3-Dsurface displacement flow projected on the SAR LOS axis,only one velocity component is available. Thus, two commonassumptions are made to retrieve the 3-D surface displacementflow [5]:
• a flow parallel to the glacier surface.• a flow in the direction of maximum averaged downhill
slope.
Fig.3(c) shows a longitudinal displacement profile on theArgentiere glacier. The first cross is the only point used tofix the LOS offset. Note that near the reference point, the 1-day displacement is stationary. There isn’t much variation onthe displacement profile from October 1995 to April 1996.Annual in-situ measurements are in good agreements with thedisplacements obtained by interferometry. On the bottom ofthe Argentere glacier, the 1-day displacement varies more withthe date of acquisition. The fluctuations between March andApril 1996 velocities seems to confirm that the hypothesis ofa stationary area would not be valid in the lower part of thisglacier.
IV. ANALYSIS OF THE WRAPPED PHASE DIFFERENCE
BETWEEN DIFFERENTIAL INTERFEROGRAMS
In this section, a study of the temporal variation of D-InSARdisplacement fields is proposed. This analysis was achieved todetermine if all non-displacement fringes are removed fromthe interferograms. If Φi and Φj denote two one-day interfer-ograms acquired at date (i, i + 1) and (j, j + 1) respectively.The wrapped phase difference between interferograms ∆Φi−j
is defined as:
∆Φi−j = [Φi − Φj ] modulo 2π (1)
The two main sources of possible residual fringes in ∆Φi−j
are topographic fringes and atmospheric perturbations. First,an algorithm is proposed to detect the presence of residualfringes in ∆Φi−j . Next, a comparison of fringes pattern isachieved to determine if atmospheric fringes can be neglected.Finally, if non-displacement (topographic, tropospheric, ...)fringes are correctly removed or negligible in each one-day interferogram phase, ∆Φi−j allows a characterization ofsurface flow field evolution.
A. Residual topographic fringes
Fig.4 shows the wrapped phase difference between interfer-ograms on the Tour, Trient and Saleina glaciers at three dates.Residual fringes can be observed on the Trient glacier situatedon the North East of the image. If all non-displacement fringesare removed from the interferograms, it means that the Trientglacier displacement is not stationary all along the year. The
1km
(a)
(b)
(c)
Fig. 4. Wrapped phase difference between interferograms on the Tour, Trientand Saleina glaciers: (a) ∆ΦApril−March, (b) ∆ΦApril−December , (c)∆ΦApril−October
displacement changes a lot from October to April. In orderto see if these fringes correspond to displacement variation orresidual fringes, we propose to make a comparison betweenthe residual fringes observed on the Trient glacier and theperpendicular baseline differences.
Let Φitopo be the interferometric terms at date i correspond-
ing to topographic fringes, ie: fringes due to height variation∆z over the studied area. Φi
topo can be expressed as a functionof the orthogonal baseline at date i (Bi
⊥) by the followingequation as:
Φitopo =
4π
λ
Bi⊥
R1 sin θ∆z =
2π
eia
∆z (2)
with the altitude of ambiguity defined as:
eia =
λ
2R1 sin θ
Bi⊥
(3)
Next, the equivalent orthogonal baseline ∆Bij⊥ can be
defined as the difference of the two orthogonal baseline atdates i and j. Similarly, the equivalent altitude of ambiguity∆eij
a can be defined by Eq. (5):
∆Bij⊥ = Bi
⊥ − Bj⊥ (4)
∆eija =
λ
2R1 sin θ
Bi⊥ − Bj
⊥=
11ei
a− 1
eja
(5)
The equivalent topographic terms ∆Φijtopo in the wrapped
phase difference between interferograms at dates i and j canbe expressed by:
∆Φijtopo =
4π
λ
|Bi⊥ − Bj
⊥|R1 sin θ
∆z (6)
=2π
∆eija
∆z (7)
Let Nij(X, Y ) be the number of fringes observed on theinterferogram difference ∆Φi−j between two points X andY and ∆z(X, Y ) a height difference between X and Y .Nij(X, Y ) is assumed to be positive if the fringe varies fromthe white to black color. The hypothesis that the observedresidual fringes are linked to the topographic variations yieldsto:
∆Φijtopo = 2πNij(X, Y ) (8)
and by combining Eq. (7) and Eq. (8) to:
∆z(X, Y ) = Nij(X, Y )∆eija (9)
This allows us to test this hypothesis by checking if theproduct Nij(X, Y )∆eij
a is constant over the different interfer-ograms pairs (i,j).
Nij(X, Y )∆eija = Cte(X, Y ) ∀i, j (10)
In this case the constant Cte(X, Y ) can be interpreted as aheight difference ∆z(X, Y ) which is not correctly removedin the D-InSAR processing and probably due to DTM errors.In other words, the equivalent altitude of ambiguity ∆eij
a
multiplied by the number of fringes observed is an indicatorof the presence of residual topographic fringes.
The proposed method is applied on the four Tandem ERS-1/2 couples from October 1995 to April 1996. The followingERS parameters are used:
• R1 = 790 km• λ = 5.6 cm• θ = 23°
Table III shows the equivalent orthogonal baseline and theequivalent altitude of ambiguity for the six different pairs ofinterferograms where coherence is preserved on glaciers. Wecan observe that the parameter N∆ea is unchanged for allthe wrapped phase difference between interferograms on theTrient glacier. Therefore, according to Eq. (9) and results in
TABLE IIIDETECTION OF RESIDUAL TOPOGRAPHIC FRINGES IN INTERFEROGRAMS
datesDec. Mar. Mar. Apr. Apr. Apr.Oct. Dec. Oct. Mar. Dec. Oct.
∆B⊥ (m) 315 -199 116 84 -115 200∆ea (m) 27 -43 74 103 -75 43
N 3 -2 1 < 1 -1 2N∆ea (m) 81 86 74 < 103 75 86
table III, we can conclude that topographic fringes are notwell removed on the Trient glacier probably because of theinsufficient precision of the DTM on the Trient glacier whichis located in Switzerland.
B. Atmospheric perturbations
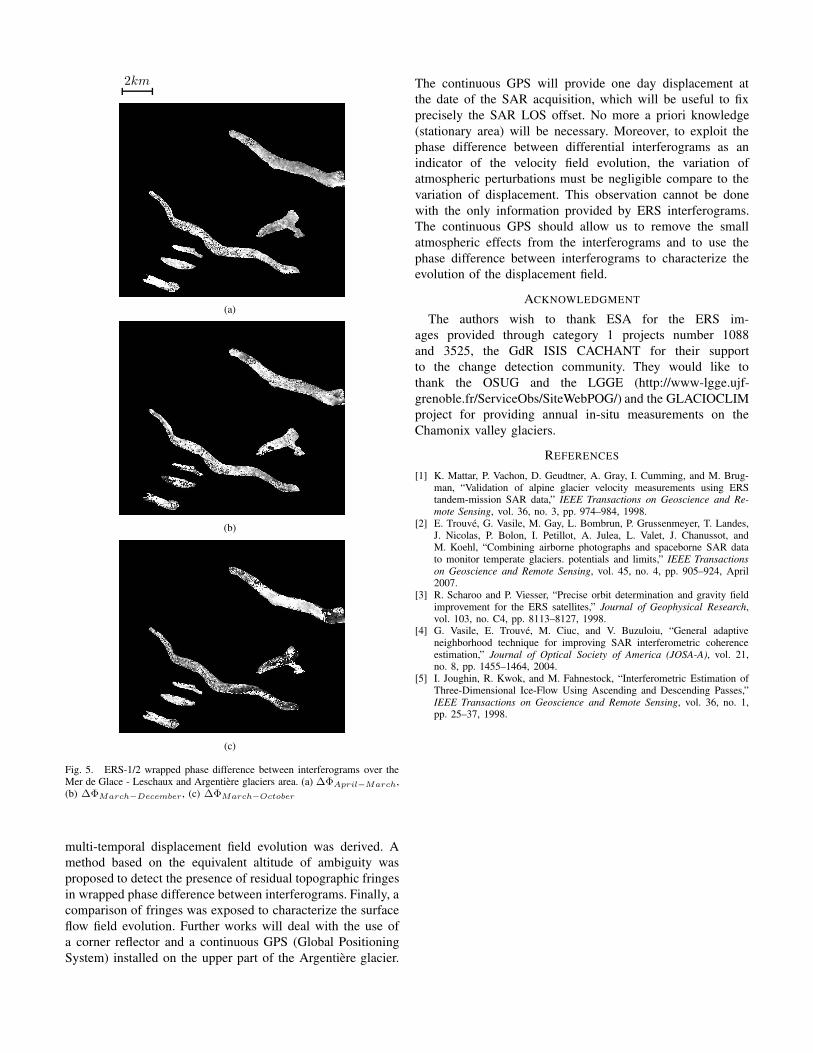
A second possible source of variation of D-InSAR fringepattern is the presence of atmospheric perturbations. Fig.5shows the wrapped phase difference between interferogramsover the Mer de Glace - Leschaux and Argentiere glaciers.As no residual fringe pattern are observable on the wrappedphase difference between interferograms, the studied glaciersare apparently not affected by global atmospheric changes[2]. Moreover, the glacier surfaces are rather small comparedto a full ERS image and the path delay variation betweendue to saturation water vapor pressure less important withwinter temperature (close or below 0 degree in this area).Accordingly, we can conclude that at first order, atmosphericperturbations are negligible compared to glacier displacement..
Once the topographic fringes are removed and atmosphericfringes neglected, ∆Φi−j allows a characterization of surfaceflow field time evolution. Note that for two consecutiveinterferograms pair (April and March in Fig.5(a)), the wrappedphase difference is closed to zero and slightly increases withthe time interval of the two interferograms (using March-December Fig.5(b) and March-October Fig.5(c) interfero-grams). Moreover, no residual fringes can be observed at thestationary area on Argentiere glacier define on section III. Itseems that at 2700m asl, the displacement is the same duringthe seasons.
Nevertheless, a precise characterization of the flow fieldevolution can be done only if topographic fringes are correctlyremoved from the interferograms and atmospheric fringestotally negligible. As topographic fringes are directly relatedwith the altitude of the glacier and the glacier surface varieswith time, a DEM at the date of acquisition should be used.Moreover, meteorological in situ measurements should beacquired at the date of the satellite acquisition to determine ifinterferograms are affected by tropospheric perturbations.
V. CONCLUSION
A multi-date ERS tandem interferogram analysis was car-ried out over glaciers and non glaciers areas in the Alps. Thisstudy shows when InSAR processings can be used to monitortemperate glaciers. A comparison of interferometric coherencepreservation as a function of altitude was exposed. Thanks tothe knowledge of a stable area over the Argentiere glacier, a
2km
(a)
(b)
(c)
Fig. 5. ERS-1/2 wrapped phase difference between interferograms over theMer de Glace - Leschaux and Argentiere glaciers area. (a) ∆ΦApril−March,(b) ∆ΦMarch−December , (c) ∆ΦMarch−October
multi-temporal displacement field evolution was derived. Amethod based on the equivalent altitude of ambiguity wasproposed to detect the presence of residual topographic fringesin wrapped phase difference between interferograms. Finally, acomparison of fringes was exposed to characterize the surfaceflow field evolution. Further works will deal with the use ofa corner reflector and a continuous GPS (Global PositioningSystem) installed on the upper part of the Argentiere glacier.
The continuous GPS will provide one day displacement atthe date of the SAR acquisition, which will be useful to fixprecisely the SAR LOS offset. No more a priori knowledge(stationary area) will be necessary. Moreover, to exploit thephase difference between differential interferograms as anindicator of the velocity field evolution, the variation ofatmospheric perturbations must be negligible compare to thevariation of displacement. This observation cannot be donewith the only information provided by ERS interferograms.The continuous GPS should allow us to remove the smallatmospheric effects from the interferograms and to use thephase difference between interferograms to characterize theevolution of the displacement field.
ACKNOWLEDGMENT
The authors wish to thank ESA for the ERS im-ages provided through category 1 projects number 1088and 3525, the GdR ISIS CACHANT for their supportto the change detection community. They would like tothank the OSUG and the LGGE (http://www-lgge.ujf-grenoble.fr/ServiceObs/SiteWebPOG/) and the GLACIOCLIMproject for providing annual in-situ measurements on theChamonix valley glaciers.
REFERENCES
[1] K. Mattar, P. Vachon, D. Geudtner, A. Gray, I. Cumming, and M. Brug-man, “Validation of alpine glacier velocity measurements using ERStandem-mission SAR data,” IEEE Transactions on Geoscience and Re-mote Sensing, vol. 36, no. 3, pp. 974–984, 1998.
[2] E. Trouve, G. Vasile, M. Gay, L. Bombrun, P. Grussenmeyer, T. Landes,J. Nicolas, P. Bolon, I. Petillot, A. Julea, L. Valet, J. Chanussot, andM. Koehl, “Combining airborne photographs and spaceborne SAR datato monitor temperate glaciers. potentials and limits,” IEEE Transactionson Geoscience and Remote Sensing, vol. 45, no. 4, pp. 905–924, April2007.
[3] R. Scharoo and P. Viesser, “Precise orbit determination and gravity fieldimprovement for the ERS satellites,” Journal of Geophysical Research,vol. 103, no. C4, pp. 8113–8127, 1998.
[4] G. Vasile, E. Trouve, M. Ciuc, and V. Buzuloiu, “General adaptiveneighborhood technique for improving SAR interferometric coherenceestimation,” Journal of Optical Society of America (JOSA-A), vol. 21,no. 8, pp. 1455–1464, 2004.
[5] I. Joughin, R. Kwok, and M. Fahnestock, “Interferometric Estimation ofThree-Dimensional Ice-Flow Using Ascending and Descending Passes,”IEEE Transactions on Geoscience and Remote Sensing, vol. 36, no. 1,pp. 25–37, 1998.


