Embed Size (px)
Citation preview

Monitoring South Florida Wetlands Using ERS-1 SAR Imagery
Eric S. Kasischke and Laura L. Bourgeau-Chavez
Abstract This study evaluates the utility of synthetic aperture radar (SAR) imagery collected by the ERS-1 satellite for monitoring wetland vegetation communities in southwestern Florida. Two images were analyzed, one collected at the end of the dry season in April 1994 and one collected at the end of the wet season in October 1994. The range of image intensity values from the different test sites varied by a factor of 6.2 (7.9 dB) on the dry season ERS-I SAR image and by a factor of 2.6 (4.1 dB) for the wet season ERS-1 SAR image. The re- sults from the radar observations were found to be consistent with theoretical micro wave scattering models that predict variations in backscatter as a function of vegetation struc- ture, soil moisture, surface roughness, and the presence or absence of standing water. Both the radar data and models show that, in wetlands dominated by herbaceous vegetation, the presence of standing water results in a decrease in back- scatter. Conversely, in wetlands with woody plants (trees and shrubs), the radar data and models show that the presence of water results in an increase in backscatter. The results of this study illustrate that radar imagery is uniquely suited to detect and monitor changes in soil moisture, flooding, and aboveground biomass in these wetland ecosystems.
Introduction Wetland ecosystems represent an important natural resource and provide benefits to the environment in several ways. Wetlands provide (1) natural filtering systems for purification of water; (2) breeding sites for a variety of insect, amphibian, fish, and animal species; and (3) natural buffers to floods and shoreline erosion. Between 1780 and 1980 the conterminous U.S. lost 53 percent of its wetlands mainly due to land con- version (Dahl, 1990).
Remote sensing techniques are widely used to map and monitor wetlands. Aerial photography is commonly used for the discrimination of different vegetation types within wet- lands, (Shima et al., 1976; Howland 1980; Niedzwiedz and Batie, 1984). Because of the high level of specificity required about location and vegetation classification, the National Wetland Inventory uses manual interpretation of low-alti- tude, false-color infrared aerial photography as a basis for their wetland maps (U.S. Fish & Wildlife Service, 1990; 1994). In contrast, the NOAA Coastal Change Analysis Pro- gram and others have developed approaches to use Landsat imagery from the visible and near-infrared regions of the electromagnetic spectrum to automatically classify and map wetlands and wetland change (Dobson et al., 1995a; Jensen et al., 1993; Jensen et al., 1995; Rutchey and Vilcheck 1994). Digital multiband data in the visible and near-infrared region of the electromagnetic spectrum also offer the potential to develop quantitative estimates of wetland biomass (Hardisky
Environmental Research Institute of Michigan (ERIM), P.O. Box 134001, Ann Arbor, MI 48113-4001.
et al., 1984). The efficacy of satellite data is improved signifi- cantly if they are combined with other sources of spatial in- formation in geographic information systems (Federal Geographic Data Committee, 1992).
Recent launches of several spaceborne imaging radar systems (ERS-1 in 1991, ERS-2 in 1995, JERS-1 in 1992, and Ra- darsat in 1995) provide new spaceborne sources of data for monitoring wetlands. Information available from imaging ra- dars is inherently different than that derived from other sat- ellite systems such as the Landsat, SPOT, and IRS sensors which operate in the visible and near-infrared regions of the electromagnetic spectrum.
Imaging radars have three characteristics which make them unique. First, the microwave energy transmitted by ra- dars to a large extent penetrates the vegetation canopy, and much of the backscattered energy detected by radars is a re- sult of electromagnetic interactions at the ground layer. Sec- ond, the reflection of microwave energy from vegetated terrain is highly dependent on the dielectric constant of the vegetation and surface layers. The presence or absence of water in wetlands (which has a much higher dielectric con- stant than dry or wet soil) significantly alters the signatures detected from these areas. A third important characteristic of imaging radars is their ability to operate independent of cloud cover and solar illumination. These systems can col- lect imagery during periods of rain and cloud cover, and therefore can monitor wetlands throughout periods when sig- nificant levels of precipitation are affecting water levels and vegetation growth patterns. These are capabilities not avail- able with visible and near-infrared spectrum sensors.
The goal of the research presented in this paper was to evaluate the utility of imagery collected by the ERS-1 syn- thetic aperture radar (SAR) for monitoring the hydrologic state (e.g., the presence or absence of water) of wetland eco- systems located in southwestern Florida. The ERs-1 SAR is a C-band system (5.7-cm wavelength) which transmits and receives vertically polarized microwave electromagnetic en- ergy. To achieve the goal of the study, two objectives were addressed: (1) to determine if there are differences in back- scatter in different wetland ecosystems in ERS-1 data col- lected during the wet and dry seasons; and (2) to determine if the observed differences in backscatter matched those pre- dicted by theoretical microwave scattering models.
This paper is organized in six sections, including this in- troduction. The next section presents basic formulations de- scribing microwave scattering from vegetated surfaces. These formulations are used to illustrate how the presence or ab- sence of surface water in wetlands affects the signatures de-
Photogrammetric Engineering & Remote Sensing, Vol. 63, No. 3 , March 1997, pp. 281-291.
0099-1112/97/6303-281$3.00/0 O 1997 American Society for Photogrammetry
aud Remote Sensing
PE&RS March 1997

tected by the ERS-1 SAR in the third section. The fourth sec- tion summarizes the technical approach, including a descrip- tion of the test sites and the data sets and data analysis methods used in this study. The fifth section presents the re- sults, and the final section the conclusions.
Radar Imaging of Vegetated Surfaces Understanding the capabilities of imaging radars to map wet- land ecosystems requires a basic knowledge of microwave scattering from vegetated surfaces. The fundamental charac- teristic recorded on a radar image is the spatial variation in the radar scattering coefficient, a". To understand radar scat- tering from complex vegetation covers, it is necessary to think in terms of the different canopy layers affecting the ra- dar signature. For wetlands containing shrubs and trees, there are three distinct layers to consider (Figure la): (1) a canopy layer which consists of small branches and foliage; (2) a trunk layer which consists of large branches and trunks or boles; and (3) a surface layer, which may or may not be covered by water.
For wetlands which do not contain woody plants, a sim- pler two-layer model can be used (Figure lb): (1) a canopy layer consisting of herbaceous vegetation; and (2) a surface layer, which may or may not be covered by water.
In the interaction of microwave energy with vegetated surfaces, the canopy and trunk layers function in two dis- tinctly different ways. First, they are direct sources of scatter- ing of microwave energy. And second, the components of these layers absorb or attenuate microwave energy.
The total radar scattering coefficient from woody vegeta- tion, uO,-,, can be expressed after Wang et al. (1994; 1995a) and Dobson et al. (1995b) as
where
a", is the backscatter coefficient of the crown layer of smaller woody branches and foliage,
T, is the transmission coefficient of the vegetation canopy, T~ is the transmission coefficient of the trunk layer, a", is multiple-path scattering between the ground and canopy
layer, a", is direct scattering from the tree trunks, (TO, is direct surface backscatter from the ground, and uod is double-bounce scattering between the trunks and
ground.
In terms of the total radar scattering coefficient from wetlands with non-woody, herbaceous vegetation, a",-,, by eliminating all terms pertaining to the trunk layer, Equation 1 can be simplified to
The various terms in Equations 1 and 2 are not only de- pendent on the types of vegetation present in a wetland, but also on the wavelength and polarizations of the incident mi- crowave radiation, and the dielectric constant of the vegeta- tion and the ground surface. The scattering and attenuation terms in Equations 1 and 2 are all directly proportional to the dielectric constant. Live vegetation, with a higher water content, has a higher dielectric constant than drier, dead veg- etation. The presence of dew or moisture from rainfall acts to increase the dielectric constant of vegetation surfaces.
The condition of the ground layer is very important in microwave scattering from vegetated surfaces. There are two properties of this layer which are important: the RMS surface roughness (relative to the radar wavelength) and the reflec- tion coefficient. In general, a greater RMS surface roughness (1) increases the amount of microwave energy backscattered (increasing a", ) and (2) decreases the amount of energy scat-
a. Woody Vegetation
0"i OD. aD* 0". 0". e m
canopy
malt
surface
-0PY
surface
Figure 1. Schematic drawing of major sources of scatter- ing from vegetation canopies (a0, = canopy backscatter; uO, = ground-trunk backscatter; uO, = ground-canopy backscatter; a", = ground-surface backscatter; uO, = di- rect trunk scattering).
b. Non - Woody Vegetation
tered in the forward direction (decreasing a", and uO, ). The reflection coefficient is dependent on the dielectric constant (or conductivity) of the ground layer. A dry ground layer has a low dielectric constant and therefore has a low reflection coefficient. As soil moisture increases, so does the dielectric constant and, hence, the reflection coefficient. Given a con- stant RMS surface roughness, as the soil dielectric constant increases, so does both the amount of backscattered and for- ward scattered microwave energy (resulting in increases in uO,, uom, and uO, ).
Finally, the presence of a layer of water over the ground surface of a vegetated landscape has two results: (1) it elimi- nates virtually any RMS surface roughness and (2) it signifi- cantly increases the reflection coefficient. In terms of micro- wave scattering: (1) the elimination of any RMS surface roughness means that all the energy is forward scattered, eliminating the surface backscattering term (uO,) in Equations 1 and 2; and (2) the increased forward scattering and higher reflection coefficient lead to significant increases in the ground-trunk and ground-canopy interaction terms (a0, and a",, respectively).
The approaches used to actually calculate the various terms in Equations 1 and 2 are quite complex and beyond the scope of this paper. Those desiring a more theoretical de- scription of microwave scattering from vegetated surfaces are referred to Wang et a]. (1994; 1995a; 1995b).
Monitoring Wetlands Using ERS-1 SAR Imagery The relative strength of the increase or decrease in a" when surface water is present or absent is dependent on both scene and radar system parameters. In general, the presence
March 1997 PE&RS
of water under a plant canopy increases radar backscatter from wetlands with woody vegetation and decreases radar backscatter from wetlands with non-woody (herbaceous) veg- etation. In this section, the effects of variations in surface (vegetation and ground-layer) conditions on the radar back- scatter detected by the ERS-1 SAR are illustrated through pre- sentation of results from theoretical backscatter models and results from previous studies of wetland ecosystems.
Wetlands with Non-Woody Vegetation Tanis et a]. (1994) studied multi-temporal ERS-1 SAR imagery collected over tidally inundated salt marshes in the St. Marks National Wildlife Refuge, Florida. This wildlife refuge is loc- ated on the gulf coast of northern Florida, just south of Talla- hassee. The vegetation of many of the non-woody wetlands in this salt marsh is similar to that found in the test sites of southwest Florida used in this study.
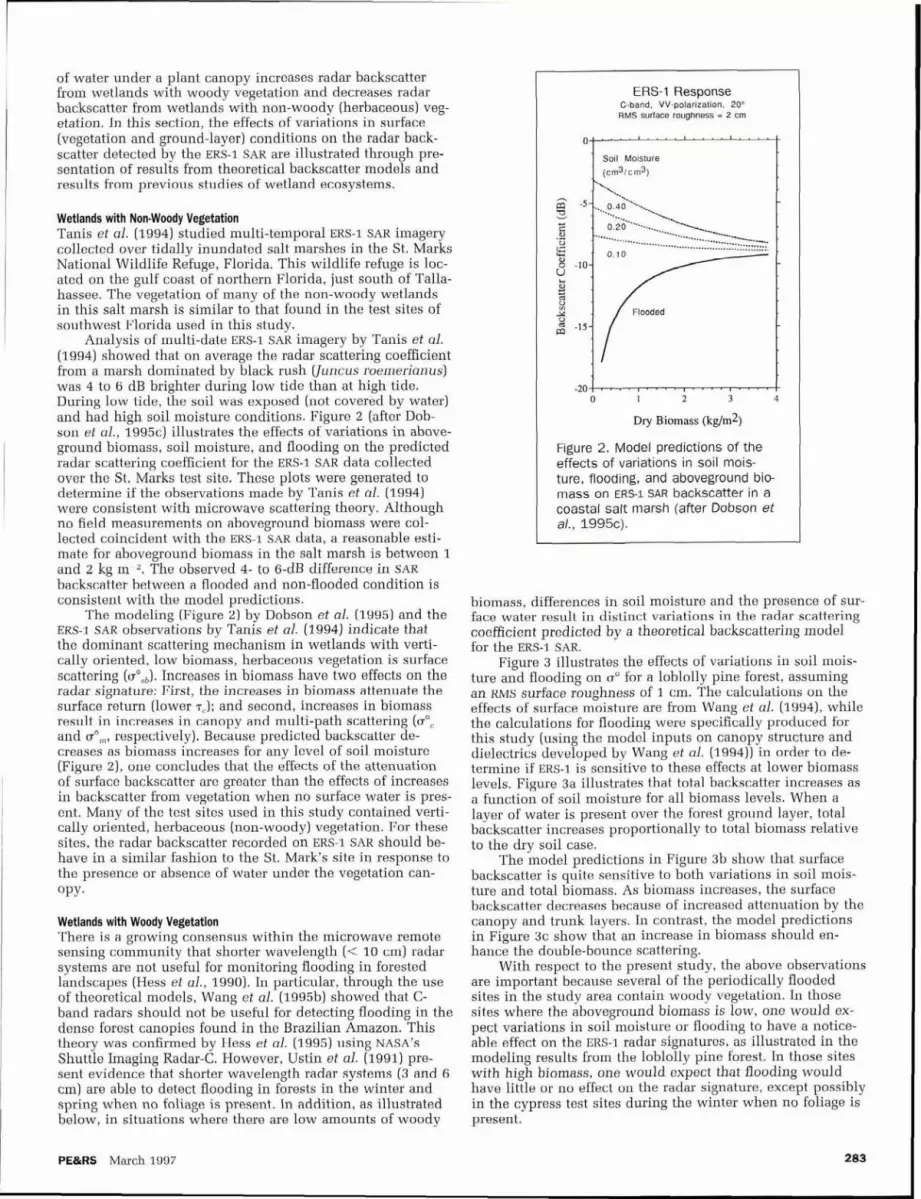
Analysis of multi-date ERS-1 SAR imagery by Tanis et a]. (1994) showed that on average the radar scattering coefficient from a marsh dominated by black rush (Juncus roemerianus) was 4 to 6 dB brighter during low tide than at high tide. During low tide, the soil was exposed (not covered by water) and had high soil moisture conditions. Figure 2 (after Dob- son et al., 1995c) illustrates the effects of variations in above- ground biomass, soil moisture, and flooding on the predicted radar scattering coefficient for the ERS-1 SAR data collected over the St. Marks test site. These plots were generated to determine if the observations made by Tanis et al. (1994) were consistent with microwave scattering theory. Although no field measurements on aboveground biomass were col- lected coincident with the ERS-1 SAR data, a reasonable esti- mate for aboveground biomass in the salt marsh is between 1 and 2 kg m-2. The observed 4- to 6-dB difference in SAR backscatter between a flooded and non-flooded condition is consistent with the model predictions.
The modeling (Figure 2) by Dobson et al. (1995) and the ERS-1 SAR observations by Tanis et a]. (1994) indicate that the dominant scattering mechanism in wetlands with verti- cally oriented, low biomass, herbaceous vegetation is surface scattering (a0,,). Increases in biomass have two effects on the radar signature: First, the increases in biomass attenuate the surface return (lower 7,); and second, increases in biomass result in increases in canopy and multi-path scattering (a0, and a",, respectively). Because predicted backscatter de- creases as biomass increases for any level of soil moisture (Figure 2), one concludes that the effects of the attenuation of surface backscatter are greater than the effects of increases in backscatter from vegetation when no surface water is pres- ent. Many of the test sites used in this study contained verti- cally oriented, herbaceous (non-woody) vegetation. For these sites, the radar backscatter recorded on ERS-1 SAR should be- have in a similar fashion to the St. Mark's site in response to the presence or absence of water under the vegetation can- opy.
Wetlands with Woody Vegetation There is a growing consensus within the microwave remote sensing community that shorter wavelength (< 10 cm) radar systems are not useful for monitoring flooding in forested landscapes (Hess et al., 1990). In particular, through the use of theoretical models, Wang et al. (1995b) showed that C- band radars should not be useful for detecting flooding in the dense forest canopies found in the Brazilian Amazon. This theory was confirmed by Hess et al. (1995) using NASA's Shuttle Imaging Radar-C. However, Ustin et al. (1991) pre- sent evidence that shorter wavelength radar systems (3 and 6 cm) are able to detect flooding in forests in the winter and spring when no foliage is present. In addition, as illustrated below, in situations where there are low amounts of woody
ERS-1 Response C-band. VV-polarization. 20' RMS surface roughness = 2 cm
1 Soil Mo~sture (cm31cm3)
Dry Biomass (kg/m2) I I
Figure 2. Model predictions of the effects of variations in soil mois- ture, flooding, and aboveground bio- mass on E R S 1 SAR backscatter in a coastal salt marsh (after Dobson et a/., 1995~) .
biomass, differences in soil moisture and the presence of sur- face water result in distinct variations in the radar scattering coefficient predicted by a theoretical backscattering model for the ERS-1 SAR.
Figure 3 illustrates the effects of variations in soil mois- ture and flooding on u" for a loblolly pine forest, assuming an RMS surface roughness of 1 cm. The calculations on the effects of surface moisture are from Wang et al. (1994), while the calculations for flooding were specifically produced for this study (using the model inputs on canopy structure and dielectrics developed by Wang et al. (1994)) in order to de- termine if ERS-1 is sensitive to these effects at lower biomass levels. Figure 3a illustrates that total backscatter increases as a function of soil moisture for all biomass levels. When a layer of water is present over the forest ground layer, total backscatter increases proportionally to total biomass relative to the dry soil case.
The model predictions in Figure 3b show that surface backscatter is quite sensitive to both variations in soil mois- ture and total biomass. As biomass increases, the surface backscatter decreases because of increased attenuation by the canopy and trunk layers. In contrast, the model predictions in Figure 3c show that an increase in biomass should en- hance the double-bounce scattering.
With respect to the present study, the above observations are important because several of the periodically flooded sites in the study area contain woody vegetation. In those sites where the aboveground biomass is low, one would ex- pect variations in soil moisture or flooding to have a notice- able effect on the ERS-1 radar signatures, as illustrated in the modeling results from the loblolly pine forest. In those sites with high biomass, one would expect that flooding would have little or no effect on the radar signature, except possibly in the cypress test sites during the winter when no foliage is present.
PE&RS March 1997 283 !

a. total backscatter -. - 7
.- -- u- .A I -*--. - *- --+, yr-. * 3 -10 1 --- - L 3 ~
I 8 -15 i I i I I ~
W $*I $ 4 5 4 I
I . I-? -40 C--
i I
0 1 2 3 4 5 6 pine biomass (kg/ sq m)
--7
j v = m + mv=15%+ m v = s ~ * f l o o d * ( ~1
b. surface backscatter
1 1
-- ; -20 \-~---* 8 -25 i
40 TI- r -.- ---
0 1 2 3 4 5 6 pine biomass (kg/ sq m)
c. ground-trunk backscatter 0 r-
.-
p -35
-40 .-.- - --- -
0 1 2 3 4 5 6 pine blomass (kg1 sq m)
-.
1 t mv=O% - mv=15% -s mv=50% +- flooded -. .- --I
Figure 3. Model predictions on the effects of variations in soil moisture, flooding, and aboveground biomass on ERS- 1 SAR backscatter in a young loblolly pine forest. (a) Total backscatter. (b) Relative contribution of surface backscat- ter (ao,). (c) Relative contribution of ground-trunk back- scatter (ao,).
Experimental Approach
Study Site The test site for this study is a region of southwestern Flor- ida located immediately south of the east-west line connect- ing Naples and Fort Lauderdale (Figure 4). This region con- tains numerous wetland ecosystems. It has a subtropical cli- mate, with a distinct wet season in the summer and early fall and a dry season from October through April or May. The average annual precipitation for this region is approximately 140 cm, with 60 percent falling between June and Septem- ber. The shallow aquifers in the study area quickly saturate during the rainy season; therefore, most of the water is drained from the land through overland flow.
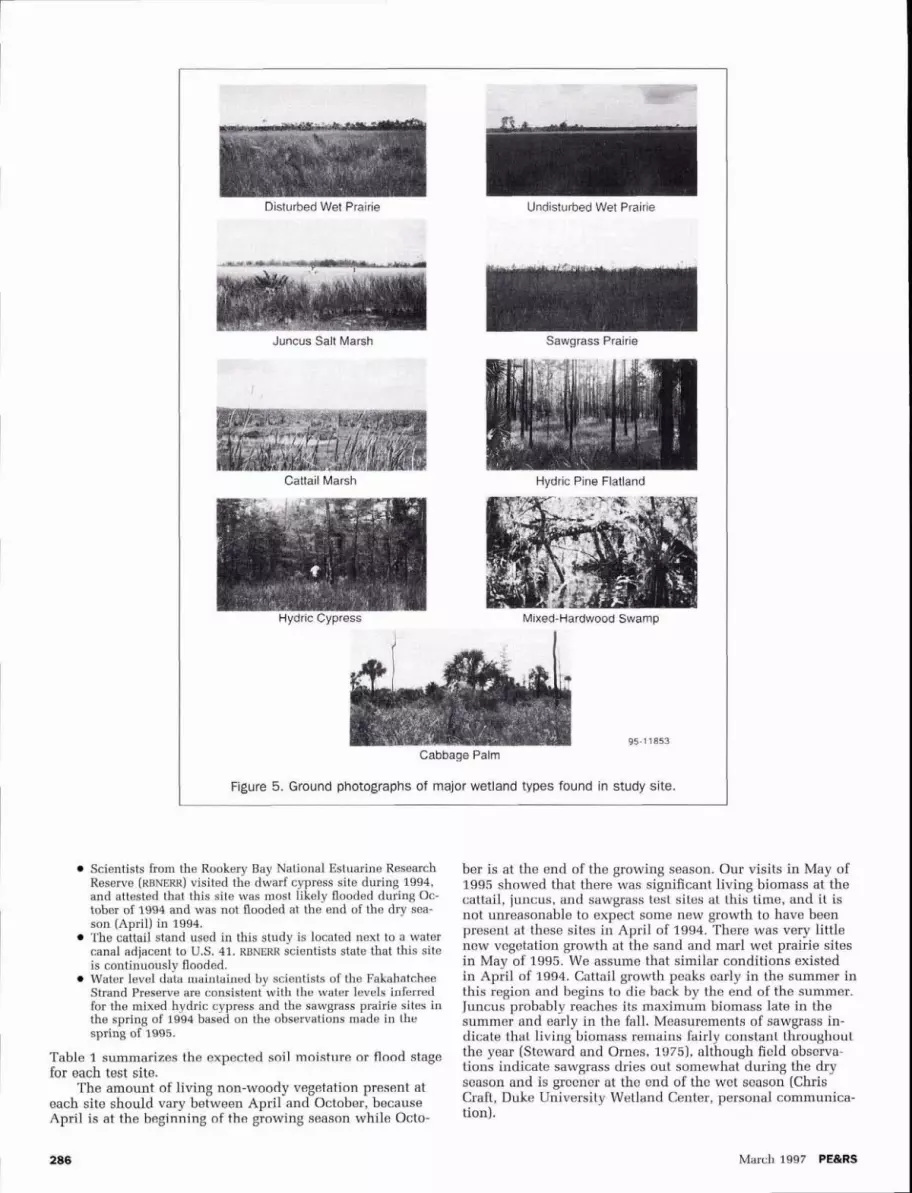
This study focused on ten different vegetation cover types common to this region. Photos of all sites except the Dwarf Cypress are presented in Figure 5. Because the Dwarf Cypress Site was in a remote location, it was not possible to obtain a surface photograph. The sites were located within areas which were relatively undisturbed (e.g., the western portion of the Big Cypress National Preserve, the Faka- hatchee Strand Preserve (state), and the Collier Seminole State Park), as well as areas which have undergone heavy human disturbance over the past two decades. The disturbed sites were located in an area called the South Golden Gate Estates Development. An extensive road and canal network had been established in this region in the early 1970s with the intent of developing home sites. The natural drainage patterns have been significantly altered in this region, and even though flooding does occur in some areas during the rainy season, the sites in this area are typically more well drained during the dry season.
The test sites used in this study included
(1) An undisturbed brackish marsh dominated by black rush (Juncus roemerianus);
(2) An undisturbed wet prairie dominated by sawgrass (Clad- ium jamaicense);
(3) A disturbed wet prairie dominated by grasses and other low stature herbaceous vegetation with sandy soils that dry completely during the dry season and become flooded only during extremely wet conditions (this site is referred to as the sand wet prairie);
(4) An undisturbed wet prairie dominated by grasses and other low stature herbaceous vegetation with a marl soil, which remains fairly moist even during the dry season and floods during the wet season (this site is referred to as the marl wet prairie site);
(5) An undisturbed cattail marsh (Typhus latifolia); (6) An undisturbed hydric pine flatland which has an open
canopy of slash pine (Pinus elliottii) with low shrubs and a ground layer of grasses and other herbaceous plants;
(7) A relatively undisturbed, mixed-hardwood swamp forest which was once dominated by cypress (Taxodium disti- chum L), but after logging, other hardwood species have invaded these forests, including red maple (Acer rubrum), willow (Salix sp.), ash (Fraxinus sp.), swamp bay (Magno- lia virginiana), and holly (Ilex cassine);
(8) An undisturbed, cypress forest which remains flooded throughout most of the wet and dry seasons (hydric cy- press);
(9) A relatively undisturbed dwarf cypress forest which remains mostly flooded throughout the wet and dry sea- sons; and
(10) A disturbed site dominated by shrubs and cabbage palm (Sabal palmetto]. Because this site remains unflooded through both thk wet and dry seasons, it is not a forested wetland. It was included to examine the effects of varia- tions in soil moisture on an open-forest site.
ERS-1 Data Analysis The ERS-1 SAR imagery used in this study were collected on 28 April 1994 during the dry season and 13 October 1994 at
March 1997 PE&RS
Southwestern fl
Southwestern Florida Hydroperiod Study Sites Site 1- Juncus Salt Marsh Site 5- Cattail Marsh Site 9- Dwarf Cypress Site 2- Sawgrass Prairie Site 6- Hydric Pine Site 10- Cabbage Palm
Site 3- Sand Wet Prairie Site 7- Mixed Hardwood mW)X 5 KM ,/,
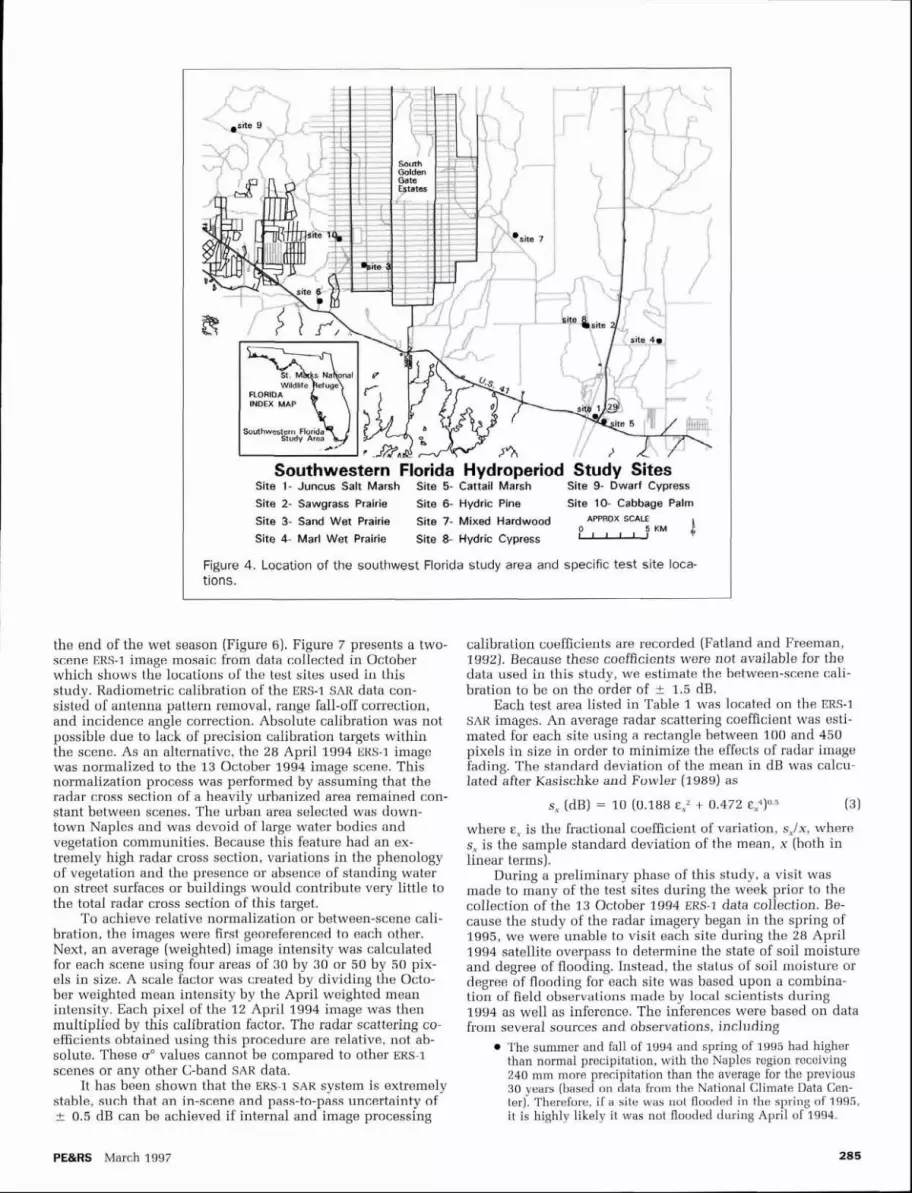
Site 4- Marl Wet Prairie Site 8- Hydric Cypress - Figure 4. Location of the southwest Florida study area and specific test site loca- tions.
the end of the wet season (Figure 6). Figure 7 presents a two- calibration coefficients are recorded (Fatland and Freeman, scene ERS-1 image mosaic from data collected in October 1992). Because these coefficients were not available for the which shows the locations of the test sites used in this data used in this study, we estimate the between-scene cali- study. Radiometric calibration of the ERS-1 SAR data con- bration to be on the order of + 1.5 dB. sisted of antenna pattern removal, range fall-off correction, Each test area listed in Table 1 was located on the ERS-1 and incidence angle correction Absolute calibration was not SAR images. An average radar scattering coefficient was esti- possible due to lack of precision calibration targets within mated for each site using a rectangle between 100 and 450 the scene. As an alternative, the 28 April 1994 ERS-1 image pixels in size in order to minimize the effects of radar image was normalized to the 1 3 October 1994 image scene. This fading. The standard deviation of the mean in dB was calcu- normalization process was performed by assuming that the lated after Kasischke and Fowler (1989) as radar cross section of a heavily urbanized area remained con- stant between scenes. The urban area selected was down- s, (dB) = 10 (0.188 E , ~ + 0.472 & , 4 ) 0 5 (3)
town Naples and was devoid of large water bodies and where E, is the fractional coefficient of variation, s,lx, where vegetation communities. Because this feature had an ex- s, is the sample standard deviation of the mean, x (both in tremely high radar cross section, variations in the phenology linear terms). of vegetation and the presence or absence of standing water During a preliminary phase of this study, a visit was on street surfaces or buildings would contribute very little to made to many of the test sites during the week prior to the the total radar cross section of this target. collection of the 13 October 1994 ERS-1 data collection. Be-
TO achieve relative normalization or between-scene cali- cause the study of the radar imagery began in the spring of bration, the images were first georeferenced to each other. 1995, we were unable to visit each site during the 28 April Next, an average (weighted) image intensity was calculated 1994 satellite overpass to determine the state of soil moisture for each scene using four areas of 30 by 30 or 50 by 50 pix- and degree of flooding. Instead, the status of soil moisture or els in size. A scale factor was created by dividing the Octo- degree of flooding for each site was based upon a combina- ber weighted mean intensity by the April weighted mean tion of field observations made by local scientists during intensity. Each pixel of the 12 April 1994 image was then 1994 as well as inference. The inferences were based on data multiplied by this calibration factor. The radar scattering CO- from several sources and observations, including efficients obtained using this procedure are relative, not ab- The summer and fall of 1994 and spring of 1995 had higher solute. These a" values cannot be compared to other ERS-1 than normal precipitation, with the Naples region receiving scenes or any other C-band SAR data. 240 mm more precipitation than the average for the previous
It has been shown that the ERS-1 SAR system is extremely 30 years (based on data from the National Climate Data Cen- stable, such that an in-scene and pass-to-pass uncertainty of ter). Therefore, if a site was not flooded in the spring of 1995, + 0.5 dB can be achieved if internal and image processing it is highly likely it was not flooded during April of 1994.
PE&RS March 1997
Juncus Salt Marsh Sawgrass Prairie I
Cattail Marsh Hydric Pine Flatland I
Hydric Cypress Mixed-Hardwood Swamp
Scientists from the Rookery Bay National Estuarine Research Reserve (RBNERR) visited the dwarf cypress site during 1994, and attested that this site was most likely flooded during Oc- tober of 1994 and was not flooded at the end of the dry sea- son (April) in 1994. The cattail stand used in this study is located next to a water canal adjacent to U.S. 41. RBNERR scientists state that this site is continuously flooded. Water level data maintained by scientists of the Fakahatchee Strand Preserve are consistent with the water levels inferred for the mixed hydric cypress and the sawgrass prairie sites in the spring of 1994 based on the observations made in the spring of 1995.
Table 1 summarizes the expected soil moisture or flood stage for each test site.
The amount of living non-woody vegetation present at each site should vary between April and October, because April is at the beginning of the growing season while Octo-
ber is at the end of the growing season. Our visits in May of 1995 showed that there was significant living biomass at the cattail, juncus, and sawgrass test sites at this time, and it is not unreasonable to expect some new growth to have been present at these sites in April of 1994. There was very little new vegetation growth at the sand and marl wet prairie sites in May of 1995. We assume that similar conditions existed in April of 1994. Cattail growth peaks early in the summer in this region and begins to die back by the end of the summer. Juncus probably reaches its maximum biomass late in the summer and early in the fall. Measurements of sawgrass in- dicate that living biomass remains fairly constant throughout the year [Steward and Ornes, 1975), although field observa- tions indicate sawgrass dries out somewhat during the dry season and is greener at the end of the wet season (Chris Craft, Duke University Wetland Center, personal communica- tion).
March 1997 PE&RS

13 October 1994 ERS-1 Image 28 April 1994 ERS-1 Image
d'
g: 7
i;; : 9 m 8 K V ) C m (D n 2 3 E 9 $
66.2 km f N F~gure 6. ERS-I SAR ~mages collected durlng the wet (13 October 1994) and dry (28 Aprll 1994) seasons.
Figure 7 . ERS-1 SAR image mosaic of south Florida region collected on October 1994 with locations of the test sites.
PE&RS March 1997

TABLE 1. OBSERVED/PREDICTED SOIL MOISTURE/FLOODING STATUS OF SOUTH FLORIDA TEST SITES
Site April 1994 October 1994
1. juncus prairie flooded' flooded. 2. sawgrass prairie flooded' flooded. 3 . sand wet prairie dry soil' wet soil" 4. marl wet prairie saturated soil' flooded' 5. cattail marsh flooded1 flooded. 6. hydric pine wet soil' floode& 7. mixed hardwood swamp flooded. flooded. 8. hydric cypress partially flooded' floode+ 9. dwarf cypress partially flooded' flooded'
10. cabbage palm dry soili wet soik
.status of water level derived from actual observations 'status of water level derived from inference
Results In interpreting the results from this study, the limitations of the experimental design need to be acknowledged. First and foremost is the lack of coincident ground-truth for the April 1994 image. Second, while the sizes of the individual test sites were large, it would be desirable to have several more replicates for each cover type in order to determine the de- gree of site-to-site variability which exists in the radar signa- tures. Both of these concerns are being addressed in the ongoing research in the southwest Florida region.
Variations in Radar Cross Section Values from Southwestern Florida Wetlands Table 2 summarizes the means and standard deviations of the radar scattering coefficients (ao va1ues)l for the ten differ- ent vegetation cover types used in this study. Table 3 sum- marizes the range and average o" values for all test sites, as well as for all herbaceous wetlands and all wooded wetlands (excluding the cabbage palm site). Figure 8 presents a com- parison of the relative a" values derived for the different test sites on the two different dates. Figure 8a presents data for the non-woody vegetation sites while Figure 8b presents data for the test sites which contained trees (woody sites). In these plots, the x-axis presents the a" values for the dry sea- son (April 1994) while the y-axis presents the estimated change in the uo values between April and October (a posi- tive value indicates an increase in backscatter between April and October while a negative value represents decrease in backscatter).
Overall, the average a" values are higher for the wooded wetlands than they are for the herbaceous wetlands in both April and October. While the presence of water on the ground surface during the wet season increases the overall radar backscatter for all sites, for some of the herbaceous
'The a" values are expressed in dB or 10 log [intensity].
wetlands the backscatter actually decreases (Figure 8b). The range of oO values for the various test sites was greater dur- ing the dry season than during the wet season, particularly for the non-wooded wetland sites. The range of oO values ob- tained during the late dry season (April) varies by a factor of 6.2 (7.9 dB). At this time, the range of oO values is far greater for the herbaceous wetlands than for the wooded test sites [a factor of 5.1 or 7.1 dB for herbaceous communities versus 1.6 (2.0 dB) for wooded test sites]. During the late wet sea- son, the range in a" values drops to a factor of 2.6 (4.1 dB) overall. While the range of values is still larger in the non- wooded wetlands, the overall range has dropped significantly [a factor of 1.6 (2.0 dB) for non-woody wetlands and 1.4 (1.5 dB) for the wooded sites]. Therefore, in terms of using sin- gle-date ERS-1 data for vegetation discrimination, it appears that dry-season ERS-1 SAR data are more preferable than wet season imagery.
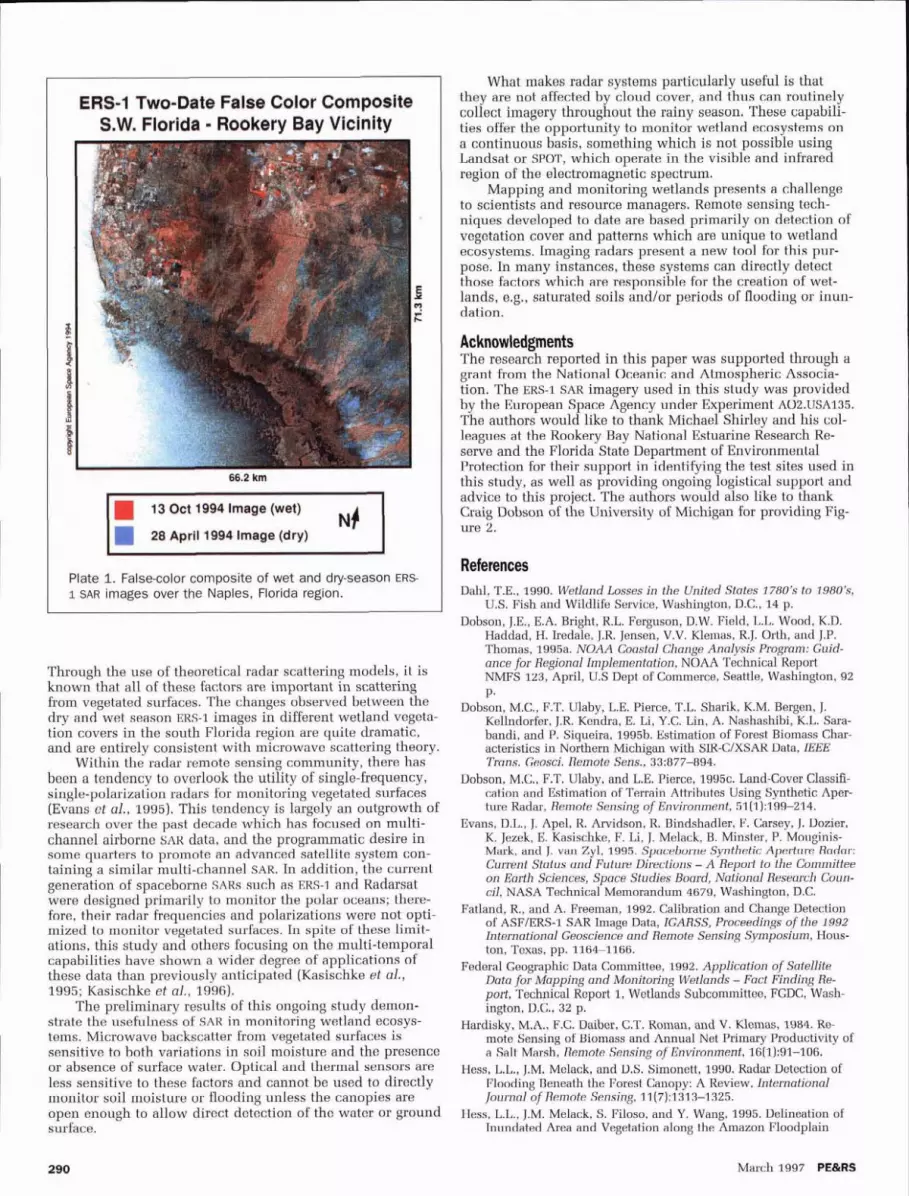
Wetland Vegetation Mapping Using Multi-Date ERS-1 Imagery Plate 1 presents a false-color composite image generated from ERS-1 SAR imagery collected on 28 April and 13 October 1994 over the test site. The October 1994 image from the wet season is displayed in red and the April 1994 image from the dry season in cyan. This two-date composite shows the sea- sonal differences in the wetland vegetation of southwestern Florida. The cyan regions of the composite are areas of low return in October. These are likely communities with short herbaceous vegetation which will produce specular reflection in the wet season when the water levels are high. The vari- ous red-shaded regions are vegetation with denser canopies, from agriculture to forest. The brighter-red areas are likely flooded vegetation, while the reddish-brown regions are non- flooded. Plate 1 illustrates that false-color images created from multi-date ERS-1 SAR can aid in the discrimination of different wetland communities.
Comparison of Observations with Theory - Non-Wooded Wetlands In April of 1994, the lowest a" value was obtained for the sand wet prairie site, and the highest for the marl wet prairie site. The low oO at the sand wet prairie site is the result of a combination of a low dielectric constant and smooth ground surface, which combine to result in a low surface scattering term (oO, in Equation 2). The marl wet prairie site had the highest radar backscatter because of a relatively rough sur- face (from rocks and limestone deposits at the surface) and a water-saturated, but not flooded, soil surface, resulting in higher surface scattering (a0, ) in Equation 2. Both of these sites had a relatively low amount of living vegetation to at- tenuate (7, ) the surface signature. As expected from micro- wave scattering theory, the flooded sites (cattail, juncus, sawgrass) have lower u0 values than the marl wet prairie site with high soil moisture because the presence of surface wa- ter eliminates the surface scattering term (a0, ) in Equation 2.
TABLE 2 . RELATIVE ERS-1 RADAR BACKSCATTER VALUES FOR SOUTHWEST FLORIDA TEST SITES
Site
1. juncus salt marsh 2. sawgrass prairie 3. sand wet prairie 4. marl wet prairie 5 . cattail marsh 6. hydric pine 7. mixed liardwood swamp 8. hydric cypress 9 dwarf cypress
10. cabbage palm
Sample Size (pixels)
April 1994 EKS-1 Backscatter
Mean (dB)
October 1994 Standard ERS-1 Backscatter Deviation Meail (dB)
Standard Deviation
March 1997 PE&RS

TABLE 3. RANGES OF BACKSCATTER VALUES OBSERVED FOR SOUTHWEST FLORIDA WETLAND TEST SITES
April October Sites High Low Range Average High Low Range Average
all -8.5 d B -16.4 dB 7.9 d B -10.4 d B -7.3 d B -11.4 d B 4.1 d B -9.2 d B herbaceous -9.3 d B -16.4 dB 7.1 d B -11.5 d B -9.4 d B -11.4 d B 2.0 dB -10.6 dB woody -8.5 d B -10.5 d B 2.0 d B -9.4 d B -7.3 d B -8.7 d B 1.4 dB -7.8 dB
These sites have a greater a" than the sand wet prairie be- cause the scattering from the vegetation canopy (a0, ) is larger due to higher biomass levels.
The change in radar backscatter at the non-woody vege- tation sites between April and October (Figure 8a) are en- tirely consistent with the predictions of the theoretical model of Dobson et al. (1995~). The a" values from the marl wet prairie site decrease because flooding eliminates direct radar backscattering (a: ) from the moist surface layer. The sand wet prairie site increases in radar backscatter because in- creases in soil moisture results in higher direct surface scat- tering (a0, in Equation 2). While the difference in the cattail site is small (-0.5 dB or 12 percent lower) and probably not statistically significant, it is in the direction one would ex-
a. non-woody vegetation
1 sand wet pmde
w snvgrau
@ juncus
-1 8 -1 5 -12 -9 April ERS-1 backscatter (dB)
b. woody vegetation
mesh cypress
hydric plw Pr3 hydrkcypreu
IXI hardwood
0
-3 -I I -- I -18 -1 5 -1 2 -9 4
April ERS-1 backscatter (dB)
Figure 8. Plots of ERS-I SAR backscatter in April 1994 ver- sus change in backscatter between April and October of 1994. (a) Non-woody (herbaceous) vegetation. (b) Woody vegetation.
pect at a flooded site with decreasing vegetation biomass (e.g., lower canopy scattering, a",). The increased radar back- scatter at the sawgrass and juncus sites is consistent with in- creases in living biomass for flooded vegetation which leads to increased canopy scattering. The sawgrass has a higher standing crop; therefore, this site should have a larger in- crease, which it does.
Comparison of Obsewations with Theory - Wooded Wetlands The wooded wetland vegetation sites are all responding as predicted by the generalized microwave scattering models presented in Equation 1. The cabbage palm site has the low- est a" value in the dry season image (April) because of the open canopy, low tree density, and, most importantly, low soil moisture. The increased soil moisture in October results in more surface scattering (a0, in Equation 1) as well as in- creased multipath scattering (a0, and a",), both of which lead to the observed 4 dB increase in the a".
The highest a" value in April was obtained for the mixed hardwood swamp site, most likely due to the fact that this site had the highest biomass density of all the forested sites, which leads to high canopy scattering (a0,). The 1 dB increase in a" between April and October is within the error bound (k 1.5 dB) for between-scene calibration and there- fore may not be significant; however, an increase in foliar biomass in the tree canopy would be expected to increase di- rect canopy scattering (a0, ).
The dwarf cypress and hydric cypress sites would be ex- pected to have higher a" values in April than would the other wooded sites (cabbage palm and hydric pine) due to several factors. First, the presence of moist or flooded soils and low canopy density at these sites leads to higher multi- path scattering (a0, and a",) than at the cabbage palm and hydric pine sites. Second, the lower tree density results in a lower attenuation by the canopy (7,) and trunk layers (73 of direct surface scattering (a0,) and multiple path scattering (a0, and a",). Increases in the amount of flooding between April and October would be expected to increase radar back- scatter at all the woody vegetation sites except the mixed hardwood forests. The higher backscatter would be expected from increases in the multipath trunk scattering terms (a", and a",) in Equation 1. Significant increases (greater than 1.5 dB) were observed for the dwarf cypress and hydric pine sites.
Conclusions In this paper, the results of a study evaluating the utility oi spaceborne SAR data to monitor wetland ecosystems in southern Florida are presented. Although this study had lim- itations in terms of coincident field truth and number of rep- licates per vegetation type, the results demonstrate that the imagery collected by the ERS-1 SAR (a single frequency and single polarization radar) is sensitive to a wide range of fac- tors which change during the growing season and between wet and dry seasons in these ecosystems. The results of this study also show that data from this radar system has the po- tential to discriminate between different vegetation commu- nities based upon canopy structure, soil moisture, the presence or absence of flooding, and vegetation growth.
PE&RS March 1997
ERS-1 Two-Date False Color Composite S.W. Florida - Rookery Bay Vlclnlty
91
i
t - -
68.2 kin
13 Oct 1994 lmage (wet)
I 1 28 April 1994 lmage (dry)
Plate 1. Falsecolor composite of wet and dry-season ERS- 1 SAR images over the Naples, Florida region.
Through the use of theoretical radar scattering models, it is known that all of these factors are important in scattering from vegetated surfaces. The changes observed between the dry and wet season ERS-1 images in different wetland vegeta- tion covers in the south Florida region are quite dramatic, and are entirely consistent with microwave scattering theory.
Within the radar remote sensing community, there has been a tendency to overlook the utility of single-frequency, single-polarization radars for monitoring vegetated surfaces (Evans et aL, 1995). This tendency is largely an outgrowth of research over the past decade which has focused on multi- channel airborne SAR data, and the programmatic desire in some quarters to promote an advanced satellite system con- taining a similar multi-channel SAR. In addition, the current generation of spaceborne SARs such as ERS-1 and Radarsat were designed primarily to monitor the polar oceans; there- fore, their radar frequencies and polarizations were not opti- mized to monitor vegetated surfaces. In spite of these limit- ations, this study and others focusing on the multi-temporal capabilities have shown a wider degree of applications of these data than previously anticipated (Kasischke et al., 1995; Kasischke et al., 1996).
The preliminary results of this ongoing study demon- strate the usefulness of SAR in monitoring wetland ecosys- tems. Microwave backscatter from vegetated surfaces is sensitive to both variations in soil moisture and the presence or absence of surface water. Optical and thermal sensors are less sensitive to these factors and cannot be used to directly monitor soil moisture or flooding unless the canopies are open enough to allow direct detection of the water or ground surface.
What makes radar systems particularly useful is that they are not affected by cloud cover, and thus can routinely collect imagery throughout the rainy season. These capabili- ties offer the opportunity to monitor wetland ecosystems on a continuous basis, something which is not possible using Landsat or SPOT, which operate in the visible and infrared region of the electromagnetic spectrum.
Mapping and monitoring wetlands presents a challenge to scientists and resource managers. Remote sensing tech- niques developed to date are based primarily on detection of vegetation cover and patterns which are unique to wetland ecosystems. Imaging radars present a new tool for this pur- pose. In many instances, these systems can directly detect those factors which are responsible for the creation of wet- lands, e.g., saturated soils andlor periods of flooding or inun- dation.
Acknowledgments The research reported in this paper was supported through a grant from the National Oceanic and Atmospheric Associa- tion. The ERS-1 SAR imagery used in this study was provided by the European Space Agency under Experiment A02.USA135. The authors would like to thank Michael Shirley and his col- leagues at the Rookery Bay National Estuarine Research Re- serve and the Florida State Department of Environmental Protection for their support in identifying the test sites used in this study, as well as providing ongoing logistical support and advice to this project. The authors would also like to thank Craig Dobson of the University of Michigan for providing Fig- ure 2.
References Dahl, T.E., 1990. Wetland Losses in the United States 1780's to 1980's,
U.S. Fish and Wildlife Service, Washington, D.C., 14 p. Dobson, J.E., E.A. Bright, R.L. Ferguson, D.W. Field, L.L. Wood, K.D.
Haddad, H. Iredale, J.R. Jensen, V.V. Klemas, R.J. Orth, and J.P. Thomas. 1995a. NOAA Coastal Change Analvsis Promam: Guid- ance for Regional Implementation, N ~ A A ~echnical-~e~ort NMFS 123, April, U.S Dept of Commerce, Seattle, Washington, 92
P. Dobson, M.C., F.T. Ulaby, L.E. Pierce, T.L. Sharik, K.M. Bergen, J.
Kellndorfer, J.R. Kendra, E. Li, Y.C. Lin, A. Nashashibi, K.L. Sara- bandi, and P. Siqueira, 1995b. Estimation of Forest Biomass Char- acteristics in Northern Michigan with SIR-CIXSAR Data, IEEE Trans. Geosci. Remote Sens., 33:877-894.
Dobson, M.C., F.T. Ulaby, and L.E. Pierce, 1995c. Land-Cover Classifi- cation and Estimation of Terrain Attributes Using Synthetic Aper- ture Radar, Remote Sensing of Environment, 51(1):199-214.
Evans, D.L., J. Apel, R. Arvidson, R. Bindshadler, F. Carsey, J. Dozier, K. Jezek, E. Kasischke, F. Li, J. Melack, B. Minster, P. Mouginis- Mark, and J. van Zyl, 1995. Spaceborne Synthetic Aperture Radar: Current Status and Future Directions - A Report to the Committee on Earth Sciences, Space Studies Board, National Research Coun- cil, NASA Technical Memorandum 4679, Washington, D.C.
Fatland, R., and A. Freeman, 1992. Calibration and Change Detection of ASFIERS-1 SAR Image Data, IGARSS, Proceedings of the 1992 International Geoscience and Remote Sensing Symposium, Hous- ton, Texas, pp. 1164-1166.
Federal Geographic Data Committee, 1992. Application of Satellite Data for Mapping and Monitoring Wetlands - Fact Finding Re- port, Technical Report 1, Wetlands Subcommittee, FGDC, Wash- ington, D.C., 32 p.
Hardisky, M.A., F.C. Daiber, C.T. Roman, and V. Klemas, 1984. Re- mote Sensing of Biomass and Annual Net Primary Productivity of a Salt Marsh, Remote Sensing of Environment, 16(1):91-106.
Hess, L.L., J.M. Melack, and D.S. Simonett, 1990. Radar Detection of Flooding Beneath the Forest Canopy: A Review, International Journal of Remote Sensing, 11(7):1313-1325.
Hess, L.L., J.M. Melack, S. Filoso, and Y. Wang, 1995. Delineation of Inundated Area and Vegetation along the Amazon Floodplain
March 1997 PE&RS

with the SIR-C Synthetic Aperture Radar, EEE Transactions on Geoscience and Remote Sensing, 33:896-904.
Howland, W.G., 1980. Multispectral Aerial Photography for Wetland Vegetation Mapping, Photogrammetric Engineering b Remote Sensing, 46(1):87-99.
Jensen, J.R., D.J. Cowen, J.D. Althausen, S. Narumalani, and 0. Weath- erbee, 1993. An Evaluation of the Coastwatch Change Detection Protocol in South Carolina, Photogrammetric Engineering 6. Re- mote Sensing, 59(6):1039-1046.
Jensen, J.R., K. Rutchey, M.S. Koch, and S. Narumalani, 1995. Inland Wetland Change Detection in the Everglades Water Conservation Area 2A Using a Time Series of Normalized Remotely Sensed Data, Photogrammetric Engineering b Remote Sensing, 61(2):199- 209.
Kasischke, E.S., and G.W. Fowler, 1989. A Statistical Approach for Determining Radiometric Precisions and Accuracies in the Cali- bration of Synthetic Aperture Radar Imagery, IEEE Transactions on Geoscience and Remote Sensing, 27:416-427.
Kasischke, E.S., L.L. Bourgeau-Chavez, N.L. Christensen, Jr., and E. Haney, 1994. Observations on the Sensitivity of ERS-1 SAR Image Intensity to Changes in Aboveground Biomass in Young Loblolly Pine Forests, International Journal of Remote Sensing, 15(1):3-16.
Kasischke, E.S., L. Morrissey, J.B. Way, N.H.F. French, L.L. Bourgeau- Chavez, E. Rignot, J.A. Stearn, and G.P. Livingston, 1995. Monitor- ing Seasonal Variations in Boreal Ecosystems Using Multi-Temporal Spaceborne SAR Data, Canadian Journal of Re- mote Sensing, 21(2):96-109.
Kasischke, E.S., J.M. Melack, and M.C. Dobson, 1996. The Use of Im- aging Radars for Ecological Applications - A Review, Remote Sensing of Environment, (in press).
Niedzwiedz, W.R., and S.S. Batie, 1984. An Assessment of Urban De- velopment into Coastal Wetlands Using Historical Aerial Photog- raphy: A Case Study, Environmental Management, 8(3):205-214.
Rutchey, K., and L. Vilcheck, 1994. Development of an Everglades Vegetation Map Using a SPOT Image and the Global Positioning
System, Photogrammetric Engineering b Remote Sensing, 60(6): 767-775.
Shima, L.J., R.R. Anderson, and V.P. Carter, 1976. The Use of Aerial Color Infrared Photography in Mapping the Vegetation of a Fresh- water Marsh, Chesapeake Science, 17(2):74-85.
Steward, K.K., and W.H. Ornes, 1975. The Autecology of Sawgrass in the Florida Everglades, Ecology, 56:162-171.
Tanis, F.J., L.L. Bourgeau-Chavez, and M.C. Dobson, 1994. Applica- tions of ERS-1 SAR for Coastal Inundation, Proceedings of the In- ternational Geoscience and Remote Sensing Symposium, Pasadena, California, 8-12 August, IEEE Catalog No. 94CH3378-7, pp. 1481-1483.
U.S. Fish & Wildlife Service, 1994. Cartographic Conventions for the National Wetlands Inventory, February, 72 p.
, 1990. Photo Interpretation Conventions for the National Wet- lands Inventory, March, 45 p.
Ustin, S.L., C.A. Wessman, B. Curtiss, E. Kasischke, J. Way, and V. Vanderbilt, 1991. Opportunities for Using the EOS Imaging Spec- trometers and Synthetic Aperture Radar in Ecological Models, Ecology, 72(6):1934-1945.
Wang, Y., E.S. Kasischke, F.W. Davis, J.M. Melack, and N.L. Christen- sen, Jr., 1994. The Effects of Changes in Loblolly Pine Biomass and Soil Moisture Variations on ERS-1 SAR Backscatter - a Com- parison of Observations with Theory, Remote Sensing of Environ- ment, 49(1), pp. 25-31.
Wang, Y., F.W. Davis, J.M. Melack, E.S. Kasischke, and N.L. Christen- sen, Jr., 1995a. The Effects of Changes in Forest Biomass on Radar Backscatter from Tree Canopies, International Journal of Remote Sensing, 16:503-513.
Wang, Y., L.L. Hess, S. Filiso, and J.M. Melack, 1996. Canopy Penetra- tion Studies: Modeled Radar Backscatter from Amazon Floodplain Forests at C-, L-, and P-Band, Remote Sensing of Environment, 55: 324-332.
(Received 13 November 1995; revised and accepted 1 2 August 1996; revised 11 September 1996)
Catalog arrived insic your January issue. a1
tures many now and di counted items. Ordering
fax, email, or tl
AZPRS websii
PE&RS March 1997


