Embed Size (px)
Citation preview
i
Acknowledgements
This master thesis represents the completion of my graduate studies in Business and
Administration with the Norwegian University of Life Sciences, School of Business and
Economics.
First, I would like to express my sincere gratitude towards my supervisor Professor Arild Wæraas,
whose assistance was instrumental in completing this thesis. Thank you for your feedback,
patience, and valuable learning processes in which you have challenged me.
I would also like to thank the informants used in this research. Thank you both for your time,
your contribution, your help in distributing the surveys, as well as the willingness to participate in
this research process. It has been interesting getting to know your companies, management styles,
and your employees.
My family deserves gratitude as well; my father for being the source to my curiousness, my
mother for constantly cheering me on, and my brother for helping me focus on other things
during this period where I may have been extremely narrow-sighted and focused. Thank you to
my extended family as well, for interesting and challenging discussions, in addition to your
continuous support.
My son, Alexander Olav – thank you for demanding my full attention during your hours awake,
forcing me to produce efficiently while you were in day care as well as remaining healthy
throughout the fall semester of 2015.
Most of all, I would like to extend my endless gratitude to my husband, Werner Olav. Without
you, I would have never returned to complete my Master’s degree. Thank you for helping me
through the last years in every way possible. Words cannot describe how much I value your daily
support, conversations, challenges, and inspiration.
Ås, December 2015
Rakel Elisabeth Filtvedt
ii
Sammendrag
Denne masteroppgaven utdyper viktigheten av at kunnskapsleder er klar over drivkreftene hos
sine ansatte, i dette tilfelle; kunnskapsarbeidere. Tidligere forskning har belyst at
kunnskapsledelse, så vel som motivasjon av kunnskapsarbeidere er et udekket felt med sårt behov
for videre utdyping. Da kunnskapsarbeidere er en voksende arbeidskraft i dagens samfunn, vil
fokuset på disse bare bli mer betydningsfullt for å kunne lede suksessfulle bedrifter.
Oppgaven er basert på «To-faktor» -teorien til Fredrich Herzberg som fokuserer på to typer
faktorer: motivasjons – og hygienefaktorer. Herzberg argumenterer for at motivasjonsfaktorer
bidrar til økt motivasjon, mens hygienefaktorer bidrar til mistrivsel om de ikke er tilstede. Gjelder
dette i dagens samfunn, 50 år etter den grunnleggende teorien, vil bli utforsket i denne oppgaven.
Det er blitt utført intervjuer av to kunnskapsledere, samt sendt ut et spørreskjema til deres ansatte
for å besvare problemstillingen. Ytterligere resultater kom frem i prosessen og alle var relatert til
hovedoppgavens essens.
Resultatene konkluderte med, at den tidligere teorien utformet av Herzberg oppfattes som en
begrensning i dagens definisjoner, i tillegg til at utdannelsesnivå også har innvirkning på
motivasjon hva gjelder arbeidsoppgavene og stillingsnivå i bedriftene. Videre ser man at
personligheter har en stor innvirkning på motivasjon og trivsel, og man kan konkludere med at
det å skape en mal for å lede og motivere kunnskapsarbeidere ikke er formålstjenlig.
iii
Abstract
This master thesis highlights the importance of a knowledge manager being fully aware of the
drive and desires of their employees, and in this case, Knowledge Workers. Previous research has
shed light upon the fact that knowledge management, as well as motivation of knowledge
workers is a field in need of more extensive research. As knowledge workers are a growing
workforce in todays’ society, the focus on this group will be increasingly important in managing
successful businesses. The thesis is based on the “Two-factor” theory formed by Fredrich
Herzberg, arguing that there are two separate factors contributing to this; motivation and hygiene
factors. He argues that motivation contributes to motivation, and that hygiene contributes to
dissatisfaction upon absence. Whether this is the case fifty years later will be explored during the
thesis.
Performing interviews of two knowledge managers as well as sending out a questionnaire to their
employees was the method used to encounter the answer to the research question, and to
uncover other relevant results formed during the process.
The results of this study concluded with the fact that not only was the previous theory formed by
Herzberg perceived as a limitation in today’s business environment, it also suggests that
education level has some form of impact on motivation regarding the work tasks in the
businesses. Whether hygiene factors have the same effect on motivation and job satisfaction as
motivation factors was also an interesting question which started to uncovered itself during the
research. Furthermore, personalities contribute a great deal to motivation and job satisfaction,
and one can conclude with the fact that creating a formula for managing and motivating
knowledge workers may not serve its purpose.
iv
Table of Contents Acknowledgements ..................................................................................................................................................... i
Sammendrag ................................................................................................................................................................ ii
Abstract ......................................................................................................................................................................... iii
List of Tables ............................................................................................................................................................... v
1. Introduction ........................................................................................................................................................ 1
1.1 Background and Research Question .................................................................................................... 1
1.2 Selection of Research Objects ................................................................................................................. 2
1.3 Outline of Thesis ......................................................................................................................................... 3
2. Theory ................................................................................................................................................................... 5
2.1 The Emerging of the Knowledge-based Economy .......................................................................... 5
2.2 Knowledge Management ......................................................................................................................... 6
2.3 The Knowledge Worker ............................................................................................................................ 7
2.4 Motivation Theories ................................................................................................................................... 9
2.5 Incentives .................................................................................................................................................... 15
3. Method................................................................................................................................................................ 19
3.1 The Qualitative Study .............................................................................................................................. 21
The Interview Guide ............................................................................................................................................... 23
3.2 The Quantitative Study ........................................................................................................................... 25
The Questionnaire ................................................................................................................................................... 26
3.4 Reliability .................................................................................................................................................... 30
3.5 Validity ......................................................................................................................................................... 32
3.6 Research Ethics ......................................................................................................................................... 34
4. Results ................................................................................................................................................................ 35
4.1 Qualitative results; the Interviews ....................................................................................................... 35
4.2 Quantitative Results; the Questionnaires ......................................................................................... 40
4.3 Answer results from the Questionnaire.............................................................................................. 41
5. Discussion ......................................................................................................................................................... 63
5.1 Assumption: Knowledge workers do not differentiate between motivation and hygiene
factors .................................................................................................................................................................. 63
5.2 Assumption: Respondent’s answers differ based on education in company A ..................... 65
5.3 Discussions around responses given in the questionnaire .......................................................... 67
5.4 Discussions around how to motivate knowledge workers ........................................................... 77
5.5 Discussions around differentiating between motivation and hygiene as executive
categories ........................................................................................................................................................... 80
6. Conclusion and Further Research .............................................................................................................. 83
6.1 Conclusion .................................................................................................................................................. 83
6.2 Limitations and Implications to the Research ................................................................................ 85

v
6.3 Further Research ...................................................................................................................................... 85
7. Bibliography ..................................................................................................................................................... 87
8. Attachments ..................................................................................................................................................... 91
Interview Guide ................................................................................................................................................... 91
Questionnaire ....................................................................................................................................................... 93
E-mail sent out to Respondents ..................................................................................................................... 97
Follow- up e-mail sent out to the two companies ..................................................................................... 99
List of Tables
Table 1: Presentation of respondents ................................................................................................................ 40
Table 2: Question 1 - factors affecting motivation - Company A .............................................................. 41
Table 3: P-values question 1 - Company A ...................................................................................................... 42
Table 4: Question 1 - factors affecting motivation - Company B.............................................................. 44
Table 5: Question 2 - factors affecting job satisfaction - Company A ..................................................... 45
Table 6: Question 2 - factors affecting job satisfaction - Company B ..................................................... 46
Table 7: Question 3 - De-motivating factors - Company A ........................................................................ 48
Table 8: P-values Question 3 - Company A ..................................................................................................... 49
Table 9: Question 3 - De-motivating factors - Company B ........................................................................ 50
Table 10: P-values Question 3 - Company B ................................................................................................... 51
Table 11: Question 4 - Inspiring factors - Company A ................................................................................. 52
Table 12: P-values Question 4 - Company A ................................................................................................... 53
Table 13: P-values between motivation and hygiene factors question 4, company A ........................ 53
Table 14: Question 4 - Inspiring factors - Company B ................................................................................ 54
Table 15: Question 5 - Factors contributing to job satisfaction - company A ...................................... 55
Table 16: P-values question 5, company A ...................................................................................................... 56
Table 17: Question 5 - Factors contributing to job satisfaction - company B ...................................... 57
Table 18: Company A's ranking of factors contributing to employment ............................................... 59
Table 19: Company B's ranking of factors contributing to employment ............................................... 60

vi
1
1. Introduction
1.1 Background and Research Question
Living in the 21st century and coping with society being in constant movement, makes managers
of today’s businesses wonder how to retain their most valuable employees. Terms like motivation
and job satisfaction are being looked closer upon, and many of today’s best managers are
genuinely interested in what their employees are thinking.
As Knowledge workers is a growing group in today’s business environment, and the traditional
“management” is slowly phasing towards “leadership,” there will be more competition and higher
expectations towards tomorrow’s leaders. Not only are they committed to reaching company
goals and strategies, but they are now in charge of employees with higher education, more
expertize, and higher demands. Hence the importance of leaders asking themselves “How do I
manage knowledge workers?”
Trying to evaluate how to manage knowledge workers from a leadership point of view, makes it
imperative to map what motivates knowledge workers. In addition, determining whether one’s
dreams and goals correlate with the company and their strategies in order to cooperate towards
motivating as well as developing capabilities. In order to receive a deeper knowledge of this, one
must also determine what defines someone’s job satisfaction, as the two are assumed to be
closely linked.
When selecting a research question, all factors would have to be present; knowledge workers,
motivation and job satisfaction. To simplify this, the option of grounding it in a theory, led me to
base it on previous research by Fredrich Herzberg’s “Two Factor Theory,” where motivation and
job satisfaction, or theoretically – hygiene factors, were clearly defined. The result generated the
following research question:
Which motivation and hygiene factors shape knowledge workers’ job satisfaction?
Knowledge-workers is a broadly defined term today, and one definition includes all employees
with a higher education (Bachelor’s degree or higher). When using this terminology we
automatically include pre-school and day-care teachers as well as health care workers at all levels
(i.e. nurses). Another definition is whether a worker knows his trait better than anyone else does,
which for instance includes waiters, mechanics, and transportation workers. Common to these

2
mentioned professions is their main goal of perfecting or adjusting something which is already
present, their freedom in defining their own work-day is limited, and they are not necessarily
“creating” something new and different. Examples of the latter case include research, consulting,
and development to name a few. These professions fit the description given by Thomas
Davenport’s last definition; “those who think for a living;” and will be the official description of
knowledge workers in this thesis. This definition opens up the term in order not to limit the
concept based on education, as it is not a given that one must have a higher degree for thinking,
however the clear bias of higher education in knowledge businesses, makes for this assumption
to be rather implicit.
The jobs that employees have today require a great deal of qualifications; formal education and
the ability to acquire and to apply theoretical and analytical knowledge. They require a different
approach to work and a different mind-set. Above all, they require a habit of continual learning, a
trait being imperative for a knowledge manager to keep developing in order to maximize results.
(Drucker 2001, p. 305)
1.2 Selection of Research Objects
The companies chosen to look closer upon operate in two separate industries. Company A is a
non-profit, privately held, research institute, who also receive state-funding. Company B is a
privately owned media agency belonging to a large international corporation. The reason for
choosing these companies was private interest in both firms, as well as being representative
entities according to the theory and definitions of knowledge-businesses. When approached, the
two managers were immediately intrigued by the research question and were interested in being
evaluated for a master-thesis. The cooperation was crucial and positive during the process as its
conclusions might help them further understand knowledge-workers and their drive.
In company A, the interview-object is a research-director in a research institute. Reporting to him
are 60-801 research- scientists, engineers, and PhD-candidates, which were the respondents in
one of the surveys. Their business model is based on researching and developing technology
mainly for usage in the industry.
1 The reason for the large variation in employees, is the number of PhD researchers who have shorter engagements and are hired in on a project-base.
3
In company B, the interview-object is a CEO for the entire Norwegian office, located in Oslo.
His approximately 75 employees were the respondents of the other survey. This company is a
consultancy, connecting advertisers with consumers using the appropriate media and designing
campaigns to serve the needs and expectations of the advertisers.
Though being performed in an objective manner, basing the research on methods widely
acknowledged for performing this type of research, results could have varied under different
circumstances. Questions in the survey could have been misinterpreted by a respondent, or
worded differently as well as being based on a social science, there will be possibilities of errors in
the data. One can also assume that one individual’s response is likely to change over the course
of time based on internal and external effects, as well as personal responsibilities, which suggests
that the responses received here are mainly indicators of reality and not definite.
1.3 Outline of Thesis
Following this introduction, there will be a presentation of the theory used in the research as well
as discussions around the applications of these theories in present time. There will be definitions
of knowledge management (known as KM throughout the thesis), knowledge workers, and
motivational theories with a natural focus towards Fredrich Herzberg’s “Two factor theory”
which is the fundamental theory for this research.
Other theories will be mentioned as well as linkage between KM and motivation/satisfaction.
Further, the research method will be introduced and explanations around the choice of research
method will be given. Hereunder, both the qualitative and quantitative methods will be presented,
as this thesis has used both interviews and surveys. In addition, the reliability and validity of the
thesis will be ascertained.
After this, the results will be explained, presented, and analyzed, and in chapter five these results
will be interpreted and discussed. The conclusion will then sum up the paper and its research.
When the main part of this master thesis has been submitted, there will be suggestions towards
further research and implications/limitations to the research. At the end of this master thesis,
there is hope that the understanding of a knowledge-worker’s motivation becomes clearer and
that they may serve a purpose in knowledge management in the future.

4
5
2. Theory
2.1 The Emerging of the Knowledge-based Economy
Already in the late 1950s, a management consultant named Peter Drucker stressed the
importance of paying more attention to knowledge workers and knowledge management.
However, the evolvement of this theory has shown slow progression and one may claim that the
understanding of these concepts are no better in the 21st century then it was 50 years ago.
Although there has been a clear evolvement from the production society upon which our
countries have been built, to the service-based society of today, the awareness around Knowledge
Management (KM)2 is limited. Managers do not have a clear understanding of how to manage
knowledge workers or what their most important daily roles are. As a matter of fact, managing
knowledge itself is a challenge for managers today. For example, in managing and defining the
company’s knowledge as stock or flow3 (Fahey and Prusak 1998). Many employers have a great
deal of tacit knowledge in their portfolios, and they hire competent and hyper-motivated
knowledge workers. As a knowledge worker’s main asset is his “thinking mind,” there are great
possibilities of distinctive capabilities being a lost asset when leaving the company. In order to
keep some of the acquired knowledge, there are those who use a codification strategy of storing
knowledge, or personalization strategy, hereunder consulting firms. There is a great focus on the
dialogue between the employees and their customers, brain-storming processes, and
conversations. Everything which has been done previously is stored in the customer database,
but the one-on-one conversation, and dialogue, will eventually disappear when a knowledge
worker leaves (Hansen, Nohira et al. 1999).
Inevitably, the knowledge society has a more competitive nature than the production-based
society did. The requirements to higher education, personal skills, and high performance have
escalated in a manner which increases expectations all the way down to children’s age.
Knowledge workers have a field of expertise in whichever form it is acquired and it is argued that
the level of effectiveness increases with its specialization. However, specialization does not
generate performance in itself; whereas the knowledge worker is dependent on an organization in
order to successfully generate output no matter how individualized the knowledge worker is.
(Drucker 2001)
2 From here on after, KM will be the official acronym for Knowledge Management 3 Stock: can the business keep the knowledge regardless of the worker, or Flow: does the knowledge disappear when the worker terminates his employment?
6
2.2 Knowledge Management
“Knowledge is our most important asset,” (Quintas, Lefrere et al. 1997) is a statement on which
many CEO’s agree. Knowledge-based assets will primarily be the element of success for
organizations in the 21st century. Literature is also emphasizing the overall goal to maximize the
company’s knowledge-related effectiveness and to constantly renew the knowledge assets of the
organization (Wiig 1997).
Lines and Sandvik (2013) state that KM essentially concerns leaders who through decision
making, process design, and relational behavior may create or destroy value through the
motivation of knowledge workers. The differences in motivation can be a factor in explaining the
variation in performance level instead of level of skills. Further, they define KM with two
diametrically different leadership methods: “an active attempt to contribute to value creation and
task oriented leadership,” and “treating employees as independent, competent, motivated, and
responsible individuals whom under no influential attempts perform outstanding” (Lines and
Sandvik 2013, p.314). Another way to define these two leadership methods are transformational
leadership; which takes on a more active leader role of knowledge workers; and HRPLTA
leadership (Hire the Right People and Leave Them Alone).
Transformational leadership is a term not only used concerning knowledge workers, even though
research has found that it has a positive relation to it (Nguyen and Mohamed 2009). KM is used
in order to leverage core competencies and make the companies more competitive. In order to
ensure these processes, leaders have a great responsibility of leading versus managing. One
argued method for doing this and successfully leading knowledge workers is being a
transformational leader. A leader the employees want to follow. According to Bernard M. Bass
(2000), transformational leadership lies in the leader’s ability to inspire trust, loyalty and
admiration in followers. It is also defined that transformational leadership focuses on the similar
values as KM; internal values as vision, values, involvement, and teamwork to mention a few. A
transformational leader has employees who want to achieve and are interested in the work itself
and the company culture. It is defined as a “soft”, “Scandinavian”, and positive management style
where the leader sees and values his employees and their capabilities. Bass also underlines the fact
that a transformational leader is most successful when gaining trust, respect, and admiration with
his employees; they lead instead of demand.
Other researchers have found that in transformational leadership, the leader spends time getting
to know his employees and values their education, background, what motivates the individual

7
employee and their daily situation in order to adjust their circumstances. Closely related to KM,
transformational leadership spends more time recruiting and training (Lines and Sandvik 2013).
However, having core motivation of employees so closely related to the leader himself, can be a
challenge. Some knowledge workers appreciate being left alone in an increasingly manner, and are
more interested in a manager being a facilitator more so than a motivational speaker. For these
knowledge workers, Thomas Davenport’s “HRPLTA” management may serve a greater purpose.
This management style asserts itself mainly to knowledge workers who are more interested in
their own research and may not have a need for teamwork and a positive organizational structure.
A knowledge leader assessing HRPLTA mainly operates as a facilitator and applies to
autonomous employees. These employees are those who generate projects and results by
themselves and are “hyper-motivated.” Though knowledge workers enjoy being left alone, and
aspire well under autonomous work-conditions, there can be arguments that this approach does
not include any formal improvements on productivity and effectiveness. Knowledge workers will
need to be followed-up in one way or another, and the company’s main goal is to achieve
competitiveness in the industry. Hence, the HRPLTA approach of leaving them entirely alone
may be phasing out in its original term.
(Davenport 2005)
2.3 The Knowledge Worker
“Knowledge workers have high level of skills/education, with technological literacy, high cognitive power and
abstract reasoning. This includes the ability to observe, synthesize and interpret data, and to communicate new
perspectives and insights to lead to more effective decisions, processes and solutions for the organizations.”
(Horowitz, Heng et al. 2003)
Thomas Davenport introduced the term “knowledge worker” by describing it as “someone who
knows more about his or her job than anyone else in the organization”. It is a large and growing
category of workers, and they are the most expensive type of workers that companies employ. As
the western society evolves from being industrialized due to agriculture and manufacturing work
is being relocated to countries with lower labor costs, the importance of having well-developed
knowledge-worker skills are critical to the countries’ survival. However, these definitions of
knowledge workers are not descriptive enough as they could include members of the work force
who indeed know more about their job, but have work tasks which are possible to automatize.
8
They do not necessarily think for a living. Therefore, Davenport (2005, p.217) reformulated his
definition to “knowledge workers have high degrees of expertise, education, or experience, and the primary
purpose of their jobs… in short; they think for a living.”
So how is a leader supposed to motivate knowledge workers making sure that they achieve job
satisfaction? The rise of knowledge workers has created a demand for a new management style
and being a manager today is clearly different from before.
A knowledge worker can be working outside office hours and might even be more productive
during non-traditional work hours. In such a case, the manager faces the challenge of adjusting
levels of expectations on productiveness so that it might fit best with his employees. This can
indeed be a challenge as many companies operate towards a customer and client base which is
operative during normal office hours. Adjustments must be made in order for the knowledge
worker to apply himself to the greatest extent, but still deliver results as the expectations see fit.
“Productivity” as a concept may be replaced with “performance” and “results” when referring to
knowledge workers and their main strengths. Since literature as well as managers today find it
challenging to find an overall formula in managing employees who mainly are self-driven and
recognize their own value for the firm, Davenport (2005) shed light upon the facilitation needs.
More often than not, managing knowledge workers include a great deal of administration. Instead
of the classical “hiring and firing” concept, firms today focus on recruitment, developing, training
and retaining their employees.
(Davenport 2005, Carleton 2011)
“I had to give power, to gain power,” is a statement where Jack Telnak, CEO of Ford Motor
Company, illustrates how delegating is an essential part of managing knowledge workers. Where
the manager used to be formal and controlling, KM essentially contains reconditioning and
accountability. Knowledge workers, who perform better, have managers who “lead” and make
the employees want to follow. A mutual respect, cooperation, and teamwork as well as having a
leader who takes responsibility, have a lot of knowledge, is result-oriented, and good at
constructive feedback. The expectations towards today’s leaders are just as high, if not higher, as
they are for the knowledge worker himself. Since knowledge workers are in lesser need of a
manager, there has evolved a different management style; be it inspirational, personal authority,
and delegation. However, no matter how much a knowledge manager is aware of his employees
and these trends, he may not be able to remove internal competition, prestige, recognition, and
immensity around the job. Today’s best leaders must possess relational and emotional capabilities
as well as a great deal of knowledge (Hillestad 2002).
9
“One does not “manage” people.
The task is to lead people
And the goal is to make productive workers the specific strengths and knowledge of each individual.” (Drucker
2001, p.81, Drucker 2008)
Peter Drucker (2001) defined motivation of knowledge workers as the same thing that motivates
volunteers. They need to be challenged, they need to work towards a mission and believe in it,
they need continuous training and to see results. Hence, this leads to the assumption that every
group in the work force have to be managed differently at different times; employees need to be
managed as ‘partners’ and be treated as equals – they must be persuaded and not ordered. In
other words, management of people is a “marketing job,” where the essential question being
asked by the manager is not, “what do we want,” but rather what the other party wants, what are
his goals, and how are results considered (Drucker 2001, Drucker 2008)?
2.4 Motivation Theories
According to a motivation study performed in 1946 by Labor Relations Institute in New York,
employees had a great need to be appreciated for work done (Wiley 1997). The workers came
from a completely different environment then; America was on its way out of depression, and
World War II was coming to an end.
In the midst of this, Abraham Maslow published a paper in 1943 presenting his “hierarchy of
needs” theory. He presented The Basic Needs, which include ‘physiological needs,’ ‘safety needs,’ and
‘love needs,’ and The Growth Needs, including ‘esteem needs,’ and ‘the need for self-actualization.’ Being a
very relevant study of its time, the “hierarchy of needs” helped explain how a person’s needs
contribute to motivation and satisfaction. One starts at the bottom and strives to achieve
satisfaction on each level, one at a time. For a workplace situation, one can compare this to
employees having their basic needs met; an office space, salary, colleagues and job security before
their supervisors can start addressing a worker’s self-esteem and actualization. It also debated that
lower-level employees only had the possibility of having the three lower levels satisfied due to
their limited work-expectations, as well as higher-level employees were able to have all the needs
of the hierarchy met (Maslow 1943, Kaufmann and Kaufmann 2003).
This supports the assumptions of knowledge-workers having more focus on The Growth Needs
and value self-realization and recognition. In addition, the 1940s mainly consisted of industry and
production workers; but the times have changed, and there are larger parts of the work force
10
becoming knowledge-workers, which supports the importance of the higher levels of the needs
hierarchy.
A study performed in 2004 had two interesting assumptions4; employees with high education are
less satisfied, and educational level has no impact on intrinsic work motivation (Eskildsen,
Kristensen et al. 2004). They found that knowledge workers were more motivated, but less
satisfied. However, they also found that educational level had no effect, and assumed the reason
for this paradox might be that knowledge workers with high education have more diversified and
challenging tasks which may motivate them even though they do not achieve job satisfaction.
Further, Clayton Alderberg developed Maslow’s hierarchy and came up with the ERG-theory5.
Here, the five needs are compressed into three levels; Existence (level 1&2 of Maslow’s
hierarchy), Relatedness (level 3), and Growth (level 4&5). It helped the flexibility of the theory
and created a more general understanding of the needs-concept.
To draw the similarities even further, Herzberg’s Two-Factor theory has been said to break down
the needs in larger bulk; motivational factors and hygiene factors, where the latter represents the
lower three levels of Maslow’s hierarchy, and motivational factors represent the two Growth
levels of the hierarchy.
(Kaufmann and Kaufmann 2003)
4 Relevant for this thesis, the study had a total of eight assumptions 5 ERG = Existence, Relatedness, and Growth

11
2.4.1 Herzberg’s Two Factor Theory
“People are motivated by a great variety of needs, which in turn vary in order of importance and over time, or in
different situations”. (Lundberg, Gudmundsom et al. 2009)
The “Two-Factor Theory” suggests that humans have two different sets of needs and that the
different elements of the work situation satisfies or dissatisfies these needs (Wright 1989).
Hygiene factors are the basic elements of survival. These are represented by the bottom three
parts of Maslow’s Hierarchy of needs (social, safety, and physiological). These factors are not
directly linked to the actual job, but the environment surrounding the knowledge worker. These
factors include salary, reward systems, status, and job safety to mention some. They do not
promote job satisfaction, though they are relevant elements to a worker’s dissatisfaction if they
are not met (Herzberg, Mausner et al. 1959).
Motivation factors, or the factors intrinsic within the work itself, may be compared to the top
parts of Maslow’s need-hierarchy (Self-actualization and esteem). According to Herzberg (1968)
these factors include task-recognition, achievement, accomplishment, responsibility,
advancement, and the work itself. These needs are also congruent with the definition of
knowledge-workers, who thrive upon evolving as a professional. These factors enhance
satisfaction if present, but not dissatisfaction upon absence – merely, absence of satisfaction
(Herzberg, Mausner et al. 1959).
Furnham, Eracleous et al (2009) cites two researchers (Westwood 1992, Warr 2002), when
defining motivation as “…an internal state… giving rise to a desire or pressure to act,” and
defining Job Satisfaction is defined as “the extent to which people are satisfied with their work.”
The two definitions separate the concepts although they are often interchanged when discussed.
Motivation and satisfaction are, if not two sides of the same coin, definitely perceived as closely
related. Herzberg (1959), postulated that satisfaction and dissatisfaction were separate entities
caused by different elements of the job. Furthermore, variables such as personality and
demographic variables were significantly related to both job satisfaction and motivation. The
same researchers (Furnham, Eracleous et al.), emphasize the fact that previous literature
regarding job satisfaction and motivation is mainly concerned with organizational or situational
predictors, also named hygiene factors. They neglect individual differences. Individuals differ
significantly in the way they perceive their jobs, even if work tasks and job description remain
12
similar. Thus claiming that individual differences must have an effect on work attitude (O'Reilly
1980, Furnham, Eracleous et al. 2009).
Having this in mind, there must be a deeper dive into defining motivation and hygiene factors as
of today. Herzberg’s theory originated in the 1950’s, and though he was ahead of his own time,
his theory was mainly directed towards a production-based society. To elaborate, the employees
he used in his studies were not defined as knowledge-workers as we experience them today. This
might limit the effect of the factors on today’s employees. When Herzberg developed the theory,
the tasks of workers were more monotonous and streamlined, and factors defined as hygiene,
may not have played an essential role. Salary, work environment, status, and relationship with co-
workers would indeed be dissatisfying if not present, but achievement, developing own skills,
self-actualization, recognition and responsibility motivated employees in a greater sense.
Dividing factors affecting motivation and job satisfaction made more sense back then, but today,
it might be perceived as a limitation. The factors in themselves can be defined and understood
differently based on the person who interprets them. When distributing a questionnaire regarding
motivation and hygiene factors, one major element to take into account is the receiver and
his/her frames of references. Definitions may be subjective, and even though there is a common
way of perception; people base their own relations to terms and situations which are presented.
Today’s knowledge workers have spent many years on developing their own skills and knowledge
by attending higher educational entities and strategically choosing workplaces where they can be
challenged, as well as contribute with their tacit knowledge. They are well aware of their worth,
and the picture we might have today of an employee knocking on an entity’s door, hat in hand,
asking for a job, is assumed to be an image belonging to the 1950’s. This leads us to assume that
today’s knowledge workers expect to develop knowledge, receiving recognition, having
responsibilities and achieving goals both personal and in line with the company in which they are
employed. Some knowledge workers with even higher educations, such as PhD’s might not even
consider it a determining factor, developing own knowledge through the workplace, as this is a
personality trait which may be in evolvement during personal time as well. It is therefore
important to keep in mind that whether said factors yield satisfaction or dissatisfactions, as well
as motivation and de-motivation, depends very much on the individual, and believing otherwise
may lead research astray (Miner 2005).
Carolyn Wiley (1997), refers to a comparative study on Herzberg’s two-factor theory where the
following statement is mentioned; “… most empirical studies refute predictions based on this
theory. Needs for salary, recognition, and responsibility, for example, have been shown to
13
operate both as motivation and as hygiene factors” (Maidani 1991). She further stated that
motivation affects behavior, rather than performance, and that it is not a fixed trait. Her studies
compare the effect of motivation factors and their changes over a period of forty years, clearly
indicating an evolvement in this area. The responses changed, but it indicated that motivational
value placed on the factors used in the survey, varied according to status, gender, income, and
occupation (Wiley 1997).
Supporting this, we may see an increase in the importance of hygiene factors and the evolving of
those becoming more motivational than previously assumed. Pamela M. Brenner indicates the
importance of the workplace when discussing retention of knowledge workers and that although
employees “do not quit based on bad carpeting”, a better office environment may contribute to
attracting valuable employees (Brenner 1999).
“To retain knowledge workers, the workspace must not only support the tasks they currently accomplish, but also
the tasks they aspire to accomplish” (Brenner 1999, p. 37).
As defined by Herzberg, the factors mentioned above are purely hygiene, and are by definition
not determinable in the employee’s motivation for further employment. However, one can see
hints of change in the evolvement of definitions of motivation and hygiene factors as the needs
and wants of the knowledge workers also have changed since the theory first emerged.
Story et. al (2009) performed a study focusing on internal and external personalities and their
effect on motivation and job satisfaction, stating that intrinsic and extrinsic values both are
relevant, and that the main difference is the personalities which allow themselves to be driven by
one or the other. They clearly indicate a contrast between the two types of factors; motivation
and hygiene, but state the following, “it seems possible that across a wide range of situations one
could be motivated by both intrinsic and extrinsic factors”.
Job satisfaction in itself may not even contribute to motivation, but primarily be a continuous
process, while motivation may have a “guest-appearance” playing a more important role when
the need for an extra push in an ordinary everyday environment emerges. Even hypermotivated
knowledge workers experience mostly the everyday – life, and may need so-called hygiene factors
as salary, work environment, and colleagues in contributing to the motivation of getting up in the
morning, heading for work and performing the work tasks. Motivation-factors, defined by
Herzberg, will in this assumption play a larger role when the knowledge worker determines his
next career move, or is considering the option of staying put or changing jobs.
14
Examining these motivation factors closer, there is, a great link to the top two levels of Maslow’s
Hierarchy of Needs (Maslow 1943, Kaufmann and Kaufmann 2003). They are defined as the
intrinsic factors, and focus mainly on the values which come from within. These factors are
achievement, developing own skills, self-actualization, as well as recognition and responsibility
(Herzberg, Mausner et al. 1959). However, a couple of these factors may also appear in defining a
knowledge worker and his main characteristics. When Herzberg first defined motivation factors
some 60-years ago, production workers clearly outnumbered knowledge workers, mainly by
definition. There was of course workers who were interested in the concept of “thinking for a
living” and many workers wanted to achieve more than working in the industry having
responsibility for machinery in a plant. This, one can assume, was the main source in Herzberg’s
study describing how they were motivated and the intrinsic factors came to the surface.
Today however, these factors may now be a given for knowledge workers. They expect jobs to
help them develop their own skills, have a great deal of responsibility, and achieving personal and
professional goals.
In the matter of self-actualization, we can question the definition of this factor. Is it subjective or
is it objective? Who defines a knowledge worker’s success? One can argue that self-actualization
is a subjective matter, and one may question what defines personal achievements and success. Is
it the way one is perceived to the people around? Do peers look at the material objects and agree
that one is successful based on status, salary, nice car, big house, and working for a known
company? On the other hand, is it defined as being content; having a home, a family, a steady
and interesting job, social network, and doing well in daily work tasks? This is an impossible
question of getting a straightforward answer to. Mostly because knowledge workers, per
definition, expand from research-scientists, to the stockbrokers on Wall Street. Who is to say
what defines each of their self-actualization and in turn their core motivation? In addition, if
knowledge managers do discover this, how will it be relevant in the motivation of these specific
workers?
15
2.5 Incentives
There are plenty of6 articles discussing how to improve knowledge worker’s performance, and
what motivates employees. Though the founding theory used earlier in this chapter discusses the
dependence on individual cases, there is also a possibility for assuming the existence of both
intrinsic and extrinsic incentives and motivation/satisfaction factors.
Taking feedback as the first example; good salary and job security will always include an element
of feedback for work accomplished. In whichever sense of the word, employees are assumed to
feel safer when they know “how they are doing”. General feedback, both positive and negative,
help most employees feel a sense of safety and competency. Employees may consider salary to be
a solid feedback concerning both their job and their abilities. Though many incentives are based
on the job itself, self-actualization, and the feeling of succeeding in a job well done, tangible or
verbal incentives may very well bestow a high level of satisfaction upon the knowledge worker.
As feedback, salary, and job security may be closely related, there have been different types of
performance-based reward systems closely examined in diverse literature; hereunder dividing
them up on an individual level and a collective level (Wiley 1997).
Performance-based bonuses can include incentives for increased units produced or sold, as well
as increased profit, and size of accounts, to name a few. Especially in sales, there are clear
examples of performance-based incentives, but this will be looked closer upon below.
In broad terms, one can divide performance-based incentives into two main purposes;
behavioral- or attitude influence, and selection (attract, retain, or end employment) (Kuvaas
2008).
Under behavioral – or attitude influence, there is a great focus on appealing to the worker’s
actions, be it changing them or adjusting them. In such cases, clear and predictable links between
work-results and rewards are imperative in order for the worker’s feeling of instrumentality7.
Individual result-oriented bonus may be discussed as the most effective as the possibilities of
measuring the job efficiency and seeing the links between one employee’s performance and
reward-systems. Much unlike the collective result-oriented bonus strategy, where the whole group
is being rewarded and the “free-rider” problem may arise (ibid).
6 But not nearly enough… 7 Mode of thought and action that identifies problems and works directly towards their solution (https://en.wikipedia.org/wiki/Instrumental_rationality)
16
Another way of adjusting to collective versus individual result-oriented bonuses can be to use
both on different hierarchical levels. For instance, rewarding the department for reaching a
collective goal, and further inspiring each worker in the department of individually contributing
towards personal goals with an individual bonus which altogether adds up to reaching the
departments collective goal. This may inspire to cooperation within the department and working
together, but still achieving a little extra for the good of oneself. One can combine motivation
factors such as achieving goals, teamwork, developing own skills, with self-actualization, salary,
status, and recognition. Appealing to both the individual worker, but also contributing to the
feeling of being a part of something bigger, may have an effect on knowledge-workers when
using incentives as a motivation and satisfaction factor. However, previous research argues
against this mix, but instead urges employers to choose between the one or the other, though this
cannot in itself lead to a conclusion seeing as how incentive systems work in different ways in
different companies.
Sales is an example where incentives and bonuses are widely used, and there is evidence of its
success. Many sales-jobs are based on commission or a combination of a monthly salary and
commission or bonuses if results are achieved or exceeded. Sales is a performance-based
profession, and as they in addition think for a living and often have a higher education, they are
considered knowledge-workers as well. Stock-brokers are also defined as knowledge-workers and
salespeople, and their jobs are highly performance-based. It is argued that the higher the
incentives and bonus possibilities, the harder one works to achieve results, which again justifies
the possibilities for having very high wages and bonuses. Working in sales may be compared to
investing in stocks; the risks are high – one may not achieve in selling anything, but the rewards
are equally high upon success.
Other critiques to individual bonuses and incentives, is the de-motivation effect it may have
when and if they stop coming, either based on cutbacks or plainly not achieving the goals.
Motivation may revert and be even lower than before the incentives were introduced. Also, it
may indirectly drive employees to resort to abusing their own efforts by compromising their own
as well as the companies’ values or ethics. Hereunder, down-prioritizing customer satisfaction by
stretching boundaries may act against the initial purpose of reward-systems.
Research also argues that autonomous workers, hyper-motivated, and highly educated employees
are no match for an incentive reward system. Their inner drive, sense of achievement, purpose of
accomplishing something – will mostly always be the winning factors when discussing their
motivation. They feel satisfaction when their tasks are completed, they’re proud when
17
contributing to innovation, and not being controlled and measured on every level, increases the
level of work affiliation and satisfaction, exceeding way beyond normal office hours (Kuvaas
2008).
Other researchers argue the fact that simpler jobs with relatively lower wages, as well as lower
educational levels, find tangible bonuses as main contributors to job satisfaction. The bonuses
were perceived as having a high instrumental value that was worth extra effort. This in turn
translates to increased performance, since there are no real needs for development in knowledge,
skill acquisition, or strategic development (Stajkovic and Luthans 2001).
However, there are discussions back and forth on the effects of incentives, social recognition,
and feedback, which makes the founding of a conclusive opinion an extreme sport. The variety in
personalities, in industries, amongst employees, work tasks, and interests will act as a limitation to
making a final strategy. However, in motivation and job satisfaction, the assumption being
formed is that there is an executive norm, being expedient to follow, helping knowledge
managers have a certain idea on how to lead and motivate their knowledge workers.
When processing the results from the survey, the main interests will not only be what motivates
and contributes to job satisfaction in each company, but also comparing the two to each other, as
they are both knowledge businesses but have completely different types of tasks and employees.
In addition, being able to see what groups within the companies have answered based on
background and education level, will be interesting in order to define previous assumptions of the
differences in motivation which may be changing rapidly for the individuals.

18
19
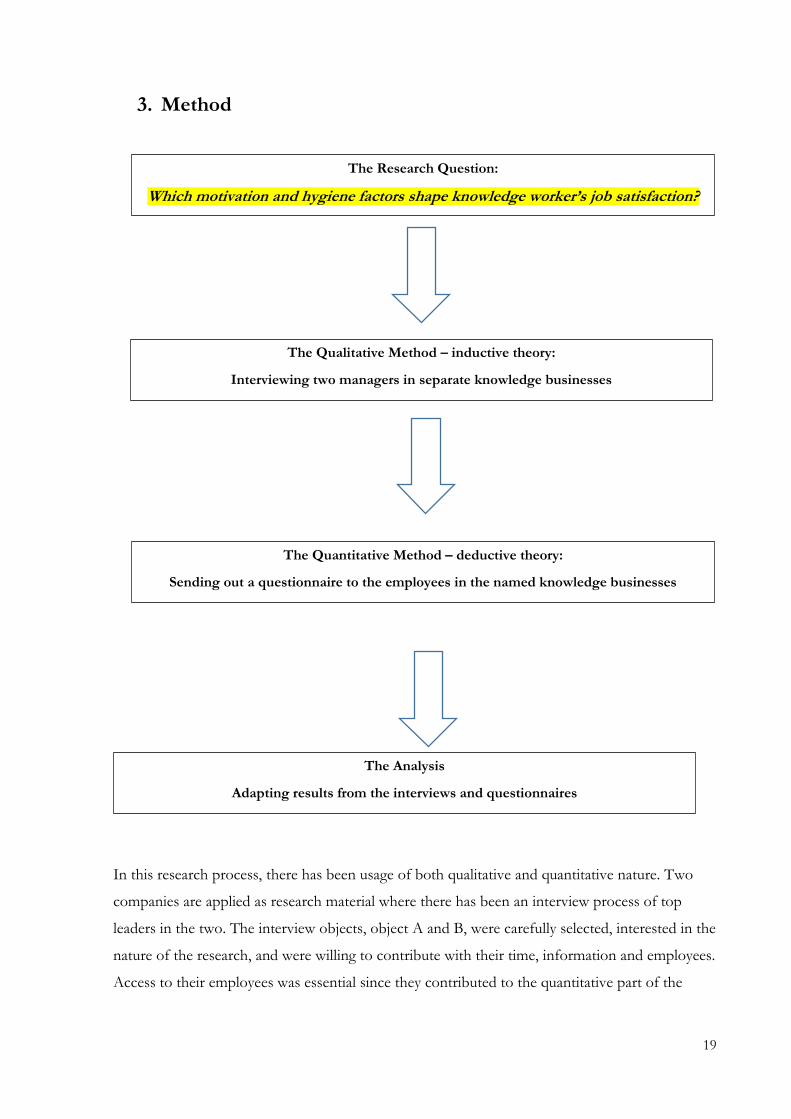
3. Method
In this research process, there has been usage of both qualitative and quantitative nature. Two
companies are applied as research material where there has been an interview process of top
leaders in the two. The interview objects, object A and B, were carefully selected, interested in the
nature of the research, and were willing to contribute with their time, information and employees.
Access to their employees was essential since they contributed to the quantitative part of the
The Research Question:
Which motivation and hygiene factors shape knowledge worker’s job satisfaction?
The Qualitative Method – inductive theory:
Interviewing two managers in separate knowledge businesses
The Quantitative Method – deductive theory:
Sending out a questionnaire to the employees in the named knowledge businesses
The Analysis
Adapting results from the interviews and questionnaires
Sending out a questionnaire to the employees in the named knowledge businesses
20
research. A questionnaire was formed for the two companies and sent out to each of the 60-80
employees (137 total).
The reason I chose both methods was the need for both types of information. The thesis
emphasizes the curiosity regarding knowledge-workers and their job satisfaction. Asking the
knowledge workers directly about it solely through a questionnaire would not necessarily give me
the proper depth developed in the survey. Only when discussing this with their supervisor and
leader, there were possibilities in unveiling possible factors which are important to the
questionnaire’s relevance. The main strength of choosing a qualitative method, is having the
ability to study situations which are not available elsewhere. Having first-hand information
directly from the source is an advantage when further developing the quantitative survey and it
makes it better founded. Being able to answer ‘how’, ‘what’, and ‘why’, were essential parts of this
research. If I had only used quantitative methods, I would have deprived the results from being
thoroughly explained and understood. In this case, the qualitative research process was used
mainly on an exploratory stage, as the interviews laid down preliminary groundwork for the
quantitative questionnaire (Silverman 2011).
I have used both deductive and inductive theory since mixed methods have been executed.
Collecting quantitative data through the survey clearly indicates a usage of a deductive theory
construction. Interviewing the two knowledge leaders and observing changes and patterns in our
service society through these conversations, indicate the fact that I have used inductive theory.
This also helped me establish the types of employees and managers there is a demand for. I was
interested in seeing patterns and figuring out the reasons for these trends. The research is based
on a naturalistic paradigm, where the informants’ view on their reality is used as background.
This indicates that their responses and perceptions gave me grounds to further prepare the
theoretical principles and assumptions. The interviews are further based on a subjective
understanding which is imperative to take into account as I am entering the natural contexts of
the informants (Babbie 2012).
Under the inductive theory, the preliminary assumptions were formed based on the qualitative
interviews. These will most likely be confirmed or denied after receiving results from the
deductive theory; the questionnaires. I started with the inductive theory; interviewing the two
managers in order to better develop the survey questions, then phased into the deductive part of
the research where the survey was distributed. I used its results in order to confirm or adjust
previous assumptions formed during the inductive theory construction. In addition, forming new
theories and assumptions as one goes along and forming opinions based on what the results tell,

21
opened up for possibilities of extensive and further research. Though both models are idealized
for linking theory and research, social sciences may introduce theory merely as background for
empirical analysis, or to strengthen theoretical arguments (Babbie 2012).
3.1 The Qualitative Study
Gathering the correct information in the most sensible way is a determining factor in doing
research studies, and according to Johannesen et.al (2011), it all begins with an area of reality on
which one wants more knowledge about. It is all about curiosity. One has to have a general
interest in the area, as well as a desire for digging deeper than how one looks for information on
a daily basis.
A semi-structured, in-depth interview was the qualitative method which I used in this research.
Open-ended interviews do not require any special skills, however, being an active listener can not
only make the respondent feel safe and heard, but it could also help me uncover things said in-
between the lines and interpret body language. It is also collaboratively produced since both the
informant and I contributed to the conversation, though my influence steered the conversation
without neither laying words in the subject’s mouth, nor having pre-determined assumptions.
The respondent elaborated based on how the conversation was being had (Silverman 2011).
The main reasons for choosing the interview in this research was the level of freedom which I
desired in terms of the informant’s answers. When discussing motivation and hygiene factors
seen from the supervisors’ vantage point, the importance lie mainly around his impressions,
historical knowledge, knowledge about the employees, specific actions related to the subject, and
based on employee feedback. Furthermore, a previous study on motivation of knowledge
workers performed by Horowitz, Heng, et.al (2003) implied that using a qualitative method,
semi-structured interviews and/or focus groups, “would shed more light on this area.” Which
confirmed my thoughts on the method I chose.
I developed an interview-guide to be used as a guideline for the conversations, but overall, the
informant had a unique way of communicating the answers. The same interview-guide was used
The Qualitative Method – inductive theory:
Interviewing two managers in separate knowledge businesses
22
in both interviews, which sets a standard. Even with a standardization, the interviews were
different, but there was little difficulty in comparing the two interviews. In addition, having a
template helped me adhere to the specific subject. The questions were thoroughly thought out,
and social conversations were minimized. Furthermore, interview is an economical method in
terms of time and resources, and the ability to access information first hand is an important part
of getting correct information. As the interview objects were managers in organizations where
they have many responsibilities, their time during a “normal” workday is scarce.
In the case of this master thesis, neither focus groups, observations, text-analysis, nor grounded
theory would give the research the type and the degree of information that was needed in order
to perform the specific research8. The main objective with the qualitative method was mapping
out peculiarities within the two companies, which can best be uncovered when having a
conversation with the people in charge. On this account, semi-structured interview was best
suited for these types of interviews.
If I had chosen a more structured Q&A session, I would eliminate the possibility of uncovering
peculiarities in the companies, and having only a couple of open subjects, would not help me
answer the research question. In the qualitative part of this research, using open-ended interviews
served its purpose due to the personal conversation with the interview object, and allowing the
interview object to answer freely with a semi-structured framework.
Another researcher may have uncovered different answers from the interview object as one has
different conversational skills: communication, understanding, and perception. Performing
interviews is considered an art form, and researchers perform this task differently, which
ultimately affects the responses that are being collected. This specific research may even have
received different results in a year or two from now, as the interview object is subjected to
personal opinions and external influences. Other possible weaknesses with performing an
interview can be the interaction between interviewer and the informant as communication can be
misinterpreted and incorrectly perceived. The interview object may misunderstand the
interviewer and vice versa. What an interview produces is a particular representation of an
individual’s views and opinions (Johannessen, Christoffersen et al. 2011, Silverman 2011).
The interviews were recorded as agreed upon between the informants and myself, and the results
were kept confidential and names were anonymous. All in line with keeping the respondent as
comfortable as possible in his role as the interview-object (Holme and Solvang 1986).
8 Using a Focus group on the two informants would be more limiting than opportunistic, Observations would be too time consuming, Text analysis would simply not qualify, and Grounded theory would not give me proper insight.

23
The Interview Guide
When constructing the interview guide, my focus was primarily to get a deeper understanding of
the managers, the business model and the company culture in the two companies I had selected. I
also wanted to uncover peculiarities within the two companies which would generate additional
and specific answer alternatives to the general questions developed in the survey. In getting to
these factors, it was important to establish a relationship with the interview object and getting to
know the person and the company better. In addition, the importance of presenting the research
and the thesis in a clear context was imperative, as the interview object’s understanding of the
goal of the research would help in responding constructively to the questions. The interview
objects were informed of their role and how the interview was voluntarily, asked if it was
approved that the interview would be recorded but deleted when finished with the research, and
informed that they would receive a final copy of the master thesis upon its completion. They
would also be able to revise statements written about them before the thesis went to print.
After the introduction, I started asking questions about the manager related to his background,
main areas of expertise, specific tasks within the department/company, and the type of business
model the interview object operates within. Further elaborations were encouraged about the
employees, who they are, what they do, and determining factors for employment. This naturally
transitioned into the question on how the interview object manages knowledge workers, and the
main challenges in having employees being autonomous and hyper-motivated.
Following this, the main and most important part of the interview took place, and the interview
object was answering what, through his perception, were the main motivation- and hygiene
factors contributing to their employee’s job satisfaction. The main goal with this specific part of
the interview was opening up for a dialogue between the interview object and the researcher with
focus on motivation and job satisfaction. There was little structure around the few pre-
determined questions in order to facilitate the possibility for the informant to feel completely
uninhibited in his responses. I wanted him to steer the conversation in the desired direction.
Having the managers determine this, opened up for establishing a more correct way of asking
questions in the survey. After learning about the companies and the managers, I had more insight
into how they operate, what they specifically focus on, and I became in possession of some inside
information helping me formulate questions.
At the end of the interview, the dialogue turned towards any elements that the interview objects
meant were important to the survey as well as how and when the survey would best be
24
distributed. Both managers were interested in promoting the survey and distributing the survey
internally, assuming that this would generate more credibility with their employees and ensuring
the anonymity of the respondents as their email addresses would not be shared.
I completed the interviews in the first week of august of 2015, mainly in order to not occupy the
managers’ time further, but to also have them completed before preparing the surveys and
distributing them as early as possible in order to allow ample time for analysis. Both meetings
occurred immediately after their summer vacation, before the new fall term had taken its toll on
their time. I met them where they work and the interview occurred in a meeting room. I did not
consider conducting the interviews elsewhere, as it was important to not lay unnecessary claim on
their time. In addition, one can argue that they felt more comfortable in their proper “homes”
versus taking the meeting elsewhere. The interviews varied in time from 60-75 minutes.
As soon as I had completed the interviews, I listened to the recordings, transcribed the interview,
and reviewed the conversation while it was still “fresh”. Then, I started the process of preparing
the survey, and based on the inductive theory being unveiled during the qualitative part of the
research, there was now time for the deductive and quantitative part of the research process.
(The Interview Guide may be found under Attachments)9
9 Attachments p. 92

25
3.2 The Quantitative Study
To gather further results on the thesis question, I integrated quantitative method with the
qualitative research. Using mixed methods was relevant since it was possible to analyze different
parts of the research question in a more thorough way. There could have been some assumptions
linked to the overall thesis which would have been destructed during the interview process. There
might even arise new assumptions along with the interview, and these would have been
confirmed or denied during the quantitative analysis in form of the questionnaire. Combining
these two may increase the likelihood of unanticipated outcomes, and being able to attack the
research questions from two angles can result extremely valuable (Bryman 2006).
The focus in quantitative research is units and variables, which may create a distance between the
researcher and the respondent(s), and there is no room for interpreting data “between the lines.”
Many researchers rely solely on quantitative research and define its results as the one and only
truth. However, this can be misleading and it can open for possibilities of abusing data. Even if it
is put in numbers, it is not necessarily the whole truth. Though working with the data collected in
a quantitative study is more concrete then in a qualitative study, there must be taken assumptions
on the data gathered (Holme and Solvang 1986).
Other potential weaknesses with a survey in quantitative method, is the interpretation of the
questions by the respondents. Since irrational human beings have different frames of references,
there will always be room for misunderstanding and misinterpreting when reading questions. In
addition, having to choose only one answer may limit the respondent in being able to answer
with complete honesty. The fact that the survey is anonymous, opens up for the possibility that it
is answered personally and privately, and the respondent may answer according to what he or she
perceives as expected of him/her, and what would make his/her total response appear in a
specific way. In other words, I cannot ensure the total absence of dishonest answers.
Most companies perform co-worker satisfaction surveys every year, and I could have been
allowed access to these responses over the course of the last 2-5 years, and used this as the
quantitative data for my master thesis. However, this would deprive the thesis from having the
preliminary foundation in Herzberg’s Two-Factor Theory, an important element in the research,
The Quantitative Method – deductive theory:
Sending out a questionnaire to the employees in the named knowledge businesses
26
as well as not being as relevant, taken into consideration the fact that the employee base may not
be the same during the research period vs. the time of collected data. Furthermore, the survey
will be more focused and specific when it is based on the interviews, I have information directly
from the managers which will help develop a well-founded questionnaire narrowing the target
instead of being too extensive. Basing the survey on own research helps me achieve high validity
in form of answering my specific interest and research question and designing it the best way I
see fit.
One can argue that focus groups, as a qualitative alternative, would be another way of getting to
know what the motivation – or hygiene-factors of the employees were, but the number of
respondents would be less, the validity of the results would be weaker, and it would be
extensively time consuming. On these grounds, I determined the choice in developing a
questionnaire based on the interviews to be the most rational and expedient method.
The Questionnaire I developed the questionnaire based on Herzberg’s “Two Factor Theory” (Herzberg, Mausner et
al. 1959, Herzberg 1968, Herzberg 2003) in order to determine motivation and hygiene factors
which affect knowledge workers regarding their job satisfaction. However, I did not use the same
type of questionnaire,10 which was used by him when he first developed his motivation/hygiene
theory. The reason for this was the complexity of his survey; he sent out a “patterned interview”
where the respondent was to “think of a time when you felt exceptionally good or exceptionally
bad about your job…” with fourteen follow-up questions which he then coded, analyzed the
wording and placed them in motivation/hygiene categories (Herzberg, Mausner et al. 1959, p.
141-150).
Based on the qualitative interviews already performed, I had the possibility of defining the
questionnaire fitting each company according to their distinctiveness. Creating the questions was
a process extending over the course of two weeks, and during one workday, I could have solely
produced one new question with answer-alternatives. This underlines the thought process
invested in each question and the extent of the underlying importance to having both motivation
factors and hygiene factors present in questions addressing job satisfaction in various forms.
Alongside the construction of the questionnaires, I experienced many processes linked towards
the theory and foundation determining motivation and hygiene factors, and though challenging,
10 It appeared to me, that Herzberg sent out a structured-interview questionnaire to his respondents
27
these processes contributed to both an increased sense of knowledge and understanding around
the thesis, as well as an impression that the final product was satisfactory.
The survey included the final operationalization of the research question. The form of this is not
random, and the template, questions, and answer formulations may affect the way the survey is
received by the respondents. The research question, along with a clear idea of what I wished to
answer, is an essential part of the process (Holme and Solvang 1986).
The first step in the questionnaire was the mapping of the respondents. This had to be included
so it would be easier to analyze the data once it was received. The respondent’s country of origin,
age, education level and seniority in the two companies were requested in order to be able to
draw possible similarities or inequalities between the respondents. This was not done by
Herzberg, and for future references, I too would have limited this part only to education level
and gender in order to satisfy the research question. After this first part of the questionnaire, the
questions regarding motivation and hygiene factors were initiated. The first parts of the answers
were directly collected from Herzberg’s theory11, and the factors indicated in his research was
rendered in the questions. Thereafter, the answers were adjusted towards the specific company,
using the material that I gathered during the interview process. When forming the questionnaire,
it was imperative to narrow it down in order for the questionnaire not to be too extensive
(Johannessen, Christoffersen et al. 2011).
The main questions regarding the thesis were developed as statements in which the respondents
could evaluate the level of application to their own being. Since the research question specifically
wants an answer to knowledge-workers motivation and hygiene factors, it was essential that the
answers were just as specific. In some cases, it will be expedient to let the respondents answer
“other”12 and fill out themselves, but the level of analysis and comparison may be more difficult
when allowing this. I limited the scale of response which is an essential decision taken on the
grounds of not receiving too vague information. Using a 10-point scale would have been too
detailed and using a 3-point scale could have deprived the respondents of answering truthfully.
Having the possibility of not having to choose the extremes, might diminish the possibilities for
the respondents in choosing “non-applicable” or “I don’t know” – since these are alternatives
not generating satisfactory results. Therefore, I chose the option of using a 5-point scale and the
respondents got an opportunity in grading their answers in a manner which helps them form an
11 Hereunder, the specific factors used in the initial theory 12 This alternative was only used under education background to not limit the employees
28
opinion in a nuanced way. This also eliminates the respondents having a sense of not being able
to answer (Johannessen, Christoffersen et al. 2011).
After the questionnaire was finished, I sent this along with an information letter to the two
managers. Their distribution varied in execution, but both were involved personally. Company
B’s manager informed his employees about the survey in a staff meeting and the fact that a
master student was researching them. He distributed the survey personally to all 75 respondents.
Within the first day, 26 had answered the survey and after one week, the count increased to 38.
At this time, the manager sent a follow-up email which generated additional responses After two
weeks and the end of the trial period, the final count was 54 respondents, or 72% which qualifies
as “very good”13 in terms of response rate (Jacobsen 2005).
In Company A, the survey was sent out five days later than Company B and the manager had
sent the survey via email to the department coordinators, as he is in charge of several separate
departments. Response rates started slowly, and in the first week, there were only 26 responses.
The number of respondents in Company A was 62, and the percentage was less than satisfactory
this first week. Because of this, the manager sent out the follow-up email himself, describing the
importance of the survey and the fact that this was a master thesis researching them, and urging
his employees to participate in the survey. Within three days14, the response rate grew rapidly, and
on the final day of the survey, the total response rate from Company A was 46 respondents, or
74%. I was inclined to assume that personal involvement from the manager played an essential
role, as Company B’s response rate grew rapidly after receiving email from their supervisor,
whereas Company A’s response rate was slow until the manager sent out an email personally and
generated a significant change in responses.
The total number of questionnaires being distributed in both Company A and B were 137.
Number of total responses was 100, or a cumulative response rate of 73%.
(The Questionnaire, the initial e-mail and the follow-up email may be found under
Attachments)15
13 Over 50% = Satisfactory Over 60% = Good Over 70% = Very Good 14 Date of survey period Company A: August 31. – September 10. Company B: August 26. – September 10 in 2015 15 Attachments p. 93
29
3.3 The Analysis
When analyzing the interviews, I transcribed the recorded audio I had acquired during the
interviews. I took notes in order to emphasize important topics that were discussed by the
informants. To found my analyzing method in a theory, one can argue that I have used elements
from thematic analysis when working with the data from the informants (Silverman 2011,
Kuckartz 2014). As the research question had concrete indicators which needed to be discussed
in order to exert a well-completed survey, I had to uncover these same indicators with the
informants, categorizing their answers as well as finding similarities and inequalities between the
two companies. I succeeded in identifying topics including knowledge workers, knowledge
management, motivation factors, and hygiene factors and was able to use these further in my
results as well as the survey I was developing. This part of the analysis was completed before I
had sent out the surveys, since its results would contribute to the completing of the
questionnaires. This underlines the fact that I performed separate data analysis; qualitative and
quantitative, and at different times.
I developed the questionnaire in a way which gave the respondents alternatives ranging from the
numeric values of 1-5 but presented in literary form with statements fitting the question. The
alternatives used were; Very important (5), Relatively important (4), Do not apply/Not relevant
(3), Relatively unimportant (2), and Completely unimportant (1). These alternatives were used for
the first two questions which mainly focused on motivation factors and hygiene factors. The
alternatives Strongly agree (5), Agree (4), Indifferent (3), Disagree (2), and Strongly disagree (1)
were used when presenting motivation and hygiene factors affecting the employee’s job satisfaction
and statements regarding the employee’s experience of satisfaction. Very inspiring (4), Somewhat
inspiring (3), Irrelevant (2), and Do not inspire at all (1) were used when answering what factors
inspired performance. The last question invited the respondents to rank certain factors which
were important for the respondent in working at their current workplace. The employees were
asked to arrange the given factors from 1-10, where 1 being most important and 10 being least
important. This was clearly the most misunderstood question as very few of the respondents
actually chose each number only once (which was requested), and the scale was also
misinterpreted as some respondents chose many of the factors as being unimportant to their
The Analysis
Adapting results from the interviews and questionnaires
Sending out a questionnaire to the employees in the named knowledge businesses
30
choice for working at their current workplace, which contradicted earlier responses. I had not
given numeric value to the earlier questions in Questback, so this could not have been the reason
for misunderstanding the significance of the numbers.
The answers were exported as a raw data file from Questback and in to Microsoft Excel. Here, I
had to manually code the answers in order to make them numeric and used the “IF” excel-
formula function defining a numeric value to the given response. When this was completed, the
Microsoft Excel spreadsheet was again imported to JMP 12, an analysis program downloaded for
free and used to calculate the mean response for each questions. JMP 12 also gave med the
standard deviation for all responses, and are also presented in the next chapter.
After this, I performed data analysis in Microsoft Excel using both the mean value and the
standard deviations; t-tests and ANOVA to uncover p-values and statistical significance. I was
interested in answering the research question; differentiating between motivation and hygiene, as
well as the respondent’s education level and its effect on the answers. These results will be
presented in the next chapter and discussed in chapter five.
3.4 Reliability
Reliability is determined by how the investigation is done, and how precise one is when treating
the data (Holme and Solvang 1986). Silverman (2011) refers to (Kirk and Miller 1986) stating that
reliability refers to the degree to which the findings of a study are independent of accidental
circumstances of the production.
Furthermore, Holme & Solvang (1986) states that one has a high reliability if there are
independent researches performed, generating the same or close to the same answer. There may
be error elements in the research, but the researcher doing a thorough job in diminishing these
errors achieves high reliability.
When performing a reliability test on a questionnaire, one can either allow two researchers
performing the same study, or sending out the same questionnaire twice to the same respondents
at another time.
However, using these types of tests will not be transferable to a qualitative research. “Theoretical
transparency” will play a far more central role, when discussing reliability in this case. This refers
to the extent of transparency around the research strategy and data analysis, in order to supply a
detailed description with no “hidden methods.”
31
In the case of the qualitative interview performed in this research, reliability can be emphasized
through the fact that I used the same interview guide for both interview objects. A professional
researcher revised the interview guide and its template matched those of previous interview
guides, as well as partial examples from various textbooks (Holme and Solvang 1986, Jacobsen
2005, Johannessen, Christoffersen et al. 2011, Silverman 2011). The main purpose of the
qualitative interview was having the interview object clarify what the researcher should be looking
for when preparing the questionnaires as well as being part of a mutual dialogue where
assumptions were formed around the motivation and hygiene factors affecting their employees’
job satisfaction.
I recorded the interview, which ensured me the correct information used in the research and I
did not have to base it on memory. The conversation was available to me long after the interview
was performed.
When discussing reliability in the quantitative sense, the main way of testing reliability can be
distributing a questionnaire to a group of respondents, receiving their answers, and re-distributing
it after some amount of time to test the consistency in their answers. In this research, the test-
retest method has not been feasible, but seeing as approximately the same questionnaire has been
sent out to two different and independent companies, the responses have no way of being
affected by each other making the reliability consistent. Furthermore, the questionnaire was
carefully developed in a way to minimize the risk of questions being misunderstood, and asking
more questions within the same question (Jacobsen 2005). In addition, there were 100
respondents and all answers were individual but within the same companies, there were
possibilities to determine trends. In other words, they had understood the questions
approximately in the same way, and the only thing separating the answers were naturally their
own opinions, as intended.
A professional researcher reviewed the questionnaire, and two test people completed the
questionnaire before distributing it. Seeing as both test persons understood the last question in
the survey regarding the arranging of factors from 1-10 and their individual values, I had no
indication that this question should have been prepared in a different manner. However, this
specific question confirms the sensitivity in personal perceptions and understandings when
answering the same survey. The researcher has only so much control over the wording, template,
and design; but in the end; the human error cannot be accounted for.
If I had randomly selected two responses from each company in order to see if their perception
of the questionnaire was in line with the intentions, there could have been a possibility for
32
choosing two respondents who had understood the last question, and I would be under the
impression that this was the norm. Two respondents who did not understand the last question
could also have been picked, and I might have thrown out the question all together under the
assumption that it was not clear and its reliability was too low to include in the results. However,
the choice for including this question in the results was grounded in the fact that presenting
possible errors is an important part of a research process, and there can be interesting discussions
surrounding misunderstandings as well.
3.5 Validity
Selecting qualitative and quantitative research methods has been the essential part of designing
this project, and there were no other methods which seemed expedient when developing a
research question. I did not initially choose to apply mixed methods to ensure the validity of the
research, but throughout the process this has indeed become the fact. As the findings uncovered
during the interview processes formed assumptions and contributed to well-developed
questionnaires, the results from the surveys backed up several of the assumptions and results
originated in the interview (Silverman 2011).
Triangulation is defined as the rationale for using multiple sources of evidence. Using multiple
research methods allowed me to look at a broader range of issues. Conclusions may be more
convincing and accurate when based on different sources of information. This specific research
has exercised triangulation of data sources and of methods. With data triangulation, potential
problems of construct validity can be addressed due to the multiple sources of evidence;
hereunder, interviewing two separate knowledge managers and distributing questionnaires to 137
knowledge workers (Yin 2009).
Using mixed-methods is an extensive and time-consuming way of researching, and the individual
knowledge around both methods requires more from the researcher. There are arguments that
the usage of mixed-methods prevents the researcher of becoming a master in one method and
leads to only performing mediocrely in both. Though this has not been my initial perception, I
cannot see another way for me to perform this specific research and this was the basis for
choosing both methods.
Validity can also be measured by seeing conformity with previous research. As the research
question is mainly based on Herzberg’s Two – factor theory, we have an indication on which way
the results went when a similar research was previously performed. However, one of the

33
assumptions under this specific research is determining whether the theory from the 1950’s is still
relevant today, and one cannot draw specific similarities but rather indications. However,
according to the findings from the qualitative interviews, the results from the questionnaires
validate and confirm some of the assumptions, which gives the indication that the research,
indeed, measured what was intended.
In terms of the validity in the qualitative interview, the interview guide was carefully developed
and controlled, and I withstood from having predetermined opinions when entering the interview
situation. Keeping an open mind and allowing the interview object to contribute to the
conversation, only being carefully led by the prepared questions, allows the interview object to
speak freely and discuss the questions asked. This method also limited my personal effect on the
interview object, and offered free reign in discussing the research question in depths as the
interview object saw fit.
The interview object did not receive the interview guide beforehand, but was presented with the
research question which determined his interest for contributing to the research. The companies
which were analyzed had already a clear perception of the key terms in the research, being
knowledge businesses as well as having focus on motivation and job satisfaction.
In terms of the questionnaire, its validity could have been utterly emphasized if I had similar
questionnaires about motivation and job satisfaction available in order to perform a comparison
to previous surveys. However, as the two companies are vastly different, and these types of
questionnaires usually are disclosed material, this was not available to me. The differences in my
survey and previous worker-satisfaction surveys would be prepared differently and limit the direct
comparison needed.
An important factor to discuss in the validity of the questionnaire is the possibility for both
human error and human manipulation (Silverman 2011). As the questionnaire presented
motivation and hygiene factors, there is the possibility that some respondents answered based on
what was expected of them. This may originate in a company culture where one is expected to be
motivated by intrinsic factors and that it may be “incorrect” to be driven by tangible factors,
these being salary, office space, or the likes. To ensure the minimization of this type of error, I re-
formulated the questions in different ways in order to map out how the respondents actually
think. Though one can interpret this as unprecise, it has to be taken into consideration that this
specific research may not offer a defined and underlined answer, but present different nuances,
approaches and views supporting or contradicting the original theory.

34
By combining qualitative and quantitative research methods, the researcher’s claim for validity of
the conclusions is enhanced if they can be shown to provide a mutual confirmation (Bryman
1988). In other words, if one suspects falsifiability in one of the research methods, the other may
confirm or decline this. If there is a case of human manipulation in the questionnaires, the
assumptions drawn out from the qualitative interviews may help the researcher discover this and
consider it. In addition, as the response rate was as high as over 70%, the internal validity
concludes relatively safe in this matter.
3.6 Research Ethics
The informants in this study were carefully selected, as they fulfill the ‘knowledge manager’
description being essential to this research. They were closely informed during the preparation of
the studies and they knew what they agreed to when the process started. However, it was
important for me to keep their names and their companies anonymous for several reasons. First,
though they have not released sensitive information, it is ethical to keep their identities discrete as
the thesis will be available online after it is submitted. Their employees and competitors may get
ahold of the thesis, and it was important to prevent possible conflicts in the future. The
respondents are also kept anonymous from the research as well as their managers in order to
answer freely during the questionnaire. There will be no possibilities for these two informants to
trace answers back to their employees.
The informants as well as the respondents have received the right to informed consent, and their
participation has been optional. The informants notified their employees of the fact that there
was a master-student researching the companies and that they had agreed to participate. The
factors being used in informed consent include giving information about the research which was
relevant to their decision making, ensuring that the subjects understood the dimensions of the
research, and ensuring the fact that participation was voluntarily (Silverman 2011).
In addition, I chose to send the thesis to the interview objects asking them to perform
respondent validation and confirming that information given about their companies in the thesis
is correct. This has been chosen in order to ensure both proper research ethics, as well as validity.
35
4. Results
4.1 Qualitative results; the Interviews
In the two qualitative interviews, I met the interview objects at their work place, and performed
an open ended, semi-structured interview based on the interview guide16. The conversation
started out with small-talk in order to feel out the situation and establish a positive setting. I then
asked the informant to elaborate about themselves, their job, their background and their work
tasks. Having people introduce and talk about themselves, promotes a low threshold and the
complexity of the interview starts out on a basic level (Johannessen, Christoffersen et al. 2011).
4.1.1 The Interview Objects
The manager in Company A is a research-director for three separate departments. Their business
model is 100% project oriented. He attended University of Oslo and received his PhD at this
university in 1991. He kept working at the university with different research projects. After this,
he started his own company where he worked for four years but returned to the university for a
while before he started working with company A in 2000. He started as a sector leader, and has
advanced in ranks throughout his years. Four years ago (2011), he received his position, in which
he is in possession of today, as research-director.
The interview object in company B was a young CEO with a background in information
technology and 10 years of experience with advertising, who started working in the digital
department in company B in 2007. He worked one year there before the board approached him
with the request to take over as CEO. Company B operates under a consulting business model
where they act as consultants for advertiser. In this case, the most important trait with his staff is
the ability to create solutions that are not only competitive in the market, but also tailored to
meet the clients’ very specific needs.
16 See Interview Guide, page 89
36
4.1.2 The Employees (Respondents in Questionnaire) in Company A
The employees in company A are mainly researchers with PhD degrees, post-doc positions, as
well as engineers and technicians with bachelor’s or master’s degrees.
According to interview object A, his employees are dedicated and interested in their jobs, but
their capabilities are not necessarily superior to other workplaces because of their education level.
“People who are interested in their field usually do a good job, and the most important thing is that they thrive in
their workplace.”
- Interview object A
His employees are mainly interested in Research and Development (from now on R&D), but
there are different personalities gathered in one place; some are interested in recognition from the
scientific environment, while others are more interested in contributing to making the world a
better place. Some employees stay employed because of the job security. Some of his employees
are very autonomous- They may create growth and expansion around themselves and only need
minimal supervision, while some, though they are few, needs to be guided through each day.
“Developing our knowledge and expertise is a continuous process. My employees have access to many academic
journals; they publish their work, and attend conferences where they meet colleagues within research and the
industry. These conferences are most important in order to make new contacts and potential research-project
partnerships.”
- Interview object A
His main job is helping employees focusing on the right projects and assisting them in their
projects through infrastructural facilitation and determining which research projects are the most
relevant to the industry. This indicates Interview object A using the HRPLTA17 strategy discussed
in chapter two, operating as a facilitator instead of a “boss” in the traditional sense.
“I do not actively “manage” the employees who are dedicated and autonomous. I provide the infrastructure, and the
assistive technology, which is needed for their research. In addition, I am present in meetings they have and show
that these specific projects are important to us and help them build relationships with new clients.
- Interview object A
17 Hire the Right People and Leave Them Alone
37
The employee turnover is very low at company A, with employees ranging from 10-20 years in
seniority though lately they have gone through a restructuring process in the whole company,
where they had to retire some employees early. Almost 40 employees received a severance
package that proved to be economical for both parties18. Naturally, some departments housed
older employees than others that were those in need of a restructuring.
During the interview, I got a clearer picture when discussing management of hyper-motivated
and autonomous knowledge workers. Motivation and job satisfaction is therefore a complex
picture and based on this, there were assumptions formed to support the research question.
Hereunder are some assumptions formed for company A.
Assumption: The importance of hygiene factors in terms of both satisfaction and motivation
The traditional hygiene factors defined by the theory includes salary, office space, colleagues,
flexible hours, and infrastructural facilities were assumed to play a more important part in
employee motivation then previously determined by Herzberg’s theory. In many R&D projects,
the infrastructural facilitation may prevent the employees from actually performing their job and
the work space is also an important factor. Cooperation between the employees and a strong,
positive work-culture plays a role for performing according to the business model, so the
relationship with colleagues is essential for motivation as well.
Based on these main findings during the interview, additional information and factors were
included in the questionnaire. Though this assumption contradicts the main theory, the research
question was strongly kept in mind and present during the interview process and when receiving
the results from the questionnaires. In addition, based on previous research (Story, Hart et al.
2009), there are indications that hygiene factors indeed contribute to motivation and job
satisfaction, and therefore the research is particularly interesting as there may be confirmations of
these types of literature.
Assumption: The answers from the respondents may vary based on education background
The fact that there is a large span of employees and backgrounds, mainly having everything from
upper secondary education to those with a PhD, helped form the assumption that there were
differences in the responses based on this. The fact that the employees have different types of
jobs based on their education level, is assumed to be visible through the questionnaire. An
employee with a bachelor’s degree working in the administration is assumed to answer differently
18 These employees were not employed in Interview Object A’s departments, but other sectors in the company.
38
on questions regarding “own research,” than their PhD colleagues. Furthermore, the previous
research based on (Eskildsen, Kristensen et al. 2004) establishes differences in education level
regarding motivation and job satisfaction. Which made me curious towards this being the case in
this research as well.
4.1.3 The Employees (Respondents in Questionnaire) in Company B
The employees in company B have mainly bachelors or master’s degrees in business and
administration, marketing or economics, to name a few. They are analytical, interested in the
business and want to expand their capabilities and knowledge within the industry. They are also
hyper-motivated and autonomous and the manager’s main role is delegating, inspiring, and
contributing to feedback.
The employee turnover for company B is higher than in company A, as many use this job as a
stepping-stone to other industries, but on average, they stay employed five years.
“Creating results, and professional development, is a strong driving force. The employees are ambitious on behalf of
themselves and the clients.”
- Interview object B
In terms of motivation factors, the manager of company B is very interested in helping his
employees develop themselves and expand their client portfolios. When pitching ideas to
potential clients, or in order to keep existing clients, he is very involved in the process though the
employees perform the job itself. Their hierarchy is based on a flat line concept and he is very
aware that many of his employees have knowledge in their field which exceeds his own in that
specific field.
They have recently changed head-quarter locations. They are now operating under the “free-
seating” concept, which has eliminated personal offices, and assigned spaces. Each employee has
a locker, in which all their personal belongings fit, and they choose a new desk every day. This
has opened up communication and cooperation across departmental borders, and the company
hierarchy has been eliminated, as Interview object B, himself, also changes space every day and sit
amongst his employees as a peer. He has opened up a broader communication with his
employees, and has had the opportunity of getting to know them better and under different
circumstances, which in turn helps him lead them in a more constructive manner.
The assumption formed during the interview with company A, was contradicted during the
interview with company B, and I was presented with the fact that the employees were more
39
driven by intrinsic than extrinsic factors. However, as the educational background is not as
widespread, the following assumption was formed:
Assumption: The respondents’ answers do not differ as much based on education background
The reason for underlining this assumption is that the internal focus on education background is
not as transparent in company B, as few of the employees are mainly educated in the trait being
used in this company. Though economics and marketing are important factors in the company,
there is more to the “trait” of this company specializing them in this. Therefore, one can assume
that all employees, regardless of their educational background, have the same opportunities in
developing their skills. Whether education level has an impact on the employees’ motivation and
satisfaction is assumed to contradict the previous mentioned research by Esklidsen et al. (2004)
This supports the basic theory by Herzberg in a greater sense. Having researched two different
companies generated conclusions with obvious differences. Both companies are knowledge
businesses and the interview objects set a standard for their employees which can be seen in
terms of their own perceptions of motivation and the confirmation of the assumptions in the
questionnaire. There are great indications that the manager knows his employees well and that
motivation and hygiene factors uncovered during the interview, applied to the respondents of the
survey. However, as both companies employ knowledge workers with higher education, they
were somewhat coherent in terms of answers.
The survey gave an indication to differences between company A and B as well as differences
within the two companies based on education level. Their results are presented in the next
section.
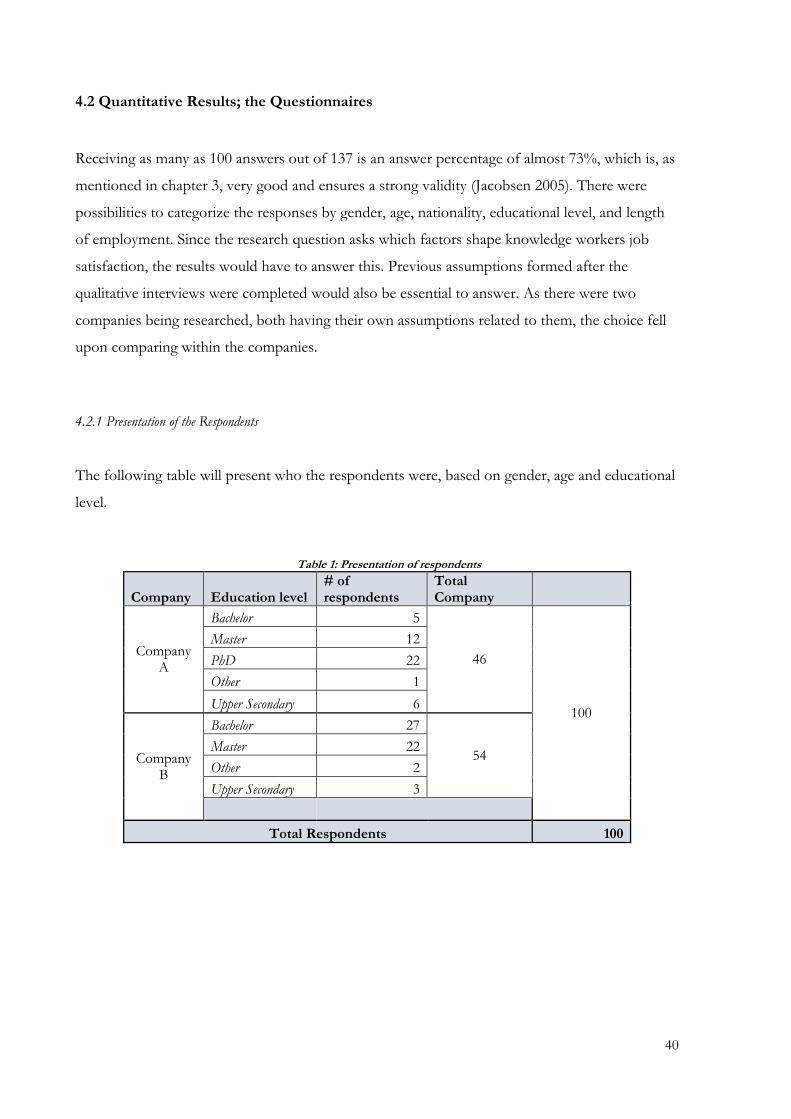
40
4.2 Quantitative Results; the Questionnaires
Receiving as many as 100 answers out of 137 is an answer percentage of almost 73%, which is, as
mentioned in chapter 3, very good and ensures a strong validity (Jacobsen 2005). There were
possibilities to categorize the responses by gender, age, nationality, educational level, and length
of employment. Since the research question asks which factors shape knowledge workers job
satisfaction, the results would have to answer this. Previous assumptions formed after the
qualitative interviews were completed would also be essential to answer. As there were two
companies being researched, both having their own assumptions related to them, the choice fell
upon comparing within the companies.
4.2.1 Presentation of the Respondents
The following table will present who the respondents were, based on gender, age and educational
level.
Table 1: Presentation of respondents
Company Education level # of respondents
Total Company
Company A
Bachelor 5
46
100
Master 12
PhD 22
Other 1
Upper Secondary 6
Company B
Bachelor 27
54 Master 22
Other 2
Upper Secondary 3
Total Respondents 100
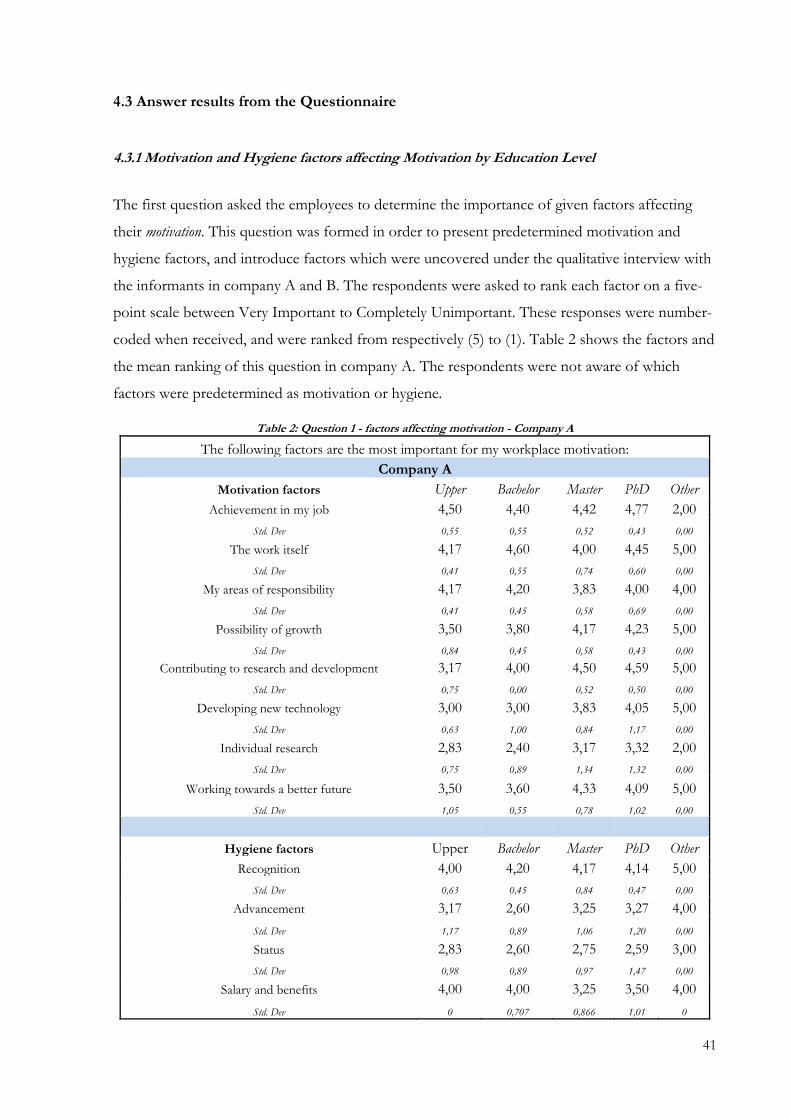
41
4.3 Answer results from the Questionnaire
4.3.1 Motivation and Hygiene factors affecting Motivation by Education Level
The first question asked the employees to determine the importance of given factors affecting
their motivation. This question was formed in order to present predetermined motivation and
hygiene factors, and introduce factors which were uncovered under the qualitative interview with
the informants in company A and B. The respondents were asked to rank each factor on a five-
point scale between Very Important to Completely Unimportant. These responses were number-
coded when received, and were ranked from respectively (5) to (1). Table 2 shows the factors and
the mean ranking of this question in company A. The respondents were not aware of which
factors were predetermined as motivation or hygiene.
Table 2: Question 1 - factors affecting motivation - Company A
The following factors are the most important for my workplace motivation:
Company A
Motivation factors Upper Bachelor Master PhD Other
Achievement in my job 4,50 4,40 4,42 4,77 2,00
Std. Dev 0,55 0,55 0,52 0,43 0,00
The work itself 4,17 4,60 4,00 4,45 5,00
Std. Dev 0,41 0,55 0,74 0,60 0,00
My areas of responsibility 4,17 4,20 3,83 4,00 4,00
Std. Dev 0,41 0,45 0,58 0,69 0,00
Possibility of growth 3,50 3,80 4,17 4,23 5,00
Std. Dev 0,84 0,45 0,58 0,43 0,00
Contributing to research and development 3,17 4,00 4,50 4,59 5,00
Std. Dev 0,75 0,00 0,52 0,50 0,00
Developing new technology 3,00 3,00 3,83 4,05 5,00
Std. Dev 0,63 1,00 0,84 1,17 0,00
Individual research 2,83 2,40 3,17 3,32 2,00
Std. Dev 0,75 0,89 1,34 1,32 0,00
Working towards a better future 3,50 3,60 4,33 4,09 5,00
Std. Dev 1,05 0,55 0,78 1,02 0,00
Hygiene factors Upper Bachelor Master PhD Other
Recognition 4,00 4,20 4,17 4,14 5,00
Std. Dev 0,63 0,45 0,84 0,47 0,00
Advancement 3,17 2,60 3,25 3,27 4,00
Std. Dev 1,17 0,89 1,06 1,20 0,00
Status 2,83 2,60 2,75 2,59 3,00
Std. Dev 0,98 0,89 0,97 1,47 0,00
Salary and benefits 4,00 4,00 3,25 3,50 4,00
Std. Dev 0 0,707 0,866 1,01 0
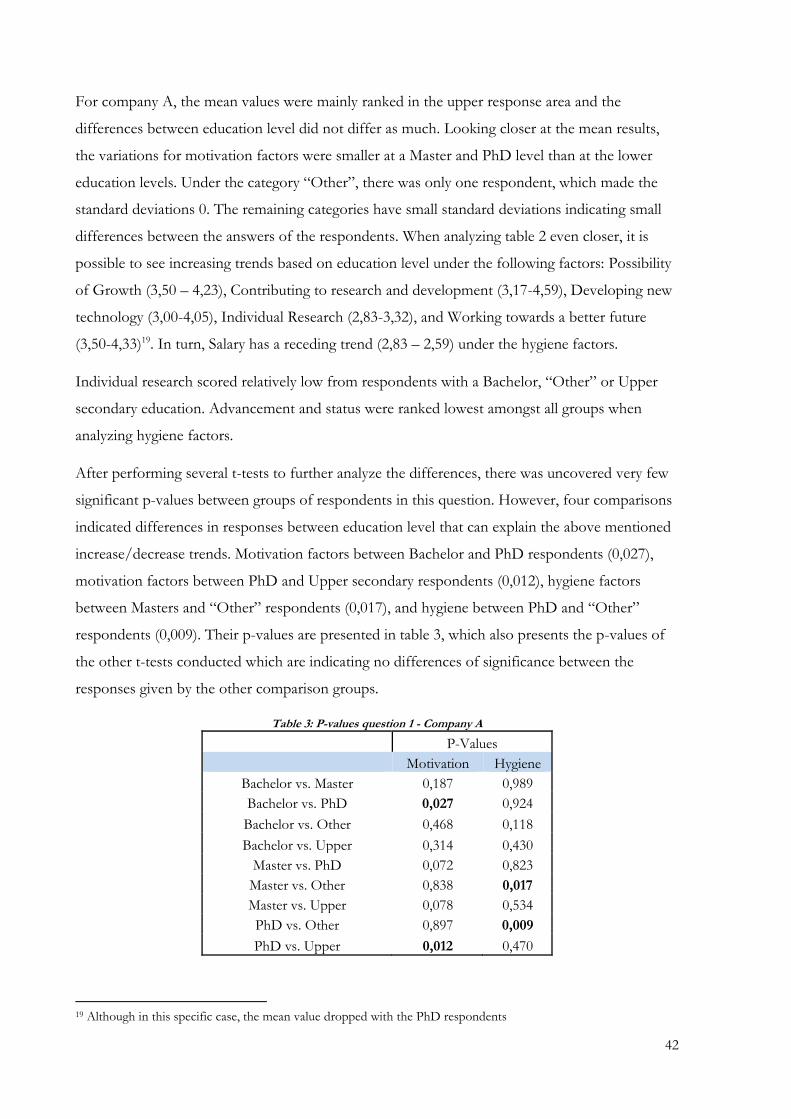
42
For company A, the mean values were mainly ranked in the upper response area and the
differences between education level did not differ as much. Looking closer at the mean results,
the variations for motivation factors were smaller at a Master and PhD level than at the lower
education levels. Under the category “Other”, there was only one respondent, which made the
standard deviations 0. The remaining categories have small standard deviations indicating small
differences between the answers of the respondents. When analyzing table 2 even closer, it is
possible to see increasing trends based on education level under the following factors: Possibility
of Growth (3,50 – 4,23), Contributing to research and development (3,17-4,59), Developing new
technology (3,00-4,05), Individual Research (2,83-3,32), and Working towards a better future
(3,50-4,33)19. In turn, Salary has a receding trend (2,83 – 2,59) under the hygiene factors.
Individual research scored relatively low from respondents with a Bachelor, “Other” or Upper
secondary education. Advancement and status were ranked lowest amongst all groups when
analyzing hygiene factors.
After performing several t-tests to further analyze the differences, there was uncovered very few
significant p-values between groups of respondents in this question. However, four comparisons
indicated differences in responses between education level that can explain the above mentioned
increase/decrease trends. Motivation factors between Bachelor and PhD respondents (0,027),
motivation factors between PhD and Upper secondary respondents (0,012), hygiene factors
between Masters and “Other” respondents (0,017), and hygiene between PhD and “Other”
respondents (0,009). Their p-values are presented in table 3, which also presents the p-values of
the other t-tests conducted which are indicating no differences of significance between the
responses given by the other comparison groups.
Table 3: P-values question 1 - Company A
P-Values
Motivation Hygiene
Bachelor vs. Master 0,187 0,989
Bachelor vs. PhD 0,027 0,924
Bachelor vs. Other 0,468 0,118
Bachelor vs. Upper 0,314 0,430
Master vs. PhD 0,072 0,823
Master vs. Other 0,838 0,017
Master vs. Upper 0,078 0,534
PhD vs. Other 0,897 0,009
PhD vs. Upper 0,012 0,470
19 Although in this specific case, the mean value dropped with the PhD respondents
43
As there were increasing trends from Bachelor level to PhD, there will naturally be some
differences between the lowest and the highest group. A significant p-value emphasizes the
importance of this in question one.
Herzberg claimed that there were differences between the importance of motivation factors and
hygiene factors when the question referred to motivation (Herzberg, Mausner et al. 1959).
Theory claimed that an employee considered the presence of motivation factors to exceed the
presence of hygiene factors in order to experience workplace motivation. Comparing the
motivation factors to the hygiene factors in the questionnaires gave a result that on no
educational level, would there be grounds for assuming large differences. However, examining
table 2 shows that respondents with a PhD background ranked three out of four hygiene factors
lower than the motivation factors, but this gave no significant impact in the analysis.
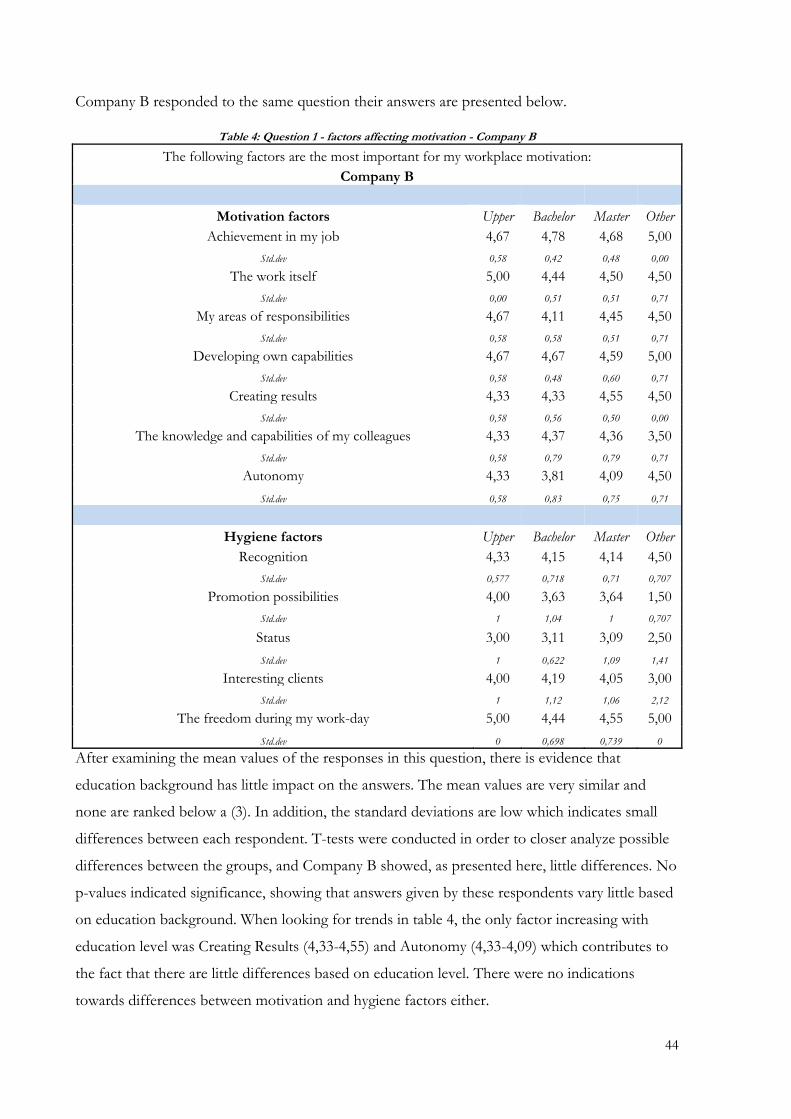
44
Company B responded to the same question their answers are presented below.
Table 4: Question 1 - factors affecting motivation - Company B
The following factors are the most important for my workplace motivation:
Company B
Motivation factors Upper Bachelor Master Other
Achievement in my job 4,67 4,78 4,68 5,00
Std.dev 0,58 0,42 0,48 0,00
The work itself 5,00 4,44 4,50 4,50
Std.dev 0,00 0,51 0,51 0,71
My areas of responsibilities 4,67 4,11 4,45 4,50
Std.dev 0,58 0,58 0,51 0,71
Developing own capabilities 4,67 4,67 4,59 5,00
Std.dev 0,58 0,48 0,60 0,71
Creating results 4,33 4,33 4,55 4,50
Std.dev 0,58 0,56 0,50 0,00
The knowledge and capabilities of my colleagues 4,33 4,37 4,36 3,50
Std.dev 0,58 0,79 0,79 0,71
Autonomy 4,33 3,81 4,09 4,50
Std.dev 0,58 0,83 0,75 0,71
Hygiene factors Upper Bachelor Master Other
Recognition 4,33 4,15 4,14 4,50
Std.dev 0,577 0,718 0,71 0,707
Promotion possibilities 4,00 3,63 3,64 1,50
Std.dev 1 1,04 1 0,707
Status 3,00 3,11 3,09 2,50
Std.dev 1 0,622 1,09 1,41
Interesting clients 4,00 4,19 4,05 3,00
Std.dev 1 1,12 1,06 2,12
The freedom during my work-day 5,00 4,44 4,55 5,00
Std.dev 0 0,698 0,739 0
After examining the mean values of the responses in this question, there is evidence that
education background has little impact on the answers. The mean values are very similar and
none are ranked below a (3). In addition, the standard deviations are low which indicates small
differences between each respondent. T-tests were conducted in order to closer analyze possible
differences between the groups, and Company B showed, as presented here, little differences. No
p-values indicated significance, showing that answers given by these respondents vary little based
on education background. When looking for trends in table 4, the only factor increasing with
education level was Creating Results (4,33-4,55) and Autonomy (4,33-4,09) which contributes to
the fact that there are little differences based on education level. There were no indications
towards differences between motivation and hygiene factors either.
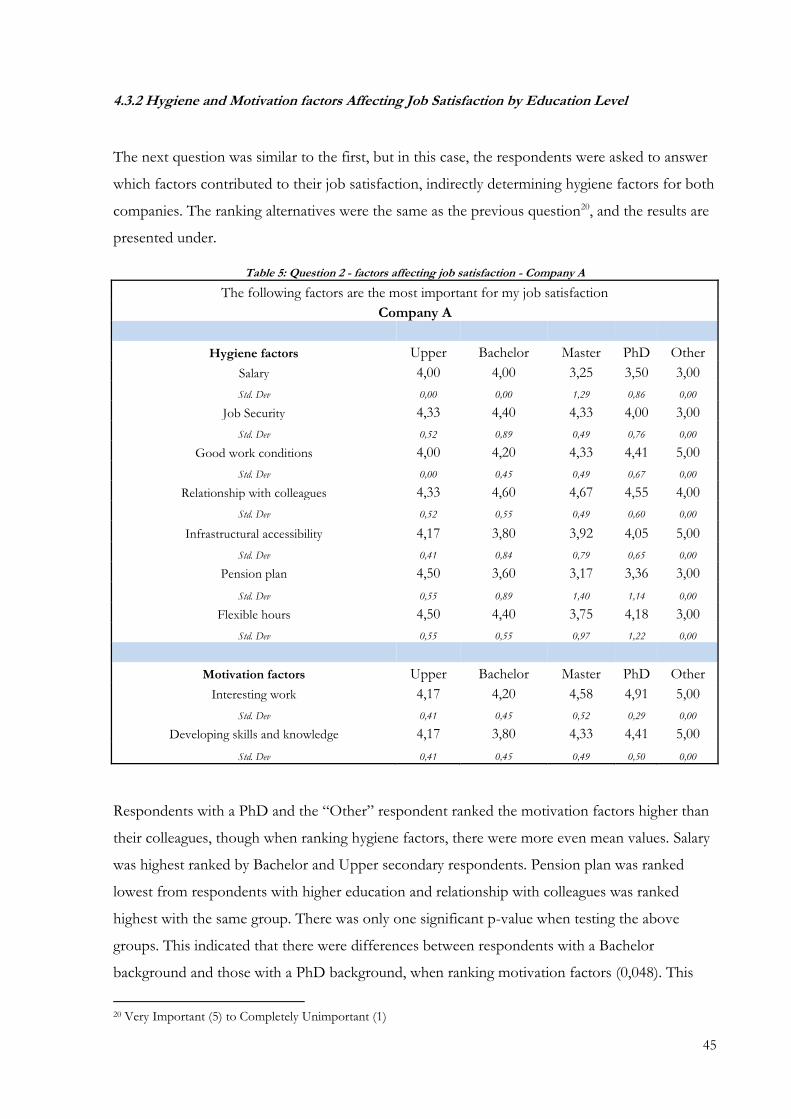
45
4.3.2 Hygiene and Motivation factors Affecting Job Satisfaction by Education Level
The next question was similar to the first, but in this case, the respondents were asked to answer
which factors contributed to their job satisfaction, indirectly determining hygiene factors for both
companies. The ranking alternatives were the same as the previous question20, and the results are
presented under.
Table 5: Question 2 - factors affecting job satisfaction - Company A
The following factors are the most important for my job satisfaction
Company A
Hygiene factors Upper Bachelor Master PhD Other
Salary 4,00 4,00 3,25 3,50 3,00
Std. Dev 0,00 0,00 1,29 0,86 0,00
Job Security 4,33 4,40 4,33 4,00 3,00
Std. Dev 0,52 0,89 0,49 0,76 0,00
Good work conditions 4,00 4,20 4,33 4,41 5,00
Std. Dev 0,00 0,45 0,49 0,67 0,00
Relationship with colleagues 4,33 4,60 4,67 4,55 4,00
Std. Dev 0,52 0,55 0,49 0,60 0,00
Infrastructural accessibility 4,17 3,80 3,92 4,05 5,00
Std. Dev 0,41 0,84 0,79 0,65 0,00
Pension plan 4,50 3,60 3,17 3,36 3,00
Std. Dev 0,55 0,89 1,40 1,14 0,00
Flexible hours 4,50 4,40 3,75 4,18 3,00
Std. Dev 0,55 0,55 0,97 1,22 0,00
Motivation factors Upper Bachelor Master PhD Other
Interesting work 4,17 4,20 4,58 4,91 5,00
Std. Dev 0,41 0,45 0,52 0,29 0,00
Developing skills and knowledge 4,17 3,80 4,33 4,41 5,00
Std. Dev 0,41 0,45 0,49 0,50 0,00
Respondents with a PhD and the “Other” respondent ranked the motivation factors higher than
their colleagues, though when ranking hygiene factors, there were more even mean values. Salary
was highest ranked by Bachelor and Upper secondary respondents. Pension plan was ranked
lowest from respondents with higher education and relationship with colleagues was ranked
highest with the same group. There was only one significant p-value when testing the above
groups. This indicated that there were differences between respondents with a Bachelor
background and those with a PhD background, when ranking motivation factors (0,048). This
20 Very Important (5) to Completely Unimportant (1)
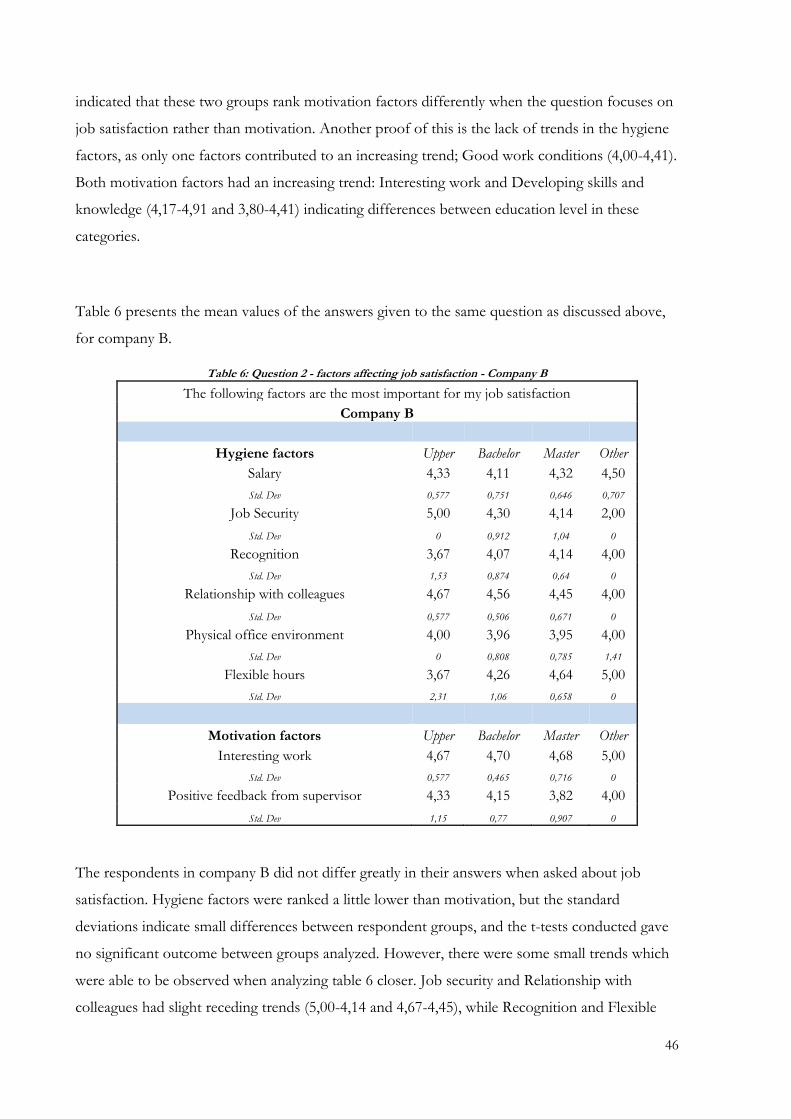
46
indicated that these two groups rank motivation factors differently when the question focuses on
job satisfaction rather than motivation. Another proof of this is the lack of trends in the hygiene
factors, as only one factors contributed to an increasing trend; Good work conditions (4,00-4,41).
Both motivation factors had an increasing trend: Interesting work and Developing skills and
knowledge (4,17-4,91 and 3,80-4,41) indicating differences between education level in these
categories.
Table 6 presents the mean values of the answers given to the same question as discussed above,
for company B.
Table 6: Question 2 - factors affecting job satisfaction - Company B
The following factors are the most important for my job satisfaction
Company B
Hygiene factors Upper Bachelor Master Other
Salary 4,33 4,11 4,32 4,50
Std. Dev 0,577 0,751 0,646 0,707
Job Security 5,00 4,30 4,14 2,00
Std. Dev 0 0,912 1,04 0
Recognition 3,67 4,07 4,14 4,00
Std. Dev 1,53 0,874 0,64 0
Relationship with colleagues 4,67 4,56 4,45 4,00
Std. Dev 0,577 0,506 0,671 0
Physical office environment 4,00 3,96 3,95 4,00
Std. Dev 0 0,808 0,785 1,41
Flexible hours 3,67 4,26 4,64 5,00
Std. Dev 2,31 1,06 0,658 0
Motivation factors Upper Bachelor Master Other
Interesting work 4,67 4,70 4,68 5,00
Std. Dev 0,577 0,465 0,716 0
Positive feedback from supervisor 4,33 4,15 3,82 4,00
Std. Dev 1,15 0,77 0,907 0
The respondents in company B did not differ greatly in their answers when asked about job
satisfaction. Hygiene factors were ranked a little lower than motivation, but the standard
deviations indicate small differences between respondent groups, and the t-tests conducted gave
no significant outcome between groups analyzed. However, there were some small trends which
were able to be observed when analyzing table 6 closer. Job security and Relationship with
colleagues had slight receding trends (5,00-4,14 and 4,67-4,45), while Recognition and Flexible

47
hours had a small increasing trend (3,67-4,14 and 3,67-4,64) between education groups. Under
motivation factors, Positive feedback from supervisor was also observed with a marginal receding
trend (4,33 – 3,82) between education groups. This may underline the fact that there are
insignificant differences which did not pan out during the t-tests. I tried several different
approaches in order to uncover differences between groups; mean values based on gender and
age as well. However, the mean values did not differ from the above-mentioned values. This was
the reason for continuing to stick with analyzing based on education level, as well as this
grouping being a part of the research question determining what motivates knowledge workers.
This was also the case in the study performed by Furnham et al. (2009) where a similar study was
conducted; demographics and personalities were here proven to be significant; job tenure, age,
and gender were just as insignificant as they were in these results. Wiley (1997), on the other
hand, argues that status, gender, income, and occupation are relevant to employees responses, but
agrees that main differences lie in demographics and personalities.
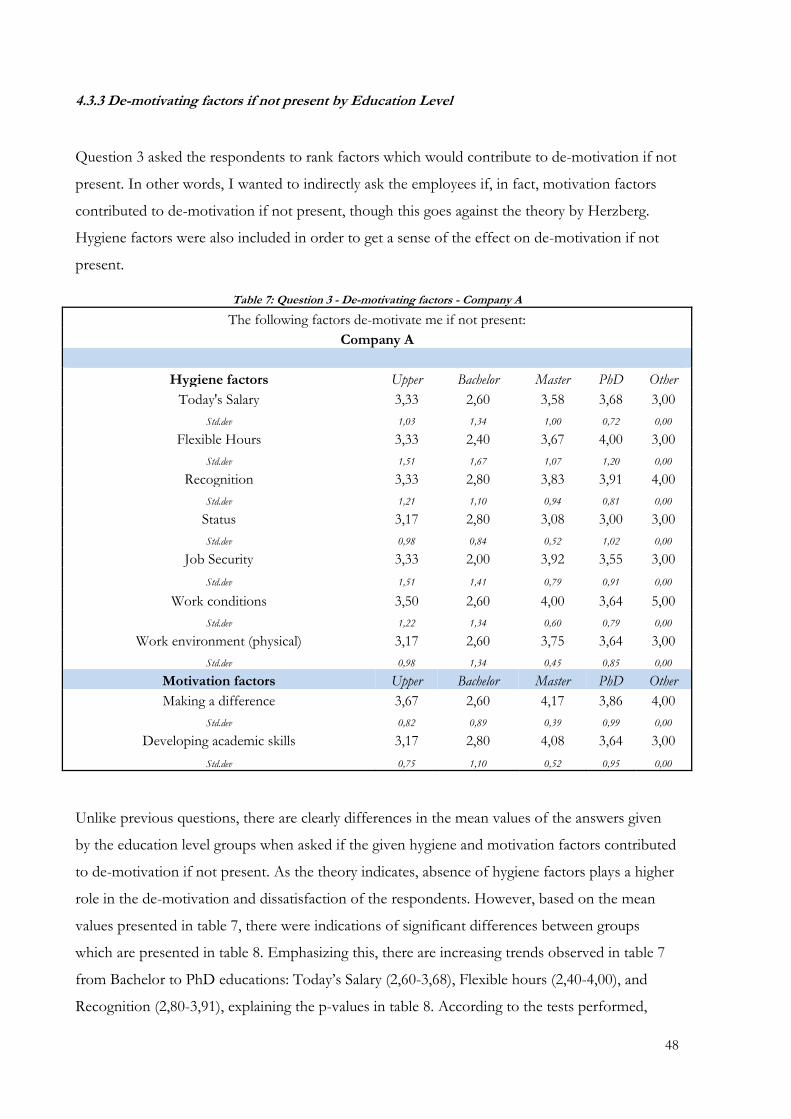
48
4.3.3 De-motivating factors if not present by Education Level
Question 3 asked the respondents to rank factors which would contribute to de-motivation if not
present. In other words, I wanted to indirectly ask the employees if, in fact, motivation factors
contributed to de-motivation if not present, though this goes against the theory by Herzberg.
Hygiene factors were also included in order to get a sense of the effect on de-motivation if not
present.
Table 7: Question 3 - De-motivating factors - Company A
The following factors de-motivate me if not present:
Company A
Hygiene factors Upper Bachelor Master PhD Other
Today's Salary 3,33 2,60 3,58 3,68 3,00
Std.dev 1,03 1,34 1,00 0,72 0,00
Flexible Hours 3,33 2,40 3,67 4,00 3,00
Std.dev 1,51 1,67 1,07 1,20 0,00
Recognition 3,33 2,80 3,83 3,91 4,00
Std.dev 1,21 1,10 0,94 0,81 0,00
Status 3,17 2,80 3,08 3,00 3,00
Std.dev 0,98 0,84 0,52 1,02 0,00
Job Security 3,33 2,00 3,92 3,55 3,00
Std.dev 1,51 1,41 0,79 0,91 0,00
Work conditions 3,50 2,60 4,00 3,64 5,00
Std.dev 1,22 1,34 0,60 0,79 0,00
Work environment (physical) 3,17 2,60 3,75 3,64 3,00
Std.dev 0,98 1,34 0,45 0,85 0,00
Motivation factors Upper Bachelor Master PhD Other
Making a difference 3,67 2,60 4,17 3,86 4,00
Std.dev 0,82 0,89 0,39 0,99 0,00
Developing academic skills 3,17 2,80 4,08 3,64 3,00
Std.dev 0,75 1,10 0,52 0,95 0,00
Unlike previous questions, there are clearly differences in the mean values of the answers given
by the education level groups when asked if the given hygiene and motivation factors contributed
to de-motivation if not present. As the theory indicates, absence of hygiene factors plays a higher
role in the de-motivation and dissatisfaction of the respondents. However, based on the mean
values presented in table 7, there were indications of significant differences between groups
which are presented in table 8. Emphasizing this, there are increasing trends observed in table 7
from Bachelor to PhD educations: Today’s Salary (2,60-3,68), Flexible hours (2,40-4,00), and
Recognition (2,80-3,91), explaining the p-values in table 8. According to the tests performed,
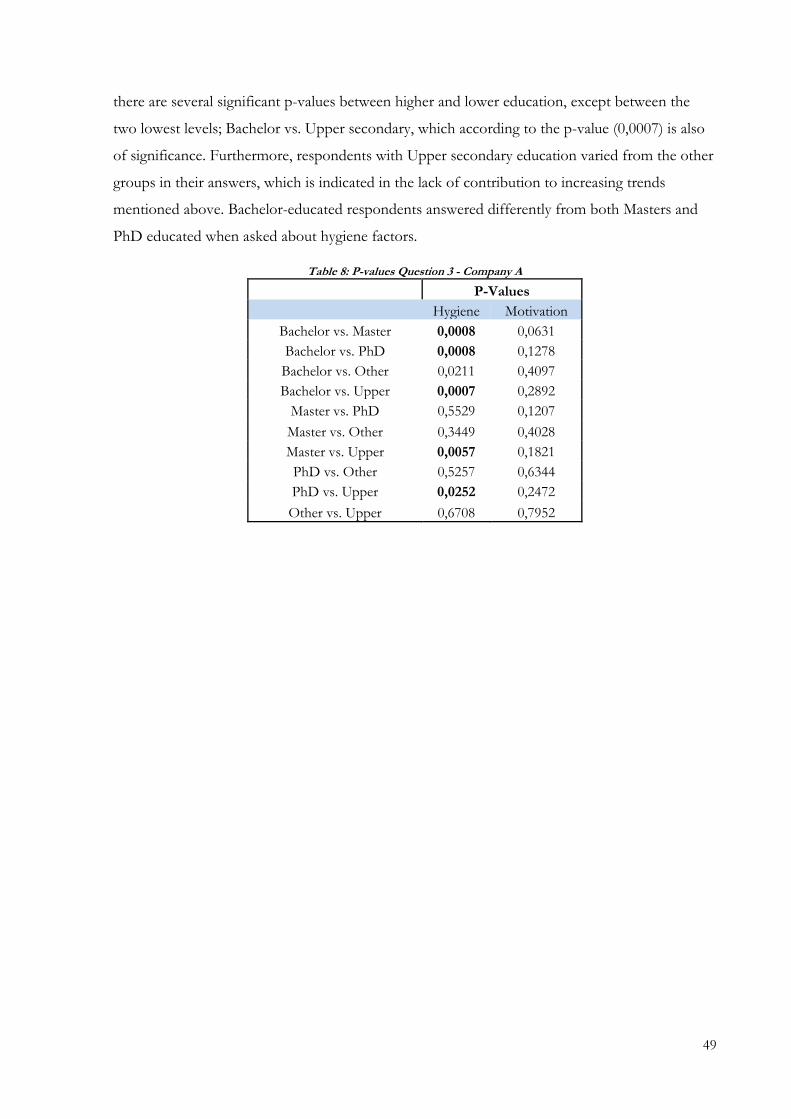
49
there are several significant p-values between higher and lower education, except between the
two lowest levels; Bachelor vs. Upper secondary, which according to the p-value (0,0007) is also
of significance. Furthermore, respondents with Upper secondary education varied from the other
groups in their answers, which is indicated in the lack of contribution to increasing trends
mentioned above. Bachelor-educated respondents answered differently from both Masters and
PhD educated when asked about hygiene factors.
Table 8: P-values Question 3 - Company A
P-Values
Hygiene Motivation
Bachelor vs. Master 0,0008 0,0631
Bachelor vs. PhD 0,0008 0,1278
Bachelor vs. Other 0,0211 0,4097
Bachelor vs. Upper 0,0007 0,2892
Master vs. PhD 0,5529 0,1207
Master vs. Other 0,3449 0,4028
Master vs. Upper 0,0057 0,1821
PhD vs. Other 0,5257 0,6344
PhD vs. Upper 0,0252 0,2472
Other vs. Upper 0,6708 0,7952
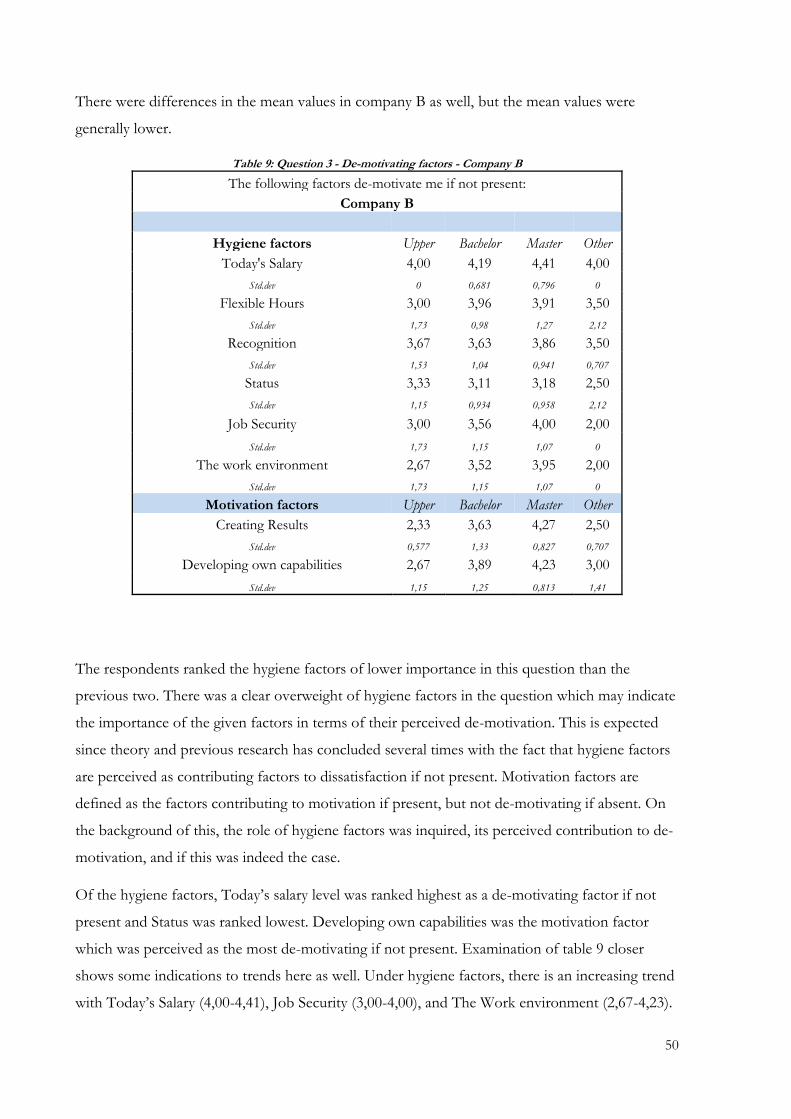
50
There were differences in the mean values in company B as well, but the mean values were
generally lower.
Table 9: Question 3 - De-motivating factors - Company B
The following factors de-motivate me if not present:
Company B
Hygiene factors Upper Bachelor Master Other
Today's Salary 4,00 4,19 4,41 4,00
Std.dev 0 0,681 0,796 0
Flexible Hours 3,00 3,96 3,91 3,50
Std.dev 1,73 0,98 1,27 2,12
Recognition 3,67 3,63 3,86 3,50
Std.dev 1,53 1,04 0,941 0,707
Status 3,33 3,11 3,18 2,50
Std.dev 1,15 0,934 0,958 2,12
Job Security 3,00 3,56 4,00 2,00
Std.dev 1,73 1,15 1,07 0
The work environment 2,67 3,52 3,95 2,00
Std.dev 1,73 1,15 1,07 0
Motivation factors Upper Bachelor Master Other
Creating Results 2,33 3,63 4,27 2,50
Std.dev 0,577 1,33 0,827 0,707
Developing own capabilities 2,67 3,89 4,23 3,00
Std.dev 1,15 1,25 0,813 1,41
The respondents ranked the hygiene factors of lower importance in this question than the
previous two. There was a clear overweight of hygiene factors in the question which may indicate
the importance of the given factors in terms of their perceived de-motivation. This is expected
since theory and previous research has concluded several times with the fact that hygiene factors
are perceived as contributing factors to dissatisfaction if not present. Motivation factors are
defined as the factors contributing to motivation if present, but not de-motivating if absent. On
the background of this, the role of hygiene factors was inquired, its perceived contribution to de-
motivation, and if this was indeed the case.
Of the hygiene factors, Today’s salary level was ranked highest as a de-motivating factor if not
present and Status was ranked lowest. Developing own capabilities was the motivation factor
which was perceived as the most de-motivating if not present. Examination of table 9 closer
shows some indications to trends here as well. Under hygiene factors, there is an increasing trend
with Today’s Salary (4,00-4,41), Job Security (3,00-4,00), and The Work environment (2,67-4,23).
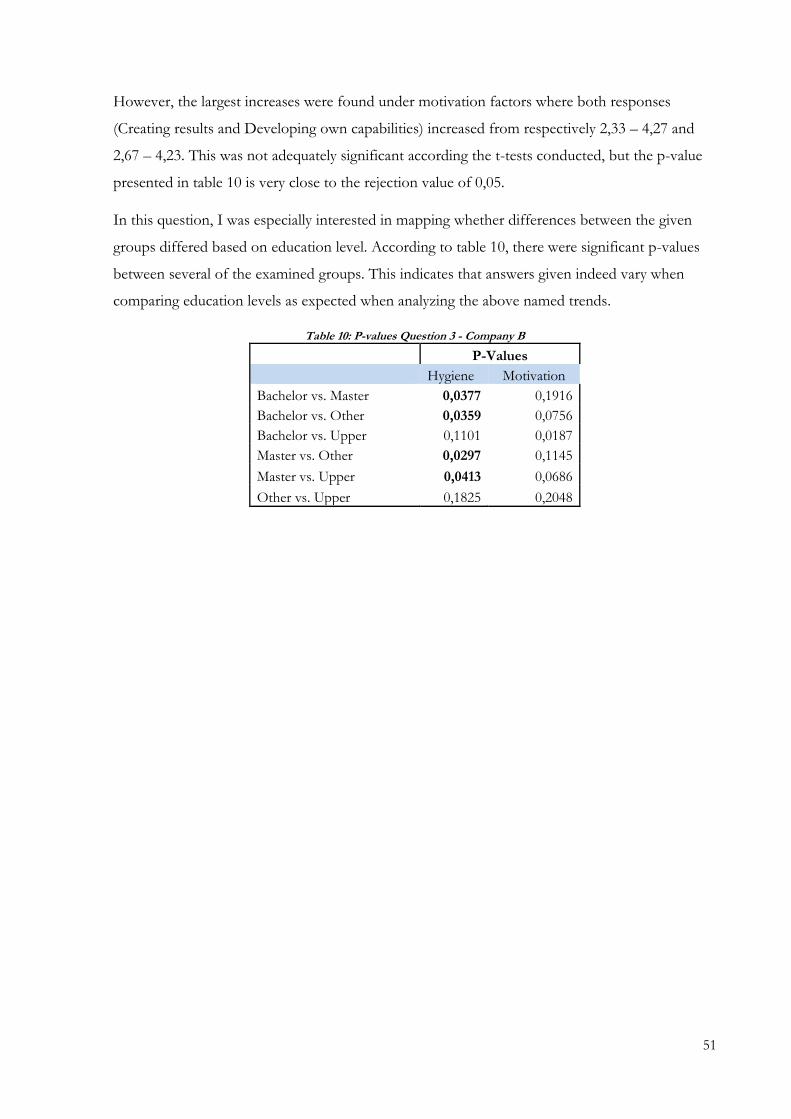
51
However, the largest increases were found under motivation factors where both responses
(Creating results and Developing own capabilities) increased from respectively 2,33 – 4,27 and
2,67 – 4,23. This was not adequately significant according the t-tests conducted, but the p-value
presented in table 10 is very close to the rejection value of 0,05.
In this question, I was especially interested in mapping whether differences between the given
groups differed based on education level. According to table 10, there were significant p-values
between several of the examined groups. This indicates that answers given indeed vary when
comparing education levels as expected when analyzing the above named trends.
Table 10: P-values Question 3 - Company B
P-Values
Hygiene Motivation
Bachelor vs. Master 0,0377 0,1916
Bachelor vs. Other 0,0359 0,0756
Bachelor vs. Upper 0,1101 0,0187
Master vs. Other 0,0297 0,1145
Master vs. Upper 0,0413 0,0686
Other vs. Upper 0,1825 0,2048
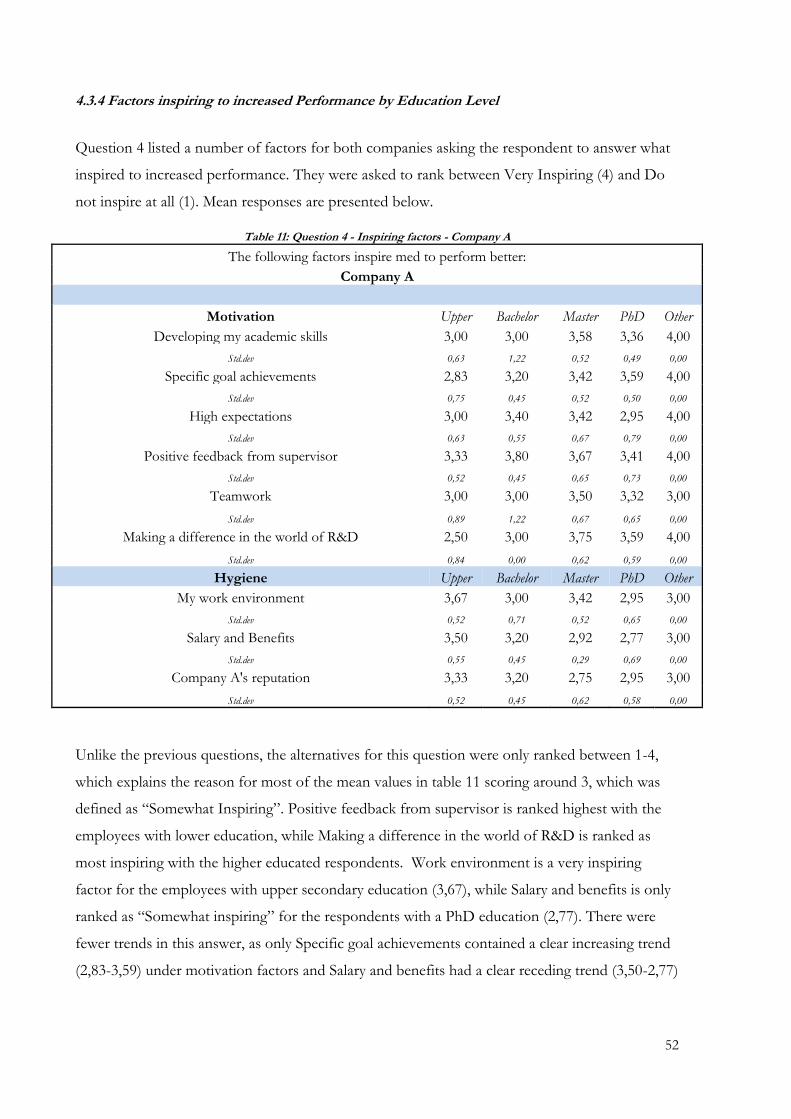
52
4.3.4 Factors inspiring to increased Performance by Education Level
Question 4 listed a number of factors for both companies asking the respondent to answer what
inspired to increased performance. They were asked to rank between Very Inspiring (4) and Do
not inspire at all (1). Mean responses are presented below.
Table 11: Question 4 - Inspiring factors - Company A
The following factors inspire med to perform better:
Company A
Motivation Upper Bachelor Master PhD Other
Developing my academic skills 3,00 3,00 3,58 3,36 4,00
Std.dev 0,63 1,22 0,52 0,49 0,00
Specific goal achievements 2,83 3,20 3,42 3,59 4,00
Std.dev 0,75 0,45 0,52 0,50 0,00
High expectations 3,00 3,40 3,42 2,95 4,00
Std.dev 0,63 0,55 0,67 0,79 0,00
Positive feedback from supervisor 3,33 3,80 3,67 3,41 4,00
Std.dev 0,52 0,45 0,65 0,73 0,00
Teamwork 3,00 3,00 3,50 3,32 3,00
Std.dev 0,89 1,22 0,67 0,65 0,00
Making a difference in the world of R&D 2,50 3,00 3,75 3,59 4,00
Std.dev 0,84 0,00 0,62 0,59 0,00
Hygiene Upper Bachelor Master PhD Other
My work environment 3,67 3,00 3,42 2,95 3,00
Std.dev 0,52 0,71 0,52 0,65 0,00
Salary and Benefits 3,50 3,20 2,92 2,77 3,00
Std.dev 0,55 0,45 0,29 0,69 0,00
Company A's reputation 3,33 3,20 2,75 2,95 3,00
Std.dev 0,52 0,45 0,62 0,58 0,00
Unlike the previous questions, the alternatives for this question were only ranked between 1-4,
which explains the reason for most of the mean values in table 11 scoring around 3, which was
defined as “Somewhat Inspiring”. Positive feedback from supervisor is ranked highest with the
employees with lower education, while Making a difference in the world of R&D is ranked as
most inspiring with the higher educated respondents. Work environment is a very inspiring
factor for the employees with upper secondary education (3,67), while Salary and benefits is only
ranked as “Somewhat inspiring” for the respondents with a PhD education (2,77). There were
fewer trends in this answer, as only Specific goal achievements contained a clear increasing trend
(2,83-3,59) under motivation factors and Salary and benefits had a clear receding trend (3,50-2,77)
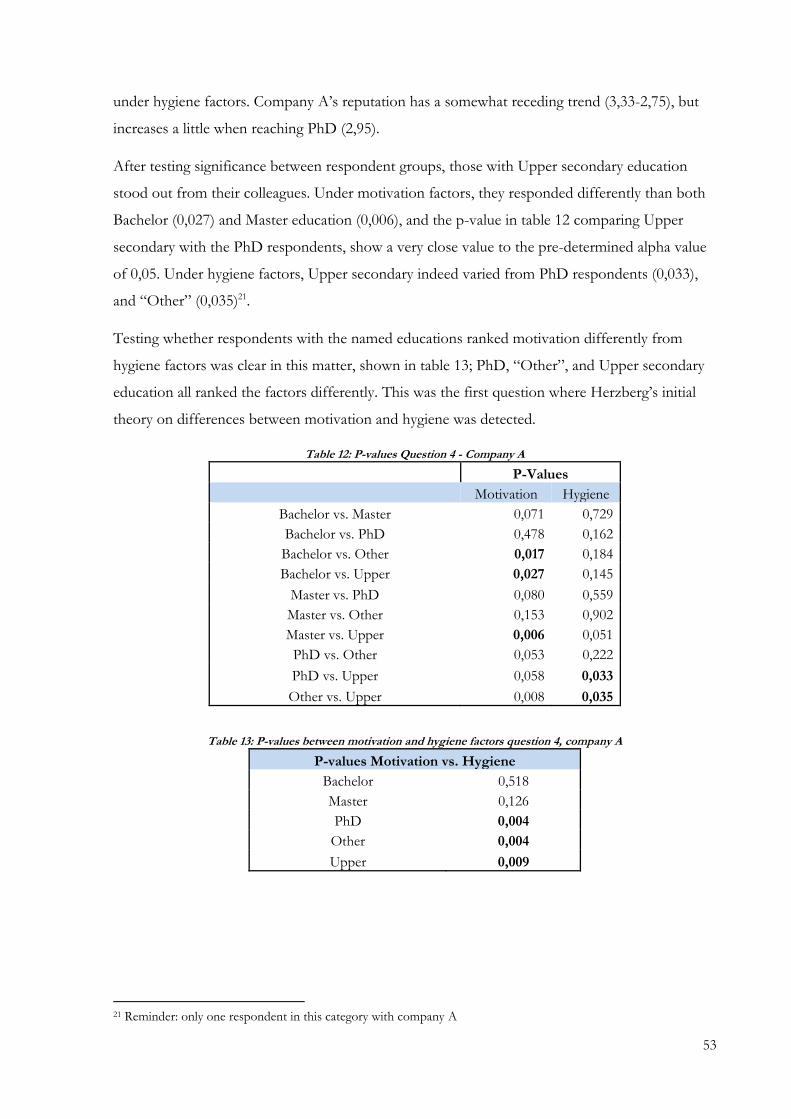
53
under hygiene factors. Company A’s reputation has a somewhat receding trend (3,33-2,75), but
increases a little when reaching PhD (2,95).
After testing significance between respondent groups, those with Upper secondary education
stood out from their colleagues. Under motivation factors, they responded differently than both
Bachelor (0,027) and Master education (0,006), and the p-value in table 12 comparing Upper
secondary with the PhD respondents, show a very close value to the pre-determined alpha value
of 0,05. Under hygiene factors, Upper secondary indeed varied from PhD respondents (0,033),
and “Other” (0,035)21.
Testing whether respondents with the named educations ranked motivation differently from
hygiene factors was clear in this matter, shown in table 13; PhD, “Other”, and Upper secondary
education all ranked the factors differently. This was the first question where Herzberg’s initial
theory on differences between motivation and hygiene was detected.
Table 12: P-values Question 4 - Company A
P-Values
Motivation Hygiene
Bachelor vs. Master 0,071 0,729
Bachelor vs. PhD 0,478 0,162
Bachelor vs. Other 0,017 0,184
Bachelor vs. Upper 0,027 0,145
Master vs. PhD 0,080 0,559
Master vs. Other 0,153 0,902
Master vs. Upper 0,006 0,051
PhD vs. Other 0,053 0,222
PhD vs. Upper 0,058 0,033
Other vs. Upper 0,008 0,035
Table 13: P-values between motivation and hygiene factors question 4, company A
P-values Motivation vs. Hygiene
Bachelor 0,518
Master 0,126
PhD 0,004
Other 0,004
Upper 0,009
21 Reminder: only one respondent in this category with company A
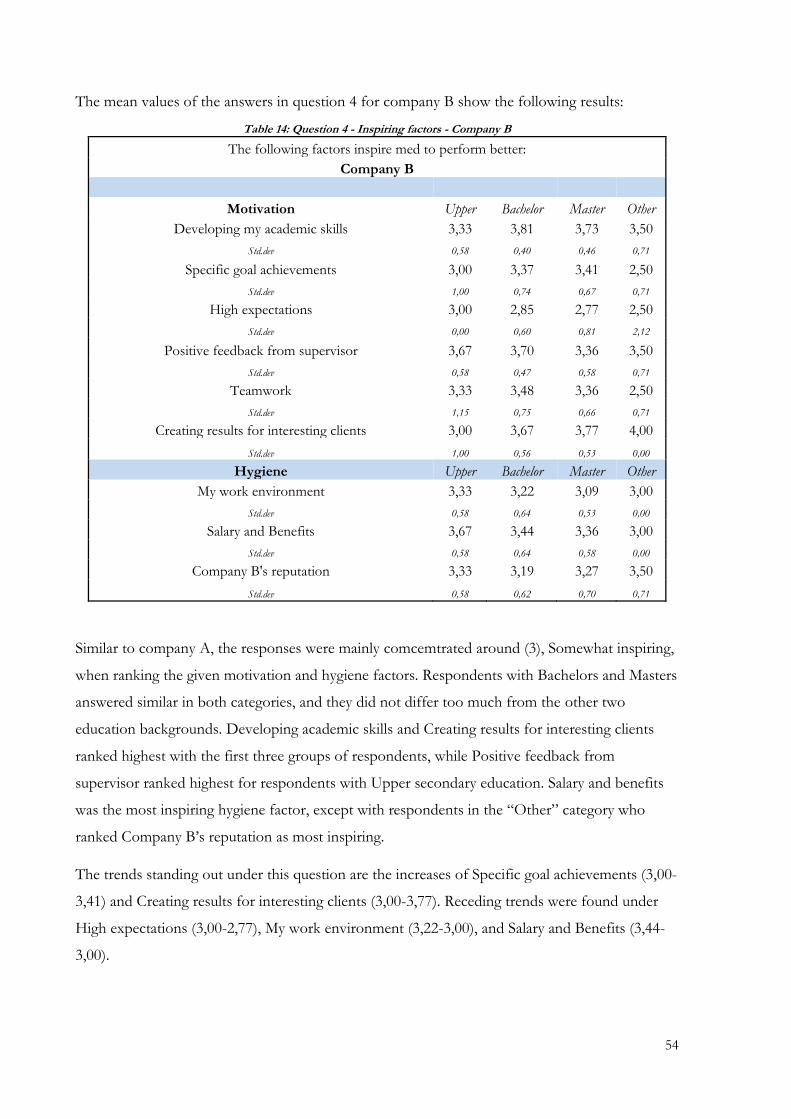
54
The mean values of the answers in question 4 for company B show the following results:
Table 14: Question 4 - Inspiring factors - Company B
The following factors inspire med to perform better:
Company B
Motivation Upper Bachelor Master Other
Developing my academic skills 3,33 3,81 3,73 3,50
Std.dev 0,58 0,40 0,46 0,71
Specific goal achievements 3,00 3,37 3,41 2,50
Std.dev 1,00 0,74 0,67 0,71
High expectations 3,00 2,85 2,77 2,50
Std.dev 0,00 0,60 0,81 2,12
Positive feedback from supervisor 3,67 3,70 3,36 3,50
Std.dev 0,58 0,47 0,58 0,71
Teamwork 3,33 3,48 3,36 2,50
Std.dev 1,15 0,75 0,66 0,71
Creating results for interesting clients 3,00 3,67 3,77 4,00
Std.dev 1,00 0,56 0,53 0,00
Hygiene Upper Bachelor Master Other
My work environment 3,33 3,22 3,09 3,00
Std.dev 0,58 0,64 0,53 0,00
Salary and Benefits 3,67 3,44 3,36 3,00
Std.dev 0,58 0,64 0,58 0,00
Company B's reputation 3,33 3,19 3,27 3,50
Std.dev 0,58 0,62 0,70 0,71
Similar to company A, the responses were mainly comcemtrated around (3), Somewhat inspiring,
when ranking the given motivation and hygiene factors. Respondents with Bachelors and Masters
answered similar in both categories, and they did not differ too much from the other two
education backgrounds. Developing academic skills and Creating results for interesting clients
ranked highest with the first three groups of respondents, while Positive feedback from
supervisor ranked highest for respondents with Upper secondary education. Salary and benefits
was the most inspiring hygiene factor, except with respondents in the “Other” category who
ranked Company B’s reputation as most inspiring.
The trends standing out under this question are the increases of Specific goal achievements (3,00-
3,41) and Creating results for interesting clients (3,00-3,77). Receding trends were found under
High expectations (3,00-2,77), My work environment (3,22-3,00), and Salary and Benefits (3,44-
3,00).
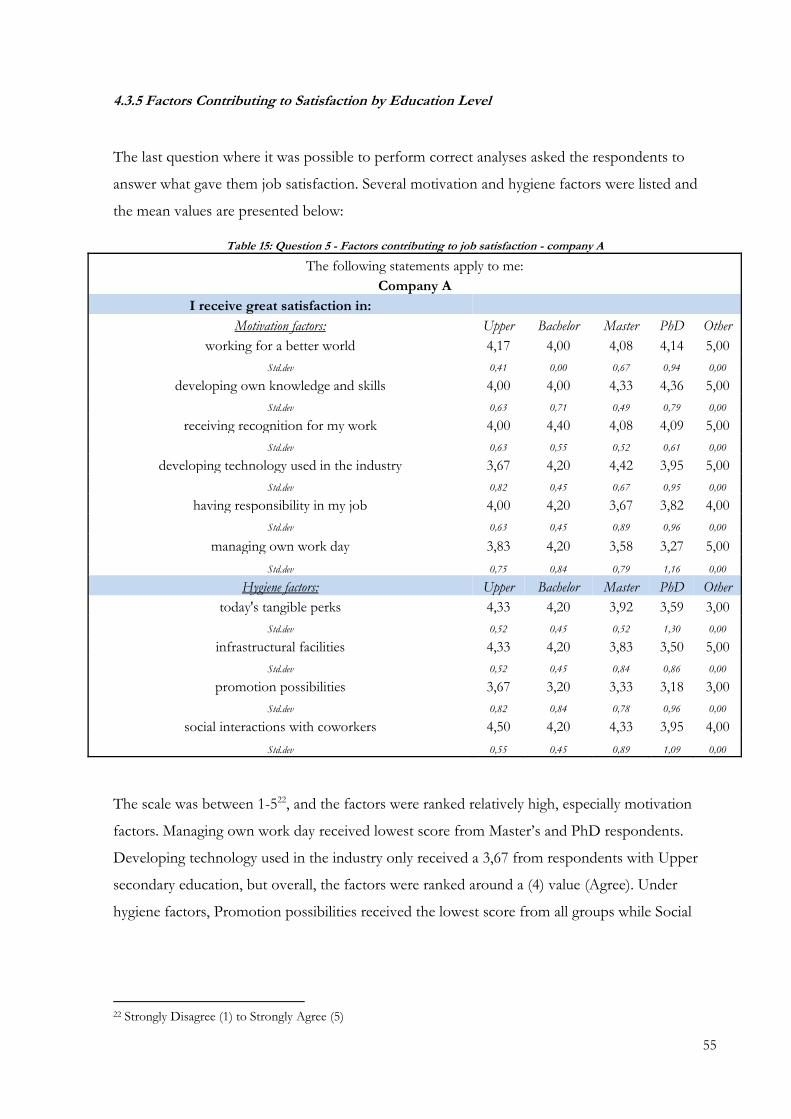
55
4.3.5 Factors Contributing to Satisfaction by Education Level
The last question where it was possible to perform correct analyses asked the respondents to
answer what gave them job satisfaction. Several motivation and hygiene factors were listed and
the mean values are presented below:
Table 15: Question 5 - Factors contributing to job satisfaction - company A
The following statements apply to me:
Company A
I receive great satisfaction in:
Motivation factors: Upper Bachelor Master PhD Other
working for a better world 4,17 4,00 4,08 4,14 5,00
Std.dev 0,41 0,00 0,67 0,94 0,00
developing own knowledge and skills 4,00 4,00 4,33 4,36 5,00
Std.dev 0,63 0,71 0,49 0,79 0,00
receiving recognition for my work 4,00 4,40 4,08 4,09 5,00
Std.dev 0,63 0,55 0,52 0,61 0,00
developing technology used in the industry 3,67 4,20 4,42 3,95 5,00
Std.dev 0,82 0,45 0,67 0,95 0,00
having responsibility in my job 4,00 4,20 3,67 3,82 4,00
Std.dev 0,63 0,45 0,89 0,96 0,00
managing own work day 3,83 4,20 3,58 3,27 5,00
Std.dev 0,75 0,84 0,79 1,16 0,00
Hygiene factors: Upper Bachelor Master PhD Other
today's tangible perks 4,33 4,20 3,92 3,59 3,00
Std.dev 0,52 0,45 0,52 1,30 0,00
infrastructural facilities 4,33 4,20 3,83 3,50 5,00
Std.dev 0,52 0,45 0,84 0,86 0,00
promotion possibilities 3,67 3,20 3,33 3,18 3,00
Std.dev 0,82 0,84 0,78 0,96 0,00
social interactions with coworkers 4,50 4,20 4,33 3,95 4,00
Std.dev 0,55 0,45 0,89 1,09 0,00
The scale was between 1-522, and the factors were ranked relatively high, especially motivation
factors. Managing own work day received lowest score from Master’s and PhD respondents.
Developing technology used in the industry only received a 3,67 from respondents with Upper
secondary education, but overall, the factors were ranked around a (4) value (Agree). Under
hygiene factors, Promotion possibilities received the lowest score from all groups while Social
22 Strongly Disagree (1) to Strongly Agree (5)
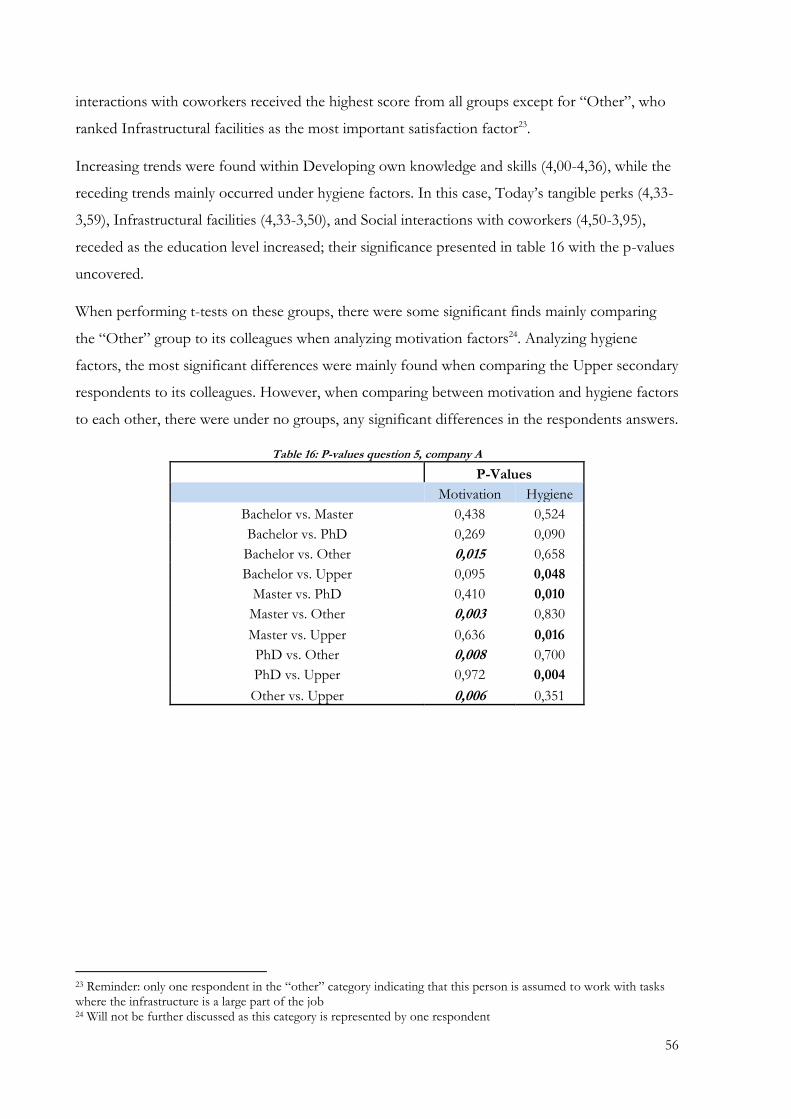
56
interactions with coworkers received the highest score from all groups except for “Other”, who
ranked Infrastructural facilities as the most important satisfaction factor23.
Increasing trends were found within Developing own knowledge and skills (4,00-4,36), while the
receding trends mainly occurred under hygiene factors. In this case, Today’s tangible perks (4,33-
3,59), Infrastructural facilities (4,33-3,50), and Social interactions with coworkers (4,50-3,95),
receded as the education level increased; their significance presented in table 16 with the p-values
uncovered.
When performing t-tests on these groups, there were some significant finds mainly comparing
the “Other” group to its colleagues when analyzing motivation factors24. Analyzing hygiene
factors, the most significant differences were mainly found when comparing the Upper secondary
respondents to its colleagues. However, when comparing between motivation and hygiene factors
to each other, there were under no groups, any significant differences in the respondents answers.
Table 16: P-values question 5, company A
P-Values
Motivation Hygiene
Bachelor vs. Master 0,438 0,524
Bachelor vs. PhD 0,269 0,090
Bachelor vs. Other 0,015 0,658
Bachelor vs. Upper 0,095 0,048
Master vs. PhD 0,410 0,010
Master vs. Other 0,003 0,830
Master vs. Upper 0,636 0,016
PhD vs. Other 0,008 0,700
PhD vs. Upper 0,972 0,004
Other vs. Upper 0,006 0,351
23 Reminder: only one respondent in the “other” category indicating that this person is assumed to work with tasks where the infrastructure is a large part of the job 24 Will not be further discussed as this category is represented by one respondent
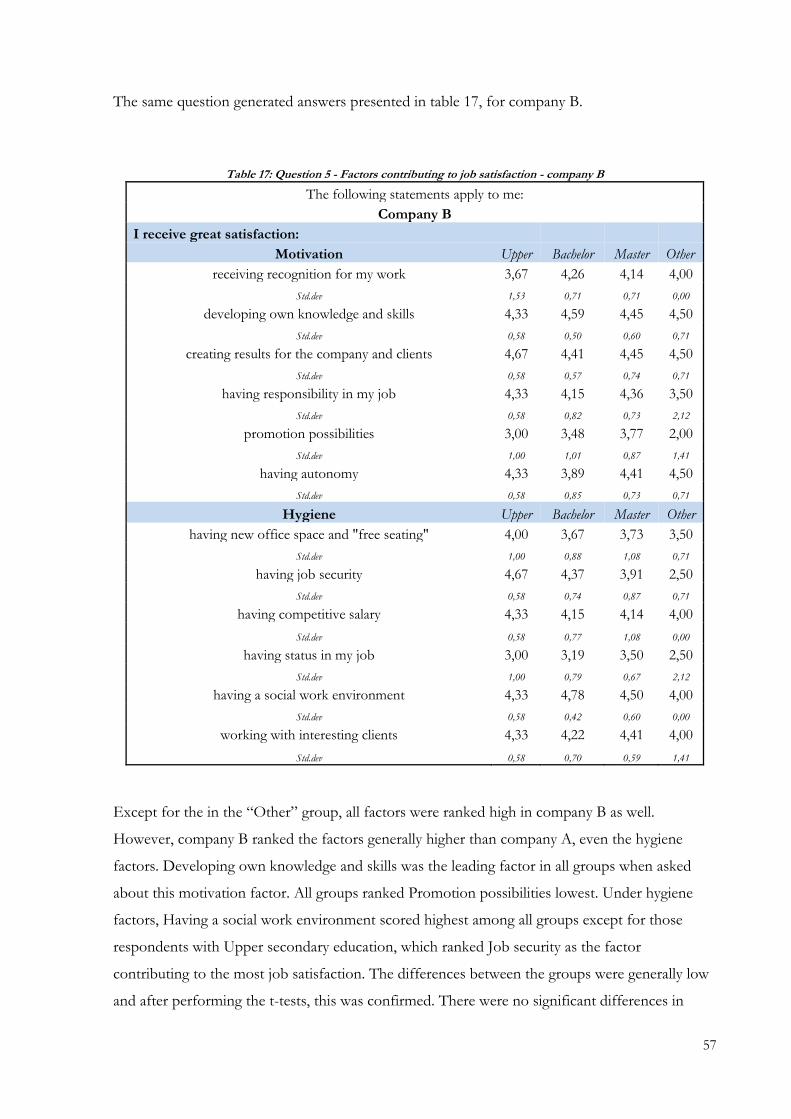
57
The same question generated answers presented in table 17, for company B.
Table 17: Question 5 - Factors contributing to job satisfaction - company B
The following statements apply to me:
Company B
I receive great satisfaction:
Motivation Upper Bachelor Master Other
receiving recognition for my work 3,67 4,26 4,14 4,00
Std.dev 1,53 0,71 0,71 0,00
developing own knowledge and skills 4,33 4,59 4,45 4,50
Std.dev 0,58 0,50 0,60 0,71
creating results for the company and clients 4,67 4,41 4,45 4,50
Std.dev 0,58 0,57 0,74 0,71
having responsibility in my job 4,33 4,15 4,36 3,50
Std.dev 0,58 0,82 0,73 2,12
promotion possibilities 3,00 3,48 3,77 2,00
Std.dev 1,00 1,01 0,87 1,41
having autonomy 4,33 3,89 4,41 4,50
Std.dev 0,58 0,85 0,73 0,71
Hygiene Upper Bachelor Master Other
having new office space and "free seating" 4,00 3,67 3,73 3,50
Std.dev 1,00 0,88 1,08 0,71
having job security 4,67 4,37 3,91 2,50
Std.dev 0,58 0,74 0,87 0,71
having competitive salary 4,33 4,15 4,14 4,00
Std.dev 0,58 0,77 1,08 0,00
having status in my job 3,00 3,19 3,50 2,50
Std.dev 1,00 0,79 0,67 2,12
having a social work environment 4,33 4,78 4,50 4,00
Std.dev 0,58 0,42 0,60 0,00
working with interesting clients 4,33 4,22 4,41 4,00
Std.dev 0,58 0,70 0,59 1,41
Except for the in the “Other” group, all factors were ranked high in company B as well.
However, company B ranked the factors generally higher than company A, even the hygiene
factors. Developing own knowledge and skills was the leading factor in all groups when asked
about this motivation factor. All groups ranked Promotion possibilities lowest. Under hygiene
factors, Having a social work environment scored highest among all groups except for those
respondents with Upper secondary education, which ranked Job security as the factor
contributing to the most job satisfaction. The differences between the groups were generally low
and after performing the t-tests, this was confirmed. There were no significant differences in
58
respondents from the different education groups in this question. There were no significant
differences uncovered when comparing motivation and hygiene factors as well.
Though there were no significant differences uncovered in the t-tests, there were some trends
which were possible to trace after examining table 17 closely. Promotion possibilities (3,00-3,77)
and Having status in the job (3,00-3,50) had increasing trends. Having job security (4,67-3,91) as
well as Having competitive salary (4,33 – 4,14) had marginal, but receding trends as education
level increases.
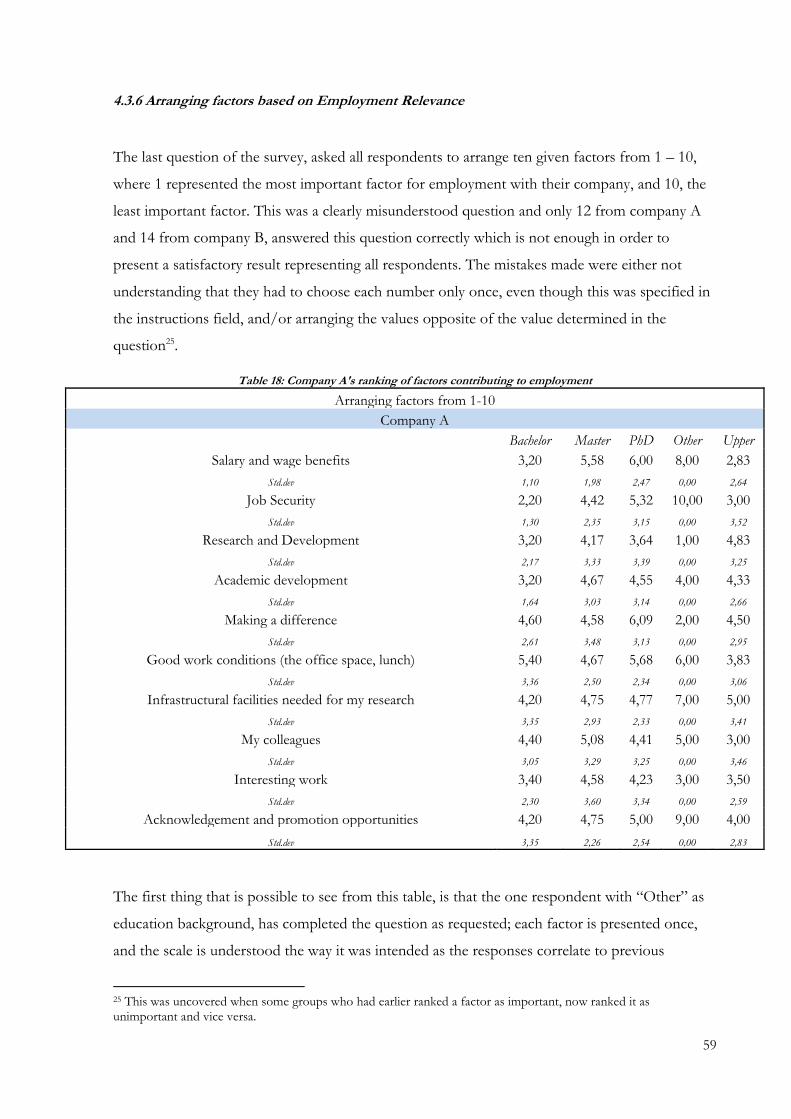
59
4.3.6 Arranging factors based on Employment Relevance
The last question of the survey, asked all respondents to arrange ten given factors from 1 – 10,
where 1 represented the most important factor for employment with their company, and 10, the
least important factor. This was a clearly misunderstood question and only 12 from company A
and 14 from company B, answered this question correctly which is not enough in order to
present a satisfactory result representing all respondents. The mistakes made were either not
understanding that they had to choose each number only once, even though this was specified in
the instructions field, and/or arranging the values opposite of the value determined in the
question25.
Table 18: Company A's ranking of factors contributing to employment
Arranging factors from 1-10
Company A
Bachelor Master PhD Other Upper
Salary and wage benefits 3,20 5,58 6,00 8,00 2,83
Std.dev 1,10 1,98 2,47 0,00 2,64
Job Security 2,20 4,42 5,32 10,00 3,00
Std.dev 1,30 2,35 3,15 0,00 3,52
Research and Development 3,20 4,17 3,64 1,00 4,83
Std.dev 2,17 3,33 3,39 0,00 3,25
Academic development 3,20 4,67 4,55 4,00 4,33
Std.dev 1,64 3,03 3,14 0,00 2,66
Making a difference 4,60 4,58 6,09 2,00 4,50
Std.dev 2,61 3,48 3,13 0,00 2,95
Good work conditions (the office space, lunch) 5,40 4,67 5,68 6,00 3,83
Std.dev 3,36 2,50 2,34 0,00 3,06
Infrastructural facilities needed for my research 4,20 4,75 4,77 7,00 5,00
Std.dev 3,35 2,93 2,33 0,00 3,41
My colleagues 4,40 5,08 4,41 5,00 3,00
Std.dev 3,05 3,29 3,25 0,00 3,46
Interesting work 3,40 4,58 4,23 3,00 3,50
Std.dev 2,30 3,60 3,34 0,00 2,59
Acknowledgement and promotion opportunities 4,20 4,75 5,00 9,00 4,00
Std.dev 3,35 2,26 2,54 0,00 2,83
The first thing that is possible to see from this table, is that the one respondent with “Other” as
education background, has completed the question as requested; each factor is presented once,
and the scale is understood the way it was intended as the responses correlate to previous
25 This was uncovered when some groups who had earlier ranked a factor as important, now ranked it as unimportant and vice versa.
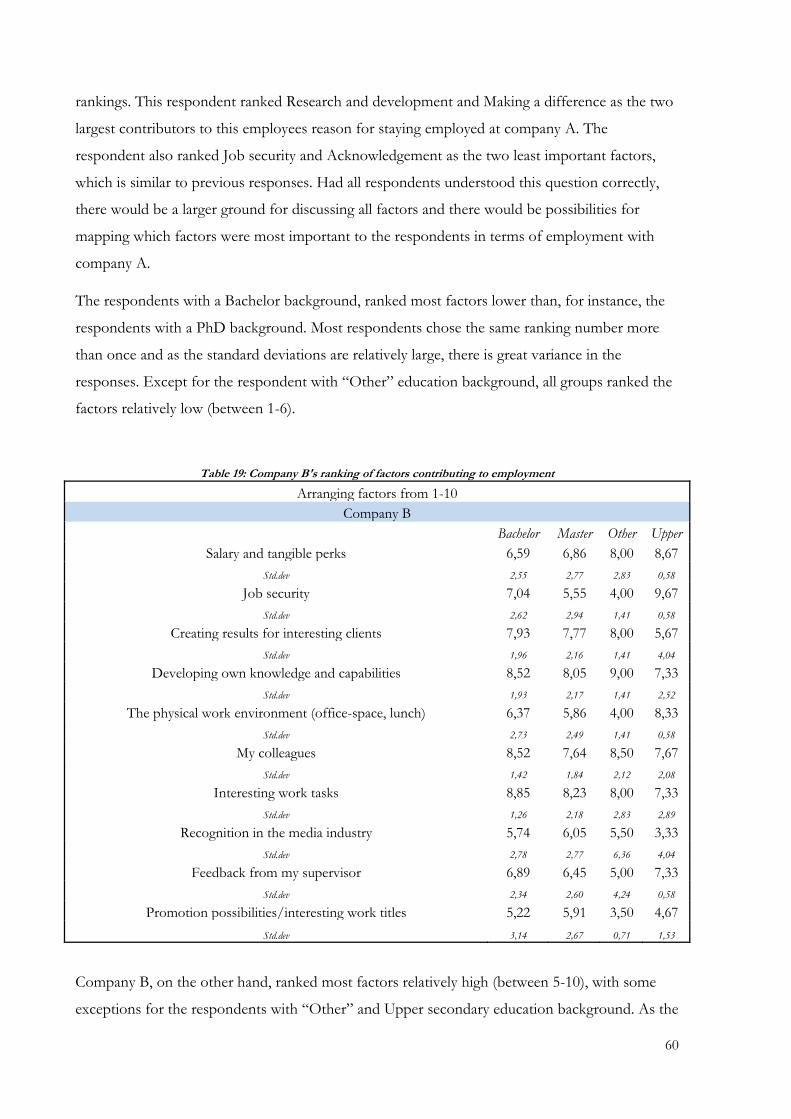
60
rankings. This respondent ranked Research and development and Making a difference as the two
largest contributors to this employees reason for staying employed at company A. The
respondent also ranked Job security and Acknowledgement as the two least important factors,
which is similar to previous responses. Had all respondents understood this question correctly,
there would be a larger ground for discussing all factors and there would be possibilities for
mapping which factors were most important to the respondents in terms of employment with
company A.
The respondents with a Bachelor background, ranked most factors lower than, for instance, the
respondents with a PhD background. Most respondents chose the same ranking number more
than once and as the standard deviations are relatively large, there is great variance in the
responses. Except for the respondent with “Other” education background, all groups ranked the
factors relatively low (between 1-6).
Table 19: Company B's ranking of factors contributing to employment
Arranging factors from 1-10
Company B
Bachelor Master Other Upper
Salary and tangible perks 6,59 6,86 8,00 8,67
Std.dev 2,55 2,77 2,83 0,58
Job security 7,04 5,55 4,00 9,67
Std.dev 2,62 2,94 1,41 0,58
Creating results for interesting clients 7,93 7,77 8,00 5,67
Std.dev 1,96 2,16 1,41 4,04
Developing own knowledge and capabilities 8,52 8,05 9,00 7,33
Std.dev 1,93 2,17 1,41 2,52
The physical work environment (office-space, lunch) 6,37 5,86 4,00 8,33
Std.dev 2,73 2,49 1,41 0,58
My colleagues 8,52 7,64 8,50 7,67
Std.dev 1,42 1,84 2,12 2,08
Interesting work tasks 8,85 8,23 8,00 7,33
Std.dev 1,26 2,18 2,83 2,89
Recognition in the media industry 5,74 6,05 5,50 3,33
Std.dev 2,78 2,77 6,36 4,04
Feedback from my supervisor 6,89 6,45 5,00 7,33
Std.dev 2,34 2,60 4,24 0,58
Promotion possibilities/interesting work titles 5,22 5,91 3,50 4,67
Std.dev 3,14 2,67 0,71 1,53
Company B, on the other hand, ranked most factors relatively high (between 5-10), with some
exceptions for the respondents with “Other” and Upper secondary education background. As the
61
higher values represent “non-important” reasons for employment, there can be drawn
assumptions that the respondents misinterpreted the significance of the number scale as previous
questions indicate that many of the given factors were, indeed, important to the respondents. For
instance, respondents with a Bachelor and Master education background ranked Interesting work
tasks and Developing own knowledge and capabilities as relatively non-important factors for
employment, which is clearly a wrong indication after having researched previous answers by the
same respondents. There are not any factors which clearly stand out with a low score neither,
which also indicated response failure.
The standard deviations were slightly smaller than those of company A, which can indicate
somewhat of a collectively misunderstanding between the respondents.
I created a simulation in excel in order to see what mean values and standard deviations would
have been if respondents had indeed followed the instructions correctly. What was uncovered
was a larger span in mean values and the possibility to see a clear indication towards which factor
was the most contributing factor towards employment, and which was least important.

62
63
5. Discussion
Motivation of knowledge workers and ensuring their job satisfaction may be a complicated job
for managers. However, their role in this matter may be less visible in today’s knowledge-based
environments. As theory has previously stated, as well as results from this research, there is
evidence that knowledge workers holds an internal drive in performing their job. Unlike the times
where Herzberg’s theory was established, today’s knowledge workers choose jobs according to
education, interests, and abilities.
5.1 Assumption: Knowledge workers do not differentiate between motivation and
hygiene factors
Primarily, the essential matter of the research is to confirm if, in fact, the informants and
respondents qualify under the terminology “knowledge workers”. According to the many
definitions which can be applied in the matter, “they think for a living” stuck out and was
perceived as most precise in this specific thesis (Davenport 2005). Concluding that this is the case
for the 102 individuals participating in the study is relatively safe. Knowledge workers are a large
and growing category of workers, they are the most expensive workforce that the company
employs, and they are essential to the growth of many economies. The importance for managing
them was confirmed by the two informants and the fact that they could under no circumstances
follow a template as all knowledge workers are different and in need of different treatment.
Interview object A emphasized this when uttering the fact that his employees varied from being
completely autonomous not in need of manager interaction for weeks at a time, while some
workers needed to be “carried” through each workday. Though both are extreme cases, he
implied having the whole range as his sub-ordinates. Interview Object B indicated the exchange
of information and knowledge between the workers contributes to the fact that the differences
between education groups are diminished and that his involvement role is also reserved for
special cases.
This confirms the previous studies on the knowledge manager being a transformational leader or
a HRPLTA26 leader. Both informants can arguably fit in under both descriptions. As stated by
previous research, (Bass 2000, Nguyen and Mohamed 2009), knowledge management has a
positive relation to transformational leadership, and Interview Object B emphasizes this by
26 Hire the Right People and Leave Them Alone
64
implying his focus on gaining trust and understanding his employees. Interview object A, though
also a transformational leader, has more clearly chosen the HRPLTA approach, as his focus is on
facilitating and recruiting (Davenport 2005).
When it comes to the assumption of knowledge workers in the two companies, not
differentiating between motivation and hygiene factors would in this case be relevant. The range
of individuals in the respondent pool varied in age, education, and origin, which underlines the
difficulty for managing them somewhat similarly. There were certainly respondents who were
genuinely interested in their field, developing their knowledge, and working for a higher cause.
However, there were respondents who were motivated by the latter factors, they also saw the
importance in elements contributing to their everyday satisfaction; an acceptable salary, good
colleagues, and nice office spaces.
The research question wants to establish which factors are relevant for knowledge-workers, and
the predetermined factors presented by Herzberg were used as a foundation for the research.
After studying previous research in depth, one main assumption grew; knowledge-workers, and
generally today’s population have more possibilities than before, so their expectations are higher
– in this case, hygiene factors may not differ from motivation factors anymore. Whether some of Herzberg’s
hygiene factors, today may be perceived as motivation factors, is also an interesting discussion.
Taking the example of infrastructure and research equipment needed by researchers in company
A; these are, by definition, hygiene factors, but prevent the researchers from physically doing
their job if not present. This contributes to the motivation, hygiene, and work execution and its
importance may even surpass the basic motivation factors. Furthermore, company B has a
portfolio of interesting and well-known clients; a hygiene factor as this is an external factor
contributing to motivation and satisfaction. Its absence would indeed contribute to lower
motivation and satisfaction; however, the company would not be in its current position as market
leader and be an interesting workplace if they lacked these specific clients. This would contribute
to the absence of additional motivation and hygiene factors present today, affecting the attraction
of knowledge workers.
Based on these examples, and the results presented in the previous chapter, the motivation and
satisfaction scenario is more complex then presented fifty –some years ago. Motivation and
hygiene factors depend on each other, and there is sufficient evidence supporting the hypothesis
that their importance is somewhat similar. This was also the case in studies performed by
Furnham et al. (2009) indicating that demographics and personality were significantly related to
both job satisfaction and motivation.
65
Both companies offer salaries which are considered acceptable; the employees do not have to
compromise their current situations in order to work there; they can afford living and family
expenses. Assumptions around non-satisfactory salary surrounds the fact when it is objectively
too low (Kuvaas 2008). In company B, Today’s salary received highest mean score when asked
which factor contributed to de-motivation if not present (question 3) which can be linked to
Kuvaas’ research on its effect when not meeting today’s standards.
Other evidence supporting the assumption of equal relevance between motivation and hygiene
factors were presented in the previous chapter. In the first two questions of the survey, the p-
values were not significant and there could not be a rejection of the null hypothesis that there
were similarities between responses. This in turn means that the importance of motivation and
hygiene is approximately similar in these cases.
The main perception of the research and according to the statistical tests, there were not enough
null hypothesis’ being able to reject in the matter of motivation versus hygiene. This emphasizes
the assumption that knowledge-workers do not deliberately differentiate between the two. This
does not conclude them valuing extrinsic factors like salary, office space, and colleagues on the
same level as intrinsic factors, like professional development and the work itself, but more so that
they consider all factors playing essential roles in the whole job satisfaction and motivation
picture.
5.2 Assumption: Respondent’s answers differ based on education in company A
Another definition of a knowledge worker is according to Davenport, higher education. As stated
in the introduction, this includes a much larger group of workers, and not all of these higher
educated individuals qualify as knowledge workers. One can be knowledge worker without higher
education, but this does not necessarily mean that everybody with higher education is a
knowledge worker (Davenporrt, Thomas et al. 2002, Davenport 2005)
The respondents in the survey, as well as the two informants, are clearly defined as knowledge
workers, however, there were respondents with lower education; be it Upper secondary school
and “Other”. The respondents have different education backgrounds and the assumption
regarding the differentiation between the unlike levels gave answers indicating personal
preferences.
66
In company A, the respondents varied vastly in education level, as well as job descriptions. They
are researchers with PhD degrees, administrative employees with lower education, and engineers
mainly working with technology and development. This was the reason for assuming differences
in responses based on education level, as well as underlining the information given by the
manager in company A regarding the difference in leading employees with different backgrounds.
In many of the questions, there were clear increasing trends in the mean values between
education groups. Especially within motivation factors, the value received higher value as the
level of education increased. These results contribute to confirming the previous research
performed by Eskildsen et al. (2004), indicating the relevance of education level having an impact
on motivation.
With this in mind, the individual’s personality plays such an important role in what the
respondent ultimately answers, and combining this with different levels of education, supports
and underlines the named assumption.
“Personalities are not easy to change; one cannot turn an academic in to an innovator.”
-Interview Object A
Supporting this, the previous mentioned research which is confirming how demographics and
personalities affect motivation and how there are vast difference based on this (Furnham,
Eracleous et al. 2009). People are motivated by a great variety of needs, which, as previously
mentioned, vary in order of importance, in different situations, and over time (Lundberg,
Gudmundsom et al. 2009). In addition, there has been research on employees’ personalities and
work motivation, where results have indicated extrovert personalities being motivated by
motivation factors, while employees with an introvert personality rated hygiene factors as more
important (Furnham, Forde et al. 1999). All of which was uncovered in this research as well.
The way information was retrieved, is argued to have an effect on how they answer. The
Furnham, Forde et al. research, implies that answers also varied when applying questionnaires,
focus groups, interviews, or behavioral observations, in other words, respondents respond to the
way they are approached with questions regarding motivation and work satisfaction.
If the respondents in this research had answered differently involved in a focus group or
behavioral observation, will hardly be answered with other than assumptions; but that their
answers may vary under different circumstances and at another time, may very well be argued
67
without this having an impact on the reliability of the research. Furthermore, as they undergo
personal developments throughout their careers, their personalities will also change, and this may
shape their answers at other times.
5.3 Discussions around responses given in the questionnaire
5.3.1 Motivation and Hygiene factors affecting Motivation by Education Level
The first ranking question27 in the survey asked the respondents to answer which motivation and
hygiene factors were most relevant to their workplace motivation. Answers uncovered when
analyzing this confirmed the assumption that motivation and hygiene have approximately same
effect on the respondents.
In company A, employees with a Bachelor’s degree cannot perform the same work tasks as their
colleagues with a PhD education. The way this company is structured, job descriptions are
allocated based on education background. As company A mainly is a research institution, the
PhD employees perform the research, and the employees with Upper secondary, “Other”, and
Bachelor’s degree perform administrative tasks. Comparing company A to a hospital; a nurse
cannot operate, and a doctor does not work with the financials. This is in many ways how
company A is structured.
As was presented in the previous chapter, individual research was ranked relatively low from
respondents with a Bachelor, “Other”, and Upper secondary education background. This makes
natural sense, as these three groups most likely do not perform individual research. Some of them
might do some research, but this is not the main part of their job. Ranking this factor low when
asked about motivation, will therefore be logical. However, this concrete factor did not rank
highest with the PhD employees either, and the reason which is possible to name as the main
argument, is the business model. Company A focuses on research and development towards the
industry, and a lesser part of the PhD employees work on their own, individual research. This
further confirm the response results, which scored second highest with the PhD respondents;
Contributing to research and development.
The work itself scored in the upper part for all education groups, which can indicate that the
employees are satisfied with their current work situation. The employees with lower education
want to achieve and complete their specific jobs with the same excellence as their colleagues who
27 The survey had 5 initial questions mapping the respondents, but the actual survey started on question 6 in the attached survey (but these will be referred to as the first, second, and third question (and so on) in this chapter).
68
research. Work tasks being completed by these groups are mainly administrative, lab technicians,
or facilitators. There are tasks during a research project which only can be completed by others
then those who are performing the research, and their importance is just as relevant to complete
projects. This can also be interpreted through the relatively high score from “my areas of
responsibilities” response as well as the low score from “status” under hygiene factors. The
research indicates that all employees regardless of education level play a significant role in their
department.
In table 3, there were a few p-values indicating significance between the groups and their
responses. As mentioned above, the work tasks are different based on education, which explains
why responses varied between respondents with a Bachelor’s degree and a PhD. This also
explains the difference between responses given by the respondents with Upper secondary
education and PhD education. In addition, there was clear evidence of increasing trends between
education levels in several of the motivation factors, emphasizing the origin of the p-values
between lower and higher educations, again confirming Eskildsen et al. (2004). However, there is
limited literature on previous research which has been conducted, so there are clear difficulties in
confirming and/or denying the elements in these responses.
The education group “Other,” was represented by one single respondent which limits the
significance of the p-values and will not be discussed further.
In company B, the differences between the responses as well as the trends, varied much less than
company A. One main reason for this is also here, the work tasks. Company B operates with
several roles that one can perform well in, regardless of education level. An employee with lower
education, as well as one with a Master’s degree can perform the same job in many roles.
Seniority and experience are just as important factors in this company. Operating under a
consulting business model, there will definitely be different opportunities for employees who
work hard, are dedicated to the workplace, and interested in investing time and capabilities. In
addition, the “trait” in company B is not profession-based, which allows all employees to achieve
regardless of scholar background.
“Few of my employees get a master’s in business & administration with the sole intention of working with this,
they end up here as a coincidence, and some use this job as a stepping stone towards other jobs; the client side, or
other related jobs. Some end up staying and making this their career.”
- Interview object B
69
Similar to company A, “achievement in my job” received highest score under motivation factors.
The interesting observation is the difference in reasons for choosing this. Employees in company
A may have ranked this the highest as they achieve on their own job level, while employees in
company B may rank this the highest as their performance and achievement may give them more
interesting tasks and projects in the future.
This assumption can be underlined based on the fact that the hygiene factor ‘recognition’
received the second-highest score from all education groups, as achieving in their jobs and being
recognized may lead to increased development of capabilities and areas of responsibilities; two
motivation factors ranked high with the respondents.
Furthermore, when analyzing the differences in responses between education groups, there were
no significance proving that respondents answer approximately the same regardless of education
background. There were no differences between motivation and hygiene factors either, so there
can be drawn assumptions that on some level, all named factors contribute to motivation for
respondents in company B and that education level is not relevant enough in this question, clearly
disputing the previous research indicating differences in education levels regarding motivation
(Eskildsen, Kristensen et al. 2004).
5.3.2 Hygiene and Motivation factors affecting Job Satisfaction by Education Level
The second question presented hygiene and motivation factors and their effect on job
satisfaction. Previous research, as well as the assumptions formed, were confirmed, indicating
that hygiene factors indeed contributed to job satisfaction, but that the differences between the
given hygiene factors differed marginally to the given motivation factors.
In company A, the mean values from hygiene factors, were a little lower than motivation factors.
However, this mainly concerned salary, pension plans, and flexible hours. Pension plan was the
least important hygiene factor which stood out from the mean values. For the three groups
including higher education; Bachelor, Master, and PhD; relationship with colleagues was the
hygiene factor which received highest score. Assumptions around this result, may be the fact that
the work environment is perceived as relatively good, which can be underlined by the given
answers that good work conditions and job security also ranked high from these groups.
70
Interesting work was the motivation factor which received highest rank in company A, and this
supports the answers given in the previous question. This was also the motivation factor which
had an increasing trend based on education.
T-tests conducted for this question confirmed the fact that differences between education groups
as well as differences between motivation and hygiene factors were not significant enough to be
discussed. This was also indicated by the lack of clear trends; and except for the two factors
which had increasing trends (Good work conditions and Interesting work), and the one factor
having decreasing trends (Job security); there were clear evidence against the relevance of
education level on the hygiene factors presented in this question of the survey. A reason for this
may be related to previous research (Eskildsen, Kristensen et al. 2004), indicating that education
level has an effect on motivation factors, but not necessarily hygiene factors.
In company B, the differences in responses were marginal, however, there were, also here,
hygiene factors receiving a slightly higher score. For respondents with a Bachelor and Master’s
degree, relationship with colleagues and flexible hours received a relatively high score. Under
motivation factors, the same groups ranked interesting work as the most important factor
contributing to job satisfaction.
T-tests conducted proved the fact that there were no significant differences between answers
given by respondents based on education level. There were no differences between hygiene or
motivation factors affecting job satisfaction. Similar to question 1 (see previous section 5.3.1), all
named factors contribute on some level to job satisfaction. In this case, there were clear
representations of decreasing trends based on education level, and as many as three hygiene
factors and one motivation factor had decreasing trends28. This also emphasizes previous
research indicating education effects motivation factors more so then hygiene factors, which here
were affected negatively.
5.3.3 De-motivating factors if not present by Education Level
The third question was asked in a different way29 in order to receive quality assurance on the
previous two questions, and was asked in an opposite manner; which factors are de-motivating if
28 Decrease: Job security, Relationship with colleagues, Physical office environment, and Positive feedback from supervisor. Increase: Recognition and Flexible hours. 29 “The following factors de-motivate me if not present:” (See attachment – questionnaire).
71
not present and as mentioned in the previous chapter, there were significant results between
education groups as well as between motivation and hygiene factors.
Company A’s respondents ranked the given factors generally lower, especially respondents with a
Bachelor’s education. Job security was ranked lowest by this group, while higher education
groups, Masters and PhD, ranked status as least important. There were some growing trends
based on education level; Today’s salary, Flexible hours, Recognition, and Job security received
increasing scores as the education level got higher. This is the main explanation to the several
significant p-values formed in this question, emphasizing differences between lower and higher
education.
The group of respondents with a Bachelor’s education generally differed from the other
education groups. The reason for this can be that few of the factors apply to their work day. The
named respondents may in fact not value the given factors, and are not motivated nor de-
motivated by them. The answer response (3) was “indifferent”, while (2) was “relatively disagree”
– indicating that the given hygiene factors apply little contribution to de-motivation if not
present, for respondents with a Bachelor degree. According to table 8 in the previous chapter, the
main significant differences in responses varied between groups with lower and higher education.
The respondents with a Masters and PhD education arranged the hygiene factors similarly, while
the remaining three education groups perceive the effects of hygiene factors in the same way.
One deviant p-value, was uncovered when comparing Bachelor with Upper secondary which
goes against the above-mentioned assumption that education level determines the role of hygiene
factors in this question. One can assume that these two groups have different works tasks, where
the given factors play different relevance roles in the employees’ everyday life.
Except for respondents with a Master’s degree, there are no differences between the answers
under hygiene or motivation factors, which is interesting according to the theory on which the
research is based.
Herzberg (1959) argues that hygiene factors contribute to dissatisfaction if not present. In line
with this definition, there were expectations around high scores under hygiene factors. The
respondents were expected to strongly agree that the given hygiene factors would contribute to
dissatisfaction and de-motivation if not present. Not only was this not the case, but the given
motivation factors, which are defined as motivating if present, but not de-motivating if not
present, were expected to be given low scores in order to satisfy the theory.
72
The initial reason for this may be difficult to determine. However, underlining the fact that this
research method differed substantially from the one Herzberg performed may be a contributing
factor to the gap in results. If one method is more correct than the other will not be further
discussed, even though the survey-design may be fitted for the time-periods in which they were
conducted. Another reason for this question to generate different results from original theory,
may be the fact that the surveyed knowledge workers are generally higher educated than the
sample used in the initial research from that time. The respondent selection used in 1959 may
have been lower educated than the selection used today, and there are great differences in work
tasks as well as business models. Herzberg’s respondents belonged to a time-period where the
Western world was greatly industrialized, and there were fewer attending higher education
institutes. Today’s respondents are, as underlined in the research question, knowledge workers,
and their expectations, frames of references, and work tasks are vastly different.
Furthermore, this underlines the assumption from earlier in the research indicating that dividing
motivation and hygiene factors may be more limiting in today’s research. Other researchers have
mentioned this as well and have discovered the importance of hygiene factors as the standard of
living and employment has changed over time (Wiley 1997).
The groups within company B rank hygiene factors somewhat differently than company A.
Today’s salary receive a score of 4,41 from the group with Master’s degree, and this underlines
the theory from Herzberg; hygiene factors contribute to dissatisfaction if not present. However,
the same group has also ranked the given motivation factors, creating results and developing own
capabilities, as even more de-motivating if not present which contradicts Herzberg and his theory
stating that motivation factors do not contribute to de-motivation if not present; just absence of
motivation (Herzberg, Mausner et al. 1959).
Response differences between the groups were significant in the matter of hygiene factors and
the contribution to de-motivation if not present. There were clear indications from the p-values
in table 10 that the groups had different perceptions of hygiene factors. However, the groups did
not differentiate between hygiene and motivation, and ranked all given factors relatively similar
regardless of their hygiene or motivation origin. Except for Recognition and Status, increasing
trends with the education level of the respondents in company B were uncovered.
The p-values were uncovered when comparing all motivation factors between two education
backgrounds. Reasons for the differences originate from the answers given by the respondents,
however, when examining table 9, there are little differences between education groups
individually though most trends were, as mentioned, increasing. There can therefore be
73
assumptions drawn towards the fact that given relatively high standard deviations in several of
the responses, this may be the main factor in the uncovering of differences. Only eight out of
twenty-four standard deviations were below 1 which can indicate large disagreements within the
answers. This in turn may be the reason for the p-values indicating significant differences
between the analyzed groups.
There were apparent differences between education background when analyzing motivation
factors, and one could have assumed more significance around these responses, however, the
sample was smaller and the number of factors were fewer which may affect the p-values
uncovered.
5.3.4 Factors inspiring to increased Performance by Education Level
The fourth question asked the respondents to answer which factors inspired to increased
performance. This question was the only one with a four-point scale where (4) was Very
inspiring, and (1) was not inspiring at all. This being presented, company A ranked the factors as
relatively inspiring and the mean values were high. The most inspiring factor for respondents
with a Bachelor education was positive feedback from supervisors while making a difference in
the world of R&D received the highest score from respondents with a Master’s degree. The PhD
educated respondents ranked the latter factor, as well as specific goal achievements highest. The
respondents with “Other” or Upper secondary education ranked several factors as inspiring for
increased performance.
The respondents with an Upper secondary education ranked the hygiene factors cumulatively
higher than the other groups and compared to the motivation factors. The reason for this may be
the fact that the work tasks performed by this group are largely dependent on the hygiene factors
in order to physically perform their jobs. They may have more administrative responsibilities
which makes them value the given hygiene factors higher than the motivation factors. There is a
clear indication that making a difference in the world of R&D is not necessarily an important
factor for increased performance for this specific group underlining the assumption of this
group’s work tasks. Another determining factor for this assumption is the p-values between
Upper secondary education and the groups with higher education. They have significant p-values
on all comparisons under motivation factors when compared to Bachelor and Master education.
There were in addition, significant p-values under hygiene factors when comparing them to their
colleagues with a PhD and the “Other” group.
74
Comparing motivation to hygiene factors, significant differences are shown in the PhD group,
the “Other”30 group, and the Upper secondary group. This indicates, especially in the case of
PhD and Upper secondary, that motivation factors may contribute more to performance for
higher education level, and the importance of hygiene factors may be present with the lower
education level. This confirms the studies performed by Story et al. (2009) who used the two-
factor theory in examining performance and the effect on achievement and motivation based on
extrinsic and intrinsic factors.
Company B had smaller differences between the education groups which may be argued as
logical based on the nature of the question. Factors inspiring to increased performance, may, as
indicated with company A, be based on which work tasks one possesses. However, the variations
between work tasks are smaller in company B and the relevance of educational background is
equally small, the factors contributing to increased performance was suspected to be ranked
somewhat similar.
Developing academic skills was ranked highest in the Bachelor group, and respondents with a
Master education ranked Creating results for interesting clients as most inspiring. The “Other”
group included respondents with some higher college education, and they ranked the two latter
factors as the most inspiring, equal to their higher educated colleagues. Upper secondary
respondents ranked positive feedback as most inspiring, although there were little differences
between the given responses from this group; both in terms of motivation and hygiene factors.
Salary and benefits was the hygiene factor receiving the highest score from the respondents with
a Bachelor and Masters education, while “Other” ranked company B’s reputation as the hygiene
factor inspiring to increased performance. There were some trends in the results, mainly
decreasing; High expectations, Work environment, and Salary & Benefits had diminishing trends
based on education level. Specific goal achievements and Creating results for interesting clients
had an increasing trend supporting previous research indicating that factors determining intrinsic
values and self-actualization, contribute to motivation based on the higher level of education.
The researcher generated this question in order to get a more clear impression on what can be
considered motivation factors in today’s day and age. The results underlined the assumption that
even though motivation factors are theoretically more important than hygiene factors, the
employees value salary and work environment as well, which is confirmed in the lack of
30 As mentioned, this group has only one respondent.
75
difference between the motivation and hygiene factors. The respondents answered similarly when
ranking these factors, and once again, defying Herzberg’s theory.
5.3.5 Factors contributing to Satisfaction by Education Level
Question 5 requested the respondents in completing the sentence “I receive great satisfaction
in…” with a number of responses. One reason for wording the question in this way was to
examine respondent’s perception of differentiating between motivation and satisfaction.
Herzberg’s theory clearly indicated hygiene factors as contribution to job satisfaction, while
motivation factors contribute to motivation. However, the researcher was interested in examining
the assumption that motivation factors indeed contribute to job satisfaction as well, and that once
again, the labels given all factors in the initial theory are more limiting than opportunistic as
indicated by Carolyn Wiley and other previous research (Maidani 1991, Wiley 1997).
Analyzing the mean values for motivation factors in company A, the “Other” group has generally
ranked all factors slightly higher than its colleagues, which is confirmed in the p-values uncovered
based on the t-tests. However, as mentioned in 5.3.1, this group is only represented by one
respondent, and based on the high mean values in the other education groups, there may be
respondents ranking the factors just as high as this individual, but naturally will not be as
transparent based on the population giving the answers.
Furthermore, it is apparent to the reader that the hygiene factors were ranked lower as well as
having a decreasing trend, especially with the higher education groups, and promotion
possibilities received the lowest score from these respondents when asked about job satisfaction.
Social interactions with coworkers stand out as the highest satisfaction factor for the Master’s,
PhD, and Upper secondary education group. Based on the mean values presented in table 15,
respondents with a Bachelor’s education generally ranked the hygiene factors higher than the
PhD respondents, which is shown in the p-value table 16 as well. There is a significant difference
between responses from the two groups, which is assumed to be rational as the work tasks for
the two groups include a different level of hygiene factor presence during the workday. There
were decreasing trends uncovered under hygiene factors underlining the fact that these named
factors have diminishing values as the education level increases. This in turn is supporting the
assumption of the relevance of these factors to the work tasks. The same assumption can be
argued as relevant when comparing the Master’s group with the Upper secondary education
group; and yet again confirmed by the p-value after comparing Upper secondary to PhD
76
respondents. In company A, there is a clear difference in the roles of motivation and hygiene
factors based on works tasks. How a knowledge manager shall take this into consideration when
motivating and leading his employees, will be discussed further down.
There is far more coherence between the respondents in company B regarding this question. The
mean values do not differ too much, and the standard deviation indicate little disagreement
between the respondents. Developing knowledge and skills, as well as creating results for the
company and clients, stand out, once again as the key motivation factors on all education levels.
“By working with other competent workers, learning from colleagues and acknowledging that others have different
strengths is a motivation factor, as well as having interesting clients; we work with some of the largest companies in
Norway, which is perceived as an important factor as well.”
- Interview object B
The indication received by the informant ahead of developing the questionnaire, as well as
forming assumptions around the answers received, indicates clearly that interview object B has
somewhat of an insight regarding his employees and what motivates them. Furthermore, having a
social work environment scores relatively high with company B as well, and even though this
factor is most likely present at all workplaces, the importance of thriving on the workplace will
essentially come down to the social interaction with the people one works with. This correlates
with previous research stating that some companies use workplace as a way of retaining valuable
employees which secures intellectual and social capital (Brenner 1999).
Status receives the lowest hygiene score from all education groups, which again confirms
previous results from this company’s answers on hygiene factors.
5.3.6 Arranging factors based on Employment Relevance (question 6)
After analyzing five questions which have generated approximately the same impression
regarding motivation and hygiene factors for both companies, the last question was not coherent
with previous answers which lead the researcher to assume that this question was clearly
misunderstood. Though the instructions stated to only choose the numbers between 1-10 once, as
well as ranking the most important factor with the number (1) and the least important factor with
77
number (10), this was not followed through by more than a total of 26 respondents, or 26%.
This does not generate a large enough sample to use the question in a scientific manner.
According to the received answers given by the Bachelor group in company A, Job security is the
most important factor for employment. Although this is a theoretically correct employment
reason, as once received a permanent position with company A, the employees are very secure
for the future, this factor has not come across as an important factor for the employees through
previous results. Receiving a permanent position with company A, usually applies to the PhD
educated, which also underlines the level of incorrectness in this answer. Salary and benefits is
ranked as the most important factor for employment with the Upper secondary education group,
yet another answer not being coherent with previous results.
The least important factor of employment for the PhD respondents is Making a difference, a
factor which has received high scores as motivation factors in previous questions.
Company B were no better off and Developing own knowledge and capabilities, previously
ranked important, received the lowest score from several education groups. In addition, the little
range between the numeric values, as several responses were ranked with high numbers, indicate
that most factors were highly ranked, and the misunderstanding is confirmed, as the higher the
number, the less importance the factor.
This question may have contributed to interesting finds if understood correctly, as the
respondents were able to rank all factors with a larger scale.
5.4 Discussions around how to motivate knowledge workers
As indicated in the introduction, results from this research may not generate a template for
managers in motivation their knowledge workers, however, having closely examined two
different knowledge businesses, and uncovering interesting results, this thesis may act as a
contribution to the literature in the large field of knowledge management and motivation.
Results are based on individuals and their personal perception. This makes the results somewhat
subjective, though the small variations within the responses can indicate some level of objectivity
applied to these types of workers. After the interviews were performed, the researcher came up
with the impression that the managers of both company A and company B, had somewhat of an
indication to what motivates their employees which contributed to the validation of the
questionnaire. Had the responses varied greatly from the managers perceptions, there would be a
78
completely different type of research needed in order to map out how and what motivates the
named knowledge workers. This confirms the previous research performed by Furnham et al. as
well as Story et al. indicating the importance of regarding the different personalities when
focusing on motivation of knowledge workers (Furnham, Forde et al. 1999, Furnham, Eracleous
et al. 2009, Story, Hart et al. 2009).
As stated by interview object A, it must be taken into consideration that leading different
personalities, with different education backgrounds, as well as different geographical
backgrounds, is a demanding position. However, grouping the backgrounds may not necessarily
operate as a blueprint. According to several of the results for his company, work tasks separate
the employees in a larger sense, and as their work tasks are originated in their education, this may
be the main difference in motivating and ensuring job satisfaction. Trying to motivate an
administrative employee in the same way as one motivates a self-driven researcher, can be argued
as a lost cause. Gender, age, and seniority may not play a significant role for this type of
leadership, though these contributing factors are important to keep in mind (Wiley 1997).
Interview object B emphasized the importance of knowledge development and interesting clients,
results which were found through the questionnaire as well. Unlike company A, the work tasks,
though different, do not primarily differ based on education level. Personality plays an important
role for the employment and seniority for these knowledge workers.
“If an employee is wanted as a strong collaborator from several of our clients, or other workers define a specific
employee’s personality to contribute a great deal in their every-day work life, these employees will be taken care of in
our company.”
- Interview object B
This statement underlines the assumption from the researcher diminishing the education
background as an important factor for delegating work tasks. In this case, interview object B has
a more demanding role in seeing the individual and his needs for motivation. He cannot
generalize in the same sense as interview object A.
To elaborate the importance of the knowledge worker, the definition earlier in the research stated
he is “one who thinks for a living” (Davenport 2005). In addition, some of these knowledge
workers in both company A and company B know more about their specific work tasks then
their manager which diminishes the possibility for the manager to directly tell them how to do
their job. In these cases, the interview objects agreed upon their role as administrators,
facilitators, and motivators. Transformational leadership is indirectly a pre-requisite in
79
successfully managing knowledge workers, as the employees want to follow and be leaded by
their leaders. Though not being aware of this as a chosen leadership role, the interview objects
are assumed to be in possession of this ability. Previous literature (Bass 2000, Nguyen and
Mohamed 2009) indicates the fact that transformational leadership has a positive correlation with
knowledge management, and through this research, the results indicated a confirmation of these
studies based on the responses regarding ‘feedback from supervisors’ and ‘infrastructural
facilitation.’31
Both interview objects focused on their role as a leader as more of a supporting role, rather than
the “one in charge”. Though there is no mistaking who is, indeed, the highest leader, there is a
more flat structure within both companies allowing all employees to address their leader without
having to go through a long hierarchical chain of sub-leaders on different levels.
Interview object A is present during meetings when his employees are starting new projects, in
order to communicate the importance of this project, though not having an active role while
Interview object B participates in the daily life of his employees by not having his own office, and
contributing to the “free-seating” arrangements established in this company. This indicates the
downplaying the strictness of their leadership role in the company.
The results found during this research can be supported by previous research performed by
Karen Carleton (2011). The indications that knowledge workers are driven by tacit knowledge
and superior problems solving skills, the importance of retaining this group is an essential part of
today’s management. She argues that proper management and developing of skills contribute to
retention. With no indication that hygiene factors play a role, there was clear recognition that
“each knowledge worker is unique and is informed differently, based on their prior experiences.”
Further, previous studies also indicate the relevance towards work tasks and employment, as
motivation and retention strategies have been proven to differ based on the industry. In some
companies, the focus is on intrinsic factors as main retainers, while other companies use extrinsic
factors in ensuring employment for their top workers (Horowitz, Heng et al. 2003).
31 Two hygiene factors present in several of the questions in the survey
80
5.5 Discussions around differentiating between motivation and hygiene as executive
categories
As mentioned previously in the research, Herzberg clearly differentiates between the importance
of motivation and hygiene factors and their effect on the employee motivation and satisfaction.
Refutation of this theory is not the main intention of this research, but the questionnaire was
indeed worded in a way which could help determine whether this indeed is the case when
analyzing knowledge workers in 2015. The main assumption formed was that categorizing factors
in to these two groups acts more of a limitation than a valid explanation.
As indicated by Story et.al. (2009), personalities have an effect on motivation and job satisfaction,
and they argue the significance of both elements; motivation and hygiene, which enforces this
assumption. This has also been argued for by Furnham et al. (2009) and Wiley (1997) indicating
the difficulties of forming clear templates for enforcing motivation and job satisfaction. As this is
highly individualized, managers can, at best, receive somewhat of an indication, but performing
surveys continuously regarding this, may help them better develop their own management skills
(Wiley 1997, Horowitz, Heng et al. 2003, Furnham, Eracleous et al. 2009).
Supporting the above named assumption regarding the significance of both motivation and
hygiene factors, the t-tests performed between the two groups, and their effect on the asked
questions, proved insignificant. The respondents were not informed under which category the
responses were placed, and they were asked on a general basis to rank the factors and their
contribution to motivation, job satisfaction, performance, as well as the remaining questions. The
researcher used Herzberg’s definition, when categorizing the factors, and allowed this to be the
indications for what played an important role.
The reason for forming this assumption in the first place, was the perception of changes in
today’s knowledge based society and the fact that using a study from a different country, from a
different time, and with a separate type of economy, would logically not fully apply to the
population of today’s research. Comparing knowledge workers to industry workers, employees
working in America during the 50’s to employees working in Scandinavia in the year 2015, the
20th century to the 21st century, the technology available, and the evolvement of history may
definitely contribute to differences in the results.
81
The number of people having a higher education in 2015 is higher than in the 1960-1970’s32 and
constantly growing, which supports the research concerning the evolvement of the knowledge
economy. The knowledge workers have different backgrounds, preferences, and expectations
compared to the sample used in Herzberg’s studies. They are more aware of their value and how
they contribute to the work force. The world has figuratively gotten smaller, and access to
knowledge and technology across country and continents has opened up for a whole new
information and knowledge society. Knowledge workers have access to attending the best
academic institutes in the world, and they can choose to work in countries which supply the most
interesting jobs and opportunities. Competition has grown and knowledge workers expect great
stimulation of intrinsic factors; be it developing capabilities and knowledge, having interesting
work tasks, great job achievements, and self-actualization. These factors have become hygiene
factors for some of the best knowledge workers, they expect them to be there – they completed
higher education in order to be qualified for jobs who offer this, and if not present, the
knowledge worker will not even consider employment possibilities.
What about the “old” hygiene factors? If Herzberg’s motivation factors are degraded to
necessities, what has happened to salary, work space, relationship with colleagues? Have they
been even more degraded as well, and what has taken the place of the old motivation factors?
According to this research, the predetermined hygiene factors have not been degraded in the
same sense as one can argue the motivation factors. However, the importance may be equal, and
the gap between motivation and hygiene has slowly closed. A knowledge worker may answer that
his expectations around an interesting job are coherent with his expectations towards a good
salary. The population is generally better off both in terms of standard of living and
opportunities. Though there are large differences within the world population, the quality of life
has in most ways improved over the last sixty years.
Categorizing motivation and hygiene factors had a higher purpose when this theory was first
developed; the work tasks were repetitive and contributed to little inspiration among the workers
performing them. The values of today’s population have changed and the work tasks are more
and more a contributing factor to motivation and job satisfaction, and in this case, amongst
knowledge workers.
On the other hand, there has to be exercised caution when stating this and generalizing between
motivation and hygiene factors. It can be argued that it is strictly individualized. There are
32 https://www.ssb.no/utniv/
82
knowledge workers who are only interested in digging deep in history, social developments, or
other fields who are genuinely motivated by finding answers, contributing to information
availability – and might as well have done these things for free. There are also the highly incentive
driven knowledge workers which were previously discussed, who are motivated by salary, bonus,
or other incentives; for instance stockbrokers or sales people where it “does not really matter
what they sell as long as they make money and achieve success.” (Kuvaas 2008)
Though very generalizing statements, the importance remains clear; as the term “knowledge
workers” is so widely defined, so will the population belonging in this definition also have a wide
span. Naturally, there will in this case be clear differences between what motivates the latter
group, and how they indicated this through increased job performance. Knowledge workers may
not necessarily stay in one job during their whole career, but increased opportunities and benefits
may diminish knowledge workers loyalty. However, having a clear understanding of what a
manager may do in order to retain his most valued employees may, in best case scenario,
postpone a knowledge workers need for job changes, but this must include both extrinsic
incentives and benefits as well as intrinsic opportunities and self-development (Carleton 2011).
83
6. Conclusion and Further Research
6.1 Conclusion
“Never before has the motivation and retention of knowledge workers been more critical for organizational
sustainability than it is today” (Carleton 2011).
This is the concluding statement of previous research performed by Karen Carleton and is most
definitely part of my conclusion to this thesis as well.
The impressions left to the reader as well as the researcher may clearly indicate that Herzberg’s
“Two-factor” theory is somewhat outdated. Differentiating so boldly between motivation and
hygiene factors may be a limitation when discussing employee motivation and job satisfaction.
Whether there are clear factors affecting this in today’s knowledge society rather than an overall
package involving elements effecting different personalities, was another assumption being
formed as the researched progressed. Though the most interesting element of this research was
the lack of difference between predetermined motivation and hygiene factors, the reason for this
has been explained in the sense that it depends on the personalities and backgrounds of the
worker. However, one must go through an even more extensive research process in order to map
out what indeed is the fundamental reason for this, but that means moving towards fields like
psychology and human behavior which is outside the purpose of this thesis.
The research question: “Which motivation and hygiene factors shape knowledge worker’s
job satisfaction?” has been answered in the sense that the overall answer may be: all of them.
Some in a larger sense than others, but ultimately, most predetermined motivation and hygiene
factors contributed on some level to the surveyed knowledge worker’s job satisfaction. Though
there were expectations towards receiving higher scores from the motivation factors, the primary
assumption formed during the interviews made the researcher be vastly aware of the fact that
hygiene factors indeed played a significant role. When confirmed in the questionnaires sent out to
the 100 respondents, the researcher formed yet another assumption; the fact that motivation
versus hygiene differ insignificantly. This was yet again confirmed when the analytical tests were
performed in order to closely examine the differences in mean values generated from the survey.
Knowledge workers are already a homogenous group who stand out based on their educational
backgrounds, their areas of expertise and interest, as well as their continuous drive to contribute
to something larger. This may be the reason for such a clear agreement stating the relevance of
84
motivation and hygiene factors. However, the sample selected, represented two vastly different
groups of knowledge workers and their work tasks.The business model for both companies have
clear differences, indicating that there are different personalities one has to take into account. The
concept of customizing management styles in order to fit each knowledge worker, will be too
extensive and demanding for any knowledge manager, regardless of his capabilities and previous
achievements. It will be crucial for these managers to somehow form a communicative
relationship with his employees which promotes a stabile work environment containing
development of skills and knowledge, as well as being an attractive workplace where knowledge
workers thrive and want to be employed. Underlining this, there are clear indications of the
importance of both motivation and hygiene factors, and finding a balance between these, as well
as managing them and the employees correctly, may prove expedient when managing knowledge
workers.
Further, it was possible to confirm the assumption formed for company A, stating that there
would be uncovered some differences between education background of the respondents. As
work tasks differed based on education, it was found that the main difference in motivation and
job satisfaction could be bulked based on education. Which again implies the significance for
interview object A to be aware of his role as a motivator and contributor for each of these
employees. Though being somewhat aware of his main focus as an administrator and facilitator
for his employees, this specific way of managing applies mainly to his higher educated employees,
and the administrative employees may have a need for more specific follow ups as well as
feedback on tasks and job performance. In addition, personalities as well as work tasks, play a
significant role in the responses generated by the survey, and having a clear conception of what
his employees are in need of, is also proven to drive motivation and job satisfaction for
employees with company A.
Opposite to these assumptions, company B have confirmed the fact that education level has no
significant effect on the responses, and that their work tasks differ based on individual skills and
interests. Interview object B will have a more personal touch when motivating his employees and
not necessarily being able to treat particular groups in a specific manner. Teamwork is the main
form for work execution. The importance of each worker and his/her skills promotes the feeling
of self-worth and plays a significant role in the company, which was visible to the informant. For
informant B to successfully contribute to motivation and job satisfaction towards his employees
will differ in a greater sense based on personalities.
85
6.2 Limitations and Implications to the Research
The fact that this research has been performed over a period of one school semester indicates
limits to its extensions. In addition, being the author’s first research work will also contribute to
minor faults. These being the following:
- The questionnaire may have been developed in a different manner with more knowledge
and previous preparations which the research did not hold at the time. Even as the results
began to be analyzed, I saw flaws in the wording and especially regarding the last question
which was so clearly misunderstood. It would have been prepared in a different way at
another time. This concrete question could have contained additional and interesting
results and may have let me form an even deeper understanding on specific factors
contributing to motivation and job satisfaction.
- There could have been a question asking the respondents to concretely form own factors
which contribute to motivation and job satisfaction, though this would have been
demanding for the analysis on this level of research
- There could have been more companies selected. I could have chosen two companies
within the same industry which would allow me to directly compare the differences in
work environments and norms which may have had an effect on the responses from the
surveys. If I had chosen four companies, I would have had more informants who may
have given me different motivation and hygiene factors, and there would have been more
respondents in the survey which could contribute to a broader view.
However, regarding these limitations, one can argue that this research may have managed to
contribute to the views on Herzberg’s “Two-factor” theory and based on previous research
which indicates approximately same views, the fact that using knowledge businesses and mixed
methods may be useful further on.
6.3 Further Research
Researching within Human Resources is an extensive progress and as well as time consuming-
One has to be aware of and consider the “human being” factor. In this case, receiving clear
indications that contribution to motivation and job satisfaction is highly individualized, there will
most likely be differences based on work environments, tasks, and industries. A third-party
researcher in the field of business and economics, or human behavior psychology will potentially
be able to study this specific area with great depths. However, this may just as well be a job for

86
employees working in the HR department of the specific companies and having a more extensive
knowledge to both the management styles and the industries expectations to the workers.
In addition, using questionnaires in order to determine motivation and hygiene factors, as well as
interviewing employees, mapping out their drive and their personalities, will give a deeper
understanding towards how to manage them in the best way. Literature needs to have more
contributions towards motivating knowledge workers. However, if academic researchers are the
right group performing this research or if this should be done by managers who operate with
these challenges every day, may be a discussion worth having.
In a Norwegian business newspaper, Dagens Næringsliv, there was, at the end of this study’s
time-frame, published an article about Swedish knowledge businesses who had introduced six-
hour work days and emphasizing the fact that “…when one thinks for a living, we are convinced that eight
hour work days is too long”.33 These businesses had not only increased motivation and job
satisfaction, but also performance and results. A clear hygiene factor as “flexible hours” or in this
case, “shorter work days,” would be an interesting future study spin off from this specific thesis.
This emphasizes the conclusion of this study: hygiene factors may play a more significant role in
today’s knowledge environment.
Conclusively, the need for further research on how to motivate knowledge workers as well as
determining factors contributing to this, are we in great need of. In which sense is outside the
elements of this paper, but having uncovered the interesting facts in this thesis, opens up for a
desire towards finding out more and coming to terms with the faulty literature available today. I
hope that we will see a more concrete development during the next fifty years.
Emphasizing Furnham et al. (2009); “…work attitudes are not the product of situational factors alone, and
that both literature and organizations should further investigate the variables that contribute to these values with
the intention of increasing job satisfaction and performance…”
33 Dagens Næringsliv, Magasinet, Saturday, November 28th 2015. http://www.dn.no/magasinet/2015/11/27/2127/Arbeidsliv/-nr-man-lever-av--bruke-hodet-er-tte-timer-for-lenge
87
7. Bibliography
Babbie, E. R. (2012). Paradigms, Theory, and Social Research. The Practice of Social Research. Australia, Wadsworth Cengage Learning: 30.
Bass, B. M. (2000). "The Future of Leadership in Learning Organizations." The Journal of Leadership Studies 7(3): 18-40.
Brenner, P. M. (1999). "Motivating Knowledge Workers: The Role of the Workplace." Quality Progress 32(1): 33-37.
Bryman, A. (1988). Quantity and Quality in Social Research. London and New York, Routledge.
Bryman, A. (2006). "Integrating quantitative and qualitative research: how is it done?" Qualitative Research 6(1): 97-113.
Carleton, K. (2011). "How to motivate and retain knowledge workers in organizations: A review of Literature." International Journal of Management 28(2): 459-468.
Davenporrt, T. H., et al. (2002). "The Mysterious Art and Science of Knowledge-Worker Performance." MIT Sloan Management Review.
Davenport, T. H. (2005). From Strategy to Execution. USA, SAP AG.
Drucker, P. F. (2001). The Essential Drucker. Oxford.
Drucker, P. F. (2008). "http://www.edbatista.com/2008/10/drucker-1.html." from http://www.edbatista.com/2008/10/drucker-1.html.
Eskildsen, J. K., et al. (2004). "Work Motivation and job satisfaction in the Nordic countries." Employee Relations 26(2): 122-136.
Fahey, L. and L. Prusak (1998). "The Eleven Deadliest Sins of Knowledge Management." California Management Review 40(3): 265-276.
Furnham, A., et al. (2009). "Personality, motivation and job satisfaction: Hertzberg meets the Big Five." Journal of Managerial Psychology 24(8): 765-779.
Furnham, A., et al. (1999). "Personality and Individual DIfferences." Personality and work motivation 26(6): 1035-1043.
Hansen, M. T., et al. (1999). "What's Your Strategy for Managing Knowledge?" Harvard Business Review: 106-116.
Herzberg, F. (1968). Work and the Nature of Man. New York, World Publishing.
88
Herzberg, F. (2003). One More Time How do you Motivate Employees? Harvard Business Review, Harvars Business Review Business School Publishing Corporation.
Herzberg, F., et al. (1959). The Motivation to Work. New Jersey, Transaction Publishers.
Hillestad, T. (2002). Organisering og ledelse av kunnskapsvirksomhet. Kunnskapsledelse Trender og Utfordringer
Oslo, Universitetsforlaget.
Holme, I. M. and B. K. Solvang (1986). Metodevalg og Metodebruk, TANO.
Horowitz, F. M., et al. (2003). "Finders, keepers? Attracting, motivating and retaining knoiwledge workers." Human Resource Management Journal 13(4): 23-44.
Jacobsen, D. I. (2005). Hvordan gjennomføre undersøkelser? Kristiansand, Norway.
Johannessen, A., et al. (2011). Forskningsmetode for økonomisk-administrative fag. Oslo, Abstrakt forlag AS.
Kaufmann, G. and A. Kaufmann (2003). Psykologi i Organisasjon og Ledelse. Bergen.
Kirk, J. and M. Miller (1986). Reliability and Validity in Qualitative REsearch. London.
Kuckartz, U. (2014). Three basic methods of qualitative text analysis. Qualitative text Analysis. A Guide to Methods, Practice & Using Software. S. Publications. London, Sage Publications Co.
Kuvaas, B. (2008). Prestasjonsbasert belønning og motivasjon. Lønnsomhet gjennom menneskelige ressurser. Bergen, Fagbokforlaget.
Lines, R. and A. M. Sandvik (2013). Verdiskaping og ledelse av kunnskapsarbeidere. Livet som Leder, Lederundersøkelsen 3.0. Bergen, Fagbokforlaget: 309-330.
Lundberg, C., et al. (2009). "Herzberg's Two Factor Theory of work motivation tested empirically on seasonal workers in hospitality and tourism." Tourism Management 30: 890-899.
Maidani, E. A. (1991). "Comparative study of Herzberg's two-factor theory of job satisfaction among public and private sectors." Public Personnel Management 20(4): 441-448.
Maslow, A. (1943). "A Theory of Human Motivation." Psychological Review 50(4): 370-396.
Miner, J. B. (2005). Organizational behavior I. Essential theories of motivation and leadership. New York, USA.
89
Nguyen, H. N. and S. Mohamed (2009). "Leadership behaviors, organizational culture and knowledge management practices." Journal of Management Development 30(2): 206-221.
O'Reilly, C. A. (1980). "Perceptual measures of task characteristics: the biasing effects of differing frames of references and job attitudes." Academy of Management Journal 23: 118-131.
Quintas, P., et al. (1997). "Knowledge Management: a Strategic Agenda." Long Range Planning 30(3): 385-397.
Silverman, D. (2011). Interpreting Qualitative Data. London, SAGE Publications.
Stajkovic, A. D. and F. Luthans (2001). "Differential Effects of Incentive Motivators on Work Performance." Academy of Management Journal 4(3): 580-590.
Story, P. A., et al. (2009). "Using a two-factor theory of achievement motivation to examine performance-based outcomes and self-regulatory processes." Personality and Individual Differences 46: 391-395.
Warr, P. B. (2002). Psychology at Work. Harmondsworth.
Westwood, R. (1992). Organizational Behaviour: South East Asian Perspective. Longman. Hong Kong.
Wiig, K. M. (1997). "Integrating Intellectual Capital and Knowledge Management." Long Range Planning 30(3): 399-405.
Wiley, C. (1997). "What motivates employees accorgin to over 40 years of motivation surveys." International Journal of Manpower 18(3): 263-280.
Wright, P. (1989). "Motivation and Job Satisfaction." Human Resource Management.
Yin (2009). Collecting Case Study Evidence. Case Study Research. Sage. Los Angeles, Sage: 98-125.

90
91
8. Attachments
Interview Guide
Interview guide – managers of knowledge businesses A and B
Which motivation and hygiene factors shape knowledge worker’s job satisfaction?
I. Chat
a. Develop a good atmosphere
II. Introduction (ca. 5 min)
a. Presenting the background for the interview
i. Introduce the master thesis and underline the company’s role and its employees
– important for the informant to be aware of before the interview.
b. Focus on the fact that the interview is voluntarily
c. Ask for permission to record
i. Will be deleted upon completion of thesis.
d. Inform that all notes can be sent upon request after being adapted as well as the final
paper
e. Present the survey in its form so far in order to receive input on questions which are
relevant or not.
1) Can you please tell a little about your company and your position? (ca. 5 min.)
- Who is the informant, position, background
- How long have you worked with company A/B?
- How long have you had a managing role?
- What is the company’s business model?
- Please elaborate on the employees, how many, education and so on.
- What do the workers do in the company
- How big is the company?
2) What is it like being a manager of a knowledge business? (Max 10 min.)
- Pros, cons, challenges?
- How do you promote an organizational structure which strengthens the involvement of your
employees?
o Ownership culture
- How do you retain and recruit your employees?
- How do you maintain the tacit knowledge which your workers possess?
- How do you keep your best employees from leaving the company?
- Do you send your employees to conferences or other knowledge developing courses?
92
3) How do you motivate your employees? ( The goal with this question is creating a dialogue
about motivation and job satisfaction. Emphasize on getting an impression around the
employees’ workday, what the management does in order to motivate the employees – map the
hygiene factors) – Main part of interview - estimated time: 30 min. (MAX)
- Do you have a clear perception about what your employees view as motivating?
- Do you have any measuring tools indicating whether your employees perceive job satisfaction?
- Do you focus on motivation as a leader?
o If yes, how do you know that they are motivated?
- How do you focus on motivating the employees and which elements do you think contribute to
your employees being both motivated and experience job satisfaction?
o Office space, the option to work from home, autonomous work, challenging tasks ++
- In your opinion, which hygiene factors do you have as basic elements in you workplace?
- Do your employees have the opportunities of developing their own capabilities?
- Do you challenge your employees in their work tasks?
- Which factors do you think would be perceived as de-motivation if not present?
- How does the work environment seem to your employees and to you?
- How do you create an efficient work place?
4) Questionnaire being sent out to the employees (ca. 5 min.)
Present the survey as it is so far-
- What does the informant wish to include in the survey?
- How should we move forward in distributing the survey
Ask if he wants to include something at the end.
End and thank him for his time
93
Questionnaire
Motivation and job satisfaction
Thank you for taking time to answer this survey.
Its goal is to analyze factors affecting motivation and job satisfaction.
The survey will take approximately 5-8 minutes, and all answers must be
answered before completing. 1) * Please select gender
Female Male
2) * Please select age
20-25 26-30 31-35 36-40 41-45 46-50 >51
3) * Please select birthplace
Norway/Scandinavia Western Europe Eastern Europe Asia &
Oceania Africa North America South America
4) * Please select highest completed educational degree
Upper Secondary School Bachelor Masters PhD Other
5) * How long have you worked at company A/B?
0-3 years 4-5 years 6-15 years 16-20 years >21 years
6) * The following factors are the most important for my workplace motivation:
Completely unimportant
Relatively unimportant
Do not apply
Relatively important
Very important
Achievement in my job
Recognition
The work itself
My areas of responsibility
Advancement
Possibility of growth
Status
Contributing to research and development
Developing new technology
Individual research
Working towards a better future
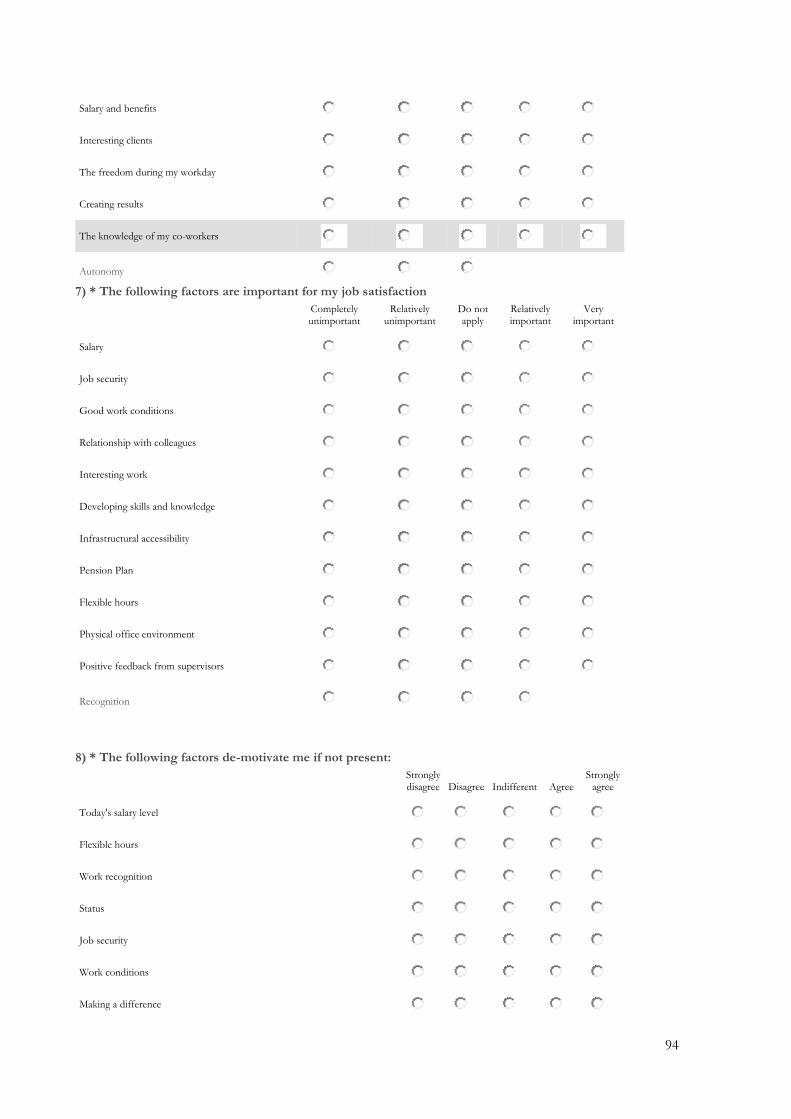
94
Salary and benefits
Interesting clients
The freedom during my workday
Creating results
The knowledge of my co-workers
Autonomy
7) * The following factors are important for my job satisfaction
Completely unimportant
Relatively unimportant
Do not apply
Relatively important
Very important
Salary
Job security
Good work conditions
Relationship with colleagues
Interesting work
Developing skills and knowledge
Infrastructural accessibility
Pension Plan
Flexible hours
Physical office environment
Positive feedback from supervisors
Recognition
8) * The following factors de-motivate me if not present:
Strongly disagree Disagree Indifferent Agree
Strongly agree
Today's salary level
Flexible hours
Work recognition
Status
Job security
Work conditions
Making a difference
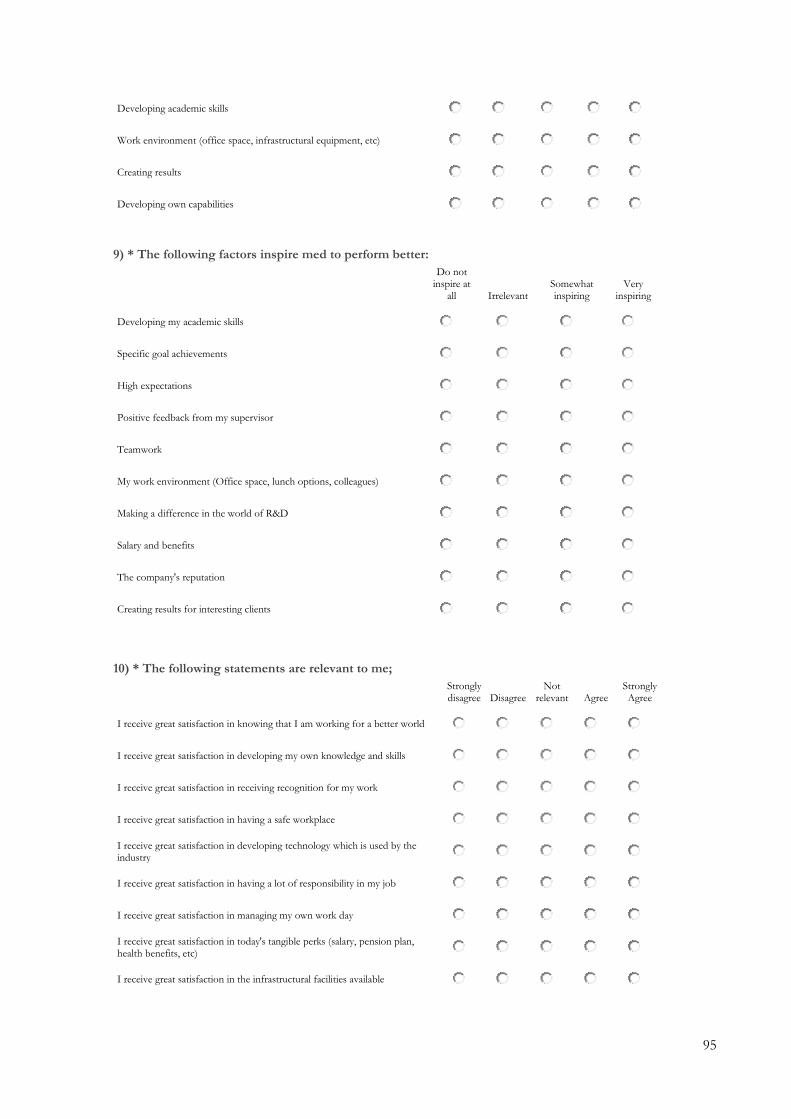
95
Developing academic skills
Work environment (office space, infrastructural equipment, etc)
Creating results
Developing own capabilities
9) * The following factors inspire med to perform better:
Do not
inspire at all Irrelevant
Somewhat inspiring
Very inspiring
Developing my academic skills
Specific goal achievements
High expectations
Positive feedback from my supervisor
Teamwork
My work environment (Office space, lunch options, colleagues)
Making a difference in the world of R&D
Salary and benefits
The company's reputation
Creating results for interesting clients
10) * The following statements are relevant to me;
Strongly disagree Disagree
Not relevant Agree
Strongly Agree
I receive great satisfaction in knowing that I am working for a better world
I receive great satisfaction in developing my own knowledge and skills
I receive great satisfaction in receiving recognition for my work
I receive great satisfaction in having a safe workplace
I receive great satisfaction in developing technology which is used by the industry
I receive great satisfaction in having a lot of responsibility in my job
I receive great satisfaction in managing my own work day
I receive great satisfaction in today's tangible perks (salary, pension plan, health benefits, etc)
I receive great satisfaction in the infrastructural facilities available
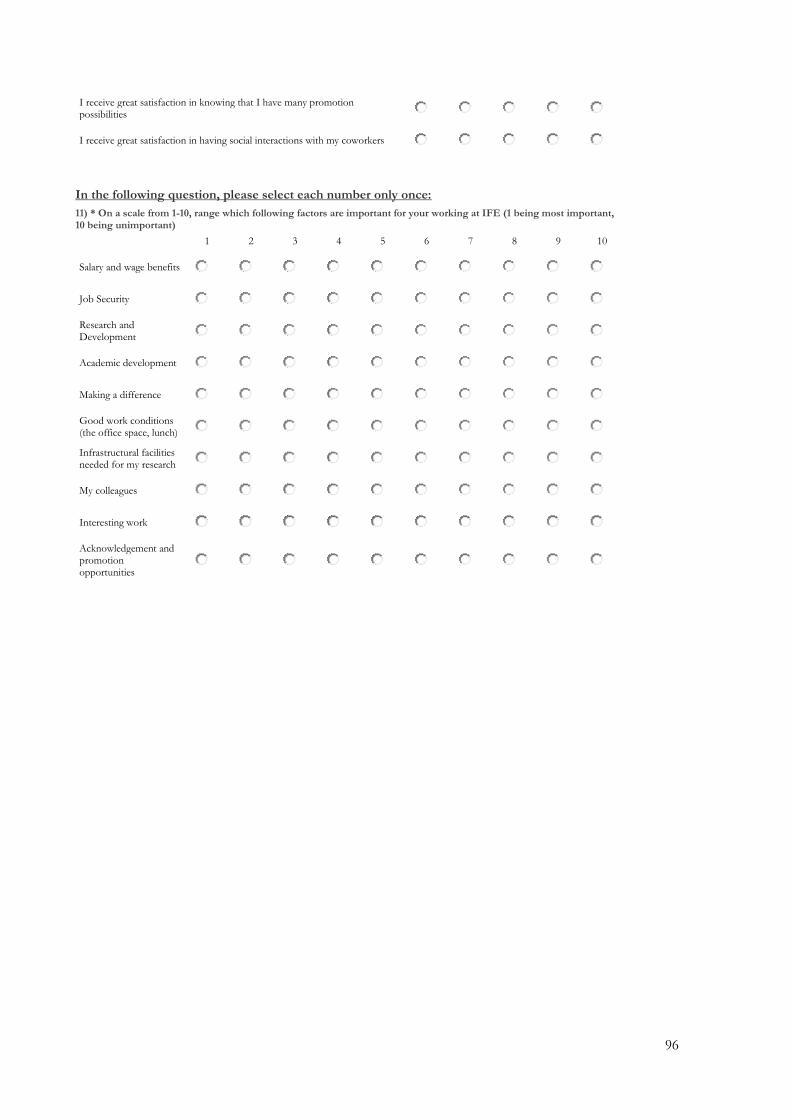
96
I receive great satisfaction in knowing that I have many promotion possibilities
I receive great satisfaction in having social interactions with my coworkers
In the following question, please select each number only once:
11) * On a scale from 1-10, range which following factors are important for your working at IFE (1 being most important, 10 being unimportant)
1 2 3 4 5 6 7 8 9 10
Salary and wage benefits
Job Security
Research and Development
Academic development
Making a difference
Good work conditions (the office space, lunch)
Infrastructural facilities needed for my research
My colleagues
Interesting work
Acknowledgement and promotion opportunities
97
E-mail sent out to Respondents
Hi, My name is Rakel Elisabeth Filtvedt and I am a master student at Norwegian University of Life Sciences in Ås (NMBU). I am currently working on my master thesis with the research question: "Which motivation and
hygiene factors shape knowledge worker’s job satisfaction?”
In this research, I am interested in answering what motivates you and what determines your day-to-day job satisfaction. The survey will be sent out through IFE internally so that it maximizes your discretion and it is completely anonymous, so please feel free to keep this in mind while answering. I appreciate each answer I receive and hope that you will take the time to answer this survey. It shall only take you about 5-8 minutes to respond. Please have the answers in by September 10th. In advance, thank you very much. English link: https://response.questback.com/rakelfiltvedt/etf51sneu6 Norwegian link: https://response.questback.com/rakelfiltvedt/aioo513jtw Sincerely, Rakel Elisabeth Filtvedt Ås, 25.08.15

98

99
Follow- up e-mail sent out to the two companies
Hi,
To all of you who already have answered the survey referring to motivation and job satisfaction
sent out last week; Thank you very much! You may also disregard this email.
To you who have yet to complete the survey, I am hereunder sending out the link one more time
in order to give you the opportunity of answering by next Thursday, September 10th. The
survey only takes about 5-8 minutes to complete.
English link: https://response.questback.com/rakelfiltvedt/etf51sneu6 Norwegian link: https://response.questback.com/rakelfiltvedt/aioo513jtw
Again, thank you all for contributing to the research!
Sincerely,
Rakel Elisabeth Filtvedt
Master student at NMBU (Norwegian University of Life Sciences)

Postboks 5003 NO-1432 Ås, Norway+47 67 23 00 00www.nmbu.no


