Embed Size (px)
Citation preview
This article appeared in a journal published by Elsevier. The attachedcopy is furnished to the author for internal non-commercial researchand education use, including for instruction at the authors institution
and sharing with colleagues.
Other uses, including reproduction and distribution, or selling orlicensing copies, or posting to personal, institutional or third party
websites are prohibited.
In most cases authors are permitted to post their version of thearticle (e.g. in Word or Tex form) to their personal website orinstitutional repository. Authors requiring further information
regarding Elsevier’s archiving and manuscript policies areencouraged to visit:
http://www.elsevier.com/copyright
Author's personal copy
Case study
Monitoring sustainability in insular areas
Ioannis Spilanis a, Thanasis Kizos b,*, Maria Koulouri a, Julia Kondyli a,Hristos Vakoufaris a, Ioannis Gatsis b
aDepartment of Environmental Studies, University of the Aegean, Mytilini, GreecebDepartment of Geography, University of the Aegean, Mytilini, Greece
1. Introduction: sustainability and islands
Sustainability and sustainable development are notions that
are widely used today in areas of research, policies, monitor-
ing and planning. The two notions are used in different
contexts. In the European Union (EU), sustainable develop-
ment aims to achieve economic prosperity, social equity and
cohesion and environmental protection and is considered as
an over-arching principle in all EU policies. Sustainability can
be considered as the state and potential of an area for
achieving sustainable development. Many estimation
approaches for sustainability have been developed, most of
them with indicators, either with a single index or with many
indicators (Bell and Morse, 1999, 2004; Zoeteman, 2001;
Wiggering et al., 2006; Wilson et al., 2007), with the selection
of the indicators performed by experts, or with the help of
stakeholders. Indicators in general should be useful to the
users by being simple and capable of illustrating temporal
changes and by offering common ground for comparisons
with other areas and critical values; they should also be
reliable and based on sound scientific concepts and comply
with international standards; and they should be measurable,
with data that can be acquired and monitored with reliable
procedures (OECD, 2002).
Methodologically, islands are ideal ‘laboratories’ for study-
ing and measuring sustainability, with easily discernible
limits and defined flows. For small areas or islands, estimation
methods are either adaptations of some of the general
sustainability approaches, or entirely new approaches. Such
adaptations are the Island of Wight ecological footprint
e c o l o g i c a l i n d i c a t o r s 9 ( 2 0 0 9 ) 1 7 9 – 1 8 7
a r t i c l e i n f o
Article history:
Received 18 September 2007
Received in revised form
15 March 2008
Accepted 19 March 2008
Keywords:
Islands
Sustainability indicators
State indicators
Sustainability measurement
Aegean islands
Greece
a b s t r a c t
The notion of sustainability is used widely at the policy level, but only few approaches deal
with its measurement, especially at the local level. Here, we develop and apply a practical
tool for the estimation of the sustainability state at the island level with the use of indicators
selected and adapted from international agencies and institutes, in a framework which is an
expanded version of the DPSR approach. The identification of the significant sustainability
state factors and the selection of the indicators are based on areas’ characteristics, namely
their insularity and the fact that they are in the Mediterranean. The values of these
indicators were obtained or calculated for the islands of Paros and Kos in Greece. The
findings reveal that the method can be of great use for the sustainability evaluation and for
planning the sustainable development of islands.
# 2008 Elsevier Ltd. All rights reserved.
* Corresponding author. Tel.: +30 2251036447; fax: +30 2251036409.E-mail address: [email protected] (T. Kizos).
avai lab le at www.sc iencedi rec t .com
journal homepage: www.e lsev ier .com/ locate /eco l ind
1470-160X/$ – see front matter # 2008 Elsevier Ltd. All rights reserved.doi:10.1016/j.ecolind.2008.03.003
Author's personal copy
(www.bestfootforward.com) and the sustainability indicators
for Malta (Bell and Morse, 2004). Novel approaches include the
‘‘Sustainable Guernsey’’ project (Barrett, 1998; Policy Council,
2004); a multi-criteria analysis with environmental perfor-
mance at the municipality level in Italy (Ferrarini et al., 2001); a
sustainability matrix for remote and insular Scotland (Copus
and Crabtree, 1996); and another approach for local sustain-
ability indicators for mountain ecosystems in Scotland
(Crabtree and Bayfield, 1998).
Here, we develop and apply a practical tool for the
measurement and improvement of sustainability at the local
level, applied on two islands, Paros and Kos in the South
Aegean Region of Greece. In the next section, the method is
presented and the results follow with a discussion of the
positive and negative points of the application.
2. Methods and data
2.1. The method developed
In the approach followed here, we propose a concept that can
monitor the ‘progress’ of local societies towards sustainability
with the use of indicators via a broadened DPSR framework
(with economic, social and environmental issues). By sustain-
ability state (S) of an area, we refer to the quality and quantity
of the economic, social and environmental capitals under
pressure (P) from human activities that change by economic
and social driving forces (D), internal or external. The
knowledge of the state can finally lead to responses (R),
policies that seek to improve the state by affecting and
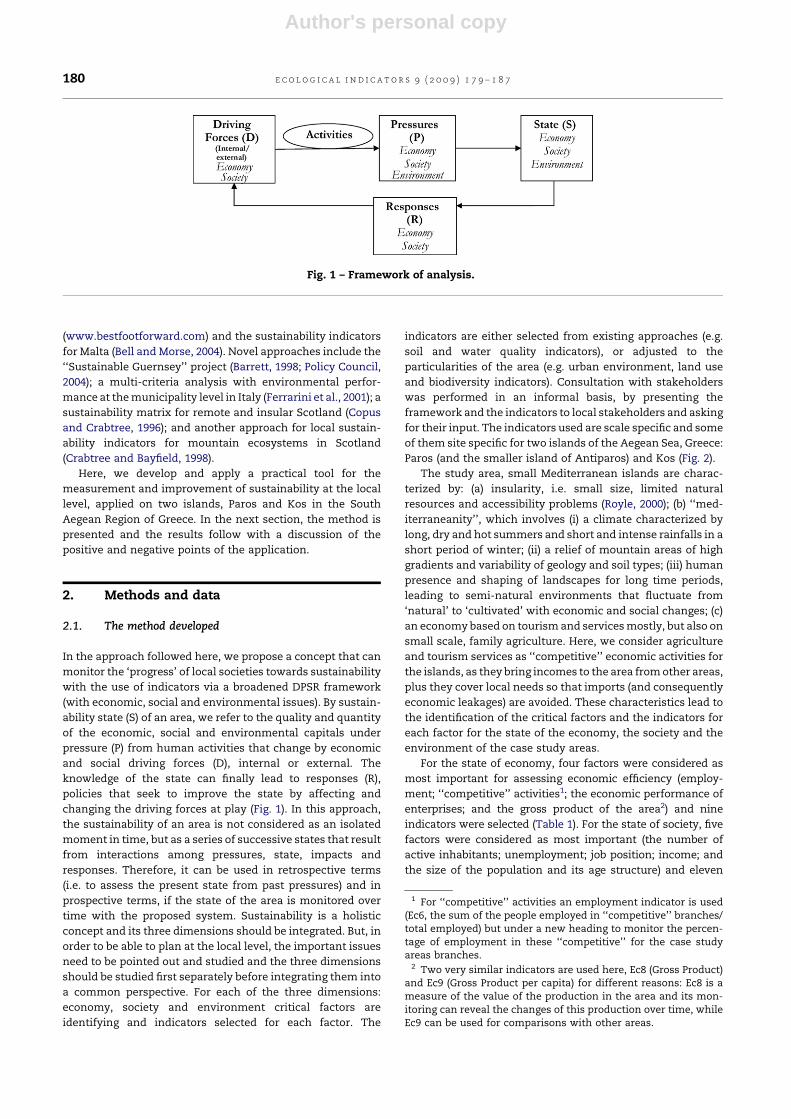
changing the driving forces at play (Fig. 1). In this approach,
the sustainability of an area is not considered as an isolated
moment in time, but as a series of successive states that result
from interactions among pressures, state, impacts and
responses. Therefore, it can be used in retrospective terms
(i.e. to assess the present state from past pressures) and in
prospective terms, if the state of the area is monitored over
time with the proposed system. Sustainability is a holistic
concept and its three dimensions should be integrated. But, in
order to be able to plan at the local level, the important issues
need to be pointed out and studied and the three dimensions
should be studied first separately before integrating them into
a common perspective. For each of the three dimensions:
economy, society and environment critical factors are
identifying and indicators selected for each factor. The
indicators are either selected from existing approaches (e.g.
soil and water quality indicators), or adjusted to the
particularities of the area (e.g. urban environment, land use
and biodiversity indicators). Consultation with stakeholders
was performed in an informal basis, by presenting the
framework and the indicators to local stakeholders and asking
for their input. The indicators used are scale specific and some
of them site specific for two islands of the Aegean Sea, Greece:
Paros (and the smaller island of Antiparos) and Kos (Fig. 2).
The study area, small Mediterranean islands are charac-
terized by: (a) insularity, i.e. small size, limited natural
resources and accessibility problems (Royle, 2000); (b) ‘‘med-
iterraneanity’’, which involves (i) a climate characterized by
long, dry and hot summers and short and intense rainfalls in a
short period of winter; (ii) a relief of mountain areas of high
gradients and variability of geology and soil types; (iii) human
presence and shaping of landscapes for long time periods,
leading to semi-natural environments that fluctuate from
‘natural’ to ‘cultivated’ with economic and social changes; (c)
an economy based on tourism and services mostly, but also on
small scale, family agriculture. Here, we consider agriculture
and tourism services as ‘‘competitive’’ economic activities for
the islands, as they bring incomes to the area from other areas,
plus they cover local needs so that imports (and consequently
economic leakages) are avoided. These characteristics lead to
the identification of the critical factors and the indicators for
each factor for the state of the economy, the society and the
environment of the case study areas.
For the state of economy, four factors were considered as
most important for assessing economic efficiency (employ-
ment; ‘‘competitive’’ activities1; the economic performance of
enterprises; and the gross product of the area2) and nine
indicators were selected (Table 1). For the state of society, five
factors were considered as most important (the number of
active inhabitants; unemployment; job position; income; and
the size of the population and its age structure) and eleven
Fig. 1 – Framework of analysis.
1 For ‘‘competitive’’ activities an employment indicator is used(Ec6, the sum of the people employed in ‘‘competitive’’ branches/total employed) but under a new heading to monitor the percen-tage of employment in these ‘‘competitive’’ for the case studyareas branches.
2 Two very similar indicators are used here, Ec8 (Gross Product)and Ec9 (Gross Product per capita) for different reasons: Ec8 is ameasure of the value of the production in the area and its mon-itoring can reveal the changes of this production over time, whileEc9 can be used for comparisons with other areas.
e c o l o g i c a l i n d i c a t o r s 9 ( 2 0 0 9 ) 1 7 9 – 1 8 7180
Author's personal copy
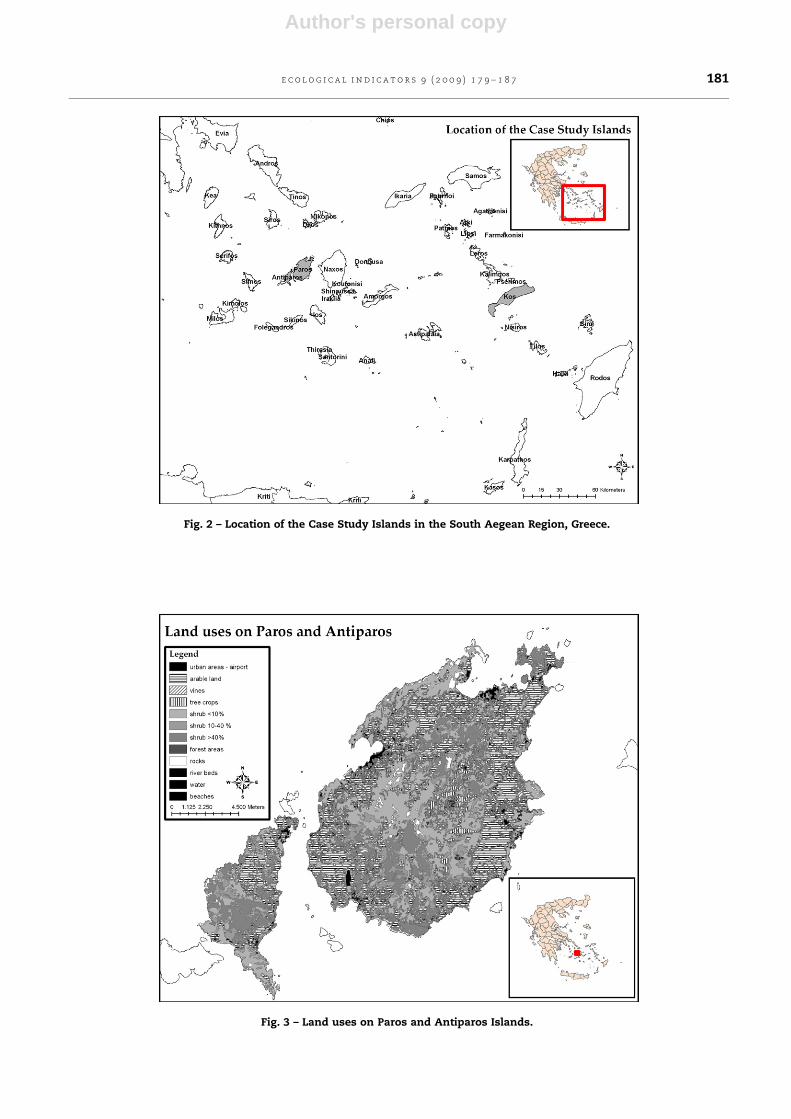
Fig. 2 – Location of the Case Study Islands in the South Aegean Region, Greece.
Fig. 3 – Land uses on Paros and Antiparos Islands.
e c o l o g i c a l i n d i c a t o r s 9 ( 2 0 0 9 ) 1 7 9 – 1 8 7 181

Author's personal copy
indicators were selected (Table 1), reflecting not only demo-
graphic issues but issues of prosperity, social equity and gender
equality as well.
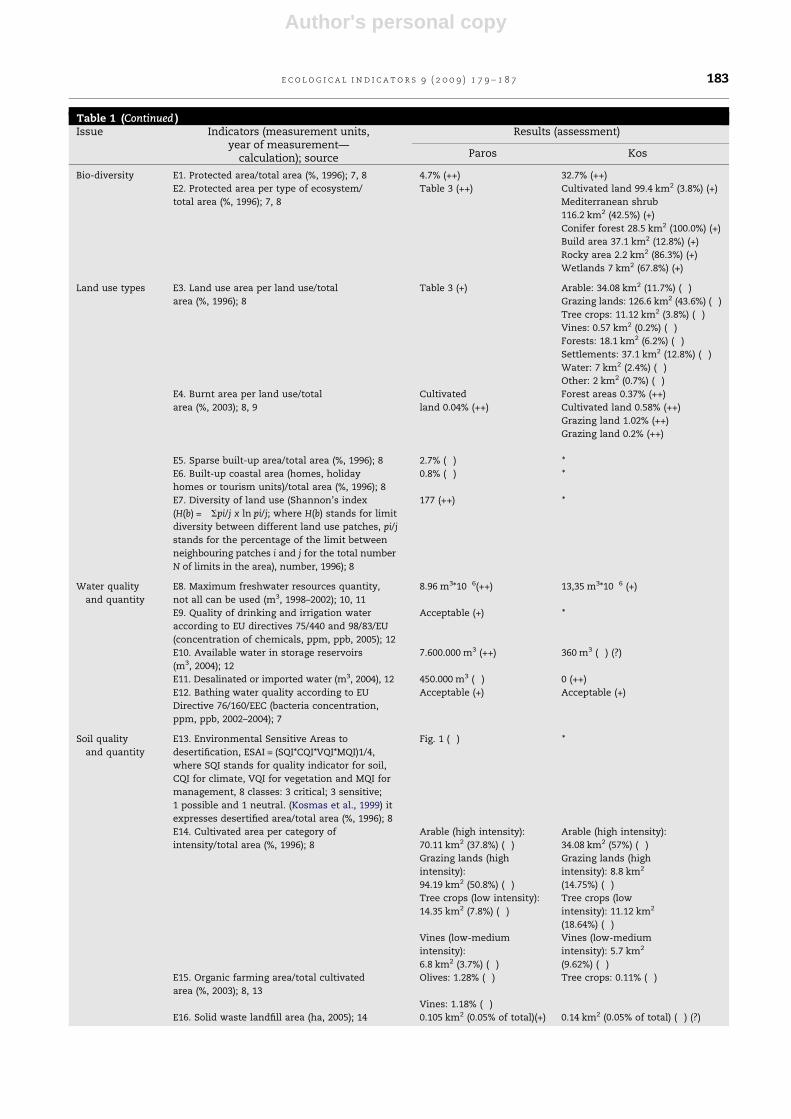
For the state of the environment, five factors were
considered as the most important in the case study areas
(biodiversity; land use; water quantity and quality for marine,
coastal, surface and underground waters; soil quantity and
quality; and urban environment) and 19 indicators were
selected (Table 1), adapted from international agencies’ and
institutes’ approaches (EC, 2005; EEA, 2004; OECD, 2002; UNCSD,
2001). Some of the indicators used (Table 1) are not considered
as State indicators in the DPSR framework: E1 and E2 (protected
areas per total area and per type of ecosystem, respectively) are
considered as Response indicators, but are used here as an
estimation of the state of the biodiversity at the local level (the
more protected areas, the better biodiversity is preserved); E3
(land uses in the area), is considered as an Impact indicator for
land use changes, but in this paper it is used in a static manner
as a feature of the state of the area in each respective period of
time; E14 (intensity of practices for cultivated land) is
considered as Pressure indicator but the degree of intensity
reflects to a great extent soil quality; and E15 (percentage of
organic farming area) is considered as a Response indicator, but
here it is linked with improved soil and water quality compared
to most conventional similar cultivations.
The indicators selected are very diverse and the setting
of value thresholds for the sustainability assessment is
complex. For some of them, such as the water quality
indicators, the thresholds used are encountered in the
literature, while especially for economic and social ones,
such thresholds cannot be set and values are compared with
those of the Prefecture or national averages, or their change
over time is examined when possible. The assessment of the
values of the indicators is performed with a four scale
system that compares the value of the indicator to the
corresponding thresholds or to the national average for the
same indicator (Table 1): good state (++) is attributed to
values that are ‘‘better’’ (higher/lower) than the correspond-
ing thresholds; acceptable state (+) to values that are close
to the corresponding thresholds; not acceptable state (�) to
values that are ‘‘worse’’ (higher/lower) than the correspond-
ing thresholds; and not possible without time series (0) to
values that cannot be assessed without more data. In this
framework, it is possible to have an indicator that is
assessed positively in one dimension and negatively in
another (e.g. seasonal jobs in tourism services in the case
study areas). Moreover, it is a clear methodological choice
not to sum the indicators to an overall sustainability index
or three sub-indexes, one for each dimension of sustain-
ability. Such indexes are problematic (Wilson et al., 2007)
Table 1 – Sectors of the state of the areas studied, indicators used per sector, data sources and calculation method
Issue Indicators (measurement units,year of measurement—
calculation); source
Results (assessment)
Paros Kos
Employment (Ec1) Employed (number, 2001); 1 4712 (0) 12,311 (0)
(Ec2) Most important employment branch/total
number of employed (%, 2001); 1
Constructions (18.1%) (+) Hotels and restaurants
(30.8%) (++)
(Ec3) Second most important employment
branch/total number of employed (%, 2001); 1
Hotels and restaurants
(16.5%) (+)
Wholesale—retail
trade (11.7%) (�)
(Ec4) Third most important employment
branch/total number of employed (%, 2001); 1
Wholesale—retail
trade (13.7%) (�)
Public services and
defense (9.4%) (+)
(Ec5) New enterprises (number, 2004); 2, 3 87 (0) 91 (0)
Exports (Ec6) The sum of the people employed in
‘‘competitive’’ branches/total employed
(%, 2001); 1
36.9 (Prefecture 35.2) (++) 42.8 (Prefecture 38.2) (++)
Economic
performance
of enterprises
(Ec7) The amount of the added value
tax (s, 2004); 2
3,164,156.1 (0) *
Product (Ec8) Gross Product (millions s, 2001); 4 1345 (0) 2647 (0)
(Ec9) Gross Product per capita (s/capita, 2001); 4 12,217 (�) 14,008 (0)
Active population (S1) Active inhabitants/population (%, 2001); 1 40.7 (Prefecture 39.3) (+) 46.3 (Prefecture 31.2) (++)
(S2) Active women/total women (%, 2001); 1 27.8 (Prefecture 26.1) (++) 36.4 (Prefecture 31.2) (++)
Unemployed (S3) Unemployed women/active women (%, 2001); 1 22.6 (Prefecture 15.2) (�) 19.1 (Prefecture 23) (+)
(S4) Unemployed/population (%, 2001); 1 4 (Prefecture 3.9) (+) 6.5 (Prefecture 7.6) (+)
(S5) New unemployed/unemployed (%, 2001); 1 30.8 (Prefecture 33.2) (�) 8.1 (Prefecture 9.8) (+)
Job position (S6) Employers/employed (%, 2001); 1 20.4 (Prefecture 16.2) (+) 15.7 (Prefecture 13.6) (++)
(S7) Seasonal workers/employed (%, 2001); 5 * *
Income (S8) Income declared to tax services
(s/family, 2004); 6
11,334 (Prefecture
10,876) (++)
12,393 (Prefecture 10,271) (++)
(S9) Tax per capita (s/capita, 2001); 2 712.6 (0) *
Population (S10) Population (number, 2001); 1 12,853 (0) 30,947 (0)
(S11) Ageing indicator (number, 2001); 1 0.77 (Prefecture 1.1) (++) 0.54 (Prefecture 0.64) (++)
e c o l o g i c a l i n d i c a t o r s 9 ( 2 0 0 9 ) 1 7 9 – 1 8 7182
Author's personal copy
Table 1 (Continued )Issue Indicators (measurement units,
year of measurement—calculation); source
Results (assessment)
Paros Kos
Bio-diversity E1. Protected area/total area (%, 1996); 7, 8 4.7% (++) 32.7% (++)
E2. Protected area per type of ecosystem/
total area (%, 1996); 7, 8
Table 3 (++) Cultivated land 99.4 km2 (3.8%) (+)
Mediterranean shrub
116.2 km2 (42.5%) (+)
Conifer forest 28.5 km2 (100.0%) (+)
Build area 37.1 km2 (12.8%) (+)
Rocky area 2.2 km2 (86.3%) (+)
Wetlands 7 km2 (67.8%) (+)
Land use types E3. Land use area per land use/total
area (%, 1996); 8
Table 3 (+) Arable: 34.08 km2 (11.7%) (�)
Grazing lands: 126.6 km2 (43.6%) (�)
Tree crops: 11.12 km2 (3.8%) (�)
Vines: 0.57 km2 (0.2%) (�)
Forests: 18.1 km2 (6.2%) (�)
Settlements: 37.1 km2 (12.8%) (�)
Water: 7 km2 (2.4%) (�)
Other: 2 km2 (0.7%) (�)
E4. Burnt area per land use/total
area (%, 2003); 8, 9
Cultivated
land 0.04% (++)
Forest areas 0.37% (++)
Cultivated land 0.58% (++)
Grazing land 1.02% (++)
Grazing land 0.2% (++)
E5. Sparse built-up area/total area (%, 1996); 8 2.7% (�) *
E6. Built-up coastal area (homes, holiday
homes or tourism units)/total area (%, 1996); 8
0.8% (�) *
E7. Diversity of land use (Shannon’s index
(H(b) = �Spi/j x ln pi/j; where H(b) stands for limit
diversity between different land use patches, pi/j
stands for the percentage of the limit between
neighbouring patches i and j for the total number
N of limits in the area), number, 1996); 8
177 (++) *
Water quality
and quantity
E8. Maximum freshwater resources quantity,
not all can be used (m3, 1998–2002); 10, 11
8.96 m3*10�6(++) 13,35 m3*10�6 (+)
E9. Quality of drinking and irrigation water
according to EU directives 75/440 and 98/83/EU
(concentration of chemicals, ppm, ppb, 2005); 12
Acceptable (+) *
E10. Available water in storage reservoirs
(m3, 2004); 12
7.600.000 m3 (++) 360 m3 (�) (?)
E11. Desalinated or imported water (m3, 2004), 12 450.000 m3 (�) 0 (++)
E12. Bathing water quality according to EU
Directive 76/160/EEC (bacteria concentration,
ppm, ppb, 2002–2004); 7
Acceptable (+) Acceptable (+)
Soil quality
and quantity
E13. Environmental Sensitive Areas to
desertification, ESAI = (SQI*CQI*VQI*MQI)1/4,
where SQI stands for quality indicator for soil,
CQI for climate, VQI for vegetation and MQI for
management, 8 classes: 3 critical; 3 sensitive;
1 possible and 1 neutral. (Kosmas et al., 1999) it
expresses desertified area/total area (%, 1996); 8
Fig. 1 (�) *
E14. Cultivated area per category of
intensity/total area (%, 1996); 8
Arable (high intensity):
70.11 km2 (37.8%) (�)
Arable (high intensity):
34.08 km2 (57%) (�)
Grazing lands (high
intensity):
94.19 km2 (50.8%) (�)
Grazing lands (high
intensity): 8.8 km2
(14.75%) (�)
Tree crops (low intensity):
14.35 km2 (7.8%) (�)
Tree crops (low
intensity): 11.12 km2
(18.64%) (�)
Vines (low-medium
intensity):
6.8 km2 (3.7%) (�)
Vines (low-medium
intensity): 5.7 km2
(9.62%) (�)
E15. Organic farming area/total cultivated
area (%, 2003); 8, 13
Olives: 1.28% (�) Tree crops: 0.11% (�)
Vines: 1.18% (�)
E16. Solid waste landfill area (ha, 2005); 14 0.105 km2 (0.05% of total)(+) 0.14 km2 (0.05% of total) (�) (?)
e c o l o g i c a l i n d i c a t o r s 9 ( 2 0 0 9 ) 1 7 9 – 1 8 7 183

Author's personal copy
and for localities, the use of more than one indicator is
preferred (Bell and Morse, 2004; Crabtree and Bayfield, 1998;
Policy Council, 2004), even if some appear to describe similar
issues or even if their values are correlated, as the main
objective is the assessment of the area’s sustainability over
time and not comparisons with other localities.3 A con-
sultation with some important local stakeholders on Paros
(mostly from the Municipality) was also conducted, as part
of a wider Agenda 21 approach. Local officials regarded the
theoretical framework satisfactory and agreed on the
necessity of such a monitoring system and of the indicators.
However, the Greek planning system limits local planning at
the Municipality or island level and the actual use of such a
system is of more use for higher planning authorities for
response, mostly the South Aegean Region and the Ministry
for Public Affairs and Regional Policy.
2.2. Data and application of the method: results anddiscussion
The case study islands Paros (and the smaller islands of
Antiparos) and Kos, are both located in the South Aegean
Region (44 inhabited islands of various sizes and populations,
Fig. 2). Paros is a medium size island (approximately 195 km2),
dependent on tourism and is a popular summer destination
for Greeks and foreigners. It can be reached via ferry-boat
from Piraeus port and via airplane from Athens airport and is
one of the most accessible Aegean islands. In the past,
agriculture was also dominant, but nowadays it is mostly
abandoned. Kos is another medium size island (290 km2),
highly dependent on charter tourism and a very popular
destination for foreigners. It is also easily accessible; it can be
reached easily by airplane from many European towns during
the high season and via ferry-boat from Piraeus port. As in
Paros, agriculture was dominant in the past, but today it is
mostly abandoned.
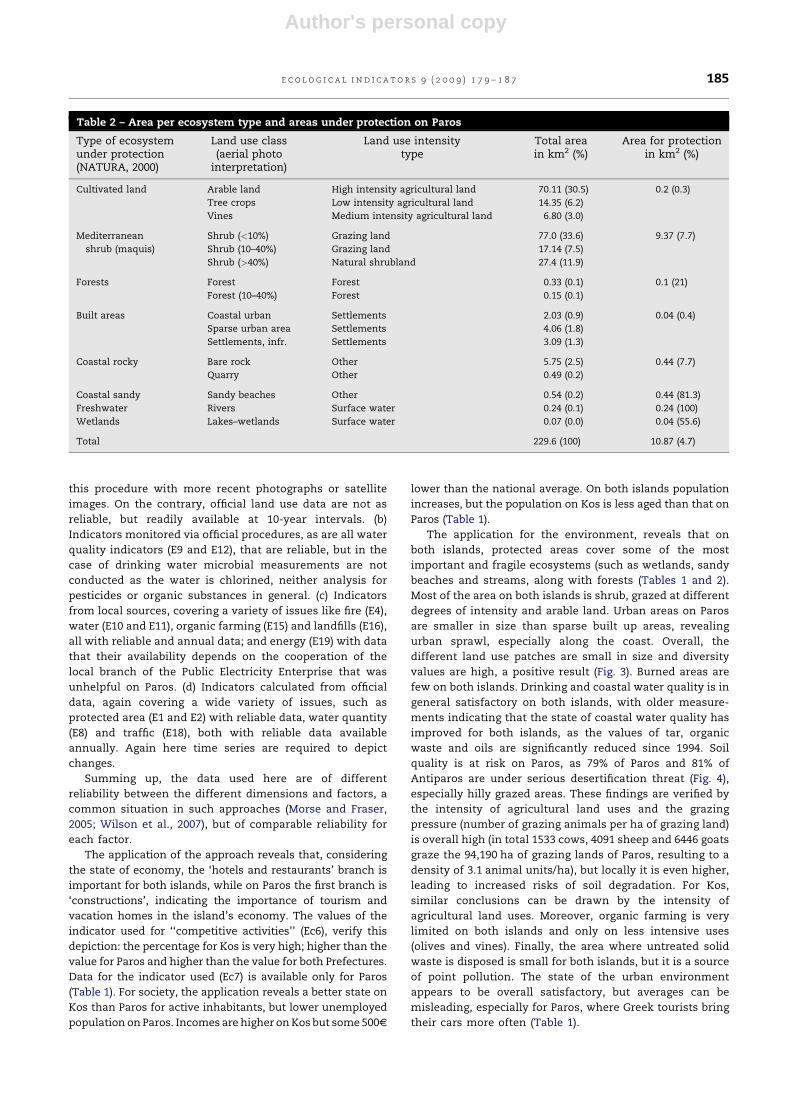
Data for calculating the values of the selected indicators
were obtained through research and official sources (pub-
lished or unpublished, Table 1). Land uses were calculated for
Paros only via photograph interpretation of the most recent
available aerial photos (1996). These photographs were
digitally corrected and 16 different categories of land uses
were calculated (Table 2). Field observations were conducted
in the winter of 2006 for disputed areas.
The issue of data reliability is very important in this
approach, as unreliable data can lead to wrong conclusions
and sustainability state estimations. Regarding the state of the
economy and society, the indicators can be divided in three
major groups in terms of data availability and reliability: in the
first group are indicators derived from the population census;
in the second indicators from local sources and in the third
from gross product data (only for economy). For the first group
(indicators Ec1–Ec4 and Ec6 and S1–S4 and S10–S11) the data
are reliable but available only at 10-year intervals. Some
doubts about the reliability of the 2001 census data for the
Kyklades Prefecture are only raised for the new unemployed
(Table 1). For the second group (Ec5 and Ec7 and S7–S9), the
data are available theoretically annually and reliable, but their
availability depends on the cooperation of the local and
national Public Finance Administration (PFA). The PFA on
Paros was helpful and assisted the application, but the one on
Kos was unhelpful claiming personal data conflicts. For the
third group (Ec8 and Ec9), the values are available annually but
only at the level of the Prefecture. The setting up of a local
estimation system is not easy and the reliability of the data
depends on GDP estimation procedures at the national level
that have changed recently in Greece. All indicators require
time series to clearly depict changes in the area, at different
time intervals for the different groups of indicators depending
on the data availability.
For the state of the environment, the indicators can be
divided into four groups in terms of data availability and
reliability: (a) Indicators calculated from the interpretation
of land use with the use of aerial photography (E3, E5–E7,
E13, E14 and E17) for Paros and with official land use data for
Kos. Here, the interpretation has yielded reliable data, but
the continuation of monitoring requires the repetition of
Table 1 (Continued )Issue Indicators (measurement units,
year of measurement—calculation); source
Results (assessment)
Paros Kos
Urban
environment
E17. Non built-up urban areas/total
urban area (%, 2005); 8, 14
0.057 km2 (20%
of urban) (++)
0.265 km2 (0)
E18. Number of cars per km
(cars/Km, 2003); 4, 14
1178 (�) 81.74 (�)
E19. Renewable/conventional
energy produced (%); 15
No data (*) 6.4% (+)
(++): good state; (+): acceptable state; (�): not acceptable; (0): not possible without time series; (*): unknown (no data); (?): not complete data
(from all municipalities).
Data Sources: 1: Population Census (2001); for employment, the branches used are taken from the official Greek employment classification; 2:
Public Finance Administration (2004); 3: Chamber of Commerce (2004); 4: National Statistics Service of Greece; 5: Social Security Service; 6:
Ministry for Economic and Finance (2004); 7: Ministry of Environment, Spatial Planning and Public Works; 8: Our interpretation of aerial photos
from the Ministry of Agriculture (1996); 9: Fire Department of Paros (2003); 10: Water reserves management program for Greece (2002); 11:
Meteorological data; 12: Public Enterprise for Drinking Water and Sewages of Paros; 13: Department of Agriculture and Rural Development on
Siros island (2003); 14: Municipality of Paros (2005); 15: Local branch of Public Electricity Enterprise.
3 Another reason for not constructing an overall index here isthat some indicators are spatially explicit while others are not andthe construction of such an index would be problematic.
e c o l o g i c a l i n d i c a t o r s 9 ( 2 0 0 9 ) 1 7 9 – 1 8 7184
Author's personal copy
this procedure with more recent photographs or satellite
images. On the contrary, official land use data are not as
reliable, but readily available at 10-year intervals. (b)
Indicators monitored via official procedures, as are all water
quality indicators (E9 and E12), that are reliable, but in the
case of drinking water microbial measurements are not
conducted as the water is chlorined, neither analysis for
pesticides or organic substances in general. (c) Indicators
from local sources, covering a variety of issues like fire (E4),
water (E10 and E11), organic farming (E15) and landfills (E16),
all with reliable and annual data; and energy (E19) with data
that their availability depends on the cooperation of the
local branch of the Public Electricity Enterprise that was
unhelpful on Paros. (d) Indicators calculated from official
data, again covering a wide variety of issues, such as
protected area (E1 and E2) with reliable data, water quantity
(E8) and traffic (E18), both with reliable data available
annually. Again here time series are required to depict
changes.
Summing up, the data used here are of different
reliability between the different dimensions and factors, a
common situation in such approaches (Morse and Fraser,
2005; Wilson et al., 2007), but of comparable reliability for
each factor.
The application of the approach reveals that, considering
the state of economy, the ‘hotels and restaurants’ branch is
important for both islands, while on Paros the first branch is
‘constructions’, indicating the importance of tourism and
vacation homes in the island’s economy. The values of the
indicator used for ‘‘competitive activities’’ (Ec6), verify this
depiction: the percentage for Kos is very high; higher than the
value for Paros and higher than the value for both Prefectures.
Data for the indicator used (Ec7) is available only for Paros
(Table 1). For society, the application reveals a better state on
Kos than Paros for active inhabitants, but lower unemployed
population on Paros. Incomes are higher on Kos but some 500s
lower than the national average. On both islands population
increases, but the population on Kos is less aged than that on
Paros (Table 1).
The application for the environment, reveals that on
both islands, protected areas cover some of the most
important and fragile ecosystems (such as wetlands, sandy
beaches and streams, along with forests (Tables 1 and 2).
Most of the area on both islands is shrub, grazed at different
degrees of intensity and arable land. Urban areas on Paros
are smaller in size than sparse built up areas, revealing
urban sprawl, especially along the coast. Overall, the
different land use patches are small in size and diversity
values are high, a positive result (Fig. 3). Burned areas are
few on both islands. Drinking and coastal water quality is in
general satisfactory on both islands, with older measure-
ments indicating that the state of coastal water quality has
improved for both islands, as the values of tar, organic
waste and oils are significantly reduced since 1994. Soil
quality is at risk on Paros, as 79% of Paros and 81% of
Antiparos are under serious desertification threat (Fig. 4),
especially hilly grazed areas. These findings are verified by
the intensity of agricultural land uses and the grazing
pressure (number of grazing animals per ha of grazing land)
is overall high (in total 1533 cows, 4091 sheep and 6446 goats
graze the 94,190 ha of grazing lands of Paros, resulting to a
density of 3.1 animal units/ha), but locally it is even higher,
leading to increased risks of soil degradation. For Kos,
similar conclusions can be drawn by the intensity of
agricultural land uses. Moreover, organic farming is very
limited on both islands and only on less intensive uses
(olives and vines). Finally, the area where untreated solid
waste is disposed is small for both islands, but it is a source
of point pollution. The state of the urban environment
appears to be overall satisfactory, but averages can be
misleading, especially for Paros, where Greek tourists bring
their cars more often (Table 1).
Table 2 – Area per ecosystem type and areas under protection on Paros
Type of ecosystemunder protection(NATURA, 2000)
Land use class(aerial photo
interpretation)
Land use intensitytype
Total areain km2 (%)
Area for protectionin km2 (%)
Cultivated land Arable land High intensity agricultural land 70.11 (30.5) 0.2 (0.3)
Tree crops Low intensity agricultural land 14.35 (6.2)
Vines Medium intensity agricultural land 6.80 (3.0)
Mediterranean
shrub (maquis)
Shrub (<10%) Grazing land 77.0 (33.6) 9.37 (7.7)
Shrub (10–40%) Grazing land 17.14 (7.5)
Shrub (>40%) Natural shrubland 27.4 (11.9)
Forests Forest Forest 0.33 (0.1) 0.1 (21)
Forest (10–40%) Forest 0.15 (0.1)
Built areas Coastal urban Settlements 2.03 (0.9) 0.04 (0.4)
Sparse urban area Settlements 4.06 (1.8)
Settlements, infr. Settlements 3.09 (1.3)
Coastal rocky Bare rock Other 5.75 (2.5) 0.44 (7.7)
Quarry Other 0.49 (0.2)
Coastal sandy Sandy beaches Other 0.54 (0.2) 0.44 (81.3)
Freshwater Rivers Surface water 0.24 (0.1) 0.24 (100)
Wetlands Lakes–wetlands Surface water 0.07 (0.0) 0.04 (55.6)
Total 229.6 (100) 10.87 (4.7)
e c o l o g i c a l i n d i c a t o r s 9 ( 2 0 0 9 ) 1 7 9 – 1 8 7 185

Author's personal copy
3. Conclusion: sustainability anddevelopment on small islands
The method developed in this paper for the estimation of the
sustainability state at the local scale and its application on two
islands has revealed a number of issues. The first of these
refers to the fact that the case studies are islands, which is very
helpful in defining and measuring people, material and energy
flows. A weakness is that separate estimations are necessary
for each island. Another issue refers to the difficulty of
conducting sustainability state estimations at the local scale.
As the level of detail grows, averages prove their limitations
and explicit spatial data are required, especially for environ-
mental issues. Some examples of how averages shade local
issues are grazing pressure that available data do not allow its
spatial allocation and water quantity and quality, where
acceptable average values may hide local problems. The last
issue is related to the need of constant monitoring to produce
useful results. As existing approaches of similar monitoring–
planning systems demonstrate (Policy Council, 2004), different
indicators require different monitoring time scales. The
method presented here provides a useful start for a monitor-
ing system and offers a conceptual context of the complex
issues involved as an initial but necessary step for sustain-
ability state evaluation and eventually planning for sustain-
able development at the local scale.
Acknowledgments
The method and its application were financed by the
ISTOS program (Innovation for Sustainable Tourism and
Services in the South Aegean, Action 1.1 of Activity 7.1, co-
financed by EC and the Greek Ministry of Economics and
Finance).
r e f e r e n c e s
Barrett, J., 1998. Sustainability Indicators and EcologicalFootprints the Case of Guernsey. John Moores University,Liverpool.
Bell, S., Morse, S., 1999. Sustainability Indicators: Measuring theImmeasurable. Earthscan, London.
Bell, S., Morse, S., 2004. Experiences with sustainabilityindicators and stakeholder participation: a case studyrelating to a ‘Blue Plan’ project in Malta. SustainableDevelopment 12, 1–14.
Copus, A.K., Crabtree, J.R., 1996. Indicators of socio-economicsustainability: an application to remote rural Scotland.Journal of Rural Studies 12 (1), 41–54.
Crabtree, B., Bayfield, N., 1998. Developing sustainabilityindicators for mountain ecosystems: a study of theCairngorms, Scotland. Journal of EnvironmentalManagement 52, 1–14.
Fig. 4 – Environmentally Sensitive Areas (ESA index) to desertification for Paros and Antiparos Islands.
e c o l o g i c a l i n d i c a t o r s 9 ( 2 0 0 9 ) 1 7 9 – 1 8 7186

Author's personal copy
EEA, 2004. Indicator Factsheet, WEU11, www.eea.eu.int/indicators, accessed 09/09/2007.
European Commission, 2005. Measuring progress towards amore sustainable Europe: Sustainable developmentindicators for the European Union, data 1990–2005. Officefor Official Publications of the European Communities,Luxembourg, http://ec.europa.eu/sustainable/library/index_en.htm, accessed 17/09/2007.
Ferrarini, A., Bodini, A., Becchi, M., 2001. Environmental qualityand sustainability in the province of Reggio Emilia (Italy):using multi-criteria analysis to assess and comparemunicipal performance. Journal of EnvironmentalManagement 63, 117–131.
Kosmas, C., Kirkby, M., Geeson, N. (Eds.), 1999. Manual on KeyIndicators of Desertification and Mapping EnvironmentallySensitive Areas to Desertification. The MEDALUS Project:Mediterranean Desertification and Land Use. EC,Luxemburg.
Morse, S., Fraser, E.D.G., 2005. Making ‘dirty’ nations lookclean? The nation state and the problem of selectingand weighting indices as tools for measuringprogress towards sustainability. Geoforum 36 (5),625–640.
OECD, 2002. Environmental Data, Compendium 2002,Environmental Performance and Information Division.OECD, Paris.
Policy Council, 2004. 2004 sustainable Guernsey. Monitoringsocial, economic & environmental trends. Policy Council:The States of Guernsey.
Royle, S., 2000. Geography of Islands: Small Island Insularity.Routledge, London.
UNCSD, 2001. Indicators of Sustainable Development:Guidelines and Methodologies. United Nations, New York,http://www.un.org/esa/sustdev/natlinfo/indicators/indisd/indisd-mg2001.pdf, accessed 09/09/2007.
Wiggering, H., Dalchow, C., Glemnitz, M., Helming, K., Mueller,K., Schultz, A., Stachowa, U., Zander, P., 2006. Indicators formultifunctional land use—Linking socio-economicrequirements with landscape potentials. EcologicalIndicators 6, 238–249.
Wilson, J., Tyedmers, P., Pelot, R., 2007. Contrasting andcomparing sustainable development indicator metrics.Ecological Indicators 7, 299–314.
Zoeteman, K., 2001. Sustainability of nations. InternationalJournal of Sustainable Development and World Ecology 8,93–109.
e c o l o g i c a l i n d i c a t o r s 9 ( 2 0 0 9 ) 1 7 9 – 1 8 7 187


