Embed Size (px)
Citation preview
Running head: MONITORING GHG EMISSION USING GIS TECHNOLOGY
Monitoring GHG Emission from ABC's Participants Using GIS
Technology
Ahmed Alhazmi
Client Organization Name: ABC (A Better City)
Technology Geographic Information System Project Implementation
GPH945
Salem State University
Spring 2015
MONITORING GHG EMISSION USING GIS TECHNOLOGY2
Executive summary
As a graduate student in the Department of Geography at
Salem Stata University, it is a part of Technology Geographic
Information System Project Implementation Course (GPH945) for
everyone to undergo and explore GIS implementation plan with non-
profit organization. This report is an attempt to know how the
theories of monitoring GHG emissions using GIS-based approach can
be applied to practical live situation, which was ABC (A Better
City), especially working with the challenge of sustainability
program coordinators to implement GIS techniques in gathering,
managing, and tracking the GHG emissions progress from ABC’s
participants.
In the first part of project report, previous literature of
reviews has been explored to know the manner of implementing GIS-
based approach in such organization’s activity. Besides that,
brief description about client organization and current sequences
MONITORING GHG EMISSION USING GIS TECHNOLOGY3
of work frame of monitoring GHG emissions reduction from client
organization participants’ facilities were declared.
Successively, project’s goal, Project’s objectives, Project’s
benefits, and Project’s workflow (including need-to-know
questions) were identified for second phase.
In the second part of project report, system requirements
have been described, including all needed software, hardware,
institutional, and output requirement limitations. Also, all
required steps in making project’s information products have been
stated to create interactive vector basemap or operational layers
in interactive maps. Error tolerance consideration also has been
identified in that part.
In the third part of project report, Database schema
specification, Data categorization, Attributes able
specification, Data source steps, Data acquisition constraints,
and Future data preparation to analysis stage are stated in
sequenced manner. This part defined all needed steps to structure
the GHG emission inventory to be ready to Data Entry and Results
Analysis stage.
MONITORING GHG EMISSION USING GIS TECHNOLOGY4
In the fourth part of project report, analysis stage has
been investigated to link Need-to Know Questions to available
data of all four categories (Participants, Energy End-uses, GHG
emissions, Actions). This stage is essential to investigate the
declared benefits of GIS-based approach in deep in the first
part.
In the fifth part of project report, detailed description of
Cost-Benefits Analysis steps has been declared, starting with
modeling cost consideration to showing the estimated benefits of
the applied GIS-based approach in the challenge of sustainability
program.
My focus was on how to reach the targets of ABC’s
coordinators, which was GHG reduction attempts and communicate
them about GIS course and its advantages. In last decades, rapid
growth in urbanization was observed in Boston, MA, increasing the
possibilities in releasing more emissions especially from big and
small business sector’s facilities.
The outcomes of implementing GIS-based approach in the
challenge of sustainability program at ABC shows observable
MONITORING GHG EMISSION USING GIS TECHNOLOGY5
benefits during the time span of GHG reduction plan of ABC’s
program. An example of successful story of a participant for the
first year, and projected cost-benefit growth for that
participant has been contemplated over project period, in attempt
to empower the application of GIS-based approach.
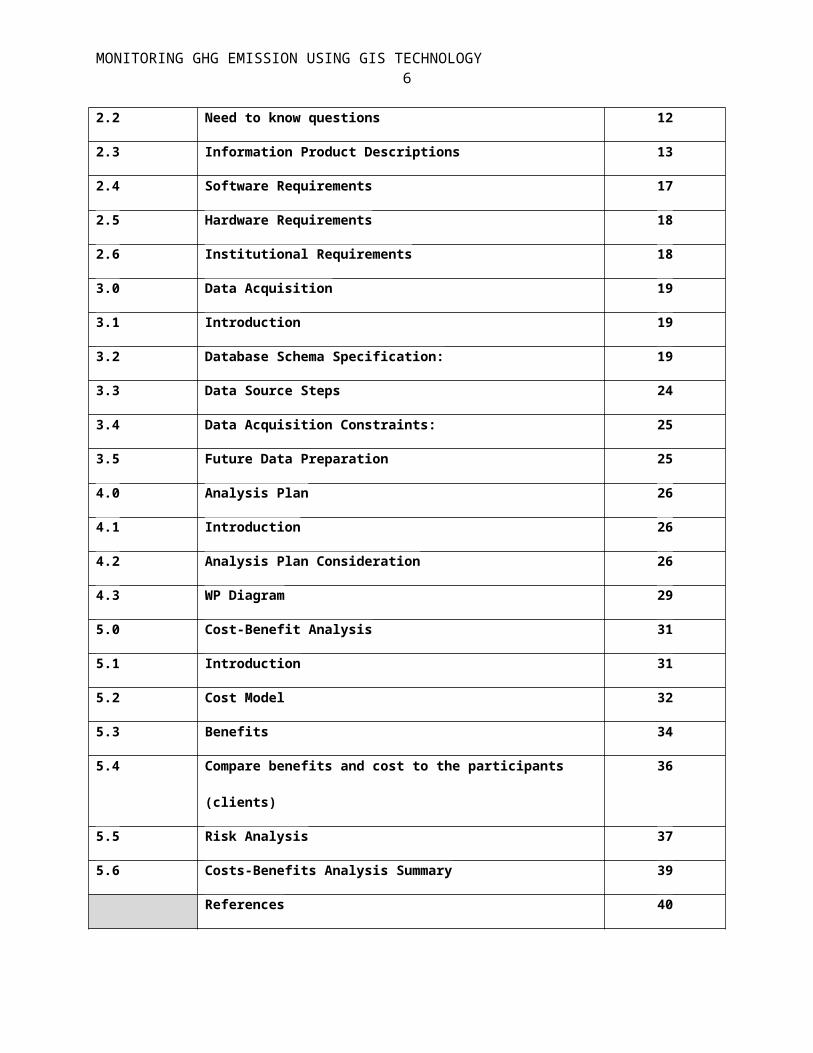
TABLE OF CONTENTS
Section Description page
1.0 Background and Problem Statement 4
1.1 Background 4
1.2 Literature review 6
1.3 Project client 8
1.4 Project goal 9
1.5 Project objectives 9
1.6 Project benefits 9
1.7 Project workflow 10
2.0 System Requirements 12
2.1 Introduction 12
MONITORING GHG EMISSION USING GIS TECHNOLOGY6
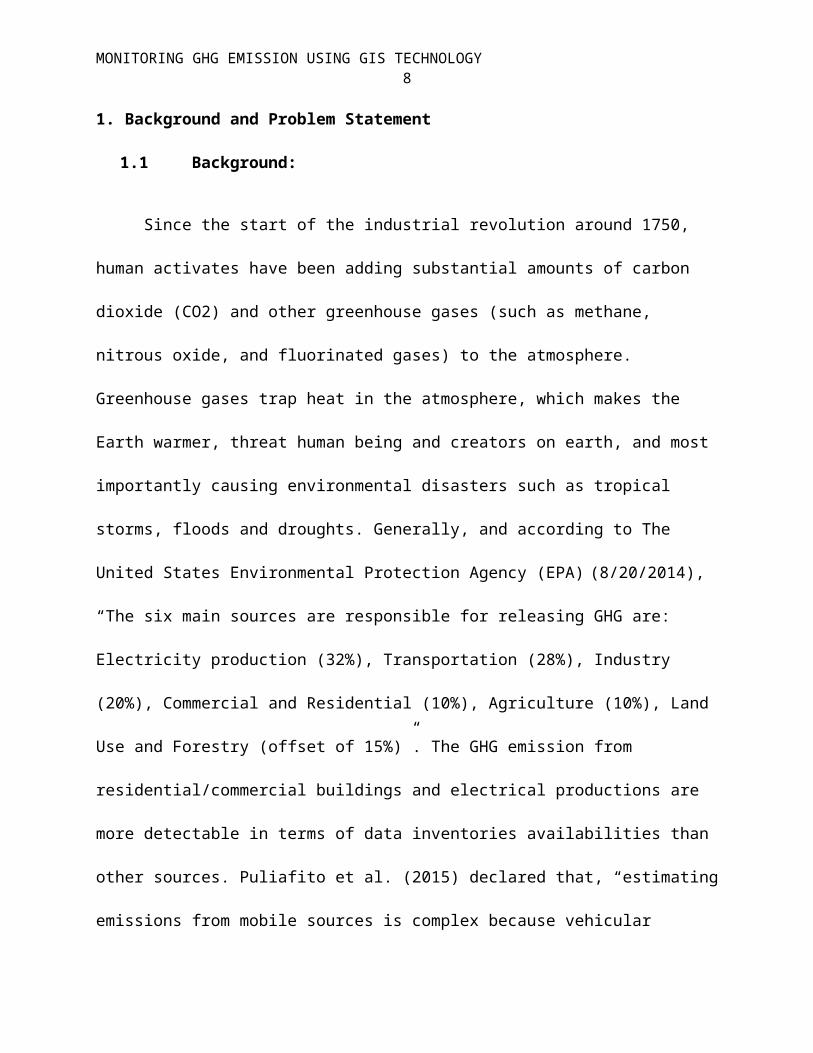
2.2 Need to know questions 12
2.3 Information Product Descriptions 13
2.4 Software Requirements 17
2.5 Hardware Requirements 18
2.6 Institutional Requirements 18
3.0 Data Acquisition 19
3.1 Introduction 19
3.2 Database Schema Specification: 19
3.3 Data Source Steps 24
3.4 Data Acquisition Constraints: 25
3.5 Future Data Preparation 25
4.0 Analysis Plan 26
4.1 Introduction 26
4.2 Analysis Plan Consideration 26
4.3 WP Diagram 29
5.0 Cost-Benefit Analysis 31
5.1 Introduction 31
5.2 Cost Model 32
5.3 Benefits 34
5.4 Compare benefits and cost to the participants
(clients)
36
5.5 Risk Analysis 37
5.6 Costs-Benefits Analysis Summary 39
References 40

MONITORING GHG EMISSION USING GIS TECHNOLOGY7
Appendix 42
Monitoring GHG Emission from ABC's Participants Using GIS
Technology
MONITORING GHG EMISSION USING GIS TECHNOLOGY8
1. Background and Problem Statement
1.1 Background:
Since the start of the industrial revolution around 1750,
human activates have been adding substantial amounts of carbon
dioxide (CO2) and other greenhouse gases (such as methane,
nitrous oxide, and fluorinated gases) to the atmosphere.
Greenhouse gases trap heat in the atmosphere, which makes the
Earth warmer, threat human being and creators on earth, and most
importantly causing environmental disasters such as tropical
storms, floods and droughts. Generally, and according to The
United States Environmental Protection Agency (EPA) (8/20/2014),
“The six main sources are responsible for releasing GHG are:
Electricity production (32%), Transportation (28%), Industry
(20%), Commercial and Residential (10%), Agriculture (10%), Land
Use and Forestry (offset of 15%)”. The GHG emission from
residential/commercial buildings and electrical productions are
more detectable in terms of data inventories availabilities than
other sources. Puliafito et al. (2015) declared that, “estimating
emissions from mobile sources is complex because vehicular
MONITORING GHG EMISSION USING GIS TECHNOLOGY9
traffic statistics are randomly detected both temporally and
spatially, so mobile sources inventories estimation is considered
a difficult mission.” (p.304). Therefore, in residential and
commercial (real estate buildings) case, we can largely rely on
readily the available data about fuel and electricity consumption
and usage rates to determine emissions.
For these reasons, it is important for the local
environmental bodies and related organizations to take advantage
to use tools to monitor GHG emissions for the purposes of
planning and implementing more sustainable action, strategies,
and future practices. GIS applications have proven their
capabilities in monitoring, managing and even predicting the
environmental hazards. GIS power in modeling GHG emission lies in
processing the inputs data, and then visualizing the obtained
results in maps, tables, charts, or diagrams format. Many
governmental agencies have created tools to create interactive
maps to visualize the distribution of greenhouse gases emissions
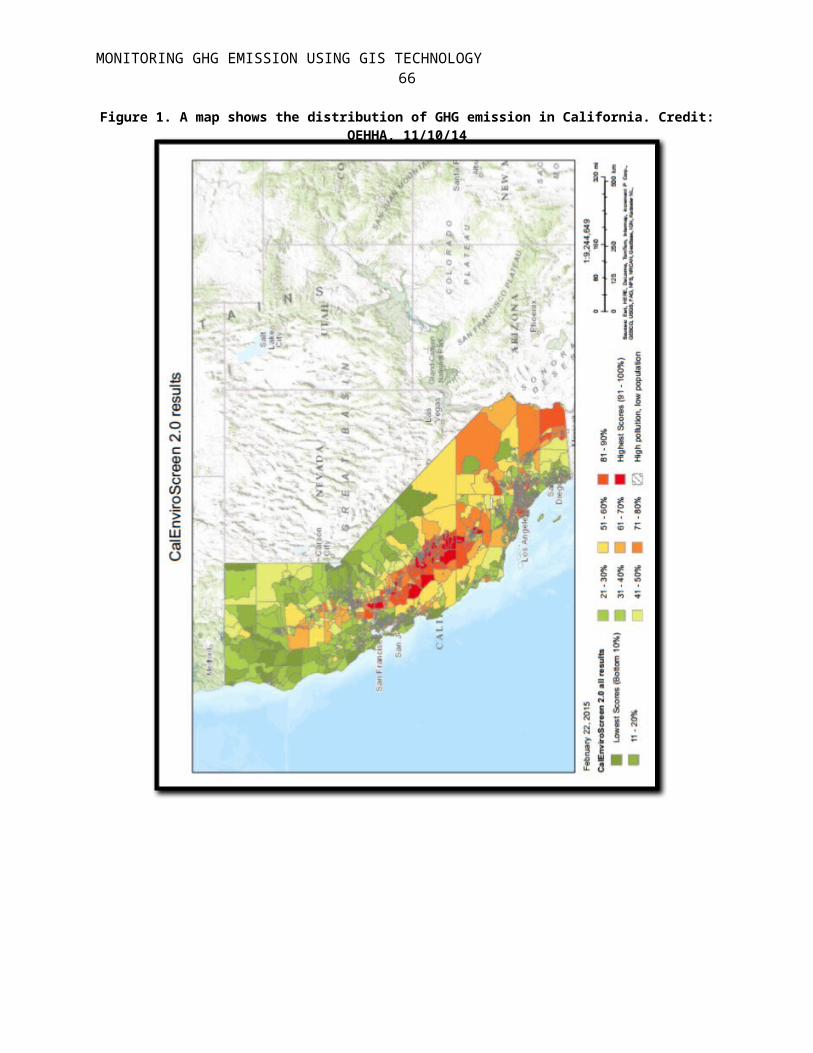
using GIS technology. For instance, in October 2014, the Office
of Environmental Health Hazard Assessment, a branch of California
MONITORING GHG EMISSION USING GIS TECHNOLOGY10
with assistance with EPA developed screening tool, called
CalEnviroScreen (Fig.1 Appendix A). According to The Office of
Environmental Health Hazard Assessment (OEHHA) (11/10/14),
“CalEnviroScreen is a screening methodology that can be used to
help to identify where are the most vulnerable communities with
the highest exposure to multiple environmental hazards, including
polluted air and water, waste facilities and contaminated soil.”
Another live example of using GIS in detecting GHG emission
is when California passed its Global Warming Solutions Act, which
established plans, incentives, techniques, and regulations to
reduce GHG emissions in 2006, which requires the California Air
Resource Board (ARB) to set regional GHG targets for emissions:
seven percent reduction target for 2020 and a 16 percent
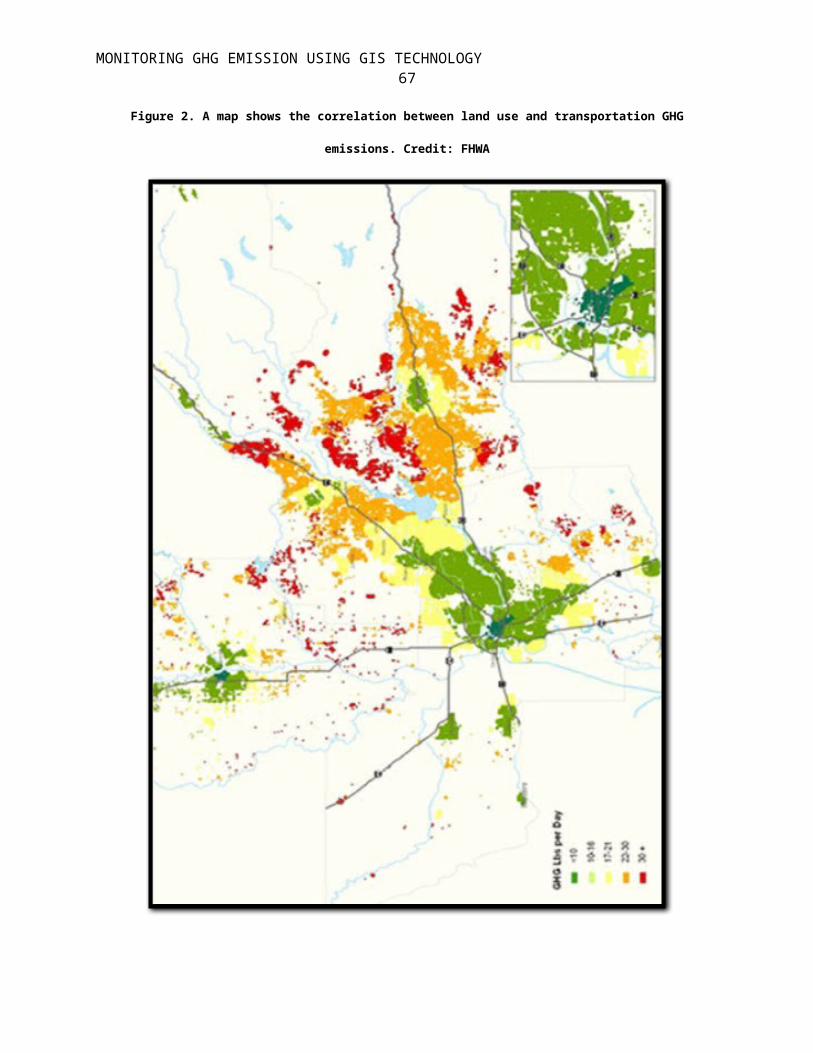
reduction target for 2035 (Fig.2 Appendix A). According to U.S.
Department of Transportation John A. Volpe National
Transportation Systems Center (Volpe Center), in Cambridge,
Massachusetts report (August, 2011), “In order to achieve their
goals in GHG reduction plan, Sacramento Area Council of
Government (SACOG) is currently developing a land use and
transportation plan to achieve its GHG emissions targets”. The
MONITORING GHG EMISSION USING GIS TECHNOLOGY11
report also stated that, “Previously, SACOG's land use and
transportation model used zones as the primary unit of
measurement, which did not provide enough details to assess the
land use impact on travel behavior.” Therefore, SACOG developed a
GIS parcel-based travel model to better capture GHG emission
distribution in the city and quantify the transportation-related
GHG emissions associated with each buffered parcel, which
provides a more accurate vision of the interaction between land
use and transportation.
1.2 Literature of reviews:
Multiple studies conducted in exploring the use of GIS
technology in predicting and estimating the amounts and
distribution of GHG emission. Van Hoesen & Letendre (2013) stated
that, “GIS-based approach used to develop reducing energy
consumption attempts in older buildings in a small rural town in
Vermont, to increase the efficiency of those buildings, and thus
help to address and map the locations of buildings that have the
higher GHG emissions rates.” (p. 630). Another study was done by
Asdrubali et al. (2013) on implementing GIS-based tool to support
MONITORING GHG EMISSION USING GIS TECHNOLOGY12
local policy making—application in the municipality of Spoleto,
Italy. According to Asdrubali et al. (2013) “GIS-based tool
helped decision makers in the city to have a real time spatial
monitoring of GHG emissions of the city” (p.590).
Approaches to modelling GHG emissions using GIS
significantly differ depending on research’s objectives. However,
Boychuk & Bun (2014) mentioned that, “Creating a spatial
inventory of GHG emission for an area consist two steps:
performing an inventory for each grid cell, and for each category
of GHG activity using the ‘bottom-up’ approach, and then
summarizing that inventory results for all activity subsectors.”
(p. 563). Therefore, to build a spatial database of a particular
gas emission activity from a specific facility, it is preferable
to calculate GHG emission amount per unit area of that facility,
taking into account plotting the geographical locations of these
emissions activates over a period of time. Bun et al. also added
that, “For each activity sector selected, the used GIS modules
use a number of digital maps, which help to geographically
MONITORING GHG EMISSION USING GIS TECHNOLOGY13
allocate the amount of fuel used in these selected individual
grid cells.” (p.2 33)
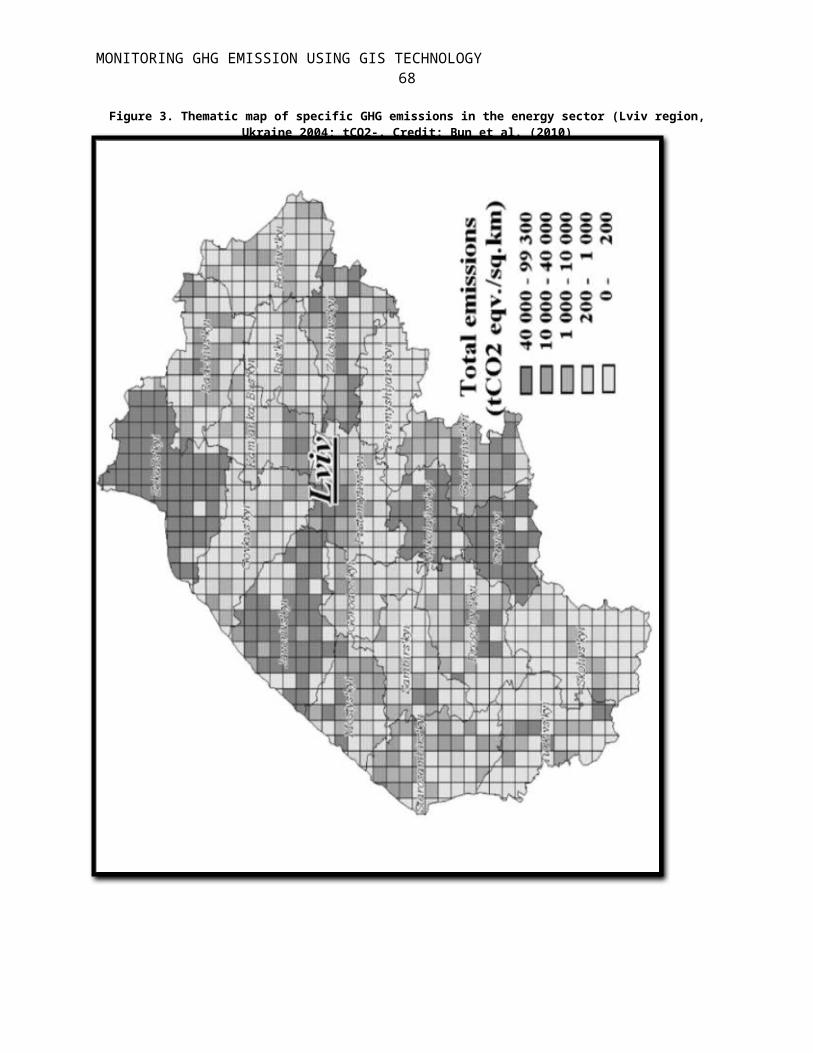
In addition, Boychuk & Bun (2014) also pointed out that, “To
establish a spatial analysis, it is important to categorize all
emission sources into three groups: line, area, and large-scale
point sources.” (p. 563). Boychuk & Bun (2014) in their study on
Western Ukraine classified “most of industrial facilitates such
as power stations and refineries as a large-scale point source
due to the huge amount emissions relative to area scale whereas
residential and commercial facility which are occupied with high
population as area source.” (pp. 565-566). All transportation
infrastructures which serve mobile sources (cars, trains, buses,
truck, ships, and airplanes) are considered line sources in GHG
emission.
However, due to the huge input data and the diversity in GHG
emission strategies, the rate of uncertainty will be high and
affect the results’ credibility. Thanks to GIS technology, the
inventory of GHG emission data have referenced spatially and
geocoded in order to decrease the uncertainty of these data.
MONITORING GHG EMISSION USING GIS TECHNOLOGY14
1.3 Project client:
ABC (A Better City) organization has a long experience in
working with their participants to monitor and manage the GHG
emission that released from their facilities. One of the goals of
ABC organization in the Challenge of Sustainability Program, that
was launched in 2009, is to achieve or exceed a cumulative average of 2.5%
greenhouse gas reduction per year and assist commercial real estate sector in meeting
the “25% by 2020” goal of the Climate Action Plans of Massachusetts, and the cities of
Boston and Cambridge. They work hard to draw attention new
participants and spread their business in the whole city. In
addition, they offer to their participants a list of 1500
sustainable actions to implement in order to contribute in GHG
emissions.
The philosophy of this huge program lies in benchmarking
facilities’ environmental impact with the created sustainability
scorecard by program’s decision-makers; engaging participants in
monthly events in order to keep their data updated and share the
results with them; sharing success stories to highlight
achievements and motivate others participants; and reducing CO2
MONITORING GHG EMISSION USING GIS TECHNOLOGY15
and greenhouse gas emissions. According to the program
coordinator: Garrett Sprague, “The very first meeting with a new
participant starts with identifying the facilities’ energy end-
uses statistics, and what are already done in term of
sustainability actions from that facility, and then discuss with
that participant’s representative the available actions as
starting point to achieve GHG emission reduction goal.” Users of
this program are mostly buildings owners, including hotels and
restaurants owners, and even small local businesses. The
challenge of sustainability program at ABC has a strategy to know
the updated GHG emissions from their participants’ facilities,
and if a GIS-based approach had been implemented in their
operations, that could help the programs coordinators to monitor
the distribution of GHG emissions spatially.
Participants trust in the program has increased due to the
benefits that could gained from implementing sustainable actions
in their facilities, including energy efficiency, reduce
environmental impact and decrease operational costs, and success
to have Leadership in Energy & Environmental Design (LEED)
MONITORING GHG EMISSION USING GIS TECHNOLOGY16
certificate. In attempt to encourage their participants, each
year challenged participants and other stakeholders come together
to honor and celebrate their accomplishments at the Annual
Challenge for Sustainability Awards for achieving environmental
goals and excellence in the following categories: People, Energy,
Water, Waste, Purchasing, Cleaning & Toxins and Transportation.
Participants’ feelings toward the program accomplishments have
been increased since it launched in 2009.
1.4 Project goal:
The goal of this project is to allocate ABC organization’s
participants and their progress in GHG emission reduction within
the Challenge for Sustainability program spatially. Once the GHG
emissions forecast are complete, and the reduction target is
established, mitigation actions to reduce the facility’s GHG
emissions must be developed and adopted.
1.5 Objectives:
To determine name and location of potential participant
facility that release GHG emission.
To determine the GHG emissions statistics from a
participant’s facility.
MONITORING GHG EMISSION USING GIS TECHNOLOGY17
To provide a monthly scorecard to participant’s facility
about its progress in reduction GHG emission.
To provide list of actions that contribute in GHG emission
reduction.
To provide an interactive map to ABC organization to
visualize the locations of participants facilities
spatially.
To provide a scorecard to ABC organization to know the
energy end-uses in each facility.
To provide a charts to ABC organization to highlight on the
participant’s location that needs more focus due to high GHG
emissions.
1.6 Project Benefits:
The benefits of implementing a GIS-based approach in ABC
organization especially the challenge of sustainability program
lie in the following:
Managing participants data in an organized manner and easy
to reach any time.
Showing the GHG emissions statistics spatially.
MONITORING GHG EMISSION USING GIS TECHNOLOGY18
Identifying the locations of participants who have high
rates of GHG emissions.
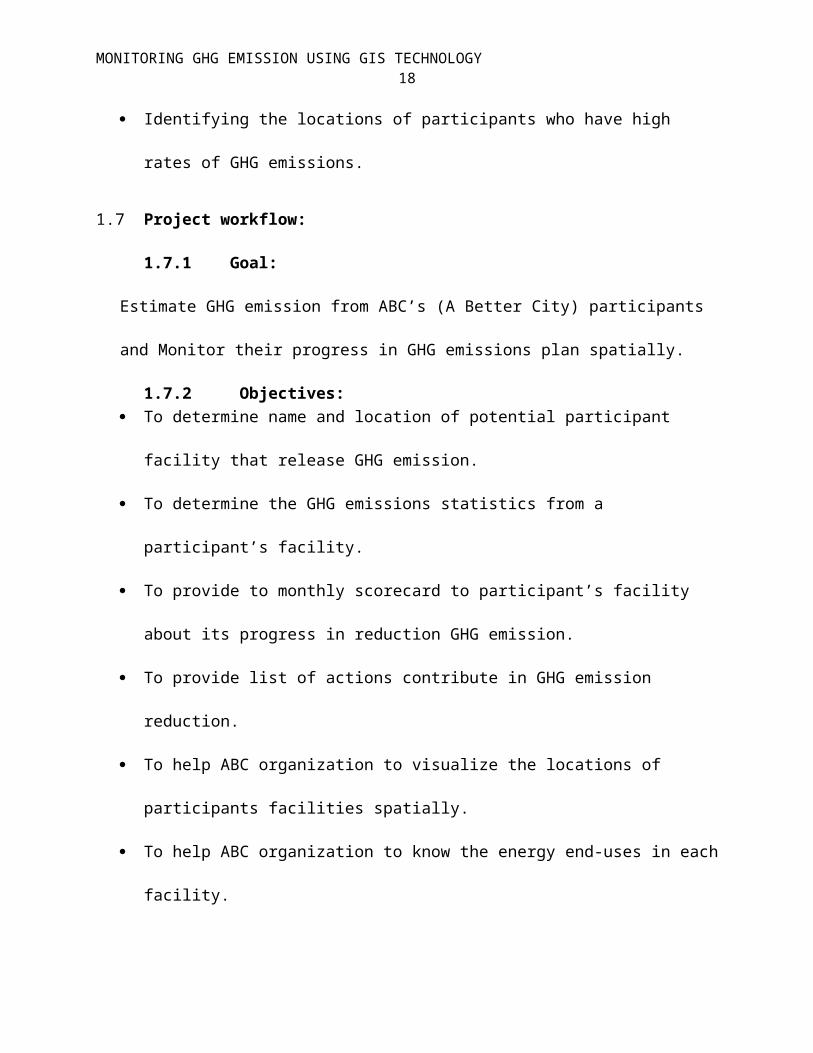
1.7 Project workflow:
1.7.1 Goal:
Estimate GHG emission from ABC’s (A Better City) participants
and Monitor their progress in GHG emissions plan spatially.
1.7.2 Objectives: To determine name and location of potential participant
facility that release GHG emission.
To determine the GHG emissions statistics from a
participant’s facility.
To provide to monthly scorecard to participant’s facility
about its progress in reduction GHG emission.
To provide list of actions contribute in GHG emission
reduction.
To help ABC organization to visualize the locations of
participants facilities spatially.
To help ABC organization to know the energy end-uses in each
facility.

MONITORING GHG EMISSION USING GIS TECHNOLOGY19
To help ABC organization to highlight on the participant’s
location that needs more focus due to high GHG emissions.
1.7.3 Need-to-Know Questions: What are energy end-uses in the residential and commercial
sectors?
Information Categories:
- Types of energy end-use and their percentages in each
facility
- Location of participant facility
Who are the organization’s participants?
- List of participants
- Participants facilities classification
- History of participants with ABC organization
- Location of participant facility
How Emissions are reduced?
- List of Actions to reduce emissions
- cost of applied action
- Time of implementing the action
- Availability of action to apply
MONITORING GHG EMISSION USING GIS TECHNOLOGY20
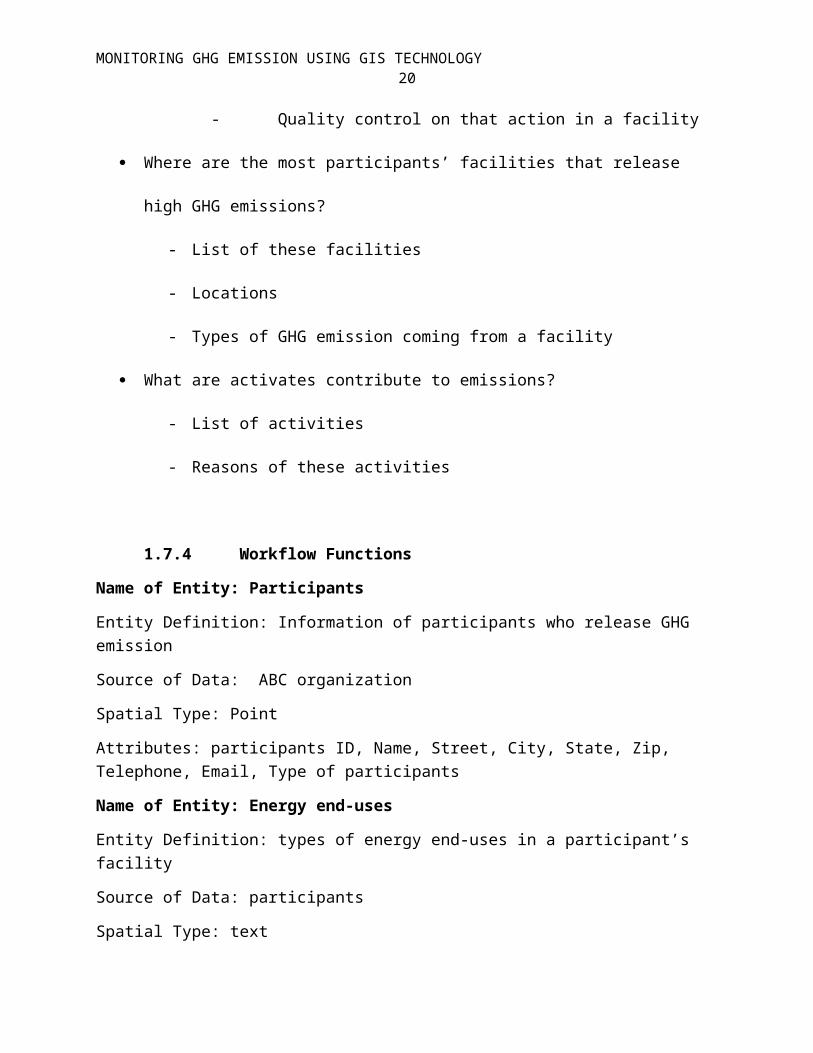
- Quality control on that action in a facility
Where are the most participants’ facilities that release
high GHG emissions?
- List of these facilities
- Locations
- Types of GHG emission coming from a facility
What are activates contribute to emissions?
- List of activities
- Reasons of these activities
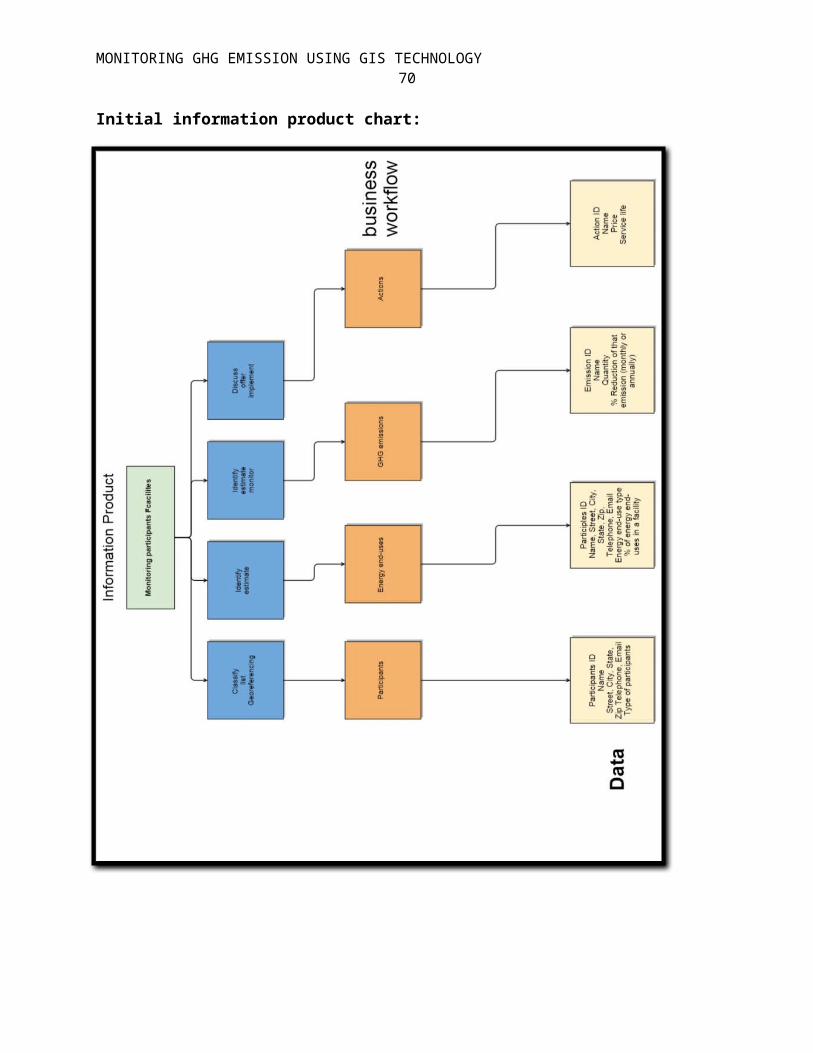
1.7.4 Workflow Functions
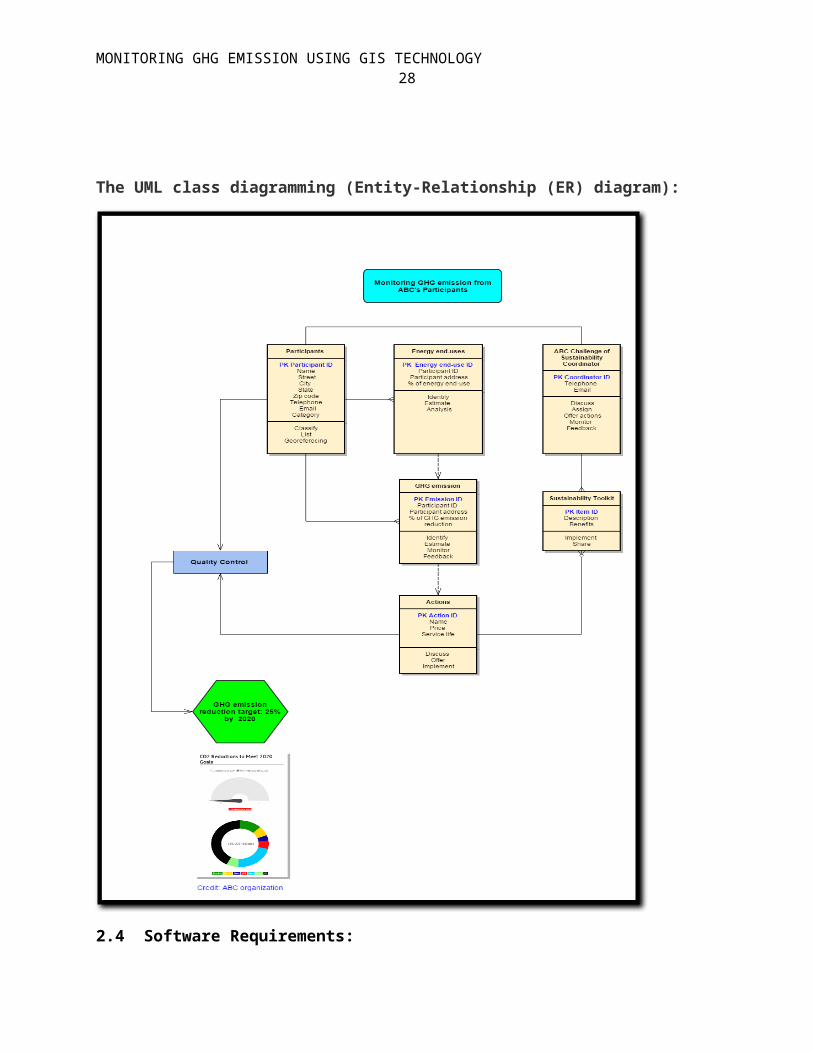
Name of Entity: Participants
Entity Definition: Information of participants who release GHG emission
Source of Data: ABC organization
Spatial Type: Point
Attributes: participants ID, Name, Street, City, State, Zip, Telephone, Email, Type of participants
Name of Entity: Energy end-uses
Entity Definition: types of energy end-uses in a participant’s facility
Source of Data: participants
Spatial Type: text
MONITORING GHG EMISSION USING GIS TECHNOLOGY21
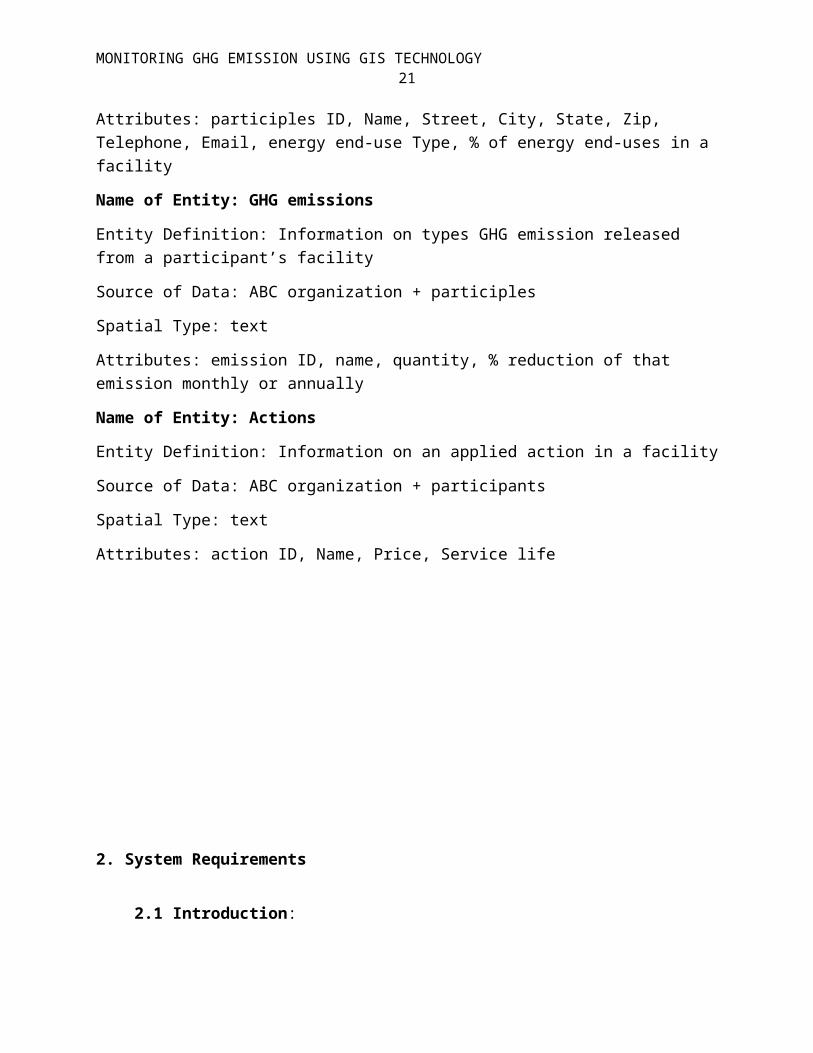
Attributes: participles ID, Name, Street, City, State, Zip, Telephone, Email, energy end-use Type, % of energy end-uses in a facility
Name of Entity: GHG emissions
Entity Definition: Information on types GHG emission released from a participant’s facility
Source of Data: ABC organization + participles
Spatial Type: text
Attributes: emission ID, name, quantity, % reduction of that emission monthly or annually
Name of Entity: Actions
Entity Definition: Information on an applied action in a facility
Source of Data: ABC organization + participants
Spatial Type: text
Attributes: action ID, Name, Price, Service life
2. System Requirements
2.1 Introduction:
MONITORING GHG EMISSION USING GIS TECHNOLOGY22
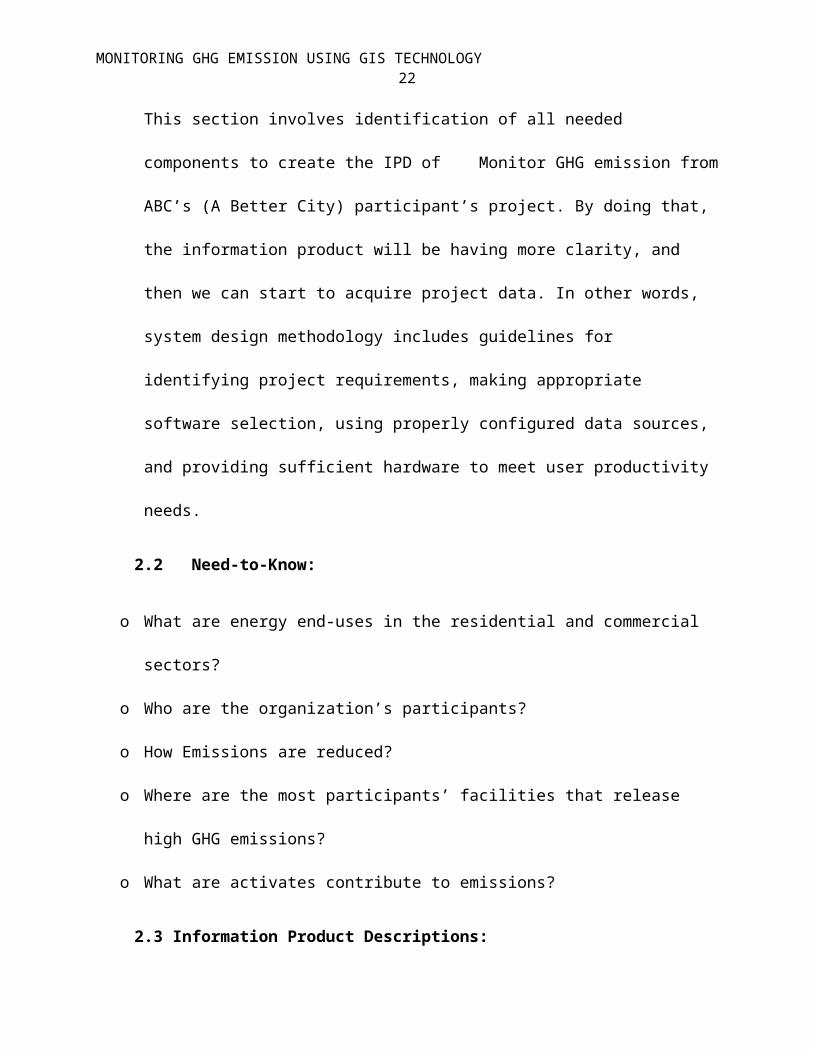
This section involves identification of all needed
components to create the IPD of Monitor GHG emission from
ABC’s (A Better City) participant’s project. By doing that,
the information product will be having more clarity, and
then we can start to acquire project data. In other words,
system design methodology includes guidelines for
identifying project requirements, making appropriate
software selection, using properly configured data sources,
and providing sufficient hardware to meet user productivity
needs.
2.2 Need-to-Know:
o What are energy end-uses in the residential and commercial
sectors?
o Who are the organization’s participants?
o How Emissions are reduced?
o Where are the most participants’ facilities that release
high GHG emissions?
o What are activates contribute to emissions?
2.3 Information Product Descriptions:
MONITORING GHG EMISSION USING GIS TECHNOLOGY23
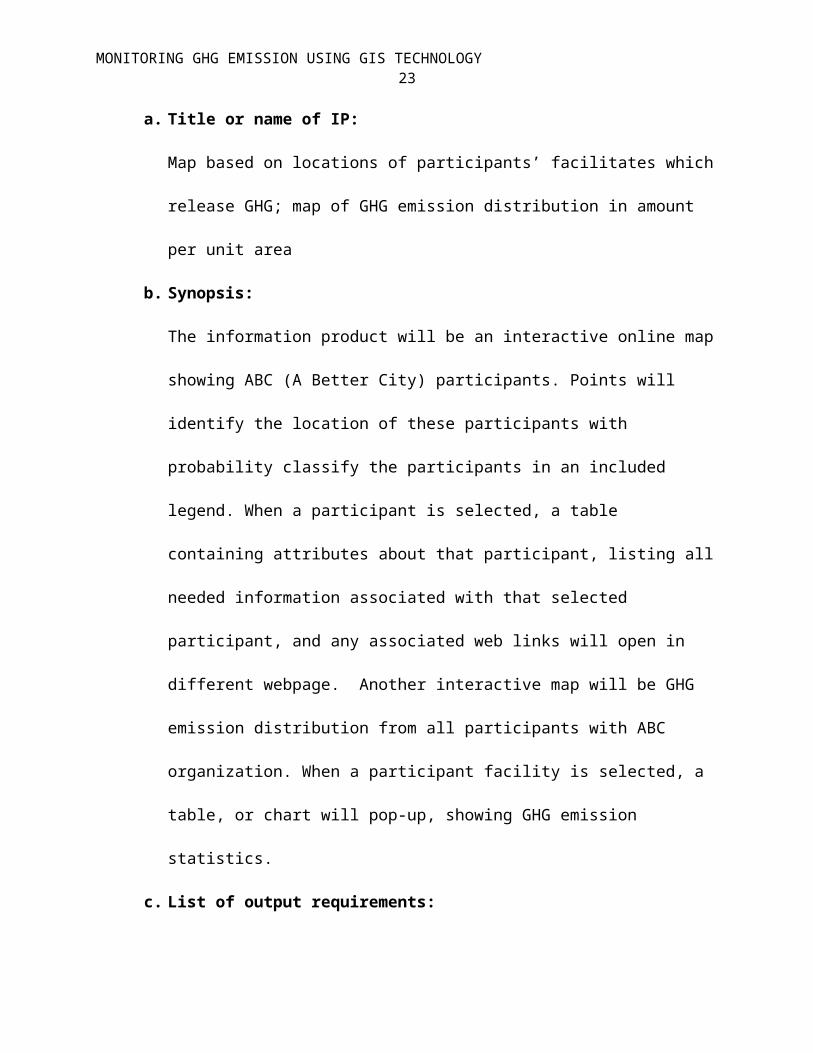
a. Title or name of IP:
Map based on locations of participants’ facilitates which
release GHG; map of GHG emission distribution in amount
per unit area
b. Synopsis:
The information product will be an interactive online map
showing ABC (A Better City) participants. Points will
identify the location of these participants with
probability classify the participants in an included
legend. When a participant is selected, a table
containing attributes about that participant, listing all
needed information associated with that selected
participant, and any associated web links will open in
different webpage. Another interactive map will be GHG
emission distribution from all participants with ABC
organization. When a participant facility is selected, a
table, or chart will pop-up, showing GHG emission
statistics.
c. List of output requirements:
MONITORING GHG EMISSION USING GIS TECHNOLOGY24
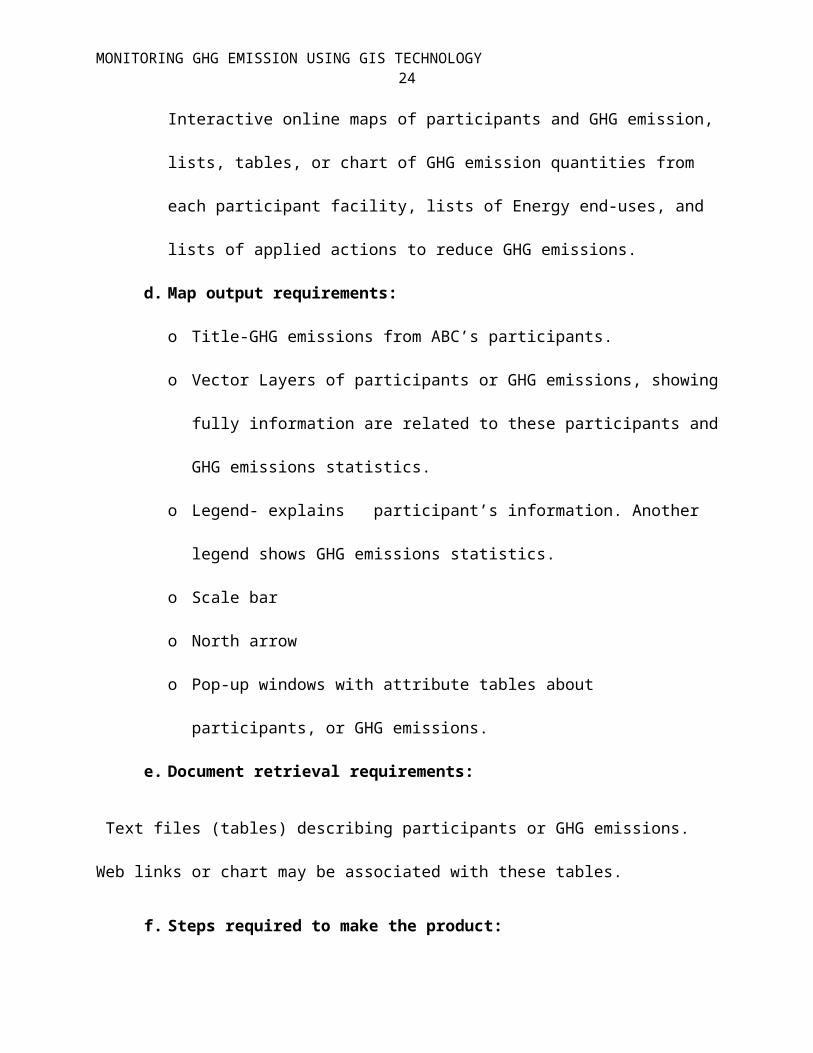
Interactive online maps of participants and GHG emission,
lists, tables, or chart of GHG emission quantities from
each participant facility, lists of Energy end-uses, and
lists of applied actions to reduce GHG emissions.
d. Map output requirements:
o Title-GHG emissions from ABC’s participants.
o Vector Layers of participants or GHG emissions, showing
fully information are related to these participants and
GHG emissions statistics.
o Legend- explains participant’s information. Another
legend shows GHG emissions statistics.
o Scale bar
o North arrow
o Pop-up windows with attribute tables about
participants, or GHG emissions.
e. Document retrieval requirements:
Text files (tables) describing participants or GHG emissions.
Web links or chart may be associated with these tables.
f. Steps required to make the product:
MONITORING GHG EMISSION USING GIS TECHNOLOGY25
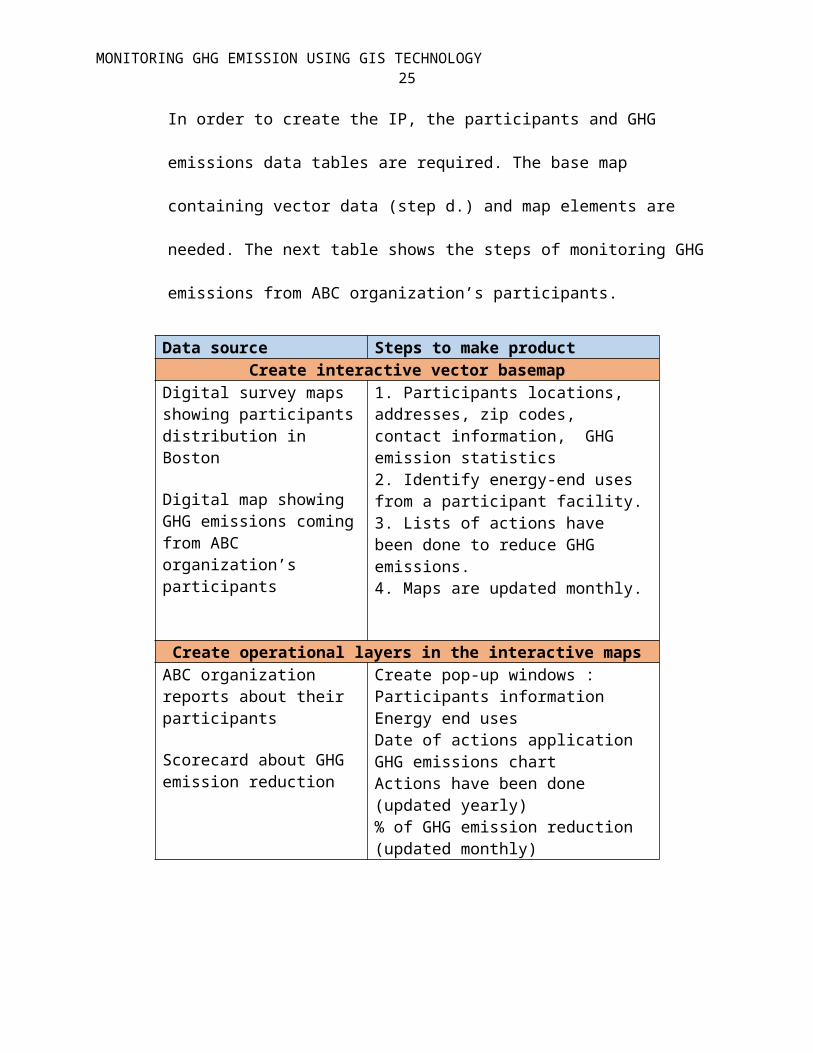
In order to create the IP, the participants and GHG
emissions data tables are required. The base map
containing vector data (step d.) and map elements are
needed. The next table shows the steps of monitoring GHG
emissions from ABC organization’s participants.
Data source Steps to make productCreate interactive vector basemap
Digital survey maps showing participantsdistribution in Boston
Digital map showing GHG emissions comingfrom ABC organization’s participants
1. Participants locations, addresses, zip codes, contact information, GHG emission statistics2. Identify energy-end uses from a participant facility.3. Lists of actions have been done to reduce GHG emissions.4. Maps are updated monthly.
Create operational layers in the interactive mapsABC organization reports about their participants
Scorecard about GHG emission reduction
Create pop-up windows :Participants informationEnergy end usesDate of actions applicationGHG emissions chartActions have been done (updated yearly)% of GHG emission reduction (updated monthly)

MONITORING GHG EMISSION USING GIS TECHNOLOGY26
g. Processing complexity in the project is high due to the
four functions will be used (participants, energy end-uses, GHG
emission, actions)
h. Display complexity is light for this project.
i. Frequency of use:
Ideally the IP will be updated on a monthly basis
(possibly yearly especially for some data such as actions have
been done to reduce GHG emissions in a facility)
j. Logical linkages:
1) Point feature layer between participants and GHG
emissions tables will be used.
2) Point feature layer between participants and Actions
list will be used
3) Point feature layer between participants and Energy
end-uses tables will be used
k. Error tolerance:
MONITORING GHG EMISSION USING GIS TECHNOLOGY27
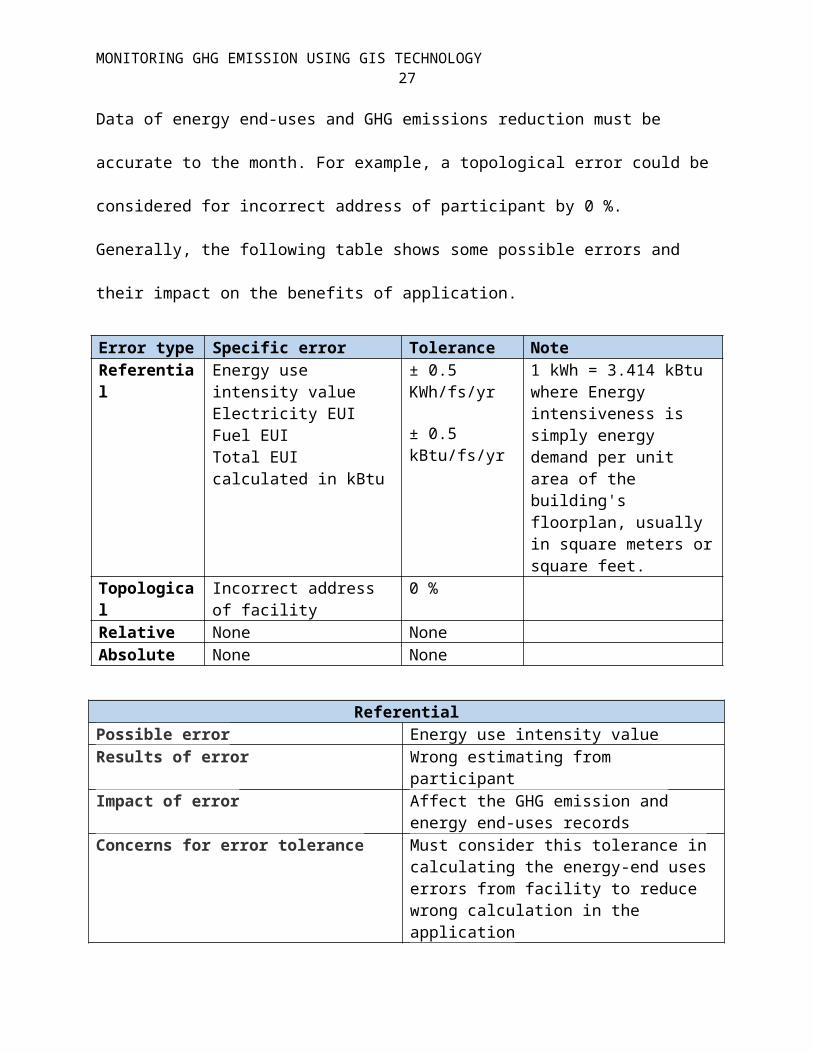
Data of energy end-uses and GHG emissions reduction must be
accurate to the month. For example, a topological error could be
considered for incorrect address of participant by 0 %.
Generally, the following table shows some possible errors and
their impact on the benefits of application.
Error type Specific error Tolerance NoteReferential
Energy use intensity valueElectricity EUIFuel EUITotal EUI calculated in kBtu
± 0.5 KWh/fs/yr
± 0.5 kBtu/fs/yr
1 kWh = 3.414 kBtu where Energy intensiveness is simply energy demand per unit area of the building's floorplan, usually in square meters orsquare feet.
Topological
Incorrect address of facility
0 %
Relative None NoneAbsolute None None
ReferentialPossible error Energy use intensity valueResults of error Wrong estimating from
participantImpact of error Affect the GHG emission and
energy end-uses recordsConcerns for error tolerance Must consider this tolerance in
calculating the energy-end uses errors from facility to reduce wrong calculation in the application
MONITORING GHG EMISSION USING GIS TECHNOLOGY28
The UML class diagramming (Entity-Relationship (ER) diagram):
2.4 Software Requirements:
MONITORING GHG EMISSION USING GIS TECHNOLOGY29
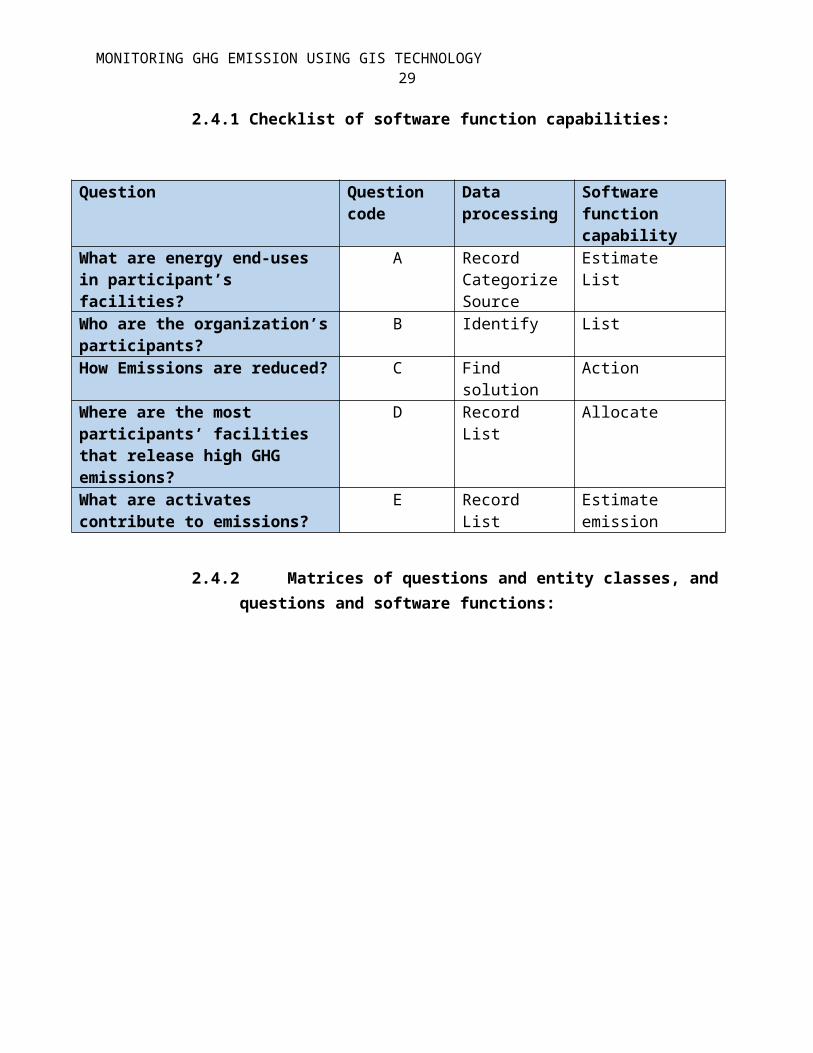
2.4.1 Checklist of software function capabilities:
Question Question code
Data processing
Software function capability
What are energy end-uses in participant’s facilities?
A RecordCategorizeSource
EstimateList
Who are the organization’sparticipants?
B Identify List
How Emissions are reduced? C Find solution
Action
Where are the most participants’ facilities that release high GHG emissions?
D RecordList
Allocate
What are activates contribute to emissions?
E RecordList
Estimate emission
2.4.2 Matrices of questions and entity classes, andquestions and software functions:
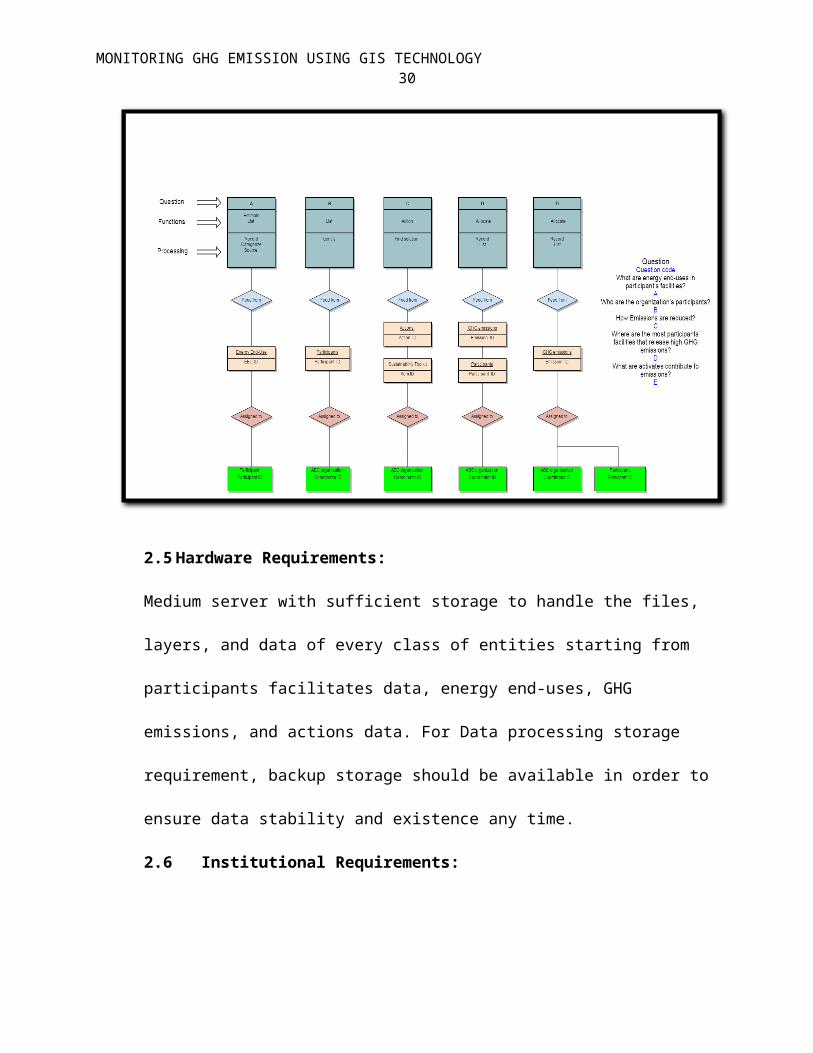
MONITORING GHG EMISSION USING GIS TECHNOLOGY30
2.5 Hardware Requirements:
Medium server with sufficient storage to handle the files,
layers, and data of every class of entities starting from
participants facilitates data, energy end-uses, GHG
emissions, and actions data. For Data processing storage
requirement, backup storage should be available in order to
ensure data stability and existence any time.
2.6 Institutional Requirements:

MONITORING GHG EMISSION USING GIS TECHNOLOGY31
Most Commercial real estate and business leaders in Greater
Boston are involved in the challenge of sustainability
program from ABC organization. A possible elite group of
businesses, property owners and governmental and non-
governmental institutions such as BARR FOUNDATION, CITY OF
BOSTON, and GREENOVATE BOSTON provide access to knowledge,
resources, and/or perspectives to support the development of
the project. Other organizations which concerned about
sustainability such as GREEN PLUS, Union of Concerned
Scientists, and EPA could also be involved in this
application.
MONITORING GHG EMISSION USING GIS TECHNOLOGY32
3. Data Acquisition
3.1 Introduction:
This stage involves identifying Database schema specification,
Data categorization, Attributes able specification, Data source
steps, Data acquisition constraints, and Future data preparation
to analysis stage. After identifying the systems requirements in
the previous stage, analyst or ABC coordinator starts
manipulating the data and asking some questions in order to
assure that input data are precise and accurate and readily to
run in the system. These questions will be discussed in next
steps. All data of this project will be tables containing all
required data for four categories (Participants, Energy end-uses,
GHG emissions, Actions).
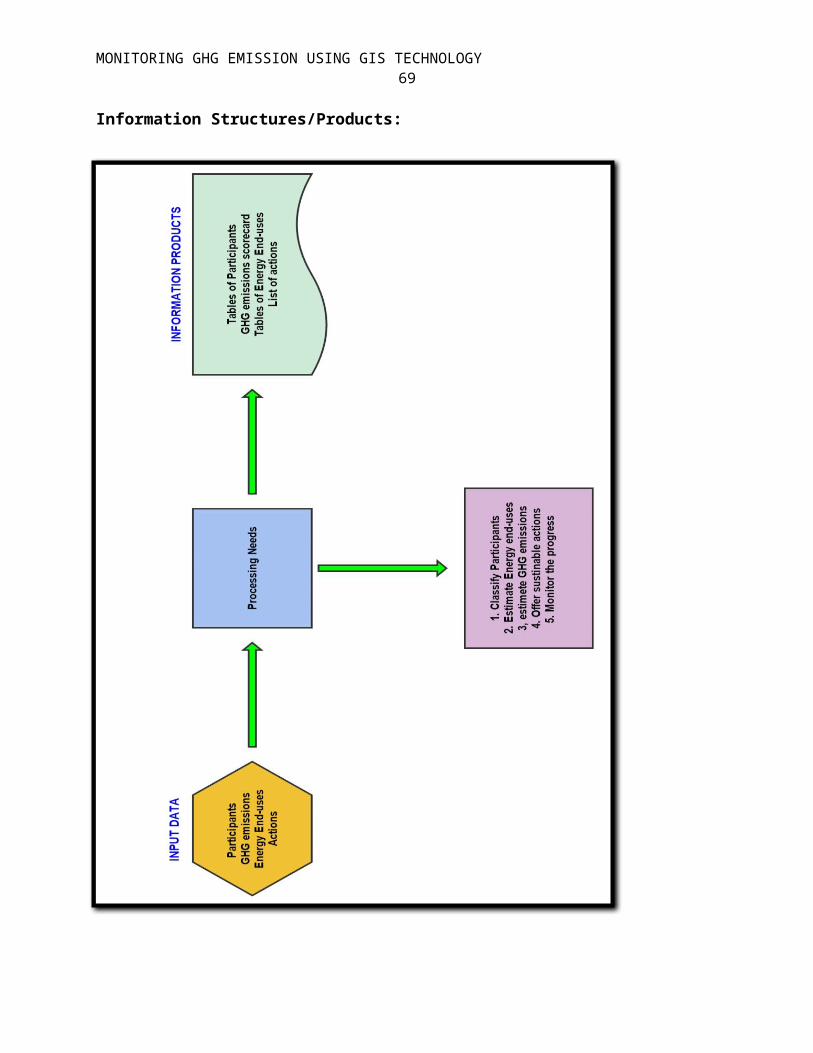
3.2 Database Schema Specification:
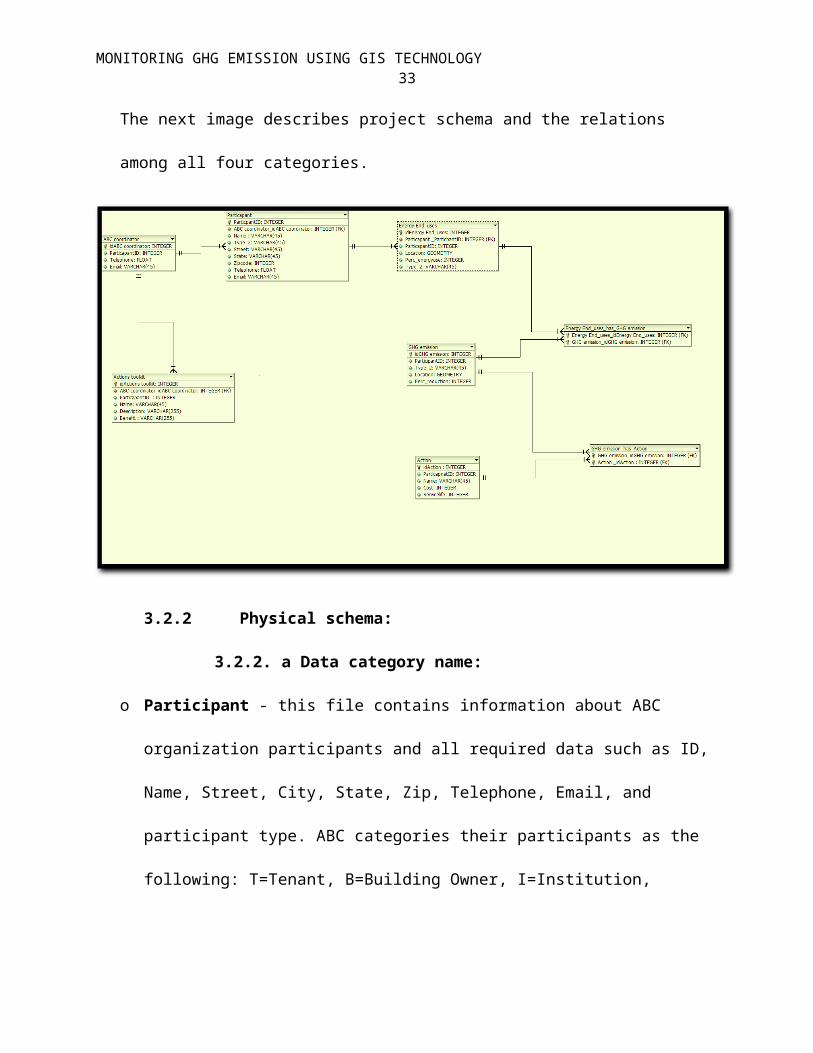
3.2.1 Logical schema: database structure in this project will
be in table’s format of all data categories (will described in
next section). The name and formatting of project database
will be combination of shapefiles, text files, and xls files.
MONITORING GHG EMISSION USING GIS TECHNOLOGY33
The next image describes project schema and the relations
among all four categories.
3.2.2 Physical schema:
3.2.2. a Data category name:
o Participant - this file contains information about ABC
organization participants and all required data such as ID,
Name, Street, City, State, Zip, Telephone, Email, and
participant type. ABC categories their participants as the
following: T=Tenant, B=Building Owner, I=Institution,
MONITORING GHG EMISSION USING GIS TECHNOLOGY34
TO=Tenant and Owner, R=Retail, H=Hotel, RS=Restaurant. 105
participants
Source of the data: the Challenge for Sustainability program
coordinator at ABC
Spatial object type: point
o Energy end-uses - this file contains a list of energy uses
in a particular participant, including participles ID, Name,
Street, City, State, Zip, Telephone, Email, energy end-use
Type (space heating, water heating, air conditioning,
appliances, lighting, electronics), % of energy end-uses in
a facility.
Source of the data: participant’s facility coordinator
Spatial object type: text
o GHG emission - this file contains a list of all GHG
emission that released from a particular participant,
including , participant, ID, emission ID, name, quantity,
unit (CO2 / kWh, metric tons CO2/gallon of gasoline), , %
reduction (monthly or annually)
Source of the data: participant’s facility coordinator
Spatial object type: text
MONITORING GHG EMISSION USING GIS TECHNOLOGY35
o Actions - this file contains information about all possible
actions to apply in a particular participant’s facility,
including Action ID, Name, Price, Service life. 1,800
sustainable actions.
Source of the data: ABC’s coordinator
Spatial object type: text
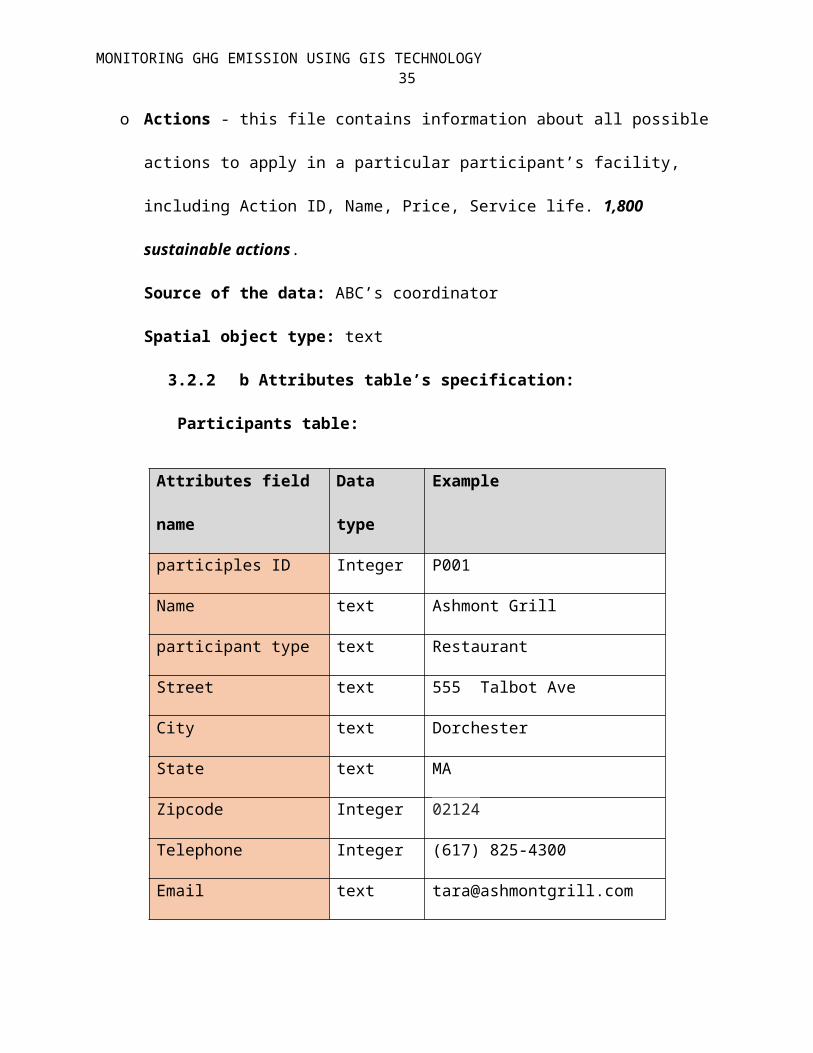
3.2.2 b Attributes table’s specification:
Participants table:
Attributes field
name
Data
type
Example
participles ID Integer P001
Name text Ashmont Grill
participant type text Restaurant
Street text 555 Talbot Ave
City text Dorchester
State text MA
Zipcode Integer 02124
Telephone Integer (617) 825-4300
Email text [email protected]
MONITORING GHG EMISSION USING GIS TECHNOLOGY36
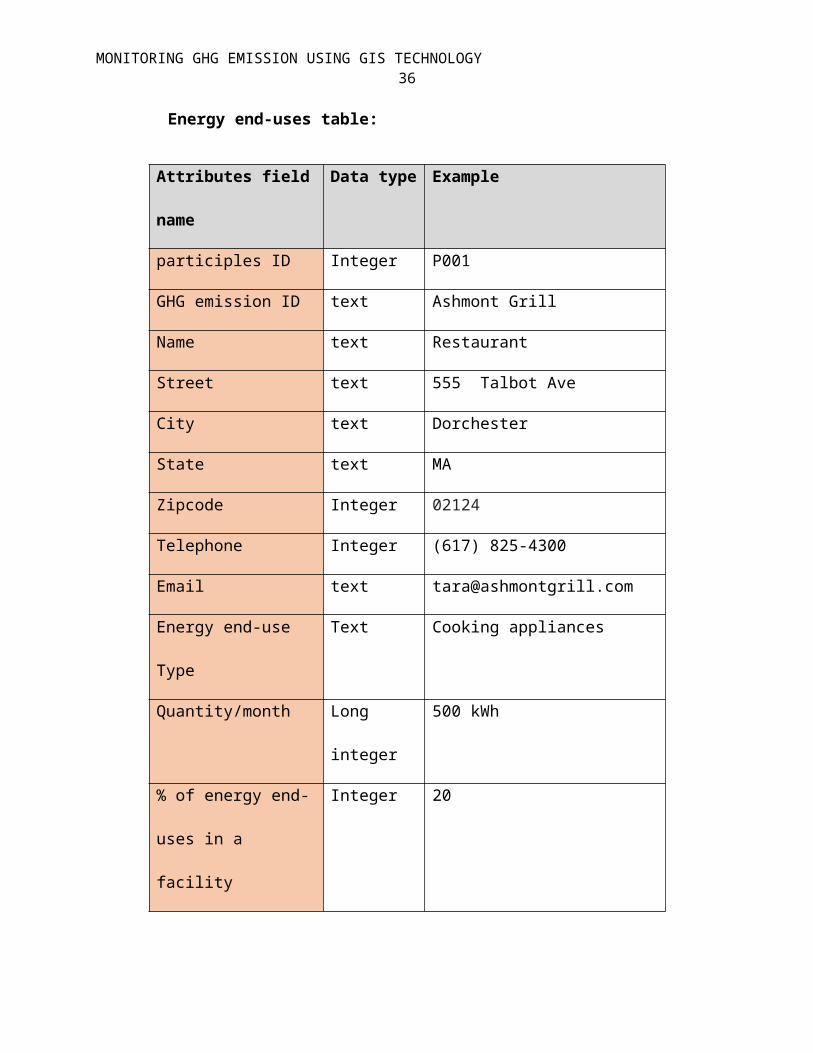
Energy end-uses table:
Attributes field
name
Data type Example
participles ID Integer P001
GHG emission ID text Ashmont Grill
Name text Restaurant
Street text 555 Talbot Ave
City text Dorchester
State text MA
Zipcode Integer 02124
Telephone Integer (617) 825-4300
Email text [email protected]
Energy end-use
Type
Text Cooking appliances
Quantity/month Long
integer
500 kWh
% of energy end-
uses in a
facility
Integer 20
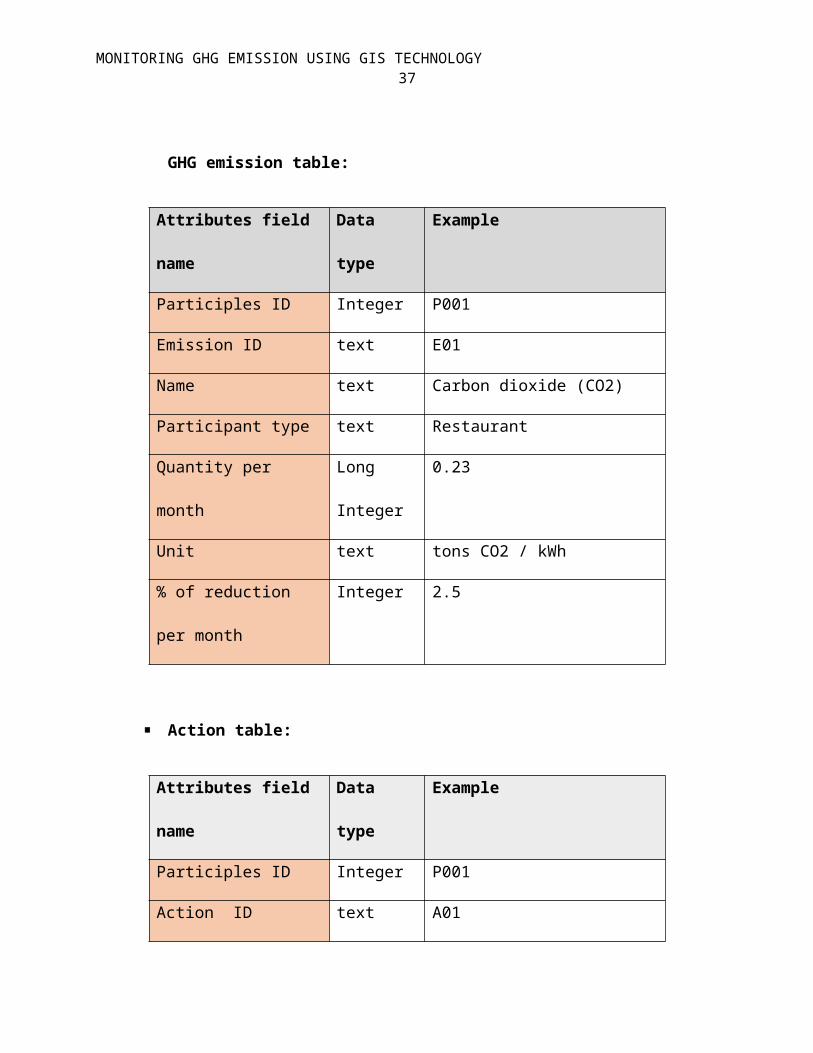
MONITORING GHG EMISSION USING GIS TECHNOLOGY37
GHG emission table:
Attributes field
name
Data
type
Example
Participles ID Integer P001
Emission ID text E01
Name text Carbon dioxide (CO2)
Participant type text Restaurant
Quantity per
month
Long
Integer
0.23
Unit text tons CO2 / kWh
% of reduction
per month
Integer 2.5
Action table:
Attributes field
name
Data
type
Example
Participles ID Integer P001
Action ID text A01
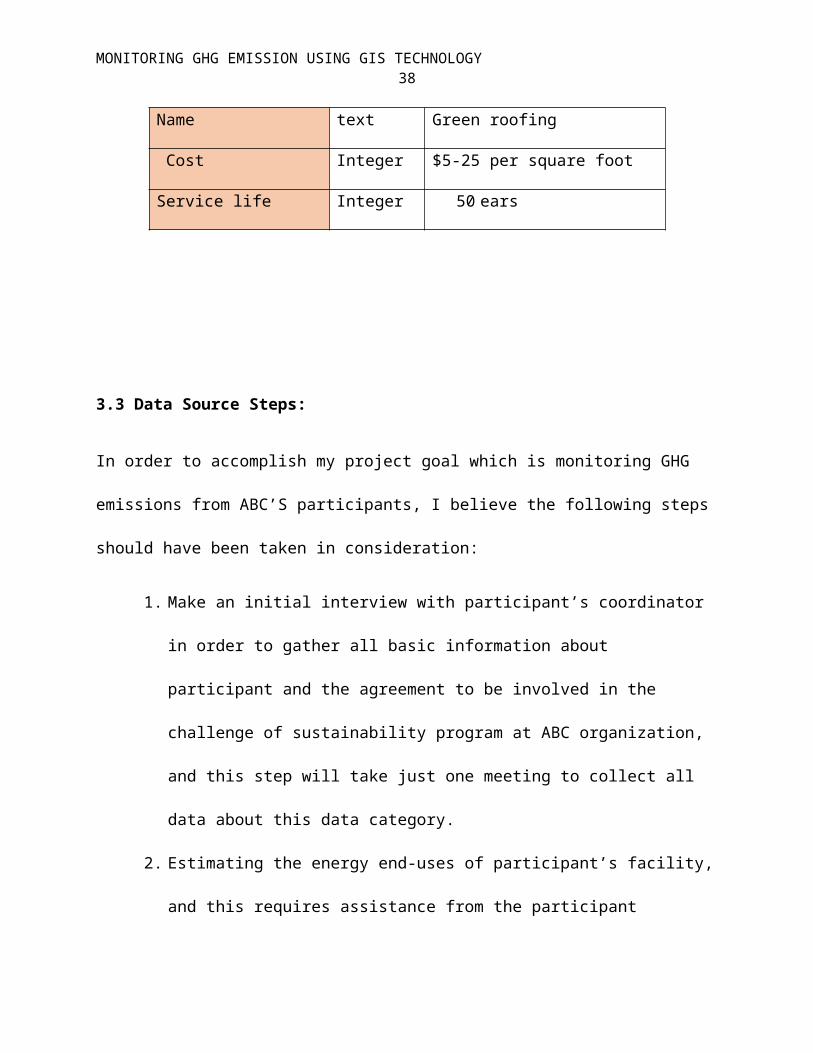
MONITORING GHG EMISSION USING GIS TECHNOLOGY38
Name text Green roofing
Cost Integer $5-25 per square foot
Service life Integer 50 ears
3.3 Data Source Steps:
In order to accomplish my project goal which is monitoring GHG
emissions from ABC’S participants, I believe the following steps
should have been taken in consideration:
1. Make an initial interview with participant’s coordinator
in order to gather all basic information about
participant and the agreement to be involved in the
challenge of sustainability program at ABC organization,
and this step will take just one meeting to collect all
data about this data category.
2. Estimating the energy end-uses of participant’s facility,
and this requires assistance from the participant
MONITORING GHG EMISSION USING GIS TECHNOLOGY39
coordinator to feed the ABC organization with scorecard
of GHG emissions. Categorization of energy end-uses to
the following aspects: kilowatt- hour of electricity,
therms of natural gas. Most of big participants such as
hotels and business buildings have their energy
consumption’ consultant, and that shorten the time period
of getting GHG emissions data. Some small participants
such as restaurants need more time to get from them GHG
emissions data, but in over all this step has range of
time about 10-15 days.
3. Estimating GHG emission that releases from a
participant’s facility depends on the scorecard of energy
uses. Once these scorecards are on the table, processing
of finding the amount of GHG emissions will be run and
inserted in the system. EPA provides Greenhouse Gas
Equivalencies Calculator tool in tons and pounds. By
following such approach, analyst decreases the time of
estimating GHG emissions from small participants’
facilities, provided that energy uses data which comes
from participant coordinator should have a higher
MONITORING GHG EMISSION USING GIS TECHNOLOGY40
accuracy and precision. This step just takes a regular
processing time (several hours).
4. Finally, we have all data about GHG emissions as tables
to be inserted in GIS software to run the distribution of
emissions spatially. After that, set of actions will be
offered to participant on order to reduce the GHG
emission, increase the energy efficiency, and decline the
operational cost. No specific time in that final stage
because of the continuous monitoring of GHG emissions of
participants’ facilities.
3.4 Data Acquisition Constraints:
In case of this kind of projects, few constraints should be taken
in consideration, so data can be acquired in a timelier manner in
the future. However, here are some possible constraints could be
shown on the surface:
In most cases, the project team conducts only one
interview with each participant coordinator; brief
follow-up interviews will be held on in the future
MONITORING GHG EMISSION USING GIS TECHNOLOGY41
depending on the accuracy of received data of energy uses
and GHG emissions.
Low effectiveness of initial applied actions to reduce
GHG emissions; in order to acquire data of actions,
monthly feedback from participants of cumulative of
percentage of energy uses reduction should be sent to the
program coordinator.
3.5 Future Data Preparation:
In order to prepare project data for analysis stage, analyst or
program coordinator should check data quality in terms of
accuracy and precision of locations, attributes (all data related
to data categories: Participants, Energy end-uses, GHG emissions,
Actions). Also, the analyst should manipulate input data in terms
of logical consistency (does the data follow normal rules of
logic?), completeness (is the data complete or lacking in
coverage?), data currency (is data up to date?), and
accessibility (is the data readily accessible?)
4. Analysis Plan:
4.1 Introduction:
MONITORING GHG EMISSION USING GIS TECHNOLOGY42
ABC organization especially the challenge of sustainability
program took the initiative to monitor the GHG emissions that
released from some business building including commercial real
estate, hotels, restaurants, and even non-profit institutions.
Then, they have tried to estimate the amount of these released
emissions and apply sustainable actions to reduce them. There is
no change in project goal but some questions are added to the
need-to-know questions in order cover all data categories.
4.2 Analysis Plan Considerations
The goal is to monitor GHG emission from ABC’s (A Better City)
participants spatially and answering the following updated need-
to-know questions according on the data requirements in the
analysis stage:
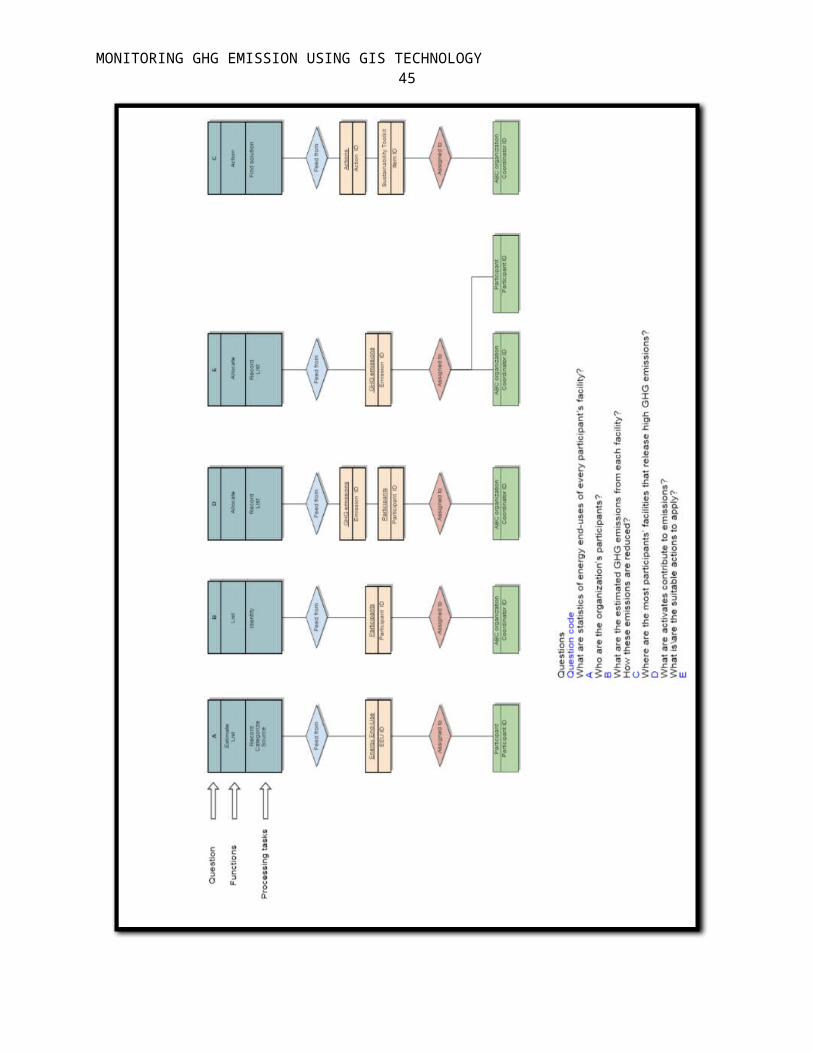
What are statistics of energy end-uses of every participant’s
facility?
To answer this question, three processing tasks should be
applied: record, categorize, and identify the source of data
about energy uses in each facility. Scorecards will contains all
information such as type and quantity for each energy end-use in
MONITORING GHG EMISSION USING GIS TECHNOLOGY43
a particular facility as mentioned in the previous table in data
category section. This question will be assigned to participant’s
coordinator to achieve desired results.
Who are the organization’s participants?
To answer this question, analyst should identify and list all
general information about participants because this data category
considered essential in terms of commination between program
coordinator and each facility one. This question will be assigned
to ABC’s coordinator to achieve desired results.
What are the estimated GHG emissions from each facility?
How these emissions are reduced?
To answer these questions, analyst should gather all data about
GHG emission from each facility in order to apply action later.
Then, he identifies suitable approaches to reduce these GHG
emissions by discussing that with each participant’s coordinator.
That requires few meetings to assign the appropriate actions.
These questions will be assigned to ABC’s coordinator to achieve
desired results.
Where are the most participants’ facilities that release high GHG
emissions?
MONITORING GHG EMISSION USING GIS TECHNOLOGY44
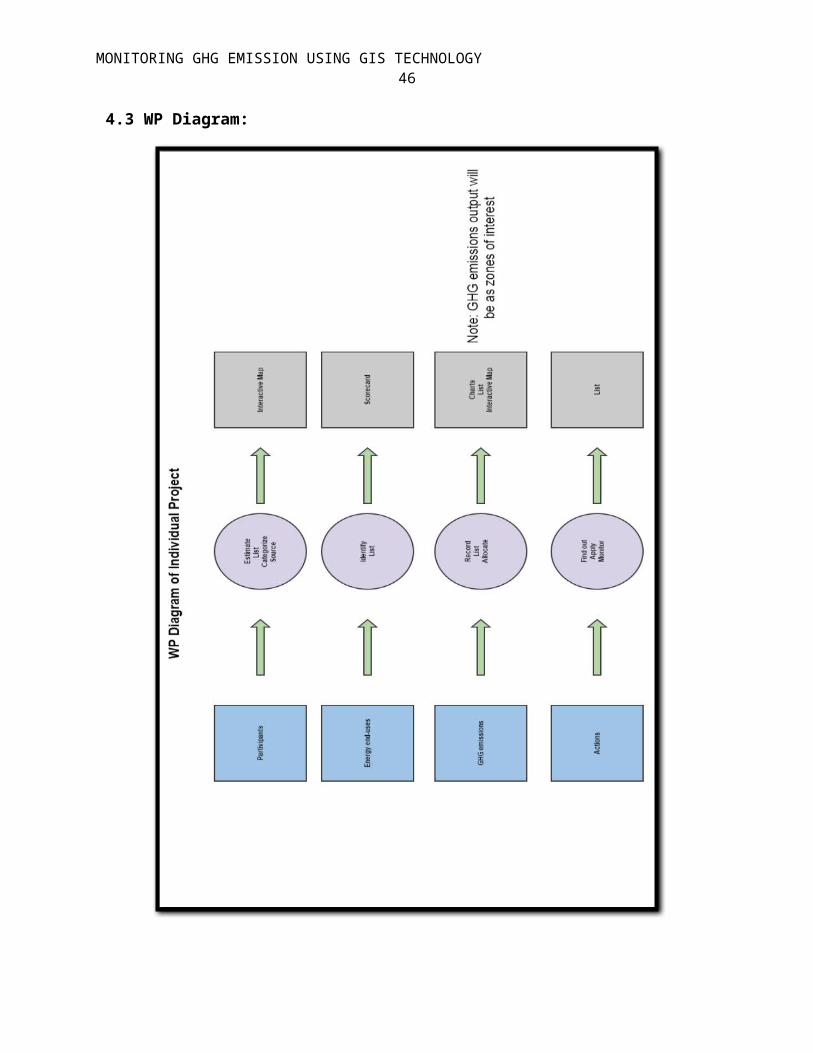
To answer this question, analyst shows map allocate the
distribution of the higher GHG emission on an interactive after
identifying and listing these participants’ facilities of
concern. This question is very important in terms of future
analysis in different aspects such as showing the EJ communities
or areas of Boston and other surrounding cities. This question
will be assigned to both ABC’s coordinator and participant one to
achieve desired results.
What are activates contribute to emissions?
What is\are the suitable actions to apply?
These questions also are fundamental in determining the
appropriate actions to reduce GHG emission, decline the
operational cost, and increase energy efficiency in each business
participant in the program. Finding a suitable action to apply is
assigned to ABC’s coordinator to achieve the desired results.
The following conceptual diagram describes GIS data analysis
tasks for each updated need-to-know question:
MONITORING GHG EMISSION USING GIS TECHNOLOGY45
MONITORING GHG EMISSION USING GIS TECHNOLOGY46
4.3 WP Diagram:
MONITORING GHG EMISSION USING GIS TECHNOLOGY47
5. Cost-Benefit Analysis:
5.1 Introduction:
In order to understand the benefits of GIS implementation in
estimating and monitoring GHG emissions, it is preferable to
identify the current situation of the operational system in the
department that one attends to implement a GIS-based approach in.
In my project case, the challenge of sustainability department in
ABC organization use a basic technique (excel sheets) in
gathering, managing, estimating, and monitoring and GHG emissions
from their participants’ facilities. Using GIS-based approach in
estimating GHG emissions from participants of ABC organization
enables to create an emissions baseline, monitor progress, assess
the relative contributions of emission sources, communicate with
these participants’ coordinators, and create an informed
mitigation strategy based on the available information.
Understanding the scope of GHG emissions can help to inform the
development of a climate action plan or the implementation of
climate policies. Generally, an inventory is usually considered
the first step should be taken in order to establish entities
MONITORING GHG EMISSION USING GIS TECHNOLOGY48
structure of GHG emissions. An inventory can help ABC’s
coordinator to:
Identify the participant’s facility , sources, and
activities within their jurisdiction that are
responsible for greenhouse gas emissions
Understand emission trends from each facility
Quantify the benefits of activities that reduce
emissions
Establish a basis for sustainable actions plan
Track progress in reducing emissions
Set goals and targets for future reductions (as ABC’s
goal: Since 2009, Challenge for Sustainability
participants has reduced CO2 emissions by 18% moving the
City closer to achieving its "25% by 2020" goal.)
5.2 Cost Model:
Based on the timeline of the challenge of sustainability
program in ABC, the primary strategy will continue until 2020
to achieve the ultimate of GHG reduction (25%) in each
facility has been participated in the program. Accordingly,
MONITORING GHG EMISSION USING GIS TECHNOLOGY49
the cost matrix will consider the following timeline: 2015
(current year) to 2020.
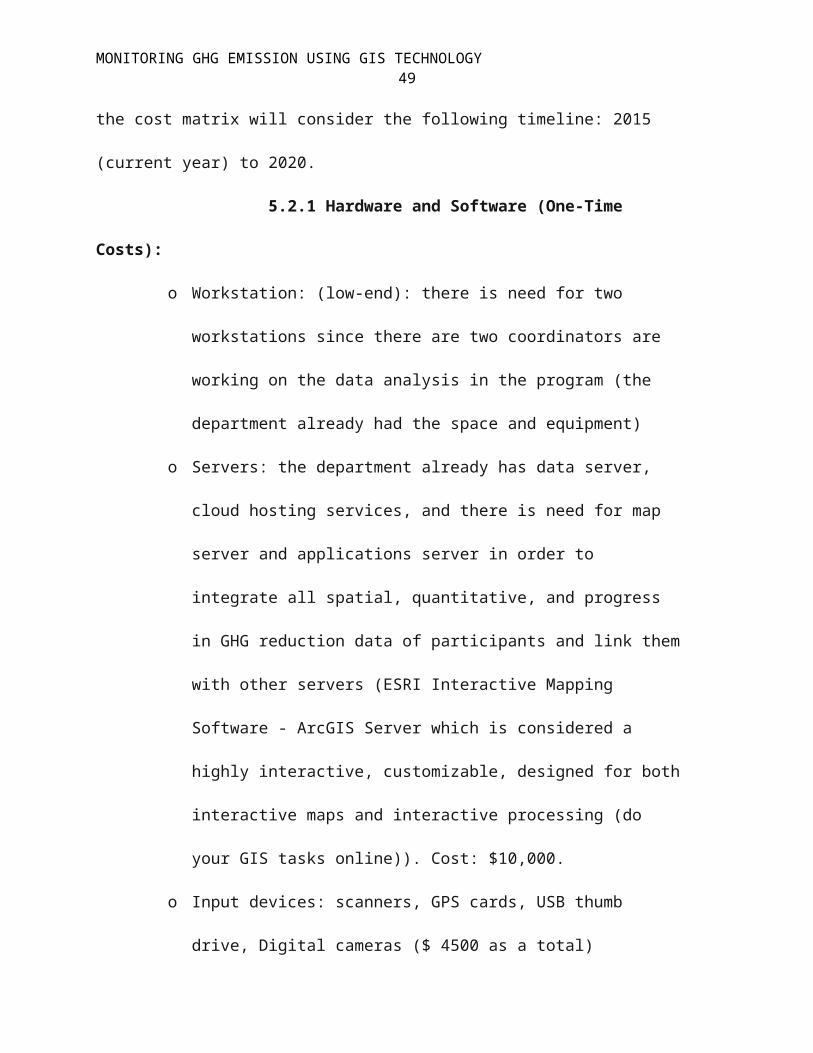
5.2.1 Hardware and Software (One-Time
Costs):
o Workstation: (low-end): there is need for two
workstations since there are two coordinators are
working on the data analysis in the program (the
department already had the space and equipment)
o Servers: the department already has data server,
cloud hosting services, and there is need for map
server and applications server in order to
integrate all spatial, quantitative, and progress
in GHG reduction data of participants and link them
with other servers (ESRI Interactive Mapping
Software - ArcGIS Server which is considered a
highly interactive, customizable, designed for both
interactive maps and interactive processing (do
your GIS tasks online)). Cost: $10,000.
o Input devices: scanners, GPS cards, USB thumb
drive, Digital cameras ($ 4500 as a total)
MONITORING GHG EMISSION USING GIS TECHNOLOGY50
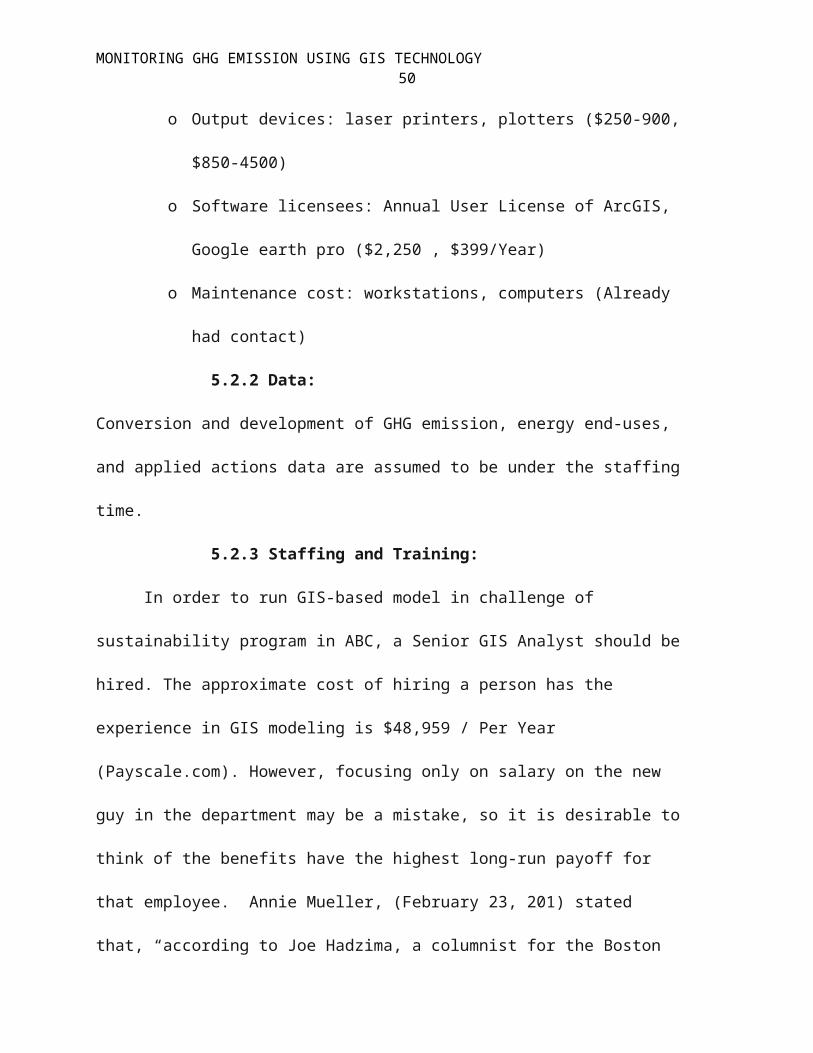
o Output devices: laser printers, plotters ($250-900,
$850-4500)
o Software licensees: Annual User License of ArcGIS,
Google earth pro ($2,250 , $399/Year)
o Maintenance cost: workstations, computers (Already
had contact)
5.2.2 Data:
Conversion and development of GHG emission, energy end-uses,
and applied actions data are assumed to be under the staffing
time.
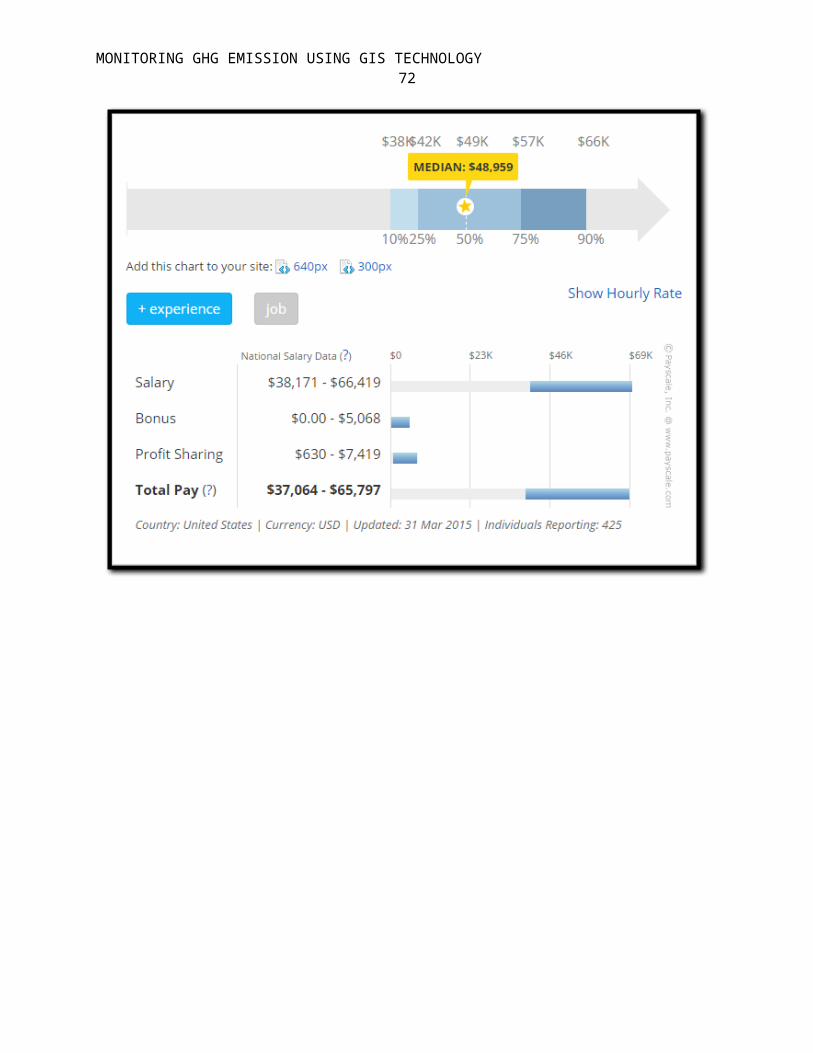
5.2.3 Staffing and Training:
In order to run GIS-based model in challenge of
sustainability program in ABC, a Senior GIS Analyst should be
hired. The approximate cost of hiring a person has the
experience in GIS modeling is $48,959 / Per Year
(Payscale.com). However, focusing only on salary on the new
guy in the department may be a mistake, so it is desirable to
think of the benefits have the highest long-run payoff for
that employee. Annie Mueller, (February 23, 201) stated
that, “according to Joe Hadzima, a columnist for the Boston
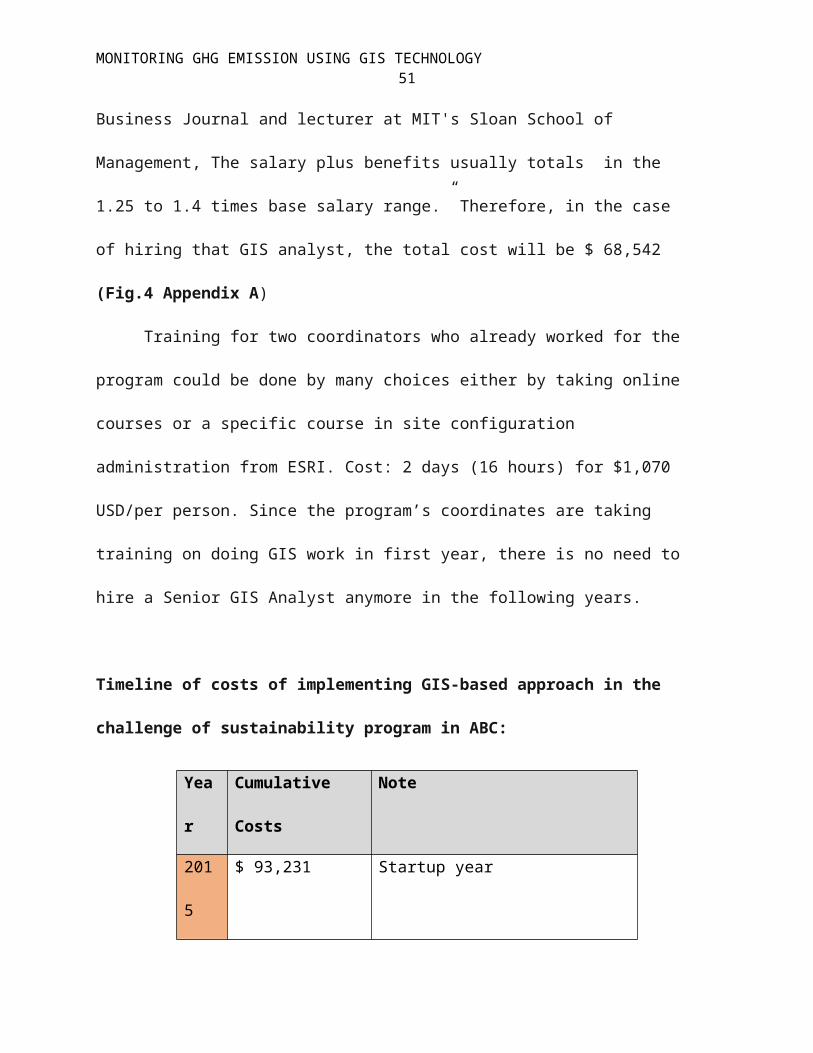
MONITORING GHG EMISSION USING GIS TECHNOLOGY51
Business Journal and lecturer at MIT's Sloan School of
Management, The salary plus benefits usually totals in the
1.25 to 1.4 times base salary range.” Therefore, in the case
of hiring that GIS analyst, the total cost will be $ 68,542
(Fig.4 Appendix A)
Training for two coordinators who already worked for the
program could be done by many choices either by taking online
courses or a specific course in site configuration
administration from ESRI. Cost: 2 days (16 hours) for $1,070
USD/per person. Since the program’s coordinates are taking
training on doing GIS work in first year, there is no need to
hire a Senior GIS Analyst anymore in the following years.
Timeline of costs of implementing GIS-based approach in the
challenge of sustainability program in ABC:
Yea
r
Cumulative
Costs
Note
201
5
$ 93,231 Startup year
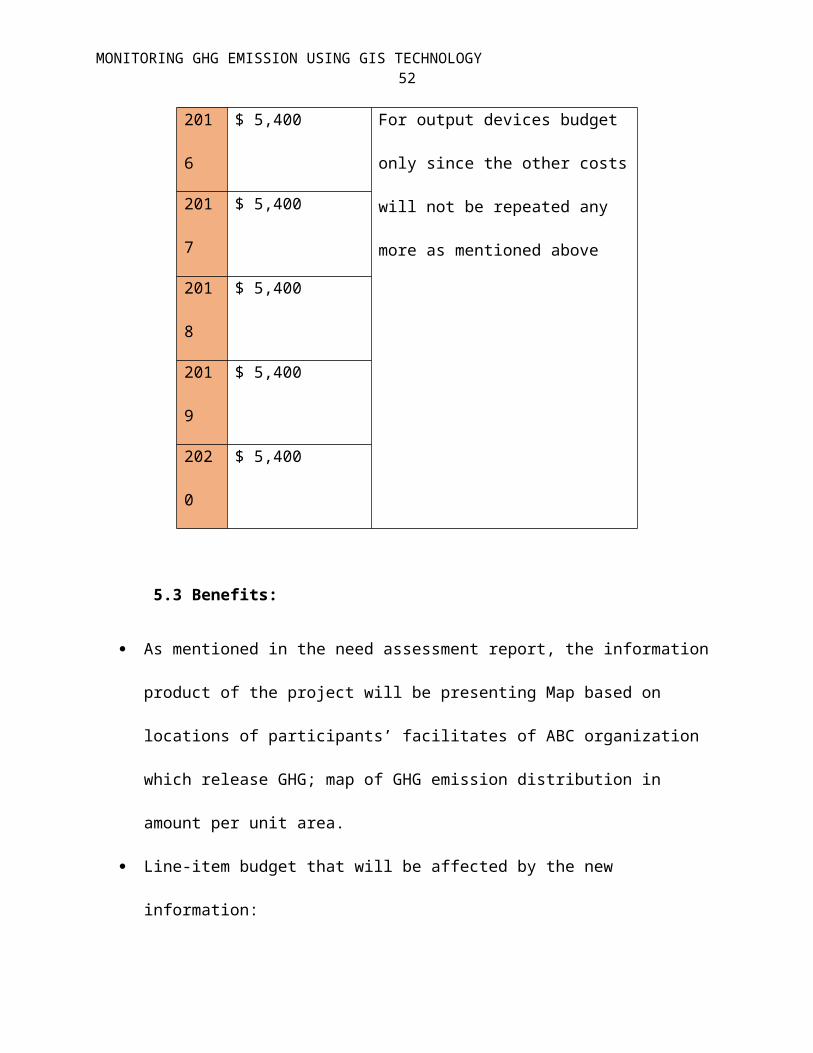
MONITORING GHG EMISSION USING GIS TECHNOLOGY52
201
6
$ 5,400 For output devices budget
only since the other costs
will not be repeated any
more as mentioned above
201
7
$ 5,400
201
8
$ 5,400
201
9
$ 5,400
202
0
$ 5,400
5.3 Benefits:
As mentioned in the need assessment report, the information
product of the project will be presenting Map based on
locations of participants’ facilitates of ABC organization
which release GHG; map of GHG emission distribution in
amount per unit area.
Line-item budget that will be affected by the new
information:
MONITORING GHG EMISSION USING GIS TECHNOLOGY53
1. Saving: by following the implemented GIS-based approach
in detecting, measuring, and monitoring GHG emissions,
there is absolutely saved staff time in preparing and
managing the GHG emissions data that come in from
participants as well as shrinkage the meetings with
participants’ coordinators as is the case formerly.
Another benefits will be the visualizing the
distribution of participants facilities spatially, and
thus helps the program coordinator to see directly
where the area of interest across Boston area and other
towns in Massachusetts. In details,
2. Benefits to the organization: noticeable upgrade in the
operational efficiency of gathering, managing,
estimating, monitoring GHG emissions as well as the
progress in reduction in energy uses in each facility
after applying the appropriate action. Increasing on
the program’s coordinator ability in detecting where
the most participants are release more emissions are
spatially. Also, Increase in the credibility and
MONITORING GHG EMISSION USING GIS TECHNOLOGY54
accuracy of collected data of energy consumption and
GHG emissions.
3. Benefits to the participants: reduction in energy uses
after applying the offered action from ABC
organization. For instance, and according to ABC,
“Between 2012 and 2013, DANA-FARBER CANCER INSTITUTE-
Shields Warren Building reduced energy consumption by
21%, which was the equivalent of saving approximately
200,000 kWh of electricity per year, which values in
dollars about 145,000 annually and paid back the cost
of applied action in 0.95 year after installing motion
sensor lighting and retro-commissioning the HVAC system
to improve operation and control.” Knowing that, there
is no similar progress in all participants since there
is variation in actions that applied and the periods
that take actually to accomplish the energy reduction
target.
4. Future benefits: the aim of program is to reduce the
released GHG emissions from participants’ facilitates ,
increase the energy efficiency, and that will
MONITORING GHG EMISSION USING GIS TECHNOLOGY55
contribute in helping city planners and other
environmental agencies such as EPA in their broad goal
in GHG emission reduction plan.
5.4 Compare benefits and cost to the participants
(clients):
Let’s take the DANA-FARBER CANCER INSTITUTE- Shields Warren
Building as an example in costs-benefits analysis. Savings will
vary depending on the area size, type of lighting, and occupancy
pattern. Manufacturers claim that in some applications, savings
can approach 75%, but average estimates show that typical savings
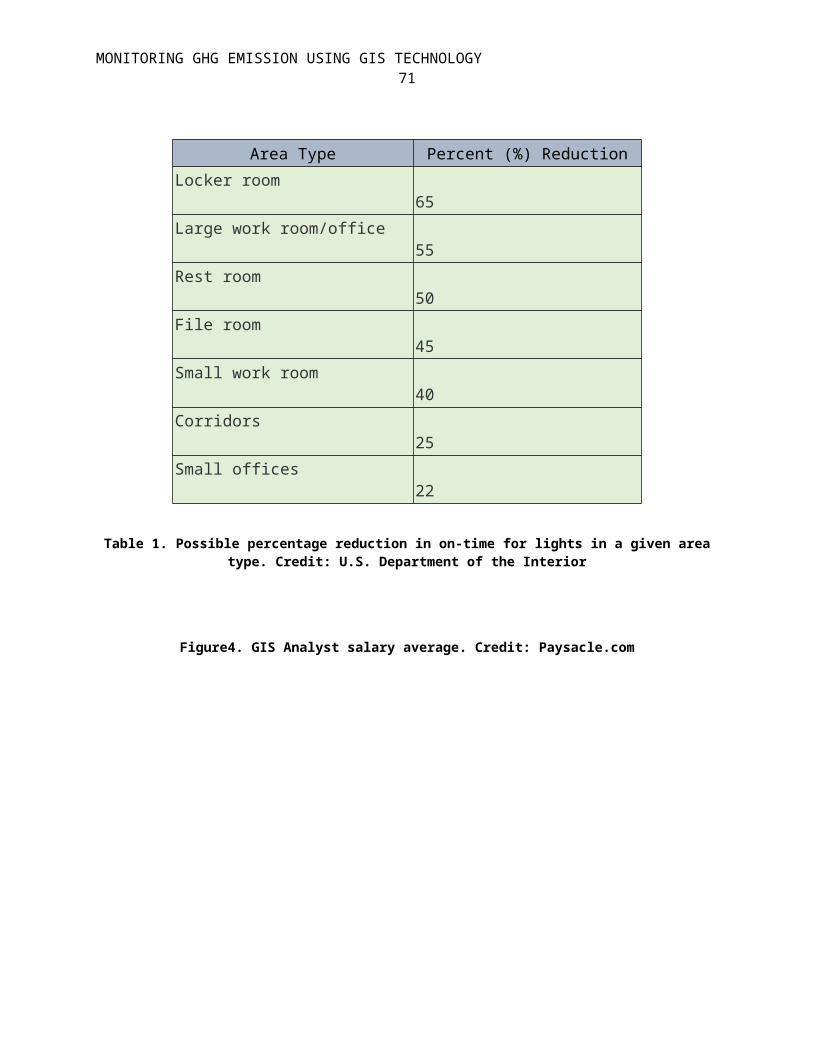
range from 35-45% (Tabe.1 Appendix A)
However, and according to ABC, “Prior to the retro-
commissioning, the HVAC system at the Shields Warren Building
operated twenty- four hours, seven days a week. The new system
features an operating schedule configured to match building
occupancy and a control switch that allows employees working off-
peak hours to run the system on a shorter, two hour cycle.
Improved control of the HVAC system has already contributed to
MONITORING GHG EMISSION USING GIS TECHNOLOGY56
energy reduction and will continue to be paramount for future
energy conservation at the facility.”
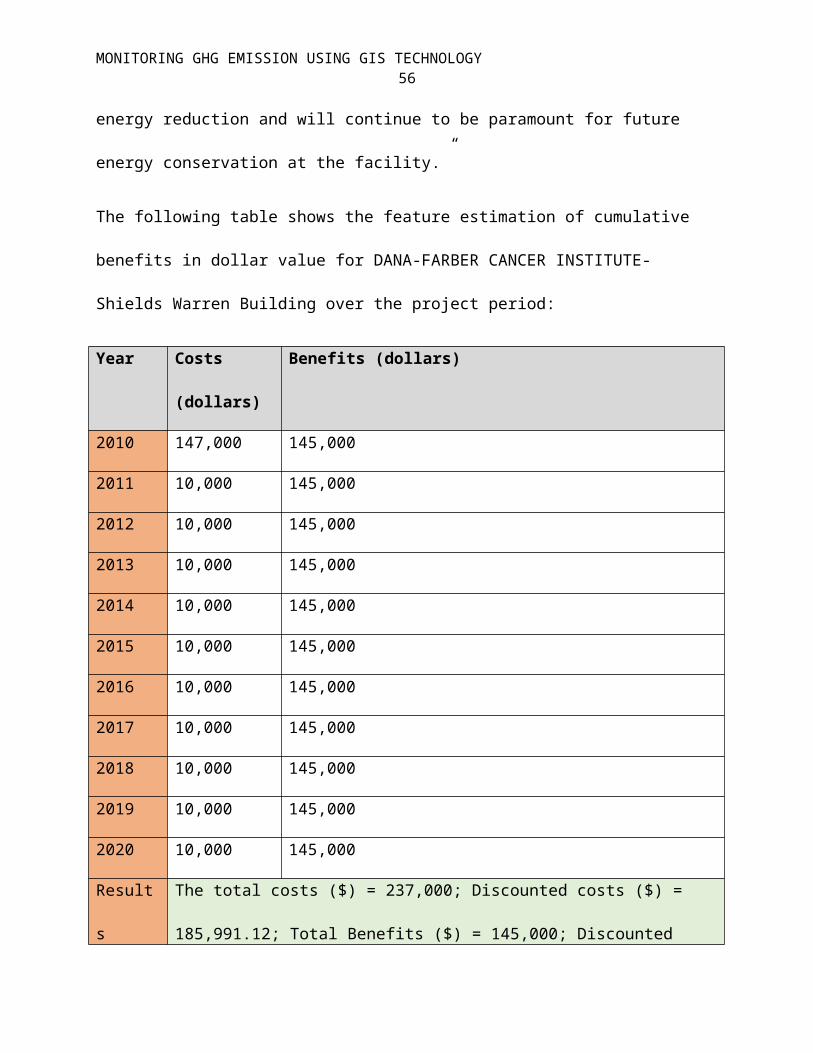
The following table shows the feature estimation of cumulative
benefits in dollar value for DANA-FARBER CANCER INSTITUTE-
Shields Warren Building over the project period:
Year Costs
(dollars)
Benefits (dollars)
2010 147,000 145,000
2011 10,000 145,000
2012 10,000 145,000
2013 10,000 145,000
2014 10,000 145,000
2015 10,000 145,000
2016 10,000 145,000
2017 10,000 145,000
2018 10,000 145,000
2019 10,000 145,000
2020 10,000 145,000
Result
s
The total costs ($) = 237,000; Discounted costs ($) =
185,991.12; Total Benefits ($) = 145,000; Discounted
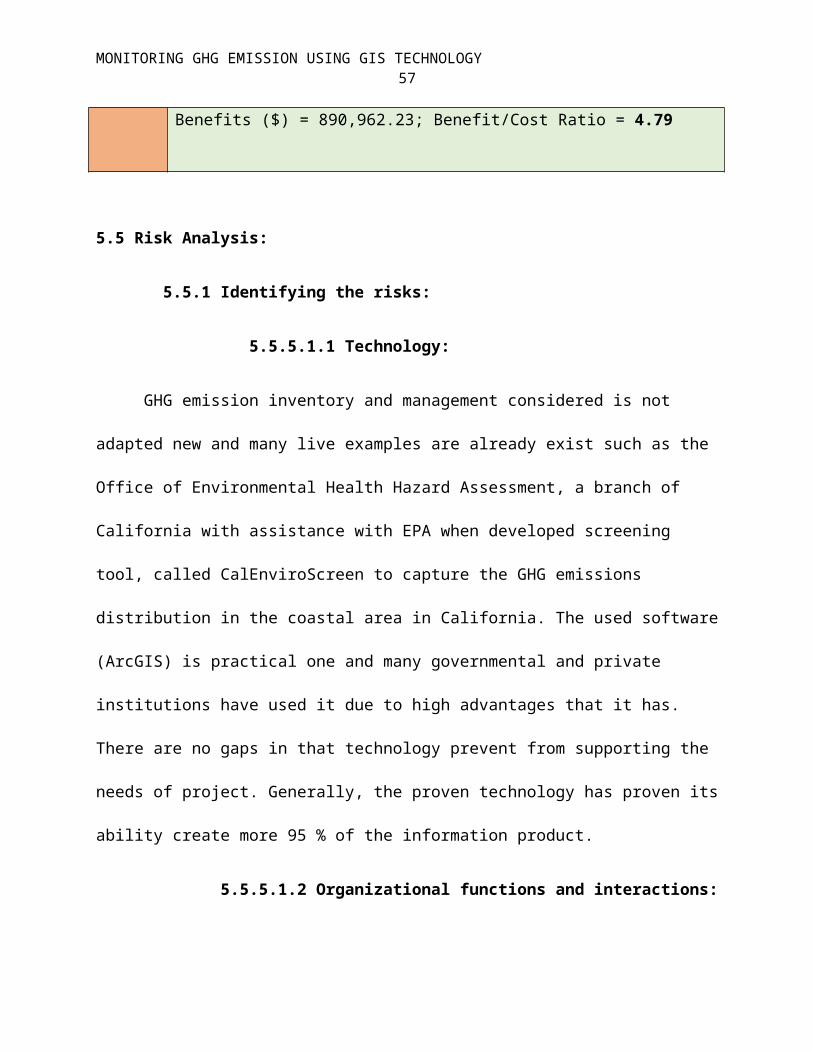
MONITORING GHG EMISSION USING GIS TECHNOLOGY57
Benefits ($) = 890,962.23; Benefit/Cost Ratio = 4.79
5.5 Risk Analysis:
5.5.1 Identifying the risks:
5.5.5.1.1 Technology:
GHG emission inventory and management considered is not
adapted new and many live examples are already exist such as the
Office of Environmental Health Hazard Assessment, a branch of
California with assistance with EPA when developed screening
tool, called CalEnviroScreen to capture the GHG emissions
distribution in the coastal area in California. The used software
(ArcGIS) is practical one and many governmental and private
institutions have used it due to high advantages that it has.
There are no gaps in that technology prevent from supporting the
needs of project. Generally, the proven technology has proven its
ability create more 95 % of the information product.
5.5.5.1.2 Organizational functions and interactions:
MONITORING GHG EMISSION USING GIS TECHNOLOGY58
There are no functional changes will be shown if the GIS-
based approach will be implanted in the workflow of the challenge
of sustainability program. There is no interaction with other
organizations, and the output of project is considered
complementary effort to be added to the governmental GHG
emissions plan such as the huge program in EPA.
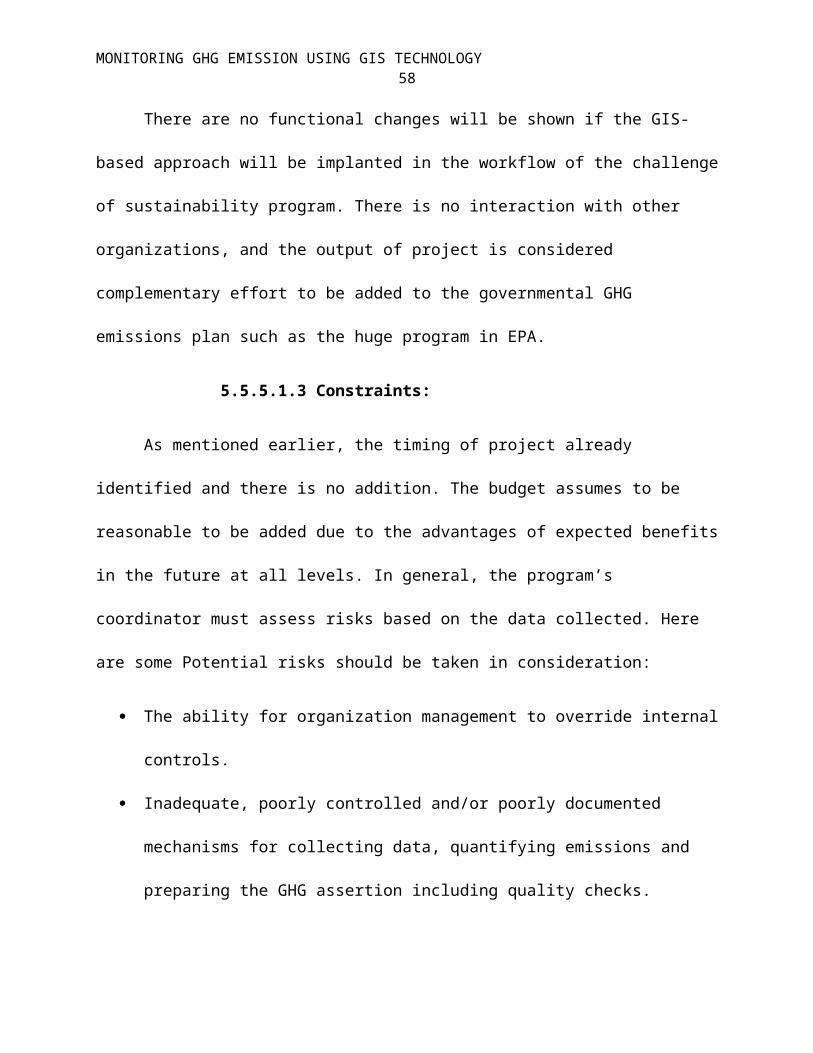
5.5.5.1.3 Constraints:
As mentioned earlier, the timing of project already
identified and there is no addition. The budget assumes to be
reasonable to be added due to the advantages of expected benefits
in the future at all levels. In general, the program’s
coordinator must assess risks based on the data collected. Here
are some Potential risks should be taken in consideration:
The ability for organization management to override internal
controls.
Inadequate, poorly controlled and/or poorly documented
mechanisms for collecting data, quantifying emissions and
preparing the GHG assertion including quality checks.
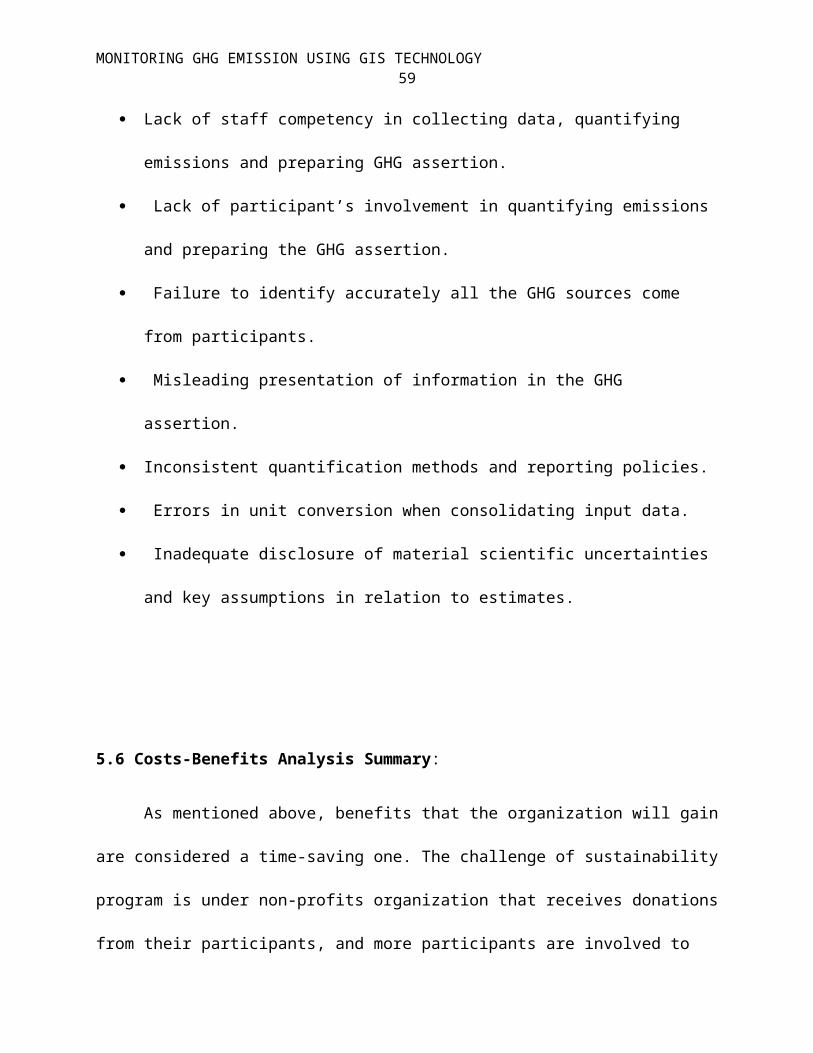
MONITORING GHG EMISSION USING GIS TECHNOLOGY59
Lack of staff competency in collecting data, quantifying
emissions and preparing GHG assertion.
Lack of participant’s involvement in quantifying emissions
and preparing the GHG assertion.
Failure to identify accurately all the GHG sources come
from participants.
Misleading presentation of information in the GHG
assertion.
Inconsistent quantification methods and reporting policies.
Errors in unit conversion when consolidating input data.
Inadequate disclosure of material scientific uncertainties
and key assumptions in relation to estimates.
5.6 Costs-Benefits Analysis Summary:
As mentioned above, benefits that the organization will gain
are considered a time-saving one. The challenge of sustainability
program is under non-profits organization that receives donations
from their participants, and more participants are involved to
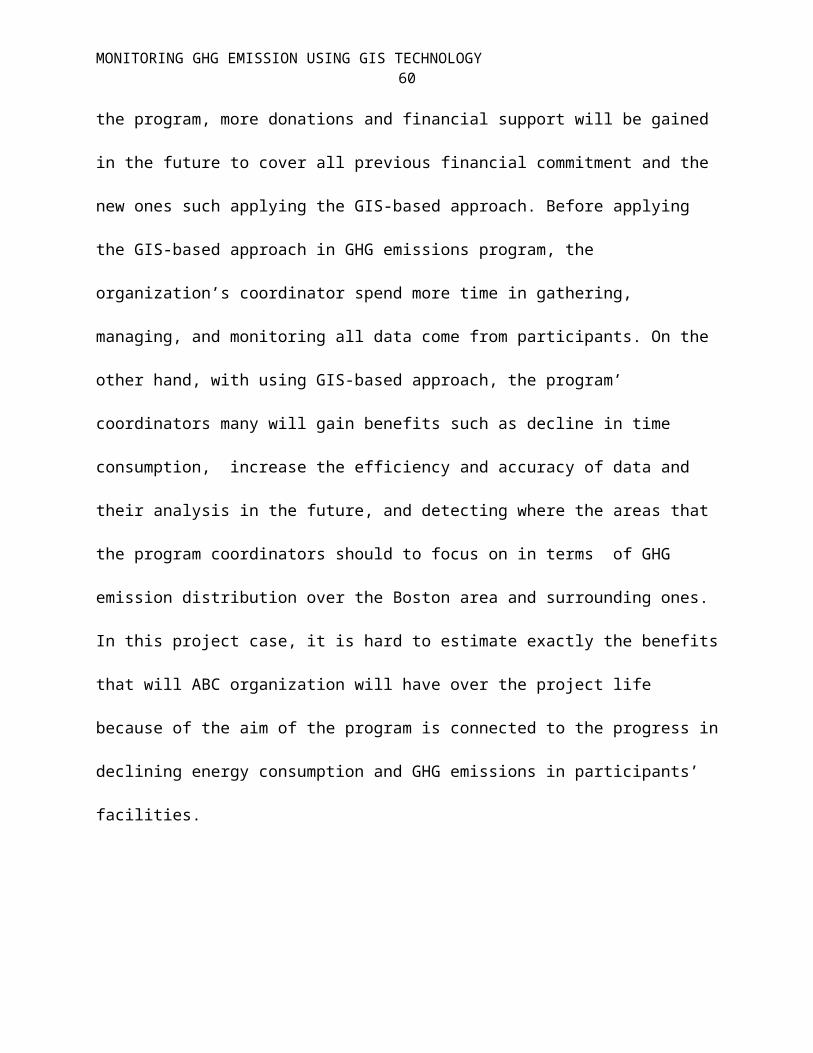
MONITORING GHG EMISSION USING GIS TECHNOLOGY60
the program, more donations and financial support will be gained
in the future to cover all previous financial commitment and the
new ones such applying the GIS-based approach. Before applying
the GIS-based approach in GHG emissions program, the
organization’s coordinator spend more time in gathering,
managing, and monitoring all data come from participants. On the
other hand, with using GIS-based approach, the program’
coordinators many will gain benefits such as decline in time
consumption, increase the efficiency and accuracy of data and
their analysis in the future, and detecting where the areas that
the program coordinators should to focus on in terms of GHG
emission distribution over the Boston area and surrounding ones.
In this project case, it is hard to estimate exactly the benefits
that will ABC organization will have over the project life
because of the aim of the program is connected to the progress in
declining energy consumption and GHG emissions in participants’
facilities.
MONITORING GHG EMISSION USING GIS TECHNOLOGY61
Summary, Conclusions, and Recommendations:
This report was an attempt to assure that GIS-based approach
can be applied in GHG emissions reduction plan for ABC’s
participants, and provides observable benefits on short time and
long time. Current situation of gathering, managing, and tracking
GHG emissions has been identified, and then compared to suggested
GIS-based approach. The results show that using GIS technology in
gathering, managing, and tracking GHG reduction in commercial
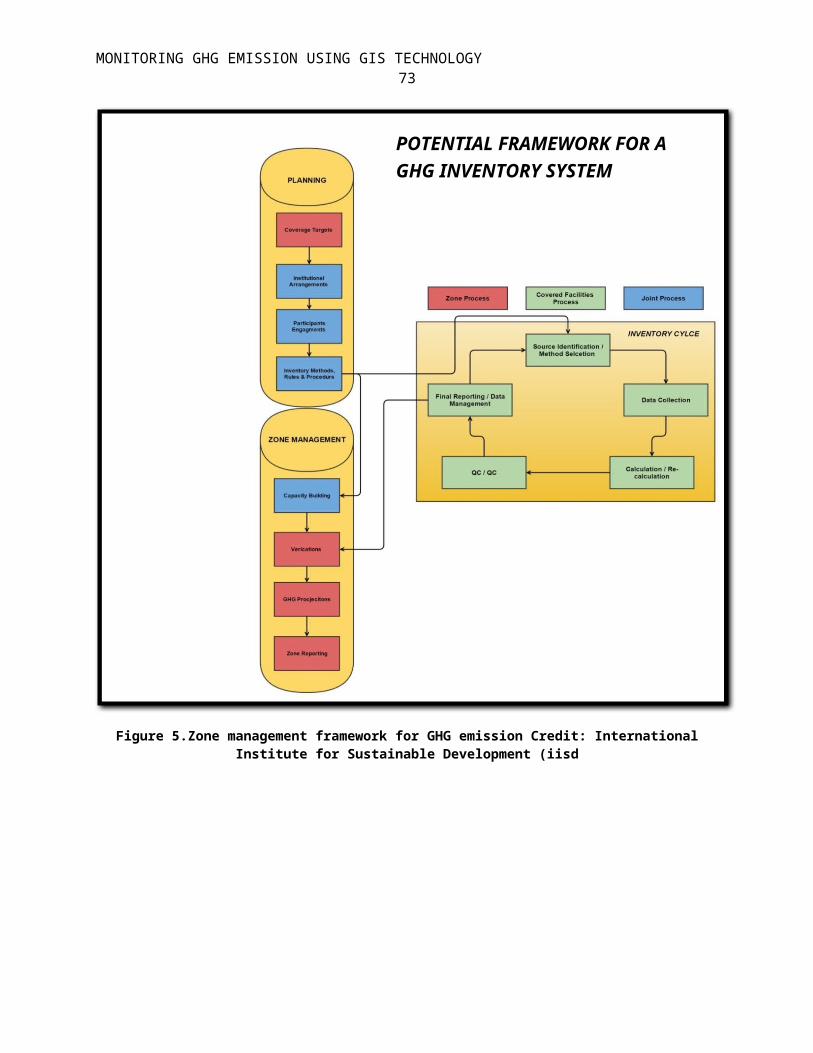
buildings and business facilities. For future analysis, I would
recommend taking in consideration using Energy End-Uses zones
interactive map as guide to them in GHG emissions reduction plan,
and link it to the data that will be analyzed. Other finding was
that estimating GHG emissions from buildings requires more
attention to data collection stage in terms QA & QC. Therefore,

MONITORING GHG EMISSION USING GIS TECHNOLOGY62
Fig.5 Appendix shows a potential framework of linking GHG
observation zone management plan linked to small projects as the
Challenge of Sustainability Program at ABC.
References
Annie Mueller, (February 23, 2015). The Cost of Hiring a New Employee.
Retrieved (04/20/15) from
MONITORING GHG EMISSION USING GIS TECHNOLOGY63
http://www.investopedia.com/financial-edge/0711/the-cost-of-
hiring-a-new- employee.aspx
Asdrubali, F., Presciutti, A., & Scrucca, F. (2013). Development
of a greenhouse gas accounting GIS-based tool to support
local policy making—application to an Italian municipality.
Energy Policy, 61587-594. doi:10.1016/j.enpol.2013.05.116
Boychuk, K., & Bun, R. (2014). Regional spatial inventories (cadastres) of GHG emissions in the Energy sector: Accounting for uncertainty. Climatic Change, 124(3), 561-574. doi:10.1007/s10584-013-1040-9
Bun, R., Hamal, K., Gusti, M., & Bun, A. (2010). Spatial GHG inventory at the regional level: accounting for uncertainty. Climatic Change, 103(1/2), 227-244.
doi:10.1007/s10584-010-9907-5.
Federal Highway Administration's (FHWA) Office of Planning.
Application of Geographic Information Systems (GIS) for Transportation and
Climate Change (August, 2011). Retrieved from
http://www.gis.fhwa.dot.gov/documents/Climate_Change_Report_Aug20
11.htm
Office of Environmental Health Hazard Assessment (OEHHA).
CalEnviroScreen 2.0 (11/10/14). Retrieved from
http://oehha.ca.gov/ej/ces2.html
MONITORING GHG EMISSION USING GIS TECHNOLOGY64
Payscale Human Capital. Geographic Information Systems (GIS) Analyst Salary (United States). Retrieved (04/20/15) from
http://www.payscale.com/research/US/Job=Geographic_Information_Systems_%28GIS %29_Analyst/Salary .
Puliafito, S. E., Allende, D., Pinto, S., & Castesana, P. (2015).
High resolution inventory of GHG emissions of the road
transport sector in Argentina. Atmospheric Environment,
101303-311. doi:10.1016/j.atmosenv.2014.11.040
Van Hoesen, J., & Letendre, S. (2013). Characterizing the
spatiotemporal evolution of building-stock age in Poultney,
Vermont: a GIS-based approach to improve thermal efficiency
in historical buildings. Environment & Planning B: Planning & Design,
40(4), 630-643. doi:10.1068/b38085
United Stated Environmental Protection Agency. Sources of Greenhouse
Gas Emissions (8/20/2014). Retrieved from
http://www.epa.gov/climatechange/ghgemissions/sources.html
U.S. Department of the Interior - Greening of the Interior.
Occupancy Sensors. Retrieved (04/20/15) from
http://www.doi.gov/archive/greening/energy/occupy.html.

MONITORING GHG EMISSION USING GIS TECHNOLOGY65
Appendix:
MONITORING GHG EMISSION USING GIS TECHNOLOGY66
Figure 1. A map shows the distribution of GHG emission in California. Credit:OEHHA, 11/10/14
MONITORING GHG EMISSION USING GIS TECHNOLOGY67
Figure 2. A map shows the correlation between land use and transportation GHG
emissions. Credit: FHWA
MONITORING GHG EMISSION USING GIS TECHNOLOGY68
Figure 3. Thematic map of specific GHG emissions in the energy sector (Lviv region,Ukraine 2004; tCO2-. Credit: Bun et al. (2010)
MONITORING GHG EMISSION USING GIS TECHNOLOGY69
Information Structures/Products:
MONITORING GHG EMISSION USING GIS TECHNOLOGY70
Initial information product chart:
MONITORING GHG EMISSION USING GIS TECHNOLOGY71
Area Type Percent (%) ReductionLocker room
65Large work room/office
55Rest room
50File room
45Small work room
40Corridors
25Small offices
22
Table 1. Possible percentage reduction in on-time for lights in a given areatype. Credit: U.S. Department of the Interior
Figure4. GIS Analyst salary average. Credit: Paysacle.com
MONITORING GHG EMISSION USING GIS TECHNOLOGY72
MONITORING GHG EMISSION USING GIS TECHNOLOGY73
Figure 5.Zone management framework for GHG emission Credit: InternationalInstitute for Sustainable Development (iisd
POTENTIAL FRAMEWORK FOR A GHG INVENTORY SYSTEM


