Embed Size (px)
Citation preview
BioMed CentralBehavioral and Brain Functions
ss
Open AcceResearchMoment-to-moment dynamics of ADHD behaviour in South African childrenHeidi Aase*1,3,4, Anneke Meyer2,4 and Terje Sagvolden3,4Address: 1Norwegian Institute of Public Health, Division of mental health, P.O Box 4404 Nydalen, N-0403 Oslo, Norway, 2School of Health Sciences, University of Limpopo, South Africa, 3Department of Physiology, University of Oslo, Norway and 4Centre for Advanced Study at the Norwegian Academy for Science and Letters, Oslo, Norway
Email: Heidi Aase* - [email protected]; Anneke Meyer - [email protected]; Terje Sagvolden - [email protected]
* Corresponding author
AbstractBackground: The behaviour of children with Attention-Deficit/Hyperactivity Disorder is characterized by lowpredictability of responding. Low behavioural predictability is one way of operationalizing intra-individual ADHD-related variability. ADHD-related variability may be caused by inefficient behavioural selection mechanisms linkedto reinforcement and extinction, as suggested by the recently published dynamic developmental theory (DDT) ofADHD. DDT argues that ADHD is a basic neurobehavioural disorder, caused by dysfunctioning dopaminesystems. For establishing ADHD as a neurobehavioural disorder, findings from studies conducted in Westerncountries should be replicated in other cultural populations. The present study replicated the study conducted inNorway, with children from the Limpopo province in the Republic of South Africa.
Methods: Boys and girls, aged 6–9 yr, from seven ethnic groups participated. Scores by teachers on theDisruptive Behavior Disorders rating scale defined participation in either ADHD-hyperactive/impulsive (-HI),ADHD-predominantly inattentive (-PI), or ADHD-combined (-C) groups. Children below the 86th percentilewere matched on gender and age and comprised the non-ADHD group. The children completed a computerizedgame-like task where mouse clicks on one of two squares on the screen resulted in delivery of a reinforceraccording to a variable interval schedule of reinforcement. Reinforcers were cartoon pictures presented on thescreen together with a sound. Predictability of response location and timing were measured in terms of explainedvariance.
Results: Overall, the results replicated findings from Norway. Specifically, the ADHD-C group showedsignificantly lower predictability of responding than the non-ADHD group, while the ADHD-HI and the ADHD-PI groups were in-between. In accordance with the previous study, response location, but not response timing,was a sensitive behavioural measure. There were no significant gender differences. Cartoon pictures wereeffective reinforcers as the non-ADHD group showed learning of the task. There was no relation betweenbehavioural predictability and motor functions.
Conclusion: The present study makes a strong case for ADHD as a basic, neurobehavioural disorder, not acultural phenomenon, by replicating findings from a wealthy Western country in a poor province of a developingcountry. The results were, generally, in line with predictions from the dynamic developmental theory of ADHDby indicating that reinforcers were less efficient in the ADHD group than in the non-ADHD group. Finally, theresults substantiated ADHD-related variability as an etiologically important characteristic of ADHD behaviour.
Published: 28 March 2006
Behavioral and Brain Functions 2006, 2:11 doi:10.1186/1744-9081-2-11
Received: 07 November 2005Accepted: 28 March 2006
This article is available from: http://www.behavioralandbrainfunctions.com/content/2/1/11
© 2006 Aase et al; licensee BioMed Central Ltd.This is an Open Access article distributed under the terms of the Creative Commons Attribution License (http://creativecommons.org/licenses/by/2.0), which permits unrestricted use, distribution, and reproduction in any medium, provided the original work is properly cited.
Page 1 of 13(page number not for citation purposes)
Behavioral and Brain Functions 2006, 2:11 http://www.behavioralandbrainfunctions.com/content/2/1/11
BackgroundAttention-deficit/hyperactivity disorder (ADHD) [1] is abehavioural disorder affecting about 2–5% of gradeschool children [2], making it one of the most commonchild psychiatric diagnoses in the United States of Amer-ica and in Europe. In childhood, the diagnosis is more fre-quent among boys. Depending on the referral practice,boys to girls ratios vary between 10:1 (clinical samples)and 3:1 (community samples) [3]. Research indicates thatthe major aetiological factor is genetic [4], probablymainly expressed as alterations in catecholaminergic reg-ulation of brain activity [5,6]. The disorder places thechild at risk for school failure and dropout, juvenile delin-quency, criminality, substance abuse, and sexual promis-cuity with HIV/AIDS and teenage pregnancies as possibleconsequences. In this way, the disorder is extremelycostly, both to the afflicted individuals and their families,and to the society [7,8]. Although it has been discussedwhether ADHD is a phenomenon of the Western culture,e.g., [9], its worldwide existence is well documented [10-13]. However, it seems that inconsistent assessment crite-ria and procedures affect prevalence rates of ADHD acrosscountries and cultural groups [10]. The reliance on behav-ioural observations and clinical descriptions of the behav-iour makes the diagnosis vulnerable to subjective andcultural perceptions, and the need for more objective cri-teria for diagnosing is long needed. No biological markerhas yet been found, and no existing neuropsychologicaltest can reliably define a case of ADHD [14]. However,theory-driven research aimed at identifying dysfunctionsin basic behavioural mechanisms may provide an empiri-cal basis for understanding processes and functions onother levels of analysis (e.g., developmental, neuropsy-chological, psychosocial), and for generating moresophisticated tests for early and reliable identification ofaffected individuals. The main purpose of the presentstudy is to replicate an earlier study [15] showing thatmoment-to-moment dynamics of ADHD behaviour mayrepresent a new way of understanding underlying behav-ioural mechanisms basic to ADHD.
ADHD is characterized by age-inappropriate hyperactiv-ity, impulsiveness, and deficient sustained attention [1].Most clinical and experimental reports show increasedvariability, both between and within subjects in theADHD group. While the group heterogeneity suggestsmultiple independent pathways to the disorder [16], theintra-individual variability might be a key characteristic ofan endophenotype of ADHD and has recently become atopic of particular interest [15-17]. A purportedly impor-tant step in the direction of describing and explaining therole and function of this variability is more fine-grainedanalyses of behaviour as opposed to the traditional statis-tical summary measures of means and standard devia-tions [18]. In the present study, response data is analyzed
on a microlevel in order to identify possible mechanismsunderlying the observed intra-individual variability.
ADHD-related variability is mainly observed at the behav-ioural level [16], so a thorough behavioural account iswarranted in order to guide the investigation of, forinstance, underlying neurobiological processes. Castel-lanos and colleagues [16] raised a number of key ques-tions about ADHD-related variability that need to beaddressed in a basic research programme, including itsrobustness in its association with ADHD; whether it is arandom or dynamic-periodic phenomenon, whether itvaries dynamically as a function of context, whether it isunique to ADHD, and finally, whether it reflects processescausal to ADHD. In the recently published dynamic devel-opmental theory of ADHD (DDT) [19] it is argued thatthe main behavioural selection mechanisms, reinforce-ment and extinction, are altered in ADHD. These altera-tions bring about a different learning style resulting inincreased behavioural variability, in addition to hyperac-tivity, impulsiveness, and deficient sustained attention.Some of the variability may be the result of deficientacquisition of reinforced behaviour combined with defi-cient extinction of non-reinforced behaviour causingshorter and less predictable behavioural sequences[15,19]. Thus, the DDT places ADHD-related variabilitywithin a causal model [19]. The DDT thereby suggests thatADHD-related variability is not a random phenomenon,but can be predicted in the combined and the hyperactive/impulsive subtypes of ADHD. Further, the DDT arguesthat ADHD-related variability will vary dynamically as afunction of context, task, and motivational preferences.Recently, we showed that boys with ADHD combined andhyperactive/impulsive subtypes had significantly less pre-dictable response sequences than normal boys [15] andthat the overall variability was observed during infrequentreinforcement as opposed to frequent [20]. However, onlyboys from a culturally homogeneous population partici-pated, so it is of vital importance that the phenomenoncan be replicated in other samples.
The present study is a replication and extension of thatstudy, with a larger sample including both genders. Fur-ther, the study is conducted in a developing country witha culturally less homogeneous population. However, clin-ical resources are sparse, and assessment methods devel-oped and validated in Western countries may not berelevant or feasible. A recent prevalence study conductedin various language groups in South Africa showed thatwhen using a teacher rating scale, similar figures for prev-alence as in Western countries were obtained. Also, rathersimilar distributions across the three ADHD subtypes(inattentive, hyperactive/impulsive, and combined) werefound, in addition to a similar gender distribution [12].
Page 2 of 13(page number not for citation purposes)
Behavioral and Brain Functions 2006, 2:11 http://www.behavioralandbrainfunctions.com/content/2/1/11
The primary aim of the present study was to investigate ifthe results from the Norwegian study could be replicatedin a different sample derived from various languagegroups in the Limpopo province of South Africa. If repli-cated, the combined results from the Norwegian and theSouth African studies would make a strong case for abasic, neurobiological mechanism differentiating ADHDfrom non-ADHD children, refuting the argument thatADHD is a cultural phenomenon resulting from Westernway of life, or from Western conceptualization of psychi-atric problems. In addition, the findings might lend sup-port to the recently published dynamic developmentaltheory of ADHD [19] arguing that the main behaviouralselection mechanisms, reinforcement and extinction, arealtered in ADHD and will result in increased behaviouralvariability.
The present sample made it possible to investigate poten-tial differential effects of reinforcers on response patternsin the three subtypes of ADHD [2]: the predominantlyinattentive type (ADHD-PI), the hyperactive/impulsivetype (ADHD-HI), and the combined type (ADHD-C). Inaddition, potential gender differences could be studied.
ADHD-related variability was defined as reduced predict-ability of consecutive responses. The task used was a com-puterized game where mouse clicks on either of twosquares on the screen resulted in the presentation of areinforcer. Reinforcers were cartoon pictures displayed onthe screen for a short period accompanied by a sound.These were delivered according to variable interval (VI)schedules of reinforcement. VI schedules specify thatresponses result in a reinforcer after varying time intervals.Thus, reinforcers are presented at unpredictable times[21], avoiding any confounding with time discriminationproblems. All mouse clicks were recorded both in terms ofwhere on the screen responses were placed (response loca-tion; the spatial dimension) and response timing (thetemporal dimension). Thus, the present task allowed foranalysis of both spatial and temporal aspects of behav-iour.
MethodsParticipantsChildren from seven ethnic groups of the Limpopo Prov-ince of South Africa (Northern Sotho, Venda, Tsonga,Tswana, North Ndebele, Afrikaans, and English) wererecruited from a school-based population. The 179 chil-dren (128 boys and 51 girls) were recruited followingscreening of the general population of primary schoolchildren representative of all socio-economic levels forADHD-like behaviour. The Disruptive Behavior Disorders(DBD) rating scale [22,23] was standardized for the pop-ulations of the Limpopo province of South Africa in anearlier study [12] and used as the screening instrument.
Both teachers and parents were given the rating scale tocomplete. Only the teacher's ratings were used for thescreening, since the return of the parent's rating scale wasbelow 50%, probably because many children either didnot live with their parents or the parents were illiterate.Teacher ratings are usually regarded as an accurate meas-ure of assessment [24,25]. The teachers returned ratings ofclose to 100% of their pupils. The children meeting thecriteria for inclusion into the clinical group (~7%) wereselected for further testing. They were matched for gender,age, and language with children without ADHD as meas-ured by the screening process.
Children were divided into a group classified as ADHD,the "ADHD group" and a comparison group withoutADHD symptoms (Table 1), based on teacher ratings onthe DBD rating scale. The cut off point for the ADHDgroup (95th percentile or above) was based on the resultsfrom the prevalence study [12] in which more than 6000children in the Limpopo Province were rated on the DBDscale. Norms were developed for a high cut-off based onthe qualified assumption that ADHD exists in about 5%of the population [12]. According to these norms, scoreshigher than 18 on the hyperactive/impulsive (H/I) itemswere classified as ADHD-HI and higher than 21 on theinattentive (Inatt) items were classified as the ADHD-PIgroup. If the criteria were met on both types of items, thechild was classified as ADHD-C. The cut off point for thecomparison group was set at the 85th percentile or below inorder to decrease the risk for false negatives in this group,as the DBD rating was the only measure. Thus, childrenwith scores on H/I-related items less than 15 and Inattitems less than 17 were regarded as comparisons.
The final sample consisted of children from seven ethnicgroups inhabiting the Limpopo Province of South Africa.For the Afrikaans and English speaking groups, the IQ wasestablished with the Senior South African Individual Scale(SSAIS-R) [26]. As there are no standardized IQ tests forthe indigenous African populations, Raven's progressivematrices were used to estimate IQ. This test is also consid-ered to be "culture-fair" [27,28]. Children with IQ lowerthan 80 and/or with a history of neurological problems(e.g. epilepsy, head injuries, cerebral palsy, or cerebralmalaria) were excluded. None of the children were on psy-chostimulant medication at the time of testing.
ProcedureWritten permission was obtained from the Department ofEducation, Limpopo Province, as well of the principals ofthe selected schools. Participation was voluntary.Informed consent was obtained from the child's parentsor guardians.
Page 3 of 13(page number not for citation purposes)
Behavioral and Brain Functions 2006, 2:11 http://www.behavioralandbrainfunctions.com/content/2/1/11
The children were always tested by a tester fluent in thechild's own language. Most assessments were done at theirschools during school hours, where one of the classroomswas made available. The exceptions were children whoseschool was within a radius of 2 km from the Universityand children referred for clinical assessment. These weretested at the University Clinic.
The SSAIS-R IQ test [26] and the Raven Progressive Matri-ces Test were administered by Masters students in ClinicalPsychology who were doing their hospital internship.
As many of the children were not acquainted with com-puters, a 'mouse-training' session was part of the testingprocedure.
Reinforcement taskThe task was designed as a computer "game" and was runon one of three similar laptops. The screen resolution wasset to 640 by 480 pixels. The response device was a stand-ard computer mouse and clicks on either left or right but-ton were recorded as responses. Moving the mouse madethe cursor move on the screen, the cursor being in theshape of an arrow. Two squares (140 × 140 pixels) 120pixels apart, one in a light and one in a dark shade of grey,were displayed on the screen 120 pixels from the verticalsides (left-right) and 170 pixels from the top and from thebottom. A click within one of the squares induced a briefchange in colour as feedback; the dark grey square turnedinto a lighter shade and the light grey square turned intoa darker shade. Clicks outside the squares were recorded,but gave no feedback. Following reinforcer presentations,
the two squares switched sides at random, but were neverdisplayed on the same side more than twice in a row. Thenumber of presentations on each side was the same.
The task was designed according to a multiple variableinterval (VI) schedule of reinforcement. A schedule iscalled multiple when two or more schedule componentsalternate and are signalled by discriminative stimuli. In aninterval schedule some time must elapse before a responsewill result in delivery of a reinforcer. In VI schedules, theintervals will vary around a specified arithmetic mean[21]. The reinforcer-dense schedule was a VI 2 s and thereinforcer-lean schedule was a VI 20 s schedule of rein-forcement. The screen's background colour changedaccording to the contingency in operation and functionedas the conditioned discriminative stimulus for the twocontingencies. A navy blue background signalled the VI 2s, while a yellow background signalled the VI 20 s. Thedark grey square was always associated with reinforce-ment (the correct square), thus this was the discriminativestimulus. Reinforcers were cartoon pictures displayed onthe screen for 1.5 s simultaneously with a sound (differentcomputer-generated sounds).
The child was introduced to the test with the followinginstruction (told in the child's own native language):
"This is a game you may play now. It is a little strange, becauseI will not tell you how to play the game. Your task is to find outhow the game works. You may use this mouse and move thearrow across the screen like this (experimenter demonstrateshow to move the mouse and cursor). If you want to point, you
Table 1: Means and Standard Deviations, for Age and DBD Scores, by Subtype
ADHD-C ADHD-HI ADHD-PI Non-ADHDBoys Girls Boys Girls Boys Girls Boys Girls Total
Age (mo)* 102.4 ± 10.6 104.4 ± 11.8 109.5 ± 20.7 103.6 ± 9.0 104.5 ± 15.7 102.9 ± 19.2 108.0 ± 14.9 101.5 ± 11.8 106. 4 ± 5.1
DBD** Inatt 24.0 ± 3.8 23.8 ± 2.7 13.8 ± 4.2 14.8 ± 2.5 22.2 ± 4.4 25.8 ± 2.6 6.6 ± 5.7 5.2 ± 5.9 13.5 ± 9.2
DBD** H/I 22.0 ± 3.2 20.9 ± 3.2 20.2 ± 1.8 20.6 ± 2.1 10.0 ± 6.0 9.9 ± 4.1 4.1 ± 3.6 4.4 ± 5.1 10.6 ± 8.4
NAfrikaans 2 3 1 1 3 1 10 5 26English 0 0 0 0 1 0 2 1 4N Sotho 1 3 4 1 0 1 12 9 31Tsonga 3 1 3 1 8 2 3 1 22Venda 4 2 2 4 11 2 17 8 50N Ndebele 3 4 3 0 4 2 8 3 27Tswana 3 0 3 1 1 0 9 2 19
Total 16 13 16 8 28 8 61 29 179
* There were no statistically significant differences in age between the subtypes** Differences between groups were not tested, as the groups were defined by these scores.DBD: Disruptive Behavior Disorder rating scale [22]; Inatt: Scores on inattentive items; H/I: Scores on hyperactive/impulsive items
Page 4 of 13(page number not for citation purposes)
Behavioral and Brain Functions 2006, 2:11 http://www.behavioralandbrainfunctions.com/content/2/1/11
can click with one of these buttons (experimenter points to themouse buttons). You may talk while you are playing, but I willnot answer any questions about the game. I will sit back hereand write a little while you play. Do you understand your task?You may start now."
The task started with a shaping sequence where every cor-rect response was reinforced. The screen background wasblue and the correct square was always on the same side(right). After six correct responses, the VI 2 s schedulecame into effect without any signal. The child receivedfour reinforcers upon responding during the VI 2 s contin-gency before the schedule changed to the VI 20 s contin-gency (and the background changed from blue to yellow)where four reinforcers were to be obtained. The time ittook to obtain these eight reinforcers constitute the firstsegment of the test. The schedules alternated so that eachwas displayed five times; i.e., there were five segments,resulting in a total of 40 reinforcers per child (plus sixfrom the shaping sequence). The entire task, includinginstruction and shaping, took about 10–13 min to com-plete.
Data recording and statisticsData were recorded by the laptops. Percentage of allresponses within the correct square, response side (left orright), response coordinates (i.e. the horizontal and verti-cal pixel that the tip of the arrow-shaped cursor touchedwhen the child clicked a mouse button), and interre-sponse times (IRTs) were the recorded dependent varia-bles. The individual IRT distributions were highly skewedwith a long tail towards long IRTs. IRTs were thereforenormalized by log transformations prior to analysis[logIRT = log10 ((IRT/1000) + 0.001)].
Behavioural measuresThe same behaviours were analyzed in the previous [15]and the present study. Response sequences were analyzedin the VI 20 s condition only; as the short schedule usuallywould not allow for enough responses in a segment (i.e.,four reinforcer deliveries within the VI 2 s condition) tocalculate autocorrelations and explained variance (seebelow). The following behaviours were analyzed: 1) Ageneral side response pattern, i.e., whether consecutiveresponses were on the left or right side of the screen.Highly predictable responding would typically be on theside where the correct target was positioned, and indicatesgood stimulus control. Likewise, low predictabilityimplies that responses are unsystematically distributed onthe two sides and means poor stimulus control. 2) The dis-tance-to-nearest-centre measure was based on the distancefrom the pixel where the response was placed, to the cen-tre of the selected square, whether it was the correct squareor not. This measure indicates whether the children devel-oped strategies of responding that was related to the bor-
ders of the squares, disregarding whether the square wascorrect or not. 3) The distance-to-correct-centre measure wasbased on the distance from where the response was placedto the centre of the correct square. Thus, this measure wasa variant of the distance-to-nearest-centre measure,anchored to the centre of the correct square. Both distancescores (measure 2 and 3) were in terms of vertical and hor-izontal pixels, with 0,0 defining the centre of the square.4) Timing response patterns were based on consecutiveinterresponse times (IRTs).
The predictability of responses spatially and temporallywas assessed by explained variance, i.e., autocorrelationssquared. Explained variance is a better measure for overallpredictability than autocorrelations by itself since the lat-ter will have both positive and negative values cancellingeach other when added. Autocorrelations (serial correla-tions) of each measure were correlations of consecutiveresponse measures across five lags. Thus, correlationsbetween the value of response n and of response n+1 isthe first lag, between n and n+2 is the second lag, and soon up to correlations between response n and n+5 beingthe fifth lag. For programming reasons, autocorrelationswere computed on consecutive responses through a fullsegment and not reset at reinforcer delivery because thenumber of responses was huge compared to the numberof reinforcers. Changes in predictability of respondingthroughout the experiment could be observed in theexplained variance for each child from segment to seg-ment. An increase in autocorrelations over segmentswould indicate that performance became more and morepredictable throughout the experiment, and thus be anindirect measure of learning. We hypothesised that com-pared to the non-ADHD group less of the behaviour ofchildren with ADHD would be predictable, indicated bygenerally less explained variance. In addition, predictabil-ity of responses in the ADHD group should, to a largerextent than in the non-ADHD group, be restricted to thefirst lag, indicating shorter behavioural sequences.
In addition to the response sequences, learning was meas-ured as mean percent of all responses that were placedwithin the correct square. A high score on percent correctwould indicate that the dark grey square exerted goodstimulus control over the responding of the children, andis thus a measure of attention.
StatisticsData were analyzed by means of SPSS 11.0 for Windows(SPSS) and Statistica 6.1 [29] program packages. The dis-tance scores were computed as the square root of the sumof squared horizontal and vertical distances. Explainedvariance (autocorrelations squared) was analyzed usingrepeated measures ANOVA across segments and lags. TheANOVA was supplemented with MANOVA. A multivari-
Page 5 of 13(page number not for citation purposes)
Behavioral and Brain Functions 2006, 2:11 http://www.behavioralandbrainfunctions.com/content/2/1/11
ate approach to repeated measures is recommended whenvariables have more than two levels because MANOVAscorrect for the assumption of compound symmetry andsphericity in ANOVAs [29].
Analyses relevant for the primary aim were performedfirst, with Group (2: ADHD and non-ADHD) as thebetween-group variable; and segment (5) and lag (5) aswithin-group variables. The ADHD group consisted ofchildren with ADHD-C and ADHD-HI in order to repli-cate the Norwegian study. Then, as follow-up analyses,subtypes of ADHD (ADHD-HI, ADHD-PI, and ADHD-C)versus non-ADHD were analysed across segments andlags, in order to investigate potential differences betweensubtypes of ADHD. Results were followed up with posthoc Scheffé tests where relevant. Non-published resultsmay be obtained from the first author upon request.
Demographic dataDemographic and diagnostic measures of the ADHD-related subtypes and the non-ADHD comparison groupare displayed in Table 1.
ResultsGenerally, there was no effect of Gender, neither maineffects nor interaction effects. Consequently, the reportedfindings combine boys and girls. Further, predictable
responding was found for the three spatial behaviouralmeasures, but not for the timing measure. The ADHDCombined group had the lowest explained variance of allgroups on the spatial measures.
Side response patternThis measure assessed whether the child's choice of side ofthe screen (left or right) was predictable irrespective of onwhich side the correct response target was displayed.Highly predictable responding across lags would implythat behaviour was orderly related to side of screen.
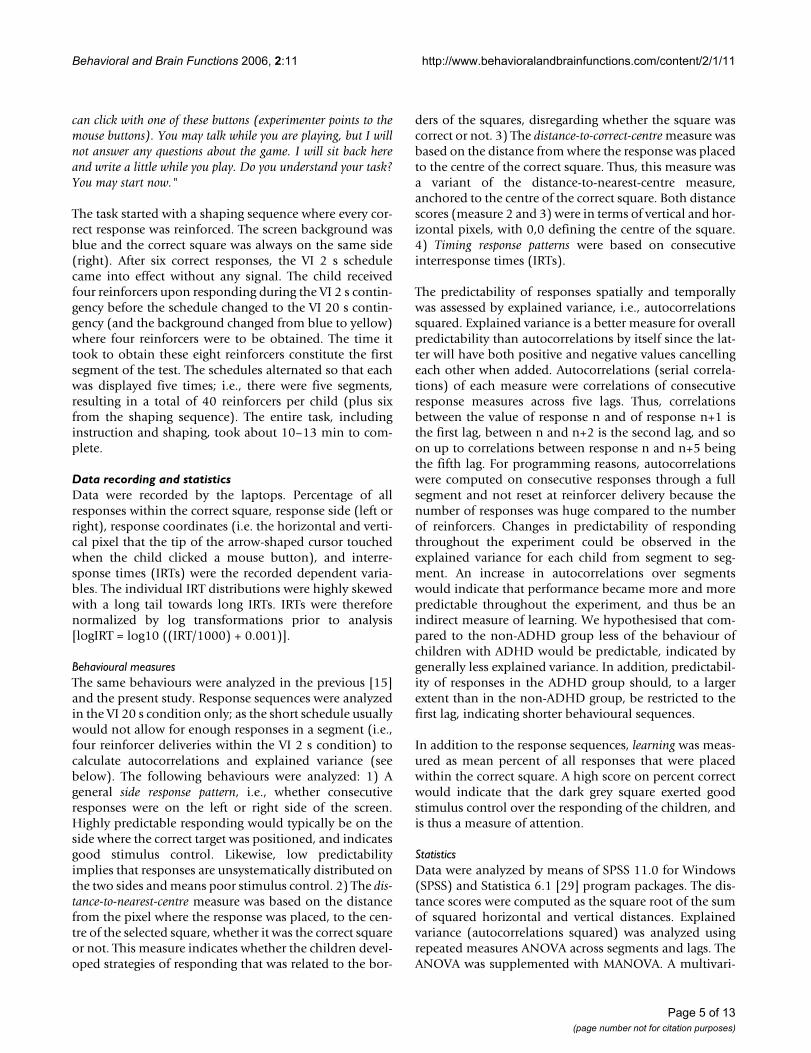
Generally, predictability from one response to the imme-diate next (first lag) was in the low range (0.31 > mean R2
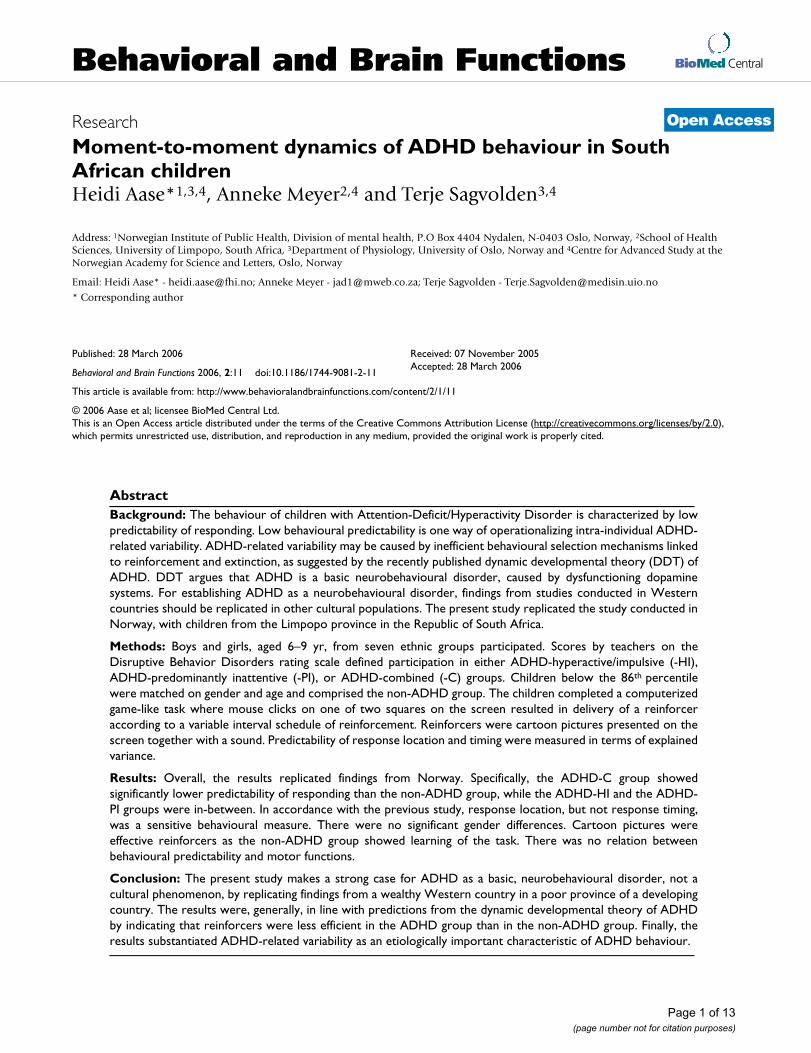
> 0.17; median R2 = 0.22) compared to previously pub-lished results [15]. The side response pattern of the non-ADHD group was more predictable compared to theADHD group (Fig. 1). There were significant main effectsof Group and of Segment (Table 2). The ANOVA showedsignificant interaction effects between Group and Seg-ment, between Group and Lag, and between Group, Seg-ment, and Lag. All interactions were confirmed with themultivariate analysis (Table 2). The significant main effectof Segment implies that there was a general upward trendin predictability from segment 1 to segment 4.
The follow-up ANOVA of the three ADHD subtypes andthe non-ADHD group showed no significant main effectof Subtype, but the main effects of Segment and of Lagwere significant. There was a significant interactionbetween Subtype and Lag (F(12, 720) = 2.99; p < .001),and between Subtype, Segment, and Lag (F(48, 2880) =1.62; p < .005). Only the three-way interaction was con-firmed by the MANOVA. The interaction effects impliedthat predictability in responding for the three ADHD sub-types and the non-ADHD group changed differentlyacross segments and lags. The ADHD-C group showed theleast predictable responding across segments. No otherinteraction effects were statistically significant.
Distance to nearest centreThis measure assessed to what degree the childrenresponded in predictable patterns in terms of the distancefrom where the response was placed to the centre of thenearest square irrespective of whether it was the correctresponse target or not.
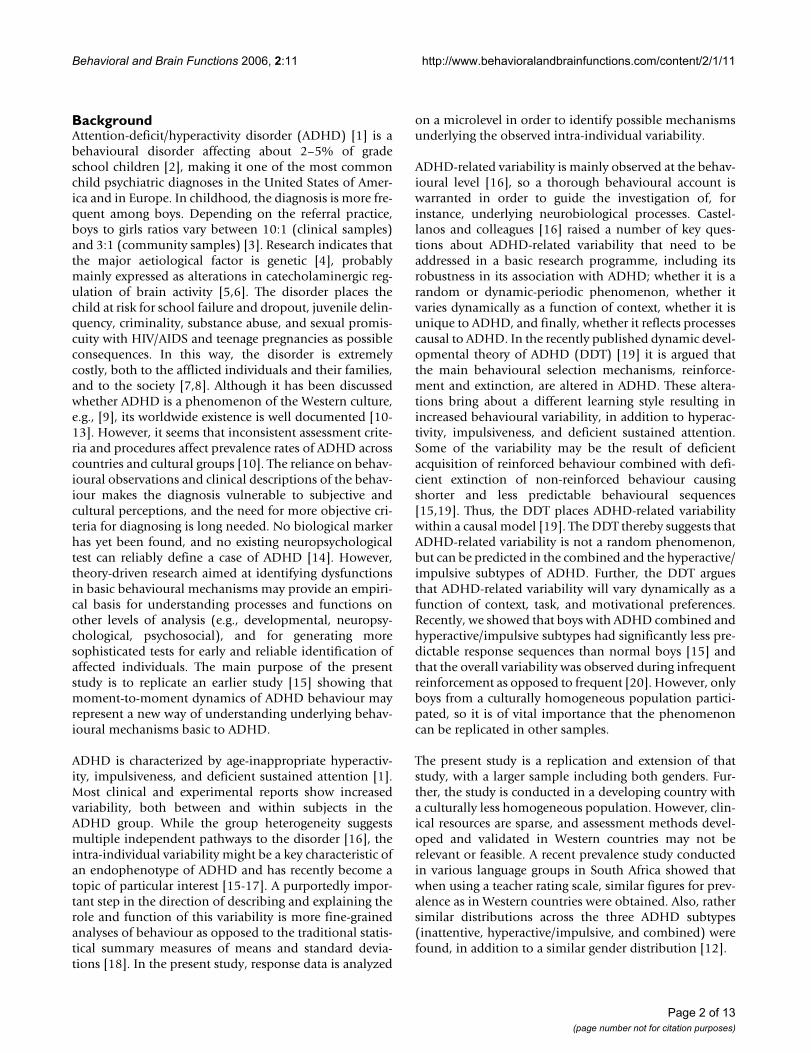
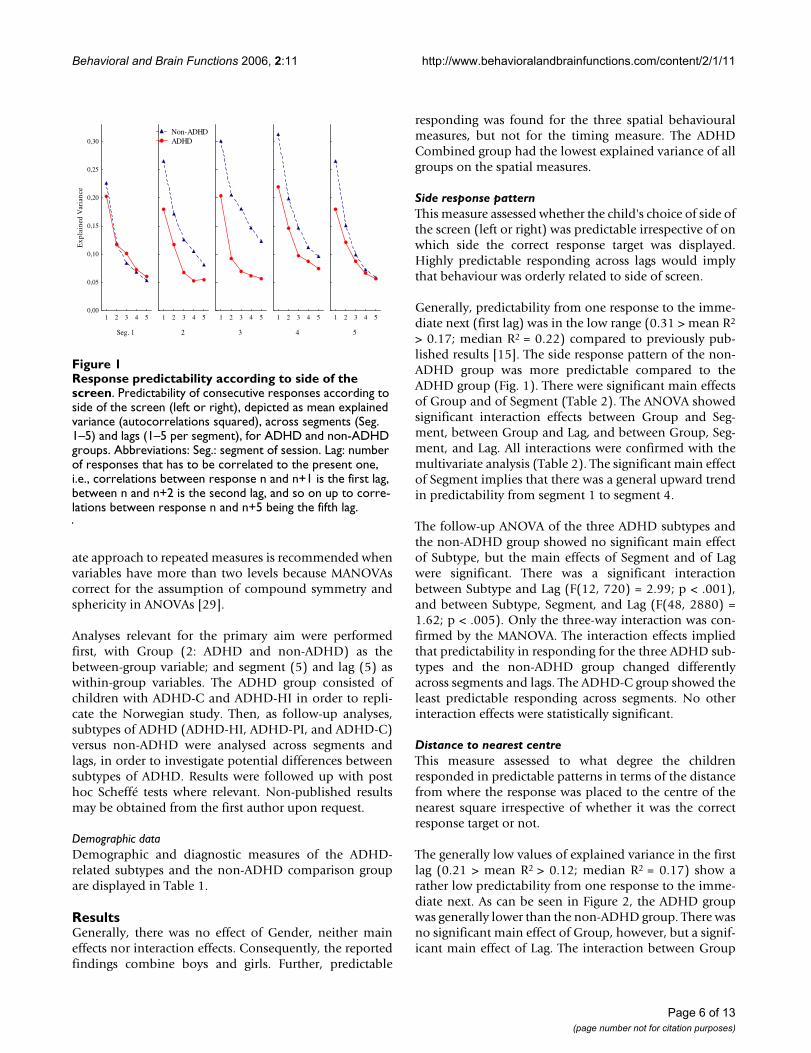
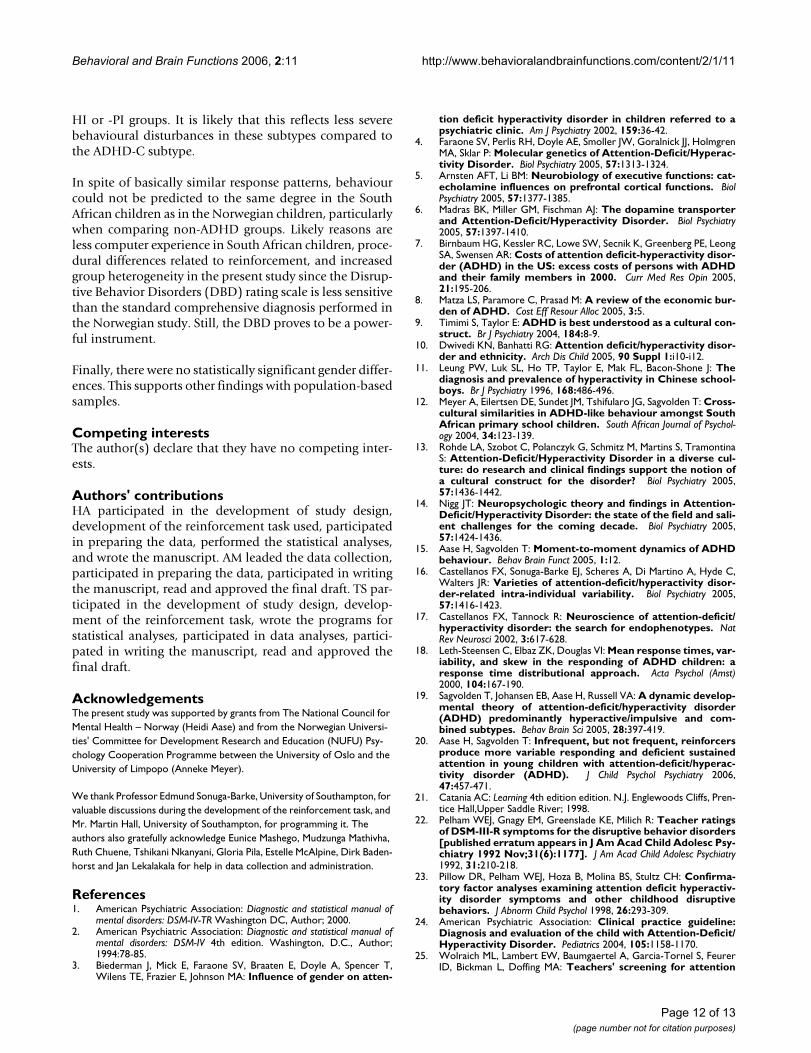
The generally low values of explained variance in the firstlag (0.21 > mean R2 > 0.12; median R2 = 0.17) show arather low predictability from one response to the imme-diate next. As can be seen in Figure 2, the ADHD groupwas generally lower than the non-ADHD group. There wasno significant main effect of Group, however, but a signif-icant main effect of Lag. The interaction between Group
Response predictability according to side of the screenFigure 1Response predictability according to side of the screen. Predictability of consecutive responses according to side of the screen (left or right), depicted as mean explained variance (autocorrelations squared), across segments (Seg. 1–5) and lags (1–5 per segment), for ADHD and non-ADHD groups. Abbreviations: Seg.: segment of session. Lag: number of responses that has to be correlated to the present one, i.e., correlations between response n and n+1 is the first lag, between n and n+2 is the second lag, and so on up to corre-lations between response n and n+5 being the fifth lag.
Seg. 1
1 2 3 4 50,00
0,05
0,10
0,15
0,20
0,25
0,30
Exp
lain
ed V
aria
nce
2
1 2 3 4 5
3
1 2 3 4 5
4
1 2 3 4 5
5
1 2 3 4 5
Non-ADHD ADHD
Page 6 of 13(page number not for citation purposes)
Behavioral and Brain Functions 2006, 2:11 http://www.behavioralandbrainfunctions.com/content/2/1/11
and Lag was significant in the multivariate analysis (Table2).
The follow-up ANOVA of the three subtypes and the non-ADHD group showed no significant effects except a signif-icant main effect of Lag (F(4, 720) = 149.27; p < .001). Inorder to check if there were statistically significant differ-ences between any two subtypes, a post hoc Scheffé test ofSubtype and Lag was performed. The main results fromthis test indicate a larger decrease in explained variancefrom the first to the next lags in the non-ADHD group andin the ADHD-PI subtype compared to the other subtypes,and that there was a larger difference between the ADHD-C subtype and the non-ADHD group compared to anyother combination of subtypes.
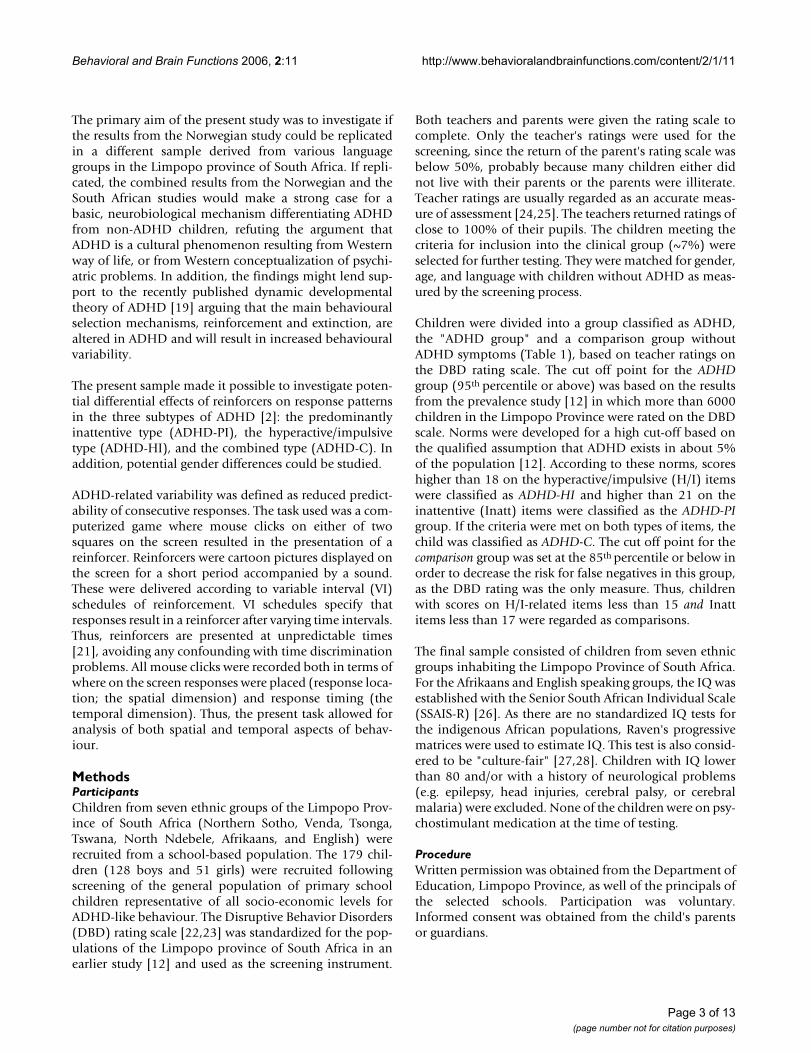
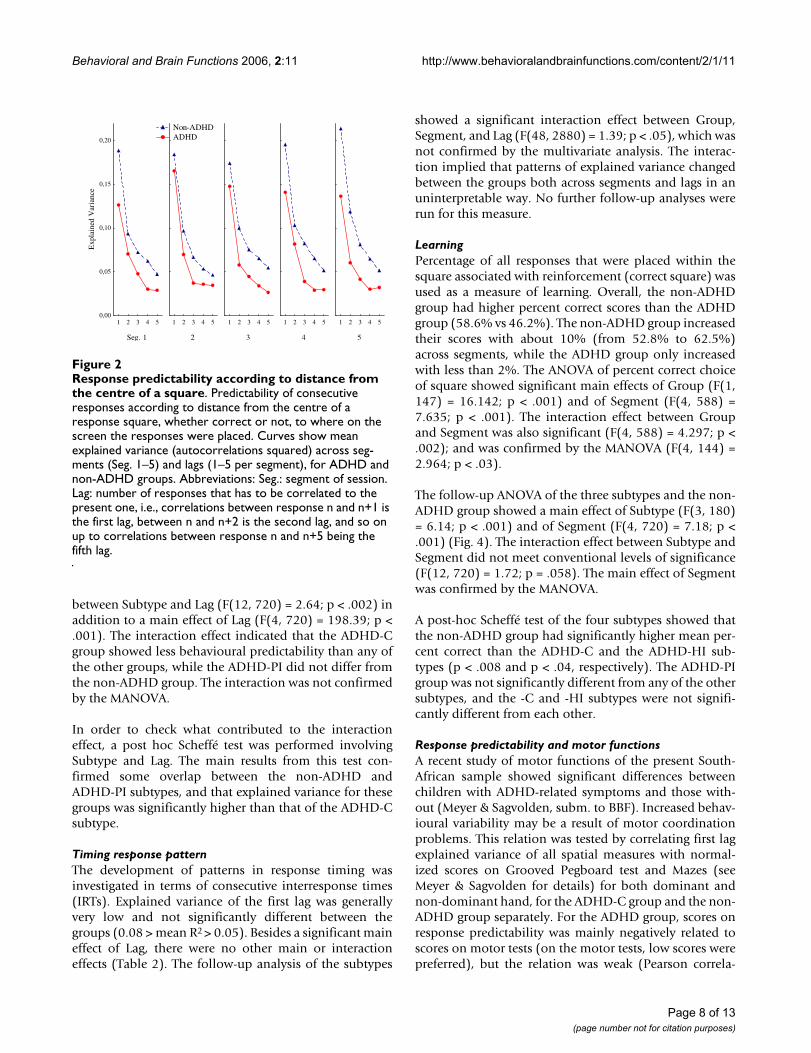
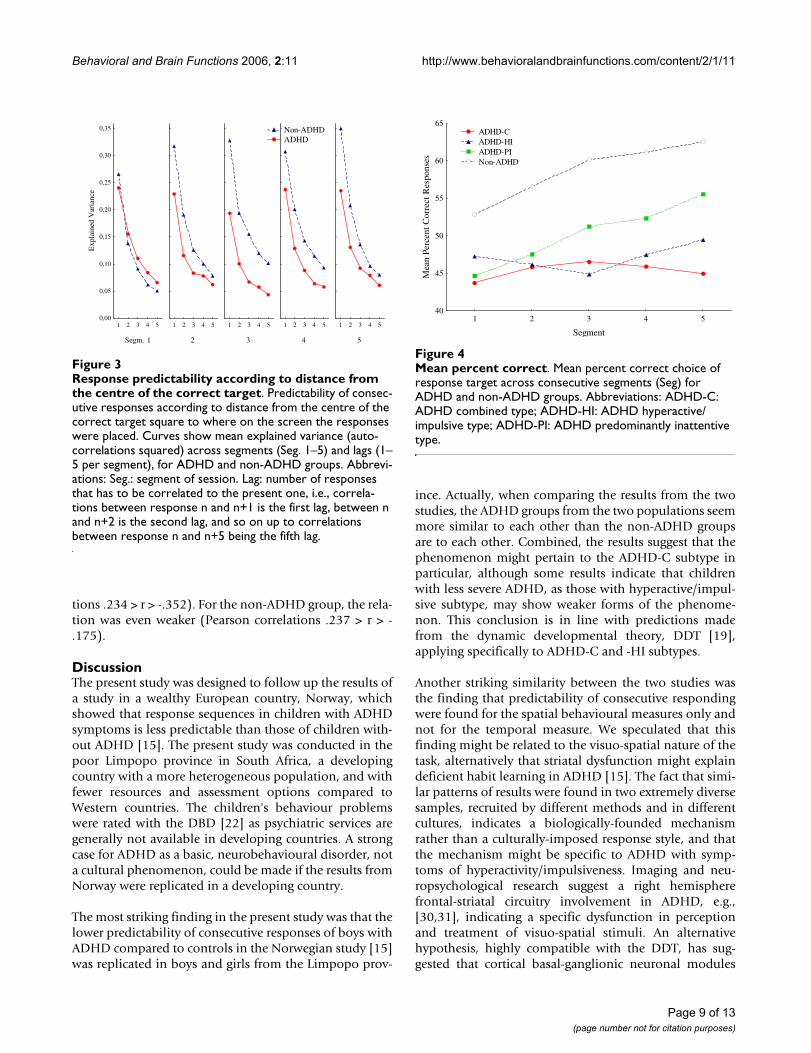
Distance to correct centreThis measure assessed patterns in response placements interms of distance from the centre of the correct square.Again, low explained variance indicated high variability inspatial responding. As can be seen in Figure 3, respondingwas somewhat more predictable with this measure of
behaviour compared to the two other spatial measures.Predictability from one response to the immediate next(explained variance in the first lag) was generally in thelower middle range (0.35 > mean R2 > 0.19; median R2 =0.25) compared to previous results [15]. The ADHDgroup had less predictable behaviour than the non-ADHDgroup.
The ANOVA showed a significant main effect of Group, inaddition to the main effect of Lag (Table 2). There werealso significant interaction effects between Group andSegment, and between Group and Lag. The interactionbetween Group, Segment, and Lag did not meet conven-tional levels of significance (p > .08). Only the interactioninvolving Group and Segment was confirmed by the mul-tivariate analysis (Table 2). This interaction showed thatwhile the non-ADHD group's behaviour increased in pre-dictability over segments, the ADHD group's behaviourdid not improve over segments.
The follow-up ANOVA of the three subtypes and the non-ADHD group only showed a significant interaction effect
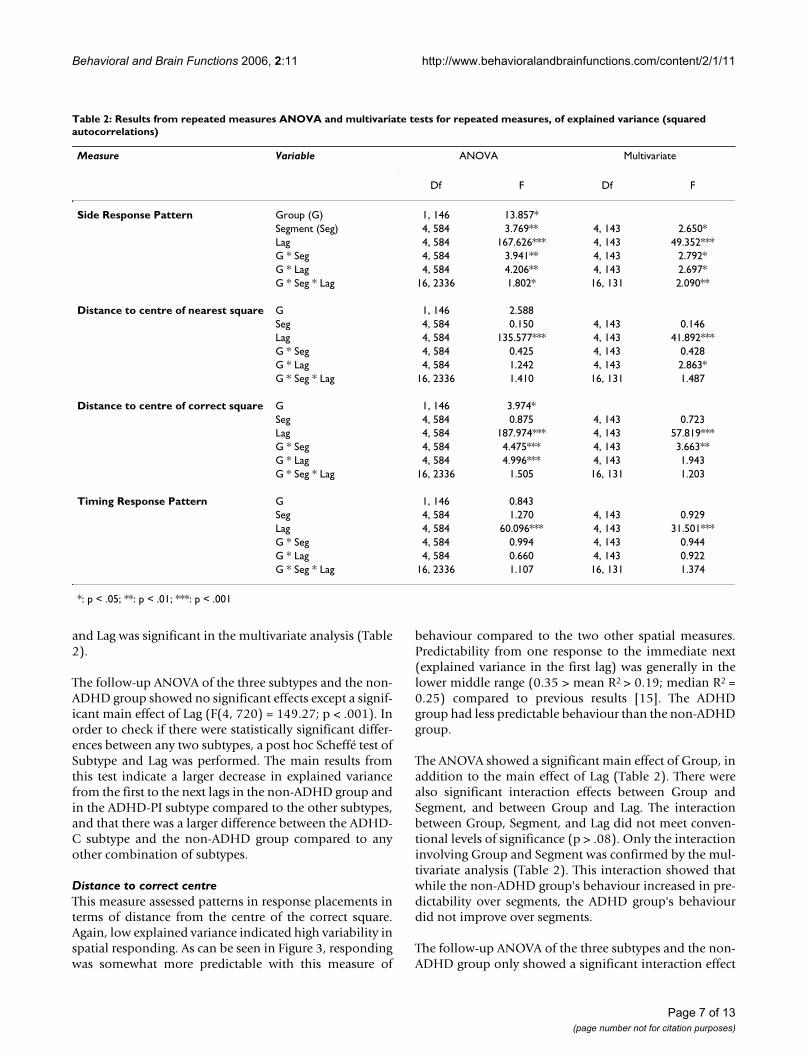
Table 2: Results from repeated measures ANOVA and multivariate tests for repeated measures, of explained variance (squared autocorrelations)
Measure Variable ANOVA Multivariate
Df F Df F
Side Response Pattern Group (G) 1, 146 13.857*Segment (Seg) 4, 584 3.769** 4, 143 2.650*Lag 4, 584 167.626*** 4, 143 49.352***G * Seg 4, 584 3.941** 4, 143 2.792*G * Lag 4, 584 4.206** 4, 143 2.697*G * Seg * Lag 16, 2336 1.802* 16, 131 2.090**
Distance to centre of nearest square G 1, 146 2.588Seg 4, 584 0.150 4, 143 0.146Lag 4, 584 135.577*** 4, 143 41.892***G * Seg 4, 584 0.425 4, 143 0.428G * Lag 4, 584 1.242 4, 143 2.863*G * Seg * Lag 16, 2336 1.410 16, 131 1.487
Distance to centre of correct square G 1, 146 3.974*Seg 4, 584 0.875 4, 143 0.723Lag 4, 584 187.974*** 4, 143 57.819***G * Seg 4, 584 4.475*** 4, 143 3.663**G * Lag 4, 584 4.996*** 4, 143 1.943G * Seg * Lag 16, 2336 1.505 16, 131 1.203
Timing Response Pattern G 1, 146 0.843Seg 4, 584 1.270 4, 143 0.929Lag 4, 584 60.096*** 4, 143 31.501***G * Seg 4, 584 0.994 4, 143 0.944G * Lag 4, 584 0.660 4, 143 0.922G * Seg * Lag 16, 2336 1.107 16, 131 1.374
*: p < .05; **: p < .01; ***: p < .001
Page 7 of 13(page number not for citation purposes)
Behavioral and Brain Functions 2006, 2:11 http://www.behavioralandbrainfunctions.com/content/2/1/11
between Subtype and Lag (F(12, 720) = 2.64; p < .002) inaddition to a main effect of Lag (F(4, 720) = 198.39; p <.001). The interaction effect indicated that the ADHD-Cgroup showed less behavioural predictability than any ofthe other groups, while the ADHD-PI did not differ fromthe non-ADHD group. The interaction was not confirmedby the MANOVA.
In order to check what contributed to the interactioneffect, a post hoc Scheffé test was performed involvingSubtype and Lag. The main results from this test con-firmed some overlap between the non-ADHD andADHD-PI subtypes, and that explained variance for thesegroups was significantly higher than that of the ADHD-Csubtype.
Timing response patternThe development of patterns in response timing wasinvestigated in terms of consecutive interresponse times(IRTs). Explained variance of the first lag was generallyvery low and not significantly different between thegroups (0.08 > mean R2 > 0.05). Besides a significant maineffect of Lag, there were no other main or interactioneffects (Table 2). The follow-up analysis of the subtypes
showed a significant interaction effect between Group,Segment, and Lag (F(48, 2880) = 1.39; p < .05), which wasnot confirmed by the multivariate analysis. The interac-tion implied that patterns of explained variance changedbetween the groups both across segments and lags in anuninterpretable way. No further follow-up analyses wererun for this measure.
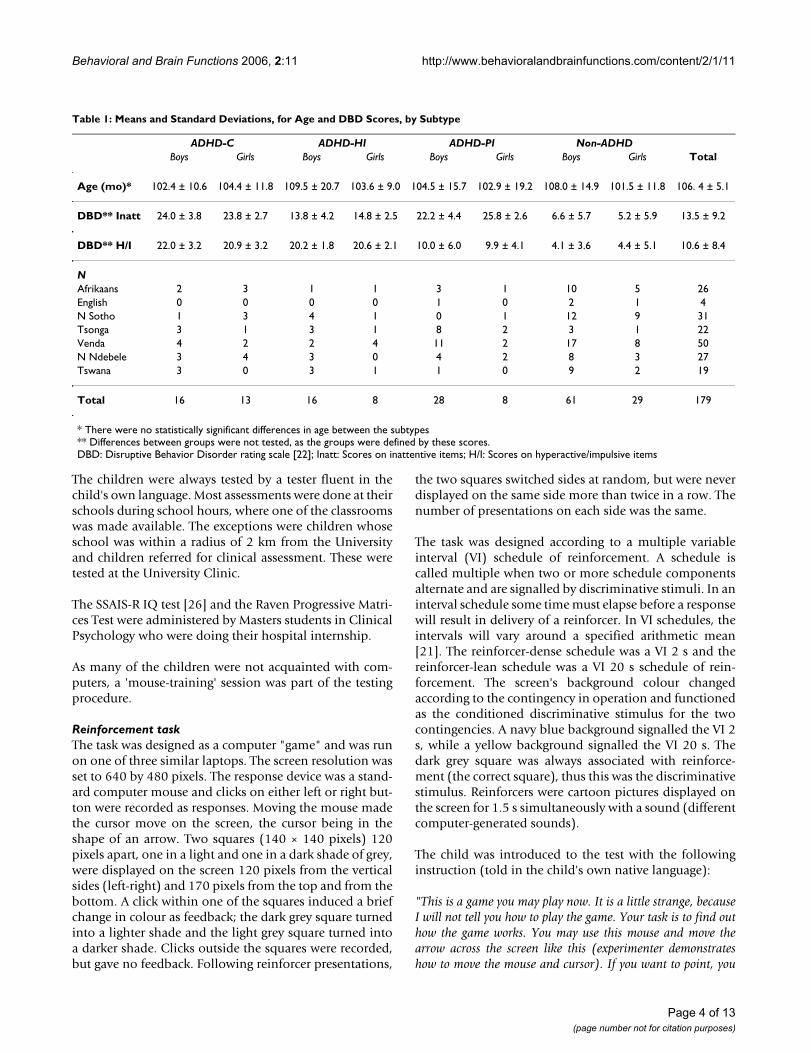
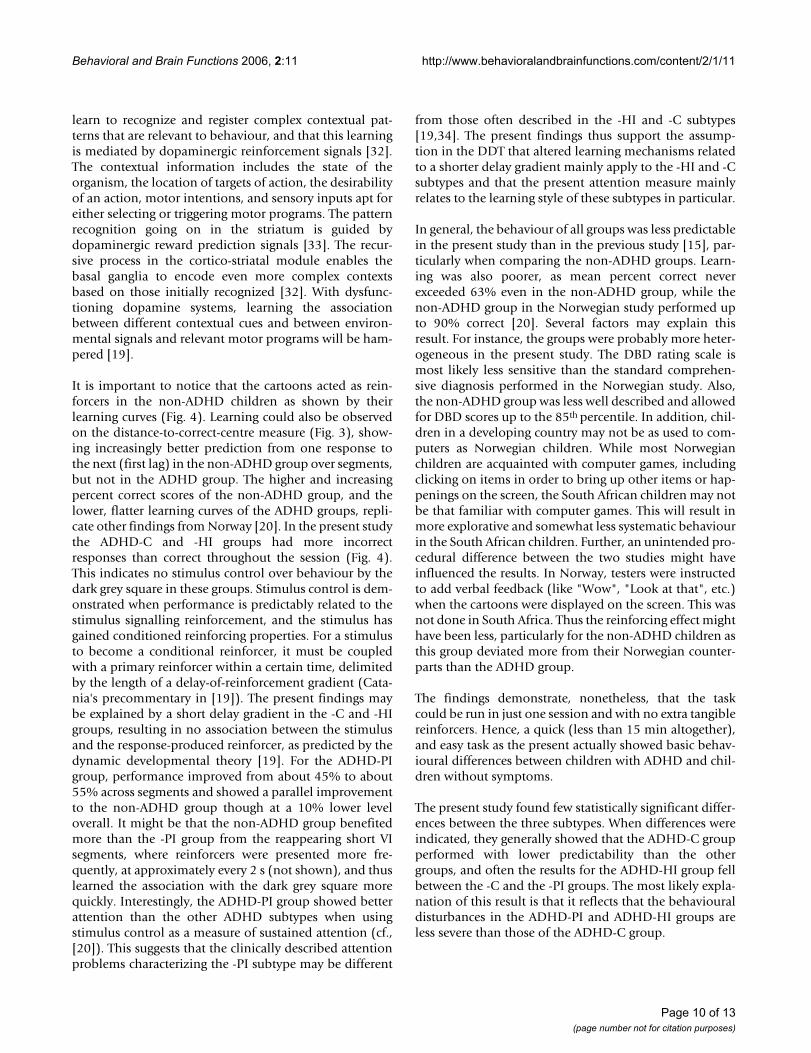
LearningPercentage of all responses that were placed within thesquare associated with reinforcement (correct square) wasused as a measure of learning. Overall, the non-ADHDgroup had higher percent correct scores than the ADHDgroup (58.6% vs 46.2%). The non-ADHD group increasedtheir scores with about 10% (from 52.8% to 62.5%)across segments, while the ADHD group only increasedwith less than 2%. The ANOVA of percent correct choiceof square showed significant main effects of Group (F(1,147) = 16.142; p < .001) and of Segment (F(4, 588) =7.635; p < .001). The interaction effect between Groupand Segment was also significant (F(4, 588) = 4.297; p <.002); and was confirmed by the MANOVA (F(4, 144) =2.964; p < .03).
The follow-up ANOVA of the three subtypes and the non-ADHD group showed a main effect of Subtype (F(3, 180)= 6.14; p < .001) and of Segment (F(4, 720) = 7.18; p <.001) (Fig. 4). The interaction effect between Subtype andSegment did not meet conventional levels of significance(F(12, 720) = 1.72; p = .058). The main effect of Segmentwas confirmed by the MANOVA.
A post-hoc Scheffé test of the four subtypes showed thatthe non-ADHD group had significantly higher mean per-cent correct than the ADHD-C and the ADHD-HI sub-types (p < .008 and p < .04, respectively). The ADHD-PIgroup was not significantly different from any of the othersubtypes, and the -C and -HI subtypes were not signifi-cantly different from each other.
Response predictability and motor functionsA recent study of motor functions of the present South-African sample showed significant differences betweenchildren with ADHD-related symptoms and those with-out (Meyer & Sagvolden, subm. to BBF). Increased behav-ioural variability may be a result of motor coordinationproblems. This relation was tested by correlating first lagexplained variance of all spatial measures with normal-ized scores on Grooved Pegboard test and Mazes (seeMeyer & Sagvolden for details) for both dominant andnon-dominant hand, for the ADHD-C group and the non-ADHD group separately. For the ADHD group, scores onresponse predictability was mainly negatively related toscores on motor tests (on the motor tests, low scores werepreferred), but the relation was weak (Pearson correla-
Response predictability according to distance from the cen-tre of a squareFigure 2Response predictability according to distance from the centre of a square. Predictability of consecutive responses according to distance from the centre of a response square, whether correct or not, to where on the screen the responses were placed. Curves show mean explained variance (autocorrelations squared) across seg-ments (Seg. 1–5) and lags (1–5 per segment), for ADHD and non-ADHD groups. Abbreviations: Seg.: segment of session. Lag: number of responses that has to be correlated to the present one, i.e., correlations between response n and n+1 is the first lag, between n and n+2 is the second lag, and so on up to correlations between response n and n+5 being the fifth lag.
Seg. 1
1 2 3 4 50,00
0,05
0,10
0,15
0,20
Exp
lain
ed V
aria
nce
2
1 2 3 4 5
3
1 2 3 4 5
4
1 2 3 4 5
5
1 2 3 4 5
Non-ADHD ADHD
Page 8 of 13(page number not for citation purposes)
Behavioral and Brain Functions 2006, 2:11 http://www.behavioralandbrainfunctions.com/content/2/1/11
tions .234 > r > -.352). For the non-ADHD group, the rela-tion was even weaker (Pearson correlations .237 > r > -.175).
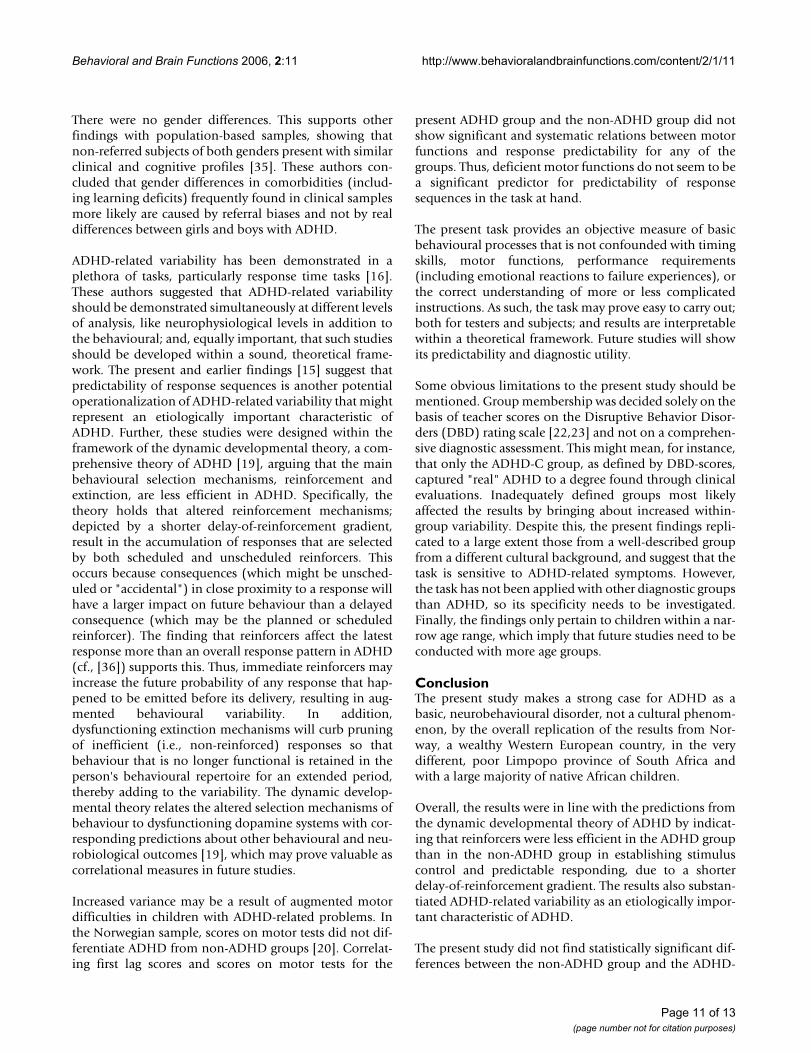
DiscussionThe present study was designed to follow up the results ofa study in a wealthy European country, Norway, whichshowed that response sequences in children with ADHDsymptoms is less predictable than those of children with-out ADHD [15]. The present study was conducted in thepoor Limpopo province in South Africa, a developingcountry with a more heterogeneous population, and withfewer resources and assessment options compared toWestern countries. The children's behaviour problemswere rated with the DBD [22] as psychiatric services aregenerally not available in developing countries. A strongcase for ADHD as a basic, neurobehavioural disorder, nota cultural phenomenon, could be made if the results fromNorway were replicated in a developing country.
The most striking finding in the present study was that thelower predictability of consecutive responses of boys withADHD compared to controls in the Norwegian study [15]was replicated in boys and girls from the Limpopo prov-
ince. Actually, when comparing the results from the twostudies, the ADHD groups from the two populations seemmore similar to each other than the non-ADHD groupsare to each other. Combined, the results suggest that thephenomenon might pertain to the ADHD-C subtype inparticular, although some results indicate that childrenwith less severe ADHD, as those with hyperactive/impul-sive subtype, may show weaker forms of the phenome-non. This conclusion is in line with predictions madefrom the dynamic developmental theory, DDT [19],applying specifically to ADHD-C and -HI subtypes.
Another striking similarity between the two studies wasthe finding that predictability of consecutive respondingwere found for the spatial behavioural measures only andnot for the temporal measure. We speculated that thisfinding might be related to the visuo-spatial nature of thetask, alternatively that striatal dysfunction might explaindeficient habit learning in ADHD [15]. The fact that simi-lar patterns of results were found in two extremely diversesamples, recruited by different methods and in differentcultures, indicates a biologically-founded mechanismrather than a culturally-imposed response style, and thatthe mechanism might be specific to ADHD with symp-toms of hyperactivity/impulsiveness. Imaging and neu-ropsychological research suggest a right hemispherefrontal-striatal circuitry involvement in ADHD, e.g.,[30,31], indicating a specific dysfunction in perceptionand treatment of visuo-spatial stimuli. An alternativehypothesis, highly compatible with the DDT, has sug-gested that cortical basal-ganglionic neuronal modules
Mean percent correctFigure 4Mean percent correct. Mean percent correct choice of response target across consecutive segments (Seg) for ADHD and non-ADHD groups. Abbreviations: ADHD-C: ADHD combined type; ADHD-HI: ADHD hyperactive/impulsive type; ADHD-PI: ADHD predominantly inattentive type.
1 2 3 4 5
Segment
40
45
50
55
60
65
Mea
n P
erce
nt
Corr
ect
Res
po
nse
s
ADHD-C
ADHD-HI
ADHD-PI
Non-ADHD
Response predictability according to distance from the cen-tre of the correct targetFigure 3Response predictability according to distance from the centre of the correct target. Predictability of consec-utive responses according to distance from the centre of the correct target square to where on the screen the responses were placed. Curves show mean explained variance (auto-correlations squared) across segments (Seg. 1–5) and lags (1–5 per segment), for ADHD and non-ADHD groups. Abbrevi-ations: Seg.: segment of session. Lag: number of responses that has to be correlated to the present one, i.e., correla-tions between response n and n+1 is the first lag, between n and n+2 is the second lag, and so on up to correlations between response n and n+5 being the fifth lag.
Segm. 1
1 2 3 4 50,00
0,05
0,10
0,15
0,20
0,25
0,30
0,35
Ex
pla
ined
Var
ian
ce
2
1 2 3 4 5
3
1 2 3 4 5
4
1 2 3 4 5
5
1 2 3 4 5
Non-ADHD
ADHD
Page 9 of 13(page number not for citation purposes)
Behavioral and Brain Functions 2006, 2:11 http://www.behavioralandbrainfunctions.com/content/2/1/11
learn to recognize and register complex contextual pat-terns that are relevant to behaviour, and that this learningis mediated by dopaminergic reinforcement signals [32].The contextual information includes the state of theorganism, the location of targets of action, the desirabilityof an action, motor intentions, and sensory inputs apt foreither selecting or triggering motor programs. The patternrecognition going on in the striatum is guided bydopaminergic reward prediction signals [33]. The recur-sive process in the cortico-striatal module enables thebasal ganglia to encode even more complex contextsbased on those initially recognized [32]. With dysfunc-tioning dopamine systems, learning the associationbetween different contextual cues and between environ-mental signals and relevant motor programs will be ham-pered [19].
It is important to notice that the cartoons acted as rein-forcers in the non-ADHD children as shown by theirlearning curves (Fig. 4). Learning could also be observedon the distance-to-correct-centre measure (Fig. 3), show-ing increasingly better prediction from one response tothe next (first lag) in the non-ADHD group over segments,but not in the ADHD group. The higher and increasingpercent correct scores of the non-ADHD group, and thelower, flatter learning curves of the ADHD groups, repli-cate other findings from Norway [20]. In the present studythe ADHD-C and -HI groups had more incorrectresponses than correct throughout the session (Fig. 4).This indicates no stimulus control over behaviour by thedark grey square in these groups. Stimulus control is dem-onstrated when performance is predictably related to thestimulus signalling reinforcement, and the stimulus hasgained conditioned reinforcing properties. For a stimulusto become a conditional reinforcer, it must be coupledwith a primary reinforcer within a certain time, delimitedby the length of a delay-of-reinforcement gradient (Cata-nia's precommentary in [19]). The present findings maybe explained by a short delay gradient in the -C and -HIgroups, resulting in no association between the stimulusand the response-produced reinforcer, as predicted by thedynamic developmental theory [19]. For the ADHD-PIgroup, performance improved from about 45% to about55% across segments and showed a parallel improvementto the non-ADHD group though at a 10% lower leveloverall. It might be that the non-ADHD group benefitedmore than the -PI group from the reappearing short VIsegments, where reinforcers were presented more fre-quently, at approximately every 2 s (not shown), and thuslearned the association with the dark grey square morequickly. Interestingly, the ADHD-PI group showed betterattention than the other ADHD subtypes when usingstimulus control as a measure of sustained attention (cf.,[20]). This suggests that the clinically described attentionproblems characterizing the -PI subtype may be different
from those often described in the -HI and -C subtypes[19,34]. The present findings thus support the assump-tion in the DDT that altered learning mechanisms relatedto a shorter delay gradient mainly apply to the -HI and -Csubtypes and that the present attention measure mainlyrelates to the learning style of these subtypes in particular.
In general, the behaviour of all groups was less predictablein the present study than in the previous study [15], par-ticularly when comparing the non-ADHD groups. Learn-ing was also poorer, as mean percent correct neverexceeded 63% even in the non-ADHD group, while thenon-ADHD group in the Norwegian study performed upto 90% correct [20]. Several factors may explain thisresult. For instance, the groups were probably more heter-ogeneous in the present study. The DBD rating scale ismost likely less sensitive than the standard comprehen-sive diagnosis performed in the Norwegian study. Also,the non-ADHD group was less well described and allowedfor DBD scores up to the 85th percentile. In addition, chil-dren in a developing country may not be as used to com-puters as Norwegian children. While most Norwegianchildren are acquainted with computer games, includingclicking on items in order to bring up other items or hap-penings on the screen, the South African children may notbe that familiar with computer games. This will result inmore explorative and somewhat less systematic behaviourin the South African children. Further, an unintended pro-cedural difference between the two studies might haveinfluenced the results. In Norway, testers were instructedto add verbal feedback (like "Wow", "Look at that", etc.)when the cartoons were displayed on the screen. This wasnot done in South Africa. Thus the reinforcing effect mighthave been less, particularly for the non-ADHD children asthis group deviated more from their Norwegian counter-parts than the ADHD group.
The findings demonstrate, nonetheless, that the taskcould be run in just one session and with no extra tangiblereinforcers. Hence, a quick (less than 15 min altogether),and easy task as the present actually showed basic behav-ioural differences between children with ADHD and chil-dren without symptoms.
The present study found few statistically significant differ-ences between the three subtypes. When differences wereindicated, they generally showed that the ADHD-C groupperformed with lower predictability than the othergroups, and often the results for the ADHD-HI group fellbetween the -C and the -PI groups. The most likely expla-nation of this result is that it reflects that the behaviouraldisturbances in the ADHD-PI and ADHD-HI groups areless severe than those of the ADHD-C group.
Page 10 of 13(page number not for citation purposes)
Behavioral and Brain Functions 2006, 2:11 http://www.behavioralandbrainfunctions.com/content/2/1/11
There were no gender differences. This supports otherfindings with population-based samples, showing thatnon-referred subjects of both genders present with similarclinical and cognitive profiles [35]. These authors con-cluded that gender differences in comorbidities (includ-ing learning deficits) frequently found in clinical samplesmore likely are caused by referral biases and not by realdifferences between girls and boys with ADHD.
ADHD-related variability has been demonstrated in aplethora of tasks, particularly response time tasks [16].These authors suggested that ADHD-related variabilityshould be demonstrated simultaneously at different levelsof analysis, like neurophysiological levels in addition tothe behavioural; and, equally important, that such studiesshould be developed within a sound, theoretical frame-work. The present and earlier findings [15] suggest thatpredictability of response sequences is another potentialoperationalization of ADHD-related variability that mightrepresent an etiologically important characteristic ofADHD. Further, these studies were designed within theframework of the dynamic developmental theory, a com-prehensive theory of ADHD [19], arguing that the mainbehavioural selection mechanisms, reinforcement andextinction, are less efficient in ADHD. Specifically, thetheory holds that altered reinforcement mechanisms;depicted by a shorter delay-of-reinforcement gradient,result in the accumulation of responses that are selectedby both scheduled and unscheduled reinforcers. Thisoccurs because consequences (which might be unsched-uled or "accidental") in close proximity to a response willhave a larger impact on future behaviour than a delayedconsequence (which may be the planned or scheduledreinforcer). The finding that reinforcers affect the latestresponse more than an overall response pattern in ADHD(cf., [36]) supports this. Thus, immediate reinforcers mayincrease the future probability of any response that hap-pened to be emitted before its delivery, resulting in aug-mented behavioural variability. In addition,dysfunctioning extinction mechanisms will curb pruningof inefficient (i.e., non-reinforced) responses so thatbehaviour that is no longer functional is retained in theperson's behavioural repertoire for an extended period,thereby adding to the variability. The dynamic develop-mental theory relates the altered selection mechanisms ofbehaviour to dysfunctioning dopamine systems with cor-responding predictions about other behavioural and neu-robiological outcomes [19], which may prove valuable ascorrelational measures in future studies.
Increased variance may be a result of augmented motordifficulties in children with ADHD-related problems. Inthe Norwegian sample, scores on motor tests did not dif-ferentiate ADHD from non-ADHD groups [20]. Correlat-ing first lag scores and scores on motor tests for the
present ADHD group and the non-ADHD group did notshow significant and systematic relations between motorfunctions and response predictability for any of thegroups. Thus, deficient motor functions do not seem to bea significant predictor for predictability of responsesequences in the task at hand.
The present task provides an objective measure of basicbehavioural processes that is not confounded with timingskills, motor functions, performance requirements(including emotional reactions to failure experiences), orthe correct understanding of more or less complicatedinstructions. As such, the task may prove easy to carry out;both for testers and subjects; and results are interpretablewithin a theoretical framework. Future studies will showits predictability and diagnostic utility.
Some obvious limitations to the present study should bementioned. Group membership was decided solely on thebasis of teacher scores on the Disruptive Behavior Disor-ders (DBD) rating scale [22,23] and not on a comprehen-sive diagnostic assessment. This might mean, for instance,that only the ADHD-C group, as defined by DBD-scores,captured "real" ADHD to a degree found through clinicalevaluations. Inadequately defined groups most likelyaffected the results by bringing about increased within-group variability. Despite this, the present findings repli-cated to a large extent those from a well-described groupfrom a different cultural background, and suggest that thetask is sensitive to ADHD-related symptoms. However,the task has not been applied with other diagnostic groupsthan ADHD, so its specificity needs to be investigated.Finally, the findings only pertain to children within a nar-row age range, which imply that future studies need to beconducted with more age groups.
ConclusionThe present study makes a strong case for ADHD as abasic, neurobehavioural disorder, not a cultural phenom-enon, by the overall replication of the results from Nor-way, a wealthy Western European country, in the verydifferent, poor Limpopo province of South Africa andwith a large majority of native African children.
Overall, the results were in line with the predictions fromthe dynamic developmental theory of ADHD by indicat-ing that reinforcers were less efficient in the ADHD groupthan in the non-ADHD group in establishing stimuluscontrol and predictable responding, due to a shorterdelay-of-reinforcement gradient. The results also substan-tiated ADHD-related variability as an etiologically impor-tant characteristic of ADHD.
The present study did not find statistically significant dif-ferences between the non-ADHD group and the ADHD-
Page 11 of 13(page number not for citation purposes)
Behavioral and Brain Functions 2006, 2:11 http://www.behavioralandbrainfunctions.com/content/2/1/11
HI or -PI groups. It is likely that this reflects less severebehavioural disturbances in these subtypes compared tothe ADHD-C subtype.
In spite of basically similar response patterns, behaviourcould not be predicted to the same degree in the SouthAfrican children as in the Norwegian children, particularlywhen comparing non-ADHD groups. Likely reasons areless computer experience in South African children, proce-dural differences related to reinforcement, and increasedgroup heterogeneity in the present study since the Disrup-tive Behavior Disorders (DBD) rating scale is less sensitivethan the standard comprehensive diagnosis performed inthe Norwegian study. Still, the DBD proves to be a power-ful instrument.
Finally, there were no statistically significant gender differ-ences. This supports other findings with population-basedsamples.
Competing interestsThe author(s) declare that they have no competing inter-ests.
Authors' contributionsHA participated in the development of study design,development of the reinforcement task used, participatedin preparing the data, performed the statistical analyses,and wrote the manuscript. AM leaded the data collection,participated in preparing the data, participated in writingthe manuscript, read and approved the final draft. TS par-ticipated in the development of study design, develop-ment of the reinforcement task, wrote the programs forstatistical analyses, participated in data analyses, partici-pated in writing the manuscript, read and approved thefinal draft.
AcknowledgementsThe present study was supported by grants from The National Council for Mental Health – Norway (Heidi Aase) and from the Norwegian Universi-ties' Committee for Development Research and Education (NUFU) Psy-chology Cooperation Programme between the University of Oslo and the University of Limpopo (Anneke Meyer).
We thank Professor Edmund Sonuga-Barke, University of Southampton, for valuable discussions during the development of the reinforcement task, and Mr. Martin Hall, University of Southampton, for programming it. The authors also gratefully acknowledge Eunice Mashego, Mudzunga Mathivha, Ruth Chuene, Tshikani Nkanyani, Gloria Pila, Estelle McAlpine, Dirk Baden-horst and Jan Lekalakala for help in data collection and administration.
References1. American Psychiatric Association: Diagnostic and statistical manual of
mental disorders: DSM-IV-TR Washington DC, Author; 2000. 2. American Psychiatric Association: Diagnostic and statistical manual of
mental disorders: DSM-IV 4th edition. Washington, D.C., Author;1994:78-85.
3. Biederman J, Mick E, Faraone SV, Braaten E, Doyle A, Spencer T,Wilens TE, Frazier E, Johnson MA: Influence of gender on atten-
tion deficit hyperactivity disorder in children referred to apsychiatric clinic. Am J Psychiatry 2002, 159:36-42.
4. Faraone SV, Perlis RH, Doyle AE, Smoller JW, Goralnick JJ, HolmgrenMA, Sklar P: Molecular genetics of Attention-Deficit/Hyperac-tivity Disorder. Biol Psychiatry 2005, 57:1313-1324.
5. Arnsten AFT, Li BM: Neurobiology of executive functions: cat-echolamine influences on prefrontal cortical functions. BiolPsychiatry 2005, 57:1377-1385.
6. Madras BK, Miller GM, Fischman AJ: The dopamine transporterand Attention-Deficit/Hyperactivity Disorder. Biol Psychiatry2005, 57:1397-1410.
7. Birnbaum HG, Kessler RC, Lowe SW, Secnik K, Greenberg PE, LeongSA, Swensen AR: Costs of attention deficit-hyperactivity disor-der (ADHD) in the US: excess costs of persons with ADHDand their family members in 2000. Curr Med Res Opin 2005,21:195-206.
8. Matza LS, Paramore C, Prasad M: A review of the economic bur-den of ADHD. Cost Eff Resour Alloc 2005, 3:5.
9. Timimi S, Taylor E: ADHD is best understood as a cultural con-struct. Br J Psychiatry 2004, 184:8-9.
10. Dwivedi KN, Banhatti RG: Attention deficit/hyperactivity disor-der and ethnicity. Arch Dis Child 2005, 90 Suppl 1:i10-i12.
11. Leung PW, Luk SL, Ho TP, Taylor E, Mak FL, Bacon-Shone J: Thediagnosis and prevalence of hyperactivity in Chinese school-boys. Br J Psychiatry 1996, 168:486-496.
12. Meyer A, Eilertsen DE, Sundet JM, Tshifularo JG, Sagvolden T: Cross-cultural similarities in ADHD-like behaviour amongst SouthAfrican primary school children. South African Journal of Psychol-ogy 2004, 34:123-139.
13. Rohde LA, Szobot C, Polanczyk G, Schmitz M, Martins S, TramontinaS: Attention-Deficit/Hyperactivity Disorder in a diverse cul-ture: do research and clinical findings support the notion ofa cultural construct for the disorder? Biol Psychiatry 2005,57:1436-1442.
14. Nigg JT: Neuropsychologic theory and findings in Attention-Deficit/Hyperactivity Disorder: the state of the field and sali-ent challenges for the coming decade. Biol Psychiatry 2005,57:1424-1436.
15. Aase H, Sagvolden T: Moment-to-moment dynamics of ADHDbehaviour. Behav Brain Funct 2005, 1:12.
16. Castellanos FX, Sonuga-Barke EJ, Scheres A, Di Martino A, Hyde C,Walters JR: Varieties of attention-deficit/hyperactivity disor-der-related intra-individual variability. Biol Psychiatry 2005,57:1416-1423.
17. Castellanos FX, Tannock R: Neuroscience of attention-deficit/hyperactivity disorder: the search for endophenotypes. NatRev Neurosci 2002, 3:617-628.
18. Leth-Steensen C, Elbaz ZK, Douglas VI: Mean response times, var-iability, and skew in the responding of ADHD children: aresponse time distributional approach. Acta Psychol (Amst)2000, 104:167-190.
19. Sagvolden T, Johansen EB, Aase H, Russell VA: A dynamic develop-mental theory of attention-deficit/hyperactivity disorder(ADHD) predominantly hyperactive/impulsive and com-bined subtypes. Behav Brain Sci 2005, 28:397-419.
20. Aase H, Sagvolden T: Infrequent, but not frequent, reinforcersproduce more variable responding and deficient sustainedattention in young children with attention-deficit/hyperac-tivity disorder (ADHD). J Child Psychol Psychiatry 2006,47:457-471.
21. Catania AC: Learning 4th edition edition. N.J. Englewoods Cliffs, Pren-tice Hall,Upper Saddle River; 1998.
22. Pelham WEJ, Gnagy EM, Greenslade KE, Milich R: Teacher ratingsof DSM-III-R symptoms for the disruptive behavior disorders[published erratum appears in J Am Acad Child Adolesc Psy-chiatry 1992 Nov;31(6):1177]. J Am Acad Child Adolesc Psychiatry1992, 31:210-218.
23. Pillow DR, Pelham WEJ, Hoza B, Molina BS, Stultz CH: Confirma-tory factor analyses examining attention deficit hyperactiv-ity disorder symptoms and other childhood disruptivebehaviors. J Abnorm Child Psychol 1998, 26:293-309.
24. American Psychiatric Association: Clinical practice guideline:Diagnosis and evaluation of the child with Attention-Deficit/Hyperactivity Disorder. Pediatrics 2004, 105:1158-1170.
25. Wolraich ML, Lambert EW, Baumgaertel A, Garcia-Tornel S, FeurerID, Bickman L, Doffing MA: Teachers' screening for attention
Page 12 of 13(page number not for citation purposes)
Behavioral and Brain Functions 2006, 2:11 http://www.behavioralandbrainfunctions.com/content/2/1/11
Publish with BioMed Central and every scientist can read your work free of charge
"BioMed Central will be the most significant development for disseminating the results of biomedical research in our lifetime."
Sir Paul Nurse, Cancer Research UK
Your research papers will be:
available free of charge to the entire biomedical community
peer reviewed and published immediately upon acceptance
cited in PubMed and archived on PubMed Central
yours — you keep the copyright
Submit your manuscript here:http://www.biomedcentral.com/info/publishing_adv.asp
BioMedcentral
deficit/hyperactivity disorder: comparing multinational sam-ples on teacher ratings of ADHD. J Abnorm Child Psychol 2003,31:445-455.
26. Van Eeden R: Manual for the South African Individual Scale - Revised(SSAIS-R). Pretoria, Human Sciences Research Council; 1997.
27. Raven J: The Raven's progressive matrices: change and stabil-ity over culture and time. Cognit Psychol 2000, 41:1-48.
28. Wilkes J, Weigel A: [Comparison of WISC-R and Raven's Pro-gressive Matrices tests in a clinical consultation population].Z Kinder Jugendpsychiatr Psychother 1998, 26:261-265.
29. Inc. SS: STATISTICA for Windows [Computer software].Tulsa, OK: StatSoft Inc.; 2003.
30. Giedd JN, Blumenthal J, Molloy E, Castellanos FX: Brain imaging ofattention deficit/hyperactivity disorder. Ann N Y Acad Sci 2001,931:33-49.
31. Stefanatos GA, Wasserstein J: Attention deficit/hyperactivitydisorder as a right hemisphere syndrome. Selective litera-ture review and detailed neuropsychological case studies.Ann N Y Acad Sci 2001, 931:172-195.
32. Houk JC, Wise SP: Distributed modular architectures linkingbasal ganglia, cerebellum, and cerebral cortex: their role inplanning and controlling action. Cereb Cortex 1995, 5:95-110.
33. Schultz W: Getting formal with dopamine and reward. Neuron2002, 36:241-263.
34. Barkley RA: ADHD and the nature of self control New York, Guilford;1997.
35. Biederman J, Kwon A, Aleardi M, Chouinard VA, Marino T, Cole H,Mick E, Faraone SV: Absence of gender effects on attention def-icit hyperactivity disorder: findings in nonreferred subjects.Am J Psychiatry 2005, 162:1083-1089.
36. Tripp G, Alsop B: Sensitivity to reward frequency in boys withattention deficit hyperactivity disorder. J Clin Child Psychol 1999,28:366-375.
Page 13 of 13(page number not for citation purposes)


