Embed Size (px)
Citation preview
Louisiana State University Louisiana State University
LSU Digital Commons LSU Digital Commons
LSU Historical Dissertations and Theses Graduate School
1992
Molecular Phylogenies and Biogeography of Central American Molecular Phylogenies and Biogeography of Central American
Birds. Birds.
Shannon J. Hackett Louisiana State University and Agricultural & Mechanical College
Follow this and additional works at: https://digitalcommons.lsu.edu/gradschool_disstheses
Recommended Citation Recommended Citation Hackett, Shannon J., "Molecular Phylogenies and Biogeography of Central American Birds." (1992). LSU Historical Dissertations and Theses. 5437. https://digitalcommons.lsu.edu/gradschool_disstheses/5437
This Dissertation is brought to you for free and open access by the Graduate School at LSU Digital Commons. It has been accepted for inclusion in LSU Historical Dissertations and Theses by an authorized administrator of LSU Digital Commons. For more information, please contact [email protected].
INFORMATION TO USERS
This manuscript has been reproduced from the microfilm master. UMI films the text directly from the original or copy submitted. Thus, some thesis and dissertation copies are in typewriter face, while others may
The quality of this reproduction is dependent upon the quality of the copy submitted. Broken or indistinct print, colored or poor quality illustrations and photographs, print bleedthrough, substandard margins, and improper alignment can adversely afreet reproduction.
In the unlikely event that the author did not send UMI a complete manuscript and there are missing pages, these will be noted. Also, if unauthorized copyright material had to be removed, a note will indicate the deletion.
Oversize materials (e.g., maps, drawings, charts) are reproduced by sectioning the original, beginning at the upper left-hand corner and continuing from left to right in equal sections with small overlaps. Each original is also photographed in one exposure and is included in reduced form at the back of the book.
Photographs included in the original manuscript have been reproduced xerographically in this copy. Higher quality 6" x 9" black and white photographic prints are available for any photographs or illustrations appearing in this copy for an additional charge. Contact UMI directly to order.
be from any type of computer printer.
University Microfilms International A Bell & Howell Information C o m p a n y
3 0 0 North Z e e b Road. Ann Arbor. Ml 4 8 1 0 6 -1 3 4 6 USA 3 1 3 /7 6 1 - 4 7 0 0 8 0 0 /5 2 1 - 0 6 0 0
Order Number 9316968
M olecular phylogenies and biogeography of Central Am erican birds
Hackett, Shannon J., Ph.D.
The Louisiana State University and Agricultural and Mechanical Col., 1992
U M I300 N. ZeebRd.Ann Arbor, MI 48106
MOLECULAR PHYLOGENIES AND BIOGEOGRAPHY OF CENTRAL AMERICAN BIRDS
A Dissertation
Submitted to the Graduate Faculty of the Louisiana State University and
Agricultural and Mechanical College in partial fulfillment of the
requirements for the degree of Doctor of Philosophy
in
The Department of Zoology and Physiology
byShannon J. Hackett
B.S., The University of Victoria, 1983 M.S., Louisiana State University, 1987
December 1992
ACKNOWLEDGMENTS
I w ould like to take this opportunity to thank the many people who helped
me w ith this dissertation. My committee members Dr. J. V. Remsen, Jr., R. L.
Chapman, D. P. Pashley, and M. S. Hafner provided help and guidance
throughout this process. In particular I thank Dr. Robert M. Zink for providing a
stimulating environment for learning and the freedom to pursue my own
interests.
Field work was accomplished through the aid of many people, and I wish
to acknowledge governmental agencies in Costa Rica, the Solano family, the
Castro family, and the many ticos who crossed our paths, for their help,
consideration, and kindness. I also owe a debt of gratitude for specimen collection
to Kevin Burns, Dave Moyer, Kenny Rosenberg, Gary Rosenberg, John Bates, and
Bob Bates. In particular, I thank John P. O'Neill for all his help, even while
enduring pneumonia in San Jos£. I also thank the Academy of Natural Sciences
in Philadelphia and Field Museum of Natural History in Chicago for additional
specimens.
This research was supported by grants from the Fugler Fellowship of the
Louisiana State University Museum of Natural Science, the Chapman Fund of
the American Museum of N atural History, the American Ornithologists' Union,
National Sigma Xi, and the National Science Foundation (NSF Doctoral
Dissertation Improvement Grant, BSR-9101289). Field work was supported by the
Mcllhenny family and by all generous donors to the LSUMNS Bird-a-thon. I am
grateful for the LSUMNS Frozen Tissue Collection and other LSU personnel who
donated precious time collecting and preparing specimens on the hope that some
day someone would use them.
I w ould also like to acknowledge the inspiration I received from the works
of Frank M. Chapman; many times I was excited about an idea only to find out
that Chapm an said something similar 70 years ago. In particular I thank my
parents for their love and support (both emotional and financial) and LSU
students both past and present for stimulating discussions and friendship.
Finally, I thank John Bates for providing me the intellectual stimulation,
encouragement, and love 1 required to complete this journey.
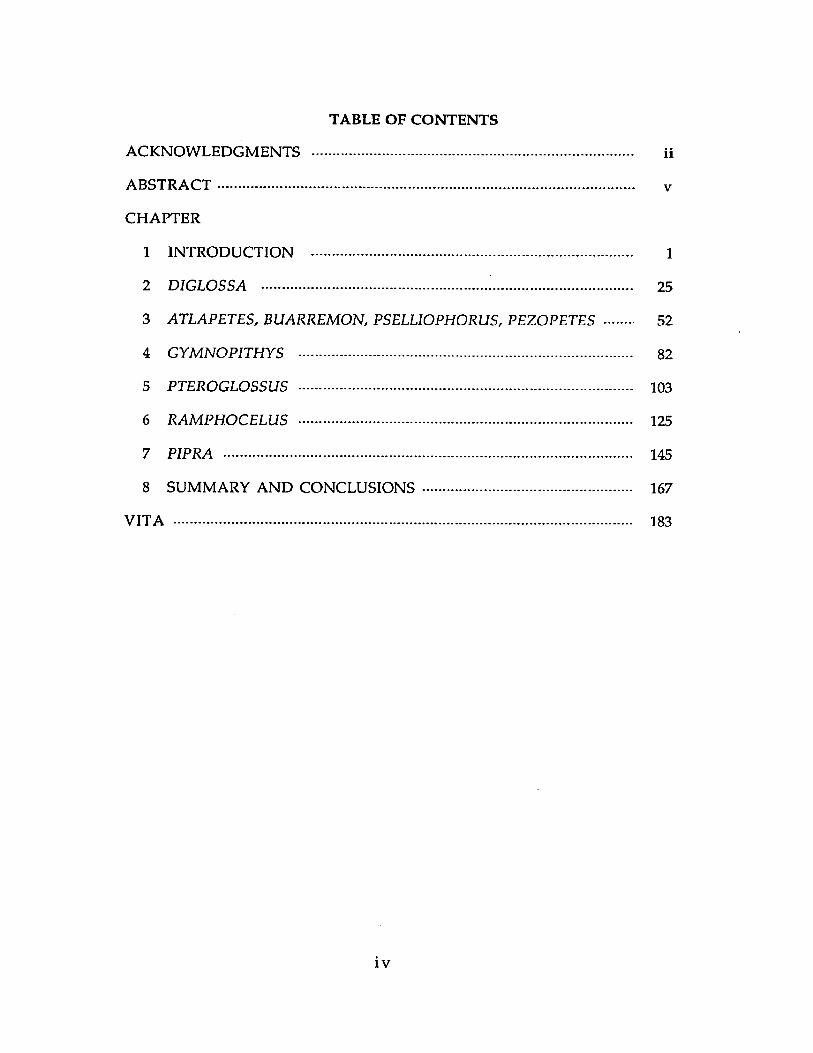
TABLE OF CONTENTS
ACKNOWLEDGMENTS .................................................................................... ii
ABSTRACT.............................................................................................................. v
CHAPTER
1 INTRODUCTION .................................................................................... 1
2 DIGLOSSA ........................................................... 25
3 ATLAPETES, BUARREMON, PSELLIOPHORUSr PEZOPETES ....... 52
4 GYM NOPITHYS ..... 82
5 PTEROGLOSSUS ....................................................................................... 103
6 RAMPHOCELUS ....................................................................................... 125
7 P1PRA ........................................................................................................... 145
8 SUMMARY AND CONCLUSIONS ...................................................... 167
VITA ......................................................................................................................... 183
iv
ABSTRACT
This dissertation presents data on the biogeography and molecular
systematics of seven independent lineages of birds; both allozyme and
m itochondrial DNA (mtDNA) characters were used. The purpose of this study
w as to discover biogeographic patterns am ong endemic taxa distributed in the
highlands and low lands of southern Central America and sister taxa in either
N orth or South America. Analyses of the genera Diglossa, Buarremon, Pselliophorus,
and Pezopetes suggested a complex biogeographic pattern in the highlands of
southern C entral America; divergence of some highland lineages occurred
relatively recently (during the Pleistocene) after the landbridge connection
betw een Central and South America was com pleted, w hereas divergence of other
b irds occurred m ore anciently (8-10 million years ago) before the landbridge w as
com pleted. In addition, both northern (N orth America, northern M iddle
America) and southern (South America) sources of taxa contributed to the
endem icity in the highlands of southern Central America.
Analyses of low land lineages (Gymnopithys, Pteroglossus, and Ramphocelus)
suggested a single area cladogram for low land areas of endemism: Pacific and
Caribbean Central American areas of endem ism as sister areas, Choco (western
South America) as the sister area to the Central American areas of endem ism , and
Am azonia as the sister to the Central A m erican/Chocd areas. Analysis of Pipra
suggested a different area cladogram relative to the other three lineages; however,
a cladogram of one step longer supported the general area cladogram suggested by
the other three low land lineages. Examination of rates of m olecular divergence
suggested that Pteroglossus taxa are m uch less differentiated across similar
geographic areas than are the other lowland lineages, possibly the result of
v
Pteroglossus possessing increased dispersal abilities relative to the other lowland
lineages.
There was a high degree of evolutionary concordance of both mtDNA and
allozyme characters. However, mtDNA sequence data (from the cytochrome b
gene) reached the multiple hit zone after approximately 10% sequence divergence,-
a result consistent with other studies of the cytochrome b gene.
v i
CHAPTER 1
INTRODUCTION
This dissertation presents data on the biogeography and molecular
systematics of several Neotropical bird lineages. My focus is on Central American
birds and their sister taxa in either northern M iddle America (Mexico) or South
America. In this introduction, I will address w hy I chose to study Central
American birds, the geologic history of Central America, the general methodology
of study of birds lineages, and the choice of taxa.
Why Central America?—The distribution of Central American vertebrates
presents an intriguing problem for biogeographic analysis. Savage (1966, 1982)
divided the Central American herpetofauna into three groups: (1) those that are
endemic to Central America and have no close or obvious relatives, (2) those that
are closely related to northern taxa, and (3) those that are closely related to
southern taxa. Howell (1966) independently recognized these same three
divisions for Central American birds. Savage (1982) described ten major areas of
endemism (AOEs) in Central America based on herpetofaunal ranges, but he
could not apply vicariance methods because of the paucity of cladistic hypotheses
for the Central American herpetofauna (Cadle 1985).
A lthough endemic bird taxa have been tabulated and areas of origin
postulated (Haffer 1967a, 1967b, 1974,1985; Chapman 1978; Cracraft 1985; Cracraft
and Prum 1988; Prum 1988), explicit analysis of the biogeography of the Central
American avifauna is lacking. General descriptions of biogeographic patterns,
however, do aid in deriving more explicit studies of the biogeography of Central
American birds. It is apparent from examining lists of endemic species that most
endemic bird species with no clear or obvious relatives (group 1 above) are
distributed in the highlands of southern Central America. For example, the
1
2
m ontane avifauna of southern Central America contains 8 endemic monotypic
genera (12% of total genera represented in the highlands), whereas the lowland
avifauna contains 5 endemic monotypic genera, only 1% of total genera
represented in the lowlands. None of the eight endemic m onotypic genera in the
highlands can be unequivocally considered m ost closely related to lowland taxa.
In addition to com parisons at the generic level, few highland endemic species
appear to have their sister taxon in the lowlands. Thus, a dichotomy exists
betw een highland and lowland birds. As evidenced by the higher num ber and
proportion of endemic monotypic genera, m ore highland birds, in comparison to
low land birds, have unclear affinities, and m any highland endemics are more
closely related to other highland taxa than to lowland taxa. In contrast, lowland
endemic forms are m ore clearly allied w ith lowland South American or N orth
American species groups. These aspects of highland and lowland avifaunas, in
com bination w ith the geologic history of southern Central America (described
below), provide support for the decision to treat the highland and lowland
avifaunas as separate entities for biogeographic analysis.
Geologic history o f Central America.—A central feature of an attem pt to
explain the distribution of southern Central American faunas is the history of
intercontinental land connections betw een Central and South America. It is now
generally accepted that a continuous land mass extended from N orth America to
northern Nicaragua throughout the Tertiary (Howell 1966, Coney, 1982, Hedges
1982, Pindell and Dewey 1982, Savage 1982, Buskirk 1985, Rosen 1985, Briggs 1987).
Most workers hypothesize that by the end of the Pliocene [3 million years ago
(mya)], the landbridge connecting Central and South America was formed,
although Pindell and Dewey (1982) imply that the landbridge m ay be as old as
eight million years (my). The geologic evidence suggests that the Central
American highlands and lowlands have had very different histories. These
differences lead to different predictions about the faunal relationships w ithin
Central American highland and lowland avian lineages, and betw een these
lineages and related South or N orth American taxa.
H ighlands.—Several workers (MacFadden 1981, Hedges 1982, Rosen 1985;
bu t also see Pregill 1981 and Briggs 1987) have suggested that a series of island arcs
developed betw een w hat is commonly called "Nuclear Central America"
[northern Central America, extending from the Isthmus of Tehuantepec to the
uplands of Nicaragua (Rosen 1976)] and South America around the late
Cretaceous to early Tertiary (50 mya). According to Rosen (1976,1985) and Malfait
and Dinkelm an (1972), a proto-Antillean archipelago existed in the Panam anian
region during the late Cretaceous (approximately 70 mya) that allowed for
dispersal of South American and North American stocks into N uclear Central
America. However, m ovem ent of the proto-Antilles eastw ard during the early
Tertiary (65 mya) separated N orth and South America and fragm ented the
distributions of those taxa that had dispersed into northern Central America,
allowing for their differentiation from South American ancestors. According to
Pindell and Dewey (1982), a Panama-Costa Rica arc formed around 50-40 mya,
although a continuous land m ass was present south only to about present-day
Costa Rica. Although intervening details are sketchy, highland areas in the
present-day position of the Panam anian and Costa Rican highlands appeared by
the Oligocene (40-25 mya). Volcanic action uplifted a single m ountain range (the
Costa Rica-Chiriqui highlands) in the Miocene (25-5 mya); another uplift a t the
start of the Pleistocene (2 mya) gave this m ountain range its present-day form.
Thus, the highlands of Costa Rica were in place as early as 20 million years
ago (Rosen 1985), although for m uch of this time they were not directly connected
to either N orth or South America. Thus, the possibility existed for ancient
divergence of taxa in Central America. Possible ancient sources of colonizing taxa
could have been the G uianan and Brazilian shield highlands or the eastern slopes
of the Andes, all of w hich predate the Central American highlands. Relictual
distributions of avian taxa that m ay suggest an ancient divergence include two
cotingid taxa, Oxyruncus cristatus and Procnias spp., which are found in the
highlands of Costa Rica and Panama, in the rem nants of the G uianan shield
highlands (the Tepuis of Venezuela, Guyana, Surinam ) and Brazilian shield
highlands (eastern Brazil and Paraguay), and on some outlying ridges of the
eastern slopes of the Andes in Peru (O xyruncus only), but not in the intervening
areas. If there were an ancient divergence of these cotingid taxa in Central
America, then one w ould predict that South American and Central Am erican
populations of Oxyruncus cristatus are old, seemingly contrary to the low degree of
phenotypic differentiation that resulted in their recognition as only subspecifically
distinct. However, the presence of large am ounts of genetic differentiation
am ong populations considered conspecific but no t greatly differentiated
pheno typically is being docum ented w ith increasing frequency in tropical birds
(Capparella 1987, 1988, 1991; Hackett and Rosenberg 1990; Peterson et al. 1992; see
o ther chapters in this dissertation).
In addition to ancient opportunities for divergence or colonization in the
Central Am erican highlands, there have also been m ore recent avenues for taxa
to dispersal into Central America. Many taxa probably dispersed into Central
America after the landbridge was formed. During glacial periods in the
m ountains of Central and South America, m ontane forests were depressed to
low er elevations (Vuilleumier 1969, Van der Ham m en 1974, Graves 1982, Liu and
Colinvaux 1985). As m ontane forests were depressed, a m ore continuous band of
"high-elevation" forest existed, and m ontane taxa could have dispersed into
Central America from South America at this time. D uring interglacial periods,
high-elevation forests retreated and forest connections were severed, along w ith
gene flow am ong populations that had dispersed into Central America. The
present-day m ountains of Costa Rica and w estern Panam a are strongly isolated to
the north and south by the low lands of N icaragua and central Panam a,
respectively. Thus, long-range dispersal of A ndean taxa from the south, or
M exican taxa from the north, over alm ost certainly unsuitable habitat into
Central America is unlikely.
This description of geologic history combined w ith distributional data for
b irds suggest that two levels of genetic divergence m ay exist separating Central
A m erican endem ics from the N orth Am erican or South A m erican relatives.
Ancient divergences, which w ould be associated w ith high degrees of genetic
differentiation, m ay be found betw een some highland Central Am erican taxa and
their probable closest relatives in South America. In addition, ancient
divergences in Central America m ay be relicts of ancient dispersal of b irds that
m oved sou th into South America from Mexico and N orth America before the
landbridge w as connected. Examples of these ancient divergences m ay include
the endem ic m onotypic genera Pczopetes, Pselliophorus, and Acanthidops. On the
other hand, a series of southern Central American endem ic taxa show m uch
clearer affinities w ith either m ore northern Central and N orth A m erican taxa or
South American taxa, are probably m uch m ore recent in origin, and thus show
lower levels of genetic differentiation betw een sister taxa. For example,
hum m ingbirds and some tanagers ( Diglossa and Bnarremon, for example) probably
dispersed into Central America from South America (Diglossa) or northern
M iddle America (Mexico, Bnarremon brunneimicha) during a period of glacial
advance that tem porarily created a connection of high-elevation forests betw een
Central and South America. Vicariance occurred as the glaciers retreated and the
ranges of these taxa were isolated. Thus, these taxa should be m uch less
differentiated from their South American relatives than are taxa m entioned
previously (Pselliophorus, Procnias, etc.).
Low lands.—The emergence of the Panam anian isthm us in the late Tertiary
(approximately 3 mya) created a new lowland dispersal route for South American
low land taxa into Central America and for N orth American taxa into South
America. During interglacial and post-Pleistocene times, hum id forests were
pushed southw ard on each side of the Andes and were replaced by m uch drier
types of vegetation. The Central American forests were considerably reduced
(Haffer 1967b, 1987a). Haffer (1967b, 1974, 1987a) hypothesized that connection of
Central American and w estern Colombian forests was disrupted during these dry
periods (based on current rainfall patterns) and that the lowlands of central and
eastern Panama were devoid of forest in m any areas. During the Pleistocene dry
periods, fauna of more open and arid areas east of the Andes may have advanced
into northern Colombia and followed the M agdalena Valley (devoid of forest and
m ore or less arid its entire length); the unforested areas around the Gulf of Uraba
offered a pathw ay through Panama into nuclear Central America. At the same
time, fauna of m ore arid portions of M iddle America and N orth America
invaded South America. Rich and Rich (1983) showed that w hen the land
connection was formed betw een N orth and South America, a nearly continuous
band of savanna existed across Central America. This band of savanna m ay have
allow ed predom inantly savanna-inhabiting forms to cross from South America
to N orth America. In the late Pliocene and early Pleistocene, 22 of 31 mam m alian
genera involved in the interchange betw een South and N orth America were
savanna-inhabiting forms (Webb 1978). The return of more hum id conditions
interrupted the connection between Central American and northern Colombian
savannas. Northern South American open-country fauna then retreated into
several small, dry refuges (northern Pacific coast of Central America, upper
Magdalena Valley, Patid Valley, for example). Thus, avian taxa of the Central
American lowland forests may have diverged from their South American
ancestors within the past 3 my, when the lowland forest connecting the land
masses was fragmented by climactic changes (spread of savanna) during the
Pleistocene.
Taxa in the Central American lowlands (for example, in the Pacific and
Caribbean lowlands) also could have diverged from each other as the result of
vicariant events, such as the formation of forest refugia during the late
Pleistocene (1 mya-100,000 ya; Haffer 1974). According to Haffer (1974), three forest
refuges existed in southern Central America during the Pleistocene: (1) Pacific
coast region of Costa Rica (Golfo Dulce region, in particular), (2) Caribbean coast of
Nicaragua and Costa Rica, and (3) Darien region of Panama. These postulated
refuges correspond to three of the AOEs described by Savage (1982) based on
herpetological distributions. Thus, Pleistocene climatic changes resulted in the
separation of Central American and western South American forests, allowing
the differentiation (via vicariance) of the lowland forms in Central America from
their South American sister taxa, and may have resulted in the differentiation of
lineages within Central America as well.
Although it has long been noted that the avifauna of lowland Central
America resembles that of the Choc6 region of western south America (Chapman
1978, Cracraft 1985, Cracraft and Prum 1988), there remain two competing
hypotheses for the historical South America source of the Central American
8
lowland lineages. Chapman (1978) suggested that the uplifting of the Andes
separated taxa found in the Chocd of western South America from Amazonian
South America. Thus, the Chocd was the historical source for the endemic
southern Central American lowland taxa, and the Central American avifauna
should be most closely related to the Chocd avifauna. An alternative hypothesis
put forth by Haffer (1967a, 1967b), suggests that the interchange took place
relatively recently around the northern end of the Colombian Andes during a
period of lowered sea level and a more humid climate. In this scenario,
Amazonian South America would be the historical source for the endemic
Central American taxa, and taxa invaded the Choco from Central America and
not vice versa. Evidence for either hypothesis is weak, and Cracraft and Prum
(1988) found no strong reason for accepting or rejecting either hypothesis given
current knowledge. Enough lowland forest might have existed on the western
coast of South America to support a Choco fauna for the last several hundred
million years (see Cracraft and Prum 1988), and climatic changes during the
Pleistocene almost certainly had an effect on the distributions of plants and
animals. Unfortunately, both hypotheses lead to the same relationships among
the areas of endemism: Central America and Choco should be sister areas with
Amazonia as the sister area to the Central America/Chocd clade. Thus, additional
geologic data are necessary to resolve the question of the historical source of the
Central American endemic lowland taxa.
Biogeographic analyses.—Vicariance biogeography (see Wiley 1988a, 1988b for
reviews) is a relatively new discipline that arose as a result of the emergence of
phylogenetic systematics as a method for reconstructing evolutionary histories of
species. The basic principle of vicariance biogeography is that common
distributional patterns are more likely due to vicariance, or splitting of ancestral
biotas than to random, uncorrelated dispersal events. That is, dispersal should
not be a first-order explanation for the pattern of distribution of organisms
because it is untestable. Rosen (1978) was the first to articulate a method for
vicariance biogeography.
The first step in a biogeographic analysis involves examination of the
distributions of taxa. Despite differing ecological and historical aspects of species'
distributions, m any species' distributions are coincident. The recognition of these
coincident ranges determine the areas of endemism (AOE) in a biogeographic
study (Zink and Hackett 1988). The goal is to determine how these AOEs are
related to each other; that is, w hat is the history of interconnections between the
AOEs of interest.
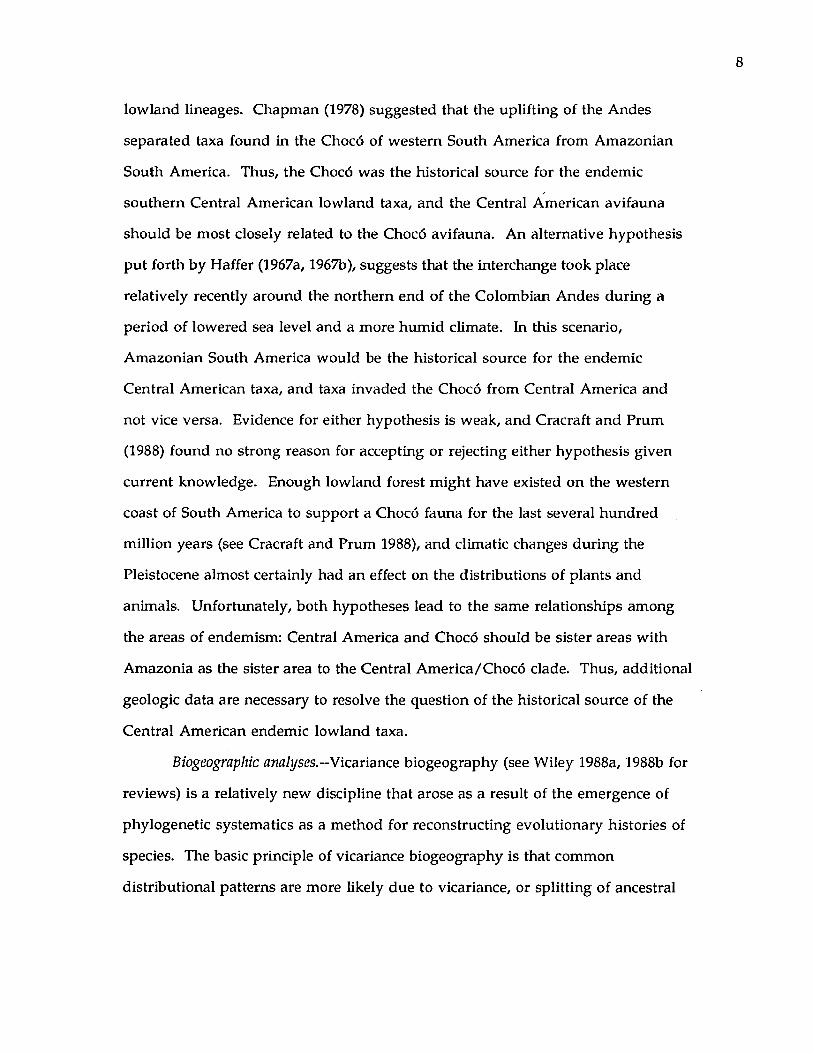
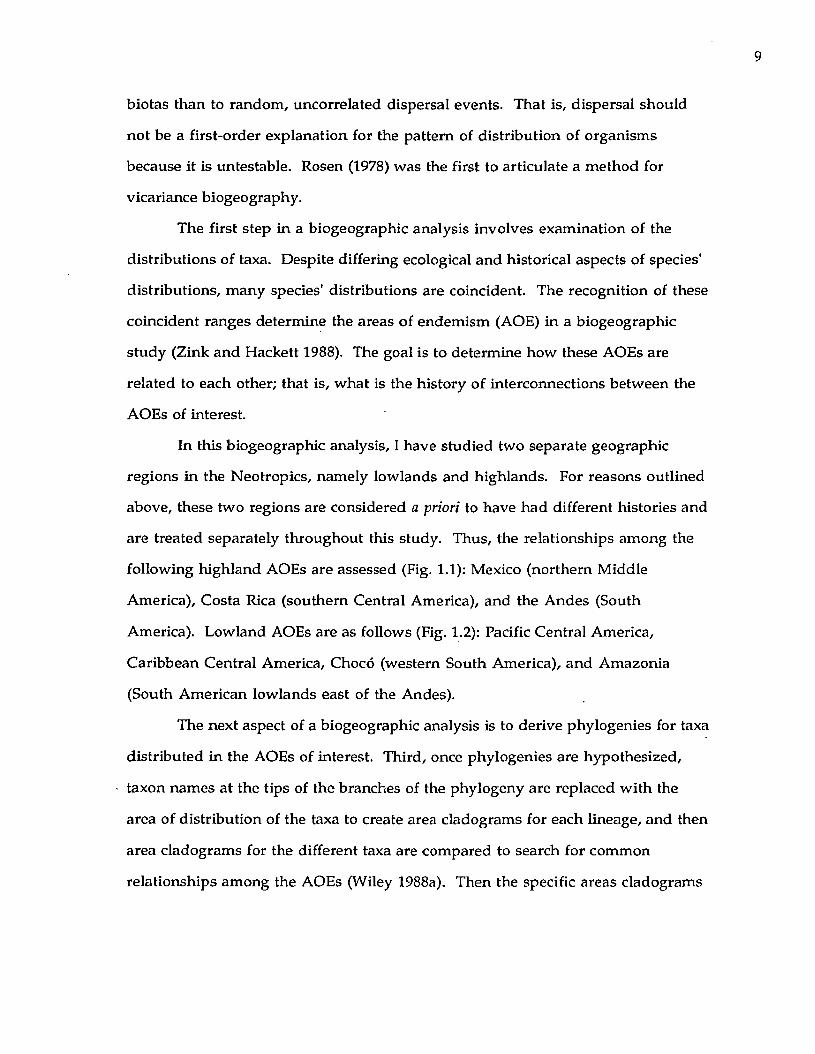
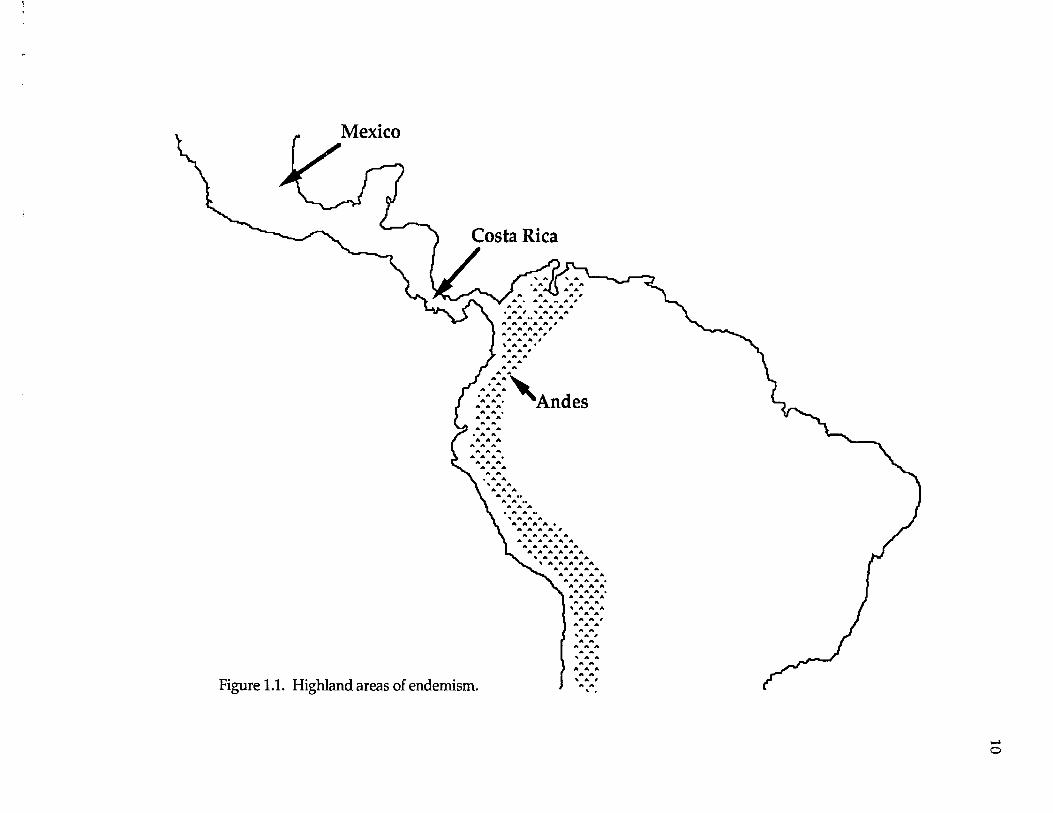
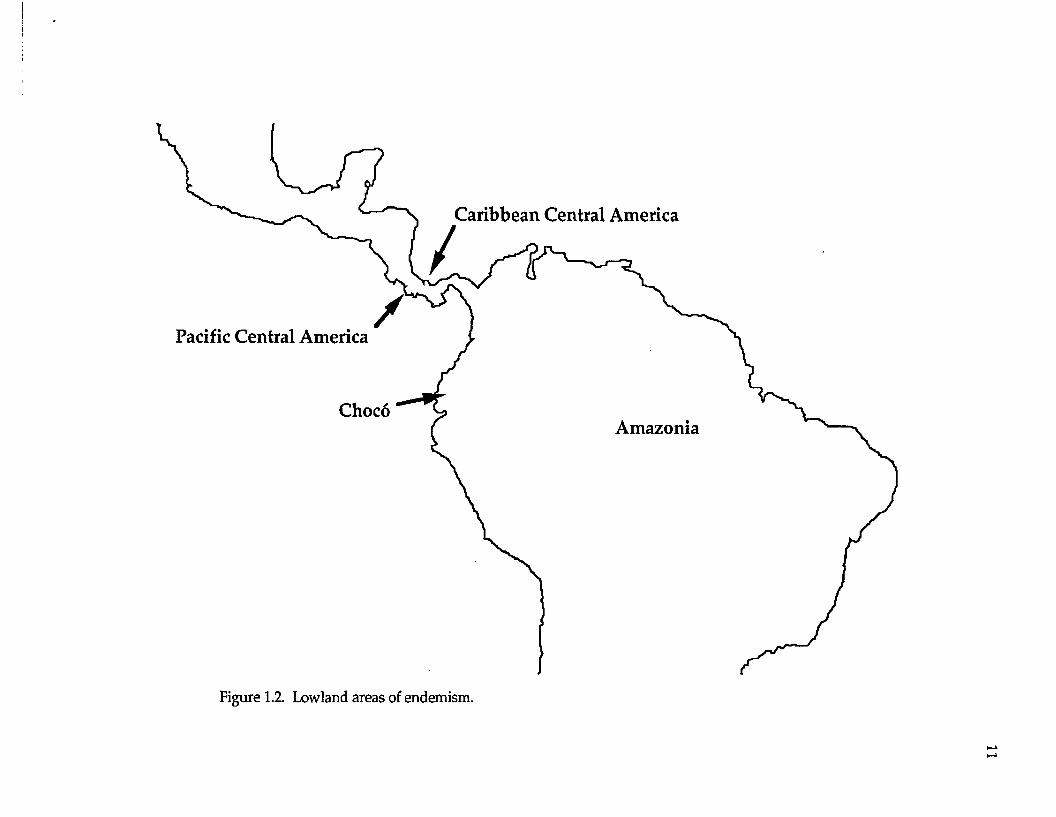
In this biogeographic analysis, I have studied two separate geographic
regions in the Neotropics, namely lowlands and highlands. For reasons outlined
above, these two regions are considered a priori to have had different histories and
are treated separately throughout this study. Thus, the relationships among the
following highland AOEs are assessed (Fig. 1.1): Mexico (northern Middle
America), Costa Rica (southern Central America), and the Andes (South
America). Lowland AOEs are as follows (Fig. 1.2): Pacific Central America,
Caribbean Central America, Choco (western South America), and Amazonia
(South American lowlands east of the Andes).
The next aspect of a biogeographic analysis is to derive phylogenies for taxa
distributed in the AOEs of interest. Third, once phylogenies are hypothesized,
taxon names at the tips of the branches of the phylogeny are replaced w ith the
area of distribution of the taxa to create area cladograms for each lineage, and then
area cladograms for the different taxa are compared to search for common
relationships among the AOEs (Wiley 1988a). Then the specific areas cladograms
II
Mexico
Costa Rica
'Andes
Figure 1.1. Highland areas of endemism,
o
Caribbean Central America
Pacific Central America
//
ChocoAmazonia
Figure 1.2. Lowland areas of endemism.
12
are combined to form a general area cladogram that summ arizes relationships
am ong the individual geographic areas (Wiley 1988a, Kluge 1988).
Finally, one m ust have m ethods for dealing w ith conflicting biogeographic
hypotheses; that is, w hat does one do w hen taxon-specific area cladograms differ?
There are two com peting methods of vicariance biogeography: com ponent
analysis (Platnick and Nelson 1978, Nelson and Platnick 1981, Page 1990) and
parsim ony analysis (Brooks 1981, Kluge 1988, Wiley 1988a, 1988b, Brooks and
McLennan 1991). Com ponent analysis involves the use of consensus trees to
show the inform ation common to sets of area cladograms for each lineage
studied. Consensus trees, however, often result in trees that are less
parsim onious than those derived from parsim ony analysis (Miyamoto 1985,
Zandee and Roos 1987, but also see Page 1990). In parsim ony analysis,
distributional areas are considered independent variables and cladograms of taxa
are dependent variables. Using parsim ony m ethods, area relationships are
determ ined from an area x taxon matrix produced by binary coding of the
occurrence of terminal taxa and their hypothetical ancestors, w ithin the
framework of the phylogeny of the groups in question. I will use parsim ony
analysis to derive area cladograms, as outlined by Kluge (1988), because it avoids
the problems associated w ith consensus techniques (Wiley 1988a).
Vicariance hypotheses of the diversification w ithin (and among) lineages
are corroborated by congruence of cladograms, especially if consistent w ith known
geological history of the areas themselves (Kluge 1988). The relatively well-
know n geologic history of Central America m akes it an appropriate choice for
testing of biogeographic hypotheses. Falsification of vicariance is an im portant,
first-order step, and allows us to infer that dispersal or overlapping AOEs are
involved in the history of biotas. That is, the history of faunal diversification
13
cannot be explained by a simple series of vicariance events given non-congruence
of well-supported area cladograms (Cracraft 1988).
Hypotheses to be addressed.—Combining the knowledge of geologic and
faunal patterns, I have tested the following predictions about avian evolution in
southern Central America.
1. Phylogenetic relationships within lineages of Central American lowland
taxa and between these taxa and their South American sister taxa will be
congruent across different lineages of birds. Taxa distributed in the
Choc6 AOE will be most closely related to the Central American taxa,
implicating common historical events effecting diversification.
2. If disjunctions of Central American lowland taxa were a result of
vicariance, then levels of divergence, measured by genetic distances,
between Central American lowland taxa and their South American sister
taxa will be consistent across different lineages. These distances should
roughly correspond to a Pleistocene spread of the arid areas in northern
Colombia, which isolated forested areas in Central America from South
America. Under this hypothesis, diversification among Central
American taxa should have occurred after the separation of Central
American taxa from their South American sister taxa.
3. In contrast to the lowlands, the relatively greater age of the Central
American highlands, w ith multiple geologic events shaping their
history, has resulted in more variable geographic affinities of South
American sister taxa (i.e., Andean, Guianan shield, or North American)
to Central American highland endemics than is the case w ith lowland
taxa. That is, a single area of origin does not exist for the highland taxa.
4. Some southern Central Am erican highland taxa are m ore distantly related
to their sister taxa in either N orth or South America than are low land
taxa. O thers diverged at roughly similar time periods to low land taxa,
after the landbridge w as completed.
Methods and molecular analyses.— It has been dem onstrated by a num ber of
researchers that m olecular analyses (especially of m itochondrial DNA) can be
extremely useful for biogeographic studies (Bermingham et al. 1992, Bates and
Zink in review; see especially Avise 1991, 1992). Molecular analyses facilitate
biogeographic studies in two ways. First, biogeographers have dism issed
w idespread species as uninform ative for biogeographic analyses. For example,
w idespread taxa have been interpreted as either no t responding to a biogeographic
event or as evidence of high dispersal, and thus of no biogeographic use (Nelson
and Platnick 1978, Kluge 1988, Wiley 1988a). A recent discovery is that m any
w idespread, sedentary b ird species that are relatively undifferentiated
m orphologically exhibit considerable genetic divergence am ong populations
separated by small geographic distances. Phenotypically undifferentiated
populations of low land forest birds separated by the Amazon River show
allozyme genetic distances equivalent to those found am ong N orth American,
phenotypically differentiated, warbler species (Capparella 1987, Hackett and
Rosenberg 1990, C hapter 4, Bates unpubl. data). In addition, Peterson et al. (1992)
dem onstrated h igh levels of genetic differentiation, in the absence of m uch
phenotypic variation, am ong m id-elevation cloud forest birds isolated in different
cloud-forest patches in Mexico. Results such as these reveal that w idespread bird
species, w ith or w ithout phenotypic differentiation, m ay contain distinct genetic
units. Therefore w idespread taxa should not necessarily be view ed a priori as
plesiomorphies (primitive; Nelson and Platnick 1978, Kluge 1988, Wiley 1988a)
and eliminated from biogeographic analyses.
Second, a general area cladogram is only one part of a biogeographic
analysis. Estimates of timing of divergence events are also important. In the
Neotropics, a debate exists over whether high species diversity can be explained by
recent Pleistocene events (Haffer 1967b, 1974, 1985, 1987b), by the formation of
rivers (Capparella 1987, 1988, 1991), or vicariant events that occurred earlier than
the formation of rivers or Pleistocene refugia (Cracraft 1988, Cracraft and Prum
1988, Hackett and Rosenberg 1990). Molecular data offer the potential to date
speciation events using the controversial idea of a molecular clock (Wilson et al.
1977). Although many cautions exist for the use of molecular clocks (Britten 1986,
Avise 1992, Hillis and Moritz 1990), the use of molecular clocks to date speciation
events and the correspondence of the timing of divergence events based on clock
calibrations to timing of geologic events have been little explored (see M urphy
1983, Cadle 1985, Zink 1988, Zink and Avise 1990, and Randi et al. 1992 for some
examples).
Concordant estimates of genetic distances across taxa that show similar
general area cladograms would be strong evidence for a general molecular clock
among lineages. For allozyme data in birds, two calibrations, based on the same
fossil quail humerus, suggest that one unit of Nei's (1978) genetic distance equals
approximately 19-26 million years of independent evolution (Gutierrez et al. 1983,
Marten and Johnson 1986). For mitochondrial DNA data an estimate of 2%
sequence divergence per million years of independent evolution (Shields and
Wilson 1987) has been widely used. Although this mitochondrial calibration was
derived for restriction site data averaged over the entire mtDNA genome, Shields
and Kocher (1991) suggested that this calibration may apply to cytochrome b
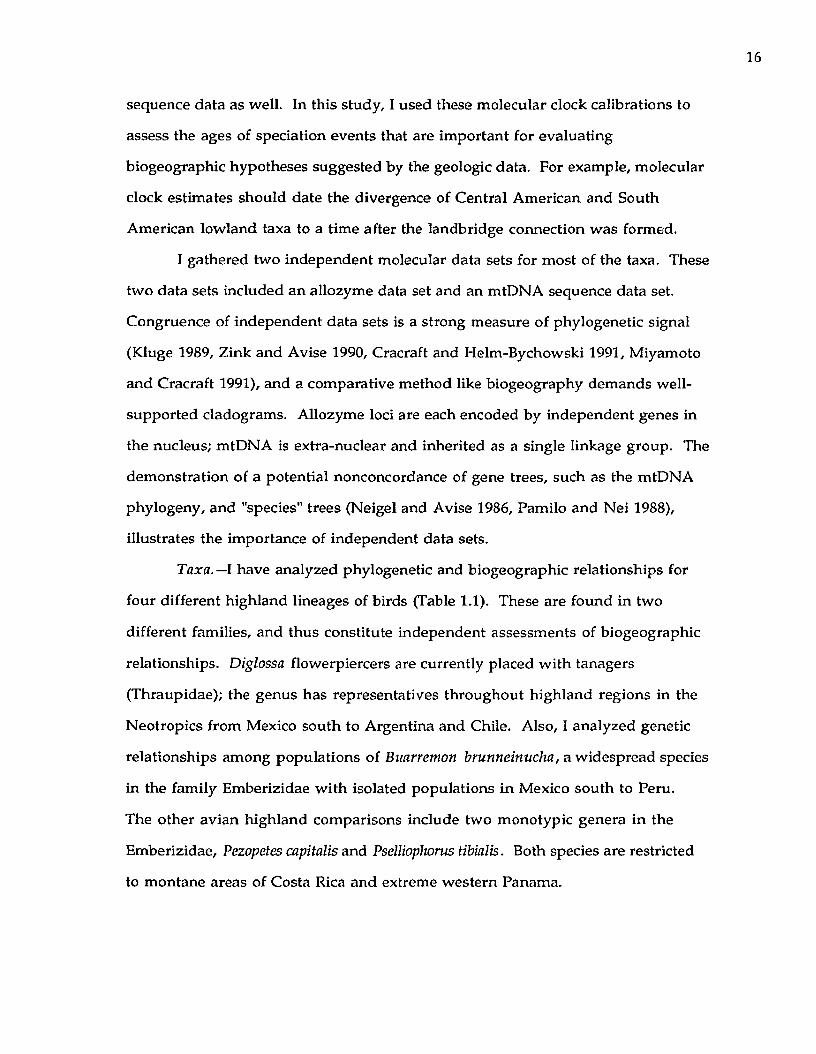
sequence data as well. In this study, I used these molecular clock calibrations to
assess the ages of speciation events that are im portant for evaluating
biogeographic hypotheses suggested by the geologic data. For example, molecular
clock estimates should date the divergence of Central American and South
American lowland taxa to a time after the landbridge connection was formed.
I gathered two independent molecular data sets for most of the taxa. These
two data sets included an allozyme data set and an mtDNA sequence data set.
Congruence of independent data sets is a strong measure of phylogenetic signal
(Kluge 1989, Zink and Avise 1990, Cracraft and Helm-Bychowski 1991, Miyamoto
and Cracraft 1991), and a comparative method like biogeography demands well-
supported cladograms. Allozyme loci are each encoded by independent genes in
the nucleus; mtDNA is extra-nuclear and inherited as a single linkage group. The
dem onstration of a potential nonconcordance of gene trees, such as the mtDNA
phylogeny, and "species" trees (Neigel and Avise 1986, Pamilo and Nei 1988),
illustrates the importance of independent data sets.
Taxa.— I have analyzed phylogenetic and biogeographic relationships for
four different highland lineages of birds (Table 1.1). These are found in two
different families, and thus constitute independent assessments of biogeographic
relationships. Diglossa flowerpiercers are currently placed w ith tanagers
(Thraupidae); the genus has representatives throughout highland regions in the
Neotropics from Mexico south to Argentina and Chile. Also, I analyzed genetic
relationships among populations of Buarremon brunneinucha, a widespread species
in the family Emberizidae w ith isolated populations in Mexico south to Peru.
The other avian highland comparisons include two monotypic genera in the
Emberizidae, Pezopetes capitalis and Pselliophorus tibialis. Both species are restricted
to montane areas of Costa Rica and extreme western Panama.
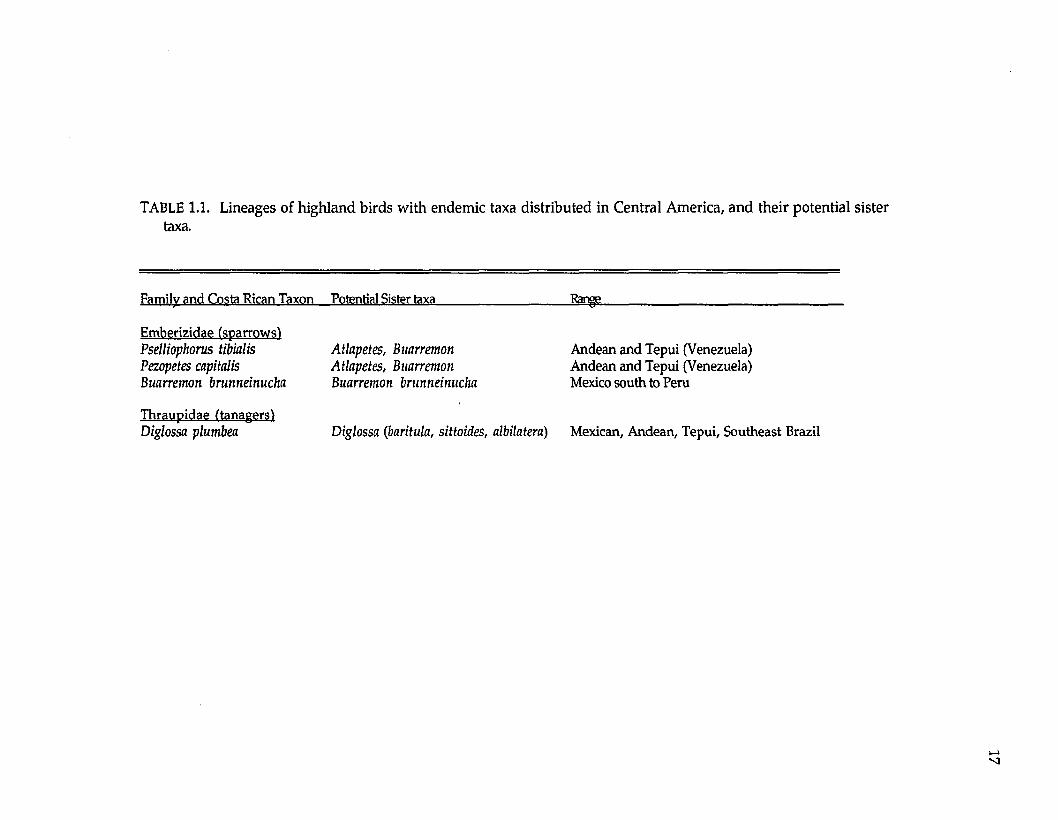
TABLE 1.1. Lineages of highland birds with endemic taxa distributed in Central America, and their potential sister taxa.
Family and Costa Rican Taxon Potential Sister taxa Range
Emberizidae (sparrows! Pselliophorus tibialis Pezopetes capitalis Buarremon brunneinucha
Atlapetes, Buarremon Atlapetes, Buarremon Buarremon brunneinucha
Andean and Tepui (Venezuela) Andean and Tepui (Venezuela) Mexico south to Peru
Thraupidae Managers) Diglossa plumbea Diglossa (baritula, sittoides, albilatera) Mexican, Andean, Tepui, Southeast Brazil
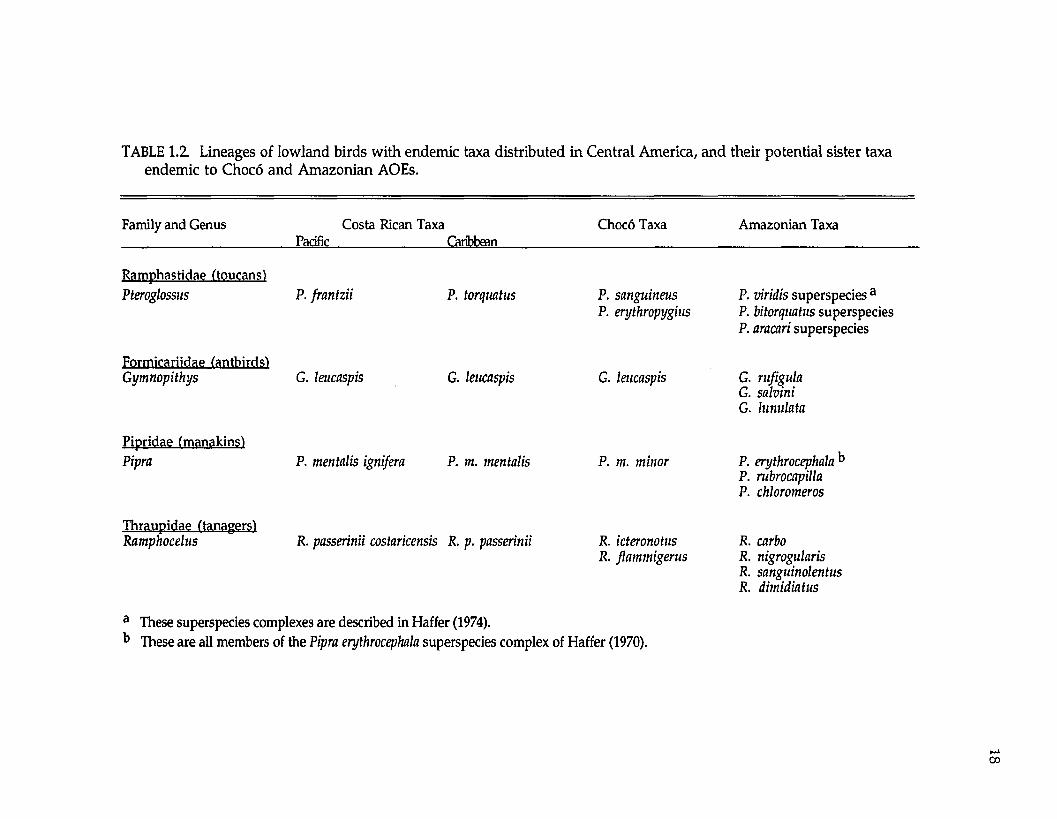
TABLE 1.2. Lineages of lowland birds with endemic taxa distributed in Central America, and their potential sister taxa endemic to Choco and Amazonian AOEs.
Family and Genus Costa Rican TaxaPacific
iCaribbean
Choco Taxa Amazonian Taxa
Ramphastidae ftoucansl Pteroglossus P. frantzii P. iorquatus P. sanguineus
P. erythropygiusP. viridis superspecies a P. bitorquatus superspecies P. aracari superspecies
Formicariidae (antbirdsl Gymnopithys G. leucaspis G. leucaspis G. leucaspis G. rufigula
G. salvini G. lunulata
Pipridae fmanakinsl Pipra P. mentalis ignifera P. m. mentalis P. m. minor P. erythrocephala b
P. rubrocapilla P. chloromeros
Thraupidae (tanagersl Ramphocelus R. passerinii costaricensis R. p. passerinii R. icteronotus
R. flammigerusR. carbo R. nigrogularis R. sanguinolentus R. dimidiatus
a These superspecies complexes are described in Haffer (1974). b These are all members of the Pipra erythrocephala superspecies complex of Haffer (1970).
The lowland lineages analyzed include representatives of four avian
families (Table 1.2), also ensuring their independence for biogeographic testing.
Pteroglossus is a genus nonpasserine toucans (Ramphastidae). Pipra and
Gymnopithys are suboscines. Pipra is a genus of manakins (Pipridae); Gymnopithys
is a genus of antbirds (Formicariidae). Ramphocelus is a genus of oscine tanagers
(Thraupidae). All these genera are widespread in the Neotropical lowlands with
representatives in Mexico, Central America, and South America.
LITERATURE CITED
AVISE,J. C. 1991. Ten unorthodox perspectives on evolution prom pted by comparative population genetic findings on mitochondrial DNA. Ann.Rev. Genet. 25: 45-69.
----------- 1992. Molecular population structure and the biogeographic history of aregional fauna: a case history w ith lessons for conservation biology. Oikos 63: 62-76.
BERMINGHAM, E., S. ROHWER, S. FREEMAN, AND C. WOOD. 1992. Vicariance biogeography in the Pleistocene and speciation in North American wood warblers: a test of Mengel's model. Proc. Natl. Acad. Sci. 89: 6624-6628.
BRIGGS, J. C. 1987. Biogeography and plate tectonics. Elsevier Science Publishers B.V., Amsterdam, The Netherlands.
BRITTEN, R. J. 1986. Rates of DNA sequence evolution differ between different taxonomic groups. Science 231: 1393-1398.
BROOKS, D. R. 1981. Hennig’s parasitological method: A proposed solution. Syst. Zool. 30: 229-249.
AND D. A. MCLENNAN. 1991. Phylogeny, ecology, and behavior. Univ.Chicago Press, Chicago, Illinois.
BUSKIRK, R. E. 1985. Zoogeographic patterns and tectonic history of Jamaica and the northern Caribbean. J. Biogeogr. 12: 445-461.
CADLE, J. E. 1985. The Neotropical colubrid snake fauna (Serpentes: Colubridae): lineage components and biogeography. Syst. Zool. 34:1-20.
CAPPARELLA, A. P. 1987. Effects of riverine barriers on genetic differentiation of Amazonian forest undergrow th birds. Ph.D. dissertation, Louisiana State University, Baton Rouge, Louisiana.
1988. Genetic variation in Neotropical birds: implications for thespeciation process. Proc. Int. Ornithol. Congr. 19: 1658-1664.
----------. 1991. Neotropical avian diversity and riverine barriers. Acta XXCongressus Internationalis Ornithologici: 307-316.
CHAPMAN, F. M. 1978. Essays in South American ornithogeography. Arno Press Inc., New York.
CONEY, P. J. 1982. Plate tectonic constraints on the biogeography of Middle America and the Caribbean region. Ann. Missouri Bot. Gard. 69: 432-443.
CRACRAFT, J. 1985. Historical biogeography and patterns of differentiation w ithin the South American avifauna: areas of endemism. Ornithol. Monogr. 36: 49-84.
----------. 1988. Deep-history biogeography: retrieving the historical pattern ofevolving continental biotas. Syst. Zool. 37: 221-236.
-----------ANDK. HELM-BYCHOWSKI. 1991. Parsimony and phylogenetic inferenceusing DNA sequences: some methodological strategies. Pages 184-220 in Phylogenetic analysis of DNA sequence data (M. M. Miyamoto and J.Cracraft, Eds.). Oxford Univ. Press, New York.
-----------AND R. O. PRUM. 1988. Patterns and processes of diversification:speciation and historical congruence in some Neotropical birds. Evolution 42: 603-620.
GRAVES, G. R. 1982. Speciation in the Carbonated Flower-Piercer (Diglossa carbonaria) complex of the Andes. Condor 84:1-14.
GUTIERREZ, R. J., R. M. ZINK, AND S. Y. YANG. 1983. Genic variation, systematic, and biogeographic relationships of some galliform birds. Auk 100: 33-47.
HACKETT, S. J. AND K. V. ROSENBERG. 1990. Evolution of South American antwrens (Formicariidae): comparison of phenotypic and genetic differentiation. Auk 107: 473-489.
----------- In review. Phylogenetic and biogeographic relationships in theNeotropical genus Gymnopithys (Formicariidae). Wilson Bull.
HEDGES, S. B. 1982. Caribbean biogeography: implications of recent plate tectonic studies. Syst. Zool. 31: 518-522.
21
HAFFER, J. 1967a. Some allopatric species pairs of birds in northwestern Colombia. Auk 84: 343-365.
----------. 1967b. Speciation in Colombian forest birds west of the Andes. Amer.Mus. Novitates 294: 1-57.
----------- 1970. Art-Entstehung bei einigen Waldvogeln Amazoniens. J. Orn. I l l :285-331.
----------. 1974. Avian speciation in tropical South America. Publ. NuttallOrnithol. Club. 14.
----------- 1985. Avian zoogeography of the Neotropical lowlands. Ornithol.Monogr. 36: 113-146.
----------. 1987a. Quaternary history of tropical America. Pages 1-18 inBiogeography and Quaternary History in Tropical America (T. C. Whitmore and G. T. Prance, eds.). Clarendon Press, Oxford.
--------- - 1987b. Biogeography of Neotropical birds. Pages 105-150 in Biogeographyand Quaternary History in Tropical America (T. C. Whitmore and G. T. Prance, eds.). Clarendon Press, Oxford.
HILLIS, D. M. AND C. MORITZ. 1990. An overview of applications of molecular systematics. Pages 502-515 in Molecular Systematics (D. M. Hillis and C, Moritz, eds.). Sinauer Assoc., Inc., Sunderland, Massachusetts.
HOWELL, T. R. 1966. Avian distribution in Central America. Auk 86: 293-326.
KLUGE, A. G. 1988. Parsimony in vicariance biogeography: a quantitative method and a Greater Antillean example. Syst. Zool. 37: 315-328.
----------. 1989. A concern for evidence and a phylogenetic hypothesis ofrelationships among Epicrates (Boidae, Serpentes). Syst. Zool. 38: 7-25.
LIU, K.-B. AND P. COLINVAUX. 1985. Forest changes in the Amazon Basin during the last glacial maximum. Nature 318: 556-557.
MACFADDEN, B. J. 1981. Comments on Pregill's appraisal of historicalbiogeography of Caribbean vertebrates: vicariance, dispersal, or both? Syst. Zool. 30: 370-372.
MALFAIT, B. J. AND M. G. DINKLEMAN. 1972. Circum-Caribbean tectonic and igneous activity and the evolution of the Caribbean plate. Geol. Soc. Am. Bull. 83: 251-272.
MARTEN, J. A. AND N. K. JOHNSON. 1986. Genetic relationships of North American cardueline finches. Condor 88: 409-420.
MIYAMOTO, M. M. 1985. Consensus cladograms and general classifications. Cladistics 1: 186-189.
AND J. CRACRAFT. 1991. Phylogenetic inference, DNA sequence analysis,and the future of molecular systematics. Pages 3-17 in Phylogenetic analysis of DNA sequence data (M. M. Miyamoto and J. Cracraft, Eds.). Oxford Univ. Press, New York.
MURPHY, R. W. 1983. Paleobiogeography and genetic differentiation of the Baja California herpetofauna. Occas. Pap. Calif. Acad. Sciences 137:1-48.
NEI, M. 1978. Estimation of average heterozygosities and genetic distance from a small num ber of individuals. Genetics 89: 583-590.
NEIGEL, J. AND J. C. AVISE. 1986. Phylogenetic relationships of m itochondrial DNA under various demographic models of speciation. Pages 515-534 in Evolutionary Processes and Theory (E, Nevo and S. Karlin, Eds.). Academic Press, New York.
NELSON, G. AND N. PLATNICK. 1978. The perils of plesiomorphy: W idespread taxa, dispersal, and phenetic biogeography. Syst. Zool. 27: 474-477.
----------AND-----------. 1981. Systematics and biogeography: cladistics andvicariance. Columbia University Press, New York.
PAGE, R. D. M. 1990. Component analysis: a valiant failure? Cladistics 6:119-136.
PAMILO, P. AND M. NEI. 1988. Relationships between gene trees and species trees. Mol. Biol. Evol. 3: 254-259.
PETERSON, A. T„ P. ESCALANTE P., AND A. NAVARRO S. 1992. Genetic variation in Mexican populations of Common Bush-tanagers and Chestnut-capped Brush-finches. Condor 94: 244-253.
PINDELL, J. AND J. F. DEWEY. 1982. Permo-Triassic reconstruction of W estern Pangaea and the evolution of the Gulf of M exico/Caribbean region.Tectonics 1:179-211.
PLATNICK, N. I. AND G. NELSON. 1978. A m ethod of analysis for historical biogeography. Syst. Zool. 27:1-16.
PREGILL, G. K. 1981. An appraisal of the vicariance hypothesis of Caribbeanbiogeography and its application to West Indian terrestrial vertebrates. Syst. Zool. 30: 147-155.
PRUM, R. O. 1988. Historical relationships am ong avian forest areas of endemism in the Neotropics. Proc. Int. Ornithol. Congr. 19: 2562-2572.
23
RANDI, E., A. MERIGGI, R. LORENZINI, G. FUSCO, AND P. ALKON. 1992.Biochemical analysis of relationships of M editerranean Alectoris partridges. Auk 109: 358-367.
RICH, P. V. AND T. H. RICH. 1983. The Central Am erican dispersal route: biotic history and paleogeography. Pages 12-34 in Costa Rican N atural H istory (D.H. Janzen, Ed.). Univ. Chicago Press, Chicago.
ROSEN, D. E. 1976. A vicariance m odel of Caribbean biogeography. Syst. Zool. 24: 431-464.
------------ 1978. Vicariant patterns and historical explanations in biogeography.Syst. Zool. 27: 159-188.
------------ 1985. Geologic hierarchies and biogeographic congruence in theCaribbean. Ann. M issouri Bot. Gard. 72: 636-659.
SAVAGE, J. M. 1966. The origins and history of the Central Am erican herpetofauna. Copeia 1966: 719-766.
---------- . 1982. The enigma of the Central Am erican herpetofauna: dispersals orvicariance? Ann. M issouri Bot. Gard. 69: 464-547.
SHIELDS, G. F. AND A. C. WILSON. 1987. Calibration of m itochondrial DNA evolution in geese. J. Mol. Evol. 24: 212-217.
ANDT. D. KOCHER. 1991. Phylogenetic relationships of N orth Am ericanursids based on analysis of m itochondrial DNA. Evolution 45: 218-221.
VAN DER HAMMEN, T. 1974. The Pleistocene changes of vegetation and climate in tropical South America. J. Biogeogr. 1: 3-26.
VUILLEUMIER, F. 1969. Systematics and evolution in Diglossa (Aves, Coerebidae). Am. Mus. Novit. 2381: 1-44.
W EBB, S. D. 1978. A history of savanna vertebrates in the New World. Part 2. South America and the great interchange. Ann. Rev. Ecol. Syst. 9: 393-426.
WILEY, E. O. 1988a. Vicariance biogeography. Ann. Rev. Ecol. Syst. 19: 512-542.
---------- 1988b. Parsim ony analysis and vicariance biogeography. Syst. Zool. 37:271-290.
WILSON, A. C., S. S. CARLSON, AND T. J. WHITE. 1977. Biochemical evolution. Ann. Rev. Biochem. 46: 573-639.
ZANDEE, M. AND M. C. ROOS. 1986. Com ponent-com patibility in historical biogeography. Cladistics 3: 305-332.
ZINK, R. M. 1988. Evolution of brow n towhees: allozymes, morphometries and species limits. Condor 90: 72-82.
— AND J. C. AVISE. 1990. Patterns of mitochondrial DNA and allozyme evolution in the avian genus Amm odram us. Syst. Zool. 39:148-161.
— AND S. J. HACKETT. 1988. Biogeographic patterns in the avifauna of North America. Proc. Int. Ornithol. Congr. 19: 2573-2580.
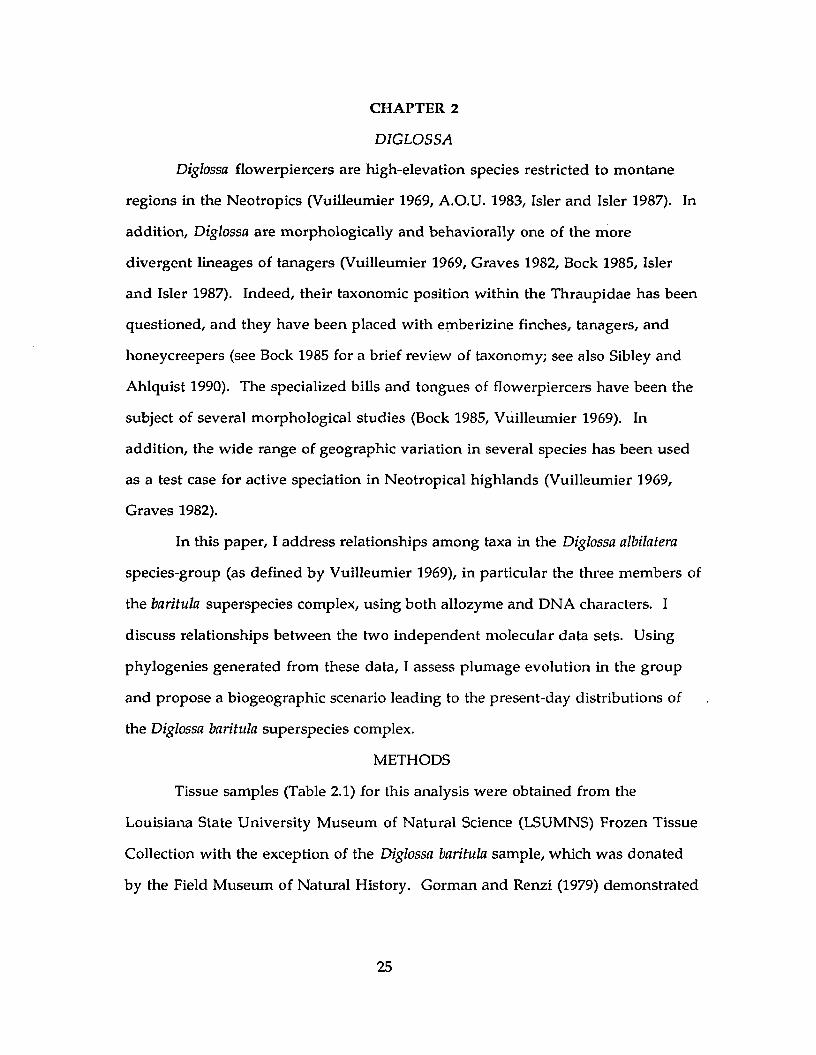
CHAPTER 2
D1GLOSSA
Diglossa flowerpiercers are high-elevation species restricted to montane
regions in the Neotropics (Vuilleumier 1969, A.O.U. 1983, Isler and Isler 1987). In
addition, Diglossa are morphologically and behaviorally one of the more
divergent lineages of tanagers (Vuilleumier 1969, Graves 1982, Bock 1985, Isler
and Isler 1987). Indeed, their taxonomic position within the Thraupidae has been
questioned, and they have been placed with emberizine finches, tanagers, and
honeycreepers (see Bock 1985 for a brief review of taxonomy; see also Sibley and
Ahlquist 1990). The specialized bills and tongues of flowerpiercers have been the
subject of several morphological studies (Bock 1985, Vuilleumier 1969). In
addition, the wide range of geographic variation in several species has been used
as a test case for active speciation in Neotropical highlands (Vuilleumier 1969,
Graves 1982).
In this paper, I address relationships among taxa in the Diglossa albilatera
species-group (as defined by Vuilleumier 1969), in particular the three members of
the baritula superspecies complex, using both allozyme and DNA characters. I
discuss relationships between the two independent molecular data sets. Using
phylogenies generated from these data, I assess plumage evolution in the group
and propose a biogeographic scenario leading to the present-day distributions of
the Diglossa baritula superspecies complex.
METHODS
Tissue samples (Table 2.1) for this analysis were obtained from the
Louisiana State University Museum of Natural Science (LSUMNS) Frozen Tissue
Collection w ith the exception of the Diglossa baritula sample, which was donated
by the Field Museum of Natural History. Gorman and Renzi (1979) demonstrated
25
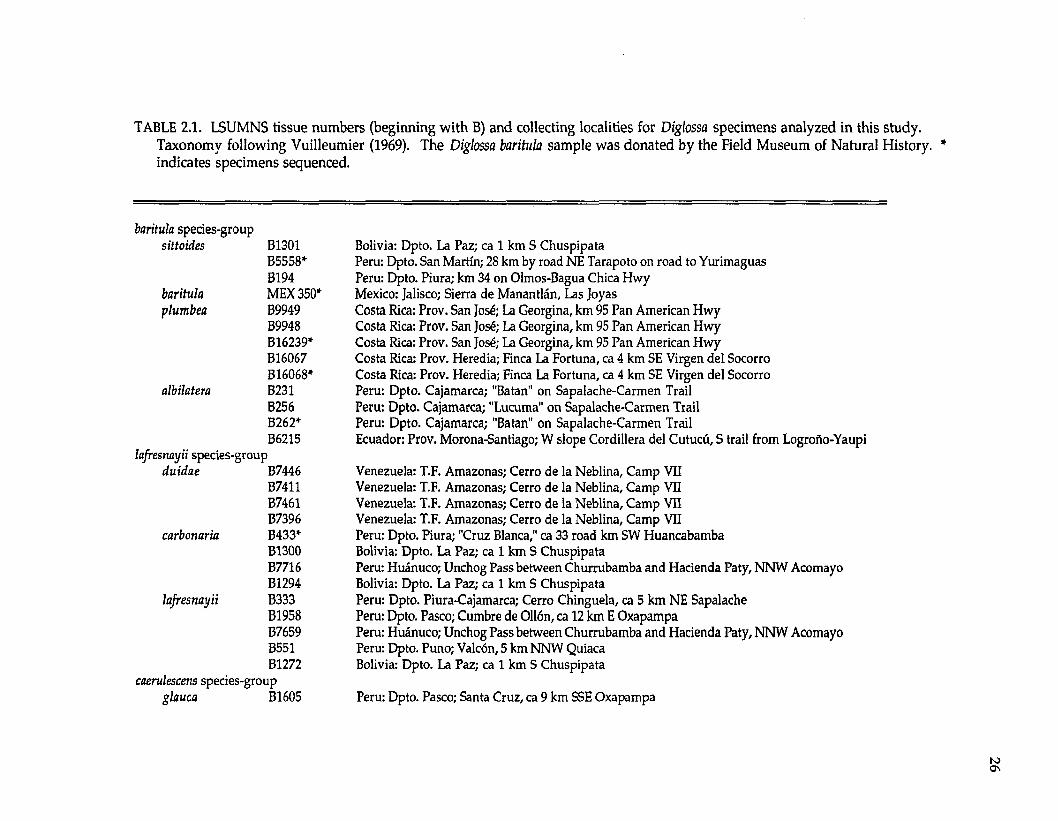
TABLE 2.1. LSUMNS tissue numbers (beginning with B) and collecting localities for Diglossa specimens analyzed in this study. Taxonomy following Vuilleumier (1969). The Diglossa baritula sample was donated by the Field Museum of Natural History, indicates specimens sequenced.
baritula species-group sittoides
baritulaplumbea
albilatera
B1301 B5558* B194MEX 350* B9949 B9948 B16239* B16067 B16068* B231 B256 B262* B6215
lafresnayii species-groupduidae B7446
B7411 B7461 B7396
carbonaria B433*B1300 B7716 B1294
lafresnayii B333B1958 B7659 B551 B1272
caerulescens species-group glauca B1605
Bolivia: Dpto. La Paz; ca 1 km S ChuspipataPeru: Dpto. San Martin; 28 km by road NE Tarapoto on road to YurimaguasPeru: Dpto. Piura; km 34 on Olmos-Bagua Chica HwyMexico: Jalisco; Sierra de Manantlan, Las JoyasCosta Rica: Prov. San Jos£; La Georgina, km 95 Pan American HwyCosta Rica: Prov. San Jos£; La Georgina, km 95 Pan American HwyCosta Rica: Prov. San Jose; La Georgina, km 95 Pan American HwyCosta Rica: Prov. Heredia; Finca La Fortuna, ca 4 km SE Virgen del SocorroCosta Rica: Prov. Heredia; Finca La Fortuna, ca 4 km SE Virgen del SocorroPeru: Dpto. Cajamarca; "Batan" on Sapalache-Carmen TrailPeru: Dpto. Cajamarca; "Lucuma" on Sapalache-Carmen TrailPeru: Dpto. Cajamarca; "Batan" on Sapalache-Carmen TrailEcuador: Prov. Morona-Santiago; W slope Cordillera del Cutucu, S trail from Logrofio-Yaupi
Venezuela: T.F. Amazonas; Cerro de la Neblina, Camp VII Venezuela: T.F. Amazonas; Cerro de la Neblina, Camp VII Venezuela: T.F. Amazonas; Cerro de la Neblina, Camp VII Venezuela: T.F. Amazonas; Cerro de la Neblina, Camp VII Peru: Dpto. Piura; "Cruz Blanca," ca 33 road km SW Huancabamba Bolivia: Dpto. La Paz; ca 1 km S ChuspipataPeru: Huanuco; Unchog Pass between Churrubamba and Hacienda Paty, NNW AcomayoBolivia: Dpto. La Paz; ca 1 km S ChuspipataPeru: Dpto. Piura-Cajamarca; Cerro Chinguela, ca 5 km NE SapalachePeru: Dpto. Pasco; Cumbre de 0116n, ca 12 km E OxapampaPeru: Huanuco; Unchog Pass between Churrubamba and Hacienda Paty, NNW Acomayo Peru: Dpto. Puno; Valcon, 5 km NNW Quiaca Bolivia: Dpto. La Paz; ca 1 km S Chuspipata
Peru: Dpto. Pasco; Santa Cruz, ca 9 km SSE Oxapampa
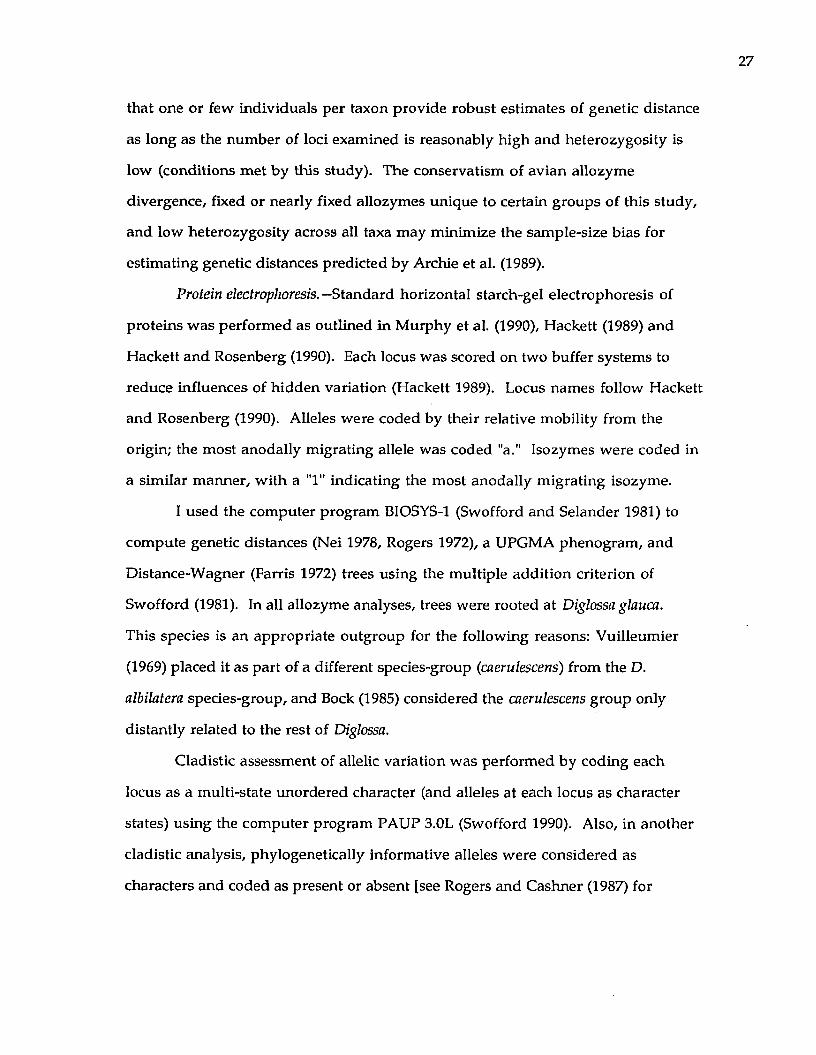
that one or few individuals per taxon provide robust estimates of genetic distance
as long as the number of loci examined is reasonably high and heterozygosity is
low (conditions met by this study). The conservatism of avian allozyme
divergence, fixed or nearly fixed allozymes unique to certain groups of this study,
and low heterozygosity across all taxa may minimize the sample-size bias for
estimating genetic distances predicted by Archie et al. (1989).
Protein electrophoresis. —Standard horizontal starch-gel electrophoresis of
proteins was performed as outlined in M urphy et al. (1990), Hackett (1989) and
Hackett and Rosenberg (1990). Each locus was scored on two buffer systems to
reduce influences of hidden variation (Hackett 1989). Locus names follow Hackett
and Rosenberg (1990). Alleles were coded by their relative mobility from the
origin; the most anodally migrating allele was coded "a." Isozymes were coded in
a similar manner, w ith a "1" indicating the most anodally migrating isozyme.
I used the computer program BIOSYS-1 (Swofford and Selander 1981) to
compute genetic distances (Nei 1978, Rogers 1972), a UPGMA phenogram, and
Distance-Wagner (Farris 1972) trees using the multiple addition criterion of
Swofford (1981). In all allozyme analyses, trees were rooted at Diglossa glauca.
This species is an appropriate outgroup for the following reasons: Vuilleumier
(1969) placed it as part of a different species-group (caerulescens) from the D.
albilatera species-group, and Bock (1985) considered the caerulescens group only
distantly related to the rest of Diglossa.
Cladistic assessment of allelic variation was performed by coding each
locus as a multi-state unordered character (and alleles at each locus as character
states) using the computer program PAUP 3.0L (Swofford 1990). Also, in another
cladistic analysis, phylogenetically informative alleles were considered as
characters and coded as present or absent [see Rogers and Cashner (1987) for
defense of this method of coding; see also Buth (1984), Mickevich and Mitter
(1981), and Swofford and Berlocher (1987) for problems with this method of
coding]. One hundred bootstrap replicates were performed on each cladistic
analysis to assess confidence in the branching pattern (Felsenstein 1985,
Sanderson 1989). The g\ statistic of Hillis and Huelsenbeck (1992) was calculated
to determine the extent of randomness versus phylogenetic signal in the data set.
DNA sequences— Following Hillis et al. (1990), a total nucleic acid
preparation was made from liver tissue frozen at -80°C (see Table 2.1 for
specimens sequenced). Amplifications of a specific region of the mitochondrial
(mt) cytochrome b gene were performed via the polymerase chain reaction (PCR).
A 307 base pair fragment (not including primers) was amplified using the primers
L14841 (5'-CCATCCAACATCTCAGCATGATGAAA-3') and H15149 (5'-
CCTCAGAATGATATTTGTCCTCA-3’; Kocher et al. 1989). Double-stranded PCR
amplifications were performed in 50 pi total reaction volumes [10 pi of a 10 ~2
dilution of the total DNA preparation, 2.5 pi of a 10 pM solution of each primer, 5
pi of 10X buffer (including MgCl2 ), 2 pi of a 1.0 mM solution of dNTP's, 0.20 pi Taq
DNA polymerase (Promega), up to 50 pi with H2 O]. Thirty to 35 cycles were
performed using the following cycling parameters: first cycle—denaturation at
94°C for 3 minutes, annealing at 56°C for 1 minute, extension at 72°C for 30
seconds; remaining cycles—denaturation at 94°C for 1 minute, annealing at 56°C
for 1 minute, extension at 72°C for 30 seconds.
Single-stranded DNA was generated following the procedure of Allard et
al. (1991) in which only one primer is used (no limiting primer). Five pi of the
double-stranded product were used to generate single-stranded DNA in 100 pi
reactions [5 pi double-stranded DNA, 2 pi of a 10 pM solution of one primer, 10 pi
of 10X buffer (including MgCl2 ), 4 pi dNTP’s, 0.40 pi Taq DNA polymerase
29
(Promega), up to 100 pi w ith H 2 O]. Twenty cycles were perform ed using the
following cycling parameters: first cycle—denaturation at 94°C for 3 minutes,
annealing at 56°C for 1 m inute, extension at 72°C for 45 seconds; rem aining cycles-
-denaturation at 94°C for 1 minute, annealing at 56°C for 1 m inute, extension at
72°C for 45 seconds. Single-stranded DNA was generated for both the heavy and
light mtDNA strands, and the products were cleaned by 5 washings w ith H 2 O
through Ultrafree®-MC 30,000 NNMWL filters (Millipore Corp., Bedford, MA),
and concentrated to a final volume of approximately 30 pi. Seven pi of cleaned
single-stranded DNA were used for DNA sequencing using T7 DNA polymerase
(Sequenase® version 2.0, United States Biochemical, Cleveland, OH).
The DNA sequence data were analyzed cladistically w ith PAUP 3.0L
(Swofford 1990). I sequenced another tanager, Hemispingus superciliaris, and this
sequence w as used to root the DNA sequence trees. All base positions were used
in the analysis; there were few transversions, non-third-position changes, or non
synonym ous changes. As with the allozyme data, 100 bootstrap replicates were
perform ed to assess confidence in the branching pattern, and the g i statistic was
calculated to determ ine the extent of random ness versus phylogenetic signal.
Percent sequence divergence was calculated as p= n a /n , where p is the percent
sequence divergence, is the num ber of nucleotides different betw een two
sequences, and tt is the total num ber of nucleotides com pared (Nei 1987).
In addition, the allozyme and DNA data sets were combined (Kluge 1989)
and analyzed cladistically using PAUP 3.0L (Swofford 1990).
RESULTS
Protein electrophoresis. —Levels and patterns of genetic variation at 33
presum ptive gene loci were resolved (Tables 2.2 and 2.3; the three UDH’s are
unidentified dehydrogenases). Twenty-four (73%) loci were variable w ithin or
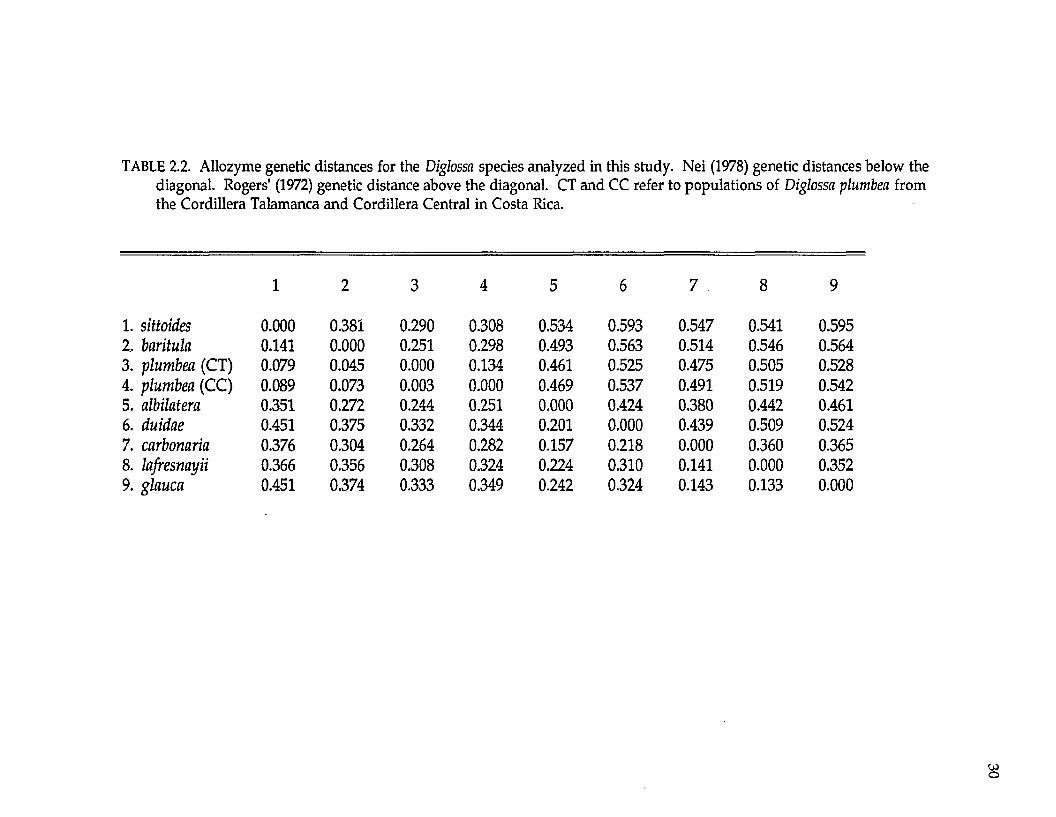
TABLE 2.2. Allozyme genetic distances for the Diglossa species analyzed in this study. Nei (1978) genetic distances below the diagonal. Rogers' (1972) genetic distance above the diagonal. CT and CC refer to populations of Diglossa plumbea from the Cordillera Talamanca and Cordillera Central in Costa Rica.
1 2 3 4 5 6 7 8 9
1. sittoides 0.000 0.381 0.290 0.308 0.534 0.593 0.547 0.541 0.5952. baritula 0.141 0.000 0.251 0.298 0.493 0.563 0.514 0.546 0.5643. plumbea (CT) 0.079 0.045 0.000 0.134 0.461 0.525 0.475 0.505 0.5284. plumbea (CC) 0.089 0.073 0.003 0.000 0.469 0.537 0.491 0.519 0.5425. albilatera 0.351 0.272 0.244 0.251 0.000 0.424 0.380 0.442 0.4616. duidae 0.451 0.375 0.332 0.344 0.201 0.000 0.439 0.509 0.5247. carbonaria 0.376 0.304 0.264 0.282 0.157 0.218 0.000 0.360 0.3658. lafresnayii 0.366 0.356 0.308 0.324 0.224 0.310 0.141 0.000 0.3529. glauca 0.451 0.374 0.333 0.349 0.242 0.324 0.143 0.133 0.000
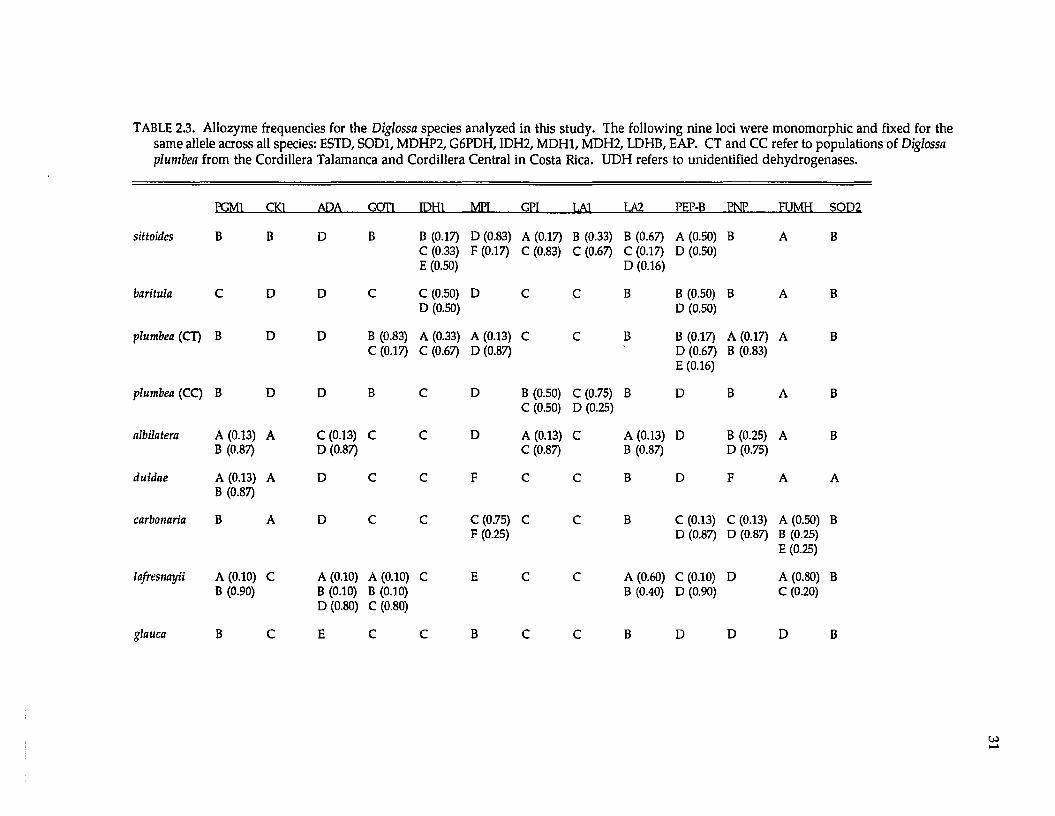
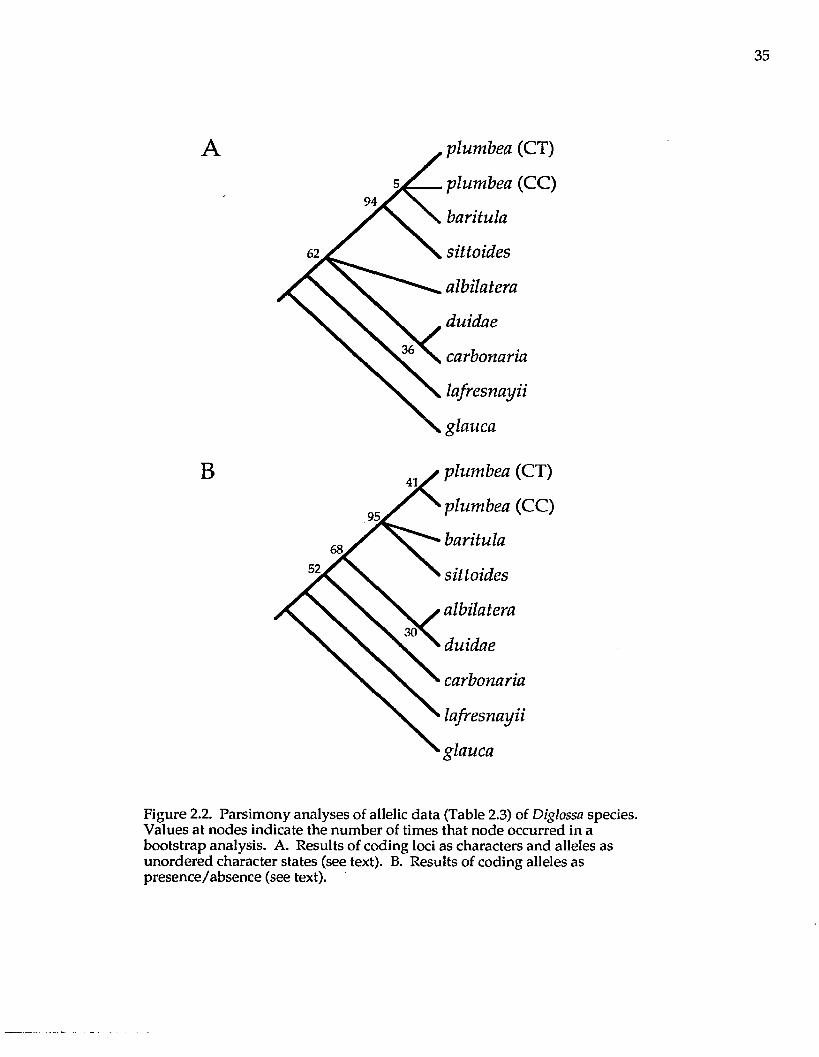
TABLE 2.3. Allozyme frequencies for the Diglossa species analyzed in this study. The following nine loci were monomorphic and fixed for the same allele across all species: ESTD, SOD1, MDHP2, G6PDH, IDH2, MDH1, MDH2, LDHB, EAP. CT and CC refer to populations of Diglossa plumbea from the Cordillera Talamanca and Cordillera Central in Costa Rica. UDH refers to unidentified dehydrogenases.
EGM1 QO M2A SOU B2H1 MEI GPI LAI LA2 EEEdB ENE FUMH SOD2
sittoides B B D B B (0.17) C (0.33) E (0.50)
D (0.83) F (0.17)
A (0.17) C (0.83)
B (0.33) C (0.67)
B (0.67) C (0.17) D (0.16)
A (0.50) D (0.50)
B A B
baritula C D D C C (0.50) D (0.50)
D C C B B (0.50) D (0.50)
B A B
plumbea (CT) B D D B (0.83) C (0.17)
A (0.33) C (0.67)
A (0.13) D (0.87)
c C B B (0.17) D (0.67) E (0.16)
A (0.17) B (0.83)
A B
plumbea (CC) B D D B C D B (0.50) C (0.50)
C (0.75) D (0.25)
B D B A B
albilatera A (0.13) B (0.87)
A C (0.13) D (0.87)
C C D A (0.13) C (0.87)
C A (0.13) B (0.87)
D B (0.25) D (0.75)
A B
duidae A (0.13) B (0.87)
A D c C F C C B D F A A
carbonaria B A D c C C (0.75) F (0.25)
c C B C (0.13) D (0.87)
C (0.13) D (0.87)
A (0.50) B (0.25) E (0.25)
B
lafresnayii A (0.10) B (0.90)
C A (0.10) B (0.10) D (0.80)
A (0.10) B (0.10) C (0.80)
C E c C A (0.60) B (0.40)
C (0.10) D (0.90)
D A (0.80) C (0.20)
B
glauca B C E c C B c C B D D D B
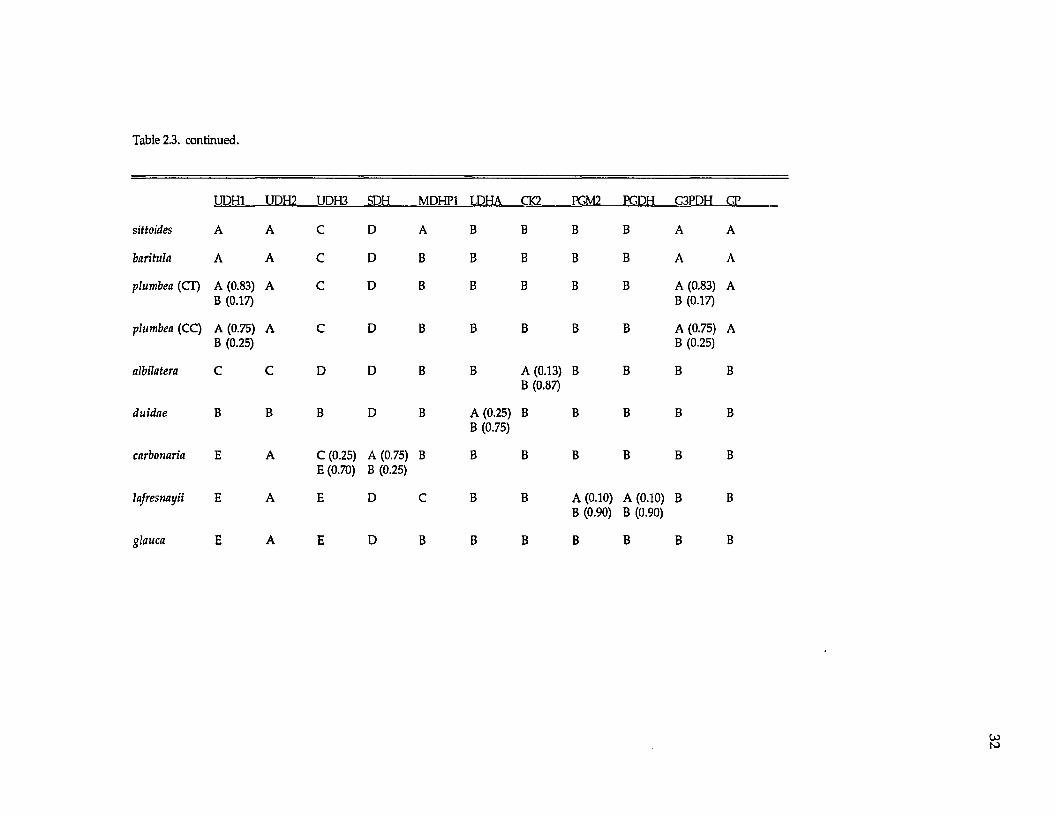
Table 2.3. continued.
UDH1 UDH2 UDH3 SDH MDHP1 LDHA CK2 PGM2 PCDH C3PDH CT
sittoides A A C D A B B B B A A
baritula A A C D B B B B B A A
plumbea (CT) A (0.83) B (0.17)
A c D B B B B B A (0.83) B (0.17)
A
plumbea (CC) A (0.75) B (0.25)
A c D B B B B B A (0.75) B (0.25)
A
albilatera C C D D B B A (0.13) B (0.87)
B B B B
duidae B B B D B A (0.25) B (0.75)
B B B B B
carbonaria E A C (0.25) E (0.70)
A (0.75) B (0.25)
B B B B B B B
lafresnayii E A E D C B B A (0.10) B (0.90)
A (0.10) B (0.90)
B B
glauca E A E D B B B B B B B
wto
among species. Average genetic distance (Nei 1978; ± standard deviation) within
the Diglossa baritula superspecies complex (between D. sittoides, D. baritula, and D.
plumbea) is 0.088 + 0.049; between the D. baritula complex and D. albilatera genetic
distances average 0.289 + 0.055. Genetic distance is 0.003 among the two
population samples of D. plumbea from the Cordillera Central and Cordillera
Talamanca in Costa Rica (Table 2.1).
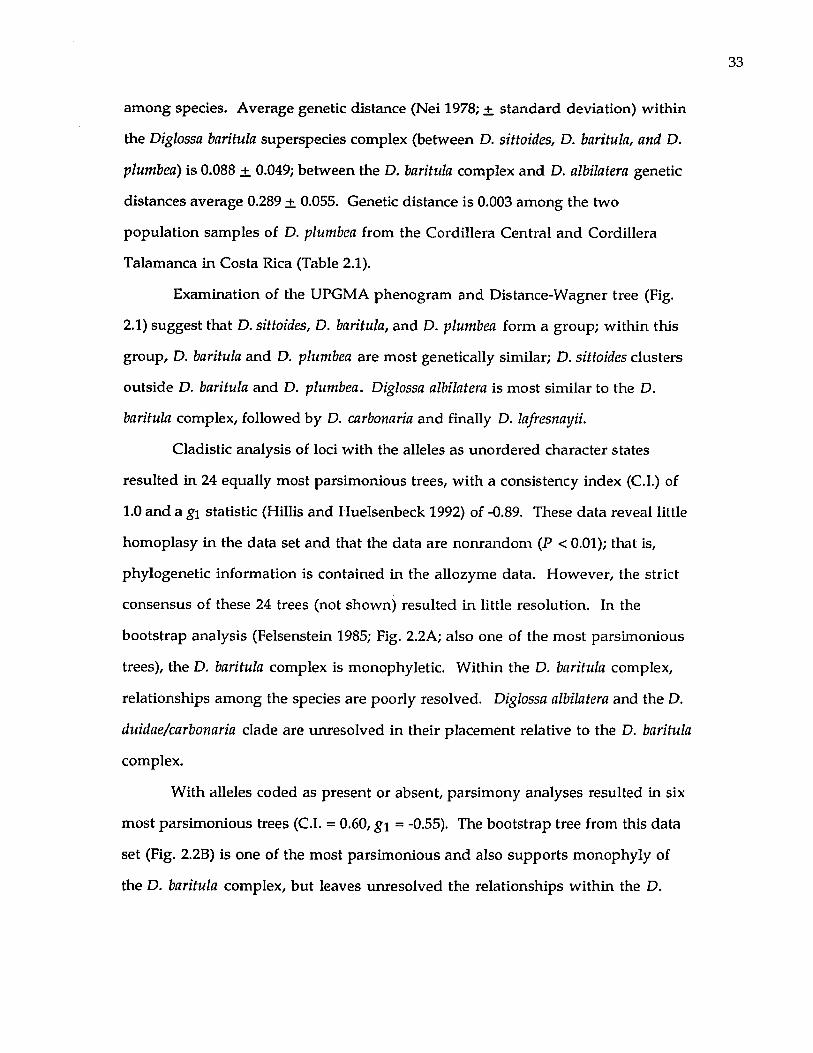
Examination of the UPGMA phenogram and Distance-Wagner tree (Fig.
2.1) suggest that D. sittoides, D. baritula, and D. plumbea form a group; within this
group, D. baritula and D. plumbea are most genetically similar; D. sittoides clusters
outside D. baritula and D. plumbea. Diglossa albilatera is most similar to the D.
baritula complex, followed by D. carbonaria and finally D. lafresnayii.
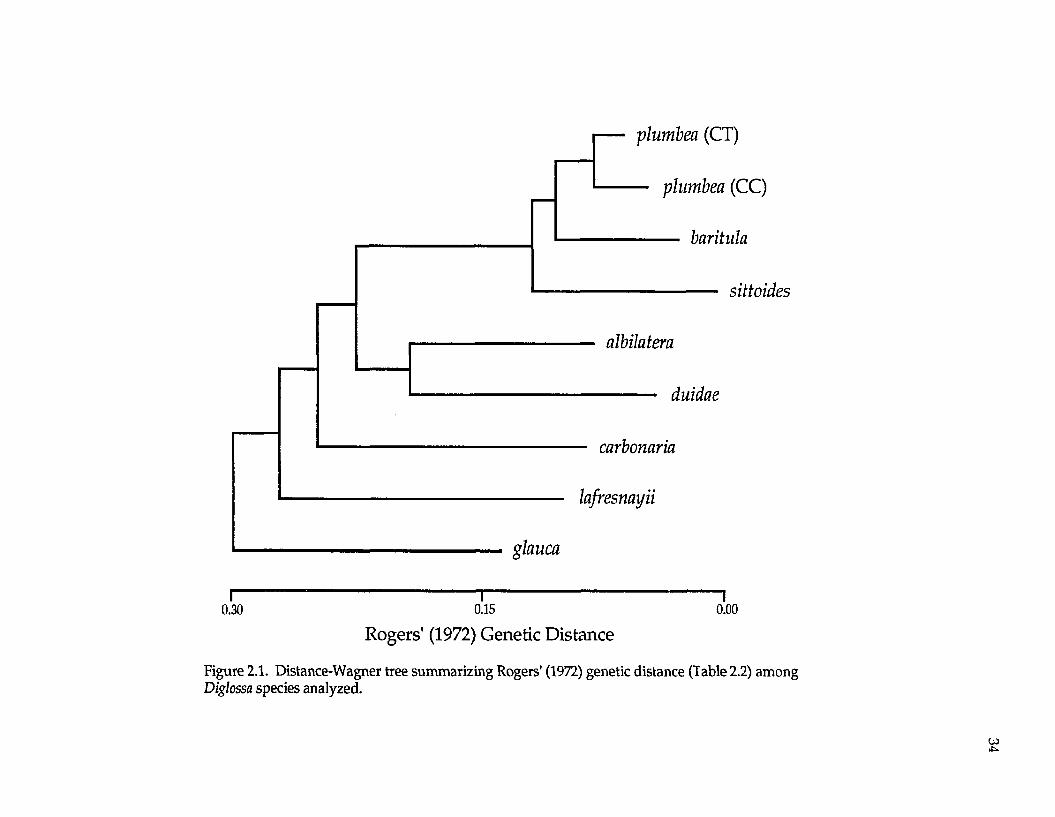
Cladistic analysis of loci with the alleles as unordered character states
resulted in 24 equally most parsimonious trees, with a consistency index (C.I.) of
1.0 and a gi statistic (Hillis and Huelsenbeck 1992) of -0.89. These data reveal little
homoplasy in the data set and that the data are nonrandom (P < 0.01); that is,
phylogenetic information is contained in the allozyme data. However, the strict
consensus of these 24 trees (not shown) resulted in little resolution. In the
bootstrap analysis (Felsenstein 1985; Fig. 2.2A; also one of the most parsimonious
trees), the D. baritula complex is monophyletic. Within the D. baritula complex,
relationships among the species are poorly resolved. Diglossa albilatera and the D.
duidae/carbonaria clade are unresolved in their placement relative to the D. baritula
complex.
With alleles coded as present or absent, parsimony analyses resulted in six
most parsimonious trees (C.I. = 0.60, g \ = -0.55). The bootstrap tree from this data
set (Fig. 2.2B) is one of the most parsimonious and also supports monophyly of
the D. baritula complex, but leaves unresolved the relationships within the D.
p lu m b e a (CT)
— p lu m b e a (CC)
b a r itu la
s i t to id e s
a lb ila te ra
d u id a e
ca rb o n a ria
la fr e s n a y ii
g la u c a
0.30 0.15“10.00
Rogers' (1972) Genetic Distance
Figure 2.1. Distance-Wagner tree summarizing Rogers' (1972) genetic distance (Table 2.2) among Diglossa species analyzed.
w
A
B
p lu m b e a (CT)
p lu m b e a (CC)
b a r i tu la
s i t t o i d e s
a lb i la te r a
d u id a e
c a r b o n a r ia
la f r e s n a y i i
g la u c a
p lu m b e a (CT)
p lu m b e a (CC)
b a r i tu la
s i t t o i d e s
a lb i la te r a
d u id a e
c a r b o n a r ia
la f r e s n a y i i
g la u c a
Figure 2.2. Parsimony analyses of allelic data (Table 2.3) of Diglossa species. Values at nodes indicate the number of times that node occurred in a bootstrap analysis. A. Results of coding loci as characters and alleles as unordered character states (see text). B. Results of coding alleles as presence/absence (see text).
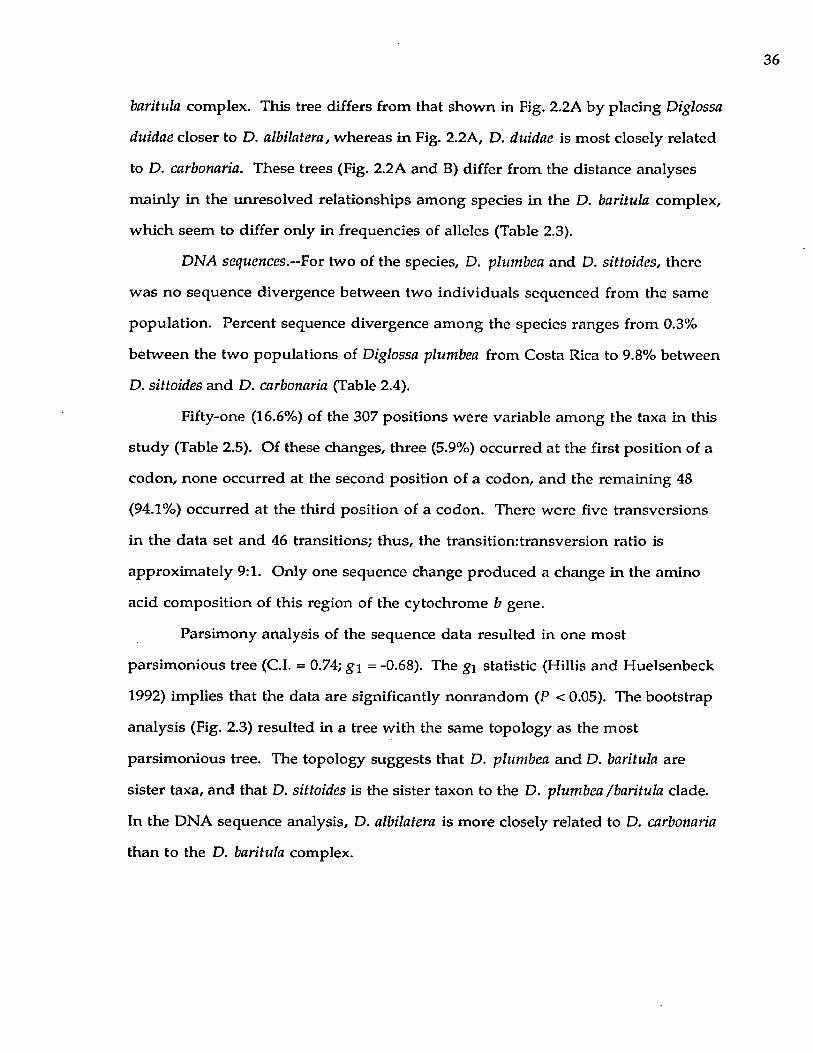
baritula complex. This tree differs from that shown in Fig. 2.2A by placing Diglossa
duidae closer to D. albilatera, whereas in Fig. 2.2A, D. duidae is m ost closely related
to D. carbonaria. These trees (Fig. 2.2A and B) differ from the distance analyses
m ainly in the unresolved relationships am ong species in the D. baritula complex,
w hich seem to differ only in frequencies of alleles (Table 2.3).
D N A sequences.—For two of the species, D. plumbea and D. sittoides, there
w as no sequence divergence betw een two individuals sequenced from the same
population. Percent sequence divergence am ong the species ranges from 0.3%
betw een the two populations of Diglossa plumbea from Costa Rica to 9.8% between
D. sittoides and D. carbonaria (Table 2.4).
Fifty-one (16.6%) of the 307 positions w ere variable am ong the taxa in this
study (Table 2.5). Of these changes, three (5.9%) occurred at the first position of a
codon, none occurred at the second position of a codon, and the rem aining 48
(94.1%) occurred at the third position of a codon. There were five transversions
in the data set and 46 transitions; thus, the transition: transversion ratio is
approxim ately 9:1. Only one sequence change produced a change in the amino
acid com position of this region of the cytochrome b gene.
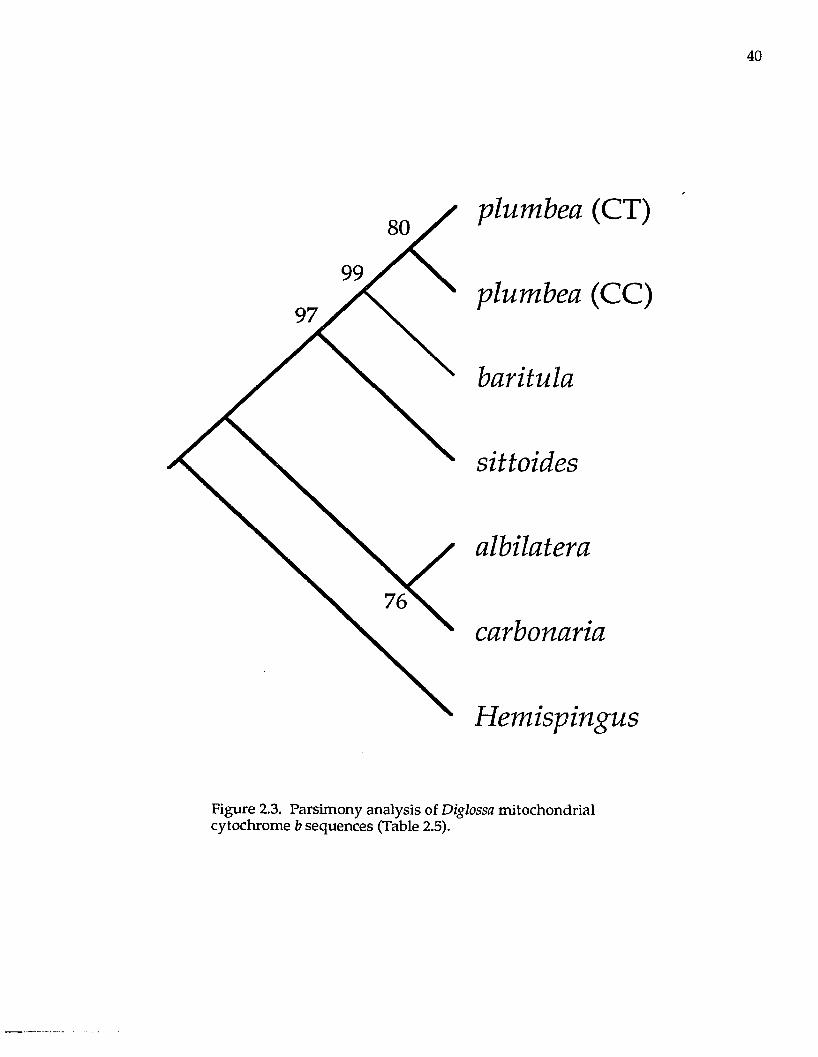
Parsim ony analysis of the sequence data resulted in one m ost
parsim onious tree (C.I. = 0.74; g i = -0.68). The gi statistic (Hillis and Huelsenbeck
1992) implies that the data are significantly nonrandom (P < 0.05). The bootstrap
analysis (Fig. 2.3) resulted in a tree w ith the same topology as the m ost
parsim onious tree. The topology suggests that D. plumbea and D. baritula are
sister taxa, and that D. sittoides is the sister taxon to the D. plumbea /baritula clade.
In the DNA sequence analysis, D. albilatera is m ore closely related to D. carbonaria
than to the D. baritula complex.
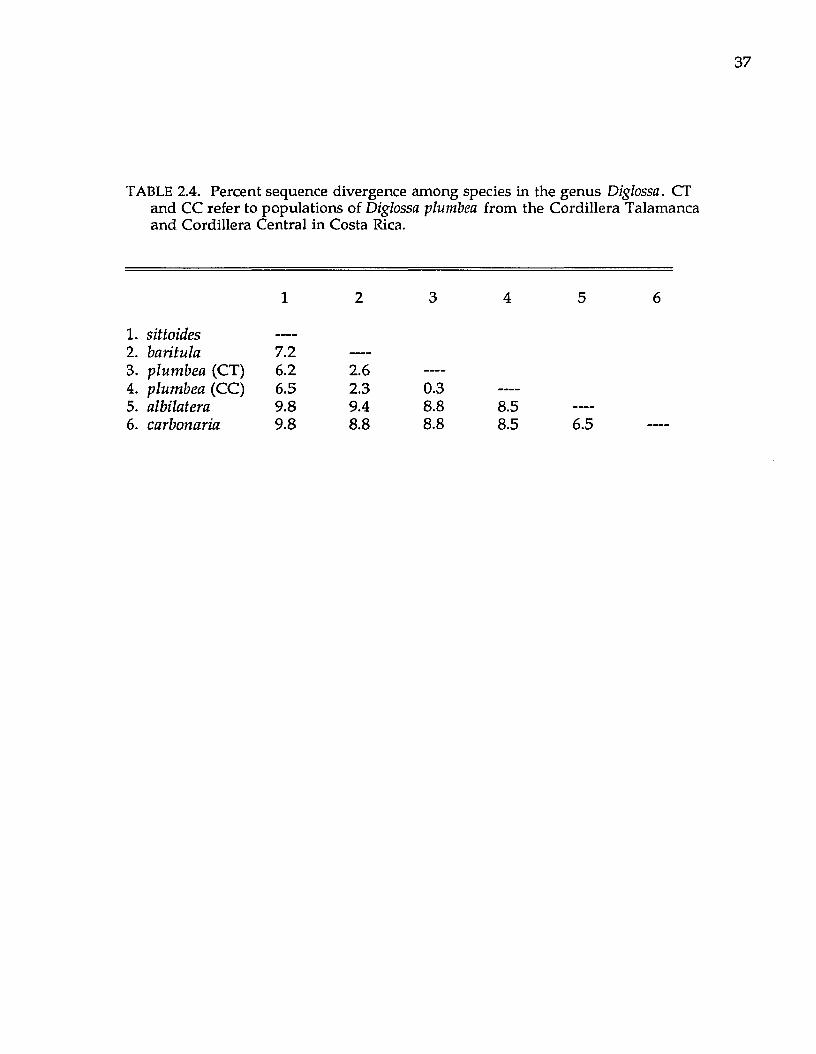
TABLE 2.4. Percent sequence divergence among species in the genus Diglossa. CT and CC refer to populations of Diglossa plumbea from the Cordillera Talamanca and Cordillera Central in Costa Rica.
1 2 3 4 5
1. sittoides ____ __
2. baritula 7.2 —
3. plumbea (CT) 6.2 2.6 —
4. plumbea (CC) 6.5 2.3 0.3 —
5. albilatera 9.8 9.4 8.8 8.5 —
6. carbonaria 9.8 8.8 8.8 8.5 6.5
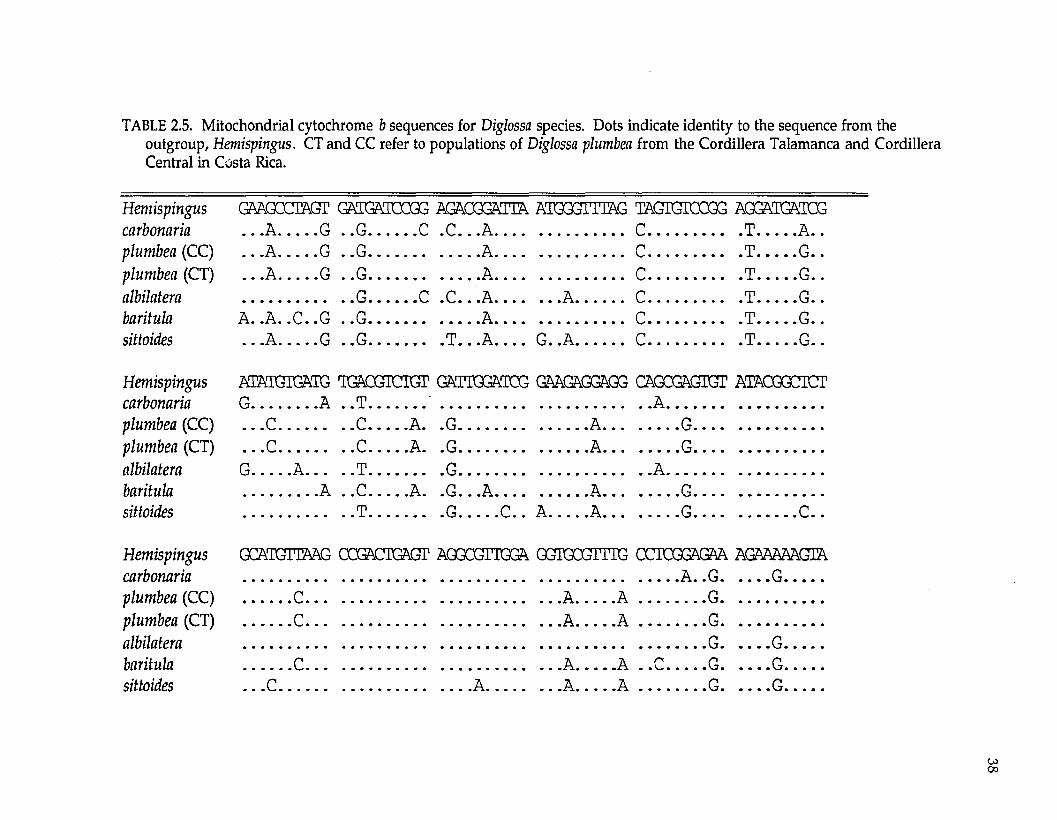
TABLE 2.5. Mitochondrial cytochrome b sequences for Diglossa species. Dots indicate identity to the sequence from theoutgroup, Hemispingus. CT and CC refer to populations of Diglossa plumbea from the Cordillera Talamanca and Cordillera Central in Costa Rica.
H em ispingus GAAGCCIAGT GATCATCCGG AGAQQGATTA ATGGGITTAG TAGIGICQGG AGGADGATOGcarbonaria . . .A G . .G C .C.. .A........................... C...................... T A..plum bea (C C ) . . .A G . .G.........................A........................... C......................T..........G..plum bea (CT) . . .A G . .G.........................A........................... C......................T..........G..albilatera ........................G C .C.. .A.............. A.......... C...................... T G..baritula A..A..C..G . .G.........................A........................... C......................T..........G..sittoides . . .A G . .G................T . . .A.. . . G. .A C.................... T G..
H em ispingus ATATGIGATG TGAOGICTGT GATPGGATCG GAAGAGGAGG CAGCGAGIGT ATACGGCICTcarbonaria G A . .T .............................................A..................................plum bea (C C ) . . .C ................ C.........A. .G.............................A................G...........................plum bea (CT) .. .C................ C.........A. .G.............................A................G............................albilatera G A T................G......................................... A..................................baritula A . .C A. .G.. .A....................A................ G............................sittoides ........................T................ G C.. A A.................G......................C. .
H em ispingus GCATGTIMG COGACIGAGT AGGCGITGGA GGIGCGTTIG (XTCGGAGAA AGAAAAAGIAcarbonaria ............................................................................................. A...G.......... G.........plum bea (C C ) C....................................................... A.......A ................G.....................plum bea (CT) C....................................................... A.......A ................G.....................albilatera ................................................................................................... G.......... G.........baritula C.......................................................A........ A . .C........ G...........G........sittoides . . . C ......................................... A................A........ A .............. G.......... G.........
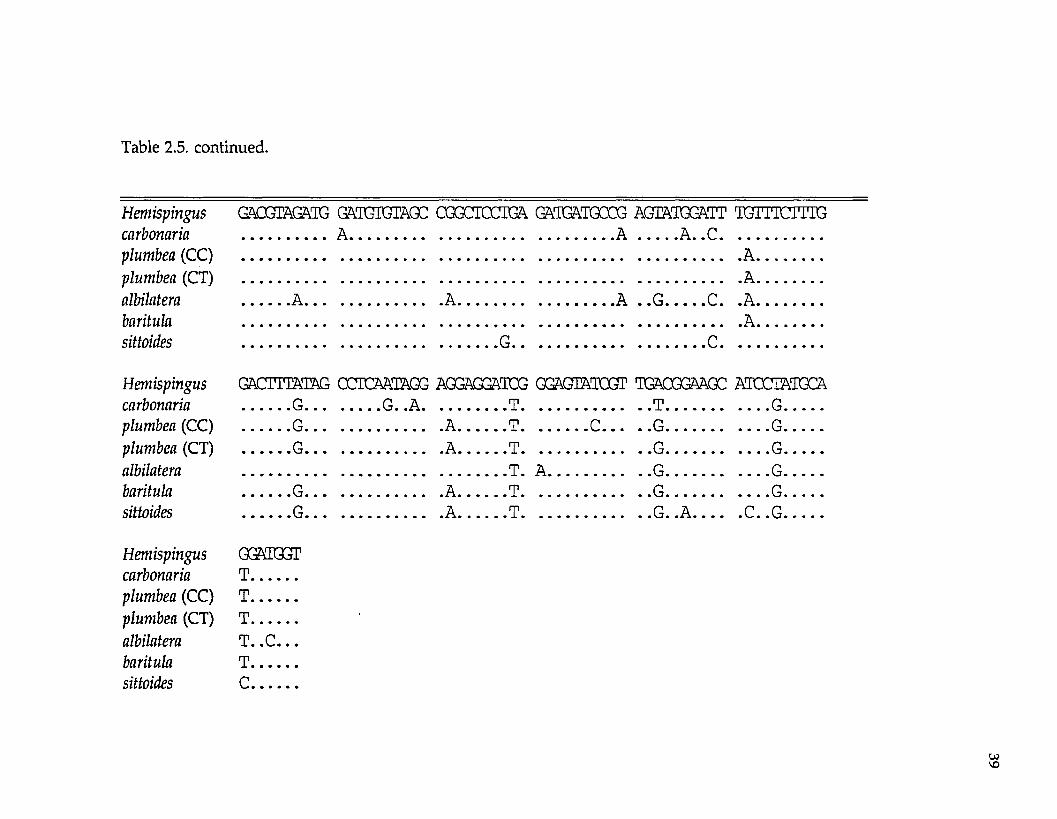
Table 2.5. continued.
H em ispinguscarbonariaplum bea (CC)plum bea (CT)albilaterabaritulasittoides
H em ispinguscarbonariaplum bea (CC)plum bea (CT)albilaterabaritulasittoides
H em ispinguscarbonariaplum bea (CC)plum bea (CT)albilaterabaritulasittoides
GACGIAGATG GATGIGIAGC CGGCICCIGA GATGAIQCCG AGIATGGATT TGTTICITTG..................A.........................................................A .......... A..C.................................................................................................................................A.........................................................................................................................A.............. A............................. A..................................A . . G ........ C. .A.........................................................................................................................A.....................................................................G......................................... C......................
GACITIATAG CCICAATAGG AGGAGGATCG GGACTATCGT TGACGGAAGC ATCCTATGCA G................G..A.................. T............................T.......................G....................G. . . . .......................A . . . . . .T........... . . C . . . . .G.......... .......... G...................G. . . . .......................A . . . . . .T.......... . .G.......... ............G..........
. . .T. A. . . . .G.......... ............G......................G. . . . .......................A . . . . . .T.......... . .G.......... .......... G...................G... . .......................A . . . . . . T .......... ..G. . A . . . . -C..G..........
GGAIGGTT..........T..........T..........T..C.. .T..........C..........
plumbea (CT)
plumbea (CC)
baritula
sittoides
albilatera
carbonaria
Hemispingus
Figure 2.3. Parsimony analysis of Diglossa mitochondrial cytochrome b sequences (Table 2.5).
The combined data from allozymes and mtDNA sequences resulted in one
tree (not shown; C.I. = 0.88; g\ = -1.26), which was identical to the mtDNA
sequence tree (Fig. 2.3).
DISCUSSION
Molecules. —Both allozyme and mtDNA sequence data reveal a high degree
of differentiation among the taxa analyzed in this study relative to that found in
many comparable avian studies. This result provides additional data on the high
levels of differentiation among sedentary (nonmigratory) Neotropical birds that
have also been reported by Capparella (1987,1988), Hackett and Rosenberg (1990),
Peterson (1992), and Chapters 3-7.
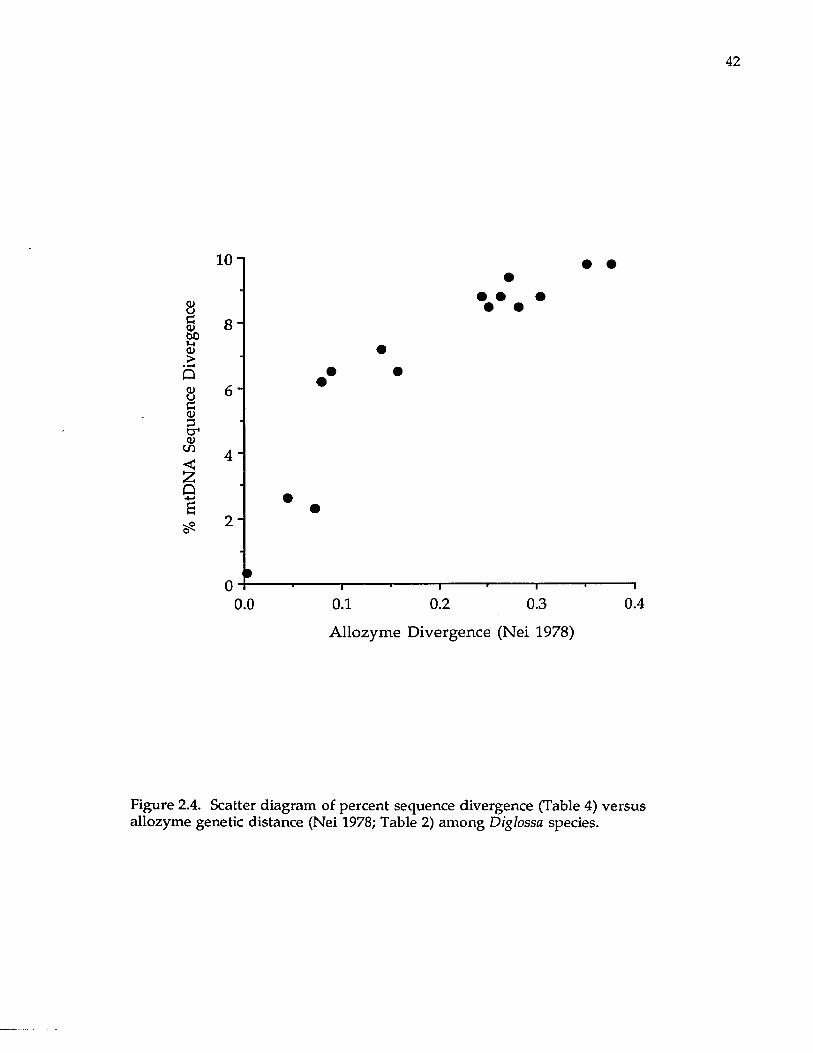
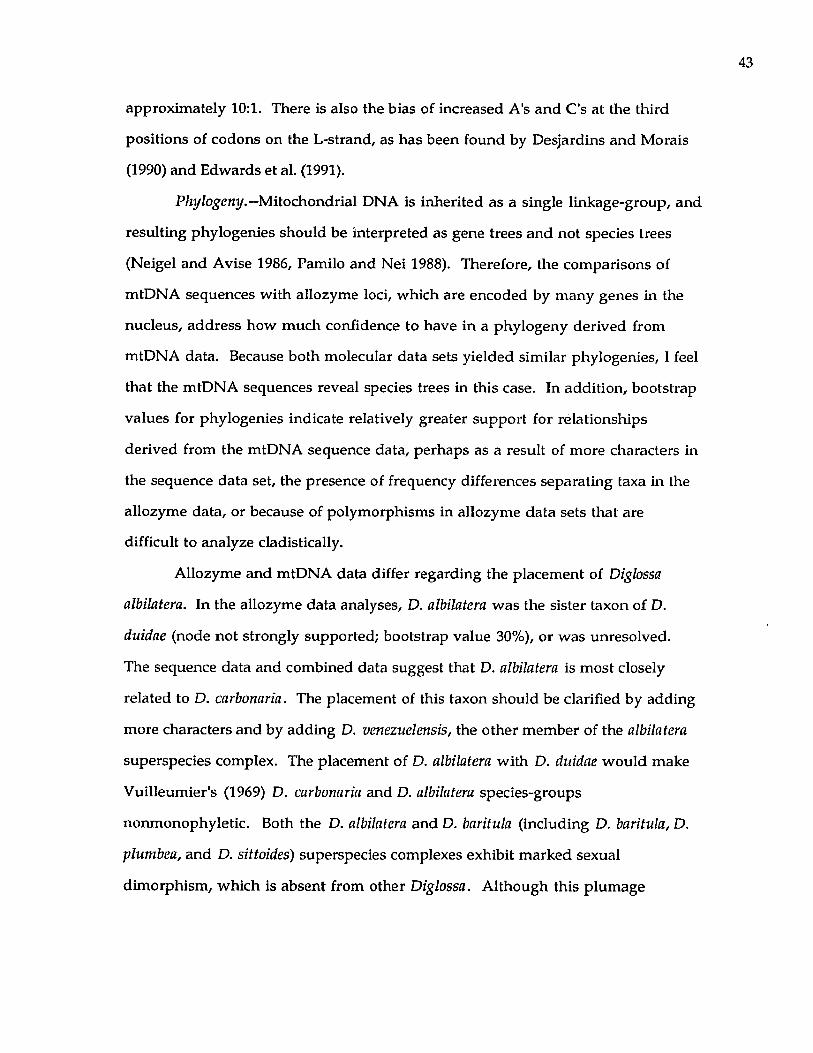
Results of allozyme and mtDNA sequence analyses can be compared at not
only the level of evolutionary pattern (phylogenies) bu t also at the level of genetic
differentiation. A lthough allozyme and mtDNA sequence divergence (Fig. 2.4)
are highly correlated (R = 0.90), sequence divergence seems to level off after
around 0.20 units of Nei's (1978) allozyme genetic distance. Although DNA
sequence changes are limited to four character states (excluding gaps), more than
four are possible at allozyme loci. Therefore, sequence change at third positions
appears to become saturated, whereas saturation at allozyme loci seems not to
have occurred in Diglossa. Edwards et al. (1991) found 92% of changes at the
cytochrome b gene in a range of passerine birds occurred at third positions of
codons, an expected result for a gene evolving under functional constraints. They
suggested that third positions were saturated within a genus of babblers at
approximately 10% sequence divergence among species, a result consistent with
the findings of the present study.
Although transition:transversion ratios of 20:1 have been proposed for
birds (Edwards et al. 1991), in Diglossa the transition:transversion ratio is
% m
tDNA
Se
quen
ce
Div
erge
nce
42
1 0 -j #
• • • •8
• •m6 H
2 -
00.0 0.1 0.2 0.3 0.4
A llozym e D ivergence (Nei 1978)
Figure 2.4. Scatter diagram of percent sequence divergence (Table 4) versus allozyme genetic distance (Nei 1978; Table 2) among Diglossa species.
approximately 10:1. There is also the bias of increased A's and C's at the third
positions of codons on the L-strand, as has been found by Desjardins and Morais
(1990) and Edwards et al. (1991).
Phylogeny.— Mitochondrial DNA is inherited as a single linkage-group, and
resulting phylogenies should be interpreted as gene trees and not species trees
(Neigel and Avise 1986, Pamilo and Nei 1988). Therefore, the comparisons of
mtDNA sequences with allozyme loci, which are encoded by many genes in the
nucleus, address how much confidence to have in a phylogeny derived from
mtDNA data. Because both molecular data sets yielded similar phylogenies, I feel
that the mtDNA sequences reveal species trees in this case. In addition, bootstrap
values for phylogenies indicate relatively greater support for relationships
derived from the mtDNA sequence data, perhaps as a result of more characters in
the sequence data set, the presence of frequency differences separating taxa in the
allozyme data, or because of polymorphisms in allozyme data sets that are
difficult to analyze cladistically.
Allozyme and mtDNA data differ regarding the placement of Diglossa
albilatera. In the allozyme data analyses, D. albilatera was the sister taxon of D.
duidae (node not strongly supported; bootstrap value 30%), or was unresolved.
The sequence data and combined data suggest that D. albilatera is most closely
related to D. carbonaria. The placement of this taxon should be clarified by adding
more characters and by adding D. venezuelensis, the other member of the albilatera
superspecies complex. The placement of D. albilatera with D. duidae w ould make
Vuilleumier's (1969) D. carbonaria and D. albilatera species-groups
nonmonophyletic. Both the D. albilatera and D. baritula (including D. baritula, D.
plumbea, and D. sittoides) superspecies complexes exhibit marked sexual
dimorphism, which is absent from other Diglossa. Although this plumage
dim orphism suggests monophyly of the D. albilatera species-group, m olecular
analyses provide little support for monophyly. It could be that historical
speciation events leading to the albilatera species-group were too closely spaced for
there to be m olecular characters that document monophyly of the group (Lanyon
1988).
There is, however, strong molecular support for the m onophyly of the
baritula superspecies complex (Figs. 2.1-2.3). Relationships w ithin the D. baritula
group are also well supported by the sequence data (Fig. 2.3). Diglossa plumbea and
D. baritula are sister taxa with D. sittoides as the sister taxon to the D.
plumbea/baritula clade. This phylogeny contributes insight into plum age
evolution in the D. baritula superspecies. Male D. sittoides and D. baritula resemble
each other in having rufous underparts (although the shading of rufous is
different; D. sittoides is darker). Given the molecular phylogeny (Fig. 2.3), the
rufous belly is either an ancestrally retained trait in the group, or arose
independently in both sittoides and baritula. The outgroups, D. lafresnayii and D.
carbonaria, both have rufous bellies, and thus the gray belly of male D. plumbea is
an autapom orphy and the rufous bellies of D. sittoides and D. baritula are
ancestrally retained characters (Maddison et al. 1984). Remsen (1984) has described
this "leapfrog" pattern of plum age variation in A ndean birds. Geographically
interm ediate birds (D. plumbea in this case) are more phenotypically
differentiated, and the phenotypes of birds at the geographic ends of ranges are
more similar. In contrast to belly color, males of D. baritula and D. plumbea have
gray throats; thus, the character "gray throat" is consistent w ith the hypothesized
phylogeny. Female plum age characteristics also suggest a sister-taxon relationship
between D. baritula and D. plumbea; females of these species are darker and more
heavily streaked underneath than are female D. sittoides.
Biogeography.—The phylogeny (Fig. 2.3) provides a fram ew ork for
understanding historical biogeography. The genetic distance data perm it rough
estim ates of tim ing of divergence events. Diglossa flowerpiercers are high-
elevation species restricted to m ontane regions in the N eotropics (Vuilleumier
1969, A.O.U. 1983, Isler and Isler 1987). Diglossa baritula is endemic to the
m ountains of Mexico, G uatem ala, and H onduras, w ith tw o disjunct populations
on either side of the Isthm us of Tehuantepec. Diglossa plumbea has two disjunct
populations on m ountains in Costa Rica and w estern Panam a, and Diglossa
sittoides is w idespread throughout the Andes, from extrem e northw estern
Venezuela to Argentina. There are large gaps of non-m ontane (unsuitable)
habitat separating the ranges of these three species.
The landbridge connection betw een southern Central America and South
America w as com pleted three to five million years ago (Malfait and D inklem an
1972, Pindell and Dewey 1982). One hypothesis explaining the distribution of
some Central Am erican highland birds is that South Am erican taxa dispersed
into Central Am erican after the landbridge w as completed (Chapm an 1978,
Vuilleum ier 1969). D uring glacial periods in the m ountains of Central and South
America, it is generally accepted that m ontane forests w ere depressed in
elevation, and then w ere m ore continuous in distribution than they are today
(Vuilleumier 1969, Van der H am m en 1974, Graves 1982, Liu and Colinvaux 1985,
Haffer 1987). This connection of high-elevation habitats could have provided a
dispersal route for m ontane species from South America th rough southern
Central America and into Mexico. D uring interglacial times, the high-elevation
forests retreated and forest connections were severed. This vicariant event w ould
effect the separation of ranges of taxa that had dispersed during the glacial period.
Given the pattern of phylogeny of the Diglossa baritula superspecies
complex, I hypothesize the following biogeographic scenario. The sister taxa of
the D. baritula complex (Fig. 2.1-2.3) are found in highland regions of South
America, in the Andes, in particular; thus, I hypothesize that the group originated
in the Andes. This is also supported by D. sittoides (the Andean member of the
baritula complex) being basal to the other two members of the complex. I
hypothesize that the ancestor to the D. baritula superspecies complex was in the
Andes before the landbridge connection was formed. Climatic changes during the
last 2 million years caused temporary connections between high elevation forests
in South and Central America, and the ancestor of the D. baritula complex spread
northw ard through Central America into Mexico. During interglacial times,
forests retreated, ranges of the D. baritula complex were severed, and speciation
via vicariance resulted. A northward movement of taxa is supported by the
phylogeny (Fig. 2.3)—the most basal member of the group is found in South
America (D. sittoides) and the more northern forms (D. plumbea and D. baritula)
are sister taxa. The alternative of a southward movement, would require that the
northern species, D. baritula, be basal to the other two species. This hypothesis
would add 8 steps to the phylogeny in Fig. 2.3, an increase of 11%, and is not
suggested by analyses of allozymes, sequence data, or plumage characters. The
hypothesis of a northw ard movement of montane taxa and subsequent vicariance
presents a testable hypothesis for other taxa.
One proposed advantage of molecular data is that genetic differences
between taxa accrue in an approximately time-dependent manner (Wilson et al.
1977); thus a molecular clock can be calibrated and age of splitting events can be
estimated. The potential to date approximate splitting events using molecular
clocks has not been widely explored (see M urphy 1983; Cadle 1985; Zink 1988; Zink
and Avise 1990; Hackett in review for some examples). For the biogeographic
scenario outlined above, it is unlikely that dispersal into Central America
occurred before the landbridge connection between Central and South America
was completed around 3 mya. Thus, the ancestor of the D. baritula complex
should have arisen in the Andes prior to the connection, and speciation events in
the D. baritula complex should have taken place sometime during the Pleistocene,
over the last 2 million years.
The use of molecular clocks is controversial, and a variety of molecular
clocks have been proposed for avian taxa (Gutierrez et al. 1983, Marten and
Johnson 1986, Sibley et al. 1988). Two calibrations for allozyme data, from the
same quail fossil, estimate that one unit of Nei's (1978) genetic distance
corresponds to 19-26 million years of independent evolution (Gutierrez et al. 1983,
Marten and Johnson 1986). For the Diglossa baritula complex, genetic distance
calibrations suggest that the superspecies complex has been evolving
independently for approximately five to seven million years. Divergence among
D. sittoides, D. plumbea, and D. baritula occurred during the last two million years.
These dates are consistent with timing predicted by the independent geologic and
biogeographic evidence.
LITERATURE CITED
ALLARD, M. W., D. L. ELLSWORTH, AND R. L. HONEYCUTT. 1991. The production of single-stranded DNA suitable for sequencing using the polymerase chain reaction. BioTechniques 10: 24-26.
AMERICAN ORNITHOLOGISTS’ UNION. 1983. Check-list of North American birds, 6th ed. American Ornithologists’ Union, Washington, D.C.
ARCHIE, J. W., C. SIMON, AND A. MARTIN. 1989. Small sample size doesdecrease the stability of dendrograms calculated from allozyme-frequency data. Evolution 43: 678-683.
BOCK, W. A. 1985. Is Diglossa (?Thraupinae) monophyletic? Ornithol. Monogr. 36: 319-332.
BUTH, D. G. 1984. The application of electrophoretic data in systematic studies. Ann. Rev. Ecol. Syst. 15: 501-522.
CADLE, J. E. 1985. The Neotropical colubrid snake fauna (Serpentes: Colubridae): lineage components and biogeography. Syst. Zool. 34:1-20.
CAPPARELLA, A. P. 1987. Effects of riverine barriers on genetic differentiation of Amazonian forest undergrowth birds. Ph.D. dissertation, Louisiana State University, Baton Rouge, Louisiana.
----------. 1988. Genetic variation in Neotropical birds: implications for thespeciation process. Proc. Int. Ornithol. Congr. 19: 1658-1664.
CHAPMAN, F. M. 1978. Essays in South American ornithogeography. Arno Press Inc., New York.
DESJARDINS, P. AND R. MORAIS. 1990. Sequence and gene organization of the chicken mitochondrial genome: a novel gene order in higher vertebrates. J. Mol. Biol. 212: 599-634.
EDWARDS, S. V., P. ARCTANDER, AND A. C. WILSON. 1991. Mitochondrialresolution of a deep branch in the genealogical tree for perching birds. Proc. R. Soc. Lond. B. 243: 99-107.
FARRIS, J. S. 1972. Estimating phylogenetic trees from distance matrices. Am.Nat. 106:645-668.
FELSENSTEIN, J. 1985. Confidence limits on phylogenies: an approach using the bootstrap. Evolution. 79: 783-791.
GORMAN, G. C. AND J. RENZI, JR. 1979. Genetic distance and heterozygosityestimates in electrophoretic studies: effects of sample size. Copeia 1979: 242- 249.
GRAVES, G. R. 1982. Speciation in the Carbonated Flower-Piercer (Diglossa carbonaria) complex of the Andes. Condor 84:1-14.
GUTIERREZ, R. J., R. M. ZINK, AND S. Y. YANG. 1983. Genic variation, systematic, and biogeographic relationships of some galliform birds. Auk 100: 33-47.
HACKETT, S. J. 1989. Effects of varied electrophoretic conditions on detection of evolutionary patterns in the Laridae. Condor 91: 73-90.
--------- . In review. Phylogenetic and biogeographic relationships in theNeotropical genus Gymnopithys (Formicariidae). Wilson Bull.
-----------AND K. V. ROSENBERG. 1990. Evolution of South American antwrens(Formicariidae): comparison of phenotypic and genetic differentiation. Auk 107: 473-489.
HAFFER, J. 1987. Quaternary history of tropical America. Pages 1-18 inBiogeography and Quaternary History in Tropical America (T. C. Whitmore and G. T. Prance, eds.). Clarendon Press, Oxford.
HILLIS, D. M. AND J. P. HUELSENBECK. 1992. Signal, noise, and reliability in molecular phylogenetic analyses. J. Hered. 83: 189-195.
-, A. LARSON, S. K. DAVIS, AND E. A. ZIMMER. 1990. Pages 318-370 inMolecular Systematics (D. M. Hillis and C, Moritz, eds.). Sinauer Assoc., Inc., Sunderland, Massachusetts.
ISLER, M. L. AND P. R. ISLER. 1987. The tanagers: natural history, distribution, and identification. Smithsonian Inst. Press, W ashington, D.C.
KLUGE, A. G. 1989. A concern for evidence and a phylogenetic hypothesis of relationships among Epicrates (Boidae, Serpentes). Syst. Zool. 38: 7-25.
KOCHER, T. D., W. K. THOMAS, A. MEYER, S. V. EDWARDS, S. PAABO, F. X. VILLABLANCA, AND A. C. WILSON. 1989. Dynamics of mitochondrial DNA evolution in animals: amplification and sequencing w ith conserved primers. Proc. Natl. Acad. Sci. 86: 6196-6200.
LANYON, S. M. 1988. The stochastic mode of molecular evolution: what consequences for systematic investigations? Auk 105: 565-573.
LIU, K.-B. AND AND P. COLINVAUX. 1985. Forest changes in the Amazon Basin during the last glacial maximum. Nature 318: 556-557.
MADDISON, W. P., M. J. DONOGHUE, AND D. R. M ADDISON. 1984. Outgroup analysis and parsimony. Syst. Zool. 33: 83-103.
MALFAIT, B. J. AND M. G. DINKLEMAN. 1972. Circum-Caribbean tectonic and igneous activity and the evolution of the Caribbean plate. Geol. Soc. Am. Bull. 83: 251-272.
MARTEN, J. A. AND N. K. JOHNSON. 1986. Genetic relationships of North Amerian cardueline finches. Condor 88: 409-420.
MICKEVICH, M. M. AND C. M. MITTER. 1981. Treating polymorphic characters in systematics: a phylogenetic treatment of electrophoretic data. Pages 45-58 in Advances in Cladistics, vol. 1 (V. A. Funk and D. R. Brooks, Eds.). New York Botanical Gardens, New York.
MURPHY, R. W. 1983. Paleobiogeography and genetic differentiation of the Baja California herpetofauna. Occas. Pap. Calif. Acad. Sciences 137: 1-48.
50
----------, J. W. SITES, JR., D. G. BUTH, AND C. H. HAUFLER. 1990. Proteins 1:isozyme electrophoresis. Pages 45-126 in Molecular systematics (D. M. Hillis and C. Moritz, Eds.). Sinauer Assoc., Inc., Sunderland, Massachusetts.
NEI, M. 1978. Estimation of average heterozygosities and genetic distance from a small num ber of individuals. Genetics 89: 583-590.
---------- . 1987. Molecular evolutionary genetics. Columbia Univ. Press, NewYork.
NEIGEL, J. AND J. C. AVISE. 1986. Phylogenetic relationships of m itochondrial DNA under various demographic models of speciation. Pages 515-534 in Evolutionary Processes and Theory (E, Nevo and S. Karlin, Eds.). Academic Press, New York.
PAMILO, P. AND M. NEI. 1988. Relationships between gene trees and species trees. Mol. Biol. Evol. 3: 254-259.
PETERSON, A. T. 1992. Phylogeny and rates of molecular evolution in the Aphelocoma jays (Corvidae). Auk 109: 133-147.
PINDELL, J. AND J. F. DEWEY. 1982. Permo-Triassic reconstruction of W esternPangea and the evolution of the Gulf of M exico/Caribbean region. Tectonics 1:179-211.
REMSEN, J. V ., JR. 1984. High incidence of "leapfrog" pattern of geographicvariation in A ndean birds: implications for the speciation process. Science 224:171-173.
ROGERS, J. S. 1972. Measures of genetic similarity and genetic distance. Studies in Genetics VII. Univ. Texas Publ. No. 7213: 145-153.
-----------AND R. C. CASHNER. 1987. Genetic variation, divergence, andrelationships in the subgenus Xenisma of the genus Fundulus. Pages 251-264 in Com m unity and Evolutionary Ecology of N orth American Stream Fishes (W. J. M atthews and D. C. Heins, Eds.). University of Oklahoma Press, N orm an.
SANDERSON, M. J. 1989. Confidence limits on phylogenies: the bootstrap revisited. Cladistics 5:113-130.
SIBLEY, C. G., J. E. AHLQUIST, AND B. L. MUNROE. 1988. A classification of the living birds of the w orld based on DNA-DNA hybridization studies. Auk 105: 409-423.
— AND---------- . 1990. Phylogeny and classification of birds: a study inmolecular evolution. Yale Univ. Press, New Have, Connecticut.
SWOFFORD, D. L. 1981. On the utility of the distance Wagner procedure. Pages 25-43 in Advances in Cladistics, vol. 1 (V. A. Funk and D. R. Brooks, Eds.). New York Botanical Gardens, New York.
----------. 1990. PAUP: phylogenetic analysis using parsimony, Version 3.0. IllinoisNatural History Survey, Champaign.
--------- AND S. H. BERLOCHER. 1987. Inferring evolutionary trees from genefrequency data under the principle of maximum parsimony. Syst. Zool. 36: 293-325.
AND R. B. SELANDER. 1981. BIOSYS-1: a FORTRAN program for thecomprehensive analysis of electrophoretic data in population genetics and systematics. J. Hered. 72: 281-283.
VAN DER HAMMEN, T. 1974. The Pleistocene changes of vegetation and climate in tropical South America. J. Biogeogr. 1: 3-26.
VUILLEUMIER, F. 1969. Systematics and evolution in Diglossa (Aves, Coerebidae). Am. Mus. Novit. 2381: 1-44.
WILSON, A. C., S. S. CARLSON, AND T. J. WHITE. 1977. Biochemical evolution. Ann. Rev. Biochem. 46: 573-639.
ZINK, R. M. 1988. Evolution of brown towhees: allozymes, morphometries and species limits. Condor 90: 72-82.
— ANDJ. C. A VISE. 1990. Patterns of mitochondrial DNA and allozyme evolution in the avian genus Am m odram us. Syst. Zool. 39:148-161.
CHAPTER 3
ATLAPETES, BU ARREM O N, PSELLIOPHORUS, PEZOPETES
Atlapetes brush-finches comprise a large group of similarly-sized
em berizids that are found m ainly in forest edges in m ontane areas from northern
Mexico to northw estern Argentina (Paynter 1978). M aximum species richness is
reached in the northern Andes, w here 14 species are found in Colombia alone.
Some Atlapetes species have broad distributions (A. brunneinuclm) and some have
restricted ranges (A . flaviceps). In addition, some species are discontinuously
distributed, having isolated populations in different A ndean regions (A.
schistaceus and A. rufinucha; Paynter 1978, Remsen and Graves unpubl. data). An
exam ination of genetic differentiation am ong species and am ong populations of
the w idespread species w ould provide insight into avian evolution in
N eotropical m ontane areas.
Paynter (1978) sum m arized distributional and phenotypic data on all
m em bers of the genus. He recognized four groups: the Atlapetes albinucha
superspecies complex, the Atlapetes rufinucha species-group, the Atlapetes schistaceus
species-group, and the Atlapetes torquatus species-group; interrelationships of the
four m ain groups w ere uncertain. Also, there are two m onotypic genera,
Pselliophorus and Pezopetes, in the highlands of Costa Rica and w estern Panam a
w ith possible affinities to Atlapetes (Paynter 1970), bu t whose relationships are
uncertain. Resolution of relationships of Pselliophorus and Pezopetes provide clues
to evolution in the highlands of Central America.
In this paper, I address relationships among Atlapetes species using both
allozym e and m itochondrial (mt) DNA sequence data. In addition, I included
Pselliophorus, Pezopetes, Lysurus, and Pipilo because these genera presum ably are part
of a closely related group that includes Atlapetes (Paynter 1970). I address the
52
pattern of phylogeny of these genera, monophyly of Paynter's species-groups, and
levels of genetic differentiation and biogeography.
METHODS
Collecting localities for specimens used in the allozyme and DNA analyses
are listed in Table 3.1. Tissue samples for this analysis were obtained from the
Louisiana State University Museum of Natural Science (LSUMNS) Frozen Tissue
Collection and the Field M useum of Natural History (the Atlapetes brunneinuclia
from Mexico that was included in the sequencing study).
Protein electrophoresis.— Standard horizontal starch-gel electrophoresis of
proteins was performed as outlined in M urphy et al. (1990), Hackett (1989), and
Hackett and Rosenberg (1990). Locus names follow M urphy et al. (1990).
BIOSYS-1 (Swofford and Selander 1981) was used to compute genetic
distances (Nei 1978, Rogers 1972) and a UPGMA phenogram. Cladistic assessment
of allelic variation was performed by coding each locus as a multi-state unordered
character (and alleles at each locus as character states) using the computer
program PAUP 3.0L (Swofford 1990). Also, in another cladistic analysis,
phylogenetically informative alleles were considered as characters and coded as
present or absent.
DNA sequences.—A total nucleic acid preparation was made from 0.1 gram
of liver tissue (Hillis et al. 1990; see Table 3.1 for specimens sequenced).
Amplification of a 433 base pair region (not including primers) of the
m itochondrial (mt) cytochrome b gene was performed via the polymerase chain
reaction (PCR), using prim ers L14841 (5'-CCATCCAACATCTCAGCATGATG
AAA-3'; Kocher et al. 1989) and the reverse and complement of L15299 (5'-
GGAGGAAGTGCAGGGCGAAGAATCG-3'; Edwards et al. 1991). Double
stranded PCR amplifications were performed in 50 pi total reaction volumes (10
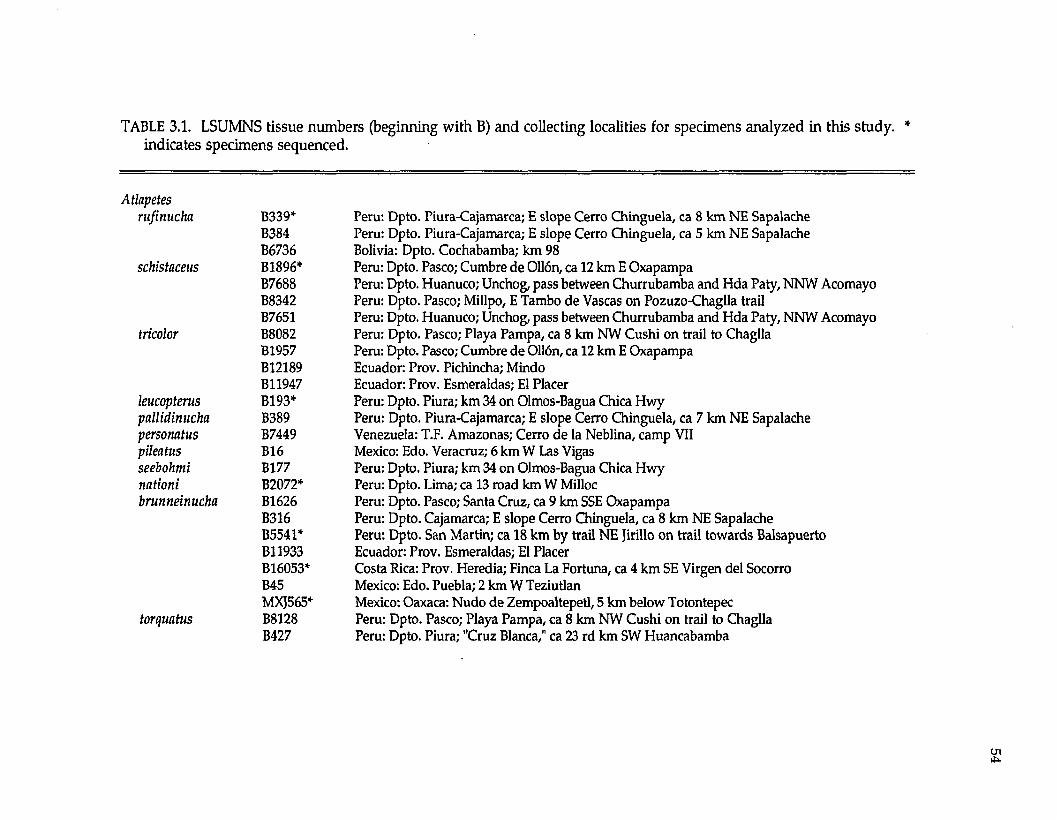
TABLE 3.1. LSUMNS tissue num bers (beginning w ith B) and collecting localities for specim ens analyzed in this study. * indicates specim ens sequenced.
Atlapetesrufinucha B339* Peru: Dpto. Piura-Cajamarca; E slope Cerro Chinguela, ca 8 km NE Sapalache
B384 Peru: Dpto. Piura-Cajamarca; E slope Cerro Chinguela, ca 5 km NE SapalacheB6736 Bolivia: Dpto. Cochabamba; km 98
schistaceus B1896* Peru: Dpto. Pasco; Cumbre de 0116n, ca 12 km E OxapampaB7688 Peru: Dpto. Huanuco; Unchog, pass between Churrubamba and Hda Paty, NNW AcomayoB8342 Peru: Dpto. Pasco; Millpo, E Tambo de Vascas on Pozuzo-Chaglla trailB7651 Peru: Dpto. Huanuco; Unchog, pass between Churrubamba and Hda Paty, NNW Acomayo
tricolor B8082 Peru: Dpto. Pasco; Playa Pampa, ca 8 km NW Cushi on trail to ChagllaB1957 Peru: Dpto. Pasco; Cumbre de 0116n, ca 12 km E OxapampaB12189 Ecuador: Prov. Pichincha; MindoB11947 Ecuador: Prov. Esmeraldas; El Placer
leucopterus B193* Peru: Dpto. Piura; km 34 on Olmos-Bagua Chica Hwypallidinucha B389 Peru: Dpto. Piura-Cajamarca; E slope Cerro Chinguela, ca 7 km NE Sapalachepersonatus B7449 Venezuela: T.F. Amazonas; Cerro de la Neblina, camp VIIpileatus B16 Mexico: Edo. Veracruz; 6 km W Las Vigasseebohmi B177 Peru: Dpto. Piura; km 34 on Olmos-Bagua Chica Hwynationi B2072* Peru: Dpto. Lima; ca 13 road km W Millocbrunneinucha B1626 Peru: Dpto. Pasco; Santa Cruz, ca 9 km SSE Oxapampa
B316 Peru: Dpto. Cajamarca; E slope Cerro Chinguela, ca 8 km NE SapalacheB5541* Peru: Dpto. San Martin; ca 18 km by trail NE Jirillo on trail towards BalsapuertoB11933 Ecuador: Prov. Esmeraldas; El PlacerB16053* Costa Rica: Prov. Heredia; Finca La Fortuna, ca 4 km SE Virgen del SocorroB45 Mexico: Edo. Puebla; 2 km W TeziutlanMXJ565* Mexico: Oaxaca: Nudo de Zempoaltepetl, 5 km below Totontepec
torquatus B8128 Peru: Dpto. Pasco; Playa Pampa, ca 8 km NW Cushi on trail to ChagllaB427 Peru: Dpto. Piura; "Cruz Blanca," ca 23 rd km SW Huancabamba
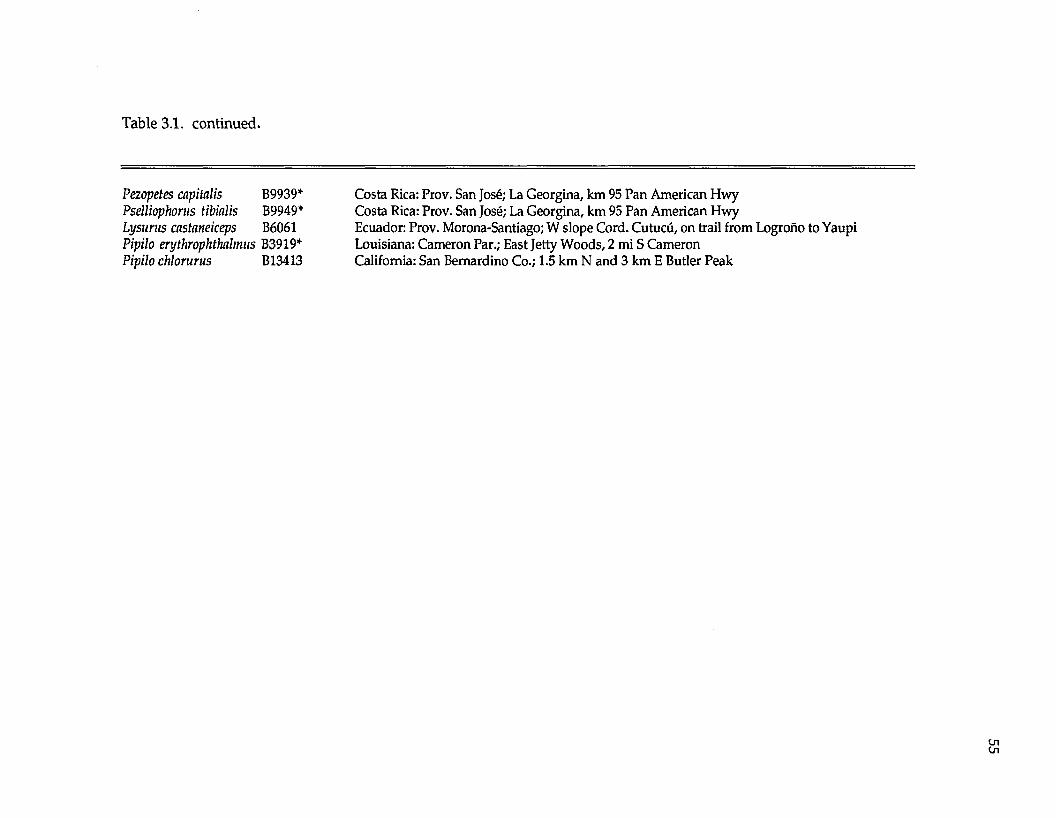
Table 3.1. continued.
Pezopetes capitalis B9939*Pselliophorus tibialis B9949*Lysurus castaneiceps B6061Pipilo erythrophthalmus B3919* Pipilo chlortirus B13413
Costa Rica: Prov. San Jose; La Georgina, km 95 Pan American HwyCosta Rica: Prov. San Jose; La Georgina, km 95 Pan American HwyEcuador: Prov. Morona-Santiago; W slope Cord. Cutucu, on trail from Logrono to YaupiLouisiana: Cameron Par.; East Jetty Woods, 2 mi S CameronCalifornia: San Bernardino Co.; 1.5 km N and 3 km E Butler Peak
|xl of a 10'2 dilution of the total DNA preparation, 4 pi of a 10 pM solution of each
primer, 5 pi of 10X buffer, 3.6 pi of a 25 mM solution of M gCl2,3 pi of a 1.0 mM
solution of dNTP’s, 0.20 pi Taq DNA polymerase [Promega], up to 50 pi with H 2 O).
Thirty to 35 cycles were performed using the following cycling parameters: first
cycle—denaturation at 94°C for 3 minutes, annealing at 49°C for 1 minute,
extension at 72°C for 45 seconds; remaining cycles—denaturation at 94°C for 1
minute, annealing at 49°C for 1 minute, extension at 72°C for 45 seconds.
Annealing temperature was lowered to 42°C for samples that yielded a small
am ount of double-stranded product under the original conditions.
Single-stranded DNA was generated using only one prim er (Allard et al.
1991). Six pi of the double-stranded product were used to generate single-stranded
DNA in 100 pi reactions (6 pi double-stranded DNA, 6 pi of a 10 pM solution of
one primer, 10 pi of 10X buffer, 6 pi of a 25 mM solution of MgCl2 , 5 pi dNTP's,
0.40 pi Taq DNA polymerase [Promega], up to 100 pi with H 2 O). Twenty-two to 29
cycles were performed using the following cycling parameters: first cycle—
denaturation at 94°C for 3 minutes, annealing at 49°C for 1 m inute, extension at
72°C for 1 minute; remaining cycles—denaturation at 94°C for 1 minute, annealing
at 49°C for 1 minute, extension at 72°C for 1 minute. Single-stranded DNA of
both the heavy and light mtDNA strands were cleaned by 5 washings with H 2 O
through Ultrafree®-MC 30,000 NNMWL filters (Millipore Corp., Bedford, MA),
and concentrated to a final volume of approximately 30 pi. Seven pi of cleaned
single-stranded DNA were used for DNA sequencing using T7 DNA polymerase
(Sequenase® version 2.0, United States Biochemical, Cleveland, OH).
The DNA sequence data were analyzed cladistically using PAUP 3.0L
(Swofford 1990). The sequence of another nine-primaried oscine (the tanager
Ramphocelus carbo; see Chapter 6 for sequence) was used as an outgroup. All base
positions were used in the analysis. One hundred bootstrap replicates were
performed (Felsenstein 1985, Sanderson 1989). Percent sequence divergence was
calculated as follows: p = n j / n , where p is the percent sequence divergence, nj is
the num ber of nucleotides different between two sequences, and n is the total
number of nucleotides compared (Nei 1987).
RESULTS
Protein electrophoresis. —Of the 38 allozyme loci analyzed (Table 3.2), 13 (32%)
were monomorphic and fixed for the same allele across all populations, and 25
(64%) were variable either within or among samples. Genetic distances (Table 3.3)
were large between many species in the genus Atlapetes. For example, among the
species Atlapetes rufinucha, A. schistaceus, A. tricolor, A. seebohmi, A. leucopterus, and
A. personatus, genetic distances (Nei 1978 ± S.D.) averaged 0.092 + 0.050. However,
between these species and A. brunneinucha and A. torquatus, genetic distances
averaged 0.412 ± 0.075. Between Pselliophorus and Atlapetes (excluding A.
brunneinucha and A. torquatus), genetic distances averaged 0.263 ± 0.038; between
Pezopetes and Atlapetes (excluding A. brunneinucha and A. torquatus), genetic
distances averaged 0.205 ± 0.020. Nei's (1978) genetic distance between Pipilo and
Atlapetes (excluding A. brunneinucha and A. torquatus) averaged 0.237 + 0.044.
W ithin Atlapetes brunneinucha, genetic distances averaged 0.086 ± 0.058.
The UPGMA phenogram (not shown) summarizing genetic distances
demonstrated that Atlapetes brunneinucha and A. torquatus are not genetically
similar to the other Atlapetes species. In fact, Pipilo, Pselliophorus, and Pezopetes are
more genetically similar to the other Atlapetes than are A. brunneinucha and A.
torquatus. Pipilo, which was considered a priori to be an outgroup to Atlapetes,
Pselliophorus and Pezopetes, groups with Atlapetes (excluding A. brunneinucha and A.
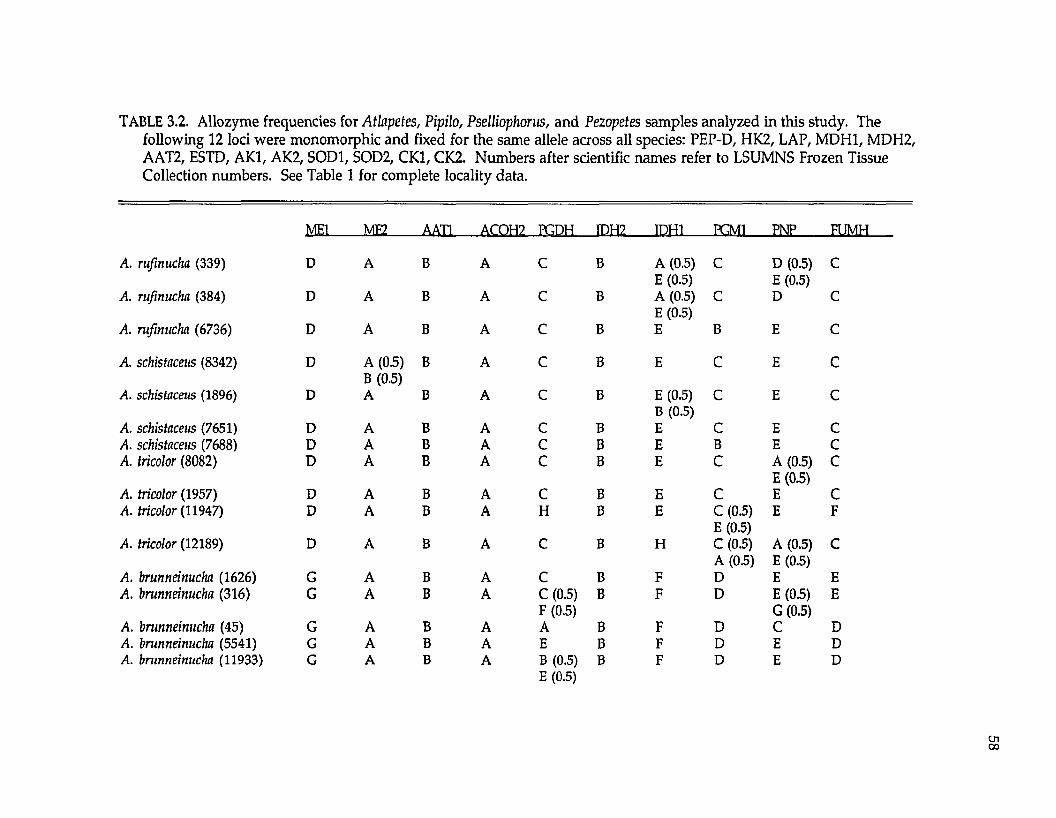
TABLE 3.2. Allozyme frequencies for Atlapetes, Pipilo, Pselliophorus, and Pezopetes samples analyzed in this study. The following 12 loci were monomorphic and fixed for the same allele across all species: PEP-D, HK2, LAP, MDH1, MDH2, AAT2, ESTD, AK1, AK2, SOD1, SOD2, CK1, CK2. Numbers after scientific names refer to LSUMNS Frozen Tissue Collection numbers. See Table 1 for complete locality data.
ME1 ME2 AATl ACOH2 PGDH IDH2 TDH1 PCM1 PNP FUMH
A. rufinucha (339) D A B A C B A (0.5) E (0.5)
C D (0.5) E (0.5)
C
A. rufinucha (384) D A B A C B A (0.5) E (0.5)
C D C
A. rufinucha (6736) D A B A C B E B E cA. schistaceus (8342) D A (0.5)
B (0.5)B A C B E C E c
A. schistaceus (1896) D A B A C B E (0.5) B (0.5)
c E cA. schistaceus (7651) D A B A C B E c E cA. schistaceus (7688) D A B A C B E B E cA. tricolor (8082) D A B A c B E C A (0.5)
E (0.5)c
A. tricolor (1957) D A B A c B E C E cA. tricolor (11947) D A B A H B E C (0.5)
E (0.5)E F
A. tricolor (12189) D A B A C B H C (0.5) A (05)
A (0.5) E (0.5)
cA. brunneinucha (1626) G A B A C B F D E EA. brunneinucha (316) G A B A C (0.5)
F (0.5)B F D E (0.5)
G (0.5)E
A. brunneinucha (45) G A B A A B F D C DA. brunneinucha (5541) G A B A E B F D E DA. brunneinucha (11933) G A B A B (0.5)
E (0.5)B F D E D
U l00
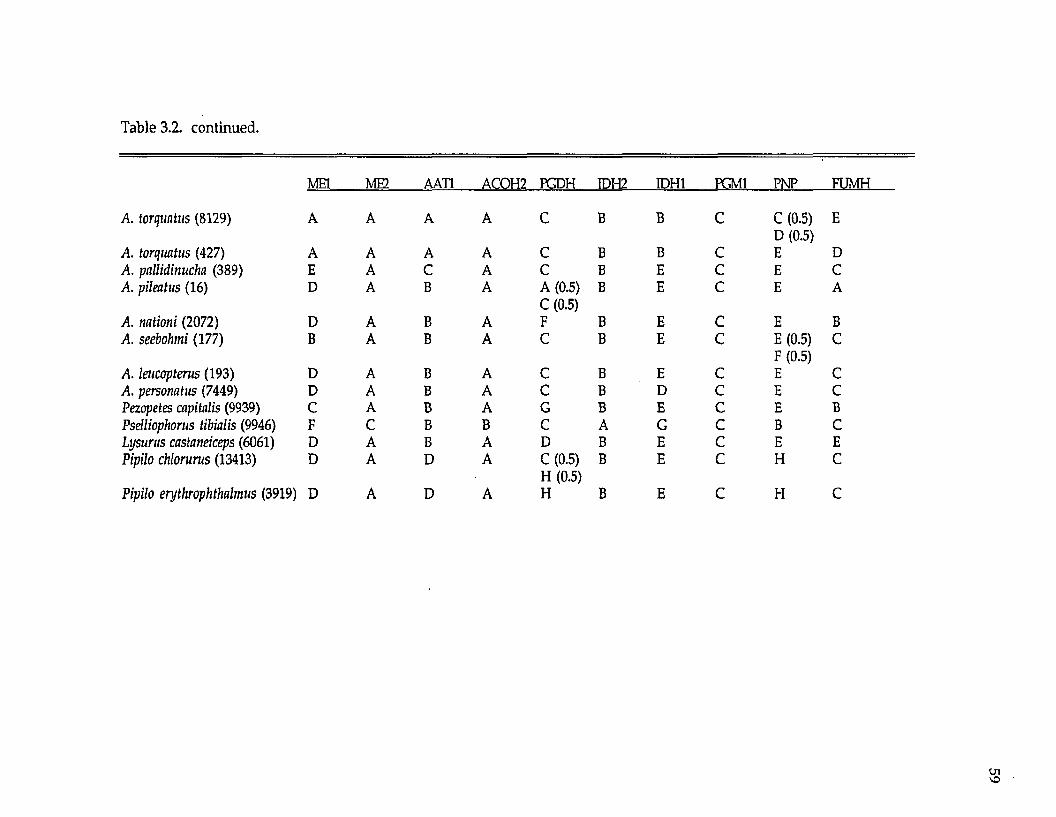
Table 3.2. continued.
ME1 ME2 AATl ACOH2 FGDH IDH2 IDH1 PGM1 PNP
A. torquatus (8129) A A A A C B B C C (0.5) D (0.5)
A. torquatus (427) A A A A C B B C EA. pallidinucha (389) E A C A c B E c EA. pileatus (16) D A B A A (0.5)
C (0.5)B E c E
A. mlioni (2072) D A B A F B E c EA. seebohmi (177) B A B A C B E c E (0.5)
F (0.5)A. leucopterus (193) D A B A C B E c EA. persomtus (7449) D A B A C B D c EPezopetes capitalis (9939) C A B A G B E c EPselliophorus tibialis (9946) F C B B C A G c BLysurus castaneiceps (6061) D A B A D B E c EPipilo chlorurus (13413) D A D A C (0.5)
H (0.5)B E c H
Pipilo erythrophthalmus (3919) D A D A H B E c H
QU
<
MU
UU
ta
Uw
U
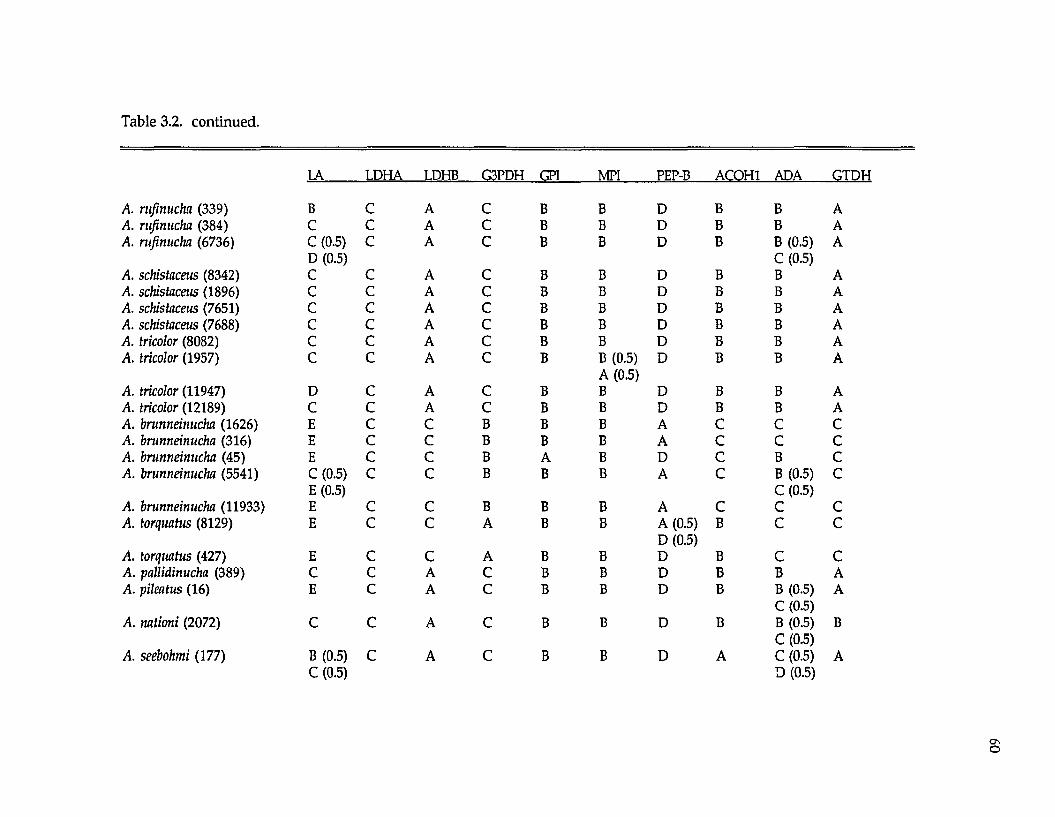
Table 3.2. continued.
LA LDHA
A. rufinucha (339) B CA. rufinucha (384) C CA. rufinucha (6736) C (0.5)
D (0.5)C
A. schistaceus (8342) C CA. schistaceus (1896) C CA. schistaceus (7651) C CA. schistaceus (7688) C CA. tricolor (8082) C cA. tricolor (1957) C cA. tricolor (11947) D cA. tricolor (12189) C cA. brunneinucha (1626) E cA. brunneinucha (316) E cA. brunneinucha (45) E cA. brunneinucha (5541) C (0.5)
E (0.5)c
A. brunneinucha (11933) E cA. torquatus (8129) E cA. torquatus (427) E cA. pallidinucha (389) C cA. pileatus (16) E cA. nationi (2072) C cA. seebohmi (177) B (0.5)
C (0.5)c
LDHB G3PDH GPI MPI PEP-B
A C B B DA C B B DA C B B D
A C B B DA C B B DA C B B DA C B B DA C B B DA C B B (0.5) D
A (0.5)A C B B DA C B B DC B B B AC B B B AC B A B DC B B B A
C B B B AC A B B A (0.5)
D (0.5)C A B B DA C B B DA C B B D
A C B B D
A c B B D
ACOHl ADA GTDH
B B AB B AB B (0.5)
C (0.5)A
B B AB B AB B AB B AB B AB B A
B B AB B AC C CC C CC B CC B (0.5)
C (0.5)C
C C CB C C
B C CB B AB B (0.5)
C (0.5)A
B B (0.5) C (0.5)
B
A C (0.5) D (0.5)
A
ONO
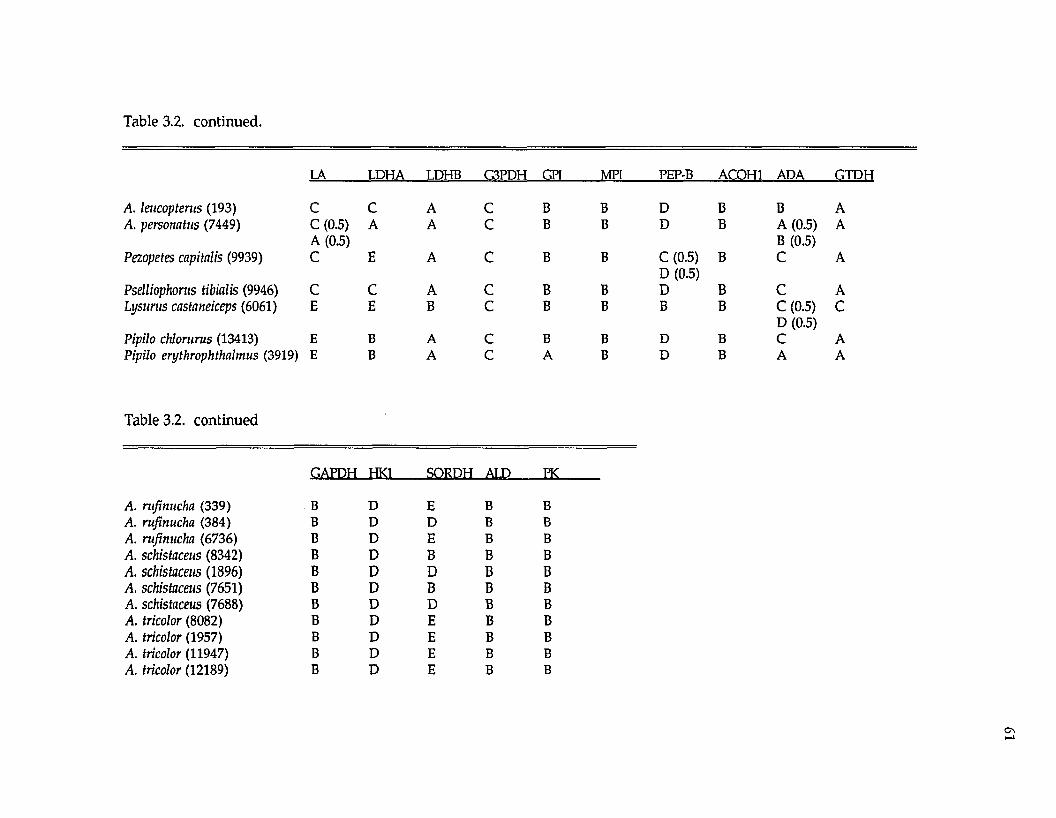
Table 3.2. continued.
LA LDHA LDHB G3PDH GPT MPI PEP-B AC1QH1 ADA GTDH
A. leucopterus (193) C C A C B B D B BA. personatus (7449) C (0.5)
A (0.5)A A C B B D B A
BPezopetes capitalis (9939) C E A C B B C (0.5)
D (0.5)B C
Pselliophorus tibialis (9946) C C A C B B D B CLysurus castaneiceps (6061) E E B C B B B B C
DCPipilo chlorurus (13413) E B A C B B D B
Pipilo erythrophthalmus (3919) E B A C A B D B A
Table 3.2. continued
GAPDH HK1 SORDH ALP PK
A. rufinucha (339) B D E B BA. rufinucha (384) B D D B BA. rufinucha (6736) B D E B BA. schistaceus (8342) B D B B BA. schistaceus (1896) B D D B BA. schistaceus (7651) B D B B BA. schistaceus (7688) B D D B BA. tricolor (8082) B D E B BA. tricolor (1957) B D E B BA. tricolor (11947) B D E B BA. tricolor (12189) B D E B B
> >
n >
> >
>
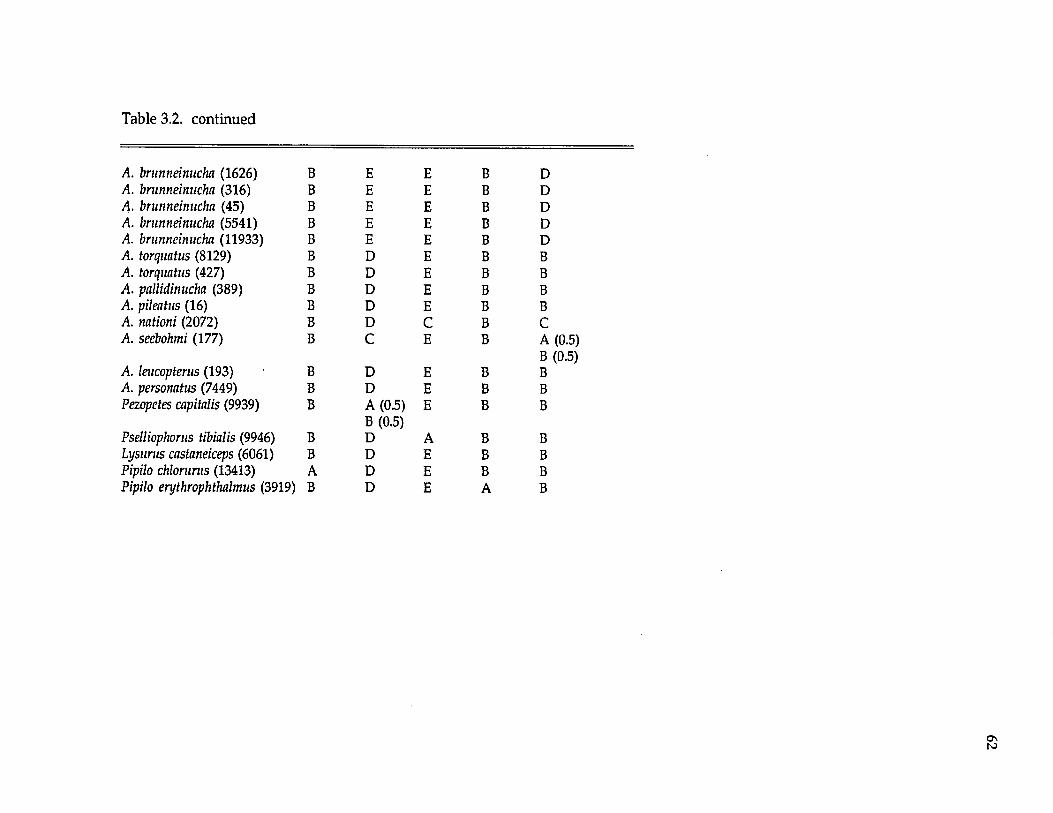
Table 3.2. continued
A. brunneinucha (1626) B E EA. brunneinucha (316) B E E4- brunneinucha (45) B E E4. brunneinucha (5541) B E E4. brunneinucha (11933) B E E4. torquatus (8129) B D E4. torquatus (427) B D E4. pallidinucha (389) B D E4. pileatus (16) B D E4. nationi (2072) B D C4. seebohmi (177) B C E
4. leucopterus (193) B D E4. personatus (7449) B D EPezopetes capitalis (9939) B A (05) E
B (0.5)Pselliophorus tibialis (9946) B D A BLysurus castaneiceps (6061) B D E BPipilo chlorurus (13413) A D E BPipilo erythrophthalmus (3919) B D E A
CacQ
CQ
CacO
CQ
CQ
CQ
CQ
PQ
CQ
CD
CQ CQ
cflc
awcd
w
cd
cu
a>
nw
D3
D3
«o
oo
oO
(0.5)(05)
to
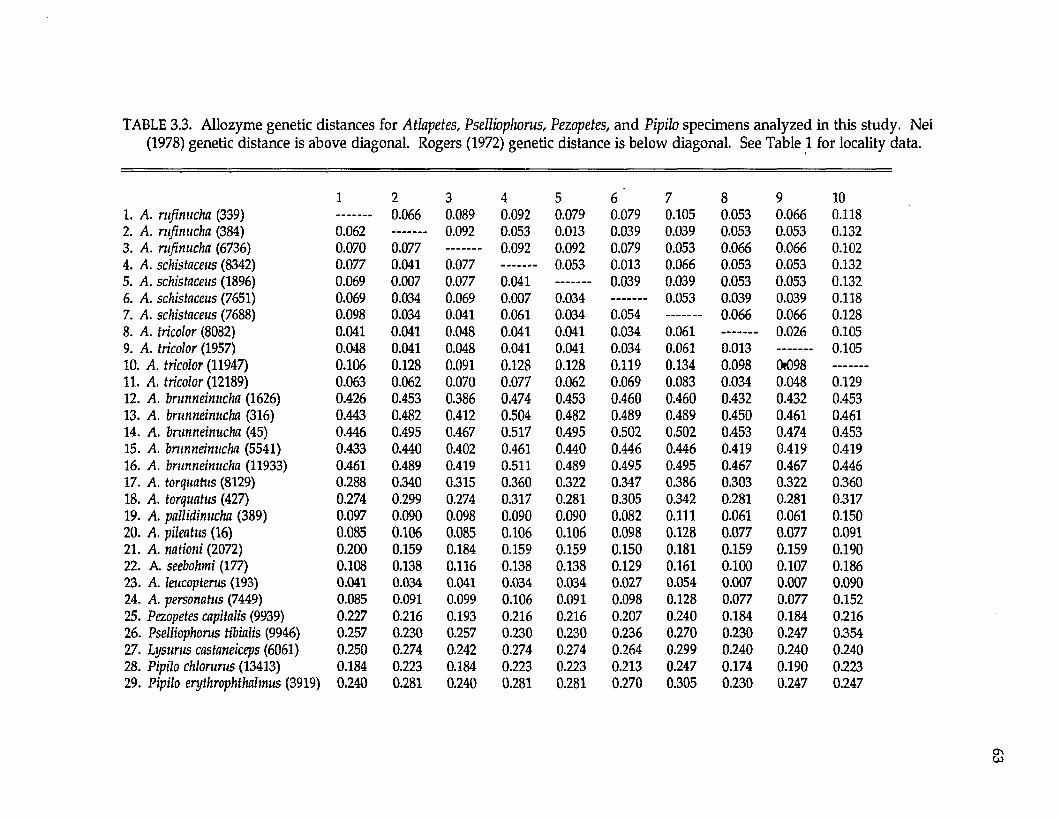
TABLE 3.3. Allozyme genetic distances for Atlapetes, Pselliophorus, Pezopetes, and Pipilo specimens analyzed in this study. Nei (1978) genetic distance is above diagonal. Rogers (1972) genetic distance is below diagonal. See Table 1 for locality data.
1 2 31. A. rufinucha (339) 0.066 0.0892. A. rufinucha (384) 0.062 ......... 0.0923. A. rufinucha (6736) 0.070 0.0774. A. schistaceus (8342) 0.077 0.041 0.0775. A. schistaceus (1896) 0.069 0.007 0.0776. A. schistaceus (7651) 0.069 0.034 0.0697. A. schistaceus (7688) 0.098 0.034 0.0418. A. tricolor (8082) 0.041 0.041 0.0489. A. tricolor (1957) 0.048 0.041 0.04810. A. tricolor (11947) 0.106 0.128 0.09111. A. tricolor (12189) 0.063 0.062 0.07012. A. brunneinucha (1626) 0.426 0.453 0.38613. A. brunneinucha (316) 0.443 0.482 0.41214. A. brunneinucha (45) 0.446 0.495 0.46715. A. brunneinucha (5541) 0.433 0.440 0.40216. A. brunneinucha (11933) 0.461 0.489 0.41917. A. torquatus (8129) 0.288 0.340 0.31518. A. torquatus (427) 0.274 0.299 0.27419. A. pallidinucha (389) 0.097 0.090 0.09820. A. pileatus (16) 0.085 0.106 0.08521. A. nationi (2072) 0.200 0.159 0.18422. A. seebohmi (177) 0.108 0.138 0.11623. A. leucopterus (193) 0.041 0.034 0.04124. A. personatus (7449) 0.085 0.091 0.09925. Pezopetes capitalis (9939) 0.227 0.216 0.19326. Pselliophorus tibialis (9946) 0.257 0.230 0.25727. Lysurus castaneiceps (6061) 0.250 0.274 0.24228. Pipilo chlorurus (13413) 0.184 0.223 0.18429. Pipilo erythrophthalmus (3919) 0.240 0.281 0.240
4 5 6 7 8 9 100.092 0.079 0.079 0.105 0.053 0.066 0.1180.053 0.013 0.039 0.039 0.053 0.053 0.1320.092 0.092 0.079 0.053 0.066 0.066 0.102
0.053 0.013 0.066 0.053 0.053 0.1320.041 0.039 0.039 0.053 0.053 0.1320.007 0.034 0.053 0.039 0.039 0.1180.061 0.034 0.054 0.066 0.066 0.1280.041 0.041 0.034 0.061 0.026 0.1050.041 0.041 0.034 0.061 0.013 0.1050.128 0.128 0.119 0.134 0.098 0098 -------0.077 0.062 0.069 0.083 0.034 0.048 0.1290.474 0.453 0.460 0.460 0.432 0.432 0.4530.504 0.482 0.489 0.489 0.450 0.461 0.4610.517 0.495 0.502 0.502 0.453 0.474 0.4530.461 0.440 0.446 0.446 0.419 0.419 0.4190.511 0.489 0.495 0.495 0.467 0.467 0.4460.360 0.322 0.347 0.386 0.303 0.322 0.3600.317 0.281 0.305 0.342 0.281 0.281 0.3170.090 0.090 0.082 0.111 0.061 0.061 0.1500.106 0.106 0.098 0.128 0.077 0.077 0.0910.159 0.159 0.150 0.181 0.159 0.159 0.1900.138 0.138 0.129 0.161 0.100 0.107 0.1860.034 0.034 0.027 0.054 0.007 0.007 0.0900.106 0.091 0.098 0.128 0.077 0.077 0.1520.216 0.216 0.207 0.240 0.184 0.184 0.2160.230 0.230 0.236 0.270 0.230 0.247 0.3540.274 0.274 0.264 0.299 0.240 0.240 0.2400.223 0.223 0.213 0.247 0.174 0.190 0.2230.281 0.281 0.270 0.305 0.230 0.247 0.247
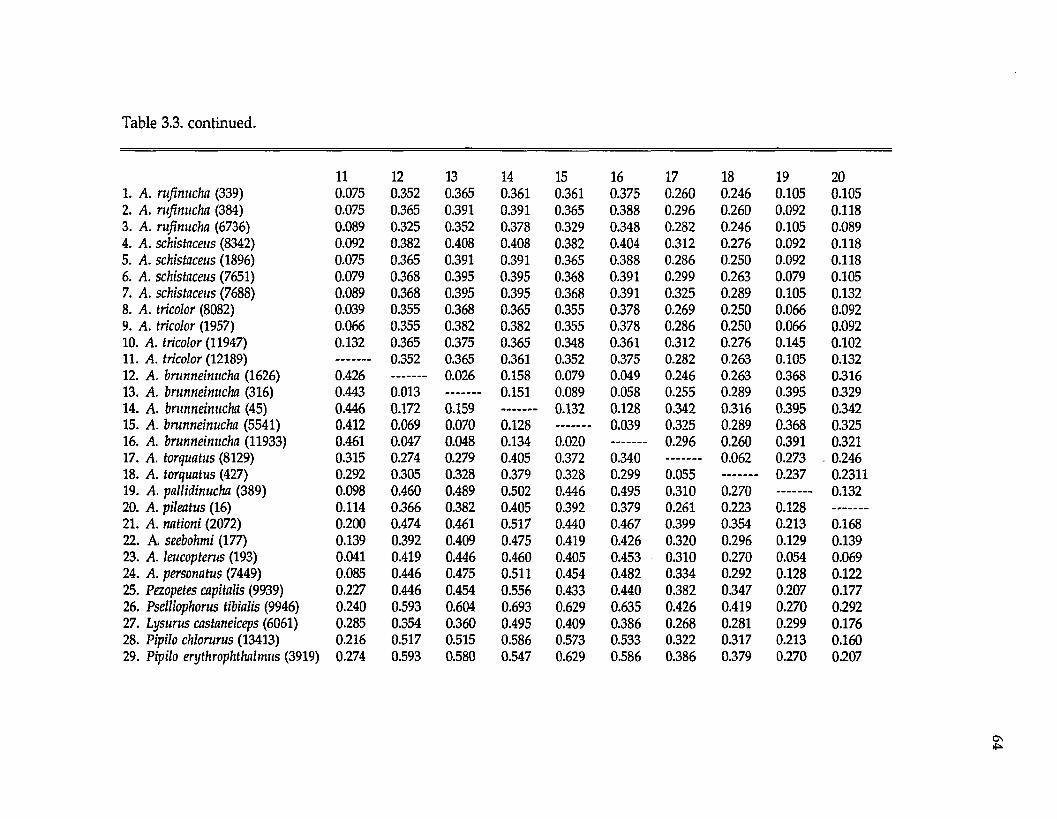
Table 3.3. continued.
1. A rufinucha (339)2. A. rufinucha (384)3. A. rufinucha (6736)4. A. schistaceus (8342)5. A. schistaceus (1896)6. A. schistaceus (7651)7. A schistaceus (7688)8. A tricolor (8082)9. A. tricolor (1957)10. A. tricolor (11947)11. A. tricolor (12189)12. A. brunneinucha (1626)13. A. brunneinucha (316)14. A. brunneinucha (45)15. A. brunneinucha (5541)16. A. brunneinucha (11933)17. A. torquatus (8129)18. A. torquatus (427)19. A. pallidinucha (389)20. A. pileatus (16)21. A. nationi (2072)22. A seebohmi (177)23. A. leucopterus (193)24. A. personatus (7449)25. Pezopetes capitalis (9939)26. Pselliophorus tibialis (9946)27. Lysurus castaneiceps (6061)28. Pipilo chlorurus (13413)29. Pipilo erythrophthalmus (3919)
11 12 13 140.075 0.352 0.365 0.3610.075 0.365 0.391 0.3910.089 0.325 0.352 0.3780.092 0.382 0.408 0.4080.075 0.365 0.391 0.3910.079 0.368 0.395 0.3950.089 0.368 0.395 0.3950.039 0.355 0.368 0.3650.066 0.355 0.382 0.3820.132 0.365 0.375 0.365
0.352 0.365 0.3610.426 0.026 0.1580.443 0.013 0.1510.446 0.172 0.1590.412 0.069 0.070 0.1280.461 0.047 0.048 0.1340.315 0.274 0.279 0.4050.292 0.305 0.328 0.3790.098 0.460 0.489 0.5020.114 0.366 0.382 0.4050.200 0.474 0.461 0.5170.139 0.392 0.409 0.4750.041 0.419 0.446 0.4600.085 0.446 0.475 0.5110.227 0.446 0.454 0.5560.240 0.593 0.604 0.6930.285 0.354 0.360 0.4950.216 0.517 0.515 0.5860.274 0.593 0.580 0.547
15 160.361 0.3750.365 0.3880.329 0.3480.382 0.4040.365 0.3880.368 0.3910.368 0.3910.355 0.3780.355 0.3780.348 0.3610.352 0.3750.079 0.0490.089 0.0580.132 0.128
0.0390.0200.372 0.3400.328 0.2990.446 0.4950.392 0.3790.440 0.4670.419 0.4260.405 0.4530.454 0.4820.433 0.4400.629 0.6350.409 0.3860.573 0.5330.629 0.586
17 180.260 0.2460.296 0.2600.282 0.2460.312 0.2760.286 0.2500.299 0.2630.325 0.2890.269 0.2500.286 0.2500.312 0.2760.282 0.2630.246 0.2630.255 0.2890.342 0.3160.325 0.2890.296 0.260
0.0620.0550.310 0.2700.261 0.2230.399 0.3540.320 0.2960.310 0.2700.334 0.2920.382 0.3470.426 0.4190.268 0.2810.322 0.3170.386 0.379
19 200.105 0.1050.092 0.1180.105 0.0890.092 0.1180.092 0.1180.079 0.1050.105 0.1320.066 0.0920.066 0.0920.145 0.1020.105 0.1320.368 03160.395 03290.395 03420.368 0.3250.391 0.3210.273 . 0.2460.237 0.2311
0.1320.1280.213 0.1680.129 0.1390.054 0.0690.128 0.1220.207 0.1770.270 0.2920.299 0.1760.213 0.1600.270 0.207
O n
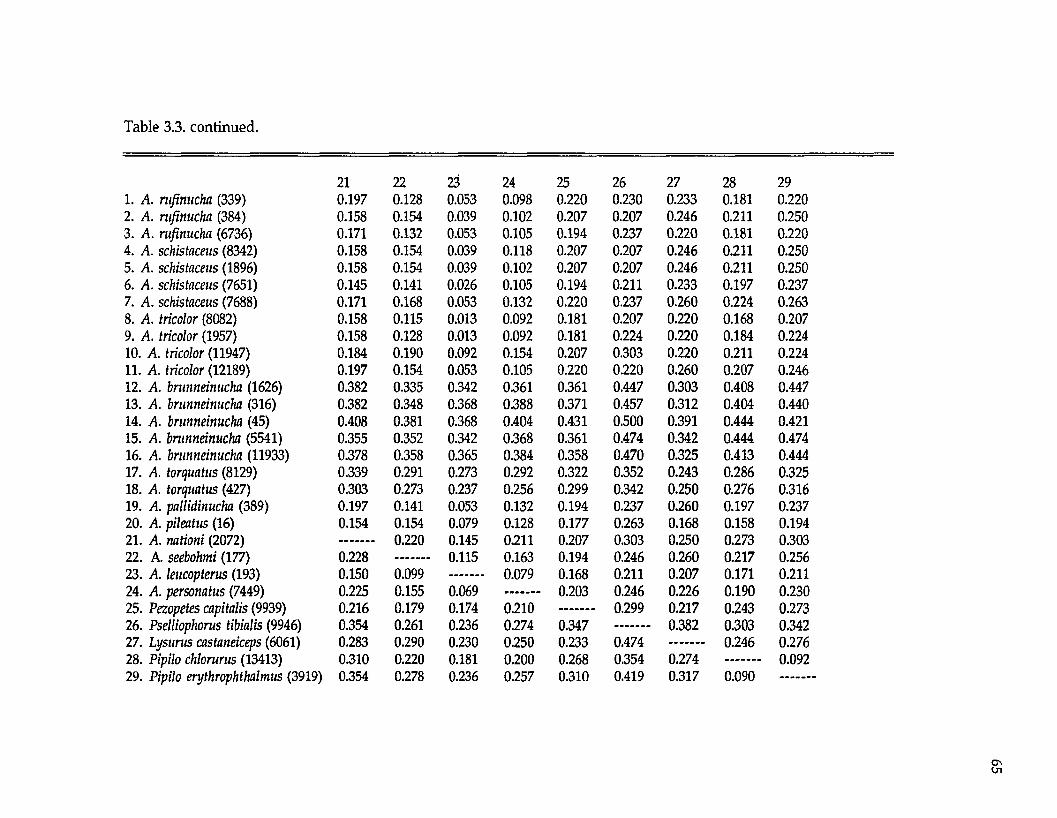
Table 3.3. continued.
1. A. ntfimicha (339)2. A. rufinucha (384)3. A. rufinucha (6736)4. A. schistaceus (8342)5. A. schistaceus (1896)6. A. schistaceus (7651)7. A. schistaceus (7688)8. A. tricolor (8082)9. A. tricolor (1957)10. A. tricolor (11947)11. A. tricolor (12189)12. A. brunneinucha (1626)13. A. brunneinucha (316)14. A. brunneinucha (45)15. A. brunneinucha (5541)16. A. brunneinucha (11933)17. A. torquatus (8129)18. A. torquatus (427)19. A. pallidinucha (389)20. A. pileatus (16)21. A. nationi (2072)22. A. seebohmi (177)23. A. leucopterus (193)24. A personatus (7449)25. Pezopetes capitalis (9939)26. Pselliophorus tibialis (9946)27. Lysurus castaneiceps (6061)28. Pipilo chlorurus (13413)29. Pipilo erythrophthalmus (3919)
21 22 23 240.197 0.128 0.053 0.0980.158 0.154 0.039 0.1020.171 0.132 0.053 0.1050.158 0.154 0.039 0.1180.158 0.154 0.039 0.1020.145 0.141 0.026 0.1050.171 0.168 0.053 0.1320.158 0.115 0.013 0.0920.158 0.128 0.013 0.0920.184 0.190 0.092 0.1540.197 0.154 0.053 0.1050.382 0.335 0.342 0.3610.382 0.348 0.368 0.3880.408 0.381 0.368 0.4040.355 0.352 0.342 0.3680.378 0.358 0.365 0.3840.339 0.291 0.273 0.2920.303 0.273 0.237 0.2560.197 0.141 0.053 0.1320.154 0.154 0.079 0.128
0.220 0.145 0.2110.228 0.115 0.1630.150 0.099 0.0790.225 0.155 0.0690.216 0.179 0.174 0.2100.354 0.261 0.236 0.2740.283 0.290 0.230 0.2500.310 0.220 0.181 0.2000.354 0.278 0.236 0.257
250.2200.2070.1940.2070.2070.1940.2200.1810.1810.2070.2200.3610.3710.4310.3610.3580.3220.2990.1940.1770.2070.1940.1680.203
0.3470.2330.2680.310
260.2300.2070.2370.2070.2070.2110.2370.2070.2240.3030.2200.4470.4570.5000.4740.4700.3520.3420.2370.2630.3030.2460.2110.2460.299
0.4740.3540.419
270.2330.2460.2200.2460.2460.2330.2600.2200.2200.2200.2600.3030.3120.3910.3420.3250.2430.2500.2600.1680.2500.2600.2070.2260.2170.382
0.2740.317
280.1810.2110.1810.2110.2110.1970.2240.1680.1840.2110.2070.4080.4040.4440.4440.4130.2860.2760.1970.1580.2730.2170.1710.1900.2430.3030.246
0.090
290.2200.2500.2200.2500.2500.2370.2630.2070.2240.2240.2460.4470.4400.4210.4740.4440.3250.3160.2370.1940.3030.2560.2110.2300.2730.3420.2760.092
OnO l
torquatus). Thus, the phylogenetic hypothesis in Figure 3.1 should be considered
unrooted.
Cladistic assessment of allelic variation considering loci as characters
resulted in at least 300 trees of 88 steps (C.I. = 0.735). The strict consensus tree was
unresolved except for a clade that was composed of Atlapetes brunneinucha, A.
torquatus, and Lysurus castaneiceps. Coding allelic variation with regards to the
presence/absence of alleles resulted in 76 trees of 85 steps (C.I. = 0.518). The 50%
majority-rule consensus tree, which is also one of the most parsimonious, is
depicted in Fig. 3.1; nodes that collapsed, basally, in the strict consensus tree are
denoted. This phylogeny suggested that there were three large groups: one that
included Pipilo, a second that included Atlapetes brunneinucha, A. torquatus, and
Lysurus, and a third group that included all other Atlapetes species analyzed, plus
Pselliophorus and Pezopetes. This phylogeny is unrooted; relationships among these
groups were unresolved w ith allozyme data because of the lack of an appropriate
outgroup,. Further resolution awaits systematic studies w ith more emberizid
taxa.
Within the second major group, Atlapetes brunneinucha and A. torquatus
were sister taxa. Lysurus was the sister taxon to A. brunneinucha and A. torquatus.
Within Atlapetes brunneinucha, populations from Mexico were basal, and
populations from Costa Rica and the Andes were sister taxa.
Within the third major group, Pselliophorus and Pezopetes were basal to the
other species. There was also a clade that included Atlapetes pallidinucha, A.
personatus, A. leucopterus, and A. seebohmi. Another clade demonstrated a close
relationship between Atlapetes rufinucha, A. schistaceus, and A. tricolor. The
relationships among these latter three species await further analyses. Preliminary
allozyme data, including more specimens and populations (unpubl. data) than
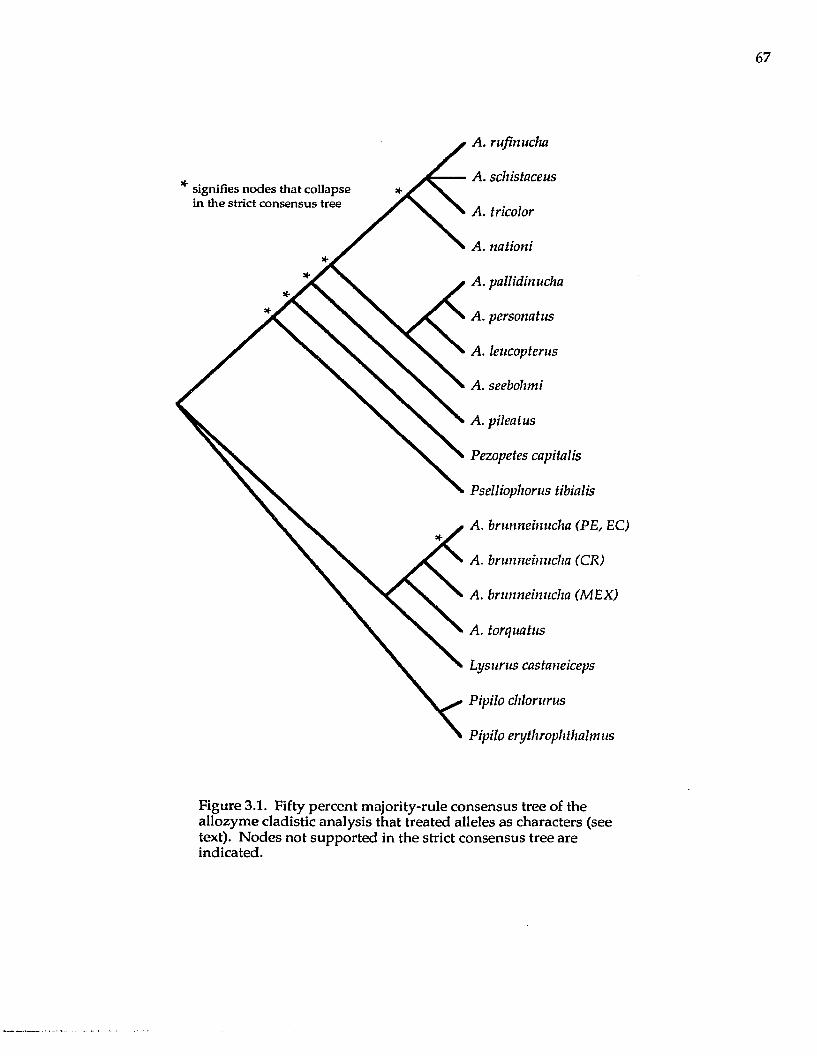
signifies nodes that collapse in the strict consensus tree
A. rufinucha
A. schistaceus
A. tricolor
A. nationi
A. pallidinucha
A. personatus
A. leucopterus
A. seebohmi
A. pileatus
Pezopetes capitalis
Pselliophorus tibialis
A. brunneinucha (PE, EC)
A. brunneinucha (CR)
A. brunneinucha (MEX)
A. torquatus
Lysurus castaneiceps
Pipilo chlorurus
Pipilo erythrophthalmus
Figure 3.1. Fifty percent majority-rule consensus tree of the allozyme cladistic analysis that treated alleles as characters (see text). Nodes not supported in the strict consensus tree are indicated.
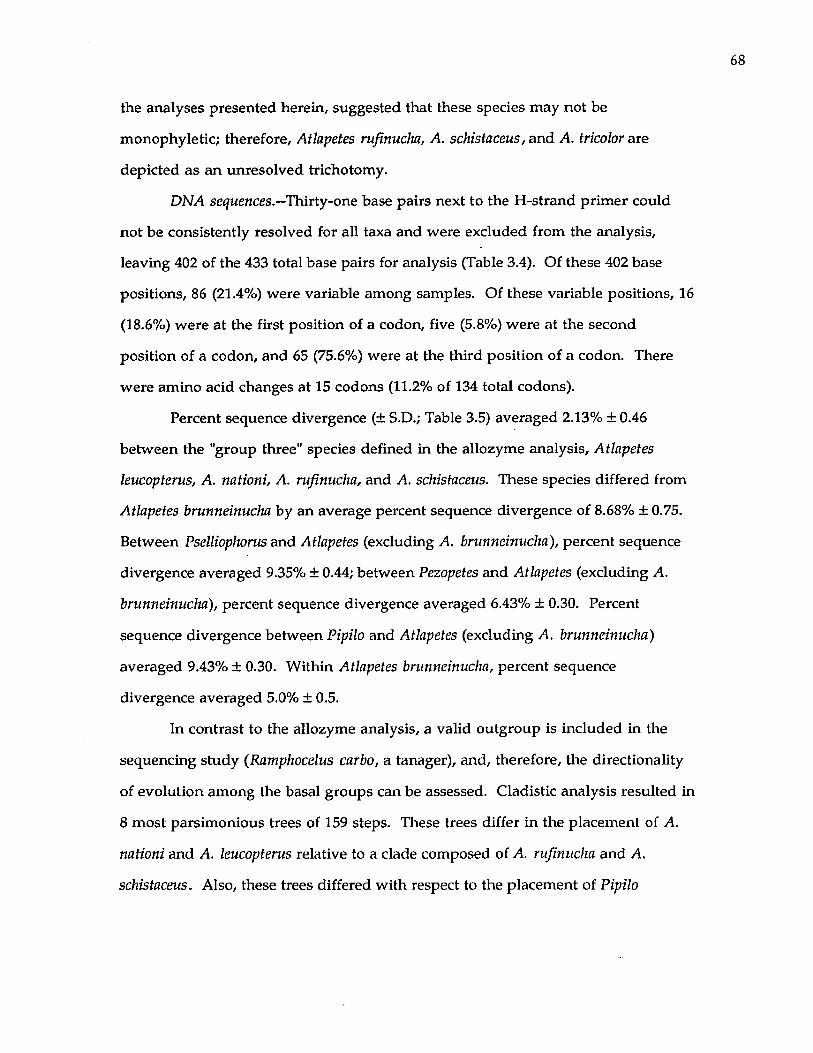
the analyses presented herein, suggested that these species may not be
monophyletic; therefore, Atlapetes rufinucha, A. schistaceus, and A. tricolor are
depicted as an unresolved trichotomy.
DNA sequences.—Thirty-one base pairs next to the H-strand prim er could
not be consistently resolved for all taxa and were excluded from the analysis,
leaving 402 of the 433 total base pairs for analysis (Table 3.4). Of these 402 base
positions, 86 (21.4%) were variable among samples. Of these variable positions, 16
(18.6%) were at the first position of a codon, five (5.8%) were at the second
position of a codon, and 65 (75.6%) were at the third position of a codon. There
were amino acid changes at 15 codons (11.2% of 134 total codons).
Percent sequence divergence (± S.D.; Table 3.5) averaged 2.13% ± 0.46
between the "group three" species defined in the allozyme analysis, Atlapetes
leucopterus, A. nationi, A. rufinucha, and A. schistaceus. These species differed from
Atlapetes brunneinucha by an average percent sequence divergence of 8.68% ± 0.75.
Between Pselliophorus and Atlapetes (excluding A. brunneinucha), percent sequence
divergence averaged 9.35% ± 0.44; between Pezopetes and Atlapetes (excluding A.
brunneinucha), percent sequence divergence averaged 6.43% ± 0.30. Percent
sequence divergence between Pipilo and Atlapetes (excluding A. brunneinucha)
averaged 9.43% ± 0.30. Within Atlapetes brunneinucha, percent sequence
divergence averaged 5.0% ± 0.5.
In contrast to the allozyme analysis, a valid outgroup is included in the
sequencing study (Ramphocelus carbo, a tanager), and, therefore, the directionality
of evolution among the basal groups can be assessed. Cladistic analysis resulted in
8 most parsimonious trees of 159 steps. These trees differ in the placement of A.
nationi and A. leucopterus relative to a clade composed of A. rufinucha and A.
schistaceus. Also, these trees differed with respect to the placement of Pipilo
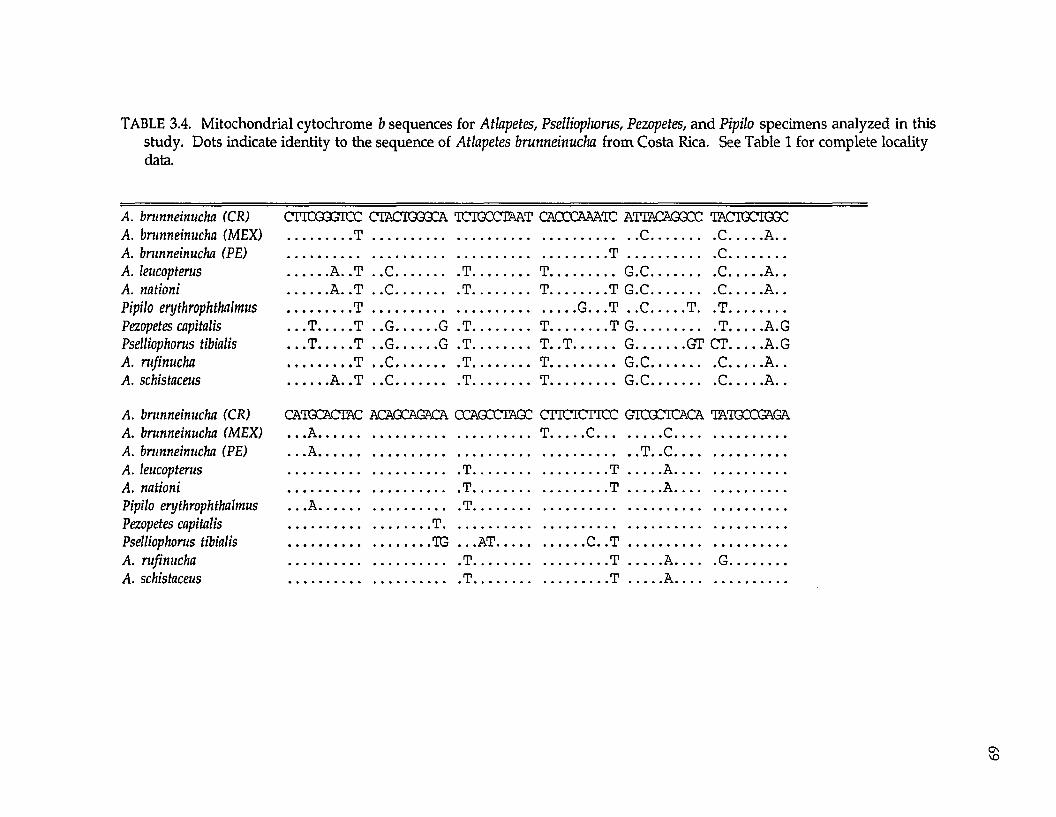
TABLE 3.4. Mitochondrial cytochrome b sequences for Atlapetes, Pselliophorus, Pezopetes, and Pipilo specimens analyzed in this study. Dots indicate identity to the sequence of Atlapetes brunneinucha from Costa Rica. See Table 1 for complete locality data.
A. brunneinucha (CR) CTICGGGTCC CTACTGGQCA TCTGCCIAAT CACCCMATC ATTACAGGCC TACIGCIGGCA. brunneinucha (MEX) T .........................................................................C................. C A ..A. brunneinucha (PE) .................................................................................. T ......................... C...............A. leucopterus A. .T ..C ................T................ T.................G.C................... C......... A ..A. nationi A. .T . .0 .................T............... T T G.C.................C A ..Pipilo erythrophthalmus ...............T ........................................................G .. .T . .C T. .T ...............Pezopetes capitalis . . .T T . .G G .T...............T..................T G .....................T A.GPselliophorus tibialis . . .T T . .G G .T...............T. .T G GT CT A.GA. rufinucha T . .C.................T............... T................... G.C................... C A ..A. schistaceus A. .T . .C................T................T................... G.C...................C..........A ..
A. brunneinucha (CR) CATGCACTA.C ACAGCAGACA CCAGCCTAGC CTICTCTICC GTCGCTCACA TATGCCGAGAA. brunneinucha (MEX) . . .A ....................................................... T C....................C.............................A. brunneinucha (PE) . . .A.................................................................................... T. .C.............................A. leucopterus ............................................. T...................................T .......... A.............................A. nationi ............................................. T...................................T .......... A.............................Pipilo erythrophthalmus . . .A.....................................T...................................................................................Pezopetes capitalis................ T...........................................................................................Pselliophorus tibialis 1G . . .AT....................... C. . T ...........................................A. rufinucha ............................................. T..................................T ...........A...........G...............A. schistaceus ............................................. T.................................. T ..........A.............................
GVVO
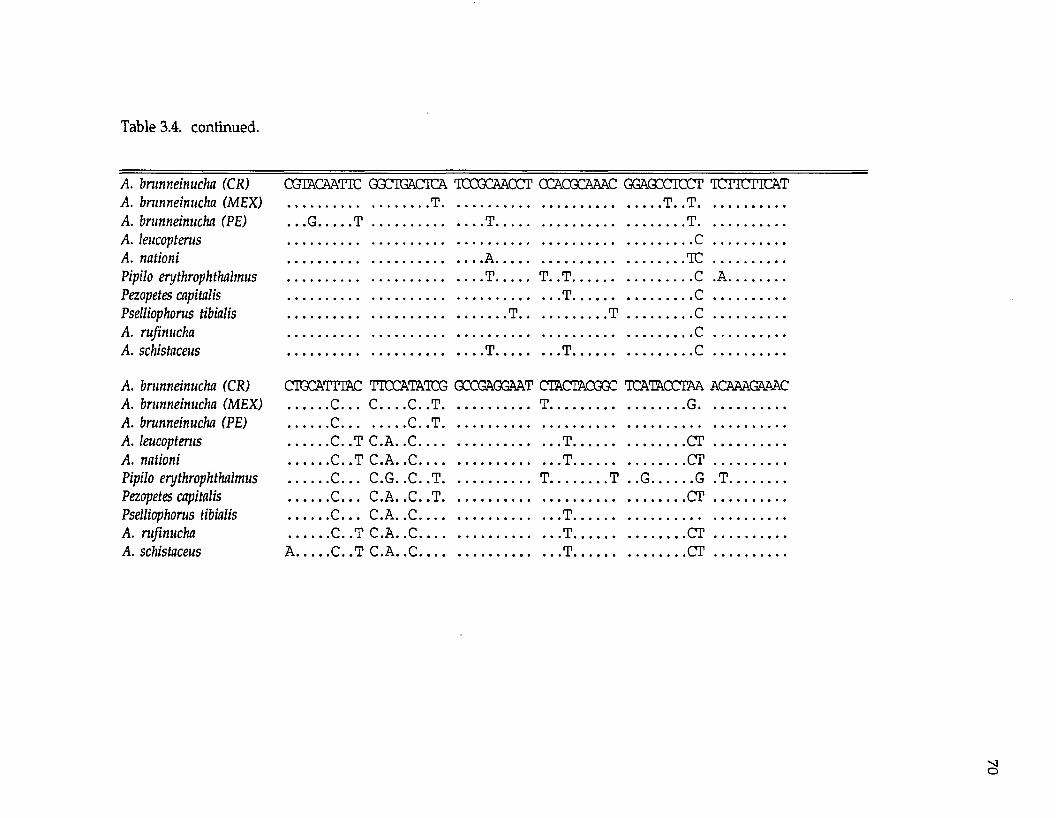
Table 3.4. continued.
A. brunneinucha (CR) CGIACAATIC GGCIGACICA TCCGCAACCT GCACQCAAAC GGAQCCICCT TCTTCTICATA. brunneinucha (MEX) .......................................... T .................................................................. T . . T ..........................A. brunneinucha (PE) . . .G T ................................. T .........................................................T ..........................A. leucopterus C......................A. nationi A ........................... TC........................Pipilo erythrophthalmus ...........................................................T ..........T. .T ....................................... C .A.................Pezopetes capitalis T .C....... ............Pselliophorus tibialis ..................................................................T........................ T .......................C........................A. rufinucha C......................A. schistaceus T .T .......................... C........................
A. brunneinucha (CR) CTGCATTmC TICCA'IATCG GCCGAGGAAT CTACIACGGC TCATkCCIM ACAAAGAAACA. brunneinucha (MEX) ............ C . . . C C . . T ..........................T........................................... G...........................A. brunneinucha (PE) C...................C. .T ........................................................................................................A. leucopterus ............C. .T C.A. .C........................................... T .................................C T .......................A. nationi ............C. .T C.A. .C........................................... T .................................C T .......................Pipilo erythrophthalmus ............ C . . . C.G. . C . . T ..........................T T . .G.............G .T .................Pezopetes capitalis C . . . C.A. . C . . T ...................................................................... C T ........................Pselliophorus tibialis ............C . . . C . A . . C ........................................... T ................................................................A. rufinucha ............C. .T C.A. .C........................................... T ................................ C T .......................A. schistaceus A C . . T C . A . . C ...........................................T ...............................C T ........................
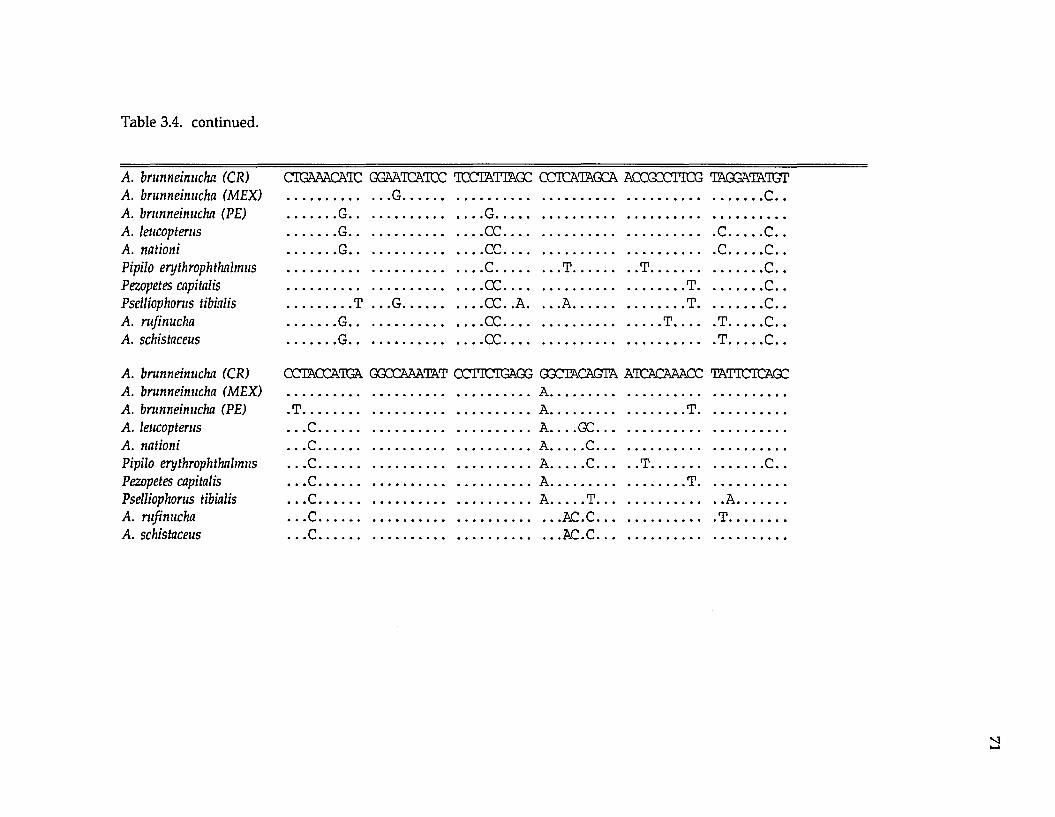
Table 3.4. continued.
A. brunneinucha (CR) CIGAAACATC GGAATCATCC TCCTATTAQC OCTCATAGCA ACCGCCTTOG TAGGATA.TGTA. brunneinucha (MEX) ...............................G............................................................................................................ C ..A. brunneinucha (PE) G........................................G.......................................................................................A. leucopterus G........................................CC..................................................................C ..........C ..A. nationi G........................................CC..................................................................C..........C ..Pipilo erythrophthalmus .......................................................... C ....................T ................... T .................................. C ..Pezopetes capitalis .......................................................... CC.......................................................T .................... C ..Pselliophorus tibialis T . . . G ........................ CC..A. . . . A ..................................T .................... C. .A. rufinucha G........................................ CC................................................T.............T .......... C . .A. schistaceus G........................................CC..................................................................T ..........C. .
A. brunneinucha (CR) CCIAOCATGA GGCCAMTAT CCTICTGAGG GGCIACAGTA ATCACAAACC TATTCTCAGCA. brunneinucha (MEX) ................................................................A ................................................................A. brunneinucha (PE) .T .................................................................... A ............................................T ..........................A. leucopterus . . . C ................................................. A GC...........................................................................A. nationi . . . C.................................................A C...........................................................................Pipilo erythrophthalmus . . . C............................................................... A C T ....................................C . .Pezopetes capitalis . . . C ................................................................A ............................................T ..........................Pselliophorus tibialis . . .C............................................................... A T.........................................A ...............A. rufinucha . . .C........................................................................ AC.C.................................... T .................A. schistaceus C.........................................................................AC.C.........................................................
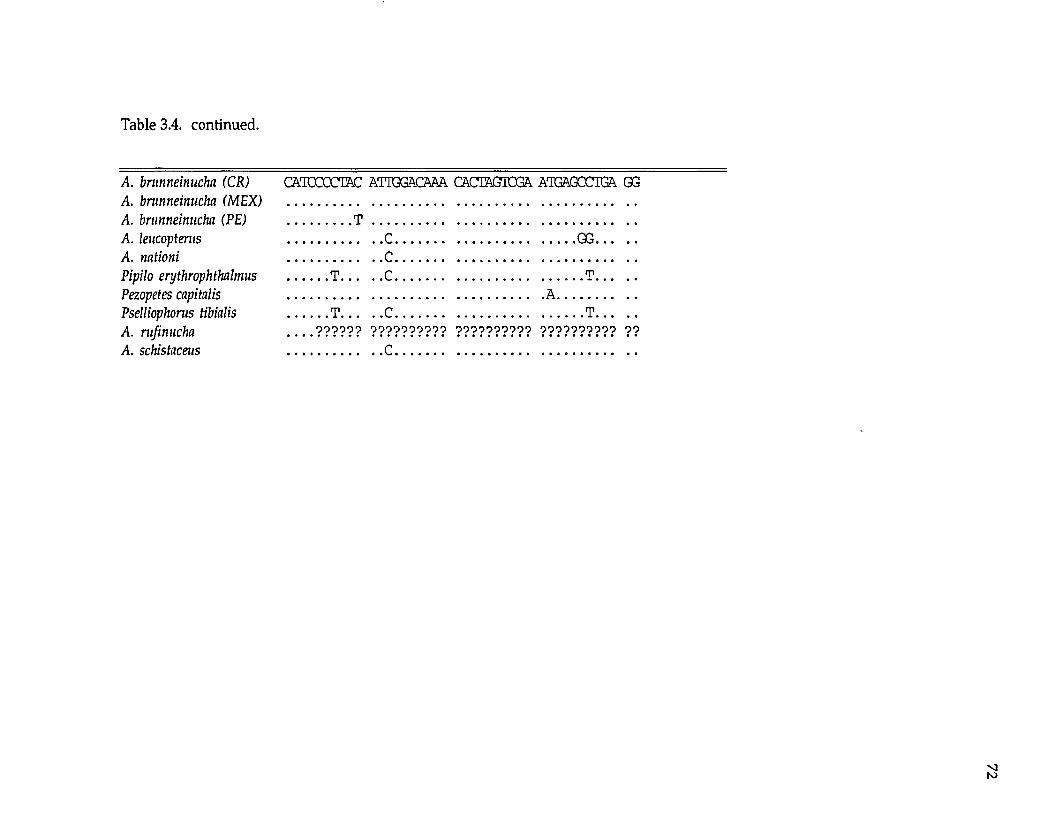
Table 3.4. continued.
A. brunneinucha (CR) CATCCOC'IAC ATTGGACMA CACTAGTCGA ATGAGCCTGA GGA. brunneinucha (MEX) ............................................................................................A. brunneinucha (PE) ............... T .......................................................................A. leucopterus C...................................................... GG.............A. nationi C.........................................................................Pipilo erythrophthalmus T .............C......................................................... T...........Pezopetes capitalis A.....................Pselliophorus tibialis T...........C.................................................. T..........A. rufinucha . . . .? ? ? ? ? ? ?????????? ?????????? ?????????? ??A. schistaceus C................................................................
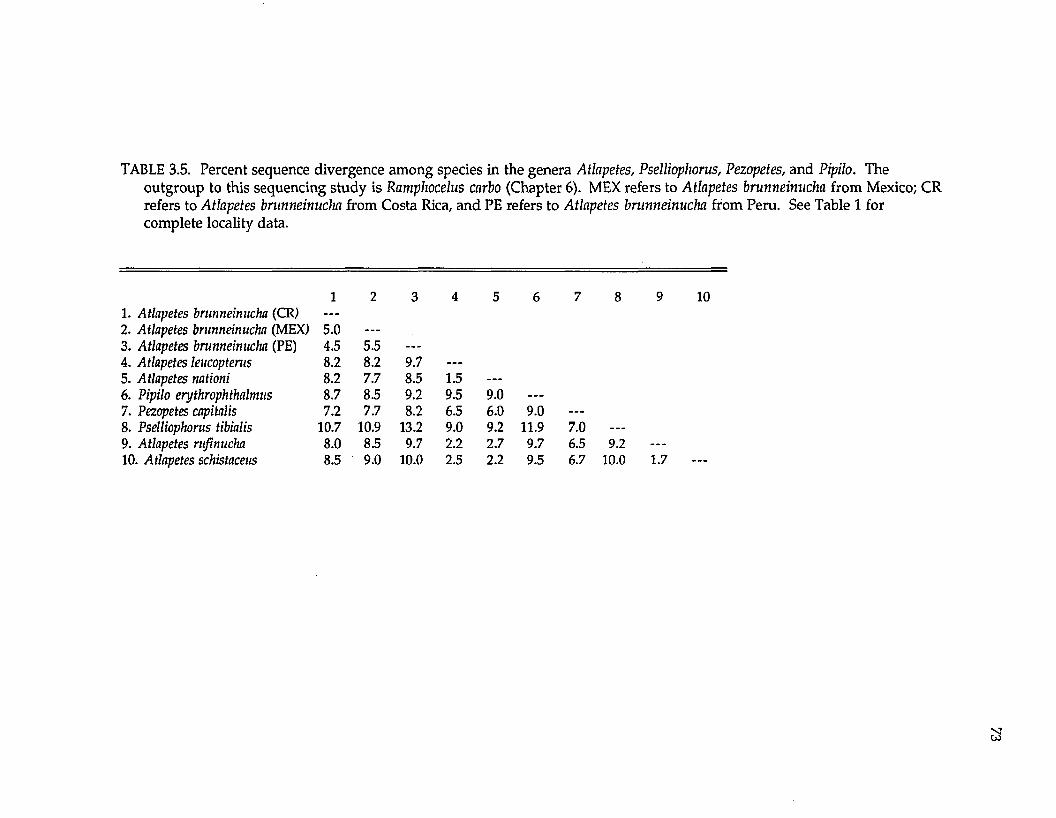
TABLE 3.5. Percent sequence divergence among species in the genera Atlapetes, Pselliophorus, Pezopetes, and Pipilo. Theoutgroup to this sequencing study is Ramphocelus carbo (Chapter 6). MEX refers to Atlapetes brunneinucha from Mexico; CR refers to Atlapetes brunneinucha from Costa Rica, and PE refers to Atlapetes brunneinucha from Peru. See Table 1 for complete locality data.
1 2 3 4 5 6 7 8 9 101. Atlapetes brunneinucha (CR) —2. Atlapetes brunneinucha (MEX) 5.0 . . .
3. Atlapetes brunneinucha (PE) 4.5 5.5 . . .
4. Atlapetes leucopterus 8.2 8.2 9.7 —
5. Atlapetes nationi 8.2 in 8.5 1.5 . . .
6. Pipilo erythrophthalmus 8.7 8.5 9.2 9.5 9.0 . . .
7. Pezopetes capitalis 7.2 7.7 8.2 6.5 6.0 9.0 . . .
8. Pselliophorus tibialis 10.7 10.9 13.2 9.0 9.2 11.9 7.0 . . .
9. Atlapetes rufinucha 8.0 8.5 9.7 2.2 2.7 9.7 6.5 9.210. Atlapetes schistaceus 8.5 9.0 10.0 2.5 2.2 9.5 6.7 10.0 1.7 —
erythrophthalmus; this species was either placed as basal to all Atlapetes species or as
more closely related to a clade composed of A. leucopterus, A. nationi, A. rufinucha,
A. schistaceus, Pselliophorus and Pezopetes. Thus, basal relationships remain
unresolved with sequence data as well as allozyme data. None of the most
parsimonious trees suggested that Atlapetes, including A. brunneinucha, was a
monophyletic group. The bootstrap consensus tree (Fig. 3.2) was one of the most
parsimonious trees, and it suggested the same three groupings as the allozyme
study: one group that included Atlapetes (except A. brunneinucha), Pselliophorus, and
Pezopetes; a second group that included Pipilo, and a third group that included A.
brunneinucha. There is weak support (11% bootstrap value) for Pipilo being basal to
the other species analyzed.
Finally, sequence data supported the same relationships among the
population samples of Atlapetes brunneinucha as did the allozyme analysis (Fig.
3.2): Mexican populations are basal, Costa Rican and Andean as sister taxa.
DISCUSSION
Levels and patterns of genetic differentiation.—A growing number of researchers
(Capparella 1987, Capparella 1988, Hackett and Rosenberg 1990, Peterson 1992,
Peterson et. al 1992, Bates and Zink in review; see also Chapters 2 - 7 ) have noted
that sedentary Neotropical birds show high levels of genetic differentiation, both
within and among species, relative to other birds that are much less sedentary.
Atlapetes are no exception to the sedentary, increased genetic divergence pattern
(see Table 3.3). As early as 1923, Chapman pointed out the potential phenotypic
effects of isolation of upper-elevation populations that characterize most of
Atlapetes. This is also reflected, genetically, in the high degree of differentiation
among many populations and species that was the result of this study.
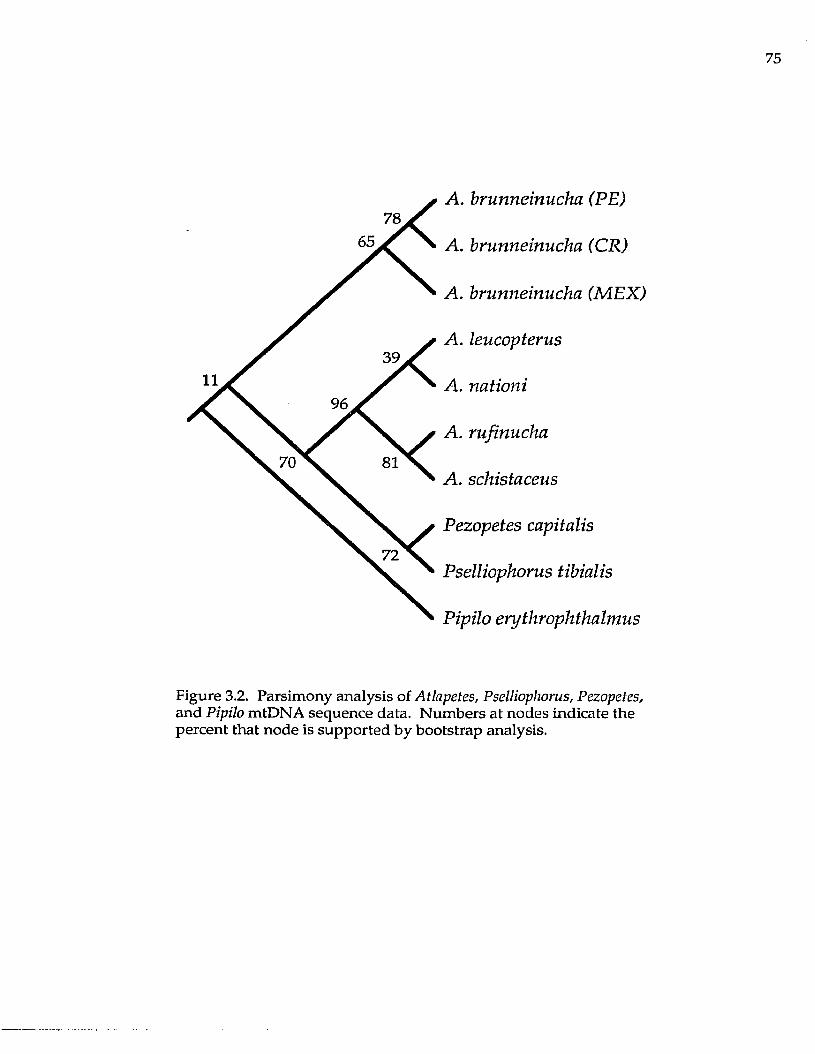
7865
39
96
72
A. brunneinucha (PE)
A . brunneinucha (CR)
A. brunneinucha (MEX)
A. leucopterus
A . nationi
A. rufinucha
A . schistaceus
Pezopetes capitalis
Pselliophorus tibialis
Pipilo erythrophthalmus
Figure 3.2. Parsimony analysis of Atlapetes, Pselliophorus, Pezopetes, and Pipilo mtDNA sequence data. Num bers at nodes indicate the percent that node is supported by bootstrap analysis.
76
The pattern of phylogeny (Fig. 3.1 and Fig. 3.2) indicates that Atlapetes
torquatus and A. brunneinucha are sister taxa, although highly genetically
differentiated from one another (average Nei's 1978 genetic distance of 0.238).
This provides support for the A. torquatus species-group of Paynter (1978);
however, these species are only very distantly related to the group of (mainly)
A ndean Atlapetes. Indeed, the monotypic Pselliophorus and Pezopetes are more
closely related to the A ndean Atlapetes than are A. brunneinucha and A. torquatus,
and it is not clear whether or not Pipib is more closely related to the Andean
Atlapetes/Pselliophorus/Pezopetes clade than are Atlapetes torquatus and A.
brunneinucha. In addition, Lysurus appears to be more closely related to Atlapetes
brunneinucha and A. torquatus than are the other Atlapetes species (Fig. 3.1). Thus,
the genus Atlapetes, as currently recognized, is not a monophyletic assemblage of
species, and I will refer to Atlapetes torquatus and A. brunneinucha by the genus
name Buarremon (as did Chapm an 1923). Both allozyme and mtDNA genetic
distances support this taxonomic decision. W ithin Atlapetes, Nei's (1978) genetic
distance averaged 0.092, whereas, average genetic distance betw een Atlapetes and
Buarremon was 0.412. A genetic distance of 0.412 is similar to that found among
genera w ithin other avian Neotropical families (see sum m ary in Hackett and
Rosenberg 1990). Genetic distances between Pselliophorus and Atlapetes average
0.263, and between Pezopetes and Atlapetes, genetic distances average 0.205. Pipilo
differs from Atlapetes by a Nei's (1978) genetic distance of only 0.237.
M itochondrial DNA sequences illustrate a similar pattern; w ithin Atlapetes,
sequence divergence averages 2.13%, whereas between Atlapetes and Buarremon
sequence divergence averages 8.68%.
Thus, I recommend rem oving the "Atlapetes" torquatus species-group of
Paynter (1978) from Atlapetes and resurrecting the genus Buarremon. This
taxonomic decision preserves more phylogenetic information than lum ping all
genera into Atlapetes. To make Atlapetes, as currently recognized, monophyletic,
Pselliophorus, Pezopetes, Lysurus, and maybe even Pipilo, w ould have to be subsumed
into Atlapetes. In addition, there could be other genera not analyzed in this study
that could be closely related to these Emberizids (for example, Oreothraupis,
Arremon, and Arremonops).
Besides nonmonophyly of the genus Atlapetes, the sister-taxon relationship
between Atlapetes rufinucha and A. schistaceus (Fig. 3.2) suggests that two of
Paynter's species-groups, themselves, may also not be monophyletic. According
to the phylogenies of both allozyme and mtDNA data presented in this study and
more extensive allozyme results (unpublished data), the m onophyly of some of
Paynter's species groups and superspecies complexes should be further
investigated.
Chapm an (1923) posited that Buarremon had the "innate ability to produce
variations," such as the presence or absence of a pectoral band or superciliary or
the presence of a chestnut, black and gray, or black cap; these traits are not
necessarily under environmental control or the result of natural selection. The
high degree of plumage variation found this group of Emberizids, combined w ith
the sedentary nature of the birds and the geographic isolation of many
populations, could lead to rapid plumage evolution. If the range of plumage
variations is limiting, as the result of constraints inherited from a common
Emberizid ancestor or developmental constraints, then plum age characteristics
could be highly homoplasious. This is analogous to highly variable DNA
sequence positions (third positions of a codon, for example) that have been shown
to be phylogenetically misleading as taxa become more distantly related. Thus, a
synthesis of genetic and morphological variation w ithin this group of birds will
require extensive population sampling for the genetic study, and a reevaluation
of the plum age characters used for assigning taxa to particular species and
superspecies groups.
Biogeography.—The phylogenies (Fig. 3.1 and Fig. 3.2) suggest that
Pselliopltorus and Pezopetes are only distantly related to other Atlapetes species and
m ay be sister taxa (Fig. 3.2), although genetic distances suggest an ancient split.
Molecular clock calibrations applied to allozyme data (Gutierrez et al. 1983,
M arten and Johnson 1986) suggest that these species have been evolving
independently for roughly ten million years (Pselliophorus, for 10-13 my, Pezopetes
for 9-12 my). Thus, divergence is hypothesized to predate the completion of a
landbridge connection of Central and South America (Pindell and Dewey 1982,
Malfait and Dinkelman 1972). There are two ways this ancient speciation of
Pselliophorus and Pezopetes could have occurred, either by dispersal from the south
of a proto -Atlapetes from the Andes and subsequent differentiation or by dispersal
of an ancestral em berizid (perhaps proto -Buarremon or proto -Pipilo) from the
north and subsequent differentiation. Sibley and Ahlquist (1990) suggested that
emberizids originated in the N orthern Hemisphere, w hich provides weak
support for a southw ard m ovem ent of ancestral lineages of Emberizids, w ith a
subsequent radiation in the Andes.
The pattern of phylogeny of isolated populations w ithin Buarremon
brunneinucha also supports a north-to-south dispersal and subsequent
differentiation; the sample of B. brunneinucha from Mexico is m ost basal (and
hence older), w hereas samples of B. brunneinuclm from the Andes are sister taxa to
the Costa Rican sample and more recently separated. In addition, Chapm an (1923)
also suggested that Buarremon originated in Mexico. However, this general area
cladogram for Buarremon brunneinucha is not concordant w ith the general area
cladogram for the Diglossa baritula complex (Chapter 1), which suggested a south to
north pattern of dispersal and subsequent differentiation (Mexican and Costa
Rican samples were sister taxa, and the Andean samples were sister taxa to the
M exican/Costa Rican clade). Timing of divergence events based on a molecular
clock are roughly similar for the two lineages; divergences date to the early
Pleistocene. Thus, it does not appear that two different time periods were
responsible for diversification of these two lineages, one complicating feature of
continental biogeographic patterns (Cracraft 1988). With phylogenetic analyses of
only two lineages, a strong case can not be made for either area cladogram, and
resolution of this biogeographic dilemma awaits phylogenetic analyses of other
lineages with codistributed taxa.
LITERATURE CITED
ALLARD, M. W., D. L. ELLSWORTH, AND R. L. HONEYCUTT. 1991. Theproduction of single-stranded DNA suitable for sequencing using the polymerase chain reaction. BioTechniques 10: 24-26.
BATES, J. M. AND R. M. ZINK. Sub. Evolution into the Andes: molecular evidence for species relationships in the genus Leptopogon. Auk.
CAPPARELLA, A. P. 1987. Effects of riverine barriers on genetic differentiation of Amazonian forest undergrowth birds. Ph.D. dissertation, Louisiana State University, Baton Rouge, Louisiana.
--------- . 1988. Genetic variation in Neotropical birds: implications for thespeciation process. Proc. Int. Ornithol. Congr. 19: 1658-1664.
CHAPMAN, F. M. 1923. Mutation among birds in the genus Buarremon. Bull.Amer. Mus. Nat. Hist. 48: 243-278.
CRACRAFT, J. 1988. Deep-history biogeography: retrieving the historical pattern of evolving continental biotas. Syst. Zool. 37: 221-236.
EDWARDS, S. V., P. ARCTANDER, AND A. C. WILSON. 1991. Mitochondrialresolution of a deep branch in the genealogical tree for perching birds. Proc. R. Soc. Lond. B. 243: 99-107.
FELSENSTEIN, J. 1985. Confidence limits on phylogenies: an approach using the bootstrap. Evolution. 79: 783-791.
GUTIERREZ, R. J., R. M. ZINK, AND S. Y. YANG. 1983. Genic variation, systematic, and biogeographic relationships of some galliform birds. Auk 100: 33-47.
HACKETT, S. J. 1989. Effects of varied electrophoretic conditions on detection of evolutionary patterns in the Laridae. Condor 91: 73-90.
-----------AND K. V. ROSENBERG. 1990. Evolution of South American antwrens(Formicariidae): comparison of phenotypic and genetic differentiation. Auk 107: 473-489.
HILLIS, D. M., A. LARSON, S. K. DAVIS, AND E. A. ZIMMER. 1990. Pages 318-370 in Molecular Systematics (D. M. Hillis and C, Moritz, eds.). Sinauer Assoc., Inc., Sunderland, Massachusetts.
KOCHER, T. D., W. K. THOMAS, A. MEYER, S. V. EDWARDS, S. PAABO, F. X. VILLABLANCA, AND A. C. WILSON. 1989. Dynamics of mitochondrial DNA evolution in animals: amplification and sequencing w ith conserved primers. Proc. Natl. Acad. Sci. 86: 6196-6200.
MALFAIT, B. J. AND M. G. DINKLEMAN. 1972. Circum-Caribbean tectonic and igneous activity and the evolution of the Caribbean plate. Geol. Soc. Am. Bull. 83: 251-272.
MARTEN, J. A. AND N. K. JOHNSON. 1986. Genetic relationships of North Amerian cardueline finches. Condor 88: 409-420.
MURPHY, R. W., J. W. SITES, JR., D. G. BUTH, AND C. H. H AUFLER. 1990. Proteins 1: isozyme electrophoresis. Pages 45-126 in Molecular systematics (D. M.Hillis and C. Moritz, Eds.). Sinauer Assoc., Inc., Sunderland, Massachusetts.
NEI, M. 1978. Estimation of average heterozygosities and genetic distance from a small num ber of individuals. Genetics 89: 583-590.
----------. 1987. Molecular evolutionary genetics. Columbia Univ. Press, NewYork.
PAYNTER, R. A, JR. 1970. Subfamily Emberizinae. Pages 3-214 in Check-Iist of Birds of the World, vol. 13 (R. A. Paynter, Jr., Ed.). M useum of Comparative Zoology, Cambridge, Massachusetts.
. 1978. Biology and evolution of the avian genus Atlapetes (Emberizinae).Bull. Mus. Comp. Zool. 148: 323-369.
PETERSON, A. T. 1992. Phylogeny and rates of molecular evolution in the Aphelocoma jays (Corvidae). Auk 109:133-147.
--------- , P. ESCALANTE P., AND A. NAVARRO S. 1992. Genetic variation inMexican populations of Common Bush-tanagers and Chestnut-capped Brush-finches. Condor 94: 244-253.
PINDELL, J. AND J. F. DEWEY. 1982. Permo-Triassic reconstruction of WesternPangea and the evolution of the Gulf of Mexico/Caribbean region. Tectonics 1:179-211.
RIDGELY, R. S. AND G. TUDOR. 1989. The birds of South America: the oscine passerines: jays and swallows, wrens, thrushes, and allies, vireos, and wood warblers, tanagers, icterids, and finches. Univ. Texas Press, Austin, Texas.
ROGERS, J. S. 1972. Measures of genetic similarity and genetic distance. Studies in Genetics VII. Univ. Texas Publ. No. 7213: 145-153.
SANDERSON, M. J. 1989. Confidence limits on phylogenies: the bootstrap revisited. Cladistics 5: 113-130.
SIBLEY, C. G AND J. E. AHLQUIST. 1990. Phylogeny and classification of birds: a study in molecular evolution. Yale Univ. Press, New Haven, Connecticut.
SWOFFORD, D. L. 1990. PAUP: phylogenetic analysis using parsimony, Version 3.0. Illinois Natural History Survey, Champaign.
---------- AND R. B. SELANDER. 1981. BIOSYS-1: a FORTRAN program for thecomprehensive analysis of electrophoretic data in population genetics and systematics. J. Hered. 72: 281-283.
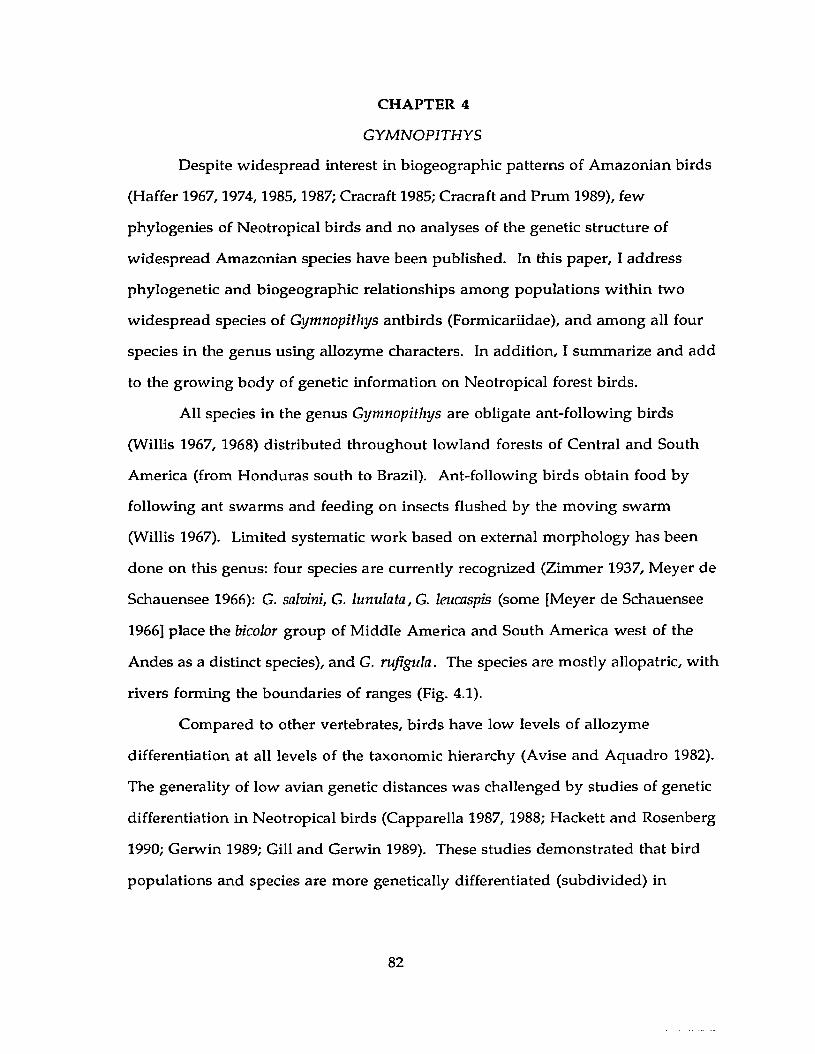
CHAPTER 4
G YM N O PITH YS
Despite w idespread interest in biogeographic patterns of Am azonian birds
(Haffer 1967,1974,1985,1987; Cracraft 1985; Cracraft and Prum 1989), few
phylogenies of Neotropical birds and no analyses of the genetic structure of
w idespread Amazonian species have been published. In this paper, I address
phylogenetic and biogeographic relationships am ong populations w ithin two
w idespread species of Gymnopithys antbirds (Formicariidae), and am ong all four
species in the genus using allozyme characters. In addition, I summ arize and add
to the growing body of genetic information on Neotropical forest birds.
All species in the genus Gymnopithys are obligate ant-following birds
(Willis 1967, 1968) distributed throughout low land forests of Central and South
America (from H onduras south to Brazil). Ant-following birds obtain food by
following ant swarms and feeding on insects flushed by the m oving swarm
(Willis 1967). Limited systematic work based on external m orphology has been
done on this genus: four species are currently recognized (Zimmer 1937, Meyer de
Schauensee 1966): G. salxnni, G. lunulata, G. lencaspis (some [Meyer de Schauensee
1966] place the bicolor group of M iddle America and South America w est of the
Andes as a distinct species), and G. rufigula. The species are mostly allopatric, w ith
rivers forming the boundaries of ranges (Fig. 4.1).
Com pared to other vertebrates, b irds have low levels of allozyme
differentiation at all levels of the taxonomic hierarchy (Avise and A quadro 1982).
The generality of low avian genetic distances was challenged by studies of genetic
differentiation in Neotropical birds (Capparella 1987, 1988; Hackett and Rosenberg
1990; Gerwin 1989; Gill and Gerwin 1989). These studies dem onstrated that bird
populations and species are more genetically differentiated (subdivided) in
82
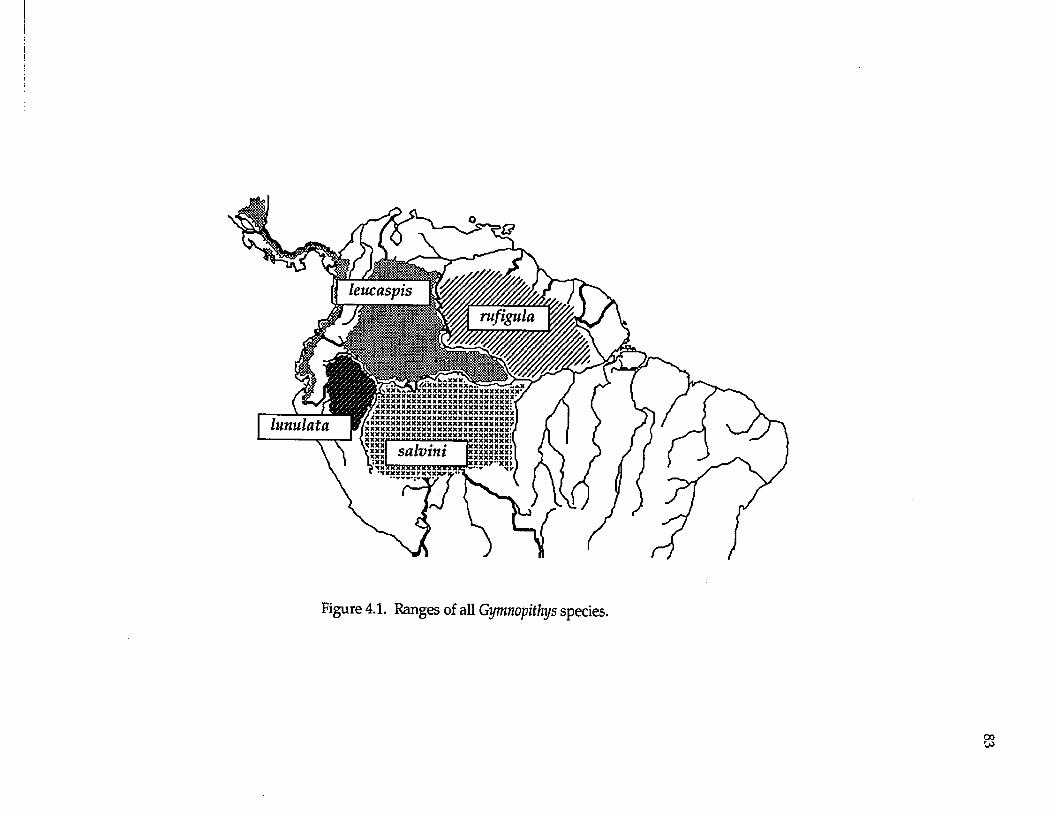
lu n u la tasalvini
Figure 4.1. Ranges of all Gymnopithys species.
00
lowland tropical forests, although they still do not reach levels found in some
other vertebrate groups. Hypotheses proposed to explain greater population
subdivision include increased age of Neotropical taxa, low levels of gene flow
between Neotropical avian demes, and differences in social systems (for example,
reduced effective population sizes due to lekking behavior).
METHODS
Samples were obtained for all species of Gymnopithys, six population
samples representing four subspecies of G. leucaspis, and two population samples
from one subspecies of G. salvini. Three other genera of ant-following birds
(Myrmeciza fortis, Pithys albifrcms, and Rhegmatorhina melanosticta) suggested by
Willis (1967) to be closely related to Gymnopithys were used as outgroups.
Abbreviations for the outgroups are as follows MFORT, PALBI, and RMELA,
respectively. All tissue samples were from the Louisiana State University
M useum of Natural Science Frozen Tissue Collection. Collecting sites and
sample sizes are listed in Table 4.1. Although my sample sizes are small, Gorman
and Renzi (1979) demonstrated that one or few individuals per taxon provide
robust estimates of genetic distance as long as the num ber of loci examined is
reasonably high and heterozygosity is low (conditions met by this study). The
conservatism of avian allozyme divergence, fixed or nearly fixed allozymes
unique to certain groups of this study, and low heterozygosity may minimize the
sample-size bias for estimating genetic distances predicted by Archie et al. (1989).
Standard horizontal starch-gel electrophoresis of proteins was performed
as outlined in Hackett (1989) and Hackett and Rosenberg (1990). Each locus was
scored on two buffer systems to reduce influences of hidden variation (Hackett
1989). Alleles were coded by their relative mobility from the origin; the most
anodally migrating allele was coded "a." Isozymes were coded in a similar
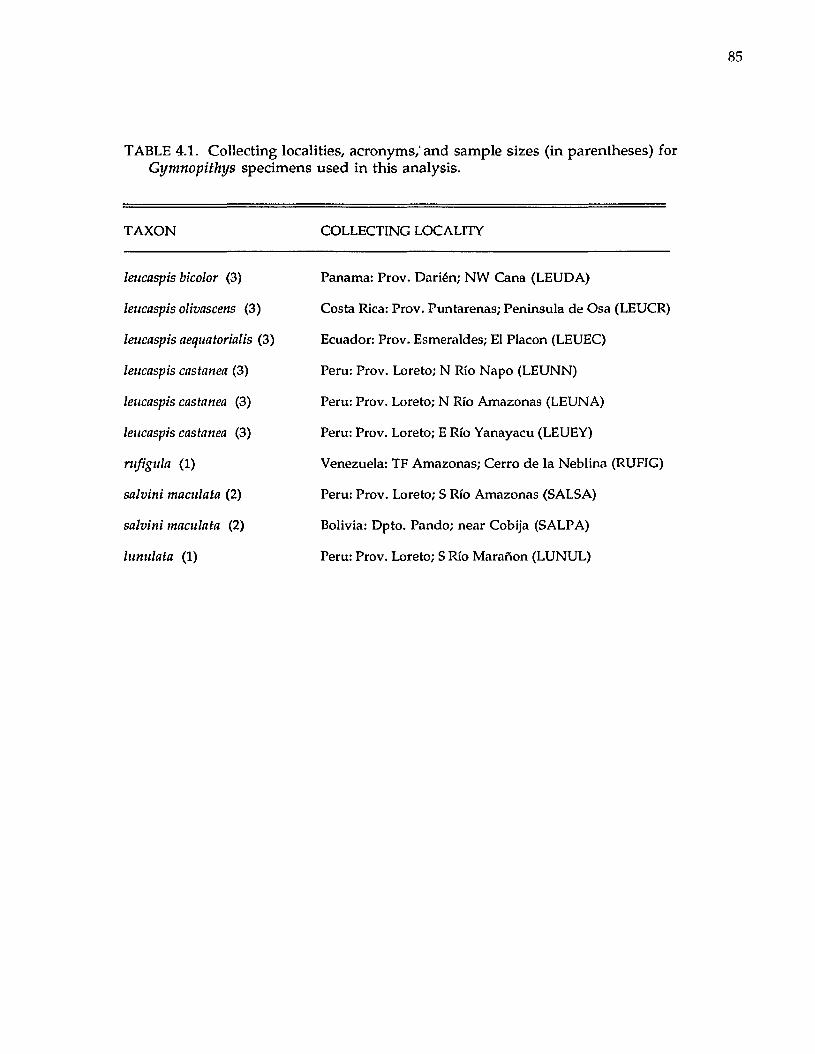
85
TABLE 4.1. Collecting localities, acronyms,'and sample sizes (in parentheses) for Gymnopithys specimens used in this analysis.
TAXON COLLECTING LOCALITY
leucaspis bicolor (3)
leucaspis olivascens (3)
leucaspis aequatorialis (3)
leucaspis castanea (3)
leucaspis castanea (3)
leucaspis castanea (3)
rufigula (1)
salvini maculata (2)
salvini maculata (2)
lunulata (1)
Panama: Prov. Darien; NW Cana (LEUDA)
Costa Rica: Prov. Puntarenas; Peninsula de Osa (LEUCR)
Ecuador: Prov. Esmeraldes; El Placon (LEUEC)
Peru: Prov. Loreto; N Rio Napo (LEUNN)
Peru: Prov. Loreto; N Rio Amazonas (LEUNA)
Peru: Prov. Loreto; E Rio Yanayacu (LEUEY)
Venezuela: TF Amazonas; Cerro de la Neblina (RUFIG)
Peru: Prov. Loreto; S Rio Amazonas (SALSA)
Bolivia: Dpto. Pando; near Cobija (SALPA)
Peru: Prov. Loreto; S Rio Maranon (LUNUL)
86
m anner, w ith a "1" indicating the most anodally migrating isozyme. Locus
acronyms follow M urphy et al. (1990).
I used the computer program BIOSYS-1 (Swofford and Selander 1981) to
compute genetic distances (Nei 1978, Rogers 1972), a UPGMA phenogram, and
Distance-Wagner (Farris 1972) trees using the m ultiple addition criterion of
Swofford (1981); all trees were rooted at the non-Gymnopithys, ant-following
Formicariids (Myrmeciza fortis , Pithys albifrons, and Rhegmatorhina melanosticta).
The com puter program PHYLIP (Felsenstein 1986) was used to construct two trees
from Rogers’ (1972) genetic distances: one that assumes a constant rate of
evolution ("KITSCH"), and one that does not ("FITCH"). Cladistic assessment of
allelic variation was perform ed by coding each locus as a multi-state unordered
character (and alleles at each locus as character states) using the computer
program PAUP 3.0L (Swofford 1990). Also, in another cladistic analysis,
phylogenetically informative alleles were considered as characters and coded as
present or absent (see Rogers and Cashner (1987) for defense of this method of
coding; see also Buth (1984), Mickevich and Mitter (1981), and Swofford and
Berlocher (1987) for problems with this method of coding). One hundred
bootstrap replicates were performed on each cladistic analysis to assess confidence
in the branching pattern (Felsenstein 1985, Sanderson 1989). The homoplasy
excess ratio (HER) proposed by Archie (1989a, 1989b) was calculated to give a
measure of homoplasy less influenced by num ber of taxa than the consistency
index (C.I.; Kluge and Farris 1969) and to assess whether the distribution of the
allozyme data was nonrandom.
Measures of genetic population subdivision, F$t (Wright 1978), were
calculated for G. leucaspis and G. salrnni using a computer program provided by G.
87
F. Barrowclough that takes into account small numbers of individuals sampled
from a population.
RESULTS
Levels and patterns of genetic variation at 37 presumptive gene loci were
resolved (Tables 4.2 and 4.3). Nineteen loci (51%) were variable within or among
species. Average genetic distance (Nei 1978; + standard deviation) within
Gymnopithys (n=6) as a whole is 0.173 + 0.025; within G. leucaspis (n=15) genetic
distances average 0.053 + 0.012. Genetic distance averages 0.065 among the 3
population samples of G. leucaspis castanea (LEUNN, LEUNA, LEUEY). The two
population samples of G. salvini differ by a Nei's (1978) genetic distance of 0.028.
Fst among the six populations of G. leucaspis is 0.365, and between the two salvini
populations FSf is 0.333 (Table 4.4).
The UPGMA phenogram (Fig. 4.2) reveals that the four species of
Gymnopithys form a group, as do the six population samples of G. leucaspis
(representing four different subspecies). There is weak support, as evidenced by
short branch lengths, for the bicolor group of leucaspis from Middle America and
western South America (LEUEC, LEUDA, LEUCR) as genetically distinct from the
Amazonian leucaspis (LEUNA, LEUNN, LEUEY). Gymnopithys rufigula is most
similar to G. leucaspis, and G. salvini and G. lunulata form a group. This topology is
found in the KITSCH and FITCH trees. The Distance-Wagner tree differs in
placing the Costa Rican sample of G. leucaspis (LEUCR) basal to the 5 other
population samples.
Cladistic analysis of loci with the alleles as unordered character states (not
shown) resulted in 12 equally most parsimonious trees, with a consistency index
(C.I.) of 1.0 and a homoplasy excess ratio (HER) of 0.88. These data indicate that
there is little homoplasy in the data set and that the data are nonrandom; that is,
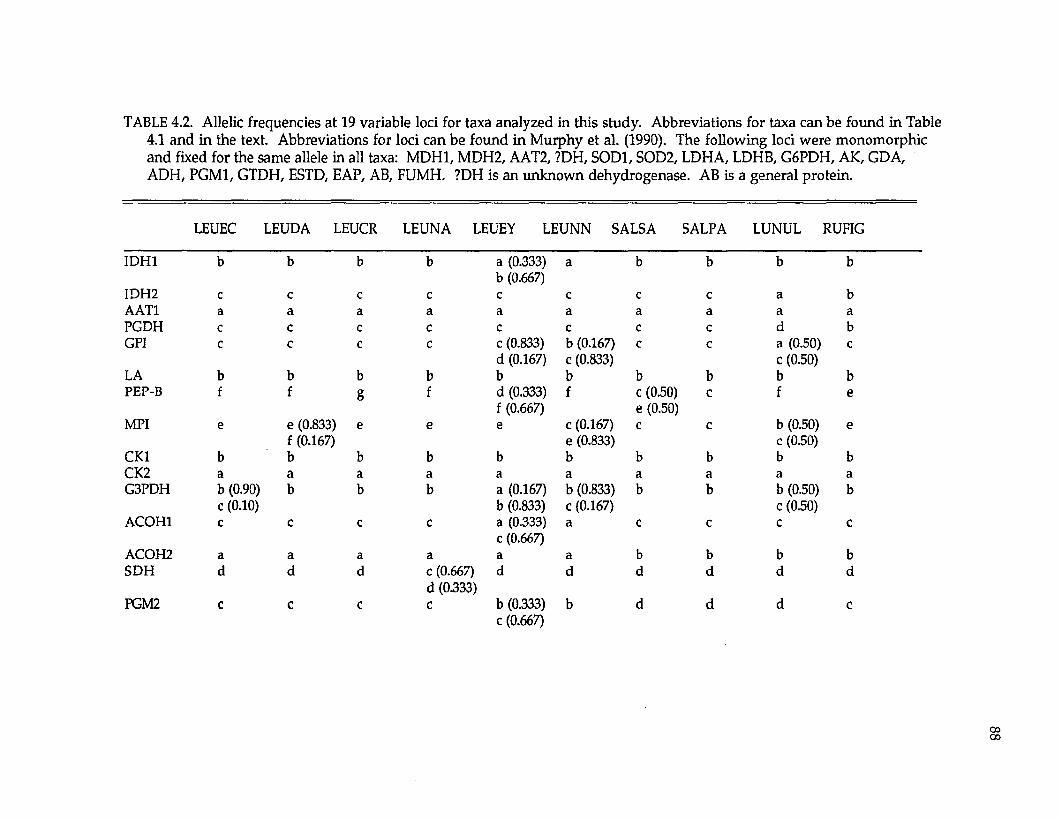
TABLE 4.2. Allelic frequencies at 19 variable loci for taxa analyzed in this study. Abbreviations for taxa can be found in Table 4.1 and in the text. Abbreviations for loci can be found in Murphy et al. (1990). The following loci were monomorphic and fixed for the same allele in all taxa: MDH1, MDH2, AAT2, ?DH, SOD1, SOD2, LDHA, LDHB, G6PDH, AK, GDA, ADH, PGM1, GTDH, ESTD, EAP, AB, FUMH. ?DH is an unknown dehydrogenase. AB is a general protein.
LEUEC LEUDA LEUCR LEUNA LEUEY LEUNN SALSA SALPA LUNUL RUFIG
IDH1 b b b b a (0.333) b (0.667)
a b b b b
IDH2 c c c c c c c c a bAAT1 a a a a a a a a a aPGDH c c c c c c c c d bGPI c c c c c (0.833)
d (0.167)b (0.167) c (0.833)
c c a (0.50) c (0.50)
c
LA b b b b b b b b b bPEP-B f f g f d (0.333)
f (0.667)f c (0.50)
e (0.50)c f e
MPI e e (0.833) f (0.167)
e e e c (0.167) e (0.833)
c c b (050) c (0.50)
e
CK1 b b b b b b b b b bCK2 a a a a a a a a a aG3PDH b (0.90)
c (0.10)b b b a (0.167)
b (0.833)b (0.833) c (0.167)
b b b (0.50) c (0.50)
b
ACOH1 c c c c a (0.333) c (0.667)
a c c c c
ACOH2 a a a a a a b b b bSDH d d d c (0.667)
d (0.333)d d d d d d
PGM2 c c c c b (0.333) c (0.667)
b d d d c
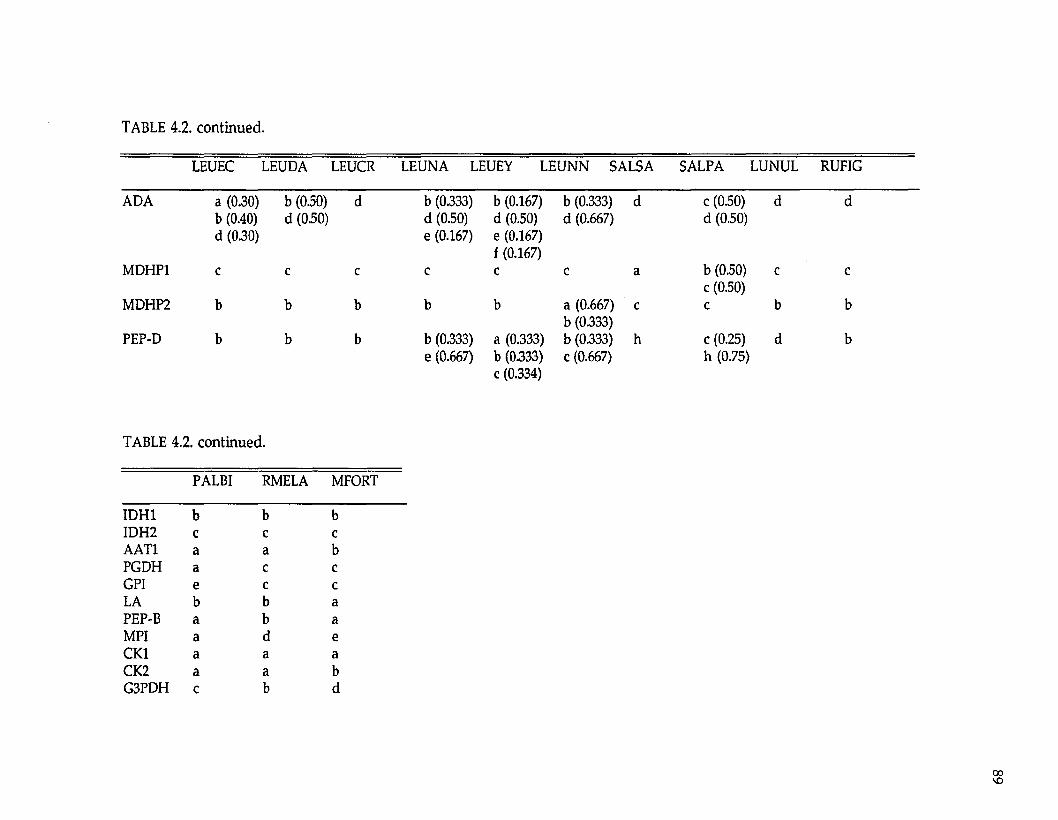
TABLE 4.2. continued.
LEUEC LEUDA LEUCR LEUNA LEUEY LEUNN SALSA SALPA LUNUL RUFIG
ADA a (0.30) b (0.40) d (0.30)
b (0.50) d (0.50)
d b (0.333) d (0.50) e (0.167)
MDHP1 c c c c
MDHP2 b b b b
PEP-D b b b b (0.333) e (0.667)
b (0.167) d (0.50) e (0.167) f (0.167)
b (0.333) d (0.667)
d c (050) d (0.50)
d d
c c a b (0.50) c (0.50)
c c
b a (0.667) b (0.333)
c c b b
a (0.333) b (0.333) c (0.334)
b (0.333) c (0.667)
h c (0.25) h (0.75)
d b
TABLE 4.2. continued.
PALBI RMELA MFORT
IDH1 b b bIDH2 c c cAAT1 a a bPGDH a c cGPI e c cLA b b aPEP-B a b aMPI a d eCK1 a a aCK2 a a bG3PDH c b d
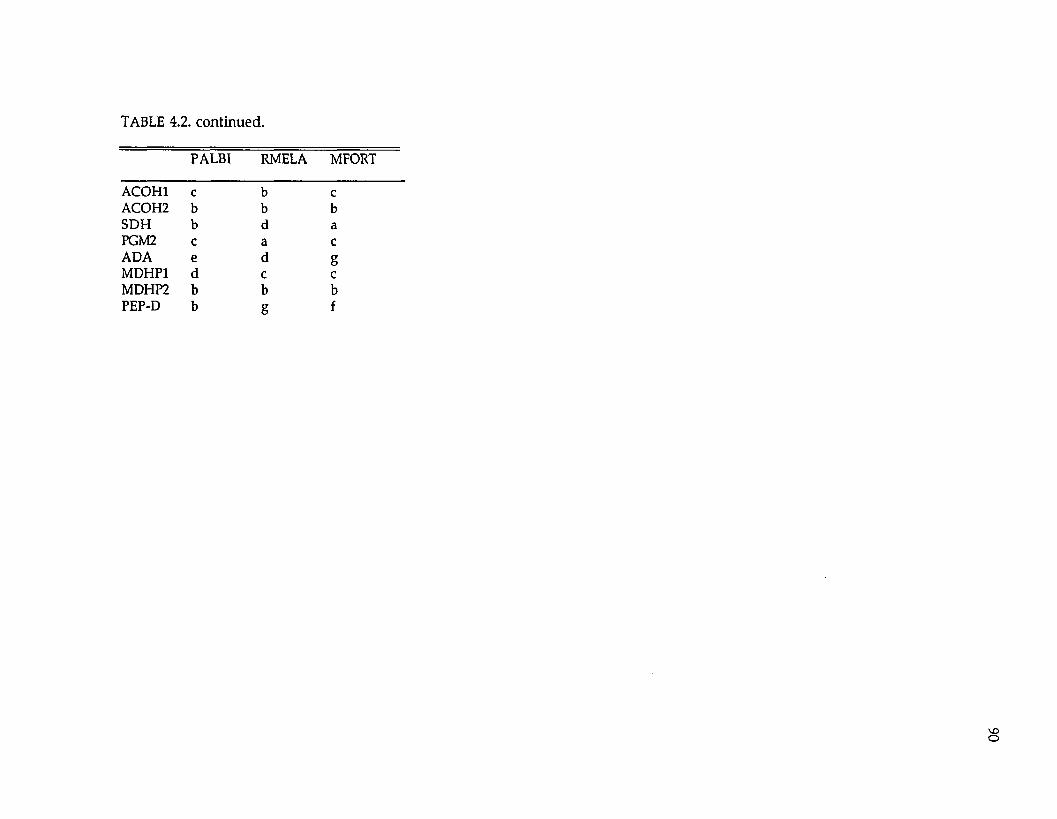
TABLE 4.2. continued.
PALBI RMELA MFORT
ACOH1 c b cACOH2 b b bSDH b d aPGM2 c a cADA e d gMDHP1 d c cMDHP2 b b bPEP-D b g f
VOO
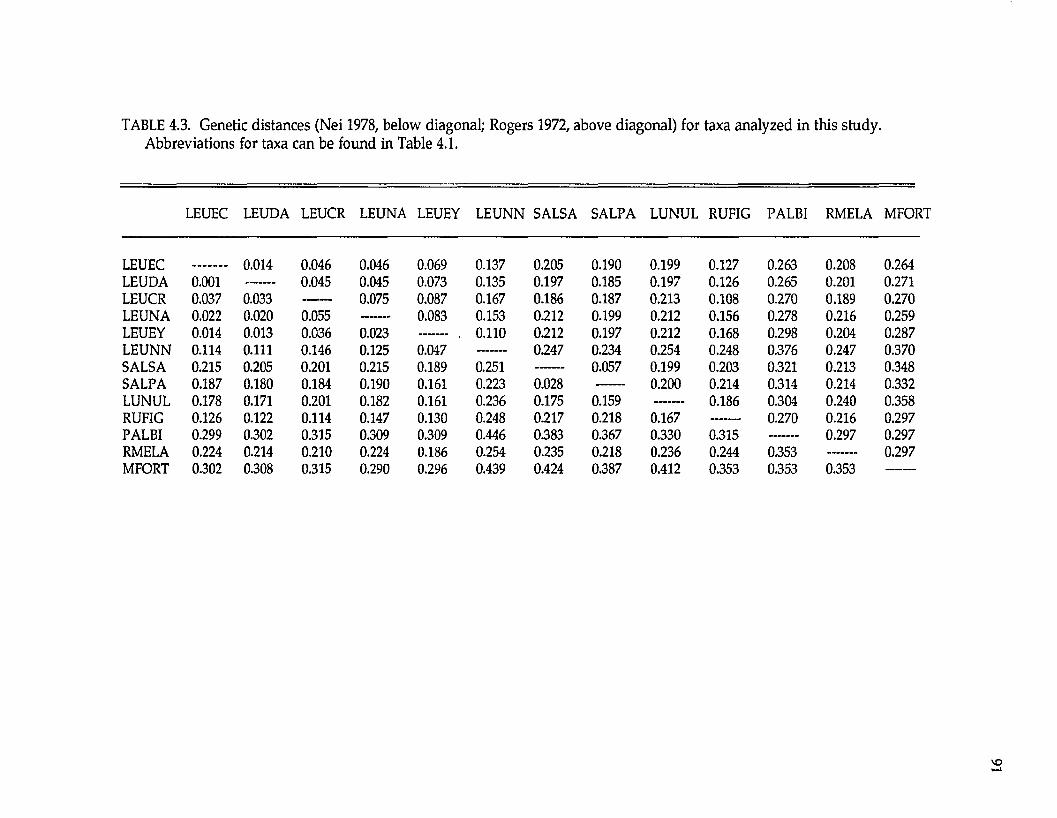
TABLE 4.3. Genetic distances (Nei 1978, below diagonal; Rogers 1972, above diagonal) for taxa analyzed in this study. Abbreviations for taxa can be found in Table 4.1.
LEUEC LEUDA LEUCR LEUNA LEUEY LEUNN SALSA SALPA LUNUL RUFIG PALBI RMELA MFOI
LEUEC 0.014 0.046 0.046 0.069 0.137 0.205 0.190 0.199 0.127 0.263 0.208 0.264LEUDA 0.001 ------ 0.045 0.045 0.073 0.135 0.197 0.185 0.197 0.126 0.265 0.201 0.271LEUCR 0.037 0.033 ------ 0.075 0.087 0.167 0.186 0.187 0.213 0.108 0.270 0.189 0.270LEUNA 0.022 0.020 0.055 ------ 0.083 0.153 0.212 0.199 0.212 0.156 0.278 0.216 0.259LEUEY 0.014 0.013 0.C36 0.023 0.110 0.212 0.197 0.212 0.168 0.298 0.204 0.287LEUNN 0.114 0.111 0.146 0.125 0.047 0.247 0.234 0.254 0.248 0.376 0.247 0.370SALSA 0.215 0.205 0.201 0.215 0.189 0.251 ------ 0.057 0.199 0.203 0.321 0.213 0.348SALPA 0.187 0.180 0.184 0.190 0.161 0.223 0.028 ------ 0.200 0.214 0.314 0.214 0.332LUNUL 0.178 0.171 0.201 0.182 0.161 0.236 0.175 0.159 0.186 0.304 0.240 0.358RUFIG 0.126 0.122 0.114 0.147 0.130 0.248 0.217 0.218 0.167 ------ 0.270 0.216 0.297PALBI 0.299 0.302 0.315 0.309 0.309 0.446 0.383 0.367 0.330 0.315 ------ 0.297 0.297RMELA 0.224 0.214 0.210 0.224 0.186 0.254 0.235 0.218 0.236 0.244 0.353 ------ 0.297MFORT 0.302 0.308 0.315 0.290 0.296 0.439 0.424 0.387 0.412 0.353 0.353 0.353
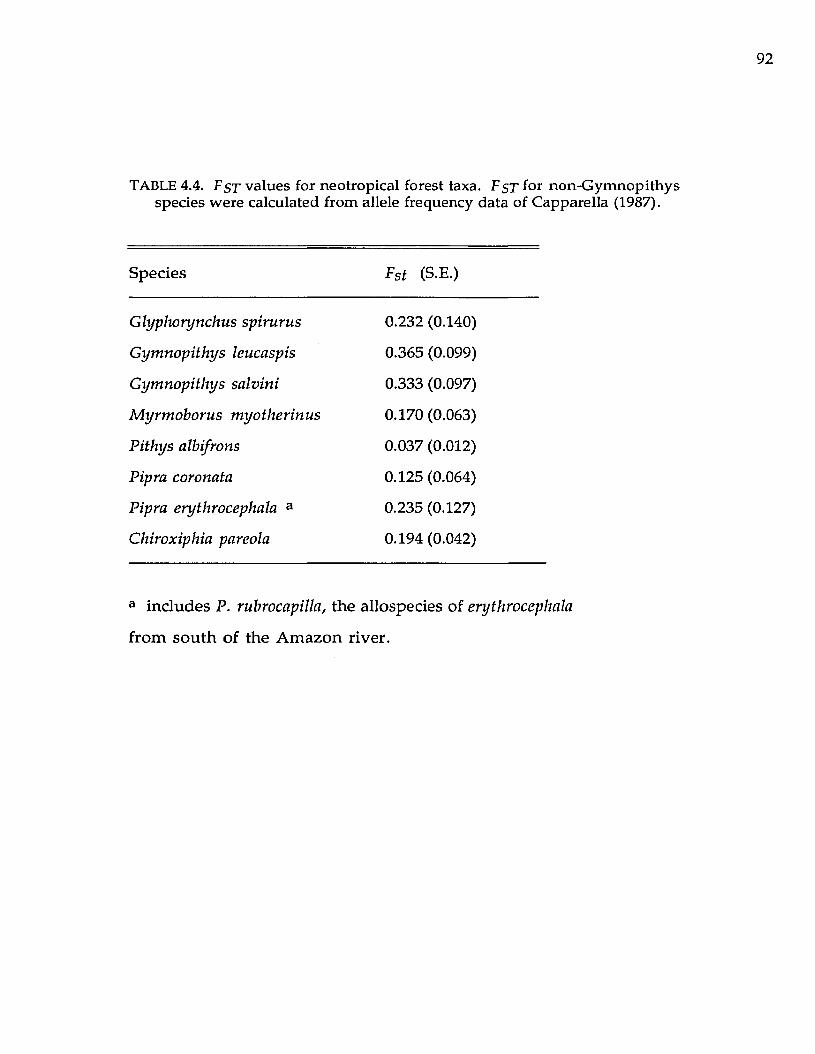
92
TABLE 4.4. Fs t values for neotropical forest taxa. F s t for non-G ym nopithys species were calculated from allele frequency data of Capparella (1987).
Species Fst (S-E.)
G lyphorynchus spirurus 0.232 (0.140)
G ym nopithys leucaspis 0.365 (0.099)
G ym nopithys salvin i 0.333 (0.097)
M yrm oborus m yotherinus 0.170 (0.063)
P ithys albifrons 0.037 (0.012)
Pipra coronata 0.125 (0.064)
Pipra erythrocephala a 0.235 (0.127)
Chiroxiphia pareola 0.194 (0.042)
a includes P. rubrocapilla, the allospecies of erythrocephala
from south of the Am azon river.
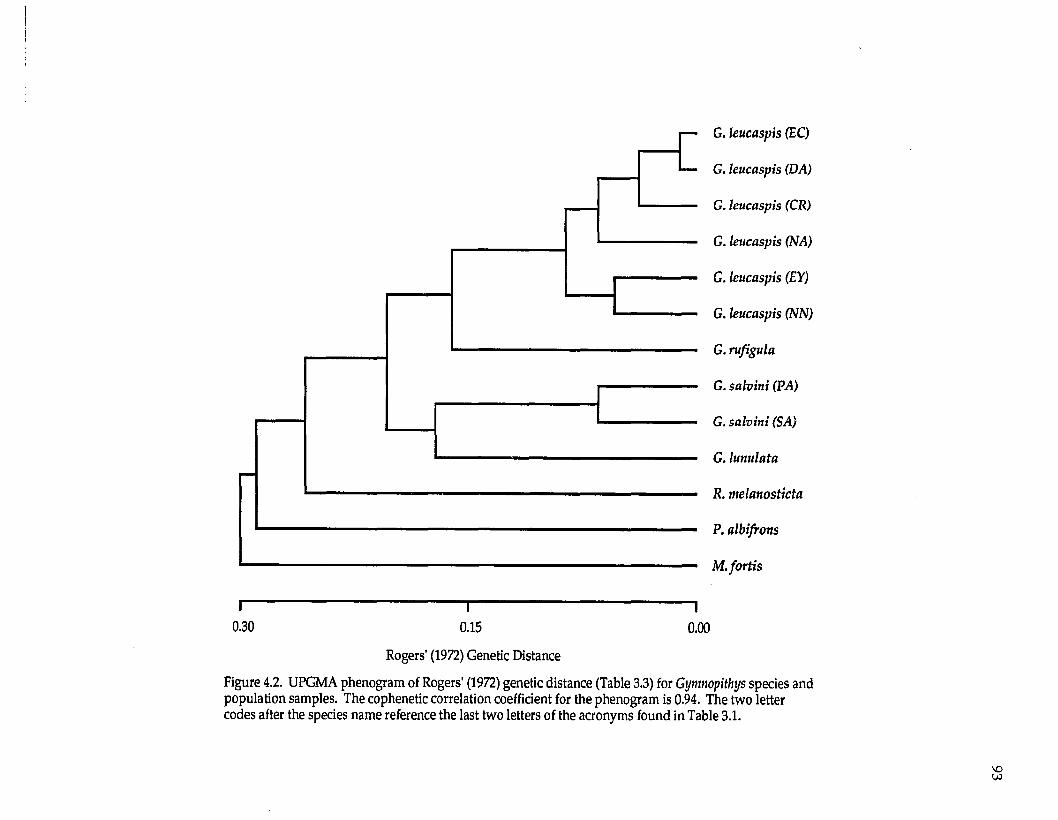
— G. leucaspis (EC)
— G. leucaspis (DA)
_ _ _ G. leucaspis (CR)
— — G. leucaspis (NA)
r— — — G. leucaspis (EY)
■■■" G. leucaspis (NN)
. " 1,1 1 G. rufigula
i— — — — G. salvini (PA)
“ “ _____ 1— — — — G. salvini (SA)
■" — G. lunulata
■" ■■ —11 1 11 1?. melanosticta
—..................................... ■ — P. albifrons
■ .... - i M.fortis
\ 1 10.30 0.15 0.00
Rogers' (1972) Genetic Distance
Figure 4.2. UPGMA phenogram of Rogers' (1972) genetic distance (Table 3.3) for Gymnopithys species and population samples. The cophenetic correlation coefficient for the phenogram is 0.94. The two letter codes after the species name reference the last two letters of the acronyms found in Table 3.1.
there is phylogenetic inform ation contained in the allozyme data. However, the
consensus of these 12 trees resulted in little resolution. The genus G ym nopithys is
monophyletic; the monophyly of population samples of G. leucaspis and G. salvini
indicate the m onophyly of each of these two species. Gymnopithys salvini and G.
lunulata are sister taxa. However, the sister-taxon relationship between G. rufigula
and G. leucaspis suggested in Fig. 4.2 is not shown here; rufigula, leucaspis, and
lunulata/salvini form an unresolved trichotomy. The relationships am ong
population samples w ithin G. leucaspis are also unresolved.
The topology w hen alleles are coded as present or absence (Fig. 4.3; two
most parsim onious trees, C.I. = 0.700, HER = 0.78) supports monophyly of both the
genus Gymnopithys and the population samples of leucaspis and salvini. This tree
differs from the distance analysis mainly in the relationships am ong the six
population samples of Gymnopithys leucaspis. Samples of leucaspis from eastern
Panama (Daridn) and Ecuador have the same alleles and are identical for this
analysis (they differ in allele frequency only). Bootstrap values for the nodes (Fig.
4.3) indicate that there is only weak support for the sister-taxon relationship
between rufigula and leucaspis suggested by the distance analysis. There is stronger
support for salvini and lunulata as sister taxa.
DISCUSSION
Genetic data. — Genetic distances w ithin the few other species of
Neotropical birds studied average 0.052 (range 0.003 in Pithys albifrons to 0.066
Chiroxiphia pareola-, see Hackett and Rosenberg 1990). The average w ithin G.
leucaspis (0.053) is comparable to the other Neotropical species, and an order of
m agnitude greater than north tem perate birds (0.005; Barrowclough and Corbin
1978; 0.02 Barrowclough and Johnson 1988). In addition, Fgf values (Table 4.4)
suggest a high degree of subdivision among populations of G. leucaspis and G.
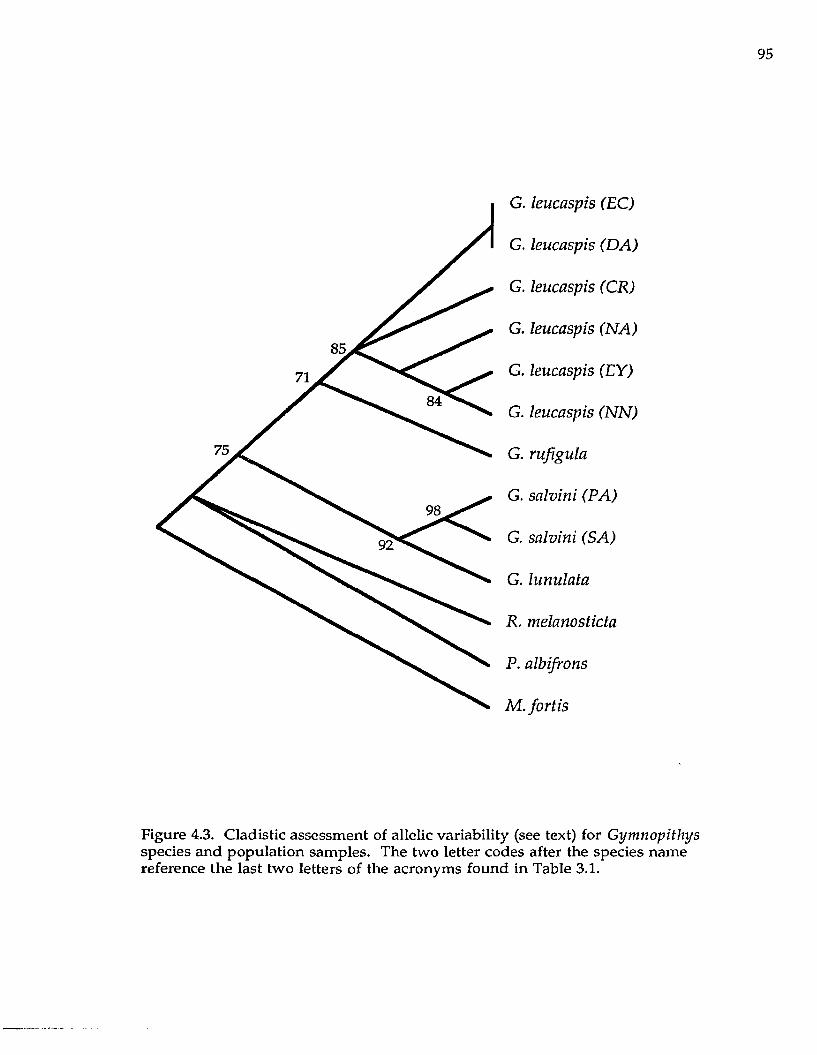
G . le u c a sp is (E C )
G . le u c a sp is ( D A )
G. le u c a sp is (C R )
G . le u c a sp is ( N A )
G . le u c a sp is (E Y )
G . le u c a sp is ( N N )
G. ru fig u la
G. s a lv in i (P A )
G. s a lv in i (S A )
G. lu n u la ta
R . m e la n o s tic ta
P . a lb ifro n s
M .f o r t i s
Figure 4.3. Cladistic assessment of allelic variability (see text) for G ym nopithys species and population samples. The two letter codes after the species name reference the last two letters of the acronyms found in Table 3.1.
salvini. These data also demonstrate a high degree of population subdivision
among the majority of Neotropical forest species analyzed to date, implicating
increased age of Neotropical forest populations of birds in comparison w ith north
temperate birds.
Gymnopithys antbirds are obligate ant-following birds, which could result
in increased movements as they search for the ant swarms at which they forage.
This life-history characteristic has the possible genetic consequence of increase
gene flow, which would lead to a prediction that genetic subdivision (i.e., Fsf or
genetic distances) within Gymnopithys species should be low relative to other
more sedentary forest birds that forage for insects on individual territories. This
prediction is not supported by the genetic data, which clearly indicate that
Gymnopithys separated by even small geographic distances are genetically
differentiated. LEUNN and LEUEY are separated by approximately 100 km (and
no major rivers) and their genetic distance is 0.047, which is equivalent to the
genetic distances separating many species of Dendroica warblers (Barrowclough
and Corbin 1978).
The genetic data support the monophyly of the genus Gymnopithys relative
to three other genera of ant-following formicariids. To address behavioral
evolution within the Formicariidae, the next step is to document whether the
ant-following formicariids are indeed each others closest relatives. If so, this
would indicate that a complex life-history strategy and associated behaviors are
key innovations that evolved once in the history of antbirds, and thus document
monophyly of a group of antbird genera. Hackett and Rosenberg (1990)
documented a similar situation in Myrmotherula antwrens; the presence of a
particular behavioral, life-history character (dead-leaf foraging) paralleled
allozymic results in defining a lineage of antbirds.
97
The genetic data support a sister-taxon relationship betw een G ym nopithys
lunulata and G. salvini. I recommend, therefore, that these species be placed next to
each other in linear classifications. There is w eak support for considering the
populations of leucaspis in Central America and South America w est of the Andes
as distinct (bicolor), and I recommend study w ith m ore sensitive molecular
markers. Willis (1967) hypothesized a close relationship between leucaspis, bicolor,
and rufigula based on vocalizations and suggested that they should be placed in the
same species. A lthough genetic data weakly support a sister-taxon relationship
betw een rufigula and leucaspis, each is diagnosable by a num ber of allozymic and
plum age characters. Thus considering rufigula and leucaspis as conspecific is not
recom m ended.
Biogeography.— One proposed advantage of molecular data is that genetic
differences between taxa accrue in an approximately tim e-dependent m anner
(Wilson et al. 1977); thus a molecular clock can be calibrated and age of splitting
events can be estimated. The potential to date approxim ate splitting events using
molecular clocks has not been widely explored (see M urphy 1983; Cadle 1985; Zink
1988; and Zink and Avise 1990 for some examples). In addition, the concept of
molecular clocks is controversial and a variety of m olecular clocks have been
proposed for avian taxa (Gutierrez et al. 1983, M arten and Johnson 1986, Sibley et
al. 1988). Two calibrations for allozyme data estimate that one unit of Nei's (1978)
genetic distance corresponds to 19-26 million years of independent evolution
(Gutierrez et al. 1983, M arten and Johnson 1986). For Gymnopithys, these
calibrations suggest that the genus has been evolving independently for
approximately six million years. The species seem to be old as well; origin of
lunulata, salvini, leucaspis, and rufigula m ay have occurred three to five million
years ago. Because the ranges of Gymnopithys species are delimited by rivers (Fig.
4.1), I hypothesize that the developm ent of major river systems in South America
(Capparella 1987, 1988) separated a formerly w idespread range of the ancestral
G ymnopithys roughly three to six million years ago. W ithin Gymnopithys leucaspis
and salvini, divergence of populations seemed to have occurred early in the
Pleistocene (700,000 to 1 million years ago), perhaps as a result of the effects of
glacial periods on forest fragmentation (Haffer 1974).
Because Gymnopithys leucaspis is distributed in both South and Central
America, relationships am ong its populations m ay shed light on hypotheses
concerning the origin of Central American lowland birds. The landbridge
connection betw een southern Central America and South America w as
completed three to five million years ago (Malfait and Dinkleman 1972, Pindell
and Dewey 1982). One hypothesis explaining the distribution of some Central
American lowland taxa is that South American taxa dispersed into the Central
American landm ass after the landbridge was completed (Cracraft 1985; Haffer
1967,1974,1985,1987), and that Pleistocene climatic fluctuations subsequently
effected the separation of Central American and South American low land forests
(Haffer 1974,1987). The genetic data suggest that G. leucaspis was present in South
America w hen the landbridge connection was formed. The pattern of genetic
distances (Fig. 4.2) suggest that Central American and Ecuadorian populations
form a group (although the cladistic analysis of allozyme data was unable to
recover this), and that separation of Costa Rican (LEUCR) from Ecuadorian
(LEUEC) populations occurred 700,000 - 900,000 years ago. This supports the
hypotheses of Haffer (1967,1974,1985,1987), Cracraft (1985), and Cracraft and Prum
(1989) that Central American taxa w ould be m ost closely related to taxa found in
Ecuador, in the Choc6 region of w estern South America, and that divergence
occurred after the landbridge was completed (some time during the Pleistocene).
LITERATURE CITED
ARCHIE, J. W. 1989a. A random ization test for phylogenetic inform ation in systematic data. Syst. Zool. 38: 239-252.
---------- 1989b. Homoplasy excess ratios: new indices for m easuring levels ofhom oplasy in phylogenetic systematics and a critique of the consistency index. Syst. Zool. 38: 253-269.
----------, C. SIMON, AND A. MARTIN. 1989. Small sample size does decrease thestability of dendrogram s calculated from allozyme-frequency data.Evolution 43: 678-683.
AVISE, J. C. AND C. F. AQUADRO. 1982. A comparative study of genetic distances in the vertebrates. Pp. 151-185 in Evolutionary Biology, vol. 15 (M. K. Hecht, B. Wallace, and G. T. Prance, Eds.). Plenum Press, New York.
BARROWCLOUGH, G. F. 1980. Gene flow, effective population sizes, and genetic variance components in birds. Evolution 34: 789-798.
----------AND K. W. CORBIN. 1978. Genetic variation and differentiation in theParulidae. Auk 95: 691-702.
----------AND N. K. JOHNSON. 1988. Genetic Structure of N orth American birds.Proc. Int. Omithol. Congr. 19: 1630-1638.
BUTH, D. G. 1984. The application of electrophoretic data in systematic studies. Ann. Rev. Ecol. Syst. 15: 501-522.
CADLE, J. E. 1985. The Neotropical colubrid snake fauna (Serpentes: Colubridae): lineage components and biogeography. Syst. Zool. 34: 1-20.
CAPPARELLA, A. P. 1987. Effects of riverine barriers on genetic differentiation of Amazonian forest undergrow th birds. Ph.D. dissertation, Louisiana State University, Baton Rouge, Louisiana.
----------. 1988. Genetic variation in Neotropical birds: implications for thespeciation process. Proc. Int. Omithol. Congr. 19: 1658-1664.
CRACRAFT, J. 1985. Historical biogeography and patterns of differentiation w ithin the South American avifauna: areas of endemism. Ornithol. Monogr. 36: 49-84.
----------AND R. O. PRUM. 1988. Patterns and processes of diversification:speciation and historical congruence in some Neotropical birds. Evolution 42: 603-620.
FARRIS, J. S. 1972. Estimating phylogenetic trees from distance matrices. Am.Nat. 106:645-668.
FELSENSTEIN, J. 1985. Confidence limits on phylogenies: an approach using the bootstrap. Evolution. 79: 783-791.
----------. 1986. PHYLIP-Phylogeny inference package, Version 3.0. University ofWashington, Department of Genetics, Seattle, Washington.
GERWIN, J. A. AND R. M. ZINK. 1989. Phylogenetic patterns in the genusHeliodoxa (Aves: Trochilidae): an allozymic perspective. Wilson Bulletin 101: 525-542.
GILL, F. B. AND J. A. GERWIN. 1989. Protein relationships among hermit hummingbirds. Proc. Acad. Nat. Sci. Philadelphia 141: 409-421.
GORMAN, G. C. AND J. RENZI, JR. 1979. Genetic distance and heterozygosityestimates in electrophoretic studies: effects of sample size. Copeia 1979: 242- 249.
GUTIERREZ, R. j ., R. M. ZINK, AND s . Y. YANG. 1983. Genic variation, systematic, and biogeographic relationships of some galliform birds. Auk 100: 33-47.
HACKETT, S. J. 1989. Effects of varied electrophoretic conditions on detection of evolutionary patterns in the Laridae. Condor 91: 73-90.
----------AND K. V. ROSENBERG. 1990. Evolution of South American antwrens(Formicariidae): comparison of phenotypic and genetic differentiation. Auk 107: 473-489.
HAFFER, J. 1967. Speciation in Colombian forest birds west of the Andes. Amer. Mus. Novitates 294: 1-57.
--------- . 1974. Avian speciation in tropical South America. Publ. NuttallOmithol. Club. 14.
. 1985. Avian zoogeography of the Neotropical lowlands. Omithol.Monogr. 36: 113-146.
. 1987. Biogeography of Neotropical birds. Pp. 105-150 in Biogeographyand Quaternary History in Tropical America (T. C. Whitmore and G. T. Prance, eds.). Clarendon Press, Oxford.
KLUGE, A. G. AND J. S. FARRIS. 1969. Quantative phyletics and the evolution of anurans. Syst. Zool. 18: 1-32.
MALFAIT, B. J. AND M. G. DINKLEMAN. 1972. Circum-Caribbean tectonic and igneous activity and the evolution of the Caribbean plate. Geol. Soc. Am. Bull. 83: 251-272.
MARTEN, J. A. AND N. K. JOHNSON. 1986. Genetic relationships of North Amerian cardueline finches. Condor 88: 409-420.
MEYER DE SCHAUENSEE, R. 1966. The species of birds of South America with their distribution. Livingston Publ. Co, Narberth, Pennsylvania.
MICKEVICH, M. M. AND C. M. MITTER. 1981. Treating polymorphic characters in systematics: a phylogenetic treatment of electrophoretic data. Pp. 45-58 in Advances in Cladistics, vol. 1 (V. A. Funk and D. R. Brooks, Eds.). New York Botanical Gardens, New York.
MURPHY, R. W. 1983. Paleobiogeography and genetic differentiation of the Baja California herpetofauna. Occas. Pap. Calif. Acad. Sciences 137: 1-48.
-----------, J. W. SITES, JR., D. G. BUTH, AND C. H. H AUFLER. 1990. Proteins 1:isozyme electrophoresis. Pages 45-126 in Molecular systematics (D. M. Hillis and C. Moritz, Eds.). Sinauer Assoc., Inc., Sunderland, Massachusetts.
NEI, M. 1978. Estimation of average heterozygosities and genetic distance from a small num ber of individuals. Genetics 89: 583-590.
PINDELL, J. AND J. F. DEWEY. 1982. Permo-Triassic reconstruction of W esternPangea and the evolution of the Gulf of M exico/Caribbean region. Tectonics 1:179-211.
ROGERS, J. S. 1972. Measures of genetic similarity and genetic distance. Studies in Genetics VII. Univ. Texas Publ. No. 7213: 145-153.
----------AND R. C. C ASHNER. 1987. Genetic variation, divergence, andrelationships in the subgenus Xenisma of the genus Fundnlus. Pp. 251-264 in Community and Evolutionary Ecology of North American Stream Fishes (W. J. Matthews and D. C. Heins, Eds.). University of Oklahoma Press, N orm an.
SANDERSON, M. J. 1989. Confidence limits on phylogenies: the bootstrap revisited. Cladistics 5:113-130.
SIBLEY, C. G., J. E. AHLQUIST, AND B. L. MUNROE. 1988. A classification of the living birds of the world based on DNA-DNA hybridization studies. Auk 105:409-423.
SWOFFORD, D. L. 1981. On the utility of the distance Wagner procedure. Pp. 25- 43 in Advances in Cladistics, vol. 1 (V. A. Funk and D. R. Brooks, Eds.).New York Botanical Gardens, New York.
—. 1989. PAUP: phylogenetic analysis using parsimony, Version 3.0. Illinois N atural History Survey, Champaign.
102
-----------AND S. H. BERLOCHER. 1987. Inferring evolutionary trees from genefrequency data under the principle of maximum parsimony. Syst. Zool. 36: 293-325.
-----------AND R. B. SELANDER. 1981. BIOSYS-1: a FORTRAN program for thecomprehensive analysis of electrophoretic data in population genetics and systematics. J. Hered. 72: 281-283.
WILLIS, E. O. 1967. The bevavior of bicolored antbirds. Univ. Calif. Publ. Zool. 79: 1-132.
----------. 1968. Studies of the behavior of lunulated and salvin's antbirds. Condor70:128-148.
WILSON, A. C., S. S. CARLSON, AND T. J. WHITE. 1977. Biochemical evolution. Ann. Rev. Biochem. 46: 573-639.
W RIGHT, S. 1978. Evolution and genetics of populations. Vol. 4, Variability W ithin and Among Populations. Univ. Chicago Press, Chicago.
ZIMMER, J. T. 1937. Studies of Peruvian birds. No. XXV. Notes on the genera Tham nophilus, Tham nocharis, Gym nopithys, and Ram phocaenus. Amer. Mus. Novitates 917: 1-16.
ZINK, R. M. 1988. Evolution of brow n towhees: allozymes, morphom etries and species limits. Condor 90: 72-82.
AND J. C. AVISE. 1990. Patterns of m itochondrial DNA and allozymeevolution in the avian genus Am m odram us. Syst. Zool. 39:148-161.
CHAPTER 5
PTEROGLOSSUS
Aragaris, toucans of the genus Pteroglossns, have been long considered a
group whose pattern of distribution supports the "refugia hypothesis" of
historical diversification in the Neotropics (Haffer 1969, 1974, 1985, 1987). This
nonpasserine genus is composed of some 30 differentiated units distributed over
much of the Neotropics, and Haffer (1974) has suggested that much of the
diversification of Pteroglossus is the result of Pleistocene climatic fluctuations.
Despite interest in distributional patterns for biogeographic analyses, few rigorous
phylogenetic analyses have been performed on Pteroglossus. In the last 30 years,
since Lewontin and Hubby (1966), molecular techniques, in the forms of both
protein electrophoresis and, more recently, DNA sequencing, have been used to
document genetic variation and estimate phylogenies both within and among
species. Although genetic data bases for many vertebrates have been developed
(Nevo 1978), genetic information on nonpasserine, in particular Neotropical,
birds remains meager (Barrowclough et al. 1985).
Molecular data have a number of advantages for phylogenetic and
biogeographic analyses (Hillis 1987, Miyamoto and Cracraft 1991). One of the most
controversial aspects of molecular data is the application of a molecular clock
(Wilson et al. 1977, Hillis and Moritz 1990). Molecular clocks allow estimation of
the timing of divergence events, which can be important in testing different
biogeographic scenarios for diversification of taxa. In this paper, results of genetic
data are used to address the relationships within Pteroglossus and to assess the role
of Pleistocene versus pre-Pleistocene events in shaping the current distribution of
taxa.
103
METHODS
Tissue samples for this analysis were obtained from the Louisiana State
University M useum of N atural Science (LSUMNS) Frozen Tissue Collection.
Collecting localities for specimens used in the allozyme and DNA analyses are
listed in Table 5.1. The allozyme study encompassed all species in the genus
Pteroglossus for which tissues were available. Ramphastids chosen as outgroups to
the genus Pteroglossus were Baillonius bailloni, Selenidera reinwardtii, and Ramphastos
cuvieri. Following a phylogeny of toucans proposed by Haffer (1974), Ramphastos
was considered the outgroup. Because the goal of this research was to assess
phylogenetic and biogeographic relationships among the four members of the
Pteroglossus torquatus complex, results of the allozyme analysis were used to choose
a relevant taxon outside the P. torquatus complex for mitochondrial DNA
(mtDNA) sequencing. Strength of the phylogenetic signal in the P. torquatus
complex could be assessed based on topological congruence of branching patterns
derived from the two independent molecular data sets.
Protein electrophoresis. —Standard horizontal starch-gel electrophoresis of
proteins was perform ed as outlined in M urphy et al. (1990), Hackett (1989), and
Hackett and Rosenberg (1990). Locus names follow M urphy et al. (1990). Alleles
were coded by their relative mobility from the origin; the most anodally
migrating allele was coded "a." Isozymes were coded in a similar manner, w ith a
"1" indicating the m ost anodally migrating isozyme.
BIOSYS-1 (Swofford and Selander 1981) was used to compute genetic
distances (Nei 1978, Rogers 1972) and a UPGMA phenogram. The computer
program PHYLIP (Felsenstein 1986) was used to construct one tree, from Rogers'
(1972) genetic distance, that assumes a constant rate of evolution ("KITSCH"), and
one that does not ("FITCH").
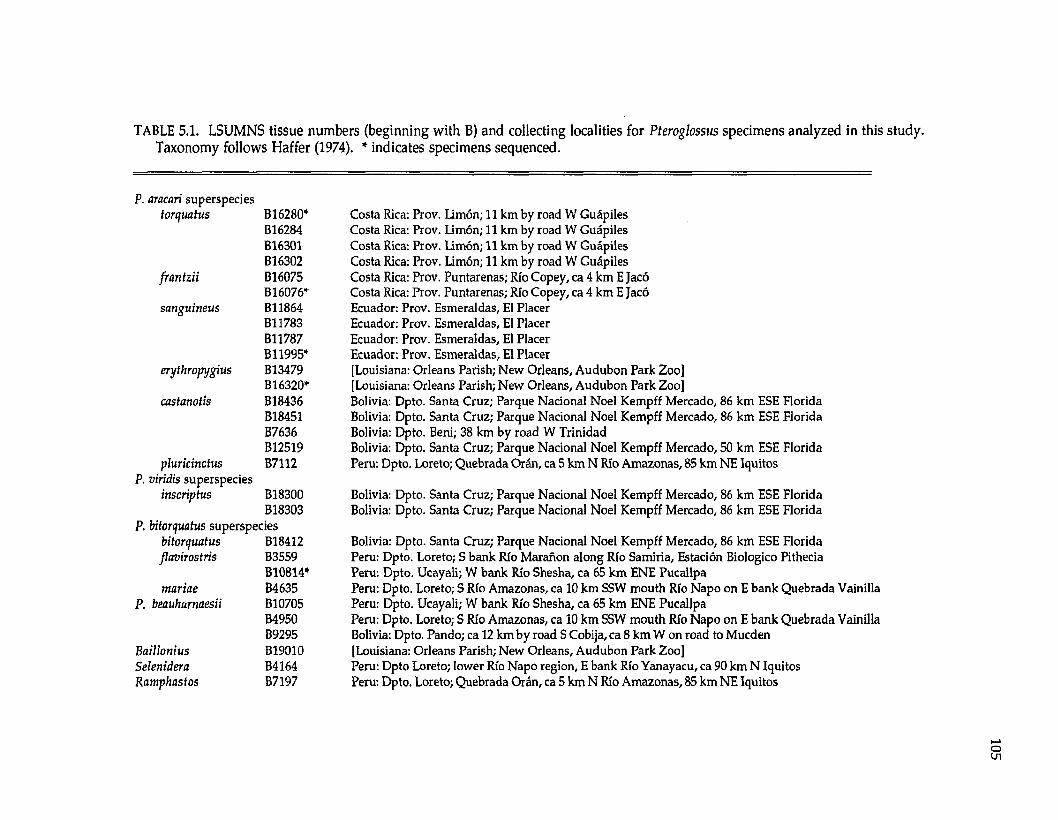
TABLE 5.1. LSUMNS tissue numbers (beginning with B) and collecting localities for Pteroglossus specimens analyzed in this study. Taxonomy follows Haffer (1974). * indicates specimens sequenced.
P. aracari superspeciestorquatus B16280* Costa Rica: Prov. Limon; 11 km by road W Guapiles
B16284 Costa Rica: Prov. Limon; 11 km by road W GuapilesB16301 Costa Rica: Prov. Limon; 11 km by road W GuapilesB16302 Costa Rica: Prov. Limon; 11 km by road W Guapiles
fr a n tz i i B16075 Costa Rica: Prov. Puntarenas; Rio Copey, ca 4 km E Jac6B16076* Costa Rica: Prov. Puntarenas; Rio Copey, ca 4 km E Jaco
sanguineus B11864 Ecuador: Prov. Esmeraldas, El PlacerB11783 Ecuador: Prov. Esmeraldas, El PlacerB11787 Ecuador: Prov. Esmeraldas, El PlacerB11995* Ecuador: Prov. Esmeraldas, El Placer
erythropygius B13479 [Louisiana: Orleans Parish; New Orleans, Audubon Park Zoo]B16320* [Louisiana: Orleans Parish; New Orleans, Audubon Park Zoo]
castanotis B18436 Bolivia: Dpto. Santa Cruz; Parque Nacional Noel Kempff Mercado, 86 km ESE FloridaB18451 Bolivia: Dpto. Santa Cruz; Parque Nacional Noel Kempff Mercado, 86 km ESE FloridaB7636 Bolivia: Dpto. Beni; 38 km by road W TrinidadB12519 Bolivia: Dpto. Santa Cruz; Parque Nacional Noel Kempff Mercado, 50 km ESE Florida
pluricinctus B7112 Peru: Dpto. Loreto; Quebrada Oran, ca 5 km N Rio Amazonas, 85 km NE IquitosP. viridis superspecies
inscriptus B18300 Bolivia: Dpto. Santa Cruz; Parque Nacional Noel Kempff Mercado, 86 km ESE FloridaB18303 Bolivia: Dpto. Santa Cruz; Parque Nacional Noel Kempff Mercado, 86 km ESE Florida
P. bitorquatus superspeciesbitorquatus B18412 Bolivia: Dpto. Santa Cruz; Parque Nacional Noel Kempff Mercado, 86 km ESE Floridaflavirostris B3559 Peru: Dpto. Loreto; S bank Rio Maranon along Rio Samiria, Estaci6n Biologico Pithecia
B10814* Peru: Dpto. Ucayali; W bank Rio Shesha, ca 65 km ENE Pucallpam ariae B4635 Peru: Dpto. Loreto; S Rio Amazonas, ca 10 km SSW mouth Rio Napo on E bank Quebrada Vainilla
P. beauharnaesii B10705 Peru: Dpto. Ucayali; W bank Rio Shesha, ca 65 km ENE PucallpaB4950 Peru: Dpto. Loreto; S Rio Amazonas, ca 10 km SSW mouth Rio Napo on E bank Quebrada VainillaB9295 Bolivia: Dpto. Pando; ca 12 km by road S Cobija, ca 8 km W on road to Mucden
B aillon ius B19010 [Louisiana: Orleans Parish; New Orleans, Audubon Park Zoo]Selenidera B4164 Peru: Dpto Loreto; lower Rio Napo region, E bank Rio Yanayacu, ca 90 km N IquitosR am phastos B7197 Peru: Dpto. Loreto; Quebrada Oran, ca 5 km N Rio Amazonas, 85 km NE Iquitos
106
Cladistic assessment of allelic variation was performed in two ways. First,
each locus was coded as a multi-state unordered character and alleles at each locus
as character states (Buth 1984). In the second method, phylogenetically
informative alleles were considered as characters and coded as present or absent
[see Rogers and Cashner (1987) for defense of this method of coding; see also Buth
(1984), Mickevich and Mitter (1981), and Swofford and Berlocher (1987) for
problems with this m ethod of coding]. The Branch-and-Bound option of the
computer program PAUP 3.0L (Swofford 1990) was used for both cladistic analyses.
One hundred bootstrap replicates were performed on the presence/absence coding
of alleles to assess confidence in the branching pattern (Felsenstein 1985,
Sanderson 1989). The g\ statistic of Hillis and Huelsenbeck (1992) was calculated
to determine the extent of randomness versus phylogenetic signal in the data set.
DNA sequences—A total nucleic acid preparation was made from 0.1 gram
of liver tissue frozen at -80°C [Hillis et al. (1990); see Table 5.1 for specimens
sequenced]. Amplifications of a 307 base pair fragment (not including primers) of
the mitochondrial cytochrome b gene were performed via the polymerase chain
reaction (PCR). The primers L14841 (5'-CCATCCAACATCTCAGCATGATGAAA-
3'; Kocher et al. 1989) and H 15149 (5'-CCTCAGAATGATATTTGTCCTCA-3';
Kocher et al. 1989) were used. Double-stranded PCR amplifications were
performed in 50 pi total reaction volumes [10 pi of a 10'2 dilution of the total DNA
preparation, 2.5 pi of a 10 pM solution of each primer, 5 pi of 10X buffer (including
MgCl2 ), 2 pi of a 1.0 mM solution of dNTP's, 0.20 pi Taq DNA polymerase
(Promega), up to 50 pi with H2 O]. Thirty to 35 cycles were performed using the
following cycling parameters: first cycle—denaturation at 94°C for 3 minutes,
annealing at 56°C for 1 minute, extension at 72°C for 30 seconds; remaining cycles-
107
-denaturation at 94°C for 1 minute, annealing at 56°C for 1 minute, extension at
72°C for 30 seconds.
Single-stranded DNA was generated following the procedure of Allard et
al. (1991) in which only one primer is used (no limiting primer). Five pi of the
double-stranded product were used to generate single-stranded DNA in 100 pi
reactions [5 pi double-stranded DNA, 2 pi of a 10 pM solution of one primer, 10 pi
of 10X buffer (including MgCl2 ), 4 pi dNTP's, 0.40 pi Taq DNA polymerase
(Promega), up to 100 pi with H 2 O]. Twenty cycles were performed using the
following cycling parameters: first cycle—denaturation at 94°C for 3 minutes,
annealing at 56°C for 1 minute, extension at 72°C for 45 seconds; remaining cycles-
-denaturation at 94°C for 1 minute, annealing at 56°C for 1 minute, extension at
72°C for 45 seconds. Single-stranded DNA was generated for both the heavy and
light mtDNA strands, and the products were cleaned by 5 washings with H2 O
through Ultrafree®-MC 30,000 NNMWL filters (Millipore Corp., Bedford, MA),
and concentrated to a final volume of approximately 30 pi. Seven pi of cleaned
single-stranded DNA were used for DNA sequencing using T7 DNA polymerase
(Sequenase® version 2.0, United States Biochemical, Cleveland, OH).
The DNA sequence data were analyzed cladistically using PAUP 3.0L
(Swofford 1990). Pteroglossus Jlavirostris was sequenced as the outgroup to the
Pteroglossus torquatus complex (see allozyme results), and sequence of the Andean
Flicker, Colaptes rupicola, (Edwards et al. 1991) was used to root the DNA sequence
trees. All base positions were used in the analysis. In addition, the allozyme and
sequence data sets were combined and analyzed cladistically (Kluge 1989).
RESULTS
Protein electrophoresis. —Low levels of genetic differentiation were observed
among Pteroglossus species in the allozyme analysis (Table 5.2 and 5.3). Genetic
distances (Nei 1978) among Pteroglossus species averaged 0.095 (± 0.045 SD); among
the four members of the Pteroglossus torquatus complex (P.frantzii, P. torquatus, P.
sanguineus, and P. erythropygius), genetic distances averaged 0.047. However,
heterozygosity within species was typical of birds, averaging 4%.
Distance analyses (Fig. 5.1) showed many short branch lengths separating
groups of Pteroglossus species (i.e., the node subtending the members of the P.
torquatus complex). There appeared to be two major groups of Pteroglossus toucans.
The first group included members of the P. torquatus complex, P.flavirostris, P.
mariae, P. castanotis, and P. pluricinctus. Within the P. torquatus complex, P.
torquatus and P.frantzii were most similar, followed by P. sanguineus and P.
erythropygius. The second group included the species P. inscriptus, P. bitorquatus,
and P. beaulmmaesii. Baillonius bailloni was allozymically more similar to
Pteroglossus than to Selenidera.
Cladistic analysis of loci with the alleles as unordered character states
resulted in at least 200 equally most parsimonious trees, with a consistency index
(C.I.) of 0.923. The strict consensus of these trees (not shown) resulted in little
resolution. Two nodes appeared in all of the most parsimonious trees: one
indicating monophyly of the genus Pteroglossus and the second supporting a clade
of P. inscriptus, P. bitorquatus, and P. beauharnaesii. In 80% of the most
parsimonious trees Baillonius bailloni was the sister taxon to Pteroglossus. When
alleles are coded as present/absent (nine equally most parsimonious trees, C.I. =
0.61, gi = -0.78; trees not shown) monophyly of Pteroglossus was again supported, as
was the P. inscriptus /P. bitorquatus/P. beaulmmaesii clade. There was also strong
support for Baillonius as the sister taxon of Pteroglossus (supported by all most
parsimonious trees, and a bootstrap value of 80%). The g\ statistic indicated that
the data set contained phylogenetic signal (P < 0.05) but bootstrap values for
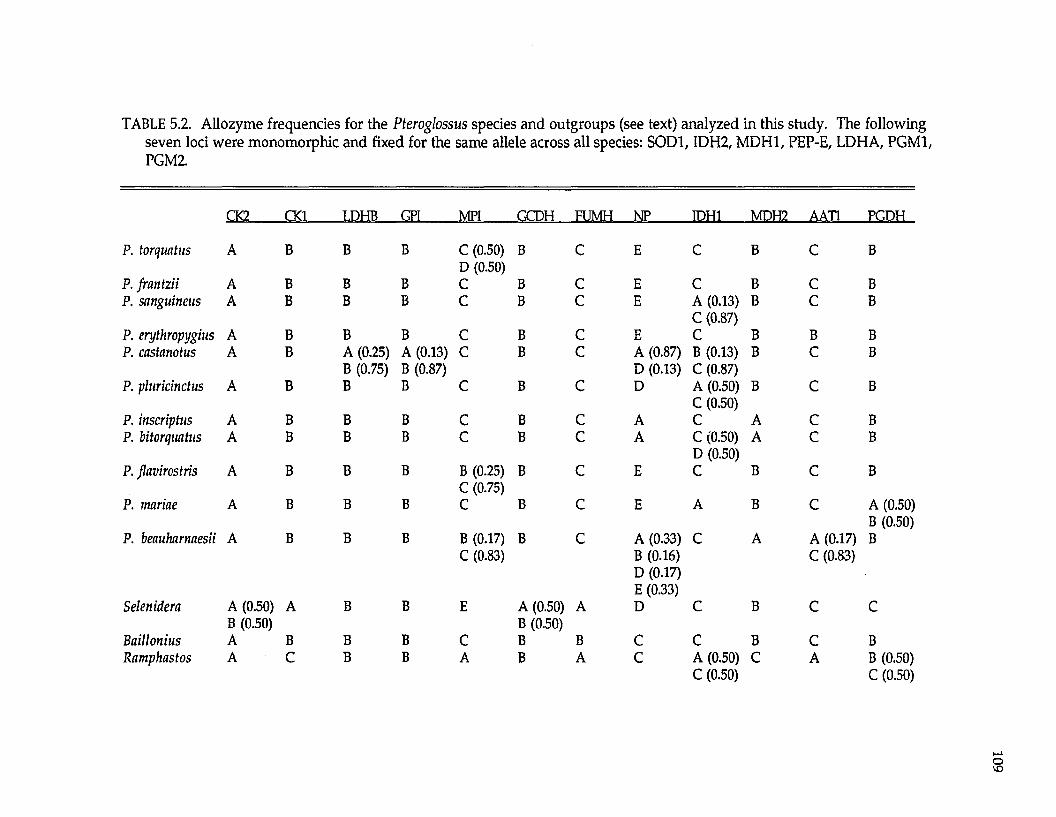
TABLE 5.2. Allozyme frequencies for the Pteroglossus species and outgroups (see text) analyzed in this study. The following seven loci were monomorphic and fixed for the same allele across all species: SOD1, IDH2, MDH1, PEP-E, LDHA, PGM1, PGM2.
CK2 CK1 LDHB GPI MPI GCDH FUMH NP IDH1 MDH2 AAT1 PGDH
P. torquatus A B B B C (0.50) D (0.50)
B C E C B C B
P. frantzii A B B B C B C E C B C BP. sanguineus A B B B C B C E A (0.13)
C (0.87)B C B
P. erythropygius A B B B C B C E C B B BP. castanotus A B A (0.25)
B (0.75)A (0.13) B (0.87)
C B C A (0.87) D (0.13)
B (0.13) C (0.87)
B C B
P. pluricinctus A B B B C B c D A (0.50) C (0.50)
B C B
P. inscriptus A B B B C B c A C A C BP. bitorquatus A B B B C B c A C (0.50)
D (0.50)A C B
P. Jlavirostris A B B B B (0.25) C (0.75)
B c E C B C B
P. mariae A B B B C B c E A B C A (0.50) B (0.50)
P. beauharnaesii A B B B B (0.17) C (0.83)
B c A (0.33) B (0.16) D (0.17) E (0.33)
C A A (0.17) C (0.83)
B
Selenidera A (0.50) B (0.50)
A B B E A (0.50) B (0.50)
A D C B C C
Baillonius A B B B C B B C c B c BRamphastos A C B B A B A C A (0.50) C A B (0.50)
C (0.50) C (0.50)
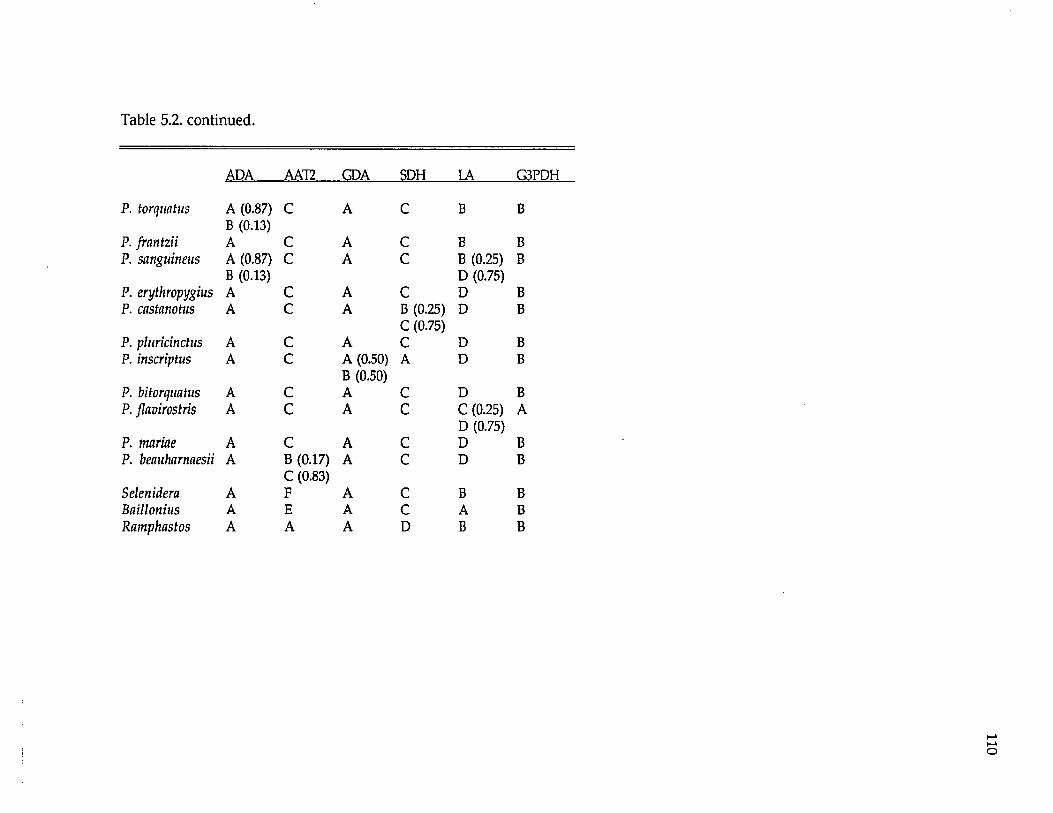
Table 5.2. continued.
ADA AAT2 GDA SDH LA G3PDH
P. torquatus A (0.87) B (0.13)
C A C B B
P. frantzii A C A C B BP. sanguineus A (0.87)
B (0.13)C A C B (0.25)
D (0.75)B
P. erythropygius A C A C D BP. castanotus A C A B (0.25)
C (0.75)D B
P. pluricinclus A C A C D BP. inscriptus A C A (0.50)
B (0.50)A D B
P. bitorquatus A C A C D BP. flavirostris A C A c C (0.25)
D (0.75)A
P. marine A C A c D BP. beauharnaesii A B (0.17)
C (0.83)A c D B
Selenidera A F A c B BBaillonius A E A c A BRamphastos A A A D B B
110
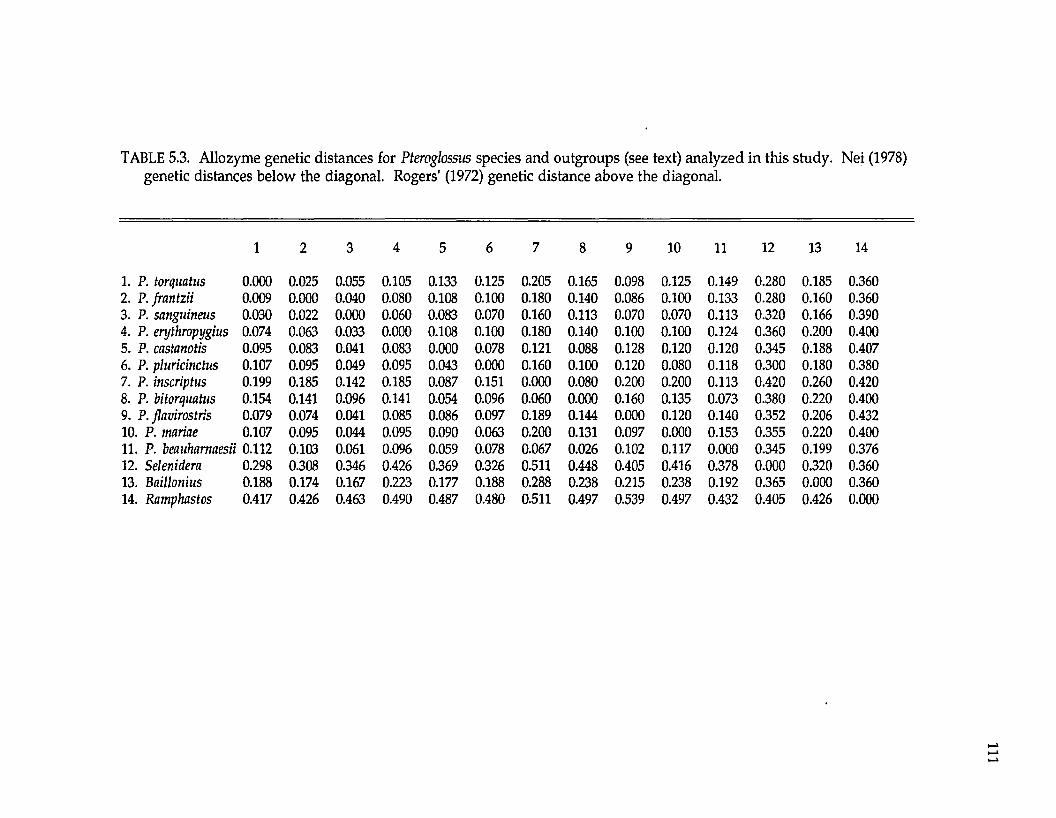
TABLE 5.3. Allozyme genetic distances for Pteroglossus species and outgroups (see text) analyzed in this study. Nei (1978) genetic distances below the diagonal. Rogers' (1972) genetic distance above the diagonal.
1 2 3 4 5 6
1. P. torquatus 0.000 0.025 0.055 0.105 0.133 0.1252. P.frantzii 0.009 0.000 0.040 0.080 0.108 0.1003. P. sanguineus 0.030 0.022 0.000 0.060 0.083 0.0704. P. erythropygius 0.074 0.063 0.033 0.000 0.108 0.1005. P. castanotis 0.095 0.083 0.041 0.083 0.000 0.0786. P. pluricinctus 0.107 0.095 0.049 0.095 0.043 0.0007. P. inscriptus 0.199 0.185 0.142 0.185 0.087 0.1518. P. bitorquatus 0.154 0.141 0.096 0.141 0.054 0.0969. P. flavirostris 0.079 0.074 0.041 0.085 0.086 0.09710. P. marine 0.107 0.095 0.044 0.095 0.090 0.06311. P. beauhamaesii 0.112 0.103 0.061 0.096 0.059 0.07812. Selenidera 0.298 0.308 0.346 0.426 0.369 0.32613. Baillonius 0.188 0.174 0.167 0.223 0.177 0.18814. Ramphastos 0.417 0.426 0.463 0.490 0.487 0.480
7 8 9 10 11 12 13 14
0.205 0.165 0.098 0.125 0.149 0.280 0.185 0.3600.180 0.140 0.086 0.100 0.133 0.280 0.160 0.3600.160 0.113 0.070 0.070 0.113 0.320 0.166 0.3900.180 0.140 0.100 0.100 0.124 0.360 0.200 0.4000.121 0.088 0.128 0.120 0.120 0.345 0.188 0.4070.160 0.100 0.120 0.080 0.118 0.300 0.180 0.3800.000 0.080 0.200 0.200 0.113 0.420 0.260 0.4200.060 0.000 0.160 0.135 0.073 0.380 0.220 0.4000.189 0.144 0.000 0.120 0.140 0.352 0.206 0.4320.200 0.131 0.097 0.000 0.153 0.355 0.220 0.4000.067 0.026 0.102 0.117 0.000 0.345 0.199 0.3760.511 0.448 0.405 0.416 0.378 0.000 0.320 0.3600.288 0.238 0.215 0.238 0.192 0.365 0.000 0.3600.511 0.497 0.539 0.497 0.432 0.405 0.426 0.000
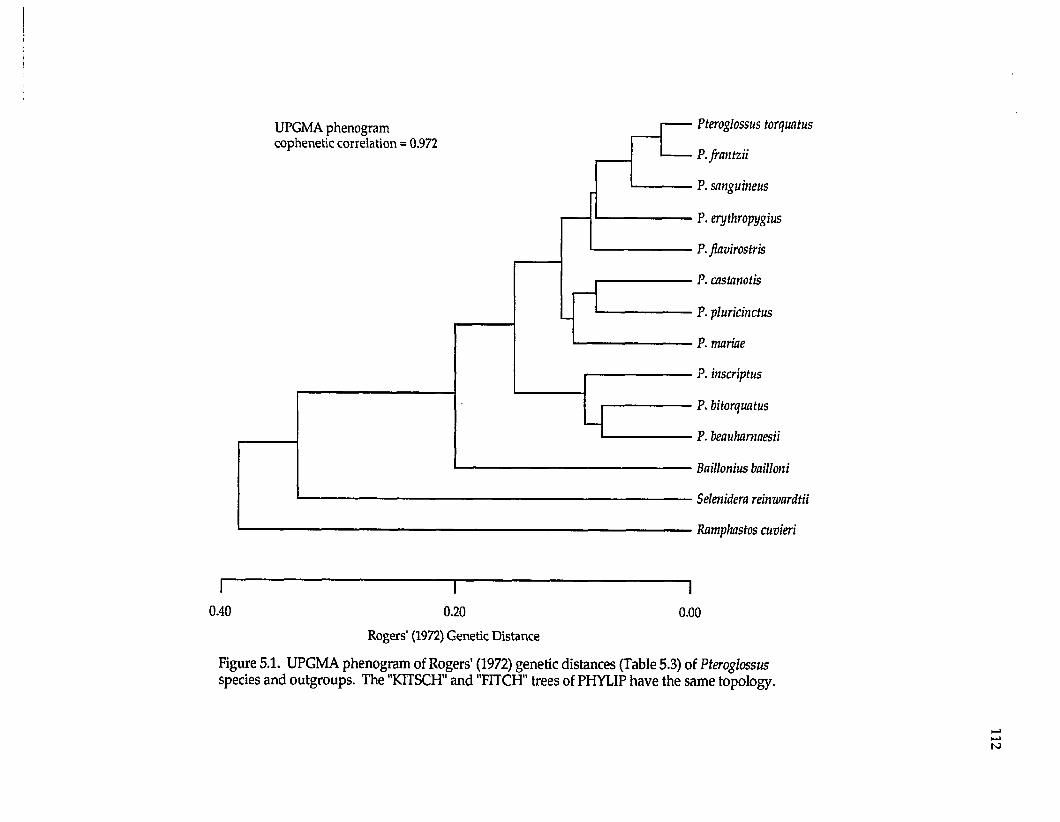
Pteroglossus torquatus
P.frantzii
P. sanguineus
P. erythropygius
P. flavirostris
P. castanotis
P. pluricinctus
P. marine
P. inscriptus
P. bitorquatus
P. beauhamaesii
Baillonius bailloni
Selenidera reinwardtii
Ramphastos cuvieri
UPGMA phenogram cophenetic correlation = 0.972
0.40 0.20 0.00
Rogers' (1972) Genetic Distance
Figure 5.1. UPGMA phenogram of Rogers' (1972) genetic distances (Table 5.3) of Pteroglossus species and outgroups. The "KITSCH" and "FITCH" trees of PHYLIP have the same topology.
113
relationships w ithin the genus Pteroglossus were all less than 60%. Thus, cladistic
analyses of allozyme data provided little support for species-level relationships
w ithin Pteroglossus.
D N A sequences in the Pteroglossus torquatus complex .—O nly 10 positions of
the 307 sequenced (3.3%) were variable w ithin the complex, and the num ber of
base substitutions varied from zero to nine am ong the four m em bers of the
Pteroglossus torquatus complex (Table 5.4). Seven of the 10 variable sites were at the
third position of a codon, and three were at the first position. W ithin the
Pteroglossus torquatus complex, the transition:transversion ratio w as 9:1. Two of
the substitutions produced an amino acid change in the region of the cytochrome
b protein coded for by this sequence. Including the outgroup to the P. torquatus
complex, Pteroglossus flavirostris, an additional 16 positions were variable. Twelve
of these were at the third position of a codon, one at the second position, and
three at the first position. There were 18 to 21 changes between members of the P.
torquatus complex and Pteroglossus flavirostris, and between P. flavirostris and
members of the P. torquatus complex, the transition:transversion ratio was 3:1.
W ithin the torquatus complex, only one nucleotide position was
phylogenetically informative, and it united P. erythropygius and P. sanguineus. The
other variable nucleotide positions were autapomorphic. The bootstrap analysis
of the combined allozyme and sequence data sets (not shown) united frantzii and
torquatus as sister taxa and sanguineus and erythropygius as sister taxa. However, the
bootstrap values for nodes w ere only 41% and 45%, respectively.
DISCUSSION
Levels o f genetic differentiation.—Both allozyme and sequence data
dem onstrate little interspecific differentiation w ithin Pteroglossus. This is
surprising given the high levels of genetic differentiation among species in other
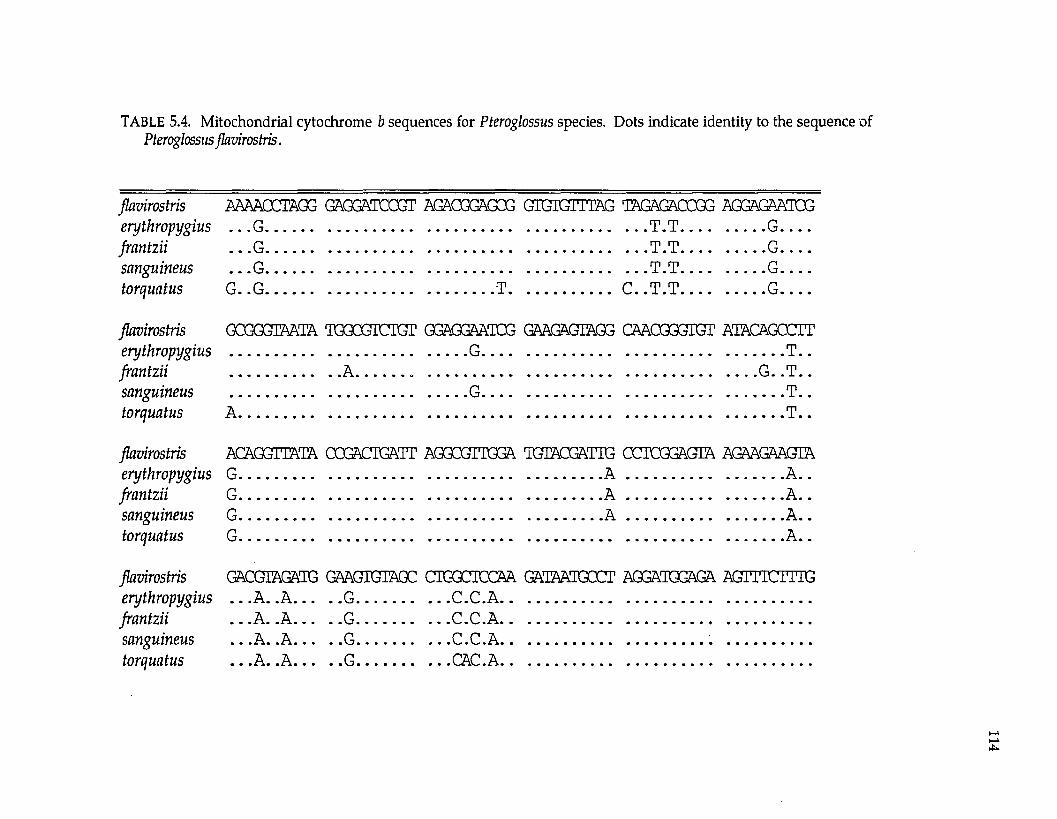
TABLE 5.4. Mitochondrial cytochrome b sequences for Pteroglossus species. Dots indicate identity to the sequence v Pteroglossus flavirostris.
flavirostris AAAACCTAGG GAGGATCCGT AGACGGAGCG GIGIGITTAG TAGAGACCGG AGGAGAATCGeryth ropyg ius . . . G....................................................................................T.T.................. G----fra n tz ii . ..G .......................................................... T.T....................G__sanguineus . . .G ....................................................................................T.T.................. G----torquatus G. .G.................................................T........................ C...T.T.................. G___
flavirostris GCGGGIAATA T3GCGICTGT GGAGGAATCG GAAGAGTAGG CAACGGGIGT ATACAGCCITeryth ropyg ius ...................................................G................................................................. T ..fra n tz ii............ A.......... . G. .T . .sanguineus ...................................................G................................................................. T . .torquatus A......................................................................................................................T . .
flavirostris ACAGGITATA CCGACIGATT AGGCGTIGGA TGEACGATTG CCTGGGAGTA AGAAGAAGIAeryth ropyg ius G............................................................................. A .................................. A ..fra n tz ii G............................................................................. A .................................. A ..sanguineus G............................................................................. A .................................. A ..torquatus G...................................................................................................................... A ..
flavirostris GACGIAGATG GAAGIGTAGC CTGGCICCAA GATAATGCCT AGGATGGAGA AG1TTCTTTGeryth ropyg iu s . . .A... .A.......... G...................C.C.A...................................................................fra n tz ii . . .A. .A.......... G...................C.C.A...................................................................sanguineus . . .A... .A.......... G...................C.C.A............................................. ..................torquatus . . .A... .A.......... G...................CAC.A...................................................................
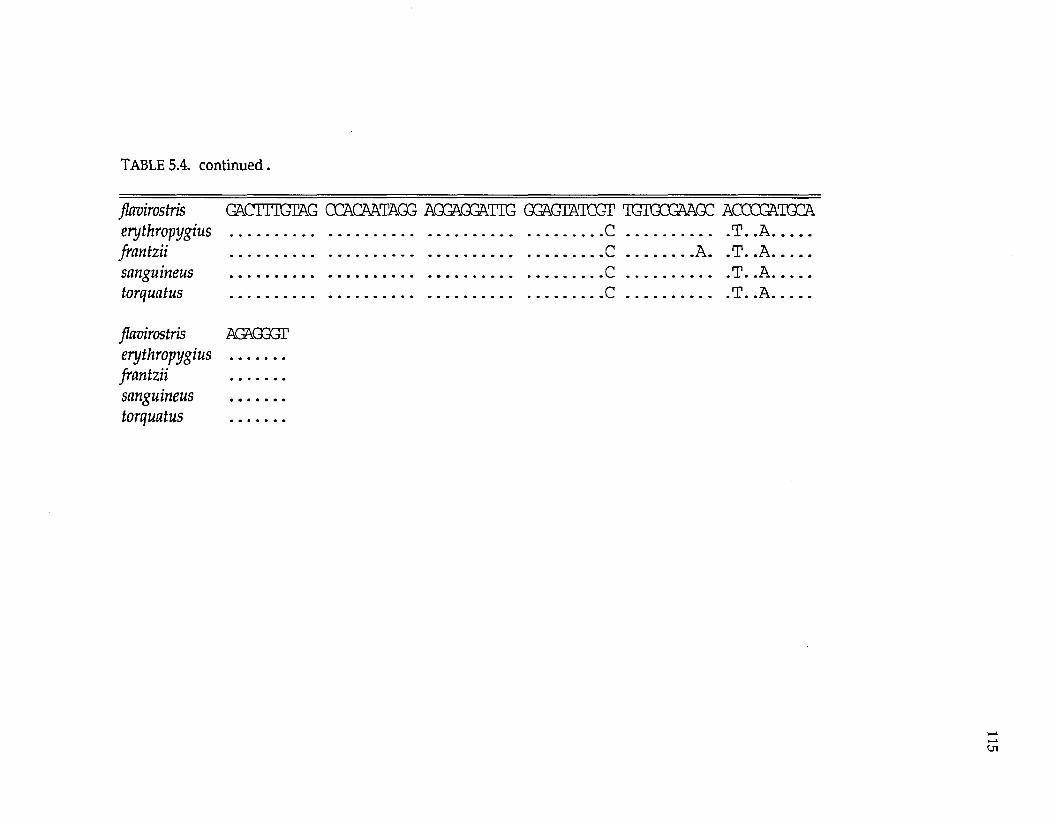
TABLE 5.4. continued.
flavirostris GACTTTGTAG CCACAATAGG AGGAGGATTG GGAGHATGGT TGUGCGAAGC ACOCGATGCAeryth ropyg ius ..............................................................................C ........................T. .A........fra n tz ii C .................A. . T . .A ..........sanguineus ..............................................................................C ........................T. .A........torquatus ..............................................................................C ........................T. .A........
flavirostris AGAQGGTeryth ropyg ius ...........fra n tz ii ............sanguineus ...........torquatus ...........
116
Neotropical genera (summary in Hackett and Rosenberg 1990, see also Chapters 2-
7). For example, N ei’s (1978) genetic distances averaged 0.173 among the four
species of G ymnopithys, a Neotropical antbird (Formicariidae) genus similarly
distributed across Central and South America (Chapter 4). W ithin G ym nopithys
leucaspis, w hich overlaps in range w ith and has a similar general area cladogram
to the Pteroglossus torquatus complex in Central America and South America west
of the Andes (the Choc6 region), Nei's (1978) genetic distances averaged 0.053
(Chapter 4) in comparison to 0.020 among Pteroglossus. An additional aspect of
Pteroglossus distribution that makes the low levels of genetic differentiation even
m ore surprising is the high degree of sym patry of up to five Amazonian species of
Pteroglossus (Haffer 1974). One might predict that Pteroglossus is old because of the
m agnitude of phenotypic differences, large ranges, and high levels of sympatry
(Mayr and Short 1970). However, speciation and geographic range overlap in
Pteroglossus toucans have been accomplished w ith little genetic differentiation at
allozyme loci. There are several possible explanations for the low levels of
genetic divergence: speciation m ay be extremely recent; rates of molecular change
at allozyme loci and mtDNA can be lower in toucans relative to other
codistributed species; or natural-history characteristics, like dispersal ability or
gene flow, m ay affect the molecular divergence am ong populations and species.
A multi-lineage comparison of taxa codistributed w ith toucans w ould indicate the
degree to which levels of genetic differentiation in toucans are different from
other lineages of Neotropical birds (Chapter 8).
P hytogeny.~W ith in Pteroglossus, many species differ only in frequencies of
alleles at allozyme loci. MtDNA sequence data were uninform ative w ith respect
to relationships w ithin the Pteroglossus torquatus complex. Thus, the phylogenetic
content of allozyme frequency differences m ust be addressed. One way of
addressing the phylogenetic content of data sets is to examine congruence of
branching diagrams derived from independent character systems ( Kluge 1989,
Zink and Avise 1990, Miyamoto and Cracraft 1991, Cracraft and Helm-Bychowski
1991). For Neotropical birds, congruence of independent data sets is difficult to
establish because there are few published phylogenies. However, Haffer (1974),
Prum (1988), and Cracraft and Prum (1988) have published phylogenies of
Pteroglossus toucans based on different character systems.
Perhaps the only strongly supported relationship in the allozyme data,
beyond the m onophyly of Pteroglossus, is the placement of Baillonius bailloni as the
sister taxon to Pteroglossus. This relationship has been suggested by Meyer de
Schauensee (1966), Haffer (1974), and Prum (1988). All allozyme analyses place
Baillonius as the sister to Pteroglossus, and the bootstrap values support this
grouping at 80%.
Prum (1988) used cladistic analyses of plumage characters to document
monophyly of the Pteroglossus torquatus complex, and bill color and patterns to
hypothesize relationships w ithin the complex. Prum found P. sanguineus and P.
erythropygius to be sister taxa, as were P.frantzii and P. torquatus. This is the
phylogeny found by the combined allozym e/DNA sequence data set. The
allozyme data set supported monophyly of the torquatus complex and sister-taxon
relationship of P. frantzii and P. torquatus; however, the sister-taxon relationship
of P. sanguineus and P. erythropygius was not supported (Fig. 5.1).
Cracraft and Prum (1988) addressed relationships among the Pteroglossus
bitorquatus and P. mridis species-groups of Haffer (1974) using morphological
characters. W ithin the bitorquatus species-group, they found that Pteroglossus
flavirostris and mariae were sister taxa (these differentiated units are often placed as
subspecies of a single species [Haffer 1974]). The allozyme data were unable to
recover this grouping; however, the two are placed in the same major group in
the distance analysis (Fig. 5.1). The UPGMA phenogram of allozyme genetic
distances (Fig. 5.1) differs from the relationships suggested by Cracraft and Prum
(1988) in the placement of P. bitorquatus. The allozyme data support a clade
comprised of inscriptus (a member of the viridis species-group), beaidtarnaesii, and
bitorquatus, a hypothesis not suggested by Haffer (1974) or Cracraft and Prum
(1988). However, until a complete morphological phylogeny of the genus
Pteroglossus is published, it is difficult to assess monophyly of the species-groups
used by Haffer (1974) and Cracraft and Prum (1988), and therefore, the degree to
which allozyme distance data and morphological phylogenies conflict. In
addition, the allozyme analysis did not include Pteroglossus viridis, the only other
m ember of the viridis species-group. Sampling of taxa can have an effect on
branching topology during phylogenetic analysis, especially w hen the missing
taxon is the only member of a group (Gauthier et al. 1988; Weller et al., in press).
Thus, the inclusion of P. viridis could have an influence on the allozyme distance
tree.
The branching diagram of Haffer (1974) is the only estimate of
relationships in the genus that includes all species. He hypothesized species-
groups based on a num ber of characters, e.g., plumage similarity, calls, and
distribution, but he w as tentative about joining the species groups into higher-
level relationships. He did place the torquatus complex in the same group as
pluricinctus and castanotis (the Pteroglossus aracari species-group); these taxa group
together in the allozyme distance analysis (Fig. 5.1). To make the tentative
phylogeny of Haffer (1974: 189) conform to the presence/absence coding of
allozyme data w ould result in a tree of 26 steps (in comparison to the 18 steps of
the m ost parsim onious tree). Standard deviation on the "KITSCH" tree increased
119
from 16% to 26% by forcing Haffer's (1974) topology on the phenogram. However,
most extra steps occur as the result of making the Pteroglossus aracari species-group
monophyletic, and of placing flavirostris and marine, which are members of the
bitorquatus species-group, with P. bitorquatus. Thus, w ithout molecular studies
that have more phylogenetically informative characters and morphological
analyses that confirm monophyly of species-groups, the conflicting branching
patterns suggested by the allozyme data and Haffer (1974) cannot be resolved.
Crother (1990) dismissed the phylogenetic information in allozyme
frequency differences due to temporal instability of allele frequencies. However,
few studies have demonstrated temporal instability of alleles in birds (Burns and
Zink 1990, see also discussion by M urphy et al. 1990: 51). Thus, the agreement of
different data sets on relationships within the Pteroglossus torquatus complex and
the placement of Baillonius suggests that the distance data have a phylogenetic
com ponent.
Biogeography.—The pattern of phylogeny of the Pteroglossus torquatus
complex suggested by the combined allozyme/mtDNA sequence data set and the
morphological data set of Prum (1988) supports the following general area
cladogram: Pacific and Caribbean Central America as sister areas (frantzii and
torquatus), Choco as the sister area to Central America (sanguineus and
erythropygius), and Amazonia as the sister to the Chocd/Central American area
{flavirostris and the rest of Pteroglossus). This area cladogram was suggested by Prum
(1988), Cracraft and Prum (1988), and Hackett (Chapters 4 and 6), and its
implications are outlined in Cracraft and Prum (1988), Prum (1988), and Chapter 8.
The molecular distance data, however, can be used to date splitting events, if one
is willing to accept the controversial hypothesis of a molecular clock (Wilson et al.
1977). Two calibrations estimate that one unit of Nei’s (1978) genetic distance
corresponds to 19-26 million years of independent evolution (Marten and
Johnson 1986, Gutierrez et al. 1983, respectively). This w ould im ply that
divergence of members of the Pteroglossus torquatus complex had occurred during
the last 150,000 to 800,000 years. This is consistent w ith Pleistocene climatic
fluctuations causing population fragmentation, even though direct evidence for
climatic fluctuations is limited (Haffer 1982).
The relationship of Baillonius and Pteroglossus also has im portant
biogeographic implications. Baillonius is endemic to southeast Brazil, and Prum
(1988) hypothesized that some lineages endemic to southeast Brazil are old and
that these are sister taxa to large radiations throughout lowland Neotropics (also
see Chapter 1). The pattern of relationships (Fig. 5.1), which places Baillonius as
basal to the Pteroglossus radiation, supports Prum's hypothesis. In addition, the
genetic distance data suggest that Baillonius has been evolving independently for
roughly four to five million years.
The results of this study suggest that diversification of Neotropical
lowland bird taxa occurred as the result of many different vicariant events over
different time periods. For example, divergence within the Pteroglossus torquatus
complex probably occurred during the Pleistocene, whereas Baillonius has been
evolving independently for millions of years. Thus, the events of a single time
period cannot explain the high diversity of forms found in the Neotropics, and
the challenge is to identify which particular geologic events and time periods
influenced which particular taxa.
LITERATURE CITED
ALLARD, M. W., D. L. ELLSWORTH, AND R. L. HONEYCUTT. 1991. The production of single-stranded DNA suitable for sequencing using the polymerase chain reaction. BioTechniques 10: 24-26.
121
BARROWCLOUGH, G. F., N. K. JOHNSON, AND R. M. ZINK. 1985. On the nature of genic variation in birds. Current Ornithol. 2: 135-154.
BURNS, K. J. AND R. M. ZINK. 1990. Temporal and geographic homogeneity of gene frequencies in the Fox Sparrow (Passerella iliaca). Auk 107: 421-425.
BUTH, D. G. 1984. The application of electrophoretic data in systematic studies. Arm. Rev. Ecol. Syst. 15: 501-522.
CRACRAFT, J. AND R. O. PRUM. 1988. Patterns and processes of diversification: speciation and historical congruence in some Neotropical birds. Evolution 42: 603-620.
--------- AND K. HELM-BYCHOWSKI. 1991. Parsimony and phylogenetic inferenceusing DNA sequences: some methodological strategies. Pages 184-220 in Phylogenetic analysis of DNA sequence data (M. M. Miyamoto and J.Cracraft, Eds.). Oxford Univ. Press, New York.
CROTHER, B. I. 1990. Is "some better than none" or do allele frequencies contain phylogenetically useful information? Cladistics 6: 277-281.
EDWARDS, S. V., P. ARCTANDER, AND A. C. WILSON. 1991. Mitochondrialresolution of a deep branch in the genealogical tree for perching birds. Proc. R. Soc. Lond. B. 243: 99-107.
FELSENSTEIN, J. 1985. Confidence limits on phylogenies: an approach using the bootstrap. Evolution. 79: 783-791.
----------- 1986. PHYLIP-Phylogeny inference package, Version 3.0. University ofWashington, Department of Genetics, Seattle, Washington.
GAUTHIER, J., A. G. KLUGE, AND T. ROWE. 1988. Amniote phylogeny and the importance of fossils. Cladistics 4: 105-210.
GUTIERREZ, R. J., R. M. ZINK, AND S. Y. YANG. 1983. Genic variation, systematic, and biogeographic relationships of some galliform birds. Auk 100: 33-47.
HACKETT, S. J. 1989. Effects of varied electrophoretic conditions on detection of evolutionary patterns in the Laridae. Condor 91: 73-90.
----------AND K. V. ROSENBERG. 1990. Evolution of South American antwrens(Formicariidae): comparison of phenotypic and genetic differentiation. Auk 107: 473-489.
HAFFER, J. 1969. Speciation in Amazonian forest birds. Science 165: 131-137.
---------- - 1974. Avian speciation in tropical South America. Publ. NuttallOrnithol. Club. 14: 1-390.
122
---------- . 1982. General aspects of the refuge theory. Pages 6-24 in Biologicaldiversification in the tropics (G. T. Prance, Ed.). Columbia Univ. Press, New York.
---------- . 1985. Avian zoogeography of the Neotropical lowlands. Ornithol.Monogr. 36: 113-146.
---------- . 1987. Biogeography of Neotropical birds. Pages 105-150 in Biogeographyand quaternary history in tropical America (T. C. W hitmore and G. T. Prance, Eds.). Clarendon Press, Oxford.
HILLIS, D. M. 1987. Molecular versus morphological approaches to systematics. Ann. Rev. Ecol. Syst. 18: 23-42.
----------AND J. P. HUELSENBECK. 1992. Signal, noise, and reliability in molecularphylogenetic analyses. J. Hered. 83: 189-195.
----------AND C. MORITZ. 1990. An overview of applications of molecularsystematics. Pages 502-515 in Molecular systematics (D. M. Hillis and C. Moritz, Eds.). Sinauer Assoc., Inc., Sunderland, Massachusetts.
---------- , A. LARSON, S. K. DAVIS, AND E. A. ZIMMER. 1990. Nucleic acids III:sequencing. Pages 318-370 in Molecular systematics (D. M. Hillis and C. Moritz, Eds.). Sinauer Assoc., Inc., Sunderland, Massachusetts.
KLUGE, A. G. 1989. A concern for evidence and a phylogenetic hypothesis of relationships among Epicrates (Boidae, Serpentes). Syst. Zool. 38: 7-25.
KOCHER, T. D., W. K. THOMAS, A. MEYER, S. V. EDWARDS, S. PAABO, F. X. VILLABLANCA, AND A. C. WILSON. 1989. Dynamics of m itochondrial DNA evolution in animals: am plification and sequencing w ith conserved primers. Proc. Natl. Acad. Sci. 86: 6196-6200.
LEWONTIN, R. C. AND J. L. HUBBY. 1966. A molecular approach to the study of genic heterozygosity in natural populations. II. Amount of variation and degree of heterozygosity in natural populations of Drosophila pseudoobscura. Genetics 54: 595-609.
MARTEN, J. A. AND N. K. JOHNSON. 1986. Genetic relationships of N orth American cardueline finches. Condor 88: 409-420.
MAYR, E. AND L. L. SHORT. 1970. Species taxa of N orth American birds. Publ. Nuttall Ornithol. Club 9: 1-127.
MEYER DE SCHAUENSEE, R. 1966. The species of birds of South America w ith their distribution. Livingston Publ. Co, Narberth, Pennsylvania.
MICKEVICH, M. M. AND C. M. MITTER. 1981. Treating polym orphic characters in systematics: a phylogenetic treatment of electrophoretic data. Pages 45-58 in
Advances in cladistics, vol. 1 (V. A. Funk and D. R. Brooks, Eds.). New York Botanical Gardens, New York.
MIYAMOTO, M. M. AND J. CRACRAFT. 1991. Phylogenetic inference, DNA sequence analysis, and the future of molecular systematics. Pages 3-17 in Phylogenetic analysis of DNA sequence data (M. M. Miyamoto and J.Cracraft, Eds.). Oxford Univ. Press, New York.
MURPHY, R. W., J. W. SITES, JR., D. G. BUTH, AND C. H. HAUFLER. 1990. Proteins 1: isozyme electrophoresis. Pages 45-126 in Molecular systematics (D. M.Hillis and C. Moritz, Eds.). Sinauer Assoc., Inc., Sunderland, Massachusetts.
NEI, M. 1978. Estimation of average heterozygosities and genetic distance from a small num ber of individuals. Genetics 89: 583-590.
NEVO, E. 1978. Genetic variation in natural populations: patterns and theory. Theor. Pop. Biol. 13: 121-177.
PRUM, R. O. 1988. Historical relationships among avian forest areas of endemism in the Neotropics. Proc. Int. Ornithol. Congr. 19: 2562-2572.
ROGERS, J. S. 1972. Measures of genetic similarity and genetic distance. Studies in Genetics VII. Univ. Texas Publ. No. 7213: 145-153.
---------- AND R. C. C ASHNER. 1987. Genetic variation, divergence, andrelationships in the subgenus Xenisma of the genus Fundulus. Pages 251-264 in Community and evolutionary ecology of North American stream fishes (W. J. Matthews and D. C. Heins, Eds.). University of Oklahoma Press, N orm an.
SANDERSON, M. J. 1989. Confidence limits on phylogenies: the bootstrap revisited. Cladistics 5: 113-130.
SWOFFORD, D. L. 1990. PAUP: phylogenetic analysis using parsimony, Version 3.0. Illinois N atural History Survey, Champaign.
-----------AND S. H. BERLOCHER. 1987. Inferring evolutionary trees from genefrequency data under the principle of maximum parsimony. Syst. Zool. 36: 293-325.
-----------AND R. B. SELANDER. 1981. BIOSYS-1: a FORTRAN program for thecomprehensive analysis of electrophoretic data in population genetics and systematics. J. Hered. 72: 281-283.
W ELLER, S. J., T. P. FRIEDLANDER, J. A. MARTIN, AND D. P. PASHLEY. In Press. Phylogenetic studies of ribosomal RNA variation in higher moths and butterflies (Lepidoptera: Dityrsia). Molecular Phylogenetics and Evolution.

WILSON, A. C., S. S. CARLSON, AND T. J. WHITE. 1977. Biochemical evolution. Ann. Rev. Biochem. 46: 573-639.
ZINK, R. M. AND J. C. AVISE. 1990. Patterns of mitochondrial DNA andallozyme evolution in the avian genus Ammodramus. Syst. Zool. 39:148-161.
CHAPTER 6
RAMPHOCELUS
The genus Ramphocelus contains eight or nine species of tanagers that are
distributed throughout the Neotropical lowlands from Mexico to Paraguay.
Previous systematic work on the genus involved describing zones of
hybridization for assessment of species status under the biological species concept
(Sibley 1958, Novaes 1959). As yet, there are no published hypotheses of
relationships among species. Isler and Isler (1987) recognized three species groups:
one included Ramphocelus sanguinolentus and R. nigrogularis, the second included
R. dimidiatus, R. melanogaster, R. carbo, and R. bresilius, and the third consisted of R.
passerinii and R. flammigerus (including the subspecies groups icteronotus and
flammigerus). Most recent authors have included Ramphocelus sanguinolentus in
Ramphocelus (e.g., Isler and Isler 1987, Morony et al. 1975, A.O.U. 1983); however, it
has also been recognized in the monotypic genus Phlogothraupis (Storer 1970).
In this paper, I address relationships among five species of Ramphocelus
tanagers, and among subspecies of the Central American endemic, Ramphocelus
passerinii. I examine the congruence of two independent molecular data sets,
allozymes and mitochondrial DNA sequences. Given the phylogeny suggested by
the molecular data sets, I discuss species limits and historical biogeography in the
genus.
METHODS
Collecting localities for specimens used in the allozyme and DNA analyses
are listed in Table 6.1. Tissue samples for this analysis were obtained from the
Louisiana State University Museum of Natural Science (LSUMNS) Frozen Tissue
Collection and the Field Museum of Natural History (Ramphocelus sanguinolentus).
W ithin Ramphocelus flammigerus, I examined specimens of R. f. icteronotus, and
125
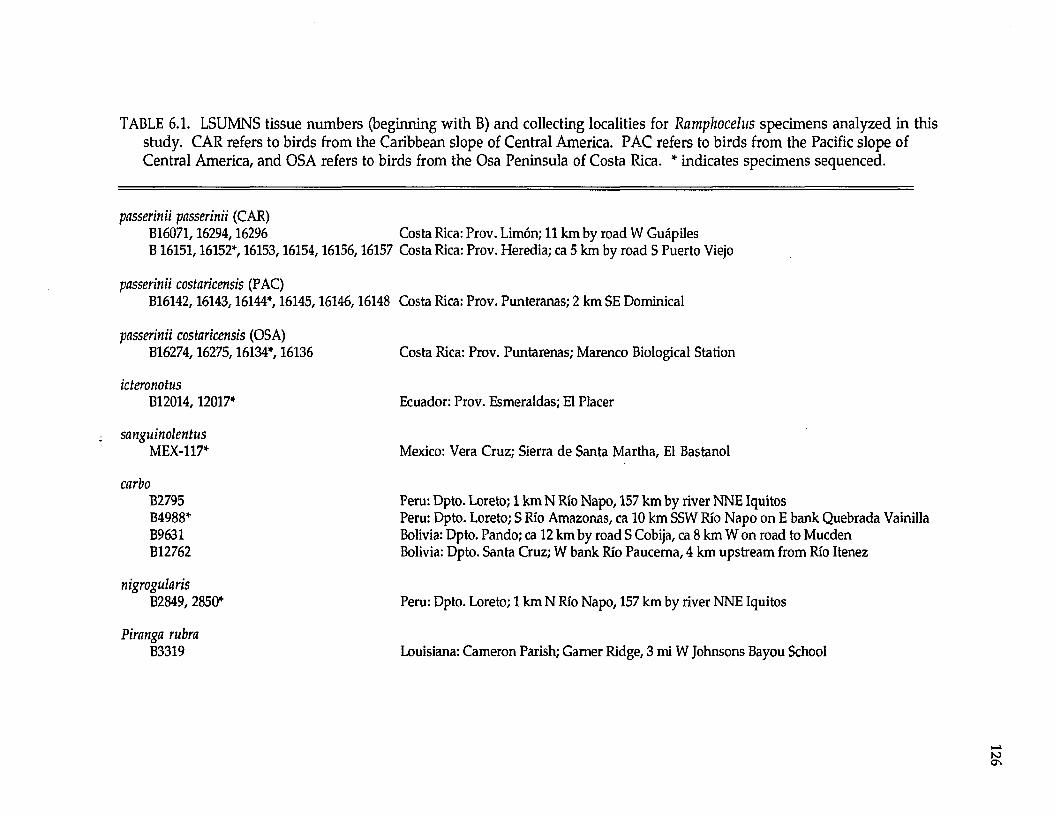
TABLE 6.1. LSUMNS tissue numbers (beginning with B) and collecting localities for Ramphocelus specimens analyzed in this study. CAR refers to birds from the Caribbean slope of Central America. PAC refers to birds from the Pacific slope of Central America, and OSA refers to birds from the Osa Peninsula of Costa Rica. * indicates specimens sequenced.
passerinii passerinii (CAR)B16071,16294,16296 Costa Rica: Prov. Limon; 11 km by road W GuapilesB16151,16152*, 16153,16154,16156,16157 Costa Rica: Prov. Heredia; ca 5 km by road S Puerto Viejo
passerinii costaricensis (PAC)B16142,16143,16144*, 16145,16146,16148 Costa Rica: Prov. Punteranas; 2 km SE Dominical
passerinii costaricensis (OSA) B16274,16275,16134*, 16136
icteronotusB12014, 12017*
sanguinolentusMEX-117*
carboB2795B4988*B9631B12762
nigrogularis B2849, 2850*
Piranga rubra B3319
Costa Rica: Prov. Puntarenas; Marenco Biological Station
Ecuador: Prov. Esmeraldas; El Placer
Mexico: Vera Cruz; Sierra de Santa Martha, El Bastanol
Peru: Dpto. Loreto; 1 km N Rio Napo, 157 km by river NNE IquitosPeru: Dpto. Loreto; S Rio Amazonas, ca 10 km SSW Rio Napo on E bank Quebrada VainillaBolivia: Dpto. Pando; ca 12 km by road S Cobija, ca 8 km W on road to MucdenBolivia: Dpto. Santa Cruz; W bank Rio Paucema, 4 km upstream from Rio Itenez
Peru: Dpto. Loreto; 1 km N Rio Napo, 157 km by river NNE Iquitos
Louisiana: Cameron Parish; Gamer Ridge, 3 mi W Johnsons Bayou School
will refer to this sample (Table 6.1) as Ramphocelus icteronotus throughout this
paper.
Protein electrophoresis. —Standard horizontal starch-gel electrophoresis of
proteins was performed as outlined in M urphy et al. (1990), Hackett (1989), and
Hackett and Rosenberg (1990). Locus names follow M urphy et al. (1990).
BIOSYS-1 (Swofford and Selander 1981) was used to compute genetic
distances (Nei 1978, Rogers 1972) and a UPGMA phenogram. Another tanager,
Piranga rubra, was used as an outgroup for the allozyme study. Also, the computer
program PHYLIP (Felsenstein 1986) was used to generate a distance tree that does
not assume equal evolution in all lineages (FITCH option).
Cladistic assessment of allelic variation was performed by coding each
locus as a multi-state unordered character (and alleles at each locus as character
states) using the computer program PAUP 3.0L (Swofford 1990). Also, in another
cladistic analysis, alleles were considered as characters and coded as present or
absent. One hundred bootstrap replicates were performed on each cladistic
analysis to assess confidence in the branching pattern (Felsenstein 1985,
Sanderson 1989). The gi statistic of Hillis and Huelsenbeck (1992) was calculated
to determine the extent of randomness versus phylogenetic signal in the data set.
D NA sequences—A total nucleic acid preparation was made from 0.1 gram
of liver tissue (Hillis et al. 1990; see Table 6.1 for specimens sequenced).
Amplification of a 433 base pair region (not including primers) of the
m itochondrial (mt) cytochrome b gene was performed via the polymerase chain
reaction (PCR), using primers L14841 (5-CCATCCAACATCTCAGCATGAT
GAAA-3'; Kocher et al. 1989) and the reverse and complement of L15299 (5'-
GGAGGAAGTGCAGGGCGAAGAATCG-3'; Edwards et al. 1991). Double
stranded PCR amplifications were perform ed in 50 pi total reaction volumes (10 pi
of a 10"2 dilution of the total DNA preparation, 4 pi of a 10 pM solution of each
primer, 5 pi of 10X buffer, 3.6 pi of a 25 mM solution of MgCl2 , 3 pi of a 1.0 mM
solution of dNTP's, 0.20 pi Taq DNA polymerase [Promega], up to 50 pi with H 2 O).
Thirty to 35 cycles were performed using the following cycling parameters: first
cycle—denaturation at 94°C for 3 minutes, annealing at 49°C for 1 minute,
extension at 72°C for 45 seconds; remaining cycles—denaturation at 94°C for 1
minute, annealing at 49°C for 1 minute, extension at 72°C for 45 seconds.
Single-stranded DNA was generated using only one primer (Allard et al.
1991). Six pi of the double-stranded product were used to generate single-stranded
DNA in 100 pi reactions (6 pi double-stranded DNA, 6 pi of a 10 pM solution of
one primer, 10 pi of 10X buffer, 6 pi of a 25 mM solution of MgCl2 , 5 pi dNTP's,
0.40 pi Tacj DNA polymerase [Promega], up to 100 pi with H2 O). Twenty-two cycles
were performed using the following cycling parameters: first cycle—denaturation
at 94°C for 3 minutes, annealing at 49°C for 1 minute, extension at 72°C for 1
minute; remaining cycles—denaturation at 94°C for 1 minute, annealing at 49°C
for 1 minute, extension at 72°C for 1 minute. Single-stranded DNA of both the
heavy and light mtDNA strands were cleaned by 5 washings with H2 O through
Ultrafree®-MC 30,000 NNMWL filters (Millipore Corp., Bedford, MA), and
concentrated to a final volume of approximately 30 pi. Seven pi of cleaned single
stranded DNA were used for DNA sequencing using T7 DNA polymerase
(Sequenase® version 2.0, United States Biochemical, Cleveland, OH).
The DNA sequence data were analyzed cladistically using PAUP 3.0L
(Swofford 1990). Sequences of a babbler Pomastomas temporalis (Edwards et al.
1991), and two tanagers, Hemispingus superciliaris and Diglossa carbonaria (sequences
in Chapter 2), were used to root the DNA sequence trees. All base positions were
used in the analysis. One hundred bootstrap replicates were performed, and the
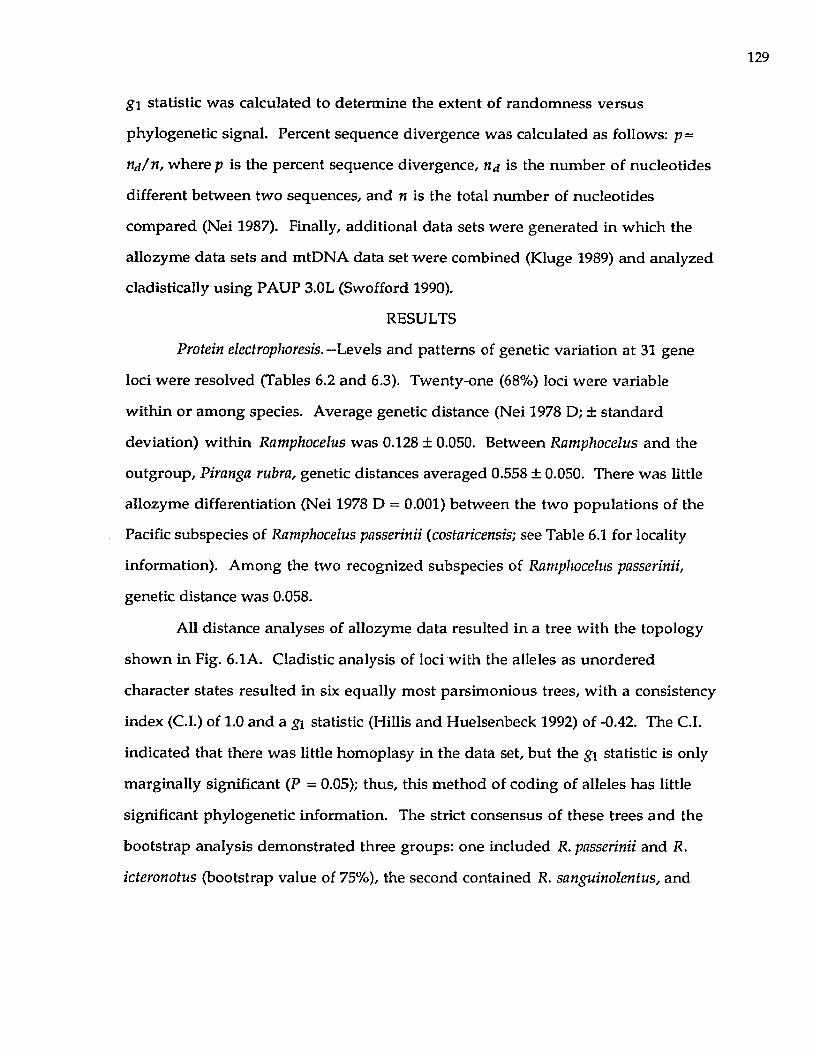
129
g l statistic was calculated to determ ine the extent of random ness versus
phylogenetic signal. Percent sequence divergence was calculated as follows: p =
ttd /n , where p is the percent sequence divergence, n j is the num ber of nucleotides
different betw een two sequences, and n is the total num ber of nucleotides
com pared (Nei 1987). Finally, additional data sets were generated in which the
allozyme data sets and mtDNA data set w ere combined (Kluge 1989) and analyzed
cladistically using PAUP 3.0L (Swofford 1990).
RESULTS
Protein electrophoresis. —Levels and patterns of genetic variation at 31 gene
loci were resolved (Tables 6.2 and 6.3). Twenty-one (68%) loci were variable
w ithin or am ong species. Average genetic distance (Nei 1978 D; ± standard
deviation) w ithin Ramphocelus was 0.128 ± 0.050. Between Ramphocelus and the
outgroup, Piranga rubra, genetic distances averaged 0.558 ± 0.050. There was little
allozyme differentiation (Nei 1978 D = 0.001) between the two populations of the
Pacific subspecies of Ramphocelus passerinii (costaricensis; see Table 6.1 for locality
information). Among the two recognized subspecies of Ramphocelus passerinii,
genetic distance was 0.058.
All distance analyses of allozyme data resulted in a tree w ith the topology
show n in Fig. 6.1A. Cladistic analysis of loci w ith the alleles as unordered
character states resulted in six equally m ost parsim onious trees, w ith a consistency
index (C.I.) of 1.0 and a g\ statistic (Hillis and Huelsenbeck 1992) of -0.42. The C.I.
indicated that there was little homoplasy in the data set, but the g\ statistic is only
m arginally significant (P = 0.05); thus, this m ethod of coding of alleles has little
significant phylogenetic information. The strict consensus of these trees and the
bootstrap analysis dem onstrated three groups: one included R. passerinii and R.
icteronotus (bootstrap value of 75%), the second contained R. sanguinolentus, and
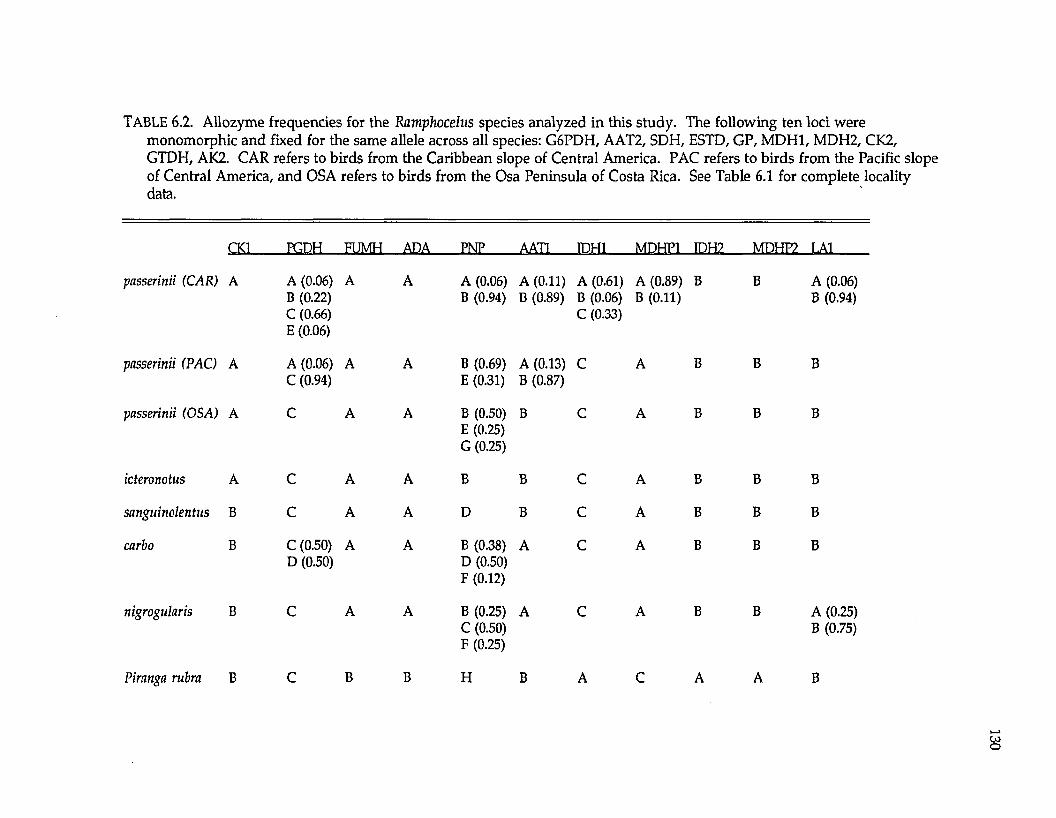
TABLE 6.2. Allozyme frequencies for the Ramphocelus species analyzed in this study. The following ten loci were monomorphic and fixed for the same allele across all species: G6PDH, AAT2, SDH, ESTD, GP, MDH1, MDH2, CK2, GTDH, AK2. CAR refers to birds from the Caribbean slope of Central America. PAC refers to birds from the Pacific slope of Central America, and OSA refers to birds from the Osa Peninsula of Costa Rica. See Table 6.1 for complete locality data.
CK1 PGDH FUMH ADA PNP AAT1 IDH1 MPHP1 IDH2 MPHP2 LAI
passerinii (CAR) A A (0.06) B (0.22) C (0.66) E (0.06)
A A A (0.06) B (0.94)
A (0.11) B (0.89)
A (0.61) B (0.06) C (0.33)
A (0.89) B (0.11)
B B A (0.06) B (0.94)
passerinii (PAC) A A (0.06) C (0.94)
A A B (0.69) E (0.31)
A (0.13) B (0.87)
C A B B B
passerinii (OSA) A C A A B (0.50) E (0.25) G (0.25)
B C A B B B
icteronotus A C A A B B C A B B B
sanguinolentus B C A A D B C A B B B
carbo B C (0.50) D (0.50)
A A B (0.38) D (0.50) F (0.12)
A C A B B B
nigrogularis B C A A B (0.25) C (0.50) F (0.25)
A C A B B A (0.25) B (0.75)
Piranga rubra B C B B H B A C A A B
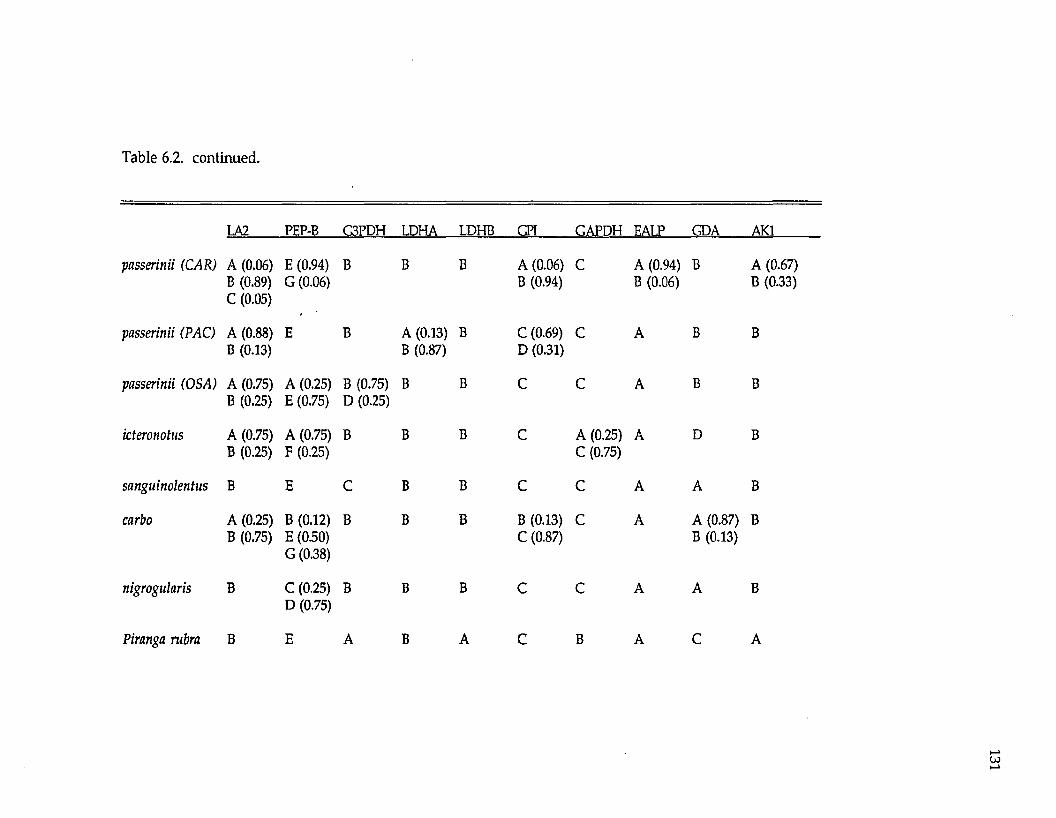
Table 6.2. continued.
passerinii (CAR)
passerinii (PAC)
passerinii (OSA)
icteronotus
sanguinolentus
carbo
nigrogularis
Piranga rubra
LA2 PEP-B G3PDH LDHA LDHB GPI GAPDH EALP GDA AKl
A (0.06) B (0.89) C (0.05)
E (0.94) G (0.06)
B B B A (0.06) B (0.94)
C A (0.94) B (0.06)
B A (0.67) B (0.33)
A (0.88) B (0.13)
E B A (0.13) B (0.87)
B C (0.69) D (0.31)
C A B B
A (0.75) B (0.25)
A (0.25) E (0.75)
B (0.75) D (0.25)
B B C C A B B
A (0.75) B (0.25)
A (0.75) F (0.25)
B B B C A (0.25) C (0.75)
A D B
B E C B B C C A A B
A (0.25) B (0.75)
B (0.12) E (050) G (0.38)
B B B B (0.13) C (0.87)
C A A (0.87) B (0.13)
B
B C (0.25) D (0.75)
B B B C C A A B
R F. A R A r R A r A
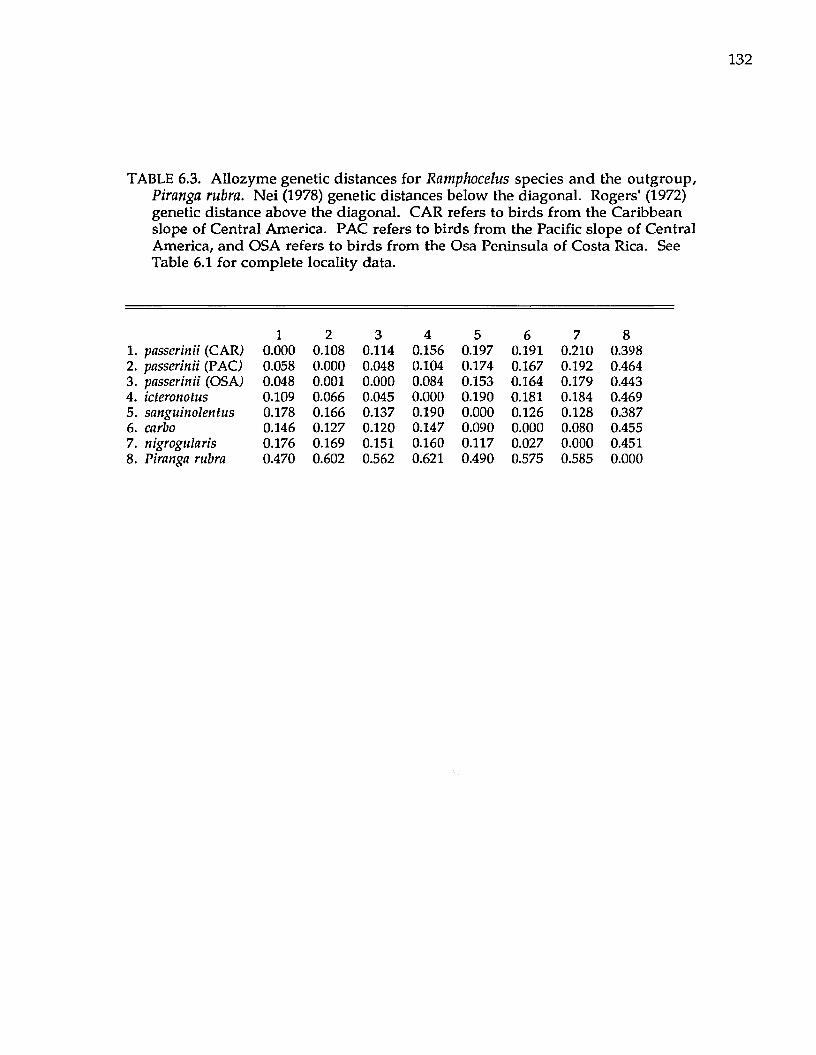
TABLE 6.3. Allozyme genetic distances for Ramphocelus species and the outgroup, Piranga rubra. Nei (1978) genetic distances below the diagonal. Rogers' (1972) genetic distance above the diagonal. CAR refers to birds from the Caribbean slope of Central America. PAC refers to birds from the Pacific slope of Central America, and OSA refers to birds from the Osa Peninsula of Costa Rica. See Table 6.1 for complete locality data.
1 2 3 4 5 6 7 81. passerinii (CAR) 0.000 0.108 0.114 0.156 0.197 0.191 0.210 0.3982. passerinii (PAC) 0.058 0.000 0.048 0.104 0.174 0.167 0.192 0.4643. passerinii (OSA) 0.048 0.001 0.000 0.084 0.153 0.164 0.179 0.4434. icteronotus 0.109 0.066 0.045 0.000 0.190 0.181 0.184 0.4695. sanguinolentus 0.178 0.166 0.137 0.190 0.000 0.126 0.128 0.3876. carbo 0.146 0.127 0.120 0.147 0.090 0.000 0.080 0.4557. nigrogularis 0.176 0.169 0.151 0.160 0.117 0.027 0.000 0.4518. Piranga rubra 0.470 0.602 0.562 0.621 0.490 0.575 0.585 0.000
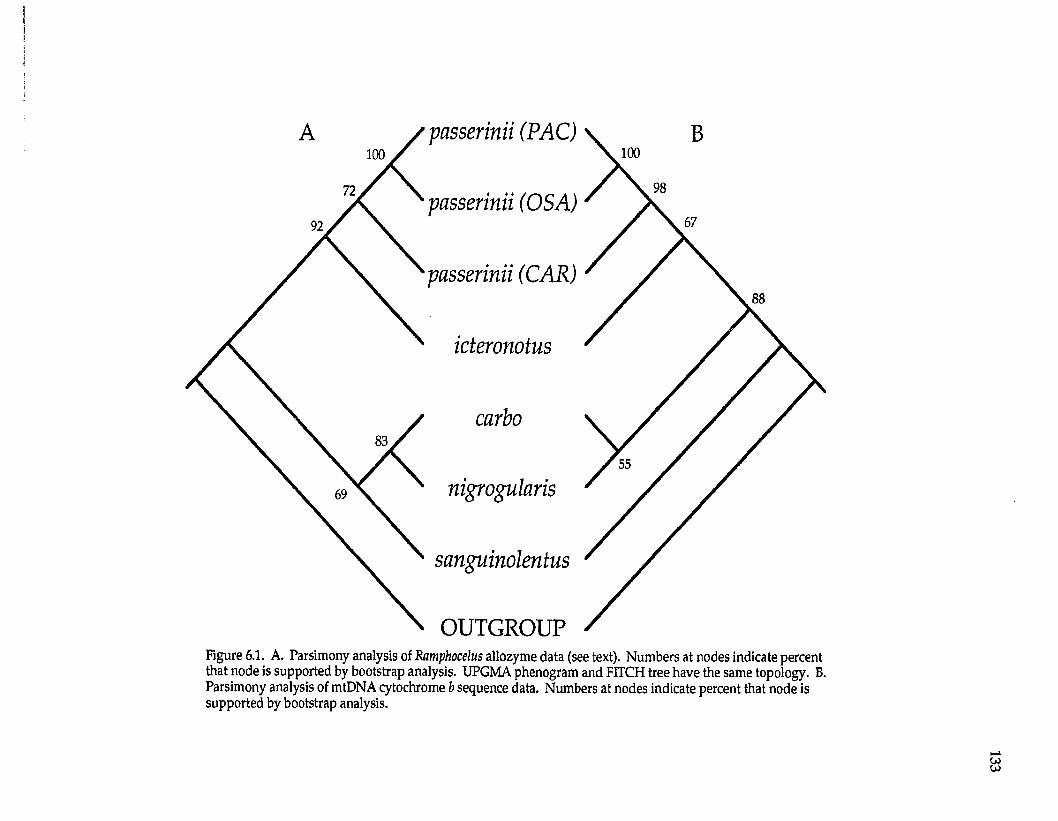
passerinii (PAC)100100
passerinii (OSA)
passerinii (CAR)
icteronotus
carbo
nigrogularis
sanguinolentus
OUTGROUPFigure 6.1. A. Parsimony analysis of Ramphocelus allozyme data (see text). Numbers at nodes indicate percent that node is supported by bootstrap analysis. UPGMA phenogram and FITCH tree have the same topology. B. Parsimony analysis of mtDNA cytochrome b sequence data. Numbers at nodes indicate percent that node is supported by bootstrap analysis.
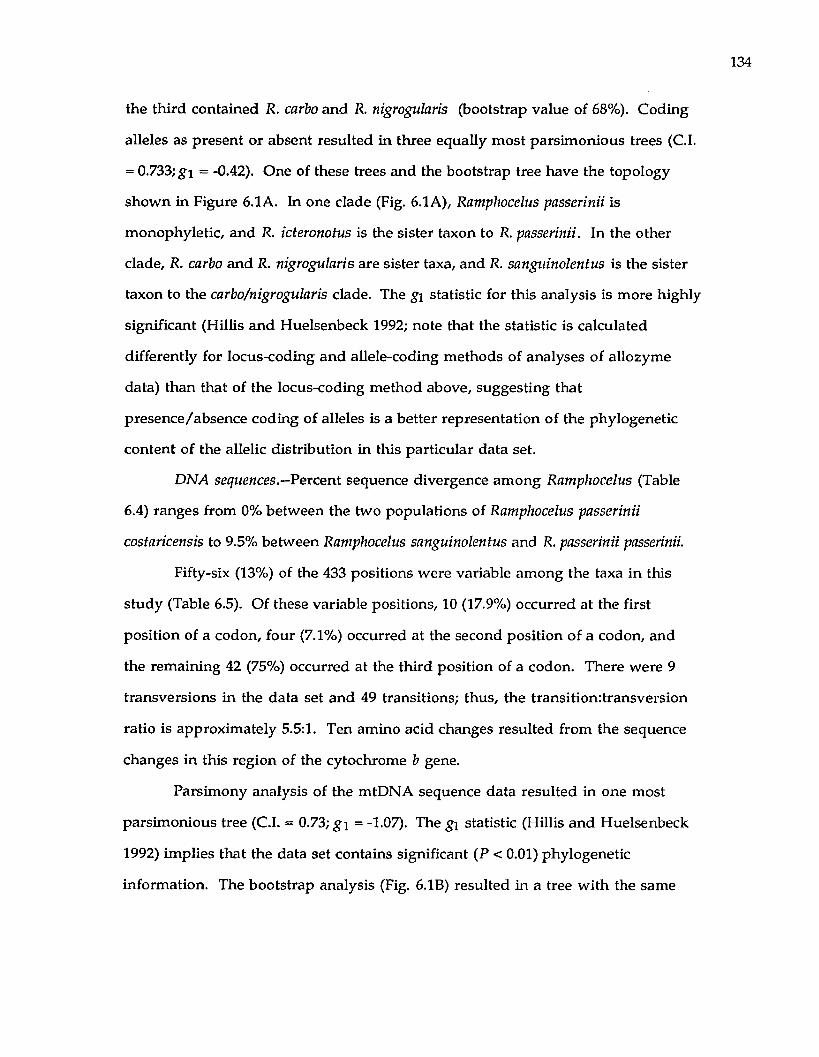
134
the third contained R. carbo and R. nigrogularis (bootstrap value of 68%). Coding
alleles as present or absent resulted in three equally most parsimonious trees (C.I.
= 0.733; g i - -0.42). One of these trees and the bootstrap tree have the topology
shown in Figure 6.1A. In one clade (Fig. 6.1A), Ramphocelus passerinii is
monophyletic, and R. icteronotus is the sister taxon to R. passerinii. In the other
clade, R. carbo and R. nigrogularis are sister taxa, and R. sanguinolentus is the sister
taxon to the carbo/nigrogularis clade. The g\ statistic for this analysis is more highly
significant (Hillis and Huelsenbeck 1992; note that the statistic is calculated
differently for locus-coding and allele-coding methods of analyses of allozyme
data) than that of the locus-coding method above, suggesting that
presence/absence coding of alleles is a better representation of the phylogenetic
content of the allelic distribution in this particular data set.
DNA sequences.—Percent sequence divergence among Ramphocelus (Table
6.4) ranges from 0% between the two populations of Ramphocelus passerinii
costaricensis to 9.5% between Ramphocelus sanguinolentus and R. passerinii passerinii.
Fifty-six (13%) of the 433 positions were variable among the taxa in this
study (Table 6.5). Of these variable positions, 10 (17.9%) occurred at the first
position of a codon, four (7.1%) occurred at the second position of a codon, and
the remaining 42 (75%) occurred at the third position of a codon. There were 9
transversions in the data set and 49 transitions; thus, the transitionrtransversion
ratio is approximately 5.5:1. Ten amino acid changes resulted from the sequence
changes in this region of the cytochrome b gene.
Parsimony analysis of the mtDNA sequence data resulted in one most
parsimonious tree (C.I. = 0.73; g \ = -1.07). The g\ statistic (Hillis and Huelsenbeck
1992) implies that the data set contains significant (P < 0.01) phylogenetic
information. The bootstrap analysis (Fig. 6.1B) resulted in a tree with the same
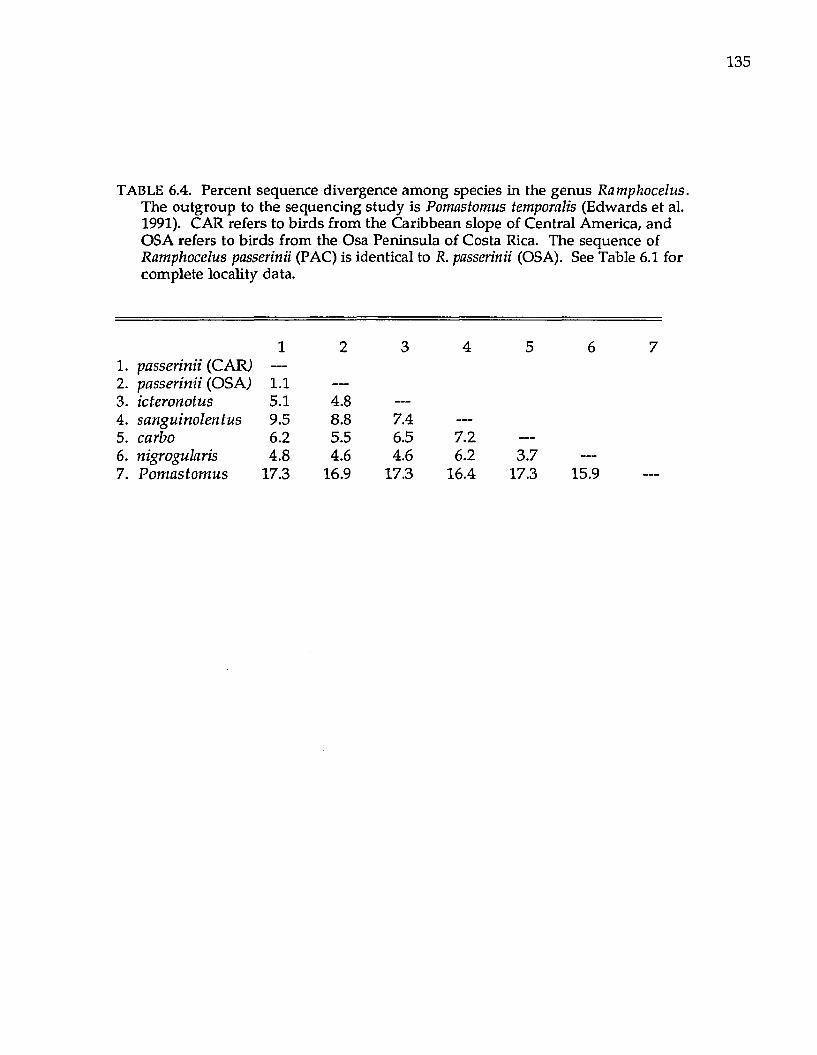
TABLE 6.4. Percent sequence divergence among species in the genus Ramphocelus. The outgroup to the sequencing study is Pomastomus temporalis (Edwards et al. 1991). CAR refers to birds from the Caribbean slope of Central America, and OSA refers to birds from the Osa Peninsula of Costa Rica. The sequence of Ramphocelus passerinii (PAC) is identical to R. passerinii (OSA). See Table 6.1 for complete locality data.
1 2 3 4 5 6 71. passerinii (CAR) —
2. passerinii (OSA) 1.1 —
3. icteronotus 5.1 4.8 —
4. sanguinolentus 9.5 8.8 7.4 —
5. carbo 6.2 5.5 6.5 7.2 —
6. nigrogularis 4.8 4.6 4.6 6.2 3.77. Pom astom us 17.3 16.9 17.3 16.4 17.3 15.9 —
TABLE 6.5. Mitochondrial cytochrome b sequences for Ramphocelus species. Dots indicate identity to the sequence of Ramphocelus carbo. CAR refers to birds from the Caribbean slope of Central America, and OSA refers to birds from the Osa Peninsula of Costa Rica. The sequence of Ramphocelus passerinii (PAC) is identical to R. passerinii (OSA). See Table 6.1 for complete locality data.
carbo CTTTGGATCC TTACTAGGCC TATGCCTAAT CACTCAAATC GTCACAGGCC TCCTACTAGCicteronotus ......................... C .G ..................................T ____ T .......................G T C .....................................................nigrogularis ......................... C ........................................T .....................................................................................................passerinii (CAR) ......................... C ........................................T ____ T ...............................A .....................................................passerinii (OSA) ......................... C ..................................................... T .......................... A . . . G ..............................................sanguinolen tus ......................... C ................................................................ C ........................T .......................... T ..................
carbo AATACACTAC ACAGCCGACA CCAGCCTGGC TTTCTCCTCT GTTGCCCACA TATGCCGAGAicteronotus T . .G ........................................................A C C . . C ........................................G . .nigrogularis ...................................................................A C C . . C ........................................G . .passerinii (CAR) T . . G ...................................................T ...................... C ....................C . . C .........................................G . .passerinii (OSA) T . .G ...................................................T ..................... C ....................C . . C ............................ ...........G . .sanguinolentus C .................... T T .............. A . T . A ................................ C . . C G ..........................
carbo CGTACAATTC GGCTGACTCA TCCGTAACCT CCATGCAAAC GGAGCCTCCT TCTTCTTCATicteronotus C .................. i ...............................................nigrogularis T . . T ................................passerinii (CAR) ...............................................................................................................G ............................................................passerinii (OSA) ..................................................................................................................................................................................sanguinolen tus ........................................................... C ............ C ........................................ T ................................
carbo CTGCATCTAC CTACACATCG GCCGAGGAAT TTACTACGGC TCATACCTAA ACAAAGAAACicteronotus ......................................................................................C ................................................... G ................................nigrogularis ......................................................................................C ........................................................................................passerinii (CAR) ................................. T ................................................ C ........................................................................................passerinii (OSA) ................................. T ................................................ C ........................................................................................sanguinolentus ......................................................................................C ........................................................................................
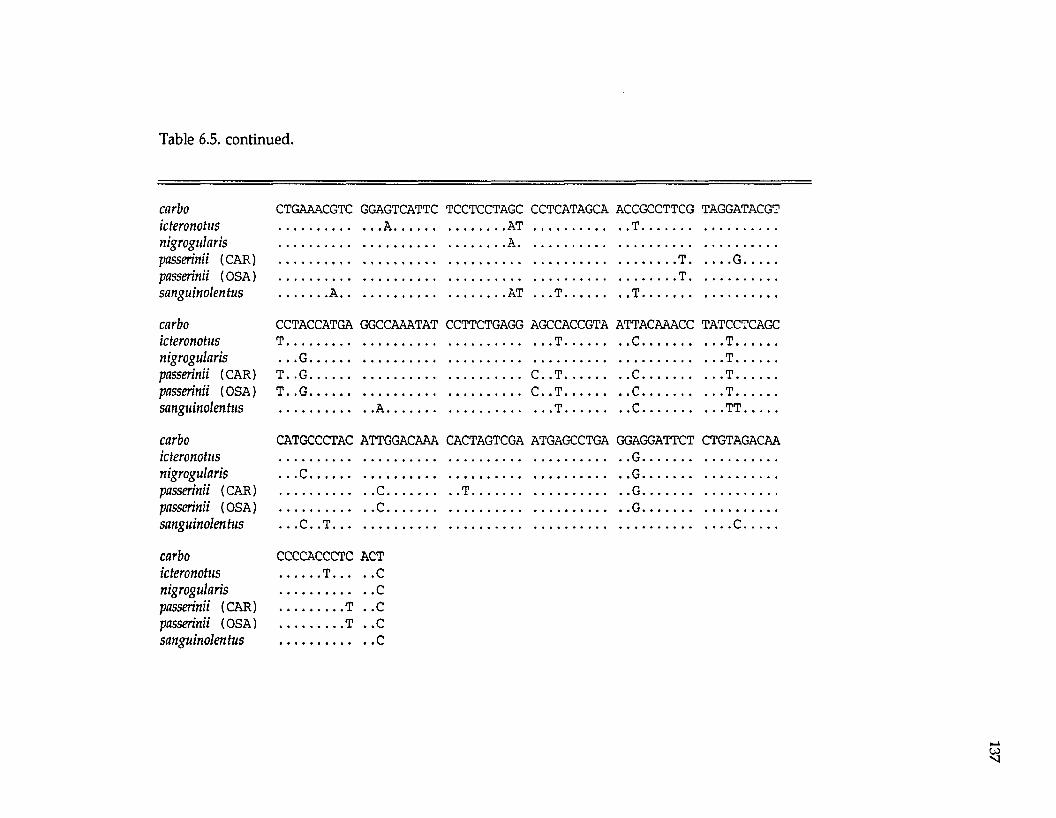
Table 6.5. continued.
carboicteronotus nigrogularis passerinii (CAR) passerinii (OSA) sanguinolentus
CTGAAACGTC GGAGTCATTC TCCTCCTAGC
....................A .
CCTCATAGCA ACCGCCTTCG TAGGATACGT
....................T . ____ G ............
....................T ..................A . . ....................AT . . .T .............. . . T .................
carboicteronotus nigrogularis passerinii (CAR) passerinii (OSA) sanguinolentus
CCTACCATGAT ....................... . .G ..............
GGCCAAATAT CCTTCTGAGG AGCCACCGTA ATTACAAACC .................................... T ........................C ..................
TATCCTCAGC. . . T ............... . . T ..............
T . .G ..............T . .G ..............
. .A .................
C . . T ..............C . . T ............... . . T ..............
. .C............
. .C.............
. .c .................
. . . T ..............
. . . T ..............
. . . T T ...........
carboicteronotus
CATGCCCTAC ATTGGACAAA CACTAGTCGA ATGAGCCTGA GGAGGATTCT.............................................................................................................................G ..................
CTGTAGACAA
nigrogularis passerinii (CAR) passerinii (OSA) sanguinolentus
. . ,c .............. . .G .................. .c ................. . .T ................. . .G .................. .c ................. . .G .................
. . .C . . T . . . ____ C............
carboicteronotus nigrogularis passerinii (CAR) passerinii (OSA) sanguinolentus
CCCCACCCTC ACT..............T ...............C................................. C...................... T . .c...................... T . .C................................. C
topology as the most parsimonious tree. This topology results w hether only the
babbler was used to root the sequence trees or whether both tanagers (Hemispingus
and Diglossa; see methods) were used in the analysis. Thus, the choice of
outgroup had no effect on branching topology w ithin Ramphocelus. In contrast to
the allozyme results, sequence data placed JR. sanguinolentus basal to all other
Ramphocelus species.
The combined data from allozymes and mtDNA sequences resulted in
trees that were topologically identical to the mtDNA sequence tree (Fig. 6.IB).
DISCUSSION
Differentiation and species limits.— The evidence for a high degree of genetic
differentiation among nonmigratory taxa is growing. Sedentary species analyzed
to date are highly subdivided genetically (Capparella 1987, 1988; Hackett and
Rosenberg 1990; Peterson 1992; Peterson et al. 1992; Hackett, in review; Avise and
Nelson 1989; Zink and Dittmann 1991), and genera comprised of sedentary species
show high degrees of among-species differentiation (Hackett and Rosenberg 1990;
Bates and Zink ms; Peterson 1992; Hackett, in review; Chapters 2-7; Zink and
Avise 1990), w ith one exception (Pteroglossus; Chapter 5). Levels of divergence
among Ramphocelus tanagers provides further confirmation of the high degree of
differentiation among nonm igratory species.
The two subspecies of Ramphocelus tanagers on either coast of Central
America are highly differentiated from one another. Based on sample sizes of
nine individuals of each subspecies, Nei's (1978) D is 0.058, and there is no
overlap of alleles at the GPI locus (Table 6.2). Ramphocelus passerinii passerinii
(Caribbean slope birds) have alleles A and B; R. passerinii costaricensis (Pacific slope
birds) have alleles C and D. In addition, these subspecies have 1.1% sequence
divergence at the mitochondrial cytochrome b gene and are diagnosably distinct
based on female plum age characters. The intensity of the orange rum p and breast
band of females differs betw een the two subspecies (Isler and Isler 1987, Stiles and
Skutch 1989, Hellmayr 1936, Hackett pers. obs.). Thus, under the phylogenetic
species concept (Cracraft 1983, McKitrick and Zink 1988, Cracraft 1992), these taxa
are considered different species. Although there is direct evidence of
hybridization betw een m any members of the genus Ramphocelus (Sibley 1958,
Novaes 1959, Sick 1985), there are no published records of hybridization between
R. p. passerinii and R. p. costaricensis. These two taxa meet in central Guanacaste,
Costa Rica (Isler and Isler 1987), and in the absence of evidence of interbreeding
m ay be considered separate biological species as well. Cherrie (1891) described
Ramphocelus costaricensis as a species separate from R. passerinii, and I recommend,
therefore, that two species be recognized, Ramphocelus passerinii and Ramphocelus
costaricensis.
Phylogeny and biogeography.—The two independent molecular data sets give
highly concordant branching topologies (Fig. 6.1); only one node differs betw een
the two data sets. The degree of concordance of evolution of allozymes and
mtDNA sequences suggests that the mtDNA gene tree tracks the phylogeny of
species (Neigel and Avise 1986, Pamilo and Nei 1988).
Both allozyme and m tDNA data support the following relationships (Fig.
6.1): in one clade, Ramphocelus passerinii is m ost closely related to R. costaricensis; R.
icteronotus is the sister taxon to the passerinii/costaricensis clade; in the other clade,
Ramphocelus carbo and nigrogularis are sister taxa. These results suggest that the R.
nigrogularis/sanguinolentus species group of Isler and Isler (1987) is not
m onophyletic.
The molecular analyses differ w ith respect to the placement of Ramphocelus
sanguinolentus. Allozyme data suggest that R. sanguinolentus is the sister taxon to
140
the carbo/nigrogularis clade, whereas mtDNA sequence data place R. sanguinolentus
basal to the other Ramphocelus species. Forcing the allozyme topology, w ith R.
sanguinolentus as sister to the nigrogularis/carbo clade, on the mtDNA sequence data,
adds 6 steps to the most parsimonious resolution (132 vs. 138 steps; all characters
used). In the allozyme bootstrap analysis, the node subtending carbo/nigrogularis
and R. sanguinolentus occurred in 69% of the replicates. The node in the mtDNA
sequence bootstrap analysis placing R. sanguinolentus basal is supported at 88%.
Thus, there appears to be comparatively better support in the mtDNA data, which
place R. sanguinolentus basal to the other Ramphocelus species than in the allozyme
data, which place R. sanguinolentus as the sister taxon to R. carbo and R.
nigrogularis. In addition, bootstrap values in analyses of both molecular data sets
indicate comparatively less support for relationships among R. carbo, R.
nigrogularis, and R. sanguinolentus, than among R. passerinii, R. costaricensis, and R.
icteronotus (Fig. 6.1).
Samples of six species of Ramphocelus were analyzed; three species and one
subspecies of Ramphocelus were missing from my analysis. Ramphocelus passerinii,
R. costaricensis, and R. flammigerus form a superspecies group according to Isler
and Isler (1987); the present study is missing only the subspecies Ramphocelus
flammigerus flammigerus. The three missing species, R. dimidiatus, R. melanogaster,
and R. bresilius, belong to the Ramphocelus carbo species group (Isler and Isler 1987).
The influence of exemplars (representing groups by one or few taxa) on branching
topology is little studied in molecular analyses (Weller et al., in press), and the
exclusion of taxa can affect tree topology (Weller et al., in press; Gauthier et al.
1988; Maddison et al. 1984). Whether R. carbo is an appropriate exemplar, that is,
representative of the Ramphocelus carbo species group, is not known. Thus, the
effect that sampling the missing species (dimidiatus, melanogaster, and bresilius)
could have on tree topology, and in particular on the placement of Ramphocelus
sanguinolentus, is also not known.
The phylogeny (Fig. 6.1) suggests the following history of areas (area
cladogram): lowland Pacific (R. costaricensis) and Caribbean (R. passerinii) Central
America are sister areas, Choc6 (R. icteronotus) is the sister area to lowland Central
America, and lowland Amazonia (R. carbo, R. nigrogularis) is the sister to the
Central American/Choc6 clade. This same general area cladogram has been
suggested by molecular phylogenetic analyses of Gymnopithys antbirds (Chapter 4)
and Pteroglossus (Chapter 5) araqaris, and by morphological analyses of Pionopsitta
parrots (Cracraft and Prum 1988), Selenidera toucanets (Cracraft and Prum 1988),
Ramphastos toucans (Prum 1988), and Celeus woodpeckers (Prum 1988).
LITERATURE CITED
ALLARD, M. W., D. L. ELLSWORTH, AND R. L. HONEYCUTT. 1991. Theproduction of single-stranded DNA suitable for sequencing using the polymerase chain reaction. BioTechniques 10: 24-26.
AMERICAN ORNITHOLOGISTS'UNION. 1983. Check-list of North American birds, 6th ed. American Ornithologists' Union, W ashington, D.C.
AVISE, J. C. AND W. S. NELSON. 1989. Molecular genetic relationships of the extinct Dusky Seaside Sparrow. Science 243: 646-648.
BATES, J. M. AND R. M. ZINK. Evolution into the Andes: molecular evidence for species relationships in the genus Leptopogon. Auk, submitted.
CAPPARELLA, A. P. 1987. Effects of riverine barriers on genetic differentiation of Amazonian forest undergrowth birds. Ph.D. dissertation, Louisiana State University, Baton Rouge, Louisiana.
----------. 1988. Genetic variation in Neotropical birds: implications for thespeciation process. Proc. Int. Ornithol. Congr. 19: 1658-1664.
CHERRIE, G. K. 1891. Description of a new species of Ramphocelus from Costa Rica. Auk 8: 62-64.
CRACRAFT, J. 1983. Species concepts and speciation analysis. Curr. Ornithol. 1: 159-187.
----------. 1992. The species of the birds-of-paradise (Paradisaeidae): applying thephylogenetic species concept to a complex pattern of diversification. Cladistics 8:1-43.
----------AND R. O. PRUM. 1988. Patterns and processes of diversification:speciation and historical congruence in some Neotropical birds. Evolution 42: 603-620.
EDWARDS, S. V., P. ARCTANDER, AND A. C. WILSON. 1991. M itochondrialresolution of a deep branch in the genealogical tree for perching birds. Proc. R. Soc. Lond. B. 243:99-107.
FELSENSTEIN, J. 1985. Confidence limits on phylogenies: an approach using the bootstrap. Evolution. 79: 783-791.
---------- - 1986. PHYLIP-Phylogeny inference package, Version 3.0. University ofW ashington, D epartm ent of Genetics, Seattle, W ashington.
GAUTHIER, J., A. G. KLUGE, AND T. ROWE. 1988. Amniote phylogeny and the im portance of fossils. Cladistics 4: 105-210.
HACKETT, S. J. 1989. Effects of varied electrophoretic conditions on detection of evolutionary patterns in the Laridae. Condor 91: 73-90.
---------- AND K. V. ROSENBERG. 1990. Evolution of South Am erican antw rens(Formicariidae): com parison of phenotypic and genetic differentiation. Auk 107: 473-489.
HELLMAYR, C. E. 1936. Catalogue of birds of the Americas. Field M useum of N atural History Zool. Series, Vol. XIII, Part IX.
HILLIS, D. M. AND J. P. HUELSENBECK. 1992. Signal, noise, and reliability in m olecular phylogenetic analyses. J. Hered. 83: 189-195.
---------- , A. LARSON, S. K. DAVIS, AND E. A. ZIMMER. 1990. Pages 318-370 inM olecular Systematics (D. M. Hillis and C, Moritz, eds.). Sinauer Assoc., Inc., Sunderland, M assachusetts.
ISLER, M. L. AND P. R. ISLER. 1987. The tanagers: natural history, distribution, and identification. Sm ithsonian Inst. Press, W ashington, D.C.
KLUGE, A. G. 1989. A concern for evidence and a phylogenetic hypothesis of relationships am ong Epicrates (Boidae, Serpentes). Syst. Zool. 38: 7-25.
KOCHER, T. D., W. K. THOMAS, A. MEYER, S. V. EDWARDS, S. PAABO, F. X. VILLABLANCA, AND A. C. WILSON. 1989. Dynamics of m itochondrial DNA evolution in animals: am plification and sequencing w ith conserved prim ers. Proc. Natl. Acad. Sci. 86: 6196-6200.
143
MADDISON, W. P., M.J.DONOGHUE, AND D .R .M ADDISON. 1984. Outgroup analysis and parsimony. Syst. Zool. 33: 83-103.
MCKITRICK, M. C. AND R. M. ZINK. 1988. Species concepts in ornithology. Condor 90:1-14.
MORONY, J. J., W. J. BOCK, AND J. FARRAND. 1975. Reference list of birds of the world. Department of Ornithology, American Museum of Natural History, New York.
MURPHY, R. W., J. W. SITES, JR., D. G. BUTH, AND C. H. HAUFLER. 1990. Proteins 1: isozyme electrophoresis. Pages 45-126 in Molecular systematics (D. M.Hillis and C. Moritz, Eds.). Sinauer Assoc., Inc., Sunderland, Massachusetts.
NEI, M. 1978. Estimation of average heterozygosities and genetic distance from a small number of individuals. Genetics 89: 583-590.
----------. 1987. Molecular evolutionary genetics. Columbia Univ. Press, NewYork.
NEIGEL, J. AND J. C. AVISE. 1986. Phylogenetic relationships of mitochondrial DNA under various demographic models of speciation. Pages 515-534 in Evolutionary Processes and Theory (E, Nevo and S. Karlin, Eds.). Academic Press, New York.
NOV AES, F. C. 1959. Variagao geogr^fica e o problema da especie nas aves dogrupo Ramphocelus carbo. Bol. Mus. Para. Emilio Goeldi Nova Ser. Zool. 22: 1-63.
PAMILO, P. AND M. NEI. 1988. Relationships between gene trees and species trees. Mol. Biol. Evol. 3: 254-259.
PETERSON, A. T. 1992. Phylogeny and rates of molecular evolution in the Aphelocoma jays (Corvidae). Auk 109:133-147.
--------- , P. ESCALANTE P., AND A. NAVARRO S. 1992. Genetic variation inMexican populations of Common Bush-tanagers and Chestnut-capped Brush-finches. Condor 94: 244-253.
PRUM, R. O. 1988. Historical relationships among avian forest areas of endemism in the Neotropics. Proc. Int. Ornithol. Congr. 19: 2562-2572.
ROGERS, J. S. 1972. Measures of genetic similarity and genetic distance. Studies in Genetics VII. Univ. Texas Publ. No. 7213: 145-153.
SANDERSON, M. J. 1989. Confidence limits on phylogenies: the bootstrap revisited. Cladistics 5:113-130.
144
SIBLEY, C. G. 1958. Hybridization in some Colombian tanagers, avian genus Ramphocelus. Proc. Amer. Phil. Soc. 102: 448-453.
SICK, H. 1985. Ornithologia Brasileira, uma introduqao. Editora Univ. Brasilia, Brasilia.
STILES, F. G. AND A. F. SKUTCH. 1989. A guide to the birds of Costa Rica. Cornell Univ. Press, Ithaca, New York.
STORER, R. W. 1970. Subfamily Thraupinae. Pages 246-408 in Check-list of Birds of the World, vol. 13 (R. A. Paynter, Jr., Ed.). Museum of Comparative Zoology, Cambridge, Massachusetts.
SWOFFORD, D. L. 1990. PAUP: phylogenetic analysis using parsimony, Version 3.0. Illinois Natural History Survey, Champaign.
---------- AND R. B. SELANDER. 1981. BIOSYS-1: a FORTRAN program for thecomprehensive analysis of electrophoretic data in population genetics and systematics. J. Hered. 72: 281-283.
WELLER, S. J., T. P. FRIEDLANDER, J. A. MARTIN, AND D. P. PASHLEY. In Press. Phylogenetic studies of ribosomal RNA variation in higher moths and butterflies (Lepidoptera: Dityrsia). Molecular Phylogenetics and Evolution.
ZINK, R. M. AND J. C. AVISE. 1990. Patterns of mitochondrial DNA andallozyme evolution in the avian genus Am m odram ns. Syst. Zool. 39:148-161.
— AND D. L. DITTMANN. 1991. Evolution of Brown Towhees: mitochondrial DNA evidence. Condor 93: 98-105.
CHAPTER 7
PIPRA
Courtship and lekking behavior have been described for many of the 51
species of manakins (Pipridae), and some species have been studied in great detail
(Sick 1967; Snow 1963, 1977; Prum and Johnson 1987). However, few systematic
studies are available for placing the behavioral data in a phylogenetic framework
(Brooks and McLennan 1991). Systematic work has been restricted to phylogenetic
analyses of biochemical characters (Lanyon 1985) and display characters (Prum and
Johnson 1987) at taxonomic levels above the genus and lower-level allozyme
analyses of Pipra erythrocephala and P. rubrocapilla across Amazonian river systems
(Capparella 1987).
The five species in the genus Pipra have black bodies and red or yellow
heads. Because various combinations of these black-bodied species occur
sympatrically, membership in the "Pipra erythrocephala" superspecies complex has
been interpreted differently by various researchers. According to Snow (1979), the
Pipra erythrocephala superspecies complex includes the following species: P.
erythrocephala (lowlands of Panama and much of Amazonia north of the
Amazon), P. rubrocapilla (lowlands of central and eastern South America, east of
the Andes in Peru, northern Bolivia, and southern Amazonian Brazil), P.
chloromeros (upper tropical zone of western South America, east of the Andes in
eastern Peru and northeast Bolivia), and P. mentalis (lowlands of Middle America
and northw estern South America, from Mexico on Caribbean slope to Nicaragua,
both slopes of Costa Rica and Panama, and in western Colombia and
northw estern Ecuador). Sibley and Monroe (1990) included P. erythrocephala, P.
mentalis, and P. rubrocapilla in the erythrocephala allospecies; however, they
excluded P. chloromeros. Distributional information seemed to have shaped Sibley
145
and M onroe's (1990) decision to exclude P. chloromeros from the P. erythrocephala
allospecies, because P. chloromeros occurs sympatrically w ith P. rubrocapilla (Haffer
1970), w hereas other m em bers of the P. erythrocephala superspecies are allopatric
to one another. In contrast to these two taxonomies, Haffer (1970) included P.
erythrocephala, P. rubrocapilla, P. chloromeros, P. mentalis, and P. cornuta (upper
tropical zone of the Pantepui region of northeast South America) in the P.
erythrocephala superspecies complex. Thus, there is uncertainty concerning how
the both the distributional data and phenotypic appearance of these b irds are best
represented in a classification.
In this paper, I address phylogenetic and biogeographic relationships
am ong species in the Pipra erythrocephala superspecies complex and w ithin two of
the species (Pipra mentalis and P. erythrocephala) using m itochondrial DNA
sequence data. In addition to assessing genetic relationships am ong taxa, I address
p lum age evolution as well.
METHODS
D N A sequences.—Tissue samples for this analysis were obtained from the
Louisiana State U niversity M useum of N atural Science (LSUMNS) Frozen Tissue
Collection and the Academ y of N atural Sciences, Philadelphia (see Table 7.1 for
collecting localities).
A total nucleic acid preparation w as m ade from 0.1 gram of liver tissue
(Hillis et al. 1990). Amplification of a 433 base-pair region (not including primers)
of the m itochondrial (mt) cytochrome b gene was perform ed via the polym erase
chain reaction (PCR), using prim ers L14841 (5-CCATCCAACATCTCAGCATG
ATGAAA-3'; Kocher et al. 1989) and the reverse and com plem ent of L15299 (51-
GGAGGAAGTGCAGGGCGAAGAATCG-3'; Edw ards et al. 1991). D ouble-
stranded PCR amplifications were perform ed in 50 m l total reaction volum es (10
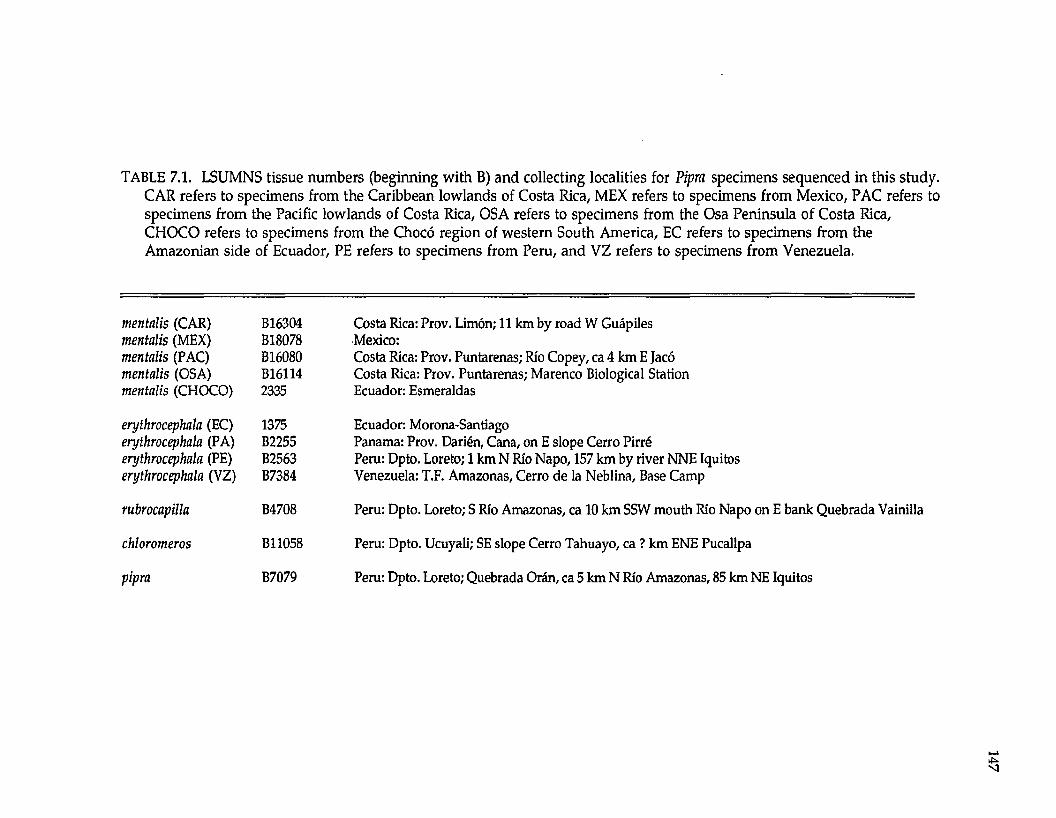
TABLE 7.1. LSUMNS tissue numbers (beginning with B) and collecting localities for Pipra specimens sequenced in this study. CAR refers to specimens from the Caribbean lowlands of Costa Rica; MEX refers to specimens from Mexico, PAC refers to specimens from the Pacific lowlands of Costa Rica, OSA refers to specimens from the Osa Peninsula of Costa Rica, CHOCO refers to specimens from the Choco region of western South America, EC refers to specimens from the Amazonian side of Ecuador, PE refers to specimens from Peru, and VZ refers to specimens from Venezuela.
mentalis (CAR) B16304mentalis (MEX) B18078mentalis (PAC) B16080mentalis (OSA) B16114mentalis (CHOCO) 2335
erythrocephala (EC) 1375erythrocephala (PA) B2255erythrocephala (PE) B2563erythrocephala (VZ) B7384
rubrocapilla B4708
chloromeros B11058
pipra B7079
Costa Rica: Prov. Lim6n; 11 km by road W Guapiles Mexico:Costa Rica: Prov. Puntarenas; Rio Copey, ca 4 km E Jaco Costa Rica: Prov. Puntarenas; Marenco Biological Station Ecuador: Esmeraldas
Ecuador: Morona-SantiagoPanama: Prov. Darien, Cana, on E slope Cerro PirrePeru: Dpto. Loreto; 1 km N Rio Napo, 157 km by river NNE IquitosVenezuela: T.F. Amazonas, Cerro de la Neblina, Base Camp
Peru: Dpto. Loreto; S Rio Amazonas, ca 10 km SSW mouth Rio Napo on E bank Quebrada Vainilla
Peru: Dpto. Ucuyali; SE slope Cerro Tahuayo, ca ? km ENE Pucallpa
Peru: Dpto. Loreto; Quebrada Oran, ca 5 km N Rio Amazonas, 85 km NE Iquitos
148
m l of a 10'2 dilution of the total DNA preparation, 4 m l of a 10 mM solution of
each prim er, 5 ml of 10X buffer, 3.6 ml of a 25 mM solution of MgCl2 / 3 ml of a 1.0
mM solution of dNTP’s, 0.20 ml Taq DNA polymerase [Promega], up to 50 ml
w ith H 2 O). Thirty to 35 cycles were performed using the following cycling
parameters: first cycle—denaturation at 94°C for 3 minutes, annealing at 49°C for 1
minute, extension at 72°C for 45 seconds; remaining cycles—denaturation at 94°C
for 1 m inute, annealing at 49°C for 1 minute, extension at 72°C for 45 seconds.
Single-stranded DNA was generated using only one prim er (Allard et al.
1991). Six m l of the double-stranded product were used to generate single
stranded DNA in 100 ml reactions (6 ml double-stranded DNA, 6 ml of a 10 mM
solution of one primer, 10 ml of 10X buffer, 6 ml of a 25 mM solution of MgCl2 , 5
ml dNTP's, 0.40 ml Taq DNA polymerase [Promega], up to 100 ml w ith H 2 O).
Twenty-two cycles were performed using the following cycling parameters: first
cycle—denaturation at 94°C for 3 minutes, annealing at 49°C for 1 minute,
extension at 72°C for 1 minute; remaining cycles—denaturation at 94°C for 1
m inute, annealing at 49°C for 1 minute, extension at 72°C for 1 minute. Single
stranded DNA of both the heavy and light mtDNA strands were cleaned by 5
washings w ith H2 O through Ultrafree®-MC 30,000 NNMWL filters (Millipore
Corp., Bedford, MA), and concentrated to a final volume of approximately 30 ml.
Seven ml of cleaned single-stranded DNA were used for DNA sequencing using
T7 DNA polymerase (Sequenase® version 2.0, United States Biochemical,
Cleveland, OH).
The DNA sequence data were analyzed cladistically using PAUP 3.0L
(Swofford 1990). The sequence of Pipra pipra was used to root the DNA sequence
trees. All base positions were used in the analysis. One thousand bootstrap
replicates were performed (Felsenstein 1985, Sanderson 1989). Percent sequence
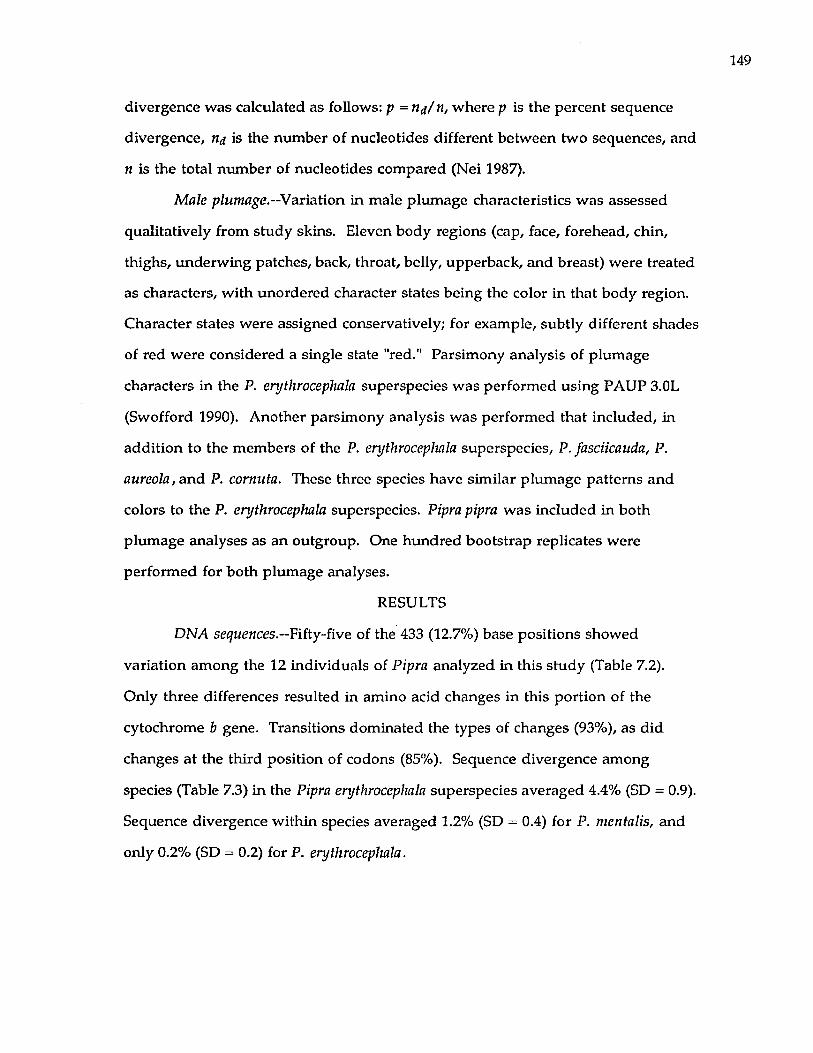
divergence was calculated as follows: p = n&/n, where p is the percent sequence
divergence, tia is the number of nucleotides different between two sequences, and
n is the total num ber of nucleotides compared (Nei 1987).
Male plumage.—V ariation in male plumage characteristics was assessed
qualitatively from study skins. Eleven body regions (cap, face, forehead, chin,
thighs, underwing patches, back, throat, belly, upperback, and breast) were treated
as characters, w ith unordered character states being the color in that body region.
Character states were assigned conservatively; for example, subtly different shades
of red were considered a single state "red." Parsimony analysis of plumage
characters in the P. erythrocephala superspecies was performed using PAUP 3.0L
(Swofford 1990). Another parsimony analysis was performed that included, in
addition to the members of the P. erythrocephala superspecies, P. fasciicauda, P.
aureola, and P. comuta. These three species have similar plumage patterns and
colors to the P. erythrocephala superspecies. Pipra pipra was included in both
plumage analyses as an outgroup. One hundred bootstrap replicates were
performed for both plumage analyses.
RESULTS
DNA sequences.—Fifty-five of the 433 (12.7%) base positions showed
variation among the 12 individuals of Pipra analyzed in this study (Table 7.2).
Only three differences resulted in amino acid changes in this portion of the
cytochrome b gene. Transitions dominated the types of changes (93%), as did
changes at the third position of codons (85%). Sequence divergence among
species (Table 7.3) in the Pipra erythrocephala superspecies averaged 4.4% (SD = 0.9).
Sequence divergence within species averaged 1.2% (SD = 0.4) for P. mentalis, and
only 0.2% (SD = 0.2) for P. erythrocephala.
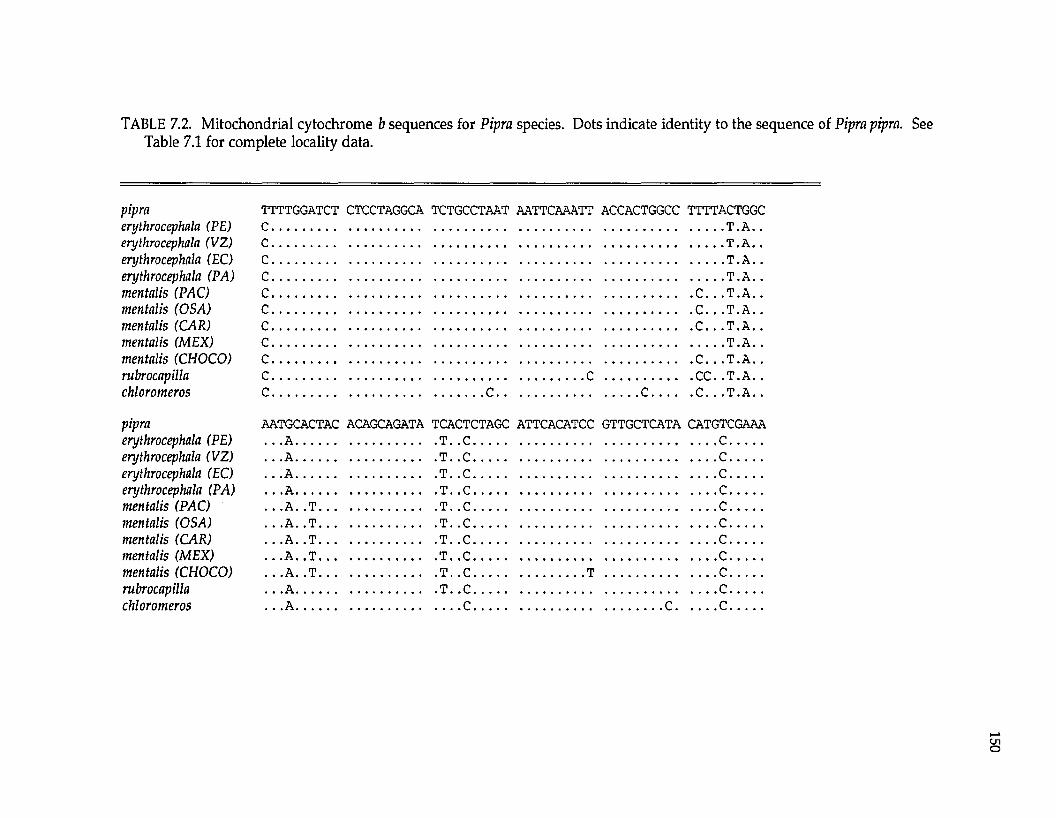
TABLE 7.2. Mitochondrial cytochrome b sequences for Pipra species. Dots indicate identity to the sequence of Pipra pipra. SeeTable 7.1 for complete locality data.
pipra TTTTGGATCT CTCCTAGGCA TCTGCCTAAT AATTCAAATT ACCACTGGCC TTTTACTGGCerythrocephala (PE) C ................................................................................................................................................................. T . A . .erythrocephala (VZ) C................................................................................................................................................................. T . A . .erythrocephala (EC) C ................................................................................................................................................................. T . A . .erythrocephala (PA) C................................................................................................................................................................. T . A . .mentalis (PAC) C ........................................................................................................................................................C . . . T . A . .mentalis (OSA) C ........................................................................................................................................................C . . . T . A . .mentalis (CAR) C ........................................................................................................................................................C . . . T . A . .mentalis (MEX) C ................................................................................................................................................................... T . A . .mentalis (CHOCO) C ........................................................................................................................................................ C . . . T . A . .rubrocapilla C ................................................................................................................ C CC. . T . A . .chloromeros C........................................................................... C ....................................................C ...............C . . . T . A . .
pipra AATGCACTAC ACAGCAGATA TCACTCTAGC ATTCACATCC GTTGCTCATA CATGTCGAAAerythrocephala (PE) . . . A .................................................... T . . C .......................................................................................C .............erythrocephala (VZ) . . . A .................................................... T . . C .......................................................................................C .............erythrocephala (EC) . . . A .................................................... T. . c .......................................................................................C .............erythrocephala (PA) . . . A .................................................... T . . C .......................................................................................C .............mentalis (PAC) . . . A. . T ..........................................T. . C ......................................................................................C .............mentalis (OSA) . . . A. . T ..........................................T . . C .......................................................................................C .............mentalis (CAR) . . . A. . T ..........................................T. . C ......................................................................................C .............mentalis (MEX) . . . A. . T ..........................................T. , C ......................................................................................C .............mentalis (CHOCO) . . . A. . T ..........................................T. . C .........................................T... ........................................C ............rubrocapilla . . . A ..................................................T . . C ........................................................................................C ............chloromeros . . . A .......................................................... C .................................................................... C ............... C ............
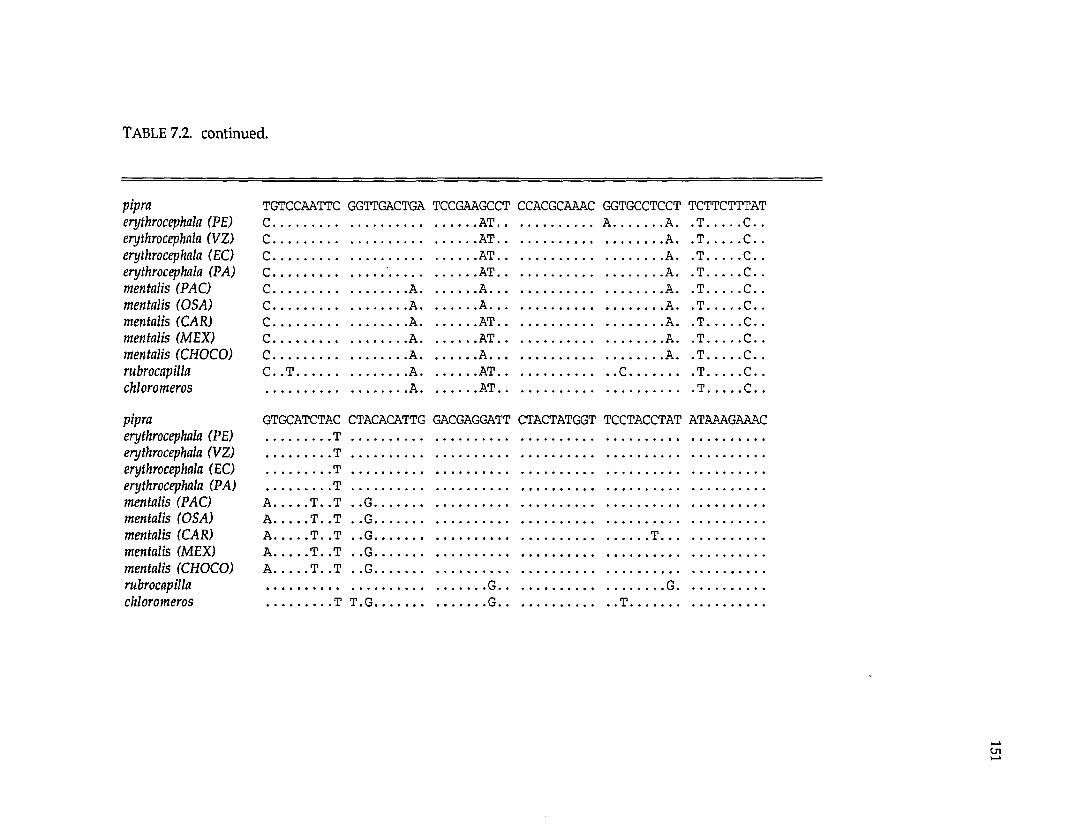
TABLE 7.2. continued.
pipra TGTCCAATTC GGTTGACTGA TCCGAAGCCT CCACGCAAAC GGTGCCTCCT TCTTCTTTATerythrocephala (PE) C ........................................................................ A T..................................... A A . . T .............C . .erythrocephala (V Z) C ....................................................................... A T .............................................................. A . . T ...........C . .erythrocephala (EC) C ....................................................................... A T .............................................................. A . . T ...........C . .erythrocephala (PA ) C ........................................................................AT..............................................................A . . T ...........C . .mentalis (PAC) C .................................................A .................. A ................................................................. A . . T ............ C . .mentalis (O SA ) C .................................................A .................. A ................................................................. A . .T ............ C . .mentalis (C AR) C .................................................A .................. A T...............................................................A . . T ............ C . .mentalis (M EX) C .................................................A .................. A T...............................................................A . . T ............ C . .mentalis (CH OCO ) C ................................................ A .................. A ................................................................. A . . T ............ C . .rubrocapilla C . . T . ..................................... A .....................A T...........................................C ........................T .............C . .chloromeros......................... A .....................A T .......................................................................t .............c . .
pipra GTGCATCTAC CTACACATTG GACGAGGATT CTACTATGGT TCCTACCTAT ATAAAGAAACerythrocephala (PE)........... ..................... T ......................................................................................................................................................erythrocephala (V Z)................................ T ......................................................................................................................................................erythrocephala (EC)................................ T ......................................................................................................................................................erythrocephala (PA ).......... .........................T .....................................................................................................................................................mentalis (PAC) A T . . T . . G ...........................................................................................................................................mentalis (O SA ) A T . . T . . G ...........................................................................................................................................m entalis (C AR) A ............ T . . T . , G .................................................................................................. T .....................................mentalis (M EX) A T . . T . . G ...........................................................................................................................................mentalis (CH OCO) A T . . T . . G ...........................................................................................................................................rubrocapilla ..............................................................................G ............................................................G ................................chloromeros......................... T T . G ........................................G ........................................... T .................................................
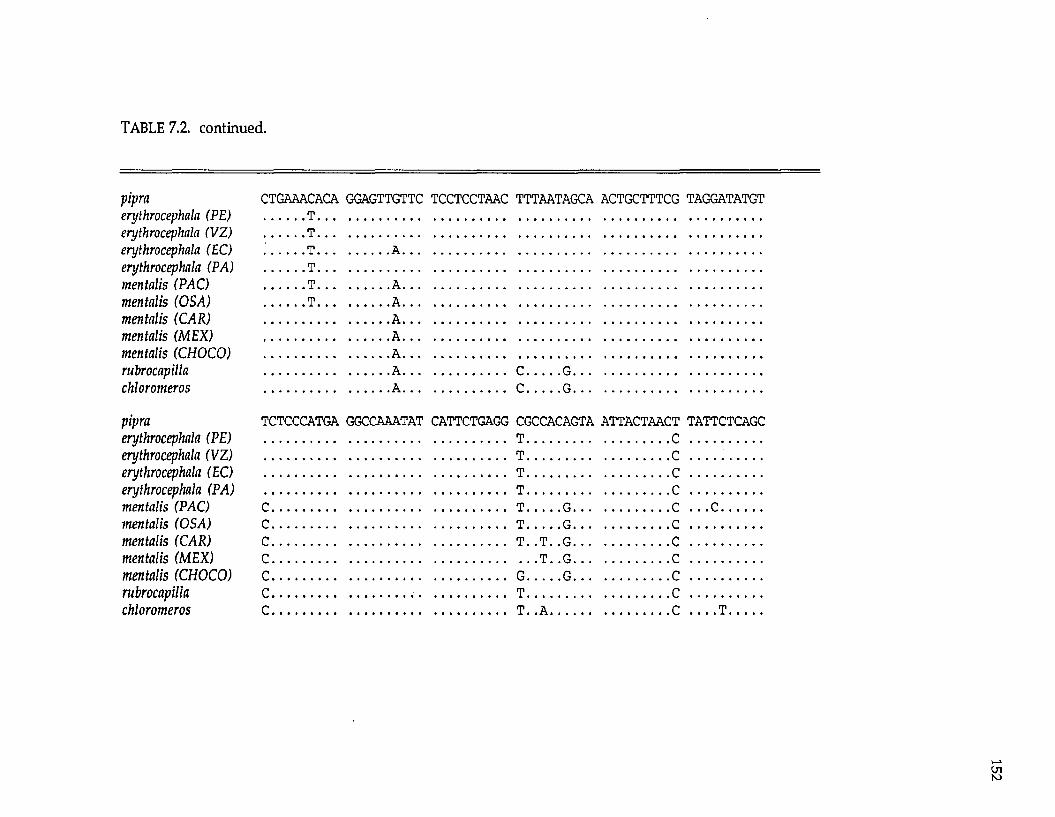
TABLE 7.2. continued.
pipraerythrocephala (PE) erythrocephala (VZ) erythrocephala (EC) erythrocephala (PA) mentalis (PAC) mentalis (OSA) mentalis (CAR) mentalis (MEX) mentalis (CHOCO) rubrocapilla chloromeros
pipraerythrocephala (PE) erythrocephala (VZ) erythrocephala (EC) erythrocephala (PA) mentalis (PAC) mentalis (OSA) mentalis (CAR) mentalis (MEX) mentalis (CHOCO) rubrocapilla chloromeros
CTGAAACACA GGAGTTGTTC TCCTCCTAAC TTTAATAGCA ACTGCTTTCG TAGGATATGT T ............................................................................................................................................................... T ...............................................................................................................................................................i T ...........................A ............................................................................................................................... T ............................................................................................................................................................... T ...........................A ................................................................................................................................ T ...........................A ........................................................................................................................................................................A ...........................................................................................................................................................A ................................................................................................................................................................A ............................................................................................................................................................................. A ........................................C .............. G .............................................................................................................. A ........................................C .............. G ..................................................................
TCTCCCATGA GGCCAAATAT CATTCTGAGG CGCCACAGTA ATTACTAACT TATTCTCAGC...................................................................................... T C ................................................................................................................ T ...................................................C ............... ...................................................................................................T C ................................................................................................................ T C ..........................C ................................................................................... T G ...................................... C . . .C ...............C ................................................................................... T G . . .C... ..........................C ................................................................................... T . .T . .G ...................................... C... ..........................C ............................................................................................... T . .G ....................................C... ..........................C ................................................................................... G G ...................................... C... ..........................C ............................................... .. .................................T .......................................................C... ..........................C ................................................................................... T . . A ........................................... C ______ T ............
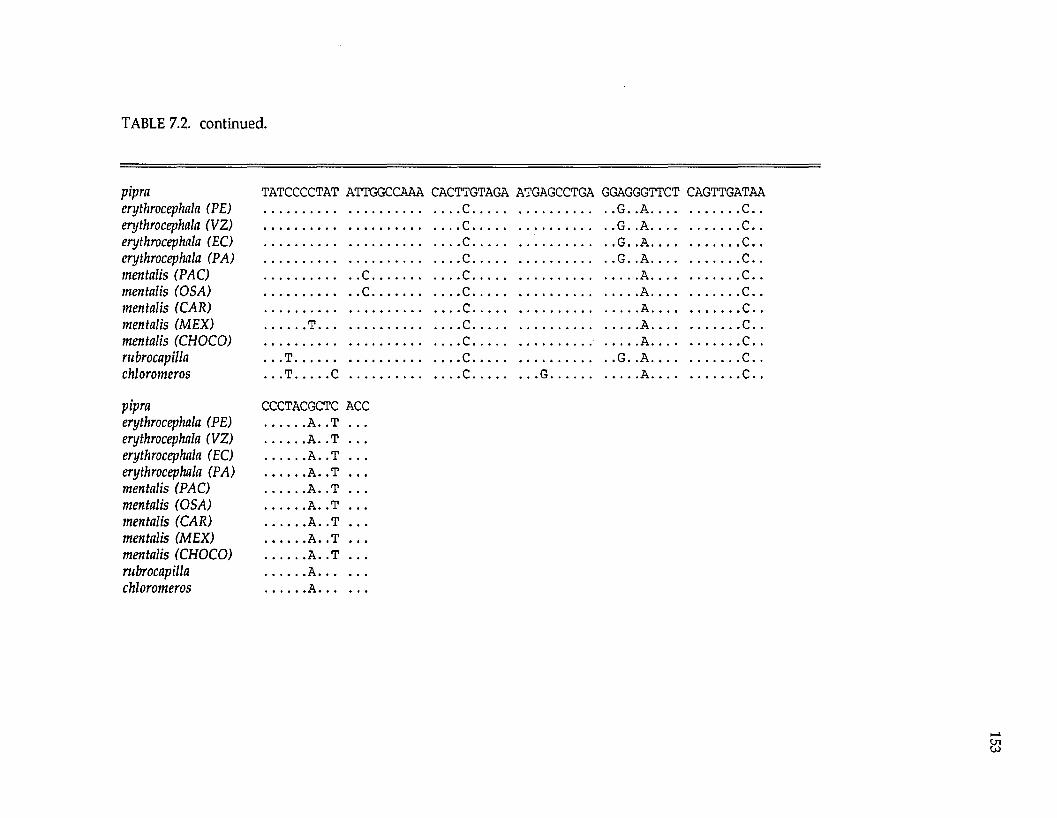
TABLE 7.2. continued.
pipraerythrocephala (PE) erythrocephala (V Z) erythrocephala (EC) erythrocephala (PA) mentalis (PAC)
TATCCCCTAT ATTGGCCAAA CACTTGTAGA ATGAGCCTGA GGAGGGTTCT CAGTTGATAA. . . .C .................................................. G. .A ................................C . .____ c ............. ..................................G. . A . . . . ................. C. .____ c ............ ..................................G. . A ____ ................. c . .. . . . c ........... ..................................G. . A ____ ................. c . .
................................. C .................. ____ c ............ . A. . . . ................. c . .mentalis (O SA ) mentalis (C AR) m entalis (M EX) mentalis (CH OCO ) rubrocapilla chloromeros
................................. c .................. . . . . c ........... . A. . . . ................. c . .____ c ............ . A ____ ................. c . .
.............. T ..................................... ____ c ............ . A ____ ................. c . .____ c ............. . A. . . . ................. c . .
. . . T ............................................. ____ c ............ ..................................G. . A . . . . ................. c . .
. . . T ........... C .......................... ____ c ............ . . . G ............................ . A ____ ................. c . .
pipraerythrocephala (PE) erythrocephala (V Z) erythrocephala (EC) erythrocephala (PA) mentalis (PAC) mentalis (O SA ) mentalis (C AR) mentalis (M EX) mentalis (CH OCO ) rubrocapilla chloromeros
CCCTACGCTC ACC..............A . . T . . ...............A . . T . . ...............A . . T . . ............... A . . T . . ............... A . . T . . ............... A . . T . . ............... A . . T . . ...............A . . T . . ...............A . . T . . ............... A ................................ A ..................
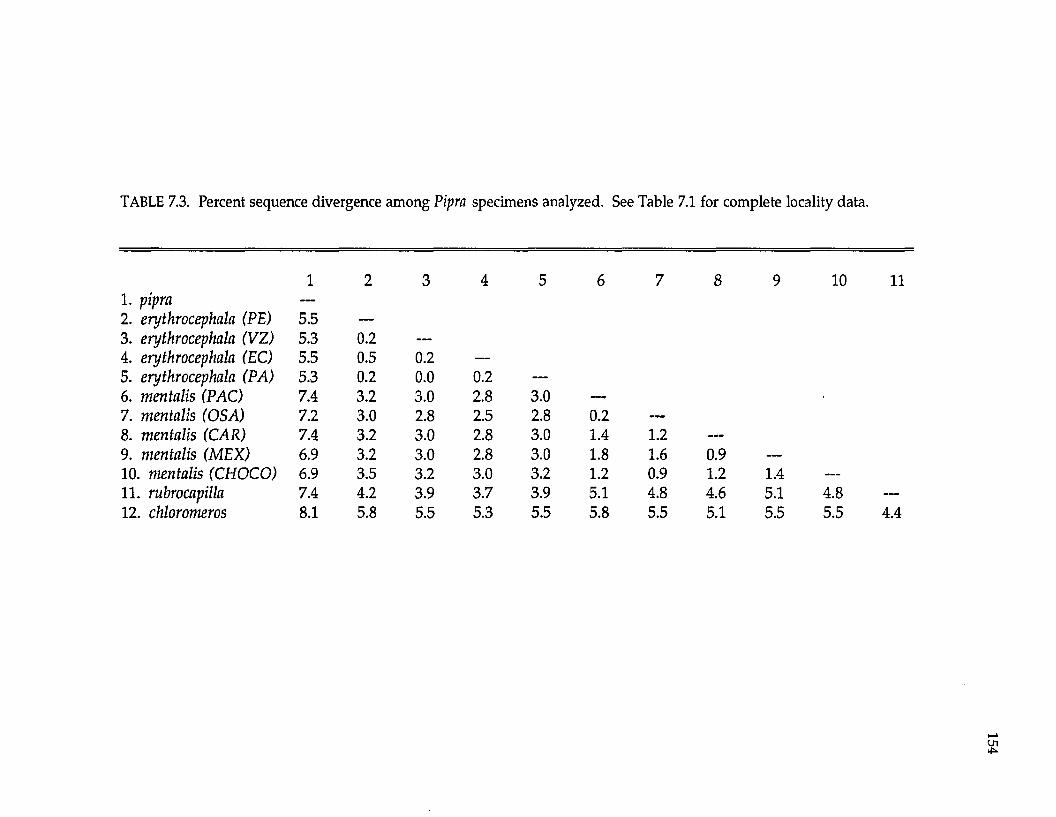
TABLE 7.3. Percent sequence divergence among Pipra specimens analyzed. See Table 7.1 for complete locality data.
1 2 3 4 5 6 7 8 9 10 111. pipra —2. erythrocephala (PE) 5.5 —3. erythrocephala (V Z ) 5.3 0.2 —
4. erythrocephala (EC) 5.5 0.5 0.2 —
5. erythrocephala (P A ) 5.3 0.2 0.0 0.2 —6. m entalis (PA C ) 7.4 3.2 3.0 2.8 3.0 —
7. m entalis (O SA ) 7.2 3.0 2.8 2.5 2.8 0.2 —
8. m entalis (C A R ) 7.4 3.2 3.0 2.8 3.0 1.4 1.2 —
9. m entalis (M E X ) 6.9 3.2 3.0 2.8 3.0 1.8 1.6 0.9 —
10. m entalis (C H O C O ) 6.9 3.5 3.2 3.0 3.2 1.2 0.9 1.2 1.4 —
11. rubrocapilla 7.4 4.2 3.9 3.7 3.9 5.1 4.8 4.6 5.1 4.8 —12. chloromeros 8.1 5.8 5.5 5.3 5.5 5.8 5.5 5.1 5.5 5.5 4.4
155
Parsimony analysis of the mtDNA sequence data resulted in two most
parsimonious trees of 70 steps (C.I. = 0.70). These two trees differ in the placement
of the Ecuadorian specimen of Pipra erythrocephala. One of the most parsimonious
trees (Fig. 7.1) places this specimen basal to the other three P. erythrocepliala; the
other places all the P. erythrocephala as an unresolved polychotomy. The bootstrap
analysis (Fig. 7.1) resulted in a tree w ith the same topology as one of the most
parsim onious trees. In this tree, specimens of P. erythrocephala and P. mentalis
form monophyletic groups. W ithin P. mentalis, two clades are evident. The first
clade consists of populations from Mexico and the Caribbean slope of Costa Rica.
In the second clade, birds from the Osa Peninsula of Costa Rica are most closely
related to birds from farther north on the Pacific slope of Costa Rica, and birds
from Ecuador are sister taxa to the birds in Pacific/Osa Costa Rica. The phylogeny
(Fig. 7.1) suggests the following relationships among species: Pipra rubrocapilla and
P. chloromeros are sister taxa, P. mentalis is the sister to the rubrocapilla/chloromeros
clade, and P. erythrocephala is the sister species to the
rubrocapilla/chloromeros/mentalis clade.
Male plumage.— Analysis of plum age coloration resulted in little
phylogenetic resolution among the four species of the Pipra erythrocephala
superspecies (11 characters; Table 7.4). There were eight most parsimonious trees
of 12 steps (C.I. = 0.75) and 7 more trees at 13 steps. Not surprisingly, the strict
consensus tree shows all relationships unresolved. The phylogenetic analysis of
plumage that included eight taxa and 11 characters (Table 7.4) generated 32 trees of
21 steps (C.I. = 0.85). The only node in the strict consensus tree united Pipra
fasciicauda and P. aureola. This node also occurred in 95% of the bootstrap
replicates. The bootstrap tree (Fig. 7.2) suggested some weakly supported groups.
The red-capped Pipra formed a group, including not only members of the P.
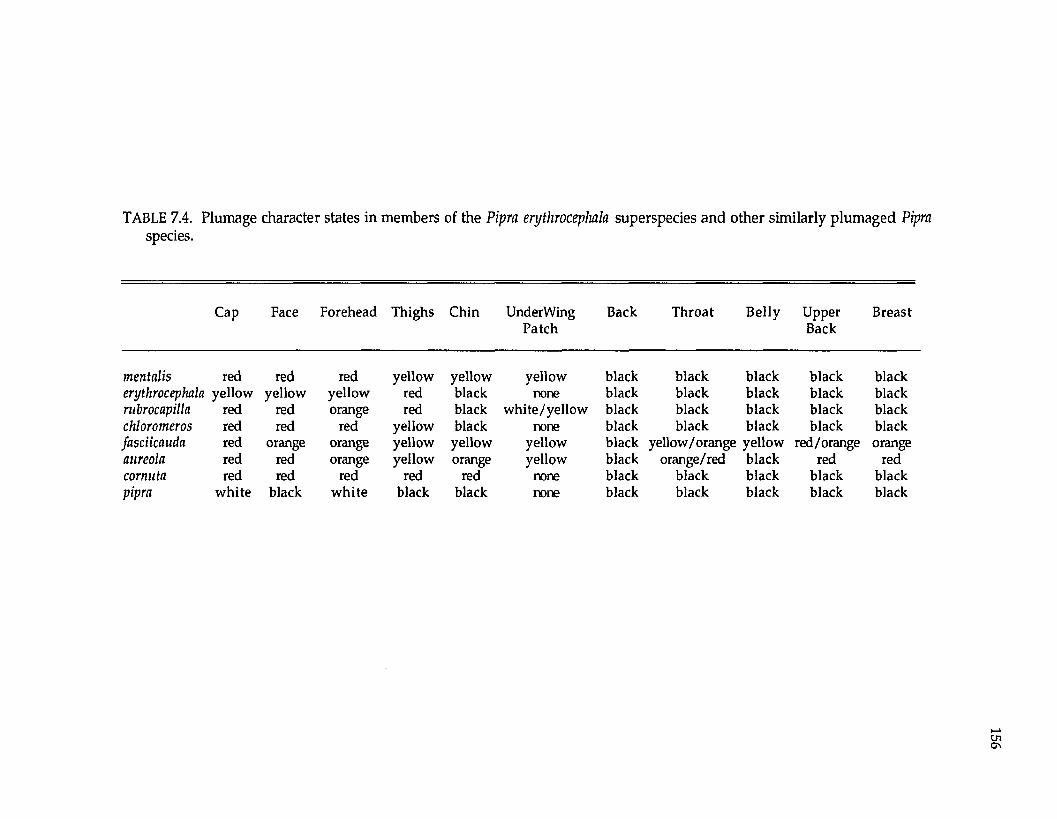
TABLE 7.4. Plumage character states in members of the Pipra erythrocephala superspecies and other similarly plumaged Pipra species.
Cap Face Forehead Thighs Chin UnderWingPatch
Back Throat Belly UpperBack
Breast
m entalis red red red yellow yellow yellow black black black black blackerythrocephala yellow yellow yellow red black none black black black black blackrubrocapilla red red orange red black white/yellow black black black black blackchloromeros red red red yellow black none black black black black blackfasciicauda red orange orange yellow yellow yellow black yellow/orange yellow red/orange orangeaureola red red orange yellow orange yellow black orange/red black red redcornuta red red red red red none black black black black blackpipra white black white black black none black black black black black
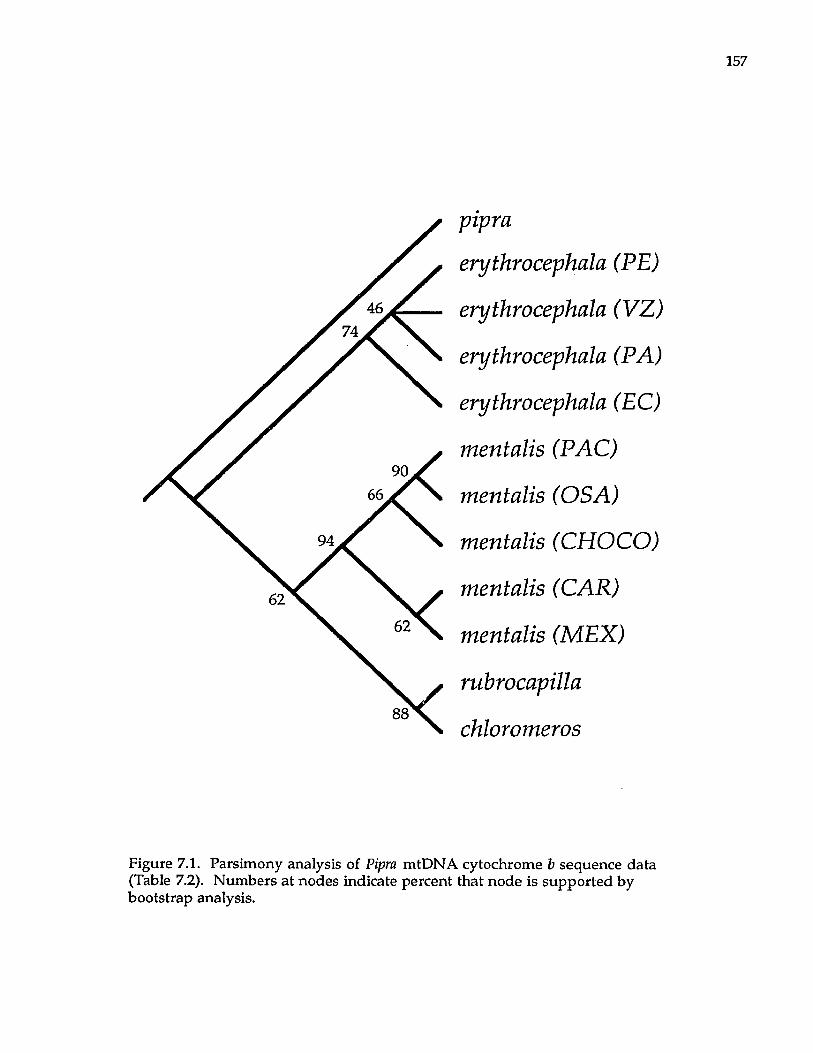
157
46
■pipra
erythrocephala (PE)
erythrocephala (VZ)
erythrocephala (PA)
erythrocephala (EC)
mentalis (PAC)
mentalis (OSA)
mentalis (CH OCO)
mentalis (CAR)
mentalis (MEX)
rubrocapilla
chloromeros
Figure 7.1. Parsimony analysis of Pipra mtDNA cytochrome b sequence data (Table 7.2). Numbers at nodes indicate percent that node is supported by bootstrap analysis.
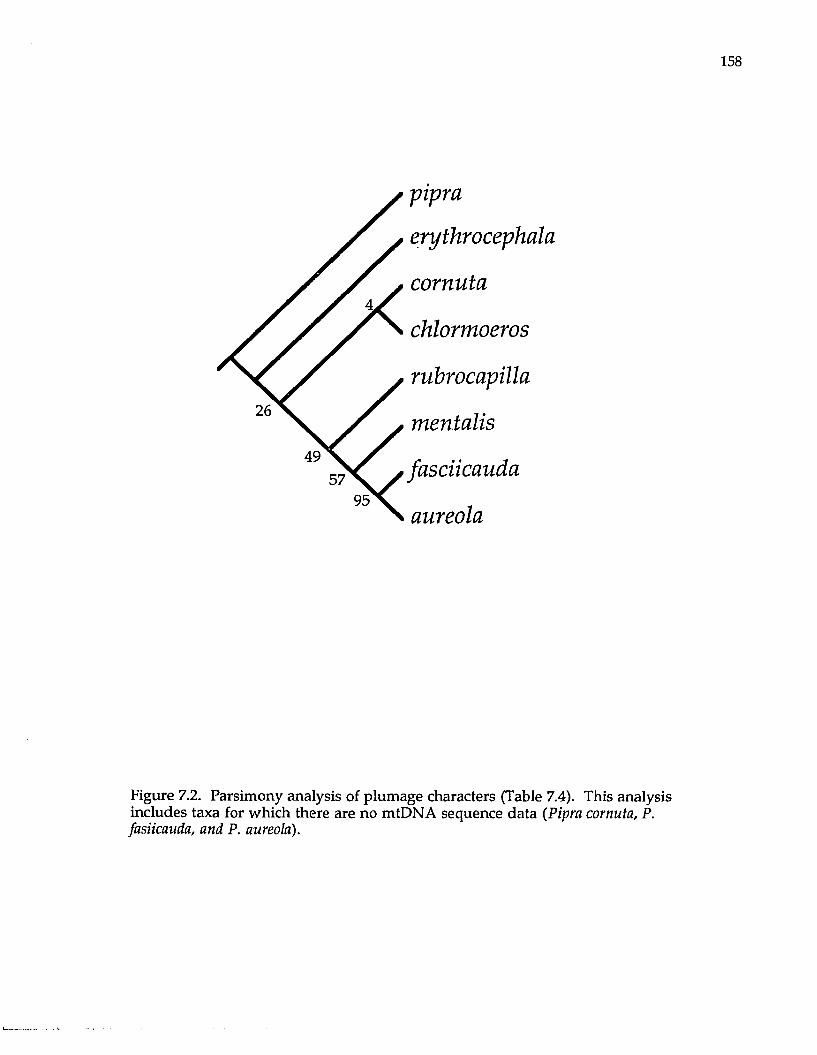
158
■pipra
erythrocephala
cormita
chlormoeros
rubrocapilla
mentalis
fasciicauda
aureola
Figure 7.2. Parsimony analysis of plumage characters (Table 7.4). This analysis includes taxa for which there are no mtDNA sequence data (Pipra cornuta, P. fasiicauda, and P. aureola).
159
erythrocephala superspecies (P. mentalis, P. rubrocapilla, P. chloromeros), but also P.
fasciicauda, P. comuta, and P. aureola. According to plumage characters, there is no
strong evidence for a monophyletic P. erythrocephala superspecies.
DISCUSSION
Phylogenies of DNA and morphology.—The correspondence of different data
sets is a powerful method for assessing confidence of phylogenetic hypotheses
(Miyamoto and Cracraft 1991, Cracraft and Helm-Bychowski 1991, Kluge 1989,
Zink and Avise 1990), and, in this study, correspondence of plumage
characteristics with DNA sequence data can be addressed at different taxonomic
levels. At lower taxonomic levels, within the Pipra erythrocephala superspecies
complex, plumage characteristics seem to have little phylogenetic information
(Table 7.4). There are no nonhomoplasious, informative, synapomorphic
plumage characters among the 11 characters analyzed. All members appear to
have unique (autapomorphic) combinations of characters (Table 7.4; Fig. 7.2).
Some potential synapomorphies do not correspond to sister-taxon relationships
suggested by the DNA sequence data. For example, Pipra mentalis and P.
chloromeros share the derived character (relative to the outgroup Pipra pipra) of
"yellow thighs," but they are not sister taxa based on the DNA data (Fig. 7.1). In
addition, P. erythrocephala and P. rubrocapilla have red thighs, another derived
character, but they are not sister taxa based on DNA sequence data. At a higher
taxonomic level, including species from outside the P. erythrocephala superspecies,
there may be some phylogenetic information in plumage coloration. For
example, Pipra fasciicauda and P. aureola form a monophyletic group corresponding
to the Pipra aureola superspecies group suggested by Haffer (1970) and Snow (1979).
To address the phylogenetic signal in plumage characters among manakins
in the genus, detailed analyses of pigments might prove more informative than
the color itself. H udon et al. (1989) perform ed an analysis of pigm entation among
Pipra erythrocephala, P. rubrocapilla, and P. chloromeros (P. mentalis was not
analyzed). Even though the types of pigm ents in the head and thighs differed, all
pigm ents are closely related biochemically. H udon et al. (1989) found that the
pigm ents (carotenoids) in the red crown of both P. chloromeros and P. rubrocapilla
were m ore similar to each other than either species was to P. erythrocephala. In
addition to the types of pigments, the deposition of pigm ents differed. Pipra
rubrocapilla and P. chloromeros have keto-carotenoids over their entire head,
whereas P. erythrocephala has keto-carotenoids only a t the tips of nape feathers.
These pigm ent characters suggest a close relationship betw een P. rubrocapilla and
P. chloromeros; however, w ithout including P. mentalis and other potentially
closely related red-headed congeners, it is not possible to assess w hether these
pigm ent characters are derived (synapomorphies) or prim itive (H udon et al.
1989).
It has also been argued that molecular characters are preferable to
m orphological characters for a num ber of reasons (Sibley and Ahlquist 1987, 1990),
one of the m ost im portant reasons being the unknow n genetic com ponent of
phenotypic characters. W ithout examining the concordance of phylogenies
derived from different character systems, it is difficult to make broad
generalizations about the phylogenetic inform ation w ithin any particular
character system. For example, plum age characters may be used to docum ent
monophyly of groups of Pipra (corresponding to superspecies), but there does not
seem to be enough phylogenetic information in this analysis of plum age
coloration, as evidenced by the lack of phylogenetically informative characters, to
assess relationships among species w ithin the Pipra erythrocephala superspecies as
defined by Snow (1979) or Sibley and Monroe (1990).
161
M anakins have also been extensively studied from a behavioral
perspective, and the links between behavior and phylogeny have a long, albeit
troubled, history (Brooks and McLennan 1991). Unfortunately, the behaviors of
all members of the Pipra erythrocephala superspecies complex have not been
described, nor have all behaviors of potentially closely related congeners. Thus,
detailed phylogenetic analyses of behavioral data are not possible. However,
some interesting conclusions can be m ade from w hat is known of behavior. The
morphological data suggested that Pipra cormita might be closely allied to some
members of the Pipra erythrocephala superspecies (Fig. 7.2). Pipra comuta has been
placed in the monotypic genus Ceratopipra, most likely because of the pair of
"horns" found at the hindcrown; however, Snow (1977) described the display
behaviors of Pipra comuta as similar to members of the Pipra erythrocephala
superspecies, suggesting a close phylogenetic relationship [as was noted by Haffer
(1970)].
This study demonstrated that using range overlaps as criteria for
membership in superspecies complexes can cause problems if taxonomies are to
reflect phylogeny (Wiley 1981). For example, Snow (1977) suggested that, based on
sympatry of P. cormita and P. erythrocephala, P. comuta should not be placed in the
P. erythrocephala superspecies. However, the potential exists (based on plumage
analyses) that P. comuta could be more closely related to the "red-capped"
members of the Pipra erythrocephala superspecies than is P. erythrocephala.
Similarly, Sibley and Monroe's (1990) decision not to place P. chloromeros in the P.
erythrocephala allospecies does not reflect my mtDNA phylogeny. The extent to
which species composition of other avian superspecies may not reflect phylogeny
(or monophyly) is worthy of further investigation.
Levels o f genetic differentiation and biogeography.--The level of intraspecific
genetic differentiation differs within P. mentalis and P. erythrocephala. Sequence
divergence averages only 0.2% (range 0.0% to 0.5%) among four samples of P.
erythrocephala, whereas sequence divergence averages 1.2% among five samples of
P. mentalis (range 0.2% to 1.8%). Indeed, samples of P. mentalis separated by less
than 200 km on the Pacific coast of Costa Rica are as differentiated from each other
as are P. erythrocephala samples separated by at least 1000 km in South America
(Panama to Peru). These differences in levels of divergence among samples
suggest that differentiation within P. erythrocephala occurred much more recently
than did differentiation within P. mentalis. Alternatively, P. erythrocepluila could
have higher rates of dispersal (gene flow) than P. mentalis, although it is difficult
to imagine that these sedentary species differ greatly in their dispersal ability.
Finally, P. erythrocephala could have undergone more frequent or severe genetic
bottlenecks that P. mentalis.
Capparella (1987) observed a Nei's (1978) genetic distance of 0.101 between
samples of P. rubrocapilla and P. erythrocephala across the Amazon River in Peru.
This genetic distance was much higher than that found xoithin other avian species
(suboscines) similarly sampled across the Amazon (Capparella 1987). However,
Capparella attributed differentiation of all the taxa that he studied to the origin of
the Amazonian river system. The DNA sequence data presented in this paper
suggest that P. erythrocephala and P. rubrocapilla are not sister taxa. Perhaps
different biogeographic events shaped the distribution of manakins in the Pipra
erythrocephala superspecies relative to the other species in Capparella's study. It is
possible that these manakins are older than the other taxa studied by Capparella,
and more ancient biogeographic events caused speciation. Thus, the Amazon
serves as a present-day barrier to dispersal for P. erythrocephala and P. rubrocapilla,
as opposed to serving as the causal agent for diversification of P. erythrocephala
and P. rubrocapilla. It is also im portant to note that P. mentalis (distributed in the
Chocd and Central America) is the sister taxon to the P. chloromeros/P. rubrocapilla
clade (both distributed south of the Amazon), and not to P. erythrocephala
(distributed north of the Amazon), which further casts doubt on the role of the
Amazon River in causing speciation in this group of birds.
The phylogeny (Fig. 7.1) suggests the following area cladogram for the Pipra
taxa analyzed in this study: lowland Pacific Central America (P. mentalis from the
Osa Peninsula of Costa Rica and Pacific coast samples from farther north in Costa
Rica) and Chocd (Ecuador sample of P. mentalis) are sister areas, and this clade is
the sister area to lowland Caribbean Central America (samples of P. mentalis from
the Caribbean slope of Costa Rica and Mexico). Amazonian taxa (P. rubrocapilla, P.
chloromeros, and P. erythrocephala) are the sisters to the Central Am erican/Choc6
manakins. This general area cladogram differs in only one aspect from the
general area cladogram suggested for several other Neotropical taxa distributed in
the same areas of endemism [Chapters 4, 5, and 6; Cracraft and Prum (1988), and
Prum (1988)]. Relationships among these other taxa suggested the following
general area cladogram: Pacific and Caribbean Central America are sister areas;
Chocd is the sister area to Central America, and Amazonia is the sister to Central
America/Chocd. Forcing this general area topology on the Pipra DNA sequence
data presented in this paper adds only one step to the phylogeny illustrated in
Figure 7.1. Thus, more species groups need to be examined to assess how
common the Pipra area cladogram is, and a weighting scheme (Cracraft 1983)
should be developed for biogeographic analyses that takes into account relative
strengths of phylogenetic hypotheses when deriving general area cladograms.
LITERATURE CITED
ALLARD, M. W., D. L. ELLSWORTH, AND R. L. HONEYCUTT. 1991. Theproduction of single-stranded DNA suitable for sequencing using the polymerase chain reaction. BioTechniques 10: 24-26.
BROOKS, D. R. AND D. A. MCLENNAN. 1991. Phylogeny, ecology, and behavior. Univ. Chicago Press, Chicago, Illinois.
CAPPARELLA, A. P. 1987. Effects of riverine barriers on genetic differentiation of Amazonian forest undergrow th birds. Ph.D. dissertation, Louisiana State University, Baton Rouge, Louisiana.
CRACRAFT, J. 1983. Commentary. Pages 456-467 in Perspectives in ornithology (A. H. Brush and G. A. Clark, Jr., Eds.). Cambridge University Press, Cambridge.
---------- AND K. HELM-BYCHOWSKI. 1991. Parsimony and phylogenetic inferenceusing DNA sequences: some methodological strategies. Pages 184-220 in Phylogenetic analysis of DNA sequence data (M. M. Miyamoto and J.Cracraft, Eds.). Oxford Univ. Press, New York.
---------- AND R. O. PRUM. 1988. Patterns and processes of diversification:speciation and historical congruence in some Neotropical birds. Evolution 42: 603-620.
EDWARDS, S. V., P. ARCTANDER, AND A. C. WILSON. 1991. Mitochondrialresolution of a deep branch in the genealogical tree for perching birds. Proc. R. Soc. Lond. B. 243: 99-107.
FELSENSTEIN, J. 1985. Confidence limits on phylogenies: an approach using the bootstrap. Evolution. 79: 783-791.
HAFFER, J. 1970. Art-Entstehung bei einigen Waldvogeln Amazoniens. J. Orn. I l l : 285-331.
HILLIS, D. M., A. LARSON, S. K. DAVIS, AND E. A. ZIMMER. 1990. Pages 318-370 in Molecular Systematics (D. M. Hillis and C, Moritz, eds.). Sinauer Assoc., Inc., Sunderland, Massachusetts.
HUDON, J., A. P. CAPPARELLA, AND A. H. BRUSH. 1989. Plumage pigmentdifferences in Manakins of the Pipra erythrocepluila superspecies. Auk 106: 34- 41.
KLUGE, A. G. 1989. A concern for evidence and a phylogenetic hypothesis of relationships among Epicrates (Boidae, Serpentes). Syst. Zool. 38: 7-25.
KOCHER, T. D„ W. K. THOMAS, A. MEYER, S. V. EDWARDS, S. PAABO, F. X. VILLABLANCA, AND A. C. WILSON. 1989. Dynamics of mitochondrial
DNA evolution in animals: amplification and sequencing w ith conserved primers. Proc. Natl. Acad. Sci. 86: 6196-6200.
LANYON, S. M. 1985. Molecular perspective on higher-level relationships in the Tyrannoidea (Aves). Syst. Zool. 34: 404-418.
MADDISON, W. P., M. J. DONOGHUE, AND D. R. M ADDISON. 1984. O utgroup analysis and parsimony. Syst. Zool. 33: 83-103.
MIYAMOTO, M. M. AND J. CRACRAFT. 1991. Phylogenetic inference, DNA sequence analysis, and the future of molecular systematics. Pages 3-17 in Phylogenetic analysis of DNA sequence data (M. M. Miyamoto and J.Cracraft, Eds.). Oxford Univ. Press, New York.
NEI, M. 1978. Estimation of average heterozygosities and genetic distance from a small num ber of individuals. Genetics 89: 583-590.
----------. 1987. Molecular evolutionary genetics. Columbia Univ. Press, NewYork.
PRUM, R. O. 1988. Historical relationships am ong avian forest areas of endemism in the Neotropics. Proc. Int. Ornithol. Congr. 19: 2562-2572.
----------AND A. E. JOHNSON. 1987. Display behavior, foraging ecology, andsystematics of the Golden-winged M anakin (Masius chn/sopterus). Wilson Bull. 99: 521-539.
SANDERSON, M. J. 1989. Confidence limits on phylogenies: the bootstrap revisited. Cladistics 5: 113-130.
SIBLEY, C. G AND J. E. AHLQUIST. 1987. Avian phylogeny reconstructed from comparisons of genetic material, DNA. Pages 95-121 in Molecules and m orphology in evolution: conflict or compromise (C. Patterson, Ed.). Cambridge Univ. Press, London.
----------AND-----------. 1990. Phylogeny and classification of birds: a study inmolecular evolution. Yale Univ. Press, New Have, Connecticut.
----------AND B. L. MONROE, JR. 1990. Distribution and taxonomy of birds of theworld. Yale Univ. Press, New Haven, Connecticut.
SICK, H. 1967. Courtship behavior in the manakins (Pipridae): a review. Living Bird 6: 5-22.
SNOW, D. W. 1963. The evolution of M anakin displays. Proc. XIII Intern. Ornithol. Congr.: 553-561.
— . 1977. The display of the Scarlet-horned M anakin (Pipra comuta) Bull. B.O.C. 97:23-27.
166
---------- . 1979. Family Pipridae. Pages 268-280 in Check-list of Birds of the World,vol. 8 (M. A. Traylor, Jr., Ed.). Museum of Comparative Zoology, Cambridge, Massachusetts.
SWOFFORD, D. L. 1990. PAUP: phylogenetic analysis using parsimony, Version 3.0. Illinois Natural History Survey, Champaign.
WILEY, E. O. 1981. Phylogenetics: the theory and practice of phylogenetic systematics. John Wiley and Sons, New York.
ZINK, R. M. AND J. C. AVISE. 1990. Patterns of mitochondrial DNA andallozyme evolution in the avian genus Ammodramus. Syst. Zool. 39:148-161.
CHAPTER 8
SUMMARY AND CONCLUSIONS
The purpose of this study was to explore biogeographic patterns of Central
American birds. In this chapter, I summarize the molecular and biogeographic
results in Chapters 2-7.
Highland biogeographic patterns.—Data I have presented for Atlapetes and
Diglossa address lower taxonomic levels, among subspecies of Atlapetes and among
allospecies w ithin a superspecies complex of Diglossa. In contrast, Pselliophorus and
Pezopetes are both monotypic genera of uncertain affinities. Thus, one w ould
predict, based on taxonomic status, that genetic comparisons w ith Buarremon and
Diglossa should be m uch lower than levels of differentiation betw een Pselliophorus
and Pezopetes and identified sister taxa. Indeed, this is the case. Using molecular
clock calibrations (see Chapter 1), differentiation w ithin Buarremon brunneinucha
started 2.5 -3.4 million years ago (mya) based on allozymes or 2.75 m ya based on
mtDNA sequence data. W ithin Diglossa, divergence started 2.1 - 2.7 mya based on
allozymes and 3.3 m ya based on mtDNA sequence data. These divergences date to
the very early Pleistocene or late Pliocene, after the landbridge connection
betw een Central and South America was completed. Thus, it appears that
dispersal of both Atlapetes and Diglossa, and subsequent divergence of populations,
occurred as per predictions (Chapter 1, Hypothesis 4) and may have resulted from
Pleistocene climatic fluctuations. That is, dispersal into Central America, from
either northern Mexico or the Andes, and separation of ranges occurred relatively
recently and over roughly the time frame as divergence in the lowlands was
occurring.
In contrast, calibrations of allozyme genetic distance to time since
divergence of taxa for Pselliophorus and Pezopetes indicate that these taxa have been
167
evolving independently for roughly ten million years (Pselliophorus, for 10-13 my,
Pezopetes for 9-12 my). Thus, divergence is hypothesized to predate the
completion of a landbridge connection of Central and South America.
Divergence may have occurred on the island arcs present in the regions of
Panama and Costa Rica for the last 20 million years (see Chapter 1). Data on
Pselliophorus and Pezopetes complete the support for Hypothesis 3 (Chapter 1).
H ighland divergence occurred during two time periods, relatively recently, as
evidenced by Atlapetes and Diglossa, and more ancient, as evidenced by Pselliophorus
and Pezopetes. Thus, it is doubtful that a single series of vicariant events or a
single time-period of divergence can explain a majority of differentiation in the
highlands of Central America (Chapter 1, Hypotheses 3 and 4).
M itochondrial DNA clock calibrations for the monotypic genera
Pselliophorus and Pezopetes suggest a four-fold reduction in times of divergence
(only 4-5 mya). Thus, discrepancy in the molecular clock calibrations needs to be
addressed (see section on Rates of Molecular Evolution). In contrast, for lower
taxonomic levels, w ithin species or closely relates species (Diglossa and Atlapetes)
genetic distance calibrations indicate that both mtDNA and allozyme data give
roughly similar dates of divergence. This is significant because the mtDNA clock
calibration is based on percent divergence between taxa being derived from
restriction fragm ent length polym orphism data from presum ably the whole
mtDNA genome, and the data presented here are percent sequence divergence of
roughly 400 base pairs of a mitochondrial gene (cytochrome b). In addition,
Shields and Kocher (1991) found a similar correspondence of tim ing of divergence
events in ursids based on percent sequence divergence of mtDNA sequences
(using the 2% per million years calibration) to the hypothesized time since
divergence of ursids based on a protein molecular clock.
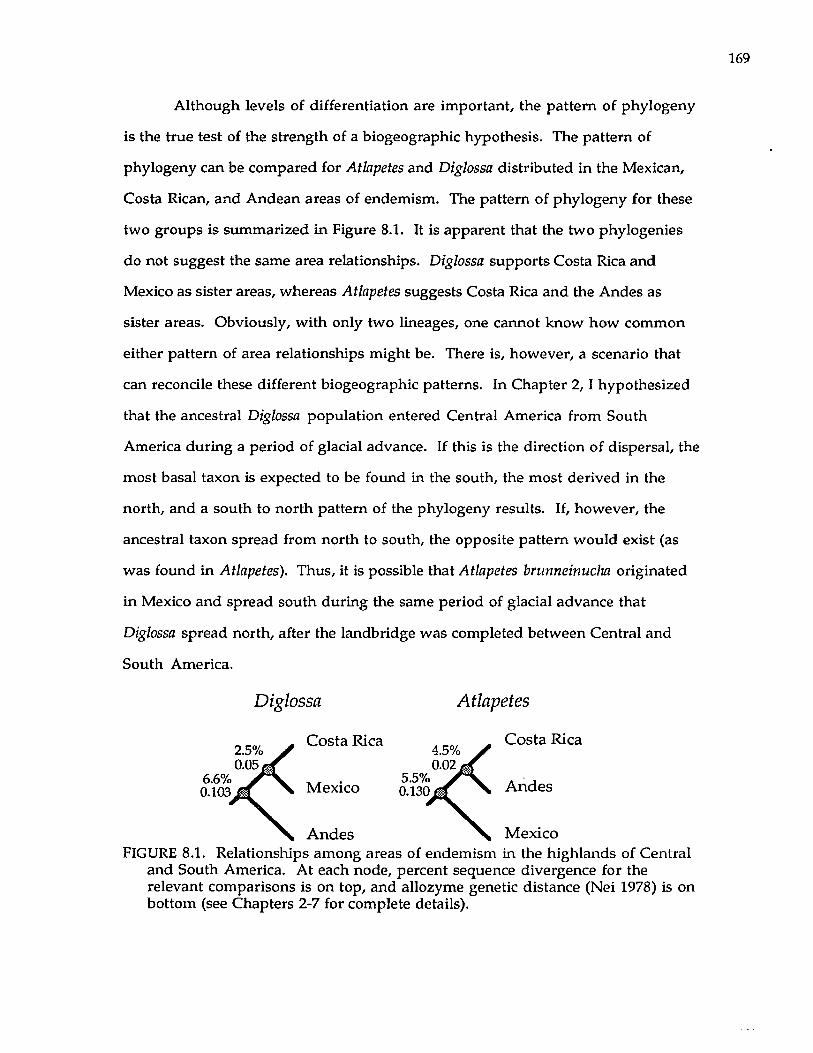
Although levels of differentiation are important, the pattern of phylogeny
is the true test of the strength of a biogeographic hypothesis. The pattern of
phylogeny can be compared for Atlapetes and Diglossa distributed in the Mexican,
Costa Rican, and Andean areas of endemism. The pattern of phylogeny for these
two groups is summarized in Figure 8.1. It is apparent that the two phylogenies
do not suggest the same area relationships. Diglossa supports Costa Rica and
Mexico as sister areas, whereas Atlapetes suggests Costa Rica and the Andes as
sister areas. Obviously, with only two lineages, one cannot know how common
either pattern of area relationships might be. There is, however, a scenario that
can reconcile these different biogeographic patterns. In Chapter 2, I hypothesized
that the ancestral Diglossa population entered Central America from South
America during a period of glacial advance. If this is the direction of dispersal, the
most basal taxon is expected to be found in the south, the most derived in the
north, and a south to north pattern of the phylogeny results. If, however, the
ancestral taxon spread from north to south, the opposite pattern would exist (as
was found in Atlapetes). Thus, it is possible that Atlapetes brunneinucha originated
in Mexico and spread south during the same period of glacial advance that
Diglossa spread north, after the landbridge was completed between Central and
South America.
Diglossa Atlapetes
Costa Rica
A ndes
MexicoFIGURE 8.1. Relationships among areas of endemism in the highlands of Central
and South America. At each node, percent sequence divergence for the relevant comparisons is on top, and allozyme genetic distance (Nei 1978) is on bottom (see Chapters 2-7 for complete details).
2.5%0.05
6 .6%0.103
Costa Rica
Mexico
A ndes
5.5%0.130
4.5% O.i
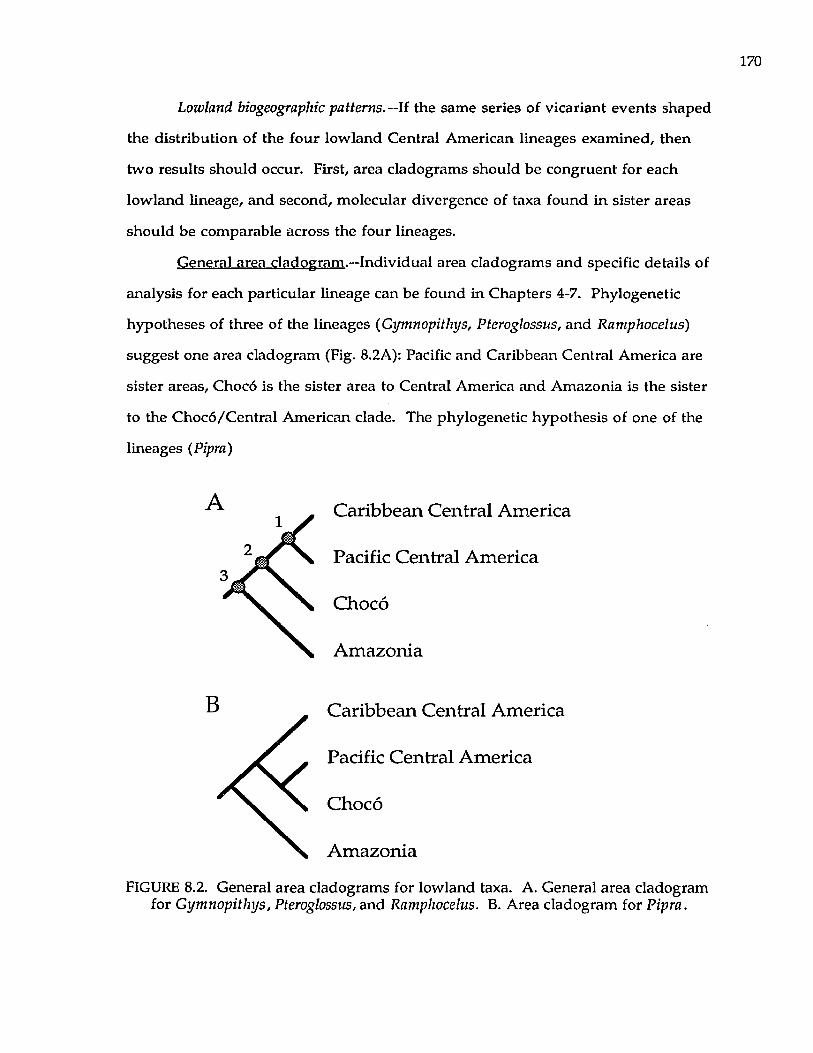
170
Lowland biogeographic patterns.— If the same series of vicariant events shaped
the distribution of the four lowland Central American lineages examined, then
two results should occur. First, area cladograms should be congruent for each
lowland lineage, and second, molecular divergence of taxa found in sister areas
should be comparable across the four lineages.
General area cladogram.—Individual area cladograms and specific details of
analysis for each particular lineage can be found in Chapters 4-7. Phylogenetic
hypotheses of three of the lineages (Gymnopithys, Pteroglossus, and Ramphocelus)
suggest one area cladogram (Fig. 8.2A): Pacific and Caribbean Central America are
sister areas, Choc6 is the sister area to Central America and Amazonia is the sister
to the Choc6/Central American clade. The phylogenetic hypothesis of one of the
lineages (Pipra)
Caribbean Central America
Pacific Central America
Choco
Amazonia
Caribbean Central America
Pacific Central America
Choco
Amazonia
FIGURE 8.2. General area cladograms for lowland taxa. A. General area cladogram for G ymnopithys, Pteroglossus, and Ramphocelus. B. Area cladogram for Pipra.
A
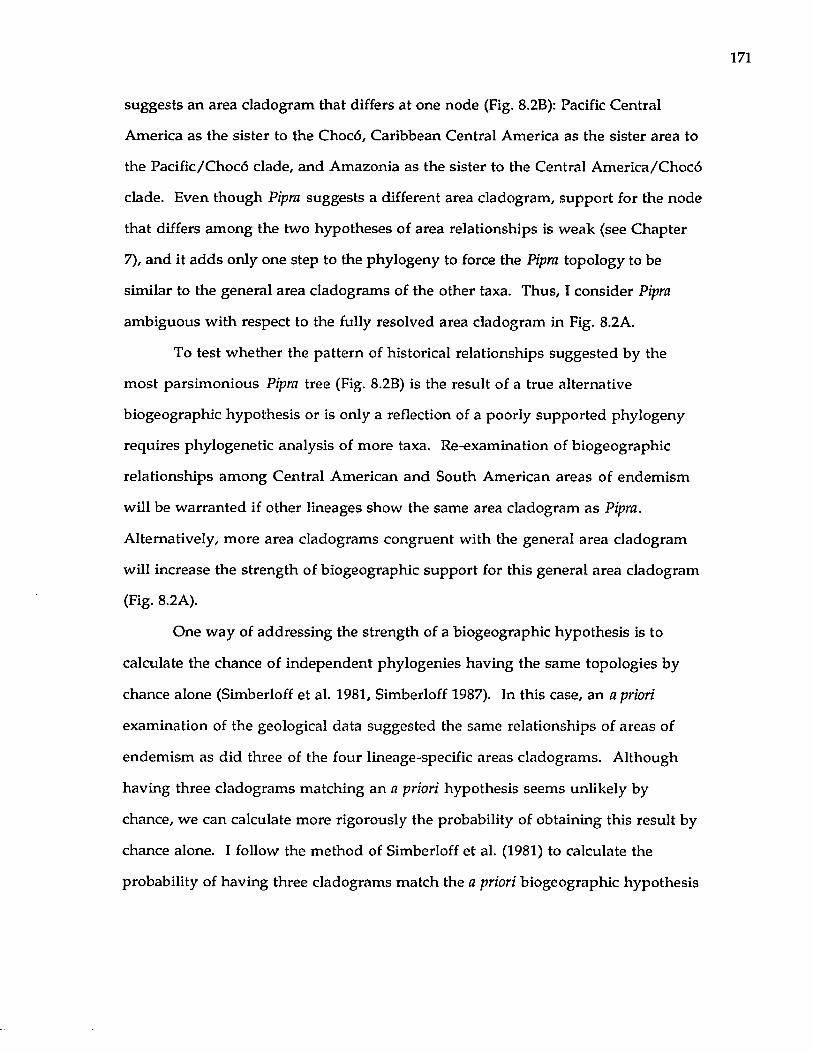
suggests an area cladogram that differs at one node (Fig. 8.2B): Pacific Central
America as the sister to the Choc6, Caribbean Central America as the sister area to
the Pacific/Choc6 clade, and Amazonia as the sister to the Central America/Choc6
clade. Even though Pipra suggests a different area cladogram, support for the node
that differs among the two hypotheses of area relationships is weak (see Chapter
7), and it adds only one step to the phylogeny to force the Pipra topology to be
similar to the general area cladograms of the other taxa. Thus, I consider Pipra
ambiguous w ith respect to the fully resolved area cladogram in Fig. 8.2A.
To test whether the pattern of historical relationships suggested by the
most parsimonious Pipra tree (Fig. 8.2B) is the result of a true alternative
biogeographic hypothesis or is only a reflection of a poorly supported phylogeny
requires phylogenetic analysis of more taxa. Re-examination of biogeographic
relationships among Central American and South American areas of endemism
will be warranted if other lineages show the same area cladogram as Pipra.
Alternatively, more area cladograms congruent with the general area cladogram
will increase the strength of biogeographic support for this general area cladogram
(Fig. 8.2A).
One way of addressing the strength of a biogeographic hypothesis is to
calculate the chance of independent phylogenies having the same topologies by
chance alone (Simberloff et al. 1981, Simberloff 1987). In this case, an a priori
examination of the geological data suggested the same relationships of areas of
endemism as did three of the four lineage-specific areas cladograms. Although
having three cladograms matching an a priori hypothesis seems unlikely by
chance, we can calculate more rigorously the probability of obtaining this result by
chance alone. I follow the method of Simberloff et al. (1981) to calculate the
probability of having three cladograms match the a priori biogeographic hypothesis
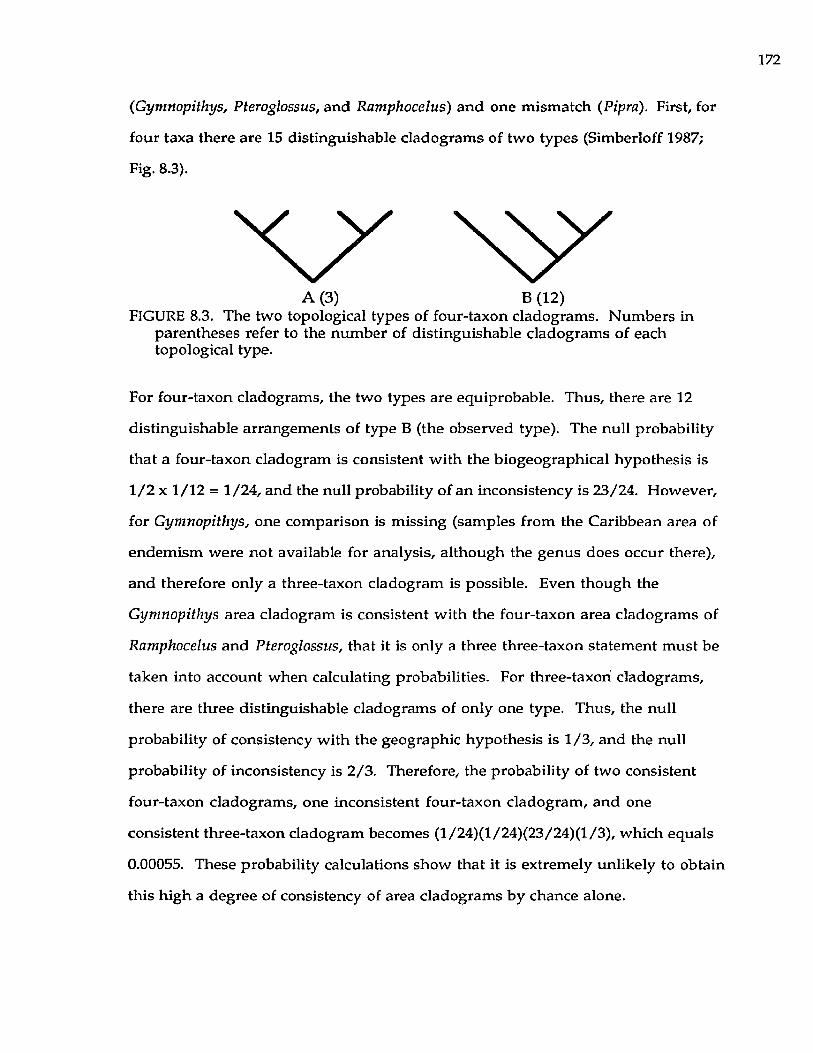
172
(Gymnopithys, Pteroglossus, and Ramphocelus) and one m ism atch (Pipra). First, for
four taxa there are 15 distinguishable cladogram s of two types (Simberloff 1987;
Fig. 8.3).
A (3) B (12)FIGURE 8.3. The two topological types of four-taxon cladograms. Num bers in
parentheses refer to the num ber of distinguishable cladogram s of each topological type.
For four-taxon cladograms, the two types are equiprobable. Thus, there are 12
distinguishable arrangem ents of type B (the observed type). The null probability
that a four-taxon cladogram is consistent w ith the biogeographical hypothesis is
1 /2 x 1/12 = 1/24, and the null probability of an inconsistency is 23/24. However,
for Gymnopithys, one com parison is m issing (samples from the Caribbean area of
endem ism w ere not available for analysis, although the genus does occur there),
and therefore only a three-taxon cladogram is possible. Even though the
Gymnopithys area cladogram is consistent w ith the four-taxon area cladogram s of
Ramphocelus and Pteroglossus, that it is only a three three-taxon statem ent m ust be
taken into account w hen calculating probabilities. For three-taxon cladogram s,
there are three distinguishable cladogram s of only one type. Thus, the null
probability of consistency w ith the geographic hypothesis is 1 /3 , and the null
probability of inconsistency is 2 /3 . Therefore, the probability of two consistent
four-taxon cladogram s, one inconsistent four-taxon cladogram , and one
consistent three-taxon cladogram becomes (l/2 4 )(l/2 4 )(2 3 /2 4 )(l/3 ), w hich equals
0.00055. These probability calculations show that it is extremely unlikely to obtain
this high a degree of consistency of area cladogram s by chance alone.
One caution w ith this method is that it does not take into account the
relative strengths of phylogenetic hypotheses. For example, the node in the Pipra
phylogeny that suggests an alternative biogeographic hypothesis, is only weakly
supported. This cladogram mismatch decreases by a factor of 23 the level of
support for the general area cladogram. For example, had the Pipra phylogeny
matched those of Pteroglossus and Ramphocelus, the probability calculation would
have been as follows: (l/24 )(l/24 )(l/24 )(l/3 ) = 0.000024. It may be more
appropriate to design a weighting scheme that would take into account the
relative strengths of phylogenetic hypotheses before calculating probabilities as
outlined by Simberloff (Cracraft 1983).
Timing of molecular divergence.—If the same series of vicariant events
caused the distribution patterns of taxa in Central and South America, then
similar genetic distances should be observed between sister taxa found in sister
areas. A number of assumptions are made to compare distances in this way.
First, either the same suite of allozyme loci or the same region of DNA m ust be
compared across all taxa. Second, nodes in the phylogenies, and thus area
cladograms, should be well supported, and third, a common molecular clock
must exist across all taxa studied. Indeed, data such as these would provide strong
support for a molecular clock that operates across many different avian lineages.
For the lowland Central American taxa analyzed, there does seem to be a
general agreement of timing of divergence events (especially for mtDNA
sequence comparisons; Table 8.1). The genetic distance calibrations all suggest that
divergence of the lowland areas of endemism occurred over the last two million
years, a time consistent with hypotheses based on geologic data.
However, some differences in levels of differentiation between sister taxa
in sister areas can be found. Pteroglossus toucans have consistently lower levels of
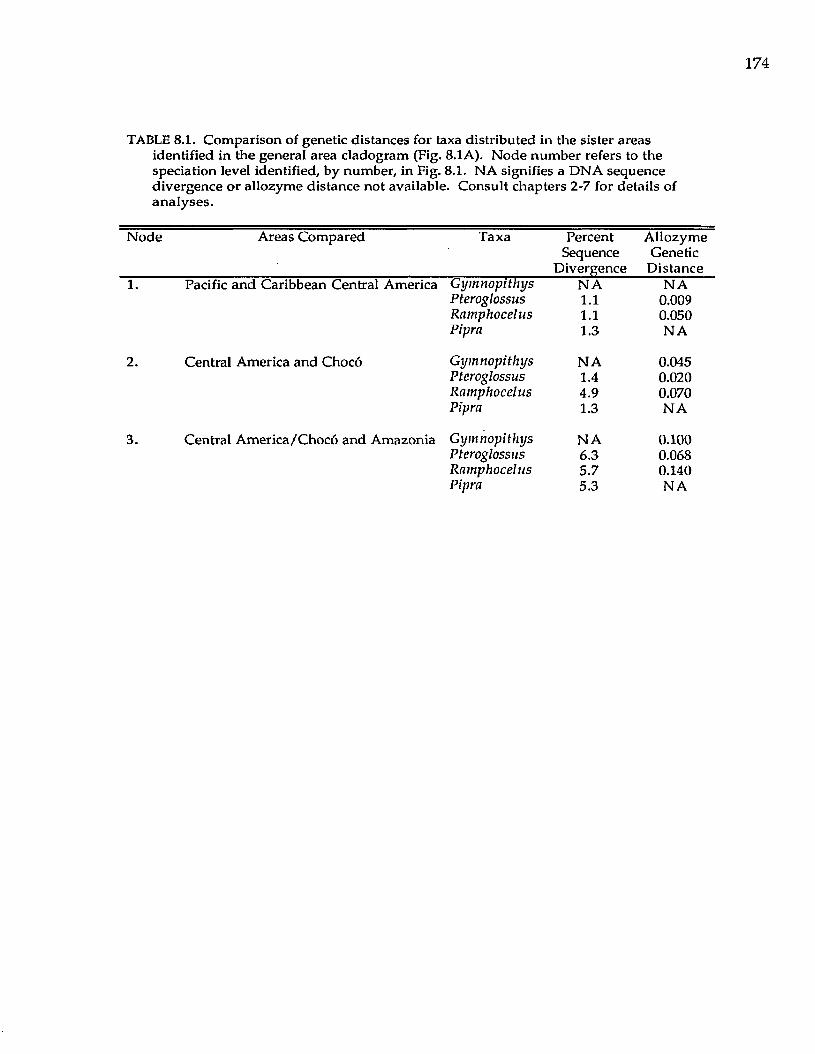
TABLE 8.1. Comparison of genetic distances for taxa distributed in the sister areas identified in the general area cladogram (Fig. 8.1A). Node number refers to the speciation level identified, by number, in Fig. 8.1. NA signifies a DNA sequence divergence or allozyme distance not available. Consult chapters 2-7 for details of analyses.
Node Areas Compared Taxa Percent AllozymeSequence Genetic
____________________ Divergence Distance1. Pacific and Caribbean Central America Gymnopithys NA NA
Pteroglossus 1.1 0.009Ramphocelus 1.1 0.050Pipra 1.3 NA
2. Central America and Choc6 Gymnopithys NA 0.045Pteroglossus 1.4 0.020Ramphocelus 4.9 0.070Pipra 1.3 NA
3. Central America/Choco and Amazonia Gymnopithys NA 0.100Pteroglossus 6.3 0.068Ramphocelus 5.7 0.140Pipra 5.3 NA
175
allozyme differentiation am ong species than do Ramphocelus tanagers or
Gymnopithys antbirds. For example, allozymically, Pteroglossus frantzii and P.
torquatus differ by only 0.009 units of Nei's (1978) genetic distance, whereas
Ramphocelus distributed in the same areas of endem ism differ by 0.05 units of
Nei's (1978) genetic distance. Divergence betw een Central American and Choco
Pteroglossus averages 0.02; divergence between Central American and Choco
Gymnopithys and Ramphocelus averages 0.045 and 0.070, respectively. I have also
show n that allozyme distances betw een Pteroglossus species are low for the entire
genus (see Chapter 5). In contrast, percent sequence divergence is not
anomalously low for these taxa (Table 8.1). This is possibly explained by the fact
that mtDNA is transm itted as a m aternal haploid, and as such has an effective
population size one quarter that of nuclear genes (Avise 1991). Historically, this
indicates that there may be strong geographic structuring (divergence) in
mitochondrial DNA characters b u t not in allozymes (Avise and Zink 1988, Zink
and Avise 1990, Zink 1991).
The low allozyme genetic distances w ithin Pteroglossus could be the result
of a num ber of factors. There could be lower levels of w ithin-population
variability (heterozygosity and num ber of alleles per locus, for example) in
Pteroglossus relative to other taxa. This is not the case; heterozygosity w ithin
Pteroglossus species averaged 5% (typical of birds), and average num ber of alleles
per locus (1.2) is also similar to other birds. A second reason for lower rates of
molecular divergence could be that Pteroglossus responded to a similar series of
vicariant events that influenced the distributions of G ymnopithys and
Ramphocelus, but this series occurred m uch m ore recently. It seems, however,
extremely unlikely that the same series of vicariant events that influenced the
distributions of Ramphocelus and Gymnopithys were repeated in the same
sequence later on in history to influence the distribution of Pteroglossus.
Finally, natural-history characteristics of Pteroglossus could influence rates
of molecular divergence between taxa. Pteroglossus are strong-flying, canopy birds.
Gymnopithys and Ramphocelus are more sedentary forest and second-growth birds.
These characteristics could influence the levels of genetic divergence currently
observed between taxa. A growing body of evidence suggests that sedentary bird
taxa show high levels of population subdivision compared to migratory or less-
sedentary birds (see Chapters 2-7). Thus, even in the absence of vicariant events,
local population differentiation will occur in sedentary taxa. For lowland Central
and South America, this implies that strong-flying canopy birds, like Pteroglossus,
will show lower levels of genetic divergence among populations, whereas
sedentary birds, like Gymnopithys and Ramphocelus, will show greater levels of
population subdivision. W hen vicariant events occur, such as those that
separated the lowland areas of endemism in this study, populations of toucans on
either side of a barrier are genetically more similar than populations of antbirds or
tanagers. Thus, the populations begin diverging at differing levels of allozyme
divergence, and these differences are maintained. This hypothesis can be tested by
comparing levels of divergence for less sedentary, canopy birds (like toucans,
some tanagers, parrots, some flycatchers) to more sedentary understory birds (like
tinamous, antbirds, furnariids, some flycatchers) distributed across similar
geographic areas.
Evolution of mtDNA sequences and allozymes.—The correspondence of
evolution between the two independent molecular data sets can be assessed in
two ways: first, by comparing phylogenetic hypotheses derived from the
independent data sets, and second, by plotting allozyme and DNA sequence
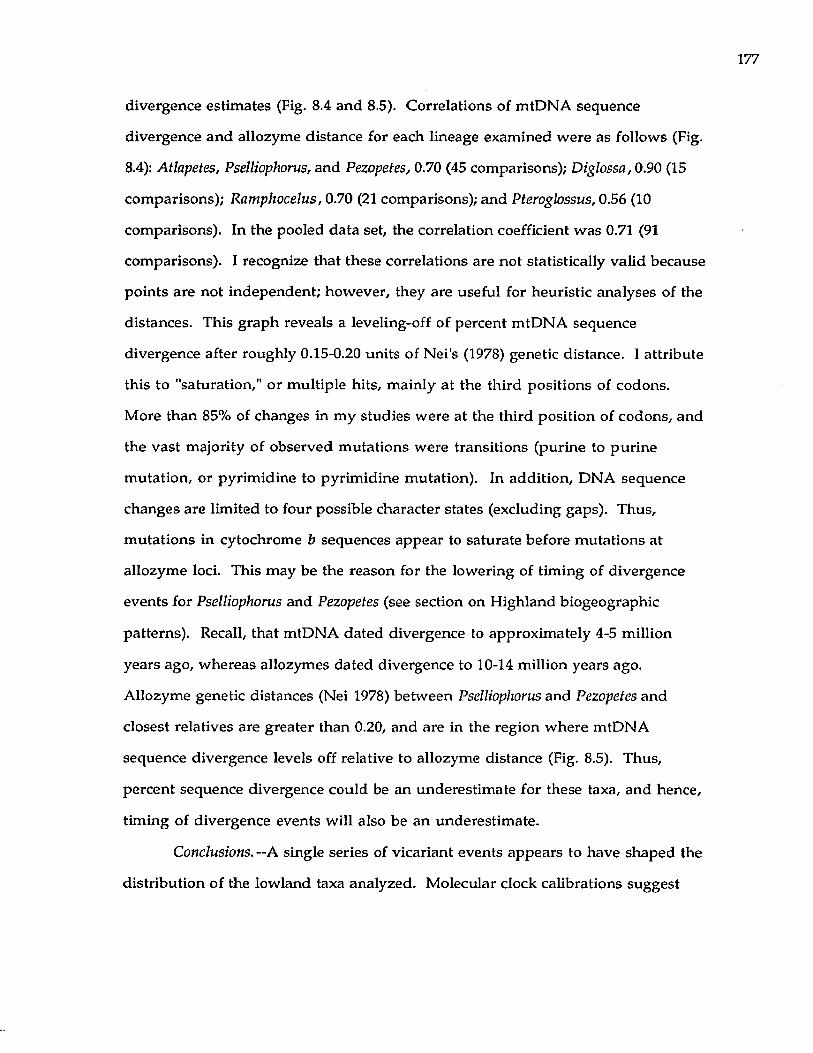
divergence estimates (Fig. 8.4 and 8.5). Correlations of mtDNA sequence
divergence and allozyme distance for each lineage examined were as follows (Fig.
8.4): Atlapetes, Pselliophorus, and Pezopetes, 0.70 (45 comparisons); Diglossa, 0.90 (15
comparisons); Ramphocelus, 0.70 (21 comparisons); and Pteroglossus, 0.56 (10
comparisons). In the pooled data set, the correlation coefficient was 0.71 (91
comparisons). I recognize that these correlations are not statistically valid because
points are not independent; however, they are useful for heuristic analyses of the
distances. This graph reveals a leveling-off of percent mtDNA sequence
divergence after roughly 0.15-0.20 units of Nei's (1978) genetic distance. I attribute
this to "saturation," or multiple hits, mainly at the third positions of codons.
More than 85% of changes in m y studies were at the third position of codons, and
the vast majority of observed m utations were transitions (purine to purine
mutation, or pyrim idine to pyrim idine mutation). In addition, DNA sequence
changes are limited to four possible character states (excluding gaps). Thus,
m utations in cytochrome h sequences appear to saturate before m utations at
allozyme loci. This may be the reason for the lowering of timing of divergence
events for Pselliophorus and Pezopetes (see section on Highland biogeographic
patterns). Recall, that mtDNA dated divergence to approximately 4-5 million
years ago, whereas allozymes dated divergence to 10-14 million years ago.
Allozyme genetic distances (Nei 1978) between Pselliophorus and Pezopetes and
closest relatives are greater than 0.20, and are in the region w here mtDNA
sequence divergence levels off relative to allozyme distance (Fig. 8.5). Thus,
percent sequence divergence could be an underestimate for these taxa, and hence,
timing of divergence events will also be an underestimate.
Conclusions. —A single series of vicariant events appears to have shaped the
distribution of the lowland taxa analyzed. Molecular clock calibrations suggest
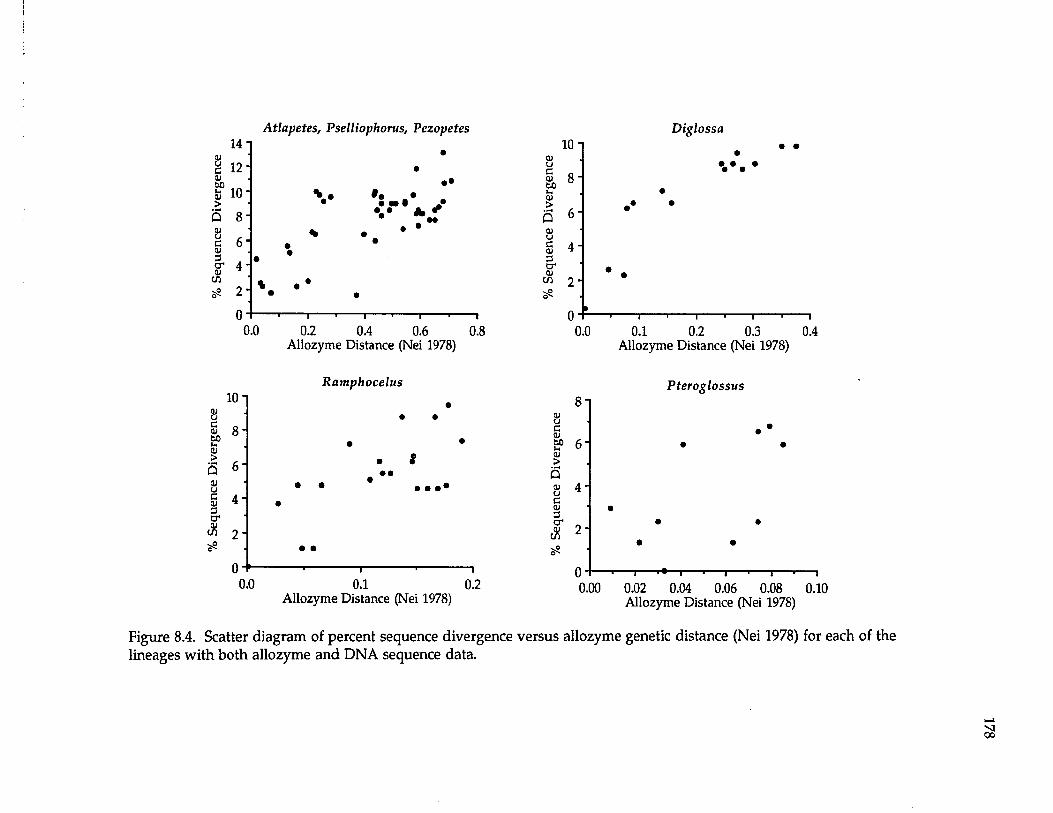
14 l
g 12cu to £ 10 >5 8cuc 6cu3 ,cr 4cu *
A tlapetes, Pselliophorus, Pezopetes
• •
-v W «
• • • * *- —
« •
— '-----------1 1 1 1 1 1 1
0.0 0.2 0.4 0.6 0.8Allozyme Distance (Nei 1978)
10101UccutcU.CU>
8 -
n 6'cuuc(U3crcucn
4-
2-
D iglossa
• •
— ,------------,------------1------------ j------------1------------1------------1----------- 1
0.0 0.1 0.2 0.3 0.4Allozyme Distance (Nei 1978)
100)oC 0& 8 toucu>
OJuCcu
<8
4-
R am p h o ce lu s
0.0 0.1 0.2 Allozyme Distance (Nei 1978)
0)uCcufcDuo>>CUuCcu3cr$
8 l
6 -
4-
2 -
P te r o g lo s s u s
0.00 0.02 0.04 0.06 0.08 0.10Allozyme Distance (Nei 1978)
Figure 8.4. Scatter diagram of percent sequence divergence versus allozyme genetic distance (Nei 1978) for each of the lineages with both allozyme and DNA sequence data.
00
% Se
quen
ce
Div
erge
nce
1 5 - |
Combining all Taxa
1 0 -
n□ □ • • •
• •* A *
A A
5 -
□ •A
A * C »
A A m □ *
° ° mP
□
* A tlapetes
• D iglossa
At A
A tJ0 -P-*-
0.0— I—
0.2
4 Pteroglossus
a Ramphocelus
— i—
0.6—i0.80.4
Allozyme Distance (Nei 1978)
Figure 8.5. Summary scatter diagram of percent sequence divergence versus allozyme genetic distance (Nei 1978) for all of the lineages represented in Fig. 8.4.
that much of the divergence of Central American and South American taxa, and
within Central American taxa occurred in the early Pleistocene or late Pliocene.
In the highlands, however, a single series of events cannot be invoked to explain
the distribution of taxa. Different events, as evidenced by the different area
cladograms for Diglossa and Atlapetes, during the same time period (over the last 3
million years) resulted in similar distributions for at least two lineages. In
addition, different times of divergence, ancient (Pselliophorus and Pezopetes), and
more recent (Atlapetes and Diglossa), have both affected the distribution of Central
American endemic birds. Thus, in agreement with the geologic evidence, my
data suggest that biogeographic patterns in the highlands are more complex than
biogeographic patterns in the lowlands.
There is a high degree of concordance of evolution between allozyme and
mtDNA sequence data. There were no major discrepancies of phylogenetic
patterns between allozymes and DNA sequence data for four lineages that were
analyzed with both allozymes and mtDNA sequence data. Congruence of
independent data sets not only strengthens phylogenetic hypotheses, but it also
provides evidence that, for these taxa, mtDNA gene trees are tracking the
phylogeny of the species themselves.
The high correlation, and linear relationship, of allozyme distances and
DNA sequence divergence occurs to approximately 0.15 - 0.20 units of Nei's (1978)
genetic distance. After 0.15 - 0.20 units of Nei's (1978) genetic distance, percent
sequence divergence appears to level off (at roughly 10%). A saturation of
mutations at the cytochrome b gene after 10% sequence divergence was also
suggested by Edwards et al. (1991). Thus, saturation of changes may need to be
taken into consideration when analyzing DNA sequence data.
The avifauna of the Neotropics is the richest in the world, and I have
addressed relationships within only a few of the hundreds of genera. It is
im portant to test the biogeographic hypotheses of this study w ith analyses of
m any m ore lineages, including nonavian groups. Not only will we understand
the historical events that shaped present-day distributions, bu t we will also gain
knowledge of the phylogenetic histories of little-known groups of organisms.
LITERATURE CITED
AVISE, J. C. 1991. Ten unorthodox perspectives on evolution prom pted bycomparative population genetic findings on mitochondrial DNA. Ann. Rev. Genet. 25: 45-69.
-----------AND R. M. ZINK. 1988. Molecular genetic divergence between aviansibling species: King and Clapper rails, Long-billed and Short-billed dowitchers, Boat-tailed and Great-tailed grackles, and Tufted and Black- crested titmice. Auk 105: 516-528.
CRACRAFT,J. 1983. Commentary. Pages 456-467 in Perspectives in ornithology (A. H. Brush and G. A. Clark, Jr., Eds.). Cambridge University Press, Cambridge.
EDWARDS, S. V., P. ARCTANDER, AND A. C. WILSON. 1991. Mitochondrialresolution of a deep branch in the genealogical tree for perching birds. Proc. R. Soc. Lond. B. 243: 99-107.
SHIELDS, G. F. AND T. D. KOCHER. 1991. Phylogenetic relationships of NorthAmerican Ursids based on analysis of mitochondrial DNA. Evolution 45: 218-221.
SIMBERLOFF, D., K. L. HECK, E. D. MCCOY, AND E. F. CONNOR. 1981. There have been no statistical tests of cladistic biogeographical hypotheses. Pages 40-63 in Vicariance biogeography: a critique (G. Nelson and D. E. Rosen, Eds.). Columbia University Press, New York.
----------. 1987. Calculating the probabilities that cladograms match: a m ethod ofbiogeographical inference. Syst. Zool. 36: 175-195.
SWOFFORD, D. L. AND G. J. OLSEN. 1990. Phylogeny reconstruction. Pages 411- 501 in Molecular Systematics (D. M. Hillis and C, Moritz, eds.). Sinauer Assoc., Inc., Sunderland, Massachusetts.
ZINK, R. M. 1991. The geography of mitochondrial DNA variation in two sympatric sparrows. Evolution 45: 329-339.
AND J. C. AVISE. 1990. Patterns of mitochondrial DNA and allozymeevolution in the avian genus Ammodramus. Syst. Zool. 39:148-161.
VITA
Shannon J. Hackett was bom on September 6, 1961 in Trail, British
Columbia, Canada. She attended elementary school, and junior and senior high
school in Trail. After graduation, Shannon attended the University of Victoria,
where she received a Bachelor of Science degree (with distinction) in May of 1983.
After 2 years working at the Royal British Columbia Museum, she returned to
school at Louisiana State University and successfully completed a Masters of
Science degree in December 1987. She is completing her Doctor of Philosophy
degree at Louisiana State University in the Fall of 1992 and plans to accept a post
doctoral position at the American Museum of Natural History in New York.
183
DOCTORAL EXAMINATION AND DISSERTATION REPORT
Candidate: Shannon J . H a c k e t t
Major Field: Zoology
Title of Dissertation: M o le c u la r P h y l o g e n ie s an d B io g e o g ra p h y o f C e n t r a l
A m erican B i r d s
Approved:
Major Profesgpif and Chairman
<J> _______________Dean of the Gra&Ludte School
EXAMINING COMMITTEE:
Date of Examina'tion:
O c to b e r 2 3 , 1992


