Embed Size (px)
Citation preview
Introduction
Molecular orientation refers to the directional alignmentof molecular chains, and it develops whenever the chainsare subjected to either a shear or an elongational flow. Ina polymer melt at rest, molecular segments are in arandom state, i.e., in a state of a maximum disorder.
During forming processes, the flow forces the molecularchains to assume an orientation along preferentialdirections. Part of this orientation freezes during solid-ification, and produces anisotropy of the solid polymerproperties.
One of the most challenging problems in present daypolymer science concerns the reliable prediction of
Roberto Pantani
Andrea Sorrentino
Vito Speranza
Giuseppe Titomanlio
Molecular orientation in injection molding:experiments and analysis
Received: 5 December 2002Accepted: 12 August 2003Published online: 13 September 2003� Springer-Verlag 2003
Abstract Modeling and simulationof the injection molding process ofthermoplastic polymers has remark-ably improved over the last decade.One of the most challenging scien-tific objectives is currently the reli-able prediction of molecularorientation simulations of themolding process. Indeed, althoughpressure and velocity distributioncan be satisfactorily described byviscous models, the viscoelastic nat-ure of the polymer needs to be ac-counted for in the description ofmolecular orientation evolution. Inthis work, an amorphous PS wasinjection molded into a line gaterectangular cavity. Molding tests arecarefully characterized and allinformation needed for furtheranalysis is provided. The moldscontained special dies that couldaccept various sized gates. In par-ticular two gates were used whosethicknesses were 1.5 mm and0.5 mm, respectively. Birefringencedistribution (which for PS is essen-tially the orientation distribution)
along the thickness direction wasmeasured by using the wedge meth-od at different positions in the mol-dings, and inside the gates. Dataregarding the amount of frozen-inmolecular strain were gathered bymeasuring the thermal shrinkage atdifferent positions along the flow-path. Molding tests were simulatedby means of a software developed atthe University of Salerno, and asimple viscoelastic model was usedto describe the evolution of molecu-lar orientation due to the effect ofkinematics obtained using a viscousapproach. Simulation results de-scribe the main features of experi-mental data collected from themolded samples; in particular, theeffect of the packing flow is clear inboth the data and simulations. Inaddition, the importance of the effectof pressure on relaxation time isdiscussed.
Keywords Polystyrene ÆBirefringence Æ Orientation ÆRelaxation time
Rheol Acta (2004) 43: 109–118DOI 10.1007/s00397-003-0325-8 ORIGINAL CONTRIBUTION
R. Pantani (&) Æ A. SorrentinoV. Speranza Æ G. TitomanlioDepartment of Chemicaland Food Engineering,University of Salerno,via Ponte Don Melillo,I-84084, Fisciano (SA), ItalyE-mail: [email protected]
molecular orientation during transformation processes.Indeed, although pressure and velocity distribution canoften be satisfactorily described by viscous models, de-tails of the viscoelastic nature of the polymer need to beaccounted for in the description of the evolution ofmolecular orientation. Isayev and Hieber (1980) adoptedthe Leonov constitutive equation to analyze the injectionmolding process and predicted birefringence distribu-tions in injection-molded PS samples. Baaijens andDouven (1990) applied a compressible version of theLeonov model to calculate the development of orienta-tion in injection molded rectangular strips. Flaman(1990) adopted the same approach to predict frozen-inbirefringence in an injection molded strip. More re-cently, Kim et al. (1999) applied the Leonov model todescribe experimental data of birefringence distributionalong thickness in center-gated PS disks. Pantani et al.(2002) compared different choices of accounting for non-linearities in the dumbbell model to describe the evolu-tion of molecular orientation in Kim’s samples.
The aim of this paper is twofold. The first is to collectdetailed measurement results, including material char-acterization, a thorough description of experimentalconditions, mold and nozzle geometry and measuredpressure curves, orientation and strain distributions inmolded samples. These results have all qualificationneeded for any analysis. The second is to analyze theproblem of orientation evolution from a theoreticalpoint of view, by applying a simple non-linear dumbbellmodel, which provides description of both orientationand strain.
An amorphous PS was thus injection molded into aline gated rectangular cavity; tests were performedadopting two gates of different thickness. Injectionmolding tests were carried out so as to elucidate theeffect of packing/holding flow on orientation distribu-tion. Birefringence (which for an amorphous PS meansessentially orientation) along thickness direction wasmeasured by using the wedge method in different posi-tions of the moldings and also inside the gates. Indica-tions regarding frozen-in strain were collected bymeasuring the thermal shrinkage at different positionsalong the flow path.
Molding tests were simulated by means of a softwarecode developed at the University of Salerno, adoptingthe choice of the dumbbell model identified in a previouswork (Pantani et al. 2002) as adequate to describe theevolution of molecular orientation by effect of kine-matics obtained by a viscous approach.
Experimental
Material An atactic polystyrene (Dow PS 678E) was used in allmolding tests. The optical constants of this material are such thatthe component of birefringence due to frozen-in stresses is negli-
gible with respect to the component induced by orientation(Wimberger-Friedl 1995).
The rheological behavior of polymer melt was characterized forthe temperature range 473–503 K by means of a rotational rhe-ometer used in a dynamic mode (frequencies, 0.1–100 rad/s) and ina constant shear rate mode (range, 0.1–4 s-1). Both viscosity andfirst normal stress difference were measured in the constant shearrate mode.
Viscosity measurements of the polymer were found to be con-sistent with data reported in the literature (Flaman 1990; Douvenet al. 1995) and were well described by a simple Cross model:
g _c; T ; Pð Þ ¼ g0 T ; Pð Þ1þ g0 T ; Pð Þs� _cð Þ1�n ð1Þ
where the zero shear rate viscosity, g0, is given by the modifiedWLF equation
g0 T ; Pð Þ ¼ D1 � 10�A1 T�D2�D3Pð Þ
A2þT�D2
� �ð2Þ
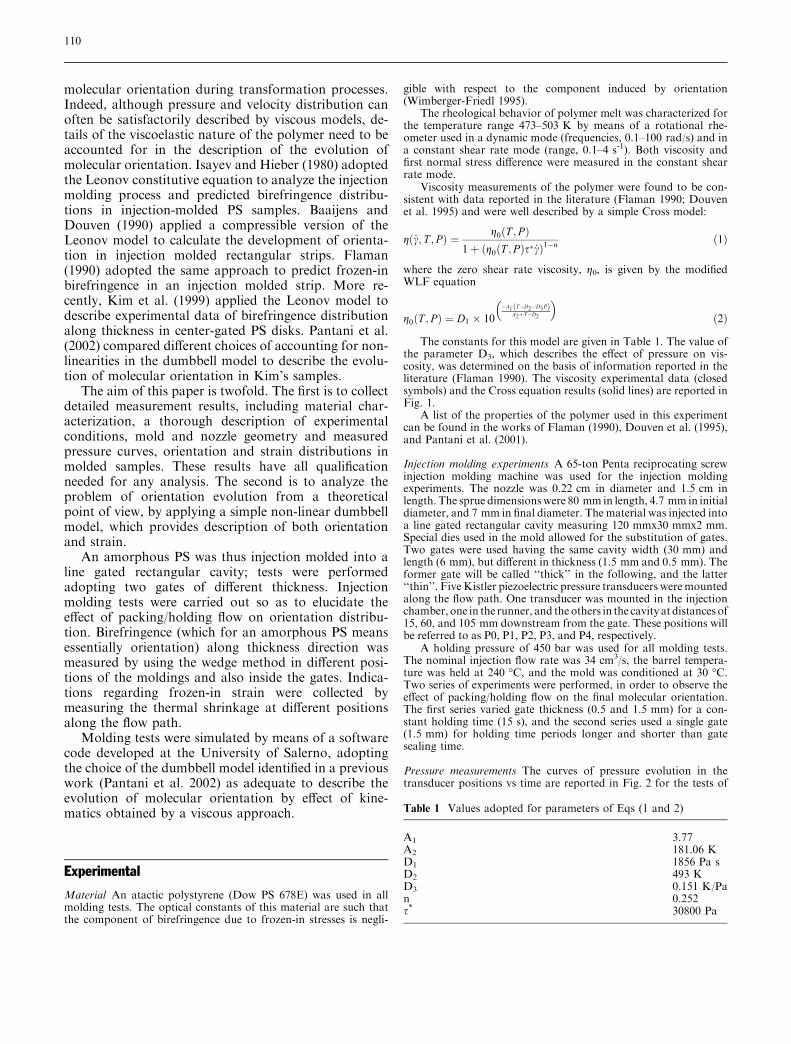
The constants for this model are given in Table 1. The value ofthe parameter D3, which describes the effect of pressure on vis-cosity, was determined on the basis of information reported in theliterature (Flaman 1990). The viscosity experimental data (closedsymbols) and the Cross equation results (solid lines) are reported inFig. 1.
A list of the properties of the polymer used in this experimentcan be found in the works of Flaman (1990), Douven et al. (1995),and Pantani et al. (2001).
Injection molding experiments A 65-ton Penta reciprocating screwinjection molding machine was used for the injection moldingexperiments. The nozzle was 0.22 cm in diameter and 1.5 cm inlength. The sprue dimensionswere 80 mm in length, 4.7 mm in initialdiameter, and 7 mm in final diameter. The material was injected intoa line gated rectangular cavity measuring 120 mmx30 mmx2 mm.Special dies used in the mold allowed for the substitution of gates.Two gates were used having the same cavity width (30 mm) andlength (6 mm), but different in thickness (1.5 mm and 0.5 mm). Theformer gate will be called ‘‘thick’’ in the following, and the latter‘‘thin’’. FiveKistler piezoelectric pressure transducers weremountedalong the flow path. One transducer was mounted in the injectionchamber, one in the runner, and the others in the cavity at distances of15, 60, and 105 mm downstream from the gate. These positions willbe referred to as P0, P1, P2, P3, and P4, respectively.
A holding pressure of 450 bar was used for all molding tests.The nominal injection flow rate was 34 cm3/s, the barrel tempera-ture was held at 240 �C, and the mold was conditioned at 30 �C.Two series of experiments were performed, in order to observe theeffect of packing/holding flow on the final molecular orientation.The first series varied gate thickness (0.5 and 1.5 mm) for a con-stant holding time (15 s), and the second series used a single gate(1.5 mm) for holding time periods longer and shorter than gatesealing time.
Pressure measurements The curves of pressure evolution in thetransducer positions vs time are reported in Fig. 2 for the tests of
Table 1 Values adopted for parameters of Eqs (1 and 2)
A1 3.77A2 181.06 KD1 1856 Pa sD2 493 KD3 0.151 K/Pan 0.252s* 30800 Pa
110
the first series. As expected, the role of gate thickness is enormous.The analysis of pressure recordings in pos. P1 (just upstream fromthe gate) (Pantani et al. 2001) shows that after about either 1 s or5 s of packing the gate seals. The pressure in the thin gate case soonbecomes homogeneous inside the cavity and, vice versa, in the thickgate case the pressure gradient along the flow direction nevervanishes. In particular, thick gate pressure levels inside the cavityare much higher, and remain high for a much longer time thanthose for the thin gate.
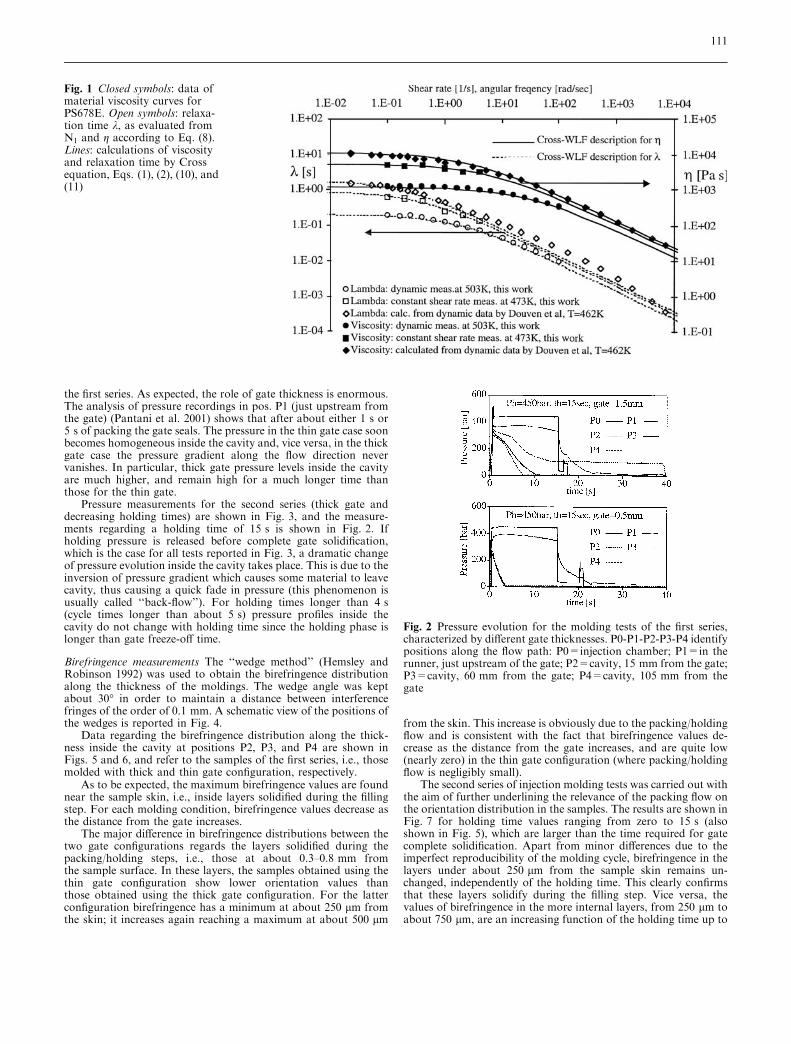
Pressure measurements for the second series (thick gate anddecreasing holding times) are shown in Fig. 3, and the measure-ments regarding a holding time of 15 s is shown in Fig. 2. Ifholding pressure is released before complete gate solidification,which is the case for all tests reported in Fig. 3, a dramatic changeof pressure evolution inside the cavity takes place. This is due to theinversion of pressure gradient which causes some material to leavecavity, thus causing a quick fade in pressure (this phenomenon isusually called ‘‘back-flow’’). For holding times longer than 4 s(cycle times longer than about 5 s) pressure profiles inside thecavity do not change with holding time since the holding phase islonger than gate freeze-off time.
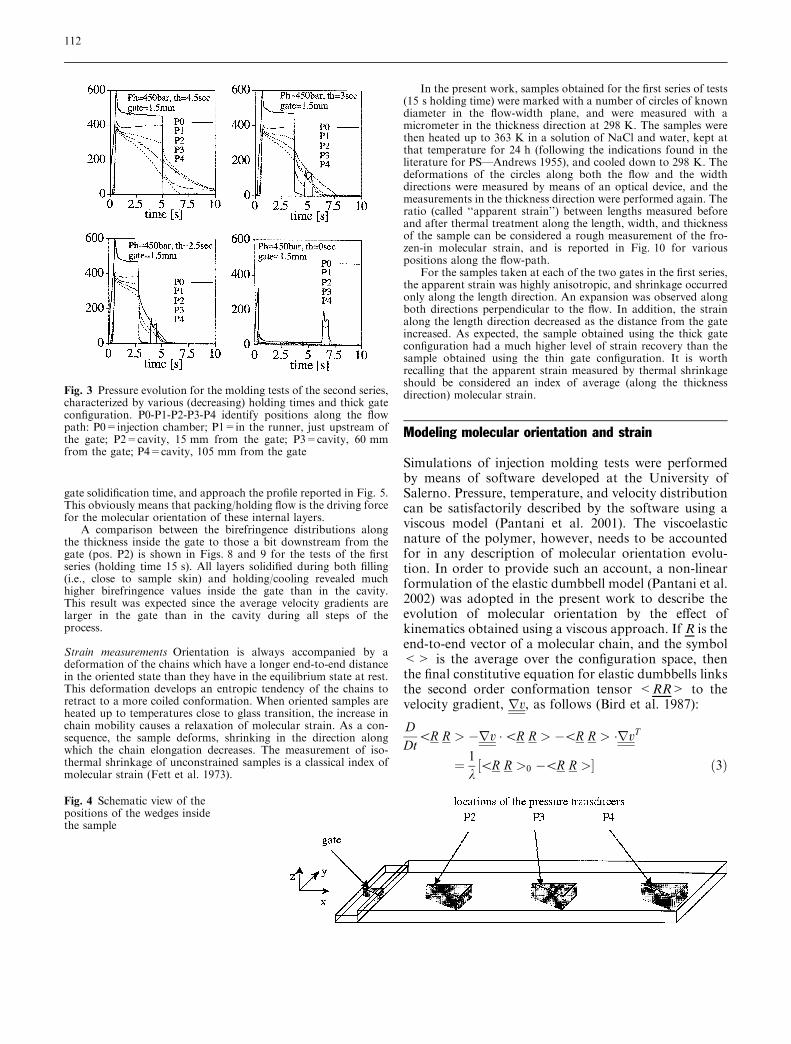
Birefringence measurements The ‘‘wedge method’’ (Hemsley andRobinson 1992) was used to obtain the birefringence distributionalong the thickness of the moldings. The wedge angle was keptabout 30� in order to maintain a distance between interferencefringes of the order of 0.1 mm. A schematic view of the positions ofthe wedges is reported in Fig. 4.
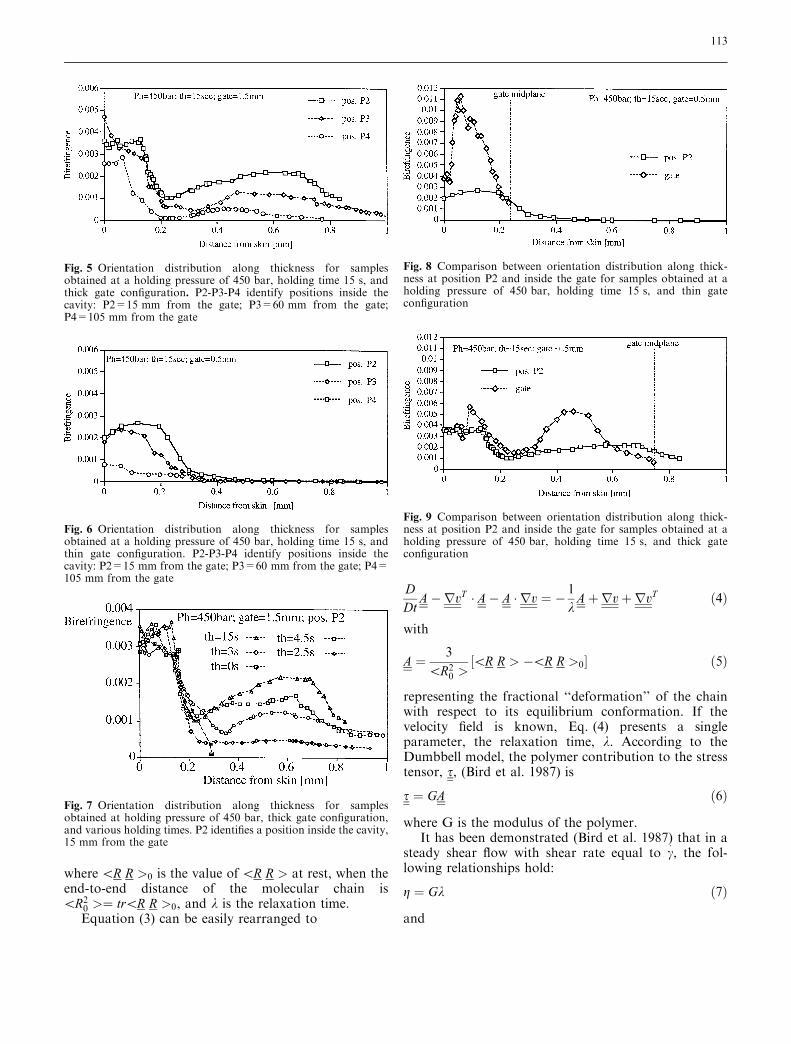
Data regarding the birefringence distribution along the thick-ness inside the cavity at positions P2, P3, and P4 are shown inFigs. 5 and 6, and refer to the samples of the first series, i.e., thosemolded with thick and thin gate configuration, respectively.
As to be expected, the maximum birefringence values are foundnear the sample skin, i.e., inside layers solidified during the fillingstep. For each molding condition, birefringence values decrease asthe distance from the gate increases.
The major difference in birefringence distributions between thetwo gate configurations regards the layers solidified during thepacking/holding steps, i.e., those at about 0.3–0.8 mm fromthe sample surface. In these layers, the samples obtained using thethin gate configuration show lower orientation values thanthose obtained using the thick gate configuration. For the latterconfiguration birefringence has a minimum at about 250 lm fromthe skin; it increases again reaching a maximum at about 500 lm
from the skin. This increase is obviously due to the packing/holdingflow and is consistent with the fact that birefringence values de-crease as the distance from the gate increases, and are quite low(nearly zero) in the thin gate configuration (where packing/holdingflow is negligibly small).
The second series of injection molding tests was carried out withthe aim of further underlining the relevance of the packing flow onthe orientation distribution in the samples. The results are shown inFig. 7 for holding time values ranging from zero to 15 s (alsoshown in Fig. 5), which are larger than the time required for gatecomplete solidification. Apart from minor differences due to theimperfect reproducibility of the molding cycle, birefringence in thelayers under about 250 lm from the sample skin remains un-changed, independently of the holding time. This clearly confirmsthat these layers solidify during the filling step. Vice versa, thevalues of birefringence in the more internal layers, from 250 lm toabout 750 lm, are an increasing function of the holding time up to
Fig. 1 Closed symbols: data ofmaterial viscosity curves forPS678E. Open symbols: relaxa-tion time k, as evaluated fromN1 and g according to Eq. (8).Lines: calculations of viscosityand relaxation time by Crossequation, Eqs. (1), (2), (10), and(11)
Fig. 2 Pressure evolution for the molding tests of the first series,characterized by different gate thicknesses. P0-P1-P2-P3-P4 identifypositions along the flow path: P0=injection chamber; P1=in therunner, just upstream of the gate; P2=cavity, 15 mm from the gate;P3=cavity, 60 mm from the gate; P4=cavity, 105 mm from thegate
111
gate solidification time, and approach the profile reported in Fig. 5.This obviously means that packing/holding flow is the driving forcefor the molecular orientation of these internal layers.
A comparison between the birefringence distributions alongthe thickness inside the gate to those a bit downstream from thegate (pos. P2) is shown in Figs. 8 and 9 for the tests of the firstseries (holding time 15 s). All layers solidified during both filling(i.e., close to sample skin) and holding/cooling revealed muchhigher birefringence values inside the gate than in the cavity.This result was expected since the average velocity gradients arelarger in the gate than in the cavity during all steps of theprocess.
Strain measurements Orientation is always accompanied by adeformation of the chains which have a longer end-to-end distancein the oriented state than they have in the equilibrium state at rest.This deformation develops an entropic tendency of the chains toretract to a more coiled conformation. When oriented samples areheated up to temperatures close to glass transition, the increase inchain mobility causes a relaxation of molecular strain. As a con-sequence, the sample deforms, shrinking in the direction alongwhich the chain elongation decreases. The measurement of iso-thermal shrinkage of unconstrained samples is a classical index ofmolecular strain (Fett et al. 1973).
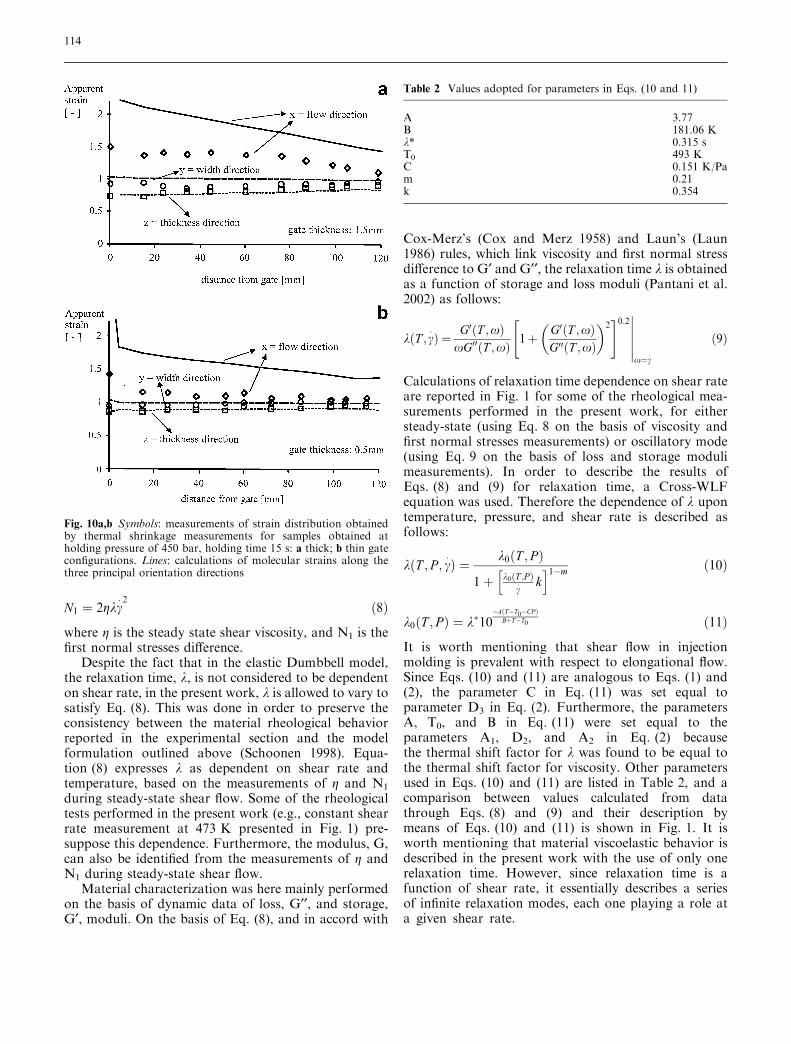
In the present work, samples obtained for the first series of tests(15 s holding time) were marked with a number of circles of knowndiameter in the flow-width plane, and were measured with amicrometer in the thickness direction at 298 K. The samples werethen heated up to 363 K in a solution of NaCl and water, kept atthat temperature for 24 h (following the indications found in theliterature for PS—Andrews 1955), and cooled down to 298 K. Thedeformations of the circles along both the flow and the widthdirections were measured by means of an optical device, and themeasurements in the thickness direction were performed again. Theratio (called ‘‘apparent strain’’) between lengths measured beforeand after thermal treatment along the length, width, and thicknessof the sample can be considered a rough measurement of the fro-zen-in molecular strain, and is reported in Fig. 10 for variouspositions along the flow-path.
For the samples taken at each of the two gates in the first series,the apparent strain was highly anisotropic, and shrinkage occurredonly along the length direction. An expansion was observed alongboth directions perpendicular to the flow. In addition, the strainalong the length direction decreased as the distance from the gateincreased. As expected, the sample obtained using the thick gateconfiguration had a much higher level of strain recovery than thesample obtained using the thin gate configuration. It is worthrecalling that the apparent strain measured by thermal shrinkageshould be considered an index of average (along the thicknessdirection) molecular strain.
Modeling molecular orientation and strain
Simulations of injection molding tests were performedby means of software developed at the University ofSalerno. Pressure, temperature, and velocity distributioncan be satisfactorily described by the software using aviscous model (Pantani et al. 2001). The viscoelasticnature of the polymer, however, needs to be accountedfor in any description of molecular orientation evolu-tion. In order to provide such an account, a non-linearformulation of the elastic dumbbell model (Pantani et al.2002) was adopted in the present work to describe theevolution of molecular orientation by the effect ofkinematics obtained using a viscous approach. If R is theend-to-end vector of a molecular chain, and the symbol<> is the average over the configuration space, thenthe final constitutive equation for elastic dumbbells linksthe second order conformation tensor <RR> to thevelocity gradient, rv, as follows (Bird et al. 1987):
DDt
\R R > �rv �\R R > �\R R > �rvT
¼ 1
k\R R >0 �\R R >½ � ð3Þ
Fig. 3 Pressure evolution for the molding tests of the second series,characterized by various (decreasing) holding times and thick gateconfiguration. P0-P1-P2-P3-P4 identify positions along the flowpath: P0=injection chamber; P1=in the runner, just upstream ofthe gate; P2=cavity, 15 mm from the gate; P3=cavity, 60 mmfrom the gate; P4=cavity, 105 mm from the gate
Fig. 4 Schematic view of thepositions of the wedges insidethe sample
112
where\R R >0 is the value of\R R > at rest, when theend-to-end distance of the molecular chain is\R2
0 >¼ tr\R R >0, and k is the relaxation time.Equation (3) can be easily rearranged to
DDt
A�rvT � A� A � rv ¼ � 1
kAþrvþrvT ð4Þ
with
A ¼ 3
\R20 >
\R R > �\R R >0½ � ð5Þ
representing the fractional ‘‘deformation’’ of the chainwith respect to its equilibrium conformation. If thevelocity field is known, Eq. (4) presents a singleparameter, the relaxation time, k. According to theDumbbell model, the polymer contribution to the stresstensor, s, (Bird et al. 1987) is
s ¼ GA ð6Þ
where G is the modulus of the polymer.It has been demonstrated (Bird et al. 1987) that in a
steady shear flow with shear rate equal to c�, the fol-
lowing relationships hold:
g ¼ Gk ð7Þ
and
Fig. 6 Orientation distribution along thickness for samplesobtained at a holding pressure of 450 bar, holding time 15 s, andthin gate configuration. P2-P3-P4 identify positions inside thecavity: P2=15 mm from the gate; P3=60 mm from the gate; P4=105 mm from the gate
Fig. 5 Orientation distribution along thickness for samplesobtained at a holding pressure of 450 bar, holding time 15 s, andthick gate configuration. P2-P3-P4 identify positions inside thecavity: P2=15 mm from the gate; P3=60 mm from the gate;P4=105 mm from the gate
Fig. 7 Orientation distribution along thickness for samplesobtained at holding pressure of 450 bar, thick gate configuration,and various holding times. P2 identifies a position inside the cavity,15 mm from the gate
Fig. 8 Comparison between orientation distribution along thick-ness at position P2 and inside the gate for samples obtained at aholding pressure of 450 bar, holding time 15 s, and thin gateconfiguration
Fig. 9 Comparison between orientation distribution along thick-ness at position P2 and inside the gate for samples obtained at aholding pressure of 450 bar, holding time 15 s, and thick gateconfiguration
113
N1 ¼ 2gkc� 2 ð8Þ
where g is the steady state shear viscosity, and N1 is thefirst normal stresses difference.
Despite the fact that in the elastic Dumbbell model,the relaxation time, k, is not considered to be dependenton shear rate, in the present work, k is allowed to vary tosatisfy Eq. (8). This was done in order to preserve theconsistency between the material rheological behaviorreported in the experimental section and the modelformulation outlined above (Schoonen 1998). Equa-tion (8) expresses k as dependent on shear rate andtemperature, based on the measurements of g and N1
during steady-state shear flow. Some of the rheologicaltests performed in the present work (e.g., constant shearrate measurement at 473 K presented in Fig. 1) pre-suppose this dependence. Furthermore, the modulus, G,can also be identified from the measurements of g andN1 during steady-state shear flow.
Material characterization was here mainly performedon the basis of dynamic data of loss, G¢¢, and storage,G¢, moduli. On the basis of Eq. (8), and in accord with
Cox-Merz’s (Cox and Merz 1958) and Laun’s (Laun1986) rules, which link viscosity and first normal stressdifference to G¢ and G¢¢, the relaxation time k is obtainedas a function of storage and loss moduli (Pantani et al.2002) as follows:
kðT ;c� Þ ¼ G0ðT ;xÞxG00ðT ;xÞ 1þ G0ðT ;xÞ
G00ðT ;xÞ
� �2" #0:2������
x¼c�
ð9Þ
Calculations of relaxation time dependence on shear rateare reported in Fig. 1 for some of the rheological mea-surements performed in the present work, for eithersteady-state (using Eq. 8 on the basis of viscosity andfirst normal stresses measurements) or oscillatory mode(using Eq. 9 on the basis of loss and storage modulimeasurements). In order to describe the results ofEqs. (8) and (9) for relaxation time, a Cross-WLFequation was used. Therefore the dependence of k upontemperature, pressure, and shear rate is described asfollows:
kðT ; P ; c� Þ ¼ k0ðT ; P Þ
1þ k0ðT ;P Þc� k
h i1�m ð10Þ
k0ðT ; P Þ ¼ k�10�AðT�T0�CP Þ
BþT�T0 ð11Þ
It is worth mentioning that shear flow in injectionmolding is prevalent with respect to elongational flow.Since Eqs. (10) and (11) are analogous to Eqs. (1) and(2), the parameter C in Eq. (11) was set equal toparameter D3 in Eq. (2). Furthermore, the parametersA, T0, and B in Eq. (11) were set equal to theparameters A1, D2, and A2 in Eq. (2) becausethe thermal shift factor for k was found to be equal tothe thermal shift factor for viscosity. Other parametersused in Eqs. (10) and (11) are listed in Table 2, and acomparison between values calculated from datathrough Eqs. (8) and (9) and their description bymeans of Eqs. (10) and (11) is shown in Fig. 1. It isworth mentioning that material viscoelastic behavior isdescribed in the present work with the use of only onerelaxation time. However, since relaxation time is afunction of shear rate, it essentially describes a seriesof infinite relaxation modes, each one playing a role ata given shear rate.
Fig. 10a,b Symbols: measurements of strain distribution obtainedby thermal shrinkage measurements for samples obtained atholding pressure of 450 bar, holding time 15 s: a thick; b thin gateconfigurations. Lines: calculations of molecular strains along thethree principal orientation directions
Table 2 Values adopted for parameters in Eqs. (10 and 11)
A 3.77B 181.06 Kk* 0.315 sT0 493 KC 0.151 K/Pam 0.21k 0.354
114
Comparison and discussion
According to the derivations of Kuhn and Grun (1942),the tensor A is proportional to the refractive index ten-sor. In the present work, the maximum eigenvalue of thedeformation tensor A is referred to as /. With regards tothe injection molding kinematics, / is much larger thanthe other eigenvalues, and is therefore used as an indexof molecular orientation, directly proportional to bire-fringence.
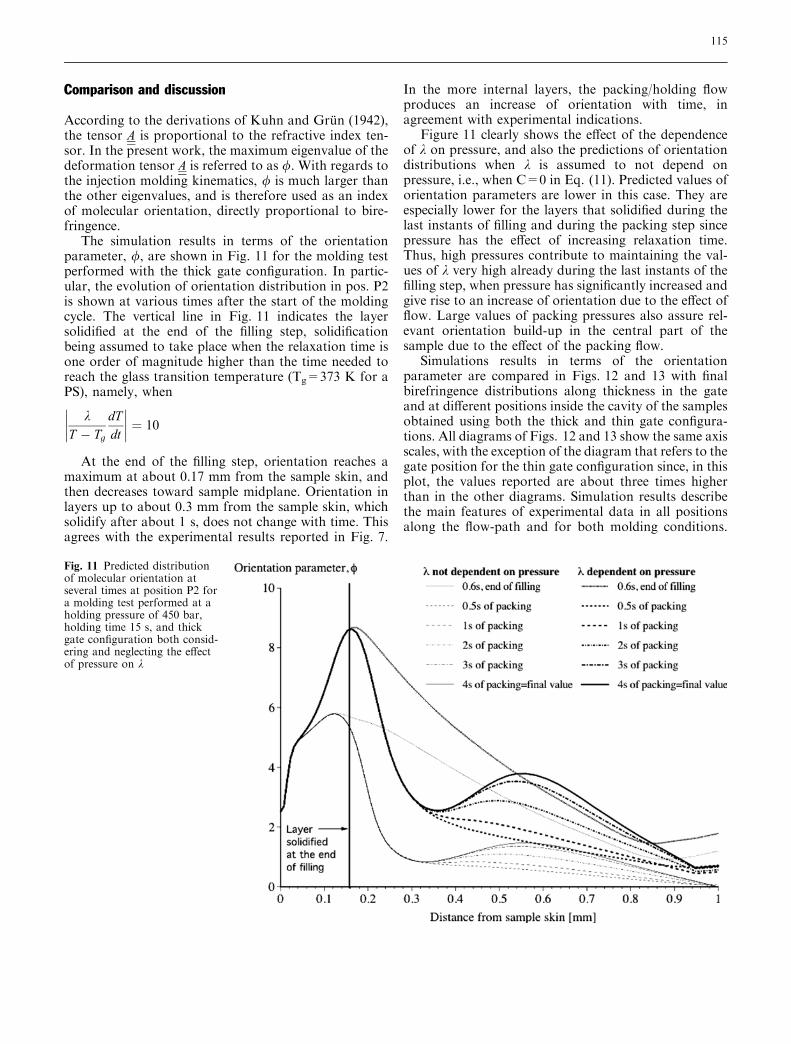
The simulation results in terms of the orientationparameter, /, are shown in Fig. 11 for the molding testperformed with the thick gate configuration. In partic-ular, the evolution of orientation distribution in pos. P2is shown at various times after the start of the moldingcycle. The vertical line in Fig. 11 indicates the layersolidified at the end of the filling step, solidificationbeing assumed to take place when the relaxation time isone order of magnitude higher than the time needed toreach the glass transition temperature (Tg=373 K for aPS), namely, when
kT � Tg
dTdt
�������� ¼ 10
At the end of the filling step, orientation reaches amaximum at about 0.17 mm from the sample skin, andthen decreases toward sample midplane. Orientation inlayers up to about 0.3 mm from the sample skin, whichsolidify after about 1 s, does not change with time. Thisagrees with the experimental results reported in Fig. 7.
In the more internal layers, the packing/holding flowproduces an increase of orientation with time, inagreement with experimental indications.
Figure 11 clearly shows the effect of the dependenceof k on pressure, and also the predictions of orientationdistributions when k is assumed to not depend onpressure, i.e., when C=0 in Eq. (11). Predicted values oforientation parameters are lower in this case. They areespecially lower for the layers that solidified during thelast instants of filling and during the packing step sincepressure has the effect of increasing relaxation time.Thus, high pressures contribute to maintaining the val-ues of k very high already during the last instants of thefilling step, when pressure has significantly increased andgive rise to an increase of orientation due to the effect offlow. Large values of packing pressures also assure rel-evant orientation build-up in the central part of thesample due to the effect of the packing flow.
Simulations results in terms of the orientationparameter are compared in Figs. 12 and 13 with finalbirefringence distributions along thickness in the gateand at different positions inside the cavity of the samplesobtained using both the thick and thin gate configura-tions. All diagrams of Figs. 12 and 13 show the same axisscales, with the exception of the diagram that refers to thegate position for the thin gate configuration since, in thisplot, the values reported are about three times higherthan in the other diagrams. Simulation results describethe main features of experimental data in all positionsalong the flow-path and for both molding conditions.
Fig. 11 Predicted distributionof molecular orientation atseveral times at position P2 fora molding test performed at aholding pressure of 450 bar,holding time 15 s, and thickgate configuration both consid-ering and neglecting the effectof pressure on k
115
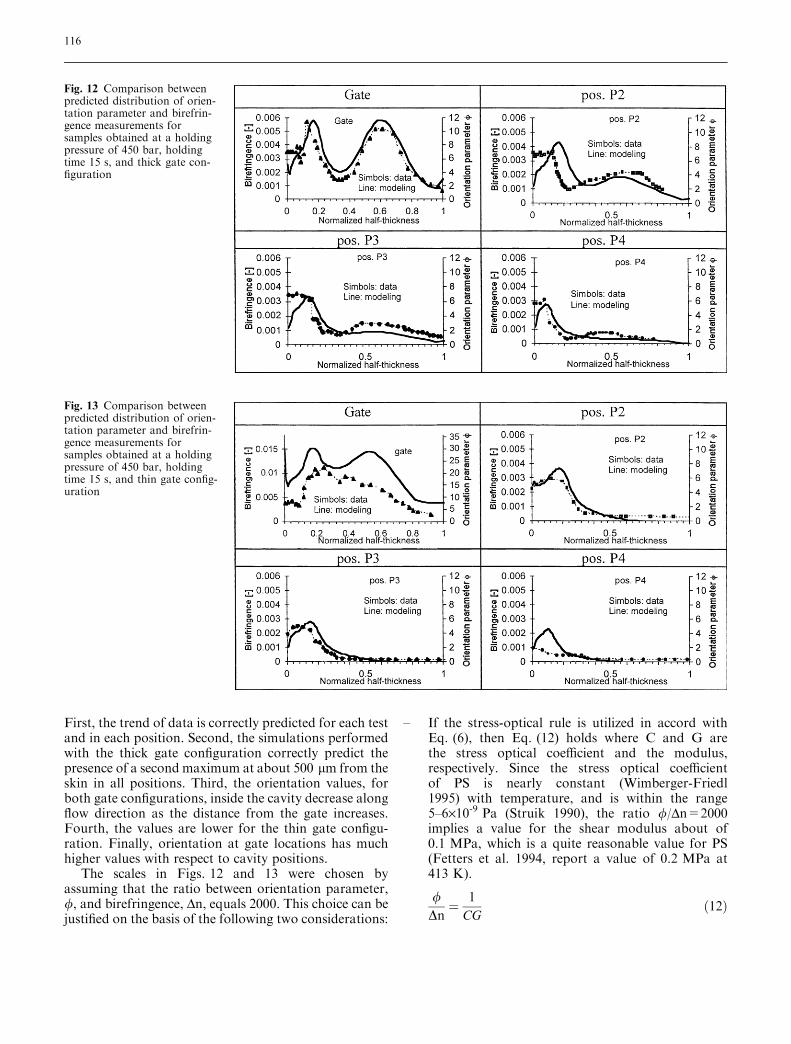
First, the trend of data is correctly predicted for each testand in each position. Second, the simulations performedwith the thick gate configuration correctly predict thepresence of a second maximum at about 500 lm from theskin in all positions. Third, the orientation values, forboth gate configurations, inside the cavity decrease alongflow direction as the distance from the gate increases.Fourth, the values are lower for the thin gate configu-ration. Finally, orientation at gate locations has muchhigher values with respect to cavity positions.
The scales in Figs. 12 and 13 were chosen byassuming that the ratio between orientation parameter,/, and birefringence, Dn, equals 2000. This choice can bejustified on the basis of the following two considerations:
– If the stress-optical rule is utilized in accord withEq. (6), then Eq. (12) holds where C and G arethe stress optical coefficient and the modulus,respectively. Since the stress optical coefficientof PS is nearly constant (Wimberger-Friedl1995) with temperature, and is within the range5–6·10-9 Pa (Struik 1990), the ratio //Dn=2000implies a value for the shear modulus about of0.1 MPa, which is a quite reasonable value for PS(Fetters et al. 1994, report a value of 0.2 MPa at413 K).
/Dn¼ 1
CGð12Þ
Fig. 12 Comparison betweenpredicted distribution of orien-tation parameter and birefrin-gence measurements forsamples obtained at a holdingpressure of 450 bar, holdingtime 15 s, and thick gate con-figuration
Fig. 13 Comparison betweenpredicted distribution of orien-tation parameter and birefrin-gence measurements forsamples obtained at a holdingpressure of 450 bar, holdingtime 15 s, and thin gate config-uration
116
– The proportionality between u and Dn also identifiesthe maximum possible value for /. Since the maxi-mum birefringence for PS is normally in the rangefrom 0.11 to 0.16 (Struik 1990), /max must have avalue from 220 to 320. According to the definition ofthe second order tensor A given by Eq. (5), /max isrelated to the maximum possible molecular strain,smax, by the relationship smax=�(/max+1). In addi-tion smax=�m, where m is the number of Kuhn seg-ments between consecutive entanglements atequilibrium. For PS, m is about 350 (Ferry 1980),which agrees well with the values found for/max=220–320.
Regarding the calculations of molecular strains,each of the three eigenvalues of A identifies themolecular strain along a principal orientation direction(which roughly correspond to x=flow, y=width, andz=thickness directions) by the equation
si ¼ffiffiffiffiffiffiffiffiffiffiffiffiffi/i þ 1
pð13Þ
where the subscript ‘‘i’’ identifies the direction, si is themolecular strain, and /i is the eigenvalue.
The molecular strain values, si, along the three prin-cipal orientation directions were averaged over thethickness and compared in Fig. 10 with the experimentalresults of apparent strain distribution along the flow-path. The model gives values higher than the data formolecular strain along flow direction. The comparison,however, is satisfactory since both the right order ofmagnitude and the trend of data are captured. Fur-thermore, a slight overprediction was expected, since, asmentioned above, the apparent strain should be lowerthan the molecular strain.
Conclusions
In the present work, molecular orientation distributionin injection molded samples of amorphous polystyrenewas measured under different molding conditions.Injection molding tests have been carried out in order toclarify the effect of packing/holding flow on orientationdistribution. In particular, it was shown that the pack-ing/holding flow is a very effective driving force formolecular orientation in internal layers, where orienta-tion can reach values comparable to those attained closeto the sample skin, that solidify during the filling step.Information about the molecular strain was also gath-ered by measuring sample thermal shrinkage.
Injection molding tests were modeled using a soft-ware developed at the University of Salerno. Thedumbbell model was used to describe the evolution ofmolecular orientation by the effect of kinematics using aviscous approach. The non-linearity of the dumbbellswas accounted for by allowing the relaxation time to bea function of temperature, pressure and shear rate. Thecharacterization of relaxation time was performed onthe basis of rheological measurements performed withrotational rheometers, both in oscillatory and in steady-state mode, since shear flow is normally prevalent ininjection molding.
Simulation results describe the main features of ori-entation and strain distribution in the molded samples.
On the basis of the results obtained in this work, itcan be concluded that, with an appropriate choice ofrelaxation time, the dumbbell model provides, on thebasis of appropriate kinematics, a reliable description ofthe evolution of molecular orientation during and afterprocessing.
References
Andrews RD Jr (1955) Retraction of ori-ented polystyrene monofilaments.J Appl Phys 26:1061–1067
Baaijens FPT, Douven LFA (1990) Inte-gration of theory and application inapplied mechanics. Dijksman JF,Nieuwstadt (eds) Kluwer AcademicPublishers, Dordrecht
Bird RB, Curtiss CF, Armstrong RC,Hassager O (1987) Dynamics of poly-meric liquids, vol 2. Wiley
Cox WP, Merz EH (1958) Correlation ofdynamic and steady-flow viscosities.J Polymer Sci 28:619–622
Douven LFA, Baaijens FPT, Meijer HEH(1995) The computation of properties ofinjection-molded products. Progr PolymSci 20(3):403–457
Ferry JD (1980) Viscoelastic properties ofpolymers. Wiley
Fett T, Nothdurft W, Racke H (1973)Shrinkage measurements for the deter-mination of states of orientation inamorphous thermoplastics. Kunststoffe63(1):41–45
Fetters LJ, Lohse DJ, Richter D, WittenTA, Zirkel A (1994) Connection be-tween polymer molecular weight, den-sity, chain dimensions, and meltviscoelastic properties. Macromolecules27(17):4639–4647
Flaman AAM (1990) Build-up and relaxa-tion of molecular orientation in injec-tion moulding. PhD Thesis, EindhovenUniversity of Technology
Hemsley DA, Robinson AM (1992) Asimple method for the assessment ofmolecular orientation in transparentplastics moldings. Polym Test11(5):373–385
Isayev AI, Hieber CA (1980) Toward aviscoelastic modeling of the injectionmolding of polymers. Rheol Acta19(2):168–182
Kim H, Park SJ, Chung ST, Kwon TH(1999) Numerical modeling of injection/compression molding for center-gateddisk. Part II. Effect of compressionstage. Polym Eng Sci 39(10):1943–1951
Kuhn W, Grun F (1942) Relation betweenthe elasticity constant and extensiondouble diffraction of highly elastic sub-stances. Kolloid Zh 101:248–271
Laun HM (1986) Prediction of elasticstrains of polymer melts in shear andelongation. J Rheol 30(3):459–501
117

Pantani R, Speranza V, Titomanlio G(2001) Relevance of mold-inducedthermal boundary conditions and cavitydeformation in the simulation of injec-tion molding. Polym Eng Sci41(11):2022–2035
Pantani R, Speranza V, Sorrentino A, Ti-tomanlio G (2002) Molecular orienta-tion and strain in injection moulding ofthermoplastics. Macromol Symp 185(Flow-Induced Crystallization of Poly-mers):293–307
Schoonen J (1998) Determination of rheo-logical constitutive equations usingcomplex flows. PhD Thesis, EindhovenUniversity of Technology
Struik LCE (1990) Internal stresses,dimensional instabilities and molecularorientations in plastics. Wiley
Wimberger-Friedl R (1995) The assessmentof orientation, stress and density distri-butions in injection-molded amorphouspolymers by optical techniques. ProgrPolym Sci 20(3):369–401
118


