Embed Size (px)
Citation preview

This article was originally published in a journal published byElsevier, and the attached copy is provided by Elsevier for the
author’s benefit and for the benefit of the author’s institution, fornon-commercial research and educational use including without
limitation use in instruction at your institution, sending it to specificcolleagues that you know, and providing a copy to your institution’s
administrator.
All other uses, reproduction and distribution, including withoutlimitation commercial reprints, selling or licensing copies or access,
or posting on open internet sites, your personal or institution’swebsite or repository, are prohibited. For exceptions, permission
may be sought for such use through Elsevier’s permissions site at:
http://www.elsevier.com/locate/permissionusematerial

Autho
r's
pers
onal
co
py
Molecular Phylogenetics and Evolution 43 (2007) 952–973www.elsevier.com/locate/ympev
1055-7903/$ - see front matter © 2006 Elsevier Inc. All rights reserved.doi:10.1016/j.ympev.2006.09.012
Molecular evidence for a species complex in the patagonian lizard Liolaemus bibronii and phylogeography of the closely related
Liolaemus gracilis (Squamata: Liolaemini)
Mariana Morando a,¤, Luciano J. Avila a, Cameron R. Turner b,c, Jack W. Sites Jr. b
a CONICET-CENPAT. Boulevard Almirante Brown s/n, 9120, Puerto Madryn, Chubut, Argentinab Department of Integrative Biology, and M.L. Bean Life Science Museum, Brigham Young University, 401 WIDB, Provo, UT 84602, USA
c Department of Biology, College of Arts and Sciences, Indiana University, Bloomington, IN 47405, USA
Received 31 May 2006; revised 14 September 2006; accepted 18 September 2006Available online 27 September 2006
Abstract
The lizard genus Liolaemus is endemic to temperate South America and includes 190 species. Liolaemus bibronii has a large geographicdistribution and inhabits a great diversity of habitats, including the Monte, Steppe, and high Andean grassland environments. Liolaemusgracilis has a similar body size and shape to L. bibronii; the two are parapatrically distributed, and L. gracilis is also widely distributed.Here we use the mtDNA cytb sequence data of these two species to investigate lizard phylogeographic patterns in southern South Amer-ica. L. bibronii is paraphyletic with respect to L. gracilis, Liolaemus ramirezae, Liolaemus robertmertensi and Liolaemus saxatilis; it is com-posed of many genetically diVerent allopatric haploclades, some of which are reciprocally monophyletic. We also found evidence forintrogression between L. bibronii and L. gracilis in the same area that introgression was hypothesized in the Liolaemus darwinii complex.We discuss the distribution of the major haploclades with inferences of their population histories, the concordance of these clades’ distri-butions and histories with other lizard complexes studied with the same markers and methods, and taxonomic implications of theseresults.© 2006 Elsevier Inc. All rights reserved.
Keywords: Argentina; Liolaemus bibronii; Liolaemus gracilis; Lizard; mtDNA; Phylogeography
1. Introduction
The Patagonian region of southern South America rep-resents a geographically extensive and ecologically andtopographically diverse area that is biologically poorlyknown. It includes two main ecoregions, Patagonian Steppeand Austral Monte (Xatlands and plateaus), with two othersmall ecoregions along its western edges, the Valdivian For-est and southern High Andes (Burkart et al., 1999). Physio-graphic complexity increases from east to west along anelevational gradient, and the landscape is dissected fromnorth to south by several east-Xowing river systems. The
southern Andean Range and adjacent regions have beenaVected by orogenic and volcanic events, and cyclical glaci-ations (Simpson-Vuilleumier, 1971; Simpson, 1975, 1979,1983; Villagrán et al., 1995, 1998; Thorson, 1999; McCul-loch et al., 2000). Andean uplift began in the Miocene andcontinues to the present (Ramos, 1989), and mountain-building has been accompanied by multiple Pleistocene gla-ciations (Hollin and Schilling, 1981; Clapperton, 1993;McCulloch and Bentley, 1998; Hulton et al., 2002; Sugdenet al., 2002). Superimposed on these events have beenrepeated Pleistocene volcanic disturbances and marine int-rogressions (Rabassa and Clapperton, 1990), which collec-tively form a remarkably diverse landscape.
The biogeographic and phylogeographic eVects ofthe Pliocene–Pleistocene historical events have beenwell documented in Europe and North America (e.g.
* Corresponding author. Fax: +54 2965 451543.E-mail addresses: [email protected] (M. Morando), cartune
@indiana.edu (C. Turner), [email protected] (J.W. Sites).

Autho
r's
pers
onal
co
py
M. Morando et al. / Molecular Phylogenetics and Evolution 43 (2007) 952–973 953
Hewitt, 1996, 2000; Comes and Kadereit, 1998; Petitet al., 2003; Taberlet et al., 1998; Avise et al., 1998;Hewitt, 2004). These events have promoted extensiveshifts in distributions as well as fostered speciation andintraspeciWc diVerentiation, and refugia have been identi-Wed in some regions (e.g. Hewitt, 1996, 2000). In contrast,homogenization of populations through long-distancepostglacial dispersal is also hypothesized (Hewitt, 1996).Concordant genetic signals of population expansion intodeglaciated areas have been found across taxa withwidely diVerent life histories, perhaps reXecting the com-mon role of glacial vicariant events in shaping commu-nity composition at higher latitudes (Lessa et al., 2003).
In southern South America, Miocene to Pliocene paleo-climatic and geological events have also presumablyimposed strong selective forces on the evolutionary histo-ries of the southern temperate-adapted vertebrate fauna(Baez and Scillato Yané, 1979; Markgraf et al., 1995).Marine incursions in several regions along coastlines andregional tectonic uplift may have contributed to habitatfragmentation during this period, promoting divergencebetween isolated populations. During the late Pliocene toearly Pleistocene (0.7–2 Ma), climatic oscillations intensiWedand produced rapid Xuctuations between cool–dry andwarm–wet conditions across southeastern Patagonia(Simpson, 1979). The impacts of glaciations have been lesswell documented than in the northern hemisphere,although it is clear that much local glaciation occurred,which most probably caused extinction or migration north-ward and to lower elevations for many plant and animalgroups (Simpson-Vuilleumier, 1971; Simpson, 1975, 1979,1983; Villagrán et al., 1995, 1998; Thorson, 1999; McCul-loch et al., 2000). Indeed the major part of Patagoniaappears to have been a bogland (Simpson-Vuilleumier,1971) dissected by outwash streams and lakes from glacial-melt waters, although there was an overall cooling–dryingtrend evident by late Pliocene (Baez and Scillato Yané,1979; Markgraf et al., 1995), causing dramatic shifts in theranges of taxa by latitude and topography.
Although the extensive glaciations, habitat shifts, marineincursions, and tectonic and volcanic activities in the Pata-gonia region over the past several million years (Clapper-ton, 1993) have likely generated interesting biogeographicpatterns, few phylogeographic studies have been conductedfor widely distributed Patagonian vertebrates (Avila et al.,2006; Kim et al., 1998; Morando et al., 2003, 2004).Detailed information about the geographical distributionof population genetic variation within and among diverg-ing taxa is critical for analyses of the evolutionary processesdriving divergence and speciation (Hewitt, 1996, 2000;Avise et al., 1998; Klicka and Zink, 1999; Knowles, 2000,2001). Analysis of phylogeographic structure is particularlyimportant for species with extensive ranges and complexgeographical patterns of polymorphism (Irschick andShaVer, 1997; Starkey et al., 2003). Phylogeographic datacan be used to infer the biogeographic and demographichistories of such organisms (Avise, 2000, 2004), and under-
standing the role of historical environmental change in gen-erating current patterns of biodiversity is central toidentifying processes of divergence and speciation and theirimplications for conservation (Moritz et al., 2000; Hewitt,2004).
The lizard genus Liolaemus is endemic to temperateSouth America, where it is distributed over a wide geo-graphic region and occupies a large range of latitudinal(14°30’–52°30’S), altitudinal (0–4500 m), and climaticregimes; Liolaemus range from the extremely arid Atacamadesert to temperate Nothofagus rainforest (Cei, 1986, 1993;Donoso Barros, 1966; Etheridge and de Queiroz, 1988;Lobo, 2001). This genus includes 190 recognized speciesand subspecies and new species are being discovered at arapid rate (see examples in Abdala, 2002, 2003, 2005; Avila,2003; Avila et al., 2003; Avila et al., 2004; Espinoza et al.,2000; Etheridge, 2001; Etheridge and Christie, 2003; Espi-noza and Lobo, 2003; Martínez Oliver and Lobo, 2002;Nuñez et al., 2000; Pincheira-Donoso and Nuñez, 2003;Verrastro et al., 2003). Some new species are endemic to sin-gle mountaintops or recently explored isolated areas (e.g.Avila, 2003; Avila et al., 2003), whereas others were for-merly grouped into single species (“inertial species” ofGood, 1994) and later recognized after detailed studies (e.g.Abdala, 2002, 2003, 2005; Espinoza and Lobo, 2003; Martí-nez Oliver and Lobo, 2002; Lobo and Kretzschmar, 1996).Morando et al. (2003) recently estimated that the actualnumber of Liolaemus species could be as high as twice thenumber currently recognized.
Although lizard biogeography of these regions isscarcely known, some historical and demographichypotheses have been recently proposed for some Liolae-mus species (Avila et al., 2006; Morando et al., 2003,2004). All of these studies revealed that several widely dis-tributed species constituted species complexes, withsmaller distributions and more genetically structuredclades in the unglaciated northern regions and largerranges and lower genetic diversity—signatures for recentrange expansions—in the southern regions. Based onthese results, high levels of genetic diVerentiation arelikely to be uncovered among populations of many otherwidespread Liolaemus groups (and by extension, to otherunrelated clades) in the Andean–Patagonian areas. There-fore current taxonomy likely conceals a long history ofmultiple evolutionary processes operating throughout thisregion (Morando et al., 2003).
Liolaemus bibronii is a species typical of several of thegroups mentioned above; it has a large geographic distribu-tion and inhabits a great diversity of habitats, including theMonte, Steppe, and high Andean grassland environments.This species is common in high elevation Andean valleys(up to 3000 m) in southern San Juan Province (32°S), andremains common across all environments extending to thecoastline of Santa Cruz Province (48°S). Like most Liolae-mus, L. bibronii is insectivorous, and according to Cei(1986) is oviparous, but Donoso Barros (1966) consideredChilean populations to be viviparous.

Autho
r's
pers
onal
co
py
954 M. Morando et al. / Molecular Phylogenetics and Evolution 43 (2007) 952–973
Due to its wide geographic distribution, the variety ofhabitats it occupies, and conXicting interpretations of par-ity mode, we hypothesize that L. bibronii may be a speciescomplex, and that as with the complexes previously studiedby Morando et al. (2003, 2004) and Avila et al. (2006), itssouthernmost clades will have wider geographic distribu-tions than northern clades, and southern clades will showevidence for recent range expansions and less genetic diver-sity and/or genetic structure than northern clades.
A sister-group relationship of L. bibronii (from its north-ernmost distribution) to Liolaemus gracilis with Liolaemusrobertmertensi (L. bibronii) (L. gracilis + L. robertmertensi)was reported by Schulte et al. (2000). However, Morandoet al. (2004) recovered southern populations of L. bibroniias the sister species of Liolaemus ramirezae, and this cladeas the sister group of the clade ((L. gracilis + Liolaemussaxatilis) L. robertmertensi). L. gracilis has a similar bodysize and shape to L. bibronii; the two are parapatrically dis-tributed, and L. gracilis is also widely distributed latitudi-nally through a variety of habitats in the Monte region andthe Monte-Patagonia ecotone. Here we use the mitochon-drial DNA (mtDNA) sequence (cyt-b) data of these twospecies, L. bibronii and L. gracilis, to investigate lizard phy-logeographic patterns in southern South America.
2. Materials and methods
2.1. Taxon sampling
Previous experience (Morando et al., 2003, 2004; Avilaet al., 2006) has suggested that the mtDNA cyt-b gene wassuYciently variable for exploratory phylogeographic stud-ies in Liolaemus, and we use this region here. Sequence datawere collected from a total of 150 lizards, of which 138 sam-ples from 41 localities (Table 1, Fig. 1) represented popula-tions under the names L. bibronii (Bell, 1843) (105individuals) and L. gracilis (Bell, 1843) (32 individuals);these were the “focal species” (Wiens and Penkrot, 2002) ofthis study. L. saxatilis Avila et al., 1992; L. robertmertensiHellmich, 1964; L. ramirezae Lobo and Espinoza, 2000; L.pictus (Dumeril and Bibron 1837), L. cyanogaster (Dumeriland Bibron, 1837), L. chiliensis (Lesson, 1828), L. neuquen-sis (Müller and Hellmich, 1938), L. punmahuida Avila et al.,2003; and L. tenuis Dumeril and Bibron, 1837, were used asnon-focal species (nD1 each, Table 1). L. lineomaculatusBoulenger 1885, and L. kingii (Bell, 1843), members of theLiolaemus clade Eulaemus were used to root the trees, thusallowing the position of the non-focal species to remainunconstrained with respect to the “focal species”.
Table 1 summarizes the number of individualssequenced per locality and distributional information forall taxa used in this study (Table 1, Fig. 1), and voucherspecimens are deposited in the LJAMM herpetological col-lection (now housed in the Centro Nacional Patagónico[CENPAT], Puerto Madryn, Argentina), Fundación Mig-uel Lillo (FML, San Miguel de Tucumán, Argentina),Museo de Ciencias Naturales La Plata (MLP.S, La Plata,
Argentina) and M.L. Bean Life Science Museum (BYU,Provo, USA). Museum voucher numbers are listed bytaxon and locality in Appendix A, and museum acronymsfollow Leviton et al. (1985).
2.2. Laboratory procedures
Total genomic DNA was extracted from liver/muscletissues preserved in 96% ethanol, following the protocoldeveloped by Fetzner (1999). Three �l of extraction prod-uct were electrophoresed on 1% agarose gel to estimatethe quality and amount of genomic DNA, and sampledilutions were performed where necessary prior to poly-merase chain reaction (PCR) ampliWcation. The cyt-bgene region was ampliWed via PCR following Morandoet al. (2003). A 607 bp fragment was ampliWed using thelight-strand primers GluDGL (Palumbi, 1996) and cyt-b 1(Kocher et al., 1989), and the heavy-strand primer Cyt b 3(Palumbi, 1996); Cyt b 2 (Palumbi, 1996) and Cyt.F.1(Whiting et al., 2003) were used as internal sequencingprimers. Double-stranded PCR-ampliWed products werechecked by electrophoresis on a 1% agarose gel (the sizeof the target region estimated using a molecular-weightmarker), puriWed using a GeneClean III kit (BIO101, Inc,Vista, CA), and directly sequenced using the Perkin ElmerABI PRISM Dye Terminator Cycle Sequencing ReadyReaction (PE Applied Biosystems, Foster City, CA).Excess Dye Terminator was removed with CentriSep spincolumns (Princeton Separations Inc.), and sequences werefractionated by polyacrylamide gel electrophoresis on anABI PRISM 3730XL automated DNA sequencer (PEApplied Biosystems, Foster City, CA) at the DNASequencing Center at BYU. Sequences are deposited inGenBank under Accession Numbers DQ989648 toDQ989791. Individuals previously deposited in GenBankand included in these analyses: L. bibronii: AY173791; L.gracilis: AY367804; outgroups: AY367848, AY367803,AY173828, AY367818.
2.3. Sequence alignments
Sequences were edited and aligned using the programSequencher 3.1.1 (Gene Codes Corp. Inc. 1995), andtranslated into amino acids for conWrmation of align-ment. No indels were present, and missing data werecoded as “?”.
2.4. Phylogenetic analyses
Only non-redundant haplotypes (from the 137sequences of the ingroup) selected with the program Col-lapse v.1.1 (http://bioag.byu.edu/zoology/crandall_lab/programs.htm), were used for the tree-based phylogeneticmethods. ModelTest (version 3.06; Posada and Crandall,1998) identiWed the best Wt model of evolution for thecomplete data set of unique haplotypes (106 individuals -93 haplotypes from the ingroup + 13 outgroup—and

Autho
r's
pers
onal
co
py
M. Morando et al. / Molecular Phylogenetics and Evolution 43 (2007) 952–973 955
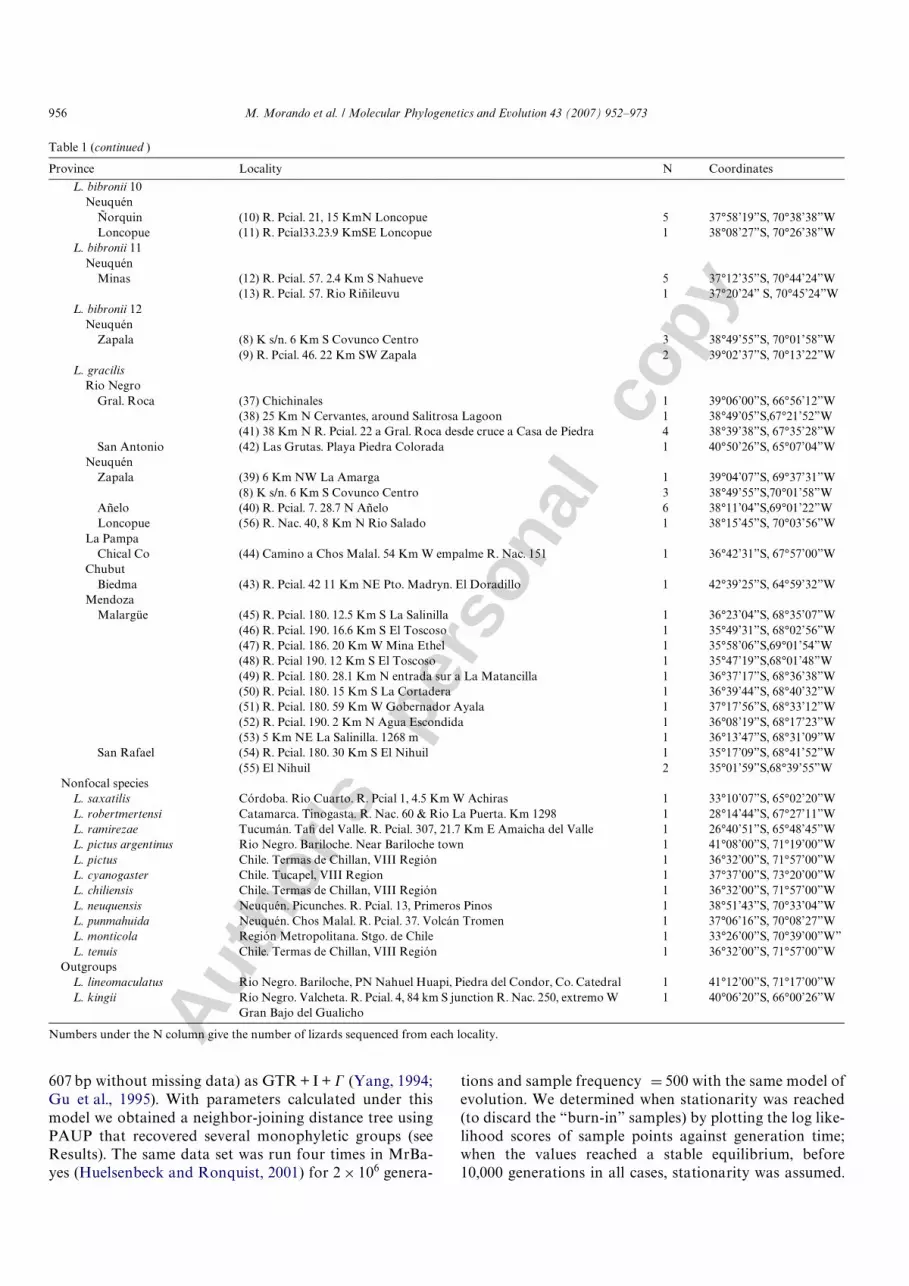
Table 1Number of individuals of all ingroup and outgroup taxa, by locality and ordered according to results, used in this study; locality numbers (in parentheses)match those in Fig. 1 and Appendix A (which provides museum numbers for all specimens)
Province Locality N Coordinates
DepartmentFocal species
Liolaemus bibroniiRio Negro
25 de Mayo (1) R. Nac. 23, 14 Km W Aguada de Guerra 4 41°09’37”S, 68°30’53”W(2) R. Pcial. 5, 40 Km SE Maquinchao 3 41°30’07”S68°33’16”W(4) 7.5 Km W Los Menucos 3 40°51’06”S, 68°10’48”W
Valcheta (3) R. Pcial 60. 10 Km SE Chipauquil 3 41°00’37”S, 66°44’02”WSanta Cruz
Lago Buenos Aires (5) R. Pcial 43, 19 Km W Perito Moreno 1 46°36’02”S, 71°09’53”W(57)R.Pcial. 43. El Pluma 1 46°28’50”S, 70°02’56”W
Deseado (6) R. Pcial 43. 16 Km E Las Heras 4 46°33’50”S, 68°40’16”W(7) R. Nac. 281, 45 Km NW Tellier 1 47°28’20”S, 66°33’14”W(58) Empalme R. Nac. 281 y R. Nac. 3, 7 Km NW Jaramillo 1 47°08’17”S, 67°12’44”W
Escalante (59) R. Nac 26, 27 Km W Pampa del Castillo 1 45°42’57”S, 68°19’27”WL. bibronii 1
ChubutTelsen (16) R. Pcial 4. 0.8 Km E Gan Gan 1 42°31’35”S, 68°15’29”W
(17) 65.5 Km W Telsen 1 42°31’35”S, 68°15’29”W(19) 9 Km W Telsen 1 42°26’55”S, 67°02’42”W(20) R. Pcial. 4. 41.6 Km W Telsen 4 42°22’06”S, 67°24’07”W(60) R. Pcial. 4. 5.4 Km W Telsen 2 42°26’40”S, 67°00’06”W(61) R. Pcial. 4. 2 Km E Gan Gan 2 42°31’44”S, 68°01’06”W
L. bibronii 2Chubut
Cushamen (18) R. Pcial. 13, 8 Km N El Molle 3 42°10’24”S, 69°32’51”WL. bibronii 3
Rio NegroPilcaniyeu (26) R. Nac. 40. 15 Km S entrada Alicura 4 40°40’46”S, 70°42’56”W
(27) 2.7 Km S Estancia San Pedro 4 40°52’43”S, 70°34’28”WEl Cuy (28) R. Pcial 67. 19.2 Km NE Mencue 3 40°19’31”S, 69°26’18”W
L. bibronii 4Rio Negro
El Cuy (29) R. Pcial. 67. 20 Km S Mencue 2 40°34’04”S, 69°44’59”WPilcaniyeu (30) R. Pcial. 67. 3.5 Km N Cañadon Chileno 6 40°51’09”S, 69°58’15”W
(31) R. Pcial. 67. 2 Km N Cañadon Chileno 5 40°52’30”S, 70°01’14”W(32) R. Pcial. 23. 4.8 Km SE Comallo 1 41°02’40”S, 70°12’56”W(27) 2.7 Km S Estancia San Pedro 1 40°52’43”S, 70°34’28”W
L. bibronii 5Neuquén
Catan Lil (33) R. Pcial. 23. 8 Km N Pilolil 1 39°32’29”S, 70°57’21”WL. bibronii 6
NeuquénHuiliches (34) 2 Km W CEAN. R. Pcial. 61. Valle Chimehuin 1 39°52’00”S, 71°10’00”W
L. bibronii 7Rio Negro
Ñorquinco (35) R. Pcial. 6. 1 Km NW Ojo de Agua 1 41°32’30”S, 69°51’33”W25 de Mayo (62) R. Nac. 23, 10 Km W Ing. Jacobacci 2 41°20’16”S, 69°41’42”W
L. bibronii 8Mendoza
Malargüe (21) R. Nac. 40. 6 Km S Laguna Coipo Lauquen 4 36°37’57”S, 69°50’15”W(22) R. Nac. 40. 3.2 Km N. Ranquil Norte 3 36°38’24”S, 69°49’55”W(23) R. Nac. 40. 1.5 Km S Bardas Blancas 1 35°52’11”S, 69°47’43”W(24) 3.4 Km W. Bardas Blancas, entrada Paso Pehuenche 1 35°52’01”S, 69°46’39”W(36) R. Pcial. 180, 90 Km S El Nihuil 2 35°48’59”S, 68°40’05”W
San Rafael (25) 22 Km NW El Sosneado 2 35°04’47”S, 69°34’54”WL. bibronii 9
NeuquénMinas (14) Las Olletas. 7 Km N Aguas Calientes 4 36°39’35”S, 70°35’04”W
(15) 28.5 Km NW empalme R. Pcial. 43 6 36°55’57”S, 70°55’04”W
(continued on next page)
Autho
r's
pers
onal
co
py
956 M. Morando et al. / Molecular Phylogenetics and Evolution 43 (2007) 952–973
607 bp without missing data) as GTR + I + � (Yang, 1994;Gu et al., 1995). With parameters calculated under thismodel we obtained a neighbor-joining distance tree usingPAUP that recovered several monophyletic groups (seeResults). The same data set was run four times in MrBa-yes (Huelsenbeck and Ronquist, 2001) for 2£ 106 genera-
tions and sample frequency D 500 with the same model ofevolution. We determined when stationarity was reached(to discard the “burn-in” samples) by plotting the log like-lihood scores of sample points against generation time;when the values reached a stable equilibrium, before10,000 generations in all cases, stationarity was assumed.
Table 1 (continued )
Numbers under the N column give the number of lizards sequenced from each locality.
Province Locality N Coordinates
L. bibronii 10Neuquén
Ñorquin (10) R. Pcial. 21, 15 KmN Loncopue 5 37°58’19”S, 70°38’38”WLoncopue (11) R. Pcial33.23.9 KmSE Loncopue 1 38°08’27”S, 70°26’38”W
L. bibronii 11Neuquén
Minas (12) R. Pcial. 57. 2.4 Km S Nahueve 5 37°12’35”S, 70°44’24”W(13) R. Pcial. 57. Rio Riñileuvu 1 37°20’24” S, 70°45’24”W
L. bibronii 12Neuquén
Zapala (8) K s/n. 6 Km S Covunco Centro 3 38°49’55”S, 70°01’58”W(9) R. Pcial. 46. 22 Km SW Zapala 2 39°02’37”S, 70°13’22”W
L. gracilisRio Negro
Gral. Roca (37) Chichinales 1 39°06’00”S, 66°56’12”W(38) 25 Km N Cervantes, around Salitrosa Lagoon 1 38°49’05”S,67°21’52”W(41) 38 Km N R. Pcial. 22 a Gral. Roca desde cruce a Casa de Piedra 4 38°39’38”S, 67°35’28”W
San Antonio (42) Las Grutas. Playa Piedra Colorada 1 40°50’26”S, 65°07’04”WNeuquén
Zapala (39) 6 Km NW La Amarga 1 39°04’07”S, 69°37’31”W(8) K s/n. 6 Km S Covunco Centro 3 38°49’55”S,70°01’58”W
Añelo (40) R. Pcial. 7. 28.7 N Añelo 6 38°11’04”S,69°01’22”WLoncopue (56) R. Nac. 40, 8 Km N Rio Salado 1 38°15’45”S, 70°03’56”W
La PampaChical Co (44) Camino a Chos Malal. 54 Km W empalme R. Nac. 151 1 36°42’31”S, 67°57’00”W
ChubutBiedma (43) R. Pcial. 42 11 Km NE Pto. Madryn. El Doradillo 1 42°39’25”S, 64°59’32”W
MendozaMalargüe (45) R. Pcial. 180. 12.5 Km S La Salinilla 1 36°23’04”S, 68°35’07”W
(46) R. Pcial. 190. 16.6 Km S El Toscoso 1 35°49’31”S, 68°02’56”W(47) R. Pcial. 186. 20 Km W Mina Ethel 1 35°58’06”S,69°01’54”W(48) R. Pcial 190. 12 Km S El Toscoso 1 35°47’19”S,68°01’48”W(49) R. Pcial. 180. 28.1 Km N entrada sur a La Matancilla 1 36°37’17”S, 68°36’38”W(50) R. Pcial. 180. 15 Km S La Cortadera 1 36°39’44”S, 68°40’32”W(51) R. Pcial. 180. 59 Km W Gobernador Ayala 1 37°17’56”S, 68°33’12”W(52) R. Pcial. 190. 2 Km N Agua Escondida 1 36°08’19”S, 68°17’23”W(53) 5 Km NE La Salinilla. 1268 m 1 36°13’47”S, 68°31’09”W
San Rafael (54) R. Pcial. 180. 30 Km S El Nihuil 1 35°17’09”S, 68°41’52”W(55) El Nihuil 2 35°01’59”S,68°39’55”W
Nonfocal speciesL. saxatilis Córdoba. Rio Cuarto. R. Pcial 1, 4.5 Km W Achiras 1 33°10’07”S, 65°02’20”WL. robertmertensi Catamarca. Tinogasta. R. Nac. 60 & Rio La Puerta. Km 1298 1 28°14’44”S, 67°27’11”WL. ramirezae Tucumán. TaW del Valle. R. Pcial. 307, 21.7 Km E Amaicha del Valle 1 26°40’51”S, 65°48’45”WL. pictus argentinus Rio Negro. Bariloche. Near Bariloche town 1 41°08’00”S, 71°19’00”WL. pictus Chile. Termas de Chillan, VIII Región 1 36°32’00”S, 71°57’00”WL. cyanogaster Chile. Tucapel, VIII Region 1 37°37’00”S, 73°20’00”WL. chiliensis Chile. Termas de Chillan, VIII Región 1 36°32’00”S, 71°57’00”WL. neuquensis Neuquén. Picunches. R. Pcial. 13, Primeros Pinos 1 38°51’43”S, 70°33’04”WL. punmahuida Neuquén. Chos Malal. R. Pcial. 37. Volcán Tromen 1 37°06’16”S, 70°08’27”WL. monticola Región Metropolitana. Stgo. de Chile 1 33°26’00”S, 70°39’00”W”L. tenuis Chile. Termas de Chillan, VIII Región 1 36°32’00”S, 71°57’00”W
OutgroupsL. lineomaculatus Rio Negro. Bariloche, PN Nahuel Huapi, Piedra del Condor, Co. Catedral 1 41°12’00”S, 71°17’00”WL. kingii Río Negro. Valcheta. R. Pcial. 4, 84 km S junction R. Nac. 250, extremo W
Gran Bajo del Gualicho1 40°06’20”S, 66°00’26”W

Autho
r's
pers
onal
co
py
M. Morando et al. / Molecular Phylogenetics and Evolution 43 (2007) 952–973 957
The Bayesian analysis recovered the same clades as didthe NJ distance method; thus, one individual from eachclade (the one with the most complete sequence) wasselected for further phylogenetic analyses to study therelationships between these clades and outgroups (27 indi-viduals and 762 bp).
A maximum parsimony (MP) search with all charac-ters equally weighted was performed with 10,000replicates and 10,000 pseudoreplicates for non-paramet-ric bootstrap analyses (Felsenstein, 1985). A maximum-likelihood (ML) search was performed with theGTR + I + � (Yang, 1994; Gu et al., 1995) model of evo-lution (selected with ModelTest as described above) with
10 replicates and 100 pseudoreplicates for bootstrapanalyses. The MP and ML searches were implementedusing PAUP* 4b5 (SwoVord, 2002), and Bayesian analy-ses were performed with this reduced dataset using MrBayes 2.0 (Huelsenbeck and Ronquist, 2001) for 2 £ 106
generations and sample frequencyD 500. The equilibriumsamples (3961 trees) were used to generate a 50% major-ity-rule consensus tree. The percentage of samples thatrecover any particular clade on this tree represents thatclade’s posterior probability; we consider p 7 95% as evi-dence of signiWcant support for a clade (Huelsenbeck andRonquist, 2001). Recent simulation analyses indicate thatalthough Bayesian support values are usually higher than
Fig. 1. Geographic distributions of the taxa and populations sampled in this study. Symbols denote the following: numbers with cross D localities for L.gracilis, and squares and circles D localities for the diVerent clades of L. bibronii. Locality numbers correspond to those in Table 1 and Appendices I & II,and symbols correspond to those in Fig. 2.

Autho
r's
pers
onal
co
py
958 M. Morando et al. / Molecular Phylogenetics and Evolution 43 (2007) 952–973
those from non-parametric bootstrap, they provide amuch closer estimate of the phylogenetic accuracy (Wil-cox et al., 2002). We also used a genetic algorithm asimplemented in MetaPIGA (Lemmon and Milinkovitch,2002) with diVerent settings for population size (n D 4and 10) and with diVerent replicates (n D 10 and 100).MetaPiga implements a new algorithm (the metapopula-tion genetic algorithm) based on a heuristic search thatimproves the speed with which maximum likelihood(ML) trees are found. It also estimates the posteriorprobability distribution of possible trees, with clade fre-quencies closely approximating their posterior probabili-ties (Lemmon and Milinkovitch, 2002). To obtain aconsensus tree based on this algorithm, we ran MetaPigafor 10£ with 10 populations each and generated a con-sensus tree from the 100 recovered trees (as suggested byLemmon and Milinkovitch, 2002).
2.5. Nested clade phylogeographic analyses
The complete set (no missing data) of 138 short cyt-bsequences (607 bp) was used for the nested clade phyloge-ographic analyses (NCPA). We have suggested elsewhere(Avila et al., 2006) that the NCPA is useful when theabsence of climatic, geological, or paleoecological datapreclude the a priori formulation and statistical testing ofmultiple alternative hypotheses, as advocated by some(Knowles and Maddison, 2002). We are aware that uncrit-ical use of the NCPA for a single gene tree may lead toover-interpretation (Irwin, 2002; Knowles, 2004 (Table1)), but our position here is that the NCPA with the mito-chondrial locus is ideal for generating hypotheses of evo-lutionary and demographic histories that are thenamenable to further testing (Templeton, 2004), and we usethis method (Templeton et al., 1995; Templeton, 1998,2001, 2004) to infer the population history of L. bibroniiand L. gracilis.
The program TCS version 1.13 (Clement et al., 2000;available at http://bioag.byu.edu/zoology/crandall_lab/programs.htm), was used to construct the haplotype net-work, and nesting categories were assigned followingTempleton et al. (1995) and Templeton and Sing (1993).The networks were then used for NCPA, which wasimplemented with the GeoDis program (version 2.0,Posada et al., 2000) available from the same web site. Allstatistical analyses were performed using 10,000 MonteCarlo replications. A single ambiguous connection (loop)in the L. gracilis network was resolved using predictionsfrom coalescent theory (reviewed in Nordborg, 2001 andRosenberg and Nordborg, 2002), as validated withempirical data sets (Crandall and Templeton, 1993; seealso Pfenninger and Posada, 2002 and Morando et al.,2004; for recent examples). The rule used here, that highfrequency haplotypes in a population are expected to befound on the interior of the cladogram (i.e., ancestral)while lower frequency haplotypes should be found at thetips, was used to resolve the loop in the L. gracilis net-
work in favor that the network shown here (Fig. 4). How-ever, we compared the other equally parsimoniousresolutions for this connection, and no diVerences werefound between them. Statistically signiWcant results wereinterpreted following the inference key of Templeton(2004, also available from the same website).
2.6. Neutrality tests and molecular-diversity analysis
To check the assumption that cyt-b sequence evolutionapproximates neutral expectations (Ballard and Whitlock,2004), we used the McDonald and Kreitman (1991) test(hereafter M–K) of neutrality as implemented in the pro-gram DNASP vs. 3.99.4 (Rozas and Rozas, 1999), and toassess population equilibrium independent of the NCPAinferences, we implemented Tajima’s (1989) D and Fu’s(1997) Fs tests. These tests diVer in their statistical power(Wayne and Simonsen, 1998; Ford, 2002) but both assumethat populations are in mutation-drift and migration-driftequilibrium. SigniWcant values for either may indicate thatthe populations are not evolving in a neutral manner (i.e.,they are not in mutation-drift equilibrium), or that theywere previously subdivided and/or have experienced pastpopulation growth (i.e., they are not in migration-drift equi-librium). The Fs test appears to be more sensitive to detec-tion of population expansion (Fu, 1997), and we evaluatedsigniWcance of this test by comparing the Fs statistic againsta distribution generated from 1000 random samples underthe hypotheses of selective neutrality and populationequilibrium.
For the main clades identiWed in the phylogenetic andNCPA analyses (see below), we calculated the uncor-rected average pairwise genetic distances using PAUP¤
4b5 (SwoVord, 2002). We also estimated gene diversity(Nei, 1987, p. 180) and nucleotide diversity (�, the meanof pairwise sequence diVerences, Nei, 1987, p. 257) forthese same clades. The parameter � can be estimatedusing � or the number of segregating sites (S). If evolu-tion is neutral then both estimates give the same value of�, and this can be compared via the Tajima’s test (Tajima,1989) to assess whether impacts of selection or popula-tion change can be detected (see below). As alternativeevidence of gene Xow we calculated M (2 Nm) as a rela-tive estimate of the number of migrants between identi-Wed clades (see below). According to the phylogeneticresults we performed three AMOVAs (ExcoYer, 2001)to: (1) estimate the genetic structure between the south-ern and northern clades of L. bibronii (see below); (2)estimate the genetic structure among three groups withinthe southern clade (group 1: L. bibronii, L. bibronii 1, 2;group 2: L. bibronii 3, 4; group 3: L. bibronii 5, 6); and (3)estimate the genetic structure between two groups (group1: L. bibronii 9, 10, 11; group 2: L. bibronii 12) within thenorthern clade. As a Wnal assessment of populationdemographic histories, we performed mismatch analyses(1,000 permutations) and calculated the raggedness index(Harpending, 1994) for several clades of L. bibronii and

Autho
r's
pers
onal
co
py
M. Morando et al. / Molecular Phylogenetics and Evolution 43 (2007) 952–973 959
L. gracilis (see below). This index takes larger values(Rgg > 0.05) for multimodal distributions expected in sta-tionary populations, relative to unimodel and smootherdistributions typical of expanding populations(Rgg < 0.05). We calculated the probability of observingby chance a higher value of the raggedness index than theobserved value p (Ragobs), under the hypothesis of popu-lation expansion. The nucleotide diversity, populationstructure, estimates of migration rates, Tajima and Futests, and uncorrected and corrected average pairwisegenetic distances were performed with the program Arle-quin vs. 2.00 (Schneider et al., 2000). This combination ofmethods permits us to evaluate speciWc NCPA inferencestied to population growth—including dispersal or rangeexpansions—by statistical tests based on completelydiVerent assumptions.
2.7. Coalescent estimation of population divergence times and migration rates
We used the program MDIV (Nielsen and Wakeley,2001) to evaluate whether shared mtDNA variationbetween L. gracilis and L. bibroni 8 (see below) likelyreXected gene Xow or recent isolation. The method pro-vides a non- equilibrium approach that uses a Bayesianframework to estimate both parameters by calculatingtheir posterior probabilities given the genealogy (Nielsenand Wakeley, 2001), under a Wnite sites model ofsequence evolution (Hasegawa et al., 1985). MDIV usesMarkov-Chain Monte Carlo simulations to estimate thelikelihood of the parameters � (2Nef�), M (Nef m), and T(t/Nef) (where Nef is the female eVective population size, mis the migration rate and � is the mutation rate per locusper generation). We ran 5,000,000 generations with burn-in of 500,000. We made several runs with diVerent priorsfor M and T (from 0 to 10 for M, and from 1 to 10 for T).When possible, we estimated credibility intervals for theestimates as the interval that contains 95% of the poster-ior probability distribution. In general for iguanidmtDNA (Macey et al., 1998, 1999), and cyt-b from otherreptiles (Zamudio and Greene, 1997; Malhotra andThorpe, 2000; Giannasi, 1997) a pairwise sequence diver-gence has been estimated in the range of 1.3–2%. Accord-ing to this, we calculated Nef from the estimate of thetafor a range of values of �D 3.94£ 10¡6–6.07£ 10¡6 perlineage per locus (607 bp in this case) per generation,assuming a generation time of one year. This estimate ofNef was used to obtain an estimate of the populationdivergence time and the gene divergence time (Time-to-Most-Recent-Common-Ancestor; TMRCA).
3. Results
3.1. Phylogenetic relationships of cyt-b haplotypes
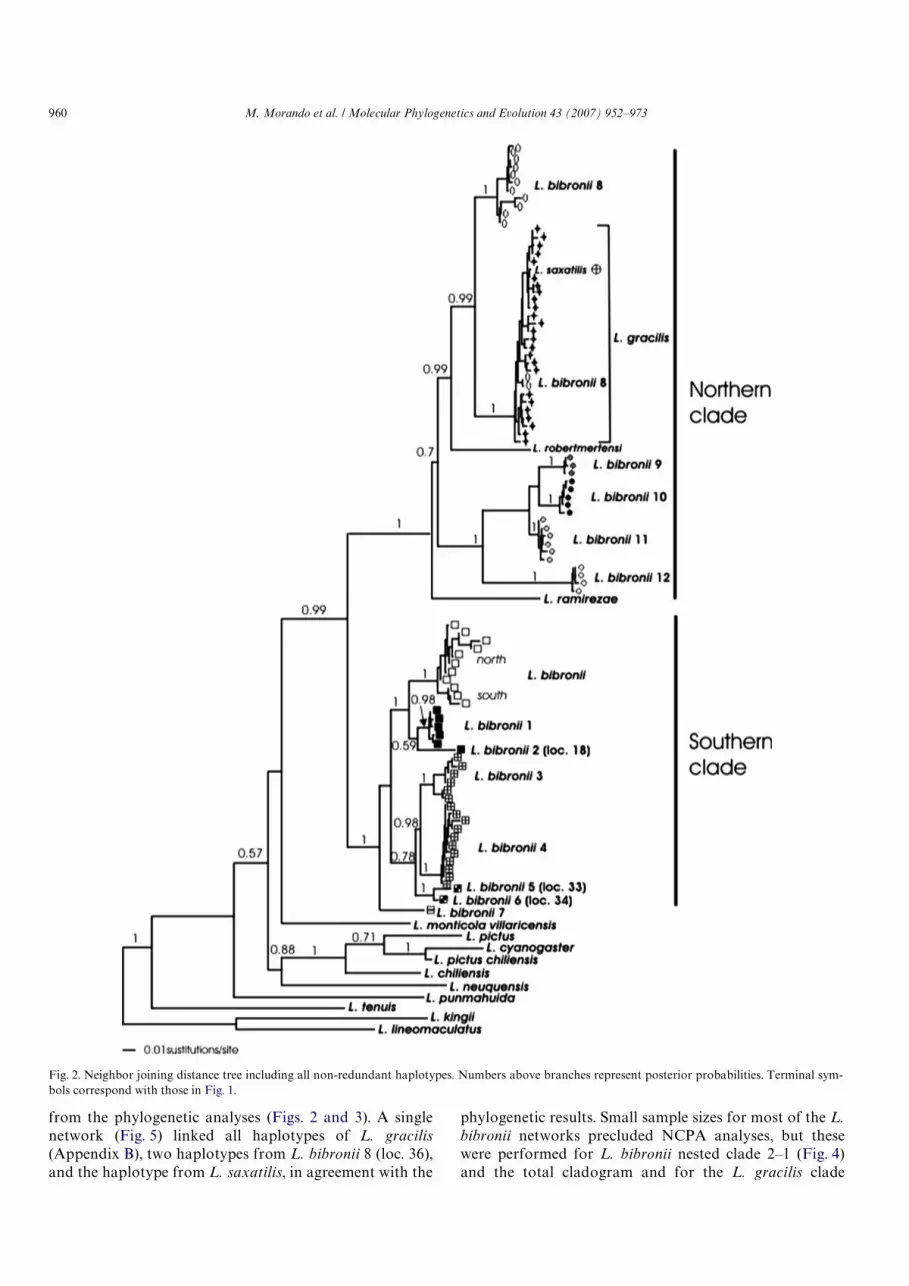
A total of 68 diVerent haplotypes were identiWedamong the 105 L. bibronii specimens and 25 diVerent
haplotypes among the 32 L. gracilis individuals. Theneighbor-joining tree for the non- redundant haplotypesset is depicted in Fig. 2. Almost identical results wereobtained in the four Bayesian runs, and posterior proba-bilities for each clade are given in Fig. 2. Eight of theeleven non-focal taxa were phylogenetically outside thefocal group, but L. ramirezae was recovered as the sistertaxon of one of the two main clades recovered for theingroup taxa (northern clade) with strong support (pos-terior probability [PP]D 1.0). The non-focal taxa L. rob-ertmertensi and L. saxatilis are nested within thenorthern clade, both with strong support (Fig. 2). All ofthe L. bibronii samples were grouped into two mainclades (northern and southern) with strong support(Fig. 2, PP D 1.0), but there is extensive structure withineach. All L. bibronii haploclades were numbered (L.bibronii 1) to facilitate description and discussion, exceptfor the group that includes all haplotypes from animalscollected from the type locality (Puerto Deseado in SantaCruz Province); these are called L. bibronii.
The northern clade includes two well-supported groups;one recovers four haploclades (Fig. 2 : L. bibronii 9, 10, 11,12; PPD 1.0) from central and northern areas of the Neu-quén Province (Fig. 1), and the second clade includes L.robertmertensi as the sister taxon of (L. gracilis + L. bibronii8) (PPD0.99). Two haplotypes corresponding to L. bibronii8 and the sequence from L. saxatilis are nested within thegroup that includes all sequences from L. gracilis (PPD 1.0).
The Wrst phylogenetic split within the southern cladeseparates L. bibronii 7 (localities 35 and 62, west of RioNegro Province, Fig. 1) from a group containing theremaining species, which are divided into two haploc-lades: one consists of samples north of L. bibronii 7(localities 35 and 62, Fig. 1) with L. bibronii 3, L. bibronii4, L. bibronii 5 and L. bibronii 6 (PP D 0.78), and the sec-ond contains samples south of L. bibronii 7 and includingL. bibronii, L. bibronii 1 and L. bibronii 2 (PP D 1.0). TheMP search recovered one tree (L D 1063, CI D 0.420,RID 0.563), which was almost identical to the consensusBayesian tree, the genetic algorithm tree, and the ML tree(¡lnD 5527.89411). We present only the ML tree here(Fig. 3), but all recovered phylogenetic relationships aresimilar to those depicted in Fig. 2. Exceptions are rela-tionships between haploclades L. bibronii 9, 10 and 11 inthe northern clade.
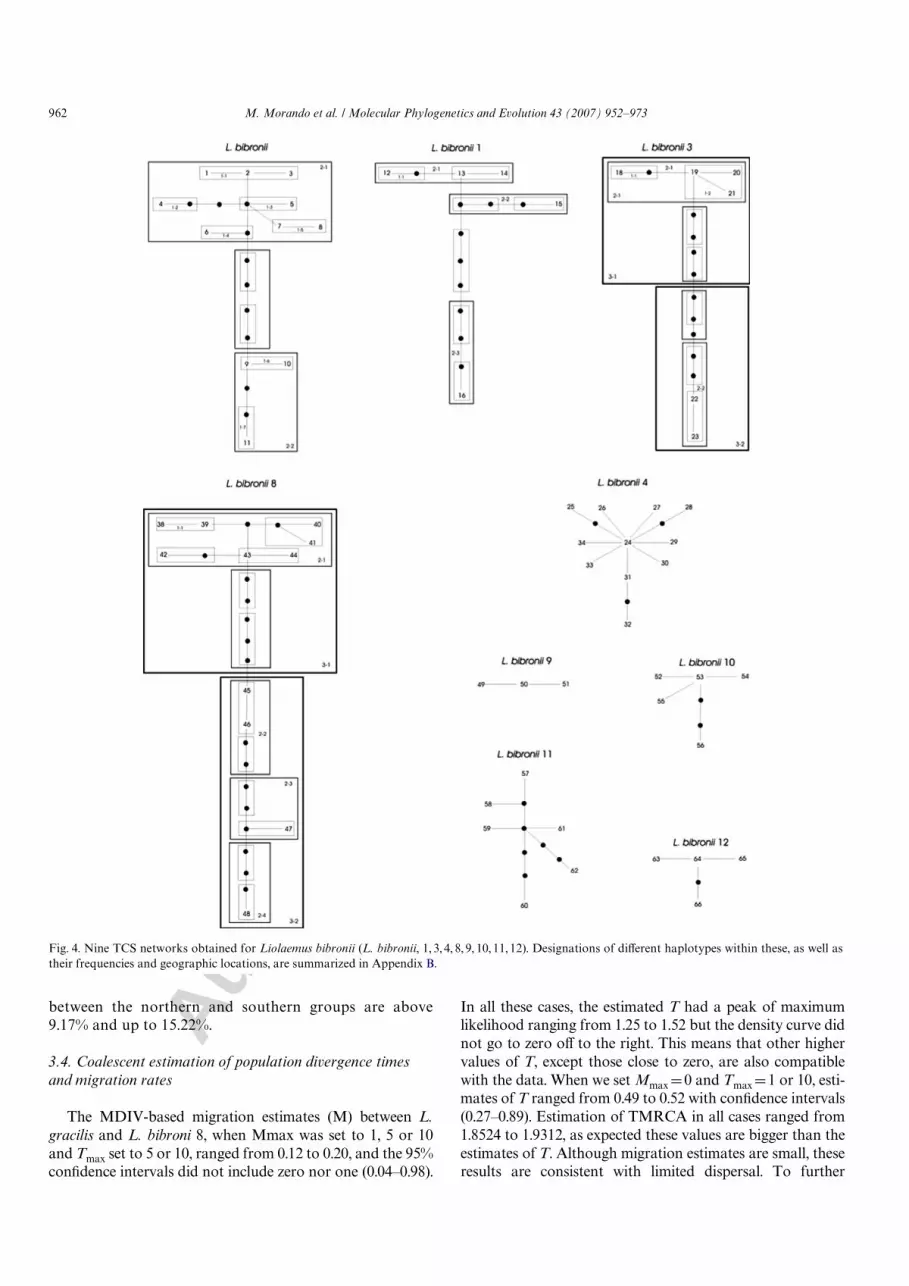
3.2. Nested-clade phylogeographic analyses
Application of the Templeton et al. (1992) algorithm(as implemented in TCS) to the 66 cyt-b haplotypes of L.bibronii (Appendix B) showed that sequences diVering byup to 10 substitutions have at least a 0.95 probability ofbeing parsimoniously connected. L. bibronii 2, 5, 6, and 7are represented by unique haplotypes, and haplotypenetworks of L. bibronii and L. bibronii 1, 3, 4, 8, 9, 10, 11,and 12 are represented in Fig. 4. The limits of individualnetworks were largely congruent with the haploclades
Autho
r's
pers
onal
co
py
960 M. Morando et al. / Molecular Phylogenetics and Evolution 43 (2007) 952–973
from the phylogenetic analyses (Figs. 2 and 3). A singlenetwork (Fig. 5) linked all haplotypes of L. gracilis(Appendix B), two haplotypes from L. bibronii 8 (loc. 36),and the haplotype from L. saxatilis, in agreement with the
phylogenetic results. Small sample sizes for most of the L.bibronii networks precluded NCPA analyses, but thesewere performed for L. bibronii nested clade 2–1 (Fig. 4)and the total cladogram and for the L. gracilis clade
Fig. 2. Neighbor joining distance tree including all non-redundant haplotypes. Numbers above branches represent posterior probabilities. Terminal sym-bols correspond with those in Fig. 1.

Autho
r's
pers
onal
co
py
M. Morando et al. / Molecular Phylogenetics and Evolution 43 (2007) 952–973 961
(Fig. 5), and inferences from these analyses are summa-rized in Table 2. For L. bibronii N (clade 2–1, Fig. 4, Table2) it was not possible to discriminate isolation by distanceand long-distance colonization, and due to a geographicsampling gap between the northern and southern haplo-groups of L. bibronii (sensu estricto) (Fig. 1, white squaresin Río Negro correspond to L. bibroni N and whitesquares in Sta. Cruz and Chubut correspond to L. bibroniS), it was not possible to discriminate between contiguousrange expansion, long distance colonization, and pastfragmentation. Two clades (clade 3–5 and clade 4–1,Fig. 5, Table 2) of L. gracilis showed evidence for a con-tiguous range expansion, and for clade 4–2 restricted geneXow with isolation by distance was inferred.
3.3. Neutrality tests and molecular diversity analysis
Results of the McDonald–Kreitman tests are consis-tent with neutral evolution expectations in all sister-cladecomparisons within the ingroup, and for the ingroup as a
whole compared with the outgroups. Estimations of hap-lotype and gene diversity and �, as well as results of Taj-ima and Fu tests and the raggedness index, aresummarized in Table 3. All the M (DNm) values betweenthe identiWed clades were <1.00, and results of theAMOVA analyses are summarized in Table 4. In the WrstAMOVA most of the genetic variation was strongly parti-tioned between the northern and southern clades (72%).In the southern and northern clades (second and thirdAMOVAS) the within-population variation was very low(9.54 and 2.97%, respectively), and genetic diversity wasapproximately equally distributed among groups (46.46and 58.14%, respectively) and among populations withingroups (44 and 38.89%, respectively).
The average pairwise genetic distances (uncorrectedand corrected) between L. bibronii, L. gracilis and allother recovered clades are summarized in Table 5. Groupcomparisons within the northern clade had higher pair-wise p values (min. 2.94–11.44% max) than those withinthe southern clade (1.81–7.29%). All comparisons
Fig. 3. Maximum likelihood tree based on single haplotypes from each of the major haploclades shown in Fig. 2. Numbers above branches represent MPand ML bootstrap support, respectively, and numbers below branches represent Bayesian and genetic algorithm generated posterior probabilities.
Autho
r's
pers
onal
co
py
962 M. Morando et al. / Molecular Phylogenetics and Evolution 43 (2007) 952–973
between the northern and southern groups are above9.17% and up to 15.22%.
3.4. Coalescent estimation of population divergence times and migration rates
The MDIV-based migration estimates (M) between L.gracilis and L. bibroni 8, when Mmax was set to 1, 5 or 10and Tmax set to 5 or 10, ranged from 0.12 to 0.20, and the 95%conWdence intervals did not include zero nor one (0.04–0.98).
In all these cases, the estimated T had a peak of maximumlikelihood ranging from 1.25 to 1.52 but the density curve didnot go to zero oV to the right. This means that other highervalues of T, except those close to zero, are also compatiblewith the data. When we set MmaxD0 and TmaxD1 or 10, esti-mates of T ranged from 0.49 to 0.52 with conWdence intervals(0.27–0.89). Estimation of TMRCA in all cases ranged from1.8524 to 1.9312, as expected these values are bigger than theestimates of T. Although migration estimates are small, theseresults are consistent with limited dispersal. To further
Fig. 4. Nine TCS networks obtained for Liolaemus bibronii (L. bibronii, 1, 3, 4, 8, 9, 10, 11, 12). Designations of diVerent haplotypes within these, as well astheir frequencies and geographic locations, are summarized in Appendix B.

Autho
r's
pers
onal
co
py
M. Morando et al. / Molecular Phylogenetics and Evolution 43 (2007) 952–973 963
examine the migration hypothesis we compared the likeli-hood value at MD0.002 with the maximum-likelihood esti-mate of M in a log likelihood ratio. If the log likelihood ratiois suYciently large, we can reject the hypothesis of MD0. Weobtained a value of ¡0.84 that based on the simulations pre-sented in Nielsen and Wakeley (2001), are consistent withsmall amounts of gene Xow, probably due to migrationevents occurring at or near the original divergence time. Con-
sidering migration, one of the estimates of T was 1.46, whichgives an estimate of 2.6–4.0mys of divergence between thesetwo populations, consistent with the estimates derived fromthe genetic distance (4.7%, Table 5) comparison (2.3–3.6mys).If we make the same estimation of years but considering theestimates of T without migration (TD0.522), then the esti-mated divergence time between these populations rangesbetween 917,000 years to 1.4mys; considerably younger than
Fig. 5. Network of Liolameus gracilis. Haplotype 9 (star) corresponds to a L. saxatilis individual shared with one L. gracilis individual. Haplotypes 19 and20 (circles) correspond to L. bibronii 8 individuals.

Autho
r's
pers
onal
co
py
964 M. Morando et al. / Molecular Phylogenetics and Evolution 43 (2007) 952–973
expected for the level of genetic divergence exhibited by thesepopulations. These results also favor the hypothesis of smallamount of gene Xow between these populations.
4. Discussion
4.1. General patterns
We have produced a mtDNA phylogeny for lizards ofthe L. bibronii and L. gracilis species groups in southernSouth America. A substantial phylogenetic break separatesL. bibronii into two main clades, each of which is furthersplit into geographically isolated haploclades. The follow-ing discussion highlights the main features of the phyloge-ography of L. bibronii and L. gracilis, speciWcallyexamining: (4.2) the distribution of the major haplocladeswith inferences of their population histories; (4.3) the con-cordance of these clades’ distributions and histories withother lizard complexes studied with the same markers andmethods; and (4.4) taxonomic implications of these results.
4.2. Population histories of L. bibronii haploclades and L. gracilis
The mtDNA gene tree for L. bibronii is clearly paraphy-letic; it is composed of many allopatric haploclades, someof which are closer to haplotypes of other species than tosome other L. bibronii haplotypes. With respect to geneticdiVerences, the levels of mtDNA sequence divergence inmost of these haplotypes are similar to those found amongspecies in other lizard genera (Carranza et al., 2000; Harris,2002). The L. bibronii complex includes reciprocally mono-phyletic northern and southern haploclades separated bythe central region of Neuquén Province (Fig. 6; Catan LilMountains). This is an area in which the geological andtopographic character of the Andes changes dramatically,and mean elevation declines by some 2000 m (Rabassa andClapperton, 1990), evidently coincident with a thinner andyounger portion of continental crust (Clapperton, 1993).The southern clade includes L. bibronii (sensu stricto),which contains two haploclades (Fig. 2), L. bibronii S (thearea of the type locality) and L. bibronii N (corrected pair-wise genetic diVerence 0.93%), but with a considerableunsampled area between them (LbN and LbS; Fig. 6); mostprobably this is why despite statistical signiWcance NCPAwas unable to distinguish range expansion, long coloniza-tion or a past fragmentation (Table 2) as explanations ofthis pattern. Estimates of gene and nucleotide diversity forclade 2–1 (L. bibronii N) are almost double those from thesouth (L. bibronii S); the Fu test was signiWcant (Table 3),and isolation-by-distance or long-distance colonizationwere inferred as likely causes for this structure (Table 2).We favor the Wrst of these two interpretations because thesecond may be an artifact of insuYcient sampling and/orextinction of intermediate populations (Masta et al., 2003).
Also included in the southern clade are L. bibronii 3 andL. bibronii 4. These sister clades are geographically close
Table 2Clades identiWed by resolved haplotype network/nesting design (Figs. 4and 5) for which statistically signiWcant clade distances (Dc) and/or nestedclade distances (Dn) were obtained
The nested phylogenetic clade analysis (NCPA) inferences are: IbD, isolationby distance; LDD, long distance dispersal; RE, range expansion; CRE, con-tinuous range expansion; LDC, long distance colonization; RGFwIbD,restricted gene Xow with isolation by distance; and PF, past fragmentation.
Clade �2 p Inference chain
L. bibroniClade 2-1 (north) 29.25 0.0002 1-2-3-5-6-7-8: IbD or LDDTotal Cladogram 21 0.0004 1-19: CRE, LDC or PF
L. gracilisClade 3-5 48 0.048 1-2-11: RE-12: CREClade 4-1 16 0.0785 1-19-20-2-11 :RE -12: CREClade 4-2 35 0.0232 1-19-20-2-11-17-4: RGFwIbD
Table 3Estimates of gene and nucleotide diversity (�) and two diVerent estimates of the parameter theta (�� and �s) for the diVerent clades identiWed in the phylo-genetic analyses
Tajima’s D-statistic and Fu’s Fs test with associated level of signiWcance. SSD’p, sum of square deviations’ probability for mismatch analyses. Rgg, ragged-ness index with its associated probability, in bold probabilities <0.05. N.S., not signiWcant.¤ p < 0.05.
¤¤ p < 0.01.¤¤¤ p < 0.001.
N Gene diversity Nucleotide diversity (in %)
�� �s Tajima’s D Fu’sF SSD’p Rgg
L. bibroni 21 0.900 (0.0022) 0.8378 (0.4726) 5.08571 (2.8684) 5.28109 (2.0900) ¡0.1383 N.S. ¡1.4478 N.S. 0.38 0.0373 N.S.L. b.N 12 0.9242 (0.0575) 0.4967 (0.3135) 3.0151 (1.9029) 3.6425 (1.7222) ¡0.71664 N.S. ¡2.54831¤ 0.08 0.1099 N.S.L. b. S 9 0.5556 (0.1653) 0.1739 (0.1436) 1.0555 (0.8715) 1.4717 (0.9054) ¡1.14944 N.S. 0.45295 N.S. 0.39 0.166 N.S.
L. bibroni 1 11 0.782 (0.0086) 0.6290 (0.3865) 3.8181 (2.3458) 4.4384 (2.0730) ¡0.6116N.S. 1.1618N.S. 0.26 0.1626 N.S.L. bibroni 3 8 0.893 (0.0124) 0.9120 (0.5585) 5.5357 (3.3900) 5.7851 (2.8223) ¡0.2205 N.S. ¡0.2733 N.S. 0.07 0.07 N.S.L. bibroni 4 17 0.904 (0.0033) 0.3004 (0.2033) 1.8235 (1.2342) 3.8453 (1.6730) ¡1.9925¤ ¡7.6912¤¤¤ 0.40 0.092 N.S.L. bibroni 8 11 1.000 (0.0015) 1.3120 (0.7456) 7.9636 (4.5256) 7.8525 (3.4213) 0.0646 N.S. ¡5.0070¤¤ 0.68 0.023 N.S.L. bibroni 9 10 0.378 (0.0329) 0.0659 (0.0751) 0.4000 (0.4556) 0.7069 (0.5387) ¡1.4008 N.S. ¡1.1639¤ 0.36 0.182 N.S.L. bibroni 10 6 0.933 (0.0148) 0.3295 (0.2480) 2.0000 (1.5055) 2.6277 (1.5530) ¡1.3673 p D 0.055 ¡2.1119¤ 0.39 0.20 N.S.L. bibroni 11 6 1.000 (0.0093) 0.6370 (0.4292) 3.8666 (2.6054) 4.8175 (2.5951) ¡1.1936N.S. ¡2.6960¤ 0.50 0.079 N.S.L. bibroni 12 5 0.900 (0.0259) 0.2636 (0.2172) 1.6000 (1.3185) 1.9200 (1.2666) ¡1.0938 N.S. ¡1.4047 N.S. 0.62 0.15 N.S.L. gracilis 32 0.974 (0.0003) 1.4877 (0.7823) 9.0302 (4.7486) 13.1603 (4.3174) ¡1.1605 N.S. ¡10.4781¤¤¤ 0.21 0.014 N.S.

Autho
r's
pers
onal
co
py
M. Morando et al. / Molecular Phylogenetics and Evolution 43 (2007) 952–973 965
(Fig. 6) and are the only haploclades not completely allo-patric; haplotypes from both groups are sympatric at local-ity 27 (Fig. 1). The ancestral haplotypes of L. bibronii 4 arefrom localities 30 and 31 (Figs. 1 and 4), and its networkpresents the typical star design of population expansion.Neutrality tests were signiWcant, and haplotype diversity ishigh but nucleotide diversity low (Table 3). All of theseobservations suggest a range expansion for L. bibronii 4,which may have brought this group into contact with L.bibronii 3 in locality 27. The pairwise diVerence betweenthese clades is 3.27 % (corrected) suggesting that these mayrepresent diVerent lineages, but more sampling in the over-lapping area and independent markers are necessary toassess the interactions between these two lineages.
Liolaemus bibronii 5 and L. bibronii 6 are geographicallyclose and represented by only one individual each. In thephylogeny (Fig. 3) they are hypothesized to be the sisterclade of the (L. bibronii 3 + L. bibronii 4) clade, from whichthey are separated by the Limay River. They are geographi-cally close to the samples from L. bibronii 12 (part of the
northern clade), but isolated by the north-south axis of theCatan Lil Mountains (Fig. 6). Further sampling mainlysouth of this area is needed to study the relationshipsbetween these samples and among these and the other L.bibronii clades.
The last lineage included in the southern clade of thecomplex is L. bibronii 7, represented only by three individu-als from localities 35 and 62 (Fig. 1). It is the sister lineageto the rest of the southern clade (Figs. 2 and 3) of thecomplex, although its phylogenetic position is not stronglysupported. The geographic area between these localitiesand L. bibronii 3 and L. bibronii 4 in the north includes theMesaniyeu Mountains (Fig. 6) and several adjacent pla-teaus, which most probably are barriers separating thesepopulations. The corrected pairwise diVerence of L. bibronii7 is very high compared with any of the other groups of thesouthern clade (5.21–7.29%, Table 5), suggesting that it mayrepresent a distinct species.
Three outgroup species (L. ramirezae, L. saxatilis & L.robertmertensi) are distributed farther north than any of the
Table 4AMOVA for L. bibroni (group 1: southern clade; group 2: northern clade); South clade (group 1: L. bibroni, L. bibroni 1, L. bibroni 2; group 2: L. bibroni3, L. bibroni 4; group 3: L. bibroni 5, L. bibroni 6); North clade (group 1: L. bibroni 9, L. bibroni 10, L. bibroni 11; group 2: L. bibroni 12)
Source of variation d.f Sum of squares Variance components Percentage of variation Fixation indexes
L. bibroniAmong populations 1 30.052 2.8152 72Within populations 19 20.806 1.09503 28 Fst: 0.71996, p < 0.000
20 50.857 3.91025
South cladeAmong groups 2 442.886 9.20190 46.46 Fct: 0.46464, p < 0.01Among populations within groups 4 273.880 8.71313 44.00 Fsc: 0.82181, p < 0.01Within populations 55 103.911 1.88930 9.54 Fst: 0.90460, p < 0.01
North cladeAmong groups 1 199.322 16.75915 58.14 Fct: 0.58139, p D 0.32Among populations within groups 2 160.715 11.21189 38.89 Fsc: 0.92914, p < 0.01
Within populations 23 19.667 0.85507 2.97 Fst: 0.97034, p < 0.01
Table 5Above the diagonal uncorrected average pairwise distances in percentages (Pi xy)
Diagonal: percentage of divergence within each haploclade. Below the diagonal: corrected average pairwise distances (Pi xy ¡ (Pi x + Pi y)/2). Light shad-ing: pairwise comparisons within the southern clade. Dark shading: pairwise comparisons within the northern clade. (Bold) Largest and smallest values forcomparisons within the north and south clades.

Autho
r's
pers
onal
co
py
966 M. Morando et al. / Molecular Phylogenetics and Evolution 43 (2007) 952–973
L. bibronii complex haploclades identiWed in this study.Also, all samples of L. gracilis fall within the northern cladeof the L. bibronii complex as the sister group to L. bibronii8, the northernmost populations of the L. bibronii complex(Fig. 6). These two clades have the highest haplotype andnucleotide diversities, but only for L. bibronii 8 was Fu’stest signiWcant (Table 3). In L. gracilis the genetic structurereturns NCPA inferences of range expansions andrestricted gene Xow with isolation by distance. It is proba-ble that a combination of diVerent factors generated theseinferred processes, including marine ingressions that inter-mittently bisected the current distribution, and climaticchanges associated with glacial periods.
The L. saxatilis haplotype and two haplotypes ofL. bibronii 8 (Fig. 1, loc. 36) are recovered within theL. gracilis samples. In the L. gracilis network the L. bibronii8 haplotypes are in a terminal position, and these haplo-types were sampled from the middle of the L. gracilis distri-bution. These observations together with the coalescentresults that detect small amounts of gene Xow, suggest thatintrogression (probably historical) between L. gracilis andL. bibronii 8 may be the process responsible for this pattern(vs. incomplete sorting or selective sweeps). In contrast, theL. saxatilis haplotype recovered within the L. gracilis sam-ples is from a locality further north than our L. gracilissampling distribution (Fig. 1), and in the L. gracilis
Fig. 6. Approximate geographic distribution of L. gracilis and main groups of the L. bibronii complex (in blue) and some concordant haplogroups fromother Liolaemus complexes. Provincial codes, MZAD Mendoza; SLS D San Luis; LPA D La Pampa; BAS D Buenos Aires; NQN D Neuquén; RNG D RioNegro; CHT D Chubut; STA D Santa Cruz.

Autho
r's
pers
onal
co
py
M. Morando et al. / Molecular Phylogenetics and Evolution 43 (2007) 952–973 967
network it is an internal haplotype shared with an individ-ual of L. gracilis from locality 8 (Fig. 1), the most south-western locality of the L. gracilis distribution (»650 kmfrom the nearest L. saxatilis location). Although one indi-vidual of L. gracilis was found near the locality of L. saxa-tilis (Morando and Avila, 1999), which precludesdiscarding an old introgression event, our observations areconsistent with expectations of incomplete lineage sortingand retention of ancestral haplotypes (L. saxatilis) inL. gracilis.
Populations of L. bibronii from central and northernNeuquén (Lb9–Lb12) are recovered in a monophyleticgroup within the northern clade, with L. bibronii 12 fromcentral Neuquén falling outside a group containing theremaining haplotypes (Figs. 1 and 2). The corrected pairwisediVerence of L. bibronii 12 relative to the three other haploc-lades in the north is 8.37–10.07% (Table 5), while betweenL. bibronii 9, 10 and 11, it ranges 2.94– 4.02% (Table 5). Innorthern Neuquén there are several high mountain chains(to 4,000 m) running N–S between the areas of these threehaploclades, for which the Fu test was signiWcant and thenucleotide diversity was low. However, the gene diversitywas very low only for L. bibronii 9, but sample sizes are thelowest of the entire L. bibronii complex (Table 1). It is prob-able that these mountains act as barriers to these popula-tions, but more sampling and independent markers areneeded to identify geographic limits of these three.
4.3. Concordance of L. bibronii haploclades’ distributions and histories with other lizard complexes
Liolaemus bibronii S has a similar distribution to somepopulations of L. Wtzingerii (Fig. 6; Avila et al., 2006),which are also characterized by very low haplotype andnucleotide diversities. These concordant distributions forthis area in these phylogenetically unrelated complexessupport the hypotheses proposed for L. Wtzingeri (Avilaet al., 2006); the central area of Chubut Province has beenan historical isolating barrier for multiple taxa. For smallrodents of the genus Phyllotys, Kim et al. (1998) foundevidence that the Chubut River (Fig. 6) may have beensuch a barrier; this river Xows eastward from the Andeanglacial Welds (Flint and Fidalgo, 1968) and was an impor-tant historical drainage as well as the latitudinal bound-ary between tundra (to the south) and wetter, warmerconditions to the north (Iriondo and Garcia, 1993;Clapperton, 1993). Pleistocene landscape divisions arestill undeWned in this part of Patagonia, but presumablythe warm-adapted biota shifted from west-to-east andcontracted from south-to-north during periods of glacialadvance. These boundaries almost certainly shifted west-ward and southward again during glacial retreat andwarming; further sampling of L. bibronii and other taxain this region will allow more precise testing of this popu-lation-expansion hypothesis.
Liolaemus bibronii N has a similar approximate distri-bution with the ranges of two other two Liolaemus com-
plexes previously studied with mtDNA markers(L. petrophilus N (Morando et al., 2003); and L. melanopsN (Avila et al., 2006), (Fig. 6), and for which range expan-sions were hypothesized. Between L. bibronii N andL. bibronii 1 is the Somuncura Plateau (Fig. 6), a 2000 mhigh tableland that most probably acts as a barrier, andthe connection between L. bibronii N and S may havebeen through the east, as hypothesized for a secondaryzone of contact in the L. Wtzingerii complex (Avila et al.,2006). South of the Somuncura Plateau, the distributionof L. bibronii 1 is similar to L. melanops S (Avila et al.,2006) and L. petrophilus S (Morando et al., 2003); allthree groups have average pairwise distances betweentheir northern and southern populations of »3.5%. Forthe petrophilus and melanops complexes range expansionwas inferred, and although small sample sizes for manyL. bibronii clades precluded any NCPA inferences, it wasnot possible to reject the range-expansion hypothesis onthe basis of mismatch-distribution tests (Table 3). Theseconcordant geographic patterns north and south of theSomuncura Plateau, population histories of range expan-sion and similar genetic distance estimates suggest thatthese three phylogenetically unrelated complexes wereaVected in similar ways, and possibly at similar points intime (see below), by a shared set of environmental andorogenic factors.
There are two possible areas for the ancestral populationof the southern clade: 1-south west of Rio Negro provinceand diVerent expansions towards the north (L. b. 3, L. b. 4,L. b. 5, L. b. 6) and the south (L. b., L. b. 1, 2), which pro-moted the diversiWcation of these diVerent lineages; or 2 -central/south Neuquén (locs. 33–34, L. bibronii 5 and 6,Fig. 1), with diVerent expansions towards the south andsubsequent isolation and divergence of the groups in thesouthern clade of the complex. In the elongatus and kriegicomplexes evidence suggests that ancestral populations alsoinhabited this area in Neuquén, and later expansionsallowed extension of these groups to more southern areas(Morando et al., 2003; unpublished). Thus there also seemsto be a concordant pattern between these complexes andsome groups of the L. bibronii southern clade.
The geographical separation between the northern andsouthern clades of the L. bibronii complex is in centralNeuquén Province, speciWcally north and south of theCatan Lil Mountain Range (Fig. 6); this range seems to bea barrier that separates L. bibronii 5 (southern clade) fromL. bibronii 12 (northern clade). It is very interesting tonote that in the elongatus and kriegi complexes this moun-tain chain also constitutes a geographic barrier, separat-ing two diVerent groups in both complexes (Morandoet al., 2003; Morando et al., unpublished). In this case,both L. elongatus and L. kriegi (sensu stricto) are widelydistributed to the south, while geographically morerestricted and strongly diVerentiated clades of both spe-cies are isolated to the north of Catan Lil Mountains. Inthis region, L. bibronii 12 has a concordant distributionwith some diVerentiated populations in the elongatus,
Autho
r's
pers
onal
co
py
968 M. Morando et al. / Molecular Phylogenetics and Evolution 43 (2007) 952–973
petrophilus and kriegi complexes (Morando et al., unpub-lished), suggesting that this area had enough separation inspace and time to promote diVerentiation in all of thesecomplexes. Furthermore, in northern Neuquén provincein the areas of L. bibronii 9, 10, and 11, there are alsodiVerentiated clades from the elongatus and kriegi com-plexes (Morando et al., unpublished).
In the same geographic area where we hypothesizedintrogression between L. gracilis and L. bibronii 8, wealso found strong evidence for introgression in theLiolaemus darwinii complex (a species complex includedin the Eulaemus clade and phylogenetically very distantfrom the bibronii complex; Fig. 6 in Morando et al.,2004); speciWcally, some L. grosseorum individuals arecharacterized by L. darwinii mtDNA haplotypes. Part ofthe distribution of L. gracilis mapped in this study over-laps L. grosseorum (Lb8 in Fig. 6; and see Morando et al.,2004), for which a range expansion was also inferred andthe average genetic divergence estimates betweenL. gracilis-L. bibronii 8 and L. grosseorum-L. darwini, arevery similar (4.7 and 5.2%, respectively). The L. darwiniicomplex and the L. bibronii–L. gracilis complexes belongto phylogenetically distantly related groups (Schulteet al., 2000), and this evidence suggests that their popula-tions may have been aVected in similar ways by the pro-cesses that inXuenced their distributional shifts in thepast.
In the diVerent clades of the L. bibronii complex wehave found concordance with other Liolaemus complexes(elongatus, kriegi, petrophilus, darwinii, grosseorum, andmelanops), both in geographic distributions (allopatricclades) as well as in inferred processes (range expansions,secondary contact and possible hybridization/introgres-sion, incomplete lineage sorting), and current or histori-cal isolation by geographic barriers. Although these arecrude qualitative observations, they suggest that the geo-logical and environmental factors that aVected theselandscapes may have produced similar eVects on popula-tion histories of these complexes. We acknowledge thatinterpretation of geographically structured single-locusgenetic variation is complicated by inXuences from avariety of processes, including demographic and coales-cent stochasticity, incomplete lineage sorting, samplingeVects, and phylogenetic uncertainty (Carstens et al.,2005). Reciprocal monophyly for the mtDNA locus alonewill, for example, lead to overestimates of divergencetimes (Edwards and Beerli, 2000), and diVerences inancestral population sizes may produce phylogeographicstructure that is not reXected in other loci (Avise, 2000).However, these exploratory investigations are crucial toprovide starting points for testing speciWc hypotheseswith approaches that can accommodate some of thisuncertainty. As another example, coalescent methodsbased on unlinked loci permit reWned estimates of ances-tral population sizes and divergence times (Jennings andEdwards, 2005; Doman and Moritz, 2006). Newapproaches also oVer means to testing multi-species phy-
logeographic divergence in space (LaPointe and Rissler,2005) and time (Hickerson et al., 2006), and are beingimplemented in our group for co-distributed Andean spe-cies of Liolaemus (Victoriano et al., in prep).
4.4. Species boundaries and divergence times
This analysis reveals deep mtDNA subdivisions withinL. bibronii (most of which are morphologically cryptic),until now considered one species. Do these genetically dis-tinct groups represent independently evolving populationallineages, or could some of them simply represent singlegene sorting of local populations that may otherwise beinter-connected by gene Xow (Irwin, 2002) and subject tomerger on secondary contact (Avise et al., 1998; Danielset al., 2005; Wake and Schneider, 1998)? In some cases largegeographic distances separate haploclades, and outgroupspecies are deeply nested within the focal taxa; in thesecases distinct mtDNA haploclades may actually representdiVerent species (e.g. L. bibronii, L. bibronii 7, L. bibronii 8,L. bibronii 12). Other cases are far less certain (L. bibronii 1& L. bibronii 2; L. bibronii 3 & L. bibronii 4; L. bibronii 5 &L. bibronii 6; L. bibronii 9, L. bibronii 10 & L. bibronii 11),but in all cases detailed morphological studies and indepen-dent nuclear markers (currently being developed) areneeded to delimit species.
Although we do not know the exact number of diVerentlineages that L. bibronii may include, there is no doubt thatit contains many genetically distinct units. We have nodirect evidence for rates of cyt-b evolution in Liolaemus,but if we use the estimate of 1.3–2% sequence divergenceper million years for iguanid mtDNA (Macey et al., 1998,1999), and cyt-b from other reptiles (Zamudio and Greene,1997; Malhotra and Thorpe, 2000; Giannasi, 1997), we canplace the divergences within these groups into a crude tem-poral framework. The genetic diVerences in cyt-bsequences suggest that the two main clades of the complex(south and north) diverged from each other between 7.8and 11.5 million years ago (9.17–15.22% corrected p values,Table 5) with the 1.3% rate, or between 4.6 and 7.6 millionyears ago (with 2% rate), placing this split in the middleMiocene. During this period a climatic deteriorationstarted with cooler climates. A stressing of climatic zona-tion occurred (Simpson, 1975; Solbrig, 1976) and, as fossilevidence suggests (Pascual, 1984; Pascual and Ortiz Jaure-guizar, 1990), the Patagonian Andes may have exerted anappreciable rain-shadow eVect on the North Patagonianmassif, turning it into a more arid region. Most of thedivergences within the northern clade also started in theMiocene, with the most recent between L. bibronii 10 andL. bibronii 11 approximately 1.5–2.3 m.a. (2.94% uncor-rected p, Table 5), placing this split in the very late Plio-cene. Divergences in the southern clade have been far morerecent, most of them in the Pliocene or Pleistocene; theoldest, between L. bibronii and L. bibronii 3 and L. bibronii4, was approximately 5.6 m.a. ago, placing it at theMiocene-Pliocene boundary. The most recent split

Autho
r's
pers
onal
co
py
M. Morando et al. / Molecular Phylogenetics and Evolution 43 (2007) 952–973 969
between L. bibronii 5 and L. bibronii 6, 900.000 years–1.4 m.a. ago (1.81%, Table 5); this is the only split wasplaced unambiguously in the Pleistocene. The relativelyrecent climatic events of late Pliocene and Quaternary(Simpson, 1975, 1986) might have driven (some) diversiW-cation in this complex. Although mitochondrial lineagesmay have predated the formation of species (biasing ourrates toward over-estimates of divergence times), if most ofthe divergences in this group occurred in the Miocene,some in the Pliocene and only one in the Pleistocene, wesuspect that there should be a general agreement betweenthe more distinct of these groups and actual species bound-aries. Following Morando et al. (2003) we refer to thesedistinct haploclades as “candidate species”, pending fur-ther study based on independent molecular and morpho-logical data (Johnson et al., 2004). Better distributionaldata and support for species boundaries will permit morerigorous assessments of speciation rates through time(Kozak et al., 2005, 2006), further tests of possible specia-tion mechanisms (Cicero, 2004; Graham et al., 2005), andmore precise estimates of Patagonia’s globally rankedendemism (Lamoreaux et al., 2006).
Acknowledgments
We thank C. H. F. Perez, F. Torres, K. Dittmar, D.Perez, N. Frutos, and M. Christie for assistance in Weldcollections or provision of tissues samples. Financial sup-port was provided by Grants (PEI 0178/98, PEI 6397/01;L. Avila), a postdoctoral fellowship (M. Morando), and apostdoctoral fellowship (L. Avila) from Consejo Nac-ional de Investigaciones CientíWcas y Técnicas (CONI-CET), various sources from Brigham Young University(the Kennedy Center for International Studies, theDepartment of Integrative Biology, and the M. L. BeanLife Science Museum), and NSF awards DEB 98-15881and DEB 01-32227 to J. W. Sites, Jr. We also acknowl-edge the NSF “Partnership for International Researchand Education” award (OISE 0530267) for support ofcollaborative research on Patagonian biodiversity,granted to the following institutions (listed alphabeti-cally): BYU, CENPAT, Dalhousie Univ., DarwinionBotanical Inst., Univ. Austral de Chile, Univ. de Coma-hue, Univ. de Concepción, and Univ. of Nebraska. Wethank fauna authorities from Neuquén and Chubut prov-inces for collection permits.
Appendix A. Voucher numbers for individuals used as outgroups
L. pictus argentinus: BYU47193. L. robertmertensi:LJAMM 1961. L. punmahuida: FML 11958. L. neuquensis:FML 09465. L. kingi: LJAMM 3040. L. ramirezae: BYU47180. L. saxatilis: LJAMM 5044. L. gracilis: LJAMM5060. L. chiliensis: chil362. L. cyanogaster: cyano380. L.monticola villaricensis 117. L. tenuis: L-306 Chile. L. pictuschiliensis: L-367. L. lineomaculatus: SDSU4268.
Appendix B
DiVerent haplotypes included in the NCPA analyses, with frequencies foreach (N) and voucher numbers with locality number in parentheses (local-ity numbers match those in Table 1 and Fig. 1)
Haplotype number
N Collection numbers
L. bibronii1 1 fn 142 (1)2 2 LJAMM 5903-5904 (1)3 1 BYU 47184 (2)4 1 BYU 47183 (1)5 1 BYU 47182 (2)6 3 fn 41 - LJAMM 5900-5901 (3)7 1 LJAMM 5907 (4)8 2 LJAMM 5908-MLP.S 2577 (4)9 6 LJAMM 5918 (5) -5905 (57) -5912
(58) -5916 (59) - BYU 47185 - LJAMM 5913 (6)10 2 BYU 47186-47188 (6)11 1 LJAMM 5909 (7)
L. bibronii 112 1 LJAMM 5529 (17)13 4 LJAMM 5406 (16) -5602 (20) - 5511-5692 (61)14 1 LJAMM 5695 (20)15 4 LJAMM 5474 (19) -5601 (20) -5490-5491 (60)16 1 LJAMM 5600 (20)
L. bibronii 217 3 LJAMM 5681-5682-5693 (18)
L. bibronii 318 1 LJAMM 5423 (26)19 3 LJAMM 5403-5457 (26) -5421 (27)20 1 LJAMM 5418 (27)21 1 LJAMM 5402 (26)22 1 LJAMM 5538 (28)23 1 LJAMM 5540 (28)
L. bibronii 424 5 LJAMM 5615-5619-5620 (30) -5648-5653 (31)25 1 LJAMM 5647 (31)26 1 LJAMM 5588 (32)27 1 LJAMM 5649 (31)28 1 LJAMM 5651 (31)29 1 LJAMM 5654(31)30 1 LJAMM 5617 (30)31 1 LJAMM 5419 (27)32 1 LJAMM 5551 (29)33 3 LJAMM 5552 (29) -5616-5618 (30)34 1 LJAMM 5646 (31)
L. bibronii 535 1 fn 933 (33)
L. bibronii 636 1 MIC 1645 (34)
L. bibronii 737 3
3LJAMM 2339 (35) - 5574-5575 (62)
L. bibronii 838 1 LJAMM 5724 (22)39 1 LJAMM 1387 (21)40 1 LJAMM 5723 (22)41 1 LJAMM 1391 (21)42 1 LJAMM 1203 (21)43 1 LJAMM 5725 (22)44 1 LJAMM 1388 (21)
(continued on next page)

Autho
r's
pers
onal
co
py
970 M. Morando et al. / Molecular Phylogenetics and Evolution 43 (2007) 952–973
References
Abdala, C.S., 2002. Nuevo Liolaemus (Iguania: Liolaemidae) perteneciente al grupoboulengeri de la provincia de Neuquén, Argentina. Cuad. Herp. 16, 3–13.
Abdala, C.S., 2003. Cuatro nuevas especies del género Liolaemus (Iguania:Liolaemidae), pertenecientes al grupo boulengeri, de la PatagoniaArgentina. Cuad. Herp. 17, 3–32.
Abdala, C.S., 2005. Dos nuevas especies del genero Liolaemus (Iguania:Liolaemidae) y redescripción de Liolaemus boulengeri (Koslowsky,1898). Cuad. Herp. 19, 3–33.
Avila, L.J., 2003. A new species of Liolaemus (Squamata: Liolaemidae)from Northeastern Argentina and Southern Paraguay. Herpetologica59, 282–291.
Avila, L.J., Pérez, C.H.F., Morando, M., 2003. A new species of Liolaemus(Squamata: Iguania: Liolaemidae) from northwestern Patagonia (Neu-quén, Argentina). Herpetologica 59, 534–545.
Avila, L.J., Morando, M., Perez, C.H.F., Sites Jr., J.W., 2004. Phylogeneticrelationships of lizards of the Liolaemus petrophilus group (Squamata,Liolaemidae), with description of two new species from western Argen-tina. Herpetologica 60, 187–203.
Avila, L.J., Morando, M., Sites, J.W. Jr., 2006. Congeneric phylogeogra-phy: hypothesizing species limits and evolutionary processes in Patago-nian lizards of the Liolaemus boulengeri group (Squamata: Liolaemini).Biol. J. Linnean Soc. 89, 241–275.
Avise, J.C., 2000. Phylogeography: The History and Formation of Species.Harvard Univ. Press, Cambridge, MA.
Avise, J.C., 2004. Molecular Markers, Natural History and Evolution.Sinauer, Sunderland, MA.
Avise, J.C., Walker, D., Johns, G.C., 1998. Speciation durations and Pleis-tocene eVects on vertebrate phylogeography. Proc. R. Soc. Lond. B,Biol. Sci. 265, 1707–1712.
Baez, A.M., Scillato Yané, G.J., 1979. Late Cenozoic environmentalchanges in temperate Argentina. In: W.E. Duellman (Ed.), The SouthAmerican Herpetofauna: its origin, evolution, and dispersal. Museumof Natural History. The University of Kansas. Monograph No. 7. pp.141–156.
Ballard, J.W.O., Whitlock, M.C., 2004. The incomplete natural history ofmitochondria. Mol. Ecol. 13, 729–744.
Burkart, R., Barbaro, N.O., Sanchez, R.O., Gomez, D.A., 1999. Ecoregi-ones de la Argentina. Administración de Parques Nacionales, BuenosAires, Argentina.
Carranza, S., Arnold, E.N., Mateo, J.A., Lopez-Jurado, L.F., 2000. Long-distance colonization and radiation in gekkonid lizards, Tarentola(Reptilia: Gekkonidae), revealed by mitochondrial DNA sequences.Proc. R. Soc. Lond. B 267, 637–649.
Carstens, B.C., Degenhardt, J.D., Stevenson, A.L., Sullivan, J., 2005.Accounting for coalescent stochasticity in testing phylogeographicalhypotheses: modeling Pleistocene population structure in the Idahogiant salamander Dicamptodon aterrimus. Mol. Ecol. 14, 255–265.
Cei, J.M., 1986. Reptiles del centro, centro-oeste y sur de la Argentina.Herpetofauna de las zonas áridas y semiáridas. Monogr. IV. Mus. Reg.Sci. Nat. Torino.
Cei, J.M., 1993. Reptiles del noroeste, nordeste y este de la Argentina. Her-petofauna de las selvas subtropicales, Puna y Pampas. Monogr. XIV.Museo Regionale di Scienze Naturali Torino.
Cicero, C., 2004. Barriers to sympatry between avian sibling species(Paridae: Baeolophus) in local secondary contact. Evolution 58,1573–1587.
Clapperton, C.M., 1993. Quaternary Geology and Geomorphology ofSouth America. Elsevier, Amsterdam.
Clement, J., Posada, D., Crandall, K.A., 2000. TCS, a computer program toestimate gene genealogies. Mol. Ecol. 9, 1657–1659.
Comes, H.P., Kadereit, J.W., 1998. The eVect of Quaternary climaticchanges on plant distribution and evolution. Trends Plant Sci. 3, 432–438.
Crandall, K.A., Templeton, A.R., 1993. Empirical tests of some predictionsfrom coalescent theory with applications to intraspeciWc phylogenyreconstruction. Genetics 134, 959–969.
Daniels, S.D., Heideman, N.J.L., Martin, G.J., Hendricks, M.E.M., Crand-all, K., 2005. Unraveling evolutionary lineages in the limbless fossorialskink genus Acontias (Sauria: Scincidae): are subspecies equivalent sys-tematic units? Mol. Phylogenet. Evol. 34, 645–654.
Appendix B (continued )
Haplotype number
N Collection numbers
45 1 MIC 1615 (25)46 1 MIC 1614 (25)47 1 BYU 47177 (24)48 1 BYU 47176 (23)
L. bibronii 949 1 LJAMM 5290 (15)50 8 LJAMM 5258-5274-5276 (14) -5279-5280-5291-
5292-5293 (15)51 1 LJAMM 5275 (14)
L. bibronii 1052 1 LJAMM 5340 (10)53 2 LJAMM 5341-5342 (10)54 1 LJAMM 5343 (10)55 1 LJAMM 5344 (10)56 1 LJAMM 5387 (11)
L. bibronii 1157 1 LJAMM 5319 (12)58 1 LJAMM 5321 (12)59 1 LJAMM 5317 (12)60 1 LJAMM 5320 (12)61 1 LJAMM 5318 (12)62 1 LJAMM 5323 (13)
L. bibronii 1263 1 LJAMM 5364 (8)64 2 LJAMM 5362 (8) - 5396 (9)65 1 LJAMM 5395 (9)66 1 LJAMM 5363 (8)
L. gracilis1 1 LJAMM 2640 (39)2 4 FML10360 (37) - LJAMM 5178 (41) - 5366 (8) -
MIC1609 (56)3 1 LJAMM 5367 (8)4 1 LJAMM 5170 (38)5 1 BYU 47169 (44)6 1 LJAMM 5084 (45)7 1 LJAMM 5107 (46)8 1 LJAMM 5177 (41)9 2 LJAMM 5368 - L. saxatilis: LJAMM 5044 (8)10 1 LJAMM 5713 (40)11 1 LJAMM 5701 (40)12 1 LJAMM 5175 (41)13 1 LJAMM 5176 (41)14 1 LJAMM 5700 (40)15 1 LJAMM 5699 (40)16 2 LJAMM 5711-5712 (40)17 1 LJAMM 2572 (42)18 1 LJAMM 2620 (43)19 1 L. bibronii 8: BYU 47178 (36)20 1 L. bibronii 8: BYU 47179 (36)21 1 BYU 47170 (53)22 1 LJAMM 5108 (48)23 4 BYU 47166 (47) - 47168 (54) - fn 411-412 (55)24 1 LJAMM 5103 (52)25 1 BYU 47167 (49)26 1 LJAMM 5060 (50)27 1 LJAMM 5128 (51)

Autho
r's
pers
onal
co
py
M. Morando et al. / Molecular Phylogenetics and Evolution 43 (2007) 952–973 971
Doman, G., Moritz, C., 2006. A multilocus perspective on refugial isolationand divergence in rainforest skinks (Carlia). Evolution 60, 573–582.
Donoso Barros R., 1966. Reptiles de Chile. Santiago: Ediciones Universi-dad de Chile.
Edwards, S.V., Beerli, P., 2000. Perspective: gene divergence, and the vari-ance in coalescence time in phylogeographic studies. Evolution 54,1839–1854.
Espinoza, R., Lobo, F., Cruz, F., 2000. Liolaemus heliodermis, a new lizardfrom northwestern Argentina with remarks on the content of the elong-atus group (Iguania: Tropiduridae). Herpetologica 56, 507–516.
Espinoza, R., Lobo, F., 2003. Two new species of Liolaemus lizards fromnorthwestern Argentina: speciation within the northern subclade of theelongatus group (Iguania: Liolaemidae). Herpetologica 59, 89–105.
Etheridge, R., 2001. A new species of Liolaemus (Reptilia: Squamata:Liolaemidae) from Mendoza Province, Argentina. Cuad. Herp. 15, 3–15.
Etheridge, R., de Queiroz, K., 1988. A phylogeny of Iguanidae. In: Estes,R., Pregill, G. (Eds.), Phylogenetic Relationships of Lizards Families:Essays Commemorating Charles L. Camp. Stanford University Press,USA, pp. 283–368.
Etheridge, R., Christie, M.I., 2003. Two new species of the lizard genus Lio-laemus (Squamata: Liolaemidae) from northern Patagonia, with com-ments on Liolaemus rothi. J. Herpetol. 37, 325–342.
ExcoYer, L., 2001. Analysis of population subdivision. In: Balding, D.,Bishop, M., Cannings, C. (Eds.), Handbook of statistical genetics.Wiley & Sons, Ltd, New York, pp. 271–308.
Felsenstein, J., 1985. ConWdence limits on phylogenies: an approach usingthe bootstrap. Evolution 39, 783–791.
Fetzner, J., 1999. Extracting high-quality DNA from shed reptiles skins: asimpliWed method. BioTechniques 26, 1052–1054.
Flint, R.F., Fidalgo, K., 1968. Drift glacial al Este de los Andes entre Baril-oche y Esquel. Instituto Nacional de Geología y Minería. Boletín 119,1–19.
Ford, M.J., 2002. Applications of selective neutrality tests to molecularecology. Mol. Ecol. 11, 1245–1262.
Fu, Y.X., 1997. Statistical tests of neutrality of mutations against populationgrowth, hitchhiking and background selection. Genetics 147, 915–925.
Giannasi, N.C., 1997. Morphological, molecular and behavioural evolu-tion of the Anolis roquet group. Ph.D. Diss. University of Wales, Ban-gor, U.K.
Good, D.A., 1994. Species limits in the genus Gerrhonotus (Squamata:Anguidae). Herp. Monogr. 8, 180–202.
Graham, C.H., Ron, S.R., Santos, J.C., Schneider, C.J., Moritz, C., 2005.Integrating phylogenetics and environmental niche models to explorespeciation mechanisms in dendrobatid frogs. Evolution 58, 1781–1793.
Gu, X., Fu, Y.X., Li, W.H., 1995. Maximum likelihood estimation of theheterogeneity of substitution rate among nucleotide sites. Mol. Biol.Evol. 12, 546–557.
Harpending, H.C., 1994. Signature of ancient population growth in a low-resolution mitochondrial DNA mismatch distribution. Human Biol.66, 591–600.
Harris, D.J., 2002. Reassessment of comparative genetic distance in reptilesfrom the mitochondrial cytochrome b gene. Herp. J. 12, 85–86.
Hasegawa, M., Kishino, H., Takaaki, Y., 1985. Dating of the human-apesplitting by a molecular clock of mitochondrial DNA. J. Mol. Evol. 22,160–174.
Hewitt, G.M., 1996. Some genetic consequences of ice ages, and their rolein divergence and speciation. Biol. J. Linn. Soc. 58, 247–276.
Hewitt, G.M., 2000. The genetic legacy of the Quaternary ice ages. Nature405, 907–913.
Hewitt, G.M., 2004. Genetic consequences of the climatic oscillations inthe Quaternary. Phil. Trans. R. Soc. Lond. B 39, 183–195.
Hickerson, M.J., Dolman, G., Moritz, C., 2006. Comparative phylogeo-graphic summary statistics for testing simultaneous vicariance. Mol.Ecol. 15, 209–223.
Hollin J.T., Schilling, D.H., 1981. Late Wisconsin-Weichselian mountainglaciers and small ice caps. In: Denton, G.H., Hughes, T.J. (Eds.), TheLast Great Ice Sheets Wiley, New York. pp.179–206.
Huelsenbeck, J.P., Ronquist, F., 2001. MRBAYES: Bayesian inference ofphylogeny. Bioinformatics 17, 754–755.
Hulton, N.R.J., Purves, R.S., McCulloch, R.D., Sugden, D.E., Bentley, M.J.,2002. The last glacial maximum and deglaciation in southern SouthAmerica. Quater. Sc. Rev. 21, 233–241.
Iriondo, M.H., Garcia, N.O., 1993. Climatic variation in the Argentineplains during the last 18000 years. Palaeogeogr. Palaeoclimatol. Palae-oecol. 101, 209–220.
Irschick, D.J., ShaVer, H.B., 1997. The polytypic species revisited: morpho-logical diVerentiation among tiger salamanders (Ambystoma tigrinum)(Amphibia: Caudata). Herpetologica 53, 30–49.
Irwin, D.E., 2002. Phylogeographic breaks without geographic barriers togene Xow. Evolution 56, 2383–2394.
Jennings, W.B., Edwards, S.V., 2005. Speciational history of Australinagrass Wnches (Poephila) inferred from thirty gene trees. Evolution 59,2033–2047.
Johnson, J.B., Dowling, T.E., Belk, M.C., 2004. Neglected taxonomy ofrare desert Wshes: congruent evidence for two species of leathersidechub. Syst. Biol. 53, 841–855.
Kim, I., Phillips, C.J., Monjeau, J.A., Birney, E.C., Noack, K., Pumo, D.E.,Sikes, R.S., Dole, J.A., 1998. Habitat islands, genetic diversity, and geneXow in a Patagonian rodent. Mol. Ecol. 7, 667–678.
Klicka, J., Zink, R.M., 1999. The importance of recent ice ages in specia-tion: a failed paradigm. Science 277, 1666–1668.
Knowles, L.L., 2000. Tests of Pleistocene speciation in montane grasshop-pers from the sky islands of western North America (Genus Melan-opus). Evolution 54, 1337–1348.
Knowles, L.L., 2001. Did the Pleistocene glaciations promote divergence?Tests of explicit refugial models in montane grasshoppers. Mol. Ecol.10, 691–701.
Knowles, L.L., 2004. The burgeoning Weld of statistical phylogeography. J.Evol. Biol. 17, 1–10.
Knowles, L.L., Maddison, W.P., 2002. Statistical phylogeography. Mol.Ecol. 11, 2623–2635.
Kocher, T.D., Thomas, W.K., Meyer, A., Edwards, S.V., Paabo, S., Villa-blanca, F.X., Wilson, A.C., 1989. Dynamics of mitochondrial DNAevolution in animals: ampliWcation and sequencing with conservedprimers. Proc. Nat. Acad. Sci. USA 86, 6196–6200.
Kozak, K.H., Larson, A., Bonett, R.M., Harmon, L.J., 2005. Phylogeneticanalysis of ecomorphological divergence, community structure, anddiversiWcation rates in dusky salamanders (Plethodontidae: Desmogna-thus). Evolution 59, 2000–2016.
Kozak, K.H., Weisrock, D.W., Larson, A., 2006. Rapid lineage accumula-tion in a non-adaptive radiation: phylogenetic analysis of diversiWca-tion rates in eastern North American woodland salamanders(Plethodontidae: Plethodon). Proc. R. Soc. B 273, 539–546.
Lamoreaux, J.F., Morrison, J.C., Ricketts, T.H., 2006. Global tests of bio-diversity concordance and the importance of endemism. Nature 440,212–214.
LaPointe, F.J., Rissler, L.J., 2005. Congruence, consensus, and the compar-ative phylogeography of codistributed species in California. Am. Nat.166, 290–299.
Lemmon, A.R., Milinkovitch, M.C., 2002. The metapopulation geneticalgorithm: and eYcient solution for the problem of large phylogenyestimation. Proc. Nat. Acad. Sci. USA 99, 10516–10521.
Lessa, E.P., Cook, J.A., Patton, J.L., 2003. Genetic footprints of demo-graphic expansion in North America, but not Amazonia, during theLate Quaternary. Proc. Nat. Acad. Sci. USA 100, 10331–10334.
Leviton, A.E., Gibbs, R.H., Heal, E., Dawson, C.E., 1985. Standards in herpe-tology and ichthyology: Part 1. Standard symbolic codes for institutionalresource collections in herpetology and ichthyology. Copeia 1985, 802–832.
Lobo, F., 2001. A phylogenetic analysis of lizards of the Liolaemus chilien-sis group (Iguania: Tropiduridae). Herpetol. J. 11, 137–150.
Lobo, F., Kretzschmar, S., 1996. Descripción de una nueva especie de Lio-laemus (Iguania: Tropiduridae) de la Provincia de Tucumán, Argen-tina. Neotropica 42, 33–40.
Macey, J.R., Schulte II, J.A., Ananjeva, N.B., Larson, A., Rastegar-Pouy-ani, N., Shammakov, S.M., Pappenfuss, T.J., 1998. Phylogenetic

Autho
r's
pers
onal
co
py
972 M. Morando et al. / Molecular Phylogenetics and Evolution 43 (2007) 952–973
relationships among agamid lizards of the Laudakia caucasia speciesgroup: testing hypotheses of biogeographic fragmentation and an areacladogram for the Iranian Plateau. Mol. Phylogenet. Evol. 10, 118–131.
Macey, J.R., Wang, Y., Ananjeva, N.B., Larson, A., Pappenfuss, T.J., 1999.Vicariant patterns of fragmentation among gekkonid lizards of thegenus Teratoscincus produced by the Indian collision: a molecular phy-logenetic perspective and an area cladogram for Central Asia. Mol.Phylogenet. Evol. 12, 320–332.
Malhotra, A., Thorpe, R.S., 2000. The dynamics of natural selection andvicariance in the Dominican anole: patterns of within-island molecularand morphological divergence. Evolution 54, 245–258.
Markgraf, V., McGlone, M., Hope, G., 1995. Neogene paleoenvironmentaland paleoclimatic change in southern temperate ecosystems: a south-ern perspective. TREE 10, 137–178.
Martínez Oliver, I., Lobo, F., 2002. Una nueva especie de Liolaemus delgrupo alticolor (Iguania: Liolaemidae) de la Puna Salteña, Argentina.Cuad. Herp. 16, 47–64.
Masta, S.E., Laurent, N.M., Routman, E.J., 2003. Population genetic struc-ture of the toad Bufo woodhousii: an empirical assessment of haplotypeextinction on nested cladistic analysis. Mol. Ecol. 12, 1541–1554.
McCulloch, R.D., Bentley, M.J., 1998. Late glacial ice advances in theStrait of Magellan, southern Chile. Quaternary Sci. Rev. 17, 775–787.
McCulloch, R.D., Bentley, M.J., Purves, R.S., 2000. Climatic inferencesfrom glacial and palaeoecological evidence at the last glacial termina-tion, southern South America. J. Quaternary Sci. 15, 409–417.
McDonald, J.H., Kreitman, M., 1991. Adaptive protein evolution at theAdh locus in Drosophila. Nature 54, 1218–1233.
Morando, M., Avila, L.J., 1999. Geographic distribution: Liolaemus graci-lis. Herpetol. Rev. 30, 110.
Morando, M., Avila, L.J., Sites, J.W. Jr., 2003. Sampling strategies fordelimiting species: genes, individuals, and populations in the Liolaemuselongatus-kriegi complex (Squamata: Liolaemidae) in Andean–Patago-nian South America. Syst. Biol. 52, 159–185.
Morando, M., Avila, L.J., Baker, J.J., Sites, J.W. Jr., 2004. Phylogeny andphylogeography of the Liolaemus darwinii complex (Squamata: Liola-emidae): evidence for introgresión and incomplete lineage sorting. Evo-lution 58, 842–861.
Moritz, C., Patton, J.L., Schneider, C.J., Smith, T.B., 2000. DiversiWcationof rainforest faunas: an integrated molecular approach. Ann. Rev.Ecol. Syst. 31, 533–563.
Nei, M., 1987. Molecular evolutionary genetics. Columbia Univ. Press,NY.
Nielsen, R., Wakeley, J.W., 2001. Distinguishing migration from isolation:an MCMC approach. Genetics 158, 885–896.
Nordborg, M., 2001. Coalescent theory. In: Balding, D., Bishop, M., Can-nings, C. (Eds.), Handbook of Statistical Genetics. Wiley, Chichester,United Kingdom, pp. 1–37.
Nuñez, H., Navarro, J., Veloso, A., 2000. Liolaemus foxi, una nueva especiede lagarto para el norte de Chile (Squamata: Reptilia: Sauria). Bol.Mus. Nac. Hist. Nat. Chile 49, 117–130.
Palumbi, S.R., 1996. Nucleic acids I: the polymerase chain reaction. In:Hillis, D.M., Moritz, C., Mable, B.K. (Eds.), Molecular Systematics,2nd Ed. Sinauer Associates, Sunderland, MA, pp. 205–247.
Pascual, R., 1984. La sucesión de las edades mamífero, de los climas y deldiastroWsmo sudamericano durante el Cenozoico: fenómenos concur-rentes. An. Acad. Nac. Cs. Ex. Fcas. y Nat. 36, 15–37. Buenos Aires.
Pascual, R., Ortiz Jaureguizar, E., 1990. Evolving climates and mammalfaunas in Cenozoic South America. J. Hum. Evol. 19, 23–60.
Petit, R.J., Aguinagalde, I., de Beaulieu, J.L., 2003. Glacial refugia: hot-spots but not melting pots of genetic diversity. Science 300, 1563–1565.
Pfenninger, M., Posada, D., 2002. Phylogeographic history of the land snailCandidula unifasciata (Helicellinae, Stylommatophora): fragmentation,corridor migration, and secondary contact. Evolution 56, 1776–1788.
Pincheira-Donoso, D., Nuñez, H., 2003. Liolaemus robertoi, una nuevaespecie de los Andes del norte de Chile perteneciente al grupo ruibali(Iguania: Tropiduridae: Liolaeminae). Multequina 12, 1–15.
Posada, D., Crandall, K.A., 1998. Modeltest: testing the model of DNAsubstitution. Bioinformatics 14, 817–818.
Posada, D., Crandall, K.A., Templeton, A.R., 2000. GeoDis, a program forthe cladistic nested analysis of the geographical distribution of genetichaplotypes. Mol. Ecol. 9, 487–488.
Rabassa, J., Clapperton, C.M., 1990. Quaternary glaciations of the south-ern Andes. Quaternary Sci. Rev. 9, 153–174.
Ramos, V., 1989. The birth of southern South America. Amer. Sci. 77,444–450.
Rosenberg, N.A., Nordborg, M., 2002. Genealogical trees, coalescent the-ory and the analysis of genetic polymorphisms. Nature 3, 380–390.
Rozas, J., Rozas, R., 1999. DNASP, Version 3. An integrated program formolecular population genetics and molecular evolution analysis. Bioin-formatics 15, 174–175.
Schneider, S.D., Roessli, D., ExcoYer, L., 2000. Arlequin ver. 2.0: a soft-ware for population genetic data analysis. Genetics and Biometry Lab-oratory, University of Geneva, Switzerland.
Schulte II, J.A., Macey, J.R., Espinoza, R.E., Larson, A., 2000. Phyloge-netic relationships in the iguanid lizard genus Liolaemus: multiple ori-gins of viviparous reproduction and evidence for recurring Andeanvicariance and dispersal. Biol. J. Linn. Soc. 69, 75–120.
Simpson, B.B., 1975. Pleistocene changes in the Xora of the high tropicalAndes. Palaeobiology 1, 273–294.
Simpson, B.B., 1979. Quaternary biogeography of the high montaneregions of South America. In: W.E. Duellman (Ed.), The SouthAmerican Herpetofauna: its Origin, Evolution, and Dispersal, Uni-versity of Kansas, Museum of Natural History, Monograph No. 7,pp. 157–187.
Simpson, B.B., 1983. An historical phytogeography of the high AndeanXora. Rev. Chil. Hist. Nat. 56, 109–122.
Simpson-Vuilleumier, B.B., 1971. Pleistocene changes in the fauna andXora of South America. Science 173, 771–780.
Solbrig, O.T., 1976. The origin and Xoristic aYnities of the South Amer-ican temperate desert and semideserts regions. In: Goodall, D.W.(Ed.), Evolution of Desert Biota. Univ. of Texas Press, Austin, pp.7–49.
Starkey, D.E., ShaVer, H.B., Burke, R.L., 2003. Molecular systematics, phy-logeography, and the eVects of Pleistocene glaciation in the paintedturtle (Chrysemys picta) complex. Evolution 57, 119–128.
Sugden, D.E., Hulton, N.R.J., Purves, R.S., 2002. Modelling the inceptionof the Patagonian ice sheet. Quaternary Int. 95–96, 55–64.
SwoVord, D.L., 2002. PAUP*: Phylogenetic analysis using parsimony(*and other methods), Beta Version 4.0.b5b. Sinauer Associates, Sun-derland, MA.
Tajima, F., 1989. The eVect of change in population size on DNA poly-morphism. Genetics 123, 597–601.
Taberlet, P., Fumagalli, L., Wust-Saucy, A.G., Cosson, J.F., 1998. Compar-ative phylogeography and postglacial colonization routes in Europe.Mol. Ecol. 7, 453–464.
Templeton, A.R., 1998. Nested clade analyses of phylogeographic data,testing hypotheses about gene Xow and population history. Mol. Ecol.7, 381–397.
Templeton, A.R., 2001. Using phylogeographic analyses of gene trees totest species status and processes. Mol. Ecol. 10, 779–791.
Templeton, A.R., 2004. Statistical phylogeography: methods of evaluatingand minimizing inference errors. Mol. Ecol. 13, 789–809.
Templeton, A.R., Crandall, K.A., Sing, C.F., 1992. A cladistic analysis ofphenotypic associations with haplotypes inferred from restrictionendonuclease mapping and DNA sequence data. III. Cladogram esti-mation. Genetics 132, 619–633.
Templeton, A.R., Sing, C.F., 1993. A cladistic analysis of phenotypic asso-ciations with haplotypes inferred from restriction endonuclease map-ping. IV. Nested analyses with cladogram uncertainty andrecombination. Genetics 134, 659–669.
Templeton, A., Routman, R.E., Phillips, C.A., 1995. Separating populationstructure from population history: A cladistic analysis of the geograph-ical distribution of mitochondrial DNA haplotypes in the tiger sala-mander, Ambystoma tigrinum. Genetics 140, 767–782.
Thorson, R.M., 1999. The glacial limit in South America and its role inbiogeography: Darwin’s observations. Ciencia al DÂa 4, 1–15.

Autho
r's
pers
onal
co
py
M. Morando et al. / Molecular Phylogenetics and Evolution 43 (2007) 952–973 973
Verrastro, L., Veronese, L., Bujes, C., Martins, E., Fias Filho, M., 2003.New species of Liolaemus from Southern Brazil (Iguania: Tropiduri-dae). Herpetologica 59, 105–118.
Victoriano, P.F., Ortiz, J.C., Benavides, E., Adams, B.J., Sites, J.W., Jr., inprep. Comparative phylogeography of three co-distributed species ofChilean Liolaemus (Squamata: Tropiduridae) from the central-south-ern Andean range.
Villagrán C., Moreno, P., Villa, R., 1995. Antecedentes palinológicos acerca dela historia cuaternaria de los bosques chilenos. In: Armesto, J.J., Villagran,C., Arroyo, M.T.K. (Eds.), Ecología de Los Bosques Nativos de Chile.Editorial Universitaria, Universidad de Chile, Santiago, pp. 51–53.
Villagrán, C., Le-Quesne, C., Aravena, J.C., Jiménez, H., Hinojosa, F.,1998. El rol de los cambios de clima del Cuaternario en la distribuciónactual de la vegetación de Chile central-sur. Bamberger GeographischeSchriften 15, 227–242.
Wake, D.B., Schneider, C.J., 1998. Taxonomy of the plethodontid sala-mander genus Ensatina. Herpetologica 54, 279–298.
Wayne, M.L., Simonsen, K., 1998. Statistical test of neutrality in the age ofweak selection. TREE 13, 236–240.
Wiens, J.J., Penkrot, T.A., 2002. Delimiting species using DNA and mor-phological variation and discordant species limits in spiny lizards(Sceloporus). Syst. Biol. 51, 69–91.
Whiting, A.S., Bauer, A.M., Sites Jr., J.W., 2003. Phylogenetic relationshipsand limb loss in sub-Saharan African scincine lizards (Squamata: Scin-cidae). Mol. Phyl. Evol. 29, 582–598.
Wilcox, T.P., Zwickl, D.J., Heath, T.A., Hillis, D.M., 2002. Phylogeneticrelationships of the dwarf boas and a comparison of Bayesian andbootstrap measures of phylogenetic support. Mol. Phyl. Evol. 25,361–371.
Yang, Z., 1994. Estimating the pattern of nucleotide substitution. J. Mol.Evol. 39, 105–111.
Zamudio, K.R., Greene, H.W., 1997. Phylogeography of the bush-master(Lachesis muta: Viperidae): implications for neotropical biogeography,systematics, and conservation. Biol. J. Linn. Soc. 62, 421–442.


